LABORATORY (ACL) Volume 3: Inorganic Instrumental AU6f ...
582
PNL-MA-599 Analytical ChemistryLaboratory Department ANALYTICAL CHEMISTRY LABORATORY (ACL) PROCEDURE COMPENDIUM Volume 3: Inorganic Instrumental AU6f 81993 Methods 0 S T I Upon termination or transfer this manual shall _v4L., be returned to Document Control, K3-70 Approved for Use DISCLAIMER and Application, by f" This report was prepared as an account of work sponsored by an agency of the United States Government. Neither the United States Government nor any agency thereof, nor troy of their employees, makes any warranty, express or implied, or assumes any legal liability or responsi- bility for the accuracy, completeness, or usefulness of any information, apparatus, product, or process disclosed, or represents that its use would not infringe privately owned rights. Refer- ence herein to any specific commercial product, process, or service by trade name, trademark, A. G. King manufacturer, or otherwise does not necessarily constitute or imply its endorsement, recom- Departmen_/_anager mendation, or favoring by the United States Government or any agency thereof. The views and opinions of authors expressed herein do not necessarily state or reflect those of the United States Government or any agency thereof. Battelle Pacific Northwest Laboratories Richland, Washington _ _..,tj.,._;; _ _:/_1_ DI_TItlBUTION OF DilS OOClIM[NTtSUNLIMITEII
-
Upload
khangminh22 -
Category
Documents
-
view
0 -
download
0
Transcript of LABORATORY (ACL) Volume 3: Inorganic Instrumental AU6f ...

PNL-MA-599
Analytical ChemistryLaboratory Department
ANALYTICAL CHEMISTRYLABORATORY (ACL)PROCEDURE COMPENDIUM
Volume 3: Inorganic Instrumental AU6f 8 1993
Methods 0 S T I
Upon termination or transfer this manual shall _v4L.,be returned toDocument Control, K3-70
Approved for Use DISCLAIMERand Application, by f"
This report was prepared as an account of work sponsored by an agency of the United StatesGovernment. Neither the United States Government nor any agency thereof, nor troy of theiremployees, makes any warranty, express or implied, or assumes any legal liability or responsi-
bility for the accuracy, completeness, or usefulness of any information, apparatus, product, or
process disclosed, or represents that its use would not infringe privately owned rights. Refer-ence herein to any specific commercial product, process, or service by trade name, trademark,
A. G. King manufacturer, or otherwise does not necessarily constitute or imply its endorsement, recom-
Departmen_/_anager mendation, or favoring by the United States Government or any agency thereof. The views
and opinions of authors expressed herein do not necessarily state or reflect those of theUnited States Government or any agency thereof.
BattellePacific Northwest Laboratories
Richland, Washington _ _..,tj.,._;;_ _:/_1_
DI_TItlBUTIONOF DilS OOClIM[NTtS UNLIMITEII

INTERIM CHANGE NOTICE
(ICN) ICN - PNL-MA-599-Vol .3-IPage I of i_____
A.Document Number: See Attachment Revision Number: Effective Date
Document Title: See Attachment of ICN: 12 / 23 / 92
Change Requested by:
Document's Original Author: See Attachment AG Kinq
B. Action: Place the attached procedures in PNL-MA-599 manual, Volume 3. Placethis ICN and attachment _ith the Table of Contents.
C. Effect of Change: Incorporates the procedures from the PNL-MA-597 manual intoPNL-MA-599.
D. Reason for Change/Description of Change:
Incorporates the procedures from PNL-MA-597 manual into PNL-MA-599 manual bychanging the procedure numbers. This eliminates the need for maintaining twosets of technical procedures. Procedural references in these procedures havebeen updated. See attachment for the procedures to be incorporated intoPNL-MA-599 manual, Volume 3.
_. Approval Signatures: Type of Change: (Check one):
(Please sign and date) _ Minor Major
Process __,Quality Department: TL Ehlert /_ Date: /_ / ._._/_2__/1 ..,! -
_' _'_ j,_', Date" I_ / z S/ tApproval Authority: AG Kinq "(" _,,-/-7
Other Approvals: ," Date: / / ,,.
: Date: / / ,.

ICN- PNL-HA-599- Vo|.3-1
New Doc# Rev. Author Document Title Old Doc#
PNL-ALO-223 0 MC Burt Oxygen to metal ratio 2-30.5Thermogravimetry
PNL-ALO-224 0 MC Burt Weight loss upon ignition 2-30.7
PNL-ALO-229 0 MC Burt Uranium by Automated 2-30.8PotentiometricTitration
PNL-ALO-231 0 FE Holt Separation of carbon from 7-40.16soil/sediment/sludgesamples
PNL-ALO-233 0 MC Burt PlutoniumPurificationby 2-30.9Ion Exchange
PNL-ALO-237 0 MC Burt Total Nitrogen by fusion and 2-40.7Gas Chromatography
PNL-ALO-238 0 MC Burt Water by constant voltage 2-40.11Coulometry
PNL-ALO-240 0 MC Burt Carbon and Sulfur by 4-30.4 &Combustion and infrared 2-40.19absorption
PNL-ALO-241 0 MC Burt Total nitrogen by fusion and 4-30.6gas chromatography
PNL-ALO-242 0 RW Stromatt Surface Chloride and Fluoride 4-30.8using swab test
PNL-ALO-243 0 RW Stromatt Water leachablechloride and 4-40.3Fluoride in cloth and othermaterials
PNL-ALO-244 0 MW Goheen Vacuum Outgas of intrinsic 7-30.1Germanium Detector dewars
PNL-ALO-245 0 MW Goheen Gas mixing 7-30.4
PNL-ALO-246 0 SJ Bos Mass spectrometerisotopic 7-40.4analysis of gases
PNL-ALO-247 0 JJ McCown Analysis of metals, metal 7-40.6alloys and metal compoundsby x-ray fluorescence

ICN- PNL-MA-599- Vol.3-1
NewDoc# Rev. Author Document Tttle Old Doc#
PNL-ALO-249 0 DL Baldwin Hydrogen in Zircaloy by 7-40.I0inert gas fusion/gaschromatography
PNL-ALO-250 0 RF Keough Determinationof hydrogen 7-40.11in metals by the inert gasfusion method
PNL-ALO-251 0 RF Keough Determinationof oxygen 7-40.12in metals by the inert gasfusion method
PNL-ALO-254 0 MC Burt Impurity separation by 7-40.19liquid-liquidextraction
PNL-ALO-255 I MC Burt Spectrophotometricdeter- 7-40.20mination of reduced and totaliron in glass with 1,10phenanthroline
PNL-ALO-256 0 MC Burt Determinationof free acid 7-40.22in uranium/plutoniumsolutions
PNL-ALO-257 0 MC Burt Density of solutions 7-40.23
PNL-ALO-258 0 MW Goheen Isotopic analysis of Krypton 7-40.28and xenon in FFTF cover gas
PNL-ALO-259 0 RF Keough Determinationof hydrogen by 7-40.31combustion
PNL-ALO-260 0 MW Goheen Mass spectrometerisotopic 7-40.32analysis of lithium
PNL-ALO-261 0 MW Goheen Mass spectrometerisotopic 7-40.33analysis of cesium
PNL-ALO-262 0 MW Goheen Mass spectrometerisotopic 7-40.35analysis of lanthanideseries elements
PNL-ALO-263 0 RF Keough Operation of gas 7-40.44chromatographs

ICN- PNL-MA-599- Vol.3-1 _)
New Doc# Rev. Author Document Tttle Old Doc#
PNL-ALO-265 0 PK Melethil Determinationof total sodium 7-40.46on filters by flame atomicemission
PNL-ALO-266 I RW Sanders Procedures and quality 7-40.48control for energy dispersivex-ray fluorescencespectroscopyusing the BFP approachwith theKEVEX 0810A system
PNL-ALO-267 0 FE Holt Operation of the Canberra 7-40.51model 20 multichannelanalyzer
PNL-ALO-283 I ED Jenson Solids analysis: Microprobe HTA-3-5analysis
PNL-ALO-284 0 MW Goheen Quantitativeanalysis of gas 7-40.18 &samples HTA-4-34

PNL-NA-599 ANALYTICAL CHEHISTRY LABORATORY(ACL) PROCEDURECOMPENDIUHVolume 3: Inorganic Instrumental Hethods
April 5, ]993
TABLE OF CONTENTS
NO, OFDOCUHENT REV ICNS TITLE EFFECTIVE
NUHBER NUH ISSUED DATE
PNL-SP-7 0 2 ICP ANALYSIS (325 BUILDING) 6/02/87
7-40.7 0 0 SOLUTION ANALYSIS: CARBON 3/31/88
HWVP-2 0 0 FLUORIDEBY ELECTRODE 6/21/88
PNL-ALO-212 1 0 DETERMINATIONOF INORGANIC ANIONS 12/04/92BY ION CHROMATOGRAPHY
........................................ .........................
PNL-ALO-214 1 1 ARSENIC (ATOMIC ABSORPTION, FURNACE 05/11/92TECHNIQUE)
PNL-ALO-215 1 2 SELENIUM (ATOMIC ABSORPTION, 05/26/92FURNACETECHNIQUE)
PNL-ALO-216 0 2 . BISMUTH (ATOMIC ABSORPTION, FURNACE 05/21/92TECHNIQUE)
PNL-ALO-217 0 1 LEAD (ATOMIC ABSORPTION, FURNACE 05/21/92TECHNIQUE)
PNL-ALO-218 0 I CP AND lC DATA CALCULATIONS FOR SST 09/26/90SAMPLES
PNL-ALO-219 0 0 ANTIMONY (ATOMIC ABSORPTION, 04/23/92FURNACETECHNIQUE)
PNL-ALO-220 0 1 THALUUM (ATOMIC ABSORPTION, 05/21/92FURNACETECHNIQUE)
PNL-ALO-221 0 1 SILVER (ATOMICABSORPTION, FURNACE 05/08/92TECHNIQUE)
i

PNL-HA-599 VOLUME3April 5, ]993
NO. OFDOCUMENT REV ICNS TITLE EFFECTIVE
NUMBER NUM ISSUED DATE
PNL-ALO-226 0 2 AMMONIA (NITROGEN)IN AQUEOUS 08/25/92SAMPLES
PNL-ALO-227 0 1 DETERMINATION OF CR(VI) IN AQUEOUS 05/07/92SAMPLES
PNL-ALO-228 0 0 DETERMINATION OF HYDROXYL (OH"') 03/07/92AND ALKALINITYOF AQUEOUS SOLUTIONS,LEACHATESAND SUPERNATES
ii

PNL-HA-599 VOLUME3April 5, 1993
NO. OFDOCUMENT REV ICNS TITLE EFFECTIVENUMBER NUM ISSUED DATE
::::::::::::::::::::::::::::::::::::::::_
____ .................................
___ _ _ :" __i_l_i_i_t_,.._'_i_i_iz_ :,_i_..................................................._l__ii_i_____.,._ ..........___
......... ___i!i_ii_i___i_i_l_ .........................................
................................ __ii i__i__iii_ ........................"i'ii

PNL-MA-599 VOLUME3April 5, 1993
NO. OFDOCUMENT REV I(,NS TITLE EFFECTIVE
NUMBER NUH I SSU_O DATE
._:ii_:i__ _ _ ...........
_:....:._::.:...:...:.__4/_""::!'......._"_ _...................................................................................................._ ___iii_ii_ ii__. :.'.Q__................................................_!__:.:.:.:............................
................................... _iiii__i_i_'.'_!__ .................
__i__ ............................
......................................................._#<Ti__.i___ ............................................................
PNL-ALO-270 0 1 TOTAL CYANIDE IN WATERS, SOLIDS OR 05/12/92SLUDGES
PNL-ALO-271 0 3 PROCEDUREFOR ANALYSIS OF FREE 12/03/92CYANIDE IN WATERAND SOLID SAMPLELEACHATES
PNL-ALO-272 0 1 SPECTROPHOTOMETRIC DETERMINATION 05/08/92OF HYDRAZINE CONCENTRATION USINGLAMBDA-1US/VIS SPECTROPHOTOMETER
PNL-ALO-280 0 1 INDUCTIVELYCOUPLED PLASMA-MASS 05/14/92SPECTROMETRIC(ICP-MS) ANALYSIS
iv

PNL-MA-599 VOLUME3April 5, 1993
NO. OFDOCUMENT REV ICNS TITLE EFFECTIVE
NUMBER NUM ISSUED DATE
PNL-ALO-282 0 2 DETERMINATIONOF URANIUM 10/28/91CONCENTRATION/ISOTOPICCOMPOSITIONUSINGICP-MS
.. o ..o-'.o :.;o;...;..o;o;.:o;.;.;.:.;....;.;.*.°.*;...;o.;.;o...;.;.;.:_.;:;;F;.;.:.:...°;°;°...%__;___;_'°;__;:_;___;_____:_:_:__:_:_;____°;__°___'_;__°;_:_;_;_;_:_:_____:_;°__;°___......;.:.;°..:o:.;.;..F;.,.;._. .°..°.O..o...o.°....°.........o..°....°.°.
......... __i_i ___iii@_iii__e_!_

dm '
PNL TEST PROCEDURE,.. , ,,,.
TITLE" 7-40.7, SOLUTIONS ANALYSIS" CARBON
I.0 /_pPLICABILITY
Thls procedure provides instructions for the analysis of aqueous solutlonsfor total organic carbon, inorganic carbon and total carbon using the UVllght catalyzed oxidation method.
2•0 DEFINITIONS
None.
3.0 RESPONSIBLE STAFF
Staff responsible for implementing this procedure are.
• Cognizant Scientist
• Anal yst
4.0
4•1 Eautoment and Materials
• Carbon analyzer (procedure based on Dohrmann DC_0 total organiccarbon analyzer)•
• Hypodermic syringes (25, 50, 250 and lO00 ul)•
• Carbon standards (10, 400 and 2000 ug/ml carbon) In aqueous solutionsof potassium acld phtha]ate --The 2000 ug/ml standar_ ts purchasedfrom the manufacturer or prepared as follows; dissolve 425 (+_1)mg NBS SRM-84 potassium acid phthalate In I5 M or better delonlzedwater as determined by the delonlzer readoutj add 0.1 ml concentratedphosphoric actd and dilute the solutions to i00 ml• The i0 and 400ug/ml standards are prepared by diluting the 2000 ug/m] standard•The l0 ug/m] standard should be prepared fresh the day tt ts used•WARNING; Because of the potential for biodegradation of the standard,tt Is to be stored In a refrigerator to mlnlmlze the biodegradationprocess• Before use, the solution shall be checked visually; andtf any precipitation ls observed, a new 2000 ug/m] standard shallbe prepared.
• Oxidizing reagent (2 to 3.5 wt_ K2S208 In 0.2 vol_ concentratedH3P04).
Concurrence gate Appr(_e_ A _ Date.
Prepared by_ . / / / Date qAD_13d_/currence. Date
Procedure No_/ Revision No. ec ive ate Page of
7-40.7 0 3/31/88 1 3

,jPNL TEST PROCEDURE
4,2 Method _-
Total carbon fs determined by Injecting the sample into an actdlcoxidizing reagent that flows through an ultravlolet light catalyzedreactor. A11 the carbon is converted to CO2, which is measured bya nondispersive infrared detector. DetectoF response is convertedelectronically to carbon concentration in the sample. Total organiccarbon Is determined by acidifying the sample, purging the CO2 fromthe solutlon, and injecting the inorganic carbon-free sample Intothe analyzer.
Inorganic carbon can be measured indirectly by subtracting theresults of the total organic carbon from the results of the totalcarbon measurement. A direct determination of inorganic carbon ismade by injecting the sample Into the analyzer after replacing theoxidizing solution with acld or turning off the ultraviolet lightin the analyzer and allowing the reactor solution to cooi.
4.3 Callbratlon
Perform the following steps according to the instrument's operatingmanual (see Section 5.0).
Step 1) Turn on detector and reaction module power, UV lamp, pump,and oxygen. AIlow detector current to stabilize.r
f
: Step 2) Set the instrument to the appropriate range- l-ml forthe 10 ppm calibration, 200-ul for 400 ppm or 40 ul for2000 ppm.
Step 3) Inject the standard into the instrument and depress STARTimmediately, When the determination Is completed, theREADY llght wlll glow.
Step 4) Repeat the determinations until two successive resultsare within 1_ relative.
Step 5) Depress the CALIBRATE switch,
4.4 Sample Analysts
Step 1) Set the instrument to the concentration range used forthe calibration (Sectlon 4,3).
Step 2) To determine total carbon inject the sample (sample volumets set according to instrument range used) and press STARTas in Section 4,3,
Step 3) To determine inorganic carbon turn off the UV lamp and
wait 10 mlnutes, Inject sample as in Step 2 and press START. (@
Procedure No. Revision No. Effective Date Page of
7-40.7 0 3/31/88 2 3

/
iiii i
PNL TEST PROCEDURE
Step 4) To detemlne total organic carbon place about 5-ml (orless) In test tube and acidify wtth concentrated phosphoricactd. Place a drop of the acidified solution on pHIndicator paper; If the pH ts <_than about 3 continue asfollows otherwise add more actd and repeat acldtty check•Place the sample on the external sparger, and bubble gasthrough the sample 5-mtn. Then inject the sample andpress START.
Step 5) If a dilution Is used tt may be necessary to detemtne adiluent blank•
4•5 Calculations
If an undiluted _=ampleIs analyzed, record the instrument readout,R• If a diluted sample ts analyzed, use the following equations•
c = z_[R -V1 vz
where, C = carbon concentration, ppm
i_ = final volume, ml= Inltlal volume, ml
• = carbon reading tn sample, ppmB = carbon reading tn blank, ppm
4.6 Records
Records will be controlled according to PAP-1701. Laboratorynotebooks will be controlled according to PAP-1704•
4•7 Procedure Qualification
None required• Thts procedure Is self-qualifying due to ttsdependence on analytlcal standards•
5•0 REFERENCES
• DohrmannDC80 Total Oraantc Carbon Analysts System Eautoment Manual,v
XERTEX,Dohnnann, Santa Clara, CA.
Procedure Ito. RevJston tlo. Effective Date Page of
7-40.7 0 3/31/88 3 3

o
PNL TEST PROCEDURE,,
TITLE: HWVP-2; FLUORIDE ION IN AQUEOUS SAMPLES
1.0 APPLICABILITY
This procedure is applicable for the analyses of fluoride ionconcentration in aqueous samples using the fluoride specific ionelectrode.
2.0 DEFINITIONS
Total Ionic Strength Adjustor (TISAB)- Solution to provide a constantbackground ionic strength, decomplex fluoride and adjust solution pH.
3.0 RESPONSIBLE STAFF
Responsible ScientistCognizant Staff
4.0 PROCEDURE
4.1 Summary of method
An aliquot of the sample is mixed with TISAB and the fluoride iondetermined using the specific fluoride ion electrode using theknown addition method.
4.2 Specific Qualification
4.2.1 A RESPONSIBLESCIENTIST shall supervise the individualperforming the analyses.
4.2.2 The COGNIZANT STAFF shall follow this procedure inperforming the analyses.
4.3 Reagent
4.3.1 Fluoride Standard Solution (1.0 ml = 1.0 mg F)
Dissolve 2.210 + O.O05g of sodium fluoride in water anddilute to I liter. Store in a polypropylenebottle. Orpurchase a certified 1.00 g/L fluoride stam ard solution.
o, eD. L. Widri9 4/Z///°°_ /_Ki-_c{_ownPrepared by Date _ Concurrence
F. T. Hara _I"H_-,_- (;f?_,/,, L.J. Ethridge --__tPae_-g_ d_ (_/_),/_R_/Procedure No. Revision No. EffectiveDate of
HWVP-2 0 6/21/88 I 5

PNL TEST PROCEDURE
4.3.2 100 ppm FluorideStandardWith TISABIII
Pipet25 ml of 1000ppm fluoridestandardsolutionintoa250 ml volumetricflask.Add 25 ml of TISAB III solutionintothe flaskand diluteto volumewith demineralizedwater.Storethis solutionin a polypropylenebottle.
4.3.3 10 ppm FluorideStandardWith TISABIII
Pipet25 ml of 100 ppm fluoridestandardfrom 4.3.2 intoa250 ml volumetricflask. Add 25 ml of TISABIII solutionintothe flaskand diluteto volumewith demineralizedwater. Storethis solutionin a polypropylenebottle.
4.3.4 TISABIII
A commerciallyavailablebufferingmixturecontainingaceticacid,NaCl,and CDTA used to decomplexfluorideion.
4.4 SampleLogqinqProcedure
4.4.1 COGNIZANTSTAFFshalllog the sampleonto the samplelogsheet. Seriesof similarliquidsampleswhich requirenospecialsamplepreparationexceptsampledilutioncan beloggedunderone laboratoryserialnumbersincethecustomer'ssampleidentificationmaintainstraceability.Sampleswhichrequirea sampleweighingor uniquesamplepreparation(e.g.fusion)shallbe loggedwith separatelaboratoryserialnumber.
4.4.2 For each laboratoryserialnumber,preparea "ReportofAnalysis"card (Exhibit1) whichuniquelyidentifieseach customer'ssample. Any analysiswhich requiresweighingthe sampleor uniquesamplepreparation(e.g.fusion)shallhave the data writtenon the back of theanalysiscard. Theseentriesshallbe datedand signedbythe COGNIZANTSTAFFperformingthe analysis.
4.5 Calibrationand Analysesof Sample
4.5.1 Turn the slopethumbwheelswitchesto read about-56.0. Ifthe instrumenthad been used previouslyfor fluorideanalysis,do not changesettingfrompreviousvalues.
4.5.2 If the SET BLANKbuttonis lit, pressto turn it off.
4.5.3 Turn STD thumbwheelswitchesto read ]0.0.
4.5.4 Set the mode switchKA]O.
ProcedureNo. RevisionNo. EffectiveDate Page ofHWVP-2 0 6/21/88 2 5

PNL TEST PROCEDURE
4.5.5 For setting blank correction, place the electrode in 2.5 mlof distilled water. Add 250 microliter of TISAB. Allowthe reading to stabilize. Press th_ C!.EAR/READMVbutton.
4.5.6 Press SETCONCNbutton. The display may be unstable.
4.5.7 Pipet 250 microliter of ]0 ppmstandard fluoride into blank.Allowtime for readingto stabilize.
4.5.8 PressSET BLANKbutton. The buttonlightwill turn on.
4.5.9 Rinsethe electrode,blotdry and place2.5 ml of 10 ppmstandardintothe disposablebeaker. Add 250 microliterofTISABto the beaker. PressCLEAR/READMV button.
4.5.10Allowtime for readingto stabilize. PressSET CONCNbutton.
4.5.11Pipet250 microliterof 10 ppm standardto the beaker. Ifreadingis not 10.0_+.Ippm, adjustthe thumbwheel_witchesso the displayreads10.00ppm.
4.5.12Run the .I, 1.0 and 10 ppm solution, Recordthesevaluesinthe notebooklocatedat this station.
4.5.13Fluorideconcentrationin the sampleis measuredbypipetting2.5 ml sampleinto a disposablebeaker. Add 250microliterof TISAB. Placethe electrodein the sampleandpressthe CLEAR/READMV button.
4.5.14Allowtime for readingto stabilize. PressSET CONCNbutton.The displaymay be unstableif the fluorideconcentrationin the sampleis very low.
4.5.]5Pipet250 microliterof the 10 ppm standardinto the samplecup.
4.5.16Allowthe readingto stabilize.Recordthe sampleconcentrationfrom the display.
4.6 Calculation
The ORIONRESEARCHmicroprocessorIonalyzer/g01calculatestheresultsautomatically.The formulafor calculatingtheseresultsis givenin the ORIONoperationmanual.
4.7 ReportinqResults
Upon completionof the analysisthe COGNIZANTSTAFFshalltabulatethe valuesto be reportedonto the frontof the "Reportof
ProcedureNo. RevisionNo. EffectiveDate Page of
HWVP-2 0 6/21/88 3 5

PNL TEST PROCEDURE
Analysis" card. These entries shall be signed and dated by theCOGNIZANTSTAFF. The RESPONSIBLESCIENTIST shall review theresults for acceptability and document this review by signing anddating the "Report of Analysis" card. The "Report of Analysis"
card shall be xeroxed and the xeroxed copy submitted to thecustomer. The original "Report of Analysis" card shall be retainedin the laboratory for at least one year.
Procedure No. Revision No. Effective Date Page of
HWVP-2 0 6/21/88 4 5

#
PNL TEST PROCEDURE
BNW ANALYTICAL LABORATORY -- 3720 BLDG.
#.)Ballelle . po.-r .N..¥s,sPacific Northwest Laboratories
i i i |
Serial No. CONSTITUENT ANALYSIS
Sample 01
Source
For Sampling Date Time AMArea PM
Submitted By
Remarks
i ii
Date Reported Time AMPM
Analyst Report Approved
A.1700-165 (7-79)
EXHIBITI
Procedure No. Revision No. EffectiveDate Page of
HWVP-2 0 6/21/88 5 5

INTERIM CHANGE NOTICE4
ICNICN-PNL-ALO-211.2 R 0PAGE1 OF 1
A. Document Number: PNL-ALO-211.2 Revision Number: 0 Effective
Date of ICN:
DocumentTitle:Determinationof Elements b.yInductively 2/23/93,C,oupled Arqon Plasma Atomic EmissionsSpectrometry
Document's Original Author JJ Waqner ChangeRequestedby:R.MNipper
B.Action:Replacepages 15 & 16 with the attached pages 15 & 16.
c.Effectof Change:This change will give a more accurate records requirementresource.
D. Reason for Change/Description of Change:
Reason:1. Deletes inaccurate information.
Description:I. Replaced: PNL-MA-70, PAP-70-1701with the Analytical Chemistry Lab
(ACL) Quality Assurance Plan (QAP) MCS-033.
2. Replaced: "LRB's will be used in accordancewith the ACT Now Directive89.1" with "LRB's will be used in accordancewith established recordsmanaqement practices."
IE. Approval Signatures: I Type of Change (Check (,#)one)
(Please Sign and Date) I (J) Minor Change ( ) Major Change
QP Concurrence: TL Ehlert Date: ._/_<_'/_'5
Approval Authority: AG Kinq_ . _ Date: a/_J'/C) ?
Other Approvals: JJ Waqner_c.. ___ Date: _._d_--_.. _-_-<
C _ "_'_ ._._ "-,...k2.._t_: _b,._, _'_ fd.,,.."_ Date:..)

!
PNLTECHNICALPROCEDURE
TITLE: PNL-ALO-211,DETERMINATION OF ELEMENTS BY INDUCTIVELY COUPLED ARGONPLASMA ATOMIC EMISSION SPECTROMETRY
APPLICABILITY
This procedure is applicable for determining the concentration of inorganicanalytes in aqueous samples and leachates from solids (for example, soils andsediments). The methodology is comparable to EPA Method 200.7 CLP-M. Solidsamples shall be subjected to an appropriate dissolution procedure beforeanalysis, such as PNL-ALO-I01.
DEFINITIONS/ACRONYMS
Batch: A group of samples of similar matrix prepared at the same time.
RESPONSIBLE STAFF
Cognizant ScientistTechnician/Analyst
PROCEDURE
1.0 Tolerances
Tolerances for all measurementsmade during an analysis shall be specifiedas follows : I) a tolerance limit may be stated with a measurement valuegiven in a method, or 2) if a tolerance limit is not stated with ameasurement value, then the following system of tolerances shall be ineffect:
a. Unless otherwise specified,all values for measurements stated in themethods, such as volume, weight, time, etc., are approximate values.The actual measurements used, however, shall be within I0% of thestated value.
i" Te¢lipic'='lRevi,_w]_" Oat _l:in,Wgr. ; _ Oat, Other O=_e
' ...... 'i, ;zI.
Procedure No. " 1_evision_v/] "I " Effective Dite " Pige 'ofPNL-ALO-211 3 A_I_2 6 I_| I 17
.........

i
i
PNLTECHNICALPROCEDURE
b. When one or more significant figures are given to the right of thedecimal point, the tolerance limit is + 0.5 of the least significantdigit. The maximum number of significantfigures for this method isthree.
c. All class "A" glass pipets shall be considered sufficiently accurate(1% or better) for use without verification, provided that a visualinspection of the pipet reveals no evidence of breaks or chips to theglass tip or other obvious damage.
d. Mechanical or electronicallyoperated pipets shall be verified by theuser, before and after single or repetitive deliveries, by weighingat least one aliquot of water. The equivalent volume determined by theweight of the aliquot measured shall be within the manufacturersstatedaccuracy, typically0.8% or better, for volumes greater than 500 pL.
2.0 Summary of Method
ICP-AES is a technique for the simultaneous or sequential multi-analytedetermination of inorganic analytes in solution. The basis of the methodis the measurementof atomic emissionby an optical-spectroscopictechnique.Aqueous or solubilized solutions of solid samples are nebulized and theaerosol that is produced is transportedto a plasma torch where excitationoccurs. Characteristicatomic-lineemission spectra is produced by a radiofrequency inductivelycoupled argon plasma (ICP). The spectra is dispersedby a grating spectrometer and intensities of the lines monitored byphotomultiplier tubes. Photocurrents from the photomultiplier detectortubes are processed by a computer system.
3.0 Interferences
3.1 Several types of interferenceeffects may lead to inaccuraciesin thedeterminationof trace inorganic analyte concentrations.
3.1.1 Spectral interferences can be classified as I) overlap of aspectral line from another element, 2) unresolved overlap ofmolecular band spectra, 3) background contribution fromcontinuum or recombination phenomena, and 4) backgroundcontribution from stray light by intense line emission ofelements present in high concentrations.
3.1.1.1 Overlap interferencewill beminimizedusingacomputercalculatedadjustmentof the analyte data, based uponthe measured intensityof the interfering element.
Procedure No. Revision No. Effect, iva Data Page of
PNL-ALO-211 0 APR _,0 1991 2 17

a
i i i i
PNLTECHNICALPROCEDUREI
| i III I
3.1.1.2 Unresolved overlap of molecular band spectra mayrequire use of an alternate ana]yte wavelength.
3.1.1.3 Backgroundcontribution from continuum, recombinationphenomenaor from stray light shall be corrected,provided the resulting adjustment does not degrade theaccuracy of the analysis. The correction can be madeby applying backgroundcorrection adjustment to theanalyte data whenan appropriate wavelength region canbe found on either or both sides of the analyticalwavelength. An alternate technique of applying abackgroundcorrection adjustment, similar to overlapinterference correction method, can be made if theoffending analyte can be identified and quantified.
3.1.2 Physical interferences are considered to be effects associatedwith sample nebulization and transport processes.
3.1.2.1 Interference effects causedby viscosity and surfacetension can be reduced by the use of a peristalticpumpin the nebulizer sample-delivery system.
3.1.2.2 Interference effects causedby sample concentrationsof total dissolved solids greater than 5,000 mg/L (0.5wt%) can be reduced by an appropriate dilution of thesample.
3.1.2.3 Nebulizer effects caused by salt buildup at the tipof the nebulizer can be reduced by .using watersaturated argon aerosol.
3.1.2.4 Nebulizer argon aerosol flow rates can be stabilizedby using a massflow controller for improved instrumentperformance.
3.1.3 Chemical interferences are nok normallypronouncedwith the ICPtechnique. Whenobserved, their effect can be reduced bycarefu] se]ection of operating conditions, such as incidentpower, carrier argon flow rates, by buffering of the sample,by matrix matching, or by standard addition procedures.
4.0 Apparatus
4.1 ICP-AES system: Analytical system composedof sample nebulizationsystem, optical dispersion system, computer control, calculationsoftware, andassociated ancillary equipment(for example, e]ectronic
Procedure No. Rayision No. Effect ive DaLe Page of
PNL-ALO-211 0 APR 1_G _991 3 17

I i
-e
i i
PNLTECHNICALPROCEDURE
power supplies, RF power generator and gas flow controls, etc.).Thermo Jarrell Ash Corp. model ICP-61 or equivalent (eg. AppliedResearch Laboratory ICP model 3580 ).
4.2 Balance: Analytical, capable of accurately weighing to the nearest0.0001 g.
4.3 Micropipet: Calibrated, manual or electronicallyoperated, rangingfrom 5 to 10,000 pL, as required.
4.4 Autosamoler: (Optional) Thermo Jarrell Ash, or equivalent system.
5.0 Reagents an(JStandards
5.1 Water: Water of sufficientquality, similar to ASTM Type II reagentwater, shall be used for preparing standards and samples, such thatcalibration blanks and sample blanks will produce concentrationsator below instrument detection limits for all analytes of interest.
5.2 Acids: All acids used in the preparation of standards and sampleprocessing shall be ultra-high purity grade or redistilled acids ofsufficientqualitysuch thatcalibrationblanks and sample preparationblanks produce concentrationsat or below the instrument detectionlimit for all analytes of interest.
5.2.1 Hydrochloricacid, concentrated.
5.2.2 Hydrochloric acid, (I+I): Add 500 mL concentrated HCl toapproximately400 mL water and dilute to I liter.
5.2.3 Nitric acid, concentrated.
5.2.4 Nitric acid, (I+I)" Add 500 mL concentrated HNO3 to 400 mLwater and dilute to I liter.
5.3 Standard stock solutions: Stock standard solutions, Sections 5.3.1through 5.3.25, are needed to support CERCLA requirements andadditional stock standard solutions, Sections 5.3.26 through 5.3.45,are needed for general laboratory support.
Preferred:Purchase certifiedaqueous stock standardsfrom a supplierand verify by comparison with second standard.
Alternative: Prepare stock standard solutions from reagent gradematerials (dried for one hour at I05°C unless otherwise specified)as described below. Reagent stock solutions prepared as specified
Procedure No. Revision No. Effect, ive Date Page of
PNL-ALO-211 0 ,APR _ G I_91 4 17

t m
i ii,ii
PNLTECHNICALPROCEDURE
below remain stable for at least one year from date of preparation.All stock reagents shall be kept at room temperature to preventprecipitation.
5.3.1 Aluminum solution, stock (1000 mcj/L):Dissolve 1.000 g of aluminum metal in an acid mixture of 40mL of (I+I) HCf and 10 mL of concentrated HNO3 in a beaker.Warm gently to effectdissolution. When solution is complete,transfer quantitativelyto a liter flask, add 10 mL of (I+I)HCl and dilute to 1000 mL with water.
5.3.2 Antimony solution, stock (I000 mg/L):Dissolve 2.669 g K(SbO)CAH406 in water, add 10 mL (I+I) HCland dilute to 1000 mL with water.
5°3.3 Arsenic solution, stock (1000 mg/L):Dissolve 1.320 g of As_O_ in 100 mL of water containing 4 gNaOH. Acidify the soluI:i_nwith 20 mL concentratedHNO3 anddilute to 1000 mL with water.
5.3.4 Barium solution, stock (1000 mg/L):Dissolve 1.516 g BaClo (dried at 250°C for 2 hours) in 100 mLreagent water with 20"mL (I+I) HCI. Dilute to 1000 mL withwater.
5.3.5 Beryllium solution, stock (100 rag/L):
Do not dry. Dissolve I g66 g tBeSIOo40-o4Hm2L0 in water, add 10 mLconcentratedHNO3 and dilute with water.
5.3.6 Boron solution, stock (1000 mg/L):Do not dry. Dissolve 5 716 g anhydrous H_BO_ in water anddilute to 1000 mL. Use a reagentmeeting ACS ]_pecifications,keep the bottle tightly sealed and store in a desiccator toprevent the entrance of atmosphericmoisture.
5.3.7 Cadmium solution, stock (1000 mg/L):Dissolve 1.142 g CdO in a minimum amount of (I+1) HNO3. Heatto increase rate of dissolution. Add 10 mL of concentrated
HNO3 and dilute to 1000 mL with water.
5.3.8 Calcium solution, stock (1000 mg/L):
Suspend 2.498 g CaCO3, dried at 180°C for I hour, in water anddissolvecautiouslywith aminimumamount of (I+I)HNO3. Aftereffervescencesubsides,add 10 mL concentratedHNO3 and diluteto 1000 mL with water.
Procedure No. Rovision No. Effect, ire Dat,o Page of
PNL-/_LO-211 0 APR _ 6 i5!_1 5 17

PNLTECHNICALPROCEDUREi i i
i
5.3.9 Chromium solution, stock (1000 mg/L):
Dissolve 1.923 g of CrO3 in water. When solution is completeacidifywith 10mL concentratedHNO3 and dilute to 1000 mL withwater.
5.3.10 Cobalt solution,Stock (1000mg/L): Dissolve 1.000gofcobaltmetal in a minimum amount of (I+I) HCI and dilute to 1000 mLwith water.
5.3.11 Copper solution, stock(t000 mg/L):Dissolve 1.252 g CuO in a minimum amount of (I+I) HNO_. Add
10 mL concentratedHNO3 and dilute to 1000 mL with waI_er.
5.3.12 Iron sqlution, stock (1000 mg/L):Dissolve 1.430 g Fe_O_ in a warm mixture of 50 mL (I+I) HCIand 20 mL of concent_ra_cedHNO_. Cool, add an additional 5 mL
of concentratedHNO3 and dilute to 1000 mL with water.
5.3:13 Lead solution, stock (I000 mg/L):Dissolve 1.599 g Pb(NO_)p in a minimum amount of (I+I).HNO_.Add 10 mL of concentr_ti}dHNO3 and"dilute to 1000 mL wi_hwater.
5.3.14 Maqnesium solution, stock (1000 rag/L):Dissolve 1.658 g MgO in a minimum amount of (I+I) HNO_ Add10 mL concentratedHNO3 and dilute to 1000 mL with wa_er.
5.3.15 Manqanese solution, stock (1000 mg/L):Dissolve 1.000 g of manganese metal in the acid mixture, 50
mL concentrated HCl and 10 mL concentratedHN03, and diluteto 1000 mL with water.
5.3.16 Molybdenum solution, stock (1000 mg/L):
Dissolve 2.043 g (NH4)2MoO4 in water and dilute to 1000 mL.
5.3.17 Nickel solution, stock (1000 mg/L):Dissolve 1.000 g of nickel metal in 50 mL hot concentrated
HNO3, cool and dilute to 1000 mL with water.
5.3.18 Potassium solution, stock (1000 mg/L):Dissolve 1.907g KCI, dried at 110°C, in water. Dilute to 1000mL with water.
5.3.19 Selenium solution, stock (1000 rag/L):
Do not dry. Dissolve 1.727 g H_SeO3 (actual assay 94.6%) inwater and dilute to 1000 mL with water.
Procedure No. Revi$ ion No. Effect, ive Dite Page of
PNL-ALO-211 0 APR _ G !_I 6 17

PNLTECHNICALPROCEDURE
5.3.20 Silicon solution, stock.(1000 mg/L):
Do not dry. Dissolve 10.1189g Na_SiO_'gH20in approximately500 mL water. Add 20 mL concentratedRNO3 and dilute to 1000mL"with water.
5.3.21 Silver solution, stock (1000 mg/L):Dissolve 1.575 g AgNO_ in 100 mL of water and 20 mL
concentratedHNO3. Dilu'teto I000 with water.
5.3.22 Sodium solution, stock (1000 mg/L):Dissolve 2.542 g NaCl in water. Add 20 mL concentrated HNO3and dilute to 1000 mL with water.
5.3.23 Thallium solution, stock (1000 rag/L):Dissolve 1.303 g TINO_ in water. Add 20 mL concentrated HNO3and dilute to 1000mL"with water.
5.3_24 Vanadium solution, stock (1000 mg/L):
Dissolve 2.297 g NH4VO3 in a minimum amount of concentratedHNO_. Heat to increase rate of dissolution. Add 20 mLconcentrated HNO3 and dilute to 1000 mL with water.
5.3.25 Zinc solution, stock (1000 mg/L):Dissolve 1.245 g ZnO in a minimum amount of dilute HNO3. Add50 mL concentratedHNO3 and dilute to 1000 mL with water.
5.3.26 Bismuth solution, stock (1000 mg/L):Dissolve 1.1148 g BipO_ in a minimum amount of concentrated
HNO3. Add 50 mL cofic_ntratedHNO3 and dilute to 1000 withwater.
5.3.27 Cerium solution, stock (1000 mg/L):
Dissolve3.9126 g (NH4)2Ce(N03)6in water. Dilute to 1000 withwater.
5.3.28 Dysprosium solution, stock (1000 mg/L):
Dissolve_(_1477g DY203 in aminimumamount of hot concentrateHCI. Add mL concentratedHCl and dilute to 1000 with water.
5.3.29 Europium solution, stock (1000 mg/L):
Dissolve _(_15799Eu203 in a minimumamount of hot concentrateHCI. Add mL concentratedHCI and dilute to 1000 with water.
Procedure No. Revision No. Effective Date I Page of
PNL-ALO-211 0 AP_ '/L3'.99! I 7 17

PNLTECHNICALPROCEDUREii i ,
5.3.30 Gadolinium solution, stock (1000 rag/L):Disso]ve 1.1526 g Gd_O_ in a minimumamount of hot concentrateHCI. Add 50 mLconce_t?ated HCl and dilute to 1000 with water.
5.3.31 Lanthanum solution, stock (1000 mg/L):Dissolve 1.]728g La_O_ in aminimumamount of hot concentrateHC]. Add 50 mLconcei_t?ated HC] and dilute to 1000 with water.
5.3.32 Lithium Solution, stock (1000 mcj/L):
Dissolve 50.3243 Li_CO3 in a minimum amount of concentrateHC]. Add ml. concentrated HC] and dilute to 1000 with water.
5.3.33 Neodymium solution, stock (1000 mg/L):Dissolve 1.1664 Nd_O3 in aminimumamount of concentrate HC].Add 50 mL concentr-al_ed HC] and dilute to 1000 with water.
5.3.34 Phosphorus solution, stock (1000 rag/L):Dissolve 4.3937 g KH2PO4 in water. Dilute to 1000 with water.
5.3.35 Rhenium solution, stock (1000 mg/L):Dissolve 1.000 g Re powdered metal "in a minimum amount ofconcentrated HNO3. Add 50 mL concentrated HNO3 and dilute to1000 mL with water.
5.3.36 Rhodium $o]ution, stock (1000 mg/L)-Dissolve 1.000 g Rh powdered meta] in a minimum amount of Hotconcentrated H2SO4. Dilute to 1000 mL with water.
5.3.37 Rut___heniumsolution, stock (1000 mg/L)-Dissolve 1.6332 g RuO4 in water. Dilute to 1000 with water.
5.3.38 Strontium solution, stock (1000 mg/L):Disso,.ve 1.6849 SrCO_ in a minimumamount of concentrate HCI.Add 50 mL concentrated HNO3 and dilute to 1000 with water.
5.3.39 Te__!luriumsolution, stock (1000 rag/L):Dissolve 1 2507 g TeO2 in a minimum amount oF concentratedHNO_. Add "50 mL concentrated HNO3 and dilute to 1000 mLwith_at_r.
5.3.40 Thorium solution, stock (1000 mg/L):
Dissolve 1.138g ThO_ in a minimum amountof concentratedHNO3.Add 50 mL concentraCedHNO3 and dilute to 1000 mL with water
Procedure No. Revision No. Effect, ire Dat,e Page of
PNL-ALO-211 0 AP_ . t._'_':_! 8 17

i
PNLTECHNICALPROCEDURE
Q5.3.41 Titanium solution, stock (1000 mg/L):
Dissolve 1.000 g Ti powdered metal in a minimum amount ofdilute (1:1) H2SO4. Dilute to 1000 mL with water.
5.3.42 Tunqsten solution, stock (1000 mg/L):Dissolve 1.7942 g Na2WO4.2H20 in water. Dilute to 1000 withwater.
5.3.43 Uranium solution, stock (1000 mg/L):Dissolve 1.1344 g UO_ in a minimumamount of concentrated HNO_.Add 50 mL concentrated HNO3 and dilute to 1000 mL with wateF
5.3.44 Yttrium solution, Stock (1000 rag/L):Dissolve 1.270 g Y20_ in a minimum amount of Hot concentratedHC1. Add 50 mL concentrated HNO3 and dilute to 1000 mL withwater.
5.3.45 Zirconium solution, stock (1000 rag/l):Place 1.000 g powdered metal Zr in a covered platinum dish anddissolve the metal using 5 mL of water and 1 mL of HF. Oncedissolved, the fluoride is removed "by adding 1 to 2 mL ofsulfuric acid (cold) and eva;orating to dryness. Add 5 mL ofwater and 5 mL concentrated HNOqand dissolve the residue inplatinum di sh. Transfer al_ oF the solution to a 1000 mLvolumetric flask. Add 95 mL of concentrated HNO3 and diluteto 1000 mL with water.
5.4 Multia.nalyte workinq standards: Following are examples of multianalyteworking standards, other analyte combinations may be required asgoverned by the Statement of Work from the client, with the analysisprotocol transmitted to the analyst via Test Instructions.Prepare multianalyte standard solutions by combining and dilutingaccurately measured volumes of stock solutions. Transfer themultianalyte standard solutions to a clean, labeled, teflon (orpolyethylene) bottle. Hultianalyte working standards are to be preparedas needed and initially verified using quality control standards.Multianalyte working standards shall be preserved in two percent (byvolume) nitric acid or other appropriate preservation as deemedappropriate by the cognizant scientist. All standards shall be storedat room temperature to avoid precipitation. Multianalyte workingstandards shall be prepared every six months (or more frequently)unless stability can be verified using quality control standards.Record all standards and pipet checking informationon Data Sheets orin LRB (projectdependent).
Procedure No. Revision No. Effect, ire Oat,e Page " of"
PNL-ALO-211 0 ._?Fi,__ '!_91 9 17

i ii
PNLTECHNICALPROCEDUREml i i i i
5.4.1 Standard solution #1: (Calibration Blank) 2% v/v HNO3.[See 5.5.1].
5.4.2 Multianalyte standard solution #2: (14 elements)
500 /_g/mL Mg250 /_g/mL Na;TOO/_g/mL Fe
50 /_g/mL Pb20 /_g/mL Co, Cr, Cu, Ni, Zn, ZrIO /zg/mL Ba, Mo, Sr, Ti
(In 2% v/v HN03).
5.4.3 Multianalyte standard solution #3: (lO elements)
500 _g/mL Al, Ca, K200 pg/mL Si100 pg/mL P20 pg/mL B, Li10 pg/mL Cd, Mn, Na
(In 2% v/v HN03).
5.4.4 Multianalyte standard solution #4: (6 elements)
50 pg/mL Dy, Nd, Ru, Th20 _g/mL Eu, La
(In 2% v/v HN03).
5.4.5 Mu]tianalyte standard solution #5: (8 elements)
50 pg/mL As, Ce, Gd, Sb, Te20 pg/mL V10 _g/mL Y! pg/mL Be
(In 2% V/v HN03).
5.4.6 Standard solution #6: (I element)
500 _g/mL U
(In 2% v/v HN03).
5.4.7 System PerformanceCheck Standard: (4 elements)
10 _g/mL Cu, Li, Mn, Zn
(In 2% v/v HN03).
Procedure No. Revi=ion No. Effective Oat,e .Page of
PNL-ALO-211 0 JkP,R_ 6 'i_! 10 17

i ii ii i
PNLTECHNICALPROCEDUREi ii
5.4.8 InterferenceCheck Standard (ICS): (16 elements)
500 pg/mL Al, Ca, Mg200 pg/mL FeI pg/mL Ag, Cd, Ni, Pb, Zn
0.5 pg/mL Ba, Be, Co, Cr, Cu, Mn, V
(In 2% v/v HN03).
5.4.9 InstrumentDe.tectionLimit Check Standard (IDL): (22 elements)
For each analyte of interest, dilute an accurately measuredaliquotof stock reagent and combinetogether into one solutionsuch that the final concentrationwill be within three to fivetimes the estimatedinstrumentdetectionIimit for each analyte.Following is an example of a multianalyte standard solutioncontaining all the analytes specifiedper protocols defined byEPA Method 200.7.
1500 pg/L K800 pg/L As375 pg/L Se300 pg/L Mg, Pb, Tl250 pg/L Al, Sb150 pg/L Ni100 pg/L Ca, Cr, Na, Zn50 pg/L Co, Fe, V25 pg/L Ag, Ba, Be, Cd, Cu, Mn
(In 2% v/v HN03).
5.4.10.1 Sample Spiking Stock Concentrate (Part I of 2): (16 elements)
200 pg/mL As, Ba, Se, Tl50 pg/mL Co, Mn, Ni, Pb, Sb, V, Zn25 pg/mL Cu20 pg/mL Cr5 pg/mL Ag, Be, Cd
(In 2% v/v HN03).
5.4.10.2 Sample Spiking Stock Concentrate (Part 2 of 2): (2 elements)
200 /_g/mLAlI00 pg/mL Fe
(In 2% v/v HN03).
Procedure No. Revision No. Effect, ire Dat,e Page of
PNL-ALO-211 0 APR _ C I':_! 11 17

PNLTECHNICALPROCEDURE
5.4.11 MidranqeCalibration VerificationStandard: Prepare amidrangecalibration verificationcheck standard. (23 elements)
25 /_g/mLAl, Ca, K, Mg13 /_g/mLNa20 /_g/mLFe2.5 /_g/mLAs, Pb, Sb, Se, Tl1.0 /_g/mLCo, Cr, Cu, Ni, V, Zn0.5 /_g/mLAg, Ba, Cd, Mn, SrO.1/_g/mL Be
(In 2% v/v HN03).
5.5 Two types of blanks are required for the analysis. The calibrationblank is used in establishingthe analytical calibration curve whilethe method blank (or preparation blank) may be used to correct forpossiblecontaminationresultingfrom varyingamounts of the acids usedin the sample processing. Method blank correction requirementsshallbe governed by the Statementof Work from the client, with the analysisprotocol transmitted to the analyst via Test Instructions.
5.5.1 The calibration blank shall be prepared by diluting 20 mL of
concentratedHNO3 to 1000 mL with water. The calibration blankisused for instrumentcalibration(zeroconcentrationstandard)and flushingthe system between standardsand between samples.
5.5.2 The method blank (or preparation blank) must contain allreagents and in the same amounts as used in processing thesamples. The method blank shall be carriedthrough the completeprocedure and contain the same acid concentration in the finalsolution as the sample solution used for analysis.
6.0 Calibration
6.1 The system shall be calibrated for each analyte of interest followingthe manufacturer'srecommended calibration procedure provided in theinstrument reference manual (See 11.0) and using the CalibrationStandards described in Section 5.4 and 5.5. Calibration parametersshall be establishedand recorded;the performanceof the calibrationverification standards shall determine the calibration frequency perSection 6.2.
6.2 The Midrange CalibrationVerificationStandard shall be used to checkthe working calibration curve daily. The responses for all analytesof interest shall all be within + 10% of the initial calibrationvalues. If this condition is not satisfied, verification shall berepeated. If the results are still greater than + 10% a new
Procedure No. Royision No. Effect,i ve Oat,e Page of
PNL-ALO-211 0 _,.,,_,_",_.3_ 12 17

i iii i
PNLTECHNICALPROCEDUREi li i i i ii i
7.0 Qual ity Control
7.1 All quality control data shall be maintained and available for easyreference or inspection.
7.2 Minimum quality control requirements.
Note: the statements in Section 6.0 relate to all analytes which areto be reported for a sample group. That is, if all analytes definedin the Statement of Work from the client or in the Test Instructionsare:to be reported, then verificationstandards, etc. must exist forall analytes.
7,,2.2 All measurementsmust be within the instrument'slinear rangewhere interferencecorrection factors are valid. If they arehigher than the linear range coveredby the correction factors,the samples shall be diluted, and reanalyzed.Alternatively,a samplemeasurementof an analytethat exceeds the calibrationrange may be quantified without dilution provided that ananalyte standard of higher concentration than the sample isshown to be linear,within the tolerancelimits of Section 6.2and, the analytebeing measured shall not interferewith otheranalyte measurementsin the sample.
7.2.3 The total dissolved solids concentrationfor a sample must beless than 5,000 mg/L. If it is more concentrated then thesample shall be diluted and reanalyzed.
7.2.4 Analyze a minimum of one method blank for each batch of samplesprepared.
• 7.2.5 Analyze at least one calibration verification standard forevery sample batch or more frequently. If results of thecalibrationverification standard are not within the controlboundaries (_+ 10 percent), the Cognizant Scientist shalldetermine the corrective action. All samples bracketed by averificationstandard that falls outsideof control boundariesshall be flagged on the data reports and corrective actiondocumented with the data. Validation of the data is the
responsibilityof the Technical Group Leader or his designee.
Procedure No. Revision No. Effect, ire Date Page of
PNL-ALO-211 0 _PF_'_,6 !ggl 13 17

PNLTECHNICALPROCEDURE
7.2.6 Additional quality control (i.e., duplicates, spikes,additionalmethod or matrixblanks,tightertolerances,holdingtimes, etc.) is governed by the analytical requirementsof theproject or specific analyses requested• Specific QCrequirementsare providedby the Analytical RequestForm (ARF),the project Statement of Work, or the sample analysis TestInstruction (TI).
7.2.7 AQuality ControlChart of Mn/Cu-RATIOmeasurements, using theSystem Performance Check Standard, shall be maintained andreadily available for viewing. Initially the upper controllimit (UCL) and lower control limit (LCL), and mean shall bedetermined by measuring the system performancecheck standardonce a day for a minimum of seven days. The UCL and LCL aredetermined using three times the standard deviation above andbelow the mean, respectively. The System Performance CheckStandard shall be measured daily prior to calibration usingIntensitymode. If theMn/Cu Ratio falls outside the UCL or LCLit must be re-measured.Failure the second time shall requirecorrective action as determined by the Cognizant Scientist•
7.3 QualityControlfor clientsrequestingcompliancewith ComprehensiveEnvironmental Response, Compensation, and Liability Act of 1980(CERCLA) requirements.
7.3.1 Analyses shall be performedper protocolsdefined in AppendixA. Also, all definitions/acronyms (e.g. Sample DeliveryGroup, SDG) shall be consistent with USEPA CLP SOW 788[Reference 11] usage. These QC requirementsare summarized:
' t
Sample PreparationQC Requirements
• Spike Sample Analysis (S) - one for every group of samples oF asimilarmatrix type (e.g.water, soil) or for each Sample DeliveryGroup, whichever is more frequent.
• Duplicate Sample Preparations- one duplicate for every group ofsamples of a similar matrix type (e.g. water, soil) or for eachSample Delivery Group, whichever is more frequent
• Method Blanks or PreparationBlank (PB) - one per Sample DeliveryGroup or with each batch of samples digested, whichever is morefrequent
Procedure No. Revision No. Effect, ire Date Page of
PNL-ALO-211 0 AlrrL,5 !9',)I 14 17

• InterferenceCheck Sample (ICS) - analyzed at the beginning and end ofeach analysis run or a minimum of twice per 8 hours, whichever is morefrequent, but not before Initial CalibrationVerification• Analysisresults for the ICS must fall within the control limit of + 20% of thetrue value
• InstrumentDetection Limit (IDL) - determined within 30 days of thestart of contract and quarterly thereafter
• InterelementCorrections - determined prior to the start of contractanalyses and at least annually. Correction factorsfor spectralinterferencedue to Al, Ca, Fe, and Mg shall be determined at allwavelengths used for each analyte reported. Determinationmust alsobe performed_!ili!)_any adjustmentwas made that may affect theInterelement (_o_;_;ecti.ns
• Linear Range Analysis (LRA) - determined quarterly. Analytial resultsmust be within + 5% of the true value
• Multiple dilutions of samples shall be made so that all analytes fallwithin the calibrationrange.
7.3.2 Additional quality control requirementsshall be governed by the Statementof Work from the client, with the analysis protocol transmittedto theAnalyst via Test Instructions•
8.0 Analysis Method
Sample collection, preservation,and preparation are not within the scopeof this procedure• However, it is importantthat samples be collected andpreserved in order to maintain sample integrity• The applicability ofsample preparationschemes, such as PNL-ALO-I01or PNL-ALO-102,forspecific matrices shall be demonstratedby analyzing spiked samples orrelevent standard referencematerial, or by use of other qualifyingtechniques•
Note I" Aqueous samples which have been properly preserved (i.e.stabilized at pH < 2) and leachates/digestatesfrom solid samples shall bekept at room temperature to prevent precipitating•
Note 2" Non-acidifiedsamples and solids shall be refrigeratedat 4°C(_+2°C),radioactivitylevels permitting•
Note 3" All samples are to be analyzed within the holding times specified(i.e. CLP SOW 7/88 Section II or the governing SOW)
8.1 Analyze aqueous samples by inserting the sample uptake tube of theinstrument into the aqueous sample and initiatingan analytical cycle
ProcedureNo. Revision No. Effective Date Page
PNL-ALO-211 I AUG 19 1991 15 of 17

PNL TECHNICALPROCEDURE I
by entering the appropriate commandsusing the instrument's computerkeyboard. After a few minutes, the system will display theconcentration of all the analytes on the video display terminal,produce a printed copy of the analyte data, and record the analyticalresults onto magnetic media (floppy disk).
8.2 If the concentration of any of the analytes exceed the calibrationrange, dilute the sample with an appropriate quantity of acidifiedwater (e.g. 2% v/v HN03) and reanalyze.
8.3 Refer to the computer calculated concentrationdata readout foranalyte concentrations.
8.3.1 Aqueous samp.!es,"Apply all preparation and analysis dilutionfactors and report results in mg/L or ppm (or pg/L for CERCLA).
e
8.3.2 Solid samples" Determine the percent solids using procedurePNL-ALO-504.Calculate and report the concentrationin mg/Kg ona dry weight basis:
Concentration (mg/Kg) = (C * V) / (W * (P/lO0))
Where:C = mg/L analyte in the measured solution
(correctedfor all analysis dilutions).
V - Final volume after sample preparation (L)
W = Weight of wet sample (Kg)
P = Percent solids (%)
9.0 Specific Qualifications:
This procedure is self-qualifyingdue to dependence on analyticalstandards, calibrations,and quality control standards according to PNL-MA-70, PAP-70-901.
10.0 Records:
Records will be maintained and controlled so as to conform to reguirementsn _l i U t "/n D mn 7 n 1 _ n I ....:i":::::::::::::::::::::::::::::::!i'!:*:::"::i_:_i::_*::::!;'i_ii::'i{i":::_:::::::::::!:_i:::::i:"::i:::::::::::::::::::::::::::::":::_i_::Fiii:"_:"i;!"!!iF_::i_ii:""::i::i!::::_::':!:"!:,":!i:!!::
_i_i_.i_!iiiili_ii_!iiiii_¢_i_:.. La6oratory Record BooRs ([RBs) an_ Analytical Data_'i_:_:_:__::::_:_:_:_:_:_e::a:::_:_:_:__nismfor control of most records. LRBs will be used
' • e ,._ 1 : :::::::'::::::::::"": ::::::"::::""::::;::;:::c:',:::::::::::::":;:::::::::::::::::::::::::::::::::::::::':'.::':in accordancewith +h._,,._a_*_',,_,.....Dircct;.._.°n.._;_i.s:_a_:_;sl_efl_;_r:ecor:fl_s
ProcedureNo. RevisionNo. Effectiv%Da_t%_l,/lp_&l:J Lg_}| PagePNL-ALO-211 I 16 of 16

b
i i
PNLTECHNICALPROCEDURE
8.3 Refer to the computer calculated concentration data readout foranalyte concentrations.
8.3.1 Aqueous samples: Apply all preparation and analysis dilutionfactors and report results in mcj/Lor ppm (or _g/L for CERCLA).
8.3.2 Solid samples: Determine the percent solids using procedurePNL-ALO-504.Calculate and report the concentration in mg/Kgon a dry weight basis:
Concentration (mg/Kg) - (C * V) / (W * (P/lO0))
Where:
C = mg/L analyte in the measured solution(corrected for all analysis dilutions).
V = Final volume after sample preparation (L)
W = Weight of wet sample (Kg)
P = Percent solids (%)
9.0 Specific Qualifications
This procedure is self-qualifying due to dependence on analyticalstandards, calibrations, and quality control standards according to PNL-MA-70, PAP-70-g01.
10.0 Records
Records will be maintained and controlled so as to conform to requirementsof PNL-ML-70, PAP-70-1701. LaboratoryRecord Books (LRBs) and AnalyticalData Sheets provide a mechanism for control of most records. LRBs willbe used in accordancewith the Act Now Directive 89.1.
11.0 References
EPA Test Method 200.7 CLP-M: "InductivelyCoupled Plasma-Atomic EmissionSpectroscopy Method for Trace Element Analysis of Water and Wastes" (SOW3/90: ILM01.0);
ICAP 61 Operator's Manual. January 1988. Thermo Jarrell Ash Corporation.Part Number 125791-01.
USEPA Contract LaboratoryProgramStatementof Work for InorganicAnalysis,SOW 788.
Procedure No. Revis ion No. Effect, ive Date Pzge of
P_!L-ALO-211 0 _PIR_ 6 199_ 17 17

. r i
o
APPENDIX A
SECTION I
c_';_v_.,qA/qc P_c"=ICES
Suandard laboratory praccices for laboratory cleanliness as appliedLo glassware and appara:us mus_ be adhered Co. Laboraco_ 7 p=accices wi_h.
regard co reagents, solvents, and gases musC also he adhered Co. For
addIclonal guidelines, re_ard£n S these general labocaCory procedures, seeSections 4 and 5 of uhe Handbook fo__.Analy_cal Qual_t?r Control _n _a_eT
and _est_.v@ceT Laboracorles EPA-600/A-79-019, USEPA Envlronmenual
Monitoring and $upporu Laboraco_-y, C£nclnnacl, Ohio, March 1979.
,-1 7/88

.°
SECTION II
SPECIFIC QA/QC PROCEDU_S
The qualic 7 assurance/q_ality con=rol (QA/QC) procedures definedherein muse be used by the Contractor when performing the methods specifiedin Exhibit D. When additional qA/qc procedures are specified in C.hemethods in Exhibit D. the Contractor must also follow _ese procedures.NOTE: The cos: of performing all QA/QC procedures specified in thisScacemen: of Work is included in the price of performing the bid lo:,except for duplicate, spike, and laboratory control sample analyses, whichshall be considered separate sa=ple analyses.
The purpose of this document is Co provide • uniform seC ofprocedures for che analysis of inorganic cons=icuencs of samples.docu=en_ation of me:hods and cheir performance, and verification of uhesample data generated. The program will also assist laboratory personnelin recalling and defending their actious under cross examination ifrequired to present court testimony in enforcement case litigation.
The primary function of the QA/QC program is the deflnlclon ofprocedures for the evaluatlon and documentation of sampling and analyticalmethodologies and the reduction and reporting of data. The objective is coprovide a uniform basis for sample collection and handling, instrument andmethods maintenance, performance evaluation, and analy=ical data gatheringand reporting. Almhough it is impossible mo address all analy=icalsituations in one documen=, the approach taken here is to define minimumrequirements for all major steps relevant to any inorganic analysis. Inmany instances where mechodologles are available, specific quality controlprocedures are incorporated into r.hemethod documentation (Exhiblc D).
Ideally, samples involved in enforcement actions are analyzed only afterr.hemeuhods have met r.heminimum performance and documentation requirementsdescribed in chls docunen=.
The Contractor is required to parcicipace in the Laboratory Audio andlncercomparison Study Program run by EPA EMSL-Las Vegas. The Contractorcan expect Co analyze tvo samples per calendar quarter during the conuractperiod.
The Contractor must perform and report to SMO and EMSL/LV asspecified in Exhibit B quarterly verification of instrument dececclonlimits (IDL) by the method specified in Exhibic E. by type and model foreach instrument used on thls contract. All uhe IDLe must meet the CRDLs
specified in Exhibit C. For ICP methods, the Contractor must also report,as specified in Exhibic B, llnearlcy range verification, all Incerelemen_correction factors, wavelengths used, and incegraclon times.
In thls Exhlblc, as well as other places withln'uhls Statement ofWork, the term "analycical sample" is used in dlscusslng the requiredfrequency or placement of certain QA/QC measurements. The term °analyticalsample" is defined in the glossary, Exhiblc C. As the Cerro is used,
analytical sample includes ali field samples, including Performance --Evaluation samples, received from an excernal source, buc lc also includesall required QA/QC samples (ma_rlx spikes, analytical/posc-digescion
-2 "7/88

e.
' spikis, dupl£caces, aerial dilutions. LCS. IrS. CRDL acandacds, preparationblanks and linear range analyses) except chose directly related ColnsCrument calibracion or calibration veriftcacion (calibracion standards,
ICV/IC3, CCV/CC3). A "frequency of 10t" means once every 10 analytical|amples. Note" Calibration verification IAarptes (ICV/CCV) and calibrationverificaclon blanks (ICB/CC3) are not counted as arualycical samples when
determining 10, frequency.
In order for the QA/QC information co reflect the status of the
aamples analyzed, all samples and their QA/QC analysis muse be analyzedunder the same operacins and procedural conditions.
If any QC measurement fails Co meec contract criteria, r.he analyticalmeasurement may noc be repeated prior co cakins che appropriate corrective
action as Ipecified in Exhiblc E.
The Contractor muse report all QC deca in the exact for-mac apecified
in Exhibits B .and H_
This section outlines the minimum QA/QC operations necessary co
satisfy the analytical requirements of the contract. The following QA/_Coperations muse be performed as described in this Exhibit:
1. Instrument Calibration
2. Initial Cali.bration Verification (ICV) and Continuing CalibrationVerification (CCV)
3. CRDL Standards for AA (CRA) and ICP (CRI)
A. Znlclal Calibration Blank (ICB), Contlnulng Calibration Blank
(CCB), and Preparation Blank (PB) Analyses
5. ICP Interference Check Sanple (ICS) Analyses
6. Spike Sample Analysls (S)
7. Dupllcace Sa=ple Analysis (D)
8. Laboratory Control Sample (LCS) Analysis
9. ICP Serial Diluclon Analysis (L)
10. Instrument De_eccion Limit (IDL) Determination
11. Interelemenc Corrections for ICP (ICP)
12. Linear Ranse Analysis (I.RA)
13. Furnace AA QC Analyses
1. Instrument Calibration
Guidelines for Insmrumenmal callbraulon are given in EPA 600/&-79-020
and/or Exhlblu D. Xnsmrumenms musm be calibrated daily or once every 24hours and each Clme the instrument is sem up. The Insurumenc
acandardlzacion dace and ulme musu be included In the raw dace.
For atomic absorption systems, calibracion standards are prepared bydilutlng che stock metal solutlons at the clme of analys_s. Date and
Ciae of preparation and analysis muse be Kiven in the raw deca.
-3 7/88
-..m

o
o" :o
Calibration standards =u_: be prepared fresh each tlme an analysls isuo be made and discarded after use. Prepare a blank and at least r.hree
calibration standards in graduated Amounts in r.he appropriate range.
One atomic absorption calibration standard must be at _he CRDL except
for mercury. The calibration standards must be prepared using .nhe sametype of acid or combination of acids and a: the game concentration as
will result in the samples following sa=ple preparation.
Beginning wi_h _he blank, aspirate or inject _he suandard_ and record
r.he readings. If the AA instrument conflgurauion prevents r.he requiredk-polnt calibration, calibrate according to instrument manufacturer's
" Yecom_endatlons, And analyze the remaining required standards
immediately &fuer callbratlon. Results for r.hese s_andards must bewithin +_ 5% of the true value. Each standards concenuratlon and _he
calculations to show r_hat the +_St criterion has been met, m_ASU be given
in r_he raw data. Sf the values do not fall within this range,
recallbratlon is necessary.
The + 5% criteria does not apply to r.he auomlc absorption calibrationstandard at r.he CRNL.
Calibration standards for AA procedures must he prepared as describedin Exhibit D.
5aseline correction is acceptable as long as lt is performed after
every sa=ple or af:er _he continuing calibration verlflcaulon and blank
check; resloplng is acceptable as long as iu is immediately preceded
and immediately followed by CCV and CCB. For cyanide and mercury,
follow _he calibration procedures outlined in Exhibit D. One cyanidecalibration standard must be at _he CRDL. For ICP systems, calibratethe instrument according to instrument manufacturer's recommendedprocedures.. At least two standards mu.st he used for ZCP callbraulon.One of r.he standards must be a blank.
2. InIEia! Callbra_on _erlf_ca_ioD (_CV_ and Co_Inu_n_ CallbrsEionVeriflcamlon (CCd)
a. Inluial Calibration Verification (ICV)
Immediately after each of the ICP. AA and cyanide systems have
been calibrated, r_he accuracy of the initial calibration shall be
verified and documented for every analyte.by the analysis of EPA
Initial Calibration Verification Solutlon(s) at each wavelengthused for analysis. _Then measurements exceed the control limits of
Table l-Initial and Continuing Calibration Verification Control
Limits for Inorganic Analyses (in Exhibit E), the analysis must betermlnaued, r.he problem corrected, _he instrument recallbrated,and r_he calibration reverified.
.-_, 7/88

• . If f/_e Initial Calibration Verification Solution(s) are not&va ilable from EPA, or where a certified solution of an analyte is
not available from any source, analyses shall he conducted on an
independent standard at a concentration other than that used forInstrument callbrat_on, but wi_hln _he calibration range. An
independent standard Ix defined as a standard composed of r.he
inalytes fro= a different source _.han r.hose used in _he s_andard_for r_he Instrument callbraclon.
For ICP, the Inlulal Callbraclon Verification Solutlon(s) _t be
tun at each wavelen_r.h used for analysis. For CN, the initialcalibration verlflcaclon s_andard muse he distilled. The Iniclal
Calibration Verlflcaclon for CN serves as a Laboratory Control
Sample; thu_ Iu _s= be distilled v£ch _he hatch of samples
analyzed in assocla=ion vi_.h _hac ZCV. This means that an ZCVmus_ he dtsuilled with each batch of samples analyzed and thac the
samples dlscilled rich an ZC'V musu be analyzed wi_h _hat
parulcular _C'V. The values for the Inlulal and subsequentcontinuing calibration verlflcaulons shall be recorded on FO_ II-
IH for ICP_ AA, and cyanide analyses, as Indlcaced.
b. Conclnuln_ Calibration Verlflca_ion (CCU)
To ensure ¢allbra_io._ accuracy during each analysis run, one of
_he following suand_rds is co be used for con_inulng calibrationver£flcatlon and mu.sr be be analyzed and reported for every
wavelength used for the analysis of each analyue, at a frequencyof 10% or every 2 hours during an analysis run, whlchever is more
frequent. The standard, must also be analyzed and rep_rced for
every waveleng_-h used for analysls at _he beginning of the run andafter the last anaiyulcal sample. The analyue concentraclons in
r_he conclnulng calibration suand_rd mu.s= be one o£ _he follovin_
solutions ac or near _he mid-range levels of the calibration
¢ul-ve•
I. EPA Solutions
2. NBS S_-½ 16_3a
5. A Contraccor-prep_red s_andard solution
TASLE I. INITIAL AND CONTINUING CALIBRATION VERIFICATIONCONTROL LIMITS FOR INORGANIC ANALYSES
of True Value (EP.% $eCl
Analyulcal Method Inorganic Low Limit High Limi:Species
, i,,
ICP/AA l_etals 90 _10
Col4 Vapor AA Mercury 80 120
Other Cy_nlde 85 II5
II
iiii _ ii
°..
• o

0 •
The s_e continuing calibration standard must be used throughoutthe _nalysis runs for a Case of sa=ples received.
Each CCV analyzed must reflecc the conditions of analysis of aliassocia_ed analytical samples (the preceding 10 analytical samplesor the preceding analytical samples up co the previous CCV). The
duration of analysis, rinses and other related operatior.s chac mayaffect the CC'V measured result may noc be applied co the CCV co a
greater exUent than the extent: applied co the associatedar_l_rcical samples. For irt•rance, che difference in CLme between
a CCV analysis and r.he blank i_mediacely following ic as well asthe difference in cime bec_een the CC'V and the analycical sample
Innnediauely preceding lc may not exceed r.he lowest difference in
time between any two consecutive analyclcal samples associ_uedrich Che CCV.
If che deviation of the conulnuing calibraclon veriflcaclon is
sre•cef than the conurol limius specified in Table l-_niulal and
Conuinuing Calibration Verification Concrol Limics for Znorganic
Analyses, uhe analysis musu be suopped, the problem correcued, uheinsurument must be recalibrated, chs calibration verified and the
reanalysls of preceding I0 analyulcal samples or all analytical
samples analyzed since uhe lasu good calibration verlficaulon must
be perfo_ed for the an•lyres affected. Znformaulon regarding theconulnulng verlflcaulon of callbra_ion shall be recorded on FOR._
II-IN for ICP, AA and cyanide as indlcaued.
3. C_DL S_anda;ds fo_ _C_ (CRT) add AA (C_
To verify linearlty near uhe CRDL for ICP analysis, the Concracuor mustanalyze an ICP standard (CRI) _t cvc clmes the CRDL or cvo clmes uhe
IDL, whichever is greaUer, aC chs beginning and end of each sample
analysis run, or a minimum of twice per '_hour working shlfu, whicheveris more frequent, buu nou before Inlulal Callbraulon Verlficaulon.
This suandard must be run by ICP for every wavelength used for
analysis, excepu those for AI, Be, Ca, Fm, Mg, Na and K.
To verify linearlcy near the CRDL for AA analysis, the Contractor musu
analyze an AA suandard (CRA) ac uhe CRDL or the IDL, whichever is
grea_er, ac the beginning of each sample analysis run, but nou beforethe Znlulal Calibration Verificaulon.
Specific acceptance crluerla for the cvo standards will be aec by EPA
in che future. In uhe Inuerlm, uhe Contractor muse analyze and reporuuhese Suandar_s on FORM II(PART 2)-IN.
&. _nlClal Cali_)racton Blan_ (_CB). Conctnu[n_ Caltbrscion Blank (CCd),
and Pre_arat_gn Blank _B) Analyses
a. Initial Callbraulon Blank (ICB) and Conuinuing Cal£bracion Blank(CCB) Analyses
A calibration blank musu be analyzed ac each wavelength used foranalysis immediately after every Iniulal and conulnulng
calibration verification, ac a frequency of lOt or every 2 hours
-6 7/88

• during che run, whichever is more frequenc. The blank muse beanalyzed ac c.he beg_nnin S of che run and after che lasCanalytical sample. Note" A CC3 muse be run after the last CC"7chac was run after c_e last analyc£¢al sample of che run. Theresults for the calibracion blanks shall be recorded on FORM III-IN for ICP, _ and cyanide analyses, as lndicaced. If chemagnic-_de (absolute value) of the callbracion blank resulc exceedschs IDL, che result muse be so reported in us/L on FOP_ III-IN,ocherwise report as IDL-U. Zf the absoluc8 value blank resultexceeds the CRnL (F._hibtc C), cerm£nace analysis, correct theproblem, recalibrace, verify the cal£bracion and reanalyse r.hepreceding 10 analycical samples or all analytical samples analyzedsince r_e lasc good calibration blank.
b. Preparer/on Blar_. (PB) A_alysis
AC lease one preparation blank (or reagenc blank), consiscing ofdeion/=ed distilled water processed chrough each samplepreparation and analysis procedure .(See Exhibit D, Seccion liT),muse be prepare_ and analyzed with every Sample Delivery Croup, orwith each batch" of samples digested, whichever is more frequent.
The first batch of samples in an SDG Is to be ass£Ened copreparation blank one, the second beech of samples to preparationblank two, ecr. (see FORM lIT-IN). Each deca package muse containthe results of all the preparation blank analyses associated vlchr.hesa=_les in =ha= $DC.
This blank is co be. reported for each SD<; and used in all analysesCo ascertain whether sample concentrations reflect contaminationin the following manner:
I) If the absolute value of the _oncencraclon of che blank is
less than or equal co the Contract Required Dececclon Limlc(Ey.hibic C), no correction of sample results is performed.
[] 2) If any aualyce concentration in the blank is above the CP_L,C.he lowest concencracion of chac analyce in r.he associatedsamples muse be 10x the blank concencracion. Ochervise, allsamples associated wich the blank with the analyce'sconcentration less than lOx che blank concentration and abover.he CRDL, muse be rediges_ed and reanalyzed for thac analyce(except for an idenclfied aqueous soil field blank). Thesample concentration is not Co be corrected for the blankValUe.
3) If the concencrac._on of the blank is below the negaclve CRDL,chem all samples reported below 10x CRDL assoclaced wlch uheblank mus_ be redlgesced and reana lyzed.
lA Stoup of samples prepared ac the same rime.
:7 7/88
°.."

o.
The values for the preparation bla_ un.st be recorded in ug/L for
aqueous samples and in mg/_g for solid samples on FOR.M I_I-I_ forICP, AA, and cyanLde analyses.
5. ICP T_cerference Check $a__le (_C_ Ar'.alvs_.s
To verify Interelemenc and "background correction factors, _heContractor _ast analyze and report che resulcs for the ICP Interference
Check S_=ples at r.he beginning and end of each analysis run or amlnlmu_ of t",,rice per 8 hour vorkln 8 shift, whichever is more frequent,but noc before Initial Calibration Verlflcauion. The ICP Interference
Check Samples mus_ be ohtalned from EPA (L%SL/LV) if available and
analyzed accordln_ _o r.he In_ructior_ supplied with _he _CS.
The Interference Check Samples consist of two solutions: Solution A andSoluulon A3. Soluulon A conslsus of _he interferents, and Solution A3
toryises of r.he analytes mixed with _he inuerferen_s. An ICS analysis
consists of analy:Ing both solutions consecuulvely (s_artlng with
Solution A) for all wavelengths used for each analyte reported by ICP.
Resulus for r_e ICP analyses of Solution A5 durlng _he analytical runsmust fall within the control limit of +_201 of the urue value for the
analytes included in uhe Interference Check Samples. If not, uernlnata
uhe analysis, correct the problem, recallbra_e the instrument, and
reanalyze r.he analytical sa=ples analyzed since uhe last good IUS. Ifurue values for analy_es contained in r/le ICS and analyzed by ICF are
no_ supplied with r_he ICS, _he =can mus_ be determined by initially
analyzing the IUS a_ least five times repeuitively for _he particular
• analy_es. This mean deternination mus_ be made during an analytical runwhere _he results for _he previously supplied EPA ICS me_ all contract
specifications. Addi_ionally, uhe resul_ of uhis Inlulal meandeterulna_ion is to he used as _he urue value for _he llfeuime of uhau
solution (i.e., until the solution is exhausued).
If the ICP _nterference Check Sample is not available from EPA,
independent ICP Check Samples must be prepared with Interferent and
analy_e concentrations at the levels specified in Table 2-1nterferenu
and Analy_e Elemental Concentrations Used for ICP Interference CheckSample. The mean value and standard deviation must be escabllshed by
ini_lally analyzing the Check Samples at least five times repetlclvely
for each parameter on FORM IV-IN. Results must fall wiuhin the conurol
limit of _+20% of the es_abllshed mean value• The mean and standard
deviation must be reported in the raw data. Results from _he
Interference Check Sample analyses must be recorded on FORM IV-IN forall ICP parameters.
-_ 7/88

6. $ot]<e Sa_role Analysts f_5)
The spike sample analysis is designed 1:o provide Information abou_ _heeffecu of r.hesa-_le ma:fix on uhe digesulon and measuremenune_hodoloEy. The spike is added before the digestion (i.e., prior cor.headdiulon of other reagents) and prior _o any dlsuillaulon steps(i.e., C_-), At leas_ one spike sanple analysis musu be performed oneach group of samples of a similar matrix type (i.e., wa_er, soil) agdconcentration (i.e., low, medium) ob"for each Sample Delivery Group."
Zf r_he spike analysis is performed on _.he sane sacrple than is chosenfor the duplicate sample analysis, spike calculations musu be performedusing the results of the sample deslgT_ated as the =original sample"(see section 7, Duplicate Sample Analysis). The average of uheduplicate results cannot be used for the purpose of determining percen_recovery. Samples identified as field blanks canner be u_ed for spikedsample analysis. EPA may require chat a specific sample be used forthe spike sample analysis. " .
The analyte spike must be added in the amoun_ given in Table 3-SplklngLevels for Spike Sample Analysis, for each elemen_ analyzed. If C_,roanalytical methods are used to obtain the reporued values for the sameelement within a Sample Delivery Group (i.e. ICP, GFAA), spike samplesmuse he run by each method used.
2EPA may require addlt£onal spike sample analysis, upon Project Officer• request, for which the Contractor will be paid•
-9 7/8S
I°°

Zf Che s_Ike recovery is noc ac or wi_hln the llmi_s of 75-125%, rbe
da_a of all sa=ples received assoclaced wlch thac spike sa=_le and
decernined by the sa_e analyclcal method must be flagged wluh thelecuer "N" on FO_Hs I-IN and V-IN. An exception to this rule is
granued in sluuaulor_s where uhe sa=ple concencraulon exceeds the _-p_ue
concanura_ion by a facuor of four or more. In such an event, the clara
shall be reported unflagged even if the percent recovery does noc _ee=the 75-125q recovery crlcerla.
For flame AA, ICP, and CN analyses, when the pre-dlgesulon/pre-dlscillaclon spike recovery falls outside the control limits and r.he
sample resul_ does noc exceed 4x the spike added, a posu-
di_astlon/posC-dlscilla_ion spike muse be performed for chose elemenns
cha_ do no_ mee_ che specified cricerla (excepClon: Ag). Spike theunsplked allquo_ of the sample aC 2x the indigenous level or 2x CRDL,
whichever is greater. Results of the pos_-dlges_ion/posc-dlscillaulou
spike muse he reported on FO_K V(PART 2)-IN. Note: No pose dlgesuspike is required for HS.
In the instance where there is more than one spike sample per macr_.x
and concencraulon per me_hod per SDG, if one spike sample recovery is
noc wlchln conuracc crluerla, flag all the samples of uhe same matrix,
level, and meuhod in uhe SDG. Indlvidual component percent recoveries(qR) are calculaued as follows:
_Recovery -_ x I00SA
T.lhere, SSR - Spiked Sa.mple ResultS_ - Sa=ple Result
SA - Spike Added
',/hen sa=ple concentration is less than the instrument detection limit,
use SR - 0 only for purposes of calculaclng t Recovery. The spike
sample resul_s, sa=ple results and q Recovery (poslClve or negaclve)
muse be reported on FO_H V-IN for ICP, AA and cyanide analyses, asindlcaced.
The units for reporting spike sample results will be identical to chose
used for reporting sample results in FO_ I-IN (i.e., ug/L for aqueousand mS/KS dry welgh_ basis for solid).

TABLE 3. SPIKINC lEVELS l_3R SPIKE S_._LE ANALYSISmm
For ZCP/_ For Furr_ce AA Ocher (1)
Element Water
Alcmin_ 2,000 *AncL_ony 500 500 100 100._:s enic 2,000' 2,000 /40 /40BAric= •"2,000" 2.000_rylllum • 50" 50Cadmium • 50 50 5 5Calcium * *Chromium • 200" 200Cobalc 500" 500
Copper • 250" 250Zron J 1,000 *L_Ad ' • 500" 500 20 20
Magneslum * *Manganese • 500" 500 1Mercuz7Nickel • 500' 500potassium * *Selenium 2,000 2,000 I0 I0Silver 50 50Sodiun _ *Thallium 2,000 2.000 50 50Vanadium • 500' 500
Zinc .500' 500 I00Cyanide
NOTE: Ele_ents vichou_ spike levels and not desiEnated wlth anasterisk, mu.su be spiked at appropriate levels.
1Spikin S level reporued is for both water and soil/sediment matrices.
2The levels shown indicate concentrations in the final digescate of uhe
spiked sample (200 mL final volume).
•No spike required.
-11 7/88

.°Q
One duplicace sa---ple muse be analyzed from each sroup of samples of a
slmilar macrlx type (i.e.. waCer° soil) an_ concenCraClon (i.e., low,medium) or for each Sample Delivery Group. Duplicates cannot be
averaged for reporting on FOR._ I-IN.
Dupllcace sa=ple analyses are required for percent solids. Samples
idenulfled as field blanks cannot be used for dupllcaue sample
analysis. EPA may require chat a specific sample be used for duplicate
sample analysis. If two analytical methods are used Co obcaln the
reported values for r.he same element for a Sample Delivery Group (i.e.,ICP, GFAA), duplicate sa=ples must be run by each method used.
The relaclve percenu differences (RPD) for each component arecalculated as follows"
RPD - !$ - DI x I00
(S+D)/2
Where, RPD - Relaclve Percent Difference
S - Yirsc Sample Value (original)
D - Second Sample Value (duplicaue)
The results of the duplicate sa=ple analyses must be reported on FOR.M
VI-XN in ug/L for aqueous samples and mg/Kg dry weight basis for solidoriginal and dupllcace samples. A control llmlC of 20q for R.PD shall
be used for original and dupllcace sample values greater than or equalto 5x CRDL (Exhibit C). A control limit of (__) the CREL muse be used
for sample values less than 5x CRDL, and the absolute value of theco._trol limit (CRDL) =ust be entered in the "Control Limit" column onFOR._ Vl -IN.
If one resulu is above the 5x CRDL level and the ocher is below, use
the _+ CP.DL criteria. If both sample values are less than the IDL, the
RPD is noc calculated on FORM VI-IN. For solid sample or dupllca_eresults < 5x CRDL, enuer r.he absolute value of the CRDL, corrected for
sample welghc and percent solids, in the "Control Limlu" column.
If the duplicate sample results are oucslde the control limlcs, flag
all the data for samples received assoclaued wlch thac duplicate samplewlch an "_° on FOR.w.sI-IN and VI-IN. In the instance where there is
more r.han one duplicate sample per SD<:, if one duplicate result is noc
within conuracc criueria, flag all samples of _he same maurlx,
concencraclon, and meuhod in r.he SDG. The percent difference deca will
be used by EPA Co evaluate the long-cerro precision of the methods foreach parameter. Specific control limits for each element will be added
Uo FOR._ VI-IN ac a later dace based on uhese precision results.
3EPA may require addlclonal duplica:e sample analyses, upon ProJecc Officer
request, for which the Contractor will be paid. i
-12 v/s8

8. l_borscorv Con_ro! SL-91e (LCS_ Ana!vs_s
AqueouJ and solid _bora_o=_r Control S_=ples (LES) mus_ be analyzed foreach •nalyCe using C_e same sample preparaciorcs, analytical mechod.s andQA/QC procedures en_loyed for r.he EPA samples received. The aqueousLCS solution must be obtained from EPA (if unavailable, the InitialCalibracion Verification Solutions may be u.sed). One aqueous LCS un_s_
be prepared and analyzed for every Stoup of aqueous samples in • SampleDelivery Croup, or for each bacch of aqueous samples digested,whichever Is more frequent. An aqueous LCS is noc required for mercury
and cyanide analysls.
The EPA-provided solid LCS c_zsc be prepared and analyzed using each ofchs procedures applied co the solid samples received (exception:percent soticLs decet'mir_acion noc required). If the EPA solid LCS isunavailable, other EPA _alt_ Assurance Check samples or ocher_ercified materials may be used. One solid LCS must be prepared and
analyzed for every g=oup of solid samples in a Sample Delivery Croup,or for each batch of samples digested, whichever is more frequent.
All LCS results and percent recovery (qR) will be reported on FOP_I VII-IN. If che percent recovery for che aqueous LCS falls outside _hecontrol limits of 80-120q (exception: Ag and Sb), the analyses mus_ be
Cermina_ed, the problem correcced, and c_e samples associated wich chatLCS redigested and reanalyzed.
If the results for the solid LOS fall outside the control limits
established by EPA, the analyses must be terminated, the problemcorrected, and the samples associated wich that LCS redisesced and
reanalyzed.
9. I¢_ Serial D_lu=!on Ar_alvs_s (I._
Prior co reporting concen=racion deca for the analyte elements, theContractor must analyze and report the results of the ICP SerialDilution Analysis. The ICP Serial Dilution Analysis must be performed
on • sample from each group of samples of a similar matrix cy_e (i.e.,water, soil) and concen=racion (i.e., low, medium) or for each Sample
Delivery Croup, whichever is more frequent. Samples identified asfield blanks canno= be used for Serial Dilution Analysis.
If the analyte concentration is sufficiently hish (minimally • factorof 50 •bore the instrumental detection limit in the original sample),the serial diluclon (a five fold diluclon) must then agree wlchln lOq
of che original determina=ion &feet correction for dilution. If Lhc
dilution analys_s for one or more an•lyres is not ac or within lOq, a
chemical or physical interference effect must be suspected, and thedeca for all affected analyces in the samples received associated withchac serial diluclon mu_c be flagged wlch an "E" on FOR._ IX-IN and FO_l-IN.
( -13 7/88
..°.

° . .. •
° -.
The percent differences for each component are calculated as follows"
k Difference -- _I - S_ x 100I
where. I - Initial S_,=ple ResultS - Serial Dilution Result (Instrument Reading x 5)
In the instance where there is more than one serial d£1ucton per SDC,if one serial dilution result is not within contract criteria, flag all
c.he samples of the same matrix and concentration in che Sample Delivery
Group• Serial dilution resul_s and "E" flags must be reported on FOR._IX-IN.
i0. Instrument Decec'.fon tfmfC (TDL_ DeCer_fnaclon
Before any field samples are analyzed under _hls conuracc, theinstrument detecclon limits (in ug/L) muse be determined for eachinsurtnnenc used, vluhln 30 days of the scare of contract analyses and
aC lease quarterly (every 3 calendar months), and must: meeC the levelsspecified in Exhibit C.
The Ins:rumenc Detection L_m_:s (in ug/L) shall be determined bymultiplying by 3, the average of the icandard deviations obcalned on
_hree nonconsecutive days from the analysis of a s_andard soluclon
(each analyce in reagent water) ac a concentraclon 3x-Sx uhe Instrument
manufacturer's suggested IDL, with seven consecutive measurements per
day. Each measurement muse be performed as _hough lc were a separate
analytical sample (i.e., each measurement musu be followed by a rinse
and/or any other procedure normally performed be_'ween the analysis ofseparate samples). IDL's muse be determined and reported for eachwavelength used in _he analysis of the samples.
The quarterly determined IDL for an instrument muse always be used as_he IDL for chat IrLstru_ent during chac quarter. If r.he inscrumen_ is
adjusted in anyway uhac may affect the IDL, uhe ZDL for uhac Inscrumen_mu_c be redeceruined and the results submluced for use as the
escabllshed IDL for chat instrument for the remainder of the quarter.
ZDLs muse be reported for each Instrument used on FOR-q X-IN submlcced
vluh each data package. If multiple AA Instruments are used for uhe
analysis of an element within a Sample Delivery Group, the highest IDL
for the AAs musu be used for reporting concentration values for chacSample Delivery Croup. The same reporting procedure muse be usedformultlple ICPs.
-1_ 7/88

11. IntereI_ment Corrections for ICP
Before any field samples are analyzed under this contract, the ICPinterelement correction factors must be determined prior co the startof contract analyses _nd at least annually thereafter. Correctionfactors for spectral interference due Co Al, Ca, Fe, and Mg must bedetermined for all ICP instruments ac all wavelengths used for eachanalyte reported by ICP. Correction factors for spectral interferencedue to analytes other than AI. Ca, Fe, and Hg must be reported if theywere applied.
If the instrument was adjusted in anyway thac may affect the ICPlnterelement correccio, factors, the factors must be redetermined andthe results submitted for use. Results from lnterelemenc correction
factors determination must be reported on FORM XI(PART 1)-IN and FORHXI(PART 2)-IN for all ICP parameters.
12. Linear Ran_e Analysts (LR.A)
For all ICP analyses, a linear range verification check standard mustbe analyzed and reported quarterly (every 3 calendar months) for each
element on FORH XII-IN. The standard must be analyzed during a. routineanalytical run performed under this contract. The analytically
.determined concentration of this standard must be within + 5q of thetrue value. This concentration is the upper limit of the ICP linear
', range beyond which results cannot be reported under this contractwlthouC dilution of the analytical sample.
13. Furnace Atomic Absorp_lon (AA) _C Analyses
Because of the nature of the Furnace AA technlque, the special
procedures summarized in Figure l-Furnace AA Analysis Scheme ("HSA
Tree") will be required for quantltat[on. (These procedures do not
replace those in Exhlblc D of this SO_, but supplement the guldanceprovided thereln.)
• . Ali furnace analyses must fall wlchln the callbrat£on range. Inaddition, all analyses, except during full methods of Standard
Addlclon (HSA), will require duplicate injections. The absorbance
or concentration of each InJectlon must be reported in the rawdata as well as the average absorbance or concentration values andthe relative standard deviation (KSD) or coefflcienC of variation
(CV). Average concenCratlon values are used for reporclng
purposes. The Contractor must be conslstent per method and SDG inchooslng absorbance or concentraclon to evaluate which route is co
be followed in the HSA Tree. The Contractor must also Indlcace
which of the two ts being used "If both absorbance and
concencraclon are reported in the raw data. For MSA analysis, theabsorbance of each InJectlon must be Included £n the raw data. A
maximum of lO full sample analyses to • maxlmum 20 InJecclons maybe performed between each consecutive calibration verlflcacLons
and blanks. For concentrations greater than CP.Di.,the duplicateinjection readings must agree within 20% RSD or CV, or the
analyclcal sample must be rerun once (i.e., two addlclonal burns).
If the readings are still ouc, flag the value reported on FORM Z-
-15 Rev. 2/89

oi
IN with an "M'. The "M" flag La required for the analytical spikeas well as the sample. 1£ the analytical spike for a samplerequires an "H" flag, the flag must be reported on FORM I- IN forchac sample.
b. AI1 furnace analyses for each analytical sample, including choserequiring sn "M" flag, will require ac least an analyclcal spikeco determine if the HSA will be required for quanClCaClon. The
analytical spike" will be required co be ac a concenCracion (inthe sample) 2x CRDL• This requlremenc for an analyclcal spikewill include the LCS and the preparation blank. (The LCS must be
quanclcated from the calibration curve and correcclve acclon, ifneeded, taken accordingly. MSA is not Co be performed on the LCS
or preparaClon blank, regardless of spike recovery results.) Ifthe preparation blank analytical spike recovery is ouc of control
(85-I15t), the spiking solution must be verified by respiking andrerunning the preparation blank once. If the preparation blankanalyclcal spike recovery is still ouc of control, correct the
problem and reanalyze all analytical samples associated with chac
blank. An analyclcal spike is noc required on the pre-digesClonspike sample.
The analytical spike of a sample must be run ImmedlaCely afterchac sample. The percent: recovery (%R) of the spike, calculatedby the same formula as Spike Sample Analyses (see item 6, this
secclon), will then determine how the smnple will be quanCicaced,as follows •
i) If the spike recovery is less than 40%, the sample muse be
diluted and rerun with another spike. Dilute the sample by afactor of 5 Co 10 and rerun. This step must only be
performed once. If a£ter the diluclon the spike recovery isstill <40q, report dlata and flag wich an "E" Co IndlcaCeInterference problegs.
2) I£ the spike recovery is gr'eater than or equal co 40% and thesample _bsorbance or concentration is less than 50% of the
"spike "_. report the sample results co the IDL. If the spikerecovery is less than 85% or greater than I15t, flag theresult wlch a "_".
3) If the sample absorbance or concencraclon is greater than orequal Co 50t of the spike and the spike recovery is ac or
iAnalyCical Spikes are posc-digestlon spikes co be prepared prior coanalysis by adding a known quantity of the analyte co an aliquot of the
dlgested sample. The unsplked sample aliquot must be compensated for any. volume change in the spike samples by addition of delonized water Co the
• unsplked sample aliquot. The volume o_ the spiking solution added must
not exceed lOq of the analytical sample volume; this requiremenc alsoapplies co MSA spikes.
5"Splke" is defined as [absorbance or concentraClon of spike sample] minus[absorbance or concentration of the sample].
-16 Rev. 2/89

e
between 85t and list, the sample must be quantltated directlyfrom the callbrat£on curve and reported down to the IDL.
4) If the sample absorbance or concentratlon is greater than orequal to 501 of the spike and the spike recovery is less than85t or greater than I151, the sample must be quantltaCed byHSA.
c. The following procedures will be incorporated Into HSA analyses.
1) Data from HSA calculations must: be within the linear range asdetermined by the callbration curve generated at the
, beginning of the analytlcal run.
2) The sample and chree spikes must be analyzed consecutivelyfor HSA quantlcacion (t:he "initial" spike run data isspecifically excluded from use in the HSA quanCitacion).Only single injections are required for HSA quantltatlon.
Each full HSA counts as two analytical samples towardsdetermining lO% QC frequency (i.e., flve full MSAs can beperformed between callbracion ver£ficatlons).
3) For analytical runs containing only MSAs. single InJectionscan be used for QC samples during that run. For Instrtunencs
that operate in an HSA mode only, MSA can be used to
determine QC samples during that run.
4) Spikes must be prepared such that:
a) Spike i is approximately 50% of the sample absorbance orconcentratlon.
b) Spike 2 is approximately I001 of the sample absorbance orconcentration.
c) $p_ke 3 ts ._[,pro×imately 150% of the sample absorbance orconcentratlon.
5) The data for each HSA analysis must be clearly identified inthe raw data documentation (using added concenCratlon as the
x-variable and absorbance as the y-varlable) along with theslope, x-lntercept, y-lntercept and correlatlon coefficient
(r) for the leas_ squares fic of the data. The results must
be reported on FORM VIII-IN. Reported values obtained by HSAmust be flagged on the data sheet (FORM I-IN) vith the letter
"S" if the correlation coefficient is greater than or equalto 0.995. ..
6) If the correlation coefficient (r) for a particular analysisis less than 0.995, the HSA analysis must be repeated once.
If che correlation coefflclenc is still less than 0.995,report the results on FORM I-IN from the run with the best
"r" and flag the result with a "+" on FORM _II-IN and FORMI-IN.
-17 Rev. 2/89

.i
• |.
oh
Figure 1FURNACE ATOMIC ABSORPTION ANALYSIS SCHEME
PREPARe A_P _ALYZE |,. SAMPL.EAND Ot_E SPZKE L
(2 X CP.DL) i TM
I(Doubl_. Injections Required)
, . .JA_JALYSES WITHIN NO DILUTE SAMPLE
1CAL.VBP.ATION P_A_JGE N SPIKE
' If YES, Repeat Only ONCERECOVERY OF SPIKE
LESS THAN 40%i| i,,, ,,
FLAG DATAWITH AN "E"
,,NO
,,, , ,|• Jl
..... REPORT RESULTS
DOWN TO IDL_ , ,,
, SAMPLE ABSON/_ANCE OR SPIKE RECOVERYCONCENTRATION LESS THAN
LESS THAN 85% OR
50% OF SPIKE ABSOP-BANCE GREATER THAN 115%OR CONCENTRATION ......... _ , , ,
I I REPORT RESULTS
INO YES _ DOWN TO IDL,
"[ " FLAG WITI{ A "W"&,,,, , ,,, ,,, ,,
1 1....SPIKE RECOVERY QUANTITATE F_OM
LESS THAN 85% OR NO CALIBRATION CURVE
GREATER THAN 115% AND REPORT DOWN
l TO IDLYES
QUANTITATE BY HSA WITH 3 I
SPIKES AT 50, I00 & 150%
OF SAMPLE ABSORBANCE .....
OR CONCENTRATION "
(Only Single Injections Re,luircd)
If YES, Repeat Only ONCE
I CORRELATION COEFFICIENT _ .....LESS THAN 0.995 I£ Still YES
_ NO i'Ll FLAG DATAv WITH A "+"
I FLAG DATA WITH "S" 1
-18 Rev. 2/89

' PNL TECHNICt& PROCEDURE !
TITLE: PNL-ALO-212,DETER,HINATION OF INORGANICANIONS BY ION CHROMATOGRAPHY
APPLICABILITY
This p,,ocedureis applicable for determiningthe con_centratio&of severalinorganicanions (i._., F', Cl', NOZ, Br-, NO.-,PO4"°,and SO."_) in aqueoussamples and leachatesfrom solids _e.g., soil'sand sediments_. Themethodology is comparable to EPA Method 300.0. Solid samples shall bes,bjectedto an appropriate leaching procedure prior to analysis, such asPNL-ALO-103 or PNL-ALO-108.
DEFINITIONS/ACRONYMS
Batch - group of samples of similar matrix prepared and analyzed as a set.
Cal - calibrationstandard used to initiallycalibrate the ionchromatograph(lC).
Ve__ - calibrationverificationcheck standard used to verify the init'alcalibration. The Ver standard is obtained/preparedfrom a source thatis independentfrom the Cal standard.
RE_PONSIBL{STAFF
Cognizant ScientistTechnician/Analyst
PROCEDURE
1.0 Tolerances
Tolerancesfor all measurementsmade during an analysis shall bespecifiedin the following manner: I) a tolerance limit can be statedwith a measurenlentvalue given in a method, or 2) if a tolerance limitis not stated with a measurement value, then the following system oftolerances shall be in effect:
Au_,_/)_ Date Pro_ectMgr.. Date QP Representa_tive Date,,_._ ,--,/.,_,_ _,_,_..._../-____ _.__ .,_/"_/_,,_Urie TY,Tl_saka TL Ehler't
Technical Reviewer Date Line Mgr. _ Date Other Date
( PProcedtJreNo. Revision No. / Effe'ctive Date Page
PNL-ALO-212 I DEC 0 4 IN I of g......

I PNL TECHNICALPROCEDURE I
(a) Unless otherwise specified, all values for measurements stated inthe methods (volume, weight, time, etc.) are approximate values.The actual measurements used, however, shall be within ±10% of thestated value.
(b) Whenone or more significant figures are given to the right of thedecimal point, the tolerance limit is _+5 in the next digit locatedbeyond the lasl one stated.
2.0 Summaryof Method
Ion chromatography is a rapid, multi-ion method for analyzing antons ina small volume (typically 5 mL) of sample solution. The method utilizedin this procedure is based on separation of the anions on an anionexchange column, suppression of eluent conductivity by a cation exchangemembrane, and conductimetric detection ot' the separated anions as they -pass through a small conductivity cell. The increase in conductivitycaused by each anion is recorded and the anion concentrations aredetermined by comparison with detector responses from standardsolutions. The anions are identified by their retention time, the timerequired for the anion peak to appear following injection.
Ion chromatography is an evolving technique which often requiresoperational modifications for optimal performance for unusual matrices.In the interest of introducing changes or modifications in a timelymanner, the changes will be documented in the sample records when suchchanges are of a non-permanent nature and documented by ICN when thechanges are to be permanent. Whenrequired by the client, notificationof such changes will be made in _,,riting.
3.0 Interferences
3.1 Substances with retention times that are similar to and overlapthose of the anion of interest can cause interference. It isdifficult to correct or compensate for interference caused by suchsubstances without changing analytical conditions, such as column,el uent, etc.
3.2 Large amounts of an anion can interfere with the peak resolution ofan adjacent anion. Sample dilution can be used to solve most ofthis type of interference problems.
3.3 The water dip or negative peak which elutes near (and can interferewith) the fluoride peak can be eliminated by the addition of theequivalent of I mL of IOOX concentrated eluent to 100 mL of eachstandard or sample.
3.4 Method interferences may be caused by contamination in the reagentwater, reagents, glassware, and other sample processing apparatus
ProcedureNo. Revision No. EffectiveDate Page
PNL-ALO-212 1 __'C t)4 'm_ 2 of 9 J

that lead to discrete artifacts or elevated baseline in ionchromatograms.
3.5 Sa._plesand reagent solutions that contain particles larger than0.45 can damage columns and flow apparatus. Filtrationmay berequired for visually turbid samples.
3.6 Retention time is affected by concentration. Late eluting anions,such as nitrate and sulfate, exhibit the greatest amount of change,although all anions are affected to some degree. In some cases,this peak migration can reduce resolutionor lead tomisidentification.
3.7 Weak organic acids (e.g., formic, acetic) can coelute with thefluoride and chloride. A weaker eluent {_ra gradient elutionprogram is required to eliminate this type of interference. -
3.8 Maintain the maximum separator column loading below 400 /_g/mL(forall anions), since nonlinear response can result from exceeding thecolumn capacity.
4.0 Appa_'atus
4.1 Ion chromatoqraphsystem: Analytical system complete with ionchromatographand all required accessoriesincluding analyticalcolumns, compressed air, detector, and recorder/plotter(Dionex 2000 series, or equivalent). A data system is recommendedfor peak integration.
4.2 Balance: Analytical,capable of weighing to the nearest 0.001 g.
4.3 Anion separatorcolq.mn: Dionex IonPac AS4A, or equivalent.
4.4 Anion quard column: Dionex IonGuardAG4A, or equivalent.
4.5 Anion suDoressor column: Dionex AMMS, or equivalent.
4.6 Conductivitydetecto.r: 6 /_Lvolume, Dionex, or equivalent.
4.7 Micropipet: 5 to 10,000 /_L,as required.
4.8 Autosampler: (Optional)Dionex, low-volume,pressure delivery, orequivalent.
5.0 Reagents and Standards
Guidelines for the preparation of standardsand reagents are givenbelow. The cognizant scientistmay implementchanges when required;such changes will be documented in the sample record.
ProcedureNo. Revision No. EffectiveDate PagePNL-ALO-212 I DEC 0 4 1992 3 of 9

i PNLTECHNICALPROCEDURE I
5.1 Deionized water: Water shall be used for sample, standard andreagent dilutions such that no anions above the method detectionlimit are found in it.
5.2 Eluent solution (0.00175 14NaHCO.+ 0.00185 14NazCO)): Dtssolve0.588 g sodium bicarbonate (NaHC03) and 0.784 g sodium carbonate(NazC03) in water and dilute to 4.00 L.
5.3 Suppressor reqeneration solution (0.025 N H_S04): Dilute 2.8 mL ofconcentrated sulfuric acid with water to 4.0 L.
5.4 Stock standard solutions (1000 rag/L): Preferred: Procurecertified aqueous stock standards from a supplier and verify bycomparison with a second standard. Alternative: Prepare stockstandard solutions from reagent grade materials as described below.Solid sources used for standard preparation will be stored in a -dessicator when not being used. Dilute working standards should beprepared from stock standard solutions as needed [See Sections 5.5and 6.3]. All anion stock standard solutions must be stored underrefrigerated conditions.
5.4.1 Bromide (1000 pg Br-/mL): Dissolve 0.1286 g sodium bromide(NaBr) in water and dilute to 100.0 mL.
5.4.2 Chloride (1000 pg Cl"/mL): Dissolve 0.1649 g sodium chloride(NaCl) in water and dilute to 100.0 mL.
5.4.3 Fluoride (1000 pg F'/mL): Dissolve 0.2210 g sodium fluoride(NaF) in water and dilute to 100.0 mL.
5.4.4 Nitrate (1000 pg NO3"/mL): Dissolve 0.1371 g sodium nitrate(NANO3) in water and dilute to 100.0 mL.
5.4.5 Nitrite (1000 pg NO2"/mL): Dissolve 0.1499 g sodium nitrite(NaNOz) in water and dilute to 100.0 mL.
5.4.6 Phosphate (1000 pg PO4"3/mL): Dissolve 0.1263 g monobasicsodium phosphate (NaH2P04) in water and dilute to 100.0 mL.
5.4.7 Sulfate (lO00 pg S04"Z/mL)• Dissolve 0.1479 g sodium sulfate(NazS04) in water and dilute to 100.0 mL.
5.5 14ultiana1yte workinq standards: For each analyte of interest,prepare calibration standards at a minimum of three concentrationlevels by adding accurately measured volumes of one or more of thestock standards and diluting to the appropriate volume with water.Deionized water [See Section 5.1] is used as a blank. Thestandards should define the working range of the detector.Standards should be madeevery two weeks or as required, based on
ProcedureNo. Revision No. Effectivetlate Page
PNL-ALO-212 1 T)I_P.O 4 Igg_ 4 of 9

I PNL TECHNICALPROCEDURE I
results from the calibrationverificationcheck standards [SeeSection 6.3]. All anion working standardsmust be stored underrefrigeratedconditions.
Calibration & VerificationStandards Preparation6uideline
F- Cl- NO2- Br" NO " PO4"3 SO,."2(pg/mL) (pg/mL) (pg/mL) (pg/mL) (pg_mL) (pg/mL) (pg/mL)
Cal 1 0.25 0.25 0.5 0.25 0.5 0.5 0.5Cal 2 0.50 0.50 1.0 0.50 1.0 1.0 1.0Cal 3 1.00 1.00 5.0 1.00 5.0 5.0 5.0Cal 4 2.50 2.50 10.0 2.50 10.0 10.0 10.0Cal 5 5.O0 5.O0 20.0 5.O0 20.0 20.0 20.0Cal 6 7.50 7.50 30.0 7.50 30.0 30.0 30.0
Ver H 6.00 6.00 25.0 6.00 25.0 25.0 25.0Ver M 4.00 4.00 15.0 4.00 15.0 15.0 15.0Ver L 1.50 1.50 5.0 1.50 5.0 5.0 5.0
The Ver H, M and L are the high-, mid- and low-range calibrationverificationcheck standardswhich are prepared from secondarystock aqueous standardsor solids as described in Step 5.4.
Note: The calibration (Cal) and calibrationverificationcheckstandards (Vet) shall be obtained and/or prepared fromdi fferent sources.
6.0 Calibration
6.1 The system shall be calibrated for each anion of interest using theCalibrationStandards from Section 5.5. Calibration parametersshall be establishedand recorded;the performanceof thecalibration verificationcheck standards shall determine thecalibration frequencyper Section 6.3. The same injection volumewill be used on samples analyzed using this calibration curve.
6.2 Using injections of each calibration standard [Section 5.5,Calibration Standards],tabulate the peak height or peak arearesponse against concentration. The results shall be used toprepare a calibration curve for each analyte. This becomes theworking calibration curve.
6.3 The working calibrationcurve shall be verified each working day orwhenever the anion eluent is changed, and after at least every 10samples. The responses and retention times for analytes shall bewithin_+10% (_+15%for F" and Cl" retentiontimes) of theverificationstandard'snominal values. If this condition is notsatisfied, the verificationrun shall be repeated. If the results
ProcedureNo. Revision No. EffectiveDate PagePNL-ALO-212 I BF,I;0 _ _ 5 of g

I PNL TECHNICALPROCEDURE J
are still greater than _+10%(_+15%for F- and Cl- retention times),new calibrationcurves may need to be generated.
NOTE: It is possible that a sample matrix may affect analytequantitationin a reversiblemanner. The interpretationofthe cognizant scientistcan override the need forrecalibrationif operations such as column cleanup willrecover calibrationquality.
7.0 Quality Control
7.1 All quality control data shall to be maintained and available foreasy reference or inspection.
7.2 Minimum quality control requirements.
7.2.1 Samples shall be diluted, and reanalyzed, if they are moreconcentratedthat the highest calibrationstandard.
7.2.2 When appropriate,analyze a minimum of one method blank persample group (typically10 samples) or one for each batch ofsamples prepared,whichever is more frequent.
7.2.3 Analyze at least one calibrationverificationcheck standardprior to beginning sample analyses after every 10 samples,and at the end of the analysis run. If results of thecalibrationverificationcheck standard is not within thecontrol boundaries established[See Section 6.3], theCognizant Scientistshall determine the corrective action.All sampleswithin the previously analyzed sample groupshall be flaggedon the data reports and the correctiveaction documentedwith the data. Validation of the data is
the responsibilityof the TechnicalGroup Leader orCognizantScientist.
7.2.4 Additional quality control (i.e., duplicates, spikes,additionalsystem or matrix blanks, etc.) is governed by theanalyticalrequirementsof the project or specific analysesrequested. Specific QC requirementsare provided by theAnalytical Request Form (ARF), the project Statement ofWork, or the sample analysisTest Instruction (TI).
7.3 Quality Control for clients requestingcompliance withComprehensive EnvironmentalResponse,Compensation, and LiabilityAct of 1980 (CERCLA)requirements.
7.3.1 Samples and standardsshall be analyzed per protocolsdefined by EPA 300.0. These QC requirements are:
ProcedureNo. Revision No. EffectiveDate Page
PNL-ALO-212 1 T)FC0 4 _gg_ 6 of g

I I
Sample Preparation qC Requirements
• Duplicate SamplePreparations - one per 10 samples or perbatch of similar matrix, whichever is smaller.
• MethodBlanks - one per 10 samplesor per batch ofsimilar matrix, whichever is smaller.
• Matrix Spikes - one per 10 samplesor per batch ofsimilarmatrix,whicheveris smaller.
• MatrixSpikeDuplicates- one per 20 samplesor per batchof samplematrix,whicheveris smaller.
Anion Analysis OCRequirements
• At a minimum,a fourpointcalibrationshallbe used inthe initialcalibratingfor each analyte.
• A calibrationverificationchecksampleshallbe runbeforeanalysesbegin,afterevery10th sample,and atthe end of the analysisrun.
Q • A deionizedwaterblankshallbe run aftereachcalibrationverificationchecksampleis run.
• Multipledilutionsof samplesshallbe made so that allanalytesfallwithintheirinstrumentcalibrationrange.
7.3.2 Additionalqualitycontrolrequirementsshallbe governedby the Statementof Work fromthe client,with theanalysisprotocoltransmittedto the Analystvia TestInstructions.
8.0 AnalysisMethod
8.1 Samplecollectionand preservation:All samplesshallberefrigeratedat 4°C (+2"C),radioactivitylevelspermitting,andanalyzedwithinthe holdtimesspecifiedeitherby EPA Method300.0(i.e.,48 hoursfor NOs', "
sNo0_.,and PO4-°and 28 days for the otheranions) or the governihg
8.2 Solidspreparation:Solids(e.g.,soilsand sediments)shallbepreparedaccordingto PNL-ALO-I03or PNL-ALO-I08as directedby theTI, ARF, or SOW. If no directionis provided,the CognizantScientistshalldeterminethe appropriatesolidpreparationmethod.The applicabilityof othersamplepreparationtechniquesfor likeor othermatricesshallbe demonstratedby analyzingspikedsamples
)cedureNo. Revision No. EffectiveDate Page
PNL-ALO-212 1 _ O4 1_ 7 of g

I PNL TECHNICALPROCEDURE I
0and/or relevant standard referencematerials. Solid sampleleachatesshall be refrigeratedat 4"C (_+2°C),radioactivitylevelspermitting,and analyzed within the holding times specified.
8.3 Load and inject an aliquot of the sample. Record the resultingpeak height or area.
NOTE: For all injectionswithin a batch, the size of the samplingloop should be the same for calibration,verification,andsample analyses.
NOTE: The experience of the CognizantScientist should be weighedheavily in the interpretationof chromatograms;specificallypeak shapes, retentiontimes, overlapped peaks and detectorresponses.
8.4 If the response of the peak exceeds the calibrationrange, dilutethe sample with an appropriatequantity of water and reanalyze.
8.5 If the resulting chromatogramfails to produce adequate resolutionor if identificationof specific anions is questionable,the samplemay be spiked, if possible,with an appropriatequantity ofstandardand reanalyzed.
8.6 Refer to the separate calibrationcurves for each anion of interest[See Section 6]. Compute sample concentrationby comparing samplepeak response with the standard curve.
8.6.1 Aqueous samples: Apply all dilution factors and reportresults in /_g/mL.
8.6.2 Solid samples: Determinethe percent solids using procedurePNL-ALO-504. Apply all dilution factors to the leachate.Calculate and report the concentration in mg/kg on a dryweight basis"
Concentration (mg/kg)= (C * V) / (W * (P/lO0))
Where:
C = /_g/mLanion in the measured solution (correctedforany analysis dilution)
V = Final volume after sample preparation (L)
W = Weight of wet sample (kg)
P = Percent solids (%).
IProcedureNo. Revision No. Effective Date Page _r"
PNL-ALO-212 I O_C l)4 1992 8 of 9 I

PNL TECHNICAL !PROCEDURE
O9.0 Specific Qualifications
This procedureis self-qualifyingdue to dependence on analyticalstandards, calibrations,and quality control standards according toPNL-MA-70, PAP-70-901.
10.0 Records
Recordswill be maintained and controlled so as to conform torequirementsof PNL-MA-70, PAP-70-1701. Laboratory Record Books (LRBs)and Analytical Data Sheets provide a mechanism for control of mostrecords. LRBs will be used in accordancewith establishedrecordsmanagement practices.
11.0 References
EPA Test Method 300.0. September, 1991. "The DeterminationofInorganicAnions in Water by Ion Chromatography,"EPA-600/4-84-017.
ASTM StandardTest Method D4327-84. 1984. "Anions in Water by IonChromatography."
AI4SO Software Reference Manual. July 1990, or later version. DionexCorp. Document 034039, Revision 05 or higher.
'rocedureNo. Revision No. EffectiveDate PagePNL-ALO-212 1 8_C 0 4 _992 9 of g

tam=.
INTERIM CHANGE NOTICEIC__N.N
ICN-pNL-ALO-213.1 R 0. .PAGE1 OF 1
--- , i i ,
A. Oo,_umentNumber:PNL-ALO-213.1 Revision Number: 0 EffectiveDate of ICN:
DocumentTitle:Mercury in Water, Solids and Sludqes B.yManual Cold Vapor Technique
i i
Document's Original Author JJ Waqner ChangeRequestedby:RH Nipper
, , i
B.Action:Replacepages 11 & 12 with the attached pages 11 & 12.. .
C.Effectof Change:This change will give a more accurate records requirementsresource.
i i i iiii, i
O. Reason for Change/Descriptionof Change:Reason:
I. Deletes inaccurate information.
Description:
I. Replaced" PNL-MA-70,PAP-70-1701with Analytical ChemistryLab (ACL) QualityAssurance Plan (QAP) MCS-033.
2. Replaced: "LRB's will be used inaccordancewith the 8CT Now Directive89.1"with "LRB's will be used in accordancewith establishedrecords manaqement .practices."
IE. Approval Signatures: I Type of Change (Check (/) one)
(PleaseSign and Date) I (/) Minor Change ( ) Major Change
QP Concurrence: TL Ehlert _ .__ Date: .--_)v//_-;_/._L'_
Approval Authority: ..AB Kinq ,./y,/_l _ Oate: °- /'_"7 !/C_#'___
Other Approvals: MW Urie ; Date:
: Date:

I ° .
I PNLTECHNICALPROCF.._RE
TITLE: PNL-ALO-213,MERCURY IN WATER, SOLIDS, AND SLUDGES BY MANUAL COLDVAPOR TECHNIQUE
APPLICABILITX
This procedure is applicable for determining the concentration of totalmercury (organic and inorganic) in water, soils, sediments and sludge typematerials. The methodology is comparable to CLP SOW 788 Methods 245.1 and245.5.
DEFINITIONS
Batch- A group of samples of similarmatrix prepared at the same time.
RESPONSIBLE STAFF
Cognizant ScientistTechnician
PROCEDURE
1.0 Summary of Method
1.1 The flameless AA procedure is a physical method based on theabsorption of radiation at 253.7 nm by mercury vapor. Organicmercury compounds are oxidized and the mercury is reduced to theelemental state and aerated from solution in a single pass system.The mercury vapor passes through a cell positioned in the lightpath of an atomic absorption spectrophotometer. Absorbance (peakheight) is measured as a function of mercury concentration andrecorded.
1.2 The method detection limit is 0.01 pg Hg. Using the nominal samplesizes of 50 mL for waters and 0.2 g for soils/sludges,thedetection limits are 0.2 pg/L and 0.05 mg/Kg, respectively.
JymlA .... " <,Technical _'evielmr Line Igr. Dite Other Dite
Procedure No. Effective Date Page of
PNL-ALO-213 APR 2 6 1991 I 12

PNLTECHNICALPROCEDURE
2.0 Interferences
2.1 Possible interferencefrom sulfide is eliminated by the addition ofpotassium permanganate. Concentrationsas high as 20 mg/L ofsulfide as sodium sulfide have been shown to have no effect onrecovery of mercury from spiked samples.
2.2 Copper has also been reported to interfere; however, copperconcentrationsas high as 10 mg/L have been shown to have no effecton recovery of mercury from spiked samples.
2.3 Sea waters, brines and industrialeffluents high in chloridesrequire additional permanganate. Care must be taken to assure thatfree chlorine, which absorbs radiation of 253 nm, is absent beforethe mercury is reduced and swept into the cell. This may beaccomplishedby using an excess of hydroxylamine hydrochloridereagent.
2.4 Sampiescontaining high concentrationsof oxidizable organicmaterials may not be completely oxidized by this procedure. Whenthis occurs, the recovery of organic mercury will be low. Theproblem can be eliminated by reducing the weight of the originalsample or by increasing the amount of potassium persulfate used inthe digestion.
2.5 Because of the extreme sensitivityof the analytical procedure andthe omnipresenceof mercury, care must be taken to avoidcontamination. Sampling devices and sample containers should beascertainedto be free of mercury; the sample should not be exposedto any condition in the laboratorythat may result in contact orairborne mercury contamination.
3.0 Tolerances
Tolerances for all measurements made during an analysis shall bespecified via the following: I) a tolerance limit is stated with ameasurement value, or 2) the following system of tolerances shall be ineffect:
a. When two or more significant figures are specified, the tolerancelimit is +5 in the next digit beyond the last one stated. Forexample, 5.0 mL means 5.0 + 0.05 mL; 450 g means 450 + 5 g; 369 mLmeans 369.0 + 0.5 mL.
Procedure No. Revis ion No. Effect,i ve Dat,e Pzge of
PNL-ALO-213 0 APE Z.6 _99_ 2 12

i,i , i
PNLTECHNICALPROCEDUREi
b. If a single significant figure is specified, the actual measurementshall be within +_5% of the stated value. For example, 20 mL means avolume between 19 and 21 mL.
4.0 Apparatus
4.1 Atomic Absorption Spectrophotometer: Any atomic absorption unithaving an open sample presentation area for mounting the absorptioncell is suitable. Instrument settings recommendedby theparticular manufacturer should be followed. Instruments designedspecifically for the measurement of mercury using the cold vaportechnique are commercially available and may be substituted for theatomic absorption spectrophotometer.
4.2 Mercury hollow cathode lamp or electrodeless discharge lamp (EDL).
4.3 Recorder: Any multi-range variable speed recorder that iscompatible with the UV detection system is suitable; multi-pen isrecommended.
4.4 Absorption Cell" Standard spectrophotometer cells 10 cm long,having quartz end windows may be used. Suitable cells may beconstructed from plexiglass tubing (1" O.D. x 4.5" length). Theends are ground perpendicular to the longitudinal axis and quartzwindows (1" O.D. x 1/16" thickness) are cemented in place. Gasinlet and outlet ports (also of plexiglass but 1/4" O.D.) areattached approximately 1/2" from each end. The cell is strapped toa burner for support and aligned in the light beam to give themaximumtransmittance.
4.5 Compressed Air: Regulated, industrial grade.
4.6 Flowmeter: Capable of measuring an air flow of I L/rain.
4.7 Aeration Tubing: Tygon tubing is used for passage of the mercuryvapor from the sample bottle to the absorption cell. Straightglass tubing terminating in a coarse porous frit is used forsparging air into the sample.
4.8 Drying Tube: Containing magnesium perchlorate;typically 20 g intube 6" long by 3/4" diameter.
4.9 Pipets: Calibrated,with disposable tips, sized from 5 to 1000 pL,as required.
Procedure No. Revision No. Effective Date Page of
PNL-ALO-213 0 :,?i__.C _'-d" 3 12

PNLTECHNICALPROCEDUREi
4.10 Balance: Analytical, capable of accurately weighing to thenearest 0.0001 g.
5.0 Reagents
5.1 Sulfuric Acid (H_SO4), Concentrated" Reagent grade of low mercurycontent as indic_ited by absence of mercury in the preparationblank.
5.2 Nitric Acid (HN03), Concentrated: Reagent grade of low mercurycontent as indicated by the absence of mercury in the preparationblank.
Note: If a high reagent blank is obtained, it may be necessary topurify the nitric acid by distillation.
5.3 HydrochloricAcid (HCI), 0.5 N: Add 20 mL of concentrated HClcarefully to 400 mL of water then dilute to 500 mL.
5.4 Stannous Chloride Solution" Add 25 g SnCl2 to 250 mL of 0.5 N HCI.
Note- A 10% solution of stannous sulfate in 0.5 N H2SO4 may be usedin place of SnCl2. However, this mixture is a suspension andrequires continuous stirring during use.)
5.5 Sodium Chloride-Hydroxylamine Hydrochloride Solution: Dissolve 12g of NaCl and 12 g of NH2OH.HC1in water and dilute to 100 mL.
Note: Hydroxylamine sulfate may be used in place of hydroxylaminehydrochloride.
5.6 Potassium Permanganate Solution: 5% solution, w/v. Dissolve 5 gof KMnO4 in 100 mL of distilled water.
5.7 Potassium Persulfate- 5% solution, w/v. Dissolve 5 g of K2S208 inI00 mL of distilled water.
5.8 Stock Mercury Standard Solution: Dissolve 0.1354 g of mercuricchloride (HgCl_) in 75 mL of distilled water. Add 10 mL ofconcentratednTtric acid and adjust the volume to 100.0 mL. [ImL - I mg Hg].
5.9 Working Mercury Standard Solution: Make successive dilutions ofthe stock mercury standard solution [See 5.8] to obtain a workingstandard containing 0.1 pg/mL. This working standard, as well as
Procedure No. Revision No. Effect,i ve Dat,e Page of
PNL-ALO-213 0 APR _.',6 i_gl 4 12

PNLTECHNICALPROC[JURE
the dilutions of the stock mercury standard solution, shall beprepared fresh daily. Acidity of the working standard shall bemaintained at 0.15% nitric acid. This acid should be added to theflask as needed before the addition of the aliquot. [1 mL - 1 pgHg].
6.0 Quality Control
6.1 All quality control data shall be maintained and available for easyreference or insp_:tion.
6.2 Minimum qualit), control requirements
6.2.1 A minimum of four calibration standards and one measurementblar, k are required for calibration [See section 7.2.1].
6.2.2 Sa:_;Jes shall be redigested and reanalyzed if they are moreconcentrated than the highest standard which is within thecalibration r_nge.
6.2.3 -At ]east one quality control standard shall be analyzed witheach batch/group of samples, or at a mlnimum, once duringdaily operation. A sample batch/group contains <_20 samples.If the result of the QC standard is not within 80% to 120%of the mean value, the Cognizant Scientist shall determineand document the corrective action. Validation of the datais the responsibility of the technical group leader.
6.2.4 lt is not necessary that all standards be digested in likemam,_r to the samples. For calibration verification,undigested mid-range verificationstandards shall beanalyzed every 10-15 samples. If the v_rification standarddoes not agree to within 85% to 115% of the mean value, theCognizant Scientist shall determine and document thecorrective action. Validation of the data is theresponsibilityof the technical group leader.
-]
6.2.4 Additional quality control (e.g., duplicates, spikes,additional system blanks or matrix blanks, tightertolerances, hold time requirements,etc.) is governed by theanalytical requirementsof the projecl or specific analysisrequested. These additional QC requirementsare provided bythe Analytical Request Form (ARF) or the project Statementof Work (SOW) and transmitted to the analyst via TestInstructions(TI).
Procedure No. Re _sion No. Effective Date Page of
PNL-ALO-213 0 APR _ 6 1991 5 12I __ | I , , ,
PNLTECHNICALPROCEDUREp,
6.3 Quality control for clients requesting compliance with CERCLArequirements. Note: All definitions/acronyms(e.g. SampleDelivery Group, SDG) shal_ be consistent with USEPA CLP SOW 788[Reference 10] usage.
6.3.1 A minimum of four calibration standards and one blank arerequired for the calibration of the atomic absorption system[See 7.2.1].
6.3.2 A minimum of one methods blank, one duplicate and one matrixspike shall be prepared and analyzed for every sample batchof similar matrix type. Spikes shall be added at the timeof sample preparation.
6.3.2.1 The methods blank shall be a water sample processedthrough each preparation and analysis step. Note"If the methods blank is not < the requesteddetection limit (from the SOW, ARF, or TI), thenall samples in the batch associated with themethods blank shall be prepared and analyzed again.
6.3.2.2 The duplicate samples shall have a relative percentdifference (RPD) control limit less than or equalto the required precision (from the SOW, ARF or TI)if the sample values are >5x the requesteddetection limit. If no required precision isgiven, the RPD shall be <20%.
Note: If the sample values are <5x the requesteddetection limit, a control limit of + the detectionlimit shall be used This criterial also appliesif one result is >Sx and one <Sx.
Note: If the RPD is outside control limits, flagall samples in the batch/group with an asterisk(*).
Note" RPD = I S - D I * 100(S + D)/2
Where, S = Original sample valueD = Duplicate sample value
6.3.2.3 The matrix spike is added to a replicate sampleprior to any preparation or analysis. The spike,which is prepared from the stock, is added in suchmanner as to add 0.1 pg Hg to the replicate.
Procedure No. Revision No. Effective Date Page of
PNL-ALO-213 0 "_6 _°9_ 6 12

PNLTECHNICALPROCEDUREiii
Note: Spike recoveries shall be within the limitsof 75% to 125%. If this recovery is not met, thenthe results for each sample in the batch/groupshall be flagged with an "N". In the event thesample results exceed the spike by 4x no flag isnecessary.
Note: %Recovery -- .....(SSR - SR) * I00SA
Where, SSR = Spiked Sample ResultsSR = Sample ResultsSA = Spike Added
Note: The units for reporting the spike sampleresults shall be identicalto those used forreporting the sample results (i.e., pg/L foraqueous and mg/Kg dry weight basis for solids).
6.3.3 An initial calibration verificationstandard (ICV) shall beanalyzed immediatelyfollowing calibration.Note: The ICV result shall be within +20% of the truevalue. If the measurement is outside the limit, the analysisshall be terminated,the problem corrected, the instrumentrecalibrated,and the calibration reverified.
6.3.4 At a minimum, a continuing calibrationverification (CCV)standard shall be analyzed at a frequency of 10% or every 2hours during an analysis run, whichever is more frequent.
Note" The CCV is made from the stock standard and dilutedto a concentrationat or near the mid-range of thecalibration curve.
Note- The CCV result shall be within _+20%of the truevalue. If the measurement is outside the limit, the analysisshall be terminated, the problem corrected, the instrumentrecalibrated,and the calibration reverified.
6.3.5 A calibrationblank shall be analyzed after the ICV, aftereach CCV, and after the last sample in a set of samplesbeing analyzed. A calibration blank sample is a blank (0.0pg/L Hg) sample made up exactly like the methods blank ofthe calibration standards. The calibration blank sample isnot digested.
Procedure No. Revision No. Effec&ive Dat,e Page of
PNL-ALO-213 0 APR _ 6 _991 7 12

PNLTECHNICALPROCEDURE
Note: If the absolute value of the calibration blank sampleexceeds the requested detection limit (from the SON, ARF orTI), the analysis is terminated, the problem corrected, theinstrument recalibrated, and all analytical samples analyzedsince the last good calibration blank are to be redigestedand reanalyzed.
7.0 Analysis Method
Caution: Because of the toxic nature of mercury vapor, precaution mustbe taken to avoid its inhalation. Therefore, a bypass must be includedin the system to either vent the mercury vapor into an exhaust hood orpass the vapor through someabsorbing media, such as, equal volumes of0.1 N I(HnO4 and 10% H2SO4, or 0.25% iodine in a 3% KI solution.
7.1 Sample collection, preservation, and handling.
Sample collection and field preservation is not within the scope ofthis procedure. However, it is important, whenever possible, thatthe samples be collected and preserved properly in order tomaintain sample integrity. Once received, the samples should bepreserved according to the steps below.
7.1.1 If not already treated at the time of collection, aqueoussamples shall be preserved by acidification with nitric acidto a pH of 2 or lower.
7.1.2 Samples shall be refrigerated at 4°C (+2°C), radioactivitylevels permitting, and analyzed within the holding timesspecified (i.e., by either Appendix A or the governingSOW/TI).
7.1.3 The soil/sediment/solidsamples shall be analyzed withoutdrying. A separate percent solids determination (e.g.,procedure PNL-ALO-504)is required.
7.2 Calibration standard preparation
7.2.1 Transfer 0.0, 0.5, 1.0, 5.0 and 10 mL aliquots of theworking mercury solutions [See 5.9] containing 0.0 to 1.0 pgHg to a series of sample analysis bottles (e.g., 300 mL BODor equivalent).
Procedure No. Rayis ion No. Effect, ive Oat,e Page of
PNL-ALO-213 0 APR ,_6 I_ _. 8 12

ii i
PNLTECHNICALPROCEDUREi i i i
7.2.2 When processing aqueous samples, add enough distilled waterto each bottle to make a total volume of 50 mL, then proceedto step 7.3.2.
7.2.3 When processing s__oil/sediment/solidsamples, add enoughdistilled water to each bottle to make a total volume of 5mL, then proceed to 7.4.2.
7.3 Aqueous sample digestion
7.3.1 Transfer 50 mL [Va] of sample, or an aliquot [Va] diluted to50 mL, containing not more than 1.0 pg Hg, to a sampleanalysis bottle.
7.3.2 Mix thoroughly and add 5 mL of conc. H_SO4 [See 5.1]. Mixand add 2.5 mL of conc. HNO3 [See 5.2].=
7.3.3 Add 15 mL of KMnOa solution [See 5.6] to each bottle andallow to stand at'least 15 minutes.
Note: Some samples may require additional KMnO4 [See 2.3,for example]. If this is necessary, add additional portions
of KMnO4 until the purple color persists for at least 15minutes.
7.3.4 Add 8 mL of K_S_O_ solution [See 5.7] to each bottle, mixthoroughly, aBd'h_at for 2 hours in a.water bath maintainedat 95°C.
7.3.5 Cool and proceed to 7.5.
7.4 Soil/Sediment/Solidsample digestion
7.4.1 Weigh a representative0.2 g portion of wet sample [Ws] andplace in the bottom of a sample analysis bottle.
7.4.2 Mix thoroughly and add 5 mL of conc. H_SO4 [See 5.1]. Mixand add 2.5 mL of conc. HNO3 [See 5 2].=
7.4.3 Heat for 2 minutes in a water bath at 95°C. Remove andallow the sample to cool.
7.3.4 Add 50 mL distilled water and 15 mL of KMnO4 solution [See5.6] to each bottle and allow to stand at l_ast 15 minutes.
Procedure No. Revision No. Effec',,i ve Dat,e Pige of
PNL-ALO-213 0 APR ;.r_ :,9_'! 9 12

PNLTECHNICALPROCEDURE
Note: Some samples may require additional KHnOa [See 2.3,for example]. If this is necessary, add additidnal portionsof KHnOa until the purple color persists for at least 15minutes_
7.4.5 Add 8 mL of K_S20R solution [See 5.7] to each bottle, mixthoroughly, and r_turn to the water bath for 30 minutes.
7.4.6 Cool and proceed to 7.5
7.5 Calibration and Analysis
7.5.1 Process each standard [See 7.2.1] through 7.5.2 to 7.5.6.Construct a standard curve by plotting absorbance peakheight (mm) versus Hg content (pg). An alternate approachis to perform a linear regression to establish Hgconcentration based on absorbance peak height [Use in7.5.7].
7.S.2 Treating each sample individually, add 6 mL of NaC1-NH2OH.HC1solution [See S.S] to reduce the excesspermanganate.
Note" It may be necessary to add additional reductant in 6
mL increments until KHnO4 is completely reduced.
7.5.3 By partially inserting the sparge tube into the analysisbottle, purge the bottle head space for at least I minuteand then add 5 mL of SnCI_ [See 5.4]. Immediately attach theanalysis bottle to the aePation apparatus which has beenpreviously adjusted for a constant flowrate of I L/min.
7.5.4 Allow sample to stand quietly without manual agitation. Theabsorbance will increase and reach a maximum within 30seconds.
7.5.5 As soon as the recorder pen levels off (approximatelyIminute), transfer the sparge tube to the standby analysis
bottle which contains 5 mL conc. H2SO4 [See 5.1], 2.5 mLconc. HNO3 [See 5.2], and 50 mL water.
7.5.6 Continue the aeration until the absorbance returns to itsminimum value.
Procedure No. Revis ion No. Effect,ire Dat,e Page of
PNL-ALO-213 0 APR _6 19Q_i, 10 12

7.5.7 Measure and record the peak height of thesample from the recorder chart and obtainthe Hg content [C] from the standard curveconstructed in 7.5.I.
7.6 Calculation of Hg concentration.
7.6.I Aqueous samples
Hg (/_g/L)= (C * I000) / Va
Where• C -/_g Hg in sample aliquotVa= Volume of aliquot in mL
7.6.2 Soil/Sediment/Solidsamples
Hg (mg/Kg)--C / (Ws * Ps)
Where: C = (/_gHg in sample aliquot)* 1000W = (Weightof aliquot in g) * 1000$
Ps= (PercentSolids in %) / 100
8.0 Specific Qualifications
This procedure is self-qualifyingdue to dependence on analyticalstandards, calibrations,and quality control standards as per PNL-MA-70,PAP-70-g01.
9.0 Records
Records will be maintained and ocntrolled so as to conform to• nMt H ^ "In r}̂ ¢} 7n I _t_I i":i:::::!:::::!"i:':!:_::":'_:"iii:_:;:i:::':i!iii'i_i..........:iii:::::::'_:i:"!i:::::i:":_i:':::::::_:_:ii_i"ii:::!_":':i_i_i!:"i"'i"i_i::"ii"i_
requIrements of ......... , ......... ___]___I_E_:_(_E_
........R__6F_."C"__"_"_/D"__.'_''_"Fi"__'_."_,""providea mechanism for control ofmost records. LaboratoryRecord Books will be used in accordance with
•:_:_____:___________:_:___:____'_'______:_________:___'_______:_:_:_:_:___________:_:___:________`_':_______:_:_'_:_____:_________:_:_:_____________'__..............,.................-.............,.,......°...............................,
Procedure No. Revision No. Effective Date Page
PNL-ALO-213 0 11/27/90 11 of 12

•= ,v. "'
I0.0 References
Koop, J.F., Longbottom,M.C. and Lobring, L.B. "Cold Vapor Method forDeterminingMercury", AWWA, vol. 64, p. 20, Jan. 1972.
Standard Method for the Examinationof Water and Wastewater 14th •Edition, p. 156 (Ig75).
USEPA Contract Laboratory Program, Statement of Work for InorganicAnalysis, SOW 7/88; Methods 245.1 and 245.3.
ProcedureNo. Revision No. EffectiveDate Page
PNL-ALO-213 0 11/27/90 12 of 12

INTERIM CHANGE NOTICE
(ICN) :CN- PNL-ALO-214.IRIelof I
A.
DocumentNumber: PNL-ALO-214 RevisionNumber:__.i_ Effective DateDocumentTltle:Arsenic(AtomicAbsorption,Furnace of ICN: _ / II /(_
Technique) ChangeRequestedby:Document's Original Author: MWUrie TE Jone@
B. Action.
DeletingACT 89.1 and replacingwith establishedrecordsmanagementpractices.
Replacepages I through7 due to new format.
C. Effectof Change:
Bringsprocedureinto compliance.
D. Reasonfor Change/Descriptionof Change:ACT NOW Directive89.1 no longerin existence.
E. Approval Signatures: Type of Change: (Check one):(Please sign and date)
Minor __ Major
ProcessQuality Department: . TI,Ehlert _ ._____ Date: ._'/ _ / _'-.P_
ApprovalAuthoritY:OtherApprovals: AG Ktnq _ _/_'2J_/__. _/ Date: I_-/'-)_PK Melethtl F_j__T-_Xj(_ / Date: _-/ it
: i Date: / /


PNLTECHNICALPROCEDURE
TITLE: PNL-ALO-214,ARSENIC(ATOMICABSORPTION,FURNACETECHNIQUE)
APPLICABILITY
This procedureis applicablefor determiningthe concentrationof arsenicinwastes,mobility-procedureextracts,soils,and groundwater. The methodologyis comparableto CLP SOW 788 Method206.2. All samplesmust be subjectedtoan appropriatedissolution/digestionprocedurepriorto analysisas specifiedby the cognizantscientistor in Test Instructions(TI) or AnalyticalRequestForm (ARF).
DEFINITIONS
Batch: A groupof samplesof like matrixpreparedat the same time.
Modifier: A substanceaddedto the furnaceto alterthe atomizationcharacteristicsof eitherthe analyteor interferingmatrix. Modifiersareemployedto separateanalyteand matrixin time allowingreductionof matrixinterferenceson the measurementof the analyteatomizationsignalprofile.Modifiersmay be addedas a liquidto the samplesolution,injectedinto thefurnaceor incorporatedin the argongas streamduringthe pretreatment,atomizationor the clean-outsteps.
RESPONSIBLESTAFF
CognizantScientistTechnician
1.0 Summaryof Method
1.1 Followingthe dissolutionof the sample,a representativesamplealiquotand modifierare placed,by means of an automaticsampler,into a graphitetube furnace. The samplealiquotis then slowlyevaporatedto dryness,charred(ashed),and atomized. The
• i , i i Jl i i ,
Author Date Project Mgr. Date QAD Representative Date
MW Urle TE Jones GK Gerke
echntcal Reviewer Date Line Mgr. Date Other , DateALL ORIGINAL SIGNATURESON FILEIPmllq[Mele_hll JM Latkovlch
I ii i ii
Procedure No. Revision No. ETfective Date Page
PNL-ALO-214 1 04/26/91 I of 7i Jl llll

i i i ii • iu NIl I InUlll I IIIIN |111
I PNLTECHNICALPROCEDURE
absorptionof lamp radiationduringatomizationis proportionaltothe arsenicconcentration.
1.2 The method detection limit for As is 1 mg/Kg for soils and 10 pg/Lfor waters. Typical instrument detection limits (IDL) for As is 1/_g/L In the analysis solution.
2.0 Interferences
2.1 Elemental arsenic and many of its compounds(e.g., arsenicchloride) are volatile; therefore, samples may be subject to lossesof arsenic during sample preparation. Spiked samples and relevantstandard reference materials should be processed to determine ifthe chosen dissolution procedure is appropriate.
2.2 C_ution must be employed during the selection of times andtemperature for the drying and charring cycles. A palladium orother acceptable modifier (e.g., Nickel) should be added to alldigestates prior to analysis to minimize volatilization lossesduring drying and charring.
2.3 In addition to the normal interferences experienced during graphitefurnace analysis, arsenic analysis can suffer from severenonspecific absorption and light scattering caused by matrixcomponentsduring atomization. Arsenic analysis is particularlysusceptible to these problems because of its low analyticalwavelength (193.7 nm). Simultaneous backgroundcorrection isrequired to avoid erroneous results. Phosph:)rus and aluminumcancause interferences when using deuterium background correction.Zeemanbackground correction can be useful in these situations.
2.4 The analyte may not be completely volatilized during atomization,causing potential memoryeffects. This situation can be minimizedby operating the furnace at 2500-2600oC immediately afteratomization.
3.0 Tolerances
Tolerances for all measurementsmadeduring an analysis shall bespecifiedin the following: I) a tolerancelimit is statedwith ameasurementvalue,or 2) the followingsystemof tolerancesshallbe ineffect:
a. When two or more significant figures are specified, the tolerancelimit is +5 in the next digit beyond the last one stated. Forexample, 5.0 mLmeans5.0 + 0.05 mL; 450 g means450 ± 5 g; 369 mLmeans369.0 ± 0.5 mL.
ni n I n i ii i i i i i i in
Procedure No. Revision No. Effective Date ! PagePNL-ALO-214 1 04/26/91 2 of 7
i i ml i iii i ii

PNLTECHNICALPROCEDURE
b. If a single significant figure is specified, the actual measurementshall be within ± 5%of the stated value. For example, 20 mLmeansa volume between 19 and 21 mL.
4.0 Apparatus and Materials
4.1 Atomic absorption spectrophotometer: Double-beam instrument with agrating monochromator, photomultiplier detector, adjustable slits,a wavelength range of 190-800 nm, provisions for simultaneousbackgroundcorrection, and interfacing with a computer and/orstrip-chart recorder. Example: Perkin-Elmer 5100 AASpectrophotometer with AS60 autosampler, deuterium lamp backgroundcorrection, and P-E 7300 computer.
4.2 Arsenic hollow cathode lamp. or electrodeless discharqe lamp (EDL):An EDLprovides better sensitivity for the analysis of As.
4.3 Graohite furnace: Any graphite furnace device with the appropriatetemperature and timing controls. Exa_nple: Perkin-Elmer HG600.
4.4 Pioel;_: Calibrated, with disposable tips, sized from 5 to 1,000pL, as required.
4.5 Balance: Analytical, capable of accurately weighing to the nearest0.0001 g. (Optional)
5.0 Reagents
5.1 Deionized water: Deionized water of sufficient quality, similar toASTMType II reagent water, shall be used for preparing samples,standards, and reagent dilutions. Calibration and sample blankswill produce concentrations at or below instrument detectionlimits.
5.2 Concentrated nitric acid (HNOz): Ultrex grade.
5.3 Arsenl¢ _tandard stock solution (1,000 rag/L): preferred: Procurea certified aqueousstandard from a supplier and verify bycomparison with a second standard. Alternative; Dissolve ].320 gof arsenic trioxide (AszOz, analytical reagent grade or equivalent)in 100 mL of water containing 4 g NaOH. Acidify the solution with20 mL concentrated HNOz,dilute to 1000.0 mL, and verify bycomparison with a second standard.
Caution: Arsenic compoundsare extremely toxic and should behandled with care.
5.4 Arsenic workinq standards: Prepare dilutions of the stock solutionto be used as calibration standards at the time of the analysis.
Procedure No. J Revision HD. Effective Date Page J
PNL-ALO-214 J 1 04/26/91 3 of 7 I

ill i II PNLTECHNICAL,PROCEDURE ..........
Withdrawappropriatealiquotsof the stocksolution,addconcentratedHNO3 at I% of finalvolumeand dilutewith water tovolume.
5.5 Palladiummodifiersolution(I000/_g/mLPd in.HN03): Preferred:Procurea certifiedPd solutionfrom a suppller. Alternative;Dissolve0.I00g palladiumwire in a minimumvolumeof aqua regiaand evaporateto near dryness,add 5 mL of concentratedHNO_,warmuntildissolutionis complete,diluteto 100 mL; or dissolv_0.167g palladiumchloride(PdCl2)in 5 mL of concentratedHNO3, evaporateto near dryness,repeatwith 5 mL of concentratedHNO3, and dilutewith water to 100 mL.
5.7 Arqon ouraeqa_: Industrial-grade
6.0 qualtty Control
6.1 All qualitycontroldata shallbe maintainedand availablefor easyreferenceor inspection.
6.2 Minimumqualitycontrol.
6.2.1 The systemshallbe calibratedfollowingmanufacturer'srecommendedcalibrationprocedurewhich is in the instrumentreferencemanual (see SectionI0.0). Calibrationparametersshall be establishedand recordedeach day of operation.
6.2.2 Samplesshallbe diluted,and reanalyzed,if they are moreconcentratedthan the highestcalibrationstandard.
6.2.3 Employa minimumof one method blankper samplegroup(typically20 samples)or one for each batch of samplesdigested,whicheveris more frequent.
6.2.4 Analyzeat leastone verificationcheckstandardor onequalitycontrolstandardevery8 to 12 samples. If theresultsof the verificationor QC standardare not within80% to 120% of theirmean value,the cognizantscientistshalldeterminethe correctiveaction. All sampleswithinthe previouslyanalyzedsamplegroup shallbe flaggedon thedata reportsand the correctivePctiondocumentedwith thedata. Validationof the data is _he responsibilityof thetechnicalgroup leader.
6.2.5 Additionalqualitycontrol(i.e.,duplicates,spikes,duplicatematrixspikes,multipleinjections,additionalsystemor matrixblanks,tightertolerances,holdingtimes,etc.) shallbe governedby the analyticalrequirementsofthe projector specificanalysesrequested. SpecificQC
i i • i i i ii i i ii mill I I i
PNL-ALO-214 I 04/26/91 4 of 7k i i i ii ii i i III

PNLTECHNICALPROCEDURE ]
requirements are provided by the Analytical Request Form(ARF), _!,_ project Statement of Work (SOW), or the sampleanalysis TeSt Instruction (TI).
6.3 Quality control for clients requesting compliance with CERCLArequirements.
6.3.1 Analyze samples per protocol detailed in Appendix A. UseFigure 1 of Appendix A to establish quantitation method tobP used; that is, either direct calibration or methodofstandard addition. Also, all definitions/acronyms (e.g.Sample Delivery Group, SDG) shall be consistent with USEPACLPSOW788 [Reference 10] usage.
6.3.2 Any additional quality control requirements shall begoverned by the Statement of Work (SOW)from the client withthe analysis protocol transmitted to the analyst via TestInstructions(TI).
7.0 AnalysisMethod
Samplecollection,preservationand preparationis not withinthe scopeof this procedure. However,it is important,wheneverpossible,_hat
the samplesbe collecte_and preservedproperlyin orderto maintainsampleintegrity. Thz ,pplicabilityof samplepreparationschemes,suchas PNL-ALO-I01,for specificmatricesshallbe demonstratedby analyzingspikedsamplesor relevantstandardreferencematerials,or by the useof otherqualifyingtechniques.
7.1 The 193.7nm wavelengthline and a backgroundcorrectionsystemshallbe employed. Followthe manufacturer'ssuggestionsfor allotherspectrophotometerparameters.
7.2 Furnaceparameterssuggestedby the manufacturerin the referencemanual (seeSection10.0)shouldbe employedas guidelines. Thefurnaceparametersused shallbe optimizedand remainconstantthroughoutbatchanalyses. All parametersshallbe recordedwiththe data.
Guidelinesfor furnacesettings-- P-E 5100
Step Temp(oC) Time(sec)Dryi_Ig 150 15-30Charring 1100 30-180Atomization 2400 1-5Cleaning 2500 1-2Cool down 20 1-10
i ml i ,Hl i i i
I Procedure No. I nevi,_ ... I _...... I Page
.... ON .... _i_l.lve 04Le IL PNL'ALO'214 l I l 04/26/91 50f7--- | l ,,m li

PNLTECHNICALPROCEDURE
Note: Becausetemperature-sensingmechanismsand temperatu_econtrollerscan vary betweeninstrumentsor with time,thevalidityof the furnaceparametersmay beconfirmedbysystematicallyalteringthe furnaceparameterswhileanalyzinga standard. In this manner,lossesof analytedueto overlyhigh temperaturesettingsor lossesin sensitivitydue to less than optimumsettingscan be minimized. Similarverificationof furnaceparametersmay be requiredforcomplexsampl• matrices.
7.3 InjectmeasuredpL-aliquotsof sampleand modifiersolution(typically,20 pL of sampleand 5 /_Lof modifier)into the furnaceand atomize. If the concentrationfoundis greaterthan thehigheststandard,the sampleshallbe dilutedin the same acidmatrixand reanalyzed. Note: Multipleinjectionsimproveprecisionand help detect furnacepipetting6rrors.
7.4 Analyzea verificationstandardor a QC standardafterevery8 to12 samples. Note: Verificationstandardshelp monitorthe lifeand performanceof the graphitetube. An RSD for duplicateinjectionsof mid-rangestandardsexceeding10% or an instrumentresponse<70% of the manufacturer'srecommendationas statedin thereferencemanual (see Section10.0),shallbe investigatedandcorrectiveaction,if required,documented.
7.5 Calculationof arsenicconcentration:(I) by the methodofstandardadditions,(2) from a calibrationcurve,or (3) directlyfrom the instrument'sconcentrationread-out. All dilutionorconcentrationfactorsmust be taken into account. Concentrationsreportedfor multiphasesamplesmust be appropriatelyqualified(e.g.,#g/mL aqueousphase). Documentthe methodused.
8.0 SpecificQualifications
This procedureis self-qualifyingdue to dependenceon analyticalstandards,calibrations,and qualitycontrolstandards.
9.0 Records
Recordswill be maintainedand controlledso as to conformtorequirementsof PNL-MA-70,PAP-70-1701.LaboratoryRecordBooks (LRB)and AnalyticalReportCards/DataSheetsprovidea mechanismfor controlof most records. LaboratoryRecordBookswill be used in accordance
6E(.10.0 References
' ' , , i ,,
I Procedure NO. I Revision NO. I _f,_.o_,v. o_. I p.g. I

PNL TECHNICALPROCEDURE
USEPA Contract Laboratory Program, Statement of Work for InorganicAnalysis, Multi-Media, Multi-Concentration,SOW788, Method 206.2
Gaskill, A., Compilation and Evaluation of RCRA Method PerformanceData, Work Assignment No. 2, EPA Contract No. 68-01-7075, September1986.
SW-846, Method 7060, 3td Edition.
Perkln-Elmer Atomic Absorption SpectrophotometerReference Manual, Model5100, Volume I and Volume 2.
Procedure No. Revise,on No. Effective Date Page

INTERIM C_GE NOTICE
(ICN) ICN - pNL-ALO-215.2 R1elof 1
DocumentNumber: PNL-ALO-215 Revision Number: _..L Effective Date
DocumentTitle:Selenium (Atomic Absorption, Furnace of ICN: _ /_Lo/q_
Technique) ChangeRequestedby:TE Jones/ TG WalkerDocument's Origtnal Author: MWUrie
iiiiii . i 'J';ll , ii i ,. i i r ii ,i= i i. iii |, lllltl
B. Actton:
Replace pages 1 through 7 due to new format..,., .....r,,,,', , ,..... i , ' i I : i i 'ii ' i , i ,i
C. Effect of Change:
Deleting ACT89.1 and replacing with established records managementpractices.
Brings procedure into compliance.
Changes in concentrations and volumedue to typographical errors.
Due to errors produced by [CN'No. PNL-ALO-215.1; corrections have been madetoSection 7.2.
I . I I I I I I I I Iq I I I1_11 I I 111 1 i i 11 II II I II II 111 1 1 I II
). Reason for Change/Description of Change:
Section 9.0: Change"ACT NOWDirective 89.1" to "established records managementpractices" because ACTNOWDirective 89.1 is no longer in existence.
• : " andSection 5 5 Change"3000 pg/L" to "3000 rag/L," "2000 pg/L" to 2000 rag/L,"5 pg/L" to "5 pl."
Section7.2: Ad__dd:"Furnaceparameterssuggestedby the manufacturerin thereferencemanual,shouldbe employedas guidelines."due to omissionby aboveICN.
Section7.2: Delete: "The furnaceparametersused shallbe recordedwith thedata" with "." due to errorsin the aboveICN.
i . iii ii i i ,. i i i ..,i , i ,,. ,, i
E. Approval Signatures: nType of Change: (Check one):
II
(Please sign and date) IIX__,Minor ___Major
Process ,quality Department: TLEhlert _ . _I_-Z_ Date: _ / ._0 / _-
./I,,T..--Z
ty:. AG Kinq ._/_-',/_ '_-_..,_/ Date: i_ _Approval Authori
Other Approvals: MWu,,e //_/_-_'_//_L_---- Date: :_-/_ /_ZJ
: Date: __-, ......... II

INTERIM CI-IANGE NOTICE
(ICN) ICN- PNL-AL0-215.1Page 1 of 8
A. l)(}cumcnLNumbs:r: PNL-AL0-215 R.cvisionNumber: 1 El'L'cctiv(:l)oculn_:nl Date of ICN: H / g /q /"Fill_: Selenium (Atomic Absorption, Furnace Technique)D_)cumcnl's Change Requested By:Original Au|hor: M.W. Urie M.W. Orie
B. A_|it_tl:
Replace existing sections with changed sections as described in Section D ofthis ICN. Replace affected pages.
C. I':l'fu'_.'iof Change:
This change adds clarity to sections which are not currently consistent with otherapproved AA procedures for CERCLAclients.
Reason: Although approved, this procedure is not ccmpatible with other, more recentAA procedures. This ICN has been requested by CERCLAclients and is required tocontinue CERCLAsupport.
Description: See attached
E. Al_p,'m':il Sig,laturcs '1"},1)¢t)l"Change: {Chuck (./) one)
(I)lu'anc Sign and l)atc) ( ) Mim)r Change (_) Major Change
QS.'.;:P. l)¢i_arlmclll '
Aulh()rily: _...._, _ Dale: 13 lA _[ '? 1
Other, " L _.
• Date: / /

PNLTECHNICALPROCEDURE
TITLE: PNL-ALO-215,SELENIUM(ATOMICABSORPTION,FURNACETECHNIQUE)
Author Date Project Mgr. Date QAD Representative Date
_,--/ BM GiIIespie GK Gerke
nical Reviewer Date Line Mgr. Date Other DateALL ORIGINAL SIGNATURES ON FILE
P'AFMelethiI PF 5alter
Procedure No. Revlsion No. Effective Date Page
J PNL-ALO-215 I ,1 04/26/91 I of 7

L
i |
1.2_iii__I__i_!_iiiiii_ii_i_ii_!i!ili_iiiii_lii_i_ili_i_iii__iiiii_iIi_l_ii_iili_iiii!i_iiii_
_jii_j_._j.ij._i_.t.ij_,_j.lij_:_._i_j_i_i_._,._.i_ji._i_.i_._._._i_i.........................................................................................................2.0 Interferences
2.1 Elementalseleniumand many of its compounds(e.g.,seleniumchloride)are volatile;therefore,samplesmay be subjectto lossesof seleniumduring samplepreparation. Spikedsamplesand relevantstandardreferencematerialsshouldbe processedto determineifthe chosendissolutionprocedureis appropriate.
•'.,_;',:':':';*":,'*;,,."":';'_.:,:':':';'N.'.;.:*.,'4,:,,.,....,..o,,.,...........,.,.,.,.,.,..,,......*,,o,...,,._
2.3 In additionto the normalinterferencesexperiencedduringgraphitefurnaceanalysis,seleniumanalysiscan sufferfrom severenonspecificabsorptionand light scatteringcausedby matrixcomponentsduring atomization.Seleniumanalysisis particularlysusceptibleto these problemsbecauseof its low analyticalwavelength(196.0nm). Simultaneousbackgroundcorrectionisrequiredto minimizeerroneousresults. High iron and cobaltcan ..cause interferenceswhen usingdeuteriumbackgroundcorrection.Zeemanbackgroundcorrectioncan be useful in these situations.
2.4 The analytemay not be completelyvolatilizedduringatomization;potentiallycausingmemory effects. This situationcan beminimizedby operatingthe furnaceat 2500-2600"Cimmediatelyafteratomization.
2.5 Seleniumanalysissuffersinterferencefrom chloride(>800mg/L)and sulfate(>200rag/L).The additionof palladiumnitratesuchthat the final concentrationis about0.1% palladiumwill lessenthis interference.
3.0 Tolerances
Tolerancesfor all measurementsmade duringan analysisshallbespecifiedin the following: I) a tolerancelimit is statedwith ameasurementvalue,or 2) the followingsystemof tolerancesshall be ineffect:
! I .............i.....iProcedure No. Revision No. Effective Date Page
PNL-ALO-215 I 04/26/9] 2 of 7,, , _ - - I,, I

i
ii
I , PNLTCHNXCALPROC DU"E , I
a. When two or more significant figures are specified, the tolerancelimit is _+5in the next digit beyond the last one stated. Forexample, 5.0 mL mea:is5.0 _+O.OS mL; 450 g means 450 _+5 g; 369 mLmeans 369.0 + 0.5 mL.
b. If a single significant figure is specified, the actual measurementshall be within -+5% of the stated value. For example, 20 mL meansa volume between Ig and 21 mL.
4.0 Apparatus and Materials
4.1 Atomic absorotion soectrophotometer: Double-beam instrument with agrating monochromator, photomultiplier detector, adjustable slits,a wavelength range of 1g0-900 rim,provisions for simultaneousbackground correction, and interfacingwith a computer and/orstrip-chart recorder. Example: Perkin-Elmer 5100 AASpectrophotometerwith AS60 autosampler, deuterium lamp backgroundcorrection, and _i!!ii!_i_iiiii_i_i_;i_i
4.2 Selenium hollow cathode lamp, or electrodeless discharclelamp(EDL): An EDL provides better sensitivity for the analysis of Se.
4.3 Graphite furnace: Any graphite furnace device with the appropriatetemperature and timing controls. Example: Perkin-Elmer HGA 600
4.4 Pioets: Calibrated, with disposable tips, sized from 5 to1,000 pL, as required.
,
4.5 Balance: Analytical, capable of accurately weighing to the nearest0.0001 g. (Optional)
5.0 Reagents
_ii!_:__iiiiiii_i_ii_'_ii__ _i_ii,il____i_!!iiiil_,__i_'_ii!i_i:__i!i!',!__iB!ii!i!_,ili___i_!_i_ii!__ ,i!i...................
5.2 Concentrated nitric acid: (HN03): Ultrex grade.
5.3 Selenium standard stock solution: (1,000 rag/L):....Preferred:Procure a certified aqueous standard from _!_iii_i_iiiiii_i_i_i_T_i_i_!_supplier and verify by comparison with a se_6_ia_da_B_ ..........
Alternative: Dissolve 0.3453 g of selenous acid (analyticalreagent grade, assay 94.6% H_Se03,or equivalent) i_ water, diluteto 200.0 mL, and verify by comparison with a second standard.
I Pr_edure No. Revision No. Effective Date I PagePNL-ALO-215 I 04/26/91 l 3 of 7I

[ PNLTECHNICALPROCEDURE i
...... •'-" '. • '.' '.._.'.._ :..' • .:." ._ .'.'•, "K _ .2• _• .... : . .. _.... T.:...:.:.:.;....:...,._'.,T::_" : '.'..';.-'-:.:.;...;';.:.o..:.'.:._.;.;....:.;.H.;...:.:...;.;...:.:.-'.'.'.:."
5.4 Selenium workinq standards: Prepare dilutions of the stocksolution to be used as calibration standards aL the time of theanalysis. Withdraw appropriate al iquots of the stock solution, addconcentrated HNO3 at 1%of final volume and dilute with water tovolume.
::::::::::::::::::::::::::::::::::::::::::::::::::::::::::::::::::::::::::::::::::::::::::::::::::::::::::::::::::::::::::::::::::::::::::::::::::::::::::::::: ::::::.'.:'.' ::.: :::::::::::::::::::::::::: ;:: :"._!!::::: :'!_":-'.!:.".:.'._::::: !_: : _ : !' : _... : :'::
__iii_i !_S..iiiii:::_:::::::iii!ii6!_iii!iE_iiii!i_iii_2i_iiSiiiii::_,::::::ii_i:i_b:.:i:iiiiiiili_iiiiiii_i_i_:'_':_:::::iii_iiii:"'::':i:ii:"_i:::i°'i::::i_ii_ii:._"_::::_......
.....
5.6 Ar_on pur_e _as: Industri al-grade _:i_ii:i!:ii_ii!!i!_!i:iii_i_i_i_iiiii:_lii!;__i:_i_::':_0...........................................el.._::!::i:!:!9._!"i5_i:_: _::
6.0 QualityControl(QC)
6.1 All QC data shall be maintainedand availablefor easy referenceorinspection.
6.2 MinimumQC.
6.2.1 The systemshall be calibratedfollowingmanufacturer'srecommendedcalibrationprocedurewhich is in the instrumentreferencemanual (seeSection10.0). Calibrationparametersshallbe establishedand recordedeach day of operation.
6.2.2 Samplesshallbe diluted,and reanalyzed,if they are moreconcentratedthan the highestcalibrationstandard.
6.2.3 Employa minimumof one methodblankper samplegroup(typically20 samples)or one for each batchof samplesdigested,whicheveris more frequent.
6.2.4 Analyzeat leastone verificationcheck standardor one QCstandardevery8 to 12 samples. If the resultsof theverificationor QC standardare not within80% to 120% oftheirmean value,the cognizantscientistshalldetermine
i i
Procedure No. Revision No. Effective Date Page
PNL-ALO-215 I 04/26/9! 4 of 7n I

PNL TECHNICALPROCEDURE
the correc'_ive action. All samples within the previouslyanalyzed sample group shall be flagged on the data reportsand the corrective action documented wiLh the data.Validation of the data is the responsibility of thetechnical group leader.
........................................................................................
6.2.5 Additional QC (i.e., duplicates, matrix spikes, duplicatematrix spikes, multiple injections, additional system ormatrix blanks, tighter tolerances, and holding times, etc.)shall be governed by the analytical requirements of theproject or specific analyses requested. Specific QCrequirements are provided by the ARF, the project Statementof Work (SOW), or the sample analysis TI.
6.3 QC for clients requesting compliance with CERCLA requirements.
6.3.1 Analyze samples per protocol detailed in Appendix A. UseFigure I of Appendix A to establish the quantitation methodto be used; that is, either direct calibration or..met...ho.d...ofstandard addition. i_:_iiii_i_]i!_iiiiiii:_i_i_::_ii_!__i_"_i_i_i_igi_ii!_ii...........
..........................................................................................6.3.2 Any additional QC requirements shall be governed by the SOW
from the client with the analysis protocol transmitted tothe analyst via T2.
7.0 Analysis Method
Sample collection, preservation and preparation is not within the scopeof this procedure. However, it is important that samples be collectedand preserved properly in order to maintain sample integrity. Theapplicability of sample preparation schemes, such as ProcedurePNL-ALO-101, for specific matrices shall be demonstrated by analyzingspiked samples or relevant standard reference materials, or by the useof other qualifying techniques.
7.1 The 196.0 nm wavelength line and a background correction systemshall be employed. Follow the manufacturer's suggestions for allether spectrophotometerparameters. These are located in theinstrument reference manual (see Section I0.0).
- [ Procedurer_.|No.^,_ Revision No. I EffectivenaOate/oAtal Page 5 of 7 I

i
I ,N, ,OC;OU I
_.i;i;i;i;i;_;i;;_:.,,...,;i;i_:_;`;:_;::;.;.;;;;_;;.:_;_;;;i;i;i;i;i;_;_;_;,;_;_;_;_;_;;i_iiiiiiiiitiiiii',iii!iiiiiii',iiiiii#i!iiiiiii_i_......_.!_]i!i_!!i!!]_i_!ii]iiii!iiiiiiiiiiiii!i!!i!!ili!ii!!l!!!!ii!!ii!!_]iiiiiil_"_'::::' " iiiiiiiiiiiii!iiiiii!iiiiiiiiiiiiiiiiiliiiiii!iiii_'__iiii_iiiiii_i_ii!iiiiii!!ii!iiiiliiiiiiiiiiiiiiiiiiiiiiiiiiiii',_ii_i__ Iii#!i_iiiii i_i_i_ii_!_l!_i_i_i_i_!_i_!_!_!t_i_i_i_i_i_i_i_i_i_i_:,_..................
_.._;_!_ii_.._2_:_i_!_i.i_._._!_ii.!.ii._.i.i._.i.!._.i.}._._.i.:._.!.i_i._J_,._..¢!J!_ii.!!.!_!_ii._iii!'_ii!i_ii!i_ii!i!:, ,,_
Note: Becausetemperature-sensingmechanismsand temperaturecontrollerscan vary.betweeninstrumentsor with time,the validityof the furnaceparametersmay be confirmedby systematicallyalteringthe furnaceparameterswhile analyzinga standard. Inthis manns_-,losses of analytedue to overlyhigh temperaturesettingsor lossesin sensitivitydue to less than optimumsettingscan be minimized. Similarverificationof furnaceparametersmaybe requiredfor complexsamplematrices.
7.3 Injectmeasured/_L-aliquotsof sampleand modifiersolution(typically,20 /_Lof sampleand 5 /_Lof modifier)into the furnaceand atomize. If the concentrationfound is greaterthan thehigheststandard,the sampleshallbe dilutedin the same acidmatrixand reanalyzed. Note: Multipleinjectionsimproveprecisionand help detectfurnacepipettingerrors.
7.4 Calculatethe seleniumconcentration: (I) by the methodofstandardadditions,(2) from a calibrationcurve,or (3) directlyfrom the instrument'sconcentrationread-out. All dilutionorconcentrationfactorsshallbe taken into account. Concentrationsreportedfor multiphasesamplesshal]be appropriatelyqualified(e.g.,/_g/mLaqueousphase).
8.0 SpecificQualifications
This procedureis self-qualifyingdue to depend_nceon analyticalstandards,calibrations,and QC standardsas per PNL-MA-70,PAP-70-g01.
Procedure No.Revlsi on No. Effect Ive Date Page
PNL-ALO-215 I 04/26/91 6 of 7' I

q •,e •
J PNLTECHNICALPROCEDURE ]
9.0 Records
Recordswill be maintainedand controlledso as to conformtorequirementsof Manual PNL-MA-70,ProcedurePAP-70-1701.LaboratoryRecordBooks (LRB)and AnalyticalRepOrtCards/DataSheetsprovideamechanismfor controlof most records LaboratoryRecordBookswill beused in accordance with *_^ ^_T _,n,.,Di.^_...^ on 1_:..::_:_:_:_:::_:_::._:_:._:::_::::_::::::_:_:._:_:_:::_:::_.................._:._................................._i_!i,...............................ii_i_i. :::::::::::::::::::::::::::::::::::::::::::::::::::::::";:_:':'::::'....................__
10.0 References
USEPAContractLaboratoryProgram,Statementof Work for InorganicAnalysis,Multi-Media,Multi-Concentration,SOW 788, Method270.2.
Gaskill,A. Compilationand Evaluationof RCRA Method PerformanceData,Work AssignmentNo. 2, EPA ContractNo. 68-01-7075,September1986.
SW-846,Method7740,3rd Edition.
Perkin-ElmerAtomicAbsorptionSpectrophotometerReferenceManual,Model5100,VolumeI and 2.
I IProcedure No. Revision No. Effective Date Page
PNL-ALO-215 1 04/26/91 7 of 7

INTERIM CHANGE NOTICE
(ICN) ICN - PNL-ALO-2]6.2ROPa(e I of l
A.
DocumentNumber: PNL-ALO-2][6 RevisionNumber:0Effective Date
DocumentTitle:Bismuth (AtomicAbsorption,Furnace of ICN: _5/_l /_Techniaue)
ChangeRequested by:Document'sOriginalAuthor: MW Urie TE Jones/ TG Walker
B. Action:
Replacepages I through7 due to new format.
C. Effect of Change:
Deleting ACT89.1 and replacing with "established records managementpractices"•
Brings procedure into compliance,
Change in concentration and _olume due to typographical errors•
Reasonfor Change/Descriptionof Change:
Sectiong.o: Change"ACT NOW Directive89.1"to "establishedrecordsmanagementpractices"becausethe ACT NOW Directive89.1 is no longerin existence.
•
' " "2000pg/L" to 2000 mg/L"Section5 5 Change"3000pg/L" to "3000mg/L, and"5 pg/L" to "5 pl."

INTERIM CIIANGE NOTICE
(ICN) ICN- PNL-AL0-216.1Page 1 of 8
A. Dt_cument Number: PNL-ALO-216 Revision Number: 0 EffectiveDOCtllll¢ill Date of ICN: v..]/,_ iq]
Title: BiSll!uth (Atomic Absorption_ Furnace Technique)Dt)culilelit's Change Requested By:Origiii:tl Autilor: M. W. Urie M. 1'1. Urie
1]. Actit_n:
Replace existing sections with changed sections as described in Section D ofthis ICN. Replace affected pages.
C. l:ffcct t}f Chat_g¢:
This change adds clarity to sections which are not currently consistent with otherapproved AA procedures for CERCLAclients.
I). l_cast_n I't_r Ch_lngc/Dcscriptitm of Change
Reason: Although approved, this procedure is not compatible with other, more recent,AA procedures. This ICN has been requested by CERCLA clients and is required tocontinue CERCLA support.
Description: See attached
E. Apprt_v:ll Signatures "lYl)Cof Change: (Check (_/) one)
Sigti and Date) ( ) Minor Change (¢_) Maj_r Changeii'leant
,eS& i_.-l)c ixtr t nlcnt
tAutll_rit),: '_'_ Dale: 13 / 2 '[/ _/Olhcr !
f
" Date: / /

PNLTECHNICALPROCEDURE ]
TITLE: PNL-ALO-216,BISMUTH(ATOMICABSORPTION,FURNACETECHNIQUE)
APPLICABILITY
This procedureis applicablefor determiningthe concentrationof bismuthinwastes,mobility-procedureextracts,soils,and groundwater. The methodologyis comparableto CLP SOW 788 graphitefurnacetechniquesfor analysisofmetals. All samplesshallbe subjectedto an appropriatedissolution/digestionprocedurepriorto analysisas specifiedby the cognizantscientistor in Test Instructions(TIs)or AnalyticalRequestForms (ARFs).DEFINITIONS
.............................................................................................................................................................:.......................,,.i!iiiiii:iiilllil!iiiiil
.._:...t:_:::i_eiiil;_i_iii!_i
_RESpONSIBLt_STAFF
Cognizant ScientistTechnician
PROCEDURE
1.0 Summaryof Method
1.1 Followingthe dissolution/digestionof the sample,a representativesamplealiquotand modifierare placed,by means of an automaticsampler,into a graphitetube furnace. The samplealiquotis thenslowlyevaporatedto dryness,charred(ashed),and atomized. Theabsorptionof lamp radiationduringatomizationis proportionaltothe bismuthconcentration.
Author Date Project Mgr. Date QAD Representative Date
MW Urie _i e GK Gerke
_nlcalRevlewer Date Line Mgr. Date Other Date
PF Salter -------.--- ALL ORIGINAL SIGNATURES ON FILE
I Procedure No. Effective Date Page
04/26/91 1 of 7


i
PNLTECHNICALPROCEDURE
background correction, and interfacing with a computer and/orstrip-chart recorder. Example: Perkin-Elmer 5100 AASpectrophotometer with AS60 autosampler, deuterium lamp backgroundcoecton,
4.2 Bismuth hollow cathode lamo, or electr.odeless discharae lamo (EDL):An EDLprovtdes better sensitivity for the analysis of Bt.
4.3 t_raohite furnace: Any graphtte furnace device wtth the appropriatetemperature and timing controls. Example: Perkin-Elmer HGA600
4.4 Pioets: Calibrated, with disposable tips, sized from 5 to1,000 pL, as requi red.
4.5 Balance: Analytical, capable of accurately weighing to the nearest0.0001 g. (Optional)
5.0 Reagents
5.2 Concentrated 0i.tric. acid: (HNO_): Ultrex grade.
5.3 Bismuth standard stock sol.ution: (1,000 rag/L): Preferred:Procurea certifiedaqueousstandardfrom Hi_i_i_i_i!i!_i_i_i__i_ii_iC_i_and verifyby comparisonwith a s__6_'cF''_"t"_"_i_i_"__[_................
A.!t.ernative_Dissolve1.000g of bismuthmetal in a minimumvolumeof 1:1 HNOs-water,diluteto 1000.0mL with water,and verifybycomparisonwith a secondstandard.
5.4 BismuthworkinQstandard_: Preparedilutionsof the stocksolutionto be used as calibrationstandards_t the time of the analysis.Withdrawappropriatealiquotsof the stocksolution,addconcentratedHNO_at I% of finalvolumeand dilutewith water tovolume.
_e_e::cd::::::::::::::::;:::::::::::::::::::::::::e:qUa)::_ilili::wo]umes!_::::i::o_ii!i_.O00;i!__ii!i_!ii!ii_i_iiii!!_ii;_i_]i!_!_
_i;',_',_!_i_!_P_i]:',_,!',_:i'.O_;_,i':ii',_hii::':_iii',!i_,_]':_!__:._,i',',',!_':i_!ii!',_Bd_id:'_!ii',',_!_i_,_:_!',i',ii_:_i!]_i_:_F':...............".....................
" , , , ,, m , m, , i ,,
Procedure No. Revi sion No. Effecttve Date Page
PNL-ALO-216 0 04/26/91 3 of 7

op
,, n, , ii mu n , rolli n n i i mn ,,
] ...... r PNLTECHN'C,'L",",OCEOU",,':' I
.............i__,.w._....._._....._._,____,__ __!_,_i__ _i__i__ii!iil_i_i__i_
5.6 Ar_onp,qrqeoas: Industrial-grade:_::_::_:.........:::::::::::iii::i!_:::::i_::iiiii:_::_::i!ii_:::::i_i:::::i:ii::_::_:::::::::_::i::_:::_iiii!i::,:::y,:::::_::::::_i::Ii:::::::::::::::::::::::::::::::::::::_:::
6.0 QualityControl(QC)
6.1 All QC data shallbe maintainedand availablefor easy referenceorinspection.
6.2 MinimumQC.
6.2.1 The systemshallbe calibratedfollowingmanufacturer'srecommendedcalibrationprocedurein the instrumentreferencemanual (SeeSectionI0.0). Calibrationparametersshallbe establishedand recordedeach day of operation.
6.2.2 Samplesshallbe diluted,and reanalyzed,if they are moreconcentratedthan the highestcalibrationstandard.
6.2.3 Employa minimumof one methodblankper samplegroup(typically20 samples)or one for each batchof samplesdigested,whicheveris more frequent.
6.2.4 Analyzeat leastone verificationcheck standardor one QCstandardevery8 to I0 samples. If the resultsof theverificationor QC standardare not within80% to 120% oftheirmean value,the cognizantscientistshalldeterminethe correctiveaction. All sampleswithin the previouslyanalyzedsamplegroup shallbe flaggedon the data reportsand the correctiveactiondocumentedwith the data.Validationof the data is the responsibilityof thetechnicalgroup Ieader.
:_i___ii_',_,iii_._iiiii!_i_:i__ii_i_!ii_ _i',i_,_!__ii',_sl...D..i_)ii_::_iii_'_t_',i_:,_
lm l l I iii I i |
Procedure No. Revision No. Effective Date Page
PNL-ALO-216 0 04/26/91 4 of 7n i ii m

q 11 "_
PNLTECHNICALPROCEDURE
6.2.5 AdditionalQC (i.e.,duplicates,matrix spikes,duplicatematrixspikes,multipleinjections,additionalsystemormatrixblanks,tightertolerances,and holdingtimes,etc.)shallbe governedby the analyticalrequirementsof theprojector specificanalysesrequested. SpecificQCrequirementsare providedby the ARF, the projectStatementof Work (SOW),or the sampleanalysisTI.
6.3 QC for clientsrequestingcompliancewith CERCLArequirements.
6.3.1 Analyzesamplesper protocoldetailedin AppendixA. UseFigureI of AppendixA to establishthe quantitationmethodto be used;that is, eitherdirectcalibrationor methodof tand rdaddition. .......
6.3.2 Any additionalQC requirementsshallbe governedby the SOWfrom the clientwith the analysisprotocoltransmittedtothe analystvia TI.
7.0 AnalysisMethod
Samplecollection,preservationand preparationis not withinthe scopeof this procedure. However,it is important,wheneverpossible,thatthe samplesbe collectedand preservedproperlyin order to maintainsampleintegrity. The applicabilityof samplepreparationschemes,suchas ProcedurePNL-ALO-101,for specificmatricesshallbe demonstratedbyanalyzingspikedsamplesor relevantstandardreferencematerials,or bythe use of otherqualifyingtechniques.
7.1 The 223.1nm wavelengthline and a backgroundcorrectionsystemshall be employed. Followthe manufacturer'ssuggestionsin theinstrumentreferencemanual(see Section_i_i_)for all otherspectrophotometerparameters.
i i ii m i
Procedure No. Revt si on No. Effecttve Date Page
PNL-ALO-216 0 04/26/91 5 of 7

D p
iii ii i iii i ii i i i i ii ii iii Ill I I
II I I I • II I I I • i _ I'111 I I I
Note: Because temperature-sensing mechanisms and temperaturecontro]]ers can vary between _nstruments or w_th t_me, the validityof the Furnace parameters may be conf:_rmed by systemat_ca]lyaltering the Furnace parameters wh_le analyzing a standard. Inthis manner, losses of: ana]yte due to overly hfgh temperaturesettings or losses in sensitivity due to less than optimum settingscan be minimized. Similar verification oF Furnace parameters maybe required f:or complex samp]e matrices.
7.3 [n_ect measured pL-al_quots of: sample and modif:ier solution(typically, 20 pL of: sample and 5 pL of: modif:ier) into the Furnaceand atomize. If: the concentration found Is greater than theh_ghest standard, the sample sha]] be d_luted _n the same acidmatrix and reanalyzed. Note: Hult_ple injections improveprecision and help detect f:urnace pipetting errors.
7.4 Calculate the b_smuth concentration: (1) by the method of: standardadditions, (2) From a calibration curve, or (3) directly from theinstrument's concentration read-out. All d_lution or concentrationf:actors shal] be taken _nto account. Concentrations reported Formultiphase samples shall be appropriately qualified (e.g., pg/mLaqueous phase).
8.0 Spec_f:ic qual_f:icat_ons
Th_s procedure is self:-qualifying due to dependence on analyticalstandards, calibrations, and QC standards as per Hanua] PNL-HA-70,Procedure PAP-70-901.
Procedure No, Revtston No. Effective Date Page
PNL-ALO-216 0 04/26/91 6 of: 7

t . .
PNL TECHNICALPROCEDURE
9.0 Records
Records will be maintained and controlled so as to conform torequirements of PNL-MA-70, PAP-70-1701. Laboratory Record Books (LRB)and Analytical Report Cards/Data Sheets provide a mechanism for controlof most records. Laboratory Record Books will be used in accordance
• 1 i:i !:::!::':i:_"'::i::'::i' :'::/: :"':!::':!!"::ii:;::i:"'ii i!::':_:!:;:':ii:::!:::::::::::::::::::::::::i i i:::::i:::':i:_:::ii:::ii:::::i:::!:::::::::::::::::::::::::,.,..................... ::es ::_:_.... _e¢o s:::_O:_::::::::::::::::::::::::::::::::::::::_i::*.".:,::_,_i
10.0 References
USEPAContract Laboratory Program, Statement of Work for InorganicAnalysis, Multi-Media, Multi-Concentration, SOW 788, Graphite FurnaceMethods.
Standard Methods for Examination of Water and Wastewater, 1986, 16thEdition, Method 303a.
Perkin-Elmer Atomic Absorption Spectrophotometer Reference Manual, Model5100, Volume 1 and 2.
Procedure No. Revision No. Effective Date Page
PNL-ALO-216 0 04/26/91 7 of 7i,mml

,, 4.
" " INTERIM CHANGE NOTICE
(ICN) ICN - PNL-ALO-217.1 ROle 1 of 1
DocumentNumber: PNL-ALO-_17 Revision Number:0 Effective DateDocumentTitle: Lead (Atomic Absorption, Furnace of ICN: oS /;LI /_o_--
Technique)ChangeRequestedby:
Document's Original Author: JM Robbins TE Jones / TG Walker
B. Action:
Replace pages 1 through 9 due to new format.
C. Effect of Change:
Deleting ACT 89.1 and replacing with established records managementpractices.
Brings procedure into compliance.
Change in matrix modifier volume do to a typographical error.
D. Reasonfor Change/Description of Change:
Section 9.0: Change"ACT NOWDirective 89.1" to "established records managementpractices" because ACTNOWDirective 89.1 is no longer in existence.
Section 5.5: Change"10 /_]" to "5 /_]" due to typographical error.
E. Approval Signatures: Type of Change: (Check one):(Please stgn and date)
Minor MajorProcessQualityDepartment: TLEhlert _--_fTT_f__2_- Date:5/_o / y__
ApprovalAuthority= AGKioq _/_Ff_j/j_j_/1.f Date: _ / z/ /_7__
OtherApprovals: _// 0 Date: / /: Date: / /

PNLTECHNICALPROCEDURE
TITLE: PNL-ALO-217,LEAD (ATOMICABSORPTION,FURNACETECHNIQUE)
APPLICABILITY
This procedureis applicablefor determiningthe concentrationof lead inwastes,mobility-procedureextracts,soils,and groundwater. The methodologyis comparableto CLP Method239.2 in SOW 788 or SOW 390. All samplesshallbesubjectedto an appropriatedissolution/digestionprocedurepriorto analysisas specifiedby the cognizantscientistor in Test Instructions(TIs)orAnalyticalRequestForms (ARF.s).
DEFINITIONS
Batch: A groupof samplesof like matrixpreparedat the same time.
Modifier: A substanceaddedto the furnaceto alterthe atomizationcharacteristicsof eitherthe analyteor interferingmatrix. Modifiersareemployedto separateanalyteand matrixin time allowingreductionof matrixinterferenceson the measurementof the analyteatomizationsignalprofile.Modifiersmay be addedas a liquidto the samplesolution,injectedintothefurnaceor incorporatedin the argongas streamduringthe pretreatment,atomizationor the clean-outsteps.
RESPONSIBLESTAFF
CognizantScientistTechnician
PROCEDURE
1.0 Summaryof Method
1.1 Followingthe dissolution/digestionof the sample,a representativesamplealiquotand modifierare placed,by meansof an automaticsampler,into a graphitetube furnace. The samplealiquotis thenslowlyevaporatedto dryness,charred(ashed),and atomized. Theabsorptionof lamp radiationduringatomizationis proportionaltothe lead concentration.
i iii i
Author Date Project Mgr, Date QADRepresentative Date
JM Robbi_Is BM Gillespte GK Gerke
Technical Reviewer Date Line Mgr. Date Other Date
ALL ORIGINAL SIGNATURES ON FILEJM Latkovich
Procedure No. Revision No. Effective Date I Page
PNL-ALO-217 0 04/26/91 1 I of 9i i i ii ii , • | i ,

I •
PNL TECHNICALPROCEDURE ]
1.2 The method detection limit for Pb is 0.3 mg/Kg for soil and 3 pg/Lfor water. Typical instrument detection limit (IDL) for Pb isI /_g/Lin the analysis solution.
2.0 Interferences
2.1 Spiked samples and relevant standard reference materials should beprocessed to determine if the chosen dissolution procedure isappropriate.
2.2 Care must be employed in selecting the drying and charring steptimes, temperatures and temperature ramps. A palladium, or otheracceptable analyte modifier (e.g., platinum), and magnesium nitrateshould be added to all digestates prior to analysis to minimizevolatilization losses during drying and charring. Magnesiumnitrate assists in spreading the Pd-Pb compounds more evenly in thefurnace reducing diffusion time of the analyte in the Mg oxidematrix (Slavin et al., 198'I;Jackson and Qiao, 1990). Magnesiumthus serves to sharpen the analyte peak shape during atomizationand increases analytical precision.
2.3 Pb analysis is affected by sodium chloride (Welz et al., 1988b).Use of an argon-hydrogen gas mixture (95-5%) during temperatureramp to 1000"C eliminate interferences from chloride by evolving itas HCI during the charring step (Shrader, et al., 1988; Rettbergand Beach, 1989; Gilchrist et al., 1990). Presence of hydrogenalso enhances reduction of Pd to the metal which is necessary forPb stabilization (Voth-Beach and Shrader, 1987). Use of thisargon-hydrogen gas mixture lowers the appearance temperature of Pb,requiring a modification of the temperature programming of thepyrolysis and atomization steps (Ni Zhe-ming and Shah Xiao-quan,1987). Use of the new fork platform design can improve Pbrecoveries in high salt matrices (Zhang Li et al., 1990).
Dammonium phosphate has been used as a matrix modifier in thepresence of high chloride; it increases atomization temperature ofPb by binding it as a less volatile lead phosphate. This allowsthe removal of most salt interferences during the char step (Slavinand Manning, 1979).
2.4 Lead may condense at cool ends of the graphite furnace duringatomization; potentially causing memory effects in subsequentanalyses. This situation can be minimized by operating the furnaceat 2500-2650"C immediately after atomization or enhancing removalof Pb by use of an argon (99%) and freon (1%) gas mixture in theclean-out step (Welz and Schlemmer, 1988).
Procedure No. Revi sion No. Effective Date Page
PNL-ALO-217 0 04/26/91 2 of 9

, 4W
PNL TECHNICALPROCEDURE
2.5 Potential Zeeman effect background overcorrection in lead analysiscan occur at the 283.3 nm wavelength in the presence of platinum,osmium and tin. If the more sensitive 217 nm wavelength is chosencopper, antimonj, nickel and iron can cause backgroundovercorrection in Zeeman mode (Slavin and Carnrick, 1988). The217 nm line for Pb should be avoided when deuterium arc backgroundcorrection is used, as this line is subject to high backgroundinterference.
3.0 Tolerances
Tolerances for all measurements made during an analysis shall bespecified in the following: I) a tolerance limit is stated with ameasurement value, or 2) the following system of tolerances shall be ineffect:
a. When two or more significant figures are specified, the tolerancelimit is _+5in the next digi.tbeyond the last one stated. Forexample, 5.0 mL means 5.0 _+0.05 mL; 450 g means 450 _+5 g; 369 mLmeans 369.0 _+0.5 mL.
b. If a single signifiEant figure is specified, the actual measurementshall be within +5% of the stated value. For example, 20 mL meansa volume between 19 and 21 mL.
4.0 Apparatus and Materials
4.1 Atomic absorption spectrop.hotometer:Double-beam instrumentwith a grating monochromator, photomultiplier detector,adjustable slits, a wavelength range of 190-900 nln,provisionsfor simultaneous background correction, and interfacing with acomputer and/or strip-chart recorder. Example: Perkin-Elmer5100 AA Spectrophotometerwith AS60 autosampler, deuterium lampof Zeeman effect background correction, and IBM PS/2 computer.
4.2 Lead hollow cathode lamp or elect.r.odelessdischarqe !amp:Electrodeless discharge lamps (EDL) are generally preferred asthey have greater lamp output and longer life than hollowcathode lamps (HCL). Lead EDL lamps provide the samesensitivity and detection limit as lead HCL lamps.
4.3 G.raphitefurnace: Any graphite furnace device with theappropriate temperature and timing controls. Example:Perkin-Elmer HGA 600
4.4 P__p____:Calibrated, with disposable tips, sized from 5 to1,000 pL, as required.
i | ii ii ii ,i iii i
Procedure No. [ Revision No. Effective Date PagePNL-ALO-217 0 04/26/91 3 of 9
i i ii j mm

_L TECHNICALPROCEDURE
4.5 J).t]J!_!.q__:Analytical, capable of accurately weighing to thenearest 0.0001 g. (Optional)
5.0 Reagents
5.1 D_eJonii:_dwater: Deionized water of sufficient quality, similarto ASTM Type II reagent water, shall be used for preparingsample, standards, and reagent dilutions. Calibration andsample blanks shall produce concentrations at or below IDLs.
5.2 ConceNtrated nitric acid (HN031: Ultrex grade.
5.3 Lead standard stock solution (1,000 mq/L): _: Acquirea certified aqueous standard from NIST or an equivalent supplierand verify by comparison with a second standard.
Alternatives: Dissolve 1.000 g of lead (Johnson Matthey or
equivalent) in a minimum amount of concentrated HNO3 and diluteto I L, using deionized distilled water. The analyst may
alternatively use 0.7992 g of Pb(N03)2 diluted with 2% HNO3 to500 mL.Q
Caution: Lead and its compoundsare toxic and should be handledwith care,
5.4 Lead workinq standards: Prepare dilutions of the stock standardsolution to be used as calibration standards at the time of theanalysis. Withdraw appropriate aliquots of the stock solution,add concentrated HNO3 at 1% of final volume and dilute with waterto volume.
5.5 Palladium nitrate - maqnesium nitrate mixed.modifier solution:Preferred: Mix equal volumes of 3000 mg/L of a Pd standard
(Inorganic Ventures, Inc. or equivalent) in HN03 and 2000 mg/L ofMg(N03)2 (Merck, Suprapure or equivalent), respectively, lt issuggested that modifier may be made up in batch by combining30 mL of 5,000 mg/L Pd standard, 20 mL of DDI water and 50 mL of2000 mg/L of Mg(N03)2.
A _4)_ pL volume of this solution is added to each sample,corresponding to masses of 15 pg of Pd (32.5 pg PdN03) and 10 pgof Mg(N03)2 (Schlemmer and Welz, 1986 and Welz et al., 1988a,b).The amount of Mg(N03)_ used may be increased from 10 pg
(Schlemer and Welz, 1986 and Welz et al°, 1988) to 50 pg, ashigher concentrations have been shown to improve peak shape 'forPb analysis (Bozsai et al., 1990).
Alternative source for palladium. Dissolve 0.300 g Pd wire in aminimum volume of aqua regia and evaporate to dryness, add 5 mL
Procedure No. No. Effective Date Page
PNL-ALO-217 0 04/26/91 4 of 9

. b
PNL TECHNICALPROCEDURE
of concentrated HNO_, warm until dissolution is complete, diluteto 100 mL; or dissolve 0.5001 g palladium chloride (PdCl_)in5 mL of concentrated HNO_, evaporate to near dryness, reI3eatwith5 mL of concentrated HNO_, and dilute with water to 100.0 mL.
5.6 Araon purge qaS: Industrial-gradeargon. When chlorideinterference is suspected, the use of a mixture of argon-hydrogen (95-5%) is recommended.
6.0 Quality Control (QC)
6.1 All QC data shall be maintained and available for easy referenceor inspection.
6.2 Minimum QC.
6.2.1 The system shall be calibrated following manufacturer'srecommended calibration procedure which is in the instrumentreference manual (see Section 10.0). Calibration parametersshall be established and recorded each day of operation.
6.2.2 Samples shall be diluted, and reanalyzed, if they are moreconcentrated than the highest calibration standard.
6.2.3 Employ a minimum of one method blank for each sampledelivery group or batch of samples digested.
6.2.4 Analyze at least one verification check standard or one QCstandard every 8 to 12 samples. If the results of theverification or QC standard are not within 80% to 120% oftheir mean value, the cognizant scientist shall determinethe corrective action. The instrument must be recalibrated,the calibration verified, and all analytical samplesanalyzed since the last good calibration verification mustbe reanalyzed for the analytes affected. This correctiveaction taken shall be documented with the data. Validationof the data is the responsibility of the technical groupleader.
Note: Verification standards help monitor the life andperformance of the graphite tube. An RSD for duplicateinjections of midrange standards exceeding 10% or aninstrument response <70% of the manufacturer'srecommendation as stated in the reference manual (seeSection 10.0), shall be investigatedand corrective action,if required, documented.
0
Procedure No. J Revtston No. Effective DaLe Page_ PNL-ALO-217 0 04/26/91 5 of 9i i,i ,,,i .,, , ,,, _.. .--T - - .,,.

m
i ii i i • • iii mill1 i i| i i i li i iii i
! ....... PNL TECHNICALPROCEDURE ...... J
6.2.5 Additional QC (i.e., duplicates, matrix spikes, duplicatematrix spikes, multiple injections, additional system ormatrix blanks, tighter tolerances, and holding times, etc.)shall be governed by the analytical requirements of theproject or specific analyses requested. Specific QCrequirements are provided by the ARF, the project Statementof Work (SOW), or the sample analysis TI.
6.3 QC for clients requesting compliance with ComprehensiveEnvironmental Response, Compensation and Liability Act of 1980(CERCLA) requirements.
6.3.1 Analyze samples per protocol detailed in Appendix A. UseFigure I of Appendix A to establish the quantitation methodto be used; that is, either direct calibration or method ofstandard addition. Also, all definitions/acronyms (e.g.Sample Delivery Group, [SDG]) shall be consistent with USEPACLP SOW 788 (Reference 10) usage.
6.3.2 Any additional QC requirements shall be governed by the SOWfrom the client with the analysis protocol transmitted tothe analyst via TI.
7.0 Analysis Method
Sample collection, preservation and preparation is not within the scopeof this procedure. However, it is important that samples be collectedand preserved properly in order to maintain sample integrity. Theapplicability of sample preparation schemes, such as ProcedurePNL-ALO-I01, for specific matrices shall be demonstrated by analyzingspiked samples or relevant standard reference materials, or by the useof other qualifying techniques.
7.1 The 283.3 nm wavelength line and a background correction systemshall be employed. Follow the manufacturer's suggestions for allother spectrophotometer parameters. These are located in theinstrument reference manual (see Section 10.0).
7.2 Furnace parameters suggested by the manufacturer in the referencemanual should be employed as guidelines. The furnace parametersused shall be optimized and remain constant _Iroughout batchanalyses. All parameters shall be recorded with the data.
iii i i ml i iii i i i
Procedure HD. Revision HD. I Effective Date PagePNL-ALO-217 0 04/26/91 6 of gj ii

• b
PNL TECHNICALPROCEDURE
Suggested graphite furnace program settings P-E 5000 or 5100
Ramp HoldStep TemD('C) Time(seC) Time(sec)
Drying #I 90 I 15Drying #2 130 10 10Charring 1000 10 20Cool down #I 30 I 15Atomization 2100 0 5Cleaning 2600 1 5Cool down #2 20 1 5
Note: Because temperature-sensingmechanisms and temperaturecontrollers can vary between instruments or with time, the validityof the furnace parameters may be confirmed by systematicallyaltering the furnace parameters while analyzing a standard. Inthis manner, losses of analyte due to overly high temperaturesettings or losses in sensitivity due to less than optimum settingscan be minimized. Similar verification of furnace parameters maybe required for complex sample matrices.
The char step can be removed from the furnace program whenanalyzing low salt matrices while using Zeeman backgroundcorrection to decrease sample analysis time (Slavin et al., 1989)
7.3 Inject measured pL-aliquots of sample and modifier solution(typically, 20 pL of sample and 5 pL of modifier) into the furnaceand analyze for lead following graphite furnace program. If theconcentration found is greater than the highest standard, thesample shall be diluted in the same acid matrix and reanalyzed.Note: Multiple injections improve precision and help detectfurnace pipetting errors.
7.4 Calculate the lead concentration: (I) by the method of standardadditions, (2) from a calibration curve, or (3) directly from theinstrument'sconcentration read-out. All dilution or concentrationfactors shall be applied prior to reporting results.Concentrations reported for multiphase samples shall beappropriately qualified (e.g., pg/L aqueous phase or mg/Kg forsolids).
8.0 Specific Qualifications
This procedure is self-qualifyingdue to dependence on analyticalstandards, calibrations, and QC standards as per Manual PNL-MA-70,Procedure PAP-70-901.
ii ii l ii ii i ,.
I Procedure No. Revision No. Effective Date PagePNL-ALO-217 0 04/26/91 7 of 9

[ .... PNL T,ECHNICALPROCEDURE ....... I
9.0 Records
Recordswill be maintainedand controlledso as to conformtorequirementsof PNL-MA-70,PAP-70-1701. LaboratoryRecordBooks (LRB)and AnalyticalReportCards/DataSheetsprovidea mechanismfor controlof most records LaboratoryRecordBookswill be used in accordance
10.0 References
Bozsai,G., Schlemmer,G. and Grobenski,Z. 1990. Determinationofarsenic,cadmium,lead and seleniumin highlymineralizedwatersbygraphite-furnaceatomic-absorptionspectrometry.Talanta
Gilchrist,G. F. R., Chakrabarti,C. L., Byrne,J. P. and Lamoureux,M.1990. Gas-phasethermodynamicequilibriummodel and chemicalmodificationin graphitefurnaceatomicabsorptionspectrometry.J.Anal.At. Spectro. 5: 175-181.
Gaskill,A. Compilationand Evaluationof RCRA Method PerformanceData,Work AssignmentNo. 2, EPA ContractNo. 68-01-7075,September1986.
Jackson,K. W. and Qiao,H. C. 1990. Effectsof charringon particledistributionand atomizationcharacteristicsin slurryETAAS (Sch.Pub.Health. StateUniv.New York,WadsworthLabs.,Albany,N.Y.)
Zhe-ming,Ni and Xiao-quan,Shan. 1987. The reductionand eliminationof matrix interferencesin graphitefurnaceatomicabsorptionspectrometry.Spectrochim.Acta.42B: 937-949.
Perkin-ElmerAtomicAbsorptionSpectrophotometerReferenceManual,Model5100,Volume 1 and 2.
Rettberg,T and Beach,L. M. 1989. Peak profilecharacteristicsin thepresenceof palladiumfor graphitefurnaceatomicabsorptionspectrometry.J. Anal At. Spectro.4: 427-431.
Slavin,W. and Manning,D. C. 1979. Reductionof matrix interferencesfor lead determinationwith the L'vov platformand the graphitefurnace.Anal. Chem. 51: 261-265.
Slavin,W., Carnrick,G. R. and Manning,D. C. 1982. Magnesiumnitrateas a matrixmodifierin the stabilizedtemperatureplatformfurnace.Anal.Chem. 54: 621-624.
Slavin,W. and Carnrick,G. R. 1988. Backgroundcorrectionin atomicabsorptionspectrometry.CRC criticalreviewsin analyticalchemistry.Vol 19:95-134.
Procedure No. Revtsion No. Effective Date Page
.......PNL-ALO-217 l 0 I 04/26/91 8 of 9 ,,
6
Slavin, W., Manning, D. C. and Carnrick, G. R. 198g. Fast analysiswith Zeeman graphite furnace AAS. Spectro. Acta. 44B: 1237-1243.
Schlemmer, G. and gelz, B. 1986. Palladium and magnesium nitrates, amore universal modifier for graphite furnace atomic absorptionspectrometry. Spectro. Acta. 41B: 1157- 1165.
Shrader, D. E., Beach, L. M. and Rettberg, T. M. 1988. Graphitefurnace AAS: Application of reduced palladium as a chemical modifier.J. of Res. Natl. Bureau of Stds. 93: 450-452.
USEPA Contract Laboratory Program, Statement of Work for InorganicAnalysis, Multi-Media, Multi-Concentration,SOW 788 and SOW 3go, EPATest Method 279.2 CLP-M.
Voth-Beach, L. M. and Shrader, D. E. 1987. Investigation of a reducedpalladium chemical modifier for graphite furnace atomic absorptionspectrometry. J. Anal. At. Spectro. 2:45-50.
Welz, B., Schlemmer, G. and Mudakit, J. R. 1988. Palladium nitrate-magnesium nitrate modifier for graphite furnace atomic absorption-spectrometry. Part 2*. Determination of arsenic, cadmium, copper,manganese, lead, antimony, selenium and thallium in water. J. Anal. At.Spectro. 3:93-97.
Welz, B. and Schlemmer, G. 1988. The use of freon as an alternate gasin graphite furnace atomic absorption spectrometry. At. Spectrosc.g: 81-83.
Zhang Li, Carnrick, G. R., Schickli, J., Mclntosh, S. and Slavin, W.1990. Using the sodium sulfate interference for lead to test the forkplatform design. At. Spectrosc. 11:216-221.
i , | ,i
-Procedure No. Revision No. Effective Date Page
I PNL-ALO-217 0 04/26/91 9 of 9lm i

• d '
APPENDIX A
SECTION I
GE__ q^lqC r_CT_CES
Standard laboratory pracclces for laboratory cleanliness as appliedto glassware and apparatus must be adhered to. Laboratot 7 practices wlr.b=egard to reagents, solvents, and gases muse. also be adhered to. Foraddlclorml Euldellnes.regardlng _hese general laboratory procedures, seeSect:Ions 4 and 5 of the Handbook for Analytical Ouall_'y Control IrA Wa_erand Vas_ewa_er Laboratories EPA-600/4-79-OIg, USEPA Environmental
Moniuorlng and Support Laboratory, Cinclrmatl, Ohio, March 1979.
.-I 7/88

, 4
• °.
° O
O
SECTION II
SPECIFIC QA/QC PROCEDURES
The quality assurance/quality control (QA/QC) procedures definedherein must be used by the Contractor when performing the methods specifiedin Exhibit D. When additional QA/QC procedures are specifie_ in r.hemethods in Exhibit D, the Contractor must also follow these procedures.
NOTE: The cost of performing all QA/QC procedures specified in thisStatement of Work is included in the price of performing the bid lot,
except for duplicate, spike, and laboratory control sample analyses, which•hall be considered separate sample analyses.
The purPose of this document is to provide • uniform set of
procedures for r.he analysis of inorganic constituents of samples,documentation of methods and their performance, and verification of the
sample data generated. The program will also assist laboratory personnelin recalling and defending their actions under cross examination if
required to present court testimony in enforcement case litigation.
The primary function of the QA/QC program is the definition of
procedures for the.evaluatlon end documentation of sampling and analyticalmethodologies and the reduction and reporting of data. The objective is to
provide • uniform basis for sample collection and handling, instrument andmethods maintenance, performance evaluation, and analytical data gathering
and reporting. Although it is impossible to address all analyticalsituations in one document, the approach taken here is to define minimum
requirements for all major steps relevant to any inorganic analysis. In
many instances where methodologies are available, specific quality control
procedures are incorPorated into Lhc method documentation (Exhibit D).
Ideally, samples involved in enforcement actions are analyzed only afterr.he methods have met r.he minimum performance and documentation requirements
described in this document.
The Contractor is required to participate in the Laboratory Audit and
Intercowparlson Study Program run by EPA DiSL-Las Vegas. The Contractor
can expect to analyze two samples per calendar quarter during the contractperiod.
The Contractor must perform and report to SMO and F.½SL/LV as
specified in Exhibit B quarterly verification of instrument detectionlimits (IDL) by r.he method specified in Exhibit E, by _ype and model foreach instrument used on this contract. All _he IDLe must meet _he CRDLs
specified in Exhibit C. For ICP methods, the Contractor must also report,as specified in Exhibit B, llneari_y range verification, •II interelementcorrection factors, wavelengths used, and integration times.
In this Exhibit, as well as other pl•ees within this Statement of
Work, the term "analytical sample" is used in discussing the required
frequency or placement of certain OA/QC measurements. The term "analyticalsample" is defined in the glo.ssary, Exhibit C. As the term is used,
analytical sample includes all field samples, including Performance "Evaluation samples, received from an external source, but it •lee includes
all required QA/QC samples (matrix spikes, analytlcal/post-dlgestion
-2 7/88

, i
• !
'' ' splkas, dupllcaces, aerial dilutions, LCS, ItS, CRDL standards, preparationblanks and linear range analyses) except those directly related toInstrument calibration or calibration verlflcaclon (callbratlon acandard_,XCV/IC3, CCV/CC3). A "frequency of 10t" means once ever 7 I0 analytlcalsamples. Note: Calibration verification samples (ICV/CCV) and calibrationverification blanks (ICB/CC3) are not counted as analytical samples whendetermining 10t frequency.
In order for the qA/QC information to reflect the status of thesamples analyzed, all samples and their qA/qC analysis must be 'analyzedunder the same operating and procedural condi_ions.
If any QC measurement fails to meet contract criteria, the analyticalmeasuremen_ auay not be repeated prior to taking the appropriate correctiveactlon as specifled in F.xhiblt E.
The Contractor must report all QC data in the exact format speclfledIn Exhibits B and H.
This section outllnes the mi1_imum QA/qC operations necessary cosaclsfy the analytical requirement;; of the contract. The follow_ng qA/QCoperatlons must be performed as described in r.hls F_hlblt:
1. Instrument Calibration
2. Initial Call.bratlon Veriflcatlon (ICV) and Contlnuin8 CallbratlonVerification (CCV)
3. CRDL Standards for AA (CRA) and ICP (CRI)
4. Initial Callbratlon Blank (ICB), Continuln8 Callbraclon Blank(CCB), and Preparaclon Blard¢ (PB) Analyses
5. ICP Interference Check Sample (ICS) Analyses
6. Spike Sample Analysis (S)
7. Dupllcate Sample Analysis (D)
8. Laboratory Control Sample (LCS) Analysls
9. ICP Serial Dilution Analysis (L)
10. Instrument Detection Limit (IDL) Determination
11. Interelement Corrections for ICP (ICP) I
12. Linear Range Analysis (LRA)
13. Furnace AA QC Analyses
1. Instrument Cal_bra_o_
Cuidelines for instrumental calibration are given in EPA 600/4-79-020and/or Exhibit D. Instruments must be calibrated daily or once ever 7 2Ahours and each time the instrument is set up. The instrumentstandardization _te and time must be included in the raw data.
For atomic absorpclon systems, callbratlon standards are prepared bydiluting the stock metal solutions ac the time of analysis. Dace andt:t_e of preparation and analysis must: be given in the raw data.
-3 7/S8
o. ,"

Q
e
Calibration atandards must be prepared fresh each time an analysis isto be made and discarded after use. Prepare a blank and at least three
calibration standards in graduated a=ounts in the appropriate range.
"" One atomic absorption calibration standard must be at the CRDL exceptfor mercur 7. The calibration standards must be prepared using .the same
_rpe of acid or combination of acids and at the same concentration asvi11 result in the ag=plea folloving sa=ple preparation.
Beginning wlth the blank, aspirate or inject _he standards and recordthe readings. If the AA instrument config_ratlon prevents _e required4-polnt calibration, calibrate according to Ir_trument manufacturer'srecommendations, and analyze the remaining required standards
immediately after calibration. Results for _..hese standards must bevichin +_ 5% of the true value. Each standards concentration and r.hecalculations to shov chat the +5t criterion has been met, must be givenin the ray data. If the values do not fall within this range,
recalibratlon is necessary.
The + 5% criteria does not apply to the atomic absorption calibrationstandard at the CRDL.
Calibration standards for AA procedures mu_u be prepared as described
in Exhibit D.
5asellne correction is acceptable as long as iu is performed after
every sample or after the continuing calibration verification and blank
check; resloplng is acceptable as long as it is immediately preceded
and immedlacely followed by CCV and CCB. For cyanide and mercury,follov the calibration procedures outlined in Exhibit D. One cyanide
calibration standard must _e at: the CRDL. For ICP systems, calibrate
the instrument according to instrument manufacturer' s recommended
procedures.. Au least t_o standards must be used for ICP callbraulon.one of the standards must be a blank.
2. Inltlal Calibration Verlflcatlon (ICV)land Co_Cinulnf Calibration
Verlfica_ion (ccv)
a. Initial Calibration Verification (ICV)#
Immediately after each of the ICP. AA and cyanide systems have
been calibrated, the accuracy of the initial calibracion shall beverified and documented for every analyte.by the analysis of EPA
Initial Calibration Verification Solution(s) at each vavelength
used for analysis. _Jhen measurements exceed the control limits ofTable l-lnitial and Continuing Calibration Verification Control
Limits for Inorganic Analyses (in Exhibit E), the analysis must be
terminated, the problem corrected, c.he instrument recalibrated,and the calibration reverlfled.
:._ 7/88

"" Zf the Zn£tial Calibration Verification Solution(s) are not
• available from EPA, or where a certified solution of an analyce isnot available from any source, analyses shall be conducted on snindependent standard at a concentration other than that used forinstrument calibration, but wlchln Cho calibration range. Anindependent standard is defined as a standard composed of theanalytes from a different source than Chose used in the standardsfor cho instrument calibration.
For ICP, cho Inlclal Calibration Verification Solution(s) must berun at each wavelength used for analysis. For CN, the initialcalibration verification standard must be distilled. The Initial
Calibration Veriflcat£on for CN serves as a Laboratory ControlSample; thus lt must be distilled with the batch of samplesanalyzed in association with chat ICV. This means chat an I_must be distilled with each batch of samples analyzed and chac thesamples distilled wlch an ICV must be analyzed wluh thatparticular ICV. The values for the initial and subsequentcontinuing calibration verlflcatlo_ shall be recorded on POeM _I-IN for ICP. AA. and cyanide analyses, as indicated.
b. Continuing Calibration Verification (tCV)
To ensure calibration accuracy during each analysis run, one ofcho following standards is to be used for continuing calibrationverification and must be be analyzed and reported for everywavelength used for the analysis of each analyte, at a frequencyof 10% or every 2 hours during an analysis run, whichever is morefrequent. The standard must also be analyzed and reported forevery wavelength used for analysis at the beginning of the run andafter cho last analytical sample. The analyte concentrations inc.hecontinuing calibration standard must be one of cho followingsolutions at or near the mid-range levels of the calibrationcurve:
I. EPA Solutions2. NBS SRM 1643a
3. A Contractor-prepared standard solution
-- m i litr i i m li i
TABLE i. INITIAL AND CONTINUING CALIBRATION V,EKIFICATIONCONTROLLIMITS FOR INORGANIC ANALYSI_S
-- T i ,, , ,m | I i,
q of True Value (EPA SeC)Analytical Method Inorganic Low Limit High Limit
Species-- -- L m ii , ii
ICP/A% He tals 90 ii0
Cold Vapor AA Mercury 80 120
Oche r Cyanide 8 5 115
m i un i i m In mi , n m ii u i
o.,°

The same continuing calibration s_andard un.st be used throughout
the analysis runs for a Case of samples received.
"" Each CCV analyzed must reflect the conditions of analysis of ali• ssoclated analyclcal samples (the preceding I0 analytical samplesor the preceding analytical samples up co the previous CCV). Theduraclon of analysis, rinses and ocher related operations thac mayaffect the CCV measured result may noC be applied' to the CC_ co agreater extent than the extent applied to the associatedanalytical samples. For instance, the difference in cime betweena CCV •nalysls and the blank immediately following it as well asthe difference in time between the CCV and the analytical sampleImmedlately preceding lt may noc exceed the lowest difference intime between any two consecutlve analytical samples •ssoclatedwith _he CCV.
If the deviation of the continuing callbratlon verlficatlon is
greater than the control X_nlcs specified in Table l-lnitial andContlnulng Calibration Verlflcatlon Control Limits for InorganicAnalyses, the analysis must be stopped, the problem corrected, theinstrument must be recalibrated, the calibration verified and thereanalysis of preceding I0 analytical samples or all analytlcalsamples analyzed since the last good callbratlon verlfication mustbe perfo_ned for the an•lyres affected. Information regarding thecontlnuln 8 verlflcatlon of calibration shall be recorded on FOP_II-IN for ICP, AA and cyanide as indicated.
3. _DL $_andard$ for ICP (CRI_ and _. (_
To verify llnearlty near the CRDL for ICP analysis, the Contractor must• n•ly=e •n ICP standard (CRI) _t tvo t_mes the CRDL or two tlmes theIDL. whichever is greater, at the beginning and end of each sampleanalysis run, or • mlnlmum of twice per 8 hour working shift, whicheveris more frequent, but not before Initial Calibration Verification.This standard on.st be run by ICP for every wavelength used foranalysis, except those for Al, Ba, Ca, Fe, Mg, Na and K.
To verify linearity near the CEDL for AA analysis, the Contractor mustanalyze an AA standard (CRA) at the CRDL or the IDL, @hlchever isgreater, •t r_hebeginning of each sample analysis run, but not beforecho Initlal Calibration Verification.
Specific acceptance crlterla for the two standards will be set by EPAin the future. In the interim, the Contractor must analyze and reportr.heae Standards on FORMII(PART 2)-IN.
_. Inltl81 Csllbratlon Blank (ICB). Conclnulnz Calibratlon Blank (CCBa.and Preoaratlon Blank (PB) Analyses
a. Initial Calibration Blank (ICB) and Continuing Callbratlon Blank(CCB) Analyses
A callbraclon blank must be analyzed at each wavelength used foranalysis immediately after every iniclal and conClnulngcalibration verlflca_ion, ac a frequency of 10q or every 2 hours
-6 7/8s

.. ' during the run, _4_lchever is uore frequent. The blank _us_ be
• analyzed at the begiruning of the run and a_ter the lastanalytical sample. Note: A CCB nn-st be run a£ter the last CCVr.ha_ was run after the las_ analyc£cal sample of the run. The
results for the calibration blanks shall be recorded on FORM III-
IN for ICP, AA and cyanide analyses, as indicated. If the
ma_lL_de (absolute value) of the calibration blank result exceedst_e IDL, the result nnAst be so reported in u_ on FOP_ III-IN,o_hervise report as IDL-U. I_ the absolute value blank resultexceeds t_e C_L (Exhibit C), terminate analysis, correct the
problem, recalibrate, verify the calibrac_on and reanalyze thepreceding l0 analytical samples or all analytical samples analyzedsince t_e last good calibration blank.
b. Preparaclon Blank (PB) Analysis
At least one preparation blank (or reagent blank), consisting of
delon£zed distilled water processed _hrough each senile
preparation and analysis procedure (See F._hibit D, Section III),must be prepare_ and analyzed with every Sample Delivery Croup, orwith each batch" of samples digested, whichever is more £requen_.
,The flrsc batch of samples in an SDC is to be assigned co
preparation blank one. the second batch o£ samples to preparationblank t-_o, ecr. (see FORM III-IN). Each data package must contain
the results of all the preparation blank analyses assoclaced with
the samples in that SDC.
This blank is co be. reported for each SD(; and used in all analyses
co aster=sin whether sample concentrations reflect contamination
in the following manner: .
l) I£ chs absolute value of chs concentration of the blank isless than or equal _o the Contract Required Detection Limit
(Exhibi_ C), no correction of sample results is per£ormed.
2) I£ any analyce concentration in chs blank is above r_e C_L,the lowest concentration of thac analyte in the associated
samples anasc be lOx chs blank concencra_ion. Otherwise, all
samples associated vi_h the blank vlch the analyce'_concentration less _han 10x the blank concentration and above
the CRDL, must be redlgested and reanalyzed for r.hat analyte
(excep_ for an iden_ifled aqueous soll field blank). The
sample concen_ratlon is not to be corrected for r.he blankvalue.
3) If the concentration of the blank is below the negative CRDL,
then ali samples _eported below lOx CRDL associated vi_h theblank must be redigesced and reana!yzed.
iA group o£ samples prepared at: the same time.
"7 7/88
.o..

t "°
The values for the preparation blank must be recorded in u_/L for
aqueous sanples and in mg/Kg for solid samples on FOR._ III-IN for
ICP, AA, and cyanide analyses....
• 5. ICP Interference Chec_ $a_ole {ICS_ Analysls
To verify interelement and background correction factors, theContractor must analyze and report the results for the ICP Interference
Check Samples at the beginning and end of each analysis'run or aminimum of t-_ice per 8 hour working shift, whichever is more frequent,but not before Initial Calibration Verification. The ICP Interference
Check Samples must be obtained from EPA (L_SL/LV) if available and
analyzed according to the instructions supplied with the ICS.
The Interference Check Samples consist of two aolu_ions" Solution A andSolution AB. Solution A consists of the interferents, and Solution AB
consists of _he analytes mixed with _he £nterferents. An ICS analysisconsists of analyzing both solutions consecutively (starting with
Solution A) for all wavelengths used for each analyte reported by ICP.
Results for the ICP analyses of Solution AB during the analytical runs
must fall within the control limit of +20_ of the true value for theanalytes included in the Interference Check Samples. If not, terminate
the analysis, correct the problem, recalibrate the instrument, andreanalyze the analytical samples analyzed since the last good ICS. Iftrue values for analyces contained in r_e ICS and analyzed by ICP are
not supplied wlth the ICS, the mean must be determined by initially
analyzing the ICS at leas_ five times repe=Itively for the particular
• analytes. This mean de_ermlnatlon must be made during an analytical Tun
where the resul_s for the previously supplied EPA ICS met all conuract
speclflca_ions. Addluionally, the result of thls Inltlal meandetermination is to be used as the true value for the llfetlme of that
solution (i.e., untll the solution is exhausted).
If the ICP Interference Check Sample is not available from EPA,
independent ICP Check Samples _ust be prepared wlth Interferent and
analyte concentrations at the levels specified in Table 2-Interferent
and Analyte Elemental Concentrations Used for ICP Interference CheckSample. The mean value and standard devla_ion must. be established by
initially analyzing the Check Samples at least five tikes repe_Itlvely
for each parameter on FORM IV-IN. Results must fall within the conurol
limit of _+20t of the establlshed mean value. The mean and standard
devlatlon must be reported in the ray data. Results from the
Interference Check Sample analyses must be recorded on FORM IV-IN for
all ICP parameters.
-8 7/88

• o
, ii ii ii
"" TABLE 2. II___T AND ANALYTE ELEN_'_'TALCONCENTRATIONSUSED FOR ICPZNT_CE CHECK SAM13LE
. Analytes (mE/L) Interferencs '(mE/L)
Ag i.0 A1 500Ba 0.5 Ca 500 .Be 0.5 Fe , 200Cd 1.0 MS 500Co O. 5Cr 0.5Cu O. 5
O.5Ni 1.0Fo 1.0V 0.5Zn 1.0
ii Im, 'II
6. S_o£_e Sample Anal vs£s CS)
The spike sample analysis is des£Ened Co provide Informatlon about theeffect of the sample matrix on the digesclon and measurementmethodology. The spike is added before the dIsesclon (i.e., prior co"..he addlulon of ocher reagents) and prior Co any discillaclon steps(i.e., CN-), AC least one spike sample analysis must be performed oneach group of samples of a similar matrix type (i.e.. water, soil) a_dconcentration (i.e.. lov, medium) o," for each Sample Delivery Group."
If the spike analysis is performed on the same sample that is chosenfor the duplicate sample analysis, spike calculaUlons mu3c be performedusing the results of the sample designated as the "original sample"(see section 7, Duplicate Sample Analysis). The averase of theduplicate results cannot be used for the purpose of decerminins percentrecovery. Samples identified as field blanks cannot be used for spikedsample analysis. EPA may require thac a specific sample be used for_e spike sample analysis.
The analyce spike muse be added in r_heamount given in _able 3-$piklngLevels for Spike Sample Analysis, for each element analyzed. If twoanalytical methods are used co obtain r,he reported values for the sameelement within a Sample Delivery Group (i.e. ICP. GPAA). spike samples
muse be run by each met.hod used.
_,, ,,
2EPA may require addiclonal spike sample analysis, upon ProJecc Officerrequest, for which the Contractor will be paid.
-9 7/88
!°.

• oo
.
If the spike recovery is not at or within the limits of 75-125t, c.bedata of all samples received associated with that spike sample anddecermlned by the same analytical method must be flagged vith theletter "N" on FOP.½s I-IN and V-IN. An exception to this rule is
granted in situations where the sample concentration exceeds the rpLkeconc_-ntratlon by a factor of four or more. In such sn event, the data
shall be reported unflagged even if the percent recovery does not _ee_the 75-125t recovery criteria.
0
For flame AA, ICP, and CN analyses, when the pre-digestlon/pre-
distillation spike recovery falls outside the control limits and the
sample result does not exceed 4x the spike added, a post-
dlgcstlon/post-dlstillation spike must be performed for those elemeuns
that do not meet the specified criteria (exception" Ag). Spike nhe
unsplked aliquot of the sample a_ 2x the indigenous level or 2x CRDL,
whichever is greater. Results of the post-dlgestlon/post-distillatlon
spike must be reported on FORM V(PART 2)-IN. Note" No post digest
spike is required for H8.
In the instance where there is more than one spike sample per matrLx
and concentration per method per SD<;, if one spike sample recovery isnot within contract criteria, flag all the samples of the same matrix,
level, and method in the $DG. Individual component percent recoveries
(tR) are calculated as follows"
tKecovery - (SSR-SR) x 100SA
_here, SSR - Spiked Sample ResultSR - Sample Result
SA - Spike Added
hThen _ample concentration is less than the instrument detection limit,
use SR - 0 only for purposes of calculating t Recovery. The spike
sample :esults, sample results and t Recovery (positive or negative)must be reported on FORM V-IN for ICP, AA and cyanide analyses, asindicated.
The u:tlts fur reporting spike sample results will be identical to those
used for reporting sample results in FOP.½ I-IN (i.e., _g/L for aqueousand mg/gg dry weight basis for so_lid).
-10 7/88

, ,
la i i_11i i
• i inl|
"., TAB_ 3. SPIKING _L_-'VELSFOR SPIK_ SAHPLE A_ALYSIS
For ICP/AA For Furnace AA Or.her (1)
(u_fL) (uzIL) (u_rL)Elemen_ _aCer $o£1_ L) Water So_l('_
Alumln_m 2,000 *iCnc£mony 500 500 100 100Arsenic 2,000' 2,000 40 40Bariuu • "2,000" 2,000
_ryllium • 50" 50Cadmium ' 50 50 5 5Calcium * *Chromiu_ • 200" 200Cobalt 500" 500
Copper • 2.50" 250Iron ) 1,000 *lead ' • 500" 500 20 20Magnesium * *Manganese • 500" 500Mercury IN_.ckel • 500" 500Pocasslum * *.Selenium 2,000 2,000 I0 I0Silver 50 50Sodium * *Thallium 2,000 2,000 50 50Vanadium - 500' 500Zinc . 5_0" 500
Cy.anlde I00i I i I Iii I
NOTE" Elements wir..houc spLke levels and not: designaced rich anas_erisk, muse be spiked ac appropriate levels.
1Spiking level reported is for both water and soil/sediment matrices.
2The levels shown Indlca_e concen_ratlons in the final d£ges_a_e of the
spiked sample (200 mL final volume).
•No spike required.
I
-ll 7/88._

.o
7. DuV!tcete San:,ole Ana!ys_,s (D)
One duplicate sample must be analyzed from each group of samples of •similar matrix tTpe (i.e., water, soil) •n_ concentration (i.e., low,medium) or for each Szmple Delivery Group.- Duplicates c•runot be
averaged for reporting on FORH I-IN.
Dupllc•ce sa=ple analyses are required for percent solids. SamplesIdenclf£ed •s fleld bl•nk• cannot be used for duplicate sample
analysis. EPA may require r_•t • specific sample be used for duplicate
sample analysis. If _wo arualy=tcal methods are used to obe•in thereported values for r_e same element for • Sample Delivery Croup (i.e.,ICP, GFAA), duplicate samples must be _ by each me_od used.
The relative percent differences (tG_D) for each co=ponent arecalculated as follows"
l_D - _ x 100(S+D)/2
Where, R.PD - Relative Percent DifferenceS - First Sample Value (original)D - Second Sample Value (duplicate)
The results of the duplicate sanple analyses muse be reported on FOP._VI-IN in ug/L for aqueous sa=ples and mg/Xg dry weight basis for solid
original and duplicate samples. A control limit of 20t for R_D shallbe used for original and duplicate sanple values greater than or equalco 5x CRDL (Exhibit C). A control limit of (_+) the CRDL must be used
for sample values less than 5x CI_DL, and the absolute value of thecontrol limit (_,DL) :use be entered in the "Control I.tmit" column onFOR._ VI-IN.
If one result is above the 5x CRnL level and the ocher is below, use
the _+ CRDL criteria. If both sample values are less than the IDL, theI_D is uoc calculated on FOR._I VI-IN. For solid sample or duplicateresults < 5x C_DL, enter r_e absolute value of the CRDL, corrected for
sample weight and percent solids, in the "Control I.tmic" column.
If the duplicate sample results are outside the contrbl limits, flagall r_e data for samples received associated with chat duplicate samplevir.h au "*" on FOR_s I-IN and VI-IN. In the in•rance where there ismore r.h•n one duplicate sample per SD<;, if one duplicate result is notvithin contract criteria, flag all samples of the same matrix,concentration, and method in _he SDC. The percent difference data will
be used by EPA co evaluate r_e long-Cerro precision of the ne_ods foreach parameter. Specific control limits for each element will be addedto FO_ VI-IN ac a later dace based on these precision results,
3EPA may require additional dupllcate sample analyses, upon Project Officer
request, for which the Contractor will be paid. (-12 7/88

• 8. T_boracoc_ Control S---ole (LCS_ Analys_s
Aqueous and solid Labora_oz7 Control Saz_les (LCS) rous= be analyzed foreach an_lyce using che sa_e sample preparations, analytical methods and
QA/QC procedures e_ployed for the EPA sa=ples received. The aqueous- • LCS solution mu_c be obtained from EPA (if unavailable, che Inicial
Calibration Verification Solutions may be used). One aqueous LCS muse
be prepared and analyzed for every group of aqueous samples in a SampleDeltvecy Croup, or for each batch of aqueous samples digested,whichever is mars frequent. An aqueous LCS is nac requi_ed for mercury
and cyanide analysis.
The EPA-provided solid LOS muse be prepared and analyzed using each of
the procedures applied co the solid samples received (exception:percenc solids decermlnaclon nac required). If the EPA solid LCS £sunavailable, ocher EPA quality Assurance Check samples or ocher
cerclfied macerlals may be used. One solid LCS muse be prepared and
analyzed for every group of solid samples in a Sample Delivery Group,or for each beech of samples dlgesced, whichever is more frequent:.
All LCS results and percent recovery (tR) will be reported on FORM VII-
2N. If the percenc recovery for the aqueous LCS falls ouuside thecontrol llmics of 80-1201 (exception: Ag and Sh), the analyses must be
cermlnaced, the problem corrected, and the samples associated with chs=
LCS red£gesced and reanalyzed.
If the results for the solid LOS fall ou_slde c.he control llm[_s
escabllshed by EPA, the analyses muse be cermlna_ed, Che problemcorrected, and the samples assoclaued with chat LCS redIgested and
reanalyzed.
9. ICP Serial Diluclon Aualys_s (L)
Prior Co reporclns concen_ratlon deca for the analyce elements, the
Contractor muse analyze and report the results of the ICP Serial
Diluclon Analysis. The ICP Serial Diluulon Analysis muse be performed
on a sample from mach lroup of samples of a similar macrlx type (i.e.,wacer, soil) and concen_raclon (i.e., log, medium) or for each Sample
Delivery Croup, whichever is more frequent. Samples Idenclfled asfield blanks cannot be used for Serial Dilution Analysis.
If the analyce concencraclon is sufflclen_ly high (mlnlJmally a factorof 50 above the Instrumental decectlon llmlc in the original sample),
cba serial diluclon (a five fold diluclon) muse then agree within 10q
of the original determination after correction for dilution. If thedilution analysis for one or more analyces is nac at or within 10q, achemical or physical incerference effect muse be suspected, and thedeca for all affected analyces in the samples received associated richchac serial dilution musc be flagged with an "E" on FOR.½ IX-IN and FORMI-IN.
( -13 7/88

t,'
•o.
The percent differences for each com?onent are calculated as follovs"
II- Sl.. t Difference - ,, x 100
I
where, I - Initial Sample Result
S - Serial Dilution Result (Instrument Reading x 5)
In the instance where there is more than one serial diluClon per SDC,
if one serial dilution result is not within contract criteria, flag all
the samples of the zame matrix and concentraClon in the Sample Delivery
Group. Serial dilution results and "E" flags must be reported on FOR.qIX-IN.
I0. Inscrumen_ Decectlon Limlt (IDL) De_ermlnaclon
_efore any field samples are analyzed under this contract, theInstrument detecClon limits (in ug/L) must be determined for each
Instrument used, wlchln 30 days of the start of contract analyses and
at least quarterly (every 3 calendar months), and must meet the levels
specified in Exhibit C.
The Instrument Detection Limits (in ug/L) shall be determined by
multiplying by 3, the average of the standard deviations obcalned on
three nonconsecutive days from the analysis of a standard soluclon
(each analyte in reagent water) at a concentration 3x-Sx the Instrument
manufacturer's suggested IDL, with seven consecutive measurements per
day. Each measurement must be performed as though lt were a separate
analy1:ical sample (i.e., each measurement must be followed by a rinse
and/or any'other procedure normally performed between the analysis of
separate samples). IDL's must be determined and reported for each
wavelength used in the analysis of the samples.
The quarterly determined IDL for an instrument must always be used asthe XDL for thac instrument during that quarter. Sf the instrument isadjusted in anyway thac may affect the IDL, the IDL for thac instrumentmust be redetermined and the results submitted for use as the
established IDL for chat instrument for the remainder of the quarter.
!IDLe must be reported for each instrument used on FORM X-IN submitted
with each data package. If multiple AA instruments are used for theanalysis of an element within a Sample Delivery Group, chs hlghesc IDL
for chs AAs must be used for reporting concentration values for chat
Sample Delivery Croup. The same reporting procedure must be usedformultiple ICPs.
-14 7/88

II. Inter,e1_ement Corrections for ICF
Before any field samples are analyzed under this contract, the ICPlnterelement correction factors must be determined prior to the startof contract analyses 6hd at least annually thereafter. Correctionfactors for spectral interference due to Al, Ca, Fe, and Hg must bedeter_,lned for all ICP instruments at all wavelengths used for each
analyte reported by ICP. Correction factors for spect;al interferencedue co analytes other than Al, Ca, Fe, and Hg must be reported if theywere applied.
If the instrument was adjusted In anyway that may affect the ICPlnterelement correction factors, the factors must be redetermlned andthe results submitted for use. Results from lnterelement correctionfactors determinatlon must be reported on FORH XI(P/_T 1)-IN and FOPJ_XI(PART 2)-IN for ali ICP parameters.
12. J_tnear ,Range Analysis (LRAI
For all ICP analyses, a linear range verification check standard mustbe analyzed and reported quarterly (every 3 calendar months) for eachelement on FORM Xll-IN. The standard must be analyzed during a routine
analytical run performed under thIs contract. The analyticallydetermined concentration of thls standard must be within +_ 5q of the
•true value. This concentration is the upper limit of the ICP linear
'. range beyond which results cannot be reported under this contractwithout dilution of the analytical sample.
13. Furnace Atomic Absorption (AA) QC Analyses
Because of the nature of the Furnace AA technique, the special
procedures summarized in Figure 1-Furnace AA Analysis Scheme ("HSATree") will be required for quantttation. (These procedures do notreplace those in Exhibit D o£ this SOU, but supplement the guidanceprovided therein.)
a. All furnace analyses must gall within the callbrat£on range. Inaddition, all analyses, except during full methods o£ StandardAddition (HSA), w_ll require duplicate injections. The absorbance
or concentration of each Injection must be reported In the rawdata as well as the average absorbance or concentration values andthe relative standard deviation (RSD) or coefficient of variat_on
(C'q). Average concentration values are used for reportingpurposes. The Contractor must be consistent per method and SDG inchoosing absorbance or concentration to evaluate wh[ch route fs tobe followed in the HSA Tree. The Contractor must also indicate
which of the two is being used "if both absorbance andconcentration are reported in the raw data. For HSA analysis, theabsorbance of each injection must be included in the raw data. Amaximum of IO full sample analyses to a maximum 20 injections may
be performed between each consecutive calibration veriflcatlonsand blanks. For concentrations greater than CRDL, the dupllcace
• injection readings must agree within 20q RSD or CV, or theanalytical sample must be rerun once (i.e., two additional burns).If the readings are still out. £1ag the value reported on FORM I-
-15 Rev. 2/89

IN with an "H". The "H" flag is required for the analytical spikeas well as the sample• If the analytical spike for a sample
requlres an "ii" flag, the flag must be reported on FORH I- IN forthat sample.
b. All furnace analyses for each analytical sample, !ncludlng those
requiring an "H" flag, will require ac least an analyClcal spike
co determlne if _he HSA wit1 be required for quanC0ltatlon. Theanalytical spike will be required to be at a concentration (inthe sample) 2x CRDL. This requirement for an analytical spikewall include the LCS and the preparation blank. (The LC$ must be
quantltated from the callbratlon curve and corrective action, ffneeded, taken accordingly. HSA fs not to be performed on the LCS
or preparation blank, regardless of spike recovery results.) Ifthe preparaclon blnnk analytical spike recovery is out of control(85-I15_), the spiking solution must be verlfled by resp[klng and
_erunnlng the preparaclon blank once. I_ the preparation blank
analytical spike recovery is still out of control, correct the
problem and reanalyze all analytical samples associated with thatblank. An analytical spike fs not required on the pre-dfgestlon
spike sample.
The analytical spike of a sample must be run immediately after
that sample. The percent recovery (tR) of the splke, calculated
by the same formula as Spike Sample Analyses (see item 6, thissectlon), will then determine how the sample v_ll be quantltated,as follows •
I) If the spike recovery fs less than 40t, the sample must be
diluted and rerun with another spike. Dilute the sample by afactor of 5 to i0 and rerun. This step must only be
performed once. If after the dilution the spike recovery isstill <_Osl, report data and flag with an "E" to indicateInterference problems.
2) I_ the spike recovery is g,'eacer than or equal to 40t and the
sample llbsorbance or concentratlon _s less than 5011 of the"spike "_. report the sample results to the IDL. If the spikerecovery fs less than 8511 or greater than I15_. flag theresult with a "_'.
!
3) If the sample absorbance or concentration is greater than orequal to 50t of the spike and the spike recovery Is at or
IAnalyt£cal Spikes are post-d[gestlon spikes to be prepared prior toanalysis by adding a kno_nn qunntity of the analyte to sn aliquot of thedIKested sample. The unspiked sample aliquot must be compensated for any
, volume change fn the spike samples by add_tlon of delonlzed water to the
• unsplked sample aliquot. The volume of the spiking solution added must
not exceed lOt of the analytical sample volume; thLs requirement alsoapplles to HSA spikes.
5"Spike" Is defined as [absorbnnce or concentration of spike sample] minus[absorbance or concentratlon of the sample].
-16 Rev. 2/89

between 851 and I151, the sample must be quantltated directlyfrom the calibration curve and reported down to the IDL.
4) If the sample absorbance or concentration is greater than orequal to 50q of the spike and the spike recovery ts less than85t or greater than llSq, the sample must be quantltated byMSA.
c. The £ollovlng procedures wilI be incorporated Into, HSA analyses.
I) Data from HSA calculations must be wlth[n the linear range as
determined by the calibration curve generated at the, beginning of the analytical run.
2) The sample and three spikes must be analyzed consecutivelyfor HSA quantlcatlon (the "initial" spike run data is
specifically excluded from use in the MSA quantltatlon).Only single injections are required for MSA quantitatlon.
Each full MSA counts as two analytical samples towards
determining 10t QC frequency (i.e., five full MSAs can beperformed between calibration verifications).
3) For analytical runs containing only MSAs, single injections
can be used for QC samples during that run. For instruments
that operate in an MSA mode only• MSA can be used to
determine QC samples during that run.
4) Spikes must be prepared such that:
a) Spike I fs approximately 501 of the sample absorbance orconcentration.
b) Spike 2 is approximately I001 of the sample absorbance orconcentration.
c) Sp|ke 3 [s ..l,proximately 1501 of the sample absorbance orconcentration.
5) The data for each HSA analysis must be clearly identified inthe raw data documentation (using added concentration as the
x-variable and absorbance as the y-varlable) along with the
slope, x-lntercept, y-lntercept and correlatibn coefficient(r) for the least squares flC of the data. The results must
be reported on FORM VIII-IN. Reported values obtained by HSAmust be flagged on the data sheet (FORM I-IN) with the letter
wS" if the correlation coefficient is greater than or equalto O. 995. -
6) If the correlation coefficient (r) for a particular analysisis less than 0.995, the HSA analysis must be repeated once.If the correlatlon coeff[clent is still less than 0.995,report the results on FORM I-IN from the run with the best
"r" and flag the result with a "+" on FORM VIII-IN and FORMI-IN.
-17 Rev. 2/89

rLgu=.rURJqAC v- ATOHZC AD$0RJP_ZOH AJqALYS ZS SCHZH w.
i I__ES, Repeat Only ONCE
CORRELATION COEFFICIENT
LESS THAN 0.995 I_ _till YES "'
_ NO _I FLAG DATA_J WITH A "."i
rf.AG DATA WITH =S"
t
{ •
-18 Rev. 2/89

i
PNLTECHNICALPROCEDURE
TITLE: PNL-ALO-218,ICP AND lC DATA CALCULATIONSFOR SST SAMPLES
APPLICABILITY
This procedure addresses the data manipulations required to produce the datareport provided to the Analytical LaboratoryOperations (ALO) Project SupportOffice (PSO) for inductivelycoupled plasma atomic emission spectroscopy (ICP)and ion chromatography(lC) analyses using Lotus I-2-3 spreadsheetprograms.
. Calculations involve simple algebraic steps to incorporatesample weights anddilutions involved in sample preparationsteps. All calculations are easilyverified by hand calculations.
Although such calculationsare usually incorporatedin software packagespackages supplied by the instrumentvendor, such software packages have notbeen installedon the current ICP and lC instrumentationin the 325 Building.
DEFINITIONS
None
RESPONSIBLE STAFF
InorganicTask LeaderTechnical StaffALO Project Support Clerk
PROCEDURE
1.0 ICP Analyses
1.1 Background: ICP provides analyses of solutions. Primary analyticaldata are reported in units of pg/ml. Generally, data must beprocessed to account for the sample preparation methodology. Solidsamplesmust go through some type of dissolution process. Liquidsamples.mayrequire dilution or pre-concentrationprior to analysis.
1.2 Primary analytical data (in units of pg/ml) from the instrumentreport are entered into the spreadsheettemplate. This data ischecked for transcriptionaccuracy by both the enterer and verifier,as per PNL-MA-70, PAP-70-1101.
r
- ( J" ,n
h,i,io, - " u otiv/D,, of,/ /.,-,
PNL-ALO-218 0 SEP Z 6 1990 1 2

PNLTECHNICALPROCEDURE
1.3 The Inorganic Task Leader or their designee processes the primaryanalytical data through a Lotus ]-2-3 program. The approach used isdescribed in Attachment ].
].4 The Inorganic Task Leader reviews the final data report and signsthe data report.
].5 The data report provided to the ALO-PSOincludes the primaryanalytical data report (instrument print-out), instrument blankdata, estimated detection and quantitation limits, and the resolvedanalytical data for the sample.
2.0 IC Analyses
2.] Background: IC provides analyses of solutions. Primary analyticaldata are reported in units of #g/ml. Generally, data must beprocessed to account for the sample preparation methodology. Solidsamplesmust go through sometype of dissolution process. Liquidsamplesmay require dilution or pre-concentration prior to analysis.
2.2 Primaryanalytical data and sample preparation information areentered into the spreadsheet template. The data/information ischecked for transcription accuracy by both analyst and reviewer, asper PNL-MA-70,PAP-70-]IO].
2.3 The Inorganic Task Leader or their designee processes the primaryanalytical data through the Lotus ]-2-3 program. The calculationsare described in Attachment 2.
2.4 The Inorganic Task Leader reviews the final data report, includingdata transcription accuracy, and signs the report.
2.5 The data report provided to the ALO-PSOincludes the primaryanalytical data report (instrument print-out), instrument blankdata, estimated detection limits, and the resolved analytical data
_ for the sample.
Procedure No. Revi=ion No. Effective D=t,e P=ge of
PNL-ALO-218 0 SEP 2 6 lggo 2 2

PNL-ALO-218, Rev. 0_xhibjt 1
, _age _ of 9
ICP CALCULATIONS
Calculations to support the generation of the final ICP reports areperformed within a LOTUS 123 speadsheet. The raw analytical data (invg/mL) is obtained from the computer generated output of the ICPsystem and the sample preparation data is obtained from the "SamplePrep Data Sheet". These data are keyed into an ICP template;templates are available for acid leached, water leached and fusedsample sets. The calculations below (identified as A thru S)accompany ICP CALCULATION KEYS 1-5.
General Information-
The "boxed" areas in the ICP CALCULATION KEYS 1,2 & 5 are sampleanalysis information/data and worksheet data which has beenkeyed into the spreadsheet template. This data is verified byboth the enterer and verifier.
The Sample ID is generallY the sample log number and for thecalculation explanations below the 1ast digit identifies thesample number (e.g., 89-0621a3 is Sample 3).
For the spike control and blank, the results are many timesexpressed in wt%. This is actually a wt% equivalence with thespike control assuming a nominal i g sample weight and the blankusing an average sample weight of samples 1 & 2. The data ispresented in the same units for comparison purposes.
For calculation of dilution factors it has been assumed that 1
mL of water equals 1 g.
Key 2A: Spike Dilution Factor for Samples 3 & 4
(Makeup Vol mL)Spike Dilution =
(Spike Vol mL)
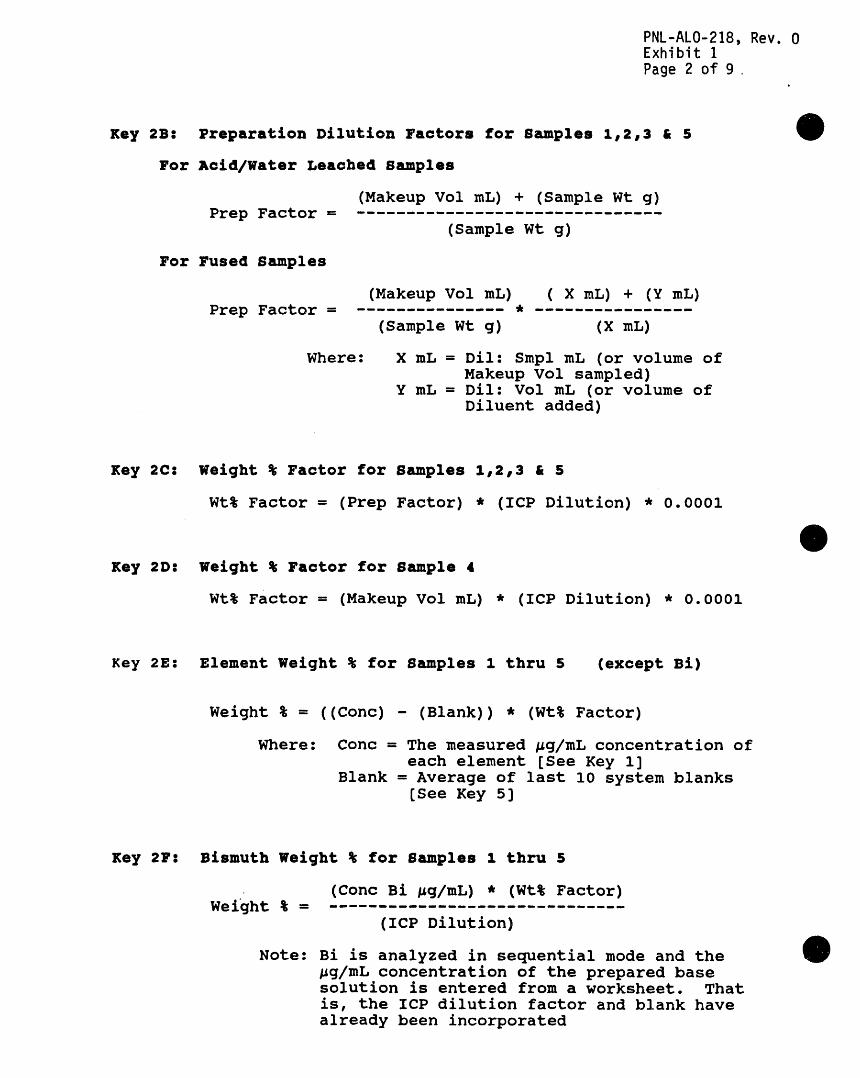
PNL-ALO-218, Rev. 0Exhibit 1
Page 2 of 9,
Key 2B: Preparation Dilution Factors for Samples 1,2,3 & 5
For _cid/Water Leached Samples
(Makeup Vol mL) + (Sample Wt g)Prep Factor = .................................
(Sample Wt g)
For Fused Samples
(Makeup Vol mL) ( X mL) + (Y mL)Prep Factor = - * .......
(Sample Wt g) (X mL)
Where: X mL = Dil: Smpl mL (or volume ofMakeup Vol sampled)
Y mL = Dil: Vol mL (or volume ofDiluent added)
Key 2C: Weight % Factor for Samples 1,2,3 & 5
Wt% Factor = (Prep Factor) * (ICP Dilution) * 0.0001
Key 2D: Weight % Factor for Sample 4
Wt% Factor = (Makeup Vol mL) * (ICP Dilution) * 0.0001
Key 2E: Element Weight % for Samples I thru 5 (except Bi)
Weight % = ((Conc) - (Blank)) * (Wt% Factor)
Where: Conc = The measured vg/mL concentration ofeach element [See Key i]
Blank = Average of last i0 system blanks[See Key 5]
Key 2Fz Bismuth Weight % for Samples 1 thru 5
(Conc Bi vg/mL) * (Wt% Factor)Weight % = ..............................
(ICP Dilution)
Note: Bi is analyzed in sequential mode and thevg/mL concentration of the prepared basesolution is entered from a worksheet. Thatis, the ICP dilution factor and blank havealready been incorporated

PNL-ALO-218, Rev. 0Exhibit IPage 3 of 9
4
Key 3Gz Weight Percent Reported
Logical Test Only -- For Initial solution [GI] andDiluted solution [G2]
If Wt% < (DL * Wt% Factor) Then Report "<DL"If Wt% > (DL * Wt% Factor) and < (QL * Wt% Factor)
Then Report Weight % within parenthesesIf Wt% > (QL * Wt% Factor) Then Report Weight %
Key 3Hs Percent Difference -- For Serial Dilutions Only
(GI - G2)% Dif = * 100
G1
Where: G1 = Wt% of Initial solutionG2 = Wt% of Diluted solution
Note: Both G1 and G2 must be above (QL * Wt% Factor)before value reported
Key 3I: Detection Limit -- DL (#g/mL)
This data is input from the "blank" Standards file. Itrepresents 3 times the standard deviation of the last 10blanks analyzed. [See Key 5]
Key 3J: Quantitaion Limit -- QL (vg/mL}
This data is input from the "blank" Standards file. Itrepresents 10 times the standard deviation of the last 10blanks analyzed. [See Key 5]
Eey 4K: Average Wt% for Samples I & 2
(Sample 1 [GI]) + (Sample 2 [GI])Average Wt% =
2
Note: Both Sample 1 & 2 must be above (DL * Wt% Factor),otherwise no average is reported.

PNL-ALO-218, Rev. 0Exhibit I
Page 4 of 9,
Key 4Lr Relative Percent Difference -- RPD
J (Sample I [GI]) - (Sample 2 [GI]) iRPD = I ! * i00
i l, ((Sample 1 [GI]) + (Sample 2 [Sl])) / 2 ,
Note: Both Sample 1 & 2 must be above (DL * Wt% Factor),otherwise no RPD is reported.
Key 4Mr Spike Added to Sample 3 -- (Wt% Equivalence Sample 3)
(Spike True Value) * (Spike Vol mL)Wt% Spike Added = --
(Sample 3 Wt g)
Note: Spike True Value is obtained from the base ICPtemplate [See Key 5]
Key 4Nz Percent Spike Recovery from Sample Matrix
(Wt% Sample 3) - (Ave Wt% Sample l&2)% Rec = ..................................... * i00
(Wt% Spike Added)
Key 4P: Measured Spike Control (#g/mL)
#q/mL = (Conc - Blank) * Spike Dilution * ICP Dilution
Where: Conc= The measured #g/mL concentration ofeach element [See Key 1]
Blank = Average of last 10 system blanks[See Key 5]
Note: P1 is the Initial solution and P2 is the Dilutedsolution
Key 4Q_ Percent Difference for Serial Dilutions of Spike Control 4
Same as "H" above _xceph P1 & P2 are substituted for G1 & G2
Key 4R: Spike Std (#g/mL)
Stock spike standard concentration as "given" in baseICP template -- [See Key 5]
Key 4Sz Percent Ri_covery for Spike Control
Spike Control [Pl]% Rec = ..... * i00
Spike Std
m
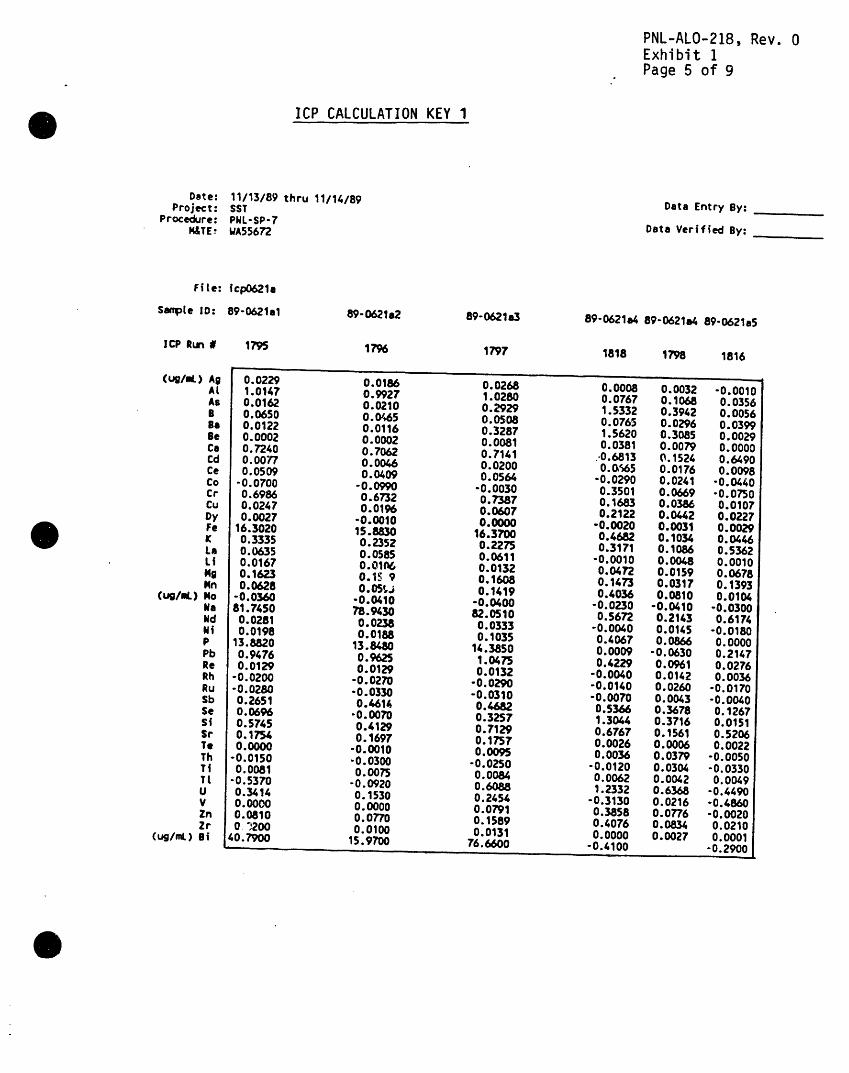
PNL-ALO-218,Rev. 0Exhibit IPage 5 of 9.
ICP CALCULATION KEY I
Date: 11113189 thru 11/14/89Project: SST Data Entry By:
Procedure: PNL-SP-7I_TE_ WA55672 Data Verified By:
FiLe: icpO621a
SampLe LD: 89-0621al 89-0621a2 89-0621a3 89-0621a4 89-0621a4 89-0621a5
ICP Run # 1795 1796 1797 1818 1798 1816
(uV/mL) AO 0.0229 0.0186 0.0268 0.0008 O.0032 -0.0010At 1.0147 0.9927 1.0280 0.0767 0.1068 0.0356As 0.0162 0.0210 0.2929 1.5332 0.3942 0.0056B 0.0650 0.0465 0,0508 0.0765 0.0296 0.03998a 0.0122 0.0116 0.3287 1.5620 0.3085 0.0029Be 0.0002 0.0002 0.0081 0.0381 0.0079 0.0000Ca 0.7240 0.7062 0.7141 .0.6813 0.1524 0.6490Cd 0.0077 0.0046 0.0200 0.G_65 0.0176 0.0098Ce 0.0509 0.0409 0.0564 -0.0290 0.0241 -0.0440Co -0.0700 -0.0990 -0.0030 0.3501 0.0669 -0.0750Cr 0.6986 0.6732 0.7387 0.1683 0.0386 0.0107Cu 0.0247 0.0196 0.0607 0.2122 0.0442 0.0227Dy 0.0027 -0.0010 0.0000 -0.0020 0.0031 0.0029Fe 16.3020 15.8830 16.3700 0.4682 0.1034 0.0446K 0.3335 0.2352 0.2275 0.3171 0.1086 0.5362La 0.0635 0.0585 0.0611 -0.0010 0.0048 0.0010Li 0.0167 O.01fW 0.0132 0.04?2 0.0159 0.0678NO 0.1623 0.1S 9 0.1608 0.1473 0.0317 0.1393Nn 0.0628 O.OS_j 0.1419 0.4036 0.0810 0.0104
(uV/mL) No -0.0360 -0.0410 -0.0400 -0.0230 -0.0410 -0.0300Wa 81.7450 78.9430 82.0510 0.5672 0.2143 0.6174Wd 0.0281 0.0238 0.0333 -0.0040 0.0145 -0.0180Ni 0.0198 0.0188 0.1035 0.4067 0.0866 0.0000P 13.8820 13.8480 14.3850 0.0009 -0.0630 0.2147Pb 0.9476 0.9625 1.0475 0.4229 0.0961 0.0276Re 0.0129 0.0129 0.0132 -0.0040 0.0142 0.0036Rh -0.0200 -0.0270 -0.0290 -0.0140 0.0260 -0.0170Ru -0.0280 -0.0330 "0.0310 -0.0070 0.0043 -0.0040Sb 0.2651 0.4614 0.4682 0.5366 0.3678 0.1267Se 0.0696 -0.0071) 0.3257 1.3044 0.3716 0.0151Si 0.5745 0.4129 0.7129 0.6767 0.1561 0.5206Sr 0.1754 0.1697 0.1757 0.0026 0.0006 0.0022Te 0.0000 -0.0010 0.0095 0.0036 0.0379 -0.0050Th -0.0150 -0.0300 -0.0250 -0.0120 0.0304 -0.0330Tf 0.0081 0.0075 0.00_ 0.0062 0.0042 0.01_9Tt -0.5370 -0.0920 0.6088 1.2332 0.6368 -0.4490U 0.3414 0.1530 0.2454 -0.3130 0.0216 -0.4860V 0.0000 0.0000 0.0791 0.3858 0.0776 -0.0020Zn 0.0810 0.0770 0.1589 0.4076 0.0834 0.0210Zr 03200 0.0100 0.0131 0.0000 0.0027 0.0001
(ug/mL) Bi 40.7900 15.9700 76.6600 -0.4100 -0.2900

PNL-ALO-218,Rev. 0Exhibit IPage 6 of 9
A ICP CALCULATIONKEY 2
Dal 11/13/89 thru 11/14/89] Analyst: File: |icpO621a_Project :Reported: [03/291901Procedure: Reviewer: --
D
Sample 89-0621a4 89-0621a4 89-0621a5 ]10 S1 5x x 52 ?x SP+S35x SP+S3 ?x SPK lx SPK 5x BLK lx BLK ?x
Prep Type Actd Acid Acid Acid Acid Acid Acid AcidMaJ 1.050 1.039 iDit: 250.0 250,0 ., 250.0 fr Di t : Vot-
U_ Prep Factor 236.60 266.65 .07Spike 10 241.52
S]>L_eVot-mL F-1 B-1Spike'b_Jution _ 087
WtX Factor1. 0.11830 0.1____33 0,11954 0.02500 0.12500 0.02_1_tCP Run # I 1_ 1796 1797 1818 1798 1816 ]
E"'i Weight X Ag 0.0024 0.0019 0.0029 -0.0001 0.0000 -0.0001At 0.1147 0,1169 0.1175 0.0008 0.0077 -0.0002As -0.0006 -0.0000 0.0325 0.0378 0.0406 -0.0004B 0.0050 0.0029 0,0033 0.0013 0.0008 0.0004lie 0. O013 0. O013 0.0392 O.0390 O.0384 0.0000Be 0.0000 0.0000 0.0009 0.0009 0.0010 -0.0000Ca 0.0856 0.0870 0.0853 0.0170 0.0190 0.0157Cd 0.0006 0.0002 0.0021 0.0016 0.0018 0.0002Ce 0.0003 -0.0009 0.0010 -0.0019 -0.0030 -0.0022Co -0.0133 -0.0174 -0.0054 0.0077 0.0031 -0.0028Cr 0.0822 0._6 0,_79 0.0041 0.0044 0.0002Cu 0.0023 0.0018 0.0066 0.0052 0.0049 0.0004Dy -0.0002 -0.0006 -0.0005 -0.0002 -0.0001 -0.0000Fe 1.9282 1.9584 1,9565 0.0116 0.0126 0.0010K 0.0358 0.0252 0.0236 0.0072 0.0098 0.0122La 0.C_5 0.0062 0.0063 -0.0002 -0.0005 -0.0002Li 0.001._ 0,0007 0.0010 0.0011 0.0014 0.0015Nii 0,0191 0.0194 0.0192 0.0037 0.0039 0.0034Nn 0.0073 0.0072 0.0169 0.0101 0.0100 0.0002No -0,0039 -0.0047 -0,00_ -0.0005 -0.0047 -0.0007Jim 9.6653 9.7302 9.8027 0.0131 0.0212 0.0138lid 0.0014 0.0010 0.0021 -0.0005 -0.0002 -0.0008Ni 0.0015 0.0015 0.0115 0.0100 0.0100 -0.0002P 1.6212 1.6859 1.6983 - O.0044 - O.0301 0.0009Pb 0.1100 0.1165 0.1231 0.0101 0.0098 0.0002Re 0.0006 0.0006 0.0006 -0.0003 0.0008 -0.0001Rh -0.0112 -0.0125 -0.0124 -0.0022 -0.0060 -0.0022Ru -0.0048 -0.0056 -0.0052 -0.0005 -0.0010 -0.0004Sb 0.0308 0.0563 0.0554 0.0133 0.0454 0.0030$e 0.0021 -0.0073 0.0327 0.0313 000400 -0.0009Si 0.0657 0.0486 0.0830 0.0164 0.0172 0.0121Sr 0.0207 0.0209 0,0209 0.0001 0.0000 0.0000Te -0.0037 -0.0039 -0.0026 -0.0007 0.0009 -0.0009Th -0.0059 -0.0080 -0.0072 -0.0012 -0.0006 -0.0016Ti 0.0007 0.0006 0.0007 0.0001 0.0002 0.0001
F'_ _t -0.0961 -0.0453 0.0399 0.0239 0.0452 -0.01750.0124 -0.0103 0.0010 -0.0137 -0.0269 -0.0175v -0.0003 -0.0003 0.0091 0.0096 0.0094 -0.0001
n 0.0092 0.0091 0.0187 0.0101 0.0101 0.0004Zr 0.0020 0.0009 0.0012 -0.0001 -0.0000 -0.0001Bi 0.9651 0.3939 1.8327 -0.0103 -0.0070

' PNL-ALO-218,Rev. 0Exhibit 1Page 7 of 9
ICP CALCULATION KEY 3
G_I G2 H J
Wtr. Factoh_ 0.11830_ 0.12333 0.02415ICP Run #_.' 1795 _ 1796 1816 QL
\1li(Wt Z) _g)if (Wt X) (Wt X) XDif (WtY. *) (WtX *) _Dif (ug/mL) (ug/mL)
-_ Ag (0.0024) (0.0019) <DL 0.0126 0.0419At 0.1147 0.1169 <DL 0.0886 0.2953As <DL <DL <DL O.1567 0.5223B <DL <DL <DL 0.0718 0.23%8a 0.0013 (0.0013) <DL 0.0033 0.0112Be <DL <DL <DL 0.0004 0.0012Ca 0.0856 0.0870 0.0157 0.0017 0.0058Cd <DL <DL (0.0002) 0.0060 0.0201Ce <I)L <I)L <DL 0.2083 0.6942Co <OL <DL <DL 0.3038 1.0128Cr 0.0822 0.(_B26 (0.0002) 0.0065 0.0218Cu (0.0023) <DL <DL 0.0177 0.0589Dy ,cOL <I)L <OL 0.0163 0.0545Fe 1.9282 1.9584 0.0010 0.0007 0.0222K <DL <:)L (0.0122) 0.4545 1.5150La (0.0065) (0.0002) <DL 0.0435 O.1448Li ,cOL <DL 0.0015 0.0138 0.0462Ng 0.0191 0.0194 0.0034 0.0012 0.0038Nn 0.0073 0.0072 0.0002 0.0021 0.0069No <DL <)L <DL 0.0717 0.2.391Wa 9.6653 9.7302 0.0138 0.1494 0,4979lid ,cOL <DL ,cOL O. 1056 0.3519Ni ,cOL <DL <OL 0.0173 0.0578P 1.6212 1.6859 <I)L 0.6388 2.1295Pb 0.1100 0.1165 <DL 0.0909 0.3028Re ,COL <I)L <I)L 0.0164 0.0547Rh <DL ,cOL <DL 0.3368 1.1227Ru <DL ,cOL <DL O.0354 O.1180Sb <I)L <DL <DL 0.6341 2.1135Se <DL <DL <OL 0.1113 0.3710Si 0.0657 0.0486 0.0121 0.0560 0.1867Sr 0.0207 0.0209 (0.0000) 0.0011 0.0036Te <DL <DL <DL O.0809 O.2696Th <DL <DL <DL O.1847 0.6157T t <DL ,cOL <DL O.0090 O.0300Ti <DL <DL <DL 2.6893 8.9644U <DL <OL <DL 1.7634 5.877'9V <DL <DL <OL 0.0084 0.0279Zn O.0092 O.0091 O.0004 O.0046 O.0153Zr (0.0020) <i)L <DL 0.0088 0.0292
• Bi 0.9651 0.3939 <DL N/A N/A
* Nethods btank - average sample weight used to caicutate wtX. 03/29/90

PNL-ALO-218,Rev. 0Exhibit 1Page 8 of 9
ICP CALCULATIONKEY 4
GI G2 ,H_____ _
89-0621
_II _ _ Cont_ Contro,_ _ S.TD_ .t (Wt X: IReO "l(gt X) O_(WtX) _l(Wt X) %-Oif eX Rec _(uglmL)_l(uQlmL) X"Oif _l(_ImL) _1%Ag 0.002' 20,0% (0,0029) rec
At 0,1158 1,9X 0,1175
As N/A 0.0388 (0.0325) 83.8_ 74.3 91.7 23.4% 80.0 92.9_B N/A <DL
Bi 0.0013 1.3% 0.0388 0.0392 97.7% 76.7 75.6 1.5% 80.0 95.9%Be N/A 0.0010 0.0009 97.6% 1.9 1.9 1.7"& 2.0 93.2%Cn O.0863 1. ?X O.0853
Cd N/A 0.0010 (0.0021) 211.8% 3.1 3.6 16.0% 2.0 156.4%Ce N/A <DL "
Co N/A 0.0097 <DL -55.9X 15.1 6.0 60.1% 20.0 75,6%Cr 0.0824 0.4% 0.0039 0.087? 141.2Z 8.1 8.6 6.7"_ 8.0 101.3%Cu N/A 0.0048 (0.0066) 137.1X 10.2 9.6 5.7% 10.0 101,8%Dy N/A <DLFe 1.9433 1.6% 1.9565K N/A <DLLa 0.0063 5.4% (0.0063)Li N/A <DLMQ 0.0193 1.4% 0.0192
O.0073 1.7% 0.0097 0.0169 99.0_ 19.8 19.7 0.5% 20.0 98.9'/,No N/A <OLNm 9.6977' 0.7'& 9.8027Hd H/A ,COL
Ni N/A 0.0097 0.0115 119._ 19.6 19.6 0.3% 20.0 98.E_P 1.6536 3.9Z 1.69&3
Pb 0.1132 5.7X 0.0097 0.1231 101.5X 19.9 19.2 3.6% 20.0 99.5%Re N/A ,cOLRh N/A ,cOLRu N/A <DL
Sb N/A 0.0097 <DL 57'2. OX 26.1 89.3 241.4% 20.0 130.7"/,Se N/A 0.0388 (0.0327) 84.5% 61.6 78.6 27.6% 80.0 76.9"/,si 0.0572 30.OX 0.0830Sr 0.0208 0.8% 0.0209Te N/A ,cOLTh N/A <DLTi NIA <OL
TL NIA 0.0388 <DL 102.9% 47.1 88.8 88.7% 80.0 58.8%U N/A <DL
V N/A 0.0097 0.0091 94.2X 18.8 18.4 2.3% 20.0 94.1%Zn 0.0092 1.1% 0,0097 000187 97.6% 19.9 19.8 0.5% 20,0 99,5%Zr N/A (0.0012)01 0.6795 84.1% 1.8327
03/29/90

PNL-ALO-218,Rev. 0Exhibit 1Page 9 of 9
ICP CALCULATIONKEY 5
Fire: icpO621aLast *TD1 Run ,= 1820
S*A*S******************************** *pi keAve[lO] Std Dev 3x SD 1Ox SD Std B-1
Run# (ug/mL) (ug/mL)
Ag 0.0029 0.0042 0.0126 0.0419 AgAI, 0.0/+52 0.0295 0.0886 0._3 Al,As 0.0212 0.0522 0.1567 0.5223 As 80.00B 0.0230 0.0239 0.0718 0.2395 BBa 0.0009 0.0011 0.0033 0.0112 Ba 80.00Be 0.0002 0.0001 0.0004 0.0012 Be 2.00Ca 0.0006 0.0006 0.0017 0.0058 CaCd 0.0028 0.0020 0.0060 0.0201 Cd 2.00Ce O.0480 O.0694 O.2083 O.6942 CeCo O.0423 O.1013 0.3038 1.0128 Co 20.00Cr 0.0034 0.0022 0.0065 0.0218 Cr 8.00Cu 0.0052 0.0059 0.0177 0.0589 " Cu 10.00Oy 0.0042 O.0054 O.0163 O.0545 DyF• 0.0029 0.0022 O.0067 O.0222 Fe 'K 0.0305 0.1515 0.4545 1.5150 KLa 0.0085 0.0145 0.0435 0.1448 LaLi 0.0047 0.0046 0.0138 0.0462 LiMg O.0005 O.0004 O.0012 O.0038 NgNn O.0009 O.0007 O.0021 O.0069 Mn 20. O0No -0.0030 0.0239 O.0717 0.2391 MoNa 0.0450 0.0498 0.1494 0.4979 NaNd 0.0160 0.0352 0.1056 0.3519 NdNI 0.0069 0.0058 0.0173 0.0578 Ni 20.00P 0.1778 0.2129 0.6388 2.1295 PPb 0.0181 0.0303 0.0909 0.3028 Pb 20.00Re 0.0078 0.0055 0.0164 0.0547 ReRh 0.0743 0.1123 0.3368 1.1227 RhRu 0.0125 0.0118 0.0354 0.1180 RuSb 0.0045 0.2114 0.6341 2.1135 Sb 20.00Se 0.0519 0.0371 0.1113 0.3710 $e 80.00Si 0.0183 0.0187 0.0560 0.1867 SiSr 0.0005 0.0004 0.0011 0.0036 SrTe 0.0310 0.0270 0.0809 0.2696 TeTh 0.0350 0.0616 0.1847 0.6157 ThT! 0.0026 0.0030 O.0090 O.0300 TtTt 0.2753 0.8964 2.6893 8.9644 Tl, 80.00U O.2367 O.5878 1.7634 5.8779 UV O.0028 0.0028 O.0084 O.0279 V 20. O0Zn 0.0028 0.0015 0.0046 0.0153 Zn 20.00Zr 0.0028 0.0029 0.0088 0.0292 Zr

PNL-ALO-218, Rev. 0Exhibit 2Page 1 of 3
IC CALCULATIONS
Calculations to support the generation of the final IC reports areperformed within a LOTUS 123 spreadsheet. The raw analytical data(in vg/mL or ppm) and sample preparation data are keyed into an ICspreadsheet template and both a raw data report and final report aregenerated. The calculations below (identified as A thru F)accompany the IC CALCULATION KEY.
General Informatlon_
The "boxed" areas in the IC CALCULATION KEY are sampleinformation and worksheet analysis data which is keyed into thespreadsheet template. This data/information is verified by boththe analyst and reviewer.
Calculated mg/kg values are calculated and displayed to 3significant digits only.
At the current time, the "measured" (not the true) spike controlvalues are used to calculate the spike added to the sample (inmg/kg) and the percent spike recovery. Difficulties have arisenin the longterm stability of the multi-anion control standardwhich has prompted this decision.
Key A: Dilution factors for Samples 1,2,3 & 5 (blank)
(Vol mL) + (Wt gm)Samp Dil = ---
(Wt gm)
Key B: Dilution factor for Spike Control, Sample 4
(Vol mL)Samp Dil = --
(Spike mL)
Key Cz Concentration for Samples I thru 5 (blank)
Sample X (mg/kg) = (vg/mL Sample X) * (Samp Dil Sample _X)

PNL-ALO-218, Rev. 0Exhibit 2
Page 2 of 3
Key D: Relative Percent Difference between Sample 1 & 2
' (Sl - S2) 'RPD = ! I , 100
,I (sz + s2) / 2 II
Where: Sl = mg/kg concentration of sample 1S2 = mg/kg concentration of sample 2
Key E: Spike added to Sample 3 [Sample 3 mg/kg equilalency]
(Sample 4 [vg/mL]) * (Spike mL) * (Samp Dil Sample 3)
Key F= Percent Spike Recovery (based on measured spike control)
% Spk Rec = $3 - ((Sl + $2)/2)% Spk Rec = ......
S 3 Spk
Where: S3 = mg/kg concentration of sample 3S2 = mg/kg concentration of sample 2Sl = mg/kg concentration of sample 1S3 Spk = mg/kg spike added

PNL-ALO-218,Rev. 0Exhibit 2Page 3 of 3

PNLTECHNICALPROCEDURE I
J
TITLE: PNL-ALO-21g,ANTIMONY(ATOMICABSORPTION,FURNACETECHNIQUE)
APPLICABILITY
This procedureis applicablefor determiningthe concentrationof antimonyinwastes,mobility-procedureextracts,soils,and groundwater. The methodologyis comparableto CLPMethod204.2in SOW 788. All samplesshallbe subjectedtoan appropriatedissolution/digestionprocedurepriorto analysisas specifiedbythecognizantscientistor inTestInstructions(TIs)orAnalyticalRequestForms(ARFs).
DEFINITIONS
Batch:A set of 20 or fewersamplesof likematrix.
Group(sampledeliverygroup):A setof 20 samplesor lesssubmittedat the sametime.
RESPONSIBLESTAFF
CognizantScientistTechnician
Q1.0 SqmmarYof Method
1.1 Followingthedissolution/digestionof the sample,a representativesamplealiquotand modifierare placed,by means of an automaticsampler,intoa graphitetube furnace. The samplealiquotis thenslowlyevaporatedto dryness,charred(ashed),and atomized. Theabsorptionof lamp radiationduringatomizationis proportionaltothe antimonyconcentration.
1.2 The reportabledetectionlimitfor Sb is 4 mg/Kg for soil and 20pg/L for water.Typicalinstrumentdetectionlimit (IDL)for Sb is6 pg/L in the analysissolution.
_._ut " Date Project Mgr. _,__ Date QADRepresentative Date
_c_.hn_, Revle_r_ _'_'"2-'_Date-c_7. Line Mgr. /_./_/_/y_ )_Date Other Date--I Waqner AG Ki nq _ "_---_._
-Procedure No. Revtston No. Effective Date Page
PNL-ALO-219 0 APR2 3 ).q,.n2 1 of 8

PNL TECHNICALPROCEDURE
2.0 Interferences
2.1 Elemental Sb and many of its compounds(e.g., antimony chloride)have relatively high volatility; therefore, samples may be subjectto losses of Sb during sample preparation. Spiked samples andrelevant standard reference materials should be processed todetermine if the chosen dissolution procedure is appropriate.
2.2 Care must be employed in selecting the drying and charring steptimes, temperatures and temperature ramps. A palladium, or otheracceptable analyte modifier (e.g., platinum), and magnesiumnitrate should be added to all digestates prior to analysis tominimize volatilization losses during drying and charring.Nagneslum nitrate has been shown to assist in spreading the Pd-Sbcompoundsmore evenly in the furnace which reduces diffusion timeof the analyte in the Hg oxide matrix (Slavin et al., 1982;Jackson and Qiao, 1990): Hagnesium thus serves to sharpen theanalyte peak shape during atomization and increases analyticalpreci sion.
2.3 Sb analysis is subject to a relatively high background absorbancein the presence of potassium sulfate which is not completelyeliminated by Zeemanbackground correction (Welz, 1988a). Use ofa hydrogen-argon gas mixture in the char step eliminates thisinterference by driving off the su]fate as HzSO4.
Hydrogen also enhances reduction of Pd which is necessary for Sbstabilization (Rettberg and Beach, 1989). Use of this argon-hydrogen gas mixture lowers the appearance temperature of Sb,requiring a modification of the temperature programming of thepyrolysis and atomization steps (Ni Zhe-ming and Shan Xiao-quan,1987).
2.4 Sb may condense at cool ends of graphite furnace duringatomization; potentially causing memory effects in subsequentanalyses. This situation can be minimized by operating thefurnace at 2650"C immediately after atomization. Alternatively,the use of a transverse heated graphite furnace (with longitudinala.c. magnet for Zeeman effect background correction), asintroduced on the Perkin-Elmer 4100ZL GFAASinstrument, canprevent this condensation phenomena.
3.0 Tolerances
Tolerances for all measurements made during an analysis shall bespecified in the following: 1) a tolerance limit is staled with ameasurement value, or 2) the following system of tolerances shall be ineffect:
+Procedure No. Revtsion No. i' Effective Date Page .....
PNL-ALO-219 0 i _F'_i :!, _i 2 of 8i ii i i

PNL TECHNICALPROCEDURE
a. When two or more significant figures are specified, the tolerancelimit is + 5 in the next digit beyond the last one stated. Forexample, 5.0 mL means 5.0 ± 0.05 mL; 369 mL means 369.0 ± 0.5 mL.
b. If a single significant figure is specified, the actualmeasurement shall be within ± 5% of the stated value. Forexample, 20 mL means a volume between 19 and 21 mL.
4.0 Aooaratus and Materials
4.1 Atomic absorotion soecl_roohotometer: Double-beam instrument witha grating monochromator, photomultiplier detector, adjustableslits, a wavelength range of 190-900 nm, provisions forsimultaneous background correction, and interfacing with acomputer and/or strip-chart recorder. Example: Perktn-Elmer 5100AA Spectrophotometer with AS60 autosampler, deuterium lampbackground correction, and IBM PS/2 computer.
4.2 Antimony hollow cathode ]amD: Electrodeless discharge lamps (EDL)are generally preferred as they have greater lamp output andlonger life than hollow cathode lamps (HCL). Sb EDL lamps providethe same sensitivity and detection limit as Sb HCL lamps.
4.3 Graohite furnace: Any graphite furnace device with theappropriate temperature and timing controls. Example:Perkin-Elmer HGA600
4.4 Pipets: Calibrated, with disposable tips, sized from 5 to 1,000pL, as required.
4.5 Balance: Analytical, capable of minimally weighing to the nearest0.001 g.
5.0 Reaaents
5.1 Deionized water: Oeionizedwater of sufficientquality, similarto ASTM Type II reagentwater, shall be used for preparing sample,standards, and reagentdilutions. Calibrationand sample blankswill produce concentrationsat or below IDL.
5.2 Concentrated nitric acid (HN03): Ultrex grade.
5.3 Antimony standard stock solution (1,000 mg/L): Preferred:Acquire a certified aqueous standard from NIST or an equivalentsupplier and verify by comparison with a second standard.
A]/Lernatlve:Dissolve 2.743 g of antimony potassium tartrate(analyticalgrade), dissolve in deionized water, and dilute to! L.
Procedure No. Rev] st on No. ( ffect tve Date Page
PNL-ALO-219 0 "¢P_:_ :; _!_' 3 of 8

i,i ii iN i i m m
I ...... P.,TEC..ICALPROCEOU,E......... }
fLl_4J;J.qll: Antt_ny compoundsare toxic and should be handledwtth care.
5.4 Antimony workina standards: Prepare dilutions of the stocksolution to be used as ca]ibration standards at the time of theanalysis. Withdraw appropriate al iquots of the stock solution,add concentrated HNO. at 2% of final vo]ume, respectively, anddilute to volume wit_ deionized water.
5.5 Palladium nil;rate - maqfleslqmnitrate mixed modifier _o]qt10r):Preferred: Mix equal volumes of 3000 _g/L of a certified aqueousPd standard in HNO3 and 2000 ,g/L of Mg(N03)_ (Merck, suprapureor equivalent), respectively. A 5 /_L volume'of this solution isadded to each sample, corresponding to masses of 15 _g of Pd (32.5_g PdN03) and 10 _g of Mg(N03)z (Schlemmer and Welz, 1986 and Welzet al., 1988a,b)
Alternative source for palladium: Dissolve 0.300 g Pd wire in aminimum volume of aqua regia and evaporate to dryness, add 5 mL ofconcentrated HNO_, warm until dissolution ts complete, dilute to100.0 mL; or dts_olve 0.5001 g palladium chloride (PdC1.) in 5 mLof concentrated HNO_, evaporate to near dryness, repeat_wtth 5 mLof concentrated HNO_, and dilute with water to 100.0 mL.
5.6 Aroon puree gas: Industrial-grade argon or a mixture of argon-hydrogen (95-5%).
6.0 Quality Cor1_rql
6.1 All quality control (QC) data shall be maintained and availablefor easy reference or inspection.
6.2 Minimum 0C.
6.2.1 The system shall be calibrated follow.frogmanufacturer'srecommendedcalibrationprocedure which is in the instrumentreferencemanual (see Section I0.0). Calibration parametersshall be establishedand recorded each day of operation.
,:
6.2.2 Samples shall be diluted, and reanalyzed, If they are moreconcentratedthan the highest calibration standard.
6.2.3 Employ a minimum of one method blank per sample group{typically20 samples) or batch of samples digested.
i ii |i| lm m ,,ii i i
Procedure No. Revision No. Effective Date Page
PNL-ALO-219 0 !_"_'. __ .- 4 of 8iii i i i ni .li mi ii roll

PNLTECHNICALPROCEDURE
6.2.4 Analyze at least one verificationcheck standard or one OCstandardeveryII samples,or more frequently.For CERCLAwork includea verificationstandardor a QC standardaftereveryI0 samples. If the resultsof the verificationor QCstandardare not within80% to 120%of theirmean value,thecognizantscientistshalldeterminethe correctiveaction.All sampleswithinthe previouslyanalyzedsamplegroupshallbe flaggedon the data reportsand the correctiveactiondocumentedwith the data. Validationof the data isthe responsibilityof the technicalgroupleader.
Note: Verificationstandardshelp monitorthe life andperformanceof the graphitetube. An RSD for duplicateinjectionsof midrangestandardsexceedingI0%,or aninstrumentresponse<70% of the manufacturer'srecommendationas statedin the referencemanual {seeSectionI0), shallbe investigatedand correctiveaction,Ifrequired,documented.
6.1.5AdditionalQC (i.e.,duplicates,matrixspikes,duplicatematrixspikes,multipleinjections,additionalsystemormatrixblanks,tightertolerances,holdingtimes,etc.)shallbe governedby the analyticalrequirementsof theprojector specificanalysesrequested. Specific(lCrequirementsshallbe providedby the ARF, the projectStatementof Work (SOW),or the sampleanalysisTI.
6.3 QC for clientsrequestingcompliancewith ComprehensiveEnvironmentalResponse,Compensationand LiabilityAct of 1980(CERCLA)requirements.
6.3.1Analyzesamplesper protocoldetailedin AppendixA. UseFigureI of AppendixA to establishthe quantitationmethodto be used;that is, eitherdirectcalibrationor methodofstandardaddition.
6.3.2Any additionalQC requirementsshallbe governedby the SOWfrom the clientwith the analysisprotocoltransmittedtothe analystvia TI.
7.0 AnalysisMethod
Samplecollection,preservationand preparationis not withinthe scopeof this procedure.However,it is importantthat samplesbe collectedand preservedproperlyin orderto maintainsampleintegrity.Theapplic-abilityof samplepreparationschemes,such as PNL-ALO-I01,forspecificmatricesshallbe demonstratedby analyzingspikedsamplesorrelevantstandardreferencematerials,or by the use of otherqualifyingtechniques.
ii m,i i i ii
Procedure No. Revision No. Effective Date Page
PNL-ALO-219 0 _i_ '-_ 5 of 8

F lm- i lr ii ill i i i i ml, m.i I II i Iii II....... PNL..TECHNICALPROCEDURE.....
7.1 The 217'.6 nm w_velength line and a background correction systemshall be employed. Follow the manufacturer's suggestions for allother spectrophotometer parameters. These are located in theinstrument reference manual (see Section 10.0).
7.2 Furnace parameters suggested by the manufacturer in the referencemanual should be employed as guidelines. The furnace parametersused shall be recorded with the data.
mol
GUIDELINES" Furnace settings -- P-E 5000 or 5100
RampStep TemD('C) Time(sec) Hold time(sc@._I
Drying# I 90 I 15
Drying #2 _30 10 I0
Charring I000 10 20
Cool down #1 ?_0 1 15
,_tomizatton 3200 0 5
Cleaning 2650 1 5Cool Down #2 20 1 5emlfm_
Note: Because temperature-sensing mechanisms and temperaturecontrollerscan vary between instrumentsor with time, the validityof the furnace parameters may be confirmed by systematicallyalteringthe furnaceparameterswhile analyzinga standard. In thismanner, losses of analytedue to overly high temperaturesettings orlosses in sensitivity due to less than optimum settings can beminimized. Similar verification of furnace parameters may berequired for c_mplex sample matrices.
7.3 Inject measured pL-aliquots of sample and modifier solution asdirected by the cognizant scientist into the furnace and atomize.If the concentrationfound is greaterthan the highest standard,thesample shall be diluted in the same acid matrix and reanalyzed.
7.4 Calculatethe antimonyconcentration: (I) by the method of standardadditions, (2) from a calibration curve, or (3) directly from theinstrument'sconcentrationread-out. All dilution or concentrationfactors shall be appliedprior to repo_-tingresults. Concentrationsreported for multiphase samples shall be appropriately qualified(e.g., pg/L aqueous phase or mg/Kg for solids).
. i, ,,=,,, .... i,. ii . i
PNL-ALO-219 0 _: :, i ............ I . ...... I 6oRe I

ii i ,,1
PNL TECHNICALPROCEDURE ]
i
8.0 Soecific Oualifications
This procedure is self-qualifying due to dependence on analyticalstandards, calibrations, and qC standards as per PNL-HA-70, PAP-70-901.
9.0 Records
Records will be maintained and controlled so as to conform to requirementsof Manual PNL-MA-70, PAP-7.0-1701. Laboratory Record Books (LRB) and DataSheets provide a mechanism for control of most records. LRBwill be usedin accordance with PNL-MA-68, Section 6.4, LRBs.
10.0 References
Gaskill, A., Compilation and Evaluation of RCRAMethod Performance Data,Work Assignment No. 2, EPA Contract No. 68-01-7075, September .'986.
Jackson, K.W. and Qiao, H.C. 1990. Effects of charring on particledistribution and atomization characteristics in slurry ETAAS (Seh. Pub.Health. State Univ.. New York, Wadsworth Labs., Albany, N.Y.)
Ni Zhe-ming and Shan Xiao-quan 1987. The reduction and el iminatioii ofmatrix interferences in graphite, furnace atomic absorption spectrometry.Spectrochim. Acta. 42B: 937-949.
Perkin-Elmer Atomic Absorption Spectrophotometer Reference Manual. 1986.Model 5100, Volume 1 and Volume 2.
Rettberg, T and Beach, L.M. 1989. Peak profile characteristics in thepresence of palladium for graphite furnace atomic absorption spectrometry.J. Anal At. Spectro. 4: 427-431.
Slavin, W., Carnrick, G. R. and Manning, D.C. 1982. Magnesiumnitrate asa matrix modifier in the stabilizedtemperature platform furnace. Anal.Chem. 54: 621-624.
Schlemmer, G. and Welz, B. 1986. Palladium and magnesium nitrates, amore universal modifier for graphite furnace atomic absorptionspectrometry. Spectro. Acta. 41B: 1157-1165.
USEPA Contract Laboratory Program, Statement of Work for Inoro_nicAnalysis, Multi-Media,Multi-Concentration,SOW 788, Method 204.2. "
Welz, B., Schlemmer, G. and Mudakit, J.R. 1988. Palladium nitrate -magnesium nitrate modifier for graphite furnace atomic absorptionspectrometry. Part I. Determinationof arsenic, antimony, selenium andthallium in airborne particulatematter*. J. Anal. At. Spectro. 3-93-97.
I _'/;.r'_. . _
PNL TECHNICALPROCEDURE
Welz, B., Schlemmer, G. and Mudakit, J.R. 1988. Palladium nitrate-magnesium nitrate modifier for graphite furnace atomic absorptionspectrometry. Part 2". Determinationof arsenic, antimony, seleniumandthallium in water, a. Anal. At. Spectro. 3:93-97.
i |ni mn n II ro,ni IIn
PNL-ALO-219 0 APR ,_3 1_.:_,, _ of 8......., .... I I -, ,, !

PNL-ALO-219.Rev. 0Attachment1, Page 1 of 18
l
' APPENDIXA
SEC¢20_ $
GDmaJ_ qA/qC F_.ACZZCCS
P.o &).usvaze ,x_ appa:sc_.s :mst be ad_e:ed Co. Lsbo:&co_f p:amc£ces v£mb.lre|a_d 1:oC8&&enlC8,so)vencs, amd Eases :m4C &1so be a_e:sd Co. ¥o:amldCl::l.Ol_S_lu_Ld41:l._s.=ei_&:d:Ln&_ese lene¢&_. _.&bol:lCocy p_ocedu_el, sscSe4_¢_Otl4 & _ 5 o_ _t'.e Handbook for" Ana1..vt:'l_eal_Oua_'v Cont:_o1_ttr _at:e_amd gasee_qae|_ Z.abo_a_o_es EPA-600/L,-79-0_Lg, USEPA F.n-v:LroruBenr_.
• t0
. .-1 7/88

• PNL-ALO-219 Rev. 0-_ Attachment 1, Page'2 of 18
$F.C'fZOHZZ
, sP£cz_c q,VQc _oc__ /_l
, II,
The quuL1Lcy _sua:_nce/qu_l£cy conc=ol (QA/QC) procsd_ures 4ef£ned• he=,Ln mu_c b, u_e4 by che Cone=Arco= vhen Per£orm£nS rh, mecho4_ spec£_£e4
in Z:chlbLc D. ghen _c£onA10_/qC pcoc,_ures z=e spec£f£,4 £n chsmethod4 _a_ F.v_ib£c D. Chs Conc_rsccol: mumc si.so fo].lov Chess p=oceduzes.NOTE: The coso of perform£nS ,11 qA/QC proc,d_r,s specL£Lsd Ln chLsScacemnc of Vo=k ls _nclu4sd _n Che prLce of performLnS che bLd loc.e_cepc lo= d_pl£c_ce, sp£ke, and l_boracory concrol sample _ruslyses. vhLchsh_l b, cons£dm:,d sspzrac, s6mpl, an61ysos.
The puarpose o£ c_ts 4ocuasnc £s co prov£de • un£fou ssc of
-- . .... ,,e p_oS_aa v£_.I &_Jo sss£sC l&oor&cor_ personnel£n rec&_Lnl _und de£en4/nl chert ,rotons un4er c=oss ,x_mLru_cLon _£required co present co,urr c, scLmony £n enforcement cue 1£c£ssc£on .
The pc_u_r_ funccLon o£ the QA/_C pro,rra _8 chs def£ntc£on of
- r 6 v. u4;s. -;-rse O0=IlCClVo £S CO
prov£d_ • un£fora bzsis £or s_mpl, collecc£on and hsndl£ns. £nscru=enc snd
_.. _mpols_o_e CO a_ress &11 _ru_lyc£c_l
a v_ _;eps _e_.ev&nC Co a_l_ lnorg&rt£c sr_lys£s . Inmm_ Ln_ca_u:es vhe=a mscho_olos£e s _r, av&£1_bls, spec£££c qu_£ conc=olproced_uroa sre £nco orJced cy
o_ .... _......... ruco=ce_enc *ccxorus _re _lyzed on1 z_Cec- ._:c:;_e_nn_; m_cua_:n:._nxmua per,ocmmc, .nd doc_menc,c£on req_u_.remencs .
The Conccsccor Ls requ£:ed co pzrcic£pac, £n chs I.sboracor_ Audtc *hdXncercompz=tson *ruby lhrosr_m run by EPA E_SL-L_s VeS&s. The Concr_ccorc_n expect co _ru_l_ze c_o s_mples per cslenc_r qcusrcar d_r£n S che concrzccper£od.
The Conc=zccor mzsc perfora and reporc co S_O and E_SL/LV Lsspec£_£ed Ln Fach£b£c B quusrce=ly ver£_£cac£on o_ £nscruaenc dececc£onIJlm,£C_ (ZDI.) by the mmC_od apec£££ed £n F-x_£bLc E, by c_p, _nd model *_or
ma, apoc_££ed £n • ru_ _;r necnoc_s, Cba C?ncr&ccor mu.sr &1so re orc
_m_m_on -&coors, v&ve£eng_ t_sed, _d £nce_r&c£on C£mos. , emenc
In chLs PachLbLc,a+ yell ss ocher pisces vichLn"Mo=k the c .---_--+--- . . chLs Scscemenc oo 8r_ mm67_m6& S 11 ° f
£_ ............ .__ - _mp _s _sed £n dLsc_ss£n_ cba _oaut_.a-'_t_-,_7 v_ p_.&cemertc oi Cir - -- " _ - _ ...... c_:tn q_/qc me*su'tenants. •8 The cormample :ta _ef:tned £n the -los .......... - *rmslyc/cal
4Jrl_lyc:tc&l sazmle £ncl,,_--&-..*_.z-Y:-/:'x_:_D. 1c C. AS r.h4t _era :ts t_;ed,- - . _. *---* -,. x_e_ s_mp_es, tnclu'd:tn Pe £ rmanJ_V&&U'41:IO_ &4,_OJ, llll- r8_._.._ _ _ .... _ r 0 Ce,*,13.r, au:tred oAJmC' ;_.._+,,..-=__++_up_,sn?.xc.r'r_+ .sou,.rc., bu'c :tc .].,so i,nc:l,u'd,es
- + -'- s--v*-- _m_mrzx sp+xe,. *ms+ycxcsX/posc.dXgescton
-2 7/88


I
• PHL-ALO-219,Rev.0Attachmentt. Page4 of 18
Qe am
• o._ •
._ 7/88 I

TA3LE 1. INITZAL AN_ CONTINUING CALIBRATION VEAIFICATIONCONTXOLLDilTS Fea INO_CANZC _¥SES
t o_ Tr'_e Value (_PA _¢_')Analyc£cal /_echod Inorganic Low LJ.mic High L£.mic-
Species
ICP/A,** /_e Cals 90 ,110
Cold VApor A_ Hercury 80 120
0 cho r Cyani de 85 115
, -5 7/S8

.... PNL-ALe-219'."P,evo "0Attachment 1. Page 6 of 18

PNL-ALO-219Rev. 0Attachment1. Page'7 of 18
lA l_ro_p of x6aples prepirad ,cpch, s_e c_,.,
!

PNL-ALO-219 Rev. 0Attachment 1, Page'8 of" 18
_°.
-8 7/88

PNL-ALO-219. Rev. 0• Attachment 1. Page 9 of 18
iii i
2F._A Lay rsqu£re eddLc£or_sl sp/ks s_mpZe analysLs, upon ProJscc off/cefrequest, £o¢ vhLch Chs Conc=_cco.¢_ va1 _ be p_£d.
,9 7/88


, i
PNL-ALO-219.Rev. 0• Attachment.1. Page11of 18
t
I


PNL-ALO-219,Rev.• Attachment1, Page13 of 1_
." -13 7/88.._t_
D. ,o

t
_t•-.-....-- ....
-14 7/88!

11. Tnterelement: Corrections for ICP
/ Sef°reincerelemencany fleldcorrec cionsamples factorsare analyzedmuscbeUnderdecerminedChis conCretE,priorco_hechelCPscsr=of conCracC amalyses _nd aC lease annually chereafcer. Correctionfactors for spectral incerference due Co Al, Ca o Fao and Mg must: bedetermined for all ICP £nscr_mencs st: all vavelengchs used for eachenalyt:e reported by /CP. Correction factors for spect:rsi interference
dUeweret:Oappl£ed.analyt:esocher chart Al, Cs, Fao and Mg mu4: be reported If t:hey
If chs /nsc_enC ras adjusted Ln anyvay thee say efface the ICPinCere].emenC correction factors, t:he faccors muse be redecermLned andChs results submitted for use. Resulcs from lnCerelemenC correcCtonfactors deCerminaCion muse be reporced on FOP.M XI(PART I)-ZN and FORMXI(PART 2)-IN for all ICP parameters.
D
12. Linear RanJ_e Analysis (lJ_)
For all ICP analyses, 8 linear range verification check standard musebe analyzed end report:sd quarterly (every 3 cml.onder months) for eachelement: on FOR_ XZZ-ZN. The standard must: be analyzed durLnf; a routineenalyCioal run performed under t:hLs contract. The analytically
.deterMined concencracLon of this standard muse be within + 5t of ChsC_e value. This concentration is cho upper lisle of chs ICP linear
" range beyond which resulcs canner be reported under ch/s contract:vithouc dilution of chs analytical sample.
13. Furnace Atomic Absorvci0n (AAI OC Analyses-
Because of chs nature of the Furnace AA technique, chs specialprocedures summarized in Figure 1-Furnace AA Analysis Scheme ('HSATree') will be required for quanc£cacion. (These procedures do nec
replaCeprovidedChOSecherein.inExhibit) D of chis SOV, buc supplemenC chs guidance
a. addLci°n'All£urnaceallanalyseenalysSeamUaC'excepcfall duringvichin fullchs calibract°nmechodaof Standardrange" InAdd£cLon (HSA). will require duplicate _nJacC£ons. The absorbanceor concentration of each injection muse be reFerEed in Chs raydeca as well as the average abaorbance or concentration values andthe relacLve standard deviation (RSD) or coefficient of variacLon
(EV). Average concenCraCion values sre used for reportingpurposes. The Concraccor muse be consiscenc per method and SDC inchoosing absorbance or concencration to evaluate vhLch fence Ls tobe folloved in che HSA Tree. The Contraccor must also LndLcacewhich of the cue is being used "Lr both absorbance and
c°ncentrati°nabsorbanceo£ eachere rep°rced£nJeccLoninsu_chet beraVLncludeddaca"F°rin MSAche r_vanalysiSdaca.. CheA
max/mUmbeperformed°£ 10befUlcveenlsampleeachconsecucLveanalysesEs acalLbracionSaxLmum20veinJrificacionseCCiOns may
andinJecblanks'rienreadingsF°r c°ncencract°nSmuscagree vichingCeacer2otthanp.sDCRDL'orCv,Cheor duplicacet:he
analycLcallft:he readLngsSamplearemuscacibel_ sscrerun, flag°scathe(L" evelue., CvOreporcsdaddicionalonFoRMburnsI.).
-15 Rev. 2/89
!

PHL-ALO-219.Rev. 0• Attacl_ent 1, Page16 of 18
IN rich •n "H'. The "H" £1a E is required for the •naly:ic•l spike• s well •s ,the sample. If the analytical spike tor • samplerequires an "N° flag. the £1ag muse be reported on FORH I- XB for\ chac sample.
J
• b. All furnace analyses for each analytical sample, Including choserequiring an "H- flag. will require aC lease an analyclcal spikeco determine I£ _he HSA wall be required for•nalycical spike" vlll be .....---_ .... quancicaClon. The
-ws_a&eu U.,ODe •C a cancan•the sample) 2x CI_DL. This ........ ration (InLequ,remenc _or sn anal c
will include the LCS and the preparer/on blank, y ic•l spike
,,_cd:d. cak:n -_co,dingly. ,S^ is net co be -.rSo---_ -';';'J" -_--or preparaCXon blank re a _ _ r --.uv un cno L._:)....... ; g rdless eS spike recover resultcna prepar&c_on O_ank an I.,,-_, ...... Y S.) IS(850115t_ _ ........ a.j.._., apL_e recovery Is auc o£ control" .... -. _": sPiKing so,melon muse be veri£1ed by res ikln and
: =e_unn_ng cna preparation blank once. vr .k ........ P _.S.6_ _.m p_epa_acxon Olanlr_
anslyclcal spike recovery is still auc o£ concrol_ cefr•ce cheproblem and reanalyze ali analytical samples associated rich chatblank. An analytical spike is nec required on the re-di •spike sample. • P g scion
The JnalyClcal spike o£ • sample must be run immediately afcerch•c sample. The percent recovery (tR) o£ the spike, calculated
"by the same £ormula as Spike Sample Analyses (see ices 60 trissection), will then determine how the sample will beas follows: quint/cared,
- 1) Z£ the spike recovery is less than A0t, the supl• must be
• diluted and rerun rich another spike. Dilute the sample by •foo, of.5 10..d ,,p o,ly b,perxormea once. I£ •_cer the dilution cre spike recovery isstill <4Oi. reporc deca and £1as rich sn mE. co indiclnCer£erence problems, ace
2) l_ the spike recovery is aL'escar Chah or eo,_l co 4:=p L, 1.,-'---- .^_0, ---spike . re orc CRe - ,,..au _us or r._e
--.-,, -_ or l;reace_ _h&n 115tresult vlch a 0_'. , £1as cre
3) X£ the sample absorb•nee or concentraCion is gr•aver vhan or vequ_al Co SOt of r_a spike and cho spike recovery is ac or
1Ar_lycical Spikes are posc-digescion spikes co be pre.noted Prior coanalysis by adding a known quancicy of che an•lyre co an aliquot of cre
sample. The unspiked sample •liquor muse be compensaced for anyvolume chan&e in the spike samples by addicion oS delonized water Co the
; un•piked sample aliquot. The volume o£ the spiking solucion added muse ---nec exceed let o£ the analyCical sample volume; this requiremenc alsoapplies co HSA spikes.
S=Spike" is de//ned as [absorb•nee or concencration o£ spike sample] minus[absorb•nee or concencracLon eS the sample|_ . ._ . •
-16Rev. 2/89

PNL-ALO-219.Rev.0AtC.achment1, Page17 of 18
..
• e
between 851 and 1151, the saaple m_mt be quancicatod directlyfrom the calibration curve and reported down Co the XDL.. *
• 4) If chs sample absorbents or concencrac:Lon :is greater than or :'' equs, l ¢o 501 of cho spike and rho epAke recovery La less than ;
851 or greater than 1151 the sample Bust be quanc:LCated byMSA. *
c. The foiler:Lng procedures w:Lll be :Lneorporated £nco HSA analyses.
I) Data from HSA calculations must: be w:Lthin t:he linear range asdetermined by the calibration curve generated ac cho
0 besLnnin_ o£ the analytAcal rum,
2) The sample and three spikes must be analyzed consecuc:Lvelyfor HSA quanCit:at:Lon (cho ":Ln:Lt£al" spAke run data £mspec:Lfically excluded from use :Lmthe HSA quanctt:ac:Lon). "Only single ¢nJect:Lons are requCred for HSA quanc£cac:Lon.
Each £ull HSA counts as rwe analyc:Lcal samples Cowardsdetermining ¢01 qC frequency (i.e., fare full HS/us can beperformed between cal£brac:Lon ver£f:Lcac£ons).
3) For ar_slycical runs containing only HSAs, single :inject:Lens.can be _sed for qC samples during that run. For :instrumentschat operat:e in an HSA mode only, HSA can be used codetermine qC samples dur:Lng Chat run.
..
_'_ A) Spikes must be prepared such char:
a) Spike 1 :Le approxCa_t:ely 501 of cho sample absorbance orconcencrac:Lon.
b) Sp:iko 2 £s approxLa_cely 100t o£ the sample absorbents orconcencrat:Lon.
c) Spike 3 ts ._pproximacely l$0t o£ the sample absorbance orconcentration.
5) The daca for each HSA analysis muse be clearly £dent:if:Led in.the raw data document:sCion (us:Lng added concencrac:Lon as chox-variable and absorbents as chs Y-varAable) along wLch theslope, x-intercept:, Y-lnt:ercepc and correlat:Lon coefficient(r) for cho leasc squares ££c o£ the dmca. The results must
be reported on FOR_ VXXX-XN. Reported values obtained by HSAmu_sCbe flal_i_edon cre data sheet (FO/1_fX-XN) w:Lt:hthe letter"$" :Li t:he correlat:£on coe££AcAenc As treater" than or equalCo 0.995. ..
6) If the correlation coefficient (r) for a parclcular, analysis£s less than 0.995, the HSA analysis must be repeated once.1£ cho correlacAon coefficient is still less than 0.995,report cho results on PORH X-IN from the run w£ch the best"¢a and £1ag chs result wAch a m,p.on FORH 1/111 IN and PORHX-IN.
-17Rev. 2/89

PNL-ALO-219. Rev 0• Attachment 1: Page 18 of' 18

INTERIM CHANGE NOTICE
(ICN) ICN - PNI.-ALO-220.1ROelof 1
A.DocumentNumber: PNL-ALO-_20 Revision Number: 0 Effective Date
of ICN: _K/_/ /@_-DocumentTitle: Thallium (Atomic AbsorPtion, Fqrnace
Techniaue) ..... ChangeRequestedby:
Document'sOriginalAuthor: jM Robbins T[ Jone_ / TG Walker
B. Action:
Replace pages 1 through 8 due to new format.
Make references to microwave digestion upgrade.
C. Effectof Change:
DeletingACT 89.1 and replacingwith establishedrecordsmanagementpractices.
Bringsprocedureinto compli.ance.
Changein matrixmodifierconcentrationdue to a typographicalerror.
Suggestsalternatedissolutionprocedure.
D. Reasonfor Change/Descriptionof Change:
Section2.1: Add the followingsentenceto end of paragraphas an alternateprocedure: "Use of the CLP closedmicrowavedigestionprocedureis suggested(EPA-CLP-M3/90)."
Section5.5" Due to typographicalerrors;change"3000/_g/L"to 3000 mg/L" and"2000_g/L" to "2000mg/L."
Sectiong.o" Change"ACT NOW Directive89.1"to "establishedrecordsmanagementpractices"becauseACT NOW Directive89.1 is no longerin existence.
........ i i 'i
E. Approval Signatures: I[ Type of Change: (Check one):
(Pleasesign and date) [[ X Minor Major' '-% _ ,, ....T
ProcessQualIty Department: TLEhlert Date: ._/02o / ___
ApprovalAuthorlty: AGKinq II Date: _'-/Z / /_C7
Other Approvals: Date: / ./II
]] : Date:,/ /II
" " i Iii i i i i m

i
PNLTECHNICALPROCEDURE
TITLE: PNL-ALO-220,THALLIUM(ATOMICABSORPTION,FURNACETECHNIQUE)
APPLICABILITy
This procedureis applicablefor determiningthe concentrationof thalliuminwastes,mobility-procedureextracts,soils,and groundwater. The methodologyis comparableto CLP Method279.2 in SOW 788 or SOW 390. All samplesshallbesubjectedto an appropriatedissolution/digestionprocedurepriorto analysisas specifiedby the cognizantscientistor in Test Instructions(Tis)orAnalyticalRequestForms (ARFs).
DEFINITIONS
Batch: A set of 20 or fewersamplesof like matrix.
Group (sampledeliverygroup): A set of 20 samplesor less submittedat thesame time.
.R._SPONSIBLESTAFF
CognizantScientistTechnician
PROCEDURE
1.0 Summaryof Method
1.1 Followingthe dissolution/digestionof the sample,a representativesamplealiquotand modifierare placed,by meansof an automaticsampler,into a graphitetube furnace. The samplealiquotis thenslowlyevaporatedto dryness,charred(ashed),and atomized. Theabsorptionof lamp radiationduringatomizationis proportionaltothe thalliumconcentration.
1.2 The reportabledetectionlimitfor Tl is 2 mg/Kgfor soil and10 pg/L for water.Typicalinstrumentdetectionlimit (IDL)for Tlis I pg/L in the analysissolution.
Author Date Project Mgr. Date QAD Representative Date
jM Robbins , BM Gillespie ...... GK Gerke
hnical Reviewer Date Line Mgr. Date Other DateALL ORIGINAL SIGNATURES ON FILE
_gUri@ , JM Latkovich ........
Procedure No. Revision No. Effective Date Page
PNL-ALO-220 0 04/26/91 I of 8,, ,,, ...

PNL TECHNICALPROCEDURE
2.0 Interferences
2.1 Elemental thallium and many of its compounds (e.g., thalliumchloride) have relatively high volatility; therefore, samples maybe subject to losses of Tl during sample preparation. Spikedsamples and relevant standard reference materials should beprocessed to determine if the ch0sen d_ss0!ution procedure is
::.:..:..::ii._._..;:_._::.::...:.:...;...-_x_!_i:_i'_i:.px.#.......iiiii:!:.:.;...:!:...i_._i:_:;:...:.._._._.;.;::!ii.:.;:i:..:.:_..i!i:;.:_
2.2 Care must be employed in selecting the drying and charring steptimes, temperatures and temperature ramps. A palladium, or otheracceptable analyte modifier (e.g., platinum), and magnesium nitrateshould be added to all digestates prior to analysis to minimizevolatilization losses during drying and charring. Magnesiumnitrate has been shown to assist in spreading the Pd-T1 compoundsmore evenly in the furnace which reduces diffusion time of theanalyte in the Mg oxide matrix (Slavin et al., 1982; Jackson andQiao, 1990). Magnesium thus serves to sharpen the analyte peakshape during atomization and increases analytical precision.
2.3 Tl analysis is affected by sodium chloride at concentrations above100 mg/L. Addition of 100 pg of Li, as LiNO the nitrate reduceschloride interference on Tl to approximately ]0% at NaCl levels of300-600 mg/L. (Welz et al., 1988b). However, in the presence of0.1% NaCl or KCI even Zeeman correction does not eliminateinterferences for Tl.
Use of an argon-hydrogen gas mixture (95-5%) during temperatureramp to 900"C eliminates interferences from up to I% chloride.Hydrogen enhances reduction of PD which is necessary for Tlstabilization (Rettberg and Beach, 1989). Use of this argon-hydrogen gas mixture lowers the appearance temperature of Tl,requiring a modification of the temperature programming of thepyrolysis and atomization steps (Ni Zhe-ming and Shah Xiao-quan,1987).
For Chloride concentrations less than 30 pg the simple solution ofelimination of the pyrolysis step and the matrix modifier allowedfull recovery of Tl when Zeeman background correction is used(Manning and $1avin, 1988).
2.4 Tl may condense at cool ends of graphite furnace duringatomization; potentially causing memory effects in subsequentanalyses. This situation can be minimized by operating the furnaceat 2500-2650oC immediately after atomization. Alternatively, theuse of a transverse heated graphite furnace (with longitudinal a.c.magnet for Zeeman effect background correction), as introduced on
i .....
Procedure No. " Page
PNL-ALO-220 '_" _"= __/_v/71 2 of 8! .... I

PNL TECHNICALPROCEDURE
the Perkin-Elmer 4100 GFAAS instrument, can prevent thiscondensation phenomena.
3.0 Tolerances
Tolerances for all measurements made during an analysis shall bespecified in the following: I) a tolerance limit is stated with ameasurement value, or 2) the following system of tolerances shall be ineffect:
a. When two or more significant figures are specified, the tolerancelimit is ±5 in the next digit beyond the last one stated. Forexample, 5.0 mL means 5.0 ± 0.05 mL; 450 g means 450 ± 5 g; 369 mLmeans 369.0 ± 0.5 mL.
b. If a single significant figure is specified, the actual measurementshall be within _+5%of the stated value. For example, 20 mL means avolume between 19 and 21 mL.
4.0 Apparatus and Materials
4.1 Atomic absorption s_)ectrophotometer: Double-beam instrument with agrating monochromator, photomultiplier detector, adjustable slits,a wavelength range of 190-900 nra, provisions for simultaneousbackground correction, and interfacing with a computer and/orstrip-chart recorder. Example: Perkin-Elmer 5100 AASpectrophotometer with AS60 autosampler, deuterium lamp backgroundcorrection, and IBM PS/2 computer.
4.2 Thallium hollow cathode lamp: Electrodeless discharge lamps (EDL)are generally preferred as they have greater lamp output and longerlife than hollow cathode lamps (HCL). Thallium EDL lamps providethe same sensitivity and detection limit as thallium HCL lamps.
4.3 Graphite furnace: Any graphite furnace device with the appropriatetemperature and timing controls. Example: Perkin-Elmer HGA 600
4.4 Pipets: Calibrated, with disposable tips, sized from 5 to1,000 pL, as required.
4.5 Balance: Analytical, capable of accurately weighing to the nearest0.0001 g. (Optional)
5.0 Reagents
5.1 Deioniz_d water: Deionized water of sufficient quality, similar toASTM Type II reagent water, shall be used for preparing sample,standards, and reagent dilutions. Calibration and sample blankswill produce concentrations at or below IDLs.
l PrOcedure NO, Revislon NQ, l Effective Dat_ Page l
l PNL-ALn-_O 0 l 04/26/gi 3 of 8 l

• r
5.Z Concentrated nttrl¢ _CI,_ (HN03): Ultrex grade.
5.3 Thallium standard stock solution: (1,000 rag/L): P_r.e,f_eJ__e_l:Acquire a certified aqueousstandard from NIST or an equivalentsupplier and verify by comparison with a second standard.
Alternative: Dissolve 1.303 g of 99.99% thallium nitrate (T1N03)JohnsonMatthey or equivalent, in detontzed water, add 10 mLofconcentrated HNO3 and dilute to 1 L, using deionized water.
Cautton: Tha11t umand i ts compoundsare extremely toxt c and shouldbe handled with care.
5.4 Thallium workinQ standard_;: Prepare dilutions of the stocksolution to be used as calibration standards at the time of theanalysis. Withdraw appropriate al iquots of the stock solution, addconcentrated HNO3 at 1%of final volume and dilute with water tovol ume.
5.5 Palladium nitrate - maqnesiumnitrate mixed modifier solution:_: Mix equal volumes of 3000 _ _iE of a certifiedaqueousPd standardin HNO 3 and 2000 _g_Jc_:':_}f Mg(N03)2 (Merck,suprapureor equivalent),respectively.A::5::_Lvolumeof thissolutionis addedto each sample,correspondingto massesof 15 #gof Pd (32.5/_gPdNO_)and 10 _g of Mg(NO3)z(Schlemmerand Welz 1986and Welz et al., 19B8a,b).
Altecnativesourcefor palladium: Dissolve0.300g Pd wire in aminimumvolumeof aqua regiaand evaporateto dryness,add 5 mL ofconcentratedHNO_,warm untildissolutionis complete,diluteto100.0mL; or dissolve0.5001g palladiumchloride(PdCl_)in 5 mL ofconcentratedHNO_,evaporateto near dryness,repeatwi£h 5 mL ofconcentratedHNO;,and dilutewith waterto 100.0mL.
5.6 Arqon ourqega_: Industrial-gradeargonor a mixtureof argon-hydrogen (g5- 5%).
6.0 QualityControl(QC)
6.1 All QC data shallbe maintainedand availablefor easy referenceorinspection.
6.2 MinimumQC.
6.2.1 The systemshallbe calibratedfollowingmanufacturer'srecommendedcalibrationprocedurewhich is in the instrumentreferencemanual (seeSection10.0). Caliorationparametersshallbe establishedand recordedeach day of operation.
Procedure No. Revision No. Effective Date Page
PNL-ALO-220 0 04/26/9] 4 of 8

PNL TECHNICALPROCEDURE
6.2.2 Samples shall be diluted, and reanalyzed, if they are moreconcentrated than the highest calibration standard.
6.2.3 Employ a minimum of one method blank per sample group (typically20 samples) or batch of samples digested.
6.2.4 Analyze at least one verification check standard or one DCstandard every 8 to 12 samples. For CERCLAwork include averification standard or a QC standard after every 10 samples.If the results of the verification or QC standard are not within80% to 120% of their mean value, the cognizant scientist shalldetermine the corrective action. All samples within thepreviously analyzed sample group shall be flagged on the datareports and the corrective action documented with the data.Validation of the data is the responsibility of the technicalgroup Ieader.
Note: Verification standards help monitor the life andperformance of the graphite tube. An RSD for duplicateinjections of midrange standards exceeding 10%, or an instrumentresponse <70% of the manufacturer's recommendation as stated inthe reference mahual (see Section 10.0), shall be investigatedand corrective action, if required, documented.
6.2.5 Additional QC (i.e., duplicates, matrix spikes, duplicate matrixspikes, multiple injections, additional system or matrix blanks,tighter tolerances, holding times, etc.) shall be governed bythe analytical requirements of the project or specific analysesrequested. Specific QC requirements are provided by the ARF,the project Statement of Work (SOW), or the sample analysis TI.
6.3 QC for clients requesting compliance with ComprehensiveEnvironmental Response, Compensation and Liability Act of 1980(CERCLA) requirements.
6.3.1 Analyze samples per protocol detailed in Appendix A. UseFigure I of Appendix A to establish the quantitation method tobe used; that is, either direct calibration or method ofstandard addition.
6.3.2 Any additional QC requirements shall be governed by the SOW fromthe client with the analysis protocol transmitted to the analystvia TI.
7.0 Analysis Method
Sample collection, preservation and preparation is not within the scopeof this procedure. However, it is important that samples be collectedand preserved properly in order to maintain sample integrity. The
Procedure No. Revision No. Effective Date Page
PNL-ALO-220 0 04/26/91 5 of 8J

PNLTECHNICALPROCEDURE
applicability of sample preparation schemes, such as PNL-ALO-IO1, forspecific matrices shall be demonstrated by analyzing spiked samples orrelevantstandardreferencematerials,or by the use of otherqualifyingtechniques.
7.1 The 276.8 nmwavelength line and a background correction systemshall be employed. Follow the manufacturer's suggestions for allother spectrophotometer parameters. These are located in theinstrument reference manual (see Section 10.0).
7.2 Furnace parameters suggested by the manufacturer in the referencemanual should be employed as guidelines. The furnace parametersused shall be recorded with the data.
_ ! I I,IB _ _ I_ i o.I I,i. w I I _ I i I i I o l,_ o i i ! o i ! ! I
Suggestedfurnacesettings-- P-E 5000 or 5100
Ramp HoldStep Temo('C} Time(sec) Time(sec)
Drying#I 90 I 15Drying#2 130 10 10
, Charring " go0 I0 20Cool down#1 30 1 15Atomization 1800 0 5Cleaning 2650 1 5Cool Down#2 20 10 5
I i I! i iii m I oi,m**, gII i.I I_ iii l..! I.ll I ! li
Note: Becausetemperature-sensingmechanismsand temperaturecontrollerscan vary betweeninstrumentsor with time,the validityof the furnaceparametersmay be confirmedby systematicallyalteringthe furnaceparameterswhile analyzinga standard. Inthis manner,lossesof analytedue to overlyhigh temperaturesettingsor losses in sensitivitydue to less than optimumsettingscan be minimized. Similarverificationof furnaceparametersmaybe requiredfor complexsamplematrices.
7.3 InjectmeasuredpL-aliquotsof sampleand modifiersolution(typically,20 pL of sampleand 5 pL of modifier)into the furnaceand atomize. If the concentrationfoundis greaterthan thehigheststandard,the sampleshallbe dilutedin the same acidmatrixand reanalyzed. Note: Multipleinjectionsimproveprecisionand help detectfurnacepipettingerrors.
7.4 Calculatethe thalliumconcentration:(I) by the methodofstandardadditions,(2) from a calibrationcurve,or (3) directlyfrom the instrument'sconcentrationread-out. All dilutionorconcentrationfactorsshallbe appliedpriorto reportingresults.Concentrationsreportedfor multiphasesamplesshallbe
,, i|i , ,, n ,
Procedure No. Revision No. Effective Date Page IPNL-ALO-220 0 04/26/91 6 of 8,i i _

= appropriately qualified (e.g., _g/L aqueous phase or mg/Kg forsolids).
8.0 Specific Qualifications
This procedure is self-qualifying due to dependence on analyticalstandards, calibrations, and QC standards as per Manual PNL-MA-70,Procedure PAP-70-901.
9.0 Records
Records will be maintained and controlled so as to conform torequirements of Manual FNL-MA-70, Procedure PAP-70-1701. LaboratoryRecord Books (LRB) and Analytical Report Cards/Data Sheets provide amechanism for control of most records. LRBswill be used in accordance
10.0 References
Gaskill, A. Compilation and Evaluation of RCRA Method PerformanceData, Work Assignment No: 2, EPA Contract No. 68-01-707_, September1986.
Jackson, K. W. and Qiao, H. C. 1990. Effects of charring on particledistribution and atomization characteristics in slurry ETAAS (Sch. Pub.Health. State Univ. New York, Wadsworth Labs., Albany, N.Y.)
Manning, D. C. and Slavin, W. 1988. The determination of thallium withthe stabilized temperature platform furnace and Zeeman backgroundcorrection. Spectrochim Acta 43B. 1157-1165.
Zhe-ming, Ni and Xiao-quan, Shan. 1987. The reduction and eliminationof matrix interferences in graphite furnace atomic absorptionspectrometry. Spectrochim. Acta. 42B" 937-949.
Perkin-Elmer Atomic Absorption SpectrophotometerReference Manual, Model5100, Volume I and 2.
Rettberg, T. and Beach, L. M. 1989. Peak profile characteristics inthe presence of palladium for graphite furnace atomic abso_ption
° spectrometry. J. Anal At. Spectro. 4" 427-431.
Slavin, W., Carnrick, G. R. and Manning, D. C. 1982. Magnesium nitrateas a matrix modifier in the stabilized temperature platform furnace.Anal. Chem. 54" 621-624.
• i .| ,, m.m , , ., , ., , .., ., , .,
Procedure No. I Revision nlo. I Effective Date PagePNL-ALO-220 0 04/26/91 7 of 8
m_mm.,=w_m. , , , ,,

PNLTECHNICALPROCEDURE .Sch]emmer,G. and Welz, B. 1986. Palladium and magnesiumnitrates, amore universal modifier for graphite furnace atomic absorptionspectrometry. Spectro. Acta. 41B: 1157-1165.
USEPAContract Laboratory Program, Statement of Work for InorganicAnalysis, Multi-Media, Multi-Concentration, SOW788, Method 279.2.
Welz, B., Schlemmer, G. and Mudakit, O. R. 1988. Palladium nitrate -magnesiumnitrate modifier for graphite furnace atomic absorptionspectrometry. Part 1. Determination of arsenic, antimony, selenium andthallium in airborne particulate matter* J. Anal At Spectro3:93-97. " " " "
Welz, B., Schlemmer, G. and Hudakit, J. R. 1988. Palladium nitrate-magnesiumnitrate modifier for graphite furnace atomic absorptionspectrometry.Part 2". Determinationof arsenic,antimony,seleniumand thalliumin water. J. Anal.At. Spectro. 3:93-97.
Nn. _ No _ -----'--
L L_ [ ,.=.,_,u,, o ! i[ffecl;|ve Dal: e PagePN ALO-220 0 I 04/26/91 8 of 8

• PNL-AL0-220, Rev.0-=, Attachment 1• Page 1 of 18
APPENDIX A
SECTIONI
c.-----_:p._qA/qc PRACTICES
Scand_cd le,,bocacory pcaccices £oc lsbocsCoc7 cleanlf, ness as appliedco I_lassw6=:e and apparacu._ mu._c be adhel:ed Co. Labor&coo 7 pcsct::f.ces richreSsrd co reasencs, solvent:s, =nd g&ses unzsc also be adheced Co. Focaddicional l_idelirtes.resacdin S these seneral labocacoc7 pcocedu=ces, seeSeccions _ and 5 o£ the Hart_boo_cfor Analvt:_cal Qua!tc v Control !rl racerand Vas;evacerLaboratories EPA-600/&-79-019,USEPA EnvironmencalMoniuorin8 and Support Laboratory, CLn¢Irmaul,Ohio. March 1979.
-I 7/88

PNL-AL0-220, Rev. 0q •.... Attachment 1
e= , e
• Page 2 of 18
SECTION I!
SPECIFIC qA/C_¢ PROCrJ_UP_:S
The qumlLc_ assurance/qualicy control (QA/Q¢) procedures de£Lnedherein muse be used by the Contractor vheu pe=£ormin& the methods =pect£1edIn Exhibit D. When &ddic£oual QA/qC procedures are specl£1ed £n themethods Ln F.x_lb£c D, the Contractor must also follow these procedures.NOTE: The cost of perf;ormLn S all qA/q¢ procedures spe¢lf;led £n this
Scacenenc of Work _Ls £ncluded in the price o£ per£ot-min S the bid loc,except f;or duplicate, sp_ke, and laboracor 7 control, sanple au_alyses, which=ha].]. be considered separate sa=ple analyses.
The put'pose of; Ch£s document: £s co provide a un£fot-m set ofprocedures for the analysis o_ Lnocsantc cortsticuencs o£ =aJnples,documencaC_ou of methods and their performance, and ver£ftc&=lou o£ r.he
sample data generated. The pcosra= vi].], also assist laboracor,/ persortne_Ln recallin K and defendin S their acciorcs under cross examination i£
=equLred co present court cesc_mony in enforcement case l£tlgat£on.
The pr£mar 7 function of the qA/QC program _s the defin_cion of
procedures for the.evalustlon and docu=encaclon o£ sAmpllng and aruslyc£calmethodolosles and the reduction and reporting of data. The objective Is toprovide a uniform bas£s for sanple collection and handl£n_, Lnstru=ent and
methods =uLintenance, performance evalcusc_on, and analytical d_=a gatheringand reporting. Although £t Is i=poss_.ble to address all arutiyt£cals1.ttusClons _n one document:, the approach taken here Is to de£tne =inlmu_
requLremenCs for all major steps relevant to any inorganic analys£s. Inmany instances where meChodologtes are available, spec£fic quality conoco1l=rocedures are £n¢ot'porated into r.he =eChod documentacion (ExhLbit D).lde&ll)', samples £nvolved in enforcement actions sre analyzed only afcerr.he mechocLs have met P.he m£nLmum per£or=ance and documencation requ_.rementsdescribed In th£s docunent.
The Coucractor Is required Co participate _n che Laboracot-y Audio andlncerco=par_son Study Prosrxm run by EPA _L-Las Vesas. The Concraccorcan expect co analyze cvo sa=ples per calendar qt_arcer dur£n_ the contractperiod.
The Contractor muse per£or= and report co SMO and _SL/LV asspecified Ln F.x_lbic B quarce=ly verification of lnscrumenc detection
llntts (IDL) by.cba mechod specified in F.x_lbic E, by c/pe and model foreach lnscrctmenc used on this contract. A].I r.he IDLs =hast meet r.he CRDI.s
=pecL£Led £n F.xhib_c ¢. For ICP methods, the Contractor must a_.so report,as specified £n F.xhibic B, linearicy ranse verificscion, all lncerelemeu=correction factors, wavelengths used, and Lncegrac_ou oi=es.
In ch_s Exl_lbic, as yell as other places vichin'c_ts State=ear ofWork, the cerro "aru_lyc_cal s==ple" _s used in discussins che required_req,Jency or _lacemertt o£ certain OA/QC measurements. T_._e ter_ "analyticalsample" La deg£ned J.n l_e _;lossar,j,, lrxhib£t C. As ¢._e tet-m ts used,analytical scmple includes all _Leld sa=l_les, including Performance ....
• EvaluaCion sa_pl.es, received from an exCe_-nal source, but It; _so includesall required q^/qC samples (matrix spikes, analytica]./posc-dl_esc_on
-2 7/88 o
o

1. Ins ct'_u=e_c Calibration
m
Cu_delines _or instrumental cal_brac_on are _ven In EPA 600/L-79-020and/or F.x_b_t D. Instruments m_sc be calibrated da_ly or once every 2&ho_rs and each CLme _he _nscrument _s ssc up. The _nscru_entstandard_zat_on (Lace and t_me an_sc be _ncluded _.n the raw data.
For atomic absorption systems, calibration etancLards are prepared by.. d_luc_nS the stock metal 8oluc_ons ac the cise o_ aual_s£s. Dace and
Ci=e o£ preparation and analys_s un_sc be g_ven _n the ray data.
-3 7/B8

PNL-ALO-220, Rev. 0
._ Attachment 1• Page 4 of 18
.@
Ca_LbracLou mcand_rds m_sc be prepared fresh each c£=e an analys£s isCo be made and d£scarded after use. Prepare a blank and ac lease r_reeczlLbracLon standards £n srad_aced amounts £n r_e approprLace range.One acomLc abso_c_C£on ca_Lbrac£on sCanctard m_tsc be ac C_e CRDL except£or mercu_/. The calLbracLon standards _usC be prepared us£ng the sLmet'_pe o£ acLd or c_mbLrcac£on ot acids and ac the same concencrac£on aswLll result Lnct;e zanrples £ollov_ng sample preparacLon.
2eg£unLug v£ch che blank, aspirate or £nJecc the scandarda _nd recordcb, read£ngs. Z£ the AA /nstrumenC cor_lgurat£on prevents C_e required_-po£nc cal£brac£on, calLbrace accord£ng co £usCr_nenc manu£'acturer's
" _ecom_encLaclor_s. and ar_ly_e the re_£ntng requ£red s_and_rdz4mmediacely after cal£bration. Resulcs for these _r.anda_ds muse bev£ch£n __ 5q of the crue vaTue. Each standards concen_rat£on and the
ca_cu_ac£ous co ahoy r_ac the ___t cr£cer£on has been mec, m_asc be S_ven£n the ray dace. l£ the values do noc tall v£ch_.n ch_s Yanse,recal_bracLon £s necessary.
The __ 5t cc£cer_a does noc apply co c_e atomic absot-pc£on cal£brac£onscandard aC rbe C_DL.
Ca_£brac£on scandarda foc AA procedures musc be prepared as descr£bed£n F..x.h£b£c D.
3asel£ne correct£on £s acceptable as long as £= £s per£o_*med a_cer
every sm_ple or a£cer C._e con_£nu_ng ca_Lbrac£on ver££_caC£on and blankcheck; reslop£ng Ls acceptable as long as £c £s L_ed_acely precededand _med_.acely fo_oved by CCV and CC3. For cyan£de and mercury,fo].lov clue calLbrac:£on procedures ouc_£ned _n _£b_.t: D. One cyanideca_£brac_on standard _u._c _e a_ C_e C_DL. For ICP systems, ca_£bracethe £nsCr_menC accord£ng Co £rtsCt'cunenC manufacturer's recounnendedprocedures. Ac lease _o standards un_sc be used tor ICP cal£brat£on.One o_ r_e scand,_rds mctsc be a b_ank.
2. Iniclal Cal_l_racton Vertf_ceclon fl_C_l an.d_Co.n_tnuIn_ Caltbreclon
V_erlf_caclon (_)
a. ]n£ci-_ Ca_£brac_on Ver£££cacton (ICU)
Im_ed£ace_y a_cer each o_ the ICP, _ and cyan£de systems havebeen calibrated, r._e acc_acy o_ the £ni_£at ca_ibra_ion sha_l be °ver_g£ed and documented £or every a_alyce.by the analys£s ot EPAIn£C£al Cal£brat£on Ver£t£cac£on So_ut£on(s) ac each vavelengthused for analys£s. W_en measurements exceed the contro_ _£m£ts ofTable 1-ln£t£a_ and Conc£uu£ng Cal£brac£on Ver£t£cac£on ControlL_z£CS for lnor_an£c Analyses (£n F.x_b_c E). the anatys_s _C be_erm£r_ed. l_e problem corrected, clue £rcsC_en_ reca_£braced,and the calLbracLon rever£££ed.
:-_, 7/88

• . , PNL-AL0-220, Rev. O, Attachment l, Page 5 of 18• e • •
_. . 15 the Inlti•l C•llbr•_ion Veri£tcatlon Solutlon(s) •re noc
available from EPA, or where • certified solucion oX •n acolyte isj noC •vail•hie from any source, analyses shall be conducced on sn
I independent sC•nd_rd •c • concentration other than chat used for. £nscrunenc calibcscion, buc vichin the calibration ca•ge. Ani independent standard is defined as a •cancLsrd composed o£ the
an&lyres from •dl£fecenc source c}_an Chose used irt the ecancLar_s)1 £oc the instrument calibration.0
.! For TCP, the Inicial Calibrscion Verification Solucton(s) muse be: _ ac each vavelensth used for analysis. For CN, the initial, calibcscion verification stand,,cd muse be distilled. The Initial: Calibration Verification for CN serves as _ LAboracoc_ Control: Sample; thus lt mu.sr be d.Lscilled rich the beech of samples .
analyzed in associscion rich that IC'V. This means thzc sn TCVi musc be distilled with each batch oX samples •r.llyzed and thac the
samples distilled rich in ICV muse be analyzed rich chacparticular 1rV. The values for the lntci•l and subsequencconCinuing caltbracion veri£tcacio_s shall be recorded on FOP._ II-IN for ICP, AA. and cyanide analyses, as indicated.
b. Continuing Calibration Verification (CCV)
To ensure calibration acc_u:acy du_ns each Lnalysis run, one o£the £ollowtn S scandards is co be used for concinuin S c&libracionverl£1cacion and muse be be analyzed and reported for every'vavelensch used for the analysis o5 each zrLalyce, ac • frequencyo£ 10t or evec 7 2 hours during an analysis run, vhichevec is =orefrequent. The scancLzrd muse also be analy=ed and reported £o=ev2ry vavelengch u.led for analysis ac the beginnin S o£ the run andafter Che last analytical sa=ple. The analyce concencracions inthe continuing calibra:ion sc•n_-_cd un_sc be one o£ che £ollovin Ssolucions ac or near the mid-range levels o5 the calibracioncurve :
1. EPA SoTucions
3. A Contractor-prepared standard solution
I I II I
TA_L= 1. INITIAL AND CO,_TIN'0ING CALI_IEATION VF..P.IFICATIONCONTROL LIMITS FOR ¿NORCANIC ANALYSES
,i i
o_ True Value (_PA $e_.)
Ar_lycic•l Kechod Inorganic Low Ltmlc High Limi:Species
tt lt ii
%CP/AA Mecals 90 II0
Cold Vapor AA Mercury 80 120
Ocher Cyanide 85 115
t r
-5 7/aS
e,.

PNL-ALO-220, Rev. 0 Attachment l, Page 6 of 18• s
e
The s-me concinuing calibration s_and_rd nusc be used throughoutthe analysis runs for a Case o£ aa=ples received.
Ltch CCV AnAlyzed su_C re_lecC Che condLcLons o_ analysLs o! all
associated ana%yc_cal samples (cho preceding %0 analycica% sa=p%esor cho preceding aruslycical samples u9 Co Cho previous CCd). The
duration o£ analysis, rinses and oc_ec re%aced operations chac mayaffect cho CCV measured resuTc nay noc be app%Led co cho CCV co zgreater extent than the extent applt.ed Co cho associatedanalyl:ical surples. For lrLscance, the difference £n c_e becveena CCV analysis and C_e blar_ lsunedLacely £olloviui; £c as yell asthe difference in =_=e be,:veen che C_r_ and t:he znalycf.cal sampleismedlacely precedtng lc nay noc exc,;ed che lovesc difference iuC_me becveen any tvo cottsecuCive and,lyrical sz=plea associatedv£ch r.he CCV.
I£ cho deviation of cho concinu_ng czlibracion vert£icaclon is
greater r._an cho conoco% 1Lm£cs specified in Table 1-InAc£al andContinuing Calibration Verification Concro% L_m£cs for Inorganic
Analyses, cho analysis muse be stopped, r.he problem corrected, choluscrumenc musc be recalibraced, cho calibration verified and Cho
rear_alysis of preceding 10 arcalycical sa=ples or all analyticalsurp%es analyzed since the lasc good calibration verification mns'.be performed for che ar_lyces a.r£ecced. In£o_'=aCion regarding choconcinuin 8 verificacton o_ cal£bcac_on shall be recorded on FOI_.½XZ-IH for XCP, AA and cyanide as £ndlcaced.
3. C'_L S__andards for TCP fC_I) and _ (CPAl
To verify linearicy near _he CRnL for ICP analysis, the Contractor museana%y:e an ICP scancLard (C_I) ac tvo oi=es c_e CRDL or tvo rimes theXDL. vhichevec £s 8reacer, ac r.he beg£ru_£ng and end of each smnpleanalysis run, or a min_.m_= o£ trice per 8 hour vat, Lng shirr, vhicheveris more frequent, buc noC before Initial Calibration Verification.This standard muse be run by ICP for every vavelengch used for
analysis, excepC chose for Ab, _a, Ca, Fe, Hg, Na and _.
To verify linear£cy near cho C_L for AA analysis, cho Concraccor musearuxlyze an AA scandard (CRA) ac cho C'ADL or the IDL, vhichever is_reacer, aC the beginning of each sa=ple analysis run, buc noc beforeT..he ]_niC_al Ca].ibra_:ion VerJ.££cacion.
Specific acceptance criteria f0c the tvo scandard_ vi11 be aec by EPA£n the future. In the incerim, C_e Concraccor muse analyze and reporCchese Sc_nd_rcl.s on F_E/4 XICPA/_T 2)-IN.
&. _ni_lal Cellbraclon _lan_ _7C_). Conclnu_nz Ce1_._a_Ion B1en_ _CC_and Preparation BlanI<_(PB_ Analyse5
a. In_clal Callbraclon _lank (IC_) and Continuing Callbracion Blank
(CCB) Analyses
A callbrac£on blank muse be analyzed ac each vavelens_h _sed for
analysis immediately a£cer every in_cial and conc£nu£n S " icalAbracAon veri£Acac_on, am a £requency o_ 10_ or every 2 hours
.s 7/88

} PNL-ALO-220, Rev.O Attachment 7 of 18,e l
o. •4
• • du_lns the run, whichever is more frequent. The blank muse be; analyzed ac r.ha beginning of che run and after cho lasti anal3rcicsl sample. Note: A CC_ muse be run after the last CC'V
i chac was run after chs lasc analytical sa=ple of cho run. The, results for cho calibracion blanks shall be recorded on FOg.q III-! ZN for ICP, AA and cyanide analyses, as indicated. If cho:_ maEn£t-_de (absoluce value) o£ che calibracion blank resulc exceeds• • cho aDL, the resulc musc be so reported in us/L on FORM III-IN," ocherv£se report as IDL-U. If cho absoluce value blank resulc: exceed_ r.he "CREL (Exhibit C), cecmirusce analysis, cocTecc the: problem, recalibrace, vec££y the calibration and rearuslTze Cho
preceding 10 snalycical saarples or all aruslycical samples analyzedsince t/_e lzsc good calibration blank.
b. Preparation _lank (P_) Analys£s
AC leasc one preparation blank (or reagent blank), cor_sis_ln S of• dmLon£zed d£scillad water processed through mach sam?le
preparaCion and analysis procedure (See Exhibit D, Section III),muse be prepace_ and analyzed with every Sample Delivery Croup, orrich each beech _ o£ samples digested, whichever is more frequent.
" The f/fsc bacch of sazaples in sn SEX; ts co be assigned copreparation blank one, the second batch of sLoples co preparationblank tvo, acc. (see FORM III-IN). Each deca package muse containcho resulcs of all cho preparation blank analyses associaced withthe samples in chac SDG.
This blank is to be. reported for each SD<; and used in all analysesCo ascercain whether sample concentrations reflect contamination£n the following manner:
1) If the absoluce value of che concentration of r.he blank isless chan or equal co the Contract Required Detection Limit
• (Exhibit C), no correccion of s_c_le results is perfoc-_ed
2) If any anzlyce concentration in cho blank is above the C'ADL,the lowest concencration of chat analyce in the associatedsa=ples ,n_s_ be fOx the blank concencration. Otherwise, allsurples associated with cho blank w_th che analyce'sconcentration less than 10x che blank concentration and above"..he CRDL, m_sc be redigesced and reanaly:ed for chac analyte(except for sn ldentlf£ed aqueous soil field blank). Thesample _oncentracion is noc to be corrected /or Cho blankvalue.
3) If the concencracion of the blank is below the negative C_DL,then all sa=ples _eported below 10x Cl_L associated with theblank muse be redigested and reana.lyzed.
lA group of s_u_les prepared at cho same time.
:7 7/88
mo°.

• e.-
..' .' PNL-ALO-220, Rev.O Attachment, Page 8 of 18-om
The values _'or _e preparatlon b18,-_ muse be recorded in ugjq. foraqueo_Ls sL_ _les and. in rag/leg for solid a-_ples on FOR.R III-I_; forICP, AA, and cyanide analyses.
S. _CY _nterfere_ce C_ec_ S_mDle (IC_;_ Ar.alvs_
To verL£y £nt:erelemenc and 'background correctlon £act:ors, 1:;he¢onC_acCor angst: analyze and report the results £or the ICP Incer._erenceCheck Samples ac the beg_nning and end o£ each analysis run or amin£mua o£ cv£ce per 8 houc vork£n S sht£c, vhLchever is more £requent:,buc mot: be£ore ZntcLal Cal£bration VerL£Lcac£on. The %CP lnter£erenceCheck Samples un,st: be obt:aLned £rom EPA (_LSL/_.V) £f available andAnalyzed accord_n_; Co Clue £nst:rucC£ons supplied v_t:h t:he ICS. "
The Zncer£erence Check Samples cor_sisc o£ cvo solucior_s: Solut:ion A andSolution A3. Solu_£on A constscs o£ the tnt:er£erencs, and Solution A_
cons_st:s o£ the ar_alyt:es m_xed v_t:h the Lncer£erent:s. An ZCS analys£scons£scs o£ analyzing bot:h solut:_ons consecutively (scart:tng richSolucton A) £or all _avelengt:hs used £or each analyce report:ed by ICP.
l_esult:s £or che ICP analyses o£ Solution _3 during t:he analyt:_cal runsmust: £all v£chin t:he control limit o£ __20t o£ t:he true value £or t:heanalyt:es included Ln t:he Incer£erence Check Samples. I£ not:, cer=inatethe an_lys£s, correct the problem, recal£brace the inst_u=enC, andreanalyze "..he analytical samples analy.-ed since the last: good ICS. 2._t:_'ue values £or ana_.ytes conta:Lned £n the ICS and analyzed by ICP arenot: supplied v_t:h r.l_e ZCS, "..he mean m_LSt be deter_J.ned by J.n£c£allyanalyzin_ the ICS ac lease ££ve times repecit£vely £or the particular
• analyCes. This mean determination :use be made during au analycica_ runvhere the result:s £or the previously supplied EPA ICS met all concraccspecl£J.cat:Lons. Addic:Lonally. the resu].t o£ th:Ls :l.n£tial meandet:erminatlon £s Co be used as the true value £or t:he _££et:Lme o£ thacsolut:£on (£.e., unc£1 che solution £s exl_aust:ed).
1_ che ICP Incer£erence Check Sa:ple £s noc ava£1able £rom EPA,£ndependent ICP Check Samples must: be prepared rich £ncer£erenc andanalyce concencracior_.s ac the levels spec£££ed £n Table 2-Incergerencand AnalyCe Element:t_l Concent:racions Used £or ICF Inter£erence CheckSample. The mean va_ue and st:andard deviation musc be escab_£shed by
• £n£c£al_y analyzing the C_eck Sa:ples ac leasc ££ve t:£mes repetitively£or each parameter on FO_.½ IV-IN. Results musc gall v_ch_n the controllimit o£ _+20q o£ t:he escabtished mean value. The mean and standarddeviation muse be reported £n the ray data. ]tesulc_ £rom theInter£erence Check S_mple analyses must be recorded on FOR._ IV-_}; £orall lep parameters.

" PNL-ALO-220 Rev 0 Attachment l, Page 9 of 18,O_ I •
e ' *
TA3LE 2. ZI_EF.FT_D_ Ab_) ANALYTEEI._R_.",'rALCONCDrTI_TZON$USED FOR ICl'I_rr_CE Cl-IECX.SAR?L_
_. i | i i
, AnAlyc,s (m_'/L) InCerferenCs '(mg/I.)i
i ii
Ag I.0 Al 500I_a O.5 Ca 500 .Be " O. 5 Fe 200Cd 1.0 Hf; 500Co O.5 •C= 0.5Cu O.5Mn 0.5Ni 1.01"o 1.0v 0.5Zn I.0
I I ml
6. So[3(e Sample Analvsl.s ('S)
The spike sample analysis £s destsned Co provide ln£oc_ation about =heeffect of c.hesample matrix on the diges_ion and measuremen_
methodology. The spike is a_ded before =he disestion (i.e., prior to=he addition of ocher reasents ) and prior to any discillation steps(i.e., C::N-), AC least one spike sa:pZe analysis :use be performed oneach Stoup o£ samples of z similar matrix type (i.e., racer, soil) a_dconcentracion (i.e., lov, mediu:) oc for each Sa:pTe Delivery Group."
If =he spike analysis is performed on =he same sa=ple chat £s chosenfor =he duplicace sample analysis, spike calculat£onn must be pec£ocuedusin S =he results of =he sa:ple deslEnaced as =he "ocisir_sl sa:ple"(see ser=ion 7, Duplicate Sz:pie Analysis). The average o£ =heduplicate resulcs cannot be used £or the purpose of detec_nin£n S pe=centrecovery. Sa:ples identified as field blanks cannot be used for spikedsample analysis. EPA may require chat a specific sample be used for=he spike sample analysis.
The analyte spike muse be added in =he _mounC siren in Table 3-Spikin SLevels for Spike Sample Analysis, for each element anAly-zed. If tvoaruLlyCical reecho=ts are used Co ob=sin =he reported values for =he sameelement within a Sample Delivery Group (i.e. TCP, GFA_), spike sz:piesmust be run by each me=hod used.
m
2EPA may require additional spike sample analysis, upon Project Officer=equest, for which =he Con=ra=eor rill be paid.
-9 7/88

-I0 7/8B

-11 7/88
""-,.'..... PNL-ALO-220,Rev.O, Attachment l, Page 12 of 18• •
• ,
,e• i
7. DuD!lceCe $a_le Ana:vs[:; ,,('D)
One dupltcaue saz=ple must _e analyzed from mach group o£ sa=ples of a
similar maC=ix C_rpe (i.e., water, soil) an_ concentration (£.e elOV,medium) or for each Sa:ple Delivery Croup." Duplicates cannoc'baveraged £o: reporting on FOP_ I-IH•
Duplicate sa:ple analyses are required for percent solids. Sa:plesidentified as £teld blanks cannot be used for dupltcsce sa:pleanalysis. EPA may require chac a specific sa:ple be used for duplicatesample analysis. If tvo analytical methods are used Co obtain the
repolted values for the same element for a Sa:ple Delivery Croup (i.e.,ICP, GF/_q), duplicate sa:ples must be :un by each method used.
The relative percent differences (ILPD) for each co:ponenc arecalculated as follows:
IU'D - IS . DI x I00(S+D)/2
Where, I_PD - Relative Percent Difference
S - First Seu:ple Value (original)D -- Second Sample Value (duplJ.cace)
The results of the duplicate sa:ple analyses _st be reported on FOP._VI-IN In ug/L for aqueous sanples and mg/Kg dry weight basis for solidorisinal and duplicate sanples. A control limit of 20q for P_PD shall
be used for origir_al and duplicate sample values greater _an or equalto 5x C'_DL (Exhibit C). A control limit of (_) the CP.DL must be usedfor sanple values less _han 5x C_L, and _he absolute value of thecontrol limit (CREL) enast be entered in the "Control Limit" column onFOIt½ VI- IN.
Zf one result is above the 5x CRnL level and the other is below, usethe _._ CRDL criteria. If both sample values are less than the IDL, uheI_PD is not calculated on FOP_ VI-IN• For solid sample or duplicateresults < 5x CRDL, enter the absolute value of the CRDL, corrected forsample weight and percent solids, in the "Control I.tmit" column.
Z£ the duplicate sample results are ouCslde the control limits, flag
all the data for samples received associated with r_a_ duplicate sample_ich an "*" on FO_ts Z-IN and VI-IN• In the instance where c.here ismore than one duplicate simple per SDC, 1£ one duplicate result is no_
• within contract criteria, flag all sa=ples of the same matrix,concentration, and method in r_e SDC. The percent difference data willbe used by EPA to evaluate r.he long-term precision of r_e met.hods foreach parameter. Specific control limits for each elemen_ will be addedCo FOP,k{ VI-IN ac a later date based on these precision results.
ii
3EPA ma 7 require additional duplicate sample anal),ses, upon PreJecc Officer eZequest, lo.';' which the Contractor will be paid. i
-12 7/88

(" -1_ 7/88

• e.j ..,main
PNL-ALO-220, Rev.O, Attachment l, Page 14 of 18 .
• e•ee
The percent differences for each co_onenc are calculated as follows:
t Difference __ " 51- x 1001
where, I - Initial Sample ResultS - Serl&l Dilution Result (Insolent Readin S x 5)
Zn the instance where there is more than one serial dilution per SDC,if one serL&l dilution resulc is noc within contract criteria, Flag allthe samples of the same matrix and concencracton in the Sample Oellve_-y%;coup. Serial dilution results and "E" flags muse be repocced on FOP,._ZZ-Lq.
I0. Instrument_Detection Limlc (IDL_ De,e--utile!ion
3efore any field samples are analyzed under ch_,s contract, theinstru=enC detection llJ=_cs (la ug/L) _t.sc be decer=lned for eachinstrument used, vich_n 30 days o£ the scare of contract analyses andac leasc quarcerly (ever 7 3 calendar months), and muse meec the levelsspecified in Exhibit C.
The Instrument Detection Limits (_n ug/L) shall be determined bymultiplying by 3, Che average of the standard devlaclons obcalned onthree nonconsecutive clays from che analysis of a standard solution(each analyce in reagent wager) ac a concencraclon 3x-Sx the instrumentl_.n_'act'-,.xrer's suggested %DL, rich seven consecutive measurements perday. Each measurement muse be per£or=ed as though lc were a separaceanal_rcical sanple (i.e., each measuremenc muse b_ followed by a rinseand/or any ocher procedure normally performed between the analysis ofseparate samples). IDL's muse be decermlned and reporced for eachv&velensch used _n Che analys_,s of the samples.
The quarterly deCermlned ZDL for sn InscrumenC muse always be used asthe IDL for thac Instrument during chac quarter. If the Inscrumenc isadjusted in anyway chac may affect the IDL, the IDL for thac Instrumentmuse he redecermined and the results submicced for use as the
established IDL for chac instrument for the remainder of che quarcer.
2DLs muse be reporced for each inscrunenc used on FOP.½X-aN submergedvl_h each data package. If ,n_lciple AA inscru=encs are used for theanalysis of an element vlchln a Sa=ple Del/very Croup, the h_ghesc IDLfor r.he AA.s muse be used for reporting concentration values for chacSmaple Delivery Croup. The sane reporcins procedure muse be usedfor=ulciple ICPs.
I
-I_ 7/88

, PNL-AL0-220,Rev. 0- = ." i Attachment l• . Page 15 of 18
11. Intere1¢ment Corrections for ICP
Before an 7 fLe_d samples ate analyzed under thts contract, the ICPlnterelemenC ¢orrectLon factors must be determLned prLor to the startof contract analyses _nd st: least annually thereaEter. Correctionfactors for spect:ra1 interference due to Al, Ca, Fs, and H_, must bedet:e_ntned £or all ICP tnstrwnents at all vavelengths used £or eachana!yt:e reported by ICP. Correction £accors £or spectral Interferencedue t:o analyt:es at:her than Al, Ca, Fe, and Hg must be report:ed If theywere applied.
If t:he instrument ras adjusted in any-aay that may afJ_ect the ICP ,£nt:erelemen_ correct£oll factors, the factors must: be redetermined andthe results submt_ted £or use. Resu_.ts fl_om tnt:ere_ement: correct:tan£actors determ£nation ml,st be reported on FORH XI(PART 1)-IN end FOPJ4XI(PAgT 2)-IH for all ICP parameter=.
_2. Ltnear_Ran__e Analysts (U_A)
For all ICP analyses, a ltnear range vertfLcatton check: standard must:be analyzed and reported quarterly (every 3 calenda_ months) £or each
element: on FOPJ4 XII-IH. The standard must be analyzed during a routineanalytical run performed under ch_s contract. The analytically
.determlned concentration o£ this standard must be vtthtn + 5% of thetrue value. Th£s concentration is the upper llmtt of the-ZCP 1_near
'. range beyond which results cannot be reported under this contractw£thout: dtlut£on of the analytical sample.
13. Furna.._.eAtomic Ab,sorpt_.on (AA} QC, Analyses
Because of the nature of the Furnace AA technLque, the specta_
procedures summarized tn F_g;ure l-Furnace AA Ana!ys_s Scheme ('HSATree') vi_ be required £or quant_tat_on. (These procedures do not
replace those _n Exhibit D of th_s SOU, but supplement the guidanceprovided therein.)
a. A11 £urnace analyses must £a11 vlthln the caltbrstlon range. Inadd£t£on, a11 analyses, except during £u_ methods of StandardAdd£t:£on (HSA), vt11 require dupILcat:e In_ectlons. The absorbanceor concentration of each tn_ect£on must be reported tn the raydata as yell as the average absorbance or concentrat£on values andt:he relat:£ve st:andard deviation (RSD) or coe££tclent of variation
(_V). Average content:ration values are used £or reportingpurposes. The Contractor must be consistent per method and SDC £nchoosing absorbance or concentration to evaluate which route is to
be £o],Ioved _n the HSA Tree. The Contractor must also _nd£catevhtch of the tvo ts being used "t£ both absorbance and
concentrat:Ion sre reported In the ray data. For HSA analysis, theabsorbsnce of each tnJectton must be tncluded _n the ray data. Amaxtmu:, o£ 10 £u1"1 sample analyses tea max_mu_ 20 _n_ect:tons maybe per£ormed betveen each consecutive cal_brst_on ver££_catlonsand blanks. For concentrations greater than CRDL, the duplicateln_eccion readings must agree vtthin 20t RSD or CV, or theanalyt£cal sample must be rerun once (i.e., tvo additional burns).T£ the readLngs are still out, £1a8 the value reported on FOR_ I-
-15 Rev. 2/89

". pNL-ALO-220,Rev.O,Attachmentl, Page 16 of 18
IN wlth an "H'. The "H" flag ts _equired for the analytical spikeas well as the sample. _[ the analytical spike for a _ample
zequLres an "H" flag, the flag must be reported on FOR_ _- IH forthat sample.
• b. All furnace analyses for each analytical sample, including thoserequiring am "Ii" flag, will require at least sm analytical spike
to determine Lf _he HSA wit1 be required for quancitatlon. "['heanalytical sp_ke _ will be required to be at a concentration (Lmthe sample) 2x CROL. This requirement for an analyClcal spikewill include the LCS and the preparation blank. (The LC5 muse bequanCitaced from the calibracLon curve and corrective action, l.fneeded, taken accordingly. HSA l.s not to be performed on the LCSor preparation blank, regardless of spike recovery results.) Ifthe preparation blank analytical spike recovery _s out of control(ES-liSt). the spL_,tng solution must be verified by respikLng andrerunning the preparation blank once. If the preparatlon blankanalytical sp_ke recovery Is still ouC of control, correct theproblem and reanalyze all analytical samples associated w_th thatblank. Am analytical sp_ke is not required on the pre-dL_esClonspike sample.
The analytical spike of a sample must be run Immediately afterthat sample. The percent: recovery (qR) of the spike, calculat:edby the same formula as Spike Sample Analyses (see Lcem 6, t:hissection), will then determine how the sample will be quantLcaced,as follows:
1) I£ the spike recovery Is less than _0t, the sample must: bediluted and rerun rich anot:her spike. Dilut:e cho sample by afactor of 5 co 10 and rerun. Th_s step must: only beperformed once. If after t:he dilution the sp_ke recovery £sstill <60q, report: data and flag vlth an "E" to indicateinterference problems.
2) II; the spike recovery Ls gL'ear.er than or ect_.l to _Oq and the
sample _bsocbance or concentration ts less than 50q of the"spike''. report the sample results to the ZDL. If the sp_kerecovery is less than 8St or greater than llSt, flag theresult with a "W'.
3) Z£ t:he sample absorbance or content:rat:ion is 8reat:er than orequal co 50q o_ the sp_ke and the spike recovery ts at or
lllll l I ii l i ill I
1Analytical Spikes are post-digestion sp_kes to be prepared pr_or Coanalysis by adding a known quancicy of the analyt:e co sn aliquot of thedt_es__ed sample. The unsp_ked sample aliquot: must be compensated for anyvolume change _n the spike samples by addition of delonized water to the!
• unsplked sample al_quoC. The volume of the sptklng solution added musenot: exceed lOq of the analytical sample volu_ue; this requirement alsoapplies Co HSA spikes.
5"Spike" is defined as (absorbance or concentration of spike sample1 mLnus|absorbance or concentrat:ton o£ the sample].
• 16 Ray. 2/89
..... PNL-ALO-220,Rev. O, Attachment l, Page 17 of 18¢
; • of • eo
B •
between 85t and ll}t. the sample must be quantLtated directlyfrom the calibration curve and reported down to the IDL.
s
&) Zf the sample absorbance or concentration is greater than orequal to 50t of the spike and the spike recovery is less than85t or greater than 115t, the sample must be quantitated byHSA.
c. The £ollowin 8 procedures will be incorporated into HSA analyses.
l) Data from HSA calculations must be within the linear range asdetermined by the calibration curve generated at the
, beginning of the analytlcal run.
2) The sample and three spikes must be analyzed consecutivelyfor HSA quantltatlon (the =Ini_£a_" spike run data is
specifically excluded from use in the HSA quantitatlon).Only single injections are required for HSA quantltatLon.
Each £u11 HSA counts as tvo analytical samples towards
determining 10t qc frequency (i.e.. five ful_ HSAs can beperformed between calibration veri£1catlons).
3) For analytical runs contalntng only HSAs, single injectionscan be used for qC samples during that run. For Instru_nents
that operate in an HSA mode only, HSA can be used todetermine QC samples during that run.
&) Spikes must be prepared such that:
a) Spike I is approximately 50t o_ the sample absorbanc_ orconcentratlon.
I
b) Spike 2 is approximately 100% of the sample absorbance orconcentration.
c) Spike 3 {s ._l,pro_imately 150t o_ the sample absorbance orconcentratlon.
S) The data Eor each HSA analysis must be clearly Identi£1ed in.the raw data docu_entation (using added concentration as thex-variable and absorbance as the _r-varlable) along w/rh theslope, x-lntercept, y-lncercept and correlation coefficient(r) for the least squares fit of the data. The results mustbe repotted on FORM VIII-IN. Reported values obtained by HSAmust be flagged on the data cheer (FORM I-IN) vith the letter
"S = if the correlation coefficient ts greater than or equalco O. 995. ..
6) I£ the correlation coefficient (r) for a parclcular analys_sis less than 0.995. the HSA analysis must be repeated once.IE the correlation coefficient Ls still less than 0,995,report the results on FOKH I-IN grom the run w|.th the best"r" and £).ag the result with a "+" on FORM VIII-IN and FORMI -IN.
-17 Rev. 2/89

I
PNL-ALO-220,REv° 0• •
" "" Attachment l° Page 18 of 18
rlgure 1
FURI_ACE ATOMIC ABSOP_P TI ON A/_ALTS IS SCHEME
f l PREPARE_D _""LYZ_
'. S_PL,E AND Ot_E SPIKE( :' X CRDL)
(Doub | _. |n.Ject ion s Required) 1
CALFBRATION RA_IGE _ DILUTE SAMPLE
AND SP IKE
i jRECOVERY OF SPIKE If YES. Repeat Only ONCELESS THAN 40%
FLAG DATA
WITH AN "E"NO ..
NO
REPORT RESULTS
DOWI_ TO IDL
( SAMPLE ABSORBANCE ORSP IKE RECOVERy
CONCENTP.ATIO, LESS THANLESS THAN 85, OR
50' OF SPIKE ABSO_BANCEOR CONCENTRATION GREATER THAN I15,
NO yES I _EPORT RESULTS I
DOW_ TO IDL,
[ FLAG WITll A "W"
,..,s.,,+,+,o,, ,+o o,.,+,.,.,.+.^.,.,:,.,,o,.,v I AND REPORT DOW_
YES TO ZDL
SPIKES AT 50, I00 & 150%
OF SAMPLE ABSO_BANCEOR CONCENTRATION ..
Only SLnqle Injections Required)
+oo_+,o._o__.+
FLAG DATA WITH "S" "( •
-18 Rev. 2189

INTERIM CHANGE NOTICE
(ICN) ICN - , PNL-ALO.-_21.1,RO._e 1 of 1
A.DocumentNumber: PNL-ALO-221 Revision Number: Effective DateDocumentTitle: Silver (AtomicAbsorption,Furnace of ICN: _ /_._ /_
Techniaue) ChangeRequested by:Document's Original Author: SI Barsoum TE Jones
B. Action:
DeletingACT 89.1 and replacingwith establishedrecordsmanagementpractices.
Replacepages I through8 due to new format.
C. Effectof Change:
Bringsprocedureinto compliance.
D. Reasonfor Change/Descriptionof Change:ACT NOW Directive89.1 no longerin existence.
E. ApprovalSignatures: Type of Change: (Checkone):(Pleasesign and date)
X Minor ___ Major
Process _QualityDepartment: TL Ehlert ,//,_ c_/_ f/'/_?_T Date: 5/ _ /,_'
ApprovalAuthority: AGKinq _J,"_J__/ ./ Date: q_-/_ /_Z
Other Approvals: M*Urie . _ Date: _ _/_7__
: Date: / /

i PNL,TECHNICALPROCEDURE ., ]
TITLE: PNL-ALO-221,SILVER (ATOMICABSORPTION,FURNACETECHNIQUE)
APPLICABILITY
This procedureis applicablefor determiningthe concentrationof silverinwastes,mobility-procedureextracts,soils,and groundwater. The methodologyis comparableto CLP Method 272.2in SOW 788 or SOW 390. All samplesshallbesubjectedto an appropriatedissolution/digestionprocedurepriorto analysisas specifiedby the cognizantscientistor in Test Instructions(TIs)orAnalyticalRequestForms (ARFs).
DEFINITIONS
Batch: A groupof samplesof like matrixpreparedat the same time.
Modifier: A substanceaddedto the furnaceto alterthe atomizationcharacteristicsof eitherthe analyteor interferingmatrix. Modifiersareemployedto separateanalyteand matrix in time allowingreductionof matrixinterferenceson the measurementof the analyteatomizationsignalprofile.Modifiersmay be added as a liquidto the samplesolution,injectedinto thefurnaceor incorporatedin the argongas streamduringthe pretreatment,atomizationor the clean-outsteps.
RESPONSIBLESTAFF
CognizantScientistTechnician
PROCEDURE
1.0 Summaryof Method
1.1 Followingthe dissolution/digestionof the sample,a representativesamplealiquotand modifierare placed,by meansof an automaticsampler,into a graphitetube furnace. The samplealiquotis thenslowlyevaporatedto dryness,charred (ashed),and atomized. Theabsorptionof lamp radiationduringatomizationis proportionaltothe silverconcentration.
Author Date Project Mgr. Date QAD Representative Date
SI Barsoum BM Gillesp!e GK Gerke
Technica| Reviewer_ Date Line Mgr. Date Other Date
II f'_j/_Z_///.t._. _//_t/,_ ALL ORIGINAL SIGNATURESON FILEUrie _ "Z- JM Latkovich
v 'l, ' i I ,i i i
Procedure No. Revtsi on No. Effect t ve Date Page
PNL-ALO-221 0 04/26/91 1 of 8i

PNL TECHNICALPROCEDURE
1.2 The method detection limit for Ag is 1 mg/Kg for soil and 10 p,g/Lfor water. The typical instrument detection limit (IDL) for Ag is0.2 pg/L in the analysis solution
2.0 Interferences
2.1 Spiked samples and relevant standard reference materials should beprocessed to determine if the chosen dissolution procedure isappropri ate.
2.2 Care must be employed in selecting the drying and charring steptimes, temperatures and temperature ramps. A modifier mixture ofpalladium and magnisium should be added to all digestates prior toanalysis to minimize volatilization losses during drying andcharring magnesium nitrate assists in spreading the Pd-Ag compoundsmore evenly in the furnace reducing diffusion time of the analyte inthe Mg oxide matrix. Magnesium thus serves to sharpen the analytepeak shape during atomization and increases analytical precision.
2.3 The use of an argon-hydrogen gas mixture (95-5%) during temperatureramp to 900" C has been shown to eliminate interferences fromchloride. Hydrogen enhances reduction of Pd which is necessary foranalyte stabilization.
2.4 Silver may condense at cool ends of the graphite furnace duringatomization; potentially causing memory effects in subsequentanalyses. This situation can be minimized by operating the furnaceat 2500-2650"C immediately after atomization.
2.5 If Zeeman background correction was used then high level ofphosphates in samples may require that less sensitive 338.3 nm beused to eliminate possible interference from the phosphates bandsplitting.
3.0 Tolerances
Tolerances for all measurements made during an analysis shall bespecified in the following: I) a tolerance limit is stated with ameasurement value, or 2) the following system of tolerances shall be ineffect:
a. When two or more significant figures are specified, the tolerancelimit is ±5 in the next digit beyond the last one stated. Forexample, 5.0 mL means 5.0 ± 0.05 mL; 450 g means 450 _+5 g; 369 mLmeans 369.0 _+0.5 mL.
b. If a single significant figure is specified, the actual measurementshall be within + 5% of the stated value. For example, 20 mL meansa volume between 19 and 21 mL.
i i | iii i .,, i i . i ii.i , i i ,, ii
ProcedureNo. Revision No. Effective Date Page
PNL-ALO 221 0 04/26/91 2 of 8i ii i

,,, PNL TECHNICALPROCEDURE I
4.0 Apparatus and Materials
4.1 Atomic absorption spectrophotometer: Double-beam instrument with agrating monochromator, photomultiplier detector, adjustable slits, awavelength range of 190-900 nm, provisions for simultaneousbackground correction, and interfacingwith a computer and/or strip-chart recorder. Example: Perkin-Elmer 5100 AA Spectrophotometerwith AS60 autosampler, deuterium lamp of Zeeman effect backgroundcorrection, and IBM PS/2 computer.
4.2 Silver hollow cathode lamp: Electrodeless discharge lamps (EDL) arenot available for silver.
4.3 Graohite furnace: Any graphite furnace device with the appropriatetemperature and timing controls. Example: Perkin-Elmer HGA 600
4.4 Pipets: Calibrated, with disposable tips, sized from 5 to 1,000 /_L,as required.
4.5 Balance: Analytical, capable of accurately weighing to the nearest0.0001 g. (Optional)
5.0 Reagents
5.1 Deionized water: Deionized water of sufficient quality, similar toASTM Type II reagent water, shall be used for preparing sample,standards, and reagent dilutions. Calibration and sample blanksshall produce concentrations at or below instrument detectionlimits.
5.2 Concentrated nitric acid (H.Nn31:Ultrex grade.
5.3 Silver @tandard stock solution (1,000 ma/t,): Preferred: Acquire acertified aqueous standard from NIST or an equivalent supplier andverify by comparison with a second standard.
Alternative: Dissolve 1.575 g of 99.99% silver nitrate (AaNO_),Johnson Matthey or equivalent, in deionized water, add 16concentrated HNO_ and dilute to I L,using deionized water Storesilver standard in an amber glass bottle as silver is sensitive tolight.
5.4 Silver workinq standard_: Prepare dilutions of the stock standardsolution to be used as calibration standards at the time of theanalysis. Withdraw appropriate aliquots of the stock solution, addconcentrated HNO. at 5% of final volume to keep silver in solutionand dilute with _vaterto volume.
Procedure No. Revision No. Effective Date Page
PNL-ALO-221 0 04126/91 3 of 8

PNL TECHNICALPROCEDURE
5.5 Palladium nitrate - magnesium nitrate mixed modifier solution:Preferred: Mix equal volumes of 3000 mg/L of a certified aqueous Pdstandard in HNO3 and 2000 mg/L of Mg(N03)2 (Merck, suprapure orequivalent), respectively. A 5 pL volume of this solution is addedto each sample, corresponding to masses of 15 /_gof Pd (32.5 /_gPdNO_) and I0 pg of Mg(NO3)2"
Alternative source for palladium: Dissolve 0.300 g Pd wire in a minimumvolume of aqua regia and evaporate to dryness, add 5 mL of concentratedHNO_, warm until dissolution is complete, dilute to 100 mL; or dissolve0.5_)01g palladium chloride (PdCl_)in 5 mL of concentrated HNO_,evaporate to near dryness, repeat-with 5 mL of concentrated HN_, anddilute with water to 100.0 mL.
5.6 Argon purge gas: Industrial-grade argon.
Note: When chloride interference is suspected the use of a mixtureof argon-hydrogen (95-5%) is recommended.
6.0 Quality Control
6.1 All quality control data shall be maintained and available for easyreference or inspection.
6.2 Minimum quality control.
6.2.1
The system shall be calibrated following manufacturer's recommendedcalibration procedure which is in the instrument reference manual [seeSection 10.0]. Calibration parameters shall be established and recordedeach day of operation.
6.2.2
Samples shall be diluted, and reanalyzed, if they are more concentratedthan the highest calibration standard.
6.2.3
Employ a minimum of one method blank for each sample delivery group orbatch of samples digested.
6.2.4
Analyze at least one verification check standard or one quality controlstandard every 8 to 12 samples. If the results of the verification orQC standard are not within 80% to 120% of their mean value, thecognizant scientist shall determine the corrective action. Theinstrument must be recalibrated, the calibration verified, and allanalytical samples analyzed since the last good calibration verificationmust be reanalyzed for the analytes affected. This corrective action
i n i , i iii ii i lm |i i .iProcedure No. Revtsion No. Effective Date Page
PNL-ALO-221 0 04/26/91 4 of 8iii i m i m,

i
PNL TECHNICAL PROCEDURE J
taken shall be documented with the data. Validation of the data is theresponsibility of the technical group leader.
Note: Verification standards help monitor the life and performance ofthe graphite tube. An RSD for duplicate injections of mid-rangestandards exceeding 10% or an instrument response <70% of themanufacturer's recommendation as stated in the reference manual (seeSection I0), shall be investigated and corrective action, if required,documented.
6.2.5
Additional quality control (i.e., duplicates, matrix spikes, duplicatematrix spikes, multiple injections, additional system or matrix blanks,tighter tolerances, holding times, etc.) shall be governed by theanalytical requirements of the project or specific analyses requested.Specific QC requirements are provided by the Analytical Request Form(ARF), the project Statement of Work (SOW), or the sample analysis TestInstruction (TI).
6.3 Quality control for clients requesting compliance with ComprehensiveEnvironmental Response, Compensation and Liability Act of 1980(CERCLA) requirements.
6.3.1
Analyze samples per protocol detailed in Appendix A. Use Figure I ofAppendix A to establish the quantitation method to be used; that is,either direct calibration or method of standard addition. Also, alldefinitions/acronyms (e.g. Sample Delivery Group, SDG) shall beconsistent with USEPA CLP SOW 788 [Reference 10] usage.
6.3.2
Any additional quality control requirements shall be governed by theStatement of Work (SOW) from the client with the analysis protocoltransmitted to the analyst via Test Instructions (TI)
7.0 Analysis Method
Sample collection, preservation and preparation is not within the scopeof this procedure. However, it is important that samples be collectedand preserved properly in order to maintain sample integrity. Theapplicability of sample preparation schemes, such as PNL-ALO-I01, forspecific matrices shall be demonstrated by analyzing spiked samples orrelevant standard reference materials, or by the use of other qualifyingtechniques.
7.1 The 328.1 nm wavelength line and a background correction systemshall be employed. Follow the manufacturer's suggestions for all
Procedure No. Revts ton No. Effect tve Date Page
PNL-ALO-221 0 04/26/91 5 of 8

PNL TECHNICALPROCI_nURE
other spectrophotometer parameters. These are located in theinstrument reference manual (see Section 10.0).
7.2 Furnace parameters suggested by the manufacturer in the referencemanual should be employed as guidelines. The furnace parametersused shall be optimized and remain constant throughout batchanalyses. All parameters shall be recorded with the data.
Suggested graphite furnace program settings P-E 5000 or 5100:
Step Temp(°C) Ramp time(sec) Hold time(sec)Drying #I go 10 10Drying #2 130 10 10Charring 1000 10 20Cool down #I 30 5 10Atomization 1800 0 5Cleaning 2600 I 5Cool down #2 20 I 5
Note: Because temperature-sensingmechanisms and temperaturecontrollers can vary between instruments or with time, thevalidity of the furnace parameters may be confirmed bysystematically altering the furnace parameters whileanalyzing a standard. In this manner, losses of analyte dueto overly high temperature settings or losses in sensitivitydue to less than optimum settings can be minimized. Similarverification of furnace parameters may be required forcomplex sample matrices.
7.3 Inject measured pL-aliquots of sample and modifier solution(typically, 20 pL of sample and 5 pL of modifier) into the furnaceand analyze for silver following graphite furnace program. If theconcentration found is greater than the highest standard, the sampleshall be diluted in the same acid matrix and reanalyzed. Note:Multiple injections improve precision and help detect furnacepipetting errors.
7.4 Calculate the silver concentration: (I) by the method of standardadditions, (2) from a calibration curve, or (3) directly from theinstrument's concentration read-out. All dilution or concentrationfactors shall be applied prior to reporting results. Concentrationsreported for multiphase samples shall be appropriately qualified(e.g., pg/L aqueous phase or mg/Kg for solids).
8.0 Specific Qualifications
This procedure is self-qualifying due to dependence on analyticalstandards, calibrations, and quality control standards as per PNL-MA-70,PAP-70-g01.
li' i , I " I' , i ! ...........!'RevtSion No Effectlve Date PageProcedure No.
PNL-ALO-221 0 04/26/91 6 of 8i i ii mi|i i i

PNL TECHNICALPROCEDURE
9.0 Records
Records will be maintained and controlled so as to conform torequirements of PNL-MA-70, PAP-70-1701. Laboratory Record Books (LRB)and Analytical Report Cards/Data Sheets provide a mechanism for controlof most records• Laboratory Record Books will be used in accordancew c .... ,,,,, Di -'`'.+
I _ _ _ I _ _mp v le • _:_:_._;_:_:_:_:_;_;_:_;_:_;_J:_:,:_;_;_;_:_;`'(_`_°_'_° ..._.., ...._.....,..._ ._..,......,,...,. ...,...,,.,.,,.
10.0 References
Gaskill, A., Compilation and Evaluation of RCRAMethod PerformanceData, Work Assignment No. 2, EPA Contract No. 68-01-7075, September1986.
Gilchrist, G.F.R., Chakrabarti, C.L., Byrne, J.P. and Lamoureux, M.1990. Gas-phase thermodynamic equilibrium model and chemicalmodification in graphite furnace atomic absorption spectrometry• J.Anal. At. Spectre. 5: 175-181.
Jackson, K.W. and Qiao, H.C. 1990. Effects of charring on particledistribution and atomization characteristics in slurry ETAAS (Sch. Pub.Health• State Univ.• New York, Wadsworth Labs•, Albany, N.Y.)
Manning, D.C. and Slavin, W. 1987. Silver as a test element for Zeemanfurnace AAS Spectrochim Acta 42B: 775-763.
Ni Zhe-ming and Shah Xiao-quan. 1987. The reduction and elimination ofmatrix interferences in graphite furnace atomic absorption spectrometry•Spectrochim. Acta. 42B: 937-949.
Ohlsson, K.E.A. and Frech, W. 1989. Photographic observation ofmolecular spectra in inverse Zeeman-effect graphite furnace atomicabsorption spectrometry. J. Anal At. Spectre. 4: 379-385.
Perkin-Elmer Atomic Absorption Spectrophotometer Reference Manual, Model5100, Volume 1 and Volume 2.
Rettberg, T and Beach, L.M. 1989. Peak profile characteristics in thepresence of palladium for graphite furnace atomic absorptionspectrometry. J. Anal At. Spectre. 4: 427-431.
Slavin, W., Carnrick, G. R. and Manning, D.C. ]982. Magnesium nitrateas a matrix modifier in the stabilized tempera_are platform furnace.Anal. Chem. 54: 621-624.
Schlemmer, G. and Welz, B. 1986. Palladium and magnesium nitrates, amore universal modifier for graphite furnace atomic absorptionspectrometry. Spectre. Acta. 41B: 1157- 1165.
lm ml ii i i ii i i
Procedure No. Revision No. Effective Date Page
PNL-ALO-221 0 04/26/91 7 of 8ill

" PNL TECHNICALPROCEDURE
USEPA Contract Laboratory Program, Statement of Work for InorganicAnalysis, Multi- Media, Multi-Concentration, SOW 788 and SOW 390, EPATest Method 279.2 CLP-M.
Welz, B., Schlemmer, G. and Mudakit, J.R. 1988. Palladium nitrate -magnesium nitrate modifier for graphite furnace atomic absorptionspectrometry. Part 2*. Determination of arsenic, antimony, seleniumand thallium in water. J. Anal. At. Spectro. 3:93-97.
Procedure No. Revision No. EffectiveDate Page
PNL-ALO-221 0 04/26/91 8 of 8

APPENDIX A
SECTION I
C__ QA/QC PRACTICES
SCan_ard labora:ary prac_ices for labo_a¢ory cleanZlness as appliedCo glassware and appara:u_ muse be adhered Co. Laboratory practices vir.h.regard Co reagents, solvents, and gases must also be adhered _o. Foraddi=ional guidelines.reEarding _hese general laboratory procedu=es, seaSections _ and 5 of the Handbook for Analytical Qualtry Con_roY in Ua_e_and WasCevamer taboracorles EPA-600/&-79-019, USEPA EnvironmentalMonluo=Ing and Support Laboratory, C£ncinnati, Ohio. March 1979.
-I 7/88

-.
SECTION II
SPECIFIC QA/QC PROCr--DUP-E$
The quality assurance/quality con=rol (QA/QC) procedures definedherein must be used by the Contractor when performing the methods specified
in Exhibit D. %'hen additional QA/QC procedures are specified in r.he
methods in Exhibit D, the Contractor must also follow r.hese procedures.
NOTE: The cost of performing ali QA/QC procedures specified in this
Statement of Work is included in the price of performing the bid lot,
except for duplicate, spike, and laboratory control sample analyses, whichshall be considered separate sa--ple analyses.
The purpose of =his document is _o provide a uniform set of
procedures for r.he analysis of inorganic corLstit-uents of samples,
documentation of methods and their performance, and veriflcatlon of r.he
sample data generated. The program will also assist laboratory personnel
in recalling and defending their ac=ions under cross examination if
required to present court tes'timony in enforcement case litigation.
.The prlmar 7 function of the QA/QC program is mbe definition of
procedures for the evaluation and documentation of sampling and analytical
methodologies and the reduction and reporting of data. The objective is to
provide a uniform basis for sample collection and handling, instrument and
methods maintenance, performance evaluation, and analytical data gar.hering
and repot=ing. Although i= is impossible to address all analytical
si=us=ions in one document, the approach taken here is to define minimum
requirements for all major steps relevant to any inorganic analysis. In
many instances where methodologies are available, specific quality control
procedures are incorporated into =he method documentation (Exhihi_ D).
Zdeally, samples involved in enforcement actions are analyzed only after
r.he me=hods have men the minimum performance and documentation requirementsdescribed in this document.
The Contractor is required to participate in the Laboratory Audit and
Inuercomparison S_udy Program run by EPA LMSL-Las Vegas. The Contractor
can expect to analyze two samples per calendar quarter during the contractperiod.
The Contractor must perform and report _o SH0 and L_SL/LV as
specified in Exhibit B quarterly verification of instrument detec=ion
limits (_DL) by r.he method specified in Exhibi_ E, by type and model foreach instrument u.sed on this contract. All r.he IDL_ must meet r.he CR_]Ls
specified in Exhiblt C. For ICP methods, =he Contractor must also report,
as specified in Exhibit B, linearity range verification, all interelemen=
correculon factors, wavelengths used, and integration times.
In this Exhibit, as well as other places wir.hin'=hls Statement of
Work, the term "analyulcal sample" is used in discussing the required
frequency or placemen_ of certain QA/QC measurements. The term "analytical
sample" Is defined in the _los6ar'y, Exhibi_ G. As =he _erm is used,
analytical sample includes ali field samples, including Performance _'.Evalua=ion samples, received from an external source, bun lt also includes
ali required QA/QC samples (matrix _plkes, analy_ical/pos_-dlgestlon
-2 7,/88

I. Yns _:r_en_: Callbratlon
Guidelines for instrumental calibration are given in EPA 600/&-79-020
and/or Exhlblu D. Znstruments _ust be calibrated daily or once every 2_hours and each time mbe instrument is set up. The instrument
scandardizaclon dace and time ausc he included in the raw dace.
For atomic absorption systems, calibration standards are prepared by
_ diluting the stock metal solutions ac the time of analysis. Date and• time of preparation and analysis must be given in _.he raw da_a.
-3 7/S8
..."• °

.-°
Callbraclon standards mu_ be prepared fresh each clme an analysis isco be made and discarded afuer use. Prepare • blank and au leasu three
calibration standards in graduated a.=oun_s in the appropriate range.
One aUomlc absorpulon callbra_ion s_andard must be at r.he CRDL except
for mercury. The callbracion suandards =use be prepared using .r.hesametype of acid or combination of acids and at the same concentration as
will result in r.he ma ples following sample preparation.
Beginning with r.he blank, aspirate or inject the scandarcLs and record
the readings. Sf the AA instrument confiEuraUlon prevents r.he required_-point calibration, calibrate according to instrument manufacturer's
reco_endacions, and analyze the re=aining required standardsi==_'_iacely after callbraulon. Results for chase standards muse bewithin __ 5q of the true value. Each standards concenuracion and r.he
calculaulons Co show chac the _+5% cricerlon has been meC. musu be given
in the raw dace. Sf the values do nou fall viuhin chls range,recallbra_ion is necessary.
The +_ 5% criteria does not apply co "..hz aUomlc absorption callbraclonstandard at C,hz CRDL.
Calibrauion standards for AA procedures =u.bc be prepared as describedin Exhibit D.
baseline correction is acceptable as Ion 8 as it is ?erformed after
every sazaple or after r.he continuing calibration verificaulon and blank
check; resloping is accepuable as lor_ as it is immedlacely preceded
and immediately followed by CCV and CCBo For cyanide and mercury,
follow chs calibration procedures outlined in Exhiblc D. One cyanide
calibrauion s_andard muse be ac r.he CRDL. For ICP systems, callbrauethe ins=rumenc according co Instrument manufacturer's recommended
procedures.. AU lease two s_andards must be used for ICP callbraclon.One of r.he standards muse be a blank.
2. In_clal Cal_brac_on V_T!f_ca_lon (_C_ and Con_u_n_ Cal_brec_0nVeriflcatloD (CCV_
a. Inlulal Callbraclon Verification (ICV)
Immediately after each of the ICP, AA and cyanide sysuems havebeen calibrated, r.he accuracy of the initial callbracion shall be
verified and documented for every analyce,by P,he analysis of EPAInitial Calibration Verification Solution(s) ac each wavelengthccsed for analysis. When measurements exceed the control limlcs of
Table l-lnlcial and Con=Inuing Calibration Verlficaclon Control
Limlcs for Inorganic Analyses (in Exhlbic E), the analysis muse becermlnaued, r.he problem correcued, r.he instrument recallbraued,and r.he calibration reverified.
.4 7/8S

' ' ' If the Ini=lal Callbraclon Verlflcaclon Soluclon(s) are not
ava£1able from EPA, or where a cerclfied soluclon of an analyce is
not available from any source, analyses shall be conducted on anindependent standard at a concentration ocher r.han thac used for
ins_ruuenc calibration, but wlr.hin r.he callbraclon range. An
independent s_andard is defined as a standard composed of r.he
analytes from a different source r.han chose used in _he sr.andardsfor the Irtscru_ent calibration.
For ICP, r.he Inlcial Calibration Verification Solution(s) must be
run a_ each wavelenguh used for analysis. For CN, _he Inlcialcallbra_ion verlficaclon standard muse be dlsuilled. The InIcial
Calibre=ion Verification for CN serves as a Laborauory Control
Sample; thus i_ =us= be d.lstilled wlch _he beech of samples +analyzed in assoclacion wi_h r.hac _C'V. This means that an ZCVmu.su be dis_illed wiuh each batch of sanples analyzed and thac =he
samples distilled with an ICV must be analyzed wlr.h that
particular IC3. The values for the initial and subsequent
conulnuins callbraulon verificaulons shall be recorded on FOR._ II-
IN for ICP, AA, and cyanide analyses, as indlcaced.
b. Continuing Calibration Verification (CCV)
To ensure calibration accuracy during each analysis run, one of
nhe following s_andards is to be used for continuing calibraclon
verification and must be be analyzed and reporued for every
wavelength used for =he analysis of each analyte, ac a frequency
of 101 or every 2 hours during an analysis run, whlchsver is more
frequent. The start=Lard mus_ also be analyzed and reported forev-.ry wavelengr_h used for analysis at =he beginning of =he run and
ulcer =he last analyulcal sample. The analyce concencratlons in
r.he continuing calibration standard mus_ be one of r.he following
solutions at or near _he mid-range levels of uhe. callbraclonCtAI'V• "
I. EPA Solution.,_
2. lqSS SI_.M1643a
3. A Contrac_or-prepared standard solution
III I i i llli iii I II Illl
TA3LE I. INITIAL AND CONTINUING CALIBRATION VERIFICATION
CONTROL LIMITS FOR INORGANIC ANALYSES
• i ii iii l i iii l
of True Value (Ep_ _e_)Analyclcal Method Inorganic Low Limlc Hi_,h Limit
Species
ICP/AA He =als 90 II0
Cold Vapor ha Mercury 80 120
Ocher Cyanide 85 115
i i ill l ii i I I
• .

The same continuing calibration stand.aral wt.st be used throughout:the analysis ru.-usfor a Case of sa=ples received.
Each CCV analyzed mus_ reflect the conditions of analysis of ali
assocla_ed analytical samples (the preceding I0 analytical sa=plesor the preceding analyclcal samples up uo the previous CCV). The
duration of analysis, rinses and ocher related operations _hac mayaffect the CCV measured result may not be applied uo the CC_ to a
8reacer extent than the extent applied to the asgoclated
analytical sa=ples. For Ir_cance, the difference in time between
a CCV analysis and _he blank in=edia_ely following it as well as
--_ the difference in ciae be_een the CC'V and the analytical samplei_edlately preceding lt =ay not exceed r.he lowest difference in
time between any two consecutive analytical sa=ples associatedwluh r.he CCV.
If the devla_ion of nhe concinuln E calibration verification is
greater than the control llmlus _pecifled in Table l-_ni=ial and
Conulnulng Calibraclon Verification Control Limits for Inorganlc
Analyses, the analysis mus_ be s_opped, _he problem corrected, theinscrumen_ must be fecal!braced, the calibration verified and the
:analysis of preceding I0 analytical samples or all analyticalsamples analyzed since the last good calibration verlficaulon must
be performed for the an-_lyues affected. Informaclon regarding the
continuing verification of callbra_ion shall be recorded on FOR._
II-IN for ICP0 AA and cyanide as indicated.
3. CFIL _anda_ds for TCp (CR_ _a_d AA (CP3_
To verify llnearlty near the CRDL for ICP analysis, _he Contractor mus_analyze an ICP standard (CRI) ac two times the C'RDL or two ulmes the
_DL, whichever is greater, ac the beginning and end of each sample
analysis run, or a minimum of twice per 8 hour working shift, whicheveris more frequent, buc noc before Inlcial Calibration Verification.
This standard muse be run by ICP for every wavelength used for
analysis, except those for AI, 5a, Ca, Fe, Mg, Na and K.
To verify linearity near _he CRDL for AA analysis, _he Contractor must
analyze an AA s_andard (CRA) ac the CRDL or the IDL, whichever is
grea_er, ac F.he beglnning of each sample analysis run° but not beforer.he Inlulal Callhraulon Verification.
Specific acceptance criteria for the two standards will be set by EPA
in the future. In the incerlm, _he Contractor must analyze and report_hese StandarcLs on FORM II(PART 2)-IN.
4. Initial Callbra_Ion Blank (TCB). Con_inuln_ Cellbraulon Bla_ (CC_,and Pre_aramion Blank (P_) Anal_ses
a. Initial Calibraclon Zlank (IC_) and Continuing Calibration _lank(CCd) Analyses
A calibration blank mus_ be analyzed ac each wavelength used for
analysis immedlacely after ever_ Iniclal and concinuln8
callbra_ion verlfica_ion, ac a frequency of 10% or every 2 hours
-6 7/88

°
during the run, whichever is =ore frequent. The blank must be
analyzed ac ch.e beginning of the run and after the lastanalyulcal sample. Note: A CCB must be run after the last CC'qr.hat was run after the last analytical sample of the ru_. The
results for the calibration blanks shall be recorded on FORM III-
IN for ICP, AA and cyanide analyses, as indlcacsd. If chs
maEnlt-_de (absolute value) of the callbraclon blank result exceedsr.he IDL, che result must be so reported in uF/L on FORM III-IN,
ouherwlse report as IDL-U. If _he absolute value blank resultexceeds r.he 'CRDL (Exhibit C), cerminace analysis, cozTecl: cheproblem, recalibrate, verify the calibration and reanalyze r.he
preceding I0 analytical ,ambles or all analytical samples analyzedaince the las_ good calibration blaztk.
b. Preparation _lank (PS) Analysis
AC least one preparation blank (or reagent blank), conslsclng ofdelonized distilled water processed _hrough each sample
preparation and analysis procedure (See F.xhlblc D, Section III),
must he prepare_ and analyzed wlch every Sample Delivery Group, orwlch each batch _ of samples digested, whichever is more frequent.
The firs_ batch of samples in an SDG is Co be assiEned Co
preparation blank one, the second batch of samples co preparacion
blank _ao, ecr. (see FOP_ III-IN). Each data package must con_aln
the results of ali the preparation blank analyses assoclaced wi_h
the san_les in uhac SD<;.
This blank is co be. reported for each SDG and used in all analyses
co ascercaln whether sample concentrations reflect concamlnacion
in r.he following manner"
I) If the absolute value of the concencratlon of _he blank is
less than or equal Co r_he Contract Required Detection Limit(Exhibit C), no correction of sample results is performed.
2) If any analyte concentration in r.he blank is above the CRDL,
the lowest concencraclon of chat analyce in r.he associated
samples musu be 10x the blank concencraclon. O_herwlse, all
samples associated with r.he blank with the analyce'sconcentration less r/Ran 10x r.he blank concentration and above
r_he CRDL, must he redlgested and reanalyzed for r.hac analyce
(except for an idenclfled aqueous soll field blank). The
sample concentration is noC to be corrected for _he blankvalue.
3) If the concen_raclon of the blank is below the negative CRDL,
then all samples reported below 10x CRDL associated wi_h the
blank muse be rediges_ed and reanalyzed.
lA group of samples prepared ac the same time.
7 7/8 8
°..

°.
The values for the preparation blsnk muse b_ recorded in ug/L foraqueous samples and in mgP_g for solid samples on POR._III-IN forICP, AA° and cyanide analyses.
5. ICP Interference Check _am_le (_CS) _r.a!ysls
To verify incerelemenc and "background correction factors, theContraccor must analyze and reporu the resulcs for the ICP InterferenceCheck Samples at r.hebeginning and end of each analysis run or aminimun of twice per 8 hour w_rkin S shift, whichever is more frequenu,bum noc before Initial Calibration Verification. The ICP Interference
Check Samples muse be obcalned from EPA (L_SL/LV) if available andanalyzed according co the instructions supplied rich the XC$.
The Interference Check Samples consism of two solutions: Solution A andSolution A3. Solu:ion A conslscs of r.heincerferencs, and Soluulon A3consists of the analytes mixed vlch mbe incerferencs. An ZCS analysisconsists of analymlng both solutions consecuuively (scaruins vimhSolution A) for all vavelengchs used for each analyue reported by ICP.
Results for the ICP analyses of $olumion A5 during the analytical runsmuse fall within the control llmic of ±20q of the true value for theanalytes included in the Interference Check Samples. If not, termlnacethe analysis, correct the problem, recalibrate the Inscrunent, andreanalyze r.he analytical samples analyzed since the last good ICS. Iftrue values for analyues conuained in uhe ICS and analyzed by ICP arenoc supplied with the ICS, r.hemean musu be decermAned by initiallyanalyzing the ICS ac lease five times repeciclvely for the parmlcularanalytes. This mean deuerminacion must be made during an analytical runwhere the results for uhe previously supplied EPA ICS mac all contrac¢specificamions. Additionally, the result of chls inlmlal meandecerminamion is mo be used as mbe true value for che llfeulme of uha¢
solution (i.e., uncll mbe solution is exhausted).
If the ICP _nmerference Check Sample is noc available from EPA,independent ICP Check Samples muse be prepared rich incerferenc andanalyte concentrations at the levels specified in Table 2-Incerferenmand Analyte Elemental Concentrations Used for ICP Interference CheckSample. The mean value and standard deviation must be established byiniclally analyzing the Check Samples at lease five times repeclclvelyfor each paranecer on FOR._ IV-IN. Results must fall vi_hln the controllimit of _+20_ of uhe established mean value. The mean and standarddeviation must be reported in the raw data. Results from theInterference Check SAmple analyses must be recorded on FORM _V-IN forall ICP parameters.
-8 7/S8

IL _ I II I I I [] ii
TABLE 2. ZNT___ _._D ANALYTE £LL_'_AL CONCENTRATZONS USED FOR ICP
Ill--CE CHECK SAM2LE
i ii ii
Analytes (mE/L) Zn_arferen_s '(ms/L)i ii Jill
Ag 1.0 A1 500Ba 0.5 Ca 500 •Be 0.5 Pe 200
Cd 1.0 Mg 500Co 0.5
Cr 0.5
Cu 0.5
__n 0.5
Ni 1.0
Pb l.O
V 0.5Zn 1.0
I II I I I
6. _oi_e Sample Analvsls {$)
The spike sample analysis is desIEned =o provide inforaat:ionabou= t:heeffecu of r.he sa=ple =aurix on uhe dieesulon and measurement
meuhodoloEy. The spike is added before the aigestlon (i.e., prior tOr.he addiulon of ouher reagents) and prior co any distillation steps
(i.e., CN-), At lease one spike sample analysis must he performed on
each group of samples of a similar matrix type (i.e., water, soil) a_dconcentration (i.e., low, medium) o%" for each Sample Delivery Group."
Sf the spike analysis is performed on the same sample that is chosen
for the duplicate sample analysis, spike calculations must be performed
using the results of the sample desiEnated as the "original sample"
(see section 7, Duplicate Sample Analysis). The average of r.he
duplicate results cannot be used for the purpose of determining percent
recovery. Samples identified as field blanks cannot: be used for spikedsa=ple analysis. EPA may require that a specific sample be used for
the spike sample analysis.
The analyte spike must be added in the amount given in Table 3-Spiklng
Levels for Spike Sample Analysis, for each element analyzed. If _wo
analyulcal methods are used Co obtain the reported values for the sameelement within a Sample Delivery Grnup (i.e. ICP, GPAA), spike samples
must he run hy each method used.
2EPA may require addicional spike sample analysis, upon Project Officer
request, for which the Contractor will be paid.
-9 7/8S
°°- |

-e
If the spike recovery is noc at or within the llmics of 75-125%, rbe
_sca of all sa=ples received assoclaued wlch uhac spike sample anddetermined by the same analyclcal method must be flagged with the
letter "N" on FOF_s I-IN and V-IN. An excepClon Co this rule is
granted in slcua=ions where the sample concentraclon exceeds the b-plke
concancra_ion by a factor of four or more. In such an event, the da_a
shall be reported unflagged even if the percenc recovery does no_mae:the 75-125q recovery criteria.
For flame AA, ZCP, and CN analyses, when the pre-dlgesclon/pre-
distillation spike recovery falls outside the control limits and t.he
sample result does not exceed 4x the spike added . a posc-
digasuion/posc-dlstillatlon spike must be performed for chose elemenr.s
_hat do not meec the specified criteria (excepulon: AS). Spike _he
unspiked aliquot of the sample au 2x the indigenous level or 2x CRDL,
whichever is greater. Results of the post-digestlon/posc-dlstillati_n
spike must be reported on FO_M V(PART 2)-IN. Note: No post dlgesu
spike is required for HS.
In the instance where there is more than one spike sample per maurix
and concentration per method per SDG, if one spike sample recovery is
noc wlchin contract criteria, flag all the _amples of the same macrlx,
level, and method in the SDG. Individual component percent recoveries(%R) are calculated as follows:
qRecovery - (SSR-SR) x I00SA
Where, SSR - Spiked Sample Result
SR - Sample Result
SA - Spike Added
When sample concentration is less than _he inscrumen_ dececclon llmi_,
use SR - 0 only for purposes of calculaulng q Recovery. The spike
sample results, sample results and q Recovery (positive or negaclve)
must be reported on FO_M V-IN for ICP, AA and cyanide analyses, asindlcaced.
The unlcs for reporting spike sample results will he identical co chose
used for reporting sample results in FO_½ I-ZN (i.e., ug/L for aqueousand mg/Kg dry weight basis for solid).
-lo 7/88

• ii i ii i i i I i i iii• " i i i i
TA5_ 3. SPIKING I_ELS FOP, SPIKE SA.W__LEA_ALYSIS
For ICP/AA For Furr_ce AA Other (1)
_:ie-.en_ Yacer Soil (-_') Ya_:er Soil ......
Aluminum 2,000 *
Antimony 500 500 I00 I00Arsenic 2,000' 2,000 40 40
Barium '2,000" 2,000
_ryllium • 50" 50Cadmium 50 50 5 5
Calcium *
Chromium . 200" 200
Cobalu 500" 500
Copper . 250" 250Iron _ I,000 *Lead ' • 500" 500 20 20
MaEnesium * ,J.
Manganese • 500" 500 1Mer:uryNickel • 500' 500
Pocasslum * *
Selenium 2,000 2,000 I0 I0
Silve r 50 50
Sodium _ *
Thallium 2,000 2,000 50 50
Vanadium • 500" 500
Zinc 500 ' 500
Cyanide i00I
NOTE" Elements wlc.hout spike levels and not desiEnaced vlth an
asterisk, must be spiked at appropriate levels.
lspiking level reported is for both water and soil/sedimenc matrices.
2The levels sho_ indicate concentrations in _he final diges_ate of _he
spiked sample (200 mL final volume).
•No spike required.
-Ii 7/SS

°°°
?. Du_!_cate $a,-,.'oleAna_.vs_.s (D)
One duplicate sa=ple must be analyzed from each group of samples of a
similar matrix type (i.e water, soil) an_ concentration (i.e., low,medium) or for each Sa=pl'e Delivery Group." Duplicates cannot beaveraged for reporting on FORM I-IN.
Duplicate sa=ple analyses are required for percent solids. Sa=plesIdenclfied as field blanks cannot be used for duplicate srJnpleanalysis. EPA may require chaca specific sample be u_ed for dupllcauesanple analysis. If _o analytical methods are used co obualn the
reported values for c.he sa=e ele=ent for a Sample Delivery Group (i.e.,ICP, GFAA), duplicate sa=ples =ust be run by each method used.
The relative percent differences (R_D) for each courponent arecalculated as follows:
P_PD - IS - D_ x I00
(S.D)/2
_nere, RPD - Relative Percent Difference
S - First S_ple Value (original)
D - Second Sanple Value (duplicace)
Tlxe results of the duplicate sa=ple analyses must be reported on FOR._VI-IN in ug/L for aqueous sa=ples and mg/Xg dry weight basis for solidoriginal and dupllcace sanples. A control llmlC of 20q for RPD shall
be used for original and duplicate sample values greater than or equalco 5x C_DL (Exhiblc C). A control limlt of (_) the CRDL must be used
for sanple values less than 5x CRNL, and the .%solute value of the
control limit (CREL) =use be entered in the "Control Limit" column on
If one result is above the 5x _DL level and the ocher is below, use
r.he + CRDL criteria. If both saople values are less than rbe IDL, the
RPD is r.,ot calculated on FOR.½ VI-IN. For solid sample or duplicateresults < 5x CRDL, enter r.he absolute value of the CRDL, corrected forsample weight and _erc_nc solids, in the "Control Limlc" column.
If the duplicate sample results are outside r.he control llmlus, flag
all r.he c_ua for samples received assoclaued wlth chat dupllcaue samplew_ch an °_" on FOR_Is I-IN and VI-IN. In the In_tance where r.here is
more c.han one duplicate sample per SDG, if one dupllcaue result is not
wlchln contract criteria, flag all samples of the game matrix,
concentration, and method in the SDG. The percent difference data will
be u_ed by EPA to evaluate the long-cerro precision of r.he methods formach pa__ameter. Specific control limits for each element will be added
co FOR._ VI-IN at a later dace based on these precision results.
3EPA may require additional dupllcace sample analyses, upon Pro_ect Officer
request, for which the Contractor will be paid.
-12 7/88

Aqueous and solid Laboratocy Control Samples (LCS) mus_ be analyzed for
each a_lyte usin 3 the sa.:e s_=ple preparatto,.5, analy_ical mechocLs andQA/QC procedures employed for the EPA sa._ples received. The aqueousLCS solution _-_st be obcalned from EPA (if unavailable, the Initial
Calibration Verification Solutions may be u.sed). One aqueous LCS must
be prepared and a_alyzed for every group of aqueous samples in a Sample
Delivery Group, or for each batch of aqueou-5 samples digested,whichever is nor, frequent. An aqueou_ LEg is not required for mercury
and cyanide analysis.
The EPA-provlded solid LC$ must be prepared and analyzed usln8 each of
_he procedures applied co the solid samples received (exception:
percent solids deter_:in:uion not required). If the EPA solid LCS isunavailable, other EPA _ali_ Assurance Check samples or other
certified materials may he used. One solid LCS musC be prepared and
analyzed for every group of solid samples in a Sample Delivery Group,or for each batch of s_.uples digested, whichever is more £requent.
All LC$ results and percent recovery (tR) will be reported on FOR.½ VII-
IN. Sf _he percenc recove_-y for che aqueous L_S falls outside the
control limits of 80-120t (e._cep:ion" Ag and Sh), _he analyses must be
te:mina=ed, the problem co;ratted, and the samples assoclaced vlch _hat
LCS redigested and reanalyzed.
Sf the results for the solid LCS fall outside _he control limits
established by EPA, the analyses =ust be terminated, the problem
corrected, and _.he samples associa:ed wi_h _hat LCS redisesced and
reanalyzed.
9. ICP SeT,al Dilu'.ion Analvsls _L_
Prior Co reporcin 8 concenuratlon data for the analyte elements, _heContractor mu.st analyze and report the results of _he ICP Serial
Diluulon Analysis. The ICP Serial Dilution Analysis must be performed
on a sample from each group of samples of a similar matrix type (i.e.,
water, soil) and concentration (i.e., low, medium) or for each Sample
Delivery Group, whichever is more frequent. Samples identified asfield blanks cannot be used for Serial Dilution Analysis.
Sf the analyte concentration is sufficlen_ly high (minimally a factorof 50 above the Instrumental de_ectlon limit in the original sample),
cho serial dilution (a five fold dilu:ion) must then agree within 10q
of the original determine=ion after correction for diluclon. Sf r.he
dilution analysis for one or more analyces is not au or wi_hln 10q, achemical or physical interference effect mu.sr he suspected, and the
data for _II affected analyues in the samples received assoclaced wlth
chat serial dilution must be flagged wi:h an "E" on FOR._ IX-IN and FORMI-IN.
t -13 7/88
°°.

.B.°.
The percent differences for each co=ponenc are calcu!aced •s follows:
% Difference - _I - SI x I00l
where, I - Iniulal Sanple Resulu
S - Serial Dilution Result (Inscrunenu Reading x 5)
In _.he instance where there is more than one serial dilution per SDG,
if one gerlal diluulon result is noc wlchln contract crluerla, flag all
_he sanples of _he sa._e matrix and concentration in cba Sample Delivery
_roup. Serial dilution results and =E" flags mus_ be reporued on FOR.½IX-L_.
i0. _nS_l'umen_ De_ec'_iou tt_!_ (:DL_ Dete.-'m_ina_ion
_efore any field samples are analyzed under _hls conurac_, _he
ins_rumen_ de_ec_ion limits (in ug/L) muse be determined for each
insurumen_ used, within 30 days of _he snafu of conuracu analyses and
a_ least quarterly (every 3 calendar months), and mus_ meeu uhe levels
specified in Exhlblu C.
The Ins_runen_ Dececclon Liui_s (in ug/L) shall be de_ermined by
mul_iplying by 3, _he average of _he g_andard deviaulons obualned on
uhree nonconsecuuive days from the analysis of a su•hd•td soluuion
(each analyue in reagenu va_er) a_ a concenuraulon 3x-Sx _he Insurument
manufacturer's suggested IDL, wluh seven consecutive measuremenus per
clay. Each measuremenu mu.st be perfocued as choush iu were • separateanalytical sanple (i.e., each =easuremenc musu be followed by a rinse
and/or any other procedure normally performed between _he &nal>sls ofseparaue samples). IDL°s muse be de_ermined and reported for each
wavelenguh used in r.he anal>sls of uhe samples.
The quaruerly de_ermlned _DL for an In_urumen_ muse always he used as
_he _DL for _hac instrument during uhac quarter. _f _he Insurumen_ is
adJusued in an)way _ha_ may affecu uhe ¿DL, uhe IDL for _ha_ Instrumen_musu be rede_ermined and _he resulus submi_ued for use as _he
established IDL for _ha_ ins_rumenu for _he remainder of uhe quarter.
_DLs musu be reporued for each insurumenu used on FORM X-IN submitted
viuh each da_a package. If =ultlple AA Insurumenus are used for _he
analysis of an element within a Sample Delivery Group, uhe hlghes_ IDL
for uhe AAs musu be used for reporting concen_raclon values for _hat
Sample Delivery Group. The same reporulng procedure mus_ he usedformuluiple ICPs.
-1_ 7/88

m .o ,
II. _ntere_ement: C,o.rrect,,[ons _ov !,CP
Before any field samples are analyzed under this contract, the ICPin_erelemen_ correction factors mus_ be determined prior to the start
of contract analyses and ac lease annually thereafter. Correction
factors for spectral interference due to AI, Ca, Fe, and M8 must be
de_ermlned for all ICP instruments a_ all wavelengths used for each
analyte reported by ICP. Correction factors for spectral interference
due Co analytes other than AI, Ca, Fe, and M5 muse be reported if they
were applied.
If the instrument was adjusted in any-.lay that may affect the ICP
Interelement correctlou factors, _he factors must be redetermlned andthe results submitted for use. Results from lnterelement correc_ion
factors de:ermlnation must be reported on FORM XI(PART l)-IN and FOP_
XI(PA_T 2)-IN for all ICP parameters.
12. Linear Ran Ke Analysis (LEA)
For all ICP analyses, a l_near range verification check standard mus_
be analyzed and reported quarterly (every 3 calendar months) for each
element on FORH XII-IN. The standard must be analyzed during a routine
analytical run performed under chls contract. The analytically
.decermlned concentration of this s_andard must be within _ 5% of _he
true value. This concentration is the upper limit of the ICP linear
'. range beyond which results cannot be reported under this contrac_
without dilution of the analytical sample.
13. Furnace Atomic Absorption (AA) QC Analyses
Because of _he nature of the Furnace AA cechnlque, the special
procedures summarized in Figure 1-Furnace AA Analysis Scheme ("MSA
Tree") will be required for quantization. (These procedures do no_
replace those in Exhibit D of this SOW, bu_ supplemen_ the guidanceprovided thereln.)
a. Ali furnace analyses mus_ fall within the callbratlon range. In
addition, all analyses, excepc during full methods of Standard
Addition (HSA), will require duplicate injections. The absorbance
or concentration of each Injection must be reported _n _he raw
data as well as _he average absorbance or concentration values and
the relative s_andard deviation (RSD) or coefficient of variation
(C'V). Average concentration values are used for reporting
purposes. The Contractor must be consistent per method and SDG inchoosing absorbance or concen_ratlon to evaluate which route is to
be followed in the HSA Tree. The Contractor must also Indlca_e
which of the two is being used "if bo_h absorbance and
concen_ratlon are reported in the raw data. For MSA analysis, theabsorbance of each Injectlon mus_ be included in the raw da_a. A
maximum of I0 full sample analyses to a maximum 20 injections maybe performed between each consecutive ca_Ibratlon verlflca_ions
and blanks. For concentrations greater than CRDL, the dupllca_e
Injection readings must agree wi_hln 20% RSD or CV, or the
analytical sample must be rerun once (i.e., two additional burns).
If the readings are s_ill out, flag the value reported on FORM I-
-15 Rev. 2/89

{
IN with an "H". The "H" flag Is required for the analy_:Ical spike
as well as the sample. If the analytical spike for a sample
requires an "H" flag, the flag must be reported on FORH I- IN forchat sample.
b. All furnace analyses for each analytical sample, including those
requiring an "H" flag, will require at least an analytical spike
to determine If _he HSA will be required for quancita=ion Theanalytical spike _'ill be required =o be ac a concentration (in
the sample) 2x CRDL. This requiremenC for an analytical spike
will include the LCS and the prepara=lon blank. (The LCS must be
quantl=aced from the calibration curve and correcclve acclon, ifneeded, taken accordingly. HSA is no= to be performed on the LCS
or preparation blank, regardless of spike recovery result:s.) If
the preparation blank analytical spike recovery is ouc of control
(85-I15%), the spiking solution must be verified by respiklng and
rerunning =he preparation blank once. If the preparation blank
analytical spike recovery is still out of control, correct the
problem and reanalyze all analytical samples associated with that
blank. An analytical spike is not required on the pre-dlgestlonspike sample.
The analytical spike of a sample must be run immediately after
thac sample. The percent recovery (%R) of the spike, calculated
by the same formula as Spike Sample Analyses (see item 6, this
section), will then determine how the sample will be quan_itated,as follows"
i) If che spike recovery is less than 40%, the sample must be
diluted and rerun with another spike. Dilute the sample by a
factor of 5 to i0 and rerun. This step must only be
performed once. If after the dilution the spike recovery isstill <40_, repor_ data and flag with an "E" to Indlcace
interference problems.
2) lt the spike recovery is gL'ea_er than or equal no 40% and the
sample gbsorbance or concentration is less _han 50% of _he"spike" . report the sample resul_s t:o the IDL. If uhe spike
recovery is less _han 85t or greater than llSt, flag theresult with a "W".
3) If =he sample absorbance or concentraClon is grea_er than or
equal co 50t of _he spike and the spike recovery is a_ or
iAnalycical Spikes are pos_-dlgestion sp_kes to be prepared prior toanalysis by adding a known quantity of the analy=e _o an aliquot of the
diges_ed sample. The unsplked sample allquo= must be compensated for any. volume change in the spike samples by addition of delonlzed water to the
• unsplked sample aliquot. The volume of the spiking solution added mus_
no= exceed 10% of _he analytical sample volume; this requirement alsoapplies uo MSA spikes.
5"Spike" is defined as [ahsorbance or concentration of spike sample] minus[absorbance or concentration of the sample].
-16 Rev. 2/89

°°
between 85_ and I15_, the sample must be quantltated dlrec_lyfrom the calibration curve and reported down to the IDL.
4) If the sample absorbance or concencratlon is greater than or
equal to 50_ of the spike and the spike recovery is less than
85_ or greater than i15_, the sample must be quantitaced byHSA.
c. The following procedures will be incorporated into HSA analyses.
I) Data from HSA calculations must be within the llnear range asdecermlned by the cal[bratlon curve generaced at the
, beginning of the analyclcal run.
2) The sample and three spikes must be analyzed ¢onsecutlvelyfor HSA quancltaclon (the "inluial" spike run data is
specifically excluded from use in the MSA quanti_atlon).
. Only single injections are required for HSA quantltatlon.
Each full HSA counts as two analytical samples towards
decermlnlng i0% QC frequency (i.e., five full HSAs can be
performed between calibration verlflcanlons).
3) For analytical runs containing only MSAs, single injectionscan be used for QC samples during that run. For instruments
that operate in an HSA mode only, HSA can be used to
determine QC samples du=ing tha_ run.
4) Spikes must be prepared such that:
a) Spike 1 is approximately 50% of the sample absorbance orconcentration.
b) Spike 2 is approxlma_ely 100% of the sample absorbance orconcentration.
c) Spike 3 is n[,pro×imately 150% of the sample absorbance orconcentration.
5) The data for each HSA analysis must: be clearly identified inthe raw data documentation (using added concentration as the
x-variable and absorbance as the y-variable) along with theslope, x-lntercepc, y-lntercepc and correlation coefficient
(r) for the least squares fit of the data. The results must
be reported on FORH VIII-IN. Reported values obtained by HSA
must be flagged on the data sheet (FORM I-IN) with _he letter
"S" if the correlation coefficient is greater than or equalto 0. 995. ..
6) If the correlation coefficient (r) for a particular analysisis less than 0.995, the HSA analysis must be repeated once.
If _he correlation coefficient is still less _han 0.995,report the results on FORH I-IN from the run with the best
"r" and flag the result wi_h a "+" on FORM VIII-IN and FORHI-IN.
-17 Rev. 2/89

Figure 1FURNACE ATOMIC ABSORPTION ANALYSIS SCHEME
I
PREPARE AND A_ALYZE |
'. SAMPLE AND ONE SPIKE(2 X CFU:)L)
(Doublo Zn _ec=ionl Requited)
" dA_ALYSES WITHIN NODILUTE SAMPLE
iCAL.TBKATION KA_IGE AND SPIKE
If YES, Repeat Only ONCERECOVERY OF SPIKE
LESS THA_ 40% ..........
If Still YES ._ FLAG DATA
vl WITH AN "E"|NO ......
.o J' v / REPORT RESULTS
I r l DOWN TO IDL
SAMPLE ABSOKBANCE OR SPIKE RECOVERYCONCENTRATION LESS THAN
LESS THAN 85% OR
50% OF SPIKE ABSORBANCE GREATER THAN 115%OR CONCENTKATION
NO YES DOWN TO IDL,FLAG WITH A "W"
I QUANTITATE FROMSPIKE RECOVERY
LESS THAN 85% OR NO I CALIBRATION CURVE
"tGREATER THAN I15% AND REPORT DOWN
TO IDL
, + YESI
QUANTITATE BY HSA WITH 3 ISPIKES AT 50, I00 & 150%
OF SAMPLE ABSORBANCE
OR CONCENTRATION ".
(Only Single Injections Required)
i I_ YES, Repeat Only ONCE
COR/tE LAT ION COEFFICIENT
LESS THA/q 0.995 If Still YES
+ NO -_1 FLAG DATA"'l WITH A "+"
-18 Rev. 2/89

INTERIM CHANGE NOTICE
(ICN) ICN - PNL-ALO-222.1 R1
Page I of 1
A.Document Number: PNL-ALO-222 Revision Number: 1
Effective Date
Document Title: Plutonium by automated amperometric of ICN: 12 / 23 / 92titration
Change Requested by:
Document's Original Author: MC Butt AG King
Place the attached procedure into PNL-MA-599 manual, volume 3.B. Action:
C. Effect of Change: Incorporates this procedure into PNL-MA-599 manual.
D. Reason for Change/Descriptionof Change:
i) Incorporates this procedure into PNL-MA-599 manual by changing the
procedure number. (Old document # 2-30.3, PNL-MA-597).
2) Adds the figures on page 19 which were inadvertantly left out of the
last ICN (#2-30.3-RO-I).
E. Approval Signatures: Type of Change: (Check one):
(Please sign and date) __5_x Minor' __ Major
Process __-- ,'-" .<._Quality Department: TL Ehlert Date: /_ /_3/_Z_
Approval Authority: _c_ICing ._/_V_'__-/_/-_ Date: IZ/Z _/_'-L-
d)Other Approval s : Date: / /
: Date: / /

PNLTECHNICALPROCEDURE 1
TITLE: PNL-ALO-222, (Replaces2-30.3), PLUTONIUM BY AUTOMATED AMPEROMETRICTITRATION
].0 APPLICABILITY
A solid sample is dissolved either by fusion with sodium bisulfate or byheating in nitric acid with a trace of hydrofluoricacid. The fusedsample is dissolved in sulfuric acid, after which the plutonium isoxidized to plutonium(VI)with excess silver(II) oxide and the excesssilver(II) is reduced by heating. The nitric acid dissolved sample andother plutonium nitrate solutions are fumed with sulfuric acid to removethe nitrate before the plutonium is oxidized. After the oxidation ofplutonium and reduction of excess silver(II),the solution is adjustedto about 65 in sulfuric acid. Excess standardizedferrous ammoniumsulfate is added and the excess iron(II) is back-titratedwith standardpotassium dichromate using an amperometricend-point detection. Theindicating electrode is a rotating platinum or gold microelectrodethatis used in conjunctionwith a saturated mercurous sulfate referenceelectrode as the counter electrode.
(a) Material Plutonium bearing solids and solutions.
(b) Range From 5 to 20 mg of plutonium are required foreach titration.
(c) Reliability The pooled relative standard deviation obtainedover a one-year period from 44 titrations of 4solutions of mixed oxide pellets used as controlstandards was 0.10%. The average percentrecovery was 100.061%.
(d) Interferences Ions that are oxidized by silver(II) and arereduced by iron(II) (such as chromium,manganese, and vanadium) cause a high bias. A0.1 weight percent positive error will resultfrom 150 pg of chromium or 100 pg of manganeseper gram of sample. These two constituentsofstainless steel are the most probableinterferences. Metals precipitatedby sulfatemay remove some plutonium from solution,causinglow results. Iron and uranium do not interfere.
Author Date ProjectMgr. Date QAD Representative Date
MC Burr 9/8/92 N/A f TL Ehlert 9/8/92
Technical Reviewer Date Line Mgr. _ )_I Date Other Date
9/8[92 AG King //(_;_'_ on:9/8/92 All original,s_natures
ProcedureNo. I Revision No. _VE_fective Date Page
PNL-ALO-222 1 ] _J_ 9/8/92 ] of 19

I PNLTECHNICALPROCEDURE i
With amperometric tttrations, the end point is determined frommeasurementsmadeof the "amperometrtc" current durtng thetitrattons. _)(_ The amperometric current ts generated at constantpotential across a rotating platinum or gold microelectrode (indicatorelectrode) and a saturated mercuroussulfate reference electrode.Values of this current as a function of the amountsof titrant addedareplotted, giving two essentially straight lines that intersect at the endpoint of the titration. The relationship betweencurrent and thetitrant added is not linear near the end point. Consequently, thecurrent titrant data are extrapolated from the linear portions to theintersection at the end point.
If the substance betng titrated ts not electroacttve at the potentialapplied to the indicator electrode, no current will flow before the endpoint except for a small and essentially constant residual current.Then, if the titrant is electroactive at the potential, the amperometriccurrent will increase as the titrant is addedafter the end point. Thisis the case whenplutonium(VI) is titrated directly with iron(II).
The plutonium(VI) reduction by iron(II) ts a slow reaction. As aresult, upon addition of iron(II) before the end point, the current willincrease quickly and then slowly decay to the residual current, althoughnear the end point the current decays at a faster rate. Thischaracteristic makes it difficult to recognize whenthe end point isbeing approachedand it results in a time consumingtitration if thecurrent is allowed to decay to the residual current after each additionof titrant before the end point. To reduce the time of titration,commonpractice is to add titrant before the end point without waitingfor the current to decay to the residual current and then measure cur-rent as a function of titrant addedafter the end point in the linearportion of the curve. The(_nitia] residual current is assumedto beconstant up the end point. Current values are read across a 1000-ohmresistor and are thus read as mVon a digital volt meter.
The initial residual current should be less than 0.2 mV (preferably lessthan 0.1 mV) so that it is insignificant comparedto the currentmeasuredat the first data point taken after the end point. Thispermits the end point to be calculated from only a few data points pastthe end point instead of drawing a titration curve from several points.If the initial residual current is greater than 0.2 mV, there may be acompeting reaction at the surface of the electrode. Usually, lettingthe indicator electrode soak in the solution a few minutes will allowthe residual current to decay to an acceptable level. Persistent highresidual currents usually can be eliminated by soaking the indicatorelectrode in 85 nitric acid overnight.
The problems encountered by the slow plutonium(VI)--iron(II) reactioncan be eliminated by a back-titration. A knownamountof standardizediron(II) solution in excess of the amountneeded to reduce all
Procedure No. Revision No. Effective Date Page
PNL-ALO-222 1 9/8/92 2 of ]9

I PNL TECHNICALPROCEDURE I
plutonium(IV) is added and the.Rxcess is back- titrated with standardpotassium dichromate solution,l_ The chromium(VI)--iron(II)reactionis faster than the plutonium(VI)--iron(II)reaction and thus, thecurrent decays to a constant value faster after each addition ofdichromate standard. In this back-titration,the dichromate ion is notelectroactive at the potential applied to the indicator electrode and asthe titrant is added to react with the excess iron(II),the currentdecreases towards the residual current. The final titration point takenshould be at a current greater than ] mV to avoid the nonlinearitynearthe end point. The titration data are linear between ] and at least 15mV under the conditions used at PNL.
A slow drift downward in current after each addition of titrant isencounteredduring the back-titrationthat may be caused by airoxidation of the excess iron(II). By reading the current at a giventime after each addition of titrant, the effect of the drift can beminimized. A better approach, however, is to monitor the amperometriccurrent with a recorder. The recorder gives a continuous readout of thecurrent during the titration and a better estimate can be obtained ofthe amperometriccurrent when the initial decay has stopped and thedrift is minimal. The recorder also permits a better "look" atbackground noise, which helps in evaluating the performanceof theamperometric system.
Another source of current drift is leakage of electrolyte from thereference electrode compartment, in which case the drift can beeliminated by stopping the leakage. This drift is characterizedby alinear increase in current with time and it is really a measure of theleak rate from the electrode compartment.
The oxidation of plutonium with argentic oxide is done at roomtemperature in O.SN sulfuric acid. Excess argentic oxide is indicatedby a blackish-browncolor in the solution and a black precipitate.Sufficient time must be allowed for complete oxidation before reducingthe excess oxidant, which is done by increasingthe acid concentrationand heating the solution. The excess is gone when the blackish colorand precipitate disappear. The plutonium(VI)should be _%trated withina few hours to avoid possible reduction from radiolysis,_gJalthough thelength of time before reduction could become significant is not known.Using the prescribed conditions, plutonium(VI)solutions have beenstable up to at least four hours after the excess oxidant was reduced.
Amperometry is one of two methods used to determine plutonium in mixedoxides._a_With both methods, plutonium can be determined withoutseparation from uranium, which is an importantpdvantage over otherplutonium methods when analyzing mixed oxides,tejThe amperometricmethod is also free of interferencefrom iron, which is useful sinceiron is a common trace metal in plutonium containing materials.
ProcedureNo. Revlsion No. EffectlveDate Page
PNL-ALO-222 1 9/8/92 3 of 19

I I
2.0 DEFINITIONS
NONE
3.0 RESPONSIBLE STAFF
Analyst
4.0 PROCEDURE
4.1 DISCUSSION
4.2 APPARATUS
(a) AmperometricEnd-Point Detector. See Figure 30.3.1.
(b) Analytical Balance. Readable to at least 0.1 mg.
(c) Digital Volt Meter, Fluke Model 8860A with IEEE-488Interface.
(d) Flasks. Erlenmeyer,fused quartz, 50 ml, with a fusedquartz cover glass.
(e) Magnetic Stirrer.
(f) Muffle Furnace.
(g) Hot Plate.
(h) Reference Electrode,Mercurous sulfate, Brinkman InstrumentsEA 406.
(i) Rotating Platinum or Gold Electrode. Brinkman InstrumentsControl Unit 628-10 and Drive Unit 628-50. PlatinumElectrode EA 289/2 or Gold Electrode EA 289/3.
(j) Digital Buret (2), Brinkman InstrumentsModel 655 with 5 mland I ml delivery capacity.
(k) Control Unit, Brinkman InstrumentsModel 643, to controlturntableoperation, stirrer and valve operation.
(1) lO-Piace Rotating Turntable, Brinkman Instruments Model 624with Stirrer 622/] and spiral stirrer shaft.
0ProcedureNo. Revision No. Effective Date Page
PNL-ALO-222 l 9/8/92 4 of ]9

I PNL TECHNICALPROCEDURE ]
' (m) HPB5A Computer with GPIO interface, BCD interface,HPIBinterfaceand I/O ROM Drawer.
(n) Controlling Software Package.
(o) Weighing Burets. Drop dispensing bottles, 15, 30 and 60 mlvolume, polyethylene.
(p) Titration Vessels. See Figure 30.3.2.
4.3 REAGENTS
(a) Acid Mixture. 12M HNO3 - O.05M HF.
(b) Argentic Oxide.
(c) FerrousAmmonium Sulfate. __i!_ili!ii_ii!_ili!_iiii!ii_iiii_ii!ii_!_iiiiiii___iiiiii!!ii!iliThissolution, appr6x_"i_a"_ely"_:'_x""]O"_........................_YTi:_:_"_bivalentsper gram, must be standardizedeach day itis used because Fe(II) is gradually oxidized by air (seeSubsection 4.6.1).
(d) Standard Potassi.umDic..h.romate.._.NBS (NIST) 135c orequivalent,i_i_i_l_i_i_!_i_B. Dissolve 1.5-1.6 g in 2liters water:.............C_i_"EiT_:["["[I[_'F!())_))i))))))i)!)))i.)())|))|)i.
(e) Sodium Bisulfate
(f) Sulfuric Acid. 0.5N, I N, and 1BN.
4.4 STANDARDS
(a) CalibrationStandard. The calibration standard is asolution of plutonium prepared from NBS plutonium m.e,t.a!.....(SRM
_E}_"i:'6""BF_B_ss_n H,SO,and fused with sodium bisulfate tomake the standard comboKition as near to that of samples aspossible. The final concentration of plutonium is about 10mg Pu/g. Prepare as follows:
]. Take three units of NBS SRM 94gf or its replacementand carefully transfer them to a quartz Erlenmeyerflask. Add 6N HCl dropwise to effect dissolution.When dissolution is complete, add 3 or 4 ml 6N H.SO.and evaporate to dryness. Add 10 g sodium bi_ul_at_eand fuse at 600C for ] to 2 h. Dissolve melt in IN
HzSO4 and transfer to a tared bottle. Dilute toappropriatevolume with IN H_SO4 to give a final
Procedure No. RevisionNo. EffectiveDate Page
PNL-ALO-222 1 9/8/92 5 of 19

I PNL TECHNICALPROCEDURE l
solution with a concentrationof 10 to 1] mg pu/g.Weigh the solution to the nearest 0.1 mg.
2. Encapsulatethe standard in 5 ml sealed glass ampules.
3. Calculate the mg of plutonium per gram and themilliequivalentsper gram of solution using part (a)of Section 4.8.
4. _i!iiii_iiii!__._lii!i!_ii_iiii_i_l, _F_F_"":B;"__| _.0_:.:..:_._.__:::::_::::::_"_'_._..:.::::::::::::::::::::::::::::::::::::::::::::._ ._..._ _..:._..0.0_..::::::::::::::::::::::::::_:"_:::::__".B.,"_:::__:!i_:_::_._:::_:_:_._._:_:_::_i!i!i::_iii::_::i::_iii_:_ii!i!_:_:iii_i!:..i::_!:..':i::_i:::!!..-_ii:ii!i::ii::::_::iii:ii!:::_::::.:_iii_i_::.:.:
(b) Control Standard. A mixed oxide pellet is used as a controlstandard. The material has been used in the SALE programand has an established value for both plutonium and uranium.The value established for Pu is 20.16 _+0.04% in 1982. It
is corrected for isotopic decay. Prepare as follows:
1. Weigh three pellets to the nearest 0.1 mg into aquartz Erlenmeyer. Proceed as per Section 4.7.2 (a)through (e). Transfer to a tared bottle using INH2SO4 and dilute to give a concentrationofapproximately28 mg sample/gram of solution.
2. Weigh solution to the nearest 0.1 mg and calculateconcentrationusing part (b) of Section 4.8.
3. Encapsulatethe solution in 5 ml sealed glass ampules.
4.5 SAFETY
(a) Plutonium-bearingmaterials are radioactiveand toxic.Precautionsare required to avoid the contaminationof thelaboratory and personnel.
(b) Observe the general laboratory safety rules.
Procedure No. Revision No. Effective Date Page
PNL-ALO-222 1 9/8/92 6 of 19

i PNL TECHNICALPROCEDURE I
(c) Ceramic tops on hot plates can shatter if etched heavily bycaustic. Carefully check such tops before use if they havebeen exposed to caustic solutions.
4.6 _QU.ALITYCONTROL
4,6.1 Calibration
Calibrationinvolves standardizingthe ferrous ammoniumsulfate soiution [Reagent (c), Section 4.3] with NBSplutoniumSolution (the calibration standard) _i_i!iii_!_!
..........................._.._.:6._(.._._.I._)........_..6_.._.:._...6_._._`._.:_._._.:._.{:._._.a.:_.{_._.B._.:.:._.:_E_:._...._.._..:.B_:_shi ft duri ngwhich plutonium analyses are made because iron(II) isslowly oxidized by air. Standardize as follows:
(a) Weigh to the nearest 0.1 mg three or four 1-g portionsof the calibration standard into separate titrationvessels.
(b) Add 10 ml of 0.5N H,SO._and a stirring bar to eachres se.]_,....._ _! i:,i!__! _i_i_!_:.__ii!_!_!! i_i__:ii!_,ili_',i _z_!i_,_
............................................................................................................................................................................-:-:'....................................• (c) Proceed at step (b) of Subsection 4.7.3 and continue
through Subsection 4.7.4 for each vessel.
(d) Calculate the results of the standards usingSubsection 4.8 (c).
(e) Calculate the average and relative _tandard deviationfrom the results of the titrations.
The relative standard deviation should be <0.1%. Ifit is >0.2%, investigateand correct the problembefore continuing with the analysis.
4.6.2 Control
(a) Weigh to the nearest 0.1 mg two portions of thecontrol standard into separate titration vessels.
One 5 ml ampoule provides enough solution for 2portions.
i The relaLive standard deviation is defined in Section ].2 ofVolume 1.
ProcedureNo. Revisir, No. Effective Date Page
PNL-ALO-222 ] 9/8/92 7 of 19al,.., ,. ,., _1 i

i PNL TECHNICALPROCEDURE I
(b) Proceed at step (a) of Subsection 4.7.3 and continuethrough Subsection 4.7.4 for each vessel.
(c) Calculate the results using Subsection 4.8 (d) andplot results on control chart. See HCS-033.
(d) Systematic error (or bias) is monitored by averagingthe control standard results for five days analysis.The data from the current days analysis plus theprevious four analyses are averaged as X.
Bias is defined as b = _ - Xa, where Xa is theaccepted value for the control standard.
Percent bias is calculated as follows,
b(]O0)%bias - Xa
(e) Record %bias as a deviation from a straight line(zero) on a control chart. Positive or negativetrends warrant attention to standards and/orprocedure.
(f) _i_',i',ii_i_ilili!_i___ii_,iBi_!_i!ii_!iil_iii_,ii_iiiii!_i_i!iii__!i!iii_iiiiii_i_i_
_i__i_ii'_i!iii',ii',i_i_i!!i_!ili_!__ _i_,!i!_ii',_i_,_':__i_,!_:_',_i_',_i_i_..........................Y
c_:!';_:__'_!_'_',:_:h_n::.::_iii_h_:_:_!!i!iii_::i"_iiiiiii!;:::filliP::_'.........."__::!_"_H: i_i,,:::......"' "'_"_""'""
i
Procedure No. Revision No. I Effective Date Page
PNL-ALO-222 1 I 9/8/92 8 of 19

i PNL TECHNICALPROCEDURE I
4.6.3 Traininq
(a) __iiiiii_iil ii_!_i_i_ii!i
(b) The analyst shall be trained in the use of theprocedure by the responsible scientist. He shalldemonstrate qualification by successfully analyzingduplicate reference standards (following calibration)on three successive occasions. Ongoing qualificationconsists of successful analysis of NBS and referencestandards.
4.7 ANALYSIS
Samples already in solution form as the nitrate or chlorideare analyzed by starting at Step (f) of Subsection 4.7.1.
4.7.1 Sample Dissolution in Acid (12M HNO3 - O.05MHf)
(a) Add a portion of sample weighed to the nearest 0.1 mgto a ]50-ml beaker.
Select an amount of sample to give a plutoniumconcentration of 3 to 5 mg/ml in a 60-ml volume.
(b) Add 20 ml of the acid mixture; cover the beaker with awatch glass and heat on a hot plate until dissolutionis complete.
If the hot plate has a ceramic top, see Part (c) ofSection 4.5.
The solution must be examined carefully to determineif dissolution is complete, lt is difficult to detectsmall amounts of residue in the highly coloredsolution. Add additional amounts of the acid mixture,if necessary, until the dissolution is complete.
If the solution should evaporate to dryness during thedissolution, add 20 ml of the acid mixture and heat toredissolve the sample.
(c) Removethe beaker from the hot plate and let thesolution cool to room temperature.
(d) Quantitatively transfer the solution to a tared 60-mlweighing buret using I_H H2SO4 to rinse the beaker.
Procedure No. Revision No. Effective Date Page
PNL-ALO-222 I 9/8/92 9 of 19

PNL TECHNICALPROCEDURE !
(e) Dilute to about 60 ml with I_MH204, mix thoroughly,and weigh. Calculate sample concentration,Cs,accordingto Section 4.8 (b).
(f) Add an aliquot weighed to the nearest 0.1 mg andcontaining 5 to 20 mg of plutonium to a titrationvessel.
(g) Add about 0.5 ml of 18_NH2SO4 and evaporate to drynesson a hot plate.
(h) Raise the temperature of the hot plate and continueheating until all of the H_SO.is gone; remove thevessel from the hot plate._
(i) Let the vessel cool to room temperatureand then add10 ml of 0 5N H2S04,rinsing down the sides of thebeaker as the acid is added.
(j) Swirl the vessel until the residue is completelydissolved.
(k) Proceed with the oxidation of the plutonium byfollowing Subsection 4.7.3.
4.7.2 Sample Dissolution by Fusion
(a) Add a portion of sample weighed to the nearest 0.1 mgto a 50-ml quartz Erlenmeyerflask.
Select an amount of sample to give a plutoniumconcentrationof 3 to 5 rag/mlin a 60-ml volume.
(b) Add IO to 12 g of sodium bisulfate to the flask andcover with a fused quartz cover glass.
(c) Place the flask in a muffle furnace and heat at 600"Cfor one to two hours.
(d) Remove the flask from the furnace after the furnacehas cooled.
(e) Dissolve the melt in 30 ml of IN HzSO4, swirling theflask occasionallyto aid dissol-ut_on.
(f) Quantitativelytransfer the solution to tared 60-ml
weighing buret using ]N HzSO4 to rinse the flask.
I
Procedure No. Revision No. I Effective Date Page
PNL-ALO-222 ] I 9/8/92 ]0 of 19

I PNL TECHNICALPROCEDURE !
(g) Dilute to about 60 ml with IN H2S04,mix.thoroughly,and weigh. Calculate sample concentratlon,Cs,according to Section 4.8 (b).
(h) Add an aliquot weighed to the nearest 0.1 mg andcontaining 5 to 20 mg of plutoniumto a titrationvessel and add O.5N_H2SO4 to a volume of 10 ml.
(i) Proceed with oxidation of the plutonium by followingSubsection 4.7.3.
4.7.3 Oxidation of Plutonium
(a) Add a stirring bar to the titration vessel.
(b) Put the vessel on the magnetic stirrer, and while thesolution is being stirred, add 25-mg portions ofargentic oxide every 15 to 30 seconds until excessoxide has been added.
Excess argentic oxide is indicated by a brownish-blackcolor in the solution along with a black precipitate.Fused samples (Subsection4.7.2) require more argenticoxide for complete oxidation than samples dissolved inacid (Subsection4.7.1).
(c) Remove the vessel from the stirrer and let thesolution stand for at least 30 minutes.
The black precipitateand color of the solution mustpersist during the 30-min period. If not,insufficientargentic oxide was added.
(d) Add sufficient IN H SO to bring the volume ofsolution to about 2_ m_, rinsing the sides of thevessel while adding the acid.
(e) Place the vessel on the hot plate and heat thesolution until all the black precipitate disappear.Thirty minutes is usually sufficient.
If the hot plate has a ceramic top, see Part (c) ofSection 4.5.
(f) Remove the vessel from the hot plate and let it coolto room temperature.
(g) Rinse down the sides of the vessel with IN HzSO4, butdo not let the volume exceed 25 ml.
ProcedureNo. RevisIon No. Effective Date Page
PNL-ALO-222 ] 9/8/92 11 of 19

I PNL TECHNICALPROCEDURE I
(h) Proceed with the titration by followingSubsection4.7.4.
2.7.4 AmperometricTitration
The amperometrictitration is automatic and is controlled bythe program in the Hewlett-Packard85A Computer. Samplesare titrated according to the followingprocedure aftercontrol is given to the computer.
The turntable is rotated and the sample is raised to the upposition. Valve I opens and admits 10 ml of 18N H2SO.,thestirrer and rotating electrode are turned on. _he DV_monitors solution potential for 45 seconds and then readsthe base voltage. Buret I then adds an initial incrementof1.250 ml of ferrous solution,then alternatelyreadssolution potential and adds ferrous solution in 50 plincrements until the end set point is reached. After apreset wait time, the voltage is read and two 100 pladditionsof standard potassium dichromate from buret 2 areadded with voltage readings taken after set wait times.Upon completion, the stirrer and electrode are turned offand as the vessel is being lowered, Valve 2 opens and thestirrer, electrodes and solution delivery tips are rinsedwith water. The turntable then rotates and the process isrepeated.
The following steps are required prior to start oftitrations.
(a) Insure that reagent reservoirs are adequately filled(18N H2SO4 and rinse H20).
(b) Turn burets to mode I and manually discharge twovolumes from buret ! and five volumes from buret 2.Return mode switches to mode 2.
(c) Insert cassette into HP85, type LOAD "Pu" and pressENDLINE. When program has loaded (small LED belowtape goes out), press RUN. The system is left in astandby condition with the program loaded. If this isthe situation, all that is necessary is to press RUN.
(d) The CRT will display "Pu ASSAY PROGRAM" and ask forinputs from the keyboard. All entries are made bytyping the appropriate informationand pressingENDLINE.
Procedure No. Revision No. Effective Date Page
PNL-ALO-222 1 9/8/92 12 of 19

I PNL TECHNICALPROCEDURE 1
1. Option ] or 2Press ! ENDLINE
2. Time for Base VoltagePress 45 ENDLINE
3. Set Point MVPress 5 ENDLINE
4. Time for Set PointPress 25 ENDLINE
5. Time for Data PointsPress 20 ENDLINE
6. Number of SamplesPress (any) number up to 10 ENDLINE
7. Sample NumberAny combinationof alpha-numericcharacters upto eight characters.Press (eight) characters ENDLINE
8. Aliquot NumberAny integer up to 99.Press number ENDLINE
Sample number and aliquot number will keep coming upuntil the number of samples from step 6 have beenidentified. The CRT will then display "Start 643".
Prepared samples in titration vessel are placed in theturntable beakers in the order entered into the com-puter, with number I being to the immediate right ofthe titration head. The turntable may be manipulatedmanually with switches on the front of the 643controller with the auto/manual switch in manualposition.
9. Place the on/off switch on the end pointdetector to the on position; turn the I/E switchto the E position and adjust the voltage readingon the DVM to 0.600 V and then turn the switch
back to the I position.
10. Insure that the auto/manual switch on the 643controller is in the "auto" position.
ProcedureNo. RevisionNo. Effective Date Page
PNL-ALO-222 1 9/8/92 13 of 19

PNL TECHNICALPROCEDURE III. Place the stop/start switch on the 643
controller in the "start" position.
This initiatesthe titration process. The HP85 willcontrol the titration with the parameters which wereinput and will send a stop pulse to the controllerwhen the titration is completed.
12. When all titrations are completed, turn the endpoint detector to the "off" position and pressRUN on the HP85. All the other components areleft in their present mode.
13. All data pertinent to calculations along withsample number and aliquot number are printed bythe computer at the completion of each sampletitration.
..
14. A rubber cover is placed over the tip of themercurous sulfate electrode for storage.
4.8 CALCULATIONS
(a) Plutonium metal SRM 949
MFPu = "----
Wpu
where Pu = mg of plutonium per g of solutionM = wt in mg of plutonium metal usedF = Purity Factor
Wpu = wt in g of final solution.
MF(2)Cpu --" Wpu(239.08)
where Cpu = milliequivalentsper g of solution
(b) Mixed oxide control standard
WsampleCs =
Wsolution
iProcedureNo. Revision No. Effective Date Page
PNL-ALO-222 I 9/8/92 14 of 19

I PNLTECHNICALPROCEDURE I
where Cs = mgsample per g of solution
Wsw'ampleol - wt in mgof sample usedution - wt in g of ftnal solution
(c) IronStandardization.Calculatethe milliequivalentsper gram of ferrousammoniumsulfatesolutionasfollows:
Cr1 Cr2 ecr
CFe = W Cpu + Vol Cr+ (C 3 Cres) C 1- C 2 C 2 C2
VOlFe
where CF_/ = milliequivalentsper ml of solution= weightin g of plutoniumsolutiontakenPu - milliequivalentsper g of plutoniumsolutionCr = milliequivalentsper ml of dichromate
solution
VOlcr = volumein ml of dichromatesolutionusedCI = currentreadingafterFe additionC2 = currentreadingat firsttitrationpointC3 - currentreadingat secondtitrationpoint
C_es = residualcurrentVO_Fe - volumeof iron solutionused in titrationCrI - Volc_2Cr2 = VOlc_Y2
::::::::::::::::::::::::::::::::':::;:':::::':'::':'::':'::;::::::':';::':::.:.;:,:i!:::: :"" ":'::: :': :::'::::::;::":" ":" "::_"": :::::::: :':':;:::::::: :':::.,..:.;.: :4:
(d) SolidSamples. Calculatethe concentrationofplutoniumin mixedoxideand plutoniumoxidesamplesas follows:
Cr] Cr2 C Cr
Pu = VOIFeCFe - VOIcr+ (C3 - Cres) Ci _ C2+ C2 _ C3
2 .A- 100
2 (W)sC s
Procedure No. Revision No. Effective Date Page
i PNL-ALO-222 1 9/8/92 15 of 19

J PNL TECHNICALPROCEDURE 10where Pu = wt% of plutonium in sample
VOlFe = volume of iron solution used in titrationCFe= mill iequivalent per ml of iron solution
VOlcr = volume in ml of dichromate solution usedCcr = milliequivalents per ml of dichromate
solutionC1 = current reading after Fe additionCz = current reading at first titration pointC3 = current reading at second titration point
= residual current
Crbr 1 . V°Ic)_!Cr2 = VolW = wei in g of sample solution used_s = concentration of sample solution, in mg
sample/g solutionA = Isotopic correction
A = 239.082 [(0.01B)(240.0538) + (].00 - 0.01B)(239.052])]where 239.082
where B = % 24°pu in sample
Note: to calculate mg Pu found, delete Ws, Cs and lO0from the formula.
(e) Solution Samples. Calculate the concentration ofplutonium in plutonium solutions as follows:
Cr1 Cr2
Pu = Vol FeCFs- VOlcr + (C3-Cres ) C1 - C/ C2 - C3
2 • DF. SpG. A2 (Ws)
where Pu = plutonium concentration in g/PVOIFe - volume of iron solution used in titration
VoCFel= milliequivalentsper ml of iron solutionCr = volume in ml of dichromate solution usedCcr = milliequivalentsper ml of dichromate
solution
C_ = current reading after Fe additionCz = current reading at first titration point
Cr31 = current reading at second titration point_-Crz - Vol
Procedure No. Revision No. Effective Date I Page
PNL-ALO-222 ] 9/8/92 J 16 of ]9

I PNLTECHNICALPROCEDURE ]
= residualcurrent
Cre_/_-D= weightin g of samplesolutionused
= DilutionFactorSpG = SpecificGravityof samplesolutionA = Isotopiccorrection
A = 239.082 [(0.0]B)(240.0538) + (].00 - 0.01B)(239.052])]
where 239.082
where B = % 24°Puin sample
(f) ........:::..........:::::::...:::..:..:::::::::::::::::::::::::::::::::::::::::::::::::::::::::::..::.::::.::...:::..:::::.:.::::::
...,:::::_:::::."::....::::::::..:....:,...:_:..::::::::::::::::::
::::::::::::::::::::::::::::::::::::::::::::::::::::::::::::::::::::::::::::::::::::::::::::::::::::::::
•...,.:,.•.,.........;.,:.:..;......;,,..:.,..,
....................._?:_i_i_i_i_!_!_i_i_i_i_i_!_ii_:,_i_i__!_ii!ii_i_i,',ii_,i_[_.:.'...........................
5.0 BIBLIOGRAPHY
(a) Chemical,Mass Spectrometric,and SpectrochemicalAnalysisofNuclear-GradeMixedOxidesr(u.Pu)O_1,c 698, AmericanSocietyforTestingand Materials(ASTM),PhilaBelphia,PA (1972).
(b) J.L. Drummondand R. A. Grant,"PotentiometricDeterminationofPlutoniumby ArgenticOxidation,FerrousReduction,and DichromateTitration,"Talanta,]3, 477 (1966).
(c) C.E. Hedrick,C. E. Pietri,A. W. Wenzel,and M. W. Lerner,"ImprovedAmperometricProcedurefor DeterminingPlutonium,"Anal.Chem.,4__44,.
Procedure No. Revision No. I Effective Date Page
PNL-ALO-222 1 J 9/8/92 17 of 19

i PNLTECHNICALPROCEDURE 1
(d) J.J. Lingane, Electroanalvtical Chemistry, 2nd Ed., IntersciencePublishers, Inc., NY (]958).
(e) C.J. Rodden, Editor, Selected Measurement Methods for Plutoniumand Uranium in the Nuclear Fuel Cycle, TID 7029, 2nd Ed., (]972).
(f) C.A. Seils, Jr., R. O. Meyer, and R. P. Larsen, "AmperometricTitration of Plutonium(VI) with Iron(II)," Anal. Chem., 35,(1963).
(g) O.J. Wick, Editor, Plutonium Handbook, Vol. ], Gordon and Breach,NY, pp. 4]5-4]9 (]967).
(h) H.H. Willard, L. L. MerriLL, Jr., and J. A. Dean. InstrumentalMethods of Analysis, D. Van Nostrand Company, Inc., NY (]948).
Procedure No. Revision No. Effective Date Page
PNL-ALO-222 ] 9/8/92 ]8 of ]9 ,

iJ PNL TECHNICAL PROCEDURE ,
I'I' !
1.3s v _ 42A J/[ON _;_trode Switch
(2_X]
..
Io1_1
II| I
Fiqure 30.3.1. Amperometric End-Point Detector
C
A
8
A - Turntible Beaker
8 - Polyethylene Spacer
C * Pyrex TItritton Vessel
Fiqure 30.3.2. Titration Vessel
Procedure No. Revision No. Effective Date Page
PNL-ALO-222 ] 9/8/92 , 19 of 19_,

PNL TECHNICALPROCEDURE ]
TITLE: PNL-ALO-223, (Keplaces2-30.5), OXYGEN TO METAL RATIO BYTHERMOGRAVIMETRY
1.0 APPLICABILITY
Samples are weighed and then heated to constant weight at 800 to gO0°Cin an atmosphere of hydrogen-heliumsaturatedwith water vapor at O°C.The O/M is calculated from the difference between the initial and finalweights. Procedures for macroanalysis (_>O.5-gsamples) andmicroanalysis (<_100-mgsamples) are included in this method.
(a) Material Uranium oxide and mixed oxide powder andpellets; plutonium oxide derived from burningplutonium metal. Plutonium oxide derived fromother sourcesmay contain a variety ofimpurities that could affect the analysis [seePart (d) below].
(b) Range All O/M values encountered in the abovematerials.
(c) Reliability Standard deviations of 0.001 to 0.003 arenormally obtained.
(d) Interferences Inert impuritiesthat contribute significantlyto the weight of a sample and impurities thatcause a weight change during the analysis.
The oxygen-to-metalratio of uranium and plutonium oxides is commonlydetermined thermogravimetrically. In thermogravimetricmethods, anoxide is treated under conditions that are assumedI to givestoichiometricoxide by either adding oxygen to or removing oxygen fromthe sample. The difference between the initial weight of the oxide andthe weight at stoichiometryis used to calculate the O/M. The results
1 The word "assumed" is used in this discussion because it has notbeen unquestionablysubstantiatedthat stoichiometry is reachedunder the conditions used in thermogravimetricmethods. Seereferences (b), (c), (d), (e), and (g) for discussions on thecriteria used to establish stoichiometry.
Author Date Project Mgr. Date QAD Representative Date
MC Burt 6/15/88 . N/A LJ Ethridge 6/16/88
Technical Reviewer Date Line Mgro Date Other Date
All °riginalf_i_natureSonJJ McCown 6 16 88
ProcedureNo. Revision No. EffectiveDate Page
PNL-ALO-223 0 6/21/88 I of 15

I PNL TECHNICALPROCEDURE I
obtained, however, may require correction for impurities present in thesamples.
There can be two kinds of interferencesfrom impurities. A weightchang_ caused by impuritiesthat are oxidized, reduced, or thatvolatilize during analysis produces one kind of interference. Water,
which is(_dily adsorbed by some powders but not by sinteredpellets, can cause this kind of interference. The second kind,which is not as significant as the first, is caused by inert impurities.If the concentrationof inert impuritiesis large enough to measurably
affect the fractionalweight change [W2 WI/W2 - W.), see Section 4.8A]• / , . '
then a bias in the result will occur. Bias from impurities can be aparticular problem when analyzing plutonium dioxide. Oxide producedfrom the low temperature calcination of plutonium salts, particularlyfrom oxalate, may contain ma_ly undefined and volatile impurities thatwould make _ reliable determination of O/M difficult to _chieve.
Two thermogravimetric metFods, which have been used rJy laboratoriesassociated with the proddc_ion of mixed oxide fuel f)r the FFTF are theLyon and Chikalla methots. Lyon's original method involves a two-stepheating cycle in which the oxide is first heated in air at 750°C toproduce hyperstoichiometricoxide and is then heated to constant weightat 700"C in hydrogen to reduce the oxide to a composition assumed to be
000 _)stoichiometric(O/M = 2. ). Various modifications in Lyon's method
have been made; however',Lyon's basic concept has re_ined. TheChikalla method, developed by Chikalla and McNeilly, is a one-stepmethod in which the oxide is adjusted to a composition assumed to bestoichiometricwhether the initialO/M is hypo- or hyperstoichiometric.In this method, the oxide is heated to constant weight at 800°C inhydrogen-heliumthat has been saturatedwith water vapor at O°C.
The question of equivalencyof ti,_semethods has been raised from time-to-time. For example, the O/M results from a round robin held in 1969fell into two distinct gr9ups and a conclusion drawn was that biasbetween methods existed._'j To determine if that conclusion was true, astudy was made at HEDL in which three of the methods used were compared.The study showed that those methods are equivalent, at least to within
0.003 O/M units, and that the grop_ing of O/M values resulted fromsomething other than method bias.̀ °"
The equivalency of 0.003 O/M units suggested by the HEDL study wasprobably more of an indicationof variation from materials used in thestudy than from methods. Two batches of mixed oxide pellets were used.The rangRs in standard deviation for the two batches were 0.003 and0.0007.(g_ These ranges indicate that one batch was more uniform in O/Mfrom pellet to pellet than the other batc_. Difference in uniformitybetween batches of materials has been seen often in the analysis ofsamples. Since the macro O/M apparatus at PNL (Figure30.5.1) canhandle up to 30 pellets in one furnace loading, quite often samples from
Procedure No. Revis_on No. Effectlve Date Page
PNL-ALO-223 0 6/21/88 2 of 15

i PNL TECHNICALPROCEDURE !
several pellet batches are loaded at the same time. lt is not unusualto find that some of those batches have very small standard deviationswhile others have relatively large standard deviations. Also, theexaminationof results from the analysis of control standards for arecent 16-month period supports this observation.
The standard used is a mixed oxide pellet that has been adjusted tostoichiometryand is thereaftertreated as a sample during each samplerun [see Section 4.7A, Part (b) and Subsection 4.7B]. Thus, its weightbefore and after ignition should change only if the conditions ofignition Change to give a compositionother than stoichiometry. Thisassumes, of course, that between analyses the compositionof the pelletdoes not change. The pellet must also be protected from an inadvertentweight change caused by chipping or contamination. Over a 16-monthperiod, five pellets were used as control standardsand the pooledstandard deviation involving548 before- and after-weighingswas0.000065 g, which is equivalent to 0.00110/M units. For the five pel-lets, the standard deviations ranged from 0.000042 g (O/M - 0.0007) to0.000077 g (O/M = 0.0013).
This O/M method is a modified Chikalla method. The method as writtenhas procedures for both macro and microanalyses. Samples w_ighing from0.5 g to several grams and between 50 and 10_ _ are taken tor macro andmicroanalysis respectively Both procedures have provisions toeliminate water interferenc_ during analysis of powders. Theseprocedures have been compared and they give equivalent results. For thepast several years, however, the procedure for macroanalyses has beenused exclusively; the micro procedure is retained in this written methodfor information and for possible future use.
2.0 DEFINITIONS
NONE
3.0 RESPONSIBLE STAFF
Cognizant ScientistAnalyst
4.OA PROCEDURE: A o MACROANALYSIS
4.1A DISCUSSION
Procedure No. Re_ision No. Effective Date Page
PNL-ALO-223 0 6/21/88 3 of 15

I PNL TECHNICALPROCEDURE
4.2A APPARATUS
(a) Analytical Balance. Substitution-weighingtype, single pan,readable to at least 0.1 rag. A semimicro balance, readableto 0.01 mg. is used. This balance is a Mettler AE-163(ElectronicAnalytical Balance) modified for glove box use.lt has a Digitec Printer (Model 961) that provides aprintout containing 5 digits for sample identificationand 8digits for weight. With this balance all weighings are madeto 0.01 rag.
(b) O/M Macroanalysis Apparatus. Figure 30.5.1.
1. Boats, fused silica, about 10-mm o.d. x l-mm high,flat bottom.
2. Bubbler, located at the exit end of the furnace tubeto prevent back-diffusionof air into the tube.
3. Drying tube.
4. Flowmeter, capable of controlling the gas flow from300 to 1000 ml/rain.
5. Furnace tube, fused silica.
6. Ice-bath bubbler, used to saturate gas with watervapor at 0"C. A dewar flask containing ice is placedaround the bubbler.
7. Temperature controller,Honeywell Pyrovane.
8. Tube furnace, capable of sustained operation at 900°C.
4.3A REAGENTS
(a) Argon. Prepurifiedgrade or equivalent.I Helium (highpurity grade) may be used instead.
(b) Helium-HydrogenMixture. 6% hydrogen,_repared fromprepurified grade or equivalent gases.(
(c) Ice. Crushed.
i Matheson Gas Data Book, The Matheson Col, Inc., EastRutherford, NJ, 4th Ed., 1966.
Procedure No. Revision No. EffectiveDate Page
PNL-ALO-223 0 6/21/88 4 of 15

(d) Magnesium Perchlorate. Anhydrous, for the drying tube.
4.4A STANDARDS
Materials of known O/M for use as calibration and controlstandards are not available. A balance weight and a mixed oxidepellet are used for calibrationand control purposes. Thesestandards must be stored in a clean, dry, and closed container andhandledcarefully to prevent a change in weight.
(a) Calibration Standard. I- g weight, NBS Class S.
(b) Control Standard. A mixed oxide pellet that has beenadjusted to stoichiometryusing Subsection 4.7.1A or 4.7.2A.
4.5A SAFETY
(a) Plutonium-bearingmaterials are radioactive and toxic.Precautionsare required to avoid the contaminationof thelaboratory and personnel.
(b) Observe the general laboratory safety rules.
(c) Precautionsare required to avoid fires when operating afurnace in a glove box.
4.6A QUALITY CONTROL
Because of a lack of O/M standards, this method cannot becalibrated and controlled in the same manner as other analyticalmethods. Calibrationand control are limited primarily tocontrollingthe integrityof the balance.
4.6.1A Calibration
The analytical balance is maintained under a routinemaintenance and calibration schedule [see Part (a),PNL-ALO-052]. Check the calibrationof the balance at Ileast once with each set of weighings as follows"
I
(a) Adjust the zero reading of the balance.
(b) Place the 1-g calibration standard on the pan.
(c) If the weight reads 1.0000 +_0.0001 g, thecalibration is satisfactory;if not, investigateand resolve the problem before continuing with theanalysis.
ProcedureNo. Revision No. Effective Date PagePNL-ALO-223 0 6/21/88 5 of 15
=
!

4.6.2A Control
The control standard is analyzed with each set of samplesby following Subsection 4.7.1A or 4.7.2A. Plot both theinitial and final weight _n the control chart anddetermine control status. Since the oxide pellet isinitially stoichiometrJc, both weights should be equalwithin the limits of weighing error, unless theconditions of the analysis have changed to give acomposition other than stoichiometry.
4.7A ANALYSIS
This section contains two procedures: the first is for samplesthat contain little, if any, water and that do not sorb waterreadily; the second is for samples that contain amounts of wateror that readily sorb water. Sintered, high density pellets typifymaterials suitable for the first procedure, whereas powders andlow density (high open porosity) pellets are materials suitablefor the second procedure.
4.7.1A Pellet@.
(a) Prepare the O/M macroanalysisapparatus (Figure30.5.1) as follows:
I. Adjust the flow rate of helium-hydrogen from300 to SO0 ml/min.
2. Adjust valves so that the gas passes throughthe ice-bath bubbler.
3. Turn on the furnace and adjust thetemperature to gO0"C.
(b) Determine the tare weights (WT) of the boats to thenearest 0.1 mg after heating to constant weightunder the above conditions."
i Instructionsfor preparingcontrol charts and the criteriathat establish when a method is out of control are found inthe laboratoryquality assurancemanual, Volume I.
Procedure No. Revision No. Effective Date Page
PNL-ALO-223 0 6/21/88 6 of 15

(c) Place the samples in the boats and weig_,,(WI) tothe nearest 0.1 mg at room temperature."'
The sample must be a whole pellet or pieces of apellet. The minimum weight of a piece should be0.2 g and a sufficient amount of sample should betaken to give a total weight of at least 0.5 g.The most desirableweight is between I and 2 g.
(d) Place the boats containing the samples into thefurnace tube and heat for a minimum of 6 hr underthe conditions given in Step (a).
Heating for 6 hr should be sufficient for a I- to2-g sample to reach constant weight.
(e) Remove the furnace tube containing the boats andsamples from the furnace to allow rapid cooling toroom temperature.
The samplesmust remain in the helium-hydrogenatmosphere during cooling to prevent oxidation ofthe sample material.
(f) Remove the boats containing the samples from the
furnace1_ubeand weigh (W2) to the nearest0.1 mg.(
Steps (d) and (f) can be repeated to assure thatconstant weight is obtained. The difference in W2should not exceed 0.2 mg.
4.7.2A Powders.
(a) Determinethe tare weights (WT)of the boats to thenearest 0.1 mg after heating for I hr at 900°C in
dry argon (<20 ppm H20) at a flow rate of300 ml/min.
Use the O/M macroanalysis apparatus(Figure 30.5.1). The argon must bypass theice-bath bubbler.
i If the balance used has the capability,weigh to thenearest 0.01 mg.
ProcedureNo. Revision No. EffectiveDate Page
PNL-ALO-223 0 6/21/88 7 of 15

PNL TECHNICALPROCEDURE
(b) Add from I to 2 g of sample to a boat and dry thesample in the thermogravimetricapparatus byheating at 150"C for Ihr in dry argon flowing at300 ml/min.
(c) Remove the furnace tube from the furnace and allowto cool to room temperature.
(d) Quickly weigh t_,Rboat and sample (Wt) to thenearest 0.I rag.'"
(e) Prepare the O/M apparatusas follows:
I. Adjust the flow rate of the helium-hydrogenfrom 300 to 500 ml/min.
2. Adjust the valves so that the gas passesthrough the ice-bath bubbler.
3. Turn on the furnace and adjust thetemperatureto gO0°C.
(f) Place the boat and sample into the furnace tube andheat a minimum of 6 hr under the above conditions.
Heating to a I- to 2-g sample for 6 hr should besufficient for the sample to reach constant weight.
(g) Cool to 150"C and adjust the proper valves so thatthe helium-hydrogenbypasses the ice-bath bubbler.
While cooling to 150°C, the sample must remain inthe helium-hydrogento prevent oxidation of thesample material.
(h) Keep the samples at 150°C for approximately 20minutes.
The time required to dry the gas and the gas linesleading to the furnace tube (Figure 30.5.1) can bereduced to less than 20 min by increasing the flowrate of the gas by a factor of 3.
i If the balance used has the capability,weigh to the nearest 0.01mg.
ProcedureNo. Revision No. EffectiveDate Page
PNL-ALO-223 0 6/21/88 8 of 15

I P.L,Ec...c,L ]0
(i) Remove the furnace tube from the furnace and allowto cool to room temperature.
(j) Quickly weigh boat and sample (W2) to the nearestO.I mg.
Steps (f) through (j) can be repeated to assurethat constant weight is obtained. The difference
in Wz should not exceed +0.2 rag.
4.8A CALCULATION
Calculate the O/H according to the following equation. Allweights are expressed in grams.
(W2-WI)FO/M- 2.000-
(W2-WT)
where Wz - final weight of sample and boat
WI = initialweight of sample and boat
F - formqla weiqht of mQ1_aloxids15.999
WT = tare weight of boat.
Unless otherwise instructed,report results to the nearest 0.001O/M units.
4.OB pROCEDURE: B - MICROANALYSI_
4.1B DISCUSSION
4.2B APPARATUS
(a) Electrobalance. Cahn RG Automatic.
(b) Ice-Bath Bubbler. Used to saturate gas with water vapor atO°C. A Dewar flask containing ice is placed around thebubbler.
I If the balance used has the capability,weigh to thenearest 0.01 mg.
ProcedureNo. Revision No. EffectiveDate Page
PNL-ALO-223 0 6/21/88 9 of 15

I PNL TECHNICAlPROCBURE I
(c) Radiant Heater. Duel Elliptical,ResearchIncorporated,ModelE2-5-3.
(d) Recorder. Stripchart,l-mVfull scale. 0.5-secresponse.A two-penrecorderis used to recordweightand temperature.
(e) TemperatureProgrammer.F&M,Model240.
(f) VacuumPump. Capableof pumpingto a pressureof I00miIlitorr or Iess.
4.3B REAGENTS
(a) Helium-HydrpgenMixture. 6% hydrogen,prepurifiedgradeorequivalent."
{b) Ice. Crushed.
4.4B STANDARDS
Materialsof knownO/M for use as calibrationor controlstandardsare not available.Balanceweightsand a fragmentof mixedoxidepelletare used for calibrationand controlpurposes. Thesematerialsmust be storedin a clean,dry, and closedcontainerandhandledcarefullyto preventa changein weight.
(a) CalibrationStandard. 5-mgweight,NBS ClassM.
(b) ControlStandard.
I. 50-mgweight,NBS ClassM.
2. Mixedoxidepelletfragmentthat has been adjustedtostoichiometryusingSection4.7B.
4.5B SAFETY
(a) Plutonium-bearingmaterialsare radioactiveand toxic.Precautionsare requiredto avoidthe contaminationof thelaboratoryand personnel.
(b) Observethe generallaboratorysafetyrules.
I MathesonGas Data Book.,The MathesonCo., Inc.,EastRutherford, NJ, 4th Ed., 1966.
Procedure No. Revision No. Effective Date Page
PNL-ALO-223 0 6/21/88 10 of 15

PNL TECHNICALPROCEDURE I
(c) Precautions are required to avoid fires when operating afurnace in a glove box.
4.6B QUALITY CONTROL
Because of a lack of O/M standards, this method cannot becalibrated and controlled in the same manner as other analyticalmethods. Calibration and control are limited primarily tocontrolling the integrity of the balance.
4.6.1B Calibration
Calibrate the electrobalanceaccording to the procedurefound in the manufacturer'sinstructionmanual." Thecalibration is checked whenever the balance is out ofcontrol or maintenanceproblems occur.
4.6.2B Control
(a) Weigh the 50-m9 standard at least once in each 8-hrshift during which the balance is used. Plot the
weight _)nthe control chart and determine controlstatus.
(b) Analyze the pellet fragment with each set ofsamples by following Section 4.7B. Record theweight of the fragment at Steps (f) and (h). Plotboth weights on the control chart and determinecontrol status.(2) Since the oxide fragment isstoichiometric,both weights should be equal withinthe limits of weighing error, unless the conditionsof the analysis have changed to give a compositionother than stoichiometry.
4.7B ANALYSIS
This microanalysisprocedure is used for powders andfragments of pellets and it can be used for samples thatcontain water or that readily sorb water. SeeFigure 30.5.2.
i InstructionManual, RG Automatic Electrobalance,CahnInstrument Co., Paramount,California.
2 Instructionsfor preparing control charts and the criteriathat establishwhen a method is out of control are foundin the laboratory quality assurancemanual, Volume I.
ProcedureNo. Revision No. EffectiveDate Page
PNL-ALO-223 0 6/21/88 11 of 15

PNL TECHNICALPROCEDURE
(a) Evacuate the balance system to 100 millitorr or lessand backfill it to atmosphericpressure withhelium-hydrogensaturatedwith water vapor at O°C.
When helium-hydrogenis specified in the followingsteps, its saturationwith water vapor at O'C isimplied.
: (b) Heat the empty balance pan (left pan) at 100°C andrecord the weight.
This is the tare weight.
(c) Turn off the heater; allow it to cool for 5 m'_nandremove the hangdown tubes that surround both the leftand right balance pans.
(d) Add 50 to 100 mg of sample to the left pan and weightsto the right pan until the weight on the left panexceeds the weight on the right pan by less than10 nxj.
Samples weighing as little as 2 mg can be used, but aloss of precision results.
(e) Replace both hangdown tubes; evacuate the system to100 millitorr and back-fill it to atmosphericpressurewith helium-hydrogen.
(f) Heat the sample at I00"C for several minutes and weighthe sample (Wt).
The sample weight is equal to the sum of the followingweights: the weights on the right pan, the weightequivalent to the reading of the mass dial, and theweight indicated by the recorder pen on the chart.See the InstructionManual of the Cahn RG AutomaticElectrobalancefor detailed weighing instruction.I
(g) Increase the temperatureto 800"C using manualtemperature control and let the weight stabilize.
Usually about 30 min are required for the weight tostabilize.
I InstructionManual, RG Automatic Electrobalance,CahnInstrumentCo., Paramount,California.
ProcedureNo. Revision No. EffectiveDate Page
PNL-ALO-223 0 6/21/88 12 of 15

,i
PNL TECHNICALPROCEDURE I
(h) Shut off the heater and allow the sample to cool to
lO0"C; weigh the sample (W2)"
See note at Step (f).
The indicatedweight at 800"C is unreliable because ofturbulence effects caused by temperature gradientsnear the sample. Thus, the final weighing is made atlO0"C.
4.8B CALCULATION
Calculate the O/M according to the following equation. Allweights are expressed in milligrams.
(W2- WI)FO/M= 2.000-
(W2-WT)
where W2 : final weight of sample plus tare weight
W1 = initial weight of sample plus tare weight
F - formula weiqht of oxide15.999
WT = tare weight.
Unless otherwise instructed, report results to the nearest 0.001O/M unit.
5.0 BIBLIOGP,APHY
(a) W.L. Lyon. The Measurementof Oxyaen to Metal Ratio in SolidSolutions of Uranium and PlutoniumDioxides, GEAP-4271, May(1963).
(b) T.L. Harken, A. J. Walter, and R. J. Jones. The Determination ofOxyqen/Metal Ratios for Uranium, plutonium and (U,Pu) Oxides,AERE-R 4608, April (1964).
(c) I.R. McGowan, C. R. Johnson, and K. A. Swinburn. "Oxygen/MetalRatios in Plutonium/UraniumOxide Fuels: A Study of GravimetricMethods," IAEA/SM-149/23,Symposium on Analytical Methods in the
ProcedureNo. Revision No. EffectiveDate Page
PNL-ALO-223 0 6/21/88 13 of 15

i i
i PNL TECHNICALPROCEDURE
Nuclear Fuel Cycle, International Atomic Energy Agency, Vienna,November 29-December 3, 1971.
(d) C.E. McNeilly and T. D. Chikalla. "Determination of Oxygen toMetal Ratios for Uranium, Plutonium, and (U,Pu) Mixed Oxides,"National Ceramic Society Meeting, Washington D.C., May 3-8, 1969.
(e) J.E. Rein, G. M. Matlack, G. R. Waterbury R, T, Phelps and C. F.Metz, Methods of Chemical Analysis for FBRUranium- PlutoniumOxide Fuel and Source M_t@rl_]s, LA-4622, p. 153, March (1971).
(f) J.E. Rein, R. K. Zeigler, and C. F. Metz. LMFBR-FFTFFqelDevelooment Analytical Chemistry Proqram (Phase II), LA-4407,March (1970).
(g) M.W. Urie, M. C. Burt, W. L. Delvin. A Comp_riscn ofThermoqravimetric HethQds Used tC Oetermine Oxyqen-to-Metal Ratiosin Mixed Oxide Fuels, HEDL-THE72-56, April (1972).
I
ProcedureNo. Revision No. Effective Date I Page
PNL-ALO-223 0 6/21/88 1 14 of 15

t

PNL TECHNICALPROCEDURE i
TITLE: PNL-ALO-224, (Replaces2-30.7), WEIGHT LOSS UPON IGNITION
1.0 APPLICABILITY
Weight loss is determined by measuring the change in weight of a samplewhen heated to constant weight at g50oC in air.
(a) Material Plutoniumdioxide powder, prepared by calciningplutonium salts at temperaturesbelow gSOoC.
(b) Range The smallest weight loss that can be determineddepends upon the sensitivity of the balance usedfor the weight measurer._entand the weight of sampletaken.
(c) Reliability For 1-g samples the relative standard deviation is1.2 and 6% for weight losses of 2.5 and 0.5%,respectively.
(d) Interferences None are anticipated.
2.0 DEFINITIONS
NONE
3.0 P_SPONSIBLE STAFF
Analyst
4.0 PROCEDURE
4.1 DISCUSSION
The primary purpose of this method is to determine the weightchange in plutoniumdioxide when heated at gsooc. Normally a lossin weight occurs. A _econdarypurpose can be the adjustment of aplutonium oxide sample to _ "elatively stable compositionprior toanalysis, particularlywith respect to its water content. Oxideprepared from calcining plutonium salts at low temperatures,particularlyplutonium oxal_te, will readily sorb significant
Author Date ProjectMgr. Date QAD Representative Date
MC Burt 6/15/88 N/A LJ Ethridqe 6/16/88
Technical Reviewer Date Line Mgr. Date Other Date
N/A JJ McCown 6/16_88 All originalonf_i_natures
ProcedureNo. Revision No. I Effective Date Page
m
I
I PNL-ALO-224 0 I 6/21/88 1 of 4i k

i PNL TECHNICALPROCEDURE
quantities of water if exposed to a moist atmosphere.(a)Ignition
above 800oC makes the oxide relatively stable(b_ndits compositionbegins to approach stoichiometryabove gO0°C.
This analytical procedure is simple and it incorporatesstandardlaboratory practices relating to gravimetric analyses, lt can beused for determiningweight loss of other materials, althoughconditions such as temperaturemay require adjustment.
4.2 APPARATUS
(a) Analytical Balance. Readable to at least 0.1 mg.
(b) Muffle Furnace. Capable of sustained operation at 950oCwith the temperaturecontrolled to +I0oC.
(c) Platinum Crucibles. 5-ml capacity.
4.3 REAGENTS
None required.
4.4 STANDARDS
None required.
45 SAFETY
(a) Plutonium-bearingmaterials are radioactive and toxic.Precautions are required to avoid the contamination of thelaboratory and personnel.
(b) Observe the general laboratory safety rules.
(c) Precautionsare required to avoid fires when operating afurnace in a glove box.
4.6 QUALITY CONTROL
4.6.1 Calibration
The analytical balance is maintained unde_ _ routinemaintenanceand calibration schedule. So_ the generalquality assurance requirements (Volume I, Section 4.0).
4.6.2 Control
Control is not established in the usual way. Instead,instructionsfor handling plutoniumdioxide samples are
I ProcedureNo. I Revision No. I Effective Date Page I

L
PNL TECHNICALPROCEDURE ]
included to provide for control and uniform handling ofsamples. Special precautions in handling samples toprevent changes in composition before analysis arenecessary because plutonium dioxide can readily sorb or
desorb water.
(a) The requester should schedule the shipment ofplutonium dioxide samples to the laboratory so thatthe analysis can be started immediately uponreceipt of the samples in the laboratory.
(b) The weight of a sample aliquot is obtainedimmediately after the sample container is opened.Only one sample container is opened at a time.
4.7 ANALYSIS
Samples are ignited (heated) in an air atmosphere. Constantweight, as used in this procedure, is defined as a maximumdifference of 0.2 mg between weighings made after two successiveignitions.
(a) Transfer I g of sample to a cruciblethat has been tared toconstant weight at 950 +_25oC and immediatelyproceed toStep (b).
This step is done in a dry atmosphere; however, do not openthe sample container until a tared crucible is ready for useso that sample can be added to the crucible immediatelyupon opening the container. Excessive exposure of thesample to the dry atmospheremay cause a loss of water ifmoisture is present in the sample.
Larger amounts of sample may be used should be ignitedmaterial be required for other analyses.
(b) Weigh the crucible and sample to the nearest 0.1 mg withoutdelay.
(c) Place the crucible in a cold or warm (about 110°C) furnace.
Loss by spatteringmay occur when a moisture-laden sample isplaced into a hot furnace.
A dry atmosphere is not required for Steps (c), (d), and(g).
roceOureNo IRev,s,onNo iE''ect've°atsIPa°e ID_'L-A'n-224 0 6/21/88 3 of 4

o.
J
PNL TECHNICALPROCEDURE
(d) Heat the sample at 110oC for 30 min and then raise thetemperatureto 950 +_25oC; hold the sample at thistemperaturefor I hr.
(e) Remove the crucible from the furnace and let it cool to roomtemperature.
Cooling must be done in a dry atmosphere to prevent theresorptionof water as the sample cools.
(f) Weigh the crucible and sample to the nearest 0.1 mg.
(g) Replace the crucible in the furnace at 950oC for 20 min;repeat Steps (e) and (f).
Constant weight should be obtained. If not, repeat thisstep until constant weight is obtained.
4.8 CALCULATION
Calculate the percent weight loss as follows"
Weight Loss S - B= S C x 100
where Weight Loss = wt percentS = weight in g of preignited sample plus
tared crucible
B -weight in g of ignited sample pluscrucible
C = weight in g of tared crucible.
Unless otherwise instructed,report results to the nearest0.1 wt percent. Note: If a weight gain occurs, report theresult as a weight gain.
5.0 BIBLIOGRAPHY
(a) J.T. Byrne, C. E. Caldwell, R. L. Delnay, J. D. Moseley, andF. L. Oetting. Measurements Involved in Shippinq Plutonium Oxide,RKFP-502, August (1965).
(b) J.E. Rein, G. M. Matlack, G. R. Waterbury, R. T. Phelps, and C.F. Metz. Methods of Chemical Anal.ysisfor FBR Uranium-PlutoniumOxide Fuel and Source Material, LA-4622, p. 145, March (1971).
I ProcedureNo. IRevisionNo. I EffectiveDate PagePNl-ALO-PP4 0 ¢;I'_1/Qa A of 4I ....... I I vl_.I_

INTERIM CHANGE NOTICEION
ICN-PNL-ALO-225.I ROPAGE I OF I
i , f , i ,
A. Document Number: PNL-ALO-225 Revision Number: 0 EffectiveDate of ICN:
DocumentTitle:Measurementof pH in Aqueous Solutions 1/20/93
Document'sOriginal Author: MC BurtChange Requestedby:MC Burt
,,i i
B. Action:
Replace pages I through 3 with the attached I through 3.
i
C. Effectof Change:
Brings procedure into compliance.
Increasesthe number of buffers availablefor use and the number required forcalibration. Will better define slope of calibrationcurve.
D. Reason for Change/Descriptionof Change:
Reason"
Act NOW Directive89.1 no longer in existence.
Improve accuracy of pH measurementby better definition of slope of calibrationcurve.
Description"
Delete ACT NOW Directive 89.1 from the Records Section (2.0).
Increasenumber of buffers availablefor use in Section 1.3.
Increasesminimum number of buffers required for calibrationin Section 1.5.1.
See strikeout and redline changes in text.
E. Approval Signatures: I Type of Change (Check (/) one)
i
(PleaseSign and Date) I (/) Minor Change ( ) Major Change
QP Concurrence: TL Ehlert /-/_ _/_-_ Date: / _,:_L" "/'_
ApprovalAuthority: AG Kinq //_/_z ___ Date: / IC _._
Other Approvals: SG McKin_ , '. Y''-. _./-.I Date: l.'U_ _;_7
0 : MW Urie /#I#/[ii vu_ Date:2-

I PNLTECHNICALPROCEDURE t
PNL-ALO-225 MEASUREMENT OF pH IN AQUEOUS SOLUTIONS
APPLICABILITY
This method is applicable to aqueous samples, leachates and supernateswhichdo not contain suspensionsor colloids and which do not have high ionicstrength.
• Material-Aqueoussamples, leachatesand supernates.
• Range-From 0 to 14.
• Reliability-Withproper standardization,+0.1 pH unit.
• Interferences-Temperatureeffects pH measurement,therefore, calibrationand measurement shall be done at the same temperature. Some electrodesexhibit a sodium error at pH greater than 10. (Special low sodium errorelectrodes are available.)
DEFINITIONS
N/A
RESPONSIBLESTAFF
• CognizantScientist• Analyst
PROCEDURE
1.1 Discussion
pH is measured by determiningthe activity of hydrogen ions bypotentiometricmeasurement using a standard hydrogen electrode and areference electrode. Because of the difficulty of using the hydrogen
. electrode, a glass electrode is commonly used. The electromotiveforce(emf) produced in the glass electrode system varies linearlywith pH.This linear relationshipis described by plotting the measured emfagainst the pH of different buffers. There are many types of electrodesavailable includingspecializedelectrodes for specific applications.The most commonly used are combinationelectrodes; that is, both thereference and indicatingelectrodes are in a single probe. Also severaltypes of liquid junctions are available for the reference electrodewith
Author Date ProjectMgr. Date QAD Representative Date
MC Burt TE Jones GK Gerke
O Technical Reviewer Date Line Mgr. Date Other DateMW Urie AG Kin9 ALL ORIGINAL SIGNATURESON FILE.
Procedure No. ] Revision No. I EffectiveDate I Pagen_In_In_ I of 3PNL-ALO-225 I 0 I v_/v_/,_ I

I PNL TECHNICALPROCEDURE J
the quartz type being very common. Special electrodes are alsoavailable for pH values over 10 and below I.
1.2 Apparatus
• pH meter (electrometer)• Indicating (glass) and reference electrode,or combinationpH
electrode• Suitable beakers, 20-50 mL• Teflon coated stir bars• Magnetic stirrer
1.3 Reaqents
.pHbuffer solutions, 4,7,.10. Commercially.available certified buffers.
1.4 Standards
pH buffer solutions (see reagents).
1.5 Quality Control
1.5.1 Standardization. Because of the different capabilitiesofdifferent pH meters in use only minimum requirementscan bespecified. Manufacturersinstructionsshall be followed forcalibrationof the meters using standard buffers. A minimum of_:....._ii!_buffer shall be used and calibrationchecked with a_:_:_r_nt buffer. Where possible two buffers shall be used andcalibrationchecked with a third.
1.5.2 Control. Control is establishedby measuringwithin +0.1 pHun_ts a buffer not used for calibrationbefore beginninganalysis,after every lOth sample and at the end of theanalysis run.
1.6 Analysis
1.6.1 Instrumentset up.,b ".
1.6.1.1 Follow manufacturersoperating instructionsfor set upand calibrationof pH meter using buffer solutionsasspecified.
NOTE: To avoid contaminationof buffer solutionsdonot return used solutionsto the container.
1.6.1.2 Immerseelectrode(s)in buffer solution not used forcalibrationand, with stirring,allow reading to
ProcedureNo. Revision No. EffectiveDate Page
PNL-ALO-225 0 03/04/92 2 of 3

I PNL TECHNICALPROCEDURE I
equilibrate, lt shall read within +0.1 pH units ofits stated value. If not, recalibrate.
1.6.2 Sample analysis.
1.6.2.1 Sample shall be at the same temperatureas the buffersolutions (normallyambient temperature). Putsufficient sample to immerse the electrode tip andreferencejunction into a clean beaker, add stirringbar and stir continuously.
1.6.2.2 Allow sufficienttime for reading to stabilize.Stirring shall not be so vigorous that air isentrained into the sample. Record reading.
1.6.2.3 Remove e]ectrod.e.from.samp!e, rinse electrodewith
Glass electrodes are fragile and care must be taken tonot scratch or break the electrodes. Electrodes shallbe replaced when manufacturerspecifiedmaintenanceproceduresdo not return it to satisfactoryoperation.
Electrodes shall be stored according to manufacturersinstructionswhen not in use.
1.7 Calculations
None.
2.0 RECORDS
Records shall be maintained and controlled so as to conform to• _:"::'"::":::!_!i!:'"_"'!_"!i_!_:''i"':_!_!":."_:::::_::::::_i_!_i.........E:"'!i_!_._:i._.:_ii_!_i_._!_i_:_i_i_!_i_!_i_i_i_!_i_i_i!i__r e.q.u.lr ement s of m___::_n__:::::_ _ _::_;,_ _ _:: _ _ _ _ _ _ _ _ _ _ _:_ _ _ :: :: _ _ __
li_:__.':'..!::_::: _:._._::_!::::!:::_:__!_:'_;_:.::: :_.':_!_i:!:!::_: ............................................................................................................................................: .........;......_:........_, ....._ _,..: I_abora_or Recor_lBooRs ICRBs, or::.::_:_:_:_:_..:_::_:_:_:_::_:_:_:_:_:_::_:_:.:.:_._:.::_::_:_._::::::_:._::.:.:..:..._::_...:.:.:.:_.._:::.... Y ( ) .workslieets, wli_cl_ are approved by the Technical Group..Leader, p.rov_de a
• _i_i_i_!_i_i_L.'.i_i_i_F:::__i_i_:::__!_mechanism for control of data and records. :_i_i:i:;_.:_i:,::,::::_:::i_:,_:-:::i:.:::__!___i_i_)_)_i_:_._i_ii_i_::_)_:_)_!)_!_!_i_i_)_i_)_....._ii_..._._ii_)_i_)!)_i._!_::i_i_.............................................................................................................................:r_._k_..._..._.._:.._k_._:) ._.T_.:::._ -_:._!._a::::::._._',_.:::: _._. _.:::::::.__._.,..@_..-::::_::_::N::::._.._'._..._..:_ ::_:_::._:.'_.:_.:)):_:)_::':_:_:_:_:_:_:_:_:_:_:_:_:_:_:_:_:_:_:_:_:_:_:_:___:_:_:_:_:_:___:_:_:_:_:_:_:_:_:___:_:_:_:_:___:_:_:_:___:_:_:_:___:___:_:_:___:_:_:_____:_:_:':_:_:_____:_'______'____:________:_'_:_:_:_:_:___:_:_:_:_;_:_________:___:_____:___:___:,.:.:...,,....,......OoO:.:.,o.,.o
3.0 REFERENCES
Instructionmanual for meter used.
Standard Methods for the Examinationof Water and Wastewater, 1985, 16thEdition.
American Public Health Association,Washington,D.C. 20005. Bates,R.G. 1973, Determinationof pH, Theory and Practice,2nd Ed. John Wiley& Sons, New York, New York.
ProcedureNo. Revision No. EffectiveDate Page
PNL-ALO-225 0 03/04/92 3 of 3

INTERIM CHANGE NOTICE
(ICN) ICN - PNL-ALO-226.2 RO
Page 1 of ,, 1
Document Number: PNL-ALO-226 Revision Number: 0Effective Date
Document Title: Ammonia (Nitroqen) in Aqueous of ICN: 8 / 25/1992
Samples Change Requested by:
Document's Original Author: MC Burt MC Burt
B. Action:
Replace pages 1 through 6.
C. Effect of Change:
Will require use of different source compounds for calibration and controlstandards.
D. Reason for Change/Descriptionof Change:
Separate source for calibration and control standards, see redline in section5.2.
Primary calibration solution is stable for 3 months and need only be dilutedrather than redissolved within the 3 month period, see redline in section 7.0.
Additional reference, see section 10.0.
To clarify and correct typos change ld to 10ml in section 4.5, 100 to250mL insection 5.4, 6.3 to 5.3 and delete as per 8.3 in section 7.3
E. Approval Signatures: Type of Change: (Check one):
(Please sign and date) __ Minor X Major
Process _ ___y.__Quality Department: TLEhlert Date: "_F_/=_-__
Approval Authority: AG Kinq /_) ___ Date: ://__: _
Other Approvals: PKMelethil Date: @ /_S'-/qZ.
D : Date: / /

INTERIM CHANGE NOTICE
(ICN) ICN - _PNL-ALO-226,1 RO:e 1 of 1
A.
Document Number: PNL-ALO-226 . Revision Number: Effective DateDocumentTitle: Ammonia(Nitroqen) in Aqueous of ICN: ._ /11 /Cl_
SamplesChangeRequested by:
Document's Original Author: MCBurt TE Joqes
B. Action:
DeletingACT 89.1 and replacingwith establishedrecordsmanagementpractices.
ReplacepagesI through6 due to new format.
C. Effectof Change:Bringsprocedureinto compliance.
Reasonfor Change/Descrlptionof Change:ACT NOW Directive89.1 no longerin existence.
E. Approval Signatures: Type of Change: (Check one):
(?lease stgn and date) X Minor ___ MajorProcessQualityDepartment: TLEhlert _ _ '__/),.___ Date: _/ _ / 2_
Approval Authority: AGKinq "/_) _._.__'_ / Date: _"/'_ / ,_'_.._
Other Approvals: PKMelethil _ _._J_ Date: 5-/ t k / _?...
: Date: / /

, PNL TECHNICALPROCEDURE ]
TITLE: PNL-ALO-226,AMMONIA (NITROGEN) IN AQUEOUS SAMPLES
APPLICABILITY
This procedure is applicable to the determination of nitrogen as ammonia inaqueous samples: leachates, ground waters, surface waters and waste samples.
DEFINITIONS
None.
RESPONSIBLE STAFF
Cognizant ScientistTechnician
PROCEDURES
1.0 Summary of Method
1.1 Following pH adjustment to above 11, a hydrophobic gaspermeable membrane electrode measures the dissolved ammonia
• in a known volume of sample. The electrode response iscalibrated over a range of several decades with standardsolutions.
1.2 The method is applicable over the range of 0.03 to 1400 mg NH3-N/L.
2.0 Interferences
2.1 Amine compounds are a direct interference. Mercury and silver caninterfere by complexing with ammonia. If interferences aredetermined to be present in sufficient quantity to require aseparation, a distillation procedure is documented on pp. 377-378of Ref. (1).
Author Date Project Mgr. Date QAD Representative Date
MC Burr TE Jones GK Gerke
TechnicalReviewer Date Line Mgr. Date Other Date
ALL ORIGINAL SIGNATURESON FILE
Melethil JM Latkovich
-ocedureNo. Revision No. Effective Date Page
PNL-ALO-226 0 07/15/91 I of 6

s
I PNLTECHNICALPROCEDURE ]
3.0 Tolerances
Tolerancesfor all measurementsmade duringan analysisshallbespecifiedin the followingmanner: I) Statewith a measurementvaluegiven in a methodor 2) as specifiedbelowif not statedwith ameasurementvalue.
3.1 Unlessotherwisespecified,all valuesfor measurementsstatedinthe methods(volume,weight,time,etc.)are approximatevalues.The actualmeasurementsused,however,shallbe within+10% of thestatedvalue.
3.2 When one or more significantfiguresare given to the right of thedecimalpoint,the tolerancelimitis +5 in the next digitlocatedbeyondthe last one stated.
4.0 Apparatusand Materials
4.1 Electrometer,a pH meterwith expandedmillivoltscalereadingbetween-700 and +700 mV or a specificion meter.
4.2 Ammoniaselectiveelectrode. OrionModel 95-12or equivalent.
4.3 Volumetricflasks,100 mL and 250 mL.
4.4 Magneticstirrerand stir bars.
4.5 Pipets,_with disposabletips,100, 250, 1000 pL and _i_mL.
4.6 Balance,analytical,capableof weighingto 0.0001g.
4.7 Beaker,20 mL.
5.0 Reagents
5.1 Deionizedwaterto be used for sample,standardand reagentdilutions.ASTM Type II (ASTMD193)or equivalent.
_:_:_``_,`_._:_:_`_`W_::_:_:_:_._._`_:_` _'_i_!:.@._._:_!_!!!_._!i!_!_:_-_2 !'_..'.._F_.!'.___!:'._...'f_i_. .... _.`.`:._:._:_:_._:..`:_:_:_:_..:_:_._:_._:.:.:_:_..:_.`:_:_:_:_:.::....::..:._._._:_:_:_._:_:_:_:`:.:.:_• :::::::::::::::::::::::::::::::::::::::::::::::::::::::::::::::::::::::::::::::::::::::::::::::::::::::::::::::::::::: :_. :i:_::_!:_:i_:!: :_:i_:!:_:i::!::;_:_.._..:.• )......:.:,:.:......:.:,...,:,.:.:.:.:.:.,:.:.:..,..,.,._.:::,,-:.:_..::.::",:.:,:,-...-.:,.,..,:_....-....:,,...._:_'_:_:_'_'_:_:_:_':_'`_:_:_:_:_:_:_:_:_:_:_:_:_:_:_:_:_:_....,.,,.,:..,..,:.:.;....,.:.:.:,:..:.:::::::::::::::::::::::::::::::::::::::::::::::::::::::::::::::::::::::::::::::::::::::::::::::::::::::::::::::::::::::::::::::::: ::::::::::::::::::::::::::::::::::::._i_::.:_::_i:i:i:::-:::i:..q,_..:_._:_.:q,.,.,.,.,.,_..._:_.:::_i_:i_:_i:_::,_..:_.'_..:i:::_.i:,;:i:i:_:_:_:i:i:i_,.'Y_..:__::.::_:::::i:i_.._'_di_.._:i:i::_:_i:i:i:_ _,i ::::::::::::::::::::::::::::::::::::::::::::::::::::::::::
_::_:::k:_::_.,,,k_:.:::::._:.,_:,.::::,:.-_,_,__::.:,:,qq_.m_:,_:.;-:;:::_,_+;.:_q_:q:,:.:.:.:_,:,::_:::::_q.",_,_,_,_,_,_,_t:::.:._:q:.:,:,:._-:,:,:.'..nv:.:*:.qr,_:_:.;,::u__.: :-L_,__:_" ::_:i:i:i:i:::i:i_:_i_:i:_!:_i:_:_:i_:_:i.m,:_:_:i_:!:.n,i:_:_,..........-.............,.............._..................,.........,....._.:.-...........-......,,.....:_..:._......:..........,...,......................-...-......._.,_._.........._............,..............,.....,,,...._,.....,_._,..............._i$_!_'_:_!:__:_!:_:!:_i'!:!:_ t_ii_:!_'_i_:_:_'.:.::!:!.".':!:!:!:':......................................................................................
i_i___.(. :_':'=::"":"*'i:'''"":"._....._".::::::::::::::::::::::::::::::::::::::::::::::::::::::::::::::::::::::::::::::::::::::::::::::::::::::::::::::::::::::::::::::::::::::::::::::::::::::::::::::::::::::::............:::
:-:::-:o......... ............:::...... .............'
Procedure No. Revision No. Effective Date Page
PNL-ALO-226 0 07/15/91 2 of 6

I PNL TECHNICALPROCEDURE I
5.3 Control Standard, NH4CI Reagent grade. Dry at I00oC for twohours. Dissolve 0.1-0.2 g in water, add 0.5 ml conc. HCI, anddilute to 250 mL. Calculate concentration according to 8.1. Thissolution shall be made fresh daily.
5.4 NaOH, 6 N. Dissolve 60 g NaOH in 100 mL water, cool and dilute tomt.
6.0 Quality Control
All quality control data shall be maintained and available for easyreference or inspection.
6.1 The analytical system shall be calibrated on a daily basis usingfreshly prepared standards.
6.2 A freshly prepared control standard shall be analyzed with eachgroup of samples (20 samples or less).
6.3 A reagent blank shall be analyzed with each group of samples (20or less) to insure that contamination is not occurring.
6.4 After each sample is analyzed a known spike shall be added as afurther test for possible interferencesand to check properelectrode operation.
6.5 Additional quality control (i.e., duplicates, duplicate matrixspikes, etc.) shall be gbverned by the analytical requirements ofthe project or as provided by the Analytical Request Form (ARF),the project Statement of Work (SOW), or the sample TestInstruction (TI).
7.0 Analysis Method
Because of the volatiIity of ammonia only freshly _i_:':_:_i:_m_:':_::_%_i_:m_i_!_Ii__ standard solutions shall be used.
Prepare a series of standard solutionswith concentrations of 1000, 100,10, !- and 0.1 mg NH3-N/L by making successive 10 mL to 100 mL dilutionsof the stock primary calibration standard solution.
Follow directions on page 4 of the ammonia electrode instruction manual,Ref. (2), to set up the electrode for use.
7.1 Test the electrode for proper function as follows"
7.1.1 Put 10 mL water and a stir bar in a 20 mL beaker. Place on
magnetic stirrer and immerse electrode tip. Do not stir so
rocedure No. Revision No. Effective Date Page
PNL-ALO-226 0 07/15/91 3 of 6

, j.
PNLTECHNICALPROCEDURE ]
rapidlythat air bubblesare trappedunderthe electrodetip. Add 250 pL of 6N NaOH.
7.1.2 Add 100 pL of 1000 mg/L standardsolution. When a stablereadingis displayed,recordthe electrodepotentialinmillivolts.
7.1.3 Add 1000 pL of 1000mg/L standardsolution. When a stablereadingis displayed,recordthe electrodepotentialinmillivolts.
7.1.4 The differencebetweenthe firstand the secondpotentialreadingsshouldbe in the rangeof -54 to -60 millivolts.If it is not, referto the troubleshootingsectionof theelectrodemanual.
7.1.5 Removeelectrodefrom the solution. Rinsetip with water.
7.2 StandardSolutionMeasurement
7.2.1 Startingwith the lowestconcentration,pipet 10 mL ofstandardsolutioninto the beakerand stir. Immersetheelectrodetip and pipet250 pL of 6 N NaOH into thesolution. Wait for a stablereadingand record. Lowstandards(and samples)may take as long as 5-10 minutestostabilize,with higherconcentrationsequilibratingmorerapidly.
7.2.2 Rinsethe electrodewith water and repeatstep 7.2.1for allthe standardsolutions.
7.2.3 Plot the standardcurveusingsemilogarithmicpaper. Plotammoniaconcentrationin mg NH3-N/Lon the log axis andpotentialin millivoltson the linearaxis. A regressioncurvemay also be generatedwith the logarithmof theconcentrationused for the X-AxisData and the mV readingfor the Y-AxisData.
7.3 ControlStandard
Make a 10 mL to 100 mL dilutionof the controlstandardpreparedin:""_:K':'_"_f""._:i'"_step_li_i_ and analyzeit per step 7.4..Determinethe resultsas
' ._:_:.:.'..:_.!:_:_:_:_:_:_::':_._!:_:-_:per 8_"_i_'"therecoveryis calculated®iii_;_::_._:);_;::i_:.::_Recoveryon thecontrolstandardshallbe within+ IO%"_T"T_ i_[_ up value or theanalysesshallbe repeated. If stillout, make a new controlstandard. If resultsare stillunacceptable,s-=ethe CognizantScientistfor resolution.
7.4 SampleAnalysisand SpikeAddition
!
Procedure No. Revision No. Effective Date I Page
PNL-ALO-226 0 07/15/91 1 4 of 6

w L - . ,
PNL TECHNICALPROCEDURE 1
7.4.1 Pipet 10 mL of sample into the beaker, stir and immerseelectrode tip.
7.4.2 Pipet 250 pL of 6 N NaOH into the sample; confirm pH _>11using pH paper.
7.4.3 After stabilization record the millivolt reading.
7.4.4 Add 100 uL of 100 mg/L standard solution as a spike forsolutions reading up to 10 mg/L. For samples greater than10 mg/L use 100 uL of 1000 mg/L standard solution. Recordmillivolt reading after stabilization.
7.4.5 Rinse electrode tip with water.
7.4.6 Calculate samples according to 8.2 or 8.4 and spikerecoveries according to 8.3. Spike recovery shall be 80-120%. If recovery is outside range repeat anlayses. Ifstill out see Cognizant Scientist to resolve problem.
NOTE: If the electrode is not to be used for over one weekit should be disassembled and rinsed ipside and out withdistilled water, dried and reassembled. For overnight orweekly storage it should be immersed in 1000 mg/L standardsolution (no NaOHadded).
8.0 Calculations
8.1 Control Standard
c. W {1000) (1000)3.819 V
Where- C = concentration in mg NH3-N/L "_: W = weight NH_CI used, in grams
V = make up volume, in mL
8.2 Sample Concentration
Results are read directly from the calibration curve for liquidsamples, or by the use of the regression equation.
C = A*B
Where: A = dilution _actor, if usedB = concentration from calibration curve
C = concentration in mg NH3-N/L_
I
[ PNL-ALO-226 1 0 ] 07/15/91 1 5 of 6 ]

' 8"
PNL TECHNICALPROCEDURE ]
8.3 Spikerecoveriesare calculatedas follows
R= (T+V)*C- B*T * 100A
Where: R = per cent recovery
C = concentrationfrom curvefor sampleplus spike in mgNH3-N/L
A = concentrationof spike in mg NH3-N/Ltimes the volumeof addedspikein L
B = concentrationfrom curvefor samplein mg NH3-N/LV = volumeof addedspike,in LT = volumeof sample,in L
8.4 Calculationsfor solidsamples
o = C*LW
Where: D = mg NH3-N/kgof solid sampleC = concentration of liquid sample, from curve, in ag
NH-N/LL = volume of leach solution, in LW = weight of solid sample, in kg
9.0 Records
Records shall be maintained and controlled so as to conform torequirements of PNL-MA-70, PAP-70-1701. Laboratory Record Books (LRB)and AnalyticalReportCards/DataSheetsprovidea mechanismfor controlof most records. LaboratoryRecordBooksshallbe used in accordance
h Di :::_:_:_::_::_::._:._:_.:::...:_:..._.._._._:...._._:.:_._...._.:._._._._.:.:_:.:._......._:..:..:::........................................................::::.::::.-.-.-.::...-::::::::::::..::::::::::::....::::::wit,k^_,,_,,_^rT,,,_,_'n"'__,,_,._,_, ,_ _,°n.li_,e.._i_i_i_ii_i__::i_i_i;___
10.0 References
I. StandardMethodsfor the Examinationof Water and Wastewater. 16THEditionpp. 384-386. AmericanPublicHealthAssociationWashington,D.C. 20005.
2. Oriun ResearchIncorporatedInstructionManual,Model 95-12AmmoniaElectrode
:.....:;_._-._:..::!..;:;.........._...×.._;_._,._._..:..,:.:.x.....C_.!............_....,_,......,:,...,._.........................,...,...............: _..:'::'_..::':::::::::'."". ;" _'_,-i""""':""':'. _,': "":" "._ :"""':" ":';';':':,:":"_"::"".;.:"'-".'."'.'-"'_::':_-'."_:_:_::::::_:_;_:_:_:_:_:_:_:_'_:_:_;_:_:_:_:__'_°°'°_'''_°°°_°_''°°° .........
Procedure No. Revision No. Effective Date Page
PNL-ALO-226 0 07/15/91 6 of 6 I

INTERIM CHANGE NOTICE
(ICN) ICN - PNL-ALO-227.1ROle 1 of 1
A.
DocumentNumber: PNL-ALO-227 Revision Number:Effective Date
Docu_nt Title: Determinationof CR(VI)in Aqueous of ICN: _ /_ /(_, Samples
ChangeRequested by:Document's Original Author: MCBurt TE Jones
B. Action:
DeletingACT 89.1 and replacingwith establishedrecordsnlanagementpractices.
ReplacepagesI through7 due to new format.
C. Effectof Change:
Bringsprocedureinto compliance.
D. Reasonfor Change/Descriptionof Change:ACT NOW Directive89.1 no longerin existence.
E. Approval Signatures: Type of Change: (Check one):(Please sign and date)
Minor _ MajorProcess
Quality Department: .,,TLEhlert _ -f-_X_" _/_ Date: _/ _ / _-:_.
Approval Authority: AG Kinq ...i//_- '_J "_/--f-- ./_I Date: '_'/ "_ #/_,_
Other Approvals: JMRobbins_. -_-_ Date: _/ _-/ c_2_.. ,,,/x
: (J Date: , / /

i
I I
TITLE: PNL-ALO-227,DETERMINATIONOF CR(VI)IN AQUEOUSSAMPLES
APPLICABILITy
This proceduremeasure_Cr(VI)colorimetricallyin any aqueoussample;ie.,leachates,gro';ndwaters,etc.
DEFINITIONS/ACRONYMs
Samplebatch is definedas 20 or fewersampleswith the same basicmatrix,le., soils,water,sludge,etc.
RESPONSIBLESTAFF
GroupLeaderCognizantScientistAnalyst/Technician
1.0 Summaryof Method
1.1 The proceduremeasuresonly hexavalentchromiumwhich formsareddish-violetcomplexwith diphenylcarbazidein acid solution.Concentrationis determinedby measuringabsorbanceof solutionsat540 nm spectrophotometricallyand comparingto a seriesof knownstandards.
1.2 The detectionlimitis 2ug Cr (VI).
2.0 Interferences
2.1 The reactionwith diphenylcarbazideis nearlyspecificfor chromium.Hexavalentmolybdenumand mercuryreactwith the reagentbut at muchlowerintensities.Concentrationsas high as 200 mg/L can betolerated. Iron interferesabove5 mg/L and may be correctedfor byusingthe standardadditionmethod. See CognizantScientist.
Author Date ProjectMgr. Date QAO Representative Date
,MC Burr TE Jones GK Gerke
Technical Reviewer Date Line Mgr. Date Other Date
I ALL ORIGINAL SIGNATURESON FILERobblns JM Latkovich
]Procedure No. Revision No. I Effective Date I Page
I PNL-ALO-227 0 J 08/26/91 I I of 7

,rl
PNLTECHNICALPROCEDURE
2.2 Vanadiumalso interferesbut concentrationsup to ten times that ofchromiumwill not causeproblems.
3.0 Tolerances
Tolerancesfor all measurementsmade duringan analysisshallbespecifiedin the followingmanner:I) Statewith a measurementvaluegiven in a methodor 2) as specifiedbelow if not statedwith ameasurementvalue.
3.1 Unlessotherwisespecified,all valuesfor measurementsstatedin the methods(volume,weight,time,etc.)areapproximatevalues. The actualmeasurementsused,however,shallbe within_I0% of the statedvalue.
3.2 When one or more significantfiguresare givento therightof the decimalpoint,the tolerancelimit is _5 inthe next digit locatedbeyondthe last one stated.
4.0 QualityControl
All qualitycontroldata shallbe maintainedand availablefor easyreferenceor inspection.
Two qualitycontroloptions(4.1and 4.2) are definedbelow.Option4.1 shallbe used unlessa Statementof Work (SOW)writtenby aclientdefinesCERCLArequirements.Option4.2 shallthen befollowed. The analystwill recognizethe need to use option4.2when a Chain-of-Custody(COC)definesa Test Instruction(TI).AdditionalQC samplesmay be requestedby a clientin an AnalyticalRequestForm(ARF)or a Statementof Work (SOW),and thesewill beconveyedto the analystthrougha TI.
4.1 Employa minimumof one methodblankper samplebatchtodetermineif contaminationis occurring. Duplicateanalysesshallbe done upon clientrequest.A knownspikealiquotshallbe addedto one samplein each samplebatchto insurethat the procedureis workingproperlyand tocheckfor interferences.
4.2 For a]l SOWs writtenby WHC for CERCLAprotocolrequestsforanalysis,employa minimumof one methodblankper samplebatchto determineif contaminationis occurring. Analyzeat leastone duplicatesampleper samplebatch. A duplicatesampleis asecondsampletakenthroughthe entiresample-nreparationandanalyticalprocess. At leastone matrixspike"and controlstandard sampleshallbe employedfor everysamplebatch toinsurethat the procedureis workingproperly.
Procedure No. _e. _ .....
PNL-AL 0 J 08/26/91 2of7

I , " , ,, , PNLTECHNICAL,PROCEDURE I
5.0 Appratusand Materials
5.1 150 ml beakers.
5.2 100 ml volumetricflasks.
5.3 pH meter.
5.4 500 ml volumetricflasks.
5.5 Spectrophotometer,capableof measuringabsorbanceat 540 nm andscanningfrom 400 to 70Ohm. The HP 8451A DiodeArraySpectro-photometeris used.
5.6 I cm spectrophotometriccuvettes.
5.7 Tefloncoveredstir bars.
5.8 Calibratedpipets,2,5,and10 ml. Othersizesas may berequired.
6.0 Reagents
6.1 ASTM Type II water (ASTMD1193)To be used for sample,standard,and reagentdilutions.
6.2 H2S04,6 N Dilute 17 ml concentratedH_SOwto 100 mli..i.....
6.3 Buffersolutions,.pH4 and 7
6.4 Primarystandard,_Cr_O_,NIST 136c Dissolve70 73 mg in H_O anddiluteto 500 ml. l_i_._ivesa 50 _g/ml solutionwhich is stableforone year. A dilutionis made dail_for standardizationby pipeting10 ml of 50 _g/ml solutioninto a 100 ml volumetricflask. Bring tovolumewith _ater and mix weil.
6.5 Secondarystandard(usedas control),ReagentgradeK_Cr_O_,EMor BakersAnalyzedReagent. Make up same as (6.4). "...._::_
6.6 1,5-DiphenylcarbazideDissolve250 mg in 50 ml acetone. Storeinbrownbottle. Discardwhen the solutionbecomesdarkened.
6.7 Acetone,reagentgrade.
7.0 StandardCurvePreparation
7.1 CalibratepH meterwith buffersolutionsaccordingto themanufacturersinstructions.
Procedure No. I Revision No. I Effective Date IpagePNL-ALO-227 I 0 ! 08/26/91 I 3 of 7

_L TECHNICALPROCEDURE ]
7.2 Pipet 0, 2, 10, and 20 ml of diluted standard into 150 mlbeakers containing a stir bar. This gives 0 10 50, and100 _g Cr(VI). ' '
7.3 Add water to each beaker to bring volume to approximately 50 ml.
7.4 Adjust pH of solution to 1.0_0.3 by adding 6 N H_SO_ dropwiseto stirred solution. ::_::: -
7.5 Transfer solutions to 100 ml volumetric flasks, add 2 mldiphenylcarbazide, bring to volume and mix weil. Letstand 5-10 minutes for color development.
7.6 Measure absorbance according to steps 9.1 and 9.3 for eachstandard solution.
7.7 Scan the highest standard according to step 9.4 andinclude the scan as part of the analysis record.
7.8 Subtract blank (0) absorbance and plot _g Cr (abcissa) vs. netabsorbance (ordinate) on linear graph p,_per. Draw a straightIine best fit of the data. _!i!i)_:!)i_)!i_i_i_i_)_i))!_i)_!!))i))_
7.9 Calculate the slope according to step 10.2.
8.0 Sample Analysis
Concentration of Cr (VI) varies between samples and sample types andsample volumes are sometimes limited. Therefore no definitive guide tosample size can be given. S.Jmesamples also contain components whichcause premature color fading, turbidity and partial wavelengthinterference. Compromises sometimes therefore have to be made withsample size.
8.1 _ control standard is carried through steps 8.2 to 8.4 for eachgroup of samples as required by 4.2. For the control standard, add5 or 10 ml of the solution prepared in 6.5. Recovery should bewithin _I0% of the expected value. If not, repeat analysis; ifstill o_t contact cognizant Scientist to correct problem. Thecalibration blank serves as the reagent blank. Additional blanksmay be submitted with samples.
8.2 Add approximately 40 ml water to a 150 ml beaker containing a stirbar. Immerse the pH electrode and adjust the pH to 1.0 _0.3 with 6N H2S04. Add 2 ml diphenylcarbazide solution, then using:calibratedpipets, add sample in 2 to 10 ml portions, maintaining the pH at1.0, until color appears in the proper intensity (ABS - 2 - 9)Record volume sample used. " " "
PNL-ALO-227 0 _08/26/9! • -_ -C____ L J

PNL TECHNICALPROCEDURE !
If after addition of approximately40 ml sample no color developsand sufficient sample is available, use 50 ml of sample instead ofwate_ and proceed as before.
In general only blanks or samples very low in Cr(VI) would requiresample sizes in excess of 50 ml.
8.3 Transfer solution quantitatively to a 100 ml volumetric flask, bringto volume and mix weil.
8.4 Wait 5-10 minutes and measure absorbance according to steps 9.1 to9.3. For each sample complete step 9.4 and include copy of scan aspart of the analysis record.
Some samples may fade or change color in less than 5minutes. Analysis shall then be repeated and theabsorbance measured immediately.
If sample scan shows a baseline deflection, draw a line fromthe baseline at approximately 440 nm to the baseline atapproximately 630 nm. Net absorbance is then measured from thepeak top to the intersect of the new baseline at 540 nm.
8.5 Select one sample from each batch, treat as described above and add5 or 10 ml of the control standard from step 6.5 as a spike.
Calculate spike recovery as per step 10.6. Spike recovery shall be80-120%.
9.0 Absorbance Measurement
The 8451A is controlled by a touchpad keyboard on the front of theinstrument. Upon turn-on the instrumentsperforms a series of self teststo insure proper operation. Refer to the operators manual if any ofthese tests fail. The instrument shall warm up for about one hour beforemaking measurements.
g.] To set the required wavelength press labeled keysLAMBDA,5,4,0, EXECUTE.
This sets the spectrometer to measure at 540 nm.
9.2 Place a cuvette containing distilled water as referencesolution into the spectrophotometer. Press labeled keysREFERENCE,I:O,EXECUTE. The reference needs to be run onlyonce.
The '1,0' instructs the instrument to integrate the absorbancereading for 10 seconds. This instruction must be given for eachmeasurement.
QI I I I IProcedure No. Revision No. Effective Date Page
!, PNL-ALO-_ I 0 I I 5 of I

PNLTECHNICALPROCEDURE
10.5 To calculate control standard
%Rec= C * 100B
Where %Rec= per cent recovery of control standardC I ug Cr from curveB I ug Cr taken (concentration * ml taken)
10.6 To calculate spike recovery
%Rec= (C- R) * 100A
Where %RecI per cent recovery of added spikeC = _g Cr in sample plus added spike (from curve)R = _g Cr found in sample without spike (step 10_3)A = _g Cr added as spike (concentration * ml taken)
10.7 To calculatemicrogramsCr/g for leachesof solidmaterials
T _ CBVW
Where T = microgramsCr/gC = microgramsCr from curveV = volumesample,in mlW = weight solidsample,in grams (Indicatewhethersolidsampleis wet or dry weight).B = volume (orweight)waterused in leach (Ig=Iml)
note"_g Cr/g = mg Cr/kg
11.0 Recordswill be maintainedand controlledso as to conformtorequirementsof PNL-MA-70,PAP-70-1701. LaboratoryRecordBooks (LRB)and AnalyticalReportCards/DataSheetsprovidea mechanismfor controlof most records. LaboratoryRecordBookswill be used in accordancewith+_^_,,_n..^rT,,._._,_.,D..^_+,_ __......,.^ on 1:;_;_i_s:_a___h:e_i;::;_e_o____::::_:::::::_:::::_::__::":::::::::::::::::::'_:_::::::::::'::::'::::::::::*::_:::::_:::*:,_a:gemen_:**::::::::::::::::::::::::::::::::':prate]_e_.::::::::::::::::':.........____________________________________________________________________________________________________`___________________________;___:_;_;_____;_________.:.,.;.:.;.;.;.;.:.:.;...:.;.:.:.:.;.;..;,;.;.;.;.;.;.;.;.;.:.;.:.:.,.;.;.;...;.:.;.....;.;.,
12.0References
StandardMethodsfor the Examinationof Water and Wastewater. 16thEdition pp.201-204. AmericanPublicHealthAssociation,WashingtonD.C. 20005
HP 8451A DiodeArraySpectrophotometerOperator'sManual,HewlettPackardCorp.
I I IProcedure No. Revision No. Effective Date Page
PNL-ALO-227 0 08/26/9! 7 of 7' ' I I

4
PHYSICAL ANALYSIS LABORATORYHEWLETT-PACKARD CORVALLIS
II
Chromium, Hexavalent Cr 6+ Veruion 1.0
AppllcablllU_SCOlm. Partof vee_'y ene/ysls of _lusulal was_wa_ei Incompll_mcevim _beIndusu_ wu_ewa_r d/sc]_e pe_mi_No. 4, iss_l Io Hevleu-l_kard, Corvall_by the City ofCozval]is.
Me_ originator/dam: JamesM. Robbins September1,1990
PTepalutlon of smldard soluMons:
SIocksolu_ns"
Dllue 25 mLof a 1000 t._g/mLCrato_c absorptionsandard ( as K_ ) to 500 mL in avo_ flask lo yietl a _ I_g/mLCr6+ sunnd_t solution. Ttunsfer_oa _ mLn_ov r_outhLDPEbottle(Na]gens). Al_n-_t_ly dissolve 141.4 mg of K2Cr_/in disu_l wagr anddilu_ _oI000mL tor_kea50p,g/mLCr6+sandardsolution.
50mL ofCr6+s'_L_dardsolutionIo500mL inavolumeuicflasktoy_elda5 l._g/mLCr6+st_'_lardsolution.Sandardsolutlons_ verysableendcanbeusedass_mdardsforoversixmonths.S_rewithlid1_htlysea]exl1opreventevaporationofsolution.EvaporationratethroughpolyethyleneisapproxitmtelyI% ayear().
Workt_ Sa_ards:
Preparevorki_sla0_dardsolutionsdailyusingthe5l_g/mLCr6+s1_dardsolution.Transfer8,4,2,andIml.ofthisstandardIosepe_ateI00rpLvolumetricflosks.Add50mL of0.3N EI2SO4dilute_ volumewithd_ wagr.Pzt_ureyieldsworkingsIL_lardsconteining0.40,0.20,0.I0and0.05llg/mLCr6+,respec_cely.Prepareb]_kcon1_ini_50mL of0.3N H2SO4 anddilute_oI00mL volumewithdist01ed._a_er.
Rugemt preparation"
S_u'_.-a_/_'/_4), 0.:?O/q':_fer 8.3mL ofconcentratedH2SO4 _ acleanoneli_ercleanHDPE w_d::.mouthbottlecon1_ini_I000mL ofdistilledwater.Mixwell_ ._.elda 0.3NH2SO4 _lut_nnwithanacidityofapprox#nate.lypH 0.52.
D_.p_e_._.,_u'b,_n_/'e.'_/u/%_/7:Dissolve 0.5mg of1,5-dip_nylcarb_,ide(1,5-diphenylcarbo)'_vdra_ide)in100r_,1.oface_ne.S_zeina 125mL narrowmouthbrownplas_bottle.Disc_.._w}_nsolutionbecomesdiscolored.
/_. p/-/_-.'.O:Dissolveconten_soffivepHydrionbuffercapsulesin500mL ofdistilledwateri_tavolumetricflask._fer _oalabelled500 mL widemnuthHDPE bottle.
Apparatusand glmsuwaru:
HP8450AUV/VISspectrometerAdsorp_n_Us,i-cre(mashedpair)pH meterandelec_deF_.u_r_elG]_ssbeakerVolt_metricflaskI00mLfilterpaper,WhaTman#44,15cm dia_r_ter.
1

h-
PHYSICAL ANALYSIS LABORATORYHEWLETT-PACKARD CORVALLIS
I_ede_es:
ofFeandCu atconcentrationsgreaterthanoneppm cencausecolordevelopmentwith1,5-diphenylcarbe_deresultinginapositiveinterferenceinCr6+(S_ndardMethods,1989).LargeexcessesofHg,V andhexava]entMo canalsocauseminorinterferences.MeasureFeandCuconcentrationbyatomicabsorptionIodelemm_effsuchaninWrferencecanoccur.Fortheserarecasestheremovalofin_xferenlswithCupfen'onusingaCHCI3 Ikluid-liquidextractiondescribedinS_sndardMethods(I989)isrecommended.
l_m_memt t_h3#ratio_"
Measm__ forthetvoprecleanedl-creabsorptioncellsaf_r_ them_ distilled_a_r.Me_su_absorbancesofsandardsandcalculale_nessionequationrelatingconcentrationabsorbance.
Amlysis pmeedmu:
Fil_rapproximaelyI00mL ofw_ewaer throughaWhatr_an#44f-_erinloa125mL beaker._er 500_LLofsolu_n_ a!0mL volun_tr_flask,dilute_ovolumeandreserveforfluorideenalysis.If[_Irateisturbiditrillbe_ _ouseafinerffi_rsuchas0.2nm Nucleoporeorm0liporetypefi_rdisks.
"llunsfer50mL offil_red_a_e_a_rintoalabelledI00ml,volumetr_flesk.Dilu__ovolumewith50mL of0.3N H2SO4. Prep_evo_ s_dardsandablinkcon_ini_asdescn'bedinsit,lardpmpemtionsection.Pipet2mL of1,5-diphenylcarbszidesolution_oeachvolumetricflaskandallow_amdercolor_odevelopfor10rain.Transferportionofthesolutiontoa l-cmadsorptioncellandm_au_ absorbanceat_ nm ash_gaHP 8450AUV/VISspectrometer.Use._condl-cmadsorption_ _h distilledva_rasareference.Colorcomplexiss_bleforatleast2hours.Calibm_pH r_r withpH 2.0bufferandcheckacidityofSemplesolutiontoensureitiswithinpH.of1.0-1.3.
Calculations:
Determi_concentrationofCr6+m samplesolutionsfromregressionequationdescribing.,calibration
curveofconcentration_ absorbancefortheCr6+s_and_tls.Ifallabsorbancevahtesforsamplesarebelowthatofthelo_t z_dardthensamplecone.entrainscanbedetermir_edbysolvingtheequation:
Y = M(x) +SwhereY iseqtml_oconcentrationofinsolution,M istheslope(concentration/absorbance),andB isthecorc.entrationm_i_.eptoftheb]m_kabsorbar_e.Sincet_samplewasdflu_l1:IusingH2SO4,theCr6+concentra_nintheorigir_vastewatersampleisob_inedbymultiplyi_theCr6*concenb-ation(r_/L)bytvo.
Safetyconsiderations:
Hexavalentchromiumishighlytoxicandi_solutesshouldbehandledwithcare.Cellmembr'_esarereadilypermeable_ Cr6+but_t Cr3+. ,buceadsorbedCr6+isreducedtoCr3._ndboundmavidenu_uberofcoordlna_complexeswitllblo_olec_es.Mar_es_atlonsofioc_lCrexposureincludesiamandmuco_smembraneirri_.tionandchroniculcerations.Systemiceffec_includebronchialas_hemaandrenalandliverdisf_mc_ion.Researchonoccupa_ior_01yexposedworkersindicatesCrisveryslowlyeliminatedfromhumantissuesoveraperiodofseveraldecades(TsalevandZaprianov,1983).ConcentratedCr6+solutionsshouldbetreatedasatoxicwasteanddisposedofbyHP healthandsafe.tydep_nt persora_l.
2

PNL TECHNICAL PROCEDURE I
PNL-ALO-228DETERMINATION OF HYDROXYL (OH')AND ALKALINITY OF AQUEOUSSOLUTIONS, LEACHATES AND SUPERNATES
APPLICABILITY
This method is applicable to aqueous samples which may contain any or all ofthe titratable bases; carbonate, bicarbonate and hydroxyl.
• Material-Aqueous samples, leachates, supernates with a pH>7.
• Range-From 0 to (by dilution) any required concentration.
• Reliability-Dependenton the complexity and make up of the sample. Forsamples containing only hydroxyl, accuracy and precision are < _+5%orbetter.
• Interferences-Borates,phosphates, silicates, other bases or anyhydrolyzable ions which may be present.
DEFINITIONS
N/A
RESPONSIBLE STAFF
• Cognizant Scientist• Analyst
PROCEDURE
1.0 DISCUSSION
Aqueous samples are titrated potentiometrically versus a standardized strongacid. The titration curve is plotted automatically by the titrator andinflection points are marked. Samples containing only hydroxide will have atypical strong base, streng acid'S' shaped curve with an inflection pointnear neutral pH (7). Depending on components present, samples containingcarbonate, bicarbonate and hydroxyl or interferenceswill have two or moreinflection points and the shape of the curve will vary depending onconcentrati-_ of the various components. All equivalence points within thespecified ranges will be assumed to be due to carbonate, bicarbonate andhydroxyl. With complex samples containing interferences this may be an
Author Date ProjectMgr., ,_ ,/_--') Date QADRepreNsentattve - Date
TE Jones _) .,/- /Li_,-GK Gerke ,_'_f-,<'+K'(-;
__I/RI_w 7 Date Line Mgr. /I.._)/_ f/ Da_ Other _ ' Date
Procedure No. Revision No. /F_,ec_yve;D_t_)_ |_ Page
PNL-ALO-228 0 _/ v_ I of 7

PNL TECHNICALPROCEDURE
complex samples containing interferences this may be an erroneous assumption.Hydroxyl and bicarbonate do not coexist in the same solution.
1.1 Tolerances
Tolerances for all measurements made during an analysis shall bespecified in the following manner: I) State with a measurement valuegiven in a method or 2) as specified below if not stated with ameasurement value.
.. Unless otherwise specified, all values for measurements stated inthe methods (volume, weight, time, etc.) are approximate values.The actual measurements used, however, shall be within +10% of thestated value.
• When one or more significantfigures are given to the right of thedecimal point, the tolerance limit is +5 in the next digit locatedbeyond the last one stated.
2.0 APPARATUS
• Recording automatic potentiometric titrator, Brinkmann 636 Orequivalent.
• Digital buret compatible with titrator, 5 or 10 mL capacity.
• Beakers, 30 or 50 mL.
• Electrode, combination pH.
• Stir bars, teflon coated.
• Pipets, as required. PerFormance checked unless glass pipets are used.
• Magnetic stirrer.
• Volumetric flasks, 1000, 500, 100 mL.
3.0 REAGENTS
3.1 pH buffer solutions, 4, 7, 10. Use commercially available certifiedbuffers.
3.2 0.I N HCI. Dilute 8.3 mL nf co_ce,_trated reagent to I liter.Standardize versus 0.I N NaOH.
3.3 0.I N NaOH. Weigh 4.0 g NaOH, dissolve in deionized water and make tovolume in I000 mL volumetric flask. Standardize versus primary standardgrade potassium acid phthalate.
Procedure No, Revision No. Effective Date Page of
PNL-ALO-228 0

I PNL TECHNICALPROCEDURE J
3.4 0.1 N KHC_H404. Baker Analyzed Reagent, Primary Standard grade orequivalengc or NIST material. Dry reagent: at 120 _ for two hours. Cooland weigh 20.4 g and transfer to a 1000 mL volumetric flask. Dissolvein deionized water and make to volume. Calculate concentrationaccording to Section 7.1.1.
3.5 0.02 N HC1. Dilute 100 mL of standardized 0.1 N HCl to 500 mL.
3.6 Sodium carbonate, ACS reagent grade.
3.7 Sodium bicarbonate, ACS reagent grade.
4.0 STANDARDS
The solution of potassium acid phthalate is stable and if kept tightlystoppered may be kept for one year from preparation date. The HC1 solutionsare also stable if properly stored but shall be performance checked. The NaOHsolution is stable if properly stored but shall be discarded when carbonateprecipitate begins to form.
4.1 An aliquot of the standardized NaOH is titrated versus the HC1 used toverify its concentration each day titrations are performed.
4.2 A freshly prepared control standard _f sodium carbonate and sodiumbicarbonate is titrated each day titrttions are performed. This controlis not required if the sample contains only hydroxyl, which isascertained from the shape of the titration curve. Dissolve 0.53 g ofdried sodium carbonate and 0.84 g of dried sodium bicarbonate indeionized water and make to 100 mL. This gives a solution 0.1 N incarbonate and 0.1 N in bicarbonate. Concentrations are calculatedaccording to Section 7.1.4 and 7.1.5.
5.0 QUALITY CONTROL
5.1 Standardization. At least three aliquots of potassium acid phthalateare titrated versus 0.1 N_NaOH according to Section 6.2 and calculatedaccording to Section 7.1.2. The agreement between replicates shall bewithin 0.005 _N, if not, repeat analysis. The average value is used asthe titer value. Three aliquots of the 0.1 N HC1 are titrated versusthe NaOHaccording to Section 6.2 and the results calculated accordingto Section 7.1.3. Agreement between replicates shall be within 0.005 N.If the calculated values are not within the specified values repeat thereplicate titrations. If the values are still not within the specifiedvalues see Cognizant Scientist before proceeding. The average value isused as the titer value. Depending on the samples to be titrated,either the 0.1 _NHC1 or the diluted 0.02 N HCI is used in the buret.See Cognizant Scientist.
Procedure No. Revision _lu. Effective Date J Page ofPNL-ALO-228 0 _FC _J';_ tg,(.j_'_i I 3 of 7

I PNL TECHNICALPROCEDURE
5.2 Control. An aliquot of the carbonate-bicarbonatesolution is titratedif the sample(s) contain those components. Results shall be within0.01 N of the make up value. Should the sample contain only hydroxyl asdetermined by the titration curve shape, the NaOH is the control.
6.0 ANALYSIS
.6..IInstrument Set Up
6..1.1Follow manufacturers instruction manual for proper set up of theBrinkmann titrator. On turn on the display will indicate all '8'sand then display 36 0.000. Enter date as ddmmyy, then press ENTERfollowed by 100 GO. This is the electrode calibration mode. Thedisplay then reads C 25.000. Press '25' (or current temperatureif not 25"C) ENTER,GO. The display will then read PH.
6.1.2 Immerse the electrode in pH 10 buffer, start the magnetic stirrer,enter the pH of the solution and press ENTER.
6.1.3 When the display again reads PH, remove the buffer and replacewith pH 4 buffer. Enter '4' and press ENTER.
6.1.4 When display again reads PH, press GO. The calibration data isthen printed. The display will read GO. Press GO, then 101 GO.
6.1.5 Replace the buffer solution with pH 7 buffer and press MEASURE.If the reading is not within ±0.1 repeat steps a-c. Measurement
" is stopped by pressing '5'.
6.1.6 Pressing 101 loaded a built-in program which will titrate pHversus volume with automatic inflection point marking, properheading, volume titrant used to endpoint and pH at each end pointprinted out. The titrator is now ready for operation.
6.2 Sample Analysis
The volume of sample to be used in the titration is a function of theconcentration of titratable components. Sample volume may range from a fewmicroliters to 30 or more milliliters. The amount of sample used needs to belarge enough to make the initial pH in the titration vessel greater than 9,but not so large as to exceed the volume of the titrant buret. With mostsamples this will require trial and error to determine optimal sample size.For most leachate and supernate samples the 0.02 N HCI is appropriate. Forhigher concentration samples the 0.1 N_HCI is required. This selection ismade by the Cognizant Scientist.
6.2.1 Put 20-25 mL of water into the titration vessel and immerse theelectrode and titrant tip. Pipet 100 /_Lof sample into thevessel.
,, i
Procedure No. Revision No. Effective Date Page of
PNL-ALO-228 0 _'_"" :_ 4 of 7

PNL TECHNICAL PROCEDURE J
6.2.2 Press the MEASURE key. If the pH reading is not above 9 continueadding sample until it is above g (or 10). If after the additionof approximately 5-10 mL the pH is still not above 9 a much largersample will probably be required. Press the _5' key to stopmeasurement.
6.2.3 Remove electrode and tip from solution and rinse. Pour outsolution and rinse beaker. Pipet 20-30 mL of sample into thebeaker and immerse electrode and tip. Press MEASURE. If the pHis still below 10 there is no hydroxyl present and the sample maybe titrated, pH measurement is stopped by pressing '5'.
62.4 Titration is initiated by pressing GO. The titration is automaticand inflection points will be marked as the titration progresses.At the completion of the titration the pH of the inflection(end)point(s) and volume of titrant used will be printed.
6.2.5 Raise the electrode and rinse with water. Pour the sample out andrinse the beaker with water. Proceed to the next sample.
6.2.6 When analyses are completed the electrode shall be storedaccording to the manufacturers instructions. Titrants andstandards shall be tightly stoppered to prevent evaporation andc_ntamination.
7.0 CALCULATIONS
7.1 Standardization
7.1.1 Potassium acid phthalate
N = g 1000M V
Where,
N - normalityg = weight used, in gramsM = gram molecular weight, 204.23V = volume, mL
I Procedure No. a Revision No. Effective Date Page of|PNL-ALO-228 0 5 of 7

, , ,,, i
PNL TECHNICAL:PROCEDURE
7.1.2 NaOH
NI = N VVl
Where,
NI = normality of NaOH= normality of potassium acid phthalateV = volume of potassium acid phthalate used, mLVI = volume of NaOH used, mL
7.1.3 HCI
Nz " tWl._._....._.
Where,
N2 = normality of HClNI = normality of NaOHVz = volume of HCI, mL
VI = volume of NaOH, mL
7.1.4 Sodium Bicarbonate
Nb = _q I000M V
Where,
Nb = normality of N.aHCO3g = weight used, in gramsM - gram molecular weight, 84.00V = volume, mL
7.1.5 Sodium Carbonate
Nc = (2) q 1000M V
Where,
Nc = normality of N.a2CO3g = weight used, in gramsM = gram molecular weight, 105.99V = volume, mL
Procedure No. Revision No. Effective Date Page of
MAR O 7 I@8_ 6 oF 7PNL-ALO-228 0

g o
IPNL TECHNICAL PROCEDURE I
7,,.2......Samples
Ns - N1_._1s
Where,
N - normality of sampleNsV2 - normality of HCI2 " volume of HCl, mLVs - volume of sample, mL
Samples with strong acid-strong base'S' shaped titration curves may becalculated with this formula and the results reported as hydroxylconcentration. Samples with strong acid-weak base curves and/or multiple endpoints will be calculated using Section 7.2 and the following scheme. Endpoints in the range of 8.0-8.6 are designated 'P' and end points in the rangeof 4.2-4.8 are designated 'T'. Normalities are.calculated using the aboveformula for 'P' and 'T' values and the alkalinity is derived from thefollowing relationship.
Titration Hydroxyl Carbonate BicarbonateResult Normality Normality Normality
P=O 0 0 TP< I/2T 0 2P T-2PP =I/2T 0 2P 0P> I/2T 2P-T 2(T-P) 0P:T T 0 0
8.0 RECORDS
Records shall be maintained and controlled so as to conform to requirements of" Manual PNL-MA-70, Procedure PAP-70-1701 "Records System." Laboratory Record
Books (LRBs), or wor!csheetsapproved by the Technical Group Leader provide amechanism for control of data and records. LRBs shall be used in accordancewith the ACT NOW Directive 89.1.
g.o REFERENCES
Instruction Manual for Brinkmann 636 Titroprocessor, Brinkmann Instruments,Cantiague Road, Westbury, NY.
Standard Methods for the Examination of Water and Wastewater, 1985, 16thEdition, American Public Health Association, Washington, D.C. 20005.
Procedure No. Revision No. Effective Date Page of
PNL-ALO-228 0 :;_" _ i_ 7 of 7

..
TITLE: PNL-ALO-229,(Replaces2-30.8), URANIUM BY AUTOMATED POTENTIOMETRICTITRATION
1.0 APPLICABILITY
Uranium is reduced to U(IV) by excess Fe(II) in strong phosphoric acidand sulfamic acid. Excess Fe(II) is selectivelyoxidized by nitric acidin the presence of Mo(VI) catalyst. The U(IV) is titrated usingstandard potassium dichromate solution to a potentiometricend point.Vanadium (IV) solution is added before the titration to sharpen the endpoint.
(a) Material Uranium bearing materials, solid and solution.
(b) Range Twenty to 30 mg is the preferred amount of uraniumfor each titration, however, as little as 5 mg maybe successfullytitrated.
(c) Reliability Relative standard deviations from 0.025 to 0.10%are obtained for a variety of sample materials.
(d) Interferences The method is insensitiveto large concentrationsof diverse ions often present in uranium samples.Tc, Ru, Os and halides interfere and may be removed
by fuming with H2SO4. Mo interferes in thepresence of nitrate, which is removedby fumingwith sulfuric acid. As, Sb, and Sn interfere ifpresent in reduced form; the interferenceisremoved by preoxidizingthe sample and/or thecontaminatedreagent. V, Mn, Pd, Ag, lr, Pt, Hg,and Au interfereand may be removed by ion exchangeor liquid-liquidextraction.
2.0 DEFINITIONS
NONE
3.0 RESPONSIBLESTAFF
Analyst
Author Date ProjectMgr. Date r_ADRepresentative Dat_;
McBurt 6/15/88 N/A LJ Ethridqe 6/16/88
Technical Reviewer Date Line Mgr. Date Other Date
All originalonflsi_naturesAmacker Jr. ,/17/88 JJ McCown
dure No. Revision No. Effective Date Page
PNL-ALO-229 0 6/21/88 I of 14

I PNL TECHNICALPROCEDURE ]
4.0 PROCEP,URE
4.1 DISCUSSION
The titrimetricdeterminationof uranium followi_ ferrous ionreductionwas first described by Davis and Gray. Up to 300 mgof uranium was reduced to U(IV) by an excess of Fe(II) in strongphosphoric acid in the presence of sulfamic acid. The excessFe(II) was selectivelyoxidized by nitric acid in the presence ofMo(VI) catalyst. The U(IV) was titrated to a colorimetricendpoint using barium diphenylaminesulphonate indicator and standardpotassium dichromate titrant. The reaction was very sluggish nearthe end point.
The titration sensitivityand end point were improved by Cherry'suse of an emperometricend point detection._} The method wasfurther improved by the discovery at the New Brunswick Laboratory(NBL) that V(IV) added prior to the final titration sufficiep_lysharpened the end point to allow a potentiometrictitration._cjAdditional studies at NBL have characterized interferences,applicabilityto uranium product materials and scrap, and methods
of automati_S) Several automation efforts involvingvolumetric and electrometri¢I_)titrations have been reported.
This procedure has been modified to allow the titration of 20 to30 mg of uranium. Modifications include aliquoting of sample byweight, reducing volume of solution titrated by a factor of 3,increasingthe time for the reduction to 60 seconds and dilutingwith a vanadyl sulfate--sulfuricacid solution. Thesemodifications reduce the volume of liquid waste produced, which isimportantwhen plutonium is associated with the uranium. Inaddition, this modified method allows easy coordinationof sampledissolutionwith the plutonium amperometricmethod when mixed
oxide samples are involved (see Method PNL-ALO-222). j
The conditions required to reduce uranium quantitativelyand tooxidize Fe(II) selectivelyare quite specific. Careful attentionmust be given to solution volumes, reagent concentrations,reaction times, and reaction temperatures. For example, a samplevolume of less than 3 ml is necessary to maintain the requiredphosphate concentrationfor the initial uranium reduction.Solution volumes and reaction times can be controlled moreprecisely using computer controlled dispensing devices and samplepreparation stations. The system currently in use at PNL consistsof a modified Metrohm 624 turntable and a Hewlett-Packard85Acontrol computer coupled with control hardware. The modifiedturf,table has two titration stations, one for titration and theother for the oxidation state adjustment chemistry. Included isan air driven magnetic stirrer used in the pretreatmentsteps so
Procedure No. Revision No. Effective Date Page I O
PNL-ALO-229 0 6/21/88 2 of 14 ]

PNL TECHNICALPROCEDURE
that nothing contacts the sample solution and thus needs rinsingprior to titration. Each sample is prepared at station one androtated to station two for the potentiometric titration.
To maximize precision a Brinkmann E636 Titroprocessor is used toperform the titration. This instrument measures the rate ofpotential change Der unit of titrant addition and slows down theaddition rate near the end point. The titration curve is plottedand the exact end point is determined and marked by theinstrument. Once the vanadyl sulfate solution is added, thetitration must be completed within five minutes.
Special care is taken in storing the standard solutions. Thedichromate titrant dispensed by the digital buret is protectedfrom evaporation and dust by a wine fermentation lock attached tothe reservoir of the buret. Air entering the reservoir (andleaving when the room temperature increases) passes through adichromate solution of the same concentration as in the reservoir.The uranium NBS 960 calibration standard is stored in tightlycapped and taped glass bottles.
Solid samples are dissolved by fusion with sodium bisulfate at600°C, followed by dissolution of the salt cake in 14 sulfuricacid. The sulfate solution is then analyzed directly for uranium.
Solutions containing high-level nitrates or halides must be fumedwith sulfuric acid first to remove the interferences.
A small positive bias, which is reasonably constant, is associatedwith the analysis. This bias is apparently caused by cumulativeoxidation state changes in the vanadyl sulfate solution. Toprevent air oxidation of the V(IV) to V(V) in the vp,qadyl sulfatesolution, the solution is made 14 in sulfuric acid. The biasis determined by the analysis of the uranium metal standard.
4.2 APPARATUS
(a) Bottle. Dropping, polyethylene,60-ml, Nalge 2411, used asweighing buret.
(b) Bottle. Dropping,polyethylene,30-ml, Nalge 2411, used asweighing buret.
(c) Bottle. Washing, Teflon, 500-ml.
(d) Titrator. Metrohm (Brinkmann)E636 equipped with an E635buret and a 5-ml buret readable to 0.001 ml.
(e) Electrode. Platinum,Brinkmann EA-202.
,dure No. Revision No. Effective Date PagePNL-ALO-229 0 6/21/88 3 of 14

I I(f) Electrode. Reference, saturatedcalomel, Brinkmann EA-404.
(g) Hewlett-Packard85 with IEEE-488 interface.
(h) Hewlett-Packard3488A Control/Switchunit.
(i) Metrohm (Brinkmann)624 turntablemodified to have twotitration stations with a magnetic stirrer built into oneraise/lower head.
(j) Reagent addition valves, all Teflon, electrically operated.
(k) Modified 100 ml titration beakers. Top flared to fit snuglyin plastic turntable beaker.
4.3 REAGENTS
(a) Oxidizing Acid. 8M HNO., 0.24M sulfamic acid, and 0.4%ammoniummolybdate. DiSsolve3.2 g of a_onium molybdate in200 ml of distilledwater and dissolve 18.8 g of sulfamicacid in 200 ml of distilled water. Combine both solutions
and add, with $tirrinq, 400 ml of 15.7M HNO3. Replace withfreshly prepared reagent after one week.
(b) PotassiumDichromate litrant. Prepare as follows:
Weigh about 6.8-7.0 g of NBS potassium dichromate into acalibrated 2-( volumetric flask. Dilute to volume and mixthoroughly. Calculate the titer (mg U/ml of solutionequivalent)using Part (a) of Section 4.8.
(c) Reducing Acid. 11.8M phosphoric acid, o.OgM ferroussulfate, 0.17M sulfuric acid. Dissolve 25.2 g of ferroussulfate heptahydratein 200 ml of distilled water. Add,with stirrinq,9 ml of 18M H_SO.. Dilute to I-( withpre-oxidized14.8M_H_PO4.-Tli_eI_PO4 is pre-oxidizedbyadding 10 drops of 4% potassium'dichromateper 4-( of H3PO4.Replace with freshly prepared reagent after one week.
(d) Sulfamic Acid. 1.7M. Dissolve 33.0 g of sulfamic acid in200 ml of distilled water.
(e) Sulfuric Acid. I_Nand 18M (96%).
(f) Vanadyl Sulfate. O.O08_Min IN_sulfuric acid. Dissolve5.6 g of purified vanadyl sulfate dihydrate in about 2liters of distilledwater. Add, with stirrinq, 98 ml of 18MH.SO4. Cool and dilute to 3.5 liters with distilled water.Store in glass or Teflon bottle.
ProcedureNo. Revision No. EffectiveDate Page
PNL-ALO-229 0 6/21/88 4 of 14

Reagents are dispensed by gravity from vessels located ontop of the glove box. Feed lines should be flushed withfresh reagents prior to sample analysis. The valves arecontrolled from the HP3488A. To actuate (open) a valve,press CLOSE (to close relay which opens the valve), pressthe three digit channel number, then press EXECUTE. Toclose the valve press OPEN (to open the relay), press thechannel number, then press EXECUTE. Channel numbers are:
100 SULFAMIC ACID101 REDUCING ACID102 OXIDIZING ACID103 STIRRER (AIR)104 VANADYL SOLUTION105 RINSE106 STIRRER (ELEC)107 BEAKERS UP108 BEAKERS DOWN109 ROTATE TURNTABLE
The dichromatedelivery line requires flushing with twoburet volumes (10 ml) to clear any air bubbles which mayhave formed. This should be done immediatelybeforetitrations begin if the system has not been used for morethan eight hours.
4.4 STANDARDS
(a) Calibration Standard. The calibration standard is asolution having about 30 mg U/g of solution prepared fromuranium metal. Prepare the standard as follows"
I. Cut off an appropriate size piece of NBS SRM 960uraniummetal. Immerse in warm 84 HNO3 until themetal becomes shiny and all traces of oxide areremoved. Rinse three times in distilled water, rinsewith acetone, and dry in a vacuum dessicator.
The weight of metal (size of piece) taken and theweight of final solution (Step 2) should produce auranium concentrationof about 30 mg/g.
2. Weigh the piece to the nearest 0.1 mg and dissolve itin a minimum amount of 84 HNO3. Add an approximatelyequal volume of IM H.SO.and evaporate over low(approximatelyI00°C_ h_at to a moist residue. (Thisstep may be repeated if a large volume of 84 HNO3 wasused for metal dissolution.)Dissolve the moistresidue in a minimum volume of IN HzSO4.
ProcedureNo. Revision No. EffectiveDate Page
PNL-ALO-229 0 6/21/88 5 of 14
3. Transfer the solution quantitativelywith IN H2S04toa tared glass container of appropriatevolume. Weighthe container and solution and calculate the uraniumconcentrationusing Part (b) of Section 4.8.
4. Transfer aliquots of the standard to 30-ml plasticdropping bottles for dispensing as required.
(b) Control Standard. A mixed oxide pellet is used as a controlstandard. The material has been used in the SLE program andhas an established value for both plutonium and uranium.The value establishedfor U is 67.81 + 0.16% in 1982. The
same material is used for Method PNL-ALO-222. Prepare the Istandard as follows: I
I. Weigh three pellets to the nearest 0.1 mg into aquartz Erlenmeyer. Proceed as per Section 4.7.1 (a)through (e). Transfer to a tared bottle using INHzSO4 and dilute to give a concentrationofapproximately28 mg sample/gramof solution.
2. Weigh solution to the nearest 0.1 mg and calculateconcentrationusing part (b) of Section 4.8, Method
PNL-ALO-222. I
3. The solution is stored in 5 ml break seal ampules.One ampoule is sufficient for duplicate titrations.
4.5 SAFETY
(a) Plutonium-bearingmaterials are radioactiveand toxic.Precautions are required to avoid contaminationof thelaboratory and personnel.
(b) Observe the general laboratory safety rules.
4.6 QUALITY CONTROL
4.6.1 Calibration
Calibration is made by analyzing at least three, butpreferably four, aliquots of the calibration standardduring each 8-hr shift in which uranium analyses aremade. Take from 20 to 30 mg of uranium and analyze byfollowing Subsection4.7.2. Calculate the calibrationcorrection using Part (c) of Section 4.8.
Procedure No. Revision No. Effective Date Page
PNL-ALO-22g 0 6/21/88 6 of 14

mi i
4.6.2 Control
Control is established by obtaining satisfactory resultson the control sample. Control requirements are asfollows:
(a) Analyze the control standard by followingSubsection 4.7.2 and calculate the results usingPart (d) I of Section 4.8.
(b) Plot the results of the control sample on thecontrol chart and determine control status."
(c) The control standard is analyzed at least onceduring each 8-br shift in which samples areanalyzed. If possible,two control standards areanalyzed. They should be separated in time suchthat one is analyzed at the beginning of the shiftand the other in the middle or later part of theshift.
(d) Systematic error (or bias) is monitored byaveragingthe control standard results for fivedays analyses. The data from the current days
analysis plus_,the previous four analyses areaveraged as X.
Bias, b, is defined as b - X - Xa, where Xa is theac:epted value for the control std.
Percent bias is calculated as follows,
% Bias =Xa
(e) Record % Bias as a deviation from a straight line(zero) on a control chart. Positive or negativetrends warrant attention to standards and/orprocedure.
i Instructionsfor preparing control charts and the criteria thatestablishwhen a method is out of control are found in theLaboratory Quality Assurance Manual, Volume I.
ProcedureNo. RevisionNo. EffectiveDate Page
PNL-ALO-22g 0 6/21/88 7 of 14

PNL TECHNICALPROCEDURE I
4.6.3 Traininq
(a) Refer to MCS-033. I
(b) The analyst shall be trained in the use of theprocedure by the responsiblescientist. He shalldemonstratequalification by successfully analyzingduplicate reference standards (followingcalibration)on three successive occasions.Ongoing qualificationconsists of successfulanalysis of NBS and reference standards.
4.7
4.7.1 Sample Dissolution by Fusion
(a) Add a portion of sample weighed to the nearest0.1 mg to a 50-ml quartz Ernlenmeyer flask.
Select an amount of sample to give a uraniumconcentrationof about 12-15 mg/ml in a 60-mlvoIume.
(b) Add 10 g of fused Sodium bisulfate to the flask andcover with a quartz cover glass_
(c) Place the flask in a muffle furnace and heat a600"C for I to Z hr.
(d) Let furnace cool and remove flask(s).
(e) Dissolve the melt in 30 ml of IN H^SO4, swirling-;- _ ,the flask occasionallyto aid dlssolutlon.
(f) Quantitativelytransfer the solution to a tared
60-ml dropping bottle using IN_HzSO4 to rinse theflask.
(g) Dilute to about 60 ml with IN H.SO4, mixthoroughly,and weigh. Calcula_:esampleconcentration,C according to Section 4.8(b)Method PNL-ALO-2_2. I
4.7.2 Sample Preparation,System Set Up
(a) Weigh, to the nearest 0.1 mg, aliquots of samplecontaining 20 to 30 mg of uranium into 100-mlbeakers containing stir bars and proceed asfollows:
Procedure No. Revision No. Effective Date Page
PNL-ALO-22g 0 6/21/88 8 of 14

I. For sample solutionscontaining low-levelnitrate and no chloride, proceed to Step (b).
2. For sample solutionscontaining high-levelnitrate and chloride,evaporate to drynessand fume. Let cool, add 2 ml of IN H^SO4 todissolve the residue and proceed to S_cep(b).
(b) Place 100 ml beakers in plastic turntable beakersin proper order beginningwith the position to theright of the preparationstation.
Up to ten samples may be placed on the turntablebut up to fifty sample identification/aliquotnumbers may be entered into the computer prior tostart. New samples are then placed on theturntableas analyses are completed.
(c) The analysis is performed automaticallyand iscontrolled by the program in the HP85A. Samplesare analyzed according to the following procedureafter control is given to the computer.
The turntable is rotated and the first sample israised to the up position in the first station.Two ml of 1.7 M sulfamic acid is added, themagnetic stirrer is turned on for 10 sac and turnedoff. Twenty-fiveml of reducing acid is added andthe stirrer turned on. After a 60-sec wait five mlof oxidizingacid is added. The solution turnsbrown black and then clears. A wait of 260 secafter addition of oxidizing acid is required toallow for clearing and completion of the oxidation(180 sac after clearing).
The beaker is then lowered and rotated to the nextstation for titration while the next sample ispositioned for preparation. The samples are raisedand the preceding steps repeated in station one.+In station2 forty-fiveml of vanadyl solution isadded and the stirrer turned on. Following a10osec wait the computer instructsthe 636 titroprocessor to begin titration. The 636 is fullyprogrammed to perform the titration andcommunicatesvolume of titrant used and end pointpotentialto the HP85A upon completion of thetitration. When both stations have completed theiroperations,the beakers are lowered and theelectrodes/deliverytip in station two are rinsed
_ ProcedureNo. Revision No. EffectiveDate PagePNL-ALO-229 0 6/21/88 g of 14

automatically. The turntable rotates and theprocess is repeated until all samples arecompleted.
(d) The E636 is programed by use of a program card.Instructionsare as follows:
I. Turn on instrumentand E635 buret.
2. The instrumentwill briefly read all "8"s andthen 36 0.00000. This is for entry of date.Depress digit keys (example) 70984 ENTER for7 September 1984.
3. Display will then show "ENGO", depress "GO"key and display will show "CARD".
4. Slide the program card fully into the slotand slowly withdraw.
5. Press 37, "MOD", 2, then "ENTER".
6. The instrument is now ready to operate.
(e) The operating program is loaded into the HP85A byinsertingthe proper cassette into the machine,typing LOAD "UA" and pressing ENDLINE. When theprogram has loaded (small LED below tape goes out),press RUN.
(f) The CRT will display Uranium Assay System. PressCONT to start. The CRT will ask for keyboardinputs. All entries are made by typing theappropriate informationand pressing ENDLINE.
I. How many samples?
Press any number up to 50, ENDLINE
2. Sample identification?
Any combinationof alpha-numericcharactersup to eight characters, ENDLINE
3. Aliquot numbers?
Any integer up to gg, ENDLINE
Procedure No. Revision No. Effective Date Page
PNL-ALO-229 0 6/21/88 10 of 14

|
PNLTECHNICALPROCEDURE J
Query 2, 3 will be repeated until all samplesfrom query I have been identified. Thesystem will wait until CONT is pressed beforebeginning the analysis.
(g) All data pertinent to calculation along with sampleidentificationwill be printed by the HP85 at thecompletion of each sample titration. When alltitrations are completed press RUN. All componentsmay be left in their present mode.
(h) Calculate solid samples using 4.8.1 and liquidsamples using 4.8.2.
4.8 CALCULATION
Calculate the titer of the dichromate titrant, the uraniumconcentration in samples, and the calibration correction using theappropriate equations below.
(a) Dichromate Titer.
Wv(119.019) (f) (1000)Tv -
Vv(4g.0317)
where Tv -volume titrant titer, mg U/ml solutionWv = weight of dichromate in g
--volume of solution in mlV_ _ purity factor of the potassium dichromate
119.019 = equivalent weight natural uranium49.0137 = equivalent weight potassium dichromate.
(b) Uranium Concentrationin CalibrationStandard.
WstdfUcs =
WI - W2
where Ucs - concentrationof U in mg/g of solution= weight of U metal in mg
Ws_I = weight of container and solution in g[Step 3, Section 4.4(a)]
Wz = tare weight of container.
ProcedureNo. Revision No. EffectiveDate Page
PNL-ALO-22g 0 6/21/88 11 of 14

|
PNL TECHNICALPROCEDURE I
f - purity factor of the uranium
(c) Calibration
(TvVx)A _ . R1 + R2 + ...RnR -
Ucs Wa n
where R = recovery of uranium in standard
Tv - volume titrant titer
VX - volume in ml of dichromate titrant used
A = atomic weight of uranium divided by 238.038
Ucs = Concentrationof U in mg/g of solution
Wa = weight in g of aliquot takene
R = average of n values of R, used for calibrationcorrection.
(% Recovery - R x I00)
(d) Uranium Concentration in Samples.
4.8.1 Solid Samples
(TvVx) (A) (100)Uranium -
WaC R
where Uranium - concentrationof U in sample as weightpercent
T = volume titrant titerV
VX = volume in ml of dichromate used
A = atomic weight of U in sample divided by238.038
Wa = weight in g of sample aliquot taken
ProcedureNo. Revision No. Effective Date Page
PNL-ALO-229 0 6/21/88 12 of 14

Q
PNL TECHNICALPROCEDURE I
C = concentration of sample in solution, mgsample/g of solution
R = average recovery of uranium in standard.
Unless otherwise instructed,report results to the nearest0.01%.
4.8.2 Liauid SamDles
(TvVx)(A)(DF)DUranium -
Wa R
where Uranium - concentrationof U in sample as g U/lDF = Dilution Factor, if diluted, otherwise
use I.D = Density of Sample, g/ccTv = volume titrant titer
- volume in ml of dichromate usedV_ . atomic weight of U in sample divided by
238.038
_ = weight in g of sample aliquot taken= average recovery of uranium in standard.
Unless otherwise instructed,report results to the nearest0.01 g/l.
5.0 BIBLIOGRAPHY
(a) W. Davies and W. Gray. "A Rapid and Specific Titrimetric Methodfor Precise Determinationof Uranium Using Iron (II) Sulphate asReductant,"Talanta, 11, 1203 (1964).
(b) J. Cherry. "A Precise AmperometricTitration for theDeterminationof Uranium Using Ferrous Sulphate as Reductant," PGReport 827 (W) (1968).
(c) A.R. Eberle,M. W. Lerner, C. G. Goldbeck, and C. J. Rodden,"TitrimetricDeterminationof Uranium in Product, Fuel, and ScrapMaterials After Ferrous Ion Reduction in Phosphoric Acid-Part I.Manual Titration, Part II Automatic Titration,"NBL-252 (1970).
(d) "Annual Progress Report for the Period July 1970 to June 1971,"NBL-258 (1971).
ProcedureNo. Revision No. EffectiveDate Page
PNL-ALO-229 0 6/21/88 13 of 14

D
I PNL TECHNICALPROCEDURE ,li
(e) "Annual Progress Report for the Period July 1971 to June 1972,"B+NBL-265 (1972).
(f) "Annual Progress Report for the Period July 1972 to June 1973,"NBL-272 (1974).
(g) "Annual Progress Report for the Period July 1973 to June 1974,"NBL-272 (1974).
(h) C.G. Goldbeck and M. W. Lerner. "Tttrtmetric Determination ofUranium and Electrogenerated Vanadiun'_(V)," Anal. Chem., 44, 594(1972).
(i) C.D. Bingham, J. H. Scarborough, and C. E. Pietri. "Methods ofSample Preparationand Analysis for Wide Variations in MaterialTypes - A Requirementfor a National or an InternationalSafeguards Laboratory,"in InternationalSymposium on theSafequardinqof N_¢lear Materials. (IAEA,Vienna) 1975,IAEA-SM-201/22.
(j) J.V. Bender. "An Automated Titrimetry System for Process ControlApplications,"Presentedat Pittsburgh Conference on AnalyticalChemistry and Applied Spectroscopy,Cleveland, OH, March 3, 1976.
(k) "Automationof the Davies-Gray/NewBrunswick Laboratory Method forthe Determinationof Uranium," in General Chemistry DivisionQuarterly Report, UCID-15644-74-4. p. 94 (1975).
(1) J. Slanina, F. Bakker, and W. A. Lingerak. An AccuratePotentiometricTitration of 5-25 mg of Uranium," in InternationalSymposium on the Safequards of Nuclear Materials, (IAEA, Vienna)1976, IAEA-SM- 201/65.
Procedure No. Revision No. Effective Date Page
PNL-ALO-229 0 6/21/88 14 of 14

PNL TECHNICALPROCEDURE i
TITLE" PNL-ALO-231,(Replaces 7-40.16), SEPARATION OF CARBON FROM SOIL/SEDIMENT/SLUDGESAMPLES
1.0 Applicabilit.y
This procedure applies to the preparationof soil/sediment/sludgesamples bydissolution,oxidation and evolution of carbon dioxide in apparatus in the shieldedcells prior to the measurement of total carbon and/or C-14 using follow-onprocedures PNL-ALO-230,PNL-ALO-415and/or PNL-ALO-444.
2.0 DEFINITIONS
None.
3.0 RESPONSIBLESTAFF
Cognizant scientist and technician.
4.0 PROCEDURE
4.1 Equipment and Materials
. Sulfuric acid, 4M- prepare by diluting 220 (+5) ml of concentrated,reagent-gradesulfuric acid to 1000 (+I) ml with deionized, Type IIwater.
• Sulfuric acid, IM- prepare by diluting 55 (+5) ml of concentrated,reagent-gradesulfuric acid to 1000 (+I) ml with deionized, Type IIwater.
• Potassium persulfate, (potassium peroxydisulfate),crystals, reagent-grade.
• Sodium hydrozide, .6M - prepare by dissolving 24 (+O.1)g of reagent-grade NaOH in 1000 ml of deionized, Type II water.
• Silver nitrate, 2M - prepare by dissolving 34 (+O.1)gof reagent- grade
AgNO3 in 100 ml of deionized, Type II water.
• Ascarite_ for the absorption of CO2 from air.
Author Date Project Mgr. Date QAD Representative Date
FE Holt 6/17/88 N/A LJ Ethridqe 8/17/88
TechnicalReviewer Date Line Mgr. Date Other Date
All originalonf_i_naturesJJ McCown B/17/88
Procedure No. Revision No. Effective Date Page
PNL-ALO-231 0 6/17/88 1 of 4

I PNL TECHNICAL PROCEDURE
• Glass apparatus as per Figure 1.
• Drying tube, single bulb, 150 mm long, Coming 7775 or equivalent.
• Wheaton double-sidearmCelstir flask, 100 ml size, modified as perdiagram.
• Drieriteofilledcolumn.
• Hot plate and water bath.
• 35 ml screw-cap glass vials.
4.2 Sample Analysis
This procedure involves the acid dissolution/oxidationof soils, sedimentsorsludge samples to release carbon present in all carbon-containingcompounds.The heated sulfuric acid/persulfatesolution oxidizes all carbon compounds toCO2, which then evolves from solution. The released COp is trapped in acaustic trap solution. The solution is removed and transferred to anotherlaboratory for further processing.
Step I) Set up the dissolution and trap apparatus up to but not includingthe caustic trap shown in Figure I.
NOTES: a) The Ascarite-filled tube is required only if thedistillate will be analyzed for total carbon.
b) The poly insert cup shown in Figure I isrequired only when specified by the cognizantScientist.
Step 2) Add 40 ml of 4M HzSO4, 5g of potassium persulfate and 100 (+10) /_lof AgNO3 to the d_ssolver flask.
Step 3) Add 60 ml of IM H2SO4 to the acid scrubber trap.
Step 4) Establish an air flow of 50-100 cc/min through the system.
Step 5) Heat the water bath to approximately 90oC.
Step 6) Add 15.0 (+0.1)ml of O.6M NaOH to the caustic trap.
Step 7) Weigh out an amount of sample material specified by the cognizantScientist to the nearest 0.0001 g.
Step 8) Stop air flow and connect the caustic trap and remaining parts ofthe system together.
0ProcedureNo. Revision No. EffectiveDate Page
PNL-ALO-231 0 6/17/88 2 of 4

Step 9) Close the system and re-establishthe air flow rate of 50-1.00cc/min.
Step 10) Briefly open the dissolver flask and add the weighed sample to tiledissolver solution. Quickly close the flask to re-establishtheair flow.
Step 11) Sparge and heat the sample and solution for one hour.
Step i2) After one hour, stop the air flow, let the flask cool, and removethe caustic trap.
Step 13) Transfer the caustic trap solution to a 35 ml, screw-cap vial andremove from the cell for further preparation•
4.3 Records
Records will be maintained and controlled so as to conform to requirementsofMCS-033.. Laboratory notebooks and analytical report cards provide a
hani for control of most records , L...._...... _ L__,....-11 _.... _ ..mec sm . _.ouu,o_,,, 3 , _,.,,, ,, uw_ .,, , .._ ............ "4.... V_ii.l,.pan_ 1?nA
4.4 P_rocedureOualill.cat!on
None required. This procedure is considered qualified due to its dependenceon well understood chemical principals. Additionally it is consideredqualified because it has an IndependentTechnical Review.
Procedure No. Rev|ston No. Effective Date Page
PNL-ALO-231 0 6/17/88 3 of 4

II
PNL TECHNICALPROCEDURE
#
FIGURE I
Procedure No. Revision No. Effective Date Page
PNL-ALO-231 0 6/17/88 4 of 4

TITLE: PNL-ALO-233, (Replaces2-30.9), PLUTONIUM PURIFICATIONBY IoN EXCHANGE
1.0 APPLICABILITY
The oxidation state of plutonium is chemically adjusted to +4 afterwhich it is loaded on the ion exchange resin. Impurities are washedfrom the column with 8 N HNO_ and finally the plutonium is eluted withdilute HCI. After evaporati6n,fuming in H2SO4 and dissolution thesample is ready for assay analysis.
(a) Material Plutonium oxide, mixed oxide materials andplutonium/uraniumsolutions.
(b) Range From 5 to 20 mg of plutonium is required.
(c) Reliability Recovery based on NBS 949 and referencestandardsfrom 28 samples show an averagerecovery of gg.96%.
(d) Interferences There are no interferencesto this procedure.
2.0 DEFINITIONS
NONE
3.0 RESPONSIBLESTAFF
Analyst
4.0 PROCEDURE
4.I DISCUSSION
Plutonium is efficientlyand quantitativelyseparated fromimpurities by anion exchange in nitric acid medium. Thisseparation is made possible with a high degree of selectivity by
Author Date ProjectMgr. Date QAD Representative Date
MC Burt 6/15/88 N/A LJ Ethrid_e 8/16/88
Technical Reviewer Date Line Mgr. Date Other Date
OP Amacker Jr _ JJ McCown 6 16/88 All original_$_natures. on TIl
Procedure No. Revision No. EffectiveDate Page
PNL-ALO-233 0 6/21/88 I of 4

L PNL TECHNICALPROCEDURE
the ability of plutonium(IV),to the exclusion o_ most elements,to form an anionic hexanitratocomplex [Pu(NO3).B-_]which isreadily absorbed on Dowex-1 anion exchange resln. The plutoniummust be in the Pu(IV) oxidation state since Pu(III) and Pu(VI) arenot quantitativelyabsorbed on the resin. Plutonium and only afew elements such as Pd, In, Pt, Np(IV), Au, and Th are stronglyabsorbed on Dowex-1 resin, while other impurities are eitherweakly absorbed or unabsorbed. The unabsorbed or weakly absorbedelements are removed from the resin by washing with sufficientquantities of 8 N HNO3 although some impurities,especiallyuranium, require more washing than others for complete removal.Plutonium is retained on the resin column and quantitativelyeluted with 0.36 N HCI-OIN HF solution.
4.2 APPARATUS
(a) Adjustable pipet, 0-5 ml and tips.(b) Resin, AG I-X4 100-200mesh.(c) Columns, glass (see Figure I).(d) Quartz wool.(e) Titration vessels (see PNL-ALO-222).(f) 50 ml beakers.(g) Hot plate.
4.3 REAGENTS
(a) Ferrous Sulfate, 0.1 M. Dissolve 7.5g FeSO4.7H_Oin 250 mldistilled water contaTning 1.5 ml concentratedTI2SO4.
(b) Eluting solution, 0.36 N HCI-O.OIN_HF. Add 30 ml of HCl and7-8 drops of HF to 500 ml distilled water, dilute to I literand mix weil.
(c) Nitric acid, 1.5 N.
(d) Nitric acid, 8 N.
(e) Nitric acid, 15 N.
(f) Sulfuric acid, 6 N.
4.4 STANDARDS
Duplicate aliquots of either NBS 949 or the reference standard(see PNL-ALO-222)are carried through the entire procedure with Ieach group of samples. Recovery should be within the limits set
for the reference standard (see PNL-ALO-222)and should be >99.9% Ifor the NBS 949.
Procedure No. Revision No. Effective Date Page
PNL-ALO-233 0 6/21/88 2 of 4=

b
PNL TECHNICALPROCEDURE
4.5 SAFETY
(a) Plutonium-bearingmaterials are radioactiveand toxic.Precautionsare required to avoid contaminationof thelaboratory and personnel.
(b) Observe the general laboratory safety rules.
4.6 OUALITY CONTROL
This procedure is a preparationstep prior to plutonium assay.Calibration and control procedures as discussed in PNL-ALO-222 Iapply. I
4.7 ANALYSlS
Sample must be in liquid form prior to ion exchange purification.See Section 4.7.1 and 4.7.2 of PNL-ALO-222 for dissolution Iprocedures. I
4.7.I COLUMN PREPARATION
(a) Place a small quartz wool plug in the column tip.
(b) Add resin slurry to within 5-10 mm of columnshoulder.
(c) Wash with severalcolumn volumes of 8 N HNO3. Stirto remove air bubbles if necessary.
4.7.2 ANALYSIS
(a) Weigh sufficient sample into a 50 ml beaker to give10 mg plutonium and evaporate to dryness.
(b) Rinse beaker sides with 2 ml 1.5 N HNO3 and swirlto dissolve sample.
(c) When sample is dissolved add I ml 0.1 M FeSO4 andswirl.
Solution will turn a bluish color indicating Pu+3.
(d) Add 3 ml 15 N HNO3 and swirl.
Solution will turn a greenish color indicatingpu+4"
(e) Dilute to 20-25 ml with 8_N HNO3.
ProcedureNo. RevisionNo. EffectiveDate Page
I. PNL-ALO-233 0 6/21/88 3 of 4

d, i i. iii
PNL TECHNICALPROCEDURE
(f) Add solution to prepared columns in 5-10 mlincrements allowing the column to empty prior toeach addition.
(g) Rinse beaker twice with 8 _NHNO3 and add to column.
(h) Wash column with 30 ml 8 N HNO3 in 5-10 mlincrements allowing the column to empty before eachaddition.
Place clean titration vessels (PNL-ALO-222)under J(i)the columns and elute with 30 ml 0.36 N HCI-O.OIN
I
in 5-10 ml increments. Allow the column to emptyprior to each addition.
(j) Add I ml 6 N HzSO4 and evaporate to dryness.
(k) Samples are ready for plutonium assay. Add a stirbar and 10 ml 0.5 N H.SO.,allow residue todissolve and proceed _o_NL-ALO-222, Section 4.7.3(b).
4.8 CALCULATIONS
None required.
5.0 B.IBLIOGRAPHY
, .... "The Quantitative IonC. E. Pietri B P Freeman and J R Weiss,Exchange Separation of Plutonium from Impurities,"NBL-298, (1981).
Procedure No. Revision No. EffectiveDate Page
PNL-ALO-233 0 6/21/88 4 of 4

PNL TECHNICALPROCEDURE
TITLE: PNL-ALO-237,(Replaces2-40.7), TOTAL NITROGEN BY FUSION AND GASCHROMATOGRAPHY
I.0 APPLICABILITY
Powdered or small pieces of sample are fused at about 2600°C in agraphite crucible. The nitrogen is released in its elemental form andit is measured by gas chromatography,which is based upon thedifferences in thermal conductivityof gases.
(a) Material Uranium oxide and mixed oxide powder andpellets; plutonium dioxide or any solidmaterial.
(b) Range From 5 to 2500 pg of nitrogen can be determinedin a 0.3 to I g sample
(c) Reliability A pooled relative standard deviation of 12% wasobtained from the analysis of 22 standardswiththe amount of nitrogen taken for analysisranging between 5 and 300 pg. A pooled recoveryof 97% was obtained.
(d) Interferences Nitrogen from the atmosphere will enter thenitrogen analyzer if the sample is improperlyloaded and this will cause a high result.Ammonia, nitrates, and other nitrogen-containingcompounds from extraneous sourceswill causehigh results.
2.0 DEFINITIONS
NONE
3.0 RESPONSIBLESTAFF
Analyst
4.0 PROCEDURE
Author Date ProjectMgr. Date QAD Representative Date
MC Burr 6/15/88 N/A LJ Ethridqe 6/16/88
TechnicalReviewer Date Line Mgr. Date Other' Date
All originalon fTi_naturesN/A JJ McCown 6/16/88
ProcedureNo. Revision No. EffectiveDate Page
I PNL-ALO-237 0 6/21/88 I of 10

4.1 DXSCUSSlON
In this method, the sample is fused at 2600°C in a graphitecrucible to release nitrogen in all forms as elemental nitrogengas. Thus, total nitrogen is determined with this method.
The nitrogen analyzer used has an impulse furnace in which anelectrical current is passed through the graphite crucible,heating the crucible and sample material to a high temperature. Astream of helium carries the nitrogen and other gases formed bythe fusion from the furnace, through scrubbers to removeinterfering gases, and into a column of molecular sieve where thenitrogen is separated. The concentrated nitrogen is then carriedfrom the molecular sieve by helium into a gas chromatograph formeasurement. Helium is used also to flush air from the furnaceprior to heating and to purge the system of interferinggasesreleased during the outgassing of the crucible.
The analyzer has two impulse furnaces, one of which is a remotefurnace housed in an inert atmosphereglovebox. This remotefurnace is used in the analysis of materials containing plutonium.
During fusion any oxygen present in the sample material combineswith carbon from the crucible to form carbon monoxide and anycombined hydrogen present is converted to elemental hydrogen.These interferinggases are converted to carbon dioxide and waterwhen carried by the helium through a heated column of rare earthand copper oxide. The carbon dioxide is removed later from thegas stream by Ascarite and the water by Anydrone. The molecularsieve used to concentratethe nitrogen also helps to separateinterferinggases.
The gas chromatographhas a thermoconductivitycell that detectsdifferences in the thermal conductivityof gases. The cellconsists of a pair of matched thermistors used in two legs of aWheatstone bridge. The reference thermistor is kept in a heliumenvironment having constant pressure, flow, and temperature. Themeasure thermistor is kept under the same conditions as thereference except for the gas composition,which varies as nitrogenis carried into the measure thermistor by the helium carrier gas.The nitrogen causes the temperatureof the measure thermistor tochange because of the difference in thermal conductivitybetweenhelium and nitrogen. The change in temperature causes theWheatstone bridge to become unbalanced,and through the electronicsystem, the degree of imbalance is converted into a readout on thedigital voltmeter. The readout is also coupled to a digital
ProcedureNo. Revision No. EffectiveDate Page
PNL-ALO-237 0 6/21/88 2 of 10

PNL TECHNICALPROCEDURE
integrator that is set to automaticallyintegratethe nitrogenpeak. The integrator is more sensitivethan the voltmeter and thetiming for integrationof the nitrogen peak is less critical withthe integrator.
4.2 APPARATUS
(a) Analytical Balance. Capable of weighing to 1.0 rag.
(b) Digital Integrator. Autolab Minigrator, Spectra PhysicsCorp.
(c) Graphite Crucible, LECO #767-Z77 or equivalent.
(d) Nitrogen Analyzer. LECO U014 sp Nitrogen Determinator,Model #857-034.
(e) Remote Furnace. LECO, Model 875-492.
(f) Tin Capsule. LECO #501-059 or equivalent.
4.3 REAGENTS
(a) Anydrone. LECO #501-171 or equivalent.(b) Ascarite. 20-30 mesh, LECO #183-001, or equivalent.(c) Ascarite. 8-Z0 mesh, LECO #501-166 or equivalent.(d) Helium. Ultra-high purity, 99.995%(e) Molecular Sieve. 5A, 20-30 mesh.(f) Phosphorus Pentoxide. LECO #765-278 or equivalent.(g) Rare Earth Oxide. LECO #501-170 or equivalent.(h) Sulfur Absorber. LECO #763-770 or equivalent.
4.4 STANDARDS
(a) CalibrationStandard. Steel standards are used to calibratethe digital integrator and mixed uranium-plutoniumoxideblends are used to prepare a calibration curve.
I. The following stainless steel standards are used: NBSSRM 346 and 133, and LECO #501-551, #501-552, and#501-533.
(b) Control Standard. None required (see Subsection 4.6.1).
4.5 SAFETY
(a) Plutonium-bearingmaterials are radioactive and toxic.Precautionsare required to avoid the contaminationof thelaboratory and personnel.
ProcedureNo. Revision No. Effective Date Page
PNL-ALO-237 0 6/21/88 3 of 10

(b) Observe the general laboratory safety rules.
4.6 OUALITY CONTROL,
4.6.1 Calibration
(a) Prepare the instrument for analysis. The analyzermust conform to the following:
I. Be sure that the water supply to theelectrodecoolant circulator has been shutoff and disconnected;then turn on theelectrode coolant circular power switches.
2. "DVM ON" switches must be on.
3. "AUX FURN ON" indicatormust be on.
4. The "FUNCTIONSWITCH" switch must be in the"OPERATE"position.
S. The two circuit breakers at the rear of theanalyzermust be on.
6. The "STD-BY" indicatormust be green.
7. The "HELIUM BLANKET" indicatormust be off.
8. The furnace must be empty and closed.
g. The "OVEN INDICATOR"must be cycling on andoff and the oven temperaturemust beapproximately45°C.
10. The helium regulator must be set for 40 psig(2.8 kg/cmL).
11. The helium outlet valves at the back of theanalyzer must be opened.
12. Both the "MEASURE FLOW" and the "REFERENCEFLOW" rotometers must indicate theapproximate flows.
13. The digital integratormust be on with thecontrols set as follows:
PW = 10SS = 700
ProcedureNo. Revision No. Effective Date Page
PNL-ALO-237 0 6/21/88 4 of 10

k
PNL TECHNICALPROCEDURE I
All other settings are left at their defaultvalues.
14. The furnace selection valves and control plugmust be set for the furnace to be used:
Internal Furnace on AnalyzerExternal Remote Furnace in Glovebox
(b) Turn the "FUNCTIONSELECT" switch to the "DVM ZERO"and adjust the DVM zero if necessary.
(c) Depress the "STD-BY" switch. Turn the "FUNCTIONSELECT" switch to the "OPERATE" position forapproximately30 sec. Then turn the "FUNCTIONSELECT" switch to the "INTEG CHECK" position andnote the time; at the end of I min note thereading.
The DVM readingmust not change more than _+0.001during this period. If it does, refer to theElectronic Checkout in the InstructionManual(Section 4.0).
(d) Turn the function select switch to Bridge. Adjustthe DVM to read 000, by turning the screw markedBridge, on the front of the Analyzer. Push theShift button, then the Slope button on theintegrator. The integrator should read 500, if notadjust the bridge accordingly.
(e) Depress the "STD-BY" switch. Turn the "FUNCTIONSELECT" switch to the "OPERATE"position.
The "STD-BY" indicator should turn green.
(f) Open the furnace. ,
The remote furnace is operated pneumatically by thetoggle switch on the glovebox face.
The "PURGE" indicatorwill turn white and the"STD-BY" indicatorwill go off.
Inspect the interior of the upper electrode cavitywith a mirror and flashlight to make sure that nodeposits of graphite or other material are present.
I
ProcedureNo. Revision No. EffectiveDate I Page
PNL-ALO-237 0 6/21/88 1 5 of 10

Also inspect the lower electrode. The bottominterior of the lower cup must be free from allmetal or graphite particles. A small argon gas jetis ideal for cleaning the bottom interior of thelower electrode. Clean the electrodes using theproper brush, being careful to prevent scratchingof the electrodes or the "0" rings.
Do not insert your fingers or any metallic objectnear the safety thermostatmounted on the outsideof the upper electrode. When power is applied,there is 115 V on these connections.
(g) Place a LECO crucible on the lower electrodeassembly using the tweezers.
To avoid contamination,do not touch the cruciblewith your fingers.
(h) Close the furnace.
The "PURGE" indicatorwill turn green.
The furnace must be kept closed at all times exceptwhen cleaning the interiorof the furnace orloading the crucible. The furnace must be cleanedbefore each analysis.
(i) Depress the "OUT-GAS"switch.
The "OUT-GAS" indicatorwill be white during theout-gas period and the "PURGE" indictor will beoff.
The crucible current value is indicated on the"FURNACE POWER" meter and during out-gas the valueshould be greater than or equal to 1100 A. If not,refer to the procedure for adjusting fusion currentdescribed in the InstallationSection of theInstructionManual.
(j) The followingprocedure will compensate for anormal nitrogen blank:
I. Repeat Steps (d) through (h).
2. The "OUT-GAS" indicatormust be green.
ProcedureNo. Revision No. EffectiveDate Page
PNL-ALO-237 0 6/21/88 6 of 10

Q
PNL TECHNICALPROCEDURE ]
3. The empty out-gassed crucible must be left inthe furnace.
Do not put a sample into the crucible at thistime.
4. Set the digital integrator to "RUN" andsimultaneouslydepress the "ANALYZE" switch.
The "ANALYZE" indicatorwill turn white andthe "OUT-GAS" indicatorwill go off.
When the digital value for the nitrogen peakat 110 to 130 sec has been integrated, recordthe value and set the integrator to "STD-BY."
5. Repeat this procedurewith a minimum of threecrucibles to establish the proper crucibleblank value.
(k) The following describes the procedure forcalibrationof the analyzer.
I. Repeat Steps (d) through (f).
2. Place a steel calibration standard of aweight between 0.300 and 0.699 g into theloading head.
Be sure to handle the sample only withtweezers.
The sample form must be such that it can becontained in a cylinder 6 mm in dia and 8-mmhigh.
3. Close the furnace.
4. Depress the "OUT-GAS"switch.
5. Push the "SAMPLE DROP" button after the "OUT-GAS" indicator turns green.
This lets the standard fall into thecrucible.
6. Turn the digital integratorto "RUN" andsimultaneouslydepress the "ANALYZE" switch.
Procedure No. Revision No. Effective Date Page
PNL-ALO-237 0 6/21/88 7 of 10

|
i PNL TECHNICALPROCEDURE
The "OUT-GAS" indicatorwill go off and the"ANALYZE" indicatorwill turn white.
The crucible current value may be slightlylower than during out-gas (approximately30 Alower). If the current is considerablylower, the sample may not have fallen intothe crucible--checkthe loading head cavity.
7. Record the integratedvalue for the nitrogenpeak at 110 to 130 sec and set the integratorto "STD-BY."
8. Repeat this procedure with a minimum of twostandards.
9. Calculate the pg N/lO00 counts for the threeresults after subtractingthe crucible blankvalue and calculate the average.
The average must agree to within +5% of theprevious average. If not, determine thesource of the problem before proceeding.
(1) Determine a calibration factor for sample analysisand prepare a calibrationcurve by repeating Ithrough 7 of Step (k), using a mixed-oxidecalibrationstandard instead of a steel standard at2. The mixed oxide is placed into a tin capsule;the capsule is pinched flat and folded and then itis placed into the loading head.
I. Analyze at least five portions of the mixedoxide standard to provide calibration pointsranging between 10 and 300 pg of nitrogen.
The amounts of standard taken should bebetween 0.20 and 0.60 g.
2. Determine a tin capsule blank using an emptycapsule at Step (k) 2; make at least threedeterminationsand calculate an averageblank.
3. Subtract the average blank from each standardreadout and calculate an average pg N/lO00counts for the five results. This value isthe calibration factor used in the equationof Section 11.0.
|
ProcedureNo. Revision No. EffectiveDate Page
PNL-ALO-237 0 6/21/88 8 of 10

A new calibration factor is not required eachtime nitrogen analyses are made, although atleast one standard must be analyzed to checkthe factor during each 8-hr shift in whichanalyses are made. The method is incalibration if the result falls within _+5%ofthe factor. A new factor must be determinedif two consecutive results fall outside +5%.
4. Prepare a calibration curve to check forlinearityby plotting the five net readoutsversus _g of nitrogen using linear graphpaper.
4.6.2 Control
Control is not established.
4.7 ANALYSIS
(a) Repeat Steps (d) through (f) of Subsection 4.6.
(b) Place a sample into the loading head.
The sample form must be such that it can be contained ina cylinder 6 mm in dia and 8-mm high.
Weight powdered samples (0.2 to 0.6 g) in tin capsules;flatten and roll the capsule. Whole pellets and chunksof pellets (<I.5 g) need not be encapsulated.
Contaminationof sampleswith nitrogen from air can beeliminated by weighing in an argon atmosphere.
(c) Close the furnace.
(d) Depress the "OUT-GAS"switch.
(e) Push the "SAMPLE DROP" button after the "OUT-GAS"switchturns green.
This lets the sample fall into the crucible.
(f) Set the digital integratorto "RUN" and simultaneouslydepress the "ANALYZE"switch.
The "OUT-GAS" indicatorwill go off and the "ANALYZE"indicatorwill turn white.
ire No. Revision No. Effective Date Page
PNL-ALO-237 0 6/21/88 g of 10

r
PNL TECHNICALPROCEDURE
The fusion current should be between 1100 and 1200 A,which requires the highest transformer setting possiblewithout causing crucible breakdown.
If current drops to zero during analysis, discard theresult and repeat the analysis.
Record the integrated value for the nitrogen peak thatoccurs at 110 to 130 sec and set the integrator to"STD-BY."
4.5 CALCULATION
Calculate the concentrate of nitrogen in the sample using thefollowing equation:
Nitrogen - (A - B)FW
where nitrogen - nitrogen content in pg/g
A = nitrogen counts determined from the digitalintegratordivided by 1000
B - average crucible blank plus tin capsule blank(as appropriate)in digital integrator countsdivided by 1000
F = calibrationfactor in pg N per 1000 counts [SeeStep (I) 3 of Subsection 4.6.1]
W - sample weight in g.
Unless otherwise instructed,report results to two significantfigures. Report results 10 _g/g/ as <10 pg/g.
5.0 BIBLIOGRAPHY
(a) IDstructionManual. u014 sp Nitrogen Determinator, Model#875-034, Laboratory Equipmentcorp., St. Joseph, Michigan (1974).
(b) InstructionManual. Autolab Minigrator, Spectra Physics Corp.,Mountain View, California.
ProcedureNo. Revision No. EffectiveDate Page
PNL-ALO-237 0 6/21/88 10 of 10

PNL TECHNICALPROCEDURE
TITLE: PNL-ALO-238, (Replaces2-40.11),WATER BY CONSTANT VOLTAGE COULOMETRY
1.0 APPLICABILITY
Water is released from the sample by heating. A carrier gas sweeps thewater into an electrolyticcell containing phosphorus pentoxide toabsorb the water. A potential applied across the cell causes theabsorbed water to be electrolyzed. The total current is integrated anddisplayed digitally as micrograms of water.
(a) Material Any solid material.
(b) Range From five to several thousand micrograms ofwater per measurement.
(c) Reliability Relative standard deviation: about 20% for 20to 40 pg of water and 2 to 5% for > 100 pg.Over a two-month period, 17 sodium tartratestandardscontaining from 300 to 1000 pg ofwater were analyzed, and the recovery variedfrom 95 to 101% with a relative standarddeviation of 2%.
(d) Interferences Hydrogen, alcohols, and amines will give a highbias. Other materials cancoat the inside ofthe cell, making it inactive.
2.0 DEFINITIONS
NONE
3.0 RESPONSIBLESTAFF
Analyst
4.0 PROCEDURE
Author Date ProjectMgr. Date QAD Representative Date
MC Burt 6_15/88 N/A LJ Ethridge 6/16/88
Technical Reviewer Date Line Mgr. Date Other Date
All °riginalf_i_natureSonJJ McCown BIB 88
ProcedureNo. Revision No. Effective Date Page
PNL-ALO-238 0 6/21/88 I of 9

I PNL TECHNICALPROCEDURE
4.I DISCUSSION
The operation of the W_Ll_eranalyzer is based upon the coulometricelectrolysisof water._ujAs the sample is heated, the evolvedwater is carried in a stream of dry nitrogen into an electrolyticcell where the water is absorbed by phosphorus pentoxide. Thephosphorus pentoxide, which coats two parallel platinum wires,becomes conductive as the water is absorbed. When a potential isapplied across the wires, the water is electrolyzed,which in turnallows more water to be absorbed. The process continues until allof the evolved water has been electrolyzed. The total current isintegrated automaticallyand displayed digitally as micrograms ofwater. Built-in safeguards prevent the electrolyticcell frombeing overloaded by excessiveamounts of water.
Liquids and solids entrained in the gas stream as well as ammoniaand other basic substances that react with phosphorus pentoxidecan cause malfunction of the electrolyticcell. Alcohols,glycols, and similar substances respond as water and cause a highbias. Further, the level and variability of the humidity cancause a bias when samples susceptible to adsorbing or desorbingwater are analyzed. If the water analyzer is locatedwhere thehumidity is not controlled,precautionsmay be required to protectsamples from water adsorption and to prevent errors in theanalyses caused by variable blanks. If the analyzer is locatedwhere the humidity is controlled at a very low level, precautionsmay be required to prevent samples from desorbing water.
The temperature at which water is completely evolved depends uponthe material being analyzed. Studies have shown that waterevolves from uranium and plutonium oxides in at least two*emperature ranges: up to 200°C and between 200 and 400oC.(c)(g)Two additional ranges (a(O0to 600oC and 600 to 800°C) were
_lcj tobserved by Michaelso. wi h a powder blend of U0_-1% PuO_. Forsintered mixed oxide (25% PuO_) pellets, Vance(._ oSservedtwo-range evolution which was'completed below _O0oC. Althoughexperimental work at HEDL has not specifically confirmed Vance'sobservation, we believe that it is substantially correct.
WHC's experimental work (e) did show a release of water fromsintered mixed oxide pellets between 400 and 500oC. That release,however, occurred because hydrogen was present in the pellets andreacted with available oxygen to form water. Since no evidencewas found that hydrogen reacts below 400°C, a temperature of 400oCshould be low enough to avoid hydrogen interference and yet highenough to remove water completely as observed by Vance.
ProcedureNo. Revision No. Effectlve Date Page IPNL-ALO-238 0 6/21/88 2 of 9
i

PNLTECHNICALPROCEDURE
4.2 APPARATUS
(a) Analytical Balance. Readable to 0.01 mg.
(b) Gas Flowmeter. Capable of measuring a flow rate up to 150ml/min.
(c) Platinum Boat. I- by 3-by O.5-cm. Platinum boats are usedinstead of the nickel boats supplied with the water analyzerbecause nickel is more apt to have an oxide coating that canreact with hydrogen to form water (see Section 3.0).
(d) Water Analyzer. DuPont Model 902H Moisture EvolutionAnalyzer.
4.3 REAGENTS.
(a) Magnesium Perchlorate. Anhydrous, for the gas dryersupplied with the water analyzer.
(b) Nitrogen. Prepurifiedgrade or equivalent.I
4.4 STANDARDS
(a) CalibrationStandard. Not available.
(b) Control Standard. Sodium tartrate dihydrate (15.6% water),crystals,weighing from I to 7 mg.
4.5 SAFETY
(a) Plutonium-bearingmaterials are radioactive and toxic.Precautions are required to avoid the contaminationof thelaboratory and personnel.
(b) Observe the general laboratory safety rules.
4.6 OUALITY CONTROL
4.6.1 Calibration
The analyzer is precalibratedelectronicallyby themanufacturer. However, recalibration is necessary atleast twice each year and whenever maintenance problems
1 Matheson Gas Data Book, The Matheson Co., Inc., East Rutherford,New Jersey, 4th Ed., 1966.
ProcedureNo. Revision No. EffectiveDate Page
PNL-ALO-238 0 6/21/88 3 of 9

PNL TECHNICALPROCEDURE
occur. Follow the manufacturer'srecommended procedurefor calibration.
4.6.2 (_Qntrol
The control standard is analyzed at least once in each8-ht shift during which water analyses are made. Analyzethe control standard as follows:
(a) Weigh to the nearest 0.01 mg between I and 7 mg ofsodium tartrate dehydrate.
Using cloudy crystals may lead to low results;therefore, use only very clear crystals.
(b) Analyze the sodium tartrate by following Subsection10.1 with the following exception: use 125°Cinstead of the stated temperature at Steps (b),(d), (i), and (o).
Heating above 150°C will cause sodium tartrate todecompose, resulting in a high bias.
(c) Calculate the percent water using Part (c) ofSection 4.8. The control limits are 14.0 to 17.2%.If the result is outside these limits, investigateand correct the problem before analyzing samples.
4.7 ANALYSIS
4.7.I Constant Rate Procedqre
This procedure is used for samples containing over 50 pgof water. These samples are usually powders such asuranium and plutonium oxides.
(a) Adjust the nitrogen flow rate to 100 ml/min at 5psig.
The flow rate adjustment is not critical. Becausethe cell current is integrated as a function oftime, the total water present is independentof thecarrier-gasflow rate. However, a flow rate lessthan 150 ml/min is recommended.
(b) Set the temperature controller at 400°C.
ProcedureNo. Revision No. EffectiveDate Page
PNL-ALO-238 0 6/21/88 4 of 9

PNL TECHNICALPROCEDURE ]
Other temperaturesmay be required for a particularanalysis. The temperatureused at this step mustbe used at Steps (d), (i), and (o) also.
(c) Place an empty platinum boat in the oven.
(d) _tart the timer and heat at 500°C until a constantcount rate from the integrator is maintained over a10-min period.
The system must be dried sufficientlyat this stepto permit adjustment of the analyzer to zero atStep (e). The count rate that indicates sufficientdrying is determined by experience.
(e) Zero the instrument at a count rate of 0.6 pg/min.
Consult the manufacturer'soperation manual forinstructionson how to zero the analyzer.
(f) Turn off the timer and set the integrator to zero.
(g) Remove the boat when the oven reaches roomtemperature.
(h) Replace the boat in the oven after about 10 src andturn on the timer.
The time ir_tervalbetween removal and replacementof the boat should be held constant for both thehlar_kand the sample runs.
(i) Heat at 400°C until the count rate of theintegratordecreases to a constant rate of 0.6pg/min.
(j) Record the integratorreading (Rb!and the time(Tb)required to complete Step tl).
If the analyzer is not used in a controlledenvironP_.t. .he blank will vary from day-to-day,particularlyif the humidity varies. Therefore, itis recommendedthat blanks be determinedper;odicallyduring the day.
(k) Stop the timer and reset the integratorto zero.
Procedure No. I Revision No. Effective Date Page
I PNL-ALO-238 I 0 6/2!/88 I 5 of g

PNLTECHNICALPROCEDURE
(l) Removethe boat whenthe oven reaches roomtemperature.
The time interval between removal and replacementof the boat should be held constant for both theblank and the sample runs.
(m) Add a sample weighed to the nearest 1 mg (Ms) tothe boat.
For uranium dioxide powder, a minimumsample sizeof 0.5 g is recommended. The sample size requiredfor plutonium dioxide will vary becausethe watercontent of that oxide can vary considerably.Sample size for other materials will also varyaccording to water content.
(n) Replace the boat in the oven.
(o) Heat at 400oCuntil the count rate of theintegrator decreases to a constant rate of 0.6pg/min.
Samplesmaybe heated at temperatures up to 800oC.A blank must be determined at measurementtemperature.
(p) Record the integrator reading (Ro) and the time(Ts) required to complete Step (6)
The reading and time are Rc and Tc respectivelywhena control standard is analyzer.
(q) Stop the timer and reset the integrator to zero.
(r) Repeat Steps (l) through (q) for subsequent sampleanalyses.
4.7.2 Constant Time Procpdure
This procedure is used for samples containing less thanS: pg of water. These samplesare usually sinteredpellets.
(a) Follow Steps (a) through (h) of Subsection 4.7.1.
(b) Heat at 400oCfor 5 min.
Ii i iii i .i iii iii ,li iii
I PNL-ALO-P38.... l 0 i 6/21/88 j 6 of 9 I

PNL TECHNICALPROCEDURE J
(c) Record the integrator reading (Rb).If the analyzer is not used in a controlledenvironment, the blank will vary from day-to-day,particularlyif the humidity varies. Therefore,with samples containing less than 30 pg of water,it is recommendedthat a blank be determinedbetween each sample analysis.
(d) Stop the timer and reset the integrator to zero.
(e) Remove the boat when the oven reaches roomtemperature.
The time interval between removal and replacementof the boat should be held constant for both theblank and the sample runs.
(f) Add a sample weighed to the nearest I mg (Ws) tothe boat.
Whole pellets are usually taken for analysis.
(g) Replace the boat in the oven.
(h) Heat at 400°C for 5 min.
(i) Record the integratorreading (Rs).
(j) Stop the timer and reset the integrator to zero.
(k) Repeat Steps (e) through (j) for subsequent sampleanalyses.
4.8 CALCULATION
Calculate the micrograms of water per gram of sample and theweight percent of water in the control standard using theappropriateequations below.
(a) Sample, Constant Rate Procedure (Subsection4.7). Calculatethe concentrationof water in the sample as follows:
R - (B)(T )S S
Water -S
WS
ProcedureNo. Revision No. EffectiveDate Page
PNL-ALO-238 0 6/21/88 7 of gI I , I , I .

l
where Waters -/_g water/g sample
R[_= /_gwater from sample measurementRb/Tb [see Step (j), Subsection 4.7.1]Ts -mln required for sample measurementWs = sample weight in g.
Unless otherwise instructed,report results to the nearestwhole number below i00 /_g/gand to two significant figuresfor results _>100/_g/g.
(b) Sample, Constant Time Procedure (Subsection4.7.2).Calculate the concentrationof water in the sample asfollows. Unless otherwise instructed,report results to thenearest whole number.
R -Rs b
Water =s W
S
where Waters = _g water/g sampleR. = #g water from sample measurementR_b = #g water from blank measurementWs = sample weight in g.
(c) Control Standard. Calculate the concentrationof water inthe control standard as follows:
R - (B)(T)C C
Water =c 4
(W)(10 )C
where Waterc = wt% water in control standard
R_- /_gwater from control standard measurement= Rb/Tb [see Step (j), Subsection 4.7.2]Tc = mln required for control standard measurementWc = control standard weight in g.
ProcedureNo. RevisionNo. EffectlveDate Page
PNL-ALO-238 0 6/21/88 8 of g

PNL TECHNICALPROCEDURE i
5.0 BIBI.]_OGRAPHY
(a) Chemical,Mass Spectrometric,and SpectrochemicalAnalysis ofNuclear-GradeMixed Oxides F(U,PH)O_I. C 698, American Societyfor Testing and Materials (ASTM),Philadelphia, Pennsylvania(1972).
(b) F.A. Keidel. "Determination of Water by Direct AmperometricMeasurement," Anal. Chem., 31, 2043 (1959).
(c) J.G. Michaelson. Determination of Water in Plutonium and UraniumOxides by Electrolysis, HW-83487, May (1964).
(d) Ooeration and Maintenance Manual. Solids Moisture Analyzer, Model26-321 AHA, 992212-008, Conso]idated Electrodynamics Corp.,Monrovia, California (1968).
(e) C.E. Plucinski. "Water and Gas determination in Mixed Oxide,"Paper 51, 14th Conference on Analytical Chemistry in NuclearTechnology, Gatlinburg, Tennessee, October 13-15 (1970).
(f) J.E. Rein, G. M. Matlack, G. R. Waterbury, R. T. Phelps, and C.F. Metz. Methods of Chemical Analysis for FBR Uranium-PlutoniumOxide Fuel and Source Materials, LA-462Z, p. 139, March (1971).
(g) D.E. Vance, M. E. Smith, and G. R. Waterbury. DeterminationofWater Evolved from FFTF Reactor Fuel Pellets, LA-4681, July(1971).
ProcedureNo. Revision No. EffectiveDate" Page
PNL-ALO-238 0 6/21/88 9 of 9

PNL TECHNICALPROCEDURE !
TITLE: PNL-ALO-240, (Replaces4-30.4, & 2-40.19), CARBON AND SULFUR BYCOMBUSTION AND INFRAREDABSORPTION
1.0 APPliCABILITY
Samples are ignitedwith a tungsten acceleratorbetween 1600" and 1700"Cin a stream of oxygen. The carbon and the sulfur, as their oxides, areswept from the furnace into an infrared detector. The oxides absorb aportion of the infrared radiation and this absorption is used to measuresimultaneouslythe amount of those gases evolved from the sample.
(a) Material Stainless steels and other alloys or metals.
(b) Range From 5 to over 1000 pg of carbon or sulfur peranalysis.
(c) Reliability Relative standard deviations of 3 and 4 percentwere obtained for carbon and sulfur,respectively,at a concentrationof 0.1 weightpercent over a six-monthperiod. An averagerecovery of 98 percent was obtained for bothelements.
(d) Interferences Interferencesare not expected. Care must betaken, however, to avoid extraneous carbon andsulfur contaminationof sample and equipment.
2.0 DEFINITIONS
NONE
3.0 RESPONSIBI,I_STAFF
Cognizant ScientistAnalyst
4.0 PROCEDURE
Author Date ProjectMgr. Date QAD Representative Date
MC Burt 9/14/88 N/A LJ Ethridge 9/19(88
Technical Reviewer Date Line Mgr. Date Other Date
N/A WC Weimer 9/19/88 All originalonf_i_natures
IT ProcedureNo. Revision No. EffectiveDate PagePNL-ALO-240 0 9/30/88 I of 5

d
PNL TECHNICALPROCEDURE
4.I DISCUSSION
In the analysis of materials for carbon and sulfur, a separationof these elements from the matrix material is necessary prior totheir measurement. Separation is done by evolving the carbon andsulfur as gaseous compounds that are measured by one of severalavailable techniques.
In this method a commerciallyavailable analyzer is used thatsimultaneouslydetermines carbon and sulfur as their oxides usinginfrared absorption. The analyzer consists of an inductiongenerator and furnace, a measurement system, a balance, andcontrol console. The analyzer system is microprocessorcontrolled. A second analyzer was modified for glove box use andis available for use also.
With this analyzer, inductionheating is used for rapid combustionof the sample in the presence of flowing oxygen, which carries thegaseous combustion products from the furnace into the measuringpart of the analyzer. The combustion is done at 1600° to 1700°Cusing tungsten as an accelerator. About 97% of the carbon isreleased as carbon dioxide and the remainingcarbon forms carbonmonoxide. The sulfur is oxidized to sulfur dioxide and trioxide,more than 90% of which is the dioxide and the carbon monoxide isoxidized to carbon dioxide.
The measurement system consists of two cells (one each for carbonand sulfur) which contain an IR source, a chopper motor, awavelength filter and IR detector. The filter selectively passesonly the proper wavelength into the cell and as the combustiongases pass a proportionalamount of the energy is absorbed by the
product gases (CO_ or S02) thus reducing the energy received atthe detector. Th_s change in output is integrated over time andelectronicallyconvertedto percent carbon and sulfur.
The determinatorprovides a printout of the weight percent ofcarbon and sulfur in the sample. The sample weight iselectronicallytransferredfrom the balance to the determinatortoprovide the data needed to print out carbon and sulfurconcentrationsin the sample. The analyzer also providesautomatic compensationfor a system blank.
Because the sulfur trioxide produced cannot be measured byinfrared absorption, it is importantthat analytical conditions bemaintained as constant as possible to ensure a reproducible sulfurdioxide to trioxide ratio. Calibration compensates for sulfurtrioxide and thus 100% recovery of sulfur is obtained. Frequentcalibrationchecks are importantto avoid biased results.
Procedure No. Revision No. Effectlve Date Page
PNL-ALO-240 0 9/30/88 2 of 5

&
PNL TECHNICALPROCEDURE I
Calibration is performed using LECO or NBS certified standards.Calibration is checked each day samples are analyzed by analysisof a LECO or NBS standard (see instructionmanual for operationaltechnique for calibration).
4.2 APPARATUS
(a) Analyzer. CS-44 Carbon-Sulfur system, LECO Model 784-600,including:
I. Control Console, LECO 780-300,2. Determinator,LECO 781-200,3. Inductiongenerator, LECO 777-400, HF-lO0,4. Auto Loader, LECO 773-60I.
(b) Crucibles. LECO 528-081 or equivalent.
(c) Scoop. With a volume of about 0.25 cm3.
4.3 REAGENTS
(a) Accelerator (Tungsten). LECO 763-266 (Lecocel)orequivalent.
(b) Anhydrone.(c) Ascarite.(d) Iron. Granular, LECO 501-673 or equivalent.(e) Oxygen. Ultra high purity grade or equivalent.(f) Platinized Silca Gel, LECO 501-587.
4.4 STANDARDS
(a) CalibrationStandard. Steel standard, LECO 501-503. Thisstandard is certified to contain 0.187 and 0.0181 weightpercent carbon and sulfur respectively. The certificationincludes "uncertainties"of 0.005 and 0.004 for the carbonand sulfur respectively. Other steel standards can be usedas long as their carbon and sulfur values are certified byNBS or LECO.
(b) Control Standard. None required (see Subsection 4.6).
4.5 SAFETY
(a) Care must be taken to avoid contact with high frequencyinductionleads to prevent burns and electrical shocks.
(b) When using the glove box unit be aware that plutonium-bearing materials are radioactive and toxic. Precautions
Procedure No. Revision No. EffectiveDate Page
PNL-ALO-240 0 9/30/88 3 of 5

J
PNL TECHNICALPROCEDURE J
are required to avoid the contamination of the laboratoryand personnel.
(c) Observe the general laboratory safety rules.
4.6 OUALITY CONTROL
4:6.1 Calibration
The instrument is calibrated according to the instructionson page 44 of the LECO Instruction Manual.
The calibration is stored in the microprocessor memory andrecalibratton is required only when checks show a drift orpart replacement (cells, etc.) has occurred.
4.6.2 Control
Control is not established, although the calibrationprocedure does provide a degree of control.
4.7 ANALYSIS
Care must be taken to avoid contamination of the crucibles andsamples with extraneous carbon and sulfur.
(a) The analyzer must conform to the following conditions:
I. Power switch on (normallyleft in this position).2. Inductiongenerator on.3. Oxygen Regulator set at 33 to 37 psig.
(b) Prepare a crucible by adding one scoop of the accelerator(Lecocel) and about one-half to two-thirds of a scoop ofiron.
(c) Place the crucible on the balance pan.
The balancewill tare automatically.
(d) Add 0.5 to 1.0 g of sample to the crucible and press theEnter button.
The sample may be in any form (solid piece, turnings, chips,etc.), lt should be thoroughly degreased in acetone and airdried.
ProcedureNo. Revision No. EffectiveDate Page
PNL-ALO-240 0 9/30/88 4 of 5

PNL TECHNICALPROCEDURE I
The sample weight is automaticallytransferredto theDeterminator. A weight can be placed into the Determinatormanually using the key board. See InstructionManual.
(e) Place the sample identificationnumber into the analyzer bypressing ID Code and then the required digits.
(f) Place the crucible on the autoloader and press the analyzekey on the control console.
As many as eight samplesmay be placed on the autoloader andup to 50 weights and identificationnumbers in the memorystack.
(g) Repeat Steps (b) through (f) for each additional sample.
Samples are automaticallyadvanced and analyzed.
(h) When analyses are completed, shutdown the analyzer asfollows:
I. Turn off the inductiongenerator.
2. Close the oxygen regulator.
The analyzer may be left in this condition.
3. Change the Anydrone and Ascarite in the columns in theDeterminatorafter every 8 hr of use.
4.8 CALCULATION
The weight percents of carbon and sulfur are printed out at thecompletion of each analysis. By moving the decimal point 4 placesto the right, the weight percent is changed to parts per million(ppm) if required. Report no more than three significant figures.
5.0 BIBLIOGRAPHY
InstructionManual, Manual 200-319, CS-344 Carbon-SulfurSystem, Model784-600 LECO Corp., St. Joseph, Michigan.
ProcedureNo. Revision No. EffectiveDate Page
PNL-ALO-240 0 9/30/88 5 of 5

CONTROLLED DOCUMENT
' COPY NO.........
PNL TECHNICALPROCEDURE
TITLE: PNL-ALO-241, (Replaces4-30.6), TOTAL NITROGEN BY FUSION AND GASCHROMATOGRAPHY
1.0 APPLICABILITY
Small pieces of sample are fused at about 2600"C in a graphite crucible.The nitrogen is released in its elemental form and it is measured by gaschromatography,which is based upon the differences in thermalconductivityof gases.
(a) Material 300 series stainlesssteels and other alloys.
(b) Range From 0.00001% to 0.5% nitrogen can be determinedin a ]-g sample.
(c) Reliability Relative standard deviations of 5 to 10 percentare expected at concentrationlevels of 0.001 to0.02 percent nitrogen.
(d) Interferences Nitrogen from the atmospherewill enter thenitrogen analyzer is the sample is improperlyloaded and this will cause a high result.Ammonia, nitrates, and other nitrogen containingcompounds from extraneous sources will causehigh results.
2.0 DEFINITIONS
NONE
3.0 RESPONSIBLESTAFF
Cognizant ScientistAnalyst
Author Date ProjectMgr. Date QAD Representative Date
MC Burt 9[19/88 N/A LJ Ethridqe 9[19[88
TechnicalReviewer Date Line Mgr. Date Other Date
N/A WC Weimer 9119[88 All °riginalf_i_natureSon
ProcedureNo. Revision No. Effective Date Page
PNL-ALO-241 0 9/30/88 I of 5

PNL TECHNICALPROCEDURE I
4.0 PROCEDURE
4.1 DISCUSSION
In this method, the sample is fused at 2600"C in a graphitecrucible to release nitrogen in all forms as elemental nitrogengas. Thus, total nitrogen is determined with this method.
The nitrogen analyzer used has an impulse furnace in which anelectrical current is passed through the graphite crucible,heating the crucible and sample material to a high temperature. Astream of helium is used to carry the nitrogen and other gasesformed by the fusion from the furnace, through scrubbers to removeinterferinggases, and into a column of molecular sieve where thenitrogen is separated. The concentrated nitrogen is then carriedfrom the molecular sieve by helium into a gas chromatograph formeasurement. Helium is used also to flush air from the furnaceprior to heating and to purge the system of interferinggasesreleased during the outgassingof the crucible.
During the fusion, any oxygen present in the sample materialcombines with carbon from the crucible to form carbon monoxide andany combined hydrogen present is converted to elemental hydrogen.These interferinggases are converted to carbon dioxide and waterwhen carried by the helium through a heated column of rare earthand copper oxides. The carbon dioxide is removed later from thegas stream by Ascarite and the water by Anhydrone. The molecularsieve used to concentratethe nitrogen also helps to separateinterferinggases.
The gas chromatographhas a thermoconductivitycell that detectsdifferences in the thermal conductivityof gases. The cellconsists of a pair of matched thermistors used in two legs of aWheatstone bridge. The referencethermistor is kept in a heliumenvironmentalhaving constant pressure, flow, and temperature.The measure thermistor is kept under the same conditions as thereferenceexcept for the gas composition,which varies as nitrogenis carried into the measure thermistor by the helium carrier gas.The nitrogen causes the temperatureof the measure thermistor tochange because of the difference in thermal conductivity betweenhelium and nitrogen. The change in temperaturecauses the Wheat-stone bridge to become unbalanced,and through the electronicsystem, the degree of imbalanceis converted into a readout on thedigital volt meter. That readout is calibrated in terms ofmicrograms of nitrogen.
ProcedureNo. Revision No. • EffectiveDate Page
PNL-ALO-241 0 9/30/88 2 of 5

PNL TECHNICALPROCEDURE J
4.2 APPARATUS
(a) Nitrogen Analyzer LECOTN-114 Nitrogen Determinator, Model782-700.
(b) Graphite Crucibles, LECO#775-053.
4.3 REAGENTS
(a) Anhydrone. LECO501-171 or equivalent.(b) Ascarite. 20 to 30 mesh, LECO183-001 or equivalent.(c) Helium. 99.99% or better.(d) Compressed Air or Nitrogen (for pneumatics).(e) Copper Oxide. LECO501-170 or equivalent.
4.4 STANDARDS
(a) Calibration Standards. NBS SRMsteel standards and/oravailable LECOstandards are used for calibration. LECO501-551, 501-552 and 501-646 are currently on supply.
(b) Control Standard. None required.
4.5 SAFETY
Observe the general laboratory safety rules.
4.6 OUALITY CONTROL
4.6.1 Calibration
The instrument is calibrated according to the instructionson page 46 of the LECO instructionmanual. The calibrationis stored in microprocessormemory and calibration ischecked each time samples are analyzed by running astandard. Calibration is required when checks show a driftfrom accepted values or when maintenance or part replacementhas occurred.
4.6.2 Control
Control is not established,although the standard checkprovides a degree of control.
4.7 ANALYSIS
Care must be taken to avoid contaminationof crucibles and sampleswith nitrogen containing substances.
Procedure No. Revision No. Effectlve Date Page
PNL-ALO-241 0 9/30/88 3 of 5

I PNL TECHNICALPROCEDURE
The nitrogen analyzer uses the same furnace as the oxygenanalyzer. The selector switch must be set to NITROGEN. The twovalves in the flow ]ines must also be set to NITROGEN(these arelocated on the hood wall next to the analyzer).
(a) The Analyzer must conform to the following conditions:
1. Power switch on (normal ]y ] eft on).2. Furnace power on.3. He regulator set at 40 pstg ±4.4. Pneumatic supply set at 40 psig.5. Auto/Manual switch i n AUTOpositi on.
(b) Prepare a sample by cutting the appropriate size (generally<l/gram) and cleaning and drying it.
(c) Place the weighing pan on the balance. It willautomatical ]y tare.
(d) Place the sample on the pan. Whenthe weight stabilizespush the ENTERkey.
Up to 50 sample weights may be entered.
(e) Push the LOADERCONTROLswitch on the furnace, and place thesample in the loading hole.
(f) Push the LOADERCONTROLswitch again. The lower electrodewill open. Discard any electrode and clean the upper andlower electrodes with the brush.
(g) Place a new crucible on the lower electrode and press theLOADERCONTROLswitch.
• The lower electrode will close and the analysiswill automatically begin.
• The printer will print % nitrogen uponcompletion of the analytical cycle.
(h) Continue at step (e) if more than one weight was put in theweight stack initially.
The operator should familiarizehimself with pages 36-53 of theLECO InstructionManual before operating the instrument.
ProcedureNo. Revision No. EffectiveDate Page
PNL-ALO-241 0 9/30/88 4 of 5

|
PNL TECHNICALPROCEDURE I
4.8 CALCULATION
There are no calculationsto perform.
5.0 BIBLIOGRAPHY
InstructionManq(ll,782-700 System, TN-I14 Nitrogen Analyzer, LECOCorp., St. Joseph, Michigan.
_mTProcedure No. Revision No. I EffectiveDate I Page
[ PNL-ALO-241 0 I 9/30/88 1 5 of 5

J
PNL TECHNICALPROCEDURE I
TITLE: PNL-ALO-242, (Replaces4-30.8), SURFACE CHLORIDE AND FLUORIDE USINGSWAB TEST
1.0 APPLICABILITY
One square foot of surface is swabbed alternatelywith wet and dry gauzepads to remove soluble halides. The pads (swabs) are washed free of thehalides by passing water through them in a hypodermic syringe. The washwater (test solution) is analyzed for chloride by constant currentcoulometry and for fiuoride by ion selective electrode potentiometry.
(a) Material Water-solublechloride and fluoride,on metalsurfaces.
(b) Range The detection limits per test are about 5 pgchloride and 0.3 pg fluoride in the swabs, whichcorrespond to 0.035 and .0002 pg per square inchover a once squal_efoot of surface for chlorideand fluorid_ respectively.
(c) Reliability Pads spiked with known amounts of chloride d,_dfluoc'idewere analyzed with the followingresu'/'cs:
_q_CCl_ RSD % Recovery
50 12 104500 6 100
pq F
5 4 9150 2 95
(d) Interferences Bromide, iodide, sulfide, and other ionsthat form insoluble silver compounds aremeasured as chloride. Variations in pH andionic strength between standards and testsolutions adversely affect thr =luoridemeasurement. Therefore, a _.-fferingsolution is used to control those variables.
Author Date Project Mgr. Date QAD Representative Date
RW Stromatt 9/19/88 N/A LJ Ethridge _/19/88
Technical Reviewer Date Line Mgr. Date Other Date
All originalf_i_naturesonWC WeihWrr-
Procedure No. ] Revision No. I Effective Date I PagePNL-ALO-242 0 9/30/88 1 of 12I I l

I"' PNL TECHNICALPROCEDURE ' i "
2.0 DEFINITIONS
NONE
3.0 RESPONSIBLE STAFF
Cognizant ScientistAnalyst
4.0 P_Bg_r_J_)J3_
4.1 DISCUSSION
This method is based upon dissolving water-solublechloride andfluoride from the surfaces of cladding components by swabbingalternatelywith wet and dry gauze pads. The pads are washed freeof the halides and then the concentrationsof those halides insolution are measured.
The lower limits of the techniques used to measure theconcentrationsin the final solution are about 0.2 and 0.02 pg/mlof chloride and fluoride respectively. Under the conditions ofthis method, the detection limits are equivalent to 0.035 and0.002 /_gper square inch chloride and fluoride, respectively,whenone square foot of surface is swabbed. These lower limits forsurface concentrationsare 14 and 250 times below the establishedspecificationlimit for surface chloride and fluoride of 0.5 pgper square inch. Thus, this method is more than adequate fordetermining if cladding components meet the surface chloride andfluoride specification.
A commerciallyavailablechloride analyzer is used to measure thechloride content of the final solution [Section 5.0(a)]. Theinstrument electrolyticallygenerates silver ions at constantcurrent from a silver electrode. Insolublesilver chloride isformed until all of the chloride has been precipitated. The endpoint is detected by the amperometricindicationof the excesssilver ions across an indicatorelectrode pair, and the generatingcurrent is shut off automaticallyat a pre-set incrementofindicatorcurrent. Since the rate of generating silver ion isconstant, the amount of chloride precipitatedis proportional tothe time required for the titration according to Faraday's law[Section 5.0(c)].
I Specificationlimit established for cladding components for the FastFlux Test Facility (FFTF).
ProcedureNo. Revision No. Effective Date Page
PNL-ALO-242 0 9/30/88 2 of 12-- -- "..... | I

PNL TECHNICALPROCEDURE ' ]
The fluoride content of the final solution is measured with thefluoride-selectiveelectrode, which is highly specific forfluoride and which responds linearly on a semi-log plot over afluoride concentrationrange of Ig mg/ml to about 0.2 /_g/mlSection 5.0(b) and (d). The electrode responds, however, tofluoride ion activity and not concentration;therefore, it must becalibrated with fluoride standards to relate response toconcentration.
To ensure the reliabilityof the fluoride measurement,thesolution matrix of the calibration standardsmust be the same asthat used for the samples. This is necessary because the ionicstrength, complexation,and the pH of solutions affect theelectrode response. Thus, variations in these conditions betweenstandards and samples will bias the measurement. Therefore, thecalibration standards and sample solutions are prepared in thebuffering solution.
4.2 APPARATUS
(a) Automatic chloride titrator, Aminco-Cotlove,AmericanInstrumentCo.
(b) Fluoride ion selectiveelectrode/referencecombination,Orion g6-og.
(c) Forceps, 25-cm. Rinse thoroughly with deionized ordistilled water and store in plastic bags.
(d) Gauze pads, 7.6 x 7.6 - cm, 12-ply (Johnson and JohnsonSteripads or equivalent). The pads must be washed beforeuse to remove chloride and fluoride contamination. Prepareas follows;
I. Remove 100 gauze pads from their envelopes and placethem in a 2000 ml beaker.
2. Add deionizedor distilled water until the pads arecovered.
3. Boil the gauze pads eight to ten hours changing thewater every hour.
4. Set up the drying tube (Item q, Section 4.2) with thepull up screen near the bottom of the tube.
5. Using clean forceps place the pads on the screen inthe tube (the tube will hold more than 1000 pads).
Procedure No. Revision No. Effective Date Page
PNL-ALO-242 0 9/30/88 3 of 12I I I i a

i|m|ii i -, i
I PNL TECHNICALPROCEDUREii
,'6. _" Cover the top of the tube with tissue paper. Turn on: the vacuum supply to the tube to remove the residual
water from the tube and pads for a few seconds. (Thecover on the tube filters the air passing through asthe water is removed).
7. Turn off the vacuum supply to the tube. Remove thecover and slowly add 1-pL acetone to the tube allowingthe acetone to flow down the tube to soak all thepads.
8. Turn on the vacuum, and pour an additional pint ofacetone over the pads.
9. Replace the cover, and continue pulling air throughthe tube until the pads are dry. The pads will be drywhen water no longer condenses on the outside of theglass drying tube.
I0. Remove four pads and check their chloride and fluoridecontents accordingto the procedure beginning atsection 10.2. If the total chloride and fluoridefound in the pads are equal to or less than 5 and 0.3/_grespectively,the pads are adequately clean. Ifnot, repeat steps 2 to 9 (in Step 3, boil for anadditional 3 hours changing the water each hour).
11. Place two pads in each of the I and 8 oz. plasticbottles.
12. Add 7 ml of deionized or distilled water to the I oz.bottles and place caps on all bottles.
(e) Graduated cylinders, 25 ml.
(f) Hypodermic syringe, 30 ml.
(g) Magnetic stirrer.
(h) Magnetic stir bar, 0.8 cm long.
(i) Digital pH/mV meter, Beckman Model 4500 or equivalent.
(j) Parafilm M, American Can Company.
(k) Plastic or rubber gloves. Rinse the outside of the glovesthoroughly with deionized or distilled water. Some types ofgloves do not need to be rinsed, but this must be determinedfor each type and lot.
Procedure No. Revision No. EffectiveDate Page
PNL-ALO-242 0 9/30/88 4 of 12- -- - .................

a
PNL TECHNICALPROCEDURE ]
(1) Plastic bags, polyethylene, about 15- by 24-cm.
(m) Plastic bottles and caps, polyethylene, 1 and 8 oz. Thesebottles must be leached or rinsed with deionized ordistilled water before use.
(n) Plastic ruler, flexible.
(o) P1asti c beaker, 8 ml.
(p) Wash bottle.
(q) Drying tube, for gauze pads. A vertical glass tube, 60-cmlong by 6-cm o.d., with an 8-w o.d. outlet at the bottomconnected to a vacuum system that draws air down the tube.An aspirator flask is placed in the vacuum line so that theacetone and any residual water wi11 be trapped in the flask.A coarse circular plastic screen (with about 7-mm holes)attached to 2 stiff wires is used to draw the pads up thetube.
4.3 REAGENTS
(a) Acetone, ACS reagent grade.
(b) Deionized or distilled water chloride-free (<0.1 pg/ml).
(c) Nitric-acetic acid solution, lH HNO3 - 4H acetic acidcontaining 20 to 30 pg Cl/ml of solution. Prepare by adding20 to 30 ml of the 1 mg/ml chloride standard to each 1iterof the nitric-acetic acid solution. Mix thoroughly.
(d) Gelatin solution. See ODeration_; Manual for the chloridetitrator [Reference (c), Section 5.0].
(e) Silver cleaning paste. See Operations Manual for chloridetitrator. [Reference (c), Section 5.0].
(f) Total Ionic Strength Adjustment Buffer (TISAB). Add 57 mlof glacial acetic acid, 58 g of sodium chloride and 2 g of1,2-cyclohexylene dinitrilo tetraacetic acid (cyclohexanediamine tetraacetic acid) to 500 ml of deionized water in a1-1 beaker. Stir to dissolve and cool to room temperature.Adjust the solution pH to 5.3 _+0.2 with 5M NaOH (about150 ml), which has been prepared with deionized water.Transfer the solution to a 1-1 volumetric flask and diluteto volume with deionized water.
ProcedureNo. Revision No. EffectiveDate Page
PNL-ALO-242 0 9/30/88 5 of 12

°
4.4 STANDARQS
(a) Calibration Standards
I. Chloride standard,2000 pg/ml. Dissolve 1.6485 g ofsodium chloride, previously dried at 110°C, indeionized water and dilute to I l with deionizedwater. A commercial standardsof 1000 pg Cl/ml(+ 0.5%) is satisfactory.
2. Fluoride standards. Prepare a stock solution of 100/_gF/ml by dissolving 0.2210 g of sodium fluoride,previously dried at I00"C, in deionized water anddiluting to I I. A commercial standard of 100 pg F/ml(_+0.5%) is satisfactory. Prepare a set ofcalibration standards of 10, 1.0, 0.20, 0.05 and 0.01pg F/ml by appropriatedilutions of the stocksolution.
(b) Control Standard. None required (see Subsection 4.6).
4.5 SAFI[TY
Observe the general laboratory safety rules.
4.6 OUALITY CONTROL
4.6.1 Calibral_ion
(a) Chloride Titrator. Calibration involves thedeterminationof a calibrationblank and acalibration factor. Base values are determined forboth by making at least nine measurements of eachover a period of three working days or more. Thebase value is the average value obtained. The basevalues are used in calculations.
I. Calibration blank. Determine the blank byfollowing Subsection 10.3 using 5.00 ml ofdeionized water at Step (c) in place ofsample. At least three blanks shall bedetermined at the start of each 8-hr shiftduring which chloride titrations are made.If the average of the three blanks is within+ 1.0 sec. of the base value, proceed withPart 2. If not, investigateand correct theproblem before proceeding.
Procedure No. Revision No. EffectiveDate Page
PNL-ALO-242 0 9/30/88 6 of 12

2. Calibration factor. Determine thecalibration factor by following Subsection10.3, using 50.0 pl of the calibrationstandard and 5.00 ml of deionized water atStep (c) insteadof a sample solution. Thecalibration factor shall be determined atleast once each month during which chloridetitrations are made. If the result is notwithin ± I% of the base value, investigateand correct the problem before proceedingwith samples.
(b) Fluoride electrode. The fluoride electrode shallbe calibrated within 2 hr of making fluoridemeasurementsbecause the calibration may drift withtime. Calibrate the electrode as follows:
I. Assemble the electrode apparatus.
2. Turn on the stirrer and adjust it to amoderate speed.
3. Rinse the electrode with deionized ordistilled water, pipet 100 ml of TISAB and1.00 ml of 0.01 pg F/ml standard into the8-ml plastic beaker, place the electrode inthe solution and let it soak until a stablereading is obtained.
4. Remove the standard solution from the beakerand rinse the beaker with deionized ordistilled water. Repeat Step 3. The readingshould stabilizewithin 5 min and it mustagree within 2 mV of the reading in Step 3.If so, record the reading; if not, repeatStep 3.
5. Repeat Step 4 with the 0.05, 0.20, 1.0, and10 pg F/ml calibrationstandards (in thatorder) and record these readings.
6. Plot the calibrationreadings from Steps 4and 5 on 3-cycle semi-log graph paper withfluoride concentrationon the log scale.
4.6.2 Control
Control is not established.
Procedure No. Revision No. Effective Date Page
PNL-ALO-242 0 9/30/88 7 of 12

|
4.7 ANALYSIS
Extreme care shall be taken to prevent extraneous chloride andfluoride contaminationof reagents and equipment. Wash (test)solutions shall be analyzed for fluoride within 2 hr ofpreparing the calibrationcurve because the fluoridecalibrationmay drift with time.
4.7.1 Removal of Chloride Ind Fluoride fromSurface
One test will require 4 pads; 2 wet ones in the 1-ozbottle and 2 dry ones in the 8-oz bottle. The persondoing this work must wear pre-washed plastic or rubbergloves.
(a) Measure a test area of about I ft2.
For large, flat surfaces this can be done with atemplate. On other surfaces, the areameasurementcan be done using the plastic ruler.
(b) Remove a wet pad from the 1-oz bottle and swabthe test surface firmly; place the pad in anempty 8-oz bottle.
If the surface being swabbed is not horizontal,care must be taken to avoid excess water fromthe pad running out of the test area and beinglost.
(c) Swab the area next with a dry pad and place thispad in the 8-oz bottle containing the first(wet) pad.
(d) Repeat Steps (b) and (c) with new wet and drypads.
(e) Record the area of the surface tested in squareinches and describe the test area. The 8-ozbottle containing these pads should be labelledwith this information.
4.7.2 Separation of Chloride and Fluoride from Pads
The graduated cylinders and syringe used in thisSubsectionmust be reserved for this analysis. Whennot in use the cylinders should be filled withdeionized or distilled water and the syringe should bestored in a covered bottle.
Q1
Procedure No. Revision No. Effective Date Page I
IPNL-ALO-242 0 9/30/88 8 of 12

9
PNL TECHNICALPROCEDURE ]
(a) Remove the 4 pads from the bottle [Subsection4.2(d)] with clean forceps and place them in the30-m1 syringe.
(b) Rinse the bottle with about 5 ml of deionized ordistilled water and pour the rinse into thesyringe.
(c) Insert the plunger into the syringe and squeezethe water into a clean 25-mi graduated cylinder.
(d) Remove the plunger and add sufficient deionizedwater to the syringe so that 25 ml will becolIected.
(e) Replace the plunger and squeeze the water intothe same graduated cylinder (Step c).
(f) Dilute to volume with deionized water, cover thecylinder with Parafilm and mix thoroughly.
4.7.3 ChIQride Measurement
If the silver electrodes are not bright, start at Step(a); otherwise start at Step (b).
(a) Clean the silver electrodes with silver cleaningpaste and wash thoroughly with deionized ordistilledwater.
The first one or two chloride measurementsmadeafter this cleaning step may not besatisfactory. Clean only if necessary.
(b) Pipet I O0 ml of the HNO3-aceticacid solutioncontaining chloride into a clean 10-ml titrationcell.
Because this chloride constitutes a significantblank, the amount of acid to improve thesensitivityof the titration by providingsufficientchloride to exceed the solubilityproduct of silver chloride. Otherwise, asignificanterror occurs when titrating a fewmicrograms of chloride.
(c) Pipet 5.00 ml of sample solution from Subsection4.7.2, Step (f) into the titration cell.
ProcedureNo. Revision No. EffectiveDate Page
PNL-ALO-242 0 9/30/88 9 of 12

o
I PNL TECHNICALPROCEDURE
(d) Add 3 or 4 drops of the gelatin solution.
(e) Rinse the electrodes with deionized or distilledwater.
(f) Place the titration cell into position on thechloride titrator.
(g) Begin stirring by turning the titrate switch tothe "l" position.
(h) Set the timer counter to zero.
(i) Set the adjustable (red) pointer on the meter-relay 10 divisions above the indicator (black)pointer.
The Ooerations Manu_l for the chloride titratorhas instructionsfor initiallysetting theindicatorpointer.
(j) Begin the titration by turning the titrateswitch to the "Z" position.
(k) Record the time when the counter stops.
This is the titration time for the sample (T,),calibrationstandard (Tst)or calibration blank(Tcb),depending upon wliatis being determined.
4.7.4 Fluoride Measurement
(a) Prepare the electrode for the fluoridemeasurement by following Steps I and 2 of Part(b), Subsection 4.6.1 and then rinse theelectrodewith deionized water.
(b) Pipet 1.00 ml of sample solution and 1.00 ml ofTISAB into the 8-ml plastic beaker.
(c) Place the electrode into the solution and recordthe mV reading after a stable reading isobtained.
(d) Obtain the fluoride solution concentration(pg/ml) from the calibration curve.
ProcedureNo. Revision No. Effective Date Page
PNL-ALO-242 0 9/30/88 10 of 12

L
[ .....[4.8 CALCULATION
Calculate the chloride calibrationfactor and the concentration ofchloride and fluoride on the sample using the appropriateequations below.
(a) Chloride Calibration Factor.
ClF-
T -Tst cb
where F = calibration factor,/_gof chloride per sec
Cl = /_gof chloride added from the chloride standard[Step 2 of Part (a), Subsection 4.6.1]
Tsr = titrationtime of standard [Step (k) ofSubsection4.7.3]
Tcb = titration time of calibrationblank [Step (k)].
(b) Concentrationof Chloride on Surface of Sample.
F(T - T )Vs cb
C =a SA
= /_g chloride per in.2 of surfacewhereCi_= calibrationfactor
Ts = titrationtime of sample [Step (k) ofSubsection 4.7.3]
Tc_ titration time of calibration blank= sample aliquot, normally 5.00 ml
S = area of test in in.2V = total volume of solution collected, usually
25.0 ml.
Unless otherwise instructed,report results to twosignificantfigures.
(c) Concentrationof Fluoride on Surface of Sample.
Procedure No. Revision No. Effective Date Page
PNL-ALO-242 0 9/30/88 11 of 12
FVa
F -
a S
where Fa -/_g F/in. 2 of surface- pg F/ml from Step (_), Subsection 4.7.4F_ . area of test in in e
V - total volume of solutton collected,usually 25.0 ml.
Unless otherwise instructed, report results to twosignificant figures.
5.0 _.IBL_OGRAPHY
(a) E. Cotlove, H. W. Tranthan, and R. L. Bowman, "An Instrument andMethod for Rapid, Accurate, and Sensitive Titrations of Chloridein Biologic Samples," J. Lab, Clin. Med,, 51, 461 (1958).
(b) M.S. Frank and J. W. Ross, Jr., "Electrode for Sensing FluorideIon Activity in Solution," Science, J__, 1553 (1966).
(c) Operations Manual, Aminco-CotloveAutomatic Chloride Titrator,InstructionNo. 951, American InstrumentCo., Inc., SilverSprings, MD.
(d) G.A. Rechnitz. "Ion-SelectiveElectrode," Chem. Enq. News, 4__55,153, June 12 (1967).
ProcedureNo. Revision No. Effective Date Page
•PNL-ALO-242 0 9/30/88 12 of 12
PNL TECHNICALPROCEDURE I
TITLE: PNL-ALO-243, (Replaces4-40.3), WATER LEACHABLECHLORIDE AND FLUORIDEIN CLOTH AND OTHER MATERIALS
1.0 APPLICABILITY
This method is for the determinationof water soluble chloride andfluoride in their ionic form leached from materials such as cloth,paper, sponge, etc. The sample is immersed in a minimum amount of waterwhich is gently boiled for 30 minutes. The water is analyzed forchloride by constant current coulometry with an amperometricend pointfor fluoride by ion selectiveelectrode potentiometry.
(a) Material Water soluble ionic chloride and fluoride on orin water immersiblematerial.
(b) Range The detection limits per test are about 0.1pg/ml chloride and 0.01 pg/ml fluoride in theleach water solution. The actual concentrationrange for the chloride and fluoride depends onsample material size and configuration.
(c) Reliability There is no estimate of reliability for most ofthe samples. However, chloride and fluorideadded to cloth samples can be recovered towithin ± 15% (relative)of the amount added foras little as 50 pg of chloride and 5 pg offluoride.
(d) Interferences Bromide, iodide, sulfide, and other ions thatform insoluble silver salts are measured aschloride. Variations of pH and ionic strengthbetween standard and test solutions as well asthe presence of ions complexing fluoride canaffect the fluoride result; and therefore, abuffering solution is used to control thesevariables.
Author Date ProjectMgr. Date QAD Representative Date
RW Stromatt 9/19/88 N/A LJ Ethridqe 9/19/88
TechnicalReviewer Date Line Mgr. Date Other Date
"miLN/A WC Weimer 9/19/88All
originalf_i_natureson
ProcedureNo. Revision No. EffectiveDate PagePNL-ALO-243 0 9/30/88 I of 10

I PNL TECHNICALPROCEDURE
2.0 DI_FINITIONS
NONE
3.0 RESPONSIBLESTAFF
Cognizant ScientistAnalyst
4.0 PROCEDURE
4.I _|SCUS$1nN
_ater so'iubleionic chloride and fluoride are removed from asample by leaching in gently boiling water for 30 minutes. The
¢ leach solution is then analyzed for the chloride and fluoride.
Samples for this analy._isinclude gloves, plastic bags, plasticsheet, rags, tape, sponges, solid objects, etc. The sensitivityrequired for the analysis will likely be set by the requester.Since the actual sensitivitydepends on the volume of waterrequired to cover the sample, it is important to devise aconfigurdtionof sample and water container to satisfy the
requester's sensitivityrequirements. For example, if thespecificationfor a plastic sheet were 0.5 /_j/in., it would be
desirable to have the detection Izimitbe 0.2 pg/in.2 This meanstndt a plastic sheet with 100-in. total area would have to beleached in 200 ml of water.
Results are reported as pg/in.2 and/or pg/g. Usually, therequester wants the result for plastic sheet, tape and other non-porous materials such as solid metal objects in terms of pg/in.2.Results for porous materials such as cloth are usually reported asboth pg/in.2 and pg/g. Results for porous material such assponge, for which a surface area cannot be measured, are reportedas pg/g. For non-porousmaterial such as plastic sheet, oneshould consider both sides of the sheet in the surface areacalculation. On the other hand, fol porous material such ascloth, the surface area used would be one side only, sincechloride on the outer surface of a piece of cloth lying on a steelsurface can diffuse to the inner or contact surface.
4.2 APPARATUS
(a) Automatic chloride titrator, Aminco-CotloveAmericanInstrumentCo.
IProcedureNo I_ev_s,onNo IEf,ect,veO_te iPage II PN,AL02,3I 0 I ,13o188] 2oflo I

IPNL TECHNICALPROCEDURE I
(b) Balance, top loading, capable of weighing to the nearest0.01 g.
(c) Fluoride Electrode, ion selective/reference combination,Ori on 96-09.
(d) Magnetic stirrer and stir bars.
(e) Digital pH/mV Meter, Beckman Model 4500 or equivalent.
(f) Plastic beaker, 8 ml.
4.3 REAGENTS
(a) Deionized or distilledwater, chloride-free (<0.1 pg/ml).
(b) Gelatin solution, see Operations Manqal for the chloridetitrator [Reference (c), Section 5.0].
(c) Nitric-aceticacid solution, IM HNO_-4M acetic acid,} .
containing 20 to 30 pg Cl/ml of solutlon. Prepare by adding20 to 30 pl of the I mg/ml chloride standard to each literof the nitric-aceticacid solution. Mix thoroughly.
(d) Silver cleaning paste, see ODerations Manual for thechloride titrator. [Reference (c), Section 5.0].
(e) Total ionic strength adjustment buffer (TISAB). Add 57 mlof glacial acid, 58 g of sodium chloride and 2 g of I,2-cyclohexylenedinitrilo tetra-aceticacid (cyclohexanediamine tetraaceticacid) to 500 ml of deionized water in aI-I beaker. Stir to dissolve and cool to room temperature.Adjust the solution pH to 5.3 _+0.2 with 5 M NaOH (about150 ml), which has been prepared with deionized water.Transfer the solution to a I-I volumetric flask and diluteto volume with deionizedwater.
4.4 STANDARDS
(a) Calibration Standards. Stock solutions of 1000 pg/mlchloride and 100 /_g/mlfluoride with accuracy of + 0.5% areobtained from commercial sources. Prepare a set ofcalibration standardsof 10.0, 1.00, 0.20, 0.05, ar, 0.01 pgF/ml by appropriatedilutions of the stock solution.
4.5 SAFETY
Observe the general laboratory safety rules.
_ ProcedureNo. Revision No. I EffectiveDate I Page I

PNL TECHNICALPROCEDURE
4.6 OUALITY CONTROL
4.6.1 Calibration
(a) Chloride titrator. Calibration involves thedeterminationof a calibration blank andcalibrationfactor. Base values are determined forboth making at least nine measurement of each overa period of three working days or more. The basevalue is the average value obtained. The basevalues are used in calculations.
I. Calibration blank. Determine the blank byfollowing Subsection 4.7.2 using 5.00 ml ofdeionized or distilled water at Step (c) inplace of sample. At least three blanks shallbe determined at the start of each 8-hr shiftduring which chloride titrations are made.If the average of three blanks is within +1.0 sec of the base value, proceed with Part2. If not, investigateand correct theproblem before proceeding.
2. Calibration factor. Determine thecalibration factory by following Subsection4.7.2, using 50.0 pl of the calibrationstandard and 5.00 ml of deionized ordistilled water at Step (c) instead of asample solution. The calibration factorshall be determined at least once each monthduring which chloride titrations are made.If the result is not within _+I% of the basevalue, investigateand correct the problembefore proceeding with samples.
(b) Fluoride electrode. The fluoride electrode shallbe calibrated within 2 hr of making fluoridemeasurementsbecause the calibration may drift withtime. Calibrate the electrode as follows:
I. Assemble the electrode apparatus.
2. Turn on the stirrer and adjust it to amoderate speed.
3. Rinse the electrodewith deionized ordistilled water, pipet 1.00 ml of TISAB andI.C0 ml of 0.01 pg F/ml standard into thecrucible, place the electrode in the
ProcedureNo. I Revision No. I EffectiveDate Page
I I I

I
PNL TECHNICALPROCEDURE I
solutions and let it soak until a stablereading is obtained.
4. Removethe standard solution from thecrucible and rinse the crucible withdeionized or distilled water. Repeat Step 3.The reading should stabilize within 5 min andit must agree to within 2 mV of the readingin Step 3. If so, record the reading; ifnot, repeat Step 3.
5. Repeat Step 4 with the 0.05, 0.20, 1.0, and10.0 /_g F/ml calibration standards (in thatorder) and record these readings.
6. Plot the calibration readings from Steps 4and 5 on 3-cycle semi-log graph paper with
. fluoride concentrationon the log scale.
4.6.2 _qni_rql
Control is not established.
4.7 ANALYSIS
Extreme care shall be taken to prevent extraneous chloride andfluoride contaminationof reagents and equipment. Leach testsolutions shall be analyzed for fluoride within 2 hr of preparingthe calibrationcurve because the fluoride calibration may driftwith time.
4.7.I Leachinq Procedure
(a) Weigh the sample into a clean pre-weighed beaker.
The sample size and beaker volume should beselected to allow the maximum size sample with aminimum leach water volume. In preparing thesample, use are not to contaminate it. Tools toprepare the sample such as knives, scissors andforceps should be washed free of halides and shouldbe handledwith care. Washed rubber or plasticgloves should be used if the sample must be handledby hand.
(b) Add just enough deionized or distilled water tocover the sample and place a watch glass on thebeaker.
ProcedureNo. I Revision No. I EffectiveDate [ Page ]_,,,̂ ,^ _ o,_n,oo 5 of I0I r,,--,-v- 243 I I _l ! I

PNL TECHNICALPROCEDURE
(c) Heat the water to a gentle boil and continueboiling for 30 min.
Porous samples should be stirred and compressedwith a glass rod several times during the leachoperation.
(d) Allow the leach water to cool, wash condensate onthe watch glass into the beaker and weigh thebeaker with sample and water.
(e) Carefully stir the leach solution and compressporous samples to assure a homogeneousleachsolution for the subsequent chloride and fluoridemeasurements.
4.7.2 Chlori de Measurement
If the silver electrodes on the chloride titrator are notbright, start at Step (a); otherwise start at Step (b).
(a) Clean the silver electrodes with silver cleaningpaste and wash thoroughly with deionized ordistilled water.
The first one or two chloride measurements madeafter this cleaning step may not be satisfactory.Clean only if necessary.
(b) Pipet 1.00 ml of the HNO3-acetic acid solutioncontaining chloride into a clean lO-ml titrationcell.
Because this chloride constitutes a significantblank, the amount of acid solution added must beaccurately pipetted. Chloride is added to improvethe sensitivity of the titration by providingsufficient chloride to exceed the solubilityproduct of silver chloride. Otherwise, asignificant error occurs when titrating a fewmicrograms of chloride.
(c) Pipet 5.00 ml of sample solution from Step (e),Subsection 4.7.1, into the titration cell.
(d) Add 3 drops of the gelatin solution.
J ProcedureNo. Revision No. I EffectiveDate I Page
I PNL-ALO-243 0 i 9/30/88 I 6 of i0

PNL TECHNICALPROCEDURE I
(e) Rinse the electrodes with deionized or distilledwater.
(f) Place the titrationcell into position on thechloride titrator.
(g) Begin stirring by turning the titrate switch to the"I" position.
(h) Set the timer counter to zero.
(i) Set the adjustable (red) pointer on the meter-relay10 divisions above the indicator (black) pointer.
The Ooerations Manual for the chloride titrator hasinstructionsfor initiallysetting the indicatorpointer.
(j) Begin the titrationby turning the titrate switchto the "2" position.
(k) Record the time when the counter stops.
This is the titration time for the sample (T_),calibration standard (Tsr)or calibration bl_nk(Tcb),depending upon wliatis being determined.
4.7.3 FluorideMeasurement
The fluoride measurement shall be made within 2 hr ofcalibration because calibrationtends to drift with time.
(a) Make the measurementby following Steps I through 4of Part (b), Subsection 4.6.1, using 1.00 ml of theleach solution from Step (e), Subsection 4.7.1,instead of calibration standard at Step 3.
(b) From the electrode mV reading, obtain pg F/ml inthe leach solution of the calibration curve.
4.8 CALCULATION
Calculate the chloride calibrationfactor and the concentrationofchloride and fluoride in or on the sample using the appropriateequations below.
• Revision No. Effecti ve Date Page
). PNL-ALO-243 0 g/30/88 7 of 10I ,, I l

I PNL TECHNICALPROCEDURE
(a) Chloride Calibration Factor
F= ClTst - Tcb
where F - calibration factor, /R of chloride per sec
C1 m /_J of chloride added from the chloridestandard [Step 2 of Part (a), Subsection4.6.1].
Tsr- titration time of standard [Step (k) ofSubsection 4.7.2].
Tcb= titration time of calibration blank [Step Iof Part (a), Subsection 4.6.1].
(b) Concentrationof Chloride on Surface of Sample.
F(T s - Tcb)VCa l SA
where Ca - pg chloride per in. 2 of surface
F = calibration factor
T_ _ titration time of sample [Step (k) ofSubsecti on 4.7.2]
Tcb - titration time of calibration blank
A - sample aliquot, nomally 5.00 ml
2S = surface area of test in in.
V = total volume of leach solution, which is thedifference in weights of the beaker and itscontents at Steps (a) and (d) of Subsection4.7.1.
i The specific gravity of the solution is assumed to be 1.0.
Procedure No. Revision No. l Effective Date Page
PNL-ALO-243 0 I 9/30/88 8 of 10I ...... I I

PNL TECHNICALPROCEDURE [
(c) Concentration of Chloride in Sample.
F(Ts - Tcb)VCw = WA
where Cw - pg chloride per g of sample
F - calibration factor
Ts - titration time of sample
Tcb- titration time of calibration blank
V- total volume of leach solution [see Part (b),Section 4.8]
A- sample aliquot, normally 5.00 ml
W - weight of sample in g.
(d) Concentrationof Fluoride on Surface of Sample.
FcVFa "T
where Fa = pg fluoride per in.2 of surface
Fc - pg fluoride per ml of leach solutionz
S = surface area of test in in.
V - total volume of leach solution [see Part (b),Section 4.8].
(e) Concentrationof Fluoride in Sample.
FcVFw = T
where Fw = pg fluoride per g of sample
ProcedureNo. Revision No. EffectiveDate PagePNL-ALO-243 0 9/30/88 9 of 10

PNL TECHNICALPROCEDURE
Fc = pg fluoride per ml of leach solution
V = total volume of leach solution [see Part (b) ofSection 4.8]
W = weight of sample in g.
Unless othenwise |nstructed, report all results to twosignificant figures.
5.0 BIBLIOGRAPHY
(a) E. Cotlove, H. W. Trantham, and R. L. Bowman. "An Instrument andMethod for Rapid, Accurate, and Sensitive Titrations of Chloridein Biologic Samples," _. Lab. Clin. Med., 51, 461 (1958).
(b) M.S. Frank and J. W. Ross, Jr. "Electrode For Sensing FluorideIon Activity in Solution," Science, 154, 1553 (1966).
(c) Operations M_nual, Amtnco-Cotlove Automatic Chloride Titrator,Instructions No. 951, American Instrument Co., Inc., SilverSprings, HD.
(d) G.A. Rechnitz. "Ion-Selective Electrode," Chem. Enq. News., 45,153, June 12 (1967).
rProcedureNo. Revision No. EffectiveDate | Page
PNL-AL0-243 0 9/30/88 _ 10 of 10

PNL TECHNICALPROCEDURE I
TITLE: PNL-ALO-244, (Replaces7-30.I), VACUUM OUTGAS OF INTRINSICGERMANIUMDETECTOR DEWARS
1.0 APPLICABILITY
This procedure is for vacuum cleanup of the IntrinsicGermanium DetectorDewars used at the Fast Flux Test Facility (FFTF) for Fuel FailureMonitoring. After prolonged usage, air in-leakage into the vacuumchambers of the Dewar flasks decreases the resolution of the detectorsand increasesthe use of liquid nitrogen. The way to rejuvenate theDewar is to vacuum outgas the Dewar and the getter materials in thevacuum chambers to remove as much gas as possible.
2.0 DEFINITIONS
None.
3.0 RESPONSIBLE
Cognizant scientistAnalyst
4.0 PROCEDURE
4.1 EauiDment and Materials
Richardson valves for connecting the Dewar vacuum valves. Obtainthese from FFTF Engineering.
Vacuum system with vacuum gauges.
Heating system such as an air wand heater.
Temperaturecontroller.
4.2 PerformanceCheck
None required.
Author Date Project Mgr. Date QAD Representative Date
MW Goheen 8/2/88 N/A LJ Ethridqe 8/2/88
TechnicalReviewer Date Line Mgro Date Other Date
AlI origionnalf_i_naturesWC Weimer 8/2/88
ProcedureNo. Revision No. Effective Date Page
PNL-ALO-244 0 8/2/88 I of 3

4.3 VacuumOutqassing
Remove the covers over the two valves on the vacuum chambers onthe Dewar. One valve is under a small aluminum cover secured withtwo machine bolts on the detector end of the cold finger and theother valve is covered with a slip fit cap. Install theRichardson valves on to the Dewar valves. Use a little highvacuumgrease on the '0' rings. Connect the outlets on the valvesto a vacuum rack and check for leaks. Leak checking can be donesimply by observing vacuum gauges and/or watching pressure riseafter the initial pumpdown.
Before opening the Dewar valves, tnsure that the Richardson valvesare connected to the roughing system on the vacuum rack. TheDewar may be at or close to atmospheric pressure and opening tothe high vacuum system could damage or trip out the pumps.
Open the Dewar valves by inserting and engaging the Richardsonvalves and turning the Dewar valves one and a half turnscounterclockwise. Note the pressure rise if any. When thepressure is below about 0.1 Torr switch to the high vacuumpump.Do another simple leak check. If the Dewar appears to have alarge leak rather than just a high gas load problem, use a heliumleak detector to locate the leak.
When the Dewar is at a reasonable vacuum (gauge pressure of 10E-5Torr), lt is ready for heating. Insert a heat wand into neck ofthe Dewar. Use a ring stand to hold the wand steady and do nottouch the Dewar neck. Connect the wand to the building air supplyand establish an air flow of at least one scfm through the wandand into the Dewar. Connect the wand to a heater control. Besure to putthe thermocouple into the neck of the Dewar abouthalf-way down. Then set the controller for about one hundreddegrees celsius and turn the heat control on. Watch the pressureduring the warm up period. The pressure usually goes up to the10E-4 Torr range (gauge reading).
Heat the Dewar overnight or over a weekend. Usually the pressurewill drop back into the 10E-5 range while the Dewar is still warm.Cool the Dewar by simply turning off the power to the wand andincreasing the air flow.
When the Dewar is cooled the valves can be closed. Insert theRichardson valves into the Dewar valves and turn one and a halfturns clockwise until the seats are set fairly firmly withoutexcessive force.
I
Procedure No. Revision No. Effective Date Page J
IPNL-ALO-244 0 8/2/88 2 of 3

I
PNL TECHNICAL PROCEDURE I
4.4 Calculations
None needed in the procedure.
4.5 Records
None needed.
4.6 Procedure Oualification
None required. This is a cleaning procedure. The Dewar flasksare checked for acceptabilityby the customer.
r
ProcedureNo. Revision No. |Effective Date Page
PNL-ALO-244 0 l 8/2/88 3 of 3

PNL TECHNICALPROCEDURE I
TITLE: PNL-ALO-245,(Replaces7-30.4), GAS MIXING
1.0 APPLICABILITY
The proceduredescribes the methods used to mix gases. Gas tags ofvarious isotopic enrichmentsof xenon and/or krypton are prepared bythis method for use in various experimentsfor fuel or control rodbreach locators at the Fast Flux Test Facility (FFTF) or similarfacilities. Gas mixtures of most permanentgases can be blended byvariations of the procedure.
2.0 DEFINITIONS
None.
3.0 RESPONSIBLE STAFF
Cognizant scientistAnalyst
4.0 PROCEDURE
4.1 Eqqipmen_ and Materials
High vacuum/gas rack.
Capacitancemanometer.
Various gases such as xenon and krypton as needed.
Various gas cylinders for containing mixed gases.
Rotary mixer.
Gas regulators (leak tight) for high pressure gas cylinders.
Thermometer.
Author Date ProjectMgr. Date QAD Representative Date
MW Goheen 8/2/88 N/A LJ Ethridqe 8[2/88
TechnicalReviewer Date Line Mgr. Date Other Date
All originalonf_i_naturesWC Weimer 8[2/88
ProcedureNo. Revision No. EffectiveDate Page
PNL-ALO-245 0 8/2/88 I of 3

PNL TECHNICALPROCEDURE
4.2 Performance Check
An occasional check of the proper operation of the pumpsandelectronics should be made. This can be done by observingreadouts and checking set up points such as the zero and span onthe capacitance manometer. A reasonable operational check of themanometer can be made by venting and checking the reading againstatmospheric pressure. This will expose the vacuum surfaces to airand water and should be done only when it doesn't interfere withthe operation of the system. The pressure heads can be calibratedby the vendor or checked against a calibrated head. For most workcalibration is not necessary. The usual mixture is made by ratiosand if possible the mixture is ana]yzed prior to use. Host mixesmade in the mass spectrometry laboratories have been within apercent or two of the desired composition.
NOTE: Anyone b]ending gases should be familiar with vacuumequipment, use of compressed gases and the proper useof liquid nitrogen. Further an understanding of thephysical chemistry gas laws is required to make gasblends.
4.3 G_s Mixinq
A mixture is made by blending pure gases one at a time into avolume (gas cylinder) at calculated pressures until the totalpressure for the blend is reached. In this case the volume of thecylinder should be large compared to the connecting lines. Thecylinder after removal from the blending rack, must be rotated tomix the gases. The higher the pressure, the longer the rotation.If possible rotate for four hours or longer. Two hours has beensufficient in cases were the blends were made up on an emergencybasis. Host gas blends are analyzeO by an appropriate method suchas gas mass spectrometry to insure that the blend is as specifiedby the customer or laboratory need. Occasionally, blends are madewhich are beyond the capability of the laboratory to analyze. Inthese cases particular care is taken to insure that the pressureand volume measurements are as precise as possible.
Mixtures of condensible gases such as xenon and krypton can be'frozen' into cylinderswith little loss of the valuable gases.This method is used for making 'gas tags'. The isotopicallydiffering starting gases used for the mixes are bled into knownvolumes to calculated pressures in the vacuum/gas rack and thencondensed into a cylinder cooled by liquid nitrogen. The mixture
ProcedureNo. Revision No. EffectiveDate Page
PNL-ALO-245 0 8/2/88 2 of 3

-4
PNL TECHNICALPROCEDURE ]
must be blended by rotating or otherwise agitated. Gas tags areusually rotated for four hours or more. Gas tags are alwaysanalyzed for species content and isotopic distribution.
Care must be used to exclude air by always pumping connectinglines out before the blending operations. The vacuumpumps mustbe valved off before blending to protect the pumps and avoidlosses of valuable gases.
4.4 Calculations
Calculations are usually performed by a hand calculator. Thecalculations usually i_volve simple percentage or PVT relations ofthe ideal gas laws. The calculations are recorded inthe appropriate books or binders.
4.5 Records
Records will be maintained and controlled so as to coqform withthe requirementsof MCS-633-_. Laboratory Record Bilks andAnalytical Reports provide a mechanism for control of most
I .sk,_s,m,,_41...au, ....... mt L--al. ..'
records. _., _v, j ,_v, _ uv_ ._II _=...._o_-_In accordcnee-w+thPAP 70 ,',n4.-- --&#v-'
4.6 Procedure Oua]iftcattoq
None required. The methods used are those presented in manygeneral chemistry and physical chemistry text books. The idealgas laws are followed by the permanent gases involved in most gasblending operations.
QProcedure ._o. Revlslon P;_. Effect ive Date Page
_
PNI.-ALO-245 0 8/2/88 3 of 3

L.
PNL TECHNICALPROCEDURE ]
TITLE: PNL-ALO-246, (Replaces7-40.4),MASS SPECTROMETER ISOTOPICANALYSISOF GASES
1.0 APPLICABILITY
The analytical method described there applies to the isotopic analysisof gases. Samples requiring this analysis include fission gases and gastags. This procedure could apply if a backup is needed to analyze FFTFcover gas samples. Other samples can be analyzed with the use ofappropriatecalibration.
2.0 DEFINITIONS
None.
3.0 RESPONSIBLESTAEF.
Cognizant scientist.
4.0 PROCEDURE
4.1 Equipment and Materials
Mass spectrometersample inlet with a molecular leak.
High vacuum/gas separationracks.
Electron bombardment source.
Electronmultiplier of faraday cup detectors.
Computer control and data collection system.
Natural occurring gases are used as isotopic reference gases. Allgases used as referencestandardswill be supplied by commercialvendors and shall be research grade or better.
Author Date Project Mgr. Date QAD Representative Date
SJ Bos 3131188 N/A LJ Ethridqe 3/31/88
Technical Reviewer Date Line Mgr. Date Other Date
AlI originalf_i_naturesonJJ McCown 3/31/88
Procedure No. _ Revision No. _ EffEctiveDate _ Page
i PNL-ALO-246 l 0 l 3/29/88 l I of 4

PNL TECHNICALPROCEDURE
NOTE: Persons operating this equipment should befully trained in its use prior to any attemptto analyze samples.
4.2 PerformanceCheck
A performancecheck is made periodically (usuallymonthly) toensure that the instrument response is within I% of the referencevalues.
The ANALYST shall perform the following steps unless otherwisespecified. .
4.2.1 Attach a cylinder of natural reference standard gas to thevacuum rack.
4.2.2 Evacuate the connecting lines between the cylinder ofstandard gas and the mass spectrometer'sinlet system.
4.2.3 Close the valves to the vacuum pumps and allow 50 to 100microns of natural reference gas into the massspectrometer's inlet.
4.2.4 Introducethe sample into the ion source of the massspectrometer.
4.2.5 Determine which isotope has the highest concentrationandadjust signal strength to 90% of full scale for thisisotope.
4.2.6 Analyze the gas for isotopeabundance using the computercontrol system.
4.2.7 Print out a report and compare the isotopic ratios to theaccepted values. All isotopic ratios should be within 1%of the accepted values.
4.2.8 A copy of the report printout showing the isotopic ratios,from tFs performancecheck, will be permanently attached tothe laboratory record book, used to record this analysis.
4.2.9 Repeat Steps 4.2.1 to 4.2.8 for the next gas to beanalyzed.
I P,_=uu,= ,,u. I clweCLlve DaLe...._....... J Revision ,';o. _..... Page I

l
PNL TECHNICALPROCEDURE ]
4•3 Sample Analysis
The ANALYSTshall perform the following steps unless otherwisespecified.
4.3.1 Attach the cylinder containing the sample gas to the vacuumrack.
4,3.2 Evacuate the connecting lines between the sample cylinderand the mass spectrometer's inlet system.
4.3,3 Close the valves to the vacuum pumpsand allow 50 to 100microns of sample gas into the mass spectrometer's inlet.
4.3.4 Introduce the sample into the ion source of the massspectrometer•
4.3•5 Determine which isotope has the highest concentration andadjust signal strength to 90% of full scale for thisisotope.
4.3.6 Analyze the gas for tsotope abundance using the computercontrol system•
4.3.7 Print out a report and compare the isotopic ratios for eachcycle. The ratios should be similar and should not driftup or down.
4•3•8 Repeat Steps 4.3•! to 4.3.7 for the next gas Lo beanal yzed•
4•4 Calcul ations
Calculations are performed by the computer at the end of eachanalysis. The control system stops on each isotope Lo be measuredas tt steps through its routine. Five cycles are usually run. Acycle consists of measuring voltage output for each mass up anddown in a stepping mode. At the end of the analysis routine,isotopic voltage measurement are averaged and isotopic ratios arecalculated' Calculations are checked for accuracy during theperformance check.
t
4.5 Records
Records will be maintained and controlled so as to conform withthe requirements of HCS-033 • Laboratory Record Books andAnalytical Report forms provide a mechanism for control of mostrecords , __=.. ......... _ L__,..... "ll _..... "J "...... _..... _• _[,IuuI (,lt t,dpu| j_ I _,J,v| _ uuu I_ll 11 I I./_ U_l_( | l| (Jl_i,,Ju| ul.lill|[..J_ ! I bile
pAP-i.._e4.

o
I PNL TECHNICALPROCEDURE
4.6 ProcedureQualifications
None required. This procedure is considered self-qualifyingdueto its dependence on analytical standards. Additionally it isconsidered qualified because it has independenttechnical review.
ProcedureNo. ]RevisionNo. [EffectiveDate Page l
PNL-ALO-246 I 0 l 3/29/88 4 of 4 I

PNL TECHNICALPROCEDURE
TITLE: PNL-ALO-247,(Replaces7-40.6), ANALYSIS OF METALS, METAL ALLOYS ANDMETAL COMPOUNDS BY X-RAY FLUORESCENCE
1.0 APPLICABILITY
This procedure describes the identificationand analysis of variouselements within metals, metal alloys and metal compounds using x-rayfluorescencespectrometry. The elements in a sample are bombarded by x-rays, exciting atoms which emit characteristicx-rays from each element.The emitted x-rays are measured by a Si-Li detector and an electroniccounting system which present counts versus energy spectra.
2.0 DEFINITIONS
None
3.0 RESPONSIBLE STAFF
Cognizant ScientistAnalyst
4.0 PROCEDURE
4.1 DISCUSSION
4.2 APPARATUS
4.3 REAGENTS
4.4 STANDARDS
Standardswill be NBS or equivalent. Standardswill be r_n in thesame manner as samples: see Section 4.7.
4.5 SAFETY
Author Date Project Mgr. Date QAD Representative Date
Jj McCown 8/10/88 N/A LJ Ethridge 8/10/88
Technical Reviewer Date Line Mgr. Date Other Date
All originalonf_i_naturesWC Weimer
Procedure No. J Revision No. Effective Date Page
J PNL-ALO-247 J 0 8/8/88 I of 3|
I I

A
4.6 QUALITY CONTROL
None required. This procedure is considered self-qualifyingdueto its dependence on analytical standards. Additionally, it isconsidered qualified because ithas received an independenttechnical review.
4.7 ANALYSIS
Done per operating instructionsin the Operations Manuals for theKEVEX /70/8000 System.
4.7.1 Samples of metals and alloys are placed on theinstrumentsample turntable in one of 16 numberedpositions. The names of the samples and the positionnumber are entered into the system computer in a Namesfile which becomes a part of the Matrix record.
4.7.2 Elements of interest are identified to the computersoftware "Toolbox"package and the system identifiesthose secondaryx-ray targets best used for ameasurement.
4.7.3 Conditions are put into the software per the guidancein 4.7.2 and saved in the matrix set up for therespective samples or sample types.
4.7.4 Data is collected by exposing the sample to x-raysunder the conditions set up previously, i.e., kv, ma,time, range, atmosphere.
4.7.5 Followingdata collection the data is checkedvisually,peaks are identified and a method ofanalysis is chosen from the methods available in"Toolbox." Many metals and alloys are analyzed usingonly I secondary target for exposure and using a"FundamentalParameters"mathematicalmodel forquantitationby a standardlessprogram "ASAP".
For samples requiringmore than I target for measuringelements of interest in order to use "ASAP" a 1element standard must be measured by each set ofconditions for each target used on the unknown.
ProcedureNo. Revision No. Effective Date Page I(i
PNL-ALO-247 0 8/8/88 2 of 3 II

I
t
)If the samples are the same thickness and shape asavailable standards, analyses can also be performedusing a "Hatch" routine, an "Exact" routine or a"Least Squares" routine. All of these methods are inthe "Toolbox" software and require the measurement of1 or more standards under the same conditions as thesample.
4.8 CALCULATION
Done per operating instructions in the Operations Manuals forthe KEVEX770/8000 system.
Calculations are done by PDPcomputer built into the KEVEXsystem. A number of calculational options are provided in the"Toolbox" software and the choice is dependent upon the sampletype and the customers requirements. Normally, thecalcul ations involve:
1) Identifying peaks present
2) Performing an integration of the peaks to get c/s.
3) Calculating the concentration of the elements from thec/s data using either comparisons with data fromstandards or a standardless routine with mathematicalcorrections for absorption, efficiency, etc.
4.9 DOCUMENTATION
Records will be controlled according to HCS-033 .......... ., ....... ,.,.... ._,,=,l ,.,,="""_''"_'_cd ..... ding PAP-. bVllbl 1L,#| l
4.10 I_QUIPHENTANDMATERIALS
• KEVEX770/8000 X-Ray FluorescenceSystem.
• Helium gas--high purity notrequired. Used a sweep gas torp_moveair.
• Plastic sample holders.
• Mylar sheets.
Procedure No. Revision No. I Effective Date Pager'_lll a A =lr
I r,,L-ALO-_, 0 I *"**OlOlOO 3 Of 3

PNL TECHNICALPROCEDURE I
TITLE: PNL-ALO-249, (Replaces7-40.I0),HYDROGEN IN ZIRCALOY BY INERT GASFUSION/GAS CHROMATOGRAPHY
1.0 APPLICABILITY
A sample is melted within two minutes in a furnace in an inert carriergas stream. The released gas is swept out of the shielded cell and to agas chromatograph. Hydrogen is measured by thermal conductivity.
(a) Material Zirconium and Zirconium alloys. Applicable to anyother metals which will melt at 2600°C.
(b) Range Sample sizes up to 2 grams and 3/8 in. maximumdimension. Hydrogen quantities from 5-10 pg (5 ppm)and up.
(c) ReliabilitySystem recovery is verified with NBS SRM 352, 353,354. Approximately±20% at _20 pgH, ±10% at 20 _g-50pgH, ±5% at _50 #gH.
(d) InterferenceNone.
2.0 DEFINITIONS
NONE
3.0 RESPONSIBLESTAFF
Cognizant ScientistAnalyst
4.0 PROCEDURE
4.1 DISCUSSION
This procedure uses the Inert Gas Fusion method identicalto acommercial LECO Hydrogen Analyzer. A sample is fused at 2600oC in
Author Date Project Mgr. Date QAD Represent .ive Date
DL Baldwin 8/10/88 N/A LJ Ethridqe 8/10/88
Technical Reviewer Date Line Mgr. Date Other Date
All origionnalf_i_naturesN/A WC Weimer 8/9/88
ProcedureNo. I Revision No. Effective Date Page
PNL-ALO-249 II 0 8/8/88 I of 9

PNL TECHNICALPROCEDURE J
argon carrier gas in an EF-IO Resistance Furnace is a shieldedcell. A LECO XK-IO controls the furnace and carrier gas flow.Released gases are swept out of cell through purificationcolumns,through a gas flow splitter directly into a gas chromatographformeasurement by thermal conductivitydetector (see Figure).
Results oL_,ainedby the Inert Gas Fusion method agree with thoseobtained b.;the ASTM Vacuum Extractionmethod.
4.2 APPARATUS
(a) EF-I0 furnace, LECO Corp.
(b) EF-IO Controller, LECO Corp.
(c) Apparatus, as shown in figure.
(d) Gas chromatograph,with thermal conductivitydetector,Perkin Elmer Sigma 300 or equivalent.
(e) Graphite sample crucibles, LECO Corp, for use in EF-lC.
4.3 REAGENTS
(a) Magnesium Perchlorate,moisture absorbent.
(b) Schutze Reagent, LECO Corp., CO -_CO2 conversion.
4.4 STANDARDS
Three hydrogen in titanium standards are available from NBS:
(a) SRM 352, 47 ppm Hz
(b) SRM 353, 9_ ppm Hz
(c) SRM 354, 215 ppm H2
4.5 SAFETY
(a) Observe the general laboratory safety rules.
4.6 QUALITY CONTROL
Analysis of the NBS standa;'dfirst determines the calibrationfactor per use in calculations. Subsequent analyses of standardschecks for proper operation of the system and proper recoveries.Recovery of NBS standards should be +10-20%, depending upon therange.
Procedure No. Revision No. ! Effective Date PagePNL-ALO-249 0 8/8/88 2 of 9
I

PNL TECHNICALPROCEDURE
4.7 ANALYSIS
4.7.1 Instrument Preparation
(a) If furnace has been idle for 1-2 months or more,the electrode O-rings (both upper and lower) arechanged. Place light grease on each Ooring.
(b) Check Purificationcolumn containingAnhydrone/SchutzeReagent. Replace reagents ifnecessary, particularlySchutze.
(c) Dust Trap/Columnon side of in-cell furnace mustbe checked. For hydrogen analysis, it should bethin (I/2 in.) tube filled only with glass wool.(For other analyses, i.e., fission gas, this maybe fat column filled with hot copper/copperoxide.)
(d) Check complete gas flow path from supply (argon,helium, etc.) to XK-IO, into the cell andfurnace, out of cell, through purificationcolumns, into the GC, and to the gas return lineto the cell. Also check path from V-3 to XK-IOand return to cell.
(e) Check argon regulator on cylinder (set at 12-15 psi) and set Gas Miser switch to OPERATE.
(f) Tools for the handling of samples and cruciblesmust be clean and totally free of grease. Bringin new tools if necessary.
(g) When all is ready, turn on coolant circulator inRoom 200, then activate XK-IO POWER ON and GASFLOW switches.
(h) Close EF-IO electrodes and put XK-IO to STANDBY.Set V-3 to JGC] position and V-5 to [H2]position.
(i) The final check should be leak checking by theDeadhead method. Switch Vn5 to Ar position, andclose V-3 to stop exit flow from the furnace.The flow at FM-3 si_oulddecrease to 1.0 or less.If not, a leak is indicated and must berepaired.
ProcedureNo. Revision No. Effective Date Page
PNL-ALO-249 0 8/8/88 3 of 9

PNL TECHNICALPROCEDURE J
(j) Gas Chromatographconditions:
Column Temp.: 40°CDetector Current: N2/Ar position (push RESET)
(k) Recorder settings:
Scale: 0.1 V. full scale
(1) Valves - There are two importantvalves usedduring the procedure:
G.C. Carrier Gas Selection Valve, V-5 (at rearof G.C.)
Deadhead Valve, V-3 (on "From Furnace" gas line,right face of cell)
1. During all times other than actuallyrunning a sample, the GC Carrier SelectionValve, V-5, is set to [Ar] position, toallow pure argon carrier gas through thecolumn and detector. At the start of asample analysis (after electrodes areclosed and air flushed from lines), thevalve is set to [H2] position, for carriergas from the furnace.
2. The Deadhead Valve, V-3, is usually setfor gas flow from furnace to XK-IO andback to cell for normal operation. For aleakcheck test, performed several timesthroughout the day, the valve is set tothe Deadhead position (half-way,no-flowposition), allowing no gas flow, thuspressurizingthe furnace gas lines toabout 6-7 psig for a leak check.
(m) All gas flows should be checked. Typicalflowrates for each flowmeter (FM) should be asfollows:
FM - 2 Through GC I0 - 15 sccmFM - 3 To Furnace I00 - 130 sccmFM - 5B Bypass back to cell 90 - 115 sccm
through flow-spitter
ProcedureNo. Revision No. Effective Date Page
PNL-ALO-249 0 8/8/88 4 of 9

PNL TECHNICALPROCEDURE
NOTES: I) Use V-6 to adjust flow split.2) Flowrate through #2 plus #5B should
equal #3.3) Flowrate through #2 should be-10%
of #3.
(n) Check that recorder trace is stabilized andadjust to +20% of scale using the ZERO control.
4.7.2 Sample Preparation
All samples must be cleaned according to the followingprocedure, then weighed:
I) Ultrasonicallyclean each sample separately30 sec in reagent-gradetoluene.
2) Ultrasonicallyclean 30 sec in reagent-grademethanol.
3) Rinse thoroughly in distilledwater.
4) Dry, place in peanut vial.
Weight each sample to +0.0001 g and record weight innotebook.
4.7.3 General Daily Procedure
After all the above preparations have been completed,the instrument is ready for analyses. The operatingprocedure is nearly identical for the analysis ofblanks, standards, and samples.
The followinggeneral procedure should be strictlycarried out in the given order"
(a) Three to five crucible blanks are run firstuntil the blank ;ignal peak height decreases toa consistent 10-20 chart divisions (mV's).
(b) NBS hydrogen _+__s _47, 98, 215 ppm) arerun.
(c) At this point, the calibration factor (%recovery)must be calculated for each standardand checked before going on to samples. If at
ProcedureNo. Revision No. EffectiveDate Page
PNL-ALO-24g 0 8/8/88 5 of 9

PNL TECHNICALPROCEDURE I
least the two higher standards check out to 100%+10% recovery, then the samples may be begun.If not, rerun blanks, standards, and check forleaks.
(d) Finally the samples may be started. A standardand/or blank should be run periodically (every5-6 samples) throughout the day. If a very highsample is encountered,a double or triple215 ppm standard should be run.
(e) The last run of the day should be a 98 or215 ppm standard or blank, depending uponwhether the samples are high or low - run astandard if latest samples are _>25mV, run ablank if samples are <_25mV.
4.7.4 The operating procedure is nearly identical for theblanks, standards, and samples, lt is as follows:
(a) Clean electrodes and insert crucible with twotin flux discs.
(b) Set furnace tap setting to give about 1.2 Kacurrent (tap = 6 or 7).
(c) Activate XK-IO AUTO SEQUENCE. When currentcomes on, stall the program for two minutes forextra outgas of crucible. Then let cyclecontinue until OUTGAS goes off. ActivateSTANDBY.
(d) Switch circuit breakers in back of XK-IO to OFF.
NOTE: Samples are manually loaded into thecrucible because their size is generallytoo large for the Autodrop system and thepossibility of picking up greasecontamination in the chamber (the chambercannot be cleaned).
(e) Open electrodes and drop sample into crucible.Be certain that sample does not extend above topof crucible.
(f) Activate AUTO SEQUENCE (with circuit breakersoff!) to start analysis sequence and purge thechamber of air. When OUTGAS light goes off,stall the cycle.
Procedure No. Revision No. EffectiveDate Page
PNL-ALO-249 0 8/8/88 6 of 9

PNL TECHNICALPROCEDURE 1
(g) Switch V-3 for gas flow ta the GC, switch V-5 tothe [H2] position and start the recorder chartdrive. Turn circuit breakers back ON. SetEF-IO tap setting for current of 1.0-I Ka;usually 4 or 5 depending on the sample size.
(h) Verify that GC (and Minigrator if used) are setto attenuationof I. Verify that flowindicatorson FM-2, FM-3, and FM-SB are withinspecs (see Step I.13).
(i) When GC baseline has stabilized (aboutI minute), continue the AUTO SEQUENCE cycle.
(j) When "Heat" cycle is complete and furnace turnsoff, press STANDBY, and allow GC chromatogramtofinish.
(k) When complete, switch V-3 back to normalposition and V-5 to [Ar].
(1) Open electrodes, remove crucible, observe forany sign of incomplete burn, etc. Then disposeof crucible.
(m) Electrodes must be thoroughly cleaned betweenanalyses.
4.8 CALCULATIONS
(a) Measurements
Always measure peak height (ignoreshoulder on rear sideof peak).
(b) Determine the avg blank to use in calculations (I chartdivision = I mV). Throw out high blank values.
(c) Standards
i) Must use ug H in each calculation
ug H = Std conc (ug/g) x Std wt (g)
e.g.:
98 ug/g x 0.230 g = 22.5 ug H
Procedure No. Revision No. Effective Date Page
PNL-ALO-249 0 8/8/88 7 of 9

PNL TECHNICALPROCEDURE
2) Calculate new calibration factor (sensitivity):
(PkHt - Blank) - mV/ugStd ug H
3) Calculate% Recovery:
(pkHt- Blank ) X _00Cal. Factor x Std ug H
e.g.
(40.5 div - 15 div) x 1001.09 x 22.5 Std ug H = 103.9% recovery
NOTE: If the results are - 100% + 20%, then theCal. Factor is good. If it is off, a newCal. Factor may need to be determined. Thenormal Cal. factor has been 1.09 mV/ug.
(d) Samples
(PkHt - Blank)Cal. Fac. x smpl wt(g) = ppm H in sample
e.g.
(51 div - 15 div) = 33.7 ppm H1.0g x 0.9804 g
(e) If you have any doubts about any particular result, i.e.,odd peak, air, poor burn, etc., then asterisk * theresult and state your concern. This is important to do.
5.0 BIBLIOGRAPHY
Operation Manual Procedure for LECO XK-IOOperation Manual for LECO EF-IOOperation Manual for Perkin-ElmerSigma 300 Gas ChromatographOperation Procedure for LECO RHol
ProcedureNo. Revision No. Effective Date Page
PNL-ALO-24g 0 8/8/88 8 of 9

iRe,isioo o,,eIPa eo, IPNL-ALO-249 0 8/8/88 9 9

PNL TECHNICALPROCEDURE
TITLE: PNL-ALO-250, (Replaces 7-40.11), DETERMINATIONOF HYDROGENIN METALSBY THE INERT GAS FUSIONMETHOD
1.0 APPLICABILITY
Metallic samples are melted with a flux in a stream of argon. Hydrogenis evolved and swept by the argon through a chromatographic column to athermal conductivity detector where it is measured.
(a) Material Non-volatile metals such as steels, titanium,copper and scandium.
(b) Range 2 to I000 wppm of hydrogen.
(c) Reliability Blank and calibration checks performed with eachset of samples.
(d) Interferences Possible instrument damage from volatile metals,e.g., zinc and mercury.
2.0 DEFINITIONS
3.0 RESPONSIBLESTAFF
Cognizant ScientistAnalyst
4.0 PROCEDURE
4.1 DISCUSSION
This method is based on the use of the Laboratory Equipment Company(LECO) model RH-tSP hydrogen determinator; an instrument designedspecifically for measuring hydrogen in metals.
Author Date ProjectMgr. Date QAD Representative Date
RF Keouqh 8/10/88 N/A LJ Ethrid_e 8/10/88
Technical Reviewer Date Line Mgr. Date Other Date
N/A WC Weimer 8/9/88 All °riginalf_i_natureSon
ProcedureNo. Revision No. Effective Date Page
PNL-ALO-250 0 8/8/88 I of 3

PNL TECHNICALPROCEDURE
4.2 APPARATUS
(a) Balance, capable of measuring to 10 ug.
(b) LECO RH-ISP Hydrogen Determinator
(c) Graphite crucibles
4.3 REAGENTS
(a) Standard metals, tracable to the National Bureau ofStandards as to hydrogen content.
(b) Tin Flux
(c) Acetone, reagent grade
(d) toluene, reagent grade
4.4 STANDARDS
Standard metals, tracable to the National Bureau of Standards asto hydrogen content.
4.5 SAFETY
(a) Observe the general laboratory safety rules
(b) Touch used crucibleswith caution; they may be hot.
4.6 QUALITY CONTROL
Standards and blanks are run before and during each set ofsamples. They are run by the same procedure as the samples. Fora single sample, a total of at least 4 blanks plus standards willbe run. For a set of six samples, at least 8 blanks plusstandardswill be run. All sampleswill be run at least induplicate if sufficient material is available.
4.7 ANALYSIS
4.7.1 Sample Preparation
Preparationdepends on the specific sample and theneeds of the sample originator. Most samples must becut to a suitable size. This can be done with snipsor a hack saw in most cases. All tools must be free
Procedure No. Revision No. Effective Date Page
PNL-ALO-250 0 8/8/88 2 of 3

l
PNL TECHNICALPROCEDURE I
of rust, grease and paint. A final surface cleaningwith toluene or acetone in an ultrasonic bath isgenerally employed to remove grease or finger oils.
4.7.2 Anal.yticalProcedure
(a) Weight the sample (or standard) to within 0.5%.Maximum weight is I gram.
(b) Place the sample in the LECO loading chamber andpush the slide in.
(c) Place a crucible containing a pellet of tin onthe pedestal, then raise the crucible intoposition.
(d) Push the OFF GAS button.
(e) When the green light comes on, rotate the samplechamber to drop the sample into the crucible.
(f) Push the ANALYZE button.
(g) When the green light comes on again, the digitaldisplay will lock and the micrograms of hydrogenfound in the sample will be indicated.
(h) Remove and discard the used crucible. Repeatthe procedurewith more samples, standards orblanks.
4.8 CALCULATIONS
(a) wppm Hydrogen -(H - B) (T)(W)(F)
where,
H = hydrogen found in the sample (#g)B = Hydrogen found in blank (#g)T = True micrograms of hydrogen in standardW = Weight of sample in gramsF - Hydrogen found in standard (#g)
5.0 BIBLIOGRAPHY
NONE
Procedure No. Revision No. Effective Date Page
PNL-ALO-250 0 8/8/88 3 of 3

PNL TECHNICALPROCEDURE l
TITLE: PNL-ALO-251, (Replaces7-40.12), DETERMINATIONOF OXYGEN IN METALS BYTHE INERT GAS FUSION METHOD
1.0 APPLICABILITy
A sample contained in a graphite crucible with nickel flux is heated bypassing low voltage current through the graphite crucible in a stream offlowing argon. As the sample melts and alloys with the flux, carbonfrom the crucible reacts with oxygen in the sample to form carbonmonoxide gas. The carbon monoxide is swept by the argon through apurification system and into an optical cell where the attenuationof aninfrared light beam provides a measure of carbon in the sample. Anintegrator,calibrated in micrograms of oxygen, converts the analogdetector response to a digital readout.
(a) Material Non-volatilemetals such as steels, titanium,copper and vanadium.
(b) Range 5 to 1000 wppm of oxygen.
(c) Reliability Blanks and calibration checks run with each setof samples.
(d) Interferences Volatile metals such as zinc and mercury maydamage the instrument.
2.0 DEFINITIONS
3.0 RESPONSIBLESTAFF
Cognizant ScientistAnalyst
4.0 PROCEDURE
Author Date ProjectMgr. Date QAD Representative Date
RF Keouqh 10/8/88 N/A LJ Ethridge 8/10/88
TechnicalReviewer Date Line Mgr. Date Other Date
N/A WC Weimer 8/9/88 All °riginalf_i_natureSon
ProcedureNo. Revision No. Effective Date Page
PNL-ALO-251 0 8/8/88 i of 3

i PNL TECHNICALPROCEDURE
4.1 DISCUSSION
This method is based on the use of the Laboratory EquipmentCompany (LECO) model R0-116 oxygen determinator; an instrumentdesigned specificallyfor measuring oxygen in metals.
4.2 APPARATUS
LECO Oxygen analyzer R0-116Tweezers
Wire cleaning brushGraphite cruciblesBalance, capable of measuring to 10 pg
4.3 REAGENTS
(a) Nickel coils for flux
(b) Metal standards, certified by the National Bureau ofStandards as to hydrogen content
(c) Acetone, reagent grade
(d) Toluene, reagent grade
4.4 STANDARDS.
LECO oxygen standards. One gram pieces of metal containingvarious certified oxygen contents'.
4.5 SAFETY
(a) Observe the general laboratory safety rules
(b) Handle used crucibleswith caution; they may be hot
4.6 QUALITY CONTROL
Standards and blanks are run before and during each set of samplesby the same procedure as the samples. For a single sample a totalof at least 4 blanks plus standardswill be run. For a set of sixsamples, at least 8 blanks plus standards will be run. Allsamples will be run at least in duplicate if sufficient materialis available.
Procedure No. Revision No. Effective Date Page
PNL-ALO-251 0 8/8/88 2 of 3

PNL TECHNICALPROCEDURE J
4.7 ANAL.ySIS
4.7.1 Sample Preparation
(a) Use clean metal snips or hacksaw to cut samplesas necessaryto reduce the weight or size.
(b) Clean and degrease samples by ultrasonic cleaningin reagent grade grease solvent (acetone ortoluene) followed by drying in air or vacuum.
4.7.2 Ox.yqenMeasurement_
(a) Press the Loader Control switch one time. Thesample drop mechanism will open. Load theweighed sample into the sample drop mechanism.
(b) Press the Loader Control switch again. Theelectrodes will open. Remove any used crucibleand clean the electrodes. Place a new crucibleon the electrode and put one half of a nickelcoil into the crucible.
(c) Press the Loader Control switch again. Theinstrumentwill run the analysis and display /_gof oxygen found on the printer.
4.8 CALCULATIONS
wppm Oxygen = lO(w)BOF)(T)
where,
0 = oxygen found in the sample (pg)B = oxygen found in blank (pg)T = true micrograms of oxygen in standardW = weight of sample in gramsF = oxygen found in standard (/_g)
_Procedure No. Revision No. Effective Date
Page
PNL-ALO-251 0 8/8/88 3 of 3

PNL TECHNICALPROCEDURE )
TITLE: PNL-ALO-254, (Replaces7-40.19), IMPURITYSEPARATION BY LIQUID-LIQUIDEXTRACTION
1.0 APPLICABILITY
Solutions containing uranium and plutonium are extracted with TBP (Tri-Butyl Phosphate) in Hexane. The resultingU-Pu free solutions may beanalyzed for impurities by ICP-AES without interferences. Elementalimpurity recoveries are determined by adding known amounts of theimpurities of interest to starting solutions.
(a) Material Solutions containing U/Pu.
(b) Range 0 - -400 g/l HM.
(c) Reliability Four liquid/liquidcontacts reduces U/Pu to <100ug/ml.
(d) Interferences N/A.
2.0 DEFINITIONS
3.0 RESPONSIBLE STAFF
Cognizant ScientistAnalyst
4.0 PROCEDURE
4.1 DISCUSSION
Determinationof impurities in uranium and or plutonium bearingsolutions requires separation due to their extremely complexemission spectra. The liquid/liquidextraction technique removesthe interferencescompletelywhile leaving most impurity elementsin the aqueous phase for subsequent ICP-AES measurement. Most
Author Date Project Mgr. Date QAD Representative Date
MC Burt 8/9/88 N/A LJ Ethridqe 8/10/88
TechnicalReviewer Date Line Mgr. Date Other Date
WC Weimer 8/9/88.L All originalon f_i_natures
ProcedureNo. Revision No. Effective Date Page
PNL-ALO-254 0 8/8/88 I of 4

PNL TECHNICALPROCEDURE
commonmetal impurities have reported recoveries of 80-100% exceptSi which is approximately 50%. One element of particularinterest, Gd, has a recovery in the 80-100% range.
Sample acidity is adjusted to -3 N HNO_and mixed with an equalvolume of 30% TBP. The organic phase is separated and discardedand the procedure repeated. Two additional contacts are madeafter adjustment of the aqueous phase to -4 N_HNO3. The aqueousphase is evaporated to remove residual organics and finallydiluted for analysis.
Elements of particular interest may be added to separate samplesin known amounts prior to separation as a check for recovery.
4.2 APPARATUS
(a) Hot plate.
(b) Pipet, Eppendorf type, I00 ),, 200)., 1000). with disposabletips.
(c) Glass vials, 8 ml with caps.
(d) Transfer pipet with fine glass tip.
4.3 RE.AGeNTS
(a) Tri-Butyl Phosphate.
(b) Hexane.
TBP/Hexane mixture is 30 v/o.
(c) Ultrex grade concentratedHNO3.
(d) Deionized water.
(e) 3N_HNO3 made with Ultrex acid.
4.4 STANDARDS
Elemental spikes may be added to samples as required. Solutionsused are Spex Industry standard solutions at 1000 ug/ml ordilutions thereof.
ProcedureNo. Revision No. Effective Date Page
PNL-ALO-254 0 8/8/88 2 of 4

|
PNL TEC_INICALPROCEDURE I
4.5 SAFETY
(a) Plutonium bearingmaterials are radioactive and toxic.Precautions are required to avoid contaminationof thelaboratory and personnel.
(b) Observe general laboratory safety rules.
(c) Samples containing uranium only may be extracted in a hood.
4.6 QUALITYCONTROL
Control is establishedby requirementsof particular analyses.Elemental spikes and/or multi-level spikes may be used asrequired.
4.7 PROCEDURE
4.7.1 Pipet I ml sample into an 8 ml vial.
Labeled vials are used for spikes as required. A blank isalso carried through the procedure.
The acid concentrationof the sample needs to be known
PNL-ALO-256. I4.7.2 Extraction
(a) Adjust _cid concentration to -3N with Ultrexconcentrated HNO_or H20 as required. Adjust volume to2 ml (see step 4.8).
(b) Add an equal volume of 30% TBP-Hexane.
(c) Shake for 60 seconds and let phases separate for 2minutes.
(d) Remove organic layer (top) with transfer pipet anddiscard.
(e) Repeat steps 4.7.2 (c) and (d).
(f) Add IO0_LUltrex HNO3 to aqueous layer.
(g) Repeat steps 4.7.2 (c) and (d) twice. After thesecond contact remove the aqueous layer (bottom)witha fine tip transfer pipet and put it in a cleanlabeled8 ml vial.
I
Procedure No. Revision No. I Effective Date Page
PNL-ALO-254 0 •i 8/8/88 3 of 4
_

o
I PNL TECHP,XCALPROCEDURE
(h) Place on hot plate and evaporate to -I/2 ml. Cool andmake up to 5 ml with deionized water.
Sample is now ready for ICP-AES analysis. Furtherdilutions may be required as per ICP procedure.
4.8 cALCULATIONS
To calculate volume concentratedUltrex HNO_ required to adjust aon___eeml sample to 3N_in a final volume of _.
The.concentratedHNO._is added as required then 3N_HNO3 is added tobrlng sample to 2 ml.
3-SCV = T2"7_'
where,
V = volume Ultrex concentratedHNO3 requiredSC = acid concentration of sample
Note: If sample is >3_Nacid an appropriate water dilution shouldbe made.
S.O BIBLIOGRAPHY
I. C.R. Walker and O. A. Vita, "Determinationof Impuritiesin Uranium Compounds by Atomic Absorption,"AnalyticalChimica Acta, 43, (1968)27-35.
2. J.P. Maney, V. Luciano, and A. F. Ward, Jarrell-Ash PlasmaNew I, 2 (1979) 11-13.
3. R.W. Hendrie, K. C. Macleod, and B. J. Thompson, 2ndConference for Analytical Science (Analyticon84), London,September 4-6, 1984, Abstracts, Poster No. 118, in ICPInformationNewslett. 10, 554 (1984).
4. G.V. Wheeler, Atomic Energy Division, Phillips PetroleumCompany, Idaho Falls, Idaho.
5. C.J. Coleman in Analytical Spectroscopy--Proceedingsofthe 26th Conference on Analytical Chemistry in EnergyTechnology, Knoxville, TN, October 11o13, 1983, W. S. LyonEd., ACSS Volume 19, p. 195, Elsevier Science Publishers B.V. Amsterdam (1984).
Procedure No. Revision No. Effective Date Page
PNL-ALO-254 0 8/8/88 4 of 4

PNL TECHNICAL PROCEDURE !
TITLE: PNL-ALO-2S5, (Replaces 7-40.20), SPECTROPHOTOMETRIC DETERMINAION OF
REDUCED AND TOTAL IRON IN GLASS WITH I,I0 PHENANTHROLINE
1.0 APPLICABILITY
This method is an adaptation (a) of a method of Begheijn (b) for the
determination of reduced iron in rock, soil and clay. The method
eliminates the need for platinum ware and allows the measurement of both
ferrous and total iron on the same sample.
(a) Material Pulverized glasses containing ferrous and ferriciron.
(b} Range 0 to 10% Fe.
(c) Reliability Calibration checks performed with each
analytical run.
(d) Interforences Possible interference from Cd, Hg, Zn.
2.0 DEFINITIONS
3.0 RESPONSIBDE STAFF
Cognizant Scientist,
Analyst
4.C PROCEDURE
4.1 DISCUSSION
A glass sample is dissolved in a mixture of HF and H2SO4, dilutedwith buffer, colorimetric reagents added, and spectrophotometric
measurement of color intensity made. Following reduction of
Fe(III), color intensity is again measured and Fe(II) and totaliron concentrations determined from the calibration curve.
Author Date Project Hgr. Date QADRepnesentative Date
I_CBunt 3t'5/91 N/A GK Gerke 315/91
Technical Reviewer Date Line Mgr. Date Other Date
HWUrie .3/5/91 JN Latkovich _ Art originalonfsi_natures
Procedure No. [ Revision No. Effective Date Page
PNL-ALO-255 1 1 3/5/91 1 of 7

.... ,,,| , ,
4.2 APPARATUS
(a) Spectrophometer, capable of measuring at a wavelength of 510nra.
(b) 1 cm spectrophotometer cells
(c) Analytical balance, capable of weighing to 0.1 mg or better.
(d) Teflon beaker
(e) Magnetic stir bars
(f) 150 ml beakers
(g) 100 ml volumetric flasks, clasg A
(h) Pipets as required, performance checked
(i) pH meter with combination electrode
(j) Magnetic stirrer
4.3 R_AGENTS
(a) 0-phenanthroline 0.25 w/v solution. Dissolve 500 mg in 200
ml distilled H20.
(b) Potassium Acid Phthalate 0.5 M (KHP). Dissolve 102.1 g in 1
liter distilled H20.
(c) Boric Acid 4 w/v solution. Dissolve 40 g in 1 liter
distilled H20.
(d) Hydroquinone.
(e) HF, concentrated reagent.
(f) H2SO 4, concentrated reagent.
(g) NH4OH, concentrated reagent.
(h) pH buffer, pH 4.0 or 7.0.
(i) HCl, concentrated reagent.
Procedure No. Revision No. Effective Date Page
PNL-AL0-255 1 3/5/91 2 of 7

4.4 STANDARDS
(a) Fe stock solution. Current issue AA or ICP single elementstandard solutions which are traceable to NIST and contain
1000 _g Fe/ml shall be used. NIST single element standard
solutions issued at 10,000 _g Fe/ml may also be used with
appropriate dilution. A second solution from a separatesource is used as a control check. Both solutions (1000
_g/ml) are diluted by measuring 10 ml (plus 1 ml HCl) into a
100 ml volumetric flask and bringing to volume with
distilled water. This solution contains 100 _g (0.1 mg)
Fe/ml.
(b) Control Standard. A well characterized glass, designated WV
202 has been supplied by PNL MCC for use as a control
standard. An aliquot cf this material shall be analyzed
with each sample batch. Other control standards may also be
analyzed as required by a customer.
4.5 SAFETY
(a) Observe the general laboratory safety rules.
(b) Concentrated HF and H2SO 4 are extremely hazardous and greatcare should be exercised in their use.
(c) Samples containing plutonium should be dissolved in a glove
box. Applicable Radiation Work Procedures (RWP) shall be
followed when working with radioactive solutions.
4.6 QUALITY CONTRO_
4.6.1 Calibration. Calibration curve is made by adding 0, 1, 2,
3, 4 and 5 ml of the diluted (100 _g Fe/ml) standard along
with 0.5 ml of concentrated H2SO 4 and 1.5 ml of concentratedHF to 150 ml beakers containing:
• Stir bar
• 25 ml of boric acid solution
• I0 ml of KHP buffer solution
• 4 ml of o-phenanthroline solution
• 2 ml of concentrated NH4OH solution
The standards, including the blank, are carried through the
analytical procedure, starting at 4.7.2 (skip step b and e)
and 4.7.3 (skip step a).
Procedure No. Revision No. Effective Date Page
PNL-AL0-255 1 3/5/91 3 of 7

I PNL TECHNICAL PROCEDURE J
Note: Reagent addition may be made with unchecked pipets
and/or/ graduated cylinders as tolerances within
+/-10% are adequate.
Plot the measured absorbance on the ordinate versus
mg Fe. A straight line should be produced and the
calculated slope shall be 0.52 +/-0.04 mg
Fe/absorbance unit.
If this requirement is not met, a new calibrationcurve shall be made.
4.6.2 Control. The provided control standard shall be carried
through the analytical procedure on each day that samples
are analyzed. The ferrous/ferric ratio on WV 202 shall be
0.204 +/- 0.014. An aliquot (2, 3 or 4 ml) of the control
check solution is also carried through the same procedure as
the calibration standards after the calibration curve is
completed. Recovery on the control check shall be +/-10% of
expected value. If these requirements are not met the
analysis shall be repeated. See Cognizant Scientist if
repeat values are unacceptable.
4.7 ANALYS_
4.7.1 Dissolution
(a) Weigh to 0.1 mg approximately 25 mg of powdered glassinto a Teflon beaker.
(b) Add 0.5 ml of concentrated H2SO 4 and wet thesample.
(c) Carefully add 1.5 ml of concentrated HF and slowly mix
the two liquids by tipping and rolling the beaker.
(d) When dissolution is complete, add 10 ml of boric acidsolution.
4.7.2 Adjustments
(a) Calibrate pH meter with pH buffer solution.
(b) Transfer the dissolved sample to a 150 ml beaker
containing:
Procedure No. Revision No. Effective Date I Page
PNL-AL0-255 1 3/5/91 J 4 of 7

• a stir bar
• 15 ml of boric acid solution
• I0 ml of KHP buffer solution
• 4 ml of o-phenanthroline solution
• 2 ml of concentrated NH4OH.
(c) Immerse the pH electrode in the solution and while
stirring adjust the pH to between 3.3 and 3.5 by
adding dropwise NH4OH or H2SO 4 as required.
(d) Transfer to a labeled i00 ml volumetric flask and maketo volume with distilled water.
(e) After mixing let stand 1 hour.
4.7.3 Measu;emen%
(a) Measure absorbance at 510 nm versus the reagent blank
and record the result. (For ferrous iron.)
If absorbance is above 0.9 make a dilution and
remeasure. Dilution is made by adding 4 ml of
O-phenanthroline and 10 ml of the prepared samplesolution to a I00 ml volumetric flask and diluting to
volume. This solution is then remeasured.
(b) Add 20 mg of hydroquinone crystals to the remaining
solution from step 4.7.3(a), shake and let stand for 1
hour.
(c) Measure the absorbance at 510 nm versus the reagent
blank and record the results. (For total iron.)
Follow the same dilution technique as in
4.7.3 (a) if absorbance is greater than 0.9.
(d) Calculate and report results.
4.8 CALCULATIONS
(a) Ferrous Iron
% Fe(II) = (AI)(S) (i00) (DF)Sw
where,
% Fe(II) = percent ferrous iron in original sample
Procedure No. Revisi_ No. Effective Date Page
PNL-AL0-255 1 3/5/91 5 of 7

I PNL TEC_NZ C_ PROCEDURE I
A I ffiabsorbance from step 4.7.3(a}
S = slope of calibration curve in mg Fe/absorbance
unit from step 4.6.1
DF ffidilution factor, if used
Sw - weight of sample used, in mg
(b} Total Iron
% Fe(tot) = ,, (A_) (S) (100)(DF)S H
where,
% Fe(tot) w percent total iron in orlginal sample
A2 - absorbance from step 4.7.3(c)
S - slope of calibration curve in mg
Fe/absorbance unit from step 4.6.1
DF - dilution factor, if used
Sw = weight of sample used, in mg
(c) Ferrous/Ferrlc Ratio
BA -
C-B
where,
A - ratio of ferrous iron to ferric iron
B = percent of ferrous iron from 4.8(a)
C = percent of ferric iron from 4.8(b)
5.0 RECORDS
Records shall be maintained and controlled so as to conform to
requirements of PNL-Ma-70, MC_-033 • Laboratory Record Books
(LRB} and Analytical Report Cards/Data Sheets provide a mechanism for
Procedure 11o. Revision 11o. Effective Date Page
PNL-AL0-255 1 3/5/91 6 of 7

W
I
PNL TECHNICAL PROCEDURE ]
control of most records r-_-,-,---'- .... .".c=_.-d"'--_'- --._._-__ b- .... _ z
6.0 REFERENCES
(a) D.R. Jones IV, W. C. Janheski and D. S. Goldman, Analytical
Chemistry, 1981, 53, 923.
(b} Begheijn, L.T., Analyst (London} 1070. 1055-1061.
No. Revision No. Effective Date Page
PNL-ALO-255 1 3/5/91 7 of 7

PNL TECHNICALPROCEDURE.... I
TITLE" PNL-ALO-256,(Replaces7-40.22), DETERMINATIONOF FREE ACID INURANIUM/PLUTONIUMSOLUTIONS
1.0 APPLICABILITY
Solutions containing hydrolyzableions (Pu and U) are titrated to anequivalenceend point in a solution of ammonium oxalate. The oxalateion forms a complex with U-Pu to reduce their interferencein thetitration. An automaticpotentiometrictitrator is used to record thetitration curve.
(a) Material Acid solutionscontaining Pu-U.
(b) Range O-16 M HNO3, 0-400 g/l HM.
(c) Reliability Reproducibilitywith the PNL preparedstandards is within+ 0.02 molar units.
(d) Interferences Ions which form equilibra with hydrogen andhydrolyzableions not complexed by oxalate.
2.0 DEF!NITION.S
3.0 RESPONSIBLE STAFF
Cognizant ScientistAnalyst
4.0 PROCEDURE
4.I DISCUSSION
The determinationof free acid in solutions containinghydrolyzableions (Plutoniumand uranium) has been especiallydifficult and many techniques and methods have been tried withvarying degrees of success. (a,b,c,d,e,f) A study was undertakenat Hanford in 1984 to determinewhich technique worked best atheavy metal concentrationsup to 400 g/l and acid concentrations
Author Date ProjectMgr. Date QAD Representative Date
MC Burt 8/9/88 N/A LJ Ethridqe 8/10/88
TechnicalReviewer Date Line Mgr. Date Other Date
All origionnalf_i_naturesN/A WC Weimer 8/9/88 |
ProcedureNo. RevisionNo. EffectiveDate I Page
PNL-ALO-256 0 8/8/88 1 I of 5,,

L
of 0.1 M to 6 M. A series of standardswas prepared and asatisfactorymethod developed. (g)
4.2 APPARATUS
(a) Automatic potentiometrictitration system, BrinkmannInstrumentsModel 636 or 672 titroprocessor.
(b) Combinationelectrode, Orion Model 81-02.
(c) Pipets, Eppendorf, adjustable 25 _l to I00 _l withdisposable tips.
(d) Magnetic stirrer.
(e) Stir bars, teflon covered.
(f) Repipet, adjustable volume.
4.3 REAGENTS
(a) Ammonium Oxalate solution, 0.15 M.
(b) StandardizedNaOH, approximately0.1 N.
(c) StandardizedHNO_ for spike, ! N and 6 _N.
4.4 STANpARDS
(a) Uranyl nitrate standard,300 g/l U and approximately3 N
HNO_.
(b) PNL prepared U-Pu standard series. (g)
4.5 SAFETY
(a) Plutonium bearingmaterials are radioactiveand toxic.Precautionsare required to avoid contaminationof thelaboratory and personnel.
(b) Observe general laboratory safety rules.
(c) Follow manufacturersinstructionsfor operation of titrator.
Procedure No. Revision No. Effective Date Page
PNL-ALO-256 0 8/8/88 2 of 5

|
PNL TECHNICALPROCEDURE J
4.6 QUALITY CONTROL
4.6.1 Calibration. Calibrationshall include, but not belimited to, titration of standard nitric acidsolutions versus standardizedsodium hydroxide.
4.6.2 Control shall be establishedby a TBD method probablyinvolvingPNL prepared U-Pu acid standards and/or auranyl nitrate standard.
4.7 ANALYSIS
4.7.I Set up titrationsystem accordingto manufacturersinstructionsincludingcal.ibrationof electrode withpH 4 and/or pH 7 buffers. Do not change instrumentsettings once optimum conditions are established.
4.7.2 Analyze standard acid (300 g/l U, 2.71 M H+) as per4.7.3.
4.7.3 Titration of sample using complexant.
(a) Add 20 ml of oxalate solution to titrationvessel containing stirring bar.
(b) Immerseelectrode and delivery tip in solutionand start stirrer.
(c) Pipet sample into vessel and initiate titration.A measured acid spike may be added prior tosample addition to check recovery. Frequencyof spike addition to be determined.
(d) After titration is complete remove electrode anddelivery tip and rinse with distilled water.
Rinse titrationvessel and proceed to nextsample.
(e) Record volumes of sample added, spike (if used),volume of titrant consumed to end point (fromtitroprocessor).
4.7.4 For samples requiringtitration to a different pH end-point with no complexant added complete the followingsteps"
(a) Add 10 ml of deionizedwater.
ProcedureNo. Revision No. Effective Date Page
PNL-ALO-256 0 8/8/88 3 of 5

|
PNL TECHNICALPROCEDURE ,, I
|
0(b) Immerse electrode and delivery tip in solution
and start stirrer.
(c) Pipet sample into vessel and titrate to thespecified pH end-point.
(d) Complete steps (d) and (e) of 4.7.3.
4.8 CALCULATIONS
(Calculations may be performed by the titrator after insertionof appropriateinformation.)
Formulas used are as follows:
(Vb)(Nb)Na=
Vs
where,
Na = Normality of acid (sample)
Vb = Volume standard base used, in ml
N_b - Normality of standard NaOH
Vs = Volume sample used, in ml
The volume of base used for the titration as given by thetitrator is the amount required to titrate to the inflection(equivalence)point. A recordingof the shape of the curve(pH or mV vs volume base) is also produced.
If an acid spike is used the calculation becomes:
(V b - Vbs ) (Nb)Na =
Vs
Nsp Vspwhere Vbs = = Volume Standard base Lo tit, rate
spikeNb
where, Nsp= Normality of spike
where, Vsp= Volume spike used, in ml
ProcedureNo. RevisionNo. EffectiveDate Page
PNL-ALO-256 0 8/8/88 4 of 5

|
PNL TECHNICALPROCEDURE I
5.0 BIBLIOGRAPHY
(a) Smith, M. E. "The Determinationof Free Acid in PlutoniumSolutions";USAEC Report LA-1864, 1955.
(b) Dizadar, Z. I.; Obrenovic, I. D. Anal. Chim. Acta 1959, 21,560.
(c) Thiele, D.; Bahr, W. "Acidimetric Determination of Free Acidand Uranium in Nitric Acids Solutions in the Presence ofPu(IV)"; Kernforschungszentrum, Karlsruhe Rept, KFK-503, 1966.
(d) Motojima, H.; Izawa, K. Anal. Chem. 1964, 36, 733.
(e) Booman, G. L.; Elliot, M. C.; Kimball, R. B.; Cartan, F. 0.;Rein, J. E. Anal. Chem. 1958, 30, 284.
(f) Baumann, E. W. "Determination of Free Acid by StandardAddition Method in Potassium Thiocyanate"; U. S. Department ofEnergy Report DP-1632, 1982.
(g) Ryan, J. L.; Bryan, G.H.; Butt, M. C. and Costanzo, D. A.;"Preparationof Acid Standardsfor and Determinationof FreeAcid in ConcentratedPlutonium-UraniumSolutions",Ana___!.Chem., 1985, 56, 1423.
,,,,,
ProcedureNo. Revision No. EffectiveDate Page
PNL-ALO-256 0 8/8/88 5 of 5

PNL TECHNICALPROCEDURE I
TITLE: PNL-ALO-257, (Replaces7-40.23), DENSITY OF SOLUTIONS
1.0 APPLICABILITY
Solutions to be measured are inserted into a small U-shaped tubevibrating at a fixed frequency. Change of frequency is directlyproportionalto solution density and is electronicallyconverted to adigital readout.
(a) Material Any solution includingthose withparticulates.
(b) Range 0.5 g/cc to 2.5 g/cc with propercalibration.
(c) Reliability The system will measure density to+_0.0001g/cc.
(d) Interferences None.
2.0 DEFINITIONS
3.0 RESPONSIBLE STAFF
Cognizant ScientistAnalyst
4.0 PROCEDURE
4.1 DISCUSSION
The measurement is based on the change of the natural frequency ofa hollow oscillator when filled with liquids or gases of differentmass (density). The oscillator is a U-shaped glass tube supportedat the open ends and electronicallyexcited in an undampedharmonic fashion. The direction of the oscillation is
Author Date ProjectMgr. Date QAD Representative Date
MC Burt 8/9/88 N/A .... LJ E.t.,hrid_e 8/10/88
Technical Reviewer Date Line Mgr. Date Other Date
N_o WC Weimer _ All °riginalf_i_natureSon
. n No. Effective Date Page
I PNL-ALO-257 0 8/8/88 I of 3

PNL TECHNICALPROCEDURE 1
perpendicularto the plane of the tube and is thus influenced orchanged by the introductionof a liquid or gas other than air. ltis essential that no air bubblesbe trapped in the tube duringliquid sample introduction. Utilizing the simple relationshipbetween density of the sample and natural i_requencyof the filledoscillator it is possible to calculate the density of liquids orgases. The DMA 45 electronicallymakes the calculationsanddisplays the density digitally to four decimal places.
4.Z AppARATUS
(a) Mettler Pear Model DMA 45 Digital Density Meter.
(b) 2 ml plastic syringes.
4.3 R_AGENTS
(a) Acetone.
(b) Distilled water.
4.4 STANDARDS
Distilledwater and air are used as calibratingmaterials.Presentlyno other standardsare available.
4.S S.AFF.F;.!_
(a) Plutjr.iumbearing materials are radioactive and toxic.Precautions are required to avoid the contaminationof thelaboratory and personnel.
(b) Observe the general laboratory safety rules.
4.6 _L_! TY CONTROL
4.6.1 CalibratiQn. Calibration is performed at ambienttemperatureaccording to the equipment manual.Calibration should be performed if ambient temperaturevaries more than I"C from a calibrated temperature.
4.6:2 Control. Control is establishedby measuring thedensity of distilledwater at ambient tempe;ature, ltshould agree with handbook values to within _+0.0001g/cc.
ProcedureNo. Revision No. EffectiveDate Page
PNL-ALO-2S7 0 8/8/88 2 of 3i

|
PNL TECHNICALPROCEDURE J
4.7 ANALYSIS
Turn on instrumentand allow approximatelytwo hours for warm up.
(a) Fill syringe with distilledwater at ambienttemperature,insert syringe into inlet port so that itfits snugly and push plunger slowly until all liquid isexpended.
The first I ml will rinse the cell and clear it of airbubbles.
(b) Wait 20-30 sec until reading stabilizes,then wait forfive consecutive readingswithout change beforerecording result.
The instrumentcalculates density and updates thereading every four seconds.
(c) Remove syringe from port and let liquid drain out.Rinse cell with distilled water until effluentis clear,then rinse with acetone and finally, force air throughthe cell until the meter reads 0.0015 or less.
The unit is now ready for the next sample.
4.8 CALCULATION
There are no calculationsto be made as the instrument readsdirectly in grams/cc.
5.0 B.!Bl,IOGRAPHY
InstructionManual, Calculating Digital Density Meter, Anton PaarK. G., Graz, Austria.
ProcedureNo. Revision No. EffectiveDate Page
PNL-ALO-257 0 8/8/88 3 of 3

PNLTECHNICALPROCEDURE i
TITLE" PNL-ALO-258, (Replaces7-40.28), ISOTOPIC ANALYSIS OF KRYPTON ANDXENON IN FFTF COVER GAS
.
1.0 APPLICABILITY
The method applies to the isotopic analysis of krypton and xenon taggases in argon gas. Samples requiringthis analysis are tag gasestrapped from the argon cover gas at FFTF in gas tag sample traps (GTST).Samples with krypton and xenon concentrationsas low as 0.01 ppb can beanalyzed using appropriateconcentrationtechniques. Krypton and xenonin gases other than argon can be analyzed with slight changes in theseparationtechniques.
2.0 DEFINITIONS
None.
3.0 RESPONSIBLESTAFF
Cognizant ScientistAnalyst
4.0 PROCEDURE
4.1 Equipment and Materials
• Magnetic sector mass spectrometer.
• Mass spectrometersample inlet.
• High vacuum/gas separation racks.
• Gas tag sample trap (GTST).
• Small charcoal trap (SCT).
• GTST valve controllerpanel.
• GTST and SCT temperaturecontrol panel.
• Inlet and/or rack valve control panel.
Author Date ProjectMgr. Date QAD Representative Date
MW 6oheen 6/8/88 N/A LJ Ethridge 6/17/88
Technical Reviewer Date Line Mgr. Date Other Date
_N/A Jj McCown 6/17/88 All °riginalf_i_natureSon
_ ProcedureNo. Revision No. Effective Date PagePNL-ALO-258 0 6/17/88 I of 6

I PNL TECHNICALPROCEDURE
• Computer control and data collection system.
• Naturally occurring krypton and xenon for isotopic referencegases.
• Helium or neon, used in the separation process, is analyzedprior to use.
NOTE: Anyone operating this equipment should be fully trained in!ts use prior to any attempt to analyze samples.
4.2 PerformanceCheck
Performanceis checked _B_._._!))_B_i!).i_il))._!;_)_!
TheANALYST shall perform the following steps unless otherwisespecified.
4.2.1 Attach a cylinder of natural reference standard gas to theauxiliary inlet.
4.2.2 Evacuate the auxiliary inlet and connecting lines.
4.2.3 Close the valves to the vacuum pumps and allow naturalreference gas into the mass spectrometer'sinlet. Apressure of 0.03 to 0.05 Torr of referencegas is usuallysufficient to do the performance check.
4.2.4 Introducethe sample into the ion source of the massspectrometer.
4.2.5 Determine which isotope has the highest concentration andadjust signal strength to about 90% of full scale (highestattenuationon the particular electrometer in use) for thisisotope.
4.2.6 Analyze the gas for isotopic abundance using the computercontrol system.
4.2.7 Print out a report and compare the isotopic ratios to theaccepted values. All isotopic ratios should be within 2% ofthe accepted values.
4.2.8 The report printout from the performance check will beplaced in the loose leaf notebook containing standards dataand saved for at least 4 years. The notebooks are locatedin the mass spectrometerlaboratoriesin the 325 Building.
,,,,
ProcedureNo. Revision No. EffectiveDate Page
PNL-ALO-258 0 6/17/88 2 of 6

PNLTECHNICALPROCEDURE
4.2.9 Repeat step 4.2.1 to 4.2.8 for the next element to beanalyzed.
4.3 Gas Taq Sample (GTST) Processinq
Cover gas samples are collected at FFTF in the GTST and thentransported to the gas tag laboratory for further processing andanalyses. Tag gases are separated from other gases by trapping oncharcoal, purging and pumping while holding the traps at specifiedtemperatures.
NOTE: All temperaturesare ± I0°C. All times are ± 5 minutes.All flow rates are ± .1 liters.
The ANALYST shall perform the following steps unless otherwisespecified.
4.3.1 Connect the GTST to the shielded rack and pump out theconnecting lines. Observationof the vacuum gauges willgive an indicationof leaks in the connections and valves onthe GTST.
4.3.2 As requested, obtain a sample of gas from the grab sampleron the GTST cart. Mount a counting chamber on the samplingport and pump out all lines connecting the counting chamberto the grab sampler. Open the electrical valve (2) on thecart keeping the line valve (1) closed. Valves 3, 4 and 5are als_ kept closed. Pump the connecting line to apressure in the 10-6 Torr range. Close the vacuum pumpvalves then open the hand operated valve on the grabsampler. Allow the gas to expand into the counting chamber.Record the pressure reading of the manometer and samplingdata from the cover gas sample. Close the valves on thecounting chamber and grab sampler then pump out the lines.Close the valves to sampling port and manometer head.
4.3.3 Isolatethe SCT and the GTST sides of the vacuum/gas rack.Establish helium flow or neon flow-throughthe GTST bypassvalve (3) and through the vacuum/gas rack to purge anyresidual air out of the lines. At the same time, cool theGTST to -I00°C for neon or to -80°C for helium purging.
4.3.4 Purge the GTST with helium or neon for one hour. Close theGTST bypass valve, open the GTST inlet valve (5) first thenopen the GTST outlet valve (4). At the same time, bake theSCT at 300 to 350°C for about twenty minutes. Pump on theSCT with the high vacuum pump during the bake out.
Procedure No. Revision No. EffectiveDate Page
PNL-ALO-258 0 6/17/88 3 of 6

i
I PNL TECHNICALPROCEDURE
4.4 S_mple Transfer
4.4.1 After about 55 minutes of' flushing the GTST, cool the smallcharcoal trap (SCT) to -150°C.
4.4.2 Continue the helium flow through the GTST. Start the flowof helium through the SCT. If neon was used for purging,change to helium prior to this step.
4.4.3 Heat the GTST to +150"C. This will cause the sample totransfer to the SCT
4.4.4 Allow the transfer to continue i:or about 1 hour.
4.4.5 Stop the helium flow by closing the exhaust valve first thenthe SCT outlet valve and then the SCT inlet valve.
4.5 PumDinQCycle
4.5.1 Increase the temperature of the SCT to about -700C.
4.5.2 Open the rough vacuumvalve. Open the SCT outlet valveevacuating the SCT to a pressure of less than 0.05 Torr.
4.5.3 Close the rough vacuumvalve and open the high vacuum valve.
4.5.4 Pumpon the sample until a pressure of approximately 2x10⁻⁷Torr (.ion gauge reading) is reached_hile holding the trapat about -70°C. The pumping cycle will take about one hour.
4.6 GTST Bakeout
4.6.1 Establish argon flow to about 2 liters/minute through theGTST.
4.6.2 Heat the GTST to 325°C and hold ]'or about 40 minutes.
4.6.3 Cool the GTST back to room temperature while continuing theAr flow.
4.6.4 Close the GTST outlet valve allowing the Ar to pressurizethe GTST to above atmospheric pressure.
4.6.5 Close the GTST inlet valve.
4.6.6 Flush out the grab sample cylinder by opening the inlet andoutlet valves.
ProcedureNo. Revision No. Effective Date Page
PNL-ALO-258 0 6/17/88 4 of 6

!
PNL TECHNICALPROCEDURE J
4.6.7 Close the grab sample cylinder outlet valves then the inletvalves.
4.7 Sample Collection
4.7.1 Close the vacuum pumps the mass spectrometer inlet valves.
4.7.2 Open the transfer line valve.
4.7.3 Collect the sample for about 20 minutes by heating the SCTto about +150°c.
4.8 SamDle AnalYsis
The ANALYST shall perform the following steps unless otherwisespecified.
4.8.1 Introducethe sample into the ion source of the massspectrometer.
4.8.2 Set the electron multiplier power supply duodial to 190 or280 and set the variablemolecular leak to 130, 140, or 150.Use settings that give a reasonable ion beam intensity fromthe sample. Measure the total voltages for krypton andxenon. Record the data in the mass spectrometerrun book.
4.8.3 Determinewhich isotopehas the highest concentrationandadjust signal strength to approximately90% of full scale onthe highest range of the electrometer (10 volt range for theNBS parametric electrometer)for this isotope. Repeat thisstep for each element prior to isotopic analysis.
4.8.4 Analyze the gas for krypton and xenon isotopic abundanceusing the computer control system.
4.8.5 Print out the report and compare the isotopic ratios foreach cycle. Look for argon interferencein the 80/84krypton ratio and check for instrumentdrift (unexpectedmagnetic or high voltage drift) before pumping out thesample.
4.8.6 The report printout will be placed in loose leaf notebookscontaining sample analysis. The notebooks are located inthe mass spectrometerlaboratoriesin the 325 building.
NOTE: More detailed operating instructionsare available inthe mass spectrometeroperating guides and manuals.
ProcedureNo. Revision No. EffectiveDate Page
PNL-ALO-258 0 6/17/88 5 of 6

!
I PNL TECHNICALPROCEDURE
4.9 Calculations
Calculations are performed by the computer at the end of eachelement's analysis. The control system stops at each mass andmeasures the voltage as it steps through the routine. Five cyclesare usually run. A cycle consists of measuring each mass up anddown the masses selected for the element, in a stepping mode. Eachmass is measured at least 10 times. Isotopic ratios are calculatedfrom the measurements for each cycle. Then the five or more cyclesare averaged. Calculation are checked when the calibration ischecked.
4.10 Records
Records will be maintained and controlled to conform with therequirements of MCS-033. Laboratory record books and analyticalreport forms provide a mechanism for control of most records.
4.11 Procedure Qualification
None required. This procedure is considered self-qualifying due toits dependence on analytical standards. Additionally it isconsidered qualified because lt has Independent Technical Review.
Procedure No. Revision No. Effective Date Page I
PNL-ALO-258 0 6/17/88 6 of 6 I

PNL TECHNICAL PROCEDURE [
TITLE: PNL-ALO-259, (RePlaces 7-40.31), DETERMINATION OF HYDROGEN BY
COMBUSTION
1.0 ApPLiCABILITY
This procedure is intended for the measurement of hydrogen at the
percent level in such various materlals as hydrides of the transition
metals and organic materials. For trace levels of hydrogen in metals,
the inert gas fusion method is recommended.
2.0 RESPONSIBLE STAFF
Cognizant Scientist
Analyst
3.0 SAFETy
This procedure involves no special safety hazards other than the obvious
ones of working with a red hot furnace.
4.0 PROCEDURE
4.1 Definitions
None
4.2 Equipment and Materials
The apparatus (Figure 1) consists primarily of:
- a tube furnace operated at 800-900°C
- a quartz furnace tube about 25 mm diameter
- a 50 mm plug of copper oxide wool in the quartz tube
- a quartz boat of 10-20 cc volume
- a water trap weighing less than 150 grams when loaded with
magnesium perchlorate desiccant
- a supply of dry air flowing at a constant 150 cc/min.
Author Date Pnoject Mgr. Date QADRepresentative Date
R.F Keough 5/25/89 N/A LJ Ethridge 5/30/89
Technical Reviewer Date Line Ngr. Date Othen Date
N/A WCWeimer 5/31/89 All °riginal'si_natuneSonT1
I-/ Procedure No. Revision No. Effective Date Page
l PNL-ALO-259 0 5/1/89 1 of 4

i PNL TECHNICAL PROCEDURB
4.3 Performance Checks
The analyst and apparatus shall be checked by means of analysis of
a standard sample. The standard analysis shall agree to within 4%
of the expected value before any samples are analyzed.
4.4 Blank Determination
1) Heat the tube furnace to 800 C while passing air through the
water trap in 150 cc/m to dry and condition the apparatus.
2) Remove and weigh the trap to the nearest milligram. RecordM&TE used in measurements.
3) Reattach the trap to the apparatus. Open and quickly insert
an empty, dry boat. Immediately close the system and resume
air flowing at 150 cc/min.
4) After 2 hours reweigh the trap to determine weight gain.
This i8 the blank. It must be less than 10 mg and will
typically be about 1 mg.
4.5 sample/Standard p_n_ivsi8
1) weigh 0.1 to 4 grams of sample to the nearest milligram.
Sample size should be adjusted to contain about 50 mg of
hydrogen. If practical, sample particle size should be less
than 3-4 mm diameter to speed oxidation. Most types of
samples must be protected from unnecessary air exposure by
weighing in closed vials.
2) Weigh the water trap and attach it to the apparatus.
3) Transfer the sample to a quartz boat and quickly insert the
boat in the furnace tube and immediately close the tube.
4) Allow air to flow over the sample for two hours, converting
it to oxide and sweeping the resulting water into the trap.
5) After two hours of oxidation at 800 C, stop the gas flow and
reweigh the water trap.
6) If the sample is of an untested material, reconnect the
water trap to the apparatus and flow gas for another hour.
Reweigh the trap to confirm that no additional water was
produced by the extended heating.
Procedure No. Revision No. Effective Date Page
PNL-AL0-259 0 5/1/89 2 of 4

Q I
PNL TECHNICAL PROCEDURE ,I
5.0 CALCULATIONS
The weight percent hydrogen in the sample is:
= (Ws - Wb) C2_ CA) CI0000_
(C) (8) (R)
Where: Ws = Weight of water from sample (grams)
Wb - Weight of water from blank (grams)
A = Atomic weight of hydrogen (i.008)
B = Molecular weight of water (18.016)
C = Sample weight (grams)
R - Percent standard recovery
Combining numerical constants;
% hydrogen = 1119 (Ws - Wb}
(c) (R)
6.0 RECORDS
A laboratory notebook will be the recording mechanism for all data
lyrelating to this ana sis. .h& .......... Jill = ..... _ : ..... _ ....... _
7.0 PROCEDURE QUALIFICATION
None required. This procedure is considered to be self qualifying due
to its dependence on analytlcal standards. Additionally, it is
considered qualified because it has received independent technicalreview.
Procedure No. Revision Mo. Effective Date Page
PNL-ALO-259 0 5/1/89 3 of 4

• .l__ _ .......... -- .1._•._' J _ L I I
I
1 PNL 'I_CHNZC/_ PROCEDURE
AIR
APPARATUS FOR DETERMINATION HYDROGEN
FIGURE 1
Procedure No. Revision No. Effective Date Page
PNL-ALO-259 0 5/1/89 4 of 4-

PNL TECHNICALPROCEDURE I
TITLE: PNL-ALO-260, (Replaces7-40.32),MASS SPECTROMETERISOTOPIC ANALYSISOF LITHIUM
1.0 APPLICABILITY
This method describes the isotopic analysis of lithium. Lithium orsalts of lithium dissolved in dilute nitric or hydrochloricacid can berun using this method. The isotopic ratio, Atom % and Weight % aredetermined.
2.0 DEFINITIONS
NONE
3.0 RESPONSIBI_gSTAFF
Cognizant ScientistAnalyst
4.0 PROCI_DURE
4.1 EQuipment and MBterials
Thermal ionizationmagnetic sector mass spectrometer.
Thermal ionization source.
Electron multiplier or Faraday cup detectors.
Computer control and data collection system.
Bake-out system for vacuum outgassing filament assemblies.
Triple filament hats.
High purity rhenium filament ribbon. (0.001" thick and 0.030"wide.)
Spot Welder.
Heat Lamp.
Author Date Project Mgr. Date QAD Representative Date
MW Goheen 5/3/89 N/A LJ Ethridqe 5/4/89
Technical Reviewer Date Line Mgr. Date Other Date
All originalf_i_naturesonWC Weimer
Procedure No. Revision No. Effective Date Page
PNL-ALO-260 0 5/8/89 I of 4

PNL TECHNICALPROCEDURE I
Hermeticallysealed terminals.
Lithium standard (NIST interim9).
_LO.I_:Anyone operating this equipment should be fully trained inits use prior to any attempt to analyze samples.
4.2 PerformanceCheck
A standard is run each day lithium samples are run.
The ANALYST shall perform the following steps unless otherwisespecified.
4.2.1 Prepare filamentsfor triple filament hats using highpurity rhenium, hermeticallysealed terminals, andspot welder. Clean the filament hat assembly inacetone or alcohol and dry under a heat lamp. Put thefilament hat assembly into the bake-out. Pump thebell jar down and then outgas the filaments at about2000 degrees centigrade. (White hot appearance.)
4.2.2 Carefully remove or lower the center filament awayfrom the two side filaments in the filament assembly.
4.2.3 Place a drop of the standard solution between the twoside filaments. Five to ten microliters will beneeded. Dry the sample via a heat lamp until allwater is removed. Carefully install the centerfilament.
4.2.4 Close the valves to the vacuum pumps and analyzersection of the instrument. Vent the source regionwith dry air. Open the source flange. Remove theprevious filament hat and insert the sample. Connectthe center filament to the electrical leads. Don'tconnect the side filaments. Close the vent valve andsource flange.
4.2.5 Pump the source down. Use the rough pump down toabout 0.20 Torr and then the turbomolecularpump.
4.2.6 When the source ion gage shows that the pressure is2E-6 Torr or lower, open the analyzer valve.
ProcedureNo. Revision No. EffectlveDate Page
PNL-ALO-260 0 5/8/89 2 of 4

e
PNL TECHNICALPROCEDURE
4.2.7 Set the mass via the computer to seven, turn on thehigh voltage and slowly turn up the electrical currentto the center filament. Observe the electrometer(Ca_y or NIST) for indication of ions reaching thedetector. Watch the signal to observe growth andstability. When a strong (30 or 10 volt range on theelectrometer)signal that is growing or dying slowlyis obtained, check the centering on the mass positionsand then run sample via the computer control.
4.2.8 Print out a report and compare the average isotopicratio to the accepted value. The average isotopicratio should be within I% of the accepted value.
4.2.9 The report will be stored in the laboratory files.
4.3 SamDl• AnaIysi_
The ANALYST shall perform the following step unless otherwisespecified.
4.3.1 Prepare filamentsfor triple filament hats usinq high purityrhenium. Clean the filament hat assemblies in acetone oralcohol and dry under a heat lamp. Put the filament hatassemblies into the bakeout. Pump the bell jar down andthen outgas the filaments at about 2000 degrees centigrade.(White hot in appearance).
4.3.2 Lower or remove the center filament. Place a drop of thesample solution bet_een the two side filaments. Five to tenmicroliterswill be needed. Dry the sample via a heat lampuntil _II water is eemoved. Carefully reinstall the centerfiIament.
4.3.3 Close the valves to the vacuum pumps and analyzer section ofthe instrument. Vent the source region with dry air. Openthe source flange. Remove the previous filament hat andinsert the sample. Connect the center filament to theelectrical leads. Don't connect the side filaments. Closethe vent valve and source flange.
4.3.4 Pump the source down. Use _ .-._,,qhpump down to about0.200 Torr and then the turbomolecularpump.
4.3.5 When the source ion gage shows that the pressure is 2E-6Torr or lower, open the analyzer valve.
ProcedureNo. Revision No. Effective Date Page 1PNL-ALO-260 0 5/8/89 3 of 4

4.3.6 Set the mass via the computer to seven or six, turn on thehigh voltage and slowly turn up the electrical current tothe center filament. Observe the electrometer (Cary orNIST) for indication of ions reaching the detector. Checkboth mass six and mass seven. Select the mass with thehigher signal and watch the signal to observe growth andstabiltt)'. When a strong (30 or lO volt range on theelectrometer) signal that is growing or dying slowly isobtained, check the centering on the mass positions and thenrun sample via the computer control.
4.3.7 Print out a report. Check the ratios for consistency.There should be no apparent increase or decrease of ratiosduring the run. Changes should be random. If there is atrend, check peak settings and source controls and thenrerun the sample. If the problem persists try anothersample loading. If the problem sttll persists check withthe cognizant scientist for help.
4.4 Calculations
Calculations are performed by the computer at the end of eachanalysis. The control system stops on each isotope to be meas..:edas it steps through the routine. Nine cycles are usually run. Acycle consists of measuring each mass up and down in a steppingmode. At the end of the analysis routine isotopic voltagemeasurements are averaged and !sotoptc ratios are calculated.Calculation are checked for accuracy during the performance check.
4.5 Records
Records will be maintained and controlled so as to conform withthe requirements of MCS-033 i. Laboratory record books andanalytical report forms provide a mechanism for control of mostrecords L._^..+ ......... _ bcoh _;l! b_ "'"" ' ...... " .... ;lthI k_VVl _ )vi J I _Vl V _ I UJ;U I II _bVl U_II_;
..... C..... D_'"" _''" I Cf u ....... . _,,.a_,,_,,._,,,_,,_ ..,.. _ 3.
4.6 Procedure Qualification
None required. This procedure is considered self-qualifying dueto its dependence on analytical standards. Additionally tt isconsidered qualified because lt has independent technical review.
Procedure No. Revision No. Effective Date Page
PNL-ALO-260 0 5/8/89 4 of 4

TITLE: PNL-ALO-261, (Replaces 7-40.33), MASS SPECTROMETER ISOTOPIC ANALYSIS
OF CESIUM
1.0 APPLICABILITY
This method describes the isotopic analysis of cesium. Cesium or salts
of cesium dissolved in dilute nitric or hydrochloric acid can be run
using this method. Atom %, weight %, and the isotopic ratios aredetermined.
2.0 DEFINITIONS
NONE
3.0 RESPONS_LE STAFF
Cognizant Scientist
Analyst
4.0
4.1 Eo_imment and Materials
Thermal ionization magnetic sector mass spectrometer.
Therm_l ionization source.
Electron multiplier or Faraday cup detectors.
Computer control and data collection system.
Bake-out system for vacuum outgassing filament assemblies.
Triple or single filament hats.
High purity rhenium ribbon. (0.001" thick and 0.030" wide).
Spot welder.
Sample loading unit, used to evaporate a sample solution on a
filament by passing an electrical current through the filament.
Author Date Project Ngr. Date Q_ Representative Date
Gohe_ 5/3/89 N/A LJ Ethridge 5[4/89
Technicat Revie_r Date Line Ngr. Date Other Date
WCweimr _L Atr original f_ignatureson
Procedure No. Revision No. Effective Date Page
PNL-ALO-261 0 5/8/89 1 of 5i

Hermetically sealed terminals.
Rubidium NIST standard.
_: Anyone operating this equipment should be fully trained in
its use prior to any attempt to analyze samples.
4.2 Performance Check
A rubidium standard is run each day cesium samples are run. Natural
cesium is monoimotopic, therefore no natural standard is available.
Rubidium is used because it is similar to and thermally emits very muchlike cesium.
The A_LYST shall perform the following step unless otherwise specified.
4.2.1 Prepare slngle filaments for filament hats using high
purity rhenium, hermetically sealed terminals, and the
spot welder. Install the filaments in hats. Clean
the filament hat assemblies in acetone or alcohol and
dry under a heat lamp. Put the filament hat
assemblies into the bake-out. Pump the bell jar down
and then outgas the filaments at about 2000 degrees
centigrade. (White hot in appearance.} Outgassedcarbonized rhenium filaments can also be used. The
carbonization has no affect on the thermal emission of
cesium.
4.2.2 Place a drop of the standard solution on the filament.
Five to ten mlcroliters will be needed. Dry the
standard with 0.5 amps of current until all water isremoved.
4.2.3 For the C.E.C. 12-60 mass spectrometer: Close the
valves to the vacuum pumps and analyzer section of the
instrument. Vent the source region with dry air.
Open the source flange. Remove the previous filament
hat and insert the sample. Connect the filament to
the electrical leads. Close the vent valve and source
flange.
4.2.4 Pump the source down. Use the rough pump down to
about 0.200 Torr and then the turbomolecular pump.
4.2.5 When the source ion gage shows that the pressure is
2E-6 Torr or lower, open the analyzer valve.
Procedure Ho. Revision No. Effective Date Page
PNL-AL0-261 0 5/8/89 2 of 5

|
4.2.6 For the Nuclide Corporation 12-90-3S mass
spectrometer: Remove the vacuum lock carriage from theinstrument via the vacuum lock. Remove the previous
sample hat. Install the standard on the ion source
and reinstall the vacuum lock carriage in the vacuum
lock.
4.2.7 Set the mass via the computer to 85, turn on the high
voltage and slowly turn up the electrical current tothe center filament. Observe the electrometer (Cary
or NIST) for indication of ions reaching the detector.
Watch the signal to observe growth and stability.
When a strong (30 or 10 volt range on the electrometer
if possible) signal that is growing or dying slowly is
obtained, check the centering on the mass positions
and then run the standard via the computer control.
4.2.8 Print out a report and compare the average isotopic
ratio to the accepted value. The average isotopic
ration should be within 1% of the accepted value.
4.2.9 The report will be stored in the laboratory files.
4.3 S_DIe _nalvsls
The _ shall perform the following steps unless otherwise
specified.
4.3.1 Prepare single filaments for filament hats using high
purity rhenium, hermetically sealed terminals, and the
spot welder. Install the filaments in hats. Cleanthe filament hat assemblies in acetone or alcohol and
dry under a heat lamp. Put the filament hat
assemblies into the bake-out. Pump the bell jar down
and then outgas the filaments at about 2000 degrees
centigrade. (White hot in appearance.) Outgassed
carbonized rhenium filaments can also be used. The
carbonization has no affect on the thermal emission of
cesium.
4.3.2 Place a drop of the sample solution on the filament.
Five to ten microliters will be needed. Dry the
sample with 0.5 amps of current until all water is
removed, use carQ. cesium salts evaporate very
readily.
Pr_edure No. Revision No. EffectiveDate Page
PNL-AL0-261 0 5/8/89 3 of 5

|
4.3.3 For the C.E.C. 12-60 mass spectrometer: Close the
valves to the vacuum pumps and analyzer section of the
instrument. Vent the source region with dry air.
Open the source flange. Remove the previous filament
hat and insert the sample. Connect the vent valve and
source flange.
4.3.4 Pump the source down. Use the rough pump down to
about 0.200 Torr and then the turbomolecular pump.
4.3.5 When the source ion gage shows that the pressure is
2E-6 Torr or lower, open the analyzer valve.
4.3.6 For the Nuclide Corporation 12-90-3S mass
8pectrometerz Remove the vacuum lock carriage fromthe instrument via the vacuum lock. Remove the
previous sample hat. Install the sample on the ion
source and reinstall the vacuum lock carriage into thevacuum lock.
4.3.7 Set the mass via the computer to 133 or 137, turn on
the high voltage and slowly turn up the electrical
current to the center filament. Observe the
electrometer (Cary or NIST) for indication of ions
reaching the detector. Watch the signal to observe
growth and stability. When a strong (30 or 10 volt
range on the electrometer if possible} signal that is
growing or dying slowly is obtained, check the
centering on the mass positions and then run the
sample via the computer control.
4.3.8 Print out a report. Check the ratios for consistency.
There should be no apparent increase or decrease of
the ratios during the run. Changes should be random.
If there i8 a trend, check peak settings and source
controls and then rerun the sample. If the problem
persists try another sample loading. If the_problem
still persists check with the cognizant scientist for
help.
4.3.9 Calculat$ons
Calculations are performed by the computer at the end
of each analysis. The control system stops on each
isotope to be measured as it steps through the
Procedure No. Revision No. Effective Date Page
PNL-AL0-261 0 5/8/89 4 of 5

routine. Nine cycles are usually run. A cycle
consists of measuring each mass up and down in a
stepping mode. At the end of the analysis routine
isotopic voltage measurements are averaged and
isotopic ratios are calculated. Atom % and mass % are
then calculated for each isotope from the isotopic
ratios. Calculations are checked for accuracy during
the performance check.
4.3.10 Records
Records will be maintained and controlled so as to
conform with the requirements of MC$-033.Laboratory record books and analytical report forms
provide a mechanism for control of most records................ n e_er4_nee
,.J_h ,-_ ,,...._,---_,..- so_, ef Mana_c==nt _"*_- a
4.3.11 procedure Oual&$ication
None required. This procedure is considered self-
qualifying due to its dependence on analytical
standards. Additionally it is considered qualified
because it ham independent technical review.
• Revision No. Effective Date Page
I PNL-AL0-261 0 5/8/89 5 of 5

, PNL TECHNICAL PROCEDURB I
TITLE: PNL-ALO-262, (Replaces 7-40.35), MASS SPECTROMETER ISOTOPIC ANALYSIS
OF LANTHANIDE SERIES ELEMENTS
1.0 APP_ICAB;LITY
This method describes the isotopic analysis of the lanthanide series
elements neodymium, samarium, gadolinium, europium, and etc. Neodymium
and most other lanthanides can be run using this method. Atom %, Weight
% and the isotopic ratios are determined.
2.0 D_FINITIONS
None
3.0 RESPONSIBLE STAFF
Cognizant Scientist
Analyst
4.0 PROCEDURE
4.1 EquimmeDt and Materials
Thermal ionization magnetic sector mass spectrometer.
Thermal ionization source.
Electron multiplier and/or Faraday cup detectors.
Computer control and data collection system.
Bakeout system for vacuum outgassing filament assemblies.
Triple or single filament hats.
High purity rhenium ribbon. (0.001 inch thick and 0.030 inch
wide).
Benzene or trans-2-butene.
Spot welder.
Author Date Project Ngr. Date QADRepresentative Date
Goheen 5/6/89 N/A LJ Ethrid_e 5/16/89
Technicat Reviewer Date Line Ngr. Date Other Date
WCWeimer 5 18 89 Atr originatfs[_natureSon
-ocedure No. Revision No. Effective Date Page
PNL-ALO-262 0 5/19/89 1 of 5

J PNL TECHNICAL PROCBDU_,B J
Sample loading unit, used to evaporate a sample solution on a
filament by passing an electrical current through the filament.
Hermetically sealed terminals.
High purity naturally occurring neodymium.
Choroplatinic acid 0.05 g/ml in 0.02 M sucrose solution.
_: Anyone operating this equipment should be fully
trained in its use prior to any attempt to analyze
samples.
4.2 Performance Check
A natural neodymium is run each day samples are run. Natural
neodymium or other lanthinide is used as the standard since NISTdoes not have certified standards available.
The ANALYST shall perform the following step unless otherwise
specified.
4.2.1 Prepare single filaments for filament hats using high purity
rhenium, hermetically sealed terminals and the spot welder.Install the filaments in hats. Clean the filament hat
assemblies in acetone or alcohol and dry under a heat lamp.
Put the filament hat assemblies into the bakeout. Pump the
bell jar down and then outgas the filaments at about 2000
degrees centigrade, (white hot in appearance). The rhenium
filaments are then carbonized by heating for approximately
90 minutes at about 1600 degrees centigrade in benzene or-4
trans-2-butene at a pressure of about 5 x 10 Torr. The
conditions for carbonization must be found for the
particular bell jar setup. The filaments when carbonized
properly will be quite fragile and break very easily and
must be handled carefully.
4.2.2 Place a drop of the standard solution on the filament. Ten
microliters is usually needed. Add 5 _I of the
chloroplantinic acid. Dry the solution with 1.0 amps of
current until all water is removed. Increase the amperage
to 1.2 to 1.5 until a matt gray platinum overplate is
produced.
Procedure No. Revision No. Effective Date Page
PNL-RLO-262 0 5/19/89 2 of 5

PNL TECHNICAL PROCEDURE [
4.2.3 For the C.E.C. 12-60 mass spectrometer: Close the valves to
the vacuum pumps and analyzer section of the instrument.
Vent the source region with dry air. Open the source
flange. Remove the previous filament hat and insert the
sample. Connect the filament to the electrical leads.Close the vent valve and source flange.
4.2.4 Pump the source down. Use the rough pump down to about0.200 Torr and then use the turbomolecular pump.
4.2.5 When the source ion gage shows that the pressure is 2E-6
Torr or lower, open the analyzer valve.
4.2.6 For the Nuclide Corporation 12-90-3S mass spectrometer:
Remove the vacuum lock carriage from the instrument via the
vacuum lock. Remove the previous sample hat. Install the
standard on the ion source and reinstall the vacuum lock
carriage in the vacuum lock.
4.2.7 Set the mass via the computer to 142 for neodymium, turn on
the high voltage and slowly turn up the electrical currentto the center filament. For other lanthanides use an
appropriate high abundance mass position. Observe the
electrometer (Cary or NIST) for indication of ions reaching
the detector. Watch the signal to observe growth and
stability. When a strong (30 or 10 volt range on the
electrometer if possible) signal that is growing or dying
slowly is obtained, check the centering on the mass
positions and then run the standard via the computercontrol.
4.2.8 Print out a report and compare the average isotopic ratios
to the accepted values. The average isotopic ratios should
be within 1% or 2% of the accepted values.
4.2.9 The report will be stored in the laboratory files.
4.3 sample Analysis
The ANALYST shall perform the following step unless otherwise
specified.
4.3.1 Prepare single filaments for filament hats using high purity
rhenium, hermetically sealed terminals and the spot welder.
Install the filaments in hats. Clean the filament hat
assemblies in acetone or alcohol and dry under a heat lamp.
Put the filmnent hat assemblies into the bakeout. Pump the
Procedure No. Revision No. Effective Date Page
PNL-AL0-262 0 5/19/89 3 of 5

bell jar down and then outgas the filaments at about 2000
degrees centigrade, (white hot in appearance). The rhenium
filaments are then carbonized by heating for approximately
90 minutes at about 1600 degrees centigrade in benzene or-4trans-2-butene at a pressure of about 5 x 10 Torr. The
conditions for carbonization must be found for the
particular bell Jar setup. The filaments when carbonized
properly will be quite fragile and break very easily and
must be handled carefully.
4.3.2 Place a drop of the sample solution on the filament. Ten
microliters is usually needed. Add 5 _l of the
chloroplantinic acid. Dry the solution with 1.0 amps of
current until all water is removed. Increase the amperage
between 1.2 and 1.5 until a matt gray platinium overplate is
produced.
4.3.3 For the C.E.C. 12-60 mass spectrometer. Close the valves to
the vacuum pumps and analyzer section of the instrument.
Vent the source region with dry air. Open the source
flange. Remove the previous filament hat and insert the
sample. Connect the filament to the electrical leads.
Close the vent valve and source flange.
4.3.4 Pump the source down. Use the rough pump down to about
0.200 Torr and then use the turbomolecular pump.
4.3.5 When the source ion gage shows that the pressure is 2E-6
Torr or lower, open the analyzer valve.
4.3.6 For the Nuclide Corporation 12-90-3S mass spectrometer:
Remove the vacuum lock carriage from the instrument via the
vacuum lock. Remove the previous sample hat. Install the
sample on the ion source and reinstall the vacuum lock
carriage into the vacuum lock.
4.3.7 Set the mass via the computer to 145 or 146 for neodymium,
turn on the high voltage and slowly turn up the electrical
current to the center filament. Observe the electrometer
(Cary or NIST) for indication of ions reaching the detector.
Watch the signal to observe growth and stability. When a
strong (30 or 10 volt range on the electrometer if possible)
signal that is growing or dying slowly is obtained, check
the centering on the mass positions and then run the sample
via the computer control.
Procedure No. Revision No. Effective Date Page
PNL-AL0-262 0 5/19/89 4 of 5

PNL TECHNICAL PROCEDURE I
4.3.8 Print out a report. Check the ratios for consistency.
There should be no apparent increase or decrease of the
ratios during the run. Changes should be random. If there
is a trend, check peak settings and source controls and then
the rerun sample. If the problem persists try another
sample loading. If the problem still persists check with
the cognizant scientist for help.
4.4 _alculatlons
Calculations are performed by the computer at the end of each
analysls. The control system stops on each isotope to be measured
as it steps through the routine. Nine cycles are usually run. A
cycle consists of measuring each mass up and down in a steppingmode. At the end of the analysis routine isotopic voltage
measurements are averaged and isotopic ratios are calculated.
Atom % and mass % are then calculated for each isotope from the
isotopic ratios. Calculations are checked for accuracy during the
performance check.
4.5 _e¢ords
Records will be maintained and controlled so as to conform with
the requirements of MC5-033 • Laboratory record books and
analytical report forms provide a mechanism for control of most
records. L=b===t==_ _=:==_ ............................ _ ....
4.6 P_cedure oual_fication
None required. This procedure is considered self-qualifying due
to its dependence on analytical standards. Additionally, it i.s
considered qualified because it has independent technical review•
:edure Xo. Revision No. Effective Date Page
PNL-ALO-262 0 5/19/89 5 of 5

PNL TECHNICALPROCEDURE
TITLE: PNL-ALO-263, (Replaces7-40.44), OPERATION OF GAS CHROMATOGRAPHS
1.0 APPLICABILITY
This procedure details the operation of the gas chromatographsand theassociated gas handling system used for analysis of reactor cover gas(argon) by ASTM C997-83.
2.0 DEFINITIONS
None
3.0 RESPONSIBLESTAFF
Cognizant ScientistAnalyst
4.0 PROCEDURE
4.1 Equipment
Figure I shows the apparatus and the connections between theunits. Major components are:
Gas chromatographwith thermistor type TC detector. Gow-Mac#570.
Gas chromatographwith flame ionization type detector. Gow-Mac #580.
High purity argon, air and hydrogen supplies.
Standard gas mixture in argon for calibration.
Vacuum pump for operation of 0.001 psia.
Gas sampling system or manifold.
Digital manometer, 0-100 psia range.
Author Date Project Mgr. Date QAD Representative Date
RF Keough 10/2/89 N/A GK Gerke I0/3/89
Technical Reviewer Date Line Mgr. Date Other Date
All original f_i_naturesonWC Weimer
Procedure No. Revision No. Effective Date Page
PNL-ALO-263 0 10/3/89 I of 5

I PNL TECHNICALPROCEDURE 1
04.2 Startup
4.2.1 Open the plug valve blocking the exit of gas from theTCD chromatograph. This allows carrier gas to flowthrough the system.
4.2.2 Turn on the detector power to this chromatograph withthe front panel switch. Allow an hour for warm up.
4.2.3 Turn on the power to the FID chromatograph;the switchis on the rear of the instrument. Allow an hour forwarm up.
4.2.4 Turn on the gas purifier and vacuum pump by turning onthe "power strip" under the table, lt will take 30minutes for the purifier to warm up.
4.2.5 Conn_,,_.ctthe sample cylinder to the gas manifold.
4.2.6 After everything has warmed up, adjust the argon flowto the FID chromatographto 35 cc/m using the valve onthe lower front panel.
4.2.7 Open the hydrogen valve on the hydrogen generator andopen the outlet valve on the compressed air regulator.
4.2.8 Allow 5 minutes for the lines to flush then push the"ignite" button on the FID chromatographfor 5 secondsto light the detector flame.
4.3 Measurement of Oxygen Hydrogen and Nitrogen
4.3.1 Evacuate the entire gas system with all manifoldvalves open except the standard gas valve. Backfillwith argon to about 20 psia. Close the toggle valveto isolate the FID chromatograph.
4.3.2 Evacuate the manifold with the sampling valve in the"up" position then backfill with sample (or standardif doing a calibration). Adjust the pressure to 18 _+0.3 psia.
4.3.3 With the recorder and associated signal conditionerset to give a full scale response to 0.02 mV, switchthe sampling valve to the down (analyze)position.
4.3.4 Record the peaks, if any, for oxygen, hydrogen andnitrogen. Adjust sensitivity,if necessary, tocapture the full peak.
ProcedureNo. Revision No. Effective Date Page
PNL-ALO-263 0 10/3/89 2 of 5

I
PNL TECHNICALPROCEDURE I
4.3.5 Repeat the analysis once. Repeat with the standardgas to calibratethe instrument.
4.4 Measurement of Hydrocarbons
4.4.1 OpeT_the toggle valve on the gas manifold to allowsample flow to the FID chromatograph.
4.4.2 Evacuate the manifold while the sampling valve on thechromatograph is in the counter-clockwiseposition.Backfill with sample (or standard) gas via themanifold to 15 + 0.2 psia via the manifold.
4.4.3 With the recorder on tl,eI mV scale, switch thesampling valve. The single peak will appear on therecorder in about I0 seconds.
4.4.4 Repeat if sample is available. Repeat with standardgas to calibrate the instrument.
4.5 Calculations
Over the range of interest O-ZOO ppm oxygen, and nitrogen, 0-10ppm hydrogen and hydrocarbons,the concentration is proportionalto peak height. Therefore, for each impurity the concentrationin the sample is:
Concentration- (samDlepeak ht)(conc in std)std peak ht
These calculationsshould be made in the laboratory record book.Normally all concentrationsare given in parts per million byvolume (vppm).
4.6 Notes
4.6.1 Helium overlaps the hydrogen peak so samples taken inthe Gas Tag Sample Trap (GTST) are not analyzed forhydrogen since they contain at least 100 ppm ofh_.lium.
4.6.2 The FID chromatograph is set up to measure allhydrocarbongases in one peak to give "totalhydrocarbons". While it would be easy to separate thevarious hydrocarbons,that is not d_sired for the FFTFsamples this procedure is primari'lyintended toaccommodate.
I
Procedure No. I Revision No. Effective Date Page
PNL-ALO-263 1 0 10/3/89 3 of 5I I i ,

PNL TECHNICALPROCEDURE )
5.0 RECORDS
A laboratory record book will be the recording mechanism for all datarelating to this technical procedure, the-reeet_i-beek-wi4-1--be-used-in
6.0 PROCEDUREOUALIFICATION
Not required. This procedure is considered self qualifying due to itsdependence on standards and blanks analyzed with each sample or set ofsamples.
Procedure No. Revision No. Effective Date Page
PNL-ALO-263 0 ]0/3/89 4 of 5

ii
PNL TECHNICALPROCEDURE
" ] N_GON VACUUM
1
ARGaN PURIFIERSUPPLY
FIGURE 1 --
GAS CHROMATOGRAPH SYSTEM
Ai
ocedure No. Revi si on No. Ef fec t i ve Date Page
PNL-ALO-263 0 ]0/3/89 5 of 5
PNL TECHNICALPROCEDURE 1
L
TITLE- PNL-ALO-265,(Replaces7-40.46),DETERMINATIONOF TOTAL SODIUM ON FILTERSBY FLAME ATOMIC EMISSION
1.0 APPLICABILITY
This procedure describes the operation of a flame atomic emissionspectrometerfor the analysisof total sodium on FFTF air filters.
2.0 DEFINITIONS
None
3.0 "RESPONSIBL_STAFF
Cognizant ScientistAnalyst
4.0 PROCEDURE
4.I Equipment
A flame atomic emission spectrometerwith air and fuel supply (e.g.Perkin-Elmer306)Sodium-free distilledwaterA Sodium Standard (e.g. conc. 2 pg/mL)Two-inch burner head
4.2 Start-up
4.2.1 Turn on the instrumentand set the followingconditions:EM CHOPPER: ONFUNCTION" EMRANGE" VIS
4.2.2 Position the burner head in the optical path so that it isslanted at an angle; secure in place.
4.2.3 Adjust the gas flows so that the fuel and oxidizer levelsyield a flame with minimal luminosity.
Author Date ProjectMgr. Date QAD Representative Date
PK Melethil 6/18/90 N_A GK Gerke 6/21/90
Technical Reviewer Date Line Mgr. Date Other Date
All originalf_i_natures
6/20/90 WC Weimer on1-'--'-"-
ProcedureNo. I Revision No. EffectiveDate Page
I PNL-ALO-265 ] 0 6/4/90 I of 2I

PNL TECHNICALPROCEDURE
4.2.4 Set the monochromator to the emission line of Sodium. Thisshould be about 590 nm.
4.2.5 Zero the spectrometer output using Sodium-free water.
4.2.6 Add 5-ml Na-free water to each filter.
4.2.7 Optimize wavelength selection using the Sodium standard toachieve maximum emission. Adjust the gain as needed forstandardization (e.g. for a 2 ug/mL standard, adjust maximalemission to read 10.0). Thts yield I (std).
4.3 Measurement
4.3.1 Aspirate the sample into the flame and record the emissionintensity, I (samples).
4.3.2 Flush the system with Na-free water between samples and at theend of the run.
4.4 Calculations
As the instrument has been standardized, the total ug Na on thefilter, T, may be calculated as:
T - I(sample)/I(std)x 5Swhere I- Emission intensity, and
S = concentrationof standard in _g/mL
In practice, the standardizationprocedure and sample preparationhave been designed to allow the direct readout of total microgramsof sodium per filter from the spectrophotometer.
5.0 RECORDS
The results are recorded directly on forms provided by FFTF andimmediately transmitted to FFTF work control by telephone and a recordcopy delivered to in-house data entry personnel.
6.0 PROCEDURE QUALIFICATION
Not required. This procedure is considered to be self-qualifyingas astandard and blanks are run with each set of samples.
QProcedureNo. Revision No. Effective Date Page
PNL-ALO-265 0 6/4/90 2 of 2

PNL TECHNICALPROCEDURE I
TITLE: PNL-ALO-266, (Replaces7-40.48), PROCEDURESAND QUALITY CONTROLFOR ENERGY DISPERSIVE X-RAY FLUORESCENCESPECTROSCOPYUSING THEBFP APPROACH WITH THE KEVEX 0810A SYSTEM
1.0 APPLICABILITY
This procedure describes energy dispersive x-ray fluorescence (EDXRF)spectroscopyfor a variety of sample matrices. Twenty-four elements aretypically determined in one-to-two minutes. The backscatter fundamentalparameter (BFP) approach corrects for sample matrix effects withoutprior knowledge of the (usual)major sample components like hydrogen,oxygen, and carbon.
The procedure is an x-ray fluorescenceanalyticalmethod applicable to awide variety of solid and liquid samples includinggeologicals,biologicals,glasses, salts, metals, slurries, and brines, lt is alsowell suited to the analysis of filter samples. Elements normallyreported are Al, Si, P, S, Cl, K, Ca, (Ti or Zr secondary target); Ti,V, Cr, Mn, Fe, Ni, Cu, Zn, Ga, Se, As, Br, Rb, Pb, (only Zr secondarytarget); Sr, Y, Zr, Nb, Mo, U (only Ag secondary target); Ru, Rh, Pd,Ag, Cd, In, Sn, Sb, Te, I, Cs, Ba, La, and Ce (only Gd secondarytarget).
1.1 Principles of Method
An atom fluoresces when it is excited and then immediately revertsto a stable configurationthrough electron transitionswith energyloss to the atomic system. The energy loss, in this case, isusually one or more high energy photons, or x-rays, which arecharacteristicof the transitionsamong the inner shell electronsof the atom. The x-ray photons are detected, tabulated by energyand stored in a spectrum. The element masses or concentrationsare calculated from the net peak areas of the spectrum usinglibraries of fundamentalconstants and single elementsensitivities (calibrationfactors).
Atoms in the sample are excited through a 2-step process. A
Author Date ProjectMgr. Date QAD Representative Date
RW Sanders 9/7/90 NrA GK Gerke ,, 9/7,/90
Technical Reviewer Date Line Mgr. Date Other Date
All origionnalf_i_naturesRJ Arthur '9/7/90 HH Van Tuyl 9/7/90
ProcedureNo. Revision No. Effective Date Page
PNL-ALO-266 I 9/7/90 I of 25i

I PNL TECHNICALPROCEDURE ]
0primary target is bombardedwith electrons to producebremsstrahlungradiationwhich inturn irradiatesone of severalsecondarytargets (excitationsources). The bremsstrahlungradiation stimulates the excitation source to produce x-rays whichare in turn directed at the sample. The x-rays that irradiate thesample cause atoms in the sample to become excited and thereversion to the stable state produces new x-rays (fluorescence)characteristicof the sample atoms.
The x-rays are detected by a solid state lithium drifted silicon(Si(Li)) detector connected to a multichannel analyzer whichprovides counts per channel or peaks for subsequent data analysis.
The calculation of element concentrationsfrom EDXRF peakintensities is generally complicated by sample self absorption andemission of secondary x-rays from the sample. These matrix effectsare corrected by fundamentalparameter calculationswhich requireknowledgeof all major element concentrations in the sample.Because hydrogen, carbon, oxygen, and other light elements are themajor variable components of liquid, biologic, and geologicmaterials and are not directly observed in ordinary EDXRFanalysis,they are estimated by use of the incoherent and coherentbackscatter intensities.
Additional informationon the computer calculations is in theSupplemental Informationsection at the end of this procedure.
1.2 Limitations
Samples must be reasonably homogeneous and be prepared to coverthe sensitive area of the x-ray beam. Mono-energeticexcitationmust be used to generate the discrete incoherentand coherentbackscatterpeaks. The geometry of the sample chamber must becontrolled to ensure that virtually all the observed backscattercomes from the sample. The latter two limitationsare met byusing only the excitation sources and equipment specified in thisprocedure.
Because of the versatilityof the instrumentationand software,the spectroscopist(analyst)has the prerogativeof whether todilute or concentrate samples and to vary the counting parametersof live time and tube current. These variations have only asimple linear effect on the calibrationcurve. A variance must berequested and documented from the cognizant scientist if the tubevoltage is changed because the effect to the calibration curve isno longer linear and thereby requires a new curve.
Procedure No. Revision No. Effective Date Page
PNL-ALO-266 I 9/7/90 2 of 25

PNL TECHNICALPROCEDURE ]
1.3 Safety Requirements
Radiation protection instructionis required and provided annuallyfor all qualified operatorsof the EDXRF in accordancewithPNL-MA-6, Radiation Protection because the EDXRF is classed as aRadiation Generating Device (RGD). Documentationof training ismaintained in accordancewith PNL AdministrativeProcedurePAP-70-201, Indoctrinationand Training. Radioactive orradioactive-contaminatedsamplesmay be analyzed, consistent withthe current Radiation Work Permit and if the radioactivity is non-smearable or the samples are packaged to be non-smearable.
2.0 DEFINITIONS
Calibration standard - a National Instituteof Standards and Technology(NIST) traceable preparationof single or multiple pure elements on athin film.
Matrix standard - a NIST, NIST-traceable,United States GeologicalSurvey (USGS),or equivalent certified standard reference material.
Sample group - a set of samples, usually no more than 16, of any matrix.
3.0 RESPONSIBLE STAFF
Cognizant ScientistAnalyst
4.0 PROCEDURE
4.1 Equipment
4.I.I Hardware
KEVEX Subsystem 0810A - See 0810A InstructionManual
This is a commercial x-ray fluorescenceexcitation anddetection subsystemthat is used to perform X-Ray EnergySpectroscopy. This unit contains a water-cooledtungsten-x-raytube, sample chamber with multiple samplepositions, a series of secondarytargets (typically Ti, Cu,Zr, Mo, Sn, and Gd), a cryogenically-cooledLi drifted Sidetector, preamplifier,and microprocessor. The system can
ProcedureNo. Revision No. Effective Date PagePNL-ALO-266 I 9/7/90 3 of 25
be operated in vacuum, helium, or air• The system con-figuration is such that no inadvertent scatter from theshielding impinges on the detector window.
KEVEX High Voltage Generator - See KEVEX, Interlock Systemfor the KEVEX High Voltage Generator, in InstructionManual- High Voltage Generator80 kV 80 mA (milliamps),Serial No.105.79.
This commercial unit provides the tube voltage and anodecurrent to the tungsten-x-raytube in the Kevex Sub-system 0810A and is controlled by the central electronics ofthe 0810A. Voltage range extends from 10 kV to 80 kV andthe anode current range is 0 to 80 mA.
KEVEX 4620 Detector Bias Supply - This unit supplies highvoltage (typically1000 V) to the detector.
Canberra Jupiter Computer System (includesthe followingequipment).
• Canberra Series 80 MultichannelAnalyzer - see Series80 MultichannelAnalyzer Operators Manual Version 1.0,June 1978.
• This commercial unit contains a microprocessorthat isinterfaced with the main PDP-I1/34A computer. Thisunit allows user keyboard interactionwith spectrumacquisition sequence and provides visual surveillanceof the acquisitionvia the video terminal• The unitis capable of controllingand storing four separatespectra simultaneouslyand can be operated in a hands-on mode or remotely by the PDP-II/34A computer.
• Canberra Model 8623 PHA/LTC - See PHA/LTC Model 8623Operating Manual, March 1981.
• Four of these units are interfacedwith the Series 80.Each unit includes an ADC, pile-up rejector,amplifier, baseline control, and gain control.
• Digital RXOI, floppy disc drive - interfaced to maincomputer. See User's Manual RX8/RX11EK-RXOI-OP.O01,November 1976.
• Digital RL01 - (2), hard disc drive - interfaced tomain computer. See RL01 Disk Subsystem User's GuideEK-RLOI-UG-O02,April 1978.
ProcedureNo. Revision No. EffectiveDate Page
PNL-ALO-266 I 9/7/90 4 of 25

PNL TECHNICALPROCEDURE i
• Digital PDP-II/34A,112K computer - operating systemRSX-IIA.V.4.0. See PDP-II/34AUsers Manual,EK I]039-UG-001(1977) plus KYII-LB Operators Manual.
• Digital VT-I02 - (2), terminal, interfaced toPDP-II/34A. See Digital VT-I02, Video Terminal UsersGuide, EK-VTIO2-UG-O03.
• Versatec, fast printer/plotter,interfaced toPDP-II/34A. See Operation and MaintenanceManual 1110, Series Manual Edition No. 3, April 1978.
4.1.2 Software
The following computer programs are active in thePDP-II/34A computer in both source and task code. Hardcopies and floppy disc storage are maintained in 3708and 329 Buildings. All computer software shall becontrolled in accordance with the PNL Software ControlProcedures (SCPs),reference PNL-MA-70, Volume I,Procedures for Quality Assurance Program.
Program MCA (MultichannelAnalyzer); code residence -DLI:[I0,11],installed [1,54]. Listings described inCI-SE-422-I,Canberra FT 8673 Subroutine (November1979).Description: This program provides control andmonitoring functionsfor"
SecondaryTarget (0810A)Live Time (Series80 MCA)Sample Changer (0810A)High Voltage (High Voltage Generator)Tube Current (High Voltage Generator)
Spectrum Storage (Jupiter.DLO:DLI:DXI:DX_:)Provides and Records: target used, live time, clock
time, current, voltage,sample series name.
Program XRF (X-Ray Fluorescence);code residence -DLI:[I0,11], installed [1,54]. Listings described inCI-SE-422-I,FortranCallable Subroutines. X-RayFluorescencepresents an option menu to the user anddefines and provides to MCA all pertinent informationrequired for the EDXRF spectrum acquisition andstorage sequence.
ProcedureNo. Revision No. EffectiveDate Page
PNL-ALO-266 I 9/7/90 5 of 25

PNL TECHNICALPROCEDURE ]
Program DTP (Disc to Printer/Plotter);code residence-DLI:[6,14],installed [1,54]. Program DTP presentsan option menu for spectrum manipulation, lt providestwo types of plots, hard copies of digital data, andtransfers spectrum from one unit to another.
Program SAP3 (SpectrumAnalysis Program);code resi-dence - DLI:[6,14]. The SAP3 program performs thedual functionsof automaticspectrum analysis andquantitativeinterpretationof energy dispersive x-rayfluorescence(EDXRF)data.
Program XAD (X-Ray Spectra Addition). Program XADgenerates a composite spectrum by splicing a Tisecondary source generated spectrum and a Zr secondarysource spectrum.
Program SXR (Sponsor X-Ray Analysis Report). Thisprogram provides the analyte concentrationsandsupporting informationnecessary to the sponsor.
4.2 Sample Tracking
When the samples are received from the sponsor, the sponsor isrequested to complete an accompanyingEDXRF analysis request form(see attachment A). Receipt acknowledgementand inspection shallbe performed at this time, and shall be documented on the Chain-of-Custody form. Receipt inspection shall include checking samplecontainers and sample shipping containers for presence/absenceofcustody seals, locks, evidence tape, and container breakage. Thecondition of the containers shall be recorded on the Chain-of-Custody form, which shall be completed per PNL-MA-567,procedureAD-4, "SedimentSample Chain-of-Custody."
The identity of samples received with an accompanyingChain-of-Custody form shall be verified prior to signing and dating theform. A copy of the signed Chain-of-Custodyform shall be givento the individual delivering the samples or sent to the sampleoriginator. Any necessary subdividingof samples is performedprior to receipt in the EDXRF Laboratory.
Sponsor, date received,work package number, number and type ofsamples, and a short statementas to EDXRF analyses required shallbe recorded in the Sample Receipt Record Book Laboratory RecordBook (LRB) along with a code referencingthe appropriate LRB wherea detailed record of the analysis is presented. For example, anentry of 50281-76 in the Sample Receipt Record Book indicates thatthe analysis write-up can be located in (LRB) BNW-50281 on page76.
i
Procedure No. Revision No. I Effective Date Page
PNL-ALO-266 I I 9/7/90 6 of 25

PNL TECHNICALPROCEDURE ,, I
After sample and matrix standard preparationdescribed in 4.3, thesamples shall logged into the Operational LRB Record Bookdesignated specificallyfor this purpose. Entries consist ofEDXRF analysis series name, counting parameters, sample positionin the changer, and the sponsor-givenname for each sample.
4.3 Sample Preparation (General)
Solid samples are usually pelletizeddirectly from 180 to 1500 mgof the dry sample in a 3.2-cm-diameter,27,000-kg laboratorypress. Sample material which cannot be readily pressed into aself-supportingpellet (wafer)may be analyzed directly bysupporting it on or between thin plastic films such aspolypropylene,mylar, parafilm, or common tape. Liquid samplescan be processed directly, in open cells or in polypropylenepackets, or can be concentratedinto cellulose powder or to thesolid residue. Filter samples generally can be mounted on 35-mmslides and analyzed directly. Samples must be prepared to fillthe sensitivearea viewed by the x-ray detector. (See AttachmentB)
4.4 Analysis of Samples
4.4.1 Verify or set gain on PHA/LTC for Series "80MCA. Refer toSeries 80 Manual (2-40) and Canberra 8623 PHA/LTH OperatingManual, March 1981, for set-up procedures.
For secondary targets of Ti, Zr, and Ag:
Gain: 25 eV/channelResolution: 182 eV at 6.4 KeVTiming Counter" 12 psecBias" -1000 V
For secondary target of Gd:
Gain: 50 eV/channelResolution" 182 eV at 6.4 KeVTiming Counter: 12 psecBias: -I000 V
ProcedureNo. Revision No. EffectiveDate Page
PNL-ALO-266 I 9/7/90 7 of 25

PNL TECHNICALPROCEDURE I
4.4.2 Solid Samples
This procedure can be applied to sediments, clays, rocks,fly ash, salts, coal, leaves, bone, tissue, or evaporatedbrines and residues. If the average atomic number of thesample is such that the dead time exceeds 40% even withcurrent reductions, dilution with SiOz or cellulose will berequired. If cellulose is used, particle size corrections(PNL-4173, The SAP3 Computer Program for QuantitativeMultielement Analysts by Energy Dispersive X-RayFluorescence, page 60) will be required.
1. Prepare representative, homogeneoussamples less than150 mesh (use 200 to 1000 mg).
2. Press into self-supporting wafer.
3. Support wafer on 35-mm slide as to cover detectorsensitive area.
4. Place USGSor NIST matrix standard in Position #1 ofsample changer.
5. Fill remaining positions with unknowns.
6. Close shielding on x-ray subsystem.
7. Apply and verify vacuum.
8. Set KEVEX0810A and KEVEXHigh Voltage generator incomputer control mode.
9. Activate program MCA.
Type: M C A $ on TTO:
10. Activate program XRF
Type: X R F ¢ on TT3:
11. Provide XRF with necessary information for dataacquisition and storage.
Targets Ti, Zr, Ag, Gd -defaults
*Live Time Ti = 500 sec defaultsZr = 1500 sec defaultsAg = 750 sec defaultsGd = 750 sec defaults
ProcedureNo. Revision No. EffectiveDate Page
PNL-ALO-266 I 9/7/90 8 of 25

PNL TECHNICALPROCEDURE ]
Tungsten Tube Voltage (kV) Ti 20 defaultZr 40 default
• Ag 45 defaultGd 70 default
*Tube Current Ti 10 default(milliamps) Zr 20 default
Ag 20 defaultGd 20 default
* Samples may be counted at greater than but not less than 60% livetime. Vary the anode current and change the live time as necessary.Both of these functions affect the calibration curve linearly and thusrequire only a time adjustment to the concentrationof the matrixstandard in Position #I.
Number of Samples Options I to i7; defaultSeries Name Accepts 5 alphanumericinputs
Inputs - Program places the firstinitial of target in front ofinput.
Designate Spectra Storage.
Option - DLI:[IO0,10]DLO:[I00,I0]DXI:[I00,I0]DXO:[I00,I0]
End of Acquisition.
4.4.3 Powder Samples
Material that cannot be readily pressed into self-supportingwafers may be analyzed by supporting it between thin filmsuch as polypropyleneor parafilm. The procedure is thesame as for solid samplesexcept the option to correct forabsorption of the thin film must be used. See PNL-4173,page 29.
4.4.4 Liquid Samples
Brines, process waste streams, and oils may be analyzed byinjectingthe liquids directly into 33-mm polyethylenecellsfitted with O.O06-mm polypropylenex-ray windows. Samplesare excited in a He environment. Use the same libraries assolid samples and the same options as powdered samples.
I
Procedure No. Revision No. Effective Date I Page
PNL-ALO-266 I 9/7/90 1 9 of 25

l PNL T=CHNICALPROCEDURE I
4.4.5 Aqueous Samples
For analysis of trace elements irlwater samples theFollowing steps are used to prepare the sample.
I. Weigh 100 to 200 mg of micro-crystallinecelluloseinto a narrow 50 ml Teflon beaker.
2. P_.retor weigh 10 to 40 ml of the water sample intothe beaker. Record volume/wt.
3. Place beaker into laminar-flowhood to evaporate todryness. Note: this step may require 2 to 7 days tocomplete.
_.,. Break cellulese pad and mix in beaker.
5. Transfer to alumina mortar and grind.
6. Place teflon film on both surfaces of die to avoidcontam,nation in case the water sample was acidified.Transfer ground cellulose to 1 1/4 inch die and pressinto wafer.
7. Weigh resultantwafer. Record volume/wt.
8. Perform EDXRF analysis by normal procedure for solidsamples.
9. Multiply results (ppm) by weight (in grams) of waferand divide by ml of s_mple. Report results inug element/ml water sample.
ug/ml element = ppm X qm sampleVolume in ml
4.4.6 Procedurefor Steels
Samples may be analyzed as solid disks, lathe or drillturnings, or as pellets prep_'ed from the turnings.Radioactivesteels may also be analyzed. Theprocedure is the same as for liquid samples except themetal only option is used. The analytical method isdescribed in detail in 1982, Anal. Chem. 54:1782-1786and in PNL-4173, page 28.
J Procedure No. I Revision No. I Effective Date J Page i_
_

PNL T:£CHNICALPROCEDURE- I
4.4.7 Aerosol Loaded Filters
Filter samples can generally be mounted on 35 mm slideholders and analyzed without any further samplepreparation. The setup for the acquisition phase withthe exception of anode current is the same as forsolid samples. The anode current is set as follows:
Ti 15 mampsZr 30 mampsAg 35 mampsGd 30 mamps
Quantitativeinterpretationfor filters is the same asfor other samples except for dividing by calculatedweight. Results are given in mass of element/cmz. Ifthe sponsor requires the analyte concentrationto bein ppm, the weight of the aerosol deposit inmeasurements/cm_ and the assurance that the deposit isboth uniform across the filter and large enough tofill the sensitivebeam area must be provided. Havingthese assurances,the mass informationcan be inputand the program will output percent or ppm analyteconcentrations.
4.5 Quantitative Interpretationof Acquired Spectra
The basic method is described below. Modifications to the basicmethod may be performed as needed according to the sample type asdescribed above.
Type: R U N S A P 3
Program execution and user options are described, with examples,in PNL-4173,pages 26-32.
Requires the use of libraries
TZ2OIO.LIB for Ti TargetZIAgVI.LIB for Zr TargetSKBROK.LIB for Ag TargetAMGLIB.LIB for Gd Target
Options Used: Save PaperFloat Energy ScaleDivide by Calculated Weight
a-T,oceOureNo Iev,s,onNo IE,*oct,veOa<e ,a e I
- I PNL-ALO-266 I i I _ti,l_U 1i o_ zs I

I PNL TECHNICALPROCEDURE I
Determine Thickness from ScatterSubtract BlankSave Sponsor Report File
Energy Calibrate Refer to PNL-4173, page 31.
Live Time Refer to PNL-4173, page 32.
Data Set Refer to PNL-4173, page 32.
The series name designates target [Z] zirconium" " " " sponsor [R S] Ron Sanders" " " " month [07] July" " " " set [I] Ist set
For example, Z R_S 0 Z1 O_1through Z R S 0 7 I !Z isinterpretedas Ist to 17th sets of samples for sponsor RS, excitedwith Zr Target on the Ist of July.
SAP3 OUTPUT - Described in detail, with examples, in PNL-4173,pages 68-78.
Sponsor Report. Refer to PNL-4173, page 31.
Type: R U N [ I 0 , 1 2 ] S X R
This program allows the operator to output a report with allassociated information (Method,Standard, Sample Name,Series Names, etc.) plus the quantitativeinterpretationofthe spectrum. Output includes all peak analysisinformation,matrix correction factors and elementconcentrations,uncertaintiesand detection limits.
4.6 Calculationsof Uncertainty
The uncertaintycalculationsare completelydescribed in Nielsen," 1978 7"15-22 and "SAP3 " PNL-4173K. K., "X-Ray Spectrum, , . , , ,
pp. 47-50. Because of the importance of these calculations, theyare outlined here.
The standard error in the peak area, Sn, is estimated for a peakoccurring at integral channel locations as
B )11/2Sn = [N + B (I + k (bI + b2)
I Procedure No. Revision No. I Effective Date Page
i
PNL-ALO-266 I I 9/7/90 12 of 25I I I

PNL TECHNICALPROCEDURE
whereN = the partial net peak area
B = the background area beneath N
bI, bz = the counts in the two channels used todefine the background
k = number of channels used in the smoothingfunction prior to peak analysis
When interferingpeaks are encountered,element concentrations arecorrected by a simple product of the peak overlap coefficients (inunits of mass/mass) and the concentrationsof the interferingelement. In such cases, the uncertaintyof the peak area isincreasedby uncertaintyof the overlap correction as
Sn = [Sn2 + So2 f (Ao/An)]I/2
where S_ is the uncertainty in the peak area used to analyze the• Q .
interferlngelement, f is the peak overlap coefficient,and AO and
A. are the respective absorption correction factors for theiiiterferingand primary element peaks.
The uncertainty in element concentrations,Sr_,is determined fromthe peak area uncertaintyby using the same _orm of equation usedto relate peak areas to elemental quantities.
Sn.Y.Ao.P.ESc -- T.K
where Y = the normalizationfactor used to alterconcentrationunit (I unless sample is diluted)
Ao = the self absorption correction factor
P = the particle size correction factor (dilutedsamples)
E = the enhancementcorrection factor
T - the analysis live-time
ProcedureNo. Revision No. Effective Date Page
PNL-ALO-266 I 9/7/90 13 of 25I I , i

I PNL TECHNICALPROCEDURE I
K - the element calibration factor (x-ray intensityper unit element mass).
The above equations give the 1-sigma statistical precision of theelement concentrations due to counting statistics only, and thusrepresent the maximumconfidence that can be placed in theresults.
Systematic sources of errors such as calibration error, or othersource of errors are not addressed by this calculation. The SAP3program provides an option for the user to insert an estimate ofother source of error into the formula. When entered, this erroris combined with the above estimate of random error as:
Sc = C[(Sc/C)2 + e2] 1/2
where C = the element concentrations
e = the fractional error to be combined with the peakstatisticalerror.
5.0 OUALITy CONTROL REOUIREMENTS
5.1 Conditions
There must be a data library for each type of supportmatrix(blank) for each excitation source. Samples and standards must beprepared to cover the sensitivebeam area and adhere to thegeometry conditions for proper backscatter.
The EDXRF system , i.e., the equipment and software, must beoperated by trained analysts. Documented professional experiencemay be substitutedfor training. Knowledge of PNL-4173 will beacquired by the issuance of a documented reading assignment andbriefings by the cognizant scientist. Annual recertificationisrequired by means of a conceptual test which will be maintainedand posted near the EDXRF machine. Training is documented andrecords are maintained in accordancewith PNL-MA-70, PAP-201,"Indoctrinationand Training."
5.2 Calibration
5.2.1 Thin Films
Conduct the EDXRF calibration as specified in PNL-4173, using thethin film calibration standardsfor each excitation source.Follow the analytical procedure or system software instructionstorun the thin film standards.
ProcedureNo. Revision No. Effective Date Page
PNL-ALO-266 I 9/7/90 14 of 25

PNL TECHNICALPROCEDURE J
Calibrate the system the first time the system or method is used,after any significantmodificationto the equipment or software,and for each new element and excitation source.
Thin film standards are _sed for the determinationof intensity incount/min/pg(element)/cmversus element energy in KeV. Thestandards are typicallyproduced by vapor deposit of the elementson mylar or polycarbonatesubstrate and are available from MicroMatter, Eastsound,Washington. The supplier providescertificationof traceabilityto the U.S. National InstituteofStandards and Technology.
5.2.2 Matrix Standards
A matrix standard is analyzed in position number I to obtainfactors to adjust the calibrationcurve for the matrix effect.The matrix standard must have a matrix similar to the sample groupand be prepared in a similar fashionwith similar materials.Following the analytical procedureor system softwareinstructions,the matrix standard will be run and the correctionfactors applied. Documentation is maintained with the sampleanalyses.
5.3 Library Preparation
The data required for a new library includea set of thin-filmstandard spectra and one or morp spectra from samples of knowncomposition and thickness (g/cm_).
The thin-film sensitivitiesor calibrationfactors of thespectrometerusing the intended excitation source and intensityare determined by analyses of thin-film single element standardsof all elements to be included in the library. The resultingsensitivitiesare plotted logarithmicallyas a function of x-rayenergy and the data smoothed to remove the uncertainties in theindividualelement standards. The smoothed data is entered intothe library.
The incoherentand coherent scatter peak calibration constants aredetermined, in accordancewith PNL-4173,for a given excitationsource and for a given x-ray system by analysis of one or moresamples of known thickness and composition. Pellets of celluloseor carbon, or thin sheets of aluminum provide suitable samples ofsimple composition.
A data library for the blank of the intended sample mounting isalso determined from an analysis of the desired blankconfiguration. This informationcorrects for the attenuationofx-rays by the supportmaterials.
,,,
ProcedureNo. Revision No. EffectiveDate PagePNL-ALO-266 I 9/7/90 15 of 25

J PNL TECHNICALPROCEDURE J
A data library for the system blank, or background contribution isalso prepared.
Prior to routine use of the library, the set of standards isanalyzed using the new library with various options to check theaccuracy of the various calibrationsand make any refinements thatare indicated.
5.4 Quality Control Data
The quality control samplesdescribed below are analyzed with eachsample group.
A. Matrix Standards
A matrix standard,which shall be different from the one used forcalibration, shall also be analyzed as part of the sample group.
Standards must have an approximatematrix match (e.g., rock vs.rock, tissue vs. tissue) to the sample group, and be prepared toapproximatethe sample size.
Analyze at least one matrix standard, in addition to the oneanalyzed at the beginningof each sample group, for each group ofanalyses.
If the matrix standard analysis equals or exceeds the controlaction limit, re-run the matrix standard one or two times. If twoof the three analyses equal or exceed the control action limit,stop sample analysis and correct the problem. (See Section 5.8below.) The matrix standardwill be counted before and aftersample analysis run. Concentrationsof the sample and matrixstandard must comparewithin errors, or sample analysis will bestopped and reprocess_d.
Matrix standards are examined for deterioration,such as warpingor holes, prior to each use and not used if any adverse changesare detected.
B. Duplicates
Run one duplicate analysis per sample group to determine theanalytical precision. If the duplicate sample results are outsidethe control limits, the group leader must determine the correctiveaction, including renderinga judgement on the validity of thedata. If the samples are not to be re-run, then all the data forthe samples associated with that duplicate sample, i.e., all thesamples in that sample group or the samples that preceded thesuspect duplicate, must be flagged.
Procedure No. Revision No. Effective Date Page
PNL-ALO-266 I 9/7/90 16 of 25

i
PNL TECHNICALPROCEDURE ]
S.S Program Dependent Quality Control Data
Generation of the quality control data specified in this sectionis dependent on the technical nature of the program.
A. Spikes
Whenmatrix standards are unavailable or unsuitable, analyze oneduplicate spiked sample per sample group. The spike shall includethe major analytes of interest. If each spike recovery is not ator within the limits of 75 - 125%, based upon the thin filmstandard as described on page 19 of PNL-4173, the Spike will beredone and the corrective measures documented in the LRB.
B. Lab Control Samples
Analyze one lab control sample per sample group. The lab controlsample shall be prepared from certified material and lt must havea matrix (e.g., solid or aqueous) similar to the matrix of thesample group. If the percent recovery falls outside the controllimits, re-run the lab control sample one or two times. If two ofthe three analyses equal or exceed the control action limit, stopsample analysis and correct the problem. The samples associatedwith that lab control sample, i.e., all the samples in the samplegroup or that preceded the suspect lab control sample, must bereanalyzed. The group leader must determine if the samples to bereanalyzed must be reprocessed in total as well.
C. Preparation Blanks
A preparation blank shall be prepared and analyzed for thoseoccasions when the sample must be diluted or its mechanicalstrength enhanced by addition of other materials. If thepreparation blank results are outside the control limits, thegroup leader must determine the corrective action, includingrendering a judgement on the validity of the data.
5.6 Data Reports and Control Charts
A. Reports to the client shall be reviewed and signed by theanalyst and a technically qualified reviewer. Reports shallbe submitted to the group leader for review and transmissionto the client. The group leader may act as the technicalreviewer.
B. Analytical Laboratory Operations (ALO)will establish therequired control chart procedures and assure that the chartsare maintained in the laboratory on a regular basis. Toestablish the control chart initially, the first time the
I
ProcedureNo. Revision No. I Effective Date Page
PNL-ALO-266 I I 9/7/90 17 of 25

PNL TECHNICALPROCEDURE I
system is used, send the first ten results from matrixstandards to ALO Data Quality to calculate limits for thecontrol chart. Thereafter submit all (non-calibration)matrix standard analysis data to ALO.
C. Analytical results from duplicates for each sample group orrun shall be reported to the Manager, Analytical DataQuality, ALO.
S.7 Precision and Accuracy
In collaborationwith the EDXRF group leader, the Analytical DataQuality (ADQ) office will utilize the QC data provided fromSection 5.4 above to determine the precision and accuracyinitiallyfor each sample matrix.
This informationis used to prepare a control limit chart for aset of similar matrix samples. This is accomplishedby thedeterminationof the standard deviation, based on tenacquisitions,of selected analytes represented by the matrixstandards. The control limit chart is then based on +/- threetimes the standard deviation for the selected analytes. The dataaccumulateCon these matrix standardsduring the routine analysisis then compared to the control limit chart.
5.8 Sample Analyses Control
If the routine analysis of the matrix standards show that theprocedure is out of control (results equal or exceed control chartaction limits), the condition shall be corrected, and the start upinstrument calibrationprocedure applied. All samples that wereanalyzed since the last acceptablematrix standard or duplicateanalysis shall be re-analyzed and the earlier analytical datadeclared void.
6.0 REFERENCES
I. Nielson, K. K. 1978. "Applicationsof Direct Peak Analysis toEnergy-DispersiveX-Ray FluorescenceSpectra." X-Ray Spectrum7:15-22.
2. Nielson, K. K., and R. W. Sanders. 1982. The SAP3 ComputerProqram for QuantitativeMultielementAnalysis by Enerqy-Dispersive X-Ray Fluorescence. PNL-4173, Pacific NorthwestLaboratory,April 1982, 120 pp.
3. Covell, D. F. 1959. "Determinationof Gamma-Ray AbundanceDirectly from Total Absorption Peak." Anal. Chem. 31:1785-1790.
ProcedureNo. Revision No. EffectiveDate Page
PNL-ALO-266 I 9/7/90 18 of 25

PNL TECHNICALPROCEDURE I
4. Sanders, R. g., K. B. 01sen, and g. C. geimer. 1983."Multielement Analysis of Unweighted Oil Samples by X-RayFluorescence Spectrochemistry with Two Excitation Sources." Anal.Chem. 55 12:1911-1914.
5. HcMaster, g. H., N. K. Delrande, J. H. Hallett, and J. H. Hubbell,"Compilation of X-Ray Cross Sections." UCRL-50174, Sec. II, Rev.1, (1969).
6. Nielson, K. K., S. R. Garcia. 1977. "Use of X-Ray Scattering inAbsorption-Correction for X-Ray Fluorescence." Adv. X-Ray Anal.20: 497-506.
7. Nielson, K, K., R. W. Sanders, and J. C. Evans. 1982. "Analysisof Steels by Energy-Dispersive X-Ray Fluorescence with FundamentalParameters." Anal. Chem. 54 11:1782-1786.
8. PNL-MA-6, Radiation Protection (latest version)
9. PNL-MA-70, Quality Assurance Manual (latest version)
10. Kevex 0810A Instruction Manual
11. Canberra Series 80 Multichannel Analyzer Operators Manual, Version1.0, June, 1978.
12. PNL-MA-567, Procedures for Ground-Mater Investigations, AD-4,"Sediment Sample Chain-of-Custody."
ProcedureNo. Revision No. EffectiveDate Page
PNL-ALO-266 I 9/7/90 19 of 25

PNL TECHNICALPROCEDURE I
Supplemental Information
Introduction
The SAP3 program analyzes x-ray fluorescencespectra for selectedpeak areas and calculates element concentrationsfrom theresulting data. lt computes net peak areas by a background-independentmethod and uses them to calculate element masses orconcentrationsfrom a library of sensitivitiesand fundamentalconstants. The calculationsrequire no user interaction afterinitial selectionof options and entry of the analysis live time.
General Considerations
SAP3 uses thin-film spectrometer sensitivities, with mathematicalcorrections for three types of matrix effects, i.e., self-absorption, enhancement, and particle-size effects. Thecorrections permit analyses of thin, intermediate or thick sampleswithout corresponding calibrations or standards. The matrixcorrections require a complete definition of sample constituents.For metal alloys, this definition can often be determined from theFluorescent peaks in the spectrum. For geological, biological, orother materials containing significant quantities of oxygen,carbon, or other light elements not observed in the EDXRFspectrum, the remainder of the sample matrix is defined from theincoherent and coherent backscatter peaks. The contribution tothe backscatter by the observed elements is first determined, andthe remainder is attributed to two "representative lightelements", whose masses are used in the matrix correctioncalculations. The SAP3 program is thus unique form otherfundamental parameter methods in its ability to perform matrixcorrections without any prior knowledge of major sampleconstituents.
In estimating sample thickness, the program assumes that theobserved mass is spread over the sensitive area viewed by thedetector. Samples therefore must be either sufficiently large tocover the sensitive area, or be infinitely thin or thick toconform to the fundamental parameter calculations used in theprogram.
The geometry of the sample chamber must be such that virtually allobserved backscattercomes from the sample rather than from thesample chamber or other system components and monoenergeticexcitation is required to give discretely measurable incoherentand coherent backscatterpeaks.
Suitable precautions should always be taken to verify the samplepreparation method with a standard referencematerial.
Procedure No. Revision No. Effective Date Page
PNL-ALO-266 I 9/7/90 20 of 25

PNLTECHNICALPROCEDURE 1
Plastic supporting films should also be characterizedfor theirabsorption and scatter characteristics,as well as impuritycontents,prior to use in sample mounting.
Library Preparationand CalibrationCurve
The generalized calibrationis based on a set of thin-filmsensitivities,which are stored in a library disk file and usedfor all sample matrices and thicknesses. Peak overlap factors arealso determined from the thin-film standards, and are stored inthe library for calculatingpeak overlap corrections.
The peak analysis and elemental concentration sections of the SAP3program uses arrays of fundamentalphysical parameters of x-rayenergies,mass absorption coefficients,cross sections,fluorescenceyields, absorptionedge, and jump ratios to performthe matrix correctionsfor relating net peak intensitiestoelement concentrations. These arrays are read into the computerfrom a disc file when the SAP3 program is initiated. Eachexcitation source has its own unique disk file or library. Thethin film sensitivitiesor calibration factors of the spectrometerusing the intended excitation source is also part of the library.The complete library preparationprocedure is detailed andexplained in PNL-4173,pages 5 through 24.
Peak Analysis Method
The method of peak analysis is described in detail in "Nielsen,K.K. 1978. Applicationof Direct Peak Analysis to Energy-Dispersive X-Ray FluorescenceSpectra. .)'-RaySpect. 7"15-22" andin "Nielsen,K. K., and R. W. Sanders. 1982. The SAP3 ComputerProgram for QuantitativeMultielementAnalysis by Energy-
" PNL-4173 Pacific NorthwestDispersive X-Ray Fluorescence,Laboratory Report to U.S. Department of Energy, pp 43-50.
The method is a modified Covel (Covel, D. F. 1959, Anal. Chem.)approach for direct peak analysis that is applied to x-rayfluorescencespectra, lt is background independentand providesacceptable precision, and minimizes errors from instrumentalgainshifts, sum peaks, and peak overlap. The peak analysis process"a) smooths the raw spectral data using a 5-point algorithm,b) determines accurate energy/ channel scale using an observedscatter peak and a known spectral peak, c) finds peak centers interms of channel number using the energy/channelscale and knownx-ray peak energies, or, optionally,through comparisons to acorrelation spectrum,d) finds the window for each peak from itsenergy using a linear width versus energy relationship,e) computes window boundaries by successivelyadding and
1"
Procedure No. Revision No. I Effective Date Page
PNL-ALO-266 I I 9/7/90 21 of 25

I PNL TECHNICALPROCEDURE
subtractingthe appropriatewidth from the energy peak andinterpolatingto the exact window boundaries and theircorresponding intensities,and f) integrates the net peak areausing Covel's method.
ProcedureNo. Revision No. EffectiveDate Page
PNL-ALO-266 1 9/7/90 22 of 25

PNL TECHNICAL PROCEDURE ]
ATTACHMENT A Page 1 of 2
ANALYSISII£QUESTFORM
! NSTRUCT!ONS:
]. P|ease submit completed foe with s_les,QA section must be specific.
2. Sample designation cambe m to 25 characters.
3. Leave foe wf th sables In the samle receiving area,or send foewtth samples to:
R.W. SandersP8-083708 bldkJ./300 areaBattelle PacJftc North_st LaboratoriesP.O. Box 999Richland, Wa 99352
4. All prepared samples and restdual sample emtertal will be disposedof unless you specify othen, tse under "Spectal Instructions'.
GENERALINFORMATION:
Name: Ph:
Plant Mail:
Work Package:SOW:RFAS:
Sponsor:
What OA/QC requ|rements are leq)osedon tJ_|s anilys|sT(sponsor or other)%
Date Results are needed:
Todays Date:
Brtef Description of sample material:
Analyze these samles qualltatfvely/qua,tltatfvely (ctrcle one) for thefol lowfng elements:
XRFA:
ProcedureNo. RevisionNo. EffectiveDate Page
PNL-ALO-266 I 9/7/90 23 of 25

(continued)
ATTACHMENT A Page 2 of 2
ANALYSIS REQUEST FORM
SPECIAL INSTRUCTIONS :
( ) Samples need refrigeration.
( ) Other requirements =
( ) Return resldual sample material, Yes( ) No( ). to:
( ) Send prepared samples. Yes( ) No( )Lo:
( ) Send _ analysis report(s).
( ) Other comme'.ts and/or Instructions:
Author: date:
Acttvtty Manager: date:
! ProcedureNo. l Revision ,"o. I Effect!,;eDate I P_oe

PNL TECHNICALPROCEDURE 1
ATTACHMENTBi
ILLUSTRATIONOF"SENSITIVEAREA .VIEWEDBY THE X-RAYDETECTOR
///I
4 3 2 1 0
I_,, -_"/mm-- ,-.II-" q
_ Proc,ure,o. I "ev','o."o. IE,',_,,c,,v,,0,,° I P"ge I- I ,_,,_-A,O-,6°I ' I 9,,,,,90I _,so,',_I

TITLE: PNL-ALO-267, (Replaces7-40.51),OPERATION OF THE CANBERRA MODEL 20MULTICHANNELANALYZER
1.0 APPLICABILITY
This procedure describes the use of the Canberra Model 20 MCA which isconnected to a NaI(Tl)well detector in Roo_ 3B, 32g Bldg Theprocedure's only purpose is to measure the °_Srgamma ray peak at 514KeV, before and after a chemical separation per Procedure PNL-ALO-486.
2.0 D(_FINITIONS
LRB LaboratoryRecord BookMCA MultichannelAnalyzerNAI(TI) Sodium Iodide,Thallium activated crystalROI Region of Interest
3.0 RESPONSIBL[.STAFF
Cognizant Scientist - A chemist or other scientist familiar with thisprocedure who has an in-depth knowledgeof this equipment.
Analyst - An individualwho has been trained and certified in the use ofthis procedure.
4.0 PROCEDURE
4.1 Equipment and Materials
• Canberra Model 20 MCA• High Voltage Power Supply set to- 1100 volts• NaI(Tl) well Xtl• > I/2 dram glass cup set inside the NaI(Tl) well to avoid crystal
contamination in the event of sample leaks• Cs-137 "Control"._.ource,- 4000 d/m in sealed, I/2 dram, screw-cap
vial
Author Date ProjectMgr. Date QAD Representative Date
FE Holt 2/2,8/91 N/A GK Gerke 2/28/91
TechnicalReviewer Date Line Mgr. Date Other .Date
• onWeiler _ LR Greenwood 2_ All originalrf_i_natures:edureNo. I Revision No EffectiveDate I Page
_,, ^,_ _ I _ 2/28/91 1 ! of !0I I I

i ' PNL TECHNICALPROCEDURE ' i
4.2 Ouality Control
The only purpose of this procedure is to obtain the ratio
counts eSSr after chemical processing,
counts 8_Sr before chemical processing
so a simple plot of a sealed Cs-137 control source vs. date willconfirm that the equipment is functioning properly. Followinstructionsin Attachment A of Procedure PNL-ALO-490. Count the Icontrol source for 10 minutes and plot the Area (total counts in I
ROI #2 less 3 channels on either side of the peak). If the Areasfall within the _+3s boundaries,and the peak channel number isbetween channels 329 and 333 the equipment is in control. Thecontrol source shall be countedbefore and after each set ofsamples processed for their 89"9°Srcontents
4.3 S.ystemDescription and Controls
Figures I through 4 with accompanyingtext illustrate and describethe .b.asicfeatures of the counting system.
Har(T20
s_gml
I- ii
Figure I. Nal System Setup
The Series 20's front panel is illustrated in Figure 2. The keynumbers refer to the text followingthe figure.
ProcedureNo. I Revision No. EffectiveDate Page
PNL-ALO-267 1 0 2/28/91 2 of 10

• i
1. The display is an 18 cm CRT screen (measureddi agonal l y).
2. Below the display and to its right are a numberof keys. Host of the keys are labeled with twofunctions. These are called hard keys.
3. The INTENSITY control varies the display'sbrightness for comfortable viewing. The controlalso turns the Series 20 ON and initializes theunit when it i s turned c] ockwi se.
4. The numertc keys 1 through 5, are called softkeys; their labels, shown on the display'sbottom line, change with the function beingdefined.
5. The INDEX key in the lower right corner of thefront pane] moves the cursor to the start of thenext ROI, if any, otherwise it has no function.The two horizontal arrow keys control cursormovement. The two vertical arrows control thedisplay's Vertical Full Scale and someparameterentries.
HARDAND SOFT KEYS The Series 20 uses two types of function key:the "hard" key and the "soft" key. Pressing theMENU/EXIT hard key (one with a permanentlydefined function) to the right of the displaywill show a line of soft keys (keys with thechangeable function definitions) at the bottomof the screen.
Soft key labels are automatically displayed onthe line above the first five numeric keys.
These key labels change according to the currentfunction.
A hard key function is activated by pressing itskey. A soft key function is activated bypressing the numeric key just below theappropri ate l abel.
In the reference (Operator's Manual) thehard keys are shown in boldface type in abox out] i ne.
(COLLECT)
No. Revision No. Effective Date Page
L-ALO-267 , , 0 . 2/28/91 3 of 10

The soft keys are shown"with the functionname enclosed in a dashed outline.
( STATUS I
INITIALDISPLAY A few seconds after the power is applied, the displayin Flgure 3 will appear on the screen.
(1) (z) (3)i ii i i
CL- 0 MEM 1/1 FROM 2 TO 4095CTS- 0 VFS 64 INTG= 0 '
STATUS COMPUTE1 [EXECUTE PSET(L)- 1000PAGE TIME J TASK Sl ELAP(L)- 0
(4) (5) (6) (7)
Figure 3. Initial Display
I. CL = the Cursor's location in the spectrumCTS - the COUNTS at the cursor's location.ROI# - current ROI number, if any, otherwise not
shown.
2. MEM - current memory group•VFS - the display's Vertical Full Scale.Status = Series 20's current status; if idle,
nothing is shown.
3. FROM-TO - low and high channels of currentROI, if any, otherwise of display'scurrent limits.
ProcedureNo. Revision No. EffectiveDate Page
PNL-ALO-267 0 2/28/91 4 of 10I

PNL TECHNICALPROCEDURE I
INTG* = Integral (total number of counts) inthe current ROT, if any, otherwise ofthe channels in the current display.
AREA* = Integral minus the averaged backgroundof the current ROI, if any, otherwisenot shown.
STATUS PAGE If you press the STATUS PAGE soft key (the numeral I),the display will change to show a list of the currentdata acquisitionand EIA parameters. If you want tosee the current calibration parameters (thecalibration equation), press the ECAL key.
Figure 4 shows the Status Page with the defaultparameters. The Status Page always shows the lastparameter values entered. The clock and calendar showthe current time and date; they are not reset by poweroff.
CANBERRASERIES 20 V2802-A3
PRESETLIVETIME., 1000 SECONDS
MODE: IDLE TAGWORD.,0
CURRENTCOMPUTEFUNCTIONF1- shown on Model 2B02 only
AMP SCA ADC EIA CLOCK
GAIN LLD GAIN BAUD DA/MO/YR
_1130 0.322% 4096 " 2400 22/02/91
INPUT ULD PHA LENGTH TIMENEG 110.0% ADD 7 12:45
SHAPING OFFSET PARITYSLOW 0 EVEN
. ZEROO_
[AMP] [SCA] [ADC] [EIA] [CLOCK]
Figure 4. The Status Page
Procedure No. Revision No. Effective Date Page
PNL-ALO-267 0 2/28/91 5 of 10

4.4 Checkinq and Adjustinq Gain
Prior to counting the control source, it is necessary to checkand, if necessary, adjust the gain of the amplifier via theanalyzer keys. This is done as follows:
4.4.1 Check the gain by placing a s_aled Cs-137 source intothe well of the Nai(T1) detector and counting for asufficient period that the peak center can beestimated reasonably accurately.
4.4.2 The center of the Cs-137 662 kev gammaray peak shou]dbe between channe]s 329 and 333. If this is the case,no gain adjustment is needed -- proceed to 4.4.
4.4.3 If the amplifier gain needs adjustment, do thefollowing:
From the MAIN MENU, press key 1 (STATUSPAGE).
From the sub-menu which appears, press key 1 (AMP).
From the sub-menu which appears, press key 5 (GAIN).
The current value of the amplifier gain will bedisplayed, along with the range of acceptable values.To change the value, use the number keys to enter thevalue desired, then press key ENTER.
Press key 1 (COLLECT) to clear the current spectrum,initiate counting and display the spectrum.
Continue to adjust the gain as necessary until thecenter channel of the Cs-137 662 keV peak is betweenchannels 329 and 333.
Return to the main menu by pressing key MENU/EXIT.
4.5 Operatinq the Counter-Control Source
4.5.1 An automaticsequence of steps, Sl, are incorporatedinto the counting system to obtain the control counts.
/
4.5.2 Set the glass sleeve into the NaI(Tl)'swell and placethe sealed source marked "Control"inside that.
ProcedureNo. Revision No. EffectiveDate Page
PNL-ALO-267 0 2/28/91 6 of 10

I PNLTEC.N,C,,PROCOUR I4.5.3 Rress Menu/Exit once or twice until you obtain
MENU ANALYZE EXECUTE at the
bottom of the screen.
4.5.4 Press the #3 under Execute
4.5.5 Press #I under SI. The ROI channels for the 662 KeVpeak are from 27g to 406. Put in I, only, programstarts°
4.5.6 The analyzerwill clear data from the screen, set livetime to 600 seconds, and count for that period oftime.
4.5.7 Plot the Area (upper right corner of screen) onto thecontrol chart provided. The counts must be within the+ 3s boundaries and the peak channel shall be betweenchannels 32g and 333.
4.6 Operatinq the Counter-SampleCount and Standard Count
4.6.1 Set the glass sleeve into the NaI(Tl)'s well and placethe sample or standard source inside that.
4.6.2 Press Menu/Exit once or twice until you obtain
MENU ANALYZE EXECUTE at the
bottom of the screen.
4.6.3 Press the #3 under Execute
4.6.4 Press #2 under $2. The ROI channels for this peak at514 KeV are from 202 to 310, enter Number, I, enter,program starts.
4.6.5 The analyzer will clear the data from the screen, setlive time to 3600 seconds and count for that period oftime. The peak channel counts shall be betweencha_nels 283 and 261.
/
4.6.6 Record the Area of the count on the analyticalcard,labeling it sample count or standard count. The ratioof the sample count/standardcount is the fractionalrecovery of the method and is used in the c:,_.Iculations
of Procedure PNL-ALO-486,Sect_.n 5.0. I
_'_:edure No. Revision No. EffectiveDate PagePNL-ALO-267 0 2/28_I 7 of 10

I PNL TECHNICALPROCEDURE ]
5.0 R_ferences
Series 20 Multichannel Analyzer - Operator's Manual, CanberraIndustries.
ATTACHMENT A
QUALITY CONTROL
CONTROl.ANALYSES
Control data include items identified in Section 7.2 and specificrequirementsof analytical procedures. Results shall be documented indata records, which may be commingled with sample data (e.g., in a LRB).Actions taken to regain control shall be documented in data records.
STATISTICAL PRACTICES
Statistical practices used to treat analytical measurements are givenbelow. Definitionsof the statisticalterms used are found in Section I4.O, MCS-033. I
(a) Control Charts - Prepare control charts according to the followingprocedure:
I. Obtain a group of at least nine measurementsover a periodof at least three working days.
2. Calculate the average () for the group.
3. Calculate the standard deviations.
4. Calculatethe upper control limit (UCL) and the lowercontrol limit (LCL) as follows"
UCL = + 3s
LCL = - 3s
5. Prepare a control chart to plot measurements obtainedagainst the orcler in which the measurements were obtained,with control lines corresponding to , UCL and LCL.
6. Plot each measurement from the standard in the orderobtained.
|
ProcedureNo. Revision No. EffectiveDate ] Page
PNL-ALO-267 0 2/28/91 ] 8 of 10

(b) Method Out of Control - The following criteria establishwhen a method is out of control. When that happens, theproblem shall be investigated
ATTACHMENT A - CONTINUED
and the steps taken to bring the method back into controlshall be documented in the data records. Samples shall notbe analyzed using a method that is out of control.
I. If a point falls outside a control limit, immediatelyrun another standard. If the second measurement fallsoutside, the method is out of control.
2. If the second standard falls within the controllimits, run a third standard. The measurements fromthis third standard determines whether the method isin or out of control.
3. If consecutivestandard values plotted on the controlchart begin to drift toward a control limit, themethod may be going out of control and the situationshall be investigatedand recorded in LSC notebook.
(c) Outlyinq Observations- When evaluating a series of_easurementsand one (or more) value appears to deviatesignificantlyfrom the other values, a decision must be madeabout how to treat the outlier(s). The outlier shall bediscarded if it can be substantiatedthat the outlierresulted from a specific error. Justification fordiscarding the outlier shall be documented in the LSCnotebooks. Otherwise, the outlier shall be included withthe series of measurements. The outlier shall be documentedin the data records as being suspect.
LIMITS OF ERROR
Limits of error for all measurementsmade during an analysis shallbe specified in some manner. If a limit is not stated with ameasurement value, then the following system of limits of errorshall be in effect:
(a) When two or more significantfigures are specified, thelimit is + 5 in the next digit beyond the last one stated.For example, 5.0 mL means 5.0 + 0.05 mL; 450 g (4.5E+2)
A
rocedure No. Revision No. EfFective Date PagePNL-ALO-267 0 2/28/91 g of 10

means 450 ± 5 g; 369 mL means 369.0 ± 0.5 mL. (The exampleof 450 g is included to show that zeros before the decimalpoint are not considered to be significant figures.)
(b) If a single significant figure is specified, the actualmeasurement shall be within ± 5% of the stated value. Forexample, 20 mLmeans a volume between 19 and 21 mL.
Procedure No. Revision No. Effective D_te Page
PNL-ALO-267 0 2/28/91 10 of 10i

°i
INTEI_M CHANGE NOTICE
(ICN) ICN - .PNL-ALO-270,4ROelof 1
A.Document Number: PNL-ALO-_!70 Revision Number: 0
Effective Date
Document Title.. Total Cxanide in Waters, Solids or of ICN: _ /I_ yc)_
...Sludqe$ .. Change Requested by',
Document's Original Author: MWUrie TE Jones' "t
t.
,,,., ii ,, , , , ,,, ,'
B. Action:
Deleting ACT 89.1 and.replacing with established records management practices.
Replace pages 1 through 17 due to new format.
' r_, i 11, , , ii ,i i i
C. Effect of Change:
Brings procedure into compliance.
D. Reason for Change/Descriptionof Change:
ACT NOW Directive 89.1 no longer in existence.
Q
, , , i, , ii ,
E. Approval Signatures: Type of Change: (Check one):
(Please sign and date) mX Minor _ Major
Process _ _ _--____L_
quality Department:_TL Ehlert _ Date: c_-'/_ / _-_
Approval Authority: AGKin, /_T.//*V_.' ___'_ Date: _-/ -_/ /f Z-_
Other Approvals: TE Jon,sc_ _ Date: ._ / ['___/ _ _--.._
: Date: / /
, ,, , , ''1

INTERIM CHANGE NOTICE(ICN) ICN- PNL-ALO-270.2
Page I of 2
A. Document Number:PNL-ALO-270 Revision Number: 0 EffectiveDocument Date of ICN: 11/01/91Title:TOTAL CYANIDE IN WATER SOLIDS &
Document's SLUDGES ChangeOriginal Author:MW URIE RequestedBy:MW URIE
B. ActionREPLACE PAGE 3-17Delete Page 18
C. Effect of Change
CHANGE IS TO PROVIDE CONSISTENCY OF LABELING PRACTICES & ALLOW OTHERDOCUMENTATION (e.g. MA-70 & ANALYTICAL CHEMISTRY LABORATORY QA PLANMCS033) TO BE THE GOVERNING DOCUMENTS ON STANDARDS LABELING.
D. Reason for Change/Descriptionof Change
Reason: Provide for consistency in labeling standardsand working solutions.
Description: Step 5.10 changed to Stock Standard cyanide solution from StockCyanide solution.
Step 5.11 changed to Intermediateworking cyanide solution fromIntermediatestandard cyanide solution and stock standard cyanidesolution from stock cyanide solution. Delete last sentence.That is, "Record Date of Preparationon Bottle." is to be deleted.
Continued on page 2.
E. Approval Signatures Type of Change: {Check (J) one}
(Please sign and date) [-7 Minor Change _MajorChange
Process Quality _Department-GK GERKE Date:_]_/___./_Approval
Authority:AGKING jr Date://_IL//Y_Y_/__
Other /"_/<_X___Approvals:BMGILLESPIE_______,_ Dat-:]J__/J!_/____)
: Date:____j/

INTERIM CHANGE NOTICE
(ICN) ICN- PNL-ALO-270.2Page 2 of 2
Step 5.12 changed to Working cyanide solution from Workingstandard cyanide solution and to intermediateworking cyanidesolution from intermediatestandard cyanide solution.Delete last sentence. That is, "Record Date of Preparation onBottle." is to be deleted.
Step 6.3.2.3 changed to Stock Standard from Stock and toIntermediateWorking CN solutions from IntermediateCNSolutions.
Step 7.3.].I Changed to working cyanide solution fromworking standard.
Step 7.3.2.1 Changed to intermediateworking cyanide solution fromintermediatestandard solution.

TITLE: PNL-ALO-270,TOTAL CYANIDE IN WATERS, SOLIDS OR SLUDGES
APPLICABILITY
Thts procedure is applicable for determining the concentration of cyanide tnwaters, soils, and. sludges. The methodology is comparable td CLP SOW788Method 335.2 distillation and colorimetric technique for the"_nalysts ofcyanide.
DEFINITIONS/ACRONYMS
Total Cyanide: Cyanide ion and complex cyanides converted to hydrocyanic acid(HCN) by reaction in a reflux system of a mineral acid in the presence ofmagnesium ion.
RE_PO.N..SIBLESTAFF
Cognizant ScientistTechnician/Analyst
_ROCEDURE
1.0 Summary of Method
1.1 The cyanide, as hydrocyanic acid (HCN), is released from cyanidecomplexes by means of a reflux-distillationoperation and isabsorbed in a scrubber containing sodium hydroxide (NaOH) solution.The cyanide ion in the absorbing NaOH solution is then measuredcolorimetrically.
1.2 In the colorimetricmeasurement,the cyanide is converted tocyanogen chloride, CNCI, by reaction with chloramine-T at a pH lessthan 8. After the reaction is complete, color is formed on theaddition of pyridine-pyrazolonereagent and the absorbance is readat 620 nm, or on the addition of pyridine-barbituricacid reagentand the absorbance is read at 578 nm.
.ll i ii i ii i i
Author Date ProjectMgr. Date QAD Representative Date
MW ,Urle..... BM GiIIesr!e ...... GK Gerke......
TechnicalReviewer Date Line Mgr. ' Date Other DateALL ORIGINAL SIGNATURESON FILE
TE Jones , , PF,,Salte,,r, ,, i ............
Procedure No. Revision No. Effective Date Page
PNL-ALO-270 0 09/26/90 I of 17

ill i ii , i i i
I ................... PNL TECHNICALP.ROCEOURE ............... [
2.0 Interferences
2.1 Interferences are eliminated or reduced by using the distillationprocedure described in Secti on 7.2.
2.2 Sulfides have an adverse effect on the colorimetric measurement.The presence of sulfides is determined by testing t,he distillatewith lead acetate test paper.
,111
2.3 To obtain comparable color intensities for samples and standardscontaining the same concentrations of cyanide, it is important tomaintain the same salt content for the samples and standards.
3.0 Tolerances
Tolerances for all measurements made during an analysis shall bespecified in the following manner: I) a tolerance limit can be statedwith a measurement value given in a method, or 2) if a tolerance limit isnot stated with a measurement value, then the following system oftolerances shall be in effect:
(a) Unless otherwise specified, all values for measurements stated inthe methods.(volume, weight, time, etc.) are approximatevalues.The actual measurements used, however, shall be within ±10% of thestated val ue.
(b) When one or more significant figures are given to the right of thedecimal point, the tolerance limit is _+5in the next digit locatedbeyond the last one stated.
4.0 Apparatus
4.1 Reflux distillation.apparatus(such as shown in Figure I): Theboiling flask should be of I liter size with inlet tube andprovision for condenser. The gas absorber should be aFisher-Milliganscrubber, or equivalent.
4.2 Spectrophotometer: Suitable for measurementsat 620 nm or 578 nmwith a 1.0 cm cell or larger.
4.3 Balance.: Analytical, capable of accurately weighing to the nearest0.0001 g.
4.4 Filter apparatus and filters (Whatman 42, or equivalent).
4.5 Lead-acetatetest paper.
5.0 Reagents and Standards
Procedure No. Revtsion No. Effective Date Page
PNL-ALO-270 0 09/26/90 2 of 17

n i i i i ii iii , | i, | i i i i i i
!........... PNL TECHNICALPRQ,_EDURE....... I
_ _i:,_iii'_i_i1',_i:,i_i_i__!!ii!_i_!_i_',i_fi_ii_!iiiii_ii_il_i__!ii_i_i_,ii!',_:._!__':_iiii_';__i_! ............!_!__!_!i_i!',iiii_iili_!__iiiiii_i_i_i:!i_i_!!_iiiili_!_,iiii'_'_i',_,i_',_,_;,_ff_:_,_,_,,:_,,_,_i_i_i_!_fi_il..........__':__i___i_i_i i_i_,l_!_!_!_i_i_B' ii_ii!i_!_!iiiiii_i__:...___
5.2 So,_ltumhydroxide_solution (1.25 N): Dissolve 50 g,,,,of reagent NaOHin water, and cooi to room temperature. Dilute to '1.0 L withwater. .,,
, 5.3 Sulfamic acid (0.4 N): Dissolve 40 g of HzNSO_ in SO0 mL of waterand dilute to 1.0 L with water.
5.4 C.oncentratedsulfuric acid (HzSO4): Reagent grade.
5.5 MaclneSlumchloride solution: Dissolve 510 g of MgCI2.6HzOin 500 mLof water and dilute to 1.0 L with water.
Note: The use of MgSO4.IH_Ois an acceptable alternative except forEPA-CLP analysis (a_issolve 60 g MgSO_.7H_Oin 500 mL DIW anddilute to 1.0 L with water).
5.6 Rhodanine in.dicator: Dissolve 20 mg of p-dimethyl-aminobenzalrhodanine in 100 mL of acetone.
S.7 M.anual spectrophotometr, ic. reaqents:
5.7.1 Sodium dihydrogenphosphate,I M: Dissolve 138 g ofNaHzPO4.HzOin 1.0 L water. Refcigerate this solution.
5.7.2 Chloramine-Tsolution- Dissolve 1.0 g of white,water-solublechloramine-T in 100 mL water and refrigerateuntil ready to use. Prepare fresh weekly. Record date ofpreparationon the bottle of solution.
5.7.3 Color-reagent: One of the followingmay be used:
5.7.3.1 Pyridine-barbituricacid solution: Place 15 g ofbarbituric acid in a 250 mL volumetric flask andadd just enough water to wash the sides of theflask and wet the barbituric acid. Add 75 mL ofpyridine and mix. Add 15 mL of conco HCI (spgr 1.19), mix, and cool to room temperature.Dilute to 250 mL with water and mix. This reagentis stable for approximatelysix months if stored ina cool, dark place. Record date of preparation onbottle.
ProcedureNo. Rev_slon No. Effectlye Date Page
PNL-ALO-270 0 09/26/90 3 of 17

i...... ,.t .c,.,c,L,ocEouR 15.7.3.2 Pyrtdtne-pyrazolone solution: Pour solutton
5.7.3.2.1 through nonacid-washed filter paper•Collect the filtrate. Through the same filterpaper, pour solution 5.7.3.2.2, collecting thefiltrate in the same container as filtrate from5.7.3.2.1. Mix until the filtrates arehomogeneous. The mixed reagent develops a pinkcolor, but this does not affect the'colorproduction with cyanide if used witffin 24 hours ofpreparation• Record date and time of preparationon the bottle•
5.7.3.2.1 3-Methyl- l-phenyl-Z-pyrazol in-5-onereagent, saturated solution: Add 0.25 gof 3-methyl -1-phenyl-2-pyrazol in-S-oneto 50 mL of distilled water, heat to60"C with stirring. Cool to roomtemperature.
5.7.3.2.2 3,3'Dimethyl-l,l'-diphenyl [4,4'-bi-2pyraz(tl tn]-S,5'dione (bispyrazolone) :Dissolve 0•01 g of bi spyrazol one inlO mL of pyridine.
5.7.4 For non-EPA-CLP analyses, HACHchemicals may be used insteadof the reagents in 5.7.1, 5.7.2 and 5.7.3. The HACHchemicals are Cyaniver TM cyanide reagents for thecolorimetric determination of cyanide using thepyridene-pyrazolone method (HACH.Cyanide Reagent PowderPillows #14049-69, #14040-69 and #14041-69).
5•8 Hydrochloric acid (2.4 N): Add 200 mL of concentrated HC1 (reagentgrade) to 700 mL of water, cool to near room temperature, anddilute to 1.0 L.
5.9 Hydrochloric.acid (0.024 N): Add 1 mL of 2.4 N HC1 to 70 mL ofwater, cool to room temperature, and dilute to 100 mL.
5.10 Stock __ c.yantde solution (1 mL = 1 mg CN'): Dissolve2.51 g KCN and 2 g KOHin 500 mL of water and dilute to 1000.0 mL.Standardize with 0.0192 N AgNO3 solution using the rhodanineindicator. (1 mL AgNO3 solution is equivalent to 1 mg CN" in stockcyanide solution).
5.11 Intermediate_!I_T!_:I_B_:_!B_cyanide solution (I mL - 100 ug CN'):Dilute 10.0 mL Of Sto(:kCyanide solution to 100.0 mL with water.
Procedure No. Revtsion No. Effective Date Page
PNL-ALO-270 0 09/26/90 4 of 17

ii i i
5.12 Worktnq _ cyanide solution (1 mL = 10 uq CN'): Dtlute....................... " .-.- ......... _ ..... . ............ ...., ..... v w
10.0 mL of intermediate _b_]_iii__:_ cyanide solut!on to100.0 mL wtth water. Prepare frest_ _1all ........ .....,Y ...... ; ..... ,;...;:: .... • - : .... .....
•, ,.,,, ,o,° ,,., ,,,,,,,,., z..... _,...... ,,,o,,,,,,,,,°,,,,,,,,,,,,,,o,o,,, ,,, ,:,;,° ; , ,: •
5.13 Standard.silver nitrate solution (0.0192 N): Weigh 3.2647 _+
0.0002 g crushed AgNO3 which has been dried to a co_stant wetght at40"C, dissolve _n water, and dilute to 1000._mL. ,til
5.14 Cadmium carbonate (powdered).
6.0 Quality Control
6.1 All quality control data shall to be maintained and available foreasy reference or inspection.
6.2 Minimum quality control requirements.
6.2.1 A mtnimum of three calibration standards and one measurementblank are required for spectrophotometer calibration [SeeSection 7.3]
6.2.Z Samples shall be diluted, and reanalyzed, tf they.are moreconcentrated than the highest standard which is within thecalibration range.
6.2.3 At least one quality control standard shall be analyzed witheach group of samples or, at a minimum, once during dailyoperation. If the results of tile QC standard are not within80% to 120% of the mean value, the Cognizant Scientist shalldetermine the corrective action. All samples analyzed sincethe previous QC standard shall be flagged on the datareports and corrective action documented with the data.Validation of the data is the responsibility of thetechnical group leader.
6.2.4 It is not imperative that all standards be distilled in likemanner to the samples. However, at least one mid-rangeverification check standard per every 10-15 samples shall bedistilled and compared to the calibrationcurve to ensurethe distillationtechnique is reliable. If the distilledstandard does not agree to within 85% to 115% of theundistilled standard, the Cognizant Scientist shalldetermine the corrective action. All samples analyzed sincethe previous verificationcheck standard shall be flagged onthe data reports and corrective action documented with thedata. Validation of the data is the responsibilityof theTechnical Group Leader.
ProcedureNo. Revision No. EffectiveDate Page
PNL-ALO-270 0 09/26/90 5 of 17

PNL TECHNICALPROCEDURE
6.2.5 Additional quallty control (i.e,, duplicates, spikes,additional system or matrix blanks, tighter tolerances,holding times, etc.) is governed by the analyticalrequirementsof the project or specific analyses requested.Specific QC requirementsare provided by the AnalyticalRequest Form (ARF), the project Statement of Work (SOW), orthe sample analysis Test Instruction (TI).,I,
6.3 Quality control for client_ requesting compliance leithCERCLArequirements.
6.3.1 A minimum of three calibration standards and one matrixblank are required for the calibration of thespectrophotometer(See Section 7.3). One calibrationstandard shall be at the required detection limit (from theSOW, TI, or ARF).
5.3.2 A minimum of one methods blank, one duplicate, one matrixspike and a matrix spike duplicate shall be prepared andanalyzed for every sample batch/group of similar matrixtype. A sample batch/group is _<20samples. Spikes shall beadded at the time of sample preparation.
6.3.2.1 The methods blank shall be a water Sample processedthrough each sample preparation and analysis step.If the methods blank is not _<the requesteddetection limit (from the SOW, TI, or ARF), thenthe samples must be prepared and analyzed again.
6.3.2.2 The relative percent difference between theduplicate samples must be less than or equal to therequired precision per the SOW, TI, or ARF if thesample values are greater than 5x the requested
• detection limit (from SOW, TI, or ARF). If norequired precision is given, then the relativepercent difference shall be -<20%. If the samplevalue is less than 5x the requested detectionlimit, then the difference between duplicates mustbe within _+the detection limit. If one result isabove the 5x value and one below, use the _+detection limit criteria. If duplicate sampleresults are outside these control limits, flag alldata with as asterisk (*) for the samplebatch/groupassociated with that duplicate analysisin the data report.
6.3.2.3 The spike and matrix spike duplicate are added totwo replicates of a sample prior to any preparationor analysis. A field blank sample may not be
| , , ,, ,,, , , i ,, , ,i , , , i l
Procedure No. Revlslon No. Effective Date Page I_PNL-ALO-270 0 09/26/90 6 of 17

i i, ii , i . || |
I ,NL,C.NICA,,OCE.U Iselected For spike analysis. The spikes are addedto the samples such that the concentration of thespike in the sample shall be 100 _g/L. Spikesshal 1 be prepared from the Stockiii!i_i_l_ orlntePmedi ate!_iii_i_ CN sol ut ton_::'::(S_"_..................Sections 5.1_J anci S.ll).
"i
6.3.2.3.1 Spike recoveries shall I_e at or withinthe limits of 75% to !29"/,.
Note: For calculational purposes, whena measured sample concentration is < thedetection limit, the sampleconcentration value used is O.
6.3.2.3.2 If this recovery is not met for thespike or spike duplicate, all data inthe sample batch/group must be flaggedwith the letter "N" in the data report,unless the sample concentrationexceedsthe spike concentrationby a factor offour or more. In that event, the dataneed not be flagged.
6.3.2.3.3 If the recovery is not met and thesample concentrationdoes not exceed thespike concentrationby a factor of four,a post-distillationspike must beperformed..Spike an unspiked aliquot ofthe distilled sample solution at 2x theindigenous level or 2x the requireddetection limit, whichever is greater,using one of the prepared standardsolutions (Section 5). Prepare andanalyze in accordance withSection 7.4.2. Report results as"post-distillationspike sample result,spike added and % recovery" in the datareport.
6.3.3 An initialcalibration verificationstandard (ICV) shall beprocured from the EPA or a certified solution obtained froma source independentfrom the instrument calibrationstandards, lt shall be at a concentrationother than thoseused for instrument calibration,but within the calibrationrange.
H il lm i.lll ,,i
Procedure No. Revtston No. Effecttve Oate Page
PNL-ALO-270 0 09/26/90 7 of 17

NOTE: Thts standard must be distilled wtth the samples to beanalyzed. At least one ICV shall,be prepared for eachbatch of samples to be analyzed. The ICr also servesas the Laboratory Control Sample.
This standard is to be analyzed immediately following thecalibration of the spectrophotometer. The measured valuemust be at or within 85% to 115% of the tru_, value. If themeasurement is outside of this limit, then ,the analysis mustbe terminated, the problemcorrected, the instrumentrecalibrated and the calibration reverified.
6.3.4 At a minimum, a continuing calibration verification (CCV)standard (made from the original instrument calibrationstandard source) dtluted to a concentration at or near themid-range of the calibration curve must be analyzed at afrequency of 10% or every 2 hours during an analysis run,whichever is more frequent. The continuing calibrationverification standard must be at or within 85% to 115% ofthe true value. If the CCV standard is greater than theselimits, the analysis must be stopped, the problem corrected,
. the instrument recalibrated, and a reanalysis of allanalytical samples analyzed since the last good CCV beconducted. The CCV is no___ttdistil led.
6.3.5 A calibration blank sample shall be analyzed after every CCVsample and after the last sample analyzed in the set ofsamples being analyzed. The calibration blank sample is theblank solution made up as part of the calibration standards(See Section 7.3). If the absolute value of the calibrationblank sample exceeds the requested detection limit (from theSOti, TI, or ARF), the analysis is terminated, the problemcorrected, the instrument recal ibrated and a reanalysis ofall analytical samples analyzed since the last goodcalibration blank sample conducted. The calibration blanksample is no._.ttdistilled.
7.0 Analysis Method
The CN Analysis Worksheet is used to record information required toconstruct calibration curves and to calculate reportable results (SeeFigure 2). ,,
7.1 Sample collection and preservation
Sample collection and field preservation is not within the scope ofthis procedure. However, it is important,whenever possible, thatthe samples be collected and preserved properly in order tomaintain sample integrity. Once received, the samples should be
p;_'servedaccording to the steps below.
Procedure No. Revision No. Effective Date Page
PNL-ALO-270 0 09/26/90 8 of 17

e
0
I ....... PNL TECHNICAL.,PROCEDURE I
7.1.1 If not already treated at the time of collection, aqueoussamples shall be preservedwith 2 mL of 10 N sodiumhydroxide per liter of sample (pH >12) upon receipt.
7.1.2 Oxidizing agents such as chlorine decompose most of thecyanides. At the time of field sampling, test a drop of the
sample with potassium iodide-starchtest pap,er (KI-starchpaper); a blue color indicates the need for treatment. Addascorbic acid, a few crystals at a time, uni'ila drop ofsample produces no color on the indicator paper. Then addan additional 0.6 g of ascorbic acid for each liter ofsample volume.
7.1.3 Samples shall be refrigeratedat 4"C (+_2"C),radioactivitylevels permitting,and analyzed within the holding timesspecified (i.e., either Appendix A or the governing SOW).
7.2 Distillation
7.2.1 The distillationprocedure for the water, solid and sludgesamples is identicalexcept for the sampling procedure.
NOTE: For samples analyzed to EPA-CLP requirements, alaboratory control standard equivalent to the initialcalibration verification standard (See Section 6.3.3) mustbe prepared and distilled with each batch of samples.
7.2.1.1 Water sample - Transfer 500 mL of sample [VS], or analiquot of liquid sample [Vsl diluted to 500 mL withwater, to the boiling flask containing boilingchips.
7.2.1.2 Solid or sludge sample - Weigh a representative1.00- to 5.00-g portion of sample [Wsl and transferit to the boiling flask containing boiling chips.Add 500 mL of water; shake or stir to disperse thesample.
7.2.2 Measure 50 mL of the sodium hydroxide solution (5.2) intothe absorber tube. lt may be necessary to dilute with waterto obtain an adequate depth of liquid in the abse,-ber.
7.2.3 Connect the vacuum to the distillationapparatus and adjustthe flow so that between I to 2 bubbles of air per secondenter the boiling flask.
Note: The bubble rate will not remain constant after thereagents have been added and while heat is applied.Therefore, the air rate must occasionally be adjusted
i
ProcedureNo. Rev4slon No. Effective Date Page
PNL-ALO-270 0 09/26/90 g of 17

I
L,_ PNLTECHNI.._,._. CAL PROCEDURE
to prevent the solutton tn the boiling flask frombacktng up into the atr tnlet.
7.2.4 If the sample is known (or suspected) to contain htghnitrate or nitrite concentrations, add 50 mL of the sulfamicacid solution through the air inlet tube. Allow the airflow to mix the sample for at least 3 minute,s. Record theaddition of sulfamic acid.
7.2.5 Once the sample is mixed, slowly and carefully add 25 mLofthe concentrated sulfuric acid through the air inlet tube.Thoroughly wash the air inlet tube with water.
7.2.6 Add 20 mL of magnesium chloride solution through the airinlet tube and wash downwith water. (Note: For non-tLPsamples, if magnesium sulfate is being used instead ofmagnesium chloride, add 60 mL of magnesium sulfate solutionin the same manner.) Again, allow the air flow to mix thesample for at least 3 minutes.
7.2.7 Heat the solution to boiling and reflux for at least onehour. Continue to adjust the air flow during the entirereflux period to prevent the solution from backing up intoand overflowing from the air inlet tube. Turn off heat and,continuing the air flow, allow the flask to cool for atleast 20 mtnutes. After cooling, disconnect/close offvacuum and disconnect absorber tube.
7.2.8 Quantitatively transfer the abserber solution from theabsorber tube to a 250 mL volumetric flask by washing withwater. Dilute to volume [Va] with water.
7.2.9 If the sample distillate is suspected to contain sulfides,verify the presence of sulfide by placing a drop ofdistillate on lead acetate test paper. In the presence ofsulfide, the test paper will darken. Sulfide-containingdistillates should be:treated by adding cadmium carbonateuntil the distillate solution does not darken the leadacetate paper. Yellow cadmium sulfide will precipitate ifthe sample contains sulfide. Filter the distillate solutionthrough dry filter paper into a dry beaker and use thefiltrate as the sample to be analyzed.
7.3 Calibration of the Spectrophotometer
7.3.1 Calibrationof Spectrophotometerwhen using HACH chemicalsto prepare sample distillates and standards for colorimetricanalysis:
ProcedureNo. Revision No. Effective Date Page
PNL-ALO-270 0 09/26/90 10 of 17

i p.L p oc ou,L i7.3.1.1 Prepare a minimum of three standards and a bJ.ank by
ptpetting suitable volumes of the worktngiii!__!!__i_!i_i_ii_iil)i_ into 25 mL disposable b__lE_:_::_..........con_a"_"fi"_:_'"::'o:f sodium hydroxide solution. Addwater to bring volume to approximately 15 mL.
,;Standards PrepAration Gu_ideline 'mL Standard Conc. /_g/L ".
0.0 Blank0.05 200.10 400.25 1000.50 2000.75 3OO
7.3.1.2 Proceed with Steps 7.4.1.2 to 7.4.1.7. Theabsorbance readings obtained are used to constructa standard calibration curve of absorbance vs.concentration (See Figure 2).
7.3.2 Calibration of Spectrophotometer when N__ using HACHchemicals to prepare sample distillates and standards forcolorimetric analysis (this option must be followed forsamples requiring compliance with CERCLArequirements):
7.3.2.1 Prepare a minimum of 3 standards and a blank bypipetting suitable volumes of the intermediate_iiii_:_!_!!ii_:_i_:d_ solution into I00 mLvolumel___:r:_::c:_]asl(:s::"£o::which20 mL of the NaOHsolution (Section 5.2) has already been added.Note: One calibration standard must be at therequired detection limit (from the SOW, TI, orARF). Dilute to 100 mL with water.
Procedure No. Revtston No. Effective Date Page
PNL-ALO-270 0 09/26/90 11 of 17

i j
• PNL TECHNICALPROCEDURE
Standards Preparatton.llGUtdeltne
mL standard Prep. Conc., pg/L* Meas. Conc., pg/L*0 Blank Blank0.02 20 100.05 50 250.10 lO0 ; 500.25 250 ' 1250.50 500 "" 2500.75 750 375
*The prep. conc. is the concentration in the 100 mL flask;the meas. concentration is the concentration in the finalsolution used to obtain absorbance readings.
7.3.2.2 Proceed with Steps 7.4.2.1 to 7.4.2:4. Theabsorbance readings obtained are used to constructa standard calibration curve of absorbance vs.concentration (See Figure 2). Concentrations arethe Measured Concentration, not the PreparationConcentration.
7.4 Colorimetric Determination of Cyanide
7.4.1 Colorimetric Determination of Cyanide using HACHchemicalsfor sample and standards preparation:
7.4.1.1 Pipet 15.0 mL of solution IVbl from the 250 mLvolumetric flask to a disposable beaker.
7.4.1.2 Using a pH meter, add 2.4 N HC1 drop-wise to a pHbetween 9 and 10. Using 0.024 N HC1, continue toadjust the solution to a pH near 7 to 7.5.
Caution= Addition of dilute HCl should be addeddrop-wise very carefully so as to maintain pH asclose to 7 as possible.
7.4.1.3 Transfer the solution, quantitatively, to a clean25.0 mL stoppered graduated cylinder. Dilute tovolume [Vc] with water, then stopper and mixthoroughly.
7.4.1.4 Add the contents Of one Cyaniverm3 Cyanide ReagentPillow; then stopper and shake for 30 seconds.Allow the sample to stand for 30 seconds.
Procedure No. Reviston No. Effective Date Page
PNL-ALO-270 0 09/26/90 12 of 17

i i
7.4.1.5 Add the contents of one Cyantverm4 Cyanide ReagentPillow; then stopper and shake for 10 seconds.Proceed immediately to Step 7.4.6.
7.4.1.6 Add the contents of one Cyantverm5 Cyanide ReagentPillow; then stopper and shake VtqOrOUSlY for15 seconds If cyanide is presen%, a pink colorwill develop and turn blue within a few minutes.Allow at least 30 minutes for the Chlor to develop.
7.4.1.7 Transfer a portion of the solution to a 1.0 cmspectrophotometer cell and read the absorbance at620 nra.
7.4.2 Colorimetric Determination of Cyanide when NO__!Tusing HACHchemicals to prepare sample distillates and standards forcolorimetric analysis (this option must be followed forsamples requiring compliance with CERCLArequirements):
7.4.2.1 Withdraw 50 mL of the distillate or standardsolution [Vbl from the flask (Step 7.2.8 or 7.3.2.1,respectively)and transfer to a 100 mL beaker.
7.4.2.2 Add 15.0 mL of sodium dihydrogenphosphate solution(Step 5.7.1) to the beaker from 7.4.2.1 and mix.Check the pH with a pH meter. If the pH is notapproximately 7-7.5, adjust the solution pH with0.024 N HC1 or 2.4 N HC1, depending on themagnitude of adjustment needed.
-" Caution: Addition of dilute HC1 should be addeddrop-wise very carefully so as to maintaina pH as close to 7 as possible.
7.4.2.3 Transfer solution quantitatively to a 100 mLvolumetric flask. Do NOTdilute to volume. Flaskshould be no more than 85% full.
7.4.2.4 Color development:
] 7.4.2.4.1Pyridine-barbituric acid method: Add 2 mL ofchoramine-T (Step 5.7.2) to flask from 7.4.2.3and mix. After 1-2 minutes, add 5 mL ofpyridine-barbituric acid solution(Step 5.7.3.1) and mix. Dilute to volume [Vc]with water and mix again. Allow the color to
Procedure HD. Rev|ston No. Effective Date Page=
PNL-ALO-270 0 09/26/90 13 of 17

°°
i i ,i i ii i ,,
I....... ,, ,'i ........ PNLTEC.HNICALPROCEDUR.E ....... I
develop for at least 8 minutes and then readabsorbanceat 578 nm in a 1 cm cell within15 minutes from color development.
7.4.2.4.2Pyridine-pyrazolone method: Add 0.5 mL ofchloramine-T (Step 5.7.2) and;mtx. After 1-2minutes, add 5 mL of pyrtdtne-'pyrazolone
solution _Step 5.7.3.2) and nd'x Dtlute tovolume IV ] with water and mix again After atleast 40 minutes, read absorbance at 620 nm in
a 1 cm cell.NOTE: More than O.S mLof choloramtne-T
wlll preventthe colorfromdevelopingwith pyridine-pyrazolone.
7.5 Calculations
7.5.1 From the absorbancesmeasuredfrom the calibrationstandards(Section7.3),constructa standardcalibrationcurveofabsorbancevs. concentration.An alternateapproachis todeterminethe slopeand intercept(e.g.,by a linearregressionanalysis).
7.5.2 From the absorbancesmeasuredfromthe analysissolutions,use the calibrationcurve (or fit equation)to obtainthecyanideconcentration[C']in /_g/L.
7.5.3 Calculation of CN"concentration in samples:
Cs - Measured CN concentration (pg/L) in Vc solutionVa= Final volume (mL) of absorber solutionvb = Aliquot(mL)of absorbersolutiontakenfor
colorimetricmeasurementVc - Finalvolume(mL)of colorimetricmeasurementsolutionVs - Volume(mL)of watersampleWs = Weight(g) of solids/sludges;wet weightfor sludges,
dry weightfor solids%S = Percentsolidsfrom ProcedurePNL-ALO-504.
7.5.3.1 Watersamples
pg/L CN'= Cs* (VC/Vb) * (Va/Vs)
7.5.3.2 Solid samples
pg/g (mg/kg)CN-= Cs* (VC/Vb) * (Va/W,)
Procedure No. Revision No. Effecttve Date Page
PNL-ALO-270 0 09/26/90 14 of 17

i ,
,i i ii ii i | ,,
I PNLTEC..ICALPROCE.U.E I7.5.3.3 Sludge samples - reported on dry weight basis
mglgCN"- C'* (VClVb)* V°* (I001 (_S* W'))
8.0 Specific qualiflcatlons
This procedure is self-qualifyingdue to dependence on analyticalstandards, calibrations, and quality control standards per PNL-MA-70,PAP-70-901. ""
9.0 Records
Records will be maintained and controlled so as to conform torequirementsof PNL-MA-70, PAP-70-1701. Laboratory Record Books (LRBs)and Analytical Data Sheets provide a mechanism for control of mostrecords. LRBs will be used in accordance with thc _'ct.".c'_
_:_:_:_:_:_:_:_:_:_:_:_:_;_:_;_:_:_;_:_:_:_:_;_:_:_;_.:_:_:_:_:_:°_:_ .-:.:.,.:.;.;.;.:...;.:.;.;.;.;.:.:.:.:....:.;.:.:.:.;.;.:.:.;.:.:.:.:.:.:.:.:.:.:.:.;.:.;.;.:.
10.0 References
USEPA Contract Laboratory Program, SOW 788, Statement of Work forInorganicAnalysis, Multi-Media,Multi-Concentration,Method 335.2.
SW-846,Method 9010, 3td Edition
Procedure No. Revision No. Effective Date Page
PNL-ALO-270 0 09/26/90 15 of 17

Flgure 1. Cyanlde Dlstlllatlon Apparatus
Cooling Water
In
Out _ _ Screw Clamp
Condenser _ t To Low VacuumSource
o
Absorber
Inlet Tube
- Distilling Flask
Procedure No. Revlslon No. _Oate Page
PNL-ALO-270 0 _ 09/26/90 16 of 17

Figure 2. CNAnalysis Worksheet
O°
i i llllll I I
, , ,
Procedure No. I Revision No. Effective Date PagePNL-ALO-270 0 09/26/90 17 of 17

• INTERIM CHANGE NOTICEICN
ICN-PNL-ALO-Z7].4PAGE] OF 1 ..
A. Document Number: PNL-ALO-271 RevisionNum_._ o IIEffective
UDate of ICN: 12/03/92Document Title: Procedure for Anal,ysis of Free C.yanide in Water
and Soltd Sample Leachates ]l_(_e_,hS_
an R 'e d bY:
Document's Original Author: KH Pool 1
, .. ..,,.
B. Action:
Replace pages 6 and 7 with the attached pages 6 and 7.
, , ,'.
C. Effect of Change:
None. However procedure incorporates flexibility to minor changes.
D. Reason for ChangeDescription of Change:
Reason:
Use of eluant in place of 0.02 N NaOHas a diluent so as to improve matrix matching.
Description:
Added:
4.3.1 'i_)_)_)_!ii_i))_i_ii_i)_i_iii!li_i_i_)_)_i_ii_)i_)iiii_i_)_''_ fol 1owl ng standards_:_:_: _'_?_1::_:_:_::.............:...............:................................................................................
4.4.! .... , dilute the sample with 0.02 N NaOH_iiii_i_!_ appropriately,..._.:.:...:,:.;,;.:...........:.:.;....o............,..
See cedline changes in text of the procedure.
E. Approval Signatures I Type of Change (Check (/) one)(Please sign and Date) I (/)Minor Change ( )Major Change

INTERIM CHANGE NOTICE
(ICN) ICN - PNL-ALO-271.3ROPage ] of,,]
A.
DocumentNumber:....PNL-ALO-271 RevisionNumber: 0 Effective DateDocumentTitle: Procedurefor Analysisof Free of ICN: _ /_ /_
.Cyanidein Waterand SolidSampleLeachates ChangeRequestedby.
Document'sOriginalAuthor. KH Pool TE Jones,,,
B. Action:
DeletingACT 89.1 and replacingwith establishedrecordsmanagementpractices.
Replacepages] through10 due to new format.
C. Effectof Change:Bringsprocedureintocompliance.
i , ,,,,, , , i
D. Reasonfor Change/Descriptionof Change:ACT NOW Directive89.1 no longerin existence.
[] i ,
E. Approval Signatures: [[Type of Change: (Check one):
(Pleasesign and date) llll X Minor Major
Process _ ___j_Quality Department: TLEhlert Date: _'_/ _ / _
./r A" " --
: Date: / /
IV

INTERIM CHANGE NOTICE PNL-AL0-271.2
(ICN) lr_T m_,, , ..,...,,,..... AL0- 2"' I-66
Page 1 of 1 7_,
A. Dt)cument Number: PNL-ALO-271 Revision Number: 0 EffectiveDoer, merit Date or ICN: lC)/IC(l_lTitle: Procedure for Analysis of Free Cyanide in Water andDocument's Sol id Sample Leachates Change Rctluestcd By:
Original Author: Karl H. Pool P.K. Melethil
13. Actit}n:
Replace entire procedurewith the pages attached.
C. 121"fcel()f Change:
The following changes have been made to allow operations using a PulsedElectrochemicalDetector (PED) from Dionex for radioactive samples. Thedetails are appended.
No significant changes are expected. The new procedurewill allow operationof either an amperometricor electrochemicaldetector, in the pulsed mode.
I). Rcast)n Ibr Changc/Dcscril)tion t)f Change
The current procedure imposes restrictionson the use of equivalent detectorand chromatographyhardware.
E. Al}prt)val Signatures q3'pe of Change: {Check (,/) one}/
(Please Sign and Date) ( ) Minor Change (_) Major Change
Process Quality
_4_D_i,,,,,,,,_,,,f_2_r._<_k, e rS5c,,,,_.,,..,_,,_:• _ _ _ _,, _ __-- D,,_:"7/_TV/qI.'\lqm)val _, j,_ ___ _/") (,_a.th,,,i,y:I%.'_f_' ,_- Y_.,._.L.x_ • D.,,,,_:7 l;aP/?/Other (, ,o) ' /kApo,,,,,,,_:_. _/JZgL_;._:_ D,,_:-7-//7;9/
: Date: / /

Chanqes
Add to Definitions/Acronymssection:
Batch: A group of samples of like matrix prepared at the same time.
Change section 3.1.1 to read:
3.1.1 Ion chromatrograph(lC) fitted with amperometricor pulsedamperometricdetector (PAD) or equivalent system e.g. pulsedelectrochemicaldetector.
Change section 3.3 to read:
3.3 Stock Standards and Titration Reagents
All chemicals are Reagent Grade unless otherwise noted. Smallervolumes of solutions, at the same concentrations,may be prepared ifwaste generation can be reduced.
Change section 3.3.3 to read:
3.3.3 Working standard cyanide solution (1 mL _ 5.0 #g CN):Dilute 10.0 mL of intermediatecyanide solution to 100.0 mLwith water [Exact concentration is 0.10 x concentration ofintermediatestandard cyanide solution concentration from3.3.2.] Prepare fresh daily. Record date of preparation oncontainer.
Change section 4.2.3 to read:
4.2.3 Hook up electrical leads from potentiostatmodule to cell andfrom potentiostatto recorder/integratoras directed in theAppendix (AttachmentI) when using a Dionex PAD system.Manufacturer'sguidelines should be followed for other similarhardware.
Change section 4.2.4 to read:
4.2.4 Set the working electrode potential to 0.0 (zero) volts, andoutput range to 20 nA. Use manufacture recommended settingsfor other detector systems.
Change section 4.2.5 to read:
4.2.5 The chromatography-detectorsystem may be configured asindicated in the following block flow diagram:

Dionex AG6 guard column and Dionex AS6 separator column, orequivalent are used.
Change section 4.2.7 to read:
4.2.7 The following conditions are used in operation of the IC: 100/_Lor 200 /_Lsample loop; eluent flow rate 1.0 mL/min. Anychanges in operating conditions shall be recorded in the LRBused with this procedure and reported to the client, ifrequested.
(Note- The retention time for cyanide is approximately7 minutes using thechromatographicconditions specified.)
Change section 4.3.1 to read:
4.3.1 A series of working standards may be prepared by diluting thesecond IC standard cyanide solution (3.3.4)with 0.02 _NNaOH to100.0 mL accordingto the following guideline:
Change section 4.3.3 to read"
4.3.3 The operator shall either prepare a standard curve by plottingchromatographicpeak heights (or peak areas) of standardsversus cyanide concentration in the standardsor use acalculator or a computer to fit the response of the detector(peak height or peak area) to the concentrationof the analyte.The method used for calibration shall be explicitly stated inthe LRB and reported to the client, if requested.
Change section 4.4.1 to read:
4.4.1 Inject standards and samples and refer to the standard curvegenerated in 4.3.3 to determine the concentrationof cyanide in thesamples. If the concentrationfound is greater than the higheststandard used, dilute the sample with 0.02 N NaOH appropriately,document what dilution was made, and rerun.
Note: Samples containing visible particulatewill be filteredthrough a O.45um filter. This will prevept the autosamplertransfer line from being plugged.
Change section 5.0 to read:
5.0 Calculations
The concentrationof free cyanide in the sample is determined bycomparison to the calibration curve (4.3.3) and multiplied byappropriate dilution factors (if any).

Change section 6.3.2 to read:
6.3.2 A minimum of one calibration (method) blank, one duplicate, andone matrix spike shall be prepared and analyzed for everysample batch of similar matrix type. Spikes shall be added atthe time of sample preparation.
Change section 6.3.4 to read:
6.3.4 At a minimum, a continuing calibration verification (CCV)standard, from the original instrument calibration standardsource at a concentrationat or near the mid-range of thecalibrationcurve, shall be analyzed at a frequency of at least20% during an analysis run. The continuin_calibrationverificationstandard must be at or within 90% to 110% of thetrue value. If the CCV standard is outside of these limits,analyze a second calibration standard (from 6.3.1) that willbracket the previous sample response before analyzing thecalibration blank sample. The sample value immediatelypreceding the CCV plus the sample values following thebracketing standard shall be normalized to the new response.This high frequency of CCV analysis is to compensate for thefact that the PAD sensitivitytends to drift with time.

PNL TECHNICALPROCEDURE I
TITLE: PNL-ALO-271,PROCEDURE FOR ANALYSIS OF FREE CYANIDE IN WATER ANDSOLID SAMPLE LEACHATES
APPL.!CABILITY
This procedure is applicable to the determinationof free cyanide in drinking,surface and saline waters, domestic and industrialwastes andextracts/leachatesof soils. Free cyanide is determined by direct injectionthrough a 0.45 um syringe filter into a properly fitted ionchromatograph/amperometricdetector instrument system. Chromatographic peakheights or areas are compared to those obtained from matrix matched standards.The working range of the method is 0 to 0.05 mg CN'/L. Higher level samplesmust be diluted to fall within the working range. This procedure wasdeveloped by PNL Analytical Chemists for measuring free CN in groundwater andsoil.
DEFINITIONS/ACRONYMS
Free cyanide is defined as that portion of the total cyanide in a sample thatis not strongly complexed by iron, cobalt, silver, gold, or nickel.
This definition of free cyanide is philosophicallyjustifiable in the contextof toxicity, which is the ultimate considerationof the EnvironmentalProtection Agency (EPA). The measurement of free cyanide, as defined here, isa good measure of liquid sample toxicity, since the tightly bound cyanidecomplexes of metals such as Fe, Co, Ni, Ag, and Au are much less toxic toaquatic life than cyanide derived from simple salts, e.g., KCN, and weakercomplexes such as those of zinc and cadmium.
Batch,:: ....._:.: _ou _.o_:_sam] es.:.of..-.::].._II(e.:.mat-r._x....repar..e"d....a_:.::_fie..:same:::_.tme_._:
RESPONSIBLE STAFF
Cognizant ScientistTechnician/AnaIyst
-, ,, ,i
Author Date Project Mgr. Date QAD Representative Date
KH Pool , BM Gillespie .... GK Gerke,
TechnicalRevt_e,_er Date Line Mgr. Date Other Date
• MWUrte . JM Latkovtch .........
Procedure'No. Revision No. Effective Date Page
PNL-ALO-271 0 09/26/90 l of lO• ,.. , ,

PNL TECHNICALPROCEDURE
P_SEq=.EP_.
].0 Tolerances
Tolerances for all measurements made during an analysis shall bespecified in the followingmanner: 1) a tolerance limit can be statedwith a measurement value given in a method, or 2) if a tolerance limitis not stated with a measurement value, then the following system oftolerances shall be in effect:
ta) Unless otherwise specified, all values for measurements stated inthe methods (volume,weight, time, etc.) are approximate values.The actual measurements used, however, shall be within +]0% of thestated value.
(b) Whenone or more significant figures are given to the right of thedecimal point, the tolerance limit is +5 in the next digit locatedbeyond the last one stated.
2.0 Sample Handling and Preservation
2.1 All bottles shall be rinsed with deionized water (ASTM Type II}prior to use to remove soluble material from containers (performedin the field).
2.2 Oxidizing agents such as chlorine decompose most of the cyanides.At the time of field sampling, test a drop of the sample withpotassium iodide-starchtest paper (KI-starchpaper); a blue colorindicates the need for treatment. Add ascorbic acid, a fewcrystals at a time, until a drop of sample produces no color on theindicatorpaper. Then add an additional 0.6 g of ascorbic acid foreach liter of sample volume (performed in the field).
2.3 Aqueous samples are preserved with 2 mL of ]0 N sodium hydroxideper liter of sample (pH >12) at the time of collection (performedin the field).
2.4 Soil samples are prepared and preserved in accordance withPNL-ALO-]07.
2.5 Samples shall be stored at 4"C(+2"C) and shall be analyzed within]4 days of sample receipt into the analytical laboratory
Procedure No. Reviston No. Effective Date Page
PNL-ALO-271 0 09/26/90 2 of 10

3.0 Apparatus, Reagents and Supplies
3.1 Apparatus
3.1.1 Ion chromatograph (IC) f.ittedwith amperometr!.cor pulsedamperometric detector i(i_AD_}i!i!iii_:_iii!ii_i_T:_:]_:_i_{i_i{ii_i_:_iiii![_}_!!i!i{!_[i_i
3.1.2 Ten (10) mL microburet.
3.].3 Analytical balance capable of accurately weighing to0.0001 g.
3.1.4 0.45 pm syringe filter apparatus and filters.
3.2 Reagents
All chemicals are Reagent Grade unless otherwise noted.
3.2.1 Chromatographiceluent - 0.5 M sodium acetate + 0.1 I_NaOH +0.5% (v/v) ethylenediamine. To a 2.0 liter volumetricflask, add 136.1 + 0.5 g sodium acetate trihydrate, 16.0 +_0.5 g 50% NaOH and 10.0 + 0.2 mL ethylenediamine. Dissolve
in deionized water and bring to volume. Transfer to eluentreservoir.
3.2,2 ASTM Type II water. This water is to be used for sample,standard and reagent dilution.
3.2,,3 Tank of inert gas for sparging, such as He (IndustrialGrade).
3.3 Stock Standards and Titration Reagents
All chemicals are Reagent Grade unless otherwise noted. S_]i_
3.3.] Stock cyanide solution (] mL = ] mg CN'): Dissolve 2.51 g ofKCN and 2 g KOH in 500 mL water and dilute to 1000.0 mL with
water. Standardizewith 0.0192 N AgNO3. (See 4.1)
3.3.2 Standard cyanide solution, intermediate (I mL - 50 pg CN'):Dilute 5.00 mL of stock cyanide solution (3.3.1) to 100.0 mLwith water. [Exact concentration is 0.05 x concentrationfrom 4.I.4.] Prepare freshdaily. Record date ofpreparation on so]_tion container.
Procedure No. Revision No. Effective Date 1 Page
PNL-ALO-271 0 09/26/90 _ 3 of 10A | ,,

3.3.3 Working standard cyanide solution (1 mL - 5.0 pg CN):Dilute 10.0 mL of intermediatecyanide solution to 100.0 mLwith water [Exact concentration is 0.10 x concentration ofintermediatestandard cyanide solution concentrationfrom3.3.2.] Prepare fresh daily. Record date of preparation oncontainer.
3.3.4 Second lC standard cyanide solution: Prepare fresh daily bydiluting 10.0 mL of working standard cyanide solution(3.3.3)to 250.0 mL with 0.02 B NaOH. This solution has anominal cyanide concentrationof 0.20 mg CN'/L. [Exactconcentration is 0.04 x the working standard CN solutionconcentrationfrom 3.3.3.] Record date of preparation on
solution container.
3.3.5 Standard silver nitrate solution, 0.0192 N: Prepare bycrushing approximately5 g AgNO3 crystals and drying toconstant weight at 40"C. Weigh out 3.2647 ± 0.0002 g ofdried AgNO_, dissolve in distilled water, and dilute toI000.0 mL. Titer: I mg CN'/mL AgNO_.
3.3.6 Rhodanine indicator: Dissolve 20 + I mg ofp-dimethylaminobenzalrhodaninein 100 + 5 mL of acetone.
3.3.7 Sodium hydroxide solution,0.25 N: Dissolve 10.0 + 0.5 g ofNaOH in water and dilute to ].00 + 0.05 liter.
3.3.8 Sodium hydroxide solution, 0.02 _N: Dissolve 0.80 + 0.05 gof NaOH in water and dilute to 1.00 + 0.05 liter.
4.0 Procedure
4.1 Standardizationof Stock Cyanide Solution
4.1.1 Fill micro buret (3.].2) with standard silver nitratesolution (3.3.5).
4.1.2 To a 100 mL Erlenmeyer flask, add 25 mL of 0.25 N NaOH andpipet 5.00 mL of stock cyanide solution (3.3.1) into flaskwith the 25 mL 0.25 N NaOH. Add 2-3 drops of rhodanineindicator (3.3.6) and titrate with AgNO_ until the firstchange in color from yellow to brownishZpink. Record thevolume of AgNO_ titrant used (VA mL) in a Laboratory RecordBook (LRB) or Data Sheet.
4.1.3 Repeat Steps 4.].] and 4.].2 except do not add any cyanideto the titrationmixture. This is the titration blank.
Procedure No. RevIs| on No. Effect ]ve Date Page
PNL-ALO-271 0 09/26/90 4 of 10

Record volume of AgNO3 needed to produce the same indicatorcolor change (VB mL) in a LRB or Data Sheet.
4.].4 Calculate the concentration of cyanide in the stock cyanidesolution as follows and record in LRB or Data Sheet:
mg CN'/L = (VA - VB) x 200
4.2 Ion Chromatographic/Amperometric Equipment Set-Up
4.2.1 Set up the chromatograph and detector according toinstrumentmanufacturer'sinstructions. (The directionsgiven here refer to Dionex equipment, but equivalent systemsare commerciallyavailable.) Refer to the instrumentoperators manual for details of preparation and operation ofthe chromatographicsystem (See references).
4.2.2 Repolish the silver working electrode in the amperometricdetector module. Reassemble cell using the thin gasket andfill the reference compartmentwith eluent (3.2.1).Directions are given in the Appendix (AttachmentI).
4.2.3 Hook up electrical leads from potentiostatmodule to celland from potentiostatto recorder/integratoras directed inthe Appendix (Attachment I) _:_ii!ii!i_i_r_!_:_i!iii_ii!!i_i_!_:_:_/!_!!i!_E!!!i_:_:_!!!)!
4.2.4 Set the working electrode Potentialto 0.0 (zero}LvoIts,and.0..u,.t.P...U...t.......r..a.nge.. to....3.0 ..n..A..:.U)C_Iii);_i_:_i_i[f Q:_:_;)i!I)!_[_,_TB_)T
4 2.5 The chromatography-detector system _i_i!!ii_iiiii_i_._i_.ig.._._iiiiiii_indicated in the following block fl_Q_l_'_'gF_'i..............................................
l I [ J I I GuardandI Detect°r)Injection__> Separator--> CellEluent __> Pump --> -->WasteReservoir Valve Columns
NOTE: No suppressor is used.Potentiostatand Recorder
The guard and separator columns should be Dionex• AG6 andAS6, respectively,or equivalent.
, ,, -= i i i
ProcedureNo. Reviston No. Effect t ve Date Page JPNL-ALO-271 0 09/26/90 5 of 10,_

PNLTECHNICALPROCEDURE
4.2.6 Degasthe eluent using an inert gas sparge (heliumpreferred) for 10 to ]5 minutes.
4.2.7 The following conditions are used in operation of the IC:100 pL or 200 #L sample loop; eluent flow rate ].0 mL/mtn.Any changes in operating conditions shall be recorded inthe LRBused with this procedure and reported to theclient, if requested.
(Note: The retention time for cyanide is approximately7 minutes using the chromatographic conditionsspecified. )
4.3 Standards Preparation and Analysis
4.3.] A series of working standards may be prepared by dtluttngthe second IC standard cyanide solution (3.3.4) with0.02 N NaOHto 100.0 mL according to the followingguideline:
mL SecondIC Standard ConcentrationCyanide Solution Taken (,q CN-/L)
0 Blank (0)2.00 4.05.00 10.0
10.0 20.025.0 50.0
_illi_ _i!.:.iii!oi)i_/_i) t!_._i!i_!)..i_ii _)!_:,_• ... • :.:.:.:,.:.:._.._.:_v.:_..o:.:.v_:o:_ ..:.:.:.:_/..:°:._XoO.:.X_:.:o• :.:o:.:_4_.:__.:.:.: • t.X°_i_iii)_i)_._v_)_i_)ii._._i_..v.d.:((_(°X_..:_.°v.:_ ..:.:._ • ....:.1.:°. o..°.:._-.- ..°.:oO°_ _ X(°
4.3.2 Load a standard or blank into the sample loop of thechromatograph. Immediately switch to "inject" positionand activate event marker. Once the chromatogramisdeveloped (approx. 10 rain), load and inject the nextstandard or blank. After the blank and all standards havebeen run, proceed to 4.3.3.
4.3.3 The operator shall either prepare a standard curve byplotting chromatographic peak heights (or peak areas) ofstandards versus cyanide concentration in the standards oruse a calculator or a computer to fit the response of thedetector (peak height or peak area) to the concentrationof the analyte. The methodused for calibration shall beexplicitly stated in the LRBand reported to the client,i f requested.
Procedure No. Revision No. Effective Date Page
PNL-ALO-271 0 09/26/90 6 of 10

I PNLTECHNICALPROCEDURE I
4.4 SampleAnalysis
4.4.1 Inject standards and samplesand refer to the standardcurve generated in 4.3.3 to determine the concentration ofcyanide in the samples. If the concentration found isgreater than the h!ghest standard used, dilute the samplewith 0.02 N NaOH_i))__ appropriately, documentwhatdilutton was made'_an_'r_run.
Note: Samplescontaining visible particulate will befiltered through a 0.4Sum filter. This willprevent the autosampler transfer line from beingplugged.
4.4.2 If sensitivity has changedby more than 10%as indicatedby an associated increase or decrease in chromatographicpeak height to the standard, normalize the sample resultsobtained immediately preceding and immediately after thestandard accordingly. If sensitivity has changedby lessthan 10%, normalization of sample results is notnecessary. (See Section 6.3.4 for samples requiringcompliancewith CERCLArequirements.)
5.0 Calculations
The concentrationof free cyanidein the sampleis determinedbycomparisonto the calibrationcurve (4.3.3)and multiplyby appropriatedilutionfactors(ifany).
6.0 QualityControl
6.1 All qualitycontroldata shallbe maintainedand availablefor easyreferenceor inspection.
6.2 Minimumqualitycontrolrequirements.6.2.1 A minimumof threecalibrationstandardsand one
measurement(matrix)blankare requiredfor IC calibration(SeeSection4.3).
6.2.2 Samplesshallbe dilutedwith 0.02B NaOH,and reanalyzed,if they are more concentratedthan the higheststandardwhich is withinthe calibrationrange.
6.2.3 Additionalqualitycontrol(i.e.,duplicates,spikes,additionalsystemor matrixblanks,etc.)is governedbythe analyticalrequirementsof the projector specificanalysesrequested.SpecificQC requirementsare providedby the AnalyticalRequestForm (ARF),the project
ProcedureNo. Revlsion No. Effective Date Page
PNL-ALO-271 0 09/26/90 7 of 10

i PNL TECHNICALPROCEDURE
6.3 Quality control for clients requesting compliance withComprehensive Environmental Response, Compensation, and LiabilityAct of" ]980 (CERCLA) requirements.
6.3.1 A minimum of three calibration standards ,and one matrixblank are required for the calibration of the ICoPAD system(See Section 4.3). One calibration standard shall be at therequired detection limit (per SOW, TI, or ARF).
6.3.2 k minimum of one _!_i)ii_i_i_i_!!iii!(_i_:)i blank, one duplicate,I_DI_one matrix spll_6 _ii" 6_ :_F__d and analyzed forevery sample batch of similar matrix type. Spikes shall beadded at the time of sample preparation.
6.3.2.1 The methods blank shall be a water sample processedthrough each sample preparation and analysis step.If the methods blank is not < the requesteddetection limit (from the SOW, TI or ARF), then thesamples must be prepared and analyzed again.
6.3.2.2 The relative percent difference between theduplicate samples must be less than or equal to therequired precision per the SOW, T] or ARF if thesample values are greater than 5x the requesteddetection limit (from SOW, TI, or ARF). If norequired precision is given, then the relativepercent difference shall be <20%. If the samplevalue is less than 5x the requested detectionlimit, then the difference between duplicates mustbe within + the detection limit. If one result isabove the 5x value and one below, use the +detection limit criteria. If duplicate sampleresults are outside these control limits, flag alldata for the sample batch/group associated withthat duplicate analysis in the data report with anasterisk.
6.3.2.3 The spike and matrix spike duplicate are added totwo replicates of a sample prior to any preparationor analysis. A field blank sample may not beselected for spike analysis. The spikes are addedat a level to be determined by the CognizantScientist, based on results from a total CNanalysis of the sample and/or expected free CNcontent of the sample. Spikes shall be preparedfrom the Stock or Intermediate CN solutions (SeeSections 3.3.1 and 3.3.2). Spike recoveries shallbe at or within the limits of 75% to 125%. If thisrecovery is not met for the spike or spike
Procedure No. Revision No. Effective Date I Page
PNL-ALO-271 0 09/26/90 I 8 of ]0

PNLTECHNICALPROCEDURE ]
duplicate, all data in the sample batch/group mustbe flagged in the data report with the letter "N".
6.3.3 As an independent source for a free CN standard is notavailable, the standard used is cross checked by titrattngwith AgNO3 (See Section 4.1).
6.3.4 At a minimum, a continuing calibration verification (CCV)standard, from the original instrumentcalibration standardsource at a concentrationat or near the mid-range of thecalibration curve , I_!_i_!]!be analyzed at a frequency of atleast 20/,during an ana:lysisrun. The continuingcalibration verificationstandard must be at or within 90%to ]10% of the true value. If the CCV standard is outsideof these limits, analyze a second calibration standard (from6.3.1) that will bracket the previous sample response beforeanalyzing the calibration blank sample. The sample valueimmediatelypreceding the CCV plus the sample valuesfollowing the bracketing standard shall be normalized to thenew response. This high frequency of CCV analysis is tocompensate for the fact that the PAD sensitivity tends todrift with time.
6.3.5 A calibration blank sample shall be analyzed after every CCVsample and after the last sample analyzed in the set ofsamples being analyzed. The calibration blank sample is theO.02N NaOH solution used to make up the calibrationstandards. If the absolute value of the calibration blanksample exceeds the requested detection limit (from the SOW,TI or ARF), the analysis is terminated, the problemcorrected, the instrument recalibratedand a reanalysisconducted of all analytical samples analyzed since the lastgood calibration blank sample.
6.3.6 Additional quality control (i.e., duplicates, spikes,additional system or matrix blanks, etc.) is governed by theanalytical requirementsof the project or specific analysesrequested. Specific QC requirementsare provided by theAnalytical Request Form (ARF), the project Statement of Work(SOW), or Sample Analysis Test Instruction (TI).
6.3.7 Samples shall be diluted with 0.02 N NaOH, and reanalyzed,if they are more concentratedthan the highest standardwhich is within the calibration range.
Procedure No. Revision No. Effective Date Page
PNL-ALO-27! 0 09/26/90 9 of 10

PNL TECHNICALPROCEDURE
7•0 Specific Quallficatlons
This procedure is self-qualifying due to the dependence on analyticalstandards, calibrations and quality control standards as per PNL-MA-70,PAP-70-901.
8.0 Records
Records will be maintained and controlled so as to conform torequirementsof PNL-MA-70, PAP-70-1701. Laboratory Record Books (LRBs)and Analytical Data Sheets provide a mechanism for control of mostrecords• LRBs will be used in accordance with thc Act Rc'-_rt_^,-_ ^ oft : • : _ : : :
• | _ v_ lw I _ _ v gtr• _......_;.........,..........;.;,_..._.:-.;._..;..'...•.;,'.:,..,;,'.,.•....,;.'.,.•..;...,,;..,;...-.........,.;.•._.......;.;.;.,..;.'.;..;.,.,;...;...,,..._;.;.,.,,;,.•
9.0 References
Pool, K. H. 1989. "FYS9 WHC SOW EDg517-B, Final Report: Develop andDemonstrate an Analytical Procedure for Measuring Total, Complexed andFree Cyanide in Groundwaterand Soil."
Dio.nex.Ionchrom/PulsedAmperometricDetector Operator's Manual. 1986.
Procedure No. I Revtsion No. Effective Date PagePNL-ALO-271 0 09/26/90 lO of 10
b

t
INTERIM CHANGE NOTICE
(ICN) ICN - _PNL-ALO-272,2 ROleI of l
A.
Document Number: PNL-ALO-27Z Revision Number: _0Effective Date
Document Title: Spectrophotometric Determination,of of ICN- _5 /_ /C)_HYdrazine Concentration Using [AMBDA-I uv/VisSpectrophotometer Change Requested by:
TE Jonel;Document's Original Author: , KH Pool
B. Action:
Deleting ACT 89.1 and replacing with established records management practices.
Replace pages 1 through 8 due to new format.
C. Effect of Change:
Brings procedure into compliance.
D. Reason for Change/Description of Change:ACT NOW Directive 89.1 no longer in existence.
E. Approval Signatures: Type of Change: (Check one):(Please stgn and date)
Minor __ MajorProcess
Quality Department: TL E,lert _ _/_-_/_--_- Date: .5"-/ _"' ' .-. r I YS_
Approval Authority: AGKi.q_ Date: _ _ /,,'_'7...-Other Approvals: MCBurt _ Date: .S-/ _ 19 ___
: Date: _ / /

INTERIM CHANGE NOTICE" " . (]CN) ICN- PNL-ALO-272.1
• Page 1 of _,
PNl ,,,,, r,,,, ,, I ' I
A. Document Number: PNL-ALO-272 Revision Number: 0 EffectiveDocument Date of ICN:-5/J://q/ •Title: Soectro_hotometrlc Determination of Hydrazine
Document's ' Change R_quested By:Original Author: SIMON BARSOUM , _J._.._ ¢_t_e_,_III I n , n, mm I ' ii I'
B. Action: l-Insert the following noto below step 9.2.5" TO reduce the waste volume,aminimum of 3 calibration standards may be used,.
2-Insert the following note below step 9.3.5.2.2' "TO reduce the waste volume,,a minimum of 2 standard additions may be used,.
3-Revise the 2hd sentence in step 9.1.1 to road" If the ph of the received
C. Effect of Change:
-For 1 and 2 above no analytical impact.
-For 3 to avoid the possibilities of obtaining false negative results.
O. Reason for Change/Descriptionof Change
-For 1 and 2 to reduce the volume of the waste generated without affecting
the analytical validity of data generated.
-For 3 adding excess acid to a sample of unknown matrix may diminish the
hydrazine content of the sample. Experimentally, I had found this to be
true, simply because an aqueous solution of hydrazine is a diacid-baso.
* - Replace Pages 5, 6, 7, and 8 with the attached.
i i i lull i ,
E. Approval Signatures Type of Change: (Check ( ) one}
(PleaseSign and Date) (x') Minor Change ( ) Major Changei
"'Q_'_,,,..,,.._....... r.. - L, ,-
Concurrence: (__ ___L_ ] (F_:. Date: | /_(/c_(Approval --, ' 'Authority: _ __,'_• _ _; .,.._t. ._,
Date: il _I"_iOther '
Approvals: yA/_C__u v/L_-_ Date: //zr/y_
: _ Date: I/_V'IJ

PNLTECHNICALPROCE__I)URE I
TITLE: PNL-ALO-272,SPECTROPHOTOMETRICDETERMINATIONOF HYDRAZINECONCENTRATIONUSING LAMBDA-IUV/VisSPECTROPHOTOMETER
APPLICABILITY
This procedureis applicablefor determiningthe concentrationof hydrazineinaqueouswaste, boilerwater, and groundwater.
DEFINITIONS
P-DAB: P-DimethylaminobenzaldehydeP-DABAZ: P-Dimethylaminobenzalazine
RESPONSIBLESTAFF
CognizantScientistTechnician/Analyst
1.0 Summaryof Method
1.1 P-DAB,in a solutionmixtureof methanoland hydrochloricacid,reactswith the hydrazinepresentin an acidifiedsampleto formP-DABAZ. This productis yellowcolored,absorbsat 458 nm, andits absorbanceis quantitativelyproportionalto the hydrazinecontentof the sample.
1.2 The lineardynamicrangefor this method is from a detectionlimitof 5 pg/l up to 200 pg/l. Higherconcentrationsof hydrazinecanalso be determinedafterappropriatedilutions.
2.0 Interferences
Aromaticamines,turbidities,and colorsthat absorbat or near 458 nm.
Author Date Project Mgr. Date QAD Representative Date
S Barsoum TE Jones GK Gerke
Technical Reviewer Date Line Mgr. Date Other Date
ALL ORIGINAL SIGNATURESON FILEJrt JM Latkovich
,, PNL-ALO-272 I 11/29/90 1 of 8

PNL TECHNICALPROCEDURE
3.0 Tolerances
Tolerances for all measurements made during an analysis shall bespecified in the following manner: 1) a tolerance limit can be slatedwith a measurement value given in a method, or Z) if a tolerance limitis not stated with a measurement value, then the following system oftolerances shall be in effect:
(a) Unless otherwise specified, all values for measurements stated inthe methods (volume, weight, time, etc.) are approximate values.The actual measurements used, however, shall be within ±10% of thestated value.
(b) When one or more significant figures are given to the right of thedecimal point, the tolerance limit is ±5 in the next digit locatedbeyond the last one stated.
4.0 Apparatus and Materials
4.1 LAMBDA-1UV/Vis spectrophotometer with 50 mmcell.
4.2 Calibrated analytical balahce capable of accurately weighing to_._
the nearest 0.0001 g.
4.3 Glassware
• 100 ml volumetric flask
• 200 ml volumetric flask
• 500 ml volumetric flask
• 1000 ml volumetric flask
• 200 ml amber glass bottle
• 50 ml stoppered graduate cylinders
• class "A" glass pipettes of 5, 10, 25, and 50 ml
• performance-checkedmicro pipettes of 1000, 500, and 10 pL
5.0 Reagents
5.1 ASTM Type II water (ASTM D1193): water is to be used for sample,standard, and reagents dilutions.
5.2 Concentrated hydrochloric acid (HCl)" ULTREX Grade (specificgravity of 1.19).
, i, .... ,,,ml ,lii ,
Procedure No. Rev|slon No. Effect i ve Date Page
PNL-ALO-272 0 11/29/90 2 of 8,i ml i,,

PNL TECHNICALPROCEDURE I
5.3 Methanol (CH30H), reagent grade
5.4 P-Dimethylaminobenzaldehyde [(CHz)2NC6H4CHO],reagent grade
5.5 Hydrazine Dihydroch]oride (NH2NH2.2HC]), reagent grade
6.0 Safety Precautions
6.1 Read the Materia] Safety Data Sheets (MSDS) for the P-DAB and thehydrazine Dihydroch]oride prior to performing procedure.
6.2 Hydrazine Dihydrochloride is a mutagen. Hand]e with caution:wear gloves, dust mask and use the fume hood.
6.3 Comp]y with the applicable radiation zone regu]ations when workingon radioactive samples.
7.0 qua] ity Contro]
7.1 The required minimum qua]ity contro] is as fo]]ows:
7.1.1 The spectrophotometer sha]l be operated in accordance withthe manufacturer's instruction for operation.
7.1.2 Micro pipette performance check must be performed on a]l themicro pipettes prior to analysis as fo]]ows: using water atroom temperature, pipette and accurate]y weigh the dispensedvo]ume. Repeat and record this measurement 3 times thenca]cu]ate the mean and obtain the % error. If this valueexceeds 1% the micro pipette shall not be used.
7.1.3 If the sample's hydrazine content is more than 200 /_g/], itsha]] be di]uted appropriate]y to obtain a concentrationreading within the calibration range.
7.1.4 At ]east one verification check standard sha]] be emp]Dyedfor every 3 to 5 samp]es. If the resu]ts do not fa]l within80 to 120% of the mean va]ue for the check standard,reca]ibration or other corrective action sha]] be taken, andthe data wi]] be discarded and the ana]ysis shall berepeated.
7.1.5 At ]east one spike of 3 times the detection ]imit sha]l beemp]Dyed for every 6 to 10 samples.
7.1.6 If chemical interferences are suspected by an unacceptably]ow spike recovery then the standard addition method sha]lbe used to quantitate the hydrazine.
l Procedure No. Revision No. Effective Date PagePNL-ALO-272 0 11/29/90 3 of 8

_NL TECHNICALPROCEDURE
7.1.7 If samples are turbid or highly colored, they shall bediluted appropriately, then analyzed by the standardaddition method since there is no known approach toeliminate the turbidity or the coloration withoutdiminishing the hydrazine content.
8.0 Reagents and Standards Solution Preparations
8.1 Stock Hydrazine Solution of 100 mg/L
Dissolve 0.1640 g of hydrazine Dihydrochloride in a mixture of 50ml water and 5 ml hydrochloric acid in a 500 ml volumetric flask.Dilute to the mark with water. A fresh stock solution of thisconcentration shall be made once a month.
8.2 Working Stock Hydrazine Solution of 500 /_g/l
Using a calibrated micropipette transfer 2500 #L of the abovestock solution into a 500 ml volumetric flask and dilute to themark with water. This working stock solution shall be made freshdaily.
8.3 P-DAB Solution
Dissolve 2.0000 g of P-DAB in a mixture of I00 ml methanol and 10ml hydrochloric acid. The final volume of this solution is 110ml. Keep this solution in a dark bottle and in a dark location.This solution shall be prepared daily.
8.4 Blank Solution
Transfer 5 ml of concentrated hydrochloric acid into a dry andclean 500 ml volumetric flask and dilute to the mark with w_ter.
8.5 Standard Solutions
Add I ml of concentrated hydrochloric acid and 20 ml water to 6dry and clean 100 ml volumetric flasks. Transfer I, 2, 5, 10, 20,40 ml of the hydrazine working stock solution prepared in 8.2 intothese volumetric flasks and dilute to the mark with water to
obtain the standards of the following concentrations respectively:5, I0, 25, 50, 100, 200 /_g/l.
8.6 Standard Addition Solution
Transfer 80 ml of the working hydrazine stock solution prepared in8.2 into a dry, clean 200 ml volumetric flask, dilute to the markwith water. This solution is 200 #g/l hydrazine.
No. Effect ive Date Page
PNL-ALO-272 0 11/29/90 4 of 8

PNL TECHNICALPROCEDURE I8.7 Hydrazine Spiking Solution
Transfer 5 ml of the stock hydrazine solution prepared in 8.1 intoa dry, clean 10 ml volumetric flask, dilute to the mark withwater. This solution is 50 mg/l hydrazine.
9.0 Analysis Method
9.I SamplE:Preparation
9.1.1 Samples should be acidified upon collection with I ml of
hydrochloric acid for each 100 ml of sample. If the pH ofthe received samples is not between I and 3 then samplesshall be acidified as such.
9.I.Z Keep the samples refrigerated at 4°C (_+Z'C).
9.2 Calibration
9.Z.l Add 50 ml of the blank prepared in 8.4 and each of thestandards prepared in 8.5 to graduate cylinders withstoppers. Then add 10 ml of P-DAB solution prepared in 8.3.Cap and invert the cylinders several times for thorough
Q mixing and allow to stand for at least 15 minutes, but no; lorger than 60 minutes.
9.2.2 Power the LAMBDA-I spectrophotometerby pressing ON/OFFbutton (right rear corner of the instrument). The wave-length window (front center panel) starts to count down from90 to 40 then it climbs up to 400 nm and remains there (thisis a self-test and should the wavelength drop below 40 nm,'einitiatethis test by turning the instrument OFF, thenback ON. Allow a minimum of 15 minutes for the instrumentto warm up.
9.2.3 When the wavelength reading is at 400 nm, switch to Visposition (lower right front corner of the instrument) pressthe following in order: C/E, 0 (i.e., zero), SAFEMEM, thenkey in 458 and press GOTO;L. The wavelength of 458 will bedisplayed.
9.2.4 After a minimum of 15 minutes has passed for step 9.2.1,rinse the 50 mm cell with the blank solution several times.
The cell is then filled, capped, cleaned and wiped dry andplaced ia the center of the sample holder and the coverclosed. Press Mode several times until you see the ABSlight come on. Wait 10 seconds, then press AUTOZERO.
i
PNL-ALu-272 0 11/oo/on _ .= ,,

PNL TECHNICALPROCEDURE
9.2.5 Empty the cell and rinse twice with the first standardsolution. The cell is then filled, capped, cleaned andwiped dry and placed in the center of the sample holder andthe cover closed. Wait 10 seconds and record the absorbancereading in the LRB. Repeat this step for the remainder ofthe standards.
9.2.6 Plot absorbances vs. concentrations in pg/l, and calculatethe slope by linear regression (see Calculation section).The reciprocal of the slope obtained will be the C factor onthe instrument.
9.2.7 Key in the C factor value then press enter (blue button).Then press AUTOCONC. Verify that the C factor is entered bypressing and holding AUTOCONC. The reading should bedisplayed in the right front digital read-out. (You maystore this value by pressing I, enter (blue button),SAFEMEM. To recall, just press I then SAFEMEM).
NOTE" The concentration of the hydrazine in the samples can alsobe interpolated from the calibration curve establ;shed usingthe absorbance readings of the samples.
9.3 Sample Analysis
9.3.1 To a 50 ml aliquot of sample, add 10 ml of P-DAB solutionprepared in 8.3 in a graduate cylinder, cap it, and invertit several times, then let it stand for a minimum of 15minutes, but no longer than 60 minutes. Wash the cell twicewith this solution then fill and cap it. Wipe the outsidesurface dry, and place it in the center of the cell holder.Close the cover, wait 10 seconds until the reading isstabilized. This is the concentration of the sample inpg/l. Multiply concentration by the appropriate dilutionfactor, if dilution was made.
9.3.2 Perform a standard check. If the concentration readingdeviates from the true value by more than +20%,recalibration is necessary.
9.3.3 Take TO pl of the 50 mg/l hydrazine prepared in 8.7 anddilute it to the 50 ml mark with the sample to obtain 10pg/l spike level. Add 10 ml of P-DAB solution prepared in8.3. Mix well in stoppered graduate cylinder and let sitfor 15 minutes before taking any instrumental readings. If% spike recovery was found to be outside the acceptablelevel, indicative of chemical interferences, then thestandard addition method shall be utilized to quantitate thehydrazine content of the sample.
nnun Inm i
PNL-ALO-272 0 11/29/90 6 of 8, .......i ...... I ..... I i

9.3.4 If the sampleto be analyzedis turbid,or yellowcolored,then the standardadditionmethod shallalso be utilized.
9.3.5 StandardAdditionMethod
9.3.5.1 Instrumentin ABS mode, take the absorbancereadingfor 50 ml of sample (ordilutedsample)+ 10 ml ofP-DABafter15 minutesof reactiontime. Thisabsorbancewill be the Y-axisinterceptfor thestandardadditionplot.
9.3.5.2 Performthe followingfour standardadditions:
9.3.5.2.1 25 /_g/laddition. Transfer6.25 ml of200 /_g/lhydrazineinto a graduatecylinderand diluteto 50 ml mark withthe sample(or dilutedsample)then add10 ml of P-DAB. Cap the cylinder,invertseveraltimes and let it standfor a minimumof 15 minutes. Obtainthe absorbancereadingand record.
9.3.5.2.2 Repeatthe above step for 50, 100, and150 /_g/ladditionsby transferring12.5and 25 ml of the 200 /_g/land 15 ml ofthe 500/_g/l.
9.3.5.3 Plot absorbancevs. additionsconcentrationsin/_g/l. Interpolatefor X axis intercept,this willbe the concentrationof the sample. Multiplyit bythe dilutionfactorif samplewas diluted.
10.0 Calculations
I0.I SpikeRecovery
The percentspikerecoveryis calculatedfrom the followingformula:
% Spike Recovery = SpSa-Sax 1ooSP
where:
SpSa - the concentrationof the spikedsample in pg/lSa - the concentrationof the samplein pg/lSp - the spikelevelin /_g/l
I I I IProcedure No. Revision No. Effective Date Page
PNL-ALO-272 0 ]]/29/90 7 of 8I i I I I

PNLTECHNICALPROCEDURE
10.2 Slope by Linear Regression
Plotting the absorbanceson Y axis and the concentration in pg/1on the X axis, the slope is calculated from the fo]lowingrelationship:
m-_ (X'Y)_: (X2)
where:
m = the slopex = the absorbancesy = the concentration in pg/l
11.0 Records
Control of the Laboratory Record Book and a11 of the analytical sheetsconform to the requirements of PNL-MA-70, PAP-70-1701 and shall be in• A,-.&
accordance wl Lh n__ ._'c'-_Di r ......... ti_iii_i..e._:a_],:_.e.__.e.:_iQ__im.a.._ageme__•I L,,,_ OiL_Jl ii!_i::'::!:':::!:"::_!:'::i":':)'!:'_:::::::::::::::::::::::::::::::::::::::::::::::::::::::::::::::::::::: :::::: ............. ..
__!_. •..........................................................................................................:.:..._;._:._..:._..:..........:.:.:...:.:.:..lZ.O References
1990 Annua] Book of ASTMStandards Vo] 11.01 (D1385-88).
1989 Annual Book of ASTMStandards Vo]. 14.01 (E275-83).
1983 Perkin-Elmer. LAMBDA-IUV/Vis Spectrophotometer CondensedOperating Directions.
PNL-ALO-272 n 1]/29/90_-- _1 - j j 8ore j

@ "t
INTERIM CHANGE NOTICE
(ICN) ICN - pNL-ALO-280.1 ROelof 1
A.DocumentNumber: pNL-ALO-280 Revision Number: Effective Date
DocumentTitle: Inductively Coupled pla,sma-Mass of ICN: 5 /I_//_
SDectrol_etric (I_P-MS) An_lys,i_ ChangeRequested by:Document's Origtnal Author: EJ Wvse T[ Jones
B. Action:
DeletingACT 89.1 and replacingwith establishedrecordsmanagementpractices.
Replacepages I through12 due to new format.
C. Effect of Change:Bringsprocedureinto compliance.
D. Reason for Change/Descrlptionof Change:ACT NOW Directive89.1 no longerin existence.
i11 11 Iii i iii i ' iii i " i, i ,,1 i i ii i i ,1 '"1mm' i F I ' I I I' I I I'
E. Approval Signatures: Jl.Type of Change: (Check one):(Please stgn and date) .... _ Minor _ Major .Process .-
Approval Authority: AGKin. Date: _ _ / ?Z __
Other Approvals: OWKoppenaai .;_ (J_/_" Date: _//y /,___--: Date: / /

TITLE: PNL-ALO-280, INDUCTIVELYCOUPLEDPLASMA-MASSSPECTROMETRIC(ICP-MS) ANALYSIS
APPLICABILITy
This procedureis applicableto the receivingand handlingof samples,theoperationsof the ICP-MSVG Plasmaquad(Pq),and the reportingof analyticalresults. Controllingsoftwarefor this instrumentis VG supplied(latestversion). Althoughsome specificand generalinformationregardingtheanalyticaloperationsof the VG Plasmaquadare describedbelow,this procedureis not writtento replaceVG suppliedoperationsand PlasmaQuadinstructionmanuals. Specificanalyticalproceduresare describedwhich includesufficientinformationto allowa skilledoperatorto repeatthe analysesperformedusingthis instrument.
When this procedureis approvedin accordancewith ManualPNL-MA-70,thisprocedureis applicablefor the analysisby ICP-MS.
DEFINITIONS/ACRONYMS
MATRIXMATCH - Add to the calibratingstandardsany majormatrixcomponentspresentin the samples.
LRB - LaboratoryRecordBook
AMU - atomicmass unit
RSD - RelativeStandardDeviation
TUNE SOLUTION- A solutioncontaining100 ppb Mg, In, Pb for the purposeoftuningthe instrumentand establishinga mass responsecurve. Any solutioncontaining50 - 500 ppb of a low, medium,and high mass elementcan be usedalternativelyas a TUNE SOLUTION.
RESPONSIBILITIES
AnalystCognizantScientist
Author Date Project Mgr. Date QAD Representative Date
EJ Wyse BM Gillespie GK Gerke
Technical Reviewer Date Line Mgr. Date Other Date
ALL ORIGINAL SIGNATURES ON F_LE
PF Salter
ProcedureNo. Revision No. Effective Date Page
PNL-ALO-280 0 09/26/90 I of II,, I I I ,, |

i i
PROCEDURE
1.0 RECEIPT ANDHANDLINGOF SAMPLES
1.1 Receiving Samples
Upon receipt, samples are logged into a LRB designated for thatpurpose. Information logged includes the number of samples, sampleidentification, date received and from whom, blanks and standardsincluded (if any), and sample and/or standard preparation, ifnecessary. Additional information logged may include specificinstructions for analysis (e.g., a memo, DSI, Analytical RequestForm [ARF], Test Instruction [TIl, or Statement of Work [SOW]), andthe work order number, if available at the time of log-in.
1.2 Preparation
1.2.1 Dissolution
If the samples to be analyzed were received as a solid, they must bedissolved for conventional ICP-MS analysis. (This is not necessaryfor laser ablation ICP-MS.) Dissolution procedures vary greatlybetween sample types, but the chosen procedure (or designated in aTI, ARF or SOt/) is always described in its entirety in the samplelog-in LRB.
1.2.2 Dilution
If the elements of concern are in sufficiently high concentration(>500ppb), dilution is usually necessary. If the elements ofconcern are below this concentration, or are in a matrix that isexpected to dramatically diminish the elements' response signal,dilution may not be necessary. Dilutions are usually made by volume(rather than by weight) with calibrated pipets; preferred ultimatematrix is 1.0% HNO3. The dilutions are described in detail in thedesignated LRB.
Example: lOX dilution: 8.5 mLs 5% HNO3 + 1.0 mL sample + 0.5 mL1 ppm In
1.2.3 Internal Standard
An appropriate internal standard (e.g., In) is added to both samplesand standards for semi-quantitative as well as quantitativeanalyses. For quantitative analysis, it is used to correct forinstrument drift and matrix effects. For semi-quantitativeanalysis, it is used as a reference standard. The internal standardconcentration is determined by the operator based on that specificanalysis, but is typically 10-200 ppb. The internal standard chosendepends on the elements of concern and the sample matrix, lt is
Procedure No. Revision No. Effective Date Page
PNL-ALO-280 0 09/26/90 2 of 11

i PNLTECHNICALPROCEDURE I
crucial that the samplesdo not contain the internal standardselected, and that there are no interferences from other elementisotopes, molecular ion species, or matrix effects. For example,In-115 would not be appropriate as an internal standard for Snanalysis, because Sn has an isotope at 115.
1.;!.4 Standard Preparation
Standards chosen dependon the elements of concern, and aretypically prepared with element concentrations in the sameapproximate range as that of the samples. For best quantitativeresults, at least two different concentrations of the sameelementshall be prepared and run to generate a calibration curve (ratherthan a simple ratio) for the calculation of results. Standardsprepared for analysis are dilutions of NBSor other recognizedprimary standards, or dilutions of prepared stock solution standardstraceable to said primary standards, and are listed and described ina separate LRBdesignated for that purpose. This "Standards LRB"showsthe traceability of all of the standards used in analysis fromhowthey were made (pipet calibration and stock solution preparationinformation) back through information regarding all of the primarystandards used (Lot Number, concentration, matrix, etc.).
1.3 Procedure File and SampleAnalysis Identification
Whenlt is time for the samples to be analyzed, a procedure file isset up with a unique identification numberfor that analysis run.The number is four digits long, followed by a letter, and each digithas a specific meaning:
Example: Procedure File #8c15a
1st digit: Designates the year of analysis (1988)
2nd digit/letter: Designates the month of analysis(1-9 - Jan-Sep; a-c = Oct-Dec)
3td & 4th digits: Designates the date of analysis (01-31)
Sth letter: Designates the analysis procedure number (set ofsamples) of that date (a-g = first-seventh analysis)
6th digit: Designates the sample in that procedure (set).
For the example listed above, lt is the first analysis run onDecember15, 1988. Individual samples are numberedas well, meaningthe sixth sample run in Procedure File #8c15a is designated 8c15a6.
The sample ALOnumber is cross referenced in the ICP-HS log-in LRBwith the analysis procedure number(set of samples analyzed that
Procedure No. Revision No. Effective Date Page
PNL-ALO-280 0 09/26/90 3 of 11a | ' /I I

I PNLTECHNICALPROCEDURE ]
day) and the samplein that procedure(samplesin set are numberedconsecutively).
2.0 INSTRUMENTOPERATION
The followingproceduresare to be used in conjunctionwith the VGPlasmaquadOperatingand User'sManuals. 'Fheproceduresbelow assumethat the instrumentis operatingand functioningnormally.
2.1 Instrument Maintenance
The ICP/HS shall be maintained on a daily basis. The ANALYSTmustascertainthat the individualinstrumentcomponentsare clean beforebeginningan analysisprocedure. The followingis a generaldescriptionof the expectedperiodicmaintenance(seeVG PlasmaquadUser's Manual):
Cleansample,skimmercone; Dailytorch,elbow
Clean spraychamber Weeklyor biweekly(dependson samplehistory)
Clean ion lens stack Semi-annually/asneeded
Cleanquadrupole ONLY when necessary(See SCIENTIST)
Changeroughing pump oiI Semi-annualIy
Changechanneltron As needed
2.2 Tuningthe Instrument
The ICP/MSis tuned by aspiratingthe TUNE SOLUTIONand manuallyadjustingthe lens voltagesfor optimalsensitivity.The elementinthe TUNE SOLUTIONhavingthe middlemass (e.g.,indiumat 115 amu)is typicallytunedfirst,with the low and high masses beingtunedsubsequentlyto obtainapproximatelyequivalentsignalresponseforeach analytemass.
2.2.1 InstrumentResponseand PrecisionCheck: TUNEIR
The instrumentresponseand precisionare evaluatedby runhingtheTUNE SOLUTIONfive consecutivetimesusingthe isotoperatioprocedureTUNEIR in IR SCAN foundunder SCAN ACQUIRE. TUNEIR hardcopiesmust be signedand datedby the ANALYST,and loggedin anotebookdesignatedfor that purpose. (NOTE: The TUNEIRis not acalibration,but ratheran indicationof the instrument'ssensitivity,stability,and overallperformance. The maintenanceof
Procedure No. Revision No. Effective Date Page ]
PNL-ALO-280 0 09/26/90 4 of 11 J

these records are helpful in reviewing trends in performance over aperiod of time.)
2.3 Program Descriptions
Numerous programs and their subroutines are used for analysis,depending on the type of results the operator or sponsor wishes toobtain. A brief description of each program and its uses aredescribed below.
2.3.1 Element Menu Definition Program
This program is used to define the elements (isotopes) to beanalyzed, either for isotope ratio or multi-element work. Thisprogram also defines the run conditions for acquiring the data,either range scanning or peak jumping. Follow VG PlasmaQuadSoftware Manual to select the elements of interest.
The Element Menu Program also sets scan parameters such as thenumber of channels, sweeps, length of dwell time, and mass regionswhich will be skipped.
2.3.2 Multi Element Analysis Procedure Definition Program
This Program defines the order and type of samples to be run.Constructing and upgrading procedures are clearly described in theVG PlasmaQuad Software Manual. Standards, their preparation andtheir certificati;_, shall be documented in the LRB.
2.3.3 Isotope Ratio Analysis Procedure Definition Program
This program is identical to the multi-element analysis program withthe exception that the number of ratios to be performed is requestedinstead of the Conc File name.
The measurement of isotopic ratios on the VG PlasmaQuad shall becarried out in a similar manner to quantitative analysis, i.e., thesample shall be compared to a well defined isotopic standard. Thestandards, their preparation and their certification shall bedocumented in the LRB. Specific details of the isotopic ratioprogram procedures are described in the VG PlasmaQuad SoftwareManual.
2.3.4 Acquire Programs
Three acquisition programs are addressed through Survey Acquire,Scan Acquire and Peakjump Acquire programs.
Procedure No. Revision No. Effective Date PagePNL-ALO-280 0 09/26/90 5 of 11

PNL TECHNICALPROCEDURE m
2.3.4.1 Survey Acquire
Survey Acquire is typically used for short qualitative of semi-quantitative analyses. Scan parameters can be altered, but neitheran element menu nor an element procedure is necessary for surveyacquire.
Semi-quantitative calculations are also performed under surveyacquire. For semi-quantitative analysis, an internal standard isadded to each sample; calculations are performed based on theconcentration of the internal standard.
Mass calibration is also performed under survey acquire. See 2.3.7for detai 1s.
2.3.4.2 Scan Acquire
Scan Acquire is used when a commonelement menu and elementprocedure is desired ]:or running a consecutive series of samples.An element procedure is necessary for quantitative analysis; scanacquire is therefore the most efficient acquire program to use forthis capability in that an element procedure is requisite foracquisition.
2.3.4.3 Peakjump Acquire
Peakjumping Acquire does not scan, but as the name implies, it jumpsfrom pre-selected isotopes and spends a pre-selected dwell on eachindividual isotope mass. This method of acquiring is useful whenisotopes of interest are spaced across a wide mass range. Longerdwell per amu and fast acquisition times make peakjumping ideal forsmall sample volumes and for minimizing detection limits.
2.3.5 Calculations Program
With the exception of semi-quantitative calculations (see 2.3.4.1),the calculations program includes all calculation types whether theybe multi-element, isotope ratio, standard addition, or isotopedi 1uti on.
2.3.5.1 Multi-Element Calculation Program
When performing multi-element calculations, appropriate responsefiles must be used. For very precise and accurate data output,calibration curves which incorporate standard concentrations in therange of the sample concentrations are necessary. In addition, whensamples have significant amounts of dissolved solids (e.g., brines),standards which are in similar matrices must be used to account forionization factors, oxide interferences, and sample introduction(nebul ization) efficiencies.
Procedure No. Revision No. Effectlve Date Page
PNL-ALO-280 0 09/26/90 6 of 11

L PNL TECHNICALPROCEDURE !
2.3.5.2 Isotope Ratio Calculation Program
Isotope ratio calculations must include standards which havecert|f|able isotopic abundance ratios. Interference correctionsmust be considered when sample matrices are htghly variable. Allsample isotopic concentrations must also be in the range of thestandard concentrations used in order to account for the dead timedifferences between predominant versus less predominant isotopes.When considering low mass isotopes, tt is very important to considerthe quadrapole sensitivity. In general, the response curves nearthe low and high masses can be checked using standards.
2.3.5.3 Standard Addition Program
The standard addition program enables sample concentrations fromsingle isotopes to be calculated using the standard additiontechnique. If quantitative analysis cannot be achieved directly,then using the qualitative values, process samples by standardaddi t t on.
2.3.5.4 Isotope Dilution Program
In this calculation, a specific isotope of an element is added tothe sample. Knowing the concentration of this isotope and assumingnormal isotopic abundances of the element(s) of concern, theconcentrations are calculated. This is a very accurate method fordetermining elemental concentrations because quenching effects,interference corrections, and unforeseen matrix effects can beaccounted for. In the event samples do not have compositions withnormal isotopic ratios, isotopic abundances of each analyte ofinterest must first be determined.
2.3.6 Utility Program
The system utilities are designed to simplify the use of the datasystem, to provide flexibility in data manipulation, and to enablethe operator to define this system configuration. Spectralinterference corrections are input through the utilities program viaEdit Database. Data manipulation and system configurationprocedures are detailed in the VG PlasmaQuad Software Manual.Because spectral interferences other than isobaric interferences canbe incorporated by using the Edit Database option, lt is importantthat the ANALYSTqualifies these "special" interferences in thefinal report (Section 3).
2.3.7 Mass Calibration
Before the results are calculated, the ANALYSTmust first review asample spectrum to ensure that the peaks observed correspond totheir respective masses, i.e., that the instrument is properly mass
Procedure No. Revision No. Effective Date Page
PNL-ALO-280 0 09/26/90 7 of 11

calibrated. Mass calibration is performed under Survey Acquire, andshould be done if the peaks observed appear to be shifted fromcenter mass. If the instrument is operating properly, masscalibration should not have to be necessary on a regular basis, butrather only periodically; it should be done if more than 0.5 ainu offpeak center in accordance with the VG PlasmaQuad Software Manual.
Mass calibration is usually performed only when the instrument hasbeen cleaned or repaired. Oocumentatton of instrument maintenanceis in the instrument maintenance log. The new mass calibrationparameters are written to file and also are in each sample analysisfile and printed as a part of the header for each sample file.
3.0 ANALYSIS PROCEDURES
3.1 Tune machine as described in 2.2. An instrument response of lessthan 1 million counts/second/ppm is not acceptable for analysis.The instrument must be shutdown, cleaned and/or adjusted for bettersensitivity.
3.2 In the Procedure Definition Program, call Element Henu and defineelements and their isotopes for analysis. If qualitative scan isdesired, call survey acquire and proceed directly to Section 3.5.
3.3 In the Procedure Definition Program, call Hulti-Element ProcedureDefinition (HE PROCDEF) for elemental analysis; call Isotope RatioProcedure Definition (IR PROCDEF) if isotopic ratio analysis is tobe performed.
3.3.1 Hulti-Element Procedure
Define Blanks, Standards, and Samples with uniquely identifiablenames, as described in 1.3. Define the element file (defined inElement Menu Program). For standards, enter the appropriateconcentrations for the standard's elements and create the ResponseFile. If an internal standard is to be used, input the elementsymbol and mass of the internal standard. The internal standard, ifused, must be present in all solutions at the same concentration.
3.3.2 Isotope Ratio Procedure
Define Blanks, Standards, and Samples with uniquely identifiablenames, as described in 1.3. Define the isotopic ratio to beinvestigated.
3.4 Quit Procedure Definition Files and call Acquire Programs
3.5 Call Scan Acquire subroutine for analyses with pre-defined proceduredefinitions; otherwise call Survey Acquire and input element menu
and define run parameters. Aspirate the sample; once it is e
Procedure No. Revision No. Effective Date Page
PNL-ALO-280 0 09/26/90 8 of 11

i PNLTECHNICALPROCEDURE I
ascertained that the sample has entered the plasma, commencescanning.
3.6 After acquiring data, each of the mass spectra will be automaticallystored on a magnetic device under files defined in the proceduredefinition file. The files can be retrieved as raw data orintegrated data (counts/sec/mass unit).
3.7 Perform Calculations
3.7.1 Under Survey Acquire: For semi-quantitative analyses, thedefault response curve is used to calculate the resultsbased on the internal standard concentration. Input theinternal standard concentration, the analysis procedure orthe sample file identification, and commencecalculations.For better semi-quantitative accuracy, a response curve canbe generated using a standard solution containing low,medium, and high masselements; see VGPlasmaQuadSoftwareManual for details.
3.7.2 Under Calculations: For multi-element analyses, referencematerial is used to calibrate the mass responses of thesamples. For each of the elements, a mass response curve isgenerated from the responses of the reference materials; atleast two different concentrations of each element that aresimilar in concentration to that of the samples should beanalyzed to generate a proper calibration curve. An R^2value for each curve is reported; an R^2 value of less than0.9 is unacceptable, and the results for that element shalleitherbe omittedin the finalreport,or reportedassuspect.
4.0 INTERFERENCESAND MATRIXEFFECTS
4.1 SpectralInterferencus
Spectralinterferencesare usuallyfew in numberand, in most cases,small in relativemagnitude. Interferencefactorsfor normalday-to-dayoperationsare accessedby analyzingvariousconcentrationsof singleelementsolutionsfor each of the elementsto beaddressed. Only thoseinterferences>0.1%for elementscommonathigherconcentrationsand >1% for less commonelementsshallbereportedin the finalresultssummary. For more detailsoninterpretinginterferences,referto the VG PlasmaQuadSoftwareManual.
4.2 Acid Concentration
Acid concentrationcan have effectson the accuracyof the data bycausingquenchingof the analyticalsignal. For standard"ICP/MS"
Procedure No. Revision No. Effective Date Page
PNL-ALO-280 0 09/26/90 g of 11

f P.LTEC..,C,LP,OCEOUE Ianalyses, in which the calibration standards are in dilute acid, thesamples should be diluted to acid strengths of similarconcentration. In ca:es where the acid concentration is greaterthan 5%and dilution is not an acceptable solution due to loss ofsignal, then calibration standards can be madewith acidconcerJtrations which approximate the samples (+10 relative percent);see 4.3. However, if the internal standard used is similar inchemical properties to the element(s) of interest, the quenchingeffect on the internal standard will be representative of the effecton the samples, and matrix matching will then be unnecessary.
4.3 MatrixHatching
Solutionswith high levelsof dissolvedsolidsshouldbe _nalyzedagainst"matrixmatched"calibratingstandards,becausei_:creasingdissolvedsollds tend to depress {or quench)the analyt)_,lsignal.The simplestway to avoidmatrixmatchingis by dilutiJn. However,if this is not acceptable,then the matrixeffectsmu:t be accessedby spikingthe matrixwith an appropriatestandardan_(observingtheeffecton the elementsof that standard. If the effectsare notacceptable,as determinedby the qualifiedANALYSTand the customer,then matrixmatchedstandards(e.g.digestedgeologicmaterial)mustbe empluyed.
5.0 REPORTINGANDARCHIVINGRESULTS
The precision and accuracy are assessed For each data set.
5.1 QuantitativeAnalysis
If the check standardresultsare _ccurate,and the RSD of theresultsare acceptable(<I0_),the resultsare tabulatedandreportedas requested. ResultshavingRSD'sof I0-50%are reportedproceededby the RSD value;resultshavingRSD'sgreaterthan 50%shallbe reportedas semiquantitativevalues. Elementsby whichthecheck standardresultsdifferby I0-50%are eithernormalized,orreportedas beingsuspect;elementsby which the check standardresultsdifferby >50% may be normalized,but the resultsshouldbereportedas suspect.
5.2 Semi-quantitativeAnalysis
Semi-quantitativeanalysisis reportedin the same formatasquantitativeanalysis,but withoutthe constraintson accuracy;valuesshouldbe designatedas semi-quantitative,with associatederrorsas being -50% to +100%. Precisionbetweenruns shouldbe thesame as for quantitativeanalysis.
"'F'rocedureNo. RevisionNo. ] EffectiveDate I Paqe I
I PNL-A,', ")-280 0 I 09/26/90 I 10 of ll I

i i
5.3 Reporting Results
The tabulated results, along with any documentation requested in thestatement of work, are arranged in report format with a cover letterto the customer. The final report is signed by the ANALYSTandrevtewed by SCIENTIST on the basis of accuracy and technicaladequacy.
Coptes of the report, as well as the output of the results summary,the procedure listing, the element menu, the raw data, and all othercomputer output are assimilated and filed in a folder and cabinetdesignated for that purpose in 3708 Bldg., Room108.
5.4 Archiving
At least once every two months, the raw data (found in directoryC:\RAWOATAon the computer) is backed up onto a mass storage device(MSO) for every sample run since the last backup took place. TheHSD is then labelled appropriately and stored. This MSD ts storedin a file cabinet in room 3708 Bldg., Room 108 designated for thispurpose.
6.0 REFERENCES
VG Plasmaquad Software Manual.
VG Plasmaquad Operation Manual.
7.0 RECORDS
Records will be maintained and controlled so as to conform torequirements of PNL-PA-70, PAP-70-1701. Laboratory Record Books (LRB)and Analytical Report Cards/Data Sheets provide a mechanism for controlof most records. Laborator_ Record Books will be used in accordance with
M_U n¢ _ _ _._ O_ 1 _i_i:.._:::_:_::::`:_.::_::::::::::::::::::::::::::::::::::::::::::::::::::::::::::::::::::::::::::::::::::::::::::::::::::::::::::::::::::::::::::::::::::::::::::::::::::::::::::::::::::::::::::::::::::::::::::
I i mm, i
m PrOcedure NO, I ReVisiOn NO, I Effect i V_ D,ltte I Page !
I P,L-ALo-28o! o I o9/26/9o I 11 I

INTE,,RIM,CHANGENOTICE
ICN-PNL-ALO-;_81.1, ROPAGE1 OF, |
III
A. Document Number: PNL-ALO-281 I RevisionNumber: I;) Effective
DocumentTitle: ICP/MS Determination of 99T(;: Date of ICN: 1/04/93
I
Document's Origlnel Author: EJ Wyse Change Requested By:Ea Wyse
B. Actt on:
Replace pages 1 through 4 with the attached pages 1 through 6.
Imp]ement changes as specified on attached sheets.
C. Effect of Change:
The change addresses the possibility of a Ru Interference: how to identify, and howto make the necessary correction if one exists. Cognizance of this potentia]interference is required if accurate resu]ts are to be obtained.
II iii
D. Reason for Change/Description of Change:
Reason: Current procedure (Rev. O) doesn't address the possibility of a Ruinterference and how to make a correction tf an interference exists.
Description: See redllne and strike-out changes in Section 1.0, 5.0, and 7.0.
|
E. Approval Signatures: (Please Sign and Date) Type of Change (Check (if) one)
( ) Ntnor Change ( if ) Major Change
QPConcurrence: TL Ehllprt _ _ , Date: ///_/_,_
Othe, Approvals: EJ WVSe /": "_'_/_ _//-"_-_ Date: //(0 ?3_,;_ i r i,- / o.t.:
-f/, i' I I II L. I ,,

i
I ,., Tsc..icAtP--c--.Rs I
TITLE: PNL-ALO-281- ICP/HS DETERMINATIONOF 99Tc
APPLICABILITY
This procedure is applicable to the determination of 99Tc in aqueous,acidified samples, using ICP/MStechniques. Samples in other physical formsor matrices should be digested, fused, leached or otherwise prepared to resultin an aqueousmatrix, preferably acidified with HNO3 to an acid content not)p_xceeding5@&vol/vol. This procedure is applicable to the determination of="Tcat concentrations >10 ppt (170 pCi/L), in solution.
This procedure shall be applied in accordancewith PNL-ALO-280(InductivelyCoupled PlasmaMass Spectrometric (ICP/HS) Analysis) and PNL-HA-70.
DEFINITIONS/ACRONyM_
amu- atomic mass unit
acps - area counts per second (units of integrated ICP/HS signal intensity)
ARF- analytical request form
CERCLA-ComprehensiveEnvironmental Response,Compensation,andLiabilityAct
cps - countsper second(unitsof ICP/MSsignalintensity)
ICP/MS- inductivelycoupledplasmamass spectrometry
IP - ionizationpotential,in unitsof electronvolts(eV)
m/z - mass (in amu)dividedby charge
NIST - NationalInstituteof StandardsTechnology
PNL - PacificNorthwestLaboratory
ppb - partsper billion(pg/L)
ppt - partsper trillion(ng/L)
RSD - RelativeStandardDeviation
i i
Author Data Project Hor. Data QADRepresentative Date
EJ k/yse BNGi 11espi • GK Gerke
Technical Reviewer Date Line Hor. Date Other DateALL ORIGINALSIGNATURESON FILE
DWKoppenaal PF Salter
Procedure No. i Revision No. Effective Date J Page
PNL-ALO-281 J 0 09/26/90 J 1 of 6i I I , I I

SOW- statement of work
TI - test instruction
TP - Test Procedure
TUNESOLUTION- A solut|on containing 100 ppbNg, In, Pb for the purpose oftuntng the ICP/HS instrument. Any solut|on containing 50 - 500 ppb of at]east one low, medium, and high mass element can be used alternatively as aTUNESOLUTION.
1.0
anticipated c concentration, other analytes to be determined, andposstble interferences that may require monitoring and correction. Name,save and record ELEHENTHENUwith all operational parameters.
2.0 Define ANALYSISPROCEDUREas described in PNL-ALO-280, 3.3 and 1.3. Runduplicate sample acquisitions in all cases (sample volume permitting).Number and frequency of standards, bltnd standards, spiked samples, andblanks shall be in accordance with the default QUALITY CONTROLproceduresgtven below (8.0), or as specified in governing TI, SOW, or ARFinstructions. Name, save and record ANALYSISPROCEDURE.
3.0 Start up ICP/HS instrument, allow 30 minute warm-up period, and performinstrument response and precision check using TUNEIR analysts procedureas specified in PNL-ALO-Z80, 2.2 and 3.1. Verify adequate instrumentresponse and stability (criterion: response > 1 x 10° acps/ppm for tuneelements In or Pb; stability < 7 _; RSDconcentration/isotope ratioprecision for tune elements Ng, In, and Pb). Save and archive TUNEIRdata and results.
4.0 Prepare samples by adding appropriate ]eve] and type of INTERNALSTANDARDas specified in PNL-ALO-280, 1.2.3. Internal standard elements/isotopesshould be judiciously chosen based on proximity in mass range andionization potential to Tc (m/z 99 and 7.28 eV, respectively). Candidatetnternal standards for this determination tnclude Rh(m/z 103; IP 7.46 eV) and In (m/z 113,115; IF 5.79 eV).
5.0 Standards solutions shall be prepared, using dilutions o6 previouslyprepared stock calibration standards, to yteld standard concentrationsthat bracket the anticipated sample concentrations. During analysis, tfa sample concentration exceeds two times that of the maximumconcentration standard, a dtlutton shall be made of the sample so that lt
PNL-ALO-281 09/26/90,,, , i I I
PNL TECHNICALPROCEDURE Ji
ts wtthtn the calibration standard range; tf it ts below that of themtnimum concentration standard and abo_v_e100 ppt, a standard containingan appropriate lower concentration of =°Tc (e.g., 500 ppt) shall beprepared and analyzed. Internal standards shall be added to the standardsolutions tn exact concentration and form as the samples, tn accordancewtth 4.0 above. Stock calibration standards that are available for usetn thts determination are the following:
52433-43: 12.56 ppb 99Tc (BNklLR5 52433, p 43)52433-47: 98.74 ppb 99Tc (BNklLRE 52433, p 47)52433-48D: NIST SRH3.759E4 kSq/g soln (59.27 ppm 99Tc [BNWLRE
klorktng standards shall be prepared fresh weekly, at mtntmum.
6.0 Prepared samples and standards shall be analyzed by ICP/HS according toICP/HS Procedure PNL-ALO-280, 2.3.4 and 3.5, the Instrument operatingmanuals, and SOPs for thts Instrument.
7.0 Calculation of the acqutred data shall be performed vta Instrumentsoftware tn accordance wtth PNL-ALO-280, 3.7. Calibration curves shallbe constructed ustng standards Intensity and concentration data;linear/quadratic regression fttttng shall be performed ustng thts data.Zdenttty and number of standards, type of ftr, and regressioncoefficients shall be stored tn CALCULATIONPROCEDURERESPONSEfiles andoutput wtth data resul ..... _ ............. _':........... ......:• • . _ ": _.:,'
• _j• _.._..:
,. _:
_;" :_.
•"" _ • • • _ _..... _ '/. _.._" .._.-, " x._,. "_,.//-......_'//,ff_ ":_ .... _ ._.,_,_."x"'_ ;>Y_'.I_. . _::.
::."""_'_ _"" "_'_"_ ' _/'"..... " " "_ '_" _2_;_'_'_:>':"/'_'_".... _' • _::'_ _ " _ " ._'_'_'_"_-_.',_:'..'.'_,...."_':::':>'_"_:'_"._'_'_" " ."_._._'"_-_-_:_._.:_.:.::;.:_?.__..:._: ...... . -_-'.___,_?._;:_._:_.'"._._.,s,_%.:":':_
.. ._. .._ _.,. .r... /.".-_-_" .,>...,:,,..._:•_._:_.'.-..._.:-_._._:i._::_::,".::::"-__._:::_.:"._:_::!'_:._,.i_.::_..."_j_'.!:_.4_._:.'..:•:_.;;::..... •
PNL-ALO-281 0 09/26/90 3 of 6I I I I I


i Procedure No. Revision No. _ Effective Date Page
i
PNL-ALO-281 0 I 09/26/90 5 of 6I I '

i, . i i .| ,.. i .
i ......... ,.LTECX.lCAL ROCE.U S. . i8.00ualttv Control
All analysis and quallty control data shall be maintained and availablefor easy reference or inspection.
Two quality control options are defined. Option A shall be used unless aSOWwritten by WHCdeftnes CERCLAprotocols. Option B shall then befollowed. The analyst wtll recognize the need to use Option B when aChain-of-Custody (COO)deftnes a Test Instruction (TI). Additional OCsamples may be requested by a c11ent in an Analytical Request Form (ARF)or a Statement of Work (SOW), and these wtll be conveyedto the analystthrough a TI.
A. Employa minimumof one blank per sample batch (20 samplesor less)to determine if contamination is occurring. Runduplicate analysisupon c11ent request. A spiked sampleor standard (NIST traceable)shall be periodically employedto ensure that correct procedure isfollowed and that all equipment is operating properly.
B. For all SOW'swritten by WHCfor CERCLAprotocol requests foranalysis, employ a minimumof one blank per sample batch (20 samplesor less) to determine t6 contamination is occurring. Run oneduplicate sample for every 20 samples or for each set, whichever issmaller. A duplicate sample is a samplebrought through the wholesamplepreparation and analytical process. A sptke sample orstandard (NTSTtraceable) shall be run for every 20 samples analyzedor per every set of samples, whichever is smaller.
g.o Results
ICP/MSresults are normally reported in weight/volume concentrationunits, typically as ppb or ppt. Radiometric concentrations cana]ternatively be computed/reported, ustng the ca]cu]ation be]ow forresu]ts tn pCi/L untts:
[SgTc], pCt/L = ([geTc], ppt * 1x10"g *A*ln 2)/AW*tl/2 *C
where:
AW= 99 g/mo]e;._t... = 6.72 x 10" sec;-z/_ 23A = 6.023x 10 atoms/mole;andC = 0.037 dps/pC|
whtch reduces tD:
[SSTc], pCi/L = [99Tc], ppt "16.95
A, ,1|, ,i i
ProcedureNo. Revtsion No. Effective Date Page TPNL-ALO-281 0 09/26/90 6 of 6
i

INTERIMCHANGE NOTICE(ICN) ICN- PNL-ALO-282.2
Page I of 1
A. Document Number:PNL-ALO-282 Revision Number: 0 EffectiveDocument Date of ICN: 10/28/91
Title:DETEROF URANIUM CONC/ISOTOPICCOM-II
Document's POSITION USING ICP/MS ChangeOriginal Author: EJ WYSE Requested By" EJ WYSE
B. ActionREPLACE ALL PAGES
C. Effect of Change
PAGE SEVEN ADDED TO PROCEDURE
D. Reason for Change/Descriptionof Change
PAGE SEVEN INADVERTENTLYLEFT OFF OF ICN-PNL-ALO-282.1
E. Approval Signatures Type of Change: {Check (J) one}
(Please sign and date) _ Minor Change _ Major Change
Process Quality _/___Department: GK GERKE Date._l____/______/q_
A o ov. X-7Authority: AG KING Date.(_l_/z_z__/__4,_
Other x/_-1-_Approvals" BM GILLESPIE_I_, Date.]_O__/_____/___/_
• IDate'___/____/_

INTERIM CHANGE NOTICE
(ICN) ICN- PNL-ALO-282.1Page 1 of 1
A. Docu,ncqt Number: PNL-ALO-282 Revision Number: 0 EffectiveDoel, men, Date oflCN: 10]14[qlTitle:Determinationof Uranium Concentration/IsotopicComDositimDt_cUlUCnt's Using ICP/MS ChangeRcquesledBy:Origin:,l Author: E.J. Wyse E.J. Wyse ....
13. AclitHl:
Replace all pages.
C. I!fl'ccl t)l" Clmng¢:
Gives conditions for assuming natural isotopic abundance to get total uranium activitin tile absence of measurable U-234. (U-234 is not always observed, yet accounts for-50% of the total activity of natural uranium.)
!). Rcastm for Clmng¢/Dcscril)tion t)f Change
The current procedure does not consider the possibility that data may not be acquiredfor U-234; if [U]<200 ppb (natural abundance U), U-234 will not be observed. Thisneeds to be addressed (i.e. how data should be calculated and reported).
Description:Section 10.1 was added as depicted in redline.
E. Api)rt_v:tl Signatures "l},pe of Ch.',nge: (Check ( 4t) one}
(Please Sign and Dale) ( ) Minor Change (Y) Major Clmngc
QS& R Dcl_:trtmcnt f._]_A_.-_7,,/_,__
Aulht_rity: _ Date: /- /_.q/ q J
Apprtwals: _ Date: _/_//_/
• Date: / /

PNLTECHNICALPROCEDURE
TITLE: PNL-ALO-282 - DETERMINATION"OF URANIUM CONCENTRATION/ISOTOPICCOMPOSITIONUSING ICP/MS
APPLICABILITY
This procedure is applicable to the determination of uranium concentrationand/or isotope ratio composition in aqueous, acidified samples, using ICP/MStechniques. Samples in other physical forms or matrices should be digested,fused, leached or otherwise prepared to result in an aqueous matrix,preferably acidifiedwith HNO3 to an acid content not exceeding 5% vol/vol.This procedure is applicable _o the determination of total uranium and/oruranium isotopes (23BU,235U,23_U,and 236U)at concentrations>_10 ppt for eachisotope of interest.
This procedure shall be applied in accordancewith PNL-ALO-280 (InductivelyCoupled Plasma Mass Spectrometric (ICP/MS) Analysis) and PNL-MA-70.
DEFINITIONS/ACRONYMS
amu - atomic mass unit
acps - area counts per second (units of integrated ICP/MS signal intensity)
ARF o analytical request form
CERCLA - Comprehensive EnvironmentalResponse, Compensation, andLiability Act
cps - counts per second (units of ICP/MS signal intensity)
ICP/MS - inductivelycoupled plasma mass spectrometry
IP - ionization potential, in units of electron volts (eV)
m/z - mass (in amu) divided by charge
Aut,hor Date Project, Mgr. Date QADRepresent,ative Dat,e
EJ Wyse 9/17/90 BM Gillespie 9/19/90 GK Gerke 9/19/90
Technical Reviewer Date Line MOt. Date Or,hor Date
DW Koppenaal 9117/90 PF Salter 9120/90 original signatures on file
Procedure No. Revision No. Effsc_,ive Date Page of
PNL-ALO-2B2 0 SEp 26 ]990 l OF i_i

PNL TECHNICALPROCEDURE
NIST -Nationai Institute of StandardsTechnology
PNL - Pacific Northwest Laboratory
ppb - parts per billion (#g/L)
ppt - parts per trillion (ng/L)
RSD - Relative Standard Deviation
SOW - statement of work
TI - test instruction
TP - Test Procedure
TuNE SOLUTION - A solution containing 100 ppb Mg, In, Pb for the purpose oftuning the ICP/MS instrument. Any solution containing 50 - 500 ppb of atleast one low, medium, and high mass element can be used alternatively as aTUNE SOLUTION.
PROCEDURE
I.O Define ELEMENT MENU in instrument operations software to include theuranium isotopes of interest (see PNL-ALO-280 2.3.1 and 3.2). Stipulatedata acquisition in either scanning, peak jumping, or single ionmonitoring mode depending on anticipated uranium concentration,otheranalytes to be determined,and possible interferencesthat may requiremonitoring and correction. Name, save and record ELEMENT MENU with alloperational parameters.
2.0 If only total uranium concentrationdeterminations are required, skipthis instructionand proceed to 3.0 below. Otherwise, define ISOTOPERATIO ANALYSIS PROCEDURE as described in PNL-ALO-2803.3.2, 2.3.3, 1.3,and the ICP/MS instrument software manual. Uranium isotope ratios shallbe chosen with 238Uchosen as the denominator in each instance. Eachsample shall be run five times consecutivelyfor suitable isotope ratiostatistics. Number and frequency of standards, blind standards, spikedsamples, and blanks shall be in accordancewith the default QUALITYCONTROL procedures given below (9.0), or as specified in governing TI,SOW, or ARF instructions. Name, save and record ISOTOPE RATIO ANALYSISPROCEDURE.
Procedure No. Revis ion No. I Effect, iva Dato Page of
PNL-ALO-282 0 . ISEP26 1990 2 OF i_

PNL TECHNICALPROCEDURE
3.0 Define MULTI-ELEMENT ANALYSIS PROCEDURE as described in PNL-ALO-2803.3.2, 2.3.3, 1.3, and the ICP/MS instrument software manual. Identify
samples (including appropriatedilution factors) and the standards(including appropriatez8U concentrations)for the purpose ofdetermining the _BU concentrationsin the samples; by knowing this aswell as the isotope ratio, the activity of each isotope and the totaluranium concentrationcan be determined.
4.0 Start up ICP/MS instrument,allow 30 minute warm-up period, and performinstrument response and precision check using TUNEIR analysis procedureas specified in PNL-ALO-280 2.2 and 3.1. Verify adequate instrumentresponse and stability (criterion: response _ ! x 10b acps/ppm for tuneelements In or Pb; stability_ 7 % RSD concentration/isotoperatioprecision for tune elements Mg, In, and Pb). Save and archive TUNEIRdata and results.
5.0 Prepare samples by adding appropriate level and type of INTERNAL STANDARDas specified in PNL-ALO-280 1.2.3. Internal standard elements/isotopesshould be judiciously chosen based on proximity in mass range andionization potential to U (m/z 234-238 and 6.08 eV, respectively).Candidate internal standards for this determination include Bi (m/z 209;IP 7.29 eV) or Th (m/z 232; IP 6.95 eV).
6.0 Standard concentrationand isotope ratio solutions shall be prepared,using dilutions of previously prepared stock calibration standards. Theconcentrationsof total U standards shall bracket the anticipated sampleconcentrations. Isotope ratio standards shall be selected or preparedwith isotope ratios as close as feasible to those of samples but yetallowing for acquisitionof statisticallysignificant count levels forall isotopes. During total uranium concentrationdeterminations, if asample concentrationexceeds two times that of the maximum concentrationstandard, a dilution shall be made of the sample so that it is within thecalibration standard range; if it is below that of the minimumconcentration standard and above 100 ppt, a standard containing anappropriate lower concentrationof uranium (e.g., 500 ppt) shall beprepared and analyzed. Internal standards shall be added to theconcentration standard solutions in exact concentration and form as thesamples, in accordancewith 5.0 above. Stock calibration standards thatare available for use in this determination are the following"
52433-43- 10_12 ppb uranium (BNW LRB 52433, p 43)52433-46. 999.4 ppb uranium (BNW LRB 52433, p 46)NIST SRM 3164:10,000 ppm uranium
Working standards shall be prepared fresh weekly, at minimum.
Procedure No. Revision No. Effective Data Page of
PNL-ALO-282 0 SEP 26 1990 3 OFi;i

PNL TECHNICALPROCEDURE
7.0 Prepared samples and standards shall be analyzed by ICP/MS under the SCANACQUIRE (using either IR SCAN (for isotope and concentrationdeterminatioa)or ME SCAN (concentrationonl-y-'determination))instrumentprograms according to ICP/MS Procedure PNL-ALO-2802.3.4 and 3.5, theinstrument operating manuals, and SOPs for this instrument.
8.0 Calculation of the isotope ratios as well as the 23aUconcentrationsshall be performed via instrument software in accordancewith PNL-ALO-2803.7. Isotope ratio and/or concentration calculationswill be performedas a part of data acquisition in 7.0 above. Total uranium calibrationcurves shall be constructed using standards intensityand concentrationdata; linear/quadraticregression fitting shall be performed using thisdata. identity and number of standards, type of fit, and regressioncoefficients sh_ll be stored in CALCULATION PROCEDURE RESPONSE files andoutput _,ithdata results. Reporting of the results shall be inaccordance with PNL-ALO-280 5.3, and shall include the uncertaintyof theresults, which arc based on deviations between values obtained fromanalytical runs.
9.0 QUALITY CONTROL
All analysisand quality control data shall be maintained and availablefor easy reference or inspection.
Two quality control options are defined. Option A shall be used unless aSOW written by WHC defines CERCLA protocols. Option B shall then befollowed. The analyst will recognize the need to use Option B when aChain-of-Custody(COC) defines a Test Instructien. Add;tional QC samplesmay be requested by a client in an Analytical Request Form (ARF) or aStatement of Work (SOW), and these will be conveyed to the analystthrough a TI.
A. Employ a minimum of one blank per sample batch (20 samples or less)to determine if contamination is occurring. Run duplicate analysisupon client request. A spiked sample or standard (NIST traceable)shall be periodicallyemployed to ensure that correct procedure isfollowed and that all equipmer" is operating properly.
B. For all SOW's written by WHC for CERCLA protocol requests foranalysis, employ a minimum of one blank per sample batch (20 samplesor less) to determine if contamination is occurring. Run oneduplicate sample for every 20 samples or for each set, whichever issmaller. A duplicate sample is a sample brought through the wholesample preparation and analytical process. A spike sample orstandard (NIST traceable) shall be run for every 20 samples analyzedor per every set of samples, whichever is smaller.
m
ProcedureNo. IR,vi,ionNo. IEffectiveO,t,e I P,,e of --

PNL TECHNICALPROCEDURE
10.0 RESULTS
ICP/MS results are normally reported in weight/volume concentrationunits, typically as ppb or ppt. Before radiometric concentrationsforindividual isotopes can be determined,their individual isotopicweight/volume concentrationsmust first be calculated in the followingmanner:
z34 23 U/Z3eU* [ U][ U] in sample = 238235 235U'/238U * [ U][ U] in sample = 238
[236U] in sample = 236U/z38u * [238U]
Radiometric concentrations can alternatively be computed/reported, usingthe calculation below for results in pCi/L units:
[U isotope],pCi/L = ([U isotope],ppt * ]xi0"9*A-In 2)/(AW*tl/z*C)
where:
AW = 238, 235, 234, 236 g/mole;
tl/z : 23SU= 1.410 x 10¹⁷seconds23SU= 2.222 x 10¹⁶secondsz34U= 7.700 x 10¹²seconds236U= 7.391 x 10¹⁴seconds
A = 6.02 x 10z3 atoms/mole;and
C = 0.037 dps/pCi
which reduces to:
" 234 -- [235U], ppt 26{ U), pCi/L [234U *6.
[236U]{ U} pCi/L , ppt *0 00216
236{ U), pCi/L ], ppt *0 0647{23SU},pCi/L [23sU],ppt *0.000336
Total uranium activity is computed from the sum of these data:
(Tu}, pCi/L = {23_U}+ {23SU}+ {236U}+{238U}
®Procedure No. ! Revision No. _ Effective Dat,e I Page of
- ! !PNL-ALO-282 0 SEP 26 1990 5 OF

I.
PNL TECHNICALPROCEDURE

9
PNLTECHNICALPROCEDURE
"""" """ ""_" "°"°"°'"_I/'""°"""v ....'........• ...,.,.,..,'..,.'.."".!_:"!.••"-'.'.,"C.,'.','.'.'.'.'C.-',:.'°'.'.'.'.','.''.'.','.'.'.'.°,'.°;.'._.'.'.'.'.'.;.'.;-;."..:.;.:",;.''._.'.;.:,:.:':".""'"'.:.;a.,:.;.;.,'..•_°....:.:.:.:.;,:.:...,":':"2'":':"'"_";"";":';""""":_.....;I.":":':',"......"'.':':':':"°";'":"':'":':":"
rNo I_i.ionNo.IE,,o_i.o_.IPo. o,PNL-ALO-282 I 0 iSEP26 1990 I 7 OF

TITLE: PNL-ALO-283,(ReplacesHTA-3-5),SOLIDSANALYSIS:MICROPROBEANALYSIS
1.0 APPLICABILITY
This procedureestablishesthe techniquesfor electronmicroprobeanalysisof irradiatedand unirradiatedsolids. This procedureappliesto the analysisof solidsamplesusingthe electronmicroprobe.
The formof this proceduremay not complywith all the requirementsofPAP-501due to the conversionfromWestinghouseHanfordCo. formattoPNL format. Exceptionsto PAP-501will be addressedduringthe nextrevisionof this procedure.
2.0 DEFINITIONS
None.
3.0 EQUIPMENTAND MATERIALS
• Electronmicroprobe,shielded,MAC Model450 with R-Thetastageand associatedtransfercask.
®• Electronmicroprobe,nonshielded,ETEC Autoprobe or equivalent.
4.0 PROCEDURE
Samplesfor microprobeanalysismay be eitherirradiated(thereforeradioactive)or nonirradiated(thereforenonradioactive).In general,radioactivesamplesare examinedin the shieldedelectronmicroprobe,whilenonradioactivesamplesare examinedin an unshieldedinstrument.Most stepsin the procedureare the same;thosethat differare calledout separately.
®Autoprobeis a registeredtrademarkof ETEC (formerly),currentlyPerkin-ElmerCorporation,PaloAlto,California.
Author Date ProjectMgr. Date QAD Representative Date
ED Jenson 07/I/87 N/A BO Barnes 06/30/87
TechnicalReviewer Date Line Mgr. Date Other Date
All original signatureson Tl/e,_k NrA dJ McCown 07/02/87
_rProcedure No. I Revision No. EffectiveDate I PagePNl -Al n-_R_ I 07/0!/87 1 nf ,_I ...... I " I ....

A small sample of the solid material is mounted in resin or similarmounting material; the mount is cut to expose the sample, and thesurface is polished. The polished surface is examined in the electronmicroprobe by impinginga finely focused electron beam on the sample andexamining the emitted x-rays, electrons, or absorbed beam current.Variations in composition and topography are studied by observingvariations in current absorbed or x-rays emitted from the sample whilerastering the beam over the sample surface. An enlarged area of theimage surface can be displayed on a CRT screen. Elements in phases ofinterest may be identifiedby analyzing x-ray spectra from theintersectionof those areas and the electron beam. The distributionofselected elements may be observed by displaying a signal with intensityproportionalto the concentrationof the element or by displaying "dotmaps" where each x-ray detected generates one dot on the CRT.Quantitativeanalysis may be done by determining x-ray generation rateand comparing the count rate to standards.
4.1 Sample preparation
4.1.1 Loadina RadioactiveSamples
Step I) Mount sample in a cylindrical plastic mount 1.25in. in diameter.
Step 2) Cut mount at right angles to the cylinder,exposing the sample.
Step 3) Polish the cut surface through at least I _m.
Step 4) Prepare a montage of the polished surface at-2OX.
Step 5) Carbon coat the polished surface with -200 Acarbon in a carbon evaporator.
Step 6) Insert the sample in the stage and place a smalldrop of silver paint or conductive carbon at theinterface between the stage lip and the polishedsurface.
Step 7) Retract the stage in the cask body. Cap theface and transfer the assembly to the shieldedelectron microprobe.
Procedureohi!No.^! ,)oo J Revision No. l Effective Date Page
1 { 2of5 {r I_ll. , Q,,, I 07/0i/87

PNL TECHNICALPROCEDURE J
Step 8) Load the stage into the shielded electronmicroprobe by removing the face plate, rollingthe cask forward to interfaceto the column, andsliding the stage into the column using theprotruding push rod.
Step 9) Press the EVACUATE button to evacuate the airfrom the column.
4.1.2 Loading NonradioactiveSamples
Step I) Mount the sample in a cylindrical plastic mount,using either an 0.75-in. or a 1.25-in. diametermount, as specified by the cognizant scientist.
Step 2) Cut the mount to expose the sample.
Step 3) Polish the sample through at least I pm.
Step 4) Prepare a montage of the sample at -2OX.
Step S) Carbon coat the sample and count with -200 A ofcarbon.
Step 6) Deliver the mounted sample to the cognizant. scientist.
Step 7) Insert the sample into a holder, using theappropriatesprings and backing plate.
Step 8) Load the holder containing the sample into thestage.
Step 9) Press the EVACUATE button to evacuate the airfrom the column.
4.2 OperatinelConditions
Operating conditions vary considerablydepending on the type of analysisto be performed. Therefore, specifying parameter settings will notresult in optimum analysis conditions. Operation manuals for theinstrument used in the examinationassist in the selection of
appropriateparameters. In general, an acceleratingpotential between10 and 25 kV and sample currents between I and 10,000 nA are
ProcedureNo. J Revision No. Effective Date Page J
PNL-ALO-283 J I 07/01/87 3 of 5 J

PNL TECHNICALPROCEDURE I
appropriate. Scanning rates, counting times, time constants, grid bias,aperture sizes, beam diameter, pulse height analyzer lower and upperlimits, detector voltages, detector types, detector gas and flow rates,wavelength settings for peak and background determinations,andappropriate standards,must be chosen by the cognizant scientist tooptimize the data for the specific use intended.
4.3 Analyses
4.3.1 Quantitative-Ana]ysis
For quantitative analysis,appropriate computer codes areavailable to drive either microprobe in the data collectionprocess. These codes collect data in the desired areas (points,lines, or area scans) and then reduce the data to percentcomposition and location. These data are stored on discs orcassettes or are dumped to the printer, as appropriate.
Calibration of the system shall be done for quantitative analysisby determining the count rate on elements or compounds of wellknown composition under as nearly the same conditions as used forthe determination on the sample. Exceptionsmay occur if the beamconditions are too high and may damage the standard. In this casethe sample current used on the sample will be measured on thestandard support ring (steel), then reduced to a safe value forthe standard. The standard value to be used will be the productof the determined value multiplied by the ratio of the two samplescurrent measurementson the support ring. If a standard isrequired that is not present in the standard ring an adjacentelement or near by element may be used as an approximationprovided no absorption edges lie between the elements used. Theapproximate composition is given by the ratio of count rate on thesample divided by the count rate on the standard.
4.3.2 QualitativeAnalysis
Qualitative analysis using a nonshieldedmicroprobe is usuallydone with energy-dispersivespectra. Photographicrecording ofthe resulting spectral displays are a means of conveying the dataso generated.
Qualitative analysis using the shielded electron microprobe useswavelength scans over predeterminedranges of x-ray wavelength.These data are output onto chart paper and are analyzed manually.
i Procedure No. • I Revision No. Effective Date Page
i
l PN.L-ALO-283 Ii I 07/01/87 4 oF 5

I
''4 ,_.
4.3.3 Elemental Djst_jbqtions
Images of the surface or elemental distributionsusing either area(dot maps or rate meter displays) or linear (line profiles)display modes are recorded photographically.
4.4 Records
Records will be maintained and controlled so as to conform withrequirementsof MCS-033 . Laboratorynotebooks provide a mechanism forcontrol of most records.
I Procedure No. l_RevlslonNo. I Effective Date Page
I PNL-ALO-283 i i I 07/0i/87 5 of 5

TITLE: PNL-ALO-284, (Replaces 7-40.18 & HTA-4-34), QUANTITATIVEANALYSISOF GAS SAMPLES
1.0 APPLICABILITY
This procedure describes the mass spectrometertechniques for the" quantitativedeterminationof atoms, molecules or isotopes in gas
mixtures. The method is applicable to gases that are permanent gases(noncondensibleat room temperature). Condensiblegases may adsorb tothe walls of the vacuum lines and chambers. Some reactive gases whichmay react with or chemsorb to the vacuum walls are very difficult toanalyze.
2.0 DEFINITIONS
None.
3.0 RESPONS.IBLESTAFF
Cognizant Scientist.Analyst.
4.0 PROCI_DUR_
4.1 Eauipment and Materials
• Gas mass spectrometer.
• Mass spectrometerinlet.
• High vacuum/gas rack.
• Capacitancemanometer.
Calibrationgases pure and mixtures. Natural occurring gases(xenon, krypton, etc.) for isotopic analyses. Many calibrationmixtures can be purchased, other mixtures which are notavailable commerciallyor can not be purchased in a reasonabletime frame must be prepared on a gas mixing rack. For generalwork pure gases of the best quality available are usually used.Trace level impurities in gases used for standards can becorrected for by obtainingcalibrationdata on the impurity gases.
Author Date ProjectMgr. Date QAD Representative Date
MW Goheen 6115/88 N/A LJ Ethridge 6/16/88
Technical Reviewer Date Line Mgr. Date Other Date
All °riginalf_i_natureSonJJ McCown 6/15/88
PProcedureNo. Revision No. EffectiveDate Page
PNL-ALO-284 0 6/15/88 I of 3, • •

I PNL TECHNICALPROCEDURE I
NOTE: Anyone operating this type of equipment should be fullytrained prior to any attempt to analyze samples.
4.2 Performance Check and/or Calibration
A performance check should be made to ensure that the instrumentis responding properly for the particular sample to be analyzed.Usually a standard, working standard or pure gas is used for thischeck. The Frequency depends on the particular instrument and typeof sample to be analyzed. The timing could be monthly or daily asdetermined by the cognizant scientist.
Calibration is done when a major change occurs, le., (filamentreplacement--refocus, etc.). For mixture analysis, calibration ischecked whenever the measured inlet pressure differs by more than20 percent from the total of the analyzed partial pressures.Differences can be from condensible constituents such as water inthe sample mixtures. Calibration factors for seldom encounteredgases are run as determined by the cognizant scientist.
The Analyst shall perform the Following steps unless otherwisespeci fied.
4.2.1 Install a cylinder or bulb of the calibration gas on thevacuum/gas Pack of the mass spectrometer.
4.2.2 Evacuate the connecting lines between the bulb/cylinderand all inlet lines.
4.2.3 Close the valves to the vacuumpumpsand obtain a samplesized For the particular calibration. Record the readingof the manometer in the mass spectrometer diary book orlog books.
4.2.4 Introduce the sample into the mass spectrometer.
4.2.5 On a timing sequence after the inlet valve is opened,scan or peak step through the mass spectra of interest.
4.2.6 Identify and measure the recorded peaks. Makecorrections For interferences from background, molecularsfragments and multiple ionizations.
4.2.7 Calculate sensitivity/calibration Factors from themeasured isotopes, atoms, molecular ions, or ionfragments. Record the factors in the mass spectrometeroperating guide book or in the appropriate log book.
Procedure No. [ Revision No. I EffectiveDate I PagePNL-ALO-284 0 6/]5/88 2 of 3I....... I ! I I

w u
I PNLTECHHICALPROCEDURE I
4.3 SamDle Analysis
The Analyst shall perform the following steps unless otherwisespeci fled.
4.3.1 Attach the cylinder/bulb containing the sample gas to thevacuum rack.
4.3.2 Evacuate the connecting lines containing the sample gasto the vacuumrack.
4.3.3 Close the valves to the vacuum pumpsand obtain a samplesized for the particular calibration.
4.3.4 Introduce the sample tnto the ton source of the massspectrometer.
4.3.5 On a timing sequence after the inlet valve ts opened,scan or peak step through the mass spectra of interest.
4.3.6 Identify and measure the mass peaks. Hake correctionsfor interferences from background, molecular fragmentsand multiple ionizations.
4.4 Calcu]atlons
Calculate the amount of each gas or ts(_tope of interest. For gasmixture analyst s, normal ize the gases present t n the mixture tovolume or mole percent. At present this calculation is done byhand. The calculation could be done on a control and datareduction computer.
4.5 Records
Records will be maintained and controlled so as to conform withthe requirements of HCS-033. Laboratory Record Books andAnalytical Report forms provide a mechanism for control of mostrecords , _L___, .... _.... J _._L_ _ll I b: _ _"• r--QUUI QbYI _ l_Gl..Ul U UUVR*,_ 1111 e_._vl _uww_
_ File a copy of the report and also file the recorderchart of cbmputer print out (if any).
4.6 Procedure Qua1ification
None required. This procedure is considered self-qualifying dueto its dependence on analytical standards. Additionally, iL isconsidered qualified because it has independent technical review.
No. Revlston No. Effective Date Page
PNL-ALO-284 0 6/]5/88 3 of 3

" INTERIM CHANGE NOTICEIC__NN
ICN-PNL-ALO-285.I ROPAGE I OF I
,,,,, • -i.
A. Document Number:,,PNL-ALO-285 Revision Number: 0 Effective
Date of ICN: 03/05/93DocumentTitle:Total Cyanide by Remo..teMicrodistillation
and ArqentometricTitration
Change Requestedby:Document'sOriginal Author: KH pool KH Pool
. ..,, ,, . i
B. Action:
Replace pages I through 6 with the attached pages I through 7.
, ,..,, , , , ii
C. Effectof Change:
The change will give more accurate descriptions and results.
" "' "'" n"' _",' i '
D. Reason for Change/Description of Change:
Reason"
To describe the operational details actually used in applying this procedure.
Description:
1) Description of sample pretreatment to provide Bore relevant details. SeeSection 3.8, 4.4, and 4.5.
2) Results calculation description. See Sections 6.2 and 6.3.
3) Miscellaneous clarifications in language; editorial in nature.
See redline and strikeout throughout the procedure.,, ,,,
E. Approval Signatures: I Type of Change (Check (/) one)
i
(Please Sign and Date) ( ) Minor Change ( / ) Major Change
QP Concurrence: TL Ehlert _7"-_ ,._,_)_ Date: ,-_/_'/_2hr_
Approval Authority: AG Kinq __,.y,.. .... _ Date: .,,Other
Approvals: $6 McKinley__ Date: __/y_'-/f-_
: SA Bryan ¢_'//_ _-_-=_ "-/ /Date: _'- _ -c_, ,,
PNL TECHNICALPROCEDURE I
TITLE: PNL-ALO-285,Total Cyanide by Remote MicrodistillationandArgentometricTitration
APPLICABILITY
This procedure provides a method for determiningtotal cyanide in waste tankmatrices where the concentrationof total cyanide is greater than
• approximately0.1 weight percent. The detection limit for this procedure isapproximately20 pg cyanide.
DEFINITIONS
Batch - A group of samples of similar matrix treated and distilled at thesame time. A batch can not exceed (N-4) samples, where N is then..u..m._e..ro.f.a.yailab.!esp.aces,in.t..he.he.a.t...!ngblockus.e.d..._
iii!ii : iiii l!iii i ili iiii :':<<.......
RESPONSIBLESTAFF
• Cognizant Scientist• Analyst/Technician
PROCEDURE
1.0 Equipment and Materials
1.1 Micro-Distillation Tubes (Lachat ® part no. 1700-001 orequivalent)
1.2 Temperature controlled heating block designed to accommodateatleast 5 Micro-Distillation tubes simultaneously
1.3 Micro-Distillation Tube Assembler/Disassembler (MDTA/D)1.4 Pipets (adjustable or fixed volume)1.5 Disposable pipet tips1.6 Repipetor, 500 mL1.7 Analytical four place balance1.8 Buret, 10 mL, readable to nearest0.02 mL1.9 Magnetic stirrer1.10 Vials, glass, ]15mL
Author Date ProjectMgr. Date PQ Representative Date
KH Pool SG McKinley TL Ehlert
TechnicalReviewer Date Line Mgr. ,J' Date_ Other Date
i/t_" /x7:JSl Bryan AG KincI _'I > .... "
ProcedureNo. Revision No. f" j _Effective D/at_ Page
PNL-ALO-285 0 "- 02/03/93 I of 7

PNL TECHNICALPROCEDURE
1.11 Stir bars, glass1.12 Ice cream cartons (sampletransfer containers)1.13 Drug cartons (secondarycontainmentvessels)1.14 Tissue or Kleenexe (secondarycontainmentvessel packing)1.15 Silicone grease
2.0 Reaqents
2_" 0.0192 N AgNO_ solution (Titer: 1.00 mg CN-/mL): Weigh 3.2647 +0.0002 g crushed primary standardgrade (99.9% or better) AgNO3which have been dried to constant weight at 40°C, dissolve indeionizedwater (DIW), and dilute to 1000 mL. Alternatively acertifiedAgNO3 solution from a commercial source may be used.
2.2 Sample pretreatmentsolution" Acid form EDTA and Ethylenediamine.Dissolve 5.0 grams acid form EDTA and 5.0 grams EthylenediamineinDeionizedWater (DIW) to a total volume of 100 mL.
2.3 Releasing solution: 7.11 M H_SO,+ 0.79 M MgSO_: Dissolve47.5 gMgSO4 (anhydrous)in approximately150 mL-of DIW. Add 350
concentratedH_SO,slowly to avoid overheatingto lhe point ofboiling; Dil.ute_0 500 mL final total volume. _i_!!!lli_!_iiiiiiiii_i_
2.4 Deion_,ed water, greater than 15 megohm, as indicated by thedei oni zer meter readout.
2.5 Rhodanine Indicator Solution: Dissolve 0.02 g ofp-dimethylaminobenzalrhodanine in 100 mL of acetone.
2.6 Stock Standard CN" spiking solution(s): K4Fe(CN)6 and/orNa_NiFe(CN)6 dissolved in the sample pretreatment solution.CoBcentratibn -lmg CN-/mL.
2.7 0.25 M NaOHsolution: Dissolve 10.0 +_0.2 gram Reagent grade NaOHpellets in 1.0 liter of DIW.
3.0 PredistillationPreparation
3.i Unpackage the required number of micro-distillationtubes tocomplete the batch. Verify that the sealed upper portion of eachtube contains approximately1.5 mL of vendor supplied sodiumhydroxide trap solution.
3.2 Label the upper and lower halves of each micro-distillationtubewith the appropriatesample identificationinformation. Everybatch will consist of samples, a duplicate sample, spike, acontrol sample, and a methods blank. For QC requirements,seeSectiOn 7.0. Label the required number of 15 mL glass vials
I_ -_ T
vrocedureNo. I Revision No. EffectiveDate PagePNL-ALO-285 0 02/03/93 2 of 7

ii
needed to transfer the distillatesout of the hot cell. Place adisposable glass stir bar in each vial. Place the vials insecondarycontainmentto keep them externally free of radioactivecontamination.
3.3 Lightlygrease the joint where the upper and lower portions ofeach tube join. Use silicongrease.
3.4 Turn on the power to the heat block. Allow at least 30 minutesfor the unit to warm up. Verify that the temperatureof theheating block is 128 + 3 degrees C, using a calibrated thermometeror thermocouple. Record actual temperatureon a bench sheet (seeExhibit I).
3.5 Perform a balance performancecheck in accordancewith PNL-ALO-052.
3.6 Check and document the delivery of.all pipets that will be Usedboth in-cell and out. Document the checks on the bench sheet.
3.7 Pipet _ii!ii_i_the appropriateamount of spike solutions into thelower _i_"_;_'"6_the appropriatemicro-distillationtubes prior tointroducingthem into the hot cells. The appropriateamounts willbe provided by the Cognizant Scientist. Place the lower tubesections into an ice cream carton to keep them uprightwhile theyare being transferred into the cells.
................... i l ii ii i i Bi! !ii i ! i! iiiiiiii!ii!ii i
4.0 Distillation
4.1 Transfer the still separatedmicro-distillationtube sections intothe hot cell.
4.2 Place the upper tube sections in the large holding block in alogical sequential order.
4.3 Place the bottom tube sections in the small holding block inlogical order_
_._;_._i:;:ii_;:_:;:_.;:::_::_;;:;:::::;::._:_:_:_:::_::;:._::_:::_::::_::::::::_._:::;::::_::::::....._ :;....::;::...;.:._..:::.:..,.;:::;:;•;.;.;.:,:.;...;.:.;,;,;:;:.:.:.;...;.:.::;:.:;;.;., -; .. .; ..... ,.,:,,,...;;.;;;;;;;;;
I Procedure No. I R-.v_.._o_,No. I E;;=-*,,,-.-*o I p_ I
I PNL-ALO--285 l 0 1 02/03/93 I 3 of 7 I

i
PNL TECHNICALPROCEDURE
_%_,_ I i i _[m_11 l_ _ I_11_ I_1_1 vi _._d I _k l l_%_1 _HIII_ i _w_ iil_ _1 i _ i i ii _F I_ll_
apprcp_. _^.... l -_::-......_"_^ coot" v,,_^--.,,_'-_....., _v, _ _^_,,__'_'_ _,,^-the _,,_,,_^--_.. 1_,-,^4-_11155 l_ •
4.5 Fill the lower tube section to the flange with sample pretreatmentsolution. ^-_*-*^ "" " ..... ".... " .... ""''" "" .... *^-+" ^= ^'"_"
• "l^,..^v, .!.,,,I,,,,^ .^.,,,4-4^. 4.4.^ .I. 1,.^ A4.._^....1_1^ ,,..4._,n,l,. .I,.4n .I-_ .1¢',,..,.,,414.1-,.,,,4,.^l VllkI li_ _l I_ _ ,_]1_ ki_ l yI I I li 1i_ _II_ _1 l e_l_i,_g _1_ I _ _# I _,_G li_ _w l _,_ _Y l _l_ l l l G_eG
.... _^ d-..^_:_t-^, o.... _^ , """" .'p fcr-eac-h,_..,,_..,_I^ 4-,,, -_..^4A ,-_,^,, -, ,.,,_, 4- ,.,_ 4 .,, -, 4- 4 ^ .,, PAIl'rTnkl. T'I- _,, 4mnr-_,.I-,_,_.l-
,I. 1,.,,.,-,,,#.....14.4.. ^4.1.1,.^,,_ 4:'..,.,^..,, ..-......1.. ^... .,.,,,,,,41.4,,..,.,, .-,-,.aw_4n.,'l k^ .,..^..,^1^4-^1,,_111_ e_lPV I I1_1P $ _1_ I _liSJ I I ViII _lPllIl_ I _ VI _ I I_111_ IlIH_SI I H I _ _ _VIII_ J5._5 I_
•,_, _ ,v,, I" "-'-""' _ ,,,,_, ;IC ";"" ",,.I C .... ,,_ ?'C,_._,,. ...... _", _^
1 C..+ ._. ...............more ti.....for =vv..","'4mcaoure.-
4.6 Using the MDTA/D, add _._:._:y:_.,__!i!i!i_':i!i!i_li!iv_.v:-',..of the H_SO_/MgSO_releasingsolution to the lower _LiBesection. Seal th_ upper and lower tubesections together. NOTE: This sealing operation must be done asquickly as possible to minimize the potential loss of HCN. Placethe sealed tubes in the heating block•
4.7 Allow the heating/distillation process to proceed for at least 30minutes but no longer than 40 minutes.
4.8 Using the MDTA/D, disconnect the lower portions of the tubes fromthe upper and discard the lower section. The elapsed time betweenthe removal of a tube from the heat block and parting the upperand lower sections should be minimized to prevent the potential"suck-back"of distillate into the lower tube sections. Failureto minimize the time intervalmay result in low recoveries.
4.9 With each upper tube section, hold horizontallyand rotate slowlyto rinse the walls with the distillate. Tap the tube section on afirm hard surface (e.g., the hot cell floor) to ensure that all ofthe trap solution is in the lower portion just above the semi-
, permeable membrane. Break the upper tube section in the locationpre-scored b._the manufacturer. Transfer the distillate into aprelabeled 15 mL glass vial. Rinse each half of the upper tubesectionwith approximately5 mLs of 0.25 M NaOH (squeezebottle)and add the rinses to the glass vial.
4.10 Transfer the glass vials containing the distillates and rinses outof the hot cell and to the fume hood where the titrations are tobe done.
J Procedure No. I Revision No. I EfFective Date I Page
I ' I ! IPNL-AL0-285 0 02/03/93 4 of 7

5.0 Titrations
For each sample:
I) Filla clean 10 mL buret with 0.0192 N AgNO3.
2) While stirring the sample by means of magnetic stirrer andstirbar, add 3 drops of Rhodanine indicatorto the vial.
3) Continue stirring sample and titrate to the first permanentappearance of a "salmon" color. Record the volume of AgNO3 usedon the bench sheet.
6.0 Calculations
6.1 Since the titer of 0.0192 N AgNO3 is 1.00 mg CN-/mL.,the volume Ofthe titrant used (in mL) is numericallyequal to the mg CN- in thedistillate. Therefore,
mg CN found = (mL AgNO_ used to titrate - (mL AgNO_ used to titratedistillate) distillationblank)
":"..!_."_::!:_::i._?::z::::::_:_i:::!"::F':..;:'!_'!:_"".:!::':':_;"::..:_:..:i'_::::::":..........".""!::::":_ii.:_i:"':'!:._i:"":'!":::::::'ii.:.i."::"":::..._::":"..:"_:!..':::::::!:._:_""_.:_..T'";.'!:
•..,...:.°!...-.......,..,_,.,-..-:.;......................°,..,,.....-.,.,.........,.....,..........,...:._',:-.-.,.,,...,....,.............,.:-.;..-...........,,...,..,,.,.,...............,,-.,.........-..,..........,..,.........................-.....-...............Oo°..oOo°o..°,,.
.......:::.............::::::::::::::::::::::::::::::::.:::...:::::::.===================================================================================================:::::::::::::::::::::::::::::::::::::::::...........:_i:_._:_:_:::_:_._:_:_:_iiiii!i!i_.;:_;:.ii_iii_!iii_:_!_i!ii!iiii!iiiii_iiiii_._:_._:_::::__:_:_:__:__':....
_-".2:;:'::_.i.:"?""":""":":':'.'".""_"":":'i!i""F."::":"":i!:is":"""!:";!""!""".!!_:."_'_"!'_"":".'::::!:_.'__i_:_::::::_' ::::::_'.']..::__i:::;:__:]:_ _.::_::":_'::':!'!*":::::::::::::::::::::::::::::::::::::::::::..::_::.::i::.::i::.:_:i@:...:_i:i:!::...::.:::.::'!:...:...:.:::...._:!:i::...::...::i::-:$...:::.:::::..-:i::.::i
....._';.'_!_:".'!'""_ii_i_i_!_!_i_ili_!i_i!_!!_i_iii:::::':_:::::iii!i:""!!"""_i_'_ii:""::::::::::::::::::::::
_i_i_i_i.._..i.._.:..._::_i_i_i_i_ii_::i_._.._!#_i_i_i_i_i_i__....................................................
.....................................................:"::::":::::::::::::::::::::::::::::::::::::::::::::::::::::::::::::::::" ::::::::::::::::::::::::::::::::::::::::::":::::"":::::::_:"i:::::::::::::::::::::::::::::::::::::::::::::::::::::::::::::::::'',:"::::::::::::::::::::::::::::::::::::::::::::::::"°':""°°"°°°i:i:i"+°":i""!°+:':':":"""_'i"
•.,..,......,................,.....-.....,..,,..,,,....,.....,.....,.....°.°......,.........,........,......,.........,...,-........,.,.,........,........,...•-..,..,.,.o.....,,...,...,....,,...,.,......,..•.............,,.....................•............................
T
I Procedure NO ° I ReVisiOn N_" I Effect_ ve o_t_ I P_e I
I PNL-ALO-285I o I o2/oz/9. I soe7 I

....:_.................................._::.._._:::.:...............:...........:_,::::::.(...==============================..::::::.:::::_::_.::..:..::::..:_:.,._.._;,_:_:,:_:,:,.,:,:_:,:,:,._:,:.,::_:_,:],_
il_i__ iif__ii_i:_':_iii!i_:..:_/_i_ii_iii_ii!_i_!_Iii/i_ii__ili_;_i_ii_i..:.:_!_i__i_i_i_i__i__i_i__.__.__...:___-_:_:_:_:_:_ _.__._...::.:._.'..:.::::,:::.:.:.:.:._.:.--,.:................'...........................................
• •. :,..:"° .......:o:.::_• • o.. o"...o..-.... ..o.... o'o!..':o;o:':o:':O.'o'.....o..O.O:O:...oO.....*.o...*...-..o.O..o......o.O.Oo..O..o.o.......o.....,o.o.o........o.........oo....O..o...o.o....o.o....-.o.o.o...o...-.-°o...o....o.o...o....o.o.o......o.....oO
.'.:.; _...;:.:..o..:;:::_:_..::::::;-'o'-':::::;:".:-;;...;::::::;::.'.:.::;::::::"".::;:::::: : :" ... ::::o'o'.;.'-;.'_: ;::::=================================":;::::::::.°.;.;:::::::::::::::::::::::::::::::
•.'.'.!o.;O.O::.'-'..o..:.o...o..............oOoo...o..o.o......Oo.oo......, o......o.. Oo........:o....oo.......: .:.. o: • : •...:. :o: o:o'.:o::.,:... oO:O:.:.:...:.:o:
:.'....o.:O:.:.:.:.'o:::_:i:_:_o:-:.:.>:.'.:°:-."o": :...'o:.:.;.:.:.:.:.:...o o.: : :.:.'.:o:o:.::.::..:.oO:..o..:... o.:.:.:.:...o.:.:o:.:::.:.:.:-:.:o::o:o:o'.:.:.:.:.:-:o:.:;.:.-.:.:o:.:.:o:.:.:...:.-.:o:....:.:.:.:.:.:.:.:...o.:.o.:...:.:o:.:.:.:
_ _i_:o _:i_..._ _i_iiiiii_ __°::::::::::::::::::::::::::::::::::::::::::::::::::::::::::::::::::::::::::::::::::::::::::::::::::::::::::;:ii!!i!_.i!ii_ _i_l_":iii_ B _._ii_ii=================================================================================;:':_.':::;:::::::''.::::;:;:;:::::.
A-- .l. Ovvl_ ........ vv (%) 11, I., v 1", _i V 1
'"_^-^ V_ .... "_ C-_;,_:,,_ .... tc titrat _cd ;==;la d'=t'llate
,u,T6 = ....""_* _-_ cf r,- i" _piko
W_ = "' "-_* "-"_ cf .,..,1^ -,,,..',,.,_,,,___,_._ .--_^_ ::_mpl̂A -- O/ Pk,- .I:'^,,,.,A J_,,.,_ ,,_,_-.^4b^,.I ,-..-,m_-.l^
7.0 Quality Assessment
Each analytical session {distillation + titration) shall include as a minimum:one bl ank, one sp_.i._..k..e_d_s._.a..m._e_..n...e._s_amp..]_e.._.d._up.]_.i_c...a..t.e_a_n_d_e_sp....i.k..e..d..,b]...a...nka,..k.a.:ont_o1 _amp_e. _i_ii!i_i_i_i__i_i_.i_ii!ii!i_i!_!!_i!!i_i_iii_ii_i!_i!iiiii_iiii__E_!i_!_ii_i_!iiii_i_i_iThe preparation/methodblankand controlsamplerepresentknownperformanceindicatorsfor this procedureand may renderthe analyticalsessionsuspect.Evidenceof contaminationin the blankand/orcontrolsamplerecoveryfallingoutside80-120%warrantimmediatecorrectiveaction. Notifythe Coqnizan_tScientistimmediatelywhen one or bothof thesesituationsoccur.
Samplespikerecoveriesshouldfallwithin80-120%. When this recoverylimitisexceededcontactthe CoqnizantScientist.
The relativepercentdifference(RPD)for duplicatesamplesshallnot exceed15%, if the cyanidecontentof the is _>10 timesthe methoddetectionlimit.
Procedure No. Revision No. Effective Date Page

The CoanizanIL_ientist is responsiblefor investigatingall incidentsof QCfailure and di_'ectingappropriatecorrectiveaction.
8.0 Records
Records will be maintained and controlledso as to conform to requirementsofthe Analytical Chemistry LaboratoryQuality Assurance Plan, MCS-033.
9.0 Tolerances
Tolerances for all measurementsmade during an analysis shall be specified inthe followingmanner: I) a tolerance limit can be stated with a measurementvalue given in a method, or 2) if a tolerance limit is not stated with ameasurement value, then the followingsystem of tolerances shall be in effect"
a) Unless otherwise specified,all values for measurementsstated in themethods (volume,weight, time, etc.) are approximatevalues. The actualmeasurementsused, however, shall be within + 10% of the stated value.
b) When one or more significantfigures are given to the right of the decimalpoint, the tolerance limit is +_5 in the next digit located beyond thelast one stated.
10.0 References
Winters, W.I., 'AnalyticalMethods for DeterminingCyanide in Hanford NuclearWaste,' RHO-SD-WM-TI-315,Rockwell Hanford Operations, Richland,WA, September,1987.
'Micro-DistDistillationSystem Reference and Methods Manual,' LachatInstruments,6645 West Mill Road, Milwaukee,WI 53218, December 28, 1989.
I Pr°cedureN°' I Revisi°n N°" I EffectiveDate I Page I
I PNL-ALO-285 I 0 I 02/03/93 I 7 of 7 I

' :_/_L, _'T_ '_',_-_" ._L,._, O'y'o_;t,_ PNL-ALO-285, Rev '0" _ -" EXHIBIT 1Page I of 2
Page __ of _ShieldedAnalytical Laboratory
. Bench Sheet
Project ld.: Project No."? i i
....
___ ,__,__ _1_k,. °_ m, i i
ii iiii
ii iii
..

PNL-ALO-285,Re_. 0EXHIBIT 1Page 2 of 2
ProceduresUsed"
PNL-ALO-I01,Acid Digestion for Metals AnalysisPNL-ALO-I02,Fusion of Hanford Tank Waste Solids
.... PNL-ALO-I03,Water Leach of Sludges, So_ls, and Other Solid SamplesPNL-ALO-I04,Extraction ProcedureToxicity
"-'-" PNL-ALO-I06,Acid Digestion for Preparationof Samples forRadiochemicalAnalysis
PNL-ALO-I07,Leach Procedurefor Preparing Sludges, Soils and OtherSolid Samples for Free Cyanide Analysis
PNL-ALO-I08,Aqueous Leach of Sludges, Soils and Other Solid Samplesfor Anion Analysis
PNL-ALO-330 Hexadecane Extracts for Volatile Organic Compounds"' -----" PNL-ALO-S04,Percent Solids Determinationof Sj_m_&/Sludges/Solids
m " 4 ' ' PNL-ALO-120,Procedurefor Extraction of SingILe'S_ellTank Samples' for the Analysis of SemivolatileOrganic Compounds
PNL-ALO-130,Procedurefor the Receipt and Inspectionof Single.... Shell Tank (SST) Samples .....
WHC-OS3-1, Laboratory Procedure for Measurementof Physical andRheologicalProperties of Solutions, Slurries andSl udges
7.40.9 Laboratory Procedure for the Physical Characterization ofFluids
7.40.16 Separation of Carbon from SoilSedimentSludge Samples7.40.24 Measurement of Carbon-14 in Zircaloy Cladding Crud Layer7.40.25 Distillationof Caustic Trap Solutionsfor C-14 Separation7.40.29 Specific Gravity of Highly RadioactiveSolutionsiul i
7.40.30 Bulk Density of Highly RadioactiveFree-FlowingGranularSolids
7.40.34 Tritium in IrradiatedCladding Materials,,,jb
7.40.36 Analysis of Solid Samples for Carbonate by Use of------ CoulometricsModel 5011 Coulometer.
• 7.40.37 Determinationof Carbon in Solids Using the CoulometricsCarbon Dioxide Coulometer
7.40.42 Determinationof Carbon-14 in RadioactiveLiquids, Soils,;:and Sludges
7.40.47 Determinationof TC,TOC and TIC in RadioactiveLiquids,Soils, and Sludges by Hot PersulfateMethod
. Other --- iu ,,m, iii i nmn
M&TE Used-
Cell 2 Balance 360-06-01-016 - Mettler AE 160
CellG Balance 362-06-01-038 ' Mettler AE 200
Counter Balance 360-06-01-024 Sartorius R 200D
_ Corning pH meter Model 240 S/N 6629 .

i PNL TECHNICALPROCEDURE ITITLE: PNL-ALO-286,MeasurementOf Hydrogen And Nitrous Oxide In Air
APPLICABILITY
This procedureis suitablefor the measurementof hydrogen and nitrous oxide inair over the range of approximatelyI percentto 5 ppm. Minor modificationscanexpand the range to higher levels. Applicationto matrices other than air mayrequire additional modifications. This procedure was prepared especially forsamplesof SY-I01 tank atmospherewhich are delivered in 75 cc metal cylindersat a pressure of I0-14 psia.
DEFINITIONS
PSIA: Pounds per square inch, absolute.
RESPONSIBLESTAFF
Cognizant ScientistAnalyst
PROCEDURE
1.0 EauiDment
1.1 Gas Chromatograph. Thermal conductivitytype. Ideally, achromatographshould be set up for each analyte to save time andmanipulations. For hydrogen,a molecular sieve columnpreconditionedat 300° is used with dry, COm-freeair as the carrier
," o
gas. For nitrousoxide, a Haysep-S column precondltionedat 120" Cis used with helium as the carrier gas.
• Standard Gas Mixes in air, oxygen or nitrogen.• Gas sampling/dilutingsystem or manifold.• Volumetric Gas Syringes. Capacitiesof 0.1 to 500 cc.
2.0 Sample Preparation
Samplesmust be pressurizedto at least 20 psia to permit valid sampling.This results in _ dilution for which a correction;_ustultimatelybe made.A Sample Pressurization Table is provided for convenience in makingquantitativedilutions (Exhibit I). The table assumes that the samplesare in 75 cc metal cylinders and that the existing 25cc gas manifold(#M-l)is used. Recalibrationand revisionof the table will be necessaryif the volume of either is changed.
i
Aut_h°r_4/.-- ,, _.-pDa_eI/_#'"d,._'_ _ QP Representative DateI ProjectMgr. I? .. Date -_ .... /,- _--
RF Keouqh > -(s_.- _ .3 TL E.,TechnicalReviewer Date I Line Mgr. # i f hate Other Date
I ,,>SJ Bos /_(_ 31_Iq3 AGKinq _"NIA
I ' V -?I
ProcedureNo/ IRevision No. '7/ I E,f_ctiveDate PageI/ I t l ...... ,n,_nPNL-ALO-286 I 0 L/ IL/ M_tX_ _ /uuo 1 of 3
I I

L PNLTECHNICALPROCEDURE
2.1 Connect the sample cylinder to the gas manifold, as in Exhibit 1,and adjust the pressure in the manifold to 13.0 psia with valuenumber 2. Open valve number 1 and read the pressure. Add air tobring the 'ylinder pressure up to 2 or 3 times the initial pressureand into the 20-30 psia range. Use Exhibit 2 for guidance. Recordthe dilution multiple.
3.0 Hvdroaen Measurement
3.1 Prepare two or more working (dilute) standards from a commercialhydrogen standard or from pure (99+%) gas by dilution with air.
3.2 Inject a known volume of the working standards into thechromatograph and record the resulting hydrogen peaks.
3.3 Inject the samevolume of the diluted samples into the chromatographand record the resulting hydrogen peaks. There is generallyinsufficientsample for replicates.
3.4 After concluding the sample analyses,run a replicated star,,dardtoassure that there has been negligibledrift in instrumentresponse.
4.0 Nitrous Oxide Measurement
4.1 Prepare two or more working (dilute) standards from a commercialnitrousoxide standardor from pure (99+%)gas by dilutionwith air.
4.2 Inject a known volume of the working standards into thechromatographand record the resultingnitrous oxide peaks.
4.3 Injectthe same volume of the dilutedsamples intothe chromatographand record the _esultingnitrous oxide peaks.
4.4 After concluding the sample analyses, run _ replicate standard toassure that there has been negl,gibledrift in instrumentresponse.
ACCEPTANCE CRITERIA
The data is presumed to be valid if the standardsmeasured before and after thesamples are in agreementto within _+5%.
CALCULATIONS
I.) For both analytes,plot the concentration(generallyppm) of the standardsversus their observed peak heights.
2.) From the plot, read the measured ppm of the samplescorrespondingto theirpeak heights.
I Revtsi°nN°" I EffectiveDate IPage
l PNL-ALO-286 I 0 I !_AR0 8 T993 J 2of3 I

I PNL TECHNICALPROCEDURE I3.) Correct for the sample dilution (pressurization)by multiplying the
measured ppm by the dilution factor; generally2x or 3x.
RECORDS
A record book will be the recording mechanism for data relating to thisprocedure. The record book will be used in accordancewith establishedrecordsmanagement practices.
PROCEDUREQUALIFICATION
Not Required. This procedure is considered to be self qualifying due to itsdependenceon standards analyzedwith each sample or set of samples.
REFERENCES
None.
ProcedureNo. I Revision No. EffectiveDate Page
PNL-ALO-286 I 0 MAR 0 8 i993 3 of 3

PNL-ALO-286,Rev. 0Exhibit 1Page 1 of 1
CYLINDER/MANIFOLDCONNECTION
sample gauge/
cylinder\ manifold J
\

PNL-ALO-286,Rev. 0Exhibit 2Page I of 2
SAMPLEPRESSURIZATIONTABLE, , i i i ii
OBSERVED INITIAL 2X INITIAL 3X INITIALPSIA PSIA PSIA PSIA
9.7 8.60 17.20 25.809.8 8.73 17.47 26.209.9 8.87 17.73 28.6010.0 9.00 18.00 27.0010.1 9.13 18.27 27.4010.2 9.27 18.53 27.8010.3 9.40 18.80 28.2010.4 9.53 19.07 28.6010.5 9.67 19.33 29.0010.6 9.80 19.60 29.4010.7 9.93 19.87 29.8010.8 10.07 20.13 30.2010.9 10.20 20.40 30.6011.0 10.33 20.67 31.0011.1 10.47 20.93 31.4011.2 10.60 21.20 31.8011.3 10.73 21.47 32.2011.4 10.87 21.73 32.6011.5 11.00 22.00 33.0011.6 11.13 22.2711.7 11.27 22.5311.8 11.40 22.8011.9 11.53 23.0712.0 11.67 23.3312.1 11.80 23.6012.2 11.93 23.8712.3 12.07 24.1312.4 12.20 24.4012.5 12.33 24.6712.6 12.47 24.9312.7 12.60 25.2012.8 12.73 25.4712.9 12.87 25.7313.0 13.00 26.0013.1 13.13 26.2713.2 13.27 26.5313.3 13.40 26.8013.4 13.53 27.0713.5 13.67 27.3313.6 13.80 27.6013.7 13.93 27.8713.8 14.07 28.1313.9 14.20 28.4014.0 14.33 28.6714.1 14.47 28.9314.2 14.60 29.2014.3 14.73 29.4714.4 14.87 29.7314.5 15.00 30.0014.6 15.13 30.2714.7 15.27 30.53

PNL-ALO-286, Rev. 0Exhibit 2Page 2 of 2
SOURCEOF THE SAMPLEPRESSURIZATIONTABLE
The sample pressurization process is as follows:
The pressure in the 25 cc manifold is adjusted to 13 psia via valve #2.
With valve #2 closed, valve #1 is opened and the "observed psia" is noted. From thetable the "initial psia" in the sample cylinder is determined.
Valve two is then opened to allow air to pressurize the sample cylinder. It isconvenient to pressurize to either x or 3X as in the table but any pressure in the20-30 psia range could be used with manual dilution calculated.
The general equation governing the system of cylinder and manifold is:
(Pc)(Vc) + (Pm)(Vm) = (Pc,)(Vc,) + (Pm,)(Vm,)
where:
Pc = initial pressure in cylinderPc' = pressure in cylinder after valve #I is opened (this is the
"observedpsia" and is equal to Pm')Pm " initialpressure in manifold (set at 13 psia)Pm' - pressure in manifold after valve #I is opened (this is the
"observedpsia" and is equal to Pc')volume of sample cylinder (75 cc)Vc ,,
Vm = volume of manifold (25cc)
Rearrangingand substitut'ingthe fixed volume values:
Pc= 75Pc'+ 25Pm'" 25Pm
75
Reducing further:
Pc s 1.333Pc,_ 4.33
To work an example: Assume a sample cylinderis opened into the manifoldcontaining13 psia (as the procedurerequires). Assume the pressure reading changes to 10.1psia. Substitutingin the reduced equation (above),the initial pressure in thecylinder would have been:
Pc = (1.333)(10.1) - 4.33 - 9.13 psia
This is the value given in the table. Note that a dilution to 2Xwould not give the20 psia required for the analysis so dilution to 3X, or 27.4 ps;a would probably beused. If the sample were diluted to 22 psia for example, the dilution is s:mply22/9.13 = 2.42X.
®

PNL TECHNICALPROCEDURE I
TITLE: PNL-ALO-290,DETERMINATIONOF pH IN SOIL SAMPLES
APPLICABILITY
This procedure is derived from EPA SW-846 Method 9045 and is approved formeasuring pH in soils after leaching with water or a dilute calcium chloridesolution.
Interferences- Temperature affects pH measurement,therefore, calibrationandmeasurement shall be performed at ambient temperature. If electrodes becomecoated with substances from the sample matrix during measurement which do notrinse off easily, follow electrodemanufacturer'sinstructionsfor cleaningand conditioningelectrodes,
DEFINITIONS
Calcareous - Containing calcium or calcium carbonate.
RESPONSIBLE STAFF
• Cognizant Scientist• Analyst
PROCEDURE
This proceduremeasures pH of soil leachate. Water or dilute calcium chlorideis used as the leachate depending on whether or not the soil is calcareous ornon-calcareous. Calcareous soils are recognized by the presence of whitedeposits of CaCO3 and/or NaHCO3. The Coqnizant Scientist will make thedetermination as to sample type. For discussion of pH measurement see Bates,at.al, or PNL-ALO-225.
1.0 APPARATUS
- pH meter (electrometer)- Indicating (glass)and referenceelectrode, or combination pHelectrode
AuthorMCa" _/_/_ _Date _c__I,YZHosa'ka 3/I _/_jDate, TLPQ RepresentativeEhlert--_'_f'/__ _//_/_Date
MTeChn,_¢_Iw_/u__, Reviewe_r__/z,___7_/_,Data_AG Kin_LineMgr ,/____ "__' _- ._/ /(_V/_-_DataOther Date
L_' ' 'ProcedureNo. Revision No. . -_EffectiveDate Page
PNL-ALO-290 0 3/3/93 I of 4

I PNL TECHNICALPROCEDURE
- Suitable beakers, 20-50 mL- Teflon coated stir bars- Magnetic stirrer- Volumetric flask, 500 mL- Volumetric flask, I liter
2.0 REAGENTS
- High purity water, (Deionized),with p,Hof 6-7.
- CaCI2.2H20,ACS Reagentgrade or equivalent.
- Stock calcium chloride solution (CaClz), 2.0 M. Dissolve 147g ofCaCI2.2H20in high purity water, cool, dilute-to 500 mL and mix weil.
- Calcium chloride (CaCl2), 0.01 M. Dilute 5LOmL of stock 2.0 M CaCl^to I liter with high purity water. If the v,,of this solution-is no_cbetween 5 and 6.5, adjust the pH by adding Ca(OH)2or 1"10 HCI.
3.0 STANDARDS
Commerciallyavailable certifiedbuffers at pH values of 4.0, 7.0, and 10.0.Other certified buffers are availableand may be used as required.
4.0 QUALITY CONTROL
4.1 Standardization. Because of the different pH meters which may beused, only minimum requirementscan be specified. Manufacturer'sinstructionsshall be followed for calibrationof the meters usingstandard buffers. A minimum of two buffers shall be used for thecalibration.
4.2 Control. Control is establishedby measuring,within +0.1 pH unitsof the certified value, a buffer not used for calibration. Thisstep shall be performed prior to beginning analysis, after every10th sample, and at the end of the analytical run.
4.3 Quality Control. A method blank shall be analyzed with each samplegroup (typically 10 samples) or for each batch of samples prepared,whichever is more frequent. One sample from each sample group orbatch of ten samples shall be analyzed in duplicate. If pH valuesof duplicate samplesvary by more than I pH unit, notify theCoqnizant Scientist for corrective action/resolutionas required.
Procedure No. Revision No. EffectiveDate Page
PNL-ALO-2go 0 3/3/93 2 of 4

i
I PNL TECHNICALPROCEDURE
5.0 ANALYSIS
5.1 Instrument Set Up
5.1.1 Follow manufacturer'soperating instructionsfor set upand calibrationof pH meter using buffer solutions asspecified.
Note" To avoid contaminationof buffer solutionsdonot return used solutions to the container.
5.1.2 Immerse electrode(s)in buffer solution not used forcalibrationand, with stirring, allow reading tuequilibrate, lt shall read within +0.1 pH units of itsstated value. If not, recalibrate.
5.2 Sample Analysis
5.2.1 Sample preparationof non-calcareoussoils. Weigh soilinto a suitable beaker and add high purity water in aratio of one mL water to one gram of sample. Sufficientsample and water to allow immersion of the electrode isrequired. Stir several times over a 30 minute period andlet stand undisturbedfor about an hour to allow settlingof particulates. Measure as per steps 5.2.3.1 through5.2.3.3.
5.2.2 Sample preparationof calcareous soils. Weigh soil into asuitable beaker, add 2 mL 0.01 M CaClz (step 2.0) solutionper gram of soil and stir several times over a 30 minuteperiod. Let stand undisturbedfor about 30 minutes toallow settling of particulates. Measure as per steps5.2.3.1 through 5.2.3.3.
5.2.3 Sample Measurement
5.2.3.1 Sample shall be at the same temperatureas thebuffer solutions (normallyambient temperature).Immersethe electrode(s) into the solutions deepenough to ensure electrical contact.
5.2.3.2 Without stirring allow the meter reading tostabilize. Record reading. Remove electrode(s)from solution, rinse with water and repeatmeasurement. Record reading. Repeatmeasurementsshall agree within +0.1 pH unit.If not, see Coqnizant Scientist for resolution.
ProcedureNo. Revision No. EffectiveDate Page
PNL-ALO-290 0 3/3/93 3 of 4

r,
_fi:-,;:_-.:_:_.--.:?r_-,.• . . •...... -,-- ,_ _
,,. ,° .,,
For calcareous soils report as "soil pH measured•in 0.01 M CaCl2."
5.2.3.3 Remove electrode(s) from sample, and rinse withwater. GlasS electrodes are fragile and caremust be.'taken to not scratch or break theelectrodes. E!.ectrodes shall be replaced whenmanuf'acturer'S_specifiedmaintainanceproceduresdo not. return it to.satisfactory operation.
Electrodes Shall be stored according tomanu_acturer"s instructions when not in use..-
6.0 CALCULATIONS
None. " ..... ': "'
,.
7.0 SPECIFIC qUALI.F.ICAT.ION_-_-., :._:_.- , ., .,.
Thi_ pPocedd_di_"self-_ualifyingdue to dependence on the use of calibrationstandards, It,is based,on,standard,well _ihderstoodmethods,_ See PNL-MA-70,PAPI-70-901, : ,, , '
:3. .
8.0 RECORD_________S
_ Records shall be maintained and controlled so as,to.conform'to requirementsof• the Analytical Chemistry LaboratoryQuality Assurance Plan,MCS-.033. Record
Bo6ks, 'or worksheets/benchsheets, provide a mechanism for Control ofdata andr iOras.'.,. ,::;. , .. ..,
9.0 REEERENCES.
. ' . :"
In.struction"_nualfor meter used.,.
Bate_"' _ R.G, 1973, Determination of pH, Theory and Practice, 2hd Ed. JohnWi.ley,:.&Son:s,,New York,..N.Y. .
US EPA Test M_.thods for Evaluating Solid Waste-Physical/Chemical Methods;SW846, Method 9045.. •.....:
t .L-...., •
I: :,:::::hNL::ALO:2-gG..... Revision No ......0 . -Effective"i_te3/3/93. ' Page 4 of 4 _;..... ,,,,