An Infrared Array Sensor-Based Approach for Activity ... - MDPI
24
Citation: Muthukumar, K.A.; Bouazizi, M.; Ohtsuki, T. An Infrared Array Sensor-Based Approach for Activity Detection, Combining Low-Cost Technology with Advanced Deep Learning Techniques. Sensors 2022, 22, 3898. https:// doi.org/10.3390/s22103898 Academic Editors: Maria de Fátima Domingues, Hugo Plácido da Silva and Damla Turgut Received: 26 April 2022 Accepted: 18 May 2022 Published: 20 May 2022 Publisher’s Note: MDPI stays neutral with regard to jurisdictional claims in published maps and institutional affil- iations. Copyright: © 2022 by the authors. Licensee MDPI, Basel, Switzerland. This article is an open access article distributed under the terms and conditions of the Creative Commons Attribution (CC BY) license (https:// creativecommons.org/licenses/by/ 4.0/). sensors Article An Infrared Array Sensor-Based Approach for Activity Detection, Combining Low-Cost Technology with Advanced Deep Learning Techniques Krishnan Arumugasamy Muthukumar 1 , Mondher Bouazizi 2 and Tomoaki Ohtsuki 2, * 1 Graduate School of Science and Technology, Keio University, Yokohama 223-8522, Japan; [email protected] 2 Faculty of Science and Technology, Keio University, Yokohama 223-8522, Japan; [email protected] * Correspondence: [email protected] Abstract: In this paper, we propose an activity detection system using a 24 × 32 resolution infrared ar- ray sensor placed on the ceiling. We first collect the data at different resolutions (i.e., 24 × 32, 12 × 16, and 6 × 8) and apply the advanced deep learning (DL) techniques of Super-Resolution (SR) and denoising to enhance the quality of the images. We then classify the images/sequences of images depending on the activities the subject is performing using a hybrid deep learning model combining a Convolutional Neural Network (CNN) and a Long Short-Term Memory (LSTM). We use data augmentation to improve the training of the neural networks by incorporating a wider variety of samples. The process of data augmentation is performed by a Conditional Generative Adversarial Network (CGAN). By enhancing the images using SR, removing the noise, and adding more training samples via data augmentation, our target is to improve the classification accuracy of the neural network. Through experiments, we show that employing these deep learning techniques to low- resolution noisy infrared images leads to a noticeable improvement in performance. The classification accuracy improved from 78.32% to 84.43% (for images with 6 × 8 resolution), and from 90.11% to 94.54% (for images with 12 × 16 resolution) when we used the CNN and CNN + LSTM networks, respectively. Keywords: activity detection; deep learning; healthcare; computer vision; low-resolution; infrared array sensor; denoising; super-resolution; CGAN 1. Introduction 1.1. Background A new area of research is being explored: human activity recognition for intelligent healthcare. With the complications of the world’s aging population, this research field is becoming even more prominent. For instance, the elderly population in Japan in 2020 constituted 28.8% of the total population, with over 36.19 million people [1]. The aged population is the most likely to develop chronic and long-term illnesses that worsen with age [2]. Aging with chronic conditions prevents elderly people from living independently. As a result, they are reliant on social care services, such as living in nursing homes. Al- though some nursing systems focusing on monitoring and measuring vital signs related to the physical condition of patients have been developed, some requirements remain unsatisfied, indicating that this research field has broad application prospects. For instance, over the last few years, the demand for non-contact monitoring of human activities has increased steadily. Non-contact activity detection systems have several advantages over ones that rely on wearable devices. In particular, their non-contact nature allows for wireless monitoring that reduces the burden on the elderly and the handicap it might cause. Non-wearable device-based systems, such as ones based on cameras, sensors [3,4], array Sensors 2022, 22, 3898. https://doi.org/10.3390/s22103898 https://www.mdpi.com/journal/sensors
-
Upload
khangminh22 -
Category
Documents
-
view
0 -
download
0
Transcript of An Infrared Array Sensor-Based Approach for Activity ... - MDPI
Citation: Muthukumar, K.A.;
Bouazizi, M.; Ohtsuki, T. An Infrared
Array Sensor-Based Approach for
Activity Detection, Combining
Low-Cost Technology with
Advanced Deep Learning Techniques.
Sensors 2022, 22, 3898. https://
doi.org/10.3390/s22103898
Academic Editors: Maria de Fátima
Domingues, Hugo Plácido da Silva
and Damla Turgut
Received: 26 April 2022
Accepted: 18 May 2022
Published: 20 May 2022
Publisher’s Note: MDPI stays neutral
with regard to jurisdictional claims in
published maps and institutional affil-
iations.
Copyright: © 2022 by the authors.
Licensee MDPI, Basel, Switzerland.
This article is an open access article
distributed under the terms and
conditions of the Creative Commons
Attribution (CC BY) license (https://
creativecommons.org/licenses/by/
4.0/).
sensors
Article
An Infrared Array Sensor-Based Approach for ActivityDetection, Combining Low-Cost Technology with AdvancedDeep Learning TechniquesKrishnan Arumugasamy Muthukumar 1 , Mondher Bouazizi 2 and Tomoaki Ohtsuki 2,*
1 Graduate School of Science and Technology, Keio University, Yokohama 223-8522, Japan;[email protected]
2 Faculty of Science and Technology, Keio University, Yokohama 223-8522, Japan;[email protected]
* Correspondence: [email protected]
Abstract: In this paper, we propose an activity detection system using a 24× 32 resolution infrared ar-ray sensor placed on the ceiling. We first collect the data at different resolutions (i.e., 24 × 32, 12 × 16,and 6 × 8) and apply the advanced deep learning (DL) techniques of Super-Resolution (SR) anddenoising to enhance the quality of the images. We then classify the images/sequences of imagesdepending on the activities the subject is performing using a hybrid deep learning model combininga Convolutional Neural Network (CNN) and a Long Short-Term Memory (LSTM). We use dataaugmentation to improve the training of the neural networks by incorporating a wider variety ofsamples. The process of data augmentation is performed by a Conditional Generative AdversarialNetwork (CGAN). By enhancing the images using SR, removing the noise, and adding more trainingsamples via data augmentation, our target is to improve the classification accuracy of the neuralnetwork. Through experiments, we show that employing these deep learning techniques to low-resolution noisy infrared images leads to a noticeable improvement in performance. The classificationaccuracy improved from 78.32% to 84.43% (for images with 6 × 8 resolution), and from 90.11% to94.54% (for images with 12 × 16 resolution) when we used the CNN and CNN + LSTM networks,respectively.
Keywords: activity detection; deep learning; healthcare; computer vision; low-resolution; infraredarray sensor; denoising; super-resolution; CGAN
1. Introduction1.1. Background
A new area of research is being explored: human activity recognition for intelligenthealthcare. With the complications of the world’s aging population, this research fieldis becoming even more prominent. For instance, the elderly population in Japan in 2020constituted 28.8% of the total population, with over 36.19 million people [1]. The agedpopulation is the most likely to develop chronic and long-term illnesses that worsen withage [2]. Aging with chronic conditions prevents elderly people from living independently.As a result, they are reliant on social care services, such as living in nursing homes. Al-though some nursing systems focusing on monitoring and measuring vital signs relatedto the physical condition of patients have been developed, some requirements remainunsatisfied, indicating that this research field has broad application prospects.
For instance, over the last few years, the demand for non-contact monitoring of humanactivities has increased steadily. Non-contact activity detection systems have several advantagesover ones that rely on wearable devices. In particular, their non-contact nature allows forwireless monitoring that reduces the burden on the elderly and the handicap it might cause.Non-wearable device-based systems, such as ones based on cameras, sensors [3,4], array
Sensors 2022, 22, 3898. https://doi.org/10.3390/s22103898 https://www.mdpi.com/journal/sensors

Sensors 2022, 22, 3898 2 of 24
antenna [5], Light Detection and Ranging (LiDAR) [6], Wi-Fi [7], and other similar devices,require these devices to be strategically placed in certain locations for an effective monitoringof the elderly’s activities. That being said, non-wearable devices have their own shortcomingsand limitations, including privacy concerns and coverage issues.
With the development of low-cost sensing technologies, several of these issues have beenaddressed. For instance, the recent introduction of the wide-angle infrared (IR) array sensorhelped develop device-free monitoring solutions that avoid most of the aforementioned issues.In the research related to human activity detection, two types of infrared sensors are used:pyroelectric infrared sensor (PIS) [8] and thermophile infrared array sensor [9,10]. The PIS isonly capable of detecting the motion-type of human activities (i.e., activity where the person orpart of their body is moving). It is not capable of detecting static human activities (e.g., whenthey are sitting still, standing, or laying) [11]. The thermophile IR array sensor quantifies thetemperature distribution within the field of view. It is capable of detecting static and dynamichuman activities, providing us with an understanding of the surrounding environment andpertinent data. Furthermore, low-resolution thermopile infrared sensors have the advantagesof being small in size, low in cost, and simple to install. As a result, numerous studies haveused such sensors for human activity detection, position detection, counting the number ofpeople [12–16] in a room, etc.
1.2. Related Work
Device-free approaches for activity detection have attracted more attention over thelast few years. Most of them still rely on conventional machine learning techniques. In [3,4],Mashiyama et al. proposed two similar approaches for activity detection and fall detection,respectively. In their work, they used a single IR array sensor (8 × 8 pixels) attached to theceiling to collect the data with a fixed time window. No processing was performed on thedata. However, they manually engineered four features and used them to train k-nearestneighbors (k-NN) and Support Vector Machine (SVM) classifiers, allowing them to achieve94% accuracy. Due to the extremely high noise from the LR sensor used (8 × 8 pixels),the values for the extracted features present a high level of error. Kobayashi et al. [17]addressed some of the limitations of these works by introducing a few new features andusing two sensors simultaneously, improving the overall activity detection above 90%.That being said, in their work, the authors did not address the noise issue and tested theirapproach in a single environment.
Javier et al. [18] proposed an approach for fall detection that relies on a single IR arraysensor with a 32 × 31 resolution installed on the ceiling. In their work, the authors usedconventional data augmentation techniques such as rotating and cropping the image toimprove the classification accuracy up to 92%. However, due to how neural networksprocess the data, conventional techniques of data augmentation, such as the ones proposedhere, have very little effect, thus leading to poor performance enhancement.
Matthew et al. [19] proposed an unobtrusive pose recognition using five IR arraysensors with a 32 × 31 resolution. The data are collected and classified using a CNN. Intheir work, the authors analyzed the performance of classification of data collected by theindividual sensors, as well as their combination. They achieved an overall F1 score equalto 92%. This work did not perform the classification by taking into account the temporalchanges in the collected frames due to activities. Nevertheless, they used five sensors,which makes it a relatively expensive solution to justify the marginal improvements inperformance.
Tianfu et al. [20] proposed a human action recognition approach using two IR arraysensors. The collected data go through a set of pre-processing operations, such as quantifi-cation, time-domain filtering, and background removal. The classification was performedby a Convolutional Neural Network (CNN) and achieved an accuracy of 96.73%. However,this method fails to detect the person when (s)he is near the edges of coverage of the sensor.This is mainly due to the blurriness and noise in the images.
Sensors 2022, 22, 3898 3 of 24
Miguel et al. [21] proposed a fall detection system using two IR array sensors: onehaving a High Resolution (HR) and the other having a Low Resolution (LR). The collectedthermal data are in a fuzzy representation; the activities are classified using CNNs andthe achieved accuracy is equal to 94.3%. In their work, the authors used a traditional dataaugmentation method to improve the classification accuracy by rotating and cropping theimages. However, the authors did not combine the data, nor did they perform the sequencedata classification. Furthermore, they did not consider removing the noise or enhancingthe resolution of the images.
Tateno et al. [22] proposed a fall detection system using one IR array sensor placedon the ceiling. The data was pre-processed by applying noise removal and backgroundsubtraction, and activities were classified using a 3D-CNN and a 3D-Long Short-TermMemory (LSTM) separately. The highest classification accuracy reached 98.8% and 94.9%,respectively. Despite its high accuracy, this approach has not been proven to be robust as theauthors did not run classification on unknown test data taken in a different environment.Furthermore, the authors used Gaussian filtering for noise removal, which is a linearsmoothing filter that results in information loss.
In [23], Muthukumar et al. proposed an approach for activity detection that makesuse of two IR array sensors attached to the ceiling and to the wall. The two sensors collectthe data simultaneously, and their generated frames are processed together using CNNand LSTM. The CNN and LSTM were trained to perform a classification task to detect thesubject’s activity. This approach achieved an accuracy of 97%. However, in their work,the authors used the raw data collected from the sensors for the classification. Such datainclude noisy, blurry, and distorted images, from which it is hard to identify the activitycorrectly in some extreme cases. While the use of the combination of data and the intensiveexperiments were enough to address the image distortion problem, the authors did notaddress other issues such as the blurriness and large amount of noise present.
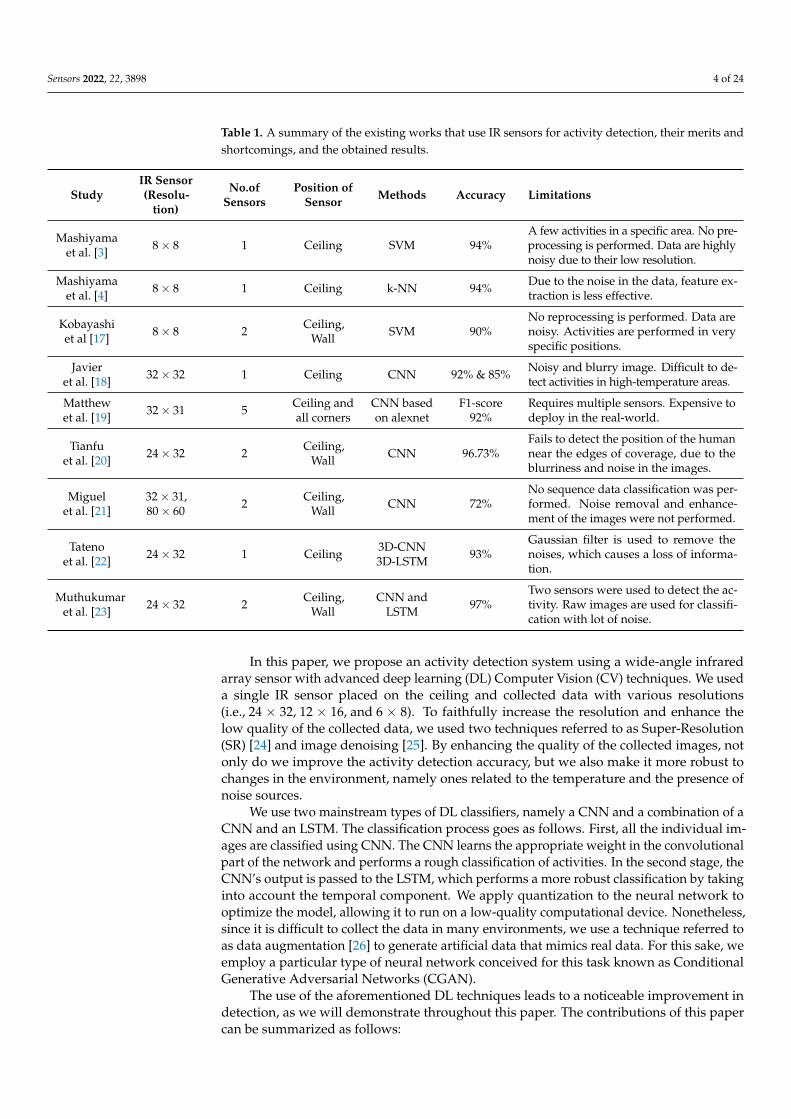
A summary of the approaches described above as well as the merits and shortcomingsof each is given in Table 1. As can be seen, most of the existing work did not address issuesrelated to the noise in the data collected and works well only in particular environments.Another common limitation is the high computational and deployment cost required forsome of these approaches. In addition, many of the works use two or more sensors toachieve the high performance, which, again, is expensive for real-world deployment.
1.3. Motivation
Most of the state-of-the-art work related to the detection of activities relies heavily on amultitude of sensors and is restricted by environmental conditions. Such activity detectionsystems are less effective when deployed in new, unseen environments. Nevertheless,these works, for the most part, ignore the effect of noise and image distortion on theirperformance. This is a key point to address as the noise level in low-resolution IR imagesis relatively high. It has a significant impact on the detection of activity. This presentsthe motivation for us to conduct this work. The current work is part of a larger project todevelop a fully functional system to monitor activity [13]. In addition, it is a continuationof the research that was previously published in [12,13,23].
Sensors 2022, 22, 3898 4 of 24
Table 1. A summary of the existing works that use IR sensors for activity detection, their merits andshortcomings, and the obtained results.
StudyIR Sensor(Resolu-
tion)
No.ofSensors
Position ofSensor Methods Accuracy Limitations
Mashiyamaet al. [3] 8× 8 1 Ceiling SVM 94%
A few activities in a specific area. No pre-processing is performed. Data are highlynoisy due to their low resolution.
Mashiyamaet al. [4] 8× 8 1 Ceiling k-NN 94% Due to the noise in the data, feature ex-
traction is less effective.
Kobayashiet al [17] 8× 8 2 Ceiling,
Wall SVM 90%No reprocessing is performed. Data arenoisy. Activities are performed in veryspecific positions.
Javieret al. [18] 32× 32 1 Ceiling CNN 92% & 85% Noisy and blurry image. Difficult to de-
tect activities in high-temperature areas.
Matthewet al. [19] 32× 31 5 Ceiling and
all cornersCNN basedon alexnet
F1-score92%
Requires multiple sensors. Expensive todeploy in the real-world.
Tianfuet al. [20] 24× 32 2 Ceiling,
Wall CNN 96.73%Fails to detect the position of the humannear the edges of coverage, due to theblurriness and noise in the images.
Miguelet al. [21]
32× 31,80× 60 2 Ceiling,
Wall CNN 72%No sequence data classification was per-formed. Noise removal and enhance-ment of the images were not performed.
Tatenoet al. [22] 24× 32 1 Ceiling 3D-CNN
3D-LSTM 93%Gaussian filter is used to remove thenoises, which causes a loss of informa-tion.
Muthukumaret al. [23] 24× 32 2 Ceiling,
WallCNN and
LSTM 97%Two sensors were used to detect the ac-tivity. Raw images are used for classifi-cation with lot of noise.
In this paper, we propose an activity detection system using a wide-angle infraredarray sensor with advanced deep learning (DL) Computer Vision (CV) techniques. We useda single IR sensor placed on the ceiling and collected data with various resolutions(i.e., 24 × 32, 12 × 16, and 6 × 8). To faithfully increase the resolution and enhance thelow quality of the collected data, we used two techniques referred to as Super-Resolution(SR) [24] and image denoising [25]. By enhancing the quality of the collected images, notonly do we improve the activity detection accuracy, but we also make it more robust tochanges in the environment, namely ones related to the temperature and the presence ofnoise sources.
We use two mainstream types of DL classifiers, namely a CNN and a combination of aCNN and an LSTM. The classification process goes as follows. First, all the individual im-ages are classified using CNN. The CNN learns the appropriate weight in the convolutionalpart of the network and performs a rough classification of activities. In the second stage, theCNN’s output is passed to the LSTM, which performs a more robust classification by takinginto account the temporal component. We apply quantization to the neural network tooptimize the model, allowing it to run on a low-quality computational device. Nonetheless,since it is difficult to collect the data in many environments, we use a technique referred toas data augmentation [26] to generate artificial data that mimics real data. For this sake, weemploy a particular type of neural network conceived for this task known as ConditionalGenerative Adversarial Networks (CGAN).
The use of the aforementioned DL techniques leads to a noticeable improvement indetection, as we will demonstrate throughout this paper. The contributions of this papercan be summarized as follows:
Sensors 2022, 22, 3898 5 of 24
1. We propose a lightweight DL model for activity classification that is robust to environ-mental changes. Being lightweight, such a model can run on devices with very lowcomputation capabilities, making it a base for a cheap solution for activity detection.
2. We apply SR techniques to LR data (i.e., 12 × 16 and 6 × 8) to reconstruct HR images(i.e., 24 × 32) from lower resolution ones.
3. We use a denoising technique that requires no training to remove noise from the IRimage, which significantly improves classification performance.
4. We use an advanced data augmentation technique known as CGAN to generatesynthetic data. The generated data are used as part of the training set to improvethe training of the networks and generate more accurate models that are robust toenvironmental changes.
5. We demonstrate that it is possible to use the LR data to achieve classification performancethat is nearly identical to that of the classification of the HR data, namely 24 × 32.
The remainder of this paper is structured as follows. In Section 2, we describe in detailour proposed system and its different components, as well as our experimental setup. InSection 3, we describe the neural network architecture used for the classification, whichallows for the judgment of the contributions of each of the introduced components. InSection 4, we present the results obtained by running the classification with different com-binations of pre-processing. In Section 5, the main findings and possible future directionsto further improve the performance of the proposed model are discussed. Finally, weconclude this work in Section 6.
2. Experiment Specifications2.1. Device Specifications
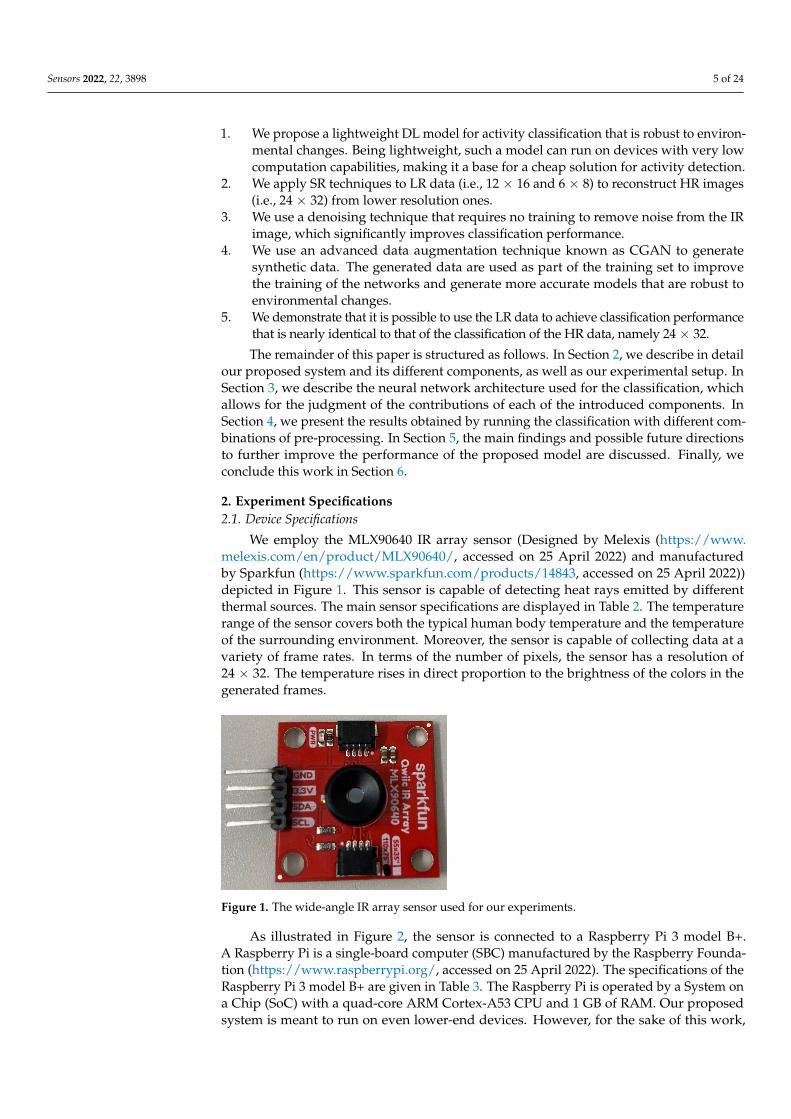
We employ the MLX90640 IR array sensor (Designed by Melexis (https://www.melexis.com/en/product/MLX90640/, accessed on 25 April 2022) and manufacturedby Sparkfun (https://www.sparkfun.com/products/14843, accessed on 25 April 2022))depicted in Figure 1. This sensor is capable of detecting heat rays emitted by differentthermal sources. The main sensor specifications are displayed in Table 2. The temperaturerange of the sensor covers both the typical human body temperature and the temperatureof the surrounding environment. Moreover, the sensor is capable of collecting data at avariety of frame rates. In terms of the number of pixels, the sensor has a resolution of24 × 32. The temperature rises in direct proportion to the brightness of the colors in thegenerated frames.
Figure 1. The wide-angle IR array sensor used for our experiments.
As illustrated in Figure 2, the sensor is connected to a Raspberry Pi 3 model B+.A Raspberry Pi is a single-board computer (SBC) manufactured by the Raspberry Founda-tion (https://www.raspberrypi.org/, accessed on 25 April 2022). The specifications of theRaspberry Pi 3 model B+ are given in Table 3. The Raspberry Pi is operated by a System ona Chip (SoC) with a quad-core ARM Cortex-A53 CPU and 1 GB of RAM. Our proposedsystem is meant to run on even lower-end devices. However, for the sake of this work,

Sensors 2022, 22, 3898 6 of 24
we run our experiments on the Raspberry Pi for its ease of operation and user-friendlyoperating system (OS).
Table 2. The technical specifications of the sensor.
IR Sensor Model Qwiic IR Array MLX90640
Camera 1
Voltage 3.3 V
Temperature range of targets −40 ◦C∼85 ◦C
Number of pixels 24 × 32, 12 × 16, 6 × 8
Viewing angle 110◦ × 75◦
Frame rate 8 frames/second
Table 3. The technical specifications of the SBC used.
Embedded SBC Raspberry Pi 3 Model B+
SoC Broadcom BCM2837B0, Cortex-A53 (ARMv8) 64-bit SoC
CPU 1.4GHz 64-bit quad-core ARM Cortex-A53 CPU
RAM 1GB LPDDR2
OS Ubuntu Mate
Power input 5 V/2.5 A (12.5 W)
Connectivity to the sensor Inter-Integrated Circuit (I2C) serial bus
I2C transmission rate 3.4 Mbps
Figure 2. An image of the Rasberry Pi 3+ with the camera and IR sensors attached, which we used tocollect data.
In addition to the sensor, a camera is connected to the Raspberry Pi to record a videoof the same event as the sensor simultaneously. The videos collected by the camera serve asthe ground truth for the data collected by the sensors, allowing for easy annotation of theIR frames. While we have made sure to align the camera to the sensors on one axis and havethem away from one another with a distance equal to 3 cm on the other axis using theirrespective boards, the alignment is not mandatory for our experiments. This is becausethe RGB camera is used only for the annotation of the frames, and the only constraint thatneeds to be satisfied is that its coverage is larger or equal to that of the IR sensor, whichis indeed the case. The annotation process goes as follows: The annotator watches theframes captured by the camera and labels the frames accordingly. Since the IR sensor andthe camera capture the data at the same frame rate, with negligible delay (if any), the IRsensor frames will have the exact same labels as their RGB counterparts. For example, ifthe annotator judges that the participants in RGB frames from 800 to 1000 are walking,

Sensors 2022, 22, 3898 7 of 24
this label (walking) is attributed to the IR frames from 800 to 1000 as well. We assembledthe device and placed it on the ceiling. The sensor and the camera both collect the dataat 8 frames per second (FPS) and store the collected frames on an SD card installed in theRaspberry Pi.
2.2. Environment
As described above, the system is built and attached to the ceiling at a height h equalto 2.6 m. The dimensions of the room and the process by which the various measurementsare extracted are depicted in Figure 3.
Detection range 110°× 75°
h =2.60 m
l = 2 . h . tan (110°/2)l′ = α1 . l
w′ = α2 . w
w = 2 . h . tan (75°/2)
Infrared Array Sensor
Figure 3. The experiment area and its dimensions.
The sensor has a wide-angle lens covering on one axis 110◦, and on the other, it covers75◦ (we refer to the two angles as θ1 and θ2, respectively). A rectangular coverage of thefollowing dimensions l and w was obtained at the floor level as a result.
l = 2 · h · tan(
θ1
2
)(1)
w = 2 · h · tan(
θ2
2
)(2)
According to the above equations, l and w are equal to 7.00 and 3.90 m, respectively.Figure 3 depicts a simplified image of a person standing at the edge of the coverage area.We can clearly see that the upper half of the body is not covered. As a result, identifying theactivity (s)he would be performing when (s)he is near the edge of the measured coveragearea is very difficult. Therefore, we use two coefficients α1 and α2 to obtain a more realisticcoverage area, which is obviously smaller than the theoretical one measured at ground level.The empirical values of α1 = 0.81 and α2 = 0.75 are used. This practical coverage area’slength and width are l′= 5.67 and w′= 2.92 m, respectively.
We conducted our experiments in three separate locations.
• The first room is a small, closed space with only one window that lets in little light.The temperature in the room has been set to 24 ◦C.
• The second room is larger, brighter, and equipped with an air conditioner whosetemperature is set to 22 ◦C.
• In comparison to the other rooms, the third room is a little dark, and its air conditionertemperature is set to 24 ◦C.
Some samples of the data collected in different environments with different resolutionsare shown in Figure 4.
People of various ages and both males and females, participated in the experiments.For each experiment, a single subject was asked to engage in a variety of activities for atotal of five minutes in a particular environment. The sensor collects data, which we later

Sensors 2022, 22, 3898 8 of 24
use for classification. We managed to run several experiments and gathered enough data totrain and evaluate the proposed approach.
First Room Second Room Third Room
24×32
12×16
6×8
Figure 4. Some samples of the raw data collected in different environments with different resolutions(The red color in the image shows the human body temperature it represents the person in the room).
2.3. Framework
A flowchart of the overall framework is shown in Figure 5. The data collected bythe sensor have 24 × 32, 12 × 16, and 6 × 8 resolutions. We apply the SR and denoisingtechniques to the LR data. The HR data of 24 × 32 was used to generate synthetic datausing CGAN to diversify the samples and cover potentially important missing samples.The synthetic data are used to train the CNN model. We classify the individual framesusing a CNN. The output of the CNN was passed to the LSTM with a time window sizeof five frames to improve the classification accuracy. Finally, we compare all the dataclassification performances.
24 ×32 12 ×16 6 ×8
Raw Sensor Data
Denoising ConditionalGAN
SuperResolution
CNN TrainModel
LSTM EvaluateModel
CNN EvaluateModel
LSTM TrainModel
Figure 5. A flowchart of the proposed system.
Sensors 2022, 22, 3898 9 of 24
3. Detailed System Architecture and Description3.1. Data Collection
The experiments were conducted as explained in Section 2.2, and data were collectedfor all the experiments run. In total, we collected 12 scenarios of data. Each scenario lastsfor five minutes. The camera and the sensor both collected data at 8 frames per second.
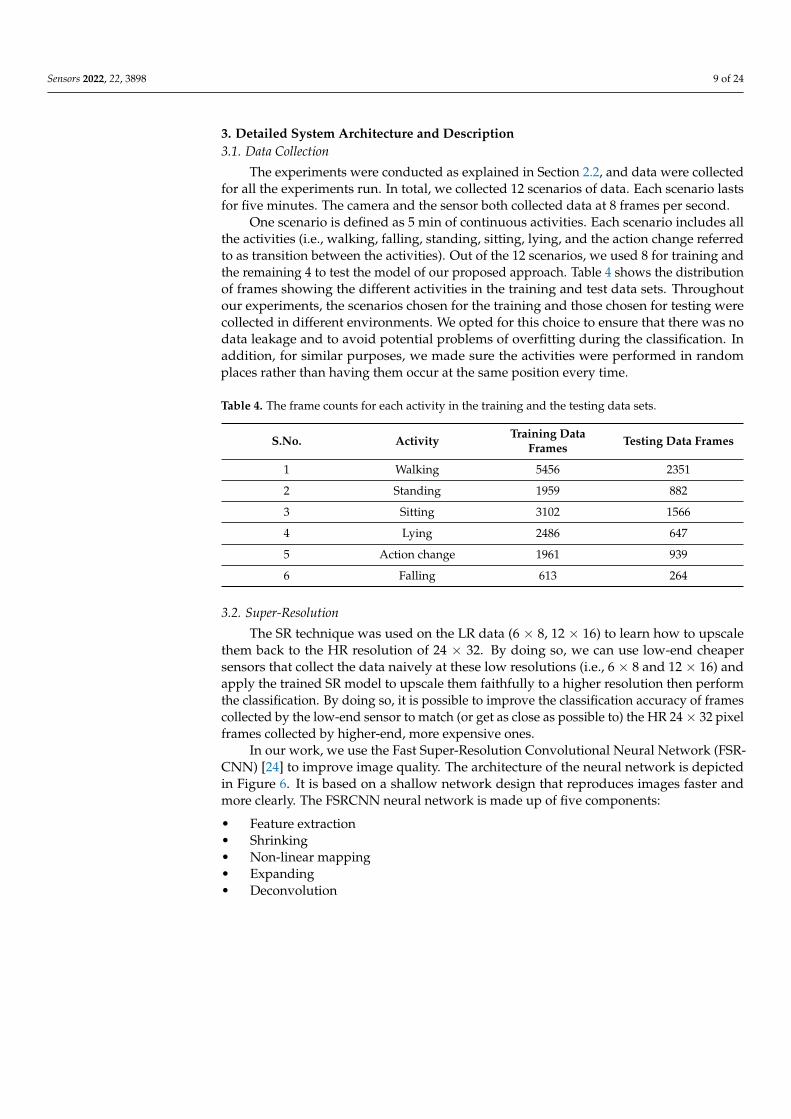
One scenario is defined as 5 min of continuous activities. Each scenario includes allthe activities (i.e., walking, falling, standing, sitting, lying, and the action change referredto as transition between the activities). Out of the 12 scenarios, we used 8 for training andthe remaining 4 to test the model of our proposed approach. Table 4 shows the distributionof frames showing the different activities in the training and test data sets. Throughoutour experiments, the scenarios chosen for the training and those chosen for testing werecollected in different environments. We opted for this choice to ensure that there was nodata leakage and to avoid potential problems of overfitting during the classification. Inaddition, for similar purposes, we made sure the activities were performed in randomplaces rather than having them occur at the same position every time.
Table 4. The frame counts for each activity in the training and the testing data sets.
S.No. Activity Training DataFrames Testing Data Frames
1 Walking 5456 2351
2 Standing 1959 882
3 Sitting 3102 1566
4 Lying 2486 647
5 Action change 1961 939
6 Falling 613 264
3.2. Super-Resolution
The SR technique was used on the LR data (6 × 8, 12 × 16) to learn how to upscalethem back to the HR resolution of 24 × 32. By doing so, we can use low-end cheapersensors that collect the data naively at these low resolutions (i.e., 6 × 8 and 12 × 16) andapply the trained SR model to upscale them faithfully to a higher resolution then performthe classification. By doing so, it is possible to improve the classification accuracy of framescollected by the low-end sensor to match (or get as close as possible to) the HR 24× 32 pixelframes collected by higher-end, more expensive ones.
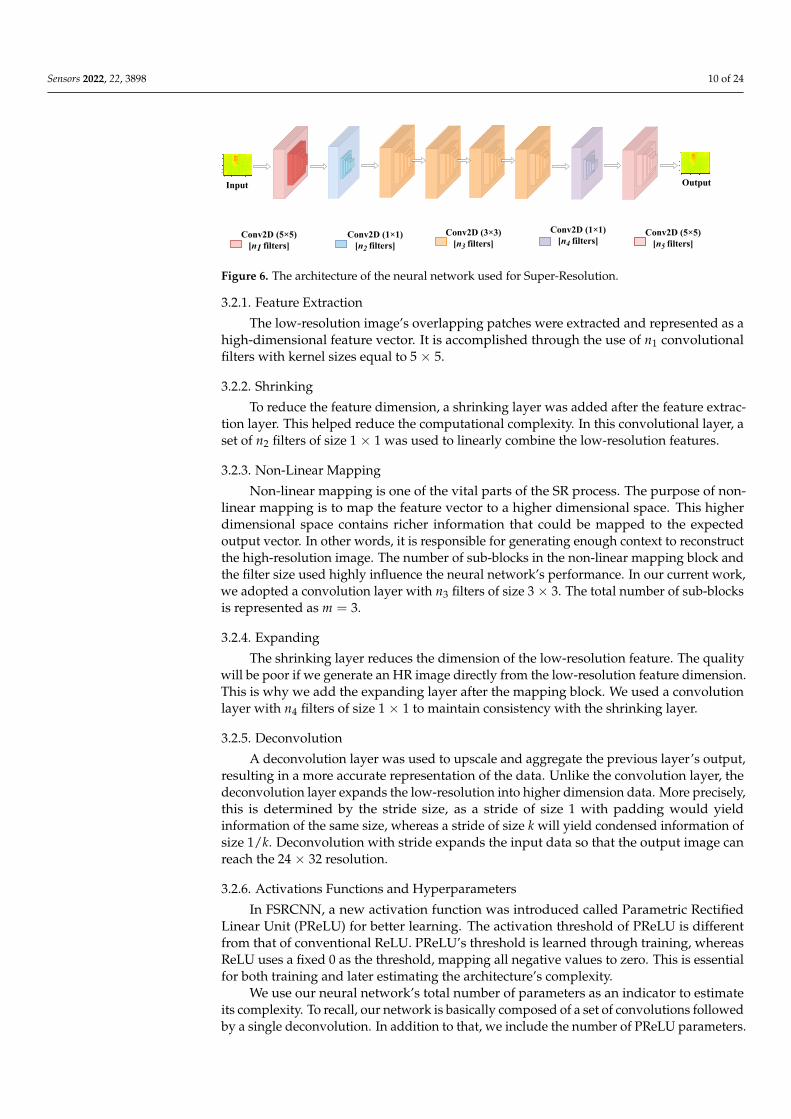
In our work, we use the Fast Super-Resolution Convolutional Neural Network (FSR-CNN) [24] to improve image quality. The architecture of the neural network is depictedin Figure 6. It is based on a shallow network design that reproduces images faster andmore clearly. The FSRCNN neural network is made up of five components:
• Feature extraction• Shrinking• Non-linear mapping• Expanding• Deconvolution
Sensors 2022, 22, 3898 10 of 24
Conv2D (5×5)[n1 filters]
Input Output
Conv2D (5×5)[n5 filters]
Conv2D (1×1)[n2 filters]
Conv2D (3×3)[n3 filters]
Conv2D (1×1)[n4 filters]
Figure 6. The architecture of the neural network used for Super-Resolution.
3.2.1. Feature Extraction
The low-resolution image’s overlapping patches were extracted and represented as ahigh-dimensional feature vector. It is accomplished through the use of n1 convolutionalfilters with kernel sizes equal to 5 × 5.
3.2.2. Shrinking
To reduce the feature dimension, a shrinking layer was added after the feature extrac-tion layer. This helped reduce the computational complexity. In this convolutional layer, aset of n2 filters of size 1 × 1 was used to linearly combine the low-resolution features.
3.2.3. Non-Linear Mapping
Non-linear mapping is one of the vital parts of the SR process. The purpose of non-linear mapping is to map the feature vector to a higher dimensional space. This higherdimensional space contains richer information that could be mapped to the expectedoutput vector. In other words, it is responsible for generating enough context to reconstructthe high-resolution image. The number of sub-blocks in the non-linear mapping block andthe filter size used highly influence the neural network’s performance. In our current work,we adopted a convolution layer with n3 filters of size 3 × 3. The total number of sub-blocksis represented as m = 3.
3.2.4. Expanding
The shrinking layer reduces the dimension of the low-resolution feature. The qualitywill be poor if we generate an HR image directly from the low-resolution feature dimension.This is why we add the expanding layer after the mapping block. We used a convolutionlayer with n4 filters of size 1 × 1 to maintain consistency with the shrinking layer.
3.2.5. Deconvolution
A deconvolution layer was used to upscale and aggregate the previous layer’s output,resulting in a more accurate representation of the data. Unlike the convolution layer, thedeconvolution layer expands the low-resolution into higher dimension data. More precisely,this is determined by the stride size, as a stride of size 1 with padding would yieldinformation of the same size, whereas a stride of size k will yield condensed information ofsize 1/k. Deconvolution with stride expands the input data so that the output image canreach the 24 × 32 resolution.
3.2.6. Activations Functions and Hyperparameters
In FSRCNN, a new activation function was introduced called Parametric RectifiedLinear Unit (PReLU) for better learning. The activation threshold of PReLU is differentfrom that of conventional ReLU. PReLU’s threshold is learned through training, whereasReLU uses a fixed 0 as the threshold, mapping all negative values to zero. This is essentialfor both training and later estimating the architecture’s complexity.
We use our neural network’s total number of parameters as an indicator to estimateits complexity. To recall, our network is basically composed of a set of convolutions followedby a single deconvolution. In addition to that, we include the number of PReLU parameters.
Sensors 2022, 22, 3898 11 of 24
To measure the total number of parameters of the neural network, we use the followingequations that measure the total number of parameters in a convolution layer (Csr), and theparameter in the PReLU layer (Asr):
Csr = ((m · n · p) + 1) · k, (3)
Asr = h · w · k, (4)
where m and n are the width and height of each filter, respectively, p is the number ofchannels, k is the number of filters used in the layer, and h and w are the input image’sheight and width, respectively.
As a result, the total number of parameters in the network is 21,745 for the 8 × 6 inputimages and 47,089 for the 16 × 12 input images.
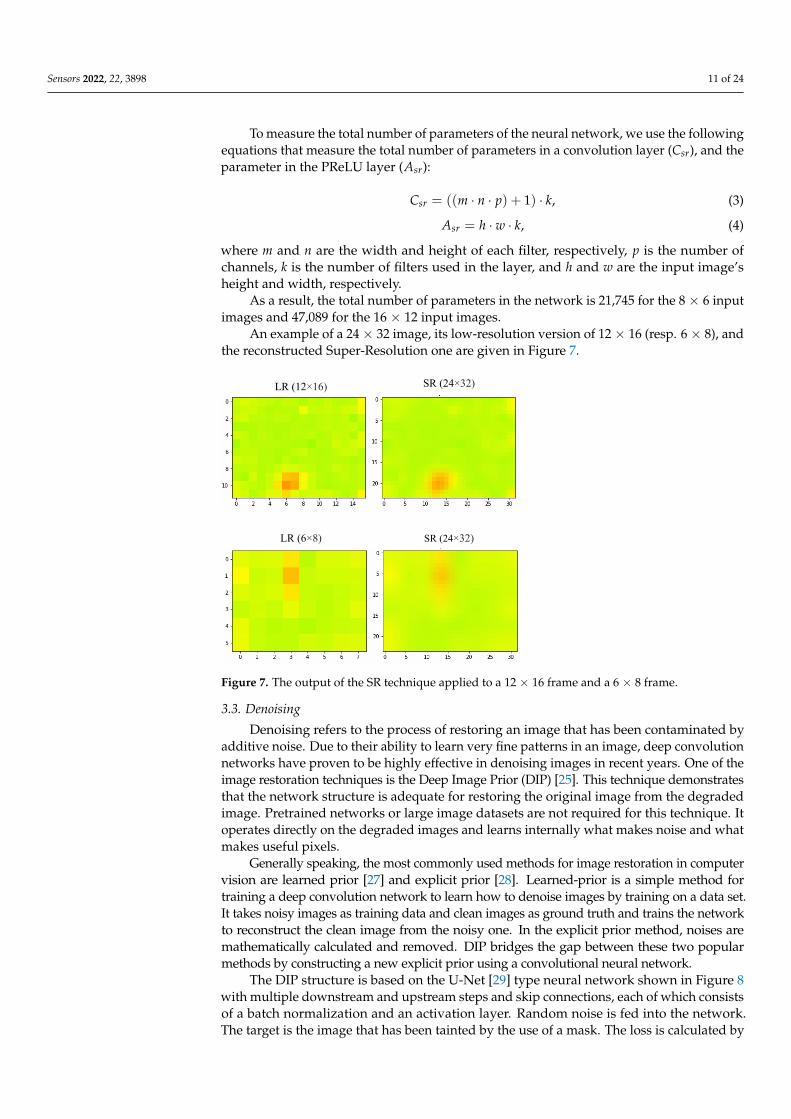
An example of a 24 × 32 image, its low-resolution version of 12 × 16 (resp. 6 × 8), andthe reconstructed Super-Resolution one are given in Figure 7.
LR (12×16) SR (24×32)
LR (6×8) SR (24×32)
Figure 7. The output of the SR technique applied to a 12 × 16 frame and a 6 × 8 frame.
3.3. Denoising
Denoising refers to the process of restoring an image that has been contaminated byadditive noise. Due to their ability to learn very fine patterns in an image, deep convolutionnetworks have proven to be highly effective in denoising images in recent years. One of theimage restoration techniques is the Deep Image Prior (DIP) [25]. This technique demonstratesthat the network structure is adequate for restoring the original image from the degradedimage. Pretrained networks or large image datasets are not required for this technique. Itoperates directly on the degraded images and learns internally what makes noise and whatmakes useful pixels.
Generally speaking, the most commonly used methods for image restoration in computervision are learned prior [27] and explicit prior [28]. Learned-prior is a simple method fortraining a deep convolution network to learn how to denoise images by training on a data set.It takes noisy images as training data and clean images as ground truth and trains the networkto reconstruct the clean image from the noisy one. In the explicit prior method, noises aremathematically calculated and removed. DIP bridges the gap between these two popularmethods by constructing a new explicit prior using a convolutional neural network.
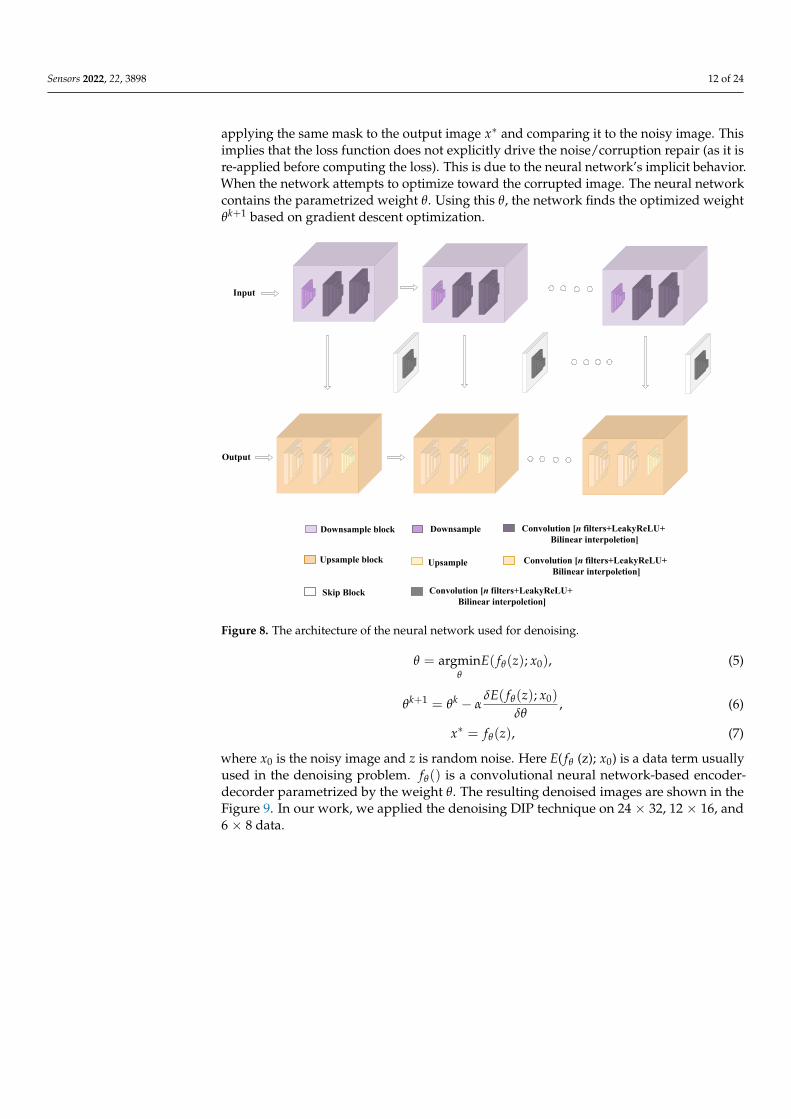
The DIP structure is based on the U-Net [29] type neural network shown in Figure 8with multiple downstream and upstream steps and skip connections, each of which consistsof a batch normalization and an activation layer. Random noise is fed into the network.The target is the image that has been tainted by the use of a mask. The loss is calculated by
Sensors 2022, 22, 3898 12 of 24
applying the same mask to the output image x∗ and comparing it to the noisy image. Thisimplies that the loss function does not explicitly drive the noise/corruption repair (as it isre-applied before computing the loss). This is due to the neural network’s implicit behavior.When the network attempts to optimize toward the corrupted image. The neural networkcontains the parametrized weight θ. Using this θ, the network finds the optimized weightθk+1 based on gradient descent optimization.
Input
Output
Upsample block
Downsample block Convolution [n filters+LeakyReLU+ Bilinear interpoletion]
Downsample
Upsample Convolution [n filters+LeakyReLU+ Bilinear interpoletion]
Skip Block Convolution [n filters+LeakyReLU+ Bilinear interpoletion]
Figure 8. The architecture of the neural network used for denoising.
θ = argminθ
E( fθ(z); x0), (5)
θk+1 = θk − αδE( fθ(z); x0)
δθ, (6)
x∗ = fθ(z), (7)
where x0 is the noisy image and z is random noise. Here E( fθ (z); x0) is a data term usuallyused in the denoising problem. fθ() is a convolutional neural network-based encoder-decorder parametrized by the weight θ. The resulting denoised images are shown in theFigure 9. In our work, we applied the denoising DIP technique on 24 × 32, 12 × 16, and6 × 8 data.

Sensors 2022, 22, 3898 13 of 24
Original image Original imageOriginal image
Denoised imageDenoised image Denoised image
Figure 9. The output of denoising technique applied to 24 × 32, 12 × 16, and 6 × 8 frames.
3.4. Conditional Generative Adversarial Network (CGAN)
When training neural networks, a common technique referred to as “data augmentation”is used to address some of the issues related to the nature and amount of data used for training.Data augmentation refers to the process of generating artificial (or synthetic) data to enlarge thesize of the training set. The synthetic data improve the classification result and strengthen thesystem’s ability to work in various environments. The most advanced deep learning techniquefor data augmentation is the Conditional Generative Adversarial Neural Network (CGAN) [26].CGAN is a generative model for supervised learning. The labeled data are used to train andgenerate synthetic data based on the number of classes. The CGAN structure is comprisedof two neural networks: a generator G and a discriminator D, as depicted in Figure 10. x isthe real image, and pdata(x) and pz(z) denote the distribution of the real and the syntheticsamples, respectively. A random noise z is taken from prior distributions with the label yand is used as an input to the generator known as a latent vector ((z | y) ∼ pz(z | y)). Thegenerator aims to create, out of the input noise, samples with a more complex distributionG(z | y) that are similar to that of the real ones (i.e., x) for the given class y. (x | y) and (z | y)are the real image with label and random noise with label, respectively. In the meantime,the discriminator should distinguish between real samples ((x | y) ∼ pdata(x | y)) and thegenerated samples (G(z | y) ∼ pz(z | y)). Backpropagation optimizations are used to trainboth networks, and they are completely independent of one another. The optimization of thegenerator is performed using the discriminator’s predictions about the samples it generated.The discriminator is trained using the generator’s synthetic data. This optimization usesCGANs’ training cost function, min–max loss, as shown in the equation below.
minGmaxD = Ex∼pdata(x)[log(D(x|y))] + Ez∼pz(z)[log(1− D(z|y))] (8)
Trainingdata
Real data
Priordistribution
Generator (G)
Syntheticdata
G(z|y)
Latent vector
Discriminiator (D)
Cost function
Real (Probability)
Logistic function
Class label
x~pdata (x)
z~pz (z)
D(x|y)
Figure 10. The architecture of data augmentation technique (CGAN).
Sensors 2022, 22, 3898 14 of 24
After several iterations of the two training techniques described above, the generatorlearns to generate more sophisticated samples that do resemble the real ones, and thediscriminator learns how to identify the slight variation between the real and synthetic data.To reduce the cost function of each network and optimize its internal weights, a gradientstep with backpropagation is performed at each iteration.
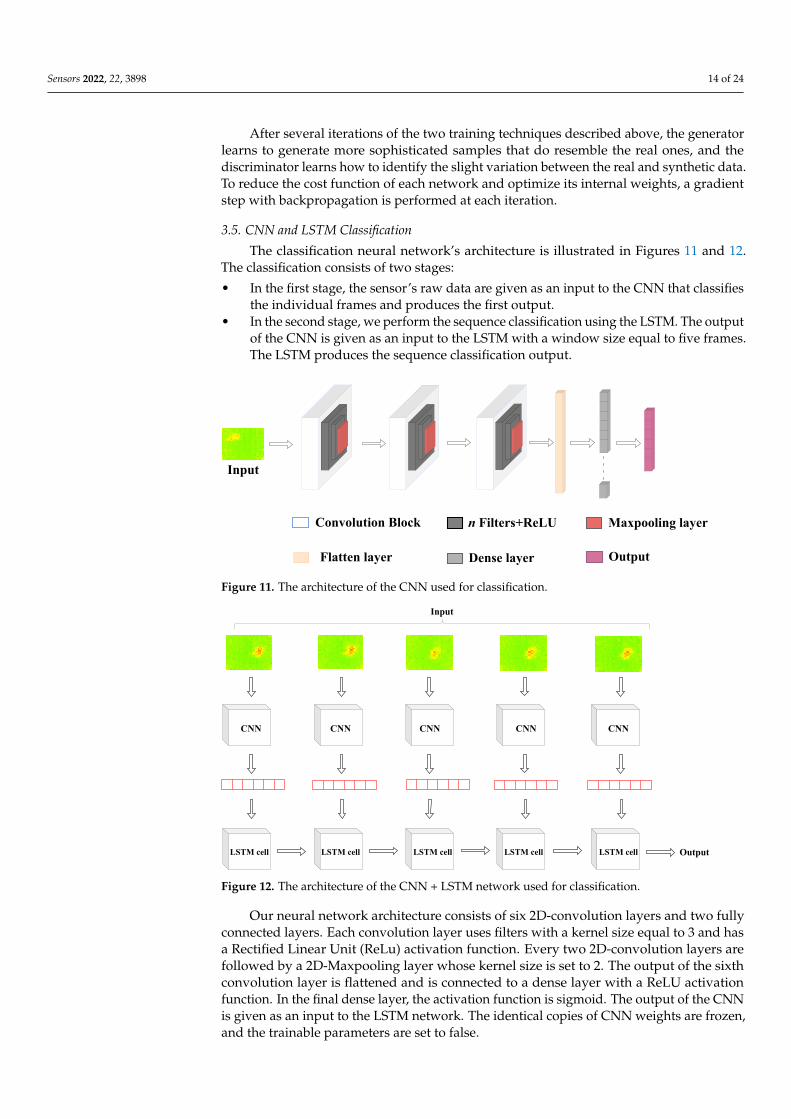
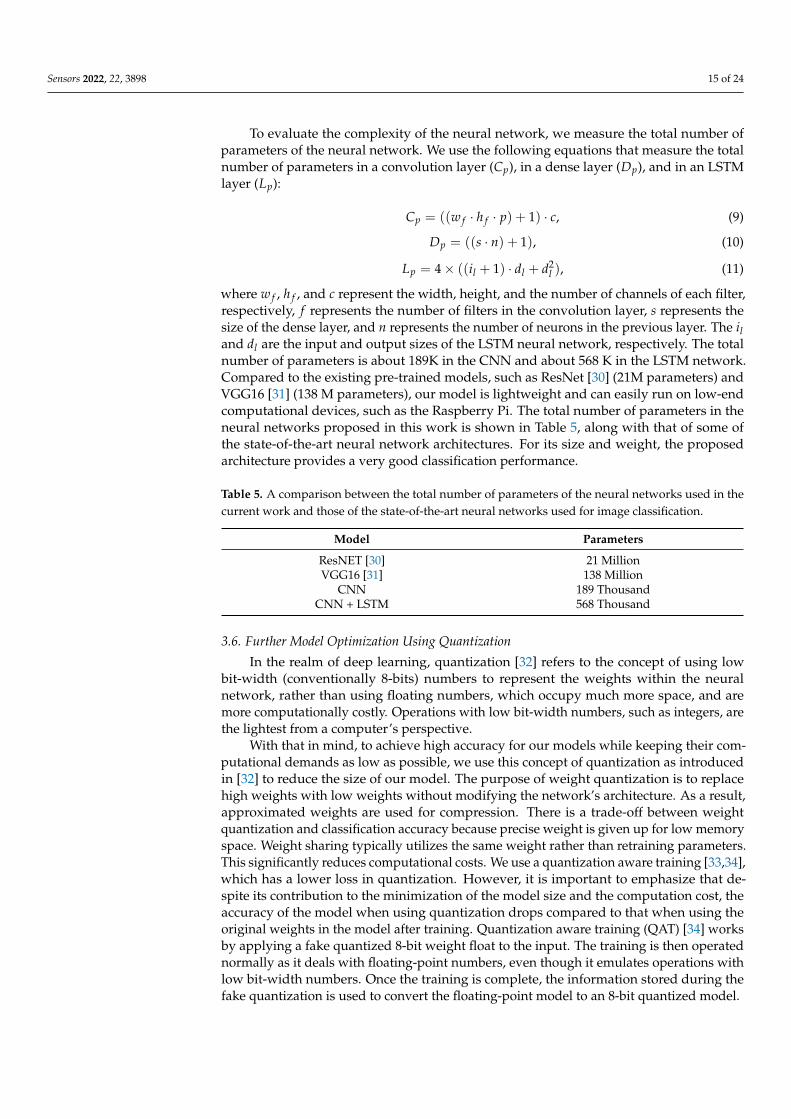
3.5. CNN and LSTM Classification
The classification neural network’s architecture is illustrated in Figures 11 and 12.The classification consists of two stages:
• In the first stage, the sensor’s raw data are given as an input to the CNN that classifiesthe individual frames and produces the first output.
• In the second stage, we perform the sequence classification using the LSTM. The outputof the CNN is given as an input to the LSTM with a window size equal to five frames.The LSTM produces the sequence classification output.
Convolution Block Maxpooling layern Filters+ReLU
Flatten layer
Input
- - - -
Dense layer Output
Figure 11. The architecture of the CNN used for classification.
CNN CNNCNN CNN CNN
LSTM cell LSTM cell LSTM cell LSTM cell LSTM cell
Input
Output
Figure 12. The architecture of the CNN + LSTM network used for classification.
Our neural network architecture consists of six 2D-convolution layers and two fullyconnected layers. Each convolution layer uses filters with a kernel size equal to 3 and hasa Rectified Linear Unit (ReLu) activation function. Every two 2D-convolution layers arefollowed by a 2D-Maxpooling layer whose kernel size is set to 2. The output of the sixthconvolution layer is flattened and is connected to a dense layer with a ReLU activationfunction. In the final dense layer, the activation function is sigmoid. The output of the CNNis given as an input to the LSTM network. The identical copies of CNN weights are frozen,and the trainable parameters are set to false.
Sensors 2022, 22, 3898 15 of 24
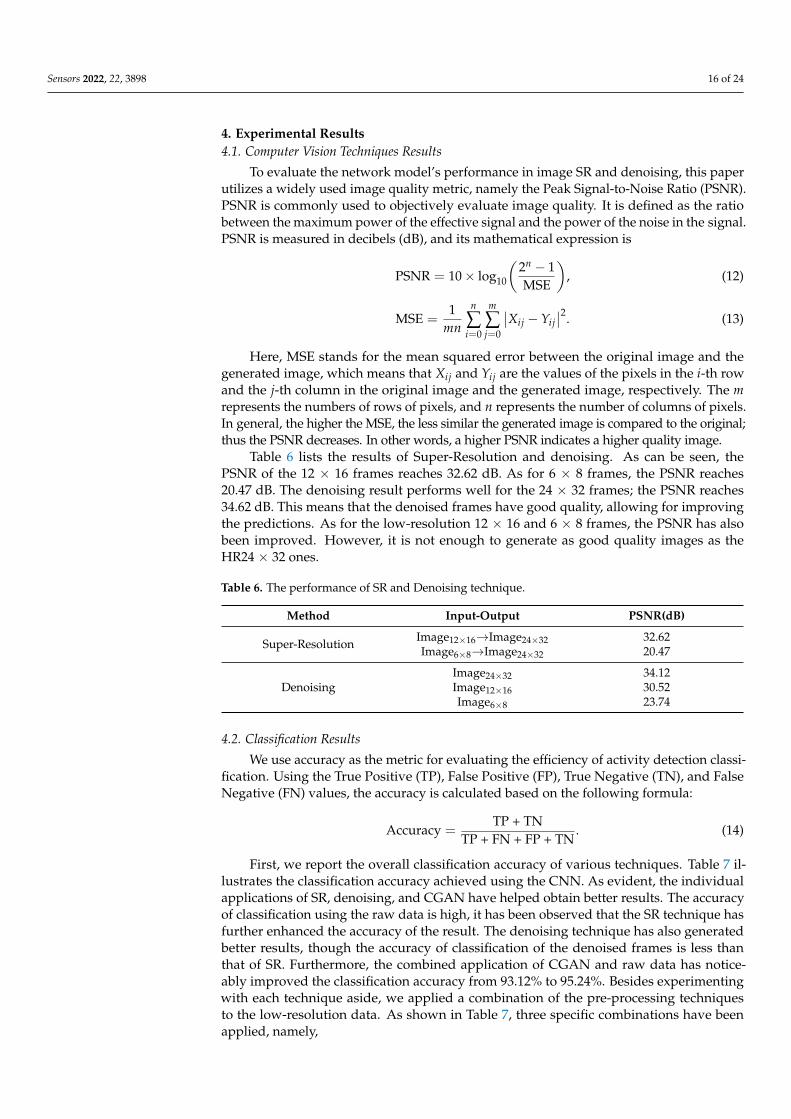
To evaluate the complexity of the neural network, we measure the total number ofparameters of the neural network. We use the following equations that measure the totalnumber of parameters in a convolution layer (Cp), in a dense layer (Dp), and in an LSTMlayer (Lp):
Cp = ((w f · h f · p) + 1) · c, (9)
Dp = ((s · n) + 1), (10)
Lp = 4× ((il + 1) · dl + d2l ), (11)
where w f , h f , and c represent the width, height, and the number of channels of each filter,respectively, f represents the number of filters in the convolution layer, s represents thesize of the dense layer, and n represents the number of neurons in the previous layer. The iland dl are the input and output sizes of the LSTM neural network, respectively. The totalnumber of parameters is about 189K in the CNN and about 568 K in the LSTM network.Compared to the existing pre-trained models, such as ResNet [30] (21M parameters) andVGG16 [31] (138 M parameters), our model is lightweight and can easily run on low-endcomputational devices, such as the Raspberry Pi. The total number of parameters in theneural networks proposed in this work is shown in Table 5, along with that of some ofthe state-of-the-art neural network architectures. For its size and weight, the proposedarchitecture provides a very good classification performance.
Table 5. A comparison between the total number of parameters of the neural networks used in thecurrent work and those of the state-of-the-art neural networks used for image classification.
Model Parameters
ResNET [30] 21 MillionVGG16 [31] 138 Million
CNN 189 ThousandCNN + LSTM 568 Thousand
3.6. Further Model Optimization Using Quantization
In the realm of deep learning, quantization [32] refers to the concept of using lowbit-width (conventionally 8-bits) numbers to represent the weights within the neuralnetwork, rather than using floating numbers, which occupy much more space, and aremore computationally costly. Operations with low bit-width numbers, such as integers, arethe lightest from a computer’s perspective.
With that in mind, to achieve high accuracy for our models while keeping their com-putational demands as low as possible, we use this concept of quantization as introducedin [32] to reduce the size of our model. The purpose of weight quantization is to replacehigh weights with low weights without modifying the network’s architecture. As a result,approximated weights are used for compression. There is a trade-off between weightquantization and classification accuracy because precise weight is given up for low memoryspace. Weight sharing typically utilizes the same weight rather than retraining parameters.This significantly reduces computational costs. We use a quantization aware training [33,34],which has a lower loss in quantization. However, it is important to emphasize that de-spite its contribution to the minimization of the model size and the computation cost, theaccuracy of the model when using quantization drops compared to that when using theoriginal weights in the model after training. Quantization aware training (QAT) [34] worksby applying a fake quantized 8-bit weight float to the input. The training is then operatednormally as it deals with floating-point numbers, even though it emulates operations withlow bit-width numbers. Once the training is complete, the information stored during thefake quantization is used to convert the floating-point model to an 8-bit quantized model.
Sensors 2022, 22, 3898 16 of 24
4. Experimental Results4.1. Computer Vision Techniques Results
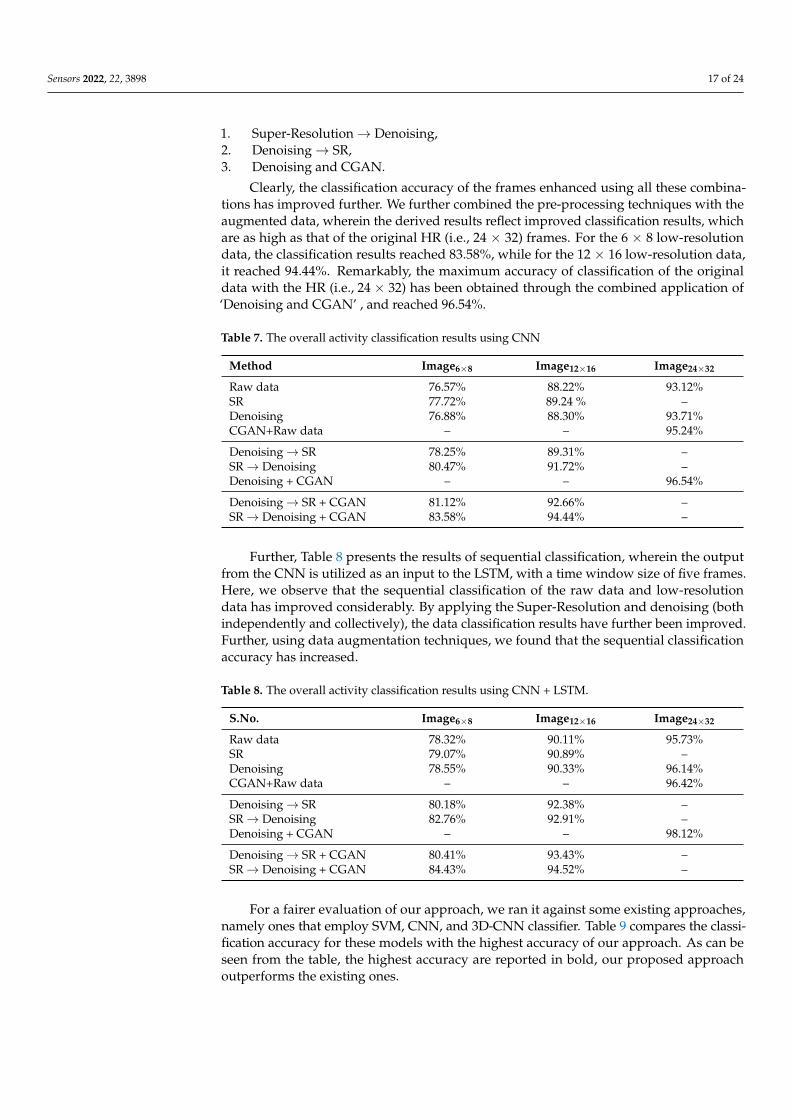
To evaluate the network model’s performance in image SR and denoising, this paperutilizes a widely used image quality metric, namely the Peak Signal-to-Noise Ratio (PSNR).PSNR is commonly used to objectively evaluate image quality. It is defined as the ratiobetween the maximum power of the effective signal and the power of the noise in the signal.PSNR is measured in decibels (dB), and its mathematical expression is
PSNR = 10× log10
(2n − 1MSE
), (12)
MSE =1
mn
n
∑i=0
m
∑j=0
∣∣Xij −Yij∣∣2. (13)
Here, MSE stands for the mean squared error between the original image and thegenerated image, which means that Xij and Yij are the values of the pixels in the i-th rowand the j-th column in the original image and the generated image, respectively. The mrepresents the numbers of rows of pixels, and n represents the number of columns of pixels.In general, the higher the MSE, the less similar the generated image is compared to the original;thus the PSNR decreases. In other words, a higher PSNR indicates a higher quality image.
Table 6 lists the results of Super-Resolution and denoising. As can be seen, thePSNR of the 12 × 16 frames reaches 32.62 dB. As for 6 × 8 frames, the PSNR reaches20.47 dB. The denoising result performs well for the 24 × 32 frames; the PSNR reaches34.62 dB. This means that the denoised frames have good quality, allowing for improvingthe predictions. As for the low-resolution 12 × 16 and 6 × 8 frames, the PSNR has alsobeen improved. However, it is not enough to generate as good quality images as theHR24 × 32 ones.
Table 6. The performance of SR and Denoising technique.
Method Input-Output PSNR(dB)
Super-Resolution Image12×16→Image24×32 32.62Image6×8→Image24×32 20.47
DenoisingImage24×32 34.12Image12×16 30.52Image6×8 23.74
4.2. Classification Results
We use accuracy as the metric for evaluating the efficiency of activity detection classi-fication. Using the True Positive (TP), False Positive (FP), True Negative (TN), and FalseNegative (FN) values, the accuracy is calculated based on the following formula:
Accuracy =TP + TN
TP + FN + FP + TN. (14)
First, we report the overall classification accuracy of various techniques. Table 7 il-lustrates the classification accuracy achieved using the CNN. As evident, the individualapplications of SR, denoising, and CGAN have helped obtain better results. The accuracyof classification using the raw data is high, it has been observed that the SR technique hasfurther enhanced the accuracy of the result. The denoising technique has also generatedbetter results, though the accuracy of classification of the denoised frames is less thanthat of SR. Furthermore, the combined application of CGAN and raw data has notice-ably improved the classification accuracy from 93.12% to 95.24%. Besides experimentingwith each technique aside, we applied a combination of the pre-processing techniquesto the low-resolution data. As shown in Table 7, three specific combinations have beenapplied, namely,
Sensors 2022, 22, 3898 17 of 24
1. Super-Resolution→ Denoising,2. Denoising→ SR,3. Denoising and CGAN.
Clearly, the classification accuracy of the frames enhanced using all these combina-tions has improved further. We further combined the pre-processing techniques with theaugmented data, wherein the derived results reflect improved classification results, whichare as high as that of the original HR (i.e., 24 × 32) frames. For the 6 × 8 low-resolutiondata, the classification results reached 83.58%, while for the 12 × 16 low-resolution data,it reached 94.44%. Remarkably, the maximum accuracy of classification of the originaldata with the HR (i.e., 24 × 32) has been obtained through the combined application of‘Denoising and CGAN’ , and reached 96.54%.
Table 7. The overall activity classification results using CNN
Method Image6×8 Image12×16 Image24×32
Raw data 76.57% 88.22% 93.12%SR 77.72% 89.24 % –Denoising 76.88% 88.30% 93.71%CGAN+Raw data – – 95.24%
Denoising→ SR 78.25% 89.31% –SR→ Denoising 80.47% 91.72% –Denoising + CGAN – – 96.54%
Denoising→ SR + CGAN 81.12% 92.66% –SR→ Denoising + CGAN 83.58% 94.44% –
Further, Table 8 presents the results of sequential classification, wherein the outputfrom the CNN is utilized as an input to the LSTM, with a time window size of five frames.Here, we observe that the sequential classification of the raw data and low-resolutiondata has improved considerably. By applying the Super-Resolution and denoising (bothindependently and collectively), the data classification results have further been improved.Further, using data augmentation techniques, we found that the sequential classificationaccuracy has increased.
Table 8. The overall activity classification results using CNN + LSTM.
S.No. Image6×8 Image12×16 Image24×32
Raw data 78.32% 90.11% 95.73%SR 79.07% 90.89% –Denoising 78.55% 90.33% 96.14%CGAN+Raw data – – 96.42%
Denoising→ SR 80.18% 92.38% –SR→ Denoising 82.76% 92.91% –Denoising + CGAN – – 98.12%
Denoising→ SR + CGAN 80.41% 93.43% –SR→ Denoising + CGAN 84.43% 94.52% –
For a fairer evaluation of our approach, we ran it against some existing approaches,namely ones that employ SVM, CNN, and 3D-CNN classifier. Table 9 compares the classi-fication accuracy for these models with the highest accuracy of our approach. As can beseen from the table, the highest accuracy are reported in bold, our proposed approachoutperforms the existing ones.

Sensors 2022, 22, 3898 18 of 24
Table 9. A comparison between the results achieved with our proposed approach and those achievedby employing some of the existing methods in the literature.
Approach Image6×8 Image12×16 Image24×32
SVM [17] 61.45% 68.52% 88.16%CNN [21] 67.11% 82.97% 90.14%
3D-CNN [22] 72.42% 90.89% 93.28%CNN + LSTMSR→ DE + CGAN 84.43% 94.52% –
CNN + LSTMDE + CGAN – – 98.12%
Further experiments were run to evaluate the contribution of the different imageenhancement techniques. We report the activity classification accuracy using various com-binations of these techniques. For simplification, and since we used different techniques,we use the following terminology for each of the resolutions or techniques used:
• The raw sensor data with various resolutions are referred to as R(24×32), R(12×16), and R(6×8).• The SR technique applied to LR data is referred to as SR(12×16), and SR(6×8).• The denoising technique applied to the HR and LR data is referred to as DE(24×32),
DE(12×16), and DE(6×8).• The combination of raw data with CGAN techniques is referred to as R + CG(24×32).• The denoising and CGAN techniques applied to HR data are referred to as
DE + CG(24×32).• The combination of denoising and SR techniques applied to LR data are referred to as
DE→ SR(12×16), DE→ SR(6×8), SR→ DE(12×16), and SR→ DE(6×8).• The combination of SR, denoising, and CGAN techniques applied to LR data are
referred to as DE → SR + CG(12×16), DE → SR + CG(6×8), SR → DE + CG(12×16),and SR→ DE + CG(6×8).
The results of activity classification accuracy of CNN using the LR 6 × 8 data areshown in Table 10. We can see that each technique improved the activity classificationperformance. Walking and sitting, for example, present high accuracy in the DE→ SR(6×8)technique, both reaching 86%. Further, the falling accuracy is 71% in SR→ DE(6×8). Dataaugmentation aids in the improvement of activity detection in SR → DE + CG(6×8) forother activities, such as standing, lying, and action change, which reach high accuracies of84%, 81%, and 80%, respectively.
The results of the activity classification accuracy of CNN using LR 12 × 16 are shownin Table 11. Here, for the particular case of the falling activity, the SR → DE(12×16) tech-nique reaches a high accuracy of 94%. Similarly, the standing accuracy is 94% in theDE→ SR + CG(12×16) technique. The performance of detection of other activities im-proved using the SR→ DE + CG(12×16) technique, reaching a maximum of 93% accuracyin the action change activity and 92% accuracy in standing and lying.
We infer from these CNN classification results that performing SR followed by denois-ing and then adding CGAN data improves performance.
Table 12 shows the results of the HR data classification using CNN. Here, theDE + CG(24×32) technique performs well for the majority of the activities. Walking reachesan accuracy of 96%, sitting reaches an accuracy of 95%, and lying reaches an accuracy of94%. The performance boost provided by denoising, which creates a clear image, aids indetecting activity.

Sensors 2022, 22, 3898 19 of 24
Table 10. The results of activity classification using CNN on 6 × 8 data.
Method Walking Standing Sitting Lying ActionChange Falling
R(6×8) 80% 68% 77% 68% 57% 55%SR(6×8) 86% 73% 86% 76% 60% 63%DE(6×8) 85% 86% 82% 68% 62% 64%
DE→ SR(6×8) 86% 78% 86% 70% 70% 62%SR→ DE(6×8) 84% 82% 84% 72% 73% 71%
DE→ SR + CG(6×8) 82% 80% 79% 75% 78% 70%SR→ DE + CG(6×8) 80% 84% 83% 81% 80% 68%
Table 11. The results of activity classification using CNN on 12 × 16 data.
Method Walking Standing Sitting Lying ActionChange Falling
R(12×16) 80% 88% 86% 75% 82% 81%SR(12×16) 84% 86% 81% 85% 84% 83%DE(12×16) 83% 85% 86% 85% 84% 79%
DE→ SR(12×16) 84% 85% 89% 90% 82% 84%SR→ DE(12×16) 90% 92% 88% 91% 90% 94%
DE→ SR + CG(12×16) 89% 94% 90% 85% 84% 88%SR→ DE + CG(12×16) 91% 92% 89% 92% 93% 91%
Table 12. The results of activity classification using CNN on 24 × 32 data.
Method Walking Standing Sitting Lying ActionChange Falling
R(24×32) 88% 90% 87% 93% 90% 91%DE(24×32) 92% 84% 92% 90% 91% 89%R + CG(24×32) 90% 95% 90% 94% 92% 92%DE + CG(24×32) 96% 92% 95% 94% 87% 93%
Table 13 shows the activity classification results using CNN + LSTM on the LR6 × 8 data. Here, again we can see that each technique improves the activity classifi-cation performance. For example, SR → DE(6×8) has a high lying and action changeaccuracy of 82%. The classification accuracy of walking, standing, and sitting activities inSR→ DE + CG(6×8) is 84%, 82%, and 84%, respectively. This is thanks to the image qualifyimprovement after applying SR, then DE.
Table 14 shows the activity classification results using CNN + LSTM on the LR12 × 16 data. Here, sitting and lying activities, after applying DE → SR + CG(12×16),reached a high accuracy of 93% and 94%, respectively. Other activities, such as walking andaction changes, reached 93% accuracy in SR(12×16) and SR→ DE + CG(12×16) techniques,respectively. This is thanks to the fact that the 12 × 16 resolution data contains significantlymore information than the 6 × 8 resolution data. By applying the denoising techniqueafter SR, the images are smoothed and enhanced, making it easier to detect sitting andlying activities.
The results of activity classification using CNN + LSTM applied to HR data are shownin Table 15. In most activities, the DE + CG(24×32) technique performs well. Walking has ahigh classification accuracy of 96%, action change has that of 97%, lying has that of 94%,and falling has that of 96%. Denoising further improves the performance by making theimage clearer, which makes it easier to recognize the activity.
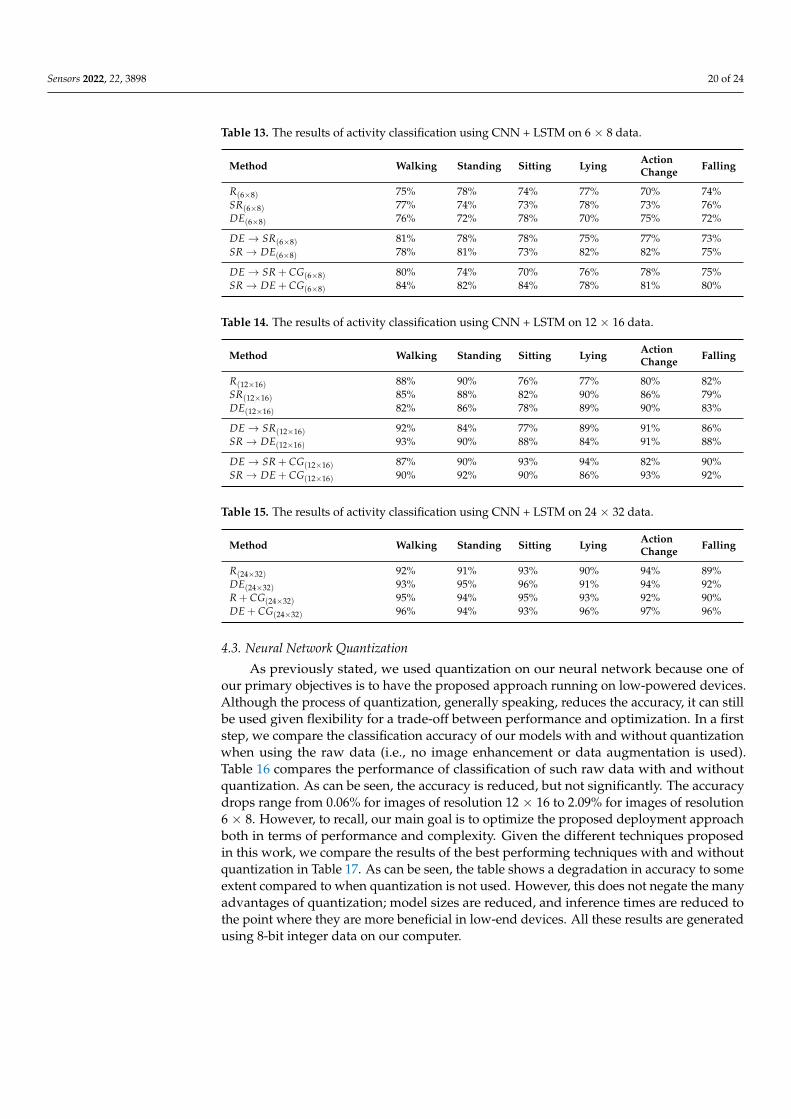
Sensors 2022, 22, 3898 20 of 24
Table 13. The results of activity classification using CNN + LSTM on 6 × 8 data.
Method Walking Standing Sitting Lying ActionChange Falling
R(6×8) 75% 78% 74% 77% 70% 74%SR(6×8) 77% 74% 73% 78% 73% 76%DE(6×8) 76% 72% 78% 70% 75% 72%
DE→ SR(6×8) 81% 78% 78% 75% 77% 73%SR→ DE(6×8) 78% 81% 73% 82% 82% 75%
DE→ SR + CG(6×8) 80% 74% 70% 76% 78% 75%SR→ DE + CG(6×8) 84% 82% 84% 78% 81% 80%
Table 14. The results of activity classification using CNN + LSTM on 12 × 16 data.
Method Walking Standing Sitting Lying ActionChange Falling
R(12×16) 88% 90% 76% 77% 80% 82%SR(12×16) 85% 88% 82% 90% 86% 79%DE(12×16) 82% 86% 78% 89% 90% 83%
DE→ SR(12×16) 92% 84% 77% 89% 91% 86%SR→ DE(12×16) 93% 90% 88% 84% 91% 88%
DE→ SR + CG(12×16) 87% 90% 93% 94% 82% 90%SR→ DE + CG(12×16) 90% 92% 90% 86% 93% 92%
Table 15. The results of activity classification using CNN + LSTM on 24 × 32 data.
Method Walking Standing Sitting Lying ActionChange Falling
R(24×32) 92% 91% 93% 90% 94% 89%DE(24×32) 93% 95% 96% 91% 94% 92%R + CG(24×32) 95% 94% 95% 93% 92% 90%DE + CG(24×32) 96% 94% 93% 96% 97% 96%
4.3. Neural Network Quantization
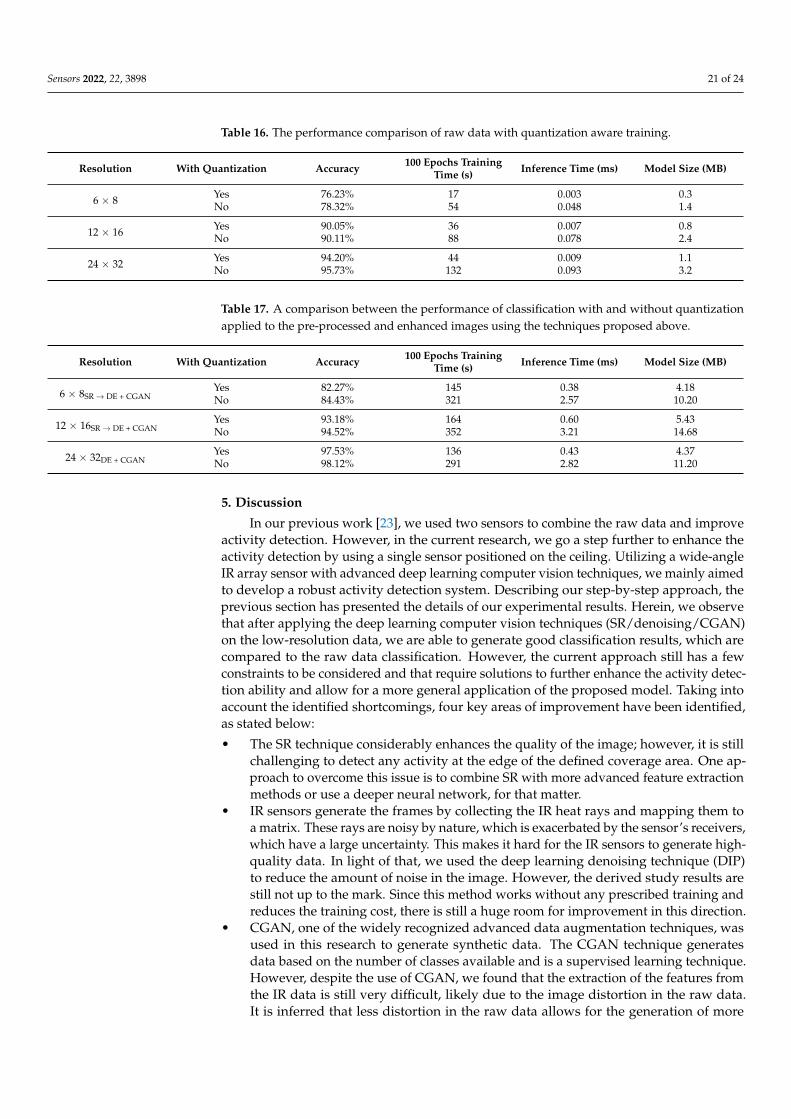
As previously stated, we used quantization on our neural network because one ofour primary objectives is to have the proposed approach running on low-powered devices.Although the process of quantization, generally speaking, reduces the accuracy, it can stillbe used given flexibility for a trade-off between performance and optimization. In a firststep, we compare the classification accuracy of our models with and without quantizationwhen using the raw data (i.e., no image enhancement or data augmentation is used).Table 16 compares the performance of classification of such raw data with and withoutquantization. As can be seen, the accuracy is reduced, but not significantly. The accuracydrops range from 0.06% for images of resolution 12 × 16 to 2.09% for images of resolution6 × 8. However, to recall, our main goal is to optimize the proposed deployment approachboth in terms of performance and complexity. Given the different techniques proposedin this work, we compare the results of the best performing techniques with and withoutquantization in Table 17. As can be seen, the table shows a degradation in accuracy to someextent compared to when quantization is not used. However, this does not negate the manyadvantages of quantization; model sizes are reduced, and inference times are reduced tothe point where they are more beneficial in low-end devices. All these results are generatedusing 8-bit integer data on our computer.
Sensors 2022, 22, 3898 21 of 24
Table 16. The performance comparison of raw data with quantization aware training.
Resolution With Quantization Accuracy 100 Epochs TrainingTime (s) Inference Time (ms) Model Size (MB)
6 × 8 Yes 76.23% 17 0.003 0.3No 78.32% 54 0.048 1.4
12 × 16 Yes 90.05% 36 0.007 0.8No 90.11% 88 0.078 2.4
24 × 32 Yes 94.20% 44 0.009 1.1No 95.73% 132 0.093 3.2
Table 17. A comparison between the performance of classification with and without quantizationapplied to the pre-processed and enhanced images using the techniques proposed above.
Resolution With Quantization Accuracy 100 Epochs TrainingTime (s) Inference Time (ms) Model Size (MB)
6 × 8SR→ DE + CGANYes 82.27% 145 0.38 4.18No 84.43% 321 2.57 10.20
12 × 16SR→ DE + CGANYes 93.18% 164 0.60 5.43No 94.52% 352 3.21 14.68
24 × 32DE + CGANYes 97.53% 136 0.43 4.37No 98.12% 291 2.82 11.20
5. Discussion
In our previous work [23], we used two sensors to combine the raw data and improveactivity detection. However, in the current research, we go a step further to enhance theactivity detection by using a single sensor positioned on the ceiling. Utilizing a wide-angleIR array sensor with advanced deep learning computer vision techniques, we mainly aimedto develop a robust activity detection system. Describing our step-by-step approach, theprevious section has presented the details of our experimental results. Herein, we observethat after applying the deep learning computer vision techniques (SR/denoising/CGAN)on the low-resolution data, we are able to generate good classification results, which arecompared to the raw data classification. However, the current approach still has a fewconstraints to be considered and that require solutions to further enhance the activity detec-tion ability and allow for a more general application of the proposed model. Taking intoaccount the identified shortcomings, four key areas of improvement have been identified,as stated below:
• The SR technique considerably enhances the quality of the image; however, it is stillchallenging to detect any activity at the edge of the defined coverage area. One ap-proach to overcome this issue is to combine SR with more advanced feature extractionmethods or use a deeper neural network, for that matter.
• IR sensors generate the frames by collecting the IR heat rays and mapping them toa matrix. These rays are noisy by nature, which is exacerbated by the sensor’s receivers,which have a large uncertainty. This makes it hard for the IR sensors to generate high-quality data. In light of that, we used the deep learning denoising technique (DIP)to reduce the amount of noise in the image. However, the derived study results arestill not up to the mark. Since this method works without any prescribed training andreduces the training cost, there is still a huge room for improvement in this direction.
• CGAN, one of the widely recognized advanced data augmentation techniques, wasused in this research to generate synthetic data. The CGAN technique generatesdata based on the number of classes available and is a supervised learning technique.However, despite the use of CGAN, we found that the extraction of the features fromthe IR data is still very difficult, likely due to the image distortion in the raw data.It is inferred that less distortion in the raw data allows for the generation of more
Sensors 2022, 22, 3898 22 of 24
realistic and useful synthetic data that could contribute to much better classificationperformance through advanced feature extraction methods.
• One specific shortcoming of this research is that the only main source of heat presentin the room during the experiments is the participants themselves. This means thatthe current model is trained for the case where there is a single person and no otherheat-emitting devices, such as a stove or a computer, are present. Thus, even thoughthe developed model performs well for the current experimental setup, it is not meantto simultaneously detect the activities of multiple persons and obstacles. A potentialalternative to address this constraint could be the generation of three-dimensionaldata, as it could help to estimate the precise height/depth of any target individualand can also simultaneously differentiate between the activities of multiple peopleand objects.
6. Conclusions
In this paper, we have proposed an activity detection system using a low-resolutionIR array sensor with advanced computer vision deep learning techniques. Using a singlesensor placed on the ceiling, we have conducted a variety of experiments (primarily sixhuman activities: walking, falling, sitting, standing, lying, and action change) in which wecollected data under different conditions for a continuous period of time with differentresolutions (i.e., 24 × 32, 12 × 16, and 6 × 8). To identify the activity of the participants,we ran a classification task that takes the frames generated by the sensor as the input andpredicts the activity. To further enhance the classification, we applied three advanced deeplearning techniques: SR, denoising, and CGAN. Herein, the key purpose was to enhancethe classification accuracy of the low-resolution data. Through the results, we observedthat the application of these techniques has helped improve the classification accuracy oflow-resolution images from 78.32% to 84.43% (6 × 8 resolution) and from 90.11% to 94.54%(12 × 16 resolution).
Author Contributions: Conceptualization, K.A.M. and M.B.; methodology, K.A.M.; software, K.A.M.;validation, K.A.M., M.B. and T.O.; formal analysis, K.A.M.; investigation, K.A.M.; data curation,K.A.M. and M.B.; writing—original draft preparation, K.A.M.; writing—review and editing, K.A.M.,M.B. and T.O.; visualization, M.K.A., M.B. and T.O.; supervision, T.O.; project administration, T.O.;funding acquisition, K.A.M., M.B. and T.O. All authors have read and agreed to the published versionof the manuscript.
Funding: This work was supported by the Grant Keio Leading-Edge Laboratory of Science andTechnology, Japan, under Grant KEIO-KLL-000045.
Institutional Review Board Statement: Not applicable.
Informed Consent Statement: Informed consent was obtained from all subjects involved in the study.
Data Availability Statement: Not applicable.
Conflicts of Interest: The authors declare no conflict of interest.
AbbreviationsThe following abbreviations are used in this manuscript:
IR InfraredDL Deep LearingSR Super-ResolutionLR Low ResolutionHR High ResolutionDIP Deep Image PriorCNN Convolutional Neural NetworkSVM Support Vector MachineLSTM Long Short-Term Memory

Sensors 2022, 22, 3898 23 of 24
CGAN Conditional Generative Adversarial NetworkFSRCNN Fast Super-Resolution Convolutional Neural NetworkPSNR Peak Signal-to-Noise RatioMSE Mean Squared ErrorTP True PositiveTN True NegativeFP False PositiveFN False Negative
References1. Statistical Handbook of Japan 2021; Statistics Bureau, Ministry of Internal Affairs and Communications: Tokyo, Japan, 2021.
[CrossRef] [PubMed]2. Mitsutake, S.; Ishizaki, T.; Teramoto, C.; Shimizu, S.; Ito, H. Patterns of Co-Occurrence of Chronic Disease Among Older Adults
in Tokyo. Prev. Chronic Dis. 2019, 16, E11.3. Mashiyama, S.; Hong, J.; Ohtsuki, T. Activity recognition using low resolution infrared array sensor. In Proceedings of the 2015
IEEE International Conference on Communications (ICC), London, UK, 8–12 June 2015; pp. 495–500.4. Mashiyama, S.; Hong, J.; Ohtsuki, T. A fall detection system using low resolution infrared array sensor. In Proceedings of
the IEEE International Symposium on Personal, Indoor and Mobile Radio Communications (PIMRC), Helsinki, Finland, 2–5September 2014; pp. 2109–2113.
5. Hino, Y.; Hong, J.; Ohtsuki, T. Activity recognition using array antenna. In Proceedings of the 2015 IEEE International Conferenceon Communications (ICC), London, UK, 8–12 June 2015; pp. 507–511. [CrossRef]
6. Bouazizi, M.; Ye, C.; Ohtsuki, T. 2D LIDAR-Based Approach for Activity Identification and Fall Detection. IEEE Internet Things J.2021. [CrossRef]
7. Nakamura, T.; Bouazizi, M.; Yamamoto, K.; Ohtsuki, T. Wi-fi-CSI-based fall detection by spectrogram analysis with CNN. InProceedings of the IEEE Global Communications Conference, Taipei, Taiwan, 7–11 December 2020; pp. 1–6. [CrossRef]
8. Lee, S.; Ha, K.N.; Lee, K.C. A pyroelectric infrared sensor-based indoor location-aware system for the smart home. IEEE Trans.Consum. Electron. 2006, 52, 1311–1317.
9. Liang, Q.; Yu, L.; Zhai, X.; Wan, Z.; Nie, H. Activity recognition based on thermopile imaging array sensor. In Proceedings of the2018 IEEE International Conference on Electro/Information Technology (EIT), Rochester, MI, USA, 3–5 May 2018; pp. 0770–0773.
10. Muthukumar, K.A.; Bouazizi, M.; Ohtsuki, T. Activity Detection Using Wide Angle Low-Resolution Infrared Array Sensors. InProceedings of the Institute of Electronics, Information and Communication Engineers (IEICE) Conference Archives, Virtual,15–18 September 2020. [CrossRef]
11. Al-Jazzar, S.O.; Aldalahmeh, S.A.; McLernon, D.; Zaidi, S.A.R. Intruder localization and tracking using two pyroelectric infraredsensors. IEEE Sens. J. 2020, 20, 6075–6082.
12. Bouazizi, M.; Ohtsuki, T. An infrared array sensor-based method for localizing and counting people for health care andmonitoring. In Proceedings of the 2020 42nd Annual International Conference of the IEEE Engineering in Medicine & BiologySociety (EMBC), Montreal, QC, Canada, 20–24 July 2020; pp. 4151–4155. [CrossRef]
13. Bouazizi, M.; Ye, C.; Ohtsuki, T. Low-Resolution Infrared Array Sensor for Counting and Localizing People Indoors: When LowEnd Technology Meets Cutting Edge Deep Learning Techniques. Information 2022, 13, 132. [CrossRef]
14. Yang, T.; Guo, P.; Liu, W.; Liu, X.; Hao, T. Enhancing PIR-Based Multi-Person Localization Through Combining Deep LearningWith Domain Knowledge. IEEE Sens. J. 2021, 21, 4874–4886. [CrossRef] [PubMed]
15. Sam, D.B.; Peri, S.V.; Sundararaman, M.N.; Kamath, A.; Babu, R.V. Locate, Size, and Count: Accurately Resolving People in DenseCrowds via Detection. IEEE Trans. Pattern Anal. Mach. Intell. 2021, 43, 2739–2751. [CrossRef]
16. Wu, C.; Zhang, F.; Wang, B.; Ray Liu, K.J. mmTrack: Passive Multi-Person Localization Using Commodity Millimeter Wave Radio. InProceedings of the IEEE INFOCOM 2020—IEEE Conference on Computer Communications, Virtual, 6–9 July 2020; pp. 2400–2409.[CrossRef]
17. Kobayashi, K.; Ohtsuki, T.; Toyoda, K. Human activity recognition by infrared sensor arrays considering positional relationbetween user and sensors. IEICE Tech. Rep. 2017, 116, 509. [CrossRef]
18. Quero, J.M.; Burns, M.; Razzaq, M.A.; Nugent, C.; Espinilla, M. Detection of Falls from Non-Invasive Thermal Vision SensorsUsing Convolutional Neural Networks. Proceedings 2018, 2, 1236. [CrossRef] [PubMed]
19. Burns, M.; Cruciani, F.; Morrow, P.; Nugent, C.; McClean, S. Using Convolutional Neural Networks with Multiple ThermalSensors for Unobtrusive Pose Recognition. Sensors 2020, 20, 6932. [CrossRef]
20. Li, T.; Yang, B.; Zhang, T. Human Action Recognition Based on State Detection in Low-resolution Infrared Video. In Proceedings of the2021 IEEE 16th Conference on Industrial Electronics and Applications (ICIEA), Chengdu, China, 1–4 August 2021; pp. 1667–1672.[CrossRef]
21. Ángel López-Medina, M.; Espinilla, M.; Nugent, C.; Quero, J.M. Evaluation of convolutional neural networks for the classificationof falls from heterogeneous thermal vision sensors. Int. J. Distrib. Sens. Netw. 2020, 16, 1550147720920485. [CrossRef] [PubMed]
22. Tateno, S.; Meng, F.; Qian, R.; Hachiya, Y. Privacy-Preserved Fall Detection Method with Three-Dimensional ConvolutionalNeural Network Using Low-Resolution Infrared Array Sensor. Sensors 2020, 20, 5957. [CrossRef]

Sensors 2022, 22, 3898 24 of 24
23. Muthukumar, K.A.; Bouazizi, M.; Ohtsuki, T. A novel hybrid deep learning model for activity detection using wide-anglelow-resolution infrared array sensor. IEEE Access 2021, 9, 82563–82576.
24. Dong, C.; Loy, C.C.; Tang, X. Accelerating the super-resolution convolutional neural network. In Proceedings of the 14thEuropean Conference on Computer Vision, Amsterdam, The Netherlands, 11–14 October 2016; pp. 391–407.
25. Ulyanov, D.; Vedaldi, A.; Lempitsky, V. Deep image prior. In Proceedings of the 2018 IEEE/CVF Conference on Computer Visionand Pattern Recognition (CVPR), Salt Lake City, UT, USA, 18–23 June 2018; pp. 9446–9454.
26. Mirza, M.; Osindero, S. Conditional generative adversarial nets. arXiv 2014, arXiv:1411.1784. [CrossRef]27. Ilesanmi, A.E.; Ilesanmi, T.O. Methods for image denoising using convolutional neural network: A review. Complex Intell. Syst.
2021, 7, 2179–2198. [CrossRef] [PubMed]28. Fan, L.; Zhang, F.; Fan, H.; Zhang, C. Brief review of image denoising techniques. Vis. Comput. Ind. Biomed. Art 2019, 2, 7.29. Ronneberger, O.; Fischer, P.; Brox, T. U-net: Convolutional networks for biomedical image segmentation. In Proceedings of the
Medical Image Computing and Computer-Assisted Intervention, Munich, Germany, 5–9 October 2015; pp. 234–241.30. He, K.; Zhang, X.; Ren, S.; Sun, J. Deep residual learning for image recognition. In Proceedings of the 2016 IEEE Conference on
Computer Vision and Pattern Recognition (CVPR), Las Vegas, NV, USA, 27–30 June 2016; pp. 770–778.31. Simonyan, K.; Zisserman, A. Very deep convolutional networks for large-scale image recognition. arXiv 2014, arXiv:1409.1556.
[CrossRef]32. Huang, Q.; Hsieh, C.; Hsieh, J.; Liu, C. Memory-Efficient AI Algorithm for Infant Sleeping Death Syndrome Detection in Smart
Buildings. AI 2021, 2, 705–719. [CrossRef]33. Huang, Q. Weight-Quantized SqueezeNet for Resource-Constrained Robot Vacuums for Indoor Obstacle Classification. AI 2022,
3, 180–193. [CrossRef]34. Jacob, B.; Kligys, S.; Chen, B.; Zhu, M.; Tang, M.; Howard, A.; Adam, H.; Kalenichenko, D. Quantization and training of neural
networks for efficient integer-arithmetic-only inference. In Proceedings of the 2018 IEEE/CVF Conference on Computer Visionand Pattern Recognition (CVPR), Salt Lake City, UT, USA, 18–23 June 2018; pp. 2704–2713.