An Imaging Mass Spectrometry Study on the Formation of Conditioning Films and Biofilms in the...
11
This article was downloaded by: [Georg-August-Universitaet Goettingen] On: 07 April 2015, At: 05:26 Publisher: Taylor & Francis Informa Ltd Registered in England and Wales Registered Number: 1072954 Registered office: Mortimer House, 37-41 Mortimer Street, London W1T 3JH, UK Click for updates Geomicrobiology Journal Publication details, including instructions for authors and subscription information: http://www.tandfonline.com/loi/ugmb20 An Imaging Mass Spectrometry Study on the Formation of Conditioning Films and Biofilms in the Subsurface (Äspö Hard Rock Laboratory, SE Sweden) Tim Leefmann a , Christine Heim a , Jukka Lausmaa b , Peter Sjövall b , Danny Ionescu c , Joachim Reitner a & Volker Thiel a a Geobiology Group, Geoscience Center, Georg-August-University of Göttingen, Göttingen, Germany b Chemistry and Materials, SP Technical Research Institute of Sweden, Borås, Sweden c Max Planck Institute for Marine Microbiology, Bremen, Germany Published online: 03 Apr 2015. To cite this article: Tim Leefmann, Christine Heim, Jukka Lausmaa, Peter Sjövall, Danny Ionescu, Joachim Reitner & Volker Thiel (2015) An Imaging Mass Spectrometry Study on the Formation of Conditioning Films and Biofilms in the Subsurface (Äspö Hard Rock Laboratory, SE Sweden), Geomicrobiology Journal, 32:3-4, 197-206, DOI: 10.1080/01490451.2014.910570 To link to this article: http://dx.doi.org/10.1080/01490451.2014.910570 PLEASE SCROLL DOWN FOR ARTICLE Taylor & Francis makes every effort to ensure the accuracy of all the information (the “Content”) contained in the publications on our platform. However, Taylor & Francis, our agents, and our licensors make no representations or warranties whatsoever as to the accuracy, completeness, or suitability for any purpose of the Content. Any opinions and views expressed in this publication are the opinions and views of the authors, and are not the views of or endorsed by Taylor & Francis. The accuracy of the Content should not be relied upon and should be independently verified with primary sources of information. Taylor and Francis shall not be liable for any losses, actions, claims, proceedings, demands, costs, expenses, damages, and other liabilities whatsoever or howsoever caused arising directly or indirectly in connection with, in relation to or arising out of the use of the Content. This article may be used for research, teaching, and private study purposes. Any substantial or systematic reproduction, redistribution, reselling, loan, sub-licensing, systematic supply, or distribution in any form to anyone is expressly forbidden. Terms & Conditions of access and use can be found at http:// www.tandfonline.com/page/terms-and-conditions
-
Upload
independent -
Category
Documents
-
view
0 -
download
0
Transcript of An Imaging Mass Spectrometry Study on the Formation of Conditioning Films and Biofilms in the...
This article was downloaded by: [Georg-August-Universitaet Goettingen]On: 07 April 2015, At: 05:26Publisher: Taylor & FrancisInforma Ltd Registered in England and Wales Registered Number: 1072954 Registered office: Mortimer House,37-41 Mortimer Street, London W1T 3JH, UK
Click for updates
Geomicrobiology JournalPublication details, including instructions for authors and subscription information:http://www.tandfonline.com/loi/ugmb20
An Imaging Mass Spectrometry Study on the Formationof Conditioning Films and Biofilms in the Subsurface(Äspö Hard Rock Laboratory, SE Sweden)Tim Leefmanna, Christine Heima, Jukka Lausmaab, Peter Sjövallb, Danny Ionescuc, JoachimReitnera & Volker Thielaa Geobiology Group, Geoscience Center, Georg-August-University of Göttingen, Göttingen,Germanyb Chemistry and Materials, SP Technical Research Institute of Sweden, Borås, Swedenc Max Planck Institute for Marine Microbiology, Bremen, GermanyPublished online: 03 Apr 2015.
To cite this article: Tim Leefmann, Christine Heim, Jukka Lausmaa, Peter Sjövall, Danny Ionescu, Joachim Reitner & VolkerThiel (2015) An Imaging Mass Spectrometry Study on the Formation of Conditioning Films and Biofilms in the Subsurface (ÄspöHard Rock Laboratory, SE Sweden), Geomicrobiology Journal, 32:3-4, 197-206, DOI: 10.1080/01490451.2014.910570
To link to this article: http://dx.doi.org/10.1080/01490451.2014.910570
PLEASE SCROLL DOWN FOR ARTICLE
Taylor & Francis makes every effort to ensure the accuracy of all the information (the “Content”) containedin the publications on our platform. However, Taylor & Francis, our agents, and our licensors make norepresentations or warranties whatsoever as to the accuracy, completeness, or suitability for any purpose of theContent. Any opinions and views expressed in this publication are the opinions and views of the authors, andare not the views of or endorsed by Taylor & Francis. The accuracy of the Content should not be relied upon andshould be independently verified with primary sources of information. Taylor and Francis shall not be liable forany losses, actions, claims, proceedings, demands, costs, expenses, damages, and other liabilities whatsoeveror howsoever caused arising directly or indirectly in connection with, in relation to or arising out of the use ofthe Content.
This article may be used for research, teaching, and private study purposes. Any substantial or systematicreproduction, redistribution, reselling, loan, sub-licensing, systematic supply, or distribution in anyform to anyone is expressly forbidden. Terms & Conditions of access and use can be found at http://www.tandfonline.com/page/terms-and-conditions

An Imaging Mass Spectrometry Study on the Formationof Conditioning Films and Biofilms in the Subsurface (€Asp€oHard Rock Laboratory, SE Sweden)
TIM LEEFMANN1, CHRISTINE HEIM1, JUKKA LAUSMAA2, PETER SJ€OVALL2, DANNY IONESCU3,JOACHIM REITNER1, and VOLKER THIEL1*1Geobiology Group, Geoscience Center, Georg-August-University of G€ottingen, G€ottingen, Germany2Chemistry and Materials, SP Technical Research Institute of Sweden, Bora
�s, Sweden
3Max Planck Institute for Marine Microbiology, Bremen, Germany
Received October 2013; Accepted March 2014
Conditioning films and biofilms forming on surfaces of solid materials exposed to aqueous media play a key role in in the interactionbetween the geo- and biospheres. In this study, time-of-flight secondary ion mass spectrometry and scanning electron microscopywere used to investigate the time scale, mode of formation, and chemistry of conditioning films and biofilms that formed on Sisubstrates exposed to aquifer water in the subsurface €Asp€o Hard Rock Laboratory, SE-Sweden. The detection of fragment ions ofamino acids, carbohydrates, and carboxylic acids revealed that different types of organic compounds had adhered to the Si surfacealready after 10 min of exposure to the aquifer fluids, whereas the attachment of microbial cells was first observed after 1000 min.The organic compounds first formed isolated mm-sized accumulations and subsequently started to distribute on the wafer surfacemore homogenously. Simultaneously further microorganisms attached to the surface and formed biofilm-like cell accumulationsafter 3 months of exposure to aquifer water.
Keywords: biofilm, groundwater, subsurface microbiology
Introduction
Biofilms (Costerton et al. 1995), consisting of microbial cellsenclosed in extracellular polymeric substances (EPS), are ofmajor interest to various scientific fields as they may form onnearly every solid surface. Biofilms may cause serious healthproblems (Costerton et al. 1999; Keevil 2003) when growingon indwelling medical devices like catheters and prostheses(Donlan 2001) and lead to increased corrosion damage of col-onized metallic components (Beech et al. 2006; Geesey et al.1996). By growing on hulls they can considerably increase thepower needed to maintain ships at a given speed (Cookseyand Wigglesworth-Cooksey 1995). From a geomicrobiologicalpoint of view, biofilms play a key role in microbial biomineral-ization and rock weathering and, consequently, as mediators
of the interaction between the geo- and biospheres. Biofilmsform on interfaces of hard substrates and the aquatic or atmo-spheric environment, respectively.
They may grow endolithically within the outer few centi-meters of rocks (Walker and Pace 2007), colonize aquaticenvironments from shallow waters (Montaggioni andCamoin 1993) to the deep sea (Jørgensen and Boetius 2007),and even inhabit the Earth’s crust (Amend and Teske 2005).As constructors of microbialites, such as stromatolites, bio-films can be traced back in the geological record to theArchean era (Schopf et al. 2007; Tice et al. 2011) thus sug-gesting that microorganisms have been organizing themselvesin this way during most of Earth’s history.
The formation of biofilms can be divided into four steps,namely (i) transport, (ii) adhesion, and (iii) attachment ofcells to a solid surface, followed by (iv) colonization of thesurface (van Loosdrecht et al. 1990). Apart from the charac-teristics of the substratum, aqueous medium, and cell surfa-ces, the rate and extent of cell attachment is affected by so-called conditioning films (Donlan and Costerton 2002). Thesethin organic films begin to form from dissolved organic mat-ter quickly after the exposure of a solid surface to an aqueousmedium and are considered as an important prerequisitebefore the establishment of complex biofilms can take place(Cooksey and Wigglesworth-Cooksey 1995; Loeb and Neihof1975).
Current address for Tim Leefmann is Earth and Planetary Sci-ence Department, Macquarie University, Sydney, Australia.Current address for Danny Ionescu is Experimental Limnology,Leibniz Institute for Freshwater Ecology and Inland Fisheries,Stechlin, Germany*Address correspondence to Volker Thiel, Geobiology Group,Geoscience Center, University of G€ottingen, 37077 G€ottingen,Germany; Email: [email protected] versions of one or more figures in this article can be foundonline at www.tandfonline.com/ugmb.
Geomicrobiology Journal, (2015) 32, 197–206Copyright © Taylor & Francis Group, LLCISSN: 0149-0451 print / 1521-0529 onlineDOI: 10.1080/01490451.2014.910570
Dow
nloa
ded
by [
Geo
rg-A
ugus
t-U
nive
rsita
et G
oetti
ngen
] at
05:
26 0
7 A
pril
2015
Using techniques like fluorescent spectroscopy (Loeb andNeihof 1975), infrared spectroscopy (Baier 1980), and X-rayphotoelectron spectroscopy (Taylor et al. 1997) compoundgroups like proteins, lipids, nucleic acids, polysaccharides,amino acids (Taylor et al. 1997), glycoproteins (Baier 1980),and humic material have been identified in conditioningfilms. However, these methods are limited in their ability toprovide detailed information on the molecular compositionof conditioning films. Time-of-flight secondary ion massspectrometry (ToF-SIMS, Benninghoven 1994), when usedin static mode, is a quasi-nondestructive technique thatallows analyzing the chemical composition of the uppermostatomic or molecular monolayer of a solid surface with highmass accuracy and at a mm-resolution (Belu et al. 2003;Benninghoven 1994). In ToF-SIMS, a pulsed primary ionbeam is rastered over the sample surface and leads to theemission of secondary ions. These ions are then analyzedaccording to their flight time, which is a function of theirm/z ratio.
The capabilities of ToF-SIMS have prompted researchersto study the chemical composition of conditioning films andbiofilms (Beech et al. 1999; de Brouwer et al. 2006; Poleuniset al. 2002; Poleunis et al. 2003; Pradier et al. 2000). Most ofthese earlier studies, using CsC and GaC ion sources, focusedon the short-term (24-h) formation of conditioning films onstainless steel panels immersed in sea water. The observationof various small, amino acid-derived fragments indicatedthat proteins were the first compounds to adsorb on these sur-faces. In recent years, the invention of cluster ion sources(e.g., Aun
C; BinC) in liquid metal ion guns (LMIGs) has led
to considerable improvements in the analysis of biologicalmolecules by ToF-SIMS, as these sources provide dramati-cally higher yields for relatively large organic fragment andmolecular secondary ions (Winograd and Garrison 2010).The cluster primary ion sources have also given rise to anincreasing number of studies employing ToF-SIMS for theanalysis of organic substances in geobiological systems (for areview, see Thiel and Sj€ovall 2011).
The purpose of the present study was to observe on anextended time scale (minutes to months) the chemicalchanges involved in the evolution from an initially formedconditioning film towards a biofilm in the subsurface. Theformation of conditioning films and biofilms in the subsurfaceis of particular interest for geobiological research as the
growth conditions and surrounding environment are thoughtto resemble the environments under which early life on Earthdeveloped (Trevors 2002).
Our experiments were conducted in €Asp€o Hard Rock Lab-oratory (€Asp€o HRL), a research tunnel operated by theSwedish Nuclear Fuel and Waste Management Company(SKB) as a testing site for the long-term deposition of nuclearwaste. The 3.6-km-long tunnel extends to a depth of 450 mbelow sea level under the island of €Asp€o located about400 km south of Stockholm in SE-Sweden. The €Asp€o HRLoffers a unique window into the subsurface. Groundwaterssampled from boreholes in the tunnel have been reported tocontain, among others, homoacetogens, methanogens (Kotel-nikova and Pedersen 1998), iron oxidizing bacteria (Ander-son and Pedersen 2003) and sulphate reducing bacteria(Pedersen et al. 1996). Our study, combining ToF-SIMS andSEM, was aimed at gaining an insight into the growth paceof conditioning films and biofilms on pristine surfacesexposed to native fluids from the continental deep biosphere.
Materials and Methods
Flow Reactor Setup
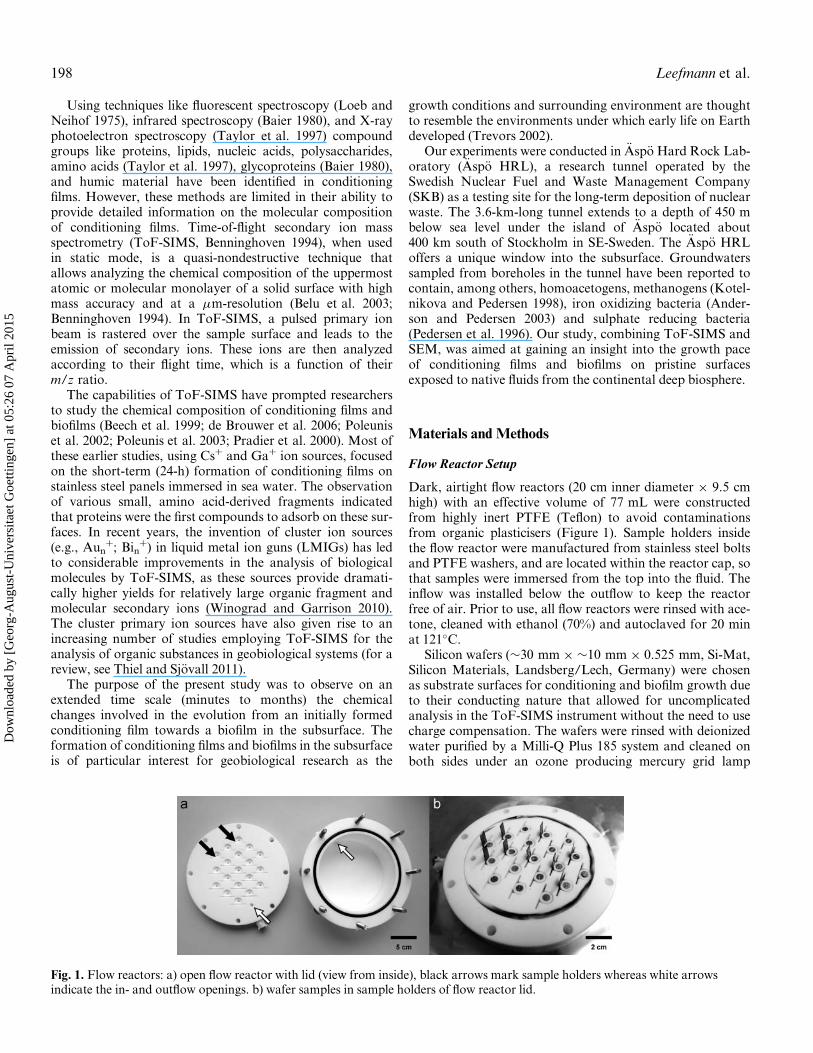
Dark, airtight flow reactors (20 cm inner diameter £ 9.5 cmhigh) with an effective volume of 77 mL were constructedfrom highly inert PTFE (Teflon) to avoid contaminationsfrom organic plasticisers (Figure 1). Sample holders insidethe flow reactor were manufactured from stainless steel boltsand PTFE washers, and are located within the reactor cap, sothat samples were immersed from the top into the fluid. Theinflow was installed below the outflow to keep the reactorfree of air. Prior to use, all flow reactors were rinsed with ace-tone, cleaned with ethanol (70%) and autoclaved for 20 minat 121�C.
Silicon wafers (»30 mm £ »10 mm £ 0.525 mm, Si-Mat,Silicon Materials, Landsberg/Lech, Germany) were chosenas substrate surfaces for conditioning and biofilm growth dueto their conducting nature that allowed for uncomplicatedanalysis in the ToF-SIMS instrument without the need to usecharge compensation. The wafers were rinsed with deionizedwater purified by a Milli-Q Plus 185 system and cleaned onboth sides under an ozone producing mercury grid lamp
Fig. 1. Flow reactors: a) open flow reactor with lid (view from inside), black arrows mark sample holders whereas white arrowsindicate the in- and outflow openings. b) wafer samples in sample holders of flow reactor lid.
198 Leefmann et al.
Dow
nloa
ded
by [
Geo
rg-A
ugus
t-U
nive
rsita
et G
oetti
ngen
] at
05:
26 0
7 A
pril
2015

(emission wavelength: 185-579 nm, irradiance: »7.5 mW/cm2, B.H.K. Inc., Ontario, CA, USA). After cleaning andsterilization, the flow reactors were equipped with up to 10clean silicon wafers and filled with purified, autoclaved water.The flow reactors were connected with flexible PTFE tubes toa tapped fluid outflow at a depth of 69 m below sea level (Site507A, REDOX-Site) in the tunnel of €Asp€o, allowing thewafers to be exposed to the aquifer water for 10 min,1000 min, 10 d, and 90 d, respectively.
After 10 min and 1000 min, samples were taken out of theflow-reactors on site, gently immersed in purified, autoclavedwater (3£), and covered with a second, clean silicon wafer.The sandwiched wafers were plunge frozen in liquid nitrogen,
and stored and transported at ¡80�C on dry ice. Sampleswith longer exposition times were kept inside the water-filledflow reactors for transport (5 h) to the ToF-SIMS laboratory.Immediately before ToF-SIMS analysis, the samples weretaken out of the reactors, gently immersed in purified, auto-claved water (3£), and dried at room temperature in a lami-nar flow box. Parallel samples for scanning electronmicroscopy (SEM) were fixed in glutaraldehyde (2%) andstored at 4�C. Prior to SEM-analysis, samples were rinsedwith purified water, dehydrated in a rising ethanol concentra-tion (15% to 99%), dried in hexamethyldisilazane, glued onSEM sample holders, and sputtered with Au until a filmthickness of »10 nm was reached. Control samples were
Table 1. Peaks and tentatively assigned ions summed for ion images in Figure 4
Compound class m/z Tentative assignment 10 min 1000 min 10 d 90 d Control
Amino acids 30 CH4NC x x x x x
44 C2H6NC x x x x x
58 C3H8NC x x x x —
61 C2H5SC x x x x x
72 C4H10NC x — — x —
83 C5H7OC x x — x x
84 C4H6NOC x x x x —84 C5H10N
C x x x x x86 C5H12N
C x — — x x87 C3H7N2O
C x — — x x88 C3H6NO2
C x — — x x102 C4H8NO2
C x — — x x107 C7H7O
C x x x x x110 C5H8N3
C — — — x —120 C8H10N
C x x x x x130 C9H8N
C x — x x x136 C8H10NOC x x — x x145 C10H11N
C x — — — —Carbohydrates 31 CH3O
C x x x x x43 C2H3O
C x x x x x45 C2H5O
C x — — x x55 C3H3O
C x x x x x57 C3H5O
C x x x x x59 C3H7O
C x x — x x69 C4H5O
C x x — x x81 C5H5O
C — — — x x85 C4H5O2
C x x — — —87 C4H7O2
C x — — x —105 C7H5O
C x x — x —
Carboxylic acids 141 C8H13O2¡ x x — — —
143 C8H15O2¡ x x x x —
157 C9H17O2¡ x x x x —
171 C10H19O2¡ x x x — —
181 C11H17O2¡ x x — — —
199 C12H23O2¡ x x x x —
213 C13H25O2¡ x x x — —
227 C14H27O2¡ x x x x x
253 C16H29O2¡ — x x — —
255 C16H31O2¡ x x x x x
281 C18H33O2¡ — — x x x
283 C18H35O2¡ x x x x X
(x D detected;— D not detected).
Conditioning Films and Biofilms in the Subsurface 199
Dow
nloa
ded
by [
Geo
rg-A
ugus
t-U
nive
rsita
et G
oetti
ngen
] at
05:
26 0
7 A
pril
2015
immersed for 1000 min in purified, autoclaved water and pre-pared in the same way as described above for ToF-SIMS andSEM analyses.
ToF-SIMS
Wafer samples were analyzed with a ToF-SIMS IV instru-ment (ION-ToF, M€unster, Germany), using 25 keV Bi3
C pri-mary ions at an accumulated dose density of 2.5 £ 1010 ions/cm2. Areas of 500 mm £ 500 mm were analyzed in bunchedmode with a resolution of 128 £ 128 pixels (lateral resolution»4 mm) and a mass resolution of ca. m/Dm 5000. Each anal-ysis was conducted in positive and negative ion mode and thespectra were individually calibrated using CH2
C, C2H2C,
C3H2C, C4H3
C, and C¡, CH¡, C2¡, C3
¡, C4¡, C4H
¡ peaks,respectively.
Ion images were acquired for fragment ions representingthree different compound classes, namely amino acids, carbo-hydrates, and carboxylic acids (see Table 1). Summed ionimages for each compound class were obtained by adding thesignal intensities of the corresponding individual ion images.
SEM
SEM analyses were conducted using a LEO 1530 Geminifield emission SEM (Zeiss, G€ottingen, Germany) at 3.8 kV.
Results
ToF-SIMS
Positive ion mode
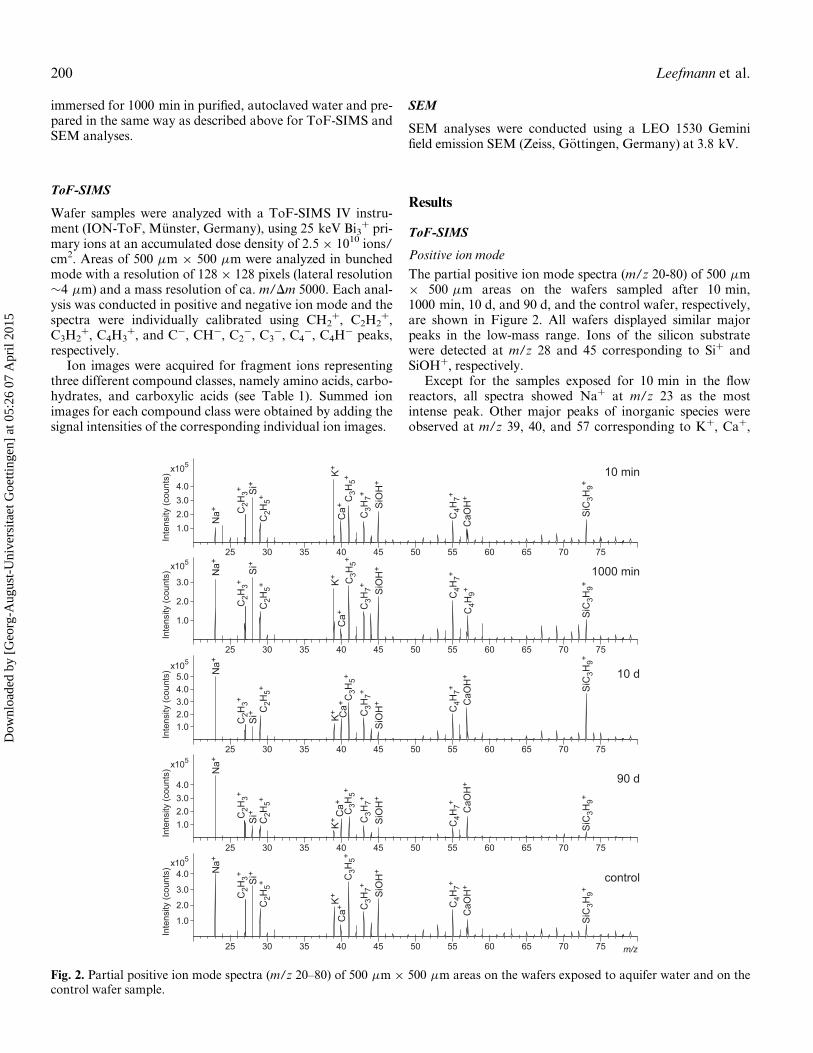
The partial positive ion mode spectra (m/z 20-80) of 500 mm£ 500 mm areas on the wafers sampled after 10 min,1000 min, 10 d, and 90 d, and the control wafer, respectively,are shown in Figure 2. All wafers displayed similar majorpeaks in the low-mass range. Ions of the silicon substratewere detected at m/z 28 and 45 corresponding to SiC andSiOHC, respectively.
Except for the samples exposed for 10 min in the flowreactors, all spectra showed NaC at m/z 23 as the mostintense peak. Other major peaks of inorganic species wereobserved at m/z 39, 40, and 57 corresponding to KC, CaC,
25 30 35 40 45 50 55 60 65 70 75
5x10
1.02.03.04.05.0
Inte
nsity
(cou
nts) 10 d
25 30 35 40 45 50 55 60 65 70 75
5x10
1.02.03.04.0
Inte
nsity
(cou
nts) 90 d
25 30 35 40 45 50 55 60 65 70 75
5x10
1.02.03.04.0
Inte
nsity
(cou
nts) 10 min
m/z
25 30 35 40 45 50 55 60 65 70 75
5x10
1.0
2.0
3.0
Inte
nsity
(cou
nts) 1000 min
25 30 35 40 45 50 55 60 65 70 75
5x10
1.0
2.0
3.0
4.0
Inte
nsity
(cou
nts) control
K+
Si+
SiO
H+
C3H
5+
SiC
3H9+
C4H
7+
Na+
Na+
Na+
Na+
Na+
Si+
Si+
Si+
Si+
K+
K+
K+
K+
C3H
5+
SiO
H+
C4H
7+
SiC
3H9+
C4H
7+C
4H7+
C4H
7+
C3H
5+
SiO
H+
C3H
5+C
3H5+
SiO
H+
SiC
3H9+
C3H
7+
CaO
H+
SiC
3H9+
SiC
3H9+
SiO
H+
CaO
H+
CaO
H+
CaO
H+
C4H
9+
C3H
7+C
3H7+
C3H
7+C
3H7+
Ca+
Ca+
Ca+
Ca+
Ca+
C2H
3+C
2H3+
C2H
3+C
2H3+
C2H
3+
C2H
5+C
2H5+
C2H
5+C
2H5+
C2H
5+
Fig. 2. Partial positive ion mode spectra (m/z 20–80) of 500 mm £ 500 mm areas on the wafers exposed to aquifer water and on thecontrol wafer sample.
200 Leefmann et al.
Dow
nloa
ded
by [
Geo
rg-A
ugus
t-U
nive
rsita
et G
oetti
ngen
] at
05:
26 0
7 A
pril
2015

and CaOHC. Major peaks consistent with the hydrocarbonfragments C2H3
C, C2H5C, C3H5
C, C3H7C, C4H7
C andC4H9
C were observed at m/z 27, 29, 41, 43, 55 and 57,respectively.
Minor peaks corresponding to fragment ions of aminoacids (Wald et al. 2010) and carbohydrates (Sj€ovall et al.2004) were detected by ToF-SIMS, but due to their low inten-sities, these peaks are not visible in the partial positive ionmode spectra shown in Figure 2 (see Supplementary FiguresS1, S3, S5, S7, and S9). Furthermore, all spectra showed apeak at m/z 73 consistent with the SiC3H9
C fragment ion,which is assigned to polydimethylsiloxane (PDMS) contami-nation, and a peak at m/z 28 consistent with the SiC ion fromthe silicon wafer substrate.
Negative ion mode
As in the positive ion mode, no major differences wereobserved for the partial negative ion mode spectra (m/z 10-80) of the wafers sampled after different exposure times tothe aquifer water (Figure 3). All spectra showed major sub-strate peaks at m/z 60 and 77, corresponding to SiO2
¡ andSiOH3
¡. Further major inorganic ions detected at m/z 16,
17, 35, and 79 are consistent with O¡, OH¡, Cl¡, and PO3¡,respectively. Intense organic fragment ions detected at m/z25, 26, and 42 are consistent with C2H
¡, CN¡, and CNO¡,respectively. Minor organic ions detected in the negative ionmode include carboxylic acids in the C8 to C18 range (Passar-elli and Winograd 2011; see also Supplementary Figures S2,S4, S6, S8, and S10). These ions are listed in Table 1.
Compound imaging
Ion images showing the spatial distributions of SiC, SiC3H9C,
and three individual organic compound classes, i.e., aminoacids, carbohydrates, and carboxylic acids, on the fluid-exposed surfaces are displayed in Figure 4. Images showingthe distribution of the latter were obtained by adding the sig-nal intensity from several fragment ions representing the cor-responding compound class (the specific fragment ions usedto produce the images are listed in Table 1 and correspondingspectral peaks are shown in Supplementary Figures S1-S10.On the wafer immersed for 10 min in the aquifer water, theion images showed a spotlike distribution common for allthree compound classes (i.e., amino acids, carbohydrates,and carboxylic acids), with only a few 20–40 mm diameter
10 d
90 d
10 min
m/z
1000 min
control20 30 40 50 60 70
5x10
1.0
2.0
3.0
Inte
nsity
(cou
nts)
20 30 40 50 60 70
5x10
1.0
2.0
3.0
Inte
nsity
(cou
nts)
20 30 40 50 60 70
5x10
1.02.03.04.05.0
Inte
nsity
(cou
nts)
20 30 40 50 60 70
5x10
1.0
2.0
3.0
4.0
Inte
nsity
(cou
nts)
20 30 40 50 60 70
5x10
1.02.03.04.05.0
Inte
nsity
(cou
nts)
O-
SiO
2-
OH
-
CN
-
Cl-
CN
O-
SiO
H3-
PO3-
O-
SiO
2-
OH
-
CN
- Cl-
CN
O-
SiO
H3-
PO3-
O-
SiO
2-
OH
-
CN
-
Cl-
CN
O-
SiO
H3-
PO3-
O-
SiO
2-
OH
-
CN
-
Cl-
CN
O-
SiO
H3-
PO3-
O-
SiO
2-
OH
-
CN
-
Cl-
CN
O-
SiO
H3-
PO3-
C2H
-C
2H-
C2H
-C
2H-
Fig. 3. Partial negative ion mode spectra (m/z 10–80) of 500 mm £ 500 mm areas on the wafers exposed to aquifer water and on thecontrol wafer sample.
Conditioning Films and Biofilms in the Subsurface 201
Dow
nloa
ded
by [
Geo
rg-A
ugus
t-U
nive
rsita
et G
oetti
ngen
] at
05:
26 0
7 A
pril
2015

spots displaying elevated signal intensities (Figure 4a-c).These spots are not colocalized with SiC or PDMS signals(Figure 4d, e).
On the wafers exposed for 1000 min to aquifer water, theion images of amino acids, carbohydrates, and carboxylicacids showed a more uniform distribution (Figure 4f-h) com-pared to the 10 min wafer sample. A chemical contrast wasobserved in the ion images showing the distribution ofPDMS and SiC (Figure 4i, j).
No chemical contrast was observed in the ion images offragments of amino acids, carbohydrates, carboxylic acids,and SiC from the wafer immersed for 10 d (Figure 4k-n)whereas PDMS was unevenly distributed on the wafer sur-face (Figure 4o).
In contrast, the ion images obtained after 90 days ofimmersion in aquifer water showed a patchy distribution ofamino acids and carbohydrates on the wafer surface (Fig-ure 4p, q), with patches of about 10–20 mm being denselyspread over the entire analysis area. The carboxylic acid frag-ments showed only very weak signals on this wafer. Lowintensities of SiC signal were colocalized with areas showinghigh intensities of amino acid and carbohydrate signal (Fig-ure 4p, q, s). The PDMS signal was patchy distributed butnot colocalized with the signals of amino acid and carbohy-drate fragments (Figure 4p, q, t).
The control wafers immersed for 1000 min in ultrapure,autoclaved water showed a non-uniform distribution ofthe SiC and PDMS signal, but no chemical contrast was
Fig. 4. Secondary ion images of summed fragment ions of amino acids (a, f, k, p, u), carbohydrates (b, g, l, q, v), and carboxylic acids(c, h, m, r, w), SiC (d, i, n, s, x) and, SiC3H9
C (e, j, o, t, y) obtained from 500 mm £ 500 mm areas on the wafers exposed to aquiferwater (a-t) and on the control wafer sample (u-y). mc Dmaximum counts, tc D total counts.
202 Leefmann et al.
Dow
nloa
ded
by [
Geo
rg-A
ugus
t-U
nive
rsita
et G
oetti
ngen
] at
05:
26 0
7 A
pril
2015

Fig. 5. SEM images of wafer surfaces. (a) wafer exposed for 10 min to aquifer water, white frame marks area enlarged in (b) showinga sodium chloride crystal, (c) wafer exposed for 1000 min to aquifer water, white frame marks area enlarged in (d) showing two soli-tary cells attached to the surface, (e) wafer exposed for 10 d to aquifer water, white frame marks area enlarged in (f) showing two sol-itary cells attached to the surface, (g) wafer exposed for 90 d to aquifer water, white frame marks area enlarged in (h) showingbiofilm-like accumulation of cells enclosed in extracellular polymeric substances, (i and j) control wafer samples showing no attach-ment of microbial cells.
Conditioning Films and Biofilms in the Subsurface 203
Dow
nloa
ded
by [
Geo
rg-A
ugus
t-U
nive
rsita
et G
oetti
ngen
] at
05:
26 0
7 A
pril
2015

observed in the ion images of the three compound classes(Figure 4u-y).
In general the highest SiC signal based on total counts (tc)was recorded for the wafer exposed for 10 d to aquifer water(9.78; Figure 4n), whereas the lowest tc was measured for the90 d wafer sample (1.66; Figure 4s). The tc of the controlwafer and the wafers immersed for 10 min and 1000 min inaquifer water, respectively, differed only slightly (3.16 and3.22; Figure 4d, i, x).
The total SiC3H9C signal was lowest for the wafer
immersed for 1000 min (1.17; Figure 4j) and increased withlonger time of immersion to 4.77 after 90 d of exposure (Fig-ure 4t). The highest tc value (8.69) for SiC3H9
C was recordedfor the control wafer (Figure 4v).
SEM
Representative SEM images obtained from the wafer surfacesdisplayed organic particles, minerals and microbial cellsattached to the wafer surface (Figure 5).
On the 10-min wafer, exclusively sodium chloride crystalswere found adhering to the surface (Figure 5 a, b). The firstsolitary cells attached to the wafer surface were observedafter 1000 min of exposure to aquifer water (Figure 5c, d).With increasing time of exposure, more solitary cells werefound to be attached to the wafer surface (Figure 5e, f) and,successively, larger accumulations (10–100 mm in diameter)of cells enclosed in a matrix were formed on the wafer (Fig-ure 5g, h). No cells were found to be attached to the surfaceof the control sample (Figure 5i, j).
Discussion
The fragment ions of amino acids, carbohydrates, and car-boxylic acids showed a non-uniform distribution with spotsof higher intensity (20–40 mm in diameter) on the wafer sur-face already after 10 min of immersion of the wafer in aquiferwater. As no microbial cells were found to be attached to thewafer surface and known artificial contaminants such asPDMS were not colocalized with these spots, the most plausi-ble explanation for the observation of these organic struc-tures is the initial formation of a conditioning film on thewafer surface. Earlier studies on surfaces exposed to seawaterhave identified carbohydrates and proteins as the initial andmost abundant constituents of the primary conditioning film(Comp�ere et al. 2001; Garg et al. 2009; Jain and Bhosle2009). Likewise, our finding of an immediate onset of theconditioning film formation after exposure of the wafer sur-face to the aquifer water is in agreement with earlier observa-tions on surfaces immersed in sea water (Bakker et al. 2003)and conditioning films produced from artificial growth media(Chen et al. 2010).
With increasing exposure time (1000 min), carbohydrateand amino acid fragment ions showed a more continuous dis-tribution on the wafer surface. The slight contrasts observedin the ion images can be plausibly explained by patches ofPDMS contaminations (Figure 4j). The continuous
distribution of carbohydrate and amino acid fragment ions isconsistent with a report stating that the primary film formingon stainless steel surfaces immersed for 24 h in sea water iscomposed of proteins and shows a uniform distribution(Poleunis et al. 2002).
However, it has to be considered that potential inhomo-genities may be present at length scales shorter than the lat-eral resolution (»4 mm) of our ToF-SIMS analysis. In fact,from atomic force microscopy analyses of stainless steel sur-faces immersed in seawater it has been concluded that pro-teins are initially adsorbed in the form of 20–100 nmdiameter “islands” (Pradier et al. 2000), which are too smallto be resolved in our ToF-SIMS ion images. Similarly, thefirst attachment of solitary microbial cells to the wafer surfaceobserved in the SEM images after 1000 min of immersionmay not have become evident in the ion images due to thelimited lateral resolution of our ToF-SIMS analyses. Consid-ering the low number of cells and their solitary distributionobserved in SEM images, these cells are unlikely to be thesource of the uniformly distributed organic signal in the ionimages.
Based on the consistent SiC signal recorded for the wafersafter 1000 min and 10 d of exposure time, the surface cover-age of the wafer remained largely constant. No majorchanges in the distribution of the ions of the three organiccompound classes could be observed between the ion imagesobtained from the wafer samples exposed to aquifer water for1000 min and 10 d. From the SEM images it can be con-cluded that in this time interval solitary cells increasinglyattached to the surface. Again, these single cells may havebeen too small to be resolved in the ToF-SIMS ion images.However, based on the higher SiC signal from the waferexposed for 10 d compared to the wafer exposed for1000 min, the coverage of the substrate surface decreased inthis time interval.
Between 10 d and 90 d of exposure, the cells, as observedby SEM, started to form larger accumulations of cells and tosecrete EPS, and thus organize themselves in biofilm-likestructures. These observations are consistent with the record-ing of the lowest SiC signal by ToF-SIMS and thus the high-est observed surface coverage compared to wafers exposedfor shorter time periods. The low resolution of the ToF-SIMS images and the unspecific organic ions observed didnot allow to identify microbial cells or surrounding EPS asspecific sources of the organic signals imaged by ToF-SIMS.However, the main constituents of EPS typically include pol-ysaccharides and proteins (Sheng et al. 2010). Hence, theisland-like distribution of amino acid and carbohydrate frag-ments observed on the 90-d wafer can plausibly be explainedby proteins and polysaccharides that make up the EPS matrixsecreted around the mm-sized biofilm structures.
Conclusions
ToF-SIMS and SEM provided insights into the chemistryand time scales of the initial conditioning film and biofilmformation during exposure of a pristine surface to a subsur-face aquifer. The organic matter that initially adhered in
204 Leefmann et al.
Dow
nloa
ded
by [
Geo
rg-A
ugus
t-U
nive
rsita
et G
oetti
ngen
] at
05:
26 0
7 A
pril
2015

small patches to the surface, prior to any attachment ofmicrobial cells, was found to be rich in amino acids, carbohy-drates and carboxylic acids. Following this initial stage, theconditioning film began to distribute on the substrate surfacemore homogenously, and microbial cells started to attachafter a few hours. The formation of actual biofilm-like struc-tures, comprising accumulations of microbial cells enclosedin EPS, took place in the time interval between 10 d and 90 dof immersion in aquifer water. In conclusion, our resultshighlight that any native surface formed, e.g., by tectonicprocesses in the shallow, continental subsurface, will underexposure to aquifer water likely be covered by organic matterwithin minutes and by complex biofilms within a time scaleof weeks to months.
Acknowledgments
We thank D. Hause-Reitner (University of G€ottingen) forassistance with scanning electron microscopy, and E. Johans-son, M. Kronberg, K. Nilsson, and M. Lundqvist from SKBfor technical and logistic support at the €Asp€o Hard RockLaboratory. We are also grateful to L. Laake (University ofG€ottingen) and his team for the construction of the flow reac-tors and the UV-ozone cleaning apparatus.
Funding
This study was financially supported by the GermanResearch Foundation (DFG; Grant FOR 571). This is publi-cation #74 of the DFG Research Unit “Geobiology ofOrgano- and Biofilms.”
Supplemental Material
Supplemental data for this article can be accessed on thepublisher’s website.
References
Amend JP, Teske A. 2005. Expanding frontiers in deep subsurfacemicrobiology. Palaeogeogr Palaeoclimatol Palaeoecol 219:131–155.
Anderson CR, Pedersen K. 2003. In situ growth of Gallionella biofilmsand partitioning of lanthanides and actinides between biologicalmaterial and ferric oxyhydroxides. Geobiology 1:169–178.
Baier R. 1980. Substrate influences on adhesion of microorganisms andtheir resultant new surface properties. In: Bitton G, Marshall KC,editors. Adsorption of Microorganisms to Surfaces. New York:John Wiley & Sons, p59–104.
Bakker DP, Klijnstra JW, Busscher HJ, van der Mei HC. 2003. Theeffect of dissolved organic carbon on bacterial adhesion to condi-tioning films adsorbed on glass from natural seawater collectedduring different seasons. Biofouling 19:391–397.
Beech IB, Sunner JA, Arciola CR, Cristiani P. 2006. Microbially-influ-enced corrosion: damage to prostheses, delight for bacteria. Inter JArtific Organs 29:443–452.
Beech IB, Zinkevich V, Tapper R, Gubner R, Avci R. 1999. Study of theinteraction of sulphate-reducing bacteria exopolymers with ironusing X-ray photoelectron spectroscopy and time-of-flight second-ary ionization mass spectrometry. J Microbiol Meth 36:3–10.
Belu AM, Graham DJ, Castner DG. 2003. Time-of-flight secondary ionmass spectrometry. Biomaterials 24:3635–3653.
Benninghoven A. 1994. Chemical analysis of inorganic and organic sur-faces and thin films by static time-of-flight secondary ion mass spec-trometry (TOF-SIMS). Angewandte Chem Inter Edit Engl33:1023–1043.
Chen M-Y, Chen M-J, Lee P-F, Cheng L-H, Huang L-J, Lai C-H,Huang K-H. 2010. Towards real-time observation of condition-ing film and early biofilm formation under laminar flow condi-tions using a quartz crystal microbalance. Biochem Eng J53:121–130.
Comp�ere C, Bellon-Fontaine MN, Bertrand P, Costa D, Marcus P,Poleunis C, Pradier CM, Rondot B, Walls MG. 2001. Kinetics ofconditioning layer formation on stainless steel immersed in seawa-ter. Biofouling 17:129–145.
Cooksey KE, Wigglesworth-Cooksey B. 1995. Adhesion of bacteria anddiatoms to surfaces in the sea: a review. Aqua Microb Ecol 9:87–96.
Costerton JW, Lewandowski Z, Caldwell DE, Korber DR, Lappin-Scott HM. 1995. Microbial biofilms. Annu Rev Microbiol 49:711–745.
Costerton JW, Stewart PS, Greenberg EP. 1999. Bacterial biofilms:A common cause of persistent infections. Science 284:1318–1322.
de Brouwer JFC, Cooksey KE, Wigglesworth-Cooksey B, Staal MJ,Stal LJ, Avci R. 2006. Time of flight-secondary ion mass spectrom-etry on isolated extracellular fractions and intact biofilms of threespecies of benthic diatoms. J Microbiol Meth 65:562–572.
Donlan RM. 2001. Biofilms and device-associated infections. EmergInfect Dis 7:277–281.
Donlan RM, Costerton JW. 2002. Biofilms. Clin Microbiol Rev 15:167–193.
Garg A, Jain A, Bhosle NB. 2009. Chemical characterization of amarine conditioning film. Int Biodeterior Biodegrad 63:7–11.
Geesey GG, Gillis RJ, Avci R, Daly D, Hamilton M, Shope P, HarkinG. 1996. The influence of surface features on bacterial colonizationand subsequent substratum chemical changes of 316L stainlesssteel. Corr Sci 38:73–95.
Jain A, Bhosle NB. 2009. Biochemical composition of the marine condi-tioning film: implications for bacterial adhesion. Biofouling 25:13–19.
Jørgensen BB, Boetius A. 2007. Feast and famine—Microbial life in thedeep-sea bed. Nat Rev Microbiol 5:770–781.
Keevil CW. 2003. Pathogens in environmental biofilms. In: Bitton G,editor. Encyclopedia of Environmental Microbiology. New York:John Wiley & Sons.
Kotelnikova S, Pedersen K. 1998. Distribution and activity of methano-gens and homoacetogens in deep granitic aquifers at €Asp€o HardRock Laboratory, Sweden. FEMSMicrobiol Ecol 26:121–134.
Loeb GI, Neihof RA. 1975. Marine conditioning films. Advan Chem145:319–335.
Montaggioni LF, Camoin GF. 1993. Stromatolites associated with cor-algal communities in Holocene high-energy reefs. Geology 21:149–152.
Passarelli MK, Winograd N. 2011. Lipid imaging with time-of-flightsecondary ion mass spectrometry (ToF-SIMS). Biochim BiophysActa 1811:976–990.
Pedersen K, Arlinger J, Ekendahl S, Hallbeck L. 1996. 16S rRNA genediversity of attached and unattached bacteria in boreholes alongthe access tunnel to the €Asp€o hard rock laboratory, Sweden.FEMSMicrobiol Ecol 19:249–262.
Poleunis C, Comp�ere C, Bertrand P. 2002. Time-of-flight secondary ionmass spectrometry. J Microbiol Meth 48:195–205.
Conditioning Films and Biofilms in the Subsurface 205
Dow
nloa
ded
by [
Geo
rg-A
ugus
t-U
nive
rsita
et G
oetti
ngen
] at
05:
26 0
7 A
pril
2015

Poleunis C, Rubio C, Comp�ere C, Bertrand P. 2003. ToF-SIMS chemi-cal mapping study of protein adsorption onto stainless steel surfa-ces immersed in saline aqueous solutions. Appl Surf Sci 203–204:693–697.
Pradier CM, Bertrand P, Bellon-Fontaine MN, Comp�ere C, Costa D,Marcus P, Poleunis C, Rondot B, Walls MG. 2000. Adsorption ofproteins on an AISI 316 stainless-steel surface in natural seawater.Surf Interf Anal 30:45–49.
Schopf JW, Kudryavtsev AB, Czaja AD, Tripathi AB. 2007. Evidenceof Archean life: Stromatolites and microfossils. Precambr Res158:141–155.
Sheng G-P, Yu H-Q, Li X-Y. 2010. Extracellular polymeric substances(EPS) of microbial aggregates in biological wastewater treatmentsystems: A review. Biotechnol Advan 28:882–894.
Sj€ovall P, Lausmaa J, Johansson BL, Andersson M. 2004. Surfacechemical analysis of carbohydrate materials used for chromatogra-phy media by time-of-flight secondary ion mass spectrometry. AnalChem 76:1857–1864.
Taylor GT, Zheng D, Lee M, Troy PJ, Gyananath G, Sharma SK. 1997.Influence of surface properties on accumulation of conditioning
films and marine bacteria on substrata exposed to oligotrophicwaters. Biofoul J Bioadhes Biofilm Res 11:31–57.
Thiel V, Sj€ovall P. 2011. Using time-of-flight secondary ion mass spec-trometry to study biomarkers. Annu Rev Earth Planet Sci 39:125–156.
Tice MM, Thornton DC, Pope MC, Olszewski TD, Gong J. 2011.Archean microbial mat communities. Annu Rev Earth Planet Sci39:297–319.
Trevors JT. 2002. The subsurface origin of microbial life on the Earth.Research in Microbiology 153:487–491.
van Loosdrecht MC, Lyklema J, Norde W, Zehnder AJ. 1990. Influ-ence of interfaces on microbial activity. Microbiol Rev 54:75–87.
Wald J, M€uller C, Wahl M, Hoth-Hannig W, Hannig M, Kopnarski M,Ziegler C. 2010. ToF-SIMS investigations of adsorbed proteins ondental titanium. Phys Stat Solid(a) 207:831–836.
Walker JJ, Pace NR. 2007. Endolithic microbial ecosystems. Annu RevMicrobiol 61:331–347.
Winograd N, Garrison BJ. 2010. Biological cluster mass spectrometry.Annu Rev Phys Chem 61:305–322.
206 Leefmann et al.
Dow
nloa
ded
by [
Geo
rg-A
ugus
t-U
nive
rsita
et G
oetti
ngen
] at
05:
26 0
7 A
pril
2015