An Exploration of Human Population Demographic Data
16
Tested Studies for Laboratory Teaching Proceedings of the Association for Biology Laboratory Education Vol. 32, 406–421, 2011 406 Behind the Numbers: An Exploration of Human Population Demographic Data Teresa C. Weglarz Department of Biological Sciences, University of Wisconsin – Fox Valley, 1478 Midway Rd, Menasha WI 54952 USA ([email protected]) Increasingly global population size has been a cause for alarm among scientists. Currently, global population size is 6.9 billion and estimates for 2050 range from 8-12 billion. It is estimated that the majority of population growth in the next 50 years will be in developing countries. This computer-based lab activity explores some of the social, economic, and political factors that influence population growth. Understanding the role of these factors in popula- tion growth is critical to the study of population demography. Population demographic data provides a glimpse into the population characteristics that are associated with rapid growth. The International Data Base provides popula- tion pyramids and demography data, on infant mortality rates, fertility rates, and life expectancy of populations in over 200 countries. This population demographic data provides a glimpse into the population characteristics that are associated with population growth and may provide clues on how to address population growth. Keywords: Population growth, demography, population pyramids © 2011 by Teresa C. Weglarz Introduction Introduction Human demography is the study of population charac- teristics. The purpose of this computer investigation is to analyze the demographic relationships between different countries. The lab includes four parts. Students examine population demographic data of the three most populous countries in part one. In part two, students compare demo- graphic data of developed and developing countries. Final- ly, students calculate their ecological footprint in part three, and propose a plan to address environmental impact in part four. The U.S. Census Bureau hosts the International Data Base (IDB) website that students use to examine popula- tion pyramids and population demographics for different countries; this site is updated routinely with the most current population statistics (See Appendix A). The IDB popula- tion data contains estimates and projections for more than 200 countries, which includes population size, fertility, mortality and migration rates. The entire investigation can be completed within approximately three hours by students with limited internet skills and a basic understanding of population growth. This lab requires no set-up time by the instructor and I use it when discussing impacts of human population on the environment. This computer investigation has been completed by students in Introductory Biology and Environmental Science courses. This lab also is an update and extension to, “A Comparative Study of the Demography of Human Populations” by Ralph Preszler, presented at the 2002 ABLE meeting http://www.ableweb.org/volumes/ vol-24/2-preszler.pdf
-
Upload
khangminh22 -
Category
Documents
-
view
0 -
download
0
Transcript of An Exploration of Human Population Demographic Data

Tested Studies for Laboratory TeachingProceedings of the Association for Biology Laboratory Education Vol. 32, 406–421, 2011
406
Behind the Numbers: An Exploration of Human Population Demographic Data
Teresa C. Weglarz
Department of Biological Sciences, University of Wisconsin – Fox Valley, 1478 Midway Rd, Menasha WI 54952 USA([email protected])
Increasingly global population size has been a cause for alarm among scientists. Currently, global population size is 6.9 billion and estimates for 2050 range from 8-12 billion. It is estimated that the majority of population growth in the next 50 years will be in developing countries. This computer-based lab activity explores some of the social, economic, and political factors that influence population growth. Understanding the role of these factors in popula-tion growth is critical to the study of population demography. Population demographic data provides a glimpse into the population characteristics that are associated with rapid growth. The International Data Base provides popula-tion pyramids and demography data, on infant mortality rates, fertility rates, and life expectancy of populations in over 200 countries. This population demographic data provides a glimpse into the population characteristics that are associated with population growth and may provide clues on how to address population growth.
Keywords: Population growth, demography, population pyramids
© 2011 by Teresa C. Weglarz
IntroductionIntroduction
Human demography is the study of population charac-teristics. The purpose of this computer investigation is to analyze the demographic relationships between different countries. The lab includes four parts. Students examine population demographic data of the three most populous countries in part one. In part two, students compare demo-graphic data of developed and developing countries. Final-ly, students calculate their ecological footprint in part three, and propose a plan to address environmental impact in part four. The U.S. Census Bureau hosts the International Data Base (IDB) website that students use to examine popula-tion pyramids and population demographics for different countries; this site is updated routinely with the most current population statistics (See Appendix A). The IDB popula-
tion data contains estimates and projections for more than 200 countries, which includes population size, fertility, mortality and migration rates. The entire investigation can be completed within approximately three hours by students with limited internet skills and a basic understanding of population growth. This lab requires no set-up time by the instructor and I use it when discussing impacts of human population on the environment. This computer investigation has been completed by students in Introductory Biology and Environmental Science courses. This lab also is an update and extension to, “A Comparative Study of the Demography of Human Populations” by Ralph Preszler, presented at the 2002 ABLE meeting http://www.ableweb.org/volumes/vol-24/2-preszler.pdf

Proceedings of the Association for Biology Laboratory Education, Volume 32, 2011 407
Mini Workshop: Exploring Human Demography Data
Student OutlineHuman Population Growth
The Population Bomb by Ehrlich (1968) presented a rather bleak view of the viability of human civilization. He suggested that the number of people on the planet was limiting; at some point the number of people would exceed the carrying capacity, or the number of individuals the environment can support. Ehrlich stated “There are only two kinds of solutions to the popula-tion problem. One is a ‘birth rate solution’, in which we find ways to lower the birthrate. The other is a ‘death rate solution,’ in which ways to raise the death rate – war, famine, pestilence – find us”. In the ensuing 40 years since the book was published, many scientists agree that human population size is an important factor in environmental impact. In fact, the relationship between population size and environmental impact can be summarized in the following equation: I = P × A × T, where I is environmental impact, A is affluence and T is technology. You will begin your investigation (Part 1) of population demography by examining population pyramids (See Figure 1) and statistics for different countries.
Population Vital Statistics Terms
Total fertility rate – The number of children a woman has during her lifetime.
Birth rate – The number of children born per 1000 people.
Death rate – The number of deaths per 1000 people.
Life expectancy – The age to which an individual can expect to live.
Gross National Income – The average earnings of a family.
Figure 1. Population pyramid. A population pyramid, or age structure diagram, is a bar graph of age versus number of people. Each horizontal bar represents the number of people in a particular age group. The width of the bar represents the total number of people in that age group.
Population Dynamics
When the number of births exceeds the number of deaths the population is growing in size. Growth at a constant rate is ex-ponential (See Figure 2). Exponential growth is unsustainable in nature; eventually resources will be limited and the population will experience a decline. As environmental deterioration accelerates around the world, many scientists, like Ehrlich 40 years ago, have pointed to rapid population growth as the culprit.
♂ ♀

408 Tested Studies for Laboratory Teaching
Weglarz
Figure 2. Exponential growth of a population over time. Growth occurs when the birth rate continually exceeds the death rate.
In Part 2, you will investigate the economic and educational disparities between less-developed countries (LDCs) and more-developed countries (MDCs). LDCs are generally defined as countries with low levels of industrialization, while MDCs are often highly industrialized. Many MDC’s have slow-growing populations, or zero growth. The population size is stable (i.e. zero growth) when the number of births and deaths are equal. The population pyramid for zero growth has bars of roughly equal width for all age groups up to the average life expectancy (when the width of bars decreases due to death). Economic development can spur demographic transition from a LDC to a MDC. Economic growth promotes increased educational op-portunities, relief from poverty, and increased access to health care including contraception; this in turn may lead to decreased death rates and often decreased birth rates. Interestingly, some environmental conservation groups are now spending their money promoting economic growth to lower population growth and advance environmental conservation (Leatherman, 2008).
Resource Use
While addressing population growth is an important aspect of environmental impact, it is certainly not the only factor to consider. Affluence tends to increase resource use. What are the environmental costs of increased consumption? Consider that the world’s oceans have lost up to 90% of all large fish, greenhouse gases are increasing, while energy demands and meat con-sumption are on the rise. The U.S. with less than 5% of the world’s population consumes 25% of the world’s resources. The ecological footprint evaluates resource use in several categories: food, shelter, mobility, goods and services. In Part 3, you will determine your ecological footprint. An ecological footprint is an estimate of the amount of resources required to sustain your lifestyle compared to the amount of biologically productive land. It includes the amount of land needed to produce the materi-als you use (from food to fiber and wood), and the amount of land required to absorb the waste produced from daily activities.

Proceedings of the Association for Biology Laboratory Education, Volume 32, 2011 409
Mini Workshop: Exploring Human Demography Data
Student Worksheet
Part 1Current Human Population Numbers
The U.S. Census Bureau website provides real-time population data from the most recent U.S. Census. A census of the U.S. population has been conducted every 10 years since 1790 with the goal to collect the name of the head of the household and the number of people residing in that household. The data are used to define legislature districts, and to determine how federal funds will be provided to states for education and transportation. This site also maintains global data, the International Data Base (IDB), with population demographics, population pyramids, and summary data for more than 200 countries. We will use this data to analyze population demographics of countries around the world.
Go to the U.S. Census Bureau home page. http://www.census.gov/ What is the current world population for the most recent month? What is the U.S. population size? Enter the data below. Use the ‘Population Finder’ on the Census Bureau page to find the population size of the state and city you reside in.
World:
U.S.:
State:
City:
From the ‘U.S. Census Bureau’ home page, select ‘International’ under the ‘People and Households’ heading. Then select ‘International Database’ (IDB) under ‘Quick Links’. [http://www.census.gov/ipc/www/idb/] From the IDB page choose ‘World Population Information’, then click on ‘World Vital Events Per Time Unit’. Fill in the following information:
World: Births/year = __________ Deaths/year = __________ Natural Increase/year = __________
Go back to the ‘World Population Summary’ page. Select ‘World Population 1950-2050’ in ‘Graphs’ under ‘World Popula-tion Trends’. What is the projected world population size in 2050?
How would you classify the type of growth seen in the graph?
Go back to the ‘World Population Summary’ page. Select ‘World Population Growth Rates 1950-2050’ in ‘Graphs’ under ‘World Population Trends’. Explain how “World Population Growth Rates” decrease from 1950-2050, yet the world popula-tion size continues to grow.
Doubling time is the time it takes a population to double in size. Calculate the doubling time for the world population using the equation T = 70/population growth rate, where T is the doubling time in years. The world population growth rate can be estimated from the “World Population Growth Rates” graph.
Doubling time of world population =

410 Tested Studies for Laboratory Teaching
Weglarz
From the IDB main page, select ‘Data Access’. Select a country and the current year, then click on the ‘Submit’ button. What is the crude birth and death rate for the U.S., Italy, Ghana and any two other countries? Enter this data in Table 1. What is the net increase or decrease (births – deaths) in population per 1000 in each country? Enter this data in Table 1. Note that a negative number indicates a shrinking population, while a positive number indicates a population that is growing in size.
Table 1. Net Change in Population Size for Selected Countries.Country: Births/1000 Deaths/1000 Net Number/1000
U.S. ItalyGhana
Population Pyramids
Draw the population pyramids for a country that is experiencing rapid growth, zero growth and negative growth. Label the axes for each diagram and clearly identify the type of growth.
Click on “Country Rankings” at the top of the International Data Base (IDB) page. List the 5 largest countries in population size for the current year.
1.
2.
3.
4.
5.

Proceedings of the Association for Biology Laboratory Education, Volume 32, 2011 411
Mini Workshop: Exploring Human Demography Data
In Table 2, enter the three most populous countries (from the previous page) at the top of each column. Start at the IDB Main. [http://www.census.gov/ipc/www/idb/index.php] Enter the Database (Data Access). Select the country and the year(s) for which you want data (See Appendix A). Submit query. Complete Table 2. Fertility and mortality data is presented under the ‘Demographic Indicators’ tab. Population pyramids are under the ‘Population Pyramids’ tab. You will need to iden-tify the type of population pyramid the country most closely represents.
Table 2. Population Demographics of the Three Most Populous Countries. Country: Country: Country:
Population size (for the current year)
Projected populationsize in 2050
Total fertility rate(for the current year)
Annual rate of growth(for the current year)
Infant Mortality Rate per 1000 live births(for the current year)Life expectancy in years(for the current year)
Doubling Time (T)(T =70/annual growth rate) in yearsType of Population Pyramid in 1995
Type of Population Pyramid (current year)
Type of Population Pyramid in 2050
Role of Migration on Population Growth
Migration rate must also be considered when examining population growth. When immigration and birth rate exceeds death rate and emigration the population is growing. Start at IDB Main. Enter the Data Base. Select the United States and the current year.
What is the Net Migration Rate for the U.S.?
What is the Net Number of Migrants for the U.S.?

412 Tested Studies for Laboratory Teaching
Weglarz
The U.S. is the only MDC on the top ten list of most populous countries in 2050. How much does immigration contribute to this? To answer this you can determine the percent of annual increase in the U.S. population that can be attributed to migration using the following equation:
Percent of increase due to in-migration = Net number of migrants/Net increase (NI) in the population × 100. (NI = Total population × Growth Rate/100.)
Percent of increase due to in-migration =
Population Policy around the World
China
China’s government adopted a policy advocating one child per couple in 1980. Select a series of years from 1990-2050 to examine the changing population pyramid of China. Note that you can examine the affect of the population policy even though no population pyramid is available for 1980 by looking at age groups. For example, in the population pyramid for 1990, the 5 to 10-year-old age group would be the first age group to be born after the 1980 policy was implemented.
Has China’s population policy slowed growth? Is the effect immediate? Explain.
How has China’s age structure changed as a result of its policy?
Give two examples of possible social consequences associated with these changes.
India
India began a campaign to lower birth rates in 1960, but their efforts were not mandatory and were largely promoted by mass media. Select a series of years from 1990-2050 to examine the changing population pyramid of India.
Has India’s population policy slowed growth? Explain.
Was India’s campaign as effective at slowing population growth as China’s? Explain.

Proceedings of the Association for Biology Laboratory Education, Volume 32, 2011 413
Mini Workshop: Exploring Human Demography Data
What is the optimum human population size? Daily et al. (1994) have said that the optimum population size is 2 billion. He claims that this number will allow a large population to have “exciting cities and still maintain substantial tracts of wilderness for the enjoyment of outdoor enthusiasts.” The United Nations stated, “Governments are becoming increasingly concerned with the consequences of population trends and international migration. Furthermore, governments are now more inclined to view population as a legitimate area for government actions and act upon these concerns by formulating and implementing poli-cies that address population issues.” (Population Newsletter, 2007) Do you think the U.S. should develop a population policy? If so, what should it entail?

414 Tested Studies for Laboratory Teaching
Weglarz
Part 2Less Developed and More Developed Country Profiles
Pick any two LDC countries from the IDB Main page that we have not already explored, and one MDC. Submit query. Complete Table 4 using the demographic data you retrieved for each of these countries. If you are not sure which countries are classified as LDC’s (by the United Nations) you can check the UN Office of the High Representative for the Least Devel-oped Countries, Landlocked Developing Countries and Small Island Developing States (UN-OHRLLS) (http://www.un.org/special-rep/ohrlls/ldc/list.htm) web page. It is also interesting to watch the animation of how the population pyramid changes over time, to do this select multiple years between 1950 and 2050. Then, in the ‘Population Pyramids’ tab press the play (►) icon to watch the population pyramid animation. Identify the type of population pyramid in Table 3.
Table 3. Population Demographics of LDC’s and a MDC.
Country TFR (current year)
Life Expectancy
(current year)
InfantMortality
Rate (current year)
Crude Birth Rate
Type of Population Pyramid
(current year)LDC
LDC
MDC
Income and education are often directly linked to population growth. Rapidly growing populations often are poor and lack access to educational opportunities. Go to The World Bank website. [http://www.worldbank.org/] Click on the ‘Data and Research’ heading at the top of the page. Under the ‘Data’ heading click on ‘Go’ next to ‘Data by Country’ and under the head-ing ‘Key Statistics’(See Appendix B). For each country listed in Table 2 and Table 3, find the Gross National Income (GNI) per capita and primary school enrollment (percent of total school-age children). List the GNI and school enrollment in the last column of Tables 2 and 3. Note that school enrollment is presented as the ratio of total enrollment, regardless of age, to the population of the age group that officially corresponds to the level of education indicated. Therefore, the percentage may be greater than 100%. Describe the relationship (if any) between GNI and population growth, and any relationship between education (i.e. school enrollment) and population growth.

Proceedings of the Association for Biology Laboratory Education, Volume 32, 2011 415
Mini Workshop: Exploring Human Demography Data
Demographic Transition and the AIDS Pandemic
Demographic transition is a model in which economic development moves a LDC with a rapidly growing population to a MDC with zero growth. In this model, birth and death rates are high in unindustrialized countries and then fall with industri-alization. The HIV/AIDS pandemic has had a dramatic effect on mortality rates and population growth in many countries, especially those in Africa. The United Nations reports that 93% of developing countries (81% in developed countries) view HIV/AIDS as the most pressing demographic challenge they are facing (Population Newsletter, 2007). In sub-Saharan Africa more than one-tenth of the adult population is infected with HIV (The AIDS Pandemic in the 21st Century, Global Population Profile: 2002, U.S. Census Bureau). In some regions, death rates are expected to increase, especially in the 15-44-year-old age category, this has lead to a unique population profile termed the ‘population chimney’. Using the International Data Base, select one of the following countries: South Africa, Lesotho or Mozambique, and a series of years; for example 1990, 2000, 2010, 2020, 2030, and 2050, and then examine the population pyramids.
Draw a representative example of a population chimney below.
What has been the overall effect on fertility rate in countries with a high incidence of HIV/AIDS? Explain.

416 Tested Studies for Laboratory Teaching
Weglarz
Part 3Ecological Footprint
This page is to be completed prior to lab. An ecological footprint is a measure of the resources and services required to maintain your lifestyle. In other words, it is a measure of your environmental impact. The ecological footprint estimates the amount of land required to provide you with food, shelter, transportation, goods, and services. One planet Earth is a sustainable footprint size, after all we only have one Earth. The ecological footprint for an average American is 5 planets (Global Footprint Network). How do you compare? Complete an ecological footprint Quiz to find out. Global Footprint Network at http://www.footprintnetwork.org/en/index.php/GFN/ is an organization that hopes to use the ecological footprint as a measure of sustainability for all nations. Print out the results of your footprint quiz and answer the questions below. There are many other on-line footprint calculators. For comparison you could try the Earth Day Network Footprint Calculator at http://earthday.net/footprint.index.html
Answer the following questions:a. What is the size of your ecological footprint in planet Earths and/or global acres? Print a paper copy of your results.
b. How much bigger, or smaller, is your ecological footprint compared to the average ecological footprint size for a U.S. citizen? Are you surprised by the size of your ecological footprint? Why or why not?
c. List two changes you could realistically make. Now re-take the quiz with those two changes. What is the size of your ‘new’ ecological footprint with those two changes?
d. Do you think you could achieve a sustainable ecological footprint? Why or why not? If you’re not sure if you can achieve a sustainable footprint, re-take the quiz again incorporating as many changes as you can.

Proceedings of the Association for Biology Laboratory Education, Volume 32, 2011 417
Mini Workshop: Exploring Human Demography Data
Materials• Computer with internet access (one computer/2 stu-
dents)• Calculator
Notes for the Instructor This investigation has been successfully completed by students as a lab assignment for an on-line course, and in a computer lab for a course that meets face-to-face. Invari-ably, students try to divide up the questions and then can not find the web page or information they need to answer a series of questions. The questions in the lab are a step-by-step guide for navigation through the web sites. I encour-age students to back up to the previous set of questions and follow the instructions if they can not find the information (or web page) they need. Alternatively, direct students back to the home page for the International Data Base. On one occasion, the International Data Base website data would not load, but connection was restored within 20 minutes. Another excellent resource for population data is from the Population Reference Bureau. Go to http://www.prb.org/ ‘Quick Links’ is on the side bar on the right. Download the ‘2009 World Population Data Sheet’. Students are asked to identify the type of population pyramid for Tables 2 and 3. Frequently, students will say that the population pyramid is ‘sort of’ rapid, but ‘sort of’ slow. I tell the students that the data they are using is actual population data and may not fit any one type of population pyramid perfectly. In-stead, they will have to use their judgment in assigning the type of population pyramid. I also show the DVD, “World Population: A Graphic Simulation of the History of Human Population Growth” by Population Connection (2003) pri-or to the lab. This short video follows human population growth from 1 AD through present and projects population size to 2050, and is a useful tool in visualizing the rate of population growth over time. There also is an interesting July 2010 TED lecture, “Hans Rosling on Global Popula-tion Growth” which links population growth to economic growth. This video is available online at http://www.ted.com/talks/hans_rosling_on_global_population_growth.html This lab can also be adopted for use in Canada by us-ing the Statistics Canada website for the activities in Part 1.
Internet ReferencesGlobal Footprint Network: http://www.footprintnetwork.org/en/index.php/GFN/Population Reference Bureau: http://www.prb.org/Statistics Canada: www.statcan.gc.caU.S. Census Bureau: http://www.census.gov/The World Bank: http://www.worldbank.org/
Literature CitedDaily G., Ehrlich A., and Ehrlich P. 1994. Optimum Hu-
man Population Size. Population and Environment 15:469-475.
Ehrlich P. 1968. The Population Bomb. New York: Ballan-tine Books.
Ehrlich P. and Ehrlich A. The Population Bomb Revisited. 2009. The Electronic Journal of Sustainable Develop-ment I(3).
Global Footprint Network (2008) Earth Overshoot Day, Media Backgrounder http://footprintnetwork.org/press/EcologicalDebtDayMediabackgrounder.pdf
Global Population Profile, 2002. US Census Bureau. Popu-lation Division. 2009. www.census.gov/ipc/www/wp02.html.
Leatherman, C., 2008. The Poverty Question: What Does Poverty mean for Conservation? Nature Conservancy Magazine.
Population Newsletter. United Nations Department of Eco-nomic and Social Affairs/Population Division. Dec. 2007: 84.
About the Author Teresa Weglarz received her B.S. from Lymann Briggs College at Michigan State University, and her Ph.D. in En-vironmental Toxicology from the University of Wisconsin-Madison. Currently, she is teaching Introductory Biology, Environmental Science, Genetics of Heredity, and co-teach-ing a course in environmental sustainability titled, ‘Beyond Recycling: Advancing toward Sustainability’ at the Univer-sity of Wisconsin-Fox Valley. She is involved in campus sustainability issues, and loves to compost everything pos-sible so she can use the soil for her vegetable garden. This helps reduce her ecological footprint, though not yet to a sustainable level.

418 Tested Studies for Laboratory Teaching
Weglarz
Part 4 - Extension Activity Consider the information you collected about human population growth, mortality and fertility rates, income, education, and environmental impact. Now suppose you are a government official of the U.S. and have been tasked with curbing environ-mental impact; an overwhelming task no doubt. However, you know that environmental impact has three main components (I =P ×A ×T), and addressing just one of these issues will go a long way toward lowering overall environmental impact. So, you immediately set out to develop a proposal, while keeping in mind that you are up for re-election in less than two years (so your proposal has to be politically viable). Proposals should be a minimum of 300 words.
Proceedings of the Association for Biology Laboratory Education, Volume 32, 2011 419
Mini Workshop: Exploring Human Demography Data
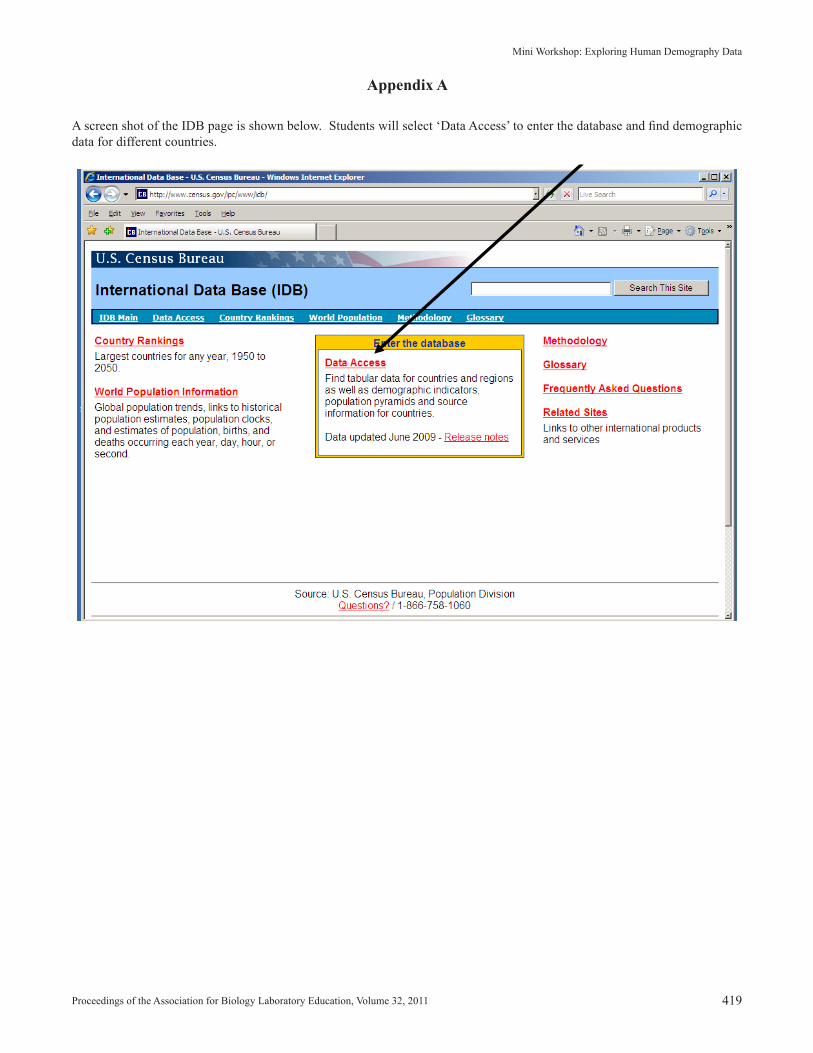
Appendix A
A screen shot of the IDB page is shown below. Students will select ‘Data Access’ to enter the database and find demographic data for different countries.
420 Tested Studies for Laboratory Teaching
Weglarz
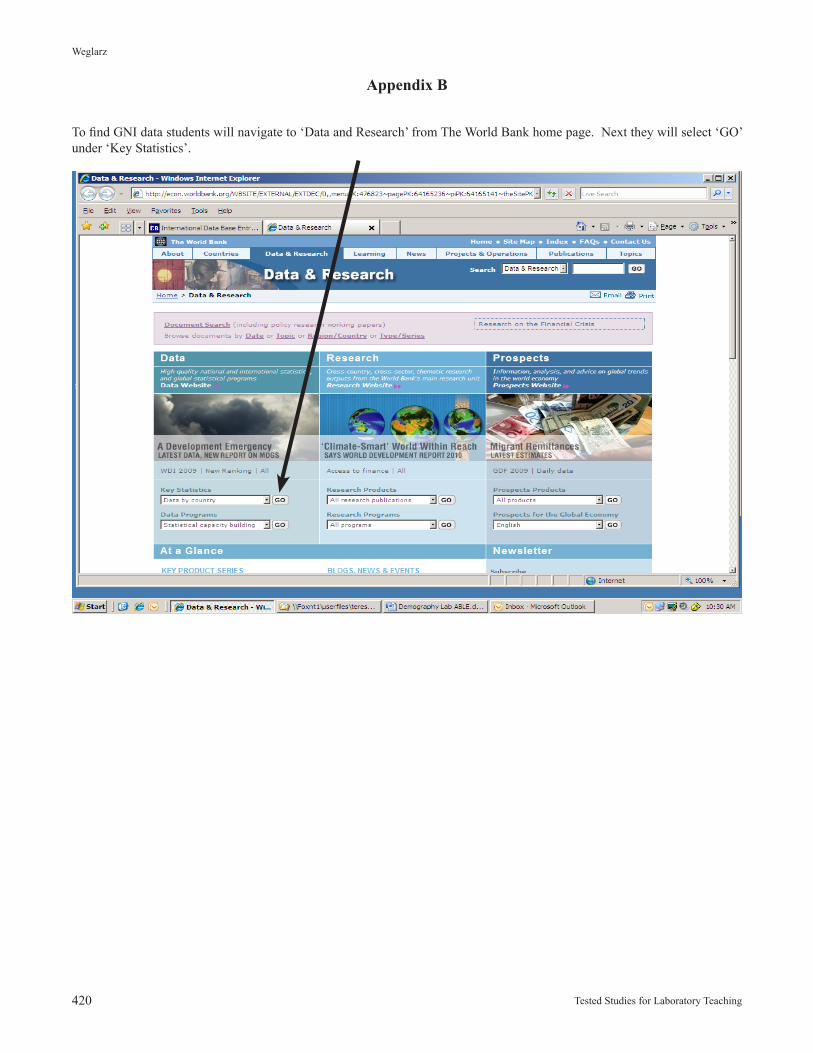
Appendix B
To find GNI data students will navigate to ‘Data and Research’ from The World Bank home page. Next they will select ‘GO’ under ‘Key Statistics’.

Proceedings of the Association for Biology Laboratory Education, Volume 32, 2011 421
Mini Workshop: Exploring Human Demography Data
Mission, Review Process & Disclaimer The Association for Biology Laboratory Education (ABLE) was founded in 1979 to promote information exchange among university and college educators actively concerned with teaching biology in a laboratory setting. The focus of ABLE is to improve the undergraduate biology laboratory experience by promoting the development and dissemination of interesting, in-novative, and reliable laboratory exercises. For more information about ABLE, please visit http://www.ableweb.org/ Papers published in Tested Studies for Laboratory Teaching: Proceedings of the Conference of the Association for Biology Laboratory Education are evaluated and selected by a committee prior to presentation at the conference, peer-reviewed by participants at the conference, and edited by members of the ABLE Editorial Board. Although the laboratory exercises in this proceedings volume have been tested and due consideration has been given to safety, individuals performing these exercises must assume all responsibilities for risk. ABLE disclaims any liability with re-gards to safety in connection with the use of the exercises in this volume.
Citing This Article Weglarz, T.C. 2011. Behind the Numbers: An Exploration of Human Population Demographic Data. Pages 406-421, in Test-ed Studies for Laboratory Teaching, Volume 32 (K. McMahon, Editor). Proceedings of the 32nd Conference of the Association for Biology Laboratory Education (ABLE), 445 pages. http://www.ableweb.org/volumes/vol-32/?art=49
Compilation © 2011 by the Association for Biology Laboratory Education, ISBN 1-890444-14-6. All rights reserved. No part of this publication may be reproduced, stored in a retrieval system, or transmitted, in any form or by any means, electronic, mechanical, photocopying, recording, or otherwise, without the prior written permission of the copyright owner. Use solely at one’s own institution with no intent for profit is excluded from the preceding copyright restriction, unless otherwise noted on the copyright notice of the individual chapter in this volume. Proper credit to this publication must be included in your laboratory outline for each use; a sample citation is given above. Upon obtaining permission or with the “sole use at one’s own institution” exclusion, ABLE strongly encourages individuals to use the exercises in this proceedings volume in their teaching program.End Adams