Demographic history and population structure of the Antarctic silverfish Pleuragramma antarcticum
13
Molecular Ecology (2006) 15, 4499–4511 doi: 10.1111/j.1365-294X.2006.03105.x © 2006 The Authors Journal compilation © 2006 Blackwell Publishing Ltd Blackwell Publishing Ltd Demographic history and population structure of the Antarctic silverfish Pleuragramma antarcticum L. ZANE,* S. MARCATO,* L. BARGELLONI,† E. BORTOLOTTO,* C. PAPETTI,* M. SIMONATO,‡ V. VAROTTO * and T. PATARNELLO *† *Dipartimento di Biologia, Università di Padova, Via G. Colombo, 3, I-35121 Padova, Italy, †Dipartimento di Sanità Pubblica, Patologia Comparata e Igiene Veterinaria, Agripolis, Università di Padova, Via Romea, 16, I-35020 Legnaro (Pd), Italy, ‡Dipartimento di Agronomia Ambientale e Produzioni Vegetali Entomologia, Agripolis, Università di Padova, Via Romea 16, I-35020 Legnaro (Pd), Italy Abstract The Antarctic silverfish Pleuragramma antarcticum (Nototheniidae) is the most abundant pelagic fish inhabiting Antarctic waters. In this study we investigated, through partial sequencing of the D-loop mitochondrial region, samples collected at four different locations in the Southern Ocean, three in the Atlantic and one in the Pacific sector. Sampling was replicated in two different years at two locations. Sequence analysis showed a remarkably high polymorphism, with 110 haplotypes over the 256 investigated specimens, and about 80% of haplotypes occurring only once. Neutrality tests indicated that all samples were not at mutation–drift equilibrium, and suggested a past population expansion. This result was supported by the presence of a star-like topology in the D-loop gene tree, and by results of mismatch distribution. The start of the expansion was dated, using a specifically calibrated clock, between 111 and 126 thousand years ago. This value corresponds to the start of the cooling period that led to the last glaciation peak, and is in close agreement with a recently suggested range expansion for pelagic Antarctic ecosystems. Analysis of molecular varia- tion indicated a small, though highly significant, value of differentiation between samples. This result, together with the lack of association between clades and geographical loca- tions, indicates a weak population structure for the species. Keywords: D-loop, genetic differentiation, mitochondrial DNA, Pleuragramma antarcticum, population expansion, Southern Ocean Received 22 May 2006; accepted 10 July 2006 Introduction The perciformes suborder Notothenioidei is a highly diverse group of fish, the majority of which inhabit Antarctic waters, with 97% of the species endemic to the Southern Ocean. This is indeed a unique environment characterized by low temperatures, the presence of ice, and large seasonal fluctuations of the primary production. The presence of a circum-Antarctic current extending up to 1000 m in depth (Kock 1992), the Antarctic Convergence (AC), reduces the exchange of surface waters and partially isolates the Southern Ocean from the surrounding oceans (Fig. 1). The importance of this barrier to dispersal is suggested by a major phylogeographical break observed in the Southern Ocean fauna corresponding to the AC (Shaw et al. 2004). Results of molecular phylogenetic investigations indicate that the majority of notothenioid fish evolved within Antarctic waters during the last 22–25 million years, after the complete establishment of the AC (Bargelloni et al. 2000b and references therein). From that time, the group has undergone an impressive diversification and is con- sidered an example of species flock (Eastman 1993; Near et al. 2004). Notothenioids evolved several remarkable adaptations to the Southern Ocean conditions that enabled them to successfully occupy a large variety of ecological niches. Among these, the most striking is certainly the presence of the antifreeze glycopeptides (AFGPs) that are responsible for the depression of the freezing point, preventing fish from freezing while exposed to temperatures constantly below zero (Cheng & DeVries 1991). In addition, notothenioids Correspondence: Prof. Tomaso Patarnello,. Fax: +39–0498276209; E-mail: [email protected]
Transcript of Demographic history and population structure of the Antarctic silverfish Pleuragramma antarcticum

Molecular Ecology (2006)
15
, 4499–4511 doi: 10.1111/j.1365-294X.2006.03105.x
© 2006 The AuthorsJournal compilation © 2006 Blackwell Publishing Ltd
Blackwell Publishing Ltd
Demographic history and population structure of the Antarctic silverfish
Pleuragramma antarcticum
L . ZANE,
*
S . MARCATO,
*
L . BARGELLONI,
†
E . BORTOLOTTO,
*
C . PAPETTI ,
*
M. S IMONATO,
‡
V . VAROTTO
*
and T . PATARNELLO
*†
*
Dipartimento di Biologia, Università di Padova, Via G. Colombo, 3, I-35121 Padova, Italy,
†
Dipartimento di Sanità Pubblica, Patologia Comparata e Igiene Veterinaria, Agripolis, Università di Padova, Via Romea, 16, I-35020 Legnaro (Pd), Italy,
‡
Dipartimento di Agronomia Ambientale e Produzioni Vegetali Entomologia, Agripolis, Università di Padova, Via Romea 16, I-35020 Legnaro (Pd), Italy
Abstract
The Antarctic silverfish
Pleuragramma antarcticum
(Nototheniidae) is the most abundantpelagic fish inhabiting Antarctic waters. In this study we investigated, through partialsequencing of the
D-loop
mitochondrial region, samples collected at four different locationsin the Southern Ocean, three in the Atlantic and one in the Pacific sector. Sampling wasreplicated in two different years at two locations. Sequence analysis showed a remarkablyhigh polymorphism, with 110 haplotypes over the 256 investigated specimens, and about80% of haplotypes occurring only once. Neutrality tests indicated that all samples were notat mutation–drift equilibrium, and suggested a past population expansion. This result wassupported by the presence of a star-like topology in the
D-loop
gene tree, and by results ofmismatch distribution. The start of the expansion was dated, using a specifically calibratedclock, between 111 and 126 thousand years ago. This value corresponds to the start of thecooling period that led to the last glaciation peak, and is in close agreement with a recentlysuggested range expansion for pelagic Antarctic ecosystems. Analysis of molecular varia-tion indicated a small, though highly significant, value of differentiation between samples.This result, together with the lack of association between clades and geographical loca-tions, indicates a weak population structure for the species.
Keywords
:
D-loop
, genetic differentiation, mitochondrial DNA,
Pleuragramma antarcticum
, populationexpansion, Southern Ocean
Received 22 May 2006; accepted 10 July 2006
Introduction
The perciformes suborder Notothenioidei is a highly diversegroup of fish, the majority of which inhabit Antarcticwaters, with 97% of the species endemic to the SouthernOcean. This is indeed a unique environment characterizedby low temperatures, the presence of ice, and large seasonalfluctuations of the primary production. The presence of acircum-Antarctic current extending up to 1000 m in depth(Kock 1992), the Antarctic Convergence (AC), reducesthe exchange of surface waters and partially isolates theSouthern Ocean from the surrounding oceans (Fig. 1). Theimportance of this barrier to dispersal is suggested by amajor phylogeographical break observed in the Southern
Ocean fauna corresponding to the AC (Shaw
et al
. 2004).Results of molecular phylogenetic investigations indicatethat the majority of notothenioid fish evolved withinAntarctic waters during the last 22–25 million years, afterthe complete establishment of the AC (Bargelloni
et al
.2000b and references therein). From that time, the grouphas undergone an impressive diversification and is con-sidered an example of species flock (Eastman 1993; Near
et al
. 2004).Notothenioids evolved several remarkable adaptations
to the Southern Ocean conditions that enabled them tosuccessfully occupy a large variety of ecological niches.Among these, the most striking is certainly the presence ofthe antifreeze glycopeptides (AFGPs) that are responsiblefor the depression of the freezing point, preventing fishfrom freezing while exposed to temperatures constantlybelow zero (Cheng & DeVries 1991). In addition, notothenioids
Correspondence: Prof. Tomaso Patarnello,. Fax: +39–0498276209;E-mail: [email protected]
4500
L . Z A N E
E T A L .
© 2006 The AuthorsJournal compilation © 2006 Blackwell Publishing Ltd
show other relevant modifications in their morphology(absence of a swim bladder) and physiology (blood viscosity,oxygen transport and cardiovascular system). Given theirunique evolutionary history, notothenioids have been ex-tensively studied at the morphological (Eastman & Lamnoo2004), biochemical (di Prisco
et al
. 1991), and molecular level(Chen
et al
. 1997), in order to establish the correct relation-ships among species (Near
et al
. 2004) and to map characterevolution onto phylogenetic trees (Bargelloni
et al
. 1998,2000a). In contrast to the efforts devoted to interspecificanalyses, few studies have investigated the pattern ofpopulation differentiation within notothenioid species.
Most notothenioids have a sedentary habit that, in addi-tion to the lack of a swim bladder in all species of the
suborder, tends to limit dispersal ability at the adult stage.However, the vast majority of notothenioids are charac-terized by a pelagic larval stage (Eastman 1993) that isexpected to promote gene flow between populations. Thislatter possibility seems to be particularly likely whenconsidering the present-day Southern Ocean current sys-tem (Fig. 1) characterized by two circumpolar currents,the clockwise flowing West Wind Drift (WWD) and thecounter-clockwise flowing Coastal Current (CC). Thesetwo major currents are expected to favour gene flow ona circum-Antarctic scale, possibly promoting long distancelarval dispersal. However, a recent study (Patarnello
et al
.2003) pointed out that significant genetic differentiationexists between populations of the icefish
Chionodraco hamatus,
Fig. 1 Pleuragramma antarcticum sampling locations and schematic representation of the Southern Ocean and the major marine currents.
P L E U R A G R A M M A A N T A R C T I C U M
P O P U L A T I O N G E N E T I C S
4501
© 2006 The AuthorsJournal compilation © 2006 Blackwell Publishing Ltd
a species considered to be demersal and thus living nearthe bottom of the sea, collected in the Weddell and RossSeas. This result suggests that, in this species, genetic iso-lation can occur, at least between geographically distantsites, and that larval-mediated gene flow is probably notstrong enough to counteract divergence by genetic drift.Notably, similar results were obtained for another noto-thenioid,
Dissostichus mawsoni,
a species that acquiresneutral buoyancy during its ontogenetic development,consequently enhancing swimming ability over long dis-tances (Near
et al
. 2003). In
D. mawsoni,
differences wereobserved between samples collected in the Ross Sea and inthe Bellingshausen Sea (Parker
et al
. 2002).Here, we report on the population genetics of the pelagic
species
Pleuragramma antarcticum,
the Antarctic silverfish,collected at different sites in the Southern Ocean.
P. antarcticum
is the most abundant pelagic fish in Antarctic waters and,among notothenioids, is the only species in which all lifestages occur throughout the water column (Vacchi
et al
.2004). This species has a circum-Antarctic distribution inareas with and without sea ice coverage and its verticalrange extends from 0 to 900 m (Gerasimchuck 1986). Thedominance of
P. antarcticum
in the Weddell Sea, where itrepresents more than 98% of the total ichthyoplankton(Hubold 1985), and in the Ross Sea (more than 90%,Guglielmo
et al
. 1998) has been well documented.
P. ant-arcticum
plays a fundamental role in the Antarctic foodweb since it is an important food resource for high-levelpredators such as seals and whales, as well as for othernotothenioid fishes. The species is characterized by a strongtrophic flexibility that may justify its success and abundance,given that silverfish can take advantage of biomass peaksof both small (copepods) and large (krill) zooplanktonthroughout its life span (Hubold & Ekau 1990).
The purpose of this study is to test how the pelagichabitus could affect the pattern of genetic variation in themitochondrial control region of
P. antarcticum
with respectto the following specific points. First, we intend to testwhether
P. antarcticum
experienced fluctuations in size atthe evolutionary time scale. In fact, we expect that thetransition from a demersal life history with pelagic eggsto a fully pelagic lifestyle, while enabling the Antarcticsilverfish to successfully occupy the enormous niche of theopen Antarctic waters, might have exposed the species toenvironmental fluctuations due to climatic changes. TheAntarctic region has experienced important climatic changesin the last 740 000 years, including temperature fluctu-ations as large as 8–10
°
C with a cyclic pattern of about100 000 years (EPICA 2004). These fluctuations promotednorthward and southward migration of the oceanographicfronts that define the boundaries of the Southern Ocean,thus potentially affecting population dynamics of Antarcticpelagic species. Second, we aim at verifying the existence ofpresent-day genetic differentiation among samples collectedin different locations and at different times. Because
P. ant-arcticum
is exposed, during both larval and adult stages, tothe major circum-Antarctic currents that should homogenizepopulations, we expect a weak population structure.
Materials and methods
Sample collection and DNA extraction
Sampling was performed between 1989 and 1997 at dif-ferent locations, during icthyoplankton surveys carriedout by several institutions (Fig. 1, Table 1). Six populationsamples were collected from the Weddell Sea (Halley Bay),the Antarctic Peninsula (Elephant Island and King George
Table 1 Site of collection, source expedition and ship where sampling was performed, sample size, number of haplotypes, haplotype andnucleotide diversity observed in each population (standard deviation in parentheses)
Population Source* (Ship)Sample size
Number of haplotypes
Haplotype diversity h
Nucleotide diversity π (10−3)
Halley Bay ANTVII/4 — AWI 46 24 0.872 (0.045) 6.694 (4.339)(Weddell Sea, 1989) (Polarstern)Halley Bay ANTIX/3 — AWI 50 26 0.864 (0.045) 7.513 (4.745)(Weddell Sea, 1991) (Polarstern)Terra Nova Bay 11th Italian expedition — PNRA 61 35 0.917 (0.030) 9.531 (5.725)(Ross Sea, 1996) (Italica)Elephant Island ANTXIV/2 — AWI 19 15 0.941 (0.048) 9.069 (5.713)(South Shetland Islands, 1996) (Polarstern)King George Island JCR 26 — BAS 47 28 0.885 (0.044) 7.709 (4.849)(Southern Scotia Arc, 1997) (RRS James Clark Ross)Terra Nova Bay 13th Italian expedition — PNRA 33 24 0.943 (0.033) 9.900 (5.989)(Ross Sea, 1997) (Italica)Total 256 110 0.896 (0.017) 8.374 (5.085)
*AWI: Alfred Wegener Institut für Polar- und Meereforschung (Germany); PNRA: National Program of Research in Antarctica (Italy); BAS: British Antarctic Survey (UK).
4502
L . Z A N E
E T A L .
© 2006 The AuthorsJournal compilation © 2006 Blackwell Publishing Ltd
Island) and the Ross Sea (Terra Nova Bay). In two cases(Halley Bay and Terra Nova Bay) specimen collection wasreplicated in two different years. The method of collectionchanged in different years/sites: during the Polarsterncruises a commercial benthopelagic trawl was used, with acod-end mesh line of 20 mm; during the RRS James ClarkRoss cruise, samples were obtained with a rectangular mid-water trawl or by a foredeck net, both with 1 mm meshcod-end; sampling on board the ship Italica was performedby means of a Hamburg Plankton net with 0.5–1 mmcod-end.
Total genomic DNA was extracted for each individualfrom 50 to 100 mg of muscle tissue, using a fast extractionprotocol (Walsh
et al
. 1991). The DNA solution was storedat
−
20
°
C before PCR amplification.
DNA amplification and sequencing
For population analyses, about 400 base pairs (bp) of themitochondrial control region (
D-loop
) were amplified froma sample of 256 individuals, using fish universal primers(Ostellari
et al
. 1996) and following published conditions(Patarnello
et al
. 2003). PCR products were sequencedusing a Thermo Sequenase premixed Cycle Sequencing Kit(Pharmacia-Amersham Bioscience) and run in a VistraDNA Sequencer 725 (Pharmacia-Amersham Bioscience).
In addition, we amplified and sequenced, from 16randomly chosen individuals, a fragment of about 1000 bpputatively encompassing the 3
′
end of cytochrome b (
cyt b
),the proline and threonine tRNAs (
tRNA-Pro
and
tRNA-Thr
) and the 5
′
end of the control region. This fragmentincluded the
D-loop
sequence used for population analysis,and will be referred to as
cyt b/D-loop
. For this purpose wedesigned a
Pleuragramma antarcticum
specific primer on
cytb
(cytbpleu3; 5
′
-CCCTGACCCGTTTCTTTGCTTTCC-
′
3)that was used in combination with HDL1 (Ostellari
et al
.1996). The PCR conditions were as follows. Two
µ
L ofChelex extracted DNA were used in 25
µ
L of reaction mix(50 mm KCl, 10 mm Tris-HCl, 0.1% TritonX-100, 2.5 m
m
MgCl
2
, 0.1 m
m
of each dNTPs and 1
µ
m
of each primer)with 1 unit of Taq DNA polymerase (Promega). Thethermal cycle was: (i) predenaturation: 94
°
C for 3 min;(ii) 8 touchdown cycles: denaturation at 94
°
C for 30 s,annealing at 58
°
C for 40 s decreased by 1
°
C with each cycle,extension at 72
°
C for 1 min; (iii) 36 cycles: denaturation at94
°
C for 30 s, annealing at 50
°
C for 40 s, extension at 72
°
Cfor 1 min; and (iv) final extension for 5 min at 72
°
C.The fragment was sequenced using an internal service(information at http://bmr.cribi.unipd.it).
DNA sequence analysis
Two datasets were analysed in this study. The firstincluded 256 sequences of the 277 bp consensus fragment
in the 5
′
D-loop
region; this was used for populationanalyses. The second consisted of 16 sequences of 958 bpobtained by amplification of the
cyt b/D-loop
region, andwas used to check the accuracy of the sequences used forpopulation analysis, to exclude the presence of a
D-loop
nuclear copy, and to calibrate a molecular clock.
D-loop
All
D-loop
sequences were aligned using
clustalx
(Thompson
et al
. 1997). After alignment, sites that showednucleotide substitutions and indels at the population levelwere re-examined by visual inspection of each individual’sraw fluorogram data.
Evolutionary relationships among
D-loop
sequences werereconstructed using a minimum spanning tree (Excoffier &Smouse 1994) that allows the retention of existing haplo-types as nodes of the tree and is therefore indicated forintraspecific data. The minimum spanning tree was usedto test the null hypothesis of no association between cladesand geographical location by performing a nested cladeanalysis (NCA) using
geodis
2.0 (Posada
et al
. 2000). Equallyparsimonious links were not included in NCA in orderto avoid ambiguity in the definition of terminal clades.Geographical distances have been calculated as theshortest waterway distance between locations.
Signatures of past demographic events were investigatedusing three neutrality tests and mismatch distributionanalysis.
Neutrality tests were originally developed to test theneutral hypothesis; however, since they are based on theexpectation of a population of constant size at mutation–drift equilibrium, they are now widely used to detectchanges in population size (Mousset
et al
. 2004). In parti-cular, we applied: (1) The Tajima test of neutrality (Tajima1989) that calculates the value of
D
, a specifically developedstatistic, and assesses its departure from zero. Zero is thevalue expected in the case of mutation–drift equilibrium.Events of population growth produce significant negative
D
-values (Aris-Brosou & Excoffier 1996). (2) The Ewens-Watterson (Ewens 1972; Watterson 1978) test of neutrality,which compares the observed level of
F
(the sum of squaredhaplotype frequencies) with the level expected under theneutral hypothesis for a sample having the same size andthe same number of alleles. A demographic expansion isexpected to generate an
F
-value higher than expected due tothe retention of low frequency haplotypes. (3) The Chakra-borty test (Chakraborty 1990), which compares the observedand expected number of alleles in the investigated sample.The latter value is calculated from the observed haplotypesidentity under the neutral hypothesis. If a populationexpansion occurred, there should be a higher number ofobserved alleles than in the case of constant populationsize, because of the relaxed action of genetic drift.
P L E U R A G R A M M A A N T A R C T I C U M
P O P U L A T I O N G E N E T I C S
4503
© 2006 The AuthorsJournal compilation © 2006 Blackwell Publishing Ltd
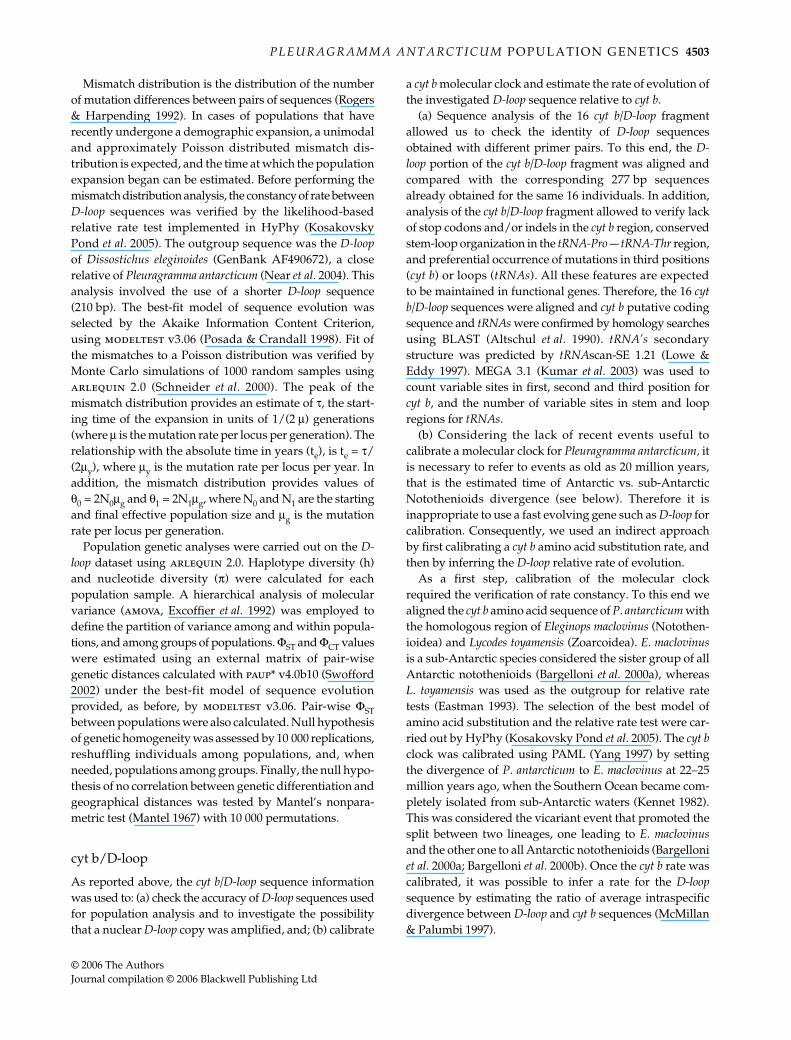
Mismatch distribution is the distribution of the numberof mutation differences between pairs of sequences (Rogers& Harpending 1992). In cases of populations that haverecently undergone a demographic expansion, a unimodaland approximately Poisson distributed mismatch dis-tribution is expected, and the time at which the populationexpansion began can be estimated. Before performing themismatch distribution analysis, the constancy of rate between
D-loop
sequences was verified by the likelihood-basedrelative rate test implemented in HyPhy (KosakovskyPond
et al
. 2005). The outgroup sequence was the
D-loop
of
Dissostichus eleginoides
(GenBank AF490672), a closerelative of
Pleuragramma antarcticum
(Near
et al
. 2004). Thisanalysis involved the use of a shorter
D-loop
sequence(210 bp). The best-fit model of sequence evolution wasselected by the Akaike Information Content Criterion,using
modeltest
v3.06 (Posada & Crandall 1998). Fit ofthe mismatches to a Poisson distribution was verified byMonte Carlo simulations of 1000 random samples using
arlequin
2.0 (Schneider
et al
. 2000). The peak of themismatch distribution provides an estimate of
τ
, the start-ing time of the expansion in units of 1/(2
µ
) generations(where
µ
is the mutation rate per locus per generation). Therelationship with the absolute time in years (t
e
), is t
e
=
τ
/(2
µ
y
), where
µ
y
is the mutation rate per locus per year. Inaddition, the mismatch distribution provides values of
θ0 = 2N0µg and θ1 = 2N1µg, where N0 and N1 are the startingand final effective population size and µg is the mutationrate per locus per generation.
Population genetic analyses were carried out on the D-loop dataset using arlequin 2.0. Haplotype diversity (h)and nucleotide diversity (π) were calculated for eachpopulation sample. A hierarchical analysis of molecularvariance (amova, Excoffier et al. 1992) was employed todefine the partition of variance among and within popula-tions, and among groups of populations. ΦST and ΦCT valueswere estimated using an external matrix of pair-wisegenetic distances calculated with paup* v4.0b10 (Swofford2002) under the best-fit model of sequence evolutionprovided, as before, by modeltest v3.06. Pair-wise ΦSTbetween populations were also calculated. Null hypothesisof genetic homogeneity was assessed by 10 000 replications,reshuffling individuals among populations, and, whenneeded, populations among groups. Finally, the null hypo-thesis of no correlation between genetic differentiation andgeographical distances was tested by Mantel’s nonpara-metric test (Mantel 1967) with 10 000 permutations.
cyt b/D-loop
As reported above, the cyt b/D-loop sequence informationwas used to: (a) check the accuracy of D-loop sequences usedfor population analysis and to investigate the possibilitythat a nuclear D-loop copy was amplified, and; (b) calibrate
a cyt b molecular clock and estimate the rate of evolution ofthe investigated D-loop sequence relative to cyt b.
(a) Sequence analysis of the 16 cyt b/D-loop fragmentallowed us to check the identity of D-loop sequencesobtained with different primer pairs. To this end, the D-loop portion of the cyt b/D-loop fragment was aligned andcompared with the corresponding 277 bp sequencesalready obtained for the same 16 individuals. In addition,analysis of the cyt b/D-loop fragment allowed to verify lackof stop codons and/or indels in the cyt b region, conservedstem-loop organization in the tRNA-Pro — tRNA-Thr region,and preferential occurrence of mutations in third positions(cyt b) or loops (tRNAs). All these features are expectedto be maintained in functional genes. Therefore, the 16 cytb/D-loop sequences were aligned and cyt b putative codingsequence and tRNAs were confirmed by homology searchesusing BLAST (Altschul et al. 1990). tRNA’s secondarystructure was predicted by tRNAscan-SE 1.21 (Lowe &Eddy 1997). MEGA 3.1 (Kumar et al. 2003) was used tocount variable sites in first, second and third position forcyt b, and the number of variable sites in stem and loopregions for tRNAs.
(b) Considering the lack of recent events useful tocalibrate a molecular clock for Pleuragramma antarcticum, itis necessary to refer to events as old as 20 million years,that is the estimated time of Antarctic vs. sub-AntarcticNotothenioids divergence (see below). Therefore it isinappropriate to use a fast evolving gene such as D-loop forcalibration. Consequently, we used an indirect approachby first calibrating a cyt b amino acid substitution rate, andthen by inferring the D-loop relative rate of evolution.
As a first step, calibration of the molecular clockrequired the verification of rate constancy. To this end wealigned the cyt b amino acid sequence of P. antarcticum withthe homologous region of Eleginops maclovinus (Notothen-ioidea) and Lycodes toyamensis (Zoarcoidea). E. maclovinusis a sub-Antarctic species considered the sister group of allAntarctic notothenioids (Bargelloni et al. 2000a), whereasL. toyamensis was used as the outgroup for relative ratetests (Eastman 1993). The selection of the best model ofamino acid substitution and the relative rate test were car-ried out by HyPhy (Kosakovsky Pond et al. 2005). The cyt bclock was calibrated using PAML (Yang 1997) by settingthe divergence of P. antarcticum to E. maclovinus at 22–25million years ago, when the Southern Ocean became com-pletely isolated from sub-Antarctic waters (Kennet 1982).This was considered the vicariant event that promoted thesplit between two lineages, one leading to E. maclovinusand the other one to all Antarctic notothenioids (Bargelloniet al. 2000a; Bargelloni et al. 2000b). Once the cyt b rate wascalibrated, it was possible to infer a rate for the D-loopsequence by estimating the ratio of average intraspecificdivergence between D-loop and cyt b sequences (McMillan& Palumbi 1997).
4504 L . Z A N E E T A L .
© 2006 The AuthorsJournal compilation © 2006 Blackwell Publishing Ltd
Results
Excluding the presence of pseudogenes
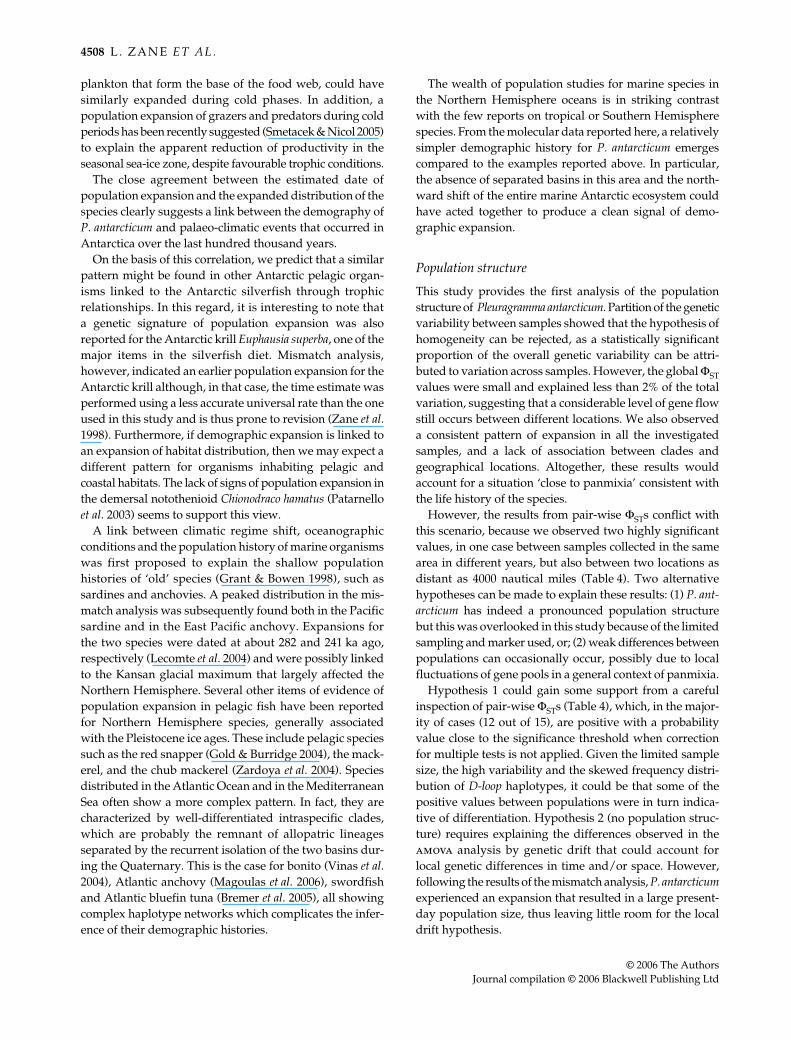
Amplification and sequencing of the D-loop region yieldeda minimal consensus of 277 bp for 256 individuals from sixpopulation samples. Sequence comparisons showed 67polymorphic sites, resulting in a high degree of poly-morphism in all populations, and a total of 110 haplotypes(Table 1, Fig. 2).
In order to exclude the possibility that this high variabilitymight have resulted from the amplification of a nuclearcopy of the D-loop or by sequencing errors, we amplified alonger fragment spanning cyt b, tRNA-Pro, tRNA-Thr andthe D-loop 5′ end (the cyt b/D-loop fragment) from 16randomly chosen individuals. In this way, we obtainedsequence information for 958 bp from all 16 samples(GenBank accession nos DQ854824 to DQ854839).
In the cyt b/D-loop fragment, the D-loop portion over-lapped with the sequence used for population analysis.This enabled us to confirm complete nucleotide identity forall 16 individuals sequenced twice for the 277 bp of the D-loop, representing 10 haplotypes. In no case did we observedouble peaks in the chromatogram, which might indicateheteroplasmy. The cyt b region consisted of an open read-ing frame of 444 bp; its translation showed 89%−93% ofamino acid sequence identity with published cyt b sequencesfor notothenioids (Derome et al. 2002). This sequenceshowed a lack of stop codons and/or indels. In addition, 11of the 13 observed variable sites were in the third codonposition. Finally, the correct anticodon and a stem-loopstructure were found in the tRNA-Pro and tRNA-Thr puta-tive sequences. The single variable site observed in thisregion was found in a loop of the tRNA-Thr gene.
In summary, in the 16 individuals re-sequenced for thecyt b/D-loop segment, three elements concur to exclude thepossibility of having amplified a nuclear gene: (1) the com-plete identity for the D-loop sequences obtained independ-ently with different primer pairs; (2) the predicted cyt bamino acid sequence indicative of a functional protein
with no stop codons, and; (3) the predicted stem and looporganization for tRNA-Pro and tRNA-Thr do support theircanonical structure.
Demographic history
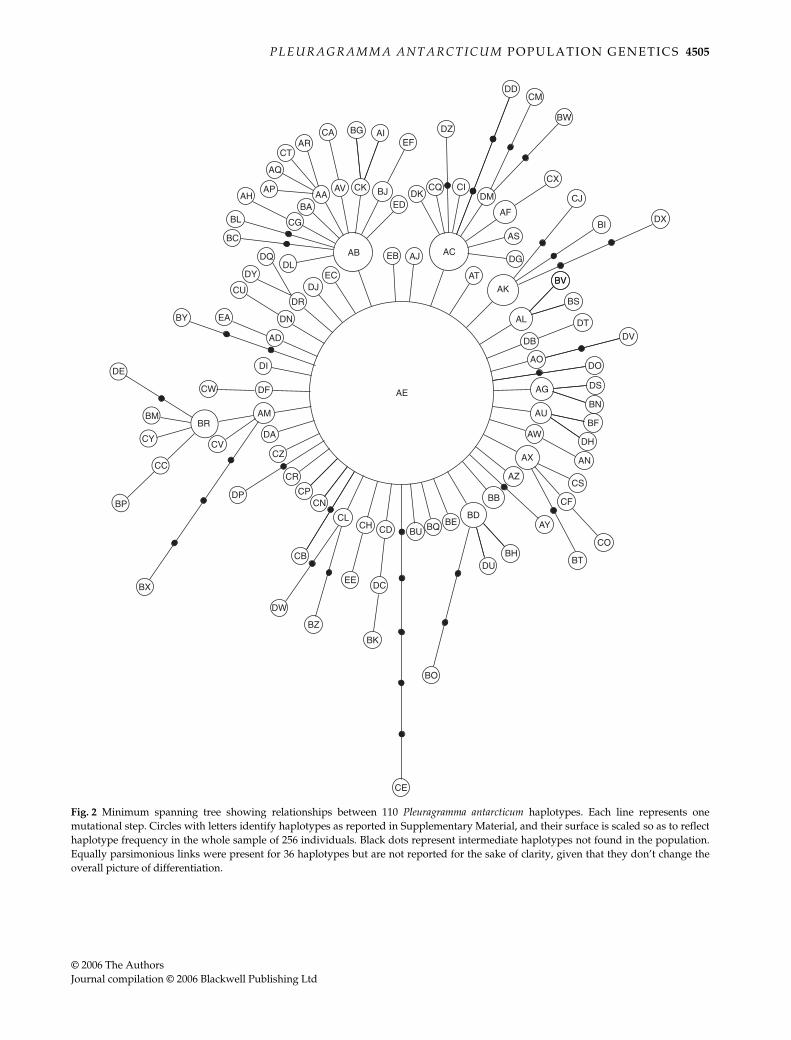
The minimum spanning tree between haplotypes resultedin a star-like topology, with all sequences coalescing to thesame haplotype AE, and separated in most cases by asingle mutational step (Fig. 2).
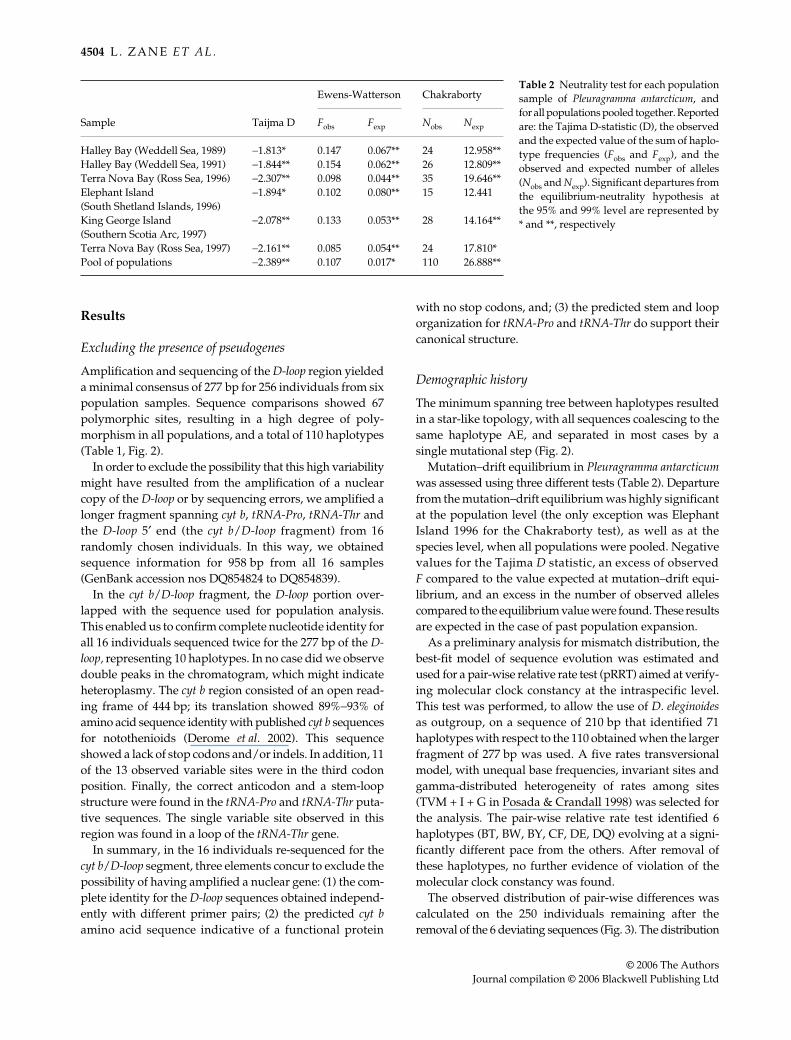
Mutation–drift equilibrium in Pleuragramma antarcticumwas assessed using three different tests (Table 2). Departurefrom the mutation–drift equilibrium was highly significantat the population level (the only exception was ElephantIsland 1996 for the Chakraborty test), as well as at thespecies level, when all populations were pooled. Negativevalues for the Tajima D statistic, an excess of observedF compared to the value expected at mutation–drift equi-librium, and an excess in the number of observed allelescompared to the equilibrium value were found. These resultsare expected in the case of past population expansion.
As a preliminary analysis for mismatch distribution, thebest-fit model of sequence evolution was estimated andused for a pair-wise relative rate test (pRRT) aimed at verify-ing molecular clock constancy at the intraspecific level.This test was performed, to allow the use of D. eleginoidesas outgroup, on a sequence of 210 bp that identified 71haplotypes with respect to the 110 obtained when the largerfragment of 277 bp was used. A five rates transversionalmodel, with unequal base frequencies, invariant sites andgamma-distributed heterogeneity of rates among sites(TVM + I + G in Posada & Crandall 1998) was selected forthe analysis. The pair-wise relative rate test identified 6haplotypes (BT, BW, BY, CF, DE, DQ) evolving at a signi-ficantly different pace from the others. After removal ofthese haplotypes, no further evidence of violation of themolecular clock constancy was found.
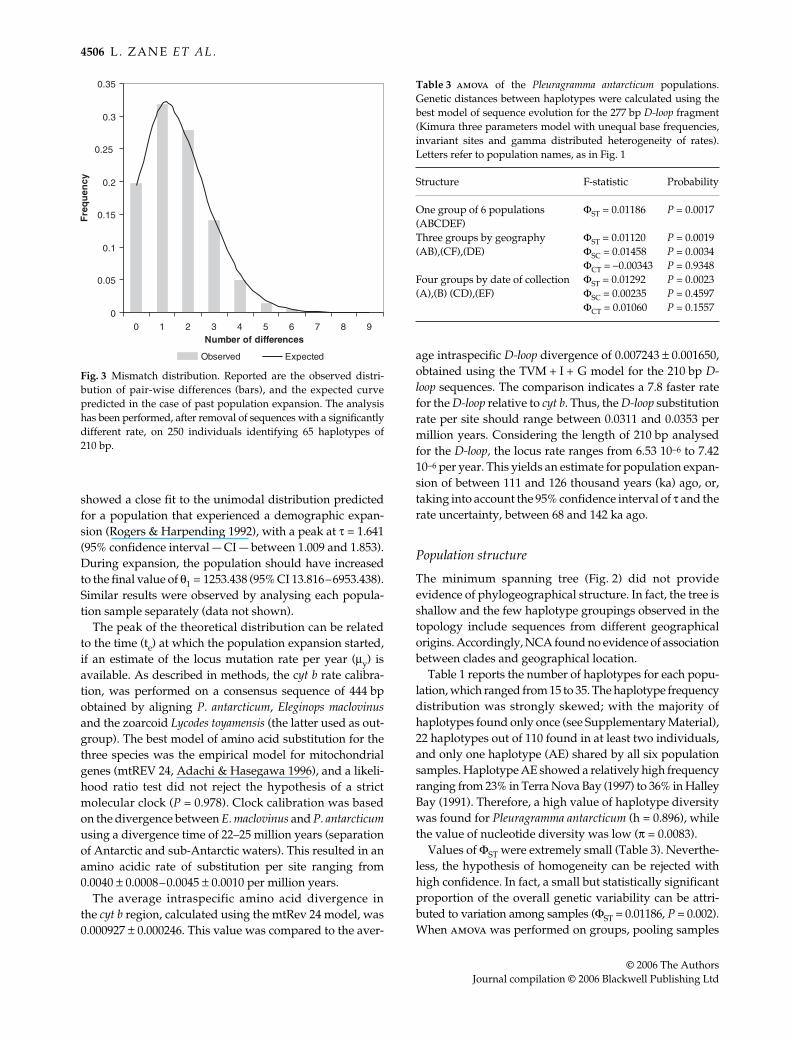
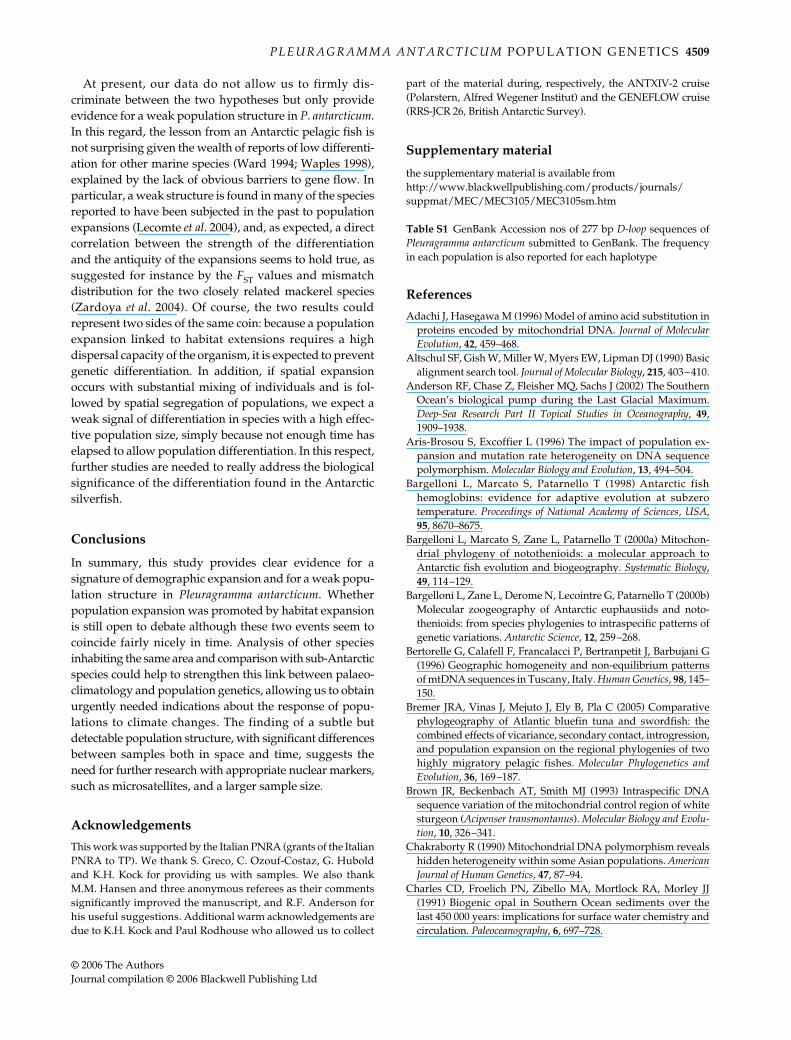
The observed distribution of pair-wise differences wascalculated on the 250 individuals remaining after theremoval of the 6 deviating sequences (Fig. 3). The distribution
Taijma D
Ewens-Watterson Chakraborty
Sample Fobs Fexp Nobs Nexp
Halley Bay (Weddell Sea, 1989) −1.813* 0.147 0.067** 24 12.958**Halley Bay (Weddell Sea, 1991) −1.844** 0.154 0.062** 26 12.809**Terra Nova Bay (Ross Sea, 1996) −2.307** 0.098 0.044** 35 19.646**Elephant Island (South Shetland Islands, 1996)
−1.894* 0.102 0.080** 15 12.441
King George Island (Southern Scotia Arc, 1997)
−2.078** 0.133 0.053** 28 14.164**
Terra Nova Bay (Ross Sea, 1997) −2.161** 0.085 0.054** 24 17.810*Pool of populations −2.389** 0.107 0.017* 110 26.888**
Table 2 Neutrality test for each populationsample of Pleuragramma antarcticum, andfor all populations pooled together. Reportedare: the Tajima D-statistic (D), the observedand the expected value of the sum of haplo-type frequencies (Fobs and Fexp), and theobserved and expected number of alleles(Nobs and Nexp). Significant departures fromthe equilibrium-neutrality hypothesis atthe 95% and 99% level are represented by* and **, respectively
P L E U R A G R A M M A A N T A R C T I C U M P O P U L A T I O N G E N E T I C S 4505
© 2006 The AuthorsJournal compilation © 2006 Blackwell Publishing Ltd
Fig. 2 Minimum spanning tree showing relationships between 110 Pleuragramma antarcticum haplotypes. Each line represents onemutational step. Circles with letters identify haplotypes as reported in Supplementary Material, and their surface is scaled so as to reflecthaplotype frequency in the whole sample of 256 individuals. Black dots represent intermediate haplotypes not found in the population.Equally parsimonious links were present for 36 haplotypes but are not reported for the sake of clarity, given that they don’t change theoverall picture of differentiation.
4506 L . Z A N E E T A L .
© 2006 The AuthorsJournal compilation © 2006 Blackwell Publishing Ltd
showed a close fit to the unimodal distribution predictedfor a population that experienced a demographic expan-sion (Rogers & Harpending 1992), with a peak at τ = 1.641(95% confidence interval — CI — between 1.009 and 1.853).During expansion, the population should have increasedto the final value of θ1 = 1253.438 (95% CI 13.816–6953.438).Similar results were observed by analysing each popula-tion sample separately (data not shown).
The peak of the theoretical distribution can be relatedto the time (te) at which the population expansion started,if an estimate of the locus mutation rate per year (µy) isavailable. As described in methods, the cyt b rate calibra-tion, was performed on a consensus sequence of 444 bpobtained by aligning P. antarcticum, Eleginops maclovinusand the zoarcoid Lycodes toyamensis (the latter used as out-group). The best model of amino acid substitution for thethree species was the empirical model for mitochondrialgenes (mtREV 24, Adachi & Hasegawa 1996), and a likeli-hood ratio test did not reject the hypothesis of a strictmolecular clock (P = 0.978). Clock calibration was basedon the divergence between E. maclovinus and P. antarcticumusing a divergence time of 22–25 million years (separationof Antarctic and sub-Antarctic waters). This resulted in anamino acidic rate of substitution per site ranging from0.0040 ± 0.0008–0.0045 ± 0.0010 per million years.
The average intraspecific amino acid divergence inthe cyt b region, calculated using the mtRev 24 model, was0.000927 ± 0.000246. This value was compared to the aver-
age intraspecific D-loop divergence of 0.007243 ± 0.001650,obtained using the TVM + I + G model for the 210 bp D-loop sequences. The comparison indicates a 7.8 faster ratefor the D-loop relative to cyt b. Thus, the D-loop substitutionrate per site should range between 0.0311 and 0.0353 permillion years. Considering the length of 210 bp analysedfor the D-loop, the locus rate ranges from 6.53 10−6 to 7.4210−6 per year. This yields an estimate for population expan-sion of between 111 and 126 thousand years (ka) ago, or,taking into account the 95% confidence interval of τ and therate uncertainty, between 68 and 142 ka ago.
Population structure
The minimum spanning tree (Fig. 2) did not provideevidence of phylogeographical structure. In fact, the tree isshallow and the few haplotype groupings observed in thetopology include sequences from different geographicalorigins. Accordingly, NCA found no evidence of associationbetween clades and geographical location.
Table 1 reports the number of haplotypes for each popu-lation, which ranged from 15 to 35. The haplotype frequencydistribution was strongly skewed; with the majority ofhaplotypes found only once (see Supplementary Material),22 haplotypes out of 110 found in at least two individuals,and only one haplotype (AE) shared by all six populationsamples. Haplotype AE showed a relatively high frequencyranging from 23% in Terra Nova Bay (1997) to 36% in HalleyBay (1991). Therefore, a high value of haplotype diversitywas found for Pleuragramma antarcticum (h = 0.896), whilethe value of nucleotide diversity was low (π = 0.0083).
Values of ΦST were extremely small (Table 3). Neverthe-less, the hypothesis of homogeneity can be rejected withhigh confidence. In fact, a small but statistically significantproportion of the overall genetic variability can be attri-buted to variation among samples (ΦST = 0.01186, P = 0.002).When amova was performed on groups, pooling samples
Fig. 3 Mismatch distribution. Reported are the observed distri-bution of pair-wise differences (bars), and the expected curvepredicted in the case of past population expansion. The analysishas been performed, after removal of sequences with a significantlydifferent rate, on 250 individuals identifying 65 haplotypes of210 bp.
Table 3 amova of the Pleuragramma antarcticum populations.Genetic distances between haplotypes were calculated using thebest model of sequence evolution for the 277 bp D-loop fragment(Kimura three parameters model with unequal base frequencies,invariant sites and gamma distributed heterogeneity of rates).Letters refer to population names, as in Fig. 1
Structure F-statistic Probability
One group of 6 populations (ABCDEF)
ΦST = 0.01186 P = 0.0017
Three groups by geography ΦST = 0.01120 P = 0.0019(AB),(CF),(DE) ΦSC = 0.01458 P = 0.0034
ΦCT = −0.00343 P = 0.9348Four groups by date of collection ΦST = 0.01292 P = 0.0023(A),(B) (CD),(EF) ΦSC = 0.00235 P = 0.4597
ΦCT = 0.01060 P = 0.1557
P L E U R A G R A M M A A N T A R C T I C U M P O P U L A T I O N G E N E T I C S 4507
© 2006 The AuthorsJournal compilation © 2006 Blackwell Publishing Ltd
from the same geographical area, or by year of collection,no sign of between-groups variation was found (Table 3).
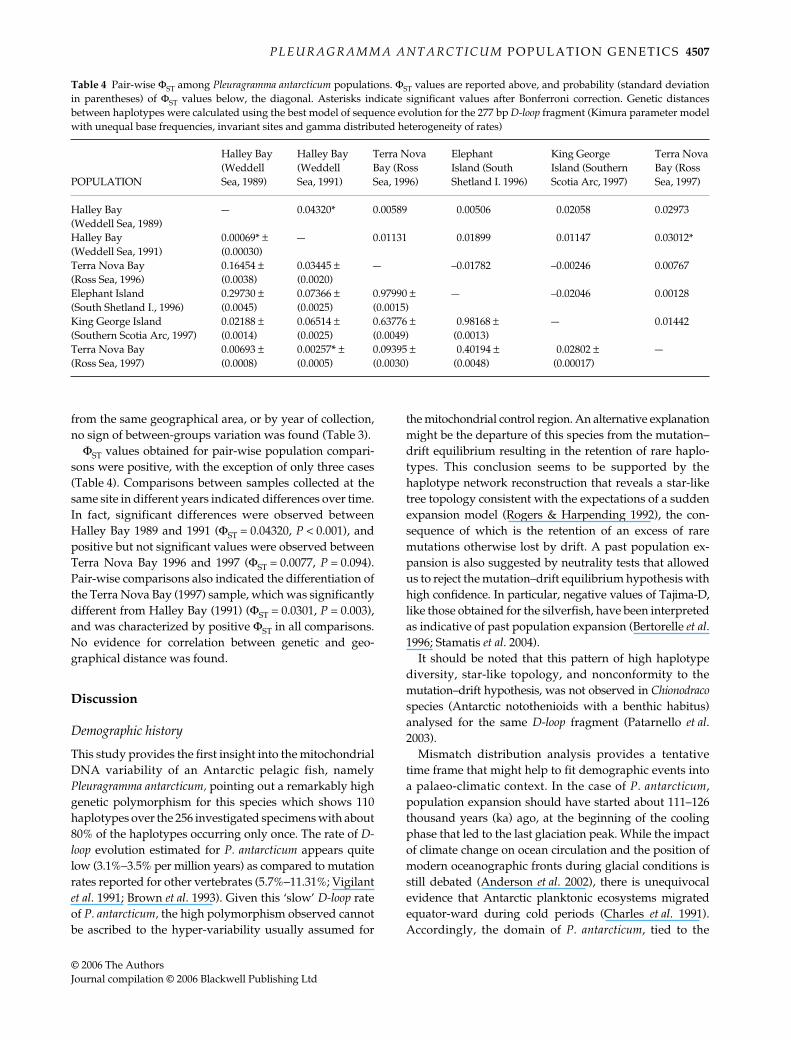
ΦST values obtained for pair-wise population compari-sons were positive, with the exception of only three cases(Table 4). Comparisons between samples collected at thesame site in different years indicated differences over time.In fact, significant differences were observed betweenHalley Bay 1989 and 1991 (ΦST = 0.04320, P < 0.001), andpositive but not significant values were observed betweenTerra Nova Bay 1996 and 1997 (ΦST = 0.0077, P = 0.094).Pair-wise comparisons also indicated the differentiation ofthe Terra Nova Bay (1997) sample, which was significantlydifferent from Halley Bay (1991) (ΦST = 0.0301, P = 0.003),and was characterized by positive ΦST in all comparisons.No evidence for correlation between genetic and geo-graphical distance was found.
Discussion
Demographic history
This study provides the first insight into the mitochondrialDNA variability of an Antarctic pelagic fish, namelyPleuragramma antarcticum, pointing out a remarkably highgenetic polymorphism for this species which shows 110haplotypes over the 256 investigated specimens with about80% of the haplotypes occurring only once. The rate of D-loop evolution estimated for P. antarcticum appears quitelow (3.1%−3.5% per million years) as compared to mutationrates reported for other vertebrates (5.7%−11.31%; Vigilantet al. 1991; Brown et al. 1993). Given this ‘slow’ D-loop rateof P. antarcticum, the high polymorphism observed cannotbe ascribed to the hyper-variability usually assumed for
the mitochondrial control region. An alternative explanationmight be the departure of this species from the mutation–drift equilibrium resulting in the retention of rare haplo-types. This conclusion seems to be supported by thehaplotype network reconstruction that reveals a star-liketree topology consistent with the expectations of a suddenexpansion model (Rogers & Harpending 1992), the con-sequence of which is the retention of an excess of raremutations otherwise lost by drift. A past population ex-pansion is also suggested by neutrality tests that allowedus to reject the mutation–drift equilibrium hypothesis withhigh confidence. In particular, negative values of Tajima-D,like those obtained for the silverfish, have been interpretedas indicative of past population expansion (Bertorelle et al.1996; Stamatis et al. 2004).
It should be noted that this pattern of high haplotypediversity, star-like topology, and nonconformity to themutation–drift hypothesis, was not observed in Chionodracospecies (Antarctic notothenioids with a benthic habitus)analysed for the same D-loop fragment (Patarnello et al.2003).
Mismatch distribution analysis provides a tentativetime frame that might help to fit demographic events intoa palaeo-climatic context. In the case of P. antarcticum,population expansion should have started about 111–126thousand years (ka) ago, at the beginning of the coolingphase that led to the last glaciation peak. While the impactof climate change on ocean circulation and the position ofmodern oceanographic fronts during glacial conditions isstill debated (Anderson et al. 2002), there is unequivocalevidence that Antarctic planktonic ecosystems migratedequator-ward during cold periods (Charles et al. 1991).Accordingly, the domain of P. antarcticum, tied to the
Table 4 Pair-wise ΦST among Pleuragramma antarcticum populations. ΦST values are reported above, and probability (standard deviationin parentheses) of ΦST values below, the diagonal. Asterisks indicate significant values after Bonferroni correction. Genetic distancesbetween haplotypes were calculated using the best model of sequence evolution for the 277 bp D-loop fragment (Kimura parameter modelwith unequal base frequencies, invariant sites and gamma distributed heterogeneity of rates)
POPULATION
Halley Bay(Weddell Sea, 1989)
Halley Bay(Weddell Sea, 1991)
Terra NovaBay (Ross Sea, 1996)
ElephantIsland (South Shetland I. 1996)
King GeorgeIsland (Southern Scotia Arc, 1997)
Terra NovaBay (Ross Sea, 1997)
Halley Bay (Weddell Sea, 1989)
— 0.04320* 0.00589 0.00506 0.02058 0.02973
Halley Bay (Weddell Sea, 1991)
0.00069* ± (0.00030)
— 0.01131 0.01899 0.01147 0.03012*
Terra Nova Bay (Ross Sea, 1996)
0.16454 ± (0.0038)
0.03445 ± (0.0020)
— –0.01782 –0.00246 0.00767
Elephant Island (South Shetland I., 1996)
0.29730 ± (0.0045)
0.07366 ± (0.0025)
0.97990 ± (0.0015)
— –0.02046 0.00128
King George Island (Southern Scotia Arc, 1997)
0.02188 ± (0.0014)
0.06514 ± (0.0025)
0.63776 ± (0.0049)
0.98168 ± (0.0013)
— 0.01442
Terra Nova Bay(Ross Sea, 1997)
0.00693 ± (0.0008)
0.00257* ± (0.0005)
0.09395 ± (0.0030)
0.40194 ± (0.0048)
0.02802 ± (0.00017)
—
4508 L . Z A N E E T A L .
© 2006 The AuthorsJournal compilation © 2006 Blackwell Publishing Ltd
plankton that form the base of the food web, could havesimilarly expanded during cold phases. In addition, apopulation expansion of grazers and predators during coldperiods has been recently suggested (Smetacek & Nicol 2005)to explain the apparent reduction of productivity in theseasonal sea-ice zone, despite favourable trophic conditions.
The close agreement between the estimated date ofpopulation expansion and the expanded distribution of thespecies clearly suggests a link between the demography ofP. antarcticum and palaeo-climatic events that occurred inAntarctica over the last hundred thousand years.
On the basis of this correlation, we predict that a similarpattern might be found in other Antarctic pelagic organ-isms linked to the Antarctic silverfish through trophicrelationships. In this regard, it is interesting to note thata genetic signature of population expansion was alsoreported for the Antarctic krill Euphausia superba, one of themajor items in the silverfish diet. Mismatch analysis,however, indicated an earlier population expansion for theAntarctic krill although, in that case, the time estimate wasperformed using a less accurate universal rate than the oneused in this study and is thus prone to revision (Zane et al.1998). Furthermore, if demographic expansion is linked toan expansion of habitat distribution, then we may expect adifferent pattern for organisms inhabiting pelagic andcoastal habitats. The lack of signs of population expansion inthe demersal notothenioid Chionodraco hamatus (Patarnelloet al. 2003) seems to support this view.
A link between climatic regime shift, oceanographicconditions and the population history of marine organismswas first proposed to explain the shallow populationhistories of ‘old’ species (Grant & Bowen 1998), such assardines and anchovies. A peaked distribution in the mis-match analysis was subsequently found both in the Pacificsardine and in the East Pacific anchovy. Expansions forthe two species were dated at about 282 and 241 ka ago,respectively (Lecomte et al. 2004) and were possibly linkedto the Kansan glacial maximum that largely affected theNorthern Hemisphere. Several other items of evidence ofpopulation expansion in pelagic fish have been reportedfor Northern Hemisphere species, generally associatedwith the Pleistocene ice ages. These include pelagic speciessuch as the red snapper (Gold & Burridge 2004), the mack-erel, and the chub mackerel (Zardoya et al. 2004). Speciesdistributed in the Atlantic Ocean and in the MediterraneanSea often show a more complex pattern. In fact, they arecharacterized by well-differentiated intraspecific clades,which are probably the remnant of allopatric lineagesseparated by the recurrent isolation of the two basins dur-ing the Quaternary. This is the case for bonito (Vinas et al.2004), Atlantic anchovy (Magoulas et al. 2006), swordfishand Atlantic bluefin tuna (Bremer et al. 2005), all showingcomplex haplotype networks which complicates the infer-ence of their demographic histories.
The wealth of population studies for marine species inthe Northern Hemisphere oceans is in striking contrastwith the few reports on tropical or Southern Hemispherespecies. From the molecular data reported here, a relativelysimpler demographic history for P. antarcticum emergescompared to the examples reported above. In particular,the absence of separated basins in this area and the north-ward shift of the entire marine Antarctic ecosystem couldhave acted together to produce a clean signal of demo-graphic expansion.
Population structure
This study provides the first analysis of the populationstructure of Pleuragramma antarcticum. Partition of the geneticvariability between samples showed that the hypothesis ofhomogeneity can be rejected, as a statistically significantproportion of the overall genetic variability can be attri-buted to variation across samples. However, the global ΦSTvalues were small and explained less than 2% of the totalvariation, suggesting that a considerable level of gene flowstill occurs between different locations. We also observeda consistent pattern of expansion in all the investigatedsamples, and a lack of association between clades andgeographical locations. Altogether, these results wouldaccount for a situation ‘close to panmixia’ consistent withthe life history of the species.
However, the results from pair-wise ΦSTs conflict withthis scenario, because we observed two highly significantvalues, in one case between samples collected in the samearea in different years, but also between two locations asdistant as 4000 nautical miles (Table 4). Two alternativehypotheses can be made to explain these results: (1) P. ant-arcticum has indeed a pronounced population structurebut this was overlooked in this study because of the limitedsampling and marker used, or; (2) weak differences betweenpopulations can occasionally occur, possibly due to localfluctuations of gene pools in a general context of panmixia.
Hypothesis 1 could gain some support from a carefulinspection of pair-wise ΦSTs (Table 4), which, in the major-ity of cases (12 out of 15), are positive with a probabilityvalue close to the significance threshold when correctionfor multiple tests is not applied. Given the limited samplesize, the high variability and the skewed frequency distri-bution of D-loop haplotypes, it could be that some of thepositive values between populations were in turn indica-tive of differentiation. Hypothesis 2 (no population struc-ture) requires explaining the differences observed in theamova analysis by genetic drift that could account forlocal genetic differences in time and/or space. However,following the results of the mismatch analysis, P. antarcticumexperienced an expansion that resulted in a large present-day population size, thus leaving little room for the localdrift hypothesis.
P L E U R A G R A M M A A N T A R C T I C U M P O P U L A T I O N G E N E T I C S 4509
© 2006 The AuthorsJournal compilation © 2006 Blackwell Publishing Ltd
At present, our data do not allow us to firmly dis-criminate between the two hypotheses but only provideevidence for a weak population structure in P. antarcticum.In this regard, the lesson from an Antarctic pelagic fish isnot surprising given the wealth of reports of low differenti-ation for other marine species (Ward 1994; Waples 1998),explained by the lack of obvious barriers to gene flow. Inparticular, a weak structure is found in many of the speciesreported to have been subjected in the past to populationexpansions (Lecomte et al. 2004), and, as expected, a directcorrelation between the strength of the differentiationand the antiquity of the expansions seems to hold true, assuggested for instance by the FST values and mismatchdistribution for the two closely related mackerel species(Zardoya et al. 2004). Of course, the two results couldrepresent two sides of the same coin: because a populationexpansion linked to habitat extensions requires a highdispersal capacity of the organism, it is expected to preventgenetic differentiation. In addition, if spatial expansionoccurs with substantial mixing of individuals and is fol-lowed by spatial segregation of populations, we expect aweak signal of differentiation in species with a high effec-tive population size, simply because not enough time haselapsed to allow population differentiation. In this respect,further studies are needed to really address the biologicalsignificance of the differentiation found in the Antarcticsilverfish.
Conclusions
In summary, this study provides clear evidence for asignature of demographic expansion and for a weak popu-lation structure in Pleuragramma antarcticum. Whetherpopulation expansion was promoted by habitat expansionis still open to debate although these two events seem tocoincide fairly nicely in time. Analysis of other speciesinhabiting the same area and comparison with sub-Antarcticspecies could help to strengthen this link between palaeo-climatology and population genetics, allowing us to obtainurgently needed indications about the response of popu-lations to climate changes. The finding of a subtle butdetectable population structure, with significant differencesbetween samples both in space and time, suggests theneed for further research with appropriate nuclear markers,such as microsatellites, and a larger sample size.
Acknowledgements
This work was supported by the Italian PNRA (grants of the ItalianPNRA to TP). We thank S. Greco, C. Ozouf-Costaz, G. Huboldand K.H. Kock for providing us with samples. We also thankM.M. Hansen and three anonymous referees as their commentssignificantly improved the manuscript, and R.F. Anderson forhis useful suggestions. Additional warm acknowledgements aredue to K.H. Kock and Paul Rodhouse who allowed us to collect
part of the material during, respectively, the ANTXIV-2 cruise(Polarstern, Alfred Wegener Institut) and the GENEFLOW cruise(RRS-JCR 26, British Antarctic Survey).
Supplementary material
the supplementary material is available from http://www.blackwellpublishing.com/products/journals/suppmat/MEC/MEC3105/MEC3105sm.htm
Table S1 GenBank Accession nos of 277 bp D-loop sequences ofPleuragramma antarcticum submitted to GenBank. The frequencyin each population is also reported for each haplotype
References
Adachi J, Hasegawa M (1996) Model of amino acid substitution inproteins encoded by mitochondrial DNA. Journal of MolecularEvolution, 42, 459–468.
Altschul SF, Gish W, Miller W, Myers EW, Lipman DJ (1990) Basicalignment search tool. Journal of Molecular Biology, 215, 403–410.
Anderson RF, Chase Z, Fleisher MQ, Sachs J (2002) The SouthernOcean’s biological pump during the Last Glacial Maximum.Deep-Sea Research Part II Topical Studies in Oceanography, 49,1909–1938.
Aris-Brosou S, Excoffier L (1996) The impact of population ex-pansion and mutation rate heterogeneity on DNA sequencepolymorphism. Molecular Biology and Evolution, 13, 494–504.
Bargelloni L, Marcato S, Patarnello T (1998) Antarctic fishhemoglobins: evidence for adaptive evolution at subzerotemperature. Proceedings of National Academy of Sciences, USA,95, 8670–8675.
Bargelloni L, Marcato S, Zane L, Patarnello T (2000a) Mitochon-drial phylogeny of notothenioids: a molecular approach toAntarctic fish evolution and biogeography. Systematic Biology,49, 114–129.
Bargelloni L, Zane L, Derome N, Lecointre G, Patarnello T (2000b)Molecular zoogeography of Antarctic euphausiids and noto-thenioids: from species phylogenies to intraspecific patterns ofgenetic variations. Antarctic Science, 12, 259–268.
Bertorelle G, Calafell F, Francalacci P, Bertranpetit J, Barbujani G(1996) Geographic homogeneity and non-equilibrium patternsof mtDNA sequences in Tuscany, Italy. Human Genetics, 98, 145–150.
Bremer JRA, Vinas J, Mejuto J, Ely B, Pla C (2005) Comparativephylogeography of Atlantic bluefin tuna and swordfish: thecombined effects of vicariance, secondary contact, introgression,and population expansion on the regional phylogenies of twohighly migratory pelagic fishes. Molecular Phylogenetics andEvolution, 36, 169–187.
Brown JR, Beckenbach AT, Smith MJ (1993) Intraspecific DNAsequence variation of the mitochondrial control region of whitesturgeon (Acipenser transmontanus). Molecular Biology and Evolu-tion, 10, 326–341.
Chakraborty R (1990) Mitochondrial DNA polymorphism revealshidden heterogeneity within some Asian populations. AmericanJournal of Human Genetics, 47, 87–94.
Charles CD, Froelich PN, Zibello MA, Mortlock RA, Morley JJ(1991) Biogenic opal in Southern Ocean sediments over thelast 450 000 years: implications for surface water chemistry andcirculation. Paleoceanography, 6, 697–728.
4510 L . Z A N E E T A L .
© 2006 The AuthorsJournal compilation © 2006 Blackwell Publishing Ltd
Chen L, DeVries AL, Cheng CHC (1997) Evolution of antifreezeglycoprotein gene from a trypsinogen gene in Antarctic noto-thenioid fish. Proceedings of National Academy of Sciences, USA,94, 3811–3816.
Cheng CC, DeVries AL (1991) The role of antifreeze glycopeptidesand peptides in the freezing avoidance of cold water fish. In: Lifeunder extreme conditions: biochemical adaptation (ed. Di Prisco G),pp. 1–14. Springer Verlag, Berlin.
Derome N, Chen WJ, Dettai A, Bonillo C, Lecointre G (2002)Phylogeny of Antarctic dragon fishes (Bathydraconidae,Notothenioidei, Teleostei) and related families based on theiranatomy and two mitochondrial genes. Molecular Phylogeneticsand Evolution, 24, 139–152.
Eastman JT (1993) Antarctic Fish Biology. Academic Press, San Diego.Eastman JT, Lamnoo MJ (2004) Brain and sense organ anatomy
and histology in hemoglobinless Antarctic icefishes (Perciformes:Notothenioidei: Channichthyidae). Journal of Morphology, 260,117–140.
EPICA community members (2004) Eight glacial cycles from anAntarctic ice core. Nature, 429, 623–628.
Ewens WJ (1972) The sampling theory of selectively neutral alleles.Theoretical Population Biology, 3, 87–112.
Excoffier L, Smouse PE (1994) Using allele frequencies and geo-graphic subdivision to reconstruct gene trees within a species:molecular variance parsimony. Genetics, 136, 343–359.
Excoffier L, Smouse PE, Quattro JM (1992) Analysis of molecularvariance inferred from metric distances among DNA haplo-types: application to human mitochondrial DNA restrictiondata. Genetics, 131, 479–491.
Gerasimchuck VV (1986) Characteristics of Antarctic silverfishPleuragramma antarcticum (Nototheniidae) from Olaf-Pruds Bay(Commonwealth Sea Eastern Antarctica) with notes on identifi-cation of the species. Journal of Ichthyology, 26, 10–17.
Gold JR, Burridge CP (2004) Historical population dynamics ofred snapper (Lutjanus campechanus) in the northern Gulf ofMexico. Texas Journal of Science, 56, 157–170.
Grant WS, Bowen BW (1998) Shallow population histories in deepevolutionary lineages of marine fishes: insights from sardinesand anchovies and lessons for conservation. Journal of Heredity,89, 415–426.
Guglielmo L, Granata A, Greco S (1998) Distribution and abundanceof postlarval and juvenile Pleuragramma antarcticum (PiscesNototheniidae) off Terra Nova Bay (Ross Sea Antarctica). PolarBiology, 19, 37–51.
Hubold G (1985) The early life history of the high-Antarctic silver-fish Pleuragramma antarcticum. In: Antarctic nutrient cycles andfood webs (eds Siegfried WR, Condy PR, Laws RM), pp. 445–451.Springer Berlin, Heidelberg, New York.
Hubold G, Ekau W (1990) Feeding patterns of post-larval andjuvenile notothenioids in the Southern Weddell Sea (Antarctica).Polar Biology, 10, 255–260.
Kennett JP (1982) Marine Geology. Prentice Hall, Englewood Cliffs.Kock KH (1992) Antarctic Fish and Fisheries. Cambridge University
Press, Cambridge.Kosakovsky Pond SL, Frost SDW, Muse SV (2005) HyPhy: hypo-
thesis testing using phylogenies. Bioinformatics, 21, 676–679.Kumar S, Tamura K, Nei M (2003) MEGA3: An integrated soft-
ware for molecular evolutionary genetic analysis and sequencealignment. Integrative and Comparative Biology, 43, 947.
Lecomte FL, Grant WS, Dodson JJ, Rodriguez-Sanchez R, Bowen BW(2004) Living with uncertainty: genetic imprints of climate shifts
in East Pacific anchovy (Engraulis mordax) and sardine (Sardinopssagax). Molecular Ecology, 13, 2169–2182.
Lowe TM, Eddy SR (1997) tRNAscan-SE: a program for improveddetection of transfer RNA genes in genomic sequence. NucleicAcids Research, 25, 955–964.
Magoulas A, Castilho R, Caetano S, Marcato S, Patarnello T (2006)Mitochondrial DNA reveals a mosaic pattern of phylogeo-graphical structure in Atlantic and Mediterranean populationsof anchovy (Engraulis encrasicolus). Molecular Phylogenetics andEvolution, doi: 10.1016/j.ympev.2006.01.016.
Mantel NA (1967) The detection of disease clustering and ageneralized regression approach. Cancer Research, 27, 209–220.
McMillan WO, Palumbi SR (1997) Rapid rate of control-regionevolution in Pacific butterflyfishes (Chaetodontidae). Journal ofMolecular Evolution, 45, 473–484.
Mousset S, Derome N, Veuille M (2004) A test of neutrality andconstant population size based on the mismatch distribution.Molecular Biology and Evolution, 21, 724–731.
Near TJ, Pesavento JJ, Cheng CHC (2004) Phylogenetic investiga-tions of Antarctic notothenioid fishes (Perciformes: Notothenioidei)using complete gene sequences of the mitochondrial encoded16S rRNA. Molecular Phylogenetics and Evolution, 32, 881–891.
Near TJ, Russo SE, Jones CD, DeVries AL (2003) Ontogenetic shiftin buoyancy and habitat in the Antarctic toothfish, Dissostichusmawsoni (Perciformes: Nototheniidae). Polar Biology, 26, 124–128.
Ostellari L, Bargelloni L, Penzo E, Patarnello P, Patarnello T (1996)Optimization of single-strand conformation polymorphimsand sequence analysis of the mitochondrial control region inPagellus bogaraveo (Sparidae, Teleostei): rationalized tools in fishpopulations biology. Animal Genetics, 27, 423–427.
Parker RW, Paige KN, DeVries AL (2002) Genetic variation amongpopulations of toothfish: evolutionary insights and implicationsfor conservation. Polar Biology, 25, 256–261.
Patarnello T, Marcato S, Zane L, Varotto V, Bargelloni L (2003)Microevolutionary processes into the Southern Ocean: relation-ships within and between species in the genus Chionodraco(Notothenioidei Channichthyidae). Molecular Phylogenetics andEvolution, 28, 420–429.
Posada D, Crandall KA (1998) MODELTEST: testing the model ofDNA substitution. Bioinformatics, 14, 817–818.
Posada D, Crandall KA, Templeton AR (2000) GeoDis: a programfor the cladistic nested analysis of the geographical distributionof genetic haplotypes. Molecular Ecology, 9, 487–488.
di Prisco G, D’Avino R, Caruso C et al. (1991) The biochemistry ofoxygen transport in red-blooded Antarctic fish. In: Biology ofAntarctic fish (eds di Prisco G, Maresca B, Tota B), pp. 263–281.Springer-Verlag, Berlin Heidelberg New York.
Rogers AR, Harpending H (1992) Population growth makeswaves in the distribution of pairwise genetic differences. Mole-cular Biology and Evolution, 9, 552–569.
Schneider S, Roessli D, Excoffier L (2000) Arlequin version 2.000: asoftware for population genetic data analysis. University of Geneva,Geneva.
Shaw PM, Arkhipkin AI, Al-Khairulla H (2004) Genetic structuringof Patagonian toothfish populations in the Southwest Atlantic Ocean:the effect of the Antarctic Polar Front and deep–water troughsas barriers to genetic exchange. Molecular Ecology, 13, 3293–3303.
Smetacek V, Nicol S (2005) Polar ocean ecosystems in a changingworld. Nature, 437, 362–368.
P L E U R A G R A M M A A N T A R C T I C U M P O P U L A T I O N G E N E T I C S 4511
© 2006 The AuthorsJournal compilation © 2006 Blackwell Publishing Ltd
Stamatis C, Triantafyllidis A, Moutou KA, Mamuris Z (2004)Mitochondrial DNA variation in northeast Atlantic and Medi-terranean populations of Norway lobster, Nephrops norvegicus.Molecular Ecology, 13, 1377–1390.
Swofford DL (2002) PAUP*. Phylogenetic analysis using parsimony(*. and Other Methods), v, 4.0b10. Sinauer, Sunderland, MA.
Tajima F (1989) Statistical method for testing the neutral mutationhypothesis by DNA polymorphism. Genetics, 105, 437–460.
Thompson JD, Gibson TJ, Plewniak F, Jeanmougin F, Higgins DG(1997) The ClustalX windows interface: flexible strategies formultiple sequence alignment aided by quality analysis tools.Nucleic Acid Research, 24, 4876–4882.
Vacchi M, La Mesa M, Dalu M, MacDonald J (2004) Early life stagesin the life cycle of Antarctic silverfish, Pleuragramma antarcticum.Terra Nova Bay, Ross Sea. Antarctic Science, 16, 299–305.
Vigilant L, Stoneking M, Harpending H, Hawkes K, Wilson AC(1991) African populations and the evolution of human mito-chondrial DNA. Science, 253, 1503–1507.
Vinas J, Bremer JA, Pla C (2004) Phylogeography of the Atlanticbonito (Sarda sarda) in the northern Mediterranean: the combinedeffects of historical vicariance, population expansion, secondaryinvasion, and isolation by distance. Molecular Phylogenetics andEvolution, 33, 32–42.
Walsh PS, Metzger DA, Higuchi R (1991) Chelex-100 as a mediumfor simple extraction of DNA for PCR-based typing for forensicmaterial. Biotechniques, 10, 298–317.
Waples RS (1998) Separating the wheat from the chaff: patternsof genetic differentiation in high gene flow species. Journal ofHeredity, 89, 438–450.
Ward RD (1994) A comparison of genetic diversity levels inmarine, fresh-water, and anadromous fishes. Journal of FishBiology, 44, 213–232.
Watterson GA (1978) Homozygosity test of neutrality. Genetics, 88,405–417.
Yang ZH (1997) PAML: a program package for phylogeneticanalysis by maximum likelihood. Computer Applications in theBiosciences, 13, 555–556.
Zane L, Ostellari L, Maccatrozzo L, Bargelloni L, Battaglia B,Patarnello T (1998) Molecular evidence for genetic subdivisionof Antarctic krill (Euphasia superba Dana) populations. Proceed-ings of the Royal Society of London. Series B, 265, 2387–2391.
Zardoya R, Castilho R, Grande C et al. (2004) Differential popula-tion structuring of two closely related fish species, the mackerel(Scomber scombrus) and the chub mackerel (Scomber japonicus), inthe Mediterranean Sea. Molecular Ecology, 13, 1785–1798.
Authors are primarily interested in evolutionary processes andpart of their research activity is currently focusing on populationgenetics of marine organisms and conservation genetics of endangeredspecies.