Multi-Constraint Optimized Planning of Tasks on Virtualized ...
An Experimental Methodology to Evaluate EnergyEfficiency and Performance in an Enterprise Virtualized
Environment
Jesus Omana IglesiasSchool of Computer Science
and InformaticsUniversity College Dublin
Dublin, [email protected]
Philip PerrySchool of Computer Science
and InformaticsUniversity College Dublin
Dublin, [email protected]
Liam MurphySchool of Computer Science
and InformaticsUniversity College Dublin
Dublin, [email protected]
Teodora Sandra BudaSchool of Computer Science
and InformaticsUniversity College Dublin
Dublin, [email protected]
James ThorburnIBM
Software GroupToronto, Canada
ABSTRACTComputing servers generally have a narrow dynamic powerrange. For instance, even completely idle servers consumebetween 50% and 70% of their peak power. Since the us-age rate of the server has the main influence on its powerconsumption, energy-efficiency is achieved whenever the uti-lization of the servers that are powered on reaches its peak.For this purpose, enterprises generally adopt the followingtechnique: consolidate as many workloads as possible viavirtualization in a minimum amount of servers (i.e. maxi-mize utilization) and power down the ones that remain idle(i.e. reduce power consumption). However, such approachcan severely impact servers’ performance and reliability.
In this paper, we propose a methodology to determinethe ideal values for power consumption and utilization fora server without performance degradation. We accomplishthis through a series of experiments using two typical typesof workloads commonly found in enterprises: TPC-H andSPECpower ssj2008 benchmarks. We use the first to mea-sure the amount of queries responded successfully per hourfor different numbers of users (i.e. Throughput@Size) in theVM. Moreover, we use the latter to measure the power con-sumption and number of operations successfully handled bya VM at different target loads. We conducted experimentsvarying the utilization level and number of users for differ-ent VMs and the results show that it is possible to reach themaximum value of power consumption for a server, withoutexperiencing performance degradations when running indi-vidual, or mixing workloads.
Permission to make digital or hard copies of all or part of this work for personal orclassroom use is granted without fee provided that copies are not made or distributedfor profit or commercial advantage and that copies bear this notice and the full citationon the first page. Copyrights for components of this work owned by others than theauthor(s) must be honored. Abstracting with credit is permitted. To copy otherwise, orrepublish, to post on servers or to redistribute to lists, requires prior specific permissionand/or a fee. Request permissions from [email protected]’14, March 22–26, 2014, Dublin, Ireland.Copyright is held by the owner/author(s). Publication rights licensed to ACM.ACM 978-1-4503-2733-6/14/03 ...$15.00.http://dx.doi.org/10.1145/2568088.2568099.
Categories and Subject DescriptorsC.4 [Performance of Systems]: Measurement techniques;D.2.8 [Software Engineering]: Metrics—performance mea-sures
1. INTRODUCTIONNowadays large investments have been made to build data
centers (i.e. purpose-built facilities composed of thousandsof servers, providing storage and computing service withinand across organizational boundaries). In our previous work,we show that one of the main contributors to the overall costof running a server is the energy-related cost [23]. Never-theless, it is often the case that enterprises have idle serversoperating at very low levels of utilization, whilst consum-ing between 50 and 70% of their peak power [10]. Moreover,data collected from more than 5, 000 production servers overa six-month period showed that servers operate only at 10-50% of their full capacity most of the time, leading to ex-penses on over-provisioning, and thus extra Total Cost ofAcquisition (TCA) [9]. With the increase of energy costs,the research community has been trying to solve the en-ergy efficiency problem from two different perspectives: (i)creating servers that consume energy proportional to theirutilization level, and (ii) maximizing the utilization of theminimum number of servers. In this work, we solely addressthe impact of the second perspective.
In order to maximize utilization, enterprises generally con-solidate workloads via virtualization. Virtualization is atechnique that enables applications to share the same physi-cal server by creating multiple virtual machines in such amanner that each application can assume the ownershipof the virtual machine (VM) [14]. One of the benefits ofvirtualization is the potentially more efficient utilization ofthe server’s hardware resources. This can be accomplishedwhen VMs with complementary workload patterns achievethe maximum utilization level that a server can handle, orwhen the workloads in each VM have complementary re-source usage patterns. Furthermore, our work is focused
on virtualized environments that run the type of workloadsthat are typically used in enterprises. We define in detail theperformance degradation for a VM depending on the typeof workload in section 4.3.
However, high levels of utilization tend to be associatedto a higher performance degradation. For instance, it isexpected that an application with average utilization ap-proaching 100% is likely to have difficulty meeting its per-formance requirements (i.e. throughput and latency service-level-agreements). Due to this fact, enterprises will not riskthe performance of their VMs in order to maximize the uti-lization of their servers, thus leading to low levels of uti-lization. Furthermore, to the best of our knowledge this isthe first attempt of analyzing empirically whether it is pos-sible to reach a balance between performance and energyefficiency for typical enterprise workloads. Moreover, previ-ous work [13, 21], assume that when VMs with complemen-tary resource usage patterns reach the maximum utilizationlevel, there will be no performance degradation. However,through our experiments, we show conclusive results thatthis hypothesis is not always true. In addition, previouswork did not study whether the state of a VM influencesthe performance degradation. For instance, we show thatidle VMs do not affect performance regardless of how inten-sively the active VMs are used. We present this in detail insection 4.4.
The main goal of this paper is to present a methodologyfor achieving energy-efficiency in a server with no perfor-mance degradation per VM. For this purpose, we experi-mentally investigate the relationship between performancedegradation and energy-efficiency for two typical workloadsused in enterprises: SPECpower ssj2008 [4] and TPC-H [8]benchmarks. We use SPECpower ssj2008 for exploring thenumber of operations successfully handled by a VM and thepower consumption associated at several levels of utilization.We further refer to SPECpower ssj2008 as SPECpower inthe remainder of this paper. We use TPC-H for evaluat-ing the response time for business-oriented ad-hoc queriesand concurrent data modifications. In particular, we usethe metric Throughput@Size from TPC-H which measuresthe amount of queries that can be executed per hour fordifferent amounts of users.
We explore different scenarios in which a server increasesits utilization and dependability and especially how that re-lates to performance degradation. In order to vary the sce-narios we introduced the concept of states of a VM (e.g,idle, constant) to aids the detection of performance degrada-tions. We experimentally studied the relationship betweenthroughput (i.e, queries per hour or number of operations)and performance degradation. Furthermore, we also inves-tigated the relationship between the type of workload (i.e.,TPC-H or SPECpower) and performance degradation. Fi-nally, we examined the consequences in performance andenergy-efficiency of mixing these two types of workloads. Itis important to mention that this experimental methodologycan be adapted to a concrete implementation, and providean automated technique to find a balance between powerconsumption and performance.
This paper is structured as follows: Section 2 presents thetwo benchmarks used in this work, namely SPECpower andTPC-H. Section 3 presents a set of relevant questions thatneed to be addressed in order to find a balance betweenenergy-efficiency and performance. In section 4 we address
these questions with the use of a set of scenarios. Section 5provides an overview of the related work. Finally, section 6concludes the paper and presents future work.
2. BACKGROUNDIn this section, we present the main features of the two
benchmarks used in this work, namely, an overview of theirdesign and functionality in order to facilitate the under-standing of the questions addressed in this work and theirresults.
2.1 Overview of SPECpower benchmarkThe SPECpower benchmark was designed to produce con-
sistent and repeatable performance and power measurements.The purpose of the benchmark is to imitate a server-sideJava transaction processing application. SPECpower strainsthe CPU, caches, and memory hierarchy, as well as the im-plementations of the Java virtual machine (JVM), just-in-time (JIT) compiler, and garbage collection. The bench-mark is based on the SPECjbb2005 benchmark [4]. It hasstrict rules for compliance in case the user wants to uploadthe results into their website. For example, it is necessaryto use two systems, namely a system under test (SUT) anda system for control and collection (CCS) [5]. However, dueto the amount of experiments that we needed to performwe set the SUT and CCS in the same VM. Furthermore, wefirst perform the experiments using a laptop as a CCS anddid not find any significant difference in the results.
SPECpower executes different types of transactions suchas: new order, payment, order status, delivery, stock level,and customer report. The input for each transaction israndomly generated and it modifies in-memory data struc-tures such as warehouses and customers. Transactions aregrouped together in batches for scheduling purposes. Thedelay between batches is calculated to achieve the desiredthroughput for each target load. In essence, SPECpowerruns the workload at different load-levels and reports thepower and performance at each load-level [6].
The benchmark starts with a calibration phase, which de-termines the maximum throughput. The calibrated through-put is set as the throughput target for 100% load-level. Thethroughput target for the rest of the load-levels is calculatedas a percentage of the throughput target for 100% load-level. For example, if the calibrated throughput is 200,000server-side Java operations per second (i.e. ssj ops), the50% target load would have a target throughput of 100,000ssj ops. With 10 warehouses, each warehouse needs to sus-tain a throughput of 10,000 ssj ops, since there are 2,000transactions per batch, each warehouse will execute an av-erage of 5 batches per second. Thus, the mean delay betweenbatches is 200 ms. The downside of this feature is that insome cases the benchmark may have an error between thetarget and the actual load, which may be easily mistakenas performance degradation. For instance, in figure 4(a)there is a ± 1% of error margin due to the way the ssj opsare batched.
The benchmark supports a set of configurable parame-ters. For example, the maximum target throughput can bemanually configured, as well as the sequence of load-levels,the time of each load, the number of calibrations, etc. Thereader can refer to [7] for more information on which pa-rameters are configurable. The flexibility, coupled with theconsistency and repeatability of SPECpower, allow us to
investigate a balance between energy-efficiency and perfor-mance for enterprise-class server workloads.
2.2 Overview of TPC-H benchmarkThe TPC-H benchmark is a decision support benchmark
comprising a suite of business oriented ad-hoc queries anddata modifications [8]. The term decision support impliesthat managers and executives would need to retrieve datafrom the database in order to draw a pattern of the com-pany financial results and facilitate their decision makingprocess. TPC-H creates the data for a relational databasecomprised of eight tables that stores typical product supplyinformation. The benchmark also involves ad-hoc workloadthat aims to produce unpredictable queries [17].
The workload of the benchmark consists of 22 queries and2 update procedures, all representing frequent decision mak-ing questions. Furthermore, the 22 queries have a high-levelof complexity and give answers to real-world business ques-tions. The queries include a rich scope of operators andselectivity constraints, access a large percentage of the pop-ulated data and tables and generate intensive disk and CPUactivity on the part of the database server. The update pro-cedures are called refresh functions (RFs) [8]. The refresh-ing functions are not included in the benchmark and theywere created by us following the TPC-H guidelines. For in-stance, RF 1 adds new sales information to the database,the insertion takes place in the two most populated tablesand represents 0.1% of the initial population of these twotables. Moreover, RF 2 removes old sales information fromthe database.
We use DBGEN, which is a data generator provided inthe TPC-H package to create the data to be inserted anddeleted by the refreshing functions.
Setting the Environment for TPC-H.In order to perform any test with TPC-H it is necessary
to: (i) create the database with the exact schema proposedby the Transaction Performance Council (TPC); (ii) addthe constraints; (iii) generate the raw data files using theDBGEN tool; (iv) load the data into the database tables;(v) generate the workload queries to be executed using theTPC-H query generation tool (QGEN); and (vi) develop andinstall the necessary stored procedures, i.e, RF 1 and RF 2.After all these steps are finished, we are able to run theworkload and measure the execution times.
Throughput Test.The purpose of the throughput test is to measure the abil-
ity of the system to process the most queries in the leastamount of time [17, 8]. In other words, this test is used todemonstrate the performance of the system against a multi-user workload. Each user is represented by a stream (S),which runs 21 queries in a random order. The stream exe-cutes queries in a serial manner but the streams themselvesare executed in parallel. We did not consider one of thequeries because its execution time was too long (i.e. morethan 1 hour). The throughput test must be executed inparallel with a single refresh stream session [8].
The Throughput@Size metric is defined as:
Throughput@Size =n× 21
Ts× 3600× SF
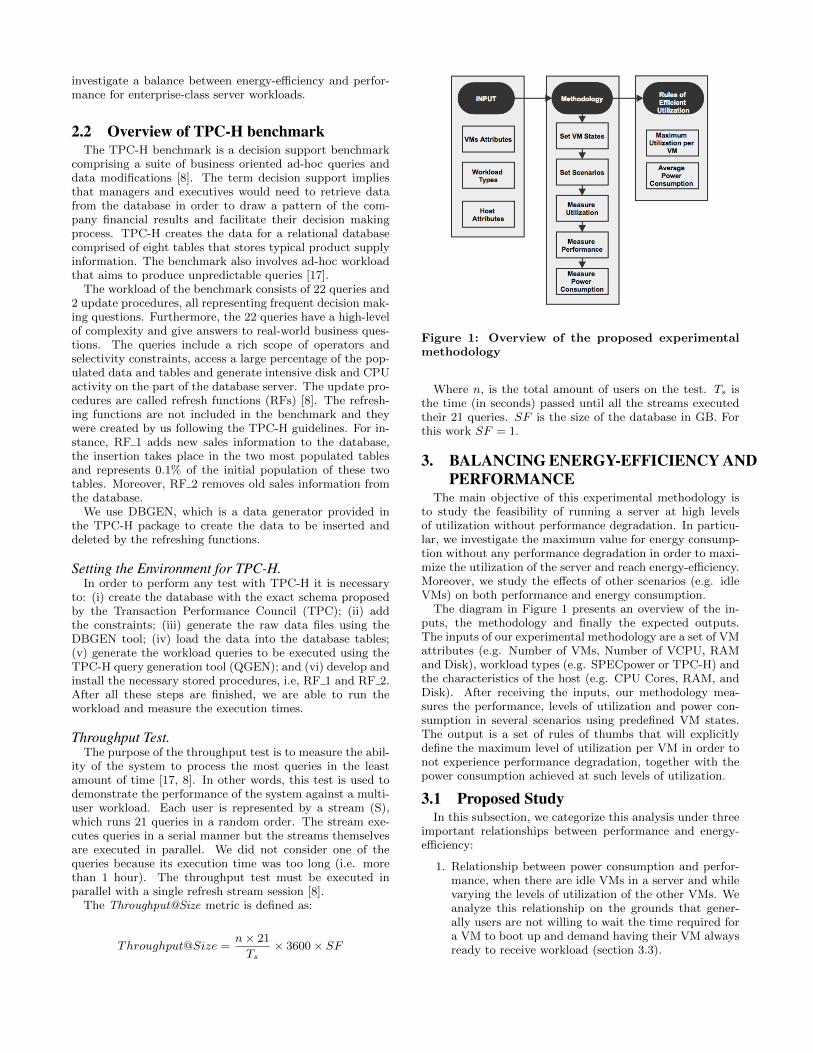
Figure 1: Overview of the proposed experimentalmethodology
Where n, is the total amount of users on the test. Ts isthe time (in seconds) passed until all the streams executedtheir 21 queries. SF is the size of the database in GB. Forthis work SF = 1.
3. BALANCING ENERGY-EFFICIENCY ANDPERFORMANCE
The main objective of this experimental methodology isto study the feasibility of running a server at high levelsof utilization without performance degradation. In particu-lar, we investigate the maximum value for energy consump-tion without any performance degradation in order to maxi-mize the utilization of the server and reach energy-efficiency.Moreover, we study the effects of other scenarios (e.g. idleVMs) on both performance and energy consumption.
The diagram in Figure 1 presents an overview of the in-puts, the methodology and finally the expected outputs.The inputs of our experimental methodology are a set of VMattributes (e.g. Number of VMs, Number of VCPU, RAMand Disk), workload types (e.g. SPECpower or TPC-H) andthe characteristics of the host (e.g. CPU Cores, RAM, andDisk). After receiving the inputs, our methodology mea-sures the performance, levels of utilization and power con-sumption in several scenarios using predefined VM states.The output is a set of rules of thumbs that will explicitlydefine the maximum level of utilization per VM in order tonot experience performance degradation, together with thepower consumption achieved at such levels of utilization.
3.1 Proposed StudyIn this subsection, we categorize this analysis under three
important relationships between performance and energy-efficiency:
1. Relationship between power consumption and perfor-mance, when there are idle VMs in a server and whilevarying the levels of utilization of the other VMs. Weanalyze this relationship on the grounds that gener-ally users are not willing to wait the time required fora VM to boot up and demand having their VM alwaysready to receive workload (section 3.3).
2. Relationship between throughput, performance degra-dation, and energy-efficiency when reaching maximumlevels of utilization. We study this relationship in orderto discover whether performance degradation occursjust after the server attains certain levels of utiliza-tion, or on the contrary, VMs can have performancedegradations even if the server is not running at par-ticularly high levels of utilization (section 3.4).
3. Relationship between workload mixes, performancedegradation and energy-efficiency when reaching max-imum levels of utilization. This relationship exploresone of the main benefits of virtualization, namely tohave different VMs in the same server running work-loads that consume different hardware resources (e.g,CPU, RAM, Disk) in order to maximize the utilizationof the server. Thus, in this analysis we use benchmarksthat simulate real applications that are typically usedin enterprises, instead of considering benchmarks thatuse a single resource. It is important to mention thatin the majority of the real-case scenarios, workloadsconsume more than one type of hardware resource atthe same time (section 3.5).
Each of these relationships explores a set of questions thatwill be answered through the testing of a set of inquiries(INQ). Moreover, it is necessary to evaluate each benchmarkseparately since their performance metrics are different fromeach other. Before presenting the inquiries in detail, we firstintroduce the concept of VM states.
3.2 VM StatesWe define the state of a VM v as a pattern of utiliza-
tion aimed to discover performance degradation symptoms.We denote by U(v) the utilization levels of v during a sin-gle run and we define it as: U(v) = 〈u1, u2, . . . , un〉, whereui represents the level of utilization of v at step i, ui ∈{0, 10, 20, . . . , 100} ∧ i ∈ [1, n]. Below we present the VMstates considered in function of their utilization pattern:
• Idle: The VM runs at 0% of utilization at all steps:∀i ∈ [1, n], ui = 0.
• Constant: The VM runs SPECpower at a constantpercentage of utilization at all steps: ∀i ∈ [1, n], ui =ct, where ct ∈ {10, 20, . . . 100}.
• Active: The VM runs SPECpower at different per-centages of utilization during a single run and respectsthe following condition: ∀i ∈ [1, n], ui ∈ {10, 20, . . . 100}∧ |ui+1 − ui| ≤ 10.
• N Users: VM running the Throughput@Size test withN users, where N ∈ [2, 7].
3.3 Presence of Idle VMsIn this subsection we present two inquiries that intend to
explain the effects, if any, of idle VMs on performance andpower consumption. Moreover, the baseline for the TPC-Hperformance degradation was established after averaging theresults from six identical experiments in which there were noIdle VMs.
INQ 1. Is there an increment in the power consumptionof the server due to the presence of Idle VMs? If so, isit constant regardless of the percentage of utilization in theActive VM?
We plan to validate this relationships by running VMs atdifferent target loads in the case of SPECpower and withdifferent number of users in the case of TPC-H.
Regarding SPECpower we answer this inquiry by compar-ing the average power consumption of running one and twoActive VMs from 10% to 100% of its maximum target loadagainst running the same experiment but with one and twoadditional Idle VMs for the case that there is one ActiveVM, and with one Idle VM in the case that there are twoActive VMs. We decided to use Active VMs because thiswill allow us to perform measurements in a very progressiveand controlled environment.
With respect to TPC-H, we analyze the effects of simul-taneously running VMs with different amount of users, westress the server by running a minimum of four users (be-tween two VMs) and a maximum of 21 users (between threeVMs). We investigate if varying the amount of users whenhaving one or two Idle VMs, besides the ones running inan N Users state, will have any repercussion in power con-sumption.
INQ 2. Is there a performance degradation due to Idle VMsin a server? If so, is it constant regardless of the percentageof utilization in the Active VM?
In order to solve this question we calculated the perfor-mance values while running the same set of experimentsfrom INQ 1 and compared them against the baseline. Thestate of the VMs as well as the number of users for solvingthis question is identical as the one described in INQ 1.
3.4 Finding the maximum number of opera-tions
We intend to empirically find the maximum number of op-erations that a server can handle and to test if the VMs willnot experience performance degradation as long as this max-imum number of operations is not reached. Below we presentthree inquiries that explain the effects in performance andenergy-efficiency whenever the sum of utilization of the VMsgets closer to the maximum number of operations that aserver can handle.
INQ 3. Is it possible to find the maximum number of oper-ations that a server can perform regardless of the number ofVMs hosted in that server without performance degradation?
The main goal of this inquiry is to establish a rule ofthumb for maximum levels of utilization without perfor-mance degradation for both benchmarks (i.e. SPECpowerand TPC-H).
In the case of SPECpower we first set two Active VMswith targets of utilization between 60 and 100%. After-wards, when having three Active VMs we set the targetsbetween 40 and 70%. This range of values was selected af-ter noticing in INQ 2 that it is likely to find performancedegradation between those levels of utilization.
INQ 4. Does the state of the VM influence the maximumnumber of operations until the performance degrades?
The purpose of this investigation is to observe whetherdepending on the state of the VM, that particular VM willexperience performance degradation faster than when theserver reaches its maximum levels of utilization. In the casethat this is true the rule of thumb will be modified accord-ingly. For SPECpower, we first set a VM to a high (between
80 and 100% of utilization) Constant state, and then we setanother VM to an Active state, and study if the VM that isrunning at a high Constant state experiences degradationin performance faster than the other. In another scenario,we set two VMs at a relatively low Active state (between 10and 60%) and a third VM in an Constant state, to corrob-orate if the performance degradation is due to high levels ofutilization or to constant levels of utilization.
INQ 5. Is there a relationship between the results of INQ3, INQ 4 and energy-efficiency?
This inquiry aims to discover whether the average powerconsumption values from the maximum levels of utilizationpresented in the previous inquiries are equal to the maximumpower consumption of the server. In particular, we wantto explore whether it is possible to achieve the maximumenergy-efficiency with no performance degradation.
3.5 Mixing different types of workloadsFollowing we present a set of experiments in which we
combine SPECpower and TPC-H at different VM states andwith different amounts of users in order to corroborate theeffects of mixing different types of workload in the sameserver. As we already mentioned in the introduction of thiswork, one of the benefits of virtualization is that we couldpotentially allocate workloads that use different hardwareresources in order to maximize the utilization of the server.It is not often the case, especially for enterprises, to findworkloads that use only one particular hardware resource.More often is the case that a type of workload uses morethan one hardware resource at the same time, however usingmore intensively one of the resources. For instance, TPC-Hheavily uses CPU and Disk. However, Disk is used moreintensively than CPU. SPECpower, as we already explainedin section 2, it uses mostly CPU.
We primarily want to evaluate if the maximum number ofoperations found in the previous inquiries is the same whenwe substitute an Idle VM by a VM running TPC-H and todetermine if we achieve better energy-efficiency levels whencombining different types of workloads.
INQ 6. Is it possible to combine different types of workloadon the same server in a way that they do not interfere witheach other and that there is no performance degradation?
The main goal of this question is to show the effects on per-formance when running complementary workloads (i.e. theyutilize different hardware resources). We performed sev-eral experiments with different number of users (in the caseof TPC-H) and different levels of utilization for Constantstates (in the case of SPECpower) in order to analyze theeffect of workload mixes. For this inquiry, we set the exper-iments for SPECpower to have the same length in durationas TPC-H depending on the number of users. For instance,as T2 < T7 SPECpower will run for less time when eval-uating TPC-H with two users than with seven users. Weare mostly interested in finding whether the rule of thumbapplies in this scenario.
INQ 7. Is there a relationship between the results of INQ 6and energy-efficiency?
This inquiry presents the increment in the average powerconsumption values when running different types of work-loads simultaneously. We have performed experiments both
with two VMs and three VMs that combine the two differenttypes of workload.
4. EVALUATIONIn this section, we present the results of the inquiries de-
fined in section 3. Furthermore, we first introduce the en-vironment used for the experiments, along with the experi-mental setup.
4.1 EnvironmentWe present below a description of the hypervisor, the char-
acteristics of the server under test (SUT), and the charac-teristics of the VMs.
In order to measure the balance between energy-efficiencyand performance it is necessary to establish a reliable vir-tualized environment. The hardware attributes of the SUT:the CPU processor is an Intel Core i7-2600 CPU at 3.40GHz.The processor has a total of 4 cores and 8 logical cores whenhyper-threading is ON, as in our experiments. The SUThas 16GB of memory, a Hard Disk of 500GB, and runs aLinux Kernel version 3.2.0-4-amd64. We employ a HAMEGHM8115-2 power meter [2] for our power measurements.
When running the experiments it is necessary to empha-size that the commands were sent via ssh, meaning that nographical interface was used in order to avoid unnecessaryusage of hardware resources. Moreover, we monitored theserver and VM’s utilization with collectd [1].
4.1.1 KVM/QEMUKVM (Kernel Virtual Machine)[3] is a Linux kernel mod-
ule that allows a user space program to utilize the hardwarevirtualization features of various processors (e.g. Intel VT orAMD-V). QEMU is a generic and open source machine emu-lator and virtualizer [3]. KVM uses QEMU for I/O hardwareemulation. KVM lets a program like QEMU safely executeguest code directly on the host CPU. This is only possiblewhen the target architecture is supported by the host CPU;(currently is limited to x86-on-x86 virtualization only).
The main responsibilities of the KVM/QEMU packageare:
• Set up the VM and I/O devices.
• Execute the operating system guest code via KVM ker-nel module.
• I/O emulation and live migration. Note that we en-abled paravirtualized devices (i.e., virtio) to improvethe I/O performance.
4.1.2 Virtual Machine AttributesThree identical VMs were created and configured. The
VM attributes are: CPU - 2 virtual CPUs (V CPUs) (outof a theoretical maximum of 8); RAM - 4GB; Disk - 20 GB.All the virtual machines have the same OS, namely, Ubuntu12.04.2 LTS.
In order to run the benchmarks we installed the followingsoftware: MySQL 5.5.32 for the TPC-H benchmark (i.e.,each VM has its own database), and Java 1.7.0 25 open-JDK for the SPECpower benchmark. Finally, we created adatabase of 1GB in each of the VMs.
4.2 Experimental SetupNext we describe the criteria used for our evaluation.
• A fixed target load was defined from averaging theresults of 10 SPECpower calibrations.
• The SUT began in an idle state prior to the launchof each experiment and was allowed to return to thisidle state for at least 20 minutes between runs. Thisallows the machine to ‘cool down’ and return to its idleenergy consumption levels.
• An Active run consisted of at least seven possible tar-get loads. Target loads do not necessarily have to beunique from each other.
• In the majority of the cases in which we used SPECpower,each target load was given 4 minutes, excluding preand post measurements. We also established a delayof 10 seconds between loads.
• We collected utilization data from the hardware re-sources and the power meter every 2 seconds.
• In all our results, we report the average power con-sumption and hardware resource’s utilization valuesover six runs.
• Before each experiments we force the kernel to dropclean caches, dentries and inodes from memory.
4.3 MetricsFor the purpose of this work, we define performance degra-
dation, based on each workload as follows:
Definition 1 (Performance degradation for SPECpower).
PDS =ssj ops− no ops
ssj ops
where ssj ops represents the number of operations targeted,and no ops the number of operations actually performed.
Definition 2 (Performance degradation for TPC-H).
PDT =baseline− Throughput@Size
baseline
where the baseline represents the average between six Through-put@Size in a single VM with all the other VMs powered offand Throughput@Size represents the result achieved in thenew scenario.
Finally, as we plan to determine the energy-efficiency levelfor a server, we measure the power consumption in Wattsand we calculate the average power consumption per numberof users (in the case of TPC-H) or per target of utilization(in the case of SPECpower).
4.4 ResultsBelow we present the results corresponding to the inquiries
introduced in section 3.
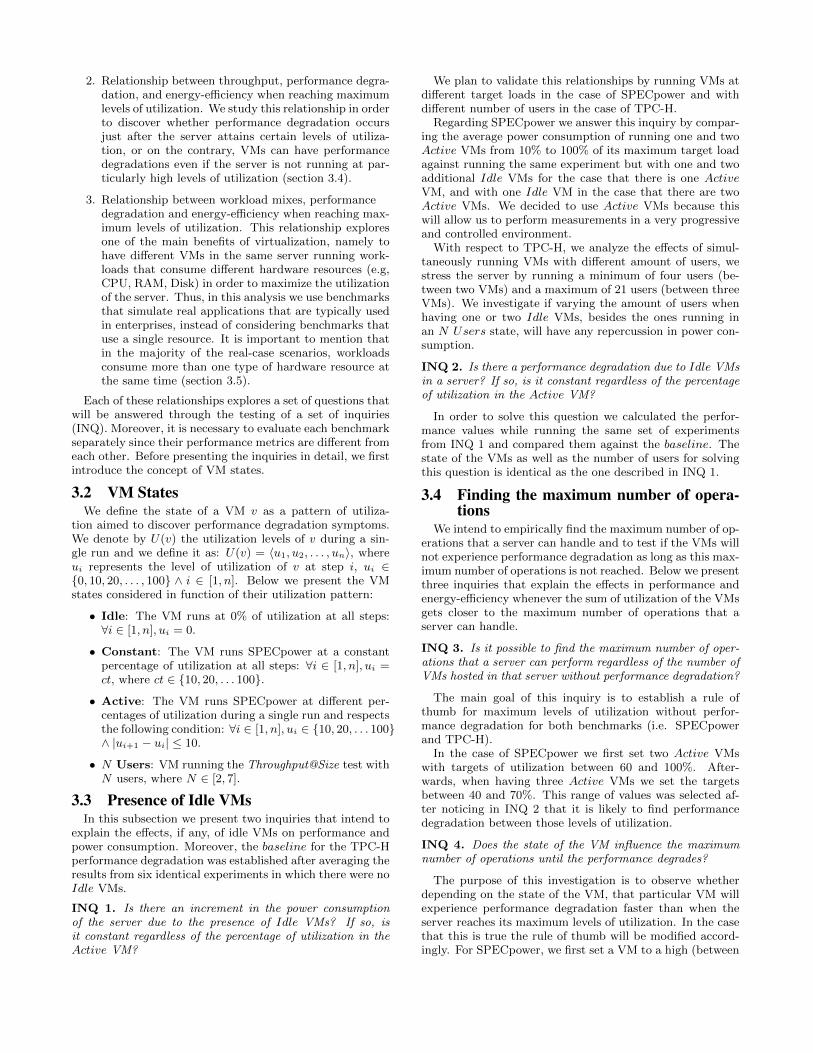
4.4.1 Effects of having idle VMsINQ 1: Figure 2 shows the variations in power consump-
tion between a VM running as a single Active VM in aserver, and an Active VM running with one or two VMsin an Idle state when using the SPECpower benchmark.
0 10 20 30 40 50 60 70 80 90 10090
100
110
120
130
140
150
160
170
180
Target Utilization per VM
Avera
ge P
ow
er
Consum
ption (
Watts)
VM1 Active
VM1 Active; VM2 Idle
VM1 Active; VM2 Idle; VM3 Idle
VM1 Active; VM2 Active
VM1 Active; VM2 Active; VM3 Idle
Figure 2: Average power consumption for differentVM states (SPECpower)
The figure also presents the relation between two VMs inActive state and two Active VMs running with a third IdleVM. The reader can notice that the difference in the averagepower consumption at every level of utilization is almost neg-ligible. Thus, the differences between having or not havingIdle VMs with regards to the average power consumptionis 3 Watts maximum, and -1 Watt minimum. In terms ofpercentage the difference is never more than 1.81%.
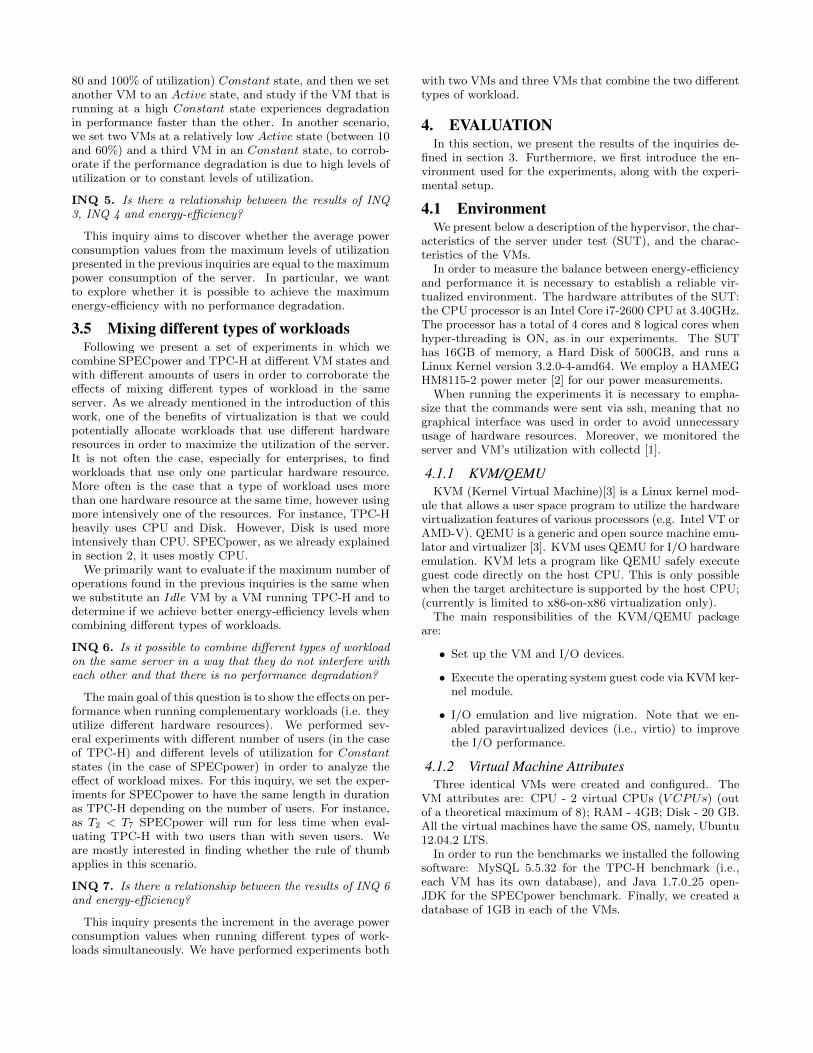
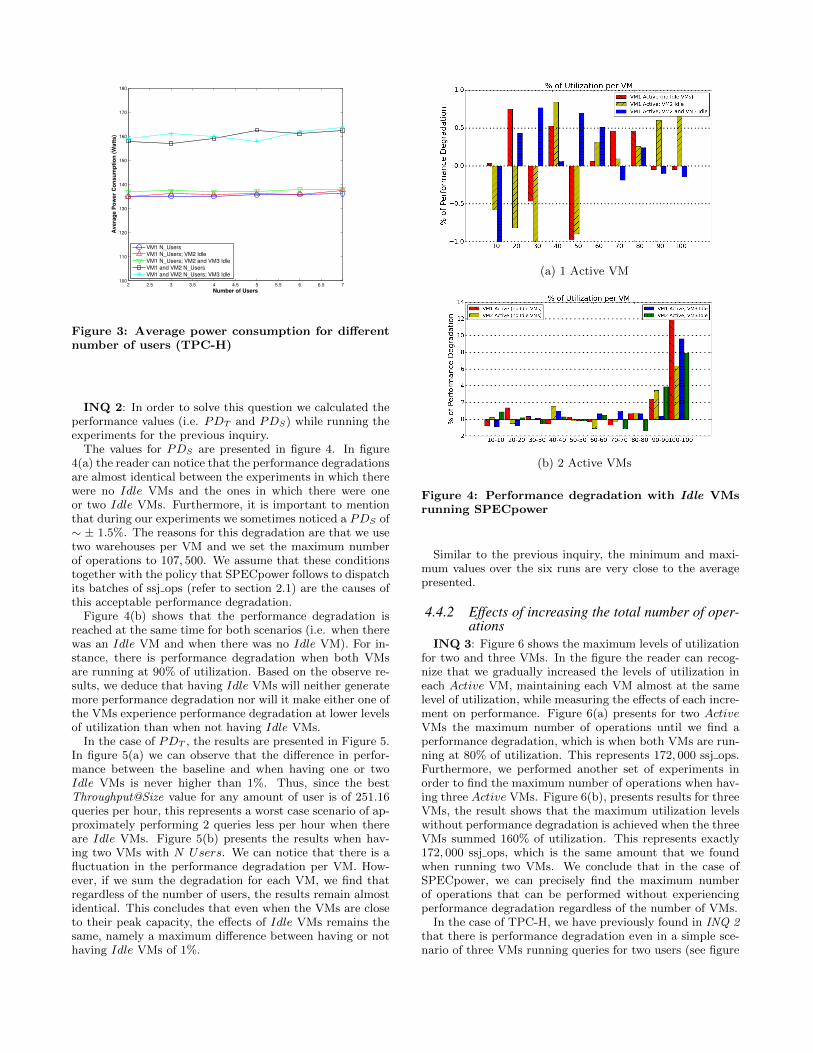
In the case of TPC-H, we notice that increasing the amountof users will not increase the average power consumption (seefigure 3). However, Table 1 shows that the execution timefor two users is significantly lower than for seven users, thus,the total amount of energy consumed by two users is lowerthan the amount of energy consumed by seven users. Figure3 also presents the relation between two VMs in N Usersstate and two N Users VMs running with a third Idle VM.We notice how the average power consumption between thefirst scenario and the second is of no more than 25 Watts.Here we can also refer to Table 1 and observe that the av-erage execution time for two VMs with two users is muchlower than the average execution time for two VMs withseven users, namely, the total average consumption is higherfor the former.
Number of Users 2 3 4 5 6 7Ts one VM 650 980 1329 1766 2004 2386Ts two VMs 720 1020 1705 1990 2521 2900
Table 1: Execution Time For Throughput@Size withdifferent amount of users
It is important to mention that even though in the fig-ures we present the averages, the maximum value over thesix runs was not more that 2% higher than such averages,and the minimum value was just 1% lower than the aver-ages presented. In fact, we discovered that the maximumstandard deviation for the graphs presented in this paper is1.8. Furthermore, in the majority of the cases the standarddeviation was always below 0.5.
2 2.5 3 3.5 4 4.5 5 5.5 6 6.5 7100
110
120
130
140
150
160
170
180
Number of Users
Av
era
ge
Po
we
r C
on
su
mp
tio
n (
Wa
tts
)
VM1 N_Users
VM1 N_Users; VM2 Idle
VM1 N_Users; VM2 and VM3 Idle
VM1 and VM2 N_Users
VM1 and VM2 N_Users; VM3 Idle
Figure 3: Average power consumption for differentnumber of users (TPC-H)
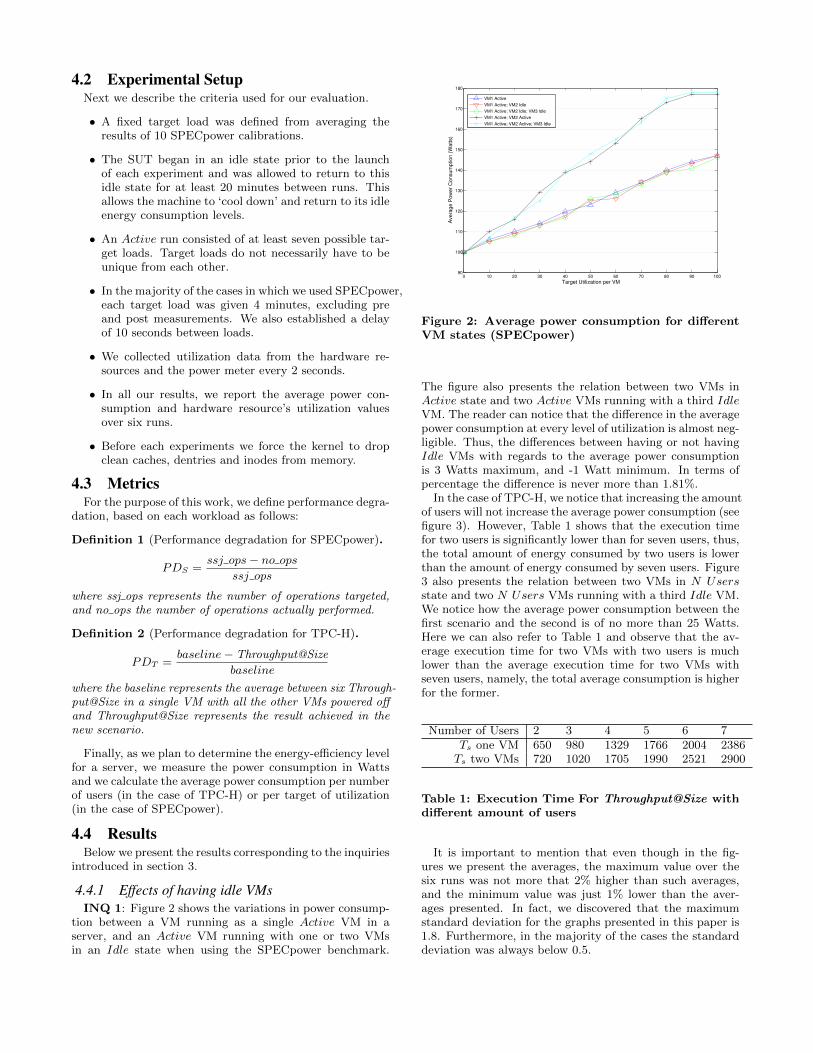
INQ 2: In order to solve this question we calculated theperformance values (i.e. PDT and PDS) while running theexperiments for the previous inquiry.
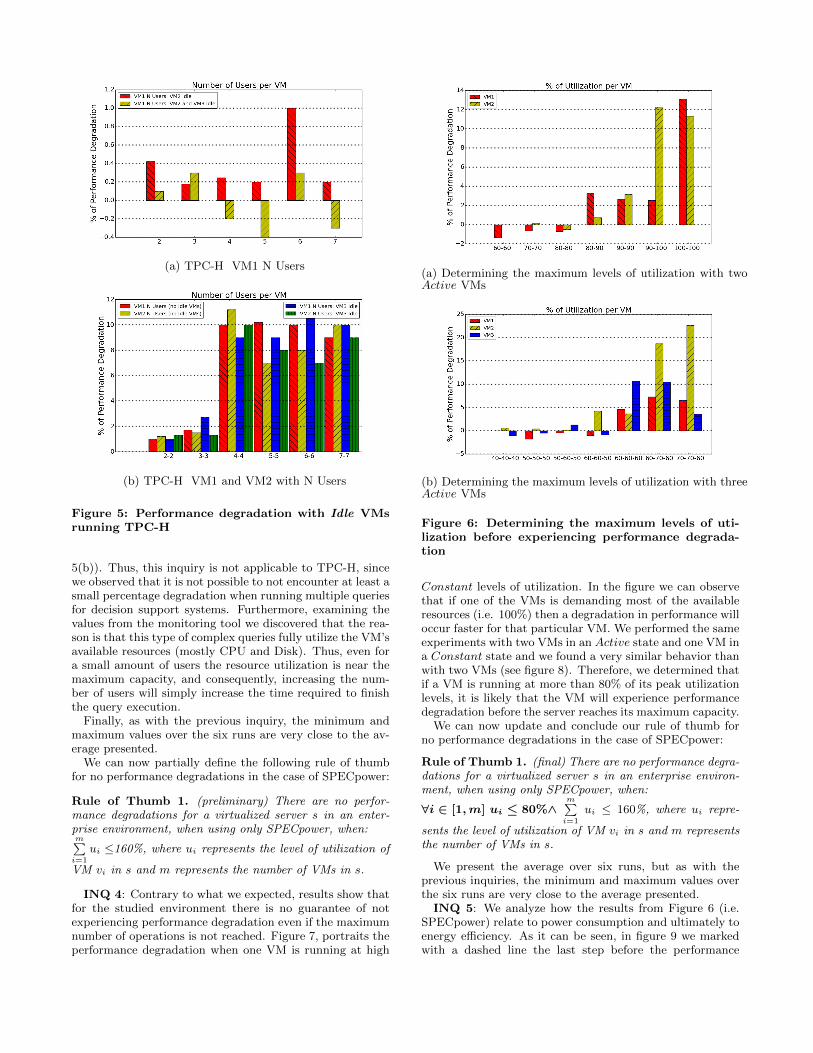
The values for PDS are presented in figure 4. In figure4(a) the reader can notice that the performance degradationsare almost identical between the experiments in which therewere no Idle VMs and the ones in which there were oneor two Idle VMs. Furthermore, it is important to mentionthat during our experiments we sometimes noticed a PDS of∼ ± 1.5%. The reasons for this degradation are that we usetwo warehouses per VM and we set the maximum numberof operations to 107, 500. We assume that these conditionstogether with the policy that SPECpower follows to dispatchits batches of ssj ops (refer to section 2.1) are the causes ofthis acceptable performance degradation.
Figure 4(b) shows that the performance degradation isreached at the same time for both scenarios (i.e. when therewas an Idle VM and when there was no Idle VM). For in-stance, there is performance degradation when both VMsare running at 90% of utilization. Based on the observe re-sults, we deduce that having Idle VMs will neither generatemore performance degradation nor will it make either one ofthe VMs experience performance degradation at lower levelsof utilization than when not having Idle VMs.
In the case of PDT , the results are presented in Figure 5.In figure 5(a) we can observe that the difference in perfor-mance between the baseline and when having one or twoIdle VMs is never higher than 1%. Thus, since the bestThroughput@Size value for any amount of user is of 251.16queries per hour, this represents a worst case scenario of ap-proximately performing 2 queries less per hour when thereare Idle VMs. Figure 5(b) presents the results when hav-ing two VMs with N Users. We can notice that there is afluctuation in the performance degradation per VM. How-ever, if we sum the degradation for each VM, we find thatregardless of the number of users, the results remain almostidentical. This concludes that even when the VMs are closeto their peak capacity, the effects of Idle VMs remains thesame, namely a maximum difference between having or nothaving Idle VMs of 1%.
(a) 1 Active VM
(b) 2 Active VMs
Figure 4: Performance degradation with Idle VMsrunning SPECpower
Similar to the previous inquiry, the minimum and maxi-mum values over the six runs are very close to the averagepresented.
4.4.2 Effects of increasing the total number of oper-ations
INQ 3: Figure 6 shows the maximum levels of utilizationfor two and three VMs. In the figure the reader can recog-nize that we gradually increased the levels of utilization ineach Active VM, maintaining each VM almost at the samelevel of utilization, while measuring the effects of each incre-ment on performance. Figure 6(a) presents for two ActiveVMs the maximum number of operations until we find aperformance degradation, which is when both VMs are run-ning at 80% of utilization. This represents 172, 000 ssj ops.Furthermore, we performed another set of experiments inorder to find the maximum number of operations when hav-ing three Active VMs. Figure 6(b), presents results for threeVMs, the result shows that the maximum utilization levelswithout performance degradation is achieved when the threeVMs summed 160% of utilization. This represents exactly172, 000 ssj ops, which is the same amount that we foundwhen running two VMs. We conclude that in the case ofSPECpower, we can precisely find the maximum numberof operations that can be performed without experiencingperformance degradation regardless of the number of VMs.
In the case of TPC-H, we have previously found in INQ 2that there is performance degradation even in a simple sce-nario of three VMs running queries for two users (see figure
(a) TPC-H VM1 N Users
(b) TPC-H VM1 and VM2 with N Users
Figure 5: Performance degradation with Idle VMsrunning TPC-H
5(b)). Thus, this inquiry is not applicable to TPC-H, sincewe observed that it is not possible to not encounter at least asmall percentage degradation when running multiple queriesfor decision support systems. Furthermore, examining thevalues from the monitoring tool we discovered that the rea-son is that this type of complex queries fully utilize the VM’savailable resources (mostly CPU and Disk). Thus, even fora small amount of users the resource utilization is near themaximum capacity, and consequently, increasing the num-ber of users will simply increase the time required to finishthe query execution.
Finally, as with the previous inquiry, the minimum andmaximum values over the six runs are very close to the av-erage presented.
We can now partially define the following rule of thumbfor no performance degradations in the case of SPECpower:
Rule of Thumb 1. (preliminary) There are no perfor-mance degradations for a virtualized server s in an enter-prise environment, when using only SPECpower, when:m∑i=1
ui ≤160%, where ui represents the level of utilization of
VM vi in s and m represents the number of VMs in s.
INQ 4: Contrary to what we expected, results show thatfor the studied environment there is no guarantee of notexperiencing performance degradation even if the maximumnumber of operations is not reached. Figure 7, portraits theperformance degradation when one VM is running at high
(a) Determining the maximum levels of utilization with twoActive VMs
(b) Determining the maximum levels of utilization with threeActive VMs
Figure 6: Determining the maximum levels of uti-lization before experiencing performance degrada-tion
Constant levels of utilization. In the figure we can observethat if one of the VMs is demanding most of the availableresources (i.e. 100%) then a degradation in performance willoccur faster for that particular VM. We performed the sameexperiments with two VMs in an Active state and one VM ina Constant state and we found a very similar behavior thanwith two VMs (see figure 8). Therefore, we determined thatif a VM is running at more than 80% of its peak utilizationlevels, it is likely that the VM will experience performancedegradation before the server reaches its maximum capacity.
We can now update and conclude our rule of thumb forno performance degradations in the case of SPECpower:
Rule of Thumb 1. (final) There are no performance degra-dations for a virtualized server s in an enterprise environ-ment, when using only SPECpower, when:
∀i ∈ [1,m] ui ≤ 80%∧m∑i=1
ui ≤ 160%, where ui repre-
sents the level of utilization of VM vi in s and m representsthe number of VMs in s.
We present the average over six runs, but as with theprevious inquiries, the minimum and maximum values overthe six runs are very close to the average presented.
INQ 5: We analyze how the results from Figure 6 (i.e.SPECpower) relate to power consumption and ultimately toenergy efficiency. As it can be seen, in figure 9 we markedwith a dashed line the last step before the performance
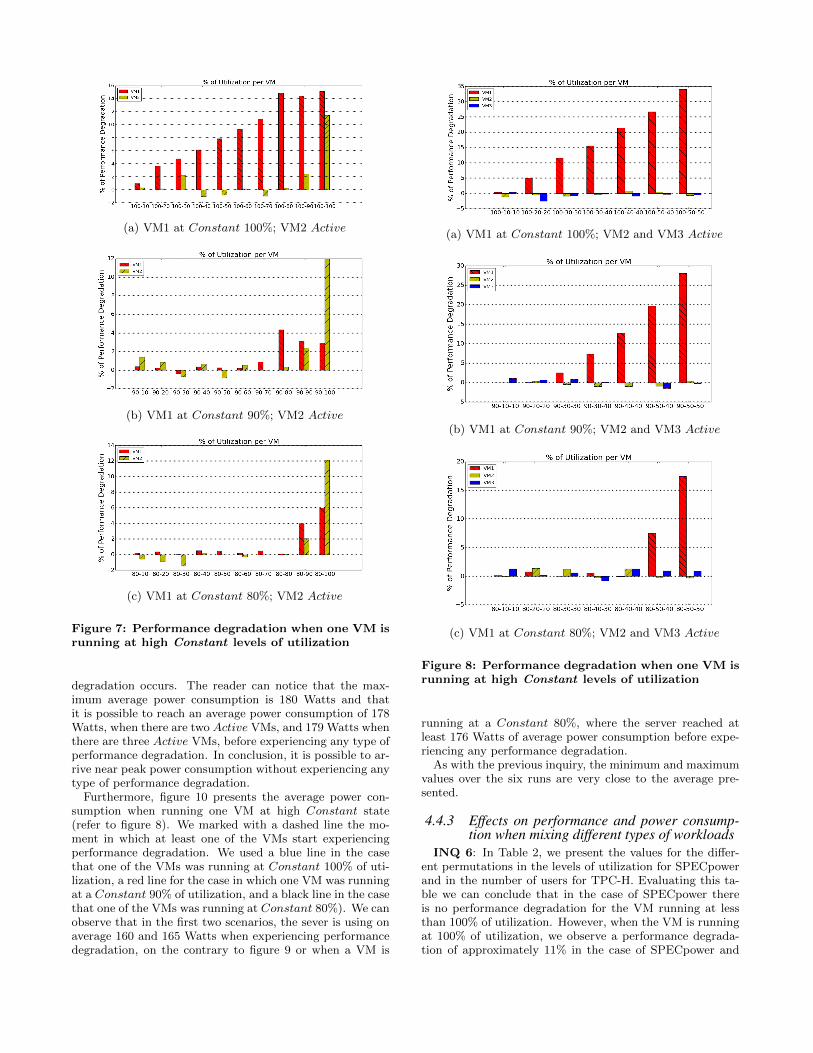
(a) VM1 at Constant 100%; VM2 Active
(b) VM1 at Constant 90%; VM2 Active
(c) VM1 at Constant 80%; VM2 Active
Figure 7: Performance degradation when one VM isrunning at high Constant levels of utilization
degradation occurs. The reader can notice that the max-imum average power consumption is 180 Watts and thatit is possible to reach an average power consumption of 178Watts, when there are two Active VMs, and 179 Watts whenthere are three Active VMs, before experiencing any type ofperformance degradation. In conclusion, it is possible to ar-rive near peak power consumption without experiencing anytype of performance degradation.
Furthermore, figure 10 presents the average power con-sumption when running one VM at high Constant state(refer to figure 8). We marked with a dashed line the mo-ment in which at least one of the VMs start experiencingperformance degradation. We used a blue line in the casethat one of the VMs was running at Constant 100% of uti-lization, a red line for the case in which one VM was runningat a Constant 90% of utilization, and a black line in the casethat one of the VMs was running at Constant 80%). We canobserve that in the first two scenarios, the sever is using onaverage 160 and 165 Watts when experiencing performancedegradation, on the contrary to figure 9 or when a VM is
(a) VM1 at Constant 100%; VM2 and VM3 Active
(b) VM1 at Constant 90%; VM2 and VM3 Active
(c) VM1 at Constant 80%; VM2 and VM3 Active
Figure 8: Performance degradation when one VM isrunning at high Constant levels of utilization
running at a Constant 80%, where the server reached atleast 176 Watts of average power consumption before expe-riencing any performance degradation.
As with the previous inquiry, the minimum and maximumvalues over the six runs are very close to the average pre-sented.
4.4.3 Effects on performance and power consump-tion when mixing different types of workloads
INQ 6: In Table 2, we present the values for the differ-ent permutations in the levels of utilization for SPECpowerand in the number of users for TPC-H. Evaluating this ta-ble we can conclude that in the case of SPECpower thereis no performance degradation for the VM running at lessthan 100% of utilization. However, when the VM is runningat 100% of utilization, we observe a performance degrada-tion of approximately 11% in the case of SPECpower and
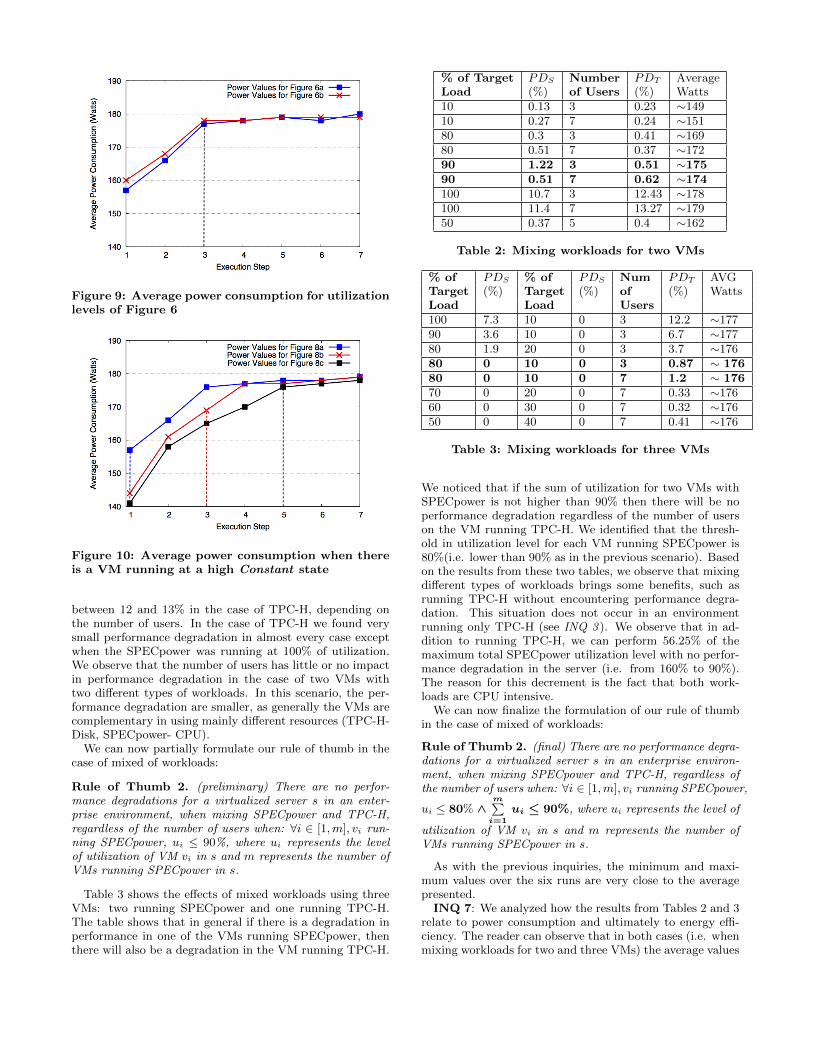
Figure 9: Average power consumption for utilizationlevels of Figure 6
Figure 10: Average power consumption when thereis a VM running at a high Constant state
between 12 and 13% in the case of TPC-H, depending onthe number of users. In the case of TPC-H we found verysmall performance degradation in almost every case exceptwhen the SPECpower was running at 100% of utilization.We observe that the number of users has little or no impactin performance degradation in the case of two VMs withtwo different types of workloads. In this scenario, the per-formance degradation are smaller, as generally the VMs arecomplementary in using mainly different resources (TPC-H-Disk, SPECpower- CPU).
We can now partially formulate our rule of thumb in thecase of mixed of workloads:
Rule of Thumb 2. (preliminary) There are no perfor-mance degradations for a virtualized server s in an enter-prise environment, when mixing SPECpower and TPC-H,regardless of the number of users when: ∀i ∈ [1,m], vi run-ning SPECpower, ui ≤ 90%, where ui represents the levelof utilization of VM vi in s and m represents the number ofVMs running SPECpower in s.
Table 3 shows the effects of mixed workloads using threeVMs: two running SPECpower and one running TPC-H.The table shows that in general if there is a degradation inperformance in one of the VMs running SPECpower, thenthere will also be a degradation in the VM running TPC-H.
% of Target PDS Number PDT AverageLoad (%) of Users (%) Watts10 0.13 3 0.23 ∼14910 0.27 7 0.24 ∼15180 0.3 3 0.41 ∼16980 0.51 7 0.37 ∼17290 1.22 3 0.51 ∼17590 0.51 7 0.62 ∼174100 10.7 3 12.43 ∼178100 11.4 7 13.27 ∼17950 0.37 5 0.4 ∼162
Table 2: Mixing workloads for two VMs
% of PDS % of PDS Num PDT AVGTarget (%) Target (%) of (%) WattsLoad Load Users100 7.3 10 0 3 12.2 ∼17790 3.6 10 0 3 6.7 ∼17780 1.9 20 0 3 3.7 ∼17680 0 10 0 3 0.87 ∼ 17680 0 10 0 7 1.2 ∼ 17670 0 20 0 7 0.33 ∼17660 0 30 0 7 0.32 ∼17650 0 40 0 7 0.41 ∼176
Table 3: Mixing workloads for three VMs
We noticed that if the sum of utilization for two VMs withSPECpower is not higher than 90% then there will be noperformance degradation regardless of the number of userson the VM running TPC-H. We identified that the thresh-old in utilization level for each VM running SPECpower is80%(i.e. lower than 90% as in the previous scenario). Basedon the results from these two tables, we observe that mixingdifferent types of workloads brings some benefits, such asrunning TPC-H without encountering performance degra-dation. This situation does not occur in an environmentrunning only TPC-H (see INQ 3 ). We observe that in ad-dition to running TPC-H, we can perform 56.25% of themaximum total SPECpower utilization level with no perfor-mance degradation in the server (i.e. from 160% to 90%).The reason for this decrement is the fact that both work-loads are CPU intensive.
We can now finalize the formulation of our rule of thumbin the case of mixed of workloads:
Rule of Thumb 2. (final) There are no performance degra-dations for a virtualized server s in an enterprise environ-ment, when mixing SPECpower and TPC-H, regardless ofthe number of users when: ∀i ∈ [1,m], vi running SPECpower,
ui ≤ 80% ∧m∑
i=1
ui ≤ 90%, where ui represents the level of
utilization of VM vi in s and m represents the number ofVMs running SPECpower in s.
As with the previous inquiries, the minimum and maxi-mum values over the six runs are very close to the averagepresented.
INQ 7: We analyzed how the results from Tables 2 and 3relate to power consumption and ultimately to energy effi-ciency. The reader can observe that in both cases (i.e. whenmixing workloads for two and three VMs) the average values
for power consumption are very close to the peak value (i.e.between 174 and 176 Watts). The main reasons for the highvalues in power consumption are: (i) the server reaches veryhigh levels of CPU utilization, and (ii) multiple hardwareresources utilized at the same time (i.e. TPC-H uses mainlyDisk and CPU, and SPECpower uses mainly CPU).
Finally, as with the previous inquiries, the minimum andmaximum values over the six runs are very close to the av-erage presented.
5. RELATED WORKIn this paper we perform a thorough analysis between per-
formance and energy efficiency in a virtualized environmentusing two enterprise benchmarks (i.e. SPECpower ssj2008and TPC-H).
Reviewing the literature we found several techniques forimproving one of these two variables. For instance, a gen-eral view for improving energy-consumption is to use serverconsolidation. However, the impact of consolidating severalVMs in the same server is not properly studied. Examplesof such approaches are: Srikantaiah, et al in [27] discussconsolidating applications or tasks on a lower number ofphysical machines. However, they do not consider the im-pact of a virtualized environment. Moreover, there is alsoa vast literature available about the use of virtual machineplacement for server consolidation ([19, 22, 26]). However,such approaches tend to place VMs based on their averageresource utilizations, disregarding the effects of peaks uti-lization in one of the VMs or if such consolidation makesthe server reaches energy-efficiency levels.
Other researchers go further and present their approachesto address the problem of achieving energy efficiency andits impact in performance. In this regard, Kephart et al.[18] proposed a coordination strategy based on utility func-tions for managing power and performance using two sepa-rate managers. However, the applications studied are verysimple, as they consume just one resource, making them un-likely to be used in a typical enterprise. Furthermore, Gaoet al. [15] propose a model for predicting the performanceand energy consumption of a server. However, they simplifythe power consumption measurements to a linear progres-sion between the ‘base’ utilization and the maximum CPUutilization, omitting the increments in power consumptionby using other hardware resources. Moreover, their work isfocus on dynamically resizing the size of the VMs dependingon their levels of utilization in order to consolidate them inthe minimum amount of servers. Leite et al. [20] developeda coordinated technique for controlling end-to-end perfor-mance and minimizing power consumption using DynamicVoltage Scaling (DVS) in a three-tier web application envi-ronment. Moreover, Brihi et al. [11] studied the effect inperformance of varying power states in modern computingservers. However, such techniques do not properly addressthe problem of energy-efficiency, which can only be solvedby increasing the utilization of the computing server to itsmaximum capacity. Furthermore, Rong et al [16] developedan analytical model for investigating energy-performance forparallel workloads. They investigate how to identify an opti-mal system configuration for running a given parallel work-load. The difference is that our work is focused on enterprisetype of application running in a virtualized environment.
There have been a number of recent efforts to understandthe relationship between performance and power consump-
tion in a virtualized environment. For instance, Smith etal [25] propose a technique for assigning tasks to computenodes with the aim of balancing the trade-off between en-ergy consumption and the application’s performance. How-ever, they use benchmarks that perform very simple tasks(e.g. compress files in memory or read and write a 1024MBtest file to and from the hard disk). In addition, they donot study if it is possible to reach energy-efficiency with-out performance degradation, but rather they aim to spreadthe workloads in order to consume just the ‘base’ powerconsumption. Moreover, Chen et al [12] propose to charac-terize and profile the energy consumption for different typeof tasks and study how the throughput for different type ofworkloads relates to power consumption. However, our workdiffers in the sense that we present a measure for perfor-mance degradation and how such performance is associatedto power consumption and utilization. Finally, with regardsto the benchmarks used in this work, Poess et al [24] stud-ied the trends in performance and power consumption forthe TPC-H benchmark and Subramaniam et al [28] utilizedSPECpower to investigate the feasibility of achieving energy-proportional operations. To our best knowledge, this is thefirst comprehensive analysis in which there is a set of sce-narios that could be found in any enterprise environment.Moreover, we answer a set of inquiries that aim to clarifysome limitations of virtualized environments and to discoverif performance and energy-efficiency can be achieved simul-taneously.
6. CONCLUSION AND FUTURE WORKThe main contribution of this work is a methodology for
detecting performance degradations for two typical work-loads, namely SPECpower and TPC-H, in an enterprise en-vironment. In order to achieve this, we introduced the con-cept of VM states based on their utilization levels. Themethodology identifies the performance degradations basedon predefined scenarios that combine VM states. The sce-narios we used include up to three virtual machines, how-ever, the methodology can be adapted for multiple machinesby using the same patterns of VM states. Moreover, we eval-uate how performance degradation is related to power con-sumption in a virtualized environment with the objective ofreaching energy efficiency. The methodology has been ver-ified on a specific type of server and yielded two rules ofthumb to enable the optimum trade off point to be found.It is expected that the methodology could be used to similareffects on other types of servers.
We demonstrated that it is possible to achieve energy-efficiency without any performance degradation in the sce-narios studied. Furthermore, we identified the maximumlevel of utilization with no performance degradation both fora server and a VM and defined accordingly a rule of thumb.Through our analysis we concluded that a server does notexperience performance degradation as long as any of thevirtual machines in the server under study does not reachhigh levels of utilization and the servers’ utilization doesn’treach its peak capacity. Moreover, we investigated the caseof a decision support system. In this case, the system per-forms complicated queries that require hardware resourcesfor a significant amount of time. Due to this fact, the VMsare constantly required to be at high levels of utilization,leading to performance degradation for the VMs runningthat type of workload. Finally, we investigated the case of
mixed workloads and defined a rule of thumb such that theserver reaches high levels of utilization and none of the VMsexperience performance degradation.
As future work, we plan to create an automated modelthat performs the analysis provided in this paper. Themodel will take as input the workload type, and a serverpower model, to subsequently investigate the feasibility ofachieving energy-efficiency without performance degradationin the particular server. If energy-efficiency is reachable, themodel will output the conditions for balancing performanceand energy-consumption (e.g. maximum utilization level).
7. ACKNOWLEDGMENTSWe thank Anthony Ventresque and Ulrich Dangel for their
valuable support and feedback. This work was supported bythe Science Foundation Ireland under grant 10/CE/I1855to Lero - the Irish Software Engineering Research Center(www.lero.ie), and by Enterprise Ireland Innovation Part-nership in cooperation with IBM and University CollegeDublin under grant IP/2010/0061.
8. REFERENCES[1] collectd - the system statistics collection daemon.
https://collectd.org.
[2] HAMEG HM8115-2 power meter.http://www.hameg.com/0.147.0.html.
[3] KVM - Kernel Based Virtual Machine. www.linux-kvm.org.
[4] SPECpower ssj2008.http://www.spec.org/power_ssj2008/.
[5] SPECpower ssj2008 - Design Document CCS.http://www.spec.org/power/docs/SPECpower_ssj2008-Design_ccs.pdf.
[6] SPECpower ssj2008 - Design Document SSJ Workload.http://www.spec.org/power/docs/SPECpower_ssj2008-Design_ssj.pdf.
[7] SPECpower ssj2008 - Run and Reporting Rulest.http://www.spec.org/power/docs/SPECpower_ssj2008-Run_Reporting_Rules.html.
[8] TPC-H. http://www.tpc.org/tpch/.[9] L. A. Barroso and U. Holzle. The case for
energy-proportional computing. Computer, 40(12):33–37,2007.
[10] A. Beloglazov and R. Buyya. Adaptive threshold-basedapproach for energy-efficient consolidation of virtualmachines in cloud data centers. In 8th InternationalWorkshop on Middleware for Grids, Clouds and e-Science(MGC), pages 4:1–4:6, 2010.
[11] A. Brihi and W. Dargie. Dynamic voltage and frequencyscaling in multimedia servers. In 27th IEEE InternationalConference on Advanced Information Networking andApplications (AINA), pages 374–380, 2013.
[12] F. Chen, J. Grundy, Y. Yang, J.-G. Schneider, and Q. He.Experimental analysis of task-based energy consumption incloud computing systems. In Proceedings of the 4thACM/SPEC International Conference on PerformanceEngineering, ICPE ’13, pages 295–306. ACM, 2013.
[13] G. Dasgupta, A. Sharma, A. Verma, A. Neogi, andR. Kothari. Workload management for power efficiency invirtualized data centers. Communications of the ACM,54(7):131–141, 2011.
[14] U. Drepper. The cost of virtualization. Queue, 6(1):28–35,Jan. 2008.
[15] Y. Gao, Z. Qi, Y. Wu, R. Wang, L. Liu, J. Xu, andH. Guan. A power and performance managementframework for virtualized server clusters. In 2011IEEE/ACM International Conference on Green Computingand Communications (GREENCOM), pages 170–175, 2011.
[16] R. Ge, X. Feng, and K. Cameron. Modeling and evaluatingenergy-performance efficiency of parallel processing onmulticore based power aware systems. In ParallelDistributed Processing, 2009. IPDPS 2009. IEEEInternational Symposium on, pages 1–8, 2009.
[17] A. G. Janopoulou. Ad-hoc decision-supports. Master’sthesis, National Technical University of Athens, 2010.
[18] J. O. Kephart, H. Chan, R. Das, D. W. Levine, G. Tesauro,F. Rawson, and C. Lefurgy. Coordinating multipleautonomic managers to achieve specifiedpower-performance tradeoffs. In 4th InternationalConference on Autonomic Computing (ICAC), pages 24–,2007.
[19] K. Le, R. Bianchini, J. Zhang, Y. Jaluria, J. Meng, andT. D. Nguyen. Reducing electricity cost through virtualmachine placement in high performance computing clouds.In 2011 International Conference for High PerformanceComputing, Networking, Storage and Analysis (SC), pages22:1–22:12, 2011.
[20] J. C. Leite, D. M. Kusic, D. Mosse, and L. Bertini.Stochastic approximation control of power and tardiness ina three-tier web-hosting cluster. In 7th internationalconference on Autonomic computing (ICAC), pages 41–50,2010.
[21] X. Meng, C. Isci, J. Kephart, L. Zhang, E. Bouillet, andD. Pendarakis. Efficient resource provisioning in computeclouds via vm multiplexing. In 7th international conferenceon Autonomic computing (ICAC), pages 11–20, 2010.
[22] K. Mills, J. Filliben, and C. Dabrowski. Comparingvm-placement algorithms for on-demand clouds. In 3rdIEEE International Conference on Cloud ComputingTechnology and Science (CloudCom), pages 91–98, 2011.
[23] J. Omana Iglesias, P. Perry, N. Stokes, J. Thorburn, andL. Murphy. A cost-capacity analysis for assessing theefficiency of heterogeneous computing assets in anenterprise cloud. In 6th IEEE/ACM InternationalConference on Utility and Cloud Computing (UCC), pageto appear.
[24] M. Poess and R. Othayoth Nambiar. A power consumptionanalysis of decision support systems. In Proceedings of thefirst joint WOSP/SIPEW international conference onPerformance engineering, WOSP/SIPEW ’10, pages147–152. ACM, 2010.
[25] J. W. Smith and I. Sommerville. Understanding tradeoffsbetween power usage and performance in a virtualizedenvironment. In 6th International Conference on CloudComputing (CLOUD), pages 725–731, 2013.
[26] B. Speitkamp and M. Bichler. A mathematicalprogramming approach for server consolidation problems invirtualized data centers. IEEE Transactions on ServicesComputing, 3(4):266–278, Oct. 2010.
[27] S. Srikantaiah, A. Kansal, and F. Zhao. Energy awareconsolidation for cloud computing. In 2008 conference onPower aware computing and systems (HotPower), pages10–10, 2008.
[28] B. Subramaniam and W.-c. Feng. Towardsenergy-proportional computing for enterprise-class serverworkloads. In Proceedings of the 4th ACM/SPECInternational Conference on Performance Engineering,ICPE ’13, pages 15–26. ACM, 2013.
Copyright © 2022 FDOKUMEN