
An experimental apparatus to study chemisorption at surfaces by He diffractive scattering,...
8
An experimental apparatus to study chemisorption at surfaces by He diffractive scattering, ultraviolet photoemission, and metastable deexcitation spectroscopies M. Canepa, C. Guarnaschelli, L. Mattera, M. Polese, S. Terreni, and D. Truffelli Citation: Review of Scientific Instruments 62, 1431 (1991); doi: 10.1063/1.1142463 View online: http://dx.doi.org/10.1063/1.1142463 View Table of Contents: http://scitation.aip.org/content/aip/journal/rsi/62/6?ver=pdfcov Published by the AIP Publishing This article is copyrighted as indicated in the article. Reuse of AIP content is subject to the terms at: http://scitationnew.aip.org/termsconditions. Downloaded to IP: 130.251.200.3 On: Sun, 22 Dec 2013 10:43:38
-
Upload
independent -
Category
Documents
-
view
3 -
download
0
Transcript of An experimental apparatus to study chemisorption at surfaces by He diffractive scattering,...

An experimental apparatus to study chemisorption at surfaces by He diffractivescattering, ultraviolet photoemission, and metastable deexcitation spectroscopiesM. Canepa, C. Guarnaschelli, L. Mattera, M. Polese, S. Terreni, and D. Truffelli Citation: Review of Scientific Instruments 62, 1431 (1991); doi: 10.1063/1.1142463 View online: http://dx.doi.org/10.1063/1.1142463 View Table of Contents: http://scitation.aip.org/content/aip/journal/rsi/62/6?ver=pdfcov Published by the AIP Publishing
This article is copyrighted as indicated in the article. Reuse of AIP content is subject to the terms at: http://scitationnew.aip.org/termsconditions. Downloaded to IP:
130.251.200.3 On: Sun, 22 Dec 2013 10:43:38

An experimental apparatus to study chemisorption at surfaces by He diffractive scattering, ultraviolet photoemission, and metastable deexcitation spectroscopies
M. Canepa, C. Guarnaschelli, L. Mattera, M. Polese, S. Terreni, and D. Truffelli Unitb INFM and Centro di Fisica delle Superjci e Basse Temperature de1 CNR, Dipartimento di Fisica, via Dodecaneso 33, 16146 Genova, Italy
(Received 28 January 1991; accepted for publication 8 February 1991)
An experimental apparatus designed to study structural and electronic properties of surfaces is described. Ultraviolet photoemission (UPS) and metastable deexcitation spectroscopies (MDS) have been implemented in order to obtain information on electronic states in the valence-band region with different surface sensitivity. The supersonic metastable beam source is fully described and characterized by time-of-flight measurements while the characteristics of the apparatus have been tested in the study of the Ag( 110) surface, clean and following the dissociative chemisorption of oxygen. Exploiting the surface sensitivity of MDS, measurements as function of the oxygen coverage allow a direct correlation between work function increase and the population of the s-p bands of the substrate near the Fermi edge. Oxygen-induced states around 7.5 eV, difficult to observe in UPS because of strong contributions from the d bands of the substrate, are also detected.
I. INTRODUCTION
The study of adsorption of atoms and molecules on solids plays an outstanding role in surface science; the in- terest in this field is motivated by both fundamental and applicative reasons, the understanding of adsorption being a primary step in the study of surface phenomena as reac- tions, selective catalysis, corrosion. Adsorption, particu- larly when a chemical bond is formed (chemisorption), is a problem characterized by a great complexity. The exper- imental approach to the problem may proceed from dif- ferent points of view;’ the nature of the orbitals involved in the bond, the bond strength as well as the long- and short- range coordinate geometry of the adsorbates, the dynamics of adsorbed layers, and several other aspects need to be investigated.
In order to comprehend the problem fully, complemen- tary information on these intrinsically related aspects, es- pecially if obtained under the same experimental condi- tions, is of great importance. Dealing with a typical toplayer process, the experimental investigation must be characterized primarily by a great surface sensitivity, and it would be useful to be able to distinguish between phys- ical information from surface and subsurface layers by methods characterized by a different information depth.’
Following these considerations, an apparatus initially devoted to the study of surface structure by helium diffrac- tive scattering,” has been modified by adding valence elec- tron spectroscopies, such as ARUPS (angular resolved ul- traviolet photoemission spectroscopy) and MDS (metastable deexcitation spectroscopy) to get information on electronic states at the surface.
It has been demonstrated that MDS, especially when combined with UPS, can lead to information on the va- lence-band electrons localized in the topmost layer.4 In MDS, noble gas atoms at thermal kinetic energies in an
excited electronic state (metastable) are made to impinge on a surface. Following the interaction, quenching occurs with probability close to one causing the emission of elec- trons carrying information on the valence bands.
A thorough discussion of the quenching mechanisms can be found elsewhere,5 while here follows a brief discus- sion of the two pathways that are of importance at sur- faces: (i) resonance ionization (RI) followed by Auger neutralization (AN), and (ii) Auger deexcitation (AD or Penning ionization). The energy diagrams relative to these processes are reported in Fig. 1. The quenching pathway depends on the relative magnitude of p’(X*), the effective ionization energy (at the surface) of the incoming particle (X*) and the local work function 4ioc.
The RI + AN process, occurring when fff(X*) < &, is to a first-order approximation determined by the transi- tion rate IRi a 1 (a* IT;> I2 where la*) and Iz) are the elec- tronic wave functions of the excited state in the metastable particle and of an unoccupied metal state, respectively.
The tunneling of the electron from I a*) into an empty state of the solid leads to an ionized particle X+ that gets neutralized by an Auger process involving two electrons of the sample. The energy distribution of the emitted elec- trons (EDC) carries information on the convolution of the density of states at the surface weighted by the appropriate matrix elements. Information on the (effective) electron density of states is therefore available through a deconvo- lution process or, to a good approximation, from the first derivative of EDC.6p7
If fff(X* ) > 4ioc or the presence of an adsorbated par- ticle on the surface prevents the tunneling process, the fill- ing of the ground-state hole of X* by a valence electron of the surface accompanied by ejection of the X* excited elec- tron (AD process) may occur. The UPS-like kinetic en- ergy distribution of the emitted electrons reflects then the
1431 Rev. Sci. Instrum. 62 (6), June 1991 0034-6?46/91/061431-07$02.00 @ 1991 American Institute of Physics 1431 This article is copyrighted as indicated in the article. Reuse of AIP content is subject to the terms at: http://scitationnew.aip.org/termsconditions. Downloaded to IP:
130.251.200.3 On: Sun, 22 Dec 2013 10:43:38

METAL X* METAL X’ METAL X’
RI AN AD
FIG. 1. Energy diagrams for the RI + AN and AD quenching pathways of metastable atoms at surfaces.
surface density of states (SDOS) and the transition rate of this process IAD a 1 (k 13 I 2 is proportional to the overlap of the occupied metal state lk) and the unoccupied core- level state IZ) of X*.
Independently on the pathway, due to the low kinetic energy of X*, the quenching occurs in vacuum at a few angstroms from the surface and only toplayer electrons are involved making this spectroscopy extremely surface sen- sitive and particularly useful in the study of adsorbated- induced electronic states.
This paper presents the main features of the experi- mental apparatus where the above-mentioned techniques have been implemented, and is organized as follows. In Sec. II a general overlook of the apparatus is given with particular emphasis on the characterization of the source of metastable atoms. In Sec. III experimental data on Ag( 1 lo), both clean and covered with atomic oxygen, are presented and discussed in order to test the capabilities of the apparatus. Finally, a brief summary is given in Sec. IV.
II. EXPERIMENTAL APPARATUS
A. General description
The experimental apparatus consists of four differen- tially pumped chambers. Three of them, respectively de- noted by S,, S,, Ss are shown in Fig. 2.
FIG. 2. Horizontal section of the experimental apparatus.
1432 Rev. Sci. Instrum., Vol. 62, No. 6, June 1991
A supersonic beam source of the nozzle-skimmer type is located in Si. The diameter of the nozzle is 10 pm and the nozzle-skimmer (Beam Dynamics) distance is of 16 mm. The source is in thermal contact with a cryostat which can be filled with liquid nitrogen. The energy distri- bution of the He beam is characterized by a (FWHM) AE/E = 4( 2) % when the source is in equilibrium at room temperature (77 K),
An electron gun (MS) for metastable atom production by electron impact is placed in SZ, along the supersonic beam path, just before a chopper disk (CD) for beam mod- ulation. The CD is a 0.2-mm-thick aluminum disk, with a 50% duty cycle, having in the closed portion a narrow slit (0.7 mm wide) used to sample the beam for time-of-flight (TOF) measurements. The characteristics of the metasta- ble atom source will be presented in more detail in Sec. II B. The sample is mounted on a four degrees of freedom manipulator allowing three rotations around the orthogo- nal axis and a f 5-mm translation along the direction nor- mal to the sample. The temperature of the sample, in ther- mal contact with a reservoir that can be filled with liquid nitrogen, can be varied between 120 and 1000 K by indi- rect heating from a tungsten filament mounted in the crys- tal holder.
The SZ and S3 stages are separated by a collimator C, (diameter 0.73 mm) determining a total angular diver- gence of the ground-state beam of 0.2”.
A quadrupole mass spectrometer Q, differentially pumped through the fourth pumping stage (not shown in Fig. 2), can rotate around the center of the scattering chamber.
A channeltron (CH) is mounted in a stainless-steel shielding box rigidly fixed to Q. It can rotate around the sample to detect angular distributions of charged particles, photons, and excited atoms. Not shown in the figures, a discrete dynode electron multiplier (EM) is mounted at the bottom of a nipple attachable to the flange FL. The EM has the first dynode at a distance of 52.5 cm from the CD and it is used for the characterization of the metastable beam through TOF measurements (as reported in Sec. II C).
A differentially pumped resonance lamp (UV) for ul- traviolet photon production (VG UVL-loo), a rear-view LEED-Auger system (LD) (Riber), and an electron en- ergy analyzer (EA) (VG ESCA3) are located in Ss.
The EA is mounted on a platform fixed to Q. This platform provides a rotation that takes the analyzer into and out of the measuring position. In the former position, as shown in Fig. 2 for the case of MDS measurements, the entrance slit of the EA (diameter 1 mm) is at 15 mm from the sample so defining an acceptance angle of 5 X 10 - 3 sr, The motion of Q provides a rotation of EA so that angu- larly resolved energy distribution of charged particles can be measured.
W ith the EA in the out position, the crystal holder can be rotated 360” around a vertical axis passing through the center of the apparatus, thus taking the sample in position for one of the beams to be used.
The beam directions, and the directions normal to the
Chemisorption at surfaces 1432 This article is copyrighted as indicated in the article. Reuse of AIP content is subject to the terms at: http://scitationnew.aip.org/termsconditions. Downloaded to IP:
130.251.200.3 On: Sun, 22 Dec 2013 10:43:38

FIG. 3. Layout of the electron gun for metastable production.
entrance slits of all the detectors, have been aligned in the scattering plane all pointing to the center of the apparatus where the sample can be positioned.
Not shown in the figure, an ion gun for sputtering (Varian 981), a secondary beam source (classical), and an atomic hydrogen source are located in Sz.
B. The metastable beam source
Metastable atoms X* can be produced in atomic colli- sions, gas discharge, and electron-atom scattering. The last mechanism* can be coupled easily to the molecular-beam technique allowing for the production of beams of meta- stable particles characterized by high intensity and well- defined kinetic energy. In the following, reference to the production of metastable He atoms will be made conve- niently, the main concepts being common to the other no- ble gas atoms.
At the electron energies necessary for metastable pro- duction (E,- > 20 eV), the atom and electron momenta are comparable (pHe2! 10 - 23 kg m/s at EHe = 60 meV and Pe- =5x 1O-24 kg m/s at E,- = 100 eV) so that a size- able momentum transfer affecting the velocity and angular distribution of He* can be expected. To overcome this problem the angle between the e - and He beams should be kept as small as possible’*” making the adoption of a co- axial geometry between supersonic and electron beams an obvious choice.
In the metastable source, schematically shown in Fig. 3, the electron gun was designed in order to minimize the e - -He scattering angle and to maximize the length of the scattering region without perturbing, with the gun switched off, the characteristics of intensity, angular, and , velocity distribution of the ground-state He beam.
The electrons are produced by the ring-shaped tung- sten filament F floating up to - 500 V and electrically insulated with respect to the lens S. The emission current may range from 1 to 15 mA depending on the voltages of the lenses, with a regime stability of the order of 1%. The potentials of the lenses S, C, and L1 can be independently adjusted in order to maximize the metastable production and to prevent electrons from reaching the tip of the skim- mer SK. The anode A and the lens L, are kept at the ground potential.
4800 6
400 4
3200
2400
1600 I yJ0~~ ---‘;,
A z C E a 400- 2
200 -
;’
t-t- r
0 I - .-A.- . .“S -.
ioo -I -s.
200 600:
TOF (ps)
FIG. 4. Time-of-flight (TOF) spectra of He* at a kinetic energy of 18 meV (curve A) and 67 meV (curve B) of the primary He beam.
The electron-atom scattering produces not only meta- stable particles but also ultraviolet photons, ions, highly excited atoms (Rydberg states), and fast neutrals. In order to remove charged particles and atoms in a Rydberg state from the beam, an electric field of the order of 2 kV/cm is applied between the plates of the condenser P,. An electri- cally shielded trap Pz for charged particles is placed in S3 just after the collimator C, in order to reduce further the presence of electrons and ions in the beam.
C. Metastable beam characterization
The detection of metastable particles can be performed either using the electron multiplier (EM), or the rotatable channeltron (CH). The pulses produced by the detector are preamplified, selected, and shaped by a fast amplifier discriminator, and sent to a multichannel analyzer.
Electron multipliers detect, though with different sen- sitivities, ultraviolet photons, charged particles, excited at- oms, and very energetic neutrals which may be present in the beam after the electron bombardment. Metastable at- oms are nevertheless characterized by thermal velocities and can be recognized easily in TOF spectra of suitable resolution; a TOF analysis of the beam is therefore ex- tremely useful to select those gun operating modes that may lead to a metastable beam of good intensity and ki- netic energy resolution accompanied by negligible percent- ages of photons and fast neutrals and efficient removal of electrons and ions.
Figure 4 shows TOF distributions of the He* beam at the kinetic energies of 18 and 67 meV [curves 4(a) and 4(b), respectively]. The TOF spectra have been obtained for the same gun operating mode (accelerating voltage
1433 Rev. Sci. Instrum., Vol. 62, No. 6, June 1991 Chemisorption at surfaces 1433 This article is copyrighted as indicated in the article. Reuse of AIP content is subject to the terms at: http://scitationnew.aip.org/termsconditions. Downloaded to IP:
130.251.200.3 On: Sun, 22 Dec 2013 10:43:38

TOF (us)
FIG. 5. TOF spectra of He* (primary He beam kinetic energy of 18 meV) for different electron accelerating voltages. (a) AI’=350 V; (b) AY= 150 V; (c) AV= 80 V.
A V = 350 V, lens L1 grounded) -with the EM detector. In both curves a peak at short times of flight is present. This peak is not due to charged particles as its intensity does not change, polarizing (positive or negative) the first dynode of the multiplier, but it is due to ultraviolet photons pro- duced in the e--He scattering. Its position conveniently gives the zero of the time scale while its shape is deter- mined by the opening of the chopper slit. The intensity of this peak can be reduced to the order of a few percent by an appropriate choice of the gun operating mode.
The TOF spectra strongly depend on the gun config- uration as shown in Fig. 5 where results obtained at dif- ferent accelerating voltages AV are reported. Lowering AV, the figure shows the appeara.nce of strong features in the region around 400 ,US and a. decrease of the overall intensity, particularly of peak R.
In order to understand the behavior of the TOF spec- tra, a simple kinematic analysis was performed. The model considers the production of He* 2’S (excitation energy of 20.6 eV) by two-dimensional, ela.stic e - -He scattering in which electrons with energy in an interval 0 < E < 400 eV collide at an angle 8 with a monochromatic and nondiver- gent He beam ( EHe = 18 meV) defining the positive z di- rection. Because of the geometry of the TOF measure- ments, only final states in which the velocity vector of He* lies along positive z are considered. Figure 6 shows the results of this analysis as a function of the electron energy, compared with the TOF spectrum of Fig. 4(a). In the figure, the full dots represent the arrival times of the He* atoms after scattering events with electrons having, in the final state, a positive z component of the velocity vector (forward scattering) while the open dots refer to backward
1434 Rev. Sci. Instrum., Vol. 62, No. 6, June 1991
0 2Qo 400 600
TOF C/is,
FIG. 6. Comparison between the TOF spectrum of Fig. 5(a) with the caIcuIated arrival time of He* as a function of electron energy. Filled dots: forward electron scattering; open dots: backward scattering. The bars indicate the arrival time of He atoms of the ground-state beam.
scattering of the electrons. TOF measurements cannot distinguish between colli-
sions occurring at different positions in the electron gun. The long tail occurring at short times, therefore, can be interpreted either as e--He collisions occurring at low scattering angles 8 in a region near the filament (low en- ergy) or as collisions occurring at high energy (near the anode) but with a larger 8.
The kinematic analysis shows that the peak D corre- sponds to an electron energy of ~2250 eV and that the peak R cannot be due to e - -He scattering as it occurs at times incompatible with this process. This peak instead coincides with the arrival time of the ground-state He beam (indi- cated by bars in Fig. 6), calculated from the chopper-de- tector distance and the most probable He velocity mea- sured from diffraction experiments. As already discussed in Ref. 10, the structure R is related to He + He* -+IIe* + He resonant collisions in the beam where the (faster)
He* atoms collide with ground-state atoms. As the accelerating voltage decreases (Fig. 5), the
structures at lower times become more prominent indicat- ing that backward collisions (open circles in Fig. 6) be- come more probable and the peak D moves towards shorter times as expected from kinematics (full circles in Fig. 6). Furthermore, the arrival time of the resonant peak R remains unchanged while its intensity decreases, eventu- ally because the mismatch between the He and IIe* veloc- ities gets larger thus reducing the time of the He-He* in- teraction.
Operation at high electron energy therefore, seems to provide some advantages with respect to intensity and ve- locity resolution and this configuration also allows a good definition of the He* internal state.
Chemisorption at surfaces 1434 This article is copyrighted as indicated in the article. Reuse of AIP content is subject to the terms at: http://scitationnew.aip.org/termsconditions. Downloaded to IP:
130.251.200.3 On: Sun, 22 Dec 2013 10:43:38

The e--He scattering produces both the 2lS and 23S excited states of He. An accurate determination of the beam populations could be obtained by measuring the beam intensity after quenching the singlet state by optical pumping of 2’S to the 2lP state (which subsequently de- cays to the ground state) via absorption of 2.06 ,um radi- ation. Although this measurement is not available at present because the quenching stage cannot be inserted into the beam path, a reasonable estimate of the beam population can be obtained from the TOF spectra of Fig. 6 and the behavior of the differential cross section for the He* 2’S and He* 23S production as function of electron energy E, 1 and scattering angle.” In fact from the figure it can be observed that collisions with E, - < 200 eV occur with a probability lower than 10%. At E,- > 200 eV and small scattering angles (8~ 5”)) the ratio of cross sections a23s/a2~s ~0.01-0.02, so that it can be concluded that the He* beam is practically a pure singlet beam, the incidence of triplet states being estimated to be of the order of a few percent.
Coming to the beam intensity, it can be observed that it normally exceeds by l-2 orders of magnitude the count- ing limit of the acquisition system (10’ counts/s) so that the flux F of the metastable beam can be estimated better by measuring the current I=SF of electrons emitted from a clean metal surface due to the metastable deexcitation process.” The coefficient S is of the order of 0.2, and gen- erally depends on the kind of surface (surface order and cleanness) and from the escape probability of excited elec- trons. This measure, therefore, necessarily gives a lower limit for F. The highest intensity is reached by adopting the configuration of Fig. 4(b), e.g., an accelerating voltage of -350 V for the electrons bombarding the beam at room temperature. A gain of a factor of 2 in intensity accompa- nied by a reduction of the tail at shorter times of flight is obtained by raising the voltage of the lens L, to N - 600 V. In these conditions, a typical value of the measured current is 1--5X lo-” A so that F>3~10* s-’ on the sample corresponding to F > 4 X 10¹² sr - ’ s - ‘.
ill. RESULTS AND DISCUSSION
In order to test the capabilities of the experimental apparatus, the energy distribution curves (EDC) of elec- trons emitted from the sample were measured either using photons (Her and Herr lines) or metastable atoms (He*) as primary particles.
UPS measurements were performed as function of the angle of emission while in the case of MDS, EDCs were recorded at 0f = 0” (normal emission). The energy resolu- tion of the electron analyzer was set at 100 meV in the case of UPS and at 250 meV in the case of MDS.
A. UPS measurements
The lamp-analyzer system was tested by comparing EDCs with data available in the literature. High-resolution dataI on Ag( 110) were quite well reproduced with respect to both energy position and relative intensities of all spec-
1436 Rev. Sci. Instrum., Vol. 62, No. 6, June 1991
.”
. . ‘.. :-..,,
_.’ ,I ,.I .
, .i,: ; -.; .....‘-. Of \.-
--------,.! . . . . .::
.-.zA-. . . . . .. ./ .,“@\.. --%&
: -+...-. . . " : 1
i,.;. ..,.-" L.-.---d c I.<":. L :.
.;: : ,+..-**,\> . . . ,
-v._> _ a*' ..+-:
..- .-.-d ,i
,' ‘i -..- .,._I
I I 1 I I 8 7 8 5 4 3 2 1
Binding energy (eV)
FIG. 7. Angularly resolved electron energy distribution curves from Ag( 110)-0(4x 1) as function of eP The uv photons (Her line, hv = 21.2 eV) impinge on the surface at 0, = 45” along the [OOI] azimuthal direc- tion. The binding energy is measured from the Fermi edge.
tral features and, as a further check, the Ag( 110) -O( 2 X 1) system was also studied.
It is well known that molecular oxygen chemisorbs dissociatively on Ag( 110) at surface temperatures higher than T,- 180 K and that, above this temperature, oxygen exposures up to 30000 lead to a series ofp(nX1) (n>2) structurest4 There is a strong experimental evidence that the adsorption site is in the long bridge position, oxygen forming chains along the [OOl] surface direction.
Previous UPS measurements by Prince, Paolucci, and Bradshawl’ on the 0(2X 1) phase with polarized light in- cident on the [OOl] azimuthal direction showed a strongly dispersed peak in the range of 1.5-3 eV (binding energy). This peak has been interpreted as due to the emission from an oxygen antibonding level as confirmed by recent ARUPS investigations on the same system supported by tight-binding calculations.‘6 The present measurements have reproduced the dispersion curve of this antibonding resonance peak well within experimental errors.
After this preliminary investigation, the Ag( 1 lO)- 0 (4 X 1) phase has been considered. The periodicity of the phase was checked by He (ground state) diffractive scat- tering obtaining a quite sharp diffraction pattern. In Fig. 7, some of the EDCs recorded on the [OOl] azimuthal direc- tion as functions of 0,= are reported. The dispersion of the structure in the 1.5-3-eV energy region is evident from the figure. The dispersion curve reported in Fig. 8 coincides, within experimental accuracy, with the one relative to the 0(2x 1) phase.
Chemisorption at surfaces 1436 This article is copyrighted as indicated in the article. Reuse of AIP content is subject to the terms at: http://scitationnew.aip.org/termsconditions. Downloaded to IP:
130.251.200.3 On: Sun, 22 Dec 2013 10:43:38
i= x
-02 0 02 a4 a6 a8 1
K (A-“)
FIG. 8. Energy dispersion curve of the ,oxygen antibonding state along [OOl].
Kinetic energy (eV)
As for the O(2 x 1) phase, accurate measurements along the Eli01 azimuth did not show evidence of disper- sion of the antibonding state giving further support to the model that interprets the Ag( 110)-O (nx 1) phases as formed by independent chains of oxygen atoms.
F3. MQS measurements
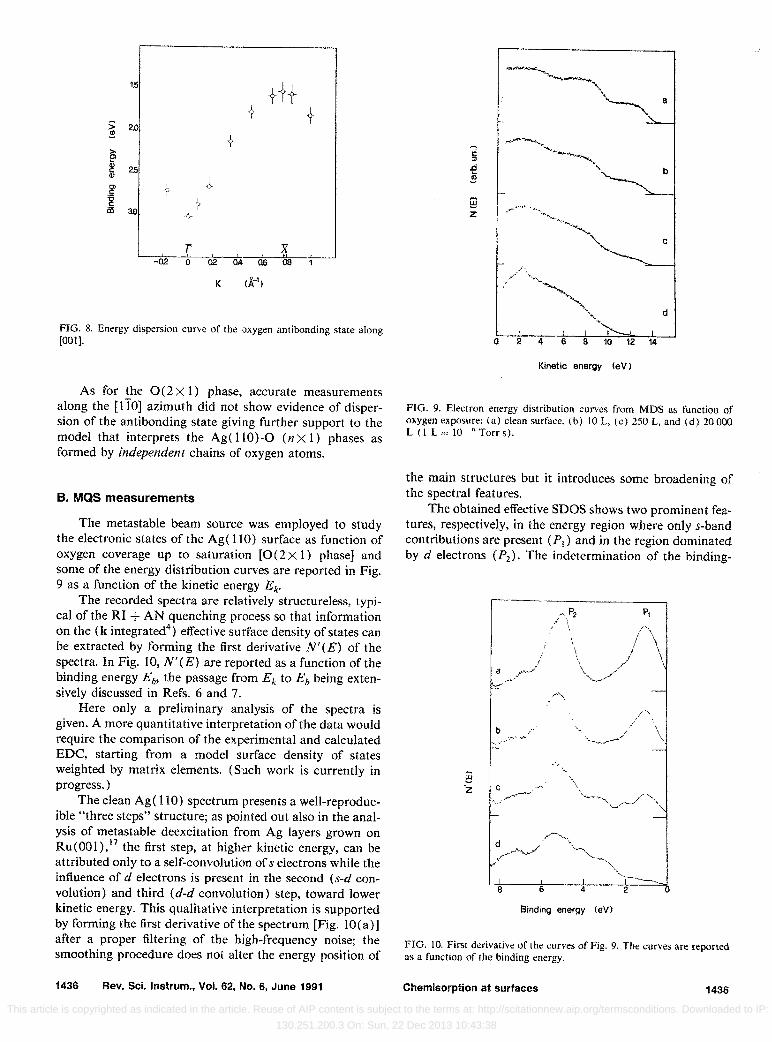
The metastable beam source was employed to study the electronic states of the Ag( 110) surface as function of oxygen coverage up to saturation [O( 2 x 1) phase] and some of the energy distribution curves are reported in Fig. 9 as a function of the kinetic energy Eke
The recorded spectra are relatively structureless, typi- cal of the RI + AN quenching process so that information on the (h integrated4) effective surface density of states can be extracted by forming the first derivative N’(E) of the spectra. In Fig. 10, N’(E) are reported as a function of the binding energy Eb, the passage from ,!$ to Eb being exten- sively discussed in Refs. 6 and 7.
Here only a preliminary analysis of the spectra is given. A more quantitative interpretation of the data would require the comparison of the experimental and calculated EDC, starting from a model surface density of states weighted by matrix elements. (Such work is currently in progress.)
The clean Ag( 110) spectrum presents a well-reproduc- ible “three steps” structure; as pointed out also in the anal- ysis of metastable deexcitation from Ag layers grown on Ru(OOi),” the first step, at higher kinetic energy, can be attributed only to a self-convolution of s electrons while the influence of d electrons is present in the second (s-d con- volution) and third (d-d convolution) step, toward lower kinetic energy. This qualitative interpretation is supported by forming the first derivative of the spectrum [Fig. IO(a)] after a proper filtering of the high-frequency noise; the smoothing procedure does not alter the energy position of
1436 Rev. Sci. Instrum., Vol. 62, Ho. 6, June 1991
FIG. 9. Electron energy distribution curves from MDS as Function of oxygen exposure: (a) clean surface, (b) 10 L, (c) 250 L, and (d) 20 Ooo L (1 L= 10 ‘Torrs).
the main structures but it introduces some broadening of the spectral features.
The obtained effective SDOS shows two prominent fea- tures, respectively, in the energy region where only s-band contributions are present (PI) and in the region dominated by d electrons (P,). The indetermination of the binding-
iii -2
A-‘\ P2 h ,’ I
\ I
:.-““: i i,J ;;‘\
h- - ;
,f’,
b ,: ..\ ,&>/ *’ *- ‘-“..--
-
I.”
‘\ C -v
/F--~ .\ -’ -\ .,-P-T,
-
I / I 8 8 4 2
Binding energy teV1
FIG. 10. First derivative of the curves of Fig. 9. The curves are reported as a function of the binding energy.
Chemisorption at surfaces 1436
This article is copyrighted as indicated in the article. Reuse of AIP content is subject to the terms at: http://scitationnew.aip.org/termsconditions. Downloaded to IP:
130.251.200.3 On: Sun, 22 Dec 2013 10:43:38

0.6
0.6
1" a2
antibonding states recalling that the MD spectroscopy gives information on the k-integrated density of states while the contribution at 7.5 eV could be assigned to the Ag 4d-0 2p bonding resonances. These resonances, ex- pected in that range of energy from tight-binding calcula- tions,16 are obscured in UPS data by intense d-manifold emission from the substrate.
, ACKNOWLEDGMENTS ,(.,,,,1 ll.llla I...24
08
06. 3
0 04
The authors would like to acknowledge the brilliant design of the original experimental apparatus by M. G. Dondi and F. Tommasini. They are also particularly grate- ful to A. Gussoni for his skillful assistance in the building of the electron gun and the insertion of the electron energy analyzer and to S. Nannarone, P. Cantini, and C. Salvo for many stimulating discussions.
‘G. Ertl, in Electron and Ion Spectroscopy of Solids, edited by L. Fi- ermans, J. Vennik, and W . Dekeyser (Plenum, New York, 1977), p. 144. exposure CL)
FIG. 11. Comparison between the work-function increase A$ and the decrease of the intensity of the structure P, of Fig. 10 as function of oxygen exposure. hi is calculated from the width of the UPS spectra. I(P)) is normalized to the peak intensity at 0 L (clean surface).
energy scale is of the order of f 0.3 eV due to physical5 and instrumental broadening.
Following the evolution of the EDCs and correspond- ing derivatives versus atomic oxygen coverage, it is ob- served that I(P, ), the intensity of P,, decreases. This be- havior could be related to the destruction of a Schockley surface state of silver located at low binding energies18 or to a backdonation of s-p metal electrons into antibonding resonances of absorbed oxygen.”
The second hypothesis seems to be confirmed from Fig. 11 where the behavior with coverage of I( P,) and A#, the work-function increase obtained from UPS data, is re- ported.
Focusing on the saturated phase, the effective SDOS seems to describe the main features of oxygen chemisorp- tion on silver, as they have been merging up from both UPS measurements and calculations on the 0-Ag( 110) (Ref. 16) and Ag20 (Ref. 20) systems. In fact, Fig. 10(d) clearly shows the presence of oxygen-induced states around 3 and 1.5 eV. The first has to be related to oxygen
‘H. Ibach, Topics Current Phys. 4, 1 ( 1977). 3 M. G. Dondi, S. Terreni, F. Tommasini, and U. Linke, Phys. Rev. B 37,
8034 (1988). 4W. Sesselman, B. Woratschek, J. Kiippers, G. Ertl, and H. Haberland,
Phys. Rev. B 35, 8348 (1987), and references therein. 5H. Hagstrum, Phys. Rev. 96, 336 (1954); in Electron and Ion Spec-
troscopy of Solids, edited by L. Fiermans, J. Vennik, and W . Dekeyser (Plenum, New York, 1977), p. 273.
‘H. Hagstrum and G. Becker, Phys. Rev. B 4, 4187 (1971). ‘W . Sesselmann, B. Woratschek, J. Kiippers, G. Ertl, and H. Haberland,
Phys. Rev. B 35, 1547 (1987). sH. Pauly, in Atomic Molecular Beam Methods, edited by G. Stoles
(Oxford University Press, New York, 1988). Vol. 1, p. 83. ‘R. D. Rundel, F. B. Dunning, and R. F. Stebbings, Rev. Sci. Instrum.
45, 116 (1974). “B Brutschy and H. Haberland, J. Phys. E 10, 90 (1977); H.
Y: Lee, and P. Siska, Adv. Chem. Phys. XLV, 487 ( 1981). Haberland,
“A. Brandsen and H. McDowell, Phys. Rep. 30, 207 ( 1977), and refer- ences therein.
“M. Zen, in Atomic Molecular Beam Methods, edited by G. Stoles (Ox- ford University Press, New York, 1988), Vol. 1, p. 254.
“H. Roloff and H. Neddermeyer, Solid State Commun 21, 561 (1977); W . Segeth, J. Wijingaard, and G. Sawatzky, Surf. Sci. 194, 615 (1988).
14H. Engelhardt and D. Menzel, Surf. Sci. 57, 591 ( 1976). I5 K. Prince, G. Paolucci, and A. Bradshaw, Surf. Sci. 175, 101 (1986). 16L. H. Tjeng, M. B. J. Meinders, and G. A. Sawatsky, Surf. Sci. 236, 341
(1990). “H. .I. JPnsch, C. Huang, A. Ludviksson, G. Rocker, J. Redding, H.
Metiu, and R. M. Martin, Surf. Sci. 214, 377 (1988). “R Courths, H. Vern, U. Hau, B. Cord, V. Bechelier, and S. Hufner, J.
Phys. F 14, 1559 (1984). t9N. Rosch and D. Menzel, Chem. Phys. 13, 243 (1976). “L. H. Tjeng, M. B. J. Meinders, J. Vanelp, J. Ghysen, G. A. Sawatsky,
and A. L. Johnson, Phys. Rev. B 41, 3190 ( 1990).
1437 Rev. Sci. Instrum., Vol. 62, No. 6, June 1991 Chemisorption at surfaces 1437 This article is copyrighted as indicated in the article. Reuse of AIP content is subject to the terms at: http://scitationnew.aip.org/termsconditions. Downloaded to IP:
130.251.200.3 On: Sun, 22 Dec 2013 10:43:38


 2 studied by infrared and Raman spectroscopies and DFT computations](https://static.fdokumen.com/doc/165x107/6316cce2d16b3722ff0d1094/molecular-structure-and-vibrational-spectrum-of-mgch-3-2so-6clo-4-2-studied.jpg)