an evaluation of the potential role of L-serine-O-phosphate as ...
153
More than a metabolite: an evaluation of the potential role of L-serine-O-phosphate as the endogenous agonist for the Group III metabotropic glutamate receptors by Jordan Ethan Antflick A thesis submitted in conformity with the requirements for the degree of Doctor of Philosophy Department of Pharmaceutical Sciences University of Toronto © Copyright by Jordan Ethan Antflick, 2012
-
Upload
khangminh22 -
Category
Documents
-
view
0 -
download
0
Transcript of an evaluation of the potential role of L-serine-O-phosphate as ...

More than a metabolite: an evaluation of the potential role of L-serine-O-phosphate as the endogenous agonist for the Group
III metabotropic glutamate receptors
by
Jordan Ethan Antflick
A thesis submitted in conformity with the requirements for the degree of Doctor of Philosophy
Department of Pharmaceutical Sciences University of Toronto
© Copyright by Jordan Ethan Antflick, 2012

ii
More than a metabolite: an evaluation of the potential role of L-serine-
O-phosphate as the endogenous agonist for the Group III metabotropic
glutamate receptors
Jordan Ethan Antflick
Doctor of Philosophy
Department of Pharmaceutical Sciences University of Toronto
2012
Abstract
The Group III metabotropic glutamate receptors (mGluR) are located presynaptically on
axon terminals and act as autoreceptors and heteroreceptors by inhibiting neurotransmitter
release. Much has been learned about these receptors through exogenous application of L-
serine-O-phosphate (L-SOP), an endogenous amino acid derivative and known activator of the
Group III mGluRs. We hypothesized that L-SOP is the endogenous co-agonist at the high
affinity Group III mGluR, mGluR4. We found the EC50 of L-SOP at mGluR4 was 0.5 μM, and
determined that the concentration of L-SOP in whole brain was approximately 5 μM. An
immunocytochemical survey revealed that cells containing the enzymatic machinery necessary
for L-SOP synthesis and metabolism were observed in two brain regions known to express
mGluR4, namely, cerebellum and hippocampus. In the cerebellum, the L-SOP synthetic and
metabolic enzymes were found in Bergmann glia and Purkinje cells, two cells which form a
tripartite synapse with parallel fiber axon terminals where the mGluR4 subtype is exclusively
expressed at high levels. In the hippocampus, the L-SOP metabolic enzyme was detected in

iii
young neurons emanating from the neurogenic subventricular zone. Attempts to raise
endogenous levels of L-SOP by crippling the L-SOP metabolizing enzyme (phosphoserine
phosphatase), over-expressing the L-SOP synthesizing enzyme (phosphoserine
aminotransferase), or through dietary protein restriction, to study the effects on
neurotransmission and neurodevelopment in the central nervous system (CNS) were
unsuccessful, suggesting that the production of L-SOP remains stable despite manipulation of the
synthetic and metabolic enzymes. Finally, the ability of L-SOP to modulate glutamate release
from presynaptic terminals was examined in cerebellar synaptosomes. Co-incident activation of
presynaptic mGluR4 and presynaptic GABAA receptors facilitated glutamate release, suggesting
that simultaneous activation of parallel fibers and Bergmann glia may serve to enhance synaptic
transmission. This observation expands the traditional view of Group III mGluRs acting solely
as inhibitory autoreceptors. Taken together, these results provide compelling evidence to support
the hypothesis that L-SOP is the endogenous agonist at mGluR4, and possibly other Group III
mGluRs.

iv
Acknowledgments
While drafting this thesis and stitching together many years of difficult work, I have been
able to reflect on the process of arriving at this point. I would like to acknowledge those
individuals who made this possible.
I owe my deepest gratitude to my supervisor, Dr. David R. Hampson, for his mentorship
and continual support throughout the course of this academic pursuit. Under his supervision I
have learned the importance of asking the right questions and also that patience and rigor are
required to get answers. I am thankful to him for challenging me to succeed through the many
opportunities he has given me to do so.
I would like to thank the members of my advisory committee, Dr. Jeffrey T. Henderson
and Dr. Lu-Yang Wang, for providing valuable insight and meaningful suggestions to help shape
the course of this thesis. Their comments and questions are greatly appreciated. Furthermore, I
would like to express my appreciation to Dr. Glen B. Baker and Dr. Joan S. Baizer for their
expertise and collaborative efforts.
It has been a pleasure to work alongside my lab members, both past and present: Yi Yao,
Erin Rose, Laura Pacey, Sujeenthar Tharmaligam, Daniel Adusei, Shervin Gholizadeh and Ingrid
Xuan. I enjoyed the comradery that came from being a part of lab culture that grew organically
from our conversations, successes and failures.
I am indebted to my parents for all their love and support, as well as the sacrifices they
each made to ensure that I got to this point. I also would like to thank my parents for recognizing
and nourishing my inquisitive tendencies at a young age which no doubt provided the impetus
for this academic pursuit.
Finally, I would like to dedicate this thesis to my wife Michelle for all we have shared,
and all we will share, in this life we are building together.

v
Table of Contents
ABSTRACT......................................................................................................................................ii
ACKNOWLEDGMENTS................................................................................................................iv
TABLE OF CONTENTS..................................................................................................................v
LIST OF PUBLICATIONS.............................................................................................................ix
LIST OF FIGURES.........................................................................................................................x
LIST OF TABLES..........................................................................................................................xii
ABBREVIATIONS........................................................................................................................xiii
CHAPTER 1. Introduction
1.1 Glutamatergic neurotransmission..................................................................................1
1.2 Metabotropic glutamate receptors..................................................................................1
1.2.1 Structure and pharmacology of the Group III mGluRs..................................5
1.2.2 Distribution of the Group III mGluRs..........................................................13
1.2.3 The functional role of mGluR4 in the CNS..................................................16
1.3 The L-serine biosynthetic pathway..............................................................................18
1.3.1 Involvement in CNS development................................................................21
1.3.2 Bioactivity of L-serine metabolites in the CNS............................................24
1.4 GABAergic neurotransmission and GABA receptors.................................................25
1.4.1 Presynaptic GABAA receptors......................................................................25
1.5 Hypotheses, objectives, and rationale..........................................................................30

vi
CHAPTER 2. Materials and Methods
2.1 Reagents.......................................................................................................................35
2.2 cDNA constructs and transfection...............................................................................35
2.3 Dose-response analysis of HEK-293 cells expressing mGluR4..................................36
2.4 Quantitation of L-SOP in rat brain and amino acid analysis.......................................37
2.5 Generation and purification of polyclonal anti-PSP antisera.......................................38
2.6 Western Blotting..........................................................................................................38
2.7 Primary astrocyte culture.............................................................................................39
2.8 Immunocytochemistry.................................................................................................40
2.9 Kainic acid injections...................................................................................................43
2.10 Low protein diets.......................................................................................................43
2.11 Generation of PSP deficient mice..............................................................................43
2.12 Generation of PSAT over-expressing mice...............................................................44
2.13 Synaptosome preparation...........................................................................................46
2.14 Immunoprecipitation..................................................................................................46
2.15 Glutamate release assay.............................................................................................47
2.16 [35S] TBPS autoradiography......................................................................................48
CHAPTER 3. L-SOP in the central nervous system
3.1 Quantitation of L-SOP in rat brain...............................................................................50
3.2 Comparative potency of L-SOP at mGluR4................................................................52
3.3 Characterization of the PSP antibody..........................................................................52
3.4 Relative abundance of PSAT and PSP in rat central and peripheral tissue.................56
3.5 Immunocytochemical analysis of PSAT and PSP in the adult rat CNS......................57

vii
3.6 Immunocytochemical analysis of PSAT and PSP in the postnatal day 2 rat
CNS..............................................................................................................................62
3.7 Neuronal vs. glial expression of PSAT and PSP.........................................................65
CHAPTER 4. Analysis of mouse models to examine the effects of elevated L-SOP in the
central nervous system
4.1 PSP deficient mouse model.........................................................................................70
4.2 PSAT over-expressing mouse......................................................................................74
4.3 Induction of PSAT and PSP expression by nutrient suppression................................76
CHAPTER 5. A potential role for L-SOP in the CNS: Co-incident activation of mGluR4
and GABAA receptors promotes glutamate release from parallel fiber axon terminals
5.1 Co-localization of mGluR4 and GABAA receptors in the cerebellum and
cerebellar synaptosomes..............................................................................................80
5.2 Immunoprecipitation of mGluR4 and GABAA receptors in the cerebellum...............83
5.3 mGluR4 and GABAA receptor modulation of glutamate release from cerebellar
synaptosomes...............................................................................................................85
5.4 Alterations in GABAA receptor subunit expression in the cerebellum of mGluR4
knockout mice..............................................................................................................89
CHAPTER 6. Discussion of L-SOP as a potential transmitter in the central nervous
system
6.1 Quantitation of L-SOP in the CNS..............................................................................94
6.2 Analysis of the L-SOP synthesizing and metabolizing enzymes in the CNS..............96
6.3 Enzyme induction in the L-serine biosynthetic pathway through dietary protein
restriction...................................................................................................................102

viii
6.4 Interactions between presynaptic mGluR4 and GABAA receptors in the
cerebellum..................................................................................................................103
6.5 L-SOP as a chemical transmitter in the CNS.............................................................113
6.6 Concluding remarks and future directions.................................................................117
REFERENCES.............................................................................................................................121

ix
List of Publications
Antflick JE, Baker GB, Hampson DR (2010) The effects of a low protein diet on amino acids and enzymes in the serine synthesis pathway in mice. Amino Acids 39:145-153.
Antflick JE and Hampson DR (2012) Modulation of glutamate release from parallel fibers by mGlu4 and pre-synaptic GABA(A) receptors. J. Neurochem. 120, 552-563.
Antflick JE, Vetiska S, Baizer JS, Yao Y, Baker GB, Hampson DR (2009) L-Serine-O-phosphate in the central nervous system. Brain Res 1300:1-13.
Broussard DM, Titley HK, Antflick J, Hampson DR (2011) Motor learning in the VOR: the cerebellar component. Exp Brain Res 210:451-463.
Hampson DR, Rose EM, Antflick JE (2008) The Structures of the Metabotropic Glutamate Receptors. In: The Glutamate Receptors (Gereau RW, Swanson GT, eds), Towtowa: Humana Press.
Rauw GA, Grant SL, Labrie V, Roder JC, Antflick JE, Hampson DR, Baker GB (2010) Determination of L-serine-O-phosphate in rat and mouse brain tissue using high-performance liquid chromatography and fluorimetric detection. Anal Biochem 405:260-262.
Rose EM, Koo JC, Antflick JE, Ahmed SM, Angers S, Hampson DR (2009) Glutamate transporter coupling to Na,K-ATPase. J Neurosci 29:8143-8155.
Tharmalingam S, Daulat AM, Antflick JE, Ahmed SM, Nemeth EF, Angers S, Conigrave AD and Hampson DR (2011) Calcium-sensing receptor modulates cell adhesion and migration via integrins. J. Biol. Chem. 286, 40922-40933.

x
List of Figures
1.1 mGluR Dendrogram.............................................................................................................3
1.2 Mechanisms of Group III mGluR-mediated inhibition of transmitter release.....................4
1.3 Putative structure of a metabotropic glutamate receptor dimer...........................................7
1.4 Proteins binding the C-terminal tail of mGluR4..................................................................9
1.5 The mammalian L-serine biosynthetic pathway................................................................19
1.6 Chemical structures of glutamate, L-SOP, L-AP4, GABA, L-serine, and D-serine.........23
1.7 Classification of GABA receptors.....................................................................................26
3.1 Dose response curve of L-SOP, L-AP4 and L-glutamate at mGluR4...............................53
3.2 Characterization of the anti-PSAT and anti-PSP antibodies and tissue distributions
in the rat by western blot analysis......................................................................................55
3.3 Immunocytochemical analysis of PSAT and PSP expression in the somatosensory
region of the cerebral cortex of the adult rat......................................................................58
3.4 Immunocytochemical analysis of PSP in the adult rat hippocampal formation................60
3.5 Immunocytochemical analysis of PSAT and PSP in the adult rat cerebellum..................63
3.6 Immunocytochemical analysis of PSAT and PSP in postnatal day 2 rat brain..................64
3.7 Immunocytochemical analysis of PSAT and PSP in mixed glial cultures........................66
3.8 PSP is not up-regulated in the rat hippocampal formation after kainic acid induced
seizures...............................................................................................................................68
4.1 Genetic screening and PSP protein analysis in PSP deficient mice...................................72
4.2 PSAT protein expression is not up-regulated in PSAT copy number variant mice...........75
4.3 Changes in the forebrain and cerebellar expression of PSAT and PSP in mice fed very
low and normal protein diets for two weeks......................................................................78

xi
4.4 Amino acid and small molecule content analysis of the forebrains from mice
fed low protein or normal diets for two weeks..................................................................79
5.1 Co-localization of GABAA α1 and mGluR4 in mouse cerebellum and cerebellar
synaptosomes.....................................................................................................................82
5.2 Immunoprecipitation of mGluR4 and GABAA from mouse cerebellum...........................84
5.3 Activation of mGluR4 facilitates muscimol-induced glutamate release from
cerebellar synaptosomes and is G-protein dependent........................................................87
5.4 GABAA receptor subunit expression in cerebellar homogenates wild-type and
mGluR4 knockout mice.....................................................................................................90
5.5 Binding of [35S] TBPS in the wild-type and mGluR4 knockout mouse cerebellum.........91
6.1 Cerebellar synapse architecture in the context of mGluR4 and GABAA receptor-
mediated glutamate release..............................................................................................109
6.2 Lateral inhibition in the cerebellum.................................................................................112

xii
List of Tables
Table 1 EC50 value ranges for Group III mGluR agonists..................................................12
Table 2 PCR primers used in the screening of PSP deficient mice....................................45
Table 3 L-serine, D-serine and L-SOP concentrations in rat whole brain and
cerebellum..............................................................................................................51

xiii
Abbreviations
AMPA 2-amino-3-(5-methyl-3-oxo-1,2-oxazol-4-yl) propanoic acid
ATP adenosine triphosphate
BAC bacterial artificial chromosome
CaM calmodulin
cAMP 3’,5’- cyclic adenosine monophosphate
CNS central nervous system
CNV copy number variant
DTT dithiothreitol
EC50 half maximal effective concentration
ECL enhanced chemiluminescence
EDTA ethylenediaminetetraacetic acid
EPSC excitatory postsynaptic current
GABA γ-aminobutyric acid
GAPDH glyceraldehyde pyruvate dehydrogenase
GFAP glial fibrillary acidic protein
GPCR G-protein coupled receptor
HEK human embryonic kidney
HPLC high performance liquid chromatography
HRP horseradish peroxidase
IC50 half maximal inhibitory concentration
ICC immunocytochemistry
KCC2 K-Cl symporter

xiv
L-AP4 (2S)-2-amino-4-phosphonobutanoic acid
L-SOP L-serine-O-phosphate
mGluR metabotropic glutamate receptor
NMDA N-methyl-D-aspartate
NKCC1 Na-K-Cl cotransporter
PBS phosphate-buffered saline
PCR polymerase chain reaction
PKA protein kinase A
PSAT phosphoserine aminotransferase
PSP phosphoserine phosphatase
qRT-PCR real-time quantitative PCR
SGZ subgranular zone
SHMT serine hydroxymethyltransferase
TBPS t-butylbicyclophosphorothionate
TBS tris-buffered saline
TE tris-ethylenediaminetetraacetic acid
WB western blot
VFD venus flytrap domain

1
CHAPTER 1: Introduction
1.1 Glutamatergic neurotransmission
Glutamate may arguably be the most important amino acid for sustaining life. In fact,
glutamate is one of the most ubiquitous molecules and is estimated to account for 2% of total
body weight in vertebrates (Adibi and Mercer 1973). Glutamate is a major amino acid
component of the proteins that make up every living organism, and is also an important
metabolic byproduct in transamination reactions and cellular metabolism. From a neurochemical
perspective, glutamate is the most abundant neurotransmitter in the mammalian CNS where it
activates two classes of receptors to facilitate neurotransmission. The binding of glutamate to
glutamate-gated ion channels including the N-methyl-D-aspartate (NMDA), 2-amino-3-(5-
methyl-3-oxo-1,2-oxazol-4-yl) propanoic acid (AMPA), and kainate receptor subtypes, mediates
rapid changes in the electric potential of neurons, and is the primary driver of excitatory
neurotransmission. The second class of receptors activated by glutamate is the metabotropic
glutamate receptors (mGluRs).
1.2 Metabotropic glutamate receptors
The mGluRs are G-protein coupled receptors (GPCR), and like other GPCRs, mGluRs
sense the extracellular environment and relay those extracellular cues to the cell interior through
activation of secondary messenger signaling cascades. As mediators of neurotransmission, the
mGluRs fine tune incoming or outgoing excitatory signals. The mGluRs belong to the Family C
GPCRs which also includes the calcium sensing receptor, T1R taste receptors, and the GABAB
receptor. Eight mammalian mGluR subtypes have been cloned and categorized into three groups
based on pharmacology, signal transduction pathways and sequence similarity (Pin et al. 2003;

2
Nicoletti et al. 2011). Group I mGluRs, mGluR1/5, are primarily located postsynaptically and
couple to phospholipase C to promote an increase in intracellular calcium upon receptor
activation. Group II mGluRs (mGluR2 and mGluR3), are found both pre and postsynaptically
and negatively couple to adenylate cyclase to decrease intracellular levels of 3’,5’-cyclic
adenosine monophosphate (cAMP). The Group III mGluRs (mGluR4, mGluR6, mGluR7, and
mGluR8) are the largest group of the mGluR family. As a group, the Group III mGluRs share
approximately 70% homology, and share approximately 45% protein sequence homology with
the Group I and II mGluRs (Wu et al. 1998) (Fig. 1.1). Group III mGluRs also share a common
secondary messenger signaling cascade and a prototypical group-specific ligand, (2S)-2-amino-
4-phosphonobutanoic acid (L-AP4). With the exception of mGluR6 which is located
postsynaptically on retinal ON-bipolar cells (Nakajima et al. 1993), the Group III mGluRs are
located presynaptically and act as autoreceptors to decrease transmitter release.
Typically, signaling through the Group III mGluRs activates the Gi/o α-subunit of the
heterotrimeric G-protein complex which inhibits adenylate cyclase, decreases the intracellular
levels of cAMP, and consequently decreases the activation of protein kinase A (PKA) (Fig. 1.2).
While PKA inhibition is known to decrease vesicular transmitter release by preventing vesicle
priming (Chavis et al. 1998), two other signaling cascades are also likely to contribute to a
decrease in transmitter release observed after Group III mGluR activation. Signaling through the
Gβγ subunit leads to the activation of potassium channels, such as the G-protein coupled inward
rectifying potassium channel which hyperpolarizes the membrane, thus dampening presynaptic
excitability (Saugstad et al. 1997). Additionally, activation of the Group III mGluRs can
decrease calcium influx into the presynaptic terminal mainly through inhibition of N-, but also
through P/Q-type voltage-gated calcium channels.

3
Figure 1.1: mGluR Dendrogram
Dendrogram showing phylogenetic relationship between all identified members of the human mGluR family. Full length protein sequences of eight human mGluRs and splice variants (indicated by ‘a’ or ‘b’) were aligned according to sequence similarity.

4
Figure 1.2: Mechanisms of Group III mGluR-mediated inhibition of transmitter release
Stimulation of the Group III mGluRs by glutamate, L-SOP or L-AP4 promotes the activation of the associated Gαi inhibitory G-protein and Gβγ subunits. Gαi inhibits adenylate cyclase (AC) catalyzed production of cAMP and causes a subsequent decrease in the phosphorylation (P) and activation of protein kinase A (PKA). PKA is necessary for synaptic vesicle cycling at the level of vesicle priming prior to vesicle release. Gβγ subunits promote hyperpolarization by activating potassium channels and prevent calcium influx by inhibiting the opening of voltage-gated calcium channels.

5
This inhibition is also likely to be mediated by the diffusible Gβγ subunit (Millan et al. 2003;
Rusakov et al. 2004). Together, the decreases in vesicle cycling, presynaptic excitability, and
calcium entry into the presynaptic terminal provide a compelling set of mechanisms whereby the
Group III mGluRs attenuate transmitter release and are thus considered glutamatergic
autoreceptors.
1.2.1 Structure and pharmacology of the group III mGluRs
Presently, no crystal structures exist for a completely intact Family C GPCR, although
subdomains of several Family C GPCRs have been solved. Recent advances in crystallization of
other GPCRs, such as the active β2 adrenoceptor (Rasmussen et al. 2011), β1 adrenergic receptor
(Warne et al. 2011), adenosine A2A receptor (Xu et al. 2011), CXCR4 (Wu et al. 2010) and D3
dopaminergic receptor (Chien et al. 2010) will hopefully facilitate structural analysis of full
length mGluRs in the near future. This section will focus on the general structure of the Family
C GPCRs with special attention allotted to the Group III mGluRs.
The Group III mGluRs, like all members of the Family C GPCRs are composed of a large
extracellular amino terminus containing a ‘Venus flytrap domain’ (VFD) and a cysteine-rich
domain, followed by a heptahelical transmembrane domain and a C-terminal domain (Hampson
et al. 2008) (Fig. 1.3A). It is widely accepted that GPCRs exist and function as dimers
(discussed below). Following the initial crystallization and structural study of mGluR1
(Kunishima et al. 2000), crystal structures of the extracellular domains (containing the VFD and
cysteine-rich domains) from the Group II (mGluR3) and Group III (mGluR7) mGluRs were
solved (Muto et al. 2007). The VFD is so named as the bi-lobed architecture revealed in the
crystal structure bears likeness to the plant of shared name, and resembles the structure found in
6
periplasmic binding proteins (O'Hara et al. 1993). Based on this structural similarity, a
mechanism for ligand binding and receptor activation has been inferred (O'Hara et al. 1993): At
rest, the two lobes of the VFD exist at equilibrium, freely alternating between open and closed
states. In this state, a partial interaction occurs between the lobes of each VFD in the receptor
dimer. Ligand binding occurs in the cleft between the two lobes of the VFD protomer, with a
preference for binding to a VFD in the open conformation. Once bound, the ligand promotes
closure of the two lobes which stabilizes the closed conformation. Stabilization of the closed
state in one VFD promotes a more extensive interaction between both lobes of each VFD leading
to a large reorientation of the extracellular portion of the receptor and activation of the
transmembrane domain.
Based on this model, where one molecule of agonist drives the transition from resting to
the active state, it was predicted that a single agonist molecule should be sufficient to activate
Family C GPCRs. This model of receptor activation has been supported by experimental
evidence demonstrating the absence of ligand binding in the BR2 subunit of the GABAB
heterodimer (Kniazeff et al. 2002). Additionally, as observed with the mGluR1 homodimer,
only one ligand is required for activation the receptor, but ligand binding in both promoters is
necessary for full receptor activation (Kniazeff et al. 2004). This subtle difference between
activation of homo and heterodimers may be due to the extent of conformational rearrangements
induced by ligand binding in each receptor. One clue to possibly explain this difference is that
the GABAB receptors lack a cysteine-rich domain and therefore require less rearrangement for
full receptor activation.
The cysteine-rich domain is composed of approximately 70 amino acids and contains
nine cysteine residues which, excluding the GABAB receptor, are highly conserved within the

7
Figure 1.3: Putative structure of a metabotropic glutamate receptor dimer.
A, cartoon schematic illustrating the four structural domains of the mGluR dimer. Venus flytrap domain (VFD), cysteine-rich domain (CRD), transmembrane domain (TMD), and C-terminal domain (CTD). B, General organization of an mGluR homodimer inferred from the dimeric crystal structure of the extracellular portion (VFD and CRD) of mGluR7 (pdb 2E4U) and the transmembrane domains of rhodopsin (pdb 2I37). For contrast, the two protomers of the mGluR homodimer are illustrated in red and blue. Four intradomain disulfide bridges (yellow) within the cysteine-rich domain and one disulfide bridge between the cysteine-rich domain and VFD stabilize the extracellular portion of the mGluR.

8
Family C GPCRs. These nine cysteine residues stabilize the cysteine-rich domain through the
formation of four intra-domain disulfide bridges (Muto et al. 2007) and the formation of another
disulfide bridge with the VFD (Rondard et al. 2006) (Fig. 1.3B). Although the cysteine-rich
domain is not involved in ligand binding, the correct folding of this domain and proper formation
of disulfide bridges is obligatory for agonist activation and signal transmission from the VFD to
transmembrane domain (Huang et al. 2011). mGluRs, like all other GPCRs, are characterized
by the heptahelical transmembrane domain which spans the lipid bilayer, although little sequence
homology exists between receptor families. Short loops connect the membrane spanning α-
helices on the cell interior. The third intracellular loop mediates G-protein binding while the
second intracellular loop is the site of kinase phosphorylation.
The least conserved region of the Group III mGluRs is the C-terminal domain which also
happens to be the major site of splice variation to generate receptor isoforms. To date, splice
variants have been discovered for two of the Group III mGluRs, mGluR7a/b and mGluR8a/b.
The mGluR C-terminus is known to mediate many intracellular protein-protein interactions
although it is not known to possess any regular defined structure. Instead, the C-terminal tails of
mGluR6, mGluR7a, and mGluR8a have been shown to have short linear motifs containing
recognition sites for protein binding interspersed between random, unstructured coils (Seebahn et
al. 2011). Although the C-terminal tail of mGluR4 was not examined in this study, it is expected
to structurally resemble the other Group III mGluRs. One of these motifs contains an apparent
protein-binding hotspot near the proximal portion of the mGluR4 C-terminus which
competitively binds calmodulin (CaM) and MAP1B (Moritz et al. 2009) as well as CaM and
Munc18-1 (Nakajima et al. 2009) in a calcium dependant manner (Fig. 1.4). A rise in
intracellular calcium activates CaM which promotes CaM binding to the C-terminus of mGluR4
and causes displacement and liberation of MAP1B and Munc18-1 which are normally

9
Figure 1.4: Protein binding the C-terminal tail of mGluR4
The protein sequence of the C-terminal tail of human mGluR4 (amino acids 848-912) is outlined in the yellow box. Spans of residues necessary for binding of each protein to the C-terminal tail of mGluR4 are indicated next to each interacting protein by maroon lines. An overlapping binding site for CaM, Gβγ, MAP1B and Munc18-1 is found in the proximal portion of the mGluR4 C-terminal tail between residues 848-890.

10
sequestered and inactive. A similar observation was made with the low affinity mGluR7 where
Munc13-1 was also found to bind the proximal portion of the C-terminus (Martin et al. 2010).
Interestingly, this same region of the Group III mGluR C-terminus is known to mediate binding
of the Gβγ subunit. Since the Munc proteins are involved in synaptic vesicle release, these
observations suggest a novel role for the mGluR C-terminus in activity dependant regulation of
synaptic activity whereby activation of at least some of the Group III mGluRs (mGluR7 and
possibly mGluR4) promotes, rather than inhibits glutamate release. The C-terminus of the
Group III mGluRs also mediates interactions with the cytoskeleton by interacting with the actin
binding protein, filamin A (Enz 2002) as well as PICK1 (El et al. 2000) and syntenin (Enz and
Croci 2003). The interactions with these proteins may facilitate presynaptic localization of the
Group III mGluRs.
It is universally accepted that like other GPCRs, the mGluRs function as oligomeric
protein complexes. At minimum, these oligomers exist as dimers but the formation of higher
order structures made up of dimers of dimers, or tetramers remains a possibility. New
techniques are being developed to elucidate the oligomeric state of GPCRs in native tissue
(Albizu et al. 2010). Most studies on the oligomeric nature of mGluRs have thus far revealed
that mGluRs exist as dimers (Romano et al. 1996; Kunishima et al. 2000; Pin et al. 2005), and
this dimeric structure is essential for inter-subunit rearrangement and the receptor activation
process (Brock et al. 2007). Although most studies have observed native mGluRs existing as
homodimers, recent reports of heterodimers have been documented including the
heterodimerization of mGluR1 and the calcium sensing receptor (Gama et al. 2001), mGluR2
and the serotonin 5HT2A receptor (Gonzalez-Maeso et al. 2008), as well heterodimers formed
between different mGluR protomers (Doumazane et al. 2011). In the latter case, a novel
approach to detect the stoichiometry of cell-surface receptors using time-resolved fluorescence
11
energy transfer and covalently linked fluorophore tags revealed that heterodimers can form
within, and between, mGluR subgroups. Interestingly, the mGluRs belonging to Group II and III
could form inter and intra group heterodimers but were not observed to heterodimerize with
Group I mGluRs. Although this work was performed in transfected cells, this observation
indicates that heterodimerization between mGluRs might be specific and functionally relevant in
vivo: Group II and III mGluRs share a common G-protein (Gi/o) and tend to be located
presynaptically, whereas the Group I mGluRs couple to Gq and are located postsynaptically. In
all cases, mGluR homo- and heterodimers are stabilized through the formation of a disulfide
bridge between the VFDs (Romano et al. 1996; Doumazane et al. 2011), non-covalent linkages
between the VFDs, and hydrophobic interactions between transmembrane domains of each
receptor protomer.
Of the Group III mGluRs, the high affinity mGluR4 and mGluR8 receptors bind
glutamate with a low micromolar affinities (~26 μM and ~45 μM, respectively), while mGluR7
binds glutamate with a submillimolar affinity of ~869 μM (Table 1) (Wright et al. 2000;
Rosemond et al. 2004). The prototypical ligand for the Group III mGluRs, L-AP4, is a synthetic
analog to the endogenous amino acid derivative, L-SOP. L-AP4 displays much higher affinity
than glutamate for the Group III mGluRs [mGluR4: ~0.5 μM, mGluR8: ~1.5 μM, mGluR7: ~200
μM (Wright et al. 2000; Antflick et al. 2009)] and as such, has been exploited as an experimental
tool towards understanding the physiology and function of the Group III mGluRs within the CNS
(Table 1). A unique microenvironment of positively charged residues in the ligand binding
pocket of the Group III mGluR VFD stabilizes phosphonate moieties and hence favors the
binding of L-AP4 and L-SOP (Rosemond et al. 2002). Despite the similarities between the
binding pockets of mGluR4 and mGluR8 selective ligands for mGluR8 exist such as (R,S)-PPG,
and (S)-3,4-DCPG which binds mGluR8 preferentially with nanomolar affinity

12
Table 1: EC50 value ranges for Group III mGluR agonists
Table adapted from (Schoepp et al. 1999)

13
(Table 1) (Naples and Hampson 2001; Thomas et al. 2001). The development of orthosteric
ligands displaying selectivity for mGluR4 over mGluR8 has been less successful; instead,
positive allosteric modulators, selective for mGluR4 have been developed beginning with (-)-N-
Phenyl-7-(hydroxyimino)cyclopropa[b]chromen-1a-carboxamide [(-)-PHCCC] (Maj et al.
2003). PHCCC binds in the transmembrane domain of mGluR4 but does not directly activate the
receptor. Instead, PHCCC binding enhances the signal generated by ligand binding in the
orthosteric binding site. The use of receptor allosterism is advantageous in treatment of diseases
since it augments normal receptor activity. PHCCC and other compounds built on the PHCCC
scaffold are emerging as promising therapeutics for the treatment of Parkinson’s disease
(Lindsley et al. 2009; Williams et al. 2010). Competitive antagonists also exist for the Group III
mGluRs and include M-SOP and M-AP4 which have IC50 values at the Group III mGluRs in the
25-190 μM range.
1.2.2 Distribution of the Group III mGluRs
With the exception of mGluR6, the Group III mGluRs are localized presynaptically on
glutamatergic axon terminals and are present within the active zone as observed with mGluR7
(Kinoshita et al. 1998) and mGluR4 (Elezgarai et al. 1999; Mateos et al. 1999; Corti et al. 2002),
or nearby the active zone as observed for mGluR8 (Ferraguti et al. 2005). The presynaptic
localization of the Group III mGluRs on glutamatergic axon terminals imparts the ability to sense
synaptic glutamate concentrations and relay this information to the presynaptic terminal.
Elevated synaptic glutamate concentrations activate the Group III mGluRs, which then provide
negative feedback to the presynaptic terminal to attenuate further glutamate release in order to
maintain homeostatic levels of synaptic glutamate. Thus, the Group III mGluRs function as
glutamatergic autoreceptors (discussed below 1.2.3).

14
In addition to the localization on glutamatergic axon terminals, several Group III mGluRs
(including mGluR4, mGluR7a, and mGluR8a) have also been identified presynaptically on non-
glutamatergic terminals such as inhibitory hippocampal interneurons (Semyanov and Kullmann
2000; Kogo et al. 2004). Although GABAergic nerve terminals contain low concentrations of
glutamate (Somogyi et al. 1986), it is unlikely that in these inhibitory interneurons the Group III
mGluRs are functioning as autoreceptors to sense the release of synaptic glutamate. Instead,
presynaptic Group III mGluRs present on GABAergic terminals are likely to function as
heteroreceptors by sensing glutamate spillover from nearby glutamatergic synapses. Support for
this idea comes from the detection of elevated GABA release in thalamocortical circuitry in the
mGluR4 knockout mouse by microdialysis (Wang et al. 2005). This observation indicates that
mGluR4 is (and possibly other Group III mGluRs are) necessary for maintaining homeostatic
levels of glutamate and GABA in the CNS. The Group III mGluRs also regulate the release of
other transmitters including substance P, dopamine, and acetylcholine [reviewed in (Cartmell
and Schoepp 2000)].
Comprehensive immunocytochemical surveys examining the expression levels and
distributions of the Group III mGluRs within the CNS have been conducted for mGluR4
(Kinoshita et al. 1996b; Corti et al. 2002), mGluR7 (Kinoshita et al. 1998) and mGluR8
(Kinoshita et al. 1996a; Ferraguti et al. 2005). When taken together, these studies illustrate that
the Group III mGluRs are widely distributed throughout the CNS and display a high degree of
brain region overlap underscoring the widespread and important function provided by the Group
III mGluRs as auto- and heteroreceptors. Of these three centrally expressed mGluRs, the low
affinity mGluR7 displays the most widespread distribution with the highest levels being detected
in the olfactory bulb, medial septal nucleus and locus coeruleus. mGluR7 is also expressed in
the neocortex, amygdala, hippocampus (entorhinal cortex, dentate gyrus) and in cerebellar

15
Purkinje cells. mGluR4 expression is detected at the highest levels in cerebellar granule cell
axons (parallel fibers), whereas moderate expression of mGluR4 is detected in granule cells of
the olfactory bulb, hippocampus, amygdala, thalamic nuclei, and immature Calyx of Held axon
terminals in the medial nucleus of the trapezoid body. mGluR8 is expressed highest in the
olfactory bulb although moderate levels of expression are found throughout the neocortex,
hippocampus, cerebellum and amygdala.
The Group III mGluRs are expressed almost exclusively in neurons, unlike the Group I
(e.g. mGluR5) and Group II (e.g. mGluR2/3) receptors which are expressed in both neurons and
glia, such as astrocytes (Nakahara et al. 1997; Ulas et al. 2000; Aronica et al. 2000). However,
emerging evidence indicates that the Group III mGluRs are also expressed in microglia
(mGluR8), and in astrocytes surrounding lesions in the brains of multiple sclerosis patients
(mGluR4), but not in the glial cells of healthy controls (Geurts et al. 2005). These results remain
somewhat controversial as glial cells in culture express mRNA for all four Group III mGluRs
(Besong et al. 2002); whether this mRNA is translated into functional protein on glial cells
within the brain remains to be clarified. Additionally, a role of mGluR4 in immunity has
recently been proposed based on the finding that mGluR4 knockout mice are vulnerable to
experimentally induced encephalitis, an animal model for multiple sclerosis, suggesting the
presence of mGluR4 on dendritic cells and T-helper immune cells (Fallarino et al. 2010).
1.2.3 The functional role of mGluR4 in the central nervous system
Within the CNS, mGluR4 predominately inhibits the release of glutamate (as an
autoreceptor), and GABA (as a heteroreceptor), from presynaptic nerve terminals. Therefore,
mGluR4 can function to balance excitation and inhibition whereby the activation of mGluR4 can

16
either decrease excitability by reducing the probability of glutamate release, or increase
excitability by reducing the probability of GABA release.
In a well studied example, immature Calyx of Held synapses (before postnatal day 8)
located in the medial nucleus of the trapezoid body, displayed reduced excitatory output upon
application of L-AP4 (Takahashi et al. 1996; von Gersdorff et al. 1997). However, when
examined from the standpoint of endogenous mGluR4 activation (by inhibiting glutamate uptake
with glutamate transporter blockers), elevated synaptic glutamate concentrations did not appear
to activate mGluR4, and had no effect on synaptic amplitude (Renden et al. 2005; Billups et al.
2005).
Another well studied example of the effect of mGluR4 on synaptic transmission is the
parallel fiber-Purkinje cell synapse in the cerebellum. In the cerebellum, mGluR4 is expressed at
very high levels on parallel fiber terminals, the axons of granule cells which form synapses with
Purkinje cell dendrites. One major advantage of this preparation for the study of mGluR4 is that
this is the only Group III receptor known to be expressed at this synapse (Abitbol et al. 2008).
Experimentally, the exogenous application of L-AP4 (or L-SOP) to cerebellar slices reduced the
excitatory postsynaptic current (EPSC) at parallel fiber-Purkinje cell synapses (Pekhletski et al.
1996; Lorez et al. 2003). At Schaffer collateral-CA1 synapses in the hippocampus, application
of L-AP4 at high (micromolar) concentrations depresses synaptic transmission in both immature
(neonatal) and mature synapses, suggesting that the low affinity mGluR7 is the predominant
Group III mGluR responsible for mediating synaptic depression (Gereau and Conn 1995).
Curiously, both mGluR4 and mGluR8 are expressed at this synapse, but the use of subtype
selective agonists for these receptors revealed that mGluR8 (activated with DCPG) is only active
at immature synapses while mGluR4 (potentiated with PHCCC) is not activated in immature nor

17
mature synapses (Ayala et al. 2008). In contrast, another hippocampal synapse, mossy fiber-
CA3 interneuron, shows synaptic depression and action potential delay mediated by high affinity
mGluR4/8 receptors and a lack of involvement of mGluR7 (Cosgrove et al. 2010).
Taken together, studies in the Calyx of Held, parallel fiber-Purkinje cell, Schaffer
collateral-CA1, and mossy fiber-CA3 synapses have established a role for mGluR4 in mediating
synaptic depression, but have yet to show that mGluR4 is endogenously activated by glutamate.
Experimental paradigms designed to examine endogenous mGluR4 autoreceptor activity have
failed to demonstrate that endogenous activation of mGluR4 by glutamate mimics the exogenous
activation by L-SOP or L-AP4. The conspicuous lack of endogenous mGluR4-mediated
synaptic depression in these preparations potentially suggests an undiscovered mechanism for
endogenous activation of mGluR4. Despite a complete understanding of mGluR4 autoreceptor
activity, mGluR4 has emerged as a viable drug target based on the ability to respond to
exogenous activation and decrease subsequent glutamate release.
Based on the CNS distribution, predominant presynaptic localization and dampening
effect on glutamatergic and GABAergic neurotransmission, the Group III mGluRs emerge as
potential therapeutic targets in the treatment of many serious CNS disorders such as Parkinson’s
disease, Alzheimer’s disease, epilepsy, anxiety and pain (Niswender and Conn 2010). To date,
no drugs targeting individual Group III mGluRs exist to treat any of the above mentioned
disorders. However, a tremendous amount of work is being conducted on the development of
allosteric modulators of the mGluRs in hopes of improving subtype specificity and efficacy
[reviewed in (Hopkins et al. 2009; Lindsley et al. 2009; Williams et al. 2010)]. Since allosteric
modulators do not directly activate the target receptor and only potentiate the activity of the
ligand binding at the orthosteric site, it is important to understand the mechanisms of endogenous

18
receptor activation. Although all subtypes of the Group III mGluRs are activated by glutamate,
other amino acid derivatives are known to possess markedly higher affinities at the Group III
mGluRs compared to glutamate; this suggests that the Group III mGluRs may be activated by an
alternative endogenous ligand(s). One possible candidate is L-SOP which is a metabolite in the
de novo synthesis of L-serine, and is known to be an agonist for Group III mGluRs. This thesis
sought to evaluate the hypothesis that L-SOP is the endogenous agonist for mGluR4 in the CNS.
1.3 The L-serine biosynthetic pathway
L-Serine is a dietary non-essential amino acid that is generated in the body, in part by
proteolysis, and in part by de novo synthesis. In mammals, the predominant intrinsic synthetic
pathways vary in different tissues and during different stages of development. For instance, the
majority of L-serine synthesized by the human fetal liver comes from glycine by the combined
action of the glycine cleavage system and serine hydroxymethyltransferases (Narkewicz et al.
1996), whereas in the adult human kidney and in the CNS, most of the L-serine is synthesized
via a route known as the phospohorylated L-serine biosynthetic pathway (Lowry et al. 1987; Fell
and Snell 1988; Snell and Fell 1990). Since L-serine has poor permeability at the blood-brain-
barrier (Smith et al. 1987), synthesis of L-serine within the CNS is necessary to meet the
demands of the developing brain. The phosphorylated pathway encompasses three enzymatic
steps (Fig. 1.5). In the first step, 3-phosphoglycerate derived from glycolysis is metabolized into
phosphohydroxypyruvate by 3-phosphoglycerate dehydrogenase (Yamasaki et al. 2001). In the
second step, phosphohydroxypyruvate and L-glutamate are transaminated to form L-SOP and α-
ketoglutarate by the vitamin B6-dependent enzyme, phosphoserine aminotransferase (PSAT)
(Hester et al. 1999). L-SOP is then hydrolyzed by phosphoserine phosphatase (PSP) (Collet et
al. 1999) to produce L-serine and inorganic phosphate. This pathway is believed to be energy
19
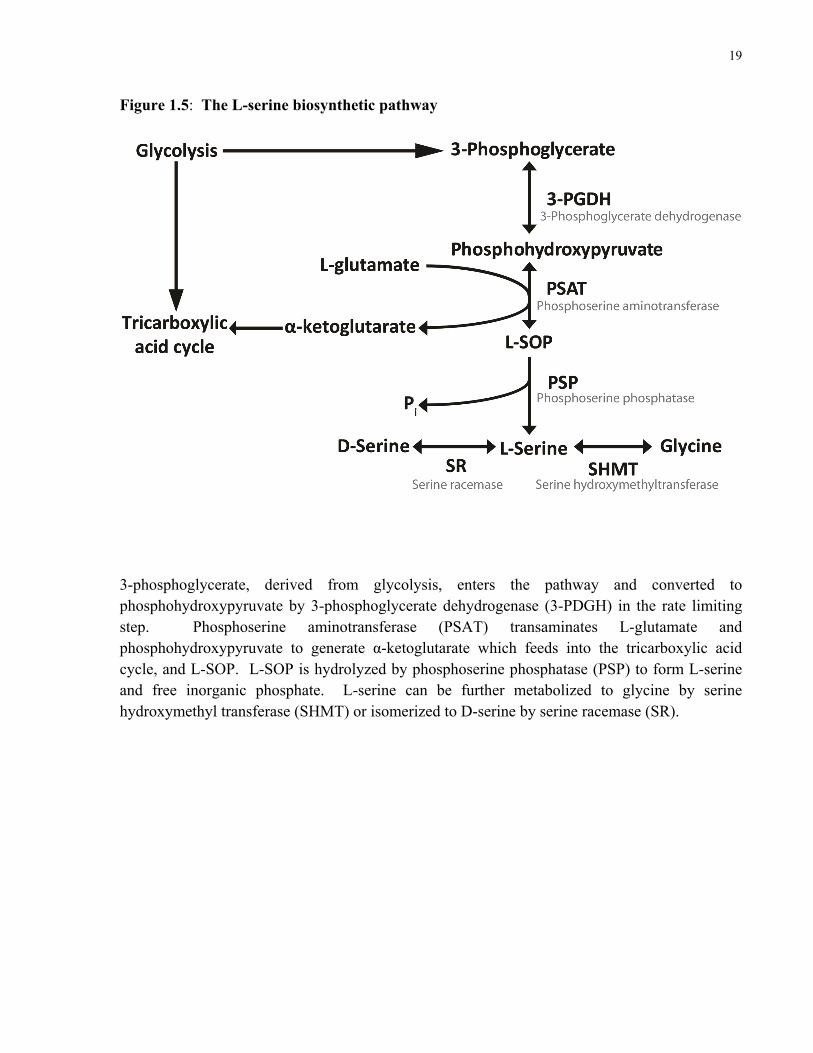
Figure 1.5: The L-serine biosynthetic pathway
3-phosphoglycerate, derived from glycolysis, enters the pathway and converted to phosphohydroxypyruvate by 3-phosphoglycerate dehydrogenase (3-PDGH) in the rate limiting step. Phosphoserine aminotransferase (PSAT) transaminates L-glutamate and phosphohydroxypyruvate to generate α-ketoglutarate which feeds into the tricarboxylic acid cycle, and L-SOP. L-SOP is hydrolyzed by phosphoserine phosphatase (PSP) to form L-serine and free inorganic phosphate. L-serine can be further metabolized to glycine by serine hydroxymethyl transferase (SHMT) or isomerized to D-serine by serine racemase (SR).

20
intensive due to the siphoning of 3-phosphoglycerate for the production of L-serine at the
expense of ATP generation through the tricarboylic acid cycle and oxidative phosphorylation.
However, the transmination reaction catalyzed by PSAT generates α-ketoglutarate which can
feed back into the tricarboxylic acid cycle to generate ATP and NADPH.
Several major alternative routes of serine catabolism also exist. L-Serine can be
isomerized to D-serine by the enzyme serine racemase (Wolosker et al. 1999) where is acts as
the co-agonist at the NMDA receptor, or converted to glycine by the cytosolic (SHMT1) and
mitochondrial (SHMT2) isoforms of serine hydroxymethyltransferase (Stover et al. 1997;
Macfarlane et al. 2008). L-Serine is also metabolized into pyruvate by serine dehydratase
(Nakagawa et al. 1967), or converted into cystathionine by cystathionine beta-synthase (Kraus et
al. 1993).

21
1.3.1 Involvement of the L-serine biosynthetic pathway in CNS
development
Biologically, L-serine is an important metabolic precursor in the synthesis of proteins,
sphingolipids, other amino acids, and nucleotides (Furuya 2008). L-serine synthesis in the CNS
was thought to occur exclusively in astrocytes in order to relieve neurons of the metabolic
burden of synthesizing L-serine (Dringen et al. 1998; Yamasaki et al. 2001). However, recent
evidence, including data presented in this thesis, has also indicated neuronal expression of the
enzymes necessary for L-serine synthesis (Kartvelishvily et al. 2006; Miya et al. 2008). The L-
serine biosynthetic pathway accounts for approximately 90% of endogenously derived L-serine
which is obligatory in regulating the growth and survival of neurons (Mitoma et al. 1998; Furuya
et al. 2000; Hirabayashi and Furuya 2008; Furuya 2008). Proper functioning of the L-serine
biosynthetic pathway is also known to be crucial for normal CNS development. Complete
genetic knockout of 3-phosphoglycerate dehydrogenase in mice was shown to result in lethality
at embryonic day 13.5. These embryos also displayed significant abnormalities in brain
morphogenesis compared to wild-type mice of the same strain (Yoshida et al. 2004) and had
impaired spinal cord neurogenesis (Kawakami et al. 2009). Conditional glial specific 3-
phosphoglycerate dehydrogenase knockout mice, driven by the GFAP promoter, survive into
adulthood, unlike the complete knockout, although CNS levels of both L- and D-serine are
drastically reduced the and overall brain size is markedly smaller than the 3-phophoglycerate
dehydrogenase expressing littermates (Yang et al. 2010). Despite the impairment in the
production of glial L-serine, some residual expression of 3-phosphoglycerate dehydrogenase
remains, and L-serine levels do not drop to zero in these mice possibly indicating a neuronal
source of L-serine synthesis.

22
Although rare, mutations in the three enzymes of the L-serine biosynthetic pathway have
been detected in humans which tend to be both heritable, and recessive. The enzyme most
commonly affected is 3-phosphoglycerate dehydrogenase. Mutations that reduce the enzymatic
activity 3-phosphoglycerate dehydrogenase prevent endogenous L-serine synthesis and cause a
reduction in cerebrospinal fluid concentrations of L-serine and glycine, decreased head
circumference, psychomotor retardation, and epilepsy (Jaeken et al. 1996; de Koning et al. 1998;
Klomp et al. 2000; Tabatabaie et al. 2011). In all cases, early supplementation with high doses
of oral serine (400-500 mg/kg/day) and glycine (200-300 mg/kg/day) can normalize head
circumference and abrogate seizures (de Koning 2006). Neurological effects in humans resulting
from mutations in 3-phosphoglycerate dehydrogenase manifest during gestation at approximately
20 weeks (de Koning et al. 2004) which coincides with a period of rapid neuronal proliferation
and the formation of glutamatergic synapses (Herlenius and Lagercrantz 2004). If diagnosed and
treated during the prenatal stage (through maternal L-serine supplementation), L-serine
deficiency syndromes can be completely prevented (de Koning et al. 2004).
Two cases of PSAT deficiency were documented in a pair of siblings where both children
presented decreased levels of L-serine and glycine in plasma and cerebrospinal fluid samples
(Hart et al. 2007). In one sibling, L-serine and glycine supplementation from 11 weeks onward
normalized the levels of L-serine and glycine in the plasma and cerebrospinal fluid but was
unable to control the seizures, and the patient died at 7 months of age. In the younger sibling,
treatment with L-serine and glycine began immediately (within 24 hours of birth) and at 3 years
of age the patient was considered to be normal.
One human case of a mutation in PSP has been documented (although complicated by a
parallel diagnosis with William’s syndrome) where the patient displayed reduced cerebrospinal

23
Figure 1.6: Chemical structures of L-glutamate, L-SOP, L-AP4, GABA, L-serine, and D-
serine.

24
fluid levels of L-serine and glycine and a decreased head circumference (Jaeken et al. 1997;
Veiga-da-Cunha et al. 2004). The common set of severe CNS deficits presented in patients with
mutations in the enzymes of the L-serine biosynthetic pathway namely, epilepsy, psychomotor
retardation and reduced head circumference (microcephaly) illustrate the importance of adequate
levels of L-serine, and downstream metabolites (D-serine and glycine) for proper CNS
development.
1.3.2 Bioactivity of L-serine metabolites in the CNS
From a neurochemical perspective, D-serine and glycine, the direct metabolites of L-
serine, are known co-agonists at the glycine site of the NMDA receptor. However, D-serine
displays much higher affinity for this binding than glycine and may be the real endogenous
agonist at the NMDA receptor (Mothet et al. 2000; Shleper et al. 2005). D-serine can also bind
to the orphan GluRδ2 receptor (Naur et al. 2007). During the early postnatal period (postnatal
days 11-17) endogenous D-serine activation of the GluRδ2 receptor, located on distal Purkinje
cell dendrites synapsing with parallel fibers has been shown to regulate cerebellar long term
depression and motor coordination (Kakegawa et al. 2011).
L-SOP, the direct precursor to L-serine, along with the synthetic analog L-AP4 are
agonists at the Group III mGluRs. Despite the use of exogenous L-SOP in the study of mGluRs
(Han and Hampson 1999; Tatarczynska et al. 2001; Yip et al. 2001), little is known regarding
the endogenous activity of this molecule. Recently, a small molecule library screen found L-
SOP to inhibit proliferation and promote differentiation of cultured neurospheres (Saxe et al.
2007). A parallel study identified L-SOP as a regulator of neurogenesis and observed PSP
expression in the subgranular zone of the hippocampus, a known neurogenic area in the adult

25
rodent CNS (Nakano et al. 2007). Both studies found the differentiation effects resulting from
L-SOP application were mediated by the activation of mGluR4. Although exogenous L-SOP
was used to activate mGluR4 in these studies, these results indicate potential involvement of
endogenous mGluR4 activation by L-SOP acting as a balance between proliferation and
differentiation. Moreover, mGluR4 activation in vivo by the positive allosteric modulator,
PHCCC, was observed to slow the proliferation of medulloblastoma cells and decrease the size
and severity of these aggressive tumors by promoting differentiation of the tumorigenic granule
precursor cells (Canudas et al. 2004; Iacovelli et al. 2006).
1.4 GABAergic neurotransmission and GABA receptors
The gamma-aminobutyric acid receptors (GABAR) are the major inhibitory receptors in
the vertebrate CNS and are classified as GABAA, GABAB, and GABAC receptors (Fig. 1.7).
Whereas the GABAB receptors belong to the Family C GPCR superfamily (with mGluRs) the
GABAA and GABAC receptors are ligand gated, heteropentameric chloride channels composed
of α, β, γ, δ or ρ1, ρ2, ρ3 subunits respectively. The most commonly found GABAA receptors
are composed of two α, two β and one γ subunit although many permutations have been
identified within the CNS. All three types of GABAR are primarily located postsynaptically and
promote hyperpolarization either though influx of chloride (GABAA) or through the activation of
potassium channels (GABAB) when bound by GABA or in the case of the GABAA receptors,
alcohol, barbiturates, benzodiazepines and volatile anesthetics.
1.4.1 Presynaptic GABAA receptors
Most GABAA receptors in the CNS are located postsynaptically. Nevertheless, the
notion of presynaptic GABAA receptors in the CNS was first posited by Eccles nearly half a

26
Figure 1.7: Classification of GABA receptors
GABAA receptors (left) are hetero-pentameric chloride channels typically composed of two α, two β and one γ subunits. GABAB receptors (center) are G-protein coupled receptor heterodimers made up of a R1 and R2 subunit. Like the GABAA receptors, GABAC receptors also function as chloride channels but are homomeric pentamers consisting of ρ subunits.

27
century ago (Eccles et al. 1967), and only recently has the existence of presynaptic GABAA
receptors been confirmed in several brain regions by electrophysiological experiments and
electron microscopy (Stell et al. 2007; Trigo et al. 2007; Long et al. 2009; Han et al. 2009; Trigo
et al. 2010). Activation of presynaptic GABAA heteroreceptors located on glutamatergic axon
terminals increases axonal excitability resulting in the promotion of glutamate release.
Although seemingly counterintuitive, activation of presynaptic GABAA receptors
promotes depolarization of the nerve terminal as the open channel permits chloride efflux
causing the terminal to become more positive relative to the extracellular space. In fact,
excitatory GABAA receptor activity is found in the immature CNS (before approximately
postnatal day 8-12). The equilibrium potential for chloride in axons and dendrites of immature
neurons is more depolarized due to the high expression and activity of the Na-K-Cl cotransporter
(NKCC1) promoting intracellular accumulation of chloride (Yamada et al. 2004). When
GABAA receptors are activated, chloride rushes out leading to a loss of negative intraterminal
charge which leads to depolarization. Conversely, as the CNS matures, a developmental switch
in the activity of GABA occurs as neurons begin to express K-Cl symporter (KCC2) on their
dendrites which actively extrudes chloride (Yamada et al. 2004), thus leading to a more
hyperpolarized equilibrium potential for chloride. In these mature neurons, activation of
postsynaptic GABAA receptors thus promotes chloride influx, leads to dendritic
hyperpolarization, and facilitates the inhibitory activity of GABA. Interestingly, KCC2
expression does not appear to increase on axon terminals even though NKCC1 expression
remains high. Therefore, even in the mature CNS, axon terminals retain the ability to
accumulate chloride and presynaptic GABAA receptors continue to remain excitatory (Jang et al.
2001; Khirug et al. 2008). The resting somatic chloride concentration is approximately 4 mM,
however owing to the activity of the NKCC1 transporter, axon terminals can accumulate

28
chloride, resulting in a 4-5 times higher chloride concentration in the terminals compared to the
soma. Although a precise value for the intraterminal chloride concentration remains elusive,
measurements in several brain regions have confirmed that it is indeed elevated relative to the
soma. Estimates include 21 mM in the Calyx of Held (Price and Trussell 2006), 20 mM in the
posterior pituitary (Zhang and Jackson 1995), 22 mM in retinal ON bipolar cells (Billups and
Attwell 2002), and 30 mM in immature neocortical neurons (Achilles et al. 2007).
When chloride efflux depolarizes the presynaptic terminal, calcium channels are opened
and the probability of transmitter release increases. Examples of this phenomenon include the
Calyx of Held terminals in the medial nucleus of the trapezoid body (Turecek and Trussell
2002), and the mossy fiber terminals in the CA3 region of the hippocampus (Ruiz et al. 2010).
In the cerebellum, presynaptic GABAA receptors located on parallel fiber axon terminals have
been shown to facilitate glutamate release onto Purkinje cell dendrites (Stell et al. 2007; Dellal et
al. 2012) and stellate cells (Pouzat and Marty 1999; Pugh and Jahr 2011) when activated by
GABA spillover from nearby GABAergic synapses. Additionally, presynaptic GABAA
receptors also act as autoreceptors on the axons of GABAergic interneurons in the neocortex
(Mantovani et al. 2009) and molecular layer interneurons the cerebellum to facilitate transmitter
release (Trigo et al. 2010). Although an initial facilitation in transmitter release is observed
when presynaptic GABAA are opened, prolonged activation (>10 seconds) produces a refractory
period of decreased excitability, presumably due to inactivation of sodium channels and closing
of voltage-gated calcium channels, as evidenced by reduced calcium influx (Stell 2011). This
biphasic action of presynaptic GABAA receptors is physiologically important: the initial
facilitation ensures reliable propagation of the outgoing parallel fiber signal, and serves to
distinguish a mossy fiber- granule cell burst of activity from random spiking. The refractory
depression is believed to prevent this positive feedback loop from running out of control,

29
specifically at inhibitory molecular layer interneuron- Purkinje cell synapses (Trigo et al. 2007;
Stell et al. 2007).
Presynaptic GABAA receptors are of particular interest in this thesis project due to an
apparent anatomical overlap with mGluR4 in many brain regions of the CNS. The earliest
evidence for presynaptic expression of GABAA receptors comes from the spinal cord. Here,
axo-axonic connections activate ‘presynaptic’ GABAA receptors and mediate presynaptic
inhibition of transmitter release (Gray 1962). Axo-axonic activation of these GABAA receptors
likely produces a large depolarization which inactivates voltage gated sodium and calcium
channels. However, there is little evidence for the existence of mGluR4 in the spinal cord, save
the presence of mGluR4 mRNA from RT-PCR analysis (Valerio et al. 1997).
Within the rat cerebellum, mGluR4 is expressed exclusively at granule cell- parallel fiber
axon terminals which synapse onto the distal portion of Purkinje cell dendrites (Tanabe et al.
1993; Corti et al. 2002). Recently, presynaptic GABAA receptors have been identified on
parallel fiber axon terminals (Stell et al. 2007), although it is presently unknown whether
mGluR4 and GABAA receptors exist on the same populations of parallel fiber terminals. These
GABAA receptors are known to contain the α1 subunit; however, the remaining subunit
composition of the pentameric receptor remains unknown. Presynaptic GABAA receptors have
also been found to exist on parallel fibers innervating molecular layer interneurons (basket cells,
stellate cells) in the immature rat cerebellum (Pouzat and Marty 1999; Trigo et al. 2007).
Within the rat hippocampus mGluR4a immunoreactivity is detected pre-synaptically on
mossy fibers (Bradley et al. 1996). Similarly, GABAA receptors have been found to also exist
pre-synaptically at mossy fiber synapses (Ruiz et al. 2003) and can both promote (Han et al.
2009; Ruiz et al. 2010) and attenuate (Ruiz et al. 2003) glutamate release at this synapse. In the

30
latter study, depression of terminal excitability was observed after an initial period of enhanced
excitability, consistent with the biphasic action of presynaptic GABAA receptors (discussed
above). It is suggested that these hippocampal presynaptic GABAA receptors contain α2 and γ2
subunits, although the exact composition of the functional receptor remains unknown.
Interestingly, it appears that in neonatal rats, mGluR-mediated mossy fiber excitability is at first
controlled by the high affinity mGluR4 or mGluR8 receptors, and in adulthood, the control of
excitability is mediated by the lower affinity mGluR7 receptor (Ayala et al. 2008).
In the Calyx of Held an interesting similarity in temporal expression is noted with both
mGluR4 and GABAA receptors. During the early stages of synapse development, mGluR4
mediated inhibition of glutamate release peaked at postnatal days 5-7 (Renden et al. 2005) while
mGluR4 labeling of calyx terminals peaked at postnatal days 8-9 (Elezgarai et al. 1999); both the
labeling and activity steadily begin to decrease after postnatal day 10. Moreover, GABAA
receptor expression at the axon terminals also peaked between postnatal day 5-7 before glycine
receptor expression gradually increased, and predominated over GABAA -mediated signaling
past postnatal day 11 (Turecek and Trussell 2002). This paired expression and activity of
mGluR4 and GABAA receptors makes it tempting to speculate that a physical, and perhaps
functional, interaction occurs between this GPCR and an ion channel.
1.5 Hypotheses, objectives, and rationale
L-SOP is a metabolite in the L-serine biosynthetic pathway and is also a high affinity
ligand for the Group III mGluRs. Despite the widespread use of exogenous applications of L-
SOP to cell and tissue preparations to study the Group III mGluRs, little is known regarding the
potential activity of endogenous L-SOP at the Group III mGluRs. The general hypothesis

31
guiding this study is that L-SOP is the endogenous ligand for mGluR4, and possibly other Group
III receptors, in the CNS. We hypothesized that (1) L-SOP is present in the CNS at
concentrations sufficient to activate mGluR4, (2) that the enzymatic machinery required for L-
SOP synthesis and metabolism is expressed in cells making up, or surrounding synapses
containing mGluR4, (3) that the L-serine biosynthetic pathway can be modulated in vivo to
increase L-SOP production in the CNS in order to elucidate the functional importance of
mGluR4 activation by endogenous L-SOP, and (4) that the L-SOP/mGluR4 ligand receptor pair
regulates excitability and glutamate release from granule cell axon terminals in the cerebellum.
Objective 1. To quantitate the levels of L-SOP in the CNS and to identify brain regions and cell
types capable of synthesizing L-SOP.
The first specific aim of this project involved measuring the levels of L-SOP in rat brain
and determining the relative potency of L-SOP at mGluR4. Very few studies have examined the
concentration of L-SOP in the CNS, and of those attempted, little agreement exists between the
values obtained in each study (Porcellati 1958; McIlwain and Bachelard 1985; Kataoka et al.
1991; Goodnough et al. 1995). The methodology that we developed for the analysis of L-SOP in
brain tissue provided a reliable and reproducible technique for the analysis of L-SOP and several
other amino acids (Rauw et al. 2010). These results will reveal a global snapshot of the rat CNS
concentrations of L-SOP in whole brain and cerebellum.
To determine if the concentrations of L-SOP in discrete brain regions are sufficiently
high to activate mGluR4, the brain regions containing cells capable of synthesizing L-SOP need
to be identified. Thus, the second specific aim of this project was to identify brain regions, and
the cells within these brain regions, capable of synthesizing L-SOP. Since no studies had
previously examined the CNS expression and distribution of the enzymes responsible for

32
synthesis and metabolism of L-SOP, antibody probes were developed to perform
immunocytochemical analysis on rat brain tissue and identify the distributions of PSAT and PSP
in the CNS. If L-SOP is the endogenous transmitter at mGluR4 it would seem applicable that the
machinery required for the synthesis and metabolism of L-SOP would be expressed in cells
nearby mGluR4 containing synapses. Since the distribution of mGluR4 is widespread
throughout the CNS, with the highest levels of mGluR4 expression found on mossy fiber
terminals in CA1-3 region of the hippocampus (Corti et al. 2002) and granule cell axon terminals
in the molecular layer of the cerebellum (Kinoshita et al. 1996b), a whole brain
immunocytochemical analysis on the expression of PSAT and PSP was conducted with special
focus on the hippocampus and cerebellum.
Objective 2. To study the effects of elevated levels of endogenous L-SOP on the CNS through
genetic or dietary manipulation of the L-serine biosynthetic pathway in mice.
The goal of this objective was to create a mouse with elevated levels of L-SOP in the
CNS in order to elucidate the functional role of the endogenous ligand receptor pair of L-
SOP/mGluR4. Three different approaches to create a mouse with elevated levels of L-SOP in
the CNS are described. L-SOP and L-serine have poor penetrance at the blood brain barrier due
to the low affinity at the neutral amino acid transporter (Smith et al. 1987) which precluded the
injection of L-SOP systemically to order to raise the levels of L-SOP in the CNS. Instead,
genetic and dietary strategies were employed to endogenously raise L-SOP levels.
The first approach involved the creation of a mouse with decreased PSP enzymatic
activity. This approach is preferable to the creation of a knockout mouse owing to the high
probability of embryonic lethality in a complete PSP knockout. The second approach involved
increasing the synthesis of L-SOP by attempting to generate PSAT over-expressing transgenic

33
mice. The third approach involved nutrient suppression of dietary protein which has been shown
to up-regulate the activity of the L-serine biosynthetic pathway in peripheral tissues (Mauron et
al. 1973). For all three strategies, a combination of western blotting and HPLC was used to
examine the expression of the enzymes in the L-serine biosynthetic pathway, and to measure the
levels of metabolites to assess the success of endogenous modulation of L-SOP in the CNS.
Objective 3. To examine the functional role of the potential endogenous L-SOP/mGluR4 ligand
receptor pair as it pertains to parallel fiber excitability and glutamate release in the cerebellum.
The third objective of this study was to examine the functional importance of mGluR4
activation by L-SOP in cerebellar tissue. From a technical standpoint, measuring mGluR4
activity through the examination of presynaptic excitability and presynaptic glutamate release are
challenging and require the use of electrophysiological approaches. For this reason, this project
was examined using biochemical methods. The first specific aim of this project was to examine
the effects of L-SOP activation of mGluR4 on the release of radiolabeled glutamate from
preloaded cerebellar synaptosomes. L-AP4, instead of L-SOP, was employed in these
experiments to study mGluR4 activation due to the enhanced stability of L-AP4. Moreover, as
demonstrated by us and others, L-SOP and L-AP4 have very similar affinity (see Fig. 3.1) and
functional responses at mGluR4. Synaptosomes are a suitable preparation for these experiments
as they are metabolically active and capable of both transmitter uptake and release. Additionally,
synaptosome preparations from cerebellar tissue are highly enriched in parallel fiber terminals
which are known to express high levels of mGluR4. The experimental conditions used to
promote glutamate release from synaptosomes were chosen to mimic the endogenous activity of
parallel fibers. During parallel fiber activity, mGluR4 is thought to function as an autoreceptor
to decrease subsequent glutamate release. Since presynaptic mGluR4 and GABAA receptors

34
exert opposite effects on glutamate release, the effect of L-SOP activation of mGluR4 was
examined for the ability to regulate GABAA receptor mediated glutamate release from
depolarized cerebellar synaptosomes.
The second specific aim of this study was to examine the neurochemical effects arising
from the loss of the L-SOP/mGluR4 ligand receptor pair in the mGluR4 knockout mouse. The
motor learning and short term plasticity deficits observed in the mGluR4 knockout (Pekhletski et
al. 1996) mouse suggest elevated levels of presynaptic excitability in parallel fibers. The
mGluR4 knockout mice are resistant to absence seizures induced by low doses of GABAA
antagonists which suggests an alteration in GABAergic signaling (Snead, III et al. 2000).
Additionally, preliminary unpublished data from our lab indicated that the expression levels of
GABAA receptors were decreased in the mGluR4 knockout mice. Taken together these
observations suggest that a decrease in GABAA receptor expression is possibly a compensatory
adaptation to decrease and normalize the elevated level of parallel fiber excitability resulting
from loss of L-SOP/mGluR4 autoreceptor signaling in the mGluR4 knockout mouse. This
hypothesis was investigated by quantitative western blotting and autoradiography of GABAA
receptors in cerebellar tissue from mGluR4 knockout mice.
35
CHAPTER 2. Materials and Methods
2.1 Reagents
Unless otherwise specified all drugs were purchased from Tocris Biosciences. All
chemicals were procured from Sigma or Bioshop. Primary antibodies used in this study for
western blot (WB) and immunocytochemistry (ICC) included the following: rabbit anti-PSP
[WB 1:100; ICC 1:1000, (Antflick et al. 2009)], chicken anti-PSAT (WB 1:4000; ICC 1:1000,
Genway Biosciences), mouse anti-GFAP (ICC 1:1000, Millipore), mouse anti-MAP2 (ICC
1:200, Millipore), mouse anti-S100β (ICC 1:200, Sigma), mouse anti-PSA-NCAM (ICC 1:200,
Millipore), mouse anti-serine racemase (WB 1:1000, BD Biosciences), sheep anti-SHMT1 [WB
1:10000, (Stover et al. 1997)], mouse anti-GAPDH (WB 1:40000, Sigma), rabbit anti-GABAA
α1 (WB 1:1000, ICC 1:1000, Millipore), mouse anti-GABAA α1 (WB 1:1000, ICC 1:500,
Neuromab), rabbit GABAA α6 (WB 1:500, Abcam), rabbit GABAA β2 (WB 1:500,
Phosphosolutions), GABAA β2/3 bd17 (WB 1:1000, Millipore), rabbit anti-mGluR4 (WB
1:1000, ICC 1:1000, Millipore).
2.2 cDNA constructs and transfection
The rat c-myc tagged mGluR4 cDNA was generated and characterized as described
previously (Hampson et al. 1999). PSP was cloned for the purpose of validating the specificity
of the anti-PSP antibodies (see below, 2.5). The rat PSP cDNA (NCBI accession number,
NM_001009679) was obtained by RT-PCR using total RNA isolated from whole rat brain. The
forward primer (5'-CGCGGCAGCCATATGGTCTCCCACTCAGAGCTG-3') contained an
NdeI site and the reverse primer (5'-GCCGGATCCTCATTCTTCCAGTTCTCCTAGCAG-3')
contained a BamHI site (restriction sites are underlined). The PCR product was digested with
36
NdeI/BamHI and ligated into the expression vector pET3a (New England Biolabs, Boston,
USA). BL21 (DE3) Gold pLysS cells were transformed with the plasmid and a single colony
was cultured in LB medium at 37ºC overnight. The overnight cultured cells were inoculated into
600 ml of M9 medium (1:30) and aerobically grown at 37ºC until the OD600 reached 0.5-0.6.
The culture was maintained on ice for 15 min., then 0.5 mM isopropylthiogalactoside was added;
after 20 hours of incubation at 37ºC, the cells were harvested by centrifugation.
HEK-293 cells were transfected in 6-well plates with 2 μg of cDNA per well using
Lipofectamine 2000 (Invitrogen) according to the manufacturer's instructions.
2.3 Dose-response analysis of HEK-293 cells expressing mGluR4
The methodology for performing the functional assay on mGluR4 transiently transfected
into HEK-293 cells has been previously described in detail (Yao et al. 2003). HEK-293 cells
were co-transfected (as described in section 2.2) with the 2 μg rat mGluR4 cDNA and 2 μg of the
promiscuous G-protein subunit Gα15 cDNA to switch signal transduction from inhibition of
adenylyl cyclase to stimulation of phospholipase C; this method has been previously validated
(Gomeza et al. 1996). At 16 hours post-transfection the cells were sub-cultured into 96 black
well plates and at 44 hours post-transfection the cells were washed once with calcium assay
buffer (20 mM HEPES, pH 7.4, 146 mM NaCl, 5 mM KCl, 1 mM MgCl2, 1mM CaCl2, 1 mg/ml
bovine serum albumin, and 1 mg/ml glucose) and then incubated at 37oC in 100 μl assay buffer
for 2 hours. The assay buffer was removed and replaced with another 100 μl assay buffer and
incubated for another hour at 37oC. The cells were then incubated in the dark for 1 hour at room
temperature with 30 μl assay buffer containing 6 μM Fluo-4 AM (Molecular Probes Inc., USA).
The cells were washed three times with assay buffer and then incubated with 150 μl assay buffer
at room temperature before analysis. L-SOP, L-AP4 and L-glutamate were dissolved in assay
37
buffer and the responses were recorded on a FLEXstation benchtop scanning fluorometer
(Molecular Devices Corp) at room temperature with settings of 485 nm excitation and 525 nm
emission. The data were analyzed using the GraphPad Prism software to plot fluorescence
intensities and calculate EC50 values.
2.4 Quantitation of amino acids in rodent tissue
All animal procedures were performed in accordance with the requirements set out by the
University of Toronto Animal Care Committee. Precautions were taken to ensure minimal pain
and discomfort with the rodents used in this study. Levels of L-SOP in adult male Sprague-
Dawley (275-325 g) rat brains were measured using an HPLC procedure modified from an
earlier method originally developed for simultaneous analysis of D- and L-serine in plasma
samples (Grant et al. 2006). The rats were euthanized by guillotine decapitation and the brains
were dissected, frozen immediately in isopentane on solid carbon dioxide, then removed to
another set of receptacles and stored at -80 degrees until the time of analysis. Brain samples
were homogenized in 5 volumes of ice-cold methanol and left to stand on ice for 10 min.
Precipitated protein was cleared from the sample by ultracentrifugation and the supernatant was
collected and diluted ten times with ice cold water. Automated precolumn derivitization was
performed by drawing 5 μl of the sample and 5 μl of the derivitization mixture (1 mg O-
pthaldialdhyde, 2 mg N-isobutyryl-L-cysteine in 100 μl methanol in 900 μl 0.1 M sodium borate
buffer, pH 10.0) and holding this mixture in the injection loop for 5 min prior to injection.
Separation of the derivatized L-SOP from other components was performed in a Waters Alliance
HPLC system and detected using a fluorescence detector (Rauw et al. 2010). Amino acid
analysis in mouse forebrain and liver was performed in an identical manner.

38
2.5 Generation and purification of polyclonal anti-PSP antisera
A 15 residue peptide, CRLALIQPSRDQVQR, corresponding to a contiguous sequence in
the rat PSP protein, plus an additional cysteine residue on the N-terminus for coupling, was
covalently coupled to activated-maleimide keyhole limpet hemocyanin (Imject mcKLH, Pierce,
Rockford, IL, USA). An NCBI database search indicated that this PSP peptide had no
significant homology with any protein other than PSP. The conjugated peptide was emulsified
with Freund’s complete adjuvant (incomplete adjuvant was used for subsequent injections) and
injected subcutaneously into two rabbits. The rabbits were boosted twice over the course of six
weeks before the first titer check, and then once every 3 weeks for two additional months. After
initial screening of the two crude antisera on western blots, one of the antisera was affinity
purified using the PSP peptide immobilized to SulfoLink gel matrix (SulfoLink kit cat. #44895,
Pierce).
2.6 Western blotting
Brains and peripheral organs were harvested from rodents (Sprague-Dawley rats and
C57/BL6 mice) killed by cervical dislocation followed by decapitation, and homogenized with a
glass-Teflon homogenizer in 50 mM Tris-HCl buffer (pH 7.4) containing 1% SDS w/v. For
analysis on cultured cells, cell pellets were resuspended in 0.1 M PBS containing protease
inhibitor cocktail (Roche). Protein concentrations were determined in the solubilized tissue
samples and resuspended cell pellets by the BCA assay (Sigma) and diluted to 1 µg/μl in 2%
SDS (w/v), 62.5mM Tris, 10% glycerol, 0.1 M DTT for electrophoresis. Equal amounts of
protein were loaded in each lane (8 to 12 µg of protein were loaded per lane, depending on the
abundance of the protein target). After protein separation on polyacrylamide gels containing

39
between 6 and 12% acrylamide (depending on resolving power required for each protein target),
the proteins were transferred to a nitrocellulose membrane (Pall) and probed with the primary
antibodies (see methods section 3.1) for two hours at room temperature or overnight at 4oC.
Following a series of washes the blots were incubated with secondary goat anti-rabbit
horseradish peroxidise (HRP) 1:2000 (Sigma), goat anti-rabbit HRP 1:5000 (Jackson
Immunoresearch), donkey anti-mouse HRP 1:2500 (Jackson Immunoresearch), goat anti-mouse
HRP 1:5000 (Jackson Immunoresearch), goat anti-chicken HRP 1:10000 (Jackson
Immunoresearch), and donkey anti-sheep HRP 1:20000 (Jackson Immunoresearch) followed by
chemiluminescent detection with West Pico ECL (Pierce). The blots were imaged with the
FluorChem multi-image light cabinet (Alpha Innotech) and densitometry was analyzed with
AlphaEaseFC software (Alpha Innotech). To account for errors in sample preparation and
loading, and for quantitation and comparison of protein abundance between different sample
sets, the band intensity of the target enzymes in each sample was normalized to the band
intensity for GAPDH.
2.7 Primary astrocyte cultures
Primary cultures of rat astrocytes were prepared as described previously (Ronaldson et al.
2004). All procedures were carried out in accordance with the University of Toronto Animal
Care Committee and the Province of Ontario Animals for Research Act. Briefly, neonatal (2 day
old) Wistar rats (Charles River Laboratories, St. Constant, PQ, Canada) were sacrificed by
cervical dislocation and the whole brains were isolated. Cerebral cortices were then dissected and
subjected to enzymatic digestion for 30 min in serum-free minimum essential medium containing
2.0 mg/ml porcine pancreatic trypsin (Sigma-Aldrich, Oakville, ON, Canada) and 0.005%
DNaseI. The tissue was then mechanically disaggregated to yield a mixed glial cell suspension.

40
Mixed glial cell suspensions were centrifuged (10 min, 100 X g) and resuspended in fresh culture
medium consisting of minimum essential medium supplemented with 5% horse serum, 5% fetal
bovine serum, and 50 μg/ml gentamicin. The cells were incubated in fresh medium at 37˚C, 5%
CO2 and 95% air overnight for 10-12 day after which they were placed on an orbital shaker at
100 rpm for 2 hours to remove contaminating oligodendrocytes, microglia, and neurons.
2.8 Immunocytochemistry
The standard protocol employed for immunocytochemical analysis has been previously
outlined (Antflick et al. 2009). Mice and rats were anesthetized by intraperitoneal injection of a
ketamine-xylazine cocktail (75 mg/kg and 5 mg/kg, respectively) and then perfused
transcardially with 0.1 M PBS (~15 ml/mouse, ~ 200 ml/rat) followed by 4% paraformaldehyde
(~25 ml/mouse, ~250 ml/rat). Brains were post-fixed in 4% paraformaldehyde overnight and
cryoprotected by infiltration with 30% sucrose in PBS at 4C overnight. Following embedding
of tissue in OCT compound (Sakura Finetek USA, Inc., Torrance, CA), sagittal or coronal
sections were cut on a Leica CM3050 S cryostat. Depending on the analysis, sections were cut
to varying degrees of thickness: 14 μm for sections thaw-mounted on poly-L-lysine coated
coverslips, 20 – 30 μm for free floating sections. Thaw-mounted sections were allowed to air
dry overnight at 4oC and rehydrated in PBS prior to usage. Free-floating and thaw mounted
sections were incubated in blocking buffer (0.3% Tween-20, 5% goat serum in PBS) for 60 min.
at room temperature. After a series of five washes in PBS, primary antisera were applied to the
sections in a humid chamber (thaw-mounted sections) or directly into the well (free-floating
sections) overnight at 4C. For a list of primary antibodies see methods section 3.1. The next
morning the brain sections were washed extensively in PBS and then incubated for two hours at
room temperature with the following fluorescent secondary antibodies: goat anti-rabbit

41
AlexaFluor 546 1:1000, goat anti-mouse AlexaFluor 488 1:1000 (Molecular Probes, Invitrogen),
goat anti-rabbit Dylight 549 1:1000, goat anti-mouse Dylight 488 1:1000, Texas Red dye-
conjugated rabbit anti-chicken 1:400 and FITC conjugated goat anti-chicken 1:50 from (Jackson
ImmunoResearch Laboratories). Where indicated DAPI (Molecular Probes, Invitrogen) was
used at a final concentration of 300 nM. The sections were then washed in PBS, cover-slipped
with ProLong Gold anti-fade reagent and visualized using a Nikon E1000 fluorescent
microscope, or a Zeiss LSM 510 confocal microscope equipped with the following Zeiss lenses:
20X, numerical aperture 0.75; 40X, numerical aperture 1.30 oil immersion; 100X, numerical
apertures 1.60, and the appropriate filters for TRITC (anti-rabbit and anti-chicken antibodies)
and FITC (anti-mouse antibody). Images were adjusted for brightness and contrast using Adobe
Photoshop CS5.
To enhance the immunostaining for GABAA receptors on thin sections of the cerebellum,
the following modifications (Fritschy and Mohler 1995) were made to the standard protocol
described above. The following modifications did not alter the immunostaining for other target
proteins. Approximately 15 ml of 0.1 M PBS (pH 7.4) was perfused intra-cardially followed by
25 ml of a fixative containing 4% formaldehyde and 15% picric acid. The brains were carefully
dissected from the skull and post-fixed in fixative for 4 hours at 4oC after which they were
transferred to a citrate buffer (pH 4.5) for an overnight incubation at 4oC. The next morning the
brains were transferred into fresh, room temperature, citrate buffer and boiled gently using a
microwave on a low power setting (600 W) for 3 min. After cooling to room temperature, the
brains were cryoprotected at room temperature for 3 hours in 0.1 M PBS containing 10%
DMSO. The brains were mounted coronally in OCT (Sakura Tissue-Tek) and cut into 30 μm
free-floating cerebellar sections with a cryostat (Leica). To further unmask the GABAA epitopes
the brains were incubated in an acidic solution (0.2 N HCl) of 0.5 mg/ml porcine pepsin (Sigma,

42
specific activity 3,200-4,500 U/mg protein) for 3 min at 37oC before blocking in a solution of 5%
goat serum (Sigma) containing 0.3% Triton X-100 (v/v) (Sigma). All subsequent steps were
performed according to the standard protocol detailed above.
Immunocytochemical analysis was also performed on percoll-gradient purified
synaptosomes (prepared as indicated in methods section 2.13) with the following modifications:
after the second centrifugation step the synaptosomes were resuspended in 5 ml gradient medium
(250 mM sucrose, 5 mM Tris-HCl, 0.1 mM EDTA, pH 7.4) and loaded onto a percoll gradient
consisting of four layers (23%, 15%, 10%, 3%). The synaptosomes were spun through the
percoll gradient at (32,500 x g) for 10 min at 4oC with a SW32 rotor. Intact synaptosomes were
collected from the 23%:15% interface and pelleted by centrifugation at 10,000 x g for 15 min in
a JA-20 rotor. Synaptosomes were resuspended in 2 ml gradient medium and diluted to a
concentration of 0.25 mg/ml to plate onto poly-L-ornithine (Sigma) coated glass cover slips
(Fisher). The synaptosomes were allowed to adhere for 1 hour at 37oC and then washed twice
with 0.1 M PBS before fixation with 4% paraformaldehyde for 5 min at room temperature.
Immunocytochemical analysis was then performed similarly to cerebellar sections less the
antigen retrieval step.
Co-localization of immunoreactive puncta was analyzed with Image J (NIH) employing
object based methods with the JACoP plugin (Bolte and Cordelieres 2006). Regions of interest
were selected and magnified as 5.0 X cropping frames from cerebellar molecular layer images
acquired with a 100 X objective lens. Immunoreactive puncta were analyzed as individual
objects where the distances between geometric centers were measured to determine co-
localization.

43
2.9 Kainic acid injections
Eight adult male Sprague-Dawley rats (200-250 g), were divided into two groups of four
and injected intraperitoneally with either a convulsive dose of kainic acid [12 mg/kg; (Jang et al.
2004)], or the saline vehicle. At 22 or 144 h post-injection the animals were sacrificed and the
hippocampi were dissected and prepared for electrophoresis as outlined above (2.6).
2.10 Low protein diets
For dietary studies 8-week-old male, C57BL/6 mice were used. The mice were fed ad
libitium standard rodent chow (normal, 18% protein), TD.92203 (2% protein, 79.6%
carbohydrate, 5.5% fat, Harlan Laboratories, Madison, WI) or TD.90016 (6% protein, 75.6%
carbohydrate, 5.5% fat Harlan Laboratories, Madison, WI) for two weeks.
2.11 Generation of PSP deficient mice
The RIKEN ENU-induced mouse mutagenic library (Sakuraba et al. 2005) was screened
at the RIKEN Institute (Japan) for mutations in the coding exons of the Psph gene which would
potentially result in a non-functional or enzymatically crippled PSP protein. Primers were
designed in our lab to amplify each of the eight exons and the small portions of intronic DNA
flanking them (Table 2). The primer sequences were sent to RIKEN for preliminary screening of
point mutations in all eight exons. Results from the screening and selection of PSP mutant mice
are detailed below (4.2.1). Once the heterozygous PSP mutant mice were received in our lab,
genomic DNA was isolated from tail clippings using phenol:chloroform:isoamyl alcohol
(25:24:1) followed by an ethanol precipitation and resuspension in TE buffer, pH 8.0. The
mutation containing exon (exon 5) was then amplified under standard PCR conditions (95oC for

44
10 min followed by 30 cycles of 95oC, 30 seconds; 55oC, 30 seconds; 72oC, 2 min; and a final
elongation at 72oC for 10 min) with Platinum Taq Polymerse (Invitrogen). The amplified PCR
product was purified with the Purelink PCR purification kit (Invitrogen) and then sequenced at
The Center for Applied Genomics (TCAG, Hospital for Sick Children, Toronto, Canada). All
genomic and protein analysis and figures were created with VectorNTI 11 software (Invitrogen).
2.12 Generation of PSAT over-expressing mice
The Psat1 containing BAC clone (MSMg01-315H15) was obtained from the RIKEN
BRC DNA Bank (Abe et al. 2004), streaked on an LB plate containing 12.5 μg/ml
chloramphenicol (Sigma) and grown overnight at 37oC. A starter culture was created by
inoculating 3 ml LB containing 12.5 μg/ml chloramphenicol and shaking overnight at 37oC. The
next day 250 μl of the starter culture was used to inoculate 500 ml LB containing 12.5 μg/ml
chloramphenicol which was shaken for 20 hours at 37oC. BAC DNA was purified using the
Nucleobond kit (Clontech) according to manufacturer instructions. The purified DNA was
linearized with Not1 and then reconstituted in microinjection buffer [10 mM Tris-HCl, 0.1 mM
EDTA, 30 μM spermine (Sigma), 70 μM spermidine (Sigma), 100 mM NaCl, pH 7.5] and sent to
the Quebec Transgenic Research Network (Sherbrooke, Quebec) for pronuclear oocyte injection.
After the injections, eight mice were received by our lab for further copy number variant
analysis. Mouse DNA isolated from ear punches were examined for copy Psat1 copy number
variance by performing quantitative real time PCR (qRT-PCR) using the standard curve method
(Bookout et al. 2006) and normalizing the amount of amplified Psat1 DNA to that of an internal
control, PEPCK. qRT-PCR primers used in the genotyping of Psat1 transgenic mice: Psat1 (F
5’-ATGACTTTGGCCTCCTGTGGACAT-3’, R5’-TGCCGTAAACCTGGGTGCCT-3’),
PEPCK (F 5’-TGCAGCCAGCAACATATGAA-3’, R 5’-TGATGCAAACTGCAGGCTCT-3’).
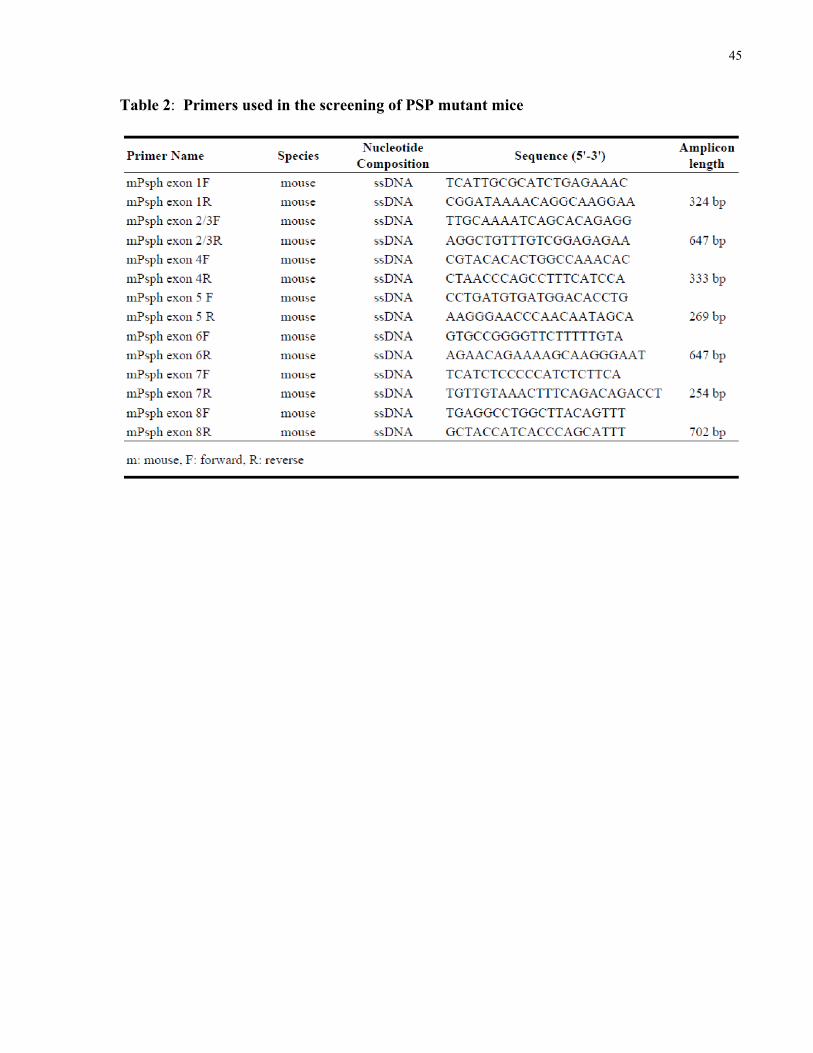
45
Table 2: Primers used in the screening of PSP mutant mice

46
2.13 Synaptosome preparation
The synaptosome preparation was adapted from a previously published method
(Chittajallu et al. 1996). One rat or three mice were rapidly killed by cervical dislocation,
cerebella were pooled and homogenized in ice cold 3 ml homogenization buffer (320 mM
sucrose, 4 mM HEPES-OH, pH 7.4) for 6-7 strokes at 500 rpm using a glass-Teflon
homogenizer. All subsequent steps were performed at 4oC. The homogenate was diluted with
an additional 27 ml of homogenization buffer and centrifuged at 1000 x g for 10 min a JA-20
rotor to pellet blood vessels, connective tissue and nuclei. The supernatant was removed and
centrifuged at 9000 x g for 15 min to form a pellet containing synaptosomes which was then
resuspended in 3 ml homogenization buffer and homogenized again for 4 strokes at 500 rpm.
The resuspended and homogenized pellet was diluted in 27 ml homogenization buffer and
centrifuged again for 15 min at 10,000 x g. The resulting pellet, containing synaptosomes was
resuspended in experiment-specific buffers indicated below for downstream use.
2.14 Immunoprecipitation
Cerebella were isolated from adult wild-type mice and quickly homogenized in 10
volumes of 50 mM Tris-buffered saline (TBS), pH 7.4 containing protease inhibitor cocktail
(Roche). All subsequent steps were performed at 4oC. Nuclei and connective tissue were
removed by a low speed spin at 1000 x g for 10 min. The supernatant was removed and
membranes were pelleted by spinning at 100,000 x g for 1 hour. The membranes were
solubilized at a protein concentration of 2.5 – 3.0 mg/ml overnight in TBS containing 1% Triton
X-100 (v/v). The next morning, insoluble material was removed by spinning at 21,000 x g for 1
hour at 4oC. The solubilized cerebellar samples were pre-cleared with a mixture of 25 μl protein

47
A and G agarose beads (BioShop, Bioshop Canada) for 1 hour while the remaining protein A and
G agarose bead mixture was blocked with a 10% BSA solution. 1 μg of each antibody was
added to the pre-cleared cerebellar samples and incubated for 1 hour before the addition of the
blocked protein A and G agarose beads and overnight incubation. The next morning the
supernatant was removed and the agarose beads were washed 3 times in IP wash buffer [20 mM
Tris-buffered saline containing 1% glycerol (w/v) and 0.1% Triton X-100 (v/v), pH 7.5] before
eluting in 125 mM Tris buffer containing 4% SDS (w/v) and 20% glycerol (w/v) at 37oC for 15
min. The eluate was removed from the agarose beads and dithiothreitol was added to a final
concentration of 100 mM; the protein samples were subject to western blotting as described in
section 2.6.
2.15 Glutamate release assay
The experimental procedures and the data analysis for the glutamate release assay were
based on those previously outlined (Chittajallu et al. 1996). Cerebellar synaptosomes were
resuspended in 2 ml oxygenated loading buffer (118 mM NaCl, 4.75 mM KCl, 25 mM NaHCO3,
2.5 mM CaCl2, 1.2 mM KH2PO4, 1.2 mM MgSO4, 11 mM D-glucose, pH 7.4) prewarmed to
37oC and homogenized for 4 strokes at 500 rpm. The synaptosomes were then loaded with 25
nM [3H] L-glutamate (49.6 Ci/mmol, Perkin Elmer) for 10 min in a 37oC water bath. To
terminate loading, the synaptosomes were cooled on ice for 2 min and then washed twice by
centrifugation (1 min, 12,000 x g) and resuspension with ice cold loading buffer. Synaptosomes
were resuspended in 4 ml loading buffer and kept on ice until use. Batch release assays were
performed in triplicate by adding the 100 μl of loaded synaptosomes to 400 μl and pre-
oxygenated release buffer (98 mM NaCl, 24.75 mM KCl, 25 mM NaHCO3, 2.5 mM CaCl2, 1.2
mM KH2PO4, 1.2 mM MgSO4, 11 mM D-glucose, pH 7.4, 37oC) containing no drugs, 10 μM

48
muscimol, 50 μM L-AP4, and 10 μM bicuculline (all from Tocris Inc.) individually or in
combination as indicated below. 10 μM bicuculline, 100 μM 8-CPT-cAMP (Ascent Scientific),
and 10 μM H89 (Ascent Scientific) were added to the synaptosomes during the resuspension in
loading buffer and incubated on ice prior to the release assay for 5 min. Pertussis toxin (Tocris)
was added to the resuspended synaptosomes at a final concentration of 3 μg/ ml and incubated on
ice for 1 hour prior to release experiments.
Batch release of [3H] L-glutamate was performed for 2 min at room temperature and
terminated by centrifugation at 12,000 x g for 1 min. The 500 μl supernatant was immediately
removed from the synaptosome pellet and counted in Ultima Gold scintillation fluid (Perkin
Elmer) on a liquid scintillation counter (Beckman-Coulter). To specifically examine muscimol-
induced glutamate release, cpm values for basal release (release buffer, no drug) were subtracted
from all conditions and each condition was then expressed as percentage of the average cpm
value of 10 μM muscimol. One-way ANOVA was performed to test for significance among
previously selected subgroups of conditions using Graph Pad Prism.
2.16 [35S] TBPS autoradiography
GABAA Receptor autoradiography was performed on cerebellar sections of wild-type and
mGluR4 knockout mice according to a previously published method (Sinkkonen et al. 2001).
Briefly, 14 μM coronal cerebellar sections were thaw mounted onto gelatin coated glass slides
and stored at -20oC until use. The slides were pre-incubated in ice cold binding buffer (50 mM
Tris-HCl, 120 mM NaCl, pH 7.4) for 15 min. A final concentration of 6 nM [35S] TBPS (200.0
Ci/mmol, Perkin Elmer) was prepared in binding buffer and added to the slides for 90 min at
room temperature. Non-specific binding was determined by the addition of 100 μM picrotoxin

49
(Tocris). After binding, the slides were washed 3 times in ice cold binding buffer for 30 min,
rinsed in ddH2O and air dried at room temperature. The dried sections were then exposed to
Kodak BioMAX MR film (Sigma) for 2-5 days before developing. [35S] TBPS binding was
measured in the cerebellar cortex as a mean grey values in Image J and compared by Student’s
T-test as indicated previously.

50
CHAPTER 3. L-SOP in the central nervous system
3.1 Quantitation of L-SOP in rat brain
Endogenous production of L-SOP is known to occur via the phosphorylated L-serine
biosynthetic pathway in the CNS (and peripheral tissues), but only a handful of studies have
attempted to measure the levels of L-SOP in brain tissue. Little agreement exists between these
studies which reported rodent whole brain concentrations of L-SOP as 40 μg/g (Porcellati 1958),
56 μg/g (McIlwain and Bachelard 1985), 0.11 μg/g (Kataoka et al. 1991), and 10 μg/g
(Goodnough et al. 1995). Thus, an accurate quantitative value for the concentration of L-SOP in
the CNS is currently lacking. Precise quantitation is required to determine if the amount of
endogenous L-SOP in the CNS at a sufficient level to activate mGluR4, and possibly other
Group III mGluRs. In this phase of the project, we collaborated with Dr. Glen Baker’s group at
the University of Alberta to develop a novel protocol to accurately and reliably measure the
levels of L-SOP in central and peripheral tissue by high-pressure liquid chromatography in
tandem with mass spectrometry (HPLC-MS/MS) (Rauw et al. 2010).
L-SOP levels were assessed in adult rat whole brain (forebrain, cerebellum, and
brainstem) and in cerebellum only. For comparison, L-serine and D-serine levels were also
measured simultaneously in the same samples (Table 3). L-SOP levels in rat whole brain were
0.99 ± 0.05 μg/g of tissue which is roughly equivalent to a whole brain concentration of 5.4 μM.
Although the concentration of L-SOP was lower than D-serine (25.10 ± 0.45 μg/g) and much
lower than L-serine (78.36 ± 1.97 μg/g), it is similar to the concentration of dopamine in rat
whole brain (Nazarali et al. 1987). The level of L-SOP in the cerebellum was 1.21 ± 0.08 μg/g
which was significantly higher (p < 0.001, t-test) than the whole brain level, while the level

51
Table 3: Concentrations of L-SOP, L-serine and D-serine in Adult Rat Whole Brain and Cerebellum
Reproduced from Antflick et al. “L-Serine-O-phosphate in the central nervous system”, Brain Research, v.1300, pp 1-13, Copyright (2009), with permission from Elsevier.

52
of D-serine in cerebellum was 4.83 ± 0.19 μg/g, or about 20% of the level in whole brain. The
L-serine concentration in the cerebellum was 68.92 ± 5.81 μg/g which was similar to the L-serine
concentration in whole brain.
3.2 Comparative potency of L-SOP at mGluR4
Although previous studies have reported potency values for L-SOP in various functional
assays at Group III mGluRs including mGluR4 (Gomeza et al. 1996; Thomsen et al. 1997;
Schoepp et al. 1999), we re-examined this by conducting a simultaneous side-by-side
comparison of L-SOP, L-glutamate, and the prototypical synthetic agonist L-AP4 on rat mGluR4
transiently expressed in HEK-293 cells. The cells were co-transfected with mGluR4 and the
promiscuous G-protein subunit, Gα15, to shift the signal transduction pathway of mGluR4 from
inhibition of adenylate cyclase and reduced cAMP production to the stimulation of
phosphoinositide turnover and release of intracellular calcium. Activation of mGluR4 and the
subsequent increase in the levels of intracellular calcium were detected by the calcium-sensitive
dye, Fluo-4, to generate dose-response curves. The EC50 values obtained for the activation of
mGluR4 were 0.52 0.08 μM, 26 ± 8, 0.46 0.04 μM, and μM for L-SOP, L-glutamate, and L-
AP4 respectively (Fig. 3.1). Although L-SOP and L-AP4 showed similar potencies, L-SOP was
29-fold more potent than L-glutamate at mGluR4.
3.3 Characterization of the anti-PSP antibody
Our data indicate that endogenous L-SOP could activate mGluR4 since the whole brain
concentration (0.99 μg/g, 5 μM) is well above the EC50 value of L-SOP for mGluR4 (0.5 μM).

53
Figure 3.1: Dose–response analysis of L-SOP, L-AP4, and L-glutamate at mGluR4 receptors expressed in transiently transfected HEK-293 cells
The EC50 values were 0.52 ± 0.08 μM, 0.46 ± 0.04 μM, and 15 ± 3 μM for L-SOP, L-AP4, and L-glutamate respectively. Each point represents the average of three independent experiments. Reproduced from Antflick et al. “L-Serine-O-phosphate in the central nervous system”, Brain Research, v.1300, pp 1-13, Copyright (2009), with permission from Elsevier.
54
However, it seems more plausible that L-SOP would be concentrated in certain brain regions,
and specific cells within these brain regions, rather than diffusely throughout the CNS. We used
an immunocytochemical approach to identify cell types and brain regions where L-SOP is
concentrated. Initially, we attempted to develop an antibody probe targeted towards L-SOP,
although we fully anticipated the possibility that this antibody could cross-react with
phosphoproteins (specifically phosphorylated serine residues). Unfortunately, this turned out to
be the case and the cross-reactivity of this antibody probe with phosphoproteins precluded the
use of this tool in the study of the CNS distribution of L-SOP. Therefore, the localization of L-
SOP was pursued by examining the CNS distribution of the enzymes responsible for the
generation and metabolism of L-SOP, PSAT and PSP respectively. A commercial antibody
targeting PSAT was available but no antibody targeting PSP existed. Therefore, we created an
anti-PSP antibody to employ with the anti-PSAT antibody for the immunocytochemical analysis.
To assess the ability of our newly generated rabbit polyclonal antibody to recognize PSP,
recombinant rat PSP protein was expressed in isopropylthiogalactoside-induced E. Coli and the
bacterial cell lysates were examined on western blots. The PSP antibody strongly labeled the 25
kDa PSP monomer in the induced samples, whereas no signal was observed in the uninduced
samples, or when the same samples were probed with the preimmune antisera (Fig. 3.2A).
Specificity of the PSP and PSAT antibodies was further tested in transfected mammalian cells.
C-myc-tagged mammalian cDNA expression constructs of PSAT and PSP were transfected into
HEK-293 cells and analyzed by western blotting. The anti-PSAT antibody and the anti-PSP
antibody labeled the respective untagged endogenous proteins, and slightly higher molecular
weight proteins corresponding to the c-myc-tagged recombinant proteins (Fig. 3.2B).

55
Figure 3.2: Characterization of the anti-PSAT and anti-PSP antibodies and tissue
distributions in the rat by western blot analysis
A, western blot of PSP expression in E. coli after induction with isopropylthiogalactoside (IPTG). The blot was probed with the anti-PSP antibody; a band of 25 kDa was observed in the induced but not in the uninduced E. coli samples. The same samples probed with the preimmune serum displayed no immunoreactivity. B, HEK-293 cells were transfected with 2 μg of PSP or PSAT cDNA and probed with either PSAT (upper) or PSP (lower) antibodies revealing immunoreactivity for both the endogenous and tagged versions of PSAT and PSP. C, PSP expression (25 kDa) in tissue samples prepared from postnatal day 2 and adult rats. D, comparison of PSAT expression (40 kDa) in tissue samples prepared from postnatal day 2 rats and adult rats. In panels C and D, equal amounts of protein (8 μg) were loaded in each lane and verified by blotting with GAPDH. Reproduced from Antflick et al. “L-Serine-O-phosphate in the central nervous system”, Brain Research, v.1300, pp 1-13, Copyright (2009), with permission from Elsevier.

56
3.4 Relative abundance of PSAT and PSP in central and peripheral
tissue
Enzyme expression of PSAT and PSP in brain and peripheral tissues was first examined
on western blots of postnatal day 2 and adult rat tissue samples probed with the anti-PSP (Fig.
3.2C) and anti-PSAT (Fig. 3.2D) antibodies. PSP was observed as the 25 kDa enzyme monomer
in all tissues. The highest levels of expression of PSP in postnatal day 2 and adult rat tissues
were in liver, kidney, and spleen. The monomer of the dominant β-isoform of PSAT at 40 kDa
was observed in all organs examined in both the adult and postnatal day 2 rats. PSAT was
expressed at widely varying expression levels in different tissues; the highest levels were seen in
heart, spleen, and especially the liver and kidney. On western blots of samples of forebrain and
cerebellum, expression of PSAT and PSP was observed in postnatal day 2 and adult rats (Fig.
3.2C, D), although the expression of PSP was lower in the adult forebrain and cerebellum
compared to postnatal day 2. In some tissues, the PSAT antibody labeled multiple bands. Two
alternatively spliced forms of PSAT have been reported in human tissues (Baek et al. 2003). The
longer β-isoform, which is translated from mRNA containing all nine coding exons and has a
molecular weight of 40 kDa is believed to be the predominant isoform as it shares greater than
90% sequence homology with PSAT found in other mammalian species (Baek et al. 2003). The
α-isoform splice variant lacks exon eight and has a lower molecular weight of 35 kDa. Although
the two isoforms of PSAT have been identified in human tissue it remains to be seen if both
isoforms exist in rat tissue; the NCBI protein database contains one entry for PSAT isolated from
rat (NP_942033.2) that is homologous to the human PSAT β-isoform. Since the PSAT antibody
used here recognizes only the dominant β-isoform, the PSAT doublet observed might correspond
to either post-translationally modified protein, an unmodified form of the enzyme, or an as of yet
uncharacterized alternative splice form. Although the level of expression of PSAT and PSP

57
appeared to be relatively low on western blots of adult rat brain, this may have been due to the
dilution of the whole forebrain and cerebellum electrophoresis samples because
immunocytochemical analyses demonstrated prominent expression in select populations of
neurons in the adult rat CNS (see section 3.5).
3.5 Immunocytochemical analysis of PSAT and PSP in the adult rat
CNS
Immunocytochemical analyses were carried out on thin thaw-mounted sections of the
adult rat brain (Figs. 3.3-3.5) and postnatal day 2 rat brain (Fig. 3.6). A parallel study examining
PSAT and PSP immunostaining in the adult macaque monkey CNS, carried out in collaboration
with Dr. Joan Baizer from the University at Buffalo, revealed essentially identical expression
patterns to what is detailed below in the adult rat CNS (Antflick et al. 2009). In our laboratory, I
focused on examining the distributions of PSAT and PSP in three brain regions: the cerebral
cortex, hippocampus, and cerebellum. In the adult rat cerebral cortex, immunostaining for both
PSAT and PSP was detected throughout all cortical layers. Within the somatosensory region of
the cerebral cortex, PSAT was detected at similar levels in the cell bodies of pyramidal neurons
in every layer (Fig. 3.3A), whereas PSP expression was more prominent in pyramidal neurons of
cortical layers II/III and V (Fig. 3.3C). PSAT (Fig. 3.3A) and PSP (Fig. 3.3D) demonstrated
cytosolic labeling in pyramidal cell bodies and an absence of labeling in nuclei as indicated by
lack of overlap with the DAPI nuclear stain. The proximal dendrites of pyramidal neurons were
also labeled with the anti-PSP antibody in many cells. No labeling was observed in tissue
sections incubated with only the anti-chicken or anti-rabbit secondary antibodies (Fig. 3.3B). In

58
Figure 3.3: Analysis of PSAT and PSP expression in the somatosensory region of the
cerebral cortex of the adult rat
A, PSAT expression was observed in cells in all layers of the somatosensory cortex including layer V illustrated here. B, omission of the primary antibodies showing absence of labeling in the presence of the combined anti-rabbit and anti-mouse secondary antibodies. C, anti-PSP immunostaining of pyramidal neurons in layers II/III and V of the somatosensory cortex. D, higher magnification image of anti-PSP staining in layers II/III overlaid with DAPI to visualize cell nuclei. Arrow indicates an example of cytosolic cell body staining. E, cortical section showing double labeling with anti-PSP and anti-GFAP and demonstrating the absence of co-localization. F, double labeling of layer V pyramidal neurons with anti-PSP and the neuronal dendritic marker MAP2 where co-expression in the same neuron is evident (example shown at arrow). Scale bars, 50 μm. Reproduced from Antflick et al. “L-Serine-O-phosphate in the central nervous system”, Brain Research, v.1300, pp 1-13, Copyright (2009), with permission from Elsevier.

59
double labeling experiments, no overlap of PSP with the glial cell marker, GFAP (Fig. 3.3E) was
observed. In contrast, the dendrites of cells in which the cell bodies and proximal dendrites were
labeled with anti-PSP, were immunostained with the neuronal dendritic marker MAP2 (Fig.
3.3F), indicating neuronal localization of PSP in the cerebral cortex.
In the rat hippocampal formation, immunoreactivity was observed for PSP in pyramidal
neurons, dentate granule neurons, and in cells of the subgranular zone (SGZ) of the dentate gyrus
(Fig. 3.4A). Compared to the cerebral cortex (Fig. 3.3) and the cerebellar cortex (Fig. 3.5), the
overall intensity of immunostaining in the hippocampus was lower for PSP and below the limit
of detection using the PSAT antibody on tissue sections. In the pyramidal cell layer,
immunolabeling of PSP was most prominent in the CA2 and CA3 regions with substantially
lower expression in CA1 pyramidal cells. In addition, in the hilus of the dentate gyrus, a few PSP
positive cells (Fig. 3.4B) co-labeled with GFAP (Fig. 3.4C, D), indicating some limited
expression in astrocytes.
The most striking observation of these experiments was the expression of PSP in the SGZ
which is a neurogenic niche in the adult brain (Cameron et al. 1998). To determine if PSP was
expressed in newly born neurons, adult rat hippocampal sections were co-labeled with anti-PSP
and anti-polysialated neural cell adhesion molecule (PSA-NCAM) (Figs. 3.4E–G). PSA-NCAM
is a selective marker for young neurons which express the modified protein during the first
12 days of existence to aid migration (Seki and Arai 1993). Interestingly, we observed co-
expression of PSP and PSA-NCAM in some cells within the SGZ (arrow, Figs. 3.4F, G).
In the adult rat cerebellum, prominent expression of both PSAT and PSP was observed in
the cell bodies and dendritic processes of Purkinje neurons (Fig. 3.5). PSAT immunoreactivity
was also observed in the Bergmann glia as indicated by co-localization with glial marker S-100β
(Fig. 3.5C, white arrow). However, PSP immunoreactivity was restricted to Purkinje cells and

60
Figure 3.4: Expression of PSP in the adult rat hippocampal formation

61
A, PSP expression was predominantly observed in the subgranular zone of the dentate gyrus (arrow) and pyramidal cells (arrowhead) of the hippocampal formation. B–D, higher magnification immunofluorescence images of the dentate gyrus labeled with anti-PSP (B) and anti-GFAP (C) and the merged image of PSP and GFAP (D). Regions of limited co-localization of GFAP and PSP are seen in panel D (example indicated by the arrow). E–G, higher magnification images showing the subgranular zone (SGZ) of the dentate gyrus labeled with anti-PSP (E), anti-PSA-NCAM (F) and the merged image of PSP and PSA-NCAM (G). The arrow in panel G denotes an example of a cell where co-localization is evident. The granular cell layer is identified by the letter G. H, hilus; scale bars, 100 μm. Reproduced from Antflick et al. “L-Serine-O-phosphate in the central nervous system”, Brain Research, v.1300, pp 1-13, Copyright (2009), with permission from Elsevier.

62
did not co-localize with GFAP. Co-expression of PSP and PSAT was often observed in the same
Purkinje cells (Fig. 3.5D). However, examples were also observed where PSP was not expressed
in the same Purkinje cells as PSAT; in the regions of the cerebellar cortex where Purkinje cells
were devoid of PSAT, PSAT was expressed in Bergmann glia. It is also noteworthy that PSAT
and PSP immunostaining was present in the cytosol of Purkinje cell bodies and that the cell
nuclei were devoid of immunoreactivity. Together these results indicate that in the rat
cerebellum, PSAT is expressed in both Bergmann glia and Purkinje neurons, while PSP
expression is restricted to Purkinje neurons. The expression of PSAT but not PSP in Bergmann
glia suggests that these glial cells may be a rich source of L-SOP in the cerebellum.
3.6 Immunocytochemical analysis of PSAT and PSP in the postnatal
day 2 rat CNS
Immunocytochemical analyses were also carried out on postnatal day 2 rat brains (Fig.
3.6). Compared to adult cortex, the cerebral cortex of postnatal day 2 rats showed a higher level
of expression of PSAT (Fig. 3.6A) and particularly PSP (Fig. 3.6B) in most neurons throughout
all cellular layers. No co-localization of PSP with GFAP was seen, indicating neuronal
expression (Fig. 3.6B). In the hippocampus, PSAT (Fig. 3.6C) and PSP immunolabeling was
observed in the dentate gyrus granule neurons and in pyramidal neurons. Double labeling with
PSP and GFAP showed some co-localization in the dentate gyrus (Fig. 3.6D), reminiscent of the
co-localization observed in the adult rat hippocampus. In the postnatal day 2 cerebellum, PSAT
staining was distributed throughout the cerebellar cortex (Fig. 3.6E), while PSP intensely stained
immature Purkinje cells. No co-localization of PSAT or PSP (Fig. 3.6F) with GFAP was
observed.

63
Figure 3.5: Immunocytochemical analysis of PSAT and PSP in adult rat cerebellum
A, PSAT labeling of Purkinje cells. B, PSP (red) was highly expressed in Purkinje cell bodies and did not co-localize with GFAP (green). C, in some regions of the cerebellar cortex, PSAT was expressed in both Purkinje cells and in Bergmann glia, the latter indicated by co-labeling with anti-S100β (arrow). D, an example of PSAT and PSP expression in the same Purkinje cell bodies and proximal dendrites. Scale bar, 50 μm. Reproduced from Antflick et al. “L-Serine-O-phosphate in the central nervous system”, Brain Research, v.1300, pp 1-13, Copyright (2009), with permission from Elsevier.

64
Figure 3.6: Expression of PSAT and PSP in postnatal day 2 rat brain
A, somatosensory cortex showing PSAT distribution. B, merged images of somatosensory cortex co-labeled with PSP and GFAP showing absence of co-localization. C, PSAT immunostaining in the dentate gyrus of the hippocampus, and (D) merged images of PSP and GFAP in the dentate gyrus; arrowheads in D indicate examples of limited co-localization of PSP with GFAP. E, PSAT in the cerebellar cortex, and (F) merged image of PSP and GFAP in the cerebellar cortex showing absence of co localization; arrow in F denotes an example of a PSP-labeled Purkinje neuron. H, hilus of the hippocampus. Scale bars, 50 μm. Reproduced from Antflick et al. “L-Serine-O-phosphate in the central nervous system”, Brain Research, v.1300, pp 1-13, Copyright (2009), with permission from Elsevier.

65
3.7 Neuronal vs. glial expression of PSAT and PSP
It is interesting that the majority of immunoreactivity for PSAT and PSP was observed in
neuronal cells when the traditional view holds that the L-serine biosynthetic pathway is chiefly
glial to relieve the metabolic burden of L-serine synthesis from neurons (Verleysdonk and
Hamprecht 2000; Yamasaki et al. 2001). These studies reached this conclusion from studying
the expression of 3-phosphoglycerate dehydrogenase in cultured glial cells, whereas our study
was performed in intact, albeit fixed tissue. To resolve this potential conflict, mixed glial
cultures derived from rat neocortical tissue were examined for expression of PSAT (Fig. 3.7A)
and PSP (Fig. 3.7B). Both PSAT and PSP were detected in western blots performed on pellets of
the mixed glial cultures (3.7A, B insets) and furthermore, immunocytochemical analysis revealed
cytosolic expression of PSAT and PSP. The expression of enzymes of the L-serine biosynthetic
pathway is correlated with cell growth and proliferation (Snell 1984) which may explain why
rapidly proliferating glial cells in culture express PSAT and PSP whereas glial cells in adult
brain tissue do not show robust expression of PSAT and PSP.
To examine PSAT and PSP expression during glial proliferation in adult tissue, adult rats
were administered a convulsive dose of kainic acid [12.5 mg/kg intraperitoneal (Jang et al.
2004)] to produce global seizure-induced lesions and subsequent neuronal loss and proliferation
of glia. All rats displayed seizure onset within 30 min which lasted 2-6 h post-injection. At 22
and 144 h post injection, hippocampi were dissected and examined for expression of PSAT, PSP,
the astrocytic marker GFAP, and the microglial marker, cd11b (Fig. 3.8). After 22 h there were
no detectable changes in the expression levels of any of the four proteins. However, at 144 h
post-injection, consistent with the expected astrogliosis and microgliosis in response to the kainic
acid-induced seizures, increased expression of both GFAP and cd11b was observed in the kainic

66
Figure 3.7: Expression of PSAT and PSP in mixed glial cultures
Glial cell cultures prepared from the cerebral cortex of two day old rats were cultured for 10-12 days. A, anti-PSAT, inset shows PSAT monomer at 40 kDa. B, anti-PSP-RLA; inset shows PSP monomer at 25 kDa. C, preimmune sera and D, no primary antibody. The cell nuclei (blue) were visualized with DAPI. Arrows identify microglia in the mixed glial cultures. Scale bars, 50 μm.

67
acid-treated animals. In contrast, no increase in PSP (Fig. 3.8) expression was detected in kainic
acid compared to saline treated rats, demonstrating that gliosis induced in vivo was not
accompanied by changes in the levels of PSP protein expression. (In rat hippocampal tissue,
PSAT expression was below the limits of detection in both saline and kainic acid treated rats.)
As demonstrated by our immunocytochemical results (detailed in the immediately preceding
sections), PSAT and PSP are expressed in both neurons and a small population of glia in the
hippocampus. Potential explanations for this lack of change include the possibilities that PSAT
and PSP containing neurons were quantitatively less affected by the seizures than non-
PSAT/PSP neurons, or that the small sub-population of glially expressed enzymes that was
increased after kainic acid was offset by a decrease in a sub-population of neurons that
degenerated, such that the net outcome was no detectable change in the enzyme levels.
The following is a summary of the results presented in this chapter which describe the
quantitative and qualitative analysis of L-SOP performed in rat brain tissue. Employing a novel
and reproducible method for the detection and quantitation of L-SOP, whole brain concentrations
were determined to be approximately 5 μM or 1 μg/g, while cerebellar concentrations were
found to be approximately 6.5 μM or 1.2 μg/g, indicating a slight elevation in cerebellar levels of
L-SOP. The global snapshot provided by this quantitative analysis indicating that L-SOP is
present in rat brain in appreciable amounts, encouraged further investigation towards identifying
discrete brain regions and cell types which contain L-SOP. Due to the somewhat anticipated
technical difficulties in successfully generating a specific antibody probe towards L-SOP (which
resembles a phosphorylated serine residue), an antibody probe was generated towards PSP. This
antibody was used in combination with a commercially available antibody directed against

68
Figure 3.8: PSP is not up-regulated in the rat hippocampal formation after kainic acid
induced seizures
Glial proliferation was induced in the rat hippocampus by administration of kainic acid (KA). Hippocampal tissue was harvested 22 and 144 h after injection and subjected to western blot analysis with anti-PSP, anti-cd11b, anti-GFAP, and anti-β-tubulin. Increased glial cell proliferation was noted at 144 h post KA treatment as indicated by increased anti-cd11b (microglia) and anti-GFAP (astrocyte) immunoreactivity compared to saline treated animals. In contrast, PSP expression was unaffected. PSAT expression was below the limits of detection.

69
PSAT to identify cells within the rat brain potentially containing L-SOP by immunocytochemical
techniques. A whole brain immunocytochemical survey was performed with special focus on the
hippocampus and cerebellum, two brain regions known to express high levels of mGluR4. In the
adult rat brain, low levels of PSAT and PSP immunoreactivity was observed in neuronal cells
including layers II/III and V pyramidal neurons throughout the somatosensory cortex, and in
Purkinje cells within the cerebellum. PSAT, but not PSP expression was also observed at high
levels in Bergmann glial cells within the cerebellum suggesting that L-SOP is potentially
concentrated in these glial cells. In the adult hippocampus PSP expression was found in newly
formed neurons within the subgranular neurogenic niche, while only a small amount of glial PSP
expression was observed in the hilus of the dentate gyrus. The presence of L-SOP in the CNS,
its higher potency at mGluR4 than glutamate, together with the localization of the enzymatic
machinery required for the synthesis and metabolism of L-SOP in cells forming synapses which
contain mGluR4, could qualify L-SOP as an endogenous agonist for mGluR4.

70
CHAPTER 4. Elevation of endogenous L-SOP levels by genetic and
dietary modulation of the L-serine biosynthetic pathway in mice
If L-SOP is an endogenous agonist at the group III mGluRs, it would follow that
phenotypic changes associated with increased activation of the group III mGluRs would manifest
as a result of elevated levels of L-SOP in the CNS. In this section, three different approaches are
described which all attempted to create a mouse with elevated levels of L-SOP in the CNS. As
discussed previously, both L-SOP and L-serine have poor penetrance at the blood brain barrier
which rules out the feasibility of injecting L-SOP into the intraperitoneal cavity. Instead, genetic
and dietary methods were employed to endogenously raise the levels of L-SOP in the CNS. The
first approach involved the creation of a mouse deficient in PSP, the enzyme which catalyzes the
conversion of L-SOP to L-serine. In the absence of PSP, or a mutation which cripples the
enzymatic activity, L-SOP levels are predicted to increase. The second approach involved
increasing the synthesis of L-SOP by over-expressing PSAT, the enzyme responsible for
synthesizing L-SOP from glutamate and 3-phosphohydroxypyruvate. The final approach
involved nutrient suppression of dietary protein which has been shown to up-regulate the activity
of the L-serine biosynthetic pathway and potentially lead to elevated levels of L-SOP.
4.1 PSP deficient mouse model
Seven primer pairs were designed to amplify the 8 coding exons of the mouse Psph gene
(NC_000071.5) in order to screen the RIKEN ENU-induced mutant mouse library (Sakuraba et
al. 2005) for point mutations which could result in altered enzymatic activity in the PSP protein.
A total of 10 point mutations were identified. Of these, three were located in the 5’ UTR, six
were identified in intronic DNA, and one mutation was found in a coding exon. The mutations

71
in the 5’UTR were ignored as they would be less likely to change the structure or expression of
the enzyme. The point mutation in the coding exon, a T>C transition, resulted in the relatively
conservative mutation of an isoleucine to a threonine. This mutation was located well outside
the catalytic portions of the enzyme and therefore unlikely to impair enzyme functionality. For
this reason, this point mutation was not selected. Of the mutations found in the intronic DNA,
two were found to occur at splicing donor sites. We chose a mutation further upstream (M2157)
in which a T>C transition mutated the intron donor site from GT>GC. This was predicted to
alter the mRNA splicing after exon 5, yielding a truncated protein lacking the catalytic domain.
The intronic DNA point mutation and predicted truncated protein are illustrated in Fig. 4.1A and
4.1B.
Forebrain and cerebellar homogenates were analyzed for PSP expression in the wild-type
(+/+), heterozygous (+/mt), and homozygous (mt/mt) mice. Somewhat unexpectedly, PSP was
expressed at equal levels brain tissues harvested from all three types of mice (Figure 4.1C)
suggesting that the M2157 mutation did not produce a truncated protein as initially predicted. To
ensure that the band observed on the western blots for PSP in the homozygotes was not another
protein of similar molecular weight, mRNA was extracted from forebrain tissue, reverse
transcribed into cDNA, amplified and sequenced. The sequencing result confirmed that the
M2157 genomic point mutation does not alter the transcription of Psph mRNA (Figure 4.1A).
This mRNA is most likely translated as the full length native protein and therefore, these mice do
not express a crippled version of PSP, negating the use of these mice in this study.
The goal of this project was to develop a mouse model for elevated levels of endogenous
L-SOP. The creation of a PSP knockout mouse was not attempted based on evidence that the
knockout of 3-phosphoglycerate dehydrogenase, the enzyme catalyzing the first committed

72
Figure 4.1: Genetic screening and PSP protein analysis in PSP deficient mice
A. Alignment of wild-type and M2157 genomic DNA sequences for exon 5. The point mutation identified as M2157 (identified in red text) is a T>C transition occurring at the exon intron junction after exon 5. The green background indicates intronic DNA sequences. Forward and reverse genomic primers used in the screen and genotyping are underlined and labeled exon 5F/R. B. Predicted protein alignment of M2157 and wild-type PSP. Each exon is indicated by a different shade. Key amino acids required for proper enzymatic activity are underlined. The M2157 mutation is predicted to result in aberrant splicing. The mutant protein is expected to contain intronic DNA after exon 5 which introduces a premature stop codon. The estimated molecular weight of this hypothetical protein is 15.7 kDa. C. Wild-type (+/+), heterozygous (+/mt) and homozygous (mt/mt) mice for the M2157 mutation were identified by genotyping and their forebrains and cerebellum were harvested for western blot analysis of PSP expression. All three types of mice expressed full length PSP (25 kDa) in both forebrain and cerebellum.
73
step of the phosphorylated pathway for L-serine biosynthesis, resulted in embryonic lethality
(Yoshida et al. 2004). Instead, a method to cripple the enzymatic function of PSP was desired.
Here, the strategy was to screen an ENU-induced mutant mouse library for point mutations
which would reduce the enzymatic function of PSP, decrease the amount of L-SOP hydrolyzed
to L-serine, and elevate the levels of endogenous L-SOP.
In genomic DNA, the 5’ exon-intron boundary splice site is universally defined by a 5’
GT (Irimia et al. 2007). The selected point mutation (a T>C transition at the intron boundary)
was predicted to prevent the proper splicing of intronic DNA after exon 5 and result in the
introduction of a premature stop codon after several missense amino acids. The predicted protein
would lack three coding exons containing amino acid sequences necessary for proper enzymatic
function. In addition, this protein would have been much smaller (15 kDa) when compared to the
full length protein (25 kDa) and would have been easily distinguished by western blot analysis.
Despite the extensive predictive work put into this project, western blot analysis
revealed no difference in the apparent molecular weight of PSP isolated from heterozygous and
homozygous mice compared to the wild-type mice. In all cases, PSP was detected as a single
band at 25 kDa (Fig. 4.1C). This was followed up by mRNA analysis of the transcript to
determine the actual sequence of the transcribed PSP mRNA and again, no changes were
detected. In fact, when compared to the wild-type, the homozygous mice shared 100% sequence
identity. The reason as to why the T>C transition did not change the transcription of the Psph
gene is unknown. Exon splicing is an extremely complex set of events. One can speculate that a
single point mutation may not be enough to alter the tightly regulated process of exon splicing.
Most likely, a larger set of nucleotides make up a consensus sequence, and perhaps this single
point mutation does not affect the overall recognition site for proper exon splicing.

74
4.2 PSAT over-expressing mouse
PSAT over-expression was examined by qRT-PCR in the 26 mouse pups resulting from
the Psat1 pronuclear injection and implantation into a pseudo-pregnant female performed at the
Quebec Transgenic Research Network. Genomic DNA was isolated and purified from ear or tail
samples from each of the 26 mice to identify the amount of Psat1 incorporated into the genome
of each mouse. The cycle threshold values for Psat1and PEPCK were converted into absolute
amounts of amplified DNA and then expressed as a ratio of Psat1:PEPCK. The Psat1:PEPCK
ratio from each of the potential copy-number variant mice was compared to the Psat1:PEPCK
ratio of wild-type mice to estimate the number of copies of Psat1 present in the genomic DNA.
Seven mice (5 males and 2 females) which had Psat1 copy number variance (CNV) ranging from
1.0 – 13.0 (indicating 2 and 26 copies of the gene respectively) were selected to be shipped to us
from the founder generation (F1). From seven mice shipped, three lines were developed from F1
parents: a normal line (CNV 1.0, 2 copies of Psat1), over-expressing line (CNV 2.0, 4 copies of
Psat1), and high over-expressing line (CNV 13.0, 26 copies of Psat1). Unfortunately, breeding
the high over-expressing mouse did not result in any pups. The over-expressing line was bred
for two generations (F2, F3) at which time enough mice were available to determine if the
incorporation of extra copies of Psat1 translated into increased levels of PSAT protein and
elevated endogenous production of L-SOP.
PSAT protein expression was analyzed in cerebellar and liver homogenates from F3 mice
of both the normal and over-expressing lines by quantitative western blot analysis. Despite the
increased Psat1 gene copy number, no differences in PSAT protein expression were detected in
cerebellar or liver compared to the normal line (Fig. 4.2C). Thus, the lack of an observable

75
Figure 4.2: PSAT protein expression is not up-regulated in PSAT copy number variant
mice
A, Map of BAC clone MsMg01-315H15 (176,091 bp) containing the entire Psat1 gene (19,894 bp) in the PBACe3.6 vector and B, the Not I digested, linearized and purified BAC clone from the pBACe3.6 vector. C, Expression of PSAT in liver and cerebellar homogenates from normal (CNV 1.0) and CNV 2.0 mice.

76
increase in PSAT expression was unlikely to cause any changes in the levels of endogenous L-
SOP and forced the abandonment of this strategy.
4.3 Induction of PSAT and PSP expression by nutrient suppression
Subjecting animals (rabbits and rats) to low protein diets was previously reported to
increase the activity of the L-serine biosynthetic pathway in hepatic tissue (Lund et al. 1985;
Guynn et al. 1986). Enzymatic activity of 3-phosphoglycerate dehydrogenase, PSAT and PSP
were upregulated 12, 20, and 2-fold respectively which resulted in the increased levels of hepatic
amino acids including L-serine, L-alanine, and L-aspartate (Guynn et al. 1986). Interestingly, L-
SOP, which was not detected in hepatic tissue of rats fed a normal diet, was found at a
concentration of 255 nmol/g (41 μg/g) in hepatic tissue from rats fed a low protein diet. A
reduction in dietary amino acid intake likely shunted the glycolytic metabolite, 3-
phosphoglycerate, from metabolism via the tricarboxylic acid cycle towards L-serine production
to enhance de novo amino acid synthesis. Previously, PSAT and PSP were shown to be
expressed in both peripheral and central tissue (Antflick et al. 2009). Therefore, I sought to
examine whether the increased metabolic flux through the L-serine biosynthetic pathway could
elevate the levels of endogenous L-SOP within the CNS. Wild-type C57/BL6 mice were
subjected to dietary protein restriction to directly study the effects on the expression of PSAT
and PSP, and the resulting levels of the metabolites of the L-serine biosynthetic pathway
including L-SOP and L-serine in the forebrain and cerebellum.
The mice were split into three groups and fed either a normal (18%), low (6%) or very
low (2%) protein diet for two weeks (for the composition of each diet see methods 2.10).
Detailed analysis was performed on total body weight changes over the two week period in

77
addition to organ weights at the end of the diet period (Antflick et al. 2010). Quantitative
western blotting was performed on forebrain and cerebellar homogenates with antibodies to
PSAT and PSP. No changes in the expression of PSAT or PSP were observed in either the
forebrain or cerebellum between the mice fed either a very low 2% or normal 18% protein diet
(Fig. 4.3A, B) (Antflick et al. 2010). As no changes were observed between these two groups,
PSAT and PSP expression was not examined in the intermediate low protein group.
In parallel, the levels of L-SOP and L-serine were quantitated in samples of forebrain
utilizing the analytical assay specifically developed for the simultaneous detection of L-SOP, L-
serine and D-serine (Rauw et al. 2010). HPLC analysis of samples from mouse forebrain
revealed a (non-significant) increase in L-serine levels in mice fed the 2% diet (Fig. 4.4). In
mice given the 6% diet, a significant reduction in the levels of L-SOP was observed compared to
the very low and normal diet (Fig. 4.4). Owing to the lack of change in the expression of PSAT
or PSP in the forebrain, the decrease of L-SOP in the 6% protein diet appears to be an anomaly.
Having observed no elevation in the levels of L-SOP within the CNS, the dietary
approach to increase the levels of endogenous L-SOP was abandoned.

78
Figure 4.3: Changes in the forebrain and cerebellar expression of PSAT and PSP in mice
fed very low protein or normal diets for two weeks
A, PSAT expression. B, PSP expression. One way ANOVA followed by Tukey’s post hoc analysis was performed (N=8 for each group). Values represent means ± SEM. Significant differences are indicated as **P<0.01, ***P<0.001.

79
Figure 4.4: Analysis of L-serine and L-SOP content in the forebrains from mice fed normal
or very low protein diets for two weeks
One way ANOVA followed by Tukey’s post hoc analysis was performed (N = 4 for each group). Values represent means ± SEM in µg/g. Significant differences are indicated as *P<0.05, **P<0.01, ***P<0.001. Reproduced from Antflick et al. “The effects of a low protein diet on amino acids and enzymes in the serine synthesis pathway in mice”, Amino Acids, v.39, pp 145-153, Copyright (2010), with permission from Springer.

80
CHAPTER 5. A potential new role for L-SOP in the CNS: Co-
incident activation of mGluR4 and GABAA receptors promotes
glutamate release from parallel fiber axon terminals
mGluR4 and presynaptic GABAA receptors exert opposite effects on glutamate release
which is intriguing given the apparent anatomical overlap on parallel fiber axon terminals
between these two receptors. We sought to examine whether mGluR4 and presynaptic GABAA
receptors are co-expressed and interact with each other to mediate glutamate release from
parallel fibers. Here, a functional interaction between mGluR4 and presynaptic GABAA
receptors is demonstrated whereby simultaneous activation of both receptors surprisingly
facilitated glutamate release from cerebellar synaptosomes. In the absence of mGluR4 receptors
in the mGluR4 knockout mouse, a compensatory decrease in the expression of GABAA receptors
was found, possibly to normalize parallel-fiber excitability. This novel finding provides the first
example of a GPCR-ion channel interaction occurring within the presynaptic terminal to regulate
excitability and glutamate release.
5.1 Co-localization of mGluR4 and GABAA receptors in the cerebellum
and cerebellar synaptosomes
While the mGluR4 receptor and the GABAA α1 subunit have both been localized on
presynaptic terminals of cerebellar parallel fibers (Corti et al. 2002; Stell et al. 2007; Trigo et al.
2010), it is not known whether they are present together on the same terminals. To investigate
this possibility, thin sections from the cerebellum of wild-type C57/BL6 mice were co-labeled
with specific antibodies for mGluR4 and GABAA α1 and imaged in the molecular layer of the
cerebellar cortex at high magnification (500X). Co-localization was quantified using object-

81
based methods and the JACoP plugin for ImageJ (see methods 2.8 for a detailed explanation).
To assess the sensitivity and validity of this method for detecting co-localized proteins, an
analysis was performed on cerebellar sections using two anti-GABAA α1 antibodies generated in
different species (rabbit and mouse, see methods) and towards different epitopes; these
antibodies were expected to label the same GABAA receptors. Indeed, high magnification
imaging of the immunoreactive puncta for the two GABAA α1 epitopes showed greater than 75%
overlap (77%) (Fig. 5.1A); this value was used as a reference to normalize the extent of co-
localization between mGluR4 and GABAA α1. Using these parameters, we observed that 33.5 ±
4.1% of all GABAA α1 immunoreactive puncta in the molecular layer were co-localized with
mGluR4. This result indicated that a substantial proportion of GABAA receptors in the
cerebellar molecular layer are expressed on mGluR4 containing parallel fiber axon terminals
(Fig. 5.1B, G).
To further validate mGluR4/GABAA co-localization, the identical analysis was
performed on cerebellar synaptosomes where each synaptosome (nerve terminal) can be
visualized as a discrete object. As in the cerebellar sections, more than 75% of the
immunoreactivity between the two different GABAA α1 antibodies was observed to co-localize
(Fig. 5.1D) which was again normalized as 100% co-localization. GABAA α1 was observed to
co-localize with 25.5 ± 3.6% of mGluR4 (Fig. 5.1E) immunoreactive puncta. Taken together,
these results indicate that in mouse cerebellar synaptosomes and in tissue sections of mouse
cerebellar cortex, a substantial proportion (26-34%) of α1-containing GABAA receptors in the
molecular layer are expressed on axon terminals of parallel fibers where they co-localize with
mGluR4 (Fig. 5.1G).

82
Figure 5.1: Co-localization of GABAA α1 and mGluR4 in mouse cerebellum and cerebellar
synaptosomes
Co-localization analysis in cerebellum of GABAA α1 with GABAA α1 (A, 100%) and mGluR4 (B, 33.5 ± 4.1%), no primary (C). Co-localization in cerebellar synaptosomes of GABAA α1 with GABAA α1 (D, 100%) and mGluR4 (E, 25.5 ± 3.6%), no primary (F). G graphical representation of the percentage of GABAA α1 co-localization. Values represent mean ± S.E.M., N = 3. Images were acquired with a 100 X objective in 5.0 X cropping frames. Scale bars indicate 5 μm. Reproduced from Antflick and Hampson “Modulation of glutamate release from parallel fibers by mGlu4 and pre-synaptic GABA(A) receptors”, Journal of Neurochemistry, v.120, pp 552-563, Copyright (2012), with permission from Blackwell Publishing.
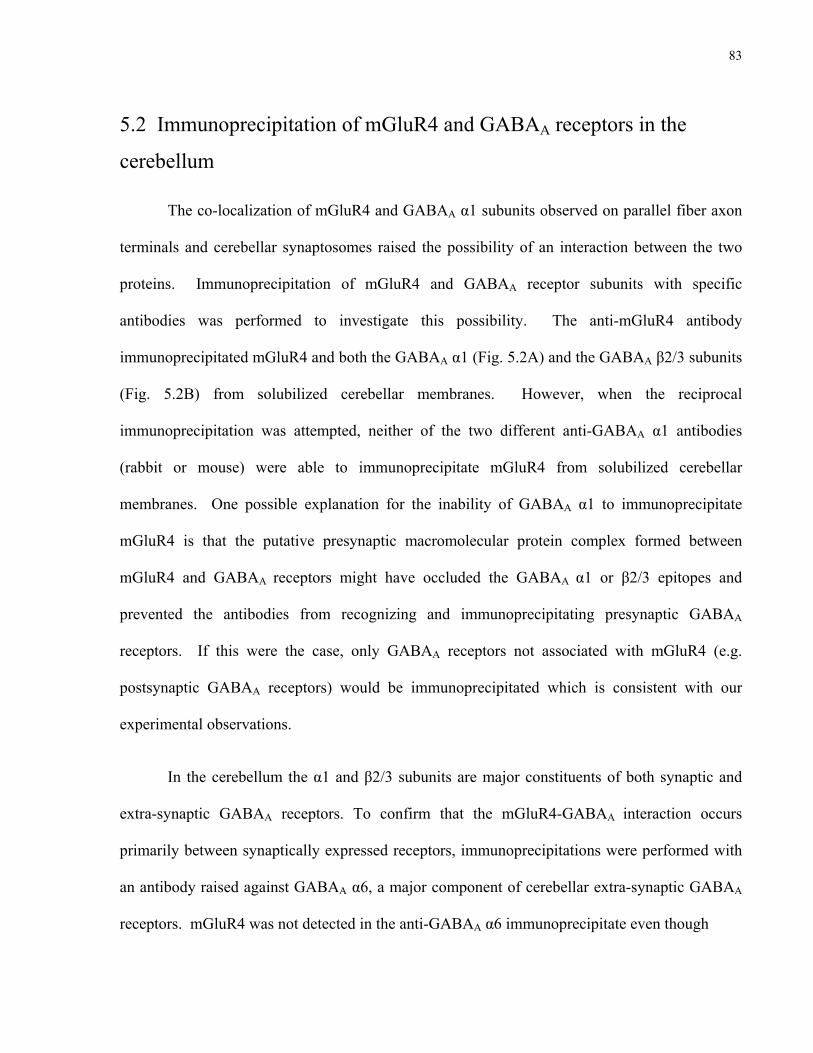
83
5.2 Immunoprecipitation of mGluR4 and GABAA receptors in the
cerebellum
The co-localization of mGluR4 and GABAA α1 subunits observed on parallel fiber axon
terminals and cerebellar synaptosomes raised the possibility of an interaction between the two
proteins. Immunoprecipitation of mGluR4 and GABAA receptor subunits with specific
antibodies was performed to investigate this possibility. The anti-mGluR4 antibody
immunoprecipitated mGluR4 and both the GABAA α1 (Fig. 5.2A) and the GABAA β2/3 subunits
(Fig. 5.2B) from solubilized cerebellar membranes. However, when the reciprocal
immunoprecipitation was attempted, neither of the two different anti-GABAA α1 antibodies
(rabbit or mouse) were able to immunoprecipitate mGluR4 from solubilized cerebellar
membranes. One possible explanation for the inability of GABAA α1 to immunoprecipitate
mGluR4 is that the putative presynaptic macromolecular protein complex formed between
mGluR4 and GABAA receptors might have occluded the GABAA α1 or β2/3 epitopes and
prevented the antibodies from recognizing and immunoprecipitating presynaptic GABAA
receptors. If this were the case, only GABAA receptors not associated with mGluR4 (e.g.
postsynaptic GABAA receptors) would be immunoprecipitated which is consistent with our
experimental observations.
In the cerebellum the α1 and β2/3 subunits are major constituents of both synaptic and
extra-synaptic GABAA receptors. To confirm that the mGluR4-GABAA interaction occurs
primarily between synaptically expressed receptors, immunoprecipitations were performed with
an antibody raised against GABAA α6, a major component of cerebellar extra-synaptic GABAA
receptors. mGluR4 was not detected in the anti-GABAA α6 immunoprecipitate even though

84
Figure 5.2: Immunoprecipitation of mGluR4 and GABAA from mouse cerebellum
A, immunoprecipitation of mGluR4 and GABAA α1 from mouse cerebellum using anti-mGluR4 and anti-GABAA α1 antibodies. Probing with anti-mGluR4 (A, upper) or anti- GABAA α1 (A, lower) revealed the presence of GABAA α1 in the mGluR4 immunoprecipitate but not mGluR4 in the anti-GABAA α1 immunoprecipitate. B, immunoblotting of the mGluR4 immunoprecipitate revealed the presence of GABAA α1 and GABAA β2/3. Probing the anti-GABAA α6 immunoprecipitate revealed the presence of GABAA α1 but not GABAA β2/3 or mGluR4. N = 3. Reproduced from Antflick and Hampson “Modulation of glutamate release from parallel fibers by mGlu4 and pre-synaptic GABA(A) receptors”, Journal of Neurochemistry, v.120, pp 552-563, Copyright (2012), with permission from Blackwell Publishing.

85
GABAA α1 was detected (Fig. 5.2B), suggesting that mGluR4 does not interact with α1α6
containing GABAA receptors present on granule cell bodies.
5.3 mGluR4 and GABAA receptor modulation of glutamate release
from cerebellar synaptosomes
The mGluR4 and GABAA co-localization and co-immunoprecipitation results provide
indirect evidence to suggest that these two proteins exist together and possibly interact within a
presynaptic macromolecular protein complex. We investigated a potential functional interaction
between presynaptic GABAA and mGluR4 receptors by examining the effect of mGluR4
activation on GABAA receptor-dependent glutamate release from cerebellar synaptosomes
preloaded with [3H] glutamate (Fig. 5.3).
In all cases, glutamate release was evoked by depolarizing synaptosomes with 26 mM
KCl to obtain baseline release values. To examine GABAA receptor-dependent glutamate
release, muscimol and other drugs (see below) were added to the release buffer already
containing 26 mM KCl. The increase in [3H] glutamate release relative to baseline by the
addition of muscimol was defined as 100% and referred to as GABAA-dependent glutamate
release. 10 μM muscimol resulted in a modest, yet significant increase in the amount of [3H]
glutamate released; this response was partially blocked by the addition of the GABAA antagonist
bicuculline (43.7 ± 8.0% of control values, Fig. 5.3A). On its own, activation of mGluR4 by the
orthosteric agonist L-AP4 (50 μM) induced a small (non-significant) 1.3 + 0.9% decrease in
[3H]glutamate release. When 50 M L-AP4 was simultaneously applied with 26 mM KCl, a
12.3 ± 9.5% (non-significant) increase in glutamate release was seen. Unexpectedly however,
the combination of muscimol and L-AP4 facilitated GABAA-dependent glutamate release (133.6

86
± 14.9%, Fig. 5.3A). Furthermore, the co-administration of 10 μM bicuculline and 50 μM L-
AP4 depressed GABAA-dependent glutamate release to baseline levels (-5.0 ± 12.7%). Both
GABAA-dependent glutamate release and L-AP4 facilitation of GABAA-dependent glutamate
release required calcium. In the absence of calcium, the amount of GABAA-dependent glutamate
release was decreased to 68.1 ± 9.2% of the release observed in the presence of calcium (Fig.
5.3B). Moreover, in the absence of calcium, L-AP4 had no further effect GABAA-dependent
glutamate release and was reduced to 62.2 ± 8.7% of + calcium control release. Thus it appeared
that at least some of the release triggered by activation of these receptors was calcium-
dependent, and likely vesicular. These results indicate that simultaneous activation of mGluR4
and GABAA receptors facilitates calcium-dependent glutamate release.
mGluR4 facilitation of GABAA-dependent glutamate release was abolished when the
cerebellar synaptosomes were incubated with pertussis toxin (Fig. 5.3C, 128.1 ± 5.3% vs. 100.9
± 12.1%), suggesting that this interaction is dependent on G-protein activation. Upon activation
of mGluR4, the Gαi/o subunit inhibits adenylate cyclase, decreases production of cAMP and
attenuates the activity of PKA. To examine the involvement of PKA in GABAA-dependent
glutamate release, the assay was repeated in the presence of the PKA activator, the cAMP
analog, 8-CPT-cAMP, or the PKA inhibitor H89. Augmentation of PKA activity with 8-CPT-
cAMP had no effect on glutamate release on its own under basal conditions with no added drugs
(data not shown), or after the addition of muscimol (97.4 ± 8.2% of control) or L-AP4 (101.8 ±
17.8% of control, (Fig. 5.3D). In contrast, inhibition of PKA with H89 (Fig. 5.3E) decreased
GABAA-dependent glutamate release to baseline values (1.7 ± 17.2% of control) and prevented
L-AP4 mediated facilitation of GABAA-dependent glutamate release (33.2 ± 16.0% of control).
Taken together, these results indicate GABAA-dependent glutamate release requires basal PKA

87
Figure 5.3: Activation of mGluR4 facilitates muscimol-induced glutamate release from
cerebellar synaptosomes and is G-protein dependent

88
Cerebellar synaptosomes were stimulated with 26mM KCl in the presence and absence of drugs. Stimulation with 26mM KCl alone (no drug) was taken as the baseline measurement and all values were then expressed as the percentage of glutamate release induced by 10 μM muscimol. A, 50 μM L-AP4 alone did not have any effect on basal glutamate release (12.3 ± 9.5%) but facilitated 10 μM muscimol-induced glutamate release (133.6 ± 14.9%). 10 μM bicuculline had no effect on basal glutamate release (4.1 ± 17.7%) but depressed muscimol-induced glutamate release (43.7 ± 8.0%). Co-administration of bicuculline and L-AP4 completely abolished muscimol induced glutamate release to baseline levels (-5.0 ± 12.7%). B, In the absence of calcium, muscimol-induced glutamate release was depressed (68.1 ± 9.2%) and L-AP4 reduced muscimol-induced glutamate release (62.2 ± 8.7%) as opposed to facilitating release (118.5 ± 9.9) in the presence of calcium. C, treatment of synaptosomes with 3 μg / ml pertussis toxin had no effect on muscimol-induced glutamate release (100.9 ± 12.1%) but prevented L-AP4 facilitation of muscimol-induced glutamate release (101.4 ± 7.3 vs. 128.1 ± 5.3). D, the addition of the cyclic AMP analog, 8-CPT-cAMP had no effect on muscimol-induced glutamate release (97.4 ± 8.2%) or L-AP4 facilitation of glutamate release (101.8 ± 17.8%). F, the PKA inhibitor, H89 depressed muscimol-induced release (1.7 ± 17.2%) and caused L-AP4 to inhibit muscimol-induced glutamate release (33.2 ± 16.0%). Black bars represent muscimol treatment and grey bars represent muscimol + L-AP4 treatment. All values represent mean ± S.E.M. N values for each condition are indicated below the axis. Statistical analysis was performed using one-way ANOVA ***p < 0.001, *p < 0.05. musc, muscimol; bicuc, bicuculline; PTx, pertussis toxin. Reproduced from Antflick and Hampson “Modulation of glutamate release from parallel fibers by mGlu4 and pre-synaptic GABA(A) receptors”, Journal of Neurochemistry, v.120, pp 552-563, Copyright (2012), with permission from Blackwell Publishing.

89
activity whereas the L-AP4 facilitation of GABAA-dependent release requires the activity of the
Gαi/o subunit.
5.4 Alterations in GABAA receptor subunit expression in the cerebellum
of the mGluR4 knockout mice
mGluR4 knockout mice are resistant to absence seizures induced by low doses of
GABAA antagonists (pentylenetetrazole, bicuculline, or picrotoxin) (Snead, III et al. 2000). One
explanation for this finding could be a reduction in GABAA receptor expression. Quantitative
western blotting of wild-type and mGluR4 knockout mouse cerebellar homogenates revealed
decreased expression of several GABAA receptor subunits (Fig. 5.4). Compared to wild-type
mice, the mGluR4 knockout mice displayed significantly lower levels of GABAA α1 (Fig. 5.4B,
72.2 ± 7.5% of wild-type), α6 (Fig. 5.4C, 85.2 ± 5.4% of wild-type), and β2 expression (Fig.
5.4D, 63.8 ± 2.1% of wild-type), whereas GABAA β3 expression was unchanged (not shown).
Quantitation of GABAA α2, α5, and β1 expression was also attempted in the cerebellar
homogenates but the expression levels of these proteins were below the limits of detection.
Receptor autoradiography with the high affinity GABAA receptor ligand, [35S]TBPS, was
performed to assess differences in the anatomical distribution of GABAA receptors in the mouse
cerebellum. [35S]TBPS binding is highly reliant on the GABAA β subunits, preferentially
binding to the highly homologous β2 and β3 isoforms (Luddens et al. 1994; Jursky et al. 2000).
However, in the cerebellum it appears that TBPS binding is primarily mediated by the GABAA
β2 subunit because no significant differences in TBPS binding were observed in the cerebellum
of the GABAA β3 knockout mouse (Uusi-Oukari et al. 2004). Our results indicated that
[35S]TBPS binding was predominately localized within the granule cell layer of the cerebellar

90
Figure 5.4: GABAA receptor subunit expression in cerebellar homogenates wild-type and
mGluR4 knockout mice
A, mGluR4 was not detectable in the mGluR4-/- mice. B, a decrease was observed in GABAA α1 expression in mGluR4-/- compared to mGluR4+/+ (72.2 ± 7.5% vs. 100.0 ± 8.1, p < 0.05). C, a significant decrease was observed in GABAA α6 expression in mGluR4-/- compared to mGluR4+/+ (85.2 ± 5.4% vs. 100.0 ± 3.9%, p < 0.05). D, a significant decrease was observed in GABAA β2 expression in mGluR4-/- compared to mGluR4+/+ (63.8 ± 2.1% vs. 100.0 ± 4.4%, p < 0.05). E, graphical representation of quantitative western blots illustrated in panels A-F showing expression in mGluR4 -/- relative to mGluR4 +/+. Values represent mean ± S.E.M., N = 4-8, * indicates p < 0.05. Reproduced from Antflick and Hampson “Modulation of glutamate release from parallel fibers by mGlu4 and pre-synaptic GABA(A) receptors”, Journal of Neurochemistry, v.120, pp 552-563, Copyright (2012), with permission from Blackwell Publishing.
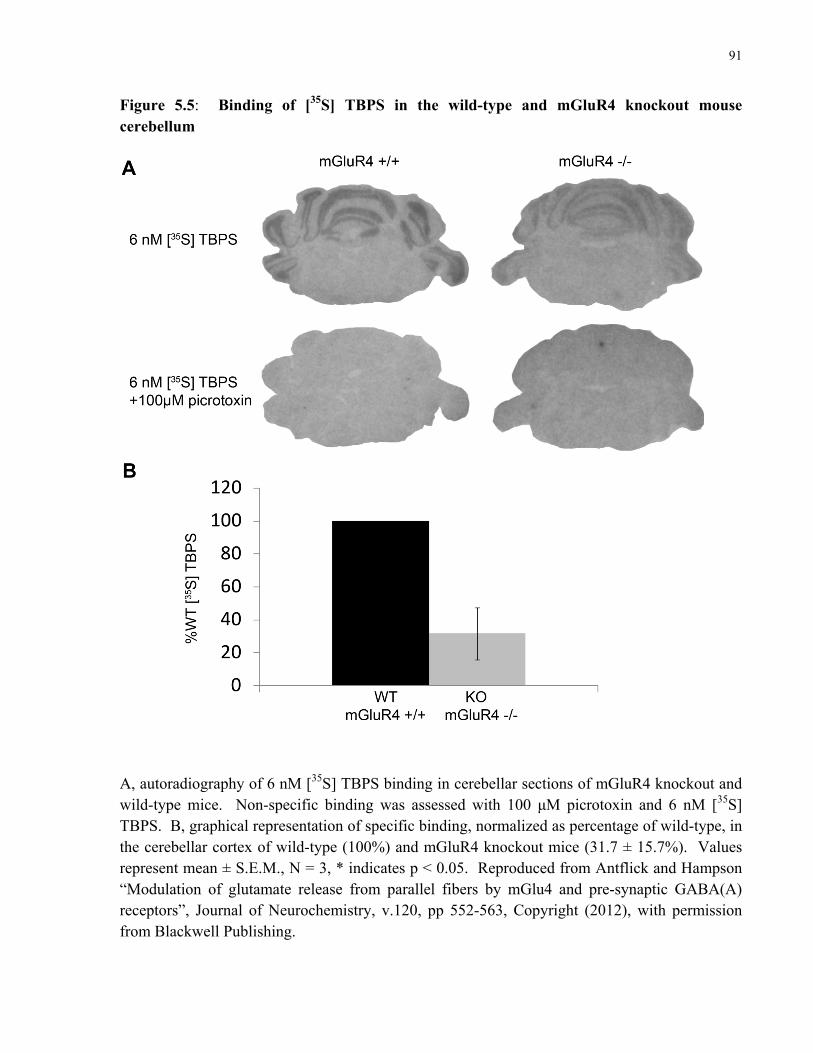
91
Figure 5.5: Binding of [35S] TBPS in the wild-type and mGluR4 knockout mouse cerebellum
A, autoradiography of 6 nM [35S] TBPS binding in cerebellar sections of mGluR4 knockout and wild-type mice. Non-specific binding was assessed with 100 μM picrotoxin and 6 nM [35S] TBPS. B, graphical representation of specific binding, normalized as percentage of wild-type, in the cerebellar cortex of wild-type (100%) and mGluR4 knockout mice (31.7 ± 15.7%). Values represent mean ± S.E.M., N = 3, * indicates p < 0.05. Reproduced from Antflick and Hampson “Modulation of glutamate release from parallel fibers by mGlu4 and pre-synaptic GABA(A) receptors”, Journal of Neurochemistry, v.120, pp 552-563, Copyright (2012), with permission from Blackwell Publishing.

92
cortex (Fig. 5.5A). Quantitation of [35S]TBPS binding revealed a marked 68% decrease in the
cerebellar cortex of mGluR4 knockout mice relative to wild-type mice (Fig. 5.5B). Taken
together, these results indicate that the expression of β2 containing GABAA receptors is reduced
in the granule cell layer of the cerebellum in the mGluR4 knockout mouse. Since granule cells
are known to express GABAA receptors composed of α1, α6, and β2 subunits on their cell
bodies, our data indicate that in the mGluR4 knockout there is a decrease in granule cell
expression of somatic GABAA receptors.
The regulation of presynaptic glutamate release is important in the maintenance and
fidelity of excitatory transmission in the nervous system. Here, we identified a novel interaction
between a ligand-gated ion channel and a G-protein coupled receptor which regulates glutamate
release from parallel fiber axon terminals. Immunocytochemical analysis revealed that GABAA
receptors and the high affinity Group III mGluR, mGluR4, are co-localized on glutamatergic
parallel fiber axon terminals in the cerebellum. GABAA and mGluR4 receptors were also found
to co-immunoprecipitate from cerebellar membranes. Independently, these two receptors have
opposing roles on glutamate release: presynaptic GABAA receptors promote, while mGluR4
receptors inhibit, glutamate release. However, coincident activation of GABAA receptors with
muscimol and mGluR4 with L-AP4, increased glutamate release from [3H]glutamate-loaded
cerebellar synaptosomes above that observed with muscimol alone. Further support for an
interaction between GABAA and mGluR4 receptors was obtained in the mGluR4 knockout
mouse which displayed reduced binding of the GABAA ligand [35S]TBPS, and decreased
expression of the α1, α6, β2 GABAA receptor subunits in the cerebellum. Taken together, our
data suggest a new role for mGluR4 whereby simultaneous activation with GABAA receptors
acts to amplify glutamate release at parallel fiber-Purkinje cell synapses. The results of this

93
study in the context of endogenous activation of mGluR4 by L-SOP will be discussed in sections
6.4 and 6.5.

94
CHAPTER 6. Discussion of L-SOP as a potential transmitter in the
CNS
6.1 Quantitation of L-SOP in the CNS
As a first step in the study of L-SOP as a potential transmitter, we and our collaborators
developed a novel analytical procedure for accurately quantifying L-SOP in brain tissue (Rauw
et al. 2010). Our results demonstrate that L-SOP is present at approximately 5 μM in rat whole
brain (equivalent to 1 μg/g tissue) which is considerably lower than the values reported in three
of the four previous studies.
The earliest attempt to measure the levels of L-SOP in rodent brain employed paper
chromatography followed by colorometric quantitation of the L-SOP ‘spot’ with ninhydrin
(Porcellati 1958). The CNS concentration reported for L-SOP in this study was 40 μg/g (with a
range of 34 - 46 μg/g). It is possible that this value overestimates the actual amount of L-SOP
based on the knowledge that ninhydrin will react with all free primary and secondary amines
belonging to other substances in the sample. The brain L-SOP values reported by McIlwain and
Bachelard as 56 μg/g (McIlwain and Bachelard 1985) was also derived from early analytical
methods. Although a detailed description of methodology employed in this study is lacking, it is
possible that there may have been interference from other substances in the brain extract. A third
estimation for the amount of L-SOP in the CNS found a concentration of 10 μg/g (Goodnough et
al. 1995), which is 10- fold higher than our reported value. When we attempted to reproduce
their method, which used Marfey’s reagent followed by HPLC and UV detection, we were
unable to separate derivatized L-SOP from other interfering substances. Therefore, it is
conceivable that in all three of the earlier studies, the presence of interfering substances in the
brain extracts may have led to overestimations of the actual CNS concentration of L-SOP. A

95
fourth study using gas chromatography to detect free phosphoamino acids in several tissues from
different species reported L-SOP concentrations of 0.33, 0.11 and 0.35 μg/g in whole brain
samples from pigs, mice, and chickens, respectively (Kataoka et al. 1991).
In our study, various derivatizing reagents and HPLC separation techniques were tested
and interfering peaks were found under several conditions. Brain levels of L-SOP measured
using this newly developed HPLC method succeeded in resolving the interfering peaks, and were
confirmed using combined HPLC/mass spectrometry (Rauw et al. 2010). For these reasons, we
are confident that the values obtained in this study are an accurate reflection of the true CNS
concentration of L-SOP.
Compared to glutamate, which has a whole brain concentration of 12 mM (Hawkins and
Mans 1983), the whole brain concentration of L-SOP, estimated at 5 μM, may seem too low for
consideration as a transmitter. However, the whole brain concentration of L-SOP is similar to
what has been reported for dopamine (~5.2 μM) (Nazarali et al. 1987). The low whole brain
concentration of dopamine is indicative of the presence of discrete dopaminergic pathways
which contain somewhere between 300,000- 400,000 neurons in the human CNS. Although the
whole brain concentration of dopamine is low, and dopaminergic neurons make up only a tiny
fraction of the total number of neurons in the brain, dopamine is nonetheless an important
neurotransmitter involved in processing emotions and cognition.
The low whole brain concentration of L-SOP indicated that L-SOP may be utilized as a
neurotransmitter in discrete pathways within the CNS. We propose that L-SOP is an endogenous
ligand for mGluR4 and therefore, we hypothesize that these discrete pathways will contain
neurons or glial cells capable of synthesizing L-SOP that form synapses with neurons expressing
presynaptic mGluR4. The identification of brain regions, and synapses within these brain
96
regions, where L-SOP functions as a transmitter to activate mGluR4 is therefore essential to the
validation of L-SOP as transmitter.
6.2 Analysis of L-SOP synthesizing and metabolizing enzymes in the
CNS
The expression of PSAT and PSP was widespread and found in both central and
peripheral tissues. Peripheral expression of PSAT and PSP, especially in the liver and kidney, is
likely necessary for generating adequate levels of circulating L-serine and glycine to meet
metabolic demands. Unlike the developing CNS where the combined effects of a more
permeable blood-brain-barrier and high capillary expression of the neutral amino acid
transporter, alanine-serine-cysteine transporter (Sakai et al. 2003), allows peripheral L-serine to
enter the CNS, the low permeability of L-serine at the blood-brain-barrier in the mature CNS
(Smith et al. 1987) dictates that intra-CNS synthesis of L-serine is obligatory.
Traditionally, the synthesis of L-serine within the CNS is thought to occur in glial cells to
relieve the metabolic burden of L-serine synthesis from neurons. This idea is supported by
previous studies demonstrating that glial-synthesized L-serine is essential for the growth and
survival of neurons in culture (Dringen et al. 1998; Verleysdonk and Hamprecht 2000). We
observed PSAT and PSP expression in both neurons and glia in the adult rat CNS. Although
some glial PSP expression was observed in the hilus of the dentate gyrus and PSAT was detected
in Bergmann glia within the cerebellum, the predominant cell type observed to express PSAT
and PSP were neuronal cells: pyramidal neurons in the cerebral cortex, dentate granule cells in
the hippocampus and Purkinje cells in the cerebellum.
The prominent neuronal expression of PSAT and PSP in the adult CNS was somewhat
unexpected in light of reports that the upstream enzyme, 3-phosphoglycerate dehydrogenase, is

97
mainly present in astrocytes (Furuya et al. 2000; Furuya and Watanabe 2003). However, support
for neuronal localization of PSAT and PSP comes from a study in which an antibody to L-serine
showed robust immunolabeling in both glia and in neurons, including pyramidal neurons of the
cerebral cortex (Yasuda et al. 2001). Although PSAT and PSP were detected in rapidly
proliferating astrocytes in culture, induction of gliosis by kainic acid induced seizures (as a
mechanism to promote rapid glial proliferation in vivo) did not increase the expression of PSP in
the hippocampus. This observation disagrees with a previous study that reported 3-
phosphoglycerate dehydrogenase expression in the hippocampus which was up-regulated in glial
cells in response to kainic acid-induced seizures (Jeon et al. 2009). A potential explanation to
resolve this disagreement may be that the synthesis of L-serine does not strictly occur in glial
cells.
The disconnect between the glial expression of 3-phosphoglycerate dehydrogenase and
neuronal expression of PSAT and PSP may be resolved by envisioning that the L-serine
biosynthetic pathway is divided between glial and neuronal cells for metabolic efficiency. This
in turn allows for differential synthesis of L-SOP and L-serine. This idea is supported by a study
employing Northern blot analyses of glial and neuronal cultures which revealed that PSP mRNA
was enriched in neuronal cultures, PSAT mRNA was expressed equally in both glial and
neuronal cultures and the mRNA encoding 3-phosphoglycerate dehydrogenase was enriched in
glial cultures (Shimizu et al. 2004). One explanation of this dispersion of the L-SOP synthetic
and metabolic enzymes between glia and neurons may be that the high metabolic tradeoff of
shunting 3-phosphoglycerate into the L-serine biosynthetic pathway, at the expense of energy
production via the tricarboxylic acid cycle, occurs in glial cells. This would ensure that
glycolytic production of 3-phosphoglycerate in neurons directly feeds into the tricarboxylic acid
cycle for the purpose of energy production. The next enzymatic step in the pathway involves the

98
transamination of L-glutamate and phosphohydroxypyruvate to form L-SOP and α-ketoglutarate
which is catalyzed by PSAT. This reaction would be metabolically favorable for both neurons
and glia since α-ketoglutarate directly feeds into the tricarboxylic acid cycle and can be directly
utilized for energy production. Our data support this idea as we observed PSAT expression in
both Purkinje cell neurons and Bergmann glial cells in the cerebellum. In the final step of L-
serine synthesis, the hydrolysis of L-SOP to form L-serine and inorganic phosphate is catalyzed
by PSP. Since L-serine is necessary for the growth and survival of neurons, it seems probable
that this final enzymatic step would occur in neurons. Fitting with this idea, we observed near
exclusive neuronal expression of PSP.
Interestingly, PSP was also expressed in the subgranular zone of the hippocampus and
partially co-localized with PSA-NCAM, a marker for young neurons. Previous work has noted a
parallel between the levels of PSP and protein synthesis, and also a direct relationship between
cellular demand for L-serine and the activity of PSP (Knox et al. 1969; Fell and Snell 1988).
These findings coupled with evidence that high levels of PSAT and PSP have been reported in
neoplastic cell lines and tissues (Snell 1984; Vie et al. 2008) suggest that these enzymes play a
role in regulating cell proliferation and growth by controlling the amount of available
metabolites produced by the L-serine biosynthetic pathway, namely L-serine, glycine and α-
ketoglutarate, all of which are necessary for cellular growth and proliferation.
Recent work in the highly aggressive human breast cancer cell line MDA MB-231
revealed that augmented activity of 3-phosphoglycerate dehydrogenase and PSAT afforded these
cells a proliferative advantage due to the elevated production of L-serine (Pollari et al. 2011).
Gene amplification of 3-phosphoglycerate dehydrogenase has also been observed in breast
cancer tumors (Possemato et al. 2011; Locasale et al. 2011) where the diversion of 3-
phosphoglycerate from the tricarboxylic acid cycle into L-serine synthesis similarly provides a

99
growth advantage. Although L-serine and glycine are circulating in plasma and readily available
for growing tumors, it appears that the production of α-ketoglutarate by PSAT yields the largest
metabolic gain for these rapidly growing cells. In fact, nearly 50% of the α-ketoglutarate
generated in these tumors was from the glutamate transamination catalyzed by PSAT (Possemato
et al. 2011).
A sufficient supply of L-serine is also crucial for the normal development of the
immature CNS. Embryonic lethality is observed at embryonic day 13.5 in the 3-
phosphoglycerate dehydrogenase knockout mice and further analysis of these mice revealed
impaired morphogenesis in the CNS, specifically hypoplasia (Yoshida et al. 2004). The
necessity of adequate levels of L-serine is also dramatically illustrated in children with mutations
that cripple the enzymatic activity of 3-phosphoglycerate dehydrogenase, PSAT, or PSP, where
severe neurological defects become apparent within several months after birth (de Koning et al.
2003; de Koning 2006). Daily supplementation with up to 500 mg/kg L-serine and 200 mg/kg
glycine can help to normalize seizures and brain development (as measured by head
circumference) if treatment begins at an early age when the blood-brain-barrier is more
permeable to L-serine (de Koning et al. 1998).
Immunocytochemical analyses of the cerebral cortex, hippocampus, and cerebellum
indicated that the anatomical distributions of the two enzymes appear to be generally conserved
in rats and primates (Antflick et al. 2009), and that PSAT, and especially PSP, are expressed
more ubiquitously in the immature rat brain compared to the adult CNS. This is particularly true
of cerebral cortical neurons where in the immunocytochemical experiments, more intense
expression was seen postnatal day 2 rats compared to adult rats. In the cerebral cortex of the
postnatal day 2 rat, virtually every cell displayed intense PSAT and PSP immunostaining,
whereas in the adult rat cortex, the number of cells expressing both enzymes was more restricted.

100
However, in the adult rat cerebral cortex, the neurons expressing PSAT and PSP appeared to
express the two enzymes at relatively high levels. High expression of PSAT and PSP in mature
neurons potentially indicates the ongoing synthesis of L-SOP, L-serine, D-serine and glycine in
the forebrain. Since the expression of both PSAT and PSP is high in forebrain pyramidal
neurons, it is unclear from our results whether L-SOP is immediately metabolized into L-serine
or accumulated within these neurons. If accumulated, the possibility exists that L-SOP is utilized
by cortical pyramidal neurons as a retrograde transmitter to activate presynaptic Group III
mGluRs (discussed below in section 6.5). Alternatively, L-SOP may be metabolized to L-serine
for usage as a building block in the synthesis of proteins, lipids and nucleotides, or converted
into D-serine or glycine which may be important in neuromodulation and plasticity in the mature
CNS.
D-serine is known to be the co-agonist at the glycine site of the NMDA receptor and can
be released from both neurons (Kartvelishvily et al. 2006) and glial cells (Henneberger et al.
2010). Decreased levels of forebrain D-serine, and the resulting hypoactivation of NMDA
receptors is becoming an important element in the pathophysiology of schizophrenia [for a recent
review see (Labrie et al. 2011)]. One potential insight into the role of D-serine in schizophrenia
comes from the serine racemase knockout mice which have drastically reduced levels of
circulating D-serine. Within the somatosensory cortex of the serine racemase knockout mice,
hypofunctioning of the NMDA receptor leads to less extensive dendritic arborization and
decreased spine density (Balu et al. 2011). Interestingly, the reduction in cortical volume,
decreased distal spine density and dendritic branching observed in the serine racemase knockout
mice resemble defects observed in the human schizophrenic condition (Kalus et al. 2000).
Our immunostaining results in the cerebellum displayed an interesting pattern of
expression: we observed a convergence in Purkinje neurons where both PSAT and PSP

101
displayed relatively high expression. In contrast, PSAT expression was also high in the
Bergmann glia, but PSP was not detected in these cells. 3-phosphoglycerate dehydrogenase was
reported to be present in Bergmann glia but not in Purkinje cells (Furuya et al. 2000; Furuya and
Watanabe 2003). Thus, the expression of the enzymes of the L-serine biosynthetic pathway
appears to be spread between Bergmann glia and Purkinje cells. Whereas Bergmann glia express
3-phosphoglycerate dehydrogenase and PSAT, Purkinje cells express PSAT and PSP but not 3-
phosphoglycerate dehydrogenase (Fig. 3.5). It is conceivable that phosphohydroxypyruvate, the
reaction product of 3-phosphoglycerate dehydrogenase, is generated in the Bergmann glia and
then either converted to L-SOP by PSAT, or taken up by neighboring Purkinje cells by an as yet
unidentified mechanism, and then further metabolized to L-SOP and L-serine. In this scenario,
Purkinje cells could utilize L-serine internally, and/or release it to support the growth of
neighboring neurons such as basket and stellate cells.
A key observation made in this series of experiments was that the enzymatic machinery
necessary for the synthesis and metabolism of L-SOP was present in the cells forming the
parallel fiber-Purkinje cell synapse. Parallel fibers express very high levels of presynaptic
mGluR4 so it was interesting to find PSAT and PSP expression in Purkinje cells that are
postsynaptic to the terminals of the parallel fibers, and that PSAT, but not PSP is expressed in
the Bergmann glia which ensheathe this synapse (Castejon 1990; Grosche et al. 1999). The
possibility and implication of L-SOP being released from as a retrograde transmitter from
Purkinje cells, or as a gliotransmitter from Bergmann glia to activate mGluR4 will be discussed
in section 6.5.

102
6.3 Enzyme induction in the L-serine biosynthetic pathway through
dietary protein restriction
We assessed the effects of protein restricted-diets on amino acids and the enzymes
responsible for serine synthesis and metabolism in the brain. A previous study has shown that in
response to dietary protein restriction, the enzymatic activity of 3-phosphoglyceate
dehydrogenase is elevated in liver (Mauron et al. 1973). At the time, it was unknown whether
the increase in enzymatic activity was due to an increase in activity or expression of 3-
phosphoglycerate dehydrogenase. A recent study demonstrated a near 20- fold increase in the
amount of 3-phosphoglycerate dehydrogenase mRNA in rodent liver after exposure to a low
protein diet (Nagao et al. 2009). Although the activity of 3-phosphoglycerate dehydrogenase can
be used to estimate the flux of serine, other regulatory enzymes in the L-serine pathway (i.e.
PSAT and PSP) have been relatively neglected in the study of protein restriction. Additionally,
these previous studies focused exclusively on changes in the enzyme activities within peripheral
tissues, specifically liver and neglected the effects of protein restriction on the activity of the L-
serine biosynthetic pathway in the brain. The results from our study were the first to report on
the effects of protein restriction on the expression of levels enzymes in the L-serine biosynthetic
pathway and subsequent changes in amino acid within the CNS.
Regulation of the rate of L-serine synthesis occurs via inhibition of the PSP- catalyzed
conversion of L-SOP to L-serine since homeostatic levels of L-serine (~500 μM) inhibit the
activity of PSP (Snell and Fell 1990). Therefore, the activity and enzymatic regulation of the L-
serine biosynthetic pathway appears to be adaptable to different rates of flux. During situations
where the demand for L-serine is low or normal, the rate determining steps of flux through the
pathway occurs at the level of the first two enzymes in the pathway, 3-phosphoglycerate

103
dehydrogenase and PSAT, and is determined by the availability of the substrate, 3-
phosphoglycerate. Alternatively, when the demand for L-serine increases, a drop in the levels of
L-serine will automatically be followed by an increase in the hydrolysis of L-SOP to form L-
serine until homeostatic levels are once again achieved (Fell and Snell 1988).
In the CNS, no changes were detected in the levels of L-SOP or L-serine in response to a
very low protein diet and accordingly, no changes in the expression of PSAT and PSP were
observed in forebrain or cerebellum. The absence of elevations in the expression of PSAT and
PSP in response to a low protein diet suggests that the demand for L-serine is constantly high in
the CNS and that the enzymes are constitutively active. Since the pathway is already functioning
in an environment with a high demand for L-serine, the CNS is insulated from the effects of
protein restriction. This conclusion complements the observation that PSAT and PSP are
expressed at high levels in neurons found in the postnatal day 2 and mature rat brain (section
6.2). The high demand for L-serine in the CNS is consistent with the role of L-serine as an
essential neurotrophic factor (Furuya et al. 2000).
6.4 Interaction of GABAA and mGluR4 in the cerebellum
For this study, the parallel fiber-Purkinje cell synapse of the cerebellum was selected
where mGluR4 and GABAA receptors are both expressed presynaptically. Since presynaptic
mGluR4 and GABAA receptors exert opposite effects on glutamate release, the effect of L-SOP
activation of mGluR4 was examined for the ability to regulate GABAA receptor mediated
glutamate release. We investigated the possibility that presynaptic GABAA and mGluR4
receptors co-localize and interact on parallel fiber axon terminals in the cerebellum. GABAA α1
receptors co-localized with mGluR4 in approximately one quarter to one third of these terminals

104
as assessed in preparations of cerebellar synaptosomes and in cerebellar tissue sections. These
results are consistent with previous findings that at asymmetric glutamatergic cerebellar
synapses, GABAA α1 was detected in 27% of the synapses examined, and that GABAA receptors
were most likely to be found presynaptically (not postsynaptically) within the active zone where
mGluR4 is expressed (Stell et al. 2007). The result of the co-localization and co-
immunoprecipitation data did not reveal whether mGluR4 and GABAA receptors are present in
the synapse in a direct protein-protein configuration, or if they interact indirectly in a larger
macromolecular complex containing additional proteins and bridging molecules. However, the
exact nature of this interaction (whether direct or indirect) can be tested in transfected cells
through tandem affinity purification or bimolecular fluorescent complementation assays in
combination with site directed mutagenesis or the construction of peptide fragments to identify
the exact interaction interface between mGluR4 and GABAA receptors. This method of inquiry
may also be challenged by the lack of the information regarding the specific subunit makeup of
the presynaptic GABAA receptor. For our purposes, the identification of a basic protein-protein
interaction between mGluR4 and GABAA is sufficient.
Although presynaptic GABAA receptors are known to contain the α1 subunit (Stell et al.
2007; Trigo et al. 2010), the complete subunit composition of presynaptic GABAA receptors
occurring at parallel fiber axon terminals was previously unknown. Our immunoprecipitation
data indicated that they contain α1 and β2 subunits. A previous study examining cerebellar
synaptosomes reported that glutamate release is dependent on α6-contaning GABAA receptors
(Raiteri et al. 2001). While GABAA α6 subunits are known to be expressed in cerebellar granule
cells (Laurie et al. 1992), the α6 subunit is typically associated with extrasynaptic somatically
expressed GABAA receptors on granule cell bodies that mediate tonic inhibition in the granule
cell layer (Santhakumar et al. 2006; Payne et al. 2007). In contrast, within the cerebellum,

105
mGluR4 is found exclusively in the molecular layer on parallel fiber terminals which are the
axons of granule cells, and are therefore unlikely to interact with α6-containing GABAA
receptors located on the granule cell body. Accordingly, the α6 subunit did not co-
immunoprecipitate with mGluR4 in the present study.
Interestingly, reduced expression of the α1, α6, and β2 subunits was detected by
quantitative western blot in the mGluR4 knockout mouse cerebellum, suggesting that non-
synaptic GABAA receptors are also affected by the loss of mGluR4. Autoradiography using the
high affinity GABAA ligand [35S]TBPS demonstrated that GABAA receptor expression was
dramatically decreased in the granule cell layer of the mGluR4 knockout mouse. Therefore, our
results suggested that the absence of mGluR4 on the presynaptic terminal of granule cells
induces changes in the expression of GABAA receptors on granule cell bodies. We propose that
in the absence of mGluR4, the reduction in somatic GABAA receptor expression on granule cells
is a compensatory attempt of these neurons to attenuate the level of inhibitory input and
normalize the parallel fiber excitability.
Previous work has demonstrated that activation of presynaptic GABAA receptors
promotes glutamate release from parallel fiber axon terminals (Stell et al. 2007; Stell 2011; Pugh
and Jahr 2011) and from cerebellar synaptosomes (Gallo et al. 1981; Levi and Gallo 1981; Aloisi
et al. 1983) by allowing chloride efflux, depolarizing the axon terminal and permitting the influx
of calcium. Accordingly, we observed a modest but reproducible increase in glutamate release
from cerebellar synaptosomes after KCl depolarization in the presence of muscimol. This
release was determined to be calcium dependent. Increased intra-terminal calcium
concentrations have been observed during GABAA-dependent glutamate release (Pugh and Jahr
2011; Stell 2011); our results demonstrating the calcium requirement for GABAA-dependent

106
glutamate release support a model whereby terminal depolarization by presynaptic GABAA
receptor-mediated chloride efflux activates calcium channels to promote calcium influx.
Typically mGluR4 has been shown to act as an autoreceptor to inhibit presynaptic
glutamate release through Gαi/o inhibition of adenylate cyclase, activation of potassium channels,
and/or inactivation of voltage-gated calcium channels (Millan et al. 2002). Therefore it was
surprising that L-AP4-mediated activation of mGluR4 facilitated GABAA-dependent glutamate
release from cerebellar synaptosomes. In the present study, treatment of cerebellar
synaptosomes with L-AP4 alone had no effect on 26 mM KCl-induced glutamate release, an
observation that has been reported by others (Xi et al. 2003). We found that L-AP4 augmented
the combination KCl and muscimol-induced glutamate release. This novel finding is consistent
with other emerging evidence suggesting a role for the Group III mGluRs in facilitation of
glutamate release. For example, mGluR7 was shown to promote glutamate release from cortical
synaptosomes through phospholipase C activation by a pertussis toxin-insensitive G-protein and
subsequent translocation of the release promoting Munc-13-1 protein (Martin et al. 2010; Martin
et al. 2011). Moreover, a ligand-independent role for mGluR4 has been indentified whereby the
receptor promotes glutamate release. This effect was dependent on calcium activation of
calmodulin and displacement of sequestered Munc18-1 from the mGluR4 C-terminal tail
(Nakajima et al. 2009). In our study, ligand-dependent activation of mGluR4 facilitated
glutamate release only upon simultaneous activation GABAA receptors. Taken together, our
findings and those of others indicate multiple modes of regulating glutamate release from
parallel fiber terminals.
The results with the PKA inhibitor, H89, indicated that basal PKA activity is necessary
for GABAA receptor mediated glutamate release. The involvement of cAMP and PKA in

107
glutamate release at parallel fiber-Purkinje cell synapses is at the level of vesicle cycling which
is downstream of calcium influx (Chavis et al. 1998). PKA phosphorylation of synapsin I
increases the rate of synaptic vesicle cycling from the ‘reserve pool’ to the ‘readily releasable
pool’ and the frequency of transmitter release (Menegon et al. 2006; Gelsomino et al. 2012).
Although PKA is known to phosphorylate and inhibit GABAA receptors (Leidenheimer et al.
1991; Moss et al. 1992), this effect is highly dependent on the subunit composition of GABAA
receptors. The inhibitory effect of PKA has been reported to be negligible on β2-containing
GABAA receptors (Nusser et al. 1999), suggesting that it is unlikely to play a prominent role in
the presynaptic GABAA-mGluR4 interaction identified here.
Despite the probable lack of PKA involvement in the L-AP4 mediated facilitation of
GABAA receptor-induced glutamate release, we found that Gαi/o inactivation by pertussis toxin
selectively prevented L-AP4 facilitation of GABAA-dependent glutamate release. Since
inhibition of adenylate cyclase, reduction in cAMP and decreased PKA activity is a primary
mechanism of Gαi/o activation by mGluR4, the fact that the cAMP analog, 8-CPT-cAMP failed
to attenuate the L-AP4 facilitation suggests that Gαi/o is targeting some other effector molecule.
We speculate that co-incident activation of mGluR4 and GABAA receptors facilitates glutamate
release from presynaptic terminals in a calcium and Gαi/o manner. Persistent activation of
presynaptic GABAA receptors potentially leads to ‘residual calcium’ which has been suggested
to play a major role in facilitation (Zucker 1999). Therefore, the GABAA-mediated elevation in
intraterminal calcium promotes calcium-dependent calmodulin displacement of Munc18-1 from
the C-terminal tail of mGluR4 and initiates synaptic vesicle priming. When this event occurs
simultaneous to L-AP4 stimulation of mGluR4, the activation of Gαi/o somehow facilitates
transmitter release. One possible explanation is that Gαi/o facilitates transmitter release by
activating or inhibiting downstream effectors aside from adenylate cyclase. To date, other

108
identified targets of Gαi/o include Rho-GEFs, Rap1GAP, and c-Src. However, none of these
molecules are known to be involved in the regulation of glutamate release. Despite an
incomplete picture of the mechanism responsible for the facilitation of glutamate release
mediated by simultaneous activation of mGluR4 and GABAA, these observations prompted us to
suggest a revised view on how mGluR4 and GABAA receptors might operate in the molecular
layer of the cerebellar cortex.
Based on their ability to detect synaptic activity and release transmitters to alter synaptic
transmission at parallel fiber-Purkinje cell synapses, Bergmann glia are emerging as critical
partners in cerebellar synaptic transmission (Lopez-Bayghen et al. 2007). In response to
stimulation by parallel fibers, Bergmann glia have been shown to release ATP, glutamate, and
recently, D-serine (Kakegawa et al. 2011) into the synaptic cleft to alter synaptic transmission.
In addition to the possibility of also releasing L-SOP (Antflick et al. 2009), Bergmann glia are
known to synthesize and release GABA through the opening of the calcium-activated
bestrophin1 (Best1) anion channel (Lee et al. 2010). In this scenario, activation of mGluR5 on
Bergmann glial cells could promote calcium oscillations leading to the opening of the Best1
channel and efflux of GABA. Another source of GABA at the parallel fiber Purkinje cell
synapse could be from spillover at nearby GABAergic synapses [e.g. stellate cells, see Fig. 6.1A
(Hamann et al. 2002)].
We speculate that in the absence of Bergmann glia activation, glutamate released from
parallel fibers would activate postsynaptic metabotropic (mGluR1) and ionotropic glutamate
receptors (NMDA, AMPA) on Purkinje cells. However, during high frequency activity of
parallel fibers, glutamate also activates mGluR5 receptors on Bergmann glia which causes the
release of L-SOP into the synaptic cleft. L-SOP activation of mGluR4 on parallel fibers

109
Figure 6.1: Cerebellar synapse architecture in the context of mGluR4 and GABAA
receptor-mediated glutamate release
Upper panel displays a schematic of simplified cerebellar architecture identifying the three cerebellar layers, molecular, Purkinje and granule cell layers as well as cells and processes (s, stellate cell; p, Purkinje cell; b, Bergmann glia; g, granule cell; pf, parallel fiber – granule cell process). A, enlarged view of a symmetric inhibitory synapse made between stellate cells and proximal Purkinje cell dendrites. GABA is packaged into synaptic vesicles by vGAT and released from stellate cells onto postsynaptic GABAA receptors. Spillover from this synapse is believed to stimulate presynaptic GABAA receptors found at excitatory synapses. B, enlarged view of an asymmetric excitatory synapse formed between the granule cell axons, parallel fibers, and distal Purkinje cell dendrites which is ensheathed by a Bergmann glia process. mGluR4 and GABAA receptors are found presynaptically on parallel fiber axon terminals which synapse onto distal Purkinje cell dendrites. vGluT1 is used in the parallel fibers to package glutamate into synaptic vesicles. Bergmann glia release GABA through the Best1 anion channel which can

110
mediate tonic inhibition and activate presynaptic GABAA receptors. Bergmann glia and Purkinje cells are also believed to contain L-SOP, a potential neurotransmitter and high affinity agonist for mGluR4. C, enlarged view of an asymmetric excitatory synapse formed between the granule cell axons, parallel fibers and stellate cells. Reproduced from Antflick and Hampson “Modulation of glutamate release from parallel fibers by mGlu4 and pre-synaptic GABA(A) receptors”, Journal of Neurochemistry, v.120, pp 552-563, Copyright (2012), with permission from Blackwell Publishing.

111
suppresses glutamate release glutamate (i.e. mGluR4 operating in the autoreceptor mode causing
negative feedback). Conversely, when high frequency parallel fiber activity coincides with the
presence of GABA in the parallel fiber-Purkinje cell synapse, the release of L-SOP from
Bergmann glia and simultaneous activation of both presynaptic GABAA and mGluR4
receptorspotentiates glutamate release and Purkinje cell firing (Fig. 6.1B).
Physiologically, the cross-talk between presynaptic GABAA and mGluR4 receptors may
serve to promote glutamate release during the phenomenon of cerebellar lateral inhibition. The
outcome of which is to sharpen the excitatory input to Purkinje cells, and to ensure the reliable
transmission of mossy fiber- granule cell bursts to the Purkinje cells. The cerebellar cortex is
made up of simple and repetitive cytoarchitecture that lends itself to information processing and
integration; parallel fibers are oriented coronally while basket and stellate cell axons run
sagittally. The perpendicular arrangement and connectivity of excitatory and inhibitory inputs
into Purkinje cells led to the ‘beam hypothesis’ of lateral inhibition (Szentagothai 1965; Eccles et
al. 1967) (Fig 6.2). Lateral inhibition is predicted to occur when a ‘beam’ of parallel fibers
coronally stimulates a row of Purkinje cells and basket/stellate cells which in turn inhibit
Purkinje cells lateral to the activated beam. The overall effect is believed to amplify the ‘on
beam’ Purkinje cells while simultaneously inhibiting the ‘off beam’ Purkinje cells. Although
somewhat controversial, the phenomena of lateral inhibition has been validated in recent years
through imaging studies using voltage sensitive dyes to confirm the presence of ‘beams of
activity’ (Cohen and Yarom 2000; Coutinho et al. 2004; Dizon and Khodakhah 2011).
The activity of presynaptic GABAA receptors on parallel fibers is synergistic with the
final outcome in this model of lateral inhibition: ‘onbeam’ Purkinje cells are activated by GABA
spillover, or possibly from GABA released by Bergmann glia, while ‘offbeam’ Purkinje cells are

112
Figure 6.2: Lateral inhibition in the cerebellum
Cerebellar granule cell glutamatergic axons (parallel fibers) project coronally to innervate the distal Purkinje cell dendrites and molecular layer inhibitory interneurons (basket and stellate cells). Basket and stellate cells project axons sagittally to innervate the Purkinje cell body or proximal Purkinje cell dendrites. The orthogonal arrangement of excitatory and inhibitory inputs into Purkinje cells permits lateral inhibition to occur. A, the caudal > rostral view of the mouse brain and cartoon schematic of the arrangement of granule cells, stellate and basket cells, and Purkinje cells. B, dorsal > ventral view of the mouse brain and cartoon schematic of the arrangement of granule cells, stellate and basket cells, and Purkinje cells. In this view ‘on beam’ and ‘off beam’ Purkinje cells are apparent.

113
inhibited by GABAergic neurons. The recruitment of the mGluR4-GABAA presynaptic complex
may additionally serve to amplify the excitatory output of parallel fibers to ‘on beam’ Purkinje
cells. Some aspects of the discussion above are somewhat speculative and further study will be
required to rigorously test the validity of these ideas as novel mechanisms for fine tuning
synaptic transmission at parallel fiber-Purkinje cell synapses.
In summary, our findings demonstrate a previously unknown interaction between
presynaptic GABAA and mGluR4 receptors in cerebellar parallel fiber axon terminals whereby
co-incident activation of both receptors promotes glutamate release. These results together with
those of others revealing a mechanism of ligand-independent activation of Group III mGluRs
and control of glutamate release (Nakajima et al. 2009), extend the traditional view whereby
mGluR4 acts solely as a classic autoreceptor.
6.5 L-SOP as a chemical transmitter in the CNS
The classical definition of a neurotransmitter states that 1) the precursors and
synthesizing enzymes for a candidate transmitter must be present in cells adjacent to the
appropriate synapse, 2) the neurotransmitter must be present at sufficient levels for activation of
the postsynaptic receptor target, 3) the neurotransmitter must be released into a synapse where it
binds to, and activates postsynaptic receptors, and 4) a mechanism for biochemical inactivation
of the neurotransmitter must be present. By addressing some of these criteria, this thesis lays the
foundation for L-SOP to be considered a novel chemical transmitter in the CNS.
We have shown that PSAT, the enzyme required for the synthesis of L-SOP, is expressed
in Bergmann glia and Purkinje cells which form a tripartite synapse with parallel fibers. The
parallel fiber terminals which make synaptic contacts with Purkinje cell dendrites in the

114
molecular layer of the cerebellar cortex express the highest levels of the mGluR4 in the CNS
(Kinoshita et al. 1996b; Thomsen and Hampson 1999; Corti et al. 2002). We speculate that L-
SOP generated by PSAT but not immediately metabolized to L-serine by PSP, could be released
from Purkinje cell dendrites that extend into the molecular layer. This release could stimulate, in
a retrograde fashion, presynaptic mGluR4 receptors present on the parallel fiber terminals.
Bergmann glia fibers that also extend into the molecular layer and envelop parallel fiber-Purkinje
cell synapses (Tzingounis and Wadiche 2007) may also release L-SOP since they display robust
PSAT expression but little if any PSP (Fig. 3.5).
Despite the relatively low concentration of L-SOP in rat whole brain, the substantially
higher potency of L-SOP compared to the putative endogenous agonist glutamate at mGluR4,
suggests that L-SOP could activate these receptors in vivo. The EC50 values for L-SOP and
glutamate at mGluR4 are 0.5 μM and 16 μM respectively. Glutamate is believed to rapidly reach
concentrations greater than 1 mM in the synaptic cleft (Clements et al. 1992) and through
diffusion, glutamate can reach concentrations as high as 190 μM in the perisynaptic space to
active extrasynaptic glutamate receptors (Dzubay and Jahr 1999). In contrast, virtually nothing
is known about the compartmentalization of L-SOP in neurons or glia and therefore a prediction
of the concentration that L-SOP can reach in the synaptic cleft would be overly speculative.
Previous work in our lab determined that L-SOP is not a substrate for any of the three vesicular
glutamate transporters (vGluT1, 2, or 3) indicating that it is not likely to be packaged into
glutamate containing vesicles (Rose, E.M., and Hampson, D.R., unpublished data). This
observation indicates that L-SOP and glutamate are not necessarily co-released and therefore
may not always directly compete with one another at the orthosteric binding site of mGluR4.

115
We have not shown a mechanism for biochemical inactivation of L-SOP, but we
hypothesize that termination of synaptic L-SOP activity is most likely via diffusion and/or
reuptake. Reuptake of L-SOP as a mechanism of transmitter inactivation is less probable as a
transporter or carrier is yet to be identified with appreciable affinity for L-SOP to facilitate
neuronal or glial reuptake.
Although the evidence presented in this thesis does not satisfy all of the above criteria, it
does provide a starting point for the consideration of L-SOP as a transmitter. However, it may
not be necessary, nor possible to meet all of the traditional criteria for a neurotransmitter in the
case of L-SOP. The rise in the number of atypical putative transmitters identified in the CNS in
recent years that do not satisfy all of the above criteria such as the discovery of retrograde
transmitters (nitric oxide, carbon dioxide), the identification of gliotransmitters (ATP, D-serine,
glutamate) and appreciation of the glial role in neurotransmission has prompted a dramatic
rework of the definition of a CNS transmitter. In light of these results, an updated criteria has
been suggested for the evaluation of potential transmitters that is both simplified and inclusive: a
transmitter is a molecule released by neurons or glia that physiologically influences the activity
of adjacent cells (Snyder and Ferris 2000). In this thesis, evidence is presented that satisfies
these updated criteria for the evaluation of L-SOP transmitter, and additionally provides
compelling evidence to suggest that L-SOP is the endogenous agonist for mGluR4 in the CNS.
Several presynaptic glutamate receptors have moderate affinity for glutamate such as
mGluR4 [16 μM (Antflick et al. 2009)], or low affinity for glutamate (e.g. GluR6-containing
kainate receptors [300 μM (Wilding and Huettner 1997)]. Since the extracellular concentration
of glutamate is estimated to be between 1 and 4 μM (Baker et al. 2002) the relatively low affinity
of presynaptic glutamate receptors permits some margin of safety to prevent tonic receptor

116
activation. The high affinity of L-SOP for mGluR4 [0.5 μM (Antflick et al. 2009)] provides an
efficient mechanism for receptor activation but appears to cross this safety margin and
potentially implies tonic activation of mGluR4. This is an important question to address in light
of ample experimental evidence indicating that mGluR4 is not tonically activated in the CNS.
Without microdialysis measurements, the free extracellular concentration of L-SOP in the CNS
remains unknown; yet the measured L-SOP whole brain concentration of 6 μM is not necessarily
indicative of the extracellular concentration. Such is the case with dopamine; the extracellular
concentration of dopamine, as measured by in vivo microdialysis is between 5 and 10 nM
(Parsons and Justice, Jr. 1992) whereas the concentration measured in whole brain is 6 μM
(Nazarali et al. 1987). However, this is not a perfect comparison as the presynaptic D2 dopamine
receptor has very high affinity for dopamine [2-4 nM (Werner et al. 1996)] and is known to be
tonically activated. Another key point is that high affinity transporters exist for both dopamine
and glutamate to ensure rapid clearance from the synaptic cleft and also to maintain low
extracellular neurotransmitter concentrations. Although a transporter for L-SOP has yet to be
identified, it is likely that L-SOP is similarly maintained at low synaptic and extracellular
concentrations to prevent tonic activation of mGluR4. In the model proposed in this thesis,
recruitment of Bergmann glia by high levels of parallel fiber activity (and high levels of
perisynaptic glutamate) would promote the release of L-SOP into the synaptic cleft to activate
mGluR4 and attenuate presynaptic glutamate release.
Although mGluR4 is expressed in other brain regions, we focused on mGluR4-containing
synapses in the cerebellum for two reasons. First, within the cerebellum, mGluR4 is exclusively
expressed in granule cells and mGluR4 is the only Group III mGluR expressed on parallel fiber
axon terminals (Abitbol et al. 2008). Second, as stated previously, the level of mGluR4
expression in the cerebellum is much higher than any other brain region (Thomsen et al. 1997).

117
The data presented in this thesis strongly indicate that L-SOP is synthesized in both Bergmann
glia and Purkinje cells due to the presence of PSAT in both cell types. However, our results
demonstrating that PSP is expressed in Purkinje cells (indicating the metabolism of L-SOP to L-
serine) but absent from Bergmann glia indicates that Bergmann glia may be a rich source of
releasable L-SOP (Antflick and Hampson 2012). As a gliotransmitter, L-SOP would be released
from Bergmann glia which ensheathe the parallel fiber-Purkinje cell synapse to regulate
glutamatergic neurotransmission via activation of mGluR4. Activation of mGluR4 is known to
elicit a reduction in glutamate release at the parallel fiber-Purkinje cell synapse (Pekhletski et al.
1996; Lorez et al. 2003). However, the much higher affinity of L-SOP for mGluR4 compared to
L-glutamate indicates that mGluR4 might be endogenously activated by L-SOP. Alternatively,
the release of L-SOP from Bergmann glia with co-incident GABA release or spillover could
simultaneously activate both mGluR4 and presynaptic GABAA receptors to facilitate glutamate
release (Antflick and Hampson 2012). Therefore, L-SOP may play a dual role in the regulating
the fidelity of glutamate release at the parallel fiber-Purkinje cell synapse raising the possibility
that endogenous activation of mGluR4 by L-SOP is important in short-term plasticity and motor
learning. In fact, impairments in short term plasticity and motor learning were observed
previously in the mGluR4 knockout mouse (Pekhletski et al. 1996).
6.6 Concluding remarks and future directions
Exogenously added L-SOP has been exploited as a pharmacological tool for the study of
the Group III mGluRs, yet little is known regarding the endogenous activity of this molecule
outside its role as a metabolite in the L-serine biosynthetic pathway. This study set out to elevate
the status of L-SOP beyond mere existence as a metabolite by laying the ground work for its
consideration as the endogenous agonist at mGluR4 and validation of as chemical transmitter in

118
the CNS. L-SOP is present in the CNS at low micromolar concentrations (~5 μM) and although
this concentration is sufficient to activate mGluR4 (EC50 ~ 0.5 – 1.0 μM), it seems plausible that
L-SOP is concentrated in discrete brain regions. Examination of the enzymes involved in L-SOP
synthesis and metabolism revealed that L-SOP potentially functions as a chemical transmitter in
the hippocampus and cerebellum, two brain regions known to contain high levels of mGluR4. It
is important to note that in cells expressing both PSAT and PSP (i.e. hippocampal granule cells
and Purkinje cells), we are unable to distinguish between the synthesis of L-SOP for the purpose
of cellular metabolism or neurotransmission. It is possible that L-SOP serves as both a
metabolite and a chemical transmitter in these cells. However, direct evidence demonstrating
endogenous activation of mGluR4 by L-SOP is yet to be obtained. Instead, using cerebellar
synaptosomes, we demonstrated a novel effect of mGuR4 activation by L-SOP. In the
cerebellum, activation of mGluR4 by endogenous L-SOP is possibly involved in the regulation
of short-term facilitation by promoting glutamate release from parallel fibers upon co-incident
activation of presynaptic GABAA receptors.
My work provides evidence to satisfy some of the requirements for L-SOP to be
considered as a possible novel chemical transmitter in the CNS. Future experiments will be
necessary to fully validate this idea and a couple of outstanding questions remain: What is the
subcellular distribution of L-SOP? And what are the mechanisms for the release and uptake of
L-SOP? These questions are likely to be answered upon the identification of a transporter for L-
SOP which could be responsible for packaging, release and uptake of L-SOP. Elucidation of the
mechanism of L-SOP release would facilitate the study of the endogenous activity of L-SOP.
The discovery of a novel pharmacological inhibitor of PSP would also be greatly
beneficial for the study of L-SOP in the CNS. The currently known pharmacological inhibitors
119
of PSP (Hawkinson et al. 1997) fail to be useful in cells or the CNS. The most potent inhibitor,
p-cholormercuriphenylsulfonic acid (IC50 ~ 9 μM) is a highly toxic compound that is no longer
commercially available. Glycerylphosphorylcholine is another potent inhibitor of PSP (IC50 ~ 18
μM) but has an extremely poor solubility profile. The next most potent inhibitor of PSP is L-
serine (IC50~ 500 μM). The difficulty with discovering novel PSP inhibitors is that the
compounds known to inhibit PSP contain sulfhydryl groups or phophorylcholine esters.
Compounds containing charged groups such as phosphates or sulfates are not typically
components of chemical libraries used in drug screening.
The data presented here were generated from experiments performed in synaptosome
preparations designed to mimic the endogenous cerebellar environment. Follow-up experiments
with electrophysiological techniques in cerebellar sections will be crucial for the verification that
endogenously released L-SOP does indeed activate mGluR4. Although this study mainly
focused on the parallel fiber-Purkinje cell synapse in the cerebellum, other brain regions capable
of L-SOP synthesis and metabolism were also identified such as the hippocampus. Here,
mGluR4 is known to be expressed presynaptically on mossy fibers and dentate granule neurons
projecting to the Schaffer collateral neurons. Therefore, the hippocampus is another brain region
where L-SOP may endogenously activate mGluR4.
The proposal that mGluR4 is the endogenous target of L-SOP is based on our data
demonstrating significant expression overlap in the CNS of mGluR4 and the enzymatic
machinery associated with L-SOP. However, the possibility of endogenous L-SOP activating
other Group III mGluRs cannot be ruled out. The three centrally occurring Group III mGluRs
(mGluR4, mGluR7, and mGluR8) are widely expressed throughout the CNS and share a higher

120
affinity for L-SOP over L-glutamate. Therefore, the possibility that endogenous L-SOP activates
the Group III mGluRs as a whole remains an intriguing possibility that requires consideration.

121
References
Abe K., Noguchi H., Tagawa K., Yuzuriha M., Toyoda A., Kojima T., Ezawa K., Saitou N., Hattori M., Sakaki Y., Moriwaki K. and Shiroishi T. (2004) Contribution of Asian mouse subspecies Mus musculus molossinus to genomic constitution of strain C57BL/6J, as defined by BAC-end sequence-SNP analysis. Genome Res. 14, 2439-2447.
Abitbol K., Acher F. and Daniel H. (2008) Depression of excitatory transmission at PF-PC synapse by group III metabotropic glutamate receptors is provided exclusively by mGluR4 in the rodent cerebellar cortex. J. Neurochem. 105, 2069-2079.
Achilles K., Okabe A., Ikeda M., Shimizu-Okabe C., Yamada J., Fukuda A., Luhmann H. J. and Kilb W. (2007) Kinetic properties of Cl uptake mediated by Na+-dependent K+-2Cl cotransport in immature rat neocortical neurons. J. Neurosci. 27, 8616-8627.
Adibi S. A. and Mercer D. W. (1973) Protein digestion in human intestine as reflected in luminal, mucosal, and plasma amino acid concentrations after meals. J. Clin. Invest 52, 1586-1594.
Albizu L., Cottet M., Kralikova M., Stoev S., Seyer R., Brabet I., Roux T., Bazin H., Bourrier E., Lamarque L., Breton C., Rives M. L., Newman A., Javitch J., Trinquet E., Manning M., Pin J. P., Mouillac B. and Durroux T. (2010) Time-resolved FRET between GPCR ligands reveals oligomers in native tissues. Nat. Chem. Biol. 6, 587-594.
Aloisi F., Gallo V. and Levi G. (1983) Substrate specificity and developmental aspects of a presynaptic GABA receptor regulating glutamate release in the rat cerebellum. J. Neurosci. Res. 10, 141-149.
Antflick J. E., Baker G. B. and Hampson D. R. (2010) The effects of a low protein diet on amino acids and enzymes in the serine synthesis pathway in mice. Amino. Acids 39, 145-153.
Antflick J. E. and Hampson D. R. (2012) Modulation of glutamate release from parallel fibers by mGlu4 and pre-synaptic GABA(A) receptors. J. Neurochem. 120, 552-563.
Antflick J. E., Vetiska S., Baizer J. S., Yao Y., Baker G. B. and Hampson D. R. (2009) L-Serine-O-phosphate in the central nervous system. Brain Res. 1300, 1-13.
Aronica E., van Vliet E. A., Mayboroda O. A., Troost D., da Silva F. H. and Gorter J. A. (2000) Upregulation of metabotropic glutamate receptor subtype mGluR3 and mGluR5 in reactive astrocytes in a rat model of mesial temporal lobe epilepsy. Eur. J. Neurosci. 12, 2333-2344.
Ayala J. E., Niswender C. M., Luo Q., Banko J. L. and Conn P. J. (2008) Group III mGluR regulation of synaptic transmission at the SC-CA1 synapse is developmentally regulated. Neuropharmacology 54, 804-814.

122
Baek J. Y., Jun D. Y., Taub D. and Kim Y. H. (2003) Characterization of human phosphoserine aminotransferase involved in the phosphorylated pathway of L-serine biosynthesis. Biochem. J. 373, 191-200.
Baker D. A., Xi Z. X., Shen H., Swanson C. J. and Kalivas P. W. (2002) The origin and neuronal function of in vivo nonsynaptic glutamate. J. Neurosci. 22, 9134-9141.
Balu D. T., Basu A. C., Corradi J. P., Cacace A. M. and Coyle J. T. (2011) The NMDA receptor co-agonists, d-serine and glycine, regulate neuronal dendritic architecture in the somatosensory cortex. Neurobiol. Dis.
Besong G., Battaglia G., D'Onofrio M., Di M. R., Ngomba R. T., Storto M., Castiglione M., Mangano K., Busceti C. L., Nicoletti F. R., Bacon K., Tusche M., Valenti O., Conn P. J., Bruno V. and Nicoletti F. (2002) Activation of group III metabotropic glutamate receptors inhibits the production of RANTES in glial cell cultures. J. Neurosci. 22, 5403-5411.
Billups B., Graham B. P., Wong A. Y. and Forsythe I. D. (2005) Unmasking group III metabotropic glutamate autoreceptor function at excitatory synapses in the rat CNS. J. Physiol 565, 885-896.
Billups D. and Attwell D. (2002) Control of intracellular chloride concentration and GABA response polarity in rat retinal ON bipolar cells. J. Physiol 545, 183-198.
Bolte S. and Cordelieres F. P. (2006) A guided tour into subcellular colocalization analysis in light microscopy. J. Microsc. 224, 213-232.
Bookout A. L., Cummins C. L., Mangelsdorf D. J., Pesola J. M. and Kramer M. F. (2006) High-throughput real-time quantitative reverse transcription PCR. Curr. Protoc. Mol. Biol. Chapter 15, Unit.
Bradley S. R., Levey A. I., Hersch S. M. and Conn P. J. (1996) Immunocytochemical localization of group III metabotropic glutamate receptors in the hippocampus with subtype-specific antibodies. J. Neurosci. 16, 2044-2056.
Brock C., Oueslati N., Soler S., Boudier L., Rondard P. and Pin J. P. (2007) Activation of a dimeric metabotropic glutamate receptor by intersubunit rearrangement. J. Biol. Chem. 282, 33000-33008.
Cameron H. A., Tanapat P. and Gould E. (1998) Adrenal steroids and N-methyl-D-aspartate receptor activation regulate neurogenesis in the dentate gyrus of adult rats through a common pathway. Neuroscience 82, 349-354.
Canudas A. M., Di Giorgi-Gerevini V., Iacovelli L., Nano G., D'Onofrio M., Arcella A., Giangaspero F., Busceti C., Ricci-Vitiani L., Battaglia G., Nicoletti F. and Melchiorri D. (2004) PHCCC, a specific enhancer of type 4 metabotropic glutamate receptors, reduces proliferation and promotes differentiation of cerebellar granule cell neuroprecursors. J. Neurosci. 24, 10343-10352.

123
Cartmell J. and Schoepp D. D. (2000) Regulation of neurotransmitter release by metabotropic glutamate receptors. J. Neurochem. 75, 889-907.
Castejon O. J. (1990) Surface and membrane morphology of Bergmann glial cells and their topographic relationships in the cerebellar molecular layer. J. Submicrosc. Cytol. Pathol. 22, 123-134.
Chavis P., Mollard P., Bockaert J. and Manzoni O. (1998) Visualization of cyclic AMP-regulated presynaptic activity at cerebellar granule cells. Neuron 20, 773-781.
Chien E. Y., Liu W., Zhao Q., Katritch V., Han G. W., Hanson M. A., Shi L., Newman A. H., Javitch J. A., Cherezov V. and Stevens R. C. (2010) Structure of the human dopamine D3 receptor in complex with a D2/D3 selective antagonist. Science 330, 1091-1095.
Chittajallu R., Vignes M., Dev K. K., Barnes J. M., Collingridge G. L. and Henley J. M. (1996) Regulation of glutamate release by presynaptic kainate receptors in the hippocampus. Nature 379, 78-81.
Clements J. D., Lester R. A., Tong G., Jahr C. E. and Westbrook G. L. (1992) The time course of glutamate in the synaptic cleft. Science 258, 1498-1501.
Cohen D. and Yarom Y. (2000) Cerebellar on-beam and lateral inhibition: two functionally distinct circuits. J. Neurophysiol. 83, 1932-1940.
Collet J. F., Stroobant V. and Van S. E. (1999) Mechanistic studies of phosphoserine phosphatase, an enzyme related to P-type ATPases. J. Biol. Chem. 274, 33985-33990.
Corti C., Aldegheri L., Somogyi P. and Ferraguti F. (2002) Distribution and synaptic localisation of the metabotropic glutamate receptor 4 (mGluR4) in the rodent CNS. Neuroscience 110, 403-420.
Cosgrove K. E., Meriney S. D. and Barrionuevo G. (2010) High affinity group III mGluRs regulate mossy fiber input to CA3 interneurons. Hippocampus.
Coutinho V., Mutoh H. and Knopfel T. (2004) Functional topology of the mossy fibre-granule cell--Purkinje cell system revealed by imaging of intrinsic fluorescence in mouse cerebellum. Eur. J. Neurosci. 20, 740-748.
de Koning T. J. (2006) Treatment with amino acids in serine deficiency disorders. J. Inherit. Metab Dis. 29, 347-351.
de Koning T. J., Duran M., Dorland L., Gooskens R., Van S. E., Jaeken J., Blau N., Berger R. and Poll-The BT (1998) Beneficial effects of L-serine and glycine in the management of seizures in 3-phosphoglycerate dehydrogenase deficiency. Ann. Neurol. 44, 261-265.
de Koning T. J., Klomp L. W., van Oppen A. C., Beemer F. A., Dorland L., van d. B., I and Berger R. (2004) Prenatal and early postnatal treatment in 3-phosphoglycerate-dehydrogenase deficiency. Lancet 364, 2221-2222.

124
de Koning T. J., Snell K., Duran M., Berger R., Poll-The BT and Surtees R. (2003) L-serine in disease and development. Biochem. J. 371, 653-661.
Dellal S. S., Luo R. and Otis T. S. (2012) GABAA receptors increase excitability and conduction velocity of cerebellar parallel fiber axons. J. Neurophysiol.
Dizon M. J. and Khodakhah K. (2011) The role of interneurons in shaping Purkinje cell responses in the cerebellar cortex. J. Neurosci. 31, 10463-10473.
Doumazane E., Scholler P., Zwier J. M., Eric T., Rondard P. and Pin J. P. (2011) A new approach to analyze cell surface protein complexes reveals specific heterodimeric metabotropic glutamate receptors. FASEB J. 25, 66-77.
Dringen R., Verleysdonk S., Hamprecht B., Willker W., Leibfritz D. and Brand A. (1998) Metabolism of glycine in primary astroglial cells: synthesis of creatine, serine, and glutathione. J. Neurochem. 70, 835-840.
Dzubay J. A. and Jahr C. E. (1999) The concentration of synaptically released glutamate outside of the climbing fiber-Purkinje cell synaptic cleft. J. Neurosci. 19, 5265-5274.
Eccles J. C., Ito M. and Szentagothai J. (1967) The Cerebellum as a Neuronal Machine. Springer-Verlag, Berlin.
El F. O., Airas J., Wischmeyer E., Nehring R. B., Karschin A. and Betz H. (2000) Interaction of the C-terminal tail region of the metabotropic glutamate receptor 7 with the protein kinase C substrate PICK1. Eur. J. Neurosci. 12, 4215-4221.
Elezgarai I., Benitez R., Mateos J. M., Lazaro E., Osorio A., Azkue J. J., Bilbao A., Lingenhoehl K., Van Der Putten H., Hampson D. R., Kuhn R., Knopfel T. and Grandes P. (1999) Developmental expression of the group III metabotropic glutamate receptor mGluR4a in the medial nucleus of the trapezoid body of the rat. J. Comp Neurol. 411, 431-440.
Enz R. (2002) The actin-binding protein Filamin-A interacts with the metabotropic glutamate receptor type 7. FEBS Lett. 514, 184-188.
Enz R. and Croci C. (2003) Different binding motifs in metabotropic glutamate receptor type 7b for filamin A, protein phosphatase 1C, protein interacting with protein kinase C (PICK) 1 and syntenin allow the formation of multimeric protein complexes. Biochem. J. 372, 183-191.
Fallarino F., Volpi C., Fazio F., Notartomaso S., Vacca C., Busceti C., Bicciato S., Battaglia G., Bruno V., Puccetti P., Fioretti M. C., Nicoletti F., Grohmann U. and Di M. R. (2010) Metabotropic glutamate receptor-4 modulates adaptive immunity and restrains neuroinflammation. Nat. Med. 16, 897-902.
Fell D. A. and Snell K. (1988) Control analysis of mammalian serine biosynthesis. Feedback inhibition on the final step. Biochem. J. 256, 97-101.
Ferraguti F., Klausberger T., Cobden P., Baude A., Roberts J. D., Szucs P., Kinoshita A., Shigemoto R., Somogyi P. and Dalezios Y. (2005) Metabotropic glutamate receptor 8-expressing

125
nerve terminals target subsets of GABAergic neurons in the hippocampus. J. Neurosci. 25, 10520-10536.
Fritschy J. M. and Mohler H. (1995) GABAA-receptor heterogeneity in the adult rat brain: differential regional and cellular distribution of seven major subunits. J. Comp Neurol. 359, 154-194.
Furuya S. (2008) An essential role for de novo biosynthesis of L-serine in CNS development. Asia Pac. J. Clin. Nutr. 17 Suppl 1, 312-315.
Furuya S., Tabata T., Mitoma J., Yamada K., Yamasaki M., Makino A., Yamamoto T., Watanabe M., Kano M. and Hirabayashi Y. (2000) L-serine and glycine serve as major astroglia-derived trophic factors for cerebellar Purkinje neurons. Proc. Natl. Acad. Sci. U. S. A 97, 11528-11533.
Furuya S. and Watanabe M. (2003) Novel neuroglial and glioglial relationships mediated by L-serine metabolism. Arch. Histol. Cytol. 66, 109-121.
Gallo V., Levi G., Raiteri M. and Coletti A. (1981) Enhancement by GABA of glutamate depolarization-induced release from cerebellar nerve endings. Brain Res. 205, 431-435.
Gama L., Wilt S. G. and Breitwieser G. E. (2001) Heterodimerization of calcium sensing receptors with metabotropic glutamate receptors in neurons. J. Biol. Chem. 276, 39053-39059.
Gelsomino G., Menna E., Antonucci F., Rodighiero S., Riganti L., Mulle C., Benfenati F., Valtorta F., Verderio C. and Matteoli M. (2012) Kainate Induces Mobilization of Synaptic Vesicles at the Growth Cone through the Activation of Protein Kinase A. Cereb. Cortex.
Gereau R. W. and Conn P. J. (1995) Roles of specific metabotropic glutamate receptor subtypes in regulation of hippocampal CA1 pyramidal cell excitability. J. Neurophysiol. 74, 122-129.
Geurts J. J., Wolswijk G., Bo L., Redeker S., Ramkema M., Troost D. and Aronica E. (2005) Expression patterns of Group III metabotropic glutamate receptors mGluR4 and mGluR8 in multiple sclerosis lesions. J. Neuroimmunol. 158, 182-190.
Gomeza J., Joly C., Kuhn R., Knopfel T., Bockaert J. and Pin J. P. (1996) The second intracellular loop of metabotropic glutamate receptor 1 cooperates with the other intracellular domains to control coupling to G-proteins. J. Biol. Chem. 271, 2199-2205.
Gonzalez-Maeso J., Ang R. L., Yuen T., Chan P., Weisstaub N. V., Lopez-Gimenez J. F., Zhou M., Okawa Y., Callado L. F., Milligan G., Gingrich J. A., Filizola M., Meana J. J. and Sealfon S. C. (2008) Identification of a serotonin/glutamate receptor complex implicated in psychosis. Nature 452, 93-97.
Goodnough D. B., Lutz M. P. and Wood P. L. (1995) Separation and quantification of D- and L-phosphoserine in rat brain using N alpha-(2,4-dinitro-5-fluorophenyl)-L-alaninamide (Marfey's reagent) by high-performance liquid chromatography with ultraviolet detection. J. Chromatogr. B Biomed. Appl. 672, 290-294.

126
Grant S. L., Shulman Y., Tibbo P., Hampson D. R. and Baker G. B. (2006) Determination of d-serine and related neuroactive amino acids in human plasma by high-performance liquid chromatography with fluorimetric detection. J. Chromatogr. B Analyt. Technol. Biomed. Life Sci. 844, 278-282.
Gray E. G. (1962) A morphological basis for pre-synaptic inhibition? Nature 193, 82-83.
Grosche J., Matyash V., Moller T., Verkhratsky A., Reichenbach A. and Kettenmann H. (1999) Microdomains for neuron-glia interaction: parallel fiber signaling to Bergmann glial cells. Nat. Neurosci. 2, 139-143.
Guynn R. W., Merrill D. K. and Lund K. (1986) The reactions of the phosphorylated pathway of L-serine biosynthesis: thermodynamic relationships in rat liver in vivo. Arch. Biochem. Biophys. 245, 204-211.
Hamann M., Rossi D. J. and Attwell D. (2002) Tonic and spillover inhibition of granule cells control information flow through cerebellar cortex. Neuron 33, 625-633.
Hampson D. R., Huang X. P., Pekhletski R., Peltekova V., Hornby G., Thomsen C. and Thogersen H. (1999) Probing the ligand-binding domain of the mGluR4 subtype of metabotropic glutamate receptor. J. Biol. Chem. 274, 33488-33495.
Hampson D. R., Rose E. M. and Antflick J. E. (2008) The Structures of the Metabotropic Glutamate Receptors, in The Glutamate Receptors, (Gereau R. W. and Swanson G. T., eds), Humana Press, Towtowa.
Han G. and Hampson D. R. (1999) Ligand binding to the amino-terminal domain of the mGluR4 subtype of metabotropic glutamate receptor. J. Biol. Chem. 274, 10008-10013.
Han J. W., Nakamura M., Choi I. S., Cho J. H., Park H. M., Lee M. G., Choi B. J., Jang H. J. and Jang I. S. (2009) Differential pharmacological properties of GABAA receptors in axon terminals and soma of dentate gyrus granule cells. J. Neurochem. 109, 995-1007.
Hart C. E., Race V., Achouri Y., Wiame E., Sharrard M., Olpin S. E., Watkinson J., Bonham J. R., Jaeken J., Matthijs G. and Van S. E. (2007) Phosphoserine aminotransferase deficiency: a novel disorder of the serine biosynthesis pathway. Am. J. Hum. Genet. 80, 931-937.
Hawkins R. A. and Mans A. M. (1983) Handbook of Neurochemistry, (Lajtha A., ed), pp. 259-294. Plenum Publishing Corp, New York.
Hawkinson J. E., Acosta-Burruel M., Ta N. D. and Wood P. L. (1997) Novel phosphoserine phosphatase inhibitors. Eur. J. Pharmacol. 337, 315-324.
Henneberger C., Papouin T., Oliet S. H. and Rusakov D. A. (2010) Long-term potentiation depends on release of D-serine from astrocytes. Nature 463, 232-236.
Herlenius E. and Lagercrantz H. (2004) Development of neurotransmitter systems during critical periods. Exp. Neurol. 190 Suppl 1, S8-21.

127
Hester G., Stark W., Moser M., Kallen J., Markovic-Housley Z. and Jansonius J. N. (1999) Crystal structure of phosphoserine aminotransferase from Escherichia coli at 2.3 A resolution: comparison of the unligated enzyme and a complex with alpha-methyl-l-glutamate. J. Mol. Biol. 286, 829-850.
Hirabayashi Y. and Furuya S. (2008) Roles of l-serine and sphingolipid synthesis in brain development and neuronal survival. Prog. Lipid Res. 47, 188-203.
Hopkins C. R., Lindsley C. W. and Niswender C. M. (2009) mGluR4-positive allosteric modulation as potential treatment for Parkinson's disease. Future. Med. Chem. 1, 501-513.
Huang S., Cao J., Jiang M., Labesse G., Liu J., Pin J. P. and Rondard P. (2011) Interdomain movements in metabotropic glutamate receptor activation. Proc. Natl. Acad. Sci. U. S. A 108, 15480-15485.
Iacovelli L., Arcella A., Battaglia G., Pazzaglia S., Aronica E., Spinsanti P., Caruso A., De S. E., Saran A., Gulino A., D'Onofrio M., Giangaspero F. and Nicoletti F. (2006) Pharmacological activation of mGlu4 metabotropic glutamate receptors inhibits the growth of medulloblastomas. J. Neurosci. 26, 8388-8397.
Irimia M., Penny D. and Roy S. W. (2007) Coevolution of genomic intron number and splice sites. Trends Genet. 23, 321-325.
Jaeken J., Detheux M., Fryns J. P., Collet J. F., Alliet P. and Van S. E. (1997) Phosphoserine phosphatase deficiency in a patient with Williams syndrome. J. Med. Genet. 34, 594-596.
Jaeken J., Detheux M., Van M. L., Foulon M., Carchon H. and Van S. E. (1996) 3-Phosphoglycerate dehydrogenase deficiency: an inborn error of serine biosynthesis. Arch. Dis. Child 74, 542-545.
Jang I. S., Jeong H. J. and Akaike N. (2001) Contribution of the Na-K-Cl cotransporter on GABA(A) receptor-mediated presynaptic depolarization in excitatory nerve terminals. J. Neurosci. 21, 5962-5972.
Jang Y. S., Lee M. Y., Choi S. H., Kim M. Y., Chin H., Jeong S. W., Kim I. K. and Kwon O. J. (2004) Expression of B/K protein in the hippocampus of kainate-induced rat seizure model. Brain Res. 999, 203-211.
Jeon G. S., Choi D. H., Lee H. N., Kim D. W., Chung C. K. and Cho S. S. (2009) Expression of L-serine biosynthetic enzyme 3-phosphoglycerate dehydrogenase (Phgdh) and neutral amino acid transporter ASCT1 following an excitotoxic lesion in the mouse hippocampus. Neurochem. Res. 34, 827-834.
Jursky F., Fuchs K., Buhr A., Tretter V., Sigel E. and Sieghart W. (2000) Identification of amino acid residues of GABA(A) receptor subunits contributing to the formation and affinity of the tert-butylbicyclophosphorothionate binding site. J. Neurochem. 74, 1310-1316.

128
Kakegawa W., Miyoshi Y., Hamase K., Matsuda S., Matsuda K., Kohda K., Emi K., Motohashi J., Konno R., Zaitsu K. and Yuzaki M. (2011) D-serine regulates cerebellar LTD and motor coordination through the delta2 glutamate receptor. Nat. Neurosci. 14, 603-611.
Kalus P., Muller T. J., Zuschratter W. and Senitz D. (2000) The dendritic architecture of prefrontal pyramidal neurons in schizophrenic patients. Neuroreport 11, 3621-3625.
Kartvelishvily E., Shleper M., Balan L., Dumin E. and Wolosker H. (2006) Neuron-derived D-serine release provides a novel means to activate N-methyl-D-aspartate receptors. J. Biol. Chem. 281, 14151-14162.
Kataoka H., Sakiyama N. and Makita M. (1991) Distribution and contents of free O-phosphoamino acids in animal tissues. J. Biochem. 109, 577-580.
Kawakami Y., Yoshida K., Yang J. H., Suzuki T., Azuma N., Sakai K., Hashikawa T., Watanabe M., Yasuda K., Kuhara S., Hirabayashi Y. and Furuya S. (2009) Impaired neurogenesis in embryonic spinal cord of Phgdh knockout mice, a serine deficiency disorder model. Neurosci. Res. 63, 184-193.
Khirug S., Yamada J., Afzalov R., Voipio J., Khiroug L. and Kaila K. (2008) GABAergic depolarization of the axon initial segment in cortical principal neurons is caused by the Na-K-2Cl cotransporter NKCC1. J. Neurosci. 28, 4635-4639.
Kinoshita A., Ohishi H., Neki A., Nomura S., Shigemoto R., Takada M., Nakanishi S. and Mizuno N. (1996a) Presynaptic localization of a metabotropic glutamate receptor, mGluR8, in the rhinencephalic areas: a light and electron microscope study in the rat. Neurosci. Lett. 207, 61-64.
Kinoshita A., Ohishi H., Nomura S., Shigemoto R., Nakanishi S. and Mizuno N. (1996b) Presynaptic localization of a metabotropic glutamate receptor, mGluR4a, in the cerebellar cortex: a light and electron microscope study in the rat. Neurosci. Lett. 207, 199-202.
Kinoshita A., Shigemoto R., Ohishi H., Van Der Putten H. and Mizuno N. (1998) Immunohistochemical localization of metabotropic glutamate receptors, mGluR7a and mGluR7b, in the central nervous system of the adult rat and mouse: a light and electron microscopic study. J. Comp Neurol. 393, 332-352.
Klomp L. W., de Koning T. J., Malingre H. E., van Beurden E. A., Brink M., Opdam F. L., Duran M., Jaeken J., Pineda M., Van M. L., Poll-The BT, van den Berg I. E. and Berger R. (2000) Molecular characterization of 3-phosphoglycerate dehydrogenase deficiency--a neurometabolic disorder associated with reduced L-serine biosynthesis. Am. J. Hum. Genet. 67, 1389-1399.
Kniazeff J., Bessis A. S., Maurel D., Ansanay H., Prezeau L. and Pin J. P. (2004) Closed state of both binding domains of homodimeric mGlu receptors is required for full activity. Nat. Struct. Mol. Biol. 11, 706-713.

129
Kniazeff J., Galvez T., Labesse G. and Pin J. P. (2002) No ligand binding in the GB2 subunit of the GABA(B) receptor is required for activation and allosteric interaction between the subunits. J. Neurosci. 22, 7352-7361.
Knox W. E., Herzfeld A. and Hudson J. (1969) Phosphoserine phosphatase distribution in normal and neoplastic rat tissues. Arch. Biochem. Biophys. 132, 397-403.
Kogo N., Dalezios Y., Capogna M., Ferraguti F., Shigemoto R. and Somogyi P. (2004) Depression of GABAergic input to identified hippocampal neurons by group III metabotropic glutamate receptors in the rat. Eur. J. Neurosci. 19, 2727-2740.
Kraus J. P., Le K., Swaroop M., Ohura T., Tahara T., Rosenberg L. E., Roper M. D. and Kozich V. (1993) Human cystathionine beta-synthase cDNA: sequence, alternative splicing and expression in cultured cells. Hum. Mol. Genet. 2, 1633-1638.
Kunishima N., Shimada Y., Tsuji Y., Sato T., Yamamoto M., Kumasaka T., Nakanishi S., Jingami H. and Morikawa K. (2000) Structural basis of glutamate recognition by a dimeric metabotropic glutamate receptor. Nature 407, 971-977.
Labrie V., Wong A. H. and Roder J. C. (2011) Contributions of the d-serine pathway to schizophrenia. Neuropharmacology.
Laurie D. J., Seeburg P. H. and Wisden W. (1992) The distribution of 13 GABAA receptor subunit mRNAs in the rat brain. II. Olfactory bulb and cerebellum. J. Neurosci. 12, 1063-1076.
Lee S., Yoon B. E., Berglund K., Oh S. J., Park H., Shin H. S., Augustine G. J. and Lee C. J. (2010) Channel-mediated tonic GABA release from glia. Science 330, 790-796.
Leidenheimer N. J., Machu T. K., Endo S., Olsen R. W., Harris R. A. and Browning M. D. (1991) Cyclic AMP-dependent protein kinase decreases gamma-aminobutyric acidA receptor-mediated 36Cl- uptake by brain microsacs. J. Neurochem. 57, 722-725.
Levi G. and Gallo V. (1981) Glutamate as a putative transmitter in the cerebellum: stimulation by GABA of glutamic acid release from specific pools. J. Neurochem. 37, 22-31.
Lindsley C. W., Niswender C. M., Engers D. W. and Hopkins C. R. (2009) Recent progress in the development of mGluR4 positive allosteric modulators for the treatment of Parkinson's disease. Curr. Top. Med. Chem. 9, 949-963.
Locasale J. W., Grassian A. R., Melman T., Lyssiotis C. A., Mattaini K. R., Bass A. J., Heffron G., Metallo C. M., Muranen T., Sharfi H., Sasaki A. T., Anastasiou D., Mullarky E., Vokes N. I., Sasaki M., Beroukhim R., Stephanopoulos G., Ligon A. H., Meyerson M., Richardson A. L., Chin L., Wagner G., Asara J. M., Brugge J. S., Cantley L. C. and Vander Heiden M. G. (2011) Phosphoglycerate dehydrogenase diverts glycolytic flux and contributes to oncogenesis. Nat. Genet. 43, 869-874.
Long P., Mercer A., Begum R., Stephens G. J., Sihra T. S. and Jovanovic J. N. (2009) Nerve Terminal GABAA Receptors Activate Ca2+/Calmodulin-dependent Signaling to Inhibit Voltage-gated Ca2+ Influx and Glutamate Release. J. Biol. Chem. 284, 8726-8737.

130
Lopez-Bayghen E., Rosas S., Castelan F. and Ortega A. (2007) Cerebellar Bergmann glia: an important model to study neuron-glia interactions. Neuron Glia Biol. 3, 155-167.
Lorez M., Humbel U., Pflimlin M. C. and Kew J. N. (2003) Group III metabotropic glutamate receptors as autoreceptors in the cerebellar cortex. Br. J. Pharmacol. 138, 614-625.
Lowry M., Hall D. E., Hall M. S. and Brosnan J. T. (1987) Renal metabolism of amino acids in vivo: studies on serine and glycine fluxes. Am. J. Physiol 252, F304-F309.
Luddens H., Seeburg P. H. and Korpi E. R. (1994) Impact of beta and gamma variants on ligand-binding properties of gamma-aminobutyric acid type A receptors. Mol. Pharmacol. 45, 810-814.
Lund K., Merrill D. K. and Guynn R. W. (1985) The reactions of the phosphorylated pathway of L-serine biosynthesis: thermodynamic relationships in rabbit liver in vivo. Arch. Biochem. Biophys. 237, 186-196.
Macfarlane A. J., Liu X., Perry C. A., Flodby P., Allen R. H., Stabler S. P. and Stover P. J. (2008) Cytoplasmic serine hydroxymethyltransferase regulates the metabolic partitioning of methylenetetrahydrofolate but is not essential in mice. J. Biol. Chem. 283, 25846-25853.
Maj M., Bruno V., Dragic Z., Yamamoto R., Battaglia G., Inderbitzin W., Stoehr N., Stein T., Gasparini F., Vranesic I., Kuhn R., Nicoletti F. and Flor P. J. (2003) (-)-PHCCC, a positive allosteric modulator of mGluR4: characterization, mechanism of action, and neuroprotection. Neuropharmacology 45, 895-906.
Mantovani M., Moser A., Haas C. A., Zentner J. and Feuerstein T. J. (2009) GABA(A) autoreceptors enhance GABA release from human neocortex: towards a mechanism for high-frequency stimulation (HFS) in brain? Naunyn Schmiedebergs Arch. Pharmacol. 380, 45-58.
Martin R., Bartolome-Martin D., Torres M. and Sanchez-Prieto J. (2011) Non-additive potentiation of glutamate release by phorbol esters and metabotropic mGlu7 receptor in cerebrocortical nerve terminals. J. Neurochem. 116, 476-485.
Martin R., Durroux T., Ciruela F., Torres M., Pin J. P. and Sanchez-Prieto J. (2010) The metabotropic glutamate receptor mGlu7 activates phospholipase C, translocates munc-13-1 protein, and potentiates glutamate release at cerebrocortical nerve terminals. J. Biol. Chem. 285, 17907-17917.
Mateos J. M., Elezgarai I., Benitez R., Osorio A., Bilbao A., Azkue J. J., Kuhn R., Knopfel T. and Grandes P. (1999) Clustering of the group III metabotropic glutamate receptor 4a at parallel fiber synaptic terminals in the rat cerebellar molecular layer. Neurosci. Res. 35, 71-74.
Mauron J., Mottu F. and Spohr G. (1973) Reciprocal induction and repression of serine dehydratase and phosphoglycerate dehydrogenase by proteins and dietary-essential amino acids in rat liver. Eur. J. Biochem. 32, 331-342.
McIlwain H. and Bachelard H. S. (1985) Biochemistry and the Central Nervous System. Churchill Livingstone, London, U.K.
131
Menegon A., Bonanomi D., Albertinazzi C., Lotti F., Ferrari G., Kao H. T., Benfenati F., Baldelli P. and Valtorta F. (2006) Protein kinase A-mediated synapsin I phosphorylation is a central modulator of Ca2+-dependent synaptic activity. J. Neurosci. 26, 11670-11681.
Millan C., Castro E., Torres M., Shigemoto R. and Sanchez-Prieto J. (2003) Co-expression of metabotropic glutamate receptor 7 and N-type Ca(2+) channels in single cerebrocortical nerve terminals of adult rats. J. Biol. Chem. 278, 23955-23962.
Millan C., Lujan R., Shigemoto R. and Sanchez-Prieto J. (2002) Subtype-specific expression of group III metabotropic glutamate receptors and Ca2+ channels in single nerve terminals. J. Biol. Chem. 277, 47796-47803.
Mitoma J., Furuya S. and Hirabayashi Y. (1998) A novel metabolic communication between neurons and astrocytes: non-essential amino acid L-serine released from astrocytes is essential for developing hippocampal neurons. Neurosci. Res. 30, 195-199.
Miya K., Inoue R., Takata Y., Abe M., Natsume R., Sakimura K., Hongou K., Miyawaki T. and Mori H. (2008) Serine racemase is predominantly localized in neurons in mouse brain. J. Comp Neurol. 510, 641-654.
Moritz A., Scheschonka A., Beckhaus T., Karas M. and Betz H. (2009) Metabotropic glutamate receptor 4 interacts with microtubule-associated protein 1B. Biochem. Biophys. Res. Commun. 390, 82-86.
Moss S. J., Smart T. G., Blackstone C. D. and Huganir R. L. (1992) Functional modulation of GABAA receptors by cAMP-dependent protein phosphorylation. Science 257, 661-665.
Mothet J. P., Parent A. T., Wolosker H., Brady R. O., Jr., Linden D. J., Ferris C. D., Rogawski M. A. and Snyder S. H. (2000) D-serine is an endogenous ligand for the glycine site of the N-methyl-D-aspartate receptor. Proc. Natl. Acad. Sci. U. S. A 97, 4926-4931.
Muto T., Tsuchiya D., Morikawa K. and Jingami H. (2007) Structures of the extracellular regions of the group II/III metabotropic glutamate receptors. Proc. Natl. Acad. Sci. U. S. A 104, 3759-3764.
Nagao K., Bannai M., Seki S., Mori M. and Takahashi M. (2009) Adaptational modification of serine and threonine metabolism in the liver to essential amino acid deficiency in rats. Amino. Acids 36, 555-562.
Nakagawa H., Kimura H. and Miura S. (1967) Crystallization and characteristics of serine dehydratase from rat liver. Biochem. Biophys. Res. Commun. 28, 359-364.
Nakahara K., Okada M. and Nakanishi S. (1997) The metabotropic glutamate receptor mGluR5 induces calcium oscillations in cultured astrocytes via protein kinase C phosphorylation. J. Neurochem. 69, 1467-1475.
Nakajima Y., Iwakabe H., Akazawa C., Nawa H., Shigemoto R., Mizuno N. and Nakanishi S. (1993) Molecular characterization of a novel retinal metabotropic glutamate receptor mGluR6

132
with a high agonist selectivity for L-2-amino-4-phosphonobutyrate. J. Biol. Chem. 268, 11868-11873.
Nakajima Y., Mochida S., Okawa K. and Nakanishi S. (2009) Ca2+-dependent release of Munc18-1 from presynaptic mGluRs in short-term facilitation. Proc. Natl. Acad. Sci. U. S. A 106, 18385-18389.
Nakano I., Dougherty J. D., Kim K., Klement I., Geschwind D. H. and Kornblum H. I. (2007) Phosphoserine phosphatase is expressed in the neural stem cell niche and regulates neural stem and progenitor cell proliferation. Stem Cells 25, 1975-1984.
Naples M. A. and Hampson D. R. (2001) Pharmacological profiles of the metabotropic glutamate receptor ligands. Neuropharmacology 40, 170-177.
Narkewicz M. R., Thureen P. J., Sauls S. D., Tjoa S., Nikolayevsky N. and Fennessey P. V. (1996) Serine and glycine metabolism in hepatocytes from mid gestation fetal lambs. Pediatr. Res. 39, 1085-1090.
Naur P., Hansen K. B., Kristensen A. S., Dravid S. M., Pickering D. S., Olsen L., Vestergaard B., Egebjerg J., Gajhede M., Traynelis S. F. and Kastrup J. S. (2007) Ionotropic glutamate-like receptor delta2 binds D-serine and glycine. Proc. Natl. Acad. Sci. U. S. A 104, 14116-14121.
Nazarali A. J., Baker G. B., Coutts R. T. and Wong T. F. (1987) N-(2-cyanoethyl)tranylcypromine, a potential prodrug of tranylcypromine: its disposition and interaction with catecholamine neurotransmitters in brain. Pharm. Res. 4, 16-20.
Nicoletti F., Bockaert J., Collingridge G. L., Conn P. J., Ferraguti F., Schoepp D. D., Wroblewski J. T. and Pin J. P. (2011) Metabotropic glutamate receptors: from the workbench to the bedside. Neuropharmacology 60, 1017-1041.
Niswender C. M. and Conn P. J. (2010) Metabotropic glutamate receptors: physiology, pharmacology, and disease. Annu. Rev. Pharmacol. Toxicol. 50, 295-322.
Nusser Z., Sieghart W. and Mody I. (1999) Differential regulation of synaptic GABAA receptors by cAMP-dependent protein kinase in mouse cerebellar and olfactory bulb neurones. J. Physiol 521 Pt 2, 421-435.
O'Hara P. J., Sheppard P. O., Thogersen H., Venezia D., Haldeman B. A., McGrane V., Houamed K. M., Thomsen C., Gilbert T. L. and Mulvihill E. R. (1993) The ligand-binding domain in metabotropic glutamate receptors is related to bacterial periplasmic binding proteins. Neuron 11, 41-52.
Parsons L. H. and Justice J. B., Jr. (1992) Extracellular concentration and in vivo recovery of dopamine in the nucleus accumbens using microdialysis. J. Neurochem. 58, 212-218.
Payne H. L., Connelly W. M., Ives J. H., Lehner R., Furtmuller B., Sieghart W., Tiwari P., Lucocq J. M., Lees G. and Thompson C. L. (2007) GABAA alpha6-containing receptors are selectively compromised in cerebellar granule cells of the ataxic mouse, stargazer. J. Biol. Chem. 282, 29130-29143.

133
Pekhletski R., Gerlai R., Overstreet L. S., Huang X. P., Agopyan N., Slater N. T., Abramow-Newerly W., Roder J. C. and Hampson D. R. (1996) Impaired cerebellar synaptic plasticity and motor performance in mice lacking the mGluR4 subtype of metabotropic glutamate receptor. J. Neurosci. 16, 6364-6373.
Pin J. P., Galvez T. and Prezeau L. (2003) Evolution, structure, and activation mechanism of family 3/C G-protein-coupled receptors. Pharmacol. Ther. 98, 325-354.
Pin J. P., Kniazeff J., Liu J., Binet V., Goudet C., Rondard P. and Prezeau L. (2005) Allosteric functioning of dimeric class C G-protein-coupled receptors. FEBS J. 272, 2947-2955.
Pollari S., Kakonen S. M., Edgren H., Wolf M., Kohonen P., Sara H., Guise T., Nees M. and Kallioniemi O. (2011) Enhanced serine production by bone metastatic breast cancer cells stimulates osteoclastogenesis. Breast Cancer Res. Treat. 125, 421-430.
Porcellati G. (1958) The levels of some free nitrogen-containing phosphate esters in nervous tissue. J. Neurochem. 2, 128-137.
Possemato R., Marks K. M., Shaul Y. D., Pacold M. E., Kim D., Birsoy K., Sethumadhavan S., Woo H. K., Jang H. G., Jha A. K., Chen W. W., Barrett F. G., Stransky N., Tsun Z. Y., Cowley G. S., Barretina J., Kalaany N. Y., Hsu P. P., Ottina K., Chan A. M., Yuan B., Garraway L. A., Root D. E., Mino-Kenudson M., Brachtel E. F., Driggers E. M. and Sabatini D. M. (2011) Functional genomics reveal that the serine synthesis pathway is essential in breast cancer. Nature.
Pouzat C. and Marty A. (1999) Somatic recording of GABAergic autoreceptor current in cerebellar stellate and basket cells. J. Neurosci. 19, 1675-1690.
Price G. D. and Trussell L. O. (2006) Estimate of the chloride concentration in a central glutamatergic terminal: a gramicidin perforated-patch study on the calyx of Held. J. Neurosci. 26, 11432-11436.
Pugh J. R. and Jahr C. E. (2011) Axonal GABAA Receptors Increase Cerebellar Granule Cell Excitability and Synaptic Activity. J. Neurosci. 31, 565-574.
Raiteri L., Schmid G., Prestipino S., Raiteri M. and Bonanno G. (2001) Activation of alpha 6 GABAA receptors on depolarized cerebellar parallel fibers elicits glutamate release through anion channels. Neuropharmacology 41, 943-951.
Rasmussen S. G., Choi H. J., Fung J. J., Pardon E., Casarosa P., Chae P. S., DeVree B. T., Rosenbaum D. M., Thian F. S., Kobilka T. S., Schnapp A., Konetzki I., Sunahara R. K., Gellman S. H., Pautsch A., Steyaert J., Weis W. I. and Kobilka B. K. (2011) Structure of a nanobody-stabilized active state of the beta(2) adrenoceptor. Nature 469, 175-180.
Rauw G. A., Grant S. L., Labrie V., Roder J. C., Antflick J. E., Hampson D. R. and Baker G. B. (2010) Determination of L-serine-O-phosphate in rat and mouse brain tissue using high-performance liquid chromatography and fluorimetric detection. Anal. Biochem. 405, 260-262.
134
Renden R., Taschenberger H., Puente N., Rusakov D. A., Duvoisin R., Wang L. Y., Lehre K. P. and von G. H. (2005) Glutamate transporter studies reveal the pruning of metabotropic glutamate receptors and absence of AMPA receptor desensitization at mature calyx of held synapses. J. Neurosci. 25, 8482-8497.
Romano C., Yang W. L. and O'Malley K. L. (1996) Metabotropic glutamate receptor 5 is a disulfide-linked dimer. J. Biol. Chem. 271, 28612-28616.
Ronaldson P. T., Bendayan M., Gingras D., Piquette-Miller M. and Bendayan R. (2004) Cellular localization and functional expression of P-glycoprotein in rat astrocyte cultures. J. Neurochem. 89, 788-800.
Rondard P., Liu J., Huang S., Malhaire F., Vol C., Pinault A., Labesse G. and Pin J. P. (2006) Coupling of agonist binding to effector domain activation in metabotropic glutamate-like receptors. J. Biol. Chem. 281, 24653-24661.
Rosemond E., Peltekova V., Naples M., Thogersen H. and Hampson D. R. (2002) Molecular determinants of high affinity binding to group III metabotropic glutamate receptors. J. Biol. Chem. 277, 7333-7340.
Rosemond E., Wang M., Yao Y., Storjohann L., Stormann T., Johnson E. C. and Hampson D. R. (2004) Molecular basis for the differential agonist affinities of group III metabotropic glutamate receptors. Mol. Pharmacol. 66, 834-842.
Ruiz A., Campanac E., Scott R. S., Rusakov D. A. and Kullmann D. M. (2010) Presynaptic GABAA receptors enhance transmission and LTP induction at hippocampal mossy fiber synapses. Nat. Neurosci. 13, 431-438.
Ruiz A., Fabian-Fine R., Scott R., Walker M. C., Rusakov D. A. and Kullmann D. M. (2003) GABAA receptors at hippocampal mossy fibers. Neuron 39, 961-973.
Rusakov D. A., Wuerz A. and Kullmann D. M. (2004) Heterogeneity and specificity of presynaptic Ca2+ current modulation by mGluRs at individual hippocampal synapses. Cereb. Cortex 14, 748-758.
Sakai K., Shimizu H., Koike T., Furuya S. and Watanabe M. (2003) Neutral amino acid transporter ASCT1 is preferentially expressed in L-Ser-synthetic/storing glial cells in the mouse brain with transient expression in developing capillaries. J. Neurosci. 23, 550-560.
Sakuraba Y., Sezutsu H., Takahasi K. R., Tsuchihashi K., Ichikawa R., Fujimoto N., Kaneko S., Nakai Y., Uchiyama M., Goda N., Motoi R., Ikeda A., Karashima Y., Inoue M., Kaneda H., Masuya H., Minowa O., Noguchi H., Toyoda A., Sakaki Y., Wakana S., Noda T., Shiroishi T. and Gondo Y. (2005) Molecular characterization of ENU mouse mutagenesis and archives. Biochem. Biophys. Res. Commun. 336, 609-616.
Santhakumar V., Hanchar H. J., Wallner M., Olsen R. W. and Otis T. S. (2006) Contributions of the GABAA receptor alpha6 subunit to phasic and tonic inhibition revealed by a naturally occurring polymorphism in the alpha6 gene. J. Neurosci. 26, 3357-3364.

135
Saugstad J. A., Kinzie J. M., Shinohara M. M., Segerson T. P. and Westbrook G. L. (1997) Cloning and expression of rat metabotropic glutamate receptor 8 reveals a distinct pharmacological profile. Mol. Pharmacol. 51, 119-125.
Saxe J. P., Wu H., Kelly T. K., Phelps M. E., Sun Y. E., Kornblum H. I. and Huang J. (2007) A phenotypic small-molecule screen identifies an orphan ligand-receptor pair that regulates neural stem cell differentiation. Chem. Biol. 14, 1019-1030.
Schoepp D. D., Jane D. E. and Monn J. A. (1999) Pharmacological agents acting at subtypes of metabotropic glutamate receptors. Neuropharmacology 38, 1431-1476.
Seebahn A., Dinkel H., Mohrluder J., Hartmann R., Vogel N., Becker C. M., Sticht H. and Enz R. (2011) Structural characterization of intracellular C-terminal domains of group III metabotropic glutamate receptors. FEBS Lett. 585, 511-516.
Seki T. and Arai Y. (1993) Highly polysialylated neural cell adhesion molecule (NCAM-H) is expressed by newly generated granule cells in the dentate gyrus of the adult rat. J. Neurosci. 13, 2351-2358.
Semyanov A. and Kullmann D. M. (2000) Modulation of GABAergic signaling among interneurons by metabotropic glutamate receptors. Neuron 25, 663-672.
Shimizu M., Furuya S., Shinoda Y., Mitoma J., Okamura T., Miyoshi I., Kasai N., Hirabayashi Y. and Suzuki Y. (2004) Functional analysis of mouse 3-phosphoglycerate dehydrogenase (Phgdh) gene promoter in developing brain. J. Neurosci. Res. 76, 623-632.
Shleper M., Kartvelishvily E. and Wolosker H. (2005) D-serine is the dominant endogenous coagonist for NMDA receptor neurotoxicity in organotypic hippocampal slices. J. Neurosci. 25, 9413-9417.
Sinkkonen S. T., Uusi-Oukari M., Tupala E., Sarkioja T., Tiihonen J., Panula P., Luddens H. and Korpi E. R. (2001) Characterization of gamma-aminobutyrate type A receptors with atypical coupling between agonist and convulsant binding sites in discrete brain regions. Brain Res. Mol. Brain Res. 86, 168-178.
Smith Q. R., Momma S., Aoyagi M. and Rapoport S. I. (1987) Kinetics of neutral amino acid transport across the blood-brain barrier. J. Neurochem. 49, 1651-1658.
Snead O. C., III, Banerjee P. K., Burnham M. and Hampson D. (2000) Modulation of absence seizures by the GABA(A) receptor: a critical rolefor metabotropic glutamate receptor 4 (mGluR4). J. Neurosci. 20, 6218-6224.
Snell K. (1984) Enzymes of serine metabolism in normal, developing and neoplastic rat tissues. Adv. Enzyme Regul. 22, 325-400.
Snell K. and Fell D. A. (1990) Metabolic control analysis of mammalian serine metabolism. Adv. Enzyme Regul. 30, 13-32.
136
Snyder S. H. and Ferris C. D. (2000) Novel neurotransmitters and their neuropsychiatric relevance. Am. J. Psychiatry 157, 1738-1751.
Somogyi P., Halasy K., Somogyi J., Storm-Mathisen J. and Ottersen O. P. (1986) Quantification of immunogold labelling reveals enrichment of glutamate in mossy and parallel fibre terminals in cat cerebellum. Neuroscience 19, 1045-1050.
Stell B. M. (2011) Biphasic action of axonal GABA-A receptors on presynaptic calcium influx. J. Neurophysiol. 105, 2931-2936.
Stell B. M., Rostaing P., Triller A. and Marty A. (2007) Activation of presynaptic GABA(A) receptors induces glutamate release from parallel fiber synapses. J. Neurosci. 27, 9022-9031.
Stover P. J., Chen L. H., Suh J. R., Stover D. M., Keyomarsi K. and Shane B. (1997) Molecular cloning, characterization, and regulation of the human mitochondrial serine hydroxymethyltransferase gene. J. Biol. Chem. 272, 1842-1848.
Szentagothai J. (1965) The use of degeneration methods in the investigation of short neuronal connexions. Prog. Brain Res. 14, 1-32.
Tabatabaie L., Klomp L. W., Rubio-Gozalbo M. E., Spaapen L. J., Haagen A. A., Dorland L. and de Koning T. J. (2011) Expanding the clinical spectrum of 3-phosphoglycerate dehydrogenase deficiency. J. Inherit. Metab Dis. 34, 181-184.
Takahashi T., Forsythe I. D., Tsujimoto T., Barnes-Davies M. and Onodera K. (1996) Presynaptic calcium current modulation by a metabotropic glutamate receptor. Science 274, 594-597.
Tanabe Y., Nomura A., Masu M., Shigemoto R., Mizuno N. and Nakanishi S. (1993) Signal transduction, pharmacological properties, and expression patterns of two rat metabotropic glutamate receptors, mGluR3 and mGluR4. J. Neurosci. 13, 1372-1378.
Tatarczynska E., Klodzinska A., Kroczka B., Chojnacka-Wojcik E. and Pilc A. (2001) The antianxiety-like effects of antagonists of group I and agonists of group II and III metabotropic glutamate receptors after intrahippocampal administration. Psychopharmacology (Berl) 158, 94-99.
Thomas N. K., Wright R. A., Howson P. A., Kingston A. E., Schoepp D. D. and Jane D. E. (2001) (S)-3,4-DCPG, a potent and selective mGlu8a receptor agonist, activates metabotropic glutamate receptors on primary afferent terminals in the neonatal rat spinal cord. Neuropharmacology 40, 311-318.
Thomsen C. and Hampson D. R. (1999) Contribution of metabotropic glutamate receptor mGluR4 to L-2-[3H]amino-4-phosphonobutyrate binding in mouse brain. J. Neurochem. 72, 835-840.
Thomsen C., Pekhletski R., Haldeman B., Gilbert T. A., O'Hara P. and Hampson D. R. (1997) Cloning and characterization of a metabotropic glutamate receptor, mGluR4b. Neuropharmacology 36, 21-30.

137
Trigo F. F., Bouhours B., Rostaing P., Papageorgiou G., Corrie J. E., Triller A., Ogden D. and Marty A. (2010) Presynaptic miniature GABAergic currents in developing interneurons. Neuron 66, 235-247.
Trigo F. F., Chat M. and Marty A. (2007) Enhancement of GABA release through endogenous activation of axonal GABA(A) receptors in juvenile cerebellum. J. Neurosci. 27, 12452-12463.
Turecek R. and Trussell L. O. (2002) Reciprocal developmental regulation of presynaptic ionotropic receptors. Proc. Natl. Acad. Sci. U. S. A 99, 13884-13889.
Tzingounis A. V. and Wadiche J. I. (2007) Glutamate transporters: confining runaway excitation by shaping synaptic transmission. Nat. Rev. Neurosci. 8, 935-947.
Ulas J., Satou T., Ivins K. J., Kesslak J. P., Cotman C. W. and Balazs R. (2000) Expression of metabotropic glutamate receptor 5 is increased in astrocytes after kainate-induced epileptic seizures. Glia 30, 352-361.
Uusi-Oukari M., Kosonen P., Homanics G. E. and Korpi E. R. (2004) Brain regional heterogeneity of pH effects on GABA(A) receptor-associated [35s]TBPS binding. Neurochem. Res. 29, 771-780.
Valerio A., Paterlini M., Boifava M., Memo M. and Spano P. (1997) Metabotropic glutamate receptor mRNA expression in rat spinal cord. Neuroreport 8, 2695-2699.
Veiga-da-Cunha M., Collet J. F., Prieur B., Jaeken J., Peeraer Y., Rabbijns A. and Van S. E. (2004) Mutations responsible for 3-phosphoserine phosphatase deficiency. Eur. J. Hum. Genet. 12, 163-166.
Verleysdonk S. and Hamprecht B. (2000) Synthesis and release of L-serine by rat astroglia-rich primary cultures. Glia 30, 19-26.
Vie N., Copois V., Bascoul-Mollevi C., Denis V., Bec N., Robert B., Fraslon C., Conseiller E., Molina F., Larroque C., Martineau P., Del R. M. and Gongora C. (2008) Overexpression of phosphoserine aminotransferase PSAT1 stimulates cell growth and increases chemoresistance of colon cancer cells. Mol. Cancer 7, 14.
von Gersdorff H., Schneggenburger R., Weis S. and Neher E. (1997) Presynaptic depression at a calyx synapse: the small contribution of metabotropic glutamate receptors. J. Neurosci. 17, 8137-8146.
Wang X., Ai J., Hampson D. R. and Snead O. C., III (2005) Altered glutamate and GABA release within thalamocortical circuitry in metabotropic glutamate receptor 4 knockout mice. Neuroscience 134, 1195-1203.
Warne T., Moukhametzianov R., Baker J. G., Nehme R., Edwards P. C., Leslie A. G., Schertler G. F. and Tate C. G. (2011) The structural basis for agonist and partial agonist action on a beta(1)-adrenergic receptor. Nature 469, 241-244.

138
Werner P., Hussy N., Buell G., Jones K. A. and North R. A. (1996) D2, D3, and D4 dopamine receptors couple to G protein-regulated potassium channels in Xenopus oocytes. Mol. Pharmacol. 49, 656-661.
Wilding T. J. and Huettner J. E. (1997) Activation and desensitization of hippocampal kainate receptors. J. Neurosci. 17, 2713-2721.
Williams R., Zhou Y., Niswender C. M., Luo Q., Conn P. J., Lindsley C. W. and Hopkins C. R. (2010) Re-exploration of the PHCCC Scaffold: Discovery of Improved Positive Allosteric Modulators of mGluR4. ACS Chem. Neurosci. 1, 411-419.
Wolosker H., Sheth K. N., Takahashi M., Mothet J. P., Brady R. O., Jr., Ferris C. D. and Snyder S. H. (1999) Purification of serine racemase: biosynthesis of the neuromodulator D-serine. Proc. Natl. Acad. Sci. U. S. A 96, 721-725.
Wright R. A., Arnold M. B., Wheeler W. J., Ornstein P. L. and Schoepp D. D. (2000) Binding of [3H](2S,1'S,2'S)-2-(9-xanthylmethyl)-2-(2'-carboxycyclopropyl) glycine ([3H]LY341495) to cell membranes expressing recombinant human group III metabotropic glutamate receptor subtypes. Naunyn Schmiedebergs Arch. Pharmacol. 362, 546-554.
Wu B., Chien E. Y., Mol C. D., Fenalti G., Liu W., Katritch V., Abagyan R., Brooun A., Wells P., Bi F. C., Hamel D. J., Kuhn P., Handel T. M., Cherezov V. and Stevens R. C. (2010) Structures of the CXCR4 chemokine GPCR with small-molecule and cyclic peptide antagonists. Science 330, 1066-1071.
Wu S., Wright R. A., Rockey P. K., Burgett S. G., Arnold J. S., Rosteck P. R., Jr., Johnson B. G., Schoepp D. D. and Belagaje R. M. (1998) Group III human metabotropic glutamate receptors 4, 7 and 8: molecular cloning, functional expression, and comparison of pharmacological properties in RGT cells. Brain Res. Mol. Brain Res. 53, 88-97.
Xi Z. X., Shen H., Baker D. A. and Kalivas P. W. (2003) Inhibition of non-vesicular glutamate release by group III metabotropic glutamate receptors in the nucleus accumbens. J. Neurochem. 87, 1204-1212.
Xu F., Wu H., Katritch V., Han G. W., Jacobson K. A., Gao Z. G., Cherezov V. and Stevens R. C. (2011) Structure of an agonist-bound human A2A adenosine receptor. Science 332, 322-327.
Yamada J., Okabe A., Toyoda H., Kilb W., Luhmann H. J. and Fukuda A. (2004) Cl- uptake promoting depolarizing GABA actions in immature rat neocortical neurones is mediated by NKCC1. J. Physiol 557, 829-841.
Yamasaki M., Yamada K., Furuya S., Mitoma J., Hirabayashi Y. and Watanabe M. (2001) 3-Phosphoglycerate dehydrogenase, a key enzyme for l-serine biosynthesis, is preferentially expressed in the radial glia/astrocyte lineage and olfactory ensheathing glia in the mouse brain. J. Neurosci. 21, 7691-7704.
Yang J. H., Wada A., Yoshida K., Miyoshi Y., Sayano T., Esaki K., Kinoshita M. O., Tomonaga S., Azuma N., Watanabe M., Hamase K., Zaitsu K., Machida T., Messing A., Itohara S., Hirabayashi Y. and Furuya S. (2010) Brain-specific Phgdh deletion reveals a pivotal role for L-

139
serine biosynthesis in controlling the level of D-serine, an N-methyl-D-aspartate receptor co-agonist, in adult brain. J. Biol. Chem. 285, 41380-41390.
Yao Y., Pattabiraman N., Michne W. F., Huang X. P. and Hampson D. R. (2003) Molecular modeling and mutagenesis of the ligand-binding pocket of the mGlu3 subtype of metabotropic glutamate receptor. J. Neurochem. 86, 947-957.
Yasuda E., Ma N. and Semba R. (2001) Immunohistochemical demonstration of L-serine distribution in the rat brain. Neuroreport 12, 1027-1030.
Yip P. K., Meldrum B. S. and Rattray M. (2001) Elevated levels of group-III metabotropic glutamate receptors in the inferior colliculus of genetically epilepsy-prone rats following intracollicular administration of L-serine-O-phosphate. J. Neurochem. 78, 13-23.
Yoshida K., Furuya S., Osuka S., Mitoma J., Shinoda Y., Watanabe M., Azuma N., Tanaka H., Hashikawa T., Itohara S. and Hirabayashi Y. (2004) Targeted disruption of the mouse 3-phosphoglycerate dehydrogenase gene causes severe neurodevelopmental defects and results in embryonic lethality. J. Biol. Chem. 279, 3573-3577.
Zhang S. J. and Jackson M. B. (1995) GABAA receptor activation and the excitability of nerve terminals in the rat posterior pituitary. J. Physiol 483 ( Pt 3), 583-595.
Zucker R. S. (1999) Calcium- and activity-dependent synaptic plasticity. Curr. Opin. Neurobiol. 9, 305-313.