Coordinating production and distribution of jobs with bundling operations
Upload
khangminh22Category
view
4download
0
An evaluation of production operations at Skretting’s Stavanger Plant, Norway,
& an overview of Skretting’s supply chain based on Lean concepts.
(A thesis Report submitted to the department of Production Engineering and Management, partially fulfilling the requirements
for the award of the degree)
Master of Sciences in Production Engineering and Management
By
Agbor Tanyi Emmanuel ([email protected] or [email protected])
University Supervisor
Professor Christer Lindh ([email protected])
Industry Supervisor
Erlend Sødal ([email protected])
Examiner
Professor Cornel Mihai Nicolescu ([email protected])
Stavanger, Norway, February 28, 2008
Royal Institute of
Technology
Stockholm, Sweden

- 2 -
Dedication
To Filip, Lisa, Ebob, Efundem and Enjema,
who are paying the price for my lengthy studies.
- 3 -
Table of Content
DEDICATION..................................................................................................................................................................................... - 2 -
ABSTRACT ........................................................................................................................................................................................ - 8 -
ACKNOWLEDGMENTS ................................................................................................................................................................... - 9 -
PREFACE.......................................................................................................................................................................................... - 10 -
1.0 Background.................................................................................................................................................................................. - 12 -
1.1. Introduction................................................................................................................................................................................. - 12 -
1.2 Historical origin of lean Manufacturing....................................................................................................................................... - 12 -
1.3. Problem statement....................................................................................................................................................................... - 13 -
1.4 Purpose and Objective ................................................................................................................................................................. - 13 -
1.5 Significance and justification for study........................................................................................................................................ - 13 -
1.6 Feasibility of doing the study....................................................................................................................................................... - 14 -
1.7 Motivation for doing the study..................................................................................................................................................... - 14 -
1.8 Scope and limitation of study....................................................................................................................................................... - 15 -
2.0 RESEARCH METHODOLOGY................................................................................................................................................. - 16 -
2.1 The thesis context ........................................................................................................................................................................ - 16 -
2.2 How this Study was conducted .................................................................................................................................................... - 16 -
2.3 Scientific methodology as applied to this thesis........................................................................................................................... - 17 - 2.3.1 The Analytical Approach..................................................................................................................................................... - 17 - 2.3.2 The actors approach............................................................................................................................................................. - 17 - 2. 3.3. The system approach ......................................................................................................................................................... - 18 -
2.4. Case Study Research................................................................................................................................................................... - 18 -
2.5. Observations and Data Collection............................................................................................................................................... - 19 -
2.6. Literature Review........................................................................................................................................................................ - 19 -
2.7 Analysis and synthesis ................................................................................................................................................................. - 19 -
2.8. Validity and Reliability............................................................................................................................................................... - 19 -
3.0 LEAN MANUFACTURING REVIEW....................................................................................................................................... - 21 -
3.1 Lean Concept, Principle and Lean Thinking. ............................................................................................................................... - 21 -
3.2 Definition of Lean........................................................................................................................................................................ - 22 -
3.3 Objectives of Lean ....................................................................................................................................................................... - 22 -
- 4 -
3.4 The five Principles of Lean .......................................................................................................................................................... - 23 - 3.4.1 Identification and implementation of value from customer perspective .............................................................................. - 23 - 3.4.1. 1. Internal related value ...................................................................................................................................................... - 24 -
3.4.1.1.1. External Customer Value......................................................................................................................................... - 24 - 3.4.1.1.2. Internal customer Values ......................................................................................................................................... - 25 -
3.4.2. Identify the value stream and eliminate or design out the major wastes and sources of wastes in the system .................... - 25 - 3.4.2.1 Waste from overproduction ......................................................................................................................................... - 26 - 3.4.2.2 Waste of waiting.......................................................................................................................................................... - 26 - 3.4.2.3 Transportation waste.................................................................................................................................................... - 26 - 3.4.2.4 Processing waste.......................................................................................................................................................... - 27 - 3.4.2.5 Inventory waste ........................................................................................................................................................... - 27 - 3.4.2.6. Waste of motion ......................................................................................................................................................... - 27 - 3.4.2.7. Waste from product defects ........................................................................................................................................ - 27 - 3.4.2.8. The waste of untapped human potential ..................................................................................................................... - 28 - 3.4.2.9. Waste of inappropriate systems. ................................................................................................................................. - 28 - 3.4.2.10. Waste of energy and water. ...................................................................................................................................... - 28 - 3.4.2.11. Waste of material...................................................................................................................................................... - 28 -
3.4.3 Standardize and level production operations to prevent variations and ensure continuous flow.......................................... - 29 - 3.4.4 Reduce batch sizes so that the system is consumption driven (pulled) and flexible ............................................................ - 29 -
3.4.5 Make the system waste prove so that it can be optimized ......................................................................................................... - 29 - 3.4.6. Continuously improve on the new state achieved. .............................................................................................................. - 30 -
3.5 The Lean manufacturing activities (methods, tools and techniques)............................................................................................ - 30 - 3.5.1 Lean Evaluation tools .......................................................................................................................................................... - 31 - 3.5.2 Tools for Implementing and Improving Operations............................................................................................................. - 31 -
3.5.2 .1. Just in time Management ........................................................................................................................................... - 31 - 3.5.2 .2. Total Productive maintenance ................................................................................................................................... - 32 - 3.5.2 .3. Production Smoothening ........................................................................................................................................... - 33 - 3.5.2 .4. Standardization of Work and Operating procedures. ................................................................................................. - 33 - 3.5.2 .5. The 5S system [18, 21] .............................................................................................................................................. - 34 - 3.5.2 .6. Cellular manufacturing .............................................................................................................................................. - 34 - 3.5.2 .7. Continuous Improvement .......................................................................................................................................... - 35 - 3.5.2.8. Value Stream Mapping (VSM)................................................................................................................................... - 35 -
3.5.2.8.1. Current State Map .............................................................................................................................................. - 36 - 3.5.2.8.2. Future State Value Stream.................................................................................................................................. - 36 -
3.6. New lean Perspectives ................................................................................................................................................................ - 38 - 3.6.1 Agile Manufacturing............................................................................................................................................................ - 38 - 3.6.2 Leagile, manufacturing philosophy...................................................................................................................................... - 39 - 3.6.3 Lean Enterprise.................................................................................................................................................................... - 40 -
3.7 Overview of Supply chain management ...................................................................................................................................... - 41 - 3.7.1 Supply chain Effectiveness .................................................................................................................................................. - 42 - 3.7.2 Integration of the Supply Chain........................................................................................................................................... - 43 -
3.7.2.1 Customer Integration ................................................................................................................................................... - 43 - 3.7.2.2. Internal customer, satisfaction. ................................................................................................................................... - 44 - 3.7.2.3. Supplier integration .................................................................................................................................................... - 44 - 3.7.2.4. Supplier Evaluation and Selection.............................................................................................................................. - 45 -
3.7.3. Manufacturer integration .................................................................................................................................................... - 46 -
3.7.3.1. Evaluating Manufacturing .......................................................................................................................................... - 46 -
3.8. Levels of Integration ................................................................................................................................................................... - 47 -
3.9. The Lean Supply Chain............................................................................................................................................................... - 48 - 3.9.1. Just in time purchasing, (JITP) ........................................................................................................................................... - 48 - 3.9.2. Just in time production - Manufacturing (JITM)................................................................................................................. - 49 - 3.9.3. Just in time Distribution-Transportation [JITD] ................................................................................................................. - 49 -
4.0 TAXONOMY OF PROCESS INDUSTRY ................................................................................................................................. - 51 -
- 5 -
4.1 Classification of the Process Industry .......................................................................................................................................... - 51 -
4.2 Product Characteristics ................................................................................................................................................................ - 51 -
4.3 Material Flow Characteristics ...................................................................................................................................................... - 52 -
4.4 Complexity of the Process industry ............................................................................................................................................. - 52 -
4.5 Lean and Aqua feed Industry ....................................................................................................................................................... - 53 -
4.6 The Farmed fish feed Industry ..................................................................................................................................................... - 54 -
4.8 Challenges and Competition in the fish feed industry.................................................................................................................. - 55 -
5.0 SURVEY OF SKRETTING’S PRODUCTION OPERATIONS................................................................................................. - 56 -
5.1 Company Presentation ................................................................................................................................................................. - 56 -
5.2 Organizational Structure .............................................................................................................................................................. - 56 -
5.3. Overview of Skretting’s Supply chain ........................................................................................................................................ - 57 - 5.3.1. Customer Base .................................................................................................................................................................... - 58 - 5.3.2. Demand for feed ................................................................................................................................................................. - 59 - 5.3.3. Location of Factories, Sales offices and Distribution ......................................................................................................... - 59 - 5.3.4 Production planning............................................................................................................................................................. - 60 - 5.3.5. Forecasting.......................................................................................................................................................................... - 62 -
5.4 Aqua Feed Production at Skretting .............................................................................................................................................. - 62 - 5.4.1. Raw Materials..................................................................................................................................................................... - 63 - 5.4.2. Reception and Storage ........................................................................................................................................................ - 63 - 5.4.3. Grinding and Mixing ........................................................................................................................................................ - 64 - 5.4.4. Extrusion Process................................................................................................................................................................ - 64 - 5.4.5. Drying................................................................................................................................................................................. - 65 - 5.4.6. Oil Coating ......................................................................................................................................................................... - 65 - 5.4.7. Cooling and packaging ....................................................................................................................................................... - 66 - 5.4.8. Sieving and Packaging........................................................................................................................................................ - 66 - 5.4.9. Warehousing, Handling and shipping, Storage................................................................................................................... - 66 -
6.0 SKRETTING STAVANGER, HISTORICAL DATA SURVEY ................................................................................................ - 67 -
6.1. Inventory ABC............................................................................................................................................................................ - 67 -
6.2. Product, Family Analysis ............................................................................................................................................................ - 70 -
6.3. Finished products ABC/Runners, Repeaters and Stranger .......................................................................................................... - 71 -
6.4. Total Contribution per product.................................................................................................................................................... - 72 -
6.5. Contribution per bottleneck minute............................................................................................................................................. - 72 -
6.6. Parts, Material, and tools............................................................................................................................................................. - 73 -
6.7. Quality Filter map ....................................................................................................................................................................... - 73 -
7.0 APPLIED STUDY: ANALYSIS OF SURVEY .......................................................................................................................... - 76 -
7.1 Evaluation and Analysis of Questionnaire Responses.................................................................................................................. - 76 -
7.2 Discussion of Questionnaire Survey ............................................................................................................................................ - 81 -
- 6 -
7.3. Current Situation of Skretting’s Value Stream............................................................................................................................ - 82 - 7.3.1. Operational Metrics ............................................................................................................................................................ - 82 - 7.3.2. Process Activity Mapping................................................................................................................................................... - 84 - 7.3.3. Value Stream Mapping at Skretting’s Stavanger plant ....................................................................................................... - 85 - 7.3.4. Production Planning............................................................................................................................................................ - 85 - 7.3.5. Customer Requirements...................................................................................................................................................... - 86 - 7.4. Manufacturing Process .......................................................................................................................................................... - 87 - 7.4.1. Raw Materials..................................................................................................................................................................... - 87 - 7.4.2. Blending Section................................................................................................................................................................. - 88 -
7.4.2. 1. Weighing ................................................................................................................................................................... - 88 - 7.4.2. 2. Grinding..................................................................................................................................................................... - 88 - 7.4.2.3. Blending ..................................................................................................................................................................... - 88 -
7.4.3. Extrusion Section................................................................................................................................................................ - 89 - 7.4.3.1. Extrusion .................................................................................................................................................................... - 89 - 7.4.3.2. Drying......................................................................................................................................................................... - 89 - 7.4.3.3 Oil Coating .................................................................................................................................................................. - 89 - 7.4.3. 4. Cooling ...................................................................................................................................................................... - 89 - 7.4.3.5. Sieving........................................................................................................................................................................ - 89 -
7.4.4. Bagging Section.................................................................................................................................................................. - 90 - 7.4.4. 1. Bagging ..................................................................................................................................................................... - 90 - 7.4.4.2. Warehouse and Shipping ............................................................................................................................................ - 90 -
7.5. Work Planning ............................................................................................................................................................................ - 90 -
7.6. How the Current State Data was collected .................................................................................................................................. - 90 -
7.7. Discussion of Skretting’s Value Stream...................................................................................................................................... - 92 - 7.7.1.. Future state Data ................................................................................................................................................................ - 92 - 7.7.2. Skretting’s Takt Time for line 1.......................................................................................................................................... - 92 - 7.7.3 Finished goods supermarket ................................................................................................................................................ - 93 - 7.7.4. Improve continuous flow of the process ............................................................................................................................. - 93 - 7.7.5. Level Production................................................................................................................................................................. - 94 - 7.7.6. Use Demand pull system. ................................................................................................................................................... - 95 - 7.7.7. Plan production at pacemaker process. ............................................................................................................................... - 95 - 7.7.8. Schedule production at pace maker process........................................................................................................................ - 95 - 7.7.9. Production Information Flow.............................................................................................................................................. - 96 - 7.7.10. Number of bags to Take out or introduce into the process................................................................................................ - 96 -
7.8. Possible process improvements................................................................................................................................................... - 97 - 7.8.1. Operator Training and Empowerment ................................................................................................................................ - 97 - 7.8.2. Standardisation of operations.............................................................................................................................................. - 97 - 7.8.3. Set up time reduction .......................................................................................................................................................... - 97 - 7.8.4. Create Visibility.................................................................................................................................................................. - 98 - 7.8.5. Total productive maintenance (TPM) ................................................................................................................................. - 98 - 7.8.6. Just in time.......................................................................................................................................................................... - 99 -
7.9 Conclusion ................................................................................................................................................................................. - 100 - 7.9.1. What are Skretting’s Weaknesses with respect to adopting Lean concepts?..................................................................... - 101 - 7.9.2. What are Skretting’s strong points with respect to lean operations?................................................................................. - 101 - 7.9.3. What can be improved? .................................................................................................................................................... - 101 -
7.10. Contribution of the project ...................................................................................................................................................... - 101 -
7.11. Recommendations................................................................................................................................................................... - 102 -
7.12. Possible Short comings in the Study ....................................................................................................................................... - 102 -
7.13. Future Direction ...................................................................................................................................................................... - 102 -
- 7 -
List of Figures Figure.1: An illustration of a lean process way of thinking - 25- Figure 2: Womack and Jones 5 lean Principles -26- Figure 3a & b: Kano Model Classification customer satisfaction factors - 27- Figure 4: seven major sources of wastes -31- Figure 5 Supplier Evaluation-Selection adapted from ADtranzs . -47- Figure 6: today’s Global business environment; ferocious competition of supply chains rather than companies. -48- Figure 7: Levels of supply chain integration (adaptation by author) - -50 - - Figure 9 Skretting’s supply chain from suppliers to first tier customers - 60- Figure 10 Skretting’s customer classification 2005 to 2007 -61- Figure.11 Skretting’s Factories and Sales offices in Norway - 62- Figure 12(a) Time between orders and deliveries. -63- Figure 12(b) Total time between orders and deliveries 2005 to 2007 -63- Figure 13, Overview of production process produced by student from a door to door mapping exercise. - 65 - Figure 14, Section of feed manufacturing process plant starting form extruder -67- Figure 15 Raw material Planed usage, forecast and variances - 70- Figure 16 Raw Material Usages and Value -71- Figure 17 (a) Product variants by commercial name - 72- Figure 17(b) Product variants by dimensions - 73- Figure 18 Product distribution - 73- Figure 19, Total Contribution per product for 2007 - 74- Figure 20: Contribution per bottle neck for 2007 - 75- Figure 21: Scrap rates per product 2005 to 2007 -76- Figure 22: Rework rates per product 2005 to 2007 - 76- Figure 23: First time through rates per product 2005 to 2007 - 77- Figre 24 lean profile for the different sections -80- Figure 25 lean profile for use of some specific lean tools -83- Figure 26, Skretting’s monthly operational Performance report spread sheet and metrics 85 Figure 27, value add and non value add activities plotted from Table 3 -87- Figure 29, Future State map 1 - 95- Figure 30, Operation Cycle times - 96- Figure 31, Future State map 2 - 98- Figure 32: Proposed location of on- line analysers -100- List of Tables Table 1 dry raw-materials Storage and Usage -70- Table 2 liquid raw-materials storage -71- Table 3 summarises the participation in the survey. - 78- Table 4 scoring of responses to questionnaire for sections -79- Table 5a, summary of responses to questionnaire and non structured interviews for lean tools -81- Table 5b scoring of responses to questionnaire for use of lean practices -82- Table 6: Process activity map (all times are in seconds) - 86- Table 7 Current state customer requirements and production schedule (See also annexe 5) -88- Table 8 Summary Current State Data -93- Table 9 Summary of Possible lean tools applicable in Skretting’s case - 101-
Appendixes Appendix 1; Lean Evaluation Questionnaire: Top Management -104- Appendix 2; Lean Evaluation Questionnaire: Major customer - 107- Appendix 3; Lean Evaluation Questionnaire: Front Line operators - 110- Appendix 4: A Brief report of Visit to Marine Harvest -114- Appendix 5: Production schedule for 19/01/08 t0 11/01/08 period of value stream mapping -116- Appendix 6: Customer requirements Vs Actual production - 117- References - 118-
- 8 -
Abstract
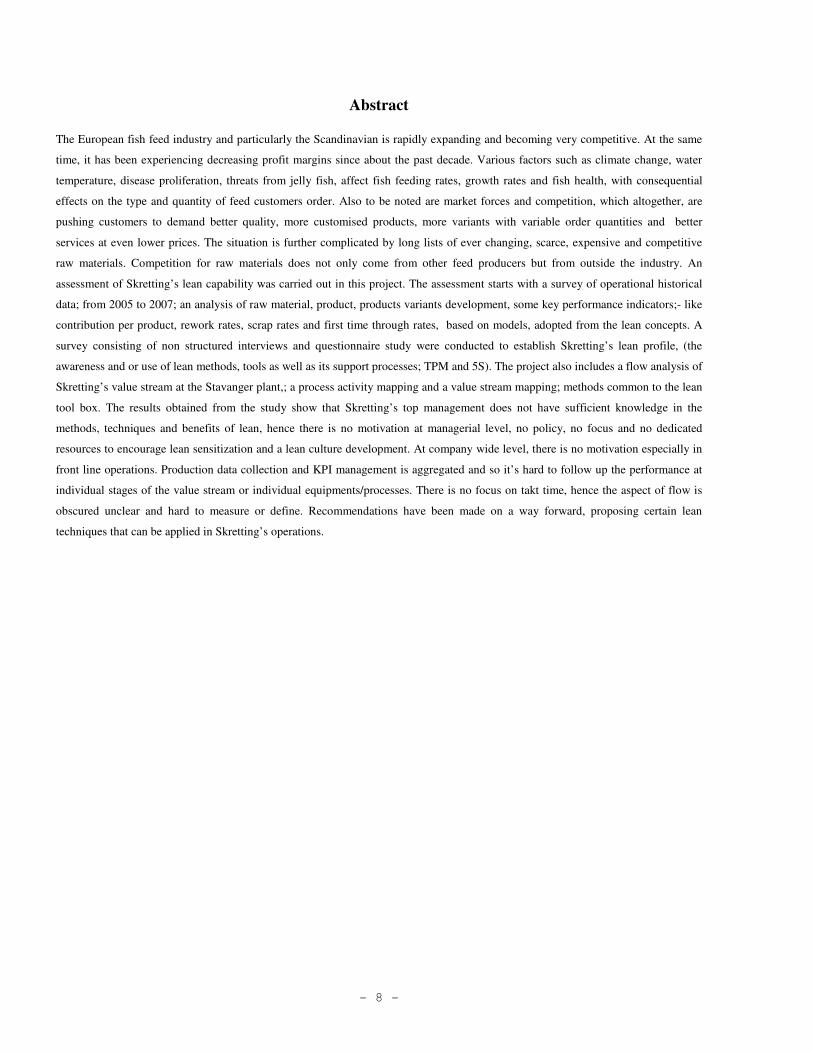
The European fish feed industry and particularly the Scandinavian is rapidly expanding and becoming very competitive. At the same
time, it has been experiencing decreasing profit margins since about the past decade. Various factors such as climate change, water
temperature, disease proliferation, threats from jelly fish, affect fish feeding rates, growth rates and fish health, with consequential
effects on the type and quantity of feed customers order. Also to be noted are market forces and competition, which altogether, are
pushing customers to demand better quality, more customised products, more variants with variable order quantities and better
services at even lower prices. The situation is further complicated by long lists of ever changing, scarce, expensive and competitive
raw materials. Competition for raw materials does not only come from other feed producers but from outside the industry. An
assessment of Skretting’s lean capability was carried out in this project. The assessment starts with a survey of operational historical
data; from 2005 to 2007; an analysis of raw material, product, products variants development, some key performance indicators;- like
contribution per product, rework rates, scrap rates and first time through rates, based on models, adopted from the lean concepts. A
survey consisting of non structured interviews and questionnaire study were conducted to establish Skretting’s lean profile, (the
awareness and or use of lean methods, tools as well as its support processes; TPM and 5S). The project also includes a flow analysis of
Skretting’s value stream at the Stavanger plant,; a process activity mapping and a value stream mapping; methods common to the lean
tool box. The results obtained from the study show that Skretting’s top management does not have sufficient knowledge in the
methods, techniques and benefits of lean, hence there is no motivation at managerial level, no policy, no focus and no dedicated
resources to encourage lean sensitization and a lean culture development. At company wide level, there is no motivation especially in
front line operations. Production data collection and KPI management is aggregated and so it’s hard to follow up the performance at
individual stages of the value stream or individual equipments/processes. There is no focus on takt time, hence the aspect of flow is
obscured unclear and hard to measure or define. Recommendations have been made on a way forward, proposing certain lean
techniques that can be applied in Skretting’s operations.

- 9 -
Acknowledgments
I will like to thank all the lecturers in the program through which I acquired the necessary knowledge to go through this program,
especially, Prof. Cornel Mihai, Dr. Daniel Tesfamariam Semere, Jerzy Mikler, Roland Langhé, Ove Bayard, Tero Stjernstoft, Per
Johansson, Mats Bejhem, Anders Eliasson, Prof. Bernard Hon (Liverpool University), Pr Dragos (Nottingham University), Ann-Sofie
Granberg and especially Prof. Christer Lindh who took his time to read through and guide me through this report.
Very special thanks to Prof. Cornel Mihai who had to travel all the way from Stockholm to Stavanger to make sure I had all the support
I needed from the company to carry out this project. And to Erlend Sødal who was my supervisor at Skretting and also did all he could
in all dimensions to support me for this project. Special thanks to Pastor Michael Johansson, his family and the whole T-Way
congregation in Hallunda, Stockholm, for all their support during this program. To Mr Kofi Solomon, his wife Bernice and his kids
Abeibum - Kelly, Andabit-uboh- Bobo, Jeremy Embanwie- Jek who hosted me all through the project. To my friend Johanne Thur
Jacobsen and her family for all the support they gave me during this period, to my sister Frida Agouo Kapah and her family for all her
support during this program, not forgetting the Cameroonian family in Stavanger.
It is a Herculean task to mention the names and thank all who assisted me morally, socially, financially and otherwise, to go through this
program, the list will be endless; I say to you all thank you to all my course mates especially Zahid, Riaz, Tonny Okoroafor, Varun,
Sofia, Maciek, Usman, Sara. To Claudio and Sofia, my opponents for their criticisms. Beteck Ivo, Ernest, Inge Markström, Roger
Clarence and Gjermund Åkre.
I thank you all at Strutting, who took your time to assist me in this project and or respond to my questionnaires, and non structured
interviews notably; Erlend Sødal, Frode.Jaasund, Arne.Dag.Hoeie, Stig.Gunvaldsen, Terje.Fuglestad, Rune.Kristoffersen, Sissel
Tjostheim, Leive Tvenning(Marine Harvest), Arne.Groetting, Geir.Bremnes, Halvard.Hovda, Nils.Tore.Hoelsboe, Tor.Paust.Andersen
Therese.Log.Bergjord, Nils.Tore.Hoelsboe, Frank and his team of operators at Avroy, Henning Paulsen and the team of operators at
Stavanger. I remain very thankful to you for your time and assistance while I was at Skretting.
To you all both mentioned here and not, “I say thank You”
Agbor Tanyi Emmanuel
--------------------- Stockholm, March 17, 2008
- 10 -
Preface
This preface here is used to give a brief summary of the report, to facilitate navigation through the work. It presents the content of
each of the sections. The farmed fish industry and consequently the fish feed industry in Europe and particularly in the Scandinavian
coast lines is rapidly expanding and becoming very competitive while profit margins have been shrinking since about the past decade.
Various factors such as climate change, water temperature, disease proliferation, threats from jelly fish, affect fish feeding rates,
growth rates and fish health, with consequential effects on the type and quantity of feed ordered. Also to be noted are market forces
and competition, which altogether, are pushing customers to demand better quality, more customised products, more variants with
variable order quantities and better services at even lower prices, making prediction of order horizons complicated. On the other side
of the equation is the long list of ever changing, scarce, expensive and competitive raw material market. The ever exploding situation
of global population resulting to the increasing use of grains: corn, wheat, are increasingly being used for ethanol; rap seed, soy bean
seed, sun flower seed: for bio diesel. Fish protein sources used for feed: fish meal and fish oil( also for industrial uses) for food, are
also in high demand in the animal feed industry. High energy costs, with increasing crude oil prices, make the situation more acute.
The only way to sustain growth or maintain competitivity in this business is to adopt more responsive manufacturing approaches
focusing on customer value to produce at lower operational costs. Skretting, a global leader in the farmed fish feed business, and
grouped as a food process industry, with typically continuous process manufacturing has not been an exception to this trend. Recently,
to cope with these challenges, Skretting revamped its production unit at Stavanger, put in place TPM and 5S system. Still faced with
lower than expected operational performances it has been thinking of adopting lean manufacturing principles.
Apart from the usual challenges lean manufacturing implementation faces in the process industry, such as but not limited to the fact
that there is little work in process inventory (WIP), it is typically characterized by very high fixed capital, with very high production
capacities and efficiencies compared to the discreet. Production is concentrated in a small number of workstations, and equipment is
physically very large and relatively fixed in nature hence not flexible with respect to moving of machines. There is a high rate of
employee turn over rate due to competition for qualified workers with the oil companies, high product proliferation with hard to
predict order horizon making it difficult to schedule production, or make appropriate scheduling plans that fit capacity which leads
sometimes to unwanted inventory. increased set up time, change over time with inexperienced operators and material storage capacity
shortage add to the problems. A failed TPM and 5S system at this plant could also be a reason for the feet dragging attitude to
opening up to new approaches like lean. An assessment of Skretting’s lean capability was carried out in this project. The assessment
starts with a survey of operational historical data; from 2005 to 2007: an analysis of raw material, product, products variants
development, some key performance indicators;- like contribution per product, rework rates, scrab rates and first time through rates
based on models, based on the lean concepts. A survey consisting of non structured interviews and questionnaire study were
conducted to assess awareness and or use of lean methods, tools as well as its support processes like, TPM and 5S. The project also
includes a flow analysis of Skretting’s value stream at the Stavanger plant, through a process activity mapping and a value stream
mapping.
The report starts with a background in chapter one, by introducing the report, followed by a brief historical background of lean
manufacturing. A definition of the problem under study, purpose, justification, feasibility, motivation and the scope of the project are
discussed next in the same chapter one. Chapter two is a general review of research methodology, how the different research
approaches relate to this study and how it was applied to the study. The section also states how the data was collected and discuses the
issue of validity and reliability. Chapter three is an overview of literature published and unpublished on the lean manufacturing
concepts, discussing its basic founding principles, tools and techniques. It also contains an overview of supply chain management
concepts relating to lean. Agile manufacturing is discussed briefly as an extension or a vision of some lean professionals and new
approaches to lean like leagile. In chapter four the process industry is classified, with the aim of bringing out where the feed
manufacturing industry fits in, as well as high lighting the complexity of the environment when it comes to applying the lean
manufacturing way of thinking. The aim was to locate what lean techniques can be suitable, where and how they can be applied, in
- 11 -
such a scenario. A point at which the feed produced becomes discrete units is established in this section. Chapter five is a presentation
of Skretting, its supply chain, description of its production operations, factories and sales offices locations in Norway. In chapter six,
historical data collected form the company’s data base is analyzed based on lean constructs. The analysis helps to profile the
companies operation with respect to lean concepts. The chapter also looks at some key performance indicators such as scrap rate,
rework rate and some not used by the company but part of the lean body of knowledge, like product contribution, and first time
through rate. Chapter seven presents the results of the survey through scoring the responses to the questionnaire and establishing a
lean profile for Skretting. It also contains a flow analysis carried out through a process mapping and a value stream mapping at the
Stavanger plant. The results obtained from the study as presented in this chapter seven, show that Skretting’s top management does
not have sufficient knowledge in the methods, techniques and benefits of lean, hence there is not enough motivation at managerial
level, or to put it in another way, very few of the managers are motivated enough to create a lean drive. There is no policy, no lean
focus in the development and use of performance metrics. No resources dedicated to encourage lean sensitization and a lean culture
development. At company wide level, there is no lean motivation especially in front line operations. Production data collection and
KPI management is aggregated and so it’s hard to follow up the performance of individual stages of the value stream or individual
equipments/process. There is no focus on takt time, hence the aspect of flow is obscured unclear and hard to measure or define flow.
There is high dependence of operations on tacit knowledge with no standardized operational working methods, a situation which can
make tracing the source of variability obscure, and the training of operators difficult. There are no forums through which to generate
ideas from frontline operators. The section end with some recommendations, a summary of Skretting’s weaknesses, strengths and
possible improvements as well as some lean techniques and support processes that can be applicable to Skretting’s situation. Possible
areas that the company can sponsor research in the improvement of the performance of its operations and supply chain have also been
suggested. The report ends with a conclusion, recommendation and possible areas Skretting may wish to sponsor more research work
- 12 -
1.0 Background
1.1. Introduction
This is a master’s thesis report that describes how the efforts of a global leader in the aqua feed business, Skretting who,
recently has been involved in trying to boost its capability to rapidly adapt its production operations to fluctuating customer
demand in volume and in product type, in order to sustain its competitive position, were assessed based on lean manufacturing
principles. The task was to map the development of the products, raw materials and corresponding KPIs, for at least the past
three years. Then an assessment of the potential for improvement, through a flow analysis of the value stream to identify
possible ways to be leaner. The report starts with a theoretical survey of lean concepts, a classification of the process industry to
see how the fish feed industry fits into the chemical process industry, how and where lean concepts can be used in this industry
and then it uses some of the concepts developed in the theory in an applied study of both historical and current data collected
from Skretting, and then presents the results of the analysis. The report ends with a summary, conclusion and recommendations.
This evaluation can be said to be qualitative although some quantitative analysis were done in some sections. Done through a
questionnaire survey, non structured interviews and a value stream mapping, all limited to the data that was accessible to the
student.
1.2 Historical origin of lean Manufacturing
Henry Ford in 1908 introduced very innovative and great ideas in the process of automobile manufacture, that later
revolutionarized manufacturing and made America become the leader in this industry. It’s model T built on the philosophy of
complete and consistent inter changeability of parts and simplicity of attaching them to each other (Standardization of parts),
can be considered to be one of the major initial attempts of lean application. This was possible with the same gauging systems
in making his parts (can be considered Jidoka), there by reducing variability in the parts produced. It facilitated the continuous
assembly line, where conveyors moved cars through car assembly process, with work coming to the worker rather than the
workers going to work, thus making the worker to perform the same task repeatedly, developing mastery (principle of flow).
The assembly time was reduced from 514 to 2.3 minutes [14]. With this processes improved, cars could be sold at prices
affordable to more people.
About 1960, the Japanese; Fiji Toyoda, Taichi Ohno and a host of others at the Toyota [7] Company after studying the ford
system and the works of Juran, Deming etc, adopted them, modifying them to fit the Japanese economic, cultural, social and
industrial setting at that time, to come up with new concepts such as TQM, JIT and the Toyota manufacturing system, which
Womack, refers to today as the Lean manufacturing system [14]. In this system, managers and employers learned to question
the need for every work sequence, the existence of every piece of in process inventory, wasted second, idle men, machine, or
material. The effect was an overall increase in production quality and the identification and elimination of different forms of
waste- muda [14]. Lean manufacturing is a way of thinking, a culture where all employees continuously look for ways to
improve the process by eliminating all non-value adding activities.
This philosophy has found its place in all production systems. In 1949 the Japanese introduced process control, oriented by
Deming’s visit to Japan in 1950. A quality assurance based on the 1954 Jurans visit to Japan, focused on building quality into
products within the process [14]. This management paradigm, Lean manufacturing, evolved from these earlier works, in the
search to produce “Just in time,” has now found widespread use by many global manufacturers. It has become an integral part
of global manufacturing. “Lean” coined by James Womack et al in their 1990s, master piece, “The Machine that changed the
World”, was finally a baptism of Taiichi Ohno’s trial and error experiments and initiatives over three decades at Toyota Motor
Company. The TPS was formally introduced in the U.S. in 1984 when NUMMI was established as a joint venture between
Toyota and General Motors, but its informal transfer to the West began much earlier, occurring over time in a piecemeal
fashion. Because TPS was an out come of the climate the Japanese auto industry found itself in, at that time, and other socio-
- 13 -
cultural considerations, it was multifaceted and complicated, for Western managers to comprehend the true nature of the
production process. These managers often focused on single, visible aspects of the process at a time, while missing the
invisible, highly inter-dependent links of the system as a whole. By the time U.S. managers realized the numerous elements
underlying TPS, and, by extension, lean production, these different terms had become deeply ingrained in the common lexicon
of the academic and business publications. Reviewing existing literature on lean provides a starting point in defining lean
production, and helps highlight the conceptual and the operational space surrounding lean production and the set of operational
measures that can be used to represent it.
1.3. Problem statement
Skretting is grouped as a food process industry, with typically continuous process manufacturing. Implementing lean
manufacturing here in Skretting creates a number of challenges not faced in discrete manufacturing, the birthplace of Lean.
Such challenges include but not limited to the fact that it has little work in process inventory (WIP), it is typically characterized
by very high fixed capital, with very high production capacities and efficiencies compared to the discreet. Skretting’s,
production data collection and KPI management is aggregated and so its hard to follow up the performance of individual
equipment. After discussions with different head of sections in Skretting, these are some of the issues raised:
� Product proliferation making it difficult to schedule production
� Difficulty in determining an appropriate scheduling plans that fit capacity leading sometimes to unwanted inventory
� Need for more smoothed production through set up time, change over time reduction. and production of appropriate batch
sizes
� Proliferation of raw material variety resulting to inadequate storage capacity
� Difficulty to set an appropriate order horizon due to frequent change of orders by customers.
� High dependence of operations on tacit knowledge
To look for possible solutions to these issues this study assessed three areas of operations:
� How operations are organized (leadership, measurement system, customer relationship, operation standards)
� How manufacturing is carried out (use of lean tools; 5S, set up time reduction, process mapping, process control)
� Type of support systems in place ( TPM, process mapping, SCM; VSM),
1.4 Purpose and Objective
The purpose of this study is to evaluate Skretting's production operations in Stavanger, Norway, based on the Lean Manufacturing
concepts. The objective is to identify and map out strengths, weaknesses, and opportunities for improvements, establish a lean
profile for Skretting’s operations. This purpose and objective fall in line with Bichenos [21] construct for the purpose and objective
of a lean evaluation which are; [21]: Identify areas of Opportunity, Identify Weaknesses, and Guidance towards lean operations
1.5 Significance and justification for study
The farmed fish industry and consequently the fish feed industry in Europe and particularly in this region is rapidly expanding and
becoming very competitive. Various factors such as climate change, proliferation of diseases, etc as well market forces are causing
customers to demand better quality, more customised products and services at even lower prices, while profit margins are on a
decline. The only way to sustain growth or maintain competitivity is to adopt manufacturing approaches that can deliver good
results. In the chemical industry, improvement practices like TQM, TPM, etc have been used with the aim of improving
performance, hence provide cost effective products. Lean implementation in the process industry has great potentials of improving
performance [75].
Skretting’s production planning uses an ERP system whose shortcomings in handling some capacity and operational issues to the
satisfaction of all stake holders in a lean system are well documented [103]. Planning is based on a yearly forecast, which is
- 14 -
developed with focus almost on budgetary lines and is further exploded down to weekly production plans. This is partly because of
the long list of changing raw materials of varying quality and some raw materials having very long order lead times. With the
variety of product variants and increasingly customized products, the plans sometimes proposed by planning or the products
demanded by marketing are sometimes not very cost effective from manufacturing point of view. This creates disconnects between
the different departments, operations, logistics, planning, and marketing, especially with very difficult to predict order horizons.
The factory in Stavanger, recently saw some capacity revamping to meet up with expanding demand, and since then it has not been
able to raise utilization to the level of the other sister factories, recording the highest rework rates and operational cost. Also to note
is the very high rate of operator turnover, which is counter to the development of experience in the manufacturing process
operation, needing standardization of operating procedures. Although 5S and TPM were put in place a few years back, they were
not targeting any specific problem so to say [99] given all these challenges, the gaps still exist. The lean concept provides a set of
tools with which we can visualise the whole value stream, from customer to supplier, serving as a useful approach to locate these
gaps and target them for improvement. Although its applications have been limited to the discrete manufacturing industry with
great success, it can be adapted and applied with success in the process industry [32, 100, 1001, 102]. Abdullah, F., Rajgopal, J.,
Needy, K.L[100, 1001] examined aspects of continuous production that are amenable to lean techniques and presented a
classification scheme to guide lean implementation in this sector. With a good information management structure in place and an
ISO and TPM a system in place, Skretting has a good foundation for the lean principles to flourish, which calls for a study like this
as a starting point.
1.6 Feasibility of doing the study
Although there is not much research or applications of lean in the process industry, the project is feasible because the student is
highly motivated on one hand and on the other he has a sound background in the process industry and in lean concepts and its
tools. There is also a lot of literature available on lean manufacturing that can be consulted. Some studies like those mentioned
above, have examined aspects of continuous production that are amenable to lean techniques and presented a classification scheme
to guide lean implementation in this sector.
There is an industrial supervisor who is very experienced in the processes of the company and also very motivated to see the
project done. There is also available an academic supervisor knowledgeable in these concepts available to be consulted.
The study does not require too much travelling, since the student is staying at the locality of the factory. It just requires some trips
to the other sister factories or the University to consult the academic supervisor. So cost wise the project is feasible.
1.7 Motivation for doing the study.
Firstly, the world’s appetite for animal proteins is rapidly increasing. Farmed aquatic protein sources have been identified as the
most potential, less risky and most ecologically friendly sources of animal proteins. With an animal farming industry plagued by a
variety of different forms of epidemics, so far, the farmed fish industry is the easy way out, and the fish feed industry on which
aquatic fish farming relies on stands out to be the point in which this whole supply chain can be made more efficient. The fish
industry as we will see later is characterised by very slim margins. This is as a result of rising prices of raw materials (grains and
fish meal), tightening regulations (especially in Europe) and rising energy prices. Increasing crude oil ($USD100 since about three
days now) prices means increasing cost of wild fishing and dependence on farmed fish. Also to mention is the increasing
competition within the industry and for the already scares raw materials. With new developments and the need to feed a
geometrically exploding world population and high demand for renewable fuels, on one hand and the surge of highly customised
and changing customer requirements, feed manufacturing operations need to be lean, the aqua feed value stream needs to be more
cost effective in terms of delivering customer value. I am very curious and motivated to see the application of lean concepts to such
a real world and challenging situation, to yield palpable benefits. The program gives me a good theoretical base in lean concepts

- 15 -
and other production and operations management tools and concepts. I am very curiose to see lean concepts being applied in the
process industry with as much success as in the discrete manufacturing industry. Skretting offers a challenging, multicultural
management approach and great opportunities that pave the way to apply these concepts and tools in a way that, the results will
yield benefits for the company, humanity, the lean manufacturing body of knowledge as a whole as well as contribute to my
personal and career development and satisfy my curiosity.
1.8 Scope and limitation of study
The project is basically a qualitative assessment, starting with a study of historical data from Skretting’s operations for the last
3years (Product dimensions, number of product variants, quality parameter ranges, etc) and comparing them with some operational
KPI's. It is not a quantitative assessment with the use of models. The project is also limited to the factory in Stavanger although the
results can be applied to all other sister factories. It is not a quantitative assessment.
- 16 -
2.0 Research Methodology
Traditionally, research methodology, has been conceived as the creation of true objective knowledge, following a scientific
method, by manipulating variables and studying the cause and effect. Then, from what is presented or appears as data, facts, the
unequivocal imprints of reality, it is possible to acquire reasonably, adequate basis for empirically grounded conclusions and as
a next step generalizations and theory building.[15] Although no experiments are conducted in this study, the approach is
identical to that described above, given that the conclusions are based on analysis of historical data from real life manufacturing
processes and current data collected on the field during a process and value stream mapping of production operations,
established tools used by lean practitioners[21, 28]. The study also applies the more of the non- experimental, descriptive
method, which seeks to explain and describe the situation rather than the manipulation of variables [16].
2.1 The thesis context
This work focuses on the evaluation of a process industry’s production operations based on lean manufacturing concepts. It
falls in the context of Skretting efforts towards achieving lean operations. Lean manufacturing concepts have been widely
applied in the discrete manufacturing industry with great success. In the continuous process manufacturing industry, (such as oil
refining, animal/fish feed, metallurgy, pharmaceuticals, chemicals, food/beverage, paper, adhesive application etc), its
adaptation has been very slow. This is because the application of these concepts creates a number of challenges not present in
discrete manufacturing environment, the birthplace of Lean. This thesis tries to look at which opportunities exist in such an
environment to apply lean concepts.
2.2 How this Study was conducted
The approaches of, action research, non structured interviews, questionnaires and case studies were applied in this study. The
approach consisted of the following faces: The first phase of the project involved discussions with the operations manager
northern Europe to understand the high level business objective and to agree on a suitable thesis scope. Then discussions with
various section managers to have an overview of the type of production operation and support systems in place. Being an
assessment, the level of understanding of lean principles and tools of operators and various supervisors was to be assessed. The
study included studying the variety as well as flow of products and information through the manufacturing system and value
chain, relationship with customers, relationship between product and processes, operational performance measurement metrics.
The literature study concerned looking at the applicability and relevance of lean concepts to the fish feed, process industry. The
second phase involved a broad based, non structured interview and questionnaires survey to have an overview of how
operations are handled. This also involved drawing of a process chart showing the flow of material from the start to the end
customer. The third face involved an analysis of historical data to group items into product families, classify customers, product
and raw material ABC analysis, to identify which products are of more value to the customers and the company. It also
involved a study of some KPIs and a visit to the most performant of Skretting’s factories. Then, none structured interviews,
questionnaires through a visit to the major customer, to understand their relationship with Skretting, and how demand is
generated. The last face involved a value stream mapping of the most valuable product family, to identify possible strengths
weaknesses and areas to improve on in the value chain.
- 17 -
2.3 Scientific methodology as applied to this thesis
This section explains what scientific methodologies were used to conduct this thesis. It also helps the student to organise the
work in a scientific manner, forming the path followed in the project, as this is relevant for its validity. Science is organised
knowledge, as an activity, a systematic and methodological retrieval of knowledge within a specific area [13]. However there
are two angles that differ, the social sciences and the natural sciences. The difference lies in the fact that while the natural
sciences have highly repeatable, experiments the social sciences do not. The social science researcher must explain, interpret
and document his investigations and experiments more thoroughly for others to be able to interpret and validate the results in
the same way as the researcher does. The engineering sciences to which this project belongs, has both the social science angle
with low repeatability e.g. when designing management systems and the natural science angle to research with high
repeatability e.g. when formulating a feed or designing a new part. This project is that with more of the low repeatability type
which demands more method description. It applies the more of the non- experimental, descriptive method, which seeks to
explain and describe the situation rather than the manipulation of variables [16]. The distinction as either action approach,
systems or analytical approach really is hard to make here since the elements from all three approaches are involved in this
project
2.3.1 The Analytical Approach
This approach assumes that all phenomena are caused by some explainable cause not influenced by the researcher. It is based
on a reality sometimes called the objective reality, so it conducts experiments to find out this reality. The fundamental problem
with this approach lies in how to gain knowledge on the stable and objective perception of the mind [9]. This varies from
environment to environment and from person to person under identical situations. It tries to break down the problem into sub
parts that are studied separately to gain a better understanding of the problem. The measurement of, cycle times, set up times,
change over time, takt time, work in process etc, in a value stream mapping illustrate this approach because it breaks the whole
value stream into its separate components yet carries out the flow analysis of the value stream as a single unit in synergy.
2.3.2 The actors approach
The actors approach assumes that the reality changes due to the researcher’s interaction with the system investigated, makes it
difficult to study an ongoing phenomena without affecting the results, so it tries to interpret the phenomenon. Carrying out a
lean assessment like this, through interviews and questionnaires involves the researcher himself interacting with the system, and
of course this will create some non measurable effects on the results. The action researcher is present in the complex, always
changing and interacting research world, in which he/she is a part of and consequently will have an effect on the results of the
research. The real world, situation is the type of world in which the engineering and natural scientists find themselves in, built
up from several interacting variables, making it obvious to look at the whole, a necessity. The action research idea is explained
by Kurt Lewins two dictates;” In order to understand something, try changing it” and “There is nothing as practical as a good
theory”. Action research has developed today from Lewins idea of the researcher formulating the problem, to Sanford’s [1, 12]
full partnership with the client. Partnership action research, involves the client’s full involvement, with the researcher in all
phases of the project.
- 18 -
2. 3.3. The system approach
This approach aims to explain phenomena by looking at the causes in a holistic perspective using analogies and comparisons of
similar phenomena before coming to generalisations [9, 17]. That is, it considers the interaction of the phenomena being studied
within its own system and the influences on the phenomena from outside the systems. It links both the analytical and the actor’s
approaches. From the systems theory, one can argue that however complex or diverse a process is, one can always find
different factors, which can be described by principles which seem independent from the process which if properly addressed
will yield solutions to the problem studied. Once the underlying dependencies are known, and addressed we would have
addressed and corrected the shortcomings in the system including its relationships [25]. Analyzing an organizations value
stream or supply chain for value add and non value add activities such as in this study, can be a good illustration of the systems
approach because it cuts through the whole value chain.
Taylor and scientific management can be considered as the origin of operations research, a systematic way to study managerial
problems. It took the form of today only after the Second World War [8]. A traditional approach to operations research
constituted the following steps [2]:
� A statement of the problem
� A review of literature
� Construction of hypothesis
� Data collection using questionnaires, interviews and experiments
� Analysis of data to test hypothesis
� Conclusions and implications consistent with the production and analysis of the generated data.
This approach has been applied to this thesis with the exception that the setting of a hypothesis is not used instead a defined
objective is set
2.4. Case Study Research
A case study is an empirical study that investigates contemporary phenomena within its real life context, when the boundaries
between the phenomena and context are not evident and in which multiple sources of evidence are used. [17] Documentations,
archival records, direct observation by researcher, physical artefacts and interviews are some of the possible ways of collecting
data [11] for case studies. The purpose is to investigate a small portion (a case) of a great event and with this the findings
describes reality and call it true [17]. A case study involves defining the problem, designing the study; preparing, collecting and
analysing data; analysing results and concluding [11]. Case studies can be based on secondary data sources or primary data
sources. Studies based on secondary sources are qualitative and based on library data, while those based on primary sources are
from direct observation. Secondary data are used to test the tools to show they have been used [18]. The main case study
approaches according to Yin et al [11] are: Explanatory, Exploratory, and Descriptive. The exploratory phase in this thesis is at
the early stages to define the problem statement of the project and in the literature review. The explanatory phase is also used
for example to explain how the techniques of lean have been used to achieve leanness. The descriptive approach is applied
when describing how these techniques can be applied in the process industry, a different environment to the traditional discrete
environment of lean application. Simon et al [2], argues that the major disadvantage with the use of case studies is that it is
largely descriptive and usually only describes positive aspects without analysing issues. However, the problem does not lie with
the method but with the user, who should use an explanatory approach in the evaluation phase. Yin et al[11] state a case study
contains the following phases; Definition and design of problem, which involves problem and theory formulation; Preparations,
collection and data analysis, which is the case study itself, and analysis of the case and. Analysis, and conclusion which
involves analysis and synthesis of the study and conclusions.
- 19 -
2.5. Observations and Data Collection
Data refers to information we come across around us every day. It could be real or concrete information that is possible to
collect by measuring, e.g. weights, distances speed, number of people within a given community, etc, or it maybe invisible
information like peoples feelings. If the information can be of use to a researcher then it is up to him to decide whether to use it
or not [16]. One of the reasons for collecting information can be to support ones opinion about a given situation or
phenomenon. Yin et al [11] proposed the following methods for data collection in research; documentation, archival records,
interviews, direct observation, participant observation, physical artefacts. These are methods used to collect the data and
observations on which the analysis and conclusions in this study are based. Data used in this report was obtained from the
companies historical operational data base (Business Object, MOVEX), and through a door to door time study, non structured
interviews and a questionnaire survey
2.6. Literature Review
This is a form of library research done early in the research process after the problem has been identified. It consists in a study
of material published in the problem area in the form of journals, books, proceedings, talking to other people and from
information on the internet. It is also based on secondary or library data collected, organized and used to support the
researcher’s position. Its purpose is to clarify the problem and to see what other attempts have been like [3]. This work involved
an extensive study of material published in journals, books, proceedings and a lot from information on the internet. It is ongoing
through out the project.
2.7 Analysis and synthesis
Analysis is needed to divide the large problem into smaller manageable parts to gain better awareness of the problem and the
interaction between the analyzed parts. A synthesis involves deciding which parts and how these parts are going to be best fitted
together to form the new system. This comes after the analysis.
2.8. Validity and Reliability
The issues about validity and reliability are the twin pillars that prove research to be either mediocre or outstanding. It is highly
recommended that whenever the methods used in research are tried and tested this fact should be documented for it greatly
increases the strength and eventually the research work. [17] They are used as one of the ways to judge the work. The construct
validity is about establishing correct operational measures for the phenomenon being studied by using multiple sources of
evidence or by persons reviewing the work [26]. Secondly, library research; studies based on secondary sources are almost
entirely based on a literature review. It is based on collecting and organizing pieces of information or research that support a
given hypothesis. It is more qualitative than non library studies. The descriptions of the methods used in this project are of a
generalized form and it is difficult to classify a conducted research to a specific research approach.
The case study approach makes no distinction between the historical analytical, actors and systems approach to research [12].
But both have much in common although they come from different research areas and do historically have different
assumptions. However there seems to be some convergence between both views and the concerns about basic views are mostly
of historical interest. According to the systems view, results validation is based on the use of multiple sources [9]. In practice,
to make a validation the researcher must look for multiple sources of evidence for each of the important components [10].
Arbnor and Bjerke [9] argue that the scientific view affects the possibility to prove validity i.e. that the actors approach does not
support this method to prove validity and reliability. Instead the actor, researcher argues for acceptance among the actors.
Acceptance in the research community is an important way to validate the results and methods, as was carried out during two
presentations at two different occasions with different opponents.

- 20 -
Reliability deals with how appropriate a measurement is or an instrument is for a specific problem e.g. is the case study method
suitable for evaluation of improvement methods? For an issue to be valid, it should be reliable, but the opposite is not always
true i.e. an issue can be valid but unreliable but not reliable and invalid. It has been noted that validity models only imply truth
i.e. a subject can be validated and found to be valid but it can still be untrue. The presentation of academic articles is a way to
test the quality of the methods used and assumptions made in the research. This is a judgment made by other researchers in the
area and provides some information on validity and reliability [12]. The validity and reliability of this project is based on the
constructs just developed, i.e. multiple sources of information, editing by supervisors and presentation of academic report and
defense.
- 21 -
3.0 Lean Manufacturing Review
3.1 Lean Concept, Principle and Lean Thinking.
An October, 2007 census of US manufacturers, by Industry Week/Manufacturing Performance Institute (IW/MPI), shows that,
nearly 70% (69.6%) of all plants have adopted lean manufacturing as an improvement methodology. It also reports that lean is
more than twice as popular as the next closest improvement method, Total Quality Management (34.2%) [27]. Womack and
Jones, extended lean manufacturing principles beyond the automotive industry, and had indicated this relevance of lean in the
Machine that changed the world, by stating that lean was at least, in the automobile companies, literally a Do or Die, this is
further stressed by John Bicheno [21] in the New lean toolbook; “reading the introduction to lean thinking should be
compulsory for every executive [21].
The lean concept, principle or thinking is an organizational change philosophy that traditionally focused on the elimination of
all forms of waste in the production system and organizing operations to increase profits. Like other concepts, the lean concept
can be seen as, a mental representation of practices[22] within a production system aiming at organizing operations with focus
on customer’s needs, to increase profits, by organizing the activities, resources and methods needed to provide these needs, into
a waste free system that assures continuous improvement. Concepts are discursive and result from reason. Adoption of lean
concepts within an organization, require a broad based Gemba sensitization brain storming and action. This ensures that the
right mind set; the “I am doing my thing” mind set or culture is in place for success, before any good results can be expected.
Principles signify points on a subject which allow for the formation of rules or norms, by interpretation of the events that can be
created. Such rules and best practices are based on the consensus that the actions and events occur under the stated principles.
Those involved, having a firm understanding of the underlying events, rules and best practices, according to the consensus [22].
A set of methods and tools suitable for the case, must be agreed up on, and procedures and routines on “the how tos” with
accompanying performance metrics to measure results.
For a better understanding of lean concepts, writers on this subject have often begun by tracing the origins and developments of
lean. This clarifies the semantic differences between lean production and its predecessors, like TQM, JIT, TPS etc, especially
when operational measures like takt time are clearly specified. Another source of confusion has been, disagreement about what
comprises lean production and how it can be measured operationally. Rachna Shah et al proposed a concept of lean production
by developing an operational measure that consists of ten reliable and valid scales [23]. Looking at the manufacturing system
as three primary processes, which create value for consumers; product development, from order to delivery, service through the
product’s life cycle, asking what value really is from the standpoint of the customer can be viewed as Lean thinking. This
process in a general sense, involves, deep thought on how ready the company at cooperate level is ready to become lean, how it
plans to measure the results and maintain the gains. It also involves identifying the specific methods to be used in doing this as
well as the support processes put in place to supporting this way of thinking. Practically issues to consider include how the
processes currently perform and how better it could perform, asking what people and business processes are needed to support
the value creating processes, aligning purpose, process, and people in search of the perfect process. [24]
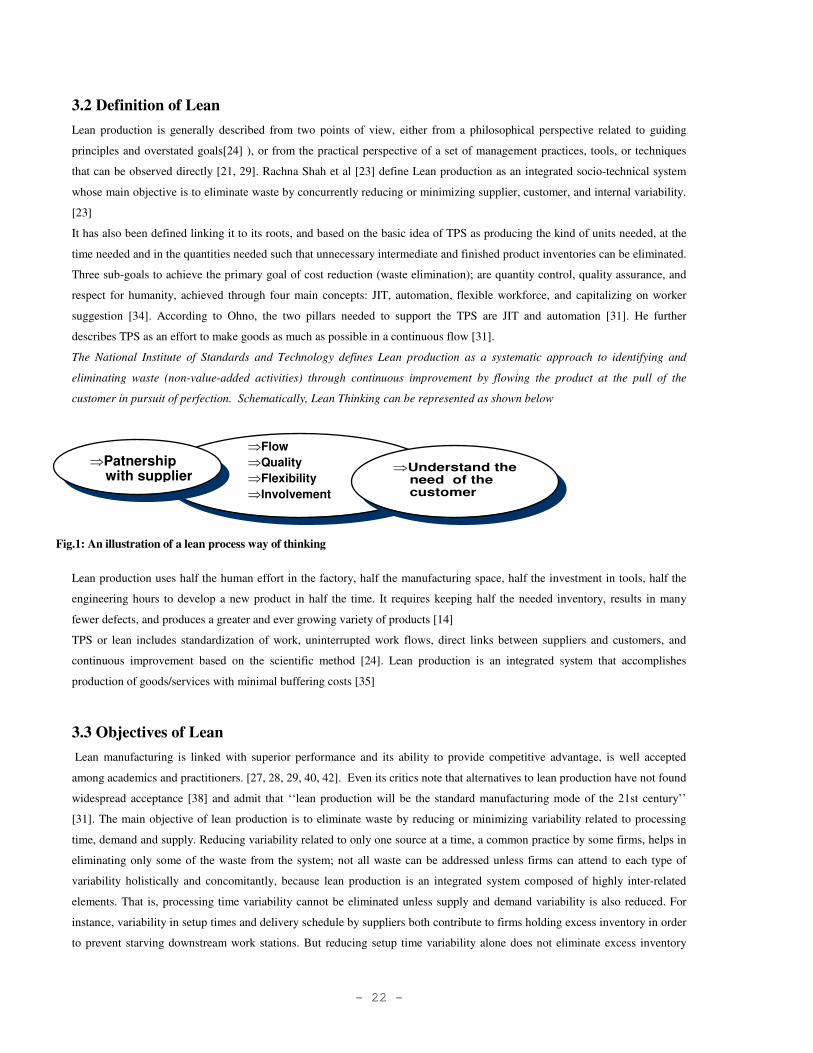
- 22 -
3.2 Definition of Lean
Lean production is generally described from two points of view, either from a philosophical perspective related to guiding
principles and overstated goals[24] ), or from the practical perspective of a set of management practices, tools, or techniques
that can be observed directly [21, 29]. Rachna Shah et al [23] define Lean production as an integrated socio-technical system
whose main objective is to eliminate waste by concurrently reducing or minimizing supplier, customer, and internal variability.
[23]
It has also been defined linking it to its roots, and based on the basic idea of TPS as producing the kind of units needed, at the
time needed and in the quantities needed such that unnecessary intermediate and finished product inventories can be eliminated.
Three sub-goals to achieve the primary goal of cost reduction (waste elimination); are quantity control, quality assurance, and
respect for humanity, achieved through four main concepts: JIT, automation, flexible workforce, and capitalizing on worker
suggestion [34]. According to Ohno, the two pillars needed to support the TPS are JIT and automation [31]. He further
describes TPS as an effort to make goods as much as possible in a continuous flow [31].
The National Institute of Standards and Technology defines Lean production as a systematic approach to identifying and
eliminating waste (non-value-added activities) through continuous improvement by flowing the product at the pull of the
customer in pursuit of perfection. Schematically, Lean Thinking can be represented as shown below
Fig.1: An illustration of a lean process way of thinking
Lean production uses half the human effort in the factory, half the manufacturing space, half the investment in tools, half the
engineering hours to develop a new product in half the time. It requires keeping half the needed inventory, results in many
fewer defects, and produces a greater and ever growing variety of products [14]
TPS or lean includes standardization of work, uninterrupted work flows, direct links between suppliers and customers, and
continuous improvement based on the scientific method [24]. Lean production is an integrated system that accomplishes
production of goods/services with minimal buffering costs [35]
3.3 Objectives of Lean
Lean manufacturing is linked with superior performance and its ability to provide competitive advantage, is well accepted
among academics and practitioners. [27, 28, 29, 40, 42]. Even its critics note that alternatives to lean production have not found
widespread acceptance [38] and admit that ‘‘lean production will be the standard manufacturing mode of the 21st century’’
[31]. The main objective of lean production is to eliminate waste by reducing or minimizing variability related to processing
time, demand and supply. Reducing variability related to only one source at a time, a common practice by some firms, helps in
eliminating only some of the waste from the system; not all waste can be addressed unless firms can attend to each type of
variability holistically and concomitantly, because lean production is an integrated system composed of highly inter-related
elements. That is, processing time variability cannot be eliminated unless supply and demand variability is also reduced. For
instance, variability in setup times and delivery schedule by suppliers both contribute to firms holding excess inventory in order
to prevent starving downstream work stations. But reducing setup time variability alone does not eliminate excess inventory
⇒Flow
⇒Quality
⇒Flexibility
⇒Involvement ⇒Understand the
need of the customer
⇒Patnershipwith supplier
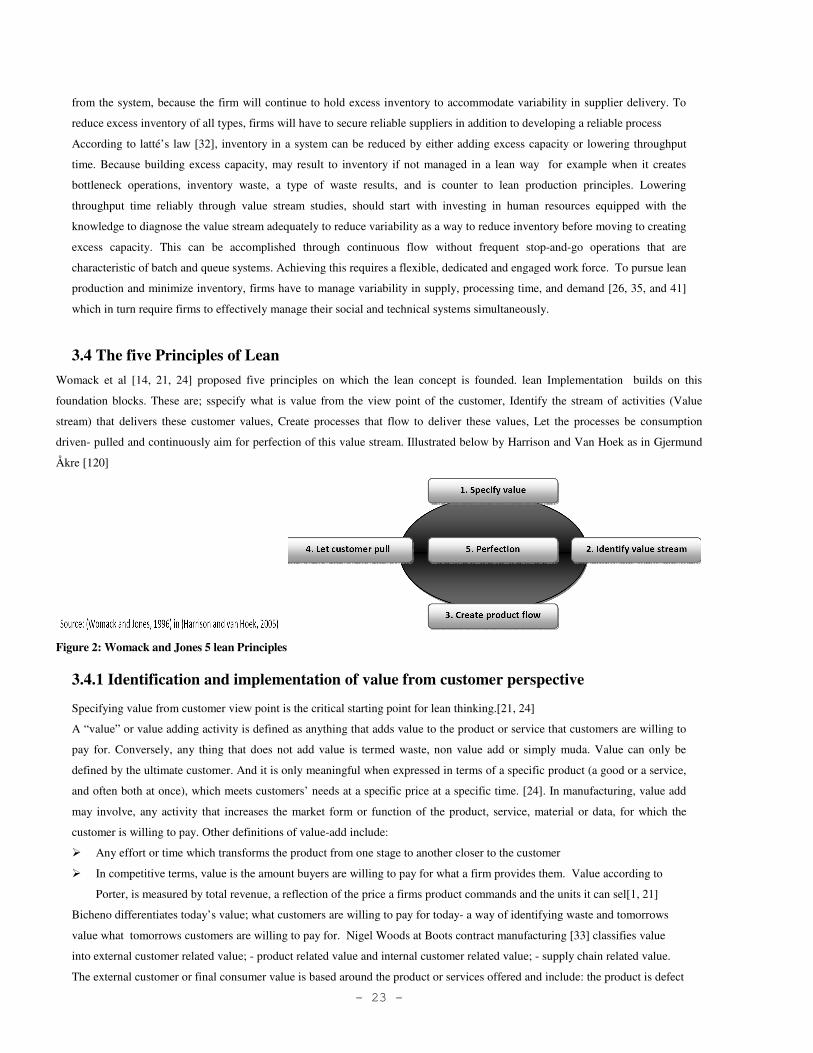
- 23 -
from the system, because the firm will continue to hold excess inventory to accommodate variability in supplier delivery. To
reduce excess inventory of all types, firms will have to secure reliable suppliers in addition to developing a reliable process
According to latté’s law [32], inventory in a system can be reduced by either adding excess capacity or lowering throughput
time. Because building excess capacity, may result to inventory if not managed in a lean way for example when it creates
bottleneck operations, inventory waste, a type of waste results, and is counter to lean production principles. Lowering
throughput time reliably through value stream studies, should start with investing in human resources equipped with the
knowledge to diagnose the value stream adequately to reduce variability as a way to reduce inventory before moving to creating
excess capacity. This can be accomplished through continuous flow without frequent stop-and-go operations that are
characteristic of batch and queue systems. Achieving this requires a flexible, dedicated and engaged work force. To pursue lean
production and minimize inventory, firms have to manage variability in supply, processing time, and demand [26, 35, and 41]
which in turn require firms to effectively manage their social and technical systems simultaneously.
3.4 The five Principles of Lean
Womack et al [14, 21, 24] proposed five principles on which the lean concept is founded. lean Implementation builds on this
foundation blocks. These are; sspecify what is value from the view point of the customer, Identify the stream of activities (Value
stream) that delivers these customer values, Create processes that flow to deliver these values, Let the processes be consumption
driven- pulled and continuously aim for perfection of this value stream. Illustrated below by Harrison and Van Hoek as in Gjermund
Åkre [120]
Figure 2: Womack and Jones 5 lean Principles
3.4.1 Identification and implementation of value from customer perspective
Specifying value from customer view point is the critical starting point for lean thinking.[21, 24]
A “value” or value adding activity is defined as anything that adds value to the product or service that customers are willing to
pay for. Conversely, any thing that does not add value is termed waste, non value add or simply muda. Value can only be
defined by the ultimate customer. And it is only meaningful when expressed in terms of a specific product (a good or a service,
and often both at once), which meets customers’ needs at a specific price at a specific time. [24]. In manufacturing, value add
may involve, any activity that increases the market form or function of the product, service, material or data, for which the
customer is willing to pay. Other definitions of value-add include:
� Any effort or time which transforms the product from one stage to another closer to the customer
� In competitive terms, value is the amount buyers are willing to pay for what a firm provides them. Value according to
Porter, is measured by total revenue, a reflection of the price a firms product commands and the units it can sel[1, 21]
Bicheno differentiates today’s value; what customers are willing to pay for today- a way of identifying waste and tomorrows
value what tomorrows customers are willing to pay for. Nigel Woods at Boots contract manufacturing [33] classifies value
into external customer related value; - product related value and internal customer related value; - supply chain related value.
The external customer or final consumer value is based around the product or services offered and include: the product is defect
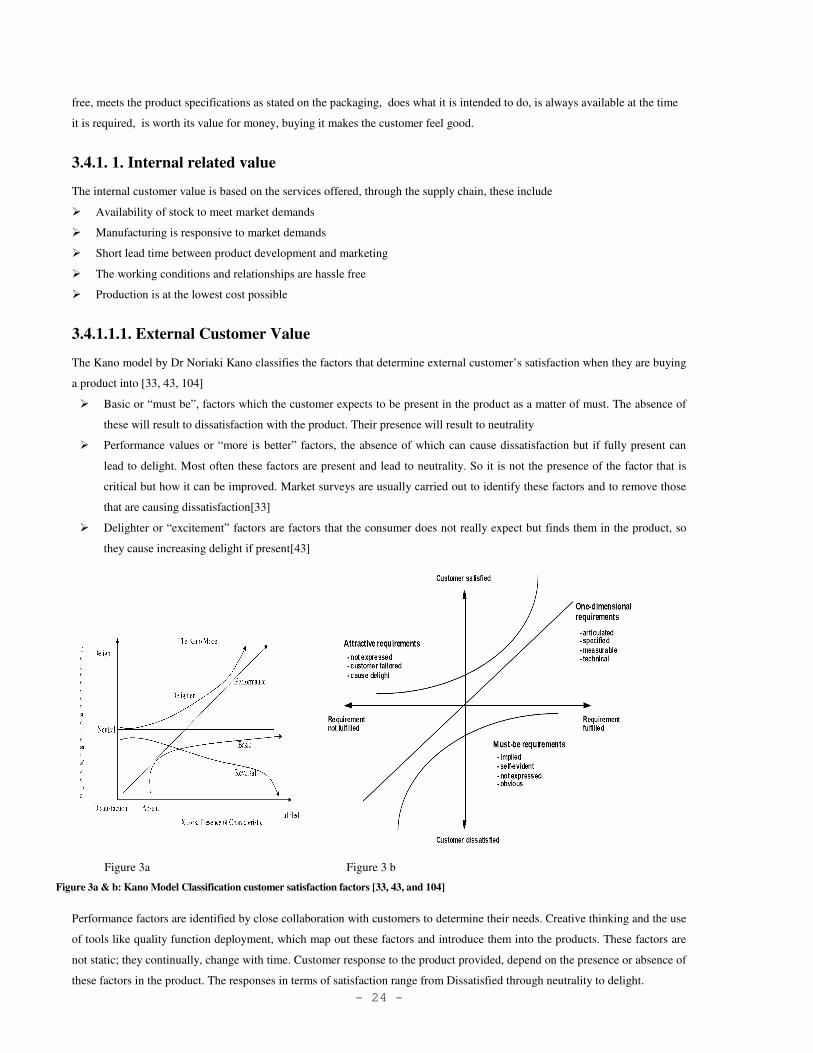
- 24 -
free, meets the product specifications as stated on the packaging, does what it is intended to do, is always available at the time
it is required, is worth its value for money, buying it makes the customer feel good.
3.4.1. 1. Internal related value
The internal customer value is based on the services offered, through the supply chain, these include
� Availability of stock to meet market demands
� Manufacturing is responsive to market demands
� Short lead time between product development and marketing
� The working conditions and relationships are hassle free
� Production is at the lowest cost possible
3.4.1.1.1. External Customer Value
The Kano model by Dr Noriaki Kano classifies the factors that determine external customer’s satisfaction when they are buying
a product into [33, 43, 104]
� Basic or “must be”, factors which the customer expects to be present in the product as a matter of must. The absence of
these will result to dissatisfaction with the product. Their presence will result to neutrality
� Performance values or “more is better” factors, the absence of which can cause dissatisfaction but if fully present can
lead to delight. Most often these factors are present and lead to neutrality. So it is not the presence of the factor that is
critical but how it can be improved. Market surveys are usually carried out to identify these factors and to remove those
that are causing dissatisfaction[33]
� Delighter or “excitement” factors are factors that the consumer does not really expect but finds them in the product, so
they cause increasing delight if present[43]
Figure 3a Figure 3 b
Figure 3a & b: Kano Model Classification customer satisfaction factors [33, 43, and 104]
Performance factors are identified by close collaboration with customers to determine their needs. Creative thinking and the use
of tools like quality function deployment, which map out these factors and introduce them into the products. These factors are
not static; they continually, change with time. Customer response to the product provided, depend on the presence or absence of
these factors in the product. The responses in terms of satisfaction range from Dissatisfied through neutrality to delight.
- 25 -
3.4.1.1.2. Internal customer Values
Internal customer values focus on the value supplied through the supply chain. These values are directly related to the
performance of the supply chain; reliability, flexibility and cost effectiveness are the key issues[33]. These can be achieved by
implementing flow and pull techniques. Classifying products as runners, repeaters and strangers is a convenient approach to
track these factors. Runners are the easiest to supply using cyclic schedules. Repeaters can be supplied through kanban systems.
Strangers are more difficult to schedule. Depending on if the lead time is acceptable to the customer, a make to order policy can
be applied. We also need to understand the demand pattern and how the supply chain is responding to demand. A useful tool for
this is the Demand amplification tool. This tool maps the amplification of disturbances along the supply chain. [33, 43, 104]
3.4.2. Identify the value stream and eliminate or design out the major wastes and sources of
wastes in the system
Typically about 95% of all lead time is non-value added [19]. Non value adding activities show up as; Overproduction,
Waiting, Transportation, Non-Value add-processing, Excess Inventory, Defects, excess Motion, Underutilized People. After
haven identified what value means to the customer, the value stream that has to provide these values is designed. A Value
stream denotes the different activities that constitute the vital steps towards delivering value. According to James Womack, a
value stream is a process. He defines a value stream as a sequence of steps that must be performed properly in the proper
sequence to create value for a customer[24]. This definition is not different from that suggested by John Bicheno [21]; a
sequence of processes all the way from raw materials to final customer or from product concept to market launch. By ISO
standards, a process is a set of interrelated activities which transform inputs into out puts. No product or services can be
provided without a process [98]. You are only as good as the weakest link in your process; the resources of the value chain are
either gathered around the process or around the product [98]. The production sequence thus involves receiving inputs into the
process, adding customer satisfying value to them and passing these transformed products to the value demanding customers.
This customer could be an internal customer i.e. at some point along the process or supply chain or the final consumer.
Processes are categorized into those that only create value for internal customers or secondary processes but are currently
necessary to run the business often referred to as type1 Muda)[33], such as; checking customer credit, collecting, receivables,
closing the books, building prototypes, identifying new suppliers, policy deployment. And those that create value for the
external customer- primary processes: Consumption from intent to completion, product development from concept to launch,
fulfillment from order to delivery, maintenance and service from delivery through the life cycle of a product. [18]. The triple
role concept [108], views a process as fulfilling three roles: receiving inputs from suppliers- customers, transforming the inputs
by adding customer value to it- process role, supplying the finished products to the customer- supplier role. These constitute
the whole supply chain or value stream. The goal in lean thinking is to achieve the perfect process, what James Womack
defines as one in which value is clearly specified from the standpoint of the customer. The perfect process is valuable, capable,
available, adequate and flexible [94]. They referred to such activities as non-value-add, waste, or muda (a Japanese word which
translates loosely to waste):
� Anything, other than the minimum amount of equipment, raw materials, space, and worker’s time, which are absolutely
essential to add value to the product is considered non value add.
� Any process or operation that does not add value is waste, and should be eliminated
Authors with an orientation towards the old lean school still see lean as simply a philosophy of eliminating waste. This in itself
can defeat the ultimate goal of the lean vision. As Bicheno points out, the elimination of waste or muda is strongly linked to
achieving the lean ideal, but not an end in itself, because waste prevention is as important as waste elimination[14, 21, 24].
The TPS system identifies activities that do not add value to the customer as; Muda (Waste, things or activities that the
customer does not pay for), Mura (self introduced unevenness e.g. end of month’s targets that introduce demand fluctuations,
- 26 -
fluctuating production plans, production of difficult recipes for part of the shift and simple ones for the other part of the shift)
and Muri (work that is hard to do e.g. huge files of procedures that are difficult to understand or adjustments that are tedious to
do, sudden changes in recipes, poor layout of tools, poor part fit, too many bolts too loose during change over, inadequate
tooling, unclear procedures). Womack and Jones [24] and J. Bicheno[21] distinguish between two types of muda. Scrap,
inspection, holding, receiving, accepting, requesting, enquiring requisitioning, counting, transmitting, tracking, filing,
handling, picking, hiding, rework, releasing, rejection, authorizing, servicing, issuing , recording, reviewing, locating,
fetching, placing, finding, unpacking, chasing , servicing , expediting, rectifying, measuring, repacking, copying, posting,
all are forms of introducing waste (JIT workshop at mdh.se) can be grouped under these two types;
� Type 1 muda (Necessary non value add activities) are activities that create no value for the customer, but are currently
necessary to maintain operations, by assisting the operators, managers or stakeholders. These are reduced through
simplification. E.g. some motion and transport muda It is the easiest to add but difficult to remove
� Type 2 muda (unnecessary non value add activities) create no value; instead, it destroys value for any stake holder,
customers and even employees. Its elimination should be priority number one, e.g. rework, and scrap, waiting etc.
Shigeo Shingo listed the seven categories of wastes at Toyota. Elimination is achieved by using tools such as 5S, Heijunka,
VSM, Jidoka, level scheduling, JIT, etc through Kaizens. It requires a strong awareness of the system, processes, and products
[24]
3.4.2.1 Waste from overproduction
Over processing is linked to doing more than the customer wants. Looking back at Pascal Denis’s new lean benefit equation:
Profit = Fixed Price- Cost [105]
The key to profitability, he concludes is cost reduction. Overproduction means, extra warehouses, parts, energy, interest
payments on loans, extra workers and machines, extra raw materials, forklifts, trucks etc. It makes problems invisible. Over
production is the root cause of other wastes.
It leads to excessive lead time, WIP, inventory, etc, discourages a smooth flow of goods and working in erratic bursts, all of
which affect the overall cost
3.4.2.2 Waste of waiting
This waste is directly linked to flow. It includes waiting of raw materials, waiting of parts, waiting for work, instructions, tools,
looking for procedures, waiting for internal orders, waiting for approval, operators slower than the line, a bottle neck operation
waiting for work etc. All these waits, affect productivity, constitute time and increase the lead time hence production cost, and
adds no value to what the customer pays.
3.4.2.3 Transportation waste
Any movement of material is waste, because customers do not pay for materials to be moved around. Although it can not be
eliminated totally, it should be reduced to the barest minimum. It is manifested by double handling. Some times, it may even
affect the quality of the product and service. Many conveyors or forklifts represent bad practice. Physically related departments
should be located together because where distances are long transportation risks increase and quality may be a victim [21]. A
useful tool to identify this waste is a spaghetti map. Monitoring, the number of none value adding steps, and flow length of
products through the system.
- 27 -
3.4.2.4 Processing waste
Over processing is a form of waste and refers to
� Producing a too good product, e.g. having more features than the customer demands, see some of the mobile phone
devices today
� Supplying too early
� Working a bottleneck resource with the wrong product or batch size
� Using one big machine whose capacity exceeds demand, complex routines to operate, difficult to maintain, instead of
smaller easily manageable ones, do not create the feeling of ownership in operators and makes work difficult.
� Machines or processes that are not capable also fall in this class of waste. Lack of clear operating instructions,
maintenance tools, methods, training of operators, clearly known standards etc
3.4.2.5 Inventory waste
Having no inventory is a goal that sounds utopian, but inventory is often the enemy of quality and productivity. Too much
inventory hides problems, constitutes cost, occupies space, makes communication, movements, transportation difficult, and
increases lead time. It constitutes money tied up. Inventory hides the actual performance of operations. Finished goods
supermarket is sometimes held to meet demand but is referred to as a wall of shame, and runs the risk of obsolens. Raw
materials inventory may sometimes be necessary like in case of long lead times or supplier constraints. JIT is about reducing
inventory.
3.4.2.6. Waste of motion
Waste of motion refers to both human and machine waste. Waste motions include operators, stretching, bending, pick-up,
holding, walking between work widely spaced centers or, reaching to see better, pick a tool, more than one turn to loosen a nut.
This stresses the importance of ergonomics in work layout. Motion waste has now become a health and safety issue. It can also
be indicated by the presence of cranes or certain material handling devices.
3.4.2.7. Waste from product defects
Defects have both short term and long term effects on the company’s bottom line benefits. Internal defects results from scrap,
rework, delays, and external include warranties, repairs, field services and sometimes loss of customer. They all lead to loss of
company credibility. The cost of defects turn to escalate the longer they stay undetected. According TPS, defects should be
regarded as a challenge, an opportunity to improve. The central theme of TQM stresses defect prevention, quality at source and
zero defect production. New lean thinking tries to integrate the aspects of six sigma and TQM so that lean actions do not only
focus on waste elimination but also on capability of processes and on waste prevention, through reliable, available processes
(TQM) and trained and empowered manpower. The need to focus on TPM is important since machines have to be reliable to
achieve good products.
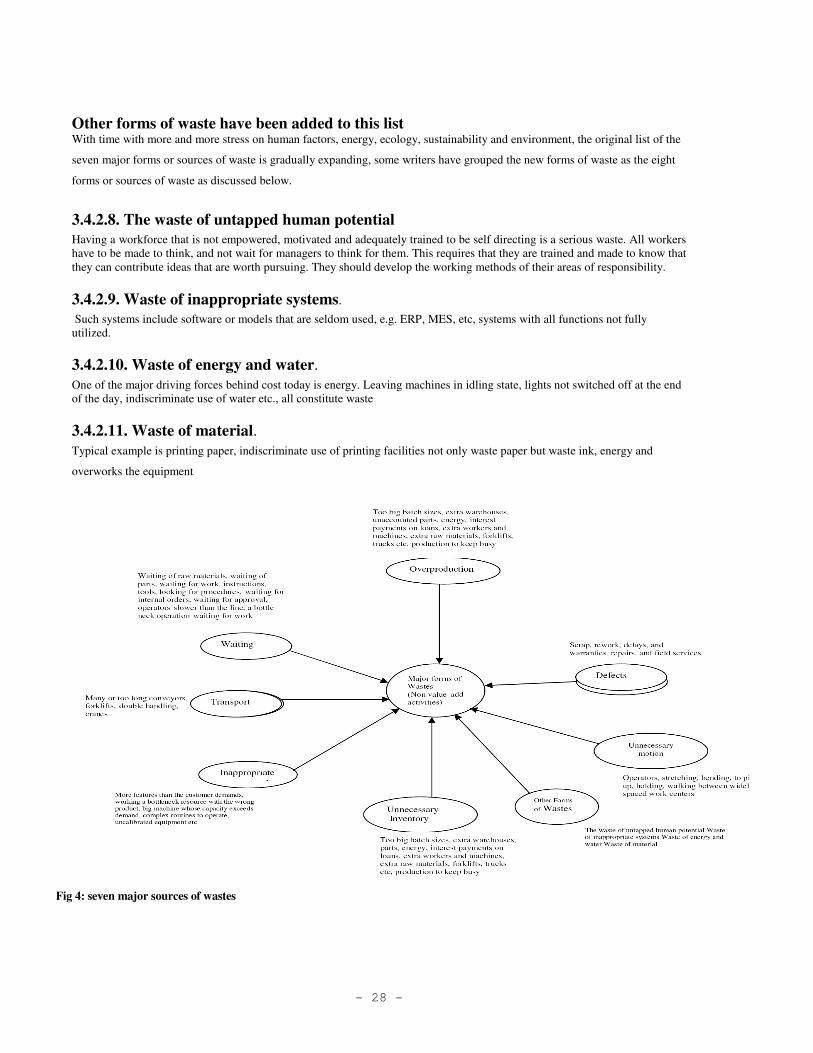
- 28 -
Other forms of waste have been added to this list With time with more and more stress on human factors, energy, ecology, sustainability and environment, the original list of the
seven major forms or sources of waste is gradually expanding, some writers have grouped the new forms of waste as the eight
forms or sources of waste as discussed below.
3.4.2.8. The waste of untapped human potential
Having a workforce that is not empowered, motivated and adequately trained to be self directing is a serious waste. All workers have to be made to think, and not wait for managers to think for them. This requires that they are trained and made to know that they can contribute ideas that are worth pursuing. They should develop the working methods of their areas of responsibility.
3.4.2.9. Waste of inappropriate systems. Such systems include software or models that are seldom used, e.g. ERP, MES, etc, systems with all functions not fully utilized.
3.4.2.10. Waste of energy and water. One of the major driving forces behind cost today is energy. Leaving machines in idling state, lights not switched off at the end of the day, indiscriminate use of water etc., all constitute waste
3.4.2.11. Waste of material. Typical example is printing paper, indiscriminate use of printing facilities not only waste paper but waste ink, energy and
overworks the equipment
Fig 4: seven major sources of wastes
- 29 -
3.4.3 Standardize and level production operations to prevent variations and ensure
continuous flow.
Having a value stream that provides customer value is not sufficient; we need to set up a framework for the value stream to
flow at customer demand rate. At Toyota people learn about three flows; material, information, and process people/ flow. Value
stream mapping faces the first two [28]; the production flow from raw materials into the arms of the customer. In the feed
manufacturing case under study, the focus of flow is on synchronous, uninterrupted flow of material, information through the
whole value chain to the customer, slightly different from the discreet manufacturing notion of flow. Flow is often interrupted
by poor process visibility, long changeover times, untrained or dissatisfied workers, unreliable machines, poor cooperation with
suppliers and customers break downs of material handling system or production process. The consequence is production of
excesses, should in case there is a problem (see appendix 6), to guard against backorders. If the process or equipment is not
capable; it produces out of specification products or bad quality products, raw materials are of bad quality, suppliers are
unreliable, failure to receive supplies on time, irregularly large or too small batch sizes, and customers constantly changing
orders, making it difficult to plan production due to sudden changes in quantities, products, or product specifications.
Disconnects between various departments, sometimes, leading to in feasible production plans. Close collaboration with
suppliers, customers, reliable and capable machines and good material, information and data management are indispensable to
ensure continuous flow of value through the value stream. Solutions must be provided to all these issues. In the lean approach,
at the process level for example the takt time should be the focus and all processes made to run below this time (Heijunka).
Dividing the total time for the process by the minimum run time gives the number of operators needed, to ensure flow. To
ensure flow with a 5S in place, the pace maker stage should be determined and the change over time at this stage be maximally
minimized. Tools like Value stream mapping, 5S, TPM, Heijunka are useful in to achieve these.
3.4.4 Reduce batch sizes so that the system is consumption driven (pulled) and flexible
With a value flow structure in place we need to make only as much as the customer needs. Pull is short term response to the
customer’s rate of demand and not over producing (21), a consumption driven process in which production is based on actual
customer orders. In the pull system of production flow management, it is customer demand that activates production. To do this
we need to reduce set up times. This can be done with, the Single Minute Exchange of Die tool. Firms with highly repetitive
processes and well defined material flows can use JIT systems because they allow for pull. [34]. This method allows for closer
control of inventory and production at the work stations. In cases with a variety of products and in low volumes with low
repeatability in production, MRP system is used. In this case customer orders are promised for delivery in some future date.
Production is started and pushed through the system. In the context of feed production; the pull system seems more practicable.
By determining the pace maker process, closest to the customer, as point of pull, then determine a minimum run time and
making the processes to run below takt time, appropriate pitch for each family of product can be determined and kanban
systems used from the point where the product becomes discrete units.[44]. Also grouping them as runners, repeaters and
strangers, then determine what batching policy to use for the different groups is another strategy. [33].
- 30 -
3.4.5 Make the system waste prove so that it can be optimized There is the need to create process visibility, so that at each point in time the operator sees exactly what is happening in the
process. This will require well calibrated, and maintained on line analyzers. The principle of TPM, Jidoka, Andons, and Poka
Yoke come into play here. Define needs according to demands of customer, work processes are standardized, work charts
pasted adjacent to work stations, showing cycle times, sequence of activities, timing of steps, makings on the floor, to show
start and end of each step, Internal training and coaching to develop a good thinking work force[18]
Make process mistake proof by setting constant values for deviations, standardized procedures and using SPC charts to follow
the process and show the deviations, each time the parameter or process is out of limit there is some signal a beep and color
code indication(Andons). Out of specification products are easily identified (Jidoka). Well labeled and locate shelves for tools
and replacement parts (See 5S). Routines are put in place to ensure operations are performed using standardized check lists or
standardized documented proven sequence
3.4.6. Continuously improve on the new state achieved.
With the whole framework above in place and sustained we now strive to maximize value for the customer, i.e. to provide the
routines for continuously improving on the quality, lead time to customers, minimize cost so as to deliver low cost for best
quality, targeting zero waste and first time through production. One way to ensure this is through the use of the Jidoka tool.
Jidoka, makes immediately self evident all production problems, stops the line for a solution to be found. Although the TPS
talks of stopping the production process as soon as a problem is detected, this may not be very feasible for technical and
economic reasons, except when absolutely necessary, but we can build quality and visibility into the process and avoid any
deviation from value adding activities. We can also use automatic stops, which turn on when any serious out of specification
situation arises, visual management is also required to expose out of specification situation, such visual management using
control charts. With JIT production, all problems are exposed. JIT makes Jidoka possible, with all inventory removed any
problems are easily exposed. Other approaches are the Deming and Shewart PDCA (Plan Do Check Act) and PDSA (Plan Do
Study Act) procedure. Literature advices, starting with simple improvements that will yield palpable result to motivate the
operators, before targeting more difficult projects. It is important to have the operators raise such projects and implement them
as this builds confidence. Usually quick Kaizens often result to huge benefits. But the projects must be evaluated and classified
to know what resources should be dedicated.
3.5 The Lean manufacturing activities (methods, tools and techniques)
Methods are a body of techniques used for investigating and acquiring new knowledge as well as for correcting and integrating
previous knowledge. They describe how we do things to be able to get results, and are based on gathering observable, empirical
and measurable evidence, subject to specific principles of reasoning, the collection of data through observation and
experimental formulation and testing of hypothesis. Lean methods and techniques are the instruments used for either evaluation
of the leanness of the system, implementation or improvement. The activities for a lean assessment or implementation have
been grouped into three categories by R Michael Donovan &Co as:
� Lean Organizational Activities: These have to do with how the company as whole is positioned with respect to
implementing, measuring the results and sustaining the benefits of the implementation. This involves setting lean
standards, training and education of the work force, synchronizing lean objectives with strategic objectives, setting
measurement standards, etc.
� Implementation of lean in manufacturing operations and processes. The activities here include; Just in time management
(purchasing, production, and distribution), SIPOC analysis, process and value stream mapping, Standardization of
operations (5S), Production Smoothening, Cellular manufacturing, Continuous improvement, capability analysis etc.
- 31 -
� Activities to support the lean system: These include Total productive maintenance (TPM), Quality control and assurance,
process and value stream mapping, Enterprise resource planning, supply chain management, information system-EDI, etc.
3.5.1 Lean Evaluation tools
For the purpose of this work lean techniques have been subdivided into evaluation and implementation techniques. Evaluation
tools enable us to identify for example fluctuations in demand (Demand Amplification), so that we can make proper schedules.
We also need to know the products most demanded (Demand classification), and what product characteristics we need to focus
on to generate the level of satisfaction we need to satisfy our clients (The Kano model). These are all external customer value
evaluation. The performance of the internal supply chain, internal customers are also very important. This involves identifying
the various components of the supply chain (SIPOC analysis), the layout of the supply chain (process flow chart, done by pencil
and paper tracing, by actually going to the factory floor, where the action is Gemba). The data collected through data archival
data collection (Pre-value stream mapping) is analyzed using tools such as the product family analysis, raw material/ inventory
ABC, quality filter map etc., to determine which products will be used for the learning to see map or value stream map (VSM).
The current state of operations is mapped through a Gemba exercise (Process activity and current state map), and evaluated,
with use of tools such as KPI analysis (Performance, Rework, Availability, Capability, productivity), Bottleneck analysis, Line
(process) balance ratio, Activity timing (cycle, Tackt /pitch time, change over time), Minimum run time.
3.5.2 Tools for Implementing and Improving Operations
Further diagnosis for the causes of waste and identification of areas of improvement is carried out through tools like fish bone
diagrams (Ischikawa Diagram), 5WHYs, 5S. Implementation of future state and sustaining attained results is carried out
through Set up time reduction; JIT, SDMED by Shigeo Shingo), Heijunka (Production leveling), Batch sizing reduction
(minimum run time calculation), Jidoka (Shigeo Shingo-make immediately self evident all production problems and stop the
production process as soon as a problem is detected), TPM [35], the 5S (Hiroyuki Hirano), Use of Andons, Poka yoke, Time
pacing, Activity Sampling, etc.
3.5.2 .1. Just in time Management
Just-in-time (JIT) management is a concept driven by the lean way of thinking, a way of managing manufacturing systems so as
to reduce waste, and lower cost, thus increasing profit. In its most basic explanation and principle, JIT is; every component in
the manufacturing system arriving just in time and the right quantity [30] for it to be used. Since the products arrive just in time
there is no need for stock holding facilities of any kind. The most common industry using JIT manufacturing has been the
discreet manufacturing industries, especially the automobile industries, from where it originated. It is not only suitable for
systems with excess capacity but, its tools and principles are also applicable to the process and service industry. Because of
limited space, capital, raw materials and other resources, the early Japanese auto industry had to look for a way to still stay in
business, with the limited demand for their products in the 1960s; this led to the JIT philosophy and the TPS. Today it is often
used as a lean technique. JIT management leads to a stockless production which does not allow room for defects or errors. It
addresses waste such as work in process, material, defects and poor scheduling of parts delivery. [36]. Inventory and material
flow systems in manufacturing are either classified as either push (traditional system) or pull (JIT system). Customer demand is
the driving force behind JIT systems. It is a vital tool to manage the internal and external activities such as purchasing,
manufacturing and distribution. Inventory is kept at minimal levels by only acquiring materials as they are needed to fulfill
placed orders for the end product. Speed-to-market is critical in a world in which businesses must have quick turn-around on
product. JIT can be thought of as having three main components; just in time purchasing, production and distribution
- 32 -
3.5.2 .2. Total Productive maintenance
Because no lean effort can be fruitfuled with a high rate of machine, instrument or equipment break down, TPM is an integral
part of lean. All machines, equipment and instruments are designed to function within certain tolerance limits, they are hardly
perfect and so it is very important to regularly monitor them to be sure they still perform within acceptable limits of the design
specification. TPM reduces the frequency and duration of downtime resulting form machine breakdowns [95]. Its prime
candidates should be bottleneck processes and those with both expensive parts and long down times resulting from failures.
Break downs at bottleneck processes limit production and are costly. Long downtimes even at none bottle neck operations,
require maintaining large safety stocks to avoid starvation of subsequent processes. It extends beyond breakdowns to cover
availability, performance, quality, safety, and capital investments through making good use of and extending the life span of
equipments [21]. Total Productive maintenance is a culture that has to be understood and adhered to on a company wide basis,
for a firm that aims at making its operations and processes lean, as a way of cutting down on production cost and delivering
customer value. TPM aims to maximizing equipment overall effectiveness. It establishes a thorough system of preventive
maintenance for the equipments entire life span. TPM like TQM is to be a company wide culture from top management to shop
floor workers, through motivation by management using autonomous small group activities [45] and implemented by various
departments. TPM is based on the promotion of preventive maintenance (PM); and widening the scope to include the product,
the operator, the process, and the environment. It spreads the load by getting front line staff to take over as much responsibility
as possible, a way of directing authority where it is most effective and freeing up specialists to do more complex tasks.
The TOTAL, in TPM has three meanings, Total effectiveness, indicates TPMs pursuit of economic efficiency or profitability,
Total maintenance system includes maintenance prevention which is a maintenance system that establishes a maintenance plan
for the equipments entire life span and includes maintenance prevention MP, maintenance free design which is pursued during
the equipment design. Once the equipment is assembled a total maintenance- TM system is put in place requiring preventive
maintenance PM- preventive medicine for equipment; and maintainability improvement -MI which is repairing or modifying
equipment to prevent breakdowns and facilitate ease of maintenance-MP, and maintainability improvement- MI as well as
preventive maintenance, Total employee participation includes autonomous maintenance by those operating the machines
through small group activities. Predictive and productive maintenance emphasizes the first principal feature of TPM, total
effectiveness [45] Use can be made of data collection tools like the control charts and check sheets. This is very important for
online analyzers and analytical instruments too, as the performance or analysis of a process is determined using data collected
through this instrument and analyzers. The instruments must be able to function well in order to produce genuine data.
Equipment and instrument calibrations and or recalibrations or revisions are indispensable for the chemical industry processes.
Re-standardizing or resetting the equipment or measuring instruments to functional specification limits or recalculated values.
Availability, Performance and Quality, the basis for OEE, are used in conjunction with the concept of the six big losses in TPM
[21]. Availability is affected by unplanned stoppages above 10 minutes due to electrical, pneumatic, mechanic or hydraulic
faults and constitutes a big form of waste. Change over and adjustment time losses are also listed. Losses to performance result
from minor stops and idling less than 10minutes. They result from blockages, lubricant top up, coolant top up, small
adjustments etc, all of which are most often short-lived, difficult to measure and hence ignored. Most often data is not collected
but when data is collected they often are most often are revealed as the most significant losses. They can be measured by letting
the operators to mark them on a fence and gate chart and determine the average time for about 20 of such stoppages. Reduced
speed losses result from the equipment running below design speed, low capacity of transfer or material handling system, flow
restrictions, program errors etc. Losses to quality result from scab, rework, variability in process parameters, malfunctioning of
previous processes, poor quality raw materials, start up losses after change over etc. They are as a result of anything that causes
the processes to function out of specification limits. One good way of using OEE is preferably for critical or bottle neck
operations through Paretos [21]
- 33 -
3.5.2 .3. Production Smoothening
Heijunka is the Japanese word for production smoothening adapted from the Toyota production system, it means
evenly distributing the production volume and production variety over the available production time, the use of
production kanbans is common in the discrete manufacturing industry. The principle of Heijunka requires that we
evenly distribute the production volume and production variety over available production time. The use of
production kanban is not very practical in our case but we can use takt and pitch time, to determine number of bags
to withdraw or start production with.
� This has the benefits that preceding operations do not experience uneven workload,
� Makes the planning process easier.
� Prevents imbalances in inventory, having too many of one product and not enough of another.
The use of JIT suppliers and balancing or evening out the total order into the daily production sequence.
Spreading out the demand for products facilitates suppliers JIT system, since production is standardized,
synchronised and smoothed out, with uniform cycle times. It is achieved by balancing or evening out the total
order into the daily production sequence. This of course requires a certain fixed or stable order horizon. To achieve
this the takt time is determined and all stages in the production process are made to operate around this takt time. It
is one of the corner stones of the value stream method. Single digit Minute Exchange of Die tool (SMED). Setup
reduction and fast, predictable setups enables small lot production, and smoothes flow.
3.5.2 .4. Standardization of Work and Operating procedures.
According to Henry Ford as sited by Bicheno[21], to standardise a method is to choose out of many methods the best one and
use it. He further describes the best way as “all the good ways we have discovered up to the present… Today’s standardisation
is the necessary foundation on which tomorrow’s improvement will be based….. Progress stops when the best become
confining “. The standard operational procedures should be done and be a property of those doing the work
Standard and Davies sited in Bicheno, outline three guidelines for standard work[21];
-It is not static and when a better way is found, the procedure is updated
Standard work supports stability and reduces variation because the work is performed the same way each time. Variations,
defects, deviations, are easily recognised. Its essential for continuous improvement, moving from one standard to a better one
without slipping. According to Bicheno,[21] standards should cover work time (Takt time and present cycle time for each
operation), work sequence, stating the time for each step and standard work in process at each work stage, all written in the
operators own words. By documenting tacit knowledge and experience standards from which others may learn will gradually be
established.
Monden [34] outlines five steps to developing standard operating procedures (SOPS)
� Determine the takt time
� Determine the production capacity; net work time / process time plus change over time
� Determine number of operators; sum of work time / takt time
� remove waste, develop the layout and standard locations then define the standard procedures
� write the standard operating procedure chart
Robert Hall as sited in Bicheno, pointed out three stages to standardisation;
� “outcome only methods” where the standard is established in a plan or drawing with no given specific way of getting
there, this usually leads to a high level of variation and the need for inspectors
- 34 -
� “Standardised processes methods” where variance is reduced by following standardised methods to achieve the out come
supported by use of tools like SPC, Poka yoke etc
� “Standardised predictive methods”, high level of consistency is achieved by using standardised methods that work first
time without the need t o test
3.5.2 .5. The 5S system [18, 21]
To facilitate the process of work standardization is the 5S tool to document all routines – make standard checklists and operation
procedures. Standardising Work is achieved by the use of the 5S system. The 5S system is based on the English translations of five
Japanese words.
Seiri - Sort through and sort out: Clean out the work area, keeping what is necessary in the work area, relocating or discarding
what is not.
Selton - Set in order, simplify and set limits: Arrange needed items so they are easy to find, use and return, to streamline
production and eliminate time searching for them. Use stickers to label specific areas, pictograms, signs etc.
Seiso –Sweep, Shine and inspect through cleaning: Clean and care for equipment and areas, and inspect while doing so.
Shitsuke - Sustain: Make these “rules” natural and instinctual. This calls for self discipline, to continuously improve on the
current state. Once they are habits, the total benefits of 5S will be reaped.
Seiketsu - Standardize: Make all work areas similar so procedures are obvious and instinctual, so defects stand out. Make
simple clear simple work check lists, indicating sequences, the time allowed for every step, output for every step, yield, limits
etc. A suitable tool is the takt time discussed earlier. Create visibility, put KPi on operator notice boards, process yields, etc.
This makes immediately self evident all production problems.
Andons (Signs) at many manufacturing facilities is an electronic device: audio and/or color-coded visual display. For example,
an Andon unit can have three color zones (red, green, and orange) when the orange zone flashes with a distinctive sound, it
calls for attention to an out of range setting, signaling the operator to reset certain material flow rate or parameter. Scania uses
andon boards that communicate the situation of production lines at each point in time [18]
3.5.2 .6. Cellular manufacturing
Cellular manufacturing, incorporates the flexibility of job shops and the high production rate of flow lines, breaking up a complex
manufacturing facility into several groups of machines, work stations or (cells), each being dedicated to the processing of a
product type or family. Therefore, each product/family is ideally produced in a work stations or single cell. With CM, material
flow is simplified and the scheduling task is made much easier, providing great benefits. In discrete manufacturing, the design of
cellular manufacturing systems can be very complex for real-life problems. But what we will see here is an adaptation of the
cellular manufacturing way of thinking to the case being studied. Some benefits of CM include; setup time reduction, change over
time, similar products can employ the same or similar work station, economic or even reduced lot sizes, more lots are possible and
economical. Small lots also facilitate production smoothening. Work-in-process, inventories are reduced. Set up times, number of
change over can be reduced since; standardization of operating conditions and parameter settings is possible. Reduced flow time.
The process-product relationship can be better studied, since there is mastery of the product behavior under varied, known
conditions [105]. Producing specific products on specific lines is an adaptation of the cellular manufacturing concept. It makes it
easier to map out a particular product and see if the difficulty to produce it is as a result of the machines, manpower, raw materials
or some other reason and a starting point for resolving the issue. It is in this context that it is discussed here. If we select a few
products and decide to produce them on a specific line while others are sent for production on a certain line we are in a way
applying the CM construct. Specific parameter can be determined for given conditions and this can help in determining standard
operating conditions for a given product for a given line, so that we don’t have to take too much time to find the right settings for a
given product on a given line.
- 35 -
3.5.2 .7. Continuous Improvement
Continuous improvement is a systematic study of the activities and flows within the value chain with the aim of improving them
by a repeated and constant attempt to remove non-value adding activities, improve flow and satisfy customer needs. Different
approaches to continuous improvement have been proposed; PDCA cycle by Dr Deming, JIT by Ohno, and theory of constraints
approach by Goldratt, Six Sigma, etc. Also important is to know what goals we are targeting. Improvement projects can be; short
term or strategic which may lead us to any of or a combination of, passive, active, immediate vicinity, priority based, goal oriented
and method based improvements[110]. But most writers and practitioners advice starting with "quick fixes"; projects that build
confidence, such as the immediate vicinity, Kaizen Blitz (an intense, highly focused continuous improvement approach) with focus
on waste reduction and used for small improvement projects that will pay off in a quick win, within 3-5days [36]. It uses a team set
up to attack waste and inefficiencies in one element of a manufacturing process, and to suggest immediate solutions. It is suitable
for projects like 5S, set up time reduction, quick change over etc, carried out by the operators themselves. Process simplification
results to reduced process variation. The reduction of work in process (WIP) and associated savings in capital, space, logistics-
flows and process simplification is a fundamental part of Lean thinking. This focus on cycle time and WIP reduction makes Lean
very powerful at addressing customer expectations with respect to delivery time and cost. To achieve this we need to make the
processes mistake proof, and create visibility. The Japanese use Poka Yoke [18]; make process “mistake proof” by using switches,
forms, color coding standard solutions, dimensions or other physical criteria's. Determine the deviations and make them constant
so that a warning or a signal(Andon) shows up whenever the deviation is out of the constant amount. Perform operations in right
standardized documented proven sequences so that any deviations are immediately evident.
3.5.2.8. Value Stream Mapping (VSM)
Typically, 95% of all lead time is non-value added [19]. Although this tool has often been neglected in improvement projects [94],
the use of value stream mapping has found widespread application in the evaluation, teaching and implimentation of lean
manufacturing principles, which have the elimination of these non value adding activities as one of its prime targets. VSM is used
to identify the location of waste and possible areas of improvement in the current process. It is a manual hand drawn , pencil and
paper map, which is created by visit to the place of action and collecting data from ongoing operations. The map is produced using
a predefined set of icons. The application of lean concepts in the future state sets the stage for the development of a coordinated
implementation plan. The most effective value stream maps are developed by using a cross-functional team composed of people
from all the activites in the value stream being evaluated. The development of a value stream map serves as a guide and part of the
training and the point of developing understanding in lean concepts and its application. According to Beau Keyte, [46] “whenever
there is a product (or service) for a customer, there is a value stream. The challenge lies in seeing it.”
Value Stream Mapping, referred to in Toyota as material and information flow mapping [28], is based on the fundamental principle
of Lean Manufacturing which holds that any activity or action which does not add value to the product is a form of waste and must
be eliminated or minimized. It is one of the lean techniques that brings together most of the tools used in the evaluation, teaching
and implementation of lean thinking, into a single tool box. A value stream map is the collection of all value adding and none value
adding activities that are needed to bring a product or product family, processed on the same set of resources, through the flow
from raw materials to the final consumer [28]. It brings to light all the actions, information and material flows across the whole
supply chain. Value is added any time the product is physically changed towards what the customer is planning to purchase. Value
is also added when a service is provided for which the customer is willing to pay (i.e. design, engineering, etc.). If we are not
adding value, we are adding cost or waste. [38]
The value stream is the set of all specific actions, both value added and non-value added, that are needed to take a product
through the information and production flows of a manufacturing operation. The value stream map follows the production path
from beginning to end and shows a visual representation of every process in the material and information flows. The maps show
- 36 -
the linkage between information flow and material flow for the product family. It is a big picture view and not individual view of
processes; It aims at improving the whole value stream and not just to optimizes pieces of the value stream or distinct section.
Through value stream mapping, a common set of evaluation tools, metrics and language is produced, facilitating the systems
analysis, thus more thoughtful conclusions on the state of the system and decisions to improve the value stream. The process of
developing the value stream map makes it possible to understand the product/product families, material and information flows,
value stream metrics and the interaction of the production processes. The value stream map is the road map that reveals the
obstructions to continuous flow, production smoothening, flexibility, a consumption driven process and the opportunities for
reducing waste through the use of other lean techniques. The steps to carry out a mapping are [28]:
� Identifying a product or product family to be mapped.
� Assign one person to lead the mapping effort
� Start at the door to door level
� Consider both material and information flow
� There are two major stages and involve
o Current state data collection, analysis and mapping
o Future state calculations and analysis development and mapping
3.5.2.8.1. Current State Map
The Current State Map shows how the shop floor currently operates. Data is collected from the processes and analyzed to
determine the performance of the current state. This serves as a foundation for future state changes. The map starts with the
customer area and works back through the process to the suppliers. A product family is used for the map. The data collected
includes customer demand and shipping data. The goal is to determine whether flow is directly tied to customer demand and if
flows are at customer pull. It also shows key production processes and data for each process box. Such data includes: Cycle
time, Changeover time, Number of operator, Available working time(minus breaks), Quality data such as reject percentage or
scrap rate, Equipment reliability data such as percentage of uptime, Pack size, Number of product variants, production batch
size based on customer demand
� Raw material and finished goods inventory are shown as well as work in process between the various processes in the
value stream.
� Production control information flow is shown to determine how the production processes are being scheduled and
controlled.
� At the bottom of the Map, the total process time and lead time are calculated for a typical product/ family unit
3.5.2.8.2. Future State Value Stream
The Future State Map shows how the shop floor will operate after lean improvements have been implemented. The Current
State Map serves as the starting point for developing the Future State. The goal in developing the Future State Map is to make
the flow continuous and to eliminate as much waste as possible. Lead time is shortened as much as possible by implementing
lean techniques. The flow in the Future State Map is built around the takt time, (how frequently a unit must be completed) to
meet customer demand. Takt time is simply the available working time per shift divided by the rate of customer demand
per shift. The key questions that must be asked while developing the Future State Map are as follows:
� What is the takt time?
� Should you build to a finished goods supermarket or directly to shipping demand?
� Where can continuous flow processing be implemented, i.e. eliminate cycle time mismatches and WIP?
� Where will supermarket pull systems be required between processes?
- 37 -
� What is the pacemaker process, i.e. the process which will be used to schedule and regulate production flow?
� How will the production mix be leveled at the pacemaker process?
� What increment of work will be released?
� What process improvements need to be made to achieve continuous flow and to eliminate waste?
The development of the Future State Value Stream Map is an iterative process that requires a very good understanding of lean
concepts. Individual companies have moved towards becoming lean by adopting different lean tools often used in the value
stream tool box such as; JIT, Set up time reduction, 5S, TPM, Production smoothening, employee empowerment and training,
etc. In many cases where firms have used theses tools singly or all the tools within specific unit in the supply chain benefits
were reported but then it was apparent that there was the need to understand the system holistically in order to maximise these
benefits. A typical example is Gelman Sciences Inc., a manufacturer of micro porous membranes filtration products, who
started their lean process with set up time reduction. Some reductions in set up were realised, but the through put remained the
same. In order to attain better results they decided to utilise value stream mapping to visualise the entire flow and select lean
tools that yielded maximum benefits [39]. Another example of the application of Value stream mapping was in the steel
industry. A current state map was developed for a steel producer, a steel centre and a first tier component supplier [40]. The
map showed the activities from hot rolling steel through delivery to the vehicle assembler. The overall goal of the study was to
improve the supply chain performance lead time. The current state map identified huge piles of inventory and long lead time. A
future state map was then developed and targeted areas were subjected to different lean tools such as kanban, continuous flow
and EDI.
- 38 -
3.6. New lean Perspectives
In recent trends, two or more of the different approaches to process improvement such as six sigma, theory of constraints, ISO,
TQM, etc. have been combined with each other or with the lean approach, to come up with what many authors refer to as
hybrid systems. A typical example is the lean six sigma approach. But the focus here is on agile manufacturing, which may be
considered as the ultimate goal of a lean vision
3.6.1 Agile Manufacturing
Agility in concept comprises; responding to change (anticipated or unexpected) in the proper ways and due time, and exploiting
and taking advantage of changes, as opportunities. Harrison and Van Hoek [118] argue that “where demand is volatile, and
customer requirements for variety is high, the elimination of waste becomes a lower priority than responding rapidly to the
turbulent marketplace” A similar view is shared by Desai et al., [112], that the lean production philosophy with its current
set of tools will not be able to tackle the increasing demand for customer specific products, favoring , organizations to
move towards more agile production philosophies, considered to be better suitable to handle customer specific
requirements with flexibility and responsiveness. According to Desai et al [112], Sharifi and Zhang, [113], with
increasingly customized products, the ‘mass markets’ will be split into multiple niche markets in which the most
significant requirements will tend to move towards service level. Christopher and Towill in (Kim et al., [115], recognized
cost as the market winner for systems operating on the lean production philosophy. While Mason Jones et al. in Kim et
al [114 ]identified service level as the market winner for agile production philosophies. In all cases named above
costs, quality, and lead time are market qualifiers where they are not market winners. Rapid changes in the business
environment and uncertainty have been part of management studies and research for a long time, so managing uncertainties still
remains one of the most important tasks for organizations. The concept of entrepreneurial task has been described as the search
for change, response to change, and exploiting change as an opportunity [50]. Ford responded to changes in his era by
introducing the continuous flow line and standardized parts. The Japanese responded to change by introducing the JIT or TPS.
Basically manufacturers have always had to do with change and uncertainty. All the buzzwords; World Class, Agile or Lean, or
even basic old Just-in-Time) should not change the focus from Bicheno’s excellent fundamentals [21]
� Understand your business.
� Identify the issues to be addressed in order to improve performance.
� Identify the technique best suited to bringing about that improvement.
� Get on with the improvements.
The term ‘agile manufacturing’ refers specifically to the operational aspects of a manufacturing company which accordingly,
try to translate into the ability to produce customized products at mass production prices and with short lead times. [56,57].
Naylor et al., [116]defines agility as using market knowledge and a virtual corporation to exploit profitable
opportunities in a volatile market place’ [116], It is a competitive strategy with the following principal aims; to enrich
customers, improve co-operation, to improve competitiveness, ‘master’ change and uncertainty through the organizational
structure, Realize the benefit of people. [55]. another principle talks of being environmentally benign [53, 54].
In a scenario where customers form small niche markets with different product requirements, and high product proliferation,
described by Desai et al., [112]to be able to capture the needs of all the niches, companies may have to move towards more
responsive and flexible operational philosophies, maybe the agile philosophy, if we choose to call it so, in order not to
suffer from reduced sales. The theory of agility, addresses the capabilities of an enterprise to reconfigure itself in response to
sudden changes in ways that are cost effective, timely, robust and of broad scope in its real sense. This in effect is the vision of
all lean practitioners and not a different construct. An agile system describes a virtual, or democratic web, with no physical
existence, because, what really counts, is not the largest company in the web nor the web itself but the product, the value
demanded, and the value stream that delivers that value[21] , which lies in a supply chain with physically identifiable
- 39 -
operations. The vision of achieving a supply chain with perfect processes (processes that are valuable, flexible (based on
demand pull and flows continuously), is capable, reliable and adequate to my opinion is not very different from an agile one.
Agility theory which seeks to provide synergies or matrices for business processes, physical operations and human resources to
respond to rapid and unpredictable change, can only be concretized practically through an effective lean enterprise
implementation; a vision of lean, if not agility may remain utopian. Many writers call it a virtual enterprise or organization; the
integration of core competencies distributed among a number of carefully chosen but real organizations all with similar supply
chain, focusing on quick time to market, cost reduction and quality [51]. Generally, a single organization may not be able to
respond quickly to changing market requirements. Temporary alliances or partnership based on core competencies which are
formed and appear to the customer as a single unit, help to improve the flexibility and responsiveness of organizations. To
achieve these targets we need to have a foundation built on lean concepts. Virtual Manufacturing (VM), a vision of lean, is an
integrated, synthetic manufacturing environment exercised to enhance all levels of decision and control in a manufacturing
enterprise.
The conceptual development of agility has not received as much attention as lean manufacturing [115].. Besides it is
achieved through the lean manufacturing tools, but with emphasis on responsiveness and flexibility. According to Kay and
Prince, in John Bicheno [21], It is a common view among authors that agile manufacturing has no tools of its own at an
operational level but is a further development of lean concepts . So, when striving for agility, by the use of lean
tools, one must be careful not to pursue the search for waste reduction too far. As it may be counter to the ability to be
agile. On the other hand, Harrison and Van Hoek [118] argue that the ability to react in accordance with agile
principles should not be over emphasized because, it is the total cost and performance of a company that defines the
bottom line, and hence agility should be pursued to such an extent that it does not damage the overall performance of
the company, an argument which favors leanness, lean being the framework on which the performance for physical product
.providing manufacturer depends.
Policies and routines must be put in place that encourages supply chain integration, relationships making it possible to predict
and have known order horizons. This way, it is possible to plan, and to some degree, optimize production
processes, distribution, and routing of all material flows According to Ansari as reported by Bicheno [21] “lean
production is a broad concept and encompasses terms such as flexible manufacturing, mass customization and even agile
manufacturing” When lean tools are effectively applied taking into consideration agility, one can increase flexibility
by further introducing safety stocks, or operating with some free capacity This will ensure that the supply chain is robust
to changes in end consumers requirements [116]
3.6.2 Leagile, manufacturing philosophy.
In the present global market dispensation, competition for consumers takes place between supply chains rather than
between companies, making supplier and customer integration very vital. Practitioners such as in the Dell Computers,
Benetton, Toyota production system, SCANIA etc) and authors like John Bicheno, James Womack, John Shook etc, all agree
that lean manufacturing concepts, responsive and flexible-agile supply chains, have been very successful. However, Naylor et
al[116] warns that leanness and agility are mutually exclusive and cannot be simultaneously applied at the same point
in a supply chain. While leanness operates best when planning horizons are long and products variants few, agility
requires reactivity to customer orders in short uncertain planning horizons and highly customized product variants. This has
resulted to the coining of a new production philosophy; leagile. Naylor et al [116]
One of his fundamental assumptions was that all links in a supply chain do not have to be organized in accordance
with one single production philosophy.
According to Agarwal et al [119], leagility, is a philosophy best suited for an entire supply chain and not for a single point in
the supply chain. Leagile blends the lean and agile. Harrison and Van Hoek [118], have suggested three ways on how both can
- 40 -
combine [21]. The first is via the Pareto curve; adopting lean for the 20% class high volume products having 80% of the
demand and agile for the 80% having 20 % of the demand. The second is the use of a decoupling point or postponement
principle. A de coupling point is a position in the supply chain where one production paradigm takes over from
another [116, 117,119. Since the lean philosophy focuses on cost efficiency along the whole value chain its tools can be
used to run operations up to the decoupling point [118, 119] in a cost efficient way. While the agile production principles are
applied on the other side of the decoupling point. But then, there are still some challenges like determining the position of a
decoupling point such that the burden is rightfully divided across the participants in the supply chain. At the same time it
is important to have the decoupling point closer to the customer so that lean practices can be applied to a greater portion of the
value chain. Since its position depends on end user, lead time sensitivity, and further, on where the variability is
greatest in the supply [116]. The basic idea here for example is to hold inventory of pre-manufactured products or some
generic form to the decoupling point and assemble them when customer orders are received to customer variety. With a lean
vision waste will continuously be removed and the lead time shortened through Kaizens moving this decoupling point up
stream, to the level of achieving the ultimate goal of lean, build to order where customer lead time is shortened. The third
approach is to classify demand into surge demand and base demand, using lean for base demand and agile for surge demand.
Again, one of the tools of evaluating a lean system, value stream mapping makes use of the technique demand amplification to
identify fluctuations in demand within the supply chain. Surges are disturbances that result from batching and inventory control
policies applied along the supply chain and poor order horizons. These can be gradually identified through mappings and
Kaizens. These methods are still within the lean context, and can be used on both sides of the decoupling point e.g. using
properly managed supermarkets and scheduling policies to even out the fluctuations, use extra capacity-machine labor, both
machine and labor, flexible time schedules, annualized hours, subcontracting etc[21]. These three approaches of combining lean
and agile are useful considerations but not about the integration of two methods [21]
Schonberger made us think a little broader than stockless production when he coined World Class, Womack and Jones pulled
our attention to attacking all forms of waste, opening our eyes to the fact that when JIT exposed all that had been seen within
the Toyota Production System and its Japanese counterparts, it did not tell the whole story. Equally, the term Agile or leagile
should remind us that we must be responsive to change and uncertainties. We may need to come up with a number of other
metrics required of our management systems and processes, all of which may exist within the companies already working at the
level of best practice and based on the same basic good manufacturing practices, but the lean tools still remain the foundation
[51]
3.6.3 Lean Enterprise
The lean process should focus on the system as a whole. A configuration approach to lean thinking helps to explain how a lean
system is designed from the interaction of its constituent elements taken as a whole, as opposed to designing the system one
element at a time. From a theoretical standpoint, lean production is seen as a tightly coupled system where the constituent
elements hold together in mutual dependence. It is the self-reinforcing effects of this kind of mutual dependence that
contributes to the superior performance associated with lean production [29] on the one hand and make it rare, valuable and
difficult to imitate by competitors on the other hand. Viewing lean production with a configurational lens provides us the logic
that glues its multiple facets together. James Womack defines a lean enterprise[24] as a group of individuals, functions, and
legally separated but operationally synchronised companies. By managing the system this way we look at the system
holistically and not as a sum of separate parts [91]. This simply means that all the workers, managers, suppliers and customers
are considered as powerful assets to the company. It is true that among a company’s core resources; the tangible and/or
intangible assets that permanently exist in a company; the manufacturing process stands out as the most value creating, but it
must be born in mind that up to about 60% of the company’s cost is in its raw materials which raises the issue of the value of
the supplier. The lean enterprise should be driven by the system of process thinking. A system is an integrated series of parts
- 41 -
with a clearly defined goal. The system of process thinking has a profound impact on how an organization operates and how
teams view their work. Peter Senge [92, 93] has argued that systems’ thinking is one of the five disciplines that are essential to
future organizational success [92] a view also shared by Dr Deming in his later teachings about TQM[106, 107]. Although the
lean system does not specifically talk about it, the value stream-mapping tool [59, 60] and process value analysis shoes the
beginning of system of process thinking in that the whole process is examined. Carefully selected ERP systems that are chosen
taking into consideration the specific needs of the value stream in question further reinforce the system. There should be no
walls in the system. To make the customers (both internal and external) believe in the organization, the company needs to put
efforts to elevate the whole enterprise as opposed to focusing on the performance of individuals, functions or parts of the
company. Lean enterprise can be seen as an extension of lean manufacturing. It goes further in the lean vision to stress focus on
the firm as a unit, its employees, its partners, its suppliers to bring value that the customer is ready to pay for to the customer,
through holistic time based management, by forming or strengthening synergies across the whole supply chain unit.
Management should recognize the importance of time and seek to reduce the level of unproductive time through out the
business unit; this should be the goal of a lean vision, the lean enterprise.
3.7 Overview of Supply chain management
A typical supply chain consists of raw material suppliers (external supplier), manufacturers, distributors, retailers and
customers. The raw material supplier ships the raw materials to a production facility, equipped with value adding/transforming
processes and equipment, the raw materials are transformed to customer valued products and then distributed, most often,
through a distributor and retailer to the end customer (external customer). In order to minimize cost and waste through this
system of events, effective supply chain management and integration is required.
Supply chain management is a set of approaches utilized to integrate suppliers, manufacturers, warehouses (distributors) and
stores (retailers) so that merchandise is produced and distributed in the right quantities, to the right locations, and at the right
time [61]. It is the chain linking each element of the manufacturing and supply process from raw materials through to the
customer or end user. It encompasses several organizational boundaries and treats all organizations within the value chain as a
unified virtual business entity [86]. Baatz [89] further expanded this scope to include recycling. The ultimate goal is improved
performance through minimizing overall systems cost, elimination of waste and better use of internal and external supplier
capability and technology [90] The merchandise that finally get to the customer must still retain the value which the customer is
ready to pay for and the quality must remain unchanged as it goes through the distribution part of the system. In order to
become lean, the company must have to or work towards an integrated supply chain from up to the down stream activities, even
to the end customer. Supply chain management extends traditional internal activities, by embracing an inter-enterprise scope,
bringing traditional partners together with common goal of optimization and efficiency [87]. The scope of SCM includes the
coordination of purchasing, manufacturing, logistics, material handling, distribution and transportation. According to Marshall
Fischer as reported by Bicheno[21], many supply and lean implementations fail because they are wrongly configured with
respect to demand. He distinguishes two categories of demand:
� Functional Demand, he claims, is physically predictable, low margin, low variety, longer life cycles and lead time and no
need to mark down at end of season. It requires an efficient supply chain or process
� Innovative, typically less predictable demand, with high margins, high variety, shorter lead times and life cycle with end of
season discounting. Requires a responsive supply chain. He argues that a mismatch between demand type and process or
supply chain type or interchange of managements, leads to problems
And that both need lean principles, but a responsive process or supply chain will in addition to fast flexible flow, need strategic
inventory buffers, or reduced order lead times and uncertainty by faster information flows such as through the use of systems
like the EDI. Fischer gives three alternatives; reduce uncertainty by faster information or mass customization; avoid uncertainty
by reducing lead times; maintain safety stock against uncertainty by buffer inventory.
- 42 -
Keah Choon Tan et al [86] in a survey of some NAPM members, categorized SCM practices into the following constructs
modified by author)
Supply chain integration;
� search for new ways to integrate SCM activities,
� Reducing response time across the SC,
� improving integration activities across the SC,
� Establishing more and frequent contact with SC members,
� Creating a more compatible communication/ information system
Information sharing
� Use of formal information sharing agreements,
� Determine customer’s future needs,
� use of informal information sharing
� Participate in the sourcing decisions for your suppliers,
� communicating customers future strategic needs
Supply chain characteristics
� Identify additional suppliers
� Supplier on time delivery directly to your point of use
� Communicating your future strategic needs to your suppliers
� Creating a greater level of trust among SC members
Customer service management
� Delivering on time to customer point of use
� Contacting the end users of your products to get feedback
� Extending SC beyond immediate suppliers and customers
� Involving SC members in your product/ marketing plans
� Creating SC teams to include different companies
JIT Capability
� Aiding your suppliers to increase JIT capabilities
� Increasing your JIT capabilities
3.7.1 Supply chain Effectiveness
Supply chain management seeks improved performance through elimination of waste and better use of internal and external
capabilities and technologies [58]. Unfortunately Ellram and Pearson [59] discovered that despite the increased emphasis on
supply chain management, the primary function of purchasing remained a clerical role of negotiating for lower prices of items.
Even with so many commentaries and literature on the importance and theoretical development of supply chain management,
there is limited empirical research in how its practitioners evaluate their suppliers, define and implement supply chain
management practices and how these practices impact firms performance [60]. Maybe because most of the data needed to study
the supply chains of firms is considered classified and not available for analysis to researchers, the companies are at the
forefront in investigations in this area. Another reason could be the focus of firms on other forms of performance improvement
such as the TQM, ISO, some lean system practice etc, unfortunately these methods are only focused on the internal processes of
the firm, even when they consider the suppliers, and they don’t have a holistic focus on the supply chain.
- 43 -
3.7.2 Integration of the Supply Chain
Supply chain integration can be considered as an ultimate target, if a firm has to achieve responsiveness in its operations. The
issue of integration is discussed here briefly looking at each component of the supply chain; customer, manufacturer and supplier.
Inputs to integration are customer needs identification, supplier selection and manufacturing evaluation, in this context, I mean
analysing the manufacturing function of the supply chain to make sure its value stream is designed to produce what the customer
orders and appropriate metrics are designed to follow the systems performance as well as being backed by robust support processes.
3.7.2.1 Customer Integration
The degree of customer satisfaction can be considered to be an ultimate measurement of the performance of a supply chain, not
financial metrics, because it is always the customer who judges the quality of our goods and services [43]. Customer satisfaction is
the concept of how well the customer is utilising the company’s products and what their feelings are of its services. [61].
Customers are always looking for better product quality, value added services, low cost, more flexibility, shorter lead times, and on
time delivery. By evaluating current customers, the company gains insight into areas that need improvement, and generates ideas,
for service and product satisfaction. Customer value is an important concept addressed by lean principles. It is how the customer
perceives the whole spectrum of what the producer offers in terms of products and services [61]. Bo Bengtman [43] groups the
external customers of a firm into those that utilise the products the firm provides and those that live in the environment that is
created by the firm, its products or production facility, as well as its owners and society at large, the interested parties or
stakeholders. Customer needs and expectations are to an increasing extent tailor-made to customer’s specific desires [43]. Recent
development in information technology such as the RFID, and EDI, have increased the possibilities for companies to individually
build lasting and in-depth relationship with their customers, the concept of one-to-one marketing, one of the foundation stones of
customer relationship marketing. Bo Bengtman [43] proposes a learning relationship with the customer in the following four steps:
� Identify the customers and their buying habits
� Differentiate the customers according to value and need, since all customers are not of equal value to the company
� Open a dialogue with the customers, possible through EDI systems.
� Customise goods and services on offer to different customers.
Presently a lot of effort is focused on creating customers with a great purchasing propensity and who speak well of the company.
Thus, companies take great pains to create faithful, loyal customers and try to make it possible for them to participate in the
development and improvement work in different ways. Fast and flexible response to customer requirements is a key issue. This
includes the physical distribution of the products and, the statues of an order, sometimes more valued than reduced lead times [61].
Permitting customers to have access to their order statues can boost trust within the supply chain. Allowing customers to
participate in the initial product design process can build customer value and trust. Another trust booster in the relationship
between customers and the producer within the lean supply chain is value added services. Quality products should be followed by,
access to information, support and maintenance services. Lean supply chains should be value creating networks, where the strict
boarders between suppliers and customers become very unclear, since business is becoming more knowledge intensive, trust
between interested parties is of utmost importance [43]
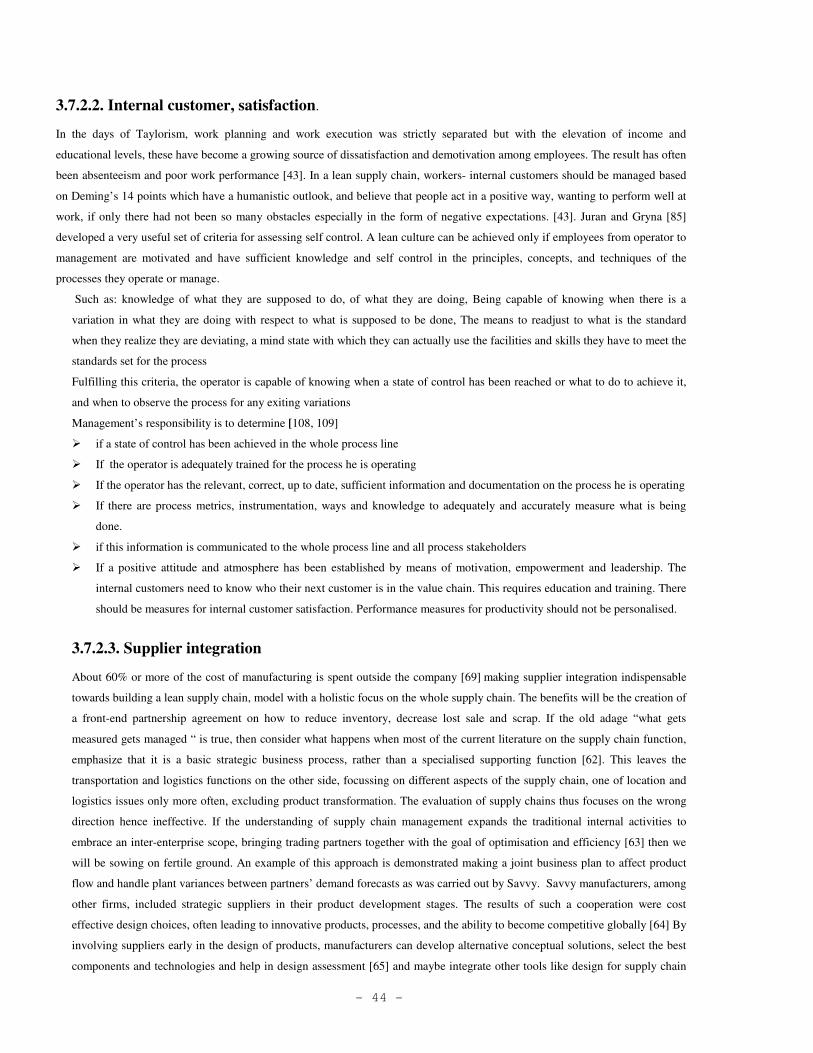
- 44 -
3.7.2.2. Internal customer, satisfaction.
In the days of Taylorism, work planning and work execution was strictly separated but with the elevation of income and
educational levels, these have become a growing source of dissatisfaction and demotivation among employees. The result has often
been absenteeism and poor work performance [43]. In a lean supply chain, workers- internal customers should be managed based
on Deming’s 14 points which have a humanistic outlook, and believe that people act in a positive way, wanting to perform well at
work, if only there had not been so many obstacles especially in the form of negative expectations. [43]. Juran and Gryna [85]
developed a very useful set of criteria for assessing self control. A lean culture can be achieved only if employees from operator to
management are motivated and have sufficient knowledge and self control in the principles, concepts, and techniques of the
processes they operate or manage.
Such as: knowledge of what they are supposed to do, of what they are doing, Being capable of knowing when there is a
variation in what they are doing with respect to what is supposed to be done, The means to readjust to what is the standard
when they realize they are deviating, a mind state with which they can actually use the facilities and skills they have to meet the
standards set for the process
Fulfilling this criteria, the operator is capable of knowing when a state of control has been reached or what to do to achieve it,
and when to observe the process for any exiting variations
Management’s responsibility is to determine [108, 109]
� if a state of control has been achieved in the whole process line
� If the operator is adequately trained for the process he is operating
� If the operator has the relevant, correct, up to date, sufficient information and documentation on the process he is operating
� If there are process metrics, instrumentation, ways and knowledge to adequately and accurately measure what is being
done.
� if this information is communicated to the whole process line and all process stakeholders
� If a positive attitude and atmosphere has been established by means of motivation, empowerment and leadership. The
internal customers need to know who their next customer is in the value chain. This requires education and training. There
should be measures for internal customer satisfaction. Performance measures for productivity should not be personalised.
3.7.2.3. Supplier integration
About 60% or more of the cost of manufacturing is spent outside the company [69] making supplier integration indispensable
towards building a lean supply chain, model with a holistic focus on the whole supply chain. The benefits will be the creation of
a front-end partnership agreement on how to reduce inventory, decrease lost sale and scrap. If the old adage “what gets
measured gets managed “ is true, then consider what happens when most of the current literature on the supply chain function,
emphasize that it is a basic strategic business process, rather than a specialised supporting function [62]. This leaves the
transportation and logistics functions on the other side, focussing on different aspects of the supply chain, one of location and
logistics issues only more often, excluding product transformation. The evaluation of supply chains thus focuses on the wrong
direction hence ineffective. If the understanding of supply chain management expands the traditional internal activities to
embrace an inter-enterprise scope, bringing trading partners together with the goal of optimisation and efficiency [63] then we
will be sowing on fertile ground. An example of this approach is demonstrated making a joint business plan to affect product
flow and handle plant variances between partners’ demand forecasts as was carried out by Savvy. Savvy manufacturers, among
other firms, included strategic suppliers in their product development stages. The results of such a cooperation were cost
effective design choices, often leading to innovative products, processes, and the ability to become competitive globally [64] By
involving suppliers early in the design of products, manufacturers can develop alternative conceptual solutions, select the best
components and technologies and help in design assessment [65] and maybe integrate other tools like design for supply chain
- 45 -
management. This will enable channel members to compete as a unified logistics entity instead of pushing inventory down the
supply chain, in a situation of low visibility which increases the bullwhip effect. Logistics will no longer result to saturation of
warehouses with inventory but integrate internal and external activities of the firm, including inventory management, vendor
relationship, transportation, and distribution and delivery services, with the goal of replacing inventory with good information
management systems such as the EDI, PDM, and novel technologies such as RFID to provide visibility, short and reliable order
cycles. Consequently raw materials and replenishment of goods will quickly arrive at the point of use and at the right quantities
or smaller sizes, facilitating the application of lean manufacturing [66]
3.7.2.4. Supplier Evaluation and Selection
A Vision or an ambition such as that of Kodak’s quality strategy; “our dramatic shareholder results are delivered through
intense customer focused and benchmark driven performance of integrated supply chain and integrated product delivery
processes”[67] can only be achieved if it is founded on a strong and well established supplier evaluation and selection base. The
integration of suppliers into a firm’s supplier chain must have this as a prerequisite. In its supplier quality process, Kodak
expects its suppliers to meet or exceed world class standards of performance in quality, reliability, cost, and delivery of the
products and services delivered to Kodak. Amongst its process improvement techniques is also the focus on a supplier
certification process, or SQP. Kodak uses what it calls a flexible design of SQP applied to improve, measure, monitor, and
approve its Kodak/supplier relationship specifics [67]. The Bellsouth supplier quality assurance proposes working with a supply
stream manager, technical staffs, field personnel, internal customers and suppliers as part of an on-going supply management
processes, including product and supplier selection, evaluation and performance improvement [68] Firms are thus called upon
to put in place procedures and processes to select those suppliers with whom they will build strategic partnerships in an
appropriate mix of the firms own capabilities with its suppliers in a relationship consistent with both of their business strategies.
The figure below illustrates a model for supplier selection and evaluation
Figure 5 Supplier Evaluation-Selection adapted from ADtranzs. [69]
- 46 -
Favoured supplies are those who focus on their competences, have good logistical delivery systems, for on time
delivery, operate in a cost effective, flexible (technological and capacity wise) manner. They must also provide
good cost incentives, have good managerial and financial policies, credibility, with interest in employee
development, and be interested in re-engineering and product improvement.
Figure 6: today’s Global business environment; ferocious competition of supply chains rather than companies.
3.7.3. Manufacturer integration
Most of the waste in a supply chain is found in the manufacturing section, the middle part of the supply chain. The main
purpose of supply chain integration, is to reduce systems wide cost and wastes, inventory holding cost, set up cost,
transportation cost, and long lead times. These create a big challenge with respect to how they will be best managed. Integration
of supplier, manufacturer and customer/distributor by the manufacturer, is a necessity to effectively mange systems inventory.
To do this the manufacturer needs an effective inventory policy which takes into account the nature of the supply chain. The
suppliers need to let the manufacturers have access to their systems through an PDM or EDI system is, the suppliers,
manufacturer and customers should have access to appropriately shared data relevant to each of the parties and usefull to
enhance the whole supply chains performance. Information sharing can reduce systems variability especially with respect to
manufacturing inventory, and demand forecast. Long lead times, on- time delivery, are two other metrics to be managed to
achieve overall systems effectiveness. Customers’ satisfaction demands shorter lead times and on time delivery [61]. With
information shearing between manufacturer, supplier and customer e g through a system such as an efficient EDI system, lead
times can be cut through elimination of wastes, related to order delays due to processing such as paperwork, transportation
delays[61]. An integrated supply chain will lead to low inventory, less over production, WIP, shorter lead times etc, and an
overall cut in systems cost.
3.7.3.1. Evaluating Manufacturing
Performance of manufacturing systems covers a wide spectrum of technology and management activities. [70]. Most of the
existing performance measurement frameworks were designed for use by general management. This is because management
needs a system to review, monitor, intervene, control and predict its performance. In a lean system performance measurement
should be brought down to the “Gemba” were the action takes place. It should in itself be able to identify and generate
continuous improvement, instead of working as a passive control [82]. Typical example is the takt time. The takt time alone, in
itself gives us a specific picture of the operations. A well conceived framework should be able to support the choice of what to
measure, how and when to measure and how to interpret the results. Schmenner and Vollman argued that most firms were both
using wrong measures and failing to use the right ones in correct ways. A large proportion of the total cost of production can be
attributed to production losses and other indirect and hidden costs [83]. The overall equipment effectiveness (OEE) attempts to
reveal these hidden costs [45]. When such measurements are applied by small autonomous groups on the shop floor together
with quality control tools and metrics like process capability index, cycle times, availability etc, one can have a better picture of
the operational state of the manufacturing system. An ideal performance measure should have a number of properties related to
its usability, adaptability and relevance to the organization, outlined as follows: [70]
- 47 -
� Simplicity: a practical measure is a simple measure which is easy for data collection and informative, for instance,
stock turnover, throughput time.
� Predictive ability: the look-ahead function of a leading measure is useful to guide planning, for instance, the total order
on hand. In contrast, financial measures are lagging indicators as they purport to summarize events happened earlier in
financial terms.
� Pervasiveness: a pervasive measure could be applied throughout the organization in both horizontal and vertical levels.
This will facilitate comparison and analysis as against a highly specific single-purpose measure.
Five major metrics are used for performance measurement, i.e., Time, Cost, Quality, Flexibility and Productivity. Under each
metric, specific measures are used for measuring a specific characteristic on manufacturing performance at that level. The
matrix framework thus covers all the essential elements for manufacturing from a systems point of view [70]. In this context,
the following metrics can be used to evaluate the manufacturing system with respect to leanness
� Flexibility measures: delivery flexibility, machine flexibility, number of different products, process flexibility,
process similarity, routing flexibility, supply chain flexibility, total system flexibility, volume flexibility.
� Productivity measures: direct labor productivity, overall equipment effectiveness, throughput efficiency, value-
added per employee.
� Time measures: average batch processing time, average lead time, changeover time, cycle time, machine
downtime, mean flow time, on-time delivery, setup time, Takt time, throughput time.
� Cost measures: overhead cost, scrap cost, setup cost, unit manufacturing costs, unit material cost, and work in
progress.
� Quality measures: average outgoing quality limit, not right first time, process capability index, return rate,
rework %, scrap %, vendor quality rate,
3.8. Levels of Integration
The University of Michigan identified four levels of integration [61]:
� Level of no integration; supplier is not involved in the product design. Raw materials or subassemblies are supplied
according to customer specification and design
� White Box Level : Informal level of integration, where buyer consults with supplier informally when designing
products and specifications
� Grey Box Level ; in which there is formal supplier integration. Collaborative teams are formed between buyers and
suppliers engineers in joint product development
� Black box Level; the buyer gives the supplier a set of interface requirements and the supplier independently designs
and develops the required component for product
The figure below illustrates another model of supply chain integration very similar to the one discussed above, discussed
in the course on operations management by Prof. Christer Lindh and in Aronsson (2003) as in Claudio Torres [121]. In this
model:
Level 1: Company consist of separate functional units, with each section or department having its own information system
and controls its material flows. The consequence is a functional silo organisation. It is characterised by reactionary and
short-lived planning horizons, with often different departmental separate inventories in the facility as a result of lack of
integration.
Level 2: At the second level of integration according to this model there is some level of coordination of logistics
activities, but there still exists some problems with excess inventory, communication and lack of transparency since
customer demand is still unclear.
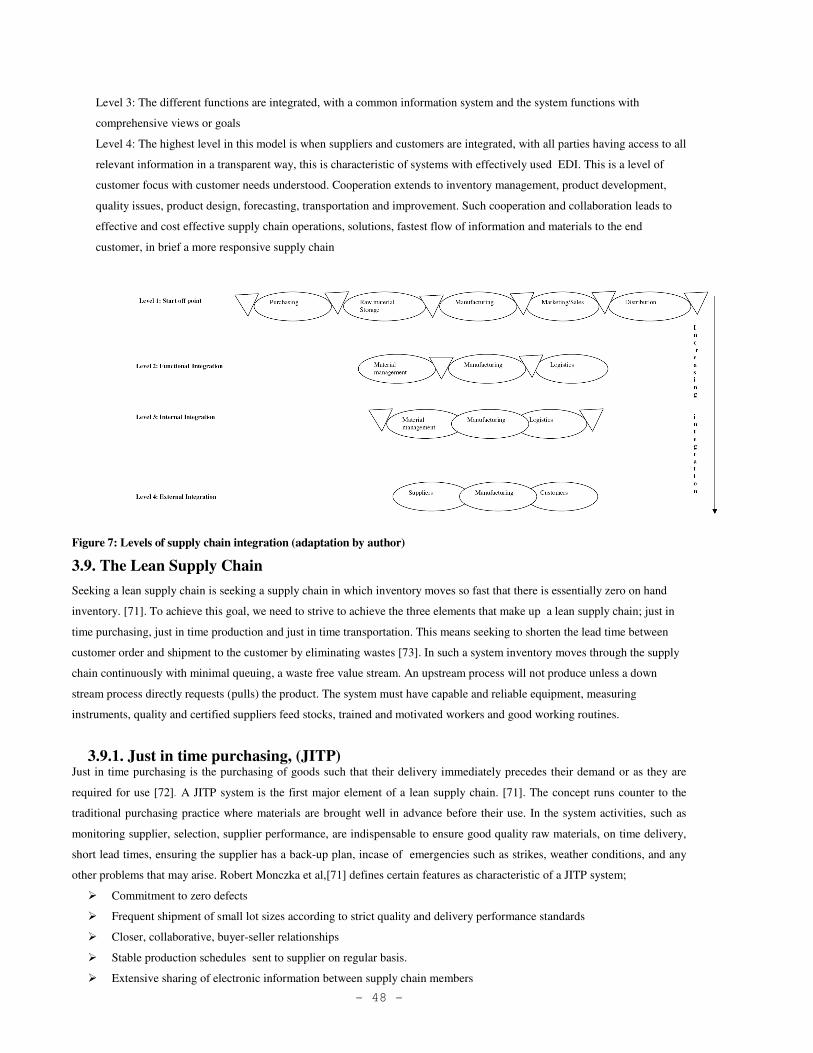
- 48 -
Level 3: The different functions are integrated, with a common information system and the system functions with
comprehensive views or goals
Level 4: The highest level in this model is when suppliers and customers are integrated, with all parties having access to all
relevant information in a transparent way, this is characteristic of systems with effectively used EDI. This is a level of
customer focus with customer needs understood. Cooperation extends to inventory management, product development,
quality issues, product design, forecasting, transportation and improvement. Such cooperation and collaboration leads to
effective and cost effective supply chain operations, solutions, fastest flow of information and materials to the end
customer, in brief a more responsive supply chain
Figure 7: Levels of supply chain integration (adaptation by author)
3.9. The Lean Supply Chain
Seeking a lean supply chain is seeking a supply chain in which inventory moves so fast that there is essentially zero on hand
inventory. [71]. To achieve this goal, we need to strive to achieve the three elements that make up a lean supply chain; just in
time purchasing, just in time production and just in time transportation. This means seeking to shorten the lead time between
customer order and shipment to the customer by eliminating wastes [73]. In such a system inventory moves through the supply
chain continuously with minimal queuing, a waste free value stream. An upstream process will not produce unless a down
stream process directly requests (pulls) the product. The system must have capable and reliable equipment, measuring
instruments, quality and certified suppliers feed stocks, trained and motivated workers and good working routines.
3.9.1. Just in time purchasing, (JITP) Just in time purchasing is the purchasing of goods such that their delivery immediately precedes their demand or as they are
required for use [72]. A JITP system is the first major element of a lean supply chain. [71]. The concept runs counter to the
traditional purchasing practice where materials are brought well in advance before their use. In the system activities, such as
monitoring supplier, selection, supplier performance, are indispensable to ensure good quality raw materials, on time delivery,
short lead times, ensuring the supplier has a back-up plan, incase of emergencies such as strikes, weather conditions, and any
other problems that may arise. Robert Monczka et al,[71] defines certain features as characteristic of a JITP system;
� Commitment to zero defects
� Frequent shipment of small lot sizes according to strict quality and delivery performance standards
� Closer, collaborative, buyer-seller relationships
� Stable production schedules sent to supplier on regular basis.
� Extensive sharing of electronic information between supply chain members
- 49 -
� Electronic data interchange capability with suppliers
Having a few number of quality certified suppliers and corporation with them like the Kodak case discussed earlier, enables
shifting the inspection function to the suppliers. Buyers should have a black box relationship with their suppliers where
suppliers can take part in new product development design and innovation. The benefits of such corporation include reduced
transaction time, purchasing cost; increase in quality of purchased materials, reduced product development time, and purchased
materials cost, manufacturing cost, and increase in final product technology levels [74]. JITP guarantees that production is as
close as possible to a continuous flow process from the raw materials reception until the distribution of the finished goods [52].
Systems such as EDI support JITP, by making it possible for the buyers to synchronise their material movements with their
suppliers. Although there are arguments that the carrying cost of small lot sizes make the system more costly, this cost is offset
by decrease in order processing time and cost, inventory cost, and creates more visibility in the supply chain. Some barriers to
JITP are lack of trust, dispersed supplier base, too many suppliers, and low supplier performance [71].
3.9.2. Just in time production - Manufacturing (JITM)
One of the important steps in implementing a lean supply chain is JITM. JITM is the backbone of lean manufacturing [30]. It is
about not having more raw materials, work in process or products than are required for a smooth operation. The importance of
JITP and JITD have most often been undermined, narrowing the focus only to JITM [71]. It utilizes the pull system to schedule
production. In this system it is customer demand that is the generator of the orders that send production signals. As a result
production takes place only at the time the signal gets to the production scheduling point. The signal indicates the type and
quantity of products that have to be produced and the sequence. Each processing point upstream waits for the signal from the
adjacent process downstream to start production. The process goes on as each process stage pulls its required materials from the
preceding process stage down stream. The whole process is coordinated by the use of Kanbans. Production and Shipments in
this system are in small lot sizes. The kanban is an information system that is used to coordinate the quantity and type of parts
to be produced in every process [30]. The most common types of Kanbans are the withdrawal, which specifies the quantity of
parts the succeeding process should pull from the preceding and the production kanbans, which specifies the quantity to be
produced by the preceding process [30]. The supplier Kanban is another type of Kanban that is used between the supplier and
the manufacturer under JIT, and circulate between the supplier and the manufacturer. For JIT delivery the supplier has to adjust
its system from the traditional run sizes to small lot sizes. The kanbans are delivered at predefined times from the manufacturer
to the supplier. Each batch that is supplied contains a Kanban that indicates the usage, so that the supplier delivers based on the
number of Kanbans received, in this way only material that will be utilized is supplied. Huge cuts in work in process inventory
and finished goods inventory are registered when using this system because every process is producing at a rate not higher than
the subsequent process requirements. JITM is implements through similar tools to the lean system.
3.9.3. Just in time Distribution-Transportation [JITD]
JITD requires the shipment of frequent small lot sizes directly to the customer’s point of use. This requires an effective
transportation management system because inbound and out bound material movements can have a significant effect on
production when there is no buffer inventory [81]. The producer must also have a fixed order horizon, this makes it possible to
plan production and avoid unprecedented changes in customer orders. To overcome the problem of not having full truck loads
since production is in small lot sizes, Monden suggests the use of mixed loading strategies, to make it possible to have full truck
loads and increase the number of deliveries. A lean transportation network relies on company owned or contracted distribution
that picks up and delivers according to regular and repeatable schedules; the closed loop system [71]. Information interchange
is very important in JITD systems. The use of systems like EDI, to respond to demand surges. Effective information
interchanges between producer and supplier or distributor. In the traditional delivery systems producers need to keep finished
- 50 -
goods inventory or have to make frequent changes in production schedules. Under the EDI system the suppliers can look at all
shipment and inventory data and adjust their production schedules accordingly [61]. The importance of visibility within the
supply chain is further discussed under supplier integration. Robert Monczka [71] suggests the following criteria to achieve a
JITD system:
� Established EDI system
� A closed loop system
� Use of state of the art material handling systems and technology
� Reduced number of carriers
� Longer term contracts
- 51 -
4.0 Taxonomy of process industry
The chemical/process industry generally involves physical and/or chemical changes on inputs into processes, modifying them to
yield products desired, by the customers. Most often, raw materials or products from process manufacturing are either measured
(weight, volume) or metered. It is different from the making of single countable parts like automobile parts or components,
often called discrete manufacturing. The aim of this section is to develop characterization of the process industry based on the
construct proposed by Fawaz Abdullah, [75]. This will help in finding where the feed industry fits in the process industry and
what lean methods can be applied.
4.1 Classification of the Process Industry
Based on production plans’, manufacturing generally has classically been grouped into Job shop, batch production and mass
production, with the mass production class characterized by high volume and low variety. In fish feed production, we have high
volumes and high variety of customized products, which makes it different from any of the categories above. These differences
have an influence on the acceptability of managers in the process industry, to open up for lean principles. The process industry
generally described as continuous manufacturing is usually grouped together based on the fact that they are designed to produce
non discrete products (products that can sometimes expand, evaporate, disintegrate, or dry out), consequently the fact that they
differ is ignored. Although they all share many common characteristics, there are unique characteristics that can be used to
categorize them. While some use discrete materials or produce discrete products (products that can preserve their solid form
with or without being put into containers or packaged) others do not. Prior classifications have used process manufacturing and
process flow production. Where process manufacturing, is production that adds value by mixing, separation, forming, and or
performing chemical changes in either batch or continuous mode [76]. And process flow production is a production with
minimum interruption in the actual processing, in any one production run or between runs of similar products. Queue time is
virtually eliminated by integrating the movement of the product into actual operation of the resources performing the work [76].
Thus process industries use process manufacturing but not all use process flow production techniques. They can also be
classified according to the product characteristics and the material flow characteristics.
4.2 Product Characteristics
On the product characteristics level of classification, we can further distinguish the product volume and the raw materials level.
The process industry has generally been grouped to produce high volume (amount of output produced) of low variety products
(number of variants). But this is not generally true as the product volume depends on the particular process industry. Based on
product volume, this industry can be grouped in to those producing high volume and low variety e.g. the heavy chemicals such
as crude oil refining, sodium hydroxide, cement etc, the beverage industry and those that produce low volumes with high
varieties, such as the fine chemical industry which produces pharmaceuticals, perfumes, colors, and photographic chemicals
[90]. There is also the class that produces high volume and high variety, the case for animal feed, and most specifically aqua
feed. This particular case for feed is because the composition and type of feed depends on the age of the animal, season and
environment.
The high volume-low variety group usually has few problems, no stops, few intermittent processes, with high efficiency,
requires no use of kanbans or small batches. With few raw materials and product variety there is basically no changeover times,
consequently it is possible to produce consistently high quality and at higher efficiency by simple use of TQM/ISO tools. For
the high variety product group this is not always true hence the need for lean techniques to increase speed to market and lower
cost of operation through better time management.
- 52 -
Starting materials for some process industries could be primary raw materials, e.g. lime stone, mineral ores, crude oil and some
agricultural products, wood chips, grains, air; water, etc. They may also be products from other chemical processes e.g. fish
oils, fish meal, pro vitamins, synthetic resins, pigments, fuel oils, distillates, naphtha. Classification could be on the variety of
raw materials used. Some process industries use a large variety of raw materials such as the animal feed industry, paint
industry. Another product classification could be the quality of the raw materials. While some raw materials have no problems
with their quality e.g. mineral ores, wood, crude oil etc, that have relatively long shelf life and stable composition, others like
agricultural products e.g. milk, eggs, etc. have short shelf life and must be free from toxins.
4.3 Material Flow Characteristics
Based on material flow, the process industry can as well be classified into the job shop, batch and the flow shop. This
contradicts the general impression that the process industry is generally a flow shop. A typical example of a job shop process is
in the manufacture of dyes. Paint manufacture is another good example of job shop and batch processes. Petroleum refining is a
flow shop process. Depending on the state of development, an aqua feed production process can be carried out as either job,
batch or flow shop process. Skretting’s process is a flow shop.
Each system of material flow or classification has its characteristics with respect to equipment layout and shop flexibility. The
equipment in the process industry can as well be categorized as general purpose or specialized. These too can be further
categorized as dedicated or none dedicated. An extruder can be said to be general purpose- non dedicated equipment if it is used
for extruding different materials, but if it is assigned only to extruding different pigmentations of aqua feed or animal feed, then
it is general purpose dedicated to those different pigmentations of aqua feed. Fridges and ovens at our homes are general
purpose non dedicated equipment because they can be used to process different products.
If the extruder on the other hand is used to produce only 3mm aqua feed pellets, it can be said to be dedicated and specialized.
The flexibility of the system is determined by the type of machine and the layout of equipment, and consequently the extend
and level (within manufacturing or associated services like supply chain) of the applicability of lean techniques. Dedicated
specialized equipment provides the least flexibility, where as non dedicated general purpose provide the most options for
flexibility. Petroleum refinery equipment arrangement for example does not allow for any flexibility. The equipment are
dedicated to the process and laid such that the product follows just one route, uninterrupted flow in the sequence of operations.
Job shop and batch processes usually offer more flexibility.
Another possible way of classification of process industry is when the products become discrete units [75]. In this category we
distinguish those in which the products become discrete units early in the process like in the textile industry, those with
discrimination coming in the middle of the process like steel industry and those for which discretization comes at the end of the
process during packaging e.g. paints or beer or, e.g. aqua feed process during bagging.
4.4 Complexity of the Process industry
In order to build value into the products, (the desired properties and performance characteristics into the finished products), the
processes must be visible to enable control. Important to this control are, the properties of the raw materials, the critical to
process parameters settings (resident times under specified temperatures, pressures, flow rates, concentrations), measurement
methods and operational procedures employed, etc. For example high-temperature, short-time (HTST) extrusion cooking can
change the nutritional value or the functionality of feed ingredients. Changes in starch, dietary fiber, mono- or disaccharides,
proteins and vitamins may be either beneficial or deleterious. [77]. Because the equipment wear out, with time and performance
drops, it is very vital to regularly monitor the processes equipment to keep them under control and thus improve on the
processes (proactive maintenance, TPM). The operator needs to know at each point in time how his processes are responding to
set processing parameters (in process control), lean principles require this visibility. To be able to improve on the processes, it
- 53 -
must be understood that besides the conventional quality control problems, the process industry faces some other more complex
ones [78] e.g.
� Some measurement methods themselves are miniature chemical processes requiring control.
� Reaction kinetics continues with time making it necessary to prevent samples from delay in delivery, contamination by air
volatilization, freezing etc
� In-process samples may greatly differ in composition to the composition of the finished products (water content online
may differ form laboratory measure).
� Testing time maybe relatively longer compared to the batch or sub process reaction time, requiring control decisions to be
anticipated.
� The same compound or element may be unstable or have different isomers or isotope and controlling or isolating the
required one maybe very difficult in the laboratory. For example most vitamins are easily destroyed by temperature,
oxygen, moisture and light. Additional parameters in extrusion cooking that influence the stability of vitamins are raw
materials, pressure, flow rate, screw speed, energy input, die open area, shear, redox reactions, drying temperatures and
duration.[77]
� Product specification may not fully define the performance under the widely varying customer uses for the product.
� In the process industry the same material may be applied to multiple customer uses, consequently controls must achieve
the dual or numerous purposes.
� Material produced must possess the desired physical and chemical properties
� Should perform satisfactorily in the customers processes, e.g. pellets must have the desired sinking rate in water, protein
content, dust free, not dripping oil etc. desired by client
4.5 Lean and Aqua feed Industry
Most applications of lean have been in the discrete manufacturing industry where it originated. Other manufacturing industries
such as the electronic have joined the wagon with success. The new comers or feet dragging today are those from the process
manufacturing industry [32].
The challenge is to adopt these methods to a process industry with high volume, high variety manufacturing environment,
typical of the feed fish business. The industry is characterized among other things by;
� Characterized by high volume flexibility.
� Highly customized product variety.
� Huge dedicated and inflexible machinery
� Long Set up times
� Raw materials with very long lead times
� Long list of ever changing raw materials
Based on the taxonomy developed above, the aqua feed industry, in terms of point of discrimination lies at the bottom end,
implying that the use of Kanbans scheduling is not very feasible rather an ERP will be better. But it also implies that the
processes have to be very capable, because far down stream, any mistake in the process will not be rework able, hence the need
for lean system to ensure that only value adding activities are performed or added to the product as it goes through the
processes. The process is a flow process and general purpose dedicated specialized to aqua feed with the possibility of enough
flexibility that allows for more product variants., with lean principles, this flexibility can be maximized if lean tool such as 5S,
TPM, Heijunka, SMED(to facilitate small lot size production), JIT, process visibility, employee empowerment, Jidoka etc, are
effectively implemented. For example stopping a line because of some poor quality in a process plant has far more
consequences than can be imagined compared to a discrete manufacturing plant. Some lean tools that can find practical
- 54 -
application in the process industry include, JIT, TPM, 5S 5why, value stream mapping, etc. In other cases it may be more useful
to focus the application of lean on non productive processes such as material movements, distribution, and storage, purchasing
and business process management. For example JIT principles were used between DOW and its customers to increase demand
forecast accuracy by 25%, average distribution lead time decreased by 25% and inventory reduced from 16 t0 6 tank car loads.
[84]
4.6 The Farmed fish feed Industry
According to 2001 statistics, the aqua feed industry represents just about 2 %( 14 millions tons (mainly salmon, trout, shrimp,
marine fishes, tilapia, catfish, carp…) of global feed production. The remaining 98% is agric feed. In Europe this is even
reduced to 1 %( 0.60 million tons (salmon, trout, bass, bream, turbot, sturgeon, pond fishes). With a greater number of aquatic
species being farmed, especially marine species the demand for feed is hopefully going to rise, this depicts a sector that is in
growth. [79]
Although both aqua feed and animal feed represent 40% to 50% of the production costs in land or aqua intensive productions,
protein requirements for the reared aqua species like Salmon, Trout, Bass, Bream, Turbot, Sole, Cod…, range from 40% to 60%
of the daily intake. Formulations for aqufeed also require high energy requirements, mainly covered by lipids, up to 38% of the
daily intake (fish oil and unsaturated vegetable oils), with low carbohydrate and very low fibre content. Specific and expensive
technologies are required for the processing of suitable pellets like extrusion technology and vacuum oil coating. Aqua feed
production can be said to be more ecologically friendly than the wild fish farming and animal feed farming given that
� 5 to 10 kg of wild prey fish produces 1 kg of live carnivorous fish (cod, hake, plaice, salmon,)
� 2 to 4 kg of wild pelagic fish under quotas to produce 1 kg of live farmed carnivorous fish (salmon, trout, bass, bream,
turbot…)
� 100 kg of feed mix (protein, carbohydrate, oil) gives as edible meat quantity:
65 kg salmon or 20 kg chicken or 13 kg pork [79]
The business is quick growing and an innovative sector with constant new challenges on economy, security and quality. It
involves heavy financing which makes R&D for industry difficult for investments, in front of a limited and less profitable
sector. The competition for specific raw materials rich in proteins is globally intense, not only with the agriculture industry but
also with human consumption and for renewable energy production. The industry is also faced with lots of regulations from
environmental and aquatic ecological regulations bodies. At the EU level there is the need to promote R&D on sustainable
protein resources, and if necessary to facilitate registration of raw materials available and suitable for aqua feeds. In such a
business environment, it is a challenge to reach the necessary final product quality within a profitable and sustainable way.
The fish feed industry, uses biological raw materials in their production processes. The main raw materials are fish meal,
various vegetable meals and fish/vegetable oils. Several of these raw materials vary considerably in quality due to e.g. different
geographical origins, seasonal changes and breed variations.
Irrespective of the variations in raw material quality customers, still demand high stable quality, customized end-products. So
manufacturers must not only focus on efficient manufacturing processes but also on modeling end-products quality as a
function of raw material properties and processing conditions. To do this they need to:
� Identify raw material properties and process variables that are important to predict the end-product quality.
� Optimize end-product quality for a given raw material, by adjusting processing variables.
� Screening raw materials, to determine their potential to make a good product. [80]
- 55 -
4.7 Overview of the Global aqua feed market
In global terms salmon feeds represented only 8.4% of total compound aqua feed production by weight in 2003 with
aquaculture in turn representing about 3% of total global industrial animal feed production in 2004[110]
A 2005 FAO, estimate show that the total production of compounded aqua feeds for salmon (includes large marine-brackish
water reared rainbow trout) was about 1.9 million tones in 2003; Norway 750,000 tones, Chile 725,000 tones, UK 225,000
tones, Canada 160,000 tones, and others 45,000 tones. Recent data indicates that Chile has now overtaken Norway as the largest
salmon feed producer, with the total aqua feed market in Chile estimated at 850,000 tones in 2004 (Larraín, Leyton &
Almendras, 2005), compared to 800,000 tones for Norway and about 200,000 tones for the UK.
However, approximately 85% of total aqua feed production in Chile is produced by the same overseas companies leading the
industry; like Skretting (Nutreco, Netherlands), Ewos (Cermaq, Norway), Alitec (Provimi Group, Netherlands) and Biomar
(Denmark), respectively. Currently, over two-thirds of the total global salmon aqua feed production is produced by
two companies, namely Skretting (Nutreco) and Ewos (Cermaq). based on FAO estimates for the most recent years, fish
consumption per annum per person across regions was projected to rise by 17,4kg in 2007, and the region of Africa with low
absolute levels consumption has a significant potential for aquaculture which is hardly exploited, this is a good indication for
feed producers, given the rapid rise in fish farming, and regression of wild fish catches.
4.8 Challenges and Competition in the fish feed industry
Although the tendency tilts towards aquaculture overtaking captured fish, as the main source of food fish supply; with a share
of about 45 percent, declining prices for salmon in the European Union salmon market, high cost of raw materials and logistics
result to very narrow profit margins in the feed business. The world fish production is thus characterized by ever increasing
aquaculture production but low profit margins. the problem of reduction of captured fish, a tendency which is likely to continue,
may greatly reshape the supply of fish meal and fish oil, major feed raw materials. The contraction in capture fisheries reflects
generalized over-fishing and reduced fish stocks, but also reduced anchoveta catches in Peru in 2006 and 2007. In addition,
high fuel prices are influencing negatively the high sea fisheries, such as tuna fisheries and other species used for fish meal. The
low prices of fish meal enjoyed by fish meal producers in the past years due to Chinas reduction in demand as a result of its
storage will soon change as china reenters purchasing.
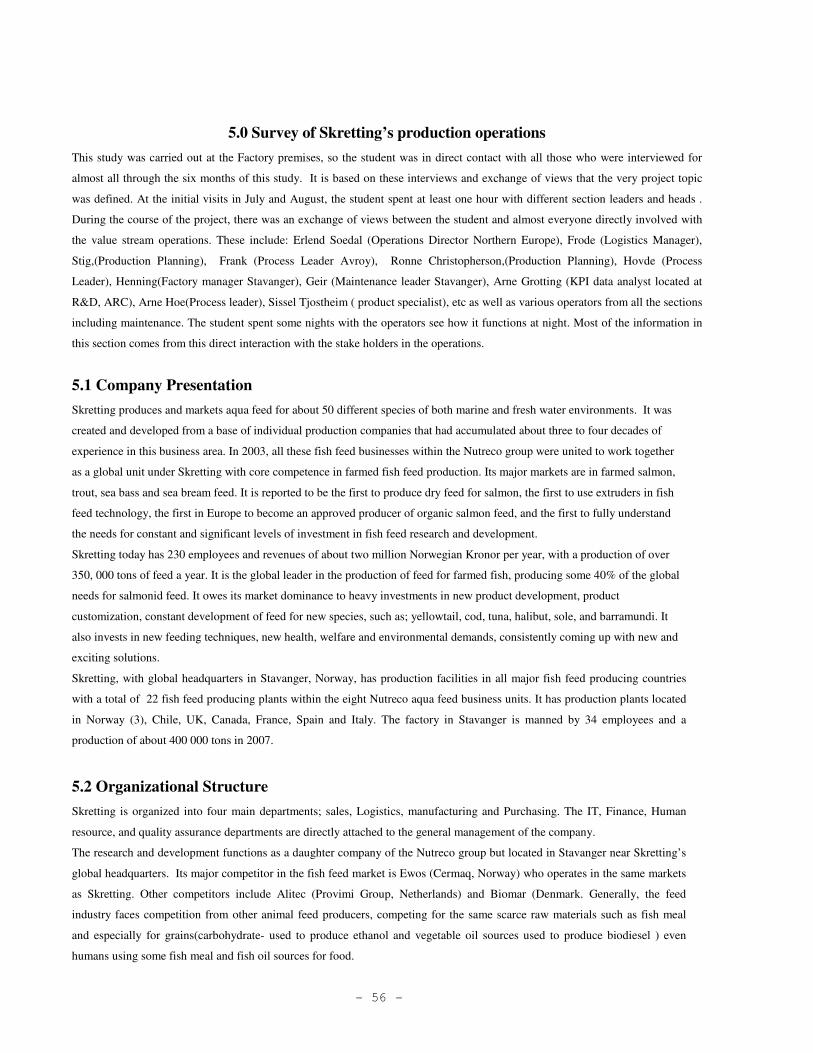
- 56 -
5.0 Survey of Skretting’s production operations
This study was carried out at the Factory premises, so the student was in direct contact with all those who were interviewed for
almost all through the six months of this study. It is based on these interviews and exchange of views that the very project topic
was defined. At the initial visits in July and August, the student spent at least one hour with different section leaders and heads .
During the course of the project, there was an exchange of views between the student and almost everyone directly involved with
the value stream operations. These include: Erlend Soedal (Operations Director Northern Europe), Frode (Logistics Manager),
Stig,(Production Planning), Frank (Process Leader Avroy), Ronne Christopherson,(Production Planning), Hovde (Process
Leader), Henning(Factory manager Stavanger), Geir (Maintenance leader Stavanger), Arne Grotting (KPI data analyst located at
R&D, ARC), Arne Hoe(Process leader), Sissel Tjostheim ( product specialist), etc as well as various operators from all the sections
including maintenance. The student spent some nights with the operators see how it functions at night. Most of the information in
this section comes from this direct interaction with the stake holders in the operations.
5.1 Company Presentation
Skretting produces and markets aqua feed for about 50 different species of both marine and fresh water environments. It was
created and developed from a base of individual production companies that had accumulated about three to four decades of
experience in this business area. In 2003, all these fish feed businesses within the Nutreco group were united to work together
as a global unit under Skretting with core competence in farmed fish feed production. Its major markets are in farmed salmon,
trout, sea bass and sea bream feed. It is reported to be the first to produce dry feed for salmon, the first to use extruders in fish
feed technology, the first in Europe to become an approved producer of organic salmon feed, and the first to fully understand
the needs for constant and significant levels of investment in fish feed research and development.
Skretting today has 230 employees and revenues of about two million Norwegian Kronor per year, with a production of over
350, 000 tons of feed a year. It is the global leader in the production of feed for farmed fish, producing some 40% of the global
needs for salmonid feed. It owes its market dominance to heavy investments in new product development, product
customization, constant development of feed for new species, such as; yellowtail, cod, tuna, halibut, sole, and barramundi. It
also invests in new feeding techniques, new health, welfare and environmental demands, consistently coming up with new and
exciting solutions.
Skretting, with global headquarters in Stavanger, Norway, has production facilities in all major fish feed producing countries
with a total of 22 fish feed producing plants within the eight Nutreco aqua feed business units. It has production plants located
in Norway (3), Chile, UK, Canada, France, Spain and Italy. The factory in Stavanger is manned by 34 employees and a
production of about 400 000 tons in 2007.
5.2 Organizational Structure
Skretting is organized into four main departments; sales, Logistics, manufacturing and Purchasing. The IT, Finance, Human
resource, and quality assurance departments are directly attached to the general management of the company.
The research and development functions as a daughter company of the Nutreco group but located in Stavanger near Skretting’s
global headquarters. Its major competitor in the fish feed market is Ewos (Cermaq, Norway) who operates in the same markets
as Skretting. Other competitors include Alitec (Provimi Group, Netherlands) and Biomar (Denmark. Generally, the feed
industry faces competition from other animal feed producers, competing for the same scarce raw materials such as fish meal
and especially for grains(carbohydrate- used to produce ethanol and vegetable oil sources used to produce biodiesel ) even
humans using some fish meal and fish oil sources for food.
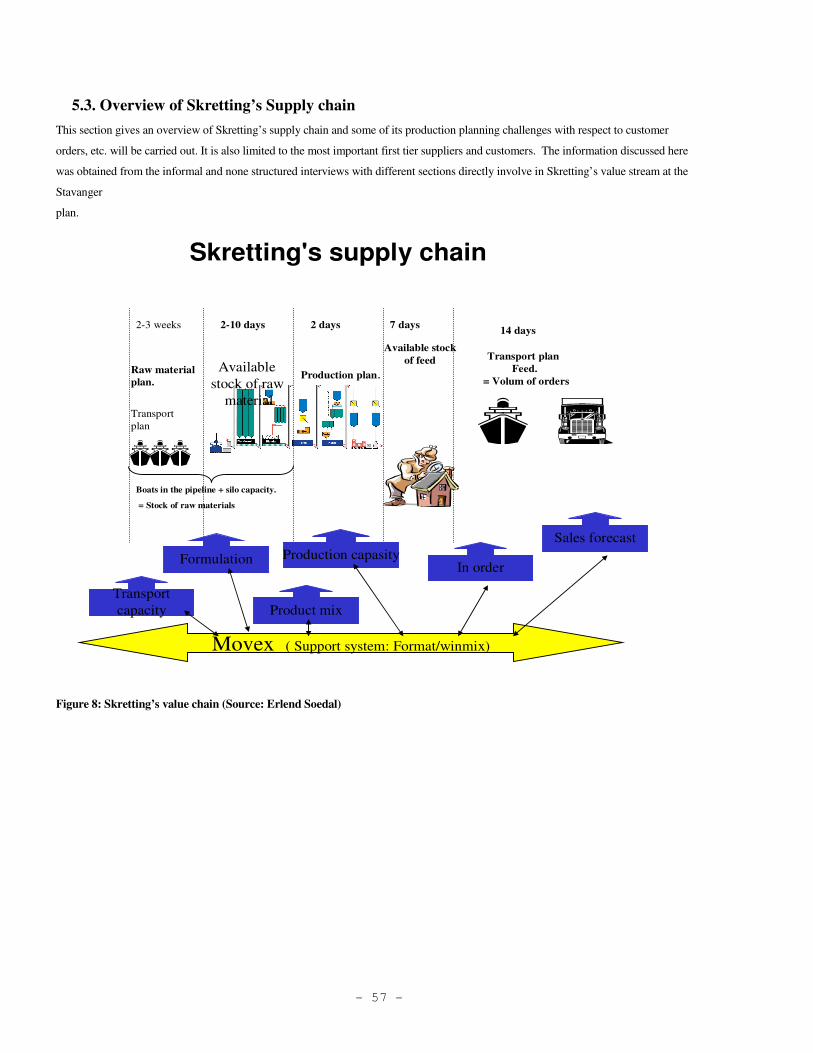
- 57 -
5.3. Overview of Skretting’s Supply chain
This section gives an overview of Skretting’s supply chain and some of its production planning challenges with respect to customer
orders, etc. will be carried out. It is also limited to the most important first tier suppliers and customers. The information discussed here
was obtained from the informal and none structured interviews with different sections directly involve in Skretting’s value stream at the
Stavanger
plan.
Skretting's supply chain
2-3 weeks 2-10 days 2 days 7 days
Raw material
plan.
Transportplan
Boats in the pipeline + silo capacity.
= Stock of raw materials
Availablestock of raw
material
Production plan.
Available stock
of feed Transport plan
Feed.
= Volum of orders
FormulationIn order
Sales forecast
Product mix
Production capasity
Transportcapacity
14 days
Movex ( Support system: Format/winmix)
Figure 8: Skretting’s value chain (Source: Erlend Soedal)
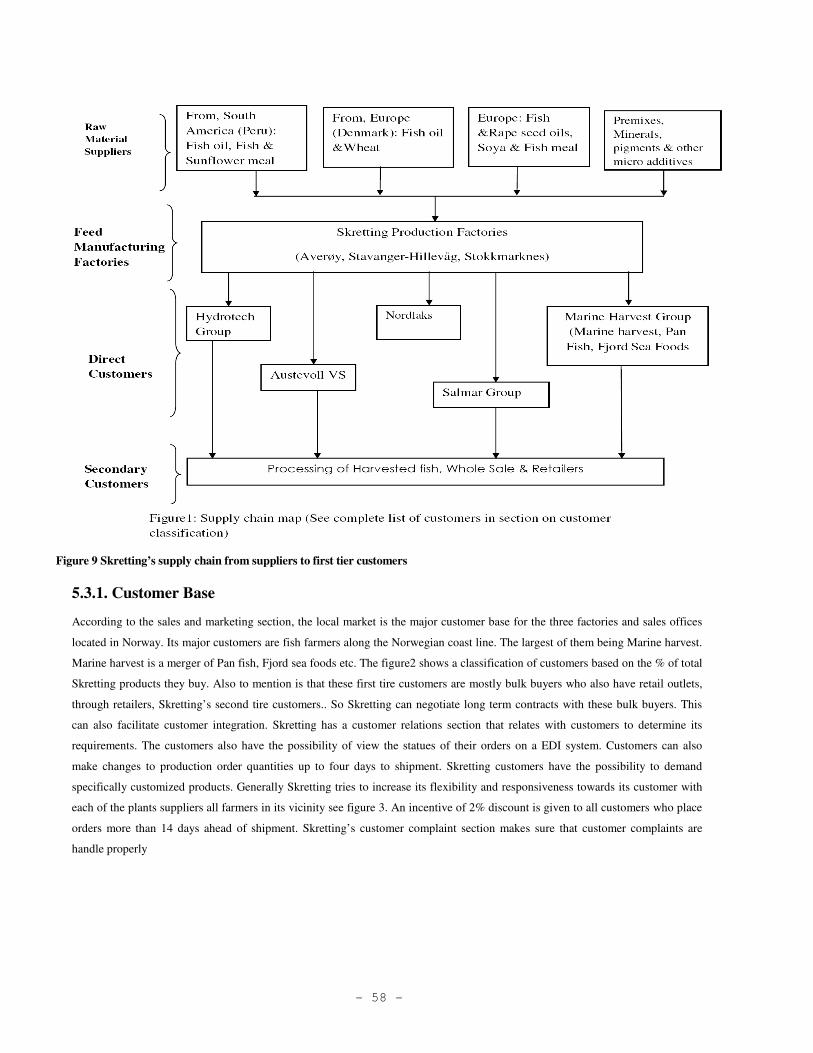
- 58 -
Figure 9 Skretting’s supply chain from suppliers to first tier customers
5.3.1. Customer Base
According to the sales and marketing section, the local market is the major customer base for the three factories and sales offices
located in Norway. Its major customers are fish farmers along the Norwegian coast line. The largest of them being Marine harvest.
Marine harvest is a merger of Pan fish, Fjord sea foods etc. The figure2 shows a classification of customers based on the % of total
Skretting products they buy. Also to mention is that these first tire customers are mostly bulk buyers who also have retail outlets,
through retailers, Skretting’s second tire customers.. So Skretting can negotiate long term contracts with these bulk buyers. This
can also facilitate customer integration. Skretting has a customer relations section that relates with customers to determine its
requirements. The customers also have the possibility of view the statues of their orders on a EDI system. Customers can also
make changes to production order quantities up to four days to shipment. Skretting customers have the possibility to demand
specifically customized products. Generally Skretting tries to increase its flexibility and responsiveness towards its customer with
each of the plants suppliers all farmers in its vicinity see figure 3. An incentive of 2% discount is given to all customers who place
orders more than 14 days ahead of shipment. Skretting’s customer complaint section makes sure that customer complaints are
handle properly
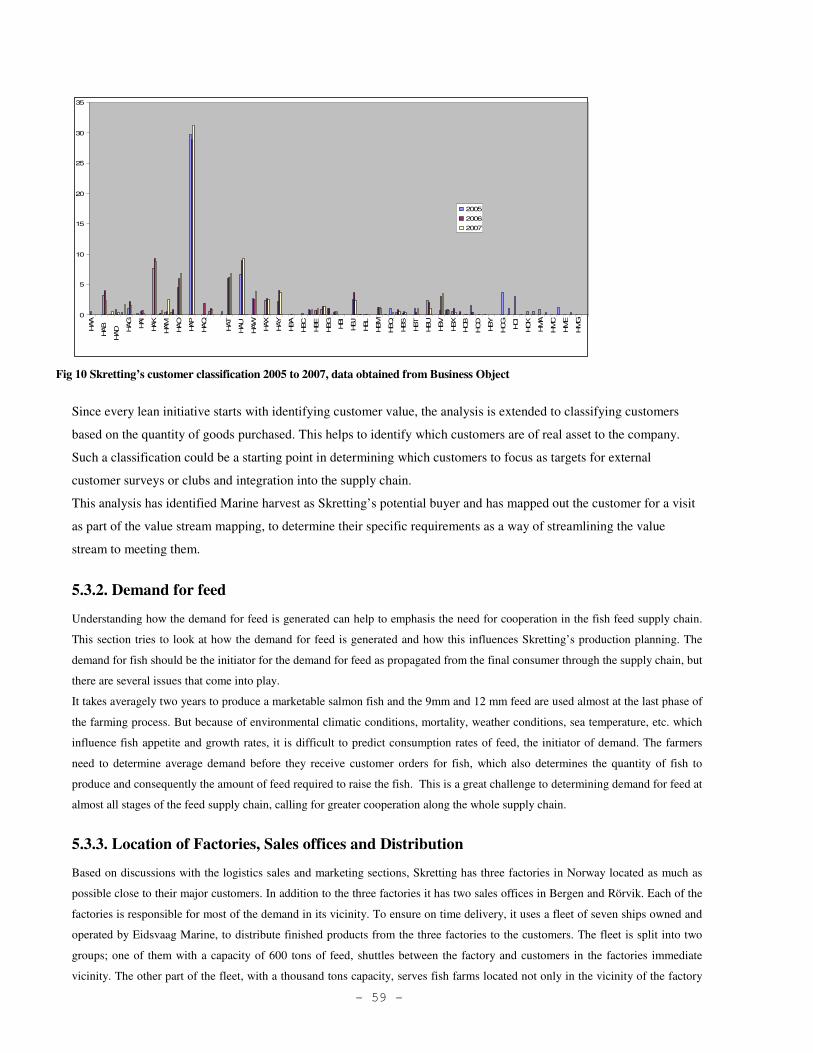
- 59 -
0
5
10
15
20
25
30
35
HAA
HAB
HAD
HAG
HAI
HAK
HAM
HAO
HAP
HAQ
HAT
HAU
HAW
HAX
HAY
HBA
HBC
HBE
HBG
HBI
HBJ
HBL
HBM
HBQ
HBS
HBT
HBU
HBV
HBX
HCB
HCD
HBY
HCG
HCI
HCK
HM
A
HM
C
HM
E
HM
G
2005
2006
2007
Fig 10 Skretting’s customer classification 2005 to 2007, data obtained from Business Object
Since every lean initiative starts with identifying customer value, the analysis is extended to classifying customers
based on the quantity of goods purchased. This helps to identify which customers are of real asset to the company.
Such a classification could be a starting point in determining which customers to focus as targets for external
customer surveys or clubs and integration into the supply chain.
This analysis has identified Marine harvest as Skretting’s potential buyer and has mapped out the customer for a visit
as part of the value stream mapping, to determine their specific requirements as a way of streamlining the value
stream to meeting them.
5.3.2. Demand for feed
Understanding how the demand for feed is generated can help to emphasis the need for cooperation in the fish feed supply chain.
This section tries to look at how the demand for feed is generated and how this influences Skretting’s production planning. The
demand for fish should be the initiator for the demand for feed as propagated from the final consumer through the supply chain, but
there are several issues that come into play.
It takes averagely two years to produce a marketable salmon fish and the 9mm and 12 mm feed are used almost at the last phase of
the farming process. But because of environmental climatic conditions, mortality, weather conditions, sea temperature, etc. which
influence fish appetite and growth rates, it is difficult to predict consumption rates of feed, the initiator of demand. The farmers
need to determine average demand before they receive customer orders for fish, which also determines the quantity of fish to
produce and consequently the amount of feed required to raise the fish. This is a great challenge to determining demand for feed at
almost all stages of the feed supply chain, calling for greater cooperation along the whole supply chain.
5.3.3. Location of Factories, Sales offices and Distribution
Based on discussions with the logistics sales and marketing sections, Skretting has three factories in Norway located as much as
possible close to their major customers. In addition to the three factories it has two sales offices in Bergen and Rörvik. Each of the
factories is responsible for most of the demand in its vicinity. To ensure on time delivery, it uses a fleet of seven ships owned and
operated by Eidsvaag Marine, to distribute finished products from the three factories to the customers. The fleet is split into two
groups; one of them with a capacity of 600 tons of feed, shuttles between the factory and customers in the factories immediate
vicinity. The other part of the fleet, with a thousand tons capacity, serves fish farms located not only in the vicinity of the factory
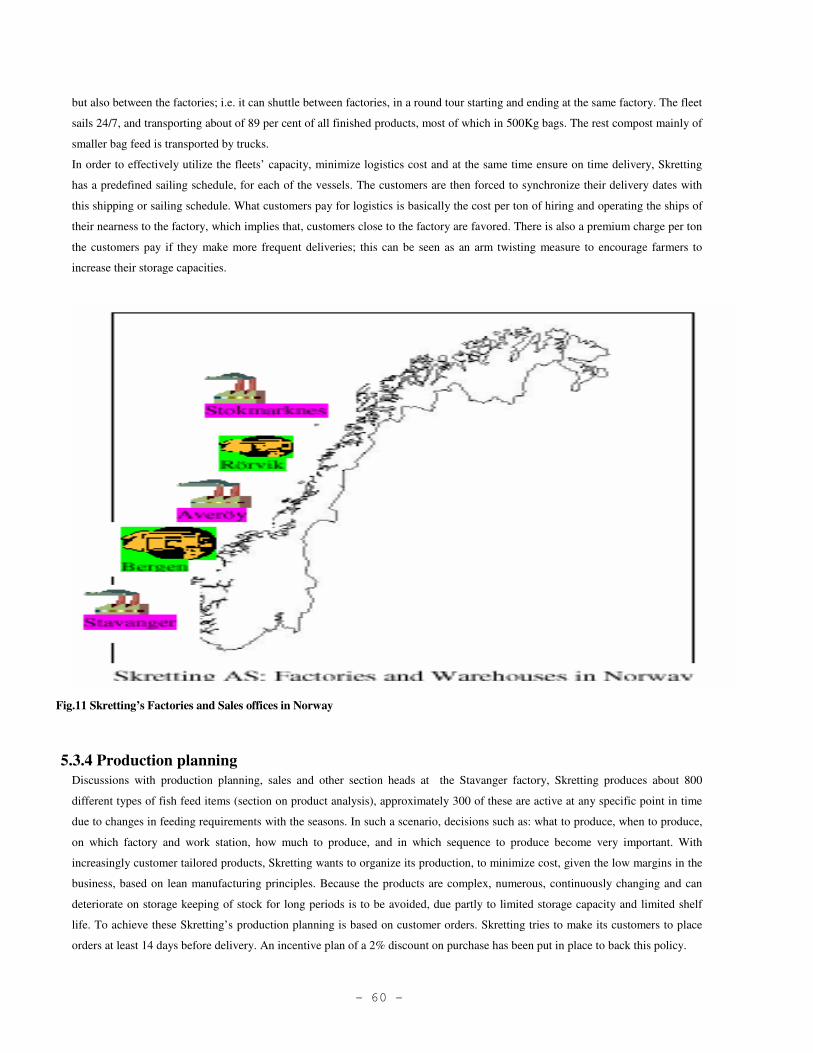
- 60 -
but also between the factories; i.e. it can shuttle between factories, in a round tour starting and ending at the same factory. The fleet
sails 24/7, and transporting about of 89 per cent of all finished products, most of which in 500Kg bags. The rest compost mainly of
smaller bag feed is transported by trucks.
In order to effectively utilize the fleets’ capacity, minimize logistics cost and at the same time ensure on time delivery, Skretting
has a predefined sailing schedule, for each of the vessels. The customers are then forced to synchronize their delivery dates with
this shipping or sailing schedule. What customers pay for logistics is basically the cost per ton of hiring and operating the ships of
their nearness to the factory, which implies that, customers close to the factory are favored. There is also a premium charge per ton
the customers pay if they make more frequent deliveries; this can be seen as an arm twisting measure to encourage farmers to
increase their storage capacities.
Fig.11 Skretting’s Factories and Sales offices in Norway
5.3.4 Production planning
Discussions with production planning, sales and other section heads at the Stavanger factory, Skretting produces about 800
different types of fish feed items (section on product analysis), approximately 300 of these are active at any specific point in time
due to changes in feeding requirements with the seasons. In such a scenario, decisions such as: what to produce, when to produce,
on which factory and work station, how much to produce, and in which sequence to produce become very important. With
increasingly customer tailored products, Skretting wants to organize its production, to minimize cost, given the low margins in the
business, based on lean manufacturing principles. Because the products are complex, numerous, continuously changing and can
deteriorate on storage keeping of stock for long periods is to be avoided, due partly to limited storage capacity and limited shelf
life. To achieve these Skretting’s production planning is based on customer orders. Skretting tries to make its customers to place
orders at least 14 days before delivery. An incentive plan of a 2% discount on purchase has been put in place to back this policy.
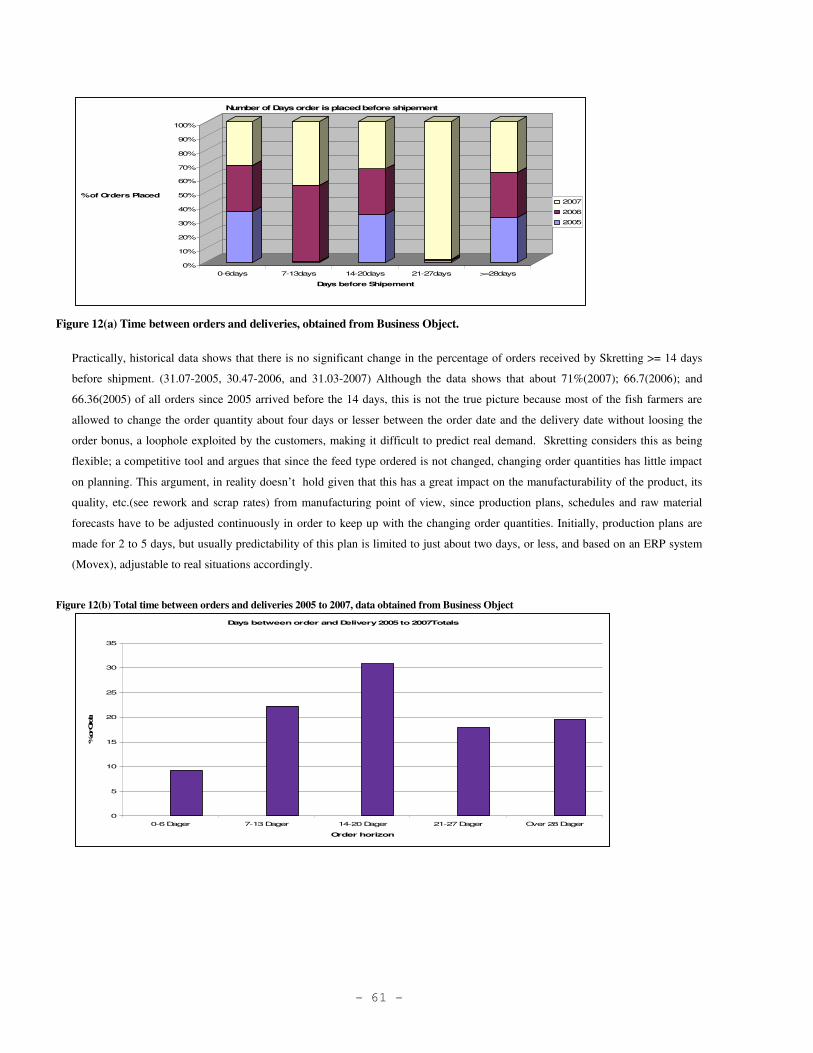
- 61 -
0%
10%
20%
30%
40%
50%
60%
70%
80%
90%
100%
% of Orders Placed
0-6days 7-13days 14-20days 21-27days >=28days
Days before Shipement
Number of Days order is placed before shipement
2007
2006
2005
Figure 12(a) Time between orders and deliveries, obtained from Business Object.
Practically, historical data shows that there is no significant change in the percentage of orders received by Skretting >= 14 days
before shipment. (31.07-2005, 30.47-2006, and 31.03-2007) Although the data shows that about 71%(2007); 66.7(2006); and
66.36(2005) of all orders since 2005 arrived before the 14 days, this is not the true picture because most of the fish farmers are
allowed to change the order quantity about four days or lesser between the order date and the delivery date without loosing the
order bonus, a loophole exploited by the customers, making it difficult to predict real demand. Skretting considers this as being
flexible; a competitive tool and argues that since the feed type ordered is not changed, changing order quantities has little impact
on planning. This argument, in reality doesn’t hold given that this has a great impact on the manufacturability of the product, its
quality, etc.(see rework and scrap rates) from manufacturing point of view, since production plans, schedules and raw material
forecasts have to be adjusted continuously in order to keep up with the changing order quantities. Initially, production plans are
made for 2 to 5 days, but usually predictability of this plan is limited to just about two days, or less, and based on an ERP system
(Movex), adjustable to real situations accordingly.
Figure 12(b) Total time between orders and deliveries 2005 to 2007, data obtained from Business Object
Days between order and Delivery 2005 to 2007Totals
0
5
10
15
20
25
30
35
0-6 Dager 7-13 Dager 14-20 Dager 21-27 Dager Over 28 Dager
Order horizon
% or Orders
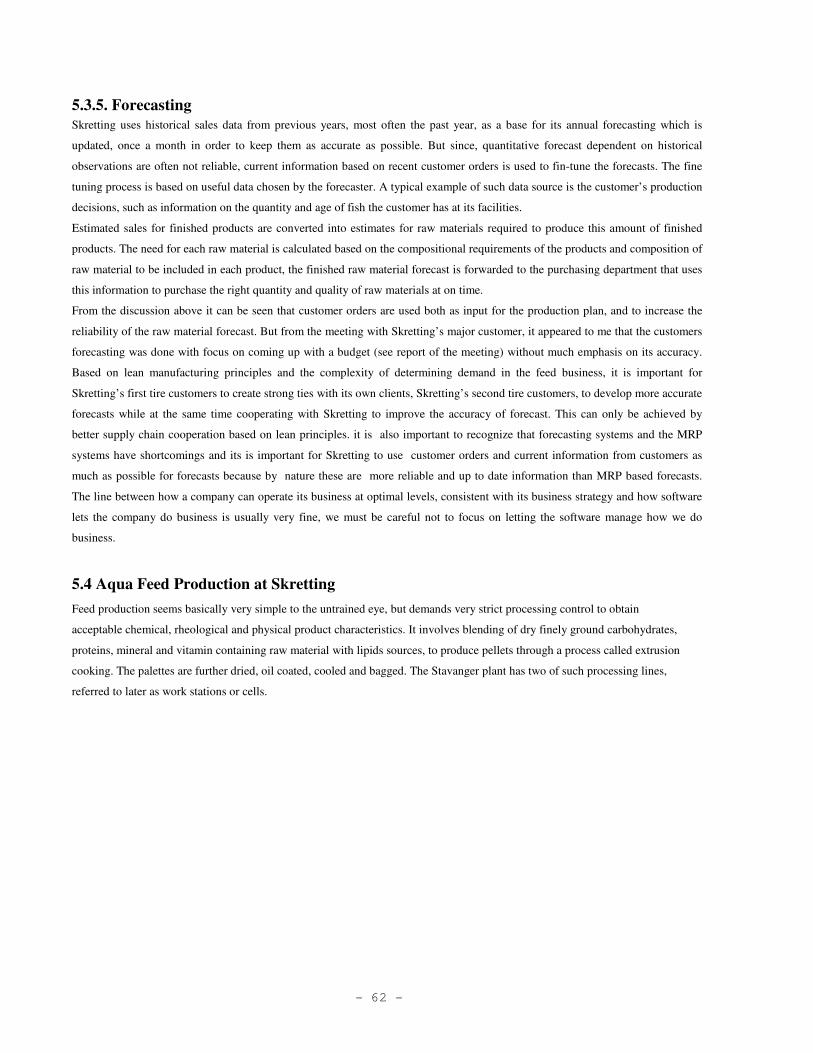
- 62 -
5.3.5. Forecasting
Skretting uses historical sales data from previous years, most often the past year, as a base for its annual forecasting which is
updated, once a month in order to keep them as accurate as possible. But since, quantitative forecast dependent on historical
observations are often not reliable, current information based on recent customer orders is used to fin-tune the forecasts. The fine
tuning process is based on useful data chosen by the forecaster. A typical example of such data source is the customer’s production
decisions, such as information on the quantity and age of fish the customer has at its facilities.
Estimated sales for finished products are converted into estimates for raw materials required to produce this amount of finished
products. The need for each raw material is calculated based on the compositional requirements of the products and composition of
raw material to be included in each product, the finished raw material forecast is forwarded to the purchasing department that uses
this information to purchase the right quantity and quality of raw materials at on time.
From the discussion above it can be seen that customer orders are used both as input for the production plan, and to increase the
reliability of the raw material forecast. But from the meeting with Skretting’s major customer, it appeared to me that the customers
forecasting was done with focus on coming up with a budget (see report of the meeting) without much emphasis on its accuracy.
Based on lean manufacturing principles and the complexity of determining demand in the feed business, it is important for
Skretting’s first tire customers to create strong ties with its own clients, Skretting’s second tire customers, to develop more accurate
forecasts while at the same time cooperating with Skretting to improve the accuracy of forecast. This can only be achieved by
better supply chain cooperation based on lean principles. it is also important to recognize that forecasting systems and the MRP
systems have shortcomings and its is important for Skretting to use customer orders and current information from customers as
much as possible for forecasts because by nature these are more reliable and up to date information than MRP based forecasts.
The line between how a company can operate its business at optimal levels, consistent with its business strategy and how software
lets the company do business is usually very fine, we must be careful not to focus on letting the software manage how we do
business.
5.4 Aqua Feed Production at Skretting
Feed production seems basically very simple to the untrained eye, but demands very strict processing control to obtain
acceptable chemical, rheological and physical product characteristics. It involves blending of dry finely ground carbohydrates,
proteins, mineral and vitamin containing raw material with lipids sources, to produce pellets through a process called extrusion
cooking. The palettes are further dried, oil coated, cooled and bagged. The Stavanger plant has two of such processing lines,
referred to later as work stations or cells.
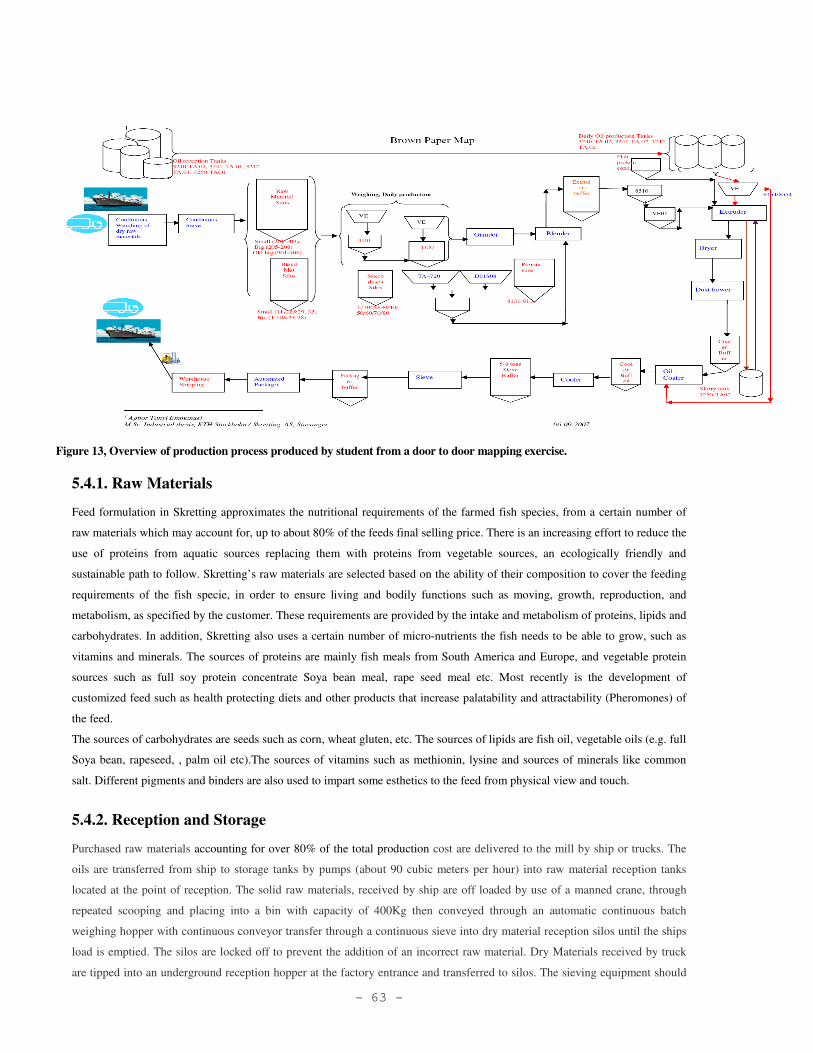
- 63 -
Figure 13, Overview of production process produced by student from a door to door mapping exercise.
5.4.1. Raw Materials
Feed formulation in Skretting approximates the nutritional requirements of the farmed fish species, from a certain number of
raw materials which may account for, up to about 80% of the feeds final selling price. There is an increasing effort to reduce the
use of proteins from aquatic sources replacing them with proteins from vegetable sources, an ecologically friendly and
sustainable path to follow. Skretting’s raw materials are selected based on the ability of their composition to cover the feeding
requirements of the fish specie, in order to ensure living and bodily functions such as moving, growth, reproduction, and
metabolism, as specified by the customer. These requirements are provided by the intake and metabolism of proteins, lipids and
carbohydrates. In addition, Skretting also uses a certain number of micro-nutrients the fish needs to be able to grow, such as
vitamins and minerals. The sources of proteins are mainly fish meals from South America and Europe, and vegetable protein
sources such as full soy protein concentrate Soya bean meal, rape seed meal etc. Most recently is the development of
customized feed such as health protecting diets and other products that increase palatability and attractability (Pheromones) of
the feed.
The sources of carbohydrates are seeds such as corn, wheat gluten, etc. The sources of lipids are fish oil, vegetable oils (e.g. full
Soya bean, rapeseed, , palm oil etc).The sources of vitamins such as methionin, lysine and sources of minerals like common
salt. Different pigments and binders are also used to impart some esthetics to the feed from physical view and touch.
5.4.2. Reception and Storage
Purchased raw materials accounting for over 80% of the total production cost are delivered to the mill by ship or trucks. The
oils are transferred from ship to storage tanks by pumps (about 90 cubic meters per hour) into raw material reception tanks
located at the point of reception. The solid raw materials, received by ship are off loaded by use of a manned crane, through
repeated scooping and placing into a bin with capacity of 400Kg then conveyed through an automatic continuous batch
weighing hopper with continuous conveyor transfer through a continuous sieve into dry material reception silos until the ships
load is emptied. The silos are locked off to prevent the addition of an incorrect raw material. Dry Materials received by truck
are tipped into an underground reception hopper at the factory entrance and transferred to silos. The sieving equipment should
- 64 -
be especially suitable for sieving finely ground, fatty fish meal substances to separate non soluble, oversize particles that can
clog the die holes during the extrusion process such as bones, scales, etc.
5.4.3. Grinding and Mixing
Based on received orders and the production plan, a base mixture for the recipes to be produced is prepared by conveying specific
weighed quantities of the different component raw materials from the raw material reception silos, weighing in three tone batches,
finely grinding ( to 100 to 250 microns), blending them with weighed quantities of other micro additives (minerals and premixes-
Vitamins) and storing the dry mix into three 40 tons daily production buffer silos prior to the Extrusion. This mix provides
improved physical (particle size) and nutritional (composition) quality of the finished feed. The final particle size has an effect on
the digestibility of the feed
5.4.4. Extrusion Process
The extrusion process is composed of two phases; first the preconditioning process and then the extrusion-pressing process.
Both processes involve heat treatment of the mixture, referred to as pre and post cooking. These transform the solid components
into a visco-elastic mass which virtually can be pressed through any size of die orifice. Starchy material in the dry mix (mainly
from starchy seeds like wheat or wheat flour and corn) are cooked or gelatinized, while proteins in the mix are plasticised. This
forms the matrix that holds the structure of the pellet and maintains water stability. The precooking process involves injecting
hot water and live steam into the hydrophilic yet stable mix, preheating to about 95 °C to start the gelatinisation of the starch in
the mix, this is the preconditioning. The high pressures and mechanical shear forces of the extruder raise the temperatures of the
mixture to about 120 to 140 °C, but the injection of water into the mix maintains the temperature of the mix in the extruder at
76 to 95 degrees, which further gelatinizes the starch to form the pellet. The mixture is held around this temperature at given
moisture level to complete the cooking process. It is very important to control the steam pressure of the hot dough mass that
results from the cooking process while it is still inside the extruder, this enables the density of the final product; sinking or
floating characteristics to be controlled across a wide range without compromising the degree of cooking. The key parameters
for obtaining the various objectives of extrusion are water, process oil, temperature, shear (mechanical energy dissipation) and
time. Mechanical shearing also disintegrates the soft, granular macromolecules into a highly viscous fluid. The dissipation of
specific mechanical energy increases the temperature of the dough and changes its rheological properties. Steam pressure is the
driving force and the viscosity (which depends on mechanical shear) the resisting force for expansion. By regulating these two
critical to process parameters, the product density and its buoyancy can be regulated over a very wide range. Beside the solid
composition, fat and water content, the viscosity of the dough is influenced by shear and temperature. It can therefore greatly be
influenced by the specific mechanical energy in-put. Critical to Extrusion process: Resident time in extruder, die, pressure,
extruder Temperature, Steam pressure, dough viscosity, assuming constant raw material composition. The quantity of material
and resident time in the extrusion process depends on the preset quantity of the mix to be run. A buffer placed in front of the
precondition is used to automatically control the amount of mix allowed into the extrusion process at each given time,
depending on the run size and the speed of the mixing determines the resident time. Shaping and cutting, are also very
important at this extruder stage. The hot product melt has to be depressurized, shaped, and cut. Evaporating moisture, hot air
addition and good aspiration are needed in order to prevent condensation and agglomeration f the products. The cutting area is
placed under vacuum, to favor the formation of a porous pellet.
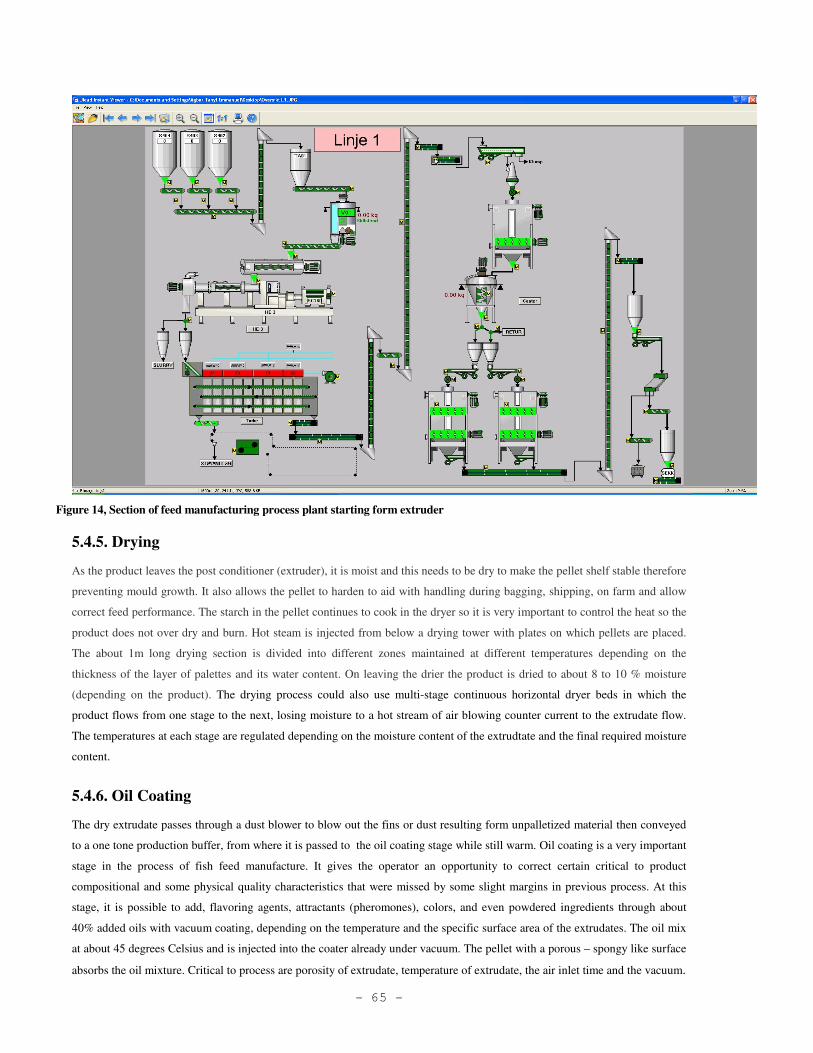
- 65 -
Figure 14, Section of feed manufacturing process plant starting form extruder
5.4.5. Drying
As the product leaves the post conditioner (extruder), it is moist and this needs to be dry to make the pellet shelf stable therefore
preventing mould growth. It also allows the pellet to harden to aid with handling during bagging, shipping, on farm and allow
correct feed performance. The starch in the pellet continues to cook in the dryer so it is very important to control the heat so the
product does not over dry and burn. Hot steam is injected from below a drying tower with plates on which pellets are placed.
The about 1m long drying section is divided into different zones maintained at different temperatures depending on the
thickness of the layer of palettes and its water content. On leaving the drier the product is dried to about 8 to 10 % moisture
(depending on the product). The drying process could also use multi-stage continuous horizontal dryer beds in which the
product flows from one stage to the next, losing moisture to a hot stream of air blowing counter current to the extrudate flow.
The temperatures at each stage are regulated depending on the moisture content of the extrudtate and the final required moisture
content.
5.4.6. Oil Coating
The dry extrudate passes through a dust blower to blow out the fins or dust resulting form unpalletized material then conveyed
to a one tone production buffer, from where it is passed to the oil coating stage while still warm. Oil coating is a very important
stage in the process of fish feed manufacture. It gives the operator an opportunity to correct certain critical to product
compositional and some physical quality characteristics that were missed by some slight margins in previous process. At this
stage, it is possible to add, flavoring agents, attractants (pheromones), colors, and even powdered ingredients through about
40% added oils with vacuum coating, depending on the temperature and the specific surface area of the extrudates. The oil mix
at about 45 degrees Celsius and is injected into the coater already under vacuum. The pellet with a porous – spongy like surface
absorbs the oil mixture. Critical to process are porosity of extrudate, temperature of extrudate, the air inlet time and the vacuum.
- 66 -
5.4.7. Cooling and packaging
Cooling actually starts at the dust blowing, as the dust is blown off the product prior to coating. It prevents cooking during
storage from carry over heat and makes the product shelf life stable. If the pellet is too hot when bagged then condensation can
form in the bag and this will lead to mould production. The cooling process involves injecting air at ambient temperature from
below a cooling tower counter current to a down flowing stream of dry coated pellet stream. Critical to process characteristics
are porosity of extrudate, temperature of extrudate and the retention time in cooler. The capacity and resident times or cycle
times of the cooling processes depend on the temperature of air injected into the cooler, the particle size and the size of the run.
My efforts at measuring the resident time during cooling failed, due to the way the operation is designed and run
5.4.8. Sieving and Packaging
The cooled pellets are conveyed to a bagging buffer silo, through a continuous final sieving process. The sieve is changed each
time a new product dimension is being produced. This reduces the level of dust and fines that escaped the dust blowing process.
At Stavanger, feed is bagged into 500kg bags and sent to the designated warehouse. Bagged feed is designed to be stored in
cool dry conditions. While the bag structure is such that they are water resistant, small holes in the bag designed to allow
product to breath' prevent them from being waterproof.
5.4.9. Warehousing, Handling and shipping, Storage
The feed in Skretting is stored in an open storage at ambient temperatures, sufficiently low at this season to prevent
condensation inside the storage bags. Shipping is done by conveying the bags with forklifts four bags per run, close to the ship
at anchor point and then use of a crane to lift and place into the ship. At the customer’s terminal, the bags are cut open and its
content vacuum sucked into the customer’s storage.
- 67 -
6.0 Skretting Stavanger, Historical Data Survey
A major stage in this lean assessment was an analysis of historical data collected from operations documented on Business Object.
The aim was to map the materials, products, their value contribution and some production performance indicators for the process
relating to the products being produced. This was done by adopting and adapting concepts proposed by John Bicheno(1999), Nigel
Woods(2004), Askin et al(2001) etc[21, 28, 95]. These include the, product family analysis, quality filter map, inventory ABC,
Product quantity analysis etc.
6.1. Inventory ABC [21, 28, 95]
Inventory ABC here has nothing to do with activity based costing; it is used as proposed by John Bicheno[21], Askin et
al(2001)[95]. It is the grouping of materials or products based on their activity, rate of use or production. This can be used as an aid
to inventory control of raw materials, products or parts. From production perspective it can serve as a guide on how to manage pull
and push systems when combined with the runners, repeaters and strangers construct. Materials classified as “A”, are of a small
percentage but constitute about 80-90% of activity and cost. It is important to carefully monitor their stocks, identify cost
parameters and track their statues. The “B” materials are intermediate and the “C”, are low cost. If we use, lead time, cost and
usage to classify raw materials, “A” materials are those of high cost with short lead times and can be locally sourced. This can be
managed using a just in time, pull management system since the suppliers are local. The “B” are those next to “A”, in terms of lead
time and geographical location of the suppliers. They can be managed on a just in time pull system but do not need strict control.
At Skretting, after demand forecast for raw materials, purchase is done “on the spot” market for suppliers within Scandinavia. For
some few suppliers located far, e.g. South America, based on they have a framework agreement stretching over a year at cooperate
level, with renegotiations every 3 months. With suppliers guaranteeing that raw materials are in accordance with predefined
quality standards within agreed downwards deviations. Raw materials are ordered with 2 to 4 weeks lead time. The average storage
capacity for the various products is about 31 and 26 days. The real transportation time from continental Europe to the factory at
Stokkmarknes takes about 5 days, or sometimes less to the other factories, since these are closer to the loading ports. Therefore,
locally sourced materials which constitute the high value and most used can be ordered based on the pull system. Properly
managed inventory management avoids the demurrage of 30 to 40 thousand a day, charges paid by Skretting, when off loading or
raw material reception is delayed. Long lead times between order and the arrival of the consignment, unreliable forecasts, and raw-
material-quality-gaps may sometimes result to insufficient free storage capacity for the cargo, and the vessel has to wait.
Classifying the raw materials as above can serve as a vital tool to face such challenges.
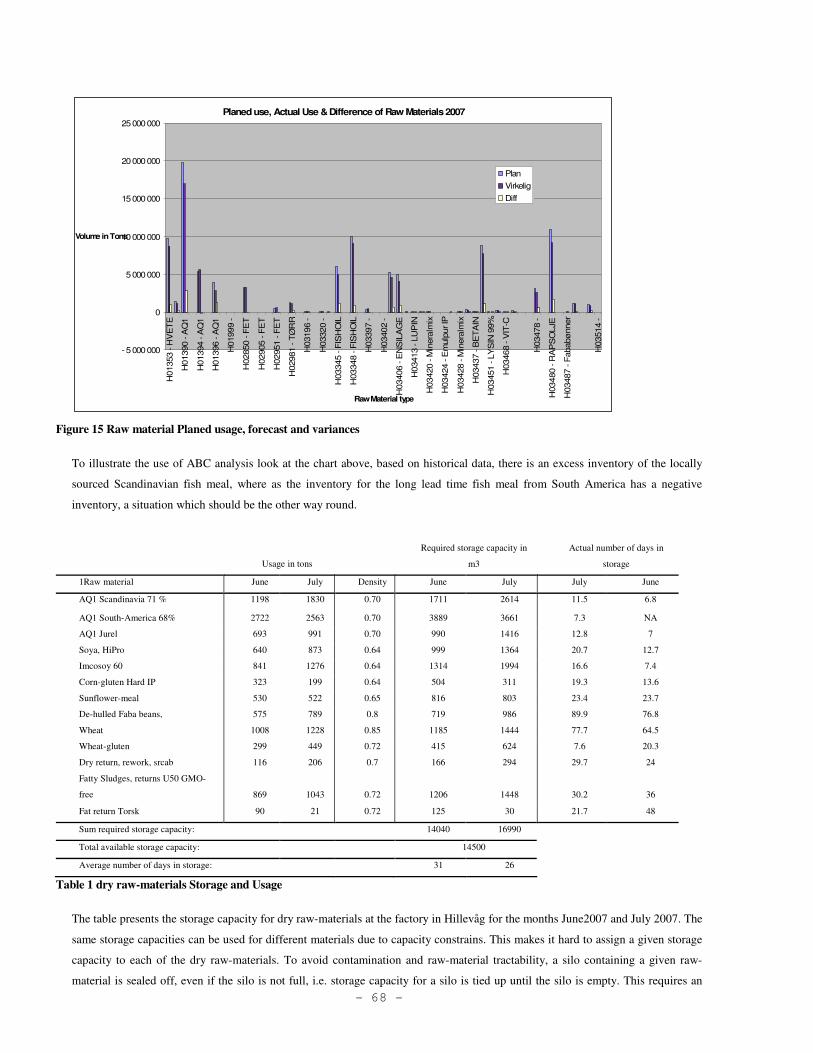
- 68 -
Planed use, Actual Use & Difference of Raw Materials 2007
- 5 000 000
0
5 000 000
10 000 000
15 000 000
20 000 000
25 000 000
H01353 - H
VE
TE
H01390 - A
Q1
H01394 - A
Q1
H01396 - A
Q1
H01999 -
H02850 - F
ET
H02905 - F
ET
H02951 - F
ET
H02981 - T
ØR
R
H03196 -
H03320 -
H03345 - F
ISH
OIL
H03348 - F
ISH
OIL
H03397 -
H03402 -
H03406 - E
NS
ILA
GE
H03413 - L
UP
IN
H03420 - M
inera
lmix
H03424 - E
mulp
ur IP
H03428 - M
inera
lmix
H03437 - B
ET
AIN
H03451 - L
YS
IN 9
9%
H03468 - V
IT-C
H03478 -
H03480 - R
AP
SO
LJE
H03487 - F
ababø
nner
H03514 -
Raw Material type
Volume in Tons
Plan
Virkelig
Diff
Figure 15 Raw material Planed usage, forecast and variances
To illustrate the use of ABC analysis look at the chart above, based on historical data, there is an excess inventory of the locally
sourced Scandinavian fish meal, where as the inventory for the long lead time fish meal from South America has a negative
inventory, a situation which should be the other way round.
Usage in tons
Required storage capacity in
m3
Actual number of days in
storage
1Raw material June July Density June July July June
AQ1 Scandinavia 71 % 1198 1830 0.70 1711 2614 11.5 6.8
AQ1 South-America 68% 2722 2563 0.70 3889 3661 7.3 NA
AQ1 Jurel 693 991 0.70 990 1416 12.8 7
Soya, HiPro 640 873 0.64 999 1364 20.7 12.7
Imcosoy 60 841 1276 0.64 1314 1994 16.6 7.4
Corn-gluten Hard IP 323 199 0.64 504 311 19.3 13.6
Sunflower-meal 530 522 0.65 816 803 23.4 23.7
De-hulled Faba beans, 575 789 0.8 719 986 89.9 76.8
Wheat 1008 1228 0.85 1185 1444 77.7 64.5
Wheat-gluten 299 449 0.72 415 624 7.6 20.3
Dry return, rework, srcab 116 206 0.7 166 294 29.7 24
Fatty Sludges, returns U50 GMO-
free 869 1043 0.72 1206 1448 30.2 36
Fat return Torsk 90 21 0.72 125 30 21.7 48
Sum required storage capacity: 14040 16990
Total available storage capacity: 14500
Average number of days in storage: 31 26
Table 1 dry raw-materials Storage and Usage
The table presents the storage capacity for dry raw-materials at the factory in Hillevåg for the months June2007 and July 2007. The
same storage capacities can be used for different materials due to capacity constrains. This makes it hard to assign a given storage
capacity to each of the dry raw-materials. To avoid contamination and raw-material tractability, a silo containing a given raw-
material is sealed off, even if the silo is not full, i.e. storage capacity for a silo is tied up until the silo is empty. This requires an
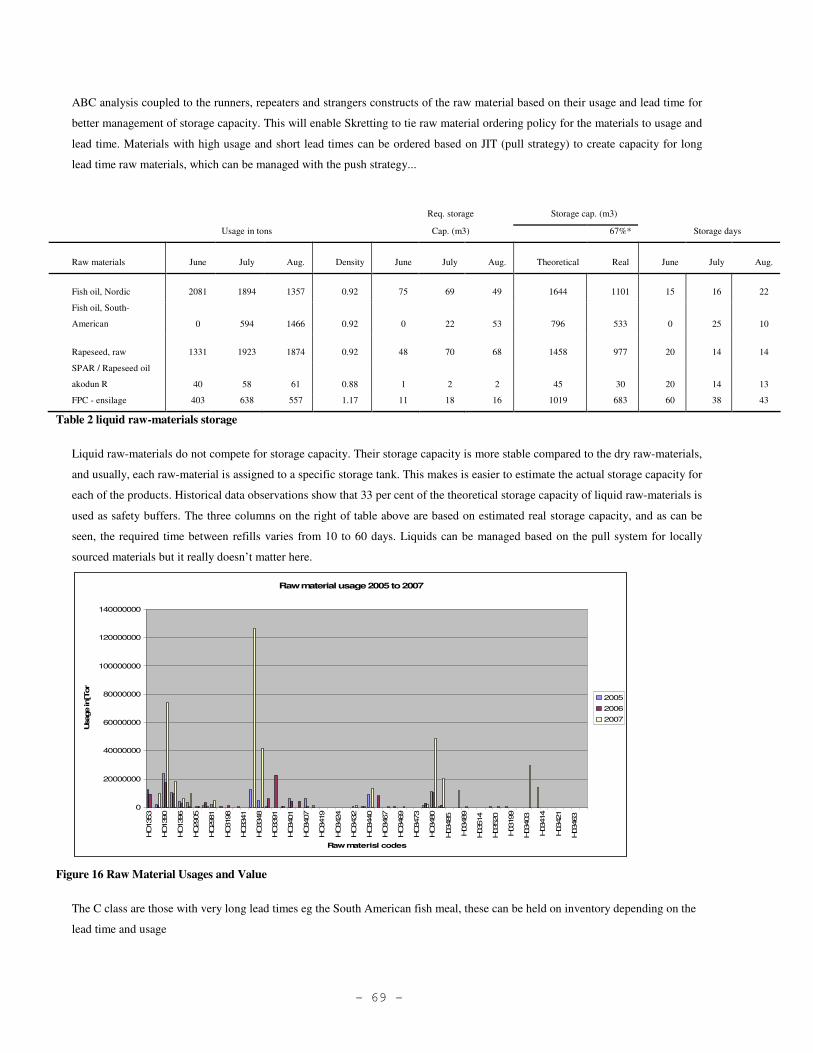
- 69 -
ABC analysis coupled to the runners, repeaters and strangers constructs of the raw material based on their usage and lead time for
better management of storage capacity. This will enable Skretting to tie raw material ordering policy for the materials to usage and
lead time. Materials with high usage and short lead times can be ordered based on JIT (pull strategy) to create capacity for long
lead time raw materials, which can be managed with the push strategy...
Table 2 liquid raw-materials storage
Liquid raw-materials do not compete for storage capacity. Their storage capacity is more stable compared to the dry raw-materials,
and usually, each raw-material is assigned to a specific storage tank. This makes is easier to estimate the actual storage capacity for
each of the products. Historical data observations show that 33 per cent of the theoretical storage capacity of liquid raw-materials is
used as safety buffers. The three columns on the right of table above are based on estimated real storage capacity, and as can be
seen, the required time between refills varies from 10 to 60 days. Liquids can be managed based on the pull system for locally
sourced materials but it really doesn’t matter here.
Raw material usage 2005 to 2007
0
20000000
40000000
60000000
80000000
100000000
120000000
140000000
HO
1353
HO
1390
HO
1396
HO
2905
HO
2981
HO
3198
HO
3341
HO
3348
HO
3391
HO
3401
HO
3407
HO
3419
HO
3424
HO
3432
HO
3440
HO
3467
HO
3469
HO
3473
HO
3480
H03485
H03489
H03514
H03520
H03199
H03403
H03414
H03421
H03463
Raw materisl codes
Usage in[T
ons]
2005
2006
2007
Figure 16 Raw Material Usages and Value
The C class are those with very long lead times eg the South American fish meal, these can be held on inventory depending on the
lead time and usage
Req. storage Storage cap. (m3)
Usage in tons Cap. (m3) 67%* Storage days
Raw materials June July Aug. Density June July Aug. Theoretical Real June July Aug.
Fish oil, Nordic 2081 1894 1357 0.92 75 69 49 1644 1101 15 16 22
Fish oil, South-
American 0 594 1466 0.92 0 22 53 796 533 0 25 10
Rapeseed, raw 1331 1923 1874 0.92 48 70 68 1458 977 20 14 14
SPAR / Rapeseed oil
akodun R 40 58 61 0.88 1 2 2 45 30 20 14 13
FPC - ensilage 403 638 557 1.17 11 18 16 1019 683 60 38 43
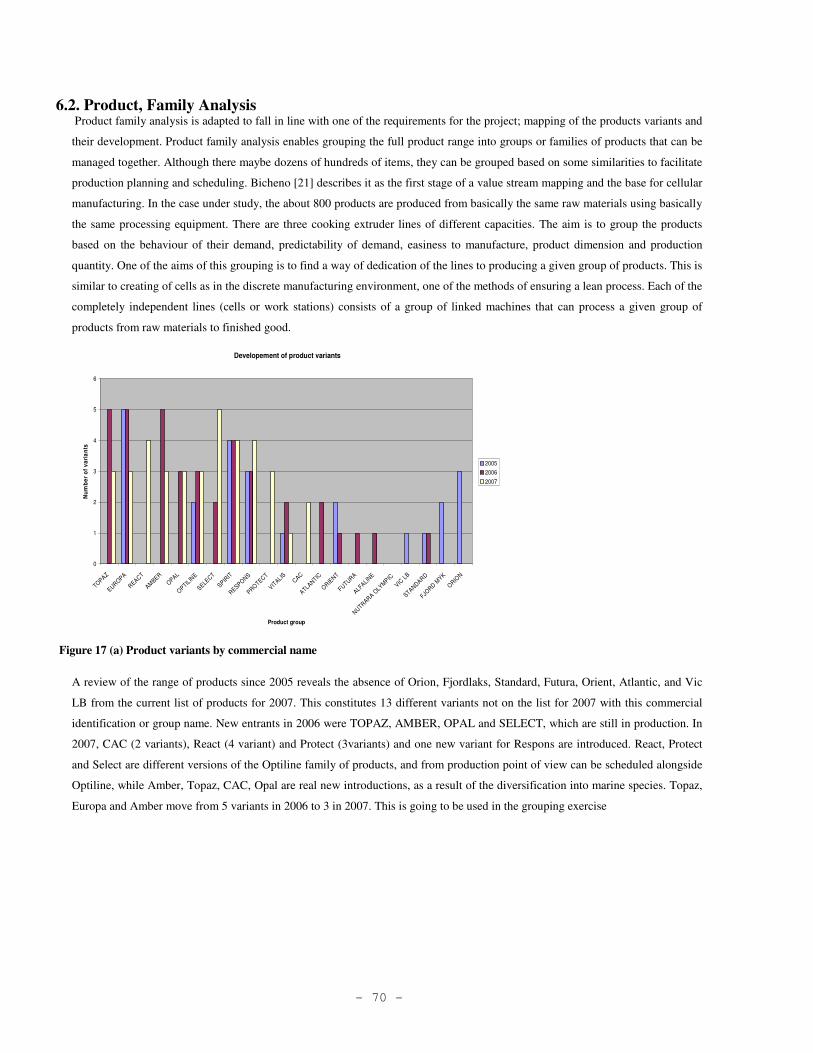
- 70 -
6.2. Product, Family Analysis Product family analysis is adapted to fall in line with one of the requirements for the project; mapping of the products variants and
their development. Product family analysis enables grouping the full product range into groups or families of products that can be
managed together. Although there maybe dozens of hundreds of items, they can be grouped based on some similarities to facilitate
production planning and scheduling. Bicheno [21] describes it as the first stage of a value stream mapping and the base for cellular
manufacturing. In the case under study, the about 800 products are produced from basically the same raw materials using basically
the same processing equipment. There are three cooking extruder lines of different capacities. The aim is to group the products
based on the behaviour of their demand, predictability of demand, easiness to manufacture, product dimension and production
quantity. One of the aims of this grouping is to find a way of dedication of the lines to producing a given group of products. This is
similar to creating of cells as in the discrete manufacturing environment, one of the methods of ensuring a lean process. Each of the
completely independent lines (cells or work stations) consists of a group of linked machines that can process a given group of
products from raw materials to finished good.
Developement of product variants
0
1
2
3
4
5
6
TOPAZ
EURO
PA
REAC
T
AMBER
OPAL
OPTIL
INE
SELECT
SPIRIT
RESPO
NS
PROTECT
VITALIS
CAC
ATLANTIC
ORIE
NT
FUTUR
A
ALFALI
NE
NUTR
ARA O
LYM
PIC
VIC L
B
STANDARD
FJORD
MYK
ORIO
N
Product group
Nu
mb
er
of
va
ria
nts
2005
2006
2007
Figure 17 (a) Product variants by commercial name
A review of the range of products since 2005 reveals the absence of Orion, Fjordlaks, Standard, Futura, Orient, Atlantic, and Vic
LB from the current list of products for 2007. This constitutes 13 different variants not on the list for 2007 with this commercial
identification or group name. New entrants in 2006 were TOPAZ, AMBER, OPAL and SELECT, which are still in production. In
2007, CAC (2 variants), React (4 variant) and Protect (3variants) and one new variant for Respons are introduced. React, Protect
and Select are different versions of the Optiline family of products, and from production point of view can be scheduled alongside
Optiline, while Amber, Topaz, CAC, Opal are real new introductions, as a result of the diversification into marine species. Topaz,
Europa and Amber move from 5 variants in 2006 to 3 in 2007. This is going to be used in the grouping exercise
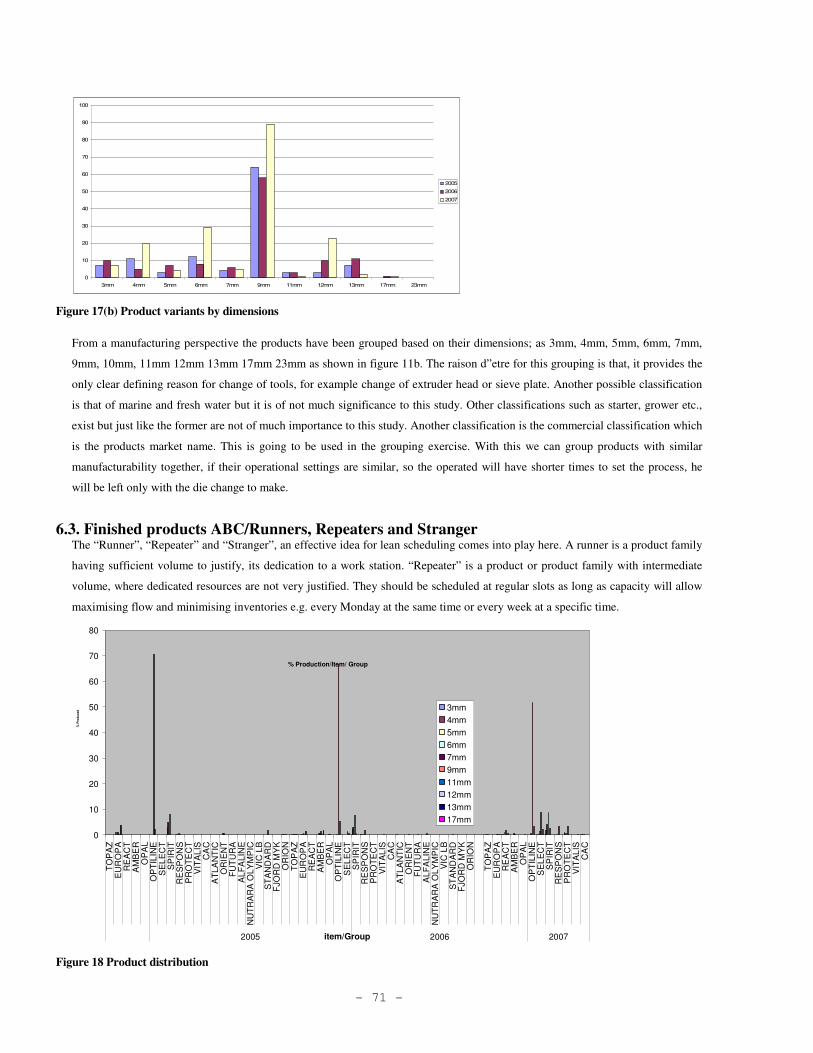
- 71 -
0
10
20
30
40
50
60
70
80
90
100
3mm 4mm 5mm 6mm 7mm 9mm 11mm 12mm 13mm 17mm 23mm
2005
2006
2007
Figure 17(b) Product variants by dimensions
From a manufacturing perspective the products have been grouped based on their dimensions; as 3mm, 4mm, 5mm, 6mm, 7mm,
9mm, 10mm, 11mm 12mm 13mm 17mm 23mm as shown in figure 11b. The raison d”etre for this grouping is that, it provides the
only clear defining reason for change of tools, for example change of extruder head or sieve plate. Another possible classification
is that of marine and fresh water but it is of not much significance to this study. Other classifications such as starter, grower etc.,
exist but just like the former are not of much importance to this study. Another classification is the commercial classification which
is the products market name. This is going to be used in the grouping exercise. With this we can group products with similar
manufacturability together, if their operational settings are similar, so the operated will have shorter times to set the process, he
will be left only with the die change to make.
6.3. Finished products ABC/Runners, Repeaters and Stranger The “Runner”, “Repeater” and “Stranger”, an effective idea for lean scheduling comes into play here. A runner is a product family
having sufficient volume to justify, its dedication to a work station. “Repeater” is a product or product family with intermediate
volume, where dedicated resources are not very justified. They should be scheduled at regular slots as long as capacity will allow
maximising flow and minimising inventories e.g. every Monday at the same time or every week at a specific time.
% Production/Item/ Group
0
10
20
30
40
50
60
70
80
TO
PA
ZE
UR
OP
AR
EA
CT
AM
BE
RO
PA
LO
PT
ILIN
ES
EL
EC
TS
PIR
ITR
ES
PO
NS
PR
OT
EC
TV
ITA
LIS
CA
CA
TLA
NT
ICO
RIE
NT
FU
TU
RA
AL
FA
LIN
EN
UT
RA
RA
OLY
MP
ICV
IC L
BS
TA
ND
AR
DF
JO
RD
MY
KO
RIO
NT
OP
AZ
EU
RO
PA
RE
AC
TA
MB
ER
OP
AL
OP
TIL
INE
SE
LE
CT
SP
IRIT
RE
SP
ON
SP
RO
TE
CT
VIT
AL
ISC
AC
AT
LA
NT
ICO
RIE
NT
FU
TU
RA
AL
FA
LIN
EN
UT
RA
RA
OLY
MP
ICV
IC L
BS
TA
ND
AR
DF
JO
RD
MY
KO
RIO
N
TO
PA
ZE
UR
OP
AR
EA
CT
AM
BE
RO
PA
LO
PT
ILIN
ES
EL
EC
TS
PIR
ITR
ES
PO
NS
PR
OT
EC
TV
ITA
LIS
CA
C
2005 2006 2007item/Group
% P
rod
uced 3mm
4mm
5mm
6mm
7mm
9mm
11mm
12mm
13mm
17mm
Figure 18 Product distribution
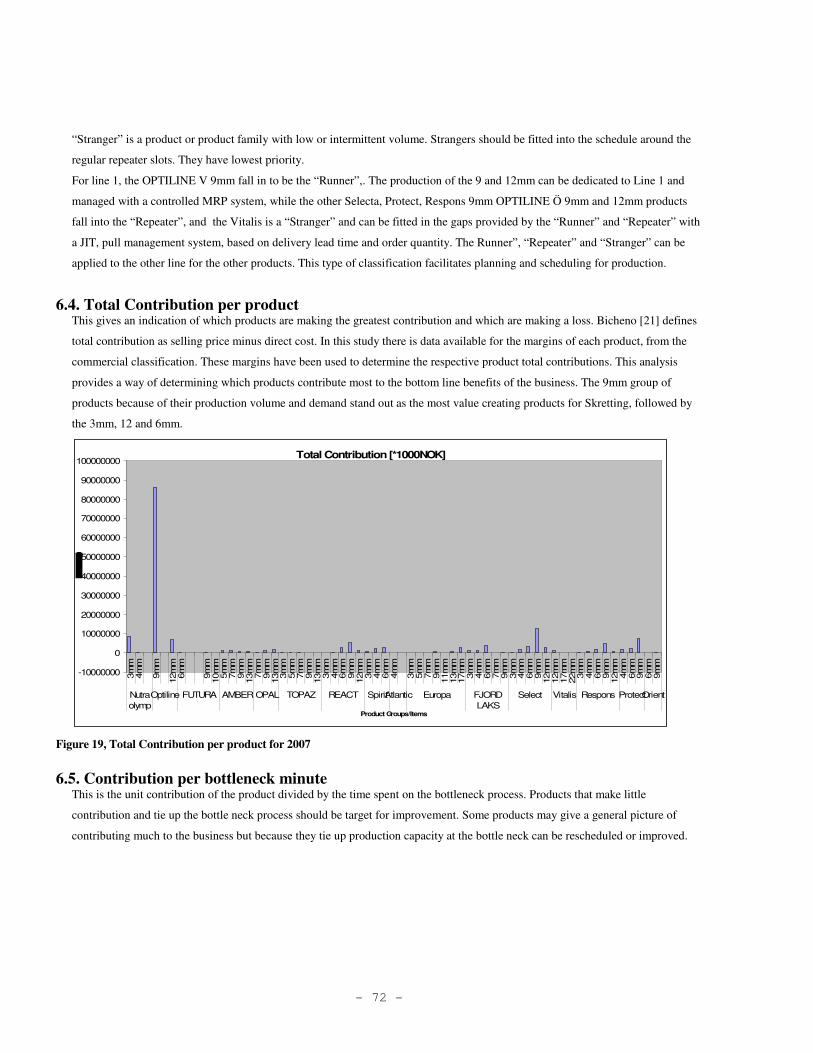
- 72 -
“Stranger” is a product or product family with low or intermittent volume. Strangers should be fitted into the schedule around the
regular repeater slots. They have lowest priority.
For line 1, the OPTILINE V 9mm fall in to be the “Runner”,. The production of the 9 and 12mm can be dedicated to Line 1 and
managed with a controlled MRP system, while the other Selecta, Protect, Respons 9mm OPTILINE Ö 9mm and 12mm products
fall into the “Repeater”, and the Vitalis is a “Stranger” and can be fitted in the gaps provided by the “Runner” and “Repeater” with
a JIT, pull management system, based on delivery lead time and order quantity. The Runner”, “Repeater” and “Stranger” can be
applied to the other line for the other products. This type of classification facilitates planning and scheduling for production.
6.4. Total Contribution per product This gives an indication of which products are making the greatest contribution and which are making a loss. Bicheno [21] defines
total contribution as selling price minus direct cost. In this study there is data available for the margins of each product, from the
commercial classification. These margins have been used to determine the respective product total contributions. This analysis
provides a way of determining which products contribute most to the bottom line benefits of the business. The 9mm group of
products because of their production volume and demand stand out as the most value creating products for Skretting, followed by
the 3mm, 12 and 6mm.
Total Contribution [*1000NOK]
-10000000
0
10000000
20000000
30000000
40000000
50000000
60000000
70000000
80000000
90000000
100000000
3m
m4m
m
9m
m
12m
m6m
m
9m
m10m
m5m
m7m
m9m
m13m
m7m
m9m
m13m
m3m
m5m
m7m
m9m
m13m
m3m
m4m
m6m
m9m
m12m
m3m
m4m
m6m
m4m
m
3m
m5m
m7m
m9m
m11m
m13m
m17m
m3m
m4m
m6m
m7m
m9m
m3m
m4m
m6m
m9m
m12m
m12m
m17m
m22m
m3m
m4m
m6m
m9m
m12m
m4m
m6m
m9m
m6m
m9m
m
Nutra
olymp
Optiline FUTURA AMBER OPAL TOPAZ REACT SpiritAtlantic Europa FJORD
LAKS
Select Vitalis Respons ProtectOrient
Product Groups/Items
Figure 19, Total Contribution per product for 2007
6.5. Contribution per bottleneck minute This is the unit contribution of the product divided by the time spent on the bottleneck process. Products that make little
contribution and tie up the bottle neck process should be target for improvement. Some products may give a general picture of
contributing much to the business but because they tie up production capacity at the bottle neck can be rescheduled or improved.
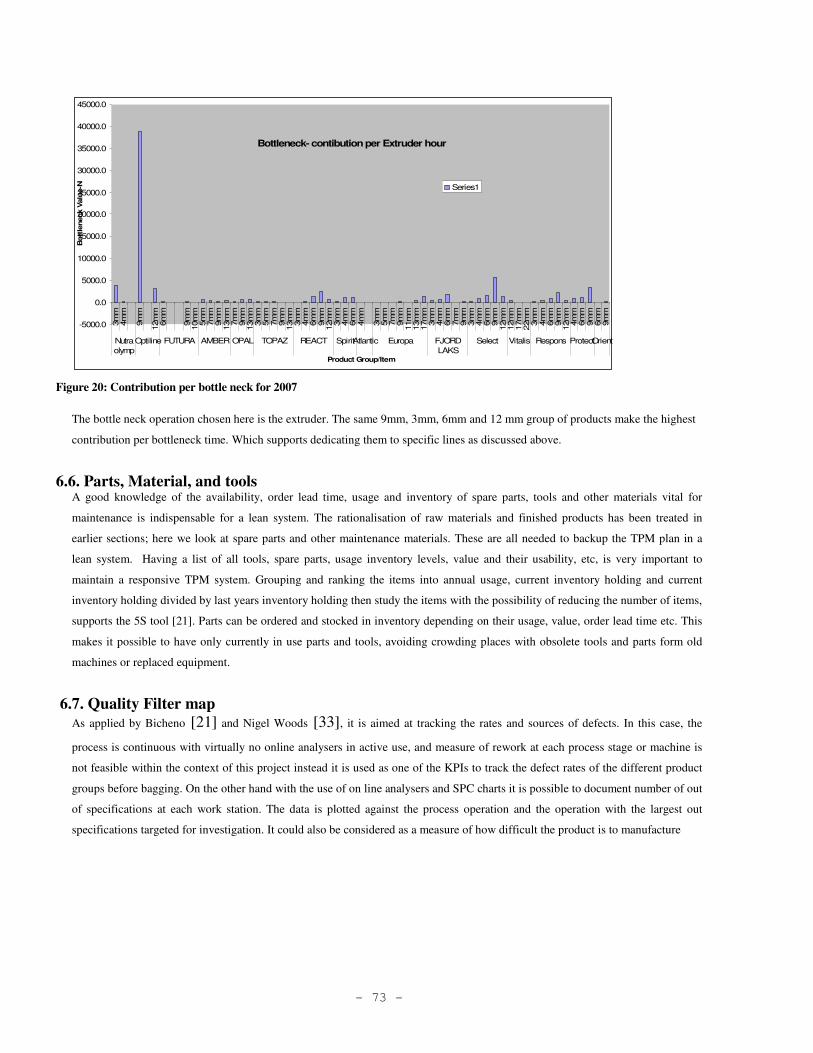
- 73 -
Bottleneck- contibution per Extruder hour
-5000.0
0.0
5000.0
10000.0
15000.0
20000.0
25000.0
30000.0
35000.0
40000.0
45000.0
3m
m4m
m
9m
m
12m
m6m
m
9m
m10m
m5m
m7m
m9m
m13m
m7m
m9m
m13m
m3m
m5m
m7m
m9m
m13m
m3m
m4m
m6m
m9m
m12m
m3m
m4m
m6m
m4m
m
3m
m5m
m7m
m9m
m11m
m13m
m17m
m3m
m4m
m6m
m7m
m9m
m3m
m4m
m6m
m9m
m12m
m12m
m17m
m22m
m3m
m4m
m6m
m9m
m12m
m4m
m6m
m9m
m6m
m9m
m
Nutra
olymp
Optiline FUTURA AMBER OPAL TOPAZ REACT SpiritAtlantic Europa FJORD
LAKS
Select Vitalis Respons ProtectOrient
Product Group/Item
Bott
leneck V
alu
e-N
OK
Series1
Figure 20: Contribution per bottle neck for 2007
The bottle neck operation chosen here is the extruder. The same 9mm, 3mm, 6mm and 12 mm group of products make the highest
contribution per bottleneck time. Which supports dedicating them to specific lines as discussed above.
6.6. Parts, Material, and tools A good knowledge of the availability, order lead time, usage and inventory of spare parts, tools and other materials vital for
maintenance is indispensable for a lean system. The rationalisation of raw materials and finished products has been treated in
earlier sections; here we look at spare parts and other maintenance materials. These are all needed to backup the TPM plan in a
lean system. Having a list of all tools, spare parts, usage inventory levels, value and their usability, etc, is very important to
maintain a responsive TPM system. Grouping and ranking the items into annual usage, current inventory holding and current
inventory holding divided by last years inventory holding then study the items with the possibility of reducing the number of items,
supports the 5S tool [21]. Parts can be ordered and stocked in inventory depending on their usage, value, order lead time etc. This
makes it possible to have only currently in use parts and tools, avoiding crowding places with obsolete tools and parts form old
machines or replaced equipment.
6.7. Quality Filter map
As applied by Bicheno [21] and Nigel Woods [33], it is aimed at tracking the rates and sources of defects. In this case, the
process is continuous with virtually no online analysers in active use, and measure of rework at each process stage or machine is
not feasible within the context of this project instead it is used as one of the KPIs to track the defect rates of the different product
groups before bagging. On the other hand with the use of on line analysers and SPC charts it is possible to document number of out
of specifications at each work station. The data is plotted against the process operation and the operation with the largest out
specifications targeted for investigation. It could also be considered as a measure of how difficult the product is to manufacture
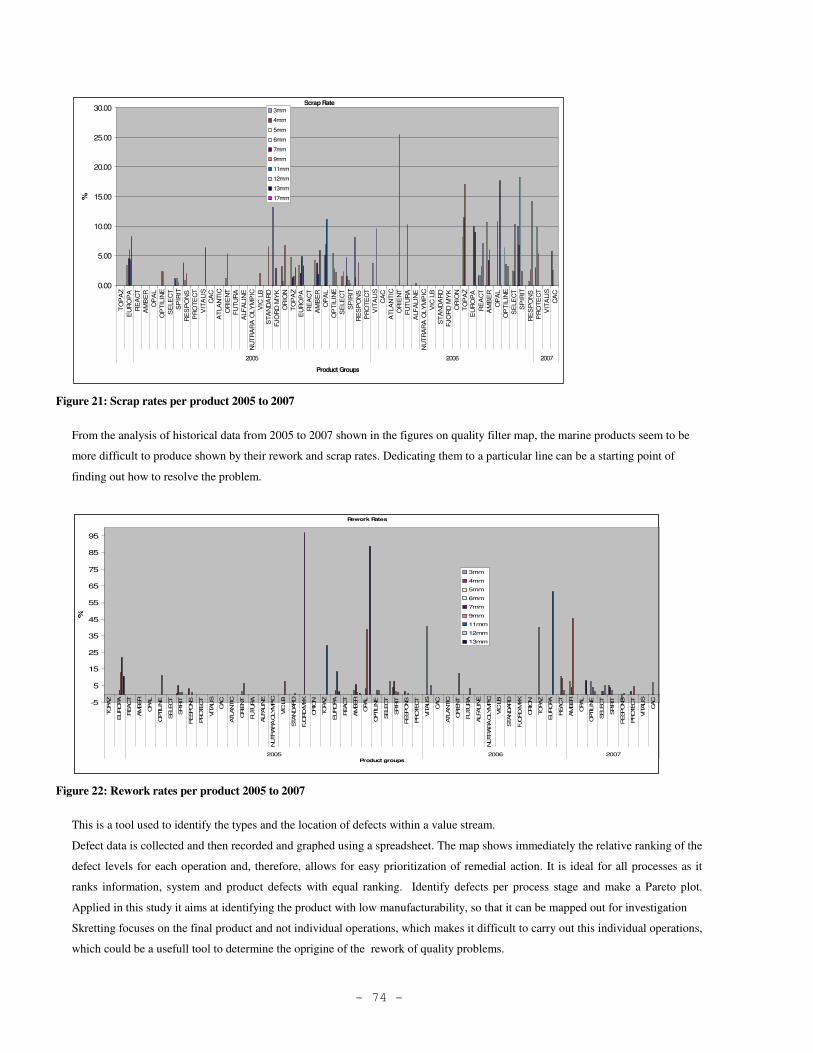
- 74 -
Scrap Rate
0.00
5.00
10.00
15.00
20.00
25.00
30.00
TO
PA
Z
EU
RO
PA
RE
AC
T
AM
BE
R
OP
AL
OP
TIL
INE
SE
LE
CT
SP
IRIT
RE
SP
ON
S
PR
OT
EC
T
VIT
ALIS
CA
C
AT
LA
NT
IC
OR
IEN
T
FU
TU
RA
ALF
ALIN
E
NU
TR
AR
A O
LY
MP
IC
VIC
LB
ST
AN
DA
RD
FJO
RD
MY
K
OR
ION
TO
PA
Z
EU
RO
PA
RE
AC
T
AM
BE
R
OP
AL
OP
TIL
INE
SE
LE
CT
SP
IRIT
RE
SP
ON
S
PR
OT
EC
T
VIT
ALIS
CA
C
AT
LA
NT
IC
OR
IEN
T
FU
TU
RA
ALF
ALIN
E
NU
TR
AR
A O
LY
MP
IC
VIC
LB
ST
AN
DA
RD
FJO
RD
MY
K
OR
ION
TO
PA
Z
EU
RO
PA
RE
AC
T
AM
BE
R
OP
AL
OP
TIL
INE
SE
LE
CT
SP
IRIT
RE
SP
ON
S
PR
OT
EC
T
VIT
ALIS
CA
C
2005 2006 2007
Product Groups
%
3mm
4mm
5mm
6mm
7mm
9mm
11mm
12mm
13mm
17mm
Figure 21: Scrap rates per product 2005 to 2007
From the analysis of historical data from 2005 to 2007 shown in the figures on quality filter map, the marine products seem to be
more difficult to produce shown by their rework and scrap rates. Dedicating them to a particular line can be a starting point of
finding out how to resolve the problem.
Rework Rates
-5
5
15
25
35
45
55
65
75
85
95
TOPAZ
EUROPA
REACT
AM
BER
OPAL
OPTIL
INE
SELECT
SPIR
IT
RESPONS
PROTECT
VIT
ALIS
CAC
ATLANTIC
ORIE
NT
FUTURA
ALFALIN
E
NUTRARA O
LYM
PIC
VIC
LB
STANDARD
FJORD M
YK
ORIO
N
TOPAZ
EUROPA
REACT
AM
BER
OPAL
OPTIL
INE
SELECT
SPIR
IT
RESPONS
PROTECT
VIT
ALIS
CAC
ATLANTIC
ORIE
NT
FUTURA
ALFALIN
E
NUTRARA O
LYM
PIC
VIC
LB
STANDARD
FJORD M
YK
ORIO
N
TOPAZ
EUROPA
REACT
AM
BER
OPAL
OPTIL
INE
SELECT
SPIR
IT
RESPONS
PROTECT
VIT
ALIS
CAC
2005 2006 2007Product groups
%
3mm
4mm
5mm
6mm
7mm
9mm
11mm
12mm
13mm
Figure 22: Rework rates per product 2005 to 2007
This is a tool used to identify the types and the location of defects within a value stream.
Defect data is collected and then recorded and graphed using a spreadsheet. The map shows immediately the relative ranking of the
defect levels for each operation and, therefore, allows for easy prioritization of remedial action. It is ideal for all processes as it
ranks information, system and product defects with equal ranking. Identify defects per process stage and make a Pareto plot.
Applied in this study it aims at identifying the product with low manufacturability, so that it can be mapped out for investigation
Skretting focuses on the final product and not individual operations, which makes it difficult to carry out this individual operations,
which could be a usefull tool to determine the oprigine of the rework of quality problems.
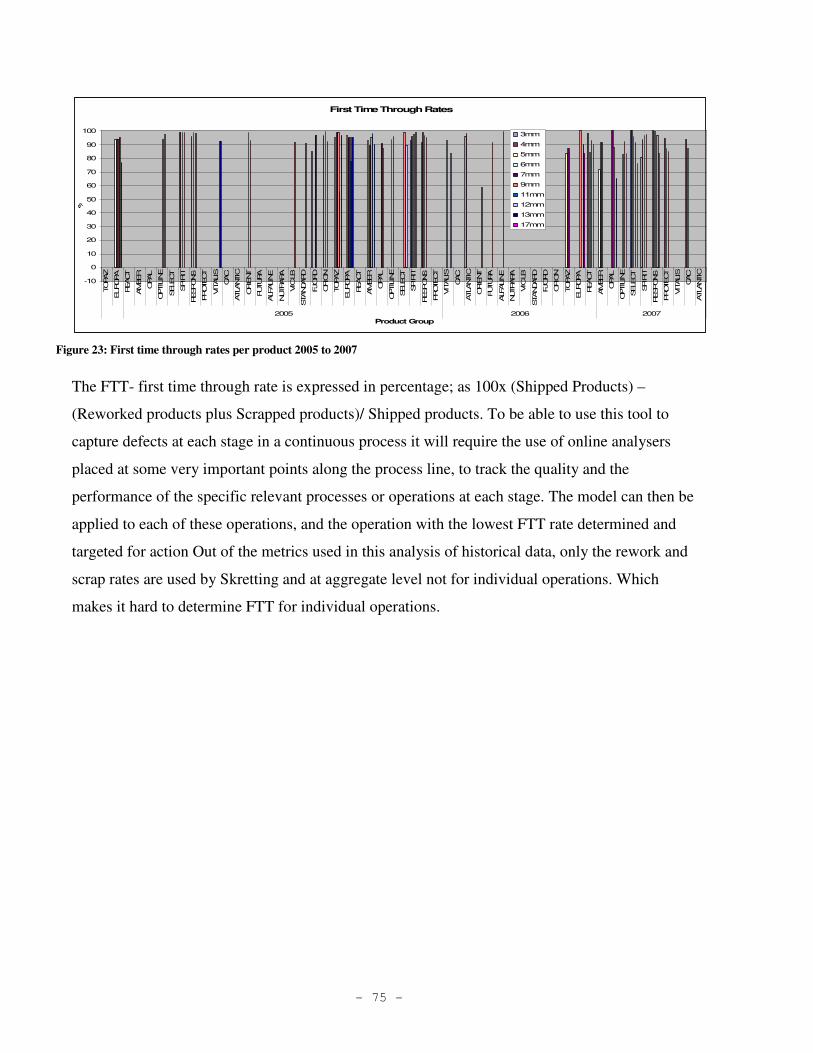
- 75 -
First Time Through Rates
-10
0
10
20
30
40
50
60
70
80
90
100
TOPAZ
EUROPA
REACT
AMBER
OPAL
OPTILIN
E
SELECT
SPIR
IT
RESPONS
PROTECT
VIT
ALIS
CAC
ATLANTIC
ORIE
NT
FUTURA
ALFALIN
E
NUTRARA
VIC
LB
STANDARD
FJORD
ORIO
N
TOPAZ
EUROPA
REACT
AMBER
OPAL
OPTILIN
E
SELECT
SPIR
IT
RESPONS
PROTECT
VIT
ALIS
CAC
ATLANTIC
ORIE
NT
FUTURA
ALFALIN
E
NUTRARA
VIC
LB
STANDARD
FJORD
ORIO
N
TOPAZ
EUROPA
REACT
AMBER
OPAL
OPTILIN
E
SELECT
SPIR
IT
RESPONS
PROTECT
VIT
ALIS
CAC
ATLANTIC
2005 2006 2007
Product Group
%
3mm
4mm
5mm
6mm
7mm
9mm
11mm
12mm
13mm
17mm
Figure 23: First time through rates per product 2005 to 2007
The FTT- first time through rate is expressed in percentage; as 100x (Shipped Products) –
(Reworked products plus Scrapped products)/ Shipped products. To be able to use this tool to
capture defects at each stage in a continuous process it will require the use of online analysers
placed at some very important points along the process line, to track the quality and the
performance of the specific relevant processes or operations at each stage. The model can then be
applied to each of these operations, and the operation with the lowest FTT rate determined and
targeted for action Out of the metrics used in this analysis of historical data, only the rework and
scrap rates are used by Skretting and at aggregate level not for individual operations. Which
makes it hard to determine FTT for individual operations.
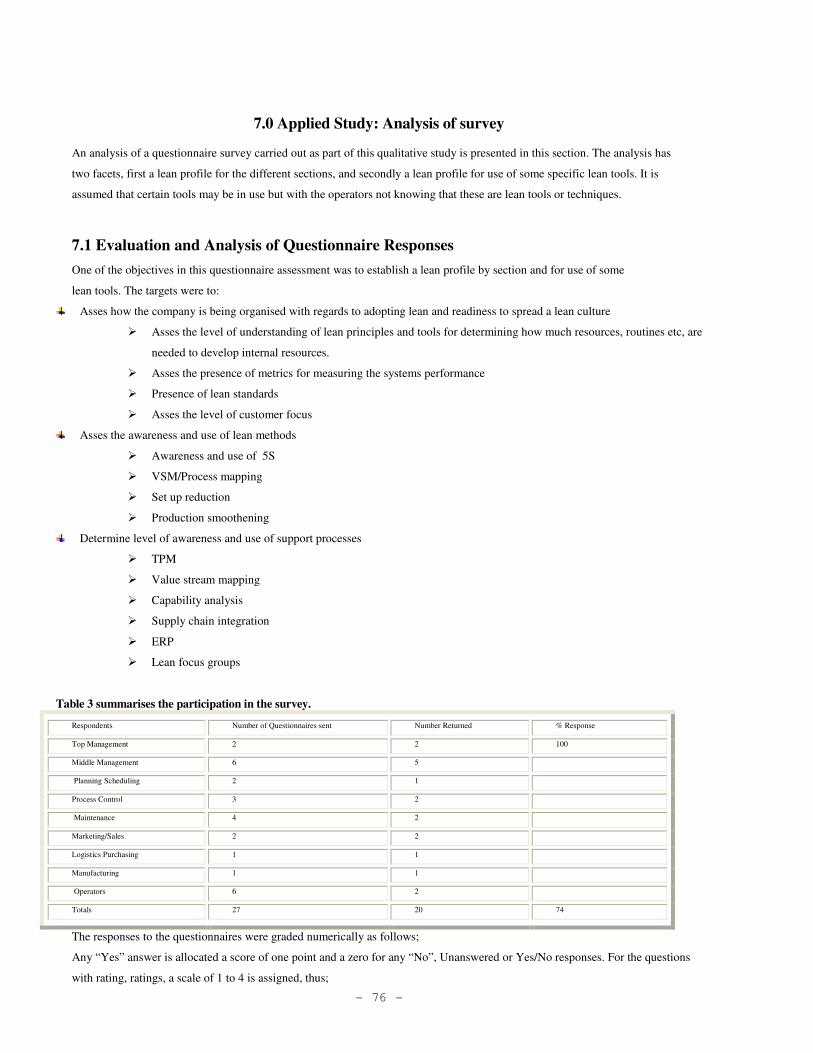
- 76 -
7.0 Applied Study: Analysis of survey An analysis of a questionnaire survey carried out as part of this qualitative study is presented in this section. The analysis has
two facets, first a lean profile for the different sections, and secondly a lean profile for use of some specific lean tools. It is
assumed that certain tools may be in use but with the operators not knowing that these are lean tools or techniques.
7.1 Evaluation and Analysis of Questionnaire Responses
One of the objectives in this questionnaire assessment was to establish a lean profile by section and for use of some
lean tools. The targets were to:
Asses how the company is being organised with regards to adopting lean and readiness to spread a lean culture
� Asses the level of understanding of lean principles and tools for determining how much resources, routines etc, are
needed to develop internal resources.
� Asses the presence of metrics for measuring the systems performance
� Presence of lean standards
� Asses the level of customer focus
Asses the awareness and use of lean methods
� Awareness and use of 5S
� VSM/Process mapping
� Set up reduction
� Production smoothening
Determine level of awareness and use of support processes
� TPM
� Value stream mapping
� Capability analysis
� Supply chain integration
� ERP
� Lean focus groups
Table 3 summarises the participation in the survey.
Respondents Number of Questionnaires sent Number Returned % Response
Top Management 2 2 100
Middle Management 6 5
Planning Scheduling 2 1
Process Control 3 2
Maintenance 4 2
Marketing/Sales 2 2
Logistics Purchasing 1 1
Manufacturing 1 1
Operators 6 2
Totals 27 20 74
The responses to the questionnaires were graded numerically as follows;
Any “Yes” answer is allocated a score of one point and a zero for any “No”, Unanswered or Yes/No responses. For the questions
with rating, ratings, a scale of 1 to 4 is assigned, thus;
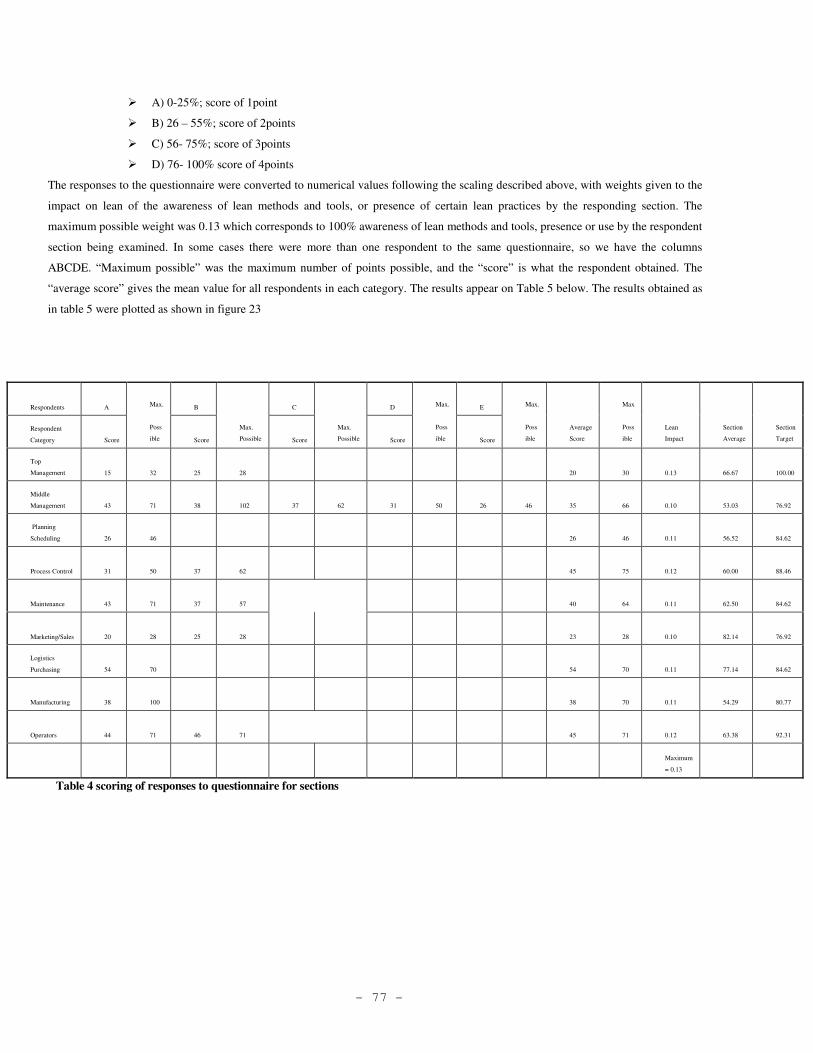
- 77 -
� A) 0-25%; score of 1point
� B) 26 – 55%; score of 2points
� C) 56- 75%; score of 3points
� D) 76- 100% score of 4points
The responses to the questionnaire were converted to numerical values following the scaling described above, with weights given to the
impact on lean of the awareness of lean methods and tools, or presence of certain lean practices by the responding section. The
maximum possible weight was 0.13 which corresponds to 100% awareness of lean methods and tools, presence or use by the respondent
section being examined. In some cases there were more than one respondent to the same questionnaire, so we have the columns
ABCDE. “Maximum possible” was the maximum number of points possible, and the “score” is what the respondent obtained. The
“average score” gives the mean value for all respondents in each category. The results appear on Table 5 below. The results obtained as
in table 5 were plotted as shown in figure 23
Table 4 scoring of responses to questionnaire for sections
Respondents A B C D E
Respondent
Category Score
Max.
Poss
ible Score
Max.
Possible Score
Max.
Possible Score
Max.
Poss
ible Score
Max.
Poss
ible
Average
Score
Max
Poss
ible
Lean
Impact
Section
Average
Section
Target
Top
Management 15 32 25 28 20 30 0.13 66.67 100.00
Middle
Management 43 71 38 102 37 62 31 50 26 46 35 66 0.10 53.03 76.92
Planning
Scheduling 26 46 26 46 0.11 56.52 84.62
Process Control 31 50 37 62 45 75 0.12 60.00 88.46
Maintenance 43 71 37 57 40 64 0.11 62.50 84.62
Marketing/Sales 20 28 25 28 23 28 0.10 82.14 76.92
Logistics
Purchasing 54 70 54 70 0.11 77.14 84.62
Manufacturing 38 100 38 70 0.11 54.29 80.77
Operators 44 71 46 71 45 71 0.12 63.38 92.31
Maximum
= 0.13
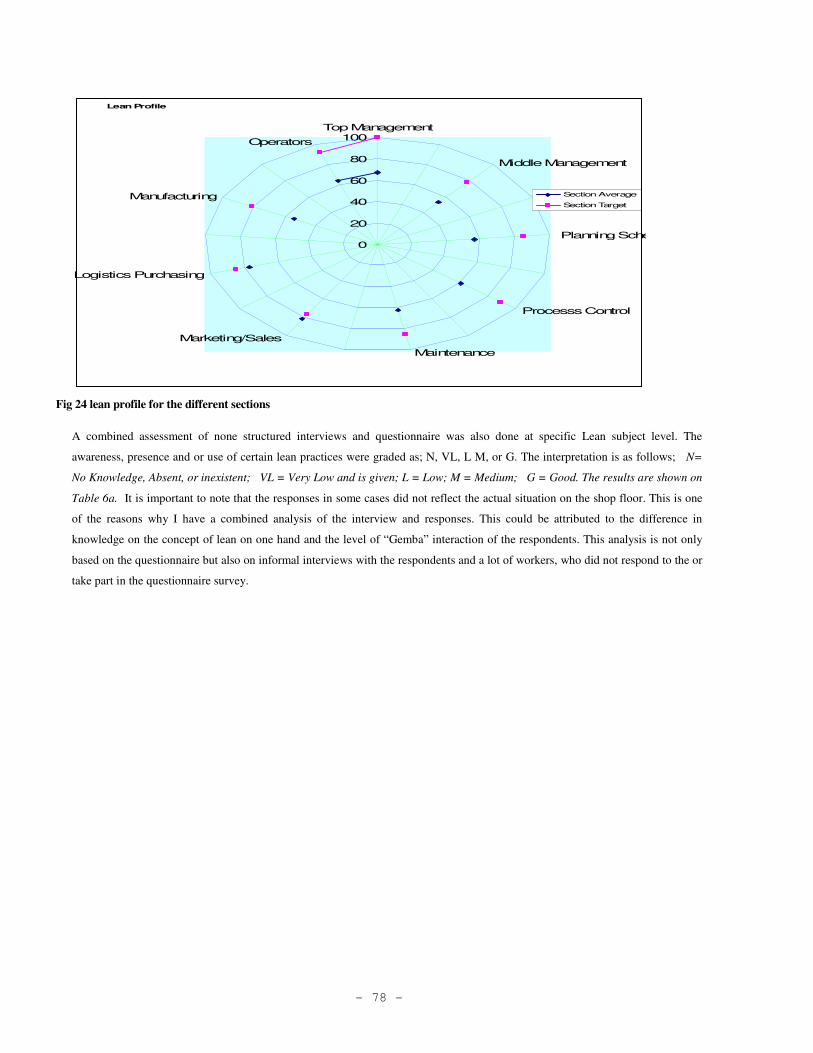
- 78 -
Lean Profile
0
20
40
60
80
100Top Management
Middle Management
Planning Scheduling
Processs Control
Maintenance
Marketing/Sales
Logistics Purchasing
Manufacturing
Operators
Section Average
Section Target
Fig 24 lean profile for the different sections
A combined assessment of none structured interviews and questionnaire was also done at specific Lean subject level. The
awareness, presence and or use of certain lean practices were graded as; N, VL, L M, or G. The interpretation is as follows; N=
No Knowledge, Absent, or inexistent; VL = Very Low and is given; L = Low; M = Medium; G = Good. The results are shown on
Table 6a. It is important to note that the responses in some cases did not reflect the actual situation on the shop floor. This is one
of the reasons why I have a combined analysis of the interview and responses. This could be attributed to the difference in
knowledge on the concept of lean on one hand and the level of “Gemba” interaction of the respondents. This analysis is not only
based on the questionnaire but also on informal interviews with the respondents and a lot of workers, who did not respond to the or
take part in the questionnaire survey.
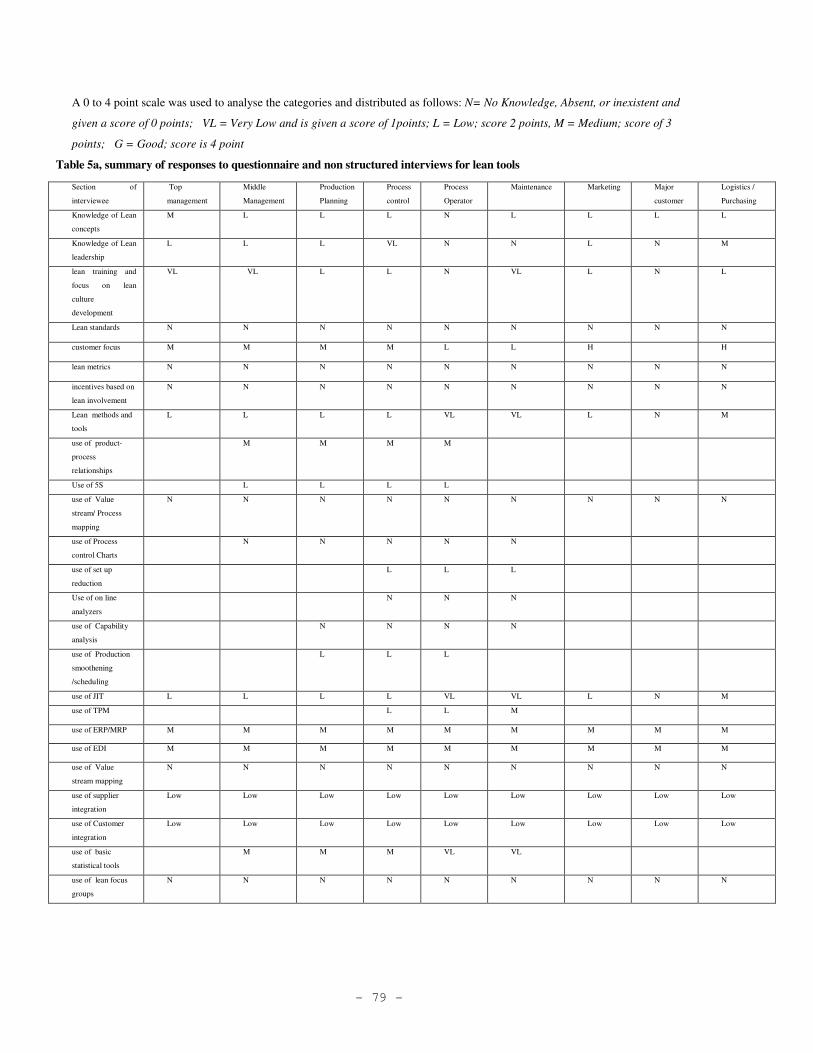
- 79 -
A 0 to 4 point scale was used to analyse the categories and distributed as follows: N= No Knowledge, Absent, or inexistent and
given a score of 0 points; VL = Very Low and is given a score of 1points; L = Low; score 2 points, M = Medium; score of 3
points; G = Good; score is 4 point
Table 5a, summary of responses to questionnaire and non structured interviews for lean tools
Section of
interviewee
Top
management
Middle
Management
Production
Planning
Process
control
Process
Operator
Maintenance Marketing Major
customer
Logistics /
Purchasing
Knowledge of Lean
concepts
M L L L N L L L L
Knowledge of Lean
leadership
L L L VL N N L N M
lean training and
focus on lean
culture
development
VL VL L L N VL L N L
Lean standards N N N N N N N N N
customer focus M M M M L L H H
lean metrics N N N N N N N N N
incentives based on
lean involvement
N N N N N N N N N
Lean methods and
tools
L L L L VL VL L N M
use of product-
process
relationships
M M M M
Use of 5S L L L L
use of Value
stream/ Process
mapping
N N N N N N N N N
use of Process
control Charts
N N N N N
use of set up
reduction
L L L
Use of on line
analyzers
N N N
use of Capability
analysis
N N N N
use of Production
smoothening
/scheduling
L L L
use of JIT L L L L VL VL L N M
use of TPM L L M
use of ERP/MRP M M M M M M M M M
use of EDI M M M M M M M M M
use of Value
stream mapping
N N N N N N N N N
use of supplier
integration
Low Low Low Low Low Low Low Low Low
use of Customer
integration
Low Low Low Low Low Low Low Low Low
use of basic
statistical tools
M M M VL VL
use of lean focus
groups
N N N N N N N N N
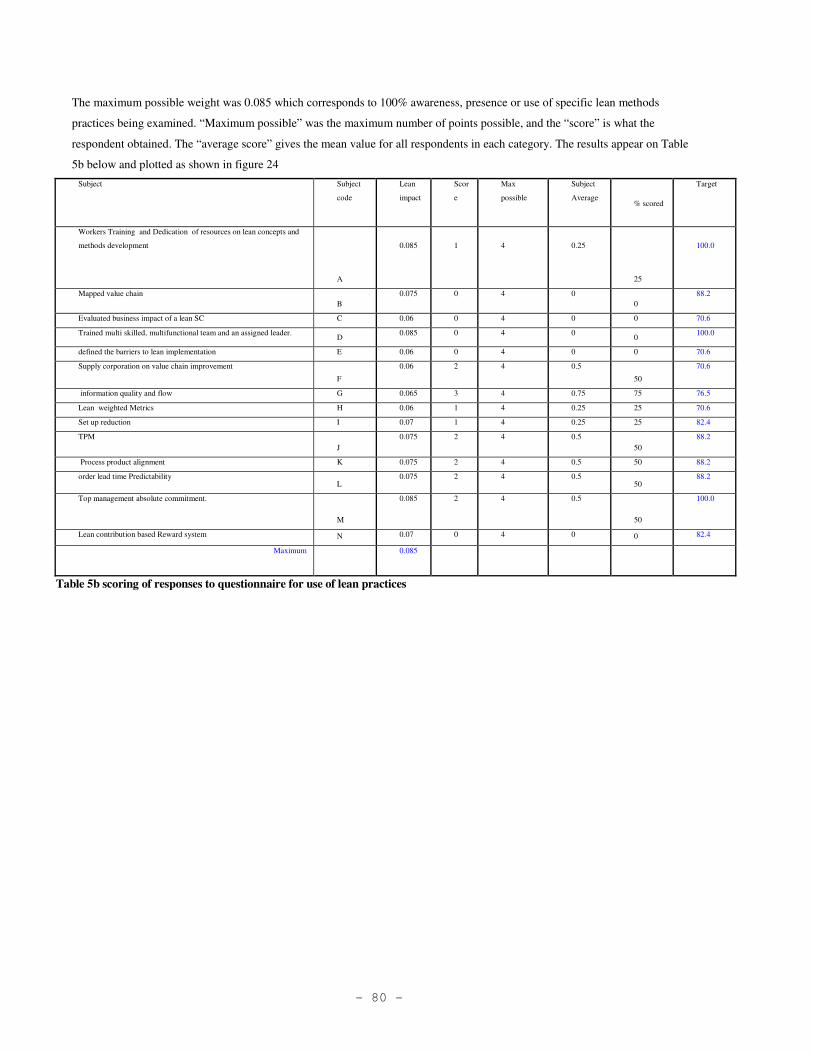
- 80 -
The maximum possible weight was 0.085 which corresponds to 100% awareness, presence or use of specific lean methods
practices being examined. “Maximum possible” was the maximum number of points possible, and the “score” is what the
respondent obtained. The “average score” gives the mean value for all respondents in each category. The results appear on Table
5b below and plotted as shown in figure 24
Subject Subject
code
Lean
impact
Scor
e
Max
possible
Subject
Average % scored
Target
Workers Training and Dedication of resources on lean concepts and
methods development
A
0.085
1
4
0.25
25
100.0
Mapped value chain B
0.075 0 4 0 0
88.2
Evaluated business impact of a lean SC C 0.06 0 4 0 0 70.6
Trained multi skilled, multifunctional team and an assigned leader. D
0.085 0 4 0 0
100.0
defined the barriers to lean implementation E 0.06 0 4 0 0 70.6
Supply corporation on value chain improvement
F
0.06 2 4 0.5
50
70.6
information quality and flow G 0.065 3 4 0.75 75 76.5
Lean weighted Metrics H 0.06 1 4 0.25 25 70.6
Set up reduction I 0.07 1 4 0.25 25 82.4
TPM J
0.075 2 4 0.5 50
88.2
Process product alignment K 0.075 2 4 0.5 50 88.2
order lead time Predictability L
0.075 2 4 0.5 50
88.2
Top management absolute commitment.
M
0.085 2 4 0.5
50
100.0
Lean contribution based Reward system N 0.07 0 4 0 0 82.4
Maximum
0.085
Table 5b scoring of responses to questionnaire for use of lean practices
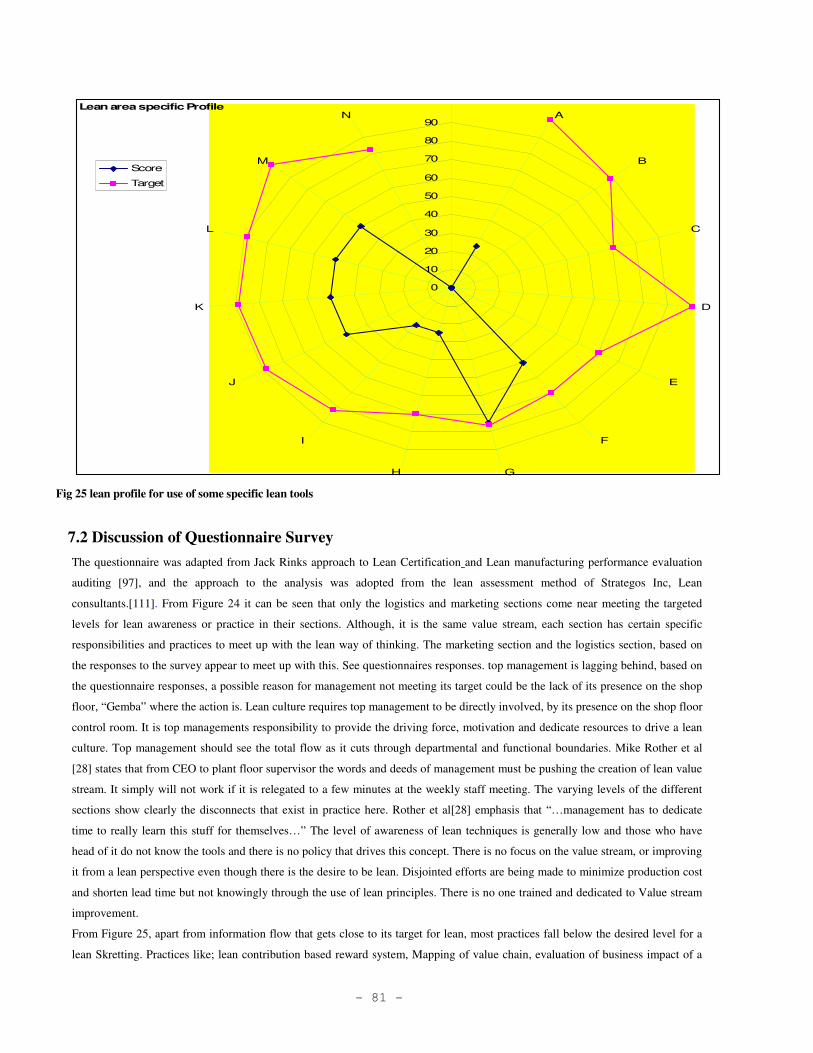
- 81 -
Lean area specific Profile
0
10
20
30
40
50
60
70
80
90A
B
C
D
E
F
GH
I
J
K
L
M
N
Score
Target
Fig 25 lean profile for use of some specific lean tools
7.2 Discussion of Questionnaire Survey
The questionnaire was adapted from Jack Rinks approach to Lean Certification and Lean manufacturing performance evaluation
auditing [97], and the approach to the analysis was adopted from the lean assessment method of Strategos Inc, Lean
consultants.[111]. From Figure 24 it can be seen that only the logistics and marketing sections come near meeting the targeted
levels for lean awareness or practice in their sections. Although, it is the same value stream, each section has certain specific
responsibilities and practices to meet up with the lean way of thinking. The marketing section and the logistics section, based on
the responses to the survey appear to meet up with this. See questionnaires responses. top management is lagging behind, based on
the questionnaire responses, a possible reason for management not meeting its target could be the lack of its presence on the shop
floor, “Gemba” where the action is. Lean culture requires top management to be directly involved, by its presence on the shop floor
control room. It is top managements responsibility to provide the driving force, motivation and dedicate resources to drive a lean
culture. Top management should see the total flow as it cuts through departmental and functional boundaries. Mike Rother et al
[28] states that from CEO to plant floor supervisor the words and deeds of management must be pushing the creation of lean value
stream. It simply will not work if it is relegated to a few minutes at the weekly staff meeting. The varying levels of the different
sections show clearly the disconnects that exist in practice here. Rother et al[28] emphasis that “…management has to dedicate
time to really learn this stuff for themselves…” The level of awareness of lean techniques is generally low and those who have
head of it do not know the tools and there is no policy that drives this concept. There is no focus on the value stream, or improving
it from a lean perspective even though there is the desire to be lean. Disjointed efforts are being made to minimize production cost
and shorten lead time but not knowingly through the use of lean principles. There is no one trained and dedicated to Value stream
improvement.
From Figure 25, apart from information flow that gets close to its target for lean, most practices fall below the desired level for a
lean Skretting. Practices like; lean contribution based reward system, Mapping of value chain, evaluation of business impact of a
- 82 -
lean SC, Training of multi skilled, multifunctional team and an assigned value stream leader., defining the barriers to lean
implementation all score zero. These are the foundations of a lean system and without them it is not lean.
Generally, the awareness and use of both lean techniques and its support processes are based on the traditional way of doing things
with no focus on the lean angle, given that the lean way of thinking is not yet a company widely spread, preached or up held
practice. It is top managements responsibility to do this. Coupled with high rate of personnel turnover, new equipment and union
regulations Skretting’s top management needs to take the lead in spreading a lean culture in its organization.
7.3. Current Situation of Skretting’s Value Stream
The current situation starts with looking at what key performance indicators Skretting focuses on, then continues with the shop floor
situation through a process activity mapping and value stream mapping both referred to here as flow analysis.
7.3.1. Operational Metrics
In this section, an analysis of some concepts introduced in the literature review are applied to analyse Skretting’s value stream. The
section presents the key operational performance measures used by Skretting to measure its value stream and some key metrics that
could give a global view of the performance of the whole value stream, based on lean concepts. Figure 26 below shows the process
performance metrics used by Skretting. Although these metrics like yield, throughput performance, uptime, quality and OEE are all
universally accepted methods, focusing only on these do not give us for example, a clear picture of the capability of the process,
which can be used for a proactive tool for obtaining low scrab, rework and high first time through rates. Process capability study
involves measuring and analysing the critical to product characteristics with the objective of determining the ability of the process
to meet the specifications for the characteristic investigated. To be able to do this, we must first be sure that, the process is under
statistical control. This is done by use of control chart. It involves plotting the data from the process (collected, probably from on
line analysers and/or laboratory tests) on a control chart and determining if the data is normally distributed, which is not the case as
noticed. Secondly, we determine if the product conforms to set specifications. This can be done by use of histograms, probability
plots or by calculating its capability indices (Cpi) which can also give us the percentage of conforming products.
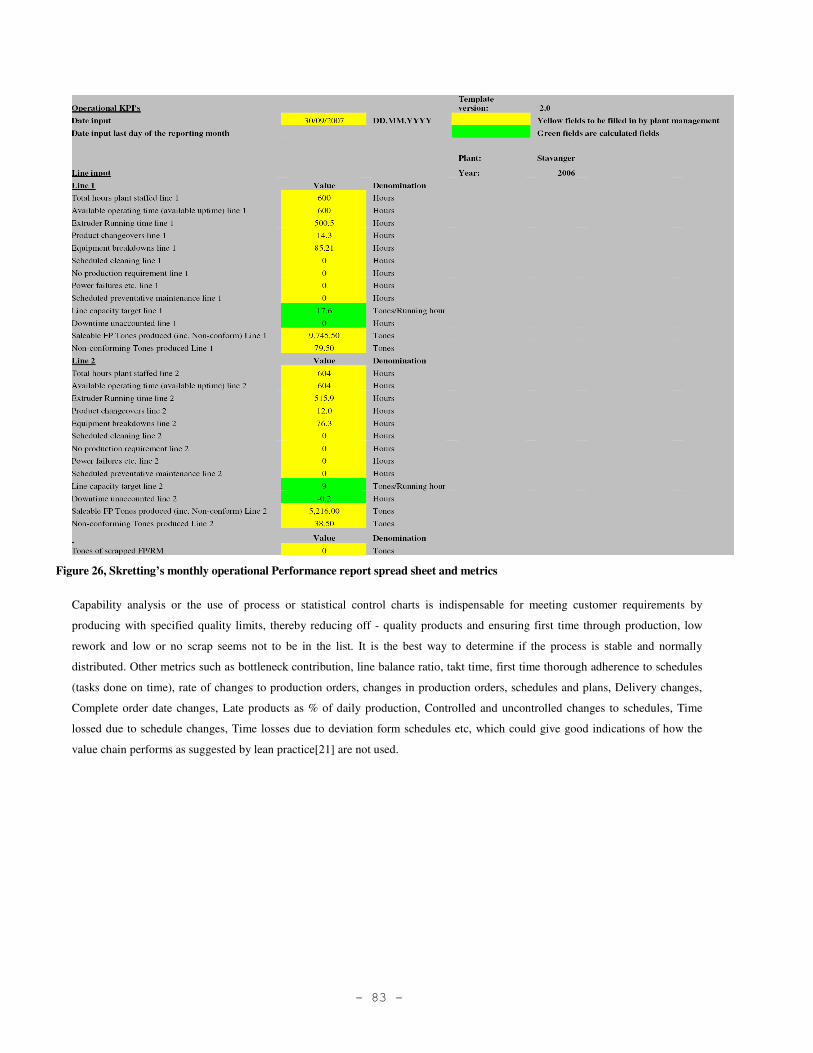
- 83 -
Figure 26, Skretting’s monthly operational Performance report spread sheet and metrics
Capability analysis or the use of process or statistical control charts is indispensable for meeting customer requirements by
producing with specified quality limits, thereby reducing off - quality products and ensuring first time through production, low
rework and low or no scrap seems not to be in the list. It is the best way to determine if the process is stable and normally
distributed. Other metrics such as bottleneck contribution, line balance ratio, takt time, first time thorough adherence to schedules
(tasks done on time), rate of changes to production orders, changes in production orders, schedules and plans, Delivery changes,
Complete order date changes, Late products as % of daily production, Controlled and uncontrolled changes to schedules, Time
lossed due to schedule changes, Time losses due to deviation form schedules etc, which could give good indications of how the
value chain performs as suggested by lean practice[21] are not used.
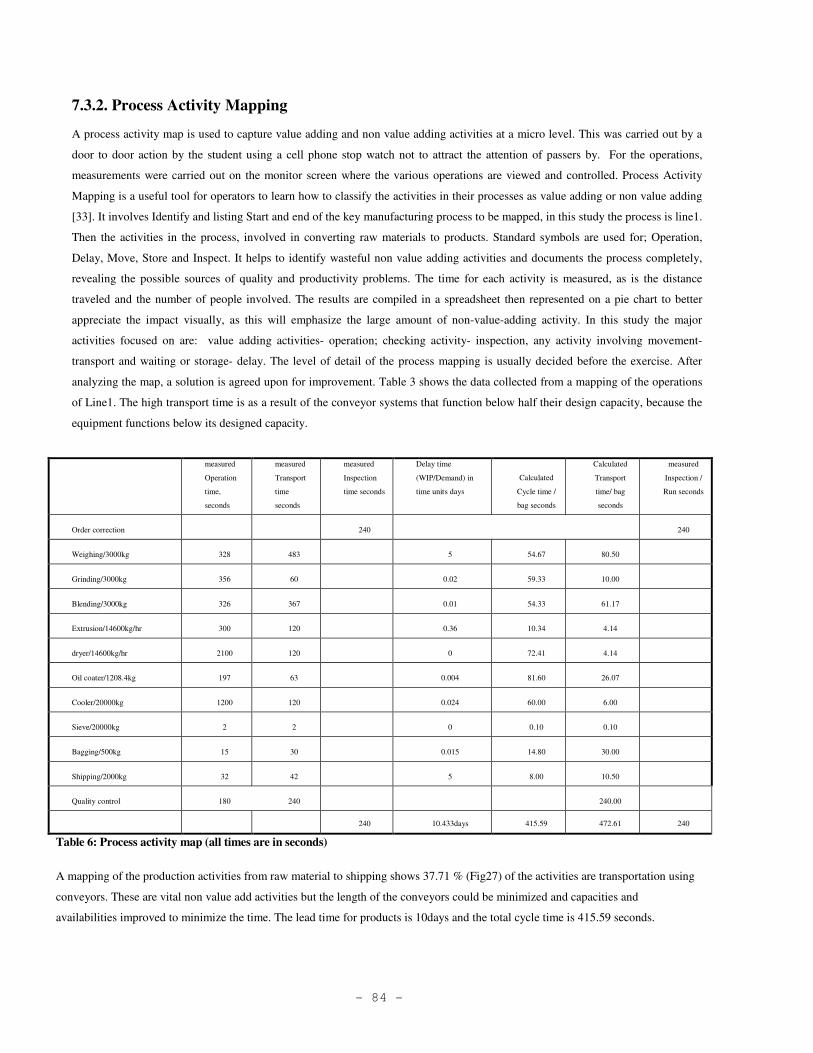
- 84 -
7.3.2. Process Activity Mapping
A process activity map is used to capture value adding and non value adding activities at a micro level. This was carried out by a
door to door action by the student using a cell phone stop watch not to attract the attention of passers by. For the operations,
measurements were carried out on the monitor screen where the various operations are viewed and controlled. Process Activity
Mapping is a useful tool for operators to learn how to classify the activities in their processes as value adding or non value adding
[33]. It involves Identify and listing Start and end of the key manufacturing process to be mapped, in this study the process is line1.
Then the activities in the process, involved in converting raw materials to products. Standard symbols are used for; Operation,
Delay, Move, Store and Inspect. It helps to identify wasteful non value adding activities and documents the process completely,
revealing the possible sources of quality and productivity problems. The time for each activity is measured, as is the distance
traveled and the number of people involved. The results are compiled in a spreadsheet then represented on a pie chart to better
appreciate the impact visually, as this will emphasize the large amount of non-value-adding activity. In this study the major
activities focused on are: value adding activities- operation; checking activity- inspection, any activity involving movement-
transport and waiting or storage- delay. The level of detail of the process mapping is usually decided before the exercise. After
analyzing the map, a solution is agreed upon for improvement. Table 3 shows the data collected from a mapping of the operations
of Line1. The high transport time is as a result of the conveyor systems that function below half their design capacity, because the
equipment functions below its designed capacity.
measured
Operation
time,
seconds
measured
Transport
time
seconds
measured
Inspection
time seconds
Delay time
(WIP/Demand) in
time units days
Calculated
Cycle time /
bag seconds
Calculated
Transport
time/ bag
seconds
measured
Inspection /
Run seconds
Order correction 240 240
Weighing/3000kg 328 483 5 54.67 80.50
Grinding/3000kg 356 60 0.02 59.33 10.00
Blending/3000kg 326 367 0.01 54.33 61.17
Extrusion/14600kg/hr 300 120 0.36 10.34 4.14
dryer/14600kg/hr 2100 120 0 72.41 4.14
Oil coater/1208.4kg 197 63 0.004 81.60 26.07
Cooler/20000kg 1200 120 0.024 60.00 6.00
Sieve/20000kg 2 2 0 0.10 0.10
Bagging/500kg 15 30 0.015 14.80 30.00
Shipping/2000kg 32 42 5 8.00 10.50
Quality control 180 240 240.00
240 10.433days 415.59 472.61 240
Table 6: Process activity map (all times are in seconds)
A mapping of the production activities from raw material to shipping shows 37.71 % (Fig27) of the activities are transportation using
conveyors. These are vital non value add activities but the length of the conveyors could be minimized and capacities and
availabilities improved to minimize the time. The lead time for products is 10days and the total cycle time is 415.59 seconds.
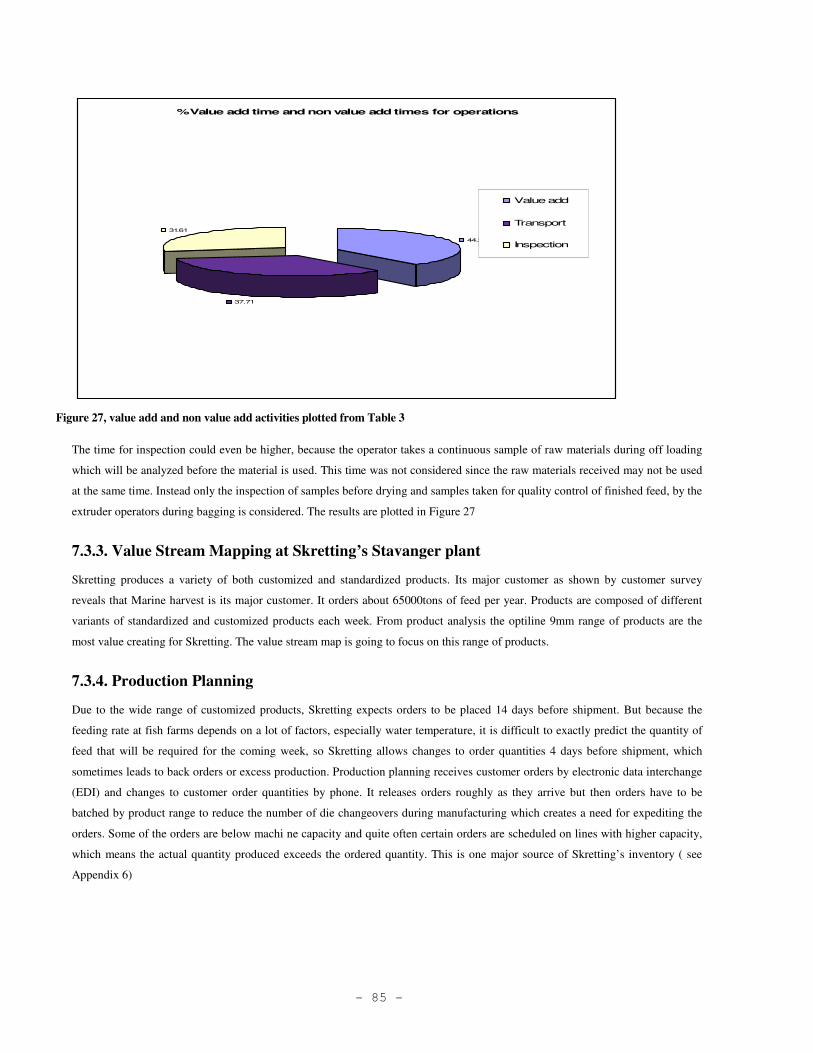
- 85 -
% Value add time and non value add times for operations
44.22
37.71
31.61
Value add
Transport
Inspection
Figure 27, value add and non value add activities plotted from Table 3
The time for inspection could even be higher, because the operator takes a continuous sample of raw materials during off loading
which will be analyzed before the material is used. This time was not considered since the raw materials received may not be used
at the same time. Instead only the inspection of samples before drying and samples taken for quality control of finished feed, by the
extruder operators during bagging is considered. The results are plotted in Figure 27
7.3.3. Value Stream Mapping at Skretting’s Stavanger plant
Skretting produces a variety of both customized and standardized products. Its major customer as shown by customer survey
reveals that Marine harvest is its major customer. It orders about 65000tons of feed per year. Products are composed of different
variants of standardized and customized products each week. From product analysis the optiline 9mm range of products are the
most value creating for Skretting. The value stream map is going to focus on this range of products.
7.3.4. Production Planning
Due to the wide range of customized products, Skretting expects orders to be placed 14 days before shipment. But because the
feeding rate at fish farms depends on a lot of factors, especially water temperature, it is difficult to exactly predict the quantity of
feed that will be required for the coming week, so Skretting allows changes to order quantities 4 days before shipment, which
sometimes leads to back orders or excess production. Production planning receives customer orders by electronic data interchange
(EDI) and changes to customer order quantities by phone. It releases orders roughly as they arrive but then orders have to be
batched by product range to reduce the number of die changeovers during manufacturing which creates a need for expediting the
orders. Some of the orders are below machi ne capacity and quite often certain orders are scheduled on lines with higher capacity,
which means the actual quantity produced exceeds the ordered quantity. This is one major source of Skretting’s inventory ( see
Appendix 6)
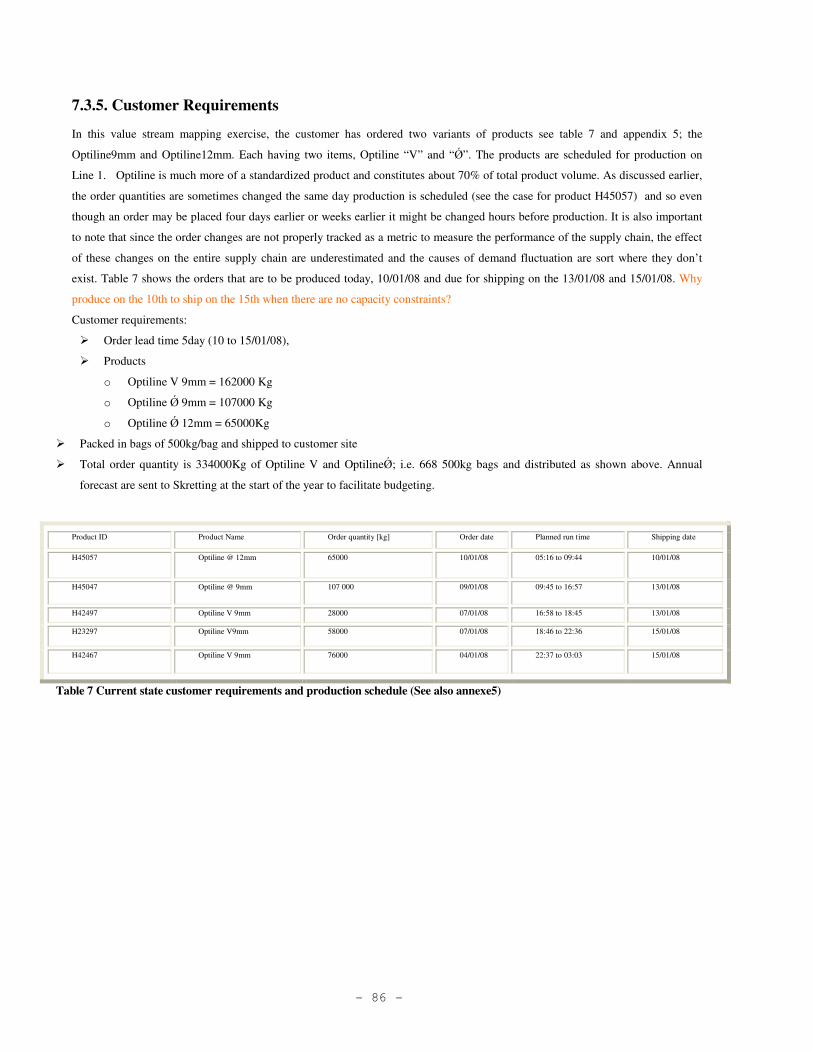
- 86 -
7.3.5. Customer Requirements
In this value stream mapping exercise, the customer has ordered two variants of products see table 7 and appendix 5; the
Optiline9mm and Optiline12mm. Each having two items, Optiline “V” and “Ǿ”. The products are scheduled for production on
Line 1. Optiline is much more of a standardized product and constitutes about 70% of total product volume. As discussed earlier,
the order quantities are sometimes changed the same day production is scheduled (see the case for product H45057) and so even
though an order may be placed four days earlier or weeks earlier it might be changed hours before production. It is also important
to note that since the order changes are not properly tracked as a metric to measure the performance of the supply chain, the effect
of these changes on the entire supply chain are underestimated and the causes of demand fluctuation are sort where they don’t
exist. Table 7 shows the orders that are to be produced today, 10/01/08 and due for shipping on the 13/01/08 and 15/01/08. Why
produce on the 10th to ship on the 15th when there are no capacity constraints?
Customer requirements:
� Order lead time 5day (10 to 15/01/08),
� Products
o Optiline V 9mm = 162000 Kg
o Optiline Ǿ 9mm = 107000 Kg
o Optiline Ǿ 12mm = 65000Kg
� Packed in bags of 500kg/bag and shipped to customer site
� Total order quantity is 334000Kg of Optiline V and OptilineǾ; i.e. 668 500kg bags and distributed as shown above. Annual
forecast are sent to Skretting at the start of the year to facilitate budgeting.
Product ID Product Name Order quantity [kg] Order date Planned run time Shipping date
H45057 Optiline @ 12mm 65000 10/01/08 05:16 to 09:44 10/01/08
H45047 Optiline @ 9mm 107 000 09/01/08 09:45 to 16:57 13/01/08
H42497 Optiline V 9mm 28000 07/01/08 16:58 to 18:45 13/01/08
H23297 Optiline V9mm 58000 07/01/08 18:46 to 22:36 15/01/08
H42467 Optiline V 9mm 76000 04/01/08 22:37 to 03:03 15/01/08
Table 7 Current state customer requirements and production schedule (See also annexe5)
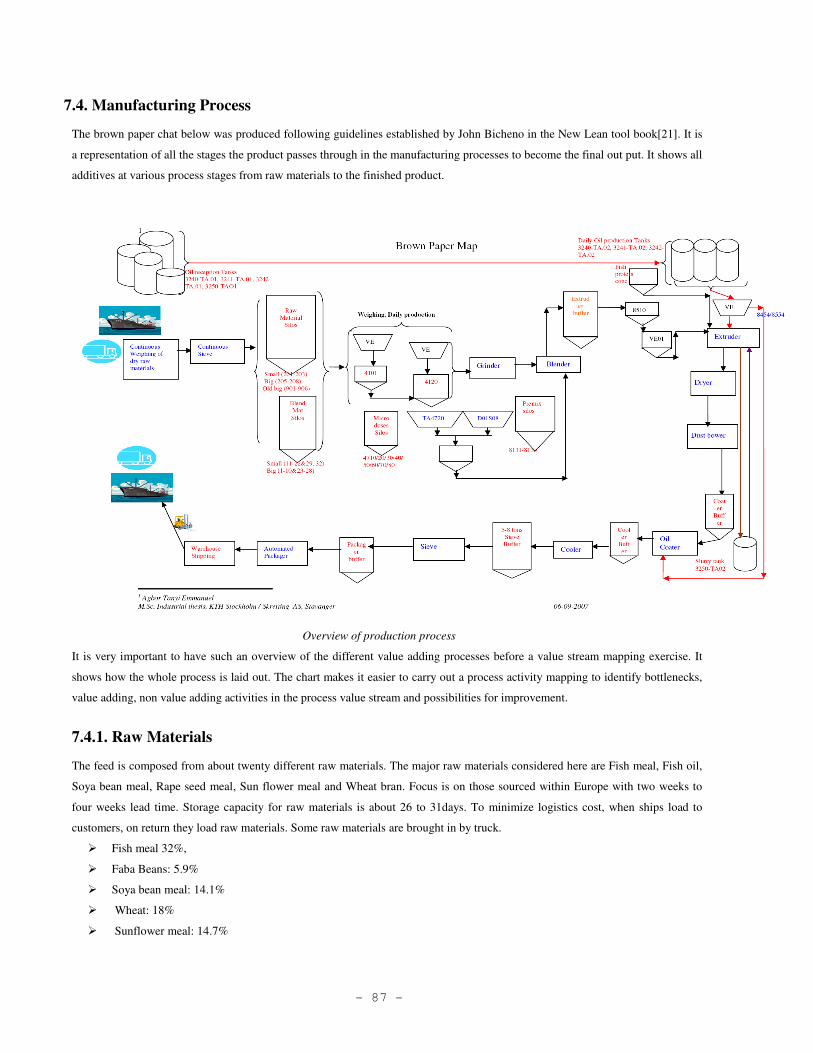
- 87 -
7.4. Manufacturing Process
The brown paper chat below was produced following guidelines established by John Bicheno in the New Lean tool book[21]. It is
a representation of all the stages the product passes through in the manufacturing processes to become the final out put. It shows all
additives at various process stages from raw materials to the finished product.
Overview of production process
It is very important to have such an overview of the different value adding processes before a value stream mapping exercise. It
shows how the whole process is laid out. The chart makes it easier to carry out a process activity mapping to identify bottlenecks,
value adding, non value adding activities in the process value stream and possibilities for improvement.
7.4.1. Raw Materials
The feed is composed from about twenty different raw materials. The major raw materials considered here are Fish meal, Fish oil,
Soya bean meal, Rape seed meal, Sun flower meal and Wheat bran. Focus is on those sourced within Europe with two weeks to
four weeks lead time. Storage capacity for raw materials is about 26 to 31days. To minimize logistics cost, when ships load to
customers, on return they load raw materials. Some raw materials are brought in by truck.
� Fish meal 32%,
� Faba Beans: 5.9%
� Soya bean meal: 14.1%
� Wheat: 18%
� Sunflower meal: 14.7%
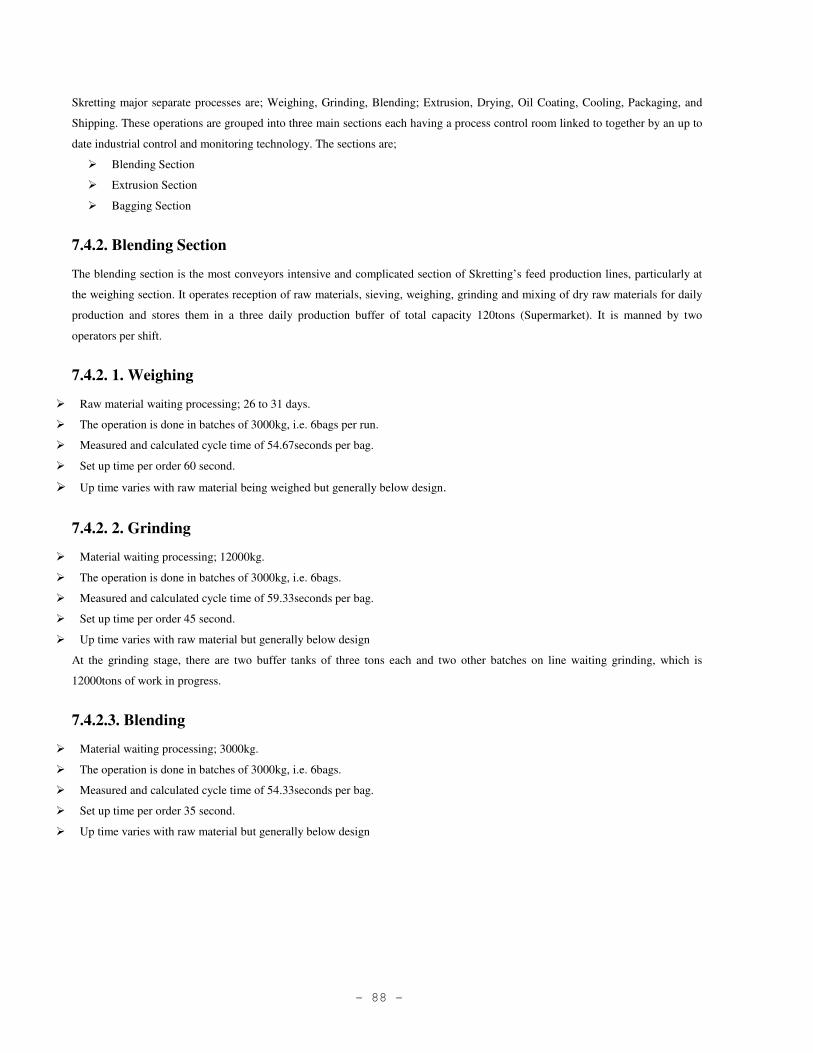
- 88 -
Skretting major separate processes are; Weighing, Grinding, Blending; Extrusion, Drying, Oil Coating, Cooling, Packaging, and
Shipping. These operations are grouped into three main sections each having a process control room linked to together by an up to
date industrial control and monitoring technology. The sections are;
� Blending Section
� Extrusion Section
� Bagging Section
7.4.2. Blending Section
The blending section is the most conveyors intensive and complicated section of Skretting’s feed production lines, particularly at
the weighing section. It operates reception of raw materials, sieving, weighing, grinding and mixing of dry raw materials for daily
production and stores them in a three daily production buffer of total capacity 120tons (Supermarket). It is manned by two
operators per shift.
7.4.2. 1. Weighing
� Raw material waiting processing; 26 to 31 days.
� The operation is done in batches of 3000kg, i.e. 6bags per run.
� Measured and calculated cycle time of 54.67seconds per bag.
� Set up time per order 60 second.
� Up time varies with raw material being weighed but generally below design.
7.4.2. 2. Grinding
� Material waiting processing; 12000kg.
� The operation is done in batches of 3000kg, i.e. 6bags.
� Measured and calculated cycle time of 59.33seconds per bag.
� Set up time per order 45 second.
� Up time varies with raw material but generally below design
At the grinding stage, there are two buffer tanks of three tons each and two other batches on line waiting grinding, which is
12000tons of work in progress.
7.4.2.3. Blending
� Material waiting processing; 3000kg.
� The operation is done in batches of 3000kg, i.e. 6bags.
� Measured and calculated cycle time of 54.33seconds per bag.
� Set up time per order 35 second.
� Up time varies with raw material but generally below design
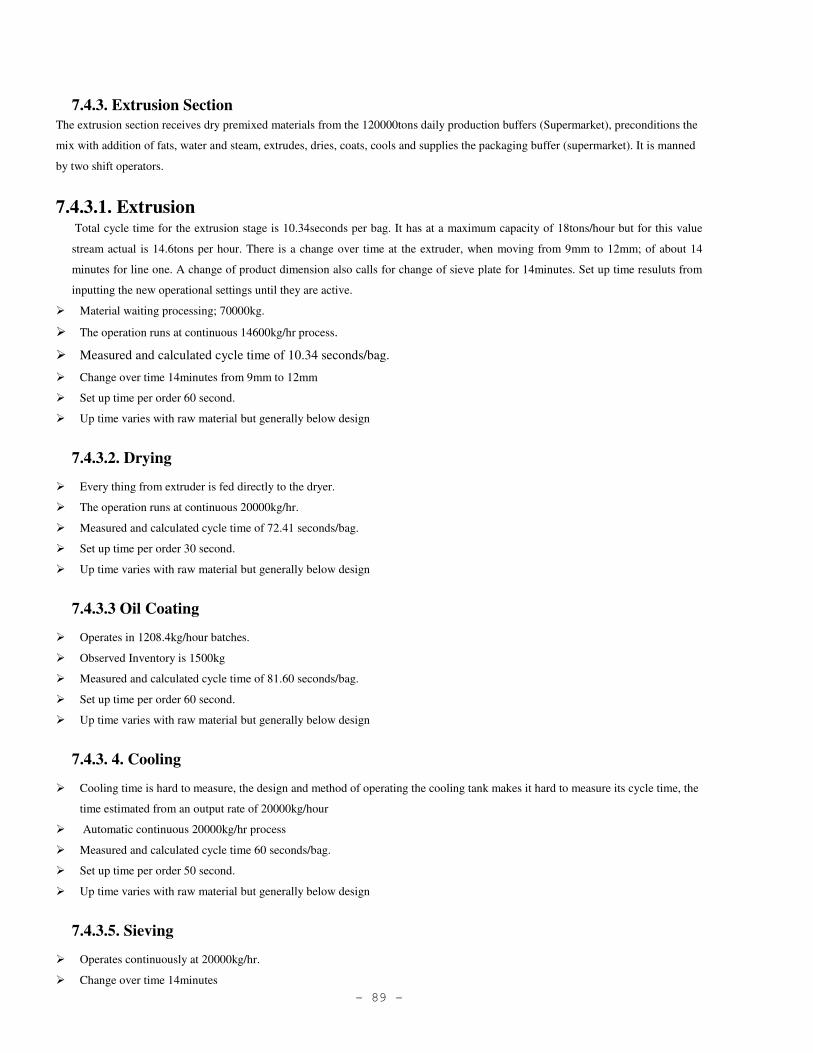
- 89 -
7.4.3. Extrusion Section
The extrusion section receives dry premixed materials from the 120000tons daily production buffers (Supermarket), preconditions the
mix with addition of fats, water and steam, extrudes, dries, coats, cools and supplies the packaging buffer (supermarket). It is manned
by two shift operators.
7.4.3.1. Extrusion Total cycle time for the extrusion stage is 10.34seconds per bag. It has at a maximum capacity of 18tons/hour but for this value
stream actual is 14.6tons per hour. There is a change over time at the extruder, when moving from 9mm to 12mm; of about 14
minutes for line one. A change of product dimension also calls for change of sieve plate for 14minutes. Set up time resuluts from
inputting the new operational settings until they are active.
� Material waiting processing; 70000kg.
� The operation runs at continuous 14600kg/hr process.
� Measured and calculated cycle time of 10.34 seconds/bag.
� Change over time 14minutes from 9mm to 12mm
� Set up time per order 60 second.
� Up time varies with raw material but generally below design
7.4.3.2. Drying
� Every thing from extruder is fed directly to the dryer.
� The operation runs at continuous 20000kg/hr.
� Measured and calculated cycle time of 72.41 seconds/bag.
� Set up time per order 30 second.
� Up time varies with raw material but generally below design
7.4.3.3 Oil Coating
� Operates in 1208.4kg/hour batches.
� Observed Inventory is 1500kg
� Measured and calculated cycle time of 81.60 seconds/bag.
� Set up time per order 60 second.
� Up time varies with raw material but generally below design
7.4.3. 4. Cooling
� Cooling time is hard to measure, the design and method of operating the cooling tank makes it hard to measure its cycle time, the
time estimated from an output rate of 20000kg/hour
� Automatic continuous 20000kg/hr process
� Measured and calculated cycle time 60 seconds/bag.
� Set up time per order 50 second.
� Up time varies with raw material but generally below design
7.4.3.5. Sieving
� Operates continuously at 20000kg/hr.
� Change over time 14minutes
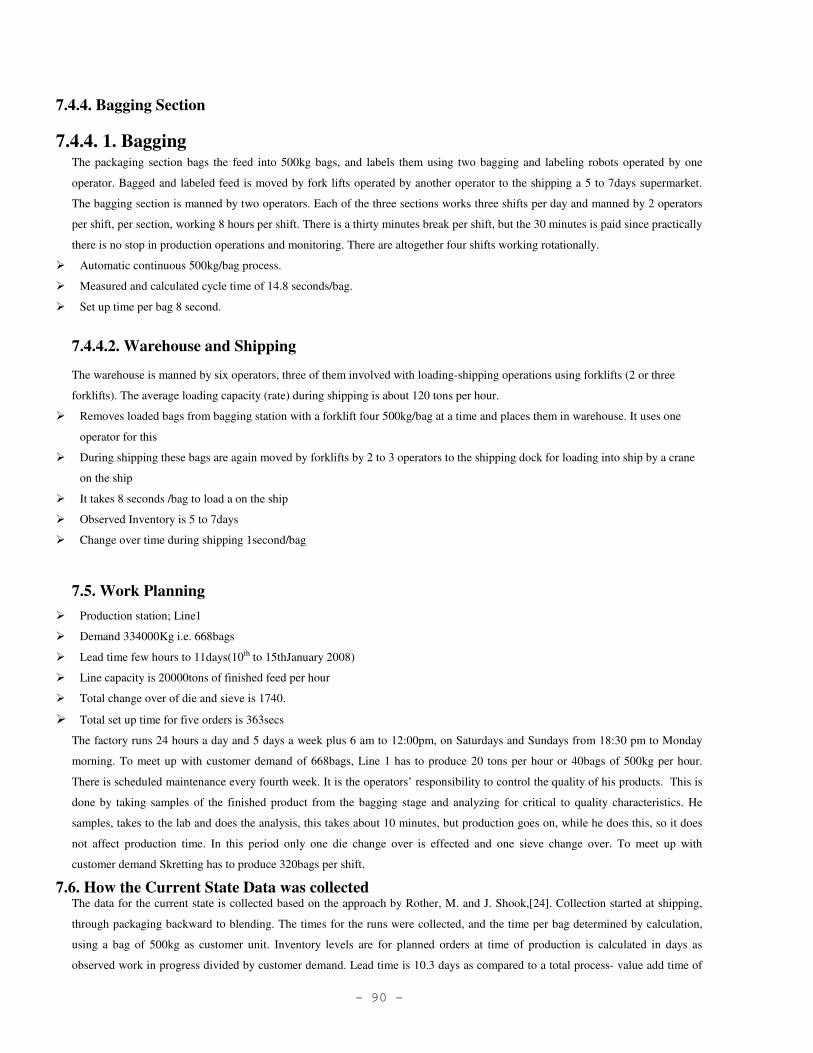
- 90 -
7.4.4. Bagging Section
7.4.4. 1. Bagging The packaging section bags the feed into 500kg bags, and labels them using two bagging and labeling robots operated by one
operator. Bagged and labeled feed is moved by fork lifts operated by another operator to the shipping a 5 to 7days supermarket.
The bagging section is manned by two operators. Each of the three sections works three shifts per day and manned by 2 operators
per shift, per section, working 8 hours per shift. There is a thirty minutes break per shift, but the 30 minutes is paid since practically
there is no stop in production operations and monitoring. There are altogether four shifts working rotationally.
� Automatic continuous 500kg/bag process.
� Measured and calculated cycle time of 14.8 seconds/bag.
� Set up time per bag 8 second.
7.4.4.2. Warehouse and Shipping
The warehouse is manned by six operators, three of them involved with loading-shipping operations using forklifts (2 or three
forklifts). The average loading capacity (rate) during shipping is about 120 tons per hour.
� Removes loaded bags from bagging station with a forklift four 500kg/bag at a time and places them in warehouse. It uses one
operator for this
� During shipping these bags are again moved by forklifts by 2 to 3 operators to the shipping dock for loading into ship by a crane
on the ship
� It takes 8 seconds /bag to load a on the ship
� Observed Inventory is 5 to 7days
� Change over time during shipping 1second/bag
7.5. Work Planning
� Production station; Line1
� Demand 334000Kg i.e. 668bags
� Lead time few hours to 11days(10th to 15thJanuary 2008)
� Line capacity is 20000tons of finished feed per hour
� Total change over of die and sieve is 1740.
� Total set up time for five orders is 363secs
The factory runs 24 hours a day and 5 days a week plus 6 am to 12:00pm, on Saturdays and Sundays from 18:30 pm to Monday
morning. To meet up with customer demand of 668bags, Line 1 has to produce 20 tons per hour or 40bags of 500kg per hour.
There is scheduled maintenance every fourth week. It is the operators’ responsibility to control the quality of his products. This is
done by taking samples of the finished product from the bagging stage and analyzing for critical to quality characteristics. He
samples, takes to the lab and does the analysis, this takes about 10 minutes, but production goes on, while he does this, so it does
not affect production time. In this period only one die change over is effected and one sieve change over. To meet up with
customer demand Skretting has to produce 320bags per shift.
7.6. How the Current State Data was collected The data for the current state is collected based on the approach by Rother, M. and J. Shook,[24]. Collection started at shipping,
through packaging backward to blending. The times for the runs were collected, and the time per bag determined by calculation,
using a bag of 500kg as customer unit. Inventory levels are for planned orders at time of production is calculated in days as
observed work in progress divided by customer demand. Lead time is 10.3 days as compared to a total process- value add time of
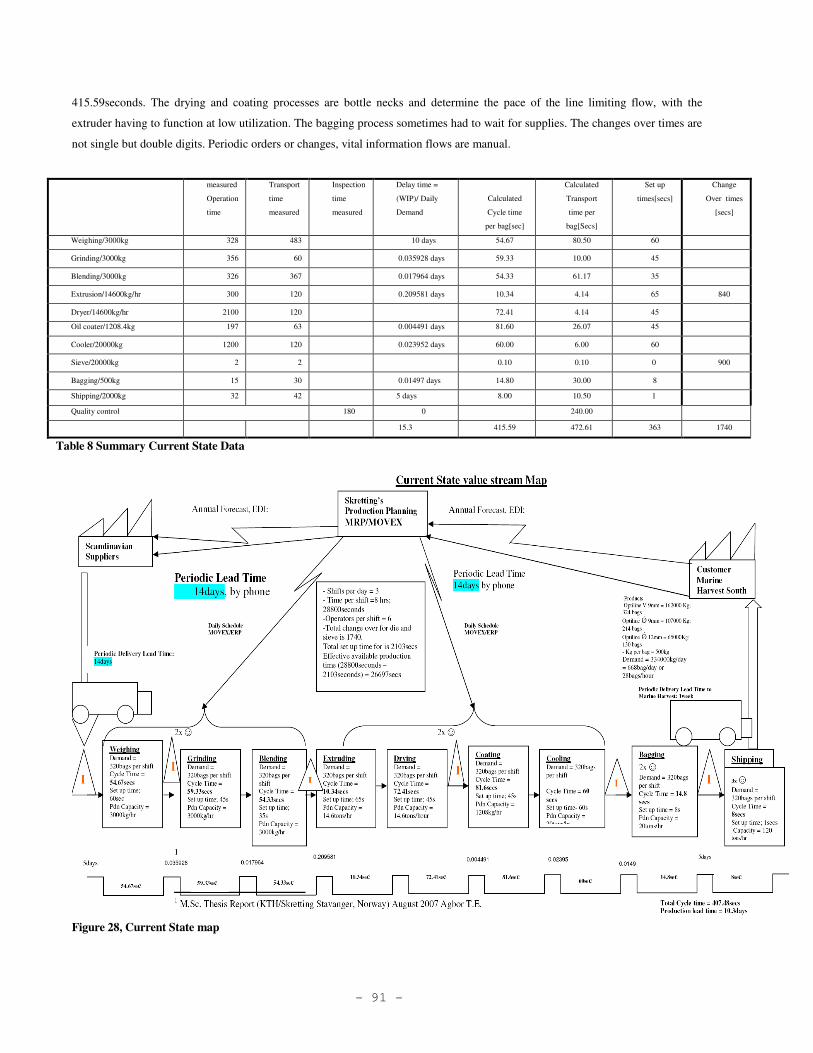
- 91 -
415.59seconds. The drying and coating processes are bottle necks and determine the pace of the line limiting flow, with the
extruder having to function at low utilization. The bagging process sometimes had to wait for supplies. The changes over times are
not single but double digits. Periodic orders or changes, vital information flows are manual.
measured
Operation
time
Transport
time
measured
Inspection
time
measured
Delay time =
(WIP)/ Daily
Demand
Calculated
Cycle time
per bag[sec]
Calculated
Transport
time per
bag[Secs]
Set up
times[secs]
Change
Over times
[secs]
Weighing/3000kg 328 483 10 days 54.67 80.50 60
Grinding/3000kg 356 60 0.035928 days 59.33 10.00 45
Blending/3000kg 326 367 0.017964 days 54.33 61.17 35
Extrusion/14600kg/hr 300 120 0.209581 days 10.34 4.14 65 840
Dryer/14600kg/hr 2100 120 72.41 4.14 45
Oil coater/1208.4kg 197 63 0.004491 days 81.60 26.07 45
Cooler/20000kg 1200 120 0.023952 days 60.00 6.00 60
Sieve/20000kg 2 2 0.10 0.10 0 900
Bagging/500kg 15 30 0.01497 days 14.80 30.00 8
Shipping/2000kg 32 42 5 days 8.00 10.50 1
Quality control 180 0 240.00
15.3 415.59 472.61 363 1740
Table 8 Summary Current State Data
Figure 28, Current State map
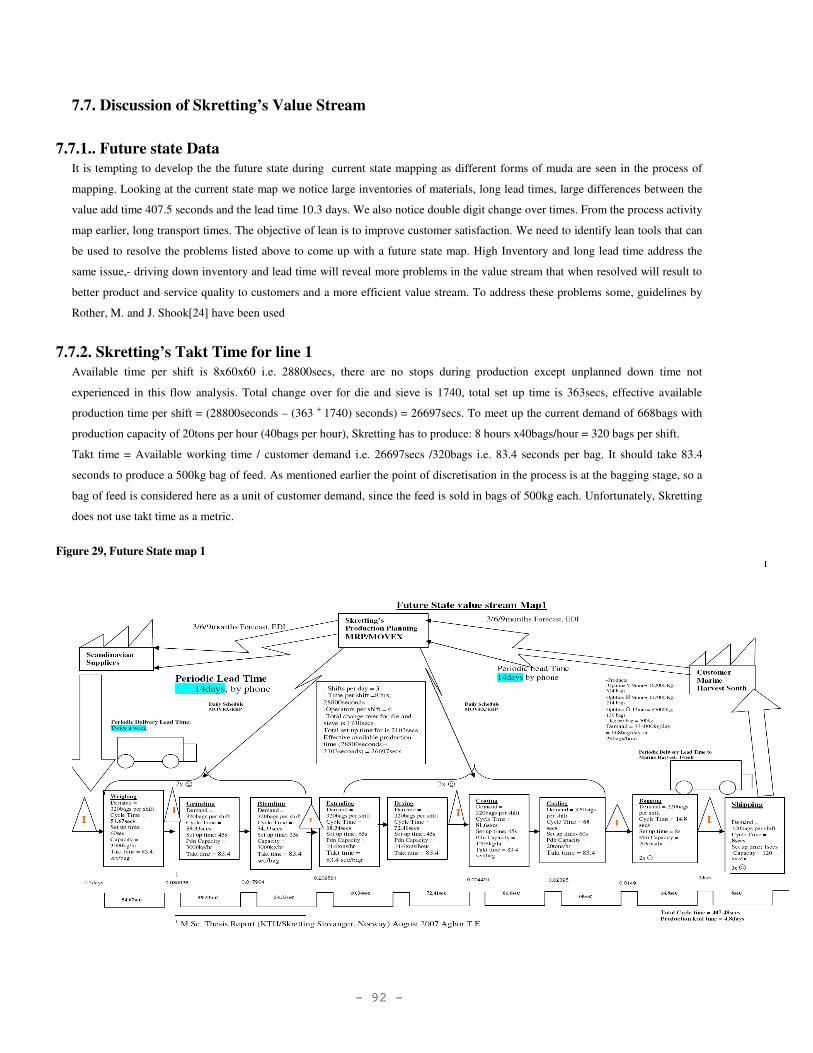
- 92 -
7.7. Discussion of Skretting’s Value Stream
7.7.1.. Future state Data
It is tempting to develop the the future state during current state mapping as different forms of muda are seen in the process of
mapping. Looking at the current state map we notice large inventories of materials, long lead times, large differences between the
value add time 407.5 seconds and the lead time 10.3 days. We also notice double digit change over times. From the process activity
map earlier, long transport times. The objective of lean is to improve customer satisfaction. We need to identify lean tools that can
be used to resolve the problems listed above to come up with a future state map. High Inventory and long lead time address the
same issue,- driving down inventory and lead time will reveal more problems in the value stream that when resolved will result to
better product and service quality to customers and a more efficient value stream. To address these problems some, guidelines by
Rother, M. and J. Shook[24] have been used
7.7.2. Skretting’s Takt Time for line 1
Available time per shift is 8x60x60 i.e. 28800secs, there are no stops during production except unplanned down time not
experienced in this flow analysis. Total change over for die and sieve is 1740, total set up time is 363secs, effective available
production time per shift = (28800seconds – (363 + 1740) seconds) = 26697secs. To meet up the current demand of 668bags with
production capacity of 20tons per hour (40bags per hour), Skretting has to produce: 8 hours x40bags/hour = 320 bags per shift.
Takt time = Available working time / customer demand i.e. 26697secs /320bags i.e. 83.4 seconds per bag. It should take 83.4
seconds to produce a 500kg bag of feed. As mentioned earlier the point of discretisation in the process is at the bagging stage, so a
bag of feed is considered here as a unit of customer demand, since the feed is sold in bags of 500kg each. Unfortunately, Skretting
does not use takt time as a metric.
Figure 29, Future State map 1
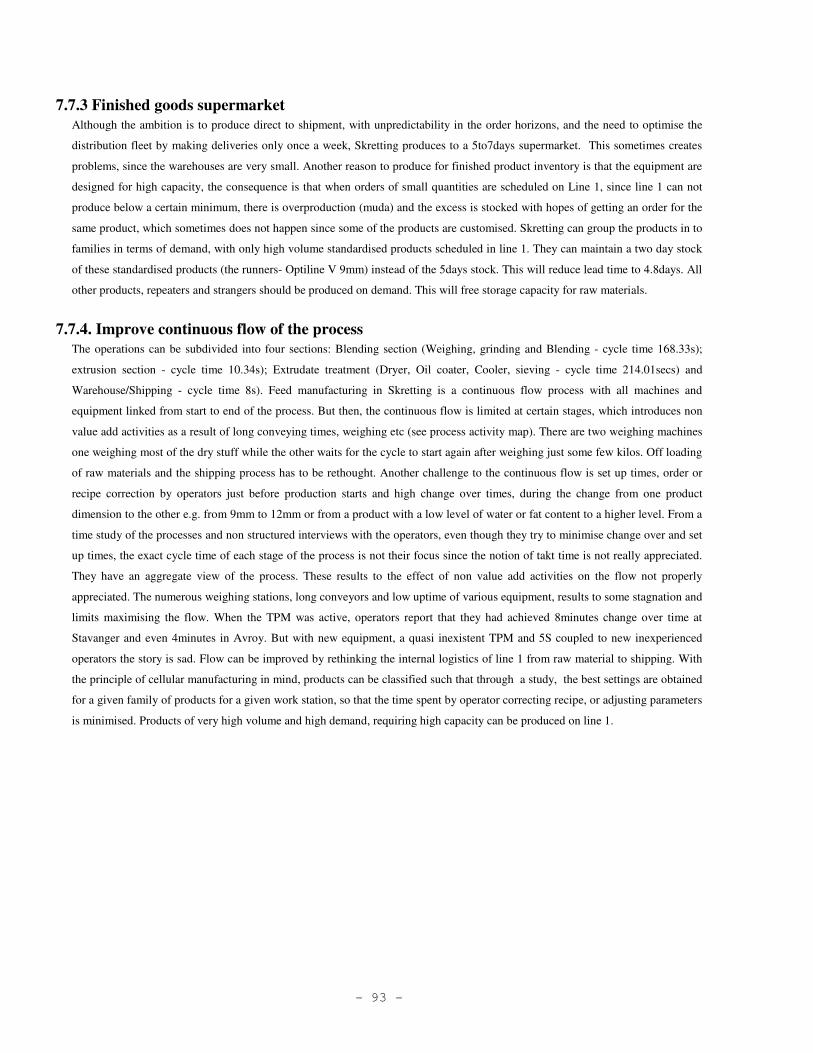
- 93 -
7.7.3 Finished goods supermarket
Although the ambition is to produce direct to shipment, with unpredictability in the order horizons, and the need to optimise the
distribution fleet by making deliveries only once a week, Skretting produces to a 5to7days supermarket. This sometimes creates
problems, since the warehouses are very small. Another reason to produce for finished product inventory is that the equipment are
designed for high capacity, the consequence is that when orders of small quantities are scheduled on Line 1, since line 1 can not
produce below a certain minimum, there is overproduction (muda) and the excess is stocked with hopes of getting an order for the
same product, which sometimes does not happen since some of the products are customised. Skretting can group the products in to
families in terms of demand, with only high volume standardised products scheduled in line 1. They can maintain a two day stock
of these standardised products (the runners- Optiline V 9mm) instead of the 5days stock. This will reduce lead time to 4.8days. All
other products, repeaters and strangers should be produced on demand. This will free storage capacity for raw materials.
7.7.4. Improve continuous flow of the process
The operations can be subdivided into four sections: Blending section (Weighing, grinding and Blending - cycle time 168.33s);
extrusion section - cycle time 10.34s); Extrudate treatment (Dryer, Oil coater, Cooler, sieving - cycle time 214.01secs) and
Warehouse/Shipping - cycle time 8s). Feed manufacturing in Skretting is a continuous flow process with all machines and
equipment linked from start to end of the process. But then, the continuous flow is limited at certain stages, which introduces non
value add activities as a result of long conveying times, weighing etc (see process activity map). There are two weighing machines
one weighing most of the dry stuff while the other waits for the cycle to start again after weighing just some few kilos. Off loading
of raw materials and the shipping process has to be rethought. Another challenge to the continuous flow is set up times, order or
recipe correction by operators just before production starts and high change over times, during the change from one product
dimension to the other e.g. from 9mm to 12mm or from a product with a low level of water or fat content to a higher level. From a
time study of the processes and non structured interviews with the operators, even though they try to minimise change over and set
up times, the exact cycle time of each stage of the process is not their focus since the notion of takt time is not really appreciated.
They have an aggregate view of the process. These results to the effect of non value add activities on the flow not properly
appreciated. The numerous weighing stations, long conveyors and low uptime of various equipment, results to some stagnation and
limits maximising the flow. When the TPM was active, operators report that they had achieved 8minutes change over time at
Stavanger and even 4minutes in Avroy. But with new equipment, a quasi inexistent TPM and 5S coupled to new inexperienced
operators the story is sad. Flow can be improved by rethinking the internal logistics of line 1 from raw material to shipping. With
the principle of cellular manufacturing in mind, products can be classified such that through a study, the best settings are obtained
for a given family of products for a given work station, so that the time spent by operator correcting recipe, or adjusting parameters
is minimised. Products of very high volume and high demand, requiring high capacity can be produced on line 1.
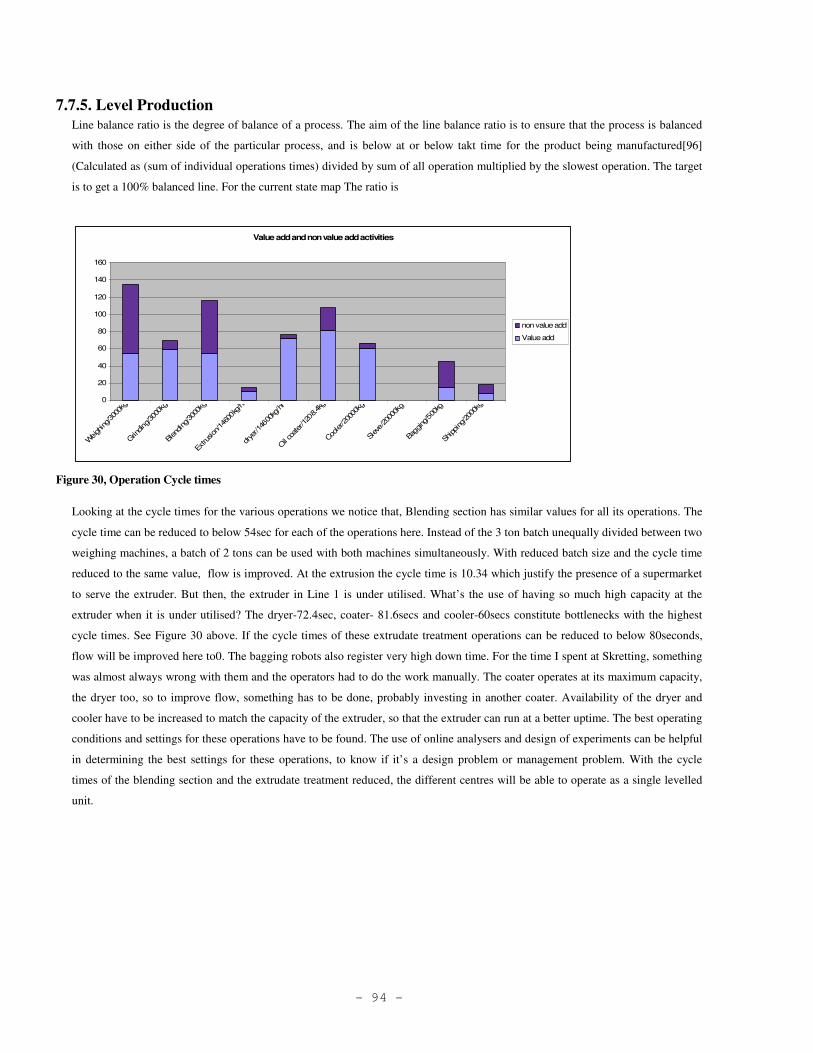
- 94 -
7.7.5. Level Production
Line balance ratio is the degree of balance of a process. The aim of the line balance ratio is to ensure that the process is balanced
with those on either side of the particular process, and is below at or below takt time for the product being manufactured[96]
(Calculated as (sum of individual operations times) divided by sum of all operation multiplied by the slowest operation. The target
is to get a 100% balanced line. For the current state map The ratio is
Value add and non value add activities
0
20
40
60
80
100
120
140
160
Weigh
ing/30
00kg
Grin
ding
/300
0kg
Blen
ding
/300
0kg
Extru
sion
/146
00kg
/hr
drye
r/146
00kg
/hr
Oil co
ater/120
8.4k
g
Coo
ler/2
0000
kg
Siev
e/20
000k
g
Bagg
ing/50
0kg
Shipping
/200
0kg
non value add
Value add
Figure 30, Operation Cycle times
Looking at the cycle times for the various operations we notice that, Blending section has similar values for all its operations. The
cycle time can be reduced to below 54sec for each of the operations here. Instead of the 3 ton batch unequally divided between two
weighing machines, a batch of 2 tons can be used with both machines simultaneously. With reduced batch size and the cycle time
reduced to the same value, flow is improved. At the extrusion the cycle time is 10.34 which justify the presence of a supermarket
to serve the extruder. But then, the extruder in Line 1 is under utilised. What’s the use of having so much high capacity at the
extruder when it is under utilised? The dryer-72.4sec, coater- 81.6secs and cooler-60secs constitute bottlenecks with the highest
cycle times. See Figure 30 above. If the cycle times of these extrudate treatment operations can be reduced to below 80seconds,
flow will be improved here to0. The bagging robots also register very high down time. For the time I spent at Skretting, something
was almost always wrong with them and the operators had to do the work manually. The coater operates at its maximum capacity,
the dryer too, so to improve flow, something has to be done, probably investing in another coater. Availability of the dryer and
cooler have to be increased to match the capacity of the extruder, so that the extruder can run at a better uptime. The best operating
conditions and settings for these operations have to be found. The use of online analysers and design of experiments can be helpful
in determining the best settings for these operations, to know if it’s a design problem or management problem. With the cycle
times of the blending section and the extrudate treatment reduced, the different centres will be able to operate as a single levelled
unit.
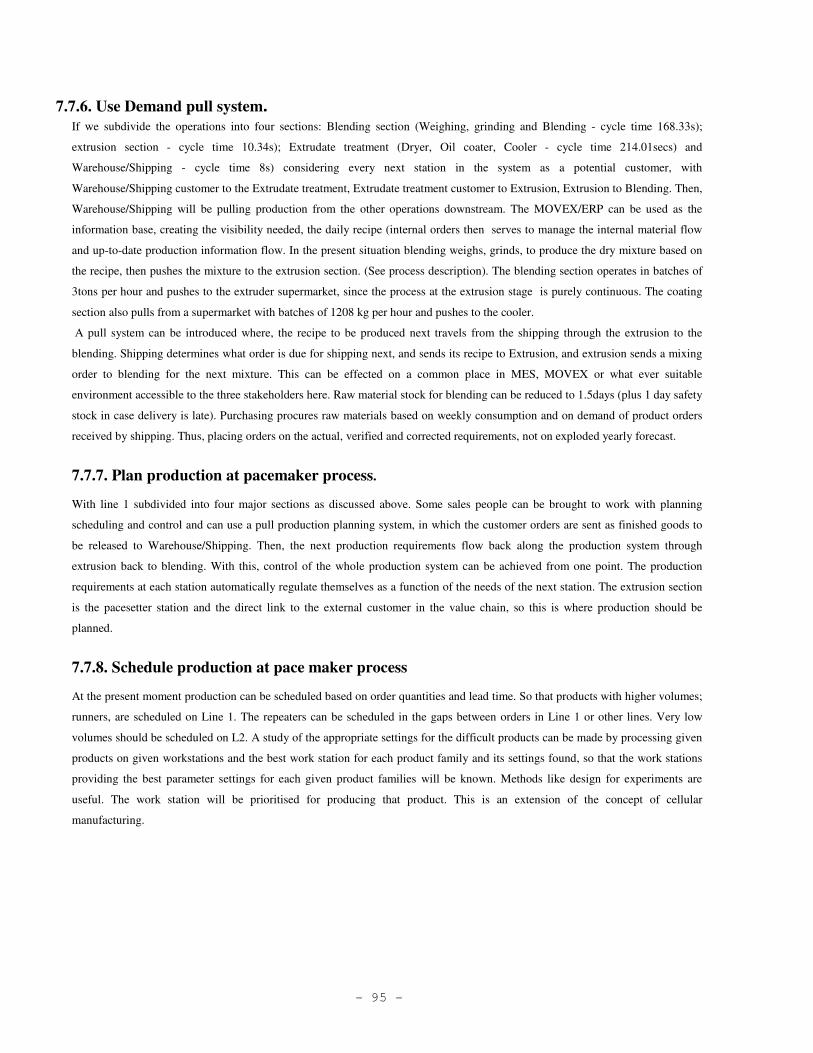
- 95 -
7.7.6. Use Demand pull system. If we subdivide the operations into four sections: Blending section (Weighing, grinding and Blending - cycle time 168.33s);
extrusion section - cycle time 10.34s); Extrudate treatment (Dryer, Oil coater, Cooler - cycle time 214.01secs) and
Warehouse/Shipping - cycle time 8s) considering every next station in the system as a potential customer, with
Warehouse/Shipping customer to the Extrudate treatment, Extrudate treatment customer to Extrusion, Extrusion to Blending. Then,
Warehouse/Shipping will be pulling production from the other operations downstream. The MOVEX/ERP can be used as the
information base, creating the visibility needed, the daily recipe (internal orders then serves to manage the internal material flow
and up-to-date production information flow. In the present situation blending weighs, grinds, to produce the dry mixture based on
the recipe, then pushes the mixture to the extrusion section. (See process description). The blending section operates in batches of
3tons per hour and pushes to the extruder supermarket, since the process at the extrusion stage is purely continuous. The coating
section also pulls from a supermarket with batches of 1208 kg per hour and pushes to the cooler.
A pull system can be introduced where, the recipe to be produced next travels from the shipping through the extrusion to the
blending. Shipping determines what order is due for shipping next, and sends its recipe to Extrusion, and extrusion sends a mixing
order to blending for the next mixture. This can be effected on a common place in MES, MOVEX or what ever suitable
environment accessible to the three stakeholders here. Raw material stock for blending can be reduced to 1.5days (plus 1 day safety
stock in case delivery is late). Purchasing procures raw materials based on weekly consumption and on demand of product orders
received by shipping. Thus, placing orders on the actual, verified and corrected requirements, not on exploded yearly forecast.
7.7.7. Plan production at pacemaker process.
With line 1 subdivided into four major sections as discussed above. Some sales people can be brought to work with planning
scheduling and control and can use a pull production planning system, in which the customer orders are sent as finished goods to
be released to Warehouse/Shipping. Then, the next production requirements flow back along the production system through
extrusion back to blending. With this, control of the whole production system can be achieved from one point. The production
requirements at each station automatically regulate themselves as a function of the needs of the next station. The extrusion section
is the pacesetter station and the direct link to the external customer in the value chain, so this is where production should be
planned.
7.7.8. Schedule production at pace maker process
At the present moment production can be scheduled based on order quantities and lead time. So that products with higher volumes;
runners, are scheduled on Line 1. The repeaters can be scheduled in the gaps between orders in Line 1 or other lines. Very low
volumes should be scheduled on L2. A study of the appropriate settings for the difficult products can be made by processing given
products on given workstations and the best work station for each product family and its settings found, so that the work stations
providing the best parameter settings for each given product families will be known. Methods like design for experiments are
useful. The work station will be prioritised for producing that product. This is an extension of the concept of cellular
manufacturing.
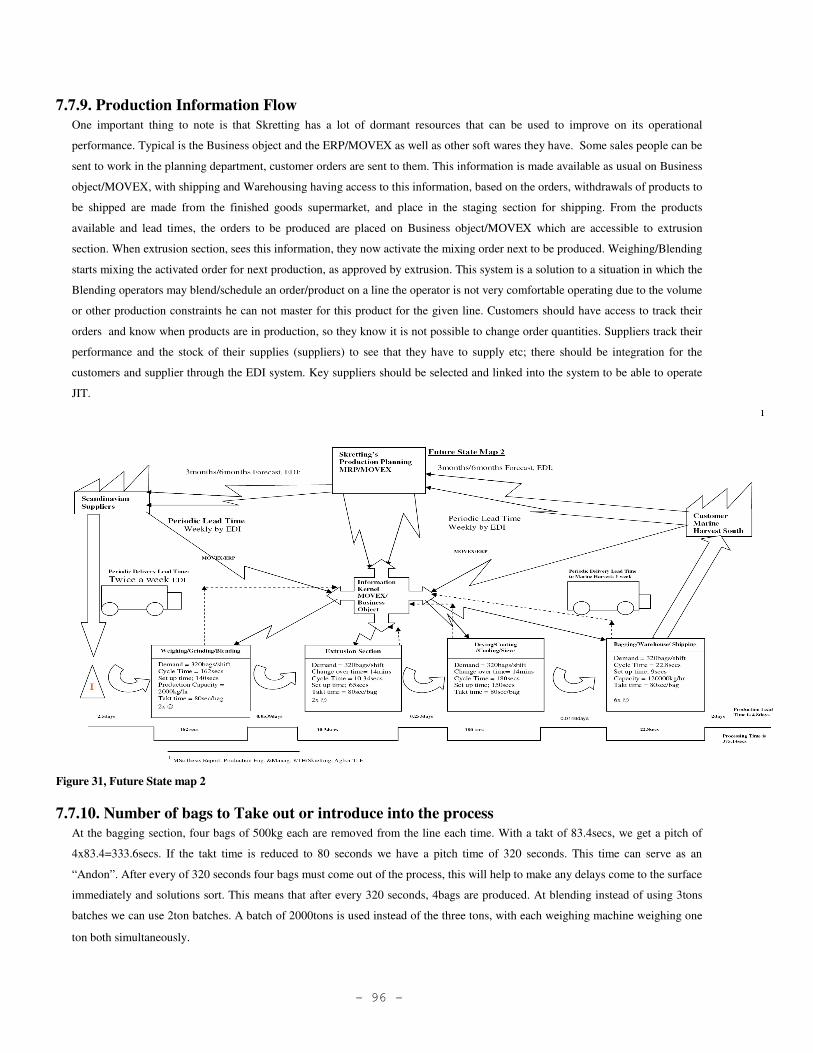
- 96 -
7.7.9. Production Information Flow
One important thing to note is that Skretting has a lot of dormant resources that can be used to improve on its operational
performance. Typical is the Business object and the ERP/MOVEX as well as other soft wares they have. Some sales people can be
sent to work in the planning department, customer orders are sent to them. This information is made available as usual on Business
object/MOVEX, with shipping and Warehousing having access to this information, based on the orders, withdrawals of products to
be shipped are made from the finished goods supermarket, and place in the staging section for shipping. From the products
available and lead times, the orders to be produced are placed on Business object/MOVEX which are accessible to extrusion
section. When extrusion section, sees this information, they now activate the mixing order next to be produced. Weighing/Blending
starts mixing the activated order for next production, as approved by extrusion. This system is a solution to a situation in which the
Blending operators may blend/schedule an order/product on a line the operator is not very comfortable operating due to the volume
or other production constraints he can not master for this product for the given line. Customers should have access to track their
orders and know when products are in production, so they know it is not possible to change order quantities. Suppliers track their
performance and the stock of their supplies (suppliers) to see that they have to supply etc; there should be integration for the
customers and supplier through the EDI system. Key suppliers should be selected and linked into the system to be able to operate
JIT.
Figure 31, Future State map 2
7.7.10. Number of bags to Take out or introduce into the process
At the bagging section, four bags of 500kg each are removed from the line each time. With a takt of 83.4secs, we get a pitch of
4x83.4=333.6secs. If the takt time is reduced to 80 seconds we have a pitch time of 320 seconds. This time can serve as an
“Andon”. After every of 320 seconds four bags must come out of the process, this will help to make any delays come to the surface
immediately and solutions sort. This means that after every 320 seconds, 4bags are produced. At blending instead of using 3tons
batches we can use 2ton batches. A batch of 2000tons is used instead of the three tons, with each weighing machine weighing one
ton both simultaneously.
- 97 -
7.8. Possible process improvements There is almost no sense of Takt time at Skretting, which obscures the pull to which the value stream can respond. To achieve the
suggested future state map, improvement actions must be carried out using specific lean tools.
7.8.1. Operator Training and Empowerment
The operators need to be trained on basic skills like SMED, 5S, 5whys, basic statistical and administrative techniques, so they will
be able to represent the data from their operations in ways that can make meaning to them. They should be able to organise
themselves in quality improvement groups that can come up with suggestions on how to monitor and improve their operations.
7.8.2. Standardisation of operations
Skretting needs to put in place standard operating procedures available at point of use. The absence makes the process of learning a
spiral, because every operator has his version of running the processes. This can only lead to high rework, and high uncertainty.
Working methods have to be developed and standardised, with operating routines and check lists developed by the operators
themselves, and placed at the point of use. Procedures for time measures have to be made so that the cycle times, takt and pitch
times, start and end of each process, clearly stated for the operators, not only the PLC programmer.
7.8.3. Set up time reduction
In the absence of an effective 5S system, high set up and change over times are rampant. There is the need to reduce set up as
well as change over time at Skretting’s extruder and sieve. This will need training on the single digit minute exchange of die
(SMED) tool. SMED, differentiates internal time – set up when machine is still and external time – set up when the machine is
running, eliminate adjustments – jigs, manual, measuring tools etc. [18]. Operators report that they had achieved 8minutes
change over time before this study. During this study, some operators could make change of dies in 6 to 8 minutes while the
majority did it in 14 to 20minutes. With a 5S in place, added to standardised checklists developed by the operators themselves,
this knowledge which is in form of tacit knowledge can be documented, improved upon and transmitted to others.
Separate the change over activities into those that can be done while the equipment is running (external change over activities) and
those that are done while it is stopped (internal). Locate all the tools needed beside the point of die change, at the correct position
and side. Avoid crowding and minimise movements during the process like bending stretching etc.
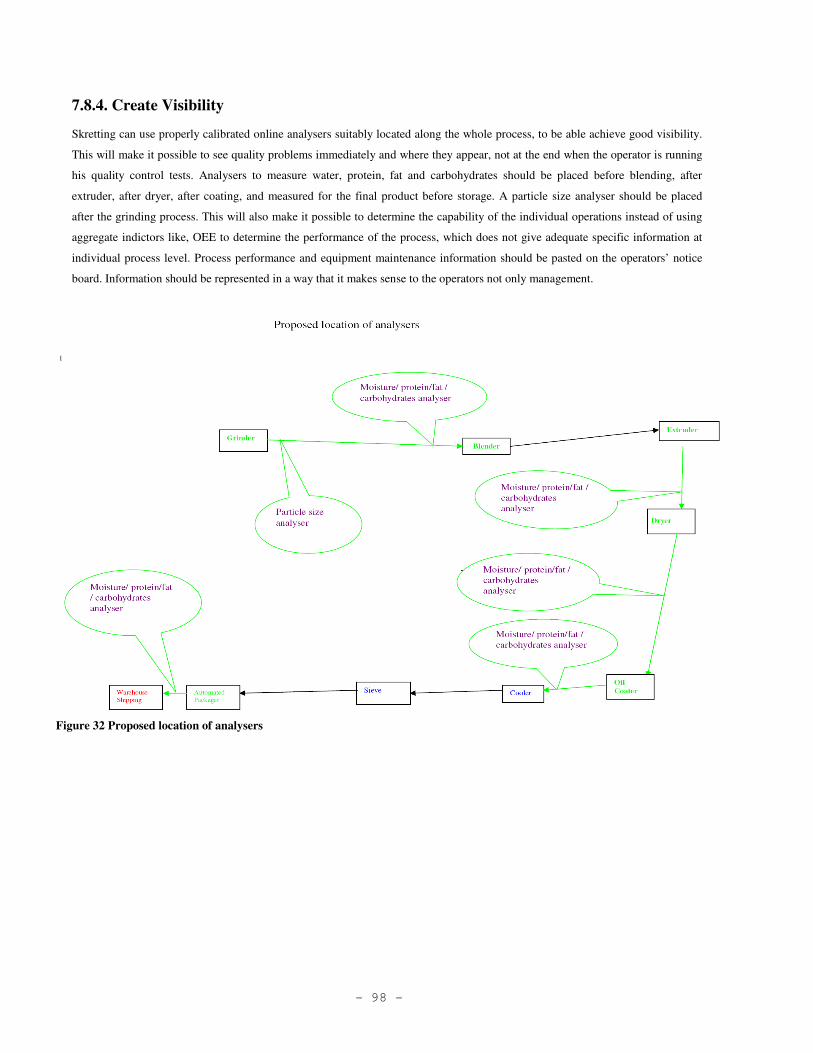
- 98 -
7.8.4. Create Visibility
Skretting can use properly calibrated online analysers suitably located along the whole process, to be able achieve good visibility.
This will make it possible to see quality problems immediately and where they appear, not at the end when the operator is running
his quality control tests. Analysers to measure water, protein, fat and carbohydrates should be placed before blending, after
extruder, after dryer, after coating, and measured for the final product before storage. A particle size analyser should be placed
after the grinding process. This will also make it possible to determine the capability of the individual operations instead of using
aggregate indictors like, OEE to determine the performance of the process, which does not give adequate specific information at
individual process level. Process performance and equipment maintenance information should be pasted on the operators’ notice
board. Information should be represented in a way that it makes sense to the operators not only management.
Figure 32 Proposed location of analysers
- 99 -
7.8.5. Total productive maintenance (TPM)
The major cause of high down time due to machine break down is the lack of an effective TPM plan. Skretting’s manufacturing
reports that maintenance is scheduled once every week from midday to 14 pm. Although no stops due to machine breakdown
occurred during this study, breakdowns have been common for the period this work was carried out. The huge equipment can not
be easily replaced, which calls for an effective TPM plan. The longer the maintenance interval between scheduled maintenance, the
more likely the equipment is to break down, hence the higher the probability of quality defects. Separate planned maintenance
activities into those that can be done by the operators themselves, and those by the maintenance operators. The planned
maintenance can be split into smaller schedules with shorter periods that can be done more often for example instead of waiting for
the weekend end, do shorter every 16 hours. These will eliminate small abnormalities that are often overlooked and delayed. This
will also result to less frequent failures, poor reliability, and avoid long and expensive overhauls. Unplanned downtime should be
scheduled as needed without waiting to look at the calendar to determine what attention the equipment needs. The state of wear for
example of the extruder should be constantly monitored, the reliability and conditions of the equipment constantly measured,
cleanliness, pressure drops, heat leakages, vibration analysis, calibration etc.
7.8.6. Just in time
For the proposed demand pull system in the future state map to be effected Skretting needs to create good collaboration with its
internal and external customers and suppliers. Specific agreements have to be signed with the external customer to established
fixed order lead time of a week with the customers. The external customers should not be allowed to change order quantities one
week before shipment this will facilitate scheduling and planning. External Suppliers need to be sorted out and the major and most
performant supplier retained and integrated into the system with access to the stock of their raw materials through the EDI system.
Agreements must be made with external suppliers on delivery lead times. Each of the process sections has to view the other as a
potential customer. This can only come through training and collaboration between operators who are also highly motivated by
senior management. Operators should know who their customers are and the customer requirements. Classify raw materials based
on their usage and lead time to be able to determine which ordering policy to use. Those with short lead time can be placed under
the JIT category. Those with long lead times can be managed differently.
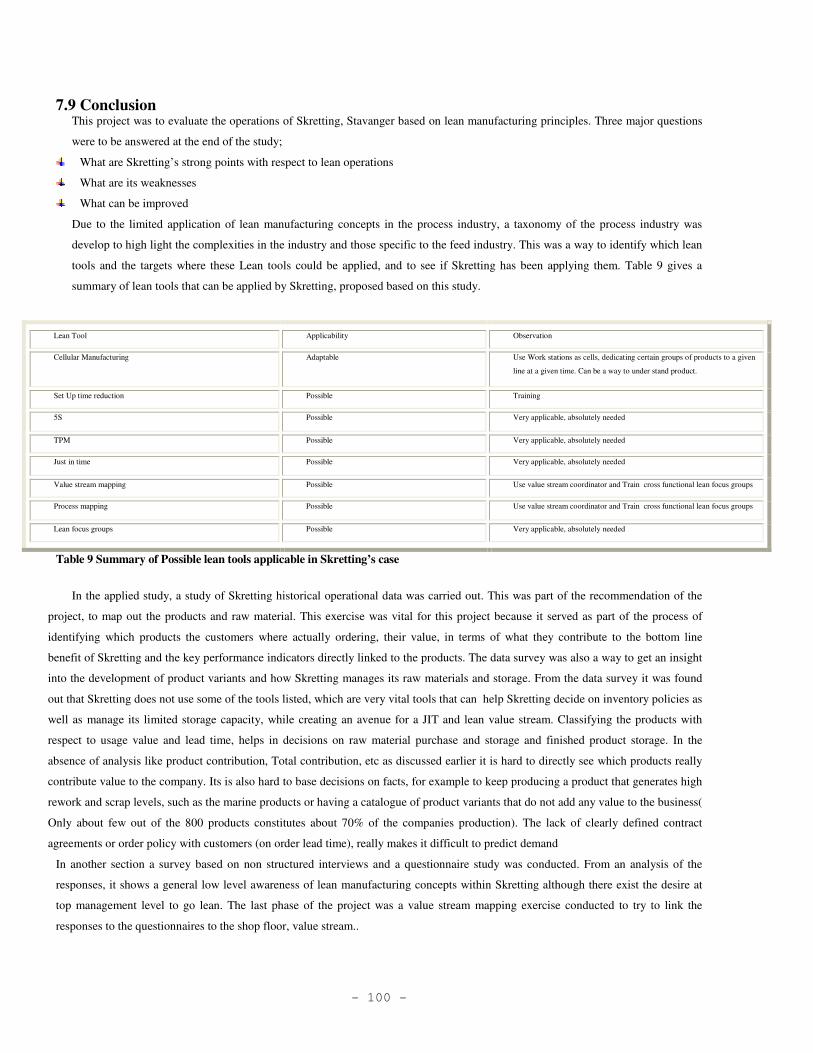
- 100 -
7.9 Conclusion This project was to evaluate the operations of Skretting, Stavanger based on lean manufacturing principles. Three major questions
were to be answered at the end of the study;
What are Skretting’s strong points with respect to lean operations
What are its weaknesses
What can be improved
Due to the limited application of lean manufacturing concepts in the process industry, a taxonomy of the process industry was
develop to high light the complexities in the industry and those specific to the feed industry. This was a way to identify which lean
tools and the targets where these Lean tools could be applied, and to see if Skretting has been applying them. Table 9 gives a
summary of lean tools that can be applied by Skretting, proposed based on this study.
Lean Tool Applicability Observation
Cellular Manufacturing Adaptable Use Work stations as cells, dedicating certain groups of products to a given
line at a given time. Can be a way to under stand product.
Set Up time reduction Possible Training
5S Possible Very applicable, absolutely needed
TPM Possible Very applicable, absolutely needed
Just in time Possible Very applicable, absolutely needed
Value stream mapping Possible Use value stream coordinator and Train cross functional lean focus groups
Process mapping Possible Use value stream coordinator and Train cross functional lean focus groups
Lean focus groups Possible Very applicable, absolutely needed
Table 9 Summary of Possible lean tools applicable in Skretting’s case
In the applied study, a study of Skretting historical operational data was carried out. This was part of the recommendation of the
project, to map out the products and raw material. This exercise was vital for this project because it served as part of the process of
identifying which products the customers where actually ordering, their value, in terms of what they contribute to the bottom line
benefit of Skretting and the key performance indicators directly linked to the products. The data survey was also a way to get an insight
into the development of product variants and how Skretting manages its raw materials and storage. From the data survey it was found
out that Skretting does not use some of the tools listed, which are very vital tools that can help Skretting decide on inventory policies as
well as manage its limited storage capacity, while creating an avenue for a JIT and lean value stream. Classifying the products with
respect to usage value and lead time, helps in decisions on raw material purchase and storage and finished product storage. In the
absence of analysis like product contribution, Total contribution, etc as discussed earlier it is hard to directly see which products really
contribute value to the company. Its is also hard to base decisions on facts, for example to keep producing a product that generates high
rework and scrap levels, such as the marine products or having a catalogue of product variants that do not add any value to the business(
Only about few out of the 800 products constitutes about 70% of the companies production). The lack of clearly defined contract
agreements or order policy with customers (on order lead time), really makes it difficult to predict demand
In another section a survey based on non structured interviews and a questionnaire study was conducted. From an analysis of the
responses, it shows a general low level awareness of lean manufacturing concepts within Skretting although there exist the desire at
top management level to go lean. The last phase of the project was a value stream mapping exercise conducted to try to link the
responses to the questionnaires to the shop floor, value stream..
- 101 -
7.9.1. What are Skretting’s Weaknesses with respect to adopting Lean concepts?
Besides other reasons like high rate of manpower turn over, a tough union within Skretting, newly modified production equipment,
there is a low level of top management’s commitment to dedicate resources to the development, implementation or adoption and
adaptation of lean concepts Skretting. The gap between top management and the operator may seem narrow on documentation and
discussions or appearances but practically wide at operational level. There are no dedicated resources such as value stream
coordinator with cross functional focus on the value stream. Infact, almost no one in the organisation has any value stream focused
responsibilities. Lean support processes like 5S, TPM, have serious handicaps. There is no company wide policy for lean. Every
one tries to improve what he can at his angle without a value stream view. There is a total lack of focus on cycle times and
especially takt time, which obscures the possibility of seeing any possibility of improving the pull system to which the value
stream responds. The frontline workforce lacks the training in basic lean tools and others like statistical tools used for analysing
data, administrative tools - vital for use in meetings or focus groups. There are no lean or improvement focus groups. Insufficient
customer and supplier integration for a system that desires to be responsive. Working methods are not standardise, which makes
the learning process for new operators difficult since all is based on tacit knowledge . The conveyor network is very complicated
and maybe a little long it could be looked at to minimise transport time.
7.9.2. What are Skretting’s strong points with respect to lean operations?
Major strong points include a good communication system (EDI). Good planning environments and data base (Business Object,
MOVEX etc.) that can enable effective planning, scheduling and reporting. Skretting can totally integrate its whole value stream
especially the major customers and suppliers, a preamble to a Just in time system. A good customer base, with few wholesale
customers that can be exploited to build a lean supply chain. Skretting’s customer proximity, favours an efficient distribution (Just
in time distribution). Most of its suppliers are within Europe and this can be exploited to create a JIT supplier base (Just in time
purchasing). Major customer, Marine Harvest is open to corporation in improving or integrating value stream.
7.9.3. What can be improved?
Management’s commitment to learning lean manufacturing, stepping up from wanting to be lean, or “sitting on the fence” position
to creating a lean policy, training dedicated people and motivating frontline operators to form lean focus groups, involving and
encouraging frontline operators to make suggestions for improvement, and a reward system for good suggestions. Focus on cycle
time and takt time can be improved and hence the focus on a pull system. Reducing transport time. Process visibility can be
improved through the use of online analysers.
7.10. Contribution of the project Through this project the awareness of the applicability of lean concepts was raised. Some of the respondents, who were skeptical
about its application in Skretting, now know it’s possible. One of the main aims of the interviews and questionnaires was to
generate debate on lean tools and techniques this was successful. Some activities that were regarded as vital in Skretting by the
operators, are now considered, even if not by all, as non value add. Through this project, the ground work has been set for
management to start its campaign for lean implementation. Another contribution of the project is the new view created by this
project of the value stream as starting from raw materials up to the customer as a unit in synergy, not functionally separate units
with each one called to satisfy its obligations.
- 102 -
7.11. Recommendations Top management should develop knowledge on lean manufacturing system, tools, implementation and its benefits, so as to build
the required motivation and knowledge needed to be the driving force for its spread.
Automate off - loading and loading system with use of bagging section minimised, reserved only for very specific products
Use smaller extruders( two or three) in line 1, instead of one big extruder, as a way to be more responsive to customer demands
Evaluate and classify suppliers with focus on their full integration same to with major customers through EDI system. Also
motivate the use of E-orders.
Use of on-line analysers and founded on an active TPM and 5S
Use extruder as scheduling point
Train operators on SMED, to minimise change over time
7.12. Possible Short comings in the Study There are certain factors that could have affected the results of the study at different levels
Some respondents to the questionnaires were not very comfortable with the English language, so the questionnaires had to be
interpreted for them in Norwegian, this could affect the responses. The respondents in some cases marked “Yes” and “No”, so the
student used his discretion based on further discussions with the respondents and the interviews to come up with the scoring of
some responses. There could as well be counting errors during the evaluation of the questionnaires, although the counting and
scoring were repeated several times. At the start of the study most people who were approach were very motivated but as the study
began, when specific information and data was sort for the general atmosphere changed, many got busy or tried to shift the
responsibility of providing the information the student was asking to someone else. This was not common to the author; it was the
same for one other master’s student at the time of the study.
The factory in Stavanger, was having lots of production problems, so several attempts had to be made to obtain the current state
data. Production operations were unstable, most operators were new, and the older once were busy initiating the new and running
the operations, so in most cases the student had to go through the processes alone
7.13. Possible future Research It is not just sufficient to be lean. The processes have as well to be capable, adequate and reliable . Further research should consider
studying the possibility of:
� Integrate Lean, with aspects of TOC and six sigma
� Search for KPIs that reflect the performance of the whole value stream.
� Splitting Stavanger operations to the other two factories, and use Stavanger as a ware house or distribution point
- 103 -
Appendix 1; Lean Evaluation Questionnaire: Top Management
My name is Tanyi Emmanuel Agbor. I am a student from the department of production engineering, Kungliga Tekniska Högskola
(KTH), Stockholm and here in Skretting for a thesis project on Lean manufacturing. The project involves an evaluation of
production operations here in Stavanger based on lean manufacturing concepts. The responses to this questionnaire study are part
of this qualitative evaluation process
Pleas in case you have any questions do not hesitate to contact me at 5931
Lean Manufacturing Evaluation
The Skretting’s business unit during the last years has been in the path of applying Lean manufacturing principles in its operations.
The main objective of my project is to make a thorough evaluation of Skretting's operations based on "Lean Manufacturing
concept" to identify strengths, weaknesses and opportunities for improvements. It is based on this that I have formulated this
questionnaire. It is a check list that will help to asses the current statues, the willingness and on going-preparedness of the plant in
Stavanger to adopting and adapting to the lean way of thinking. It also serves as a starting point to stimulate thought and
discussions among the stake holders on the issue. Although management should be in position to develop and implement
aggressive action plans that will lay the ground work for the road to lean operations in the production operations in Stavanger,
everyone in the organization is required to demonstrate the willingness and openness to accept this approach, which is just a
reminder of how to do things but with a slightly different way of thinking.
Objectives of this Questionnaire
Assesses:
� Workers and managements awareness, understanding and acceptance of the lean concepts and principles.
� Workers and managements awareness, understanding and acceptance of the lean methods and techniques.
� how widely lean concepts are used in Skretting’s
� workers and managements preparedness to adopt lean concepts
� workers and managements expectations in adopting lean methods
� possible challenges to spreading and adopting lean
� awareness of possible bottom line benefits
� top managements preparedness to adopt lean
� Top managements preparedness to involve workers.
� top managements preparedness train, dedicate resources and motivate workers
Definition of Lean manufacturing
Lean production is defined as, a systematic approach to identifying value as defined by the customer, identifying and eliminating
waste (non-value-adding activities) through continuous improvement by flowing the product at the pull of the customer in pursuit
of perfection.
It is based on five main principles
� Define value from the customers point of view or let the customer define what value is for the product
� Create a process[Value stream] that can deliver this value and eliminate all forms of activities that do not add value to the
product
� Standardize the processes and operations, to get a leveled and continuously flowing process
� Let production be customer pulled or consumption driven i.e. produce only on customer demand
- 104 -
� Continuously improve the operations by creating visibility, empowering operators, training and making the process variation
prove
The techniques of achieving a lean system include;
� Grouping the products into groups with similar processing routes and creating dedicated manufacturing cell- Cellular
manufacturing
� Ensure that equipments are always available and reliable, Total productive maintenance
� Just in time management(purchasing, production, distribution); involves, customer(internal and external), supplier and production
integration
� Production smoothening to have uniform production quantities by use of reasonable, economically determined demand based
uniform lot sizes and product mix
� Standardization and documentation of operations, routines and creating visibility
� Elimination of variations and making process mistake prove
� Set up and change over time reduction
� Continuous improvement
� Training, Empowering ,responsibilising and motivating operators
How to respond to the questionnaire
You just need to write: “Y” for “Yes” and “N” for “No”
For the questions that require rating use:
A) 0-25%; B) 26 – 55%; C) 56- 75%; D) 76- 100%
Top Management
Have you heard of the word lean before?
Do you know what it means to be lean?
Do you know the five basic principles of lean?
Are you aware of the methods and techniques of lean?
Do you know of any tools for the implementation of lean methods?
Do the key section heads know what it means to be lean?
Do your key section heads know the five basic principles of lean?
Do your key section heads know the methods and techniques of lean?
Do your key section heads know any tools for the implementation of lean methods?
Do your key section heads know exactly who their next customer in the process is?
Is there any trained multi skilled, multifunctional team and an assigned accountable leader responsible for streamlining all
activities and processes with the value chain
Have you ever assessed the impact of lean operations and quick response to your operations?
Have you ever assessed and defined the barriers to lean implementation
Are your KPIs and reward system weighted towards fast on time customer response with minimum inventory?
Can you exactly predict your lead time for customer orders or to replenish inventories?
Are you absolutely committed to active involvement to create lean operations?
Are you ready to adopt lean operations?
Have you any vision for lean operations?
Do all managers know and share this vision
- 105 -
Are they willing to pursue this vision?
Are you focused to achieve this vision?
Do all your managers understand the need to treat your supply chain as a seamless, defect free process with shortest possible cycle
times and minimum inventory?
Have you developed any performance objectives to guide operational performance improvement based on lean principles
Are your reward systems based on performance towards operational improvement based on lean concepts?
Are there any action initiated by management as evidence of its desire to pursue lean operations
Is lean manufacturing being adopted as a way of doing business?
Have you institutionalised TPM involving every department?
Does your management recognize the need for an effective TPM for product quality, schedule reliability, safety and minimum
cost?
Do you employ TPM to ensure production processes are always available and reliable?
Does every one understand that excess inventory results from:
� Inappropriate performance measures
� Poor quality
� Long change over times
� Unbalanced schedules Poor material and information flow
� Over planning
� Unreliable processes Product proliferation
� Poor sales operation planning
� Inadequate product and process documentation
� Poor information quality
Do you have an active cross training program to ensure multi skilled operator training
- 106 -
Appendix 2; Lean Evaluation Questionnaire: Major customer
Lean Manufacturing Evaluation
The Skretting business unit during the last years has been in the trend of applying Lean manufacturing principles in its operations.
The main objective of my project is to make a thorough evaluation of Skretting's operations based on “Lean Manufacturing
concepts". The objective is to identify strengths, weaknesses and opportunities for improvements. The lean concept focuses on
defining value from the view point of the customer, and managing operations to deliver to theses customer values at the most cost
effective way possible without accumulating unnecessary inventories.. It is based on this reason that I have formulated this
questionnaire. It is a check list that will help to asses the current statues, the willingness and on going-preparedness of the plant in
Stavanger to adopting and adapting to the lean way of thinking, which is focused on producing only customer demanded product. It
also serves as a starting point to stimulate thought and discussions among the stake holders on the issue. You as Skretting’s
customers should be in position to develop and implement aggressive action plans that will let Skretting know exactly what your
requirements are. This lays the ground work for the road to lean operations and exceeding your needs.
Objectives of this Questionnaire
The objective is to accesses your level of satisfaction with respect to
� Delivery performance
� On- time delivery
� Quality
� Reliability of products
� After sales Services
� Information interchange
� Level of involvement in product development
� Customisation
� Price incentives
� Corporation from Skretting
How to respond to the questionnaire
The questions require just “Yes” or “No” answers. They are designed for easy response, based on the consideration that lean
thinking itself is very specific on non value adding time.
You just need to write: “Y” for “Yes” and “N” for “No”
For the questions that require rating use:
A) exceeds expectation B) Good C) can be improved D) below expectations
Respondents Information
Company Name: Address:
- 107 -
Name Responsibility
Email Phone
Product Purchased
Questionnaire
How would you rate Skrettings delivery performance?
How would you rate Skrettings on time-delivery performance?
How would you rate Skrettings product Quality and performance
How would you rate Skrettings product reliability in meeting your customer needs?
How would you rate Skrettings product after sales Services
How would you rate Skrettings information interchange with your company?
Have you ever had any complaints or dissatisfaction with Skrettings?
� Delivery performance?
� On- time delivery?
� Product quality?
� Reliability of the products?
� After sales Services?
� Information interchange?
� Customisation?
� Price?
How were your complaints treated?
Are your order lead times to Skretting Stable?
How do you rate supply predictability
How would you rate Skrettings loyalty to your needs and its promises to meet them?
How would rate your level of involvement in product development
How would you rate your level of access to product customisation?
How would you rate Skrettings price incentives?
Do you have any metrics to measure Skrettings performances?
How do you rate your expectations of Skretting top management dedications with regards to meeting your needs?
Do you have any preferences for the agents you deal with at Skretting?
How would you rate Skrettings operators’ awareness of your requirements?
Is there a Skretting company wide understanding of your requirements
Do you give feedbacks to Skretting of its performances?
Do you involve Skretting in your current and future product offerings or improvement projects?
Does Skretting involve you in its product development?
How would you rate Skrettings present packaging?
How do you rate Skretting responsiveness to your needs, in terms of:
• Product mix
• Volume

- 108 -
Does Skretting deliver straight to where you use the products?
How would you rate Skrettings delivery schedules?
Do you visit Skrettings production plant?
Do you send Skretting a feed back on the final customer impressions about your product?
Is Skretting your only supplier?
Do you consider continuing doing business with Skretting or Start your own feed production?
What improvements have you to suggest to skretting on its products or processes
- 109 -
Appendix 3; Lean Evaluation Questionnaire: Front Line operators
My name is Tanyi Emmanuel Agbor. I am a student from the department of production engineering, Kungliga Tekniska Högskola
(KTH), Stockholm and here in Skretting for a thesis project on Lean manufacturing. The project involves an evaluation of
production operations here in Stavanger based on lean manufacturing concepts. The responses to this questionnaire study are part
of this qualitative evaluation process
Pleas in case you have any questions do not hesitate to contact me at 5931
Lean Manufacturing Evaluation
The Skretting’s business unit during the last years has been in the path of applying Lean manufacturing principles in its operations.
The main objective of my project is to make a thorough evaluation of Skretting's operations based on "Lean Manufacturing
concept" to identify strengths, weaknesses and opportunities for improvements. It is based on this that I have formulated this
questionnaire. It is a check list that will help to asses the current statues, the willingness and on going-preparedness of the plant in
Stavanger to adopting and adapting to the lean way of thinking. It also serves as a starting point to stimulate thought and
discussions among the stake holders on the issue. Although management should be in position to develop and implement
aggressive action plans that will lay the ground work for the road to lean operations in the production operations in Stavanger,
every one in the organization is required to demonstrate the willingness and openness to accept this approach, which is just a
reminder of how to do things but with a slightly different way of thinking.
Objectives of this Questionnaire
Accesses:
• Workers and managements awareness, understanding and acceptance of the lean concepts and principles.
• Workers and managements awareness, understanding and acceptance of the lean methods and techniques.
• how widely lean concepts are used in Skretting’s
• workers and managements preparedness to adopt lean concepts
• workers and managements expectations in adopting lean methods
• possible challenges to spreading and adopting lean
• awareness of possible bottom line benefits
• top managements preparedness to adopt lean
• Top managements preparedness to involve workers.
• top managements preparedness train, dedicate resources and motivate workers
Definition of Lean manufacturing
Lean production is defined as, a systematic approach to identifying value as defined by the customer, identifying and eliminating
waste (non-value-adding activities) through continuous improvement by flowing the product at the pull of the customer in pursuit
of perfection.
It is based on five main principles
• Define value from the customers point of view or let the customer define what value is for the product
• Create a process[Value stream] that can deliver this value and eliminate all forms of activities that do not add value to the
product
• Standardize the processes and operations, to get a level and continuously flowing process
• Let production be customer pulled or consumption driven i.e. produce only on customer demand
- 110 -
• Continuously improve the operations by creating visibility, empowering operators, training and making the process
variation prove
The techniques of achieving a lean system include;
• Grouping the products into groups with similar processing routes and creating dedicated manufacturing cell- Cellular
manufacturing
• Ensure that equipments are always available and reliable, Total productive maintenance
• Just in time management(purchasing, production, distribution); involves, customer(internal and external), supplier and
production integration
• Production smoothening to have uniform production quantities by use of reasonable, economically demand based
determined uniform lot sizes and product mix
• Standardization of operations, routines and creating visibility
• Elimination of variations and making process mistake prove
• Set up and change over time reduction
• Continuous improvement
• Training, Empowering ,responsibilising and motivating operators
How to respond to the questionnaire
You just need to write: “Y” for “Yes” and “N” for “No”
For the questions that require rating use A-D:
A) 0-25%; B) 26 – 20%; C) 56- 75%; D) 76- 100%
Operators
Have you heard of the word lean before?
Do you know what it means to be lean?
Do you know the five basic principles of lean?
Are you aware of the methods and techniques of lean?
Do you know of any tools for the implementation of lean methods?
Have you ever sorted out all activities along the supply chain into value adding and non value adding activities?
Can you exactly predict your lead time for customer orders or to replenish inventories?
Are you absolutely committed to active involvement to create lean operations?
Are you ready to adopt lean operations?
Are you willing to pursue this vision?
Does your management recognize the need for an effective TPM for product quality, schedule reliability, safety and minimum
cost?
Do you employ TPM to ensure production processes are always available and reliable?
Do you understand that excess inventory results from?
• Inappropriate performance measures
• Poor quality
• Long change over times
• Unbalanced schedules Poor material and information flow
• Over planning
• Unreliable processes
• Product proliferation
- 111 -
• Inadequately motivated and trained workers
• Poor sales operation planning
• Inadequate product and process documentation
• Poor information quality
Have you had any active cross training program for multi skill development?
How would you rate your expectations for top management’s involvement with regards to applying lean to satisfying customers?
How would you rate your expectations for management’s involvement with regards to applying lean to satisfying customers?
How would you rate your expectations for operator’s involvement with regards to applying lean in satisfying customers?
Do you define the customer as the next person along the process?
Do you know who the customers of the products are?
Do you have a clear understanding of what customer requirements are?
Have you classified raw materials according to usage lead time availability, value to facilitate movement, purchase and stocking?
Is your production entirely based on customer order?
Do you hold production meetings with other operators and management in the control room to determine production needs and
delivery dates?
Is production scheduled to balance product mix and volume hence facilitate and optimise manufacturing performance
Have operational parameters been recognised and physically linked to ensure balanced material flow
Have you classified products into similar groups based on ease of manufacture so that products with similar demand and ease of
processing can be dedicated to specific lines?
Does the bagging process dictate production rates in up stream processes?
Do you have any standardised operational methodology?
Is the production schedule levelled and balanced to the rate of demand and production capacity capability
Can you exactly predict your lead time for customer orders or to replenish inventories?
Are you empowered to stop production the moment quality is not acceptable
Do you have multifunctional problem resolution teams immediately available to resolve a production problem while it’s occurring?
Are you involved as part of problem resolution teams?
Is every process well defined, documented and flawlessly repeatable to takt time?
Have received any training on basic statistical techniques
Is your equipment under Statistical Control?
Do you have any regular maintenance plan?
Do you respect it?
Do you have the performance indicators, equipment maintenance information posted on operators’ notice board?
Do you have any weekly daily maintenance activity plans?
Do you maintain records of equipment maintenance?
Do you have low set ups and change over time programs that examine each operation stage for set ups and change over time
reduction or elimination
Are there any set up/ change over time reduction drills or working to lower set up?
Does everyone understand that change over time reduction is possible and necessary for production flexibility?
Are operators being trained for set ups and change over times reduction
Are your tools for change over/set up standardised and properly sorted and located for easy access and use
Do you have properly sorted and located standardised and properly documented methodologies for set up/ change over time that
includes sequences, resource requirement, tools and utilities
Have you identified bottle neck operations and prioritise them for set up reduction

- 112 -
Do you effectively apply the 5S?
Do you use any statistical techniques to reduce process variance?
Do you have clear and concise operational procedures present at each line control station?
Have you any on-line analysers that accurately measure the processes and give feed back to operators control screen
Do you have any form of training you will want to undertake to be more efficent?
- 113 -
Appendix 4: A Brief report of Visit to Marine Harvest
Purpose
Since a questionnaire addressing other customer requirements and satisfaction issues had already been sent
to the company, the focus of the visit to Skretting’s major customer, Marine Harvest was to get information
for a value stream mapping. Such as:
- The quantity of feed in tons of OPTILINE 9mm and 12 mm feed they use per given period
- The ordering frequency
- The mode of information exchange with Skretting
- How the products received are packaged and material handling.
-How forecasting is done
- Readiness to share inventory information with Skretting
-Their readiness to create stable order horizon
Participants
Participants at the meeting which lasted about 90minutes were: the student; Emmanuel, Erlend Sodal, my
Skretting supervisor, the manager of Marine Harvest Southern Region and the feed coordinator Southern
region, Leiv Tvenning.
Product types
85% of feed ordered from Skretting is the 9mm and 12 mm. due to lack of information at the moment of
the meeting the figures of 50 to 150 tons of feed were given as consumption per week, 65000tons annually.
No specific information on the specific quantities of 9mm and 12 mm were given, I was referred to get
specific figures from Skretting.
Ordering frequency
Ordering frequency is one delivery each week but twice a week in few occasions, depending on Skretting’s
shipping schedule and fish feeding rate.
The order horizon
The order horizon was stated to be >/=14 days before delivery date, motivated by the gain of a 2% discount
on prices, with a possibility of changing order quantity 4 days to shipping date
Packaging.
The products are received in 500kg bags but the larger bulk is transferred direct to the silos
Their readiness to create stable order horizon
The relevance to have a fixed and stable order horizon and its benefits to both companies was emphasised
and Marine Harvest expressed the desire to have a stable order horizon. We were told discussions are
presently on the way with between both parties respect to this issue
How they carryout forecast
- 114 -
Forecast are done based on a software, but it was not clear if forecast accuracy was evaluated
Information exchange with Skretting
Information such as orders were made on line through an EDI system but order quantity changes are done
by phone
Readiness to share inventory information with Skretting
The manager was open to sharing inventory and forecast data with Skretting. He is also open to have
Skretting manage their inventory; a position the feed manager did not very much share.
Conclusion
Based on discussions at the meeting my impression is that the company relies on Skretting for a lot of
information regarding ordering plans policy etc. They are open to share information with Skretting but
require concrete agreements to be made to create effective and stable order horizon, incentive plan and
policy. It was also made clear to Marin Harvest that MRP systems and other forecast models need to be
continuously checked and updated as they are not always accurate with current situations. Other issues
stressed by the student include the need to let Skretting have access to the customer’s inventory
management system and the use of EDI for all orders and change of order quantities. This will create more
visibility in the supply chain and facilitate production planning and scheduling at Skretting
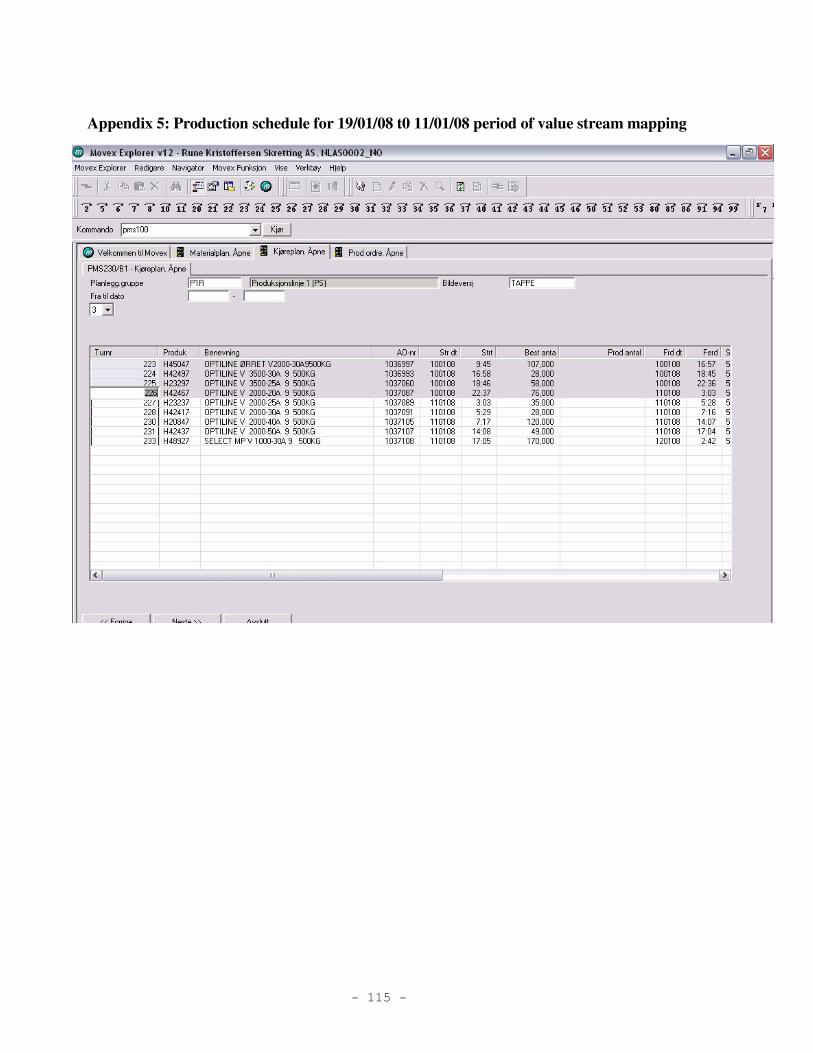
- 115 -
Appendix 5: Production schedule for 19/01/08 t0 11/01/08 period of value stream mapping
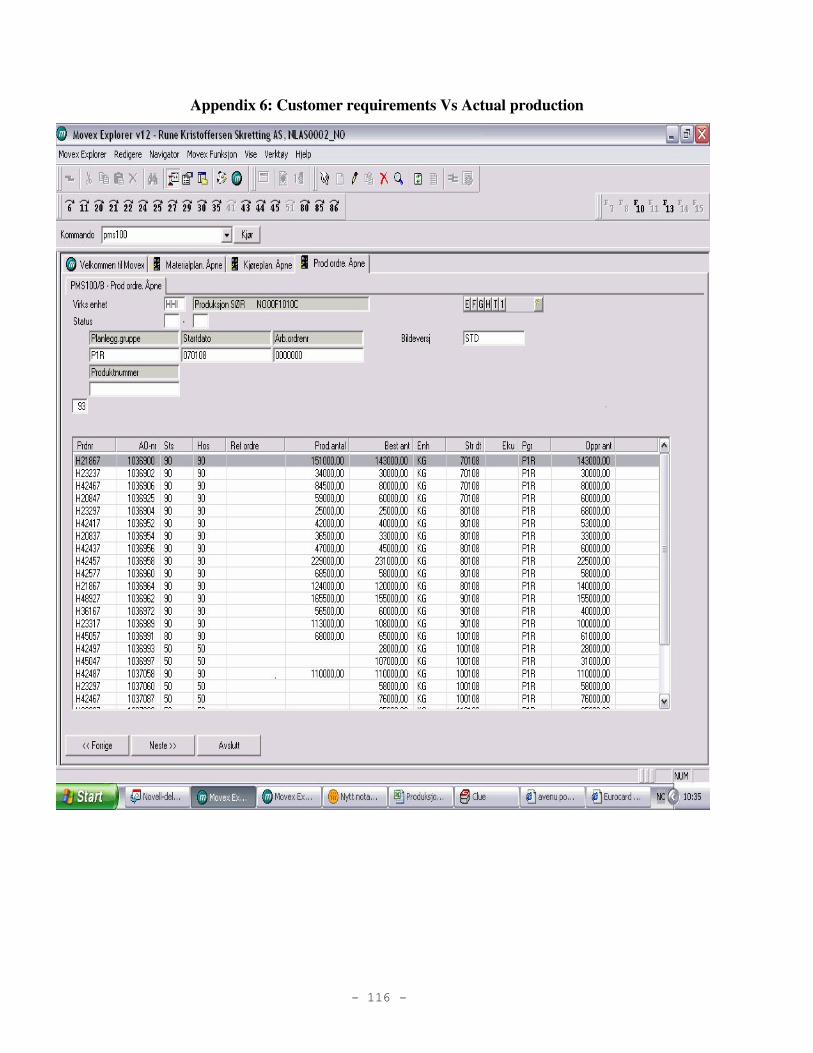
- 116 -
Appendix 6: Customer requirements Vs Actual production
- 117 -
References
[1] Sanford N (1970), “Whatever happened to action”, Journal of social issues vol. 26, nr4 pp3- 23,
[2] Simon A, Sohal A, Brown A, (1996) Generative and case study research in quality management, International Journal of
quality management 13 Number. 1
[3] Routio P: Finding Information in texts, original location http:/www.uiah.fi/projects/metodi, October 2002
[4] Sohleius G, the manufacturing system, our motor of welfare kth, 2000
[5]Slack N et al Operations Management 2nd edition Financial times Ltd, London 1998
6-Skinner W, Manufacturing- Missing link in corporate strategy, Harvard business review, may June 1969
[7] Shingo S, A study of the Toyota manufacturing system from an industrial engineering viewpoint, Productivity press, NY, USA,
1981
[8]Bertrand W Franscoo J, operations management research methodology using quantitative modeling, International journal of
operations production management vol. 19 no. 111999
[9]ArbnorI, Bjerke B företagsekonomisk metodlära, student litertuee, lund, Sweden. 1994
[10]Stuart I et al Effective case research in operations management: a process perspective, journal of operations management, 20,
and 2002
[11]Yin R, Case study research design and methods, sage publications Inc. Thousand Oaks, USA, 1994
[12] Thomas Grunberg, Performance Improvement, A method to support performance improvement in industrial operation, PhD
thesis at KTH Stockholm. Sweden, 2007
[13] National encyclopaedia 19969.
[14]James Womack, Daniel T Jones, Daniel Roos1991, the Machine that changed the world, Pub Harper Perennial USA
[15] Alvesson M. & Sköldberg K.2000, Reflexive methodology, London Sage Publications Inc
[16] Meriam, S.B (1994) Fallstudien som forskningsmetod www. Student literature.se. Student literature publication.
[17] Sofi Elfving, Managing collaborative Product Development in small companies, Licentiate thesis, Mälardalens University
Eskilstuna
[18] Lecture notes on course work for the course production and quality management by Proff. Mats Jackson for the
MIMA masters program in production and logistics management and Malardalens University in Eskilstuna
[19]- Merwan Mehta et al, IIE Lean Solutions Conference, Dec 2005, Orlando FL at www.iee.com
[20]- Industry Week/Manufacturing Performance Institute (IW/MPI), October, 2007
[21]-John Bicheno, The New Lean Tool box
[22]www.Wikipaedia.com
[23]- Rachna Shah, Peter T. Ward, 2002, Lean manufacturing: context, practice bundles, and performance, a Carlson School of
Management, University of Minnesota, Minneapolis, MN 55455, USA b Fisher College of Business, The Ohio State University,
Columbus, OH 43221, USA
Received 12 December 2000; accepted 24 June 2002, Journal of Operations Management 21 (2003) 129–149
[24]Womack, J.P. and D.T. Jones, 2003, Lean Thinking: Banish Waste and Create Wealth in Your Corporation. Simon & Schuster.
UK Ltd
[25]- PM Senge the Fifth Discipline the Art and Practice of the Learning Organization Currency Double Day New York 1990
[26] -John H. Behling, 1984 Guidelines for preparing the research proposal, University Press of America Inc USA
[27]- Industry Week/Manufacturing Performance Institute (IW/MPI)
[28]-Rother, M. and J. Shook, 2003, learning to see: value stream mapping to add value and eliminate muda. Brookline, MA: The
Lean Enterprise Institute, Inc.
[29]R. Shah, P.T. Ward / Journal of Operations Management 21 (2003) 129–149 147
- 118 -
[30]- Monden, Y., 1998. Toyota Production System—an Integrated Approach to Just-In-Time, third ed. Engineering &
Management Press, Norcross, Georgia
[31]T. Ohno (1988) TPS, Large scale production, Productivity Press, Cambridge, MA
[32]Mark Price and Kevin Simonin, Lean in Continuous Process Manufacturing: The Secrets of Successful Implementation, IOM
Journal, www.georgegroup.com
[33]-Nigel Wood, How Does your Supply Chain Function? (Number 7 2004), MIOM, Boots Contract Manufacturing,
iomnet.org.uk
[34]- Monden, Y., 1981. What makes the Toyota production system really tick? Industrial Engineering 13 (1), 13–16.
[35] Hopp, W.J., Spearman, M.L., 2004. To pull or not to pull: what is the question? Manufacturing and Service Operations
Management 6 (2), 133–148.
[36] Nahmias, S., 2001. Production and Operations Analysis, fourth Ed. McGraw Hill, New York.
[37] Nakajima, S., 1989. TPM Development Program: ImplementingTotal Productive Maintenance. Productivity Press,
Cambridge, MA.
[38]Dankbaar, B., 1997. Lean production: denial, confirmation or extension of sociotechnical systems design? Human Relations 50
(3), 653–670.
[40]- MacDuffie, J.P., 1995. Human resource bundles and manufacturing performance: organizational logic and flexible
production systems in the world auto industry. Industrial and Labor Relations Review[48] (2), 199–221.
[41]- De Treville, S., Antonakis, J., 2006. Could lean production job design be intrinsically motivating? Contextual,
configurational and levels-of-analysis issue. Journal of Operations Management 24 (2), 99–123.
[42]Li, S., Subba Rao, S., Ragu-Nathan, T.S., Ragu-Nathan, B., 2005. Development and validation of a measurement instrument
forstudying supply chain management practices. Journal of Operations Management 23 (6), 618–641.
[43]- Bo Bergman Bengt, KLEJSJO, Quality from customer needs to customer satisfaction, studiliterrature, Lund Sweden
[44] Lee Krajewski, Larry P Ritz man 2002 Operations Management, Strategy and Analysis, 6th edition, Pearson Education Inc
[45]- Seiichi Nakajima-1988 Total Productive Maintenance, productivity pres publication Cambridge
[46]- Beau Keyte, LEI Faculty, APICS Greater Jacksonville Seminar, December 5, 2002]
[47]- Frank C. Garcia, P.E.,Using Value Stream Mapping as a Strategic Planning and Implementation Tool, Director, Business
Solutions & Engineering Services Advent Design Corporation, Bristol, PA, USA
[48]- Nagel, R., Dove, R., 1991. Twenty-first Century Manufacturing Enterprise Strategy; An Industry Led Review, Vols. 1 and 2.
Iacocca Institute, Leigh University, USA
[49]- J. Thompson, Organization in Action, McGraw-Hill, New York, (1967),
[50]- P.F. Drucker, Comeback of the entrepreneur, Management Today (1968), P.F. Drucker, Comeback of the entrepreneur,
Management Today (1968),
[51] Steven P Dean, Alstom Protection & Control and Ian Henderson, MLG (Manufacturing and Logistics Group) CONTROL
Number 4 2003 iomnet.org.uk
[52]A. Gunasekaran, Agile manufacturing: Enablers and an implementation framework, International Journal of Production
Research 36 (5) (1998) 1223}1247.
[53]- Hitomi, K., 1997. Manufacturing strategy for future production moving toward manufacturing excellence. International
Journal of Technology Management 14 (6–8), 701–711.
[54]- Meier, R.L., Walker, H.F., 1994. Agile manufacturing. Journal of Industrial Technology 10 (4), 41–43
[55]- Goldman, S.L., Nagel, R.N., Preiss, K., 1995. Agile Competitors and Virtual Organizations Measuring Agility and
Infrastructure for Agility. Van Nostrand Reinhold, International Thomas Publishing, London.
[56]- Hillman-Willis, T., 1998. Operational competitive requirements for the 21st century. Industrial Management & Data,
- 119 -
[57]- Baker, J., 1996. Less lean but considerably more agile. Special section mastering management. Financial Times, 10 May.
Systems 2, 83–86
[58]- Morgan, J. and Monczka, R.M. (1995), “Alliances for new products”, Purchasing, Vol. 118 No. 1, pp. 103-9.
[59]-Ellram, L.M. and Pearson, J.N. (1994), “The role of the purchasing function: toward team participation!, International Journal
of Purchasing and Materials Management, Vol. 29 No. 3, pp.3-9
[60]- Keah C. Tan; Steven B Lyman; Joel D Wisner; International Journal of operations & Productions Management, vol22no. 6
2002, pp 614-631 MCP UP Ltd Pub].
[61]- Simchi-Levi, D et al 2000
[62]- Wisner, J. D. and Tan, K.C. (2000), “Supply chain management and its impact on purchasing”, Journal of Supply Chain
Management, Vol. 36 No. 4, pp.33-42.]
[63] Harwick, T. (1997), “Optimal decision-making for the supply chain”, APICS-The Performance Advantage, Vol.. 7 No. 1, pp.
42-4.]
[64]- Keah C. Tan; Steven B Lyman; Joel D Wisner; International Journal of operations & Productions Management, vol22no. 6
2002, pp 614-631 MCP UP Ltd Pub
[65]- Burt, D.N. and Soukup, W.R. (1985), “Purchasing role in new product development!, Harvard Business Review, Vol. 64 No.
5, pp. 90-7
[66]- Handfield, R.B. (1994), “US global sourcing: patterns of development!, International Journal of Operations & Production
Management, Vol. 14 No. 6, pp. 40-51.]
[67]- Eastman Kodak Company, supplier quality process, (2005) New York USA]
[68]- Bellsouth Telecommunications Inc 1995-2004 www.bellsouth.com/supplier/supplier_quality.htm]
[69]-Bengt-Inge Anderson, (2005) Lecture notes on Purchasing, Mälardalens University]
[70]- Benard Hon, 2006 Lecture notes on Manufacturing Strategy at KTH, Production Engineering and Management
[71]- Robert Monczka, Robert Trent, Robert Handfield(2005), Purchasing and supply chain management, 3rd edition, Thomson and
South-Western corporation, USA.
[72]-Ansari and Mondarress 1986
[73]- John Shooks, (1998) Learning to See: value stream mapping to add value and eliminate muda, M. Rother and J. Shook,
Editors. The Lean Enterprise Institute: Brookline, MA.
[74]- David Simchi-Levi D, Philip Kaminsky, and Edith Simchi-Levi (2000) Designing and Managing the supply chain: Concepts,
Strategies and case studies, second edition, Mc Graw-Hill Irwin Publishers
[75]- Fawaz Abdullah, (2003) Lean Manufacturing Tools and Techniques in the process industry with focus on Steel, PhD
dissertation report, University of Pittsburgh
[76]-Cox and Blackstone 1998
[77]- Warren G. Dominy, Ph.D., 03/21/2004 www.oceanicinstitute.org
[78]- Joseph Juran, Blanton Godfrey(1999) Jurans Quality handbook 5th edition, Mc Graw Hill publishers USA
[79]-PROFET: Athens May 2003 RDT Needs of Mediterranean Aquaculture Session 5- Threats & Weaknesses
[80]- institutt for kjemi, bioteknologi og matvitenskap (IKBM)[101] [email protected]
[81]-Spencer, Daugherty Rogers, 1994
[82]- Patrick Jonsson et al
[83]- Ericson 1997
[84]-Cook, R.C., Rogowski, R.A., 1996. ‘‘Applying JIT principles to continuous process manufacturing supply chains. Production
and Inventory Management Journal, First Quarter
12–16.
- 120 -
[85]- Harrison m, Wadsworth Kenneth, S Stephen, A Blanton Godfrey 2002 Modern methods for quality control and improvement
2nd Edition John Willey and Sons, USA
[86]- Keah C. Tan; Steven B Lyman; Joel D Wisner; International Journal of operations & Productions Management, vol22no. 6
2002, pp 614-631 MCP UP Ltd Pub.
[87]- Harwick, T. (1997), “Optimal decision-making for the supply chain”, APICS-The Performance Advantage, Vol.. 7 No. 1, pp.
42-4.
[88-] Marshall Fischer, What is the right supply chain for your product?, Harvard Business Review March/ April 1997]
[89]- Baatz, E.B. (1995), “CIO 100-best practices: the chain gang” CIO, Vol. 8 No. 19, pp. 46-52.
[90]- Morgan, J. and Monczka, R.M. (1995), “Alliances for new products”, Purchasing, Vol. 118 No. 1, pp. 103-9.
[9]- Dimancescu, Hines, Rich 1997
[92]- P M Senge the Fifth Discipline the Art and Practice of the Learning Organization Currency Double Day New York 1990
[93]- Deming, W. E. (1993), the New Economics: For Industry, Government, Education, MIT Center for Advanced Engineering
Study, Cambridge, MA
[94]. Womack, J.P. and D.T. Jones, 1999, Forward, in learning to see: value stream mapping to add value and eliminate muda, M.
Rother and J. Shook, Editors. The Lean Enterprise Institute: Brookline, MA.
[95] Ronald G. Askin , Jeffrey B. Goldberg (2002) Design and Analysis of Lean Production Systems (Paperback ISBN: 978-0-
471-11593-9, John Wiley and Sons
[96]- Nigel Wood, Moving from Batch and queue to single piece flow( Number 7 2004), MIOM, Boots Contract Manufacturing,
iomnet.org.uk
Internet Sites
[97]-R Michael Donovan & Co Inc, 945 Framingham, MA, USA. The three major focus areas are: [Lean Manufacturing
Certification. Accelerating the Pace of Business Improvement by Jack Rinks R Michael Donovan & Co Inc
[98]- Lee Krajewski, Larry P Ritz man 2002 Operations Management, Strategy and Analysis, 6th edition, Pearson
Education Inc
[99]- Erlend Sodal(2002) Change of mind and methods in manufacturing, MTM masters thesis report
[100]- Abdelmalek, F., Rajgopal, J., Needy, K.L., 2006. A classification model for the process industry to guide the
implementation of lean. Engineering Management Journal 18 (1), 15–25.
[101]- Abdullah, F., Rajgopal, J., 2003. Lean manufacturing in the process industry. Proceedings of the IIE Research Conference,
CD-ROM, Portland, OR, IIE, Norcross, GA.
[102]-Abdullah, F., Rajgopal, J., Needy, K.L., 2002. A taxonomy of the process industry with a view to lean manufacturing.
Proceedings of the American Society for Engineering Management, Tampa, FL, pp. 314–321.
103]-INFOR white paper, A proactive approach to manufacturing, 2001; www.infor.com
[104]-Roland Langhe (2007) Lecture notes in Quality control, M.Sc. Production Eng. &Management, KTH Stockholm
[105] Pascal Denis’s lean manufacturing made easy
[106]- Jerzy Micker(2007) Lecture notes on Process control and management KTH MSc Production Eng. & Management
[106] -W E Deming Quality Productivity and Competitive Position Seminar Presented by quality enhancement
seminars Phoenix AZ, 1991
[107] - Deming, W. E. (1993). The New Economics: For Industry, Government, Education, MIT Centre for Advanced
Engineering Study, Cambridge, MA
[108]- Dr Juran J M 1989 Juran on leadership for quality. An executive Handbook, Juran Institute Inc., Free press
Canada
- 121 -
[109]-Harrison m, Wadsworth Kenneth, S Stephen, A Blanton Godfrey 2002 Modern methods for quality control and
improvement 2nd Edition John Willey and Sons, USA
[110]- Kaoru Ishikawa (19919 Introduction to quality control chap 4, JUSE Press Ltd Japan
[111]- WWW.STRATEGOSINC.COM, Process and Value Stream mapping
[112]-Desai, S Irani, Z & Sharp, J. M (1999) Working Towards agile manufacturing in the UK Industry, International
Journal of production economics, 62, 155-169
[113]- Sharifi, H & Zhang Z(1999), A methodology for achieving agility in manufacturing organizations, An
introduction International Journal of production economics, 62, 7-22
[114]-Christopher, M & Towill,D(2001) An integrated model for the design of agile supply chains , An international
journal of physical distribution and logistics management, 31, 235 – 246
[115]-Kim, S.W., Narasimhan, R & Swink, M (2006) Disentangling Leaness and agility: An empirical investigation.
Journal of operations management, 24, 440-457
[116]-Naylor, J. B, Naim, M. M & Berry, D(1999) Leagility: Integrating the lean and agil manufacturing paradigms in
the total supply chain: International journal of production economics62, 107- 118.
[117]- Kay, J., M &Prince J(2003) Combining lean and agile characteristics: Creation of virtual groups by enhanced
production flow analysis. International jpournal of production economics 85, 305-318
[118]- Harrison, A. & Van Hoek, R(2005) Logistics Mangament and strategy, London, Prentice Hall.
[119]-Agawal, A Shankar R& Tiwari M. K(2006) Modelling the metrics of lean, agile and leagile supply chains: An
ANP based approach: European journal of operations research, 173, 211-225
[120] Gjermund O Åkre(2008),Cost reduction through supply chain management; a case study, MSc thesis report
Högskolan i Mölde, Norway
[121] Claudio Torres(2008), Quality of delivery, Masters thesis report, Dept. of Transportation and Logistics Royal
Institute of Technology Stockholm, Swedenpage 47
Copyright © 2022 FDOKUMEN