
International Journal of Operations & Production Management Users who downloaded this article also...
26
International Journal of Operations & Production Management The seven value stream mapping tools Peter Hines Nick Rich Article information: To cite this document: Peter Hines Nick Rich, (1997),"The seven value stream mapping tools", International Journal of Operations & Production Management, Vol. 17 Iss 1 pp. 46 - 64 Permanent link to this document: http://dx.doi.org/10.1108/01443579710157989 Downloaded on: 15 October 2014, At: 03:26 (PT) References: this document contains references to 27 other documents. To copy this document: [email protected] The fulltext of this document has been downloaded 17000 times since 2006* Users who downloaded this article also downloaded: Daniel T. Jones, Peter Hines, Nick Rich, (1997),"Lean logistics", International Journal of Physical Distribution & Logistics Management, Vol. 27 Iss 3/4 pp. 153-173 Ibon Serrano Lasa, Carlos Ochoa Laburu, Rodolfo de Castro Vila, (2008),"An evaluation of the value stream mapping tool", Business Process Management Journal, Vol. 14 Iss 1 pp. 39-52 Bhim Singh, S.K. Sharma, (2009),"Value stream mapping as a versatile tool for lean implementation: an Indian case study of a manufacturing firm", Measuring Business Excellence, Vol. 13 Iss 3 pp. 58-68 Access to this document was granted through an Emerald subscription provided by 115916 [] For Authors If you would like to write for this, or any other Emerald publication, then please use our Emerald for Authors service information about how to choose which publication to write for and submission guidelines are available for all. Please visit www.emeraldinsight.com/authors for more information. About Emerald www.emeraldinsight.com Emerald is a global publisher linking research and practice to the benefit of society. The company manages a portfolio of more than 290 journals and over 2,350 books and book series volumes, as well as providing an extensive range of online products and additional customer resources and services. Emerald is both COUNTER 4 and TRANSFER compliant. The organization is a partner of the Committee on Publication Ethics (COPE) and also works with Portico and the LOCKSS initiative for digital archive preservation. *Related content and download information correct at time of download. Downloaded by Cranfield University At 03:26 15 October 2014 (PT)
-
Upload
independent -
Category
Documents
-
view
5 -
download
0
Transcript of International Journal of Operations & Production Management Users who downloaded this article also...

International Journal of Operations & Production ManagementThe seven value stream mapping toolsPeter Hines Nick Rich
Article information:To cite this document:Peter Hines Nick Rich, (1997),"The seven value stream mapping tools", International Journal of Operations & ProductionManagement, Vol. 17 Iss 1 pp. 46 - 64Permanent link to this document:http://dx.doi.org/10.1108/01443579710157989
Downloaded on: 15 October 2014, At: 03:26 (PT)References: this document contains references to 27 other documents.To copy this document: [email protected] fulltext of this document has been downloaded 17000 times since 2006*
Users who downloaded this article also downloaded:Daniel T. Jones, Peter Hines, Nick Rich, (1997),"Lean logistics", International Journal of Physical Distribution &Logistics Management, Vol. 27 Iss 3/4 pp. 153-173Ibon Serrano Lasa, Carlos Ochoa Laburu, Rodolfo de Castro Vila, (2008),"An evaluation of the value stream mapping tool",Business Process Management Journal, Vol. 14 Iss 1 pp. 39-52Bhim Singh, S.K. Sharma, (2009),"Value stream mapping as a versatile tool for lean implementation: an Indian case study ofa manufacturing firm", Measuring Business Excellence, Vol. 13 Iss 3 pp. 58-68
Access to this document was granted through an Emerald subscription provided by 115916 []
For AuthorsIf you would like to write for this, or any other Emerald publication, then please use our Emerald for Authors serviceinformation about how to choose which publication to write for and submission guidelines are available for all. Pleasevisit www.emeraldinsight.com/authors for more information.
About Emerald www.emeraldinsight.comEmerald is a global publisher linking research and practice to the benefit of society. The company manages a portfolio ofmore than 290 journals and over 2,350 books and book series volumes, as well as providing an extensive range of onlineproducts and additional customer resources and services.
Emerald is both COUNTER 4 and TRANSFER compliant. The organization is a partner of the Committee on PublicationEthics (COPE) and also works with Portico and the LOCKSS initiative for digital archive preservation.
*Related content and download information correct at time of download.
Dow
nloa
ded
by C
ranf
ield
Uni
vers
ity A
t 03:
26 1
5 O
ctob
er 2
014
(PT
)
IJOPM17,1
46
The seven value streammapping toolsPeter Hines and Nick Rich
Lean Enterprise Research Centre, Cardiff Business School, Cardiff, UK
IntroductionWork carried out in the first Supply Chain Development Programme (SCDP I),together with early work in the second programme (SCDP II), has shown that inorder fully to understand the different value streams[1] in which the sponsorsoperate, it is necessary to map these intercompany and intracompany value-adding processes. These value-adding processes make the final product orservice more valuable to the end consumer than otherwise it would have been.The difference between the traditional supply or value chain and the valuestream is that the former includes the complete activities of all the companiesinvolved, whereas the latter refers only to the specific parts of the firms thatactually add value to the specific product or service under consideration. Assuch the value stream is a far more focused and contingent view of the value-adding process.
At present, however, there is an ill-defined and ill-categorized toolkit withwhich to understand the value stream, although several workers (e.g. [2-5]) havedeveloped individual tools. In general these authors have viewed their creationsas the answer, rather than as a part of the jigsaw. Moreover, these tools derivefrom functional ghettos and so, on their own, do not fit well with the more cross-functional toolbox required by today’s best companies. It is the purpose of thispaper to construct a typology or total jigsaw to allow for an effectiveapplication of sub-sets of the complete suite of tools. The tools themselves canthen effectively be applied, singularly or in combination, contingently to therequirements of the individual value stream.
Waste removal inside companiesThe rationale underlying the collection and use of this suite of tools is to helpresearchers or practitioners to identify waste in individual value streams and,hence, find an appropriate route to removal, or at least reduction, of this waste.The use of such waste removal to drive competitive advantage insideorganizations was pioneered by Toyota’s chief engineer, Taiichi Ohno, and
International Journal of Operations& Production Management, Vol. 17No. 1, 1997, pp. 46-64. © MCB University Press, 0144-3577
The supply-chain development programme (SCDP I and II) is an industry-focused programme ofresearch being carried out by researchers at the Cardiff Business School and the University ofBath. The work is sponsored by 18 major UK-based manufacturing, distribution and serviceorganizations which wish to remain or become world-class in their supply chain managementactivities. The authors wish to express their thanks to Dr M. Naim of the Logistics SystemsDynamics Group at the University of Wales for his comments on an earlier draft of this paper.
Dow
nloa
ded
by C
ranf
ield
Uni
vers
ity A
t 03:
26 1
5 O
ctob
er 2
014
(PT
)

The seven valuestream mapping
tools
47
sensei Shigeo Shingo[6,7] and is oriented fundamentally to productivity ratherthan to quality. The reason for this is that improved productivity leads to leaneroperations which help to expose further waste and quality problems in thesystem. Thus the systematic attack on waste is also a systematic assault on thefactors underlying poor quality and fundamental management problems[8].
In an internal manufacturing context, there are three types of operation thatare undertaken according to Monden[9]. These can be categorized into:
(1) non-value adding (NVA);(2) necessary but non-value adding (NNVA); and(3) value-adding (VA).
The first of these is pure waste and involves unnecessary actions which shouldbe eliminated completely. Examples would include waiting time, stackingintermediate products and double handling.
Necessary but non-value adding operations may be wasteful but arenecessary under the current operating procedures. Examples would include:walking long distances to pick up parts; unpacking deliveries; and transferringa tool from one hand to another. In order to eliminate these types of operation itwould be necessary to make major changes to the operating system such ascreating a new layout or arranging for suppliers to deliver unpacked goods.Such change may not be possible immediately.
Value-adding operations involve the conversion or processing of rawmaterials or semi-finished products through the use of manual labour. Thiswould involve activities such as: sub-assembly of parts, forging raw materialsand painting body work.
The seven wastesThere are seven commonly accepted wastes in the Toyota production system(TPS):
(1) overproduction;(2) waiting;(3) transport;(4) inappropriate processing;(5) unnecessary inventory;(6) unnecessary motion;(7) defects.
Overproduction is regarded as the most serious waste as it discourages asmooth flow of goods or services and is likely to inhibit quality andproductivity. Such overproduction also tends to lead to excessive lead andstorage times. As a result defects may not be detected early, products maydeteriorate and artificial pressures on work rate may be generated. In addition,overproduction leads to excessive work-in-progress stocks which result in the
Dow
nloa
ded
by C
ranf
ield
Uni
vers
ity A
t 03:
26 1
5 O
ctob
er 2
014
(PT
)
IJOPM17,1
48
physical dislocation of operations with consequent poorer communication. Thisstate of affairs is often encouraged by bonus systems that encourage the pushof unwanted goods. The pull or kanban system was employed by Toyota as away of overcoming this problem.
When time is being used ineffectively, then the waste of waiting occurs. In afactory setting, this waste occurs whenever goods are not moving or beingworked on. This waste affects both goods and workers, each spending timewaiting. The ideal state should be no waiting time with a consequent faster flowof goods. Waiting time for workers may be used for training, maintenance orkaizen activities and should not result in overproduction.
The third waste, transport, involves goods being moved about. Taken to anextreme, any movement in the factory could be viewed as waste and sotransport minimization rather than total removal is usually sought. In addition,double handling and excessive movements are likely to cause damage anddeterioration with the distance of communication between processesproportional to the time it takes to feed back reports of poor quality and to takecorrective action.
Inappropriate processing occurs in situations where overly complex solutionsare found to simple procedures such as using a large inflexible machine insteadof several small flexible ones. The over-complexity generally discouragesownership and encourages the employees to overproduce to recover the largeinvestment in the complex machines. Such an approach encourages poor layout,leading to excessive transport and poor communication. The ideal, therefore, isto have the smallest possible machine, capable of producing the requiredquality, located next to preceding and subsequent operations. Inappropriateprocessing occurs also when machines are used without sufficient safeguards,such as poke-yoke or jidoka devices, so that poor quality goods are able to bemade.
Unnecessary inventory tends to increase lead time, preventing rapididentification of problems and increasing space, thereby discouragingcommunication. Thus, problems are hidden by inventory. To correct theseproblems, they first have to be found. This can be achieved only by reducinginventory. In addition, unnecessary inventories create significant storage costsand, hence, lower the competitiveness of the organization or value streamwherein they exist.
Unnecessary movements involve the ergonomics of production whereoperators have to stretch, bend and pick up when these actions could beavoided. Such waste is tiring for the employees and is likely to lead to poorproductivity and, often, to quality problems.
The bottom-line waste is that of defects as these are direct costs. The Toyotaphilosophy is that defects should be regarded as opportunities to improverather than something to be traded off against what is ultimately poormanagement. Thus defects are seized on for immediate kaizen activity.
In systems such as the Toyota production system, it is the continuous anditerative analysis of system improvements using the seven wastes that results
Dow
nloa
ded
by C
ranf
ield
Uni
vers
ity A
t 03:
26 1
5 O
ctob
er 2
014
(PT
)
The seven valuestream mapping
tools
49
in a kaizen-style system. As such, the majority of improvements are of a smallbut incremental kind, as opposed to a radical or breakthrough type.
Waste removal inside value streamsAs the focus of the value stream includes the complete value adding (and non-value adding) process, from conception of requirement back through to rawmaterial source and back again to the consumer’s receipt of product, there is aclear need to extend this internal waste removal to the complete supply chain.However, there are difficulties in doing this. These include lack of visibilityalong the value stream and lack of the tools appropriate to creating thisvisibility. This paper aims to help researchers and practitioners remedy suchdeficiencies. The waste terminology described above has been drawn from amanufacturing environment, specifically from the automotive industry, andfrom a Japanese perspective. As a result some translation of the generalterminology will be required to adapt it to a particular part of the value streamand to particular industries in non-Japanese settings. Consequently, acontingency approach is required to some extent.
Such an approach has been the subject of considerable previous work at theLean Enterprise Research Centre. This would include the application byHines[10] of the kyoryoku kai (supplier association) to a range of UK-basedindustry sectors and the introduction by Jones[11] of the Toyota productionsystem philosophy to a warehouse environment. Jones has shown that the sevenwastes required rewording to fit an after-market distribution setting. Hetherefore retitled the seven wastes as:
(1) faster-than-necessary pace;
(2) waiting;
(3) conveyance;
(4) processing;
(5) excess stock;
(6) unnecessary motion; and
(7) correction of mistakes.
The seven value stream mapping toolsThe typology of the seven new tools is presented in terms of the seven wastesalready described. In addition the delineating of the overall combined valuestream structure will be useful and will also be combined as shown in the left-hand column in Table I. Thus, in order to make improvements in the supplychain it is suggested here that at least an outline understanding of the particularwastes to be reduced must be gained before any mapping activity takes place.
At this point it should be stressed that several of the seven mapping toolswere already well-known before the writing of this paper. At least two can beregarded as new, and others will be unfamiliar to a wide range of researchers
Dow
nloa
ded
by C
ranf
ield
Uni
vers
ity A
t 03:
26 1
5 O
ctob
er 2
014
(PT
)

IJOPM17,1
50
and practitioners. Until now, however, there has been no decision supportmechanism to help choose the most appropriate tool or tools to use.
The tools themselves are drawn from a variety of origins as show in Table II.These origins include engineering (tools 1 and 5), action research/logistics (tools2 and 6) operations management (tool 3), and two that are new (tools 4 and 7).As can be seen, they are generally from specific functional ghettos and so thefull range of tools will not be familiar to many researchers, although specifictools may be well-known to individual readers. Each of these is reviewed in turnbefore a discussion is undertaken of how they can be selected for use.
Mapping toolSupply Physical
Process chain Production Quality Demand Decision structureactivity response variety filter amplification point (a) volume
Wastes/structure mapping matrix funnel mapping mapping analysis (b) value
Overproduction L M L M M
Waiting H H L M M
Transport H L
Inappropriateprocessing H M L L
Unnecessaryinventory M H M H M L
Unnecessarymotion H L
Defects L H
Overallstructure L L M L H M H
Notes: H =High correlation and usefulnessM = Medium correlation and usefulnessL = Low correlation and usefulness
Table I.The seven streammapping tools
Mapping tool Origin of mapping tool
(1) Process activity mapping Industrial engineering(2) Supply chain response matrix Time compression/logistics(3) Production variety funnel Operations management(4) Quality filter mapping New tool(5) Demand amplification mapping Systems dynamics(6) Decision point analysis Efficient consumer response/logistics(7) Physical structure mapping New tool
Table II.Origins of the seven value stream mappingtools
Dow
nloa
ded
by C
ranf
ield
Uni
vers
ity A
t 03:
26 1
5 O
ctob
er 2
014
(PT
)

The seven valuestream mapping
tools
51
The toolsProcess activity mappingAs noted above, process activity mapping has its origins in industrialengineering. Industrial engineering comprises a group of techniques that can beused to eliminate from the workplace waste, inconsistencies and irrationalities,and provide high-quality goods and services easily, quickly andinexpensively[12]. The technique is known by a number of names in thiscontext, although process analysis is the most common[13].
There are five stages to this general approach:(1) the study of the flow of processes;(2) the identification of waste;(3) a consideration of whether the process can be rearranged in a more
efficient sequence;(4) a consideration of a better flow pattern, involving different flow layout or
transport routeing; and(5) a consideration of whether everything that is being done at each stage is
really necessary and what would happen if superfluous tasks wereremoved.
Process activity mapping involves the following simple steps: first, apreliminary analysis of the process is undertaken, followed by the detailedrecording of all the items required in each process. The result of this is a map ofthe process under consideration (see Figure 1). As can be seen from this processindustry example, each step (one-23) has been categorized in terms of a varietyof activity types (operation, transport, inspection and storage). The machine orarea used for each of these activities is recorded, together with the distancemoved, time taken and number of people involved. A simple flow chart of thetypes of activity being undertaken at any one time can then be made. These aredepicted by the darker shade boxes in Figure 1.
Next the total distance moved, time taken and people involved can becalculated and recorded. The completed diagram (Figure 1) can then be used asthe basis for further analysis and subsequent improvement. Often this isachieved through the use of techniques such as the 5W1H (asking: Why does anactivity occur? Who does it? On which machine? Where? When? and How?). Thebasis of this approach is therefore to try to eliminate activities that areunnecessary, simplify others, combine yet others and seek sequence changesthat will reduce waste. Various contingent improvement approaches can bemapped similarly before the best approach is selected for implementation.
Supply chain response matrixThe origin of the second tool is the time compression and logistics movementand goes under a variety of names. It was used by New[2] and by Forza et al.[3]in a textile supply chain setting. In a more wide-ranging work, Beesley[4]applied what he termed “time-based process mapping” to a range of industrial
Dow
nloa
ded
by C
ranf
ield
Uni
vers
ity A
t 03:
26 1
5 O
ctob
er 2
014
(PT
)

IJOPM17,1
52
sectors including automotive, aerospace and construction. A similar, if slightlyrefined, approach was adopted by Jessop and Jones[5] in the electronics, food,clothing and automotive industries.
This mapping approach, as shown in Figure 2, seeks to portray in a simplediagram the critical lead-time constraints for a particular process. In this case itis the cumulative lead time in a distribution company, its suppliers and itsdownstream retailer. In Figure 2 the horizontal measurements show the leadtime for the product both internally and externally. The vertical plot shows theaverage amount of standing inventory (in days) at specific points in the supplychain.
In this example the horizontal axis shows the cumulative lead time to be 42working days. The vertical axis shows that a further 99 working days ofmaterial are held in the system. Thus a total response time in this system of 141working days can be seen to be typical. Once this is understood, each of theindividual lead times and inventory amounts can be targeted for improvementactivity, as was shown with the process activity mapping approach.
Figure 1.Users and non-users ofDFM
Dow
nloa
ded
by C
ranf
ield
Uni
vers
ity A
t 03:
26 1
5 O
ctob
er 2
014
(PT
)

The seven valuestream mapping
tools
53
Production variety funnelThe production variety funnel is shown in Figure 3. This approach originates inthe operations management area[14] and has been applied by New[2] in thetextiles industry. A similar method is IVAT analysis which views internaloperations in companies as consisting of activities that conform to I, V, A or Tshapes[15]:
• “I” plants consist of unidirectional, unvarying production of multipleidentical items such as a chemical plant.
• “V” plants consist of a limited number of raw materials processed into awide variety of finished products in a generally diverging pattern.
• “V” plants are typical in textiles and metal fabrication industries.• “A” plants, in contrast, have many raw materials and a limited range of
finished products with different streams of raw materials using differentfacilities; such plants are typical in the aerospace industry or in othermajor assembly industries.
• “T” plants have a wide combination of products from a restricted numberof components made into semi-processed parts held ready for a widerange of customer-demanded final versions; this type of site is typical inthe electronics and household appliance industries.
Such a delineation using the production variety funnel (Figure 3) allows themapper to understand how the firm or the supply chain operates and theaccompanying complexity that has to be managed. In addition, such a mappingprocess helps potential research clients to understand the similarities anddifferences between their industry and another that may have been more widelyresearched. The approach can be useful in helping to decide where to target
Figure 2.Supply chain response matrix – a distribution
example
Main store
Dow
nloa
ded
by C
ranf
ield
Uni
vers
ity A
t 03:
26 1
5 O
ctob
er 2
014
(PT
)

IJOPM17,1
54
inventory reduction and making changes to the processing of products. It is alsouseful in gaining an overview of the company or supply chain being studied.
Quality filter mappingThe quality filter mapping approach is a new tool designed to identify wherequality problems exist in the supply chain. The resulting map itself showswhere three different types of quality defect occur in the supply chain (seeFigure 4):
(1) The first of these is the product defect. Product defects are defined hereas defects in goods produced that are not caught by in-line or end-of-lineinspections and are therefore passed on to customers.
(2) The second type of quality defect is what may be termed the servicedefect. Service defects are problems given to a customer that are notdirectly related to the goods themselves, but rather are results of theaccompanying level of service. The most important of these servicedefects are inappropriate delivery (late or early), together with incorrectpaper work or documentation. In other words, such defects include anyproblems that customers experience which are not concerned withproduction faults.
(3) The third type of defect is internal scrap. Internal scrap refers to defectsproduced in a company that have been caught by in-line or end-of-lineinspection. The in-line inspection methods will vary and can consist oftraditional product inspection, statistical process control or throughpoke-yoke devices.
Figure 3.Production varietyfunnel – a brewingindustry case
Dow
nloa
ded
by C
ranf
ield
Uni
vers
ity A
t 03:
26 1
5 O
ctob
er 2
014
(PT
)

The seven valuestream mapping
tools
55
Each of these three types of defect are then mapped latitudinally along thesupply chain. In the automotive example given (Figure 4), this supply chain isseen to consist of distributor, assembler, first-tier supplier, second-tier supplier,third-tier supplier and raw material source. This approach has clear advantagesin identifying where defects are occurring and hence in identifying problems,inefficiencies and wasted effort. This information can then be used forsubsequent improvement activity.
Demand amplification mappingDemand amplification mapping has its roots in the systems dynamics work ofForrester[16] and Burbidge[17]. What is now known as the “Forrester effect”was first described in a Harvard Business Review article in 1958 byForrester[16]. This effect is linked primarily to delays and poor decision makingconcerning information and material flow. The Burbidge effect is linked to the“law of industrial dynamics” which states:
if demand is transmitted along a series of inventories using stock control ordering, then theamplification of demand variation will increase with each transfer[17].
As a result, in unmodified supply chains generally excess inventory,production, labour and capacity are found. It is then quite likely that on manyday-to-day occasions manufacturers will be unable to satisfy retail demandeven though on average they are able to produce more goods than are beingsold. In a supply chain setting, manufacturers therefore have sought to hold – insome cases sizeable – stocks to avoid such problems. Forrester[16] likens this to
Figure 4.The quality filter
mapping approach – anautomotive example
Dow
nloa
ded
by C
ranf
ield
Uni
vers
ity A
t 03:
26 1
5 O
ctob
er 2
014
(PT
)

IJOPM17,1
56
driving an automobile blindfolded with instructions being given by apassenger.
The use of various mapping techniques loosely based on Forrester andBurbidge’s pioneering work is now quite common (e.g. [18]) and in at least onecase the basic concept has even been developed into a game called The BeerGame[19] which looks at the systems-dynamics within a retail brewingsituation[19]. The basis of the mapping tool in the supply chain setting is givenin Figure 5. In this instance an FMCG food product is being mapped along itsdistribution through a leading UK supermarket retailer. In this simple exampletwo curves are plotted. The first, in the lighter shading, represents the actualconsumer sales as recorded by electronic point-of-sale data. The second, anddarker, curve represents the orders placed to the supplier to fulfil this demand.As can be seen, the variability of consumer sales is far lower than it is forsupplier orders. It is also possible subsequently to map this product furtherupstream. An example may be the manufacturing plant of the cleaningproducts company or even the demand they place on their raw materialsuppliers.
This simple analytic tool can be used to show how demand changes alongthe supply chain in varying time buckets. This information then can be used asthe basis for decision making and further analysis to try to redesign the valuestream configuration, manage the fluctuations, reduce the fluctuation or to set
180
160
140
120
100
80
60
40
20
0
28.8
.93
25.9
.93
23.1
0.93
20.1
1.93
18.1
2.93
15.1
.94
12.2
.94
12.3
.94
09.4
.94
07.5
.94
04.6
.94
02.7
.94
30.7
.94
27.8
.94
24.9
.94
22.1
0.94
19.1
1.94
17.1
2.94
Weeks
Pallets
Retail salesOrders on Suppliers
Source: [11]
Figure 5.Demand amplificationmapping – an FMCG food product sample
Dow
nloa
ded
by C
ranf
ield
Uni
vers
ity A
t 03:
26 1
5 O
ctob
er 2
014
(PT
)

The seven valuestream mapping
tools
57
up dual-mode solutions where regular demand can be managed in one way andexceptional or promotional demand can be managed in a separate way[20].
Decision point analysisDecision point analysis is of particular use for “T” plants or for supply chainsthat exhibit similar features, although it may be used in other industries. Thedecision point is the point in the supply chain where actual demand pull givesway to forecast-driven push. In other words, it is the point at which productsstop being made according to actual demand and instead are made againstforecasts alone[21]. Thus, with reference to Figure 6 – an example from theFMCG industry – the decision point can be at any point from regionaldistribution centres to national distribution centres through to any point insidethe manufacturer or indeed, at any tier in the supply chain[22].
Gaining an understanding of where this point lies is useful for two reasons:(1) In terms of the present, with this knowledge it is possible to assess the
processes that operate both downstream and upstream from this point.The purpose of this is to ensure that they are aligned with the relevantpull or push philosophy.
(2) From the long-term perspective, it is possible to design various “what if”scenarios to view the operation of the value stream if the decision pointis moved. This may allow for a better design of the value stream itself.
Figure 6.Decision point analysis
– an FMCG example
Make & Ship To Local Stock
Make & Ship To National StockAssemble To Order
Make To Order
Purchase & Make To Order
SuppliersFactory
Stores
PurchasedGoods
Work inprogress
FinishedGood
NationalDistribution
Centre
RegionalDistribution
Centre
THE PUSH
THE PULL
Key Supply StreamDecision Point
ForecastDriven
CustomerDriven
Source: [22]
Dow
nloa
ded
by C
ranf
ield
Uni
vers
ity A
t 03:
26 1
5 O
ctob
er 2
014
(PT
)

IJOPM17,1
58
Physical structurePhysical structure mapping is a new tool which has been found to be useful inunderstanding what a particular supply chain looks like at an overview orindustry level. This knowledge is helpful in appreciating what the industrylooks like, understanding how it operates and, in particular, in directingattention to areas that may not be receiving sufficient developmental attention.
The tool is illustrated in Figure 7 and can be seen to be split into two parts,namely: volume structure and cost structure. The first diagram (Figure 7(a))shows the structure of the industry according to the various tiers that exist inboth the supplier area and the distribution area, with the assembler located atthe middle point. In this simple example, there are three supplier tiers as well asthree mirrored distribution tiers. In addition, the supplier area is seen to includeraw material sources and other support suppliers (such as tooling, capitalequipment and consumable firms). These two sets of firms are not given a tierlevel as they can be seen to interact with the assembler as well as with the othersupplier tiers.
The distribution area in Figure 7 includes three tiers as well as a sectionrepresenting the after-market (in this case for spare parts), as well as variousother support organizations providing consumables and service items. Thiscomplete industry map therefore captures all the firms involved, with the areaof each part of the diagram proportional to the number of firms in each set.
The second diagram maps the industry in a similar way with the same setsof organizations. However, instead of linking the area of the diagram to thenumber of firms involved, it is directly linked to the value-adding process (or,more strictly to the cost-adding process). As can be noted in this automotivecase, the major cost adding occurs in the raw material firms, the first-tiersuppliers and the assembler, respectively. The distribution area is not seen to bea major cost-adding area.
The basis for use of this second figure, however, is that it is then possible toanalyse the value adding required in the final product as it is sold to the
Figure 7.Physical structuremapping – anautomotive industryexample
Dow
nloa
ded
by C
ranf
ield
Uni
vers
ity A
t 03:
26 1
5 O
ctob
er 2
014
(PT
)

The seven valuestream mapping
tools
59
consumer. Thus value analysis or function analysis tools employed byindustrial engineers can be focused at the complete industry or supply chainstructure[23,24]. Such an approach may result in a redesign of how the industryitself functions. Thus, in a way similar to the application of the process activitymapping tool discussed above, attempts can be made to try to eliminateactivities that are unnecessary, to simplify others, combine yet others and toseek sequence changes that will reduce waste.
Using the toolkitThe use of this toolkit at this stage should not be confined to any particulartheoretical approach to ultimate implementation. Thus the options can be leftopen at this stage over whether to adopt a kaizen or business process re-engineering approach once the tools have been used[25,26]. It is the authors’belief that the framework does not constrain this choice process.
Value stream mapping toolsThe specific focusing of which tools to use in what circumstances is done usinga simplified version of the value stream analysis tool (VALSAT)[27]. The firstpart of this process is to identify the specific value stream to be reviewed.Second, through a series of preliminary interviews with managers in the valuestream, it is necessary to identify the various wastes that exist in the valuestream that managers believe can and should be removed (reference should bemade to the earlier discussion of the seven wastes). In addition, it is importantto gain the views of these managers on the importance of understanding thecomplete industry structure, irrespective of which wastes are to be removed.
This selection of tools is achieved by giving the interviewees a writtenoverview of each of the wastes as well as an explanation of what is meant by theindustry structure. At this stage, if necessary, descriptions of the seven wastesmay be reworded in terms more appropriate to the industry underconsideration. For instance, in the health-care industry the concept ofoverproduction may not have great value. However, to call this potential waste“doing things too early” instead may be more useful in getting the intervieweesto relate the concept to their own situations.
Once this has been done, the reworded seven wastes and the account of theoverall structure are recorded as row eight in the VALSAT in Table I diagram,or as eight rows in area A of Figure 8. Comparison of Table I and Figure 8 willshow that the former is a simplification of the latter but with sections A, B andC already completed. Thus using this VALSAT method, the differentapproaches to identifying how these eight variables can be mapped has alreadybeen completed by the addition of the seven value stream mapping tools (B). Inaddition, area C of Figure 8 has already been completed as the correlationbetween tools and wastes was completed within the main body of Table I.
At this point it is informative to ask the firm or firms involved to identify foreach of the eight wastes/structure (D) the benchmark company in their sector.In other words, by opening these discussions at this stage it forces the firm to
Dow
nloa
ded
by C
ranf
ield
Uni
vers
ity A
t 03:
26 1
5 O
ctob
er 2
014
(PT
)

IJOPM17,1
60
think about which of their competitors is best at reducing particular wastes andmanaging their complete supply/distribution chain. This knowledge may thenlead on to more formal benchmarking with these companies, if this is felt to beappropriate, or at least a good focus for subsequent mapping activities.
The next stage (E), therefore, is to ascertain the individual importanceweighting of the seven wastes and the overall industry structure. This isachieved most effectively by allocating a total of 40 points for the eight factorsand asking the interviewee to apportion these on the basis of an importancerating between the factors, with the proviso that no one factor can attract morethan ten points. If there is more than one interviewee, then the different scoresmay be aggregated and rebased to total 40 points.
The last arithmetical stage of this approach is to create total weights for eachtool. In effect, what is being done here is to give a rating to each tool in terms ofhow useful it is in identifying the various wastes designated as of mostimportance by the organization or organizations. This is achieved by givingeach of the different correlations given in Table I a score. Thus, highcorrelations are equivalent to nine points; medium three points; and low, to asingle point. Then, for each correlation, a total importance score is calculated.This is achieved by multiplying the weighting of each waste/structure by thecorrelations. Thus, referring to the correlations in Table I, if the weighting foroverproduction is six points the usefulness of the tools in addressingoverproduction will be:
Figure 8.Using the VALSATapproach to selecteffective value streammapping tools
Dow
nloa
ded
by C
ranf
ield
Uni
vers
ity A
t 03:
26 1
5 O
ctob
er 2
014
(PT
)

The seven valuestream mapping
tools
61
• six for process activity mapping (6 × 1);
• 18 for supply chain response matrix (6 × 3);
• zero for production variety funnel (6 × 0);
• six for quality filter mapping (6 × 1);
• 18 for demand amplification mapping (6 × 3);
• 18 for decision point analysis (6 × 3); and
• zero for physical structure mapping (6 × 0).
This type of calculation is then applied to each of the other rows so that scoresare recorded for each individual correlation. Once this is complete the totalscores for each column are then summed and recorded in the total weightsection, or “F” in Figure 8. The columns which have the highest scores are thosethat contain the most appropriate tools. As a rule of thumb it is useful to choosemore than one tool. Indeed, as a final check, the more important two or threewastes/structure should have been addressed by tools with which they arehighly correlated or failing this by at least two tools with which they have amedium correlation. This will ensure that each waste/structure is coveredadequately in the mapping process.
This section therefore will have assisted the reader to identify which tool ortools to use. However, once the tools have been run it may be that someunexpectedly high wastes have become apparent. For instance, the demandamplification mapping tool may have been employed to identify unnecessaryinventory and waiting. However, as the tool also has a medium correlation withoverproduction, it will be useful in identifying such waste if it exists but wasnot recognized at first by the managers involved. This backflushing maytherefore identify some unanticipated but potential improvement areas and,hence, lead to some breakthroughs.
After this mapping process is complete, the researcher will be able to useeach individual tool with its associated benefits to undertake more detailedanalysis of the value stream with a view to its improvement. As stated above, itis not the purpose of this paper to convert other researchers to a kaizen orbusiness process re-engineering approach in this subsequent work. However,the various mapping tools described will help with whichever approach ischosen. In general, the removal of non-value adding waste is best done using akaizen approach, whereas the removal of necessary but non-value adding wasterequires a more revolutionary strategy wherein the application of businessprocess re-engineering may be more appropriate.
Case exampleFor the reader to gain a better understanding of the approach, a brief caseexample will be reviewed. The company involved is a highly profitable leadingindustrial distributor with over 60,000 products and an enviable record forcustomer service.
Dow
nloa
ded
by C
ranf
ield
Uni
vers
ity A
t 03:
26 1
5 O
ctob
er 2
014
(PT
)
IJOPM17,1
62
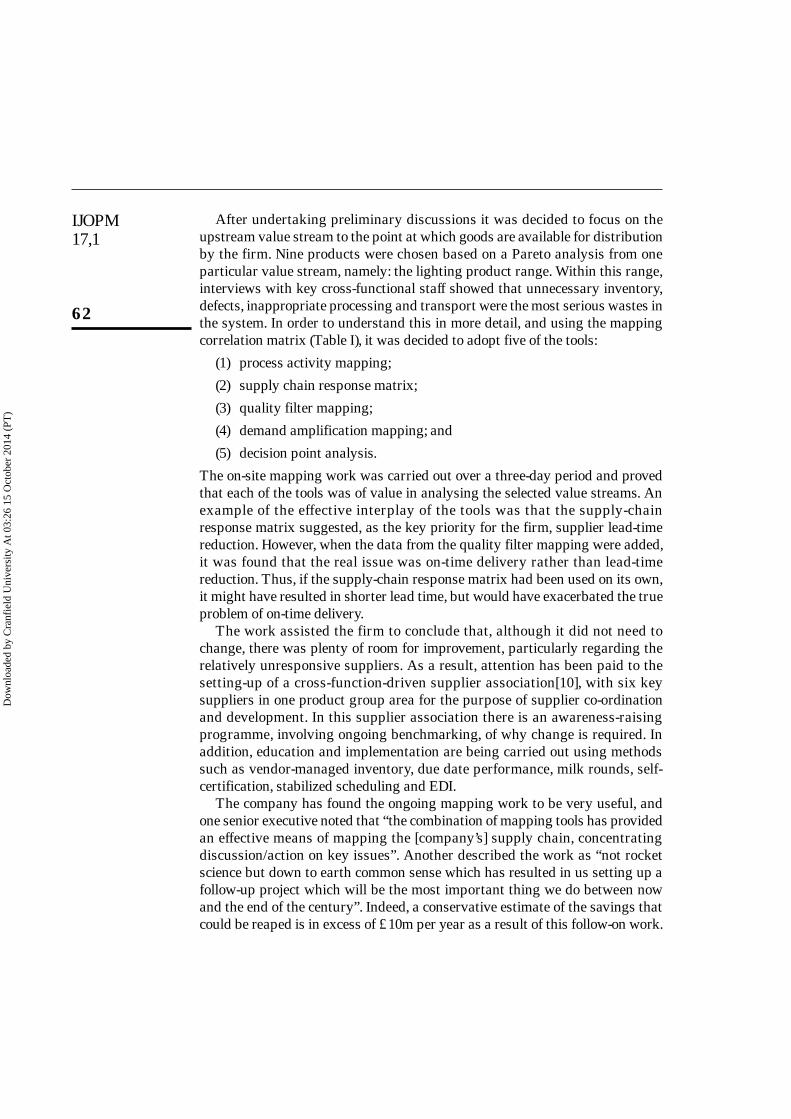
After undertaking preliminary discussions it was decided to focus on theupstream value stream to the point at which goods are available for distributionby the firm. Nine products were chosen based on a Pareto analysis from oneparticular value stream, namely: the lighting product range. Within this range,interviews with key cross-functional staff showed that unnecessary inventory,defects, inappropriate processing and transport were the most serious wastes inthe system. In order to understand this in more detail, and using the mappingcorrelation matrix (Table I), it was decided to adopt five of the tools:
(1) process activity mapping;
(2) supply chain response matrix;
(3) quality filter mapping;
(4) demand amplification mapping; and
(5) decision point analysis.
The on-site mapping work was carried out over a three-day period and provedthat each of the tools was of value in analysing the selected value streams. Anexample of the effective interplay of the tools was that the supply-chainresponse matrix suggested, as the key priority for the firm, supplier lead-timereduction. However, when the data from the quality filter mapping were added,it was found that the real issue was on-time delivery rather than lead-timereduction. Thus, if the supply-chain response matrix had been used on its own,it might have resulted in shorter lead time, but would have exacerbated the trueproblem of on-time delivery.
The work assisted the firm to conclude that, although it did not need tochange, there was plenty of room for improvement, particularly regarding therelatively unresponsive suppliers. As a result, attention has been paid to thesetting-up of a cross-function-driven supplier association[10], with six keysuppliers in one product group area for the purpose of supplier co-ordinationand development. In this supplier association there is an awareness-raisingprogramme, involving ongoing benchmarking, of why change is required. Inaddition, education and implementation are being carried out using methodssuch as vendor-managed inventory, due date performance, milk rounds, self-certification, stabilized scheduling and EDI.
The company has found the ongoing mapping work to be very useful, andone senior executive noted that “the combination of mapping tools has providedan effective means of mapping the [company’s] supply chain, concentratingdiscussion/action on key issues”. Another described the work as “not rocketscience but down to earth common sense which has resulted in us setting up afollow-up project which will be the most important thing we do between nowand the end of the century”. Indeed, a conservative estimate of the savings thatcould be reaped is in excess of £10m per year as a result of this follow-on work.
Dow
nloa
ded
by C
ranf
ield
Uni
vers
ity A
t 03:
26 1
5 O
ctob
er 2
014
(PT
)

The seven valuestream mapping
tools
63
ConclusionThis paper has outlined a new typology and decision-making process for themapping of the value stream or supply chain. This general process is groundedin a contingency approach as it allows the researcher to choose the mostappropriate methods for the particular industry, people and types of problemthat exist. The typology is based around the identification of the particularwastes the researcher/company/value stream members wish to reduce oreliminate. As such, it allows for an extension of the effective internal waste-reduction philosophy pioneered by leading companies such as Toyota. In thiscase, however, such an approach can be widened and so extended to a valuestream setting. This extension capability lies at the heart of creating leanenterprises, with each of the value stream members working to reduce wastefulactivity both inside and between their organizations.
References1. Womack, J. and Jones, D., “From lean production to the lean enterprise”, Harvard Business
Review, March-April 1994, pp. 93-103.2. New, C., “The use of throughput efficiency as a key performance measure for the new
manufacturing era”, The International Journal of Logistics Management, Vol. 4 No. 2,1993, pp. 95-104.
3. Forza, C., Vinelli, A. and Filippini, R., “Telecommunication services for quick response inthe textile-apparel industry”, Proceedings of the 1st International Symposium on Logistics,The University of Nottingham, 1993, pp. 119-26.
4. Beesley, A., “A need for time-based process mapping and its application in procurement”,Proceedings of the 3rd Annual IPSERA Conference, University of Glamorgan, 1994, pp. 41-56.
5. Jessop, D. and Jones, O., “Value stream process modelling: a methodology for creatingcompetitive advantage”, Proceedings of the 4th Annual IPSERA Conference, University ofBirmingham, 1995.
6. Japan Management Association, Kanban: Just-in-Time at Toyota, Productivity Press,Cambridge, MA, 1985.
7. Shingo, S., A Study of the Toyota Production System from an Industrial EngineeringViewpoint, Productivity Press, Cambridge, MA, 1989.
8. Bicheno, J., 34 for Quality, PICSIE Books, Buckingham, 1991.9. Monden, Y., Toyota Production System: An Integrated Approach to Just-in-Time, 2nd ed.,
Industrial Engineering and Management Press, Norcross, GA, 1993.10. Hines, P., Creating World Class Suppliers: Unlocking Mutual Competitive Advantage,
Pitman Publishing, London, 1994.11. Jones, D., “Applying Toyota principles to distribution”, Supply Chain Development
Programme I, Workshop #8 Workbook, Britvic Soft Drinks Ltd, Lutterworth, 6-7 July 1995.12. Ishiwata, J., Productivity through Process Analysis, Productivity Press, Cambridge, MA,
1991.13. Practical Management Research Group, Seven Tools for Industrial Engineering, PHP
Institute, Tokyo, 1993.14. New, C., “The production funnel: a new tool for operations analysis”, Management
Decision, Vol. 12 No. 3, 1974, pp. 167-78.15. Macbeth, D. and Ferguson, N., Partnership Sourcing: An Integrated Supply Chain
Approach, Pitman Publishing, London, 1994.
Dow
nloa
ded
by C
ranf
ield
Uni
vers
ity A
t 03:
26 1
5 O
ctob
er 2
014
(PT
)
IJOPM17,1
64
16. Forrester, J., “Industrial dynamics: a major breakthrough for decision makers”, HarvardBusiness Review, July-August 1958, pp. 37-66.
17. Burbidge, J., “Automated production control with a simulation capability”, ProceedingsIFIP Conference Working Group 5-7, Copenhagen, 1984.
18. Wikner, J., Towill, D. and Naim, M., “Smoothing supply chain dynamics”, InternationalJournal of Production Economics,Vol. 22, 1991, pp. 231-48.
19. Senge, P., The Fifth Discipl ine: The Art and Practice of the Learning Organization,Doubleday Currency, New York, NY, 1990.
20. James, R., “Promotions update”, Supply Chain Development Programme I, Workshop #8,Britvic Soft Drinks Limited, Lutterworth, 6-7 July 1995.
21. Hoekstra, S. and Romme, S. (Eds), Towards Integral Logistics Structure – DevelopingCustomer-Oriented Goods Flows, McGraw-Hill, New York, NY, 1992.
22. Rich, N., “Supply stream ‘responsiveness’ project”, Supply Chain Development ProgrammeI Workshop #6, Tesco Stores Limited, Hertford, 25-26 January 1995.
23. Miles, L., Techniques of Value Analysis and Engineering, McGraw-Hill, New York, NY,1961.
24. Akiyama, K., Function Analysis: Systematic Improvement of Quality and Performance,Productivity Press, Cambridge, MA, 1989.
25. Imai, M., Kaizen: The Key to Japan’s Competitive Success, McGraw-Hill, New York, NY,1986.
26. Hammer, M., “Re-engineering work: don’t automate, obliterate”, Harvard Business Review,July-August 1990, pp. 104-12.
27. Hines, P., Rich, N. and Hittmeyer, M., “Competing against ignorance: advantage throughknowledge”, International Journal of Physical Distribution & Logistics Management, 1996.
Dow
nloa
ded
by C
ranf
ield
Uni
vers
ity A
t 03:
26 1
5 O
ctob
er 2
014
(PT
)

This article has been cited by:
1. D. Schmidtke, U. Heiser, O. Hinrichsen. 2014. A simulation-enhanced value stream mapping approach for optimisation ofcomplex production environments. International Journal of Production Research 52, 6146-6160. [CrossRef]
2. Jordi Olivella, Ruben Gregorio. 2014. Organizational Practices Lean Enterprises Adopt to Focus on Value Streams. Journalof Enterprise Transformation 4, 309-328. [CrossRef]
3. Mark Francis, Ron Fisher, Andrew Thomas, Hefin Rowlands. 2014. The meaning of ‘value’ in purchasing, logistics andoperations management. International Journal of Production Research 1-14. [CrossRef]
4. Andrew J. Thomas, Kath Ringwald, Scott Parfitt, Alan Davies, Elwyn John. 2014. An empirical analysis of Lean Six Sigmaimplementation in SMEs – a migratory perspective. International Journal of Quality & Reliability Management 31:8, 888-905.[Abstract] [Full Text] [PDF]
5. Gareth R.T. White, Peter James. 2014. Extension of process mapping to identify “green waste”. Benchmarking: An InternationalJournal 21:5, 835-850. [Abstract] [Full Text] [PDF]
6. Protik Basu, Pranab K. Dan. 2014. Capacity augmentation with VSM methodology for lean manufacturing. InternationalJournal of Lean Six Sigma 5:3, 279-292. [Abstract] [Full Text] [PDF]
7. Thomas Staeblein, Katsuki Aoki. 2014. Planning and scheduling in the automotive industry: A comparison of industrialpractice at German and Japanese makers. International Journal of Production Economics . [CrossRef]
8. Jaiprakash Bhamu, Kuldip Singh Sangwan. 2014. Lean manufacturing: literature review and research issues. InternationalJournal of Operations & Production Management 34:7, 876-940. [Abstract] [Full Text] [PDF]
9. K. R. Zuting, P. Mohapatra, Y. Daultani, M. K. Tiwari. 2014. A synchronized strategy to minimize vehicle dispatching time:a real example of steel industry. Advances in Manufacturing . [CrossRef]
10. K. Agyapong-Kodua, Csaba Haraszkó, István Németh. 2014. Resource selection ontologies in support of a recipe-basedfactory design methodology. International Journal of Production Research 1-19. [CrossRef]
11. Mahvish Khurum, Kai Petersen, Tony Gorschek. 2014. Extending value stream mapping through waste definition beyondcustomer perspective. Journal of Software: Evolution and Process n/a-n/a. [CrossRef]
12. Naga Vamsi Krishna Jasti, Aditya Sharma. 2014. Lean manufacturing implementation using value stream mapping as a tool.International Journal of Lean Six Sigma 5:1, 89-116. [Abstract] [Full Text] [PDF]
13. Mariagrazia Dotoli, Maria Pia Fanti, Giorgio Iacobellis, Giuliana Rotunno. 2014. An integrated technique for theinternal logistics analysis and management in discrete manufacturing systems. International Journal of Computer IntegratedManufacturing 27, 165-180. [CrossRef]
14. Alireza Anvari, Norzima Zulkifli, Shahryar Sorooshian, Omid Boyerhassani. 2014. An integrated design methodology basedon the use of group AHP-DEA approach for measuring lean tools efficiency with undesirable output. The InternationalJournal of Advanced Manufacturing Technology 70, 2169-2186. [CrossRef]
15. Matthias Holweg, Petri Helo. 2014. Defining value chain architectures: Linking strategic value creation to operational supplychain design. International Journal of Production Economics 147, 230-238. [CrossRef]
16. Anja Schulze, Philipp Schmitt, Mareike Heinzen, Philipp Mayrl, Daniel Heller, Roman Boutellier. 2013. Exploring the 4Iframework of organisational learning in product development: value stream mapping as a facilitator. International Journal ofComputer Integrated Manufacturing 26, 1136-1150. [CrossRef]
17. Benjamin Kemper, Jeroen de Mast. 2013. Measurement Plans for Process Flow Improvement in Services and Health Care.Quality Engineering 25, 437-450. [CrossRef]
18. Chiarini Andrea. 2013. Waste savings in patient transportation inside large hospitals using lean thinking tools and logisticsolutions. Leadership in Health Services 26:4, 356-367. [Abstract] [Full Text] [PDF]
19. S. Vinodh, M. Somanaathan, K.R. Arvind. 2013. Development of value stream map for achieving leanness in a manufacturingorganization. Journal of Engineering, Design and Technology 11:2, 129-141. [Abstract] [Full Text] [PDF]
20. Ilias Vlachos, Aleksandra Bogdanovic. 2013. Lean thinking in the European hotel industry. Tourism Management 36, 354-363.[CrossRef]
21. Bernardo Nicoletti. 2013. Lean Six Sigma and digitize procurement. International Journal of Lean Six Sigma 4:2, 184-203.[Abstract] [Full Text] [PDF]
22. Samuel Jebaraj Benjamin, Uthiyakumar Murugaiah, M. Srikamaladevi Marathamuthu. 2013. The use of SMED to eliminatesmall stops in a manufacturing firm. Journal of Manufacturing Technology Management 24:5, 792-807. [Abstract] [Full Text][PDF]
23. Harwinder Singh, Amandeep Singh. 2013. Application of lean manufacturing using value stream mapping in an auto‐partsmanufacturing unit. Journal of Advances in Management Research 10:1, 72-84. [Abstract] [Full Text] [PDF]
Dow
nloa
ded
by C
ranf
ield
Uni
vers
ity A
t 03:
26 1
5 O
ctob
er 2
014
(PT
)

24. Alireza Anvari, Norzima Zulkifli, Rosnah Mohd Yusuff. 2013. A dynamic modeling to measure lean performance within leanattributes. The International Journal of Advanced Manufacturing Technology 66, 663-677. [CrossRef]
25. R. Murat Tabanli, Tijen Ertay. 2013. Value stream mapping and benefit–cost analysis application for value visibility of a pilotproject on RFID investment integrated to a manual production control system—a case study. The International Journal ofAdvanced Manufacturing Technology 66, 987-1002. [CrossRef]
26. Md Al Amin, M.A. Karim. 2013. A time-based quantitative approach for selecting lean strategies for manufacturingorganisations. International Journal of Production Research 51, 1146-1167. [CrossRef]
27. Ben Marriott, Jose Arturo Garza‐Reyes, Horacio Soriano‐Meier, Jiju Antony. 2013. An integrated methodology to prioritiseimprovement initiatives in low volume‐high integrity product manufacturing organisations. Journal of ManufacturingTechnology Management 24:2, 197-217. [Abstract] [Full Text] [PDF]
28. Robert Gerth, Albert Boqvist, Marcus Bjelkemyr, Bengt Lindberg. 2013. Design for construction: utilizing productionexperiences in development. Construction Management and Economics 31, 135-150. [CrossRef]
29. Paul R. Drake, Dong Myung Lee, Matloub Hussain. 2013. The lean and agile purchasing portfolio model. Supply ChainManagement: An International Journal 18:1, 3-20. [Abstract] [Full Text] [PDF]
30. Ricardo Pires de Souza, Hélio Roberto Hékis, Lucas Ambrósio Bezerra Oliveira, Jamerson Viegas Queiroz, Fernanda CristinaBarbosa Pereira Queiroz, Ricardo Alexsandro de Medeiros Valentim. 2013. Implementation of a Six Sigma project in a 3Mdivision of Brazil. International Journal of Quality & Reliability Management 30:2, 129-141. [Abstract] [Full Text] [PDF]
31. P. Lewis, G. Cooke. 2013. Developing a lean measurement system to enhance process improvement. International Journal ofMetrology and Quality Engineering 4, 145-151. [CrossRef]
32. T. J. Roosen, D. J. Pons. 2013. Environmentally Lean Production: The Development and Incorporation of an EnvironmentalImpact Index into Value Stream Mapping. Journal of Industrial Engineering 2013, 1-17. [CrossRef]
33. Antony Pearce, Dirk Pons. 2013. Implementing Lean Practices: Managing the Transformation Risks. Journal of IndustrialEngineering 2013, 1-19. [CrossRef]
34. Anoma Ariyawardana, Ray Collins. 2013. Value Chain Analysis Across Borders: The Case of Australian Red Lentils to SriLanka. Journal of Asia-Pacific Business 14, 25-39. [CrossRef]
35. K. L. Jeyaraj, C. Muralidharan, R. Mahalingam, S. G. Deshmukh. 2013. Applying Value Stream Mapping Technique forProduction Improvement in a Manufacturing Company: A Case Study. Journal of The Institution of Engineers (India): SeriesC 94, 43-52. [CrossRef]
36. Amelia Natasya Abdul Wahab, Muriati Mukhtar, Riza Sulaiman. 2013. A Conceptual Model of Lean ManufacturingDimensions. Procedia Technology 11, 1292-1298. [CrossRef]
37. Dr Djoko Setijono, Paul Martin Gibbons, Colin Kennedy, Stuart Burgess, Patrick Godfrey. 2012. The development of avalue improvement model for repetitive processes (VIM). International Journal of Lean Six Sigma 3:4, 315-338. [Abstract][Full Text] [PDF]
38. K. Agyapong-Kodua, J.O. Ajaefobi, R.H. Weston, S. Ratchev. 2012. Development of a multi-product cost and value streammodelling methodology. International Journal of Production Research 50, 6431-6456. [CrossRef]
39. K. E. K. Vimal, S. Vinodh. 2012. Leanness evaluation using IF–THEN rules. The International Journal of AdvancedManufacturing Technology 63, 407-413. [CrossRef]
40. Andrew Fearne, Marian Garcia Martinez, Benjamin Dent. 2012. Dimensions of sustainable value chains: implications forvalue chain analysis. Supply Chain Management: An International Journal 17:6, 575-581. [Abstract] [Full Text] [PDF]
41. Umit Bititci, Patrizia Garengo, Viktor Dörfler, Sai Nudurupati. 2012. Performance Measurement: Challenges for Tomorrow*.International Journal of Management Reviews 14:10.1111/ijmr.2012.14.issue-3, 305-327. [CrossRef]
42. Maximilian Bucourt, Reinhard Busse, Felix Güttler, Thomas Reinhold, Bernd Vollnberg, Max Kentenich, Bernd Hamm,Ulf K. Teichgräber. 2012. Process mapping of PTA and stent placement in a university hospital interventional radiologydepartment. Insights into Imaging 3, 329-336. [CrossRef]
43. Paul M. Gibbons, Colin Kennedy, Stuart C. Burgess, Patrick Godfrey. 2012. Developing an asset management valueimprovement model (a‐VIM) approach for an airport operational engineering environment. International Journal of Quality& Reliability Management 29:7, 797-819. [Abstract] [Full Text] [PDF]
44. Abir Fathallah, Julie Stal- Le Cardinal, Jean-Louis Ermine, Jean-Claude Bocquet. 2012. Continuous Improvement Modelingto Support Enterprise Transformation. Journal of Enterprise Transformation 2, 177-200. [CrossRef]
45. Kimberly Bates, Roberto Filippini, Andrea Chiarini. 2012. Lean production: mistakes and limitations of accounting systemsinside the SME sector. Journal of Manufacturing Technology Management 23:5, 681-700. [Abstract] [Full Text] [PDF]
46. S. Vinodh, K. E. K. Vimal. 2012. Thirty criteria based leanness assessment using fuzzy logic approach. The InternationalJournal of Advanced Manufacturing Technology 60, 1185-1195. [CrossRef]
Dow
nloa
ded
by C
ranf
ield
Uni
vers
ity A
t 03:
26 1
5 O
ctob
er 2
014
(PT
)
47. Anni-Kaisa Kähkönen, Katrina Lintukangas. 2012. The underlying potential of supply management in value creation. Journalof Purchasing and Supply Management 18, 68-75. [CrossRef]
48. Anni‐Kaisa Kähkönen. 2012. Value net – a new business model for the food industry?. British Food Journal 114:5, 681-701.[Abstract] [Full Text] [PDF]
49. Varun Ramesh, Rambabu Kodali. 2012. A decision framework for maximising lean manufacturing performance. InternationalJournal of Production Research 50, 2234-2251. [CrossRef]
50. Paul M. Gibbons, Colin Kennedy, Stuart C. Burgess, Patrick Godfrey. 2012. The development of a lean resource mappingframework: introducing an 8th waste. International Journal of Lean Six Sigma 3:1, 4-27. [Abstract] [Full Text] [PDF]
51. S. Vinodh, Dino Joy. 2012. Structural Equation Modelling of lean manufacturing practices. International Journal of ProductionResearch 50, 1598-1607. [CrossRef]
52. Pim M. A. Polesie. 2012. Reducing the use of resources in medium-sized Swedish construction enterprises: productionmanagers’ views. Construction Management and Economics 30, 193-202. [CrossRef]
53. Sainath Gopinath, Theodor I. Freiheit. 2012. A waste relationship model and center point tracking metric for leanmanufacturing systems. IIE Transactions 44, 136-154. [CrossRef]
54. L. Wang, X.G. Ming, F.B. Kong, D. Li, P.P. Wang. 2011. Focus on implementation: a framework for lean productdevelopment. Journal of Manufacturing Technology Management 23:1, 4-24. [Abstract] [Full Text] [PDF]
55. Christian Finnsgård, Carl Wänström, Lars Medbo, W. Patrick Neumann. 2011. Impact of materials exposure on assemblyworkstation performance. International Journal of Production Research 49, 7253-7274. [CrossRef]
56. Claudia Paciarotti, Valentina Ciatteo, Giancarlo Giacchetta. 2011. Value stream mapping implementation in the third sector.Operations Management Research 4, 99-110. [CrossRef]
57. Francesco Zammori, Marcello Braglia, Marco Frosolini. 2011. Stochastic overall equipment effectiveness. International Journalof Production Research 49, 6469-6490. [CrossRef]
58. David Asamoah, Patience Abor, Martin Opare. 2011. An examination of pharmaceutical supply chain for artemisinin‐basedcombination therapies in Ghana. Management Research Review 34:7, 790-809. [Abstract] [Full Text] [PDF]
59. S. Vinodh, K. R. Arvind, M. Somanaathan. 2011. Tools and techniques for enabling sustainability through lean initiatives.Clean Technologies and Environmental Policy 13, 469-479. [CrossRef]
60. Anand Gurumurthy, Rambabu Kodali. 2011. Design of lean manufacturing systems using value stream mapping withsimulation. Journal of Manufacturing Technology Management 22:4, 444-473. [Abstract] [Full Text] [PDF]
61. Anni-Kaisa Kähkönen, Veli Matti Virolainen. 2011. Sources of structural power in the context of value nets. Journal ofPurchasing and Supply Management 17, 109-120. [CrossRef]
62. Arnout Pool, Jacob Wijngaard, Durk-Jouke van der Zee. 2011. Lean planning in the semi-process industry, a case study.International Journal of Production Economics 131, 194-203. [CrossRef]
63. Alessio Trentin, Fabrizio Salvador, Cipriano Forza, M. Johnny Rungtusanatham. 2011. Operationalising form postponementfrom a decision-making perspective. International Journal of Production Research 49, 1977-1999. [CrossRef]
64. Andrew Thomas, Richard Barton. 2011. Using the Quick Scan Audit Methodology (QSAM) as a precursor towards successfulLean Six Sigma implementation. International Journal of Lean Six Sigma 2:1, 41-54. [Abstract] [Full Text] [PDF]
65. Mark Johnson, Simon Templar. 2011. The relationships between supply chain and firm performance. International Journalof Physical Distribution & Logistics Management 41:2, 88-103. [Abstract] [Full Text] [PDF]
66. Bhim Singh, Suresh K. Garg, Surrender K. Sharma. 2011. Value stream mapping: literature review and implications for Indianindustry. The International Journal of Advanced Manufacturing Technology 53, 799-809. [CrossRef]
67. S. Vinodh, Suresh Kumar Chintha. 2011. Leanness assessment using multi-grade fuzzy approach. International Journal ofProduction Research 49, 431-445. [CrossRef]
68. Rajat Roy, Mike James-MooreLean Product Introduction . [CrossRef]69. Toke Koldborg Jensen, Jette Nielsen, Erling P. Larsen, Jens Clausen. 2010. The Fish Industry—Toward Supply Chain
Modeling. Journal of Aquatic Food Product Technology 19, 214-226. [CrossRef]70. S. Vinodh, K.R. Arvind, M. Somanaathan. 2010. Application of value stream mapping in an Indian camshaft manufacturing
organisation. Journal of Manufacturing Technology Management 21:7, 888-900. [Abstract] [Full Text] [PDF]71. James H. Ford II, Meg Wise, Jennifer P. Wisdom. 2010. A Peek Inside the Box: How Information Flows Through Substance
Abuse Treatment Agencies. Journal of Technology in Human Services 28, 121-143. [CrossRef]72. Anni‐Kaisa Kähkönen, Mari Tenkanen. 2010. The impact of power on information sharing in the Finnish food industry.
British Food Journal 112:8, 821-835. [Abstract] [Full Text] [PDF]73. Li Chen, Manuel Nunez. 2010. Business Process Integration of Multiple Customer Order Review Systems. IEEE Transactions
on Engineering Management 57, 502-512. [CrossRef]
Dow
nloa
ded
by C
ranf
ield
Uni
vers
ity A
t 03:
26 1
5 O
ctob
er 2
014
(PT
)

74. Paul M. Gibbons, Stuart C. Burgess. 2010. Introducing OEE as a measure of lean Six Sigma capability. International Journalof Lean Six Sigma 1:2, 134-156. [Abstract] [Full Text] [PDF]
75. Bhim Singh, S.K. Garg, S.K. Sharma, Chandandeep Grewal. 2010. Lean implementation and its benefits to productionindustry. International Journal of Lean Six Sigma 1:2, 157-168. [Abstract] [Full Text] [PDF]
76. K. ZokaeiValue chain analysis of the UK food sector 187-211. [CrossRef]77. Bhim Singh, S.K. Sharma. 2009. Value stream mapping as a versatile tool for lean implementation: an Indian case study of
a manufacturing firm. Measuring Business Excellence 13:3, 58-68. [Abstract] [Full Text] [PDF]78. David H. Taylor, Andrew Fearne. 2009. Demand management in fresh food value chains: a framework for analysis and
improvement. Supply Chain Management: An International Journal 14:5, 379-392. [Abstract] [Full Text] [PDF]79. K. Agyapong-Kodua, J. O. Ajaefobi, R. H. Weston. 2009. Modelling dynamic value streams in support of process design and
evaluation. International Journal of Computer Integrated Manufacturing 22, 411-427. [CrossRef]80. Catalina Perez, Rodolfo de Castro, Maria Font i Furnols. 2009. The pork industry: a supply chain perspective. British Food
Journal 111:3, 257-274. [Abstract] [Full Text] [PDF]81. Benjamin Kemper, Jeroen de Mast, Michel Mandjes. 2009. Modeling process flow using diagrams. Quality and Reliability
Engineering International n/a-n/a. [CrossRef]82. Hung-da Wan, F. Frank Chen. 2008. A leanness measure of manufacturing systems for quantifying impacts of lean initiatives.
International Journal of Production Research 46, 6567-6584. [CrossRef]83. Joakim Wikner, Ou Tang. 2008. A structural framework for closed‐loop supply chains. The International Journal of Logistics
Management 19:3, 344-366. [Abstract] [Full Text] [PDF]84. Thomas Gregory Frater, Donald James Houston. 2008. Notes on progress in structuring a research project measuring energy
inputs into New Zealand apple production-combining hard and soft systems methods. Systems Research and Behavioral Science25, 827-833. [CrossRef]
85. Ibon Serrano, Carlos Ochoa, Rodolfo De Castro. 2008. Evaluation of value stream mapping in manufacturing system redesign.International Journal of Production Research 46, 4409-4430. [CrossRef]
86. Colin Herron, Christian Hicks. 2008. The transfer of selected lean manufacturing techniques from Japanese automotivemanufacturing into general manufacturing (UK) through change agents. Robotics and Computer-Integrated Manufacturing24, 524-531. [CrossRef]
87. P. Childerhouse, S.M. Disney, D.R. Towill. 2008. On the impact of order volatility in the European automotive sector.International Journal of Production Economics 114, 2-13. [CrossRef]
88. Jagjit Singh Srai, Mike Gregory. 2008. A supply network configuration perspective on international supply chain development.International Journal of Operations & Production Management 28:5, 386-411. [Abstract] [Full Text] [PDF]
89. Ibon Serrano Lasa, Carlos Ochoa Laburu, Rodolfo de Castro Vila. 2008. An evaluation of the value stream mapping tool.Business Process Management Journal 14:1, 39-52. [Abstract] [Full Text] [PDF]
90. Mark Francis, David Simons, Michael Bourlakis. 2008. Value chain analysis in the UK beef foodservice sector. Supply ChainManagement: An International Journal 13:1, 83-91. [Abstract] [Full Text] [PDF]
91. E.D. Adamides, N. Karacapilidis, H. Pylarinou, D. Koumanakos. 2008. Supporting collaboration in the development andmanagement of lean supply networks. Production Planning & Control 19, 35-52. [CrossRef]
92. Angappa Gunasekaran, Andreas Reichhart, Matthias Holweg. 2007. Creating the customer‐responsive supply chain: areconciliation of concepts. International Journal of Operations & Production Management 27:11, 1144-1172. [Abstract] [FullText] [PDF]
93. R. Darlington, S. Rahimifard. 2007. Hybrid two-stage planning for food industry overproduction waste minimization.International Journal of Production Research 45, 4273-4288. [CrossRef]
94. Andreas Reichhart, Matthias Holweg. 2007. L ean distribution: concepts, contributions, conflicts. International Journal ofProduction Research 45, 3699-3722. [CrossRef]
95. B.J. Hicks. 2007. Lean information management: Understanding and eliminating waste. International Journal of InformationManagement 27, 233-249. [CrossRef]
96. Rajesh Krishnamurthy, Charlene A. Yauch. 2007. Leagile manufacturing: a proposed corporate infrastructure. InternationalJournal of Operations & Production Management 27:6, 588-604. [Abstract] [Full Text] [PDF]
97. Keivan Zokaei, Peter Hines. 2007. Achieving consumer focus in supply chains. International Journal of Physical Distribution& Logistics Management 37:3, 223-247. [Abstract] [Full Text] [PDF]
98. Andrew Potter, Chandra Lalwani. 2007. Developing a methodology to analyse despatch bay performance. International Journalof Production Economics 106, 82-91. [CrossRef]
99. Jay Yang, Abdulsalam A. Al‐Sudairi. 2007. Evaluating the effect of construction process characteristics to the applicability oflean principles. Construction Innovation 7:1, 99-121. [Abstract] [Full Text] [PDF]
Dow
nloa
ded
by C
ranf
ield
Uni
vers
ity A
t 03:
26 1
5 O
ctob
er 2
014
(PT
)

100. R. Darlington, S. Rahimifard. 2006. A responsive demand management framework for the minimization of waste inconvenience food manufacture. International Journal of Computer Integrated Manufacturing 19, 751-761. [CrossRef]
101. Peter Hines, Mark Francis, Pauline Found. 2006. Towards lean product lifecycle management. Journal of ManufacturingTechnology Management 17:7, 866-887. [Abstract] [Full Text] [PDF]
102. M. Braglia, G. Carmignani, F. Zammori. 2006. A new value stream mapping approach for complex production systems.International Journal of Production Research 44, 3929-3952. [CrossRef]
103. Jagadeesh Raj. 2006. Exploration into the quality septet. The TQM Magazine 18:5, 433-439. [Abstract] [Full Text] [PDF]104. David H. Taylor, Andrew Fearne. 2006. Towards a framework for improvement in the management of demand in agri‐food
supply chains. Supply Chain Management: An International Journal 11:5, 379-384. [Abstract] [Full Text] [PDF]105. Dr Panayiotis H. Ketikidis, Dr. S.C. Lenny Koh, Professor Angappa Gunasekaran, S.C.L. Koh, K.H. Tan. 2006. Operational
intelligence discovery and knowledge‐mapping approach in a supply network with uncertainty. Journal of ManufacturingTechnology Management 17:6, 687-699. [Abstract] [Full Text] [PDF]
106. David H. Taylor. 2006. Demand management in agri‐food supply chains. The International Journal of Logistics Management17:2, 163-186. [Abstract] [Full Text] [PDF]
107. A. Keivan Zokaei, David W. Simons. 2006. Value chain analysis in consumer focus improvement. The International Journalof Logistics Management 17:2, 141-162. [Abstract] [Full Text] [PDF]
108. Peter Hines, Mark Francis, Kate Bailey. 2006. Quality‐based pricing: a catalyst for collaboration and sustainable change inthe agrifood industry?. The International Journal of Logistics Management 17:2, 240-259. [Abstract] [Full Text] [PDF]
109. R. K. Singh, S. Kumar, A. K. Choudhury, M. K. Tiwari. 2006. Lean tool selection in a die casting unit: a fuzzy-based decisionsupport heuristic. International Journal of Production Research 44, 1399-1429. [CrossRef]
110. Ann Esain, Lynn Massey. 2006. Value relationships and effectiveness – pilot study in health. International Journal ofProductivity and Performance Management 55:2, 143-154. [Abstract] [Full Text] [PDF]
111. R K Singh, A K Choudhury, M K Tiwari, R S Maull. 2006. An integrated fuzzy-based decision support system for theselection of lean tools: a case study from the steel industry. Proceedings of the Institution of Mechanical Engineers, Part B:Journal of Engineering Manufacture 220, 1735-1749. [CrossRef]
112. Ibrahim A. Rawabdeh. 2005. A model for the assessment of waste in job shop environments. International Journal of Operations& Production Management 25:8, 800-822. [Abstract] [Full Text] [PDF]
113. Lawrence E. Whitman, Don E. Malzahn, Barbara S. Chaparro, Mark Russell, Rebecca Langrall, Beth A. Mohler. 2005.A Comparison of Group Processes, Performance, and Satisfaction in Face-to-Face Versus Computer-Mediated EngineeringStudent Design Teams. Journal of Engineering Education 94:10.1002/jee.2005.94.issue-3, 327-337. [CrossRef]
114. David Simons, Keivan Zokaei. 2005. Application of lean paradigm in red meat processing. British Food Journal 107:4, 192-211.[Abstract] [Full Text] [PDF]
115. Dinesh Seth *, Vaibhav Gupta. 2005. Application of value stream mapping for lean operations and cycle time reduction: anIndian case study. Production Planning & Control 16, 44-59. [CrossRef]
116. Peter Hines, Matthias Holweg, Nick Rich. 2004. Learning to evolve. International Journal of Operations & ProductionManagement 24:10, 994-1011. [Abstract] [Full Text] [PDF]
117. Trevor Turner, Veronica Martinez, Umit Bititci. 2004. Managing the value delivery process. International Journal of PhysicalDistribution & Logistics Management 34:3/4, 302-318. [Abstract] [Full Text] [PDF]
118. Badr Haque, Mike James-moore. 2004. Applying lean thinking to new product introduction. Journal of Engineering Design15, 1-31. [CrossRef]
119. B Haque. 2003. Lean engineering in the aerospace industry. Proceedings of the Institution of Mechanical Engineers, Part B:Journal of Engineering Manufacture 217, 1409-1420. [CrossRef]
120. Peter McCullen, Denis Towill. 2002. Diagnosis and reduction of bullwhip in supply chains. Supply Chain Management: AnInternational Journal 7:3, 164-179. [Abstract] [Full Text] [PDF]
121. Jack G.A.J. van der Vorst, Adrie J.M. Beulens. 2002. Identifying sources of uncertainty to generate supply chain redesignstrategies. International Journal of Physical Distribution & Logistics Management 32:6, 409-430. [Abstract] [Full Text] [PDF]
122. Matthias Holweg, John Bicheno. 2002. Supply chain simulation – a tool for education, enhancement and endeavour.International Journal of Production Economics 78, 163-175. [CrossRef]
123. M.M. Naim, P. Childerhouse, S.M. Disney, D.R. Towill. 2002. A supply chain diagnostic methodology: determining thevector of change. Computers & Industrial Engineering 43, 135-157. [CrossRef]
124. William G. Sullivan, Thomas N. McDonald, Eileen M. Van Aken. 2002. Equipment replacement decisions and leanmanufacturing. Robotics and Computer-Integrated Manufacturing 18, 255-265. [CrossRef]
125. John Bicheno, Matthias Holweg, Jens Niessmann. 2001. Constraint batch sizing in a lean environment. International Journalof Production Economics 73, 41-49. [CrossRef]
Dow
nloa
ded
by C
ranf
ield
Uni
vers
ity A
t 03:
26 1
5 O
ctob
er 2
014
(PT
)
126. Christine Harland, Louise KnightSupply strategy: A corporate social capital perspective 151-183. [Citation] [EnhancedAbstract] [PDF] [PDF]
127. Peter Hines, Matthias Holweg, James Sullivan. 2000. Waves, beaches, breakwaters and rip currents – A three‐dimensional viewof supply chain dynamics. International Journal of Physical Distribution & Logistics Management 30:10, 827-846. [Abstract][Full Text] [PDF]
128. Simon Croom, Pietro Romano, Mihalis Giannakis. 2000. Supply chain management: an analytical framework for criticalliterature review. European Journal of Purchasing & Supply Management 6, 67-83. [CrossRef]
129. Donna Samuel, Peter Hines. 1999. Designing a supply chain change process: a food distribution case. International Journalof Retail & Distribution Management 27:10, 409-420. [Abstract] [Full Text] [PDF]
130. Peter Hines, Nick Rich, Ann Esain. 1999. Value stream mapping. Benchmarking: An International Journal 6:1, 60-77.[Abstract] [Full Text] [PDF]
131. Peter Hines. 1998. Benchmarking Toyota's supply chain: Japan vs U.K. Long Range Planning 31, 911-918. [CrossRef]132. Peter Hines, Nick Rich. 1998. Outsourcing competitive advantage: the use of supplier associations. International Journal of
Physical Distribution & Logistics Management 28:7, 524-546. [Abstract] [Full Text] [PDF]133. MARK FRANCIS. 1998. Lean Information and Supply Chain Effectiveness. International Journal of Logistics Research and
Applications 1, 93-108. [CrossRef]134. John S. Kiff. 1997. Supply and stocking systems in the UK car market. International Journal of Physical Distribution & Logistics
Management 27:3/4, 226-243. [Abstract] [Full Text] [PDF]135. Daniel T. Jones, Peter Hines, Nick Rich. 1997. Lean logistics. International Journal of Physical Distribution & Logistics
Management 27:3/4, 153-173. [Abstract] [Full Text] [PDF]
Dow
nloa
ded
by C
ranf
ield
Uni
vers
ity A
t 03:
26 1
5 O
ctob
er 2
014
(PT
)