An EMMA and EPG study on token-to-token variability
17
An EMMA and EPG study on token-to-token variability Christine Mooshammer Institut für Phonetik und digitale Sprachverarbeitung, Christian-Albrechts-Universität Kiel, Germany Pascal Perrier Institut de la Communication Parlée, UMR CNRS 5009, INPG & Université Stendhal Grenoble, France Susanne Fuchs, Christian Geng and Daniel Pape ZAS – Research Centre for General Linguistics, Berlin, Germany The potential role of physical correlates of articulatory variability in vowel production was studied by means of EMMA and EPG. In accordance with Perkell & Nelson (1985), the hypothesis to be tested is that the amount and shape of token-to- token variability is influenced by the amount of palatal contact in such a way that high vowels exhibit different variability patterns than the other vowels. 14 German vowels of three speakers of German were recorded with and without bite-block and in bilabial and velar consonantal contexts repeated 10 times. Statistical results indicated that the amount of tongue variability, measured as the size of the dispersion ellipses describing tongue sensor positions, was constrained by the amount of palatal contact: variability was less when the amount of contacts was large. However, the three subjects exhibited different patterns of variability and only one of them showed a main orientation of the dispersion ellipses that was clearly different for high vowels in a sense that is compatible with data collected on speakers of American English by Perkell & Nelson. These results are discussed with regards to differences in the density of each language specific vowel inventory and the inter-individual variation among German subjects is furthermore attributed, at least partly, to morphological differences in the palatal shape and compensatory strategies. 1. Introduction A classical and much debated approach in studying representations and motor control in speech production consists in looking for acoustic and/or articulatory invariants of phonemes (Stevens, 1972; Stevens & Blumstein, 1978; Blumstein & Stevens, 1979, 1980; Fujimura, 1986; Browman & Goldstein, 1985, 1986, 1990). However, the well-known noticeable variability of physiological, articulatory and acoustic signals of speech associated with coarticulation phenomena and variations in speaking style has led to an alternative approach that aims to study the variability itself. This approach consists in measuring the ranges of variation of the data (Wood, 1979; Perkell & Nelson, 1985; Folkins & Brown, 1987; Perkell, 1990; Beckman et al., 1995), in looking at the internal structure of the data distributions
-
Upload
gwz-berlin -
Category
Documents
-
view
1 -
download
0
Transcript of An EMMA and EPG study on token-to-token variability

An EMMA and EPG study on token-to-token variability Christine Mooshammer Institut für Phonetik und digitale Sprachverarbeitung, Christian-Albrechts-Universität Kiel, Germany Pascal Perrier Institut de la Communication Parlée, UMR CNRS 5009, INPG & Université Stendhal Grenoble, France Susanne Fuchs, Christian Geng and Daniel Pape ZAS – Research Centre for General Linguistics, Berlin, Germany
The potential role of physical correlates of articulatory variability in vowel production was studied by means of EMMA and EPG. In accordance with Perkell & Nelson (1985), the hypothesis to be tested is that the amount and shape of token-to-token variability is influenced by the amount of palatal contact in such a way that high vowels exhibit different variability patterns than the other vowels. 14 German vowels of three speakers of German were recorded with and without bite-block and in bilabial and velar consonantal contexts repeated 10 times. Statistical results indicated that the amount of tongue variability, measured as the size of the dispersion ellipses describing tongue sensor positions, was constrained by the amount of palatal contact: variability was less when the amount of contacts was large. However, the three subjects exhibited different patterns of variability and only one of them showed a main orientation of the dispersion ellipses that was clearly different for high vowels in a sense that is compatible with data collected on speakers of American English by Perkell & Nelson. These results are discussed with regards to differences in the density of each language specific vowel inventory and the inter-individual variation among German subjects is furthermore attributed, at least partly, to morphological differences in the palatal shape and compensatory strategies.
1. Introduction
A classical and much debated approach in studying representations and motor control in speech production consists in looking for acoustic and/or articulatory invariants of phonemes (Stevens, 1972; Stevens & Blumstein, 1978; Blumstein & Stevens, 1979, 1980; Fujimura, 1986; Browman & Goldstein, 1985, 1986, 1990). However, the well-known noticeable variability of physiological, articulatory and acoustic signals of speech associated with coarticulation phenomena and variations in speaking style has led to an alternative approach that aims to study the variability itself. This approach consists in measuring the ranges of variation of the data (Wood, 1979; Perkell & Nelson, 1985; Folkins & Brown, 1987; Perkell, 1990; Beckman et al., 1995), in looking at the internal structure of the data distributions

C. Mooshammer et al.
within the domain of variation (Kuhl, 1991, 1992), and in studying the possible relations between the density of phonological systems and the amplitude of the variability (Lubker & Gay, 1982).
Thus, physical correlates of phonemes are not considered to be strictly invariant but rather as regions of the motor, articulatory, acoustic, and/or perceptual spaces. Allophones of the same phoneme have to be located within these regions to allow communication between speakers and listeners. Keating (1990) used this concept in her window model to explain coarticulation in speech production. Guenther (1995), Guenther et al. (1998, 1999), Perkell et al. (1997) and Perrier (2003) also adopted the concept of regions to elaborate models of planning in speech production.
More generally, in order to study the interaction between perception and production in speech the characterization of the physical correlates of a phoneme in terms of range and nature of variation, rather than in terms of invariance, has been shown to be very fruitful. For instance, Lindblom (1990) within the context of the H & H and adaptive perception theories, suggested for vowels that formant patterns would be allowed to dramatically vary with speaking style (Hyper- versus Hypoarticulation), without endangering the perception, as long as the relative location of vowels in the overall vowel system are preserved. The underlying hypothesis is that the listener would adapt the size of her/his vowel space in the acoustic domain depending on the speaking style. Thus, different regions of the formants space would be associated with a same phoneme. This allows some freedom in the physical specification of the speech task, and, according to Lindblom (1990), this freedom would be used in the planning of speech sequences to minimize the articulatory effort while ensuring the perception of the articulated sound. The so-called perceptual magnet effect, introduced by Kuhl (1991, 1992) is also relevant for understanding how the negotiation between speaker-oriented criteria and listener-oriented requirements can operate. Studying the perception of phonetic categories, Kuhl provided evidence for an uneven structure of the perceptual region associated with each category: the closer a sound is to the perceptual prototype of a category the less it can be perceptually discriminated from this prototype. The proposed decrease of the perceptual discrimination ability away from the perceptual prototypes is very useful for explaining some aspects of the compensation strategies observed in speech production (Perkell et al., 2000).
Thus, from the speech motor control perspective, Lindblom's and Kuhl's theories, both purely based on analyses of acoustic variability in relation to perception, help to understand the objectives of a speaker: they propose a number of constraints that speakers have to deal with, in order to ensure the perception of their speech, and they shed light on the freedom that speakers can use in order elaborate the planning of speech sequences. Consequently, an analysis of both, articulatory and acoustic variability allows us to find out more about the gestural accuracy required in order to match the perceptual constraints. From this perspective, Perkell & Nelson (1985) (see also Perkell, 1990) proposed a study that has formed the basis of many subsequent investigations.
Perkell & Nelson (1985) analyzed X-ray microbeam data in multiple repetitions of the vowels [i] and [a] in a variety of phonetic environments produced by three speakers of American English. For both vowels they found that the major axis of the dispersion ellipses characterizing the distributions of the pellets located in or close to the constriction region was parallel to the outline of the vocal tract walls. They explained these observations with the existence of passive "saturation effects" for these vowels, which would introduce strong non-linearities in the relations between muscle commands and articulatory position. In the case of [i], Perkell & Nelson (1985) suggested that the fact that the sides of the tongue blade are being pushed against the hard palate would strongly restrain tongue position variability in the direction perpendicular to the palate. According to these authors, in the case of [a], the

Token-to-token Variability
limitation of the variability perpendicularly to the pharyngeal walls would be due to a saturation in the length-tension characteristics of the active muscles. Perkell & Nelson (1985) interpreted their results in support of the Quantal Theory of speech production (Stevens, 1972), which suggests that the most frequent vowels in the world’s languages inventory (and among them vowels [i] and [a]), would be articulated in regions of the vocal tract where articulatory changes would generate no or little auditory changes. In the case of [i] and [a], the "saturation effects" would limit the change in constriction area and then contribute to the perceptual stability of the articulated sound.
A similar experiment was carried out by Perkell & Cohen (1989) with a midsagittal electromagnetometer for vowels /i/, /a/ and /u/ in [bV1' V2b] and [bV1’CV2b] sequences, where C was one of the consonants [b, , h] and in which the influence of syllable stress was also considered. Only one point located on the dorsal tongue surface near the place of maximum constriction for /u/ was recorded and analyzed. The measured variability of this point did not exactly replicate Perkell and Nelson's (1985) findings, especially for [i]. However, given the fact that the points measured in Perkell & Nelson (1985) were more accurately located in the respective constriction location of each vowel, it can be considered that both experiments are consistent with each other and support the hypothesis of saturation effects limiting the variability in the direction perpendicular to the vocal tract midline. However, Perkell & Cohen's (1989) data show also that the phonetic context seems to influence the orientation of the dispersion ellipses, which tends to be "rotated somewhat in the direction of the context vowel target location" (Perkell, 1990, p.283), and to consistently vary with the intervocalic consonant.
Perkell & Nelson's (1985) experimental findings were replicated with different data sets and with a more systematic statistical approach by Beckman et al. (1995), and not only for /i/, /a/ and /u/, but for all vowels of English, including vowels that are not considered as quantal in the Quantal Theory.
In order to assess more precisely the respective contributions of contextual and token-to-token effects in the measured vowel variability, Hoole and Kühnert (1995) compared both effects for stressed vowels in German. They found that (a) consonantal context affects the target position of lax vowels to a greater degree than the one of tense vowels, (b) for lax vowels the amount of token-to-token variability was not influenced by vowel height or frontness and (c) tense front high vowels tended to vary to a lesser degree than tense back and low vowels. Considering Beckman et al.'s (1995) and Hoole and Kühnert's (1995) results, it can be argued that the patterns of articulatory variability measured for vowels could be largely determined by general mechanisms valid for every tongue and jaw gesture rather than by vowel specific saturation effects that would be used to satisfy specific perceptual constraints. Possible biomechanical contributions to articulatory variability have been investigated by Shiller et al. (2002) who analyzed jaw positioning in vowel production. In a first experiment they measured token-to-token jaw variability in CVC sequences using an Optotrack system. The vowels /i/, /a/, /e/ and /æ/ in /k/, /t/, /s/ environment were recorded. In a second experiment, a computer-controlled robotic device coupled with the jaw was used to deliver mechanical perturbations to this articulator and estimate its stiffness in the mid-sagittal plane. They showed that the patterns of variability observed for the 4 vowels were consistent with the stiffness patterns. Indeed for each vowel, the variability was low in directions where stiffness was high and vice versa. This finding suggests that the contribution of mechanical properties of the articulators to the orientation of articulatory variability could be the main determining factor.
In this framework, the amount of token-to-token variability at target position could be seen as a consequence of the corruption of motor control signals by neural noise, from one

C. Mooshammer et al.
repetition of the task to the next. Harris and colleagues (Harris, 1998; Harris & Wolpert, 1998) have recently demonstrated the potential impact of such a noise on the end-position of target directed movements. They have proposed that motor control strategies underlying the production of such movements would even be organized in the aim to ensure the minimization of the thus induced variability at end position.
The study1 presented in this paper is part of a larger project inspired by the objective to evaluate the possible influence of biomechanical factors on speech variability as compared to perception oriented factors. The token-to-token variability in the production of German vowels is measured in the articulatory and the acoustical domains. Based on Perkell & Nelson's (1985) conclusions, the following results were expected: - Articulatory variability should decrease when the amount of palatal contacts increases. - For high vowels, which have a high amount of palatal contacts, the major axis of the
dispersion ellipses should be oriented along the vocal-tract midline. - The articulation of quantal vowels should vary in constriction location (along the direction
parallel to the vocal tract mid-line), but should be more constrained in constriction degree (along the direction perpendicular to the vocal tract mid-line).
Discrepancies between these predictions and our experimental results will be pointed out and they will be interpreted in terms of speech production control and/or of palatal influence on tongue positioning.
2. Method
2.1. Data Acquisition
Tongue, jaw and lower lip movements of three male speakers of Standard German were recorded by means of Electromagnetic Midsagittal Articulography (EMMA, AG100, Carstens). Tongue-palate contacts were recorded simultaneously with the Reading EPG system. Four sensors were attached to the tongue, one as far back as possible (TBACK), one close to the posterior border of the artificial EPG palate (TDORS), one approximately 1 cm behind the tongue tip (TTIP) and one equidistant between TDORS and TTIP (TBLADE). Two sensors on the nasion and on the upper incisors served as references for compensation of head movements relative to the helmet and definition of an intermediate coordinate system. Additional sensors were glued on the lower incisors, one on the vermillion border of the lower lip and another on the tongue tip, but they will not be considered here. The final coordinate system was defined by recordings of two sensors on a T-bar, manufactured individually for each subject in order to determine his bite plane. Original sample frequencies were 100 Hz for EPG data, 400 Hz for EMMA data and 48 kHz for the acoustical signal. For the analysis, the EMMA signals were low-pass filtered and downsampled to 200 Hz while the acoustical signal was resampled at 16kHz.
All subjects were recorded twice, once with a 5 mm thick bite block maintained between the second molars (hereafter BB condition) and once without bite block (henceforth, the normal condition). The BB condition was recorded in order to remove the contribution of the jaw to the token-to-token variability and to focus more specifically on the tongue control itself.
The material consisted of CVC nonsense words with either velar or bilabial stops as consonantal context and one of the 14 German vowels /i, , y, , e, , ø, œ, , a, o, , u, /. The initial stop was voiced and the medial voiceless. Examples of the target words 1 The present paper is an extension of the paper presented in the 4th International Speech Motor Conference hold in June 2001 in Nijmegen, The Netherlands (Mooshammer et al., 2001)

Token-to-token Variability
are gieke, gucke, büpe. All nonsense words were embedded in the carrier sentence “Sage .... bitte” ("Say .... please") and repeated 10 to 11 times.
2.2. Measurements
Vowel specific tongue positioning was determined visually using the following criteria: (a) the selected time-point had to be within the voiced part of the vowel and close to the acoustic vowel midpoint; (b) most of the tongue trajectories showed a turning point, which was then selected; (c) in the absence of a turning point, the time location of the minimum amount of EPG contacts was chosen. For the recordings without bite-block, the highest amount of jaw opening was also taken into account. Tongue sensor positions, EPG contact patterns and frequencies of the first and second formant were measured at this time instant.
To assess the token-to-token variability, two-sigma dispersion ellipses were computed for the 10–11 repetitions of each item. This gives four ellipses per vowel and speaker, i.e. 2 bite-block conditions and two consonant contexts. The ellipses were displayed in the sagittal plane for the three most posterior tongue sensors. Tongue tip sensor positions were not taken into account here because this articulator is not assumed to have a major influence on the production of vowels. The ellipses describe Gaussian estimations of the sensor positions distributions at the vowel target. Variability was measured on the basis of the area of these ellipses and of the angle of their major axes.
A number of conventional EPG measures was calculated, e.g. the centre of gravity, the percentage of contacts in the posterior region, and the centrality index (see e.g. Gibbon & Nicolaidis 1999). Since none of these measures account for either the non-uniform spatial distribution of electrodes on the artificial palate, or for individual differences in the size of the palate, the spacing between electrodes is not considered in the above mentioned measures. Hence a new approach was adopted by measuring the EPG 3D coordinates by a calipher on the individual artificial palates (for a detailed description see Fitzpatrick and Ní Chasaide 2002) and then computing the area around the contacts by triangulation. The new EPG index APPOPC (Area of Posterior Palatal Contact in Percent) was calculated as the percentage of areas around the activated contacts in the posterior region divided by the whole posterior area.
3. Results
3.1. Relationship between tongue positions and palatal contact
The two methods used here for recording lingual articulation can be seen as complementary for consonants. Indeed, the EPG electrodes detect whether there is a contact between tongue and palate and they describe the 3D distribution of these contacts, but they do not give any information about the tongue shape outside of the contact region. EMMA, on the other hand, provides accurate data about the position of the anterior part of the tongue in the mid-sagittal plane, but does not inform about the position of the sides of the tongue.
One of the aims of the current study is to investigate the influence of the amount of palatal contacts on the patterns of token-to-token variability in vowel production. Therefore as a first step, the relationship between the horizontal and vertical position of the tongue sensors and the EPG measure APPOPC was analysed by calculating correlation coefficients. This is important especially since both EPG and EMMA are limited spatially to the hard palate and to the anterior part of the tongue. Table I shows the correlation coefficients between horizontal and vertical sensor positions and the EPG area index APPOPC averaged over the 10-11 repetitions of each item split by condition. Figure 1 shows the corresponding scatterplots for the tongue dorsum position.

C. Mooshammer et al.
Figure 1. Scatterplots of the averaged horizontal (left column) and the vertical tongue dorsum positions (right column) and the EPG measure area of palatal contact in the posterior region in percent (APPOPC), shown by row separately for the three speakers. Upper case letters: lax vowels (Ö=/œ/), lower case: tense vowels (ö=/ø/), italics: bite-block condition.
For all subjects significant negative correlations were found between APPOPC and the
horizontal positions of the three tongue sensors, i.e. the further forward the vowel was produced the more EPG contacts were found. The relationship between the amount of EPG contact and vertical tongue sensor positions was also highly significant: higher tongue positions yielded an increase in the amount of EPG contact. For all speakers, the correlations were weaker for the tongue back sensor as compared to the two more anterior sensors. This could be due to the fact that the tongue back sensor was placed behind the posterior border of the artificial palate and therefore only indirectly contributed to the amount of measured palatal contact. As can be seen in Figure 1, when all conditions were considered together, speakers CG and JD showed correlations that were considerably lower for the horizontal dimension than for the vertical one. However, for these speakers the lower correlation coefficients with
0 20 40 60 802.5
3
3.5
4
4.5
5
5.5
6
iIyY e
Eö
ÖaA
oO uU
iIy
Y
e
Eö
ÖaAo
O uU
iI yY eE öÖ
aA
o
O
uU
iI y
Ye
E öÖa A
oO
uU
CG
r= -0.40**
Dorsx in cm
0 20 40 60 80
-0.5
0
0.5
1
1.5iIy
Y
e
EöÖ
a
A oOuU
iIy
Y
e
Eö
Ö
aA
o
O
u
U
i
I
y
Y
e
E
ö
ÖaAoO
uU
i
Iy
Y
e
E
ö
Ö
aAo
O
u
U
r= 0.86***
Dorsy in cm
0 20 40 60 802.5
3
3.5
4
4.5
5
5.5
6
iIyYe
EöÖa A
oO
uU
i
I yY
e
EöÖaA
oO
uU
iIyYeEöÖa A
o Ou
U
iI yY
eE
öÖaA
oO
uU
DF
r= -0.71***0 20 40 60 80
-0.5
0
0.5
1
1.5
iIy
Ye
Eö
Öa
A
oO
uU
i
I
y
Y
e
E
ö
ÖaA
oO
u
U
i
IyY
e
EöÖ
a
Ao
Ou U
i
I
y
Y
e
E
ö
ÖaA
oO
u
Ur= 0.96***
0 20 40 60 802.5
3
3.5
4
4.5
5
5.5
6
iI yY
eEöÖa A
oO uU
iI
y
Y
eE ö
ÖaA
o
O
uU
iI yY eEöÖ
a AoO uU iI
yY
eE öÖ
a AoO
u
U
JD
r= -0.42**
EPG: Appo [%]0 20 40 60 80
-0.5
0
0.5
1
1.5
iI y
Ye
EöÖ
a
Ao
O
uU
i
I
y
Y
e
E
ö
ÖaA
o
O
u
U
iI y
Ye
EöÖ
aAoO
u
U
i
I
y
Y
e
Eö
Öa A
o
O
u
U
r= 0.87***
EPG: Appo [%]

Token-to-token Variability
horizontal positions were due to quite different tongue sensors locations for the recordings with and without bite-block as Table I shows: here the significance of correlation coefficients did not differ for horizontal and vertical positions when computed for the two bite-block conditions. Nevertheless, as mentioned above, the constriction location for high back vowels is very likely to be located behind the posterior border of the artificial EPG palate. Hence, since the real amount of contacts for these vowels was probably quite inaccurately measured with the EPG System the magnitude of the correlation along the horizontal axis should be considered with some caution.
TABLE I: Correlation coefficients between tongue positions of TBACK, TDORS and TBLADE and APPOPC, averaged over the 10-11 repetitions and split by condition: B=bite-block, N=normal. All correlations are significant, values in italics are significant at p<0.01, all others at p<0.001
Speaker BB N BACKX BACKY DORSX DORSY BLADEX BLADEY
CG B 28 -0.853 0.645 -0.924 0.923 -0.968 0.965 N 28 -0.514 0.861 -0.707 0.928 -0.798 0.827DF B 28 -0.866 0.839 -0.891 0.954 -0.928 0.820 N 28 -0.762 0.853 -0.849 0.972 -0.886 0.843JD B 28 -0.689 0.677 -0.740 0.906 -0.791 0.887 N 28 -0.598 0.817 -0.609 0.947 -0.780 0.870All B 84 -0.423 0.602 -0.459 0.833 -0.723 0.704 N 84 -0.475 0.560 -0.603 0.840 -0.767 0.763
In summary, our data have confirmed what was expected: the amount of palatal contact area increased for higher and more fronted tongue positions.
3.2. Ellipse areas and palatal contacts
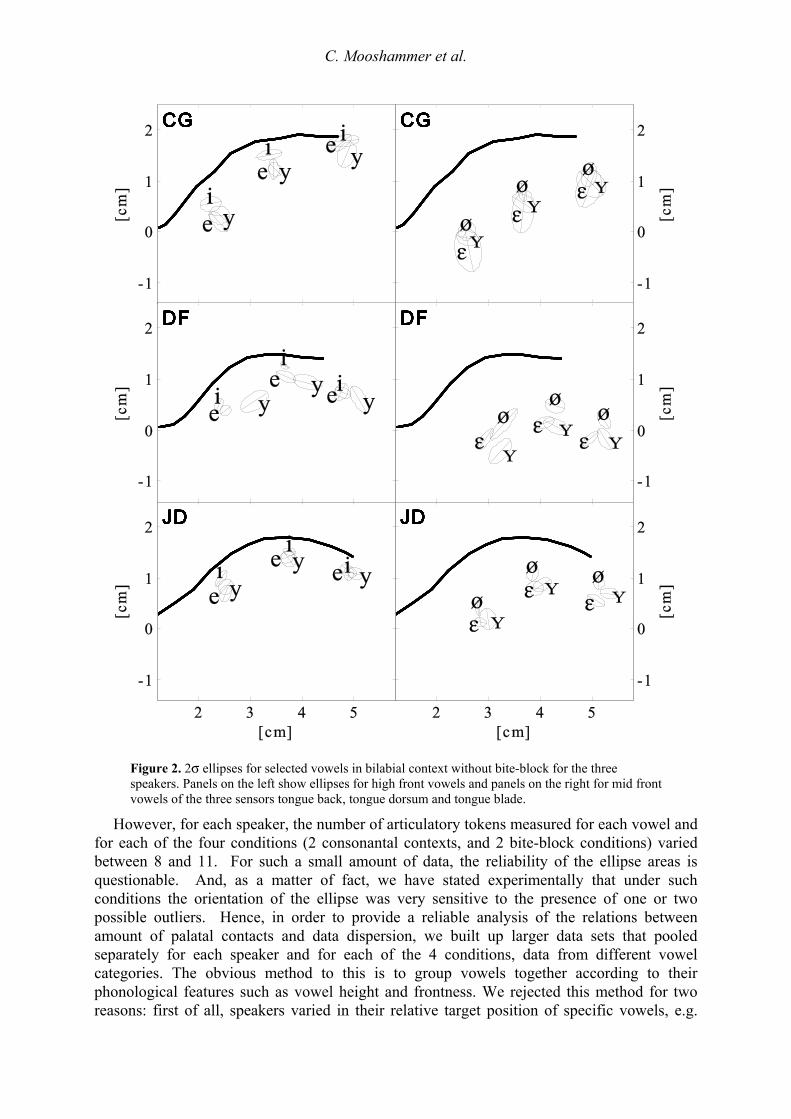
Following the predictions of Perkell & Nelson (1984), we measured the relationship between amount of palatal contact and patterns of variability. More specifically, our hypothesis is that the higher the amount of contacts, the smaller the ellipse area. Examples of ellipses for selected vowels are given in Figure 2.
As can be seen in Table II, there was a close relationship between the ellipse area and the amount of palatal contact, i.e. the more the tongue was constrained by the palate the smaller the ellipse area. This relationship was strongest for the tongue dorsum sensor, which was located in the constriction region of the front vowels. It was clearly weaker for the TBACK sensor, here again probably because it was placed behind the posterior border of the EPG palate. Thus, this preliminary result tends to support our first hypothesis that articulatory variability should decrease when the amount of palatal contacts increases.
TABLE II: Correlation coefficients between EPG-measure APPOPC and ellipse areas (italics: p<0.05, bold: p<0.01).
Speaker N Area Back Area Dors Area Blade
CG 56 -0.115 -0.386 -0.275DF 56 -0.192 -0.345 -0.252JD 56 -0.299 -0.419 -0.317All 168 -0.209 -0.379 -0.296
C. Mooshammer et al.
-1
0
1
2 iCG[c
m]
iCG
i
CGe
CG
e
CG
e
CG
yCG
y
CG
y
CG
-1
0
1
2
CG
[cm
]
CG
CG
ø
CG
ø
CG
ø
CG
CG
CG
CG
-1
0
1
2
i
DF
[cm
]
iDF
i
DF
e
DF
e
DF
e
DF
y
DF
y
DF
y
DF
-1
0
1
2
DF
[cm
]
DF
DF
ø
DF
ø
DF
ø
DF
DF
DF
DF
2 3 4 5
-1
0
1
2
i
[cm]
JD
[cm
]
iJD
i
JD
e
JD
e
JD
e
JD
y
JD
y
JD
y
JD
2 3 4 5
-1
0
1
2
[cm]
JD
[cm
]
JD
JD
ø
JD
ø
JD
ø
JD
JD
JD
JD
Figure 2. 2σ ellipses for selected vowels in bilabial context without bite-block for the three speakers. Panels on the left show ellipses for high front vowels and panels on the right for mid front vowels of the three sensors tongue back, tongue dorsum and tongue blade.
However, for each speaker, the number of articulatory tokens measured for each vowel and for each of the four conditions (2 consonantal contexts, and 2 bite-block conditions) varied between 8 and 11. For such a small amount of data, the reliability of the ellipse areas is questionable. And, as a matter of fact, we have stated experimentally that under such conditions the orientation of the ellipse was very sensitive to the presence of one or two possible outliers. Hence, in order to provide a reliable analysis of the relations between amount of palatal contacts and data dispersion, we built up larger data sets that pooled separately for each speaker and for each of the 4 conditions, data from different vowel categories. The obvious method to this is to group vowels together according to their phonological features such as vowel height and frontness. We rejected this method for two reasons: first of all, speakers varied in their relative target position of specific vowels, e.g.

Token-to-token Variability
speaker DF produced the vowel /y/ lower and more retracted than the other speakers (see Figure 2). Secondly, the articulatory positions of vowels varied with the consonantal context and the bite-block condition. Therefore pooling vowels together based on phonological features would be rather subjective and a priori. An alternative and more objective method is to transform a continuous variable into a categorical. Since we are looking for a possible influence of the amount of palatal contacts on the orientation of the dispersion, the new data subsets were built for each speaker and for each of the four conditions on the basis of the EPG parameter APPOPC. For further analysis, the function “categorize variable” of the statistics software SPSS™ was used. According to percentiles of the continuous variable APPOPC, this function computes a predefined number of levels that define the different data subsets. For example, if the new categorical variable consists of three levels, the SPSS procedure assigns 1 to all data of the original variable which are smaller than the 33rd percentile. These levels define a new, discrete, variable, called NAPPOPC that specifies each of the new data subsets. It should be noted that back vowels /u, , o, / were excluded from this automatic categorization and that we arbitrarily grouped them in a subset called “back”. We did this because the constriction location of these vowels is just at or even behind the posterior border of the EPG palate, so that the amount of contact at the soft palate cannot be reliably measured. Therefore, the relationship between EPG contact patterns and lingual articulation differs considerably from that of the front vowels, and no relevant conclusion about the effect of palatal contact on lingual variability can be made for these 4 vowels. This is why they were grouped together in a separate data subset. For the other vowels, we decided to construct 3 categories.
0
20
40
60
80
100
i y e ø œ a a
Per
cent low
midhigh
Figure 3. Distribution of the different vowel categories among the three new data subsets derived from the three-level quantization of the continuous variable APPOPC (all back vowels are excluded). Y-axis : Percentage of vowels distributed in the low (black), mid (gray), high (white) categories
Figure 3 shows how the different repetitions of each vowel were distributed among the 3 categories pooled for all speakers and conditions. This chart was generated by counting the occurrences of categories 1, 2 and 3 per vowel type and calculating the percentage. The maximum number for each vowel type was 12 (3 speakers, 2 consonants and 2 conditions) and for each vowel the APPOPC value was averaged over the 8-11 repetitions. It can be seen that the high front vowels /i, y, e/ were generally grouped together, henceforth called "high" (white bars), and that the majority of the low vowels /a, a/ were in the same category, henceforth called "low" (black bars). All 12 instances of the tense front vowel /ø/ received a
C. Mooshammer et al.
medium value, henceforth called "mid" (gray bars). The other vowels were distributed less consistently depending on speaker, consonantal context and bite-block condition.
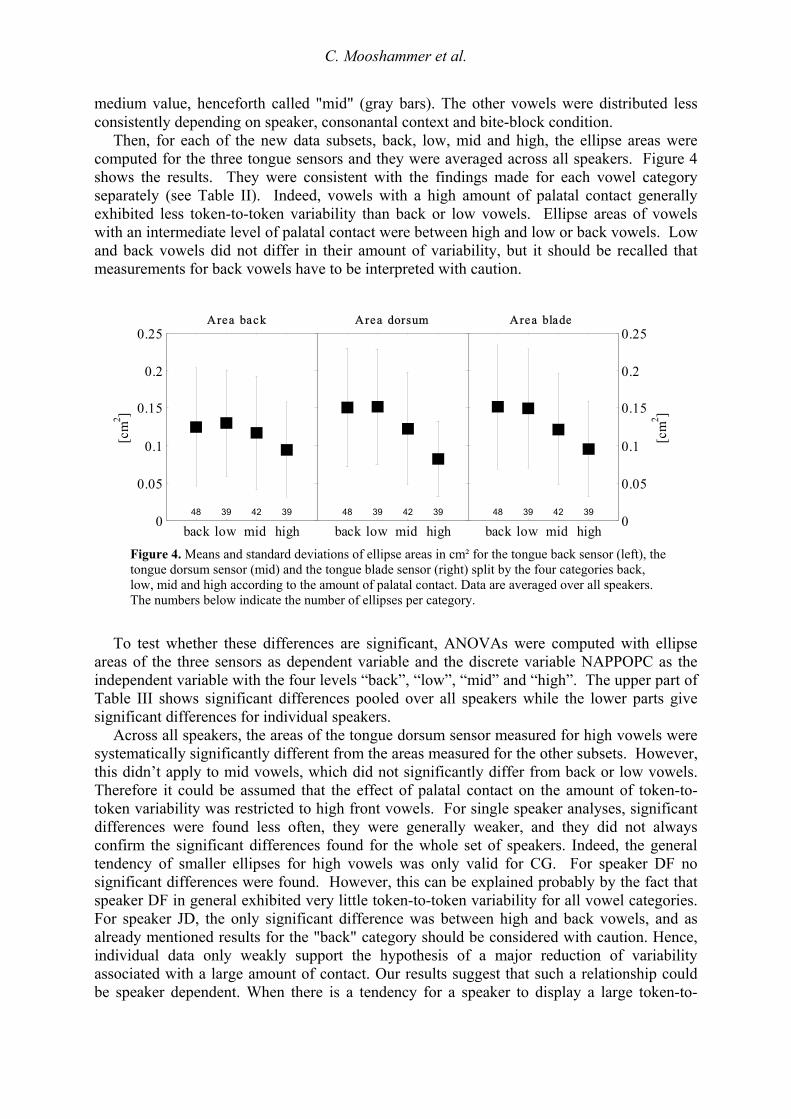
Then, for each of the new data subsets, back, low, mid and high, the ellipse areas were computed for the three tongue sensors and they were averaged across all speakers. Figure 4 shows the results. They were consistent with the findings made for each vowel category separately (see Table II). Indeed, vowels with a high amount of palatal contact generally exhibited less token-to-token variability than back or low vowels. Ellipse areas of vowels with an intermediate level of palatal contact were between high and low or back vowels. Low and back vowels did not differ in their amount of variability, but it should be recalled that measurements for back vowels have to be interpreted with caution.
back low mid high0
0.05
0.1
0.15
0.2
0.25Area back
[cm
2 ]
48 39 42 39
back low mid high
Area dorsum
48 39 42 39
back low mid high0
0.05
0.1
0.15
0.2
0.25Area blade
[cm
2 ]
48 39 42 39
Figure 4. Means and standard deviations of ellipse areas in cm² for the tongue back sensor (left), the tongue dorsum sensor (mid) and the tongue blade sensor (right) split by the four categories back, low, mid and high according to the amount of palatal contact. Data are averaged over all speakers. The numbers below indicate the number of ellipses per category.
To test whether these differences are significant, ANOVAs were computed with ellipse
areas of the three sensors as dependent variable and the discrete variable NAPPOPC as the independent variable with the four levels “back”, “low”, “mid” and “high”. The upper part of Table III shows significant differences pooled over all speakers while the lower parts give significant differences for individual speakers.
Across all speakers, the areas of the tongue dorsum sensor measured for high vowels were systematically significantly different from the areas measured for the other subsets. However, this didn’t apply to mid vowels, which did not significantly differ from back or low vowels. Therefore it could be assumed that the effect of palatal contact on the amount of token-to-token variability was restricted to high front vowels. For single speaker analyses, significant differences were found less often, they were generally weaker, and they did not always confirm the significant differences found for the whole set of speakers. Indeed, the general tendency of smaller ellipses for high vowels was only valid for CG. For speaker DF no significant differences were found. However, this can be explained probably by the fact that speaker DF in general exhibited very little token-to-token variability for all vowel categories. For speaker JD, the only significant difference was between high and back vowels, and as already mentioned results for the "back" category should be considered with caution. Hence, individual data only weakly support the hypothesis of a major reduction of variability associated with a large amount of contact. Our results suggest that such a relationship could be speaker dependent. When there is a tendency for a speaker to display a large token-to-

Token-to-token Variability
token variability, this variability is reduced when there is a large amount of contact between tongue and palate. Otherwise, the role of the palate is barely noticeable.
TABLE III. Results of ANOVAs with the dependent variable ellipse area for the three sensors and the independent variable NAPPOPC for all speakers pooled (ALL) and for the three speakers CG, DF, JD separately. Results of Post hoc Scheffé tests for the 4 levels of NAPPOPC are also given, e.g. an asterisk in row back > high means that ellipse areas for back vowels were significantly larger than for high vowels.
Speaker Back Dorsum Blade
ALL Effects df F p F p F p GLM NAPPOPC 3, 167 3.063 0.030 12.040 0.000 6.721 0.000 Speaker 2, 167 52.951 0.000 34.928 0.000 29.348 0.000 Interaction 6, 167 0.798 0.573 0.700 0.650 2.093 0.057Post hoc back > low
mid high *** ** low > mid high *** ** mid > high *
CG Effects df F p F p F p GLM NAPPOPC 3, 55 1.003 0.399 4.674 0.006 1.946 0.134Post hoc back > low mid high * low > mid high * mid > high DF Effects df F p F p F p GLM NAPPOPC 3, 55 2.308 0.087 3.163 0.032 1.700 0.178Post hoc back > low mid high low > mid high mid > high JD Effects df F p F p F p GLM 3, 55 2.397 0.079 7.267 0.000 12.478 0.000Post hoc back > low ** mid * *** high ** *** low > mid high mid > high
One of the major aims of this study is to investigate not only the amount of token-to-token
variability but also its orientation. Our hypothesis is that "for high vowels, which have a high amount of palatal contacts, the major axis of the dispersion ellipses should be oriented along the vocal-tract midline", i.e. along the outline of the palate.
Figure 5 shows the ellipses of /byp/ and /yk/ for tongue blade, tongue dorsum and tongue back sensors for speaker CG without bite-block. As discussed earlier, both the shape and the orientation of the ellipses were highly sensitive to single outliers. For instance, without the lower outlier of the tongue blade measurements for the bilabial context the front ellipse (bold) would be oriented along the palate and it would be flatter instead of being nearly circular and inclined almost parallel to the x-axis. We therefore once again decided to consider larger data subsets by grouping vowels categories together on the basis of the

C. Mooshammer et al.
amount of palatal contacts by using the three-level categorization of APPOPC (which specifies the discrete variable NAPPOPC, see Figure 3).
1 1.5 2 2.5 3 3.5 4 4.5 5 5.5-1
-0.5
0
0.5
1
1.5
2
pppp
ppp ppp
CG /y:/
front back
ppppppppp
p
front back
pppp pp
pp
p
p
front back
kkkk
kk
kk
kk
front back
k
k
k
k
kkk
kk
k
front back
k
kkk
kkk
kk k
front back
Figure 5. 2σ ellipses of 10 repetitions of /byp/ (bold lines, items marked with p) and /yk/ (thin lines, items marked with k) of sensor positions of tongue blade, tongue dorsum and tongue back for speaker CG without bite-block, measure approximately at the mid-vowel.
TABLE IV: Correlation coefficients between the x and y positions within the subsets Back, Low, Mid, High and for all measures. Gray cells correspond to significant correlations (p<0.05) and bold font is used if p<0.001
Speaker Back Low Mid High All
CG N 156 133 127 130 546 Tback -0.474 -0.218 -0.228 0.016 -0.252 Tdors -0.409 -0.324 -0.282 0.230 -0.232 Tblade -0.394 -0.373 -0.104 0.114 -0.226DF N 163 131 140 130 564 Tback -0.552 -0.182 -0.384 -0.444 -0.392 Tdors -0.218 -0.040 -0.091 -0.422 -0.172 Tblade 0.403 -0.003 0.345 0.237 0.250JD N 160 131 136 130 557 Tback -0.260 -0.352 -0.300 0.083 -0.239 Tdors 0.018 -0.222 -0.154 0.052 -0.082 Tblade 0.111 -0.050 -0.098 0.126 0.038
Before calculating ellipse orientations and sizes for the larger data subsets, the data were
centered. To do so, for each sensor, the X and Y mean values were calculated for each individual vowel category, each consonantal context and each bite-block condition separately, and they were subtracted from the original corresponding data. The centered data were then grouped according to the discrete variable NAPPOPC. Table IV gives the correlation coefficients between the x and y positions within the subsets Back, Low, Mid, High and pooled (All). A significant negative correlation means that the higher the tongue the more
[cm
]
[cm]
Token-to-token Variability
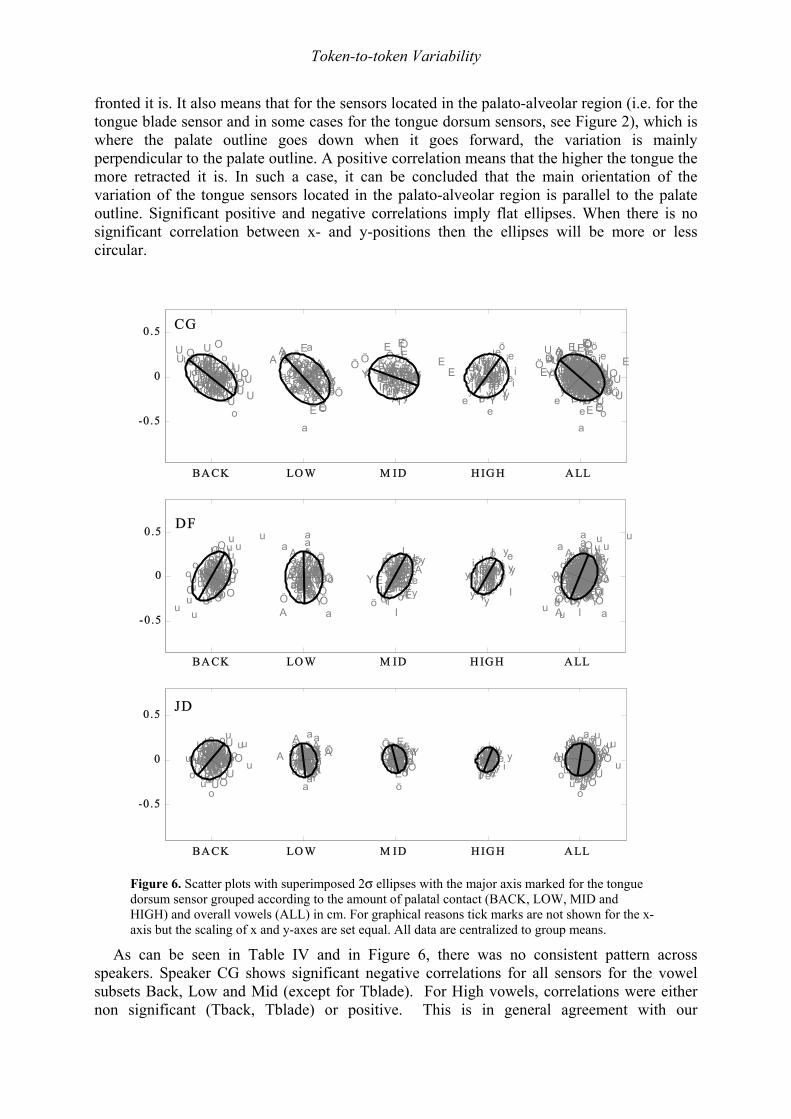
fronted it is. It also means that for the sensors located in the palato-alveolar region (i.e. for the tongue blade sensor and in some cases for the tongue dorsum sensors, see Figure 2), which is where the palate outline goes down when it goes forward, the variation is mainly perpendicular to the palate outline. A positive correlation means that the higher the tongue the more retracted it is. In such a case, it can be concluded that the main orientation of the variation of the tongue sensors located in the palato-alveolar region is parallel to the palate outline. Significant positive and negative correlations imply flat ellipses. When there is no significant correlation between x- and y-positions then the ellipses will be more or less circular.
BA CK LO W M ID H IG H A LL
-0.5
0
0.5
o
o
o o
o o
ooo
OOO
OO
OOO O
Ou
uu
uuuuu
u
u
U
UUU
UU
U
UUUo
oo
o o
oo
ooo
O
OOO
OOO
OOO
uuu uuuu uu u
UUU U
U UU
U UU
o
o o
ooooo
oo
O
O
O
O OOO
O
OOuu u
uuu
u
uuu
U
U
UUU U
U
UUU
o
oo
oo o
oo oo
OO
O
OOOO OO
uuu
uuu uu
u u
U
UU UU UUU
YE
EE
EÖ
Ö
ÖÖ
ÖÖÖÖa
a
aaa
a aa
aaAA
AAA
AA
AAAYY YE
Ö ÖÖÖÖÖ
ÖÖ
aa
aa
aaaaaa
AA
AAA
A
AAA
AY
E
EEEEE
E
E
ÖÖ
ÖÖ
ÖÖÖ
Ö
Öa
aaa
aa
a
aaa
A
AA
AA
AA
AA
E öö öÖ
Ö Ö
ÖÖÖÖ Öa
a
aa
aaa
aa
A AA
AAA A
AA
A I I
I I
II
YYYYY
YYYYee
E
EE
E
E
E
ööööö
ööö
ö
Ö
Ö
III I
yyY YY
YY YYe eEEEE EE Eöö öö ö ö
ööö
ÖÖ
III
I
II
IYYY
YY
YYeee
E
Eööö
ö
öö
Ö
AII
I
y
y yyYY YYY YY
Y YeE
EE
E
EE
E Eööö öööö
Öi
ii
ii iii ii
II
II
yyyy yy
yy
y
yeee
eeeeeöii
i i ii i
ii
iI
I IIIyy
y
y
yy
yyeee
ee ee e
Eii
ii i
ii i
iiII
I
y
yyy
yy
yyy y
Y
ee
e
ee
ee
ö
ö
ö
iii
ii i
ii
i iI III
II
yy y
y y
yeeeeeee
eE
ii
ii
i iii iiI
I
I
I II
I
I
I
Iyyy
y yyy
y
y
y
YYYYY
YYYYYe
eee
eeeeee
E
EE E
E
E EE
EE
ööööö
öööö
ö
ÖÖ
ÖÖ
ÖÖÖ
Ö
ÖÖa
a
aaa
a aaaaAA
AAA
AA
AAA
o
o
o o
o o
ooo
OOO
OO
OOO O
Ou
uu
uuuuu
u
u
U
UUU
UU
U
UUU
iii i ii i
ii
iI
I
I I II IIIyy
y
y
y
yy
yyy
Y YYYY YYY YYeeee
ee eee eEE
EE
EE EE Eöö öö ö öö
ööÖ
ÖÖ ÖÖ
ÖÖÖÖÖ
aa
aa
aaaaaa
AA
AAA
A
AAA
Aooo
o o
oo
ooo
O
OOO
OOO
OOO
uuu uuuu uu u
UUU U
U UU
U UU
iii
i i
ii i
iiI
I
I I
II
I
II
Iy
yyy
yy
yyy y
YYYY
YY
Y YYeee
e
ee
e eee
E
EEE
E
EE E
E
E
öööö
ö
ööö
ö
ÖÖ
Ö
Ö
ÖÖ
ÖÖ
Ö
Öa
aaa
aa
a
aaa
A
AA
AA
AAA
AAo
o o
ooooo
oo
O
O
O
O OOO
O
OOuu u
uuu
u
uuu
U
U
UUU U
U
UUU
iii
ii i
ii
i iII
I III
I
II
y
yy yy y
y y
yy
YY YYY YYY Yeeeeeee
eeEEEE
EE
EE
E Eö öö
öö ö
öööö
Ö Ö
Ö Ö
ÖÖÖÖ Öa
a
aa
aaa
aa
A AA
AAA A
AA
Ao
oo
oo o
oo oo
OO
O
OOOO OO
uuu
uuu uu
u u
U
UU UU UUU
CG
BA CK LO W M ID H IG H A LL
-0.5
0
0.5
ooo
oooo
oooo OO
O
OOO
O
OOOO
uu
uuu
uuu
uu
UU
UUU
UUU
UUUo
oo
ooo
o
oo
OOOOO
O
O O
Ouu
u
u
u
uuu
u u
U
UUU
U
UU UUoo
o ooo o oo ooO
O
OO
OO
O
OOOuuu
uuu u uuuuU
UUUU
UU
U
UU
Uo
o ooo oo ooo
OOOOO
OO
O O
Ouuuuuu
u
uu
u
UUUUU U
UU U
U YY
Y YE
ÖÖÖÖ
ÖÖ
ÖÖ Öa
aa a
aa
a
aa a
A
A AA
AA
AAA
A
YY
YY
ö
ÖÖ
ÖÖÖ
Ö
ÖÖ
Öa a
aaaa
a
aa
A
AA
A AA AAAE
ö
ö ö
öÖ
ÖÖ ÖÖ
ÖÖÖÖ
aa a
a
a
aa aa
a
aA
A
A AAA
AA
Y
öö ööö ö
ÖÖÖ
ÖÖ
ÖÖ
Öa
aaa
aa
a
aaaAA
AA
A
A
A
I III
I
II
II
YYY
YY
Y
EEEE
EEE E
Eööö
öö
ö
ö
öööÖ
II
IIIIII
I
Y
Y
Y
Y YY
E
EEEE E EE
E
ö
ö
öö
ö
öö
Ö
aAI
IIIy
yy
yyYYYYY
Y YYY
EEE
EEEEEEE
öööö
öÖÖ
AA
AII
yyyy
yYYY
Y
YYYY
Ye eE
EE
EE
E
E
Eöö ö öÖÖ
Aii iiiiiiiiI
yy y
y
yyyyyyy eeeeee
eeeee
ö
iiii
i ii iiiI
yyy
y
y y
yy y y
e ee
ee
eeee eEööi ii
ii
i i iii
I
II I
I
I
yyy
yeeeee
eeeeeö
ii iiii iiI
II I
I
IIIyy
y
y
ye eeeeeeeEE
ii iiiiiiiiI III
I
IIII
I
yy y
y
yyyyyyyYYYY
Y Y
Y
Y
Y Yeeeeeeeeeee EEE
EE
EEE E
Eööö
öö
ö
ö
ö
öööÖÖ
ÖÖ
ÖÖÖ
ÖÖ Öa
aa a
aa
a
aa a
A
A AA
AA
AAA
Aooo
oooo
oooo OO
O
OOO
O
OOOO
uu
uuu
uuu
uu
UUUUU
UUU
UUU iiii
i ii iii
II
IIIIII
II
yyy
y
y y
yy y y
Y
Y
Y
Y Y
YY
YYY
e ee
ee
eeee e
E
EEE
EE E EE
E
ö
ö
öö öö
ö
öö
öÖÖ
ÖÖÖ
Ö
Ö
Ö
ÖÖ
a aaa
aaa
a
aa
A
AA
A AA AA
AAo
oo
ooo
o
oo
OOOOO
O
O O
Ouu
u
u
u
uuu
u u
U
UUU
U
UU UUi ii
ii
i iiiiII
III
II I
I
I
yyyyy
yyyyYYYYY
Y YYYe
eeee
eeeeeEEE
EEEEEE
EEöö
öööö
ö
ö ö
öÖ
ÖÖ ÖÖ
ÖÖÖ
ÖÖ
Ö aa a
a
a
aa aa
a
aA
A
A
A AAA
AA
AAo
oo ooo o oo ooO
O
OO
OO
O
OOOuuu
uuu u uuuuU
UUUU
UU
U
UU
U
ii iiii iiI
II I
I
IIIIIy
yy
yyy
yy
y
yYYY
Y
YYYY
Y
Ye ee eeeee
ee
EE
EE
EEE
E
E
Eööö öö ö
öö ö
öÖÖÖÖ
ÖÖ
Ö ÖÖ
Öa
aaa
aa
a
aaaAA
AA
A
AA
Ao
o ooo oo ooo
OOOOO
OO
O O
Ouuuuuu
u
uu
u
UUUUU U
UU U
U
DF
BA CK LO W M ID H IG H A LL
-0.5
0
0.5
oo oooooo
o
oOOO OOOOO
O
Ou
uuuu
uu
u
uu
UUUUU U
U
U UU
o
ooo
o
o
ooo
o
OOO
OO OOOOOuu u
uuu
u
uuuUU U
U
UU
UUU
Uo
ooo
oooo
o
oOOOOOOOO
OOu
uuu
u
uu
u
u
u
UUUU
UU
UUU
U ooo
o
o
oo
oooOOOO
O
OOOOO uu
u
u u uuuuu
U UU
UUUUUUU YY
YY
ÖÖ ÖÖÖÖÖÖÖÖaaa
aaa
aaaaAA
AA AA
AAA
A
YYYYEEÖÖ Ö
ÖÖÖ Öaaaa
aaaaaa
AAA
AAA
A AAAE
öööÖÖÖ
ÖÖ
ÖÖÖ
a aa
a
a
a
aaaa
AAA
AA
A
AAAY
YYE Ö
ÖÖÖÖÖ
ÖÖÖaa
a a a
aaa
aa
A AAAAAA AA
A III IIIIIIIY YYYYY EEEEE EE
E EEöööööööö
II
III
III
IY
YYYYY
EE EEEEEE
ö
ö
ö ööö
ööö
ÖÖ Ö
IYY
YYYYY
YY
Yee
ee
EEEE
EEEEö
ö ööö
ö
öÖ ÖAIII
YYYYYY
Yeee eEEEE EEEEE
öö ö
öööö ö
ööÖ
iii iiiii
iiyyyyy
yyy
yyeee
e e
ee eeeööiii iiiii i
i Iyyy y yyy yy
yee ee eee ee eöiiii
iiii
iI III I
II IIyyy
y
yyyyyye
e
eeE
i ii ii ii i iiII I
IIII
yyy
yy yyy
yyee eeee
iii iiiii
iiIII IIIIIIIyyy
yyyy
yyyY
Y
YYY
YY
Y
YYe
eee e
ee eeeEEEEE EE
E EEöööööööö
ööÖÖ Ö
ÖÖÖÖÖÖÖaaa
aaa
aaaaAA
AA AA
AAA
Aoo oooooo
o
oOOO OOOOO
O
Ou
uuuu
uu
u
uu
UUUUU U
U
U UUiii iiiii i
i IIII I
III
IIyyy y yy
y yyyY Y
YYYY
YY
YY
ee ee eee ee eEE EEEEEEEE
ö
ö
ö ööö
ööööÖ
ÖÖ Ö
ÖÖÖÖ ÖÖaaaa
aaaaaa
AAA
AAA
A AAAo
ooo
o
o
ooo
o
OOO
OO OOOOOuu u
uuu
u
uuuUU UU
UU
UUU
Ui
iii
iiii
iII II
I II
I IIyyy
y
yyyyyyY
Y
YYYYY
YY
Y
eeee
eeee
E
EEEEE
E
EEEö
ö öööö
ö
öö öÖÖÖÖÖ
ÖÖÖ
ÖÖ
a aa
a
a
a
aaaa
AAA
AAA
A
AAAo
ooo
oooo
o
oOOOOOOOO
OOu
uuu
u
uu
u
u
u
UUUU
UU
UUU
Ui ii ii ii i iiII II
II III I
yyy
yy yyy
yyYYYYYY
YYYYeee
eee eeeeEEEE EEEEEE
öö ö
öööö ö
öö
ÖÖ
ÖÖ ÖÖÖ
ÖÖÖaa
a a a
aaa
aa
A AAAAAA AA
A ooo
o
o
oo
oooOOOO
O
OOOOO uu
u
u u uuuuu
U UU
UUUUUUU
JD
Figure 6. Scatter plots with superimposed 2σ ellipses with the major axis marked for the tongue dorsum sensor grouped according to the amount of palatal contact (BACK, LOW, MID and HIGH) and overall vowels (ALL) in cm. For graphical reasons tick marks are not shown for the x-axis but the scaling of x and y-axes are set equal. All data are centralized to group means.
As can be seen in Table IV and in Figure 6, there was no consistent pattern across speakers. Speaker CG shows significant negative correlations for all sensors for the vowel subsets Back, Low and Mid (except for Tblade). For High vowels, correlations were either non significant (Tback, Tblade) or positive. This is in general agreement with our

C. Mooshammer et al.
hypotheses: the main orientation of the articulatory variability was different when a large amount of contact between the tongue and the palate existed, and in this case the variability was mainly limited in the direction orthogonal to the palate. Speaker DF presented a less clear picture: the main orientation of the variability varied with the position of the sensor on the tongue, and it did not seem to depend on the vowel subset: for this speaker the large majority of the correlations were significant, and systematic negative correlations were observed for the Tback and Tdors sensors, while correlations were positive for the Tblade sensor, when they were significant. A third pattern was observed for speaker JD: the majority of the correlation were not significant, and when they were significant, the correlations were always negative, which was not in agreement with our hypotheses.
4. Discussion and Conclusions
For high vowels, our results do not confirm Perkell & Nelson's (1985) or Beckman et al.'s (1995) observations for American English speakers: while these two studies found for all subjects flat dispersion ellipses oriented along the palate outline for high front vowels, only one of our speakers, speaker CG, showed the same trend. Based on our findings, Perkell & Nelson's (1985) hypothesis that the variability for high vowels is constrained by tongue-palate contacts to be orthogonally inclined to the palate, does not generally apply for German subjects. However, this conclusion should be tempered because the data in Figure 6 also show that for speaker JD the high vowels’ articulatory variability is less important than for DF and clearly less important than for CG. This suggests that for some reason the production of high vowels could be much more constrained for JD than for DF and CG. Two factors could explain this tighter constraint.
First of all, the vowel inventory in German is much more crowded than in English. For example, if we only consider the high front vowels, German has three phonemes that are in very close proximity to each other, namely /i, y, e/ (German /e/ is a phonetically closer vowel than the cardinal vowel 2). Consequently the articulation of these sounds has to be very accurate and different strategies could be used by the different speakers. As can be seen in Figure 2, a high amount of overlap was found for speaker CG between /e/ and /y/. The speaker achieved a very clear perceptual differentation between these vowels using lip-rounding with a mean difference in horizontal lip position between /e/ and /y/ of 1.27 cm in the velar context and 0.83 cm in the bilabial context. In contrast, since speaker DF exhibited almost no lip protrusion differences (bilabial: 0.11 cm, velar: 0.24 cm), he had to adopt a retracted tongue position for /y/ in all four conditions to maintain the perceptual distinctiveness. As far as /i/ and /e/ are concerned, their distinctiveness can obviously not be enhanced by these types of compensatory lip-tongue strategies (since they are both unrounded vowels), and because the German vowel inventory is more crowded than in English, the tongue position variability for these sounds is likely to be much smaller in German than in their English counterparts. If the variability is constrained to be less, then the size of the major axis will be correspondingly less important and the ellipse will be closer to a circle, which makes the detection of its main orientation more difficult and then more variable.
Hence, differences in the density of the vowel systems seem to explain, at least in part, the differences between the extent of variability observed for our German subjects and that measured by Perkell & Cohen (1989) for native speakers of English. However, even among the German subjects, the measured patterns are quite different and the following question remains unresolved: why are these gesture accuracy requirements stronger for JD than for DF and for CG? This speaker neither uses lip protrusion (the difference between /y/ and /e/ is about 3 mm and comparable to speaker DF’s) nor tongue retraction for /y/ but positions his tongue with an extremely high precision. An explanation can be found by observing the

Token-to-token Variability
coronal shape of the palate of each speaker in the region of the vocal tract where the cross-sectional area reaches its minimum (constriction location of the vowel). Speaker JD (gray line) has a palate that is much flatter and wider in its upper part than the palate of speakers CG and DF. Consequently, for high vowels a given vertical displacement of the tongue is likely to induce for this speaker an increase of the cross-sectional area at the constriction, which is clearly larger than for speakers DF and CG, and this will in turn induce larger acoustic changes (see Majid et al., 1987 or Gay et al., 1991). This hypothesis is in agreement with Perkell et al. (1997) who provided evidence of a relation between the amount of token-to-token articulatory variability for /u/ and the coronal shape of the palate. These authors show that one of the subjects, who has a broad and flat palatal shape, exhibits a small variability with dispersion ellipses nearly circular. The second subject with a much narrower palatal shape shows a rather large variability with dispersion ellipses having their main orientation parallel to the palatal outline. In our data, the palates of subjects CG and DF have similarities with the palate of the second subject of Perkell et al.'s (1997) data, while speaker JD presents similarities with their first speaker. Hence, the nearly circular shape of the dispersion ellipses and the smallest articulatory variability observed for speaker JD could be due, at least for high vowels, to his palatal shape.
-15 -10 -5 0 5 10 15
0
5
10
15
20palatal coronal shapes
width in mm
heig
ht in
mm
CG = black lineDF = dark gray lineJD = gray line
Figure 7. Coronal shapes of the EPG palates of the speakers (at the 2nd last most posterior row = Constriction region).
Two conclusions can be drawn from these results: First, not only contextual variability as was found by Manuel (1990), but also the amount and pattern of token-to-token variability is likely to be constrained by the density of the vowel inventory. More precisely, the high front vowels in German are produced with tongue positions that are very close to each other. In contrast, American English which was studied in Perkell and Nelson and in Beckman et al. has only a single vowel in this region. We can therefore conclude that even if there might be an influence of the amount of palatal contact by limiting the variability in the direction of the palate outline, the variability in the direction of constriction location is further constrained by language-specific characteristics such as the vowel inventory.
A second conclusion is that speakers differ with respect to the strategies they use to maintain the perceptual distinction between categories (e.g. lip rounding for speaker CG vs. tongue retraction for speaker DF). The reasons for developing different strategies could lie in individual morphology as was found in our data for palate shape (Speakers CG, DF vs. JD).

C. Mooshammer et al.
However, we are still without an explanation for why the orientation in DF's high vowel ellipse does not conform to the predictions about the role of the tongue-palate interaction. We intend to assess the discrepancy between our results and the original hypotheses (see the end of section 1) by making use of 2D and 3D biomechanical models of the tongue (Perrier et al., 2003; Gerard et al., 2003). The motor commands will be corrupted by different kinds of noise and the corresponding articulatory variability will be analyzed for different conditions. First, different palatal shapes will be considered in the midsagittal plane (steep versus flat in the alveolar region, simulations made) and in the coronal plane (wide versus narrow in its upper part). This will allow us to assess the role of the palatal geometry in the articulatory variability patterns. Second, different muscle activities will be considered for each of the vowels; indeed it is well-known that due to synergies and antagonisms between muscles, very similar tongue shapes can be produced with different muscle recruitments, and, as a result, various levels of force. This should enable us to test the possible consequences for articulatory variability of the different strategies elaborated by speakers in maintaining the perceptual distinctiveness according to their vocal tract geometry or the density of their vowel system. Finally, different noise amplitudes will be considered in order to observe how variability patterns vary, when the amount of noise in the muscle-activity level changes.
This work was supported by a grant from the German Research Council (DFG) GWZ 4/8-1, P.1. We also like to thank Jörg Dreyer from the ZAS for technical support during the EMMA and EPG recordings and Jonathan Harrington for very valueable comments.
References
Beckman M.E., Jung T.-P., Lee S.-L., de Jong K., Krishnamurthy A.K., Ahalt S.C., Cohen K.B., & Collins M.J. (1995) Variability in the production of quantal vowels revisited. Journal of the Acoustical Society of America, 97, pp. 471-490.
Blumstein S.E. & Stevens K.N. (1979). Acoustic invariance in speech production: evidence from measurements of the spectral characteristics of stop consonants. Journal of the Acoustical Society of America, 66 (4), pp. 1001-1017.
Blumstein S.E. & Stevens K.N. (1980). Perceptual invariance and onset spectra for stop consonants in various vowel environments. Journal of the Acoustical Society of America, 67, pp. 648-662.
Browman C.P. & Goldstein L.M. (1985). Dynamic modeling of phonetic structure. In Phonetic linguistics (V. Fromkin, editor) pp. 35-53 New York: Academic.
Browman C.P. & Goldstein L.M. (1986). Towards an articulatory phonology. Phonology Yearbook, 3, pp. 219-252.
Browman C.P. & Goldstein L.M. (1990). Gestural specification using dynamically-defined articulatory structures. Journal of Phonetics, 18, pp. 299-320.
Fitzpatrick, L. & A. Ní Chasaide (2002). Estimating lingual constriction location in high vowels: a comparison of EMA- and EPG-based measures. Journal of Phonetics 30, pp. 397-415.
Folkins J.W & Brown C.K. (1987). Upper lip, lower lip and jaw interactions in speech: comments on evidence from repetition-to-repetition variability, Journal of the Acoustical Society of America, 82, pp. 1919-1924.
Fujimura O. (1986). Relative invariance of articulatory movements : An Iceberg Model. In Invariance & Variability in speech processes (J.S. Perkell & D.H. Klatt, editors) pp. 226-234. Hillsdale, N.J.: Lawrence Erlbaum Associates.
Gay T., Boë L.J., Perrier P., Feng G. & Swayne E. (1991). The acoustic sensitivity of vocal tract constrictions : a preliminary report. Journal of Phonetics, 19, pp. 445-452.
Gérard J.M., Wilhelms-Tricarico R., Perrier P. & Payan Y. (2003) A 3D dynamical biomechanical tongue model to study speech motor control. Recent Research Developments in Biomechanics, 1, pp. 49-64, Transworld Research Network.
Gibbon, F. & K. Nicolaidis (1999) Palatography. In Coarticulation (W. J. Hardastle & N. Hewlett, editors), pp. 229-245. Cambridge: University Press.

Token-to-token Variability
Guenther, F. H. (1995). Speech sound acquisition, coarticulation and rate effects in a neural network model of speech production. Psychological Review, 102, pp. 594–62.
Guenther, F. H., Hampson, M. & Johnson, D. (1998). A theoretical investigation of reference frames for the planning of speech movements. Psychological Review, 105,pp. 611–633.
Guenther, F. H., Espy-Wilson, C.Y., Boyce, S.E., Matthies, M.L., Zandipour, M. & Perkell, J.S. (1999). Articulatory tradeoffs reduce acoustic variability during American English /r/ production. Journal of the Acoustical Society of America, 105, 2854–2865.
Harris, C.M. (1998). On the optimal control of behaviour: a stochastic perspective. Journal of Neuroscience Methods, 83, pp. 73-88.
Harris, C.M. & Wolpert, D.M. (1998). Signal dependent noise determines motor planning. Nature, 394, pp. 780-784.
Keating P.A. (1990) The window model of coarticulation: articulatory evidence, In Papers in Laboratory Phonology I (J. Kingston & M. Beckman, editors) pp. 451-470, Cambridge: University Press.
Kuhl P. (1991). Human adults and human infants show a 'perceptual magnet effect' for the prototypes of speech categories, monkeys do not. Perception & Psychophysics, 50, pp. 93-107.
Kuhl P. (1992). Infants perception and representation of speech: development of a new theory. Proc. of the 2nd International Conference of Spoken Language Processing pp. 449-456. University of Alberta, Canada.
Lindblom B. (1990). Explaining phonetic variation: a sketch of the H&H theory. In Speech production and speech modelling (W.J. Hardcastle & A. Marchal, editors), pp. 403-439. Dordrecht: Kluwer Academic Publishers.
Lubker J.& Gay T. (1982), Anticipatory labial coarticulation: Experimental, biological, and linguistic variables. Journal of the Acoustical Society of America, 71, pp. 437-448
Majid R., Abry C., Boë L.J. & Perrier P. (1987). Contribution à la classification articulatori-acoustique des voyelles : étude des macro-sensibilités à l’aide d’un modèle articulatoire. Proceedings of the 11th International Congress of Phonetic Sciences 2, pp. 348-351. Tallin, Estonia
Mooshammer C., Perrier P., Fuchs S., Geng C. & Payan P. (2001). The control of token-to-token variability: an experimental and modeling study. Actes de la 4th International Speech Motor Conference, pp. 78-81, Nijmegen.
Perkell J.S. & Nelson W.L. (1985). Variability in production of the vowels /i/ and /a/,. Journal of the Acoustical Society of America, 77, pp. 1889-1895.
Perkell J.S. & Cohen M.H. (1989). An indirect test of the quantal nature of speech in the production of the vowels /i/, /a/ and /u/. Journal of Phonetics, 17, pp. 123-133.
Perkell J.S. (1990) Testing theories of speech production: implications of some detailled analyses of variable articulatory data. In Speech Production and Speech Modelling (W.J. Hardcastle and A. Marchal, editors) pp. 263-288. Dordrecht: Kluwer Academic Publishers.
Perkell, J., Matthies M., Lane, H., Guenther, F., Wilhelms-Tricarico, R., Wozniak, J., & Guiod, P. (1997). Speech motor control: Acoustic goals, saturation effects, auditory feedback and internal models. Speech Communication, 22, pp. 227-250.
Perkell J.S., Guenther F.H., Lane H., Matthies L.M., Perrier P., Vick J., Wilhelms-Tricarico R., & Zandipour M. (2000). A theory of speech motor control and supporting data from speakers with normal hearing and with profound hearing loss. Journal of Phonetics, 28 (3), pp. 233-272.
Perrier P. (2003). About speech motor control complexity. Proc. of the 6th International Seminar on Speech Production, pp. 225-230, Sydney, December 7-10.
Perrier P., Payan Y., Zandipour M. & Perkell J. (2003) Influences of tongue biomechanics on speech movements during the production of velar stop consonants: A modeling study. Journal of the Acoustical Society of America, 114 (3), pp. 1582-1599.
Shiller D.M., Laboissière R. & Ostry D.J. (2002). Relationship between jaw stiffness and kinematic variability in speech. J. Neurophysiology, 88, pp. 2329-2340
Stevens K.N. (1972). The quantal nature of speech: Evidence from articulatory-acoustic data. In Human Communication: A unified view (David Jr. E.E. & Denes P.B., editors), pp. 51-66. New York: Mc Graw Hill.
Stevens K.N. (1989). On the quantal nature of speech. Journal of Phonetics, 17, pp. 3-45. Stevens K.N. & Blumstein S.E. (1978). Invariant cues for place of articulation in stop consonants. Journal of the
Acoustical Society of America 64, pp. 1358-1368. Wood S. (1979). A radiographic examination of constriction location for vowels. Journal of Phonetic, 7, pp. 25-
43.