ALOH EMMA 15
19
www.ejpmr.com 76 Obeagu European Journal of Pharmaceutical and Medical Research EFFECT OF METHANOL EXTRACT OF DIALIUM GUINEENSE LEAVES ON LIVER CELL DAMAGE AND LIPID PROFILE OF ALBINO RATS Aloh,G.S. 1 , Obeagu, Emmanuel Ifeanyi 2 , Kanu, Stella Ngozika 3 , Okpara, kingsley Ezechukwu 4 , Nwosu, D.C. 5 , Ugwu Getrude Uzoma 6 and Ezeumudo Oluebube C 1 , Ndidi Monica, Udezuligbo Chiamaka Ngozi 1 Department of Biochemistry, Michael Okpara University of Agriculture, Umudike, Abia State, Nigeria. 2 Diagnostic Laboratory Unit,University Health Services, Michael Okpara University of Agriculture, Umudike, Abia State, Nigeria. 3 Abia State University Teaching Hospital, Aba, Abia State, Nigeria. 4 Rivers State College of Health Technology, Port Harcourt. 5 Department of Medical laboratory Science, Imo State University, Owerri, Nigeria. 6 School of Nursing Science, ESUT Teaching Hospital, Parklane, Enugu, Nigeria. Article Received on 29/12/2014 Article Revised on 21/01/2015 Article Accepted on 12/02/2015 ABSTRACT This study investigated the protective effect of oral administration of the different doses (250mg and 500mg) of methanol extract of Dialium guineense leaves against liver cell damage and lipid profile of albino wistar female rats. Analysis of the following parameters were made: alanine aminotransferase (ALT), aspartate aminotransferase (AST), Superoxide dismutase (SOD), catalase, glutathione (GSH), malondialdehyde (MDA), vitamin C (VIT.C), vitamin E (VIT.E), high- density lipoprotein (HDL), low-density lipoprotein (LDL), total cholesterol (T.CHOL), total protein (T.PROT), triacylglycerides (TAG) & albumin (ALB). Sixteen (16) albino rats were distributed into four (4) groups. Group 1(Normal control) was not subjected to hepatocyte damage, but only received normal feed and water ad libitum. Group 2 (negative control) received the 2.5ml of C 6 H 14 /CHCl 3 (hepatotoxicant) but was not given the extract. Groups 3 and 4 were given the C 6 H 14 /CHCl 3 and were treated with 250mg and 500mg/kg Research Article ISSN 3294-3211 EJPMR EUROPEAN JOURNAL OF PHARMACEUTICAL AND MEDICAL RESEARCH www.ejpmr.com ejpmr, 2015,2(2), 76-94 *Correspondence for Author Obeagu, Emmanuel Ifeanyi Diagnostic Laboratory Unit,University Health Services, Michael Okpara University of Agriculture, Umudike, Abia State, Nigeria. Phone: +2348037369912. [email protected] [email protected]
Transcript of ALOH EMMA 15
www.ejpmr.com
76
Obeagu et al. European Journal of Pharmaceutical and Medical Research
EFFECT OF METHANOL EXTRACT OF DIALIUM GUINEENSE
LEAVES ON LIVER CELL DAMAGE AND LIPID PROFILE OF
ALBINO RATS
Aloh,G.S.1, Obeagu, Emmanuel Ifeanyi
2, Kanu, Stella Ngozika
3, Okpara, kingsley
Ezechukwu4, Nwosu, D.C.
5, Ugwu Getrude Uzoma
6 and Ezeumudo Oluebube C
1,
Ndidi Monica, Udezuligbo Chiamaka Ngozi
1Department of Biochemistry, Michael Okpara University of Agriculture, Umudike, Abia
State, Nigeria.
2Diagnostic Laboratory Unit,University Health Services, Michael Okpara University of
Agriculture, Umudike, Abia State, Nigeria.
3Abia State University Teaching Hospital, Aba, Abia State, Nigeria.
4Rivers State College of Health Technology, Port Harcourt.
5Department of Medical laboratory Science, Imo State University, Owerri, Nigeria.
6School of Nursing Science, ESUT Teaching Hospital, Parklane, Enugu, Nigeria.
Article Received on 29/12/2014 Article Revised on 21/01/2015 Article Accepted on 12/02/2015
ABSTRACT
This study investigated the protective effect of oral administration of
the different doses (250mg and 500mg) of methanol extract of Dialium
guineense leaves against liver cell damage and lipid profile of albino
wistar female rats. Analysis of the following parameters were made:
alanine aminotransferase (ALT), aspartate aminotransferase (AST),
Superoxide dismutase (SOD), catalase, glutathione (GSH),
malondialdehyde (MDA), vitamin C (VIT.C), vitamin E (VIT.E), high-
density lipoprotein (HDL), low-density lipoprotein (LDL), total
cholesterol (T.CHOL), total protein (T.PROT), triacylglycerides
(TAG) & albumin (ALB). Sixteen (16) albino rats were distributed into
four (4) groups. Group 1(Normal control) was not subjected to
hepatocyte damage, but only received normal feed and water ad libitum. Group 2 (negative
control) received the 2.5ml of C6H14/CHCl3 (hepatotoxicant) but was not given the extract.
Groups 3 and 4 were given the C6H14/CHCl3 and were treated with 250mg and 500mg/kg
Research Article
ISSN 3294-3211
EJPMR
EUROPEAN JOURNAL OF PHARMACEUTICAL
AND MEDICAL RESEARCH
www.ejpmr.com
ejpmr, 2015,2(2), 76-94
*Correspondence for
Author
Obeagu, Emmanuel
Ifeanyi
Diagnostic Laboratory
Unit,University Health
Services, Michael Okpara
University of Agriculture,
Umudike, Abia State,
Nigeria.
Phone: +2348037369912.

www.ejpmr.com
77
Obeagu et al. European Journal of Pharmaceutical and Medical Research
body weight extract of Dialium guineense respectively. The results indicate that the 250mg
and 500mg of the extract caused elevation in total cholesterol and high-density lipoprotein
significantly (P<0.05) when compared with the negative control. 250mg of extract on low
density lipoprotein also increased significantly (p<0.05) in comparison with the negative
control. Similarly, the effect of 250mg and 500mg of the extract on vitamin E and catalase
was significantly elevated (p<0.05), whereas 500mg only caused vitamin C and SOD to
increase significantly when compared with the negative control. The effect of 500mg extract
on ALT and AST has significant elevation (p<0.05) when compared with the negative
control. No significant difference was observed in the other parameters in comparison with
the normal and control. Therefore, methanol extract of Dialium guineense did not exert a
hepatoprotective effect in the rats used, and caused the unusual effect of causing cholesterol,
HDL and LDL elevations.
KEYWORDS: Metanol extracts, Dialium guineesnse leaves, liver function parameters, Lipid
profile, Albino Rats.
INTRODUCTION
The liver plays an astonishing array of vital functions in the maintenance, performance and
regulating homeostasis of the body. It is the largest organ of the human body weighing
approximately 1500 g, and is located in the upper right corner of the abdomen on top of the
stomach (Naruse et al., 2007), right kidney and intestines and beneath the diaphragm. It is
involved with almost all the biochemical pathways to growth, fight against disease, nutrient
supply, energy provision and reproduction (Sharma et al., 1991). The major functions of the
liver are carbohydrate, protein and fat metabolism, detoxification, secretion of bile and
storage of vitamin. Thus, to maintain a healthy liver is a crucial factor for the overall health
and well being (Subramaniam and Pushpangadan, 1999). Liver parenchyma serves as a
storage organ for several products like glycogen, fat and fat soluble vitamins. It is also
involved in the production of a substance called bile that is excreted to the intestinal tract.
Bile aids in the removal of toxic substances and serves as a filter that separates out harmful
substances from the bloodstream and excretes them. (Saukkonen et al., 2006).
BACKGROUND TO THE STUDY
Hepatotoxicity implies chemical-driven liver damage. Certain medicinal agents, when taken
in overdoses and sometimes even when introduced within therapeutic ranges, may injure the
organ. Hepatotoxicants are exogeneous compounds of clinical relevance and may include
overdoses of certain medicinal drugs, industrial chemicals, Natural chemicals, herbal

www.ejpmr.com
78
Obeagu et al. European Journal of Pharmaceutical and Medical Research
remedies and dietary supplements. Hepatotoxicity may result not only from direct toxicity of
the primary compound but also from a reactive metabolite or from an immunologically-
mediated response affecting hepatocytes, biliary epithelial cells and /or liver vasculature
(Saukkonen et al., 2006; Deng et al., 2009). More than 900 drugs have been implicated in
causing liver injury and it is the most common reason for a drug to be withdrawn from the
market. Chemicals often cause subclinical injury to liver which manifests only as abnormal
liver enzyme tests. Drug induced liver injury is responsible for 5% of all hospital admissions
and 50% of all acute liver failures. More than 75 percent of cases of idiosyncratic drug
reactions result in liver transplantation or death (Ostapowicz et al., 2002).
The hepatotoxic response elicited by a chemical agent depends on the concentration of the
toxicant which may be either parent compound or toxic metabolite, differential expression of
enzymes and concentration gradient of cofactors in blood across the acinus (Kedderis, 1996).
Hepatotoxic response is expressed in the form of characteristic patterns of cytolethality in
specific zones of the acinus. Hepatotoxicity related symptoms may include a jaundice or
icterus appearance causing yellowing of the skin, eyes and mucous membranes due to high
level of bilirubin in the extracellular fluid, pruritus, severe abdominal pain, nausea or
vomiting, weakness, severe fatigue, continuous bleeding, skin rashes, generalized itching,
swelling of the feet and/or legs, abnormal and rapid weight gain in a short period of time,
dark urine and light colored stool (Bleibel et al.,2007; Chang et al., 2003).
STATEMENT OF THE PROBLEM
Hepatotoxicity is defined as injury to the liver that is associated with impaired liver function
caused by exposure to drugs or chemicals or their reactive metabolites (hepatotoxicants). The
distinction between injury and function is important because it is mainly when function is
impaired that symptoms and clinical significant diseases follow. Many research works have
been done on Dialium guineense but its hepatoprotective properties and lipid profile have not
been reported. In this work, Dialium guineense is evaluated for its lipid profile activity and
hepatoprotective effect.
OBJECTIVES OF THE STUDY
To determine the hepatoprotective potentials of the methanolic extract of the leaves of
Dialium guineense.
To determine the total antioxidant activity of the leaves of Dialium guineense.
www.ejpmr.com
79
Obeagu et al. European Journal of Pharmaceutical and Medical Research
To determine the total proteins, albumin, and the lipid profile of the leaves of Dialium
guineense.
SIGNIFICANCE OF THE STUDY
The significance of this study is to provide a hepatoprotective effect of the leaves of Dialium
guineense on the Albino wistar female rats subjected to hepatocyte damage.
MATERIALS
Source of chemicals: All the chemicals and reagents used were of analytical grade.
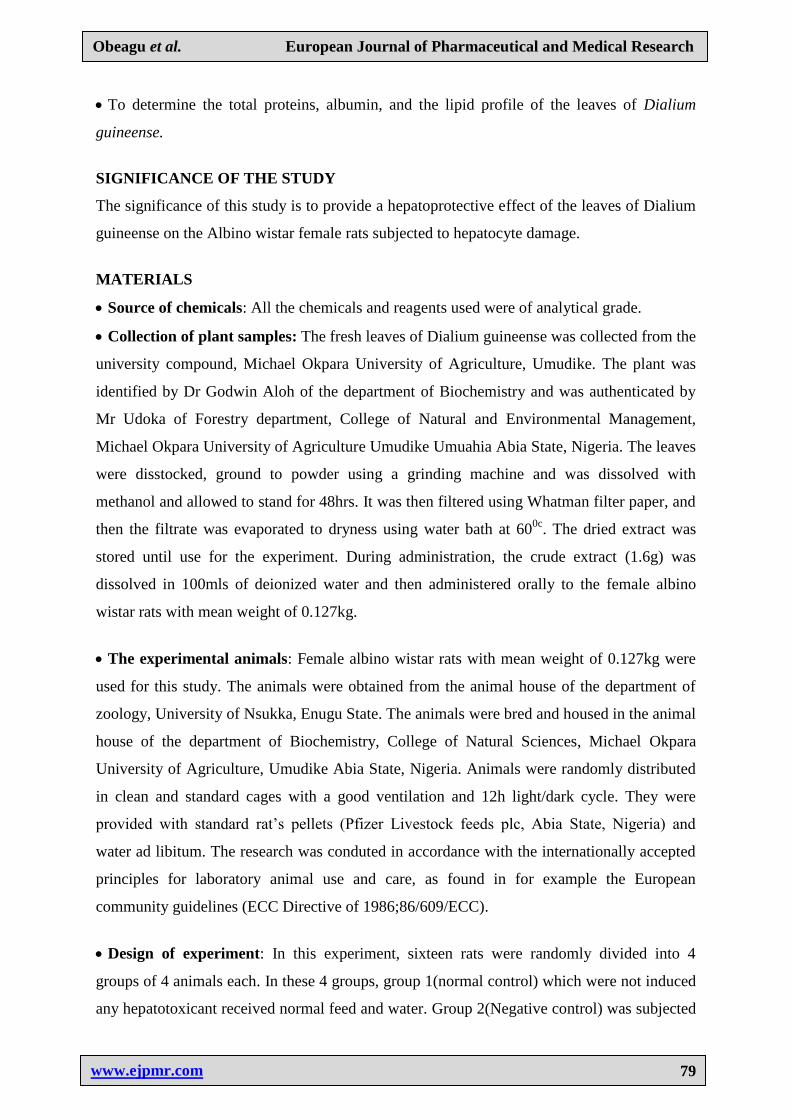
Collection of plant samples: The fresh leaves of Dialium guineense was collected from the
university compound, Michael Okpara University of Agriculture, Umudike. The plant was
identified by Dr Godwin Aloh of the department of Biochemistry and was authenticated by
Mr Udoka of Forestry department, College of Natural and Environmental Management,
Michael Okpara University of Agriculture Umudike Umuahia Abia State, Nigeria. The leaves
were disstocked, ground to powder using a grinding machine and was dissolved with
methanol and allowed to stand for 48hrs. It was then filtered using Whatman filter paper, and
then the filtrate was evaporated to dryness using water bath at 600c
. The dried extract was
stored until use for the experiment. During administration, the crude extract (1.6g) was
dissolved in 100mls of deionized water and then administered orally to the female albino
wistar rats with mean weight of 0.127kg.
The experimental animals: Female albino wistar rats with mean weight of 0.127kg were
used for this study. The animals were obtained from the animal house of the department of
zoology, University of Nsukka, Enugu State. The animals were bred and housed in the animal
house of the department of Biochemistry, College of Natural Sciences, Michael Okpara
University of Agriculture, Umudike Abia State, Nigeria. Animals were randomly distributed
in clean and standard cages with a good ventilation and 12h light/dark cycle. They were
provided with standard rat‟s pellets (Pfizer Livestock feeds plc, Abia State, Nigeria) and
water ad libitum. The research was conduted in accordance with the internationally accepted
principles for laboratory animal use and care, as found in for example the European
community guidelines (ECC Directive of 1986;86/609/ECC).
Design of experiment: In this experiment, sixteen rats were randomly divided into 4
groups of 4 animals each. In these 4 groups, group 1(normal control) which were not induced
any hepatotoxicant received normal feed and water. Group 2(Negative control) was subjected
www.ejpmr.com
80
Obeagu et al. European Journal of Pharmaceutical and Medical Research
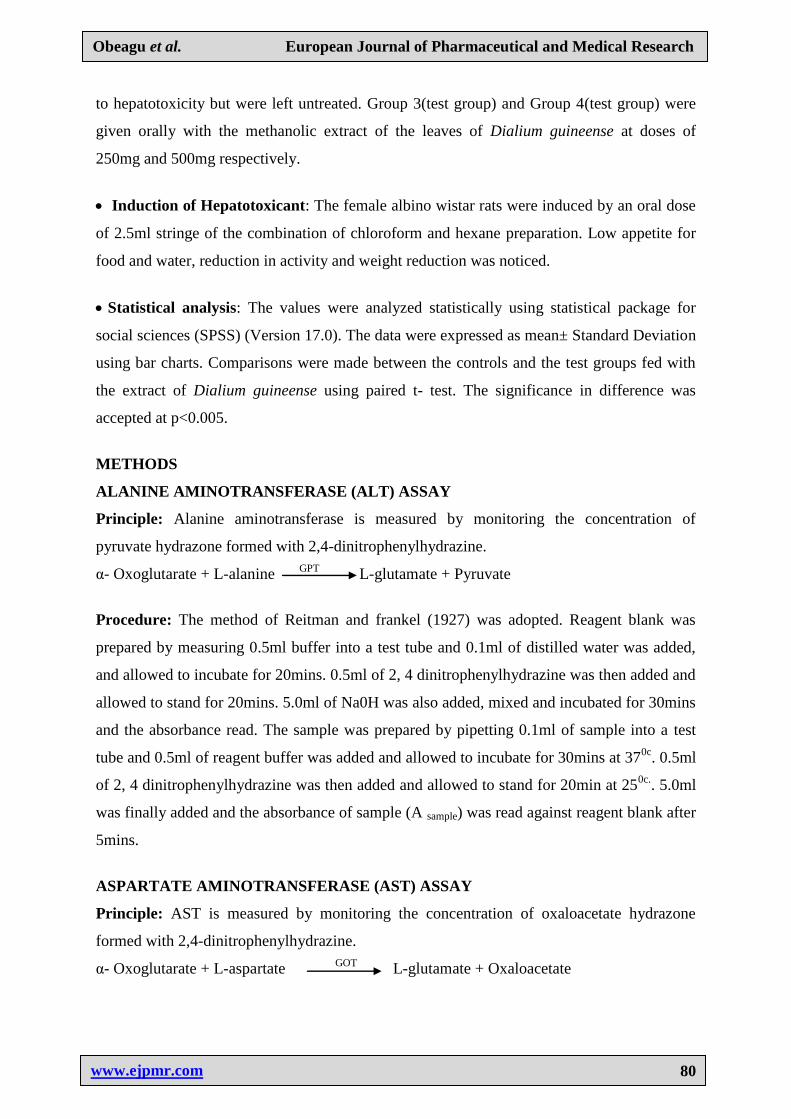
to hepatotoxicity but were left untreated. Group 3(test group) and Group 4(test group) were
given orally with the methanolic extract of the leaves of Dialium guineense at doses of
250mg and 500mg respectively.
Induction of Hepatotoxicant: The female albino wistar rats were induced by an oral dose
of 2.5ml stringe of the combination of chloroform and hexane preparation. Low appetite for
food and water, reduction in activity and weight reduction was noticed.
Statistical analysis: The values were analyzed statistically using statistical package for
social sciences (SPSS) (Version 17.0). The data were expressed as mean± Standard Deviation
using bar charts. Comparisons were made between the controls and the test groups fed with
the extract of Dialium guineense using paired t- test. The significance in difference was
accepted at p<0.005.
METHODS
ALANINE AMINOTRANSFERASE (ALT) ASSAY
Principle: Alanine aminotransferase is measured by monitoring the concentration of
pyruvate hydrazone formed with 2,4-dinitrophenylhydrazine.
α- Oxoglutarate + L-alanine GPT
L-glutamate + Pyruvate
Procedure: The method of Reitman and frankel (1927) was adopted. Reagent blank was
prepared by measuring 0.5ml buffer into a test tube and 0.1ml of distilled water was added,
and allowed to incubate for 20mins. 0.5ml of 2, 4 dinitrophenylhydrazine was then added and
allowed to stand for 20mins. 5.0ml of Na0H was also added, mixed and incubated for 30mins
and the absorbance read. The sample was prepared by pipetting 0.1ml of sample into a test
tube and 0.5ml of reagent buffer was added and allowed to incubate for 30mins at 370c
. 0.5ml
of 2, 4 dinitrophenylhydrazine was then added and allowed to stand for 20min at 250c.
. 5.0ml
was finally added and the absorbance of sample (A sample) was read against reagent blank after
5mins.
ASPARTATE AMINOTRANSFERASE (AST) ASSAY
Principle: AST is measured by monitoring the concentration of oxaloacetate hydrazone
formed with 2,4-dinitrophenylhydrazine.
α- Oxoglutarate + L-aspartate
GOT L-glutamate + Oxaloacetate
www.ejpmr.com
81
Obeagu et al. European Journal of Pharmaceutical and Medical Research
Procedure: The method used here was the same method adopted by Reitman and Frankel
(1957) described in ALT above.
DETERMINATION OF ALBUMIN
Albumin is the most abundant serum protein representing 55-65% of the total protein. It is
synthesized in the liver and has a half life of 2 to 3 weeks.
Principle: The measurement of serum albumin is based on its quantitative binding to the
indicator 3, 3′, 5, 5′ – tetrabromo –M cresol Sulphonephthalein (bromocresol green, BCG).
The albumin-BCG-Complex absorbs maximally at 578nm, the absorbance being directly
proportional to the concentration of albumin in the sample.
Procedure: The method of Grant et al., (1987) was adopted. The reagent blank (So), standard
(S1) and sample were prepared by mixing 3µl of distilled water (ddH20) with 1000µl of
reagent respectively. It was then incubated for 20mins at 20-250c
and the absorbance taken
within 60mins. In different test tubes, 0.01ml of standard (CAL) was mixed with 3.00ml of
BCG reagent and allowed to incubate for 5 minutes at 250c
. The reagent blank and the sample
also took the same procedure after which the absorbance of the sample (A sample) and of the
standard (A standard) against the reagent blank were measured.
The albumin concentration in the sample may be calculated from the following formula:
Albumin concentration (g/dl) =
TOTAL PROTEIN ASSAY
Principle: At alkaline pH value, proteins form a stable complex with Cu (11) ions which is
photometrically measured.
Procedure: Standard solution was prepared by measuring 0.02ml of standard in a cuvette and
mixed with water and allowed to stand for 10mins. The sample test was also prepared using
the same procedure. Their absorbance read against a blank of 1ml of reagent at 540nm.
A sample x Concentration of standard
A standard
Sample O.D x 5 – g of proteins/dl = Total serum proteins
Standard O.D
www.ejpmr.com
82
Obeagu et al. European Journal of Pharmaceutical and Medical Research
DETERMINATION OF CHOLESTEROL IN SERUM
Cholesterol measurements are used in the diagnosis and treatments of lipid lipoprotein
metabolism disorders.
Principle: The cholesterol is determined after enzymatic hydrolysis and oxidation. The
indicator quinoneimine is formed from hydrogen peroxide and 4-aminoantipyrine in the
presence of phenol and peroxidase.
Procedure: Serum was diluted with water in the ratio of 1:19 and cholesterol standard
diluted with glacial acetic acid. Tree test tubes were set up as follows:
Test Standard Blank
Ferric Chloride
reagent
5.0ml 5.0ml 5.0ml
Dilute Serum 0.5ml - -
Dilute Standard - 0.5ml -
Distilled Water - - 0.5ml
The test tubes where shaken for 10 seconds to mix the content of each tube. The tubes were
then placed in a boiling water bath for exactly 90 seconds and cooled in a running tap for
5mins. The absorbance was then read against the blank at 560nm.
Serum Cholesterol (mg/dl) =
Serum Total Cholesterol (mMol/l) = mg/dl x 0.0259
DETERMINATION OF TRIACYGLYCERIDES IN SERUM
Triglyceride measurements are used in the diagnosis and treatment of diseases involving lipid
metabolism and various endocrine disorders e.g diabetes mellitus, nephrosis and liver
obstruction.
Principle: The principle of this test includes the following:
1. Triglycerides + H20 Lipases
Glycerol +Fatty acids
2. Glycerol-3-phosphate + 02 GPO
Dihydroxyacetone + Phosphate + H202
3. Glycerol + ATP GK
Glycerol-3-phosphate + ADP
4. 2H20 + 4-aminophenazone + 4 Chlorephenol POD
Quinoneimine + Hcl + 4H20
Ab Test x 250
Ab Standard

www.ejpmr.com
83
Obeagu et al. European Journal of Pharmaceutical and Medical Research
Procedure: Tree test tubes were set as follows
Test Standard Blank
Colour Reagent 3.0ml 3.0ml -
Serum 0.03ml - -
Titre Standard - 0.03ml -
Distilled Water - - 0.03ml
They were mixed and incubated at 370c
for 15mins. The absorbance of test and standard was
read against the blank at 420nm.
Serum Triglycerides (mg/dl) =
Serum triglycerides mMol/L = mg/dl x 0.0113
DETERMINATION OF HDL-CHOLESTEROL IN SERUM
Principle: Low density lipoproteins (LDL) fractions are precipitated quantitatively by the
addition of phosphotungstic acid in the presence of magnesium ions. After centrifugation, the
cholesterol concentration in the HDL fraction, which remains in the supernatant is
determined.
Procedure: 1ml of serum was pipette into a centrifuge tube. 0.1ml of PTA reagent was added
and mixed. 0.005ml of magnesium Chloride was then added and mixed. It was centrifuged at
2500rpm or 1500g for 30mins. The supernatant was removed with a Pasteur pipette. Then,
the cholesterol level in the supernatant was estimated by diluting with distilled water and read
in a spectrophotometer. Cholesterol standard was also diluted with glacial acetic acid and the
absorbance read.
Serum HDL cholesterol (mg/dl) =
Serum HDL Choleterol (mmol/l) = mg/dl x 0.0257
DETERMINATION OF LDL-CHOLESTEROL IN SERUM:
Principle: LDL-cholesterol can be determined as the difference between total cholesterol and
the cholesterol content of the supernatant after precipitation of the LDL fraction by polyvinyl
sulphate (PVS) in the presence of polyethylene-glycolmonomethyl ether.
Ab Test x 100
Ab Standard
Ab Test x 115
Ab Standard

www.ejpmr.com
84
Obeagu et al. European Journal of Pharmaceutical and Medical Research
Procedure
1. Precipitation reaction: The precipitant solution (0.1ml (3 drops) and the sample (0.2ml)
was mixed well and allowed to stand for 15min. approximately at room temperature (20-
250c
). It was centrifuged at 2,000xg/15min and the cholesterol concentration in the
supernatant was determined.
2. Cholesterol assay: The concentration of the serum total cholesterol according to the
QCACHOD-PAP method was determined.
LDL-Cholesterol (mg/dl) = Total Cholesterol(mg/dl) – 1.5 x supernatant cholesterol (mg/dl)
LIPID PEROXIDATION (MALONDIALDEHYDE MDA) ASSAY
Lipid peroxidation was determined spectrophotometrically by measuring the level of the lipid
peroxidation product, malondialdehyde (MDA).
Principle: Malondialdehye (MDA) reacts with thiobarbituric acid to form a red or pink
colour complex which in acid solution, absorbs maximally at 532nm.
MDA +2TBA MDA: TBA adduct + H20
Procedure: 0.1ml of the serum was added into 0.9mls of H20. 0.5ml of 45% TCA was
added. 0.5mls of 1% TBA in 0.8% Na0H was also added. It was boiled for 40mins and
cooled. It was then mixed with 0.1ml of 20% SDS (Sodium dedocyl sulphate) and the
absorbance at 532nm and 600nm was taken.
ASCORBIC ACID (VITAMIN C) ASSAY
Principle: Ascorbic acid is oxidized and converted to diketoglutamic acid in strong acid
solution and a diphenyl hydrazone by reacting with 2,4 dinitrophenyl hydrazone. The
hydrazone dissolves into a strong sulphuric acid solution to produce a red colour which can
be maeasure colorimetrically at wavelength of 1500nm.
Procedure: 1.0ml of plasma was placed into a small test tube. 1.0ml of 10% trichloroacetic
acid and 0.5ml of chloroform was also added. It was stoppered, shaken vigorously up to 15
seconds and centrifuged at 3,000rpm. 1.0ml of clear supernatant was placed into a test tube.
Blank and standard was prepared by adding 0.5ml of 10% trichloroacetic acid to 0.5ml of
water and working standard. To each tube was added 0.4ml of prepared combined colour
reagents. The tubes were stoppered and placed to a water bath at 560C
for 1 hour. They were
cooled in the ice bath for about 5 minutes. Each tube was added, slowly with mixing 2.0ml of

www.ejpmr.com
85
Obeagu et al. European Journal of Pharmaceutical and Medical Research
ice cold 85% sulphuric acid. The tubes were left at room temperature for 30 minutes, then
mixed and the optical density (OD) read in the colorimeter at 490nm using blank to zero the
instrument. The OD of the standard was also read.
ERYTHROCYTE GLUTATHIONE PEROXIDASE ASSAY
Principle: Glutathione peroxidase catalyses hydrogen peroxide by the oxidation of GSH
according to the reaction below:
2GSH + H202 GPX
GSSH + H20
GSSG + NADPH GR
2GSH + NADP
Rather than measuring the progressive loss of GSH; however, this substrate is maintained at a
constant concentration by the addition of exogenous GR and NADPH, which immemdiately
convert any GSSG produced to GSH. The rate of GSSG formation, representing the GPX
activity is then measured by following the decrease of NADPH in absorbance of the reaction
mixture at 340nm.
Procedure: 50µls of RBC is mixed with 1ml of cyanodilution mixture and then shaken.
500l of potassium was then added to 0.02ml of diluted RBC. In this assay, Cumene
hydroperoxide is used as the peroxide substrate (ROOH), and Glutathione Reductase (GSSG-
R) and NADPH (B- Nicotinamide Dinucleotide Phosphate) Reduced are included in the
reaction mixture. The changes in A340 due to NADPH oxidation is monitored and is
indicative of GPX activity. Cumene Hydroperoxide is used to measure the total GPX activity.
This substrate is suitable for the reaction because it has a low spontaneous reaction with GSH
low spontaneous hydrolysis and is not metabolized by catalase, one of the other universally
present antioxidant enzyme.
VITAMIN E ASSAY
Procedure:1.0ml of absolute ethanol was pipette into each of two glass-stoppered test tubes.
The sample tube was marked tube 1 and the blank was marked tube 2. 1.0ml of serum was
added to the sample tube, the serum was added slowly with shaken to obtain a finely divided
protein precipitate. 1.0ml of distilled water was added to the blank. 1.0ml of working
standard and distilled water was added to a third glass-stoppered test tube marked „standard‟.
Absorbance of sample X Concentration of Standard Absorbance of standard Concentration of Sample =

www.ejpmr.com
86
Obeagu et al. European Journal of Pharmaceutical and Medical Research
Each of the tubes was added 1.0ml of reagent-grade xylene. The tubes were tightened and
shaked vigorously for at least 30 sec. The tubes were centrifuged for 5mins at an RCF of 350-
450. 0.5ml of the xylene (top) from each tube was pipetted into properly labelled 10mm
round cuvettes and then 0.5ml of TPTZ solution was added and mixed. The readings were
made in a spectrophotometer. It was set to zero absorbance with the blank at 460mμ and the
absorbance of the sample was measured within 4 minutes. Then, 0.1ml of ferric chloride
solution was added to each cuvet at definite, timed intervals and mix. Again, the instrument
was set to zero absorbance with the blank and the absorbance of both the sample and the
standard was measured at 600mμ. The colour continues to fade with time but fading is
proportional in the sample and the standard up to 12mins. After adding the ferric chloride
solution.
ERYTHROCYTE CATALASE ASSAY
Principle: The ultraviolet absorption of hydrogen peroxide can be easily measured at 240nm.
On the decomposition of hydrogen peroxide with catalase, the absorption decreases with time
and from this decrease, catalase activity can be measured.
Procedure: Red blood cell lysate is prepared by adding 1.2ml of distilled water to 0.02ml of
RBC. Then five hundred-fold dilution of RBC lysate by phosphate buffer is made before the
determination of catalase activity immediately following the addition of 1ml phosphate buffer
(blank) or hydrogen peroxide solution into 2ml RBC diluted lysate. The change of
absorbance of RBC against blank at 240nm is recorded every 15 seconds for 1minute on a
spectrophotometer. The activity of catalase is calculated by using the following equation:
Catalytic concentration (unit/l) = (0.23log A1/A2)/0.00693
Where:
A1 =A240 at t =0
A2 =A240 at t =15 seconds
ERYTHROCYTE SUPEROXIDE DISMUTASE ASSAY:
Principle: Superoxide dismutase (SOD) reduces superoxide to hydrogen peroxide. The
theory of this method is based on the competition between SOD activity and
Absorbance of sample600mμ- (0.40 x absorbance of sample460mμ) = Vitamin E (mg. /100ml)
Absorbance of Standard600mμ
www.ejpmr.com
87
Obeagu et al. European Journal of Pharmaceutical and Medical Research
iodonitrotetrazolium violet in reacting with superoxide, which is generated by xanthine
Oxidase (XOD) reaction. The reactions are demonstrated below.
1. Xanthine + 02 Uric acid + 02-
2. 02
- + 02
- + 2H
+ XOD Hydrogen peroxide +
02
-
3. 02-
+ violet SOD
Oxidized detector (generate colour)
With increasing SOD concentration, the competition between reaction 2 & 3 measured as a
decrease of the rate of the detector reaction. The SOD activity measured is related to 50%
inhibition of the detector reaction.
Procedure: 100µls of RBC is mixed with 900µls of distilled water. Then, 60µls of RBC
lysate is further diluted with 940µl of 10mM phosphate buffer, and this diluted RBC lysate is
used for the superoxide dismutase assay. 94µls of superoxide dismutase standard or diluted
RBC lysate sample and 1.2ml of carbonate buffer are added into a cuvette. Just before
reading the change of absorbance, 75µl of xanthine oxidase is added. Absorbance is read
every 20 seconds continuously for 3 minutes on a spectrophotometer at 500nm at room
temperature. The changing rate of absorbance is used to determine superoxide dismutase
activity. Concentration of superoxide in samples is determined by the comparison with the
calibration curve from SOD standards.
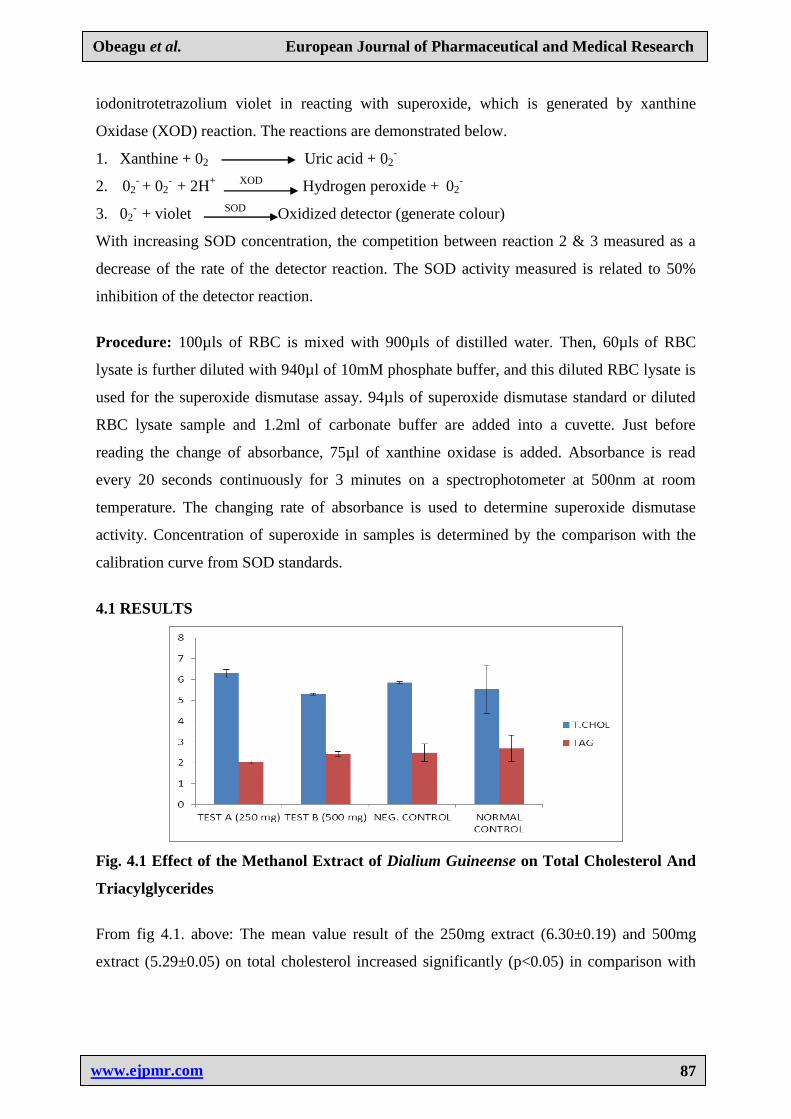
4.1 RESULTS
Fig. 4.1 Effect of the Methanol Extract of Dialium Guineense on Total Cholesterol And
Triacylglycerides
From fig 4.1. above: The mean value result of the 250mg extract (6.30±0.19) and 500mg
extract (5.29±0.05) on total cholesterol increased significantly (p<0.05) in comparison with

www.ejpmr.com
88
Obeagu et al. European Journal of Pharmaceutical and Medical Research
the Negative Control (5.86±0.06) but they have a non significant (p>0.05) increase when
compared with the Normal Control (5.54±1.16).
The mean value result of the 250mg extract (2.02±0.07) and 500mg extract (2.42±0.12) on
TAG had no significant (p >0.05) increase in comparison with the Negative Control
(2.48±0.43) and the Normal Control (2.68±0.63).
Fig 4.2: Effect of the Methanol Extract of Dialium Guineense on HDL and LDL
From fig 4.2, above : The mean value result of the 250mg extract (4.22±0.51) and 500mg
extract (4.37±0.55) on HDL increased non significantly (p>0.05) when compared with the
Negative Control (4.20±0.91) and the Normal Control (4.16±0.16).
The mean value result of the 250mg extract (1.68±0.71) and 500mg extract (0.38±0.52) on
LDL increased non significantly (p>0.05) when compared with the Normal Control
(0.99±1.06), but the 250mg increased significantly (p<0.05) in comparison with the Negative
Control (1.18±0.82). The 500mg extract increased non significantly (P>0.05) with the
Negative control (1.18±0.82)
Fig. 4.3 Effect of Extract of Methanol Extract of Dialium Guineense on AST and ALT
www.ejpmr.com
89
Obeagu et al. European Journal of Pharmaceutical and Medical Research
From fig. 4. 3 above: The mean value result of the 250mg extract (180.58±9.29) and 500mg
extract (234.43±14.70) on AST increased non significantly (p>0.05) and significantly
(P<0.05) respectively when compared with the Negative Control (161.73±10.22) and
increased non significantly (p>0.05) in comparison with the Normal Control (118.57±78.16).
The mean value result of the 250mg extract (24.10±3,29) and 500mg extract (37.98±8.57) on
ALT increased non significantly (p>0.05) significantly (p<0.05) respectively when compared
with the Negative Control (20.53±13.93) but they inreased non significantly (p>0.05) in
comparison with the Normal Control (22.68±10.69).
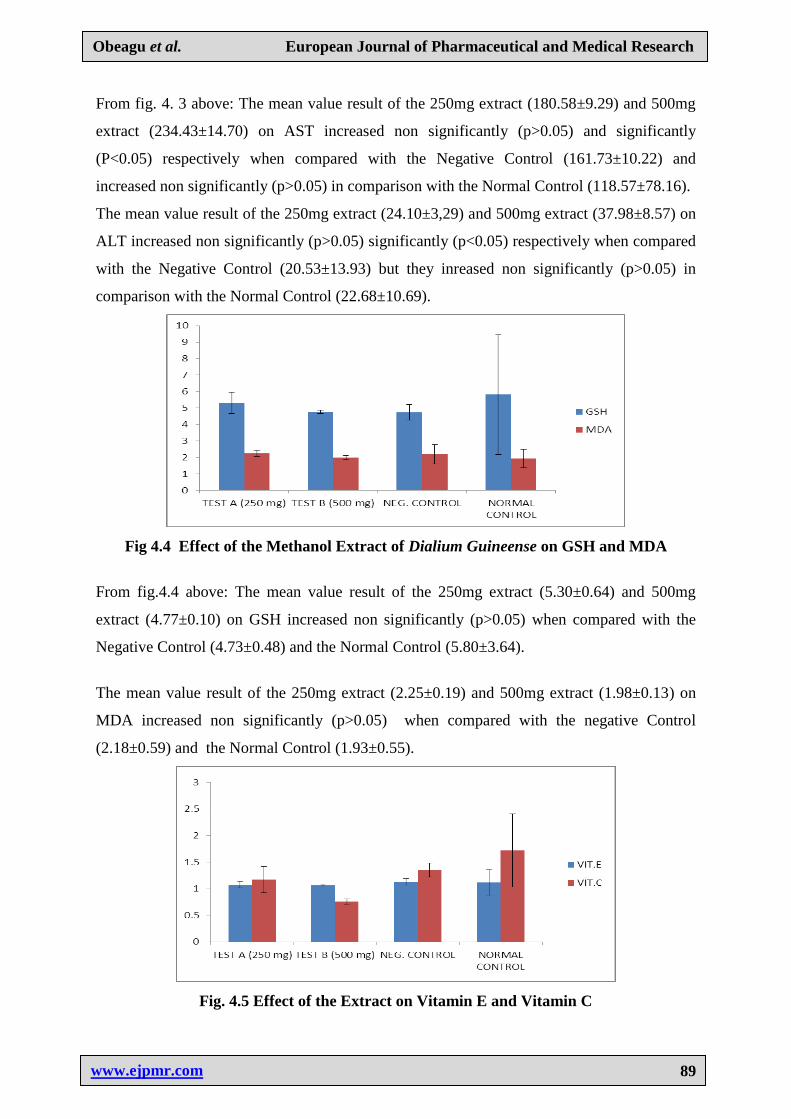
Fig 4.4 Effect of the Methanol Extract of Dialium Guineense on GSH and MDA
From fig.4.4 above: The mean value result of the 250mg extract (5.30±0.64) and 500mg
extract (4.77±0.10) on GSH increased non significantly (p>0.05) when compared with the
Negative Control (4.73±0.48) and the Normal Control (5.80±3.64).
The mean value result of the 250mg extract (2.25±0.19) and 500mg extract (1.98±0.13) on
MDA increased non significantly (p>0.05) when compared with the negative Control
(2.18±0.59) and the Normal Control (1.93±0.55).
Fig. 4.5 Effect of the Extract on Vitamin E and Vitamin C

www.ejpmr.com
90
Obeagu et al. European Journal of Pharmaceutical and Medical Research
From fig.4.5 above: The mean value result of the 250mg extract (1.07±0.06) and 500mg
extract (1.06±0.03) on VIT. E had a significant (p<0.05) increase when compared with the
Negative Control (1.13±0.06) but a non significant (p>0.05) increase in comparison with the
Normal Control (1.12±0.24).
The mean value result of the 250mg extract (1.17±0.25) and 500mg extract (0.76±0.05) on
VIT. C had a non significant (p>0.05) increase and a significant (p<0.05) increase
respectively when compared with the Negative Control (1.35±0.13) but they had a non
significant (p>0.05) in comparison with the Normal Control (1.72±0.69).
Fig. 4.6 Effect of the Extract on T.Protein and Albumin
From fig. 4.6 above: The mean value result of the 250mg extract (9.63±0.02) and 500mg
extract (9.45±1.63) on T. PROTEIN had a non significant (p>0.05) increase when compared
with the Negative Control (9.11±1.31) and Normal Control (8.93±1.6).
The mean value result of the 250mg extract (4.01±0.28) and 500mg extract (4.27±0.23) on
ALB. had a non significant increase (p>0.05) when compared with the Negative Control
(4.08±0.09) and the Normal Control (4.29±0.33).
From fig.4.7 above: The mean value result of the 250mg extract (1.07±0.57) and 500mg
extract (0.99±0.01) on SOD. had a significant (p<0.05) increase when compared with the
Negative Control (0.91±0.05) but had a non significant (p>0.05) increase when compared
with the Normal Control (0.99±0.11).
The mean value result of the 250mg extract (1.22±0.04) and 500mg extract (1.19±0.05) on
CATALASE had a significant (p<0.05) increase when compared with the negative Control

www.ejpmr.com
91
Obeagu et al. European Journal of Pharmaceutical and Medical Research
(3.09±0.61) and a non significant (p>0.05) increase in comparison with the Normal Control
(2.95±2.11).
Fig. 4.7 Effect of the Extract on Superoxide Dismutase and Catalase.
DISCUSSION
As a result of considerable attention that has been devoted to the liver diseases, the vast
majority of studies have been concerned with the liver of the experimental animals and the
characteristics of animal model‟s normal liver have been well defined.
Chloroform/hexane is one of the hepatotoxins that cause liver damage. The hepatotoxicity of
chloroform was reported to be due to phosphogene-mediated cellular glutathione depletion or
increased amounts of covalent binding to hepatocellular macromolecules (Purushothum et al.,
1998; Burke et al., 2007).
ALT and AST are important biochemical markers of hepatotoxicity in blood plasma and
serum. ALT is a liver enzyme that aids in amino acid metabolism and gluconeogenesis,
catalyzing the reductive transfer of an amino group from alaine to α-ketoglutarate to yield
glutamate and pyruvate, AST aids in producing proteins, catalyzing the reductive transfer of
an amino group from aspartate to α-ketoglutarate yielding oxaloacetate and glutamate.
In this present study, it is observed that the test group treated with the 250mg extract of
Dialium guineese had a non-significant (P>0.05) increase on AST activity when compared
with the negative control and normal control. The 500mg extract on AST activity had a
significant (P<0.05) increase when compared with the negative control but increased non
significantly (P>0.05) in comparison with the normal control. This means that the extract has
no effect in reversing the damage done by the hepatotoxicant and as such can contribute to
www.ejpmr.com
92
Obeagu et al. European Journal of Pharmaceutical and Medical Research
liver damage. Also, the 250mg extract had an increase in ALT activity but in a non
significant (P>0.05) manner when compared with the negative and normal control. The
500mg extract fed to the test groups had a significant (P<0.05) increase on ALT activity
when compared with negative control but increased non significantly (P>0.05) in comparison
with the normal. Therefore, the extract could even help in damaging the hepatocyte.
Lipids are of important functions. A lipid profile is a measurement of various lipids that
normally circulate in the blood. Cholesterol is a precursor to many important biological
hormones such as oestrogen and testosterone. LDL is referred to as the “bad cholesterol”
lipoprotein. They carry cholesterol from the liver to cells of the body. HDL collect
cholesterol from the body‟s tissues, and bring it back to the liver and are known as the „good
cholesterol” lipoprotein. Triglycerides is the most common type of lipid formed in animals.
Fat tissue is primarily for the storage of this form of lipid. From the result of this study,
250mg and 500mg extract of Dialium guineense had a non significant (P>0.05) increase on
TAG when compared with the negative and the normal control whereas the 250mg and
500mg extract on total cholersterol increased significantly (P<0.05) when compared with the
negative control, but a non significant (p>0.05) increase in comparison with the normal
control. 250mg and 500mg extract on HDL increased non significantly (P>0.05) when
compared with the negative and the normal control. There was no significant (p>0.05)
increase in 250mg and 500mg extract on LDL against the normal control. But the 250mg
increased significantly (P<0.05) against the negative group, while the 500mg increased non
significantly (p>0.05) against the negative control.
Malondialdehye (MDA) is formed by radical-mediated lipid peroxidation and shows
mutagenic and cytotoxic effects by further reaction with DNA. MDA is the end product of
lipid peroxidation and a good marker of free radical-mediated damage and oxidative stress
(Atip et al., 2010). In this result, neither the 250mg extract nor 500mg extract had a
significant (P<0.05) increase when compared with negative and normal group.
Antioxidants are substances that slow oxidative stress and lipid peroxidaton damage to
cellular components such as DNA, proteins and lipid. They are also molecules which safely
interact with free radicals and terminate free radical chain before they cause damage to cells
(Njoku et al., 2011). In this result,250mg and 500mg 0n vitamin E and Catalase had a
significant (p<0.05) increase when compared with the negative control. 500mg extract on
Vitamin C and Superoxide Dismutase had a significant (p<0.05) when compared with the
www.ejpmr.com
93
Obeagu et al. European Journal of Pharmaceutical and Medical Research
negative control. This shows that the extract is a good free radical scavenger. Others do not
have a significant increase against the negative and the normal control.
Total protein is important because its estimation is helpful in differentiatng between a normal
and a damaged liver function as the majority of plasma proteins like Albumins and globulins
are produced in the liver (Thepa and Walia, 2007). From this result, the 250mg and 500mg
extract had a non significant(p>0.05) increase on albumin against the negative control and the
normal group. Also, 250mg and 500mg extract on total protein had a non significant (p>0.05)
increase in comparison with the negative and normal control.
CONCLUSION
The hepatoprotective screening of Dialium Guineense reveals that it has no protective effect
on ALT and AST which are the important biochemical markers of hepatotoxicity. This is
because it caused an increase in the levels of AST and ALT in a dose dependent of 500mg.
Both doses exert an increase effect on total cholesterol and HDL except HDL which
increased on a 250mg dose. Interestingly, both the 250mg and the 500mg extract exert an
increase effect on vitamin C and E as well as catalase and superoxide Dismutase. Therefore,
dialium guineense has no effect on the liver cell damage and lipid profile but it is a good
source of antioxidant and should be recommended.
REFERENCES
1. Bleibel W., Kim S., D‟Silva K., Lemmer ER. (2007). Drug-induced liver injury: Review
Article. Dig Dis Science, 2007; 52: 2463-2471.
2. Burke AS., Redeker K., Kurten, RC., James LP., Hinson JA. (2007) Mechanisms of
chloroform-induced hepatotoxicity: Oxidative stress and mitochondrial permeability
transition in freshly isolated mouse hepatocytes. Journal Toxicology Environ Health,
2007; 20: 1936-1945.
3. Chang F.Y., Lee S.D. (2003). Cytochrome P450 2E1genotype and the susceptibility to
antituberculosis drug-induced hepatitis. Hepatology. 2003; 37: 924–930.
4. Deng X., Luyendyk JP., Ganey PE., Roth RA. (2009). Inflammatory stress and
idiosyncratic hepatotoxicity: Hints from animal models. Pharmacology Rev, 2009; 61:
262-282.
5. Grant G.H. (1987). Amino acids and proteins, fundamentals of Clinical chemistry, Tietz
N, W, Editor. Third Edition, WB Saunders company Philadelphia USA, 1987; 328-329.

www.ejpmr.com
94
Obeagu et al. European Journal of Pharmaceutical and Medical Research
6. Naruse K., Tang W., Makuuchi M. (2007). Artificial and bioartificial liver support: A
review of perfusion treatment for hepatic failure patients. World Jourrnal
Gastroenterology, 2007; 13: 1516-1521.
7. Njoku D., Laster M.J. (1997). Gong D.H. Biotransformation of halothane, enflurane,
isoflurane and desflurane to trifluoroacetylated liver proteins: association between protein
acylation and hepatic injury. Anest Analg. 1997; 84: 173-178.
8. Ostapowicz G., Fontana R.J., Schiodt F.V., Larson A., Davron J.T., Steven H.B., Timothy
M., Reish J. (2002). Results of a prospective study of acute liver failure at 17 tertiary care
centers in the United States. Ann International Med. 2002; 137: 947–954.
9. Purushothum KR., Lockard VG., Mehendale HM. (1998) Amplification of chloroform
hepatotoxicity and lethality by dietary chlordecone (Kepone) in mice. Toxicology,
Pathology, 1998; 16: 27-34.
10. Reitman, S., Frankel, S. (1957). American Journal. Clinical Pathology. 1957; 28:56.
11. Saukkonen JJ., Cohn DL., Jasmer RM., Schenker S., Jereb JA. (2006). An Official ATS
Statement: Hepatotoxicity of antituberculosis therapy. Am J Respir Crit Care Med, 2006;
174: 935-952.
12. Sharma A., Chakraborti K.K., Handa S.S. (1991). Anti-hepatotoxic activity of some
Indian herbal formulations as compared to silymarin. Fitoterapia. 1991; 62: 229-235.
13. Subramonium A., Pushpangadan P. (1991) Development of Phytomedicines for liver
diseases. Indian Journal Pharmacology, 1991; 31: 166-175-50.
14. Thapa BR, Walia A. (2007) Liver function tests and their interpretation. Indian Journal
Pediatrics. 2007; 74: 663-671.