An Economic Evaluation of Peru's Liquefied Natural Gas ...
28
1 An Economic Evaluation of Peru’s Liquefied Natural Gas Export Policy Leonard Leung * Department of Economics, Queen’s University, Canada [email protected] Glenn Jenkins Department of Economics, Queen’s University, Canada, and Eastern Mediterranean University, Mersin 10, Turkey [email protected] Highlights Peru’s Liquefied Natural Gas project is creating an economic loss to the country; analyses results are robust for all scenarios considered. The present value of the cost of replacing exported energy far exceeds tax revenue. Projects cannot be approved based on the immediately benefits without considering the potential opportunity costs Abstract Peru’s Camisea gas fields hold nearly 90% of the country’s natural gas reserves. In the 1990s, the government prioritized Camisea gas for domestic consumption. The revocation of this policy in the 2000s allowed private developers to export 40% of Camisea’s proven reserves, equivalent to one third of Peru’s total. This USD 3.9 billion liquefied natural gas (LNG) export project boasts the largest single foreign direct investment in Peru’s history. A major component of the financing was granted by international financial institutions on economic grounds. While the project was expected to yield a substantial return to private investors, it is clear that the export of one third of Peru’s total proven natural gas reserves is not in line with its long-term interests. We undertake cost–benefit analyses for a series of scenarios, starting with the project’s formative stage in the mid-2000s, and then in 2012, two years after it began its commercial operation. In all cases, Peru does not have sufficient reserves to warrant export, and the economic costs far exceed the benefits. This project should not have been approved by the government, nor should the loans have been granted by international financial institutions. JFL Classification: Q38; D61 Keywords: Peru; Camisea gas fields; LNG export; cost–benefit analysis, energy trade * Corresponding author We wish to express thanks to Robin Boadway and participants of a public-economics seminar at Queen’s University for their comments. The collaboration and assistance of Aaron Goldzimer, Farai Kanonda and Pradip Ghimire during the early stages of this study is greatly appreciated. The usual disclaimer applies.
-
Upload
khangminh22 -
Category
Documents
-
view
1 -
download
0
Transcript of An Economic Evaluation of Peru's Liquefied Natural Gas ...

1
An Economic Evaluation of Peru’s Liquefied Natural Gas Export Policy
Leonard Leung* Department of Economics, Queen’s University, Canada
Glenn Jenkins
Department of Economics, Queen’s University, Canada, and
Eastern Mediterranean University, Mersin 10, Turkey [email protected]
Highlights
Peru’s Liquefied Natural Gas project is creating an economic loss to the country; analyses
results are robust for all scenarios considered.
The present value of the cost of replacing exported energy far exceeds tax revenue.
Projects cannot be approved based on the immediately benefits without considering the
potential opportunity costs
Abstract Peru’s Camisea gas fields hold nearly 90% of the country’s natural gas reserves. In the 1990s,
the government prioritized Camisea gas for domestic consumption. The revocation of this policy
in the 2000s allowed private developers to export 40% of Camisea’s proven reserves, equivalent
to one third of Peru’s total. This USD 3.9 billion liquefied natural gas (LNG) export project
boasts the largest single foreign direct investment in Peru’s history. A major component of the
financing was granted by international financial institutions on economic grounds. While the
project was expected to yield a substantial return to private investors, it is clear that the export of
one third of Peru’s total proven natural gas reserves is not in line with its long-term interests. We
undertake cost–benefit analyses for a series of scenarios, starting with the project’s formative
stage in the mid-2000s, and then in 2012, two years after it began its commercial operation. In all
cases, Peru does not have sufficient reserves to warrant export, and the economic costs far
exceed the benefits. This project should not have been approved by the government, nor should
the loans have been granted by international financial institutions.
JFL Classification: Q38; D61
Keywords: Peru; Camisea gas fields; LNG export; cost–benefit analysis, energy trade
*Corresponding author
We wish to express thanks to Robin Boadway and participants of a public-economics seminar at Queen’s University
for their comments. The collaboration and assistance of Aaron Goldzimer, Farai Kanonda and Pradip Ghimire
during the early stages of this study is greatly appreciated. The usual disclaimer applies.

2
An Economic Evaluation of Peru's Liquefied Natural Gas (LNG) Export Policy
1. INTRODUCTION
In the second half of the 2000s, Peru faced a decision on whether to conserve its natural gas
reserves in the Camisea gas fields for future domestic consumption, or to implement a project for
exporting liquefied natural gas (LNG). Named Peru LNG (PLNG), the project consists of the
construction of a natural gas liquefaction plant, a marine loading terminal and a gas pipeline that
connects to the Camisea gas fields, which contain over 90% of Peru’s proven natural gas
reserves. The total investment was estimated to be USD 3.9 billion, making PLNG the largest
single private investment in Peru’s history.
During the late 1990s, the foreign company that had discovered the Camisea fields proposed a
similar project. This was rejected by President Alberto Fujimori, who favoured domestic
consumption. In the 2000s, during Ollanta Toledo’s presidency, the government approved a
project for the export of LNG, despite opposition from civil society. The concern was that Peru’s
gas reserves might be insufficient to simultaneously satisfy the export commitment and long-
term domestic needs. Proponents of the project claimed it would generate millions of dollars in
tax revenues, and stimulate economic activity from domestic procurement and local employment.
The purpose of this cost–benefit analysis (CBA) is to evaluate the claims of both sides in order to
shed light on the policy question. The findings unequivocally support the opposition’s argument.
Peru may revert to being an energy net importer as early as the mid-2030s.
The economics of PLNG touch on several strands of research in the literature. Hotelling (1931)
predicts how a mining firm would choose an extraction path that takes into account the Hotelling
rent of the underground resource. The Hotelling rent, however, includes only the firm’s
opportunity cost in terms of future revenues forgone, and the societal opportunity cost is not
internalized. As such, Hotelling-inspired theoretical models (Herfindahl, 1967; Ozkan and Ozkan,
2013) that yield (constrained) optimality under various circumstances can only be understood
with reference to the firm, but what is optimal for the firm is not necessarily optimal for society.
When the distinction between private and social optimality is recognized, the optimal extraction
problem is often framed in the context of environmental externalities (Chakravorty et al., 2008)
or non-competitive market structure (Daubanes 2011), and rarely of competing claims for the
usage of a resource. The issue involved in PLNG comes closest to those described in Im et al.
(2006) or Roumasset and Wada (2012) that feature multiple sources of demand, although these
models involve solving a single optimization problem, from the social planner’s perspective.
PLNG and the many real-life situations it presents suggest an approach to the problem in the
principal–agent framework that requires optimization of both the private investor and social
planner perspectives.
Peru’s experience with LNG export foreshadowed a situation that currently confronts many
countries, as cost-reducing shipping and drilling technological advancements and the explosive
growth of the Asian energy markets have created a global dash for LNG development. Currently,
two LNG projects are underway in the Russian Far East (OGJ, 2013a); six projects in the USA
and three in Canada have received government approval (Doshi, 2013; OGJ, 2013e), with several

3
more pending approval (OGJ, 2012a; OGJ, 2012b; OGJ, 2013b); an ambitious floating LNG
terminal was announced in Australia (Oil Drum, 2011). Beyond the resource-rich regions,
similar private initiatives have been brought forward in countries with recent gas discoveries, but
which are not conventionally associated with natural gas production. These include Cyprus (OGJ,
2013d), Ghana (OGJ, 2011), Mozambique (OGJ, 2012c), and Israel (OGJ, 2013c), to name but a
few.
The LNG opportunity has sparked national debate in the countries concerned, especially in the
USA and Israel. Balancing export commitment with domestic needs is at the core of the debate.
Governments are called upon to design suitable LNG export strategies. While the legislative
panel review in USA is ongoing, the Water and Energy Ministry of Israel recommended a 40/60
split between export and domestic market (OGJ, 2013c). In Malaysia and Indonesia, dwindling
petroleum supply, compounded by increasing domestic gas demand, will necessitate a revision of
LNG export policies.1 Hence, the findings in this study are relevant to policy makers in the
process of reviewing private LNG export projects.
The findings neither support the energy independence argument nor deny the energy trade
surplus argument, these being positions that are often taken by the two sides of the LNG debate.
The economic viability of LNG export is rather project- and country-specific, depending on the
specific terms of the projects and the amount of available resources. However, the paper does set
out an explicit evaluation criterion that gives adequate attention to the economic benefits and the
true opportunity costs of an LNG project for the host country.
2. A HISTORY OF THE CAMISEA PROJECT
2.1 History of Camisea I
Discovered by Royal Dutch Shell (Shell) in 1983, the Camisea gas fields in the Peruvian
Amazon were heralded as one of the most important natural gas reserves in Latin America. The
Camisea fields consist of two major deposits, Block 88 and Block 56. Throughout the 1990s
Shell negotiated with the Peruvian government for the commercial exploitation of Camisea gas.
This project eventually fell through in 1998 owing to a number of disagreements. Fundamentally,
whereas Shell intended gas exportation, the government gave priority to domestic consumption.
Their conflicting preferences were responses to the same phenomenon, namely that Peru had
traditionally relied on hydropower and imported petroleum products to meet its energy needs,
while the natural gas market remained underdeveloped. For Shell, gas exportation could mitigate
demand risk. However, the goal of the government was to improve Peru’s hydrocarbon trade
deficit by substituting imported petroleum products with Camisea gas in the energy matrix.2
1Indonesia has reached a paradoxical juncture where LNG is simultaneously exported to Japan and imported from
USA (Kennedy, 2013). 2 The possibility of supplying the domestic market had been explored, but no agreement could be reached on the
price and quantity of gas to be sold domestically. See Banco Wiese Sudameris (2002), The Economist (1998) and
Accion Ciudadana Camisea’s webpage for details about the Camisea project during this early phase.

4
Upon Shell’s withdrawal, the government organized an international tender for the three
components of the Camisea project: 1) gas extraction and processing near the Camisea fields; 2)
gas transportation in a pipeline across the Andes; and 3) the distribution network around the
capital, Lima. To conserve Camisea gas for domestic use, laws were passed to proscribe gas
exportation unless the proven gas reserves could meet the total projected domestic demand for
the next 20 years.3 The Ministry of Energy and Mines (MEM) was to review annually Peru’s
proven gas reserves and domestic needs for the next 20 years. If in any one year the total
projected demand exceeded the proven reserves, gas producers must suspend supplying gas to
exporters until the following year’s evaluation. The prospect of abrupt interruption in feed gas
was sufficient to deter private investment in gas export projects.
In 2000 a group of international companies won all components of the tender under the guise of
three nominally independent consortiums. Consorcio Camisea was awarded the right to extract
natural gas from Block 88 for 40 years. Transportadora de Gas del Peru (TGP) was awarded the
transportation concession, with a 33-year term. Although gas export was not explicitly ruled out,
a clause was inserted in Block 88’s licence agreement, similar to that in the aforementioned
executive order.4 The extraction right for the adjacent Block 56 was not assigned at that time.5
Construction began in 2001, and in late 2004 gas from Block 88 reached Lima. Collectively, this
phase of the Camisea project was dubbed ‘Camisea I’.
2.2 History of Camisea II
In 2003, several key consortium members formed another consortium, PLNG, to execute
Camisea II. PLNG was to build a natural gas liquefaction plant at a coastal site that turned
natural gas into liquid. The project also required a feedstock pipeline that tapped into the main
pipeline operated by TGP, and marine loading and docking facilities for the LNG to be loaded to
tankers for export. The total investment cost for PLNG was expected to be 3.47 billion USD;
43.4% of the investment was funded by equity and the balance by loans from international
financial institutions. If financing costs were included, the total investment cost amounted to
3.97 billion USD (IFC, 2008a). PLNG boasts the largest foreign direct investment in the history
of Peru.
The LNG plant’s feed gas would come from Block 56 and Block 88 of the Camisea fields.
PLNG concluded an 18-year gas-supply agreement with the sister company, Consorcio Camisea.
3 Congress §Law No 27133, Article 4, and Executive Order N° 040-99-EM, Section 2.1. 4 Section 5.11 of the Block 88 License Agreement reads: “The export of natural gas […] can be made as long as the
supply of the domestic market for the following twenty (20) years is guaranteed, according to forecasted natural gas
demand […] as published annually in the Reference Plan of Hydrocarbons of the Ministry of Energy and Mines.”
(MEM, 2000). 5 In 2006, the Toledo administration granted Consorcio Camisea Block 56’s extraction right without putting it out to
tender, for which it was heavily criticized. The government had created a situation that precluded competition
between gas companies. Given the geographical proximity of Blocks 88 and 56, and the fact that that gas reserves in
Block 56 were insufficient to justify building an independent pipeline, gas output from the two blocks would share
the same pipeline. However, the gas transportation concession contract allowed Consorico Camisea to have
exclusive use of the pipeline for 10 years. Consorico Camisea exercised a de facto stranglehold on the marketing of
gas in Block 56, since no other company could use the pipeline without its consent (Gamboa et al., 2008). Hence, no
other developer would bid for Block 56’s exploitation right, even if it were put to open tender.

5
Commencing June 2010, PLNG would receive a daily gas delivery volume of 620 million cubic
feet (MCF). This implied a commitment of 4.20 trillion cubic feet (TCF) of natural gas, or one
third of the country’s proven reserves, over the contract period. Since Block 56’s gas deposit was
insufficient to fulfil the contract obligation, natural gas would be partly sourced from Block 88.
Figure 1 illustrates the locations of the Camisea project.
Figure 1: Locations of the Camisea Project
While serving as Peru’s president from 2001 to 2006, Alejandro Toledo was instrumental in
dismantling the gas export restriction. Previously, export had to cease if MEM’s yearly
evaluation found the total proven reserves insufficient to meet the domestic demand for the
following 20 years. Toledo annulled Fujimori’s executive order. Gas reserves were now
considered sufficient if, “on the date of signing the contract for the sale of natural gas for export”,
there was enough to supply the domestic market for 20 years (Executive Order Nº 050-2005-
EM). Once contracts were signed, gas export could continue regardless of unforeseen changes in
domestic demand.
Since its inception, the Camisea project has met with opposition from conservation groups
concerned about its adverse impact on the Amazon forests and the lives of the aboriginal peoples.
When PLNG emerged, these groups were joined by those who – echoing Fujimori – held that
Camisea gas should be restricted to domestic use.
To placate opposition, Consorcio Camisea upgraded its proven reserves estimate for Camisea
from 10.9 to 13.4 TCF in early 2008 (IFC, 2008a), and further to 14.1 TCF in early 2009
(Gestión, 2009a). However, two independent assessments did not substantiate the upgrade
announcements (GCA, 2009a; GCA, 2009b; NSAI, 2010). 6 In explaining the discrepancy
6 One of the consulting companies, Gaffney, Cline and Associates, was hired by the Camisea operators. Its reserves
estimate was 8.80 TCF.

6
(Gestión, 2009b), Consorcio Camisea gave hints as to how its estimate had been derived.
Hydrocarbon deposits are classified along two dimensions, certainty and commercial
recoverability. A comparison between how Consorcio Camisea defined reserves and the industry
standards (SPE, 2007) suggests that 3.1 TCF of its last estimate of 14.1 TCF should really be
classified as resources, or gas deposits that did not meet the criteria of reserves, much less
proven reserves. There are indications that gas deposits were misclassified.7
2.3 Involvement of Inter-American Development Bank (IDB) and International Finance
Corporation (IFC) in Camisea II
Opponents of Camisea II attempted to block PLNG from obtaining financing from international
financial institutions, a strategy employed by the conservation groups during Camisea I.8 Despite
its previous modest success, the strategy failed. In December 2007 IDB approved a direct loan of
400 million USD and a syndicated loan of 400 million USD, together accounting for one third of
PLNG’s total borrowings. While conceding adverse environmental impacts,9 IDB approved the
loans on economic grounds: “PLNG will spend approximately 1 billion USD on local salaries
and goods and services [...] Additionally and as a result of the project, the Peruvian government
will receive an average of 200 million per year in incremental royalties and 150 million in
additional income taxes over the first 20 years [...] The entire project is expected to yield
4.8 billion in net present value terms in cumulative economic benefits” (IDB, 2006). In addition,
IDB claimed the project “represents a major step in the country’s efforts to develop its energy
sector and achieve oil and gas self-sufficiency” [emphasis added] (IDB, 2007). There is a
question about how long Peru can remain energy self-sufficient by the end of the project’s life,
with one third of its proven reserves being exported.
Following IDB’s lending decision, in February 2008 IFC approved a loan of 300 million USD,
the largest IFC transaction in Latin America (PLNG, 2009). Although the amount was only 40%
of IDB’s loan, IFC’s role was no less vital by virtue of its stature among development finance
institutions. IFC also highlighted the economic benefits of tax revenues, job creation and local
procurement (IFC, 2008b).
Since IDB’s project appraisal report on PLNG is not publicly available, it is unclear whether or
not IDB gave sufficient consideration to the popular belief that export might occur at the expense
of domestic needs. IFC’s appraisal report did mention gas reserves sufficiency as a risk factor:
“[c]oncerns have been raised by CSOs [civil society organizations] and other parties that Peru
may not have sufficient reserves to supply both Peru LNG, and meet forecasts for domestic gas
demand beyond 20 years”. However, the report fell short of providing a mitigation strategy,
merely suggesting that “the rising domestic demand for gas from Peru’s expanding economy as
7 In 2012 additional gas reserves were discovered in the Camisea fields and confirmed by the government. As of
December 2012, Peru registered a proven reserve of 15.38 TCF; see Section 4.2.1. Prior to 2012, proven reserve
estimates increased modestly from 11.82 to 12.70 TCF between 2007 and 2011. 8 See Vences (2006) for details. 9 Adverse environmental impacts are in fact presented as an “additionality” that justifies IDB’s involvement: “[t]he
Bank’s participation in this project contributes significantly to the environmental and social management plans and
systems of the companies, especially in terms of investments in community development and environmental
protection” (IDB, 2007).

7
well as export requirements for the Project will be met from a combination of the expansion of
current resources and future gas finds in Peru” (IFC, 2008a).
Figure 2: Key Events over the Course of the Camisea Project
Both IDB and IFC highlighted the immediate benefits the project would bring to Peru’s economy
as a justification for their loans to PLNG. However, it is contrary to the fundamentals of
economics that a decision be made based solely on what will be gained, without taking into
account what could be lost – that is, without taking into account the opportunity costs. With
PLNG, the most significant opportunity cost is that of acquiring an alternative energy resource to
replace the exported gas. While the question of reserves adequacy was muted in IFC’s appraisal,
it was clearly voiced in the public discourse. Jenkins (2007) conducted a preliminary study of the
project that pointed out the dangers of the project creating an economic loss to Peru; a summary
report was circulated on the internet and made available to both international financial
institutions. Jenkins’ study was also cited in an open letter to IFC, signed by a dozen
international non-governmental organizations (NGOs) that opposed the project (Amazon Watch,
2008).
3. CBA ANALSYIS
3.1 Theoretical Underpinning The CBA is undertaken from the perspective of Peru. Within Peru there are several major
stakeholder groups, namely 1) the government; 2) domestic consumers of natural gas; 3)
domestic contractors and the part of the labour force employed by the LNG project; and 4) the
local population that live within the project’s area of influence. Since the consortium members
Shell
•1983-87: Royal Dutch Shell discovered Camisea gas fields (Block 88 and 56).
•1998: Negotiation between Shell and the government of Peru reached deadlock; Shell pulled out.
•1998-2000: Fujimori and the Congress enacted natural gas export restrictions.
Camisea I
•2000: Concession contracts for the Camisea project were awarded to the present group of operators.
•2004: Commerical production commenced, supplying the domestic market.
Camisea II
•2001-06: Toledo drastically relaxed the natural gas export restrictions set by Fujimori.
•2003: PLNG was formed by the Camisea operators for the exportation of LNG.
•2007-08: IFC and IDB granted loans to PLNG.
•2010: PLNG began commerical operation; the first LNG shipment arrived Mexico in June.

8
that own and operate the Camisea project will remit profits abroad, the companies’ after-tax
financial performance is not a consideration in this analysis. The relationship between the
economic costs and economic benefits of the LNG project, as well as the evaluation criteria, can
be illuminated with several mathematical equations.
Let 𝑅𝑡𝐷 and 𝐶𝐼𝑇𝑡
𝐷 represent the royalties and the corporate income taxes (CIT) collected by the
government at time t, for the natural gas that is supplied to the domestic market denoted by the
superscript D. Likewise, let 𝑅𝑡𝐸 and 𝐶𝐼𝑇𝑡
𝐸 represent the royalties and the CIT associated with the
LNG project, denoted by the superscript E. Royalties are collected from Consorcio Camisea, the
licensed gas producer, whether the gas are sold domestically or abroad. CIT are paid not just by
PLNG, but also by Consorcio Camisea and TGP.
Use 𝐴𝑡 to denote the benefits of domestic procurement and job creation; 𝐵𝑡 to denote the benefits
that Peruvian gas users will generate from receiving Camisea gas; and 𝐶𝑡 to denote the adverse
socio-environmental impacts. Let 𝑃𝑡𝐺 and 𝑄𝑡
𝐺 denote the unit price and volume of Camisea gas
sold domestically, and let 𝑃𝑡𝐼 and 𝑄𝑡
𝐼 denote the unit price and barrels of oil imported to replace
the exported gas. Suppose PLNG’s project life is 𝑇 years. Since natural gas is a non-renewable
resource, its depletion is inevitable. Let T′represents such a date, where 𝑇 ′>𝑇.
During the project life, the government will receive tax revenues (𝑅𝑡𝐸 and 𝐶𝐼𝑇𝑡
𝐸 ), and the
difference between 𝐴𝑡 and 𝐶𝑡 is the benefits to society. Until natural gas depletes at date 𝑇 ′ ,
Peruvian customers enjoy the benefits of its usage (𝐵𝑡), at a cost (𝑃𝑡𝐺𝑄𝑡
𝐺) paid to the Camisea gas
producers. After 𝑇 ′, it is assumed that Peru will resume importing petroleum products for its
energy needs, as was the case before Camisea I.10 At a discount rate of 𝛽, the present value of the
economic resource flow to Peru in the with-project scenario (denoted by ′) can be summarized
by the following equation:
′ = ∑ 𝛽𝑡(𝑅𝑡𝐸 + 𝐶𝐼𝑇𝑡
𝐸 + 𝐴𝑡 − 𝐶𝑡)𝑇𝑡=0⏞
Collective benefits to Peru,from the LNG project
+ ∑ 𝛽𝑡(𝐵𝑡𝑇′
𝑡=0 − 𝑃𝑡𝐺𝑄𝑡
𝐺)⏞
Benefits to domestic gas users,
from domestic sales
+ ∑ 𝛽𝑡(𝑅𝑡𝐷 + 𝐶𝐼𝑇𝑡
𝐷)𝑇′
𝑡=0⏞
Benefits to the government,
from domestic sales
− ∑ 𝛽𝑡∞𝑡=𝑇′+1 𝑃𝑡
𝐼𝑄𝑡𝐼
⏟ .
Costs to Peru,from oil imports,
after gas depletion at 𝑇′
(1)
As noted, the Camisea project is foreign-owned, and all financial profits will be remitted abroad.
Since companies’ after-tax profitability does not affect Peru’s net proceeds from the LNG project,
it does not enter into the equation. By the same token, the companies will defray all costs
associated with bringing the Camisea gas to domestic users’ doorsteps. For Peru, the resource
cost of Camisea gas exactly equals the final price that domestic customers paid to the companies.
In the project’s absence, reserves depletion will occur at date 𝑇 ′′, with 𝑇 ′′> 𝑇 ′. The economic
resource flow to Peru in the without-project scenario (denoted by ′′) becomes
10 Alternative energy solutions, including hydropower and natural gas imports, are explored, but none appears to be
attractive on economic grounds. See Section 4.1.2.

9
′′ = ∑ 𝛽𝑡(𝐵𝑡𝑇′′
𝑡=0 − 𝑃𝑡𝐺𝑄𝑡
𝐺)⏞
Benefits to domestic gas users,
from domestic sales
+ ∑ 𝛽𝑡(𝑅𝑡𝐷 + 𝐶𝐼𝑇𝑡
𝐷)𝑇′′
𝑡=0⏞
Benefits to domestic gas users,
from domestic sales
– ∑ 𝛽𝑡∞𝑡=𝑇′′+1 𝑃𝑡
𝐼𝑄𝑡𝐼 .⏞
Costs to Peru,from oil imports,
after gas depletion at 𝑇′′
(2)
Equation (2) is similar to Equation (1), except that Peru no longer receives royalties and CIT
from operations associated with the LNG project, and that the reserves depletion date is extended
to T′′.
More realistically, as PLNG crowds out supply to the domestic market, domestic gas users
consume less gas but pay more on a per-unit basis, since the increased scarcity exerts an upward
pressure on gas price. The result is a lower net benefit to domestic gas users (𝐵𝑡 − 𝑃𝑡𝐺𝑄𝑡
𝐺) in the
with-project scenario. While the project’s impact on the tax revenues from domestic sales (𝑅𝑡𝐷
and 𝐶𝐼𝑇𝑡𝐷) during the project life is ambiguous, it is evident from a mathematical relation that the
overall net economic benefits from domestic sales are reduced owing to crowding out, although
the magnitude is difficult to quantify.11 For simplicity, the crowding-out effect is assumed away.
Between time 0 and T, Peruvian industries receive the same quantity of gas at the same price in
both scenarios, but the total amount of gas available to domestic customers will last longer, until
𝑇 ′′ without the project. This simplification makes the project appear more favourable
economically.
In performing an economic analysis, it is imperative to capture only the incremental difference
between the with-project and without-project scenarios. Define the incremental difference (∆) as
the with-project resource flow (′) minus the without-project resource flow (′′):
∆ = ′ −′′
= ∑ 𝛽𝑡(𝑅𝑡𝐸 + 𝐶𝐼𝑇𝑡
𝐸 + 𝐴𝑡 − 𝐶𝑡)𝑇𝑡=0 – ∑ 𝛽𝑡(𝑅𝑡
𝐷 + 𝐶𝐼𝑇𝑡𝐷)𝑇′′
𝑡=𝑇′+1 – ∑ 𝛽𝑡(𝐵𝑡 − 𝑃𝑡𝐺𝑄𝑡
𝐺)𝑇′′
𝑡=𝑇′+1
−∑ 𝛽𝑡𝑃𝑡𝐼𝑄𝑡
𝐼𝑇′′
𝑡=𝑇′+1 . (3)
The first term is the discounted sum of royalties and CIT associated with the LNG project, and
this represents the incremental benefits. IDB and IFC emphasized this first term in their analysis,
but attached little importance to the socio-environmental costs (𝐶𝑡) and the opportunity costs (the
rest of the terms).
11 Suppose the benefit per unit of gas consumption is 𝐵, or 𝐵𝑡 = 𝐵𝑄𝑡
𝐺 . For any positive quantity consumed it must be
the case that 𝐵 ≥ 𝑃𝑡𝐺 . Royalties and CIT are increasing with the quantity supplied and price. Suppose 𝑅𝑡
𝐷 =
𝜏𝑅𝑃𝑡𝐺𝑄𝑡
𝐺 and 𝐶𝐼𝑇𝑡𝐷 = 𝜏𝐶𝐼𝑇𝑃𝑡
𝐺𝑄𝑡𝐺 , where 𝜏𝑅 and 𝜏𝐶𝐼𝑇 represent the respective tax rates whose sum must be less than
unity. In each period the net benefit of domestic sales is 𝑡 = (𝐵𝑡 − 𝑃𝑡𝐺𝑄𝑡
𝐺) + (𝑅𝑡𝐷 + 𝐶𝐼𝑇𝑡
𝐷) = 𝐵𝑄𝑡𝐺 − 𝑃𝑡
𝐺𝑄𝑡𝐺(1 −
𝜏𝑅 − 𝜏𝐶𝐼𝑇). Given that price is decreasing with the quantity supplied (𝜕𝑃𝑡
𝐺
𝜕𝑄𝑡𝐺 <0), it is obvious that the derivative with
respect to the quantity supplied is positive ( 𝜕𝑡
𝜕𝑄𝑡𝐺 >0). In other words, the larger the quantity supplied, the greater is
the net benefit of domestic sales. It can also be verified that crowding out reduces the welfare of domestic gas users,
and has an ambiguous effect on tax revenues.

10
A vigorous analysis should weigh the first term against the rest of the terms in Equation (3). The
LNG project is economically viable if and only if the sum is a positive number. However, there
are challenges in performing a CBA based on Equation (3). First, the benefits of domestic
procurement and employment (𝐴𝑡) cannot be determined without first computing their economic
values, which is information intensive. It can be expected that the true economic surplus of such
items will be a small fraction of what the private investors bore as financial costs, after netting
the opportunity costs of the resources Peru used in providing the goods, services and local labour.
Secondly, the impact on Peruvian consumers (𝐵𝑡) is difficult to quantify. The question rests on
the type of user, and whether a substitute is available. Lastly, monetarizing the socio-
environmental impacts (𝐶𝑡) is either controversial or challenging, if not both, as in the case of
aboriginal interests. Given the information constraints, these variables need to be dropped. In all
likelihood, incorporating these missing variables would only weigh against the LNG project.
Equation (3′ ) defines the incremental benefits and costs that will be captured in the CBA
analysis:
∆ = ∑ 𝛽𝑡(𝑅𝑡𝐸 + 𝐶𝐼𝑇𝑡
𝐸)𝑇𝑡=0 – ∑ 𝛽𝑡(𝑅𝑡
𝐷 + 𝐶𝐼𝑇𝑡𝐷)𝑇′′
𝑡=𝑇′+1 – ∑ 𝛽𝑡(𝑃𝑡𝐼𝑄𝑡
𝐼 − 𝑃𝑡𝐺𝑄𝑡
𝐺𝑇′′
𝑡=𝑇′+1 ) (3′)
To recapitulate, the first term refers to the additional tax revenues generated by the LNG project.
Had Camisea gas not been exported, taxes could still be collected from their domestic sales at a
later date. The second term represents the taxes forgone. Domestic consumers must pay for the
use of energy with or without the project. In the first case the payment will be made to foreign oil
companies, and in the second to Consorcio Camisea and TGP. The last term represents the
additional costs of energy incurred by Peru as a result of accelerated gas depletion.
3.2 Elements of the CBA Model
To determine the first term in Equation (3′), which represents the total tax revenues paid to the
government, a detailed financial model was constructed for PLNG. Its first component is an
investment schedule that indicates the amount of capital expenditures incurred during the
construction phase, followed by a tax depreciation schedule to determine depreciation
allowances. Second, a loan schedule computes loan disbursements as well as interests and
principal repayments over the tenor of the loans. The third component forecasts PLNG’s
operating revenues, and fixed and variable operating costs, based on the sales agreement made
with PLNG’s sole client, Repsol Commercializadora de Gas S.A. (Repsol CG), and on the gas
purchase and gas transport agreements with Consorcio Camisea and TGP. The difference
between operating revenues and operating costs gives earnings before interest, taxes,
depreciation and amortization (EBITDA). Lastly, an income tax statement is constructed to
determine CIT liabilities by netting depreciation allowances, interest payments, loss carry-
forward and other deductible items. Along the way, royalties are calculated and the second-order
benefits of CIT contributions from Consorcio Camisea and TGP are approximated.12
12 Similar financial models were constructed for Consorcio Camisea and TGP. Although the companies produce and
transport gas for both PLNG and the domestic market, the consolidated financial statements do not distinguish the
two types of sales. There is insufficient information to isolate the cost of goods sold and other operating costs
associated with the portion of sales to PLNG. Therefore the CIT liabilities for Consorcio Camisea and TGP must be
imputed.

11
𝑅𝑡𝐷 and 𝐶𝐼𝑇𝑡
𝐷 in the second term of Equation (3′) can be calculated in essentially the same way as
for 𝑅𝑡𝐸 and the portion of 𝐶𝐼𝑇𝑡
𝐸 paid by Consorcio Camisea and TGP. 13 Once the financial
models for Consorcio Camisea and TGP have been built, the computation of 𝑅𝑡𝐷 and 𝐶𝐼𝑇𝑡
𝐷 is
relatively straightforward, for a given gas price forecast and a given counterfactual quantity of
natural gas that could be supplied to the domestic market.
The final term in Equation (3′) is a function of a number of factors, including future energy
prices (𝑃𝑡𝐺 and 𝑃𝑡
𝐼), future gas demand and its oil equivalence (𝑄𝑡𝐺 and 𝑄𝑡
𝐼), and the size of the
proven gas reserves. The larger the reserves, the later the oil import date, and thus the lower the
present value of the opportunity costs. The first step in deriving a numerical value for this final
term is to determine the expected date of reserves depletion. This is achieved by comparing the
total available gas reserves with the forecasted cumulative demand in each scenario. Once T′ and
T′′ are known, the second step is to convert the forecasted gas demand for each period (𝑄𝑡𝐺) into
barrels of oil (𝑄𝑡𝐼) using energy equivalence.14 Multiplying the quantity of gas or oil equivalence
demanded by the respective price forecasts (𝑃𝑡𝐺 and 𝑃𝑡
𝐼) gives the cost of energy for each source.
The difference between the products is the additional costs of energy incurred in substituting
petroleum products for gas.
3.3 Data Source and PLNG Operations
The parameters that populate the model were taken from a collection of publicly available
information. Primary sources include 1) publications by Peru’s MEM containing estimates on the
size of gas reserves and domestic gas demand forecasts; 2) the original concession contracts for
Blocks 56 and 88; 3) company credit reports and audited financial statements (PLNG, Consorcio
Camisea and TGP) published by credit rating agencies;15 4) IFC’s project appraisal report on
PLNG; 5) publications by the Energy Information Agency (EIA) of USA that give energy price
forecasts. The primary information was crosschecked and, to the extent possible, verified with
secondary sources. To save space, the derivation of various financial parameters is documented
elsewhere.16 Here it suffices to highlight some key aspects of PLNG’s operations.
PLNG has a project life of 20 years, including two years of construction starting in 2008. The
capital investment was 3.47 billion USD, of which 2.25 billion USD was debt-financed.
Financing was sourced from IDB (800 million), IFC (300 million), several export-import banks
(950 million) and local bonds.
13 Sales to PLNG and sales to the domestic market are subject to different royalty tax regimes. Both regimes are
modelled to capture the royalty collected from the LNG project (𝑅𝑡𝐸 ), and the future royalty forgone (𝑅𝑡
𝐷 ). 14 To give a stylized example, given that one BCF of gas contains 1,089,000 MMBtu of energy and each barrel of oil
contains 5.98 MMBtu (self-derivation based on Beychok (2012)), it takes about 182,000 barrels of oil to replace one
BCF of gas. In the actual conversion, care was taken to adjust how the way gas is consumed by domestic users
affects the oil equivalence. 15 The rating agencies are Apoyo and Associates (AAI, associated with Fitch Ratings), Equilibrium Clasificadora de
Riesgo (ECR, associated with Moody’s Ratings) and Pacific Credit Rating (PCR). The credit reports for the past two
years are available from the company websites: www.aai.com.pe; www.equilibrium.com.pe; www.ratingspcr.com. 16 The documentation will be uploaded to John Deutsch International’s website, under the title “Annex to An
Economic Evaluation of Peru’s Liquefied Natural Gas Export Policy””.

12
PLNG will acquire in total 4.20 TCF of natural gas from the Camisea fields. Its liquefaction
plant has an annual production capacity for LNG equivalent to 218 trillion British thermal units
(TBtu).17 The entire LNG output is sold to Repsol CG under an 18-year LNG sales agreement.
Since PLNG’s gas sales price is a function of the price Repsol CG receives in overseas markets,
it is necessary to describe how the latter disposes of the LNG. Repsol CG is contracted to sell
two thirds of the LNG to Mexico, and the rest to Asian and European markets on an ad hoc basis.
Sales to Mexico are indexed to Henry Hub. Repsol CG will receive 90% of the Henry Hub price,
minus 3 US cents per MMBtu.18 Sales to other markets are determined by the spot price. It is
assumed in this study that Repsol CG will sell the remaining one third of the LNG in Asia, where
gas prices have been the highest.
The feed gas cost and gas transport fee paid to Consorcio Camisea and TGP, as well as royalties,
are functions of the LNG price in overseas markets (what Repsol CG receives). Royalties are
determined following a particularly elaborate scheme. PeruPetro, a state-owned enterprise tasked
with negotiating oil and gas projects on the government’s behalf, regularly reports the overseas
price and royalty payment for each LNG shipment. Given an overseas price, the model’s royalty
estimate closely matches that in PeruPetro’s reports (PeruPetro, 2013). This gives confidence
that the royalty payment is modelled precisely, which is important as this constitutes the most
significant source of benefits for Peru.
4. CBA RESULTS
The CBA analysis was conducted for three scenarios that vary in energy price forecasts, size of
gas reserves, and domestic demand forecasts. It is more convenient to discuss this set of
parameters separately for each scenario.
For all scenarios, an economic discount rate of 8% is applied to discount the stream of economic
benefits and costs. Peru’s Ministry of Economy and Finance (MEF) issued a set of guidelines,
the National Public Investment System (SNIP), for evaluating all public investment projects. It
recommends a real discount rate of 10% (SNIP, 2012), implying that the next best alternative use of
public funds will generate an economic benefit of 10%. However, it is felt that the discount rate
appropriate for this study needs a downward adjustment, in view of a study by Munilla (2010) that
investigated how the Camisea project’s tax revenues were distributed and managed by the
various recipients. Between 2004 and 2010, 16% of the tax revenue was allocated to the national
government, 64% to the sub-national governments and the balance of 20% to a national defence
fund, which is treated as an expense of current consumption. If under ordinary circumstances
17 To be technically precise, the LNG plant has a nominal capacity of 4.4 million metric tons per annum (MMTA),
as it is an industry practice to express LNG output in weight unit. For the purpose of this paper, gas quantity is more
conveniently expressed either in units of energy (Btu) or volume (cubic feet), depending on the context. Energy
units are preferable for gauging the monetary value of the gas, since gas prices are quoted in USD per million British
thermal units (USD/MMBtu). Volume unit is preferable when comparing gas quantity with the country’s available
reserves, which is given in cubic feet. While all three measures are convertible, this paper drops the weight unit to
avoid adding to the confusion. 18 To give a numerical example, if the Henry Hub price is 1 USD/MMBtu, Repsol CG will receive 88 US cents for
the LNG that is shipped to Mexico.
13
such funds would reduce the need for government borrowing, they would generate an economic
return of 10% to the economy. If, instead, 80% is available to reduce the government’s capital
market borrowing, then the rate of return on these incomes would be reduced to 8%. The
discount rate of equal value is chosen in recognition of MEF guidelines for public project
evaluation and the particularity of the formula that directs the distribution of tax revenues from
PLNG.
4.1 Scenario 1
4.1.1 Overview
Scenario 1 uses only information that was available around late 2007. The purpose is to evaluate
the project using as much information as was available to decision makers at around the time of
the loans approval. Although IDB and IFC did not incorporate reserves depletions into their
analysis, the issue was clearly voiced in the public discussion. Key parameters are extracted from
known studies on PLNG commissioned or conducted by IDB or IFC. As such, this part of the
CBA analysis does not enjoy the benefit of hindsight.
It is useful to describe the economic situation in late 2007. The natural gas market outlook was
then positive. IFC’s gas price forecasts ranged between 6 and 7 USD/MMBtu at Henry Hub, and
between 8 and 9 USD/MMBtu in Asia (IFC, 2008a).19 This study takes the upper limits for a
more optimistic estimation of the tax revenues. As per Pluspetrol, the operator of the Camisea
fields with 27% interest in Consorcio Camisea, gas for the domestic market is priced at
4 USD/MMBtu for sales to the petrochemical industry, and 1.59–2.7 USD/MMBtu for sales to
other domestic customers (GCA, 2009b).20 Lastly, the long-term price forecast for crude oil was
50 USD/barrel (IFC, 2008a), to which are added the costs of refining, marketing and distribution
to derive a final consumer price of approximately 61 USD/barrel.21 In real terms, the future cost
of Camisea gas to be paid by domestic consumers (𝑃𝑡𝐺) is assumed to remain between 1.59 and
4 USD/MMBtu depending on the consumer types,22 and the future cost of refined oil (𝑃𝑡𝑂) to be
61 USD/MMBtu in accordance with the World Bank forecast.
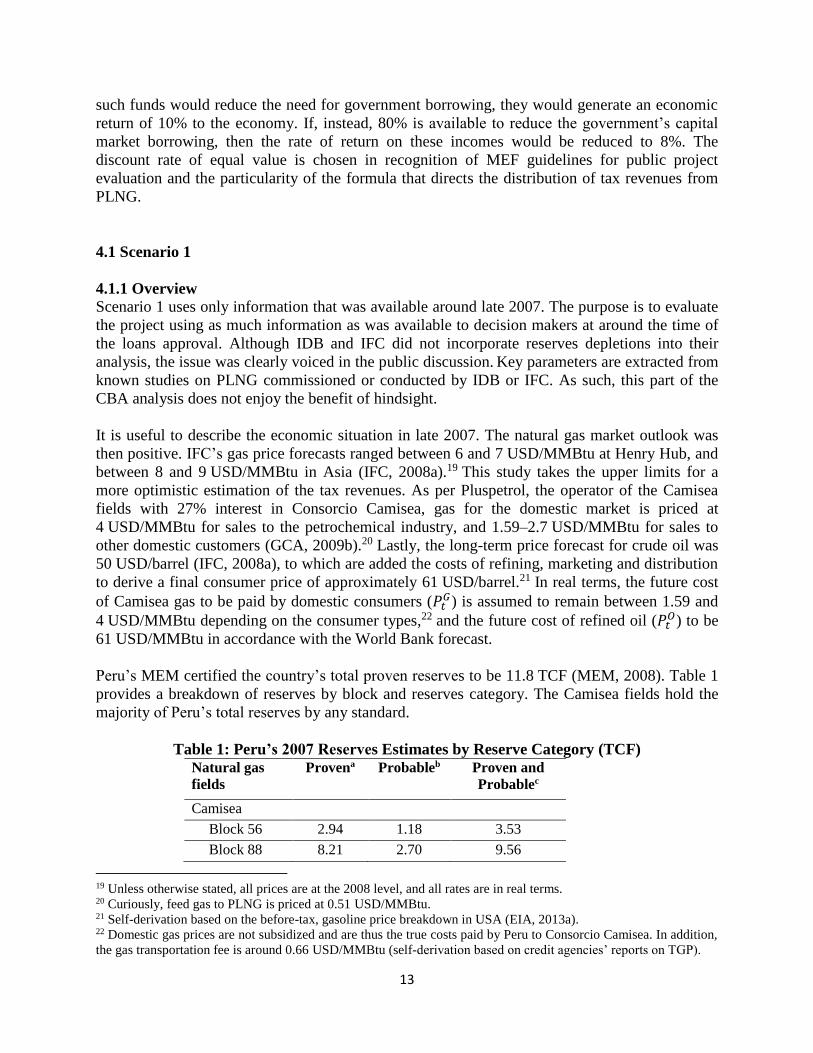
Peru’s MEM certified the country’s total proven reserves to be 11.8 TCF (MEM, 2008). Table 1
provides a breakdown of reserves by block and reserves category. The Camisea fields hold the
majority of Peru’s total reserves by any standard.
Table 1: Peru’s 2007 Reserves Estimates by Reserve Category (TCF) Natural gas
fields
Provena Probableb Proven and
Probablec
Camisea
Block 56 2.94 1.18 3.53
Block 88 8.21 2.70 9.56
19 Unless otherwise stated, all prices are at the 2008 level, and all rates are in real terms. 20 Curiously, feed gas to PLNG is priced at 0.51 USD/MMBtu. 21 Self-derivation based on the before-tax, gasoline price breakdown in USA (EIA, 2013a). 22 Domestic gas prices are not subsidized and are thus the true costs paid by Peru to Consorcio Camisea. In addition,
the gas transportation fee is around 0.66 USD/MMBtu (self-derivation based on credit agencies’ reports on TGP).

14
Subtotal 11.15 3.88 13.09
Others 0.67 2.95 2.15
Total 11.82 6.83 15.24 aProven reserves have at least a 90% chance of being present. bProbable reserves have at least a 50% chance of being present. c100% of proven reserves plus 50% of probable reserves.
Source: MEM (2008)
In accordance with industry practices, MEM’s reserves estimates are classified into three
categories according to the probability of their being present: proven, probable and possible.
Proven reserves have at least a 90% chance of being present and probable reserves have at least a
50% chance. Since possible reserves have a mere 10% chance of being present, they are not
included as part of the total available reserves. To avoid supply interruption and gas shortfall
penalties, it has been an industry practice to contract out only from proven reserves. In this study,
the proven reserves are taken to be Peru’s total available reserves in the base case, supplemented
by a sub-scenario that augments the total available reserves by 50% of the probable reserves.
A year before loan approval, IDB commissioned a consulting firm, Apoyo Consultoria (Apoyo),
to conduct a study on Camisea I. According to Apoyo (2007), Peru’s cumulative domestic gas
demand was expected to be 6.5 TCF over the period 2007–2033.23 The composition of demand is
2% by residential users and natural gas vehicles, 15% by industries, 59% by power plants, and
the remaining 23% by the petrochemical sector. For this study, demand past 2033 is assumed to
grow at a constant rate of 2% per year.24
4.1.2 CBA Results for Scenario 1
As will become apparent, Scenario 1 describes the most favourable macro-environment of all
three scenarios. Table 2 summarizes the CBA results.
Table 2: CBA Results Summary - Scenario 1 (2007 estimates) Provena Proven and Probableb
Total available reserves (TCF) 11.8 15.2
Financial analysis
Equity IRR (%) 12.8 12.8
Project IRR (%) 7.6 7.6
Economic analysis million USD million USD
ENPV @ 8% economic discount rate −3,199.9 −967.2
Immediate benefits (+)
CIT (𝐶𝐼𝑇𝑡𝐸) 764.7 764.7
PLNG 66.6 66.6
Upstream suppliers 698.2 698.2
Royalty (𝑅𝑡𝐸) 1,481.8 1,481.8
Opportunity costs (–)
23 Own derivation based on Apoyo (2007). 24 For the period 2007–2033, the implied long-run average demand growth rate in Apoyo (2007) is 8%, which may
not be sustained.
15
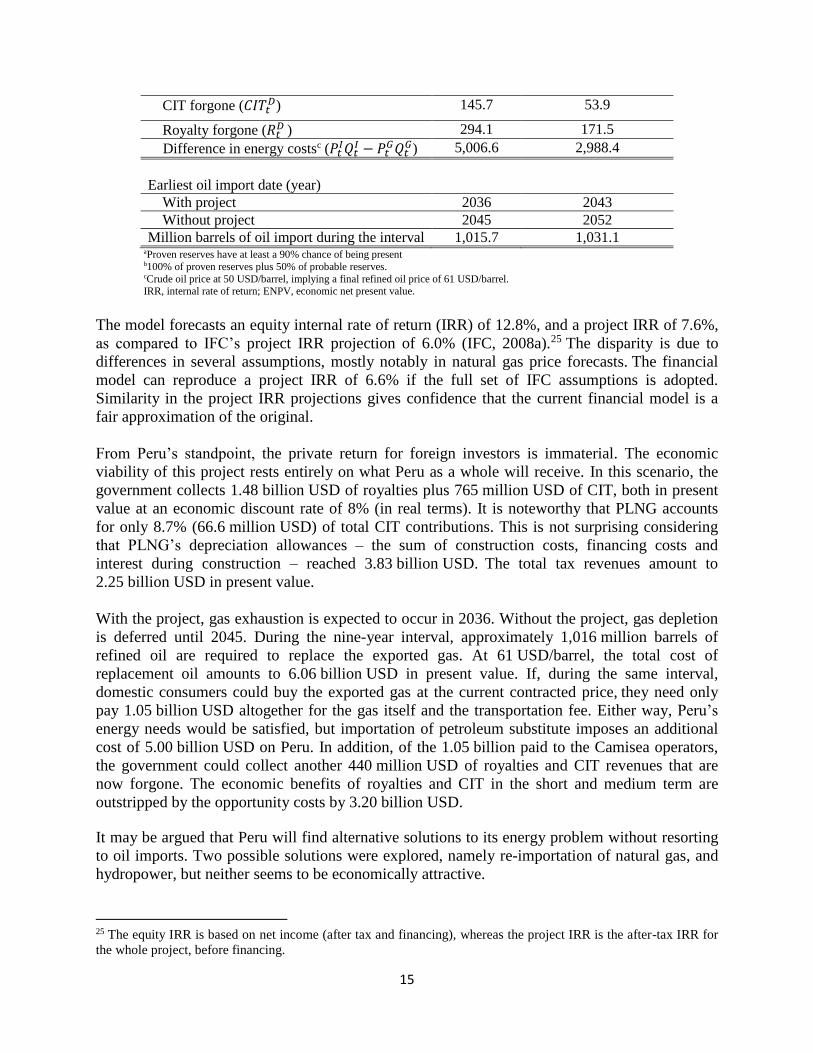
CIT forgone (𝐶𝐼𝑇𝑡𝐷) 145.7 53.9
Royalty forgone (𝑅𝑡𝐷 ) 294.1 171.5
Difference in energy costsc (𝑃𝑡𝐼𝑄𝑡𝐼 − 𝑃𝑡
𝐺𝑄𝑡𝐺) 5,006.6 2,988.4
Earliest oil import date (year)
With project 2036 2043
Without project 2045 2052
Million barrels of oil import during the interval 1,015.7 1,031.1
aProven reserves have at least a 90% chance of being present b100% of proven reserves plus 50% of probable reserves. cCrude oil price at 50 USD/barrel, implying a final refined oil price of 61 USD/barrel. IRR, internal rate of return; ENPV, economic net present value.
The model forecasts an equity internal rate of return (IRR) of 12.8%, and a project IRR of 7.6%,
as compared to IFC’s project IRR projection of 6.0% (IFC, 2008a).25 The disparity is due to
differences in several assumptions, mostly notably in natural gas price forecasts. The financial
model can reproduce a project IRR of 6.6% if the full set of IFC assumptions is adopted.
Similarity in the project IRR projections gives confidence that the current financial model is a
fair approximation of the original.
From Peru’s standpoint, the private return for foreign investors is immaterial. The economic
viability of this project rests entirely on what Peru as a whole will receive. In this scenario, the
government collects 1.48 billion USD of royalties plus 765 million USD of CIT, both in present
value at an economic discount rate of 8% (in real terms). It is noteworthy that PLNG accounts
for only 8.7% (66.6 million USD) of total CIT contributions. This is not surprising considering
that PLNG’s depreciation allowances – the sum of construction costs, financing costs and
interest during construction – reached 3.83 billion USD. The total tax revenues amount to
2.25 billion USD in present value.
With the project, gas exhaustion is expected to occur in 2036. Without the project, gas depletion
is deferred until 2045. During the nine-year interval, approximately 1,016 million barrels of
refined oil are required to replace the exported gas. At 61 USD/barrel, the total cost of
replacement oil amounts to 6.06 billion USD in present value. If, during the same interval,
domestic consumers could buy the exported gas at the current contracted price, they need only
pay 1.05 billion USD altogether for the gas itself and the transportation fee. Either way, Peru’s
energy needs would be satisfied, but importation of petroleum substitute imposes an additional
cost of 5.00 billion USD on Peru. In addition, of the 1.05 billion paid to the Camisea operators,
the government could collect another 440 million USD of royalties and CIT revenues that are
now forgone. The economic benefits of royalties and CIT in the short and medium term are
outstripped by the opportunity costs by 3.20 billion USD.
It may be argued that Peru will find alternative solutions to its energy problem without resorting
to oil imports. Two possible solutions were explored, namely re-importation of natural gas, and
hydropower, but neither seems to be economically attractive.
25 The equity IRR is based on net income (after tax and financing), whereas the project IRR is the after-tax IRR for
the whole project, before financing.

16
A supplementary CBA was conducted under the assumption that, instead of importing petroleum,
Peru will re-import LNG. Equation (3′ ) is still a valid evaluation criterion, except that the
product 𝑃𝑡𝐼𝑄𝑡
𝐼 in the last term now represents the cost of importing LNG and must be re-
estimated. Otherwise, the numerical estimates for other variables are the same as those in Table 2.
Natural gas re-importation would call for the construction of a regasification terminal; the one
built recently in Mexico to make use of Repsol CG’s LNG is estimated to have cost
900 million USD (Samsung, 2012), plus operating and maintenance costs. At the forecasted
long-term natural gas price of 7 USD/MMBtu at Henry Hub, the free on board (FOB) price of
LNG (inclusive of liquefaction at the source country and shipping) for Peru should not be less
than 8 USD/MMBtu. The 4.2 TCF of LNG alone would cost 3.17 billion USD in present value.
When the construction costs of the regasification plant are included, the total cost of imported
gas is around 3.67 billion USD as compared to the cost of Camisea gas for Peruvian gas users,
estimated at 1.05 billion USD. This implies an additional energy cost of 2.25 billion USD. When
the LNG project’s tax revenues and the tax revenues forgone (440 million USD, as reported in
Table 2) are all accounted for, the total opportunity costs amount to 2.65 billion USD. As the
project would generate a gross benefit of 2.25 billion USD of tax revenues for Peru, the
economic net present value (ENPV) in this case would be −438 million USD.
As for hydropower, it is a poor substitute for industries that rely on natural gas as a heating fuel
or a chemical ingredient, constituting 38% of the total demand. This aside, it can be inferred
from Apoyo’s gas demand forecasts that, from 2030 onward, gas-fired power plants will produce
upwards of 36,000 gigawatt-hour (GWh) of electricity each year.26 With an average availability
factor of 0.7, producing the equivalent amount of hydroelectricity would require no less than
5.87 GW of new installed hydropower capacity. To put this figure into perspective, Peru had 23
hydropower plants as of 2012, with a total installed capacity of 3.6 GW (MEM, 2012a). This
implies an additional installed capacity of 160%. It is a challenge in itself to find suitable sites
for the many new hydroplants, not to mention the monetary and environmental costs involved.
Given that Peru has been harnessing hydropower as a major energy source for three decades, it is
likely that hydroplants have already been constructed in the places that are the least expensive to
build.27 To count on hydropower replacing natural gas would imposes great risks on Peru’s
future energy security.
Column 2 of Table 2 presents results for a sub-scenario that adds 50% of the probable reserves to
the total available reserves, now totalling 15.2 TCF. The economic outcome improves drastically.
26 The figure is derived by multiplying the public utilities’ annual demand (MMCF) by the energy content of natural
gas, known as higher heating value (MMBtu/MMCF), and then dividing the product by the heat rate for gas-fired
plants. The heat rate is the amount of energy required to produce one kilowatt hour of electricity (Btu/kWh), which
varies by energy source. As a side note, gas-fired plants are typically more efficient than fuel-oil-fired plants; the
respective heat rates are 8,152 and 10,829 Btu/kWh (EIA, 2013b). The relative inefficiency of oil-fired plants
increases the LNG project’s opportunity costs as more barrels of replacement oil are required for the same amount
of electricity produced by natural gas. 27 Using a sample of 71 hydroelectric projects financed by World Bank from 1965 to 1986, Bacon and Besant-Jones
(1998) estimated that on average hydropower projects experienced a cost overrun of 27%. It can be expected that the
actual construction costs for the 5.87 GW installed capacity will negate the 2.25 billion USD tax revenues the
project is supposed to bring.

17
Increasing the total available reserve defers the earliest with-project importation date to 2043,
thereby reducing the present values of the opportunities costs from 5.45 to 3.21 billion USD.
However, the ENPV remains negative at −967.2 million USD.
4.2 Scenario 2
4.2.1 Overview
The commercial operation of PLNG commenced in mid-2010, in the wake of the 2008 financial
crisis. Scenario 2 gauges the economic contribution of PLNG to the Peruvian economy, given the
evolving circumstances.
Three factors have had a major impact on the project outcome. First, the Henry Hub price of gas
fell considerably since 2007 – from 6.5 to 3.5 USD/MMBtu – as shale gas extraction technology
became economical, bringing an ample supply to the US market. EIA’s latest Henry Hub
forecasts are bleak, with prices ranging from 3.2 to 5.7 USD/MMBtu (in 2012 prices) between
2013 and 2030 (EIA, 2012). Also in 2012 prices, the forecast is that the crude oil price will reach
82 USD/barrel by 2030, which implies a final refined oil price of 101 USD/barrel. In contrast,
Asian LNG prices have risen sharply. In this analysis the gas price in Asia is taken to be
12 USD/MMBtu.
Second, Consorcio Camisea had twice upgraded the reserves estimate, from the initial 10.9 to
14.1 TCF in 2009. The upgraded figures were found to be exaggerated by two consulting
companies that carried out independent assessments of Camisea’s gas reserves. There were no
significant finds between 2008 and 2011, but in 2012 additional proven reserves in the Camisea
fields were indeed confirmed by MEM. Consequently, Peru’s total proven reserves increased to
15.38 TCF as of December 2012. Probable reserves decreased moderately to 5.44 TCF. Since the
projection period in the spreadsheet model starts from 2008, 1.2 TCF of gas is added to 2012’s
proven reserves estimate to account for the volume extracted during the interval. Table 3
presents the quantity of gas that was actually in place in December 2007.
Table 3: Peru’s Updated Reserves Estimates by Reserve Category as of 2007 (TCF)
Natural gas
fields
Provena Probableb Proven and
Probablec
Camisea
Block 56 3.56 0.97 4.05
Block 88 12.02 1.64 12.84
Subtotal 15.58 2.61 16.89
Others 1.00 2.83 2.42
Total 16.57 5.44 19.29 aProven reserves have at least a 90% chance of being present bProbable reserves have at least a 50% chance of being present. c100% of proven reserves plus 50% of probable reserves. Source: self-derivation based on MEM (2013), inclusive of cumulative gas extraction
between 2008 and 2012.
Third, after a decade of promotion, Peruvian industries are taking an active interest in
reequipping their facilities to burn natural gas, only to find that the proven reserves are

18
inadequate for their needs. News of shortages emerged as early as June 2009, before the
commercial operation of PLNG (La Republica, 2009), and domestic gas supply is being rationed.
According to MEM’s latest estimate, the total domestic demand from 2010 to 2040 is 15.8 TCF,
compared with 6.3 TCF between 2007 and 2033 in Scenario 1.28
4.2.2 CBA Results for Scenario 2
CBA results for the second scenario are summarized in Table 4.
Table 4: CBA Results Summary - Scenario 2 (2012 estimates) Provena Proven and Probableb
Total available reserves (TCF) 16.6 19.3
Financial analysis
Equity IRR (%) 8.3 8.3
Project IRR (%) 5.4 5.4
Economic analysis million USD million USD
ENPV @ 8% economic discount rate −4,989.7 −3,481.2
Immediate benefits (+)
CIT (𝐶𝐼𝑇𝑡𝐸) 773.1 773.1
PLNG 24.0 24.0
Upstream suppliers 749.1 749.1
Royalty (𝑅𝑡𝐸) 1,765.4 1,765.4
Opportunity costs (–)
CIT forgone (𝐶𝐼𝑇𝑡𝐷) 171.8 131.7
Royalty forgone (𝑅𝑡𝐷 ) 346.3 265.5
Difference in energy costsc (𝑃𝑡𝐼𝑄𝑡𝐼 − 𝑃𝑡
𝐺𝑄𝑡𝐺) 7,010.0 5,622.5
Earliest oil import date (year)
With project 2036 2040
Without project 2042 2045
Million barrels of oil import during the interval 970.1 1,003.0
aProven reserves have at least a 90% chance of being present b100% of proven reserves plus 50% of probable reserves. c Crude oil price at 82 USD/barrel, implying a final refined oil price of 100 USD/barrel.
IRR, internal rate of return; ENPV, economic net present value.
In this scenario, the equity IRR for PLNG drops to 8.3%. It comes as a surprise that royalty
collection actually increases moderately by 283 million USD, from 1.48 to 1.77 billion, despite
the ailing Henry Hub market. Further analysis traces this counterintuitive result to the risk-
sharing structure embodied in the royalty regime. In essence, royalty is a convex function of
overseas gas price, that is, royalty increases more (less) at the margin at a higher (lower)
overseas price. Given the respective gas prices at Henry Hub and in Asia, the weighted royalty
tax is 0.7076 USD/MMBtu in this scenario, and 0.6997 USD/MMBtu in the previous. Sales to
the booming Asian markets thus make up for the losses at Henry Hub.
28 Own derivation based on MEM (2012b).

19
Alongside 2012’s new discovery that added 3.10 TCF of gas to the proven reserves, the
forecasted domestic demand has grown by 150%. Gas depletion is expected to occur in 2036, as
before, and the quantity of oil replacement (970 million barrels) is similar to that in Scenario 1
(1.02 billion barrels). Both observations indicate that domestic demand growth almost negates
the economic gains, in terms of reducing reliance on oil imports, from new gas discovery.
Nevertheless, additional energy costs rise from 5.00 to 7.01 billion USD owing to rising
forecasted oil prices. Peru forgoes another 518 million USD of royalties and CIT from
counterfactual sales to the domestic market. In summary, while the LNG project is expected to
generate 2.54 billion USD of gross economic benefits, the economic costs total 7.53 billion USD.
Peru will suffer a net economic loss of 4.99 billion USD.
4.3 Scenario 3
4.3.1 Overview
The LNG project’s short history is marked by episodic outbreaks of opposition at various levels
of society. In July 2009, seven Peruvian departments pursued joint legal action against the
federal government’s approval of the project. In place of PLNG, they argued that natural gas
transported through a South Andean pipeline could aid economic development in Southern Peru
(La Jornada, 2009). Demonstrations against the project have been frequent, but in June 2010,
several thousand protestors staged road blocks in the Cusco Region, where the Camisea fields
are located, and were joined by several thousand more in Lima (La Jornada, 2010). In response
to popular protest, former President Alan Garcia issued an executive order that set a minimum
royalty for future LNG contracts (Executive Order Nº 039-2010-EM). He also reinstalled
Fujimori’s order that Camisea developers must guarantee domestic supply for 20 years at the
time of LNG export (Executive Order Nº 053-2010-EM).29 Contract renegotiation was soon
suspended as the current incumbent, president Ollanta Humala, dislodged Garcia from office.
In honouring his pledge to rectify Camisea II, Humala issued an executive order that earmarks
Block 88 for domestic uses (Executive Order N° 008-2012-EM). Export gas can now be sourced
only from Block 56. Renegotiation is likely to take time, as the Camisea developers offered
2.5 TCF of Block 88’s proven reserves – the volume in Block 88 initially committed to the LNG
project – to the lenders group as collateral that backed PLNG’s financing (Gestión, 2011). Legal
issues need to be resolved with international financing institutions before the Camisea developers
can continue negotiation with the government. International financial institutions’ involvement
has the anticipated effect of mitigating policy risks for private investors, but creates obstacles to
Peru correcting a past mistake.
Perhaps the Humala administration was unaware of the latest reserves estimates when issuing the
executive order in mid-2012, but restricting gas export to what is available in Block 56 is
unlikely to have a significant impact. Since Block 56 is estimated to hold 3.56 TCF of proven
reserves, PLNG may still export 85% of the 4.2 TCF intended. Humala can conserve no more
than 0.64 TCF of natural gas for Peru.
4.3.2 CBA Results for Scenario 3
29 See Section 2.2.

20
For completeness, a final CBA analysis was conducted to quantify how the executive order may
help to reduce Peru’s economic loss. The renegotiation is assumed to bring no changes to the tax
regime or to other terms in the licensing agreement. Energy price forecasts, domestic demand
forecasts and reserves estimates are identical to Scenario 2. However, the exportable volume of
natural gas is reduced from 4.2 to 3.56 TCF in the base case, and to 4.05 TCF in the sub-scenario.
In this scenario, the ENPV improves from −4.99 billion to −4.36 billion USD in the base case,
indicating a reduction in economic loss of 628 million USD. For the sub-scenario, the reduction
in loss is negligible.
Table 5: CBA Results Summary - Scenario 3 (2012 estimates) Provena Proven and Probableb
Total available reserves (TCF) 16.6 19.3
Financial analysis
Equity IRR (%) 7.6 8.3
Project IRR (%) 4.9 5.4
Economic analysis million USD million USD
ENPV @ 8% economic discount rate −4,361.3 −3,810.7
Immediate benefits (+)
CIT (𝐶𝐼𝑇𝑡𝐸) 668.1 773.1
PLNG 0 24.0
Upstream suppliers 668.1 749.1
Royalty (𝑅𝑡𝐸) 1,614.7 1,765.4
Opportunity costs (–)
CIT forgone (𝐶𝐼𝑇𝑡𝐷) 151.8 131.7
Royalty forgone (𝑅𝑡𝐷 ) 306.1 265.5
Difference in energy costsc (𝑃𝑡𝐼𝑄𝑡𝐼 − 𝑃𝑡
𝐺𝑄𝑡𝐺) 6,186.2 5,622.4
Earliest oil import date (year)
With project 2037 2040
Without project 2042 2045
Million barrels of oil import during the interval 878.1 1,003.0
aProven reserves have at least a 90% chance of being present b100% of proven reserves plus 50% of probable reserves. c Crude oil price at 82 USD/barrel, implying a final refined oil price of 101 USD/barrel.
IRR, internal rate of return; ENPV, economic net present value.
5. SENSITIVITY ANALYSIS AND DISCUSSION
The analysis results in the previous section depend on the interaction of a set of variables. Since
many parameter values cannot be determined with absolute certainty, sensitivity tests are
conducted to test how changes in several critical variables influence the economic outcome. To
save space, this section only reports the results from one such test for Scenario 2, which reflects
the latest development. The sensitivity test is performed on the price of oil. The results are given
in Table 6. As a reminder, the long-term prices of crude oil and refined oil are 82 and
101 USD/barrel respectively in Scenario 2. The ENPV in the base case is −4.99 billion USD, and

21
is −3.48 billion USD in the sub-scenario. The project is still economically unviable when the
price of refined oil drops to 85 USD/barrel.
Table 6: Sensitivity Analysis on ENPV in Scenario 2 (million USD) Crude oil
(2012 prices)
Refined oil
(2012 prices)
Provena Proven and
Probableb
82 101 −4,989.7 −3,481.2
69 85 −3,690.3 −2,445.8
73 90 −4,098.1 −2,770.8
78 95 −4,505.8 −3,095.7
82 101 −4,989.7 −3,481.2
86 105 −5,321.4 −3,745.5
90 110 −5,729.2 −4,070.5
94 115 −6,137.0 −4,395.4
98 120 −6,544.8 −4,720.3 aProven reserves have at least a 90% chance of being present b100% of proven reserves plus 50% of probable reserves.
The crux of the problem is that Peru receives only a fraction of the LNG sales proceeds, but will
pay a much higher price for petroleum substitutes than it would for Camisea gas, as is apparent
from the following calculation. Table 7 reports the royalty fee for different gas price levels in the
overseas markets. For the same overseas gas price, royalties from sales to Mexico are less than
royalties from sales to Asia because the LNG to Mexico is priced at 3 US cents less than 90% of
the Henry Hub price; recall Repsol CG’s LNG supply agreement with Mexico.
Table 7: Royalty as a Function of Overseas Gas Price (USD/MMBtu) Gas
price
Royalty Gas price Royalty
HH Asia HH Asia
3.00 0.150 0.150 9.00 0.906 1.125
4.00 0.151 0.159 10.00 1.118 1.357
5.00 0.195 0.239 11.00 1.326 1.588
6.00 0.279 0.425 12.00 1.535 1.820
7.00 0.487 0.656 13.00 1.744 2.052
8.00 0.695 0.889 14.00 1.952 2.284
Even when the gas price reaches 14 USD/MMBtu, the government collects a maximum royalty
of 2.28 USD/MMBtu. Based on the terms of the present gas purchase agreements, future
Peruvian consumers will pay a weighted average cost of 2.32 USD/MMBtu for the Camisea gas,
and another 0.66 USD/MMBtu for its transportation to Lima. In contrast, at the refined oil price
of 85 USD/barrel, and given that each barrel of oil contains 5.98 MMBtu, oil replacement will
cost 14.21 USD/MMBtu. On a per-MMBtu basis, oil replacement is 11.23 USD more expensive
than Camisea gas. Peru collects no more than 2.28 USD of royalty but will pay no less than
11.23 USD extra to replace every MMBtu of Camisea gas exported.

22
6. CONCLUSION
It may appear that natural gas that is left underground has little or no immediate value. Following
the same logic, it may also appear that receiving some tax revenues from an LNG project that
exports one third of Peru’s gas reserves is better than conserving the natural gas and receiving
nothing. If such is the basis of comparison, it is understandable why the government gave the
green light to the project, and why development banks approved loans to PLNG. However,
projects cannot be evaluated solely on the basis of their immediate gross benefits without regard
to the potential opportunity costs. If only the gross benefits are considered, one might be
impressed by the billions in royalties and CIT revenues generated for Peru. However, the billions
of tax revenues are dwarfed by the billions more incurred on importing petroleum substitutes.
When Peru exhausts its natural gas resources, the private investors of the Camisea project will
seek better opportunities in other countries. By that time, Peru will have followed in the footsteps
of Indonesia, which, having exhausted much of its petroleum resources amidst growing domestic
demand, lapsed from being a net oil exporter to become a net importer in 2004. Since then, the
rising oil price has forced the Indonesian government to divert an increasing share of public
funds to subsidise fuel (Ministry of Finance of Indonesia, 2010; The Economist, 2013). With or
without subsidy, it will be the future generation of Peruvians that pay for the current generation’s
mistake. According to Scenario 2’s estimate, PLNG will generate a rate of return on equity of
8.3%, which is marginally satisfactory in compensating for the capital investment and the risks
involved. By lending to PLNG, IDB and IFC have done Peru a disservice, though ironically, to
the benefit of none.
REFERENCES
Accion Ciudadana Camisea, (n.d.). Camisea Project Background. Retrieved Dec. 19, 2013, from
http://www.accionciudadanacamisea.org/antecedentes.htm
Amazon Watch, 2008. Letter to IFC Executive Directors. Retrieved Dec. 19, 2013, from Weed-
online.org: http://www2.weed-
online.org/uploads/letter_to_european_executive_directors.pdf
Apoyo Consultoria, 2007. Camisea Project, Impact on the Natural Gas Market and Economic
Impact Estimate. Retrieved Dec. 19, 2013, from
http://www.vigilamazonia.com/uploads/files/ba3523e7d1fb847326cbb303d4ea8103.pdf
Bacon, R., Besant-Jones J., 1998. Estimating Construction Costs and Schedules: Experience with
Power Generation Projects in Developing Countries. Energy Policy 26(4), 317-333.
Banco Wiese Sudameris, 2002. Gas de Camisea: Retos y oportunidades de un proyecto país.
Retrieved Dec. 19, 2013, from
http://www.wiese.com.pe/i_financiera/pdf/especial/20021127_esp_es_Camisea.pdf

23
Beychok, M., 2012. Heat of Combustion. Retrieved Dec. 19, 2013, from Encyclopedia of Earth:
http://www.eoearth.org/article/Heat_of_combustion?topic=49557
Chakravorty, U., Moreaux, M., Tidball, M., 2008. Ordering the Extraction of Polluting
Nonrenewable Resources. Am. Econ. Rev. 98(3), 1128–1144.
Daubanes, J., 2011. Optimal Taxation of a Monopolistic Extractor: Are Subsidies Necessary.
Energ. Econ. 33(3), 399–403.
Doshi, T., 2013. The Asia-Pacific in the “Golden Age of Gas”: Implications for Middle East
LNG Exporters. Retrieved Dec. 19, 2013, from The Middle East Institute:
http://www.mei.edu/content/asia-pacific-golden-age-gas-implications-middle-east-lng-
exporters
Energy Information Administration (EIA), 2012. Annual Energy Outlook 2013 Early Release
Report. Retrieved Dec. 19, 2013, from
http://www.eia.gov/forecasts/aeo/er/pdf/0383er(2013).pdf
Energy Information Administration (EIA), 2013a. Gasoline and Diesel Fuel Update. Retrieved
Dec. 19, 2013, from http://www.eia.gov/todayinenergy/detail.cfm?id=470
Energy Information Administration (EIA), 2013b. Average Operating Heat Rate for Selected
Energy Sources. Retrieved Dec. 19, 2013, from
http://www.eia.gov/electricity/annual/html/epa_08_01.html
Executive Order N° 040-99-EM, 1999. Approve Regulation of Law of Promotion for
Development of the Natural Gas Industry (Sept. 14). Retrieved Dec. 19, 2013, from
www.perupetro.com.pe:
http://www.perupetro.com.pe/wps/wcm/connect/891b5b004aadc6f98a69debc7b4e96c3/S
.D.+N%C2%B0+040-99-
EM+Regulation+of+the+Law+N%C2%B0+27133.doc?MOD=AJPERES&lmod=150353
1984&CACHEID=891b5b004aadc6f98a69debc7b4e96c3&lmod=1503531984&CACHE
ID=891b5b004aadc6f98a69de
Executive Order N° 050-2005-EM, 2005. Authorize PeruPetro S.A. to negotiate contractual
amendment to ensure domestic market supply in the export activities of natural gas (Nov.
13). Retrieved Dec. 19, 2013, from www.perupetro.com.pe:
http://www.perupetro.com.pe/wps/wcm/connect/567b5c004a30d026ad10fdc98c102298/S
upreme+Decree+N%C2%BA+050-2005-EM.docx?MOD=AJPERES&lmod=-
2013939411&CACHEID=567b5c004a30d026ad10fdc98c102298&lmod=-
2013939411&CACHEID=567b5c004a30d026ad10fdc98c102298&lmod=-2013
Executive Order N° 039-2010-EM, 2010. Establish minimum value for the natural gas royalty in
case of export (July 6). Retrieved Dec. 19, 2013, from www.perupetro.com.pe:
https://www.google.com/url?sa=t&rct=j&q=&esrc=s&source=web&cd=1&ved=0CCoQ
FjAA&url=http%3A%2F%2Fwww.perupetro.com.pe%2Fwps%2Fwcm%2Fconnect%2F

24
ff54e5804a30dda0ad41fdc98c102298%2FSupreme%2BDecree%2BN%25C2%25BA%2
B039-2010-EM.docx%3FMOD%3DAJPERES%26lmod%3D-2012
Executive Order N° 053-2010-EM 2010. Not repeal the S.D. Nº 050-2005-EM (Aug. 18).
Retrieved Dec. 19, 2013, from www.perupetro.com.pe:
http://www.perupetro.com.pe/wps/wcm/connect/c0b595804a30e1bbad53fdc98c102298/S
upreme+Decree+N%C2%BA+053-2010-EM.docx?MOD=AJPERES&lmod=-
2012006142&CACHEID=c0b595804a30e1bbad53fdc98c102298&lmod=-
2012006142&CACHEID=c0b595804a30e1bbad53fdc98c102298&;>
Executive Order N° 008-2012-EM, 2012. Amending the License Contract for Block 88 (Apr. 4).
Retrieved Dec. 19, 2013, from www.perupetro.com.pe:
http://www.perupetro.com.pe/wps/wcm/connect/62f561004adf0cb49874dcbc7b4e96c3/S
upreme+Decree+N%C2%B0+008-2012-EM.docx?MOD=AJPERES&lmod=-
1403708830&CACHEID=62f561004adf0cb49874dcbc7b4e96c3&lmod=-
1403708830&CACHEID=62f561004adf0cb49874dcbc7b4e96c3&lmod=-1403
Gaffney, Cline & Associates (GCA), 2009a. Reserve and Resource Statement: Camisea Fields
Block 56 (Peru). Retrieved Dec. 19, 2013, from www.minem.gob.pe:
http://www.minem.gob.pe/minem/archivos/file/Hidrocarburos/Certificacion%20Reservas
%20Lotes%2056%20y%2088/reserva_lote56.pdf
Gaffney, Cline & Associates (GCA), 2009b. Reserve and Resource Statement: Camisea Fields
Block 88 (Peru). Retrieved Dec. 19, 2013, from www.minem.gob.pe:
http://www.minem.gob.pe/minem/archivos/file/Hidrocarburos/Certificacion%20Reservas
%20Lotes%2056%20y%2088/reservas_lote88.pdf
Gamboa, C., Cueto, V., Dávila, J., 2008. Análisis de los Contratos del Gas de Camisea:
Lecciones Aprendidas sobre Cómo Negociar con Nuestros Recursos Naturales (Lotes 88
y 56). Derecho, Ambiente Y Recursos Naturales (DAR).
Gestión, 2009a. Aumentan las reservas probadas de gas natural en Camisea. Retrieved Dec. 19,
2013, from http://gestion.pe/noticia/299258/aumentan-reservas-probadas-gas-natural-
camisea
Gestión, 2009b. Pluspetrol estudia el abastecimiento de gas a nuevas empresas. Retrieved Dec.
19, 2013, from http://gestion.pe/noticia/305181/pluspetrol-estudia-abastecimiento-gas-
nuevas-empresas
Gestión, 2011. Postergan negociación con Camisea otros cuatro meses. Retrieved Dec. 19, 2013,
from http://gestion.pe/noticia/1348408/postergan-negociacion-camisea-otros-cuatro-
meses
Herfindahl, O., 1967. Depletion and Economic Theory, in: Gaffney, M. (Ed.), Extractive
Resources and Taxation, 63–90.
25
Hotelling, H., 1931. The economics of exhaustible resources. J. Polit. Econ. 39(2), 137–175.
Im, E. I., Chakravorty, U., Roumasset, J., 2006. Discontinuous extraction of a nonrenewable
resource. Econ. Lett. 90(1), 6–11.
Inter-American Development Bank (IDB), 2006. IDB signs mandate letter to consider financing
liquefied natural gas project in Perú (July 24). Retrieved Dec. 19, 2013, from
http://www.iadb.org/en/news/webstories/2006-07-24/idb-signs-mandate-letter-to-
consider-financing-liquefied-natural-gas-project-in-peru,3199.html
Inter-American Development Bank (IDB), 2007. IDB approves US$400 million loan for Peru
LNG project (Dec. 19). Retrieved Dec. 19, 2013, from
http://www.iadb.org/en/news/news-releases/2007-12-19/idb-approves-us400-million-
loan-for-peru-lng-project,4245.html
International Finance Corporation (IFC), 2008a. Peru LNG Project Appraisal Report.
International Finance Corporation (IFC).
International Finance Corporation (IFC), 2008b. IFC Board Approves Gas Investment to Support
Economic Growth in Peru Project is Largest Foreign Direct Investment in the Country’s
History. Retrieved Dec. 19, 2013, from
http://www.ifc.org/IFCExt/pressroom/IFCPressRoom.nsf/0/2B18F83B4F072107852573
E6005C8783?OpenDocument
Jenkins, G., 2007. Analysis of the Peru LNG Project. Development Discussion Paper 2007-05,
John Deutsch International, Queen’s University. Retrieved Dec. 19, 2013, from
http://www.queensjdiexec.org/publications/qed_dp_225.pdf
Kennedy, C., 2013. Cheniere Clinches 20-Year LNG Deal with Indonesia. Retrieved Dec. 19,
2013, from http://oilprice.com/Finance/investing-and-trading-reports/Cheniere-Clinches-
20-Year-LNG-Deal-with-Indonesia.html
La Jornada, 2009. Rechazan en Perú vender gas a México. Retrieved Dec. 19, 2013, from
http://www.jornada.unam.mx/2009/07/19/economia/023n2eco
La Jornada, 2010. Exigen peruanos que el gas de Camisea se use dentro del país. Retrieved Dec.
19, 2013, from http://www.jornada.unam.mx/2010/06/18/economia/026n1eco
La Republica, 2009. ‘Inflaron’ las reservas de Camisea y no hay gas para la industria nacional.
Retrieved Dec. 19, 2013, from http://www.larepublica.pe/21-06-2009/inflaron-las-
reservas-de-camisea-y-no-hay-gas-para-la-industria-nacional
Ministry of Energy and Mines (MEM), Peru, 2000. Contrato de Licencia Para Explotacion de
Hidrocarburos - Lote 88. Retrieved Dec. 19, 2013, from
http://www.minem.gob.pe/minem/archivos/file/Hidrocarburos/Legislacion/Contratos%20

26
y%20Convenios%20DGH%20(Actualizado%20oct.%202010)/CONTRATO%20DE%20
LICENCIA%20LOTE%2088/1.%20(CONTRATO)%20DS%20N%C2%BA%20021-
2000-EM.pdf
Ministry of Energy and Mines (MEM), Peru, 2008. Libro Anual de Reservas al 31 de Diciembre
Del 2007. Retrieved Dec. 19, 2013, from
http://www.minem.gob.pe/minem/archivos/file/Hidrocarburos/publicaciones/Publicacion
es%202011/ResumEjec_2007(1).pdf
Ministry of Energy and Mines (MEM), Peru, 2012a. Subsector Electrico Documento Promotor.
Retrieved Dec. 19, 2013, from
http://www.minem.gob.pe/archivos/Documento_Promotor_2012.pdf
Ministry of Energy and Mines (MEM), Peru, 2012b. Elaboración de la Nueva Matriz Energética
Sostenible y Evaluación Ambiental Estratégica, como Instrumentos de Planificación.
Retrieved Dec. 19, 2013, from
http://www.minem.gob.pe/minem/archivos/file/DGEE/eficiencia%20energetica/publicaci
ones/guias/Informe_completo_Estudio_NUMES.pdf
Ministry of Energy and Mines (MEM), Peru, 2013. Libro Anual De Reservas de Hidrocarburos
Resumen Ejecutivo al 31 De Diciembre Del 2012. Retrieved Dec. 19, 2013, from
http://www.minem.gob.pe/minem/archivos/file/Hidrocarburos/publicaciones/R_E_%20Li
bro%20de%20Reservas%2031_12_2012.pdf
Ministry of Finance, Indonesia, 2010. Fuel Subsidy Policy in Indonesia. Retrieved Dec. 19, 2013,
from International Institute for Sustainable Development:
http://www.iisd.org/gsi/sites/default/files/ffs_gsiunepconf_sess2_askolani.pdf
Munilla, I., 2010. People, power, and pipelines: Lessons from Peru in the governance of gas
production revenues. Retrieved Dec. 19, 2013, from World Resources Institute:
http://www.bicusa.org/wp-content/uploads/2013/01/People_Power_Pipelines.pdf
National Congress of the Republic of Peru, §Law N° 27133, 1999. Law of Promoting the
Development of the Natural Gas Industry. Retrieved Dec. 19, 2013, from
http://www.perupetro.com.pe/wps/wcm/connect/40f104004aadc47f8a58debc7b4e96c3/L
aw+N%C2%B0+27133+Law+of+Promotion+for+Development+of+Natural+Gas+Indust
ry.doc?MOD=AJPERES&lmod=1503216542&CACHEID=40f104004aadc47f8a58debc7
b4e96c3&lmod=1503216542&CACHEID=40f104
Netherland, Sewell and Associates Inc. (NSAI), 2010. Reserves and Resources Evaluation -
Block 88 and Block 56 Final Presentation. Presentation slides.
Oil & Gas Journal (OGJ), 2011(June). Eni sees LNG potential in gas discoveries off Ghana.
Retrieved Dec. 19, 2013, from http://www.ogj.com/articles/2011/07/eni-sees-lng-
potential.html

27
Oil & Gas Journal (OGJ), 2012a (Oct.). Canadian company floats LNG export from Nova Scotia.
Retrieved Dec. 19, 2013, from http://www.ogj.com/articles/2012/10/canadian-company-
floats-lng-export-from-nova-scotia.html
Oil & Gas Journal (OGJ), 2012b (Nov.). Permits sought for South Texas LNG export. Retrieved
Dec. 19, 2013, from http://www.ogj.com/articles/2012/11/permits-sought-for-south-
texas-lng-export.html
Oil & Gas Journal (OGJ), 2012c (Dec.). Anadarko, Eni agreement advances Mozambique LNG
project. Retrieved Dec. 19, 2013, from http://www.ogj.com/articles/2012/12/anadarko-
eni-agreement-advances-anadarkos-mozambique-lng-project.html
Oil & Gas Journal (OGJ), 2013a (Sept.). Initial contracts awarded for Russian Far East LNG
project. Retrieved Dec. 19, 2013, from http://www.ogj.com/articles/2013/09/initial-
contracts-awarded-for-russian-far-east-lng-project.html
Oil & Gas Journal (OGJ), 2013b (Oct.). Alaska LNG project selects terminal location. Retrieved
Dec. 19, 2013, from http://www.ogj.com/articles/2013/10/alaska-lng-project-selects-
terminal-location.html
Oil & Gas Journal (OGJ), 2013c (Oct.). Undecided policies key to gas exports from Israel,
Cyprus. Retrieved Dec. 19, 2013, from http://www.ogj.com/articles/2013/10/undecided-
policies-key-to-gas-exports-from-israel-cyprus.html
Oil & Gas Journal (OGJ), 2013d (Nov.). MOU advances Cyprus LNG export prospects.
Retrieved Dec. 19, 2013, from http://www.ogj.com/articles/2013/11/mou-advances-
cyprus-lng-export-prospects.html
Oil & Gas Journal (OGJ), 2013e (Nov.). NEB: Canadian LNG exports possible in 2019.
Retrieved Dec. 19, 2013, from http://www.ogj.com/articles/2013/11/neb-canadian-lng-
exports-possible-in-2019.html
Oil Drum, 2011. Shell’s Floating LNG Project – A Game Changer for the Energy Industry.
Retrieved Dec. 19, 2013, from http://oilprice.com/Energy/Natural-Gas/Shells-Floating-
LNG-Project-A-Game-Changer-For-The-Energy-Industry.html
Ozkan, S., Ozkan, E., 2013. Integrating Price Path Uncertainty Into Optimal Extraction Path
Analysis of Unconventional Liquids Rich Reservoirs. Conference paper, 75th EAGE
Conference & Exhibition incorporating SPE EUROPEC 2013.
Peru LNG (PLNG), 2009. Peru LNG: A Grassroots Gas Liquefaction Project Optimized for Cost
in Difficult Times. Retrieved Dec. 19, 2013, from
http://www.igu.org/html/wgc2009/papers/docs/wgcFinal00139.pdf
28
PeruPetro, 2013. Natural Gas Royalties for Export, 2010 to 2013. Retrieved Dec. 19, 2013, from
http://www.perupetro.com.pe/wps/wcm/connect/perupetro/site-
en/ImportantInformation/Statistics/Natural%20Gas%20Royalties%20For%20Export
Roumasset, J., Wada, C., 2012. Ordering the extraction of renewable resources: The case of
multiple aquifers. Resour. Energy Econ. 34(1), 112–128.
Samsung, 2012. Samsung C&T Completes LNG Terminal in Mexico. Retrieved Dec. 19, 2013,
from Samsungvillage.com: http://www.samsungvillage.com/blog/2012/03/samsungblog-
samsung-ct-completes-lng-terminal-in-mexico.html
Sistema Nacional De Inversión Pública (SNIP), 2012. Guias, Pautas Metodologicas Generales,
Anexo SNIP 10: Parametros de Evaluacion. Retrieved Dec. 19, 2013, from Ministry of
Economy and Finance (MEF):
http://www.mef.gob.pe/contenidos/inv_publica/docs/anexos/new_direc/v12/05.3_Anexo_
SNIP_10_modificado_por_RD_006-2012.pdf
Society of Petroleum Engineers (SPE), 2007. SPE Petroleum Resources Management System.
Retrieved Dec. 19, 2013, from
http://www.spe.org/industry/docs/PRMS_guide_non_tech.pdf
The Economist, 1998 (Apr. 2). The Camisea shock. Retrieved Dec. 19, 2013, from
http://www.economist.com/node/361118
The Economist, 2013 (June 22). Unpriming the pump: Fuel Subsidies in Indonesia. Retrieved
Dec. 19, 2013, from http://www.economist.com/news/asia/21579885-sound-economics-
lousy-politics-unpriming-pump
Vences, V., 2006. Camisea Project: a Multi-Stakeholder Perspective on Conflicts and
Negotiation. Retrieved Dec. 19, 2013, from
https://gpc.stanford.edu/sites/default/files/wp027_0.pdf