Performance Evaluation on the Action Plan of Air Pollution ...
Upload
independentCategory
view
0download
0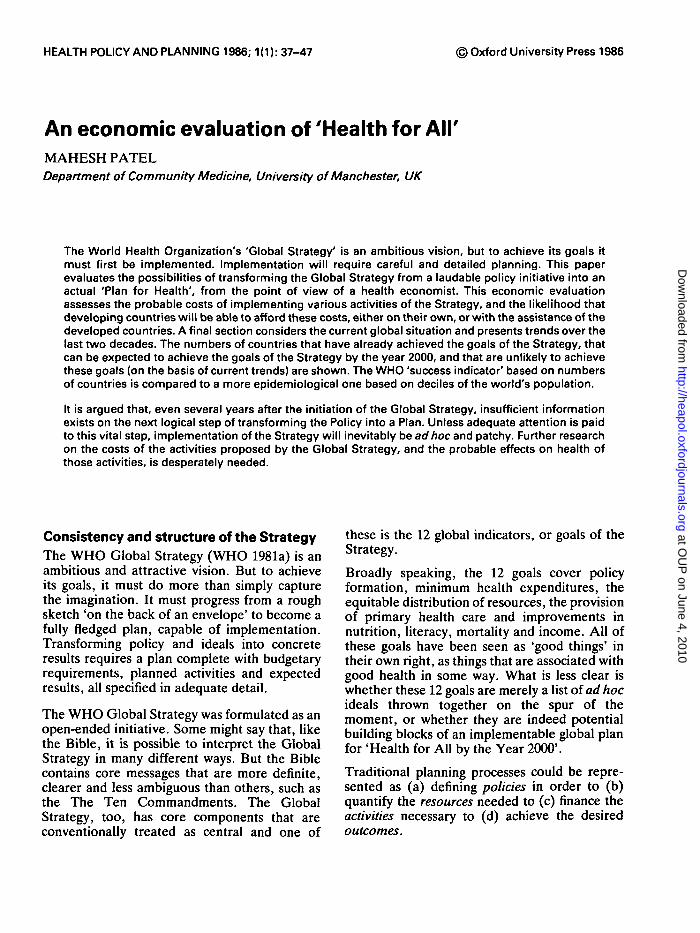
HEALTH POLICY AND PLANNING 1986; 1(1): 37-47 © Oxford University Press 1986
An economic evaluation of 'Health for AirMAHESH PATELDepartment of Community Medicine, University of Manchester, UK
The World Health Organization's 'Global Strategy' is an ambitious vision, but to achieve its goals itmust first be implemented. Implementation will require careful and detailed planning. This paperevaluates the possibilities of transforming the Global Strategy from a laudable policy initiative into anactual 'Plan for Health', from the point of view of a health economist. This economic evaluationassesses the probable costs of implementing various activities of the Strategy, and the likelihood thatdeveloping countries will be able to afford these costs, either on their own, or with the assistance of thedeveloped countries. A final section considers the current global situation and presents trends over thelast two decades. The numbers of countries that have already achieved the goals of the Strategy, thatcan be expected to achieve the goals of the Strategy by the year 2000, and that are unlikely to achievethese goals (on the basis of current trends) are shown. The WHO 'success indicator' based on numbersof countries is compared to a more epidemiological one based on deciles of the world's population.
It is argued that, even several years after the initiation of the Global Strategy, insufficient informationexists on the next logical step of transforming the Policy into a Plan. Unless adequate attention is paidto this vital step, implementation of the Strategy will inevitably be ad hoc and patchy. Further researchon the costs of the activities proposed by the Global Strategy, and the probable effects on health ofthose activities, is desperately needed.
Consistency and structure of the StrategyThe WHO Global Strategy (WHO 1981a) is anambitious and attractive vision. But to achieveits goals, it must do more than simply capturethe imagination. It must progress from a roughsketch 'on the back of an envelope' to become afully fledged plan, capable of implementation.Transforming policy and ideals into concreteresults requires a plan complete with budgetaryrequirements, planned activities and expectedresults, all specified in adequate detail.
The WHO Global Strategy was formulated as anopen-ended initiative. Some might say that, likethe Bible, it is possible to interpret the GlobalStrategy in many different ways. But the Biblecontains core messages that are more definite,clearer and less ambiguous than others, such asthe The Ten Commandments. The GlobalStrategy, too, has core components that areconventionally treated as central and one of
these is the 12 global indicators, or goals of theStrategy.
Broadly speaking, the 12 goals cover policyformation, minimum health expenditures, theequitable distribution of resources, the provisionof primary health care and improvements innutrition, literacy, mortality and income. All ofthese goals have been seen as 'good things' intheir own right, as things that are associated withgood health in some way. What is less clear iswhether these 12 goals are merely a list of ad hocideals thrown together on the spur of themoment, or whether they are indeed potentialbuilding blocks of an implementable global planfor 'Health for All by the Year 2000'.
Traditional planning processes could be repre-sented as (a) defining policies in order to (b)quantify the resources needed to (c) finance theactivities necessary to (d) achieve the desiredoutcomes.
at OU
P on June 4, 2010
http://heapol.oxfordjournals.orgD
ownloaded from
38 Mahesh Patel
Table 1. Matching the WHO goals with a rational planning process
Policies
1 Nationalendorsement ofHFA/2000 policy
2 Mobilization ofcommunity andinterest groups
Resources Activities Results
3 5%ofGNPtohealth
4 Emphasis onbasic care
5 Equitabledistribution ofstaff andresources
6 International aidsupport
7.1 Safe water for all7.2 Immunization
coverage7.3 Local health care
for all7.4 Material and
child health
8 Nutrition9 IMR < 50/1000
10 Life expectancy>60
11 Literacy > 70%12 GNP per capita,
> US$ 500
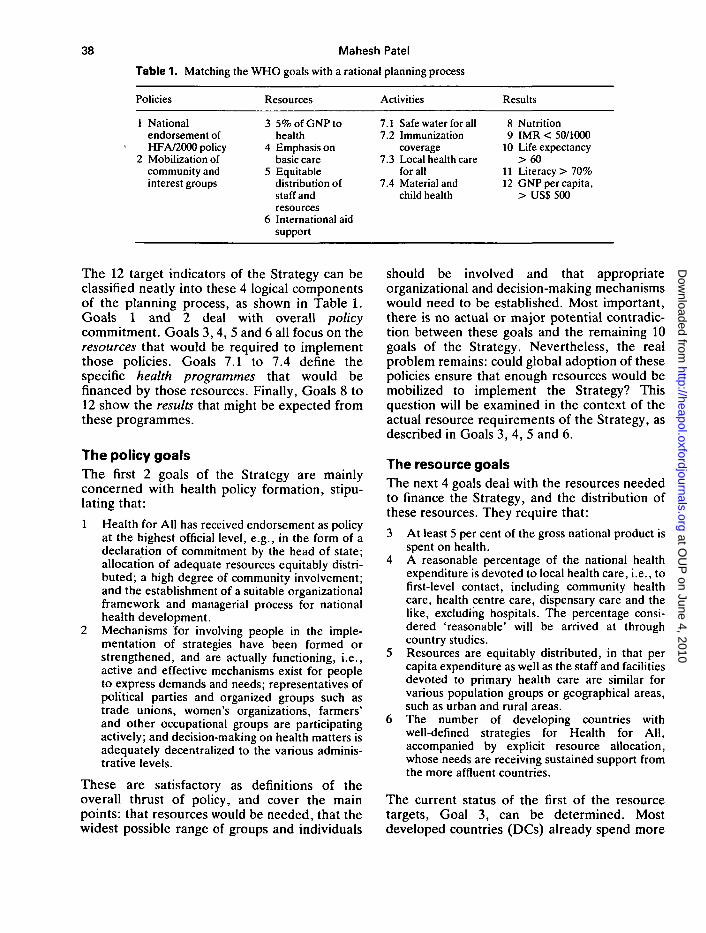
The 12 target indicators of the Strategy can beclassified neatly into these 4 logical componentsof the planning process, as shown in Table 1.Goals 1 and 2 deal with overall policycommitment. Goals 3, 4, 5 and 6 all focus on theresources that would be required to implementthose policies. Goals 7.1 to 7.4 define thespecific health programmes that would befinanced by those resources. Finally, Goals 8 to12 show the results that might be expected fromthese programmes.
The policy goalsThe first 2 goals of the Strategy are mainlyconcerned with health policy formation, stipu-lating that:
1 Health for All has received endorsement as policyat the highest official level, e.g., in the form of adeclaration of commitment by the head of state;allocation of adequate resources equitably distri-buted; a high degree of community involvement;and the establishment of a suitable organizationalframework and managerial process for nationalhealth development.
2 Mechanisms for involving people in the imple-mentation of strategies have been formed orstrengthened, and are actually functioning, i.e.,active and effective mechanisms exist for peopleto express demands and needs; representatives ofpolitical parties and organized groups such astrade unions, women's organizations, farmers'and other occupational groups are participatingactively; and decision-making on health matters isadequately decentralized to the various adminis-trative levels.
These are satisfactory as definitions of theoverall thrust of policy, and cover the mainpoints: that resources would be needed, that thewidest possible range of groups and individuals
should be involved and that appropriateorganizational and decision-making mechanismswould need to be established. Most important,there is no actual or major potential contradic-tion between these goals and the remaining 10goals of the Strategy. Nevertheless, the realproblem remains: could global adoption of thesepolicies ensure that enough resources would bemobilized to implement the Strategy? Thisquestion will be examined in the context of theactual resource requirements of the Strategy, asdescribed in Goals 3, 4, 5 and 6.
The resource goalsThe next 4 goals deal with the resources neededto finance the Strategy, and the distribution ofthese resources. They require that:
3 At least 5 per cent of the gross national product isspent on health.
4 A reasonable percentage of the national healthexpenditure is devoted to local health care, i.e., tofirst-level contact, including community healthcare, health centre care, dispensary care and thelike, excluding hospitals. The percentage consi-dered 'reasonable' will be arrived at throughcountry studies.
5 Resources are equitably distributed, in that percapita expenditure as well as the staff and facilitiesdevoted to primary health care are similar forvarious population groups or geographical areas,such as urban and rural areas.
6 The number of developing countries withwell-defined strategies for Health for All,accompanied by explicit resource allocation,whose needs are receiving sustained support fromthe more affluent countries.
The current status of the first of the resourcetargets, Goal 3, can be determined. Mostdeveloped countries (DCs) already spend more
at OU
P on June 4, 2010
http://heapol.oxfordjournals.orgD
ownloaded from
An economic evaluation of 'Health for AM' 39
than 5 per cent of GNP on health so it isunnecessary to consider them here. Neverthe-less, it is worth noticing that the target is quitedemanding. About 10 years after the end of theSecond World War, as recently as themid-1950s, many DCs spent less than 5 per centof national income on health. Known examplesinclude Belgium, Canada, Denmark, Englandand Wales, France, The Netherlands, NewZealand, Norway and the United States.
A number of estimates of health expenditures ofdeveloping countries (DgCs) are available. Themost comprehensive, in terms of the number ofcountries covered, is that of the World Bank(1982) which estimated that most developingcountries spend between 0.2 per cent and 4 percent of GNP on health. The weighted averagefor the least developed countries was 0.4 percent of GNP, and for middle income developingcountries, 1.1 per cent of GNP.
This is far below the 5 per cent required by theWHO Strategy. But the World Bank estimatesof expenditures may be too low, as only centralpublic health expenditures are considered. Localhealth expenditures, and all national expendi-tures on health in the wider sense (includingwater and sanitation), are omitted from theestimate.
Another World Bank estimate placed theoverall expenditure on health by DgCs atUS$ 75 billions (World Bank 1980). This mustsurely be an overestimate. Total GNP of alldeveloping countries at that time was only aboutUS$ 1920 billions (World Bank 1981). On thatbasis, DgCs would have been spending 4 percent of GNP on health already!
Gish (1982) estimated that DgCs (non-socialist)spent somewhere between US$ 15 billion andUS$ 30 billion (or 1-2 per cent of GNP) onhealth. The lower end of this range is probably aminimal estimate as it is only slightly more thanknown expenditure of US$ 12.7 billion by DgCsas a whole on Pharmaceuticals alone (IMS1982). Patel (1983a) estimated that totalexpenditures were 2 per cent of GDP. This is theupper limit of the range proposed by Gish.Clearly, however, these estimates are really nobetter than guess-estimates, and all that can besaid is that the truth probably lies somewhere inthat range.
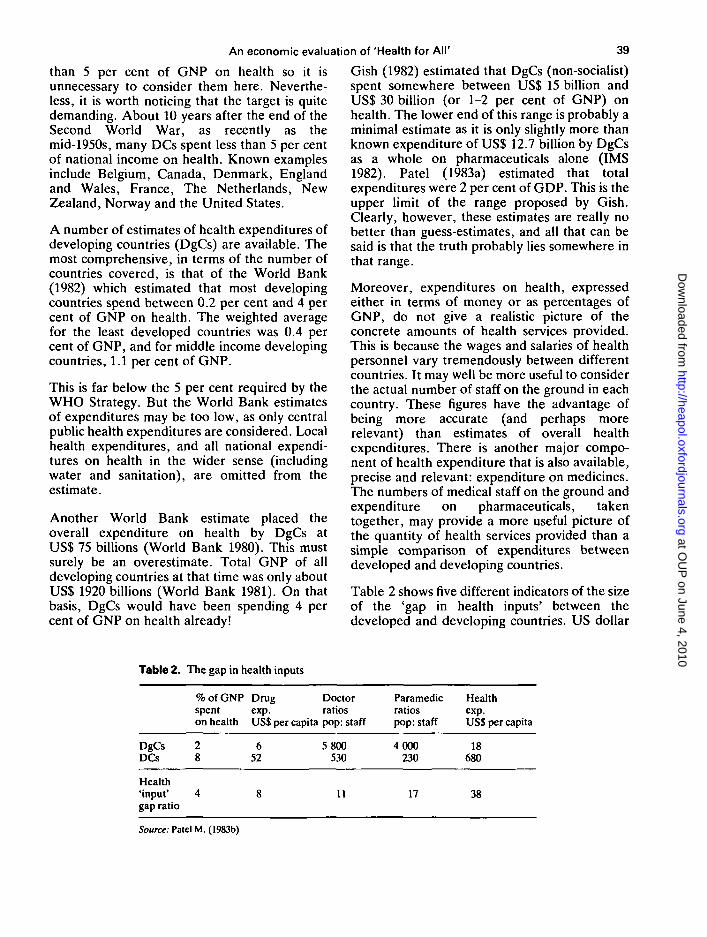
Moreover, expenditures on health, expressedeither in terms of money or as percentages ofGNP, do not give a realistic picture of theconcrete amounts of health services provided.This is because the wages and salaries of healthpersonnel vary tremendously between differentcountries. It may well be more useful to considerthe actual number of staff on the ground in eachcountry. These figures have the advantage ofbeing more accurate (and perhaps morerelevant) than estimates of overall healthexpenditures. There is another major compo-nent of health expenditure that is also available,precise and relevant: expenditure on medicines.The numbers of medical staff on the ground andexpenditure on pharmaceuticals, takentogether, may provide a more useful picture ofthe quantity of health services provided than asimple comparison of expenditures betweendeveloped and developing countries.
Table 2 shows five different indicators of the sizeof the 'gap in health inputs' between thedeveloped and developing countries. US dollar
Table 2.
DgCsDCs
Health'input'gap ratio
The gap in health inputs
% of GNPspenton health
28
4
Drugexp.US$ per capita
652
8
Doctorratiospop: staff
5 800530
11
Paramedicratiospop: staff
4000230
17
Healthexp.US$ per capita
18680
38
Source: Patel M. (1983b)
at OU
P on June 4, 2010
http://heapol.oxfordjournals.orgD
ownloaded from
40 Mahesh Patel
expenditures alone would grossly overestimatethe true size of this gap because staff are cheaperin DgCs than in DCs. On the other hand,percentages of GNP would grossly underesti-mate the extent of the gap, as the GNPs differ sogreatly. A central estimate based on all fiveindicators might show between 10 and 15 timesmore health inputs in the DCs than in the DgCs.It is to be hoped that the WHO Strategy willaddress itself to the magnitude of this gap. If, forexample, it was deemed desirable to halve thisreal gap by the year 2000, then a sixfold increasein resources devoted to health would berequired. A sixfold increase in health expendi-tures would be very difficult for DgCs to achieveand it is unlikely that such a dramatic increasecould be financed purely from national re-sources.
The obvious candidates to give assistance are theDCs, and it is to precisely this issue that the 6thgoal addresses itself. About 25 per cent of theworld's population lives in developed countriesand produces and consumes about 80 per cent oftotal world output. Only 1 per cent of the GNPsof DCs is about 0.8 per cent of world output -equal to 4 per cent of the total GNPs of theDgCs. Developing countries already spend 2 percent of GNP on health (on average). So if DCseach gave 1 per cent of GNP to improve healthin DgCs the 3rd goal of a target expenditure of 5per cent could be met without any increasedspending by DgCs. This event is unlikely.Developed countries will not give a total of 1 percent of their GNPs for health. Persuading theDCs to give even 0.5 per cent of GNP for all(health and non-health) aid projects, seems tobe a difficult task. (This difficulty is aggravatedby the fact health aid has frequently beenassociated with the construction of hospitals(Hoadley 1980) rather than PHC programmes.)So the 3rd goal can not be achieved byinternational aid alone.
On the other hand, DgCs could increase theirown expenditures on health. Might increases inexpenditures by DgCs and international aidtogether achieve the 5 per cent of GNP target?This too must be considered unlikely. Each 0.25per cent of the GNP of DCs offered as health aidwould increase the resources devoted to healthin DgCs by 1 per cent of their GNPs. Ifinternational health aid transfers at the 0.25 per
cent level actually materialized, then the 3rdgoal would still require DgCs to double theirown expenditures on health from 2 per cent to 4per cent of GNP on average. Both of theseincreases, in domestic expenditures and ininternational aid, though possible, must bejudged unlikely. So some overall resourceshortage is probable for the 5 per cent goal. Thesixfold increase in resources required to halvethe real 'health gap' between the North and theSouth must, on this basis, be judged even moreunlikely to become available.
One means of decreasing the 'health gap' interms of concrete services provided, withoutincurring proportionate expenditure increases,would be to concentrate pharmaceutical expend-itures on basic or essential drugs (WHO 1977)and to bulk purchase these under generic names(Patel 1983a, Editorial 1983). A primary healthcare (PHC) manpower policy using more of theless expensive grades of staff could beimplemented. If PHC workers are one quarterthe cost of a doctor, then staff on the groundcould be increased 4 times as quickly if thispolicy was adopted. This is precisely what isproposed by the 4th goal of the Strategy, where'local health care' is emphasized.
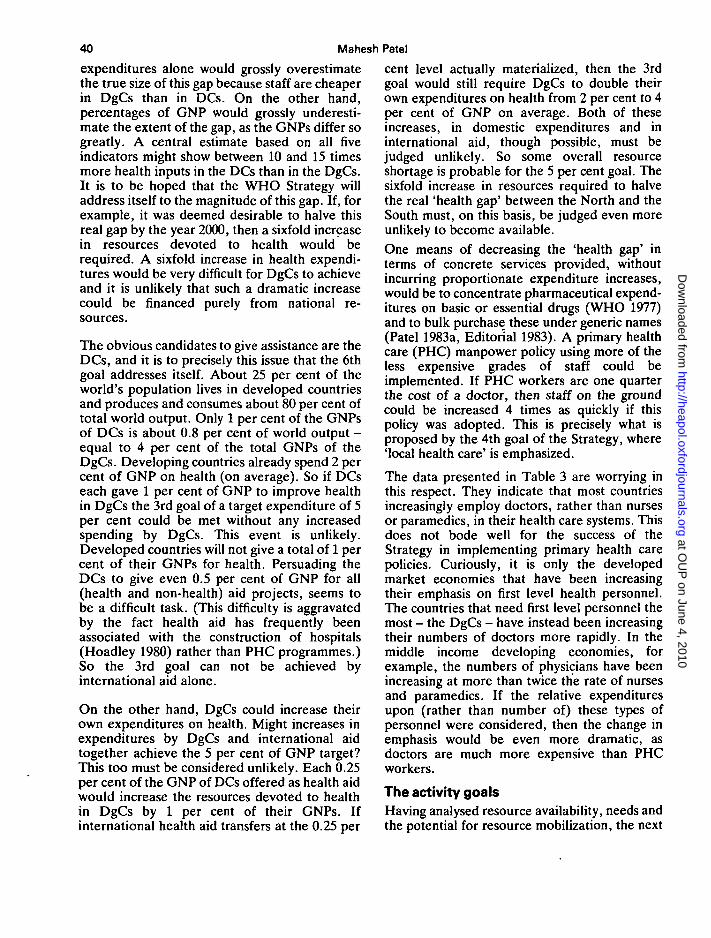
The data presented in Table 3 are worrying inthis respect. They indicate that most countriesincreasingly employ doctors, rather than nursesor paramedics, in their health care systems. Thisdoes not bode well for the success of theStrategy in implementing primary health carepolicies. Curiously, it is only the developedmarket economies that have been increasingtheir emphasis on first level health personnel.The countries that need first level personnel themost - the DgCs - have instead been increasingtheir numbers of doctors more rapidly. In themiddle income developing economies, forexample, the numbers of physicians have beenincreasing at more than twice the rate of nursesand paramedics. If the relative expendituresupon (rather than number of) these types ofpersonnel were considered, then the change inemphasis would be even more dramatic, asdoctors are much more expensive than PHCworkers.
The activity goalsHaving analysed resource availability, needs andthe potential for resource mobilization, the next
at OU
P on June 4, 2010
http://heapol.oxfordjournals.orgD
ownloaded from
An economic evaluation of 'Health for AM'
Table 3. Trends and ratios of nurses and paramedics to doctors 1960-77
41
Type of economy
Low incomeMiddle incomeHigh income oilIndustrial marketNon-market industrial
Population(billions)
2.16*1.140.010.710.35
Number ofcountries
3363
4196
Ratio of nursesand paramedicalsto doctors
1960
1.354.922.961.741.89
1977
1.202.322.082.481.70
Trendin theratio"
0.890.470.701.420.90
Source: World Bank (1982)Notea A trend in the ratio of more than 1 indicates an increasing emphasis on nurses and paramedicals.
If doctors were 4 times as expensive as paramedics, then a trend in the ratio of less than 0.Swould show that expenditure on doctors was increasing more than 8 times faster.
stage of a rational planning process is to describethe activities that these resources are to finance.Naturally, the total cost of these activities shouldbe equal - or at least close - to the estimatedavailability of resources.
Types of activities, and activity levels, aredescribed in the 7th goal of the Strategy.Unfortunately these activities are not ranked interms of their cost-effectiveness, as would havebeen the case with a more rigorous economicplan. The 7th goal stipulates that:
7 Primary health care is available to the wholepopulation, with at least the following:• safe water in the home or within 15 minutes'
walking distance, and adequate sanitaryfacilities in the home or immediate vicinity.
• immunization against diphtheria, tetanus,whooping-cough, measles, poliomyelitis, andtuberculosis.
• local health care, including availability of atleast 20 essential drugs, within one hour's walkor travel.
• trained personnel for attending pregnancy andchildbirth, and caring for children up to at least1 year of age.
Several different estimates of the costs ofimplementing these activities have been made.It is a vital part of the planning process to reviewthem, and to consider whether it is possible toachieve the desired activities with the resourcesavailable.
One 'Water Decade' study (World Water 1982)has estimated that about 20 million pumps
would be needed to provide safe drinking waterover a 10 year period. This estimate was basedon a hypothetical 'ideal' pump. An estimate ofthe costs of providing all DgC populations withsafe water (Taylor 1982) reported a figure ofUS$ 300 billion. This does not seem unreason-able, if the costs (net present value) ofpurchasing, installing and maintaining eachpump for 10 years were of the order ofUS$ 15 000. Expenditures under this heading in1979 were estimated at about US$ 10 billion(WHO 1980a), of which roughly one quarterwere international aid.
Assuming that the estimate of US$ 300 billion issomewhere close to the true costs of theprogramme, then that figure should be com-pared to the availability of resources. The totalGNP of the developing countries in 1980 wasabout US$ 2000 billion. Expenditures requiredfor providing safe water would therefore amountto 15 per cent of the total GNPs of DgCs, orabout 1.5 per cent of GNP per annum if spreadover a 10 year period.
Two estimates of the costs of immunizationprogrammes agree quite closely. Both the WHO(1979) and Henderson (1983) estimate thatcomplete immunization coverage would costsome US$ 300 million per annum. The first ofthese estimates is based on a cost ofimmunization against the 6 major immunizablediseases of US$3 per child. Similar average costsfor large scale programmes were obtained forJamaica by Baxter and Patel (1985) and for
at OU
P on June 4, 2010
http://heapol.oxfordjournals.orgD
ownloaded from
42 Mahesh Patel
Indonesia, the Philippines and Thailand byCreese et al (1982). These expenditure estimatesimply a resource requirement of about 0.015 percent of the GNPs of DgCs. Compared to thecosts of achieving safe water supplies (of 1.5 percent of GNP), the costs of immunizationcoverage pale into insignificance. They couldeasily be contained within the overall expendi-ture level of about 5 per cent of GNP suggestedby the Strategy.
The training costs for initiating a maternal andchild health programme in all DgCs could beabout US$ 126 million (Patel 1983b). Moresignificantly perhaps, this one-off expenditurewould amount to only 0.006 per cent of theGNPs of these countries. This too could easilybe contained within the 5 per cent of GNPallocated to health expenditures in the WHOStrategy.
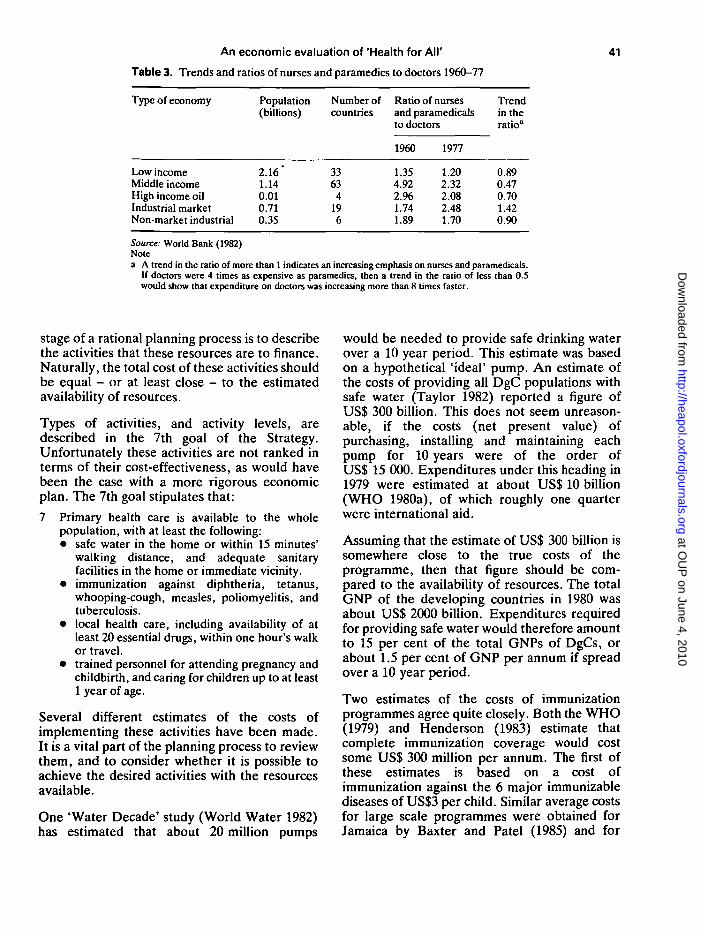
There have been many estimates of the globalcosts of primary health care (or local healthcare) programmes. Some cover training costsonly, while others assume that PHC workerswould be trained and employed by the state. Asummary of these estimates is presented asTable 4.
The wide range of costs covered by theseestimates is indicative of how little is knownabout this area, and of the degree to which PHCprogrammes are undefined in terms of theircontent. In principle, 2 columns (Grant andMahlub al Haq 1976, UNICEF 1976) could betreated as minimal estimates. Patel (1981a) isprobably the most comprehensive, as it assumesthat PHC workers would be employed by thestate.
treated as underestimates for our presentpurposes. Obviously, although the state wouldonly have to pay training costs in such a scheme,any assessment of total costs to the economywould have to include fees paid by thecommunity and private purchases of drugs. TheWHO target of 5 per cent of GNP to be spent onhealth does not specify the source of thoseexpenditures. Whether the payments are madeby individuals, communities or central govern-ments, makes little difference. In each case thesame overall costs to the economy of running theservice would arise. If the training costs of PHCworkers were about one tenth of the actual costsof employing them, the estimates by Joseph(1979) and Burki (1980) in Table 4 would haveto be increased tenfold. If the costs of watersupply and sanitation are then added, littledifference remains between these estimates andthe range proposed in Patel (1981a).
In conclusion, the overall costs of the activitiesproposed by the Global Strategy for Health forAll by the Year 2000 would account forsomething close to 5 per cent of gross nationalproduct in most developing countries. Watersupplies (1.5 per cent) and primary health care(1 per cent-3.4 per cent) are the most expensiveof these activities. Immunization and maternaland child health would cost only small fractionsof 1 per cent of GNP. Still, the total amount ofleeway may be quite small. If, for example, it isthe high PHC estimate detailed in Patel (1981a)that is correct, then little funding would remain,out of that 5 per cent of GNP, for the'conventional' health sector. In this casesomewhat more than 5 per cent of GNP mightbe needed for health.
Estimates that assume that PHC workers wouldoperate on a 'fee for service' basis must be
Table 4. A review of studies of primary health care costs
Nevertheless, the match between estimatedresource requirements and planned activities is
Gish Grant and UNICEF Joseph Burki Patel1970 Mahlub al Haq 1976 1979 1980 1981a
1976
US$ billions% of GNP
35.001.25
0.860.04
1.10 2.0-9.0 3.0-5.0 28 : 1060.05 0.1-0.4 0.1-0.2 1 : 4.9
NoteAll studies are based on average annual costs over 20 years except for Patel (1981a) which presentsaverage costs as the first figures, and total final year costs (assuming a phased implementation of theprogramme) as the second figures. The UNICEF study covers children only. Patel (1981a) includescosts of safe water, sanitation and latrines.
at OU
P on June 4, 2010
http://heapol.oxfordjournals.orgD
ownloaded from
An economic evaluation of 'Health for All' 43
quite good, and the Global Strategy is consistentand satisfactory in this respect. It probablycomes as close to a sound plan as is possible atthis stage.
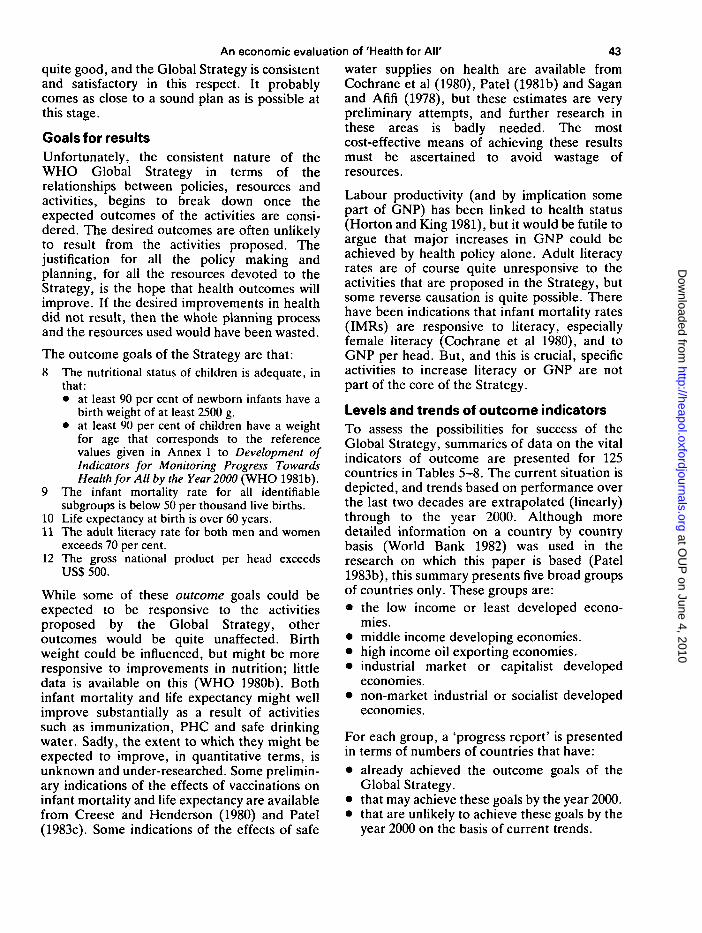
Goals for resultsUnfortunately, the consistent nature of theWHO Global Strategy in terms of therelationships between policies, resources andactivities, begins to break down once theexpected outcomes of the activities are consi-dered. The desired outcomes are often unlikelyto result from the activities proposed. Thejustification for all the policy making andplanning, for all the resources devoted to theStrategy, is the hope that health outcomes willimprove. If the desired improvements in healthdid not result, then the whole planning processand the resources used would have been wasted.
The outcome goals of the Strategy are that:8 The nutritional status of children is adequate, in
that:• at least 90 per cent of newborn infants have a
birth weight of at least 2500 g.• at least 90 per cent of children have a weight
for age that corresponds to the referencevalues given in Annex 1 to Development ofIndicators for Monitoring Progress TowardsHealth for All by the Year 2000 (WHO 1981b).
9 The infant mortality rate for all identifiablesubgroups is below 50 per thousand live births.
10 Life expectancy at birth is over 60 years.11 The adult literacy rate for both men and women
exceeds 70 per cent.12 The gross national product per head exceeds
US$ 500.
While some of these outcome goals could beexpected to be responsive to the activitiesproposed by the Global Strategy, otheroutcomes would be quite unaffected. Birthweight could be influenced, but might be moreresponsive to improvements in nutrition; littledata is available on this (WHO 1980b). Bothinfant mortality and life expectancy might wellimprove substantially as a result of activitiessuch as immunization, PHC and safe drinkingwater. Sadly, the extent to which they might beexpected to improve, in quantitative terms, isunknown and under-researched. Some prelimin-ary indications of the effects of vaccinations oninfant mortality and life expectancy are availablefrom Creese and Henderson (1980) and Patel(1983c). Some indications of the effects of safe
water supplies on health are available fromCochrane et al (1980), Patel (1981b) and Saganand Afifi (1978), but these estimates are verypreliminary attempts, and further research inthese areas is badly needed. The mostcost-effective means of achieving these resultsmust be ascertained to avoid wastage ofresources.
Labour productivity (and by implication somepart of GNP) has been linked to health status(Horton and King 1981), but it would be futile toargue that major increases in GNP could beachieved by health policy alone. Adult literacyrates are of course quite unresponsive to theactivities that are proposed in the Strategy, butsome reverse causation is quite possible. Therehave been indications that infant mortality rates(IMRs) are responsive to literacy, especiallyfemale literacy (Cochrane et al 1980), and toGNP per head. But, and this is crucial, specificactivities to increase literacy or GNP are notpart of the core of the Strategy.
Levels and trends of outcome indicatorsTo assess the possibilities for success of theGlobal Strategy, summaries of data on the vitalindicators of outcome are presented for 125countries in Tables 5-8. The current situation isdepicted, and trends based on performance overthe last two decades are extrapolated (linearly)through to the year 2000. Although moredetailed information on a country by countrybasis (World Bank 1982) was used in theresearch on which this paper is based (Patel1983b), this summary presents five broad groupsof countries only. These groups are:• the low income or least developed econo-
mies.• middle income developing economies.• high income oil exporting economies.• industrial market or capitalist developed
economies.• non-market industrial or socialist developed
economies.
For each group, a 'progress report' is presentedin terms of numbers of countries that have:• already achieved the outcome goals of the
Global Strategy.• that may achieve these goals by the year 2000.• that are unlikely to achieve these goals by the
year 2000 on the basis of current trends.
at OU
P on June 4, 2010
http://heapol.oxfordjournals.orgD
ownloaded from
44 Mahesh Patel
Table 5. Numbers of countries that have already achieved the outcome goals
Outcome goal for the year 2000(numbered as in text)
Type of economy
Low incomeMiddle incomeHigh income oilIndustrial marketNon-market industrialTotals
Population( x 109)
2.161.140.010.710.354.37
Number ofcountries
33634
196
125
9
IMR< 5 0per1000
122
1196
49
10
Lifeexp.> 6 0years
3362
196
66
11
Literacy> 7 0 %(M&F)
327
0196
55
12
GNP percapita> US$ 500(1980prices)
0544
196
83
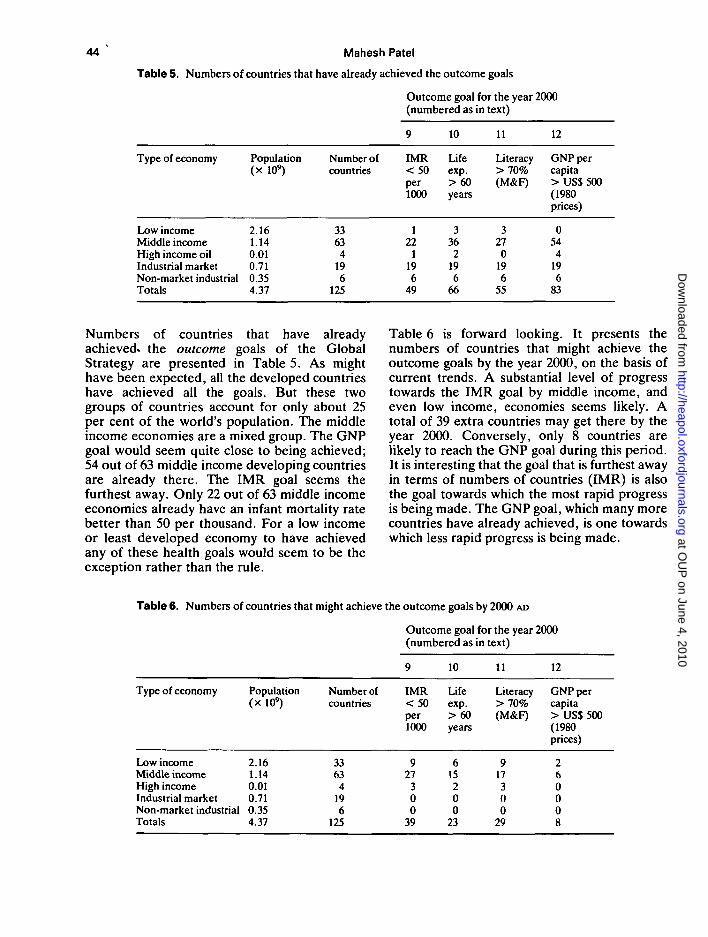
Numbers of countries that have alreadyachieved- the outcome goals of the GlobalStrategy are presented in Table 5. As mighthave been expected, all the developed countrieshave achieved all the goals. But these twogroups of countries account for only about 25per cent of the world's population. The middleincome economies are a mixed group. The GNPgoal would seem quite close to being achieved;54 out of 63 middle income developing countriesare already there. The IMR goal seems thefurthest away. Only 22 out of 63 middle incomeeconomies already have an infant mortality ratebetter than 50 per thousand. For a low incomeor least developed economy to have achievedany of these health goals would seem to be theexception rather than the rule.
Table 6 is forward looking. It presents thenumbers of countries that might achieve theoutcome goals by the year 2000, on the basis ofcurrent trends. A substantial level of progresstowards the IMR goal by middle income, andeven low income, economies seems likely. Atotal of 39 extra countries may get there by theyear 2000. Conversely, only 8 countries arelikely to reach the GNP goal during this period.It is interesting that the goal that is furthest awayin terms of numbers of countries (IMR) is alsothe goal towards which the most rapid progressis being made. The GNP goal, which many morecountries have already achieved, is one towardswhich less rapid progress is being made.
Table 6. Numbers of countries that might achieve the outcome goals by 2000 AD
Outcome goal for the year 2000(numbered as in text)
Type of economy
Low incomeMiddle incomeHigh incomeIndustrial marketNon-market industrialTotals
Population(xlO 9 )
2.161.140.010.710.354.37
Number ofcountries
3363
4196
125
9
IMR< 5 0per1000
927
300
39
10
Lifeexp.> 6 0years
615200
23
11
Literacy> 7 0 %(M&F)
917300
29
12
GNP percapita> US$ 500(1980prices)
260008
at OU
P on June 4, 2010
http://heapol.oxfordjournals.orgD
ownloaded from
An economic evaluation of 'Health for All'
Table 7. Numbers of countries that are unlikely to achieve outcome goals by 2000 AD
45
Type of economy
Low incomeMiddle incomeHigh income oilIndustrial marketNon-market industrialTotals
Population(x 109)
2.161.140.010.710.354.37
Number ofcountries
3363
4196
125
Outcome goal for the year 2000(numbered as in text)
9
IMR< 5 0per1000
2314000
37
10
Lifeexp.> 6 0years
2412000
36
11
Literacy> 7 0 %(M&F)
2013100
34
12
GNPpercapita> US$ 500(1980prices)
313000
34
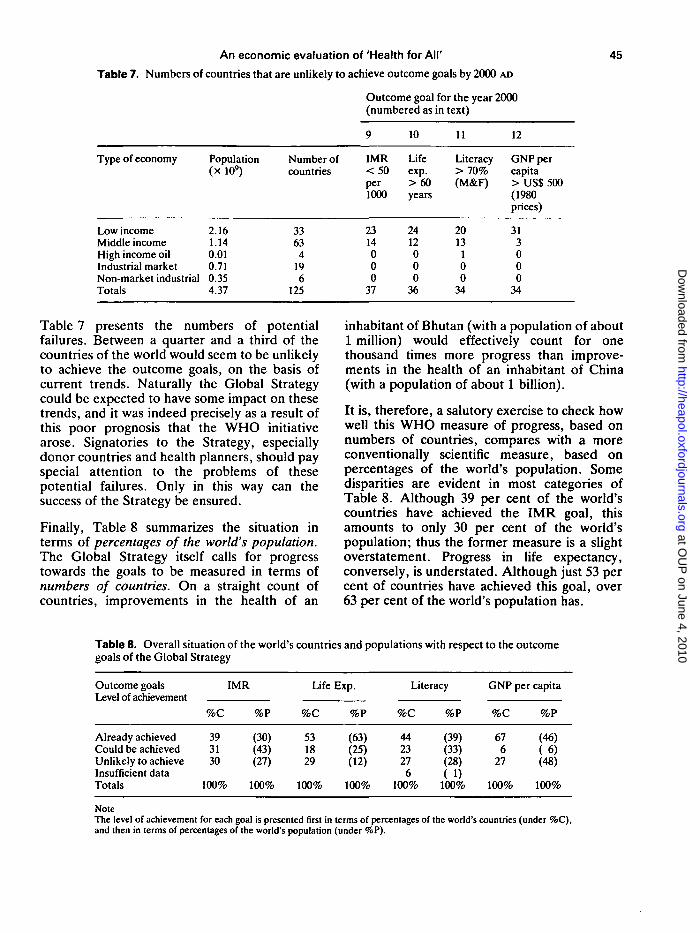
Table 7 presents the numbers of potentialfailures. Between a quarter and a third of thecountries of the world would seem to be unlikelyto achieve the outcome goals, on the basis ofcurrent trends. Naturally the Global Strategycould be expected to have some impact on thesetrends, and it was indeed precisely as a result ofthis poor prognosis that the WHO initiativearose. Signatories to the Strategy, especiallydonor countries and health planners, should payspecial attention to the problems of thesepotential failures. Only in this way can thesuccess of the Strategy be ensured.
Finally, Table 8 summarizes the situation interms of percentages of the world's population.The Global Strategy itself calls for progresstowards the goals to be measured in terms ofnumbers of countries. On a straight count ofcountries, improvements in the health of an
inhabitant of Bhutan (with a population of about1 million) would effectively count for onethousand times more progress than improve-ments in the health of an inhabitant of China(with a population of about 1 billion).
It is, therefore, a salutory exercise to check howwell this WHO measure of progress, based onnumbers of countries, compares with a moreconventionally scientific measure, based onpercentages of the world's population. Somedisparities are evident in most categories ofTable 8. Although 39 per cent of the world'scountries have achieved the IMR goal, thisamounts to only 30 per cent of the world'spopulation; thus the former measure is a slightoverstatement. Progress in life expectancy,conversely, is understated. Although just 53 percent of countries have achieved this goal, over63 per cent of the world's population has.
Table 8. Overall situation of the world's countries and populations with respect to the outcomegoals of the Global Strategy
Outcome goalsLevel of achievement
Already achievedCould be achievedUnlikely to achieveInsufficient dataTotals
%C
393130
100%
IMR
%P
(30)(43)(27)
100%
Life
%C
531829
100%
Exp.
%P
(63)(25)(12)
100%
Literacy
%C
4423276
100%
%P
(39)(33)(28)( 1)
100%
GNP per capita
%C
676
27
100%
%P
(46)( 6 )(48)
100%
NoteThe level of achievement for each goal is presented first in terms of percentages of the world's countries (under %C),and then in terms of percentages of the world's population (under %P).
at OU
P on June 4, 2010
http://heapol.oxfordjournals.orgD
ownloaded from
46 Mahesh Patel
Given the convenience of measuring progress interms of numbers of countries it would seemworth retaining this count, although it isimprecise. It might, however, also be appropri-ate for WHO to consider measuring progress inglobal health in terms of percentages of theworld's population, as well as in numbers ofpolitical units.
ConclusionsThis brief preliminary analysis indicates thatdifficulties may be experienced in reaching theexpenditure targets set by the Strategy. Theseexpenditure targets may themselves be too lowto cover the activities by health services thatwould be needed. Finally, the activities to beundertaken by the health services might notachieve all the desired results.
Unfortunately, the countries that are unlikely toachieve many of the target improvements inhealth include some of the most populous andpoorest countries of the world. As anyimprovement on current trends is likely todepend very much on the quality of healthplanning over the period leading up to the year2000, it is urgent that the Global Strategy beginsto assume a clearer and more implementableform as a 'Plan for Health'.
To achieve this development of the Strategy,further research on the costs of healthpromoting activities such as immunization andprimary health care must be treated as a highpriority. The effects of these activities on healthindicators such as life expectancy (cost-effectiveness) should also be assessed so thatthese activities can be given priority. The linksbetween policies, resources, activities, andresults must be determined. Without suchconcrete research, it will be impossible toprogress from pious generalizations towardsrational health planning. And the WHO GlobalStrategy will disappear into the mists of historyas a laudable policy initiative rather than standas a monumental achievement.
ReferencesBaxter D and Patel M 1985 Cost appraisal and management
of a mass immunisation programme in Jamaica.Department of Community Medicine, University ofManchester (in preparation)
Burki SJ 1980 Global estimates for meeting basic needs. BasicNeeds Paper No. 1. Washington: World Bank
Cochrane S, O'Hara DJ and Leslie J 1980 The effects ofeducation on health. World Bank Staff Working PaperNo. 405. Washington: World Bank
Creese AL and Henderson RH 1980 Cost-benefit analysisand immunization programmes in developing countries.Bull WHO 52: 491-7
Creese AL, Sriyabbaya N, Casabal G and Wiseso G 1982Cost-effectiveness appraisal of immunization program-mes. Bull WHO 60: 621-32
Editorial 1980 Pharmaceutical policies for the Third World -whose responsibity? Lancet 16 July: 144
Gish O 1970 Health planning in developing countries. / DevStudies 6: 67-76
Gish O 1982 Selective primary health care: new wine in oldbottles. Soc Sci Med 16': 1049-63
Grant J and Mahbub al Haq 1976 Income redistribution andthe international financing of development. Club of Rome
Henderson R 1983 Druggists of the third world. TheEconomist 12 March, p 83
Hoadley JS 1980 Aid, politics and hospitals in WesternSamoa. World Development 8: 443-55
Horton S and King T 1981 Labour productivity: un tourd'horizon. World Bank Staff Working Paper No. 497.Washington: World Bank
IMS 1982 World pharmaceutical market. PharmaceuticalNewsletter, 4 January
Joseph SC 1979 Outline of national PHC systemdevelopment: a framework for donor involvement. Paperpresented at the Bellagio Conference on Health andPopulation. 21 April, 1979. Mimeo
Patel M 1981a The global costs of primary health care. Manand Development. 3:105-29
Patel M 1981b Modelling determinants of health. Int JEpidemiol 10: 177-80
Patel M 1983a Drug costs in developing countries andpolicies to reduce them. World Development 11: 195-204
Patel M 1983b A feasibility study of the goals of the WHOGlobal Strategy for Health for All by the Year 2000.Department of Community Medicine, University ofManchester. PhD thesis
Patel M 1983c The relationship between immunisation andincidence. Paper presented at the 10th InternationalCongress of Preventative and Social Medicine, Heidelberg
Sagan LA and Afifi AA 1978 Health and economicdevelopment 1: infant mortality. Research MemorandumRM-788-41, Austria: International Institute for AppliedSystems Analysis
Taylor D 1982 Medicine, health and the poor world. CurrentHealth Problems Series No. 72. London: Office of HealthEconomics
UNICEF 1976 Basic services for children in developingcountries. Document E/ICEF/L. 1342; 12 March
WHO 1977 The selection of essential drugs. Tech Rep SerNo. 615. Geneva: World Health Organization
WHO 1979 Saving lives by immunization. WHO Chron 33:128-30
WHO 1980a A challenge to developing countries: theInternational Drinking Water Supply and SanitationDecade, 1981-1990. WHO Chron 34: 327-31
WHO 1980b The incidence of low birth weight: a criticalreview. World Health Slat Q 33: 197-224
WHO 1981a Global Strategy for Health for All by the Year2000. Health for All Series No. 3. Geneva: World HealthOrganization
at OU
P on June 4, 2010
http://heapol.oxfordjournals.orgD
ownloaded from
An economic evaluation of 'Health for All' 47
WHO 1981b Development of indicators for monitoringprogress towards Health for All by the Year 2000. Healthfor All Series No. 4. Geneva: World Health Organization
World Bank 1980 Health sector policy paper (2nd edn).Washington: World Bank
World Bank 1982 World development report 1982. Oxford:Oxford University Press
World Water 1982 Water Decade: first year review. London:World Water
AcknowledgementsThe author would like to acknowledge helpful comments onearlier drafts from Professor Abel-Smith, London School ofEconomics; Dr Tom Fryers, Reader in CommunityMedicine, University of Manchester; Dr Fred Paccaud,Institut Universitaire de M£decine Sociale et Preventive,Lausanne; Dr Selwyn St Leger, Lecturer in CommunityMedicine, University of Manchester; and a referee of thisjournal. Numerous colleagues in WHO provided usefuldiscussions and advice. Needless to say this paper does notrepresent WHO policy in any way. All errors and omissionsare entirely my own.
NoteThis paper is based on a more detailed evaluation by theauthor published in Manchester Papers on Development.July 1985; 1(2): 1-24.
BiographyMahesh Patel, MA(Econ), PhD(Com Med), Health Eco-nomist, Institut Universitaire de Medecine Sociale etPreventive, Departement de l'lnterieure et de la Sant6Publique, Rue de Bugnon 17, 1005 Lausanne, Switzerland.
Mahesh Patel is a health economist currently engaged inresearch on reimbursement mechanisms of the health systemin Switzerland. He has worked on issues in health care in theThird World and in the UK National Health Service, haslectured in health economics to health planners from bothdeveloped and developing countries and has performedconsultancies for the World Health Organization. Specialinterests include health planning, cost effectiveness analysis,high technology medicine, the economics of pharmaceutic-als, primary health care and the financial appraisal of healthprogrammes. The author would welcome any comments onthe issues raised this paper.
at OU
P on June 4, 2010
http://heapol.oxfordjournals.orgD
ownloaded from
Copyright © 2022 FDOKUMEN