
Multi-timescale Economics-Driven Traffic Management in MPLS Networks
Upload
independentCategory
view
2download
0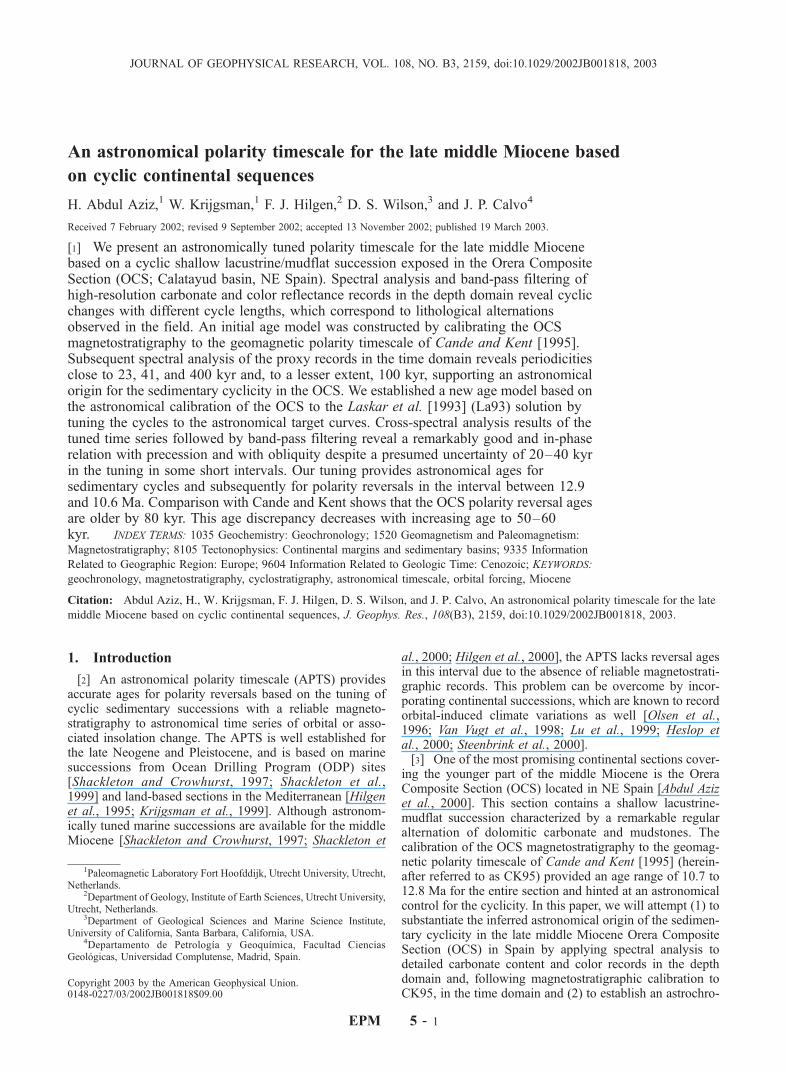
An astronomical polarity timescale for the late middle Miocene based
on cyclic continental sequences
H. Abdul Aziz,1 W. Krijgsman,1 F. J. Hilgen,2 D. S. Wilson,3 and J. P. Calvo4
Received 7 February 2002; revised 9 September 2002; accepted 13 November 2002; published 19 March 2003.
[1] We present an astronomically tuned polarity timescale for the late middle Miocenebased on a cyclic shallow lacustrine/mudflat succession exposed in the Orera CompositeSection (OCS; Calatayud basin, NE Spain). Spectral analysis and band-pass filtering ofhigh-resolution carbonate and color reflectance records in the depth domain reveal cyclicchanges with different cycle lengths, which correspond to lithological alternationsobserved in the field. An initial age model was constructed by calibrating the OCSmagnetostratigraphy to the geomagnetic polarity timescale of Cande and Kent [1995].Subsequent spectral analysis of the proxy records in the time domain reveals periodicitiesclose to 23, 41, and 400 kyr and, to a lesser extent, 100 kyr, supporting an astronomicalorigin for the sedimentary cyclicity in the OCS. We established a new age model based onthe astronomical calibration of the OCS to the Laskar et al. [1993] (La93) solution bytuning the cycles to the astronomical target curves. Cross-spectral analysis results of thetuned time series followed by band-pass filtering reveal a remarkably good and in-phaserelation with precession and with obliquity despite a presumed uncertainty of 20–40 kyrin the tuning in some short intervals. Our tuning provides astronomical ages forsedimentary cycles and subsequently for polarity reversals in the interval between 12.9and 10.6 Ma. Comparison with Cande and Kent shows that the OCS polarity reversal agesare older by 80 kyr. This age discrepancy decreases with increasing age to 50–60kyr. INDEX TERMS: 1035 Geochemistry: Geochronology; 1520 Geomagnetism and Paleomagnetism:
Magnetostratigraphy; 8105 Tectonophysics: Continental margins and sedimentary basins; 9335 Information
Related to Geographic Region: Europe; 9604 Information Related to Geologic Time: Cenozoic; KEYWORDS:
geochronology, magnetostratigraphy, cyclostratigraphy, astronomical timescale, orbital forcing, Miocene
Citation: Abdul Aziz, H., W. Krijgsman, F. J. Hilgen, D. S. Wilson, and J. P. Calvo, An astronomical polarity timescale for the late
middle Miocene based on cyclic continental sequences, J. Geophys. Res., 108(B3), 2159, doi:10.1029/2002JB001818, 2003.
1. Introduction
[2] An astronomical polarity timescale (APTS) providesaccurate ages for polarity reversals based on the tuning ofcyclic sedimentary successions with a reliable magneto-stratigraphy to astronomical time series of orbital or asso-ciated insolation change. The APTS is well established forthe late Neogene and Pleistocene, and is based on marinesuccessions from Ocean Drilling Program (ODP) sites[Shackleton and Crowhurst, 1997; Shackleton et al.,1999] and land-based sections in the Mediterranean [Hilgenet al., 1995; Krijgsman et al., 1999]. Although astronom-ically tuned marine successions are available for the middleMiocene [Shackleton and Crowhurst, 1997; Shackleton et
al., 2000; Hilgen et al., 2000], the APTS lacks reversal agesin this interval due to the absence of reliable magnetostrati-graphic records. This problem can be overcome by incor-porating continental successions, which are known to recordorbital-induced climate variations as well [Olsen et al.,1996; Van Vugt et al., 1998; Lu et al., 1999; Heslop etal., 2000; Steenbrink et al., 2000].[3] One of the most promising continental sections cover-
ing the younger part of the middle Miocene is the OreraComposite Section (OCS) located in NE Spain [Abdul Azizet al., 2000]. This section contains a shallow lacustrine-mudflat succession characterized by a remarkable regularalternation of dolomitic carbonate and mudstones. Thecalibration of the OCS magnetostratigraphy to the geomag-netic polarity timescale of Cande and Kent [1995] (herein-after referred to as CK95) provided an age range of 10.7 to12.8 Ma for the entire section and hinted at an astronomicalcontrol for the cyclicity. In this paper, we will attempt (1) tosubstantiate the inferred astronomical origin of the sedimen-tary cyclicity in the late middle Miocene Orera CompositeSection (OCS) in Spain by applying spectral analysis todetailed carbonate content and color records in the depthdomain and, following magnetostratigraphic calibration toCK95, in the time domain and (2) to establish an astrochro-
JOURNAL OF GEOPHYSICAL RESEARCH, VOL. 108, NO. B3, 2159, doi:10.1029/2002JB001818, 2003
1Paleomagnetic Laboratory Fort Hoofddijk, Utrecht University, Utrecht,Netherlands.
2Department of Geology, Institute of Earth Sciences, Utrecht University,Utrecht, Netherlands.
3Department of Geological Sciences and Marine Science Institute,University of California, Santa Barbara, California, USA.
4Departamento de Petrologıa y Geoquımica, Facultad CienciasGeologicas, Universidad Complutense, Madrid, Spain.
Copyright 2003 by the American Geophysical Union.0148-0227/03/2002JB001818$09.00
EPM 5 - 1
nology for the OCS by tuning its sedimentary cycles toastronomical target curves, using inferred phase relation-ships between different scales of sedimentary cyclicity andthe astronomical parameters. The resulting timescale willprovide astronomical ages for polarity reversals in theinterval between 12.9 and 10.6 Ma. The new ages will becompared with polarity reversal ages in CK95 and partly fillup the existing gap in the Miocene APTS.
2. Geological Setting and Section
[4] The study area is located in the Valdelosterreros areanear the village of Orera, �15 km southeast of Calatayud
(Figure 1). The shallow lacustrine/mudflat succession inthat area forms part of a thick sediment pile that wasdeposited in the NW-SE elongated intramontane Calatayudbasin during the Paleogene and Neogene. The exposedsediments are of late middle Miocene age. They weredeposited in a shallow lake that formed in an interfan zonebetween two main alluvial fans, and display a remarkableand distinct alternation of mudstone and dolomitic carbo-nate [Abdul Aziz, 2001].[5] The Orera Composite Section (OCS) was constructed
by selecting subsections (Figure 1) with the most prominentcyclicity [Abdul Aziz et al., 2000]. Correlations betweenpartially overlapping subsections were established by fol-
Figure 1. Geological setting and location map of the study area. The following subsections were, in astratigraphical order, used to construct the Orera Composite Section (OCS): Orera Base (OB),Cementerio (CM), Orera Village (ORE), Valdelosterreros I (VTI), Overlap (LY), Valdelosterreros II(VTII), and Valdelosterreros-III (VTIII).
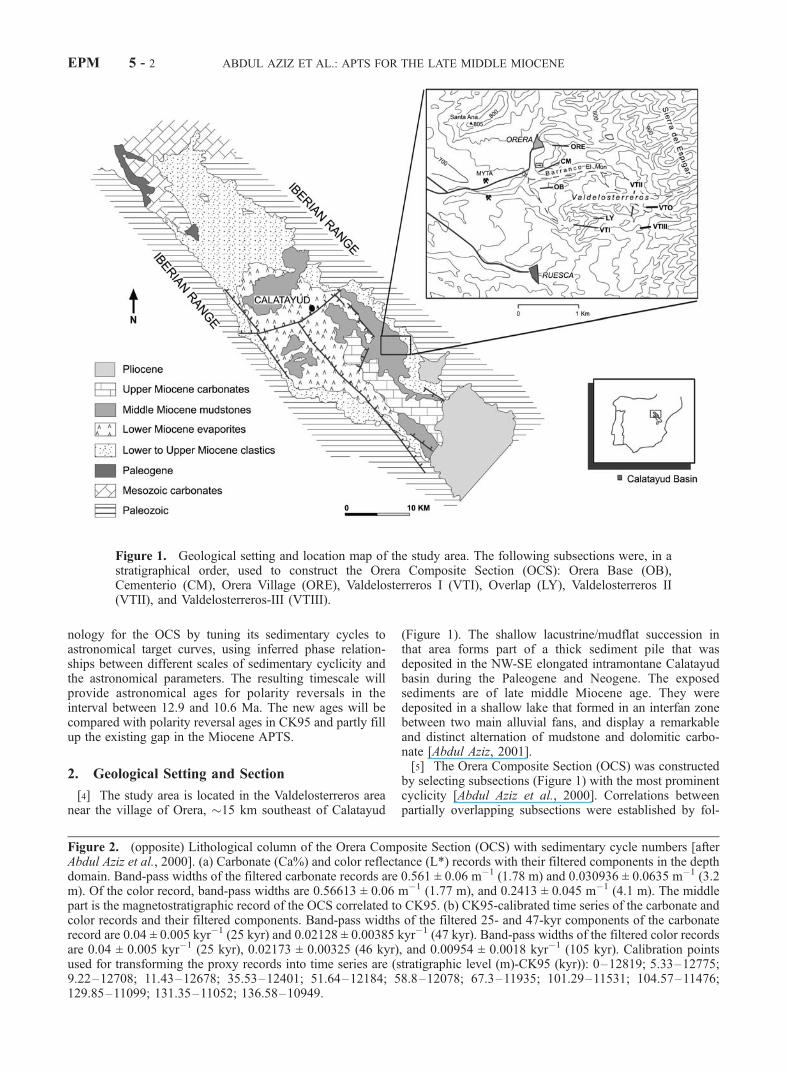
Figure 2. (opposite) Lithological column of the Orera Composite Section (OCS) with sedimentary cycle numbers [afterAbdul Aziz et al., 2000]. (a) Carbonate (Ca%) and color reflectance (L*) records with their filtered components in the depthdomain. Band-pass widths of the filtered carbonate records are 0.561 ± 0.06 m�1 (1.78 m) and 0.030936 ± 0.0635 m�1 (3.2m). Of the color record, band-pass widths are 0.56613 ± 0.06 m�1 (1.77 m), and 0.2413 ± 0.045 m�1 (4.1 m). The middlepart is the magnetostratigraphic record of the OCS correlated to CK95. (b) CK95-calibrated time series of the carbonate andcolor records and their filtered components. Band-pass widths of the filtered 25- and 47-kyr components of the carbonaterecord are 0.04 ± 0.005 kyr�1 (25 kyr) and 0.02128 ± 0.00385 kyr�1 (47 kyr). Band-pass widths of the filtered color recordsare 0.04 ± 0.005 kyr�1 (25 kyr), 0.02173 ± 0.00325 (46 kyr), and 0.00954 ± 0.0018 kyr�1 (105 kyr). Calibration pointsused for transforming the proxy records into time series are (stratigraphic level (m)-CK95 (kyr)): 0–12819; 5.33–12775;9.22–12708; 11.43–12678; 35.53–12401; 51.64–12184; 58.8–12078; 67.3–11935; 101.29–11531; 104.57–11476;129.85–11099; 131.35–11052; 136.58–10949.
EPM 5 - 2 ABDUL AZIZ ET AL.: APTS FOR THE LATE MIDDLE MIOCENE
lowing distinct beds in the field or by matching character-istics in the sedimentary cycle patterns [Abdul Aziz et al.,2000]. The position of polarity reversals was verified instratigraphic overlaps, thus confirming cyclostratigraphiccorrelations between subsections.[6] The OCS comprises at least 91 basic sedimentary
cycles, which are arranged into larger cycles on different
scales (Figure 2). Basic small-scale cycles, further referredto as S cycles, have an average thickness of 1.65 m andare characterized by an alternation of white carbonate bedsand reddish and/or greenish gray mudstone. The carbonatebeds are numbered in ascending order starting from thebase of the section. Nineteen faintly developed carbonatebeds, mostly intercalated in thick mudstone intervals, may
ABDUL AZIZ ET AL.: APTS FOR THE LATE MIDDLE MIOCENE EPM 5 - 3
represent additional/extra cycles. These beds are denotedwith the suffix ‘‘A’’ following the number of the preced-ing cycle. Large-scale cycles (L cycles) have an approx-imate thickness of 31 m and are characterized by analternation of carbonate-poor intervals, in which S cyclesare virtually absent or only weakly developed, and inter-vals with well-developed small-scale mudstone-carbonatecycles. Finally, two other types of cycles are distin-guished. An intermediate-scale cycle (I cycle) is identifiedby thick and prominent carbonate beds in the lower partand by clusters of five well-developed S cycles in theupper part of the OCS. The last type of cyclicity, termedD cycle (after double), is characterized by alternatingthick-thin carbonate beds in successive S cycles and isdistinctly present in the middle part of the OCS [AbdulAziz et al., 2000].
3. Material and Methods
3.1. Color Analysis
[7] Color measurements were taken in the field at anaverage of 16 levels per cycle, with steps of about 10 cm,using a portable photospectrometer (Minolta CM508i).The measurements are automatically converted intoL*a*b*, 400 to 700 nm reflectance (%), and other colorexpression values. The L*a*b* (or CIELAB) value is auniform color scale recommended by the CommissionInternationale de l’Eclairge (CIE). This color scale utilizesan Adams-Nickerson cube root formula, adopted by theCIE in 1976 for use in the measurement of small colordifferences. When a color is expressed in CIELAB, L*defines lightness, a* denotes the red/green value and b*the yellow/blue value. The 550 nm reflectance record ofthe OCS is more or less similar to the L* reflectancerecord. However, we prefer to use the L* reflectancerecord because it slightly enhances the differences betweenmudstone and carbonate lithologies.
3.2. Carbonate Analysis
[8] From each mudstone-carbonate cycle, eight levelswere sampled to determine the carbonate content. Thesamples were dried by deep freezing to �40�C and thenground in an agate mortar mill or in an automatic grinder.X-ray diffraction (XRD) measurements on selected sam-ples indicated a high amount of dolomite and minorcalcite in carbonate rich samples. Dolomite is a minorconstituent in the mudstones in which illite and smectitemineralogies are dominant [Abdul Aziz, 2001]. Dolomitefrom all samples was brought into solution using thefollowing procedure. Approximately 250 mg of driedsample was treated with 7.5 mL 1 M HCl and shakenfor 12 hours. The solution was then preserved and thesample residue was treated again with 7.5 mL 1 M HCl.After 4 hours of shaking, the solution from the sampleresidue was added to the preserved solution. Majorelement (Ca and Mg) measurements were performedusing an inductively coupled plasma emission spectrom-eter (ARL 34000). Analytical precision and accuracywere checked by replicate analysis of samples, and byan international and in-house standard. The relative errorswere all less than 5% for the major elements. XRDmeasurements performed on dried residues showed that
the dolomite was completely removed from the samplesusing the extraction procedure.
3.3. Statistical Analysis
[9] We used (cross) spectral analysis to investigate andevaluate the cyclicity in the color and carbonate records ofthe OCS. The Blackman-Tukey (BT) method was appliedusing the AnalySeries program [Paillard et al., 1996]. TheBT method is based on the standard Fourier transform andrequires evenly spaced time series. Therefore interpolationof unevenly spaced data sets is necessary before BT spectralanalysis can be performed and hence this procedure maybias statistical results. We also applied the Lomb-ScargleFourier transform method using the SPECTRUM program[Schulz and Stattegger, 1997], which is useful for unevenlyspaced time series allowing analysis without interpolation.We found that the AnalySeries results did not differ sig-nificantly from SPECTRUM. Therefore the spectral analy-sis results presented in this paper are based on the BTmethod. The Gaussian band-pass filter used to extract thedominant spectral components was chosen such that itcovers the maximum possible area of a peak in the powerspectrum.
4. Results
4.1. Color and Carbonate Records
[10] The L* reflectance and Ca (%) records are presentedin Figure 2 and will be termed color (reflectance) andcarbonate record throughout the paper. Although the Mg(%), Ca (%), and Mg/Ca ratios do not differ significantly,we decided to use the Ca (%) record because it most clearlyreveals the different scales of sedimentary cyclicityobserved in the field. Our color record is derived from thesame subsections that were used to construct the OCS [seeAbdul Aziz et al., 2000] except for the interval betweencycles 42 and 48, which was measured in another subsec-tion because of the less weathered surface and thereforemore distinct cyclicity.[11] The different scales of cyclicity can be distinguished
in the color and carbonate records (Figure 2). The S cyclesare recognized because carbonate beds correspond to highvalues in both records. The L cycle is apparent in the colorreflectance record in which intervals marked by low reflec-tance values and weakly developed S cycles alternate withintervals marked by high reflectance values and distinct Scycles. This L cyclicity is less evident in the carbonaterecord. However, the carbonate record clearly reflects the Dcycle identified by alternating thick-thin carbonate beds insuccessive S cycles due to variations in bed thickness. Thiscycle is also discernible in the amplitude variation of thecolor record, especially in the interval covering cycles 28–50 (Figure 2).
4.2. Spectral Analysis in Depth Domain
[12] Spectral analysis and Gaussian band-pass filteringwere performed in the depth domain on the total color andcarbonate record and on three discrete intervals, which wereselected on the basis of their characteristic cycle patterns asobserved in the field. These intervals comprise the cycles1–28, 28–51, and 51–91. The results for the total recordsreveal significant peaks, which correspond to cycle lengths
EPM 5 - 4 ABDUL AZIZ ET AL.: APTS FOR THE LATE MIDDLE MIOCENE
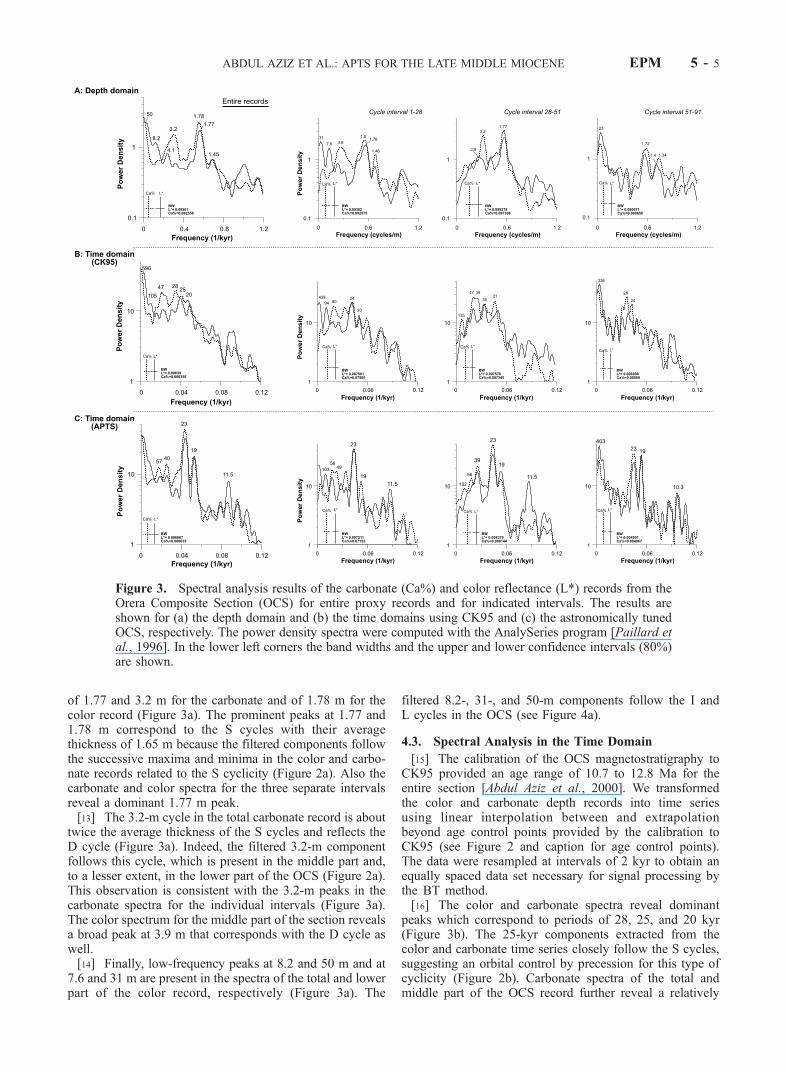
of 1.77 and 3.2 m for the carbonate and of 1.78 m for thecolor record (Figure 3a). The prominent peaks at 1.77 and1.78 m correspond to the S cycles with their averagethickness of 1.65 m because the filtered components followthe successive maxima and minima in the color and carbo-nate records related to the S cyclicity (Figure 2a). Also thecarbonate and color spectra for the three separate intervalsreveal a dominant 1.77 m peak.[13] The 3.2-m cycle in the total carbonate record is about
twice the average thickness of the S cycles and reflects theD cycle (Figure 3a). Indeed, the filtered 3.2-m componentfollows this cycle, which is present in the middle part and,to a lesser extent, in the lower part of the OCS (Figure 2a).This observation is consistent with the 3.2-m peaks in thecarbonate spectra for the individual intervals (Figure 3a).The color spectrum for the middle part of the section revealsa broad peak at 3.9 m that corresponds with the D cycle aswell.[14] Finally, low-frequency peaks at 8.2 and 50 m and at
7.6 and 31 m are present in the spectra of the total and lowerpart of the color record, respectively (Figure 3a). The
filtered 8.2-, 31-, and 50-m components follow the I andL cycles in the OCS (see Figure 4a).
4.3. Spectral Analysis in the Time Domain
[15] The calibration of the OCS magnetostratigraphy toCK95 provided an age range of 10.7 to 12.8 Ma for theentire section [Abdul Aziz et al., 2000]. We transformedthe color and carbonate depth records into time seriesusing linear interpolation between and extrapolationbeyond age control points provided by the calibration toCK95 (see Figure 2 and caption for age control points).The data were resampled at intervals of 2 kyr to obtain anequally spaced data set necessary for signal processing bythe BT method.[16] The color and carbonate spectra reveal dominant
peaks which correspond to periods of 28, 25, and 20 kyr(Figure 3b). The 25-kyr components extracted from thecolor and carbonate time series closely follow the S cycles,suggesting an orbital control by precession for this type ofcyclicity (Figure 2b). Carbonate spectra of the total andmiddle part of the OCS record further reveal a relatively
Figure 3. Spectral analysis results of the carbonate (Ca%) and color reflectance (L*) records from theOrera Composite Section (OCS) for entire proxy records and for indicated intervals. The results areshown for (a) the depth domain and (b) the time domains using CK95 and (c) the astronomically tunedOCS, respectively. The power density spectra were computed with the AnalySeries program [Paillard etal., 1996]. In the lower left corners the band widths and the upper and lower confidence intervals (80%)are shown.
ABDUL AZIZ ET AL.: APTS FOR THE LATE MIDDLE MIOCENE EPM 5 - 5
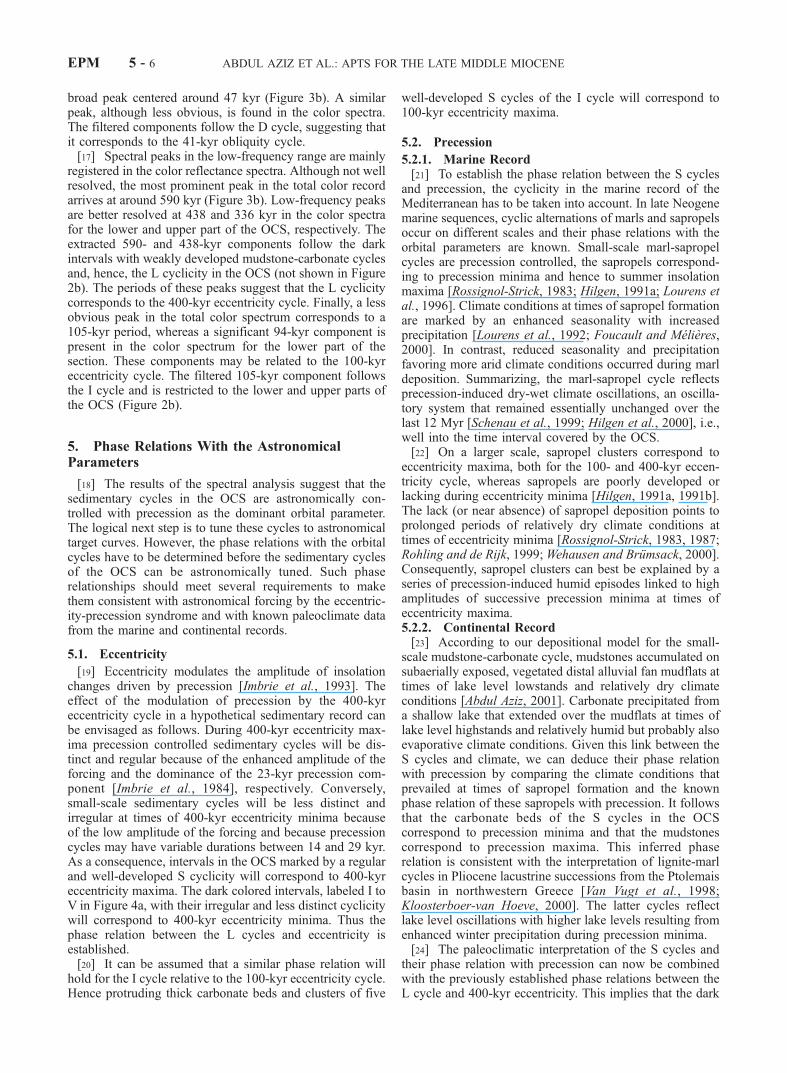
broad peak centered around 47 kyr (Figure 3b). A similarpeak, although less obvious, is found in the color spectra.The filtered components follow the D cycle, suggesting thatit corresponds to the 41-kyr obliquity cycle.[17] Spectral peaks in the low-frequency range are mainly
registered in the color reflectance spectra. Although not wellresolved, the most prominent peak in the total color recordarrives at around 590 kyr (Figure 3b). Low-frequency peaksare better resolved at 438 and 336 kyr in the color spectrafor the lower and upper part of the OCS, respectively. Theextracted 590- and 438-kyr components follow the darkintervals with weakly developed mudstone-carbonate cyclesand, hence, the L cyclicity in the OCS (not shown in Figure2b). The periods of these peaks suggest that the L cyclicitycorresponds to the 400-kyr eccentricity cycle. Finally, a lessobvious peak in the total color spectrum corresponds to a105-kyr period, whereas a significant 94-kyr component ispresent in the color spectrum for the lower part of thesection. These components may be related to the 100-kyreccentricity cycle. The filtered 105-kyr component followsthe I cycle and is restricted to the lower and upper parts ofthe OCS (Figure 2b).
5. Phase Relations With the AstronomicalParameters
[18] The results of the spectral analysis suggest that thesedimentary cycles in the OCS are astronomically con-trolled with precession as the dominant orbital parameter.The logical next step is to tune these cycles to astronomicaltarget curves. However, the phase relations with the orbitalcycles have to be determined before the sedimentary cyclesof the OCS can be astronomically tuned. Such phaserelationships should meet several requirements to makethem consistent with astronomical forcing by the eccentric-ity-precession syndrome and with known paleoclimate datafrom the marine and continental records.
5.1. Eccentricity
[19] Eccentricity modulates the amplitude of insolationchanges driven by precession [Imbrie et al., 1993]. Theeffect of the modulation of precession by the 400-kyreccentricity cycle in a hypothetical sedimentary record canbe envisaged as follows. During 400-kyr eccentricity max-ima precession controlled sedimentary cycles will be dis-tinct and regular because of the enhanced amplitude of theforcing and the dominance of the 23-kyr precession com-ponent [Imbrie et al., 1984], respectively. Conversely,small-scale sedimentary cycles will be less distinct andirregular at times of 400-kyr eccentricity minima becauseof the low amplitude of the forcing and because precessioncycles may have variable durations between 14 and 29 kyr.As a consequence, intervals in the OCS marked by a regularand well-developed S cyclicity will correspond to 400-kyreccentricity maxima. The dark colored intervals, labeled I toV in Figure 4a, with their irregular and less distinct cyclicitywill correspond to 400-kyr eccentricity minima. Thus thephase relation between the L cycles and eccentricity isestablished.[20] It can be assumed that a similar phase relation will
hold for the I cycle relative to the 100-kyr eccentricity cycle.Hence protruding thick carbonate beds and clusters of five
well-developed S cycles of the I cycle will correspond to100-kyr eccentricity maxima.
5.2. Precession
5.2.1. Marine Record[21] To establish the phase relation between the S cycles
and precession, the cyclicity in the marine record of theMediterranean has to be taken into account. In late Neogenemarine sequences, cyclic alternations of marls and sapropelsoccur on different scales and their phase relations with theorbital parameters are known. Small-scale marl-sapropelcycles are precession controlled, the sapropels correspond-ing to precession minima and hence to summer insolationmaxima [Rossignol-Strick, 1983; Hilgen, 1991a; Lourens etal., 1996]. Climate conditions at times of sapropel formationare marked by an enhanced seasonality with increasedprecipitation [Lourens et al., 1992; Foucault and Melieres,2000]. In contrast, reduced seasonality and precipitationfavoring more arid climate conditions occurred during marldeposition. Summarizing, the marl-sapropel cycle reflectsprecession-induced dry-wet climate oscillations, an oscilla-tory system that remained essentially unchanged over thelast 12 Myr [Schenau et al., 1999; Hilgen et al., 2000], i.e.,well into the time interval covered by the OCS.[22] On a larger scale, sapropel clusters correspond to
eccentricity maxima, both for the 100- and 400-kyr eccen-tricity cycle, whereas sapropels are poorly developed orlacking during eccentricity minima [Hilgen, 1991a, 1991b].The lack (or near absence) of sapropel deposition points toprolonged periods of relatively dry climate conditions attimes of eccentricity minima [Rossignol-Strick, 1983, 1987;Rohling and de Rijk, 1999;Wehausen and Brumsack, 2000].Consequently, sapropel clusters can best be explained by aseries of precession-induced humid episodes linked to highamplitudes of successive precession minima at times ofeccentricity maxima.5.2.2. Continental Record[23] According to our depositional model for the small-
scale mudstone-carbonate cycle, mudstones accumulated onsubaerially exposed, vegetated distal alluvial fan mudflats attimes of lake level lowstands and relatively dry climateconditions [Abdul Aziz, 2001]. Carbonate precipitated froma shallow lake that extended over the mudflats at times oflake level highstands and relatively humid but probably alsoevaporative climate conditions. Given this link between theS cycles and climate, we can deduce their phase relationwith precession by comparing the climate conditions thatprevailed at times of sapropel formation and the knownphase relation of these sapropels with precession. It followsthat the carbonate beds of the S cycles in the OCScorrespond to precession minima and that the mudstonescorrespond to precession maxima. This inferred phaserelation is consistent with the interpretation of lignite-marlcycles in Pliocene lacustrine successions from the Ptolemaisbasin in northwestern Greece [Van Vugt et al., 1998;Kloosterboer-van Hoeve, 2000]. The latter cycles reflectlake level oscillations with higher lake levels resulting fromenhanced winter precipitation during precession minima.[24] The paleoclimatic interpretation of the S cycles and
their phase relation with precession can now be combinedwith the previously established phase relations between theL cycle and 400-kyr eccentricity. This implies that the dark
EPM 5 - 6 ABDUL AZIZ ET AL.: APTS FOR THE LATE MIDDLE MIOCENE
colored intervals I–V correspond to relatively dry climateconditions and lake level lowstands. Conversely, carbonatebeds in intervals with regular and distinct S cycles indicatepunctuated wetter climate conditions and lake level high-stands. Such conditions are linked to high-amplitude pre-cession minima, which occur at times of eccentricitymaxima. This phase relation is consistent with the interpre-tation of cyclic patterns observed in Pliocene marine sedi-ments from drill holes located in the Gulf of Cadiz [Sierro etal., 2000]. They found that prolonged periods of relativelydry climate conditions occurred during 400-kyr eccentricityminima and punctuated wet episodes during eccentricitymaxima. Again the same will hold for the I cycle withrespect to the 100-kyr eccentricity and climate.
5.3. Obliquity
[25] Finally, even though obliquity is supposed to be lesseffective at low latitudes [Van Woerkum, 1953; Berger,1978], its influence is recorded through interference withprecession in the D cycle. The phase relation of the S cycleswith precession in combination with seasonal changes ininsolation (i.e., maximal seasonal contrast at times ofobliquity maxima) implies that the thick carbonate beds ofthis cycle correspond to obliquity maxima and the interven-ing thinner beds to obliquity minima.
6. Late Middle Miocene APTS
[26] Now that we have established the phase relationsbetween the sedimentary and orbital cycles we can continuewith the tuning procedure. The initial age model is based oncalibrating the OCS magnetostratigraphy to CK95. For theastronomical calibration we use the La93(1,1) solution withpresent-day values for the dynamical ellipticity of the Earthand tidal dissipation by the moon [Laskar et al., 1993](La93). We selected this solution because it agrees very wellwith the sedimentary cycle patterns in marine sequencesfrom the Mediterranean Plio-Pleistocene [Lourens et al.,1996, 2000]. The tuning approach follows the same proce-dure as used in the marine realm, which is based on tuningcycles with successively shorter periods to the astronomicalcurves [Hilgen et al., 1995]. The 400-kyr eccentricity cycleis considered the most secure basis for extending theastronomical timescale back in time [Shackleton et al.,2000] and, hence, the first-order tuning involves correlationof the L cycle to the 400-kyr eccentricity curve. Independ-ent confirmation of the first-order tuning can be obtainedfrom characteristic patterns in the astronomical and sedi-mentary cycle records such as interference between preces-sion and obliquity. Finally, each S cycle is tuned to theprecession and summer insolation time series.
6.1. Tuning to 400-kyr Eccentricity
[27] The first-order tuning involves the calibration of thedark colored intervals of the L cycle to 400-kyr eccentricityminima. These intervals comprise S cycles 14–17, 29–33,44–50, 61–66, and 79–85, and they are labeled I–V(Figure 4). No direct correlation between these intervalsand the eccentricity minima is found when we start from theages provided by the magnetostratigraphic calibration toCK95. The minimal adjustment necessary for a consistentcorrelation between carbonate-poor intervals and eccentric-
ity minima is shifting the ages of the calibration pointstoward older levels by 50–100 kyr. Such a shift is con-sistent with new astrobiochronological age estimates forpolarity reversals in middle Miocene marine records, whichindicated that the reversals may be about 50 kyr older thanthe ages in CK95 [Shackleton and Crowhurst, 1997; Hilgenet al., 1995, 2000].[28] Alternative calibrations involved shifting intervals I–
V to 400 kyr younger or older levels implying that the agesof the polarity reversals would become either 350 kyryounger or 450 kyr older than in CK95. Both calibrationefforts do not result in a convincing correlation becauseprecession-obliquity interference patterns support the initialfirst-order calibration shown in Figure 4a. Interferencepatterns in the OCS identified by thick-thin alternations ofcarbonate beds in successive S cycles are prominent in theinterval which comprises cycles 29 to 50 and includes 400-kyr eccentricity minimum intervals II and III. Interferencebetween precession and obliquity is expected during eccen-tricity minima related to the long-period 2.35 Myr cycle[Hilgen et al., 2000]. Such a minimum is reached between12.5 and 12.2 Ma and coincides with cycles 16–28 (Figure4a). However, also obliquity is marked by a long-term 1.2Myr cycle [Lourens and Hilgen, 1997] whereby maximumamplitude variations occur in the interval between 11.6 and12.2 Ma, which coincides with cycles 28–50. Because ofthe combined effects of these two long-period cycles,precession/obliquity interference in our insolation target isparticularly strong in the interval between 11.6 and 12.2Ma, which corresponds with the middle part of the OCShence confirming the first-order tuning to the 400-kyreccentricity cycle presented in Figure 4a. Moreover, dis-crepancies between the CK95 reversal ages and astronom-ical ages of 350 kyr (younger) or 450 kyr (older) areconsidered unlikely. A last exercise involved shifting thecarbonate-poor intervals to 100 kyr older or younger levels,but this adjustment did not result in a consistent relation ofthe L cycle with 400-kyr eccentricity.
6.2. Tuning to Precession
[29] The next logical step in the tuning would involve the100-kyr eccentricity cycle. The related I cyclicity, however,is not very distinct in the OCS and is restricted to shortintervals that are insufficiently long to establish a second-order calibration for the entire OCS. The same is true for theobliquity-related cycle. We therefore continue with thetuning of the small-scale mudstone-carbonate cycles toprecession (Figure 4b).6.2.1. Tuning of Cycles 1–28[30] A straightforward correlation is achieved for the
well-developed S cycles 1–13 and 16–27. However, dueto several weakly developed carbonate beds in 400-kyreccentricity minimum interval I, S cycles 1–13 could betuned one or two precession cycles older (Figure 4b).6.2.2. Tuning of Cycles 28–51[31] The result of the tuning is a satisfactory and straight-
forward astronomical calibration of the S cycles 28–51 toprecession (Figure 4b). The S cycles in the 400-kyr eccen-tricity minimum interval II are more regular and welldeveloped than in other 400-kyr eccentricity minimumintervals. This may be explained by the fact that eccentricitydoes not reach extreme minimum values in this interval in
ABDUL AZIZ ET AL.: APTS FOR THE LATE MIDDLE MIOCENE EPM 5 - 7
which regular precession cycles with 19- and 23-kyr periodsdominate. Obliquity exerted a strong influence as evidencedby the dominance of the D cycle. On the basis of the phaserelation with obliquity and precession, thick carbonate bedscorrelate to high-amplitude insolation maxima while theintervening thinner carbonate beds correlate to low-ampli-tude insolation maxima (Figure 4b).6.2.3. Tuning of Cycles 51–91[32] Apart from some uncertainties in the uppermost part,
the correlation to precession is rather well constrained,especially for cycles 51–71 (Figure 4b). The imprint ofthe 100-kyr eccentricity cycle is obvious in this interval asevidenced by clusters of five S cycles between cycles 67and 75 with a less pronounced cycle (71 and 77) separatingeach 100-kyr cluster (Figure 4b). The uncertainties involve(1) the correlation of cycle 72 which may possibly be tunedone precession cycle younger and (2) the complex cyclicpattern between cycles 80 and 91. Nevertheless, a correla-tion is achieved for cycles 80–91 if we use the averagecycle thickness as an additional constraint. However, thetuning presented for this uppermost part should not beconsidered definite.
6.3. Evaluation of the Tuning
[33] Except for the uppermost part, a good correspond-ence between the OCS cycles and the astronomical record isobserved (Figures 4a, 4b, and 5). The tuning of the L cycleto the 400-kyr eccentricity cycle appears convincing androbust. Also the detailed tuning of the S cycles in the well-developed mudstone-carbonate intervals to precession andinsolation is straightforward although an uncertainty of oneor possibly two precession cycles in the tuning cannot beexcluded in some intervals. In contrast, the correlation of Scycles in some of the 400-kyr eccentricity minimum inter-vals to precession is hampered due to the weak or even lackof expression of the S cyclicity. Nevertheless, our astro-nomical tuning is supported by the precession-obliquityinterference patterns as can be observed by the goodcorrespondence between alternating thick-thin carbonatebeds and amplitude variations in the insolation maxima ofthe insolation curve (Figure 4b).[34] An age model for the OCS can now be constructed
by assigning astronomical ages of the correlative precessionminima to the midpoints of the carbonate beds. The qualityof the astronomical tuning can be tested by spectral analysisof the carbonate and color reflectance records and by cross-spectral analysis between the tuned records and the orbitalparameters (Figures 3c and 6). The spectral results for thethree separate intervals of the OCS show dominant peaks inthe precession band at 23 and 19 kyr (Figure 3c), which isnot unexpected in view of the tuning of the carbonate bedsto precession. Also obvious is the 41-kyr obliquity relatedpeak in the spectra for the middle part of the section. Low-
frequency 400- and 100-kyr eccentricity related peaks arepresent in the color spectra for the lower and upper part ofthe OCS (Figure 3c).[35] Spectral and cross-spectral results of the total carbo-
nate and color reflectance records reveal the dominance ofprecession and, not surprisingly, a high significant coher-ency and in-phase relation with ETP in the precession band(Figure 6). This also holds for the signal in the obliquityband. Since the OCS is tuned to precession, the goodcoherency and in-phase relation with obliquity (Figure 6)suggest that the tuning is reliable. The filtered 41-kyrcomponents indeed show a good fit and in-phase relationof especially the filtered carbonate component with obliq-uity (Figure 5). However, also this outcome is not unex-pected because the interference pattern observed in theinsolation target curve has been taken into account duringthe tuning of the S cycles to precession. Unfortunately, it isnot clear at present whether the precession/obliquity inter-ference is still reliably resolved in the La93(1,1) solution forthe interval between 10.5 and 12.5 Ma [Laskar, 1999].[36] A good coherency is, as expected, found for the L
cycles of the OCS and the 400-kyr eccentricity cycle(Figures 5 and 6). According to Shackleton et al. [1999],the accuracy of the astronomical tuning depends on count-ing 400-kyr eccentricity cycles back from the present, anapproach that we followed when we started our tuning fromthe first-order calibration of the L cycles. Finally, the linkbetween the intermediate cycle and 100-kyr eccentricity isless convincing which can be due to small errors in thetuning, the poor expression of the 100-kyr eccentricity cyclein the proxy records (Figure 5) or small uncertainties in theLa93 solution.
6.4. Ages of the Reversal Boundaries
[37] Astronomical ages can be assigned to the polarityreversal boundaries and are compared with the polarityreversal ages of CK95. Starting with subchron C5n.2n (o)to C5An.1n (y), the ages of the polarity reversal boundariesare consistently older by about 80 kyr (Table 1). This agediscrepancy decreases to 50–60 kyr from subchronC5An.1n (o) to C5Ar.2n (o). Apart from the youngestastronomically dated age control point used in CK95,uncertainties in the ages of older tie points are fairly large[see Cande and Kent, 1992]. The next older calibrationpoint, C5Bn (y), is assigned an age of 14.8 Ma, which is theaverage of two radioisotopic ages namely 14.6 ± 0.4 Ma[Tsuchi et al., 1981] and 15.0 ± 0.3 Ma [Andreieff et al.,1976]. The third calibration point is at the Oligocene-Miocene boundary, which is assumed to correspond toC6Cn.2n (o) and assigned an age of 23.8 Ma accordingto Harland et al. [1990]. However, the error of thatestimation is ±1 Myr [Harland et al., 1990]. Consideringthe uncertainties of the calibration ages, we see no reason to
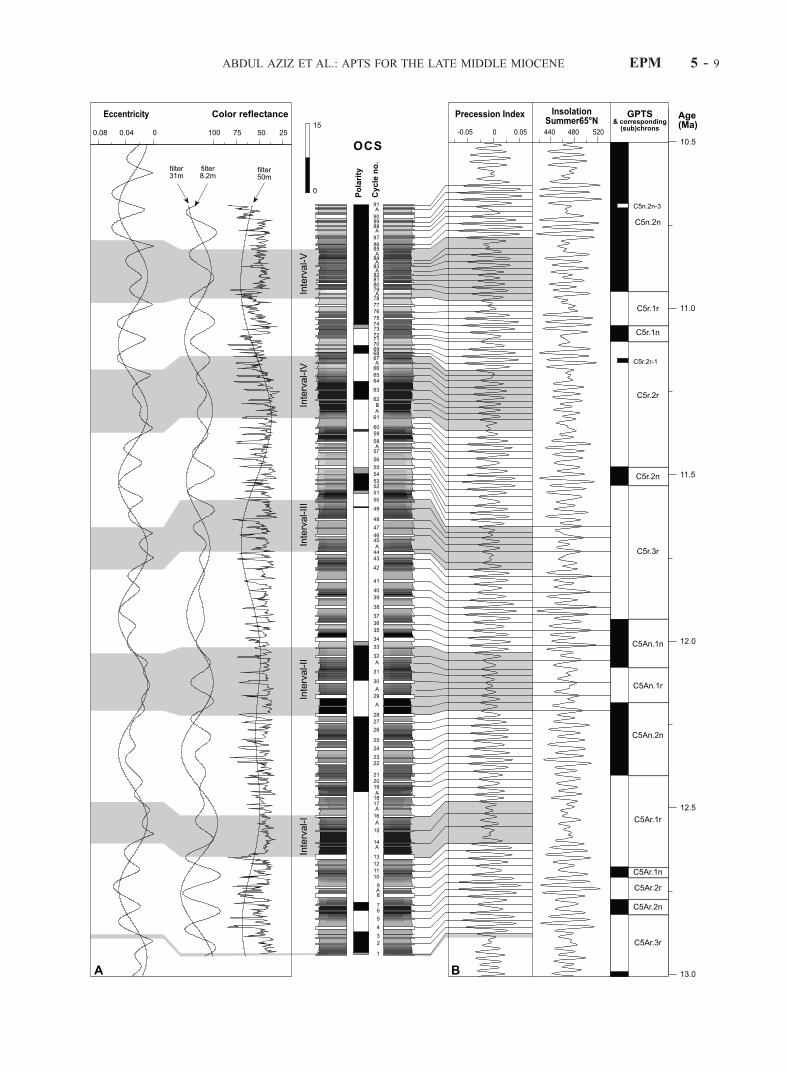
Figure 4. (opposite) (a) First-order calibration of the dark, carbonate-poor intervals of the large-scale cycles (shaded) inthe Orera Composite Section (OCS) to 400-kyr minima of the eccentricity curve of La93(1,1) [Laskar et al., 1993]. Thefiltered components of the color record in the depth domain have band-pass widths centered at 0.122 ± 0.0285 m�1 (8.2 m),0.032475 ± 0.005 m�1 (31 m), and 0.02011 ± 0.005 m�1 (50 m). (b) Detailed tuning of the OCS small-scale cycles toprecession and to 65�N summer insolation curves of La93(1,1). The thick carbonate beds of the thick-thin interferencepattern in the OCS are tuned to enhanced peaks of maximum insolation (extended solid lines). The right column shows thegeomagnetic polarity timescale (GPTS) of Cande and Kent [1995].
EPM 5 - 8 ABDUL AZIZ ET AL.: APTS FOR THE LATE MIDDLE MIOCENE
ABDUL AZIZ ET AL.: APTS FOR THE LATE MIDDLE MIOCENE EPM 5 - 9
EPM 5 - 10 ABDUL AZIZ ET AL.: APTS FOR THE LATE MIDDLE MIOCENE
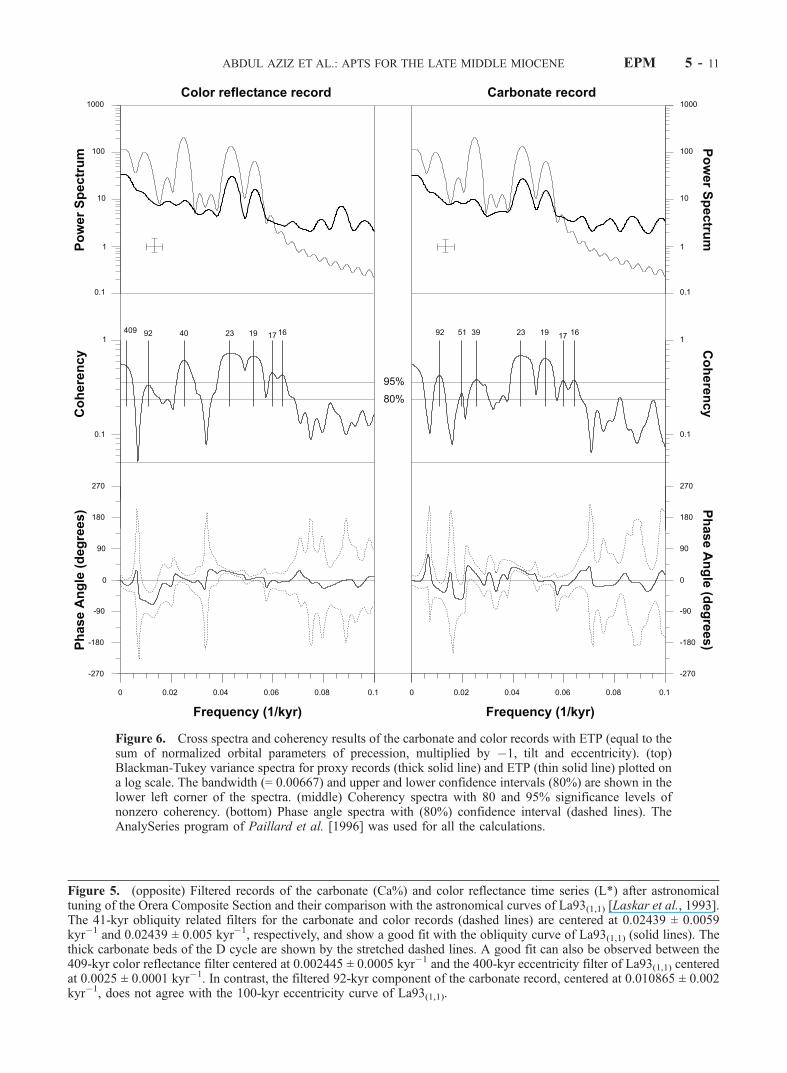
Figure 6. Cross spectra and coherency results of the carbonate and color records with ETP (equal to thesum of normalized orbital parameters of precession, multiplied by �1, tilt and eccentricity). (top)Blackman-Tukey variance spectra for proxy records (thick solid line) and ETP (thin solid line) plotted ona log scale. The bandwidth (= 0.00667) and upper and lower confidence intervals (80%) are shown in thelower left corner of the spectra. (middle) Coherency spectra with 80 and 95% significance levels ofnonzero coherency. (bottom) Phase angle spectra with (80%) confidence interval (dashed lines). TheAnalySeries program of Paillard et al. [1996] was used for all the calculations.
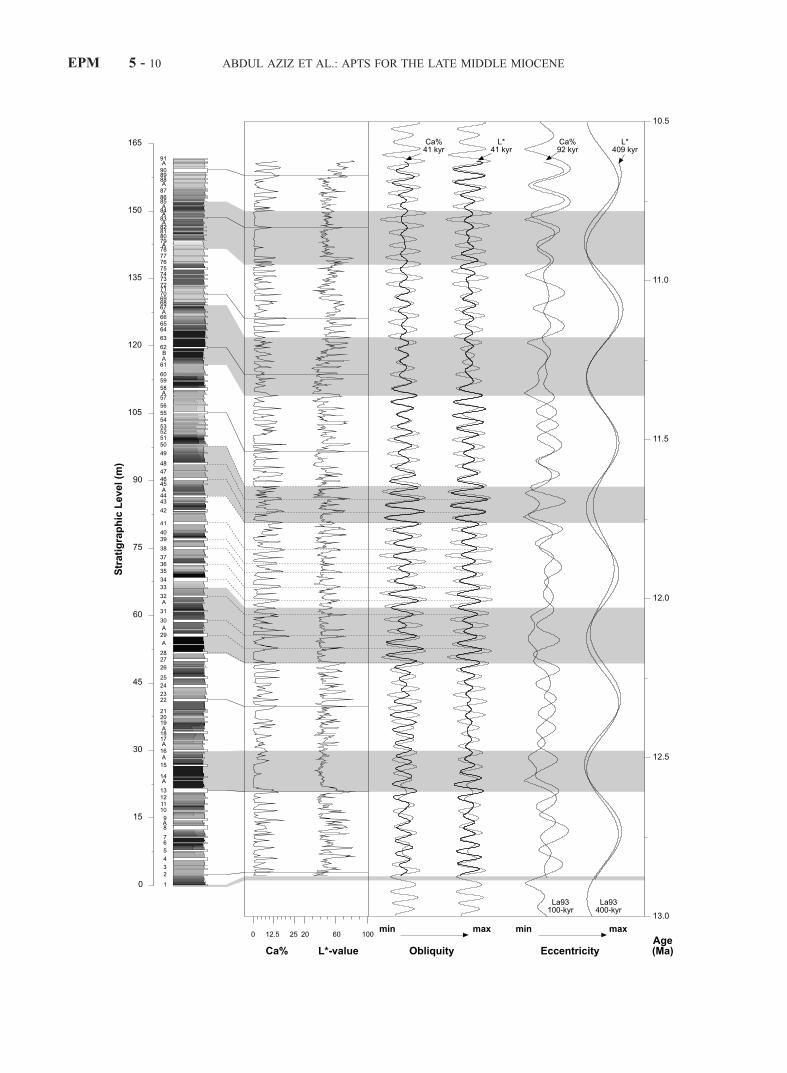
Figure 5. (opposite) Filtered records of the carbonate (Ca%) and color reflectance time series (L*) after astronomicaltuning of the Orera Composite Section and their comparison with the astronomical curves of La93(1,1) [Laskar et al., 1993].The 41-kyr obliquity related filters for the carbonate and color records (dashed lines) are centered at 0.02439 ± 0.0059kyr�1 and 0.02439 ± 0.005 kyr�1, respectively, and show a good fit with the obliquity curve of La93(1,1) (solid lines). Thethick carbonate beds of the D cycle are shown by the stretched dashed lines. A good fit can also be observed between the409-kyr color reflectance filter centered at 0.002445 ± 0.0005 kyr�1 and the 400-kyr eccentricity filter of La93(1,1) centeredat 0.0025 ± 0.0001 kyr�1. In contrast, the filtered 92-kyr component of the carbonate record, centered at 0.010865 ± 0.002kyr�1, does not agree with the 100-kyr eccentricity curve of La93(1,1).
ABDUL AZIZ ET AL.: APTS FOR THE LATE MIDDLE MIOCENE EPM 5 - 11
doubt our APTS because of modest disagreement with theCK95 ages.[38] The OCS polarity reversal ages show a slightly
better agreement with the polarity reversal ages estimatedfrom sedimentary records in the open ocean, which weredetermined by exporting astronomical ages of nannofossilevents from ODP site 925 to site 845 of ODP Leg 138having a reliable magnetostratigraphy [Backman and Raffi,1997; Hilgen et al., 2000]. In general, the OCS polarityreversal ages are about 40 kyr older than the combinedCeara Rise/eastern Pacific ages (Table 1). Age estimates forthe most reliably dated reversals of subchron C5r.2n, asso-ciated with the calcareous nannofossilDiscoaster kugleri, areeven 50 kyr older than the OCS ages. This discrepancy maypartially result from an error (of 20 or 40 kyr) in the tuning ofthe OCS, but the tuning in the Ceara Rise (and of theGibliscemi section in Sicily) might be prone to small errorsas well. Also, the basic assumption of synchronous calca-reous nannofossil events and constant sedimentation rates atODP Leg 138 site 845 might prove to be incorrect. Thereforethe estimated ages of the reversal boundaries in the openocean should not be considered as definitive, as they onlyrepresent a fair approximation of the true astronomical ages,as stated by Hilgen et al. [2000].
7. Testing and Confirming the New APTSAges Using Seafloor Spreading Rates
[39] Additional evaluation of the magnetic reversal agesis possible by testing their implications for rates of seafloorspreading (Figure 7). Our technique closely follows that ofWilson [1993] and Krijgsman et al. [1999], who demon-strated that many plate pairs show constant spreading ratesover intervals of 3–6 Myr duration according to the APTSfor the last 10 Myr. We assume that simultaneous apparentrate changes of the same ratio on multiple plate pairs are
artifacts of timescale errors, and that a successful calibrationfor older than 10 Ma will extend the pattern of commonintervals of constant spreading rate. Instead of determininginterval rates by measuring the widths of individual polarityintervals along ship tracks, we measure the total spreadingdistance by determining the finite rotation that reconstructsobserved reversal positions on opposite plates to theiroriginal common location. Testing a set of total distancesfor constant rate according to a given timescale is a simplematter of testing for linearity of age versus distance. In aslight refinement of the technique of Wilson [1993] appro-priate for large total spreading distances, we restrict therotation pole search to one dimension by solving for aninterpolation factor between two finite rotations that boundthe time interval of interest.[40] We found six plate pairs suitable for precise spread-
ing distance measurement, and in all cases interpretedreversal positions from digital magnetic data obtained fromNGDC (National Geophysical Data Center) or the scientistswho collected the data. South America-Africa distanceshave been presented by Weiland et al. [1995] and Grindlayet al. [1995]. Pacific-Antarctic and Nazca-Antarctic dis-tances are based on reanalysis of data presented by Candeet al. [1995] and Tebbens et al. [1997], respectively.Australia-Antarctic, Cocos-Pacific, and Nazca-Pacific dis-tances are based on new compilations (D. Wilson, manu-script in preparation, 2002). For anomalies C3B to C4A,distance measurements overlap substantially with thosepresented by Krijgsman et al. [1999], and ages are fromHilgen et al. [1995]. To allow an expanded vertical scale inFigure 7, the distance measurements plotted have beenreduced by subtracting a constant spreading rate prediction.The distance prediction is the product of the rate labeled inthe figure margin and the age from the spreading rate (SR)column of Table 1. These ages are directly from the OCStuning in cases where cycle ambiguity or gaps in the
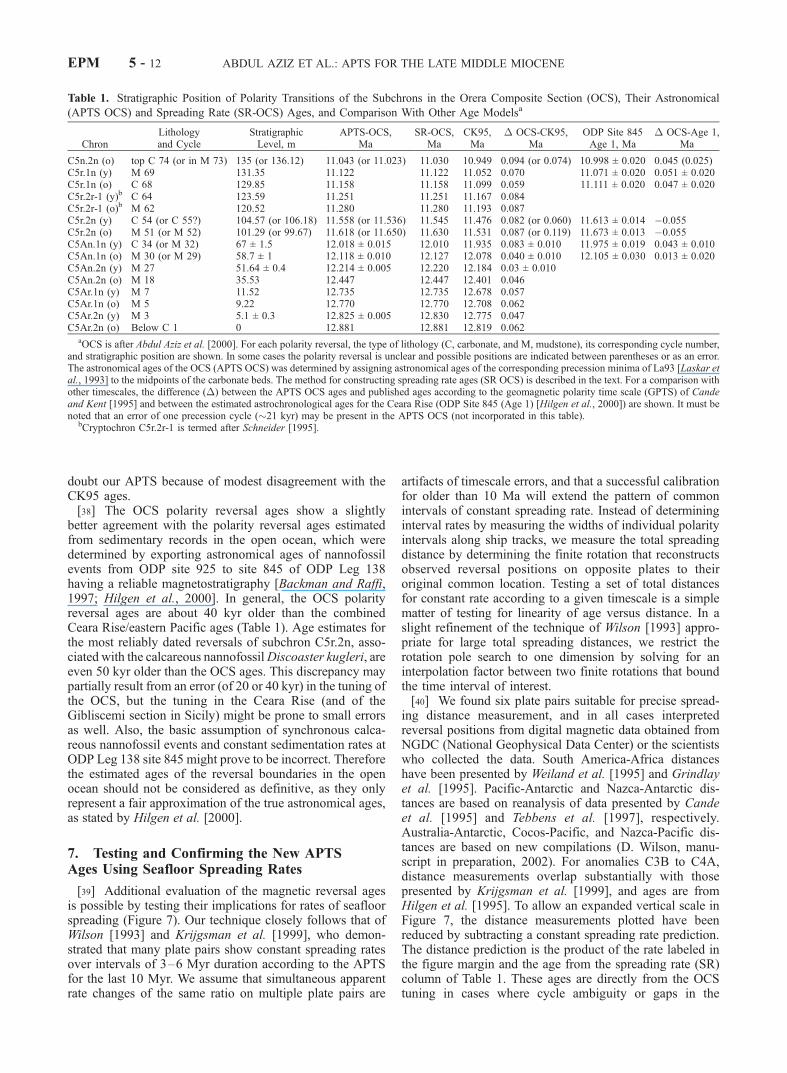
Table 1. Stratigraphic Position of Polarity Transitions of the Subchrons in the Orera Composite Section (OCS), Their Astronomical
(APTS OCS) and Spreading Rate (SR-OCS) Ages, and Comparison With Other Age Modelsa
ChronLithologyand Cycle
StratigraphicLevel, m
APTS-OCS,Ma
SR-OCS,Ma
CK95,Ma
� OCS-CK95,Ma
ODP Site 845Age 1, Ma
� OCS-Age 1,Ma
C5n.2n (o) top C 74 (or in M 73) 135 (or 136.12) 11.043 (or 11.023) 11.030 10.949 0.094 (or 0.074) 10.998 ± 0.020 0.045 (0.025)C5r.1n (y) M 69 131.35 11.122 11.122 11.052 0.070 11.071 ± 0.020 0.051 ± 0.020C5r.1n (o) C 68 129.85 11.158 11.158 11.099 0.059 11.111 ± 0.020 0.047 ± 0.020C5r.2r-1 (y)b C 64 123.59 11.251 11.251 11.167 0.084C5r.2r-1 (o)b M 62 120.52 11.280 11.280 11.193 0.087C5r.2n (y) C 54 (or C 55?) 104.57 (or 106.18) 11.558 (or 11.536) 11.545 11.476 0.082 (or 0.060) 11.613 ± 0.014 �0.055C5r.2n (o) M 51 (or M 52) 101.29 (or 99.67) 11.618 (or 11.650) 11.630 11.531 0.087 (or 0.119) 11.673 ± 0.013 �0.055C5An.1n (y) C 34 (or M 32) 67 ± 1.5 12.018 ± 0.015 12.010 11.935 0.083 ± 0.010 11.975 ± 0.019 0.043 ± 0.010C5An.1n (o) M 30 (or M 29) 58.7 ± 1 12.118 ± 0.010 12.127 12.078 0.040 ± 0.010 12.105 ± 0.030 0.013 ± 0.020C5An.2n (y) M 27 51.64 ± 0.4 12.214 ± 0.005 12.220 12.184 0.03 ± 0.010C5An.2n (o) M 18 35.53 12.447 12.447 12.401 0.046C5Ar.1n (y) M 7 11.52 12.735 12.735 12.678 0.057C5Ar.1n (o) M 5 9.22 12.770 12.770 12.708 0.062C5Ar.2n (y) M 3 5.1 ± 0.3 12.825 ± 0.005 12.830 12.775 0.047C5Ar.2n (o) Below C 1 0 12.881 12.881 12.819 0.062
aOCS is after Abdul Aziz et al. [2000]. For each polarity reversal, the type of lithology (C, carbonate, and M, mudstone), its corresponding cycle number,and stratigraphic position are shown. In some cases the polarity reversal is unclear and possible positions are indicated between parentheses or as an error.The astronomical ages of the OCS (APTS OCS) was determined by assigning astronomical ages of the corresponding precession minima of La93 [Laskar etal., 1993] to the midpoints of the carbonate beds. The method for constructing spreading rate ages (SR OCS) is described in the text. For a comparison withother timescales, the difference (�) between the APTS OCS ages and published ages according to the geomagnetic polarity time scale (GPTS) of Candeand Kent [1995] and between the estimated astrochronological ages for the Ceara Rise (ODP Site 845 (Age 1) [Hilgen et al., 2000]) are shown. It must benoted that an error of one precession cycle (�21 kyr) may be present in the APTS OCS (not incorporated in this table).
bCryptochron C5r.2r-1 is termed after Schneider [1995].
EPM 5 - 12 ABDUL AZIZ ET AL.: APTS FOR THE LATE MIDDLE MIOCENE
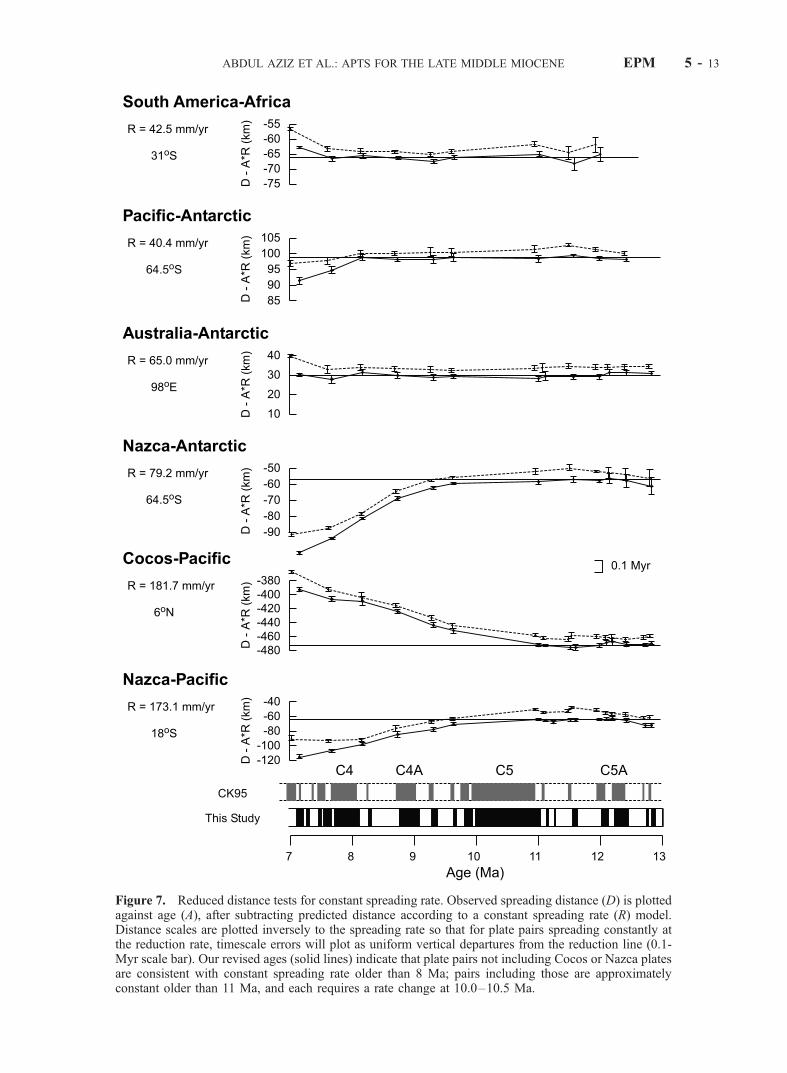
Figure 7. Reduced distance tests for constant spreading rate. Observed spreading distance (D) is plottedagainst age (A), after subtracting predicted distance according to a constant spreading rate (R) model.Distance scales are plotted inversely to the spreading rate so that for plate pairs spreading constantly atthe reduction rate, timescale errors will plot as uniform vertical departures from the reduction line (0.1-Myr scale bar). Our revised ages (solid lines) indicate that plate pairs not including Cocos or Nazca platesare consistent with constant spreading rate older than 8 Ma; pairs including those are approximatelyconstant older than 11 Ma, and each requires a rate change at 10.0–10.5 Ma.
ABDUL AZIZ ET AL.: APTS FOR THE LATE MIDDLE MIOCENE EPM 5 - 13
magnetostratigraphic record introduce only negligibleerrors. In other cases, these SR ages are an attempt touse the spreading distance observations to refine the agedetermination within the uncertainties listed in the APTSage column of Table 1. Age adjustments in these cases areintended to bring as many distance observations as possibleinto consistency with the average rates defined by thebetter determined ages. For the very fast Cocos-Pacificand Nazca-Pacific plate pairs, full spreading rates above170 km Myr�1 mean that the better determined distancemeasurements with 95% confidence intervals of ±1.5 kmcorrespond to age uncertainties slightly less than ±0.01Myr. Also, magnetic reversal ages separated by only 0.05Myr correspond to polarity boundaries spaced greater thanwater depth (3.6–4.2 km), allowing separate resolution ofthe young and old boundaries of brief polarity intervalsC5r.2n and C5An.1r.[41] For South America-Africa, Pacific-Antarctic, and
Australia-Antarctic, our reversal ages are consistent withconstant spreading rates over the age range bounded by 7–8Ma at the young end and extending to the limit of anomalycoverage or reversal ages at 12–13 Ma. The steadiness ofAustralia-Antarctic spreading is especially striking, with nodistances measurements deviating more than 2.0 km from
the prediction of a 65.0 mm yr�1 constant rate for the agerange 7–13 Ma. The faster spreading rate pairs Nazca-Antarctic, Cocos-Pacific, and Nazca-Pacific all have arelatively constant rate for the 11.0–12.8 range of the Oreraages, but all require a rate change at 10.0–10.5 Ma. Theeastern Pacific has long been recognized as having atectonic reorganization at about this time [e.g., Herron,1972; Wilson, 1996]. Because the rate changes are ofdifferent ratios, it is not possible for any alternative time-scale to predict constant spreading rate for more than one ofthese pairs. In fact, we consider the implication that theseplate pairs changed rates simultaneously to be good corrob-oration of our reversal ages.[42] The spreading rate implications support the younger
alternative in resolving the 100-kyr ambiguity in correlatinginterval V with the eccentricity model. An age 100 kyr olderfor C5n.2n (o) would introduce a 7-km departure in the caseof Australia-Antarctic from the linear age-distance relationestablished by the other reversals. For at least five of the sixplate pairs we consider, the older alternative would imply a15% rate increase at subchron C5r.2n, followed in mostcases by decrease to below the original rate near subchronC5n.2n (o), followed by another change by subchronC4Ar.2n, returning to the original rate in some cases. The
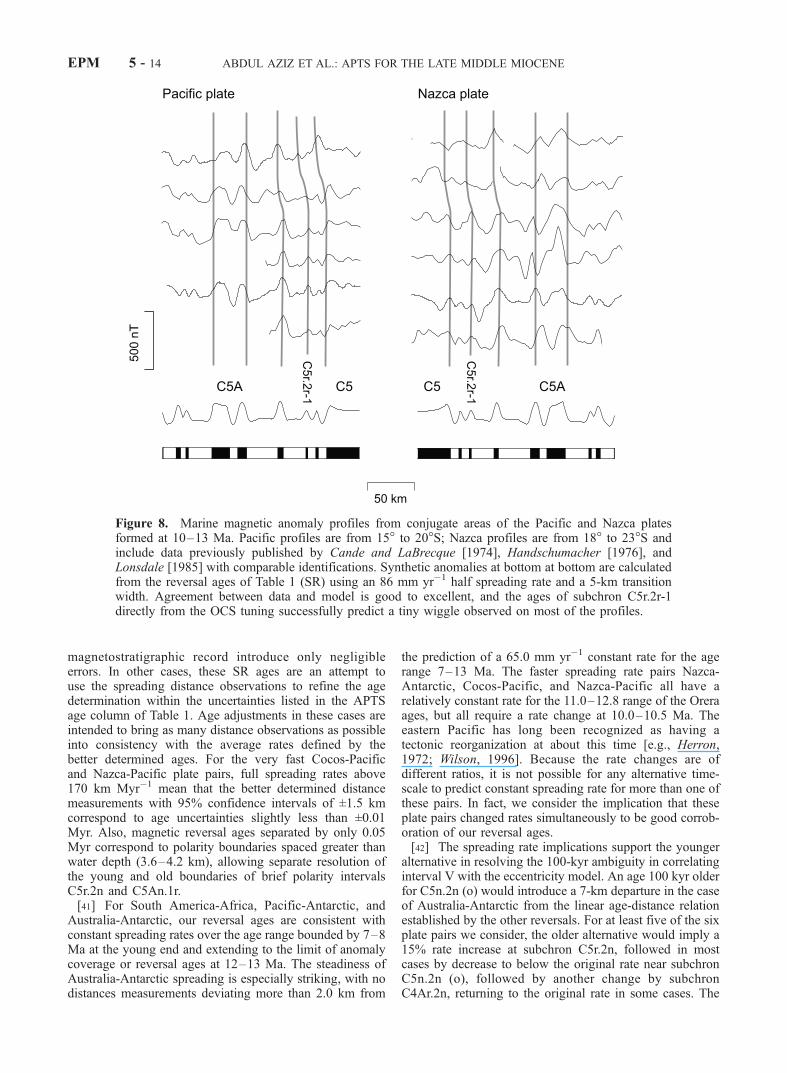
Figure 8. Marine magnetic anomaly profiles from conjugate areas of the Pacific and Nazca platesformed at 10–13 Ma. Pacific profiles are from 15� to 20�S; Nazca profiles are from 18� to 23�S andinclude data previously published by Cande and LaBrecque [1974], Handschumacher [1976], andLonsdale [1985] with comparable identifications. Synthetic anomalies at bottom at bottom are calculatedfrom the reversal ages of Table 1 (SR) using an 86 mm yr�1 half spreading rate and a 5-km transitionwidth. Agreement between data and model is good to excellent, and the ages of subchron C5r.2r-1directly from the OCS tuning successfully predict a tiny wiggle observed on most of the profiles.
EPM 5 - 14 ABDUL AZIZ ET AL.: APTS FOR THE LATE MIDDLE MIOCENE
simplicity of the younger alternative, with only a single ratechange on half of the plate pairs, is preferable.[43] Even though normal polarity interval C5r.2r-1 is not
mentioned in the timescales of Cande and Kent [1992,1995], it has been identified by Schneider [1995] in a corefrom ODP Leg 138, Site 845. Moreover, its existence as anevent of comparable duration to C5r.1n (Table 1) is evidentfrom marine magnetic anomaly profiles where fast spread-ing rate and satisfactory magnetic geometry allow resolutionof these closely spaced, brief intervals. Magnetic anomalyprofiles from the central part of the Nazca-Pacific plate pair(Figure 8) show two peaks of comparable amplitude in theyounger half of the predominately reversed interval betweenC5n and C5r.2n. For this time interval, the fine structure ofCande and Kent timescales is derived from the timescale ofBlakely [1974], who worked with profiles from the north-east Pacific formed at a half rate of 40 km Myr�1. At thatrate, two brief polarity intervals separated by �0.1 Myr willbe only marginally resolvable as distinct sea surface mag-netic anomalies. The single polarity interval reported inthese timescales appears to reflect this difficulty in resolvingthe two intervals we observe. The duration of the singleinterval approaches the sum of our two intervals and its ageis intermediate between our two intervals (after normalizingfor calibration differences). The marginal resolution of thenortheast Pacific data set for the shortest polarity intervals iswell illustrated by the differences between Blakely’s [1974]interpretation and that of Cande and LaBrecque [1974]using the same data. Blakely identified one correlatablepositive anomaly between C5n and C5r.2n, and two duringC5Ar, whereas Cande and LaBreque correlated three in theformer interval but only one in the latter.
8. Conclusions
[44] Spectral analysis results on high-resolution carbonateand color reflectance records in the depth and time domain,demonstrate that the various scales of sedimentary cyclicityobserved in the shallow lacustrine and alluvial fan mudflatdeposits of the Orera Composite Section (OCS) are relatedto the astronomical cycles of precession, obliquity andeccentricity and, thus, to astronomical induced oscillationsin regional climate.[45] The assumption of zero phase between the sedimen-
tary cyclicity and the astronomical parameters, allows thecycles to be tuned to the eccentricity, precession andinsolation time series of solution La93(1,1) with present-day values for the dynamical ellipticity and tidal dissipationby the Moon.[46] The astronomical tuning of OCS may have an
uncertainty of 20 or 40 kyr for certain intervals. Never-theless, spectral analysis shows significant coherencies withthe 41-kyr obliquity and with the 400-kyr eccentricity cycle.Less coherent is the relation with the 100-kyr eccentricitycycle. The cause of this inconsistency still remains to beexplained.[47] Finally, the astronomically tuned OCS cycles cover a
period between 10.6 and 12.9 Ma and provide new ages forpolarity reversals. The OCS reversal ages are about 80 kyrolder than the ages of CK95. This age discrepancydecreases to 50–60 kyr with increasing age. The newlyacquired astronomical ages for the polarity reversals in the
OCS are in better agreement with seafloor spreading ratesthan CK95.
[48] Acknowledgments. C. G. Langereis, J. E. Meulenkamp, and E.Sanz-Rubio are thanked for their comments on the manuscript. We alsothank David McMillan for his thorough review which considerablyimproved the manuscript. Many thanks to Y. Beukers, S. Ernst, A. J. vander Meulen, L. Pronk, and E. Sanz-Rubio for field assistance. We aregrateful to G. J. Reichart for suggestions on chemical analysis and to H. deWaard for performing the numerous ICP measurements. This research wassupported by the Netherlands Geosciences Foundation (ALW) with finan-cial aid from the Netherlands Organization for Scientific Research (NWO).The work was carried out under the program of the Netherlands ResearchSchool of Sedimentary Geology (NSG).
ReferencesAbdul Aziz, H., Astronomical forcing in continental sediments (an inte-grated study of Miocene deposits from the Calatayud and Teruel basins,NE Spain), Geol. Ultraiectina, 207, 2001.
Abdul Aziz, H., F. J. Hilgen, W. Krijgsman, E. Sanz-Rubio, and J. P. Calvo,Astronomical forcing of sedimentary cycles in the middle to late Miocenecontinental Calatayud Basin (NE Spain), Earth Planet. Sci. Lett., 177, 9–22, 2000.
Andreieff, P., H. Bellon, and D. Westercamp, Chronometrie et stratigraphiecomparee des edifices volcaniques et formations sedimentaires de laMartinique (Antilles francaises), Bull. Bur. Rech. Geol. Min. Fr., 4,335–346, 1976.
Backman, J., and I. Raffi, Calibration of Miocene nannofossil events toorbitally-tuned cyclostratigraphies from Ceara Rise, Proc. Ocean Drill.Program Sci. Results, 154, 83–99, 1997.
Berger, A., Long-term variations of caloric insolation resulting from theEarth’s orbital elements, Quat. Res., 9, 139–167, 1978.
Blakely, R. J., Geomagnetic reversals and crustal spreading rates during theMiocene, J. Geophys. Res., 79, 2979–2985, 1974.
Cande, S. C., and D. V. Kent, A new geomagnetic polarity time-scale forthe Late Cretaceous and Cenozoic, J. Geophys. Res., 97, 13,917–13,951,1992.
Cande, S. C., and D. V. Kent, Revised calibration of the geomagneticpolarity time scale for the late Cretaceous and Cenozoic, J. Geophys.Res., 100, 6093–6095, 1995.
Cande, S. C., and J. L. LaBrecque, Behavior of the Earth’s paleomagneticfield from small scale marine magnetic anomalies, Nature, 247, 26–28,1974.
Cande, S. C., C. A. Raymond, J. Stock, and W. F. Haxby, Geophysics of thePitman Fracture Zone and Pacific-Antarctic plate motions during theCenozoic, Science, 270, 947–953, 1995.
Foucault, A., and F. Melieres, Palaeoclimatic cyclicity in central Mediter-ranean Pliocene sediments: The mineralogical signal, Palaeogeogr. Pa-laeoclimatol. Palaeoecol., 158, 311–323, 2000.
Grindlay, N. R., C. Weiland, and P. J. Fox, Variations in spreading rates,plate boundary geometry, and magnetic structure of the southern Mid-Atlantic Ridge during the past 12 m.y., Eos Trans. AGU, 76(46), FallMeet. Suppl., F573, 1995.
Handschumacher, D. W., Post-Eocene plate tectonics of the esastern Paci-fic, in The Geophysics of the Pacific Ocean Basin and Its Margin, Geo-phys. Monogr. Ser., vol. 19, pp. 177–202, AGU, Washington, D. C.,1976.
Harland, W. B., R. Armstrong, A. Cox, L. Craig, A. Smith, and D. Smith,A Geologic Time Scale 1989, pp. 155, 198, Cambridge Univ. Press, NewYork, 1990.
Herron, E. M., Sea-floor spreading and the Cenozoic history of the eastcentral Pacific, Geol. Soc. Am. Bull., 83, 1671–1692, 1972.
Heslop, D., C. G. Langereis, and M. J. Dekkers, A new astronomical timescale for the loess deposits of northern China, Earth Planet. Sci. Lett.,184, 125–139, 2000.
Hilgen, F. J., Astronomical calibration of Gauss to Matuyama sapropels inthe Mediterranean and implication for the geomagnteic polarity timescale, Earth Planet. Sci. Lett., 104, 226–244, 1991a.
Hilgen, F. J., Extension of the astronomically calibrated (polarity) timescale to the Miocene/Pliocene boundary, Earth Planet. Sci. Lett., 107,349–368, 1991b.
Hilgen, F. J., W. Krijgsman, C. G. Langereis, L. J. Lourens, A. Santarelli,and W. J. Zachariasse, Extending the astronomical (polarity) time scaleinto the Miocene, Earth Planet Sci. Lett., 136, 495–510, 1995.
Hilgen, F. J., W. Krijgsman, I. Raffi, E. Turco, and W. J. Zachariasse,Integrated stratigraphy and astronomical calibration of the Serravallian/Tortonian boundary section at Monte Gibliscemi (Sicily, Italy), Mar.Micropaleontol., 38, 181–211, 2000.
ABDUL AZIZ ET AL.: APTS FOR THE LATE MIDDLE MIOCENE EPM 5 - 15
Imbrie, J., J. D. Hays, D. G. Martinson, A. McIntyre, A. C. Mix, J. J.Morley, N. G. Pisias, W. L. Prell, and N. J. Shackleton, The orbital theoryof Pleistocene climate: Support from a revised chronology of the marined18O record, in Milankovitch and Climate, Part 1, edited by A. L. Bergeret al., pp. 269–305, D. Reidel, Norwell, Mass., 1984.
Imbrie, J., A. Berger, and N. J. Shackleton, Role of orbital forcing: A two-million-year perspective, in Global Changes in the Perspective of thePast, edited by J. A. Eddy and H. Oeschger, pp. 263–279, John Wiley,New York, 1993.
Kloosterboer-van Hoeve, M., Cyclic changes in the late Neogene vegetationof northern Greece, LPP Contrib. Ser. 12, Utrecht Univ., Utrecht, Nether-lands, 2000.
Krijgsman, W., F. J. Hilgen, I. Raffi, F. J. Sierro, and D. S. Wilson, Chron-ology, causes and progression of the Messinian salinity crisis, Nature,400, 655–852, 1999.
Laskar, J., The limits of Earth orbital calculations for geological time-scaleuse, Philos. Trans. R. Soc. London, Ser. A, 357, 1735–1759, 1999.
Laskar, J., F. Joutel, and F. Boudin, Orbital, precessional, and insolationquantities for the Earth from �20 Myr to +10 Myr, Astron. Astrophys.,270, 522–533, 1993.
Lonsdale, P., Site surveys in the south Pacific with a SeaBeam swath map-ping system, Initial Rep. Deep Sea Drill. Proj., 92, 229–236, 1985.
Lourens, L. J., and F. J. Hilgen, Long-period variations in the Earth’sobliquity and their relation to third-order eustatic cycles and late Neogeneglaciations, Quat. Int., 40, 43–52, 1997.
Lourens, L. J., F. J. Hilgen, L. Gudjonsson, and W. J. Zachariasse, LatePliocene to early Pleistocene astronomically forced sea surface produc-tivity and temperature variations in the Mediterranean, Mar. Micropa-leontol., 19, 49–78, 1992.
Lourens, L. J., F. J. Hilgen, W. J. Zachariasse, A. A. M. van Hoof,A. Antonarakou, and C. Vergnaud-Grazzini, Evaluation of the Plio-Pleis-tocene astronomical timescale, Paleoceanography, 11, 391–413, 1996.
Lourens, L. J., R. Wehausen, and H. J. Brumsack, Geological constraints ontidal dissipation and dynamical ellipticity of the Earth over the past threemillion years, Nature, 409, 1029–1033, 2000.
Lu, H. Y., K. V. Huissteden, Z. S. An, G. Nugteren, and J. Vandenberghe,East Asia winter monsoon changes on millennial time scale before thelast glacial-interglacial cycle, J. Quat. Sci., 14, 101–111, 1999.
Olsen, P. E., D. V. Kent, B. Cornet, W. K. White, and R. W. Schlische,High-resolution stratigraphy of the Newark rift basin (early Mesozoic,eastern North America), Geol. Soc. Am. Bull., 108, 40–77, 1996.
Paillard, D. L., L. Labeyrie, and P. Yiou, Macintosh program performs time-series analysis, Eos Trans. AGU, 77, 379, 1996.
Rohling, E. J., and S. de Rijk, Holocene climate optimum and last glacialmaximum in the Mediterranean: The marine oxygen isotope record, Mar.Geol., 153, 57–75, 1999.
Rossignol-Strick, M., African monsoons, an immediate climate response toorbital insolation, Nature, 303, 46–49, 1983.
Rossignol-Strick, M., Rainy periods and bottom water stagnation initiatingbrine accumulation and metal concentrations, 1, Paleoceanography, 2,333–360, 1987.
Schenau, S. J., A. Antonarakou, F. J. Hilgen, L. J. Lourens, I. A. Nijenhuis,C. H. van der Weijden, and W. J. Zachariasse, Organic-rich layers in theMetochia section (Gavdos, Greece): Evidence for a single mechanism ofsapropel formation during the past 10 My, Mar. Geol., 153, 117–135,1999.
Schneider, D. A., Paleomagnetism of some Leg 138 sediments: DetailingMiocene magnetostratigraphy, Proc. Ocean Drill. Program Sci. Results,138, 59–72, 1995.
Schulz, M., and K. Stattegger, Spectrum: Spectral analysis of unevenlyspaced paleoclimatic time series, Comput. Geosci., 23, 929–945, 1997.
Shackleton, N. J., and S. Crowhurst, Sediment fluxes based on an orbitallytuned time scale 5 Ma to 14 Ma, Site 926, Proc. Ocean Drill. ProgramSci. Results, 154, 69–82, 1997.
Shackleton, N. J., S. J. Crowhurst, G. P. Weedon, and J. Laskar, Astronom-ical calibration of Oligocene-Miocene time, Philos. Trans. R. Soc. Lon-don, Ser. A, 357, 1907–1929, 1999.
Shackleton, N. J., M. A. Hall, I. Raffi, L. Tauxe, and J. Zachos, Astronom-ical calibration age for the Oligocene-Miocene boundary, Geology, 28,447–450, 2000.
Sierro, F. J., S. Ledesma, J. A. Flores, S. Torrescusa, and W. Martınez delOlmo, Sonic and gamma-ray astrochronology: Cycle to cycle calibrationof Atlantic climatic records to Mediterranean sapropels and astronomicaloscillations, Geology, 28, 695–698, 2000.
Steenbrink, J., N. Van Vugt, M. L. Kloosterboer, and F. J. Hilgen, Refine-ment of the Messinian APTS from sedimentary cycle patterns the lacus-trine Lava section (Servia Basin, NW Greece), Earth Planet Sci. Lett.,181, 161–173, 2000.
Tebbens, S. F., S. C. Cande, L. Kovacs, J. C. Parra, J. L. LaBrecque, andH. Vergara, The Chile Ridge: A tectonic framework, J. Geophys. Res.,102, 12,035–12,059, 1997.
Tsuchi, R., Y. Takayanagi, and K. Shibata, Neogene bio-events in theJapanese Islands, in Neogene of Japan—Its Biostratigraphy and Chron-ology, edited by R. Tsuchi, pp. 15–32, Kurofune, Shizuok, Japan, 1981.
Van Vugt, N., J. Steenbrink, C. G. Langereis, F. J. Hilgen, and J. E. Meu-lenkamp, Magnetostratigraphy-based astronomical tuning of the earlyPliocene lacustrine sediments of Ptolemais (NW Greece) and bed-to-bed correlation with the marine record, Earth Planet. Sci. Lett., 64,535–551, 1998.
Van Woerkum, A. J. J., The astronomical theory of climatic changes, inClimatic Change, Evidence, Causes and Effects, edited by H. Sharpley,pp. 147–157, Harvard Univ. Press, Cambridge, Mass., 1953.
Wehausen, R., and H.-J. Brumsack, Chemical cycles in Pliocene sapropel-bearing and sapropel-barren eastern Mediterranean sediments, Palaeo-geogr. Palaeoclimatol. Palaeoecol., 158, 325–352, 2000.
Weiland, C. M., D. S. Wilson, and K. Macdonald, High-resolution platereconstruction of the southern Mid-Atlantic Ridge, Mar. Geophys. Res.,17, 143–166, 1995.
Wilson, D. S., Confirmation of the astronomical calibration of the magneticpolarity timescale from sea-floor spreading rates, Nature, 364, 788–790,1993.
Wilson, D. S., Fastest known spreading on the Miocene Cocos-Pacific plateboundary, Geophys. Res. Lett., 23, 3003–3006, 1996.
�����������������������H. Abdul Aziz and W. Krijgsman, Paleomagnetic Laboratory Fort
Hoofddijk, Utrecht University, Budapestlaan 17, 3584 CD Utrecht, Nether-lands. ([email protected]; [email protected])J. P. Calvo, Departamento de Petrologıa y Geoquımica, Facultad Ciencias
Geologicas, Universidad Complutense, E-28040 Madrid, Spain. ( [email protected])F. J. Hilgen, Department of Geology, Institute of Earth Sciences, Utrecht
University, Budapestlaan 4, 3584 CD Utrecht, Netherlands. ([email protected])D. S. Wilson, Department of Geological Sciences and Marine Science
Institute, University of California, Santa Barbara, CA 93106-9630, USA.([email protected])
EPM 5 - 16 ABDUL AZIZ ET AL.: APTS FOR THE LATE MIDDLE MIOCENE
Copyright © 2022 FDOKUMEN