An Application of Item Response Theory to Investigate the ...
163
An Application of Item Response Theory to Investigate the Validity of a Learning Progression for Number Sense by Hye Kyung Lee A dissertation submitted in partial satisfaction of the requirements for the degree of Doctor of Philosophy in Education in the Graduate Division of the University of California, Berkeley Committee in charge: Professor Mark Wilson, Chair Professor Sophia Rabe-Hesketh Assistant Professor Aki Murata Professor Nicholas Jewell Summer 2016
-
Upload
khangminh22 -
Category
Documents
-
view
1 -
download
0
Transcript of An Application of Item Response Theory to Investigate the ...

An Application of Item Response Theory to Investigate the Validity of
a Learning Progression for Number Sense
by
Hye Kyung Lee
A dissertation submitted in partial satisfaction of
the requirements for the degree of
Doctor of Philosophy
in
Education
in the
Graduate Division
of the
University of California, Berkeley
Committee in charge:
Professor Mark Wilson, Chair
Professor Sophia Rabe-Hesketh
Assistant Professor Aki Murata
Professor Nicholas Jewell
Summer 2016

An Application of Item Response Theory to Investigate the Validity of
a Learning Progression for Number Sense
Copyright 2016
by
Hye Kyung Lee

1
Abstract
An Application of Item Response Theory to Investigate the Validity of
a Learning Progression for Number Sense
by
Hye Kyung Lee
Doctor of Philosophy in Education
University of California, Berkeley
Professor Mark Wilson, Chair
Learning progressions are one of the most important curriculum and assessment design
ideas to be introduced in the past decade. A well-constructed learning progression can
incorporate the knowledge needed to define the “track” that students may or should be on. This
can inform teachers about when to teach what to whom. For the development of sound learning
progressions, researchers investigate how learning typically unfolds in a particular area of study,
and should empirically test and validate it. A learning progression of Number Sense was
developed in a research project, Special Education Learning Progressions in Math (SELPM).
The progression includes hypothesized levels of achievement for grades K to 3 for four sub-
domains of Number Sense: Place Value, Addition, Magnitude Comparison, and Transcoding.
This research was concerned with the validation of the learning progression. The study used
three student assessment data sets to investigate the validity of the proposed learning
progressions using item response theory, specifically the Rasch model and its extension. This
research consists of three validation studies – Phase I: Preliminary Study, Phase II: Testing
Validity of Learning Progression, and Phase III: Validation of Alternative Learning Progression.
Through the iterative validation process, this research aimed to provide an empirically-validated
and theoretically-based Number Sense learning progression and a set of assessments for the
education community

i
To those who supported me along the way.

ii
Table of Contents
Contents
1. Chapter 1. Introduction ............................................................................................................. 1
1.1 The Special Education Learning Progression in Math (SELPM) Project ........................ 1
1.2 Validation of Learning Progression ................................................................................. 2
1.3 Research Questions .......................................................................................................... 3
1.4 Research Phases ............................................................................................................... 3
Phase I: Preliminary Study – identification of a problem ......................................................... 3
Phase II: Testing Validity of Learning Progression - confirmation of the problem and
exploration of a solution ........................................................................................................... 3
Phase III: Validation of Alternative Learning Progression - validation of the solution ........... 4
2. Chapter 2. Theoretical Framework ........................................................................................... 5
2.1 Definition of Learning Progression .................................................................................. 5
2.2 Number Sense Learning Progressions.............................................................................. 5
2.3 The Berkeley Evaluation and Assessment Research (BEAR) Assessment System......... 6
3. Chapter 3. Phase I – Preliminary Study with Pilot Test ......................................................... 12
3.1 Pilot Study Data ............................................................................................................. 12
3.1.1 Participants ................................................................................................................. 12
3.1.2 Instrument ................................................................................................................... 13
3.1.3 Scoring ........................................................................................................................ 14
3.1.4 Linking Procedure ...................................................................................................... 15
3.2 Selection of Measurement Model .................................................................................. 15
3.2.1 Psychometric Considerations ..................................................................................... 19
3.2.2 Practical Consideration ............................................................................................... 21
3.3 Validity Evidence of the Instrument .............................................................................. 22
3.4. Implications: Identification of Problems ........................................................................ 29
4. Chapter 4. Phase II – Validating Learning Progression with Field Test ................................ 31
4.1 Field Study ..................................................................................................................... 31

iii
4.1.1 Participants ................................................................................................................. 31
4.1.2 Instrument ................................................................................................................... 32
4.2 Model Selection and Measurement Properties ............................................................... 33
4.3 Comparison of Performances between GED and MLD ................................................. 35
4.3.1 Test Level ................................................................................................................... 35
4.3.2 Item Level ................................................................................................................... 37
4.4 Validation of the Proposed Learning Progressions ........................................................ 41
4.4.1 Place Value ................................................................................................................. 42
4.4.2 Addition ...................................................................................................................... 44
4.4.3 Magnitude Comparison .............................................................................................. 46
4.4.4 Transcoding ................................................................................................................ 48
4.5 Learning Relationship between Dimensions .................................................................. 50
4.6 Investigation for Alternative Learning Progressions ..................................................... 52
4.6.1 Place Value ................................................................................................................. 53
4.6.2 Addition ...................................................................................................................... 56
4.6.3 Magnitude Comparison .............................................................................................. 61
4.6.4 Transcoding ................................................................................................................ 64
4.6.5 Suggestions for Alternative Learning Progressions ................................................... 66
4.7 Conclusions .................................................................................................................... 69
5. Chapter 5. Phase III – Validation of Alternative Learning Progressions ............................... 71
5.1 Development of the Alternative CMs ............................................................................ 71
5.2 Development of the New Test Items .............................................................................. 76
5.3 Data Collection ............................................................................................................... 76
5.3.1 Participants ................................................................................................................. 77
5.3.2 Instrument ................................................................................................................... 77
5.3.3 Test Administration Procedure ................................................................................... 78
5.4 Model Selection and Measurement Properties ............................................................... 80
5.5 Validation of the Alternative Learning Progressions ..................................................... 81
5.5.1 Place Value ................................................................................................................. 82
5.5.2 Addition ...................................................................................................................... 85
5.5.3 Magnitude Comparison .............................................................................................. 88
5.6 Conclusions and Limitations .......................................................................................... 92
Appendix A ............................................................................................................................. 93
Appendix B – 1 ..................................................................................................................... 104
Appendix B – 2 ..................................................................................................................... 113

iv
Appendix C ........................................................................................................................... 114
Appendix D ........................................................................................................................... 125
Appendix E ........................................................................................................................... 136
References 148

v
List of Figures
Figure 2.1 Number Sense Learning Progression ............................................................................ 6 Figure 2.2 Construct Map of Magnitude Comparison ................................................................... 8 Figure 2.3 Example Item in the Magnitude Comparison Construct Map ...................................... 9
Figure 2.4 Scoring Exemplar .......................................................................................................... 9 Figure 2.5 Relationships between respondent location and the location of an item (Wilson, 2005)
....................................................................................................................................................... 11 Figure 2.6 The BEAR Assessment System .................................................................................. 11
Figure 3.1 An example of the Place Value scoring exemplar ...................................................... 15 Figure 3.2 Measurement Approaches to the Number Sense assessment ...................................... 17 Figure 3.3 Students’ ability profiles across the four dimensions ................................................. 22
Figure 3.4 Wright map of the Place Value dimension (Pilot Test) .............................................. 24 Figure 3.5 Wright map of the Addition dimension (Pilot Test) .................................................... 25
Figure 3.6 Wright map of the Magnitude Comparison dimension (Pilot Test) ........................... 26 Figure 3.7 Wright map of the Transcoding dimension (Pilot Test) ............................................. 27
Figure 4.1 Comparison of Mean Abilities between GED and MLD by Grade ............................ 37
Figure 4.2 Scatter plots of item difficulties in Place Value between GED and MLD ................. 38 Figure 4.3 Scatter plots of item difficulties in Addition between GED and MLD ....................... 39
Figure 4.4 Scatter plots of item difficulties in Magnitude Comparison between GED and MLD40 Figure 4.5 Scatter plots of item difficulties in Transcoding between GED and MLD ................ 41
Figure 4.6 Wright map of Place Value (Field Test) ..................................................................... 43 Figure 4.7 Wright map of Addition (Field Test)........................................................................... 45 Figure 4.8 Wright map of Magnitude Comparison (Field Test) .................................................. 47
Figure 4.9 Wright map of Transcoding (Field Test) .................................................................... 49 Figure 4.10 Multidimensional Wright Map after Delta Dimensional Alignment ........................ 51
Figure 4.11 Structure of the hypothesized CMs in SELPM ......................................................... 52 Figure 4.12 Place Value Wright Map by Performance-content ................................................... 54 Figure 4.13 Addition Wright map by Performance-content ......................................................... 57
Figure 4.14 The Addition CM Structure in SELPM ..................................................................... 60
Figure 4.15 Magnitude Comparison Wright map by Performance-content ................................. 62 Figure 4.16 Transcoding Wright map by Performance-contents ................................................. 65 Figure 4.17 Alternative Structure of the CMs .............................................................................. 67
Figure 4.18 Alternative CM structure for Place Value ................................................................ 68 Figure 4.19 Alternative CM structure for Addition ...................................................................... 68 Figure 4.20 Alternative CM structure for Magnitude Comparison .............................................. 69
Figure 5.1 Alternative CM for Place Value ................................................................................. 73 Figure 5.2 Alternative CM for Addition ....................................................................................... 74
Figure 5.3 Alternative CM for Magnitude Comparison ............................................................... 75 Figure 5.4 Information Screenshot ............................................................................................... 79 Figure 5.5 Screenshots of the Sample Items ................................................................................ 80
Figure 5.6 Wright map of Place Value sorted by the CM content order ...................................... 83

vi
Figure 5.7 Wright map of Place Value sorted by the digit-increase order ................................... 84 Figure 5.8 Wright map of Addition sorted by the CM content order ........................................... 86 Figure 5.9 Wright map of Addition sorted by the digit-increase order ........................................ 87 Figure 5.10 Wright map of Magnitude Comparison sorted by the CM content order ................. 90
Figure 5.11 Wright map of Magnitude Comparison sorted by the digit-increase order .............. 91

vii
List of Tables
Table 3.1 Distribution of the participants by Test Forms, MLD status, and Grade...................... 13 Table 3.2 Pilot Test Task Levels by Form .................................................................................... 13 Table 3.3 Comparison of Fits among the Unidimensional Composite, Consecutive, and
Multidimensional Models ............................................................................................................. 19 Table 3.4 Reliability by Dimensions ............................................................................................ 20 Table 3. 5 Correlations across Dimensions ................................................................................... 21 Table 3.6 Too easy items for the target sample ............................................................................ 29
Table 4.1 Distribution of the participants by MLD status and Grade ........................................... 31
Table 4.2 Field Test Task Levels by Form ................................................................................... 32 Table 4.3 Form Distributions between GED and MLD ................................................................ 33
Table 4.4 Comparison of Fits among the Unidimensional Composite, Consecutive, and
Multidimensional Models ............................................................................................................. 34
Table 4.5 Correlations across Dimensions.................................................................................... 35 Table 4.6 Comparison of Mean Abilities between MLD and GED ............................................. 36
Table 4.7 Performance-contents in Place Value ........................................................................... 54 Table 4.8 Performance-contents in Addition ................................................................................ 57 Table 4.9 Effects of Task Features on Item Difficulties ............................................................... 61
Table 4.10 Performance-contents in Magnitude Comparison ...................................................... 62 Table 4.11 Performance-contents in Transcoding ........................................................................ 65
Table 5.1 Distribution of the Participants by Gender and Grade .................................................. 77 Table 5.2 New Test Task Levels by Form and Domain ............................................................... 77
Table 5.3 Comparisons of Fit among the Unidimensional Composite, Consecutive, and
Multidimensional Models ............................................................................................................. 81 Table 5.4 Correlations across Dimensions.................................................................................... 81
Table 5.5 Percentages of Correct-Guessing on P9 items .............................................................. 88

1
Chapter 1. Introduction
Learning progressions are one of the most important curriculum and assessment design
ideas introduced in the past decade. In the United Sates, several committees of the National
Research Council (NRC) have argued for the use of learning progressions as a means to foster
both deeper mastery of subject-matter content and higher level reasoning abilities (Shepard, Daro,
& Stancavage, 2013, Chudowsky, & Glaser, 2001; Corcoran, Mosher, & Rogat, 2009; Daro,
Mosher, & Corcoran, 2011). Consideration of learning progressions is especially important in the
context of the new Common Core State Standards (CCSS; National Governors Association Center
for Best Practices & Council of Chief State School Officers, 2010). The CCSS are oriented toward
cumulative growth in knowledge and skills across grade levels1, which differs from the early 1990s
standards documents that emphasized what students should “know and be able to do” at a given
grade level. These earlier standards, called “mile-wide and inch-deep curricula” (Schmidt,
McKnight, & Raizen, 1997), were criticized because they contained too many topics that were
given equal priority and paid little attention to how students’ understanding can be supported from
grade to grade (Committee on Science Learning K-8, 2007). Attention to learning progressions
emerged from this criticism.
Advocates for learning progressions believe that a well-constructed learning progression
can incorporate the knowledge needed to define the “track” that students may or should be on.
This can inform teachers about when to teach what to whom. If teachers have a continuum of how
learning develops in any particular knowledge domain, then they are able to locate students’
current learning status and decide on pedagogical action to move students’ learning forward.
Learning progressions also provide an important foundation for well-designed assessments as
indicated in Knowing What Students Know (KWSK; Pellegrino, Chudowsky, & Glaser, 2001).
KWSK argues that the model of cognition and learning should serve as the keystone of the
assessment design process.
However, research on learning progressions is in a fledgling state even with their emerging
popularity in practice and research; that is, detailed, carefully wrought, and recursively tested
progressions are rare (Herman, 2006; Shepard et al., 2013). As researchers indicated, well-
constructed learning progressions are an advancement beyond traditional curricular scope and
sequence schema because they are based on research investigating how learning typically unfolds
in a particular area of study, and are (or should be) empirically tested and revised (Shepard et al.,
2013: Corcoran, Mosher, & Rogat, 2009).
1.1 The Special Education Learning Progression in Math (SELPM) Project Under this context, the Special Education Learning Progressions in Math (SELPM)2 was
launched in 2010 to develop learning progressions of Number Sense in elementary math education.
1 For instance, the specific reading standards establish “a grade-by-grade ‘staircase’ of increasing text complexity that
rises from beginning reading to the college and career readiness level.” (National Governors Association Center for
Best Practices & Council of Chief State School Officers, 2010, p. 8) Similarly, the mathematics standards pay attention
both to the hierarchical logic of disciplinary structures and to research on “how students’ mathematical knowledge,
skill, and understanding develop over time” (National Governors Association Center for Best Practices and Council
of Chief State School Officers, 2010, p. 4). 2 The official title of this project is “Learning Progressions: Developing an Embedded Formative and Summative
Assessment System to Assess and Improve Learning Outcomes for Elementary and Middle School Students with

2
The project started from the realization that there is a lack of a coherent conception of learning
progressions in Number Sense even though many researchers indicate that it is foundational for
math learning. Researchers also suggest that a lack of Number Sense relates to underlying deficits
in Mathematics Learning Difficulties (MLD) (Geary & Chard, 1999; Geary, 2004; Gerstein,
Jordan, & Flojo, 2005; McCloskey & Macaruso, 1995). SELPM aims to develop theoretically and
empirically grounded learning progressions of Number Sense as well as valid and reliable
assessments that are aligned with these progressions.
As mentioned above, “research-based” and “empirically validated” processes are critical
components for the development of sound learning progressions. Accordingly, to satisfy the
“research-based” process, SELPM developed the Number Sense learning progressions through
systematic examinations of the relevant theory and research about how students learn in this area.
Experts in Mathematics Education, Special Education, and related content domains then reviewed
and refined the progressions. These progressions include hypothesized levels of achievement for
grades K to 3 for four sub-domains: Place Value, Addition, Magnitude Comparison, and
Transcoding.
1.2 Validation of Learning Progression This research study is concerned with the validation process of the Number Sense learning
progression. In general, there are two approaches for validating learning progressions. First,
discrete levels defined in the hypothesized learning progressions are verified by collecting and
analyzing cross-sectional data from student assessments (Briggs, Alonzo, Schwab, & Wilson, 2006;
Roberts, Wilson, & Draney, 1997). In this cross-sectional approach, the assessment is an essential
tool for validation. If the assessment properly measures student understanding of key concepts and
practices and can track student developmental progress over time, data (e.g., scores, behaviors, or
interviews) collected through the assessment can be used to support the proposed learning paths.
The other approach relies on longitudinal studies of the students’ progress using a specific
curriculum (e.g. Clements, 2004; Clements & Sarama, 2008). In this approach, the initial
framework of students’ learning is based on students’ work and performances sampled over time.
The progression is then validated by collecting empirical evidence – typically through studying
students who are exposed to instruction using coherent inquiry-based curricular units. Of course,
a combination of these two approaches is also possible and preferred.
SELPM adopted the cross-sectional approach. This requires that assessments be designed
to report validly on students’ levels of achievement and to indicate whether a student had reached
a particular point in the progression. Accordingly, the assessment was designed at the same time
as the learning progression. Student assessment data were then collected through Pilot and Field
Tests. This research study used these data to investigate the validity of the learning progression,
as well as a new data set collected outside of the SELPM project.
The study used the Rasch model (Rasch, 1960) and its extension (the MRCML model:
Adams, Wilson & Wang, 1997) to test whether empirical results on the assessment items were
consistent with predictions from the progression. Where the evidence generally satisfied and
supported the hypothesized progression, the research can conclude that this progression was
Learning Disabilities in Mathematics.” The research project reported here was supported by the Institute of Education
Sciences, U.S. Department of Education, through Grant R324A100068 to SRI, International. The opinions expressed
are those of the authors and do not represent views of the Institute or the U.S. Department of Education.

3
validated. If not, then the progression, assessments, or both need revision. If any revisions were
made, then another validation process with empirical data needs to be completed. Through this
iterative validation process, the aim of this research is to provide an empirically-validated and
theoretically-based Number Sense learning progression and a set of assessments for the education
community.
1.3 Research Questions The following research questions were investigated through three validation studies,
described in the next section, using the Rasch model and its extensions:
(1) Does the empirical evidence support a multidimensional approach for assessment of the
Number Sense learning progression?
(2) Is there a substantial difference in test performance between General Education (GED)
students and Mathematics Learning Difficulty (MLD) students? Is there any empirical
evidence to support different learning progressions for the GED and MLD students?
(3) Is the proposed order of performance levels supported by empirical data?
(4) If the initial learning progression is not validated with the empirical data, what is an
alternative learning progression that can explain the student responses?
(5) Is the alternative learning progression validated with empirical data?
1.4 Research Phases This research consists of three validation studies – Phase I: Preliminary Study, Phase II:
Testing Validity of Learning Progression, and Phase III: Validation of Alternative Learning
Progression. For each phase, the study used three data sets: SELPM Pilot Test data, SELPM Field
Test data, and the New Test data. Each data set was used to answer at least one of the research
questions.
Phase I: Preliminary Study – identification of a problem
The research began with the Pilot Test of SELPM. When the Number Sense learning
progression was developed by content specialists, SELPM simultaneously constructed the
assessment tasks to measure each achievement level in the progression, and conducted the Pilot
Test during 2012 – 2013. The data from the Pilot Test were analyzed to provide information on
item difficulty and the psychometric quality of the assessment, such as model fit, item fit, reliability
etc. The Phase I study also examined whether empirical evidence supports a four-dimensional
approach for the assessment of the Number Sense learning progression by comparing three
different measurement approaches. The best fitting measurement model was selected, and the
internal robustness of the proposed progression was tested with the Pilot Test data. The Phase I
study identified significant misalignments between the expected order and the empirical difficulty
order of the test items. The Phase I study relates to the research questions 1 and 3.
Phase II: Testing Validity of Learning Progression - confirmation of the problem
and exploration of a solution
The second data collection, Field Test, was conducted with 384 students during 2013 –
2014. The Phase II study used the Field Test data to confirm the findings from the Phase I study,

4
in particular, relating to the validation of the proposed learning progression. The study investigated
whether the data validated the hypothesized progressions by employing statistical and
psychometric procedures (e.g., Wright Maps and Item-fit statistics), and explored a possible
alternative learning progression. In addition, the Phase II study compared test performances
between GED and MLD students and investigated whether there was any empirical evidence to
support different learning progressions for the GED and MLD students. The Phase II study
investigated the research questions 2, 3, and 4.
Phase III: Validation of Alternative Learning Progression - validation of the
solution
An alternative learning progression was developed based on the Phase II results. Then new
test items were constructed to test its validity. The new test items are similar to those from the
Field Test because the alternative learning progression differs in the order of the progression, not
the content. The New Test data were collected from March to April 2016. The New Test was
administered to 277 students aged 5 to 8 (grades K to 2nd) through an iOS application (Todo Math3)
for validating the updated progression with empirical data. The Phase III study employed the same
analysis procedures used for Phase I and II studies. The Phase III study addressed the research
question 5.
3 For a subject recruitment and test implementation, this research collaborated with an educational game company,
Enuma, Inc. The company’s flagship product, Todo Math app is a math-learning tool operated in iOS, which is
designed to help pre-K to 2nd grade children learn and practice early elementary math. The detailed data collection
procedure is presented in Chapter 5.

5
Chapter 2. Theoretical Framework
This chapter describes the theoretical framework for the research, including the concept
of learning progression and SELPM’s Number Sense learning progression. This chapter also
describes the Berkeley Evaluation and Assessment Research (BEAR) Assessment System (BAS:
Wilson & Sloane, 2000) which provides the theoretical framework for the development of the
Number Sense assessment and validation studies of the learning progression.
2.1 Definition of Learning Progression Learning progressions are known by various terms, such as “teaching learning paths,”
“progress maps,” “learning trajectories,” or “developmental continua.” A number of definitions
exist in the literature (Master & Foster, 1997; Wilson & Bertenthal, 2005; Stevens et al., 2007;
Popham, 2007; Smith et al., 2006), although a common point for all these definitions is that
learning is conceived as a sequence or continuum of increasing expertise (Heritage, 2008). This
study used the definition of learning progressions found in Wilson and Bertenthal (2005):
“descriptions of the successively more sophisticated ways of thinking about an idea that can follow
one another as students learn: they lay out in words and examples what it means to move toward
more expert understanding” (p. 3).
Fundamental differences between learning progressions and other approaches, such as
strand maps, scope and sequence charts, and curriculum frameworks, lie in their development and
validation processes. Learning progressions are initially guided by theory and research about how
students learn a particular concept or topic. Then they are validated by evidence gathered through
testing, whereas other approaches are confirmed by the authority of experts, professional bodies,
and government agencies (Corcoran, Mosher, & Rogat, 2009). In other words, these research-
based and empirically validated features make the learning progressions distinguishable from other
approaches. As learning progressions are tested and refined in the field to see if most students do
follow the predicted pathways, they can provide a solid foundation for developing curriculum and
assessments.
2.2 Number Sense Learning Progressions Psychologists interested in the cognitive development of children have focused on the
concept of Number Sense for decades (Bereiter & Scardamalia, 1981; Greeno, 1991; Okamoto &
Case, 1996). Unfortunately, there is no consensus on an actual definition. Like “common sense,”
it is vague and difficult to describe, although it is recognizable in action (Griffin, 2004).
When researchers discuss Number Sense, they include lists of its essential components,
descriptions of students displaying Number Sense, and an in-depth theoretical analysis from a
psychological perspective (McIntosh et al., 1992). According to Case et al. (1992), Number
Sense is a conceptual structure that relies on many links among mathematical relationships,
principles (e.g., commutativity), and procedures. The links serve as essential tools for helping
students think and develop higher-order insight when working on mathematical problems
(Gersten et al., 2005). From this point of view, Number Sense is a more complex and
multifaceted construct than what might be seen as “simply” possessing elementary intuitions

6
about quantity. Due to its complex characteristics, Greeno (1991) suggested that it may be more
fruitful to view Number Sense as a by-product of other learnings than as a goal of direct
instruction.
SELPM selected four separate domains, Place Value, Addition, Magnitude Comparison,
and Transcoding, to represent Number Sense (Figure 2.1). The Place Value domain involves
understanding the value of a digit in a number. For example, the numeral 2 in 123 is in the “tens”
place and has a value of 20. The Addition domain involves students’ arithmetic skills with two or
more whole numbers and understanding operation properties. If a student is competent in the
Addition domain, (s)he can solve various addition problems with different formats (e.g., word
problems, equation problems) using proper strategies. The Magnitude Comparison domain
represents understanding of number relations and relative magnitude. For instance, a student
compares two numbers (e.g., 3 and 5) and indicates which one is bigger or smaller. Lastly, the
Transcoding domain represents translation amongst multiple representations of numerical
quantities. A number can be represented with various forms such as verbal, Arabic, and letter-
written (alphabetic) forms. For instance, the number 13 can be spelled as “thirteen” or verbalized
as “[thərtēn].” The Transcoding domain deals with student’s ability to convert these forms
efficiently. Experts in math education and cognitive development constructed the learning
progressions for these four domains. The proposed learning progressions, which are principally
based on the number of digits, are presented in Appendix A.
Figure 2.1 Number Sense Learning Progression
2.3 The Berkeley Evaluation and Assessment Research (BEAR) Assessment
System There are different ways to conceive and measure learning progressions. The BEAR
Center has developed one approach by using the assessment structure of the domain of interest:
the BAS. BAS is based on the idea that good assessment addresses the need for sound
measurement through four principles: (1) assessment should be based on a developmental
perspective of student learning; (2) what is taught and what is assessed should be clearly aligned;
(3) teachers are the managers and users of assessment data; (4) classroom assessment should
hold sound standards of validity and reliability.
BAS includes four building blocks for constructing quality assessments: construct maps,
item design, outcome space, and measurement model. The first building block, the construct

7
map, defines a latent variable or construct and is used to represent a cognitive theory of learning
consistent with a developmental perspective. A construct map serves as a mechanism for
defining and representing what students know and can do at several levels. In this study, the four
domains are each considered constructs. Figure 2.2 shows the Magnitude Comparison construct
map as an example. The columns provide the general levels, which range from the lowest at the
left to highest at the right. The rows describe detailed performances within a general level from
the lowest at the top to highest at the bottom. The underlined levels were tested in the pilot study,
and the pink highlighted levels were tested in the field study.
Magnitude Comparisons Construct Map
Easy Difficult Level1 Level2 (0 to 5) Level3 (6-9) Level4 (two
digit)
Level5 (three
digit)
Level6 (4+
digit)
Easy
2.1 Compare two
groups of objects
(same but different
number) using
same or greater
concepts
3.1 Compare two
groups of similar
objects using the
same, greater, or
fewer concepts
2.2 Compare two
groups of objects
(same but different
number) using
same or fewer
concepts
2.3 Compare two
dissimilar objects
(in size) using
same or greater
concepts
3.2 Compare two
dissimilar objects
using same,
greater, or fewer
concepts
4.1 Compares
two dissimilar
hypothetical
objects (no
picture of
drawings) using
same, greater, or
fewer concepts
2.4 Compare two
dissimilar objects
(in size) using
same or fewer
concepts
2.5 Places
randomly ordered
consecutive
numbers from least
to greatest
3.3 Place
randomly ordered
consecutive
numbers from
least to greatest or
greatest to least
4.2 Place
randomly
ordered
consecutive
numbers from
least to greatest
or greatest to
least
5.1 Places
randomly
ordered
consecutive
numbers from
least to greatest
or greatest to
least
2.6 Places
randomly ordered
consecutive
numbers from
greatest to least

8
Difficult
2.7 Places
randomly ordered
non-consecutive
numbers from least
to greatest or
greatest to least
3.4 Place
randomly ordered
non-consecutive
numbers from
least to greatest or
greatest to least
4.3 Place
randomly
ordered non-
consecutive
numbers from
least to greatest
or greatest to
least
5.2 Place
randomly
ordered non-
consecutive
numbers from
least to greatest
or greatest to
least
6.1 Place
randomly
ordered
numbers from
least to
greatest or
greatest to
least
2.8 Determines
which of two
numbers is greater
or fewer
3.5 Determines
which of two
numbers is greater
or fewer
4.4 Determines
which of two
numbers is
greater or fewer
5.3 Determines
which of two
numbers is
greater or fewer
6.2 Determines
which of three
numbers is
greatest or
fewest
2.9 Determines
which number
comes X numbers
before or after a
given number
3.6 Determines
which number
comes X numbers
before or after a
given number
4.5 Determines
which number
comes X
numbers before
or after a given
number
5.4 Determines
which number
comes X
numbers before
or after a given
number
6.3 Determines
which number
comes X
numbers
before or after
a given
number
2.10 Determines
how much greater
(fewer) a given
number is
compared to
another number
using a number
line
3.7 Determines
how much greater
(fewer) a given
number is
compared to
another number
using a number
line
4.6 Determines
how much
greater (fewer) a
given number is
compared to
another number
using a number
line
5.5 Determines
how much
greater (fewer)
a given number
is compared to
another number
2.11 Determines
which difference is
greater or fewer
when comparing 2
pairs of numbers
3.8 Determines
which difference
is greater or fewer
when comparing
2 pairs of
numbers
4.7 Determines
which difference
is greater or
fewer when
comparing 2
pairs of numbers
5.6 Determines
which
difference is
greater or fewer
when
comparing 2
pairs of
numbers
6.4 Determines
which
difference is
greater or
fewer when
comparing 2
pairs of
numbers
Figure 2.2 Construct Map of Magnitude Comparison
The item design building block is a framework for designing items or tasks. Items are
written with the intention of producing evidence of specific levels of understanding along a
construct. The goal of a set of items in BAS is to generate student responses at every level of the
construct map. These items can vary by type. In SELPM, the items consisted mostly of short
constructed response items, but included some multiple-choice items as well. An example of a
Magnitude Comparison item is shown in Figure 2.3. This item was designed to measure level
4.3 performance on the construct map above.

9
Figure 2.3 Example Item in the Magnitude Comparison Construct Map
The outcome space describes in detail the qualitatively different levels of responses
associated with the construct map. The purpose of the outcome space is to facilitate identification
of student responses corresponding to a particular level on a construct, so that researchers can
use the outcome space to assign scores to student responses. A scoring exemplar for the example
item in Figure 2.3 is presented below.
Figure 2.4 Scoring Exemplar

10
The final building block of BAS is the measurement model, which defines how
inferences about student understandings or abilities are to be drawn from the scores. The
measurement model for the score data is from Item Response Theory (IRT), specifically the
Rasch model (Rasch, 1960) and its extensions.
For the Rasch model, a student’s score on a test item is modeled probabilistically as a
function of the student’s latent proficiency/ability (𝜃𝑝) and an item’s difficulty (𝛿𝑖). Let X𝑝𝑖
represent the response of examinee 𝑝 to item 𝑖. Then the probability that person 𝑝 answers to
item 𝑖 correctly can be written as:
𝑃 (X𝑝𝑖 = 1 | 𝜃𝑝) =𝑒(𝜃𝑝−𝛿𝑖)
1 + 𝑒(𝜃𝑝−𝛿𝑖)
The model can be written more simply using a logit scale:
log𝑃(𝑋𝑝𝑖 = 1 | 𝜃𝑝)
𝑃(𝑋𝑝𝑖 = 0 | 𝜃𝑝)= 𝜃𝑝 − 𝛿𝑖
For the polytomously scored data like the example, this model can be extended to Partial Credit
model (PCM: Master, 1982). The logit version of PCM is written as below describing the log
odds of giving response 𝑘 rather than 𝑘 − 1, after conditioning on latent ability 𝜃𝑝:
log𝑃(𝑋𝑝𝑖 = 𝑘 | 𝜃𝑝)
𝑃(𝑋𝑝𝑖 = 𝑘 − 1 | 𝜃𝑝)= 𝜃𝑝 − 𝛿𝑖𝑘
These models provide a convenient way to conceptualize person proficiencies and item
difficulties on the same scale. This alignment allows us to describe what students at a certain
proficiency can be expected to do based upon the items located at that level. For example, when
a person location 𝜃 and an item location 𝛿𝑖 are at the same point on the map, (s)he has a 50
percent chance of responding correctly to that item. The person has a higher chance of
responding correctly if 𝛿𝑖 is below 𝜃 whereas a lower chance of responding correctly if 𝛿𝑖 is
above 𝜃 (See Figure 2.5). This can improve the interpretability of student responses to the items
and help researchers or teachers focus on the specific needs of their students from the
developmental perspective of the curriculum. Most importantly, given that basic assumptions
(i.e., local independence, unidimensionality, and equal discrimination) are met, this model has a
useful measurement property: the order of the item difficulties is consistent regardless of
examinees’ abilities. Therefore, if the items are well-aligned with the performance levels in the
learning progressions, the order of the performance levels can be empirically verified by
comparing them to the order of item difficulties.
(2.1)
(2.2)
(2.3)
11
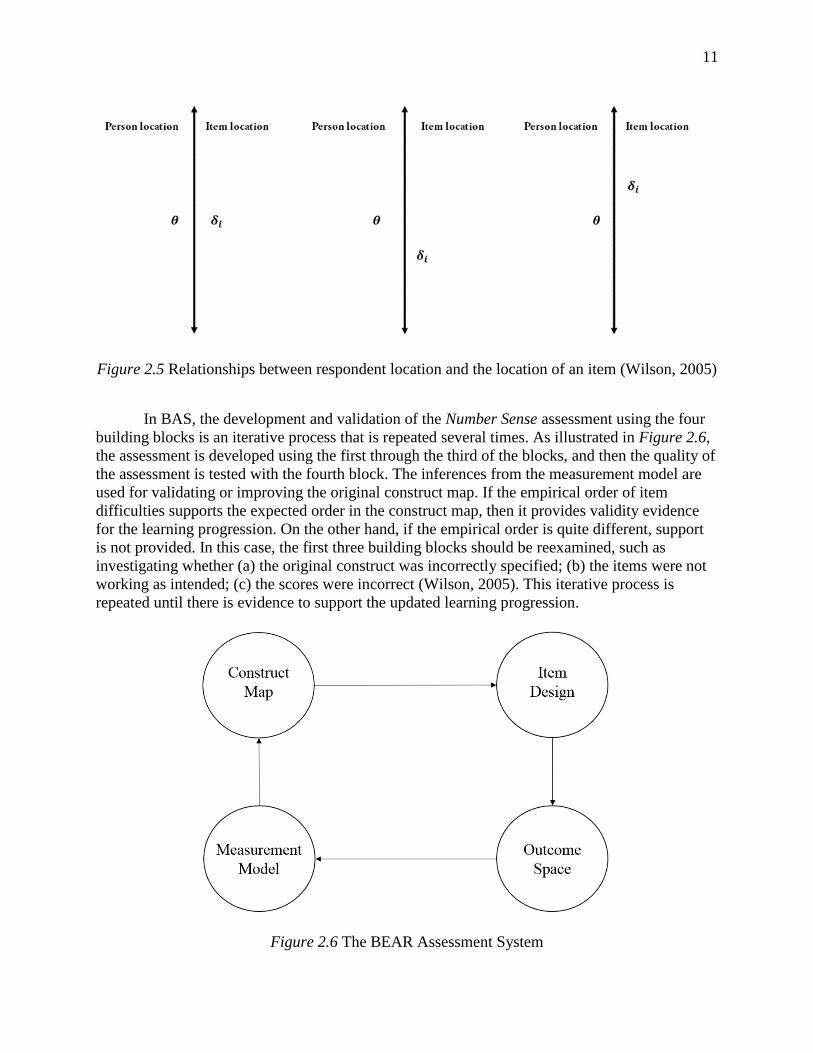
Figure 2.5 Relationships between respondent location and the location of an item (Wilson, 2005)
In BAS, the development and validation of the Number Sense assessment using the four
building blocks is an iterative process that is repeated several times. As illustrated in Figure 2.6,
the assessment is developed using the first through the third of the blocks, and then the quality of
the assessment is tested with the fourth block. The inferences from the measurement model are
used for validating or improving the original construct map. If the empirical order of item
difficulties supports the expected order in the construct map, then it provides validity evidence
for the learning progression. On the other hand, if the empirical order is quite different, support
is not provided. In this case, the first three building blocks should be reexamined, such as
investigating whether (a) the original construct was incorrectly specified; (b) the items were not
working as intended; (c) the scores were incorrect (Wilson, 2005). This iterative process is
repeated until there is evidence to support the updated learning progression.
Figure 2.6 The BEAR Assessment System

12
Chapter 3. Phase I – Preliminary Study with Pilot Test
Under the BEAR Assessment System (BAS) described in the previous chapter, SELPM
developed the assessment for general education (GED) students and math learning disability
(MLD) students in order to measure early number sense proficiency. This assessment is tightly
aligned with the achievement levels in their proposed learning progression. To ensure
measurement adequacy of the assessment, a Pilot Test was conducted in 2012 with 69 tasks. Using
the Pilot Test data, the Phase I study is designed to select a sound measurement model and to
examine the psychometric sufficiency of the assessment, including its reliability and the validity
of its internal structure. This chapter relates to the research questions 1 and 3: Does empirical
evidence support a multidimensional approach for assessment of the Number Sense learning
progression? And, is the proposed order of task levels supported by empirical data?
3.1 Pilot Study Data
3.1.1 Participants
The pilot was conducted with students from two large school districts in the Washington,
D.C. metropolitan area and Northern Virginia. A total of 222 students participated in the study,
including 102 GED students (46%) and 120 MLD students (54%). In defining MLD students, the
SELPM project adopted common factors used in several MLD research studies (Geary, Hamson,
& Hoard, 2000; Murphy, Mazzocco, Hanich, & Early, 2005; Mazzocco & Myers, 2003; Geary,
2004; Jordan et al., 2003). This study used seven criteria: (1) a student has a diagnosis of a specific
learning disability, (2) a student has Individualized Education Program (IEP) goals in math, (3) a
student is eligible for special education service, (4) a student is not an English Language Learner
(ELL), (5) a student has a standardized math score below the 25th percentile, (6) a student has an
IQ of 85 or above, and (7) a student has the lowest performance level in the state assessment score
(i.e., Basic). Students who meet all seven criteria were recruited as MLD students. Based on the
research finding that MLD students frequently have developmental lag in cognition (Geary, 2004;
Jordan et al., 2003), the study recruited MLD students from a wider spectrum of grades in order to
obtain enough variation in the target skills. All GED students were in lower grades (K through
grade 3) while the majority of the MLD students were in upper grades (beyond grade 3), as
illustrated in Table 3.1.

13
Table 3.1 Distribution of the participants by Test Forms, MLD status, and Grade
Form GED/MLD Grade
K 1 2 3 4 5 6 7 8 total
A GED 14 7 1 1 ∙ ∙ ∙ ∙ ∙ 23
MLD 3 2 4 6 6 5 4 2 1 33
B GED 6 8 4 2 ∙ ∙ ∙ ∙ ∙ 20
MLD ∙ 1 2 4 4 5 6 6 ∙ 28
C GED 2 13 19 25 . ∙ ∙ ∙ ∙ 59
MLD ∙ 1 ∙ 5 4 12 9 19 9 59
Total GED 22 28 24 28 . . . . . 102
MLD 3 4 6 15 14 22 19 27 10 120
3.1.2 Instrument
The Number Sense assessment was developed with four domains: Place Value (PV: 48
tasks), Addition (AD: 66 tasks), Magnitude Comparison (MC: 40 tasks) and Transcoding (TC: 26
tasks). Among the 180 math tasks developed, 69 were included in the Pilot Test. A description of
each task level and a matching item are presented in Appendix B – 1. Three test forms were
composed based on the conceptual difficulty in the learning progression. Forms A, B, and C were
designed as EASY, MEDIUM, and HARD, respectively. Table 3.2 shows the distribution of the
task levels by form. Theoretically, higher task levels represent more difficult tasks.
Table 3.2 Pilot Test Task Levels by Form
Domain Form A Form B From C
Place Value
1.2
1.3
1.6
1.9
2.4
3.3
4.2
4.5
1.6
1.7
2.5
2.6
3.3
3.6
4.2
4.8
1.6
1.8
3.3
3.9
4.2
5.1
5.4
5.5
Addition
2.2
2.3
2.7
2.8
3.6
3.19
5.7
5.8
2.8
2.9
3.3
3.12
3.17
3.19
5.7
7.3
2.8
2.12
3.19
4.3
5.6
5.7
5.9
Magnitude
Comparison
1.1
2.2
2.4
2.1
2.6
3.4
2.6
2.7
4.1

14
2.6
3.3
4.1
5.1
5.3
4.1
4.2
4.4
5.3
6.2
4.3
5.3
5.4
6.1
6.3
Transcoding
1.2
2.1
2.2
3.1
4.2
4.3
4.6
5.2
2.6
3.1
4.1
4.2
4.4
4.5
5.2
3.1
3.2
4.2
4.7
5.1
5.2
5.3
Total 32 31 30 †note: The underlined levels are common tasks across forms.
Each form includes 12 common tasks, shown as the 3 underlined tasks per domain in Table
3.2, and 18 to 20 unique tasks. Some tasks include multiple items, so a total of 93 items were
calibrated. Based on the pretest results4, 56 students (25%) took Form A, 48 students (22%) took
Form B, and 118 students (53%) took Form C.
3.1.3 Scoring
Scoring exemplars were developed when the items were written by the SELPM team.
The exemplars were constructed to identify students’ possible responses and assign proper scores
to student’s work. In particular, responses of open-ended test items are varied and unanticipated;
thus, it is essential to have well-constructed scoring exemplars based on researchers’ experiences
and previous studies. An example of the scoring exemplar is presented in Figure 3.1. Items were
scored not only dichotomously but also polytomously.
4 The SRI team administered a pretest to students and classified students into three groups: A, B, and C based on the
results. The author does not have information on the pretest results. For the specific procedures of the pretest, please
read Seeratan et al. (2013, April).

15
Figure 3.1 An example of the Place Value scoring exemplar
3.1.4 Linking Procedure
As indicated above, the three test forms differ in difficulty (e.g., Form C is designed to be
more difficult than the other forms); in addition, students’ mathematical abilities vary. Thus, a
linking procedure was necessary to make comparisons across the three forms. This procedure
enables researchers to place distinct item difficulties across test forms onto a common scale. In
general, different tests can be linked if the tests (a) measure the same construct and (b) share a set
of common items. This strategy is formally known as a “common-item nonequivalent groups”
linking design (Kolen & Brennan, 2004). There are two approaches for creating a common scale
across two or more different tests: separate or concurrent linking. In the separate linking approach,
item difficulties and student performances are first estimated separately for each form. Then a
common scale is created using a set of linear transformations. In contrast, the concurrent linking
approach estimates all item difficulties in one-step with a combined dataset. In this study, the
concurrent calibration method was used to link all item difficulties onto the same scale
simultaneously. Twelve common items, which are underlined in Table 3.2, provided a link
between the three test forms. After the item difficulties of the three forms are placed onto the same
scale, the ability estimates of all students become comparable.
3.2 Selection of Measurement Model The Number Sense construct included four domains (construct/dimension5), and a group
of items was designed to measure each domain. In the measurement field, there are three
5 The three terms, ‘dimension’, ‘domain’, and ‘construct’, are used interchangeable in this study. The terms
‘domain’ and ‘construct’ are more commonly used in cognitive psychology and education whereas the term
‘dimension’ is used in the psychometric field. Thus, after applying a psychometric model to the data, we commonly
used the term ‘dimension’ in order to align the results to the applied model.

16
approaches for analyzing this assessment design: the unidimensional composite approach, the
unidimensional consecutive approach, and the multidimensional approach.
First, in the unidimensional composite approach (A in Figure 3.2), only one underlying
latent dimension, Number Sense, is assumed for all items. In practice, the unidimensional
composite approach is appropriate if the dimensions are highly correlated (Adams, Wilson, &
Wang, 1997). Second, in the unidimensional consecutive approach (B in Figure 3.2; Davey &
Hirsch, 1991), each domain test measures a separate latent dimension and therefore, four
separate unidimensional models are used for estimation. This approach recognizes the
multidimensionality of the test and provides information for each dimension. However, the
consecutive approach ignores the possibility that performance across dimensions might be
interrelated. Lastly, the multidimensional approach (C in Figure 3.2) provides separate ability
information for each domain after considering the interrelation between the dimensions.

17
Figure 3.2 Measurement Approaches to the Number Sense assessment

18
Two IRT models were applied to the assessment. As some items were polytomously scored,
Master’s (1982) partial credit model (PCM) was applied to the unidimensional composite approach
and the consecutive approach. For the multidimensional approach, the multidimensional between-
item partial credit model (Wang, et al., 1997; Adams, et al., 1997) was used.
In PCM, the following equation shows the probability that a person 𝑝 with ability 𝜃𝑝 will
respond in category 𝑘 on item 𝑖, given item difficulty parameters 𝜉𝑖 = (𝛿𝑖1, 𝛿𝑖2, … , 𝛿𝑖𝑚),
where 𝑝 = 1, … , 𝑁, 𝑖 = 1, … , 𝐼, and 𝑘 = 1, … , 𝑚 and where 𝑚 is the number of steps (number of
categories−1) for the item6. In terms of the log-odds of consecutive item responses, the model can
be written more simply as:
This describes the log odds of giving response 𝑘 rather than 𝑘 − 1, after conditioning on latent
ability 𝜃𝑝.
For the case of between item multidimensionality (i.e., when each item maps at only one
dimension), the partial credit model can be generalized to the multidimensional partial credit
model (MPCM) by adding a dimension subscript to the person parameter,
where 𝑋𝑖𝑝 is the response of person 𝑝 to item 𝑖. In the model, each person has a separate latent
ability estimate for each dimension 𝑑, represented by the vector 𝜽𝒑𝒅 = (𝜽𝒑𝟏, 𝜽𝒑𝟐, … , 𝜽𝒑𝑫). This
describes the log odds of giving response 𝑘 rather than 𝑘 − 1, which depends on the latent ability
𝜃𝑝𝑑 on dimension 𝑑. In this study the person vector has four elements, one for each dimension:
Place Value, Magnitude Comparison, Addition, and Transcoding. The distribution of the
dimension is normal with unstructured covariance matrix and zero means.
All models were estimated using ConQuest 3.0 (Wu, Adams, & Wilson, 2012). ConQuest
uses a Marginal Maximum Likelihood (MML) procedure to obtain item parameters (Adams,
Wilson, & Wang, 1997). For the person ability estimates on each dimension, ConQuest produces
expected a posterior (EAP) estimates, maximum likelihood estimates (MLE), weighted likelihood
estimates (WLE), and also five sets of plausible values. This study used the EAP estimates for
representing each student’s ability estimate and used plausible values for group comparisons.
Selecting one among the three approaches depends not only on the theoretical
considerations, but also on psychometric (e.g. model fit, item fit etc.) and practical (e.g. usability
for teachers etc.) considerations. Although the theoretical framework of the assessment calls for
6 Note the conventions exp(0) ≡ 1 and ∑ (𝜃 − 𝛿𝑖𝑗) ≡ 0; and that ∑ exp ∑ (𝜃 − 𝛿𝑖𝑗)𝑘
𝑗=0𝑚𝑘=0
0𝑗=0 is the sum of the
numerators for all categories.
(3.1)
(3.2)
(3.3)

19
the multidimensional approach, if the model fit and other psychometric indicators suggest that a
unidimensional approach is more suitable for the data, one needs to change the framework or
redesign the assessment. The practical utility (e.g. how informative for instruction) of the specified
scales is also important to select a certain approach. Therefore, in this section, the study will
examine which measurement approach is the most appropriate for this assessment based on the
psychometric and practical considerations.
3.2.1 Psychometric Considerations
Model-Data Fit Analysis
First, for the model-data fit analyses, each model was estimated and then residual-based fit
statistics were examined for determining which model fits the data better (Wright, 1977; Wright
& Masters, 1982). First, the unidimensional composite model was compared to the
multidimensional model. Because these models are nested, the model fit can be compared using a
likelihood ratio (LR) test by looking at the change in the deviance (G2). As Table 3.3 indicates, the
difference in deviance statistics of these two models was 139.21 with 9 degrees (115−106) of
freedom. This difference was statistically significant at the α = .001 level, suggesting that the
four-dimensional model fits the data better than the unidimensional composite model. Second, for
the comparison between the multidimensional model and the unidimensional consecutive model,
Akaike’s Information Criterion (AIC: Akaike, 1977) was used. A smaller AIC value implies better
model-data fit. According to AIC, the multidimensional model fits the data better than the other
two models7. This provided statistical support for the multidimensional model.
Table 3.3 Comparison of Fits among the Unidimensional Composite, Consecutive, and
Multidimensional Models
Model Deviance Parameter Dev.(d.f.)Change
p-value AIC
Unidimensional 8014 106 8226 Multidimensional 7875 115 139 (9) p < 0.001 8105
Consecutive
Place Value 2944 33 Addition 2244 28
Magnitude- Comparison
1785 20
Transcoding 1300 28
Total 8273 109 8491
AIC (the Akaike Information Criterion) = -2Log(L) + 2Nparameter
Item Fit Statistics
The item level fit analysis examines the fit between individual items and the measurement
model. In particular, the residual-based fit statistics reveal whether the item has the same variation
7 The comparisons between the consecutive model and the other two models are based on the paper by Briggs and
Wilson (2003).

20
in item response pattern as the other items in the test (Wu & Adams, 2007). ConQuest provides a
weighted fit mean square (WFMS) statistic for each item parameter. WFMS is expected to have a
value of 1 if the measurement model perfectly fits the data. The WFMS is larger than 1 if the data
have more variation than the model expected, and it is less than 1 if the data have less variation
than predicted. WFMS values between .75 and 1.33 are considered acceptable by convention
(Adams & Khoo, 1996). The corresponding T statistics should also be considered because WFMS
can be affected by sample size (Wright & Masters, 1981; Wilson, 2004). If the WFMS statistics
for items lie outside the acceptable interval, then this suggests that the item responses do not
confirm the model. The four-dimensional model produced reasonable fit values for all items except
for one (See Appendix B – 2). This implies that all items except one fitted their assigned
dimensions, and this was better than for the unidimensional analysis.
Reliability
Reliability is an essential element, along with validity, to determine test quality. Reliability
means the degree to which a test gives consistent scores to individuals for the intended usage, thus
relating to measurement errors. Within IRT, the measurement errors are no longer homogenous;
rather, it depends on the test taker’s ability levels. Therefore, composite test reliability (Wang,
Chen, & Cheng, 2004; Wilson, 2005) is used as the counterpart to the classical test reliability.
The composite test reliability, based on Mislevy et al. (1992) 8 , was computed using
ConQuest 2.0. Table 3.4 compares the reliability indices between the multidimensional model and
the consecutive model. The reliability indices in the multidimensional model are close to .9 except
for Transcoding. These reliability indices are much higher than for the consecutive model. As the
scores on each dimension are correlated in the multidimensional model (see C in Figure 3.2), there
was significant improvement in reliability compared to the consecutive model. In particular,
reliability indices were improved considerably for the Magnitude Comparison and Transcoding
dimensions. The multidimensional approach was advantageous not only because it fits the data
better but also because it improved the measurement precision.
Table 3.4 Reliability by Dimensions
Dimension Reliability
in the multidimensional model Reliability
in the consecutive model
Place Value 0.90 0.85 Addition 0.89 0.74
Magnitude- Comparison
0.88 0.62
Transcoding 0.79 0.61
8 𝜌MML =
𝜎EAP2
𝜎𝜃2 , where 𝜎EAP
2 is the variance of the EAP estimates. Because IRT computer program that use MML
estimation usually report both the estimates of the variance 𝜎𝜃2 and the EAP estimate for every person, this
computation may be more practical that the general computation.

21
Correlations between Dimensions
As seen in the reliability indices, the correlations between the domains increase
measurement precision. The correlations among the four dimensions are presented in Table 3.5.
The correlations below were directly estimated as the variance-covariance matrix 9 of the
multidimensional model; thus, the correlation values are slightly higher than the Pearson product-
moment correlations calculated from the raw scores (Wang, 1999). The correlations between
dimensions were strong, with the lowest one between the Transcoding and Place Value dimensions
at 0.72. Since these four dimensions were sub-domains of Number Sense, it is reasonable to
observe these high correlations. On the other hand, high correlations sometimes suggest that the
unidimensional composite approach is more appropriate. If all dimensions were very highly
correlated to each other, there would be no need to use separate domain scores because a score on
one dimension could completely predict the scores of the other dimensions. However, there is no
predetermined cut-off correlation value for meaningfully differentiating the dimensions. The study
and SELPM took 0.95 as the cut-off correlation value where one might collapse dimensions. As
Table 3.5 shows, none of the correlations between the dimensions are greater than 0.95. These
results support that these four domain tests measure educationally distinct dimensions.
Table 3.5 Correlations across Dimensions
Dimension
Place Value Addition Magnitude
Comparison Transcoding
Place Value 0.88 0.88 0.72 Addition 0.93 0.89
Magnitude Comparison
0.90
3.2.2 Practical Consideration
The specification of dimensionality has been checked empirically with model-data fit and
item fit statistics. However, this does not mean that the multidimensional approach should be
applied to every test containing multiple domains. In practice, the dimensionality of a test also
needs to be viewed in terms of its practical utility. When there is a lack of educational and
psychological meaning in reporting sub-scores, the unidimensional composite approach might be
appropriate from the practical point of view, especially since the model is computationally much
simpler. Thus, practical utility is also important to consider when selecting the appropriate
model.
In terms of practical utility, the multidimensional approach enables us to build a profile
for each student to identify strengths and weaknesses. For example, some students have a good
understanding of Addition but may have a limited understanding of the Place Value concept,
while others need to improve their Transcoding and Magnitude Comparison abilities.
Furthermore, these individualized profiles can provide teachers and students with appropriate
9 These correlations were higher than the usual Pearson correlation coefficients because this direct estimation took
measurement errors into account for the calculation. According to Wang (1999), the correlations yielded by the
variance-covariance matrix are unbiased compared to the Pearson correlations.
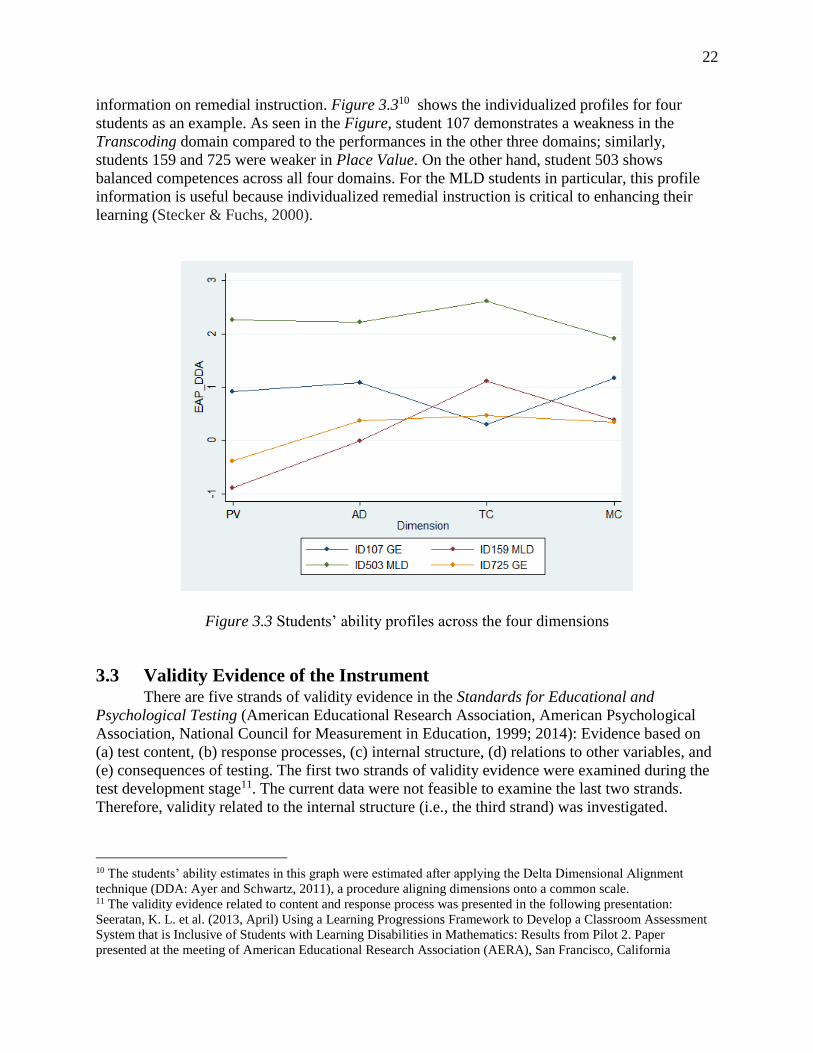
22
information on remedial instruction. Figure 3.310 shows the individualized profiles for four
students as an example. As seen in the Figure, student 107 demonstrates a weakness in the
Transcoding domain compared to the performances in the other three domains; similarly,
students 159 and 725 were weaker in Place Value. On the other hand, student 503 shows
balanced competences across all four domains. For the MLD students in particular, this profile
information is useful because individualized remedial instruction is critical to enhancing their
learning (Stecker & Fuchs, 2000).
Figure 3.3 Students’ ability profiles across the four dimensions
3.3 Validity Evidence of the Instrument There are five strands of validity evidence in the Standards for Educational and
Psychological Testing (American Educational Research Association, American Psychological
Association, National Council for Measurement in Education, 1999; 2014): Evidence based on
(a) test content, (b) response processes, (c) internal structure, (d) relations to other variables, and
(e) consequences of testing. The first two strands of validity evidence were examined during the
test development stage11. The current data were not feasible to examine the last two strands.
Therefore, validity related to the internal structure (i.e., the third strand) was investigated.
10 The students’ ability estimates in this graph were estimated after applying the Delta Dimensional Alignment
technique (DDA: Ayer and Schwartz, 2011), a procedure aligning dimensions onto a common scale. 11 The validity evidence related to content and response process was presented in the following presentation:
Seeratan, K. L. et al. (2013, April) Using a Learning Progressions Framework to Develop a Classroom Assessment
System that is Inclusive of Students with Learning Disabilities in Mathematics: Results from Pilot 2. Paper
presented at the meeting of American Educational Research Association (AERA), San Francisco, California

23
The internal structure of the assessment was manifested in the construct maps. This
structure assumed that the levels of the tasks are ordered. However, this order is a hypothesized
rather than an empirically validated one. Thus, this order needs to be supported by empirical
responses to obtain validity evidence. The concordance between the theoretical expectations in
the Construct Map (CM) and the empirical results in Wright Map (WM) reflects whether the
empirical data support the internal structure of the instrument (Wilson, 2005).
The Wright Map (Wilson & Draney, 2000), also called the item-person map (Wright &
Master, 1982), is a visual representation of the relative relations between item and person estimates.
It displays both persons (in terms of their ability) and items (in terms of their difficulty) along a
common vertical axis marked with a scale. The WM is organized as two vertical columns as shown
in Figures 3.4 – 3.7. The left side of the maps shows the distribution of the measured ability of the
examinees from most able at the top to least able at the bottom. The items on the right side of the
map are distributed from the most difficult at the top to the least difficult at the bottom. In order to
compare the expected order with the estimated item difficulty in the WM, the items are presented
in order of the task levels from lowest level at the left to highest level at the right. If the orders are
the same, the figure should show approximately an increasing slope from the first item to the last.
As shown in Figure 3.4 – 3.7, the expected increasing slopes were unfortunately not
identified across the maps for any of the four dimensions. Slightly increasing patterns were
observed only for the level 5 tasks in Place Value and Addition. The level 5 items are more difficult
than lower level items in the Place Value dimension, but there is no difference in terms of difficulty
among the other levels. In the Addition dimension, the level 5 items are more difficult when
compared to level 2 items, but not strongly for the rest.

24
Figure 3.4 Wright map12 of the Place Value dimension (Pilot Test)
12 The indicated numbers (1 or 2) on the colored marks are Thurstonian thresholds, which are used as indicators of “score difficulties.” The Thurstonian threshold
for a score category is defined as the ability at which the probability of achieving that score or higher reaches 0.5.

25
Figure 3.5 Wright map of the Addition dimension (Pilot Test)

26
Figure 3.6 Wright map of the Magnitude Comparison dimension (Pilot Test)

27
Figure 3.7 Wright map of the Transcoding dimension (Pilot Test)

28
In order to quantify the similarity of the difficulty orders between the CM and WM, the
Spearman rank-order correlations between the two orders were calculated. The correlations were
0.65, 0.78, 0.45, and 0.53 for Place Value, Addition, Magnitude Comparison, and Transcoding,
respectively. The Addition dimension was the only construct that showed a moderate correlation
between the two orders. Although there is no predetermined value for the rank correlation that is
acceptable or unacceptable, it is clear that the correlation values of the other dimensions are not
high enough to support the concordance of the orders.
These results indicate that the intended internal structure of the assessment was not
validated by empirical student responses. In other words, there was no evidence supporting the
validity of the theoretical difficulty order in the CM with the pilot data. In the CM, the task levels
were determined primarily by a “digit-increase” rule (e.g., Level 1 for a single digit, Level 2 for a
double digit) as indicated in Appendix B – 1. The sub-levels were determined by task content,
which were supported by previous research on each domain. Thus, the discordance between the
task levels and the empirical difficulty order may suggest that the task levels based on the “digit-
increase” rule do not reflect the actual developmental continuum of the dimensions, at least on the
Magnitude Comparison and Transcoding dimensions. In the Place Value and Addition dimensions,
the “digit-increase” rule seemed to have a partial effect on the difficulty levels of the tasks,
although only with high-digit numbers, in this study.
In addition, the study also examined whether there were unreasonably difficult or easy
items for the target sample. When the item difficulty distribution thoroughly covers the span of the
student ability distribution, the test can measure student proficiency more accurately over the
population. A lack of items in a difficulty range will lead to larger errors in ability estimates and
lower reliability of the overall test. As seen in Figures 3.4 to 3.7, the test items covered the student
ability distributions for the Place Value and Addition dimensions well, but not for the Transcoding
and Magnitude Comparison dimensions. In particular, for the Transcoding dimension, the items
were insufficient to provide accurate ability estimates across the whole range of students. Even the
most difficult items were easy for students in the middle ability range. This is associated with the
characteristics of the Transcoding items. As the Transcoding items deal with translation
competence across multiple representations of numerical quantities, in general, they are very basic
and easy concepts in the number sense learning progression. In particular, the items 39, 42, and 65
for the Magnitude Comparison dimension, and the items 34 and 86 for the Transcoding dimensions
were too easy for the target sample.

29
Table 3.6 Too easy items for the target sample
Dimension Item Score
Task Level Item Description 0 1 2
Magnitude
Comparison
39 0 53 1.1 Understand the concept of “more”
Which group has more
candies?
Two lollipops vs. Four
lollipops (with pictures)
42 3 47 3.3 Determine which of
two numbers is greater
(or smaller) for numbers
6 through 9
Which number is bigger?
7 vs. 9
65 2 41 4.2 Compare two non-
equal groups of objects
(i.e., drawings of objects)
and determine which is
greater (or smaller) for
groups of 10 to 99
objects
Which group has more?
10 red dots vs. 15 red dots
(with pictures)
Transcoding 34 0 54 2.1 Transcode the aural
form (number word) to
the Arabic
representation of that
number [single digit
numbers]
Which number is this?
5
86 0 11 105 5.1 Transcode number
from the aural form
(number word) to the
alphabetic form (written
number word) and to
Arabic representation of
number [multi-digit
numbers]
FADS says, “thirty-three.”
What number did you just
hear?
[13] [30] [33] [303]
Now choose the correct way
to spell that number.
[Thirty-three] [Therty-
three] [Tirte-three]
3.4 Implications: Identification of Problems The Pilot Test of SELPM was designed to examine the psychometric characteristics of the
Number Sense assessment. To fulfil the goal, this Phase I study explored the following aspects:
whether the empirical evidence supported the four-dimensional approach for the assessment,
whether the assessment was reliable enough, and whether the empirical responses supported the
theoretical learning progression embedded in the assessment.

30
The model fit comparison and item fit statistics supported the four-dimensional approach
for the assessment with sound fit indices. The reliability indices of the assessment also were close
to 0.9 for all dimensions except the Transcoding dimension, which indicates adequate quality of
measurement precision as a cognitive assessment. The reliability of the Transcoding dimension
was quite a lot lower than the other dimensions because all the Transcoding items were relatively
easy for the examinees. This suggests that more advanced task levels need to be included in the
Transcoding construct and assessment. The validity of the theoretical task levels in each CM was
examined by comparing the theoretical level order with the empirical difficulty order. Significant
disagreements were observed between the orders. This implies that empirical evidence did not
support the order of task levels in CM. Although only 38 percent of the entire set of achievement
levels in the progression was tested in the Pilot Test, the differences were substantial enough to
raise questions about the validity of the proposed learning progression.

31
Chapter 4. Phase II – Validating Learning Progression with Field
Test
Through the Phase I study, the assessment showed sound psychometric quality as a
cognitive assessment in terms of model fit, item fit, reliability etc. However, the Phase I data
analysis revealed a validity issue related to the internal structure of the assessment: the proposed
order of 69 task levels in the construct maps (CMs) was not confirmed by the student response
data. This result revealed the need to investigate further the construct validity of the CMs with
more data. Therefore, this chapter examines the Field Test data, collected in 2013 – 2014, in
order to the CMs. If the results confirm the earlier results, then a deeper analysis of the items and
the CMs is required to revise the learning progression. In addition, I explore the fundamental
measurement properties including model fit, item fit, reliability, and correlations between the
dimensions to ensure the measurement quality of the Field Test. I also investigate whether there
were differences between general education (GED) and math learning disability (MLD) students
on the test performance and item response patterns to investigate whether we should use the
same learning progression for both groups.
This chapter investigates the following research questions: (2) Was there a substantial
difference in the test performance between GED and MLD students? Was there any empirical
evidence to support different learning progressions for the GED and MLD students? (3) Did the
Field Test data support the proposed order of performance levels? (4) If the proposed learning
progression was not validated with the empirical data, what is an alternative learning progression
that can explain the student responses?
4.1 Field Study
4.1.1 Participants
A total of 384 students were recruited from the same school districts as in the Pilot Test,
including 158 GED students (41%) and 226 MLD students (59%). The same screening criteria
were used to define the MLD students. As mentioned previously, SELPM recruited MLD
students from a wider spectrum of grades in order to obtain enough variation in the target skills
and to match their competence levels to the GED students. Table 4.1 illustrates the distribution
of students by MLD status and grade.
Table 4.1 Distribution of the participants by MLD status and Grade
MLD
Status
Grade Total
K 1 2 3 4 5 6 7 8 9
GED 41 43 45 29 0 0 0 0 0 0 158
MLD 4 5 8 17 30 27 43 39 31 22 226
Total 45 48 53 46 30 27 43 39 31 22 384

32
4.1.2 Instrument
The Field Test included 102 tasks from the CMs. A total of 30 tasks (34 items), 29 tasks
(38 items), 26 tasks (26 items), and 17 tasks (39 items) were administered for the Place Value,
Addition, Magnitude Comparison, and Transcoding domains, respectively. A total of 139 items
were calibrated. The descriptions of each task and its related items are listed in Appendix C.
Similar to the Pilot Test, there were three test forms: A, B, and C, designed as EASY,
MEDIUM, and HARD, respectively. Table 4.2 illustrates the composition of the task levels
across the forms by the domains. Each form had 20 common tasks (14 in the pretest and 6 across
forms), which are underlined in Table 4.2. Two had multiple items, so there were 22 common
items across the forms. Students took one of the forms depending on their performances on a
pretest13. Table 4.3 illustrates the distribution of the forms across GED and MLD groups. More
than 60 percent of MLD students took form C compared to only 35 percent of GED students.
This contrasts with the Pilot Test where 50 percent of MLD students and 58 percent of GED
students took form C.
Table 4.2 Field Test Task Levels by Form
Pretest Form A Form B From C
Place Value
1.4
3.7
4.2
4.8
5.8
1.2
1.3
1.6
1.8
2.2
3.1
3.3
5.1
5.3
2.4
2.5
3.3
3.6
3.9
3.10
4.5
5.3
5.4
2.6
2.8
3.3
4.7
5.5
5.6
5.7
5.9
6.1
Addition
2.1
4.13
6.1
6.3
2.4
2.6
2.10
3.1
3.3
4.3
4.6
5.4
5.6
3.3
3.4
4.7
4.8
4.11
4.16
4.20
5.8
5.13
3.3
3.7
4.22
4.23
5.14
6.4
6.5
6.6
7.2
Magnitude
Comparison
2.8
4.5
6.4
2.2
2.3
2.5
2.7
2.9
2.9
2.10
3.5
3.6
4.1
2.9
2.11
4.3
4.6
5.5
13 Like in the pilot, the SRI team administered the pretest and then classified students into three groups based on the
results.

33
3.4
4.3
5.1
5.3
4.3
4.4
5.2
5.4
5.6
6.1
6.2
6.3
Transcoding
3.3
4.3
2.2
2.6
2.7
2.9
3.2
3.3
4.1
4.2
2.8
2.9
3.5
3.6
3.8
3.9
4.1
4.2
2.9
2.10
3.9
3.10
4.1
4.3
5.1
†Note: The underlined levels are common tasks across the forms.
Table 4.3 Form Distributions between GED and MLD
MLD Status Form
Total A B C
GED 66 (42%) 37 (23%) 55 (35%) 158
MLD 54 (24%) 26 (11%) 146 (65%) 226
Total 120 (31%) 63 (17%) 201 (52%) 384
4.2 Model Selection and Measurement Properties The same linking procedure from Phase I, the “common-item nonequivalent groups”
linking design (Kolen & Brenna, 2004), was used to equate the forms (see Chapter 3). Phase I
demonstrated that the multidimensional approach was better than the two unidimensional
approaches. To confirm this result, the same models (the partial credit and between-item
multidimensional partial credit model) were applied for model selection. This Phase II study
used ConQuest 3.0 (Wu, Adams, & Wilson, 2012) for parameter calibration. For the specific
formulation, see the measurement model section in Chapter 3.
Table 4.4 gives the deviances and the number of estimated parameters of the models. The
results from the likelihood ratio (deviance) test, comparing the unidimensional composite and the
four-dimensional model, suggested that the latter had a better fit. Comparing the Akaike’s
Information Criterion (AIC: Akaike, 1977) for all models, the multidimensional model had the
smallest values, indicating better model fit. This statistical finding supports the multidimensional
model.

34
Table 4.4 Comparison of Fits among the Unidimensional Composite, Consecutive, and
Multidimensional Models
Model Deviance Parameter Dev.(d.f.)Change
p-value AIC
Unidimensional 23373 172 23717 Multidimensional 22845 181 528 (9) p < 0.001 23207
Consecutive
Place Value 7445 44 Addition 6062 44
Magnitude Comparison
5425 37
Transcoding 5104 50
Total 24036 175 24386
AIC (the Akaike Information Criterion) = -2Log(L) + 2Nparameter
The individual item fits were examined using a weighted fit mean square (WFMS) statistic
(Wright, 1977; Wright & Masters, 1982). This item level statistic indicates whether each item fits
its assigned dimension (Wu & Adams, 2007). Items with WFMS values greater than 1.33 and less
than 0.75 are generally regarded as misfit items (Wilson, 2005). The fit values for all items in the
four-dimensional model were reasonable, compared to eight misfit items in the unidimensional
composite model. Thus, the multidimensional approach was selected as the best approach for
Phase II.
In order to compare the dimensions directly, it is necessary to apply a procedure
aligning14 the dimensions onto a common scale. The study applied Delta Dimensional Alignment
(DDA; Ayer and Schwartz, 2011), a procedure that transforms the item locations and step
parameters obtained after running an initial multidimensional analysis. These parameters were
transformed by using the means and standard deviations of the subsets of the items for each
dimension calculated from a unidimensional analysis.
As explained in Chapter 3, the correlation structure of the multidimensional model
improved the reliability of the instrument. The test reliabilities (Mislevy et al., 1992) are 0.94, 0.95,
0.92, and 0.90 for Place Value, Addition, Magnitude Comparison, and Transcoding, respectively.
The correlations among the four dimensions range from 0.84 to 0.9415 indicating that they were
all highly correlated (see Table 4.5). As these dimensions are sub-domain of number sense
construct, these high correlations are expected.
14 When calibrating parameters, the mean of person abilities or the mean of item difficulties must be set to zero for
every dimension for statistical identification. Due to this artificial constraint, direct comparisons across dimensions
are not appropriate unless a proper alignment procedure is applied.
15 The correlations below were directly estimated from the variance-covariance matrix of the multidimensional
model (Wang, 1999).

35
Table 4.5 Correlations across Dimensions
Dimension
Place
Value Addition
Magnitude
Comparison Transcoding
Place Value 0.94 0.94 0.85
Addition 0.93 0.84
Magnitude
Comparison 0.85
4.3 Comparison of Performances between GED and MLD This section relates to the second research question. As indicated in the participant
section, SELPM recruited MLD students from a wider spectrum of grades than for GED
students. This sampling design was different from other MLD studies, where GED and MLD
students of the same grade/age are compared to identify the relative deficits of the MLD
students. For comparing the two groups in terms of the learning progression, SELPM presumed
that recruiting the MLD students from higher grades made two groups’ ability levels comparable.
Hence, comparing test performances of the two groups were relevant for confirming the validity
of the sampling design. In addition, this study investigated whether there was any evidence
suggesting different learning progressions for the two groups by comparing two sets of difficulty
estimates, which were separately calibrated for each group.
4.3.1 Test Level
Table 4.6 presented the mean ability estimates for the two groups. The average abilities
of MLD students are considerably higher than for GED students. The largest difference was
around 1.6 logits in the Addition dimension, while the smallest difference was 0.7 logits in
Magnitude Comparison. Despite the MLD students’ developmental lag in learning mathematics,
MLD students performed better than GED students, indicating that the different grade levels had
substantial impact on the average test performances.

36
Table 4.6 Comparison of Mean Abilities between MLD and GED
Content Domain
(Dimension)
GED MLD
Mean SD Mean SD T p
Place Value -0.433 1.359 0.429 1.167 -6.48 <0.001
Addition -0.855 2.572 0.812 2.248 -6.577 <0.001
Magnitude
Comparison -0.353 1.2 0.36 1.076 -5.975 <0.001
Transcoding -0.576 2.126 0.538 1.845 -5.331 <0.001
†Note: The Mean abilities were calculated directly from ConQuest 3.0 with plausible values
In order to identify the developmental lag of MLD students, mean abilities of the two
groups were compared by grade (see Figure 4.1). In the figure, the mean abilities of MLD
students increased gradually and reached the ability level of 3rd grade GED students in 7th or 8th
grade. This demonstrates that MLD students tend to perform less well hence have grown at a
slower pace relative to their peers in learning mathematics (Clement & Samara, 2007; Geary,
2011). This result supports the assumption of the study design regarding the sample recruitment:
the extended age spectrum for MLD students is meaningful for exploring the learning
progressions of GED and MLD students.

37
Figure 4.1 Comparison of Mean Abilities between GED and MLD by Grade
4.3.2 Item Level
The item level performances of the two groups were examined by comparing two sets of
item difficulty estimates, which were separately calibrated for each group using the
multidimensional model. Since the ability distributions (e.g., mean, standard deviation) were not
identical between MLD and GED students, it is not feasible to compare the absolute values of
difficulty. Therefore, correlation coefficient indices were used for quantifying the similarity of
the difficulty parameters. There is no predetermined positive value for the correlation that is
either acceptable or unacceptable to confirm the similarity. Nevertheless, the higher the value is,
the more consistent the item difficulties are. High correlations indicate that easy (difficult) items
to the GED students were similarly easy (difficult) to the MLD students. On the other hand, if
the correlation value is very low, it may be worthwhile for the researcher to consider some
difference in the learning progressions between the two groups (Wilson, 2005). The correlations
were 0.84, 0.91, 0.90, and 0.87 for the Place Value, Addition, Magnitude Comparison, and
Transcoding dimensions, respectively. Figures 4.2 to 4.5 shows these correlations graphically.
Most Place Value items were aligned near the red fitted line indicating a perfect positive
correlation (see Figure 4.2). Since the difficulty estimations were based on small sample sizes

38
(i.e., 158 for GED/ 226 for MLD), each difficulty estimate had sizable standard error (from 0.15
to 0.45). Thus, the correlation value 0.84 is too high to suggest separate learning progressions for
the two groups.
Figure 4.2 Scatter plots of item difficulties in Place Value between GED and MLD
In Figure 4.3, as the high correlation value (i.e., 0.91) illustrated, most Addition items
were linearly aligned near the red fitted line. This high correlation supports similar learning
progressions for the two groups. There is a noteworthy pattern in the Addition dimension: higher
level items (levels 5 and 6) were relatively easier for the MLD students than for the GED
students. As the item levels were determined by the number of digits, this may indicate that the
digit-increase factor did not have much effect on the difficulty for the higher grade MLD
students.

39
Figure 4.3 Scatter plots of item difficulties in Addition between GED and MLD
The Magnitude Comparison dimension also has the high correlation value (i.e., 0.9). In
Figure 4.4, Items 127, 100, 104, and 105 were considerably away from the red fitted line, but
they had large standard errors (i.e., 0.35 to 0.7) compared to the other items. Therefore, I
concluded that there was no considerable evidence to suggest a possibility of different learning
progressions for the two groups in Magnitude Comparison.

40
Figure 4.4 Scatter plots of item difficulties in Magnitude Comparison between GED and MLD
In the Transcoding dimension, the correlation was 0.87. As Figure 4.5 illustrates, all
Transcoding items except for Items 32 were located near the red fitted line. Item 32 is the easiest
items in the dimension and had large standard errors (i.e., 1.1). Thus, the difficulty locations of
the two items on the graph did not have significant meaning.

41
Figure 4.5 Scatter plots of item difficulties in Transcoding between GED and MLD
Overall, no systematic differences were observed between the two groups after taking
account of the standard errors. The high correlations of item difficulties between the two groups
indicate that underlying constructs about item easiness or difficulty were very similar for both
groups. These results imply that there was not strong evidence for separate learning progressions
for the GED and MLD students.
4.4 Validation of the Proposed Learning Progressions The assessment was developed, under the BAS framework, to track students along the
progression as well as to test the internal robustness of the hypothesized progression. Thus, the
items have an expected difficulty order that reflects the CMs and the Number Sense learning
progression (Seeretan et al., 2013; Wilson, 2005; Kennedy & Wilson, 2007). This section
investigates whether the Field Test data supports the learning progression (the third research
question). Since different learning progressions were not identified for the GED and MLD
students, responses from both groups were aggregated.
As described in Phase I, the concordance between the expected order in the CM and the
empirical order of the items in the WM becomes evidence to support the construct validity of the
learning progression (Wilson, 2005). The WMs of the four dimensions are presented in Figures
4.6 – 4.9. The items on the right side of the map are distributed from the least difficult at the

42
bottom to the most difficult at the top. The Thurstonian thresholds16 are used as indicators of
“score difficulty” in the WM. For direct comparisons with the CM orders, the items are sorted
based on the CM order from the least difficult on the left to most difficult on the right. Therefore,
if the orders of the CM and the WM are perfectly concordant, the thresholds will form a straight
line from the bottom left to the top right corner.
4.4.1 Place Value
There are six levels in the Place Value CM. Level 1 examines students’ understanding of
place value on single and teen numbers (e.g., “How many tens and ones are in the number 16?”).
Levels 2, 3, and 4 assess students’ understanding of place value on two-, three-, and four-digit
numbers, respectively (e.g., “Select the digit in the ones place: 659”). Level 5 deals with
students’ understanding of place value on five- and more digit numbers (e.g., “What digit is in
the “hundred thousands” place? 8,753,040”). Lastly, Level 6 measures students’ rounding ability
of multi-digit numbers (e.g., “What is 614 rounded to the nearest hundred?”).
As seen in the Place Value WM (Figure 4.6), there were no systematic differences across
the six levels in terms of item difficulty. Some Level 3 (i.e., Items 50, 130, and 51) and Level 5
items (i.e., Items 57 and 97) were more difficult than all the lower level items, but they were the
exception. Within a level, only a few items in Levels 1, 3, 4, and 5 were aligned with the
increasing patterns.
16 The threshold for a score category is defined as the ability at which the probability of achieving the score or
higher reaches 0.5. These values tend to be more interpretable than the delta (𝛿𝑖𝑘 ) because they identify levels
where students are most likely to achieve specific scores (Kennedy, 2005). For example, on item 1 in Figure 4.3,
there are two square points, which are indicating score 1 difficulty and score 2 difficulty.

43
Figure 4.6 Wright map of Place Value (Field Test)

44
4.4.2 Addition
The Addition dimension includes seven levels in the CM, but level 1 was omitted from
the Field Test because its items were too easy for the sample in Phase I. Level 2 assesses
students’ competence of solving single-digit addition problems when a sum (end) is unknown
(e.g., “2 + 5 = ( )”). Level 3 measures students’ competence of solving single-digit addition
problems when addend (start or change) is unknown (e.g., “3 + ( ) = 9”). While Level 4 deals
with students’ competence of adding single and double-digit numbers with various unknowns
(end, start, or change), Levels 5 and 6 respectively cope with students’ competences of adding
double-digit numbers and of multi-digit numbers with various unknowns. Level 7 tests whether a
student can estimate reasonable answers when adding several multi-digit numbers (e.g.,
“Estimate of 59 + 78 + 52 + 31 + 61 + 98”).
In the Addition WM (Figure 4.7), a roughly increasing pattern appeared along with the
expected order in the CM. This means that items tended to become more difficult as the level
increased. As seen in the figure, all Level 3 items were more difficult than Level 2 items and
most Level 4 items were more difficult than Level 2 items. Also, Level 6 items were more
challenging than all other levels. However, the easy items of Level 4 were easier than Level 3
items, and there were no differentiations between Level 5 items and the high difficulty items of
Level 4. The Level 7 item (i.e., Item 115) had a similar difficulty estimate as the Level 5 items.
Within each level, consistently increasing patterns were observed among most items in Levels 2,
4, and 5.

45
Figure 4.7 Wright map of Addition (Field Test)

46
4.4.3 Magnitude Comparison
The Magnitude Comparison CM has six levels, but Level 1 items were not included in
Field Test because Phase I showed that they were too easy for the sample. Level 2 examines
students’ competence of understanding relative magnitude of single-digit numbers between 0 and
5 (e.g., “Put in order from the least to the greatest number: 4 – 1 – 5”). Level 3 extends the
single-digit numbers up to 9 (e.g., “Put in order from the least to the greatest number: 8 – 6 – 9”).
In Levels 4 and 5, the numbers are extended to double-digit and three-digit numbers, respectively
(e.g., “What number comes 2 after 39?”). Level 6 includes multi-digit whole numbers up to five-
digits (e.g., “Which number is the greatest? 109,209 / 18,578 / 24,998”).
The Magnitude Comparison WM (Figure 4.8) reveals that the empirical responses did
not support the hypothesized order. Level 3 items were easier than most Level 2 items. There
were no difficulty differences across Levels 2, 4, and 5. Only two Level 6 items (i.e., Items 106
and 138) were more difficult than the lower level items. No consistent pattern was observed
within levels.
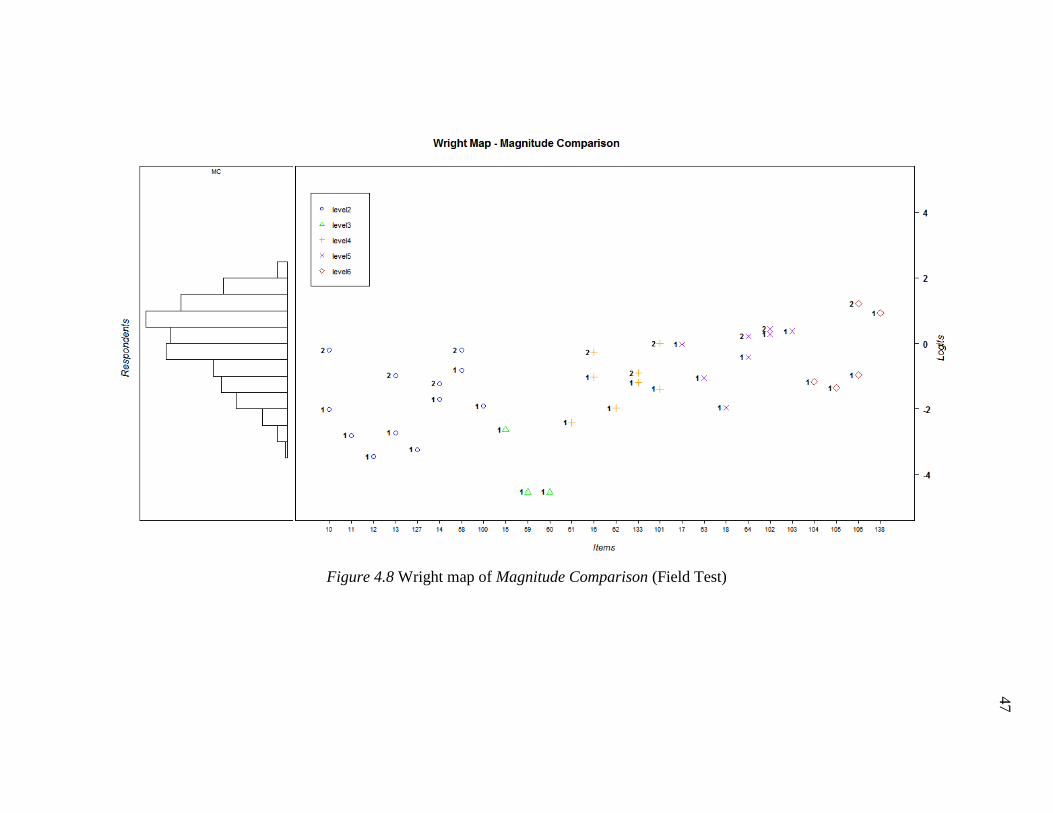
47
Figure 4.8 Wright map of Magnitude Comparison (Field Test)

48
4.4.4 Transcoding
The Transcoding CM contains five levels. Similar to the Addition and Magnitude
Comparison dimensions, Level 1 items were not tested in the Field Test. Level 2 items were
designed to assess students’ ability of translating different numerical representations of single-
digit numbers (e.g., “Spell the number: 7”). Levels 3 and 4 items measured the same ability for
teen numbers and multi-digit numbers, respectively. Level 5 item assessed whether students
could interpret a word problem by translating different numerical forms (e.g., “Lucy goes to the
store and buys twelve apples. Then she rides her bike home to twenty-eight Birch Street and
makes an apple pie. How many apples did Lucy buy at the store?”)
With respect to the concordance between CM and WM, the empirical difficulty order
failed to support the expected order in the CM. As seen in Figure 4.9, item difficulties were
similar across the levels, and it was hard to find any consistent patterns within levels. In addition,
the figure illustrated that Transcoding items were too easy for the sample. All items, except for
one, have negative difficulty values indicating that they were relatively easy compared to the
sample students’ average ability.

49
Figure 4.9 Wright map of Transcoding (Field Test)

50
4.5 Learning Relationship between Dimensions Section 4.4 focused on each individual dimension. This section examined the
relationships across dimensions. Children develop their number sense ability or proficiency
moving vertically up a single dimension as well as moving in a coordinated way across the
dimensions. As learning paths across the dimensions were not hypothesized in SELPM, this
section explored the possible connections between the dimensions by mapping all the items
across the dimensions.
To compare the item difficulties across dimensions, DDA (Schwartz & Ayers, 2011) was
applied. Figure 4.10 shows an aligned Wright map with all four dimensions. For a clearer
graphical representation, only the maximum score thresholds are shown.
From the figure, it seems that the Place Value and Addition dimensions share similar item
difficulty distributions, while the Magnitude Comparison and Transcoding dimensions are
similar. Place Value and Addition items are generally more difficult than Magnitude Comparison
and Transcoding items. Visually, the former items are located higher than the latter items.
However, if looking at the number of digits (red texts in parenthesis: e.g., L1 means
single-digit number) used in each item, the Place Value items used two-digit numbers up to five-
digit numbers whereas the Addition items used single-digit numbers to three-digit numbers. After
matching the number of digits in the items, the Addition items are relatively more difficult than
the Place Value items. This difficulty order between these two dimensions is reasonable because
a student needs to develop a multiunit conceptual structure (i.e., Place Value) first, before (s)he
can solve multiple-digit number addition problems (Fuson, 1990; Jones, et al., 1996).
For the Transcoding dimension, the underlined items in Figure 4.10 ask children to spell
out numbers and these are more difficult than the other Transcoding items. On the other hand,
the non-spelling Transcoding items were much easier than the Magnitude Comparison items.
This difficulty order between these dimensions is understandable since the Transcoding items
(except for the number-spelling items) were designed to measure children’s ability to recognize
numbers from Aural and Arabic presentations. This ability is foundational for number sense
acquisition. After a child is able to count and recognize numbers, then (s)he can understand the
magnitude of each number.
Therefore, Transcoding items are generally easier than Magnitude Comparison items,
and the Magnitude Comparison items are easier than the Place Value and Addition items –
although there are some overlaps. In terms of the Common Core State Standards (CCSS, 2010),
the items located in the blue area in Figure 4.10 fit in early Kindergarten standards whereas the
items in the green area are associated with standards for grades 2 to 4.

51
Figure 4.10 Multidimensional Wright Map after Delta Dimensional Alignment
logit PV AD MC TC PV Items AD Items MC Items TC Items
4
X
X
3 X
X 110(L2)
XXX
X XXX 57(L5)
2 XX XXXX
XXXX XXXXXX 97(L5) 113(L3)
XXXXXXXX XXXXXX 92(L4) 137(L3)
1 XXXXXXXXX XXXXXXX X 50(L3) 51(L3) 56(L5) 139(L5) 111(L3) 112(L3)
XXXXXXXXX XXXXX X 130(L3)
XXXXXXX XXXXX XX XXX 99(L3) 114(L3) 115(L2)
XXXXXXX XXXXXX XXX XXX 5(L2) 98(L5) 136(L4) 31(L2) 74(L2) 75(L2) 77(L2) 135(L3)
0 XXXXXXXX XXXXXXX XXXXXX XXXX 49(L2) 52(L3) 54(L3) 55(L4) 90(L2) 131(L2) 30(L2) 73(L2) 76(L2) 108(L2) 109(L2)
XXXXXXX XXXX XXXXXXX XXXXX 3(L2) 7(L4) 53(L3) 29(L2) 69(L2) 72(L2) 106(L4)
XXXXXXXX XXXXXX XXXXXXXXX XXXXXXXX 6(L2) 134(L4) 138(L4) 125(L2)
-1 XXXX XXXX XXXXXXXXX XXXXXXXX 8(L4) 68(L2) 71(L2) 107(L1)
XXXXX XXXXX XXXXXXXX XXXXXXXXX 1(L2) 9(L5) 93(L5) 94(L5) 95(L5) 66(L2) 70(L2) 132(L2) 102(L3) 103(L3)
XXXX XXX XXXXXXXXX XXXXXXX 4(L3) 47(L2) 23(L1) 65(L1) 64(L3)
XXXXX XXX XXXXXXXXX XXXXX 48(L2) 91(L2) 24(L1) 17(L3) 101(L2)
-2 XXXX XX XXXXXXXXX XXXXXXX 26(L2) 27(L2) 10(L1) 16(L2) 58(L1) 119(L2)
XX XXXX XXXXXX XXXXXX 22(L1) 25(L1) 28(L2) 67(L2) 122(L2) 123(L3) 129(L2)
XX XXX XXXX XXXX 21(L1) 133(L2)
-3 X XXX XXXXX XXXXX 2(L2) 96(L5) 13(L1) 14(L1) 63(L3) 104(L4) 120(L2) 121(L2)
X X XXXX XX 105(L4) 35(L1) 85(L2)
X XX XXXX XX 19(L1) 20(L1) 128(L1) 37(L1) 118(L2)
X XXX XX 18(L3) 62(L2) 100(L1) 36(L1) 45(L2) 84(L2) 88(L2) 89(L2) 116(L1) 117(L1)
-4 XX X XXX 78(L1) 79(L1) 81(L2) 82(L2)
X XX XXXX 61(L2) 34(L1) 38(L1) 46(L2) 80(L2)
X X XX 11(L1) 15(L1) 86(L2) 124(L3)
-5 X X 42(L2) 87(L2)
X XX 127(L1) 43(L2) 83(L2)
XXX 12(L1)
X X 44(L2)
-6 X 40(L2) 41(L2)
39(L2)
59(L1) 60(L1)
-7 126(L2)
32(L1)
-8
33(L1)
-9

52
4.6 Investigation for Alternative Learning Progressions
The four WMs confirmed the results from Phase I – that the expected orders of the Place
Value, Magnitude Comparison and Transcoding dimensions did not match students’ responses.
Only the Addition CM was roughly confirmed. This section describes my investigation into an
alternative learning progression, using the empirical results from the Field Test.
As shown in the CMs, the order of specific task-levels is determined by two factors: a
digit-increase element and a performance-content element. The former determines the primary
levels (e.g., Level 1, Level 2, etc.) and the latter determines specific task-levels within each
primary level (e.g., Level 1.1, Level 1.2, Level 1.3, Level 2.1, Level 2.2, etc.). Generally, the
performance descriptions are similar across all the primary levels. The main difference is the
number of digits in the item. For instance, in Magnitude Comparison, “placing randomly ordered
non-consecutive numbers from least to greatest” appears in Levels 2 and 3 for single digit
numbers, Level 4 for two-digit numbers, Level 5 for three-digit numbers, and Level 6 for four-
(and more) digit numbers. Figure 4.11 illustrates the CM structures in SELPM.
Figure 4.11 Structure of the hypothesized CMs in SELPM
The WMs in Figures 4.6 to 4.9 clearly illustrated whether the difficulty estimates
followed the digit-increase pattern: that is, whether higher-level items were more difficult than
lower-level items. However, those figures do not provide specific information about the
performance-contents. Therefore, in order to elicit evidence to construct a new relationship
among the levels, the item sides of the WMs were reorganized by their performance-content
components. These reorganized WMs are presented in Figures 4.12 to 4.13 and 4.15 to 4.16.
Item difficulties were analyzed in two ways: By exploring the effect of the digit-increase
factor on the difficulty within the same performance-content, and by exploring the difficulty
order among the performance-contents after controlling for the number of digits. The former was
examined by inspecting whether the difficulty estimates increased as the number of digits also
increased. For the latter, the difficulty order among the performance-contents was examined after
controlling for the same number of digits.

53
4.6.1 Place Value
There are 12 different performance-contents in the Place Value CM. One performance-
content (Decompose multiples of ten/hundred/thousand into its place value components) was not
tested in the Field Test. Table 4.7 describes the remaining performance-contents. For easy
identification of the number of digits, new labels were assigned: L1, L2, L3, L4, and L5
indicating single-digit, two-digit, three-digit, four-digit, and five and more digit numbers,
respectively. The symbol * in Figure 4.12 indicates that the item was multiple-choice. All others
were constructed-response.

54
Figure 4.12 Place Value Wright Map by Performance-content
Table 4.7 Performance-contents in Place Value
Performance Description
P1 Understand the meaning of 10 and teen numbers using objects
P2 Demonstrate different ways of making 100 (Item 4) or 20000 (Item 8)
P3 Demonstrate understanding that 10 times of a number forms a new unit (10 “hundreds” = 1 “thousand”)
P4 Indicate which digit represents “ones”, “tens” “hundreds”, etc.
P5 Decompose numbers into its place value components
P6 Deduce a number from place value blocks or place value components
P7 Compare two numbers based on understanding of place value
P8 Regular ten-for-one and one-for-ten trades
P9 Composing numbers in multiple flexible ways (Multiple partitioning)
P10 Express numbers using expanded form (Standard partitioning)
P11 Round multi-digit numbers
logit place value P1 P2 P3 P4 P5 P6 P7 P8 P9 P10 P11
4
3
X 57(L5)
2 XX 97(L5)
XXXXXXX
XXXXXXXXX 56(L5) 50(L3) 92(L4) 51(L3)*
1 XXXXXXXXXX 130(L3) 139(L5)*
XXXXXX 5(L2) 136(L4)* 98(L5)* 99(L3)*
XXXXXXXX 55(L4) 49(L2) 90(L2) 52(L3) 54(L3)
0 XXXXXXX 131(L2) 7(L3) 3(L2) 53(L3)
XXXXXXX 134(L4)* 6(L2)
XXXX 1(L2)* 8(L4)* 93(L5)* 94(L5)
-1 XXXXX 4(L3) 9(L5) 95(L5)
XXXXX 47(L2) 48(L2) 91(L2)
XXXX
-2 XX
XX
X 2(L2) 96(L5)
-3 X
X
-4

55
(1) The effect of the digit-increase within a performance-content
Unfortunately, for P1, P3, and P11, the effect of digit-increase was not examinable
because there was no variation in the number of digits, as seen in Figure 4.12. Support for the
digit-increase effect appeared in P2, P8, and P10. For these performance-contents, the items
became more difficult as the number of digits increased.
However, this effect was not confirmed in P4, P5, P6, and P7. One noteworthy
explanation for the lack of the digit-increase effect relates to item-design. Item-design, including
the item format, wording, or style, can have a considerable influence on the item difficulty
(Wilson, 2005). Thus, it is essential to maintain a consistent item-design in order to effectively
examine the digit-increase effect. However, no consistent item-design was used across these
items.
For example, within P4, Item 9 asked a student to indicate a digit in the ten billions place,
but also provided a hint (“Which digit is in the ten billions place (2 is in the billions place)? –
192,631,781,111”). Among all the items, only this item included a hint. Thus, when compared to
an item with fewer digits (e.g., Item 56: “What digit is in the “hundred thousands” place?
8,753,040”), one can easily understand why Item 9 was easier even though it included a higher-
digit number.
Item 5 in P5 also had a wording problem. The item asked students to indicate the value of
“1” and “0” in the number 10, which was not clear enough for young children to understand the
question17. If this item was written like the other items within P5, it would read “how many tens
and ones in the number 10?” Presumably, the difficulty would then change.
In P6, Item 93 used word-representation and multiple-choice options (“A number has 2
“hundred thousands,” 7 “ten thousands,” 3 “thousands,” 8 “hundreds,” 0 “tens,” and 0 “ones.”
What is the number? a) 2,738 b) 27,380 c) 273,800 d) 2,738,000”), while the other items in P6
used block-representations with Base-Ten blocks (Dienes, 1960) and an open-ended format.
Because of these differences in format, Item 93 appeared much easier than the other items.
Lastly, in P7, the format of Items 94, 95, and 96 differed from Items 90, 92, and 130. The
former group of items simply asked students to compare two multi-digit numbers and pick the
greater one (e.g., “Select the larger number: 85,456 vs. 9,548”). The latter group asked students
to compare two multi-digit numbers based on the place value (e.g., “which number has more
groups of ten?”). In other words, the latter required students to explain the logic behind the
comparison. Because of these differences in the item-design, P4, P5, P6, and P7 did not show the
digit-increase effect properly.
(2) The order among the performance-contents
After controlling for the number of digits, only seven performance-contents (i.e., P2, P4,
P6, P7, P9, P10, and P11) were comparable. These seven performance-contents were empirically
ordered as P2 < P4 < P10 < P11 < P7 < P6 = P9 indicating that P2 is the easiest while P6 and P9
are the most difficult. However, the expected CM order was P2 < P4 < P6 < P7 < P9 < P10 <
P11.
The most noticeable aspect of the difference in order is that P10 (Express numbers using
expanded form) and P11 (Round multi-digit numbers) were not as difficult as hypothesized in
17 Note that Item 57 in P5 had the same format. It asked students to write what the value of “9” represents in each
number (e.g., “a) 2,309 b) 1,940 c) 5,693 d) 978,021 etc.”). This item turned out to be the most difficult item in the
place value domain because only one child provided partially correct answers.

56
the CM. In the CM, P10 and P11 were expected to be the most difficult tasks, but empirically
P10 and P11 items were easier than P6, P7, and P9 items. In fact, some researchers (Ross, 1986,
1989; Resnick, 1993) have already found that non-standard multiple partitioning (P9) is more
difficult than standard partitioning (i.e., Express numbers using expanded form – P10).
Specifically, when a student is asked to partition “123” with standard partitioning, it means that
(s)he needs to present the number as 100 + 20 + 3. On the other hand, for non-standard
partitioning, 123 can be expressed in various ways such as 80 + 40 + 3 or 100 + 10 + 13. As
such, non-standard partitioning requires a student to demonstrate more flexible ways when
decomposing numbers. The empirical evidence found in this study as well as the previous
research findings suggest the need for changing the order of P9 and P10.
Unfortunately, little research explains why P6 (Deduce a number from place value blocks
or place value components) and P7 (Compare two numbers based on understanding of place
value) emerge as more difficult than P10 and P11. In fact, the result of this study is in a direct
opposition to what Ross (1989) found: P6 and P7 belong to the digit-correspondence tasks using
manipulative materials and are easier than the partitioning task (P10) in the development of place
value concept. Further qualitative analyses using think-aloud or cognitive labs are needed to
confirm this order, which is beyond the scope of this study.
4.6.2 Addition
The Addition CM has two to twenty-four specific task-levels for each primary level. The
classification of the primary levels in the Addition CM is slightly different from the other
dimensions. In the other dimensions, the levels are based on the number of digits in the test
items. In the Addition dimension, however, both the number of digits and the location of the
unknown or regrouping (carrying) are specified. For example, Levels 2 and 3 both relate to
single digit number additions. While Level 2 deals with additions when the unknown is sum
(End), Level 3 deals when the unknown is addend (Start or Change). The regrouping component
was present in Levels 4 and beyond. Level 4 focuses on single and double-digit number additions
including various locations of the unknown and with/without regrouping. Levels 5 and 6 extend
the Level 4 tasks with two-digit and three-digit numbers, respectively.
Several task features determined the specific task-levels within each primary level:
location of the unknown (End vs. Start/Change), regrouping, addition format (word vs.
equation), type of problem situations (comparison vs. non-comparison), number of addends,
timed test, recognition of addition property, and estimation. These task features influenced the
expected order in the Addition CM. Table 4.8 shows the nine performance-contents. Figure 4.13
shows the WM where the items are grouped by performance-content and the regrouping feature.
The location of the unknown (End/Start/Change) and the type of problem situations
(comparison) were also indicated.
For easy identification of the number of digits, Figure 4.10 used new labels: L1, L1/2,
L2, L3 indicating single-digit number additions, single and two-digit number additions, two-digit
number additions, and three-digit number additions, respectively. The symbol * indicates that the
item was multiple-choice. The other items were constructed response.

57
Figure 4.13 Addition Wright map by Performance-content
Table 4.8 Performance-contents in Addition
Performance Description
P1 Solve addition word problems with objects
P2 Solve addition equation problems with 2 numbers
P3 Solve addition word problems with 2 numbers
P4 Solve addition equation problems with 3 numbers
P5 Solve addition word problems with 3 numbers
P6 Understand the associate property of addition
P7 Represent a word problem with an equation and solve the problem
P8 Timed addition problems (equation format)
P9 Estimation
logit addition P1 P6 P7 P8 P9
No regrouping regrouping No regrouping regrouping No regrouping regrouping No regrouping regrouping
5
X
4 X
XXX
XX
3 XXX 113(L3-Start)
XXXX
XXXX 137(L3-Change) 111(L3-Change)
2 XXXX 112(L3-Change)
XXXXXX
XXX 114(L3-Comparison) 110(L2-End) 115(L2-End, Regroup)
1 XXXX 75(L2-Start)135(L3-End) 74(L1/2-Start) 77(L2-Comparison)
XXXXX 76(L2-Change) 73(L1/2-Change) 30(L2-End) 31(L2-End)
XXXX 109*(L1/2-Comparison) 69(L1/2-End) 108(L1/2-Change)
0 XXXX 29(L2-End) 72(L1/2-Start)
XXXXX 71(L1/2-Change)
XX 107(L1-Comparison) 68(L1/2-End)
-1 XXXX 70(L1/2-Change) 66*(L1/2)
XX 23(L1-Change) 132(L1/2-Change) 65(L1-Change)
XXX
-2 X 24(L1-Change)
XXX 26(L1/2-End) 27(L1/2-End) 28*(L1/2-End)
XXX 25(L1-Start) 67*(L1/2-End)
-3 XXX 21*(L1-End) 22(L1-End)
XX
X
-4 X 19(L1-End)
X 128*(L1-End) 20(L1-End)
X
-5 X
X
-6
P2 P3 P4 P5

58
(1) The effect of the digit-increase within a performance-content
After controlling for the task features (e.g., location of the unknown (End vs.
Start/Change), regrouping, addition format, type of problem situations etc.), I examined whether
the change in the number of digits influenced item difficulty. In P2, P3, P4, and P5, the items
became more difficult as the number of digit increased. For example, in P2, Items 26 and 27
(L1/2 – End unknown) were more difficult than Items 19 and 20 (L1 – End unknown). Similarly,
Items 75 (L2 – Start unknown) and 76 (L2 – Change unknown) were more difficult than Items
25 (L1 – Start unknown) and 24 (L1 – Change unknown). In addition, Item 137 (L3 – Change
unknown) was more difficult than Item 73 (L1/2 – Change unknown). For P1, P6, P7, P8, and
P9, the effect of digit-increase was not examined because there was no variation in the number of
digits.
(2) The order among the performance-contents
The difficulty order between the performance-contents was examined through paired
comparisons of the following task features: (a) sum-unknown (End) vs. addend-unknown
(Start/Change), (b) adding two numbers vs. adding three numbers, (c) regrouping vs. non-
grouping, (d) word problems vs. equation problems, and (e) comparison situation vs. non-
comparison situation. Unlike the other dimensions, the Addition dimension has various numbers
of task-levels within each primary level, so that paired comparisons were the only feasible way
to compare the order of the performance-contents.
First, theoretically, addend-unknown items are more difficult than the sum-unknown
items (Carpenters & Moser, 1984; Fuson, 1992). From P1 through P5, as expected, the addend-
unknown items were more difficult than the sum-unknown items after controlling for the item
format, number of digits, and regrouping.
For the second comparison, P2 (Solve addition equation problems with 2 numbers: i.e.,
Item 137) was easier than P4 (Solve addition equation problems with 3 numbers: i.e., Item 113)
after controlling for the other factors. The comparison of P3 (Solve addition word problems with
2 numbers) and P5 (Solve addition word problems with 3 numbers) was not feasible because
there were no comparable items after controlling for all other conditions. Instead, Items 30 and
31 (L2 – End Unknown) in P4 and Item 115 (L2 – End Unknown) in P8 were compared to
examine whether the number of addends affected difficulty. Items 30 and 31 asked students to
add three double-digit numbers (i.e., “57 + 19 + 16 = ( )”, “39 + 25 + 16 = ( )”) while Item
115 asked students to add six double-digit numbers using estimation (i.e., “Estimate of 59 + 78 +
52 + 31 + 61 + 98”). As shown in Figure 4.9, Item 115 was more difficult than Items 30 and 31.
These results could be limited to empirically confirm that the number of addends had an effect
on the difficulty as hypothesized in the CM because only small number of items were examined
for this comparison.
Third, the difficulty order between regrouping and non-regrouping was examined in P4:
Items 112 and 113 demonstrated that the regrouping (Item 113 – L3, Start unknown) was more
difficult than the non-regrouping (Item 112 – L3, Change unknown) when all the other
conditions were the same. One notable finding is that the regrouping factor still affected the item
difficulty even in three-digit number additions, which was different from the Addition CM. The
CM did not account for the regrouping factor in three-digit number additions because it assumed
that students who successfully solved three-digit numbers would already know how to regroup.

59
This finding suggests that the regrouping factor still needs to be taken into consideration when
constructing the learning progression even with three or more digit numbers.
Fourth, there was no clear difficulty relation between word problem and equation-format
problem. The CM hypothesized that, for young children, it would be easier to solve “how many
apples is 2 apples plus 2 apples” than to solve “what is two plus two” or “what is 2+2”. The CM
also theorized that by the time children began to work with larger digit numbers, this difficulty
sequence might reverse because word problems require translation into mathematic operations.
However, these theoretical patterns were not supported with the Field Test. For example, in P2
and P3, the word format Item 111 (L3) and equation-format Item 137 (L3) were equally difficult
when the other conditions were the same.
Lastly, the data did not support a consistent difficulty-order pattern between word
problems in a comparison situation and those in a non-comparison situation. The CM expected
that the former would be more difficult because in the comparison situation, one of the quantities
is not physically mentioned in the situation and thus, must be conceptualized and constructed as
a mathematical representation. For example, in the sentence, “Julie has three more apples than
Lucy,” a student needs to conceptualize both that Julie has more apples and that the difference is
three. In P3, when the number of digits and regrouping factors were the same, items in the
comparison situation, 107 (L1 - Comparison) and 109 (L1/2 - Comparison), were more difficult
than non-comparison Item 132 (L1/2 – Change Unknown). On the other hand, Item 114 (L3 -
Comparison) was easier than Item 111 (L3 – Change Unknown).
Why did these orders reverse? Upon closer examination of the words in the three
comparison items (107, 109, and 114), it was shown that they were conceptually different.
Specifically, Items 107 and109 asked children to do subtraction18. On the other hand, Item 114
required children to add two numbers19. Researchers such as Carpenter and Moser (1984) and
Fuson (1992) differentiated compare-word problems into a few different categories, such as
compare-addition and compare-subtraction. Based on the specific categories of the compare-
word problems, Items 107 and 109 belong to “compare-subtraction” whereas Item 114 fits in
“compare-addition”. Thus, Item 114 was easier than Item 113 because the former required the
addition-operation whereas the latter required the subtraction-operation. The results imply that
the types of compare-word problems must be accounted for in the learning progression.
In addition to the paired analyses, I also investigated whether the combinations of the
task features functioned as expected in the CM. As mentioned, the combinations of the task
features became specific task-levels of the current Addition CM. The Addition CM mapped the
digit-increase factor as a primary factor, used the location of the unknown as the second factor,
and applied the regrouping as the third (see Figure 4.14). The other features like the item format
(word vs. equation), the comparison situation, or the number of addends were included as the
next factors.
18 Item 107: “Luis has 6 goldfish. Carla has 2 goldfish. How many more goldfish does Luis have than Carla?”
Item 109: “Julia has some blocks. Isaiah has 23 blocks. Isaiah has 2 more blocks than Julia. How many blocks does
Julia have?” 19 Item 114: “Blake read 423 book pages. Ashley read 358 more pages than Blake. How many pages did Ashley
read?”

60
Figure 4.14 The Addition CM Structure in SELPM
Thus, according to the CM, double-digit addition items were hypothesized to be more
difficult than single and double-digit addition items. For instance, a double-digit addition item with
regrouping when the unknown is sum/end (Item 29) was assigned to a higher level (Level 5.4)
compared to a single and double-digit addition item with regrouping when the unknown is
start/change (Items 73 and 74: Level 4.20). However, as shown in Figure 4.13, Item 29 (L2 – End
unknown) was easier than Items 73 and 74 (L1/2 – Start/Change unknown). As another example,
a three-digit addition item with regrouping when the unknown is sum/end (Item 135: L3 – End
Unknown, Level 6.1) has similar difficulty estimate as a single and double-digit addition with
regrouping when the unknown is start (Item 74: L1/2 – Start unknown, Level 4.20). The results
showed that the digit-increase feature did not function as a primary factor as predicted by the CM.
(3) Relations between task features and item difficulties
As mentioned above, the specific items in the Addition CM were designed based on the
combinations of several task. Some models explain or predict item difficulties by their task features.
One convenient and straightforward way of examining the relations between task features and item
difficulties is to run a multiple regression analysis including the item difficulties as the dependent
variables and the scored task features as the independent variables (Embretson & Reise, 200020).
The results of the multiple regression analysis with the six task features on 39 Addition item
difficulties are presented in Table 4.9.
20 A suitable psychometric model for this type of analysis is Fisher’s (1973) linear logistic test model (LLTM).
However, researchers (Green & Smith, 1987; Hartig et al., 2012) show that multiple regression with the estimated
item difficulties yields results similar to the LLTM. This study used multiple regression analysis instead of LLTM
because it can be performed with standard statistics software and the results are accessible to a broad audience.

61
Table 4.9 Effects of Task Features on Item Difficulties
Task Features Estimate (SE) p
Word Format -0.19 (0.25) 0.46
Addend-unknown 1.35 (0.24) ≤ 0.001
Compare-situation 1.05 (0.4) 0.01
Adding three numbers 0.54 (0.24) 0.04
Regrouping 1.01 (0.29) ≤ 0.001
Number of Digits 1.14 (0.13) ≤ 0.001
Intercept -4.62 (0.34) ≤ 0.001
R2 0.88
Five dummy variables – word format, addend-unknown, compare-situation, adding three
numbers, and regrouping – were created. The reference group of these variables are equation
format, end-unknown, non-compare, adding two numbers, and no-regrouping, respectively. The
Number of Digits variable is coded continuously (single-digit addition: 1, single and double-digit
addition: 2, double-digit addition: 3, three-digit addition: 4). With the exception of Word Format,
all task features showed statistically significant effects at the 0.05 significance level. The results
confirmed the findings from the paired analyses above: (1) There was no clear order between word
and equation problems, (2) Addend-unknown items were more difficult than End-unknown items,
(3) Compare-situation items were more difficult than non-compare situation items, (4) Adding
three numbers was more difficult than adding two, (5) Regrouping items were more difficult than
no-regrouping, and (6) As the number of digits increased, the item difficulties also increased. The
Addend-unknown variable had the greatest effect, followed by the Number of Digits variable. In
addition, the R2 index showed that these features explained 88 percent of the variance, suggesting
that the item difficulties were predicted quite well by the task features.
4.6.3 Magnitude Comparison
The nine performance-contents in the Magnitude Comparison CM are listed in Table
4.10. For easy identification of the number of digits, new labels were assigned: L1A, L1B, L2,
L3, and L4 indicating single-digit (0 to 5), single-digit (6 to 9), two-digit, three-digit, and four
and more digit numbers, respectively. As Figure 4.15 illustrates, each performance-content
contained various digit numbers. For instance, P7 included items with single-digit, two-digit,
three-digit, and four-digit numbers.

62
Figure 4.15 Magnitude Comparison Wright map by Performance-content
Table 4.10 Performance-contents in Magnitude Comparison
logitMagnitude
ComparisonP1 P2 P3 P4 P5 P6 P7 P8 P9
3
2 XX
XXXXXX
XXXXXXXX 106(L4)
1 XXXXXXXXX 138(L4)
XXXXXXXX
XXXXXXXX 64(L3) 102(L3) 103(L3)
0 XXXXXXXXX 17(L3) 101(L2)
XXXXXXX 16(L2) 58(L1A)
XXXXX
-1 XXXXX 63(L3) 104(L4) 13(L1A) 133(L2)
XXXXX 105(L4) 14(L1A)
XXX
-2 XX 10(L1A) 62(L2) 18(L3) 100(L1A)
X 61(L2)
X 11(L1A) 15(L1B)
-3 X
12(L1A) 127(L1A)
-4
59(L1B) 60(L1B)
-5
Performance Description
P1 Compare two groups of objects (same objects but different number)
P2 Compare two dissimilar objects or two dissimilar hypothetical objects
P3 Place randomly ordered consecutive numbers from smallest to greatest
P4 Place randomly ordered non-consecutive numbers form smallest to greatest
P5 Place randomly ordered non-consecutive numbers from greatest to smallest
P6 Determine which of two numbers is greater or smaller
P7 Determine which number comes X (single-digit) numbers after a given number
P8 Determine how much greater (fewer) a given number is compared to another number
P9 Determine which difference is greater or fewer when comparing 2 pairs of numbers

63
(1) The effect of the digit-increase within a performance-content
The effect of the digit-increase was not examined in P1 because it only had one item. In
general, most items in the remaining eight performance-contents became more difficult as the
number of digits increased. Even in cases where this pattern did not occur, the lower-digit items
were not more difficult than the higher-digit items. For example, in P6, five items were ordered
according to the number of digits although Item 62 (L2) and Item 18 (L3) had similar difficulty
estimates. Similarly, in P8, three items (Items 58, 101, and 102) were ordered as the number of
digits increased.
(2) The order among the performance-contents
All nine performance-contents were tested with single-digit numbers while six (i.e., P3,
P4, P6, P7, P8, and P9) were tested with three-digit numbers. In the case of the single-digit
number items, however, some items (e.g., Items 12, 127, 59, and 60) were too easy for the
sample (see Figure 4.15). This resulted in large item standard errors, which makes ordering item
difficulties less reliable. Therefore, this study used only items with three-digit numbers to
examine the item difficulty order among the six performance-contents. The empirical order of
the performance-contents was P6 < P4 < P3 < P7 = P8 = P9, while the expected CM order was
P3 < P4 < P6 < P7 < P8 < P9.
In the CM, P6 was hypothesized as more difficult than P3 and P4 because they were
treated as sequential counting tasks. Theoretically, sequential counting is assumed to be
developed first and thus, easier than comparing number magnitude (P6) (Okamoto & Case, 1996;
Griffin, 2005). However, this theory is not appropriate for P3 and P4 because these items are not
literally sequential counting tasks. P3 and P4 items required students to order the numbers “from
the smallest to largest,” and this wording (smallest or largest) already contains the conception of
magnitude comparison. Thus, they are not sequence-counting items contextually. If students
solved P3 and P4 items by comparing relative magnitudes rather than counting21, then this
empirical order relation would not be surprising because the P6 item compared two three-digit
numbers whereas the P3 and P4 items compared seven three-digit numbers. Even with single-
digit numbers, the P6 item was easier than the P4 item. Therefore, this empirical order suggests
the need for reconsidering the difficulty order of these performance-contents in the alternative
CM.
Also, the empirical order between P3 and P4 differed from the CM order. The CM
hypothesized that ordering consecutive numbers (P3) is easier than non-consecutive numbers
(P4), but the order reversed with the three-digit number items in the WM above.
The difficulty order among P7, P8, and P9 was also interesting (i.e., Items 64, 102, and
103) because no difficulty differences were observed for three-digit numbers. According to the
CM, P8 (Determine how much greater a given number is compared to another number) and P9
(Determine which difference is greater when comparing 2 pairs of numbers) are hypothesized to
be more difficult than P7 (Determine which number comes X numbers after a given number). On
the other hand, when using single and double-digit numbers, P8 items were more difficult than
P7 items. The results imply that the orders of the performance-contents are less apparent after a
certain number of digits. Thus, it is also necessary to reexamine the order relation between them
with various number digits.
2121 Think-Aloud (i.e., Cognitive Labs) interview data could provide information on whether students used the same
problem solving strategy for P3, P4, and P6.

64
In addition, the order relation between P4 and P5 was examined. These two performance-
contents were almost identical except for the ordering direction: P4 is ordering numbers from
smallest to greatest while P5 is ordering numbers from greatest to smallest. Although these two
performance- contents were not differentiated in the CM, P5 was empirically more difficult than
P4 (see Figure 4.15). Specifically, a single-digit number item (Item 13 – L1) from P5 was almost
as difficult as three- and four-digit number items from P4 (Item 63 – L3 and Item 104 – L4), and
the double-digit number item (Item 16 – L2) from P5 was much more difficult than any of the P4
items. This finding indicates the need for differentiating P4 and P5 in the alternative CM.
4.6.4 Transcoding
The Transcoding CM has nine performance-contents (see Table 4.11). For the
identification of the number of digits, new labels were assigned: L1, L2A, L2B, and L3
indicating single-digit, two-digit (teen number), two-digit, and three-digit numbers, respectively.
Teen numbers were separated from two-digit numbers in the Transcoding CM because
differentiating verbal and Arabic forms of teen numbers is important in early acquisition of
numeracy, particularly for English-speaking children (Ross, 1986; Fuson, 1990; Miura, 1987;
Miura, Kim, Chang, & Okamoto, 1988). The symbol * indicates that the item was multiple-
choice.
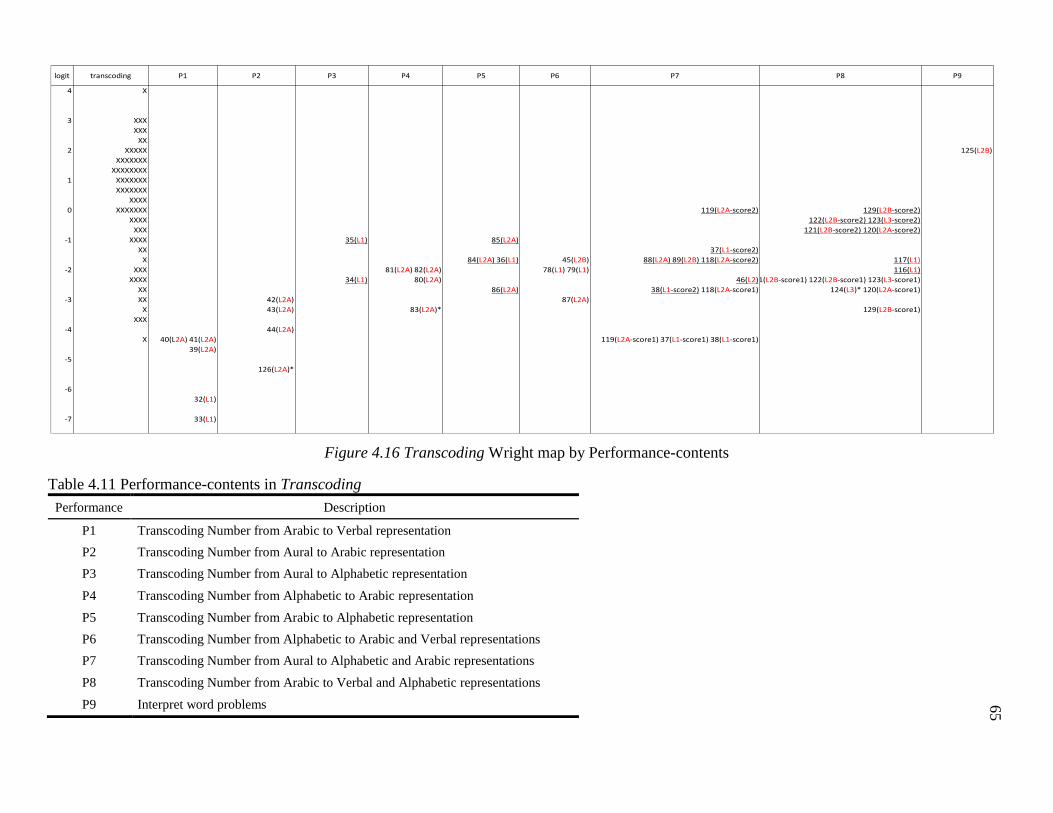
65
Figure 4.16 Transcoding Wright map by Performance-contents
Table 4.11 Performance-contents in Transcoding
logit transcoding P1 P2 P3 P4 P5 P6 P7 P8 P9
4 X
3 XXX
XXX
XX
2 XXXXX 125(L2B)
XXXXXXX
XXXXXXXX
1 XXXXXXX
XXXXXXX
XXXX
0 XXXXXXX 119(L2A-score2) 129(L2B-score2)
XXXX 122(L2B-score2) 123(L3-score2)
XXX 121(L2B-score2) 120(L2A-score2)
-1 XXXX 35(L1) 85(L2A)
XX 37(L1-score2)
X 84(L2A) 36(L1) 45(L2B) 88(L2A) 89(L2B) 118(L2A-score2) 117(L1)
-2 XXX 81(L2A) 82(L2A) 78(L1) 79(L1) 116(L1)
XXXX 34(L1) 80(L2A) 46(L2)121(L2B-score1) 122(L2B-score1) 123(L3-score1)
XX 86(L2A) 38(L1-score2) 118(L2A-score1) 124(L3)* 120(L2A-score1)
-3 XX 42(L2A) 87(L2A)
X 43(L2A) 83(L2A)* 129(L2B-score1)
XXX
-4 44(L2A)
X 40(L2A) 41(L2A) 119(L2A-score1) 37(L1-score1) 38(L1-score1)
39(L2A)
-5
126(L2A)*
-6
32(L1)
-7 33(L1)
Performance Description
P1 Transcoding Number from Arabic to Verbal representation
P2 Transcoding Number from Aural to Arabic representation
P3 Transcoding Number from Aural to Alphabetic representation
P4 Transcoding Number from Alphabetic to Arabic representation
P5 Transcoding Number from Arabic to Alphabetic representation
P6 Transcoding Number from Alphabetic to Arabic and Verbal representations
P7 Transcoding Number from Aural to Alphabetic and Arabic representations
P8 Transcoding Number from Arabic to Verbal and Alphabetic representations
P9 Interpret word problems

66
(1) The effect of the digit-increase within a performance-content
The difficulty change due to the number of digits was observed only for P1. The single-
digit number items (Items 32 and 33) were easier than the teen number items (Items 39, 40, and
41). However, in the case of P1, this difficulty order was not reliable because the items had large
measurement errors. Thus, no significant digit effect was identified in the Transcoding
dimension.
(2) The order among the performance-contents
For the given teen numbers, seven performance-contents (P1, P2, P4, P5, P6, P7, and P8)
were compared. The empirical difficulty order of these performance-contents were P1 < P2 < P4
= P6 < P5 = P7 = P8. The expected CM order for Transcoding was P1 < P2 < P3 < P4 < P5 < P6
< P7 < P8. An important feature of this order is that number-spelling tasks were more difficult
than the other tasks. P5, P7, and P8 items all required students to spell the name of numbers to
obtain full credits (i.e., score 2). As seen in Figure 4.16, the underlined score2 difficulties in P5,
P7, and P8 are harder than the other items. If the score 1 difficulties, which did not require
spelling competence, were used for comparison, these three performance-contents are no longer
harder than P4 and P6.
4.6.5 Suggestions for Alternative Learning Progressions
The primary goal for this section is to find evidence to restructure the current CM. The
effect of the digit-increase factor and the order relation between the performance-contents were
investigated with reorganized WMs. As described above, some of the performance-contents were
not eligible for these deeper analyses. As the SELPM project did not expect the substantial
misalignments between the expected and empirical orders, the design of the items and the task
level selection for the Field Test was not optimal to examine them thoroughly.
In spite of this limitation, the effect of the number of digits within a performance-content
was observed in almost all areas that were feasible to investigate the effect. In other words, for a
given performance-content, the item difficulty increased as the number of digits increased. This
finding suggests a fundamental change in the structure of the current CM relating to the number
of digits and the performance-content: Since the digit-increase effect was found within a given
performance-content, the number of digits needs to be used as a secondary factor instead of the
primary factor. Figure 4.17 illustrates an alternative meta-structure of the CM.

67
Figure 4.17 Alternative Structure of the CMs
In addition, findings in the previous sections suggest that some revisions are needed in
ordering the performance-contents for each CM. For example, in Place Value, the order between
non-standard partitioning (PV – P9) and standard partitioning (PV – P10) should be reversed.
In Addition, the unknown-location feature had the greatest effect on the item difficulty
among the several task features. Therefore, the unknown-location feature may be used as the
primary factor instead of the number of digits. The difficulty order changed among the items
with comparison-situation, after accounting for the type of comparison-situation (e.g., compare-
addition, compare-subtraction). Thus, the type of comparison-situation should be differentiated
in the alternative CM.
In Magnitude Comparison, the task comparing the magnitudes of two numbers (MC –
P6) was easier than the ordering tasks from smallest to greatest or vice versa (MC – P3, P4, and
P5). The alternative CM needs to change the difficulty order between them. Items ordering
numbers from the greatest to the smallest (MC – P5) were more difficult than items ordering
numbers from the smallest to greatest (MC – P4). Thus, the new CM needs to differentiate
between these tasks. Dividing single-digit numbers into two parts (A: 0 to 5, B: 6 to 9) was not
meaningful because no significant differences were found with the current target sample.
Tasks targeting number-spelling were more difficult than the other tasks in the
Transcoding dimension. Except for the tasks using the alphabetical form, the other performance-
contents had similar difficulty levels. Moreover, items differentiating verbal and Arabic forms of
single-digit and teen numbers were too easy for the sample. Researchers need to consider
whether these tasks would be difficult enough for the target students before constructing the
alternative CM.
Some of the suggestions are based on comparing the order of item difficulties between a
few items due to the limited number of items on the Field Test. Therefore, these suggestions
should be tested and confirmed with a new empirical study. The suggestions for the alternative
CMs are illustrated in Figure 4.18 to 4.20. A new Transcoding CM is not proposed in this study
because there was not enough information to revise the CM.

68
Figure 4.18 Alternative CM structure for Place Value
Figure 4.19 Alternative CM structure for Addition

69
Figure 4.20 Alternative CM structure for Magnitude Comparison
4.7 Conclusions The Phase II study investigated three questions relating to the validation of the proposed
Number Sense learning progressions. First, it compared test performances between GED and
MLD students to confirm the validity of the sampling design used for the Field Test. It also
examined whether the two groups have different learning progressions by comparing two sets of
item difficulties. Second, it examined whether the data from the Field Test supported the
proposed orders of performance levels in the CMs. Lastly, after identifying the misalignment
between the expected and empirical orders, it explored an alternative learning progression that
can explain the empirical difficulty orders through a deeper analysis of the items and the CMs.
The average test performances of the GED and MLD groups were compared by grade.
This indicated MLD students’ developmental lag in number sense learning. MLD students’ mean
abilities increased gradually and reached the ability level of 3rd grade GED students in 7th or 8th
grade. This result supported the sampling design extending age spectrum for MLD students in
order to match math competence levels between two groups. The comparisons of item
difficulties between the two groups illustrated that easy (difficult) items to the GED students
were similarly easy (difficult) to the MLD students. There was no strong evidence to support
different learning progressions for the GED and MLD students.
For testing the construct validity of the SELPM learning progression, the expected order
in each CM was compared with the empirical order in each WM. The findings from Phase I were
confirmed. The expected orders of the Place Value, Magnitude Comparison, and Transcoding
dimensions were not supported empirically. The expected order of the Addition CM was roughly
confirmed.

70
Following these empirical results, the study proposed an alternative learning progression.
The original learning progressions determined the order of specific performance levels based on
two factors: number of digits and performance-content. The number of digits determined the
primary levels while the content factor determined the sublevels. Because this hypothesis was
not supported empirically, the study explored the effect of digits within the same performance-
content as well as the difficulty order among the performance-contents, after controlling for the
number of digits. Although the Field Test was not optimally designed for examining this revision
thoroughly, the study found that the item difficulty increased as the number of digits increased
within the performance-contents. This finding suggested a fundamental change in the relation
between the number of digits and performance-content factors: the number of digits should be
used as a secondary factor rather than the primary factor. Moreover, the study suggested several
revisions on the order of the performance-contents for each CM.
Moreover, consistent item-design is necessary to correctly measure a desired construct.
Otherwise, it would be hard to identify a desired effect because differences of the item-design
could have a substantial influence on the difficulty as well.

71
Chapter 5. Phase III – Validation of Alternative Learning
Progressions In the previous chapter, I proposed alternative CM structures for the Place Value,
Addition, and Magnitude Comparison constructs based on the empirical findings as well as
related literature and studies. The key empirical finding was that the number of digits did not
function as a primary factor in determining empirical item difficulties as hypothesized. Rather,
items with increasing number of digits became harder only when the items measured the same
performance-content. Therefore, the number of digits became a secondary factor and the
performance-content was used as the primary factor in the alternative CM. Findings related to
the order of the performance-contents were induced by a few items within a certain digit number;
thus, another validation stage is needed.
Phase III answers the last research question: Is the alternative learning progression
validated with empirical data? (see Chapter 1). By describing the development of the alternative
CMs and test items, and a new data collection, the data analyses reveal whether these alternative
CMs are validated.
5.1 Development of the Alternative CMs Three constraints were applied in developing the alternative CMs. First, the performance-
contents were limited to the ones tested in the Phase II study. A mentioned previously, only 60%
of the original SELPM task-levels were tested in the Field Test (see Chapter 4). Thus, Phase II
results only applied to the tested task-levels. Second, the Transcoding domain was not included.
In Phases I and II, all Transcoding items were too easy for the sample, resulting in a domain-test
that was less reliable than desired. In addition, as the Transcoding items were included
particularly to evaluate some special deficits of MLD students (Camos, 2008; Passolunghi, et al.,
2007), they were not necessary here because Phase III only included GED students. Lastly, some
tasks (such as voice recording and timed addition) were not included because it was not feasible
to collect certain response formats through the online administration.
The proposed CM structures from Phase II were refined with the help of the existing
studies on mathematics education. For instance, this study built upon several studies on learning
progressions in relation to the Number Sense domains tested (Carpenter & Moser, 1984; Fuson,
1990, 1992; Griffin & Case, 1997; Okamoto & Case, 1996; Clements & Sarama, 2014; Ross,
1986; Miura et al., 1993; Resnick, 1983; Kamii, 1980). These studies provided substantial
information about anomalies of the student responses and issues from the original learning
progression.
Figures 5.1 to 5.3 illustrate the new CMs for Place Value, Addition, and Magnitude
Comparison, respectively. The columns provide the general difficulty levels with the easiest on
the left to hardest on the right. The rows describe the number of digits used within each
performance level from the lowest at the top to highest at the bottom. The highlighted tasks
indicate the common-items used to link three different test forms.
The new Place Value CM has eight performance-contents (see Figure 5.1). Compared to
the Phase II study, three performance-contents (i.e., Fields P2, P3, and P8) were excluded in this
CM. Field P2 (Demonstrate different ways of making a 10 multiple number) was omitted
because of scoring difficulty (e.g., various number combinations were correct). Field P3
(Demonstrate understanding that 10 times of a number forms a new unit) was treated as a part of

72
Field P8 (Regular ten-for-one and one-for-ten trades) based on Ross (1986) and Miura and
colleagues (1993). Field P11 (Round multi-digit numbers) was excluded because it belonged to
the third grade math standards according to CCSS. As the current study recruited children in
grades K to 2, contents beyond the standards of the target grades were eliminated. The eight
performance-contents were tested with teen, two-digit, and three-digit numbers. P5 and P8 were
not tested with teen numbers because these contents were not testable with teen numbers. For P1,
the three-digit number was not tested because of practical feasibility issues in online test
administration (i.e., graphic sizes of three-digit number objects were too big).
The new Addition CM also had eight performance-contents as shown in Figure 5.2. As
pointed out in Phase II, the SELPM Addition CM had a number of performance-contents within
each primary level; this prevented a single measure to test them all. Therefore, eight key
performance-contents were selected from the Field Test after reviewing previous studies about
Addition (Carpenter & Moser, 1984; Clements & Sarama, 2014; Common Core Standards
Writing Team, 2013; Fuson, 1990, 1992). The new Addition CM excluded following
performance-contents: timed additions, addition property, estimation, and addition with three
addends. The timed addition and three addends tasks were omitted because of practical
feasibility issues under online test administration. The addition property task was not included as
this item showed model misfit in Phase II. The estimation task was eliminated because it
belonged to the third grade math standards. Single-digit to two-digits (see Figure 5.2) were
tested.
Lastly, the new Magnitude Comparison CM has nine performance-contents, as illustrated
in Figure 5.3. Among the tested performance-contents in the Field Test, two performance-
contents (i.e., Fields P2 and P6) were excluded, and two new performance-contents were added.
Field P2 (compare two dissimilar objects in terms of magnitude) was excluded because it was
too easy for the target sample in Phase II. Field P6 (determine which of the two numbers is
greater or smaller) was excluded due to (a) the existence of the similar items in the Place Value
domain and (b) the thematic overlap with Fields P3, P4, and P5. The newly added performance-
contents were derived from Field P3 and Field P7. Specifically, as the Phase II study suggested,
the direction of ordering numbers (i.e., smallest to largest / largest to smallest) and counting (i.e.,
after / before) were differentiated in the new CM. These nine performance-contents listed in
Figure 5.3 were tested with single-digit, teen, two-digit, and three-digit numbers. P1 was not
tested with three-digit numbers because of a practical feasibility issue (i.e., graphic sizes of
three-digit number objects were too big).

73
Figure 5.1 Alternative CM for Place Value

74
Figure 5.2 Alternative CM for Addition

75
Figure 5.3 Alternative CM for Magnitude Comparison

76
5.2 Development of the New Test Items Because the alternative learning progression differs from the original only in the order of
the performance-contents, similar test items were used for Phase III. Items were designed to be
similar in item types and formats so that there was comparability between Phase III and the
previous studies. As noted in Chapter 4, inconsistent item-designs could produce unexpected
influences on difficulty. Hence, consistent item formats and styles were used when testing the
same performance-content. The new test items are located in Appendix D.
Despite similarities among items in the existing and alternative CMs, one noteworthy
difference in research design between Phase III and the two previous studies was the lack of a
pretest for Phase III. This was due to a feasibility issue: since the new measure was administered
online, it was difficult to give the pretest to the study participants and assign different test forms
by reflecting their individualized pretest results. Instead, I designed a test form difficulty based
on the grade level standards derived from the CCSS and distributed each form to each entitled
grader. Three test forms, A, B, and C were constructed for kindergarteners, first graders, and
second graders, respectively. The three test forms were linked using common items.
For Form A, six (i.e., P1, P2, P3, P4, P6, and P7) of eight performance-contents were
examined with teen numbers in the Place Value domain. For the Addition domain, all eight
performance-contents were tested with two groups of single-digit numbers. One group required a
regrouping procedure (i.e., carrying) while the other group did not. In the Magnitude
Comparison domain, all nine performance-contents were tested with single-digit and teen
numbers. The kindergartner test items are listed in Appendix E – New Test Form A.
For the Grade 1 form (Form B), all eight performance-contents of the Place Value and
nine performance-contents of the Magnitude Comparison domain were tested with two-digit
numbers. In Addition, all eight performance-contents were tested with single- and two-digit
numbers. First grade test items are listed in Appendix E – New Test Form B.
For Grade 2, the Place Value and Magnitude Comparison domains used three-digit
numbers to measure all eight and nine performance-contents, respectively. In Addition, two-digit
numbers were used to test the performance-contents. Second grade test items are presented in
Appendix E – New Test Form C.
5.3 Data Collection The new test was administered using an iOS math learning mobile app, Todo Math22.
Phase III used the online platform to recruit study participants, administer the test efficiently, and
manage the data effectively. The data collection did not relate to the app’s regular operation and
usage.
22 The researcher collaborated with a company, Enuma, Inc., to collect data. Enuma, Inc. is an educational startup
company located in Berkeley, California and founded in 2012. It’s flagship product, Todo Math, is an iPad learning
application with a suite of multi-level math games. This application is designed to help pre-K to 2nd grade children
practice math fluency at home and school. The company decided to collaborate for this research because the
company understands the importance of the validated Number Sense learning progressions for early elementary
math education.

77
5.3.1 Participants
The study recruited participants from U.S. registered users of Todo Math on a voluntary
basis. The participants were limited to grades K to 2. Although this grade-range was narrower
than the one for SELPM (grades K to 3), this decision was carefully made after confirming that
all the performance contents of the New Test were covered by CCSS’ standards of grades K to 2.
A total of 277 children including 139 kindergarteners, 85 first graders, and 53 second graders
participated. There were no demographic restrictions for participation except for the grade. Table
5.1 shows the distribution of the participants by gender and grade.
Table 5.1 Distribution of the Participants by Gender and Grade
Gender Grade
Total Kindergarten First Grade Second Grade
Male 72 39 29 140
Female 67 46 24 137
Total 139 85 53 277
5.3.2 Instrument
A total of 103 items were calibrated with 24, 40, and 39 items for the Place Value,
Addition, and Magnitude Comparison domains, respectively. Table 5.2 illustrates the
composition of the item levels across the three forms by domains. The 25 common-items are
underlined.
Table 5.2 New Test Task Levels by Form and Domain
Form A Form B From C
Place Value
Cp1
Cp2
Cp3
Cp4
Cp6
Cp7
Cp1
Cp2
Cp3
Cp4
Cp6
Cp7
Fp1
Fp2a
Fp2b
Fp3
Fp4
Fp5
Fp6
Fp7
Fp8
Cp1
Cp2
Cp3
Cp4
Cp6
Cp7
Sp2a
Sp2b
Sp2c
Sp3
Sp4
Sp5
Sp6
Sp7
Sp8
Addition
Ka1
Ka2
Ka3
Ca1
Ca2
Ca3
Ca1
Ca2
Ca3

78
Ka4
Ka5a
Ka5b
Ka6a
Ka6b
Ka7
Ka8
Ca1
Ca2
Ca3
Ca4
Ca5a
Ca5b
Ca6a
Ca6b
Ca7
Ca8
Ca4
Ca5a
Ca5b
Ca6a
Ca6b
Ca7
Ca8
Fa1
Fa2
Fa3
Fa4
Fa5a
Fa5b
Fa6a
Fa6b
Fa7
Fa8
Ca4
Ca5a
Ca5b
Ca6a
Ca6b
Ca7
Ca8
Sa1
Sa2
Sa3
Sa4
Sa5a
Sa5b
Sa6a
Sa6b
Sa7
Sa8
Magnitude
Comparison
Km1
Km2
Km3
Km4
Km5
Km6
Km7
Km8
Km9
Cm1
Cm2
Cm3
Cm4
Cm5
Cm6
Cm7
Cm8
Cm9
Cm1
Cm2
Cm3
Cm4
Cm5
Cm6
Cm7
Cm8
Cm9
Fm1
Fm2
Fm3a
Fm3b
Fm4
Fm5a
Fm5b
Fm6
Fm7
Fm8
Fm9
Cm1
Cm2
Cm3
Cm4
Cm5
Cm6
Cm7
Cm8
Cm9
Sm2
Sm3a
Sm3b
Sm4
Sm5a
Sm5b
Sm6
Sm7
Sm8
Sm9
5.3.3 Test Administration Procedure
Registered users received recruitment flyers through emails and pop-up advertisements in
the app. Volunteers submitted parental consent forms by email. Then the app generated a test

79
icon for participants and required the parents’sign-in to guide their child to the test23. Parents
helped their child enter his/her demographic information, including the name, grade, gender, and
date of birth (see Figure 5.4). Based on the child’s grade, he/she ook one of the three test forms.
Figure 5.4 Information Screenshot
Each form contained three sections (i.e., Magnitude Comparison, Place Value, and
Addition) with 6 to 20 items each. Items were presented one at a time. Figure 5.5 illustrates
screenshots of sample items. There were three item types: choosing an option, ordering numbers,
and inputting an answer using a number keypad. A child participant could also tap the “don’t
know” button at the right top corner of the screen if she/he wanted to skip an item. After
completing one section, he/she could stop and resume the next section later. Children had one
week to complete the three sections. Thus, the research icon in the app disappeared in a week
once the participant started the test. Student test data were collected between March and April
2016.
23 In the consent form, parents were informed that their involvements were limited to helping their children to access
the test.

80
Figure 5.5 Screenshots of the Sample Items
5.4 Model Selection and Measurement Properties The same linking procedure (i.e., common-item nonequivalent groups) used in the
previous two validation studies, was employed to equate the forms (see Chapter 3 for the
details). And the same IRT models (i.e., PCM and between-item multidimensional PCM) were
applied for the model selection. Parameters were calibrated using ConQuest 3.0 (Wu, Adams, &
Wilson, 2012).
Table 5.3 gives summary statistics for the model selection. The results from the deviance
test, comparing the unidimensional composite with the three-dimensional model, suggested that
the latter had a better fit. The Akaike’s Information Criterion (AIC) comparison among all
models also supported that the multidimensional model had a better fit. As in the previous
phases, these statistical results support the use of the multidimensional model for this data.

81
Table 5.3 Comparisons of Fit among the Unidimensional Composite, Consecutive, and
Multidimensional Models
Model Devianc
e Paramete
r Dev.(d.f.)Change
p-value AIC
Unidimensional 12987 116 13219 Multidimensional 12516 121 471(5) p < 0.001 12758
Consecutive
Place Value 2975 27 Addition 4727 41
Magnitude Compariso
n 5216 50
Total 12918 118 13268 AIC (Akaike Information Criterion) = -2Log(L) + 2Nparameter
The weighted fit mean square (WFMS) statistics were also examined to identify misfit
items. All items in the three-dimensional model showed reasonable item fit values (i.e., between
0.75 and 1.33) while five items in the unidimensional model showed misfit values. This result
also suggested that the multidimensional model is the best approach for the Phase III analysis.
The test reliabilities (Mislevy et al., 1992) were 0.86, 0.93, and 0.86 for Place Value,
Addition, and Magnitude Comparison, respectively. The correlations among the three
dimensions were around 0.8, indicating that they were all highly correlated (see Table 5.4).
However, these values are lower than Phases I and II, which were around 0.9.
Table 5.4 Correlations across Dimensions
Dimension
Place Value Addition Magnitude
Comparison
Place Value 0.85 0.83
Addition 0.83
5.5 Validation of the Alternative Learning Progressions As described in the previous studies, the concordance between the expected difficulty
order in the CM and the empirical order in the WM provide evidence to support the construct
validity of the learning progression. The WMs of the three dimensions were presented in Figures
5.6 – 5.11. For each domain, two sets of WMs are shown. In the first, items were sorted by the
new CM content order. That is, the items measuring the same performance-content were grouped
first and then sorted by the CM content order from least difficult on the left to most difficult on
the right. Within each performance-content, items were then sorted by the number of digits. On
the other hand, the second WM grouped items by the number of digits first and sorted them
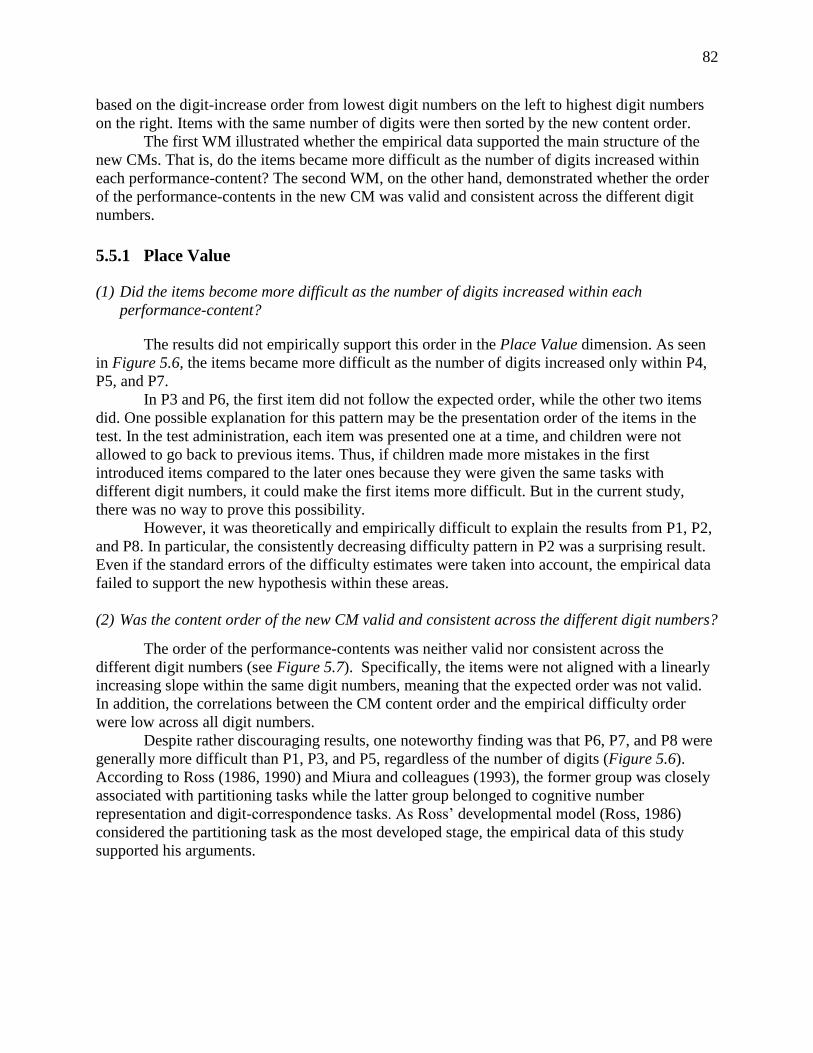
82
based on the digit-increase order from lowest digit numbers on the left to highest digit numbers
on the right. Items with the same number of digits were then sorted by the new content order.
The first WM illustrated whether the empirical data supported the main structure of the
new CMs. That is, do the items became more difficult as the number of digits increased within
each performance-content? The second WM, on the other hand, demonstrated whether the order
of the performance-contents in the new CM was valid and consistent across the different digit
numbers.
5.5.1 Place Value
(1) Did the items become more difficult as the number of digits increased within each
performance-content?
The results did not empirically support this order in the Place Value dimension. As seen
in Figure 5.6, the items became more difficult as the number of digits increased only within P4,
P5, and P7.
In P3 and P6, the first item did not follow the expected order, while the other two items
did. One possible explanation for this pattern may be the presentation order of the items in the
test. In the test administration, each item was presented one at a time, and children were not
allowed to go back to previous items. Thus, if children made more mistakes in the first
introduced items compared to the later ones because they were given the same tasks with
different digit numbers, it could make the first items more difficult. But in the current study,
there was no way to prove this possibility.
However, it was theoretically and empirically difficult to explain the results from P1, P2,
and P8. In particular, the consistently decreasing difficulty pattern in P2 was a surprising result.
Even if the standard errors of the difficulty estimates were taken into account, the empirical data
failed to support the new hypothesis within these areas.
(2) Was the content order of the new CM valid and consistent across the different digit numbers?
The order of the performance-contents was neither valid nor consistent across the
different digit numbers (see Figure 5.7). Specifically, the items were not aligned with a linearly
increasing slope within the same digit numbers, meaning that the expected order was not valid.
In addition, the correlations between the CM content order and the empirical difficulty order
were low across all digit numbers.
Despite rather discouraging results, one noteworthy finding was that P6, P7, and P8 were
generally more difficult than P1, P3, and P5, regardless of the number of digits (Figure 5.6).
According to Ross (1986, 1990) and Miura and colleagues (1993), the former group was closely
associated with partitioning tasks while the latter group belonged to cognitive number
representation and digit-correspondence tasks. As Ross’ developmental model (Ross, 1986)
considered the partitioning task as the most developed stage, the empirical data of this study
supported his arguments.

83
Figure 5.6 Wright map of Place Value sorted by the CM content order

84
Figure 5.7 Wright map of Place Value sorted by the digit-increase order

85
5.5.2 Addition
(1) Did the items become more difficult as the number of digits increased within each
performance-content?
As illustrated in Figure 5.8, all items within each performance-content demonstrated an
increasing difficulty pattern in general. As the item within each performance-content were sorted
by the number of digits, this confirmed that the main structure of the new CM was valid.
Although Items fa5a (P5) and ca6b (P6) might be exceptions, the variation observed in the two
could have originated from the unique features of the numbers in the items. For example, Item
fa5a used number triples whose sum was 20 (i.e., 14 + ( ) = 20), and Item ca6b used doubles
(i.e., “Pete had some books. He bought 6 more books. Now he has 12 books. How many books
did Pete start with?”) Because children tend to operate differently with these combinations
(Carpenter & Moser, 1984; Groen & Parkman, 1972), the unexpected easiness of these two items
are not be surprising.
In P5 and P6, the subscript “a” and “b” differentiate the location of the missing addend:
“a” refers to when the unknown is change, and “b” refers to when the unknown is start. The
Phase II study could not confirm the difficulty order between them due to inconsistent results. In
Figure 5.8, addition items when the unknown is start were relatively more difficult than items
when the unknown is change, except for double-digit addition items (i.e., sa5a/sa5b and
sa6a/sa6b). This suggests that the location of the missing addend had an effect on the item
difficulty.
(2) Was the content order of the new CM valid and consistent across the different digit numbers?
The content order of the new CM was validated by the empirical difficulty order within
single-digit number addition. As seen in Figure 5.9, the items within the single-digit number
addition were aligned with an increasing slope. Moreover, the correlation between the CM
content order and difficulty order was 0.96 within the single-digit number addition. The other
correlations – between the CM content order and the empirical difficulty orders within single-
digit number addition with regrouping, single- and two-digit number addition, and two-digit
number addition – were 0.9, 0.82, and 0.52, respectively. These correlations (and the results
shown in Figure 5.9) suggested that the order of the performance-contents was consistent across
the first three categories. However, for two-digit number addition, the ordering was not linear,
but rather in two groups—the first four performance-contents, followed by the second four—this
is associated with the lower correlation, but is an interesting finding in itself.
Regardless of the number of digits, the performance-contents having unknown-addend
(i.e., P5, P6, P7, and P8) were generally more difficult than the performance-contents having
unknown-sum (i.e., P1, P2, P3, and P4). And word problems with a comparison context (i.e., P4
and P8) were more difficult than the other addition problems (see Figure 5.8).
The degrees of the difficulty change among the performance-contents varied across the
different digit numbers. In the first block of Figure 5.9, the difficulty change among the
performance-contents was significant with a steep increasing slope. However, the difficulty
changes within the other digit numbers became smaller and less clear as the number of digits
increased. Within the two-digit number addition, the item difficulties were divided into two
parts, unknown-sum and unknown-addend.

86
Figure 5.8 Wright map of Addition sorted by the CM content order

87
Figure 5.9 Wright map of Addition sorted by the digit-increase order

88
5.5.3 Magnitude Comparison
(1) Did the items become more difficult as the number of digits increased within each
performance-content?
Items in P1, P4, P7, and P8 showed increasing difficulty patterns as the number of digits
increased (see Figure 5.10). In P2, P3, P524, and P6, some variations did occur in the order.
Although the lower-digit items were not significantly more difficult than the higher-digit items
after accounting for the standard errors, it was not enough to confirm the hypothesis in the new
CM.
In P9, two items (i.e., cm9 and fm9) appeared to be anomalously easy. These items’
irregular difficulty patterns became more questionable when compared with P8 items.
Cognitively, P8 is a prerequisite of P9, which means that children should not correctly solve P9
items if they do not solve P8 items successfully. For example, cm8 asked a child to calculate the
difference between two teen-numbers (13 and 18) while cm9 asked a child to select the pair
having the bigger difference between “11 and 16” and “13 and 19.” Logically, in order to
compare the difference (P9), the child needs to calculate the magnitude difference of each pair of
numbers (P8). Thus, the possibility that cm9 was significantly easier than cm8 was very unlikely.
As a way to explain this finding, the raw response patterns between P8 items and P9
items were examined by using contingency tables. Since P9 items had only two response options,
there was a high possibility of guessing compared to the other items. Thus, it is reasonable to
assume that a student selected the correct answer by chance if he or she incorrectly answered a
P8 item but succeeded on a P9 item. Table 5.5 describes the number of events that a child
incorrectly answered a P8 item but succeeded on a P9 item. These items had different response
rates (i.e., because of the different forms, children have received different items), so the
percentages are displayed. The table indicates that more children correctly guessed on cm9 and
fm9 in comparison with the other items.
Table 5.5 Percentages of Correct-Guessing on P9 items
Item km9 cm9 fm9 sm9
Percentage
(# of event)
12%
(16)
34 %
(95)
28 %
(24)
19 %
(10)
But what caused this inconsistent pattern? Interestingly, the answer keys for cm9 and fm9
were “b” while it is “a” for km9 and sm9. To maintain a consistent item-design, the numbers in
option “a” were smaller than the numbers in option “b” across the all four items. In other words,
the answer options for km9, cm9, fm9, and sm9 were “(a) 1 and 4, (b) 3 and 5”, “(a) 11 and 16,
(b) 13 and 19”, “(a) 28 and 31, (b) 46 and 52”, and “(a) 175 and 325, (b) 562 and 682”,
respectively. Whenever the answer was “b”, children performed better and showed a higher
percentage of correct-guessing. Each P9 item asked “Which difference is greater?” Some
children do not just randomly guess the answer although they might not know the correct choice.
24 Because P5 items have two thresholds, they appeared to have more variation compared to P3 items. However, if
only the higher thresholds are examined, the difficulty change pattern was similar to P3.

89
They tend to try a reasonable strategy. For the P9 items, children seemed to use a strategy of
choosing “greater (bigger)” numbers. This strategy might work better in cm9 and fm9 because
the correct answer was “b” by chance. However, in the current study, there was no way to
examine this possibility.
(2) Was the content order of the new CM valid and consistent across the different digit numbers?
In the Magnitude Comparison dimension, the content order of the new CM was nicely
supported by the empirical difficulty order within single-digit numbers (see Figure 5.11). The
correlation between the CM content order and empirical difficulty order was 0.98 with single-
digit numbers. With the P9 items removed, the correlations between the CM content order and
the empirical difficulty order within the other digit numbers (i.e., teen numbers, two-digit, and
three-digit numbers) were 0.9, 0.76, and 0.89. Although this dimension revealed higher
correlation values compared to the other dimensions, it is still difficult to conclude that the order
of the performance-contents was consistent across the different digit numbers due to the order
variation within two-digit numbers.
One noteworthy pattern was that the difficulty changes were steeper with single-digit and
teen numbers than with the other digit numbers. In other words, the degrees of difficulty change
among the performance-contents became smaller as the number of digits increased. The same
pattern was observed in the Addition dimension.
In P4 (green dots) and P5 (orange dots), each item had two threshold points: the higher
threshold meant the difficulty level when children correctly ordered numbers from largest to
smallest while the lower threshold meant the difficulty level when students carelessly order
numbers from smallest to largest. The bigger difference between the two thresholds indicated
that there were more students carelessly ordering the numbers from smallest to largest. As seen
in Figure 5.11, the difference was bigger in single-digit numbers, which means that younger
children made more mistakes because the single-digit numbers were tested by kindergartners.

90
Figure 5.10 Wright map of Magnitude Comparison sorted by the CM content order

91
Figure 5.11 Wright map of Magnitude Comparison sorted by the digit-increase order

92
5.6 Conclusions and Limitations The development of any learning progression relies on iterative validation processes. This
dissertation project conducted three validation studies using the BEAR Assessment System.
Analyzing the SELPM Pilot Test data, problems relating to the construct validity of the learning
progression proposed by SELPM were identified in Chapter 3. In Chapter 4, the problems were
confirmed with the Field Test data, and an alternative learning progression was proposed. In
Chapter 5, the alternative learning progression was examined with another test data set.
The new test data collected for Phase III were analyzed two ways. First, the study
investigated whether the item difficulty estimates increased as the number of digits increased
within each performance-content of the alternative CM. This positive effect of number digits was
confirmed within most performance-contents of the Addition and Magnitude Comparison
dimensions. However, in the Place Value dimension, only a few performance-contents showed
the expected effect of number digits. Second, the study examined whether the performance-
content order of the alternative CM was valid across different digit numbers. The same patterns
were identified for the Addition and Magnitude Comparison dimensions: the new content orders
were valid and distinct with single-digit numbers and became less consistent and indistinct with
two- and three-digit numbers. Since the test forms were linked for different grades, this pattern
can be interpreted from a developmental perspective. In other words, as a child became older and
more competent, the difficulty changes between the performance-contents became smaller. In the
Place Value dimension, the new order of the performance-content was not validated with any
digit numbers. However, regardless of the number of digits, the partitioning tasks were more
difficult than cognitive number representation and digit-correspondence tasks.
In sum, these empirical results suggest that the Place Value CM needs to be
reconstructed. However, the findings of this dissertation project need to be carefully interpreted
due to some limitations. First, there might be an issue with the types of samples this study used.
Although the dataset used in this study may dismiss the Place Value CM, other datasets could
support it successfully. In particular, only some of the registered users of the Todo Math
application were able to participate in the Phase III study, the sample was not representative of
the target age group. Second, as the proposed learning progression was not associated with a
specific math curriculum, the researcher did not have information on whether and how the
examinees learned the concepts or skills for the tasks in the assessment. This implies that if
children did not have a chance to learn some concepts or skills in school, they might have to
guess some items or use other problem-solving strategies that were not intended in this measure.
Even with these limitations, the results of this dissertation project provides us with
confidence that the proposed alternative learning progressions for the Addition and Magnitude
Comparison domains can serve as good initial frameworks for more refined Number Sense
learning progressions. Building on the findings of this study, future research should examine the
framework with a larger number and more diverse sample of children, across several settings, to
validate the learning progressions for the purpose of screening and progress monitoring in early
mathematics education.

93
Appendix A The columns provide general levels in each construct map. These levels range from the lowest at
the left to highest at the right. The rows describe detailed performance levels within a general level
(column) from the lowest at the top to highest at the bottom.
†Note: The underlined tasks were tested in the pilot study, and the highlighted tasks were tested
in the field study.
Place Value Construct Map
Easy Difficult
Easy
Level1 (Single
and Teens)
Level2 (Two
digits)
Level3 (Three
digits)
Level4 (Four
digits)
Level5 (5+
digits)
Level6
(Round multi-
digits)
6.1 Use
understanding
of place value
to round
numbers up or
down
1.2
Understand
the meaning
of the number
“10” using
objects
1.3
Understand
the meaning
of teen
numbers using
objects
1.4
Understands
11-19 as
composed of
ten ones and
some more
ones using
objects
4.1
Demonstrate
understanding
of the
meaning of
four digit
numbers
3.1
Demonstrate
different ways
of making
“100”
5.1
Demonstrate
different ways
of making
High digit
numbers
1.5
Demonstrate
understanding
that 10 “ones”
forms a new
unit called the
one “ten” unit
3.2
Demonstrate
understanding
that 10 “tens”
forms a new
unit called the
4.2
Demonstrate
understanding
that 10
“hundreds”
forms a new
unit called one
5.2
Demonstrate
understanding
that 10
“thousands”
form a new
unit called the

94
10 ones = 1
ten
one “hundred”
unit
10 tens = 1
hundred
“thousand”
unit
10 hundreds =
1 thousand
“ten-
thousands”
unit
10 thousands
= 1 ten-
thousands
2.1 Indicate
which digit
(positional
location) in a
two digit
number
represents the
“ones” place
and the “tens”
place
3.3
Indicate which
digit
(positional
location)
represents the
“ones”,
“tens”, and
“hundreds”
place
4.3 Indicate
which digit
(positional
location) in a
3 digit number
represents the
“ones”, “tens”,
“hundreds”,
and
“thousands”
5.3 Indicate
which digit
represents the
“ones”,
“tens”,
“hundreds” …
etc.
2.3
Decompose
multiples of
ten into its
components
“tens” and
“ones”
3.4
Decompose
multiples of a
hundred can
be
decomposed
into its
components
“hundreds”,
“tens”, and
“ones” (e.g.,
200, 300, …)
4.4
Decompose
multiples of a
thousand can
be
decomposed
into its
components
“thousands”
“hundreds”,
“tens”, and
“ones” (e.g.,
200, 300, …)
1.6
Decompose
the teen
numbers into
“tens” and
“ones”
1.8 Recognize
the “0” in 10
as
representing
zero “ones”
2.2 Indicate
how many
“tens and
“ones” there
are in numbers
0-9
2.4
Decompose 2
digit numbers
into “tens” and
“ones”
3.5
Decompose 3
digit numbers
into its
component
“hundreds”,
“tens”, and
“ones”
4.5
Decompose 4
digit numbers
into its
components
“thousands”,
“hundreds”,
“tens”, and
“ones”
5.4
Decompose
5+ digit
numbers into
its
components
1.7 Deduce a
teen number
when given its
component
“tens” and
“ones”
2.5 Deduce a
two digit
number when
given its
components
“tens” and
“ones”
3.6 Deduce a
three digit
number when
given its
components
4.6 Deduce a
4 digit number
when given its
components
5.5 Deduce a
5+ digit
number when
given its
components
2.6
Demonstrate
understanding
of the
difference in
the magnitude
of two
numbers when
they vary in

95
Difficult
terms of the
number of tens
unit displayed
2.7 Compare
the
magnitudes of
two 2 digit
numbers based
on
understanding
of place value
3.7
Compare the
magnitudes of
two 3 digit
numbers
based on
understanding
of place value
4.7 Compare
the
magnitudes of
two 4 digit
numbers based
on
understanding
of place value
5.6 Compare
the
magnitudes of
two 5+ digit
numbers
based on
understanding
of place value
2.8
Understand
that X “tens”
is X times 10
“ones”
3.8
Understand
that X
“hundreds” is
X times 10
“tens” and
100 “ones”
4.8
Understand
that X
“thousands” is
X times 10
“hundreds”,
100 “tens”,
and 1000
“ones”
5.7
Generalized
understanding
that the value
of a digit
depends on its
place in the
number. Each
place has a
value of 10
times the
place to its
right
2.9
Demonstrate
equivalence
via
decomposing
and
composing
number in
multiple
flexible ways
3.9
Demonstrate
equivalence
via
decomposing
and
composing 3
digit numbers
in multiple
flexible ways
4.9
Demonstrate
equivalence
via
decomposing
and
composing 4
digit numbers
in multiple
flexible ways
5.8
Demonstrate
equivalence
via
decomposing
and
composing 5+
digit numbers
in multiple
flexible ways
2.10 Write 2
digit numbers
in expanded
form
3.10 Write 3
digit numbers
in expanded
from
4.10 Write 4
digit numbers
in expanded
form
5.9 Write 5+
digit numbers
in expanded
form
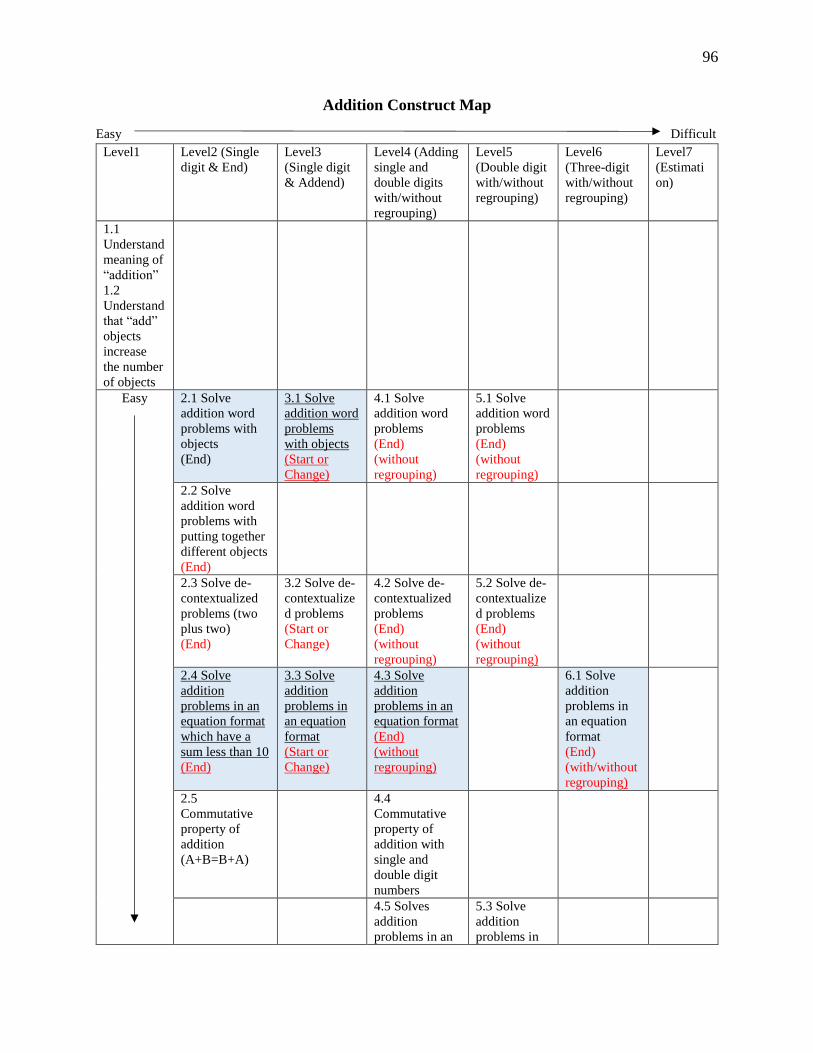
96
Addition Construct Map
Easy Difficult
Level1 Level2 (Single
digit & End)
Level3
(Single digit
& Addend)
Level4 (Adding
single and
double digits
with/without
regrouping)
Level5
(Double digit
with/without
regrouping)
Level6
(Three-digit
with/without
regrouping)
Level7
(Estimati
on)
1.1
Understand
meaning of
“addition”
1.2
Understand
that “add”
objects
increase
the number
of objects
Easy
2.1 Solve
addition word
problems with
objects
(End)
3.1 Solve
addition word
problems
with objects
(Start or
Change)
4.1 Solve
addition word
problems
(End)
(without
regrouping)
5.1 Solve
addition word
problems
(End)
(without
regrouping)
2.2 Solve
addition word
problems with
putting together
different objects
(End)
2.3 Solve de-
contextualized
problems (two
plus two)
(End)
3.2 Solve de-
contextualize
d problems
(Start or
Change)
4.2 Solve de-
contextualized
problems
(End)
(without
regrouping)
5.2 Solve de-
contextualize
d problems
(End)
(without
regrouping)
2.4 Solve
addition
problems in an
equation format
which have a
sum less than 10
(End)
3.3 Solve
addition
problems in
an equation
format
(Start or
Change)
4.3 Solve
addition
problems in an
equation format
(End)
(without
regrouping)
6.1 Solve
addition
problems in
an equation
format
(End)
(with/without
regrouping)
2.5
Commutative
property of
addition
(A+B=B+A)
4.4
Commutative
property of
addition with
single and
double digit
numbers
4.5 Solves
addition
problems in an
5.3 Solve
addition
problems in

97
equation format
with 3 numbers
(End)
(without
regrouping)
an equation
format or
word format
with 3
numbers
(End)
(without
regrouping)
2.6 Solves
addition word
problems with 3
single digit
numbers which
have a sum less
than 10
(End)
3.4 Solves
addition word
problems
with 3 single
digit numbers
which have a
sum less than
10
(Start or
Change)
4.6 Solves
addition word
problems with 3
numbers
(End)
(without
regrouping)
2.8 Associative
property of
addition -
A+(B+C)=(A+B
)+C
4.7 Associative
property of
addition with
single and
double digit
numbers
2.9 Demonstrate
understanding
of the Additive
property – A + 0
= A
4.8 Solve
addition word
problems
(End)
(with
regrouping)
5.4 Solve
addition word
problems
(End)
(with
regrouping)
6.2 Solve
addition word
problems
(End)
(with/without
Regrouping)
4.9 Solve de-
contextualized
problems
(End)
(with
regrouping)
5.5 Solve de-
contextualize
d problems
(End)
(with
regrouping)
4.10 Solve
addition
problems
represented in
an equation
format
(End)
(with
regrouping)
2.7 Solves
addition
problems in an
equation format
with 3 single
digit numbers
which have a
3.5 Solves
addition
problems in
an equation
format with 3
single digit
numbers
which have a
4.11 Solve
addition
problems in an
equation format
with 3 numbers
(End)
(with
regrouping)
5.6 Solve
addition
problems in
an equation
format with 3
numbers
(End)

98
sum less than 10
(End)
sum less than
10 (Start or
Change)
(with
regrouping)
2.10 Represent a
word problem
with an equation
and solves the
problem
(End)
3.6 Represent
a word
problem with
an equation
and solves
the problem
(Start or
Change)
4.12 Solve
addition word
problems
(End)
(with
regrouping)
4.13 Solve
addition word
problems
(Start or
Change)
(without
regrouping)
5.7 Solve
addition word
problems
(Start or
Change)
(without
regrouping)
4.14 Solve
decontextualize
d addition
problems
(Start or
Change)
(without
regrouping)
4.15 Solve
addition
problems in an
equation format
(Start or
Change)
(without
regrouping)
5.8 Solve
addition
problems in
an equation
format
(Start or
Change)
(without
regrouping)
4.16 Solve
addition
problems in an
equation format
with 3 numbers
(Start or
Change)
(without
regrouping)
5.9 Solve
addition
problems in
an equation
or word
format with 3
numbers
(Start or
Change)
(without
regrouping)
4.17 Solve
addition word

99
problems with 3
numbers
(Start or
Change)
(without
regrouping)
4.18 Solve
addition word
problems
(Start or
Change)
(with
regrouping)
5.10 Solve
addition word
problems
(Start or
Change)
(with
regrouping)
6.4 Solve
addition word
problems
(Start or
Change)
(with/without
Regrouping)
4.19 Solve
decontextualize
d addition
problems
(Start or
Change)
(with
regrouping)
4.20 Solve
addition
problems in an
equation format
(Start or
Change)
(with
regrouping)
5.11 Solve
addition
problems in
an equation
format
(Start or
Change)
(with
regrouping)
6.3 Solve
addition
problems in
an equation
format
(Start or
Change)
(with/without
Regrouping)
4.21 Solve
addition
problems in an
equation format
with 3 numbers
(Start or
Change)
(with
regrouping)
5.12 Solve
addition
problems in
an equation
or word
format with 3
numbers
(Start or
Change)
(with
regrouping)
6.5 Solve
addition
problems in
an equation
format with 3
numbers
(End/Start/Ch
ange)
(with/without
Regrouping)
4.22 Solve
addition word
problems with 3
numbers
(Start or
Change)
(with
regrouping)
3.7 Solve
addition word
problems in a
comparison
situation
(how many
more X has
than Y)
4.23 Solve
addition word
problems in a
comparison
situation
(with/without
regrouping)
5.13 Solve
addition word
problems in a
comparison
situation
(with/without
regrouping)
6.6 Solve
addition word
problems in a
comparison
situation
(with/without
Regrouping)

100
Difficult
(B has X more
than A, how
many B has?)
(B has X
more than A,
how many B
has?)
(B has X
more than A,
how many B
has?)
3.8 Timed
single digit
addition
problems in
an equation
format
4.24 Timed
single and
double digit
addition
problems in an
equation format
5.14 Timed
double digit
addition
problems in
an equation
format
7.1 Timed
additions
with any
whole
numbers
7.2
Estimate
reasonabl
e answers

101
Magnitude Comparisons Construct Map
Easy Difficult Level1 Level2 (0 to 5) Level3 (6-9) Level4 (two
digit)
Level5 (three
digit)
Level6 (4+
digit)
No items
were tested
for this level
Easy
2.1 Compare two
groups of objects
(same but different
number) using
same or greater
concepts
3.1 Compare two
groups of similar
objects using the
same, greater, or
fewer concepts
2.2 Compare two
groups of objects
(same but different
number) using
same or fewer
concepts
2.3 Compare two
dissimilar objects
(in size) using
same or greater
concepts
3.2 Compare two
dissimilar objects
using same,
greater, or fewer
concepts
4.1 Compares
two dissimilar
hypothetical
objects (no
picture of
drawings) using
same, greater, or
fewer concepts
2.4 Compare two
dissimilar objects
(in size) using
same or fewer
concepts
2.5 Places
randomly ordered
consecutive
numbers from least
to greatest
3.3 Place
randomly ordered
consecutive
numbers from
least to greatest or
greatest to least
4.2 Place
randomly
ordered
consecutive
numbers from
least to greatest
or greatest to
least
5.1 Places
randomly
ordered
consecutive
numbers from
least to greatest
or greatest to
least
2.6 Places
randomly ordered
consecutive
numbers from
greatest to least
2.7 Places
randomly ordered
non-consecutive
numbers from least
to greatest or
greatest to least
3.4 Place
randomly ordered
non-consecutive
numbers from
least to greatest or
greatest to least
4.3 Place
randomly
ordered non-
consecutive
numbers from
least to greatest
or greatest to
least
5.2 Place
randomly
ordered non-
consecutive
numbers from
least to greatest
or greatest to
least
6.1 Place
randomly
ordered
numbers from
least to
greatest or
greatest to
least
2.8 Determines
which of two
numbers is greater
or fewer
3.5 Determines
which of two
numbers is greater
or fewer
4.4 Determines
which of two
numbers is
greater or fewer
5.3 Determines
which of two
numbers is
greater or fewer
6.2 Determines
which of three
numbers is
greatest or
fewest

102
Difficult
2.9 Determines
which number
comes X numbers
before or after a
given number
3.6 Determines
which number
comes X numbers
before or after a
given number
4.5 Determines
which number
comes X
numbers before
or after a given
number
5.4 Determines
which number
comes X
numbers before
or after a given
number
6.3 Determines
which number
comes X
numbers
before or after
a given
number
2.10 Determines
how much greater
(fewer) a given
number is
compared to
another number
using a number
line
3.7 Determines
how much greater
(fewer) a given
number is
compared to
another number
using a number
line
4.6 Determines
how much
greater (fewer) a
given number is
compared to
another number
using a number
line
5.5 Determines
how much
greater (fewer)
a given number
is compared to
another number
2.11 Determines
which difference is
greater or fewer
when comparing 2
pairs of numbers
3.8 Determines
which difference
is greater or fewer
when comparing
2 pairs of
numbers
4.7 Determines
which difference
is greater or
fewer when
comparing 2
pairs of numbers
5.6 Determines
which
difference is
greater or fewer
when
comparing 2
pairs of
numbers
6.4 Determines
which
difference is
greater or
fewer when
comparing 2
pairs of
numbers

103
Transcoding Construct Map
Easy Difficult
Easy
Difficult
Level1 Level2 (Single) Level3 (Teen) Level4 (two-
digit and three-
digit)
Level5
1.1 Display the
number of objects
corresponding to the
Aural form
1.2 Enumerate a set
of objects using the
verbal form
2.1 Aural to
Arabic (choose
the number)
3.1 Aural to
Arabic (choose
the number)
5.1 Interpret
word problems
with different
numerical forms
2.2 Arabic to
Verbal
3.2 Arabic to
Verbal
2.3 Aural to
Arabic (write the
number)
3.3 Aural to
Arabic (write the
number)
2.4 Alphabetic
to Verbal
3.4 Alphabetic
to Verbal
2.5 Alphabetic
to Arabic
3.5 Alphabetic
to Arabic
2.6 Aural to
Alphabetic
2.7 Arabic to
Alphabetic
3.6 Arabic to
Alphabetic
2.8 Alphabetic
to Arabic and
Verbal
3.8 Alphabetic
to Arabic and
Verbal
4.1 Alphabetic
to Arabic and
Verbal
2.9 Aural to
Alphabetic and
Arabic
3.9 Aural to
Alphabetic and
Arabic
4.2 Aural to
Alphabetic and
Arabic
2.10 Arabic to
Verbal and
Alphabetic
3.10 Arabic to
Verbal and
Alphabetic
4.3 Arabic to
Verbal and
Alphabetic

104
Appendix B – 1 Place Value Items in Pilot Test

105

106

107
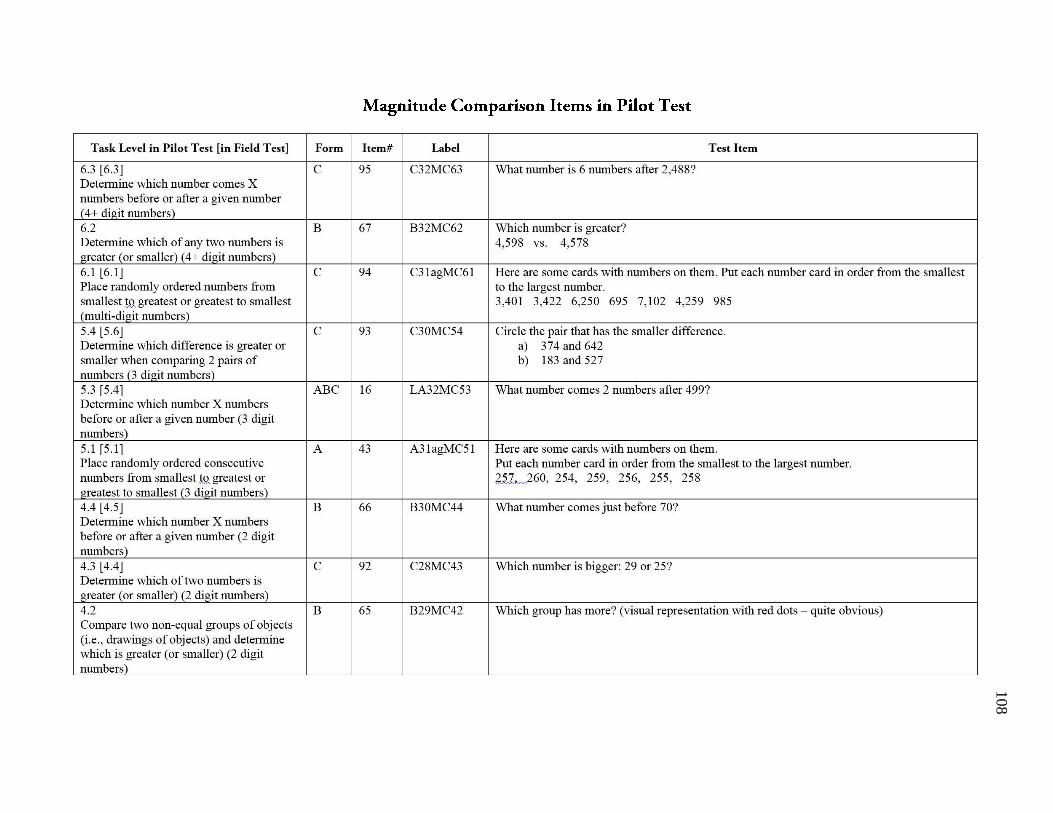
108

109

110

111

112

113
Appendix B – 2
Misfit Item
Item Number Label WFMS t
1 A3PV16 1.54 5.3

114
Appendix C
Place Value Items in Field Test

115

116

117
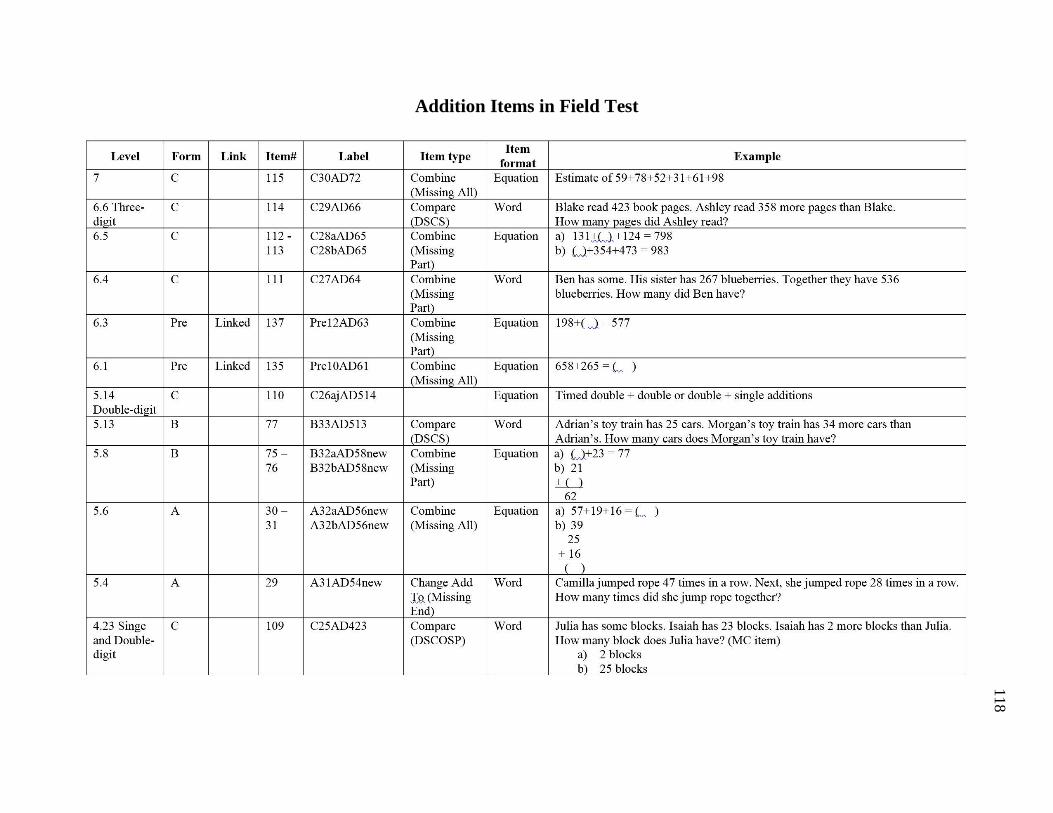
118
Addition Items in Field Test
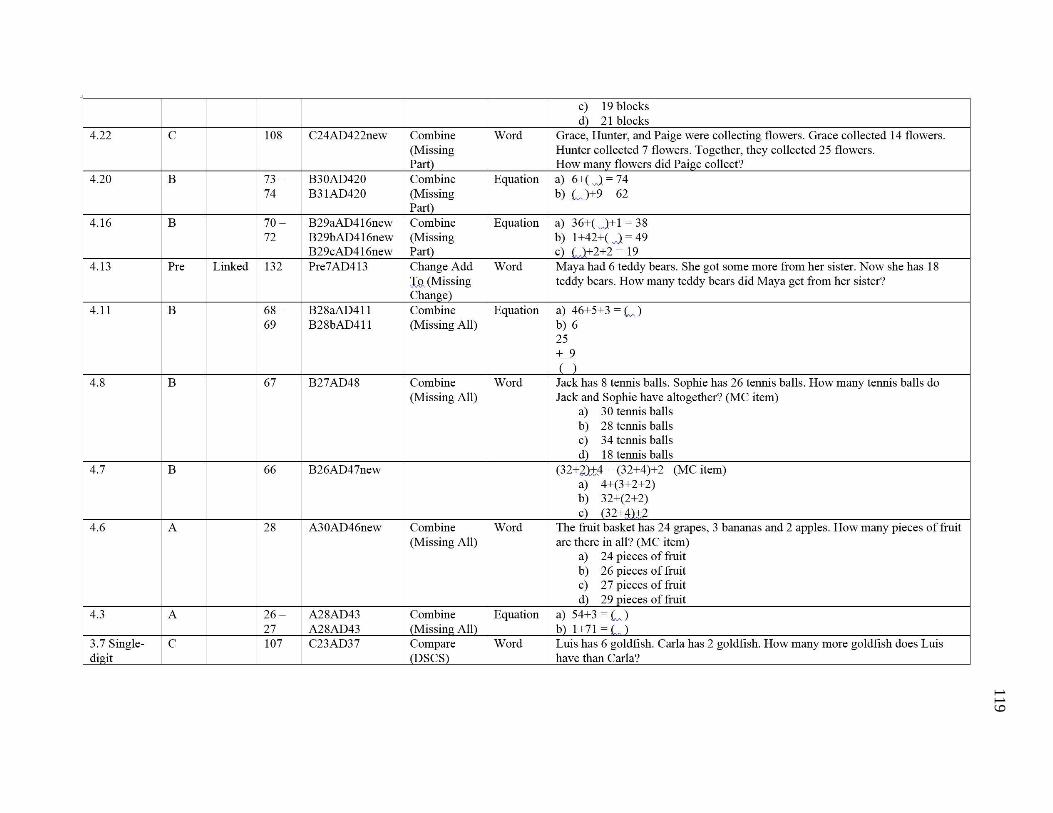
119

120

121
Magnitude Comparison Items in Field Test

122

123
Transcoding Items in Field Test
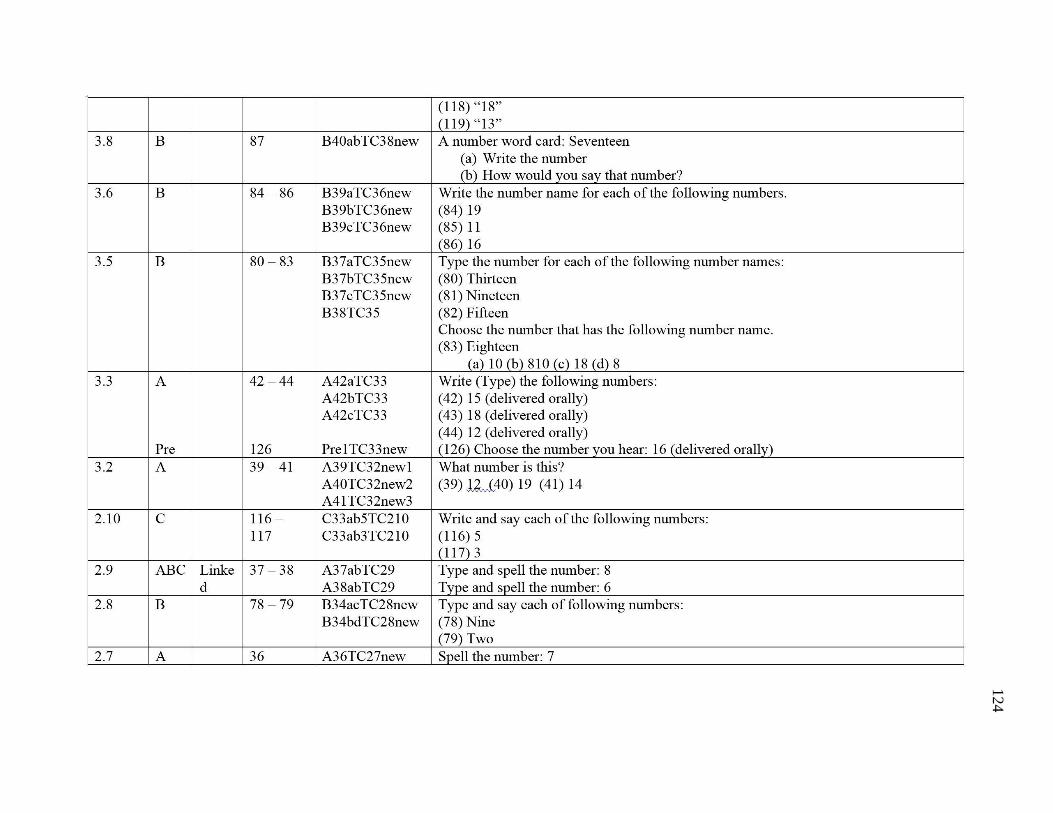
124

125
Appendix D The columns provide performance-content levels in each construct map. These levels range from the lowest at the left to highest at the right. The rows
describe digit levels within a performance-content level (column) from the lowest at the top to highest at the bottom.
Alternative Construct Map and Test Items for Place Value

126

127

128
Alternative Construct Map and Test Items for Addition

129

13
0

13
1

13
2
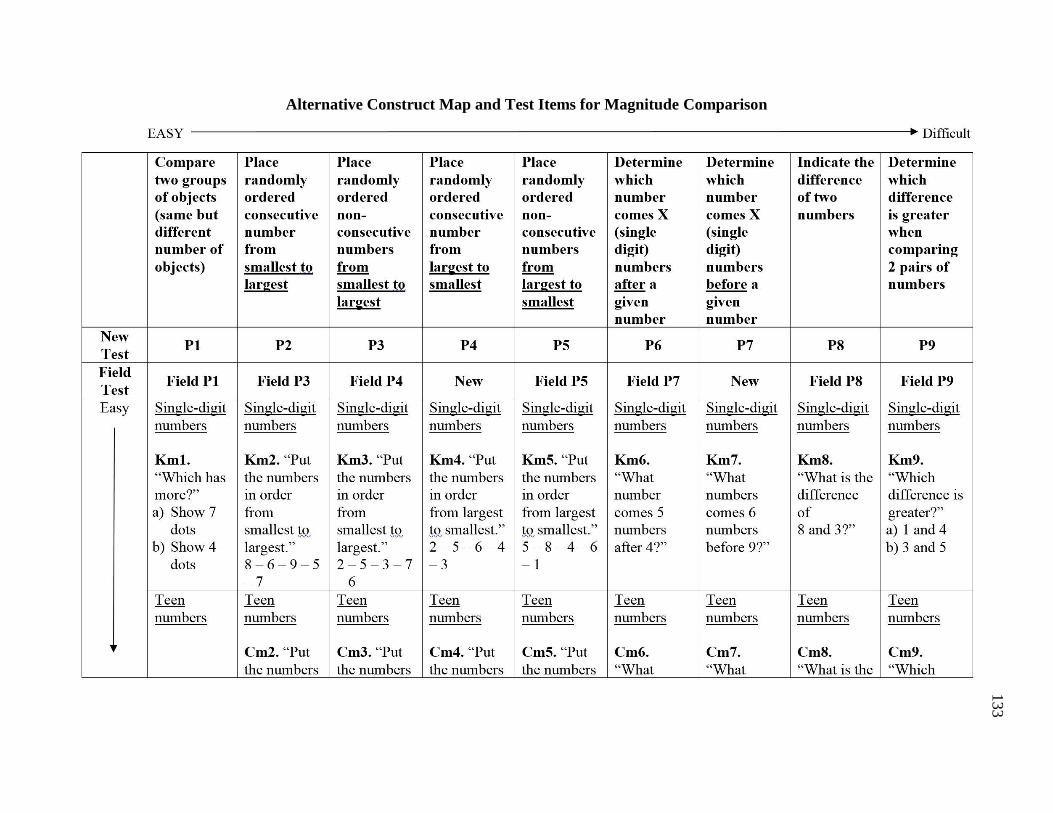
133
Alternative Construct Map and Test Items for Magnitude Comparison

134

135
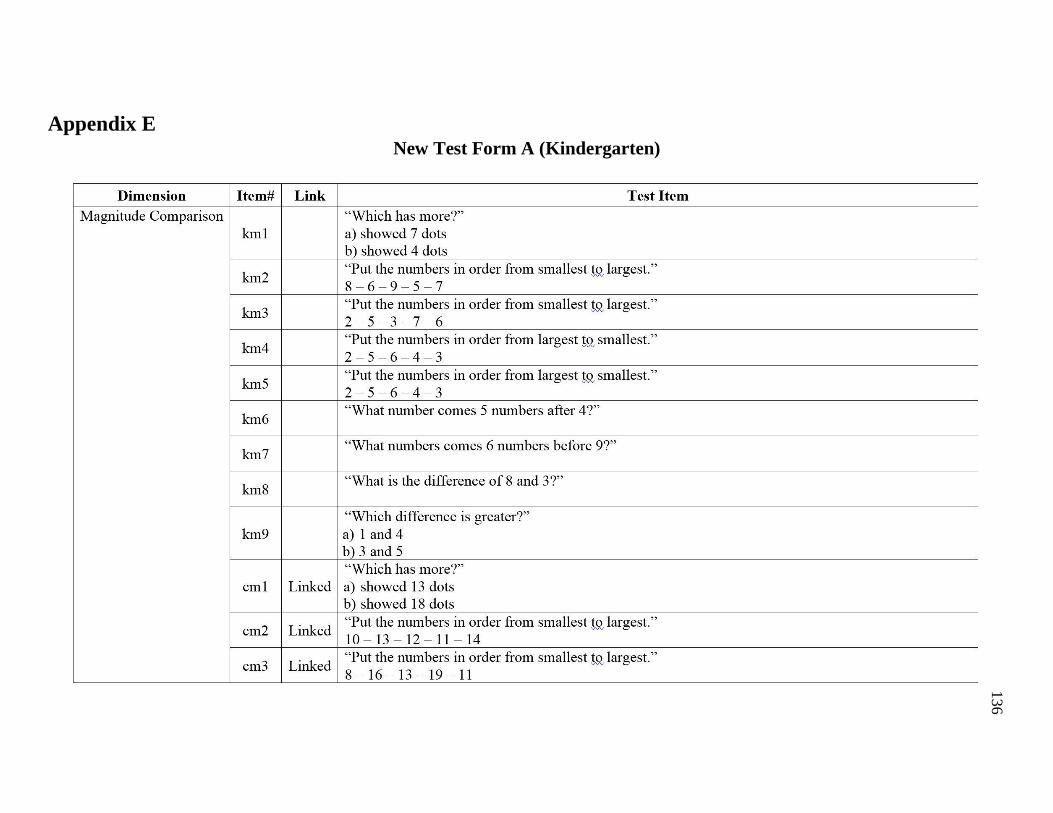
136
Appendix E
New Test Form A (Kindergarten)

137

138

139
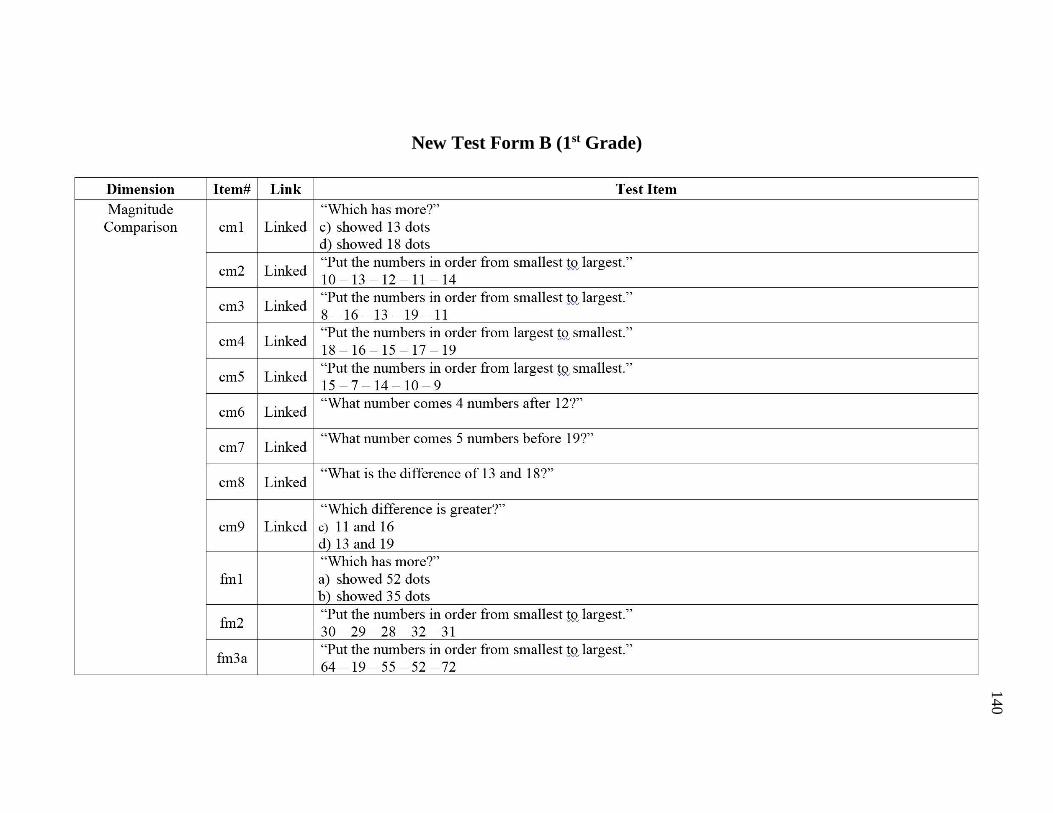
140
New Test Form B (1st Grade)

141

142

143

144
New Test Form C (2nd Grade)

145

146

147

148
References
Ackerman, T. A. (1992). A didactic explanation of item bias, item impact, and item validity from
a multidimensional perspective. Journal of educational measurement, 29(1), 67–91.
Ackerman, T. A. (1994). Using multidimensional item response theory to understand what items
and tests are measuring. Applied Measurement in Education, 7(4), 255–278.
Ackerman, T. A., Gierl, M. J., & Walker, C. M. (2003). Using multidimensional item response
theory to evaluate educational and psychological tests. Educational Measurement: Issues
and Practice, 22(3), 37–51.
Adams, R. J., & Wilson, M. (1996). Formulating the Rasch model as a mixed coefficients
multinomial logit. Objective measurement: Theory into practice, 3, 143–166.
Adams, R. J., Wilson, M., & Wang, W. (1997a). The multidimensional random coefficients
multinomial logit model. Applied Psychological Measurement, 21(1), 1–23.
Akaike, H. (1977). On entropy maximization principle. Application of statistics.
Alonzo, A. C. (2011). Learning progressions that support formative assessment practices.
Measurement: Interdisciplinary Research & Perspective, 9(2-3), 124–129.
Andrich, D. (1978). A rating formulation for ordered response categories. Psychometrika, 43(4),
561–573.
Briggs, D. C., & Wilson, M. (2003). An introduction to multidimensional measurement using
Rasch models. Journal of Applied Measurement, 4(1), 87–100.
Buzick, H., & Stone, E. (2011). Recommendations for conducting differential item functioning
(DIF) analyses for students with disabilities based on previous DIF studies. ETS Research
Report Series, 2011(2), i-26.
Carpenter, T. P., & Moser, J. M. (1984). The acquisition of addition and subtraction concepts in
grades one through three. Journal for research in Mathematics Education, 179-202.
Case, R., Okamoto, Y., Griffin, S., McKeough, A., Bleiker, C., Henderson, B., Keating, D. P.
(1996). The role of central conceptual structures in the development of children’s
thought. Monographs of the Society for Research in Child Development, i–295.
Clements, D. H., & Sarama, J. (2004). Learning trajectories in mathematics education.
Mathematical Thinking and Learning, 6(2), 81–89.
Clements, D. H., & Sarama, J. (2014). Learning and teaching early math: The learning
trajectories approach. Routledge.
Clements, D. H., Sarama, J., Spitler, M. E., Lange, A. A., & Wolfe, C. B. (2011). Mathematics
learned by young children in an intervention based on learning trajectories: A large-scale
cluster randomized trial. Journal for Research in Mathematics Education, 42(2), 127-
166.

149
Common Core Standards Writing Team (2013, March 1). Progressions for the Common Core
State Standards in Mathematics (draft). Tucson, AZ: Institute for Mathematics and
Education, University of Arizona. http://ime.math.arizona.edu/progressions
Corcoran, T., Mosher, F. A., & Rogat, A. (2009). Learning Progressions in Science: An
Evidence-Based Approach to Reform. CPRE Research Report# RR-63. Consortium for
Policy Research in Education.
Daro, P., Mosher, F. A., & Corcoran, T. (2011). Learning Trajectories in Mathematics: A
Foundation for Standards, Curriculum, Assessment, and Instruction. CPRE Research
Report# RR-68. Consortium for Policy Research in Education.
Embretson, S. E., & Reise, S. P. (2000). Item response theory for psychologists. Psychology
Press.
Forster, M. & Masters, G. (2004). Bridging the Conceptual Gap between Classroom Assessment
and System Accountability. In M. Wilson (ed.), Towards Coherence Between Classroom
Assessment and Accountability. 103rd Yearbook of the National Society for the Study of
Education, Part 2. Chicago,IL: National Society for the Study of Education. 51-73.
Fuson, K. C. (1990). Conceptual structures for multiunit numbers: Implications for learning and
teaching multidigit addition, subtraction, and place value. Cognition and Instruction,
7(4), 343-403.
Fuson, K. C. (1992). Research on learning and teaching addition and subtraction of whole
numbers. Analysis of Arithmetic for Mathematics Teaching, 53–187.
Geary, D. C. (2004). Mathematics and learning disabilities. Journal of learning disabilities,
37(1), 4–15.
Gersten, R., Jordan, N. C., & Flojo, J. R. (2005). Early identification and interventions for
students with mathematics difficulties. Journal of learning disabilities, 38(4), 293–304.
Glaser, R., Chudowsky, N., Pellegrino, J. W., & others. (2001). Knowing What Students Know:
The Science and Design of Educational Assessment. National Academies Press.
Green, K. E., & Smith, R. M. (1987). A comparison of two methods of decomposing item
difficulties. Journal of Educational and Behavioral Statistics, 12(4), 369-381.
Greeno, J. G. (1991). Number sense as situated knowing in a conceptual domain. Journal for
Research in Mathematics Education, 170–218.
Griffin, S. (2004). Building number sense with Number Worlds: A mathematics program for
young children. Early Childhood Research Quarterly, 19(1), 173–180.
Griffin, S., & Case, R. (1997). Re-thinking the primary school math curriculum: An approach
based on cognitive science. Issues in Education, 3(1), 1–49.
Groen, G. J., & Parkman, J. M. (1972). A chronometric analysis of simple
addition. Psychological review, 79(4), 329.
Hartig, J., Frey, A., Nold, G., & Klieme, E. (2012). An application of explanatory item response

150
modeling for model-based proficiency scaling. Educational and Psychological
Measurement, 72(4), 665-686.
Herman, J.L. (2006). Challenges in Integrating Standards and Assessment with Student
Learning. Measurement: Interdisciplinary research and perspectives, 4(1&2) Mahwah, NJ:
Lawrence Erlbaum. 119 –124.
Heritage, M. (2008). Learning progressions: Supporting instruction and formative assessment.
Washington, DC: Council of Chief State School Officers. Retrieved December, 2, 2009.
Jones, G. A., Thornton, C. A., Putt, I. J., Hill, K. M., Mogill, A. T., Rich, B. S., & Van Zoest, L.
R. (1996). Multidigit number sense: A framework for instruction and assessment. Journal
for Research in Mathematics Education, 310-336.
Kelderman, H. (1996). Multidimensional Rasch models for partial-credit scoring. Applied
Psychological Measurement, 20(2), 155–168.
Kennedy, C. A. (2005). Constructing measurement models for MRCML estimation: A primer for
using the BEAR scoring engine. Berkeley, CA: University of California, BEAR Center.
Kennedy, C.A., &Wilson, M. (2007). Using progress variables to interpret student achievement
and progress. BEAR Report Series, 2006-12-01.University of California, Berkeley.
Linacre, J. M. (1994). Constructing measurement with a many-facet Rasch model. Objective
measurement: Theory into practice, 2, 129–144.
Liu, O. L., Wilson, M., & Paek, I. (2008). A multidimensional Rasch analysis of gender
differences in PISA mathematics. Journal of applied measurement, 9(1), 18.
Locuniak, M. N., & Jordan, N. C. (2008). Using kindergarten number sense to predict calculation
fluency in second grade. Journal of Learning Disabilities, 41(5), 451–459.
Lord, F. M. (1980). Applications of item response theory to practical testing problems.
Routledge.
Lord, F. M., Novick, M. R., & Birnbaum, A. (1968). Statistical theories of mental test scores.
McCloskey, M., & Macaruso, P. (1995). Representing and using numerical information.
American Psychologist, 50(5), 351.
McIntosh, A., Reys, B. J., & Reys, R. E. (1992). A proposed framework for examining basic
number sense. For the Learning of Mathematics, 2–44.
Masters, G. N. (1982). A Rasch model for partial credit scoring. Psychometrika, 47(2), 149–174.
Miura, I. T., Okamoto, Y., Kim, C. C., Steere, M., & Fayol, M. (1993). First graders' cognitive
representation of number and understanding of place value: Cross-national comparisons:
France, Japan, Korea, Sweden, and the United States. Journal of Educational
Psychology, 85(1), 24.
Mosher, C. T., & Rogat, A. (2009). Learning Progressions in Science: An Evidence-Based
Approach to Reform. Philadelphi.. Consortium for Policy Research in Education, 2009:
11.

151
National Mathematics Advisory Panel. (2008). Final report of the National Mathematics
Advisory Panel. Washington, DC: U.S. Department of Education.
National Research Council. (2009). Mathematics learning in early childhood: Paths toward
excellence and equity. Committee on Early Childhood Mathematics, C. Cross, T. Woods,
& H. Schweingruber (Eds.). Center for Education, Division of Behavioral and Social
Sciences and Education. National Academies Press.
Okamoto, Y., & Case, R. (1996). II. Exploring the microstructure of children's central conceptual
structures in the domain of number. Monographs of the Society for Research in Child
Development, 61(1‐2), 27-58.
Paek, I., & Wilson, M. (2011). Formulating the rasch differential item functioning model under
the marginal maximum likelihood estimation context and its comparison with Mantel–
Haenszel procedure in short test and small sample conditions. Educational and
Psychological Measurement, 71(6), 1023-1046.
Popham, J. W. (April 2007). The lowdown on learning progressions. Educational Leadership,
64(7), 83-84.
Powell, S., Fuchs, L. and Fuchs, D. (2013). Reaching the mountaintop: Addressing the Common
Core Standards in mathematics for students with mathematics difficulties. Learning
Disabilities Research and Practices, 28(1), 38-48.
Rabe-Hesketh, S., & Skrondal, A. (2008). Multilevel and longitudinal modeling using Stata.
Stata Corp.
Rasch, G. (1960). Studies in mathematical psychology: I. Probabilistic models for some
intelligence and attainment tests.
Reckase, M. D. (1985). The difficulty of test items that measure more than one ability. Applied
Psychological Measurement, 9(4), 401–412.
Reckase, M. D., & McKinley, R. L. (1991). The discriminating power of items that measure
more than one dimension. Applied Psychological Measurement, 15(4), 361–373.
Ross, S. H. (1986). The Development of Children's Place-Value Numeration Concepts in Grades
Two through Five.
Ross, S. H. (1990). Children's Acquisition of Place-Value Numeration Concepts: The Roles of
Cognitive Development and Instruction. Focus on Learning Problems in
Mathematics, 12(1), 1-17. Schweingruber, H. A., Duschl, R. A., Shouse, A. W., & others.
(2007). Taking Science to School: Learning and Teaching Science in Grades K-8.
National Academies Press.
Sarama, J., & Clements, D. H. (2009). Early Childhood Mathematics Education Research:
Learning trajectories for young children. Routledge.
Schwartz, R., & Ayers, E. (2011) Delta Dimensional Alignment: Comparing Performances
across Dimensions of the Learning Progression for Assessing Data Modeling and
Statistical Reasoning. Unpublished manuscript, University of California, Berkeley.

152
Seeratan, K. L., Fisher, W. P., Saldarriaga, C., Lee, H., Thayer, S., Draney, K., and Murray, E.
(2013, April) Using a Learning Progressions Framework to Develop a Classroom
Assessment System that is Inclusive of Students with Learning Disabilities in
Mathematics: Results From Pilot 2. Paper presented at the meeting of American
Educational Research Association (AERA), San Francisco, California
Shepard, L., Daro, P., & Stancavage, F. B. (2013). The Relevance of Learning Progressions for
NAEP. American Institutes for Research.
Skrondal, A., & Rabe-Hesketh, S. (2004). Generalized latent variable modeling: Multilevel,
longitudinal, and structural equation models. Chapman and Hall/CRC.
Smith, C. L., Wiser, M., Anderson, C. W., & Krajcik, J. (2006). FOCUS ARTICLE: Implications
of Research on Children’s Learning for Standards and Assessment: A Proposed Learning
Progression for Matter and the Atomic-Molecular Theory. Measurement:
Interdisciplinary Research & Perspective, 4(1-2), 1–98
Stecker, P. M., & Fuchs, L. S. (2000). Effecting superior achievement using curriculum-based
measurement: The importance of individual progress monitoring. Learning Disabilities
Research & Practice, 15(3), 128-134.
Stevens, S. Y., Delgado, C., & Krajcik, J. S. (2010). Developing a hypothetical multi-
dimensional learning progression for the nature of matter. Journal of Research in Science
Teaching, 47(6), 687–715.
Wang, W. (1999). Direct estimation of correlations among latent traits within IRT framework.
Methods of Psychological Research Online, 4(2), 47–70.
Wang, Wen-chung, Wilson, M., & Adams, R. J. (1997). Rasch models for multidimensionality
between items and within items. Objective measurement: Theory into practice, 4, 139–
155.
Wilson, M. (1992). The ordered partition model: An extension of the partial credit model.
Applied Psychological Measurement, 16, 309–309.
Wilson, M. (2005). Constructing measures: An item response modeling approach. Routledge
Academic.
Wilson, M., & Bertenthal, M. (2005). Systems for state science assessment. Board on Testing
and Assessment. Center for Education, National Research Council of the National
Academies. Washington, DC: National Academies Press.
Wilson, M. (2009). Measuring progressions: Assessment structures underlying a learning
progression. Journal of Research in Science Teaching, 46(6), 716–730.
Wilson, M., & Sloane, K. (2000). From principles to practice: An embedded assessment system.
Applied Measurement in Education, 13(2), 181–208.
Wu, M., & Adams, R. (2006). Modelling mathematics problem solving item responses using a
multidimensional IRT model. Mathematics Education Research Journal, 18(2), 93–113.
Wilson, M., & Carstensen, C. (2007). Assessment to improve learning in mathematics:

153
The BEAR assessment system. In A. Shoenfeld (Ed.), Assessing Mathematical
Proficiency. London: Cambridge University Press.