An analytical Kano model for customer need analysis
24
An analytical Kano model for customer need analysis Qianli Xu, Roger J. Jiao, Xi Yang and Martin Helander, School of Mechanical and Aerospace Engineering, Nanyang Technological University, Singapore Roger J. Jiao, Woodruff School of Mechanical Engineering, Georgia Institute of Technology, USA Halimahtun M. Khalid, Damai Sciences Sdn Bhd, Malaysia Anders Opperud, Volvo Technology Corporation, Sweden In an effort to address the inherent deficiencies of traditional Kano method, this paper proposes an analytical Kano (A-Kano) model with focus on customer need analysis. Kano indices in accordance with the Kano principles are proposed to incorporate quantitative measures into customer satisfaction. Accordingly, two alternative mechanisms are proposed to provide decision support to product design, (1) the Kano classifiers are used as tangible criteria for categorizing customer needs, and (2) the configuration index is introduced as a decision factor of product configuration design. The merit of product configurations is justified using a Kano evaluator, which leverages upon both the customer’s satisfaction and the producer’s capacity. A case study of dashboard in automotive design is also presented. It is demonstrated that the A-Kano model can effectively incorporate customer preferences in product design, while leading to an optimal tradeoff between customer’s satisfaction and producer’s capacity. Ó 2008 Elsevier Ltd. All rights reserved. Keywords: product design, automotive design, perception, evaluation, Kano M anufacturing enterprises are increasingly focusing on satisfying individual customer needs (CNs) in a highly competitive global market. A constant challenge for manufacturers is how to deal with the customer satisfaction, which in turn largely determines the customers’ willingness to buy the products. Understanding and fulfilling CNs have been well recognized as one of the principle factors for product design and develop- ment to succeed in the market place (McKay et al., 2001). Analysis of customer need information is an important task with focus on the interpretation of the voice of customers and subsequently derivation of ex- plicit requirements that can be understood by marketing and engineering (Jiao and Chen, 2006). In general, it involves three major issues, namely (1) understanding of customer preferences, (2) requirement prioritization, Corresponding author: Roger J. Jiao [email protected] www.elsevier.com/locate/destud 0142-694X $ - see front matter Design Studies 30 (2009) 87e110 doi:10.1016/j.destud.2008.07.001 87 Ó 2008 Elsevier Ltd. All rights reserved. Printed in Great Britain
Transcript of An analytical Kano model for customer need analysis

Corresponding author:
Roger J. Jiao
Kano model for customer
An analyticalneed analysisQianli Xu, Roger J. Jiao, Xi Yang andMartin Helander, School of Mechanical
and Aerospace Engineering, Nanyang Technological University, Singapore
Roger J. Jiao,Woodruff School of Mechanical Engineering, Georgia Institute
of Technology, USA
Halimahtun M. Khalid, Damai Sciences Sdn Bhd, Malaysia
Anders Opperud, Volvo Technology Corporation, Sweden
In an effort to address the inherent deficiencies of traditional Kano method, this
paper proposes an analytical Kano (A-Kano) model with focus on customer
need analysis. Kano indices in accordance with the Kano principles are
proposed to incorporate quantitative measures into customer satisfaction.
Accordingly, two alternative mechanisms are proposed to provide decision
support to product design, (1) the Kano classifiers are used as tangible criteria
for categorizing customer needs, and (2) the configuration index is introduced
as a decision factor of product configuration design. The merit of product
configurations is justified using a Kano evaluator, which leverages upon both the
customer’s satisfaction and the producer’s capacity. A case study of dashboard
in automotive design is also presented. It is demonstrated that the A-Kano
model can effectively incorporate customer preferences in product design, while
leading to an optimal tradeoff between customer’s satisfaction and producer’s
capacity.
� 2008 Elsevier Ltd. All rights reserved.
Keywords: product design, automotive design, perception, evaluation, Kano
Manufacturing enterprises are increasingly focusing on satisfying
individual customer needs (CNs) in a highly competitive global
market. A constant challenge for manufacturers is how to deal
with the customer satisfaction, which in turn largely determines the customers’
willingness to buy the products. Understanding and fulfilling CNs have been
well recognized as one of the principle factors for product design and develop-
ment to succeed in the market place (McKay et al., 2001).
Analysis of customer need information is an important task with focus on the
interpretation of the voice of customers and subsequently derivation of ex-
plicit requirements that can be understood by marketing and engineering
(Jiao and Chen, 2006). In general, it involves three major issues, namely
(1) understanding of customer preferences, (2) requirement prioritization,
www.elsevier.com/locate/destud
0142-694X $ - see front matter Design Studies 30 (2009) 87e110
doi:10.1016/j.destud.2008.07.001 87� 2008 Elsevier Ltd. All rights reserved. Printed in Great Britain

88
and (3) requirement classification. Among many approaches that address cus-
tomer need analysis, the Kano model has been widely practiced in industries
as an effective tool of understanding customer preferences owing to its con-
venience in classifying CNs based on survey data (Kano et al., 1984). Never-
theless, traditional Kano methods are not equipped with quantitative
assessment. And, Kano classification provides limited decision support in
engineering design. Moreover, it inherently emphasizes the customer and
market perspectives only, with limited consideration of the producer’s capac-
ity to fulfill the CNs.
To enhance the above aspects in relation to customer need analysis, this paper
scrutinizes the theoretical foundation of the original Kano model and pro-
poses an analytical Kano (A-Kano) model. The A-Kano model extends tradi-
tional Kano model (Kano et al., 1984; Berger et al., 1993) by introducing (1)
Kano indices, which are quantitative measurements of customer satisfaction
derived fromKano questionnaires and surveys; (2)Kano classifiers, which con-
sist of a set of criteria to classify CNs based on the Kano indices; (3) Config-
uration index, which provides a decision factor for selecting the functional
requirements (FRs) that contribute to product configurations; and (4) Kano
evaluator, which is a shared surplus-based performance indicator leveraging
upon both the customer’s satisfaction and the producer’s capacity. A compre-
hensive process model is proposed to integrate these techniques for customer
need analysis.
The subsequent sections proceed as follows. A critical review of the Kano
model is presented in Section 1. The fundamental issues of A-Kano are scru-
tinized in Section 2. The A-Kano process model is proposed in Section 3 by
implementing the proposed techniques that address the fundamental issues.
In Section 4, the A-Kano model is applied to car dashboard design. The results
are compared with those derived from the traditional Kano model. Discus-
sions and conclusions are presented in Sections 5 and 6, respectively.
1 Critical review of Kano modelThe Kano model of customer satisfaction is a useful tool to classify and prior-
itize customer needs based on how they affect customer’s satisfaction (Kano
et al., 1984). It captures the nonlinear relationship between product perfor-
mance and customer satisfaction. In practice, four types of product attributes
are identified: (1) must-be attributes are expected by the customers and they
lead to extreme customer dissatisfaction if they are absent or poorly satisfied,
(2) one-dimensional attributes are those for which better fulfillment leads to
linear increment of customer satisfaction, (3) attractive attributes are usually
unexpected by the customers and can result in great satisfaction if they are
available, and (4) indifferent attributes are those that the customer is not inter-
ested in the level of their performance.
Design Studies Vol 30 No. 1 January 2009

An analytical Kano mod
The Kano model is constructed through customer surveys, where a customer
questionnaire contains a set of question pairs for each and every product attri-
bute. The question pair includes a functional form question, which captures
the customers’ response if a product has a certain attribute, and a dysfunc-
tional form question, which captures the customers’ response if the product
does not have that attribute. The questionnaire is deployed to a number of
customers, and each answer pair is aligned with the Kano evaluation table
(Berger et al., 1993), revealing an individual customer’s perception of a product
attribute. The final classification of a product attribute is made based on a sta-
tistical analysis of the survey results of all respondents.
1.1 Qualitative vs. quantitative evaluationThe Kano diagram provides a rough sketch of the customer’s satisfaction in
relation to the product performance level. In such a sense, it only allows qual-
itative assessment of product attributes (Wassenaar et al., 2005; Riviere et al.,
2006). A convenient way to incorporate quantitative measures is to assign
some scales in terms of the levels of customer satisfaction/dissatisfaction
(Matzler and Hinterhuber, 1998). However, the resulting Kano category is still
qualitative in nature, which could not precisely reflect the extent to which the
customers are satisfied (Berger et al., 1993). Hence, the application of Kano
model in engineering design is primitive in comparison with other quantitative
methods, such as conjoint analysis (Green and DeSarbo, 1978), stated choice
methods (Louviere et al., 2000), and decision-based design (Hazelrigg, 1998).
1.2 Classification criteriaDifferent criteria have been adopted for classifying customer requirements,
such as empirical observation, mode statistics, and customer satisfaction coef-
ficient (Berger et al., 1993). Timko (Berger et al., 1993) proposes a two-
dimensional representation of Kano quality category based on the customer
satisfaction coefficients. In particular, a positive number is used to represent
the relative value of meeting the respective customer requirement, whilst a neg-
ative number is used to reflect the relative cost of not meeting this customer
requirement. However, classification criteria are not explicitly defined in this
model. DuMouchel (Berger et al., 1993) proposes a graphical Kano diagram
that is based on predefined scales related to the customer’s satisfaction and
dissatisfaction. Each customer requirement can be represented as a pair of sat-
isfaction and dissatisfaction values. The nature of a customer requirement can
be delineated by the quadrant into which that point falls. However, it is very
subjective to classify the customer requirements into four quadrants because of
a lack of logical classification criteria.
1.3 Decision supportThe ultimate goal of customer need analysis is to provide decision support to
product design. Although the Kano categories may enhance designers’ under-
standing of customer needs, they fall short as concrete decision criteria. In
general, the categories of the Kano model signify different priorities in
el 89

90
designing products. For example, a designer is directed toward fulfilling all
must-be FRs, staying competitive with market leaders on the one-dimensional
FRs, and including some attractive FRs (Berger et al., 1993). However, such
approaches do not distinguish FRs within the same category. Hence, the
Kano classification is deemed to be inadequate to facilitate decisions in prod-
uct design.
1.4 Producer’s capacityThe Kano model is inherently customer-driven, i.e., it focuses exclusively on
addressing the concerns of customers (Sireli et al., 2007). As a decision-making
tool used by engineers, the Kano model fails to account for the producer’s con-
cerns in terms of the capacity to fulfill the CNs. Cost constraints are usually
accommodated by the product development team based on expertise, such
that the product will only include those features that are affordable to the pro-
ducers (Matzler and Hinterhuber, 1998). In practice, without accurate cost es-
timation, such an assumption seldom holds true. Lai et al. (2004) propose
a linear cost function to constrain the selection of product features in product
development. Tan and Shen (2000) propose an approximation transformation
function based on Kano analysis to adjust the improvement ratio of customer
attributes. However, these cost models are primitive and are inadequate to re-
flect the complexities of design and manufacturing costs. From an engineering
perspective, engineers have to seek for a leverage of the customer-perceived
value and the producer’s capacity.
2 A-Kano modelThe A-Kano model entails a series of interactions between the customers and
the producers, as shown in Figure 1. In general, the CNs tend to be imprecise
and ambiguous due to their linguistic origins (Jiao and Chen, 2006). And
hence it is difficult to apply analytical tools for CN analysis. As a quick fix,
the CNs are translated into explicit and objective statements, namely the
FRs. The distinction between CNs and FRs is in line with the domain mapping
principle proposed by Suh (2001). Essentially, what a customer de facto per-
ceives is the CNs in the customer domain, rather than FRs in the functional
domain. While providing customer-perceived diversity in CNs, the producer
must seek for an economy of scale in product fulfillment, which is meant by
FRs. In this research, analysis is carried out in the functional domain, and
the FRs are assigned different priorities for product fulfillment. From the cus-
tomer’s perspective, the priority assignment corresponds to different customer
perceptions. From the producer’s perspective, the FRs are mapped onto
various product attributes, which represent the physical form of a product
in fulfillment of the FRs.
Customer perception can be explicitly measured as the overall customer satis-
faction with respect to a combination of product attributes. On the other hand,
the legacy producer’s capacity has to be assessed in terms of delivery of the
Design Studies Vol 30 No. 1 January 2009

Figure 1 Customereproducer
interactions along the product
value chain
An analytical Kano mod
desired product attributes. The value chain converges when the customer’s sat-
isfaction overlaps with the legacy producer’s capacity. Ultimately the business
success is achieved by maximizing such an overlap, either by expanding the
producer’s capacity to meet the CNs or by directing the customers to the total
capacity of the producer so that customers are better served (Jiao et al., 2003a).
2.1 Kano indices for quantification of customer satisfactionKano survey is carried out within specific market segments that consist of cus-
tomers with similar demographic information. Let s denote themarket segment
which contains a total of J customers (respondents), i.e., shftjjj ¼ 1; 2;.; Jg.A set of FRs is identified asFhffjii ¼ 1; 2;.; Ig. Surveys are carried out to col-lect the respondents’ evaluation of fi ðci ¼ 1; 2;.; IÞ according to the func-
tional and dysfunctional forms of Kano questions (Table 1). The preliminary
category of the FR is determined using the Kano evaluation table (Table 2).
For each respondent tj˛sðcj ¼ 1; 2;.; JÞ, the evaluation of fiðci ¼ 1; 2;.; IÞis represented as eij¼ (xij,yij,wij), where xij is the score given to an FR for the
dysfunctional form question, yij is the score given to an FR for the functional
form question, and wij is the self-stated importance, which is the respondent’s
perception of the importance of an FR. Similar to the method proposed by
DuMouchel (Berger et al., 1993), this research adopts a scoring scheme that
defines customer’s satisfaction and dissatisfaction as shown in Table 3. The
scale is designed to be asymmetric because positive answers are considered to
be stronger responses than negative ones. Hence, the scaling has the effect of
diminishing the influence of negative evaluations (Berger et al., 1993). Further-
more, the self-stated importance score is normalized such that it falls within
a range of 0e1, as shown in Table 4.
Next, for each FR (fi), the average level of satisfaction for the dysfunctional
form question within market segment s is defined as Xi, and the average level
el 91

Table 1 Kano questionnaire
Kano question Answer
Functional form of the question(e.g., if the car has air bags, how do you feel?)
,I like it that way,It must be that way,I am neutral,I can live with it that way,I dislike it that way
Dysfunctional form of the question(e.g., if the car does not have air bags, how do you feel?)
,I like it that way,It must be that way,I am neutral,I can live with it that way,I dislike it that way
Table 2 Kano evaluation ta
Functional form of the que
A, Attractive; O, One-dimen
92
of satisfaction for the functional form question within the same market seg-
ment is defined as Yi, i.e.,
Xi ¼1
J
XJj¼1
wijxij; Yi ¼1
J
XJj¼1
wijyij ð1Þ
The value pair ðXi;YiÞ can be plotted in a two-dimensional diagram, where the
horizontal axis indicates the dissatisfaction score and the vertical axis stands
for the satisfaction score. Most ðXi;YiÞ should fall in the range of 0e1 because
the negative values are results of either Questionable or Reverse categories. A
questionable category will not be included in the averages, and a Reverse cat-
egory can be transformed out of the category by reversing the sense of func-
tional and dysfunctional of questions (Berger et al., 1993). Accordingly, the
classification of an FR can be defined based on the corresponding location
of the value pair in the diagram, as shown in Figure 2.
From the customer’s perspective, the characteristics of an FR (fi) can be rep-
resented as a vector, i.e., fiwr.i hðri;aiÞ, where ri ¼ jr.i j ¼ffiffiffiffiffiffiffiffiffiffiffiffiffiffiffiffiffiX2
i þ Y2i
qis the
magnitude of r.i and ai ¼ tan�1ðYi=XiÞ is the angle between r.i and the hori-
zontal axis. The rationale of representing the satisfaction and dissatisfaction
as a vector r.i is that it becomes equivalent to a polar form, i.e., the magnitude
ble
Dysfunctional form of the question
Like Must-be Neutral Live with Dislike
stion Like Q A A A OMust-be R I I I MNeutral R I I I MLive with R I I I MDislike R R R R Q
sional; M, Must-be; I, Indifferent, R, Reverse; Q, Questionable.
Design Studies Vol 30 No. 1 January 2009

Table 3 Scores for functional/dysfunctional features
Answers to the Kano question Functional form of the question Dysfunctional form of the question
I like it that way (like) 1 �0.5It must be that way (must-be) 0.5 �0.25I am neutral (neutral) 0 0I can live with it that way (live with) �0.25 0.5I dislike it that way (dislike) �0.5 1
Table 4 Scores for self-sta
Not important Some
0.1 0.2 0.3
An analytical Kano mod
of the vector denotes the overall importance of fi to the customers belonging to
segment s, and the angle ai determines the relative level of satisfaction and dis-
satisfaction. Therefore, the magnitude of the vector (ri) is called the impor-
tance index; and the angle (ai) is called the satisfaction index. Both
0 � ri �ffiffiffi2p
and 0 � ai � p=2 are collectively called the Kano indices. In
the extreme situation, ai¼ 0 means that dysfunction of fi causes dissatisfac-
tion, while functioning of fi does not enhance satisfaction, and hence it is an
ideal must-be element. Conversely, ai ¼ p=2 means that fi is an ideal attractive
element.
2.2 Kano classifiers for categorization of customer needsBased on the above formulation, the FRs can be classified into four cate-
gories, i.e., indifferent, must-be, attractive and one-dimensional, as shown
in Figure 3. A threshold value of the importance index, r0, is used to dif-
ferentiate important FRs from less important ones. If ri� r0, fi is consid-
ered as unimportant, and thus called an indifferent FR. The region
defined by the sector OFI in Figure 3, where the radius is smaller than
r0, is considered as the indifferent region. Hence r0 is called an indifference
threshold.
Likewise, a lower threshold value of the satisfaction index is defined as aL,
such that for fi, if ri> r0 and ai� aL, it is considered as a must-be FR. The
region of the must-be FRs corresponds to the sector DEFG.
A higher threshold value of the satisfaction index is defined as aH, such that for
fi, if ri> r0 and ai> aH, it is considered as an attractive FR. The region of the
attractive FRs is shown as sector ABHI.
ted importance
what important Important Very important Extremely important
0.4 0.5 0.6 0.7 0.8 0.9 1.0
el 93

Figure 2 Vector representa-
tion of customer perception
on a Kano diagram
Figure 3 Kano classifier and
Kano categories
94
If ri> r0 and aL< ai� aH, fi is considered as a one-dimensional FR. The
region of the one-dimensional FRs is shown as sector BCDGH.
The set of thresholds r0, aL, and aH are collectively called Kano classifiers,
denoted as k¼ (r0, aL, aH). According to the Kano principles, the classification
of FRs provides a decision criterion for selecting the FRs that constitute
a product configuration. To do so, this research proposes the following heuris-
tic to simulate the consequence of Kano classification on product configura-
tion design.
Design Studies Vol 30 No. 1 January 2009

An analytical Kano mod
Heuristic 1: A product configuration (p) is generated as a combination of
FRs ðfi;ci ¼ 1; 2;.; IÞ. A binary variable, zi, is used to indicate whether fiis contained in the product or not, such that
zi ¼�1; if zi �Randomð0;1Þ;0; otherwise:
where the Random(0,1) generates a random number between 0 and 1, and zi
denotes the probability that fi be included in the product configuration. The
probability zi is dependent on the Kano category that an FR belongs to, i.e.,
zi ¼ 1, if fi is a must-be FR,
zi ¼ 0:8, if fi is a one-dimensional FR,
zi ¼ 0:2, if fi is an attractive FR,
zi ¼ Randomð0; 1Þ, if fi is an indifferent FR.
Determining appropriate values of Kano classifiers is challenging in that
these threshold values may be problem-specific and context-aware for differ-
ent applications. In practice, it is deemed to be difficult to define universal
thresholds for different products. This research uses sensitivity analysis to
select and testify the appropriate settings of the Kano classifiers. Moreover,
a proper performance indicator must be defined to justify the significance of
the classification with respect to different settings of Kano classifiers, as is
discussed in Section 2.4.
2.3 Configuration index for product configuration designDecision-making based on the Kano classification inevitably suffers the dis-
continuity problem, i.e., data points located near the borders of two adjacent
regions may be classified as different categories, while their distinction is actu-
ally minor. To alleviate such a problem, this research proposes a configuration
index to indicate the priority of an FR in fulfillment of customer expectations.
The purpose of this strategy is to provide better decision support to product
configuration design. The configuration index ðriÞ is defined as a function of
Kano indices (ri, ai) to indicate the probability that an FR is contained in a
production configuration.
ri ¼2ffiffiffi2p
3
�1� ai
p
�ri ð2Þ
Given a particular ai, the configuration index ri is proportional to the impor-
tance index ri, which agrees with the observation that an FR with greater
influence on customer’s satisfaction/dissatisfaction is more likely to be
included in the product configuration. At the same time, for a specific value
el 95

96
of ri, ri decreases with an increase of the satisfaction index ai, which reflects the
decreasing priorities associated with the Kano categories in the order of must-
be, one-dimensional and attractive.
The selection of FRs that contribute to a product configuration is contingent
on the configuration indices. In particular, a product configuration p is repre-
sented as a combination of FRs ðfi;ci ¼ 1; 2;.; IÞ. The following heuristic is
used to simulate the effect of configuration index on product design.
Heuristic 2: A binary variable, zi, is used to indicate whether fi is contained
in the product or not.
zi ¼�1; if fi is contained in product p;0; otherwise:
The value of zi is assigned in the product design stage based on a stochastic
procedure. Let Random(0,1) be a function that generates a random number
between 0 and 1. Variable zi¼ 1, when ri � Randomð0; 1Þ; and zi¼ 0, when
ri < Randomð0; 1Þ.
Based on this heuristic, an FR with a larger configuration index has a higher
chance to be included in the product. It should be noted that product config-
uration design is subject to other configuration constraints. For example, two
FRs may be incompatible with each other such that only one of them may be
selected in the configuration.
2.4 Kano evaluator for leveraging customer’s satisfactionand producer’s capacityThe Kano classifiers and configuration indices provide two alternative mecha-
nisms to determine the FRs to be included in a product. While the resulting
product configuration reflects the customer’s preferences, the producers have
to strive to design products at affordable costs. Therefore, product development
involves two interrelated perspectives, i.e., increasing customer’s satisfaction
and enhancing producer’s capacity. In this respect, theA-Kanomodel explicitly
defines a Kano evaluator to estimate the value of the planned products.
2.4.1 Objective functionThis research adopts the concept of shared surplus to leverage upon both cus-
tomer’s and producer’s concerns. The consumer surplus is modeled as the
overall customer’s satisfaction (U) of the product, and the producer surplus
is simulated as the overall cycle time index (C). Accordingly, the Kano evalu-
ator (E) is defined as a shared surplus-based performance indicator, i.e.,
E¼U
Cð3Þ
Design Studies Vol 30 No. 1 January 2009

An analytical Kano mod
Based on the customer’s responses to the functional/dysfunctional form of
Kano questions, the configuration index reflects the customer’s satisfaction
level for individual FRs. Hence, the customer’s satisfaction (U) is defined as
the summation of the configuration indices ðriÞ of FRs contained in the prod-
uct configuration, i.e.,
U¼XIi¼1
rizi ð4Þ
where
zi ¼�1; if fi is contained in product p;0; otherwise
On the other hand, producer’s capacity is related to the technical feasibility of
a design and the engineering cost, which refers to the producer surplus. This
research proposes the cycle time index (C) to estimate the producer’s capacity
as discussed next.
2.4.2 Cycle time indexThe cycle time index (C) is based on the concept of process capability index
which provides an economic latitude of process variations due to product cus-
tomization (Jiao and Tseng, 1999). The process capability index gives an indi-
cation of how expensive of a customization is to be if implemented in
production. The idea is to allocate costs to those established time standards
from previously reported work and time studies and thereby circumvent the
tedious tasks of identifying various cost drivers and cost related activities.
To do so, it is necessary to find the mapping relationships between different
attribute levels and their expected consumptions of standard times within
legacy process capabilities. These part-worth standard time accounting rela-
tionships are built into the product and process platforms (Jiao et al.,
2003b). Any product configured from available attribute levels is justified
based on its expected cycle time, which demonstrates the distinctions between
variables that differ as a result of random error and are often well described by
a normal distribution (Tielemans, 1995). The one-side specification limit pro-
cess capability index (PCI) can be formulated as:
PCI ¼ USLT � mT
3sTð5Þ
where USLT, mT, and sT are the upper specification limit, the mean, and the
standard deviation of the estimated cycle time, respectively. Variations in the cy-
cle time are characterized by mT, and sT, reflecting the compound effect of mul-
tiple products on production in terms of process variations. The USLT can be
determined ex ante based on the worst case analysis of a given process platform,
in which standard routings can be reconfigured to accommodate various prod-
ucts derived from the corresponding product platform (Jiao et al., 2003b).
el 97

98
Owing to the close correlation between costs and the cycle time, PCI indicates
how expensive a product is expected to be if produced within the existing pro-
cess capabilities. Thus, the cycle time indexC corresponding to a product p can
be formulated based on the respective process capability index:
C ¼ l exp
�1
PCI
�¼ l exp
�3sT
USLT � mT
�ð6Þ
where l is a constant indicating the average dollar cost per variation of process
capabilities. The meaning of l is consistent with that of the dollar loss per devi-
ation constant widely used in Taguchi’s loss functions. It can be determined ex
ante based on the analysis of existing product and process platforms. Such
a cost function produces a relative measure, instead of actual dollar figures,
for evaluating the extent of overall process variations amongmultiple products.
The estimated cycle time for product p, namely (mT, sT), is assumed to be a lin-
ear function of the part-worth standard times for the FRs assumed by product
p, i.e.,
mT ¼XIi¼1
�zim
Ti zi þu
ð7aÞ
sT ¼
ffiffiffiffiffiffiffiffiffiffiffiffiffiffiffiffiffiffiffiffiffiXIi¼1ðsT
i ziÞ2
vuut ð7bÞ
where zi and u are regression coefficients, mTi and sT
i are the mean and the
standard deviation of the part-worth standard time associated with fi, respec-
tively, and zi is defined the same as in Eq. (4).
3 A-Kano decision-makingThe product planning stage features a series of processes including elicitation,
analysis, and fulfillment of the CNs. The A-Kano model can assist decision-
making in the process by prioritizing the FRs according to their impacts on
the customers and producers. A coherent A-Kano process model is developed
to combine the various analytical techniques presented in Section 2, and a gen-
eral roadmap is shown in Figure 4.
3.1 Identification of functional requirementsThe A-Kano model requires the survey results of customer’s satisfaction using
the Kano questionnaire. In general, the questionnaire is designed according to
a set of CNs. To allow for unambiguous understanding, the CNs are translated
into FRs, Fhffiji ¼ i; 2;.; Ig. For example, visibility of the gauges in a car
dashboard is a CN, and is manifested by the size and lighting conditions of
the gauges, namely the FRs. In this research, the FRs are typically related
to customizable product attributes from which the customers can choose
according to his/her preferences.
Design Studies Vol 30 No. 1 January 2009

Figure 4 A design process
model of analytical Kano
An analytical Kano mod
3.2 Division of market segmentsCustomers are grouped into different market segments based on their demo-
graphic information, such as age, gender, income, etc. If the division of market
segments is not evident, it becomes necessary to carry out market investiga-
tions to differentiate the customer groups. Many methods and tools are avail-
able to assist the process, such as conjoint analysis (Green and DeSarbo,
1978), perceptual mapping (Moore and Pessemier, 1993), and data mining
(Jiao and Zhang, 2005).
3.3 Kano surveyWith respect to the FRs, the Kano questionnaire is fabricated and surveys are
conducted to acquire the customers’ assessment of the FRs according to the
functional and dysfunctional forms of questions. In addition, the customers’
immediate perceptions of the importance of the FRs are extracted according
to the self-stated importance (Table 4).
3.4 Computation of Kano indicesFor each market segment, the customer’s average satisfaction/dissatisfaction
with respect to the functional/dysfunctional form question is computed ac-
cording to Eq. 1. Next, the Kano indices are computed and plotted in the
A-Kano diagram. Accordingly, the configuration index for each FR is com-
puted, which indicates the priority of the FR in product configuration design.
3.5 Product configuration design and evaluationTwo alternative methods are adopted for product configuration design,
namely (1) the Kano classification-based method, and (2) the configuration
index-based method. In each method, the candidate product configuration is
evaluated against the Kano evaluator. As a prerequisite, part-worth standard
time ðmTi ; s
Ti Þ is identified from the standard routing that constitutes the
el 99

100
process platform. Subsequently, the customer’s satisfaction (U) and cycle time
index (C) of the products are evaluated, leading to an expected value of the
Kano evaluator (E). The optimal product configuration is generated as the
one that produces the largest Kano evaluator.
3.5.1 Kano classification-based configuration designThe threshold values of the Kano classifiers, namely k¼ (r0, aL, aH) are tested
such that the FRs are classified as four categories. Different threshold values
lead to different classification schemes, which in turn influence the design of
product configuration and the expected value of the product. Sensitivity anal-
ysis is carried out to examine different settings of Kano classifiers, using the
Kano evaluator as the performance indicator. Sensitivity analysis entails an it-
erative process of evaluating the Kano evaluator based on specific FR classi-
fication schemes. This research adopts a strategy where r0 changes from 0.1 to
0.9 with an increment of 0.1, aL changes from 5� to 45� with an increment of
5�, and aH changes from 50� to 90� with an increment of 5�. A full-factorial
experiment requires 9� 9� 9¼ 729 runs of experiment. In each run, the
FRs are classified according to each set of Kano classifier k¼ (r0, aL, aH),
and a set ofN product configurations are generated based on Heuristic 1. Sub-
sequently, the customer satisfaction (U) and cycle time index (C) of the set ofN
products are evaluated according to Eqs. (4) and (6), leading to an expected
value of the Kano evaluator (E). The optimal values of Kano classifiers are
selected as those that produce the largest Kano evaluator.
3.5.2 Configuration index-based configuration designProduct configuration is generated using Heuristic 2. This is a typical combi-
natorial optimization problem where a large search space needs to be explored.
Genetic algorithms (GAs) have been proven to excel in solving combinatorial
optimization problems in comparison with traditional calculus-based or
approximation optimization techniques. In this regard, a heuristic GA (Jiao
and Zhang, 2005) is adopted to solve such a combinatorial optimization
problem.
4 Case studyThe proposed method is applied to car dashboard design in an automobile
company. The dashboard is an important subassembly in the automobile
with a number of customizable components and features (Figure 5). These
components can be represented as FRs in the design stage. The actual selection
of the FRs collectively constitutes the car interior environment, which influ-
ences the driver’s perceptions, and ultimately determines his/her satisfaction.
However, the exact correspondence between FRs and customer’s satisfaction
is not evident. Moreover, the relationship between the selection of FRs and the
producer’s production capability is not considered in product design. There-
fore, it is necessary to gain insight of the FRs with respect to the customer’s
satisfaction and the producer’s capacity.
Design Studies Vol 30 No. 1 January 2009

Upper instrumentpanel
Gauge display Air bag (inside) Storagecompartment
Radio/CD controlLower instrumentpanel
Steering wheelcolumn
Vent
Figure 5 Main components
and features of car dashboard
subassembly
Table 5 Functional require
Customer need
Gauge display type
Gauge display size
Gauge display lighting
Instrument panel material
Instrument panel color
Steering wheel material
Steering wheel height
Position of CD/radio contr
Storage configuration
Air bag
An analytical Kano mod
The company has conducted extensive market studies to collect the CNs which
are represented according to well-known FR descriptors. This case study
focuses on a set of 10 CNs, which are refined as 25 FRs, as shown in Table 5.
4.1 Kano surveyA total of 50 car drivers constituted the Kano survey respondent set. The
respondents were divided into three groups based on their age, gender and
income levels, representing three market segments as shown in Table 6.
Each respondent was required to answer the Kano questions with respect to
each and every FR, and give the perception of the importance of an FR using
the self-stated importance (Table 4). The form of Kano questions used in this
survey is shown in Table 1, including both the functional and dysfunctional
forms.
ments of car dashboard
Functional requirement Code
Analog display f1e1
Digital display f1e2
Large (15 inch) f2e1
Small (10 inch) f2e2
Back light f3e1
External light f3e2
Plasticewooden f4e1
Plastic f4e2
Plasticemetal f4e3
Cream f5e1
Gray f5e2
Black f5e3
Plasticewooden f6e1
Plastic f6e2
Plasticeleather f6e3
High (24 inch) f7e1
Low (20 inch) f7e2
ol Integrated in steering wheel f8e1
On control panel f8e2
Top f9e1
Side f9e2
Front f9e3
Passenger side f9e4
Front f10e1
Side f10e2
el 101
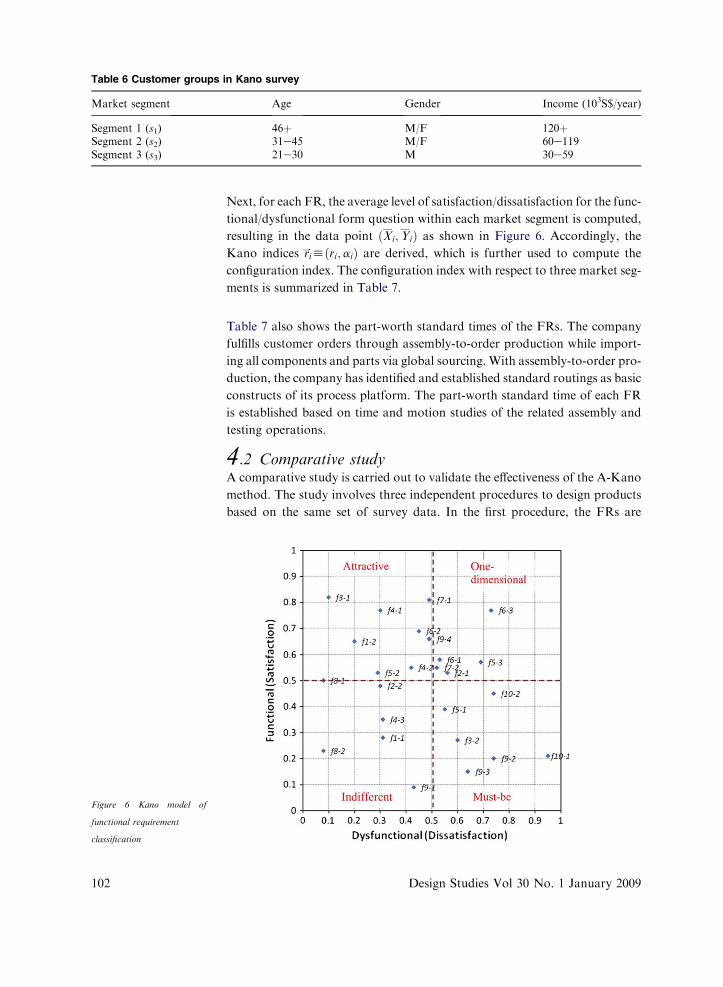
Table 6 Customer groups in Kano survey
Market segment Age Gender Income (103S$/year)
Segment 1 (s1) 46þ M/F 120þSegment 2 (s2) 31e45 M/F 60e119Segment 3 (s3) 21e30 M 30e59
Figure 6 Kano model of
functional requirement
classification
102
Next, for each FR, the average level of satisfaction/dissatisfaction for the func-
tional/dysfunctional form question within each market segment is computed,
resulting in the data point ðXi;YiÞ as shown in Figure 6. Accordingly, the
Kano indices r.ihðri;aiÞ are derived, which is further used to compute the
configuration index. The configuration index with respect to three market seg-
ments is summarized in Table 7.
Table 7 also shows the part-worth standard times of the FRs. The company
fulfills customer orders through assembly-to-order production while import-
ing all components and parts via global sourcing. With assembly-to-order pro-
duction, the company has identified and established standard routings as basic
constructs of its process platform. The part-worth standard time of each FR
is established based on time and motion studies of the related assembly and
testing operations.
4.2 Comparative studyA comparative study is carried out to validate the effectiveness of the A-Kano
method. The study involves three independent procedures to design products
based on the same set of survey data. In the first procedure, the FRs are
Design Studies Vol 30 No. 1 January 2009

Table 7 Configuration index and part-worth standard time
FR Configuration index (market segment) Part-worth standard time
s1 s2 s3 mTi (s) sT
i (s)
f1e1 0.30 0.2 0.31 498 21f1e2 0.38 0.33 0.2 557 35f2e1 0.55 0.3 0.56 505 22f2e2 0.36 0.33 0.3 493 20f3e1 0.42 0.35 0.1 90 6f3e2 0.54 0.74 0.6 50.5 4f4e1 0.48 0.44 0.3 462 15.5f4e2 0.46 0.38 0.42 465 18f4e3 0.32 0.4 0.35 411 13f5e1 0.51 0.22 0.61 50 5.5f5e2 0.38 0.56 0.29 47.5 5.5f5e3 0.66 0.55 0.69 45 6f6e1 0.54 0.46 0.53 442 28f6e2 0.53 0.48 0.45 365 30.4f6e3 0.74 0.7 0.63 483 32f7e1 0.60 0.43 0.52 365 30.4f7e2 0.53 0.23 0.35 483 32f8e1 0.26 0.19 0.08 99 9.4f8e2 0.14 0.09 0.08 99 9.4f9e1 0.39 0.55 0.47 69 8f9e2 0.66 0.69 0.74 54 5.6f9e3 0.57 0.49 0.64 80.3 5.6f9e4 0.55 0.56 0.49 40.6 4f10e1 0.85 0.55 0.74 216 33f10e2 0.67 0.59 0.95 247 40
An analytical Kano mod
classified using the Kano method proposed by DuMouchel (Berger et al.,
1993). In the second procedure, the respective FRs are classified using the
Kano classifiers proposed in the A-Kano method. In both methods, the FR
classification is applied to assist the generation of product configurations. In
the third procedure, the configuration indices of the FRs are used to guide
the design of product configurations following the decision framework pre-
sented in Section 3. The merits of the three methods are compared according
to the product performance in terms of the Kano evaluator. In this case study,
the results of only one market segment (s1) are presented for purpose of brev-
ity. The analysis of the other market segments can be carried out following the
same procedures.
4.2.1 Kano-based product configuration designBased on the method proposed by DuMouchel (Berger et al., 1993), a two-
dimensional Kano diagram is established according to customers’ satisfaction
and dissatisfaction levels, as shown in Figure 6. According to this model, the
diagram is divided into four quadrants, and accordingly the FRs are classified
into four categories. Heuristic 1 is adopted to generate product configurations
based on the Kano classification. The product configuration, called Product I,
is generated manually and is shown in Table 8, where a number ‘1’ indicates
el 103

Table 8 Product configurations generated based on three methods
FR Product I(Kano-based)
Product II(A-Kano: classifier)
Product III(A-Kano: configuration index)
f1e1 1f1e2 1 1f2e1 1 1 1f2e2
f3e1 1f3e2 1 1 1f4e1
f4e2 1f4e3 1 1f5e1 1 1 1f5e2 1f5e3 1 1f6e1 1f6e2 1 1f6e3
f7e1 1f7e2 1 1f8e1 1f8e2 1 1f9e1 1f9e2 1 1 1f9e3 1 1 1f9e4 1f10e1 1 1 1f10e2 1 1 1
Customer satisfaction 7.03 7.33 7.71
Cycle time index 14.63 7.23 6.63
Kano evaluator 0.48 1.01 1.16
104
that the respective FR is included in the product; otherwise, it is left blank. The
Kano evaluator is computed using Eqs. (3)e(7), such that Product I results in
a Kano evaluator of 0.48.
4.2.2 A-Kano-based product configurationdesign e Kano classifiersThe Kano classification is implemented based on the Kano indices and Kano
classifiers. To select the appropriate values of Kano classifiers, an iterative pro-
cess of sensitivity analysis is carried out. Each set of Kano classifiers, i.e.,
k¼ (r0, aL, aH) results in a scheme of FR classification, which in turn guides
the generation of the product configurations following Heuristic 1. Once the
product configurations are created, the Kano evaluator is computed.
The sensitivity analysis involves three variables, namely r0, aL and aH. Hence,
it is difficult to visualize the response surface using a three-dimensional graph.
A graphical illustration can be made by setting one variable at a fixed value
while changing the values of the other two variables. For example, Figure 7
Design Studies Vol 30 No. 1 January 2009

Figure 7 Sensitivity analysis
of Kano evaluator w.r.t. aL
and aH
An analytical Kano mod
shows the result of sensitivity analysis when the Kano classifier r0 is fixed as
r0¼ 0.3, aL varies from 5� to 45�, and aH varies from 50� to 90�. The Kano
evaluator is normalized for purpose of illustration. Base on the sensitivity
analysis, the largest Kano evaluator is 1.01, which is obtained when the
Kano classifiers are r0¼ 0.5, aL¼ 25�, and aH¼ 65�, respectively. The A-
Kano diagram for FRs classification is shown in Figure 8, and the product
configuration derived from this classification is called Product II, which is
shown in Table 8.
4.2.3 A-Kano-based product configurationdesign e configuration indexThe A-Kano method proposes using the category index to guide the genera-
tion of product configurations. A heuristic GA is adopted to generate a set
of solutions, each of which is evaluated against the Kano evaluator. The prod-
uct configuration (Product III) derived from this method is shown in Table 8,
which leads to a Kano evaluator of 1.16.
4.3 Results and analysisThe major difference between the three methods lies in the criteria to select the
FRs that constitute the product configuration. In the traditional Kano
method, FRs are selected manually based on the Kano category. Although
the process is straightforward, it does not reflect the differences among FRs
within the same category. For example, both f2e2 and f8e2 are classified as in-
different FRs. However, these two FRs represent different customer percep-
tions considering their importance and relative customer satisfaction. Such
a difference is effectively captured by the configuration index in the A-Kano
method, where the configuration indices are 0.36 and 0.14, respectively.
Interestingly, the polar form A-Kano classification assigns two FRs into
one-dimensional and indifferent categories, respectively, which reflects the
difference between them.
el 105
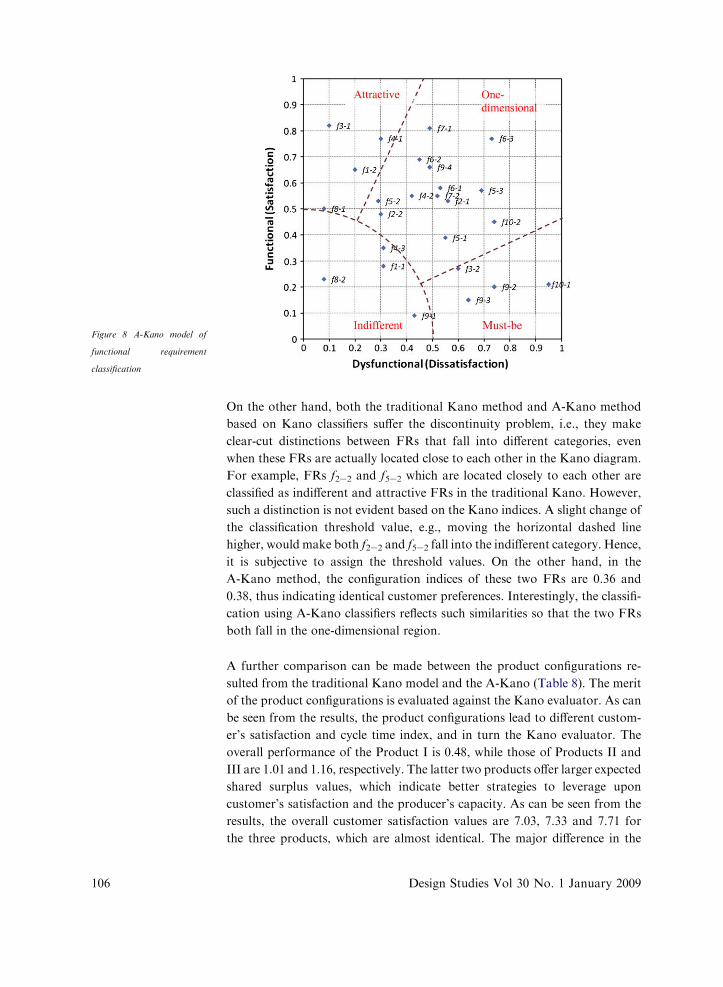
Figure 8 A-Kano model of
functional requirement
classification
106
On the other hand, both the traditional Kano method and A-Kano method
based on Kano classifiers suffer the discontinuity problem, i.e., they make
clear-cut distinctions between FRs that fall into different categories, even
when these FRs are actually located close to each other in the Kano diagram.
For example, FRs f2e2 and f5e2 which are located closely to each other are
classified as indifferent and attractive FRs in the traditional Kano. However,
such a distinction is not evident based on the Kano indices. A slight change of
the classification threshold value, e.g., moving the horizontal dashed line
higher, would make both f2e2 and f5e2 fall into the indifferent category. Hence,
it is subjective to assign the threshold values. On the other hand, in the
A-Kano method, the configuration indices of these two FRs are 0.36 and
0.38, thus indicating identical customer preferences. Interestingly, the classifi-
cation using A-Kano classifiers reflects such similarities so that the two FRs
both fall in the one-dimensional region.
A further comparison can be made between the product configurations re-
sulted from the traditional Kano model and the A-Kano (Table 8). The merit
of the product configurations is evaluated against the Kano evaluator. As can
be seen from the results, the product configurations lead to different custom-
er’s satisfaction and cycle time index, and in turn the Kano evaluator. The
overall performance of the Product I is 0.48, while those of Products II and
III are 1.01 and 1.16, respectively. The latter two products offer larger expected
shared surplus values, which indicate better strategies to leverage upon
customer’s satisfaction and the producer’s capacity. As can be seen from the
results, the overall customer satisfaction values are 7.03, 7.33 and 7.71 for
the three products, which are almost identical. The major difference in the
Design Studies Vol 30 No. 1 January 2009

An analytical Kano mod
Kano evaluator lies in the varied cycle time indices, which are 14.63, 7.23, and
6.63, respectively. Such a distinction reflects that Products II and III effectively
account for the producer’s capacity in the configuration design. It should be
noted the absolute value of the Kano evaluator is not significant. But rather,
it denotes the relative superiority of a classification in terms of the shared
surplus.
5 DiscussionsThe A-Kano method extends traditional Kano method by adopting quantita-
tive measures of customer’s satisfaction. The Kano classifiers and configura-
tion indices enhance decision support in product design. Furthermore, it
proposes a performance indicator that gives dual considerations of customer’s
satisfaction and producer’s capacity to fulfill customer needs. The main contri-
bution of this research is to extract useful customer need information from
Kano survey for decision support in product design. In comparison with tra-
ditional Kano model that relies on qualitative Kano categories, the A-Kano
method establishes a coherent decision framework that deals with the interac-
tions between the customer domain and the producer domain. The polar form
of Kano indices r.i hðri;aiÞ excels the Cartesian form ðXi;YiÞ proposed by
DuMouchel (Berger et al., 1993) as a quantification measurement of customer
preferences, in the sense that it facilitates intuitive understanding of the FRs.
In particular, the magnitude of the vector, ri, represents the importance of an
FR and the angle ai represents the relative level of satisfaction and dissatisfac-
tion, thus representing different aspects of customer perceptions.
The quantification of customer’s satisfaction based on Kano indices distin-
guishes the A-Kano method from other research techniques, such as conjoint
analysis (Green and DeSarbo, 1978), stated choice methods (Louviere et al.,
2000), and discrete choice analysis (Wassenaar and Chen, 2003; Wassenaar
et al., 2005). The major difference lies in the different denotations of customer
preference. In classical conjoint analysis as well as the stated choice methods,
customer preference/demand is modeled as a utility function of various prod-
uct attributes. In discrete choice analysis, the economic benefits to the
producer are modeled as a utility function of customer attributes, prices
and socioeconomic and demographic background of the market population
(Wassenaar and Chen, 2003; Wassenaar et al., 2005). In contrast, the A-
Kano method models customer preference based on customer’s satisfaction
and dissatisfaction. Apparently, the meanings of satisfaction and dissatisfac-
tion in the A-Kano model are different from those used in the utility theory.
For example, the questions ‘How satisfied are you with this product?’ and
‘How useful/valuable is this product to you?’ are in fact quite different. An
outdated product may be very unsatisfying, but very useful because one
may rely on it to carry out important work. In such a respect, the Kano
model implies two different perspectives e proper functioning of a product
feature arouses customer satisfaction, while the dysfunction of a product
el 107

Figure 9 Comparison of the
utility theory and Kano’s
theory
108
feature generates dissatisfaction, as shown in Figure 9. This is a useful exten-
sion to the one-dimensional utility measurement. However, this research does
not assert that the Kano’s perspective is more reasonable than that used in
the utility theory. Nevertheless, it provides an alternative measurement of
customer preferences.
6 ConclusionsProduct development for customer’s satisfaction with considerations of pro-
ducer’s capacity necessitates logical prioritization of customer needs. A few
major challenges remain unaddressed for customer need analysis, such as
quantitative measure of customer satisfaction, decision support, and capac-
ity assessment of the producers. This paper presents an analytical Kano
model for customer need analysis, following the basic principles of tradi-
tional Kano model, while consolidating the theoretical foundation. The
A-Kano model adopts the Kano indices for measuring customer’s satisfac-
tion and dissatisfaction. By adopting a polar form representation scheme,
the Kano indices are conducive to exploring the nature of customer satisfac-
tion. In accordance with the Kano indices, the Kano classifiers are deemed
to outperform traditional classification criteria based on the logical polar
form. As an alternative decision process, the configuration index is defined
to prioritize the functional requirements so as to provide decision support
to product configuration design. The merit of the designed product is eval-
uated against the Kano evaluator, leveraging upon both customer’s satisfac-
tion and the producer’s capacity. The configuration index in combination
with the Kano evaluator is deemed to be useful extensions to traditional
Kano where the classification criteria are subjective and unjustifiable. The
A-Kano method defines systematic procedures to elicit the customer needs,
and to conduct surveys for customer need analysis. The overall A-Kano
framework address the customer need analysis from a broader scenario,
such that the customizable product features can be better managed at the
product planning stage.
Design Studies Vol 30 No. 1 January 2009

An analytical Kano mod
AcknowledgmentThis research is partially sponsored by the European Commission (DG Infor-
mation Society and Media) in the framework of the 6th Research Program
(FP6) under grant IST-5-035030-STREP (www.cater-ist.org). Also acknowl-
edged is support from Singapore Agency for Science, Technology and
Research (A*STAR) Science and Engineering Research Council (SERC)
Thematic Strategic Research Programme grant on human factors engineering
(#062 131 0066).
ReferencesBerger, C, Blauth, R, Boger, D, Bolster, C, Burchill, G, DuMouchel, W, Pouliot, F,
Richter, R, Rubinoff, A, Shen, D, Timko, M and Walden, D (1993) Kano’s methodfor understanding customer-defined quality, Center for Quality of ManagementJournal Vol 2 No 4 pp 3e35
Green, P E and DeSarbo, W S (1978) Additive decomposition of perceptions datavia conjoint analysis, Journal of Consumer Research Vol 5 No 1 pp 58e65Hazelrigg, G A (1998) A framework for decision based engineering design, Journalof Mechanical Design Vol 120 pp 653e658
Jiao, J and Chen, C H (2006) Customer requirement management in productdevelopment: a review of research issues, Concurrent Engineering: Research andApplications Vol 14 No 3 pp 173e185
Jiao, J and Tseng, MM (1999) A pragmatic approach to product costing based onstandard time estimation, International Journal of Operations & Production Man-agement Vol 19 No 7 pp 738e755
Jiao, J and Zhang, Y (2005) Product portfolio planning with customereengineer-ing interaction, IIE Transactions Vol 37 No 9 pp 801e814Jiao, J, Ma, Q and Tseng, M M (2003a) Towards high value-added products and
services: mass customization and beyond, Technovation Vol 23 pp 809e821Jiao, J, Zhang, L and Pokharel, S (2003b) Process platform planning for masscustomization in Proceedings of the Second Interdisciplinary World Congresson Mass Customization and Personalization, Technical University, Munich
CD-ROMKano, N, Seraku, N, Takahashi, F and Tsuji, S (1984)Attractive quality andmust-bequality, The Journal of the Japanese Society for Quality Control 14 No 2 pp 39e48
Lai, X, Xie, M and Tan, K C (2004). Optimizing product design using the Kanomodel and QFD, in 2004 IEEE International Engineering Management Confer-ence, 18e21 Oct., pp 1085e1089
Louviere, J, Hensher, D and Swait, J (2000) Stated choice methods, analysis andapplication Cambridge University Press, Cambridge, UKMcKay, A, de Pennington, A and Baxter, J (2001) Requirements management:a representation scheme for product, Computer Aided Design Vol 33 No 7 pp
511e520Matzler, K and Hinterhuber, H H (1998) How to make product developmentprojects more successful by integrating Kano’s model of customer satisfaction
into quality function deployment, Technovation Vol 8 No 1 pp 25e38Moore, W L and Pessemier, E A (1993) Product planning management: designingand delivering value McGraw-Hill, New York
Riviere, P, Monrozier, R, Rogeaux, M, Pages, J and Saporta, G (2006) Adaptivepreference target: contribution of Kano’s model of satisfaction for an optimized
el 109

110
preference analysis using a sequential consumer test, Food Quality and PreferenceVol 17 pp 572e581Sireli, Y, Kauffmann, P and Ozan, E (2007) Integration of Kano’s model intoQFD for multiple product design, IEEE Transactions on Engineering Management
Vol 54 No 2 pp 380e390Suh, N P (2001) Axiomatic design-advances and applications Oxford UniversityPress, New York
Tan, K C and Shen, X X (2000) Integrating Kano’s model in the planning ma-trix of quality function deployment, Total Quality Management Vol 11 No 8pp 1141e1151
Tielemans, P F J (1995) Lead time performance in manufacturing systems, PhDthesis, Eburon, Delft.Wassenaar, H J and Chen, W (2003) An approach to decision-based design with
discrete choice analysis for demand modeling, ASME Journal of MechanicalDesign Vol 125 pp 490e497Wassenaar, H J, Chen, W, Cheng, J and Sudjianto, A (2005) Enhancing discretechoice demand modeling for decision-based design, ASME Journal of Mechanical
Design Vol 127 pp 514e523
Design Studies Vol 30 No. 1 January 2009