ENCCEJA ENSINO FUNDAMENTAL LIVRO DO ESTUDANTE LIVRO DO ESTUDANTE ENSINO FUNDAMENTAL
Upload
khangminh22Category
view
3download
0
International Journal of Economics and Business Administration
Volume IV, Issue 4, 2016
pp. 32 - 49
An Analytical Approach to Comparing Actual Vs.
Fundamental “Price-to-Sales” and “Enterprise Value-to-
Sales” Ratios on the European Stock Market
Dimiter Nenkov Nenkov1
Abstract:
This study is focused on the “price-to-sales ratio” (P/S) and the “enterprise value-to-sales
ratio” (EV/S), which are used in relative valuation, in the analysis of companies’
performance, as well as in the analysis of different sectors and of the market. Special
attention is paid to certain important requirements, related to the correct interpretation of
market and sector averages of these ratios nowadays, including against the background of
their historic levels.
The identification, justification and use of the proper market ratios requires in-depth
knowledge of their essence and of the fundamentals which drive their levels. In this
connection, the logic of the fundamental “price-to-sales” (P/S) and the “enterprise value-to-
sales” (EV/S) ratios is explained.
These two fundamental ratios for the European stock market are calculated and compared
with the actual P/S and EV/S. The results of the study indicate that the current levels of the
actual P/S and EV/S of the European stock market are much higher than the levels suggested
by fundamentals.
Keywords: stock markets, relative valuation, market ratios, P/S ratio, EV/S ratio,
fundamentals
JEL: G12, G15, G23, G32
1 Associate Professor, Dr., Department of Finance, University of National and World
Economy, Sofia Email: [email protected]
brought to you by COREView metadata, citation and similar papers at core.ac.uk
provided by OAR@UM

D. Nenkov Nenkov
33
1. Introduction
Market ratios, also called ratios of market performance, are one important group out
of the several groups of ratios for financial analysis of public companies (Brigham
and Gapenski, 1994). The feature which distinguishes this group of ratios is that the
numerator of each of them is the market price per share (P0), or, alternatively the
enterprise value of the company (EV). Therefore, they are called market ratios. This
specific feature of market ratios provides the opportunity to use them in several
aspects:
- for the analysis of the performance of companies, whose shares are publicly
traded;
- for the analysis of the market and of different sectors, including for
comparing among different markets and sectors;
- in the relative valuation of other companies, which is also popular as
multiples valuation, etc.
Another specific feature of market ratios makes them especially useful in the above
three aspects. This is the fact that they are a kind of “standardized prices” of stocks,
which make different companies, sectors and markets comparable with each other
(Damodaran, 2012).
According to Damodaran (2012), there are a few reasons for the popularity of
relative valuation methods: that they are quick, easy to implement, easy to explain,
they normally yield results, which are close to current market prices. The truth,
however, is that the above advantages also contain the prerequisites for the
disadvantages of relative valuation methods. Quite often, applying relative valuation,
analysts and appraisers arrive at totally wrong price, because of ignoring key
variables. The stocks are normally overpriced when the market overprices the
comparable companies and vice versa. The lack of transparency about key variables
makes relative valuation very sensitive to manipulation (Damodaran, 2012).
These are a part of the reasons why relative valuation methods are very convenient
and very much wanted during bull markets. In such conditions most stock market
players, such as investment bankers, consultants, and others, are interested in
valuation results, which are close to market prices, thus justifying the respective
transactions. Commissions are earned only if deals are finalized. Given the
expectations for continuously rising stock prices, most players seem satisfied with
such results (until the moment when the bubble bursts out). This copes perfectly
with multiples valuation, which yield overpriced stocks in the conditions of an
overpriced market. The relatively neutral DCF valuation models are often neglected
in such situations. In this way the stock bubble is kind of “legalized” in the eyes of
the public (Nenkov, 2010). In this connection some valuation experts say that the
most important question when reviewing a valuation is not which methods are used,
but who paid for the valuation (Damodaran, 2008).

An Analytical Approach to Comparing Actual Vs. Fundamental “Price-to-Sales” and
“Enterprise Value-to-Sales” Ratios on the European Stock Market
34
Many analysts contend that the multiples valuation methods are easy to implement,
but according to Koller, Goedhart and Wessels (2015) in reality it is just the
opposite. A well elaborated multiple analysis requires a lot of the same efforts and
adjustments as with the traditional DCF analysis. The disadvantages of the market
ratios, which were discussed in terms of relative valuation, need to be accounted
when used in the other two directions as well – for company analysis and for the
analysis of the sectors and of the stock market.
2. “Price-to-Sales” (P/S) and “Enterprise Value-to-Sales” (EV/S) Ratios
O’Shaughnessy (2005) qualifies the price-to-sales (P/S) ratio as the best of all
market ratios. Fisher (2008) calls it “almost perfect measure of popularity”. The P/S
is a measure of the value of company’s equity, relative to its sales. As there are
many investors who like high P/S ratios, there are also investors, who buy at low P/S
ratios, since they believe they have a bargain (O’Shaughnessy, 2005).
The price-earnings (P/E) and the price-to-book (P/BV) ratios continue to be very
popular as they used to be in the past, but during the latest two or three decades the
analysts extended the circle of ratios used, including the P/S ratios. It is very
attractive to investors and analysts for several reasons. In the first place, while P/E
ratios are often negative, the P/S ratio is available even for the worst-performing
companies, as well as for the start-up companies. There is virtually no bias of
average P/S, resulting from the exclusion of loss making companies. In the second
place, P/S is quite independent of the alternative accounting practices, unlike P/E
and P/BV (Damodaran, 2012). In the third place, P/S ratios are normally more
sustainable in time than P/Es (Reed, 2011). The latter are very volatile because of
the effects of the operating and financial leverage, and the resulting serious volatility
of earnings per share by year (Molodovsky, 1953; Thalassinos and Liapis, 2013).
The main disadvantage of the P/S and EV/S ratios is that they may lead to
determining high value of a company with growing revenues, even if this company
works at loss. To have high intrinsic value, the company should generate high profits
and cash flows. In this connection, it is extremely important to ensure that the
comparable companies have similar profitability ratios and cash flows with the
valued company. The P/S is the ratio between the market price per share and the
sales per share:
Alternatively, the P/S can also be presented as the ratio between market value of
equity (market capitalization) and sales:

D. Nenkov Nenkov
35
Another drawback of the P/S is that it is incorrectly defined – there is no compliance
between numerator and denominator. The denominator is an enterprise indicator,
which depends only on company’s operations and is not influenced by financial
leverage. The numerator is an equity indicator, which is a function of both of
operations and capital structure. This way, when comparing companies with
different capital structure, the P/S can lead to the wrong conclusions.
To overcome this drawback of P/S, an alternative sales-based market ratio is
recommended – the enterprise value-to sales ratio (EV/S). It is the ratio between
enterprise value and sales:
According to Damodaran (2002), the enterprise value (EV) is equal to:
This should correspond to the market value of the operating assets of the company. It
does not include financial and other non-operating assets. The above formula reflects
the earlier definition provided by Damodaran. In more recent publications
(Damodaran, 2012) the same author gives a little bit different definition, as follows:
This second definition should be accepted as more sustained. The main argument for
this is that when calculating equity market value, it is normal to deduct the book
value of debt from enterprise value. This is the amount due to creditors. For
example, when the company has high default risk, the market value of bonds goes
down significantly below their face value. If we deduct this low market value of
debt, we arrive at equity value, which is overpriced. The market value of debt relates
to bond holders and potential buyers of debt on the secondary bond markets. This is
the value at which bondholders could sell their bonds. But the principle due by a
company to its bondholders should equal their book value, regardless of the current
market value of bonds. Finally, it makes sense to use book value of debt in the
formula for EV.
Another important issue related to the above definition of EV concerns the scope of
“cash”. In our view this should not be limited to cash in banks, but should also
include investments in different financial and other non-operating assets. The EV,
defined in this way, is indeed the equivalent of the operating value of the company.

An Analytical Approach to Comparing Actual Vs. Fundamental “Price-to-Sales” and
“Enterprise Value-to-Sales” Ratios on the European Stock Market
36
The interpretation of EV is not unanimous by different authors. Koller, Goedhart and
Wessels (2013) have a little bit different understanding about enterprise value. They
define it in an alternative way, as the function of certain positions in the asset side of
the balance sheet, as follows:
Operating value (value of operations)
+ Value of financial assets
+ Value of non-consolidated interest in other companies
+ Excess cash
= Enterprise value (EV)
Obviously, these authors have in mind the value of the company as a whole,
including both operating and non-operating assets. For this value Damodaran uses
the term Firm Value (Damodaran, 2013).
Identifying EV with operating value is more justified in terms of ensuring
comparability between the numerator and denominator of the EV/S. The sales (S) in
the denominator are the function predominantly of the operating assets of the
company. They do not include revenue from financial and other non-operating
assets. In this connection, it is sustained that the numerator is equal to the value of
operating assets only, which corresponds to the definition of enterprise value, given
by A. Damodaran. Further in this study we stick to this interpretation of enterprise
value (EV).
3. P/S and EV/S Ratios on the European Capital Market
Table 1 contains summarized data about the P/S and EV/S ratios of companies on
the developed capital markets of Europe (only countries with developed capital
markets are included) for the post-crisis period 2010-2016. The summarized values
are determined for annual samples of about 6000 companies on average. Both ratios
do not vary significantly by years, with average P/S of 0.98 and average EV/S of
2.12. One of the first impressions is that EV/S is more than twice higher than P/S,
which is very large difference. This could eventually be explained with a relatively
high financial leverage for European companies. The average net margin for the
period is 5.13% and the average operating margin is 8.79%.
Table 1: P/S and EV/S ratios for Europe for the period 2010 – 2016.
Year
Number of
Companies P/S Net Margin EV/S
Operating
Margin
2010 4818 0.97 5.91% 2.26 9.19%
2011 5204 0.72 6.21% 2.07 9.33%
2012 6022 0.85 4.31% 2.02 8.89%
2013 6073 1.04 4.44% 2.07 8.83%
D. Nenkov Nenkov
37
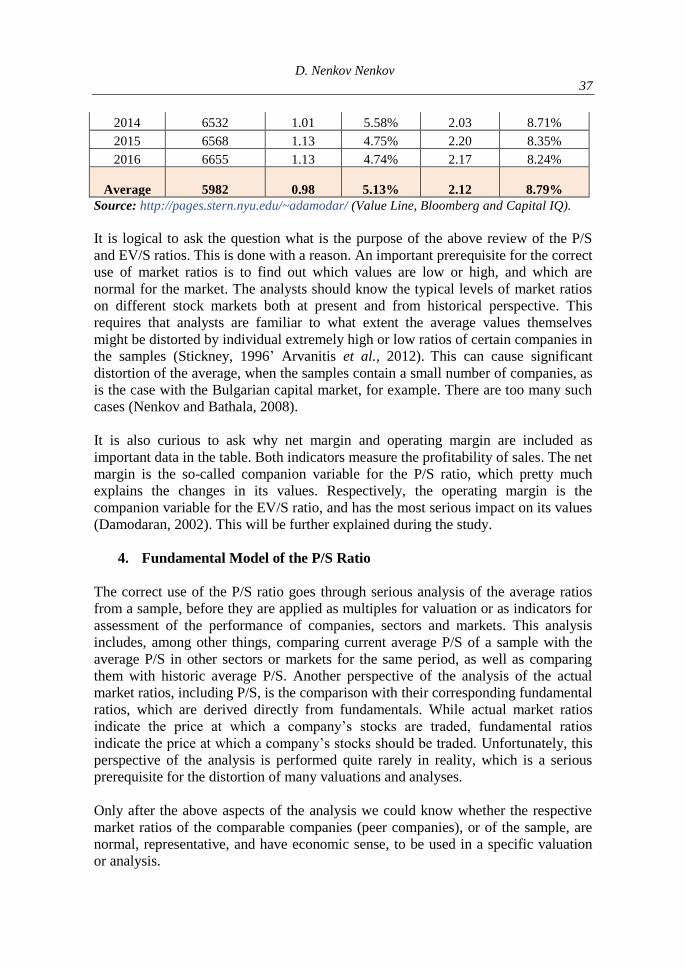
2014 6532 1.01 5.58% 2.03 8.71%
2015 6568 1.13 4.75% 2.20 8.35%
2016 6655 1.13 4.74% 2.17 8.24%
Average 5982 0.98 5.13% 2.12 8.79%
Source: http://pages.stern.nyu.edu/~adamodar/ (Value Line, Bloomberg and Capital IQ).
It is logical to ask the question what is the purpose of the above review of the P/S
and EV/S ratios. This is done with a reason. An important prerequisite for the correct
use of market ratios is to find out which values are low or high, and which are
normal for the market. The analysts should know the typical levels of market ratios
on different stock markets both at present and from historical perspective. This
requires that analysts are familiar to what extent the average values themselves
might be distorted by individual extremely high or low ratios of certain companies in
the samples (Stickney, 1996’ Arvanitis et al., 2012). This can cause significant
distortion of the average, when the samples contain a small number of companies, as
is the case with the Bulgarian capital market, for example. There are too many such
cases (Nenkov and Bathala, 2008).
It is also curious to ask why net margin and operating margin are included as
important data in the table. Both indicators measure the profitability of sales. The net
margin is the so-called companion variable for the P/S ratio, which pretty much
explains the changes in its values. Respectively, the operating margin is the
companion variable for the EV/S ratio, and has the most serious impact on its values
(Damodaran, 2002). This will be further explained during the study.
4. Fundamental Model of the P/S Ratio
The correct use of the P/S ratio goes through serious analysis of the average ratios
from a sample, before they are applied as multiples for valuation or as indicators for
assessment of the performance of companies, sectors and markets. This analysis
includes, among other things, comparing current average P/S of a sample with the
average P/S in other sectors or markets for the same period, as well as comparing
them with historic average P/S. Another perspective of the analysis of the actual
market ratios, including P/S, is the comparison with their corresponding fundamental
ratios, which are derived directly from fundamentals. While actual market ratios
indicate the price at which a company’s stocks are traded, fundamental ratios
indicate the price at which a company’s stocks should be traded. Unfortunately, this
perspective of the analysis is performed quite rarely in reality, which is a serious
prerequisite for the distortion of many valuations and analyses.
Only after the above aspects of the analysis we could know whether the respective
market ratios of the comparable companies (peer companies), or of the sample, are
normal, representative, and have economic sense, to be used in a specific valuation
or analysis.

An Analytical Approach to Comparing Actual Vs. Fundamental “Price-to-Sales” and
“Enterprise Value-to-Sales” Ratios on the European Stock Market
38
To find out which variables drive the fundamental P/S, we must get familiar with its
theoretical or fundamental model. It is derived from the Gordon’s constant growth
dividend model. For this purpose, the current dividend per share in the dividend
model is expressed as the function of the earnings per share (EPS) and the payout
ratio (1-b). After this the current earnings per share (EPS) are expressed as the
function of the net margin and current sales per share (SPS), as follows:
Finally, we divide both sides of the transformed equation by the current sales per
share to arrive at the one-stage fundamental model for P/S (Damodaran, A., 2012):
Where:
P/S = fundamental price-to-sales ratio,
b = foreseen plowback ratio,
(1–b) = foreseen payout ratio,
r = cost of equity,
g = expected growth rate of dividends per share.
If we express the plowback ratio (b) as a function of the return on equity (ROE)
and the expected growth rate (g), the model becomes as follows:
One of the advantages of this variant of the model is that it can be used to determine
the P/S of non-public companies, which do not pay dividends. It also becomes clear
from the model that the price-to-sales ratio of a company with a very low or zero
growth rate is determined by the differential between net margin and cost of capital.
If the net margin is higher than the cost of equity, the price per share should be
higher than the sales per share. And vice versa, if the net margin is lower than the
cost of equity, the price per share should be lower than the sales per share.
The more reliable model to use is the two-stage fundamental P/S model. It is more
appropriate for companies with temporary high growth, which cannot be sustained
forever. The starting point for deriving this fundamental model is the two-stage
dividend discount model. Under this model, future dividends are grouped in two
sub-periods: high growth period and stable (sustainable) growth period.
Again, the EPS0 are expressed as the function of sales per share (SPS0) and net
margin, after which both sides of the equation are divided by the sales per share,
D. Nenkov Nenkov
39
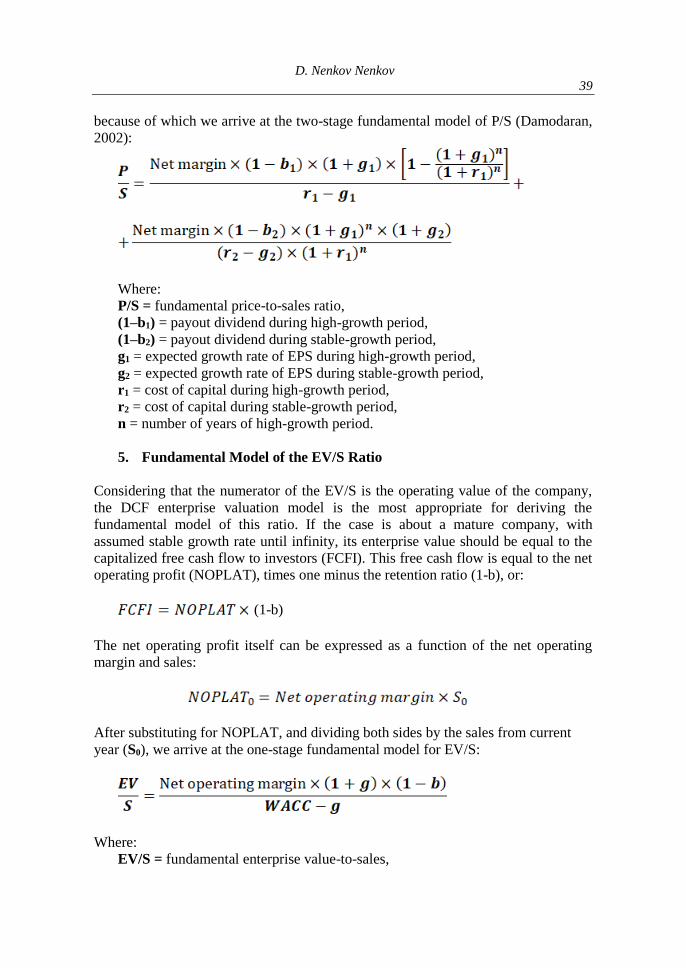
because of which we arrive at the two-stage fundamental model of P/S (Damodaran,
2002):
Where:
P/S = fundamental price-to-sales ratio,
(1–b1) = payout dividend during high-growth period,
(1–b2) = payout dividend during stable-growth period,
g1 = expected growth rate of EPS during high-growth period,
g2 = expected growth rate of EPS during stable-growth period,
r1 = cost of capital during high-growth period,
r2 = cost of capital during stable-growth period,
n = number of years of high-growth period.
5. Fundamental Model of the EV/S Ratio
Considering that the numerator of the EV/S is the operating value of the company,
the DCF enterprise valuation model is the most appropriate for deriving the
fundamental model of this ratio. If the case is about a mature company, with
assumed stable growth rate until infinity, its enterprise value should be equal to the
capitalized free cash flow to investors (FCFI). This free cash flow is equal to the net
operating profit (NOPLAT), times one minus the retention ratio (1-b), or:
(1-b)
The net operating profit itself can be expressed as a function of the net operating
margin and sales:
After substituting for NOPLAT, and dividing both sides by the sales from current
year (S0), we arrive at the one-stage fundamental model for EV/S:
Where:
EV/S = fundamental enterprise value-to-sales,

An Analytical Approach to Comparing Actual Vs. Fundamental “Price-to-Sales” and
“Enterprise Value-to-Sales” Ratios on the European Stock Market
40
b = retention (reinvestment) ratio,
WACC = weighted average cost of capital,
g = expected growth rate of NOPLAT.
In this case the net operating margin is calculated as the ratio of current NOPLAT to
current sales. From the above equation we can see that the enterprise value-to-sales
ratio is a growing function of the net operating margin and the growth rate (g) and a
decreasing function of the reinvestment rate (b) and the weighted average cost of
capital (WACC). After expressing the reinvestment rate (b) as a function of the
return on invested capital (ROIC) and the growth rate (g), the model acquires the
following shape:
It becomes clear from the model that for a company with a growth rate close to or
equal to zero, the EV/S should be determined by the differential between net
operating margin and WACC. The model also shows that for a given level of the
growth rate (g), the higher the ROIC, the higher the EV/S.
The two-stage fundamental model of EV/S can be derived from the two-stage DCF
enterprise valuation model, where the future is divided into two sub-periods - an
explicit forecast period and after it. From the DCF model we know that, other things
being equal, the free cash flow to investors (FCFI) for each year is equal to that part
of NOPLAT, which is not retained and reinvested, and can be expressed as in the
case with the one-stage model:
We assume that there is one and the same growth rate for the years of the explicit
growth period - g1, and another constant growth rate after the explicit forecast period
- g2. We can also express NOPLAT0 as a function of sales and the net operating
margin:
After that we divide both sides of the equation by sales (S0), and arrive at the two-
stage fundamental model of the EV/S:

D. Nenkov Nenkov
41
Where:
EV/S = fundamental enterprise value-to-sales,
b1 = reinvestment rate for NOPLAT during the explicit forecast period,
b2 = reinvestment rate for NOPLAT after the explicit forecast period,
g1 = expected growth rate of NOPLAT during the explicit forecast period,
g2 = expected growth rate of NOPLAT after the explicit forecast period,
WACC1 = weighted average cost of capital during the explicit forecast period,
WACC2 = weighted average cost of capital after the explicit forecast period,
n = number of years of the explicit forecast period.
The sales-based market ratios, even though a function of several variables, are
mostly influenced by the profit margin – the net margin for P/S and the net operating
margin for EV/S. Different sectors and businesses have different profit margins,
which suggests different P/S and EV/S for these businesses. Companies in
businesses with high margin should have high sales-based ratios and vice versa. A
low profit margin directly leads to lower P/S and EV/S, but it has also indirect effect
in the same direction, because it reduces the growth rate (g).
However, this does not necessarily mean that all companies with low net margin or
net operating margin would be with poor financial results and not creating value.
Many companies rely on high turnover, which very often is at the expense of low
operating margin. They bet on being the leaders in the market by volume of sales.
Others bet on high margin, trying to be the price leaders. Not always the latter are
better off than the first. This depends on the effect which the selected strategy has
over the value creation process. Value creation itself depends on the spread between
the return on invested capital (ROIC) and the cost of capital (WACC), at the
enterprise level, and respectively on the spread between the return on equity (ROE)
and the cost of equity (r), at the equity level. This is the moment to note that each of
the two sales-based market ratios is influenced also by another variable, which does
not show up in the above fundamental models of P/S and EV/S. In this connection it
is useful to express ROIC and ROE in the following way:

An Analytical Approach to Comparing Actual Vs. Fundamental “Price-to-Sales” and
“Enterprise Value-to-Sales” Ratios on the European Stock Market
42
The two equations indicate that the variable in question at the enterprise level is
capital turnover ratio and at the equity level it is equity turnover ratio. Normally
businesses with low margin have higher turnover of both invested capital and equity.
This compensates the low profit margin, leading to ROIC and ROE which are high
enough. This explains how companies with low profit margins can also create
economic value added.
The fact that the net margin is the leading (companion) variable, which has
significant impact on the values of the P/S ratio is confirmed by different studies.
For example, one very simplified regression of P/S against net margin for companies
in sector “production of machines and equipment” on the Bulgarian Stock Exchange
in 2006 establishes strong positive correlation and a relatively high determination
ratio (R2) of 0.68. The same strong positive correlation is established between EV/S
and the operating margin, with coefficient of determination (R2) of 0.78 (Nenkov,
2015). In other words, in this case both margins explain the changes in the two
market ratios to a very high extent.
Damodaran makes annual regressions for each of the main market ratios against a
group of independent variables. They also confirm the high weight of the profit
margins in explaining the changes of P/S and EV/S.
6. Fundamental Р/S ratio for the European stock market
For the calculation of the average fundamental P/S for the European stock market we
can use average values of the key variables which determine it. We can start with the
one-stage model, as a simpler one. Besides the average net margin for Europe of
5.13% for the period 2010-2016 (Table 1), some other input variables for Europe are
also needed, such as: cost of equity (r), return on equity (ROE) and retention rate (b).
The last two variables are necessary for determining forecasted growth rate (g).
It turns out that the selection of the appropriate values for each of the above
variables itself is a challenge. This refers most of all to the cost of equity, since there
is no consensus about its true value. There are quite a few different methods for
determining it. For example, when calculating cost of equity as the sum of risk free
rate and risk premium, it can be calculated at least in three variants: historic
arithmetic average, historic geometric average, and implied (current) cost of equity.

D. Nenkov Nenkov
43
The cost of equity is not the subject of discussion in this study. In this case we select
the average cost of equity (r) for Europe for the latest four years (2013-2016) of
9.84%.
The situation is not very different with selecting the proper return of equity (ROE).
The issue is about what is the ROE, which is the most representative to be used as
the basis for forecasting future ROE – whether this should be the current ROE from
the most recent year or the average for the latest several years. Each option provides
values, that in most cases are quite different from each other. These differences have
serious impact on the estimated fundamental P/S ratios. The current ROE for 2016 is
7.36% (without financial companies), while the average ROE for the period 2010-
2016 is 7.93%. What is more, usually data in different databases are different, which
additionally makes it difficult to decide on which specific value to choose for the
respective input variable. In this case we use the average ROE for the post-crisis
period (2010-2016) of 7.93%. We also use the average plowback (retention) ratio for
2016 for companies in Europe b =41.79%.
Finally, the input variables for applying the one-stage model are:
Net margin = 5.13%
Plowback (retention) ratio b = 0.4179
Cost of equity r (RRRE) = 9.84%
Growth rate g = 3.31% (ROE × b = 7.93% × 0.4179 = 3.31%)
Table 2 shows the calculated by the model average fundamental P/S ratio. It is equal
to 0.47 and is about half the actual average P/S for the European market of 0.98, as
shown in Table 1. The low value of the fundamental (theoretical) P/S should be
explained with the relatively low net margin of 5.13%. Given the much lower
fundamental P/S, a conclusion can be made that the level of the actual average P/S
for Europe is not justified.
Table 2: Average fundamental P/S for the European market for 2017 (one-stage
model)
Pace of change of net margin (in %): 10%
Pace of change of "r" (in %): 10%
Values Values of Net Margin
Of 2.6% 3.1% 3.6% 4.1% 4.6% 5.1% 5.6% 6.2% 6.7% 7.2% 7.7%
"r"
Р/S Р/S Р/S Р/S Р/S Р/S Р/S Р/S Р/S Р/S Р/S
4.9% 0.96 1.15 1.34 1.54 1.73 1.92 2.11 2.31 2.50 2.69 2.88
5.9% 0.60 0.71 0.83 0.95 1.07 1.19 1.31 1.43 1.55 1.67 1.79
6.9% 0.43 0.52 0.60 0.69 0.78 0.86 0.95 1.04 1.12 1.21 1.29
7.9% 0.34 0.41 0.47 0.54 0.61 0.68 0.74 0.81 0.88 0.95 1.02
8.9% 0.28 0.33 0.39 0.45 0.50 0.56 0.61 0.67 0.72 0.78 0.84
9.8% 0.24 0.28 0.33 0.38 0.43 0.47 0.52 0.57 0.61 0.66 0.71

An Analytical Approach to Comparing Actual Vs. Fundamental “Price-to-Sales” and
“Enterprise Value-to-Sales” Ratios on the European Stock Market
44
10.8% 0.21 0.25 0.29 0.33 0.37 0.41 0.45 0.49 0.53 0.58 0.62
11.8% 0.18 0.22 0.25 0.29 0.33 0.36 0.40 0.44 0.47 0.51 0.54
12.8% 0.16 0.20 0.23 0.26 0.29 0.33 0.36 0.39 0.42 0.46 0.49
13.8% 0.15 0.18 0.21 0.24 0.27 0.29 0.32 0.35 0.38 0.41 0.44
14.8% 0.13 0.16 0.19 0.22 0.24 0.27 0.30 0.32 0.35 0.38 0.40
Source: Calculations of the author.
The values in the table also illustrate the high sensitivity of the fundamental P/S to
the combination between net margin and r. They vary within broad range from 0.13
at the bottom left corner of the table to 2.88 at the upper right corner of the table.
This is mainly due to the application of the one-stage model. The extreme values
received under this model usually do not have economic sense and should not be
taken seriously. The one-stage models for determining the fundamental ratios
reproduce the drawbacks of the capitalization models, from which they were
derived, such as the Gordon dividend model and its analogues. Because of this, one-
stage models easily yield illogical and misleading results for the fundamental ratios.
Therefore, it is recommended in most cases to apply the two-stage fundamental
models.
From the models above, it became clear that the two-stage model divides the future
into two sub-periods: high growth period and stable growth period. More
conservative values for the growth rate g2 should normally be used for the stable
growth period. The retention ratio b2 should be with some moderate value, such as
0.50. Other things being equal, the average ROE in the long run would most likely
be equal to the average cost of equity r. Therefore, in this case we assume that ROE
during the stable growth period will be equal to the cost of equity of 9.53%.
Because of the lack of another available benchmark for the average net margin for
Europe in the long run, we use the same average net margin of 5.13% for the period
2010-2016 (from Table 1). We simply assume that it is quite representative and will
remain the same during the stable growth period.
Thus, the input variables for the two-stage model are as follows:
Net margin for the first sub-period = 5.13%
Retention ratio for the first sub-period b1 = 0.4179
Cost of equity for the first sub-period r1 = 9.84%
Growth rate for the first sub-period g1 = 3.31%
(ROE × b = 7.93% × 0.4179 = 3.31%)
Continuance of the first sub-period n = 5 years
Net margin for the stable growth period = 5.13% (remains the same)
Retention ratio during the stable growth period b2 = 0.5
Cost of equity during the stable growth period r2 = 9.84%
Growth rate during the stable growth period g2 = 4.92%
(ROE × b =9.84% × 0.5 = 4.92%)

D. Nenkov Nenkov
45
The specifics in this case is that it is not correct to talk about a high growth period at
the beginning. The input assumptions and variables are such, that forecasted growth
rate during the first sub-period is somewhat lower than growth rate during the stable
growth period.
Table 3: Average fundamental P/S for the European market for 2017 (two-stage
model).
Pace of change of net margin (in %): 10%
Pace of change of "r" (in %): 10%
Value
s Values of Net Margin
of 2.6% 3.1% 3.6% 4.1% 4.6% 5.1% 5.6% 6.2% 6.7% 7.2% 7.7%
"r"
Р/S Р/S Р/S Р/S Р/S Р/S Р/S Р/S Р/S Р/S Р/S
4.9% 0.58 0.59 0.61 0.62 0.63 0.65 0.66 0.68 0.69 0.71 0.72
5.9% 0.55 0.57 0.58 0.59 0.61 0.62 0.64 0.65 0.66 0.68 0.69
6.9% 0.53 0.54 0.56 0.57 0.58 0.60 0.61 0.62 0.64 0.65 0.66
7.9% 0.51 0.52 0.53 0.55 0.56 0.57 0.59 0.60 0.61 0.62 0.64
8.9% 0.49 0.50 0.51 0.52 0.54 0.55 0.56 0.57 0.59 0.60 0.61
9.8% 0.47 0.48 0.49 0.50 0.51 0.53 0.54 0.55 0.56 0.58 0.59
10.8% 0.45 0.46 0.47 0.48 0.49 0.51 0.52 0.53 0.54 0.56 0.57
11.8% 0.43 0.44 0.45 0.46 0.48 0.49 0.50 0.51 0.52 0.53 0.55
12.8% 0.41 0.42 0.43 0.45 0.46 0.47 0.48 0.49 0.50 0.51 0.53
13.8% 0.39 0.41 0.42 0.43 0.44 0.45 0.46 0.47 0.48 0.50 0.51
14.8% 0.38 0.39 0.40 0.41 0.42 0.43 0.44 0.46 0.47 0.48 0.49
Source: Calculations of the author
The calculated average P/S ratios is only 0.53 (Table 3) and is not sufficiently
different from the fundamental P/S calculated through the one-stage model. As a
rule, the results received under the two-stage model are much more precise. For most
businesses it is normal to forecast return on equity (ROE) for the stable growth
period, which is oriented around the level of the cost of equity. This is the most
likely scenario in the long run. This combination suggests moderate levels of the
fundamental P/S. Under the two-stage model, given a duration of the first period of 5
years, the weight of the cash flows from the stable growth period (the so called
“continuing value”) is decisive for the present value of stocks. In the applied here
two-stage model the net margin and the cost of equity (r) change only during the
first sub-period, and remain constant during the stable growth period. Therefore the
values in Table 3 are not very sensitive to the different combinations between net
margin and cost of equity. They vary within a narrow range between 0.38 and 0.72.
This fundamental average P/S of 0.53 is also much lower than the actual average P/S
for the European market of 0.98. If we assume that this actual average P/S is
An Analytical Approach to Comparing Actual Vs. Fundamental “Price-to-Sales” and
“Enterprise Value-to-Sales” Ratios on the European Stock Market
46
representative, as well as if the input variables for the calculation of the fundamental
P/S are representative, we can make the conclusion that stock prices on the European
capital market are almost two times overpriced.
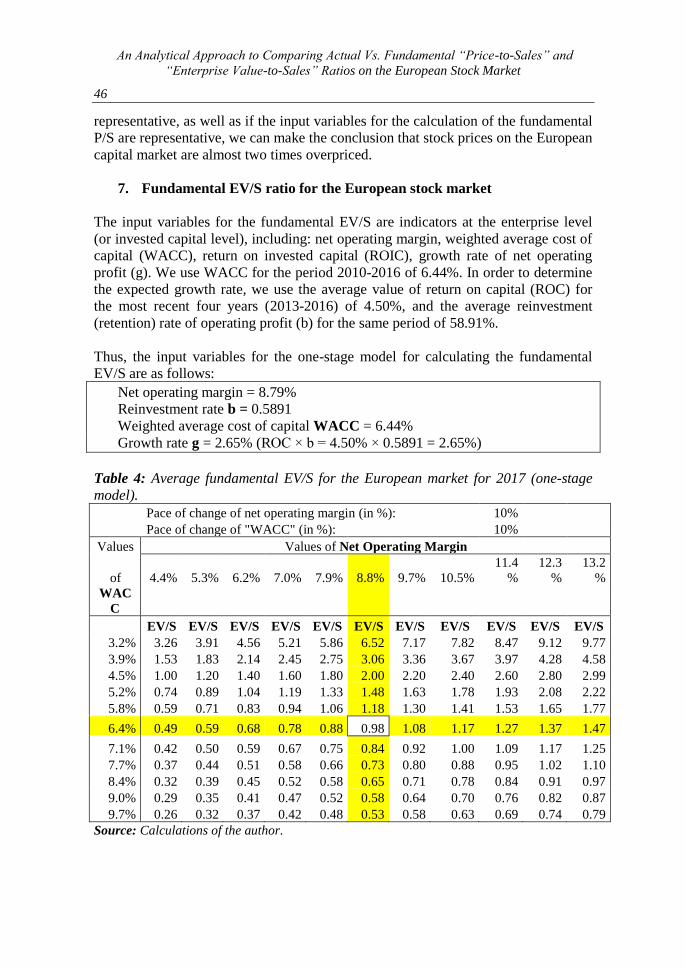
7. Fundamental EV/S ratio for the European stock market
The input variables for the fundamental EV/S are indicators at the enterprise level
(or invested capital level), including: net operating margin, weighted average cost of
capital (WACC), return on invested capital (ROIC), growth rate of net operating
profit (g). We use WACC for the period 2010-2016 of 6.44%. In order to determine
the expected growth rate, we use the average value of return on capital (ROC) for
the most recent four years (2013-2016) of 4.50%, and the average reinvestment
(retention) rate of operating profit (b) for the same period of 58.91%.
Thus, the input variables for the one-stage model for calculating the fundamental
EV/S are as follows:
Net operating margin = 8.79%
Reinvestment rate b = 0.5891
Weighted average cost of capital WACC = 6.44%
Growth rate g = 2.65% (ROC × b = 4.50% × 0.5891 = 2.65%)
Table 4: Average fundamental EV/S for the European market for 2017 (one-stage
model).
Pace of change of net operating margin (in %): 10%
Pace of change of "WACC" (in %): 10%
Values Values of Net Operating Margin
of 4.4% 5.3% 6.2% 7.0% 7.9% 8.8% 9.7% 10.5%
11.4
%
12.3
%
13.2
%
WAC
C
EV/S EV/S EV/S EV/S EV/S EV/S EV/S EV/S EV/S EV/S EV/S
3.2% 3.26 3.91 4.56 5.21 5.86 6.52 7.17 7.82 8.47 9.12 9.77
3.9% 1.53 1.83 2.14 2.45 2.75 3.06 3.36 3.67 3.97 4.28 4.58
4.5% 1.00 1.20 1.40 1.60 1.80 2.00 2.20 2.40 2.60 2.80 2.99
5.2% 0.74 0.89 1.04 1.19 1.33 1.48 1.63 1.78 1.93 2.08 2.22
5.8% 0.59 0.71 0.83 0.94 1.06 1.18 1.30 1.41 1.53 1.65 1.77
6.4% 0.49 0.59 0.68 0.78 0.88 0.98 1.08 1.17 1.27 1.37 1.47
7.1% 0.42 0.50 0.59 0.67 0.75 0.84 0.92 1.00 1.09 1.17 1.25
7.7% 0.37 0.44 0.51 0.58 0.66 0.73 0.80 0.88 0.95 1.02 1.10
8.4% 0.32 0.39 0.45 0.52 0.58 0.65 0.71 0.78 0.84 0.91 0.97
9.0% 0.29 0.35 0.41 0.47 0.52 0.58 0.64 0.70 0.76 0.82 0.87
9.7% 0.26 0.32 0.37 0.42 0.48 0.53 0.58 0.63 0.69 0.74 0.79
Source: Calculations of the author.

D. Nenkov Nenkov
47
The results of the application of the one-stage model are in Table 4. The calculated
EV/S of 0.98 is more than twice lower than the actual average EV/S for Europe of
2.12. The other calculated values in the table demonstrate high sensitivity to the
different combinations between net operating margin and cost of capital (WACC).
This should be explained with the use of the one-stage model and its drawbacks.
The input variables for the two-stage model are determined, following the same
logic as for the two-stage fundamental P/S model. We assume that the net operating
margin during the stable growth period will remain the same as for the explicit
forecast period. For determining the expected growth g2 we assume that the return
on capital (ROC) in the long term will be about the same as the weighted average
cost of capital (WACC), and the reinvestment rate of the net operating profit
(NOPLAT) is with a moderate value of 0.5.
Thus, the input variable for the model are as follows:
Net operating margin during the explicit forecast period = 8.79%
Retention (reinvestment) rate during the explicit forecast period b1 = 0.5891
Weighted average cost of capital during the explicit forecast period WACC1 =
6.44%
Growth rate during the explicit forecast period g1 = 2.65%
(ROC × b = 4.50% × 0.5891 = 2.65%)
Continuance of the explicit forecast period n = 5 years
Net operating margin after the explicit forecast period = 8.79% (remains the
same)
Retention (reinvestment) rate after the explicit forecast period b2 = 0.5
Weighted average cost of capital after the explicit forecast period WACC2 =
6.44%
Growth rate after the explicit forecast period g2 = 3.22%
(ROC × b = 6.44% × 0.5 = 3.22%)
Table 5: Average fundamental EV/S for the European market for 2017 (two-stage
model).
Pace of change of net operating margin (in %): 10%
Pace of change of "WACC" (in%): 10%
Values Values of Net Operating Margin
of 4.4% 5.3% 6.2% 7.0% 7.9% 8.8% 9.7% 10.5%
11.4
%
12.3
%
13.2
%
WACC
EV/
S
EV/
S
EV/
S
EV/
S
EV/
S
EV/
S
EV/
S EV/S EV/S EV/S EV/S
3.2% 1.46 1.48 1.49 1.51 1.53 1.55 1.57 1.58 1.60 1.62 1.64
3.9% 1.42 1.43 1.45 1.47 1.49 1.50 1.52 1.54 1.56 1.57 1.59
4.5% 1.37 1.39 1.41 1.43 1.44 1.46 1.48 1.49 1.51 1.53 1.54
5.2% 1.33 1.35 1.37 1.38 1.40 1.42 1.43 1.45 1.47 1.48 1.50

An Analytical Approach to Comparing Actual Vs. Fundamental “Price-to-Sales” and
“Enterprise Value-to-Sales” Ratios on the European Stock Market
48
5.8% 1.29 1.31 1.33 1.34 1.36 1.38 1.39 1.41 1.43 1.44 1.46
6.4% 1.26 1.27 1.29 1.31 1.32 1.34 1.35 1.37 1.39 1.40 1.42
7.1% 1.22 1.24 1.25 1.27 1.28 1.30 1.32 1.33 1.35 1.36 1.38
7.7% 1.19 1.20 1.22 1.23 1.25 1.26 1.28 1.29 1.31 1.33 1.34
8.4% 1.15 1.17 1.18 1.20 1.21 1.23 1.24 1.26 1.27 1.29 1.31
9.0% 1.12 1.13 1.15 1.16 1.18 1.19 1.21 1.22 1.24 1.25 1.27
9.7% 1.09 1.10 1.12 1.13 1.15 1.16 1.18 1.19 1.21 1.22 1.24
Source: Calculations of the author.
Table 5 shows that the received average EV/S ratio under the two-stage model is
1.34. This fundamental EV/S is also much lower than average actual EV/S for the
European market of 2.12, which is an indicator that according to the results from
two-stage model, the market seems again seriously overpriced. Of course, we again
make the provision that the above conclusion is valid only if we accept that the
actual average EV/S for Europe is representative, as well as if we accept that the
input variables for the calculation of the fundamental EV/S are also representative
enough for Europe. The table shows also that because of the change of the net
operating margin and the weighted average cost of capital during the explicit
forecast period, the fundamental EV/S ratios vary within a narrow range – between
1.09 and 1.64. This is mainly due to the moderate average input variables after the
end of the explicit forecast period (or during the stable growth period).
8. Conclusion
The P/S and EV/S ratios provide excellent opportunity for analysis of stock prices
and indexes on the main international capital markets, including European developed
markets. Besides through the comparison among different markets, and with historic
averages, actual P/S and EV/S can be even better analyzed by comparing with the
respective fundamental P/S and EV/S for each capital market. The derived
fundamental P/S and EV/S ratios on the European stock market are much lower than
the actual average ratios. This means that the stock market in Europe seems highly
overpriced, judging from these two market ratios. This conclusion, of course, is valid
only if the average actual P/S and EV/S are representative for the developed
European markets, and also if the input variables for calculating the P/S and EV/S
for Europe are representative.
References:
Alford, A.W. 1992. The Effect of the Set of Comparable Firms on the Accuracy of the Price-
Earnings Valuation Method. Journal of Accounting Research, 94-108.
Arvanitis, S., Tzigkounaki, I.S., Stamatopoulos, T.V. and Thalassinos, I.E. 2012. Dynamic
approach of capital structure of European shipping companies. International Journal
of Economic Sciences and Applied Research, 5(3), 33-63.
Block, E.F. 1995. A Study of the Price to Book Relationship. Financial Analysts Journal,

D. Nenkov Nenkov
49
January/February.
Blodget, H. 2011. Is there a New Tech Bubble? No. Business Insider, Available at:
<http://www.businessinsider.com/is-there-a-new-tech-bubble-2011-4#-1.
Brigham, E.F., Gapenski, L. 1994. Financial Management: Theory and Practice. The Dryden
Press.
Copeland, T., Koller, T., Murrin, J. 2000. Valuation – Measuring and Managing the Value
of Companies. John Wiley & Sons, New York.
Damodaran, A. 2002. Investment Valuation – Tools and Techniques for Determining the
Value of Any Asset. John Wiley & Sons, New York.
Damodaran, A. 2008. September 12 to October 16 –Five Weeks from Hell and the Lessons
We Have Learned. http://pages.stern.nyu.edu/~adamodar/
Fisher, K.L. 2008. Super Stocks. McGraw-Hill, Reissued Ed.
Fernandez, P., Andrada, B. 2007. 110 Common Errors in Company Valuations, IESE
Business School, Working Paper WP No 714.
Fernandez, P., 2015. Valuation and Common Sense, 5th ed.
http://ssrn.com/abstract=2209089
Koller, T., Goedhart, M., Wessels, D. 2015. Valuation – Measuring and Managing the Value
of Companies. John Weley & Sons, New York.
Molodovsky, N. 1953. A Theory of Price-Earnings Ratios. Financial Analysts Journal,
January/February.
Nenkov, D., Bathala, C. 2008. Price-Earnings Ratios on the Bulgarian Capital Market: An
Analytical Approach to Comparing Actual Vs. Fundamental P/E Ratios,
Globalization: Opportunities & Challenges, Wisdom Publications.
Nenkov, D. 2007. Costing methods for determining the value of companies. Nature and
peculiarities of the coefficient "Price-income", Scientific papers of UNWE, 2.
Nenkov, D. 2014. New US Stock Market Records - High Value or another Balloon?
Economic and Social Alternatives, 4, 5-16.
Nenkov, D. 2015. Determination of the Value of Companies. University of National and
World Economy, Sofia.
Nenkov, D. 2005. Estimation of investments in real assets. IM "Holding", Sofia.
Nenkov, D. 2010. Financing the financial crisis. Conference "The Global Financial Crisis in
the Bulgarian Economy", Ravda, 24-26 September, 19-26.
O’Shaughnessy, J.P. 2005. What Works on Wall Street. McGraw Hill.
Penman, S.H., 1993. The Articulation of Price-Earnings Ratios and Market-to-Book Ratios
and the Evaluation of Growth. University of California-Berkeley.
Reed, J.P. 2011. Five Fisher Super Stocks,
https://www.forbes.com/sites/investor/2011/03/07/five-fisher-super-
stocks/#33070f3752fb Reilly, F.K., Brown, K.C. 2003. Investment Analysis – Portfolio Management. Thomson
Learning, USA.
Thalassinos, E. and Liapis, K. 2013. A Comparative Analysis for the Accounting Reporting
of Employee Benefits between IFRS and other Accounting Standards: A Case Study
for the Biggest Listed Entities in Greece. International Journal of Economics and
Business Administration, 1(1), 99-124.
Copyright © 2022 FDOKUMEN