An analysis of the ecological and financial sustainability of ...
58
TFCG Technical Paper 48 An analysis of the ecological and financial sustainability of natural forest management in Tanzania Dar es Salaam November 2015
-
Upload
khangminh22 -
Category
Documents
-
view
2 -
download
0
Transcript of An analysis of the ecological and financial sustainability of ...

TFCG Technical Paper 48
An analysis of the ecological and financial sustainability
of natural forest management in Tanzania
Dar es Salaam
November 2015
© Tanzania Forest Conservation Group
Cover photograph by Michele Menegon
Suggested citation:
TFCG. 2015 An analysis of the ecological and financial sustainability of natural forest management
in Tanzania. TFCG Technical Paper 48. Pp 1 - 49.
Tanzania Forest Conservation Group
The Tanzania Forest Conservation Group (TFCG) is a Tanzanian non-governmental
organization that has been promoting the conservation of Tanzania’s forests since 1985.
TFCG’s mission is to conserve and restore the biodiversity of globally important forests in
Tanzania for the benefit of the present and future generations. We achieve this through capacity
building, advocacy, research, community development and protected area management, in
ways that are sustainable and foster participation, cooperation and partnership.
TFCG supports field-based projects promoting participatory forest management, environmental
education, community development, advocacy and research in the Eastern Arc Mountain and
Coastal Forests. To find out more about TFCG please visit our website http://www.tfcg.org.
Forest Justice in Tanzania
Forest Justice in Tanzania (FJT) is an advocacy initiative that aims to promote improved
governance and increased accountability in Tanzania’s forest sector. The initiative is a
partnership between the Community Forest Conservation Network of Tanzania, known as
MJUMITA and the Tanzania Forest Conservation Group (TFCG). The project is financed by
DfID through the Accountability in Tanzania programme (AcT). For more information about the
project, please visit: http://www.tfcg.org/ForestJusticeTanzania.html.

ii
Executive Summary
This study looks at the financial and ecological sustainability of natural forest management in
Tanzania with a view to identifying structural challenges in the sector that are contributing to current,
high rates of deforestation and concomitant economic losses. The study presents recommendations
intended to achieve more ecologically and economically sustainable forest management in
Tanzania.
The study was undertaken as part of the Forest Justice in Tanzania initiative, a project supported by
the Accountability in Tanzania programme and implemented through a partnership between
MJUMITA and TFCG.
Forests and deforestation in Tanzania
According to the National Forest Resources Monitoring and Assessment of the Tanzania Mainland
(NAFORMA, 2015), Tanzania is endowed with between 33.7 and 48.1 million hectares (ha) of forest
and woodlands (55 % of the total land area of Tanzania)1. Based on the NAFORMA inventory data,
a large proportion of the forest area (92%) is occupied by woodlands (44.7 million ha) whilst the
remaining 8% comprises mangrove forests, montane forests, coastal forests and forest plantations
(softwood and hardwood) (NAFORMA, 2015).
Natural forests and woodlands in Tanzania provide important ecological services including soil
conservation; sequestration and storage of carbon from the atmosphere; conservation of forested
watershed areas supplying water to downstream users; and maintaining important habitats for
wildlife as well as other biodiversity resources. Tanzania’s forests have exceptional biodiversity
values including 128 vertebrate species endemic to Tanzania’s Eastern Arc Mountains (Rovero et
al. 2014).
The area of annual forest loss between 1995 and 2010 is estimated at 372,816 ha (NAFORMA
2015). This gives an annual deforestation rate of 0.8% or 1.1% depending on which forest area
figure is used2. This is equivalent to over two and half times the area of Dar es Salaam Region
being cleared every year. Published NAFORMA data does not distinguish between deforestation
rates inside and outside of reserves. Other studies indicate that deforestation is occurring within
reserves at a lower rate than outside of reserves (e.g. Godoy et al. 2011).
The NAFORMA report (2015) estimates that the annual loss of wood on the mainland is 62.3 million
cubic meters (m3) year-1 whilst the annual allowable cut from forests and woodlands is only 42.8
million m3 year-1. This implies a wood deficit of about 19.5 million m3 annually.
According to UNEP (2015) a cost-benefit analysis found that the present value of net economic
losses from deforestation and forest degradation to the Tanzanian economy over the 20 years
between 2013–2033 is US$ 171 million for values that are captured by the system of national
accounts (mainly timber); or US$ 3.5 billion if other forest ecosystem services are considered.
In order to improve forest protection and management on the mainland, the government transferred
responsibility for the management of Central Government Forest Reserves and forests on general
land from the Forestry and Beekeeping Division (FBD) to the Tanzania Forest Services Agency
(TFS), a newly established Executive Agency, through the TFS establishment Order of 2010 (URT,
1 NAFORMA (2015) reports two different estimates for the area of forest and woodland in Tanzania. NAFORMA’s land
cover data based on Landsat imagery found there to be 33,799,534 ha of forest and woodland in Tanzania, whilst the
inventory data found there to be 48.1 million hectares.
2 See foot note 1.

iii
2010). According to the TFS Framework Document, one of TFS’s objectives is ‘Stable ecosystem
and biological diversity maintained.’
This study highlights issues in the forestry sector that are affecting the maintenance of stable
ecosystem services including biodiversity; and provides recommendations intended to enhance the
ecological and financial sustainability of the sector.
According to UNEP (2015) it is economically rational for the URT to invest in conserving forest and
woodland resources by directly tackling the direct and underlying drivers of deforestation and forest
degradation including expansion of agricultural crop fields into forest areas; illegal logging;
uncontrolled/unsustainable charcoal production; uncontrolled livestock numbers and grazing in
protected forest areas. Addressing the drivers of deforestation and forest degradation will shift the
nation towards a more sustainable economic model that is more effective in reducing poverty.
Objectives of the study
The study assesses the ecological and financial sustainability of natural forest management in
Tanzania.
The study focuses on six themes: revenues, expenditure, forest condition, monitoring, joint forest
management and coordination between local and central government.
Methods
The report draws upon information from published literature including publicly available Government
documents, reports and presentations; and interviews with stakeholders. Stakeholder consultation
was carried out in Handeni, Korogwe, Kilosa, Kilwa, and Rufiji Districts. Stakeholders who were
consulted include TFS Zonal and District managers and staff; and District Council officers as well as
senior staff from the Forestry and Beekeeping Division.
Results
Revenues
Forestry sector revenue collected by FBD (up to 2011/12) and then TFS (from 2012/13- ) has
increased from TZS 10.9 billion collected by FBD in 2005/06 (Mgoo, 2014) to TZS 75 billion
collected by TFS in 2014/15 with a projected revenue for 2015/16 of TZS 87 billion (TFS, 2015).
Plantations provide > 50 % of TFS’s revenues. Between 2012/13 and 2013/14, plantations
accounted for 64.5% and 56% of revenues respectively. In 2015/16 plantations are projected to
contribute 58% of revenue (TFS, 2015) with the remainder coming from natural forests.
TFS (2015) indicates that royalties from the sale of trees for timber and for charcoal are the most
significant sources of revenue from natural forests.
Some of the challenges around revenue collection identified by the study include the following:
Permits to harvest forest produce are being issued in the absence of forest management
plans.
Revenue targets are not based on forest reserve management plans nor assessments of the
available forest resource within any particular district or zone. The risk with this approach is that it
drives an annual increase in harvesting without considering sustainability and the available
resource.

iv
TFS currently collects revenue from forest produce harvested from village lands although it
has no mandate or mechanism to re-invest in the management of village land forests.
TFS are allocating TZS 25 billion to the Treasury for use on other sectors whilst funds are
still needed to achieve TFS’s own goal and objectives.
A rough comparison between GoT data on urban charcoal demand and projected revenues
from royalties suggests that royalties are being paid on less than 10 % of charcoal destined for
urban markets. This represents a significant shortfall in revenue collection and is likely to distort the
overall valuation of the forestry sector and of natural forests specifically.
The system of national accounts only includes a small fraction of the value of the forestry
sector.
Expenditure
Funds released to FBD (2005/6 to 2009/10) and then TFS (2011/12 - ) have increased from TZS 5.6
billion in 2005/6 to TZS 57.9 billion in 2013/15 (Mgoo, 2014).
In terms of expenditure on natural forest management, TFS has prioritized investment in Forest
Reserve boundary surveying, clearing and marking; and conducting an assessment of the reserves
under its control. So far more 13,238 km of reserve boundary have been re-surveyed. TFS has also
invested in law enforcement actions including evictions of farmers and charcoal producers operating
inside Central Government Forest Reserves.
In the 2015/16 TFS business plan, expenditure on Central Government Forest Reserve
management in natural forests is approximately TZS 463 / ha (US$ 0.22 / ha). This includes
continued investment in law enforcement and boundary marking. TFS are also planning to develop
management plans for 20 reserves; and to conduct forest resource assessments.
Per hectare expenditure on natural forest management is 2.6% of the US$ 8.30 that reserve
managers stated that they needed (VTA, 2014); and 2.8% of the amount that TANAPA invest per
hectare in the management of National Parks.
Per hectare expenditure on natural forest management is significantly lower than investment in
plantation management. TFS plan to spend TZS 35,846 / ha of plantation or TZS 111,346 / ha of
planted area) compared with the TZS 463 / ha of natural forest reserve.
Forest condition
The NAFORMA forest change analysis; other published forest change analyses; and stakeholder
perceptions in the Districts visited by the author point to widespread deforestation and forest
degradation in Central Government Forest Reserves; Local Authority Forest Reserves and village
forests. In Handeni, Korogwe, Kilwa, Liwale and Tunduru Districts charcoal production and timber
harvesting were reported to be continuing uncontrolled across all types of forests. Agricultural
encroachment and grazing were also reported to be significant threats in the Southern Zone.
Monitoring
Monitoring is an essential part of good governance. Monitoring data provides a basis for assessing
performance relative to targets. URT 2010 indicates that the development of monitoring and
evaluation systems is amongst the planned activities for TFS; and states that TFS HQ is responsible
for overall monitoring. Currently monitoring is activity and output based on the assumption that if the

v
planned conservation activities are implemented TFS will attain its objectives and established
targets. Monitoring of revenues and expenditures is also in place. However at a national level there
is no publicly available monitoring data showing that the objective of maintaining sound forest
ecosystems and high biodiversity values is being met. In an era of increasingly accessible and
cheap remote sensing data; and given increased national capacity on remote sensing analysis and
GIS, annual or biannual monitoring of forest cover within forest reserves (and outside) is
increasingly feasible. By establishing a robust impact-level monitoring system TFS would be able to
documents its performance; and to make a sound economic and political case for increasing
investment in natural forest management. Whilst some monitoring should be done by TFS,
independent forest monitoring would enhance the legitimacy of monitoring data. For example, with
the establishment of the national carbon monitoring centre, there is potential for forest cover change
data to be generated independently of TFS; and to be linked with REDD+. In 2007 – 8, DANIDA
supported a participatory design process in close consultation with FBD, for an independent forest
monitoring programme for Tanzania. Although this was not implemented, the report provides a basis
for reviving plans for Independent Forest Monitoring in Tanzania.
Cooperation between TFS District Forest Managers and District Forest Officers
Stakeholder consultation found that there is conflict between TFS District Forest managers and
District Forest Officers in some districts, particularly around the issue of revenue collection for forest
products from unreserved village forest lands and general land. There is a need for clearer
guidelines particularly around the issue of issuing transit permits and harvesting licenses.
Conclusions
Tanzania’s natural forests are systematically under-valued. Factors contributing to this include low
revenue collection rates by TFS and local government; the non-marketable nature of many forest
values; the current system of national accounts which does not account for natural wealth; and a
disconnect between revenue collection by Central Government for forest produce from village
forests and management responsibilities that are vested in village councils. As a result of the
natural forests being under-valued, investment in natural forest management is a fraction of what is
needed. This results in weak management leading to deforestation and concomitant economic
losses to the nation.
TFS is responsible for ensuring that stable ecosystem and biological diversity are maintained in
Central Government Forest Reserves. There have been rapid increases in revenues to TFS.
Increased revenues are being achieved in the context of uncontrolled and unsustainable harvesting
including from forests outside of TFS’s mandate. Revenue targets are being set irrespective of the
available resource; the sustainability of the harvesting; and the availability of management plans.
Continuing along this trajectory will result in the depletion of the resource with a concomitant
collapse in revenues from natural forests. Continued deforestation will also result in heavy costs to
the economy due to disruption in ecosystem functioning. Potential costs include losses to the
agricultural sector due to reduced dry season flows in rivers originating in formerly forested areas;
reduced efficiency in hydro-power generation due to increased siltation and reduced dry-season
river flows; increased soil erosion and landslides; and loss of wood and non-wood forest products
that underpin most rural livelihoods.
TFS have begun a process of consolidating the reserves under its authority through boundary
surveys and marking; and are increasing the number of staff available for reserve management.
Nonetheless NAFORMA data and other forest change analyses point to ongoing deforestation
within and outside reserves. TFS needs to establish a more robust impact level monitoring system,
particularly with regard to its remit of maintaining ecosystem services from Central Government

vi
Forest Reserves. This could build on existing initiatives such as the national carbon monitoring
centre; and the independent forest monitoring plans initiated in 2008. There remains a need to
improve coordination and cooperation between TFS District Forest Managers and District Forest
Officers in order to achieve more efficient and effective law enforcement.
Recommendations
The following recommendations are proposed on the basis of the findings of this study:
TFS should adhere strictly to the Forest Act 2002 and should only issue permits based on
current forest management plans including harvesting plans. Licences should be given based on the
harvesting plans supported by current inventory data and strictly follow the Forest Regulations of
2004 including sticking to the minimum girth requirement;
TFS should only issue permits for those forests that fall under its mandate i.e. Central
Government Forest Reserves and forests on general land;
Revenue from produce harvested from village lands should be re-invested in the
management of village land forests including in expanding areas under community-based forest
management. This will require a significant re-structuring of the current revenue collection
procedures;
TFS should not be required to remit funds to the Treasury until such time as it is fully
achieving its goal and objectives; and generating a surplus;
TFS should recognize the authority of Village Councils in determining harvesting rates from
village land forests and should ensure that it is not issuing permits for harvesting of forest produce
from village land;
National, Zonal and District TFS Revenue targets should be based on consolidated
estimates of sustainable harvesting levels from the forest reserves within that particular area.
Targets should not be based on historical revenue collection.
TFS should accord more priority to natural forest management in its plans and budgets;
It is crucial to take legal action against illegal traders including confiscation of forest products
obtained illegally and prosecution.
More effort is needed to collect revenues and fines to reduce the gap between expected
revenues based on the size of the current market for forest produce, and the current revenue levels.
There is a need to strengthen TFS’s accountability for delivering on its mandate to maintain
ecosystem services and biodiversity values. Establishing an independent forest monitoring system
is considered crucial. If adopted IFM would add value to TFS’s work.
There is a need to re-consider mechanisms for paying communities to engage in the
management of protective forest reserves, including allocating funding from other sources to cover
joint management costs including joint patrols, boundary marking and law enforcement.
Scaling up JFM and CBFM should be a priority in order to increase the effectiveness of PFM
as a protected areas conservation strategy.
There is a need to streamline the roles and responsibilities between TFS and District
Councils forestry officers who are mandated to manage forest and woodland resources in the
districts. Efforts should be undertaken to streamline revenue collection at all levels (i.e. from the
village to central government).
Expanded tree growing should not focus on softwood and hardwood plantations alone but
also expanding regeneration and planting valuable indigenous tree species like Mpingo, Mvule,
Mninga and various miombo tree species in seriously degraded CGFRs such as Pugu and
Kazimzumbwi.

vii
Table of Contents
EXECUTIVE SUMMARY .................................................................................................................................................. II
FORESTS AND DEFORESTATION IN TANZANIA ................................................................................................................................ II
OBJECTIVES OF THE STUDY ....................................................................................................................................................... III
METHODS ............................................................................................................................................................................ III
RESULTS .............................................................................................................................................................................. III
Revenues ..................................................................................................................................................................... iii
Expenditure ..................................................................................................................................................................iv
Forest condition............................................................................................................................................................iv
Monitoring ...................................................................................................................................................................iv
Cooperation between TFS District Forest Managers and District Forest Officers ........................................................ v
CONCLUSIONS ....................................................................................................................................................................... V
RECOMMENDATIONS ............................................................................................................................................................. VI
TABLE OF CONTENTS .................................................................................................................................................. VII
LIST OF FIGURES ........................................................................................................................................................ VIII
LIST OF TABLES .......................................................................................................................................................... VIII
ABBREVIATIONS AND ACRONYMS ................................................................................................................................ X
ACKNOWLEDGEMENTS ................................................................................................................................................ XI
1.0 INTRODUCTION........................................................................................................................................................1
1.1 BACKGROUND TO THE STUDY ...................................................................................................................................... 1
1.2 TANZANIA FOREST SERVICES (TFS) ESTABLISHED ............................................................................................................ 1
1.3 OBJECTIVES THE ASSIGNMENT .................................................................................................................................... 3
1.4 TASKS OF THE ASSIGNMENT ........................................................................................................................................ 3
2.0 METHODOLOGY AND APPROACH ............................................................................................................................4
2.1 INFORMATION/DATA COLLECTION AND ANALYSIS ........................................................................................................... 4
2.1.1 Data collection .................................................................................................................................................... 4
2.1.2 Information and Data analysis ............................................................................................................................ 4
3.0 RESULTS AND DISCUSSION .......................................................................................................................................5
3.1 ECOLOGICAL AND FINANCIAL SUSTAINABILITY OF ROYALTY REVENUES FROM FOREST PRODUCE AND PRODUCTS FROM NATURAL
FORESTS 5
3.1.1 Types of forest revenues ...................................................................................................................................... 5
3.1.2 Trends in TFS Revenue collection......................................................................................................................... 6
3.1.3 Revenue collection targets .................................................................................................................................. 9
3.1.4 Comparing revenue targets with demand ........................................................................................................ 12
3.1.5 Comparing revenues with the economic value of the forestry sector ............................................................... 13
3.1.6 Summary of challenges facing TFS in collecting revenues................................................................................. 13
3.2 EXPENDITURE ON NATURAL FOREST MANAGEMENT ....................................................................................................... 14
3.2.1 TFS investment in natural forest management ................................................................................................. 14
3.2.2 TFS expenditure on protective and productive forest reserves and on plantations .......................................... 15
3.2.3 Comparing actual expenditure with costs of reserve management .................................................................. 18
3.2.4 Comparing TFS revenues with expenditure ....................................................................................................... 18
3.2.5 Summary of challenges related to expenditure................................................................................................. 20
3.3 STABLE ECOSYSTEMS AND BIOLOGICAL DIVERSITY MAINTAINED: ARE THE RATES OF FOREST AND WOODLANDS DISTURBANCES
DECLINING IN CENTRAL GOVERNMENT FRS? ............................................................................................................................. 20
3.2.5 Summary of challenges related to deforestation rates ..................................................................................... 22

viii
3.4 MONITORING OF DEFORESTATION AND FOREST DEGRADATION TO INFORM TFS PLANNING AND TO EVALUATE TFS’S IMPACT ....... 23
3.5 IS PARTICIPATORY FOREST MANAGEMENT (PFM) ACHIEVING SUSTAINABLE FOREST MANAGEMENT AND WHAT IS THE IMPACT ON
THE GROUND? .................................................................................................................................................................... 25
3.5.1 JFM financing .................................................................................................................................................... 25
3.5.2 TFS investment in PFM ...................................................................................................................................... 26
3.5.2 Stakeholder consultation on CBFM ................................................................................................................... 26
3.6 WHAT ARE ROLES AND RESPONSIBILITIES OF TFS DISTRICT MANAGERS AND OTHER STAFFS WORKING IN DISTRICTS?.................. 27
3.6.1 TFS human resources capacity ......................................................................................................................... 27
5. CONCLUSIONS ..................................................................................................................................................... 29
6. RECOMMENDATIONS .......................................................................................................................................... 30
REFERENCES ................................................................................................................................................................ 32
ANNEX 1. LIST OF STAKEHOLDERS CONSULTED....................................................................................................... 33
ANNEX 2. FIGURES .................................................................................................................................................. 34
ANNEX 3. APPROVED BUDGET AND ACTUAL EXPENDITURE BY TARGET FOR 2013/2014 ........................................... 35
ANNEX 4. DISTRICT REPORTS ...................................................................................................................................... 37
HANDENI DISTRICT .............................................................................................................................................................. 37
Forest resources in Handeni District ........................................................................................................................... 37
KILOSA DISTRICT ................................................................................................................................................................. 37
Forest resources in Kilosa District ............................................................................................................................... 37
MAMBOYA FR 199HA .................................................................................................................................................. 37
TFS forest management activities in Kilosa District ................................................................................................... 38
SOUTHERN ZONE ................................................................................................................................................................. 39
Forest resources in the Southern Zone ....................................................................................................................... 39
KILWA DISTRICT .................................................................................................................................................................. 41
Forest resources in the Kilwa District ......................................................................................................................... 41
Joint Forest Management in Kilwa District ................................................................................................................ 42
TFS Investments in Kilwa District ................................................................................................................................ 42
RUFIJI DISTRICT ................................................................................................................................................................... 43
Forest resources in the Rufiji District .......................................................................................................................... 43
TFS investments in Rufiji District ................................................................................................................................ 45
KOROGWE DISTRICT ............................................................................................................................................................. 45
Forest resources in the Rufiji District .......................................................................................................................... 45
Forest Management Plans in Korogwe District .......................................................................................................... 46
List of Figures
FIGURE 1. FBD (TO 2011/12) AND TFS (2012/13 - ) REVENUES TRENDS 2008-2016 ....................................................................... 6
FIGURE 2. REVENUE FLOWS FOR CENTRAL GOVERNMENT FOREST RESERVES AND VILLAGE LAND FORESTS................................................. 11
FIGURE 3. A COMPARISON OF PROJECTED REVENUES BASED ON URBAN CHARCOAL DEMAND AND TFS PROJECTED REVENUES. ...................... 13
FIGURE 4. FUNDS RELEASED ANNUALLY TO FBD AND THEN TFS BETWEEN 2005/6 AND 2013/14 ........................................................ 14
List of Tables
TABLE 1. TYPES OF FOREST PRODUCTS AND SERVICES AND THEIR SOURCES ............................................................................................ 5
TABLE 2. TFS REVENUE COLLECTION AND EXPENDITURE FOR 2012/13 ............................................................................................... 7
TABLE 3. TFS REVENUE PROJECTIONS AND COLLECTIONS 2013/2014 ................................................................................................ 7
TABLE 4. TFS REVENUE PROJECTIONS FOR 2015/16 ....................................................................................................................... 8
TABLE 5. REVENUE COLLECTION ACCORDING TO SOURCES IN HANDENI DISTRICT .................................................................................... 8

ix
TABLE 6. OBJECTIVE B: BUDGET AND EXPENDITURE FOR 2013/2014 ............................................................................................... 16
TABLE 7. OBJECTIVE C: BUDGET AND EXPENDITURES FOR 2013/14 ................................................................................................. 16
TABLE 8. BUDGET AND PERCENTAGE RESOURCE ALLOCATION FOR THE 2015/16 TFS BUSINESS PLAN ..................................................... 17
TABLE 9. 2015/16 TFS BUDGET ALLOCATION RELATIVE TO AREA OF PLANTATION AND NATURAL FOREST ................................................. 17
TABLE 10. ANNUAL FUNDS RELEASED RELATIVE TO ANNUAL REVENUES .............................................................................................. 18
TABLE 11. TFS 2015/16 PROJECTED REVENUES AND PLANNED EXPENDITURE BY STATION .................................................................... 19
TABLE 12. STAFF AND BUDGET 5 DISTRICTS ................................................................................................................................. 22
TABLE 13. FOREST RESERVES IN HANDENI DISTRICT ....................................................................................................................... 37
TABLE 14. FOREST RESOURCES IN THE SOUTHERN ZONE ................................................................................................................. 39
TABLE 15. PERSONNEL IN THE SOUTHERN ZONE............................................................................................................................ 40
TABLE 16. CENTRAL GOVERNMENT FOREST RESERVES IN KILWA DISTRICT ......................................................................................... 41
TABLE 17. REVENUE COLLECTED IN KILWA DISTRICT IN 2014/15 ..................................................................................................... 41
TABLE 18. RUFIJI DISTRICT CENTRAL GOVERNMENT FOREST RESERVES.............................................................................................. 44
TABLE 19. FOREST RESERVES IN KOROGWE DISTRICT ..................................................................................................................... 45
x
Abbreviations and Acronyms
CBFM Community Based Forest Management
CGFRs Central Government Forest Reserves
DFM District Forest Manager
DFO District Forest Officer
DPs Development Partners
DSM Dar-Es-Salaam
FBD Forestry and Beekeeping Division
FMPs Forest Management Plans
IRA Institute of Resources Assessment
JFM Joint Forest Management
LAFRs Local Authority Forest Reserve
MDAs Ministries, Departments and Agencies
MF Ministry of Finance
MJUMITA Mtandao wa Jamii wa Usimamizi wa Misitu Tanzania
MNRT Ministry of Natural Resources and Tourism
NGOs Non-Governmental Organizations
PMO-RALG Prime Minister’s Office - Regional Administration and Local
Government
SUA Sokoine University of Agriculture
TaFF Tanzania Forest Fund
TAFORI Tanzania Forestry Research Institute
TFCG Tanzania Forest Conservation Group
TFS Tanzania Forest Service
ToRs Terms of Reference
UDSM University of Dar-Es-Salaam
UNDP United Nations Development Programme
UNEP United Nations Environment Programme
URT United Republic of Tanzania
VLFRs Village Land Forest Reserves
VPO-E Vice President’s Office-Environment
WB World Bank

xi
Acknowledgements
It is my pleasure to take this opportunity to thank all those who in one way or another assisted me to
compile this report. During the period of undertaking the study a number of helpful persons is noted
to be very large to make individual appreciation here. However, I would like to specifically
acknowledge the efforts of all who made this study fruitful. I’m highly indebted to Mrs. Devota
Kilahama and the entire family members for looking after me and for her continued encouragements
throughout then study and report writing. I also would like to thank Mr. Charles Meshack and Ms.
Nike Doggart for their invaluable facilitation, moral support and encouragements to carry out through
with this important assignment. I highly appreciate the time and efforts made by the TFS Zonal
Officers in Eastern, Northern and Southern zones as well as the TFS officers in Korogwe, Handeni,
Kilwa and Rufiji Districts for their kind assistance and support during the field visits. I would also like
to thank Mr. Mohamed L. Kilongo, Mr. Emmanuel, Legal Officer, Ms. Anna Lawuo, Mr. Msuya and
Ms. Amina Akida all from TFS HQs for their useful contributions and support.
Dr. Felician Kilahama

1.0 Introduction
Recent studies including the National Forest Resources Monitoring and Assessment of Tanzania
Mainland (NAFORMA 2015) indicate that the forest and woodland resources on the mainland are
disappearing at an alarming rate. This is because the rate of extraction exceeds the rate at which
the natural forests and woodlands can regenerate. According to NAFORMA (2015) the annual wood
deficit is about 19 million m3. This amount is extracted from forest and woodland resources with
concomitant detrimental effects to the environment.
1.1 Background to the study
The Forest Justice in Tanzania Project (FJT) is implemented through a partnership between the
Tanzania Forest Conservation Group (TFCG) and MJUMITA, both national non-governmental
organizations (NGOs). The study inter-alia, involved undertaking an in-depth analysis of the
ecological and financial sustainability of natural forest management in Tanzania. The study focuses
on the role of the Tanzania Forest Services Agency.
Natural forests and woodlands in Tanzania provide important ecological services including soil
conservation; sequestration and storage of carbon from the atmosphere; conservation of forested
watershed areas supplying water to downstream users; and maintaining important habitats for
wildlife as well as other biodiversity resources. Most of Tanzania’s major rivers originate in forest
reserves and other forested areas including the Ruaha, Wami, Pangani and Sigi rivers. Tanzania’s
forests also have exceptional biodiversity values. Tanzania’s Eastern Arc Mountains alone contain
128 endemic vertebrate species (Rovero et al. 2014).
However the natural forests and woodlands of the Tanzanian mainland are under heavy pressure
from uncontrolled human activities including deforestation to access new agricultural land and over-
harvesting of trees for timber and wood-fuels (in this case firewood and charcoal). NAFORMA
(2015) report an annual deforestation rate of 372,816 ha between 1995 and 2010. This is
equivalent to over two and half times the area of Dar es Salaam Region being cleared every year3.
Deforestation is occurring both inside and outside of reserves. Although published NAFORMA data
does not distinguish between deforestation within and outside reserves, Godoy et al. 2011 found a
constant annual deforestation rate of 0.2% in reserved coastal forests in Tanzania between 1990 –
2007, ranging from an annual deforestation rate of 3.1% in Mtwara Region forest reserves to 0.1%
in Lindi and Tanga reserves.
Since its inception the FJT project has identified areas of ongoing deforestation in Central
Government Reserves as well as governance challenges that undermine the effectiveness of forest
management. Some challenges appear to originate in the structure of forestry sector financing. The
study aimed to examine some of these issues in more detail with a view to recommending changes
that would enhance the ecological and financial sustainability of the sector.
1.2 Tanzania Forest Services (TFS) Established
The Tanzania Forest Services Agency was established under the Executive Agencies Act Cap. 245
(R.E. 2009) on 30th July, 2010 through the Establishment Order that was published in the
Government Notice No. 269.
3 Dar es Salaam Region covers 139,300 hectares. Tanzania’s annual deforestation rate is equivalent to 2.68
times the area of Dar es Salaam Region.
2
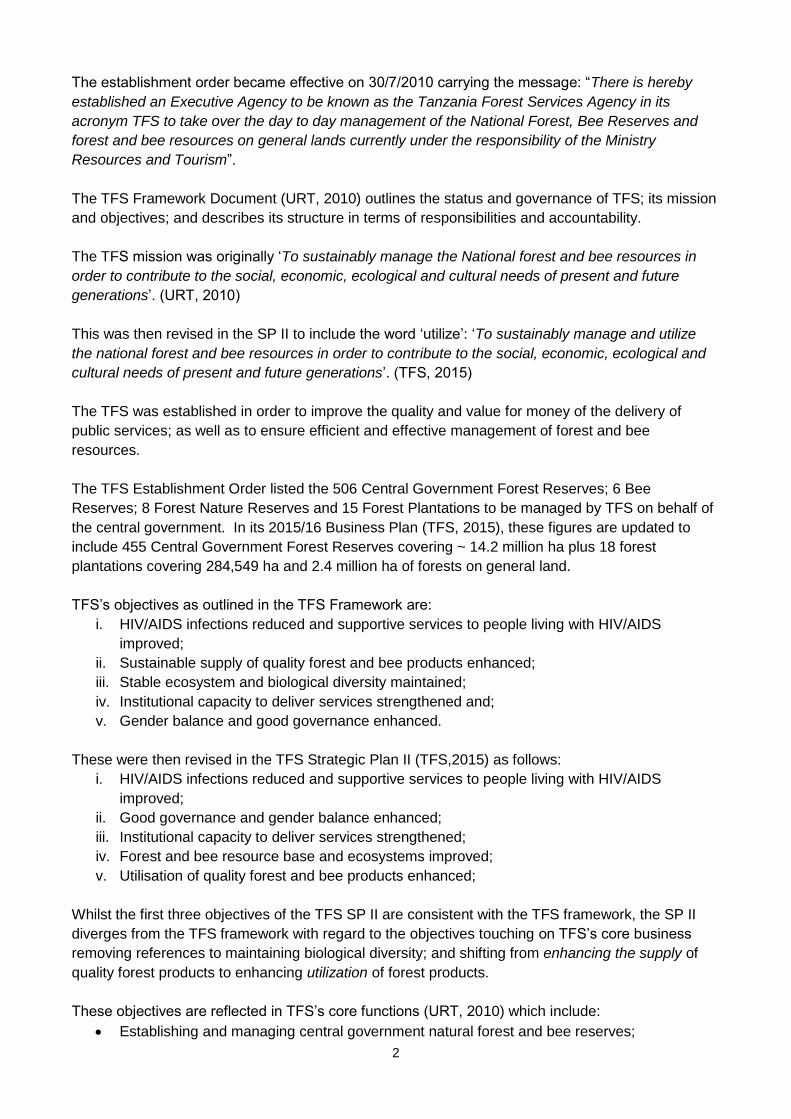
The establishment order became effective on 30/7/2010 carrying the message: “There is hereby
established an Executive Agency to be known as the Tanzania Forest Services Agency in its
acronym TFS to take over the day to day management of the National Forest, Bee Reserves and
forest and bee resources on general lands currently under the responsibility of the Ministry
Resources and Tourism”.
The TFS Framework Document (URT, 2010) outlines the status and governance of TFS; its mission
and objectives; and describes its structure in terms of responsibilities and accountability.
The TFS mission was originally ‘To sustainably manage the National forest and bee resources in
order to contribute to the social, economic, ecological and cultural needs of present and future
generations’. (URT, 2010)
This was then revised in the SP II to include the word ‘utilize’: ‘To sustainably manage and utilize
the national forest and bee resources in order to contribute to the social, economic, ecological and
cultural needs of present and future generations’. (TFS, 2015)
The TFS was established in order to improve the quality and value for money of the delivery of
public services; as well as to ensure efficient and effective management of forest and bee
resources.
The TFS Establishment Order listed the 506 Central Government Forest Reserves; 6 Bee
Reserves; 8 Forest Nature Reserves and 15 Forest Plantations to be managed by TFS on behalf of
the central government. In its 2015/16 Business Plan (TFS, 2015), these figures are updated to
include 455 Central Government Forest Reserves covering ~ 14.2 million ha plus 18 forest
plantations covering 284,549 ha and 2.4 million ha of forests on general land.
TFS’s objectives as outlined in the TFS Framework are:
i. HIV/AIDS infections reduced and supportive services to people living with HIV/AIDS
improved;
ii. Sustainable supply of quality forest and bee products enhanced;
iii. Stable ecosystem and biological diversity maintained;
iv. Institutional capacity to deliver services strengthened and;
v. Gender balance and good governance enhanced.
These were then revised in the TFS Strategic Plan II (TFS,2015) as follows:
i. HIV/AIDS infections reduced and supportive services to people living with HIV/AIDS
improved;
ii. Good governance and gender balance enhanced;
iii. Institutional capacity to deliver services strengthened;
iv. Forest and bee resource base and ecosystems improved;
v. Utilisation of quality forest and bee products enhanced;
Whilst the first three objectives of the TFS SP II are consistent with the TFS framework, the SP II
diverges from the TFS framework with regard to the objectives touching on TFS’s core business
removing references to maintaining biological diversity; and shifting from enhancing the supply of
quality forest products to enhancing utilization of forest products.
These objectives are reflected in TFS’s core functions (URT, 2010) which include:
Establishing and managing central government natural forest and bee reserves;
3
Establishing and managing central government forest plantations and apiaries;
Managing forest and bee resources in general land;
Enforcing Forest and Beekeeping legislation in areas of TFS jurisdiction;
Collecting Forestry and Beekeeping revenue;
The policies and strategies used or followed by TFS include those of the MNRT and FBD supported
by the Forest Act (Cap 323 RE: 2002), Forest Regulations and other regulatory frameworks like tree
harvesting guidelines and the cost-benefits sharing guidelines.
1.3 Objectives the Assignment
The study assesses the ecological and financial sustainability of natural forest management in
Tanzania.
The study focuses on six themes: revenues, expenditure, forest condition, monitoring, joint forest
management and coordination between local and central government.
1.4 Tasks of the Assignment
The study looks at various related questions including:
Are TFS revenues from royalties on forest produce from natural forests ecologically and
financially sustainable over a twenty year period?
Is enough being invested in the management of natural forests in Central Government
Forest Reserves to meet TFS objectives of ecologically sustainable forest management? Is it being
invested in a cost-effective way?
Do monitoring results demonstrate that TFS has achieved its targets under Objective C of
the 2012 – 13 Strategic plan: ‘stable ecosystem and biological diversity maintained.’ (TFS, 2010)?
What measures are in place to monitor and report on TFS performance in preventing natural
forest loss in Central Government reserves?
What changes are needed to the Forest Act, regulations, guidelines, budgeting and
implementation in order to increase the effectiveness of JFM as a protected area strategy?
What measures can be taken to promote improved collaboration between local government
staff and TFS?

4
2.0 Methodology and Approach
2.1 Information/Data Collection and Analysis
2.1.1 Data collection
The approach to undertake the assignment was divided into two parts: literature review and data
collection through field visits and stakeholder consultation.
The first part involved literature review and development of relevant check lists and questions to
allow focused gathering of information on: revenues, expenditure, impact and strategies in the
context of TFS’s approaches towards improving and ensuring that ecological integrity and financial
sustainability from natural forest and woodlands (Appendix A). The assignment started with
obtaining some relevant literature such as reports from TFS zones and HQs. The documents
gathered include annual and semi-annual reports and other documents like TFS establishment
order, business and strategic plans and the Forest Policy (being revised), Forest Act (Cap 323 RE:
2002) and regulations of 2004. Also other publications like the community forest-based
management (CBFM) guideline of 2007 and “Mwongozo rahisi wa usimamizi shirikishi wa misitu
kwa jamii” (2015) were included in the literature review. Most of the Government documents that
were reviewed are publicly available at www.tfs.go.tz
The second part involved undertaking field work in the selected districts of Handeni, Kilosa, Kilwa,
and Rufiji as well as undertaking consultations with key stakeholders. Among these include TFS
Zonal and District managers and staff; District Council officers and District Commissioners. Others
were TFS and FBD officers at the HQs. Where appropriate, interviews with key stakeholders were
used to generate the required data/information. Also consultations were done in DSM involving key
MDAs (MNRT, VPO-E, PMO-RALG and MF) that are relevant to this study. NGOs such as the
Mpingo Conservation and Development Initiative (MCDI), WWF and other institutions like TAFORI
and TaFF were consulted. Discussions were also held with some professors at the Faculty of
Forestry and Nature Conservation SUA, considered to have some relevant information.
Furthermore, some consultations with the relevant Development Partners (DPs) in the Embassies of
Denmark and Finland added value to this study.
2.1.2 Information and Data analysis
The information and data that were collected, were analysed using normal qualitative methods
especially calculations for totals, means, frequencies and percentages. And using the results to
make comparisons and making qualitative value judgments across the studied districts. The
information from the field was also used to make comparisons with what is contained in literature
and to making assessments on various peoples’ or public perceptions about TFS and the conditions
of the natural forests as a whole.
5
3.0 Results and Discussion
3.1 Ecological and financial sustainability of royalty revenues from forest produce and
products from natural forests
This section looks at trends in TFS revenues and attempts to determine whether revenues and
revenue collection targets are based on sustainable forest management principles; and whether
current levels of revenue collection can be sustained over a 20 year period.
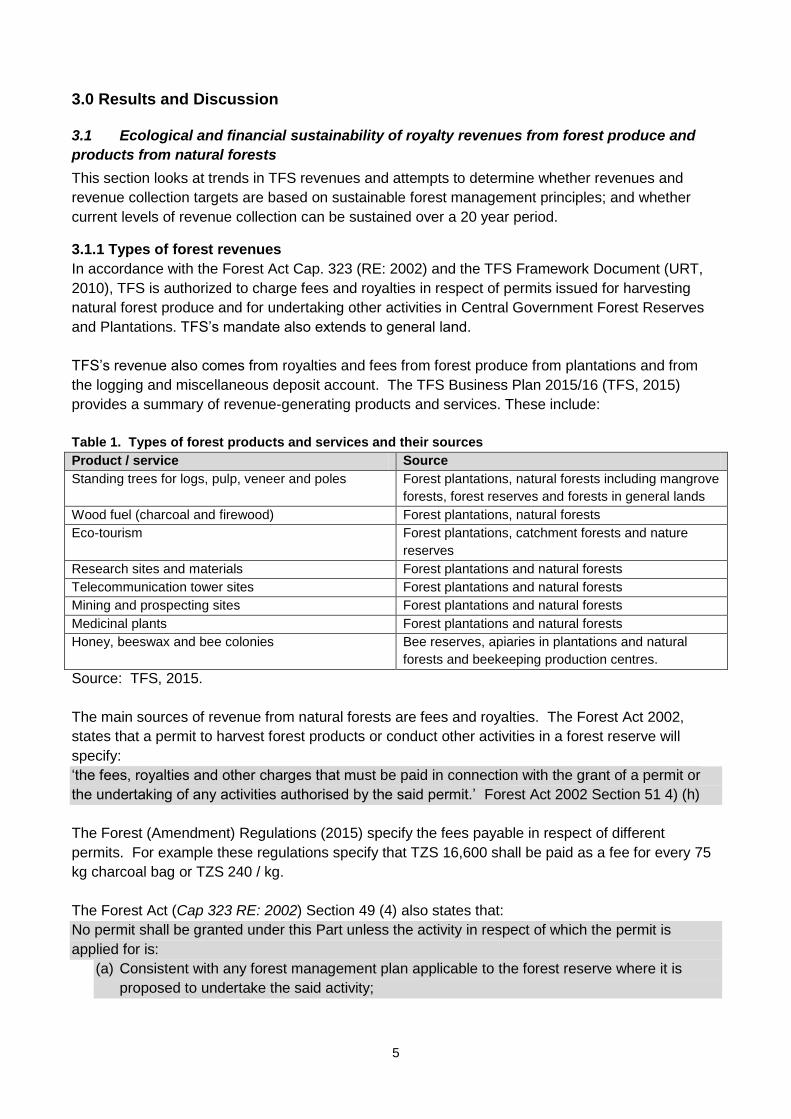
3.1.1 Types of forest revenues
In accordance with the Forest Act Cap. 323 (RE: 2002) and the TFS Framework Document (URT,
2010), TFS is authorized to charge fees and royalties in respect of permits issued for harvesting
natural forest produce and for undertaking other activities in Central Government Forest Reserves
and Plantations. TFS’s mandate also extends to general land.
TFS’s revenue also comes from royalties and fees from forest produce from plantations and from
the logging and miscellaneous deposit account. The TFS Business Plan 2015/16 (TFS, 2015)
provides a summary of revenue-generating products and services. These include:
Table 1. Types of forest products and services and their sources
Product / service Source
Standing trees for logs, pulp, veneer and poles Forest plantations, natural forests including mangrove
forests, forest reserves and forests in general lands
Wood fuel (charcoal and firewood) Forest plantations, natural forests
Eco-tourism Forest plantations, catchment forests and nature
reserves
Research sites and materials Forest plantations and natural forests
Telecommunication tower sites Forest plantations and natural forests
Mining and prospecting sites Forest plantations and natural forests
Medicinal plants Forest plantations and natural forests
Honey, beeswax and bee colonies Bee reserves, apiaries in plantations and natural
forests and beekeeping production centres.
Source: TFS, 2015.
The main sources of revenue from natural forests are fees and royalties. The Forest Act 2002,
states that a permit to harvest forest products or conduct other activities in a forest reserve will
specify:
‘the fees, royalties and other charges that must be paid in connection with the grant of a permit or
the undertaking of any activities authorised by the said permit.’ Forest Act 2002 Section 51 4) (h)
The Forest (Amendment) Regulations (2015) specify the fees payable in respect of different
permits. For example these regulations specify that TZS 16,600 shall be paid as a fee for every 75
kg charcoal bag or TZS 240 / kg.
The Forest Act (Cap 323 RE: 2002) Section 49 (4) also states that:
No permit shall be granted under this Part unless the activity in respect of which the permit is
applied for is:
(a) Consistent with any forest management plan applicable to the forest reserve where it is
proposed to undertake the said activity;

6
Section 49 (6) of the Forest Act (Cap 323 RE: 2002) is also clear that the right to issue permits for
harvesting and other activities for forests on village land rests with the Village Council:
A village council shall, by resolution, which shall require confirmation by the village assembly, ... in
respect of the granting of permission to any person to undertake, for other than domestic purposes,
any of the activities to which this Part refers in a village land forest reserve or a village forest.
Fees are required to be paid in advance of harvesting as part of the procedures stipulated to secure
a harvesting permit.
Compounding fees can also be collected in respect of illegally harvested natural forest produce.
The Forest Act 2002 describes the process of compounding an offence as follows:
95.-(1) The Director or any officer specifically authorised by the Director by notice
published in the Gazette may…., if he is satisfied that a person has committed an offence against
this Act, compound such offence by accepting from such person a sum of money together with
the forest produce, if any, in respect of which the offence has been committed.
The Forest Act 2002 also goes on to clarify that fines and royalties collected by compounding an
offence shall be paid to the Tanzania Forest Fund:
(6) Any sum of money received under this section shall, after deduction of reasonable
expenses, be paid into the Fund.
3.1.2 Trends in TFS Revenue collection
According to the TFS establishment order and the business plan, TFS revenues will be accrued
from forest and bee reserves, and products and services from the forest plantations, apiaries and
forests in general lands.
In accordance with the Forest Act 2002 fees, royalties and other charges should be obtained from
forest reserves that are managed in accordance with a management plan.
Forestry sector revenue collected by FBD (up to 2011/12) and then TFS (from 2012/13- ) have
increased from TZS 10.9 billion collected by FBD in 2005/06 (Mgoo, 2014) to TZS 75 billion
collected by TFS in 2014/15 with a projected revenue for 2015/16 of TZS 87 billion (TFS, 2015).
The revenue collection trend for 2008 to 20164 is indicated in Fig. 1.
Figure 1. FBD (to 2011/12) and TFS (2012/13 - ) revenues trends 2008-2016
Data Source: TFS, 2015
4 Includes projected revenue for 2015 /16.
7
Plantations generate > 55 % of TFS’s revenues. Between 2012/13 and 2013/14, plantations
accounted for 64.5% and 56% of revenues respectively. TFS, 2015 states that for 2015/16 ‘it is
expected that about 58% of the revenue will be generated from forest plantations’.
In the 2015/16 business plan, royalties comprise 60.58 % of the total projected revenue. Other
significant revenue collection categories include the Logging and Miscellaneous Deposit Account
(LMDA) which applies to plantations.
Data regarding the source of revenues in terms of the percentage of revenues coming from different
categories of forests e.g. plantations, productive forest reserves, protective forest reserves, general
land and unreserved forests on village land is not presented systematically with the exception of
statements about revenue from plantations. Similarly data distinguishing between royalties and fees
from different forest produce (e.g. charcoal vs. timber) is not provided in the TFS business plan.
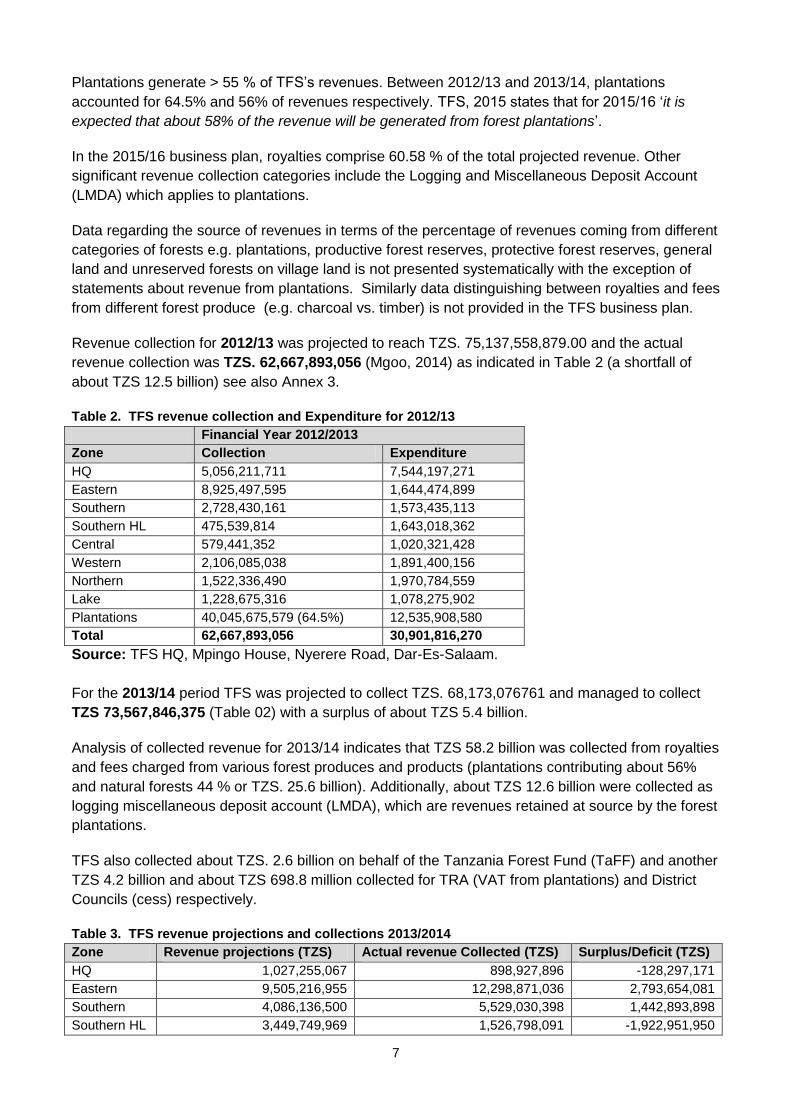
Revenue collection for 2012/13 was projected to reach TZS. 75,137,558,879.00 and the actual
revenue collection was TZS. 62,667,893,056 (Mgoo, 2014) as indicated in Table 2 (a shortfall of
about TZS 12.5 billion) see also Annex 3.
Table 2. TFS revenue collection and Expenditure for 2012/13
Financial Year 2012/2013
Zone Collection Expenditure
HQ 5,056,211,711 7,544,197,271
Eastern 8,925,497,595 1,644,474,899
Southern 2,728,430,161 1,573,435,113
Southern HL 475,539,814 1,643,018,362
Central 579,441,352 1,020,321,428
Western 2,106,085,038 1,891,400,156
Northern 1,522,336,490 1,970,784,559
Lake 1,228,675,316 1,078,275,902
Plantations 40,045,675,579 (64.5%) 12,535,908,580
Total 62,667,893,056 30,901,816,270
Source: TFS HQ, Mpingo House, Nyerere Road, Dar-Es-Salaam.
For the 2013/14 period TFS was projected to collect TZS. 68,173,076761 and managed to collect
TZS 73,567,846,375 (Table 02) with a surplus of about TZS 5.4 billion.
Analysis of collected revenue for 2013/14 indicates that TZS 58.2 billion was collected from royalties
and fees charged from various forest produces and products (plantations contributing about 56%
and natural forests 44 % or TZS. 25.6 billion). Additionally, about TZS 12.6 billion were collected as
logging miscellaneous deposit account (LMDA), which are revenues retained at source by the forest
plantations.
TFS also collected about TZS. 2.6 billion on behalf of the Tanzania Forest Fund (TaFF) and another
TZS 4.2 billion and about TZS 698.8 million collected for TRA (VAT from plantations) and District
Councils (cess) respectively.
Table 3. TFS revenue projections and collections 2013/2014
Zone Revenue projections (TZS) Actual revenue Collected (TZS) Surplus/Deficit (TZS)
HQ 1,027,255,067 898,927,896 -128,297,171
Eastern 9,505,216,955 12,298,871,036 2,793,654,081
Southern 4,086,136,500 5,529,030,398 1,442,893,898
Southern HL 3,449,749,969 1,526,798,091 -1,922,951,950

8
Zone Revenue projections (TZS) Actual revenue Collected (TZS) Surplus/Deficit (TZS)
Central 2,303,380,000 1,292,159,433 -1,011,220,567
Western 4,088,554,304 6,818,083,467 2,729,529,163
Northern 4,949,385,079 1,696,326,903 -3,253,058,176
Lake 5,198,410,000 2,374,534,535 -2,823,875,465
Plantations 33,564,822,342 41,133,114,688 (56%) 7,141,302,213
Total 68,173,076,761 73,567,846,375 4,967,779,480
Source: TFS HQ, Mpingo House, Nyerere Road, Dar-Es-Salaam.
For 2015/16 the revenue projections indicate a similar pattern with an overall projected revenue of
TZS 87.6 billion of which TZS 53 billion is projected to come from forest royalties and TZS 17 billion
from LMDA (TFS, 2015).
Table 4. TFS Revenue Projections for 2015/16
Stations Total revenue projection 2015/16 '000 TZS
Central 2,076,148.00
Eastern 12,004,008.00
Forest plantations 51,011,132.00
HQ 1,224,891.00
Lake 4,000,000.00
Northern 2,950,000.00
Southern 6,730,232.00
Southern Highland 2,400,000.00
Western 5,200,000.00
Total 87,596,411.00
Source: TFS, 2015
In terms of the geographical distribution of revenue collection, Tables 2, 3 and 4 show a range of
between TZS 0.4 and 8.9 billion per zone across the seven TFS zones in 2012/13; between TZS 0.8
and 12.2 billion in 2013/14; between TZS 2 and 12 billion in 2015/16. In all three years, the Eastern
Zone (Morogoro, Coast and Dar es Salaam Regions) has generated the highest revenues; and the
Southern Highlands and Central Zones have the lowest revenues. Natural forests generate 42 % -
45% of TFS revenue.
Since the published revenue figures are categorized according to the source of the revenues in
terms of zonal, headquarters and forest plantations (in lump-sums), they do not show how much of
the revenue was generated from different produce e.g. timber and charcoal; and how much is from
fines or from royalties / fees. National level data on revenue categorized by forest produce was not
secured during the course of the study, however, in some districts like Handeni, district-level data
shows that a large proportion (about 71%) of revenue collected for 2014/2015 accrued from
charcoal fees (Table 3) followed by timber royalties (about 20%) as indicated in Table 5.
Table 5. Revenue collection according to sources in Handeni District
No Sources of Revenues Amount Collected (TZS) % of
Total Jul - Dec 2014 Jan – Jun 2015 Total
1 Royalties from sale of trees from
natural forests
105,518,110 55,544,030 164,062,130 20.26
2 Fees collected from sale of charcoal 247,857,960 326,107,200 573,965,160 70.89
3 Royalties from sale of firewood 5,662,160 717,920 6,380,080 0.79
4 Royalties from sale of poles 409,520 562,000 971,520 0.12
5 Fees from Timber dealers 4,608,000 768,000 5,376,000 0.66

9
No Sources of Revenues Amount Collected (TZS) % of
Total Jul - Dec 2014 Jan – Jun 2015 Total
6 Fees from log dealers 512,000 256,000 768,000 0.09
7 Fees from withies dealers (registration) 1,536,000 - 1,536,000 0.19
8 Fees from Saw-millers (registration) 512,000 - 512,000 0.06
9 Frees from Charcoal dealers
(registration)
9,216,000 4,352,000 13,568,000 1.68
10 Fees from firewood dealers
(registration)
1,792,000 - 1,792,000 0.22
11 Fees from furniture mart (registration) 256,000 - 256,000 0.003
12 Fees from woodworks (registration) 9,875,400 - 9,875,400 1.22
13 Fees from other forest products
dealers
1,833,000 153,300 1,986,600 0.24
COMPOUNDING FEES
14 Fees from charcoal offences 2,080,000 3,620,000 5,700,000 0.70
15 Fees from offences related to wood 2,430,000 1,297,000 3,727,000 0.46
16 Fines related to other offences - 300,000 300,000 0.04
17 Research fees 355,000 - 355,000 0.04
18 Entrance fees to Nature Reserves 994,500 - 994,500 0.12
19 Fees from Transit passes 2,665,850 4,242,500 6,908,350 0.85
20 Camping fees in Nature Reserves - 1,032,000 1,032,000 0.13
21 Fees from other sources 487,500 - 487,500 0.06
22 Fees from honey and beeswax 2,073,000 1,512,000 3,585,000
23 Miscellaneous receipts 544,300 4,898,500 5,442,800 0.67
24 Grand Total 401,218,300 408,362,750 809,581,050 100
Source: TFS Handeni District.
The importance of charcoal as a revenue source was also documented by Albert and Monga (2014)
in a survey of revenues from forest produce in 23 districts. Albert and Monga (2014) found that in
2013/14 about TZS 3 billion was collected from 23 districts, out of which 62% (TZS 1.9 billion) was
collected from charcoal royalties and 38% (TZS 1.1 billion) were collected from timber. Albert and
Monga (2014) also found that 41% of the revenues from royalties from charcoal from the 23 districts
included in the study, came from Rufiji District alone. These high revenue figures from the Eastern
Zone should also be considered against the findings of the District-level forest governance
monitoring conducted by the Forest Justice in Tanzania project which found that Rufiji District
issued 3022 harvesting permits and yet conducted only 2 patrols in the period of 2012/13 (Albert
and Monga, 2014).
The available data indicate that royalties from the sale of trees from natural forests and fees
collected from the sale of charcoal are the most significant sources of revenue from natural forests.
In the context of assessing the sustainability of revenues from natural forests, this is significant
given the absence of forest management plans in 96% of reserves (NAO, 2012). The findings
suggest that permits to harvest forest produce are being issued by TFS in the absence of forest
management plans counter to the requirements of the Forest Act 2002. The increase in annual
revenues suggests that the rate of issuing harvesting permits is also increasing from year to year.
3.1.3 Revenue collection targets
Budgeting and revenue collection targets are currently based on the TFS strategic plan and TFS’s
overall revenue targets. Each financial year TFS agrees with the Treasury on the target for the
amount TFS should collect and on its ceiling budget. TFS’s revenue is expected to exceed its
budget with the understanding that TFS will remit the excess amount to the Treasury (see Figure 2)
to finance other Government programmes and departments. There is pressure on TFS to collect as
10
much revenue as possible. This situation means that TFS’s revenue targets are not based on forest
reserve management plans nor assessments of the available forest resource within any particular
district or zone. Instead, the targets are usually based on past records and experiences e.g. if the
zone during the past financial year had collected five billion; the expectation for the next financial
year is to collect more than that. Thus, they are encouraged to set a target with a 9 – 10 % percent
increase on previous performance. The risk with this approach is that it drives an annual increase in
harvesting without considering sustainability and the available resource.
The study found that, in terms of revenue collection, some zones are under-performing whilst others
exceeding their revenue targets. For example, in the Northern zone in 2014/15 the target for
revenue collection was TZS 3.2 billion but they managed to collect only TZS 2.8 billion. In contrast,
in the Southern zone total revenue collection in 2014/15 was TZS. 6.8 billion against the targeted
amount of TZS 4.8 billion. In 2014/15, the Southern Zone planned to collect about TZS. 2.7 billion
from the sale of timber but instead collected about TZS. 5.9 billion (196% of planned collection). The
target for revenue collection from charcoal was TZS. 641.4 million and they collected TZS.564.4
million (shortfall of about TZS. 76.9 million). The target for compounding fees or charges was
TZS.31.5 million but they collected only TZS. 3.2 million, resulting in a shortfall of about TZS 28.2
million. The zone also expected to net about TZS. 428 million however, they managed to collect
nothing (zero) from the sale of confiscated forest produces and products. In Kilwa district in 2014/15
TFS collected 1.8 billion, 82% of this was from sale of trees and timber while charcoal contributed
8%.
The plus and minus trends in revenue projections and collections is an indication that TFS has
continued to operate in the way that FBD used to project revenue collection without basing it on
natural forests and woodlands allowable cut and the accompanied management plans. A difference
noted between FBD and TFS is that TFS has increased its capacity to collect revenues, although
the revenues are mostly collected from unmanaged forests. In some cases once the trees are
harvested and produces like logs or poles or products like charcoal or timber are intercepted without
permits, these are then ‘legalised’ by TFS by issuing permits retrospectively. Instead it is crucial to
take legal action against illegal traders including confiscation of forest products obtained illegally
and prosecution instead of compounding and/or charging them royalties/fees and then allowing
them to go. Illegal traders must experience a significant negative impact if they operate illegally and
evade payment of royalties or fees by not sticking to procedures and requirements of the Forest Act.
By issuing harvesting permits without considering the source of the forest produce, TFS also risks
over-stepping its mandate by issuing permits that result in harvesting in village land forests whilst
TFS’s mandate is to manage Central Government Forest Reserves and forests on general land.
The Forest Act supports sustainable use of forest resources within village land provided that
harvesting permits are issued by the village council in accordance with an agreed management
plan. Village Councils can charge fees for produce from village land. The Village Council are also
liable to pay VAT to TRA; and forest product traders must pay their registration fees to TFS.
This requirement applies both to forests within village land forest reserves; and to unreserved
forests on village land. This latter type of forest, is the forest category referred to in the Forest Act ,
2002 Section 4 (c) (iii) on types of forests:
(c) village forests which consist of:
(i) village land forest reserves;
(ii) community forest reserves created out of village forests

11
(iii) forests which are not reserved which are on village land and of which the management is vested
in the village council.
There has been a tendency for this category of forest to be treated as ‘general land’ however this is
not supported by the Land Act 1999 nor the Village Land Act 1999. Similarly the TFS Business plan
(TFS, 2015) recognizes that 21.6 million ha of land are village land rather than general land.
Given limited harvesting potential in many productive Central Government Forest Reserves, it is
clear that a significant proportion of the revenues from natural forest produce that TFS is currently
collecting, are based on forest produce harvested on village land. This means that TFS are
collecting revenue from forests that it has no mandate or intention to manage. Within TFS, there is
no mechanism in place to channel any of those funds back into the management of the village
forests. Instead TFS note that forests on village lands are unsustainably managed. That
communities struggle to invest in the management of the forests is directly linked to the current
structure of financing whereby TFS collects revenues from the village land forests without re-
investing any of that revenue into the management of the forests. There is no mechanism by which
any proportion of the royalties or fees revenues collected from the village land forests can be used
for their management. Under the current system, village land forests will continue to be deforested.
This will result in negative livelihood impacts for rural communities and the loss of nationally
important ecological services. As the village forests decline, TFS will no longer be able to collect
revenues from those forests. This will result in a decline in TFS’s revenues from natural forests.
The natural capital is being eroded to the degree that revenue streams cannot be sustained.
The study was unable to determine precisely the relative importance of royalties from forest produce
on village land and from central government forest reserves as this data is not published, however,
in Kilosa District, TFCG found that none of the Central Government Productive Reserves could
support sustainable harvesting due to the forests already being over-harvested. Under the current
system, this link between revenue collection and investment management can only be restored
when communities establish village land forest reserves, whereby they have the exclusive right to
collect harvesting fees from those forests.
Figure 2. Revenue flows for Central Government Forest Reserves and village land forests.

12
3.1.4 Comparing revenue targets with demand
In 2005, Milledge et al. (2007) estimated that under-collection of royalties reached up to 96% of the total amount of potential revenue due. There are indications that under-collection of royalties is still widespread. If we compare TFS 2015/16 revenue targets with estimates of urban charcoal consumption, it is apparent that there are still very significant shortfalls in revenue collection.
The draft Biomass Energy Strategy and Action plan (BEST, 2014) that was developed in close
consultation with TFS includes the following chart:
If we only look at the urban charcoal consumption, we find that urban demand for charcoal is 1.51
million tonnes. According to the Forest (amendment) regulations 2015, the fee for one 75 kg bag of
charcoal is TZS 16,600. The 1.51 million tonnes is equivalent to ~ 22 million bags of charcoal. If
we multiply those 22 million bags by the TZS 16,600 fee we see that the potential revenue is TZS
334 billion. This is an order of magnitude more than TFS’s total projected revenue from royalties
from non-plantation forests of TZS 35 billion (TFS, 2015).
There remains a TZS 297 billion discrepancy between potential revenue from natural forests based
on published charcoal demand figures; and the TFS projected revenues. This is likely to be an
under-estimate given that it only includes charcoal. Other forest produce coming from natural forests
will further increase the potential earnings. This highlights that the market for natural forest produce
is far larger than is currently reflected in TFS plans; and suggests that natural forest management
should be the highest priority in the forestry sector.

13
Figure 3. A comparison of projected revenues based on urban charcoal demand and TFS projected
revenues.
3.1.5 Comparing revenues with the economic value of the forestry sector
According to UNEP (2015) a cost-benefit analysis found that the present value of net economic
losses from deforestation and forest degradation to the Tanzanian economy over the 20 years
(2013–2033) is TZS 273 billion (US$ 171 million) for values that are captured by the system of
national accounts and which can therefore be reflected in the gross domestic product (GDP). If
other ecosystem services are included in the analysis, the value of losses reaches US$ 3.5 billion.
These figures indicate that the current system of national accounts only documents 4.8% of the
value of the forestry sector to the national economy based on the present value of net losses (US$
171 million) that are captured in the national accounts compared with the US$ 3.5 billion in net
losses when other ecosystems services are included. The structure of the system of national
accounts contributes to the forestry sector being under-valued; and fails to capture the value of
natural capital that the natural forest estate comprises. For instance, environmental services from
forests and woodlands including carbon sequestration, water catchment, biodiversity and soil
conservation values are not captured in national accounts, despite their enormous value to the
national economy.
According to UNEP (2015) deforestation and forest degradation reduces the value added of the
forestry sector (tangible benefits) and the positive indirect ecological effects to other sectors
(intangible benefits). Combining these two factors the costs of deforestation (i.e. losing a hectare of
catchment forest reserve or forest nature reserve) amounts to TZS 83,771 ha-1 year-1 (2013 value-
UNEP, 2015).
3.1.6 Summary of challenges facing TFS in collecting revenues
With regard to revenue collection, the study points to the following key challenges:

14
Harvesting permits are being issued in the absence of management plans and harvesting
plans;
Revenue targets are based on historical revenues rather than on robust estimates of
harvesting potential;
Revenues are being collected by TFS on forest produce harvested from village land forests
with no mechanism in place to re-invest those revenues in the management of the village
land forests. This is contributing to widespread deforestation and forest degradation of
village land forests.
Revenues from fines are very low suggesting that forest produce is being ‘legalised’ ex post
by allowing royalties to be paid after produce are harvested.
A rough comparison of charcoal demand and projected revenues suggests a significant
shortfall in revenue collection.
The forestry sector is under-valued in the current system of national accounts due to the
exclusion of non-marketable values including ecosystem services.
The overall question for this section of the report is: are TFS revenues from royalties on forest
produce from natural forests ecologically and financially sustainable over a twenty year period?
Based on the analysis and discussion above, it is clear that the revenues are collected from
unmanaged natural forests and woodlands with no mechanism in place to safeguard the sector’s
ecological and financial sustainability over the next twenty years. Based on the current system
forest cover will continue to decline; as will revenues from natural forests as resources become
more scarce. The system is neither ecologically nor financially sustainable over a 20 year period.
3.2 Expenditure on natural forest management
This section assesses whether investment in natural forest management is adequate to meet TFS’s
objectives and whether it is proportionate to the national value of natural forests.
3.2.1 TFS investment in natural forest management
Funds released to FBD (2005/6 to 2009/10) and then TFS (2011/12 - ) have increased from TZS 5.6
billion in 2005/6 to TZS 57.9 billion in 2013/15.
Figure 4. Funds released annually to FBD and then TFS between 2005/6 and 2013/14
Source: Mgoo, 2014

15
Between 2011 /12 – 2013/14, investment in natural forest management comprises investment in
productive forest reserves under Objective B and investment in protective forest reserves under
Objective C. Whilst for the 2015 /16 plan, the re-structuring of the objectives results in all reserve
investment being included under Objective D. The level of investment in the general land forests
under TFS’s mandate is unclear. There is negligible investment in village land forests since these
fall outside of TFS’s management mandate.
Types of investment / expenditure
Most of the investments in natural forest reserve management that have been made by TFS have
been related to resurveying and consolidation of forest reserve boundaries. Achievements include
consolidation of forest boundaries of 102 forest reserves by resurveying and clearing 13,328 km of
boundary (TFS, 2015).
In addition to boundary consolidation, TFS raised over 575,000 seedlings in the Kibaha Central
Nursery (Eastern Zone) in 2013/14 of which 328,770 seedlings (57%) were planted along the
boundaries and in degraded patches of Ruvu South and North FRs. The remaining (43%) were
planted by adjacent villages and individuals (TFS Officer, pers. comm.).
Between 2011/12 – 2013/14 TFS also increased new forest plantation area by 9,947 ha from 83,659
ha – 91,606 ha; and replanted 14,200 ha (TFS, 2015). The expansion includes the establishment of
a new plantation in Korogwe District, Tanga Region. Additionally, TFS is working hard to establish
forest plantations within the Mbizi and Wino areas in Rukwa and Ruvuma Regions respectively. In
these areas TFS is planting mainly exotic tree species especially Pines, Cypress and Eucalyptus.
TFS has also been establishing a more accurate and complete inventory of the forest assets that
they are managing. This review involves all the central government FRs being assessed in terms of:
name, location, GN number and year of gazettement, area (ha), management plan (if in place),
record of inventories (harvestable volume), adjacent villages, state of forest (extent of deforestation
or degradation or species health and general condition regarding human activities such as villages,
farming and/or grazing animals etc.). TFS (2015) reports that: ‘preliminary field reports revealed
that there are 455 forest reserves5 with a total area of 14,256,133.03 ha; out of which 11 are Nature
Reserves (305,600 ha). Also there are 18 forest plantations covering an area of 284,549.85, out of
this planted area is 91,606 ha.’6
Other investments include two staff houses at Mtibwa Teak plantation plus a new office block. At
Rubare forest plantation an office block that was started by FBD, has now been completed. Other
constructions were done at Wino and Ukaguru forest plantations towards improving working
facilities. In total TFS has constructed 8 offices and staff houses (TFS Staff, pers. Comm.).
3.2.2 TFS expenditure on protective and productive forest reserves and on plantations
In order to get a sense of the level of expenditure on natural forest management, it is interesting to
compare investment in plantations and natural forest management.
As noted previously until 2014, expenditure on productive reserves and plantations falls under
Objective B, whilst expenditure on protective reserves falls under Objective C.
5 The TFS establishment order narrated 506 national FRs that are under the mandate of the Agency.
6 P. 6, TFS, 2015

16
In 2013/14 the budget for objective B: Sustainable supply of quality forest and beekeeping
Products enhanced was about TZS 24 billion with actual expenditures of about 23 billion (92%).
On the other hand, the annual budget for objective C: Stable ecosystem and biological diversity
maintained was about TZS 4 billion and actual expenditure of about TZS 3 billion (73%). The
difference in the figures between these two crucial objectives indicates significant differences
between the prioritization of these two objectives (Table 05 and 06) with the budget for objective C
comprising only 16% of the budget for objective B.
OBJECTIVE B: Sustainable supply of quality forest and beekeeping Products enhanced
Table 6. Objective B: Budget and expenditure for 2013/2014
Targets Budget (TZS) Expenditure (TZS)
% of Expenditure against budget
Target 01: 1.36 million ha of production forest reserves (natural and plantation) managed based on management plans by June 2014;
7,719,432,662 7,185,342,462 84
Target 02: 50,000 ha of new forest plantations and 26,083 ha of bee reserves gazetted by June 2014
10,005,334,307 9,679,633,798 97
Target 03: Beekeeping Improvement programme implemented in 30 districts and 4 demonstration centers by June 2014
471,487,352 375,300,714 80
Target 04: Compliance to regulation, operations and quality standards of forest and bee products and services attained at 50% by June 2014
6,605,199,864 5,552,341,699 84
Total objective B 24,801,454,186 22,792,618,672 92 Source: URT 2014c
OBJECTIVE C: Stable ecosystem and biological diversity maintained
Table 7. Objective C: Budget and expenditures for 2013/14
Targets Budget (TZS) Expenditure
(TZS)
% of Expenditure
against budget
Target 01: 1.8 million ha of protection forests
assessed and managed by June 2014
3,853,210,143 2,774,074,956 72
Target 02: Area under participatory forest
management (PFM) increased from 1.4
million to 4.5 million by 2014
176,843,000 161,509,342 91
Target 03: wood fuel Action Plan
implemented by June 2014
54,360,000 59,129,500 109
Total objective C 4,084,413,143 2,997,713,798 73.3
Source: URT 2014c
In Table 6, TFS under objective B (Target 2) spent nearly TZS 9.7 billion on the establishment of
50,000 ha of new forest plantations as well as to have 26,083 ha of bee reserves gazetted by June
2014 (equivalent to TZS 128,000 ha-1 without distinguishing plantations and bee reserves).
Although there is no distinction between the actual expenditures on plantations area relative to
expenditure on bee reserves, it is anticipated that most of this was spent on industrial plantations
rather than on bee reserves.
In Table 7 TFS under objective C (target 01) used nearly TZS 2.8 billion for assessment and
management of 1.8 million ha of protection forests. This is equivalent to TZS 1,500 ha-1 of natural
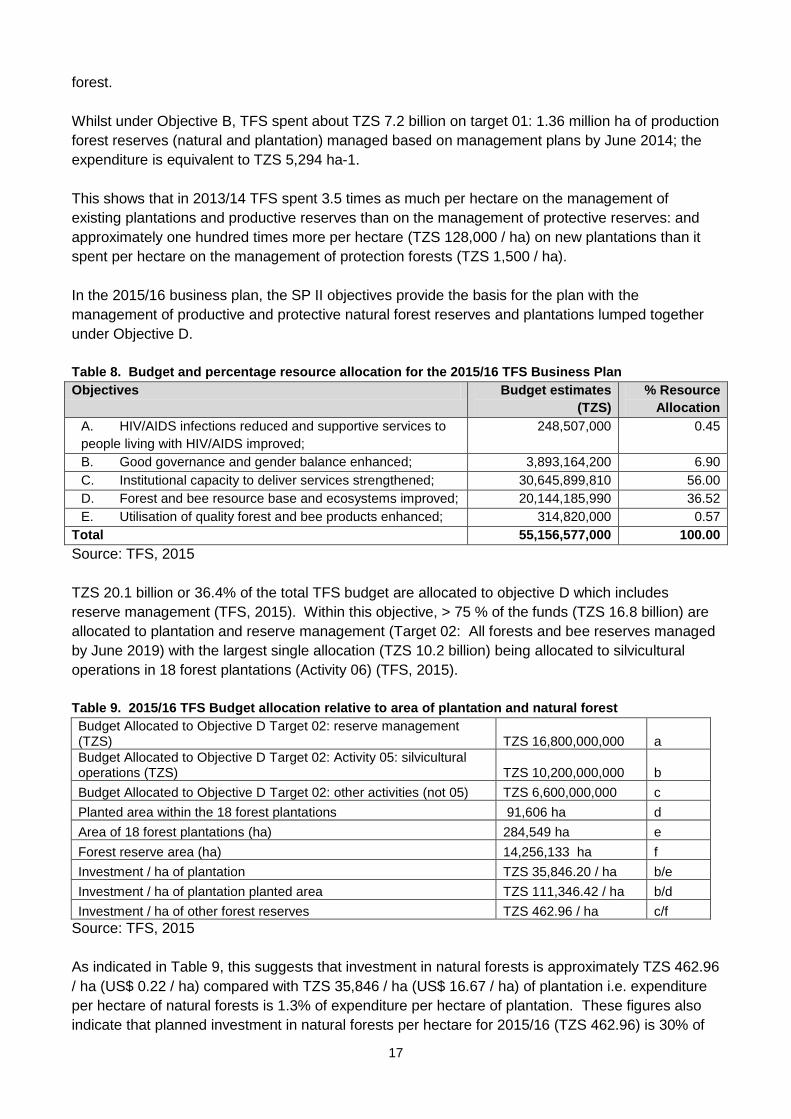
17
forest.
Whilst under Objective B, TFS spent about TZS 7.2 billion on target 01: 1.36 million ha of production
forest reserves (natural and plantation) managed based on management plans by June 2014; the
expenditure is equivalent to TZS 5,294 ha-1.
This shows that in 2013/14 TFS spent 3.5 times as much per hectare on the management of
existing plantations and productive reserves than on the management of protective reserves: and
approximately one hundred times more per hectare (TZS 128,000 / ha) on new plantations than it
spent per hectare on the management of protection forests (TZS 1,500 / ha).
In the 2015/16 business plan, the SP II objectives provide the basis for the plan with the
management of productive and protective natural forest reserves and plantations lumped together
under Objective D.
Table 8. Budget and percentage resource allocation for the 2015/16 TFS Business Plan
Objectives Budget estimates
(TZS)
% Resource
Allocation
A. HIV/AIDS infections reduced and supportive services to
people living with HIV/AIDS improved;
248,507,000 0.45
B. Good governance and gender balance enhanced; 3,893,164,200 6.90
C. Institutional capacity to deliver services strengthened; 30,645,899,810 56.00
D. Forest and bee resource base and ecosystems improved; 20,144,185,990 36.52
E. Utilisation of quality forest and bee products enhanced; 314,820,000 0.57
Total 55,156,577,000 100.00
Source: TFS, 2015
TZS 20.1 billion or 36.4% of the total TFS budget are allocated to objective D which includes
reserve management (TFS, 2015). Within this objective, > 75 % of the funds (TZS 16.8 billion) are
allocated to plantation and reserve management (Target 02: All forests and bee reserves managed
by June 2019) with the largest single allocation (TZS 10.2 billion) being allocated to silvicultural
operations in 18 forest plantations (Activity 06) (TFS, 2015).
Table 9. 2015/16 TFS Budget allocation relative to area of plantation and natural forest
Budget Allocated to Objective D Target 02: reserve management (TZS) TZS 16,800,000,000 a
Budget Allocated to Objective D Target 02: Activity 05: silvicultural operations (TZS) TZS 10,200,000,000 b
Budget Allocated to Objective D Target 02: other activities (not 05) TZS 6,600,000,000 c
Planted area within the 18 forest plantations 91,606 ha d
Area of 18 forest plantations (ha) 284,549 ha e
Forest reserve area (ha) 14,256,133 ha f
Investment / ha of plantation TZS 35,846.20 / ha b/e
Investment / ha of plantation planted area TZS 111,346.42 / ha b/d
Investment / ha of other forest reserves TZS 462.96 / ha c/f
Source: TFS, 2015
As indicated in Table 9, this suggests that investment in natural forests is approximately TZS 462.96
/ ha (US$ 0.22 / ha) compared with TZS 35,846 / ha (US$ 16.67 / ha) of plantation i.e. expenditure
per hectare of natural forests is 1.3% of expenditure per hectare of plantation. These figures also
indicate that planned investment in natural forests per hectare for 2015/16 (TZS 462.96) is 30% of

18
the level in 2013/14 (TFS 1,500) suggesting a downward trend in per hectare expenditure.
TFS (2015) state that ‘Forest plantations have been allocated TZS 25 billion which represents
45.3% of the total budget (Total budget = TZS 55.2 billion) due to priority placed in expanding areas
under plantations to enhance sustainable supply of wood raw materials. Plantations provide 60% of
the total financing of the Agency and therefore huge investments in plantation forestry is crucial in
order to build sustainable financial base of the TFS.’7
This may also reflect a perception that it is easier for TFS to earn revenues from plantation forests
than from sustainable management of natural forest in part due to the ongoing depletion of the
natural forest resource which has already resulted in the extraction of all trees of harvestable girth in
many Central Government Productive Forest Reserves.
Another contributing factor is that under the status quo, TFS are collecting revenue from forests that
are not directly under their management. This is because, in the absence of management plans and
a permitting process that can trace forest produce back to its source, some of the forest produce
from which TFS is earning a revenue come from village land; which is outside of the TFS
management mandate.
3.2.3 Comparing actual expenditure with costs of reserve management
In 2010, as part of the Valuing the Arc project, interviews were held with district forest officers,
district catchment managers and nature reserve conservators across the 22 districts of the Eastern
Arc Mountains. Information gathered related to the costs of administering reserves. The reserve
managers stated that they needed US$ 8.3 / ha per year to meet their management objectives, a
figure that is comparable to the US$ 7.7 spent by TANAPA on the management of National Parks.
The survey found that at that time, Local authority forest reserves received just 10% of the funds
needed, whilst national (catchment) Forest Reserves and Nature Reserves received around one
third (Valuing the Arc, 2014).
If we compare the planned US$ 0.22 (TZS 462.96) per hectare investment in natural forest
management for 2015/16 with the needs as outlined by the reserve managers in 2010, the current
level of investment is ~ 2.6 % of the amount that is needed.
3.2.4 Comparing TFS revenues with expenditure
When we compare the funds released to TFS (Figure 5) with the revenues presented in Figure 1 we
see that funds released to TFS range from 34 % to 63 % of the revenues.
Table 10. Annual funds released relative to annual revenues
Year Revenue '000 TZS Funds released '000
TZS Expenditure as a %
of revenue
2011/12 63,752,485 21,505,383 34
2012/13 62,668,602 30,901,816 49
2013/14 73,567,846 47,901,145 65
2015/16 (projected / planned) 87,956,411 55,156,578 63
Of the balance some goes to the Tanzania Forest Fund; some is paid as 5% Cess on royalties and
18% VAT; and some is paid direct to Treasury. For example in 2015/16 TZS 25 billion is planned be
remitted to the Treasury (TFS, 2015) equal to 25.8% of the projected revenue.
7 p. 21. TFS, 2015
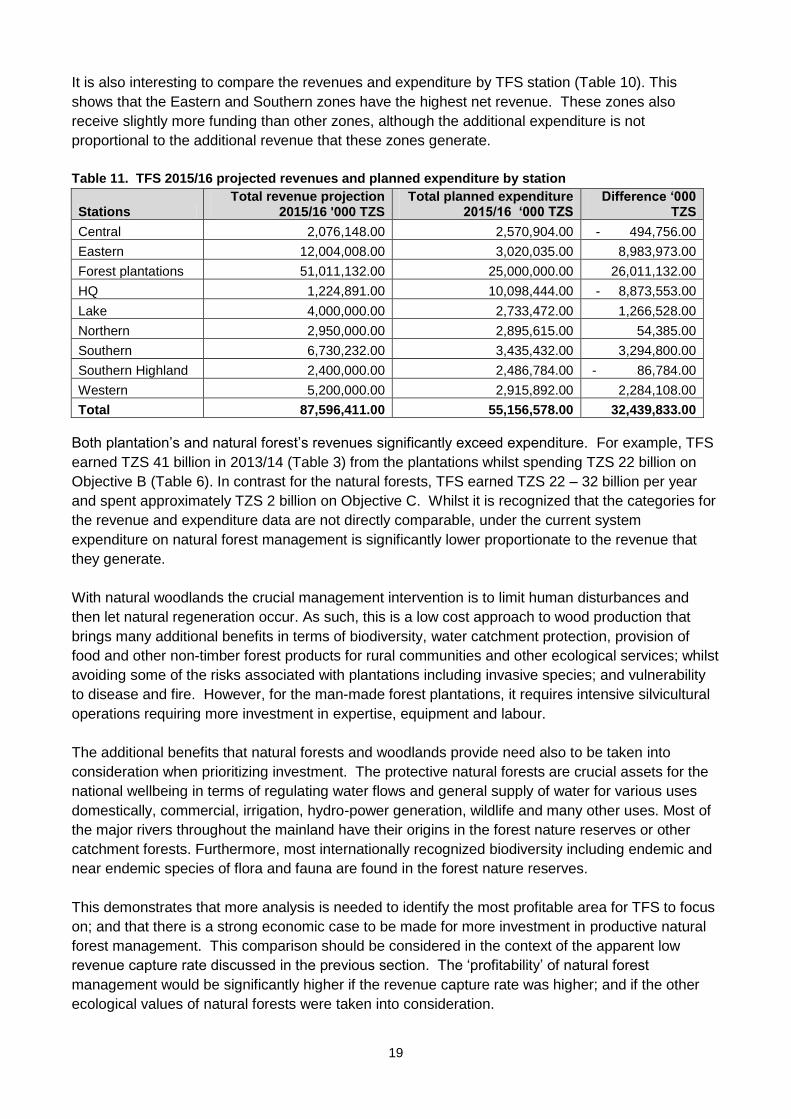
19
It is also interesting to compare the revenues and expenditure by TFS station (Table 10). This
shows that the Eastern and Southern zones have the highest net revenue. These zones also
receive slightly more funding than other zones, although the additional expenditure is not
proportional to the additional revenue that these zones generate.
Table 11. TFS 2015/16 projected revenues and planned expenditure by station
Stations Total revenue projection
2015/16 '000 TZS Total planned expenditure
2015/16 ‘000 TZS Difference ‘000
TZS
Central 2,076,148.00 2,570,904.00 - 494,756.00
Eastern 12,004,008.00 3,020,035.00 8,983,973.00
Forest plantations 51,011,132.00 25,000,000.00 26,011,132.00
HQ 1,224,891.00 10,098,444.00 - 8,873,553.00
Lake 4,000,000.00 2,733,472.00 1,266,528.00
Northern 2,950,000.00 2,895,615.00 54,385.00
Southern 6,730,232.00 3,435,432.00 3,294,800.00
Southern Highland 2,400,000.00 2,486,784.00 - 86,784.00
Western 5,200,000.00 2,915,892.00 2,284,108.00
Total 87,596,411.00 55,156,578.00 32,439,833.00
Both plantation’s and natural forest’s revenues significantly exceed expenditure. For example, TFS
earned TZS 41 billion in 2013/14 (Table 3) from the plantations whilst spending TZS 22 billion on
Objective B (Table 6). In contrast for the natural forests, TFS earned TZS 22 – 32 billion per year
and spent approximately TZS 2 billion on Objective C. Whilst it is recognized that the categories for
the revenue and expenditure data are not directly comparable, under the current system
expenditure on natural forest management is significantly lower proportionate to the revenue that
they generate.
With natural woodlands the crucial management intervention is to limit human disturbances and
then let natural regeneration occur. As such, this is a low cost approach to wood production that
brings many additional benefits in terms of biodiversity, water catchment protection, provision of
food and other non-timber forest products for rural communities and other ecological services; whilst
avoiding some of the risks associated with plantations including invasive species; and vulnerability
to disease and fire. However, for the man-made forest plantations, it requires intensive silvicultural
operations requiring more investment in expertise, equipment and labour.
The additional benefits that natural forests and woodlands provide need also to be taken into
consideration when prioritizing investment. The protective natural forests are crucial assets for the
national wellbeing in terms of regulating water flows and general supply of water for various uses
domestically, commercial, irrigation, hydro-power generation, wildlife and many other uses. Most of
the major rivers throughout the mainland have their origins in the forest nature reserves or other
catchment forests. Furthermore, most internationally recognized biodiversity including endemic and
near endemic species of flora and fauna are found in the forest nature reserves.
This demonstrates that more analysis is needed to identify the most profitable area for TFS to focus
on; and that there is a strong economic case to be made for more investment in productive natural
forest management. This comparison should be considered in the context of the apparent low
revenue capture rate discussed in the previous section. The ‘profitability’ of natural forest
management would be significantly higher if the revenue capture rate was higher; and if the other
ecological values of natural forests were taken into consideration.
20
Although we do not have data on how much of TFS revenue is derived from forests on village land,
the amount re-invested is negligible in the 2015/16 TFS Business Plan, being limited to establishing
1 village bee reserve of Chilangu (Objective D: Target 05). This is understandable given that TFS’s
mandate does not extend to forests on village land however it is concerning that TFS are collecting
revenue from village land forests with no plan or mandate to re-invest in the management of those
forests.
3.2.5 Summary of challenges related to expenditure
With regard to expenditure, the study points to the following key challenges:
TFS investment in the management of Central Government Forest Reserves is 2.6% of the
required expenditure as estimated by the reserve managers.
Per hectare investment in management of productive and protective Forest Reserves is
approximately US$ 0.22 / ha compared with US$ 16.67 / ha invested in plantation
management.
TFS are collecting revenue from village land forests with no plan or mandate to re-invest in
the management of those forests.
Low investment in natural forest management combined with low revenue capture rate for
forest produce from natural forests results in a vicious circle that directly contributes to
deforestation and forest degradation.
Sustainable management of natural forests is a valuable opportunity for national
development that the current system does not capture. The ‘window of opportunity’ to
develop this is closing rapidly given high deforestation rates.
TFS are allocating TZS 25 billion to the Treasury for use on other sectors whilst funds are
still needed to achieve TFS’s own goal and objectives.
Is enough being invested in the management of natural forest in order to meet TFS objective of
ecologically sustainably managed forests and woodlands on the mainland? Are the investment
made in a cost-benefit way? These and possibly other questions need to be explored further in
order to enable TFS to deliver and meet its objective accordingly. This study has indicated that there
is significant difference in investments made in forest plantations compared to the investments
made in natural forests. Given the deforestation that NAFORMA has recorded it is clear that not
enough is being invested in natural forests and woodlands management. It would be useful to
increase funding to natural forests to the rate of at least TZS 20,000 ha-1 year-1, in order to
maintain healthier natural forests but concentrating efforts in strategic FRs of national and global
importance for instance, forest nature reserves but also those productive forest reserves that can
generate sufficient revenues and at the same time maintaining sound environmental values such as
carbon sinks.
It would be useful for TFS and FBD in collaboration with other institutions like VPO-Division of
Environment to seek for approval for payment for environmental services (PES) from policy and
decision makers in order to increase the institutional capacity to invest, manage and conserve
critical natural forest and woodland areas on the mainland. By addressing deforestation in this way,
Tanzania would also be in a stronger position to access climate funding as the global community
move towards more performance-based REDD+ (Reducing Emissions from Deforestation and
Forest Degradation in Developing Countries).
3.3 Stable ecosystems and biological diversity maintained: are the rates of forest and
woodlands disturbances declining in Central government FRs?
The TFS strategic framework states that one of TFS’s four objectives is ‘stable ecosystems and
biological diversity maintained’. In TFS’s 2nd Strategic plan, this was changed to ‘Forest and Bee
21
resource base and Ecosystems Improved’ with the specific reference to biodiversity being
dropped. This section provides a brief look at whether the original objective is being met.
The NAFORMA data provides a national overview of deforestation rates but the published data
does not distinguish between reserved and unreserved forests. In a study by Godoy et al. (2011)
that covered 108 reserves in coastal Tanzania, they found a mean annual deforestation rate of 0.2%
between 1990 and 2007. 76 % of deforestation was accounted for by eight reserves, namely Forest
Reserve (Mangrove) No. 27, Mnazi Bay-Ruvuma Estuary Marine Park, Ruvu North Fuel FR,
Kiwengoma FR, Masanganya FR, Ngarambe-Tapika FR, Ruvu South FR and Tong’omba FR.
Localised deforestation analyses conducted by TFCG using remote sensing data have documented
annual deforestation rates in Central Government Forest Reserves ranging from a loss of 4% / yr of
high forest from Ruvu South FR between 2000 – 11 (Gwegime, 2013b); and 0.81% and 0.17% for
Mkingu Nature Reserve and Kanga Forest Reserve respectively for the period 2010 – 14 (TFCG
internal report).
Additional studies are also available documenting deforestation within Central Government Forest
Reserves including analyses conducted by the Conservation and Management of the Eastern Arc
Mountain Forests.
Most of these studies pre-date TFS management. As it was beyond the scope of the study to
conduct a forest change analysis based on remote sensing for all Central Government Forest
Reserves, the survey interviewed reserve managers to document their perceptions of current trends
in deforestation within reserves.
According to the TFS District Forest Managers in Kibaha, Kilosa and Rufiji, disturbances in FRs
have declined as a result of the TFS staff presence in the districts. Since 2012/13 the rate of visiting
various FRs in the districts has increased. In Kibaha District for instance, they have increased
patrols and undertaken evictions in collaboration with the District Councils’ authorities including the
District Security and Peace Committee under the District Commissioner (DC). The manager cited
Ruvu South FR (35,000 ha) as a typical case such that before launching TFS and eventually posting
TFS staff at the district level, the FR was under constant human pressure especially illegal logging
and charcoal production. The District Council, which was managing the FR on behalf of the central
government, was not able to control and stop human activities from taking place in the FR due to
very limited capacity with few staff and limited funds. However, upon arrival, TFS staff began to
undertake serious patrols and as a result the situation has rapidly changed.
Ruvu North FR (32,000 ha) has also experienced high rates of historical deforestation (Godoy et al.
2014). The reserve is designated for the production of woodfuels (to supply firewood and charcoal)
for the residents in Dar-Es-Salaam City and Kibaha town including adjacent peri-urban areas in the
Coast and Dar-Es-Salaam Regions. The Manager indicated that the situation in the reserve is now
more under control.
On the other hand, it was reported that disturbances in Forest Reserves in Handeni, Korogwe,
Kilwa, Liwale and Tunduru Districts are still uncontrolled particularly from charcoal producers and
timber harvesting. The forests in those districts are also pressurized for farming especially in village
land in Kilwa and Liwale District where a high rate of expansion of sesame and maize farming is
threatening natural forests and woodlands. Additionally, encroachments in FRs for illegal logging
and unauthorized livestock grazing are prevalent in the Southern regions of Lindi, Mtwara and

22
Ruvuma. The reasons provided for failure to curb illegal human activities in central government FRs
include:
Inadequate number of TFS staff in the districts; and
Inadequate facilitation in terms of financial resources and necessary equipment.
This reinforces the findings from Section 3.2 that levels of investment in natural forest management
are lower than is needed.
Although some TFS District Forest Managers indicated that the rate of disturbances in FRs has
declined, there is a vacuum of data to assess this perceived trend, whilst in some cases such as
Kazimzumbwi, Ruvu South and Ruvu North the decline in active harvesting may be a product of
there being very few harvestable trees remaining in these reserves.
As noted previously, very few FRs have approved Forest Management Plans and the funding level
in natural forests is still level low. This reinforces the findings of the National Audit Office –NAO
(2012) that only 4% of the Central Government FRs have management plans and that even where
management plans are in place, they are poorly implemented due to inadequate financing. The
majority (96%) have no approved management plans. In addition to that the NAO report (2012
noted that MNRT through FBD had no effective mechanisms of issuance of licenses at the District
level.
Table 12. Staff and Budget 5 districts
No of
Staff
FR area
(ha)
Staff
needed
Budget
2014/15
Approved
2014/15
Released
2014/15
Comments
Millions of TZS
DISTRICTS
Handeni 21,327 149
Kilwa 7 and
2 temp
192,324 38 302.47 204.22 171.69 (79.16% of
approved budget
was released). Spent
TZS 5.7 m on JFM
Kilosa 7 109,546 50
Rufiji 18 >90,000 45 167 167 167
Korogwe 8 17,591 10
On the other hands, stakeholders reported that the management of forest nature reserve for
instance, Chome, Nilo and Amani forest nature reserves seems to be improving. This may be due to
increased staff numbers and donor funding from the European Union, UNDP and others.
3.2.5 Summary of challenges related to deforestation rates
With regard to deforestation rates, the study points to the following key challenges:
Deforestation and forest degradation are occurring in many forest reserves with some
Central Government Forest Reserves including now having little forest left in them;
The absence of management plans means that management is not oriented to maintaining
ecosystem services.
Data to assess current rates of deforestation in Central Government Forest Reserves is
fragmented or absent;

23
TFS’s objective to maintain biodiversity has been subsumed in a more general objective that
loses the specific focus on biodiversity thereby risking that biodiversity conservation is no
longer a priority in TFS planning.
If the mission of TFS is to sustainably manage and utilise the national forest and bee resources
(reserves) in order to contribute to socio-economic, ecological and cultural needs of present and
future generations, then TFS needs to be more strategic and deliberate in its efforts to reduce
deforestation in its Protective and Productive Reserves. The development and implementation of
management plans is a key step. This is recognized in the TFS 2015/16 plan which includes a
target of preparing 18 forest management plans and reviewing 2 forest management plans (TZS
785 million). Whilst this is a positive step, with over 400 forest reserves, it is important that the rate
of implementation be increased; and that this step be tied to future revenue projections.
3.4 Monitoring of deforestation and forest degradation to inform TFS planning and to
evaluate TFS’s impact
Monitoring is an essential part of governance. Monitoring data provides a basis for assessing
performance relative to targets. URT (2010) states that ‘The TFS Chief Executive shall directly be
answerable to the Permanent Secretary of the Ministry of Natural Resources and Tourism. The
Permanent Secretary will oversee the interests of the Ministry and the Government in general.
There shall be a Ministerial Advisory Board (MAB) that will advise the Minister on the performance
of TFS.’
In order for the MAB and the Permanent Secretary to hold TFS accountable, they need reliable data
on its performance relative to its targets.
This study looked at the monitoring systems currently in place, particularly with a view to assessing
how Objective D “Forest and bee resource base and ecosystems improved’ is being monitored.
The TFS Business plan outlines 27 targets to be achieved under the 5 objectives with each target
having a corresponding ‘key performance indicator’. Specific targets are also documented in the
TFS strategic plan II.
URT 2010 indicated that the development of monitoring and evaluation systems is amongst the
planned activities for TFS; and states that TFS HQ is responsible for overall monitoring. In its
2015/16 business plan, TFS allocates TZS 1.5 billion to developing a performance management
system. The plan also states that it will be using the Management Effectiveness Tracking Tool to
monitor performance.
For the past three years TFS monitoring efforts have relied heavily on patrols and visits from senior
officers from the HQs as well as officers from the monitoring and evaluation unit. Furthermore, TFS
in collaboration with MNRT has regularly monitored revenue collection throughout the zones and its
impact is noted in increased revenue collection.
According to Zonal and District TFS Managers monitoring is done within the zones through regular
visits to various sites to check if what was planned and budgeted for has been accomplished with
required standards and value for money. This is conducted by officials from the zonal HQs to
districts while the district staffs are monitoring and trying to control illegal forest produces and
products through regular patrols and at established check points. Before establishing TFS most of
the monitoring in the regions and districts was done through the field surveillance units but after
abolishing them regular field monitoring is done by the staff in the districts and backed up by regular
visits by staff from Zonal HQs as well as TFS HQs. Normal planned monitoring is done by TFS HQs

24
staff quarterly or semi-annually and annually. The idea is to monitor performances i.e. result-based
performances by relating targets, planned activities and what has been achieved on the ground. In
case of contracted work and investments the monitoring exercise tries to establish whether the
planned expenditures are met if not what are the reasons. Furthermore, monitoring is conducted to
establish in the interests of the institution and the public as a whole whether the element of value for
money has been fulfilled.
Most of the monitoring currently implemented by TFS is at the activity level or output level. This
relies on the assumption that if the planned activities are implemented, TFS will attain its objectives.
The business plan does not include indicators at the objective or goal level.
In the context of maintaining natural forest ecosystem services, the NAFORMA data provides the
most robust, current national assessment of forest cover and forest change. As described
previously, the results indicate widespread deforestation although the published results do not
distinguish between deforestation in reserves and in village forests outside village forest reserves.
At a national level there is currently no publicly available monitoring data showing whether or not the
original TFS objective of maintaining sound forest ecosystems and high biodiversity values is being
achieved.
Impact indicators should include changes in forest cover in forest reserves. In an era of increasingly
accessible and cheap remote sensing data; and given increased national capacity on remote
sensing analysis and GIS as a result of programmes such as NAFORMA and CCIAM, annual or
biennial monitoring of forest cover within forest reserves (and outside) is feasible. Other impact
level indicators could include status of indicator species including endemic or near-endemic species;
changes in the rate of activities such as illegal logging that cause forest degradation (based on
base-line data if available).
TFS could also collaborate with Ministry of Water and the River Basin Offices to monitor fluctuations
in the flow of water in streams or rivers flowing from catchment forests or forest nature reserves.
By establishing a robust impact-level monitoring system TFS would be able to documents its
performance; and to make a sound economic and political case for increasing investment in natural
forest management. Whilst some monitoring should be done by TFS, independent forest monitoring
would enhance the legitimacy of monitoring data. For example, with the establishment of the
national carbon monitoring centre, there is potential for forest cover change data to be generated
independently of TFS; and to be linked with REDD+. In 2007 – 8, DANIDA supported a
participatory design process in close consultation with FBD, for an independent forest monitoring
programme for Tanzania. Although this was not implemented, the report provides a basis for
reviving plans for Independent Forest Monitoring in Tanzania. An independent monitoring system
could generate data on key indicators that could be used by TFS to improve decisions and enhance
forest and woodland resources protection and conservation.
Independent forest monitoring should be considered for incorporation in the ongoing revision of the
Forest Act in order to accommodate independent monitoring requirements including reporting and
how the generated information shall be used.
25
3.5 Is Participatory Forest Management (PFM) achieving sustainable forest management
and what is the impact on the ground?
3.5.1 JFM financing
In a review of the effectiveness of JFM involving 110 sites across Tanzania, Persha and Meshack
(2015) found that ‘there is no evidence of impact of JFM on extreme forest degradation and
deforestation, although there is weak evidence for a positive impact on slowing forest degradation.
We found no significant difference in deforestation rates between JFM and non-JFM forest reserves
during 2000 – 2012.’
The researchers also found that ‘There is wide variation in the extent to which JFM implementation
in practice confirms to the program’s formal design as went out in Tanzanian policy, particularly
around revenue generation opportunities and revenue sharing arrangements with villages, and full
legal processing of JFM agreements with villages’.
Expansion of PFM initiatives throughout the country is an important requirement. This is because
TFS may not be everywhere but FRs are surrounded by villages and local communities. If the
adjacent village communities engage in joint forest management and are motivated to protect and
look after the forest resources near them; the chances of reducing illegal human activities inside the
FRs are most likely to increase.
The government has adopted some guidelines on cost-benefit sharing. The guidelines link benefits
to reserve-specific revenues. This is challenging particularly for the catchment reserves where JFM
has mostly been piloted. These reserves tend to have low cash revenues since no harvesting is
permitted; and other revenue streams such as eco-tourism have yet to be properly developed. Thus
whilst communities may have the right to 25 % of the revenues to that reserve, if the revenues are
negligible so too will be the flow of revenues to the communities. Without an incentive to participate,
communities will not volunteer their labour, particularly in the context of widespread rural poverty.
The JFM guidelines (MNRT, 2013) state that ‘forest management costs and benefits must be
‘balanced’ – in other words if communities are undertaking approximately 25 % of the forest
management responsibilities (costs), they should expect to receive approximately 25 % of the local
forest benefits. Making JFM agreements ‘unbalanced’ will mean that they are not sustainable in the
long term.’ However the system that is then proposed makes no attempt to balance actual costs
with actual revenues.
Although development partners have spent, and continue to spend millions of dollars on joint forest
management, the sustainability of the approach as implemented at present is questionable. There
is a need to link expenditure and benefit sharing on JFM with reserve-specific budgets and
management plans rather than tying benefits solely to reserve-specific cash revenue.
As such, there is a need to re-consider mechanisms for paying communities to engage in the
management of protective forest reserves, including allocating funding from other sources to cover
joint management costs including joint patrols, boundary marking and law enforcement.
The financing mechanisms for JFM needs to be reviewed so that communities engaged in JFM
have the right to be paid for their participation in reserve management activities. This right to
participate in reserve management; and to be paid for participation should be embedded in the new
Forest Act.
26
3.5.2 TFS investment in PFM
According to the TFS Business plan and associated targets for the financial year 2013/2014 the
agency under Objective C regarding ‘stable ecosystems and biological diversity maintained’ had
three targets; one of the targets was: “area under PFM increased from 4.1 million to 4.5 million
hectares by June 2014.’
To attain this target TFS allocate TZS. 354,185,000/= to implement four activities as follows:
Carry out resources assessment , prepare management plan and Joint Forest Management
(JFM) Agreement for one FR in Western Zone;
Manage forest wildfires in forested areas by maintaining fire facilities;
Conduct training to four (4) Village Natural resources Committee (VNRC) on Community
Forest based Management (CBFM) guidelines in four (4) Districts; and
Promote income generating activities in seven (7) villages around forest nature reserves and
FRs in the Northern Zone.
The 2013/2014 performance report then indicates that the annual approved budget (target code-
C02C01) was TZS 176,843,000/= with actual expenditure of TZS. 161,509,342/=.
In terms of performance, the TFS annual report for 2013/2014 provides information on the activities
that were accomplished. The reports states that a total of 79 JFM agreements were reviewed in the
Northern Zone, and 12 village land forest management plans were endorsed in Eastern Zone.
Furthermore, initial work to prepare forest management plans, review of forest management
agreements and bylaws continued in other zones (details of these not provided). In addition, a total
of 23 VNRCs with 347 members from Central Zone were trained on PFM, encroachment,
conservation and compliance. Also participatory forest resources assessment (PFRA) meetings
were conducted in three (3) villages in Central Zone and one village in the Western Zone was
supported to establish a Village Land Forest Reserve. Additionally 163 villagers in the Northern
Zone were trained regarding income generating activities (IGAs) including aspects of raising
seedlings, beekeeping dairy/goat farming, fishing farming, growing spices and vegetable production.
Although the 2013/14 business plan indicated a target of ‘an increase of forest area under PFM from
4.1 to 4.5 million ha but the reported achievements do not include this issue’, this target was not
reported on in the 2013/14 annual report. As such it is not possible to assess the impact of the
activities that were financed.
In the 2015/16 TFS Business Plan, TZS 93 million is allocated to training VNRCs on JFM; and TZS
106 million to finalizing and signing JFM agreements.
As such, it is clear that TFS is continuing to invest some funds in the establishment of JFM.
However no funds are clearly allocated to pay communities for the ongoing costs of reserve
management.
For JFM to bring impact more widely there is a need to increase budgetary allocations for the
establishment and implementation of JFM. If JFM will be accorded priority and scaled up
accordingly and the strategies and activities effectively implemented, it can contribute to reducing
deforestation; improving livelihoods and governance.
3.5.2 Stakeholder consultation on CBFM
According to the stakeholder consultation conducted as part of this study, implementation of PFM in
the districts visited was rated low. In districts like Kilosa, Kilwa and Liwale, PFM is being
27
implemented but through the efforts of NGOs such as Mpingo Conservation and Development
Initiative (MCDI) and the Tanzania Forest Conservation Group. Most of the PFM operations in the
Southern Zone, were focused on community-based forest management (CBFM) and are being
undertaken in villages in Kilwa and Liwale districts where MCDI is collaborating with MJUMITA and
LIMAS to assist villages to benefit from forest resources available on villages’ land.
Stakeholders expressed concern at relying on NGOs and donors’ support to implement CBFM
activities in villages and communities, which is appreciated but does not ensure long-term
sustainability of PFM performances and contributions to improving livelihoods as well as poverty
reduction at the grassroots level. The experiences show that once the support from the
development partners is over, communities cease implementation due to inadequate capacities at
the local level to continue on their own; and inadequate incentives for the VNRC members to accord
priority to CBFM work. This challenge is well documented and donors and NGOs are now focusing
on CBFM that includes sustainable utilization of forest and woodland resources on village lands in
order to generate income through marketing and sale of forest produces. It is intended that the
revenues from these forest produces will then be available for investing in forest management. This
is actively taking place through programmes including the LIMAS programme in Lindi, Mtwara and
Ruvuma; the National Forestry and Beekeeping Programme; and the Transforming Tanzania’s
Charcoal Sector Pro ject.
3.6 What are roles and responsibilities of TFS District Managers and other staffs working
in Districts?
3.6.1 TFS human resources capacity
The government through TFS is recruiting more staff as a key measure to increase its capacity. The
work force in 2015 includes 1501 Forest staff; 127 beekeeping staff and 196 support staff. This
compares with a requirement of 2865 forest staff; 727 beekeeping staff and 299 support staff.
Most forest reserves have no staff managing them with the exception of the forest nature reserves.
except very few staffs allocated to FNRs (e.g. Amani Forest Nature Reserve). It was a common
practice for the district councils to take care of the central government FRS existing in the districts.
This strategy did not work out well because the capacities within the districts in natural resources
has been very low hence most of over 500 FRs have been unmanaged for a very long time giving
chance for the people to use them as “open access regimes” leading to serious deforestation and
forest degradation.
After TFS was established in 2010 it was expected that the central government FRs will be
improved in terms of forest management strategies and approaches as well as improved capacity
(staff and financial resources) to look after the reserves. TFS now have 98 District Forest Managers
in place, of whom seven have responsibility for two districts. The DFMs are supported by other staff
(e.g. Handeni 7; Kilwa 4; Rufiji 18 and Korogwe 6 including the District Managers). Furthermore,
the capacities in forest nature reserves and bee reserves has been enhanced. Despite this increase
most FRs still have no-one to manage them directly.
For the financial year 2015/16 TFS has been allowed to employ about 500 staffs to manage FRs
and bee reserves. This is an important step towards enhancing forest protection particularly in
central government FRs. The distribution of these employment opportunities is as follows:
50 professionals (degree holders);
450 technical staff (Diploma and certificate holders)

28
These will be posted directly to specific FRs and TFS may start with those forests and woodlands of
strategic importance.
The study found that staff working at the district level are trying as much as they can to enforce the
law but they are operating in difficult circumstances. TFS (2015) states that ‘In some cases, one
forest officer manages up to 130,000 hectares of natural forests8. Meanwhile some data shows a
standard rate of 5,000 ha per forester.’
Their efforts are further hampered by having little equipment (vehicles and motor cycles) thus
making it difficult for the staff to control illegal activities. For instance, in Handeni District
uncontrolled harvesting of trees for timber, charcoal production, poles etc is still a serious challenge
in both village lands and some reserves. Illegal loggers are using chain saws, which are highly
destructive leading to serious losses. It was also noted that TFS staff and the district council forestry
officers are operating according to parallel structures in most districts. For example in Handeni,
Rufiji and Korogwe they are operating from different office buildings. Only in Kilwa are they housed
in one building. This inhibits collaboration and cooperation. Management of the sector would be
enhanced if the accountability, reporting and planning channels were streamlined.
Additionally, it was noted that the relationships between TFS staff and those in the district councils
is still weak. One staff in the district council remarked “I am only involved during special tasks such
as undertaking evictions and/or specific operations”, however, on daily routines they hardly interact
with each other. This creates some weaknesses in the management of the forest and woodland
resources in the districts. Pressure for both TFS and the District Council to raise more revenues is
another source of conflict between TFS and the district councils. The experiences show that where
antagonisms exist forestry operations are jeopardized because of poor relationships between the
staffs in the sub-sector and also with the local community at the grassroots level.
Basically the roles and responsibilities between TFS and district staffs are clearly defined. For
instance, the TFS District Forest Managers and his/her team are supposed to manage and take
care of all central governments’ FRs in the district. In addition, TFS is supposed to manage forest
and bee resources in general lands but also “reserved trees” regardless where they are. The latter
is however, an area of overlap because TFS have been operating in village lands where the District
Forest officers are also trying to collect some district revenues through cess or direct royalties. It is
important that both TFS and district forest and beekeeping staff work as one team and try as much
as possible to collaborate and assist one another. This may entail undertaking regular meetings and
consultations with one another. It should also be possible to plan and strategize together for the
better performances.
There is a need to streamline the roles and responsibilities between TFS and District Councils
forestry officers who are mandated to manage forest and woodland resources in the districts. For
instance, in the context that TFS staffs are concentrating on managing the CGFRs while the district
forestry officials dealing with LAFRs and DFO’s office assisting villages to manage and benefits
from the forest resources on the village lands.
In terms of law enforcement, both offices are required to enforce national law. DFOs have
additional responsibility to enforce the district by-laws.
8 This is roughly equivalent to the area of Dar es Salaam region.

29
In terms of the issuance of licenses and transit permits, the study found that perceptions of those
who were interviewed varied regarding roles and responsibilities suggesting more clarity is needed
regarding the issuance of licenses and transit permitsTFS District Managers and DFOs.
Over the last few years, some villages implementing community-based forest management have
started producing and selling forest produces and products. The MNRT issues licenses books and
other facilities for undertaking proper business. Furthermore, the MNRT has started issuing special
hammers for use in villages and these are currently kept by DFOs with the hope that once a village
will meet the criteria the village can use the hammer directly. What is important is to define limits of
TFS District Managers, DFOs in issuing licenses and TPs but also the case of villages with own FRs
and operating under CBFM should be taken into account.
Recently TFS senior management Team met with PMO-RALG (TAMISEMI) in Dodoma. This was
meant to improve coordination and iron out differences that exist between the central government
and the local government authorities in the context of sustainable natural forest management.
5. Conclusions
Tanzania’s natural forests are systematically under-valued. Factors contributing to this include low
revenue collection rates by TFS and local government; the non-marketable nature of many forest
values; the current system of national accounts which does not account for natural wealth; and a
disconnect between revenue collection by Central Government for forest produce from village
forests and management responsibilities that are vested in village councils. As a result of the
natural forests being under-valued, investment in natural forest management is a fraction of what is
needed. This results in weak management leading to deforestation and concomitant economic
losses to the nation.
TFS is responsible for ensuring that stable ecosystem and biological diversity are maintained in
Central Government Forest Reserves. There have been rapid increases in revenues to TFS.
Increased revenues are being achieved in the context of uncontrolled and unsustainable harvesting
including from forests outside of TFS’s management mandate. Revenue targets are being set
irrespective of the available resource, the sustainability of the harvesting and the availability of
management plans. Continuing along this trajectory will result in the depletion of the resource with
a concomitant collapse in revenues from natural forests. Continued deforestation will also result in
heavy costs to the economy due to disruption in ecosystem functioning. Potential costs include
losses to the agricultural sector due to reduced dry season flows in rivers originating in formerly
forested areas; reduced efficiency in hydro-power generation due to increased siltation and
reduced dry-season river flows; increased soil erosion and landslides; and loss of wood and non-
wood forest products that underpin most rural livelihoods.
TFS have begun a process of consolidating the reserves under its authority through boundary
surveys and marking; and are increasing the number of staff available for reserve management.
Nonetheless NAFORMA data and other forest change analyses point to ongoing deforestation
within and outside reserves. TFS needs to establish a more robust impact level monitoring system,
particularly with regard to its remit of maintaining ecosystem services from Central Government
Forest Reserves. This could build on existing initiatives such as the national carbon monitoring
centre; and the independent forest monitoring plans initiated in 2008. There remains a need to
improve coordination and cooperation between TFS District Forest Managers and District Forest
Officers in order to achieve more efficient and effective law enforcement.
30
6. Recommendations
The following recommendations are proposed on the basis of the findings of this study:
TFS should adhere strictly to the Forest Act 2002 and should only issue permits based on
current forest management plans including harvesting plans. Licences should be given based on the
harvesting plans supported by current inventory data and strictly follow the Forest Regulations of
2004 including sticking to the minimum girth requirement;
TFS should only issue permits for those forests that fall under its mandate i.e. Central
Government Forest Reserves and forests on general land;
TFS should recognize the authority of Village Councils in determining harvesting rates from
village land forests and should ensure that it is not issuing permits for harvesting of forest produce
from village land;
TFS should not be required to remit funds to the Treasury until such time as TFS is fully
achieving its goal and objectives; and generating a surplus;
Revenue from produce harvested from village lands should be re-invested in the
management of village land forests including in expanding areas under community-based forest
management. This will require a significant re-structuring of the current revenue collection
procedures;
TFS should recognize the authority of village councils to manage village forests including
forests which are not reserved which are on forest land;
National, Zonal and District TFS Revenue targets should be based on consolidated
estimates of sustainable harvesting levels from the forest reserves within that particular area.
Targets should not be based on historical revenue collection.
TFS should accord more priority to natural forest management in its plans and budgets;
Mechanisms to include the value of forest ecosystem services in the system of national
accounts should be explored;
It is crucial to take legal action against illegal traders including confiscation of forest products
obtained illegally and prosecution. The practice of accepting fees or royalties retrospectively for
products intercepted whilst in transit, should be discontinued.
More research is needed in order to determine the relative profitability of investing in high-
cost, high-return plantations compared with investing in medium -cost, medium-return natural
woodlands.
There is a need to strengthen TFS’s accountability for delivering on its mandate to maintain
ecosystem services and biodiversity values
Engagement of independent monitoring agents would add value to TFS’s work hence
establishing such a tool is highly recommended;
There is a need to re-consider mechanisms for paying communities to engage in the
management of protective forest reserves, including allocating funding from other sources to cover
joint management costs including joint patrols, boundary marking and law enforcement.
Scaling up JFM and CBFM should be a priority in order to increase the effectiveness of PFM
as a protected areas conservation strategy.
Efforts should be undertaken to streamline revenue collection at all level (i.e. from the village
to central government).
There is a need to streamline the roles and responsibilities between TFS and District
Councils forestry officers who are mandated to manage forest and woodland resources in the
districts.
Expanded tree growing should not focus on exotic softwood and hardwood plantations alone
but also expanding regeneration and planting valuable indigenous tree species like Mpingo, Mvule,

31
Mninga and various miombo tree species in seriously degraded CGFRs such as Pugu and
Kazimzumbwi;
Villages with ample forest/woodland areas be encouraged and supported to gazette
sufficient forest/woodland areas for production of forest produces as well as for ecosystem
conservation for the villages’ benefits and the nation as a whole.

32
References
Albert, A. and E. Monga, 2014 Are district officials playing their part in providing forest justice in
Tanzania? A report on a survey of forest governance at District level.
http://www.tfcg.org/forestJusticeTanzania.html
Camco Clean Energy (Tanzania) Limited, 2014. Biomass Energy Strategy and Action Plan. Godoy. F. L., K. Tabor, N. D. Burgess, B. P. Mbilinyi, J. Kashaigili and M. K. Steininger. 2011.
Deforestation and CO2 emissions in coastal Tanzania from 1990 to 2007. Environmental
Conservation 1 – 10.
Gwegime, J., M. Mwangoka, H. Said, E. Mulungu, K. Nowak and N. Doggart (2013a) Two surveys of the plants, birds and forest condition of Pugu and Kazimzumbwi Forest Reserves in 2011 and 2012. TFCG Technical Paper 36. DSM, Tz. 1-121 p.
Gwegime, J., Mwangoka, M., Mulungu, E., Perkin A. and K. Nowak (2013b). The biodiversity and forest condition of Ruvu South Forest Reserve. TFCG Technical Paper 37. DSM, Tz. 1-72 pp.
Milledge, S.A.H., I. K. Gelvas and A. Ahrends (2007). Forestry, Governance and National Development: Lessons Learned from a Logging Boom in Southern Tanzania. An Overview. TRAFFIC East/Southern Africa / Tanzania Development Partners Group / Ministry of Natural Resources of Tourism, Dar es Salaam, Tanzania. 16pp.
Mgoo, J. 2014. Institutional arrangements and forest sector financing. Presentation to the National Forestry Conference. December 2014
MNRT, 2015. National Forest Resources Monitoring and Assessment of Tanzania Mainland: Main Results. 124 p.
NAO (2012) National Audit Office performance audit on management of forest harvesting by the
MNRT, Dar-Es-Salaam, Tanzania
Persha, L. and C.K.M. Meshack, 2015 Is Tanzania’s Joint Forest Management Program an triple
win? Understanding causal pathways for livelihoods, governance and forest condition impacts.
Grantee Final Report to 3iE.
Rovero, F., M. Menegon, J. Fjeldsa, L. Collett, N. Doggart, C. Leonard, G. Norton, N. Owen, A. Perkin, D. Spitale, A. Ahrends and N. D. Burgess. 2014. Targeted vertebrate surveys enhance the faunal importance and improve explanatory models within the Eastern Arc Mountains of Kenya and Tanzania. Diversity and Distributions, (Diversity Distrib.) (2014) 1–12
TFS (2015). Business plan and associated budget for financial year 2015/2016
http://www.tfs.go.tz/uploads/TFS_Business_Plan.pdf
URT (2010) TFS Framework document. 26p: TFS, Dar-Es-Salaam, Tanzania URT (2012) TFS Annual implementation report for 2011/2012, 27p; TFS, Dar-Es-Salaam, Tanzania
URT (2013a) TFS Annual implementation report (2012/2013), 21p; TFS, Dar-Es-Salaam, Tanzania
URT (2013b) TFS Business plan and associated budget for the financial year 2013/2014, 55p
TFS-Dar-Es-Salaam, Tanzania
URT (2013c) National Strategy for Reduced Emissions from Deforestation and Forest Degradation
Vice President’s Office. 100p.
URT (2014a) TFS Annual implementation report (2013/2014), 31p; TFS, Dar-Es-Salaam, Tanzania
URT (2014b) TFS Strategic plan 2014 to 2019, TFS-Dar-Es-Salaam, Tanzania, 39p
URT (2014c) An overview of the forestry and beekeeping sub sector: Achievements, Challenges and Priorities for financial year 2014/15. A paper presented by Ms. Gladness Mkamba, Ag. Director for Forest and Beekeeping at the 2014 Natural Resources Sector Review Meeting 16/10/2014. 11p
UNEP (2015) Forest ecosystems in the transition to green economy and the role of REDD+ in the
United Republic of Tanzania: UNEP, Nairobi, Kenya
Valuing the Arc. 2014. There are also costs of Conservation. The Arc Journal 29. P. 20.

33
Annex 1. List of stakeholders consulted
No Name of Stakeholder Institution/Address
1 Ms. Gladness Mkamba FBD
2 Mr. Deusdedit Bwoyo FBD
3 Mr. Mohamed Kilongo TFS-HQs
4 Mr. Emmanuel TFS-HQs
5 Ms. Amina Akida TFS-HQs
6 Ms. Anna Lawuo TFS-HQs
7 Mr. Gaspar Makala MCDI
8 Mr. Mustafa Mfangavo DFO- Kilwa District
9 Mr. Salhina Kashenge TFS Kilwa
10 Ms. Bernadetha Kadala TFS Kibaha
11 Mr. Thomas Selanniemi TA-FBD
12 Ms. Monica Kwiluhya DED Same
13 Mr. Leonard Lyimo FBD
14 Mr. Johnson Kigula TFS HQs
15 Mr. Charles Meshack TFCG – Executive Director
16 Ms. Monica Kagya FBD-MNRT
17 Ms. Nike Doggart TFCG (TA)
18 Ms. Bettie Luwuge TFCG

34
Annex 2. Figures
Table E: Summary of Annual Budget against actual Expenditures by Targets
EXPENDITURE FOR THE YEAR JULY 2012 TO JUNE 2013
Objective / Target Annual Budget
(TZS)
Expenditure
(TZS)
% of
expenditure
/ budget
Objective A: HIV/AIDS infections reduced and supportive services to people living with HIV/AIDS
improved;
Target 01: supportive services established and
operating by 2013
202,432,500 153,894,500 76%
Target 01: 1.36 million ha of production forest
reserves (natural and plantation) managed based on
management plans by June 2013;
7,049,570,812 7,812,884,592 111%
Target 02: 50,000 ha of new forest plantation and
26,083 ha of bee reserves gazetted by June 2013;
765,113,600 589,896,612 77%
Target 03: Beekeeping improvement programme
implemented in 30 districts and 4 demonstration
centers by June 2013;
344,082,629 587,515,619 171%
Target 04: Compliance to regulations, operations
and quality standards of forest and bee products and
services attained at 50% by June 2013;
3,921,583,447 2,690,438,076 69%
OBJECTIVE C: Stable ecosystem and biological diversity maintained
Target 01: 1.8 million ha of protection forests
assessed and managed by June 2013;
4,326,164,673 3,266,072,540 75%
Target 02: Area under PFM increased from 4.1
million to 4.5 million ha by June 2013;
549,806,500 413,978,355 75%
Target 03: Wood fuel action plan implemented by
June 2013;
82,115,000 51,965,200 63%
OBJECTIVE D: Institutional capacity to deliver services strengthened
Target 01: Revenue accrued from Forest and
beekeeping resources increased from 33 to TShs. 35
billion by June 2013;
1,355,822,138 1,048,645,134 77%
Target 02: TFS Human resource capacity developed
by June 2013;
1,824,690,190 1,182,287,888 65%
Target 03: Level of provision of requisite working
facilities and administrative operation attained 60%
by 2013;
12,393,999,849 10,803,218,495 87%
Target 04: physical infrastructure and service
provision maintained and increased by 30% by June
2013
2,547,376,182 1,138,661,569 45%
Target 05: monitoring and evaluation system
developed and implemented by June 2013
1,038,053,292 1,048,834,810 101%
OBJECTIVE E: Good governance and gender balance enhanced
Target 01: Good governance and National
Anticorruption strategy Action Plan implemented by
2013;
208,940,000 113,522,880 54%
GRAND TOTAL 36,609,750,812 30,901,816,270 84%
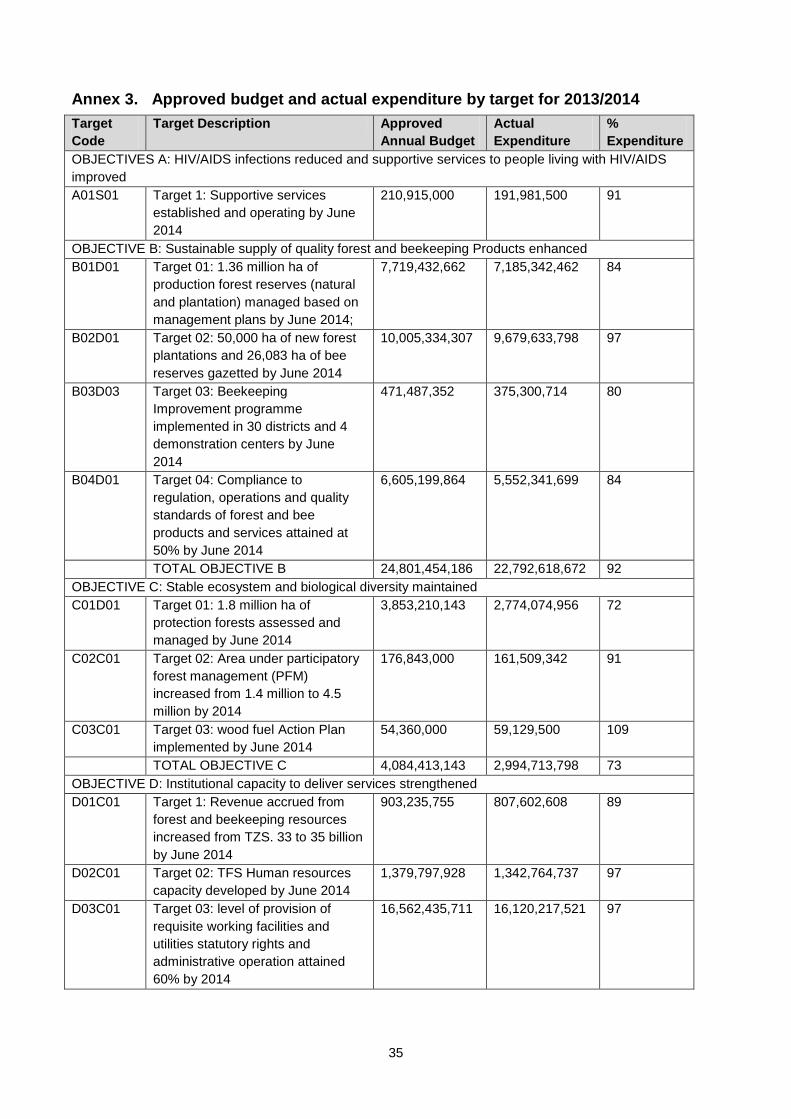
35
Annex 3. Approved budget and actual expenditure by target for 2013/2014
Target
Code
Target Description Approved
Annual Budget
Actual
Expenditure
%
Expenditure
OBJECTIVES A: HIV/AIDS infections reduced and supportive services to people living with HIV/AIDS
improved
A01S01 Target 1: Supportive services
established and operating by June
2014
210,915,000 191,981,500 91
OBJECTIVE B: Sustainable supply of quality forest and beekeeping Products enhanced
B01D01 Target 01: 1.36 million ha of
production forest reserves (natural
and plantation) managed based on
management plans by June 2014;
7,719,432,662 7,185,342,462 84
B02D01 Target 02: 50,000 ha of new forest
plantations and 26,083 ha of bee
reserves gazetted by June 2014
10,005,334,307 9,679,633,798 97
B03D03 Target 03: Beekeeping
Improvement programme
implemented in 30 districts and 4
demonstration centers by June
2014
471,487,352 375,300,714 80
B04D01 Target 04: Compliance to
regulation, operations and quality
standards of forest and bee
products and services attained at
50% by June 2014
6,605,199,864 5,552,341,699 84
TOTAL OBJECTIVE B 24,801,454,186 22,792,618,672 92
OBJECTIVE C: Stable ecosystem and biological diversity maintained
C01D01 Target 01: 1.8 million ha of
protection forests assessed and
managed by June 2014
3,853,210,143 2,774,074,956 72
C02C01 Target 02: Area under participatory
forest management (PFM)
increased from 1.4 million to 4.5
million by 2014
176,843,000 161,509,342 91
C03C01 Target 03: wood fuel Action Plan
implemented by June 2014
54,360,000 59,129,500 109
TOTAL OBJECTIVE C 4,084,413,143 2,994,713,798 73
OBJECTIVE D: Institutional capacity to deliver services strengthened
D01C01 Target 1: Revenue accrued from
forest and beekeeping resources
increased from TZS. 33 to 35 billion
by June 2014
903,235,755 807,602,608 89
D02C01 Target 02: TFS Human resources
capacity developed by June 2014
1,379,797,928 1,342,764,737 97
D03C01 Target 03: level of provision of
requisite working facilities and
utilities statutory rights and
administrative operation attained
60% by 2014
16,562,435,711 16,120,217,521 97

36
Target
Code
Target Description Approved
Annual Budget
Actual
Expenditure
%
Expenditure
D04C01 Target 04: Physical infrastructure
and service provision maintained
and increased by 30% by June
2014
5,760,794,145 1,738,936,533 30
D05C01 Target 05: Monitoring and
evaluation system developed and
implemented by June 2013
2,073,595,901 1,788,485,491 86
TOTAL OBJECTIVES D 26,679,859,439 21,789,006,890 82
OBJECTIVE E: Good governance and gender balance enhanced
Target 1: Good governance and
National Anticorruption Strategy
Action Plan implemented by 2013
155,486,000 123,824,620 80
TOTAL OBJECTIVE E 155,486,000 123,824,620 80
GRAND TOTAL 55,932,127,768 47,901,145,480 86
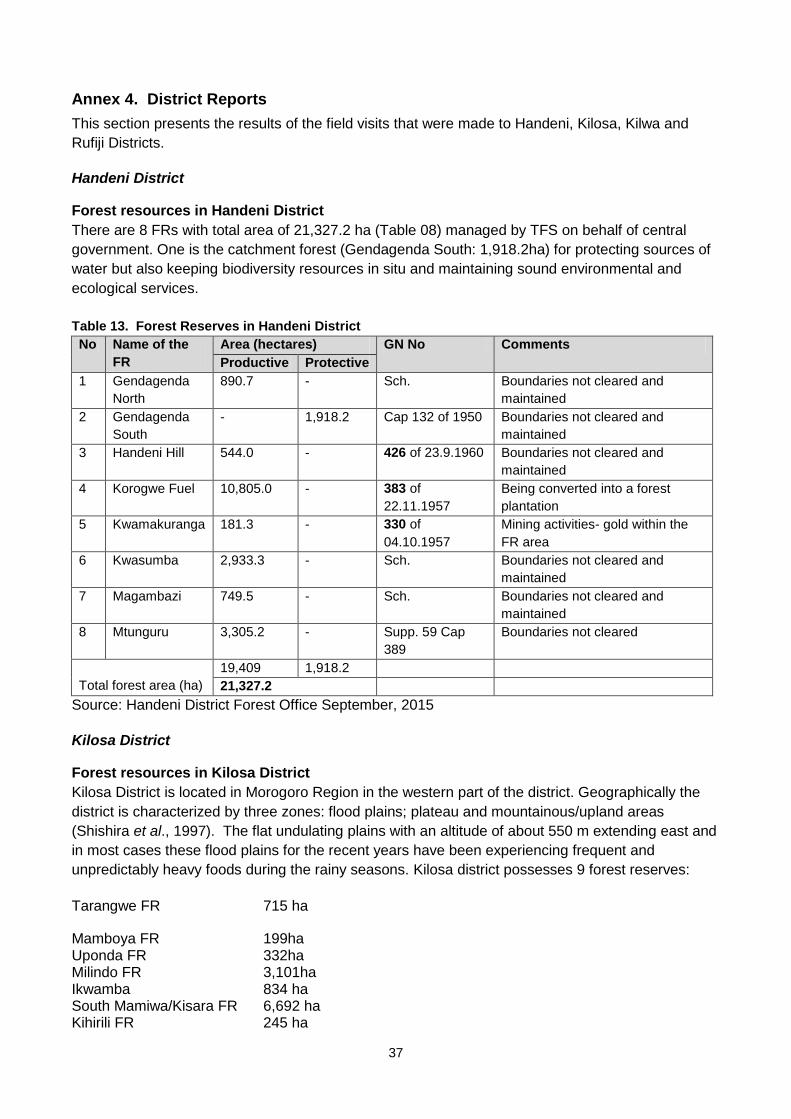
37
Annex 4. District Reports
This section presents the results of the field visits that were made to Handeni, Kilosa, Kilwa and
Rufiji Districts.
Handeni District
Forest resources in Handeni District
There are 8 FRs with total area of 21,327.2 ha (Table 08) managed by TFS on behalf of central
government. One is the catchment forest (Gendagenda South: 1,918.2ha) for protecting sources of
water but also keeping biodiversity resources in situ and maintaining sound environmental and
ecological services.
Table 13. Forest Reserves in Handeni District
No Name of the
FR
Area (hectares) GN No Comments
Productive Protective
1 Gendagenda
North
890.7 - Sch. Boundaries not cleared and
maintained
2 Gendagenda
South
- 1,918.2 Cap 132 of 1950 Boundaries not cleared and
maintained
3 Handeni Hill 544.0 - 426 of 23.9.1960 Boundaries not cleared and
maintained
4 Korogwe Fuel 10,805.0 - 383 of
22.11.1957
Being converted into a forest
plantation
5 Kwamakuranga 181.3 - 330 of
04.10.1957
Mining activities- gold within the
FR area
6 Kwasumba 2,933.3 - Sch. Boundaries not cleared and
maintained
7 Magambazi 749.5 - Sch. Boundaries not cleared and
maintained
8 Mtunguru 3,305.2 - Supp. 59 Cap
389
Boundaries not cleared
Total forest area (ha)
19,409 1,918.2
21,327.2
Source: Handeni District Forest Office September, 2015
Kilosa District
Forest resources in Kilosa District
Kilosa District is located in Morogoro Region in the western part of the district. Geographically the
district is characterized by three zones: flood plains; plateau and mountainous/upland areas
(Shishira et al., 1997). The flat undulating plains with an altitude of about 550 m extending east and
in most cases these flood plains for the recent years have been experiencing frequent and
unpredictably heavy foods during the rainy seasons. Kilosa district possesses 9 forest reserves:
Tarangwe FR 715 ha
Mamboya FR 199ha Uponda FR 332ha Milindo FR 3,101ha Ikwamba 834 ha South Mamiwa/Kisara FR 6,692 ha Kihirili FR 245 ha

38
Ukwiva FR 78,700 ha Palaulanga Mountain FR 10,488 ha
For many years the FRs in Kilosa district have provided ground cover and protected the flood plains
from unnecessary floods. This has been possible for the past decades because the ecosystem
functions have been functioning well due to sufficient forest and woodland cover. However, for the
past two decades there has been an increased rate of tree cutting because of uncontrolled human
activities related to agricultural expansion, incoming high numbers of livestock in Kilosa district as
well as increased incidences of illegal logging in FRs and other protected areas including parts of
Mikumi National Park. Furthermore, experiences shows that in most of the central government FRs,
the conditions of the forests have been worsening becoming poor over the years. The Ukaguru and
Rubeho mountains including the Ukwiva ranges as well other uplands areas have been important
water catchments with 12 permanent rivers that used to have water flowing throughout the year
originating from the catchment forests. The natural forests and woodlands often intercept rainfall
and enable the rain water to percolate (seep) into the ground and eventually emerge as streams
and rivers from within the catchment forests and other watershed areas. The forests dominated by
the main canopy stratum with other canopies underneath and eventually grasses and other
herbaceous vegetation growing thereby forming an important ecosystem within Kilosa district. In
that context the structure of forests and woodlands with multiple layers are ecologically important
not only for regulating water flows throughout the dry season; but also providing a wide range of
crucial habitats for many species of animals, birds, reptiles, amphibians and insects.
There are 10 catchment forests reserves in the district five of them (Ikwamba, Mamboto and
Mamiwa-Kisara South) are critical forests located in the high steep slopes of Ukaguru Mountain
ridges, which are part of the Eastern Arc Mountains chain that are rich in biodiversity values.
Additionally these FRs with high rainfall patterns are the main sources of water flowing throughout
the year and benefiting many local communities from uplands to downstream. Other forests (Kihirili
and Ukwiva FRs) cover an extensive area of the east facing escarpment are also important
catchment areas but most often disturbed by annual dry season fires thereby reducing their water
catchment values. The Mamiwa-Kisara South FR (about 6,692 ha and relatively undisturbed) is the
main source of Wami River, which is intake point for water supplied to the residents of Chalinze
areas and others adjacent along the pipe that enables water to flow from the river to Chalinze in
Bagamoyo District, Coast region. Other rivers originating from the Kilosa district ecosystems
including Mwega, Sasima and Iyove, which discharge water in the great Ruaha River as it flows
toward Kidatu Dam and thereafter into Rufiji River discharging water into the Indian Ocean.
TFS forest management activities in Kilosa District
Currently and TFS is struggling to control and reduce disturbances by limiting human access into
the FRs but still facing challenges related to inadequate funding and limited staff capacity. For
instant, there are 10 TFS staff while they need at least 50 foresters to be able to manage the forests
in quite difficulty terrains. Within the limited capacity TFS for the past three years has been working
on the following activities:
Pala-ulanga FR had a management plan that ended in 2009 but this plan was not implemented.
However, efforts have been made by district TFS staff to revise and update the FR management
plan.
Enhancing FRs Conservation and Ecosystem services: In Kilosa district TFS has been working on
resurveying FRs boundaries and installing signboards. For instance, South Mamiwa FR has 65 km
of boundary and about 50 km have been resurveyed and enhanced through clearing and digging

39
directional trenches, which are part of the boundary marker. Furthermore, where boundaries have
been cleared, fixing signboards indicating that this is a protected area unauthorized human activities
not allowed. When resurveying of boundaries is carried out by a multidisciplinary team involving
representatives of local communities as well as the experts from the Department of Lands in the
District Council. Where necessary new beacons are installed as the permanent boundary marker
and using the geographical positioning system (GPS) coordinates are taken to keep proper data
indicating where the beacons are installed. Boundary resurveys also done to Ukwiva FR with 141
km of boundary and over 60 km have been resurveyed during 2014/15 financial year. A total of
118.5 km have been resurveyed and cleaned at a total of TZS 36 million.
In terms of equipment TFS Kilosa has one vehicle (Nissan) a bit old although running but at very
high maintenance and running costs, Also possess five motorbikes. In total there is 10 staff
members in Kilosa district of which four are working at the district headquarters and six stations in
the field. The district for 2014/15 managed to collect about TZS 260 million (spending about TZS
142 for the same period). On the other hand, the District Council has two foresters and their budget
is about TZS 12 million annual at a rate of TZS one million per month. In most cases the budget
remains in books because the District Council hardly disburses funds to forestry section only
salaries are paid but very little if any funds for operations and/or staff allowances or other benefits at
work.
The Kilosa District Council with two foresters but have managed to prepare 10 villages harvesting
plans and in collaboration with TFS the district is trying to reduce illegal exploitation by also
collaborating with NGOs namely TFCG and MJUMITA to increase the local communities’ control of
the forest resources in the village/community lands. This is positive move towards enhancing
ecological services though improved community capacities which is rated to control illegal
exploitation of forest resources from 20 to 70%. According to the Kilosa District Strategic Plan
(2015/16 t0 2019/20: the district intends to raise 10,000 seedlings year-1 to be planted in various
localities within the district and priority will be in seriously degraded areas and in villages were tree
planting would be considered necessary. Furthermore, efforts will be done to train 10 villages in
community-based forest management (CBFM) annually. Also it is intended to reduce forest
degradation/destruction from 20,000 ha to about 5,000 ha. The district also intends to assess the
land cover types and changes by using the satellite imageries.
Southern Zone
Forest resources in the Southern Zone
The forest resource of the Southern Zone comprise Coastal Forests (including the mangrove
forests) and the Miombo Woodland. Mangrove forests are found along the coastal belt of mainland
Tanzania and the Mafia Island. The Southern zone has 49 Central government FR covering an area
of 1,223,786.8 ha, one Forest Nature Reserve (Rondo) with an area of 11,742.26 ha and 21 Local
Authority Forest Reserves covering an area of 55,647.6 ha. The central government FRs is as
indicated in the following Table 09.
Table 14. Forest Resources in the Southern Zone
Region
District Number of Forest Reserves
Productive Protective Total Area (Ha) Area (Ha) Area (Ha)
Lindi
Kilwa 11 176,297.0 16,606.0 192,903.0
Lindi 7 31,113.4 16,673.0 47,786.4
Liwale 1 80,423.0 18,000.0 98,423.0
Nachingwea 1 28,490.8
28,490.8

40
Region
District Number of Forest Reserves
Productive Protective Total Area (Ha) Area (Ha) Area (Ha)
Ruangwa 1 740.0 - 740.0
Subtotal 5 21 317,064.2 51,279.0 368,343.2
Mtwara
Masasi 3 22,089.0 - 22,089.0
Mtwara 3 14,422.4 0 14422.4
Nanyumbu 2 14,245.0 6,620.0 20,865.0
Newala 4 - 9,534.3 9,534.3
Tandahimba 1 - 48,703.0 48,703.0
Subtotal 5 13 50756.4 64857.3 115613.7
Ruvuma
Mbinga 1
1,600.0 1,600.0
Songea 6 8,903.2 465.0 9,368.2
Tunduru 4 170,945.3 154,627.0 325,572.3
Namtumbo 3 305,539.4 96,750.0 402,289.4
Nyasa 1
1,000.0 1,000.0
Subtotal 5 15 485,387.9 254,442.0 739,829.9
Grand Total 15 49 853,208.5 370,578.3 1,223,786.8
The Southern Zone has a total of 112 staff and 92 of them are permanent staff (84 being forestry
experts and 8 beekeeping staff and 10 are supporting staff) while 20 are employed on contract basis
as outlined in Table DDD.
Table 15. Personnel in the Southern Zone
S/N Category Number of
Forest staff
Number of
Beekeeping staff
Total Remarks
1. Professional
(Degree)
28 2 30 MSc. (4) and BSc. (26)
2. Technical
(Diploma)
25 5 30
3. Technical
(Certificate)
19 1 20
4. Attendants 2 - 2
4. Accountant - - 1
5. Supplies officer 1
6. Technician 1
7. Record Assistant - - 1
8. Secretary/Typist - - 2
9. Watchmen - - 4 3 employed on temporary
basis
10 Check points 5 Employed on temporary
basis
11 Office Attendants - - 3 Employed on temporary
basis
12. Drivers - - 12 9 Employed on temporary
basis
TOTAL 74 8 112
NB: Out of 30 supporting staff, 20 are employed on contract basis.
In the Sothern zone through efforts of NGOs (MJUMITA, Mpingo (MCDI) and WWF) many villages
(particularly in Kilwa, Liwale, Nachingwea, and Tunduru Districts) are becoming active in controlling

41
their forest and woodland resources after realizing financial benefits and being able to improve
community services using the money accrued from sale of forest produces and products.
In the Southern zone, the absence of management plans is compounded by low staff capacity (112
staff against needed 245 to manage 1,223,786 ha of FRs). Furthermore, financial allocations are
inadequate to enable each forest reserve to have effective management in place. As in other zones,
the combination of high levels of harvesting, no management plans and limited staff capacity is
resulting in revenues from royalties being obtained in a manner that risks being ecologically and
financially unsustainable.
Kilwa District
Forest resources in the Kilwa District
Table 16. Central Government Forest Reserves in Kilwa District
No Name of Forest Reserve
Adjacent Villages or Communities) Area (Ha)
Declaration/GN
1 Kitope Marendego, Kinjumbi, Somanga Simu 3,387 312-12/9/57 Productive and Productive value
2 Malehi Nanjilinji A 38,850 175-25/4/1957 Productive and Protective
3
Mangrove Kilwa
Mbwemkuru, Rushungi, Kiswele, Mangisani, Kisongo, Lihimalyao, Namakongoro, Pande Mikoma, akimwela, Namwedo, Mtitimira, Pande plot, Malalani, Mkondaji, Songo mnara, Kilwa kisiwani, Kilwa masoko, Kisangi, Mkwanyule, Mpara, Singino, Kivinje, Mtoni, Mtukwao, Miteja, Mtandango, Tingi, Njianne, Somanga, Marendego, Songosongo
36,737 1932-55 (GN-
4 Mbinga kimaji
Kipatimu-nandembo, Kandawale 1,874 103-27/03/1959(57) Protective
5 Mtarure Migeregere, Ngea, Kipindimbi, Kikole, Nainokwe, Liwiti
60,484 313-13/9/57 Productive
6 Mitundumbea Mchakama, Kiwawa 8,547 376-15/11/1957
7 Ngarama north
Kiwawa, Hoteli tatu, Mandawa, Mtandi 39,628 400-11/11/1955 Protective and Productive
8 Ngarama south
Kiranjeranje, Mbwemkuru, Makangaga, Mirumba
7,078 300-12/9/1957 Protective and Productive
9 Pindiro Makangaga /Nakiu 11,795 Cap 132P-1363 Protective and Productive
10 Rungo Likawage 22,586 319-2/11/1956 Productive
11 Tong'omba Kibata, Hanga, Pungutini, Mtende 1,987 250-14/7/1961 Protective
TOTAL 192,314
Kilwa District contributed TZS 1,807,088,569 or 76.57% of 6.8 billion revenue collected in the
Southern Zone for the financial year 2014/15 as indicated in Table 11.
Table 17. Revenue collected in Kilwa District in 2014/15
Code TZS Percentage of Total
140351 1,486,745,259 82.3
140353 159,315,330 8.8
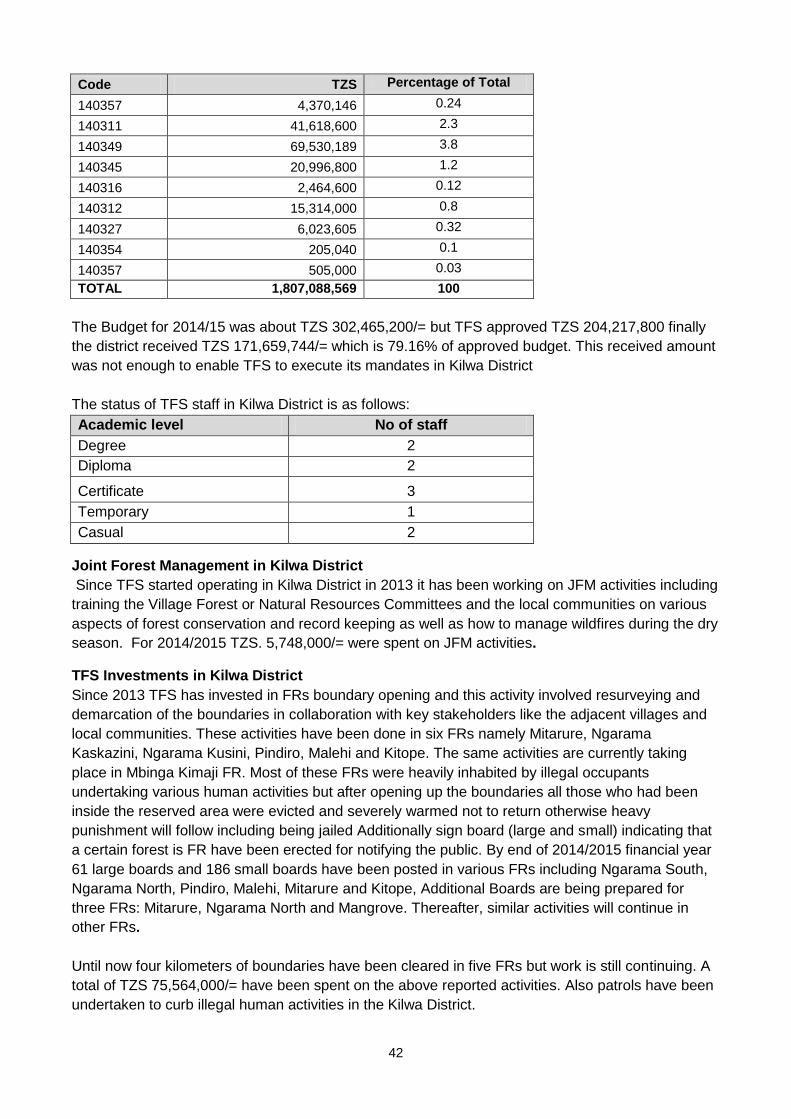
42
Code TZS Percentage of Total
140357 4,370,146 0.24
140311 41,618,600 2.3
140349 69,530,189 3.8
140345 20,996,800 1.2
140316 2,464,600 0.12
140312 15,314,000 0.8
140327 6,023,605 0.32
140354 205,040 0.1
140357 505,000 0.03
TOTAL 1,807,088,569 100
The Budget for 2014/15 was about TZS 302,465,200/= but TFS approved TZS 204,217,800 finally
the district received TZS 171,659,744/= which is 79.16% of approved budget. This received amount
was not enough to enable TFS to execute its mandates in Kilwa District
The status of TFS staff in Kilwa District is as follows:
Academic level No of staff
Degree 2
Diploma 2
Certificate 3
Temporary 1
Casual 2
Joint Forest Management in Kilwa District
Since TFS started operating in Kilwa District in 2013 it has been working on JFM activities including
training the Village Forest or Natural Resources Committees and the local communities on various
aspects of forest conservation and record keeping as well as how to manage wildfires during the dry
season. For 2014/2015 TZS. 5,748,000/= were spent on JFM activities.
TFS Investments in Kilwa District
Since 2013 TFS has invested in FRs boundary opening and this activity involved resurveying and
demarcation of the boundaries in collaboration with key stakeholders like the adjacent villages and
local communities. These activities have been done in six FRs namely Mitarure, Ngarama
Kaskazini, Ngarama Kusini, Pindiro, Malehi and Kitope. The same activities are currently taking
place in Mbinga Kimaji FR. Most of these FRs were heavily inhabited by illegal occupants
undertaking various human activities but after opening up the boundaries all those who had been
inside the reserved area were evicted and severely warmed not to return otherwise heavy
punishment will follow including being jailed Additionally sign board (large and small) indicating that
a certain forest is FR have been erected for notifying the public. By end of 2014/2015 financial year
61 large boards and 186 small boards have been posted in various FRs including Ngarama South,
Ngarama North, Pindiro, Malehi, Mitarure and Kitope, Additional Boards are being prepared for
three FRs: Mitarure, Ngarama North and Mangrove. Thereafter, similar activities will continue in
other FRs.
Until now four kilometers of boundaries have been cleared in five FRs but work is still continuing. A
total of TZS 75,564,000/= have been spent on the above reported activities. Also patrols have been
undertaken to curb illegal human activities in the Kilwa District.

43
The TFS budget for 2015/16 in Kilwa District is TZS. 220,536,500/= that will be used to implement
the following priority activities:
To open up the boundaries in two FRs including fixing the sign;
To prepared Forest Management plans for two FRs;
To establish two check-points;
To undertake regular patrols and to enforce the law accordingly especially when the villages are
mandated to harvest and sell forest produces in own villages;
Conduct training to villages and communities adjacent to FRs;
Under tree planting (gap filling or enrichment planting) in some FRs in collaboration with the
District Council;
TFS in Kilwa District is anticipating to collect about TZS. 1.8 billion for
2015/16 financial year. By end of September 2015 the revenue collection has
reached TZS. 458.1 million (25.45% of projection).
It was found that in Kilwa and Rufiji districts where MCDI is trying to assist some villages to benefit
from the natural forest and woodland resources available within the village lands, it has been rather
difficult for the villages to make use of the district forest hammer. The challenges that cropped up
was the use of forest hammers to legalize timber and logs obtained in declared or gazetted village
forests and woodlands. It was the practice that TFS District Managers had the authority of keeping
and maintaining the district hammer. However, accessing the hammer by the villages became a
serious issue in such villages like Nanjirinji “A” in Kilwa district and Likawage village in Rufiji district.
Why the situation became so hard that way for the TFS District Managers to become unwilling to
provide needed services is not easy to understand. The Services of TFS at the district level was
needed because by then the MNRT had not provided special hammer services to the villages that
are operating within the PFM guidelines and had obtained relevant documents like licence books
and receipt from MNRT but not the hammers.
The situation has been alleviated after the MNRT issuing special hammers to DFOs from Kilwa,
Liwale, Rufiji, Tunduru Districts in the Southern area to service the villages where MCDI has been
operating in collaboration with MJUMITA (e.g. in Liwale) or in collaboration with MJUMITA and
WWF (e.g. in Tunduru District). The villages can now be serviced through DFOs and TFS remain
with the overall authority of undertaking regulatory mandated making sure that forest produces and
products obtained from the villages are legally obtained and compliance is good. Issuing villages’
hammers is one of the impacts of the decision makers forest academy (DMFA) organized by MNRT
through Uongozi Institute). The last conference organized at held in the Municipality of Mtwara (15-
16 July 2015) focused on forest and local community benefits and through that conference the
participants raised the concern why it has taken very long time for MNRT to issue hammers to DFO
for use in villages. It was agreed during the conference that in future the MNRT can issue the
hammer to a specific village once it is proved that the village has required capacity to use the
hammer and has fulfilled special conditions set by the MNRT. This procedure is meant to prove that
the village is able to use the hammer well and according to stipulated rules but if proved that the
village is misusing the hammer then the MNRT can withdraw it from servicing the village and return
it to the Ministry.
Rufiji District
Forest resources in the Rufiji District
Rufiji district is in the Coast Region and possesses 33 FRs managed by TFS on behalf of the central
government.
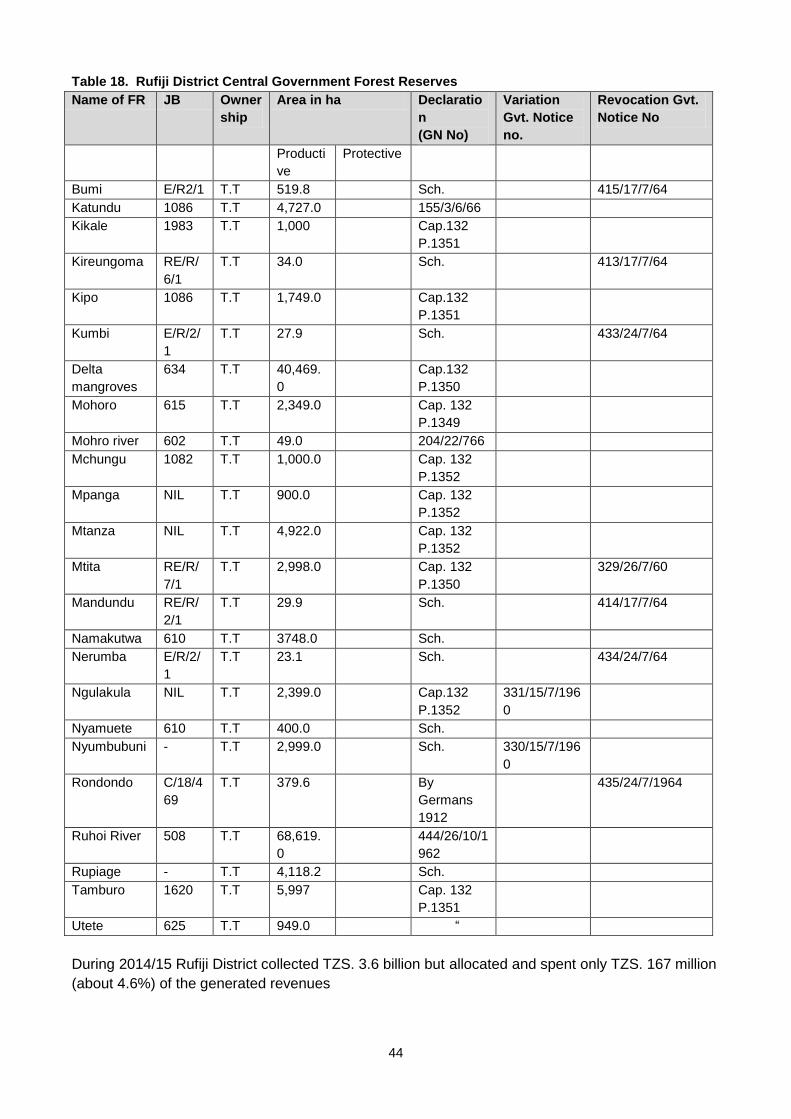
44
Table 18. Rufiji District Central Government Forest Reserves
Name of FR JB Owner
ship
Area in ha Declaratio
n
(GN No)
Variation
Gvt. Notice
no.
Revocation Gvt.
Notice No
Producti
ve
Protective
Bumi E/R2/1 T.T 519.8 Sch. 415/17/7/64
Katundu 1086 T.T 4,727.0 155/3/6/66
Kikale 1983 T.T 1,000 Cap.132
P.1351
Kireungoma RE/R/
6/1
T.T 34.0 Sch. 413/17/7/64
Kipo 1086 T.T 1,749.0 Cap.132
P.1351
Kumbi E/R/2/
1
T.T 27.9 Sch. 433/24/7/64
Delta
mangroves
634 T.T 40,469.
0
Cap.132
P.1350
Mohoro 615 T.T 2,349.0 Cap. 132
P.1349
Mohro river 602 T.T 49.0 204/22/766
Mchungu 1082 T.T 1,000.0 Cap. 132
P.1352
Mpanga NIL T.T 900.0 Cap. 132
P.1352
Mtanza NIL T.T 4,922.0 Cap. 132
P.1352
Mtita RE/R/
7/1
T.T 2,998.0 Cap. 132
P.1350
329/26/7/60
Mandundu RE/R/
2/1
T.T 29.9 Sch. 414/17/7/64
Namakutwa 610 T.T 3748.0 Sch.
Nerumba E/R/2/
1
T.T 23.1 Sch. 434/24/7/64
Ngulakula NIL T.T 2,399.0 Cap.132
P.1352
331/15/7/196
0
Nyamuete 610 T.T 400.0 Sch.
Nyumbubuni - T.T 2,999.0 Sch. 330/15/7/196
0
Rondondo C/18/4
69
T.T 379.6 By
Germans
1912
435/24/7/1964
Ruhoi River 508 T.T 68,619.
0
444/26/10/1
962
Rupiage - T.T 4,118.2 Sch.
Tamburo 1620 T.T 5,997 Cap. 132
P.1351
Utete 625 T.T 949.0 “
During 2014/15 Rufiji District collected TZS. 3.6 billion but allocated and spent only TZS. 167 million
(about 4.6%) of the generated revenues

45
For the financial year 2015/16 TFS in Rufiji District is anticipating collecting TZS. YYY and by end of
September 2015, the TFS had collected 842 million and has received only TZS 39 million (4.6%)
during the same period of collected amount. According to records 82 traders are registered for
charcoal, 35 for firewood, 13 for mangroves poles, 10 for other poles operating in Mchungu, Kikale
and Rufiji Delta FR areas for 2014/15.
TFS investments in Rufiji District
TFS has tried to protect all the forests but still in very difficult condition due to limited capacity in
terms of staff and financial resources. In that context most of the FRs are not as well managed as
expected. However, for the past two years TFS has tried to open up boundaries in five out of 22
FRs (Table 12). Boundaries have been resurveyed and consolidated through clearing and
installation of beacons as well as fixing the signboards (both concrete and aluminium types).
Investments made are as follows:
Name of FR Area (ha) Km consolidated
Tamburu 5252 30.7 km
Muhoro River 50.4 3.4 km
Muhoro 2702 27 km
Kikale 1169.5 14.45 km
Mchungu 1525 12 km
Total 10,698.9 87.55
Korogwe District
Forest resources in the Rufiji District
In Korogwe District there are seven central government’s FRs with a total area of about
17,591.88ha managed or under the jurisdictions of TFS but also two local authority FRs exist with a
total area of about 382.8 ha: Korogwe Hill (146ha) and Lukoka (236.8ha). The conditions of these
FRs are considered to be in very bad shape as no management strategies are in place
Table 19. Forest Reserves in Korogwe District
No Name of the
FR
Area (hectares) GN No Comments
Productive Protective
1 Chagandu 6,526.2 - 295 of 20.6.58 Boundaries not cleared
2 Mafi Hill - 2,509.1 436 of 24.7.64 Boundaries not cleared
3 Mwenga 1,159.0 - 297 of 20.6.58 Boundaries not cleared
4 Ndolwa 1,173.8 - 301 of 20.6.58 Boundaries not cleared
5 Bombo West 3,523.0 - 1 of 1959 Boundaries not cleared and
hardly maintained
6 Bombo East 470.0 - ? GN number not located
7 Vugiri - 40 226 of 1961 Boundaries not cleared and
hardly maintained
Total Area (ha) 4,548 13,043.88
17,591.88
Local Authority Forest Reserves-Korogwe District
8 Korogwe Hill 146.0 - GN not located
9 Lukoka 236.8 - 302 year not known?
Funding from TFS was about TZS 130 million for 2014/15 and not much revenue was collected
from sale or utilization of forest and woodland resources. Less than TZS 8 million was collected

46
month-1 or about TZS. 94 million year-1 during the financial year 2014/15. The district budget was
TZS. 120 million for the same period but received only 34 million shillings implying an expenditure
on forest and woodland management of about TZS. 2.8 million month-1.
Forest Management Plans in Korogwe District
In most cases the forest reserves in Korogwe district do not have approved forest management
plans and the reserve boundaries have not been cleared. No data on the forest resource was
available at the district, not even the data generated by NAFORAMA nor vegetation maps or
landcover maps.