
A Phase 2, Efficacy, Safety, and Tolerability Study of ALKS ...
Upload
independentCategory
view
4download
0
An Adaptive Design for Identifying the Dose with the BestEfficacy/Tolerability Profile with Application to a CrossoverDose-Finding Study
Anastasia Ivanova1,+, Ken Liu2, Ellen Snyder2, and Duane Snavely2
1Department of Biostatistics, University of North Carolina at Chapel Hill, Chapel Hill, NC27599-7420, U.S.A.2Biostatistics and Research Decision Sciences, Merck & Co., Inc., Upper Gwynedd, PA19454-1099, U.S.A.
SUMMARYProof-of-concept in clinical trials has traditionally focused on identification of a maximumtolerated dose with the assumption that the higher doses provide better efficacy. However adverseevents associated with a maximum tolerated dose may have a negative effect on efficacy. Wepresent an efficient adaptive dose-finding strategy which concentrates patient assignments at andaround the dose which has the best efficacy/tolerability profile based on a utility function. Thestrategy is applied within the setting of a crossover design. While the strategy may also be appliedto parallel studies, a crossover design provides more power for a given sample size forcomparisons between the optimal dose versus placebo and/or active control when it is reasonableto assume no carryover effects.
KeywordsProof-of-concept trial; Utility function; Dose finding
1. IntroductionThe goal of a phase II dose-finding study is to find the best dose to investigate in subsequenttrials. Such a dose should have good efficacy, which is established by comparing response totreatment with drug versus placebo and/or active control. Doses with superior efficacy mightalso have higher rates of adverse events, hence both outcomes should be taken intoconsideration for dose selection. A utility function which incorporates both positive benefitfor efficacy and negative benefit for intolerability may be constructed. If both outcomes arebinary, a natural way of combining these is to consider an outcome of success defined as thetherapeutic response without toxicity. Such strategy was considered by many in the contextof oncology trials [1-4]. The value of the utility function at each dose is then equal to asuccess rate at that dose. Other ways of defining the utility function for binary outcomeshave been suggested [5,6]. When one or both outcomes are non-binary, there are variousways of defining utility. Fedorov and Wu [7] for example, suggest defining utility using theconditional mean of efficacy (conditional on no toxicity), or dichotomizing the efficacyvariable if binary outcomes are of primary interest to a regulatory agency. Utilities may alsobe inferred from discussions with physicians. Thall and Cook [5] give an excellentdescription of such a process in the context of two different clinical trial settings. Usually
+Corresponding author, [email protected], 919 843 8086 (tel), 919 966 3804 (fax). .
NIH Public AccessAuthor ManuscriptStat Med. Author manuscript; available in PMC 2010 October 30.
Published in final edited form as:Stat Med. 2009 October 30; 28(24): 2941–2951. doi:10.1002/sim.3684.
NIH
-PA Author Manuscript
NIH
-PA Author Manuscript
NIH
-PA Author Manuscript
the utility function is specified in such a way that the doses with the most favorable responseand lowest rates of adverse events have higher values of the utility function. The goal of thetrial is then to identify the dose for which the maximum of the utility function is achieved.We will refer to this dose as the optimal dose. An additional goal is to compare the meanefficacy and tolerability at this optimal dose to active control and/or placebo.
This work was motivated by a proof-of-concept trial conducted by Merck ResearchLaboratories. The goal of the trial is to identify an effective, tolerable dose of aninvestigational drug in patients with the indication of interest and also to provide evidence ofnon-inferiority to an active control. Because of confidentiality issues and for ease ofpresentation some non-essential features of the trial description have been modified. Theefficacy of the new drug in the trial is measured by a continuous variable at the end of a two-week treatment period, while the occurrence of selected adverse events is measured as abinary variable over this same period.
This Merck trial used a 3-period, 6-sequence crossover Williams Latin square design toenable evaluation of the key objectives related to efficacy and tolerability of theexperimental treatment compared to placebo and active control. Each patient wasrandomized to one of the following 6 treatment sequences, which specifies the order oftreatments received by the patient: ABC, BCA, CAB, ACB, BAC, CBA, whereA=Experimental Treatment, B=Placebo and C=Active Control. For example, a patientrandomized to sequence BCA receives placebo in Period 1, active control in Period 2 andone of five doses of experimental treatment in Period 3. The specific dose of theexperimental treatment received by the patient is determined by the adaptive procedure. Thedesign is balanced for first order carryover effect [8] at the treatment level (but not for dose).Given the therapeutic area and pharmacokinetic properties of the experimental treatment, itwas reasonable to conduct this crossover study (with appropriate washout between periods)and assume no carryover effect. Crossover designs are often used in first in man studies [9]and in proof of concept or dose finding studies for a variety of therapeutic areas [10]. Whenused appropriately, crossover designs have some advantages over parallel designs including:higher power and independence to variability between investigative sites. In a crossoverstudy, patients act as their own control which allows the use of within-subject comparisonsand results in more power than a parallel study. Variability between investigative sites alsobecomes irrelevant, which is important since this Merck study included about 20 sites.Lastly, the dose associated with the experimental treatment period can be changed in realtime for subsequent allocation to new patients entering the trial; therefore, the crossoverdesign is also compatible with dose adaptation which is important since the best dose fortesting proof of concept was not known.
Disadvantages of a crossover design include longer trial duration and potential carryovereffects. A three-period crossover study is more than three times longer than a parallel studybecause it includes two sufficiently long washout periods between the three treatmentperiods. Therefore, crossover studies are advantageous in therapeutic areas whereenrollment rates are slow (a requirement for an adaptive design) and patient retention ishigh.
Adaptive designs require adequate time to “search” for the best dose. In a parallel designsetting, this means being able to observe the response relatively quickly with respect toenrollment rate. In a crossover setting, one can exploit the long trial duration to benefit theadaptive design by determining the dose of the experimental treatment “just-in-time” orimmediately prior to the appropriate treatment periods. Adaptive dose-finding designs arewidely used in oncology. In non-oncology setting, adaptive designs have been shown to bebeneficial in various dose-finding problems [6,11]. We developed an adaptive design to use
Ivanova et al. Page 2
Stat Med. Author manuscript; available in PMC 2010 October 30.
NIH
-PA Author Manuscript
NIH
-PA Author Manuscript
NIH
-PA Author Manuscript
in dose-finding trials with the goal of maximizing the utility function. The new adaptivedesign improves the quality of estimation of the optimal dose and increases the power of itscomparison with placebo and/or active control as compared to equal allocation. Thoughadaptive designs create logistical challenges in the execution of a trial, especially for multi-center trials like the one in the motivating example, improved precision and efficiencybrought by adaptive designs may outweigh the logistical challenges.
2. Model for the data and specification of the utility functionDenote a fixed ordered set of dose levels chosen for the trial by {d1, …, dK}, with d1denoting placebo. For ease of notation we will refer to active control as treatment K+1. Inthis three-period, six sequence crossover design each subject receives placebo, control andone of five doses of the drug according to the order prescribed by the sequence to which thesubject was randomized. Let Yijk be the efficacy outcome of subject i in period j, j = 1,2,3,receiving treatment k, k = 1,…, K+1. Then
(2.1)
where μk is a treatment effect, k = 1,…, K+1, and πj is a period effect, j = 1,2,3. Theoutcomes Yijk are assumed to be normally distributed with Var (Yijk) = σ2 and corr(Yijk,Yij’k’) = ρ, for j ≠ j’. That is, efficacy outcomes are correlated within each subject andobservations from different subjects are independent.
Tolerability outcome Vijk of subject i in period j, j = 1,2,3, receiving treatment k, k = 1,…, K+1, is binary indicating the occurrence of an adverse event. Tolerability outcomes werecorrelated within each patient corr(Vijk, Vij’k') = τ. No period effect is assumed fortolerability outcome with E (Vijk) = pi.
Efficacy and tolerability were modeled separately but considered jointly through the utilityfunction. To determine the utility function, we received extensive input from physiciansover a plausible efficacy and tolerability region. We also studied utility functions appearingin the literature on dose-finding [1-5]. A “base case” was identified that provided anacceptable balance of efficacy and tolerability; this was defined as the experimentaltreatment with adverse event rate 0.1 and efficacy of 20. To consider tolerability from the“base case” physicians decided that a dose with efficacy of 21 and adverse event rate of 0.2is as good as the “base case”. That is, 1 unit increase in efficacy is balanced by 0.1 increasein adverse event rate. Similarly, it was decided that 1 unit decrease in efficacy is balanced by0.1 decrease in adverse event rate, that is, a dose with efficacy of 19 and adverse event rateof 0 is as good as the “base case” Therefore, the utility function can be written as
(2.2)
Based upon previous studies conducted with the experimental treatment it was assumed thatthe mean efficacy response was increasing with dose with the possibly of a downturn athigher doses. Therefore, it was assumed that the mean response followed the model
(2.3)
where the response at dose h is called the peak of the dose-response function. If the peak isat the highest dose, dK, the function is non-decreasing, if the peak is at the lowest dose, the
Ivanova et al. Page 3
Stat Med. Author manuscript; available in PMC 2010 October 30.
NIH
-PA Author Manuscript
NIH
-PA Author Manuscript
NIH
-PA Author Manuscript

function is non-increasing. Mild to moderate severity adverse events were expected. Theadverse event rate of interest was assumed to be non-decreasing with dose
(2.4)
Unlike the natural utility for binary outcomes (e.g., success), which is unimodal under broadconditions [12], the utility defined in (2.2) is not necessarily unimodal. We investigatedplausible scenarios for mean efficacy and adverse events rates in the planned trial andconcluded that the assumption of a unimodal utility (2.2) was viable.
3. Allocation procedure3.1. Allocation design
The goals of the trial were 1) to identify the optimal dose and 2) to compare this dose withactive control and placebo. To improve the power of comparisons with active control andplacebo one needs as many patients as possible on the optimal dose. Therefore the goal ofour adaptive strategy is to assign as many subjects as possible in the neighborhood of theoptimal dose. The proposed allocation procedure is not specific to a crossover study andmay be used in other types of designs.
Kpamegan and Flournoy [13] suggested an up-and-down design for maximizing a functionover a fixed set of doses with binary outcomes. Their sequential procedure estimates thedifference between the two most recent observations and then determines the direction inwhich to locate the next pair of observations. Our sequential procedure, though similar inspirit, utilizes all outcome data available so far and can be used with any type of outcome.We refer to our procedure as the maximizing procedure and describe it below.
Maximizing procedureA new subject is randomized to one of two designated adjacent doses with equalprobabilities, with an exception listed below in (iv). Suppose the most recent designated pair
of doses was (dj, dj+1), j∈{2,…,K−1}. Let be the estimated difference in the utilityfunction between dj and dj+1. Then
i. if , the next designated pair of designated doses is (dj−1, dj);
ii. if , the next designated pair of doses is (dj+1, dj+2);
iii. if , the next designated pair of doses is (dj+1, dj+2) with probability φ = (K − 1− j)/(K − 3) and doses (dj−1, dj) with probability 1 − φ.
iv. The following adjustments are implemented at the highest and lowest doses. If thecurrent pair is (d1,d2) and , the randomization to (d1,d2) is with therandomization ratio of 2:1. If the current pair is (dK−1,dK) and , therandomization is to (dK−1,dK) the randomization ratio of 1:2.
If the optimal dose is dose dh, 2 < h < K, as the design zooms-in onto the maximum, theallocation starts oscillating between (dh−1,dh) and (dh,dh+1), yielding the allocation to(dh−1,dh,dh+1) in proportions 1:2:1. Provision (iii) allows the design to move from the spotwhere the utility function is flat to explore other areas. Provision (iv) facilitates theassignment of 2:1 to the maximum, if the maximum is at d2 or dK.
Ivanova et al. Page 4
Stat Med. Author manuscript; available in PMC 2010 October 30.
NIH
-PA Author Manuscript
NIH
-PA Author Manuscript
NIH
-PA Author Manuscript
The difference Sj was estimated by modeling utility as a quadratic function of dose. The goalwas to fit a local quadratic model around the current dose that uses some information fromthe doses that are further away. It is noted that a recursive search of the mode of a functionbased on quadratic approximation might be more efficient, especially in a non-adaptivesetting. Another possibility is to estimate the utility function (2.2) by computing maximumlikelihood estimates (MLEs) of mean efficacy under restriction (2.3) and of tolerabilitymeans under restriction (2.4) (see Section 3.2 for more details). The observations at doses(dh−1,dh,dh+1) where given weight 1, while the observations at the remaining doses wereassigned weight 0.5 and placebo was given a weight of 0.2. When the designated currentpair of doses was (d2,d3), placebo was given weight 1. The model included a period effectand was fitted using generalized estimating equations [14].
3.2. Estimating the optimal dose at the end of the trialIn this section we describe how to identify the optimal dose at the end of the adaptive trialand also for a non-adaptive trial with equal allocation to the same doses for comparison. Let(n1, …, nK+1) be the vector of sample sizes at {d1, …, dK+1} after the adaptive crossovertrial. For a non-adaptive crossover trial with equal allocation each subject receives placebo,active control and one of the {d2, …, dK} with equal number of subjects allocated to each ofthese doses, n2 = … = nK.
We will describe two approaches for estimating the optimal dose. The first approach can beused with any design and is based on computing MLEs of efficacy means under restriction(2.3) and MLEs for tolerability proportions under restriction (2.4) and plugging them intothe utility function. Such an approach is a middle ground between using a parsimoniousmodel in estimation and not using any assumptions, and generally yields better estimates.The second estimation procedure is used with the data obtained in an adaptive fashion and isbased on selecting the dose with the highest utility from the two adjacent doses with thehighest numbers of patients allocated. This approach is preferred for the adaptive designsince it insures that the optimal dose will be selected from doses with an adequate samplesize.
In the first estimation approach we computed MLEs of efficacy means under restriction(2.3) and of tolerability means under restriction (2.4). The quadratic model we used inSection 3.1 works well to estimate the difference in utility function between doses locally,but such a parsimonious model is not flexible enough to summarize all available data afterthe trial. This is in agreement with the previous finding that, in the case of a simple order,isotonic methods were shown to be superior to fitting parsimonious models such as a two-parameter logistic regression [15, 16]. For a given vector X = (x1, …, xK and positiveweights W = (w1,…, wK), an isotonic function Z is said to be an isotonic regression of X
under restriction (2.3) with weights w and peak h if it minimizes for Zsatisfying the ordering (2.3). Since the location of the peak h is unknown, isotonic estimatesunder restriction (2.3) are computed for every h = 1, …, K. The estimated location of thepeak is the one that maximizes the likelihood.
The mean efficacy at each dose in {d1,…, dK+1} was estimated by fitting a linear model toall available efficacy data as a function of treatment (2.1). The model was fitted usinggeneralized estimating equations (GEE) to take into account the exchangeable correlationstructure of the outcome and a period effect for the crossover design. To compute estimatesof the efficacy outcome under restriction (2.3) the algorithm described in Shi [17] and Gengand Shi [18] was applied to the fitted means of the efficacy outcome from the GEE modelfor {d1,…, dK} with weights (n1, …, nK). Such computation does not necessarily yield theestimates that maximize the likelihood under restriction, but each does provide a good
Ivanova et al. Page 5
Stat Med. Author manuscript; available in PMC 2010 October 30.
NIH
-PA Author Manuscript
NIH
-PA Author Manuscript
NIH
-PA Author Manuscript
approximation. Restricted MLEs of the tolerability outcome on {d1,…, dK} were computedusing a pooled adjacent violator algorithm [19]. Then the estimates of the utility functionwere computed using formula (2.2). The estimated optimal dose was the dose with thehighest value of the estimated utility.
This adaptive design increases the allocation around the optimal dose, hence sample sizeitself is very informative for determining the location of the optimal dose. To estimate theoptimal dose after the adaptive trial (second estimation approach), a best set of two doseswas determined and then the estimated optimal dose was chosen from that set. To determinethe best set of two, first, the smallest dose among those with the most assignments waschosen: dτ = min{arg maxi=2, …K ni}. If dτ was d2 or dK, then the best set was defined as{d2,d3} and {dK−1,dK}, respectively. If 2 < τ < K, the second dose in the best set was thedose dτ’ = max{arg max (nτ−1,nτ+1)}. Of the two doses in the best set of two, the one withthe larger estimated utility was selected as the estimated optimal dose. To avoid ties, weused fitted means of the efficacy outcome to estimate the utility.
3.3. Comparison with placebo and active controlAn important goal of the trial was to compare the mean response with active control andplacebo. When the optimal dose is selected based on the value of response, the estimatedmean response at that dose is most likely biased upward [20] and therefore type one errorrate might be inflated. Each of the two tests was performed at 0.05 level. The critical valueswere adjusted by setting the critical values equal to the 95th percentile of the distribution ofthe test statistic under the null hypothesis.
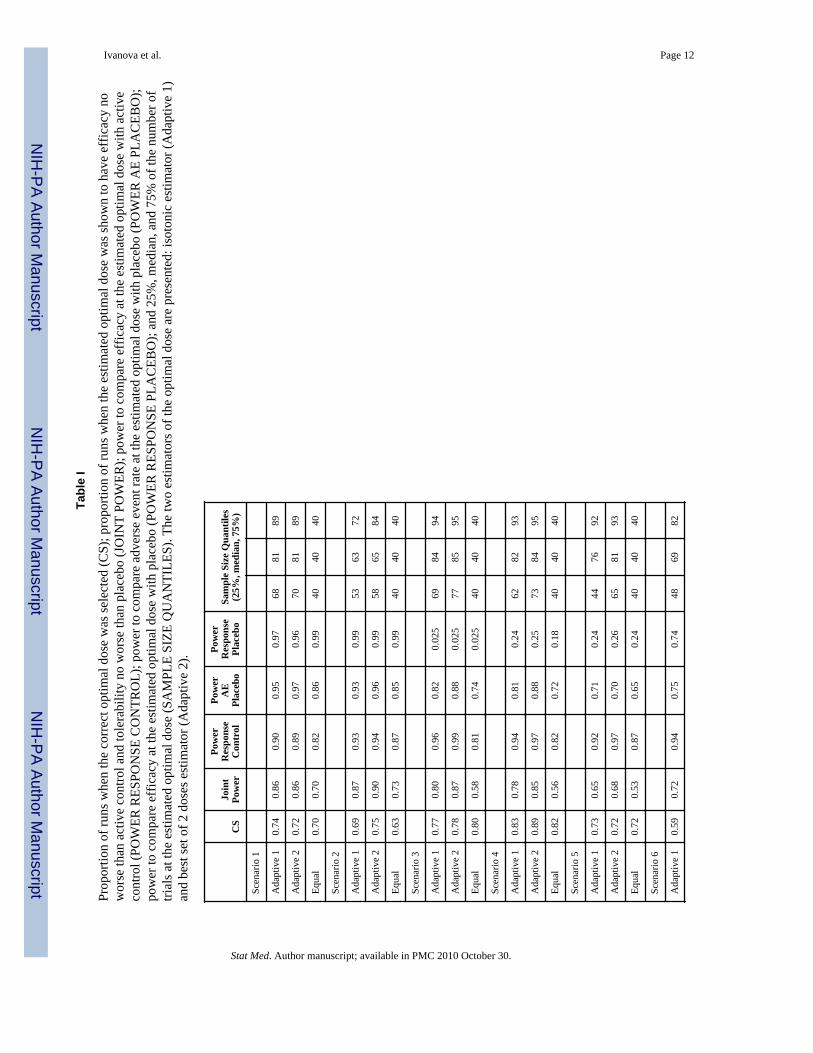
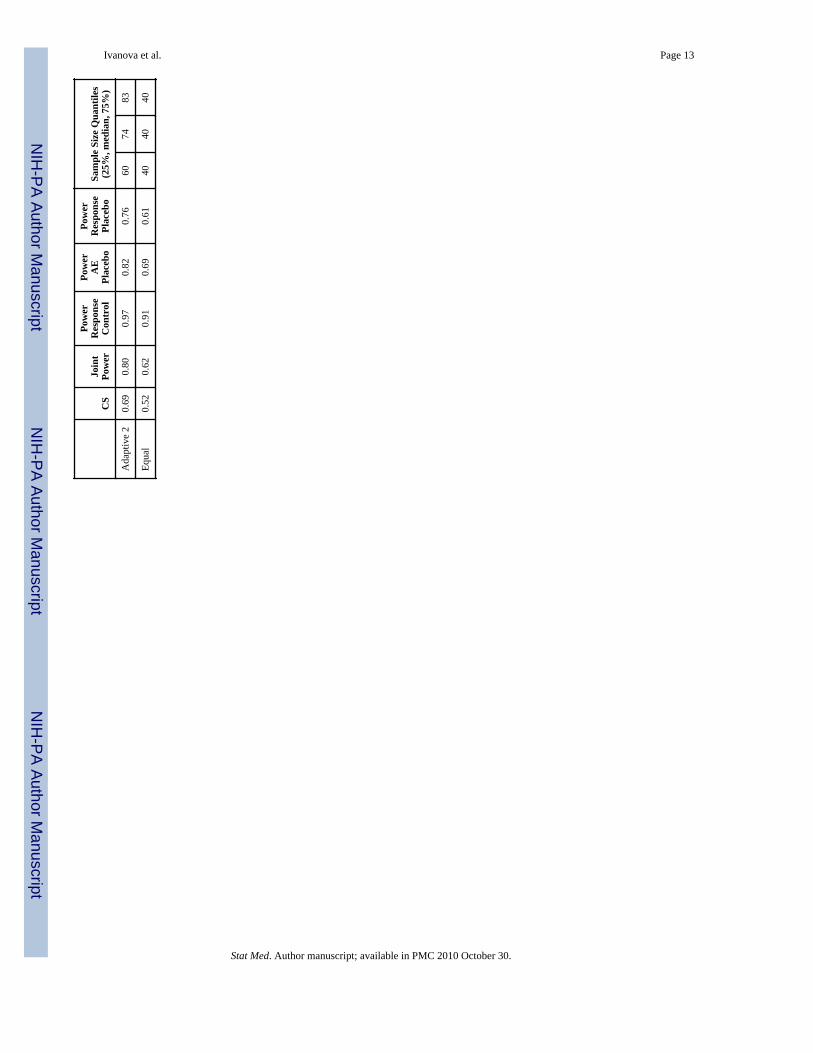
4. Simulation studyA simulation study was conducted to compare the adaptive crossover design with a non-adaptive crossover trial with equal allocation to the doses under study. In collaboration withphysicians, several plausible scenarios for the true underlying response means weredesigned (Figure 1). Scenarios included both monotonic and unimodal shapes of dose-response curve and various resulting locations of the optimal dose. The utility functions forsix scenarios are shown in Figure 1. Scaled doses levels were {0, 0.25, 0.42, 0.67, 0.83, 1}.In all scenarios the efficacy at the optimal dose was equal to 20 and the intolerability rate atthe optimal dose was 0.1. At the end of the trial the efficacy at the estimated optimal dose,dh, was compared to active control efficacy that was set to equal to 20 (non-inferiority) aswell as compared to placebo (superiority). Alternatively, one can combine the data from thebest set of two and compare mean response of the combined sample with placebo and activecontrol. The primary efficacy null hypothesis compared to placebo, μk = μ1, was testedagainst a one-sided alternative, μk > μ1, at the 0.025 significance level. The secondaryefficacy hypothesis compared the active control with placebo. The null hypothesis, μh =μK+1 + Δμ, was tested against a one-sided alternative, μh > μK+1 − Δμ, at the 0.025significance level with Δμ = 3. Another secondary hypothesis was tolerability comparisonwith placebo. The null hypothesis, ph = p1 + Δp, was tested against a one-sided alternative,ph < p1 + Δp, at the 0.025 significance level with Δp = 0.2. The joint hypothesis involved thecombination of the latter two secondary hypotheses.
Table I displays simulation results for σ = 7, ρ = 0.5, period effect π3 = 2π2 = 1, and the totalsample size of 200. Table I displays results where tolerability outcomes are independentwithin a patient. In the actual trial the potential for carryover effects was deemed low,therefore we present simulations assuming no carryover effect. The length of each treatmentwas two weeks with results on both efficacy and tolerability being available on day 14 afterthe start of the treatment. The accrual rate was 3 patients per week for the first four weeksand 5 patients per week after that. The adaptation was performed once every two weeks.
Ivanova et al. Page 6
Stat Med. Author manuscript; available in PMC 2010 October 30.
NIH
-PA Author Manuscript
NIH
-PA Author Manuscript
NIH
-PA Author Manuscript

Based on results of prior studies, all doses were expected to be generally well tolerated, andd4 and d5 were considered to be the most promising; therefore, the starting pair of doses was{d4,d5}. Simulations were repeated for other pairs of starting doses and the results were verysimilar (simulation results are available from the authors). The first adaptation wasperformed when at least two observations were available on each of placebo, d4 and d5. Theperiod effect was fitted as linear. Simulation results are based on 3000 runs.
The primary goal was to estimate the optimal dose well. Column 1 of Table I displays theproportion of runs where the optimal dose was identified correctly. We illustrate theperformance of the adaptive design based upon the two estimators: isotonic (Adaptive 1) andusing the best set of two doses (Adaptive 2). In the set-up and scenarios considered, the ‘bestset of two doses’ yields slightly better estimates than does isotonic. When equal allocation isused isotonic estimation is considerably better than using just the fitted means in estimationof the utility function (results are available from the authors). Identification of the optimaldose is generally better for the adaptive design as compared to the equal allocation crossoverdesign.
The second goal of the trial was hypothesis testing regarding efficacy and tolerability at theoptimal dose. Column 3 of Table I displays the power to compare efficacy at the estimatedoptimal dose with active control, while Columns 4 and 5 display the power to compareadverse event rates and the power for efficacy comparison at the estimated optimal dosewith placebo. The adaptive design has higher power than equal allocation for nearly everyscenario evaluated (columns 3, 4 and 5) primarily due to increased allocation at the optimaldose compared to equal allocation. Since an increase in power for efficacy (columns 3 and5) can be achieved by selecting a dose with a very high mean response, and an increase inpower for tolerability (column 4) can be achieved by selecting a dose with a low adverseevent rate, we computed the power for the joint hypothesis of both efficacy and tolerabilityto illustrate the performance of the new design. The power of the joint hypothesis isdisplayed in column 2 and is the proportion of trials where both tolerability (compared toplacebo) and efficacy (compared to active control) null hypotheses were rejected. Dosesother than optimal have either worse tolerability or lower efficacy, therefore column 2reflects not only the sample size at the estimated optimal dose but also the precision ofestimation. The larger the number of subjects at the estimated optimal dose and the betterthe precision, the higher is the value in column 2. The adaptive design substantiallyincreases the joint power compared to the equal allocation design with absolute increase inpower varying from 15% to 29%. The joint power for the adaptive design is higher than theequal allocation design for all scenarios considered.
Column 6 of Table I displays quantiles of the number of subjects at the estimated optimaldose. On average, the adaptive design assigns substantially more subjects to the estimatedoptimal dose. This translates into the increase in power of rejecting the hypotheses regardingthe efficacy and tolerability parameters. The minimum number of subjects at the optimaldose for the best set of two estimation procedure varied from 32 to 42. At the same time, theminimum number of subjects at the optimal dose using the isotonic estimation procedure canbe as low as 1 or 2. This happens very rarely and does not affect the performance of theprocedure on average (Table I), however it is a concern if this procedure is used in the trial.We recommend using the ‘best set of two’ estimation procedure.
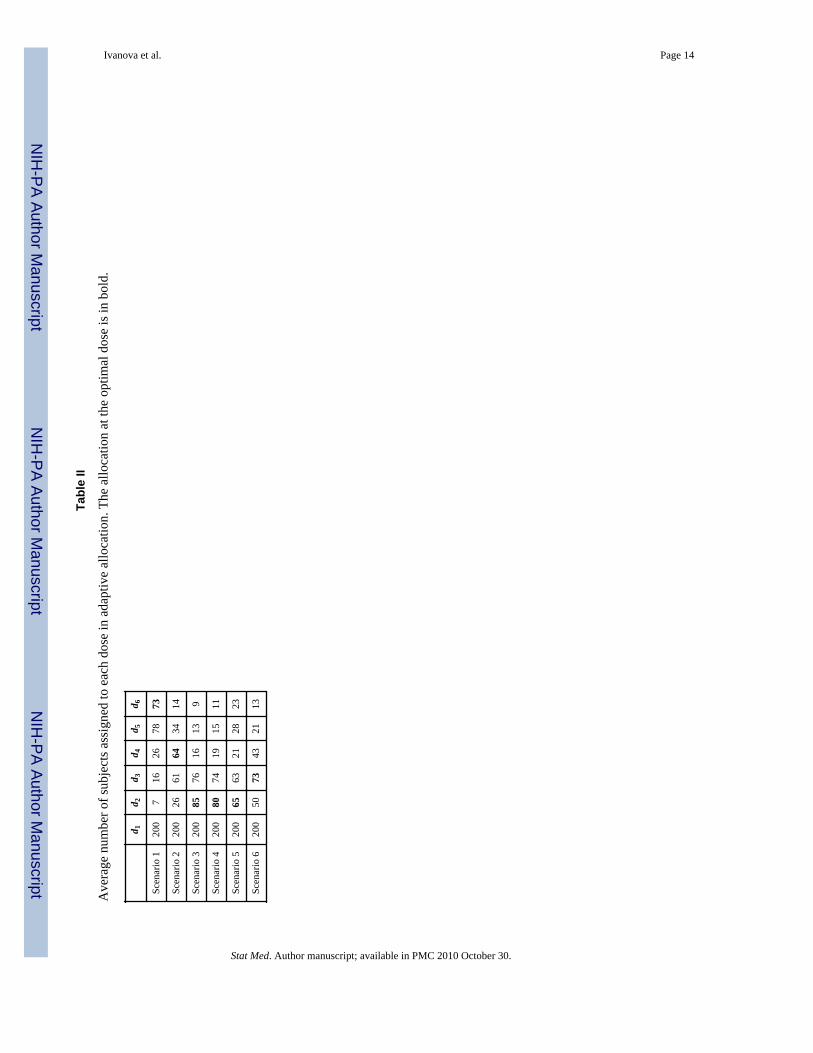
The average allocation of patients to doses is displayed in Table II. The adaptive designassigns more subjects on average to and around the optimal dose as compared to equalallocation. By assigning more patients to the doses with more favorable efficacy/tolerabilityprofiles the adaptive design assigns fewer patients to doses with higher rates of adverseevents compared to allocating equally to all doses (Table II, scenarios 3-6).
Ivanova et al. Page 7
Stat Med. Author manuscript; available in PMC 2010 October 30.
NIH
-PA Author Manuscript
NIH
-PA Author Manuscript
NIH
-PA Author Manuscript
In crossover studies missing data are likely. We performed simulations with missing dataassuming that the data were missing at random. Trials with missing data were simulated toensure that the upcoming trial would have an adequate precision and power. As far ascomparison with the equal allocation crossover design the results were very similar to thecase of no missing data. In simulations with various values of σ and ρ adaptive design wasalways superior to the equal allocation. All results are available from the authors.
If more rapid accrual is expected in the beginning of the trial, a lead-in phase beforereverting to the adaptive design may be employed. Subjects are assigned equally to doses{d2,…, dK} in the lead-in phase. The starting dose for an adaptive design is then estimatedfrom the lead-in phase data using the isotonic method. Our investigation shows that the lead-in phase with up to 25% of the total sample size improves the likelihood of selecting thecorrect optimal dose at the end of the trial.
5. DiscussionThere has been a recent increase in interest in adaptive designs in hope of improving theefficiency of drug development [21]. One promising area of application is in dose-findingstudies. One of the reasons is because the focus of dose-finding designs is estimation whereadaptive designs can be quite helpful. Adaptive trials are logistically feasible [6,22] and canbe quite beneficial in phase I studies in healthy volunteers [22] and dose ranging studies[11]. In this paper we described an adaptive design for maximizing the allocation of patientsto an optimal dose on the basis of a utility function which incorporates information onefficacy and safety. This approach provides increased power for assessing superiority of theoptimal dose to placebo or non-inferiority of the optimal dose to an active control. Wedemonstrated the advantages of using this adaptive design in such trials compared to equalallocation. Simulations suggest that correct identification of the optimal dose is generallybetter than an equal allocation design and that this adaptive design provides considerablyhigher power for the treatment comparisons of interest. Applied to the Merck study inconjunction with crossover allocation, this adaptive design used approximately 1/5 thesample size of a traditional design and maintained similar power for the primary comparisonto placebo. The savings were due to both adaptive and crossover design components. Whilethe maximizing procedure provides information for evaluating dose-response, it may bemore limited than that provided by equal allocation to all doses because the adaptive designzooms-in on the ‘best’ dose.
A key decision in preparing for the trial was to define the utility function. If both outcomesare binary, a natural way to define utility is the success rate where success is an event ofobserving therapeutic response without toxicity. If the efficacy variable is independent of thetolerability variable, such utility can be written as U1(dk) = μk(1−pk) = μk − μkpk, where μkand pk are mean efficacy and tolerability correspondingly. Utility U1 resembles the one weused in the trial, U(dk) = μk − 10 pk ; in fact, in all 6 scenarios we considered, U1 and U havethe same maximum. We also considered various forms of utility functions, and theinvestigational team felt that the utility U, where tolerability is equally weighted rather thanweighing it by the value of mean response μk, reflected the objectives of the trial in the bestway. The utility U is similar to the one in reference [5]. The utility function should becarefully considered and constructed for each new study; U and U1 are only provided asexamples. The adaptive crossover trial was conducted at Merck Research Laboratories in2008-2009.
Ivanova et al. Page 8
Stat Med. Author manuscript; available in PMC 2010 October 30.
NIH
-PA Author Manuscript
NIH
-PA Author Manuscript
NIH
-PA Author Manuscript
AcknowledgmentsThe authors thank James Bolognese and Yevgen Tymofyeyev for helpful discussions. The author thanks anassociate editor and anonymous reviewers for helpful comments. Ivanova’s work was supported by Stanley Schorscholarship from Merck Research Laboratories and in part by NIH grant RO1 CA120082-01A1.
References1. O’Quigley J, Huges MD, Fenton T. Dose-finding designs for HIV studies. Biometrics. 2001;
57:1018–1029. [PubMed: 11764240]2. Thall PF, Inoue LY, Martin TG. Adaptive decision-making in a lymphocyte infusion trial.
Biometrics. 2002; 58:560–568. [PubMed: 12229990]3. Ivanova A. A new dose-finding design for bivariate outcomes. Biometrics. 2003; 59:1003–1009.4. Dragalin V, Fedorov V. Adaptive designs for dose-finding based on efficacy—toxicity response.
Journal of Statistical Planning and Inference. 2006; 136:1800–1823.5. Thall PF, Cook JD. Dose-finding based on efficacy-toxicity trade-offs. Biometrics. 2004; 60:684–
693. [PubMed: 15339291]6. Berry, DA.; Müller, P.; Grieve, AP.; Smith, M.; Parke, T.; Blazek, R.; Mitchard, N.; Krams, M.
Adaptive Bayesian designs for dose-ranging drug trials. In: Gatsonis, C.; Kass, RE.; Carlin, B.;Carriquiry, A.; Gelman, A.; Verdinelli, I.; West, M., editors. Case Studies in Bayesian Statistics V.Springer-Verlag; New York: 2001. p. 99-181.
7. Fedorov, V.; Wu, Y. Generalized probit model in design of dose finding experiments. In: Lopez-Fidalgo, J.; Rodriguez-Diaz, JM.; Torsney, B., editors. MODA8-Advances in Model OrientedDesign and Analysis. Springer-Verlag; 2007. p. 67-73.
8. Williams EJ. Experimental designs balanced for the estimation of residual effects of treatments.Australian Journal of Scientific Research. 1949:149–168. Ser. A 2.
9. Buoen C, Bjerrum OJ, Thomsen MS. How First-Time-in-Human Studies Are Being Performed: ASurvey of Phase I Dose-Escalation Trials in Healthy Volunteers Published Between 1995 and 2004.Journal of Clinical Pharmacology. 2005; 45:1123–1136. [PubMed: 16172177]
10. Dubey SD. Current thoughts on crossover designs. Clinical Research and Regulatory Affairs.1986; 4:127–142.
11. Ivanova A, Bolognese J, Perevozskaya I. Adaptive design based on t-statistic for dose-responsetrials. Statistics in Medicine. 2008; 27:1581–1592. [PubMed: 18241082]
12. Li, W.; Durham, SD.; Flournoy, N. An adaptive design for maximization of a contingent binaryresponse. In: Flournoy, N.; Rosenberger, WF.; Wong, WK., editors. New Developments andApplications in Experimental Design. 1995. p. 50-61.
13. Kpamegan, EE.; Flournoy, N. An optimizing up-and-down design. In: Atkinson, A.; Bogacka, B.;Zhigljavsky, A., editors. Optimum Design. 2000. p. 211-224.
14. Liang KY, Zeger SL. Longitudinal data analysis using general linear models. Biometrika. 1986;73:13–22.
15. Stylianou M, Flournoy N. Dose finding using isotonic regression estimates in an up-and-downbiased coin design. Biometrics. 2002; 58:171–177. [PubMed: 11890313]
16. Ivanova A, Haghighi AM, Mohanti SG, Durham SD. Improved up-and-down designs for phase Itrials. Statistics in Medicine. 2003; 22:69–82. [PubMed: 12486752]
17. Shi N. A test of homogeneity for umbrella alternatives and tables of the level probabilities.Communications in Statistics - Theory and Methods. 1988; 17:657–670.
18. Geng Z, Shi N. Algorithm AS 257: isotonic regression for umbrella orderings. Applied Statistics.1990; 39:397–402.
19. Robertson, T.; Wright, RL.; Dykstra, RL. Order Restricted Statistical Inference. Wiley; Chichester;New York: 1988.
20. Shen L. An improved method of evaluating drug effect in a multiple dose clinical trial. Statistics inMedicine. 2001; 20:1913–1929. [PubMed: 11427949]
21. Gaydos B, Krams M, Perevozskaya I, Bretz F, Liu Q, Gallo P, Berry D, Chuang-Stein C, PinheiroJ, Bedding A. Adaptive dose-response studies. Drug Information Journal. 2006; 40:451–461.
Ivanova et al. Page 9
Stat Med. Author manuscript; available in PMC 2010 October 30.
NIH
-PA Author Manuscript
NIH
-PA Author Manuscript
NIH
-PA Author Manuscript

22. Ivanova A, Murphy M. An adaptive first in man dose-selection study of the partial M1 muscarinicagonist NGX267: Statistical, clinical, and operational considerations. Journal ofBiopharmaceutical Statistics. 2009; 19:247–255. [PubMed: 19212877]
Ivanova et al. Page 10
Stat Med. Author manuscript; available in PMC 2010 October 30.
NIH
-PA Author Manuscript
NIH
-PA Author Manuscript
NIH
-PA Author Manuscript
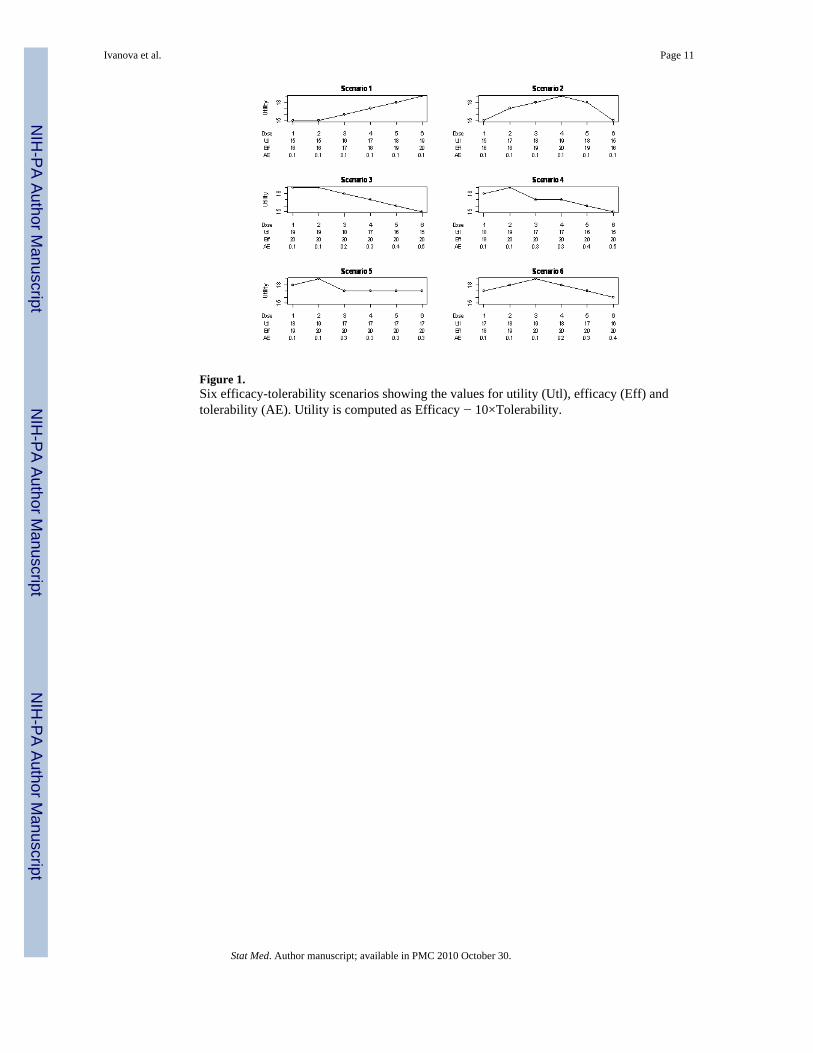
Figure 1.Six efficacy-tolerability scenarios showing the values for utility (Utl), efficacy (Eff) andtolerability (AE). Utility is computed as Efficacy − 10×Tolerability.
Ivanova et al. Page 11
Stat Med. Author manuscript; available in PMC 2010 October 30.
NIH
-PA Author Manuscript
NIH
-PA Author Manuscript
NIH
-PA Author Manuscript
NIH
-PA Author Manuscript
NIH
-PA Author Manuscript
NIH
-PA Author Manuscript
Ivanova et al. Page 12
Tabl
e I
Prop
ortio
n of
runs
whe
n th
e co
rrec
t opt
imal
dos
e w
as se
lect
ed (C
S); p
ropo
rtion
of r
uns w
hen
the
estim
ated
opt
imal
dos
e w
as sh
own
to h
ave
effic
acy
now
orse
than
act
ive
cont
rol a
nd to
lera
bilit
y no
wor
se th
an p
lace
bo (J
OIN
T PO
WER
); po
wer
to c
ompa
re e
ffic
acy
at th
e es
timat
ed o
ptim
al d
ose
with
act
ive
cont
rol (
POW
ER R
ESPO
NSE
CO
NTR
OL)
; pow
er to
com
pare
adv
erse
eve
nt ra
te a
t the
est
imat
ed o
ptim
al d
ose
with
pla
cebo
(PO
WER
AE
PLA
CEB
O);
pow
er to
com
pare
eff
icac
y at
the
estim
ated
opt
imal
dos
e w
ith p
lace
bo (P
OW
ER R
ESPO
NSE
PLA
CEB
O);
and
25%
, med
ian,
and
75%
of t
he n
umbe
r of
trial
s at t
he e
stim
ated
opt
imal
dos
e (S
AM
PLE
SIZE
QU
AN
TILE
S). T
he tw
o es
timat
ors o
f the
opt
imal
dos
e ar
e pr
esen
ted:
isot
onic
est
imat
or (A
dapt
ive
1)an
d be
st se
t of 2
dos
es e
stim
ator
(Ada
ptiv
e 2)
.
CS
Join
tPo
wer
Pow
erR
espo
nse
Con
trol
Pow
erA
EPl
aceb
o
Pow
erR
espo
nse
Plac
ebo
Sam
ple
Size
Qua
ntile
s(2
5%, m
edia
n, 7
5%)
Scen
ario
1
Ada
ptiv
e 1
0.74
0.86
0.90
0.95
0.97
6881
89
Ada
ptiv
e 2
0.72
0.86
0.89
0.97
0.96
7081
89
Equa
l0.
700.
700.
820.
860.
9940
4040
Scen
ario
2
Ada
ptiv
e 1
0.69
0.87
0.93
0.93
0.99
5363
72
Ada
ptiv
e 2
0.75
0.90
0.94
0.96
0.99
5865
84
Equa
l0.
630.
730.
870.
850.
9940
4040
Scen
ario
3
Ada
ptiv
e 1
0.77
0.80
0.96
0.82
0.02
569
8494
Ada
ptiv
e 2
0.78
0.87
0.99
0.88
0.02
577
8595
Equa
l0.
800.
580.
810.
740.
025
4040
40
Scen
ario
4
Ada
ptiv
e 1
0.83
0.78
0.94
0.81
0.24
6282
93
Ada
ptiv
e 2
0.89
0.85
0.97
0.88
0.25
7384
95
Equa
l0.
820.
560.
820.
720.
1840
4040
Scen
ario
5
Ada
ptiv
e 1
0.73
0.65
0.92
0.71
0.24
4476
92
Ada
ptiv
e 2
0.72
0.68
0.97
0.70
0.26
6581
93
Equa
l0.
720.
530.
870.
650.
2440
4040
Scen
ario
6
Ada
ptiv
e 1
0.59
0.72
0.94
0.75
0.74
4869
82
Stat Med. Author manuscript; available in PMC 2010 October 30.
NIH
-PA Author Manuscript
NIH
-PA Author Manuscript
NIH
-PA Author Manuscript
Ivanova et al. Page 13
CS
Join
tPo
wer
Pow
erR
espo
nse
Con
trol
Pow
erA
EPl
aceb
o
Pow
erR
espo
nse
Plac
ebo
Sam
ple
Size
Qua
ntile
s(2
5%, m
edia
n, 7
5%)
Ada
ptiv
e 2
0.69
0.80
0.97
0.82
0.76
6074
83
Equa
l0.
520.
620.
910.
690.
6140
4040
Stat Med. Author manuscript; available in PMC 2010 October 30.
NIH
-PA Author Manuscript
NIH
-PA Author Manuscript
NIH
-PA Author Manuscript
Ivanova et al. Page 14
Tabl
e II
Ave
rage
num
ber o
f sub
ject
s ass
igne
d to
eac
h do
se in
ada
ptiv
e al
loca
tion.
The
allo
catio
n at
the
optim
al d
ose
is in
bol
d.
d 1d 2
d 3d 4
d 5d 6
Scen
ario
120
07
1626
7873
Scen
ario
220
026
6164
3414
Scen
ario
320
085
7616
139
Scen
ario
420
080
7419
1511
Scen
ario
520
065
6321
2823
Scen
ario
620
050
7343
2113
Stat Med. Author manuscript; available in PMC 2010 October 30.
Copyright © 2022 FDOKUMEN