amphipolaria strain by solid-state fermentation of Saccharum ...
24
Page 1/24 Response surface methodology to optimize inulinase production by a newly isolated Penicillium amphipolaria strain by solid-state fermentation of Saccharum arundinaceum Deblina Das MIT, MAHE Ramananda M Bhat Department of Biotechnology, Manipal Institute of Technology (MIT), Manipal Academy of Higher Education (MAHE), Manipal, Karnataka Raja Selvaraj ( [email protected] ) Manipal Institute of Technology https://orcid.org/0000-0002-3170-7899 Research Keywords: Inulinase, Penicillium amphipolaria KAS 2555, Saccharum arundinaceum, Solid- state fermentation, Optimization, CCD, RSM Posted Date: June 17th, 2020 DOI: https://doi.org/10.21203/rs.3.rs-33849/v1 License: This work is licensed under a Creative Commons Attribution 4.0 International License. Read Full License
-
Upload
khangminh22 -
Category
Documents
-
view
1 -
download
0
Transcript of amphipolaria strain by solid-state fermentation of Saccharum ...

Page 1/24
Response surface methodology to optimizeinulinase production by a newly isolated Penicilliumamphipolaria strain by solid-state fermentation ofSaccharum arundinaceumDeblina Das
MIT, MAHERamananda M Bhat
Department of Biotechnology, Manipal Institute of Technology (MIT), Manipal Academy of HigherEducation (MAHE), Manipal, KarnatakaRaja Selvaraj ( [email protected] )
Manipal Institute of Technology https://orcid.org/0000-0002-3170-7899
Research
Keywords: Inulinase, Penicillium amphipolaria KAS 2555, Saccharum arundinaceum, Solid- statefermentation, Optimization, CCD, RSM
Posted Date: June 17th, 2020
DOI: https://doi.org/10.21203/rs.3.rs-33849/v1
License: This work is licensed under a Creative Commons Attribution 4.0 International License. Read Full License

Page 2/24
AbstractIn the present investigation, a new fungal inulinase producer Penicillium amphipolaria KAS 2555 hasbeen isolated from the soil of dead mangroves litter area, followed by the inulinase production andoptimization by solid-state fermentation using a low-cost substrate – hardy sugarcane (Saccharumarundinaceum). While screening, only Penicillium amphipolaria KAS 2555 showed the hydrolysis zone onthe plate containing inulin media. The exoinulolytic nature of inulinase and its form of action wascon�rmed by thin-layer chromatography (TLC). After 96 h of the fermentation period, an activity of 2.45U/gds was obtained. The I/S ratio of 0.59 proved that the enzyme is inulolytic in nature. Mediaoptimization was performed to obtain a regression model using Central Composite Design (CCD). Foroptimization, �ve signi�cant media components viz., inulin, (NH4)2SO4, K2HPO4, KH2PO4 and, NaCl wereused. A 3.10-fold increase in activity of inulinase (7.59 U/gds) was obtained under the optimal settings of(g/gds) inulin- 0.1, (NH4)2SO4- 0.002, K2HPO4- 0.1, KH2PO4- 0.02 and NaCl- 0.02.
1. IntroductionA variety of hydrolysing enzymes of industrial signi�cance from various sources of microbes have beenidenti�ed. Inulinases belong to one of these signi�cant class of enzymes that acts on β, 2 − 1 linkages ofinulin to yield different industrial products [1]. The β, 2 − 1 inulin linkages are affected by inulinasesdifferently. They are therefore categorized as: exoinulinase and endoinulinase according to their patternof action on inulin. Exoinulinase breaks inulin sequentially, while endoinulinase breaks the polymerinternal links randomly to create varying chain length fructooligosaccharides [2].
The two main uses of inulinases are the processing of high fructose syrup and fructooligosaccharides[3]. Other inulinase applications are production of bioethanol [4], lactic acid [5], single-cell oil [6], and citricacid [7].
Being a low calorie sweetener, fructose is bene�cial over traditional sucrose and fructooligosaccharidesare effective prebiotics [8]. Usually, production of fructose from starch involves the use of three enzymesnamely, α-amylase, amyloglucosidase and glucose isomerase which leads to only 45% yield. In contrastto this, inulinases are used in a single enzymatic inulin hydrolysis step which yields 95% of fructose [9].
Inulinase producing microbes have been widely isolated from sources like marine soil [10], rotten wood[11], inulin rich plants [12], etc. Mangrove soil is also proved to be an e�cient source of inulinaseproducing fungi [13]. A mangrove habitat consists of two parts, production-based where living mangrovetrees are found and dead-based where dead mangroves are found. Dead mangroves litter is made up ofleaves, barks, seeds, branch, wood, etc. A wide range of microbes inhabits the different parts of the dead-based mangrove environment like soil, leaf, wood, algae, and sand. In the present study, topsoil from therotten wood of mangrove trees has been used for the isolation of inulinase producing microbes [14].Mangrove soil is a rich source of microbes that produces enzymes like chitinase, cellulase, protease, andamylase [15]. To date, there is no report on the production of inulinase or any other enzymes from

Page 3/24
Penicillium amphipolaria species. This is the �rst report on the solid state production of inulinase enzymeusing this new fungal species isolated from the mangrove soil in the dead mangroves area.
Microbial sources of inulinases are bacteria, yeast and �lamentous fungi. Nevertheless, there has been aconsiderable increase in fungal sources because of thermal and pH stability and growth on low costsubstrates to produce important industrial products. Some active fungal inulinase producers areAspergillus sp., Rhizopus sp., Penicillium sp., etc [16]. In the present study a new fungal species“Penicillium amphipolaria” has been isolated. Till date there is no report on the application of this fungusin any �eld of research.
In general, inulinase is produced by submerged fermentation, nonetheless, nowadays, solid-statefermentation (SSF) is gaining a lot of attention because of the low cost process. Several cheapsubstrates such as sugarcane bagasse, peels of onion, pressmud, wheat bran and rice bran have beenused for the production of inulinase enzyme [17]. Very recently, our research group have documented theuse of a cost-effective solid substrate – “Saccharum arundinaceum”, usually called as hardy sugarcane,for the inulinase production by employing Aspergillus �avus var. �avus strain ATCC 16883 [13].
In the process of fermentation, media optimization is necessary to achieve optimal growth of microbesand enhance the synthesis of metabolites. The relevant statistical method of optimization i.e., responsesurface methodology (RSM) uses analysis of variance (ANOVA) and multiple regression analysis toanalyse the optimum model [18]. RSM determines the optimum process conditions using Centralcomposite design (CCD) and Box-Behnken design (BBD) [19]. Therefore, this method was used tooptimize the media components of inulinase production by SSF from the rotten wood mangrove soilisolated fungus, P. amphipolaria. This is the �rst report on the production of inulinase from P.amphipolaria using dead-based mangrove soil as the chief source of fungal isolation.
2. Materials And Methods2.1 Isolation and screening of inulin- degrading fungal strains
The method of isolation was performed using the surface soil of the rotten wood of the mangrovedetritus situated in the estuary of Halady river, on the Herikudru island, Kundapura Taluk (13°38'28"N,74°42'01"E), India. Here, the mangrove area is mostly comprised of mangrove trees that have died due tourbanization and deforestation. The soil collection was done in July 2017. Firstly, a serial dilution of thesoil sample was carried out followed by plating 0.1ml of the sample on the Czapex Dox Agar medium(CDA). CDA medium consists of (g/l): sucrose - 30, K2HPO4 - 1, NaNO3 - 2, KCl - 0.50, MgSO4 - 0.50,FeSO4 - 0.01 and agar - 15. It is used for the isolation of fungal species. The pH of the media was kept at7.4 and autoclaved for 45min at 121℃ and 15-20 psi. The plates were incubated for 3-4 days at 30℃ toget diverse colonies of fungal species [13]. In the process of primary screening, individual colonies fromdifferent fungal colonies were selected and plated aseptically on inulin media. The inulin media consistsof (g/l): inulin - 6.00, Na2HPO4 - 33.9, NH4Cl - 5, NaCl - 2.50, KH2PO4 - 15, and agar - 15. The plates were

Page 4/24
incubated for three days at 30℃. The pH of the media was kept at 6.7 [21]. Lugol’s plate assay wasperformed to screen the microorganisms producing extracellular inulinases [22].
2.2 Identi�cation of the fungal strain
The fungal strain which gave the highest activity was recognized using 18s rRNA gene sequencing( 571bp) at National Centre for Microbial Resource (NCMR) Pune, India. Using the Tamura-Nei model, theevolutionary history was inferred by using the Maximum Likelihood method. The tree was constructedusing 1000 bootstrap. The bootstrap support is 95 for the parent node. Tree construction method wasselected based on the best model �tting option in MEGA6 [41].
2.3 Inoculum preparation
The fungal spores were totally removed from the agar plates using 0.05% of sodium chloride solution. Ahaemocytometer (Improved Neubauer, Rohem, India) was used to count the number of cells. For SSF,2×106 spores/ mL of spore suspension was used [23].
2.4 Pretreatment of solid substrate
Stems of S. arundinaceum collected from Chitpady colony, Udupi, India were cleaned properly couple oftimes in running water. Small cubes of the stems were prepared and sun-dried for a couple of days toremove moisture. Subsequently, �ne powder was made by grinding the dried cubes in a mixer grinder andpassed through a 1.18mm sieve. After sieving, the particles with larger sizes were removed and the �nepowder was used in SSF as a solid substrate.
2.5 Solid-State Fermentation
SSF was carried out by mixing 2g of S. arundinaceum powder and 5ml of inulin media in 250ml conical�asks. Moisture on a dry basis was maintained at 77.8%. All the �asks were tightly covered withhydrophobic cotton and autoclaved. The �asks were allowed to cool followed by the addition of 2ml ofthe spore suspension prepared earlier. Proper mixing of the solid substrate, fermentation media and thespore suspension was done to ensure the availability of nutrients uniformly. The �asks were incubated at30℃ for �ve days [42]. During the process of preliminary screening, it was found that the maximumproduction of inulinase occurred at 96th h. All the subsequent experiments were thus carried out for 96 h.
2.6 Extraction of Inulinase enzyme
For the extraction of enzyme after the completion of fermentation, the fermented contents were mixedwith 30ml of sodium acetate buffer (0.1molar) having a pH of 4.75. The �asks were then kept for 1 h on arotary shaker (180rpm) to extract the enzyme. Subsequently, a clean muslin cloth was used to �lter outthe enzyme extract followed by centrifugation at 844 G-force (10,000 rpm in rotor 9, Tabletop SuperspinCentrifuge –V/FM, Plasto Crafts., Mumbai) at 4℃ for 10 min. The determination of reducing sugars wasdone by the dinitrosalicylic acid (DNS) method using the cell-free supernatant [25].
Page 5/24
2.7 Inulinase assay
For the assay of inulinase enzyme, 2g inulin was added to 10ml of 0.1M sodium acetate buffer to make asubstrate solution. Then the reaction mixture which consisted of 0.9 ml of substrate solution and 0.1 mlof the cell-free supernatant was incubated for 10 min, followed by the addition of 1ml of DNS reagent.The mixture was heated for 10 min in a water bath. For the blank, the enzyme was deactivated bypreheating the reaction mixture. The quantity of enzyme which produces 1μmol of fructose per min isde�ned as one unit of inulinase activity.
Similar to inulinase assay, the invertase assay was determined using sucrose in the reaction mixture andthe activity of invertase was determined with respect to the sucrose activity [21].
2.8 Inulinase to Sucrose activity (I/S ratio)
Usually, the inulinase activity is characterized from the activity of invertase using the I/S ratio. An I/S ratiohigher than 10-2 proves to have a high production of inulinase whereas an I/S ratio lower than 10-4 provesto have a high production of invertase enzyme in the culture media [2].
2.9 Optimization of Inulinase Production
Proper understanding and former knowledge of bioprocess are necessary to obtain a model withaccuracy. The data obtained from the experiments were studied using ‘‘Minitab 16.2.2.0”, a designsoftware. Using Central composite design, a quadratic model was obtained. A fractional CCD 2(5-1) wasused here and the signi�cance level was kept at 95%. CCD consists of factorial trials and star pointswhich assist the de�ning of quadratic effects. The centre points assess the pure variance with inulinaseproduction as the output variable [26]. The optimization of the �ve signi�cant media constituents whichincreased the inulinase production was done using RSM. A set of thirty-two experiments were performedby studying the �ve components at 5 different levels, keeping zero as the central coded value. Theexperimental results of all the 32 experiments – the inulinase activity (Y) were recorded and submitted toANOVA to carry out the analysis of data using multiple regression [27]. Lastly, an empirical modelshowing the relationship between the independent components and the measured response wasachieved.
2.10 Analysis of end products
The pattern in which inulinase enzyme works on inulin was �gured out by thin-layer chromatography(TLC) analysis. To perform the reaction of hydrolysis, 1.0 ml of the cell-free supernatant was mixed with0.01g of inulin. The reaction mixture was incubated at 56℃ for six h. Then, the reaction was stopped byboiling the reaction mixture for 10 min. Along with the sample test (T), four standards namely,deactivated inulinase (I), fructose (F), glucose (G), sucrose (S), were spotted on the TLC plates. It was thenair-dried and dipped in a developer solution composed of butanol:ethanol:water (50:30:20). The plate wasagain air-dried and sprayed with diphenylamine reagent (1% diphenylamine, 10% phosphoric acid and 1%
Page 6/24
aniline). This reagent develops colors on reaction with sugars. Finally, the plate was kept in a hot air ovenfor 10 min at 120℃ for drying [21].
2.11 Seliwanoff’s test
To distinguish between aldoses and ketoses, Seliwanoff’s color test is carried out. Ketose sugar can bedifferentiated from aldose sugar by the formation of a burgundy or cherry red color with resorcinol oncondensation, whereas aldose sugar doesn’t give any color [28]. Heating for a long time is avoided asaldose sugars will also give a red color [29]. To perform this test, three controls namely fructose, glucoseand deactivated inulinase with inulin was used and a test sample containing the supernatant along withinulinase and inulin was used. 0.5 ml of the test sample was mixed with 1ml of Seliwanoff’s reagent andheated for 2 min. To 1ml of Seliwanoff’s reagent, 1ml each of the following, namely, standard fructose,standard glucose, and a pre-heated mixture of deactivated inulinase and inulin were also mixed andheated for 2 min.
2.12 Osazone formation test
Osazone test is performed to determine and identify the sugars qualitatively. It is a simple test in whichsugars form distinctive crystals of osazone on reaction with phenylhydrazine. Distinctive broom andneedle- shaped osazones are formed by monosachharides like glucose and fructose. The following testwas carried out using the optimized cell-free liquid of inulinase and inulin mixture along with the fructosecontrol. 2 ml of the control fructose and 2 ml of the supernatant were mixed with phenylhydrazinehydrochloride solution followed by heating for 30 min in a water bath [30]. After cooling down of thesolutions, the distinctive images of the osazone crystals were visualized by a light microscope (Euromexiscope, Holland) at 40x magni�cation.
3. Results And Discussions
3.1 MicroorganismThe fungal isolate that has grown on the inulin media were chosen for Lugol’s plate assay. The fungalstrain which had formed a clear halo in the plate assay has been indicated as DD MSF 1 in Fig. 1a andFig. 1b. Figure 1a shows that the isolate has moderately deep colonies, white mycelia, and �occosetexture. Visagie et al., (2016) reported the same features for Penicillium amphipolaria KAS 2555. Theyisolated this species from the quarter main mountains of the dry valleys of Antarctica [31]. Till date, thereis no work reported in any �eld on this fungal species. Figure 2 shows DD MSF 1 represented in thephylogenetic tree as sequenced by NCMR Pune, India. DD MSF 1 was found to have a 99% similarity withPenicillium amphipolaria strain KAS 2555. This study reports the isolation of this fungal species fromdetritus mangrove soil for the �rst time. In the GenBank under the (Accession number KT887872.1), thegene sequence of the ribosomal RNA of DD MSF 1 has been deposited. Among the fungal producers ofinulinases, the Penicillium genus is one of the most common. According to the literature survey, species

Page 7/24
such as P. brevicompactum [11], P. rugulosum [32], P. citrinum [23], have been used for the production ofinulinase enzyme.
3.2 Fermentation and optimization of the signi�cantnutrientsAfter the completion of 96 h of fermentation, DD MSF 1 yielded a maximal activity of 2.45 U/gds. Theactivity gradually decreased after 96 h with the increase in the incubation period possibly due to thecarbon source exhaustion in the fermentation media, catabolic repression, or due to the secretion ofproteolytic proteins causing the denaturation of proteins. The experimental time of fermentation isconsistent with the reported values. A maximal inulinase activity of 3.48 U/gds was obtained from A.�avus ATCC 16883 [13], A. terreus gave a maximum activity of 5.680 ± 0.183 U/gds [11], a maximalactivity of 319 U/ml was obtained from A. niger ATCC 20611 in shake �ask [33]. Penicillium amphipolariaKAS 2555 gave an I/S ratio of 0.59, hence, proved the speci�city of the enzyme inulinase. The resultobtained in the present study had similarities with other microbial producers of inulinases as reported inthe literature. An I/S ratio of 2.56 was obtained from A. �avus ATCC 16883 [13], a ratio of 3.38 wasobtained from P. oxalicum BGPUP-4 [21], a ratio in the range of 0.53–0.66 was obtained from Penicilliumsp. NFCC 2768 [34], a ratio of 0.57–2.49 was obtained from Rhizopus microspores 13aIV [35].
During the preliminary process of traditional screening, �ve nutrient components viz., inulin, (NH4)2SO4,K2HPO4, KH2PO4, and NaCl were screened out to be signi�cant and their levels were determined for CCDas shown below in Table 1a. Thirty two experiments were performed according to the combinations givenby the software. The number of runs were kept randomized. The process parameters were kept constantas follows: temperature (30℃), moisture (77.77%), inoculum size (2 ml of 2 × 10⁶ fungal spores), amountof solid substrate (2 g), fermentation media (5 ml), pH (7) .The results are compared with the publishedreports. Four signi�cant nutrients namely NH4NO3, soya bean cake, MnSO4·7H2O, and K2HPO4 werescreened by Dilipkumar et al., (2011) for the of inulinase production by Streptomyces sp. in SSF [24].Three signi�cant nutrients viz. FeSO4.7H2O, yeast extract, and NH4NO3 were screened by Dilipkumar et al.,(2011) for inulinase optimization in SSF by Streptomyces sp [36]. Five signi�cant factors namely,inoculum size, moisture, the ratio of the quantity of wheat bran to rice husk, pH and temperature werescreened by Sheng et al., (2009) for the optimization of inulinase enzyme using Cryptococcus aureus G7ain SSF [37].
Among the signi�cant term, the optimum values were determined by CCD. In run 10, the highest activity of7.38 U/gds and in run 22, the lowest activity of 5.74 U/gds were obtained as presented in Table 1b. Thedata obtained from the experiments are reproducible signi�cantly as there is a small difference betweenthe central points. ANOVA was used for the design of the experiment to determine the model e�ciencyand �tness as shown in Table 2. F value of the model is shown as 10.24 which proves that it issigni�cant.

Page 8/24
At a 95% level of con�dence and a (p-value < 0.05), X1 is signi�cant among the linear model factors, X22
and X32 are signi�cant among the square interactions and X1*X2, X2*X4 are signi�cant among the two
way interactions. The coe�cient of determination (R2) for the activity of the inulinase enzyme wascalculated as 0.9490 which is responsible for causing a 94.90% variation in the response.
Table 1a- Levels of the independent variables chosen for Central Composite Design.
Nutrient factors (g/gds) Levels
(-2) (-1) (0) (+ 1) (+ 2)
Inulin 0.0100 0.0325 0.0550 0.0775 0.1000
K2HPO4 0.0500 0.0625 0.0750 0.0875 0.1000
(NH4)2SO4 0.0020 0.0065 0.0110 0.0155 0.0200
KH2PO4 0.0050 0.00875 0.01250 0.01625 0.0200
NaCl 0.0020 0.0065 0.0110 0.0155 0.0200

Page 9/24
Table 1b- Central composite design matrix to determine the optimum values of the �ve nutrient factors for the
production of inulinase.Runs Nutrient factors with codes (g/gds) Inulinase activity (U/gds)
RunOrder
Inulin
(X1)
K2HPO4
(X2)
(NH4)2SO4
(X3)
KH2PO4
(X4)
NaCl
(X5)
Inulinaseactivity
Predictedactivity
1 0.055 0.075 0.011 0.02 0.011 6.90 6.81
2 0.0775 0.0625 0.0065 0.00875 0.0065 5.92 5.74
3 0.055 0.075 0.002 0.0125 0.011 6.70 6.88
4 0.055 0.075 0.02 0.0125 0.011 7.16 6.99
5 0.055 0.075 0.011 0.0125 0.011 6.49 6.53
6 0.0775 0.0625 0.0155 0.01625 0.0065 6.17 6.12
7 0.055 0.075 0.011 0.0125 0.011 6.51 6.53
8 0.055 0.075 0.011 0.005 0.011 6.59 6.69
9 0.055 0.075 0.011 0.0125 0.002 6.67 6.82
10 0.0325 0.0625 0.0065 0.01625 0.0065 7.38 7.30
11 0.0325 0.0875 0.0065 0.01625 0.0155 5.78 5.85
12 0.0325 0.0875 0.0065 0.00875 0.0065 6.58 6.53
13 0.0325 0.0625 0.0155 0.00875 0.0065 7.01 6.97
14 0.055 0.1 0.011 0.0125 0.011 6.25 6.10
15 0.055 0.075 0.011 0.0125 0.011 6.50 6.53
16 0.055 0.075 0.011 0.0125 0.011 6.56 6.53
17 0.0325 0.0875 0.0155 0.01625 0.0065 6.31 6.40
18 0.0325 0.0625 0.0155 0.01625 0.0155 7.24 7.32
19 0.0775 0.0875 0.0065 0.00875 0.0155 7.05 7.02
20 0.0775 0.0875 0.0155 0.00875 0.0065 7.20 7.19
21 0.0325 0.0875 0.0155 0.00875 0.0155 6.15 6.26
22 0.0775 0.0625 0.0155 0.00875 0.0155 5.74 5.72
23 0.0325 0.0625 0.0065 0.00875 0.0155 7.01 6.96
24 0.055 0.075 0.011 0.0125 0.02 6.88 6.74
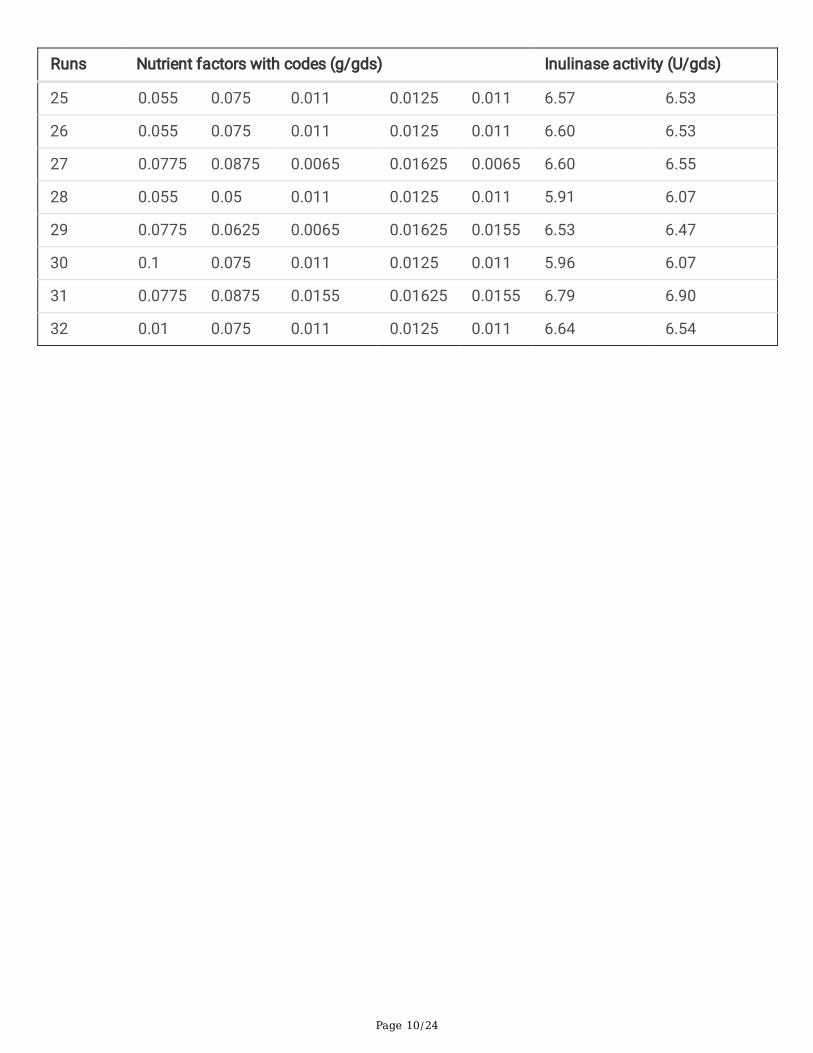
Page 10/24
Runs Nutrient factors with codes (g/gds) Inulinase activity (U/gds)
25 0.055 0.075 0.011 0.0125 0.011 6.57 6.53
26 0.055 0.075 0.011 0.0125 0.011 6.60 6.53
27 0.0775 0.0875 0.0065 0.01625 0.0065 6.60 6.55
28 0.055 0.05 0.011 0.0125 0.011 5.91 6.07
29 0.0775 0.0625 0.0065 0.01625 0.0155 6.53 6.47
30 0.1 0.075 0.011 0.0125 0.011 5.96 6.07
31 0.0775 0.0875 0.0155 0.01625 0.0155 6.79 6.90
32 0.01 0.075 0.011 0.0125 0.011 6.64 6.54

Page 11/24
Table 2Analysis of variance for the quadratic regression model obtained
from central composite design for optimal inulinase activitySource Effect Coe�cient F-value P- value
Model 10.24 0.000
Linear 2.85 0.069
Constant
(X1) Inulin -0.2350 -0.1175 12.29 0.005
(X2) K2HPO4 0.0117 0.0058 0.03 0.865
(X3) (NH4)2SO4 0.0567 0.0283 0.71 0.416
(X4) KH2PO4 0.0633 0.0317 0.89 0.365
(X5) NaCl -0.0383 -0.0192 0.33 0.579
Square
X12 -0.1125 -0.0563 3.44 0.091
X22 -0.2225 -0.1112 13.46 0.004
X32 0.2025 0.1013 11.15 0.007
X42 0.1100 0.0550 3.29 0.097
X52 0.1250 0.0625 4.25 0.064
2-Way Interaction
X1*X2 0.8875 0.4437 116.84 0.000
X1*X3 -0.0200 -0.0100 0.06 0.812
X1*X4 0.0275 0.0137 0.11 0.744
X1*X5 0.1650 0.0825 4.04 0.070
X2*X3 0.1400 0.0700 2.91 0.116
X2*X4 -0.3925 -0.1962 22.85 0.001
X2*X5 -0.1200 -0.0600 2.14 0.172
X3*X4 0.0850 0.0425 1.07 0.323

Page 12/24
Source Effect Coe�cient F-value P- value
X3*X5 -0.0825 -0.0412 1.01 0.337
X4*X5 0.0800 0.0400 0.95 0.351
Regression model equation with uncoded values
Inulinase activity (U/gds) = 7.61–121.2 X1 + 70.9 X2 − 200.7 X3 + 161.9 X4- 44.2 X5 − 111.1 X12- 712 X2
2 +
5000 X32 + 3911 X4
2 + 3086 X52 + 1578 X1*X2– 99X1 *X3 + 163 X1*X + 815 X1*X5 + 1244 X2* X3 − 4187
X2*X4 − 1067 X2*X5 + 2519 X3*X4 – 2037X3* X5 + 2370 X4*X5
The main source of energy and skeletal support to the cells of microbes are provided by the carbonsources. Thus, inulin came out to be the most signi�cant among the other variables. Penicilliumamphipolaria KAS 2555 produces inulinase using inulin as the only carbon substrate which induces theproduction process. Yet a large amount of inulin leads to a decrease in the inulinase activity as shown inFig. 3 due to catabolite repression. K2HPO4 and KH2PO4 act as a buffer and helps in basic cell growth.The inulinase activity decreases with an increase in KH2PO4 as presented in Fig. 4. This inhibitory effecton the inulinase activity could be the result of phosphate ions released in excess. Ammonium sulphate isan important source which provides nitrogen in the growth of P. amphipolaria KAS 2555. However, theinulinase activity decreases in higher concentration possibly due to excess release of ammonium ions[43]. Another important factor, NaCl helps to maintain the osmotic balance in the growth media. Theinulinase activity decreases as the concentration of NaCl increases possibly due to salinity stress whichslows down the water transportation rate in and outside the fungal cells [44].
Singh et al., (2018) reported KH2PO4 as one of the signi�cant factors in the inulinase production fromMucor circinelloides BGPUP-9 [38]. Dilipkumar et al., (2011) reported K2HPO4 as one of the signi�cantfactors in the production of inulinase from Streptomyces sp. MTCC-3119 [24]. Xiong et al., (2007)reported inulin as one of the signi�cant factors in the production of inulinase from Kluyveromyces S120[39]. Abd El Aty et al., (2014) reported KH2PO4 as one of the signi�cant factors in the production ofinulinase from Aspergillus terreus [11]. As the concentration of the �ve media components is increasedabove the peak level, the activity of the inulinase enzyme is suppressed although there is continued slowgrowth of the cells. On the other hand, if the concentration of the media components decreases, thegrowth of the microbes and the activity of the inulinase enzyme will rapidly decrease [13].
3.3 Regression model validationThe model validation was performed by the respective optimized values of the signi�cant terms for theproduction of inulinase: Inulin-0.1, K2HPO4- 0.1, (NH4)2SO4- 0.002, KH2PO4- 0.02 and NaCl- 0.02 (g/gds).The experimental inulinase activity using these values was found out to be 7.59 U/gds which was inagreement with the predicted inulinase activity of 7.53 U/gds. The inulinase activity obtained in the

Page 13/24
current study is 3.1 times higher than the un-optimized value. A comparison of the inulinase activity withthe existing literature for few fungal species is given in Table 3.
Table 3Comparison of inulinase activity with few fungal species
Microorganism Substrate Inulinase yield(U/gds)
References
Aspergillus versicolor Orange rinds 1.917 [11]
Aspergillus terreus Artichoke leaves 4.433
Aspergillus �avus ATCC 16883 Saccharumarundinaceum
8.57 [13]
Penicillium amphipolaria KAS2555
Saccharumarundinaceum
2.45 (un-optimized) Presentwork
Penicillium amphipolaria KAS2555
Saccharumarundinaceum
7.59 (optimized) Presentwork
There is no literature to date, on the production of inulinase from Penicillium amphipolaria KAS 2555both by submerged and solid-state fermentation. For the �rst time, using hardy sugarcane, this newfungal strain has shown the viability of producing the enzyme inulinase on a laboratory scale by SSF.Optimized inulinase yield (7.59U/gds) as obtained from the present study is comparable with theoptimized inulinase yield (8.57U/gds) from our previous study. Only a yield difference of 0.11U/gds isobserved between them. This study proved the e�ciency of the mangrove soil containing deadmangroves litter also has good inulinases producing microbes like the soil from living mangroves litter.
3.4 Analysis of hydrolysis productsThe TLC plate showed spots of fructose standard (F), glucose standard (G), sucrose standard (S) and thetest sample (T) containing the products of hydrolysis. No spot was observed for the control (I) containinginactivated inulinase and inulin. A single-colored spot obtained for the test sample proved that onlyfructose and a minute quantity of glucose is present in the hydrosylate. No fructooligosachharides werepresent which concludes the exoinulotytic nature of Penicillium amphipolaria KAS 2555. Some of thereported fungal microbes like A. fumigatus [40], A. �avus ATCC 16883[13], P. oxalicum BGPUP-4 [21], etcare exoinulolytic in nature.
3.5 Seliwanoff’s testIn the Seliwanoff’s test, as depicted in Fig. 6, the test solution (4) and the fructose control (1) quicklyformed a red color while heating, whereas there was no change in color in the test sample (3) containingthe heat-inactivated inulinase enzyme and the glucose control (2). This color visibility proves that thefermented culture contains ketose sugar.

Page 14/24
3.6 Osazone formation testPhenylhydrazine contains a free carbonyl moiety which reacts with the sugars to form broom and needle-shaped crystals. Similar shaped osazones were visualized under (40x) magni�cation in a lightmicroscope for both the standard fructose and the test broth. Similar shaped osazones were alsoreported by Hassid and McCready (1942)[30], Kamble et al., (2019) [12], Das et al., (2019)[13].
4. ConclusionIn the present study, a potential new inulinase producing fungus Penicillium amphipolaria KAS 2555 wasisolated from the detritus mangrove environment. According to our previous study using Aspergillus�avus var. �avus ATCC16883, living mangrove environment proved to be a rich source of organismscapable of exhibiting inulinase activity. In the present study, dead mangrove environment also proved tobe a rich source of microbes producing inulinase. This fungal species gave a good yield of extracellularinulinase in SSF using hardy sugarcane. An increase of 3.10 fold was obtained in SSF using thestatistical design of experiment. The study by CCD helped in determining the signi�cance of the nutrientspresent in the media. Among the �ve factors, inulin was found to be signi�cant. As per the cited literature,no work has been done on Penicillium amphipolaria KAS 2555 for the production of inulinase or anyother enzymes. Thus, the newly isolated fungal species, Penicillium amphipolaria KAS 2555 proved to bean e�cient producer of inulinase enzyme, leading to the production of fructose in a single step. Further,scale-up studies can be done to enhance the enzyme production.
AbbreviationsRSMResponse Surface MethodologyCCDCentral Composite DesignANOVAAnalysis of VarianceSSFSolid Substrate FermentationCDACzapex Dox Agar mediumDNSdinitrosalicylic acidTLCThin Layer Chromatography
Declarations

Page 15/24
6.1 Funding
Dr. T.M.A. Pai Ph.D. scholarship
6.2 Acknowledgements:
The �nancial support received from Dr. T.M.A. Pai Ph.D. scholarship programme provided by ManipalAcademy of Higher Education (MAHE) is gratefully acknowledged.
6.3 Author contributions:
The original idea was suggested by MRB and RS. The experimental work was carried out by DD withguidance from MRB and RS. DD drafted the article. All the authors involved in the critical revision of thearticle for important intellectual content. All the authors read and approved the �nal manuscript.
6.4 Competing interests:
The authors have declared no competing interests
6.5 Availability of data and materials
The datasets used and/or analyzed during the current study are available from the corresponding authoron reasonable request.
6.6 Ethics approval and consent to participate
Not applicable.
6.7 Consent for publication
Not applicable.
References

Page 16/24
1. Pandey A, Soccol CR, Selvakumar P, Soccol VT, Krieger N, Fontana JD (1999) Recent Developmentsin Microbial Inulinases: Its Production, Properties, and Industrial Applications.ApplBiochemBiotechnol 81:35–52
2. Neagu C, Bahrim G (2011) Inulinases-a versatile tool for biotechnology. InnovRomFood Biotechnol9:1–11
3. Singh P, Gill PK (2006) Production of Inulinases: Recent Advances. Food Technol Biotechnol 44:151–162
4. Gencheva P, Dobrev G, Delchev N, Hristov J, Ivanova V (2012) Jerusalem Artichoke and Pea HullsBased Substrates as Raw Material for Ethanol Production by Saccharomyces cerevisiae. IRECHE4:84–90
5. Petrova P, Velikova P, Popova L, Petrov K (2015) Direct conversion of chicory �our into L (+) -lacticacid by the highly effective inulinase producer Lactobacillus paracasei DSM 23505. BioresourTechnol 186:329–333
�. Zhao CH, Zhang T, Li M, Chi ZM (2010) Single cell oil production from hydrolysates of inulin andextract of tubers of Jerusalem artichoke by Rhodotorula mucilaginosa TJY15a. Process Biochem45:1121–1126
7. Liu XY, Chi Z, Liu GL, Wang F, Madzak C, Chi ZM (2010) Inulin hydrolysis and citric acid productionfrom inulin using the surface-engineered Yarrowia lipolytica displaying inulinases. Metab Eng12:469–476
�. Kango N, Jain SC (2011) Production and Properties of Microbial Inulinases: Recent Advances. FoodBiotechnol 25:165–212
9. Singh RS, Chauhan K (2018) Production, puri�cation, characterization and applications of fungalinulinases. Curr Biotechnol 7:242–260
10. Gao L, Chi Z, Sheng J, Wang L, Li J, Gong F (2007) Inulinase-producing Marine Yeasts: Evaluation oftheir Diversity and Inulin Hydrolysis by Their Crude Enzymes. Microb Ecol 54:722–729
11. Abd El AA, Aty HR, Wehaidy FA, Mostafa (2014) Optimization of Inulinase Production from Low CostSubstrates Using Plackett–Burman and Taguchi Methods. Carbohydr Polym 102:261–268
12. Kamble PP, Suryawanshi SS, Jadhav JP, Attar YC (2019) Enhanced inulinase production by Fusariumsolani JALPK from invasive weed using response surface methodology. J Microbiol Methods159:99–111
13. Das D, Bhat MR, Selvaraj R (2019) Optimization of inulinase production by a newly isolated strainAspergillus �avus var. �avus by solid state fermentation of Saccharum arundinaceum, Biocatal.Agric Biotechnol 22:101363
14. Sarma VV, Hyde KD (2001) A review on frequently occurring fungi in mangroves. Fungal Divers 8:1–34
15. Kathiresan K, Saravanakumar K, Anburaj R, Gomathi V, Abirami G, Sahu SK, Anandhan S (2011)Microbial Enzyme Activity in Decomposing Leaves of Mangroves. Int J Adv Biotechnol Res 2:382–389

Page 17/24
1�. Das D, Bhat MR, Selvaraj R (2019) Review of Inulinase Production Using Solid-State Fermentation.Ann Microbiol 69:201–209
17. Singh RS, Chauhan K, Kennedy JF (2017) A panorama of bacterial inulinases: Production,puri�cation, characterization and industrial applications. Int J Biol Macromol 96:312–322
1�. Speck F, Raja S, Ramesh V, Thivaharan V (2016) Modelling and optimization of homogenous photo-Fenton degradation of rhodamine B by response surface methodology and arti�cial neural network.Int J Environ Res 10:543–554
19. Sridevi V, Mahanty CLVV, Adimadhyam SVN, Medicherla NR (2011) Statistical optimization ofprocess variables by response surface methodology to enhance phenol degradation byPseudomonas putida (NCIM 2102). Adv Biosci Biotechnol 2:175–181
20. Guttikonda STK, Vanitha S, Anuradha K (2017) Screening of inulinase producing bacteria fromdiverse sources. Bio Disc 8:695–701
21. Singh RS, Chauhan K (2017) Inulinase production from a new inulinase producer, Penicilliumoxalicum BGPUP-4, Biocatal. Agric Biotechnol 9:1–10
22. Li AX, Guo LZ, Fu Q, Lu WD (2011) A simple and rapid plate assay for screening of inulin degradingmicroorganisms using Lugol’s iodine solution, Afr. J Biotechnol 10:9518–9521
23. Lafuente-Castaneda C, Martinez G, Contreras-Esquivel JC, Rodriguez-Herrera R, Prado-Barragan A,Aguilar CN (2012) Inulinase production by Penicillium citrinum ESS in submerged and solid-statecultures. Am J Agric Biol Sci 7:129–134
24. Dilipkumar M, Rajasimman M, Rajamohan N (2011) Optimization of Inulinase Production fromGarlic by Streptomyces Sp. in Solid State Fermentation Using Statistical Designs. Biotechnol Res Int2011:1–7
25. Miller GL (1959) Use of dinitrosalicylic acid reagent for determination of reducing sugar. Anal Chem31:426–428
2�. Olawoye B, A Comprehensive Handout on Central Composite Design (CCD), (2016)
27. Raja S, Murty VR (2013) Optimization of aqueous two-phase systems for the recovery of solubleproteins from tannery wastewater using response surface methodology. J Eng 2013:1–10
2�. Sánchez-viesca F, Gómez R (2018) Reactivities Involved in the Seliwanoff Reaction ReactivitiesInvolved in the Seliwanoff Reaction. MC 6:1–5
29. Devmurari VV, Bhadaniya CP, Ambasana PA (2018) A Comparative Study on Phyto-ConstitutionalPro�ling of Carica Papaya Leaves. J ApplicableChem 7:1011–1017
30. Hassid W, McCready R (1942) Identi�cation of sugars by microscopic appearance of crystallineosazones. Ind Eng Chem Anal Ed 14:683–686
31. Visagie1 CM, Renaud JB, Burgess KMN, Malloch DW, Clark D, Ketch L, Urb M, Louis-Seize G 1,Assabgui R, Sumarah MW, Seifert KA (2016) Fifteen new species of Penicillium. Persoonia 36:247–280

Page 18/24
32. Dilipkumar M, Rajasimman M, Rajamohan N (2014) Utilization of Copra Waste for the Solid StateFermentatative Production of Inulinase in Batch and Packed Bed Reactors. Carbohydr Polym102:662–668
33. Dinarvand M, Rezaee M, Masomian M, Jazayeri SD, Zareian M, Abbasi S, Ariff AB, Effect of C/NRatio and Media Optimization through Response Surface Methodology on SimultaneousProductions of Intra-and Extracellular Inulinase and Invertase from Aspergillus Niger ATCC 20611,Biomed Res. Int. 2013(2013) 1–13
34. Rawat HK, Jain SC, Kango N, Production and properties of inulinase from Penicillium sp. NFCC 2768grown on inulin-rich vegetal infusions, BIOCATAL BIOTRANSFOR. 33(2015) 61–68
35. Flores-Gallegos AC, Contreras-Esquivel JC, Morlett-Chávez JA, Aguilar CN (2015) R. Rodriguez-Herrera, Comparative Study of Fungal Strains for Thermostable Inulinase Production. J BiosciBioeng 119:421–426
3�. Dilipkumar M, Rajasimman M, Rajamohan N (2011) Application of Statistical Design for theProduction of Inulinase by Streptomyces Sp. Using Pressmud. Front Chem Sci Eng 5:463–470
37. Sheng J, Chi Z, Yan K, Wang X, Gong F, Li J (2009) Use of Response Surface Methodology forOptimizing Process Parameters for High Inulinase Production by the Marine Yeast CryptococcusAureus G7a in Solid-State Fermentation and Hydrolysis of Inulin. Bioprocess Biosyst Eng 32:333–339
3�. Singh RS, Chauhan K, Kaur R, Kaur R (2018) Inulinase production in shake-�ask fermentations fromMucor circinelloides BGPUP-9. J Appl Biol Biotechnol 6:018–025
39. Xiong C, Jinhua W, Dongsheng L (2007) Optimization of solid-state medium for the production ofinulinase by Kluyveromyces S120 using response surface methodology. Biochem Eng J 34:179–184
40. Gill PK, Manhas RK, Singh P (2006) Puri�cation and properties of a heat-stable exoinulinase isoformfrom Aspergillus fumigatus. Bioresour Technol 97:894–902
41. Frisvad JC, Hubka V, Ezekiel CN, Hong SB, Novakova A, Chen AJ, Arzanlou M, Larsen TO, Sklenar F,Mahakarnchanakul W, Samson RA, Houbraken J (2019) Taxonomy of Aspergillus section �avi andtheir production of a�atoxins, ochratoxins and other mycotoxins. Stud Mycol 93:1–63
42. Singh. RS, Chauhan K, Singh. J, Pandey. A, Larroche (2018) C, Solid-State Fermentation of CarrotPomace for the Production of Inulinase by Penicillium oxalicum BGPUP-4, Food Technol. Biotechnol56:31–39
43. Singh RS, Dhaliwal. R, Puri. M (2006) Production of inulinase from Kluyveromyces marxianus YS-1using root extract of Asparagus racemosus. Process Biochem 41:1703–1707
44. Phisit S, Hanmoungjai KA. P, Techapun. C, Chaiyaso. (2012) T, Leksawasdi. N, Optimization ofexopolysaccharide overproduction by lactobacillus confusus in solid state fermentation under highsalinity stress. Biosci Biotechnol Biochem 76:912–917
Figures

Page 19/24
Figure 1
3D surface plot showing the effect of Inulin and K2HPO4 on the activity of inulinase enzyme.
Figure 2

Page 20/24
Figure 3
Figure 4
3D surface plot showing the effect of K2HPO4and KH2PO4 on the activity of inulinase enzyme.

Page 21/24
Figure 5
Thin layer chromatogram of inulin hydrolysate formed by crude inulinase from fungal isolate, DD MSF 1,I- control (inactivated inulinase + inulin), F- fructose standard, G- glucose standard, S- sucrose standard, T– products of hydrolysis.

Page 22/24
Figure 6
1a- Growth of DD MSF 1 on inulin media. 1b- Formation of clear halo around DD MSF 1 after �oodingwith Lugol's iodine.

Page 23/24
Figure 7
Phylogenetic tree of 18s rRNA of the isolate Penicillium amphipolaria strain KAS 2555 shown as DD MSF1.
Supplementary Files

Page 24/24
This is a list of supplementary �les associated with this preprint. Click to download.
GraphicalAbstract.docx