American Journal of Phytomedicine and Clinical Therapeutics Development and Validation of a LC-MS/MS...
16
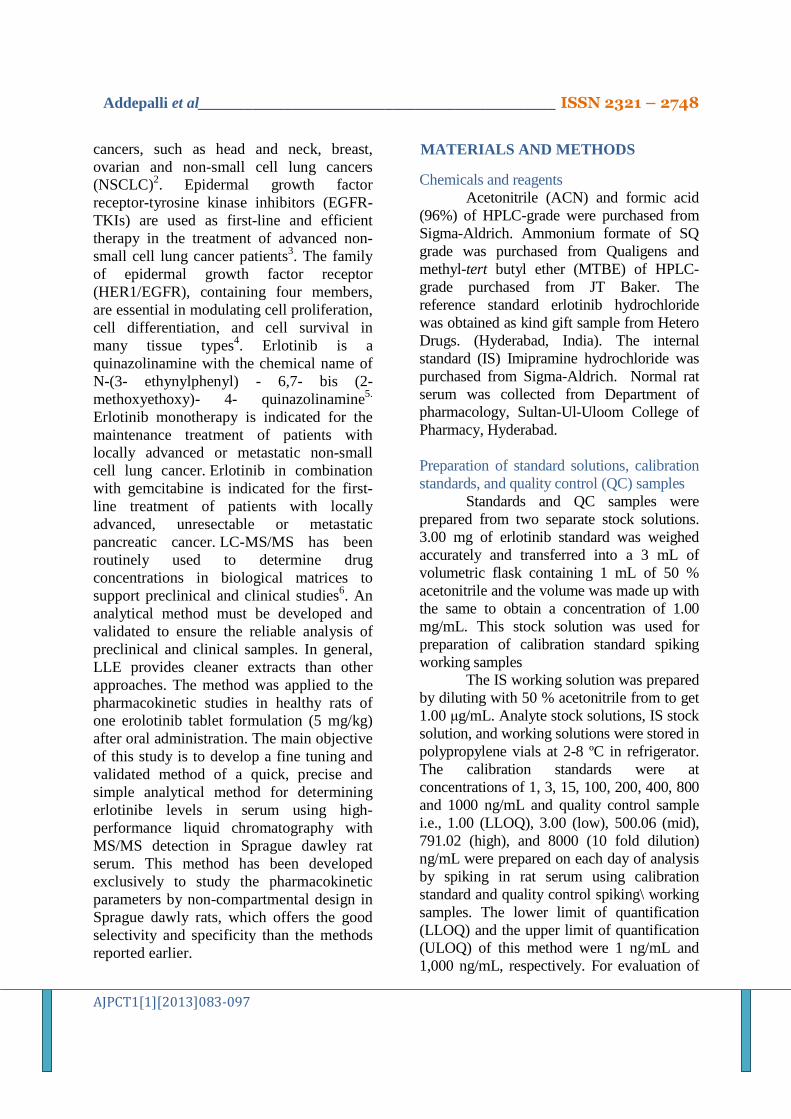
American Journal of Phytomedicine and Clinical Therapeutics www.ajpct.org Original Article Development and Validation of a LC-MS/MS Method for the Determination of Erlotinib in Sprague Dawley Rat Serum and its Application to Pharmacokinetic Study Dr.Addepalli. V. Raju* 1 and Dr. Appala Raju Nemala 2 1 A.N.U College of Pharmaceutical Sciences, Acharya Nagrjuna University, Guntur, A.P, India 2 Sultan-Ul-Uloom College of Pharmacy, Road#3, Banjara Hills, Hyderabad, A.P, India. ABSTRACT A novel bio-analytical method was developed and validated for the quantitative determination of erlotinib in rat serum by using the liquid-liquid extraction extraction chromatography and tandem mass spectrometric detection (HPLC-MS/MS). Separation of erlotinib from the endogenous substances is achieved after liquid-liquid extraction by using HPLC-MS/MS system. Erlotinib was eluted in isocratic mode with acetonitrile and 0.1% formic acid in 5 mM ammonium formate ( 80:20, v:v) at a flow-rate of 0.3 mL/min on phenominex, Gemini C18, 50*2.0 mm, 5μm particle size column. Imipramine was used as the internal standard. The liquid-liquid extraction recovery was found 76% indicates good recovery. The present method was found to be sensitive and selective at very low levels of linearity range 1-1000ng /mL based on a sample volume of 50 μL, with a linear correlation coefficient of ≥ 0.99. The validation results demonstrated that the present method was found to be precise and accurate. The stability tests indicated that the erlotinib in rat serum is stable for three freeze-thaw cycles at both -20 ºC and -70 ºC, 18-h ambient storage, 15-day frozen storage at both -20 ºC and -70 ºC. The results also showed no significant matrix effect (<4.2%). The present method was found to be sensitive and selective at very low levels of linearity range 1-1000ng. The validated method has been successfully applied to support a preclinical pharmacokinetic study. Keywords: Erlotinib; Bioanalytical; HPLC-MS/MS; Liquid liquid extraction (LLE); Quantification; Rat serum INTRODUCTION Lung cancer is the leading cause of cancer mortality in the world 1 . The epidermal growth factor receptor (EGFR) is mutated and over expressed in many human Address for Correspondence 13-5-165, V.Rama Rao Nagar, Borabanda Hyderabad-500018 Ph: +919849337182 E-mail: addepallivijay5@ gmail.com
-
Upload
independent -
Category
Documents
-
view
2 -
download
0
Transcript of American Journal of Phytomedicine and Clinical Therapeutics Development and Validation of a LC-MS/MS...
American Journal of Phytomedicine and Clinical Therapeutics www.ajpct.org
Original Article
Development and Validation of a LC-MS/MS Method for the Determination of Erlotinib in Sprague Dawley Rat Serum and its Application to Pharmacokinetic Study
Dr.Addepalli. V. Raju* 1 and Dr. Appala Raju Nemala2
1A.N.U College of Pharmaceutical Sciences, Acharya Nagrjuna University, Guntur, A.P, India
2Sultan-Ul-Uloom College of Pharmacy, Road#3, Banjara Hills, Hyderabad, A.P, India.
ABSTRACT
A novel bio-analytical method was developed and validated for the quantitative determination of erlotinib in rat serum by using the liquid-liquid extraction extraction chromatography and tandem mass spectrometric detection (HPLC-MS/MS). Separation of erlotinib from the endogenous substances is achieved after liquid-liquid extraction by using HPLC-MS/MS system. Erlotinib was eluted in isocratic mode with acetonitrile and 0.1% formic acid in 5 mM ammonium formate ( 80:20, v:v) at a flow-rate of 0.3 mL/min on phenominex, Gemini C18, 50*2.0 mm, 5µm particle size column. Imipramine was used as the internal standard. The liquid-liquid extraction recovery was found 76% indicates good recovery. The present method was found to be sensitive and selective at very low levels of linearity range 1-1000ng /mL based on a sample volume of 50 µL, with a linear correlation coefficient of ≥ 0.99. The validation results demonstrated that the present method was found to be precise and accurate. The stability tests indicated that the erlotinib in rat serum is stable for three freeze-thaw cycles at both -20 ºC and -70 ºC, 18-h ambient storage, 15-day frozen storage at both -20 ºC and -70 ºC. The results also showed no significant matrix effect (<4.2%). The present method was found to be sensitive and selective at very low levels of linearity range 1-1000ng. The validated method has been successfully applied to support a preclinical pharmacokinetic study.
Keywords: Erlotinib; Bioanalytical; HPLC-MS/MS; Liquid liquid extraction (LLE); Quantification; Rat serum
INTRODUCTION
Lung cancer is the leading cause of cancer mortality in the world1. The
epidermal growth factor receptor (EGFR) is mutated and over expressed in many human
Address for Correspondence
13-5-165, V.Rama Rao
Nagar, Borabanda
Hyderabad-500018
Ph: +919849337182
E-mail: addepallivijay5@
gmail.com
Addepalli et al______________________________________________ ISSN 2321 – 2748
AJPCT1[1][2013]083-097
cancers, such as head and neck, breast, ovarian and non-small cell lung cancers (NSCLC)2. Epidermal growth factor receptor-tyrosine kinase inhibitors (EGFR-TKIs) are used as first-line and efficient therapy in the treatment of advanced non-small cell lung cancer patients3. The family of epidermal growth factor receptor (HER1/EGFR), containing four members, are essential in modulating cell proliferation, cell differentiation, and cell survival in many tissue types4. Erlotinib is a quinazolinamine with the chemical name of N-(3- ethynylphenyl) - 6,7- bis (2- methoxyethoxy)- 4- quinazolinamine5.
Erlotinib monotherapy is indicated for the maintenance treatment of patients with locally advanced or metastatic non-small cell lung cancer. Erlotinib in combination with gemcitabine is indicated for the first-line treatment of patients with locally advanced, unresectable or metastatic pancreatic cancer. LC-MS/MS has been routinely used to determine drug concentrations in biological matrices to support preclinical and clinical studies6. An analytical method must be developed and validated to ensure the reliable analysis of preclinical and clinical samples. In general, LLE provides cleaner extracts than other approaches. The method was applied to the pharmacokinetic studies in healthy rats of one erolotinib tablet formulation (5 mg/kg) after oral administration. The main objective of this study is to develop a fine tuning and validated method of a quick, precise and simple analytical method for determining erlotinibe levels in serum using high-performance liquid chromatography with MS/MS detection in Sprague dawley rat serum. This method has been developed exclusively to study the pharmacokinetic parameters by non-compartmental design in Sprague dawly rats, which offers the good selectivity and specificity than the methods reported earlier.
MATERIALS AND METHODS
Chemicals and reagents Acetonitrile (ACN) and formic acid
(96%) of HPLC-grade were purchased from Sigma-Aldrich. Ammonium formate of SQ grade was purchased from Qualigens and methyl-tert butyl ether (MTBE) of HPLC-grade purchased from JT Baker. The reference standard erlotinib hydrochloride was obtained as kind gift sample from Hetero Drugs. (Hyderabad, India). The internal standard (IS) Imipramine hydrochloride was purchased from Sigma-Aldrich. Normal rat serum was collected from Department of pharmacology, Sultan-Ul-Uloom College of Pharmacy, Hyderabad. Preparation of standard solutions, calibration standards, and quality control (QC) samples
Standards and QC samples were prepared from two separate stock solutions. 3.00 mg of erlotinib standard was weighed accurately and transferred into a 3 mL of volumetric flask containing 1 mL of 50 % acetonitrile and the volume was made up with the same to obtain a concentration of 1.00 mg/mL. This stock solution was used for preparation of calibration standard spiking working samples
The IS working solution was prepared by diluting with 50 % acetonitrile from to get 1.00 µg/mL. Analyte stock solutions, IS stock solution, and working solutions were stored in polypropylene vials at 2-8 ºC in refrigerator. The calibration standards were at concentrations of 1, 3, 15, 100, 200, 400, 800 and 1000 ng/mL and quality control sample i.e., 1.00 (LLOQ), 3.00 (low), 500.06 (mid), 791.02 (high), and 8000 (10 fold dilution) ng/mL were prepared on each day of analysis by spiking in rat serum using calibration standard and quality control spiking\ working samples. The lower limit of quantification (LLOQ) and the upper limit of quantification (ULOQ) of this method were 1 ng/mL and 1,000 ng/mL, respectively. For evaluation of
Addepalli et al______________________________________________ ISSN 2321 – 2748
AJPCT1[1][2013]083-097
stability of erlotinib in rat serum, the QC serum samples at low and high-QC level concentrations were prepared in pre-labeled polypropylene vials (~0.4 mL per vial) and then stored in a freezer maintained at approximately -70 ºC and -20 ºC for testing sample storage stability under this temperature conditions. Sample extraction
Blank serum was withdrawn from freezer and thawed at room temperature. Calibration standards and quality control standards are prepared by spiking 2.5 µL of analyte in 47.5 µL of serum in pre-labelled polypropylene tubes (except standard blank and standard zero sample) and vortexed to mix thoroughly. Standard blank sample was prepared by spiking 12.5 of 50 % acetonitrile into 47.5 µL of interference-free blank rat serum and vortexed for complete miscibility. Standard zero was prepared by spiking 2.5 µL of 50 % acetonitrile into 47.5 µL of interference-free blank rat serum and vortexed to mix thoroughly. 10 µL of internal standard working solution (1.00µg/mL) was added to all tubes except for standard blank sample and 1.00 mL of methyl tert-butyl ether was added and vortexes to mix well. All the samples were centrifuged for 5 minutes at 4500 rpm at 4 °C temperature. Then 0.8 mL of supernatant was aliquoted into pre-labelled polypropylene tubes and evaporated to dryness under nitrogen vapor at 40 °C. The dried residue was reconstituted with 300 µL of mobile phase (reconstitution solution) and vortexed for about 30 seconds. 10 µL of reconstituted sample was injected into the API 4000 LC-MS/MS. LC-MS/MS conditions
Separation of the analyte from potential interferences in the matrix was achieved on a Phenomenex, Gemini C18, 50×2.0 mm, 5 µm column at 40 °C column oven temperature. An isocratic mobile phase
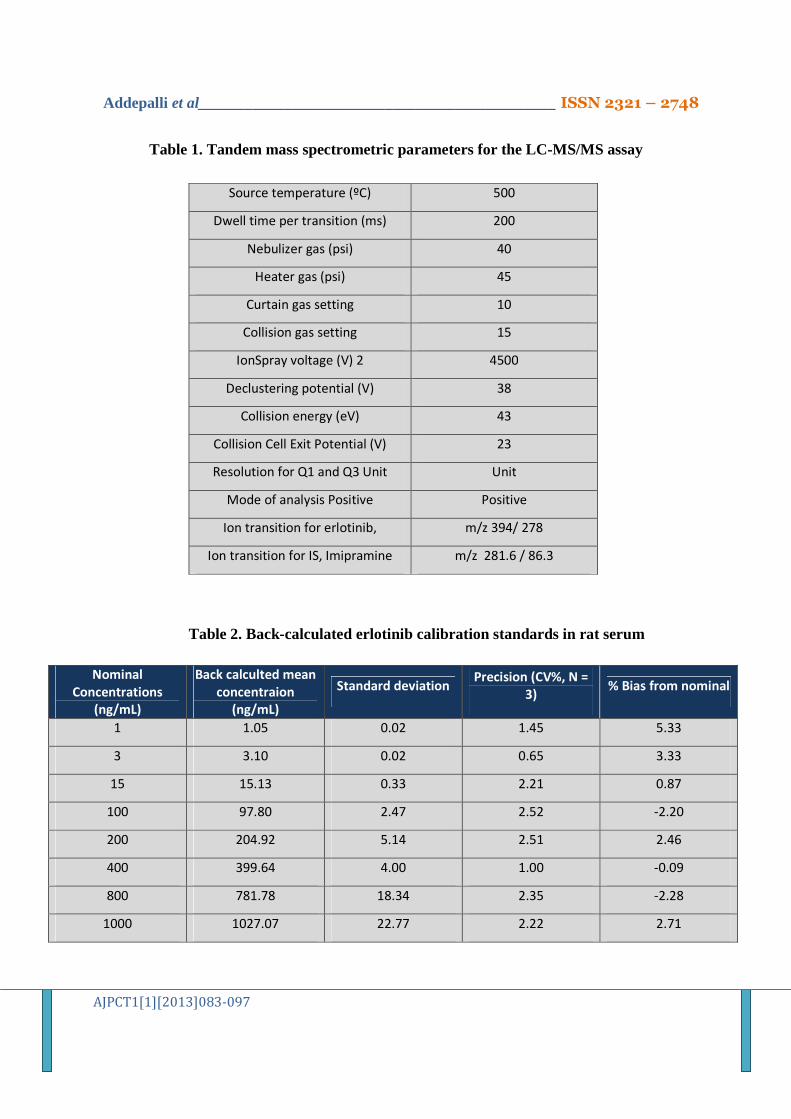
consisting of 80:20 (v/v) ACN: 5mM Ammonium formate containing 0.1% formic acid at a flow-rate of 0.300 mL/min. A 1:1 ACN-water solution was used as the injector washing solvent. MS/MS detection was performed using a Sciex API 4000 triple quadrupole mass spectrometer with a Turbo Ionspray® ionization source operated in the positive ion mode. The mass spectrometry parameters such as analyte fragmentation pattern and collision energy, etc. were optimized by infusing the analyte and the IS solutions. The LC-MS interface conditions such as gas flows, source temperature, etc. were optimized via tee-mixing the analyte standard solution with the mobile phase at a flow-rate of 0.300 mL/min. All optimized parameters for this method are presented in Table 1. Quantification and assay validation
The peak areas of the analyte and the IS were integrated by using Analyst® software version 1.4.1. For each analytical run, a calibration curve was derived from analyte/IS peak area ratio against the analyte concentration using a weighed (1/x2) linear least-squares regression. The regression equation was then used to calculate the concentration of rat serum samples. During the method validation, intra-day and inter-day precision (CV %) and accuracy (RE% or percent Bias of theoretical value) were calculated. The presented method was validated following the FDA guidance for bioanalytical method validation7 for intra-day and inter-day precision and accuracy, linearity, selectivity, sensitivity, dilution integrity, and short-term and long-term sample stability. RESULTS & DISCUSSION
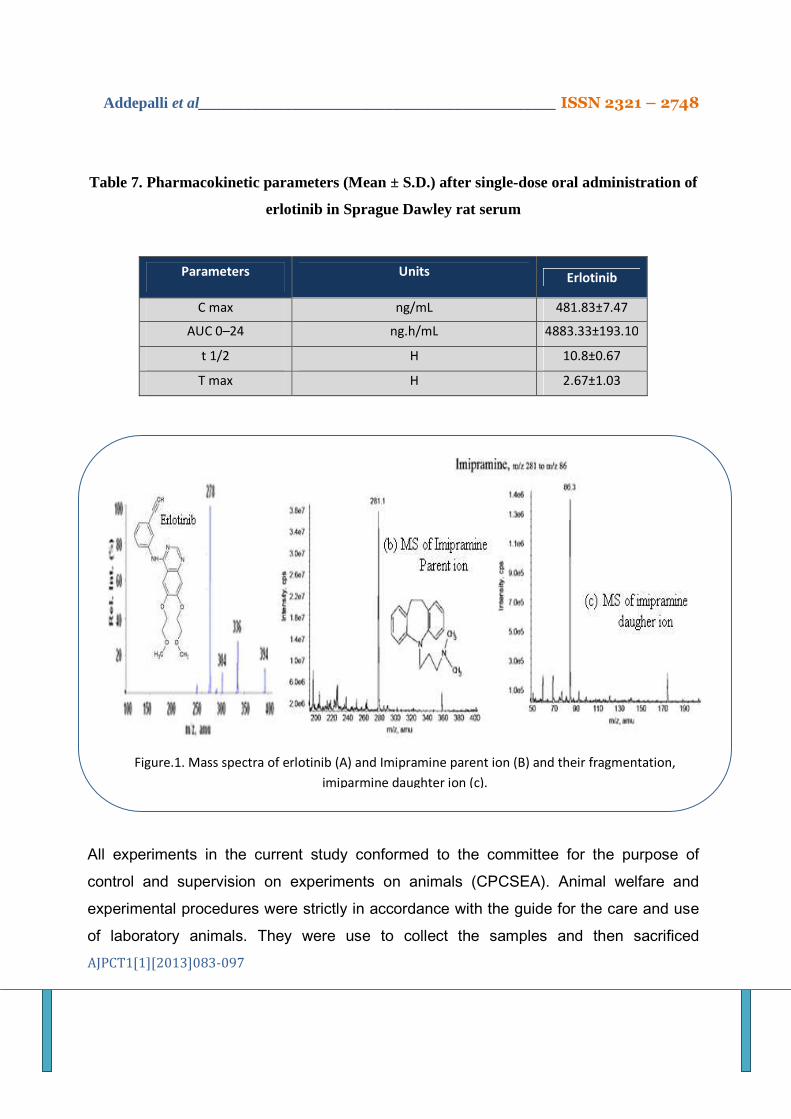
Mass spectrometry The structure formula of erlotinib,
imipramine and corresponding mass spectra
Addepalli et al______________________________________________ ISSN 2321 – 2748
AJPCT1[1][2013]083-097
with their protonated molecular ion are shown in Figure 1. Chromatography
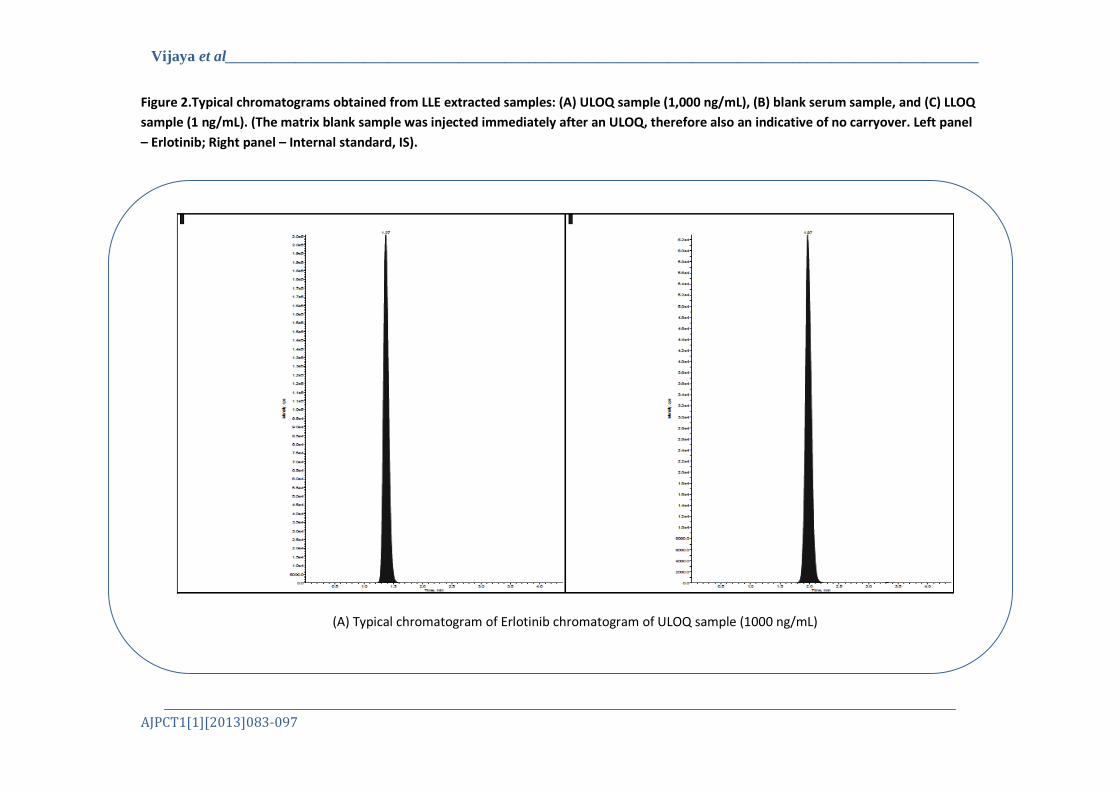
Chromatographic separation was carried out on a Phenomenex, Gemini C18, 50×2.0 mm, 5 µm column with a mobile phase of 80:20 (v:v) ACN:5mM Ammonium formats containing 0.1% formic acid at a flow-rate of 0.300 mL/min. The use of such a high organic content mobile phase resulted in a low backpressure at ~350 psi. 50% acetonitrile in Milli-Q water was used as injector wash solution for the prevention of potential carryover from the needle. No carryover from the injection needle was observed during the method validation. In addition, to minimize the evaporation of the reconstituted sample in the auto-sampler vial, the auto sampler cooling system was set at 4 ºC. Retention times for both erlotinib and its IS were approximately 1.38 min and 1.99 min, respectively. A cycle time of about 3 min per sample is several times faster than the previously published methods8. The capacity factor k’ for the analyte peak was about 2.73 (the column dead volume is about 0.37 mL and k’ = (1.38-0.37)/0.37 = 2.73), indicating that the analyte has a sufficient on-column retention for analysis. The representative chromatograms of ULOQ, matrix blank, and LLOQ samples are shown in Figure 2. The clean chromatogram of the matrix blank obtained from the injection of a matrix blank extract immediately after an ULOQ sample demonstrated that this method had neither injector carryover nor analytical column carryover. Linear curve range and assay sensitivity (LLOQ)
The linearity of the calibration curve was evaluated from three individual batches on three different days. The linear dynamic range for erlotinib was from 1.00 to 1,000 ng/mL based on a 50 µL serum. The
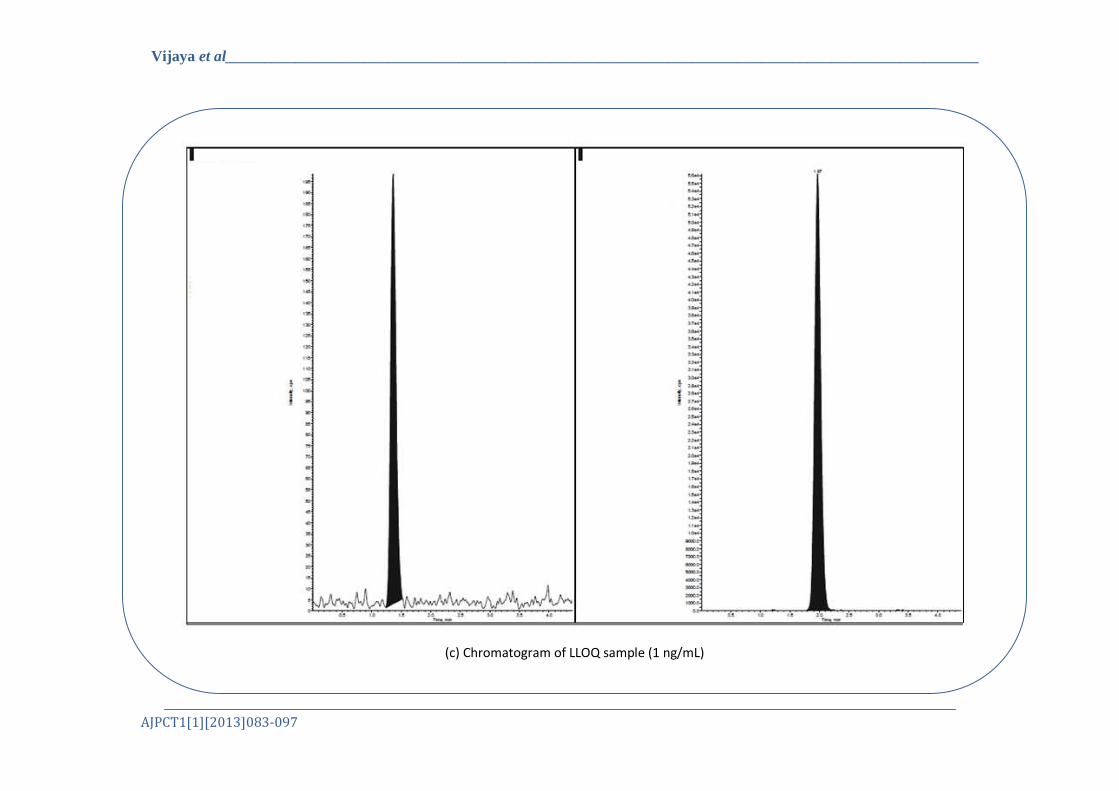
coefficient of determination (r2) of the calibration curve was between 0.9978and 0.9992 and the %bias of mean back-calculated concentrations of standards ranged from -2.28 to 5.33 of the theoretical values (Table 2). Eighteen replicates (six replicates in each of three batches) of the lower limit of quantification (LLOQ) samples were used to evaluate the inter-day precision and accuracy at the low end of the assay range in three separate runs. The inter-day CV% was 7.38% (n = 18) and the accuracy, expressed as percent bias, was -1.22 (Table 3). The representative LC-MS/MS chromatogram of an LLOQ sample is shown in Figure 2C. Precision, accuracy, dilution integrity and recovery
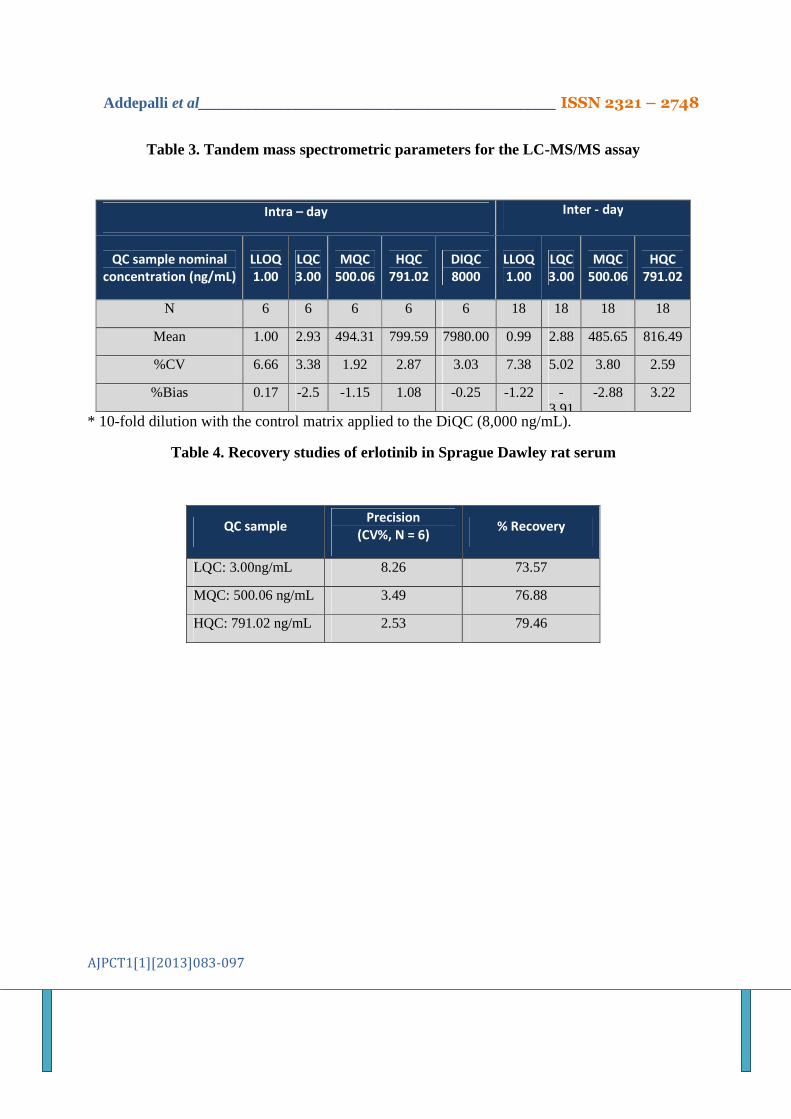
Six replicates of QC samples for each of three consecutive runs were used to evaluate the intra-day and inter-day precision and accuracy at low-, mid-, and high-QC concentration levels. As shown in Table 3, the intra-day CV (n = 6) was ≤6.66% and the inter-day CV (n = 18) was ≤7.38%. The % bias from the nominal of mean values of intra-day and inter-day assays was between -2.50 to 1.08 and -3.91 to 3.22, respectively. To validate partial-volume assay, a dilution factor of 10 with blank serum was processed with the dilution QC sample (8,000 ng/mL). A 5 µL of the dilution QC was mixed with 45 µL of blank matrix in in pre-labelled polypropylene tubes. Results for the dilution QC (DiQC) samples showed a % bias from nominal of mean value -0.25 and the corresponding CV was 3.03% (n = 6). These results indicate that the present method has satisfactory precision, accuracy and dilution integrity.
Recovery of erlotinib was evaluated by comparison of mean analyte response in processed LQC, MQC and HQC samples in Sprague Dawley rat serum with mean analyte response from clear solutions at respective levels. Mean recovery values for erlotinib
Addepalli et al______________________________________________ ISSN 2321 – 2748
AJPCT1[1][2013]083-097
were 73.57, 76.88 and 79.46 % at low, medium and high quality control levels, respectively. The results are presented in Table 4 (recovery of IS not shown). Selectivity and matrix effect
Selectivity was evaluated by extracting blank matrix from six different lots and comparing the MS/MS response at the retention times of the analyte to the responses of the LLOQ. No significant peak was observed in any of these 6 lots of blank serum samples for analyte and IS. The matrix effect on the responses for both erlotinib and its IS were investigated by preparing a LQC and HQC level with six different individual lots of serum. The matrix effects were evaluated by comparing the peak area obtained from the post-extraction spiked sample to a pure solution at the same nominal concentration. Matrix effect was calculated as ME (%) = [1 – peak area of post-extraction spiked sample/peak area of pure solution] × 100. With this LLE procedure and chromatographic conditions, the matrix effects for erlotinib and imipramine were 4.2% and 3.5%, respectively. Sample stability
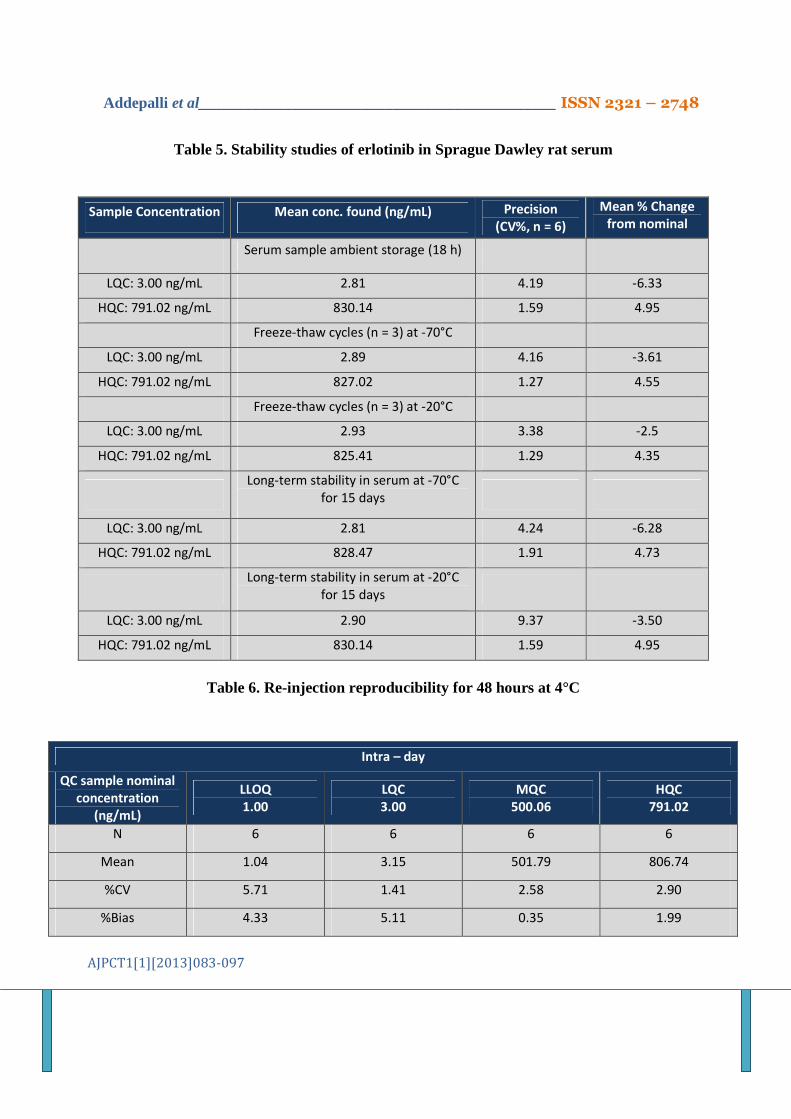
The ambient storage, freeze-thaw and long-term frozen storage stability at two different temperatures were tested and the results are presented in Table 5. The mean % change from nominal values for ambient storage at LQC and HQC level was -6.33 and 4.95, respectively. Mean % change from nominal values for freeze-thaw stability (3cycles) at -70°C for LQC and HQC level was -3.61 and 4.55, respectively and at -20°C for LQC and HQC level was -2.50 and 4.35, respectively. Mean % change from nominal values for Long-term stability in serum for 15 days at -70°C for LQC and HQC level was -6.28 and 4.73, respectively and at -20°C for LQC and HQC level was -3.50 and 4.95, respectively.
Re-injection of the accepted precision and accuracy batch stored in auto sampler at 4°C was performed to evaluate the stability of analyte in processed samples. The samples of the accepted precision and accuracy batch were re-analyzed after 48 hours and the results were within acceptance criteria. The % CV of the quality control samples ranged between 1.41 to 5.71 %. The percentage change of the nominal concentration across quality control samples ranged in between 0.35 % to 5.11 %. The results are presented in Table 6 Application
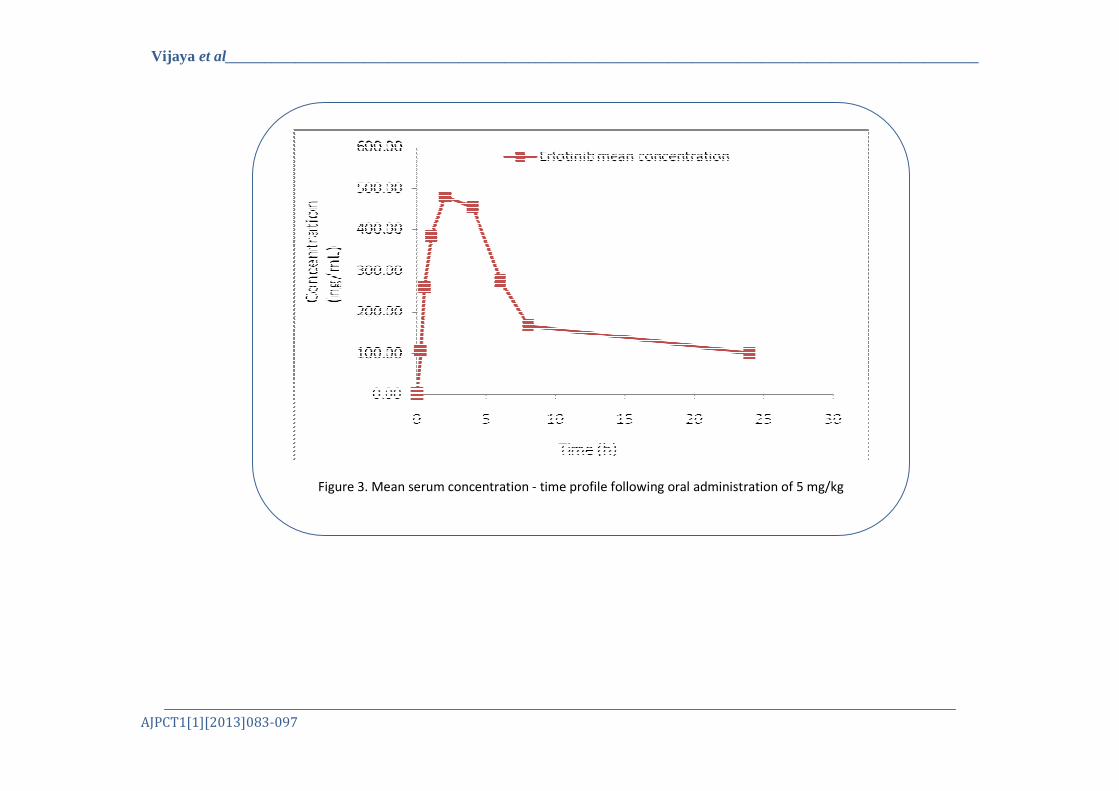
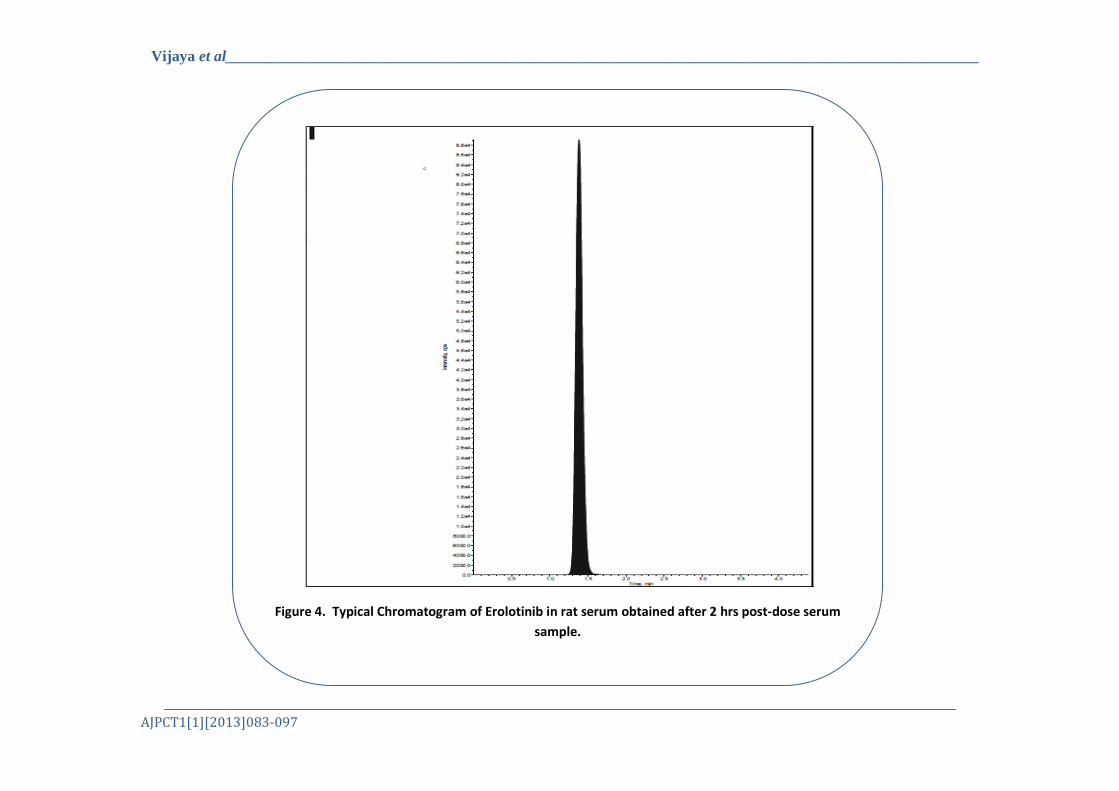
The validated method was used to determine the concentrations of erlotinib in males Sprague Dawley rat (n = 6) serum. The observed mean serum concentration - time profile of erlotinib following oral administration of 5 mg/kg is shown in Figure 3. All experiments in the current study conformed to the committee for the purpose of control and supervision on experiments on animals (CPCSEA). Animal welfare and experimental procedures were strictly in accordance with the guide for the care and use of laboratory animals. They were use to collect the samples and then sacrificed according to the Criteria for use of Laboratory Animals provided by the CPCSEA resolution on the use of animals in research. The main pharmacokinetic parameters are summarized in Table 7. The chromatogram of 2 h time point sample was shown in figure 4. All the pharmacokinetic parameters were shown low relative standard deviation, indicating high precision of pharmacokinetic parameters. Erlotinib reached the maximum serum concentrations at 2.67 h, with serum concentrations of 481.83 ng/mL. According to other published papers [9, 10], Tmax of erlotinib is 2.17 h, which are similar to our results. We quantified all serum concentrations up to 24 h, despite of low dose (5 mg/kg). The satisfactory precision and
Addepalli et al______________________________________________ ISSN 2321 – 2748
AJPCT1[1][2013]083-097
percent recovery of standard addition samples indicate that this newly developed and validated method provides a reliable quantification approach for the measurement of erlotinib in rat serum. CONCLUSION
A new LC-MS/ MS method for the quantification of erlotinib in Sprague Dawley rat serum was developed. The method was found to be superior in LLOQ compared with other methods. The specificity, sensitivity, accuracy, precision, recovery and stability met the requirements of FDA guidance. The method was successfully applied to a pharmacokinetic study in Sprague Dawley rat serum following oral administration of erlotinib at 5 mg/kg. The pharmacokinetic parameters for erlotinib were analyzed by a non-compartment model. ACKNOWLEDGMENT The authors were thankful to Sultan-Ul-Uloom College of pharmacy, Hyderabad for providing necessary laboratory facilities to carry out present research work. REFERENCES 1. Xu XH, Su J, Fu XY, Xue F, Huang Q, Li
DJ, et al. Clinical effect of erlotinib as first-line treatment for asian elderly patients with advanced non-small-cell lung cancer. Cancer Chemother Pharmacol 2011; 67(2):475-9.
2. Paez JG, Janne PA, Lee JC, Tracy S, Greulich H, Gabriel S, et al. EGFR mutations in lung cancer: correlation with clinical response to gefitinib therapy. Science 2004;304(5676):1497-500.
3. Arora A, Scholar EM. Role of tyrosine kinase inhibitors in cancer therapy. J Pharmacol Exp Ther 2005;315(3):971-9.
4. Schaefer G, Shao L, Totpal K, Akita RW. Erlotinib directly inhibits HER2 kinase activation and downstream signaling events in intact cells lacking epidermal growth factor receptor expression. Cancer Res 2007;67(3):1228-38.
5. Barghi L, Aghanejad A, Valizadeh H, Barar J, Asgari D. Modified synthesis of erlotinib hydrochloride. Adv Pharm Bull 2012;2(1):119-22.
6. Jemal M, Xia Y.-Q, LC-MS development strategies for quantitative bioanalysis. Cur. Drug Met. 2006; 7; 491–502.
7. U.S. Food and Drug Administration. 2001, This article can be found online at http://www.fda.gov/downloads/Drugs/GuidanceComplianceRegulatoryInformation/Guidances/ucm070107.pdf
8. Masters A.R, Sweeney C.J, Jones D.R, The quantification of erlotinib (OSI-774) and OSI-420 in human by liquid chromatography-tandem mass spectrometry. J. Chromatogr. B 2007;848; 379–383.
9. Smith N.F, Baker S.D, Gonzalez F.J, Harris J.W, Figg W.D, Sparreboom A, Brit. J. Cancer. 2008; 98;1630–1632.
10. Satheeshmanikandan R.S. Thappali, Kanthikiran Varanasi, Sridhar veeraraghavan, Rambabu Arla, Sandhya Chennupati, Madheswaran, Swaroop Vakkalanka, Sci. Pharma, 2012; 80; 633-646.
Addepalli et al______________________________________________ ISSN 2321 – 2748
AJPCT1[1][2013]083-097
Table 1. Tandem mass spectrometric parameters for the LC-MS/MS assay
Table 2. Back-calculated erlotinib calibration standards in rat serum
Source temperature (ºC) 500
Dwell time per transition (ms) 200
Nebulizer gas (psi) 40
Heater gas (psi) 45
Curtain gas setting 10
Collision gas setting 15
IonSpray voltage (V) 2 4500
Declustering potential (V) 38
Collision energy (eV) 43
Collision Cell Exit Potential (V) 23
Resolution for Q1 and Q3 Unit Unit
Mode of analysis Positive Positive
Ion transition for erlotinib, m/z 394/ 278
Ion transition for IS, Imipramine m/z 281.6 / 86.3
Nominal
Concentrations
(ng/mL)
Back calculted mean
concentraion
(ng/mL)
Standard deviation Precision (CV%, N =
3) % Bias from nominal
1 1.05 0.02 1.45 5.33
3 3.10 0.02 0.65 3.33
15 15.13 0.33 2.21 0.87
100 97.80 2.47 2.52 -2.20
200 204.92 5.14 2.51 2.46
400 399.64 4.00 1.00 -0.09
800 781.78 18.34 2.35 -2.28
1000 1027.07 22.77 2.22 2.71
Addepalli et al______________________________________________ ISSN 2321 – 2748
AJPCT1[1][2013]083-097
Table 3. Tandem mass spectrometric parameters for the LC-MS/MS assay
* 10-fold dilution with the control matrix applied to the DiQC (8,000 ng/mL).
Table 4. Recovery studies of erlotinib in Sprague Dawley rat serum
Intra – day Inter - day
QC sample nominal
concentration (ng/mL)
LLOQ
1.00
LQC
3.00
MQC
500.06
HQC
791.02
DIQC
8000
LLOQ
1.00
LQC
3.00
MQC
500.06
HQC
791.02
N 6 6 6 6 6 18 18 18 18
Mean 1.00 2.93 494.31 799.59 7980.00 0.99 2.88 485.65 816.49
%CV 6.66 3.38 1.92 2.87 3.03 7.38 5.02 3.80 2.59
%Bias 0.17 -2.5 -1.15 1.08 -0.25 -1.22 -3.91
-2.88 3.22
QC sample Precision
(CV%, N = 6) % Recovery
LQC: 3.00ng/mL 8.26 73.57
MQC: 500.06 ng/mL 3.49 76.88
HQC: 791.02 ng/mL 2.53 79.46
Addepalli et al______________________________________________ ISSN 2321 – 2748
AJPCT1[1][2013]083-097
Table 5. Stability studies of erlotinib in Sprague Dawley rat serum
Table 6. Re-injection reproducibility for 48 hours at 4°C
Sample Concentration Mean conc. found (ng/mL) Precision
(CV%, n = 6)
Mean % Change
from nominal
Serum sample ambient storage (18 h)
LQC: 3.00 ng/mL 2.81 4.19 -6.33
HQC: 791.02 ng/mL 830.14 1.59 4.95
Freeze-thaw cycles (n = 3) at -70°C
LQC: 3.00 ng/mL 2.89 4.16 -3.61
HQC: 791.02 ng/mL 827.02 1.27 4.55
Freeze-thaw cycles (n = 3) at -20°C
LQC: 3.00 ng/mL 2.93 3.38 -2.5
HQC: 791.02 ng/mL 825.41 1.29 4.35
Long-term stability in serum at -70°C
for 15 days
LQC: 3.00 ng/mL 2.81 4.24 -6.28
HQC: 791.02 ng/mL 828.47 1.91 4.73
Long-term stability in serum at -20°C
for 15 days
LQC: 3.00 ng/mL 2.90 9.37 -3.50
HQC: 791.02 ng/mL 830.14 1.59 4.95
Intra – day
QC sample nominal
concentration
(ng/mL)
LLOQ
1.00
LQC
3.00
MQC
500.06
HQC
791.02
N 6 6 6 6
Mean 1.04 3.15 501.79 806.74
%CV 5.71 1.41 2.58 2.90
%Bias 4.33 5.11 0.35 1.99
Addepalli et al______________________________________________ ISSN 2321 – 2748
AJPCT1[1][2013]083-097
Table 7. Pharmacokinetic parameters (Mean ± S.D.) after single-dose oral administration of
erlotinib in Sprague Dawley rat serum
All experiments in the current study conformed to the committee for the purpose of control and supervision on experiments on animals (CPCSEA). Animal welfare and experimental procedures were strictly in accordance with the guide for the care and use of laboratory animals. They were use to collect the samples and then sacrificed
Parameters Units Erlotinib
C max ng/mL 481.83±7.47
AUC 0–24 ng.h/mL 4883.33±193.10
t 1/2 H 10.8±0.67
T max H 2.67±1.03
Figure.1. Mass spectra of erlotinib (A) and Imipramine parent ion (B) and their fragmentation,
imiparmine daughter ion (c).
Addepalli et al______________________________________________ ISSN 2321 – 2748
AJPCT1[1][2013]083-097
according to the Criteria for use of Laboratory Animals provided by the CPCSEA resolution on the use of animals in research
Vijaya et al_________________________________________________________________________________________________
AJPCT1[1][2013]083-097
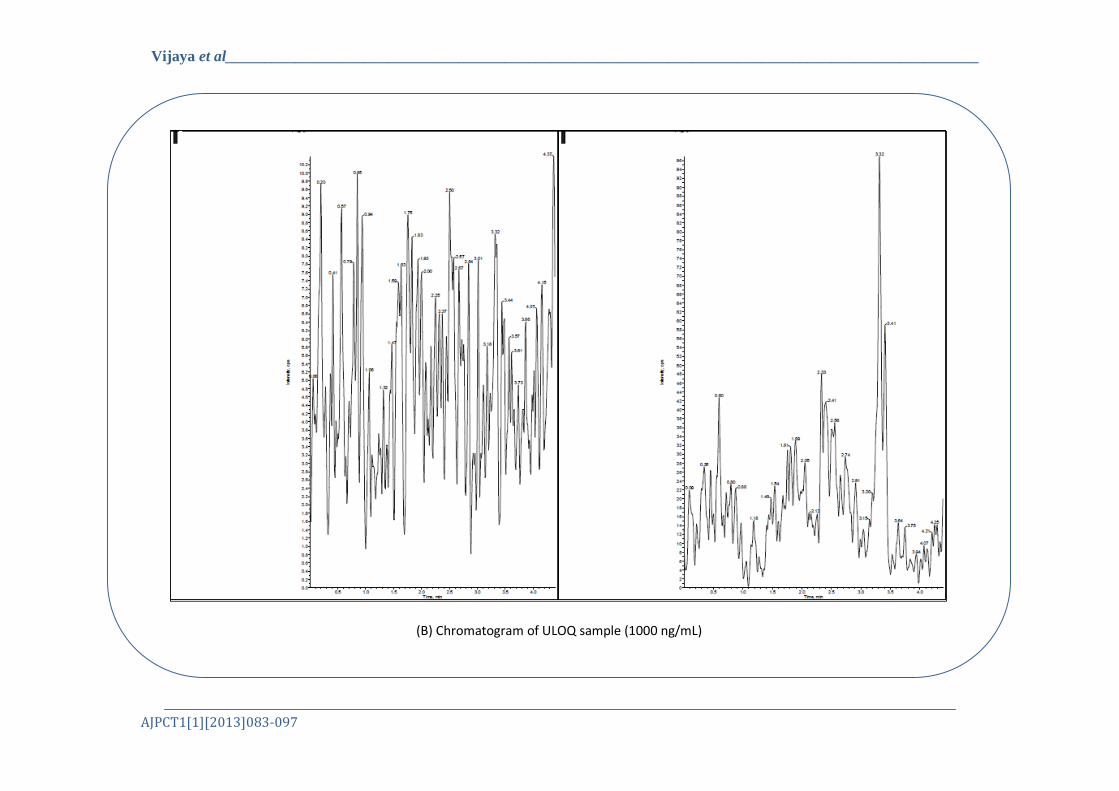
Figure 2.Typical chromatograms obtained from LLE extracted samples: (A) ULOQ sample (1,000 ng/mL), (B) blank serum sample, and (C) LLOQ
sample (1 ng/mL). (The matrix blank sample was injected immediately after an ULOQ, therefore also an indicative of no carryover. Left panel
– Erlotinib; Right panel – Internal standard, IS).
(A) Typical chromatogram of Erlotinib chromatogram of ULOQ sample (1000 ng/mL)
Vijaya et al_________________________________________________________________________________________________
AJPCT1[1][2013]083-097
(B) Chromatogram of ULOQ sample (1000 ng/mL)
Vijaya et al_________________________________________________________________________________________________
AJPCT1[1][2013]083-097
(c) Chromatogram of LLOQ sample (1 ng/mL)
Vijaya et al_________________________________________________________________________________________________
AJPCT1[1][2013]083-097
Figure 3. Mean serum concentration - time profile following oral administration of 5 mg/kg
Vijaya et al_________________________________________________________________________________________________
AJPCT1[1][2013]083-097
Figure 4. Typical Chromatogram of Erolotinib in rat serum obtained after 2 hrs post-dose serum
sample.