Ambulatory visit utilization in a national, population-based sample of adults with osteoarthritis
19
Ambulatory Visit Utilization in a National, Population-based Sample of Adults with Osteoarthritis Miriam G. Cisternas, M.A., Edward Yelin, Ph.D., Jeffrey N. Katz, M.D., M.S., Daniel H. Solomon, M.D., M.P.H, Elizabeth A. Wright, Ph.D, and Elena Losina, Ph.D MGC Data Services (MGC) Carlsbad, CA; Department of Medicine and Rosalind Russell Medical Research Center for Arthritis, University of California, San Francisco (EY), San Francisco, CA; Orthopaedic and Arthritis Center for Outcomes Research, Department of Orthopaedic Surgery (JNK, EAW, EL), Division of Rheumatology, Immunology and Allergy, Brigham and Women’s Hospital (JNK, DHS, EAW, EL), Harvard Medical School; Departments of Environmental Health (JNK) and Health Policy and Management (JNK), Harvard School of Public Health, Boston, MA; Department of Biostatistics, Boston University School of Public Health, Boston (EL). Abstract Objectives—To estimate the proportion of adults with osteoarthritis (OA) seeing various medical providers and ascertain factors affecting the likelihood of seeing an OA specialist. Methods—We use data from the Medical Expenditures Panel Survey (MEPS), a stratified random sample of the civilian non-institutionalized population. We classify adults as having symptomatic OA if: (1) their medical conditions include at least one occurrence of ICD-9-CM 715, 716, or 719, and (2) they report joint pain, swelling, or stiffness during the previous twelve months. For the purpose of our analysis we define rheumatologists, orthopedists and physical therapists as OA specialists. We first estimate the proportion of OA individuals seen by OA specialists and other health care providers in a one-year period. We then use logistic regression to estimate the impact of demographic and clinical factors on the likelihood of seeing an OA specialist. Results—9,933 persons meet the definition of OA, representing 22.5 million adults in the U.S. Virtually all (92%) see physicians during the year; 34% see at least one OA specialist; 25% see an orthopedist, 11% a physical therapist, and 6% a rheumatologist. The following are significant positive predictors for seeing an OA specialist: higher educational attainment, having more comorbidities, and residing in the Northeastern U.S. Significant negative predictors for seeing OA specialists are being unmarried but previously married, and having no health insurance. Conclusions—Most adults with OA do not visit OA specialists. Those without insurance and with lower levels of education are less likely to see these specialists. Key Indexing Terms osteoarthritis; population studies Osteoarthritis (OA) is the most prevalent form of arthritis, second only to ischemic heart disease as a cause of U.S. work disability in men over 50 1, 2 . The most recently published prevalence estimate of OA was 26.9 million among U.S. adults age 25 and over in 2005 2 . Corresponding author: Miriam Cisternas, MGC Data Services, 5051 Millay Court, Carlsbad, CA 92008, (760) 804 5751, [email protected]. NIH Public Access Author Manuscript Arthritis Rheum. Author manuscript; available in PMC 2010 December 14. Published in final edited form as: Arthritis Rheum. 2009 December 15; 61(12): 1694–1703. doi:10.1002/art.24897. NIH-PA Author Manuscript NIH-PA Author Manuscript NIH-PA Author Manuscript
Transcript of Ambulatory visit utilization in a national, population-based sample of adults with osteoarthritis

Ambulatory Visit Utilization in a National, Population-basedSample of Adults with Osteoarthritis
Miriam G. Cisternas, M.A., Edward Yelin, Ph.D., Jeffrey N. Katz, M.D., M.S., Daniel H.Solomon, M.D., M.P.H, Elizabeth A. Wright, Ph.D, and Elena Losina, Ph.DMGC Data Services (MGC) Carlsbad, CA; Department of Medicine and Rosalind Russell MedicalResearch Center for Arthritis, University of California, San Francisco (EY), San Francisco, CA;Orthopaedic and Arthritis Center for Outcomes Research, Department of Orthopaedic Surgery(JNK, EAW, EL), Division of Rheumatology, Immunology and Allergy, Brigham and Women’sHospital (JNK, DHS, EAW, EL), Harvard Medical School; Departments of Environmental Health(JNK) and Health Policy and Management (JNK), Harvard School of Public Health, Boston, MA;Department of Biostatistics, Boston University School of Public Health, Boston (EL).
AbstractObjectives—To estimate the proportion of adults with osteoarthritis (OA) seeing variousmedical providers and ascertain factors affecting the likelihood of seeing an OA specialist.
Methods—We use data from the Medical Expenditures Panel Survey (MEPS), a stratifiedrandom sample of the civilian non-institutionalized population. We classify adults as havingsymptomatic OA if: (1) their medical conditions include at least one occurrence of ICD-9-CM715, 716, or 719, and (2) they report joint pain, swelling, or stiffness during the previous twelvemonths. For the purpose of our analysis we define rheumatologists, orthopedists and physicaltherapists as OA specialists. We first estimate the proportion of OA individuals seen by OAspecialists and other health care providers in a one-year period. We then use logistic regression toestimate the impact of demographic and clinical factors on the likelihood of seeing an OAspecialist.
Results—9,933 persons meet the definition of OA, representing 22.5 million adults in the U.S.Virtually all (92%) see physicians during the year; 34% see at least one OA specialist; 25% see anorthopedist, 11% a physical therapist, and 6% a rheumatologist. The following are significantpositive predictors for seeing an OA specialist: higher educational attainment, having morecomorbidities, and residing in the Northeastern U.S. Significant negative predictors for seeing OAspecialists are being unmarried but previously married, and having no health insurance.
Conclusions—Most adults with OA do not visit OA specialists. Those without insurance andwith lower levels of education are less likely to see these specialists.
Key Indexing Termsosteoarthritis; population studies
Osteoarthritis (OA) is the most prevalent form of arthritis, second only to ischemic heartdisease as a cause of U.S. work disability in men over 501, 2. The most recently publishedprevalence estimate of OA was 26.9 million among U.S. adults age 25 and over in 20052.
Corresponding author: Miriam Cisternas, MGC Data Services, 5051 Millay Court, Carlsbad, CA 92008, (760) 804 5751,[email protected].
NIH Public AccessAuthor ManuscriptArthritis Rheum. Author manuscript; available in PMC 2010 December 14.
Published in final edited form as:Arthritis Rheum. 2009 December 15; 61(12): 1694–1703. doi:10.1002/art.24897.
NIH
-PA Author Manuscript
NIH
-PA Author Manuscript
NIH
-PA Author Manuscript

OA treatment results in substantial direct costs. In 2006, OA was listed as the primarydiagnosis for 735,087 hospitalizations (1.9% of all discharges in that year).3 Ambulatoryvisits listing OA as the primary diagnosis accounted for 7.1 million ambulatory visits (0.7%of all ambulatory visits) in 19974. The most recent U.S. study of direct costs attributable toOA was restricted to adults 18 – 64 and presented in 2004 U.S. dollars; the 2006 equivalentper-patient annual total is $4,0915, 6. The most recent OA-attributable cost estimate for theelderly population, based on a managed-care sample, represents a per-patient annual total of$4,719 attributable to OA in 2006 dollars7, 6.
While many of the risk factors for the development and worsening of symptoms in OAcannot be prevented (female gender, increasing age, genetic predisposition), others (excessbody mass, activities that promote stress on joints, and injury) are potentially modifiablethrough interventions such as weight loss and muscle strengthening exercise programs8.Understanding patterns of care for the population affected by OA is crucial for targetinginterventions, but no national, population-based study of ambulatory care patterns in OApatients has been published.
The objectives of this study are to use a population-based US data source to ascertain: (1)the percentage of adults with OA seeing various medical providers, including specialistswho provide arthritis-related care (rheumatologists, orthopedists, and physical therapists),and (2) which factors affect the likelihood of individuals with OA seeing specialists focusedon arthritis-related care.
Materials and MethodsData Source
We use the Medical Expenditure Panel Survey (MEPS) household component (HC), anationally representative survey of the United States civilian, non-institutionalizedpopulation, to estimate the proportion of U.S. adults with OA seeing various providers inambulatory settings. MEPS is a joint endeavor of the Agency for Healthcare Research andQuality (AHRQ) and the National Center for Health Statistics.
The MEPS-HC collects data on healthcare use, demographic characteristics, and healthstatus from five interviews over a two-year period9, 10. The presence of medical conditionsis ascertained primarily by prompting HC respondents for the causes of medical events anddisability episodes, but also as “bothering” the person during the reference period.Conditions identified by one or more of these methods are then coded using the InternationalClassification of Diseases, Clinical Modification, Ninth Revision (ICD-9-CM) system at thethree-digit level.11 For example, patient-reported “generalized osteoarthritis of the hand”,corresponding to a five-digit ICD-9-CM of 715.04, would be coded in MEPS as 715.
The MEPS Medical Provider Component (MPC) collects date, diagnostic, procedure, andexpenditure data from medical providers for visits made by a sub-sample of the MEPS-HCparticipants. The accuracy of some self-reported condition data from MEPS-HC respondentshas been assessed by comparison to MEPS-MPC data, using the diagnostic data in theMEPS-MPC as the gold standard. 12
MEPS has an overlapping panel design that allows for pooling of estimates from a numberof years to provide stable estimates. The present study uses 2002 to 2005 MEPS data.
Definition of OAWe classify adults as having OA if the following two requirements are met: (1) their medicalconditions listed in the MEPS-HC include at least one occurrence of OA (ICD-9-CM 715),
Cisternas et al. Page 2
Arthritis Rheum. Author manuscript; available in PMC 2010 December 14.
NIH
-PA Author Manuscript
NIH
-PA Author Manuscript
NIH
-PA Author Manuscript

arthropathies and related conditions (ICD-9-CM 716), or other and unspecified disorders ofthe joint (ICD-9-CM 719), and (2) and they report pain, swelling, or stiffness around a jointduring the previous twelve months. Originally, the medical conditions were restricted toICD-9-CM 715, the discrete code for OA, but this requirement was broadened becausepatient-reported ICD-9-CM 715 has demonstrated low agreement with ICD-9-CM 715recorded in the MEPS-MPC subsample (kappa=0.15, 95% CI=0.12, 0.19)12. Recent researchhas demonstrated that the addition of ICD-9-CM 719 and 716 to the OA definition results insubstantial increases in OA sensitivity (from 17% to 81%) with only minor decreases inspecificity (99% to 89%) when using ICD-9-CM 715 recorded in the MPC as the goldstandard (Louise Murphy, Centers for Disease Control and Prevention, personalcommunication, 11/12/2008). By adding ICD-9-CM codes 716 and 719 to our definition, weestimate that our study population includes 81% of all OA adults in the MEPS sample with adoctor diagnosis of OA in a year, but that 19% of individuals included on our studypopulation did not have a doctor-provided diagnosis.
Data elementsDemographic factors—Demographic variables include age in years, female gender,Hispanic ethnicity, white race, marital status (married, widowed/separated/divorced, nevermarried), and highest level of education attained (less than high school, high school grad,some college, college grad, some graduate school). Other demographic variables includegeographic region of residence (Northeast, Midwest, South, West), and living within ametropolitan statistical area (MSA).
Clinical characteristics (specific ICD-9-CM codes provided in the electronicappendix)—Comorbid condition indicator variables are created by flagging ICD-9-CMcodes for: cancer, ischemic heart disease/chronic heart failure, COPD/asthma, depression,diabetes, and non-OA musculoskeletal disease. Obesity is defined as a body mass index(BMI) of 30 kg/m2 or higher. These binary comorbid condition variables are summed tocreate a variable recording whether the study subject had zero, one, or two or morecomorbid conditions. Binary variables for patient-perceived health status (poor/fair vs.excellent/very good/good)13 and activity limitation (any limitation at work, home, or schoolvs. none) are also created.
Measures of healthcare utilizationWe combine visits to offices and hospital outpatient facilities to estimate ambulatory carevisits. Physician providers include primary care (family practice, general practice, andinternal medicine), orthopedists, rheumatologists, and all other specialties. Nonphysicianhealth care providers include nurse/nurse practitioner/physician’s assistant, physicaltherapist, and all other specialties. We define rheumatologists, orthopedists and physicaltherapists as OA specialists.
Statistical analysisRegression models
The dependent variables for these regressions are the odds of subjects seeing each of the OAspecialists. Logistic regression is used to ascertain which of the potential demographic andclinical factors are associated with seeing these providers.
Three types of regression models are created for each outcome. Univariate analyses areperformed with each of the potential explanatory variables as an independent variable. Wethen create multivariable main-effects models by including all potential factors into a singlemultivariable model. Because demographic characteristics are known to influence access to
Cisternas et al. Page 3
Arthritis Rheum. Author manuscript; available in PMC 2010 December 14.
NIH
-PA Author Manuscript
NIH
-PA Author Manuscript
NIH
-PA Author Manuscript
care, we decided to implement the following multivariable model building strategy:demographic variables are included in all models regardless of statistical significance,whereas non-demographic covariates require a P<.05 significance level to be retained. Theexclusion of non-demographic covariates is done one variable at a time, starting with theleast significant variable, until all non-demographic variables that remain in the model aresignificant at P<.05. Our final step is to investigate whether important interactions existbetween variables included in the main effects models and any of the following: obesity,activity limitation, age, gender, race, ethnicity, marital status, education status, region, MSAstatus, and number of comorbidities, all of which we hypothesized a priori could interactwith specialist utilization. Interactions that are statistically significant at P<0.05, do notinclude sparse cells (sample N≤10), and add important information to the interpretation ofthe model when compared to the main effects model are retained to yield the interactionmodel for each outcome. While odds ratios (ORs) and 95% confidence intervals (CIs) arepresented in tables for all covariates included in the models, only those statisticallysignificant at α< 0.05 are discussed in the text.
Accounting for complex survey designPopulation sampling weights are applied in all analyses. We use SAS version 9.2 Surveyprocedures (Surveyfreq, Surveymeans, and Surveylogistic) to adjust standard error estimatesfor MEPS’ clustered sampling design14. Annual estimates are obtained by dividing samplingweights in the pooled file by four, the number years of MEPS data used.
Missing dataFor the 416 (4%) of adult OA observations with missing data, we impute data using multipleimputation procedures (SAS version 9.1.3 PROC MI and PROC MIANALYZE). SASmultiple imputation procedures are implemented on the missing at random (MAR)assumption, which states that the probability of missing values for any variable of interest isconditioned on the value of other variables in the analysis, not on the value of this variableitself.14 Specific variables imputed are highest level of education attained, marital status,BMI, self-perceived health status, and joint pain during the year. Because the missing datafor these variables are arranged in a general pattern, we use the Markov Chain Monte Carloimputation method.
ResultsPopulation Characteristics
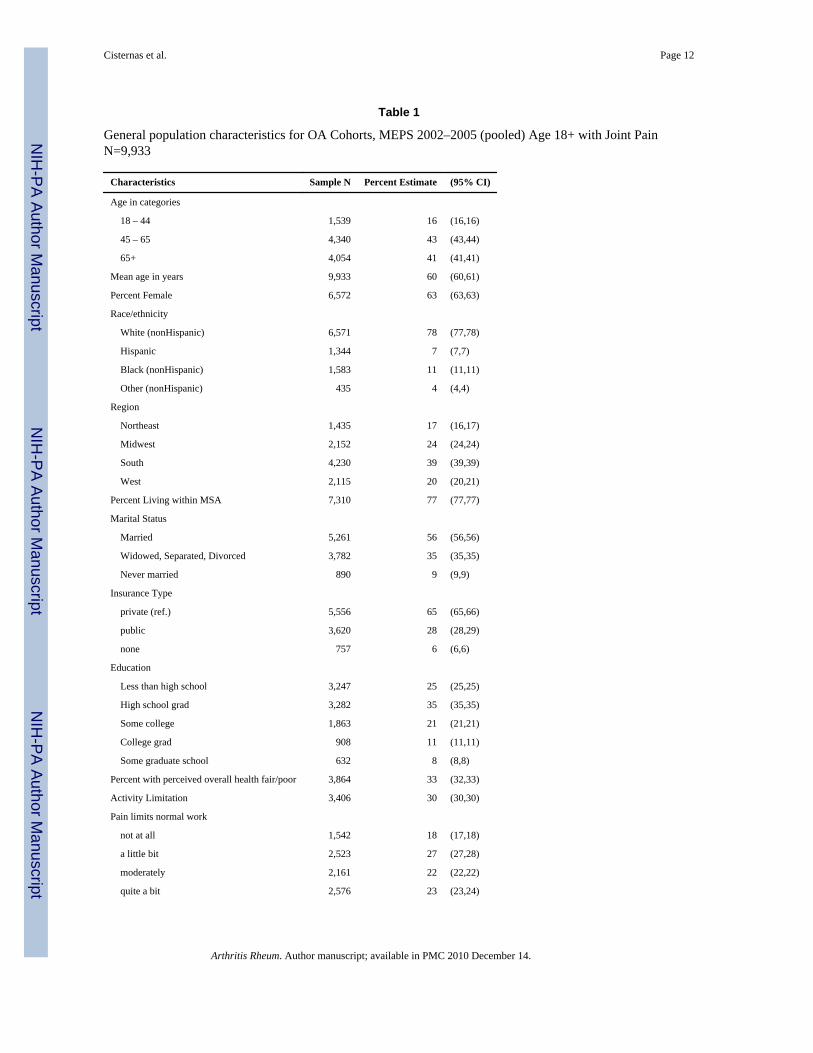
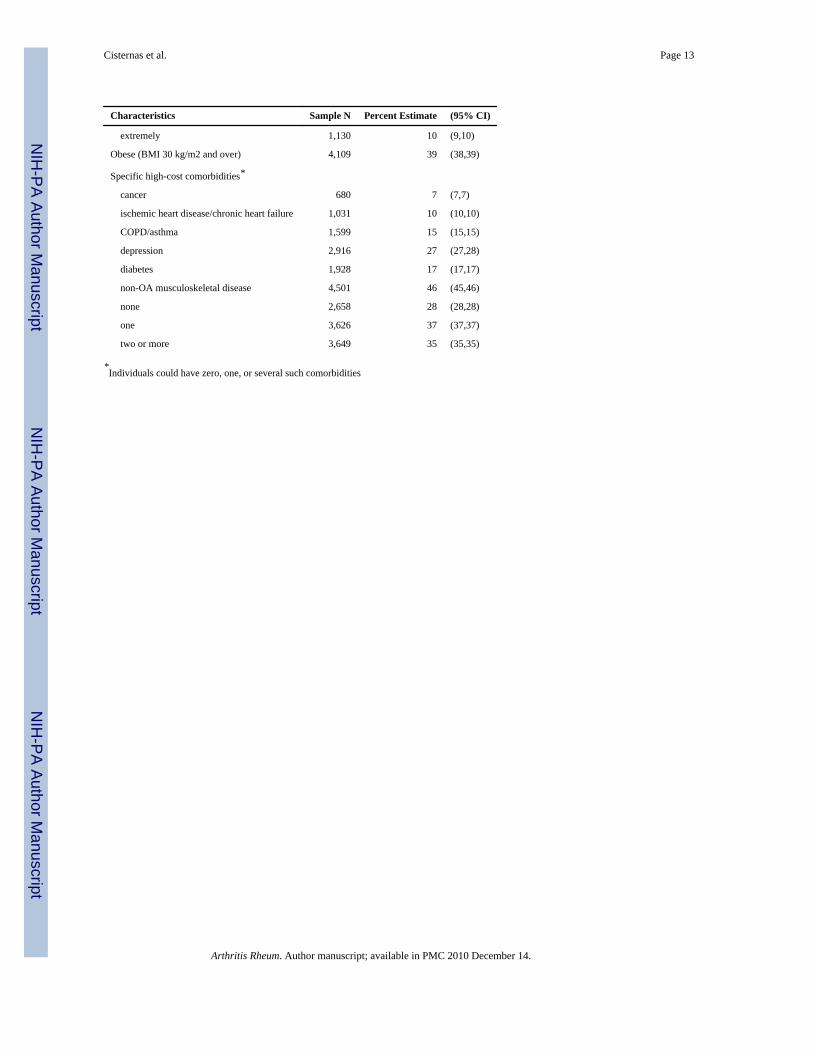
The population for this study includes the 9,933 adults in MEPS meeting the study definitionof OA; these represent an annual prevalence of 22.5 million or 10% of the adult population.General characteristics of the OA population used in the current analysis are exhibited inTable 1. Individuals in the cohort are 60 years of age on average, and 63% are female. Most(78%) identify themselves as nonHispanic white; 7% are Hispanic, 11% are Black, while theremaining 4% identified with some other racial group. The majority (77%) resides in aMSA, are married (56%), and have at least some private insurance coverage (65%). Onequarter have not obtained a high-school diploma; 35% have graduated from high school,while the remaining 40% have at least some college education. One third perceive theirhealth as fair or poor, and 30% report activity limitation. Fifty-five percent of respondentsindicate that pain limits their normal work at least moderately. Obesity is present for 39% ofOA respondents, and 72% of study subjects are classified as having at least one of the sixcomorbidities.
Cisternas et al. Page 4
Arthritis Rheum. Author manuscript; available in PMC 2010 December 14.
NIH
-PA Author Manuscript
NIH
-PA Author Manuscript
NIH
-PA Author Manuscript
Ambulatory Visit UtilizationVirtually all OA patients (92%) visit a physician at least once annually (Figure 1). Primarycare physicians are seen by 80% of this group; one quarter visit an orthopedist, whereas only6% are seen by a rheumatologist. Other physician specialists are seen by 65% of OApatients.
The majority of patients (65%) see a nonphysician at least once annually. Twenty-twopercent are seen by a nurse, nurse practitioner, or physician’s assistant, 11% by a physicaltherapist, and 58% by some other nonphysician provider. In all, 34% see an OA specialist atleast once annually. As expected, individuals who see an OA specialist are much more likelyto see a primary care physician (OR 29; 95% CI 13 – 63) than those who do not (data notshown).
Factors Associated with Specialist VisitsSeeing a rheumatologist—Results of logistic regression models predicting visits torheumatologists are presented in Table 2. Unadjusted logistic regression models demonstratethat younger age (18 – 44 vs. 65 and over), identification as belonging to an “other” racialgroup, being widowed, separated or divorced (vs. married), living in the Midwest or West(vs. Northeast), and not having insurance coverage are associated with significantly lowerodds of seeing a rheumatologist. Uninsured individuals with OA are about one third as likelyto see a rheumatologist when compared to those who are privately insured. The univariatemodels also highlight factors associated with increased likelihood of seeing arheumatologist: being female (OR 1.85), having attended some college (OR 1.62) orgraduate school (OR 1.87) (compared to not completing high school), residing within anMSA (1.41), the presence of one (OR 1.65) and two or more (OR 2.28) comorbidities(compared to no comorbidities), and perceived overall health being poor or fair (OR 1.58).
Odds ratios from the multivariable main-effects model predicting rheumatologist visits aresimilar to those of the univariate models, with a few exceptions. Hispanic ethnicity becomessignificant (OR 1.56), and ORs for all of the education categories show a positiveassociation between higher education levels and the likelihood of seeing a rheumatologistwhen compared to study subjects without a high school diploma. The effects of one (OR1.47) and two (OR 1.91) comorbidities when compared to individuals without anycomorbidities is slightly lower in the main-effects model than the univariate model.
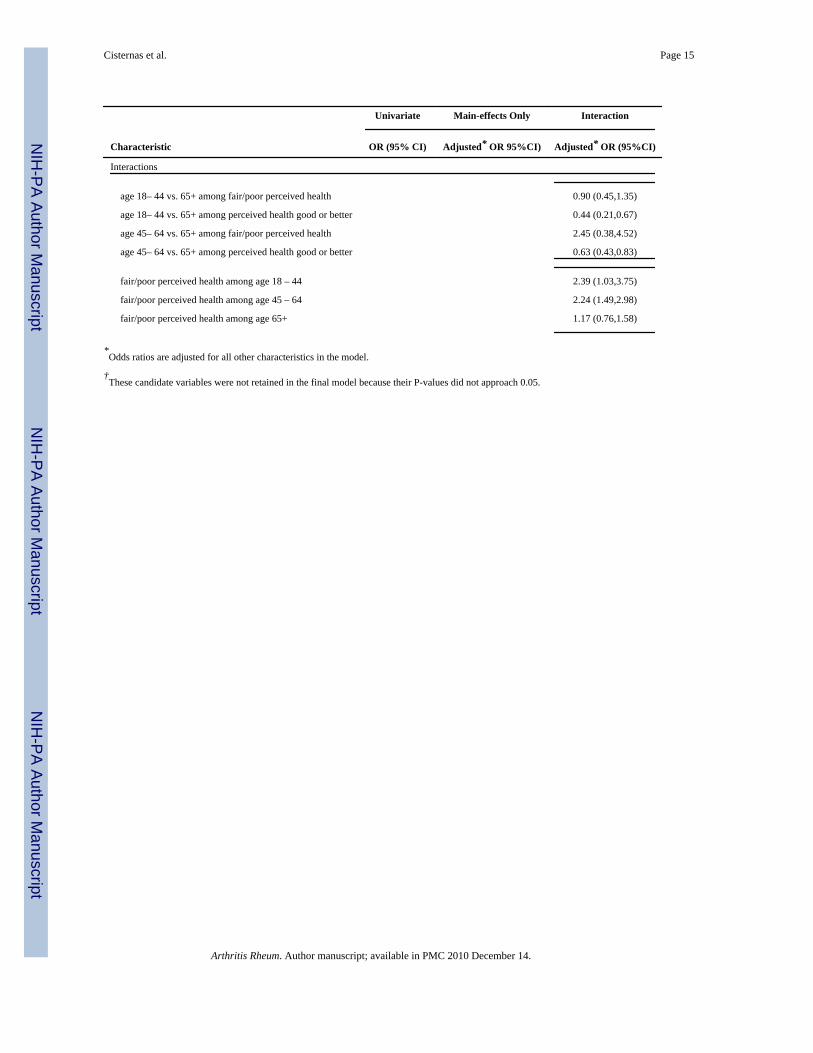
Two main effects predicting rheumatologist visits interact in important ways: age andperceived health. Whereas only the 18–44 age group is statistically significantly less likelyto see a rheumatologist in the main-effects model, for individuals with good or excellentself-perceived health, the interaction model yields significantly lower likelihoods for boththe 18–44 (OR 0.44) and 45–64 (OR 0.63) groups. Similarly, while the main effects modelpredicts increased odds of seeing a rheumatologist for individuals with self-perceived fair orpoor health (OR 1.69), the interaction model predicts even stronger likelihoods forindividuals with perceived fair or poor health in the 18 – 44 (OR 2.39) and 45 – 64 (OR2.24) age groups, but no significant difference between fair or poor vs. good or better healthamong older individuals.
Seeing an orthopedist—Odds ratios estimated from logistic models predicting at leastone orthopedist visit in a year are displayed in Table 3. Significant univariate predictors ofdecreased orthopedist utilization include no (OR 0.28) or only public (OR 0.68) insurance,self-identification as Hispanic (OR 0.55), nonHispanic Black (OR 0.60), or “other” race(0.52), residence in western (OR 0.61) or southern (OR 0.72) states, and being widowed,separated, or divorced (OR 0.73). Univariate predictors associated with the increased odds
Cisternas et al. Page 5
Arthritis Rheum. Author manuscript; available in PMC 2010 December 14.
NIH
-PA Author Manuscript
NIH
-PA Author Manuscript
NIH
-PA Author Manuscript
of seeing an orthopedist include increasing levels of education (ORs ranging from 1.55 forhigh-school grad to 1.79 for graduate school when compared to individuals with less than ahigh-school education) one (OR 1.31) and two or more (OR 1.49) comorbid conditionswhen compared to individuals with no such conditions, and obesity (OR 1.25). The main-effects model exhibits similar ORs when compared to the univariate models, with oneexception: activity limitation is associated with a significant 30% increase in the likelihoodof seeing an orthopedist, whereas in the univariate model, no significant relationship isobserved.
An important interaction from the orthopedist model is identified in the interactive model-building process. Younger ages are associated with increased likelihood of seeing anorthopedist among those with activity limitation (age 18 – 44 OR 1.64 and age 45 – 64 OR1.34 when compared to age 65 and older), but with a decreased likelihood (18 – 44 OR 0.72and age 45 – 64 OR 0.76) among those without an activity limitation. The effect of activitylimitation on utilization is likewise modified by age: while we do not see significant impactof activity limitation in the elderly group, it is associated with increased likelihood oforthopedist utilization in the youngest (age 18 – 44 OR 2.12) and middle (age 45 – 64 OR1.65) age groups.
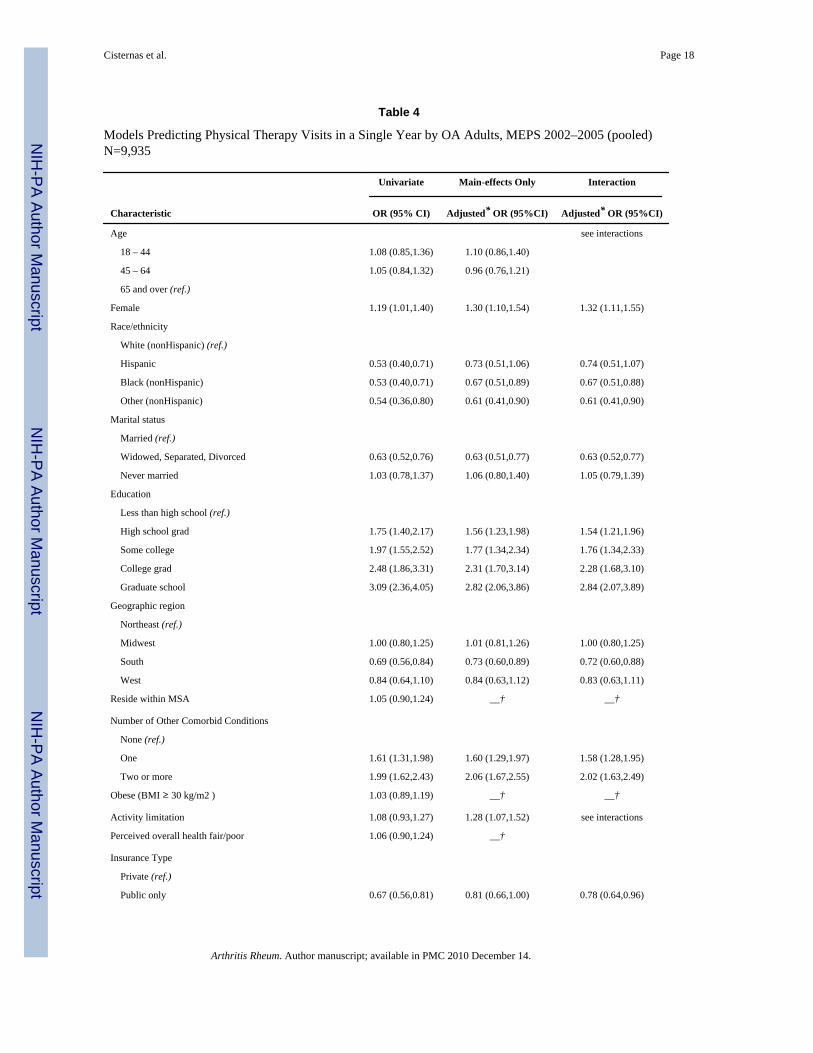
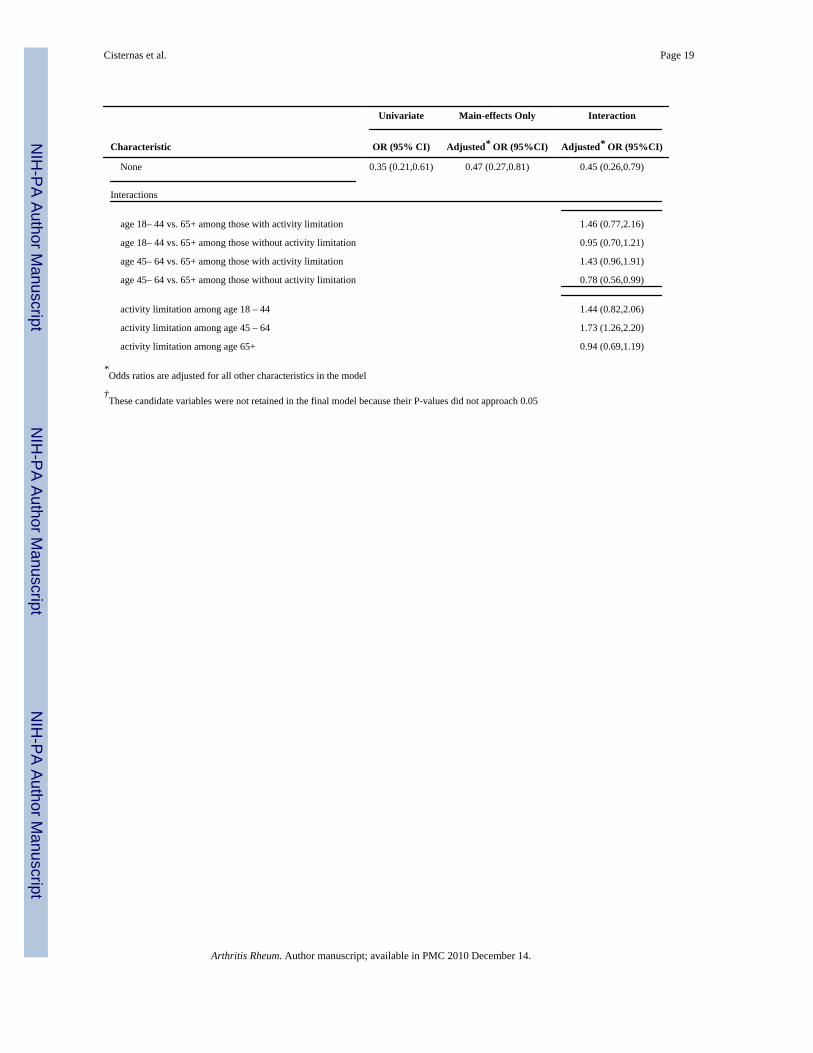
Seeing a physical therapist—Univariate models show significantly decreasedlikelihood of seeing a physical therapist for individuals with no insurance (OR 0.35) orpublic insurance only (OR 0.67) when compared to privately insured subjects (Table 4).Self-identification as Hispanic (OR 0.53), nonHispanic Black (OR 0.53), or “other” race(OR 0.54), in addition to widowed, separated, or divorced status (OR 0.63) and residing inthe South (OR 0.69) are also associated with decreased odds of incurring physical therapyvisits. Female gender (OR 1.19), increasing levels of education (ORs ranging from 1.75 forhigh school graduates to 3.09 for graduate school when compared to individuals with lessthan a high school education) and one (OR 1.61) or two or more (OR 1.99) comorbiditiesare associated with an increased likelihood of seeing a physical therapist. Results from themain-effects model are similar to those of the univariate models, with two exceptions:Hispanic ethnicity is no longer a significant predictor, and activity limitation becomes asignificant predictor of increased likelihood of physical therapy utilization (OR 1.28). Themultivariable model uncovers an important interaction between activity limitation and age:activity limitation is associated with increased odds of seeing a physical therapist, but onlyamong individuals 45 – 64 (OR 1.73). Although we did not find age to be significantlyassociated with the odds of physical therapy utilization in the main-effects model, theinteraction model shows the middle age group less likely than the older age group to incurphysical therapy utilization among those without an activity limitation (OR 0.78).
DiscussionWe estimate that 22.5 million adults between 2002 and 2005 had at least one interactionwith health care that documented OA diagnosis or reported symptoms evident of OA. This issimilar to the most recent estimate of 26.9 million, based on clinically defined OA from theNational Health and Nutrition Survey I (NHANES I) applied to the 2005 population2.Because the 26.9 million figure is considered by its authors to be conservative2, and currentresearch concerning the reliability of patient-reported OA in MEPS indicate high specificityand sensitivity for the ICD-9-CM codes included in our definition, we feel this estimatecaptures most of the individuals with physician-diagnosed, symptomatic OA. The 4.4million (16%) difference between the NHANES I estimate and the current study may beattributed to the different years and methodologies used to obtain each estimate. TheNHANES I prevalence rate is derived from samples of physical examinations and symptomscollected between 1971 – 1975, and then applied to the 2005 U.S. Census population
Cisternas et al. Page 6
Arthritis Rheum. Author manuscript; available in PMC 2010 December 14.
NIH
-PA Author Manuscript
NIH
-PA Author Manuscript
NIH
-PA Author Manuscript

estimates. Whether the 1971–1975 NHANES estimates reflect the 2005 U.S. populationprevalence is not known. The high rates of comorbid conditions we observed in our OApopulation mirror those of other U.S.-based OA studies15, 16, 17, as do the proportion offemales and mean age18.
Although no other study has examined ambulatory utilization patterns on a national basis,comparisons of annual specialist utilization found here (primary care at 80%, orthopedics at25%, rheumatology at 6%, and physical therapy at 11%) with that of a regional study isinformative. Lanes and colleagues analyzed health-utilization data for OA subjects from acentral Massachusetts managed-care organization incurred between July 1993 and June1994. Sixty-seven percent of OA subjects had at least one OA-related office visit during thatone-year period; orthopedists, rheumatologists, and physical therapists were seen by 23%,16%, and 13% of patients for OA-related treatment, respectively19. An analysis of surveydata collected between 1996 and 1998 for OA patients derived from an outpatientrheumatology clinic in Wichita, Kansas, showed a similar low rate for rheumatologistutilization: during a six-month period, only 6% of OA patients consulted a rheumatologist18.
Our analysis of factors associated with seeing the specialists most trained to provide OAcare shows similarities among the specialists. Having no health insurance, or only publicinsurance, or being widowed, separated or divorced is associated with a much lowerlikelihood of seeing any of the arthritis specialists in the adjusted models. Conversely,higher levels of education, the presence of one or more comorbid conditions, and femalegender are associated with increased odds of specialist utilization. Older ages are associatedwith higher odds of seeing either physician specialist, but only among those subjects whoperceived their health as good to excellent. Interestingly, obesity is associated with increasedodds of orthopedics utilization, but not the other two specialties; this may be worthy offurther study. Many of the factors predicting increased utilization of ambulatory OA carefound here have been found in other studies20, 21, 22, 23.
Results of our study should be interpreted within data limitations. First of all, utilization ofspecialists is derived through patient self-report; it is possible that some individuals visit“arthritis specialists” without being aware of the providers’ medical specialty.24 Secondly,visits to these specialists may not have been related to subjects’ OA. Finally, our definitionof OA relied on patient self-report, which is less accurate than a provider-identifieddefinition, and provides no information as to the severity of the respondent’s OA.
The present study highlights important associations of low OA-specialist utilization with alack of health insurance coverage, being widowed, separated or divorced, and lower levelsof education, but it does not inform us why utilization rates to arthritis specialists are so lowin the U.S. overall, nor does it explain why some groups are more or likely to see a specialistthan others. A 1999 survey of adults from all four U.S. regions with self-reported doctor-diagnosed rheumatoid arthritis (RA) or OA enrolled in either a private or public health-careplan assessed the unmet need for specialist care in the previous six months, andrehabilitation (physical therapy, occupational therapy, or speech therapy) during theprevious three months. In the latter study, the most common reason given for this lack ofaccess was that the individual’s insurance plan would not cover the service, others reasonsincluded the service being too expensive or that a referral could not be obtained.25 Thissupports the hypothesis that insurance coverage, or lack thereof, is one of the most importantbarriers to specialist care. The lack of adequate insurance coverage, as well associoeconomic barriers such as poverty and lack of fluency in English are also known to beassociated with decreased access to more costly care across most medical specialty areas,including diabetes26, cancer27, orthopedics28 and vascular disease29.
Cisternas et al. Page 7
Arthritis Rheum. Author manuscript; available in PMC 2010 December 14.
NIH
-PA Author Manuscript
NIH
-PA Author Manuscript
NIH
-PA Author Manuscript
There is evidence that rheumatologists achieve superior outcomes treating RA patientsrelative to other providers30; it is unknown whether this also applies to OA patients. What isknown, however, is that the supply of rheumatologists in the U.S. is increasing at a slowerrate than the demand for their services31. It seems clear that non-rheumatologists will needto become knowledgeable about risks associated with common OA-medications such asNSAIDS as well as evidence-based interventions for OA including weight reduction throughdiet modification and exercise. Because weight loss for overweight and obese populationscan prevent or decrease progression of other prevalent chronic conditions such as heartdisease and diabetes in addition to preventing OA and reducing OA symptoms, anopportunity exists for primary care providers and health-care plans to encourage healthybehavior through implementation of evidence-based weight loss programs. In fact, there isevidence to support the hypothesis that implementation of such programs can actuallydecrease health care expenditures above and beyond the initial investment.32
We are aware that OA is much too prevalent to be cared for exclusively or even primarily byspecialists. The general practitioner has a central role in recognizing OA and beginningtreatment. A small percentage of general practitioners may develop expertise similar to thatof a specialist, but currently, most do not. Given OA patients’ low utilization rates ofspecialists trained to provide OA care in general and specific second-line treatments(injections, bracing, and total joint arthroplasty) in particular, in addition to the variation inthe provision of guideline-concordant care both within and among specialties,33, 34 studiesare needed to determine which types of providers are providing effective care andcommunicating OA-related treatment information. If effective care is not the norm, targetededucational initiatives should be implemented. For example, it is known that primary careproviders often avoid administering injections for arthritis35, 36, but training can increaseprovider self-confidence and injection skill.37 In the interim, the present paper describesrelatively low rates of usage of OA specialists and disparities by insurance coverage andeducational status associated with such usage.
Supplementary MaterialRefer to Web version on PubMed Central for supplementary material.
AcknowledgmentsGrant Support: NIH/NIAMS R01 AR053112, P60 AR 47782, K24 AR 02123, and P60 AR 053308; ArthritisFoundation Innovative Research Grant (to Dr. Losina)
References1. Lawrence RC, Helmick CG, Arnett FC, et al. Estimates of the prevalence of arthritis and selected
musculoskeletal disorders in the United States. Arthritis Rheum. 1998; 43:778–799. [PubMed:9588729]
2. Lawrence RC, Felson DT, Helmick CG, et al. Estimates of the Prevalence of Arthritis and OtherRheumatic Conditions in the United States. Arthritis Rheum. 2008; 58:26–35. [PubMed: 18163497]
3. Agency for Healthcare Research and Quality (AHRQ). HCUPNet. [Accessed: February 8, 2009.].Available athttp://hcupnet.ahrq.gov/HCUPnet.jsp?Id=27CD594BF07CA7D3&Form=DispTab&JS=Y&Acti
4. Hootman JM, Helmick CG, Schappert S. Magnitude and characteristics of arthritis and otherrheumatic conditions on ambulatory medical care visits, United States, 1997. Arthritis Care Res.2002; 47(6):571–581.
5. American Association of Orthopaedic Surgeons. Burden of Musculoskeletal Diseases in the UnitedStates: Prevalence, Societal and Economic Cost. 1. Rosemont, IL: American Academy of
Cisternas et al. Page 8
Arthritis Rheum. Author manuscript; available in PMC 2010 December 14.
NIH
-PA Author Manuscript
NIH
-PA Author Manuscript
NIH
-PA Author Manuscript

Orthopaedic Surgeons; 2008. Health Utilization and Economic Cost of Musculoskeletal Diseases; p.195-225.
6. Source: Bureau of Labor Statistics. [Accessed May 8, 2008]. Available athttp://data.bls.gov/PDQ/outside.jsp?survey=cu(Selections: Area = U.S. city average, Item=Medicalcare, Seasonal Adjustment = Not Seasonally Adjusted.)
7. Maclean CH, Knight K, Paulus H, et al. Costs Attributable to Osteoarthritis. J Rheumatology. 1998;25:2213–2218.
8. Breedveld FC. Ostheoarthritis the impact of a serious disease. Rheumatology. 2004; 43(Suppl 1):i4–i8. [PubMed: 14752169]
9. Cohen, S. Sample design of the 1996 Medical Expenditure Panel Survey Household Component.Rockville (MD): Agency for Health Care Policy and Research; 1997. AHCPR Publication No.97-0027
10. Cohen, S. Sample design of the 1997 Medical Expenditure Panel Survey Household Component.Rockville (MD): Agency for Healthcare Research and Quality; 2000. AHRQ Publication No.01-0001
11. Agency for Healthcare Research and Quality. MEPS HC-096 2005 Medical Conditions. Rockville(MD): Agency for Healthcare Research and Quality; 2007 [Accessed: May 7, 2008.]. Available athttp://www.meps.ahrq.gov/mepsweb/data_stats/download_data/pufs/h96/h96doc.pdf
12. Murphy L, Cisternas M, Yelin E, Helmick C. Validity of self-reported arthritis and other rheumaticconditions in a US population health survey. Arthritis Rheum. September.2005 52(9Supplement):S466.
13. Rates of self-perceived health status of fair or poor have been observed to be higher amongindividuals with arthritis than in the population at large. Centers for Disease Control andPrevention. Health related quality of life among adults with arthritis Behavioral Risk FactorSurveillance System, 11 states, 1996–1998. MMWR Morb Mortal Wkly Rep. 2000; 49:366–9.[PubMed: 10821480]
14. SAS Institute. SAS 9.1.3 Help and documentation. Cary (NC): SAS Institute; p. 2002-2004.15. Singh G, Miller JD, Lee FH, Pettitt D, Russell MW. Prevalence of cardiovascular disease risk
factors among US adults with self-reported osteoarthritis: data from the Third National Health andNutrition Examination Survey. Am J Manage Care. 2002; 8:S383–91.
16. Kadam UT, Jordan K, Croft PR. Clinical comorbidity in patients with osteoarthritis: a case-controlstudy of general practice consulters in England and Wales. Ann Rheum Dis. 2004; 63:408–414.[PubMed: 15020335]
17. Cronan TA, Shaw WS, Gallagher RA, et al. Predicting Health Care Use among OlderOsteoarthritis Patients in an HMO. Arthritis Care and Research. June; 1995 8 (2):66–72. [PubMed:7794988]
18. Ethgen O, Kahler Kh, Kong SX. The Effect of Health Related Quality of Life on Report Use ofHealth Care Resources in Patients with Osteoarthritis and Rheumatoid Arthritis: A LongitudinalAnalysis. Journal of Rheumatology. 2002; 29(6):1147–1155. [PubMed: 12064827]
19. Lanes SF, Lee LL, Radensky PW. Resource utilization and cost of care for rheumatoid arthritis andosteoarthritis in a managed care setting. Arthritis Rheum. 1997; 40(8):1475–1481. [PubMed:9259428]
20. Dominick KL, Ahern FM, Gold CH, et al. Health-Related Quality of Life and Health Service UseAmong Older Adults with Osteoarthritis. Arthritis Rheum. 2004; 51(3):326–331. [PubMed:15188315]
21. Dominick KL, Dudley TK, Cofman CJ. Comparison of Three Comorbidity Measures forPredicting Health Service Use in Patients with Osteoarthritis. Arthritis Rheum. 2005; 53(5):666–672. [PubMed: 16208675]
22. Rosemann T, Joos S, Szecsenyi J, et al. Health service utilization patterns of primary care patientswith osteoarthritis. BMC Health Services Research. 2007; 7:169–177. [PubMed: 17956605]
23. Rosemann T, Grol R, Herman K, et al. Association between obesity, quality of life, physicalactivity, and health services utilization in primary care patients with osteoarthritis. InternationalJournal of Behavioral Nutrition and Physical Activity. 2008; 5(4):5868–5874.
Cisternas et al. Page 9
Arthritis Rheum. Author manuscript; available in PMC 2010 December 14.
NIH
-PA Author Manuscript
NIH
-PA Author Manuscript
NIH
-PA Author Manuscript
24. Yelin E, Bernhard G, Pflugrad D. Access to medical care among persons with musculoskeletalconditions. Arthritis Rheum. 1995; 38(8):1128–1133. [PubMed: 7639810]
25. Hagglund KJ, Clark MJ, Hilton SA, Hewett JE. Access to healthcare services among persons withosteoarthritis and rheumatoid arthritis. Am J Phys Med Rehabil. 2005; 84(9):702–711. [PubMed:16141749]
26. Ward MM. Access to care and the incidence of end-stage renal disease due to diabetes. DiabetesCare. 2009 Jun; 32(6):1032–6. [PubMed: 19460914]
27. Goss E, Lopez AM, Brown CL, Wollins DS, Brawley OW, Raghavan D. American Society ofClinical Oncology Policy Statement:Disparities in Cancer Care. J Clin Oncol. 2009 Apr 29. [Epubahead of print].
28. Weiner BK, Black KP, Gish J. Access to spine care for the poor and near poor. Spine. 2009;9:221–224.
29. Giacovelli JK, Egorova N, Nowygrod R, Gelijns A, Kent KC, Morrissey NJ. Insurance statuspredicts access to care and outcomes of vascular disease. J Vasc Surg. 2008 Oct; 48(4):905–11.[PubMed: 18586449]
30. Solomon D, Bates D, Panush R, Katz J. Costs, outcomes, and patient satisfaction by provider typefor patients with rheumatic and musculoskeletal conditions: a critical review of the literature andproposed methodologic standards. Ann Int Med. 1997; 127(1):52–60. [PubMed: 9214253]
31. Deal CL, Hooker R, Harrington T, et al. The United States Rheumatology Workforce: Supply andDemand, 2005–2025. Arthritis Rheum. 2007; 56(3):772–729. [PubMed: 17328049]
32. Mazzuca S, Brandt K, Katz BP. Reduced utilization and cost of primary care clinic visits resultingfrom self-care education for patients with osteoarthritis of the knee. Arthritis Rheum. 1999; 42(6):1267–1273. [PubMed: 10366121]
33. DeHaan MN, Guzman J, Bayley MT, Bell MJ. Knee osteoarthritis clinical practice guidelines—how are we doing? Journal of Rheumatology. 2007; 34:2099–2105. [PubMed: 17722223]
34. Jawad AS. Analgesics and osteoarthritis: are treatment guidelines reflected in clinical practice?American Journal of Therapeutics. 2005; 12:98–103. [PubMed: 15662297]
35. Jolly M, Curran JJ. Underuse of Intra-articular and Periarticular Corticosteroid Injections byPrimary Care Physicians: Discomfort With the Technique. Journal of Clinical Rheumatology.2003; 9(3):187–192. [PubMed: 17041456]
36. Liddell WG, Carmichael CR, McHugh NJ. Joint and soft tissue injections: a survey of generalpractitioners. Rheumatology. 2005; 44:1043–1046. [PubMed: 15888502]
37. Wilcox T, Oyler J, Harada C, Utset T. Musculoskeletal Exam and Joint Injection Training forInternal Medicine Residents. J Gen Intern Med. 2006; 21:521–523. [PubMed: 16704403]
Cisternas et al. Page 10
Arthritis Rheum. Author manuscript; available in PMC 2010 December 14.
NIH
-PA Author Manuscript
NIH
-PA Author Manuscript
NIH
-PA Author Manuscript

Figure 1.Percent and 95% CIs of Persons with OA in MEPS Seeing Various Medical Specialties in anAmbulatory Setting over a One-Year Period, U.S., 2002–2005Respondents can be seen by multiple specialties. NP=Nurse Practitioners, PA=Physician’sAssistants.95% CIs are all within ±2% of the estimate.The MEPS sample reflects the non-institutionalized civilian population; analyses limited toindividuals age 18 and over.
Cisternas et al. Page 11
Arthritis Rheum. Author manuscript; available in PMC 2010 December 14.
NIH
-PA Author Manuscript
NIH
-PA Author Manuscript
NIH
-PA Author Manuscript
NIH
-PA Author Manuscript
NIH
-PA Author Manuscript
NIH
-PA Author Manuscript
Cisternas et al. Page 12
Table 1
General population characteristics for OA Cohorts, MEPS 2002–2005 (pooled) Age 18+ with Joint PainN=9,933
Characteristics Sample N Percent Estimate (95% CI)
Age in categories
18 – 44 1,539 16 (16,16)
45 – 65 4,340 43 (43,44)
65+ 4,054 41 (41,41)
Mean age in years 9,933 60 (60,61)
Percent Female 6,572 63 (63,63)
Race/ethnicity
White (nonHispanic) 6,571 78 (77,78)
Hispanic 1,344 7 (7,7)
Black (nonHispanic) 1,583 11 (11,11)
Other (nonHispanic) 435 4 (4,4)
Region
Northeast 1,435 17 (16,17)
Midwest 2,152 24 (24,24)
South 4,230 39 (39,39)
West 2,115 20 (20,21)
Percent Living within MSA 7,310 77 (77,77)
Marital Status
Married 5,261 56 (56,56)
Widowed, Separated, Divorced 3,782 35 (35,35)
Never married 890 9 (9,9)
Insurance Type
private (ref.) 5,556 65 (65,66)
public 3,620 28 (28,29)
none 757 6 (6,6)
Education
Less than high school 3,247 25 (25,25)
High school grad 3,282 35 (35,35)
Some college 1,863 21 (21,21)
College grad 908 11 (11,11)
Some graduate school 632 8 (8,8)
Percent with perceived overall health fair/poor 3,864 33 (32,33)
Activity Limitation 3,406 30 (30,30)
Pain limits normal work
not at all 1,542 18 (17,18)
a little bit 2,523 27 (27,28)
moderately 2,161 22 (22,22)
quite a bit 2,576 23 (23,24)
Arthritis Rheum. Author manuscript; available in PMC 2010 December 14.
NIH
-PA Author Manuscript
NIH
-PA Author Manuscript
NIH
-PA Author Manuscript
Cisternas et al. Page 13
Characteristics Sample N Percent Estimate (95% CI)
extremely 1,130 10 (9,10)
Obese (BMI 30 kg/m2 and over) 4,109 39 (38,39)
Specific high-cost comorbidities*
cancer 680 7 (7,7)
ischemic heart disease/chronic heart failure 1,031 10 (10,10)
COPD/asthma 1,599 15 (15,15)
depression 2,916 27 (27,28)
diabetes 1,928 17 (17,17)
non-OA musculoskeletal disease 4,501 46 (45,46)
none 2,658 28 (28,28)
one 3,626 37 (37,37)
two or more 3,649 35 (35,35)
*Individuals could have zero, one, or several such comorbidities
Arthritis Rheum. Author manuscript; available in PMC 2010 December 14.

NIH
-PA Author Manuscript
NIH
-PA Author Manuscript
NIH
-PA Author Manuscript
Cisternas et al. Page 14
Table 2
Models Predicting Rheumatologist Visits in a Single Year by OA Adults, MEPS 2002–2005 (pooled) N=9,935
Univariate Main-effects Only Interaction
Characteristic OR (95% CI) Adjusted* OR 95%CI) Adjusted* OR (95%CI)
Age
18 – 44 0.59 (0.42,0.84) 0.58 (0.39,0.86) see interactions
45 – 64 0.96 (0.77,1.21) 0.82 (0.64,1.05)
65 and over (ref.)
Female 1.85 (1.46,2.35) 1.96 (1.53,2.51) 1.97 (1.54,2.53)
Race/ethnicity
White (nonHispanic) (ref.)
Hispanic 1.25 (0.89,1.74) 1.56 (1.09,2.22) 1.58 (1.10,2.25)
Black (nonHispanic) 1.07 (0.79,1.46) 1.13 (0.81,1.59) 1.13 (0.91,1.59)
Other (nonHispanic) 0.44 (0.23,0.87) 0.52 (0.27,1.01) 0.53 (0.27,1.02)
Marital status
Married (ref.)
Widowed, Separated, Divorced 0.75 (0.60,0.93) 0.62 (0.49,0.79) 0.61 (0.49,0.78)
Never married 0.88 (0.59,1.30) 0.96 (0.61,1.53) 0.96 (0.60,1.52)
Education
Less than high school (ref.)
High school grad 1.34 (1.00,1.79) 1.52 (1.13,2.04) 1.49 (1.11,2.01)
Some college 1.62 (1.16,2.28) 1.94 (1.38,2.71) 1.92 (1.38,2.67)
College grad 1.41 (0.95,2.11) 1.83 (1.22,2.74) 1.81 (1.21,2.70)
Graduate school 1.87 (1.20,2.90) 2.49 (1.57,3.95) 2.51 (1.59,3.95)
Geographic region
Northeast (ref.)
Midwest 0.62 (0.42,0.92) 0.67 (0.46,0.99) 0.67 (0.45,0.98)
South 0.81 (0.60,1.10) 0.86 (0.62,1.19) 0.86 (0.62,1.19)
West 0.55 (0.39,0.78) 0.55 (0.38,0.78) 0.54 (0.38,0.77)
Reside within MSA 1.41 (1.07,1.86) 1.43 (1.07,1.91) 1.44 (1.08,1.92)
Number of Other Comorbid Conditions
None (ref.)
One 1.65 (1.24,2.19) 1.47 (1.10,1.98) 1.44 (1.07,1.93)
Two or more 2.28 (1.71,3.05) 1.91 (1.39,2.61) 1.85 (1.35,2.55)
Obese (BMI ≥ 30 kg/m2 ) 1.02 (0.82,1.26) —† —†
Activity limitation 1.11 (0.90,1.38) —† —†
Perceived overall health fair/poor 1.58 (1.27,1.95) 1.69 (1.32,2.16) see interactions
Insurance Type
Private (ref.)
Public only 0.86 (0.66,1.12) 0.80 (0.60,1.08) 0.79 (0.59,1.05)
None 0.35 (0.19,0.62) 0.44 (0.24,0.79) 0.42 (0.23,0.76)
Arthritis Rheum. Author manuscript; available in PMC 2010 December 14.
NIH
-PA Author Manuscript
NIH
-PA Author Manuscript
NIH
-PA Author Manuscript
Cisternas et al. Page 15
Univariate Main-effects Only Interaction
Characteristic OR (95% CI) Adjusted* OR 95%CI) Adjusted* OR (95%CI)
Interactions
age 18– 44 vs. 65+ among fair/poor perceived health 0.90 (0.45,1.35)
age 18– 44 vs. 65+ among perceived health good or better 0.44 (0.21,0.67)
age 45– 64 vs. 65+ among fair/poor perceived health 2.45 (0.38,4.52)
age 45– 64 vs. 65+ among perceived health good or better 0.63 (0.43,0.83)
fair/poor perceived health among age 18 – 44 2.39 (1.03,3.75)
fair/poor perceived health among age 45 – 64 2.24 (1.49,2.98)
fair/poor perceived health among age 65+ 1.17 (0.76,1.58)
*Odds ratios are adjusted for all other characteristics in the model.
†These candidate variables were not retained in the final model because their P-values did not approach 0.05.
Arthritis Rheum. Author manuscript; available in PMC 2010 December 14.

NIH
-PA Author Manuscript
NIH
-PA Author Manuscript
NIH
-PA Author Manuscript
Cisternas et al. Page 16
Table 3
Models Predicting Orthopedics Visits in a Single Year by OA Adults, MEPS 2002–2005 (pooled) N=9,935
Univariate Main-effects Only Interaction
Characteristic OR (95% CI) Adjusted* OR Adjusted* OR (95%CI)
Age see interactions
18 – 44 0.86 (0.72,1.04) 0.91 (0.75,1.11)
45 – 64 0.99 (0.86,1.13) 0.93 (0.80,1.08)
65 and over (ref.)
Female 1.04 (0.92,1.18) 1.08 (0.94,1.24) 1.09 (0.96,1.25)
Race/ethnicity
White (nonHispanic) (ref.)
Hispanic 0.55 (0.44,0.73) 0.74 (0.58,0.94) 0.75 (0.59,0.95)
Black (nonHispanic) 0.60 (0.50,0.73) 0.68 (0.55,0.82) 0.68 (0.55,0.83)
Other (nonHispanic) 0.52 (0.39,0.69) 0.63 (0.47,0.86) 0.64 (0.47,0.86)
Marital status
Married (ref.)
Widowed, Separated, Divorced 0.73 (0.64,0.84) 0.76 (0.65,0.89) 0.76 (0.65,0.89)
Never married 0.83 (0.66,1.04) 0.95 (0.74,1.21) 0.95 (0.75,1.21)
Education
Less than high school (ref.)
High school grad 1.55 (1.31,1.84) 1.40 (1.17,1.69) 1.38 (1.15,1.66)
Some college 1.49 (1.23,1.81) 1.38 (1.12,1.69) 1.37 (1.11,1.68)
College grad 1.71 (1.38,2.12) 1.62 (1.28,2.05) 1.61 (1.27,2.03)
Graduate school 1.79 (1.40,2.29) 1.67 (1.28,2.18) 1.67 (1.28,2.18)
Geographic region
Northeast (ref.)
Midwest 0.84 (0.68,1.05) 0.84 (0.68,1.05) 0.84 (0.67,1.04)
South 0.72 (0.59,0.88) 0.78 (0.63,0.95) 0.77 (0.63,0.94)
West 0.61 (0.49,0.76) 0.65 (0.52,0.80) 0.64 (0.52,0.79)
Reside within MSA 0.98 (0.83,1.15) —† —†
Number of Other Comorbid Conditions
None (ref.)
One 1.31 (1.12,1.53) 1.26 (1.08,1.48) 1.25 (1.06,1.47)
Two or more 1.49 (1.28,1.73) 1.42 (1.21,1.67) 1.38 (1.17,1.62)
Obese (BMI ≥ 30 kg/m2 ) 1.25 (1.11,1.40) 1.25 (1.11,1.41) 1.26 (1.12,1.42)
Activity limitation 1.14 (1.00,1.29) 1.30 (1.12,1.50) see interactions
Perceived overall health fair/poor 1.00 (0.88,1.13) —† —†
Insurance Type
Private (ref.)
Public only 0.68 (0.60,0.76) 0.74 (0.64,0.86) 0.71 (0.62,0.82)
None 0.28 (0.21,0.38) 0.34 (0.25,0.47) 0.33 (0.24,0.45)
Arthritis Rheum. Author manuscript; available in PMC 2010 December 14.

NIH
-PA Author Manuscript
NIH
-PA Author Manuscript
NIH
-PA Author Manuscript
Cisternas et al. Page 17
Univariate Main-effects Only Interaction
Characteristic OR (95% CI) Adjusted* OR Adjusted* OR (95%CI)
Interactions
age 18– 44 vs. 65+ among those with activity limitation 1.64 (1.03,2.24)
age 18– 44 vs. 65+ among those without activity limitation 0.72 (0.57,0.87)
age 45– 64 vs. 65+ among those with activity limitation 1.34 (1.03,1.65)
age 45– 64 vs. 65+ among those without activity limitation 0.76 (0.63,0.90)
activity limitation among age 18 – 44 2.13 (1.42,2.85)
activity limitation among age 45 – 64 1.65 (1.30,2.01)
activity limitation among age 65+ 0.94 (0.75,1.13)
*Odds ratios are adjusted for all other characteristics in the model
†These candidate variables were not retained in the final model because their P-values did not approach 0.05.
Arthritis Rheum. Author manuscript; available in PMC 2010 December 14.
NIH
-PA Author Manuscript
NIH
-PA Author Manuscript
NIH
-PA Author Manuscript
Cisternas et al. Page 18
Table 4
Models Predicting Physical Therapy Visits in a Single Year by OA Adults, MEPS 2002–2005 (pooled)N=9,935
Univariate Main-effects Only Interaction
Characteristic OR (95% CI) Adjusted* OR (95%CI) Adjusted* OR (95%CI)
Age see interactions
18 – 44 1.08 (0.85,1.36) 1.10 (0.86,1.40)
45 – 64 1.05 (0.84,1.32) 0.96 (0.76,1.21)
65 and over (ref.)
Female 1.19 (1.01,1.40) 1.30 (1.10,1.54) 1.32 (1.11,1.55)
Race/ethnicity
White (nonHispanic) (ref.)
Hispanic 0.53 (0.40,0.71) 0.73 (0.51,1.06) 0.74 (0.51,1.07)
Black (nonHispanic) 0.53 (0.40,0.71) 0.67 (0.51,0.89) 0.67 (0.51,0.88)
Other (nonHispanic) 0.54 (0.36,0.80) 0.61 (0.41,0.90) 0.61 (0.41,0.90)
Marital status
Married (ref.)
Widowed, Separated, Divorced 0.63 (0.52,0.76) 0.63 (0.51,0.77) 0.63 (0.52,0.77)
Never married 1.03 (0.78,1.37) 1.06 (0.80,1.40) 1.05 (0.79,1.39)
Education
Less than high school (ref.)
High school grad 1.75 (1.40,2.17) 1.56 (1.23,1.98) 1.54 (1.21,1.96)
Some college 1.97 (1.55,2.52) 1.77 (1.34,2.34) 1.76 (1.34,2.33)
College grad 2.48 (1.86,3.31) 2.31 (1.70,3.14) 2.28 (1.68,3.10)
Graduate school 3.09 (2.36,4.05) 2.82 (2.06,3.86) 2.84 (2.07,3.89)
Geographic region
Northeast (ref.)
Midwest 1.00 (0.80,1.25) 1.01 (0.81,1.26) 1.00 (0.80,1.25)
South 0.69 (0.56,0.84) 0.73 (0.60,0.89) 0.72 (0.60,0.88)
West 0.84 (0.64,1.10) 0.84 (0.63,1.12) 0.83 (0.63,1.11)
Reside within MSA 1.05 (0.90,1.24) —† —†
Number of Other Comorbid Conditions
None (ref.)
One 1.61 (1.31,1.98) 1.60 (1.29,1.97) 1.58 (1.28,1.95)
Two or more 1.99 (1.62,2.43) 2.06 (1.67,2.55) 2.02 (1.63,2.49)
Obese (BMI ≥ 30 kg/m2 ) 1.03 (0.89,1.19) —† —†
Activity limitation 1.08 (0.93,1.27) 1.28 (1.07,1.52) see interactions
Perceived overall health fair/poor 1.06 (0.90,1.24) —†
Insurance Type
Private (ref.)
Public only 0.67 (0.56,0.81) 0.81 (0.66,1.00) 0.78 (0.64,0.96)
Arthritis Rheum. Author manuscript; available in PMC 2010 December 14.
NIH
-PA Author Manuscript
NIH
-PA Author Manuscript
NIH
-PA Author Manuscript
Cisternas et al. Page 19
Univariate Main-effects Only Interaction
Characteristic OR (95% CI) Adjusted* OR (95%CI) Adjusted* OR (95%CI)
None 0.35 (0.21,0.61) 0.47 (0.27,0.81) 0.45 (0.26,0.79)
Interactions
age 18– 44 vs. 65+ among those with activity limitation 1.46 (0.77,2.16)
age 18– 44 vs. 65+ among those without activity limitation 0.95 (0.70,1.21)
age 45– 64 vs. 65+ among those with activity limitation 1.43 (0.96,1.91)
age 45– 64 vs. 65+ among those without activity limitation 0.78 (0.56,0.99)
activity limitation among age 18 – 44 1.44 (0.82,2.06)
activity limitation among age 45 – 64 1.73 (1.26,2.20)
activity limitation among age 65+ 0.94 (0.69,1.19)
*Odds ratios are adjusted for all other characteristics in the model
†These candidate variables were not retained in the final model because their P-values did not approach 0.05
Arthritis Rheum. Author manuscript; available in PMC 2010 December 14.