ISG15 Regulates Peritoneal Macrophages Functionality against Viral Infection

e-Blood
PHAGOCYTES, GRANULOCYTES, AND MYELOPOIESIS
Alternatively activated macrophages derived from monocytes and tissuemacrophages are phenotypically and functionally distinctUma Mahesh Gundra,1 Natasha M. Girgis,1 Dominik Ruckerl,2 Stephen Jenkins,2 Lauren N. Ward,1 Zachary D. Kurtz,1
Kirsten E. Wiens,1 Mei San Tang,1 Upal Basu-Roy,1 Alka Mansukhani,1 Judith E. Allen,2 and P’ng Loke1
1Department of Microbiology, New York University School of Medicine, New York, NY; and 2Centre for Immunity, Infection and Evolution, and the Institute
for Immunology and Infection Research, School of Biological Sciences, University of Edinburgh, Edinburgh, United Kingdom
Key Points
• Alternatively activatedmacrophages derived frommonocytes and tissuemacrophages have distincttranscriptional profiles andphenotypes.
• Monocyte-derived AAMs aremore involved with immuneregulation than tissue-derivedAAMs.
Macrophages adopt an alternatively activated phenotype (AAMs) when activated by the
interleukin-4receptor(R)a. AAMs can be derived either from proliferation of tissue resident
macrophages or recruited inflammatory monocytes, but it is not known whether these
different sources generate AAMs that are phenotypically and functionally distinct. By
transcriptional profiling analysis, we show here that, although both monocyte and tissue-
derived AAMs expressed high levels of Arg1, Chi3l3, and Retnla, only monocyte-derived
AAMs up-regulated Raldh2 and PD-L2. Monocyte-derived AAMs were also CX3CR1-green
fluorescent protein (GFP)high and expressed CD206, whereas tissue-derived AAMs were
CX3CR1-GFP and CD206 negative. Monocyte-derived AAMs had high levels of aldehyde
dehydrogenase activity and promoted the differentiation of FoxP31 cells from naıve CD41
cells via production of retinoic acid. In contrast, tissue-derived AAMs expressed high levels
of uncoupling protein 1. Hence monocyte-derived AAM have properties associated with
immune regulation, and thedifferent physiological properties associatedwithAAM function
may depend on the distinct lineage of these cells. (Blood. 2014;123(20):e110-e122)
Introduction
There has recently been a major paradigm shift in the field of mac-rophage biology with the recognition that tissue resident macrophagescan be established independently of definitive hematopoiesis.1-4 Thesecells are of embryonic origin and are maintained throughout life byproliferative self-renewal.5 In contrast, macrophages infiltrating thetissues during an inflammatory response are derived from bloodmonocytes.6,7 This paradigmholds true inmany tissues including theserous cavities1,3 but not for the intestines8,9 and the skin,10where theresident cells are of bone marrow origin.
DuringThelper 2 (TH2)-mediated immune responses, interleukin(IL)-4 and/or IL-13 can induce macrophage proliferation, leadingto expansion beyond steady-state levels.11,12 Signaling through theIL-4receptor(R)a also leads to a state of alternative activation.13,14
Alternatively activatedmacrophages (AAMs) are a critical componentof type 2 immunity during helminth infection15 and allergicresponses.16 However, type 2 immune responses extend beyond justinfection and autoimmunity17 and contribute to the maintenance oftissue homeostasis,16 damage repair,18 andmetabolic homeostasis.19
IL-4will induce proliferation and alternative activation ofmacro-phages regardless of their embryonic or bone marrow origins.11 Thisraises critical questions about the contribution of tissue-residentmacrophages vs blood-derivedmacrophages to the diverse processesassociated with AAMs. Bone marrow chimeras in which the peri-toneal and pleural cavity cells are shielded from irradiation, and thus
remain of host origin, allow us to distinguish cells of bonemarrow vsresident origins.11 Using this method, we have demonstrated thatIL-4 induces the proliferation and expansion of resident peritonealmacrophages, whereas delivery of IL-4 plus thioglycollate causedrecruitment and proliferation of blood monocyte-derived macro-phages.11 Here, we demonstrate that AAMs derived from pro-liferation of local tissue resident macrophages are phenotypicallyand functionally distinct fromAAMs derived through recruitment ofinflammatory monocytes.
Materials and methods
Mice treatment and infections
C57BL/6, Stat62/2 (Jackson Laboratories) and CX3CR1GFP/1 mice (kindly
provided by Dr Dan Littman) were treated with IL-4/anti-IL-4 monoclonalantibody (mAb) complexes (IL-4c), prepared as described previously.11 Micewere injected intraperitoneally (i.p.) with IL-4c on days 0 and 2. Mice werealso treated with 4% thioglycollate alone or in combination with IL-4c for coad-ministration experiments. Mice were euthanized on day 4. Mice were infectedsubcutaneously with 25 Litomososides sigmodontis L3,20 and analysis ofpleural cavity cells was performed 12 days after infection. For Schisotosomamansoni infection, mice were infected percutaneously on the abdominalsurface with 25 to 35 cercariae of a Puerto Rican strain (Biomedical Research
Submitted August 8, 2013; accepted March 25, 2014. Prepublished online as
Blood First Edition paper, April 2, 2014; DOI 10.1182/blood-2013-08-520619.
U.M.G. and N.M.G. contributed equally to this work.
This article contains a data supplement.
The publication costs of this article were defrayed in part by page charge
payment. Therefore, and solely to indicate this fact, this article is hereby
marked “advertisement” in accordance with 18 USC section 1734.
© 2014 by The American Society of Hematology
e110 BLOOD, 15 MAY 2014 x VOLUME 123, NUMBER 20

Institute, Rockville, MD), and analysis of liver leukocytes was performed8 weeks after infection. This study was carried out in strict accordance with therecommendations in the Guide for the Care and Use of Laboratory Animals. Allanimal procedures were approved by the New York University InstitutionalAnimal Care and Use Committee under protocol numbers 131004 and 130504,as well as in accordance with the United Kingdom Home Office requirements.
Flow cytometry
Cells were stained with LIVE/DEAD Aqua or Blue (Invitrogen),blocked with 4 mg/mL aCD16/32 (2.4G2; Bioxcell), and stained withCD11b eFluor450 (eBioscience), MHCII APC-Cy7 (Biolegend),PD-L2 PE (BD Bioscience, Biolegend), F4/80 PE-Cy7 (eBioscience),CD206 APC (Biolegend), and Siglec-F, DX5, B220, and CD3 PE (BDBioscience). Cells were acquired on an LSR II (BD Biosciences) and analyzedusing FlowJo software (Treestar). For 5-ethynyl-29-deoxyuridine (EdU) labeling,mice were injected i.p. with 0.5 mg EdU (Invitrogen) 3 hours prior to euthanasiaand stained for EdU according to the manufacturer’s instructions. Aldehydedehydrogenase (ALDH) activity wasmeasured using the ALDEFLUOR stainingkit (StemCell Technologies) with or without the ALDH inhibitor, diethylamino-benzaldehyde (DEAB) (at a final concentration of 15 mM) as control.
Foxp31 T-regulatory cell differentiation assay
43 105 naıve T cells isolated from lymph nodes using theNaiveCD41TCellIsolation Kit II (Miltenyi Biotec) were cultured together with 2 3 105
peritoneal macrophages and 1 mg/mL of soluble anti-CD3 and 5 ng/mLrecombinant human IL-2 (R&D) in complete RPMI. On day 3, cultureswere supplemented with fresh medium containing 5 ng/mL IL-2. Retinoicacid (RA) receptor inhibitor LE540 (Wako Chemicals USA) was added tosome culture wells. To track cell division, T cells were labeled with VioletCellTracker (Invitrogen). On day 6, cells were stained for Foxp31 cellsby intracellular nuclear staining.
Microarray analysis of sorted cells
CD11b and F4/80 double positive cells (supplemental Figure 3, available ontheBloodWeb site) sorted using a BDFACSAria cell were analyzed by usingSureprint G3 Mouse GE 8x60K array (Agilent) in one color (Cy3)-basedgene expression analysis (Agilent). Processing and downstream analysis ofmicroarray data (Gene Expression Omnibus accession number GSE54679)was performed with R/Bioconductor and associated packages and SAM:Significance Analysis of Microarrays.21 Background correction to log-transformed expression values was performed, and the expression values ofeach array was scaled so that the median absolute values are equal for allarrays. TheClustering of LargeApplications function fromRwas used to findthe best clustering solution that coincidedwith the globalminimumBayesianinformation critera score and a locally maximum silhouette width. Eachcluster was assessed by measuring the Gene Ontology (GO) term over-representation by the hypergeometric distribution, as implemented in theGOstats package using gene annotations from the mouse.db0 package.
Figure 1. IL-4c and Thio1IL-4c induces alterna-
tively activated macrophages with distinct pheno-
types.Mice were untreated (naıve/resident) or injected
i.p. with IL-4c alone (IL-4c) or thioglycollate alone
(Thio) or Thio and IL-4c (Thio1IL-4c) on day 0 and
then with IL-4c again (for IL-4c and Thio1IL-4c) on day
2, and PEC was analyzed on day 4. (A) Representative
FACS plots shows EdU incorporation by peritoneal
macrophages after treatment. EdU was injected
3 hours before analysis. (B) Quantification of EdU
incorporation in macrophages. Results are representa-
tive of 3 independent experiments. (C) RNA of peritoneal
macrophages was isolated for RT-PCR analysis for
expression of Chi3l3, Arg1, Retnla, and Raldh2 and
normalized to expression of GAPDH. Graphs depict
mean 6 standard error of the mean of individual
mice pooled from 5 to 6 independent experiments. (D)
EdU incorporation by peritoneal macrophages after
injection of wild-type Stat61/1 mice or Stat62/2 mice
with IL-4c alone, Thio, or Thio1IL-4c. (E) Quantifica-
tion of EdU incorporation in macrophages. (F) Total
number of F4/801 macrophages recovered. Results
shown are representative of 2 separate experiments.
(G) Representative FACS plots gated on CD11b1
cells for CX3CR1GFP/1 reporter mice treated as
above. (H) The median fluorescent intensity (MFI)
of GFP, gated on CD11b1 cells from the peritoneal
cavity of individual mice. Data are representative of
3 independent experiments. *P, .05 and **P, .01 as
determined by ANOVA.
BLOOD, 15 MAY 2014 x VOLUME 123, NUMBER 20 DISTINCT M2 MACROPHAGE PHENOTYPES AND FUNCTIONS e111
RT-PCR and western blot
Quantitative reverse transcription-polymerase chain reaction (RT-PCR)was performed using the SYBR Green qPCR kit (Applied Biosystems) andnormalized to the housekeeping geneGapdh by comparative Ct. For westernblots, anti-UCP1 antibody (ab-10983; Abcam) and antiglyceraldehyde-3-phosphate dehydrogenase (GAPDH) antibody (sc-32233; SCBT) were used.
Statistical analysis
Significance between groups was determined by analysis of variance(ANOVA) plus Bonferroni or Dunnett’s correction formultiple comparisons.
Results
Peritoneal AAMs derived from inflammatory monocytes and
tissue macrophages both proliferate and express markers of
alternative activation
Using shielded bone marrow chimeras, we previously showed thatinjection of IL-4c into the pleural cavity leads to the expansion of theresident cell population independently of the bone marrow, whereassimultaneous injection of IL-4c with thioglycollate (Thio1IL-4c)generates a large population of AAMs that are derived frominflammatory blood monocytes.11 We applied this system to theperitoneal cavity to compare AAMs derived from proliferating tissueresident macrophages (IL-4c) with AAMs derived from inflamma-tory monocytes (Thio1IL-4c). Resident macrophages from naıveuntreated animals (Res) andmacrophages recruited by thioglycollatealone (Thio) were used as controls. We confirmed by 3-hour pulselabeling and EdU staining that both IL-4c treatment and Thio1IL-4ctreatment can induce macrophage proliferation, although Thio1IL-4cinduced macrophages proliferated to a lesser degree with lowerproportion of cells in S phase (Figure 1A-B). Less proliferationmay bedue to reduced availability of IL-4 per cell, as the recruited populationwill quickly outnumber the resident cells in the Thio1IL-4c-treatedmice.
We next examined expression of the well-defined markers ofalternative activation, arginase I (Arg1), resistin-like molecule a
(Retnla), and Ym1 (or Chi3l3), in both types of AAMs. By real-time
PCR analysis, expression of all 3 genes was highly up-regulatedin both IL-4c- and Thio1IL-4c-induced macrophages (Figure 1C).This was consistent with our previous studies in the pleural cavityin which both IL-4c and Thio1IL-4c led to extensive alternativeactivation as measured by high percentages of resistin-like moleculea (RELMa)1 and Ym11 macrophages.11 Stat6 is essential for alter-native activation,22,23 but its role in macrophage proliferation hasnot been previously demonstrated. Both Thio1IL-4c and IL-4cactivated macrophages from Stat62/2 mice failed to increase pro-liferation and incorporate EdU in contrast to wild-type littermates(Figure 1D-E), confirming Stat6 dependence. The failure to proliferatewas reflected in reduced total cell numbers especially among F4/801
macrophages (Figure 1F).In CX3CR1-green fluorescent protein (GFP)/1 reporter mice,
CX3CR1-GFP is highly expressed by blood monocytes but not bytissue resident peritoneal macrophages.24 To validate the differentorigins of cells derived from IL-4c vs Thio1IL-4c, we injectedCX3CR1-GFP/1 reporter mice with these reagents. Gating on theCD11b1 cells, the majority of macrophages induced by IL-4c alonewere F480high and CX3CR1-GFPlow, similar to the residentpopulation in naıve mice. In contrast, the AAMs induced byThio1IL-4c were F480int and CX3CR1-GFPhigh (Figure 1G-H).These results are consistent with a monocyte origin for AAMsinduced by Thio1IL-4c (F480int), whereas those induced by IL-4calone are derived from resident macrophages (F480high). Notably,there is a small CX3CR1-GFPhigh F4/80int macrophage population innaıve mice and IL-4c alone-treated mice that is likely of monocyteorigin.25
We confirmed that IL-4c induces expansion of the resident cellpopulation in the peritoneal cavity independently of the bonemarrowby generating bonemarrow chimeras in which the serous cavities areshielded from irradiation and assessing the chimerism in the blood vsthe peritoneal cavity (supplemental Figure 1). The blood chimerismwas;30% of donor origin, whereas only 1% to 2% of macrophagesin the peritoneal cavity were of donor origin in both phosphate-buffered saline (PBS) and IL-4c-injected mice. Similarly, byintravenous transfer of purified Ly6CHigh monocytes fromCX3CR1-GFP/1 mice (CD45.2) into congenic recipient CD45.1hosts, we confirmed that Thio1IL-4c but not IL-4c alone inducesmonocyte recruitment and differentiation (supplemental Figure 1).
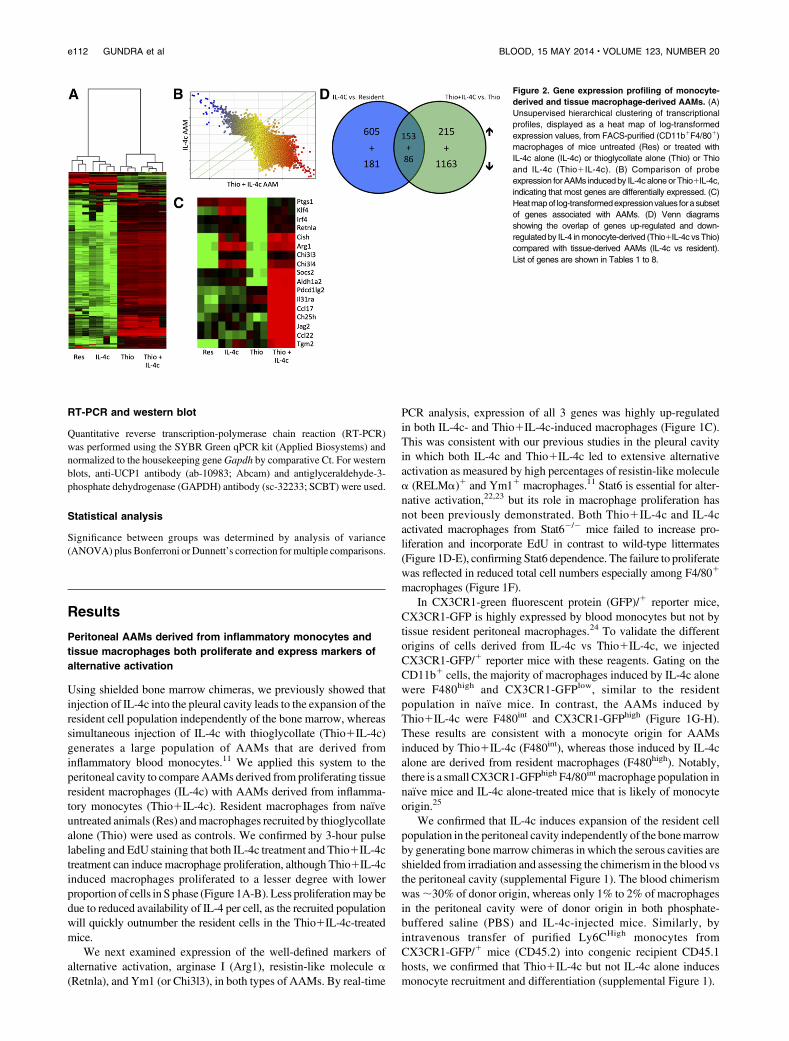
Figure 2. Gene expression profiling of monocyte-
derived and tissue macrophage-derived AAMs. (A)
Unsupervised hierarchical clustering of transcriptional
profiles, displayed as a heat map of log-transformed
expression values, from FACS-purified (CD11b1F4/801)
macrophages of mice untreated (Res) or treated with
IL-4c alone (IL-4c) or thioglycollate alone (Thio) or Thio
and IL-4c (Thio1IL-4c). (B) Comparison of probe
expression for AAMs induced by IL-4c alone or Thio1IL-4c,
indicating that most genes are differentially expressed. (C)
Heatmapof log-transformedexpressionvalues forasubset
of genes associated with AAMs. (D) Venn diagrams
showing the overlap of genes up-regulated and down-
regulated by IL-4 inmonocyte-derived (Thio1IL-4c vsThio)
compared with tissue-derived AAMs (IL-4c vs resident).
List of genes are shown in Tables 1 to 8.
e112 GUNDRA et al BLOOD, 15 MAY 2014 x VOLUME 123, NUMBER 20
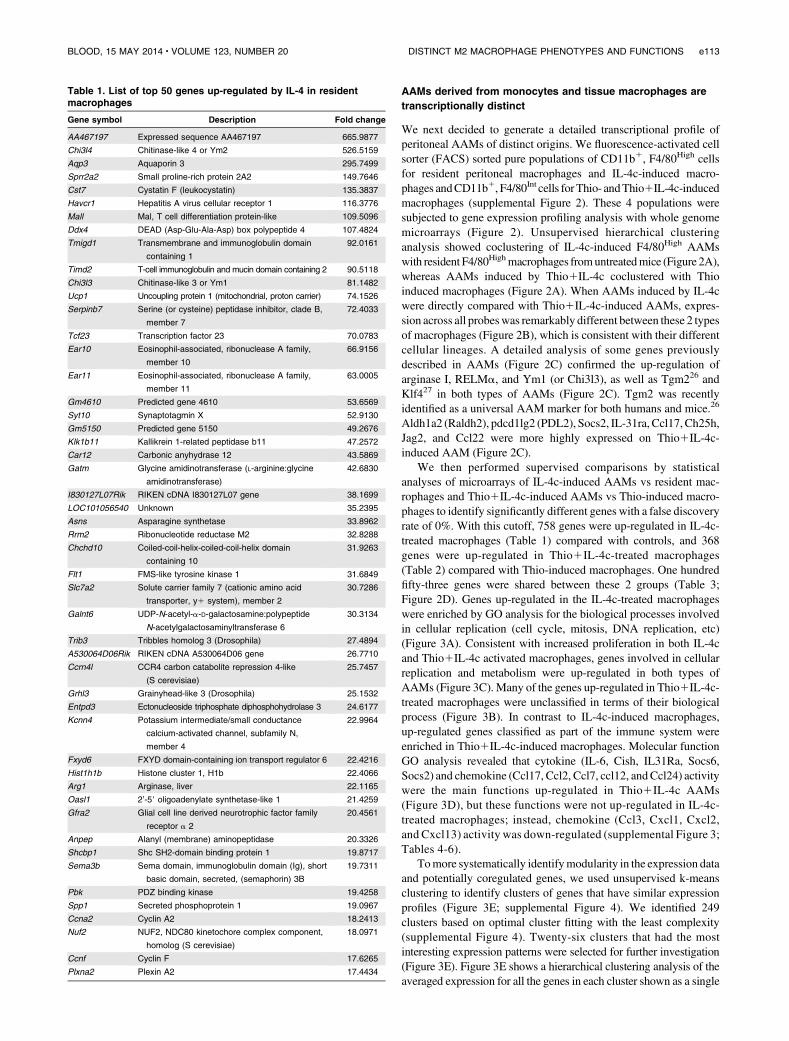
AAMs derived from monocytes and tissue macrophages are
transcriptionally distinct
We next decided to generate a detailed transcriptional profile ofperitoneal AAMs of distinct origins. We fluorescence-activated cellsorter (FACS) sorted pure populations of CD11b1, F4/80High cellsfor resident peritoneal macrophages and IL-4c-induced macro-phages andCD11b1, F4/80Int cells for Thio- andThio1IL-4c-inducedmacrophages (supplemental Figure 2). These 4 populations weresubjected to gene expression profiling analysis with whole genomemicroarrays (Figure 2). Unsupervised hierarchical clusteringanalysis showed coclustering of IL-4c-induced F4/80High AAMswith resident F4/80Highmacrophages fromuntreatedmice (Figure 2A),whereas AAMs induced by Thio1IL-4c coclustered with Thioinduced macrophages (Figure 2A). When AAMs induced by IL-4cwere directly compared with Thio1IL-4c-induced AAMs, expres-sion across all probeswas remarkably different between these 2 typesof macrophages (Figure 2B), which is consistent with their differentcellular lineages. A detailed analysis of some genes previouslydescribed in AAMs (Figure 2C) confirmed the up-regulation ofarginase I, RELMa, and Ym1 (or Chi3l3), as well as Tgm226 andKlf427 in both types of AAMs (Figure 2C). Tgm2 was recentlyidentified as a universal AAM marker for both humans and mice.26
Aldh1a2 (Raldh2), pdcd1lg2 (PDL2), Socs2, IL-31ra, Ccl17,Ch25h,Jag2, and Ccl22 were more highly expressed on Thio1IL-4c-induced AAM (Figure 2C).
We then performed supervised comparisons by statisticalanalyses of microarrays of IL-4c-induced AAMs vs resident mac-rophages and Thio1IL-4c-induced AAMs vs Thio-induced macro-phages to identify significantly different genes with a false discoveryrate of 0%. With this cutoff, 758 genes were up-regulated in IL-4c-treated macrophages (Table 1) compared with controls, and 368genes were up-regulated in Thio1IL-4c-treated macrophages(Table 2) compared with Thio-induced macrophages. One hundredfifty-three genes were shared between these 2 groups (Table 3;Figure 2D). Genes up-regulated in the IL-4c-treated macrophageswere enriched by GO analysis for the biological processes involvedin cellular replication (cell cycle, mitosis, DNA replication, etc)(Figure 3A). Consistent with increased proliferation in both IL-4cand Thio1IL-4c activated macrophages, genes involved in cellularreplication and metabolism were up-regulated in both types ofAAMs (Figure 3C). Many of the genes up-regulated in Thio1IL-4c-treated macrophages were unclassified in terms of their biologicalprocess (Figure 3B). In contrast to IL-4c-induced macrophages,up-regulated genes classified as part of the immune system wereenriched in Thio1IL-4c-induced macrophages. Molecular functionGO analysis revealed that cytokine (IL-6, Cish, IL31Ra, Socs6,Socs2) and chemokine (Ccl17, Ccl2, Ccl7, ccl12, andCcl24) activitywere the main functions up-regulated in Thio1IL-4c AAMs(Figure 3D), but these functions were not up-regulated in IL-4c-treated macrophages; instead, chemokine (Ccl3, Cxcl1, Cxcl2,and Cxcl13) activity was down-regulated (supplemental Figure 3;Tables 4-6).
Tomore systematically identifymodularity in the expression dataand potentially coregulated genes, we used unsupervised k-meansclustering to identify clusters of genes that have similar expressionprofiles (Figure 3E; supplemental Figure 4). We identified 249clusters based on optimal cluster fitting with the least complexity(supplemental Figure 4). Twenty-six clusters that had the mostinteresting expression patterns were selected for further investigation(Figure 3E). Figure 3E shows a hierarchical clustering analysis of theaveraged expression for all the genes in each cluster shown as a single
Table 1. List of top 50 genes up-regulated by IL-4 in residentmacrophages
Gene symbol Description Fold change
AA467197 Expressed sequence AA467197 665.9877
Chi3l4 Chitinase-like 4 or Ym2 526.5159
Aqp3 Aquaporin 3 295.7499
Sprr2a2 Small proline-rich protein 2A2 149.7646
Cst7 Cystatin F (leukocystatin) 135.3837
Havcr1 Hepatitis A virus cellular receptor 1 116.3776
Mall Mal, T cell differentiation protein-like 109.5096
Ddx4 DEAD (Asp-Glu-Ala-Asp) box polypeptide 4 107.4824
Tmigd1 Transmembrane and immunoglobulin domain
containing 1
92.0161
Timd2 T-cell immunoglobulin and mucin domain containing 2 90.5118
Chi3l3 Chitinase-like 3 or Ym1 81.1482
Ucp1 Uncoupling protein 1 (mitochondrial, proton carrier) 74.1526
Serpinb7 Serine (or cysteine) peptidase inhibitor, clade B,
member 7
72.4033
Tcf23 Transcription factor 23 70.0783
Ear10 Eosinophil-associated, ribonuclease A family,
member 10
66.9156
Ear11 Eosinophil-associated, ribonuclease A family,
member 11
63.0005
Gm4610 Predicted gene 4610 53.6569
Syt10 Synaptotagmin X 52.9130
Gm5150 Predicted gene 5150 49.2676
Klk1b11 Kallikrein 1-related peptidase b11 47.2572
Car12 Carbonic anyhydrase 12 43.5869
Gatm Glycine amidinotransferase (L-arginine:glycine
amidinotransferase)
42.6830
I830127L07Rik RIKEN cDNA I830127L07 gene 38.1699
LOC101056540 Unknown 35.2395
Asns Asparagine synthetase 33.8962
Rrm2 Ribonucleotide reductase M2 32.8288
Chchd10 Coiled-coil-helix-coiled-coil-helix domain
containing 10
31.9263
Flt1 FMS-like tyrosine kinase 1 31.6849
Slc7a2 Solute carrier family 7 (cationic amino acid
transporter, y1 system), member 2
30.7286
Galnt6 UDP-N-acetyl-a-D-galactosamine:polypeptide
N-acetylgalactosaminyltransferase 6
30.3134
Trib3 Tribbles homolog 3 (Drosophila) 27.4894
A530064D06Rik RIKEN cDNA A530064D06 gene 26.7710
Ccrn4l CCR4 carbon catabolite repression 4-like
(S cerevisiae)
25.7457
Grhl3 Grainyhead-like 3 (Drosophila) 25.1532
Entpd3 Ectonucleoside triphosphate diphosphohydrolase 3 24.6177
Kcnn4 Potassium intermediate/small conductance
calcium-activated channel, subfamily N,
member 4
22.9964
Fxyd6 FXYD domain-containing ion transport regulator 6 22.4216
Hist1h1b Histone cluster 1, H1b 22.4066
Arg1 Arginase, liver 22.1165
Oasl1 2’-59 oligoadenylate synthetase-like 1 21.4259
Gfra2 Glial cell line derived neurotrophic factor family
receptor a 2
20.4561
Anpep Alanyl (membrane) aminopeptidase 20.3326
Shcbp1 Shc SH2-domain binding protein 1 19.8717
Sema3b Sema domain, immunoglobulin domain (Ig), short
basic domain, secreted, (semaphorin) 3B
19.7311
Pbk PDZ binding kinase 19.4258
Spp1 Secreted phosphoprotein 1 19.0967
Ccna2 Cyclin A2 18.2413
Nuf2 NUF2, NDC80 kinetochore complex component,
homolog (S cerevisiae)
18.0971
Ccnf Cyclin F 17.6265
Plxna2 Plexin A2 17.4434
BLOOD, 15 MAY 2014 x VOLUME 123, NUMBER 20 DISTINCT M2 MACROPHAGE PHENOTYPES AND FUNCTIONS e113

Table 2. List of top 50 genes up-regulated by IL-4 inmonocyte-derived macrophages
Gene symbol Description Fold change
Ccl24 Chemokine (C-C motif) ligand 24 308.1040
Ddx4 DEAD (Asp-Glu-Ala-Asp) box polypeptide 4 147.2503
Ear11 Eosinophil-associated, ribonuclease A family,
member 11
129.8195
Tuba8 Tubulin, a 8 114.0360
Ear10 Eosinophil-associated, ribonuclease A family,
member 10
109.5308
Chi3l4 Chitinase-like 4 or Ym2 95.2618
Ear1 Eosinophil-associated, ribonuclease A family,
member 1
90.4369
Ear12 Eosinophil-associated, ribonuclease A family,
member 12
88.9709
Cdh1 Cadherin 1 73.2850
Il4i1 Interleukin 4 induced 1 71.5692
AA467197 Expressed sequence AA467197 68.8517
Asns Asparagine synthetase 60.0067
Ch25h Cholesterol 25-hydroxylase 59.7103
Cish Cytokine inducible SH2-containing protein 59.3660
Gm6756 Predicted gene 6756 53.0013
Ear2 Eosinophil-associated, ribonuclease A family,
member 2
47.4012
Vdr Vitamin D receptor 42.3885
Timp1 Tissue inhibitor of metalloproteinase 1 40.8995
Pi16 Peptidase inhibitor 16 39.9049
Fbp1 Fructose bisphosphatase 1 37.6432
Cst7 Cystatin F (leukocystatin) 36.9475
Klk8 Kallikrein related-peptidase 8 36.9350
Gfra2 Glial cell line derived neurotrophic factor family
receptor a 2
36.3341
Phgdh 3-phosphoglycerate dehydrogenase 36.1081
Tarm1 T cell-interacting, activating receptor on myeloid
cells 1
36.1055
Ramp3 Receptor (calcitonin) activity modifying protein 3 31.2576
A530064D06Rik RIKEN cDNA A530064D06 gene 26.3184
Slc7a2 Solute carrier family 7 (cationic amino acid
transporter, y1 system), member 2
24.4996
Msx3 msh homeobox 3 21.9209
Nlrp1a NLR family, pyrin domain containing 1A 21.6752
Ccl7 Chemokine (C-C motif) ligand 7 21.4119
Car6 Carbonic anhydrase 6 20.7420
Cebpe CCAAT/enhancer binding protein (C/EBP), e 20.2090
Aldh1a2 Aldehyde dehydrogenase family 1, subfamily A2 19.2205
Ccl17 Chemokine (C-C motif) ligand 17 19.2074
Mthfd2 Methylenetetrahydrofolate dehydrogenase
(NAD1 dependent), methenyltetrahydrofolate
cyclohydrolase
16.9681
Aqp3 Aquaporin 3 16.4622
Alox15 Arachidonate 15-lipoxygenase 15.4346
Retnla Resistin like a 15.3394
Ltb4r1 Leukotriene B4 receptor 1 15.2231
Retnlg Resistin like g 15.1644
Flt1 FMS-like tyrosine kinase 1 14.4730
Olr1 Oxidized low density lipoprotein (lectin-like)
receptor 1
14.4345
Cd81 CD81 antigen 14.2763
Slc7a5 Solute carrier family 7 (cationic amino acid
transporter, y1 system), member 5
13.8395
Fcrls Fc receptor-like S, scavenger receptor 12.9906
Ap4e1 Adaptor-related protein complex AP-4, e 1 12.5573
Hic1 Hypermethylated in cancer 1 12.2985
Rnase6 Ribonuclease, RNase A family, 6 12.1713
Slc30a4 Solute carrier family 30 (zinc transporter), member 4 12.0286
Table 3. List of 50 genes regulated by IL-4 in both resident andmonocyte-derived macrophages
Gene symbol Description Fold change*
AA467197 Expressed sequence AA467197 367.4197
Chi3l4 Chitinase-like 4 or Ym2 310.8889
Aqp3 Aquaporin 3 156.1061
Ddx4 DEAD (Asp-Glu-Ala-Asp) box polypeptide 4 127.3663
Ear11 Eosinophil-associated, ribonuclease A family,
member 11
96.4100
Ear10 Eosinophil-associated, ribonuclease A family,
member 10
88.2232
Cst7 Cystatin F (leukocystatin) 86.1656
Tuba8 Tubulin, a 8 58.8395
Ear12 Eosinophil-associated, ribonuclease A family,
member 12
46.9911
Asns Asparagine synthetase 46.9515
Chi3l3 Chitinase-like 3 or Ym1 44.8807
Cdh1 Cadherin 1 44.7643
Cish Cytokine inducible SH2-containing protein 33.5730
Gm4610 Predicted gene 4610 28.9111
Gm6756 Predicted gene 6756 28.5975
Gfra2 Glial cell line derived neurotrophic factor
family receptor a 2
28.3951
Phgdh 3-Phosphoglycerate dehydrogenase 28.1069
Slc7a2 Solute carrier family 7 (cationic amino acid
transporter, y1 system), member 2
27.6141
Gm5150 Predicted gene 5150 26.6933
A530064D06Rik RIKEN cDNA A530064D06 gene 26.5447
Ear2 Eosinophil-associated, ribonuclease A family,
member 2
25.9995
Gatm Glycine amidinotransferase (L-arginine:glycine
amidinotransferase)
25.6794
Pi16 Peptidase inhibitor 16 23.3797
Flt1 FMS-like tyrosine kinase 1 23.0790
Fbp1 Fructose bisphosphatase 1 22.4783
Apoe Apolipoprotein E 0.0499
Clec4d C-type lectin domain family 4, member d 0.0532
Apoc2 Apolipoprotein C-II 0.0551
Atf7 Activating transcription factor 7 0.0663
Irf8 Interferon regulatory factor 8 0.0682
Gm11538 Predicted gene 11538 0.0778
Fcgr1 Fc receptor, IgG, high affinity I 0.0858
Rgs1 Regulator of G-protein signaling 1 0.0877
Ccl3 Chemokine (C-C motif) ligand 3 0.0880
Prom1 Prominin 1 0.0982
Gm1673 Predicted gene 1673 0.1016
Cdkn1c Cyclin-dependent kinase inhibitor 1C (P57) 0.1045
Olfr871 Olfactory receptor 871 0.1055
Neurl3 Neuralized homolog 3 homolog (Drosophila) 0.1063
Lyz2 Lysozyme 2 0.1138
Itgb5 Integrin b 5 0.1160
Lst1 Leukocyte specific transcript 1 0.1253
Rnf150 Ring finger protein 150 0.1274
Itga6 Integrin a 6 0.1277
Cnrip1 Cannabinoid receptor interacting protein 1 0.1286
Abca1 ATP-binding cassette, sub-family A (ABC1),
member 1
0.1294
Cbr2 Carbonyl reductase 2 0.1316
1700003F12Rik RIKEN cDNA 1700003F12 gene 0.1339
Lmo2 LIM domain only 2 0.1416
Ldhb Lactate dehydrogenase B 0.1431
*Calculated as average fold change of genes regulated by IL-4 in resident
macrophage and genes regulated by IL-4 in monocyte-derived macrophages.
e114 GUNDRA et al BLOOD, 15 MAY 2014 x VOLUME 123, NUMBER 20
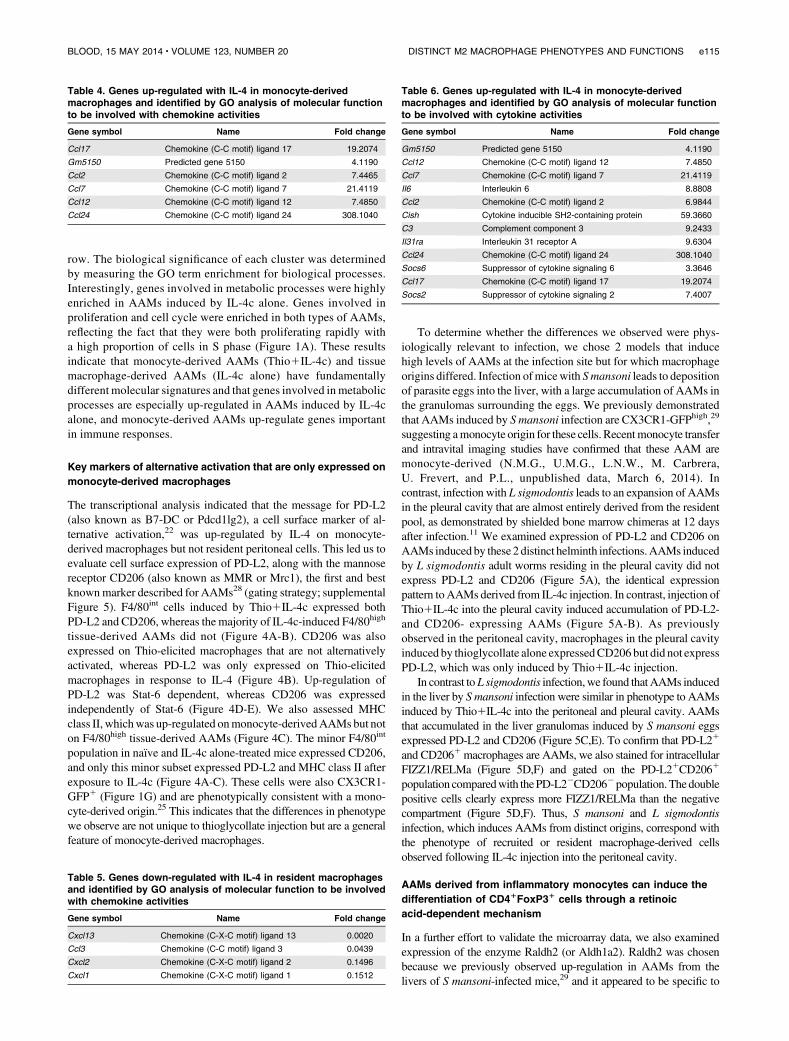
row. The biological significance of each cluster was determinedby measuring the GO term enrichment for biological processes.Interestingly, genes involved in metabolic processes were highlyenriched in AAMs induced by IL-4c alone. Genes involved inproliferation and cell cycle were enriched in both types of AAMs,reflecting the fact that they were both proliferating rapidly witha high proportion of cells in S phase (Figure 1A). These resultsindicate that monocyte-derived AAMs (Thio1IL-4c) and tissuemacrophage-derived AAMs (IL-4c alone) have fundamentallydifferent molecular signatures and that genes involved in metabolicprocesses are especially up-regulated in AAMs induced by IL-4calone, and monocyte-derived AAMs up-regulate genes importantin immune responses.
Key markers of alternative activation that are only expressed on
monocyte-derived macrophages
The transcriptional analysis indicated that the message for PD-L2(also known as B7-DC or Pdcd1lg2), a cell surface marker of al-ternative activation,22 was up-regulated by IL-4 on monocyte-derived macrophages but not resident peritoneal cells. This led us toevaluate cell surface expression of PD-L2, along with the mannosereceptor CD206 (also known as MMR or Mrc1), the first and bestknownmarker described for AAMs28 (gating strategy; supplementalFigure 5). F4/80int cells induced by Thio1IL-4c expressed bothPD-L2 and CD206, whereas the majority of IL-4c-induced F4/80high
tissue-derived AAMs did not (Figure 4A-B). CD206 was alsoexpressed on Thio-elicited macrophages that are not alternativelyactivated, whereas PD-L2 was only expressed on Thio-elicitedmacrophages in response to IL-4 (Figure 4B). Up-regulation ofPD-L2 was Stat-6 dependent, whereas CD206 was expressedindependently of Stat-6 (Figure 4D-E). We also assessed MHCclass II, whichwas up-regulated onmonocyte-derivedAAMs but noton F4/80high tissue-derived AAMs (Figure 4C). The minor F4/80int
population in naıve and IL-4c alone-treated mice expressed CD206,and only this minor subset expressed PD-L2 and MHC class II afterexposure to IL-4c (Figure 4A-C). These cells were also CX3CR1-GFP1 (Figure 1G) and are phenotypically consistent with a mono-cyte-derived origin.25 This indicates that the differences in phenotypewe observe are not unique to thioglycollate injection but are a generalfeature of monocyte-derived macrophages.
To determine whether the differences we observed were phys-iologically relevant to infection, we chose 2 models that inducehigh levels of AAMs at the infection site but for which macrophageorigins differed. Infection ofmicewith Smansoni leads to depositionof parasite eggs into the liver, with a large accumulation of AAMs inthe granulomas surrounding the eggs. We previously demonstratedthat AAMs induced by S mansoni infection are CX3CR1-GFPhigh,29
suggesting amonocyte origin for these cells. Recentmonocyte transferand intravital imaging studies have confirmed that these AAM aremonocyte-derived (N.M.G., U.M.G., L.N.W., M. Carbrera,U. Frevert, and P.L., unpublished data, March 6, 2014). Incontrast, infection with L sigmodontis leads to an expansion of AAMsin the pleural cavity that are almost entirely derived from the residentpool, as demonstrated by shielded bone marrow chimeras at 12 daysafter infection.11 We examined expression of PD-L2 and CD206 onAAMs inducedby these 2 distinct helminth infections.AAMs inducedby L sigmodontis adult worms residing in the pleural cavity did notexpress PD-L2 and CD206 (Figure 5A), the identical expressionpattern toAAMs derived from IL-4c injection. In contrast, injection ofThio1IL-4c into the pleural cavity induced accumulation of PD-L2-and CD206- expressing AAMs (Figure 5A-B). As previouslyobserved in the peritoneal cavity, macrophages in the pleural cavityinduced by thioglycollate alone expressedCD206 but did not expressPD-L2, which was only induced by Thio1IL-4c injection.
In contrast toL sigmodontis infection,we found thatAAMs inducedin the liver by S mansoni infection were similar in phenotype to AAMsinduced by Thio1IL-4c into the peritoneal and pleural cavity. AAMsthat accumulated in the liver granulomas induced by S mansoni eggsexpressed PD-L2 and CD206 (Figure 5C,E). To confirm that PD-L21
and CD2061macrophages are AAMs, we also stained for intracellularFIZZ1/RELMa (Figure 5D,F) and gated on the PD-L21CD2061
population comparedwith thePD-L22CD2062population.The doublepositive cells clearly express more FIZZ1/RELMa than the negativecompartment (Figure 5D,F). Thus, S mansoni and L sigmodontisinfection, which induces AAMs from distinct origins, correspond withthe phenotype of recruited or resident macrophage-derived cellsobserved following IL-4c injection into the peritoneal cavity.
AAMs derived from inflammatory monocytes can induce the
differentiation of CD41FoxP31 cells through a retinoic
acid-dependent mechanism
In a further effort to validate the microarray data, we also examinedexpression of the enzyme Raldh2 (or Aldh1a2). Raldh2 was chosenbecause we previously observed up-regulation in AAMs from thelivers of S mansoni-infected mice,29 and it appeared to be specific to
Table 4. Genes up-regulated with IL-4 in monocyte-derivedmacrophages and identified by GO analysis of molecular functionto be involved with chemokine activities
Gene symbol Name Fold change
Ccl17 Chemokine (C-C motif) ligand 17 19.2074
Gm5150 Predicted gene 5150 4.1190
Ccl2 Chemokine (C-C motif) ligand 2 7.4465
Ccl7 Chemokine (C-C motif) ligand 7 21.4119
Ccl12 Chemokine (C-C motif) ligand 12 7.4850
Ccl24 Chemokine (C-C motif) ligand 24 308.1040
Table 5. Genes down-regulated with IL-4 in resident macrophagesand identified by GO analysis of molecular function to be involvedwith chemokine activities
Gene symbol Name Fold change
Cxcl13 Chemokine (C-X-C motif) ligand 13 0.0020
Ccl3 Chemokine (C-C motif) ligand 3 0.0439
Cxcl2 Chemokine (C-X-C motif) ligand 2 0.1496
Cxcl1 Chemokine (C-X-C motif) ligand 1 0.1512
Table 6. Genes up-regulated with IL-4 in monocyte-derivedmacrophages and identified by GO analysis of molecular functionto be involved with cytokine activities
Gene symbol Name Fold change
Gm5150 Predicted gene 5150 4.1190
Ccl12 Chemokine (C-C motif) ligand 12 7.4850
Ccl7 Chemokine (C-C motif) ligand 7 21.4119
Il6 Interleukin 6 8.8808
Ccl2 Chemokine (C-C motif) ligand 2 6.9844
Cish Cytokine inducible SH2-containing protein 59.3660
C3 Complement component 3 9.2433
Il31ra Interleukin 31 receptor A 9.6304
Ccl24 Chemokine (C-C motif) ligand 24 308.1040
Socs6 Suppressor of cytokine signaling 6 3.3646
Ccl17 Chemokine (C-C motif) ligand 17 19.2074
Socs2 Suppressor of cytokine signaling 2 7.4007
BLOOD, 15 MAY 2014 x VOLUME 123, NUMBER 20 DISTINCT M2 MACROPHAGE PHENOTYPES AND FUNCTIONS e115

the monocyte-derived cells in our microarray analysis. Raldh2 is anenzyme that regulates production of retinoic acid (RA) with importantimplications for immune regulation.30Raldh2was up-regulated to a fargreater extent by Thio1IL-4c than IL-4c only, suggesting that AAMsgenerated frommonocytes preferentially produceRA (Figure 6A).Weused the fluorescent substrate aldefluor (ALD) to confirm enzymaticactivity by flow cytometry and found that Thio1IL-4c induced asubstantial number of ALD1 cells that were F4/80int (Figure 6B;supplemental Figure 6). As expected from its monocyte origins,
some of the minor F4/80int peritoneal population of naıve untreatedanimals and IL-4c-treated animals were also ALD1 (Figure 6C),although there were many fewer ALD1 cells than in Thio1IL-4c-treated animals.
Because RA can induce Foxp3 expression in CD41 T cells, wecompared the ability of IL-4c- and Thio1IL-4c-induced AAMs toinduce expression of Foxp3 in naıve CD41 T cells. Strikingly, onlyThio1IL-4c induced AAMs were able to induce differentiationof Foxp31 cells, detected after 7 days of culture (Figure 6D-E).
Table 7. List of top 50 genes down-regulated by IL-4 in residentmacrophages
Gene symbol Name Fold change
Cxcl13 Chemokine (C-X-C motif) ligand 13 0.0020
Lyz2 Lysozyme 2 0.0081
Atf7 Activating transcription factor 7 0.0131
Lpl Lipoprotein lipase 0.0177
Irf8 Interferon regulatory factor 8 0.0192
Apoc2 Apolipoprotein C-II 0.0196
Dusp6 Dual specificity phosphatase 6 0.0219
Clec7a C-type lectin domain family 7, member a 0.0238
Apoc1 Apolipoprotein C-I 0.0300
Hp Haptoglobin 0.0339
Gm1673 Predicted gene 1673 0.0344
Gm11538 Predicted gene 11538 0.0367
Fcgr1 Fc receptor, IgG, high affinity I 0.0375
Pltp Phospholipid transfer protein 0.0386
Ccl3 Chemokine (C-C motif) ligand 3 0.0439
Abca1 ATP-binding cassette, sub-family A (ABC1),
member 1
0.0441
Hspa1a Heat shock protein 1A 0.0494
Rgs2 Regulator of G-protein signaling 2 0.0526
Lama3 Laminin, a 3 0.0563
Nat8l N-acetyltransferase 8-like 0.0564
Apoc4 Apolipoprotein C-IV 0.0644
Clec4d C-type lectin domain family 4, member d 0.0673
Rab6b RAB6B, member RAS oncogene family 0.0704
Emb Embigin 0.0707
F13a1 Coagulation factor XIII, A1 subunit 0.0713
Fpr1 Formyl peptide receptor 1 0.0714
Upk1a Uroplakin 1A 0.0718
Cd63 CD63 antigen 0.0744
Gm4788 Predicted gene 4788 0.0773
Ccm2l Cerebral cavernous malformation 2-like 0.0782
Marco Macrophage receptor with collagenous structure 0.0804
Fpr2 Formyl peptide receptor 2 0.0805
Fkbp1a FK506 binding protein 1a 0.0805
1700003F12Rik RIKEN cDNA 1700003F12 gene 0.0806
Apoe Apolipoprotein E 0.0850
Rprm Reprimo, TP53 dependent G2 arrest mediator
candidate
0.0854
Cfhr2 Complement factor H-related 2 0.0855
Abca9 ATP-binding cassette, sub-family A (ABC1),
member 9
0.0913
Cfh Complement component factor h 0.0924
Egfl7 EGF-like domain 7 0.0930
Olfr871 Olfactory receptor 871 0.0934
Neurl3 Neuralized homolog 3 homolog (Drosophila) 0.0949
Rgs1 Regulator of G-protein signaling 1 0.0949
Rs5-8s1 Unknown 0.0977
Prom1 Prominin 1 0.0986
Ldhb Lactate dehydrogenase B 0.0987
Rhbdf1 Rhomboid family 1 (Drosophila) 0.1027
Fut7 Fucosyltransferase 7 0.1038
Pilra Paired immunoglobin-like type 2 receptor a 0.1082
Lst1 Leukocyte specific transcript 1 0.1086
Table 8. List of top 50 genes downregulated by IL-4 inmonocyte-derived macrophages
Gene symbol Name Fold change
Mamdc2 MAM domain containing 2 0.0148
Apoe Apolipoprotein E 0.0148
Dio2 Deiodinase, iodothyronine, type II 0.0169
AF251705 cDNA sequence AF251705 0.0211
Cdkn1c Cyclin-dependent kinase inhibitor 1C (P57) 0.0226
Hpgds Hematopoietic prostaglandin D synthase 0.0232
Syt10 Synaptotagmin X 0.0287
C77080 Expressed sequence C77080 0.0338
Mmp27 Matrix metallopeptidase 27 0.0356
Mcoln3 Mucolipin 3 0.0364
Tspan7 Tetraspanin 7 0.0368
Htra1 HtrA serine peptidase 1 0.0371
Saa3 Serum amyloid A 3 0.0373
Clec4d C-type lectin domain family 4, member d 0.0390
Cd200 CD200 antigen 0.0412
Ms4a7 Membrane-spanning 4-domains, subfamily A,
member 7
0.0413
Sh2d3c SH2 domain containing 3C 0.0430
Htr2b 5-Hydroxytryptamine (serotonin) receptor 2B 0.0452
Reps2 RALBP1 associated Eps domain containing
protein 2
0.0489
Npy Neuropeptide Y 0.0494
Cnrip1 Cannabinoid receptor interacting protein 1 0.0495
Tmem140 Transmembrane protein 140 0.0502
Lhfpl2 Lipoma HMGIC fusion partner-like 2 0.0503
Arhgap22 r GTPase activating protein 22 0.0507
Prss46 Protease, serine 46 0.0512
Spp1 Secreted phosphoprotein 1 0.0513
Cd93 CD93 antigen 0.0519
Pcp4l1 Purkinje cell protein 4-like 1 0.0525
Mfge8 Milk fat globule-EGF factor 8 protein 0.0547
Gstm1 Glutathione S-transferase, m 1 0.0547
Gpr137b G protein-coupled receptor 137B 0.0576
Cd109 CD109 antigen 0.0581
Tspan13 Tetraspanin 13 0.0586
Gas6 Growth arrest specific 6 0.0587
4930404N11Rik RIKEN cDNA 4930404N11 gene 0.0631
Mpeg1 Macrophage expressed gene 1 0.0655
Tecpr1 Tectonin b-propeller repeat containing 1 0.0680
Gprc5b G protein-coupled receptor, family C, group 5,
member B
0.0703
Pianp PILR a associated neural protein 0.0707
Gpr137b-ps G protein-coupled receptor 137B, pseudogene 0.0734
Gdpd1 Glycerophosphodiester phosphodiesterase
domain containing 1
0.0742
Lrrc27 Leucine rich repeat containing 27 0.0748
Fstl1 Follistatin-like 1 0.0750
Pdzk1ip1 PDZK1 interacting protein 1 0.0759
Fhdc1 FH2 domain containing 1 0.0765
Itgb5 Integrin b 5 0.0792
Speg SPEG complex locus 0.0795
Gstm3 Glutathione S-transferase, m 3 0.0799
Rgs1 Regulator of G-protein signaling 1 0.0805
e116 GUNDRA et al BLOOD, 15 MAY 2014 x VOLUME 123, NUMBER 20
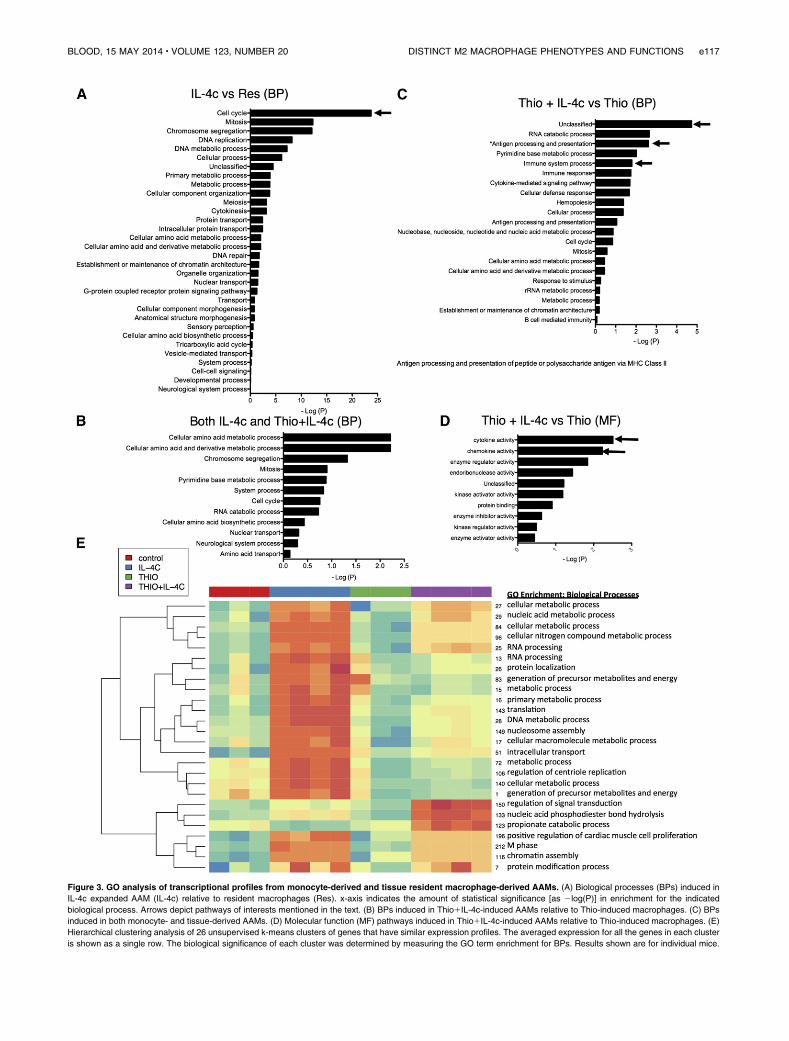
Figure 3. GO analysis of transcriptional profiles from monocyte-derived and tissue resident macrophage-derived AAMs. (A) Biological processes (BPs) induced in
IL-4c expanded AAM (IL-4c) relative to resident macrophages (Res). x-axis indicates the amount of statistical significance [as 2log(P)] in enrichment for the indicated
biological process. Arrows depict pathways of interests mentioned in the text. (B) BPs induced in Thio1IL-4c-induced AAMs relative to Thio-induced macrophages. (C) BPs
induced in both monocyte- and tissue-derived AAMs. (D) Molecular function (MF) pathways induced in Thio1IL-4c-induced AAMs relative to Thio-induced macrophages. (E)
Hierarchical clustering analysis of 26 unsupervised k-means clusters of genes that have similar expression profiles. The averaged expression for all the genes in each cluster
is shown as a single row. The biological significance of each cluster was determined by measuring the GO term enrichment for BPs. Results shown are for individual mice.
BLOOD, 15 MAY 2014 x VOLUME 123, NUMBER 20 DISTINCT M2 MACROPHAGE PHENOTYPES AND FUNCTIONS e117

Addition of the synthetic RA receptor antagonist LE540 blockedthe induction of Foxp31 expression by Thio1IL-4c-induced AAMs(Figure 6D), supporting a direct role for RA in the induction ofFoxp31 T-regulatory (Treg) cells by monocyte-derived AAMs.
Importantly, tissue-derived AAMs did not induce Foxp31 expres-sion on CD41 T cells, despite having the same ability to suppressT-cell proliferation (Figure 6F). Arginase activity has been shownto block T-cell proliferation,31,32 and because both types of AAMs
Figure 4. AAMs derived from inflammatory mono-
cytes express PD-L2, CD206, and MHC class II, but
not tissue macrophage-derived AAMs. FACS anal-
ysis of (A) PD-L2, (B) CD206 and (C) MHC class II
from peritoneal macrophages of mice untreated (naıve/
resident) or injected i.p. with IL-4c alone (IL-4c) or
thioglycollate alone (Thio) or Thio and IL-4c (Thio1IL-4c).
Graphs depict the geometric median fluorescent
intensity (MFI) of PD-L2 and CD206 and percentage
of MHC class II, gated on CD11b1 cells from the
peritoneal cavity of individual mice. Data are repre-
sentative of 3 independent experiments. (D) Stat6 is
required for regulating PD-L2 but not CD206 expres-
sion in monocyte-derived AAMs. (E) Quantitation of
CD11b1 cells that are CD2061PD-L21 from the
peritoneal cavity of individual mice and (F) the total
number of peritoneal cavity cells recovered from
treated animals. Results shown are representative of 2
independent experiments. *P , .05 and **P , .01 as
determined by ANOVA.
Figure 5. Different helminth infections induce either monocyte-derived or tissue-derived AAMs. (A) Representative FACs plots of pleural cavity macrophages on day 12
after L sigmodontis infection compared with pleural cavity macrophages of mice untreated (Res) or injected i.p. with thioglycollate alone (Thio) or Thio and IL-4c (Thio1IL-4c) or IL-4c
alone (IL-4c). (B) Graphs depict proportion of CD206 and PD-L2 positive pleural cavity macrophages. (C) Representative FACs plots of PD-L2 and CD206 expression gated on CD11b1
cells isolated from the liver of S mansoni-infected mice (8 weeks after infection) compared with CD11b1 cells isolated from the liver of mice untreated (naıve) mice. (D) FIZZ1/RELMa
intracellular staining on PD-L21CD2061 macrophages from S mansoni-infected livers compared with PD-L22CD2062 macrophages. (E) Graph depicts the percentage of PD-L2 and
CD206 double positive cells, gated on CD11b1 cells, from the livers of individual mice. (F) MFI of FIZZ1/RELMa staining on PD-L21CD2061 and PD-L22CD2062 macrophages from
livers of individual infected mice. *P , .05 and **P , .01 as determined by ANOVA. Results shown representative of 2 independent experiments.
e118 GUNDRA et al BLOOD, 15 MAY 2014 x VOLUME 123, NUMBER 20

express Arg1 at similarly high levels, this may contribute towardproliferative inhibition.
Uncoupling protein 1 is expressed only by resident
macrophage-derived AAMs
Having confirmed specific features of monocyte-derived AAMs, wenext validated potential markers for resident macrophage-derivedAAMs. One of the most highly up-regulated genes was Ucp1(Figure 7A), which is thought be highly selective for brownadipocytes,33 where it is responsible for thermogenesis.34 Weconfirmed by RT-PCR that Ucp1 was highly expressed by IL-4ctreatment in peritoneal macrophages isolated by adherence(Figure 7B), as well as by FACS sorting on CD11b1F4/801 cells(Figure 7C), but not expressed by Thio1IL-4c-induced AAMs. Toconfirm the expression of Ucp1 by resident-derived AAMs ina more physiological setting, we used the L sigmodontis infectionmodel. AAMs induced in the pleural cavity of L sigmodontis-infected mice are resident cell derived11 and up-regulated Ucp1expression (Figure 7D). Ucp1 expression increased in a linearfashion over 4 days after injection of IL-4c (Figure 7E) and wasregulated in Stat6-dependent manner (Figure 7F). Finally, we
confirmed that UCP1 protein was abundant in AAMs induced byIL-4c alone and was not detectable in Thio1IL-4c-induced AAMs(Figure 7G). Therefore, Ucp1 expression may prove a usefulexpression marker for tissue-derived AAMs.
Discussion
Tissue resident macrophages can be of embryonic origin and differ incellular lineage from macrophages derived from monocytes thatinfiltrate tissues during an inflammatory response.5 In the context ofhelminth infection, IL-4/IL-13 can expand tissue resident AAMs11 ormonocyte-derived AAMs,29,35 depending on the type of infection andthe tissue inflicted. A key unanswered question is whether these2 types of macrophages will respond differently to type 2 cytokines inways that reflect their heterogeneous existing transcriptional programsand/or epigenetic differences.36 In this study, we find that AAMs fromdiffering origins exhibit functional differences and cellular phenotypesthatmay reflect different physiological roles in type 2 responses.Thesefindings have relevance beyond helminth infection becauseAAMs arenow implicated in many noninfectious disease processes.37-39
Figure 6. Differential effects of monocyte- and tissue macrophage-derived AAMs on naıve CD41 T cells. (A) RT-PCR analysis of Aldh1a2/Raldh2 expression in
peritoneal macrophages normalized to expression of GAPDH. Graphs depict mean 6 standard error of the mean of individual mice pooled from 5 to 6 independent
experiments. (B) FACS analysis of Aldh activity gated on CD11b1 cells from the peritoneal cavity. Peritoneal cells were stained with aldefluor to detect Aldh activity for 2 hours
prior to staining with cell surface antibodies antibodies. (C) Graph depicts the proportion of CD11b1 cells that are ALD1 from individual mice. Results are pooled from 4
independent experiments. (D) Flow cytometry contour plots showing the percentage of CD251, Foxp31CD41 T cells after 6 days of coculture with peritoneal macrophages
either with or without the RA inhibitor LE540 (1 mM). (E) Quantitation of the percentage of CD251, Foxp31 cells from the CD41 compartment after coculture. Data are shown
from 3 independent experiments. (F) Inhibition of CD41 T-cell proliferation by IL-4c- and Thio1IL-4c-induced AAMs. FACS analysis of activated (anti-CD31IL-2) Cell tracer-
labeled naıve CD41 cells cultured with peritoneal macrophages (ratio of 2:1) after 3 days of coculture. Results are representative of 3 independent experiments.
BLOOD, 15 MAY 2014 x VOLUME 123, NUMBER 20 DISTINCT M2 MACROPHAGE PHENOTYPES AND FUNCTIONS e119

This study also identifies potentially useful markers to indicatewhetherAAMs in a particular setting are derived from tissue-residentmacrophages or from inflammatory monocytes. PD-L2 has beenvalidated as a marker of AAM in several in vivo models of type 2inflammation.23,35,40 Here, we show that IL-4 up-regulation ofPD-L2 is limited tomonocyte-derivedmacrophages. Further, PD-L2expression is a more specific marker than the mannose receptorCD206,28 because thioglycollate-elicited macrophages also expressCD206 in the absence of IL-4 and independently of Stat6. Hence, theabsence of PD-L2 expression on macrophages that express Arg1,Relma, and Chi3l3 could be an indication of tissue-resident origin.In contrast, Ucp1 was thought to be highly selective to adipocytes,33
but we find here that it is highly expressed in tissue-derived AAMs.In the context of a type 2 immune response, Ucp1 may prove usefulas a marker to distinguish between tissue-derived and monocyte-derived macrophages. The physiological relevance of Ucp1 expres-sion by tissue-derived AAMs warrants further study.
The production of RA by dendritic cells (DCs) can drive gut-tropic immune responses and promote the differentiation of FoxP31
Tregs.30 AAMs also express RALDH2, providing a source of RAthat can induce the differentiation of FoxP31 Tregs.29 The ex-pression of RALDH2 was recently described in human AAMs.26
Here, we show that RALDH2 expression and functional abilityto induce FoxP31 Treg differentiation through RA is restrictedto monocyte-derived AAMs. This restriction may reflect a greaterneed for Tregs during inflammatory responses involving monocyterecruitment. For example, the phagocytosis of apoptotic cells byinflammatory monocytes, instead of resident macrophages, resultsin a more inflammatory response,41 which may require Tregcontrol. DCs rather than macrophages may be more anatomically
positioned to induce Tregs in draining lymph nodes. Nonetheless,monocytes have recently been shown to traffic through the tissuesinto the lymph nodes.10 Perhaps monocyte-derived AAMs havemore active roles in directing host responses than expanded residentAAMs. This would be consistent with up-regulated chemokineactivity in monocyte-derived AAMs (Figure 3D) and down-regulation in tissue-derived AAMs (supplemental Figure 3). Thepreferential expression of MHC class II and thymus and activationregulated chemokine/Ccl17 by monocyte-derived AAMs (Table 4)42
is also notable because this may attract T cells to specifically interactwith monocyte-derived AAMs.
The differences between global transcriptional profiles of tissue-derived AAMs vs monocyte-derived AAMs (Figure 2B) are greaterthan differences previously reported in the ImmGen project,43
perhaps because that study focused on tissue-resident macrophages.Molecules associated with antigen presentation, migration, andregulation of immune responses were preferentially associatedwith monocyte-derived AAMs, as was previously described forDCs.44 Because infiltrating monocytes during an inflammatoryprocess can give rise tomacrophages and DC-like cells dependingon the environment, a key question is how they differ fromthe local resident macrophages and DCs as inflammation resolves. Itis important to note that the interaction of thioglycollate with IL-4is unclear and may synergistically enhance the observed immunesignature on monocyte-derived AAMs. To exclude the effects ofthioglycollate, future studies will examine the minor populationof CX3CR12GFP1PD-L21 cells (Figure 4) induced by IL-4ctreatment alone.
Egg granulomas from S mansoni infection predominantly recruitmonocyte-derivedAAMs,whereasL sigmodontis adult worms in the
Figure 7. Ucp1 is a unique marker for tissue resident macrophage-derived AAMs. (A) Microarray data for Ucp1 from AAMs. (B) Real-time PCR measurement of Ucp1
expression (relative to GAPDH) in peritoneal macrophages isolated by adherence. (C) RT-PCR measurement of Ucp1 expression in FACS sorted (CD11b1F4/801)
macrophages. (D) RT-PCR measurement of Ucp1 expression in pleural cavity macrophages on day 12 after L sigmodontis infection. (E) Time course analysis of Ucp1
expression after injection with IL-4c. (F) RT-PCR analysis of Ucp1 expression in peritoneal macrophages of treated Stat6-deficient animals. (G) Western blot analysis of Ucp1
protein from total peritoneal cells of individual mice treated with Thio, Thio1IL-4c, and IL-4c, with GAPDH as a loading control.
e120 GUNDRA et al BLOOD, 15 MAY 2014 x VOLUME 123, NUMBER 20

pleural cavity induce tissue-derived AAMs. A proximal explanationfor this difference would be that the egg triggers the release ofinflammatory chemokines (eg, Ccl2/MCP1) that recruit monocytesto a type 2 environment, whereas L sigmodontis infection does not.More fundamentally, are monocytes recruited to contain parasites,whereas resident cells minimize host damage? Although the answeris likely to be both tissue and parasite specific, it is not yet resolvedwhether inflammatory monocytes can eventually become tissue-resident F4/80-bright AAMs over time. In this study, we examinerelatively short time periods after stimulation, but it will be importantto know whether conversion occurs over time and whether thedistinct functions we observed in this study are driven by cell originor by long-term vs short-term tissue residence.
Acknowledgments
The authors thank Dr Nikollaq Vozhilla for help with breedingand maintaining mice and Alison Fulton for maintenance of theL sigmodontis life cycle.
Flow cytometry was performed at the NewYork University FlowCytometry and Cell Sorting Center, which is partially supported byNational Institutes of Health (NIH), National Cancer Institute grantP30CA16087-31. This work is supported by NIH, National Institute
of Allergy and Infectious Diseases grants AI093811 and AI094166(P.L.), Ruth L. Kirschstein National Research Service Award fellow-ship F32AI102502 (N.M.G.), NIH National Cancer Institute traininggrant, T32 CA009161; Principle Investigator: Levy (U.B.R.), andMedical Research Council program grant MR/K01207X/1 (J.E.A.).
Authorship
Contribution: U.M.G. performed research and analyzed data; N.M.G.performed research and analyzed data; D.R. and S.J. performedresearch, analyzed data, and helped draft the manuscript; L.N.W.performed research; M.S.T. and Z.D.K. analyzed data; K.E.W.performed research; U.B.R. performed research; A.M. contributedvital reagents and designed research; and P.L. and J.E.A. designedresearch, analyzed data, and wrote the paper.
Conflict-of-interest disclosure: The authors declare no competingfinancial interests.
Correspondence: P’ng Loke, Department of Microbiology,Division of Medical Parasitology, Old Public Health Building,Room 209, 341 East 25th St, New York, NY 10010; e-mail:[email protected]; or Judith E. Allen, Institute of Immunologyand Infection Research, University of Edinburgh, Edinburgh EH93JT, United Kingdom; e-mail: [email protected].
References
1. Schulz C, Gomez Perdiguero E, Chorro L, et al.A lineage of myeloid cells independent of Myband hematopoietic stem cells. Science. 2012;336(6077):86-90.
2. Yona S, Kim KW, Wolf Y, et al. Fate mappingreveals origins and dynamics of monocytes andtissue macrophages under homeostasis.Immunity. 2013;38(1):79-91.
3. Hashimoto D, Chow A, Noizat C, et al. Tissue-resident macrophages self-maintain locallythroughout adult life with minimal contribution fromcirculating monocytes. Immunity. 2013;38(4):792-804.
4. Hoeffel G, Wang Y, Greter M, et al. AdultLangerhans cells derive predominantly fromembryonic fetal liver monocytes with a minorcontribution of yolk sac-derived macrophages.J Exp Med. 2012;209(6):1167-1181.
5. Sieweke MH, Allen JE. Beyond stem cells: self-renewal of differentiated macrophages. Science.2013;342(6161):1242974.
6. Shi C, Pamer EG. Monocyte recruitment duringinfection and inflammation. Nat Rev Immunol.2011;11(11):762-774.
7. Ingersoll MA, Platt AM, Potteaux S, Randolph GJ.Monocyte trafficking in acute and chronicinflammation. Trends Immunol. 2011;32(10):470-477.
8. Bain CC, Scott CL, Uronen-Hansson H, et al.Resident and pro-inflammatory macrophages inthe colon represent alternative context-dependentfates of the same Ly6Chi monocyte precursors.Mucosal Immunol. 2013;6(3):498-510.
9. Zigmond E, Jung S. Intestinal macrophages:well educated exceptions from the rule. TrendsImmunol. 2013;34(4):162-168.
10. Jakubzick C, Gautier EL, Gibbings SL, et al.Minimal differentiation of classical monocytes asthey survey steady-state tissues and transportantigen to lymph nodes. Immunity. 2013;39(3):599-610.
11. Jenkins SJ, Ruckerl D, Cook PC, et al. Localmacrophage proliferation, rather than recruitment
from the blood, is a signature of TH2inflammation. Science. 2011;332(6035):1284-1288.
12. Jenkins SJ, Ruckerl D, Thomas GD, et al. IL-4directly signals tissue-resident macrophages toproliferate beyond homeostatic levels controlledby CSF-1. J Exp Med. 2013;210(11):2477-2491.
13. Gordon S, Martinez FO. Alternative activationof macrophages: mechanism and functions.Immunity. 2010;32(5):593-604.
14. Van Dyken SJ, Locksley RM. Interleukin-4- andinterleukin-13-mediated alternatively activatedmacrophages: roles in homeostasis and disease.Annu Rev Immunol. 2013;31:317-343.
15. Allen JE, Maizels RM. Diversity and dialogue inimmunity to helminths. Nat Rev Immunol. 2011;11(6):375-388.
16. Palm NW, Rosenstein RK, Medzhitov R. Allergichost defences. Nature. 2012;484(7395):465-472.
17. Pulendran B, Artis D. New paradigms in type 2immunity. Science. 2012;337(6093):431-435.
18. Allen JE, Wynn TA. Evolution of Th2 immunity:a rapid repair response to tissue destructivepathogens. PLoS Pathog. 2011;7(5):e1002003.
19. Odegaard JI, Chawla A. Alternative macrophageactivation and metabolism. Annu Rev Pathol.2011;6:275-297.
20. Graham AL, Taylor MD, Le Goff L, Lamb TJ,Magennis M, Allen JE. Quantitative appraisal ofmurine filariasis confirms host strain differencesbut reveals that BALB/c females are moresusceptible than males to Litomosoidessigmodontis. Microbes Infect. 2005;7(4):612-618.
21. Storey JD, Tibshirani R. Statistical methods foridentifying differentially expressed genes in DNAmicroarrays. Methods Mol Biol. 2003;224:149-157.
22. Loke P, Allison JP. PD-L1 and PD-L2 aredifferentially regulated by Th1 and Th2 cells. ProcNatl Acad Sci USA. 2003;100(9):5336-5341.
23. Huber S, Hoffmann R, Muskens F, Voehringer D.Alternatively activated macrophages inhibit T-cell
proliferation by Stat6-dependent expression ofPD-L2. Blood. 2010;116(17):3311-3320.
24. Jung S, Aliberti J, Graemmel P, et al. Analysisof fractalkine receptor CX(3)CR1 function bytargeted deletion and green fluorescent proteinreporter gene insertion. Mol Cell Biol. 2000;20(11):4106-4114.
25. Ghosn EE, Cassado AA, Govoni GR, et al. Twophysically, functionally, and developmentallydistinct peritoneal macrophage subsets. Proc NatlAcad Sci USA. 2010;107(6):2568-2573.
26. Martinez FO, Helming L, Milde R, et al. Geneticprograms expressed in resting and IL-4alternatively activated mouse and humanmacrophages: similarities and differences. Blood.2013;121(9):e57-e69.
27. Liao X, Sharma N, Kapadia F, et al. Kruppel-likefactor 4 regulates macrophage polarization. J ClinInvest. 2011;121(7):2736-2749.
28. Stein M, Keshav S, Harris N, Gordon S.Interleukin 4 potently enhances murinemacrophage mannose receptor activity: a markerof alternative immunologic macrophageactivation. J Exp Med. 1992;176(1):287-292.
29. Broadhurst MJ, Leung JM, Lim KC, et al.Upregulation of retinal dehydrogenase 2 inalternatively activated macrophages duringretinoid-dependent type-2 immunity to helminthinfection in mice. PLoS Pathog. 2012;8(8):e1002883.
30. Hall JA, Grainger JR, Spencer SP, Belkaid Y. Therole of retinoic acid in tolerance and immunity.Immunity. 2011;35(1):13-22.
31. El Kasmi KC, Qualls JE, Pesce JT, et al. Toll-likereceptor-induced arginase 1 in macrophagesthwarts effective immunity against intracellularpathogens. Nat Immunol. 2008;9(12):1399-1406.
32. Pesce JT, Ramalingam TR, Mentink-Kane MM,et al. Arginase-1-expressing macrophagessuppress Th2 cytokine-driven inflammation andfibrosis. PLoS Pathog. 2009;5(4):e1000371.
BLOOD, 15 MAY 2014 x VOLUME 123, NUMBER 20 DISTINCT M2 MACROPHAGE PHENOTYPES AND FUNCTIONS e121

33. Nedergaard J, Cannon B. UCP1 mRNA does notproduce heat. Biochim Biophys Acta. 2013;1831(5):943-949.
34. Fedorenko A, Lishko PV, Kirichok Y. Mechanismof fatty-acid-dependent UCP1 uncoupling inbrown fat mitochondria. Cell. 2012;151(2):400-413.
35. Obata-Ninomiya K, Ishiwata K, Tsutsui H, et al.The skin is an important bulwark of acquiredimmunity against intestinal helminths. J Exp Med.2013;210(12):2583-2595.
36. Ostuni R, Piccolo V, Barozzi I, et al. Latentenhancers activated by stimulation indifferentiated cells. Cell. 2013;152(1-2):157-171.
37. Biswas SK, Mantovani A. Macrophage plasticityand interaction with lymphocyte subsets: cancer
as a paradigm. Nat Immunol. 2010;11(10):889-896.
38. Moore KJ, Sheedy FJ, Fisher EA. Macrophages inatherosclerosis: a dynamic balance. Nat RevImmunol. 2013;13(10):709-721.
39. Odegaard JI, Chawla A. Pleiotropic actions ofinsulin resistance and inflammation in metabolichomeostasis. Science. 2013;339(6116):172-177.
40. Egawa M, Mukai K, Yoshikawa S, et al.Inflammatory monocytes recruited to allergic skinacquire an anti-inflammatory M2 phenotype viabasophil-derived interleukin-4. Immunity. 2013;38(3):570-580.
41. Uderhardt S, Herrmann M, Oskolkova OV, et al.12/15-lipoxygenase orchestrates the clearanceof apoptotic cells and maintains immunologictolerance. Immunity. 2012;36(5):834-846.
42. Liddiard K, Welch JS, Lozach J, Heinz S, GlassCK, Greaves DR. Interleukin-4 induction of theCC chemokine TARC (CCL17) in murinemacrophages is mediated by multiple STAT6 sitesin the TARC gene promoter. BMC Mol Biol. 2006;7:45.
43. Gautier EL, Shay T, Miller J, et al; ImmunologicalGenome Consortium. Gene-expression profilesand transcriptional regulatory pathways thatunderlie the identity and diversity of mouse tissuemacrophages. Nat Immunol. 2012;13(11):1118-1128.
44. Miller JC, Brown BD, Shay T, et al;Immunological Genome Consortium.Deciphering the transcriptional network of thedendritic cell lineage. Nat Immunol. 2012;13(9):888-899.
e122 GUNDRA et al BLOOD, 15 MAY 2014 x VOLUME 123, NUMBER 20
Copyright © 2022 FDOKUMEN