Alternative splicing of c-fos pre-mRNA: contribution of the rates of synthesis and degradation to...
13
BioMed Central Page 1 of 13 (page number not for citation purposes) BMC Molecular Biology Open Access Research article Alternative splicing of c-fos pre-mRNA: contribution of the rates of synthesis and degradation to the copy number of each transcript isoform and detection of a truncated c-Fos immunoreactive species Juan Jurado, Carlos A Fuentes-Almagro, María J Prieto-Álamo and Carmen Pueyo* Address: Universidad de Córdoba, Departamento de Bioquímica y Biología Molecular, Campus Rabanales, Edificio Severo Ochoa, planta-2a, 14071-Córdoba, Spain Email: Juan Jurado - [email protected]; Carlos A Fuentes-Almagro - [email protected]; María J Prieto-Álamo - [email protected]; Carmen Pueyo* - [email protected] * Corresponding author Abstract Background: Alternative splicing is a widespread mechanism of gene expression regulation. Previous analyses based on conventional RT-PCR reported the presence of an unspliced c-fos transcript in several mammalian systems. Compared to the well-defined knowledge on the alternative splicing of fosB, the physiological relevance of the unspliced c-fos transcript in regulating c-fos expression remains largely unknown. This work aimed to investigate the functional significance of the alternative splicing c-fos pre- mRNA. Results: A set of primers was designed to demonstrate that, whereas introns 1 and 2 are regularly spliced from primary c-fos transcript, intron 3 remains unspliced in part of total transcript molecules. Here, the two species are referred to as c-fos-2 (+ intron 3) and spliced c-fos (- intron 3) transcripts. Then, we used a quantitatively rigorous approach based on real-time PCR to provide, for the first time, the actual steady- state copy numbers of the two c-fos transcripts. We tested how the mouse-organ context and mouse- gestational age, the synthesis and turnover rates of the investigated transcripts, and the serum stimulation of quiescent cells modulate their absolute-expression profiles. Intron 3 generates an in-frame premature termination codon that predicts the synthesis of a truncated c-Fos protein. This prediction was evaluated by immunoaffinity chromatography purification of c-Fos proteins. Conclusion: We demonstrate that: (i) The c-fos-2 transcript is ubiquitously synthesized either in vivo or in vitro, in amounts that are higher or similar to those of mRNAs coding for other Fos family members, like FosB, ΔFosB, Fra-1 or Fra-2. (ii) Intron 3 confers to c-fos-2 an outstanding destabilizing effect of about 6- fold. (iii) Major determinant of c-fos-2 steady-state levels in cultured cells is its remarkably high rate of synthesis. (iv) Rapid changes in the synthesis and/or degradation rates of both c-fos transcripts in serum- stimulated cells give rise to rapid and transient changes in their relative proportions. Taken as a whole, these findings suggest a co-ordinated fine-tune of the two c-fos transcript species, supporting the notion that the alternative processing of the precursor mRNA might be physiologically relevant. Moreover, we detected a c-Fos immunoreactive species corresponding in mobility to the predicted truncated variant. Published: 21 September 2007 BMC Molecular Biology 2007, 8:83 doi:10.1186/1471-2199-8-83 Received: 11 December 2006 Accepted: 21 September 2007 This article is available from: http://www.biomedcentral.com/1471-2199/8/83 © 2007 Jurado et al; licensee BioMed Central Ltd. This is an Open Access article distributed under the terms of the Creative Commons Attribution License (http://creativecommons.org/licenses/by/2.0 ), which permits unrestricted use, distribution, and reproduction in any medium, provided the original work is properly cited.
Transcript of Alternative splicing of c-fos pre-mRNA: contribution of the rates of synthesis and degradation to...

BioMed CentralBMC Molecular Biology
ss
Open AcceResearch articleAlternative splicing of c-fos pre-mRNA: contribution of the rates of synthesis and degradation to the copy number of each transcript isoform and detection of a truncated c-Fos immunoreactive speciesJuan Jurado, Carlos A Fuentes-Almagro, María J Prieto-Álamo and Carmen Pueyo*Address: Universidad de Córdoba, Departamento de Bioquímica y Biología Molecular, Campus Rabanales, Edificio Severo Ochoa, planta-2a, 14071-Córdoba, Spain
Email: Juan Jurado - [email protected]; Carlos A Fuentes-Almagro - [email protected]; María J Prieto-Álamo - [email protected]; Carmen Pueyo* - [email protected]
* Corresponding author
AbstractBackground: Alternative splicing is a widespread mechanism of gene expression regulation. Previousanalyses based on conventional RT-PCR reported the presence of an unspliced c-fos transcript in severalmammalian systems. Compared to the well-defined knowledge on the alternative splicing of fosB, thephysiological relevance of the unspliced c-fos transcript in regulating c-fos expression remains largelyunknown. This work aimed to investigate the functional significance of the alternative splicing c-fos pre-mRNA.
Results: A set of primers was designed to demonstrate that, whereas introns 1 and 2 are regularly splicedfrom primary c-fos transcript, intron 3 remains unspliced in part of total transcript molecules. Here, thetwo species are referred to as c-fos-2 (+ intron 3) and spliced c-fos (- intron 3) transcripts. Then, we useda quantitatively rigorous approach based on real-time PCR to provide, for the first time, the actual steady-state copy numbers of the two c-fos transcripts. We tested how the mouse-organ context and mouse-gestational age, the synthesis and turnover rates of the investigated transcripts, and the serum stimulationof quiescent cells modulate their absolute-expression profiles. Intron 3 generates an in-frame prematuretermination codon that predicts the synthesis of a truncated c-Fos protein. This prediction was evaluatedby immunoaffinity chromatography purification of c-Fos proteins.
Conclusion: We demonstrate that: (i) The c-fos-2 transcript is ubiquitously synthesized either in vivo orin vitro, in amounts that are higher or similar to those of mRNAs coding for other Fos family members, likeFosB, ΔFosB, Fra-1 or Fra-2. (ii) Intron 3 confers to c-fos-2 an outstanding destabilizing effect of about 6-fold. (iii) Major determinant of c-fos-2 steady-state levels in cultured cells is its remarkably high rate ofsynthesis. (iv) Rapid changes in the synthesis and/or degradation rates of both c-fos transcripts in serum-stimulated cells give rise to rapid and transient changes in their relative proportions. Taken as a whole,these findings suggest a co-ordinated fine-tune of the two c-fos transcript species, supporting the notionthat the alternative processing of the precursor mRNA might be physiologically relevant. Moreover, wedetected a c-Fos immunoreactive species corresponding in mobility to the predicted truncated variant.
Published: 21 September 2007
BMC Molecular Biology 2007, 8:83 doi:10.1186/1471-2199-8-83
Received: 11 December 2006Accepted: 21 September 2007
This article is available from: http://www.biomedcentral.com/1471-2199/8/83
© 2007 Jurado et al; licensee BioMed Central Ltd. This is an Open Access article distributed under the terms of the Creative Commons Attribution License (http://creativecommons.org/licenses/by/2.0), which permits unrestricted use, distribution, and reproduction in any medium, provided the original work is properly cited.
Page 1 of 13(page number not for citation purposes)

BMC Molecular Biology 2007, 8:83 http://www.biomedcentral.com/1471-2199/8/83
BackgroundActivator protein-1 (AP-1) is a dimeric transcription factorregulating major physiological processes such as cell pro-liferation, differentiation, neoplastic transformation,apoptosis, and response to stress [1]. Main AP-1 compo-nents in mammals are members of the Fos and Jun pro-tein families. The Fos family includes the products of thec-fos (the cellular counterpart of oncogene v-fos), fosB, fra-1 and fra-2 genes. Fos proteins associate with Jun, but alsowith other basic leucine-zipper (bZIP) proteins to create avariety of AP-1 complexes [2].
The expression of c-fos is subjected to a tight regulation atmultiple levels. The c-fos gene undergoes rapid and tran-sient transcriptional activation in response to a variety ofextracellular stimuli [3]. Both c-fos mRNA and proteinturn over with short half-lives [4,5]. Additionally, whenthe c-Fos protein is over-synthesized, the c-fos gene is tran-scriptionally repressed [6].
Alternative splicing is a widespread mechanism of geneexpression regulation. The typical form of this regulationresults from tissue- or temporal-specific splicing eventsthat lead to the synthesis of either productive (protein-coding) or non-productive (no protein- coding) RNAs.Regarding transcription factors, alternative splicing prefer-entially adds or deletes domains that are important fortheir architectures and functions ([7] and referencesherein). The production of multiple isoforms is a com-mon strategy for regulating the activity of genes within theFos family (e.g. [8]). A particularly instructive example isthe differential splicing of the fosB transcript, which gen-erates two mRNAs that encode proteins with antagonisticactivities. Briefly, alternative splicing removes codons238–284 and causes a shift in the reading frame thatplaces a stop codon following the bZIP region. The trun-cated protein (referred to as ΔFosB), missing the C-termi-nal 101 aa of FosB, functions as a trans-negative regulatorof transcriptional activation and transformation, presum-ably by competing with the full-length Fos protein in thedimerization with Jun and binding to DNA steps [9-11].
Previous analyses [12,13] based on RT of total RNA fol-lowed by conventional PCR have reported the presence ofa transcript isoform (hereinafter referred to as c-fos-2) inseveral mammalian systems: (i) rat brain following kainicacid treatment, (ii) primary cortical culture of mousebrain treated with lipopolysaccharide, (iii) cartilage fromnewborn mouse, and (iv) mouse and human culturedstromal cells. Compared to the well-defined knowledgeon the alternative splicing of fosB, the physiological rele-vance of c-fos-2 transcript in regulating c-fos expression hasnot been well addressed.
The work described herein aimed to gain further insightsinto the functional significance of the alternative splicingof c-fos. To this end, we first undertook a systematic andmeticulous quantitation of the real copy numbers of c-fostranscript variants by means of a real-time PCR methodol-ogy [14-17]. We tested how the organ context, gestationalage, synthesis and turnover rates, and serum stimulationof quiescent cells modulate the absolute expression pro-files of the investigated c-fos transcripts. The translation ofthese transcripts predicts the synthesis of a truncated c-Fosprotein, in addition to the canonical full-length counter-part. From cultured cells we partially purified a c-Fosimmunoreactive species corresponding in mobility to thepredicted truncated species.
ResultsAlternative splicing variants of c-fos messengerDifferential pre-mRNA splicing is an important mode ofregulating the steady-state abundance of a specific mRNA.Based on the known structure of c-fos gene (Fig. 1A), a setof primers (Fig. 1B) was designed to investigate the occur-rence of any splicing variant that might be derived fromthe primary c-fos transcript. Gene fosB was included forcomparison. Primer pairs E1U-E2L and E2U-E3L (locatedin exons 1 and 2 and in exons 2 and 3, respectively) gen-erated single RT-PCR amplicons of expected sizes andsequences after regular splicing of introns 1 and 2 (Fig.1C). However, the primer pair E3U-E4L revealed the pres-ence of two transcript populations: while the shorteramplicon (141 nt) corresponded to the canonical splicedform of c-fos message, the larger amplicon (258 nt)retained the 117 nt of intron 3. These data confirmed thatintron 3 is not always spliced from the primary c-fos tran-script [12,13]. To quantitate this second transcript species,an additional primer pair (E3U-I3L) was designed. Asexpected, these primers gave a unique RT-PCR product ofthe predicted size (120 nt) and sequence.
Steady-state molecules of c-fos transcripts in animal tissues and cultured cellsHere we used a quantitatively rigorous approach based onRT and real-time PCR amplification [14-17] to providenovel information on the actual steady-state copy num-bers of the two c-fos transcripts. Quantitations were car-ried out in adult mouse organs, whole mouse embryos atdifferent developmental stages, and murine cultured cells.
We found that both transcripts were ubiquitouslyexpressed and presented vast differences in abundancedepending on the sample (Fig. 2). In the adult organsexamined, the canonical spliced c-fos mRNA displayedhigh steady-state levels in brain (10 molecules/pg of totalRNA) followed by heart, lung, and ovary (average of 4molecules/pg), as compared to spleen and testis (about0.4 molecules/pg), and the rest of the organs (around 0.07
Page 2 of 13(page number not for citation purposes)

BMC Molecular Biology 2007, 8:83 http://www.biomedcentral.com/1471-2199/8/83
Page 3 of 13(page number not for citation purposes)
RT-PCR amplicons from c-fos and fosB transcriptsFigure 1RT-PCR amplicons from c-fos and fosB transcripts. A) Schematic drawing of c-fos and fosB gene structures. Exons (E) are boxed and shaded in grey. Introns (I) are indicated by lines between exons, except for the alternatively spliced sequences that are indicated by brick filled in boxes. The beginning and end of exons are indicated by the corresponding nucleotide posi-tions (NCBI/GeneBank accession numbers: V00727 and AF093624 for c-fos and fosB, respectively). B) Names, sequences and 5'-position of upper (U) and lower (L) primers. C) Agarose (1.5%) gel electrophoresis analysis of RT-PCR products generated by different primer pairs (identified at the top of each line). Total RNA from NIH 3T3 cells was used as template. Forty cycles of PCR were performed as detailed [16]. Genomic DNA was further amplified by the E1U-E2L primer pair to exclude the pos-sibility that our PCR conditions were not optimal for the amplification of the longest theoretical fragment, i.e. the 933 nt ampli-con that should be observed if intron 1 remained unspliced in the c-fos transcript population [see Additional file 7]. The molecular weight marker was a 100-nt ladder from Roche.
A)E1U E2U E3U
E2LE3L
E4L
I3L
551 843 1598 1849 2255 2362 2480 3967
c-fos
E4U E5L
27827 27293 25472 25152 24696 24589 23328 20945
I4U I4L
23172 23033
fosB
C)
100
200300nt
E1U
-E2L
E2U
-E3L
E3U
-E4L
E3U
-I3L
MW
mar
ker
MW
mar
ker
E4U
-E5L
I4U
-I4L
c-fos fosB
B) 5’ end
E1U 5’-CCAGCATGGGCTCTCCTGTCAACACA 815E2U 5’-CCACGGTGACAGCCATCTCCACCA 1641E2L 5’-TCCGTAAGGATGGGGCGCTCTGGT 1747E3L 5’-GGCTGCAGCCATCTTATTCCGTTCCC 2317E3U 5’-CGGAATCGGAGGAGGGAGCTGACAGATA 2324
E4L 5’-TCGGTGGGCTGCCAAAATAAACTCCAGT 2581I3L 5’-ATGCTCAAGGACCCTGCGCCCATAGT 2440
E4U 5’-CGGGCTGCAAGATCCCCTACGAAGA 23225I4U 5’-GCCGAGGTGAGAGATTTGCCAGGGTC 23178
E5L 5’-GACCTCCGGGCAGGTGAGGACAAAC 22951I4L 5’-AGCCGTCAGGTTGGGGGGTGC 23050
c-fos primers
fosB primers

BMC Molecular Biology 2007, 8:83 http://www.biomedcentral.com/1471-2199/8/83
molecules/pg). Notably, this quantitative tissue-expres-sion profile is not in good agreement with qualitative RT-PCR results in public database. For instance, qualitativeRT-PCR (accession ID, MGI:1204456) generated a strongc-fos amplification band from either liver or lung RNA andno detectable signal from kidney RNA. However, quanti-tative data given here (Fig. 2) showed much lower expres-sion levels in both liver and kidney (around 0.07molecules/pg RNA) than in lung (5.7 molecules/pg RNA).These discrepancies might be due, at least partly, to theexperimental uncertainties of the end-point RT-PCRmethodology.
The c-fos-2 variant was present in smaller amounts in all8-tissue samples, where its presence accounted for differ-ent percentages of the total transcript molecules, rangingfrom more than 20% in lung and ovary to about 2% intestis. Regarding whole embryos, an over 7-fold overex-pression in both c-fos transcripts occurred as early as E7(gastrulating embryos). Thereafter, their amountsdeclined to approximately the average numbers of thesteady-state copies measured in adult tissues. Therefore,the c-fos-2 species accounted for a constant 8–9% of thetotal transcript molecules throughout mouse embryonicdevelopment.
Elevated levels of the two c-fos transcripts were also quan-titated in NIH 3T3 and Hepa1-6 confluent cells. Interest-ingly, at least in these 2 cell lines, we observed bothproducts with an about equal yield. This finding differsfrom a recent report in which confluent stromal cellsexpressed only the c-fos-2 transcript [13]. With regard tothe absolute amounts of transcripts coding for the rest ofproteins within the Fos family (Table 1 and data notshown), we found that the c-fos-2 variant was nearly asabundant in lung, liver, and kidney and in NIH 3T3 cellsas the transcripts coding for Fra-1 and Fra-2. Compara-tively, the transcript coding for FosB displayed a muchlower level.
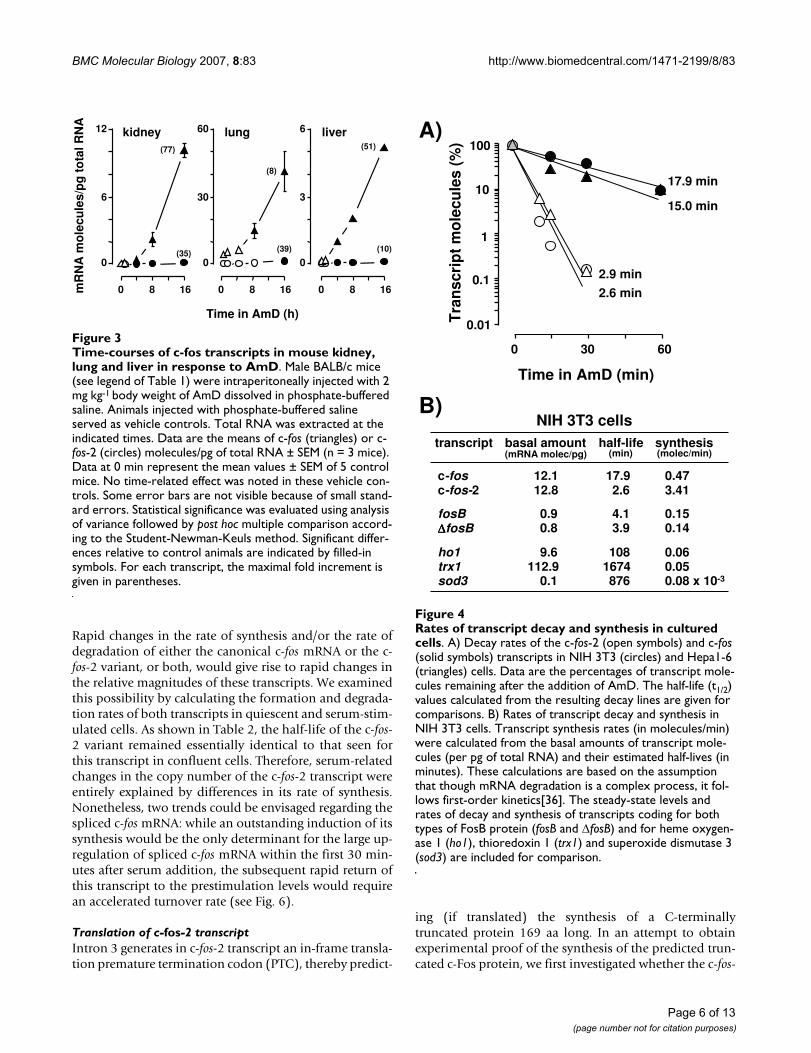
Differential stability of the two c-fos transcriptsThe intrinsic stability of any transcript is an importantcomponent of the gene expression program. We first triedto determine the half-life of each investigated c-fos tran-script in a whole animal study. For this purpose, weadministered actinomycin D (AmD) to stop transcriptionand then quantitated the number of transcript moleculesremaining at various times after the transcription shut-off.Surprisingly, in contrast to previous results with othermurine mRNAs [15], the decay rates of the c-fos transcriptscould not be calculated in animals, since their hepatic,pulmonary and renal levels increased (not decreased)upon the intraperitoneal injection of AmD (Fig. 3). Theseresults indicate that c-fos (an early response gene) is up-regulated in vivo by AmD under conditions in which thetranscription of other genes is blocked [15]. We have pre-viously addressed this problem in Saccharomyces cerevisiae[18], where the levels of mRNAs that are particularlyresponsive to environmental changes are up-regulated bycurrent procedures for blocking transcription (i.e. RNApolymerase inhibition by specific drugs or thermal inacti-vation of a temperature-sensitive mutant). Since AmDdoses higher than 2 mg kg-1 body weight and incubationtimes longer than 16 h could not be used without affect-ing the apparent healthy aspect of mice, we next consid-ered the possibility of quantifying the decay rates of theinvestigated c-fos transcripts in the cell-cultured model.
In contrast to animals, in cultured cells the moleculenumber of each c-fos transcript isoform decayed exponen-tially in the presence of AmD and their half-lives werereadily calculated from the equation of each decay line(Fig. 4A). The turnover of the two spliced forms of fosBmRNA and those of various non proto-oncogene tran-scripts were also determined for comparison (Fig. 4B). Wefound that the two species of c-fos transcripts displayedrather different half-lives in cultured cells: the c-fos-2decayed with a half-life of less than 3 min, whereas thehalf-life of the spliced c-fos messenger was over 15 min(Fig. 4A). Moreover, the kinetics and magnitudes of thequantitated decays suggested that c-fos-2 is not merely a
Organ-, embryo-, and cell type-associated differences in basal amounts of c-fos transcriptsFigure 2Organ-, embryo-, and cell type-associated differences in basal amounts of c-fos transcripts. Data are the num-bers of transcript molecules per pg of total RNA. Regarding cultured cells, error bars (SEM) indicate transcript level vari-ability among 13 (NIH 3T3) or 8 (Hepa1-6) independent cul-tures. Total RNA (pool of ~200 BALB/c mice) from animal organs and whole embryos were from Clontech. No error bars are shown for quantitations of these commercial sam-ples of total RNA. E17 embryos are in late gestation (total of about 19 days). The percentage of c-fos-2 in total transcript amount (c-fos-2 plus spliced c-fos) is indicated for each of the sample examined.
mRNA molecules/pg total RNA
c-fosc-fos-2
5.6 %Brain
8.0 %Heart
0 6 12
21.4 %Lung
28.1%Ovary
9.4%Liver
8.9%Spleen
7.1%Kidney
2.1%Testis
0 0.25 0.5
0 5 10
E7
E15
E17
8.8%
8.1%
8.1%
0 12.5 25
44.2%NIH 3T3
Hepa1-637.7%
Page 4 of 13(page number not for citation purposes)

BMC Molecular Biology 2007, 8:83 http://www.biomedcentral.com/1471-2199/8/83
splicing intermediate in the production of the mature c-fostranscript [see theoretical considerations in Additional file1]. In contrast to c-fos, both fosB transcripts exhibited iden-tical half-lives of about 4 min (Fig. 4B). Transcript turno-ver rates in the order of minutes was a characteristic ofproto-oncogenes since other mRNA species such as thoseencoding for heme oxygenase 1, thioredoxin 1, and super-oxide dismutase 3 presented turnover rates in the order ofhours.
The steady-state abundance of any transcript depends onthe balance between two opposing factors, its rate of for-mation and degradation. We show that though both c-fostranscripts are similarly abundant in cultured cells, the c-fos-2 turned over about 6-fold faster than the spliced c-fosmRNA. Both findings can only be conciliated if, at thesame time, the c-fos-2 isoform is produced at a higher rate.Having determined the numbers of transcript copies andthe transcript half-lives, we can estimate their synthesisrates. The result of such a calculation (Fig. 4B) suggeststhat the major determinant of c-fos-2 transcript level incultured cells is its high rate of synthesis, as compared tothat of the spliced c-fos variant, and particularly to thoseof both fosB and of non proto-oncogenes mRNAs.
Next, we asked ourselves whether cycloheximide (Cx), aprotein synthesis inhibitor, leads to the stabilization ofthe alternative c-fos-2 transcript. We found (Fig. 5), thatthe fast decay rate of the c-fos-2 species is not coupled totranslation, since it went on being ≤ 3 minutes in the pres-ence of Cx, irrespective of the cell type (NIH 3T3 orHepa1-6). In contrast, as expected [5], the inhibition ofthe translation transformed the spliced c-fos mRNA into astable species (at least in the 120 min period examined).
Transcript levels upon serum stimulationPrevious studies have shown that the stimulation of qui-escent cells with 15% CS causes a rapid transient increasein c-fos mRNA [19]. To gain more insight into the mecha-nisms that might be influencing the cellular level of thealternative c-fos-2 transcript, we decided to analysewhether its accumulation mode after serum induction wasidentical or not to that of the canonical spliced mRNA.
We found (Fig. 6) that CS induced different expressionprofiles for both the spliced c-fos and the c-fos-2 transcriptvariant. In both cases, a dramatic 11-fold increase (fromabout 2.3 to 25 molecules/pg) was quantitated as soon as5 min after serum addition. However, following this earlyup-regulation, while the c-fos-2 copy number remainedrelatively constant within 5–30 min, the amount of thespliced c-fos mRNA increased until a maximum of 100-fold was reached 30 min past stimulation. Thereafter,both transcript levels decayed with different kinetics:spliced c-fos mRNA molecules decreased to 50% of maxi-mum in 20 min, while c-fos-2 lasted 37 min. Overall, thesedistinguishing features caused rapid changes in the rela-tive abundance of both transcripts throughout the periodanalyzed in this experiment. Comparatively, our quantita-tive PCR analysis revealed a much less differential expres-sion of both fosB mRNA isoforms. Moreover, in contrastto previous observations [11], the expression of fosB didnot precede that of ΔfosB mRNA at any time followingserum stimulation. In fact, both transcripts were inducedin a close parallelism throughout the first 30 min of serumtreatment, and, additionally, the ΔfosB mRNA increasepersisted longer (Fig. 6).
Table 1: Absolute steady-state levels of transcripts encoding proteins of the Fos family in mouse lung
mouse c-fos c-fos-2 fosB fra1 fra2
1 2.80 0.59 0.035 0.96 1.932 4.52 0.62 0.039 0.98 2.423 3.37 0.81 0.033 1.03 2.484 3.04 0.66 0.030 1.03 1.635 2.00 0.49 0.022 1.15 2.736 3.08 0.47 0.023 1.26 2.347 2.14 0.16 0.012 1.26 2.048 2.41 0.41 0.018 1.44 2.609 3.57 0.61 0.022 1.51 2.6110 3.71 0.88 0.033 1.29 2.8211 4.16 0.42 0.014 1.13 2.6712 3.90 0.58 0.038 1.37 2.94
mean ± SEM 3.22 ± 0.23 0.56 ± 0.053 0.027 ± 0.003 1.20 ± 0.050 2.44 ± 0.11
Male BALB/c mice of 7 weeks of age were obtained from Charles River Laboratories (Spain). Following a 3-day acclimation period animals were individually killed by cervical dislocation. The lung was removed and immediately frozen in liquid nitrogen. Mice were handled according to the norms stipulated by the European Community. The investigation was performed after approval by the Ethical Committee of the University of Córdoba (Spain). Data are transcript molecules/pg of total RNA.
Page 5 of 13(page number not for citation purposes)
BMC Molecular Biology 2007, 8:83 http://www.biomedcentral.com/1471-2199/8/83
Rapid changes in the rate of synthesis and/or the rate ofdegradation of either the canonical c-fos mRNA or the c-fos-2 variant, or both, would give rise to rapid changes inthe relative magnitudes of these transcripts. We examinedthis possibility by calculating the formation and degrada-tion rates of both transcripts in quiescent and serum-stim-ulated cells. As shown in Table 2, the half-life of the c-fos-2 variant remained essentially identical to that seen forthis transcript in confluent cells. Therefore, serum-relatedchanges in the copy number of the c-fos-2 transcript wereentirely explained by differences in its rate of synthesis.Nonetheless, two trends could be envisaged regarding thespliced c-fos mRNA: while an outstanding induction of itssynthesis would be the only determinant for the large up-regulation of spliced c-fos mRNA within the first 30 min-utes after serum addition, the subsequent rapid return ofthis transcript to the prestimulation levels would requirean accelerated turnover rate (see Fig. 6).
Translation of c-fos-2 transcriptIntron 3 generates in c-fos-2 transcript an in-frame transla-tion premature termination codon (PTC), thereby predict-
ing (if translated) the synthesis of a C-terminallytruncated protein 169 aa long. In an attempt to obtainexperimental proof of the synthesis of the predicted trun-cated c-Fos protein, we first investigated whether the c-fos-
Rates of transcript decay and synthesis in cultured cellsFigure 4Rates of transcript decay and synthesis in cultured cells. A) Decay rates of the c-fos-2 (open symbols) and c-fos (solid symbols) transcripts in NIH 3T3 (circles) and Hepa1-6 (triangles) cells. Data are the percentages of transcript mole-cules remaining after the addition of AmD. The half-life (t1/2) values calculated from the resulting decay lines are given for comparisons. B) Rates of transcript decay and synthesis in NIH 3T3 cells. Transcript synthesis rates (in molecules/min) were calculated from the basal amounts of transcript mole-cules (per pg of total RNA) and their estimated half-lives (in minutes). These calculations are based on the assumption that though mRNA degradation is a complex process, it fol-lows first-order kinetics[36]. The steady-state levels and rates of decay and synthesis of transcripts coding for both types of FosB protein (fosB and ΔfosB) and for heme oxygen-ase 1 (ho1), thioredoxin 1 (trx1) and superoxide dismutase 3 (sod3) are included for comparison.
Time in AmD (min)
Tra
nsc
rip
t m
ole
cule
s (%
)
0.01
0.1
1
10
100
0 30 60
17.9 min
15.0 min
2.9 min
2.6 min
A)
NIH 3T3 cells
(mRNA molec/pg)
12.112.8
9.6112.9
0.1
0.90.8
basal amount half-life
17.92.6
1081674876
4.13.9
(min)synthesis
0.473.41
0.150.14
0.060.050.08 x 10-3
(molec/min)
c-fosc-fos-2
ho1trx1sod3
fosBΔΔΔΔfosB
transcript
B)
Time-courses of c-fos transcripts in mouse kidney, lung and liver in response to AmDFigure 3Time-courses of c-fos transcripts in mouse kidney, lung and liver in response to AmD. Male BALB/c mice (see legend of Table 1) were intraperitoneally injected with 2 mg kg-1 body weight of AmD dissolved in phosphate-buffered saline. Animals injected with phosphate-buffered saline served as vehicle controls. Total RNA was extracted at the indicated times. Data are the means of c-fos (triangles) or c-fos-2 (circles) molecules/pg of total RNA ± SEM (n = 3 mice). Data at 0 min represent the mean values ± SEM of 5 control mice. No time-related effect was noted in these vehicle con-trols. Some error bars are not visible because of small stand-ard errors. Statistical significance was evaluated using analysis of variance followed by post hoc multiple comparison accord-ing to the Student-Newman-Keuls method. Significant differ-ences relative to control animals are indicated by filled-in symbols. For each transcript, the maximal fold increment is given in parentheses.
Time in AmD (h)
mR
NA
mo
lecu
les/
pg
to
tal R
NA
kidney
0
6
12
0 8 16 0 8 16
0
3
6 liver
(8)
(39)
(51)
(10)
(77)
(35)
lung
0
30
60
0 8 16
Page 6 of 13(page number not for citation purposes)

BMC Molecular Biology 2007, 8:83 http://www.biomedcentral.com/1471-2199/8/83
2 transcript was present in the cellular cytoplasm. To thisend, RNA was isolated from separate cytoplasmic andnuclear fractions of NIH 3T3 cells, and then the resultingRNAs were analyzed by end-point RT-PCR. As shown inFig. 7, the c-fos-2 transcript was present in both cellularfractions, like the unspliced fosB transcript. In contrast, nounspliced gpx1 pre-mRNA was present in the cytoplasmicfraction showing an efficient cellular fractionation.
Given the presence of the c-fos-2 transcript in the cyto-plasm, we next evaluated whether the truncated c-Fos var-iant accumulated in serum-stimulated cells. For thispurpose, c-Fos proteins were partially purified by immu-noaffinity chromatography from NIH 3T3 cell extract fol-lowing 30 min serum stimulation. Immunoblot analysiswith anti-cFos Ab of the eluate column revealed severalelectrophoretically distinguishable bands (Fig. 8B). Thehigher molecular weight bands matched the multipleforms of the full-length c-Fos protein that appeared in therange of 53- to 68-kDa [4,20]. Bands detected in the rangeof 42- to 50-kDa might be c-Fos breakdown products.Finally, the discrete immunoreactive species correspond-ing in mobility to a ~23-kDa protein would be the trun-cated c-Fos form. This band was not detected in crudeextract from either serum-starved or serum-stimulatedcells. The possibility that the ~23-kDa band would be pri-mary Ab light chains leaching off the immunoaffinity col-umn was excluded by using only the secondary Ab [seeAdditional file 2]. Furthermore, the possibility that the~23-kDa band would be a non-specific protein co-puri-fied with the rabbit anti-cFos Ab was excluded by using adifferent primary Ab in the Western blotting [see Addi-tional file 3].
Discussionc-Fos proto-oncoprotein is a key cell regulator, whoseimproper expression is oncogenic, both in cultured cellsand living organisms. To avoid the deleterious effects ofderegulated expression, c-fos is subjected to numeroustranscriptional and posttranscriptional controls [2]. Dif-ferential pre-mRNA splicing is an important mode of reg-ulating the activity of mammalian genes (e.g. [7]). Ourinterest in c-fos splicing stems from previous studies onfosB where a truncated spliced variant missing the C-ter-minus of FosB appears to be of great physiological rele-vance, e.g. in mediating long-term adaptive changes in thenervous system [21].
Murine c-fos gene comprises 4 exons and 3 introns span-ning ~3.4 kb of chromosome 12. By means of specificprimers, we first explored the presence of intronsequences in the transcript population derived from c-fos.We demonstrated that whereas introns 1 and 2 are regu-larly spliced from the precursor RNA, intron 3 remainsunspliced in part of the total transcript molecules. Follow-ing this finding, we performed a robust and sensitive RT-PCR methodology for providing for the first time a com-prehensive quantitation of the absolute expression levelsof each transcript isoform: the canonical spliced c-fos andthe alternative c-fos-2. Comparisons of expression levelsacross 8 mouse organs, 3 fetal stages and 2 cultured celllines led to four observations: (i) The c-fos-2 transcript isubiquitously synthesized either in vivo or in vitro situa-tions. (ii) This isoform is present in amounts that are
Time-course of c-fos (left) and fosB (right) transcript levels in serum-stimulated NIH 3T3 cellsFigure 6Time-course of c-fos (left) and fosB (right) transcript levels in serum-stimulated NIH 3T3 cells. Data are the means of transcript molecules per pg of total RNA ± SEM from independent cultures. Some error bars are not visible because of small SEM.
mR
NA
mo
lecu
les
/ pg
to
tal R
NA
Time (min)
300
150
0
90600
c-fosc-fos-2
40
20
0
fosBΔΔΔΔfosB
120 90600 12030 30
Changes in transcript decay upon translation inhibitionFigure 5Changes in transcript decay upon translation inhibi-tion. Decay rates of c-fos-2 (circles) and c-fos (triangles) transcripts were determined as in Fig. 4, excepting that half of the plates were pretreated for 15 min with Cx (10 μg/ml). Then, AmD was added to all the plates and transcript decay was followed in the presence (solid symbols) and absence (open symbols) of Cx.
Time in AmD (min)
mR
NA
mo
lecu
les
(%)
0.01
0.1
1
10
100
0 60 120
19.2 min
3.2 min3.0 min
Hepa1-6
0.01
0.1
1
10
100
0 60 120
13.6 min
2.3 min2.2 min
NIH 3T3
Page 7 of 13(page number not for citation purposes)

BMC Molecular Biology 2007, 8:83 http://www.biomedcentral.com/1471-2199/8/83
higher or similar to those of mRNAs coding for other Fosfamily members like FosB, ΔFosB, Fra-1 or Fra-2. (iii) Thec-fos-2 variant is frequently processed in certain mouse tis-sues, like ovary and lung, and in confluent cell cultures,where both transcript isoforms are produced in aboutequal quantities. (iv) No obvious relationship existsbetween total amount of c-fos transcripts and the relativequantity of the c-fos-2 form. For instance, c-fos-2accounted for about 9% of total transcript molecules inliver and about 6% in brain, though this last organexceeds the hepatic steady-state amount by over 75-fold.On the whole, these findings support the notion that thec-fos-2 copy number might be controlled.
The number of copies of any transcript is determined by adelicate balance between opposing synthesis and degrada-tion mechanisms. Here we show that the presence ofintron 3 confers to the c-fos-2 transcript a destabilizingeffect of about 6-fold, e.g. reducing the transcript half-lifefrom 18 to 3 min in confluent NIH 3T3 cells (Fig. 4).
The canonical c-fos mRNA is targeted for decay by twofunctionally independent instability determinants. Oneof these determinants (designated mCRD) is located inthe protein-coding region and the other (an AU-rich ele-ment) in the 3'-untranslated end of the c-fos mRNA [22].The mRNA decay mediated by mCRD represents a "sui-cide" mechanism in which translation of the mCRD-con-taining RNA results in the rapid degradation of themessage [23]. Here we show that the half-lives of the c-fosand c-fos-2 transcripts are affected differently by inhibi-tion of the translation, since cycloheximide caused the sta-bilization of only the canonical c-fos mRNA (Fig. 5). Thisresult suggests that the shorter half-life of the alternative c-fos-2 species is independent of translationally coupledmRNA turnover mechanisms, like the one directed by themCRD determinant. Accordingly, the c-fos-2 transcriptwith the PTC lying in the last intron 3 (Fig. 8A) should bealso immune to the so-called nonsense-mediated decay(NMD). It is noteworthy that this latter was anticipatedgiven that one critical determinant of whether a mamma-lian transcript is subjected to NMD is the presence of asplicing-generated exon-exon junction >50–55 nt down-
stream the PTC (recently reviewed in [24] and [25]). Inthe absence of these two translationally coupled mRNAturnover mechanisms, an intriguing question remains tobe answered: Why is the c-fos-2 transcript degraded at afaster rate than the canonical c-fos message?.
A recent paper by Moraes et al [26] indicates that the CUG-binding protein (CUG-BP) plays a role in c-fos mRNAdecay. By means of an in vitro deadenylation assay, theyshowed that CUG-BP binding to c-fos mRNA stimulatesthe poly(A) shortening by the PARN deadenylase. Sincedeadenylation is a rate-limiting step in the turnover ofmost mRNAs, we hypothesized that the presence of intron3 in the c-fos-2 transcript might accelerate its decay by theabove-referred mechanism. We reasoned that in this case,the proportion between both c-fos transcript variantsmight change when using an anchored oligo(dT)primer(5'-T20VN-3'), rather than random primers, in the cDNAsynthesis. This approach allowed us to track specificallythe transcripts that retained poly(A)+ tails of a sufficientlength to allow priming. We found [see Additional file 4]that the poly(A)+ population has practically the same copynumbers of c-fos and c-fos-2 transcripts as the overall RNApopulation. Moreover, the rate at which each transcriptdisappeared from the poly(A)+ population was similar totheir overall decay rates [see Additional file 4]. These dataseem to favour the idea that the two transcripts undergodeadenylation at the same rate, which seems to be inagreement with the synchronous deadenylation patternseen for c-fos RNA both in vivo and in vitro [26,27]. Furtherwork should pursue the identification of new instabilitydeterminants within the c-fos-2 transcript variant.
Shur et al [13] have recently reported rapid changes in c-fos-2 and c-fos transcript levels in response of the osteob-lastic cells to a challenge with dexamethasone (a pharma-cological glucocorticoid hormone). Control of c-fossplicing through the interaction of the glucocorticoidreceptor with the c-fos-2 transcript was the mechanismproposed to explain the observed changes. Here we tooshow that the proportion between both c-fos transcriptvariants changes rapidly and transiently upon the stimu-lation by serum of NIH 3T3 fibroblasts in quiescence. Our
Table 2: Rates of synthesis and degradation of c-fos and c-fos-2 transcripts upon serum stimulation
c-fos c-fos-2
NIH 3T3 cells amount (molec/pg) half-life (min) synthesis (molec/min)
amount (molec/pg) half-life (min) synthesis (molec/min)
confluent 12.1 17.9 0.47 12.8 2.6 3.41quiescent 2.6 17.5 0.10 2.2 2.3 0.66serum (15 min) 116.1 17.1 4.71 28.1 2.3 8.47serum (60 min) 77.1 8.5 6.29 10.2 2.7 2.62
Experimental conditions are as in Figs. 4 and 6. Confluent cell data are those in Fig. 4.
Page 8 of 13(page number not for citation purposes)

BMC Molecular Biology 2007, 8:83 http://www.biomedcentral.com/1471-2199/8/83
data indicate that differential rates of synthesis determinethe large up-regulation of spliced c-fos relative to c-fos-2level at the early stage of the serum response. However,destabilization of the newly synthesized c-fos message,possibly as it is being translated, contributes to complet-ing the response and restoring the ~50% yield (percentageof total transcript molecules) quantitated in confluent cul-tures. This temporal sequence of events further supports
the idea that the alternative processing of the primary c-fostranscript might be of physiological relevance, given thata relatively short extension of c-fos expression is sufficientfor fibroblasts to manifest properties of cell transforma-tion [28].
Detection of c-Fos immunoreactive speciesFigure 8Detection of c-Fos immunoreactive species. A) Nucle-otide sequence of c-fos intron 3 and flanking exons 3 and 4. Lower case letters refer to intronic nucleotides and upper case letters to exonic nucleotides. Minimal functional sequences within the mCRD are underlined. The encircled triplets encode the aa residues that contact to DNA. Triplets encoding two out of the five-leucine residues of the LZ motif are indicated in italics. The stop codon in intron 3 is boxed and shaded in grey. B) Western blot analysis of c-Fos pro-teins purified by immunoaffinity chromatography. A crude extract from NIH 3T3 cells stimulated with serum for 30 min was loaded onto the immunoaffinity column. The column elu-ate (E-30), as well as the input crude extract (CE-30) and the crude extract from serum-starved (CE-0) cells were sub-jected to inmunoblot analysis as described under "Methods". The positions of molecular size standards are indicated on the left in kDa. GAPDH was used for loading control.
B)
75
kDa
50
37
25
20
CE-30 E-30CE-0
c-Fos
GAPDH
A)
CTA TCT CCT GAA GAG GAA GAG AAA CGG AGA ATC
CGA AGG GAA CGG AAT AAG ATG GCT GCA GCC AAG
TGC CGG AAT CGG AGG AGG GAG CTG ACA GAT ACA
CTC CAA GCG gta ggt tga accagctgctgctcctgaa
actttattaaagttggagcttgggactatgggcgcagggtcct
tgagcatgcccgtgtctatgctttcttatatctctccctatgc
ag GAG ACA GAT CAA CTT GAA GAT GAG AAG TCT
RT-PCR analysis of cytoplasmic and nuclear RNAsFigure 7RT-PCR analysis of cytoplasmic and nuclear RNAs. Cytoplasmic (C) and nuclear (N) RNAs were isolated by using the PARIS™ Kit (Ambion) according to the manufac-turer's protocol. RT-PCR conditions were as in Fig. 1. The RT-PCR product of 120 nt amplified by the E3U-I3L primer pair (see Fig. 1) indicates the presence of the c-fos-2 tran-script in both cytoplasmic and nuclear fractions. Amplifica-tion of the unspliced fosB transcript (I4U-I4L primers) was included for comparison. Transcript coding for glutathione peroxidase 1 was amplified as control of efficient cellular fractionation. Primer UGPX1 (5'-GCAGAAGCGTCT-GGGACCTCGTG) was located in gpx1 exon 1, and primer LGPX1 (5'-GGGAATTCAGAATCTCTTCATTCT TGCCA) in gpx1 exon 2 (the intron between both exons is 218 nt long). UGPX1- LGPX1 primers generated a single RT-PCR product of 101 nt when using the cytoplasmic RNA as template, indicat-ing no detectable contamination with nuclear gpx1 pre-mRNA. In contrast when using the nuclear RNA as template, a fragment 319 nt long was detected in addition to the expected product from spliced gpx1 mRNA. Since the Ambion's PARIS™ Kit is designed for the isolation of both RNA and protein from the same sample, efficient cellular fractionation was further confirmed by Western blot analysis (botton panel) with an Ab specific for the cytoplasmic glycer-aldehyde-3-phosphate-dehydrogenase (GAPDH). GAPDH was present only in the cytoplasmic fraction, further indicat-ing no detectable contamination with the nuclear fraction.
100200
400
nt
MW
mar
ker
MW
mar
ker
E3U-I3Lc-fos-2
I4U-I4LfosB
UGPX1-LGPX1
gpx1
C N C N C N
Western Blot GAPDH
C N
Page 9 of 13(page number not for citation purposes)

BMC Molecular Biology 2007, 8:83 http://www.biomedcentral.com/1471-2199/8/83
Translation of the c-fos-2 transcript predicts the synthesisof a truncated protein lacking 211 aa at the carboxyl-ter-minus. We partially purified by immunoaffinity chroma-tography a c-Fos protein (verified by Western blot) withan apparent molecular weight of 23-kDa as judged bySDS-polyacrylamide gel electrophoresis. This finding sug-gests that the truncated variant of c-Fos is expressed inNIH 3T3 cells. The truncation would occur after the con-served basic domain for DNA binding but prior to theadjacent leucine zipper for dimerization (Fig. 8). There-fore, the truncated c-Fos should be inactive for transfor-mation and transactivation since the functional integrityof the bZIP motif is required for these activities [29].Moreover, the truncated c-Fos (unable to heterodimerize)should not exhibit antagonistic functional properties withthe canonical longer counterpart, as in the case of ΔfosB[9-11]. On the other hand, however, the truncated c-Fosspecies might gain in stability as predicted by the loss ofthe main destabilizing activity residing at the C-terminalregion [30,31].
What might the biological significance of the above-referred truncated variant of c-Fos protein be? One couldspeculate with the idea that the truncated species is justthe side effect of the c-fos-2 translation occurring or toler-ated in the cells. Nonetheless, a more active role in regu-lating gene expression could also be envisaged, since thetruncated c-Fos would retain the DNA binding domain(Fig. 8). Two pathways have been described for bindingdimeric proteins to DNA. In the dimer pathway, proteinsfirst form dimers and then go on to bind DNA. Along themonomer pathway, a monomer•DNA complex is formedfirst, followed by recruitment of the second monomer toform the final complex. A growing number of dimericDNA-binding proteins are able to form complexes withDNA via a monomer pathway. In fact, the monomer path-way is considered the best option for a faster and morespecific formation of the final complex ([32] and refer-ences herein). Although Fos and Jun monomer•DNAcomplexes are difficult to observe, particularly in gel retar-dation experiments (e.g. see [33]), recent stopped-flowfluorescence studies on the kinetics of Fos•Jun•DNAcomplex formation indicate that both protein monomersbind DNA sequentially and assemble their dimerizationinterface while interacting with DNA [32]. These dataallow us to speculate with the possibility [34] that evenlow levels of the truncated c-Fos variant might influenceAP-1 mediated gene expression through the formation ofnon-productive monomer•DNA intermediates at specificDNA target sites. Additional experiments would berequired to support such a notion.
ConclusionHere we provide the first absolute (molecule number)quantitative analysis of alternative spliced transcript iso-
forms derived from the c-fos precursor RNA. We confirmthat intron 3 remains in the transcript population derivedfrom c-fos. We demonstrate that this transcript (herereferred as c-fos-2) is ubiquitously synthesized, either invivo (various mouse-tissues, gestational-ages) or in vitro(different murine cell lines), in amounts that are higher orsimilar to those of mRNAs coding for other Fos familymembers. Changes in the synthesis and/or degradationrates of both isoforms (the canonical spliced c-fos mRNAand the c-fos-2 variant) indicate a co-ordinated fine-tuneof transcript molecules, supporting the notion that thealternative processing of the c-fos precursor RNA might bephysiologically relevant. Moreover, translation of the c-fos-2 transcript predicts the synthesis of a truncated c-Fosprotein. We detected a c-Fos immunoreactive species cor-responding in mobility to the predicted truncated protein.
MethodsCell culture and treatmentsNIH 3T3 (ATCC: CRL-1658) and Hepa1-6 (ATCC: CRL-1830) cells were cultured in Dulbecco's modified Eaglemedium (DMEM) supplemented with 10% calf serum(CS) or foetal bovine serum, respectively. For mRNAdecay quantitation, cells were seeded into 75 cm2 flask ata density of 3 × 10⁶ cells/flask and cultivated for 48 hbefore the addition of 10 μg/ml actinomycin D (AmD). Atdifferent times thereafter, cells were scraped, washed oncewith phosphate-buffered saline, and immediately frozenin liquid nitrogen for total RNA purification. For serumstimulation, NIH 3T3 cells were made quiescent by 48 hincubation in DMEM with 0.5% CS. Cultures were thenstimulated by re-feeding quiescent cells with 15% CS.Cells were incubated further and collected at differenttimes as for AmD treatment. Data presented are means ofat least two independent cell cultures.
Primer designPrimers directed against different regions of the c-fos andfosB genes (Fig. 1A) were designed with the Oligo 6.1 soft-ware (Molecular Biology Insights), as detailed in [35].Primer positions (Fig. 1B) were chosen to detect intronsequences in the transcript population derived from c-fos.For comparison, primers for quantitation of the two well-defined forms of fosB transcript were also designed [9-11].To obtain high specificity and performance, primers wererequired to have high Tm (≥82°C), optimal 3'-ΔG (≥ - 3kcal/mol) value, and to be hairpin and duplex free. Allprimer pairs produced amplicons of the predicted size(Fig. 1C). All PCR products were further verified by nucle-otide sequencing (ABI 377 DNA sequencer).
RNA preparations and reverse transcriptionTotal RNA was extracted by using Tri-Reagent™ (Sigma)according to the manufacturer's protocol. Contaminatinggenomic DNA was removed by DNase I (Ambion). RNA
Page 10 of 13(page number not for citation purposes)

BMC Molecular Biology 2007, 8:83 http://www.biomedcentral.com/1471-2199/8/83
quality was checked electrophoretically and quantitationwas made spectrophotometrically. Lack of DNA contami-nation was confirmed by PCR amplification of RNA sam-ples without previous cDNA synthesis. The standard RNAwas synthesized in vitro from a laboratory-engineeredDNA fragment containing a T7 polymerase-binding site,by means of a commercial RNA transcription kit (Strata-gene). cDNA was generated from 2 μg of total RNA fromeach sample, using the M-MLV reverse transcriptase (LifeTechnologies) and random hexamers (Invitrogen).
Real-time PCRReal-time PCR reactions were performed in quadruplicateby using 50 ng of cDNA template, 0.3 μM of each primer(Fig. 1), 3 mM MgCl2, 250 μM of each dNTP, 0.75 units ofPlatinum Taq DNA polymerase, and 1:100000 SYBRGreen I dye (Roche) in a volume of 25 μl. Reactions wereanalyzed on an iCycler iQ Real-Time PCR System (Bio-Rad). Cycling conditions were as follows: 2 min at 95°Cfor the Platinum Taq activation and 40 cycles for the melt-ing (15 s, 95°C) and annealing/extension (30 s, 70°C)steps. Replicate PCR reactions generated highly reproduc-ible results with SEM <10% of the mean (<1% for thresh-old cycle) [see Additional file 5]. No primer-dimers weredetected. Primers used for absolute quantitation of c-fosand fosB transcripts showed optimal (~100%) PCR effi-ciencies in the range of 20 to 2 × 10⁵ pg of total RNA inputwith high linearity (r > 0.99) [see Additional file 6]. Anabsolute calibration curve was constructed with an exter-nal standard in the range of 102 to 109 RNA molecules [seeAdditional file 5]. The number of transcript molecules wascalculated from the linear regression of the standardcurve, as described previously [16] and exemplified inAdditional file 5. The amount of c-fos mRNA moleculeslacking intron 3 was estimated by subtracting the mole-cules with intron 3 (determined with E3U-I3L) from thetotal molecule number (determined with E3U-E4L). Sim-ilarly, the amount of mRNA molecules coding for ΔFosBwas estimated by subtracting the molecules for the full-length FosB (determined with I4U-I4L) from the totalmolecule number (determined with E4U-E5L) (Fig. 1).
Immunoaffinity purification of c-Fos proteinsRabbit polyclonal Ab (Calbiochem, PC05) against the N-terminal region (aa 4–17) shared by the full-length andthe putative truncated c-Fos protein were coupled to cya-nogen bromide (CNBr)-activated agarose (Sigma C9142)following the manufacturer's recommendations. NIH 3T3cells were cultured as described above. The accumulationof c-Fos proteins was promoted by 30 min serum stimula-tion. The cells were harvested and then lysed in 150 μl ofbuffer A (50 mM Tris-HCl pH7.4, 150 mM NaCl, 0.03%Tween 20, 0.4 mM Na3VO4, 0.4 mM EDTA, 10 mM NaF,10 mM sodium pyrophosphate, 10 μg/ml aprotinin, 10μg/ml leupeptin, and 1 mM phenylmethylsulfonyl fluo-
ride), by using a polypropylene pestle for microcentrifugetubes mounted in a cordless motor and 4 cycles of freez-ing in liquid nitrogen and thawing at room temperature.The cell lysate was centrifuged at 16000 × g for 10 min at4°C. The resulting supernatant (crude extract) wasapplied to the immunoaffinity column, which was thenwashed extensively with buffer A. The bound proteinswere eluted with two volumes of 100 mM glycine-HCl(pH 2.8). The eluate from the immunoaffinity columnwas neutralized with NaOH for Western blot analysis asdescribed below.
Western blottingProteins were separated on 12% sodium dodecyl sulfate(SDS)-polyacrylamide gel and transferred onto Hybond-PPVDF membrane (Amersham Biosciences) by electroblot-ting. Membranes were blocked with 2% non-fat milkpowder in TTBS (25 mM Tris-HCl pH 7.6, 150 mM NaCl,0.03% Tween-20) for 4–5 h at room temperature and thenincubated overnight with 1:250 of primary Ab (Anti-c-Fos, Calbiochem PC05) in blocking buffer at 4°C. Afterwashing the blots with blocking buffer, the membraneswere incubated with 1:4000 of a secondary anti-rabbit IgGAb (Sigma, A9169) to which horseradish peroxidase hadbeen covalently coupled. Blots were developed using theECL-Plus kit (Amersham Biosciences) following the man-ufacturer's instructions. The membranes were stripped bywashing 30 min in stripping buffer (0.2 M glycine pH2.5,0.1% SDS) at room temperature and reprobed with1:2000 of anti-GAPDH Ab (Santa Cruz Biotechnology, sc-25778) for control loading.
AbbreviationsAP-1, activator protein-1; bZIP, basic leucine-zipper; RT,reverse transcription; PCR, polymerase chain reaction;DMEM, Dulbecco's modified Eagle medium; CS, calfserum; AmD, actinomycin D; Cx, cycloheximide; aa,amino acid(s); Ab, antibody(ies); nt, nucleotide(s);DNase, deoxyribonuclease; PTC, premature terminationcodon; kDa, kilodalton(s)
Competing interestsThe author(s) declares that there are no competing inter-ests.
Authors' contributionsJJ carried out the purification of c-Fos proteins and CAF-Athe absolute quantification of transcripts. In addition,both participated in the rest of the experiments and JJhelped to draft the manuscript. MJP-A participated in thedetermination of transcript half-lives and provided somecell culture samples. CP supervised the study design, par-ticipated in data analysis and drafted the manuscript. Allthe authors read and approved the final manuscript.
Page 11 of 13(page number not for citation purposes)

BMC Molecular Biology 2007, 8:83 http://www.biomedcentral.com/1471-2199/8/83
Additional material
AcknowledgementsThe work was supported by the Spanish Ministerio de Educación y Ciencia (Grant BFU2005-02896) and co-financed by FEDER funds. JJ and MJP-A were funded by the Spanish Ministerio de Ciencia y Tecnología (Ramón y Cajal Programme). CAF-A was recipient of a predoctoral fellowship from the Spanish Ministerio de Educación y Ciencia (Formación de Personal Investigador Programme).
Additional file 1Empirical and theoretical decay of c-fos transcript. Various theoretical decays were generated under the assumption that the c-fos-2 transcript is merely a splicing intermediate and therefore the molecule number of c-fos might increase on behalf of c-fos-2 in a time-dependent manner in the presence of the transcription inhibitor AmD. Theoretical data are com-pared with experiment results shown in Fig. 4.Click here for file[http://www.biomedcentral.com/content/supplementary/1471-2199-8-83-S1.doc]
Additional file 2Confirmation that the ~23-kDa band detected by Western blot is not the primary Ab light chain. The E-30 eluate was subjected to inmunoblot analysis as described in Fig. 8. The ~23-kDa band was not detected when using only the secondary Ab, excluding the possibility that this band might be anti-cFos Ab light chains leaching off the immunoaffinity column.Click here for file[http://www.biomedcentral.com/content/supplementary/1471-2199-8-83-S2.ppt]
Additional file 3Confirmation that the ~23-kDa band detected by Western blot is not a non-specific protein co-purified with the rabbit anti-cFos Ab. c-Fos pro-teins were partially purified by immunoaffinity chromatography as described under "Methods" for the experiment in Fig. 8. The exception was that the rabbit polyclonal anti-cFos Ab (Calbiochem, PC05) was cou-pled to N-hydroxysuccinimide (NHS)-activated (instead of to CNBr-acti-vated) Sepharose (Amersham Biosciences 28-903-28). Western blotting was as described under "Methods", except for the primary (mouse mono-clonal anti-cFos; Calbiochem OP17) and secondary (anti-mouse IgG; Sigma A9917) Ab. The immunogen used to generate the mouse anti-cFos Ab was a synthetic peptide corresponding to aa residues 128–152 (trans-lation of the c-fos-2 transcript predicts the synthesis of a truncated protein 169 aa long). For other details see the Fig. 8 legend.Click here for file[http://www.biomedcentral.com/content/supplementary/1471-2199-8-83-S3.ppt]
Additional file 4Comparison between poly(A)+ and overall RNA populations. Total RNAs from NIH 3T3 cells treated as in Fig. 4 were retrotranscribed with ran-dom hexamers (see "RNA preparations and reverse transcription" subsec-tion of "Methods") or anchored oligo(dT)primer (5'-T20VN-3') (Invitrogen). A) Overall (solid symbols) versus poly(A)+ (open symbols) decay rate of c-fos-2 (circles) and c-fos (triangles) transcripts, respec-tively. B) Starting amounts (100% at time 0 min) of c-fos and c-fos-2 transcripts.Click here for file[http://www.biomedcentral.com/content/supplementary/1471-2199-8-83-S4.ppt]
Additional file 5Absolute standard curve used to calculate the number of copies of each experimental transcript per pg of total RNA. A) The absolute standard curve was prepared with the in vitro synthesized standard RNA. The standard RNA [16] was a 457-nt fragment identical in sequence (except for a 7-bp deletion) to the mouse gapdh transcript (from 316 to 779 posi-tion in GenBank sequence M32599). The concentration of the standard RNA was determined by measuring the optical density at 260 nm and converting the absorbance to the number of copies by using its molecular weight. Ten-fold serial dilutions from 109 to 102 RNA copies were pre-pared, retrotranscribed and amplified by real-time PCR. Primers for the amplification of the standard have been previously described [16]. These primers generate a 130 bp PCR product. The standard curve was con-structed by plotting the log of starting RNA molecules versus the threshold cycle (Ct). The resulting standard curve is linear (r = 0.998) over 7 orders of magnitude. The efficiency (E) value is calculated from the slope of the standard curve equation, as E = 10[-1/slope]-1. The slope of the standard curve indicates that the standard is amplified with 99.8% efficiency. This standard curve was used to determine the number of copies of each exper-imental transcript, as exemplified for c-fos-2 in total RNA from mouse ovary. B) Ct values used in the quantitation of the c-fos-2 transcript in 4 out of the 8 adult mouse tissues analyzed in Fig. 2. Real-time PCR reac-tions were carried out in quadruplicate by using 50 ng of cDNA template.Click here for file[http://www.biomedcentral.com/content/supplementary/1471-2199-8-83-S5.ppt]
Additional file 6Real-time PCR efficiency of experimental transcript amplification. Ten-fold serial dilutions from 2 × 10⁵ to 2 × 101 pg of total RNA input were prepared, retrotranscribed and amplified by real-time PCR. RNA sample was a pool of available total RNA from culture cells. A plot of the log RNA dilution versus the Ct value was made for each pair of primers, as exem-plified here for E3U-E4L and E3U-I3L primers. Investigated transcripts showed optimal real-time PCR efficiencies of ~100% with a very high lin-earity (r>0.99) over 4 orders of magnitude.Click here for file[http://www.biomedcentral.com/content/supplementary/1471-2199-8-83-S6.ppt]
Additional file 7PCR products amplified with E1U-E2L primer pair. Agarose (1.5%) gel electrophoresis analysis of PCR products generated by E1U-E2L primer pair. Cycling conditions were as in Fig. 1. Genomic DNA was from mouse liver. For comparison, total RNA from NIH 3T3 cells and cDNA retro-transcribed from this RNA were amplified in parallel with genomic DNA.Click here for file[http://www.biomedcentral.com/content/supplementary/1471-2199-8-83-S7.ppt]
Page 12 of 13(page number not for citation purposes)

BMC Molecular Biology 2007, 8:83 http://www.biomedcentral.com/1471-2199/8/83
Publish with BioMed Central and every scientist can read your work free of charge
"BioMed Central will be the most significant development for disseminating the results of biomedical research in our lifetime."
Sir Paul Nurse, Cancer Research UK
Your research papers will be:
available free of charge to the entire biomedical community
peer reviewed and published immediately upon acceptance
cited in PubMed and archived on PubMed Central
yours — you keep the copyright
Submit your manuscript here:http://www.biomedcentral.com/info/publishing_adv.asp
BioMedcentral
References1. Hess J, Angel P, Schorpp-Kistner M: AP-1 subunits: quarrel and
harmony among siblings. J Cell Sci 2004, 117(Pt 25):5965-5973.2. Milde-Langosch K: The Fos family of transcription factors and
their role in tumourigenesis. Eur J Cancer 2005, 41(16):2449-2461.3. Greenberg ME, Greene LA, Ziff EB: Nerve growth factor and epi-
dermal growth factor induce rapid transient changes in proto-oncogene transcription in PC12 cells. J Biol Chem 1985,260(26):14101-14110.
4. Curran T, Miller AD, Zokas L, Verma IM: Viral and cellular fos pro-teins: a comparative analysis. Cell 1984, 36(2):259-268.
5. Rahmsdorf HJ, Schonthal A, Angel P, Litfin M, Ruther U, Herrlich P:Posttranscriptional regulation of c-fos mRNA expression.Nucleic Acids Res 1987, 15(4):1643-1659.
6. Cahill MA: c-Fos transrepression revisited. FEBS Lett 1997,400(1):9-10.
7. Taneri B, Snyder B, Novoradovsky A, Gaasterland T: Alternativesplicing of mouse transcription factors affects their DNA-binding domain architecture and is tissue specific. Genome Biol2004, 5(10):R75.
8. Sherwood DR, Butler JA, Kramer JM, Sternberg PW: FOS-1 pro-motes basement-membrane removal during anchor-cell inva-sion in C. elegans. Cell 2005, 121(6):951-962.
9. Nakabeppu Y, Nathans D: A naturally occurring truncated formof FosB that inhibits Fos/Jun transcriptional activity. Cell 1991,64(4):751-759.
10. Yen J, Wisdom RM, Tratner I, Verma IM: An alternative splicedform of FosB is a negative regulator of transcriptional activa-tion and transformation by Fos proteins. Proc Natl Acad Sci U S A1991, 88(12):5077-5081.
11. Mumberg D, Lucibello FC, Schuermann M, Muller R: Alternativesplicing of fosB transcripts results in differentially expressedmRNAs encoding functionally antagonistic proteins. Genes Dev1991, 5(7):1212-1223.
12. Feng Z, Kong LY, Qi Q, Ho SL, Tiao N, Bing G, Han YF: Induction ofunspliced c-fos messenger RNA in rodent brain by kainic acidand lipopolysaccharide. Neurosci Lett 2001, 305(1):17-20.
13. Shur I, Socher R, Benayahu D: Dexamethasone regulation of cFosmRNA in osteoprogenitors. J Cell Physiol 2005, 202(1):240-245.
14. Jiménez A, Prieto-Álamo MJ, Fuentes-Almagro CA, Jurado J, GustafssonJA, Pueyo C, Miranda-Vizuete A: Absolute mRNA levels and tran-scriptional regulation of the mouse testis-specific thioredox-ins. Biochem Biophys Res Commun 2005, 330(1):65-74.
15. Jurado J, Prieto-Alamo MJ, Madrid-Risquez J, Pueyo C: Absolute geneexpression patterns of thioredoxin and glutaredoxin redoxsystems in mouse. J Biol Chem 2003, 278(46):45546-45554.
16. Prieto-Álamo MJ, Cabrera-Luque JM, Pueyo C: Absolute quantita-tion of normal and ROS-induced patterns of gene expression:an in vivo real-time PCR study in mice. Gene Expr 2003,11(1):23-34.
17. Ruiz-Laguna J, Abril N, García-Barrera T, Gómez-Ariza JL, Lopez-BareaJ, Pueyo C: Absolute transcript expression signatures of Cypand Gst genes in Mus spretus to detect environmental con-tamination. Environ Sci Technol 2006, 40(11):3646-3652.
18. Monje-Casas F, Michan C, Pueyo C: Absolute transcript levels ofthioredoxin- and glutathione-dependent redox systems inSaccharomyces cerevisiae: response to stress and modulationwith growth. Biochem J 2004, 383(Pt 1):139-147.
19. Greenberg ME, Hermanowski AL, Ziff EB: Effect of protein synthe-sis inhibitors on growth factor activation of c-fos, c-myc, andactin gene transcription. Mol Cell Biol 1986, 6(4):1050-1057.
20. Coronella-Wood J, Terrand J, Sun H, Chen QM: c-Fos phosphoryla-tion induced by H2O2 prevents proteasomal degradation of c-Fos in cardiomyocytes. J Biol Chem 2004, 279(32):33567-33574.
21. McClung CA, Ulery PG, Perrotti LI, Zachariou V, Berton O, Nestler EJ:ΔFosB: a molecular switch for long-term adaptation in thebrain. Brain Res Mol Brain Res 2004, 132(2):146-154.
22. Shyu AB, Greenberg ME, Belasco JG: The c-fos transcript is tar-geted for rapid decay by two distinct mRNA degradationpathways. Genes Dev 1989, 3(1):60-72.
23. Grosset C, Chen CY, Xu N, Sonenberg N, Jacquemin-Sablon H, ShyuAB: A mechanism for translationally coupled mRNA turnover:Interaction between the poly(A) tail and a c-fos RNA codingdeterminant via a protein complex. Cell 2000, 103(1):29-40.
24. Wilkinson MF: A new function for nonsense-mediated mRNA-decay factors. Trends Genet 2005, 21(3):143-148.
25. Lejeune F, Maquat LE: Mechanistic links between nonsense-medi-ated mRNA decay and pre-mRNA splicing in mammaliancells. Curr Opin Cell Biol 2005, 17(3):309-315.
26. Moraes KC, Wilusz CJ, Wilusz J: CUG-BP binds to RNA sub-strates and recruits PARN deadenylase. Rna 2006,12(6):1084-1091.
27. Xu N, Chen CY, Shyu AB: Modulation of the fate of cytoplasmicmRNA by AU-rich elements: key sequence features control-ling mRNA deadenylation and decay. Mol Cell Biol 1997,17(8):4611-4621.
28. Miao GG, Curran T: Cell transformation by c-fos requires anextended period of expression and is independent of the cellcycle. Mol Cell Biol 1994, 14(6):4295-4310.
29. Schuermann M, Neuberg M, Hunter JB, Jenuwein T, Ryseck RP, BravoR, Muller R: The leucine repeat motif in Fos protein mediatescomplex formation with Jun/AP-1 and is required for transfor-mation. Cell 1989, 56(3):507-516.
30. Ferrara P, Andermarcher E, Bossis G, Acquaviva C, Brockly F, Jariel-Encontre I, Piechaczyk M: The structural determinants responsi-ble for c-Fos protein proteasomal degradation differ accord-ing to the conditions of expression. Oncogene 2003,22(10):1461-1474.
31. Murphy LO, Smith S, Chen RH, Fingar DC, Blenis J: Molecular inter-pretation of ERK signal duration by immediate early geneproducts. Nat Cell Biol 2002, 4(8):556-564.
32. Kohler JJ, Schepartz A: Kinetic studies of Fos•Jun•DNA complexformation: DNA binding prior to dimerization. Biochemistry2001, 40(1):130-142.
33. Nakabeppu Y, Ryder K, Nathans D: DNA binding activities ofthree murine Jun proteins: stimulation by Fos. Cell 1988,55(5):907-915.
34. Zondlo NJ, Schepartz A: Highly specific DNA recognition by adesigned miniature protein. J Am Chem Soc 1999, 121:6938-6939.
35. Pueyo C, Jurado J, Prieto-Alamo MJ, Monje-Casas F, Lopez-Barea J:Multiplex reverse transcription-polymerase chain reaction fordetermining transcriptional regulation of thioredoxin and glu-taredoxin pathways. Methods Enzymol 2002, 347:441-451.
36. Michán C, Monje-Casas F, Pueyo C: Transcript copy number ofgenes for DNA repair and translesion synthesis in yeast:contribution of transcription rate and mRNA stability tothe steady-state level of each mRNA along with growth inglucose-fermentative medium. DNA Repair (Amst) 2005,4(4):469-478.
Page 13 of 13(page number not for citation purposes)
http://www.ncbi.nlm.nih.gov/entrez/query.fcgi?cmd=Retrieve&db=PubMed&dopt=Abstract&list_uids=3877054
http://www.ncbi.nlm.nih.gov/entrez/query.fcgi?cmd=Retrieve&db=PubMed&dopt=Abstract&list_uids=3877054
http://www.ncbi.nlm.nih.gov/entrez/query.fcgi?cmd=Retrieve&db=PubMed&dopt=Abstract&list_uids=3877054
http://www.ncbi.nlm.nih.gov/entrez/query.fcgi?cmd=Retrieve&db=PubMed&dopt=Abstract&list_uids=6319013
http://www.ncbi.nlm.nih.gov/entrez/query.fcgi?cmd=Retrieve&db=PubMed&dopt=Abstract&list_uids=6319013
http://www.ncbi.nlm.nih.gov/entrez/query.fcgi?cmd=Retrieve&db=PubMed&dopt=Abstract&list_uids=3103102
http://www.ncbi.nlm.nih.gov/entrez/query.fcgi?cmd=Retrieve&db=PubMed&dopt=Abstract&list_uids=3103102
http://www.ncbi.nlm.nih.gov/entrez/query.fcgi?cmd=Retrieve&db=PubMed&dopt=Abstract&list_uids=9000503
http://www.ncbi.nlm.nih.gov/entrez/query.fcgi?cmd=Retrieve&db=PubMed&dopt=Abstract&list_uids=1900040
http://www.ncbi.nlm.nih.gov/entrez/query.fcgi?cmd=Retrieve&db=PubMed&dopt=Abstract&list_uids=1900040
http://www.ncbi.nlm.nih.gov/entrez/query.fcgi?cmd=Retrieve&db=PubMed&dopt=Abstract&list_uids=1905017
http://www.ncbi.nlm.nih.gov/entrez/query.fcgi?cmd=Retrieve&db=PubMed&dopt=Abstract&list_uids=1905017
http://www.ncbi.nlm.nih.gov/entrez/query.fcgi?cmd=Retrieve&db=PubMed&dopt=Abstract&list_uids=1905017
http://www.ncbi.nlm.nih.gov/entrez/query.fcgi?cmd=Retrieve&db=PubMed&dopt=Abstract&list_uids=1648531
http://www.ncbi.nlm.nih.gov/entrez/query.fcgi?cmd=Retrieve&db=PubMed&dopt=Abstract&list_uids=1648531
http://www.ncbi.nlm.nih.gov/entrez/query.fcgi?cmd=Retrieve&db=PubMed&dopt=Abstract&list_uids=1648531
http://www.ncbi.nlm.nih.gov/entrez/query.fcgi?cmd=Retrieve&db=PubMed&dopt=Abstract&list_uids=2431274
http://www.ncbi.nlm.nih.gov/entrez/query.fcgi?cmd=Retrieve&db=PubMed&dopt=Abstract&list_uids=2431274
http://www.ncbi.nlm.nih.gov/entrez/query.fcgi?cmd=Retrieve&db=PubMed&dopt=Abstract&list_uids=2431274
http://www.ncbi.nlm.nih.gov/entrez/query.fcgi?cmd=Retrieve&db=PubMed&dopt=Abstract&list_uids=2496006
http://www.ncbi.nlm.nih.gov/entrez/query.fcgi?cmd=Retrieve&db=PubMed&dopt=Abstract&list_uids=2496006
http://www.ncbi.nlm.nih.gov/entrez/query.fcgi?cmd=Retrieve&db=PubMed&dopt=Abstract&list_uids=2496006
http://www.ncbi.nlm.nih.gov/entrez/query.fcgi?cmd=Retrieve&db=PubMed&dopt=Abstract&list_uids=9234718
http://www.ncbi.nlm.nih.gov/entrez/query.fcgi?cmd=Retrieve&db=PubMed&dopt=Abstract&list_uids=9234718
http://www.ncbi.nlm.nih.gov/entrez/query.fcgi?cmd=Retrieve&db=PubMed&dopt=Abstract&list_uids=9234718
http://www.ncbi.nlm.nih.gov/entrez/query.fcgi?cmd=Retrieve&db=PubMed&dopt=Abstract&list_uids=8196666
http://www.ncbi.nlm.nih.gov/entrez/query.fcgi?cmd=Retrieve&db=PubMed&dopt=Abstract&list_uids=8196666
http://www.ncbi.nlm.nih.gov/entrez/query.fcgi?cmd=Retrieve&db=PubMed&dopt=Abstract&list_uids=8196666
http://www.ncbi.nlm.nih.gov/entrez/query.fcgi?cmd=Retrieve&db=PubMed&dopt=Abstract&list_uids=2492453
http://www.ncbi.nlm.nih.gov/entrez/query.fcgi?cmd=Retrieve&db=PubMed&dopt=Abstract&list_uids=2492453
http://www.ncbi.nlm.nih.gov/entrez/query.fcgi?cmd=Retrieve&db=PubMed&dopt=Abstract&list_uids=2492453
http://www.ncbi.nlm.nih.gov/entrez/query.fcgi?cmd=Retrieve&db=PubMed&dopt=Abstract&list_uids=3142691