
Alternative credit and its - asset classes
140
Alternative credit and its asset classes A guide to understanding the complex universe of private debt assets First edition, May 2017 For professionals
-
Upload
khangminh22 -
Category
Documents
-
view
0 -
download
0
Transcript of Alternative credit and its - asset classes

Alternative credit and its asset classes A guide to understanding the complex universe of private debt assets
First edition, May 2017For professionals

Important disclosure:
The opinions expressed and conclusions reached by the authors in this publication are their own and do not represent an official position. The publication has been prepared solely for the purpose of information and knowledge-sharing. Neither NN Investment Partners B.V., NN Investment Partners Holdings N.V. nor any other company or unit belonging to NN Group make no guarantee, warranty or representation, express or implied, to the accuracy, correctness or completeness thereof. Readers should obtain professional advice before making any decision or taking any action that may affect their finances or business or tax position. This publication and its elements may contain information obtained from third parties, including ratings from credit rating agencies. Reproduction and distribution of (parts of) this publication, logos, and third party content in any form is prohibited, except with the prior written permission of NN Investment Partners B.V. or NN Investment Partners Holdings N.V. or the third party concerned.
© 2017 NN Investment Partners is part of NN Group N.V. NN Group N.V. is a publicly traded corporation, and it and its subsidiaries are currently using trademarks including the “NN” name and associated trademarks of NN Group under license. All rights reserved.

Alternative credit and its asset classes A guide to understanding the complex universe of private debt assets

4Guidebook: Alternative credit and its asset classes
Table of contentsPreface ...............................................................................................................................................................6
1. Introduction .................................................................................................................... 8
2. The history and rise of alternative credit .....................................................................11
2.1. The shift towards the capital market ......................................................................................... 11
3. Asset categories: categorisation can be multi-dimensional ..................................... 13
4. Key stakeholders in the financial ecosystem ............................................................. 19
4.1. Asset managers: managing loans with diversified perspectives ................................... 20
4.2. Fintech: the digital transformation in the financial sector ................................................22
5. The role of banks.......................................................................................................... 29
6. Key reasons to invest in alternative credit ................................................................ 32
6.1. Pick-up in return, better downside protection .......................................................................32
6.2. Diversification and low correlation to other asset classes ...............................................34
6.3. Defensive asset class in volatile environment and natural inflation hedge ...............34
6.4. Ability to apply ESG ..........................................................................................................................34
6.5 Matching liabilities ............................................................................................................................34
6.6. How can alternative credit improve risk-adjusted returns and enhance income? .... 35
6.7. Formats for investing in alternative credit .............................................................................. 39
7. The approach to alternative credit investments ....................................................... 42
7.1. The triangle approach to alternative credit ............................................................................44
7.2. Cash flow pattern of the loan ...................................................................................................... 46
7.3. Tenor and flexibility .......................................................................................................................... 48
7.4. Expected return of the loan .......................................................................................................... 50
7.5. Expected loss of the loan .............................................................................................................. 53
7.6. Expected loss (EL): risk-adjusted return ................................................................................. 60
7.7. Management costs .......................................................................................................................... 64
7.8. Net return after management fee .............................................................................................. 66
7.9. Capital and other charges related to investments ............................................................. 66
7.10. Liquidity, volatility and portfolio diversification .................................................................... 68
7.11. Complexity: the intellectual and sourcing premium in private debt ..............................73

5Guidebook: Alternative credit and its asset classes
8. How to incorporate alternative credit in the matching portfolio ..............................77
8.1. What is liability-driven investing? ...............................................................................................78
8.2. What does a liquid matching portfolio look like? ..................................................................79
8.3. Specific characteristics of alternative credit and the impact on LDI strategies .... 80
8.4. Illiquidity ................................................................................................................................................ 81
8.5. Expected and unexpected repayment..................................................................................... 83
8.6. Valuation of private debt ............................................................................................................... 84
8.7. What private debt asset classes are suitable for a matching portfolio? .................... 84
8.8. The impact of private debt on risk-adjusted net returns .................................................. 86
9. Key sub-asset classes in alternative credit ............................................................... 88
9.1. Government-Guaranteed Loans ................................................................................................ 89
9.2. Infrastructure Debt .......................................................................................................................... 94
9.3. Leveraged Loans .............................................................................................................................103
9.4. European Residential Mortgages .............................................................................................. 107
9.5. European Commercial Mortgages .............................................................................................114
9.6. Private Placements ..........................................................................................................................118
9.7. Direct Lending ..................................................................................................................................122
10. Conclusion ...................................................................................................................126
Authors .......................................................................................................................................................... 127
Acknowledgements ..................................................................................................................................129
Appendix 1. Key legal documents in private debt .........................................................................130
Glossary of terms ........................................................................................................................................131
List of figures ...............................................................................................................................................134
List of tables ................................................................................................................................................136
Bibliography ................................................................................................................................................. 137

6Guidebook: Alternative credit and its asset classes
PrefaceAlternative credit offers investors a variety of opportunities for earning income and provides them with the benefits of portfolio diversification. It is an emerging asset class that was formerly dominated by the banking sector. Clearly, navigating and comparing the benefits of individual products remains challenging.
The purpose of this guide is to enable investors to adopt a structured approach to the benefits and risks of the individual sub-asset classes by providing a framework for comparing most of the key features.
This book is the result of the combined efforts of the Alternative Credit and Integrated Client Solutions teams at NN Investment Partners. It does not contain any investment advice, nor does it make recommendations on the suitability of any asset classes for the portfolios of professional investors. It is aimed at helping investors navigate the complex world of alternative credit investments.
On behalf of the authors, I wish you an informative and interesting read and hope this guide inspires you to select appropriate investment opportunities.
Gabriella Kindert Head of the Alternative Credit Boutique at NN Investment Partners

7Guidebook: Alternative credit and its asset classes
NN Investment Partners Alternative Credit Team
Editor/Co-author: Gabriella Kindert
Team members and co-authors: Alistair PerkinsBart BakxBart OldenkampBas JonkerDirk BekkersEvelien van HiltenGabriella KindertJos Kalb Kees-Jan van de KampLennart van MierloMagdalena Kowalska Mark van de WielPetra Stassen - van LochemRichard SandersSam TaylorSimon Uiterwijk Suresh HegdeVirginia Wasikowska

8Guidebook: Alternative credit and its asset classes
1. Introduction
This book aims to provide a consistent framework to assist investors in navigating the complex world of alternative credit investments. The focus is on Europe.
Traditionally, alternative credit assets have been instruments arranged and executed by banks. Institutional investors have mainly been exposed to alternative credit assets in securitised formats. The securitisation market in Europe collapsed in the wake of the 2008 financial crisis and has yet to recover to the same extent as its US counterpart.
Banks currently face two major challenges: maturity transformation and liquidity transforma-tion. They mainly need to lend long term, whereas most of their deposits are short term, as their depositors want to have the flexibility to access their deposits. Without long-term lending, however, our economy would cease to function. Retail clients need funding for long-term mort - gages and companies need to finance their capital expenditure and acquisitions. Governments as well as private companies need funding for projects and infrastructure investments.
The ability to access credit is critical, especially in Europe where businesses traditionally rely far less on capital markets for funding than US companies. This is particularly the case for small and medium-sized enterprises (SMEs), which are the source of most innovation and economic growth. They are often cited as the major driver of economies and a major force in job creation, yet they still experience difficulty in securing the proper financing to allow them to prosper. SMEs account for more than half the world’s gross domestic product (GDP) and employ almost two-thirds of the global workforce. According to the International Financial Corporation, a funding gap of more than USD 2 trillion exists for small businesses in emerging markets alone (Stein, Ventura, and Tufano, 2015).

9Guidebook: Alternative credit and its asset classes
A large percentage of long-term money in the economy rests with institutional investors, such as pension funds, saving funds, insurance companies, trusts and endowments. Investors are on the lookout for yield and, unlike banks, often have a long-term liability profile. They back their portfolios with long-dated liabilities and seek long-term investment opportunities. Without the involvement of institutional investors, the funding of the economy would be subdued. It is therefore essential to facilitate institutional funding and access via sensible investment solutions and investment structures. Many institutional investors have started various direct and indirect initiatives to invest in loans and, in doing so, boost the economy.
Figure 1. Liability profiles of insurance companies and banks
Source: Gabriella Kindert, market size data from European Central Bank
Liability profile of insurance companies is better suited for long-term investments
Short-term profile (average maturity ≈ 5 years)
Should remain liquid
(withdrawable at discretion)
Banks Insurers
Long-term profile (average maturity 20+ years)
Illiquid
(triggered by events)
• Equity • CPs / CDs (1-5 years) • Retail and commercial deposits (5-7 years) • Term debt (5-7 years) FU
NDI
NG
SO
URC
ES • Equity
• Retail annuities (15-25 years) • Life insurance (15-30 years) • Pension close-outs (10-20+ years)
€ 30.4 trillion SIZE
€ 6.2 trillion
Some investors seek exposure to loans in various ways, often directly but also via banks, asset managers, or even financial technology (“fintech”) players that securitise their loan portfolios. In this complex set-up, it is easy to become confused about risk, return, liquidity, potential drawdowns and investment loss/recovery potential.
This guide offers industry professionals independent insight into the attractiveness and risks of investing in alternative credit as an asset class. Throughout the book, we cover the following aspects: • Key trends and developments in alternative credit investments • Definitions, characteristics, risks and return features of the various sub-asset classes• Opportunities for gaining exposure• Key pitfalls in investment considerations• Insights on alternative credit in portfolio context

10Guidebook: Alternative credit and its asset classes
We start by explaining the history of alternative credit investments, the key players in the ecosystem and the most important sub-asset classes. Chapter 4 devotes special attention to clarifying the role of fintech players in alternative credit. We explain the role of banks in alternative credit in Chapter 5, and the key reasons to invest in the asset class in Chapter 6.
Chapter 7 is the heart of our guide. In it, we explain how investors can develop a framework for assessing individual alternative credit products in a systematic, structured way. Indeed, with the advent of so many different players and products, navigating the wide-ranging terminology has become very challenging in recent years, even for experienced profession-als. At the end of the book, we have also included a glossary of terms for quick reference.
We have developed a “Return-Liquidity-Complexity” triangle that raises key questions for investors who are considering investments in any alternative fixed-income assets, particularly those non-listed debt instruments known as alternative credit or private debt assets.
Our approach considers the different aspects of cash flow elements, the development of a risk-adjusted return framework, the importance and justification of investment fee levels and costs, as well as liquidity and complexity aspects. It is essential to address these issues before investing in alternative credit products.
Chapter 8 explains how investors can potentially incorporate alternative credit products into their matching portfolio and Chapter 9 contains a more detailed overview of the individual sub-asset classes.

11Guidebook: Alternative credit and its asset classes
2. The history and rise of alternative credit
In the past decade, the European lending landscape has become highly complex, with many players, numerous alliances and partnerships, and a wide range of overlapping terminology.
Even for experienced professionals it is difficult to capture the meaning of the different terms used in this field: private debt, direct lending, alternative credit, syndicated lending, lever-aged loans, senior secured bank loans, club deal, private placement, alternative fixed income, mezzanine, senior, unitranche etc.
The list is extensive and each term may mean different things to different players. Further-more, it can be just as difficult to decipher the corresponding business models, cooperation structures, alignment of interests of counterparties and the regulatory framework.
As terminology also overlaps, it can be even more difficult to assess and compare different investment strategies and the corresponding risks and returns of the asset strategies and counterparties.
2.1 The shift towards the capital marketTwo decades ago, the lending landscape was simple. Banks provided financing to the economy and enjoyed a high growth rate and stable funding. Additional growth was fuelled via the securitisation market, which collapsed in 2008.

12Guidebook: Alternative credit and its asset classes
Since 2008, the landscape has changed dramatically, particularly as a result of the emergence of new business models. Meanwhile, tougher legislation has been hitting long-term invest-ments and SME lending harder than just about any other type of lending. The regulatory framework currently favours short-term, low-risk and more liquid assets.
To this day, the fundamental problem in the funding space is that a high percentage of long-term capital remains outside the banking sector as it resides with insurance and pension companies.
Banks continue to experience pressure on their capital levels, constraining their capacity to lend. The total asset size of the banking sector has been steadily declining since the 2008 crisis. The financial sector is undergoing radical changes as policymakers impose new regulations, hoping to facilitate lower leverage and consequently a more stable financial sector. This approach is understandable. The banking sector is immensely vulnerable due to its liability structure. The withdrawal of short-term funding can cause banks to sell illiquid assets at prices that are well below their purchase price and intrinsic value, consequently forcing a downward spiral. The maturity transformation exposes banks to considerable liquidity risk if the assets cannot be liquidated.
The bottom line is that European banks remain short on their capital requirements and will therefore find it difficult to raise long-term funding. Consequently, they will need to reduce their long-term assets. The upshot is that there is an imminent need for financing which is not being met in Europe.
Many different solutions have been launched on the market in order to fill this gap, in both regulated and unregulated formats.
Overall, it is early days for non-bank players in Europe and the entire financial ecosystem still needs time to become better acquainted with the similarities, differences, competitive positioning and regulatory requirements of the various players.

13Guidebook: Alternative credit and its asset classes
3. Asset categories: categorisation can be multi-dimensional
The alternative credit market is dynamic, complex and evolving, with many different types of loans. There is a lot of confusion, even among experienced professionals, about the terminology used.
This is due to the fact that categorisation may occur at different levels:• multiple dimensions (risk, return, geography, size, financing short- or long-term assets, etc.);• multiple perspectives (banks, investors, clients) regarding the purpose of financing or
investment; and• the business model (alternatives being part of a traditional and regulated framework).
Investors are most familiar with public markets where investments are traded on a public exchange, either in the form of debt or equity. Many of these instruments are also accessible to retail investors. The companies or instruments listed on public exchanges have high disclosure requirements. Many analysts monitor these companies and review the assump-tions. The information asymmetry is deemed low, especially in the case of larger, widely traded companies.

14Guidebook: Alternative credit and its asset classes
Private markets comprise investments (instruments/companies) that are not publicly traded on an exchange. These can be offered subject to various instructions and for different purposes. The information asymmetry is very high.
Figure 2. Relative security across private and public debt markets
Source: Gabriella Kindert
<!!Private Equity
Senior Debt
PRIVATE
Subordinated
Second Lien Mezzanine
Stocks Listed Equity
PUBLIC
High Yield Debt
Bonds
Uni-tranche
Secu
rity
PRIVATE DEBT
Banks often classify the lending types and categories using a different type of matrix from the one used by investors. When assessing loans, banks and dedicated asset managers tend to use the purpose of the financing and the underlying geographies as key factors to link human capital with risk assessment and structuring transactions.

15Guidebook: Alternative credit and its asset classes
Figure 3. Loans can be classified across multiple dimensions
Source: Gabriella Kindert
Type
Industry/size
Location
Tenor
Capital structure
Purpose
Platform
Public/private B2C/B2B
Direct lending or syndicated market
Industry (Listed) corporate/SME/micro
US/EU/CEE/Emerging Markets
Current assets: working capital trade & commodity finance, factoring
Long term: term loan
Super senior/senior debt/mezzanine/equity Combina7on or unitranche
MBO/LBO cash flow-based financing: Leveraged loans Asset-based financing (shipping, trade and commodity finance, leasing, factoring)
Project financeReal estateSustainable micro financingPerforming – distressed
Traditional (regulated bank) or alternative to banks, e.g. asset managers, investors, new intermediaries (fintech)
Requ
ire d
iffer
ent I
T sy
stem
s, v
aryi
ng sk
illse
ts a
nd d
iffer
ent l
evel
s of f
ocus
and
ded
icati
on
Investors mainly use the cash flow and risk-return characteristics of the credit facilities to classify the individual alternative credit instruments.

16Guidebook: Alternative credit and its asset classes
Liability Matching Government Bonds Investment Grade Credits
Alternative Credit Mortgage Loans Commercial Real Estate
Loans Project Finance Corporate Debt Government Guaranteed
Loans
Real Assets Real Estate Infrastructure Renewable Energy
Return Seeking Equities High Yield Emerging Markets
Matching Return
Stat
us
Mar
ket
Liquid Low / negative return
Attaractive return Lower volatility Lower correlations Less liquid
Attaractive return High volatility High correlations Liquid
Figure 4. Selected asset classes on the cash flow and risk-return spectrum
Source: Gabriella Kindert, NN Investment Partners
There is no right or wrong approach. The purpose of this chapter is to illustrate that, as a result of the multidimensional aspects, there are many different options for clustering the asset categories. It is important, however, that investors use a consistent framework to assess and compare the different options in a systematic manner.
What is the importance of private markets?Private markets are very important in both the US and Europe. One-quarter of the US economy by value and 98% by number of companies is controlled by private capital (Towers Watson, 2012). Similarly, most businesses in Europe are privately owned. Given the relative size of the public and private markets, investors significantly limit their investment universe by not investing in private markets.
Privately owned businesses are predominantly SMEs, which are significant contributors to European GDP. There are several channels through which SMEs fuel economic growth. Most importantly, they play a vital role in new business creation. By investing in private markets, investors supply capital that allows private companies to expand their business and further develop their potential (Anson, 2006). This enables them to boost their market competitive-ness and the supply of jobs, consequently enhancing the overall productivity of the economy.
Private markets also act as important facilitators of innovation, one of the key drivers of economic growth in Europe, by providing financing for R&D initiatives and stimulating R&D spending (Frontier Economics, 2013). The stimulative effect comes from the fact that private investors often take an active stance, for instance by delivering insights to company management. In general, privately owned companies tend to be smaller, with a more entrepreneurial approach that fuels innovation and thus economic growth.

17Guidebook: Alternative credit and its asset classes
Which individual components make up private debt?Alternative investments and alternative credit in particular have asset solutions that are very different from each other, with very different drivers. A comprehensive understanding of these asset classes requires a high level of specialisation. At banks, for example, sub-asset classes such as shipping, trade and commodity finance, leverage loans and leasing are executed by specialist departments and treated as asset classes in their own right.
Figure 5. Position of private debt within the broader investment universe
Source: Gabriella Kindert
+
-
Equity
F. I.
PRIVATE
Others
Government Bonds Corporate Bonds
Fixed Income
Mainstream
High Yield Debt EM Debt
Structured Credit CAT bonds
REITs Commodities
Volatility Currencies
Large, Mid Cap Growth/Value Equity
Private real asset Hedge Funds Microfinance
Private Equity (Venture Capital, Buy-out,
Special Situation)
Private Debt
Government-guaranteed debt Infrastructure
Real estate (consumer, commercial) Consumer Finance
Asset Based Direct Lending/Venture Debt
Leveraged Loans Mezzanine Distressed
ALTERNATIVE
ALTERNATIVE F.I.
PRIVATE DEBT
PUBLIC
Alternative
The key components of private debt strategies include:
Table 1. Private debt strategies
Covered in more detail in our guide (Spring 2017 edition)Government-guaranteed loans YES
Residential mortgages YES
Commercial mortgages YES
Leveraged loans YES
Private placements YES
Infrastructure debt YES
Venture debt NO
Mezzanine NO
Special situation/distressed NO
Emerging market loans NO
Direct lending YES
Asset-based finance (TCF) NO

18Guidebook: Alternative credit and its asset classes
How is private debt financing positioned in the capital structure?Traditionally, the capital structure is formed by a combination of mainly cash interest-bearing debt financing and equity. Debt is often secured by assets (registered pledge) and shares in the company and enjoys priority when it comes to repayment (versus unsecured bonds or bank loans with negative pledge). Equities consequently have higher expected returns.
Private debt is usually arranged and provided based on extensive private information and after thorough due diligence. Transactions involve lengthy documentation and often include covenant protection (information covenants, financial and non-financial covenants) in order to monitor developments.
Yet private markets often imply limited liquidity. The investments can only be sold at short notice at a significant discount. This means that investors need to take a long-term view of holding the assets and carefully assess their liquidity constraints and potential opportunity costs. Investments in private debt instruments therefore require a hold-to-maturity approach.
Who provides this financing on private markets?Most debt for private companies has been provided by commercial banks and, in recent years, some institutional investors: insurance companies, hedge funds, credit fund managers, business development companies (BDCs), and specialty finance companies such as mezzanine funds. Most of these entities operate within a legislative framework. Overall, regulators aim to protect retail investors from investing in high-risk or illiquid assets unless they know what they are getting themselves into.
In recent years, the growing regulatory burden on incumbent players has coincided with the emergence of innovative market players in the financial services industry. The advent of many new players has changed the landscape, with various alternative lenders requiring different levels of legislation.
What are the common parameters for alternative credit assets?Despite their differing dynamics and risk parameters, alternative credit investments share the following common features:• Deep understanding is required to assess the asset class and credit risk; • The investment decision is bottom-up;• Soft factors play a crucial role in risk assessment; • The investment is illiquid (less illiquid in the case of leveraged loans) and investors must
have a hold-to-maturity mindset when assessing risks. Repayment sources are mostly refinancing and/or amortisation rather than trading out from the assets;
• Transparency remains an issue in many asset classes. It is not easy to find an appropriate, objective benchmark to assess the quality of investment selection and monitoring;
• True sources of alpha generation in alternative credit remain (i) the assessment of assets both on secondary and primary markets, (ii) the quality of risk assessment and ability to avoid losses without compromising on the expected portfolio return and (iii) costs and efficiency in managing assets.

19Guidebook: Alternative credit and its asset classes
4 . Key stakeholders in the financial ecosystem
In Europe, an increasingly complex financial ecosystem has emerged over the past 20 years with regard to which players can provide financing, with different partnerships and different levels of regulation. The investor base active in the private market and in alternative credit has deepened, while banks remain an integral, essential intermediary in the ecosystem. Nevertheless, the market is still a work in progress, with new business models and players appearing every day.
These players (regulated banks, asset managers, institutional investors, peer-to-peer lending platforms) operate with different business models, regulatory scrutiny, risk pricing and, consequently, cost bases. This confusion fuels not only the arbitrage opportunities for borrowers (who may get cheaper loans more easily on certain platforms than others), but also leads to confusion among investors in terms of investment risk, the risk assessment framework and the appropriate benchmark.

20Guidebook: Alternative credit and its asset classes
Figure 6. Changing financial landscape
Source: Gabriella Kindert
• Peer-to-Peer Lending Platforms
• Online Private Placement
• Invoice Exchange Markets
• Private Debt Funds • Partnerships
• JVs, Listed Funds
• Asset Managers
• Direct Lending Funds
• Banks •
Asset Managers
•
Institutional Investors (directly)
• Banks (>90% market share)
• Asset Managers (mostly CLO)
• Institutional Investors (directly)
Landscape in 2007 Landscape in 2017
Varying level of regulation Regulated
Table 2. The segmentation of key players in corporate lending in 2017
Traditional lenders Alternative lendersBank (most regulated) Non-bank lenders:regulated Not yet regulated
• Regulated banks operating under licence
• Increasing scrutiny at all levels
• E.g. ABN Amro, ING, BNP Paribas etc.
• Asset Managers: M&G, BNP Paribas IP, Ares, AXA, Alcentra, Bluebay, ICG etc.
• Institutional investors: E.g. PGGM, APG etc.
• The newly-emerged so-called fintech players: peer-to-peer lending. Most attract capital without licences in place
• E.g. Lending Circle, Lending Club, Prosper etc.
Source: Gabriella Kindert
4.1 Asset managers: managing loans with diversified perspectivesUntil 2008, the most broadly accepted and common way to obtain exposure to the alter-native credit market was via collateralised loan obligations (CLOs), which are securitised vehicles usually managed by asset managers or banks. After the collapse of the CLO market, many managers who had previously accessed private debt assets through structured formats such as CLOs or asset-backed securities (ABS) moved on to unleveraged or “unstructured” formats, bypassing the investment banks in structuring and placing funds. The underlying securities remained the same, but the name and fund structure changed. For example, in the context of leveraged loans, the new format is often referred to as “senior secured bank loans”.

21Guidebook: Alternative credit and its asset classes
Table 3. Same underlying securities in new packaging
Pre-2008 Post-2008: private debt fundsLeveraged loans (mostly backing financial sponsors)
CLO Senior secured bank loans direct lending
Mortgage loans Residential Mortgage Backed Securities (RMBS)
Residential mortgage fund
Commercial mortgage loans
Commercial Mortgage Backed Securities (CMBS)
Commercial real estate loan fund
Source: Gabriella Kindert
In addition to these new formats, private equity (PE) firms such as 3i, KKR and EQT went on to establish debt management platforms. Furthermore, many private banks and independent boutiques set up platforms to manage loans, often referred to as “direct lending” platforms. The amount of money raised in direct lending as of today essentially corresponds to the CLO activities prior to the 2008 crisis.
Figure 7. The size of CLO markets
0
20
40
60
80
100
120
140
US CLO Issuance ($ bn)
0
10
20
30
40
50
60
70
80
90
EU CLO Issuance (€ bn)
* 2016 figures include data until November 2016
Post crisis: ca. $ 70-120 bn Post crisis: ca. € 14 bn
52.6
78.3 89
79.1 88.3
93.3 88.5
124 113
117.9
11.4 13.8 14.2 16.7 17 27.7 24.5
40.5
54.5 59.3
0
20
40
60
80
100
120
140
Dec. 2006
Dec. 2007
Dec. 2008
Dec. 2009
Dec. 2010
Dec. 2011
Dec. 2012
Dec. 2013
Dec. 2014
Dec. 2015
Dry
Pow
der (
$ bn
)
Private Debt Dry Powder (raised, not yet invested): North America-Focused vs. Europe-Focused
North America-Focused
Europe-Focused
cc. $ 120 bn
cc. $ 60 bn
Source: S&P Global Market Intelligence.
Investors seek yield and yield is not easy to find, which can clearly make investors biased. It is essential to remain critical, not only in terms of credit risk perception, but also when assessing the risks of the underlying cooperation and business models of the entities involved. As always, this information asymmetry favours players with a sales-driven strategy. Data and transparency are limited in this sector and it takes time to understand the details. The essential questions remain:• Who is delivering what value, in which value chain and at what cost/risk? • Do we have objective, comparable frameworks, means and tools to assess the processes,
people and systems on different platforms? • Do we have the ability to assess and compare risks and safeguard the investment
restrictions?

22Guidebook: Alternative credit and its asset classes
Figure 8. Private debt dry powder (raised, not yet invested): North America-focused vs. European-focused
0
20
40
60
80
100
120
140
US CLO Issuance ($ bn)
0
10
20
30
40
50
60
70
80
90
EU CLO Issuance (€ bn)
* 2016 figures include data until November 2016
Post crisis: ca. $ 70-120 bn Post crisis: ca. € 14 bn
52.6
78.3 89
79.1 88.3
93.3 88.5
124 113
117.9
11.4 13.8 14.2 16.7 17 27.7 24.5
40.5
54.5 59.3
0
20
40
60
80
100
120
140
Dec. 2006
Dec. 2007
Dec. 2008
Dec. 2009
Dec. 2010
Dec. 2011
Dec. 2012
Dec. 2013
Dec. 2014
Dec. 2015
Dry
Pow
der (
$ bn
)
Private Debt Dry Powder (raised, not yet invested): North America-Focused vs. Europe-Focused
North America-Focused
Europe-Focused
cc. $ 120 bn
cc. $ 60 bn
Source: Preqin (2016)
4.2 Fintech: the digital transformation in the financial sectorThe future of our economic activity is becoming increasingly digital (Drapp, 2014). We are living in an era which will very likely be documented in history books as the second major industrial revolution. In the last decade, new technologies were created that have enabled increasing connectivity and digital computing power. The internet has become essential infrastructure for any business and social interaction. While only 0.6% of the world’s population was connected to the internet in 1995, this figure had increased to 39% by the end of 2014.1 Google is currently developing a technology that uses high-altitude balloons to achieve internet coverage of close to 100% in five to ten years.2 These game-changing devices with higher computing power, combined with increased connectivity around the world, have shaped a new order. This is often referred to as the “digital transformation”. It is revolutionising how people connect and work with each other. It creates new opportunities, but also new risks that we need to understand, measure and manage.
Indeed, this connectivity and digital computing power has provided opportunities for new companies and new business models: Upwork, Coursera, LinkedIn, Amazon, Uber, Airbnb and Tesla, to name but a few. The list of new start-ups is extensive. • Facebook is now the largest media company yet it owns virtually zero content;• Airbnb became the largest hotel business yet it owns no hotels or homes; • Upwork has become a large temping agency yet employs essentially no staff.
This raises the question of how a company can provide financial services without owning any substantial financial assets. Many of these business models share the feature of connecting excess capacity to existing or new demand, based on engagement and social control. Could this model be applied to the financial services industry?
Banking is one of the world’s oldest industries. It facilitates the transfer of goods and services by providing a “utility function” for our economy. Given this utility function, it has
1 Source: Euromonitor, ITU based on Meeker (2016)2 Project Loon: https://x.company/loon/
23Guidebook: Alternative credit and its asset classes
always been essential for banks to ensure that stability, reliability, trustworthiness, sound-ness and risk awareness come across at all levels of corporate communications, from their employees’ conservative attire to the respectable premises they occupy.
Since 2008, an alignment of market conditions has supported the emergence of new market participants in the financial industry. These aspects are public perception, regulatory scrutiny, political demand, a lack of high-yielding investment opportunities and economic conditions. Financial technology, or “fintech”, is a dynamically growing segment that focuses on technological innovations in the financial services domain. It is commonly referred to as “the new marriage of financial services and information technology” (Arner, Barberis & Buckley, 2015). The fintech wave is significantly altering our perception of finance in the future, affecting such facets of consumer experience as complexity, access, speed and convenience. Traditional business models are being challenged by new fintech companies providing alternative payment and financing methods on new platforms and often providing disruptive products, such as Bitcoin. Technology and the internet are playing a radically increasing role.
Payments, financial management, peer-to-peer lending, online marketplaces, crowdfunding and data analytics are all part of a whole new wave of innovation that is targeting the very heart of the finance industry (”The fintech revolution”, 2015 ). Although it accounts for less than 1% of today’s total financing market, the prospects are enormous and a paradigm shift in how financial institutions conduct business is inevitable. Progressing digitalisation is filtering through to numerous other sectors and interacting with the forces of globalisation, but the combined effect of these two factors still remains largely underestimated (Dapp, 2015).
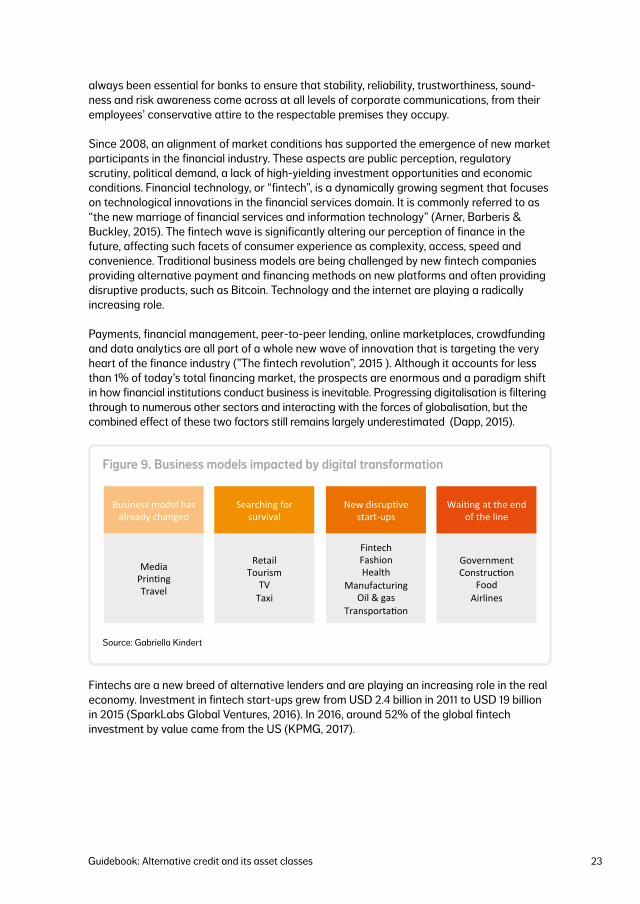
Figure 9. Business models impacted by digital transformation
Business model has already changed
Searching for survival
New disruptive start-ups
Waiting at the end of the line
Media Printing Travel
Retail Tourism
TV Taxi
Fintech Fashion Health
Manufacturing Oil & gas
Transportation
Government Construction
Food Airlines
Source: Gabriella Kindert
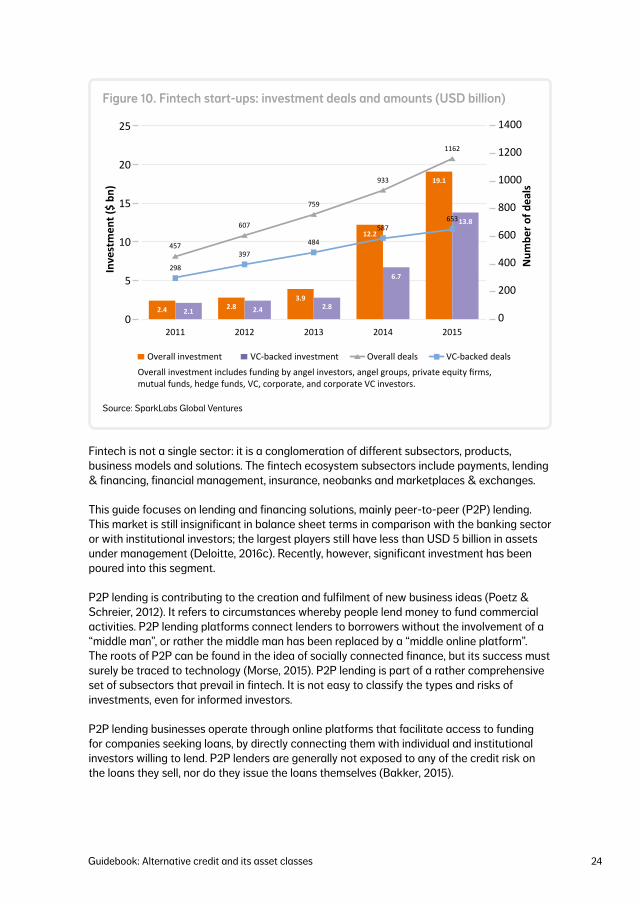
Fintechs are a new breed of alternative lenders and are playing an increasing role in the real economy. Investment in fintech start-ups grew from USD 2.4 billion in 2011 to USD 19 billion in 2015 (SparkLabs Global Ventures, 2016). In 2016, around 52% of the global fintech investment by value came from the US (KPMG, 2017).
24Guidebook: Alternative credit and its asset classes
Figure 10. Fintech start-ups: investment deals and amounts (USD billion)
2.4 2.8 3.9
12.2
19.1
2.1 2.4 2.8
6.7
13.8
457
607
759
933
1162
298
397 484
587 653
0
200
400
600
800
1000
1200
1400
0
5
10
15
20
25
2011 2012 2013 2014 2015
Num
ber o
f dea
ls
Inve
stm
ent (
$ bn
)
Overall investment VC-backed investment Overall deals VC-backed deals
Overall investment includes funding by angel investors, angel groups, private equity firms, mutual funds, hedge funds, VC, corporate, and corporate VC investors.
Source: SparkLabs Global Ventures
Fintech is not a single sector: it is a conglomeration of different subsectors, products, business models and solutions. The fintech ecosystem subsectors include payments, lending & financing, financial management, insurance, neobanks and marketplaces & exchanges.
This guide focuses on lending and financing solutions, mainly peer-to-peer (P2P) lending. This market is still insignificant in balance sheet terms in comparison with the banking sector or with institutional investors; the largest players still have less than USD 5 billion in assets under management (Deloitte, 2016c). Recently, however, significant investment has been poured into this segment.
P2P lending is contributing to the creation and fulfilment of new business ideas (Poetz & Schreier, 2012). It refers to circumstances whereby people lend money to fund commercial activities. P2P lending platforms connect lenders to borrowers without the involvement of a “middle man”, or rather the middle man has been replaced by a “middle online platform”. The roots of P2P can be found in the idea of socially connected finance, but its success must surely be traced to technology (Morse, 2015). P2P lending is part of a rather comprehensive set of subsectors that prevail in fintech. It is not easy to classify the types and risks of investments, even for informed investors.
P2P lending businesses operate through online platforms that facilitate access to funding for companies seeking loans, by directly connecting them with individual and institutional investors willing to lend. P2P lenders are generally not exposed to any of the credit risk on the loans they sell, nor do they issue the loans themselves (Bakker, 2015).

25Guidebook: Alternative credit and its asset classes
Figure 11. The emerging fintech ecosystem
Emerging Fintech ecosystem
Insurance Financial management Payments
Mobile wallets Remiaances
Point of sale (POS) P2P transactions
Banking Markets & exchanges
Lending & financing
P2P lending B2B/B2C lending
Credit scoring Crowdfunding
Trading & brokerage Savings tracking
Financial planning Robo advisory
Exchanges Trading platforms Cryptocurrencies
P2P Insurance Internet of Things
Aggregator platforms Neobanks
ApplePay PayPal iZettle Venmo Square
VISA checkout Flywire Stripe
Braintree Adyen Klarna Dwolla Xoom
Transferwise AndroidPay
LendingClub Prosper OnDeck
Funding Circle Advent Credit
Orchard Asset Avenue
Affirm Credible Credibly
SoFi Atom
Earnest Fundrise
Toborrow
LendingRobot Betterment CreditKarma
Motif Investing Nutmeg
BillGuard M-Changa
Juntos Mint
Wealthfront RobinHood
CreditMantri Calastone FinBase
WeSwap Ripple
Coinbase BitStamp Kraken
BTC Coinseaer
LendingRobot Revolut Kantox
CleverCoin Happy Coins
Metromile Oscar
Friendsurance MyDrive Bizinsure
Insly Simply Business
Smart2Cover
Simple Moven Atom Ally Kiva
WeBank Namu Metro
Gobank Tandem
CapitalOneBank Number26
AirBank Mondo
Examples of companies
Big Data & analytics Blockchain technology
Financial research Risk management & security
Figure 12. Marketplace lending
Marketplace Lending
Borrowers Investors
ONLINE PLATFORM BORROWERS LENDERS (INVESTORS)
Receive funding based on information provided on the platform
Provide funding Connects two distinct client groups
Source: Gabriella Kindert
InvestorsBorrowers
Marketplace Lending
Though definitions vary, P2P has the following characteristics: • An online platform functions as an operating space;• Multiple investors back different ideas;• The platform provides certain services to match business ideas with investor appetite.

26Guidebook: Alternative credit and its asset classes
The infrastructure of banks is mostly based on digital and physical assets for transaction security and scrutiny, right down to a physical check of the assets. By contrast, a P2P company is entirely digital.
The first models were set up in the US and UK, followed by many in continental Europe and Asia. The creation of the vast majority of these platforms overlapped with the financial crisis. While P2P platforms currently only represent a very small percentage of the total market, they have enormous potential.
There are two important users:• Borrowers, i.e., the paying customer; • Investors, who can be retailor institutional.
The P2P lending process varies according to the platform, but usually involves the following steps:1. Borrower application and validation by the platform; 2. Proprietary models to assign a risk grade; 3. The request is put on the platform and investors can apply; 4. If there are enough investors to fund the loan, the loan is originated by the back office
process (originating bank); 5. The originating bank sells notes to the platform, which distributes these to the investors.
P2P lending can provide significant access and reduce financing costs for borrowers.
Figure 13. P2P lending
Lenders (investors)
Platform
Borrowers
Intermediary (bank)
Note assessment
Promissory note
Loan request
Funds
Funds
Source: Gabriella Kindert

27Guidebook: Alternative credit and its asset classes
The aim of marketplace lending platforms is to match lending needs and borrowers directly to willing lenders via a highly transparent lending process and risk profiles, and at reduced transaction costs (WEF, 2015).
One of the most significant differences between banks, asset managers and P2P lenders is that P2P lending platforms are not yet regulated. This implies that on several fronts, the platform can get away with much less stringent checks and balances on borrowers and investors than those currently required and applicable to banks and asset managers. Although this may mean lower costs, it also implies a need for measures to ensure that investor interests are sufficiently protected.
The P2P platforms differ greatly with respect to quality and scrutiny of risk management practices, and it is very hard to navigate the value-added features of different business models, even for experienced investors. For example, how are the details verified and what support is available for recovering loans? Another aspect is the level of due diligence performed. Only 76% of platforms carry out due diligence directly before the initiative is posted on the website (Borello, De Crescenzo & Pichler, 2015).
Figure 14. Fintech: three different models of lending
The Market Place Hybrid Lending Lender Agnostic
• No balance sheet exposure
• Connecting capital and borrowers
• Easy and efficient
• No alignment of interests
• Both marketplace and own exposure
• Securitisation
• Many different types of lending
Represented by: Lending Club
Prosper Funding Circle
Represented by: OnDeck Kabbage
Represented by: Biz2Credit Fundera
Transparent Pricing + Terms
Fundera Direct Lenders
Shop Several Offers at Once
Lowest Rates, Guaranteed
A Long-Term Relationship
Free Resources + Tools
Source: Gabriella Kindert
Financial losses arise mainly from a combination of a lack of alignment of interests and a lack of understanding of the risk among investors. Our financial history proves that the most important factor to make sure investors are protected is to ensure alignment of interests between the originator and investors, and that the originator has an equal incentive to be repaid. This is one of the lessons learned after the collapse of the credit markets in 2008, and regulators have worked very hard over the past few years to ensure that a comprehen-sive framework applies to players in the financial sector.

28Guidebook: Alternative credit and its asset classes
The emergence of P2P lending platforms enables new investors to participate directly in lending to the economy. From a private and retail investor perspective, investment was formerly restricted to publicly listed companies and real estate, and did not include private debt or equity. These asset classes (e.g. public equity) are subject to very high disclosure requirements, are awarded credit ratings by agencies and are often covered in publicly available analyst reports. The financial counterparty entering into the transaction on behalf of the client needs to make sure that clients are aware of the possible consequences (i.e. they can lose their entire investment and the market can be volatile).
Similarly, transparency and investor protection needs to be ensured on P2P platforms. It takes time and effort, even for experienced investors, to understand the credit ratings and risk management practices of individual platforms. There are significant differences and each business model should be assessed on its own merits. Recent surveys taken among financially savvy investors show that advisors are concerned about consumers’ low level of understanding of the potential risks of P2P lending. P2P corporate communications and marketing messages rely heavily on sentiments of “banker-bashing”, and they are attempting to position the new set-ups as different from old business models. In recent years, customer sentiment has turned against traditional banks, especially in retail and among SMEs, and this creates fertile ground for promoting something “revolutionary” or “more efficient”.

29Guidebook: Alternative credit and its asset classes
5. The role of banks
Historically, the banking landscape has always been fairly clear-cut. Banks collected funds from depositors via straightforward credit intermediation, which they subsequently used to fund loans to borrowers. These loans were held on banks’ balance sheets until maturity, which gave the name to this traditional banking business model: originate-to-hold.
Over time, banks slowly started to diverge from the conventional model in search of new sources of funding. Eventually, a new banking model emerged: originate-to-distribute.
Rather than holding the loans until maturity, banks began pooling them in portfolios and selling them to specifically established entities called special purpose vehicles (SPVs). SPVs then repackaged the loan portfolios into tranches with varying seniorities and risk profiles. These were subsequently funded by issuing marketable debt securities known as asset-backed securities (ABS). Cash flows from the underlying loans were used to fund cash flows paid on these newly issued securities. This new banking model allowed banks to diversify the credit risk of the underlying loans and to access funds more cheaply, thus fuelling extra growth. As the sub-prime crisis unfolded, the securitisation market collapsed and the banking landscape has since changed dramatically.
Banks in Europe are currently facing a persistently adverse regulatory environment. Tightened supervisory policies and stricter capital requirements as a result of Basel III and Solvency II have brought about a heightened delevering tendency among European banks (Deloitte, 2016a).

30Guidebook: Alternative credit and its asset classes
Not only does the risk-taking capacity of banks remain constrained by stricter capital adequacy regulations, but many opportunities for risk-sharing have diminished due to the decline of the securitisation market.
Figure 15. The total asset size of the European banking sector has been declining since 2008
Source: Thompson Reuters Datastream
-15%
-10%
-5%
0%
5%
10%
15%
20%
25%
30%
35%
0
5,000,000
10,000,000
15,000,000
20,000,000
25,000,000
30,000,000
35,000,000
40,000,000 19
97
1998
19
99
2000
20
01
2002
20
03
2004
20
05
2006
20
07
2008
20
09
2010
20
11
2012
20
13
2014
20
15
2016
20
17
$ bn
Total Assets Growth in Assets (yoy)
As these banks find themselves in need of balance sheet reductions, their long-term lending potential is becoming increasingly impaired. This, combined with the persistent need to finance the real European economy, offers new opportunities for investors willing to contribute to sustainable development in Europe via alternative financing solutions.
Today, we are witnessing the swift emergence of unique partnership and cooperation models involving banks, asset managers and institutional investors. If efficient, such models can bring mutual benefits for all counterparties, which in turn can aid economic development.
One might call it originate-and-collaborate rather than originate-to-distribute, reflecting some new techniques for diffusing the risk concentrations that these partnerships entail.
Still, banks remain essential to arranging lending facilities for borrowers. Most of the lending facilities are arranged by banks via a complicated legal framework. They remain key, not only to arranging and underwriting loans but also as administrative agents.

31Guidebook: Alternative credit and its asset classes
Figure 16. The role of banks in arranging credit facilities
Arranging banks
Agent banks
Borrower SPV/corporate
Participating banks and
investors (junior)
Participating banks and
investors (senior)
Administration Security
Junior loan facility
Senior loan facility
FINANCING
INVESTMENT JUNIOR
INVESTMENT SENIOR
Underwriting process
Syndication process
Loan admin. process
Loan admin. process
Intercreditor agreement
Source: Gabriella Kindert

32Guidebook: Alternative credit and its asset classes
6. Key reasons to invest in alternative credit
There are many benefits to investing in alternative credit, some more obvious than others. In this chapter, we address both the advantages and any accompanying caveats. We compare them to their liquid counterparts, to the extent that these can be identified, and suggest ways for investors to optimise their portfolios.
In short, alternative credit investments have the potential to enhance the risk-adjusted return profile of a portfolio, especially for anyone willing to accept illiquidity and adopt a buy-and-hold approach. They can act as a portfolio diversifier because, due to their illiquidity and the opening up of “new” asset classes, the correlation between most categories of alternative credit and liquid equity/credit markets is low. The investments that bear a floating rate coupon provide a natural hedge against inflation and many sub-asset classes have a strong focus on environmental, social and governance (ESG) factors.
6.1 Pick-up in return, better downside protection Naturally, one of the first questions asked when it comes to investing is: “What are the expected returns?” As will be described in Chapter 7, determining the risk-adjusted returns in any of the alternative credit sub-asset classes requires more than looking at just one number. In general, we can say there is a yield advantage in alternative credit versus

33Guidebook: Alternative credit and its asset classes
comparable liquid investments in fixed-income instruments with similar credit profiles. This is often referred to as the illiquidity premium, but it actually represents more than just illiquidity.
To illustrate this, we take the example of a corporate loan and compare it to a corporate bond with a similar structure and credit profile. When comparing the expected returns on these two instruments, there is a pick-up in return in favour of the corporate loan. This level of this pick-up is determined by: • Compensation for less liquidity. Loans are less liquid than bonds and investors require
higher returns for the fact that they cannot easily sell them when they want to switch to a different investment (opportunity costs);
• Complexity. The structure and documentation of a loan often require more advanced intellectual skills, for which investors demand additional return. The ability to source is also included in this, as these asset classes often have high entry barriers;
• Downside protection. Negotiating covenants in the documentation of a loan and the ability to work together with a borrower in the event of financial distress (instead of just selling the bond) leads to a lower probability of default as well as a lower loss on default. The combination of the two leads to lower expected losses, adding to the already higher expected return compared to their liquid counterparts.
Let us elaborate on the downside protection. It is very common in alternative credit to negotiate tailor-made documentation. This allows investors to include certain rules and limitations to which the borrower must adhere. These so-called covenants are monitored throughout the life of the loan. They are designed to track the financial health of a borrower and limit aspects such as the borrower’s ability to incur additional debt. Violations of these restrictions by the borrower give the lenders/investors the right to take certain actions, ranging from increasing the interest rate to calling the contract and requiring immediate repayment in full.
Covenants are unique to each sub-asset class and each transaction. They can vary widely depending on the circumstances and pose a significant advantage compared to their liquid counterparts. The covenants are designed to maintain pari passu (equal) treatment with other senior creditors and to trigger renegotiation while the company is still financeable.
The key takeaway here is that downside protection increases expected returns.
Getting back to the total improvement in returns, it is not always straightforward to deter-mine this for alternative credit, as many of the sub-asset classes do not have a directly comparable liquid counterpart. For example, when investing in residential mortgage loans, in the liquid market one would choose covered bonds or residential mortgage-backed securities (RMBS). However, these instruments generally have a much shorter maturity than the underlying loans, as well as a very different structure than would be the case if one were to invest in whole loans. Comparing the yields on these would be like comparing apples to oranges. Investors must therefore be careful to assess the many aspects that influence returns to make a fair evaluation.

34Guidebook: Alternative credit and its asset classes
6.2 Diversification and low correlation to other asset classesAlternative credit offers portfolio construction opportunities for diversifying to other sub-asset classes traditionally owned by banks and segments that are not yet on the public market’s radar. Alternative credit sub-asset classes often provide exposure that is not otherwise available via liquid investments. In most cases, they represent investments in the real economy, for example the funding of infrastructure assets, SMEs and consumer loans. At first sight, corporate loans resemble corporate bonds from a diversification point of view, but investing in the loans actually broadens the issuer universe, as corporates do not usually tap both the public and private markets at the same time. Last but not least, alternative credit sub-asset classes tend to display a low correlation with traditional investments.
6.3 Defensive asset class in volatile environment and natural inflation hedgeAlternative credit is a defensive asset class in an uncertain world. In recent years, the invest-ment environment has become increasingly complex, making it more and more difficult to get a long-term view on value and risk. Assessing the current stage of the economic cycle is also becoming ever more challenging, as the economic dynamics are intensifying. In these uncertain times, alternative credit can often offer a plausible solution by investing in the secured part of the capital structure and negotiating tailor-made documentation. For investors who fear a rise in interest rates or inflation, several sub-asset classes offer the opportunity to invest in floating rate loans, thus providing a natural hedge against both rising interest rates and inflation.
Another aspect when it comes to volatility is that illiquidity has a positive side-effect: as these types of investments are valued based on mark-to-model, they display lower fluctua-tions and are less vulnerable to sentiment-driven movements in demand and supply in the secondary market. Valuation usually takes place on a monthly basis, using pricing models that have often been validated by an external party.
6.4 Ability to apply ESGSeveral sub-asset classes in alternative credit provide the ability to have a meaningful impact in relation to ESG aspects. First of all, projects or corporates can be selected based on their direct positive ESG impact. In asset classes such as infrastructure debt, investors can choose to adopt the Equator Principles,3 a risk management framework for determining, assessing and managing environmental and social risk in projects.
In some sectors, it is even common for loans to have ESG factors included in the covenants, which means that repayment can be triggered if these are not adhered to. Other examples can be found in the real estate sector, where buildings have to meet certain energy stand-ards. Following the developments in public markets, the measurability of impact investing is gaining more ground in private markets as well, and the ability to customise loans is certainly supportive of this trend.
6.5 Matching liabilitiesInvesting in alternative credit opens up opportunities for both return and matching. While it provides an improvement versus liquid instruments (such as government bonds and invest-ment-grade credits), it also has a strong focus on capital preservation. As mentioned above, the probability of default tends to be lower, while recovery rates are higher. In some of the sub-asset classes, principal repayments may be less predictable. However, the higher returns could more than compensate for the resulting additional portfolio risk. Meanwhile, mitigating actions and flexible portfolio management could further lower the impact of unpredictability.
3 Equator Principles: http://www.equator-principles.com/

35Guidebook: Alternative credit and its asset classes
Some of the sub-asset classes have a long interest duration that could naturally suit the liability structure of a life insurer or pension fund. At the same time, the shorter maturity loans could also fit such a portfolio, as the variety of tenors, credit quality, structures etc. provides a wide range of opportunities for constructing a portfolio.
Even floating rate loans can be used in the matching portfolio, for example in combination with a swap overlay, allowing investors to benefit from the improved return versus traditional instruments. An example of this is government-guaranteed loans, such as export credit agency loans, acting as a substitute for government bonds. The key aspects to consider when looking at alternative credit in a matching context will be discussed in more detail in Chapter 8.
Figure 17. Markowitz Efficient Frontier
Portfolio of only mainstream investments
Portfolio incorporating both mainstream and alternative
credit investments
Risk/volatility
Expe
cted
retu
rn
1
2a
2b
Markowitz Efficient Frontier Inclusion of alternative investments enhances the risk-return profile of the portfolio
Source: NN Investment Partners
6.6 How can alternative credit improve risk-adjusted returns and enhance income? The information asymmetry in alternative credit is a challenging feature, mainly because of the lack of publicly available information. Apart from leveraged loans (where participation of institutional investors already exceeds 50%), transparency remains low. Due to the number of sub-asset classes (e.g. infrastructure, direct lending, commercial real estate and distressed debt) and the private nature of the data, it is difficult to provide comparisons as we could easily end up comparing different classes of sub-assets. Finally, many of the newly established platforms do not yet have market data over the full cycle that can be used to assess return performance in the longer term.

36Guidebook: Alternative credit and its asset classes
Figure 18. The transforming market will reduce information asymmetry
REDUCING INFORMATION ASYMMETRY IN PRIVATE DEBT
High potential to generate alpha to investors by sourcing, analysing, and
structuring transactions
Lack of transparency
Limited availability of information on the track record of the asset classes
Lack of comparability to other asset
classes (both within private and public markets)
Potential for high transaction costs
(connecting sources and uses of capital)
Transforming market: evolution is diminishing inefficiencies and
increasing transparency
Source: Gabriella Kindert
Empirical research from Preqin (2017), a leading source of data for the alternative assets industry, shows that the vast majority of investors confirm that their private debt fund investments have lived up to expectations. The increasing participation of the institutional investor market and the growth of new platforms are likely to bring greater transparency regarding the actual return contribution of the individual sub-asset classes in the future.
The “private” aspects allow for excess return: private pricing differential (PPD)
Most liquid fully “institutionalised” asset classes do not currently offer the appropriate balance between risk and return. Over the past few years, monetary policy interventions have themselves caused a positive return on the most liquid public assets, solely as a result of artificial demand pressure.

37Guidebook: Alternative credit and its asset classes
There is a clear consensus and rich academic literature that support the existence of the so-called “illiquidity premium” in private markets which, although it varies, can be substantial over time. However, estimating the level of the premium remains challenging.
Contrary to public traditional fixed-income markets, alternative credit offers an attractive PPD of 0.5% to 5% over the fixed-income market. Private companies with similar risk features are often forced to pay a significantly higher rate than businesses that have access to public markets. This is especially true of SMEs, which rely mainly on bank funding and in many cases are still struggling to obtain funding at a reasonable cost of debt. As banks shed assets to meet capital requirements, non-bank lenders are stepping in to fill the gap.
What is the PPD?Many institutional investors compare the pricing of private and public instruments and request a so-called “illiquidity premium” of at least 50 bps. We believe the difference may be assessed on different merits. The premium is not only requested to compensate for illiquidity.
Figure 19. The Private Pricing Differential (PPD)
100 bps
150 bps
Private
Public
BBB
BBB
EL: 10 bps EL: 15 bps
Private Pricing Differential (PPD)
55 bps PPD Sourcing
Structuring Illiquidity Flexibility
Better Expected Loss due to
secured nature
Source: Gabriella Kindert

38Guidebook: Alternative credit and its asset classes
The premium is a result of multiple attributes as there are many other sources of alpha in private markets: • Sourcing and connecting sellers and buyers, matching demand and supply of capital;• Structuring based on a specialist understanding of the asset class;• Market inefficiencies: supply and demand characteristics of the capital markets often
lead capital in one direction due to regulatory or monetary interventions;• Although there is illiquidity, many private instruments offer a higher degree of control and
flexibility, allowing the adjustment of terms in a fast-changing environment;• A higher recovery rate is observed in such investments due to their secured nature.
The recovery rate in such debts is often over 80%, which is significantly higher than the 38.4% reported by Moody’s for senior unsecured bonds from 1992 through 2006 (Preqin, 2015). This favourable expected loss also contributes to the PPD.
Furthermore, liquidity on the bond market could also change significantly. The perception of market liquidity used to be much like that of insurance: you do not need it until you do. However, liquidity assumptions about public bonds should also be reassessed because traditional liquidity providers such as broker-dealers and banks have become more risk-averse since the financial crisis. New rules regarding capital requirements and proprietary trading apply, drastically reducing bond inventory at previously market-making banks, while at the same time concentrating global holdings at buy-and-hold investors/central banks.
Several recent publications by regulatory institutions (ESRB, 2016) suggest liquidity in bond markets has changed, which can be attributed to the increase in regulation in the financial sector. Banks most often cite regulation and balance sheet capacity as reasons for the decline in market-making activities (Hannappel, 2016). Consequently, investors need to consider the risk of a structural change towards lower liquidity, as well as the volatile nature of liquidity on public markets. Some researchers are highlighting the concern that current market prices, influenced by low volatility and low interest rates, do not sufficiently compen-sate investors for the ongoing decline in liquidity and a potential hike in turbulent times (Hannappel, 2016).
The time duration to liquidate bond portfolios could increase significantly compared to pre-2008. This implies that bond investments, which were previously considered to be a liquid investment, might become as illiquid as private instruments.
It can be concluded that portfolio income can be enhanced through higher PPD rates due to the credit risk, sourcing premium, illiquidity premium and market inefficiencies.
It is quite safe to invest in the higher investment-grade segments of private debt, with expected losses ranging from 0 to 20 bps, while offering a PPD of 50 to 100 bps. In some segments, such as direct lending, debt is being offered at 6-8%. Even if we assume a lower credit rating (BB) and a higher expected loss of 200 bps, the PPD is significant compared to traditional fixed-income markets4.
4 For full overview of individual strategies see Table 5 (Chapter 7).

39Guidebook: Alternative credit and its asset classes
6.7 Formats for investing in alternative creditInvestors can obtain exposure to alternative credit in several investment formats, each with various advantages and disadvantages. When considering an allocation to one or more of these strategies, investors must carefully consider which format is most suitable, taking many factors into account. The table below sets out these factors and scores for the various formats. To provide further insight, the factors are described in more detail below the table.
Table 4. Formats for investing in alternative credit
Format Segregated mandate
Fund Direct investment
Securitisation
Description As sole investor via an investment
manager (IM)
Joint investment with other
investors in regulated fund
vehicle
As sole investor directly involved
in syndicate
Joint investment in regulated
securitisation vehicle, either through fund,
mandate or directly
Liquidity - + - +
Adverse selection in case of asset disposal
+ - + -
Use IM skills + + - +
Use IM sourcing capabilities + + - +
Achieve own objectives + - + -
Adjust investment criteria during the cycle
+ - + +/-
Apply own constraints + - + -
Reporting + + +/- +
Customised reporting + - +/- -
Size < 150 million - + - +
Size > 150 million + + + +
Alignment of interests +/- + - +
Source: NN Investment Partners
LiquidityLiquidity, or rather the lack thereof, has been described several times already in this guide. When considering an allocation to alternative credit, there must be a certain amount of room to relinquish liquidity. However, many of these strategies are not 100% illiquid and it is important to realise that the investment format also determines how much liquidity can be provided.
When investing directly in a loan through a syndicate, investors are dependent on the secondary market. If investors wish to sell the loan, they must find a buyer themselves, often at a (significant) discount. Roughly the same applies when investing through a segregated mandate, although in this case, the investment manager can help find a buyer. This can prove an advantage, especially if the investment manager services a broader range of clients and has good access to the market.

40Guidebook: Alternative credit and its asset classes
If investors choose to invest in a fund, they can benefit from the cash that is being collected in the fund. For example, in a Dutch residential mortgage loan fund, the average cash collected through coupons and redemptions is around 10% on an annual basis. If the fund is EUR 5 billion in size, it can facilitate outflows of EUR 500 million per year. It is also more likely that there will be other investors or new participants that might want to enter the fund, in which case participations can be netted.
Last but not least, if investors opt for a securitised transaction, it is typically in a bond format. This means liquidity is somewhat higher, as it is regularly priced in the secondary market and investors can benefit from the presence of other market participants. This also means that part of the illiquidity premium is lost.
Adverse selection in the event of asset disposalThe flipside of liquidity is the potential adverse selection that can occur in the event of asset disposal. If clients invest jointly in a fund and one wishes to exit (and there is no-one to take over the participations, nor sufficient cash available in the fund), this could be facilitated by the sale of one or more assets. However, the sale of assets out of the fund affects existing clients and could have a negative effect if it is not conducted properly (for example, compensation for those investors that stay in the fund via exit fees).
Use of skills and sourcing capabilities of investment managerAs mentioned above, investing in alternative credit requires several special skills. The first is access to the market, as the ability to source transactions is not as straightforward as it is in liquid, more transparent markets. These asset classes often have high entry barriers. The complexity of the products requires strong analytical and intellectual skills, as well as specialist professionals in risk management and legal counsel. Moreover, even the adminis-tration of loans requires specialist skills and this aspect is easily underestimated. Investment via a fund, segregated mandate or securitisation allows investors to benefit from the investment manager’s capabilities, while directly investing in a syndicate means investors must handle everything themselves. The downside risks of making a mistake are rather high, as the loan cannot easily be sold once the transaction is closed. The cost of using an investment manager should therefore be carefully weighed against the total cost of running the activities alone.
Ability to control investors’ objectives and constraintsThe only way for investors to control their own objectives and constraints is via a segregated mandate or direct investments. When opting for a fund, changes to investment criteria obviously apply to all investors, and the same applies to securitisation. If investors wish to maintain the option to change their investment criteria based on market developments and/or during the business cycle, fund investments are less suitable. Securitisation options enjoy somewhat higher liquidity, and investors could therefore still consider selling the investment in order to re-allocate the proceeds.
(Customised) reportingReporting has become an increasingly important service due to the introduction of stricter regulation for many institutional clients, such as Solvency II. The benefit of investing in a fund is that reporting has been developed for a broad range of clients, taking into account several requirements, including regulatory obligations. However, customisation of these reports is often impossible. Clients that require specialist reports are often better off with a segregated mandate, although this will usually also imply higher fees.

41Guidebook: Alternative credit and its asset classes
SizeFor many alternative credit sub-asset classes, small tickets are difficult to manage. For example, a mandate in infrastructure debt is not feasible below EUR 150 million. In order to obtain a decent level of diversification, a minimum of 10 loan holdings is required; tickets of EUR 15 million per transaction are already at the low end of market practice. This is a plausible solution when working with an investment manager who can pool such tickets with other clients, but it will be hard to find these loans and cover the costs associated with them for a stand-alone investment. Fund investments obviously start at a much lower level.
Alignment of interestsA very important aspect of investing in alternative credit is ensuring an alignment of interests between all parties, especially since it is impossible to simply sell the investment. For example, when investing in mortgage loans, investors must make sure that the incentives of the originator that sources the mortgage loans are fully aligned with their own objectives and beliefs. Not only should the underwriting criteria match their preferences, but so should the factors that impact the loan throughout the remainder of its life. These include the long-term commitment of the originator to stay in the market, the (special) servicing activities, etc. Last but not least, cherry-picking should be avoided and a system of checks and balances should be in place that ensures investors are not structurally left with the worst-performing assets.

42Guidebook: Alternative credit and its asset classes
7. The approach to alternative credit investments
Making a structured and systematic comparison of the different asset classes.
Investing in alternative credit requires a very different approach compared to investing in other traditional credits, such as corporate or government bonds.
One of the key challenges for investors is finding a way to navigate the complex landscape of alternative fixed-income products. The investment environment has become very convoluted in recent years. New players are appearing with new products (e.g. direct lending, senior secured bank loans, mezzanine, leveraged loans, unitranche financing). The overlap-ping terminologies make it hard even for experienced banking and asset management professionals to understand the differences.
How can we compare the attractiveness of leveraged loans, commercial real estate financing, infrastructure debt, residential mortgages or direct lending with other investment opportuni-ties? Can we find a framework that structures the attractiveness and risks of these investment opportunities in a comparable matrix? This chapter aims to do so. The purpose here is to ensure that investors know what questions to ask, and that they have the right framework to be able to compare alternative credit investments with traditional fixed-income products and to make the investment decisions that best match their real needs and preferences.

43Guidebook: Alternative credit and its asset classes
Investors are becoming increasingly knowledgeable about private debt as an asset class and are now more comfortable in making allocations to alternative credit. According to Preqin, 45% of institutional investors plan to increase their private debt allocations in the next 12 months. Even so, the culture of investing in illiquid alternative assets is much less developed in Europe than in the US. Historically, pension funds in Europe have used alterna-tive credit investments far less than those in North America. These investments account for 15% of pension investments in the UK, 14% of those in the Netherlands and even lower percentages in other European countries. That compares with 29% in the US and 22% in Canada. (Towers Watson, 2015).
Though every investor and organization is different, a few common factors determine the successful implementation of the alternative strategies.
One of them is the ability to simplify the strategies. A concise, to-the-point presentation of an investment opportunity has the best chance of approval and implementation. It is especially important to focus on key risks and address them with caution, so as to facilitate proper assessment and oversight.
It is equally vital for investors to seek cost-efficient solutions. In a low-yielding environment, the investment management cost has a significant impact on the net result. Offering cost-efficient solutions should be considered both externally (e.g., through cooperation agreements with banks) and internally (e.g., by avoiding unnecessary duplication of procedures).
Behavioural aspects are also at play. Alternative credit is a relatively new asset class. Few institutions have seen results across the full economic cycle. How the asset class will perform in a crisis? What will happen to the business model in declining markets? Will the manager or the company still be around? These are frequently asked questions. Investors need to be able to overcome the fear factor. To a certain extent, these concerns can be mitigated by selecting best-in-class asset managers with an established track record and committing them for the long term.
Starting with a limited number of more conservative strategies and seeking alignment of interest between the arranging banks, advisors, asset managers and investors can also help to address fear-related concerns.
Despite investment managers’ enthusiasm for alternative credit, we often see resistance from board members of pension funds, insurers and other institutional investors due to their lack of understanding of the asset class. A variety of factors have created confusion and suspicion. The risk-adjusted return and the value in private debt instruments may appeal to investment managers, but it is not always easy to incorporate it into investment strategies, nor is it always simple to achieve the desired exposure to the private debt instruments. Therefore, seeking executive support remains a key success factor. The process requires a commitment to deepening the knowledge in the asset class, especially from management and supervisory boards, whose members are often not familiar with the asset class. This can often be a long and fractious process. Creating a diverse and learning culture at all levels of the organization is essential to success.

44Guidebook: Alternative credit and its asset classes
7.1 The triangle approach to alternative credit Our framework enables investors to methodically evaluate alternative credit investments, and to make a consistent comparison of these often complex and unfamiliar assets. We hope it will allow the investors to tap into the key success factors for implementing these strategies. Three key aspects of alternative credit underpin this framework and help investors formulate the questions that need to be addressed when considering an investment in alternative credit products. These are:• Risk-adjusted return• Liquidity• Complexity
In these areas we consider cash flow elements, development of risk-adjusted return frame-work, the importance and justification of fee levels and costs of investments as well as liquidity and complexity aspects.
The framework can be seen as a compass readers can use to navigate the opaque environ-ment of alternative credit investments. We hope that it will provide a deeper understanding of these assets and empower investors to explore new investment opportunities.
Figure 20. The triangle approach to alternative credit
RETURN
COMPLEXITY LIQUIDITY
THE TRIANGLE
APPROACH TO ALTERNATIVE
CREDIT
Cash flow pattern
Tenor and flexibility
Expected return
Security and expected loss
Risk-adjusted return
Management fees
Net return
Charges
Governance and reputation risk
Certainty about assumptions
Overall intellectual complexity
ESG factors
Illiquidity
Volatility
Diversification
Source: Gabriella Kindert
Table 5 provides an overview of various alternative credit sub-asset classes across individual aspects embedded in the three key areas of our evaluation framework – return, liquidity and complexity. The rest of this chapter further explains each specific element.

45Guidebook: Alternative credit and its asset classes
Tabl
e 5.
Ove
rvie
w o
f key
sub
-ass
et c
lass
es in
alte
rnat
ive
cred
it
Gov
ernm
ent-
Gua
rant
eed
Loan
s
Infr
astr
uctu
re
Deb
tLe
vera
ged
Loan
s(E
urop
ean)
R
esid
entia
l M
ortg
ages
(Eur
opea
n)
Com
mer
cial
M
ortg
ages
Pri
vate
P
lace
men
tsD
irec
t Len
ding
RET
UR
N
Cas
h flo
w p
atte
rnB
oth
Bot
hFl
oatin
gB
oth
Floa
ting
(mos
tly)
Fixe
dFl
oatin
g
Lega
l ten
or7-
30 y
ears
Ca.
18 y
ears
5-8
year
s10
-30
yea
rs5-
7 ye
ars
5-15
yea
rs5-
7 ye
ars
Gro
ss re
turn
40
-120
bps
210
bps
400
-525
bps
150
-350
bps
150
-250
bps
200
-350
bps
600
-10
00
bps
Expe
cted
loss
0 b
ps10
bps
130
bps
10-5
0 b
ps10
bps
20 b
ps25
0 b
ps
Ris
k-ad
just
ed re
turn
40-1
20 b
ps20
0 b
ps27
0-3
95 b
ps14
0-3
00
bps
140
-240
bps
180
-30
0 b
ps35
0-7
50 b
ps
Man
agem
ent f
ee15
bps
30 b
ps50
bps
50 b
ps30
bps
30 b
ps10
0 b
ps
Net
Ret
urn
25-1
05
bps
170
bps
220
-345
bps
90-2
50 b
ps11
0-2
10 b
ps15
0-2
70 b
ps25
0-6
50 b
ps
Cos
t of h
oldi
ng th
e as
sets
Low
Med
ium
Hig
hLo
wM
ediu
mLo
w/M
ediu
mH
igh
LIQ
UID
ITY
Liqu
idity
Low
Low
Med
ium
Low
Med
ium
Hig
hLo
w
Vola
tility
Low
Low
Hig
hM
ediu
mLo
wLo
wLo
w
Port
folio
div
ersi
ficat
ion
Hig
hH
igh
Med
ium
Hig
hH
igh
Hig
hM
ediu
m
CO
MP
LEX
ITY
Ove
rall
com
plex
ityLo
wH
igh
Very
hig
hM
ediu
mH
igh
Low
Hig
h
Tran
spar
ency
H
igh
Med
ium
Med
ium
Hig
hH
igh
Hig
hLo
w
ESG
fact
ors
Med
ium
Hig
hLo
wM
ediu
mM
ediu
mM
ediu
mH
igh
Rep
utat
ion
risk
Low
Med
ium
Hig
hLo
wLo
wLo
wH
igh
Impo
rtan
t dis
clos
ure:
The
com
pila
tion
of th
e fig
ures
is b
ased
on
the
auth
ors’
est
imat
es a
nd d
oes
not r
epre
sent
an
offic
ial p
ositi
on. R
eade
rs s
houl
d co
nsul
t pro
fess
iona
l adv
ice
befo
re m
akin
g an
y de
cisi
on o
r ta
king
any
act
ion
that
may
aff
ect t
heir
finan
ces
or b
usin
ess
or ta
x po
sitio
n.

46Guidebook: Alternative credit and its asset classes
7.2 Cash flow pattern of the loanFirst, it is essential to identify the nature and stability of the actual coupon cash flows of the underlying security. Apart from the sector and geography, the interest rate basis is an initial indication. As traditional bank products, many loans are based on a floating rate (e.g. EURIBOR, as banks fund themselves on this basis) and could therefore provide a more natural hedge against inflation in the form of a rising EURIBOR rate.
Figure 21. Composition of loan coupon
Base rate Additional interest margin
Originally aimed at covering funding cost of lenders
Europe: 3-month EURIBOR rate
US: 3-month LIBOR rate
Reset periodically (i.e. every 3 months)
Provides hedge against
inflation
Usually subject to base rate floors (notably in the US)
Additional compensation for credit risk and liquidity risk
Dependant on the credit profile
of the loan issuer
Oten linked to ratchet and
therefore inherent risk adjustments
Provides cash flow stability
Total contractual cash coupon
Floating component Fixed component
Source: Gabriella Kindert
Fixed vs. floating rate
Is the cash flow based on floating rate and coupon (e.g. LIBOR plus 300 bps) or fixed rate (e.g. 400 bps)? The vast majority of the loans have floating rates. This implies that the interest rate the borrower needs to pay is most often linked to EURIBOR or LIBOR rates (“base rates”) and is reset on a regular basis (such as monthly, quarterly or semi-annually). The “agent” calculates the interest rate payment that the borrower needs to transfer to the lenders, based on the actual EURIBOR or LIBOR rate.
This coupon is variable and linked to the actual level of the base rate. If the base rate goes up, the interest payments the borrower must pay also go up. Such loans are therefore often referred to as “natural hedges against inflation”. Other loans are similar to bonds and have a fixed rate during the tenor. These are mostly private placements (corporate credit) or infrastructure debt-related and are often tailored to the needs of institutional investors.
For the investor, however, the question of whether to invest in fixed- or floating-rate debt largely depends on whether the investor buys the floating part only or the associated hedging (e.g., an interest rate swap) as well. It is also important to realise that, unlike fixed-rate debt, floating-rate debt does not include a “make-whole” provision. This is explained further below under tenor/repayment.

47Guidebook: Alternative credit and its asset classes
Figure 22. Example of loan with hedging requirement
LOAN Face value : € 100 mln
Floating rate: LIBOR + 3% Condition: hedge 50% of the loan outstanding
SWAP Pay fixed rate: 4%
Receive floating rate: LIBOR + 2% Based on a notional amount of: € 50 mln
1. The lender provides a loan of € 100 mln to the borrower. 2. In return, the borrower agrees to pay LIBOR + 3% interest (+ principal repayment at maturity). 3. Under the loan agreement, the borrower agrees to hedge 50% of the loan outstanding, thus engaging in an
interest rate swap with a bank. The borrower agrees to pay a 4% fixed rate on a notional amount of € 50 mln. 4. In exchange, the borrower receives LIBOR + 2% on a notional amount of € 50 mln.
Lender Borrower Bank
(swap counterparty)
LOAN SWAP
1
2
3
4
Loan with hedging requirement
Borrower’s net interest payment obligations without the swap (€ mln):
(LIBOR + 3%)100
Interest on the loan
Borrower’s net interest payment obligations with the swap (€ mln):
(LIBOR + 3%)50 + (1%)50 + (4%)50
Interest on unhedged portion of the loan + interest on hedged portion of the loan + payments to swap counterparty
Source: NN Investment Partners
Hedging conditions of the loan
What are the hedging conditions? Is the borrower obliged to hedge the interest rate?Many lenders want to avoid the risks that rising inflation and, consequently, base rates pose to borrowers. When interest payments increase, the borrower is less able to meet the payment obligations. Therefore, loans often include clauses stipulating that the borrower needs to hedge 50% or 60% of the loan outstanding, or even almost 100% in the case of infrastructure loans, which are structured quite tightly around contracted cash flows. This hedging is typically done via banks.
The lenders may decide not to impose hedging requirements if they believe the borrower’s underlying cash flows provide enough flexibility to adjust, for example if the borrower is able to pass on rising costs via pricing adjustments.
Investors should be mindful about hedging conditions and requirements, especially in leveraged loans and loans with ratings below investment grade. For highly risky loans like those with credit ratings below BB-, interest cover ratios (EBITDA/Total Cash Interest) are relatively tight to begin with and the company may not have the resources to afford actual hedging costs. The investor should thoroughly review the borrower’s current and future cash flow flexibility. The same holds for infrastructure loans, which reflect a different risk quality

48Guidebook: Alternative credit and its asset classes
and are usually rated in the BBB-A range but are nonetheless normally structured quite tightly around contracted cash flows and call for a solid sensitivity analysis. However, given the contracted cash flows and limited ability to pay for increased base rates, the hedging is a very important risk mitigant.
Payment requirements of interest coupon
Is the return cash flow-based (cash out) or rolled up with the principal?Normally, when investing in senior secured loans such as corporates, commercial real estate and infrastructure, interest is payed quarterly or semi-annually. The ability to service the debt is also tightly monitored in covenants such as interest cover ratios or debt service (scheduled principal and interest) cover ratios and the transactions will have been stress-tested for interest rate scenarios during the due diligence phase.
However, not all loans pay out the actual cash interest to the lenders. In some cases, the interest payment requirements are rolled up and added to the principal of the loan. This practice, also known as pay-in-kind (PIK), is especially common in the following situations:• Loans with lower seniority
In most cases, the loans that have the highest ranking regarding seniority pay cash interest to lenders. The most senior loans often pay out cash interest entirely, while mezzanine loans have a partial rolled-up element and shareholder loans are fully rolled-up.
• Borrowers that cannot afford paying actual cash interest This can be due to factors such as high growth and associated working capital and capex requirements, or distressed borrower situations.
The loan agreement’s terms might provide flexibility by stipulating that in case the debt service cover and interest cover drop below certain levels, the interest obligations change from actual cash to rolled-up interest. Often, in cases of restructuring, the lenders decide to opt for this route to give the company some financial flexibility. This can go hand in hand with a higher interest rate to compensate for the increased risk due to the restructuring, and is often combined with an extension of the loan to allow for payment of the increased debt service.
7.3 Tenor and flexibility
The legal and expected tenor of the loan
What is the legal tenor of the loan? What expectations affect and determine the actual tenor? What influence does the borrower have on the tenor?
In private debt, the actual tenor and legal tenor do not always coincide. A loan agreement always includes predetermined legal tenors and amortisation obligations; in reality, these expectations are often adjusted.
Project finance and leveraged loans are a good illustration. The legal tenor of an infrastruc-ture project is usually set within the life of the concession in order to benefit from that concession (as the only source of cash flows) in case of a rescheduling. However, the fixed amortisation schedule will depend on the type of project finance. In the case of safer projects, such as public-private partnerships, the schedule will be linked to the legal tenor.

49Guidebook: Alternative credit and its asset classes
Figure 23. Example of legal tenor ≠ actual tenor of the loan
Face value: € 100 mln
Time (years)
Expected cash flows
Bullet: 100%
Rate (fixed): 4%
Legal tenor: 6 years
Legal tenor ≠ actual tenor of the loan
Timeline of cash flows to the lender:
Consider a loan with the following characteristics:
Actual cash flows
0 1 2 3 4 5
- € 100 mln
6
€ 4 mln € 4 mln € 4 mln € 4 mln € 4 mln € 104 mln
- € 100 mln € 4 mln € 4 mln € 4 mln € 104 mln
IPO of the company triggers loan prepayment after 4 years Prepayment risk materialises: the actual loan yield is lower
than estimated at inception
Projects with more volume or market risk will be given room to repay more of the loan above a minimum repayment schedule. Such projects may also include “cash sweeps” (a certain percentage, usually 50-100%) of available cash flows for faster repayment. The legal tenor of leveraged loans generally ranges from five to seven years. In the US, most loans are bullet loans that officially mature at the end of the tenor, creating potential prepayment risk for the lenders. In Europe, most loans have a 20% amortisation component combined with 80% bullet. The actual loan life is around three to four years. This has to do with the fact that the owner of the company (usually a private equity sponsor) frequently sells the company, which automatically triggers the clause to refinance the existing loans.
There are other reasons that the legal tenor and actual tenor do not coincide, which could have credit positive, neutral or adverse impacts: • Sale of the company (IPO, secondary buy-out), see example above;• Major acquisition being undertaken by the company; • Higher-than-anticipated growth requiring new credit lines; • More favourable conditions on the credit market (tightening spreads). The loan document
may offer favourable terms for optionality of the borrower; • Distressed situation of the borrower requiring changes in the loan conditions (rolled-up
interest or debt-to-equity swap).
Depending on the credit matrix, there could also be different optionalities included in the documentation. One such optionality is a cash sweep, often linked to high leverage, whereby lenders would like to use excess cash to reduce the loan amount. Other optionalities can be linked to selling assets, prepayments or reducing loan amounts below a certain level.
It is important to assess the flexibility, optionality and all other conditions for the borrower and the associated costs for the lender/investor. Prepayment penalties, such as make-whole

50Guidebook: Alternative credit and its asset classes
fees, are common in traditional fixed-income products but far less so in private debt. Banks, which are financed on a floating rate basis, typically do not match assets and liabilities and see refinancing as a chance to earn a new upfront fee and unwind and close new hedging. Embedment of such prepayment options might come at no extra cost to the borrowers, but if triggered, they could be an unpleasant surprise for the investors, especially those expecting high predictability in terms of cash returns.
The cash flow certainty should therefore be carefully assessed. The borrower’s interests often conflict with those of the investors in this regard. Borrowers are accustomed to flexibility and will usually push for prepayment options. Investors generally like cash flow predictability. They are used to investing in traditional fixed-income and high-yield bonds, which protect investors from prepayments. They also like to see similar clauses in the loan agreement for the underlying private placement or infrastructure investments. Borrowers have several reasons to accept these requirements: • to create the potential to borrow for a longer term as banks are reducing the maximum
tenors they are willing to provide under Basel III and IV; • to create the potential to borrow at competitive rates as investors are usually deciding on
the basis of relative value and not cost of funds, nor on the basis of any side business; and • to diversify their funding base.
7.4 Expected return of the loan
What is the expected return on the loan? What are the potential sources of returns?Many different factors can influence the potential return. In this section, we review the elements that add to the return.
Table 6. Factors affecting loan return
Adding to Return Reducing Return Base (LIBOR / EURIBOR) Credit Loss
Coupon Trading costs
Fees (amendment fees, waiver fees) during the tenor
FX hedging (if required)
Initial purchase price Management fees
These elements can be:• Base rate and coupon (explained earlier).• Fee, both at inception and during the loan’s life. The arranging bank (or, in the case of a
bilateral loan, the borrower) pays a fee up front for the work done in concluding the credit process with a commitment. This is somewhat comparable to the original issue discount (see below), which is cheaper for the borrower and is typically offered by the arranging bank. The level of the up-front fee is a function of a competitive process and the relationship between the bank and the borrower. Depending on subsector, the up-front fee will be somewhere between 50 and 250 bps. In certain cases, arrangers will make a fraction (e.g. one-fifth) of this available to end-investors. During the life of the loan, the borrower will have to pay for certain amendments to the loan conditions. These can be linked to changes in certain covenants or obtaining the lender’s consent to acquisitions or

51Guidebook: Alternative credit and its asset classes
modifications. The underlying reason for this is usually to cover the costs and the work lenders need to undertake. These fees can be quite significant and can add to the overall profitability.
• Initial purchase price of the loan and the original issue discount Private debt is generally illiquid and does not have an active secondary market for most products. We will address this further when assessing liquidity. In some cases, investors have the opportunity to purchase loans at a discount to their face value. This is illustrated in Figure 24, where a lender purchases a loan with a face value of EUR 100 million for the price of EUR 98 million. So even though the lender’s initial investment is only EUR 98 million, he will be repaid EUR 100 million when the loan matures. The resulting EUR 2 million difference is what we call the original issue discount (OID). Essentially, the lender receives an additional cash flow of EUR 2 million at maturity. Such discounts have a favourable impact on the return, not only because of the potential to recover the full face value of the loan (“pull to par”), but also because the investor receives the cash yield (carry) on the face value, not on the invested amount, as shown in Figure 24.
Figure 24. Original issue discount – example
Initial purchase price: € 98 mln
0 1 2 3 4 5
- € 98 mln € 4 mln € 4 mln € 4 mln € 4 mln € 104 mln
Time (years)
Expected cash flows
Face value: € 100 mln
Rate (fixed): 4%
Tenor: 5 years
Original Emission Discount: € 2 mln
Cash yield based on the face value: € 4 mln
Original Emission Discount can be thought of as an additional interest payment received at maturity.
Timeline of cash flows to the lender:
Consider a loan with the following characteristics:
Other conditions are also included in the loan documents to ensure that if the underlying borrower risk changes, the return requirements are also modified. These are often called “ratchets” to ensure that the pricing is linked to certain risk parameters. These parameters, or covenant-linked pricing mechanisms, can be linked to factors such as:• Asset values, to reflect a higher risk in case of higher loan-to-value (LTV) or an initial
construction phase if an infrastructure loan is involved;• Cash flow-based items such as interest cover ratio, debt service cover ratio, debt/EBITDA,
to reflect a higher pricing if the cash flow is insufficient to cover debt service obligations; • Balance sheet-related ratios such as solvency (e.g. in the case of longer tenors).

52Guidebook: Alternative credit and its asset classes
These automatic mechanisms help to ensure that the return is more reflective of the underly-ing credit risks. Loans are often structured to ensure that if the risks are higher than perceived in the ratchet, there will be a so-called covenant breach. In this case, the lenders have the right to increase the pricing or include some other mechanisms to adjust the balance of risk and return (e.g. rolled-up interest, equity kicker, debt-equity swap). A good loan structure includes an automatic mechanism to ensure investors get paid commensurately for the risks.
In the fast-changing loan market environment, which has become a lot less predictable since the credit crisis, it remains essential to take a dynamic approach in structuring and ensure that these automatic mechanisms are incorporated in measuring and pricing risks. One cannot always be certain that the predictions will be met and the company will perform in line with expectations. Future promises and projections can be broken, often unintentionally and in spite of thorough markets, legal and technical due diligence. It is essential, however, that there is an understanding that investors/lenders will get paid more in return for higher risks.
Finding a balance between risk and return on both sides is crucial in structuring loan facilities.
What determines the actual pricing of the loan? How do banks or direct lenders price loans?The business model of banks is quite simple. They collect customer deposits for a cost. Revenues are mostly linked to providing loans and services (fees and interest margins). Banks incur the following major costs:• Cost of funding (cost of deposits)• Cost of operation (people, systems)• Credit loss (loss on loans that are not repaid)As profit-driven entities, banks try to ensure that their revenues exceed their entire cost base. This margin forms the return on equity.
In principle, for each loan a bank would need to determine the cost of funding by measuring the cost of operation (hours spent and systems used). The expected credit loss (EL) can be calculated based on probability of default (PD) and loss given default (LGD). Not all banks have the systems to conduct such sophisticated exercises. Many banks do not measure LGD and some cannot allocate fixed costs to products via activity-based costing.
What is the best way to price a loan to ensure sustainable operation, stability for depositors and return for the equity providers? Banks have made significant changes to their pricing mechanisms in the last decade. They may use several inputs in determining the price of the loan including market practices, cost-based pricing models and economic value added, all of which are discussed below.
Market practicesMany companies have used simple pricing models based on market practices with less sophisticated risk-based systems. This was especially true before the crisis. For example, in early 2000, leveraged loans had a more or less flat pricing in Europe (EURIBOR + 250 bps), with no distinction being made between better credit ratings (BB+) and weaker ones (B).
Cost-based pricing modelsSome banks apply different pricing models, mostly based on cost of funding and credit risk measures (mostly PD), and apply a mark-up to cover costs.

53Guidebook: Alternative credit and its asset classes
Economic value added (EVA) Some banks have a more sophisticated pricing mechanism that lets them allocate cost and product revenues per client and enables them to determine whether or not the client adds overall positive value. Some banks may try to adjust or terminate their relations with clients whose overall profitability is low and who destroy economic value for the shareholders. Other banks stay committed during the cycle, and try to keep market presence and their staff in place.
Many banks still take market practices and developments for pricing into account. Supply and demand do, after all, play a role in determining the loan prices. Fundamental pricing tools are not the only factor. Sometimes the larger wholesale banks with established relationships might decide to “subsidise” the loss-making loan product, given the overall relationship. This can lead to more attractive side-business activity, such as hedging or M&A advice, and retention of optional value when liquidity and loan market prices change.
7.5 Expected loss of the loanThe (partial) loss of investment, or credit loss, is the most important cost in private debt. Unlike in the case of equity, however, there is an asymmetric upside and downside potential. In equity investments, the downside is limited to the maximum investment amount while the upside is potentially unlimited, giving investors the possibility of earning back substantially higher amounts than the original investment.
In the case of credit investments, the potential upside is limited. It is priced mostly at the beginning of the investment period, it is a given and quite predictable. Consequently, the potential downside also needs to be limited. Lenders/investors try to limit the downside potential by conducting a comprehensive risk analysis to limit defaults and obtaining a security package as collateral that can be used to restructure or can even be sold to guarantee recovery in case of a default.
Arranging a loan investment is a comprehensive process that requires extensive skills and especially experience, given the possible downside and relatively limited upside. In order to anticipate what can go wrong and how to prevent it, loan officers need to have seen deals “go sour” and must have credit risk and restructuring experience. This is especially true in a competitive market with pressure on both pricing and credit standards. The fact that loan markets are private markets means it is important to have the right network of borrowers, arrangers and advisors to get the best leads and the right background information on transactions and situations.
Table 7. Calculation of the expected loss and risk-adjusted return
Expected Return (a) Probability of Default
Loss Given Default
Net Return – Risk-adjusted return
500 bps
2% 20% 460 bps(a) – (b)
40 bpsExpected Loss (b)
Source: Gabriella Kindert

54Guidebook: Alternative credit and its asset classes
The expected loss (EL) is the probability of default (PD) multiplied by loss given default (LGD). The LGD is 1 minus the recovery rate.
Probability of defaultThe probability of default (PD) is a more commonly used term than LGD and is known by most investment professionals inside and outside the banking world. The PD is the output of the credit rating process. It gauges the likelihood of default over a certain time horizon, usually one year. It is the chance, expressed as a percentage, that the client/borrower will not meet debt service (interest, payment) obligations. For fixed-income investors, the PD serves their prime focus of avoiding defaults in their portfolios and their natural tendency to trade out of positions that might default or have defaulted. The typical fixed-income investor has no mandate for defaulted issuers and, being one of many investors and with limited time and manpower, does not have the means to influence the processes around a work-out.
LGD and recovery: assessing the security package In private debt, the groups of lenders and investors are typically much smaller. It pays to get involved with the company or project before any covenant breach or default. Deals are specifically structured (covenants, headrooms) to allow for early flagging of potential issues, well ahead of an actual payment default. Also the list of default events is quite elaborate and includes many non-payment-related items to give the lenders ample control. As such, there could be significant differences between expected and realised recovery. It is quite difficult to predict the circumstances of default (e.g. single credit event, industry downturn, external circumstances due to events). These conditions largely determine the potential recovery value.
Realising recovery value can be cumbersome and costly, and it requires special expertise. Not all organisations are equally adept at dealing with these circumstances. Information asymmetry appears to be a key issue in most work-out situations. One can hardly avoid information asymmetry between lenders, owners, and the management of the company.
Creating appropriate alignment of interests is a key mitigant in structuring loan facilities, especially in countries where information disclosure and discipline might be limited.
The most important factors in determining the recovery are: • Capital structure: debt type, seniority grade, number of creditors. It is important to assess
the ranking of the security in case of bankruptcy. Certain legally determined costs rank senior to creditors (salary payments, tax, payment to curator) and could significantly undermine recovery values for lenders, especially in a long-drawn process.
• Ability to identify problems for lenders/investors. Research shows that there is a direct relationship between early intervention (provided that it is appropriate) and recovery. In this respect, monthly monitoring and quarterly covenant assessment remain eminently important in providing legal means to start a dialogue with the company and potentially intervene. A pro-active role in the work-out phase often results in substantial benefits and increased future upside. It is also important to realise that the largest lenders can usually drive a restructuring, in spite of a balanced steering group composition.
• Insolvency regime of the country: bankruptcy regimes and practices. Resolution through sale as a “going concern” usually results in higher recovery. Not all local legislation allows and favours this option, however, which drives companies to liquidation. The liquidation value and break-up value of the company are often disappointing. For project finance, the

55Guidebook: Alternative credit and its asset classes
concession or public-private partnerships (PPP) contracts are leading and the amount and speed of the recovery will vary per jurisdiction, as will the willingness and ability of governments and government agencies to be a predictable counterparty in case of contract termination. For renewable energy, the quality and stability of the subsidy regime is very important and will also vary per jurisdiction. Often, the positioning of the government depends on the future pipeline for projects and the way in which a country is positioned as “issuer” in general.
• Asset quality. Quality, liquidity and domicile of assets and collateral. There could be significant differences in potential and costs to exercise securities in a given country.
• Macroeconomics (correlated with general economic trends) and the type of industry. Often, an important question in determining the value of the collateral is: “where are we in the cycle?” Asset values might drop well below the previous years’ average, particularly in cyclical industries like shipping, paper/packaging and chemicals. This can leave lenders and investors considerably underwater.
• Reason for default. The reason for the default could be structural or related to some short- term event. The longer the problem persists, the tougher the recovery potential may be.
• Alignment of interest with management, equity and other subordinated lenders and banking/lender groups. Quality and experience of the equity sponsor have an essential role in determining recovery. For the lenders and investors, it is therefore critical to address these questions:
- Do they still have “skin in the game”? What do they have to lose (credit loss, reputation)? What’s in it for them?
- Would they care to invest time, reputation and energy in helping the recovery? Would this manager or equity sponsor go the extra mile and work through the night to save the company?
These questions often boil down to the personal motivations of key individuals as well as professional reasons and legal circumstances.
As outlined in Table 8, the key aspects for lenders/investors involve maintaining a strong focus on reviewing long-term trends. This also applies to competition, which may drive other participants to price risk lower or to alleviate credit standards, affecting potential EL.
Figure 25. Diversification in debt investments – example
Portfolio A: € 100 million
€ 10 mln
Portfolio B: € 100 million
Inve
stm
ents
One default with 80% recovery
Total loss: € 2 million
One default with 80% recovery
Total loss:
€ 1 million
Diversification remains essential in mitigating downside potential in debt investments.
€ 5 mln
€ 10 mln
€ 10 mln
€ 10 mln
€ 10 mln
€ 10 mln
€ 10 mln
€ 10 mln
€ 10 mln
€ 10 mln
€ 5 mln
€ 5 mln
€ 5 mln
€ 5 mln
€ 5 mln
€ 5 mln
€ 5 mln
€ 5 mln
€ 5 mln
€ 5 mln
€ 5 mln
€ 5 mln
€ 5 mln
€ 5 mln
€ 5 mln
€ 5 mln
€ 5 mln
€ 5 mln
€ 5 mln In
vest
men
ts

56Guidebook: Alternative credit and its asset classes
Table 8. Most important factors leading to default and how to circumvent them
Most important factors How to avoid/circumvent?Lack of understanding of industry and operating environment• Cyclicality not understood• Competitive environment
overlooked
• Own industry expertise, independent review of trends. Assess projections in the context of historical cyclicality
• Always perform peer group analysis and assess new leverage in the context of competitors (will the newly leveraged company have room to manoeuvre?)
• Focus on assessing entry barriers
Too much debtForecasting is built on overly optimistic information and, consequently, excessively aggressive debt structure
• Review inconsistencies between track record and industry; forecast company assumptions
• Enhance understanding of companies’ strategy vs. assumptions. Assess management actions vs. strategy
• Use common sense• Focus on free cash flow (gap analysis between past and future)• Assess CAPEX needs carefully
Integration(underestimated execution risk)
• Review track record in integration• Assess execution power• Solid review of integration risks (systems, culture)
Lack of monitoring • Warning signs should be taken seriously• Monitoring is of outmost importance in the first 6-12 months• Review due diligence recommendations/execution within 6-12
months
Structuring(wrong structure)
• Repatriation of cash?• Liquidity issues• Seasonality analysis• Currency hedging?
Management • Ensure risk sharing (equity stake). Excellent sponsor with strong industry knowledge. Cultural fit between sponsor and management
ConcentrationEvent risk
• Stress case on losing customers and changing bargaining power• Ensure sufficient liquidity buffer• Insurance
Project finance risks • Cost overruns and delays• Improperly forecasted operations and maintenance costs• Volume (traffic, wind) risk
Real estate risks • Rapidly dropping values, creating LTV breaches• Demographic and macro disruptions requiring less or different
real estate values
Source: Gabriella Kindert
One should review risks systematically, create alignment of interests and, finally, always maintain a diversified portfolio. In equity investments, one might be able to afford to lose one out of ten investments, as other investments have the potential to outperform, but when it comes to debt investments, investors simply cannot afford such odds. Diversification in mitigating downside potential remains essential. Therefore, banks and other credit institu-tions are seeking granularity in their portfolios as this not only spreads the default risks but also reduces the lumpiness of potential losses. This is illustrated in Figure 25.
This is the main reason why, for instance, the CLO fund market for leveraged loans is a market that typically seeks smaller tickets of about EUR 5-15 million, which is also the ticket size in the secondary loan markets. This is even more important for private debt investors than for banks, which have far more sizeable and diverse balance sheets. To create a successful

57Guidebook: Alternative credit and its asset classes
private debt portfolio, an asset manager with a relatively compact team needs to have time to ramp up the portfolio and at the same time must be smart about which assets or portfolio trades to focus on. In a competitive market, many asset managers will seek out good quality deals from a risk/return perspective and as such, allocations will be oversubscribed and scaled back as arrangers and advisors need to provide ample cover for deals to ensure certainty of funds for borrowers. This is particularly true for underwritten transactions where banks have provided the full commitment from their own books first and sell on transactions after financial close.
Overall, asset managers need to strike the right balance between working efficiently on meaningful tickets and not putting all their assets in one basket. This is why, in the CLO fund market for example, a warehouse is already built-up with a bank in order to be able to “seed” the fund with a meaningfully diversified portfolio that is yielding from day one. For infrastructure loans, a portfolio of assets in a secondary or legacy portfolio may actually provide a good start.
On the other hand, in terms of a work-out one must recognise that building a portfolio of small tickets has to be done with a certain minimum size, usually EUR 5 million, to be able to shed assets in the secondary loan market. Furthermore, in case of a distressed scenario, a EUR 5 million ticket may be easier to sell to a specialised distressed asset fund. For infra-structure, which is a far more “clubby” market, such small tickets are not an option and tickets on a primary market need to be around EUR 15 million to be meaningful. For potential work-outs, one needs to keep in mind that in steering committees, the largest lenders will probably drive the direction of any work-out, usually in the direction most favourable to them. And this may be far removed from what is rational from an outside perspective, and can be influenced by (home market) jurisdiction, other lending or commercial positions and capabilities and sector exposures. In addition, a more granular portfolio will be more cumber-some in terms of reporting and (administrative) waivers.
Let us go back to the example in Figure 25 and assume that a loan is in default. The original investment amount was EUR 100 million. If the recovery rate is 80%, then the LGD of the loan is 20%.
When arranging or investing in a loan, the investor tries to assess the expected loss of the loan to determine the required pricing. It is a dynamic process. If little or no security (collateral, pledges, etc.) is given, the expected loss and the pricing will be higher. If there is more security, the EL is lower and the loan pricing can consequently also be lower. That said, EL remains a function of loss given default, which in these calculations is usually based on the bank’s experience over many years and a large number of different cases. On a case-by-case basis, the pricing will usually not be able to offset the potential losses over the (early) life of the loan. This highlights the need for a diversified portfolio. Moreover, LGDs for project finance are historically much lower than for corporate loans. This is mainly due to their stand-alone, ring fenced, bankruptcy remote, and non-recourse structures. Real estate and asset-based (shipping, aviation etc.) finance have their own LGD dynamics, which are driven by the markets for their corresponding collaterals.
The pricing of the loan is a competitive process. Often, arrangers do not look at the borrowers from one single product angle. They might have other products they can use to make up for the return in order to win the client. A bank can offer many different products, both in corporate banking but also beyond. These can be hedging facilities, forex products, M&A advice, private banking and other investment services. These are cross-selling related products.

58Guidebook: Alternative credit and its asset classes
For an investor, however, it is essential to assess lending products on their own merits without taking into account other cross-selling services and/or products. A bank’s interests and economics can be different than those of an investor. Lending products should be always assessed on a case-by-case basis. Such an assessment should concentrate on relative value compared to liquid corporate and government fixed income opportunities. The product should generate a sufficient spread pick-up to justify the complexity premium and should be interest-ing for the entire tenor (or the weighted average life, for liability matching purposes), also with regard to ESG aspects such as investing in home markets or renewable energy.
Table 9. Security in fixed-income investments
Unsecured Semi-secured SecuredBondsHigh Yield BondsPrivate Placement
Emerging Market Debt Private Placement
Commercial Real EstateMortgages Infrastructure
Source: Gabriella Kindert
Figure 26. The credit analysis process - output in two words: PD and LGD
Business risk analysis
Financial analysis
Transaction/debt structure analysis
• Comprehensive industry analysis (incl. structure, cycle, dynamics and drivers, entry barriers, and future prospects) is essential
• Competitor analysis (operational and financial leverage of the peer group) • Supply chain analysis (product mix and business segments) • Management assessment (incl. the track record of managing the debt book) • Proprietary industry analysis is essential; we cannot rely on due diligence reports alone
• Analysis of historical performance (long term over the cycle) • Forecasting (sensitivities) • Focus on assessing debt repayment capacity and refinancing risk • Special attention on a free cash flow (recurring costs, adjustments)
• Spirit of the ‘loan doc’ (cash sweep, covenants, mandatory prepayments) • Structural/contractual subordination analysis • Collateral analysis • Cash circulation within the borrowing group • Assess each lending opportunity as a combination of risk/return • Ensure ‘risk-sharing parties’ and alignment in the transaction, including
motivation of the lender group
Source: Gabriella Kindert

59Guidebook: Alternative credit and its asset classes
Security and collateral value Some products have registered security packages (pledge on assets, pledge on shares). Others are “unsecured”, which means that in case of default, investors may recover less and will be lining up with other creditors. It does not mean that there is no recovery in the event of a default.
In real “loan” life, it is not always that simple. Just as in personal relationships or business, the best outcome is when nothing goes wrong. But things sometimes do go wrong and when they do, the road to recovery might be unpredictable and difficult to navigate.
One of the most challenging tasks in credit assessment is to evaluate the probability that a company will default and the recovery in case of a default.
Figure 27. Fixed-income strategies on an EBITDA-credit rating plane
Distressed
Special situations
Public High Yield
EBITDA
1 bn
500 mln
200 mln
100 mln
50 mln
25 mln
Public Investment
Grade
C & below
CC CCC B BB BBB A & above
Leveraged Finance
(Senior Bank Loans) Corporate
Loans
SME Loans
Private Placements
Rating
Source: NN Investment Partners

60Guidebook: Alternative credit and its asset classes
The rating process is a comprehensive assessment, whereby the experts assess the different business risks and financial risks. Most banks and asset managers work with rating models calibrated by accredited ratings agencies, based on qualitative and quantitative input. The rating process might still contain subjective factors, in spite of all efforts to ensure profes-sionalism. Receiving an external rating is a costly process and often not viable. Lenders and investors should remain cautious of the limitations of the rating process and apply stress tests to assets and portfolios.
7.6 Return after expected loss (EL): risk-adjusted returnThe risk-adjusted return is the return after subtracting the expected loss. In the real life of a single company, a situation where losses occur every year is highly unlikely. The risk- adjusted return should be seen on a portfolio basis. Defaults do happen in cycles, though, which is why it is important to diversify between the various private debt sub-strategies. For example, when corporates are going through the cycle, infrastructure will still be performing due to a completely different stream of (government-related) income.
Figure 28. US speculative grade default rate (%)
0
2
4
6
8
10
12
14
dec/
81
mrt
/83
jun/
84
sep/
85
dec/
86
mrt
/88
jun/
89
sep/
90
dec/
91
mrt
/93
jun/
94
sep/
95
dec/
96
mrt
/98
jun/
99
sep/
00
dec/
01
mrt
/03
jun/
04
sep/
05
dec/
06
mrt
/08
jun/
09
sep/
10
dec/
11
mrt
/13
jun/
14
sep/
15
dec/
16
Source: S&P Global Market Intelligence
Default cycles may be linked to economic conditions and the availability of funding. Compa-nies can experience a period when it is easy and cheap to borrow, resulting in excess liquidity and often overleverage. This is generally followed by a period when credit conditions tighten, interest rates rise and lending is less readily available. This shift from the first to the second period is often linked to an external shock or event. Industry experts use different matrices to assess when a bubble is building up and whether it is going to burst.

61Guidebook: Alternative credit and its asset classes
How do we know where we are in the credit cycle? What are the leading indicators in alternative credit for identifying the momentum and outsmarting others?
In general terms, the following aspects are good indicators: • Transaction volume (in certain subsectors) • Credit quality • Pricing trends • Entry of new (non-core) competitors • Relaxed conditions and new innovations favouring the borrower • Regulators issuing guidance and warnings on a given sector Transaction volume in certain subsectors Transaction volume is normally a good indication of growing appetite on the market. Arranging banks and advisors know when transactions are easily taken up by end investors, and in their bids for business they will become more aggressive in pricing. End investors have little power to jointly push back on more aggressive structures, especially in more granular end-investor markets. In clubbier markets with longer lead times, processes have less of a “take it or leave it” nature and lender clubs can jointly push back a bit more on competitive structures. In all cases, longer ramp-up periods and a disciplined approach should allow asset managers to avoid being squeezed into the riskiest deals just before the peak of a credit cycle.
Credit quality based on statisticsThe following generic ratios provide a good idea of the status of a credit cycle: • Leverage ratio• Purchase multiple • Percentage of equity in a transaction • Percentage of senior loan in a transaction • Rating deterioration: can be measured based on percentage of lower-grade credits in
the portfolio• Loan-to-value (LTV) development in asset-based lending (shipping, real estate)
Figure 29. Equity contribution: large corporate LBOs
20%
25%
30%
35%
40%
45%
50%
2008 2009 2010 2011 2012 2013 2014 2015 1H 2016 2Q 2017
Source: S&P LCD

62Guidebook: Alternative credit and its asset classes
Figure 30. Debt multiples, middle market loans
2
2.5
3
3.5
4
4.5
5
5.5
2000 2001 2002 2003 2004 2005 2006 2007 2008 2009 2010 2011 2012 1Q-3Q 2013
3Q 2013
First lien Second lien Other senior debt Subordinated debt
Source: S&P LCD
Pricing trends Pricing is a good indicator of appetite and liquidity for the purpose of analysing the status of the cycle. Demand pressures and inventory risks are one of the sources of illiquidity. Such demand pressures are a product of market participants’ asynchronous presence in the market (Amihud, Mendelson & Pedersen, 2005). For example, an investor willing to sell may not always find the buying counterparty straightaway. Because of the limited demand, he may be forced to incur additional costs in search for the willing buyer, as well as bear the risks of prolonged exposure to the investment. New, non-core competitors entering the marketLate entrance of non-core lenders is usually a good indicator to assess the status of the market. Banking and lending is primarily a specialised industry in which certain “core” banks are committed to specific segments, such as leverage loans, project finance or commodity finance. These banks remain committed to the segments over the cycle, and their lack of appetite beyond a certain level of credit risk might be a good indicator. New players often gain market share from traditional players by relaxing pricing or other conditions.
A good illustration of this is the development of the leveraged loan market. From 2005 to 2007, some banks entered the leverage loan market aggressively. They obtained arranging mandates in France, for example, and won market share from the house banks of companies that were no longer willing to accept their conditions.
When one observes new market players gaining market share from traditional house banks or lenders, one should try to understand what are the reasons behind it.
Since 2012, institutional investors have increased their presence on the lending market. They have had different incentives to carry out transactions and are certainly not in the

63Guidebook: Alternative credit and its asset classes
game for a “race to the bottom”. Although institutional investors have established a perma-nent bridgehead in the loan markets, it is mainly the banks that have responded with aggres-sive conditions and are setting the market. As such, this has led to stable market shares for institutional investors, as shown in the illustration below for the infrastructure market:
Figure 31. European European infrastructure market trends - bank debt vs. institutional debt
0%
5%
10%
15%
20%
25%
30%
35%
40%
45%
0
5,000
10,000
15,000
20,000
25,000
30,000
35,000
40,000
45,000
H1 H2 H1 H2 H1 H2 H1 H2 H1 H2 H1 H2 H1 H2 H1
2009 2010 2011 2012 2013 2014 2015 2016
Bank debt Institutional debt
€ mln
Source: InframationGroup
Relaxed conditions or new innovations mostly favour the borrower The relationship between lenders and borrowers should be balanced. Imbalances of supply and demand reduce market liquidity and often create a borrower- or lender-friendly environment. The bargaining power of the parties changes as a function of liquidity. In a borrower-friendly credit environment, borrowers frequently “push back” on many loan features to demonstrate that they have alternative choices. These features are gradually relaxed over the years under competitive pressure. This is also a function of the depth and level of granularity in each market. In the clubbier markets, lenders are less interchangeable and mutually understand each other’s responsibility not to give in too easily to borrower push-back.
Below we list the leading indicators which can be reviewed to assess the status and health of the borrower-lender relationship. Signals of a borrower-friendly environment include: • Covenant-light transactions, in which lenders are unable to intervene and prevent certain
cash outflow decisions or expenditures; • Higher headroom in covenants and in overall constraints;• Lower debt service cover ratios, fewer guarantees and the acceptance of debt service
reserve facilities instead of accounts in project finance;• Less documentation, legal terms that favour borrowers; • No amortisation requirements; • Key decisions require consent of 50% instead of 66% of lenders;

64Guidebook: Alternative credit and its asset classes
• Omission of key risk-mitigating features (e.g. hedging); • Shorter average commitment time; • Inclusion in documents of pre-approved and excessively repeated cure mechanism in case
of default;• Reduction or elimination of certain fees and payments to junior capital providers; • New provisions, e.g. “Yank a Bank” (allowing the borrower to remove one or more lenders
from the syndicate) and “Snooze You Loose” (allowing the borrower to disregard the vote of lenders that do not respond in time).
Regulators and other industry players issuing guidance and warnings on certain sectors Regulators and industry associations often raise concerns about practices. These are warranted but are often ignored. These regulatory warnings are powerful signals that liquidity trends in certain markets are resulting in weakening credit structures. Investors would be well-advised to review industry discussions on a given alternative credit subsector. Annual reports of banks with their views on certain sectors are also an objective source.
As is the case with supply and demand, the balance of power is also shifting between the different stakeholders in financing. Observing these signals of power and balance should be part of any investor’s analysis prior to exploring a new alternative credit product. Investors often enter financing with less knowledge about and experience with the borrower than counterpar-ties from banks. Assessing the six soft factors discussed above can be immensely revealing.
All in all, market timing can be crucial in investment selection due to peaks in default, the nature of default cycles and related risk-adjusted return features in credit investments. A disciplined approach with a conservative asset manager employing a seasoned team of loan officers and investment professionals that have seen the entire credit cycle is a must when investing in these markets. This does not come for free, but one should recognise that, unlike equity investments with unlimited upside, private debt requires professionals who are focused on the downside and capital preservation.
7.7 Management costs Alternative credit is a specialised discipline. Sourcing, structuring and managing assets requires a specific skillset and the right platform of people, system and processes. In banking, these are called overhead costs and show up in the profit & loss account. In asset manage-ment, these costs occur at the manager level and are usually passed on to investors as a management fee.
The management fee is an important aspect of the overall profitability of the investment. This is especially true in credit investment, were the upside is more limited than in equity.
Considering the limited upside, the level of management fees should be proportionally balanced with the benefits the manager delivers. The cost of this platform must be passed on to the investor in a transparent way to reflect the manager’s efforts and added value. Needless to say, the incremental benefits for the investors should exceed any incremental costs.
Management fees in alternative credit usually range from 0.1% to 1%, depending on the complexity of sourcing and managing the assets. The complexity of management has some specific characteristics that are worth mentioning.

65Guidebook: Alternative credit and its asset classes
Private markets are characterised by a lack of transparency, which creates opportunities for managers who are better at selecting assets and determining entry/exit moments.
Why a cost premium? Loans are not for public purchase and necessitate a private set-up. The market works by invitation only and requires seasoned loan professionals, usually ex-bankers or private debt asset managers. These professionals need to have deep relation-ships with arrangers, advisors and borrowers and must have been involved in the loans business throughout at least one credit cycle. They should also have experience in risk, restructuring and syndications. This type of background is necessary for performing these key functions:• Sourcing• Asset selection, risk analysis, monitoring, bottom-up assessment of risk-adjusted returns
(coupon, OID, PD, LGD)• Assessing value in a world where information asymmetry prevails and superior risk
assessment is rewarded• Carrying out the loan settlement process and administrative procedures, which are often
cumbersome • Portfolio optimisation • Product (re)structuring
Sourcing premium: sourcing difficulties on the private market In product categories like direct lending, mezzanine loans and infrastructure debt, sourcing can be more challenging and labour intensive than for other traditional products. It is not only the professionals who need to have outstanding contacts and reputations; the reputa-tion and know-how of the asset management firm that employs them is also important to guarantee smooth delivery and execution. Overall, the certainty of funding and execution are the key measures in private debt markets. Understanding the drivers of markets is also a plus in dealing with arranging banks, advisors and borrowers.
Information premium: lack of information efficiency Private markets are far less efficient than public markets. This means the added value of the sourcing, structuring manager or bank can be far more significant. In public markets, managers select assets on the basis of information that is broadly available. Control premium: ability to control the nature of investments In illiquid asset classes, the ability to control the fate, life cycle, or governance features of the company and its lenders has specific advantages. In syndicated lending, one single asset manager does not usually have a controlling power. However, this can be the case in some types of investments, such as direct lending. In such situations, asset managers can have more influence and, consequently, more ability to represent his interests in negotiating exit or a fee change. This control premium has value, as it can influence investment return.
Considering the illiquid nature of the investments, the investors should also pay special attention to the alignment of interests and the franchise’s long-term commitment to the market. The strong alignment of interests should be balanced with appropriate checks and balances, a robust management information system infrastructure and strict valuation procedures within a strong culture of compliance. Finally, the liquidity offered to investors should be carefully matched to that of the portfolio assets.

66Guidebook: Alternative credit and its asset classes
Operational fees should be limited as long as assets are performing. However, waivers and meetings with bankers can easily add up if borrowers want to amend or add facilities in cases where assets are underperforming. Most of these costs are for the account of the borrowers, although some costs, such as travel expenses, are typically not recouped. The opportunity costs also need to be assessed.
What is the appropriate benchmark?One of the most difficult challenges in alternative credit is determining an appropriate benchmark. A lot depends on which sub-segments of alternative credit are being assessed. Typically, end investors must agree on the benchmark choice. For example, Barclays provides a good selection of indexes that can be tailored quite precisely to the subsectors invested in. For some corporates, public issues or those of parent companies or relevant sister companies can be used. For infrastructure, (semi) government benchmarks are typically used or, for instance, the Barclays BBB Industrials index.
7.8 Net return after management feeNet return after management fee is calculated as the risk-adjusted return after credit losses and management fee. Investors should use net returns after management fee for comparing different investment opportunities. Using net returns allows them to make more informed investment decisions than simply looking at gross returns, because it takes into account the management fee an investor expects to pay. As a result, net-of-fees returns facilitate comparability and transparency across investments and make it easier to determine whether investment manager’s skills are superior to those of his peers. Conversely, comparing investments on the basis of gross returns alone is less meaningful.
In theory, calculating net-of-fees returns seems like a relatively simple exercise. In practice, however, several issues can complicate the process, such as differences in when the fees are charged and reported, or intricacies that arise when evaluating portfolios of investments.
7.9 Capital and other charges related to investments These charges relate to the investing institution itself and should be reviewed carefully. This is especially true in light of changing legislation such as Solvency II and other rules on the treatment of securitisations, as issued by the European Commission, the European Insurance & Occupational Pensions Authority, and other regulatory agencies. For instance, in the case of infrastructure, the recent changes under Solvency II led to more focus on the definition of “qualifying infrastructure” as well as to the use of external (shadow) ratings.
Capital charges Capital charges related to alternative asset classes will largely vary per investor, depending on factors such as the jurisdiction where the investor is based and the applicable regulatory authority. Key here is whether a standard model or regulator-approved internal model is used. To give an idea of the extent to which capital charges can be affected by regulatory changes, Figure 32 shows the impact of recent changes on infrastructure debt.

67Guidebook: Alternative credit and its asset classes
Figure 32. Comparison of capital charges - qualifying infrastructure vs. corporates
Corporates BBB Unrated Corporates Infrastructure BBB & Unrated Infrastructure
0%
5%
10%
15%
20%
25%
30%
35%
40%
45%
1 2 3 4 5 6 7 8 9 10 11 12 13 14 15 16 17 18 19 20 21 22 23 24 25 26 27 28 29 30
Ch
arg
es
(%)
Duration (Years)
New Solvency II charges for infrastructure > 1/3 lower than
corporates
Source: European Commission Regulations for Infrastructure enforced 1 April 2016
Structuring charges Investors might require structuring of the platform on which the assets are booked to ensure that the assets complie with accounting and regulatory standards. The assets themselves cannot be tweaked to each investor’s needs, although sponsors and borrowers are aware and willing to incorporate typical institutional requirements such as fixed-rate tranches and make-whole payments as well as items such as longer tenor and higher coupon against lower up-front fees.
Monitoring charges• Investors do not need to invest in additional resources and costs to ensure that the
investments are monitored properly if they trust the asset manager selected. Investors will find it helpful to have one or two responsible professionals who understand the asset class and the mandate sufficiently to assess the reports and to have a meaningful conversation in case of waivers, re-pricings or other credit events.
• The investment needs in terms of front office, risk management and/or legal departments are potentially quite substantial and should lie within the responsibility of the selected asset manager, who is typically in a position to (responsibly) scale them. This is also an advantage for the investors. One can imagine that a sizeable asset manager representing a significant number of multiple subsectors of the private debt market is a force to be reckoned with, particularly when taking into account the “traditional” fixed income and equity business that such an asset manager represents for larger arranging banks.

68Guidebook: Alternative credit and its asset classes
7.10 Liquidity, volatility and portfolio diversificationDiversification is a key aspect when investing. An allocation to alternative credit gives investors access to issuers that are not present in the public market. In these private markets, the investor base and the size of the issuers are more limited and the transactions are more bespoke.
With the proliferation of alternative lending platforms, liquidity might have improved but the vast majority of the alternative lending assets remains largely illiquid. This illiquidity constrains the flexibility of investors, who therefore require an “illiquidity premium”. Still, the benefit of illiquidity is the lower volatility. Alternative credit assets tend to show low correlation with other asset classes and can therefore reduce risks.
Table 10. Performance of private debt and public assets (1999-2015)(Annualised) Corporate
BondsHigh Yield
BondsSyndicated
LoansMiddle Market
Loans
10-year Treasury
Bonds
S&P 500 Index
Average return (%) 5.63 6.27 4.61 6.21 4.17 4.99
Standard deviation 5.31 10.65 9.06 7.42 3.58 16.67
Sharpe ratio 1.06 0.59 0.51 0.84 1.16 0.30
Performance represented by the following indices/proxies (respectively): BoA Merrill Lynch US Corporate Bond Index; BoA Merrill Lynch US High Yield Index; S&P/LISTA Leveraged Loan Index; S&P/LISTA Leveraged Loans Index (only loans to companies with EBITDA ≤ USD 50 million); BoA Merrill Lynch 10-year US Treasury Index. Performance based on quarterly returns.
Source: S&P LCD, Morningstar, TIAA Global Asset Management
A difficult aspect of alternative credit is the inability to demonstrate the low correlation and the benefits of diversification. With the exception of leveraged loans (also known as senior secured bank debt), there is no publicly available index of returns for most segments. The majority of funds are bespoke and the inclusion of non-standard features, such as allocation to subordinated debt, allocation to higher risk countries or potential to include leverage, makes it hard to provide a meaningful comparison.
The returns on traditional asset classes are often linked to the Capital Asset Pricing Model,5 which is determined by the risk-free rate of return and a risk premium linked to credit quality. In alternative credit, the additional premium is linked to illiquidity and complexity. For investors that have an understanding of the asset class and can bear the illiquidity risk, the asset class offers excellent yield opportunities against less volatility than liquid alternatives. Furthermore, many instruments in alternative credit have floating rates and can implicitly offer a natural hedge against inflation.
The illiquidity and the illiquidity premium: All assets are illiquid, but there are differences in the degree of illiquidity Damordan (2015) provides a simple and intuitive interpretation of illiquidity. He suggests considering it as a cost of instantaneously reversing a just-executed asset trade. Because all transactions carry costs, all exhibit some level of illiquidity. Therefore, assets commonly thought of as “liquid” should in fact be referred to as “more liquid”.
5 CAPM was introduced independently by William Sharpe (1964) and John Lintner (1965).

69Guidebook: Alternative credit and its asset classes
Most alternative credit assets are considered illiquid. Since the financial crisis, there has been a positive bias towards liquid securities. This increased demand for liquid assets has resulted in lower yields in the more liquid market segments, while yields in less liquid parts of the market have increased due to lower demand. This mismatch between supply and demand of liquid assets has created a big spread differential between liquid and illiquid assets.
The higher yields of less liquid assets are higher than justified by their risk. This creates an attractive opportunity for those able to sacrifice liquidity for better risk-adjusted return.
Tighter bank regulations, particularly the stricter liquidity requirements, have made large proprietary trading banks more difficult to maintain. As the mass flight to liquidity in 2008 showed, “liquid markets” are often less liquid that one might think. Similarly, the perception that loans are “illiquid” can also be misguided, given that a substantial secondary loan market exists between banks and loan funds. Nevertheless, it is important to bear in mind that alter - native credit is a private market. Often, quotes will be unavailable or – if provided privately on broker runs to market participants – they will be unrealistic. For example, a broker might issue a quote to provoke a trade on the basis of a single very large or very small trade.
What is the so-called illiquidity premium and how is it measured?The illiquidity premium in private debt typically ranges from 50 to 150 bps. The extra yield compensates investors for holding assets that are not publicly traded. It is a compensation for opportunity costs. Many industry players agree that the premium does not reflect the illiquidity premium alone. Complexity is often a bigger contributor to the excess pricing (M&G, 2015).
There are many different measures of the illiquidity premium. One straightforward method involves computing it as a residual return left after adjusting the expected return of a given asset for other risk premia (Towers Watson, 2016). Total expected return of the asset (net of fees and transaction costs) is taken as a starting point, from which we subtract a risk-free rate, inflation risk premium, credit risk premium and other relevant risk premia. The residual expected return constitutes an estimate of the illiquidity risk premium. Although conceptually simple, this approach may be difficult to apply in practice and involves a fair amount of “noise”.
How easily and quickly can the asset be converted into cash?Liquidity is the ease with which the investor can convert the asset into cash, taking into account the required time, effort and cost. The liquidity of the asset is largely determined by the willingness and ability of buyers and sellers to transact.
Banks are traditionally hold-to-maturity investors. This implies that they do not invest/lend to companies or consumers with the intention of selling the loan investments in the future. Consequently, there is no requirement to mark the asset prices on their book, unless there is a distressed situation and the value of the asset is impaired. For assets that are non-per-forming, banks are also required to provide fair-value accounting.
However, for any other performing assets, banks are assuming that the price of the asset equals the price at the time of investment. Banks do have considerations besides asset prices and asset management. These include cross-selling, relationship and deposit aspects.

70Guidebook: Alternative credit and its asset classes
Institutional investors take a more disciplined approach to assets. They tend to assess the value of an asset based on its own merits. If they see higher relative value in certain assets, they are prone to switch and trade out of one asset and into another. This is also facilitated by the deep and liquid markets that have developed along with the data providers and trading platforms that have enhanced the growth of the insurance and pension fund industries. However, institutional investors also need to reconcile these considerations with liability matching factors in their investment approach. Here, a “buy and hold” strategy is common, which puts constraints on trading.
European loan prices exhibit less volatility than their US equivalents. This stems from the fact that in Europe, loans are classified as non-UCITS compliant with regulators willing to protect investors against excess illiquidity. Therefore, in contrast to the US where mutual funds are allowed to invest in loan assets, there are no traditional retail loan funds in Europe. Conse-quently, daily liquidity is not needed and there are no dramatic price swings driven by inflows and outflows of funds, which in turn translates into greater stability. In addition, European CLO managers and banks do not trade these assets, which makes it a less liquid market overall. As a result, the European loan market is characterised by much less volatility than the one in the US (Schwimmer, 2016).
We can say that institutional investors do have an impact on the underlying liquidity of the assets, but not a significant one. Even in the most liquid private debt asset classes, like leveraged loans, liquidity remains low.
Why is low liquidity a problem?
Inconvenience and lack of flexibility Though institutional investors may not need high liquidity due to the nature of their liabilities, the perceived lack of liquidity may seem inconvenient and is contrary to basic nature of institutional investors, such as the way they are set up, their processes, their cost base and their risk management and compliance procedures.
Opportunity costThe lack of flexibility to convert assets into cash may result in the investor being unable to take advantage of more appealing investment opportunities. The longer the tenor of the illiquid asset, the less the flexibility and the higher the potential opportunity costs. For example, if one only sees great investment opportunities in illiquid real estate, it is difficult to take advantage of these new opportunities due to a lack of available cash.
We should also note that the alternative credit market is evolving. New players are interested in increasing allocations and many online platforms focusing on the lower end of the lending segment are offering liquidity by opening an additional secondary market. These trends create additional liquidity for existing and new investors.
What are the objective measures for assessing the liquidity of certain asset classes?There are a few suggestions for investors wishing to assess the liquidity of the underlying assets and asset class. These are shown in Table 11.
Investors need to assess the time and cost of trading the underlying assets. Further, the illiquidity might hit different assets to different degrees when the overall market goes down. The illiquidity might increase, which should be built into the requested rate of premium (Damordan, 2015).

71Guidebook: Alternative credit and its asset classes
Table 11. Measures of liquidity
Bid-Ask spread The difference between the price at which one can buy an asset and the price at which one can sell. The mere presence of such a spread as well as the size of the spread is an indication of illiquidity.
Quotes in source For loans, quotes might be available through some dedicated pricing sources such as Markit. Less frequent quotes mean lower expected liquidity. Loans are often bid on or offered only if the number of syndicate members willing to sell or buy is limited and/or a broker is positioning for an unknown buyer or seller. Further to this, the wider the spread, the less clear a broker or other market participant is about the loan’s exact value. A bid-ask spread of 10 percentage points is often seen in cases of loans with uncertain situations regarding risk.
Size of loans The size of loans and, indirectly, the number of existing lenders/investors in the credit facility have a direct impact on liquidity. A higher loan amount and a greater number of participants usually implies more liquidity.
Time to execute The time delay needed to execute a trade gives an appropriate indication of the status of the market.
Price impact A trade can have an impact on pricing. A large sell/buy might create an immediate imbalance and move the price in a certain direction. It should also be noted that buyers and sellers tend to keep the price to themselves and may have an interest in not disclosing the actual price in the network, or even creating diffusion around it. For example, they can talk of a price being in a “low 90s context”, which could mean anything from 90 to 95 cents on the dollar.
Complexity and access to information
Assessing the value of the underlying assets requires comprehensive risk assessment where variables might change rapidly. For complex assets with information barriers, the assessment process can create additional illiquidity. Therefore, liquidity is often found within the syndicate, or with a specialist (mostly distressed) buyer who has a long-term interest in acquiring as much of the debt as possible and therefore can do the credit work on a borrower. This can initially even be done without access to the information memoranda or due diligence.
Swaps For floating rate bank loans, which carry an associated swap, the seller will probably want to sell both loan and swap pro rata, especially when exiting a loan completely. The ability to buy the accompanying swap (often involving substantial mark-to-market and back-to-back collateral payments) makes this an additional hurdle. This does not apply to “naked” floating rate exposure or fixed-rate loans.
Transferability Loan documentation often restricts transferability to a pre-defined lender group (e.g. OECD, minimum rating, financial institution regularly involved in lending operations), or requires a minimum amount or borrower’s consent for any new lenders. All these features could impact the de facto transferability of the private debt. Transfer fees could also impact the economic viability of the trade.
Liquidity varies over time. In particular, market liquidity can decline very rapidly and unexpect-edly in times of financial market stress. Research also suggests a correlation between liquidity and complexity. During the 2008 crisis, complex assets suffered the most (Stanworth, 2008).
While much work has been done on the loan market to facilitate standardisation and ensure an efficient trade and settlement process, transferability still differs among assets, as agreed between borrowers and lenders separately for each individual transaction. Investors should consider these questions when assessing liquidity.
The potential discount to net asset value (NAV) is changing in line with market circumstances and should be carefully assessed.

72Guidebook: Alternative credit and its asset classes
Volatility: illiquidity is resulting in lower volatility of NAVVolatility is linked to the rate at which the price of the security increases or decreases. In private markets, prices are not readily available and often not frequently enough to draw meaningful conclusions, especially as the price expressed in NAV based on underlying value does not mean that the asset can be sold at that price. These caveats should always be highlighted when investors wish to compare the volatility of different asset classes in private and public markets. Lower liquidity generally means lower potential volatility. Overall, one could say that most loans have zero volatility until a credit event such as a default or restructuring occurs. If one calculates loan values back to the current market, valuations can fluctuate and show volatility. Such valuing of loans based on the price that they would currently realise in the open market is called “marking to market”, and can be done either on margin (spread) alone, or on both margin and the base rate of the loan.
Private debt is traditionally an asset class dominated by banks. However, banks are not prone to mark-to-market accounting. The increasing participation of institutional investors is changing the dynamics of the market. An example of this is senior secured bank loans, or leveraged loans. The involvement of the institutional market has enhanced the secondary market activities, and loans that have active secondary markets have a higher volatility than direct lending loans, for example. We can see a direct correlation between the expected volatility and the percentage of institutional investor involvement in the respective asset classes.
Portfolio diversification in alternative assets (many assets – many countries – many borrowers)Diversification can be achieved by appropriate asset allocation to a diverse set of uncorre-lated asset classes.
Key aspects investors should consider are:• Improvement of allocation to multiple asset classes within alternative credit • Increased diversification within the strategy.
The latter can be achieved by allocation across numerous countries and issuers:• Geographical allocation: improve geographical diversification. Evaluate reduction of home
country bias after careful assessment of country risk (regulation, repatriation of gain, etc.).• Broad issuers universe: allocating to multiple issuers will help reduce event risk, which
remains key given the volatile, unpredictable investment environment. Therefore, an appropriate level of diversification will help the investor avoid unnecessary concentration and potential downside risk.
In addition, private debt also offers diversification benefits in the context of structural protec-tions (Rajan, 2015). Thorough due diligence processes, scenario assessment, covenants and seniority structures provide alternative credit with structural protection that is superior to that found in traditional fixed-income products. These types of protection further enhances the diversification value of the asset class.

73Guidebook: Alternative credit and its asset classes
7.11 Complexity: the intellectual and sourcing premium in private debt Many factors contribute to the complexity of assessing alternative credit products and sub-asset classes. These complexity factors act as barriers of entry for investors at all levels. The more complex an asset class, the more difficult and challenging it is to assess it and to monitor it in an open, transparent manner, both for organisations and for individuals.
Alternative credit investments have a high level of information asymmetry and require dedicated expertise. These are also the sources of risk not normally seen in mainstream, more traditional assets classes.
We propose to review and analyse four aspects: complexity (“sweat”) premium; transparency; reputation and integrity risks; and ESG (“feel-good”) factors.
Overall intellectual complexity: the sweat premium
Table 12. Factors increasing complexity of the investment
Portfolio companies Number of companiesComplexity of the individual subsectors Financial leverage
Geography Complexity of political risk Economic considerations Understanding the nuances of each local market
Regulatory framework Fiscal and finance structures, execution of securities, bankruptcy regimes
Fund structure Complex fund structure and multifaceted legislationPossibility of leverage in the structure
Selected strategy Use of derivatives
Manager Structure, strength, market commitment, organisation structure
Tax considerations Complexity of tax transparency and structure
Before investing in alternative credit assets, investors should reflect on how difficult it will be to explain to others within the organisation different aspects of the investment: the greater the intellectual complexity, the higher the “sweat” premium. Investors should also consider the execution risk and opportunity cost, i.e., other potentially easier investment options. In addition, the process may involve the necessity of having to employ or trust a professional, which is not a natural part of an institutional investor’s internal organisation. Differences in culture and organisational processes can further exacerbate the complexity premium. Also, the associated platform requires special internal advisors for due diligence as well as legal and tax matters. All this requires additional support and procedures, and is recommended only for larger or specialist asset managers. Even when one gives a mandate to such an asset manager, the asset class will require additional attention and an open mind to the specifics of alternative credit.
TransparencyCertainty about the assumptions is difficult to obtain in private debt. Market participants will have to make up their own minds and information will often be asymmetric. Rating agencies, accountants and due diligence providers can offer some objectivity as concerns rating agencies and expected loss, for instance.

74Guidebook: Alternative credit and its asset classes
How certain are the assumptions concerning return, expected loss, capital charges and net asset value calculations? Do different sources give similar or strongly deviating answers?The pricing transparency of alternative credit investments is not high. NAV often differs from actual executable price of the underlying assets, especially in cases when markets stop functioning due to contraction and liquidity dries up.
Investors need to consider several questions. How robust are the assumptions? What are the risks of the investment underperforming while the fees continue, thereby eating up capital?
Investors should also carefully assess transparency regarding liquidity features, drawdown potential of investors, the composition of liquid and illiquid assets. Semi-closed investment vehicles may offer liquidity but might eventually penalise the most loyal and committed investors as in case of redemption requests the most liquid assets are sold.
The impact of the fund’s leverage might be crucial and needs to be carefully evaluated, however it might not be transparent on the surface.
Reputation and integrity risks No institutional investor wants to make the front page of the newspapers for questionable financing practices – whether those be financing the “wrong” companies, using the “wrong” means, or associating with the “wrong” partners. Integrity and reputation risks may arise for institutional investors because of close associations with the wrong asset manager or partner, or because of investments in companies that might be negatively perceived by the public (IOPS, 2011).
The past decade has been especially challenging for the financial services sector. In the aftermath of the credit crisis, financial institutions needed to navigate adverse economic conditions, a record-low interest rate environment, and ever-increasing regulatory scrutiny. Most detrimental of all, perhaps, was the damage to public perception and trust in the industry. Emerging from this prolonged period of write-offs, fines and charges, financial institutions must adopt a new approach and understand that the health of their businesses is directly connected to the financial well-being of their clients (Porter, 2015).
For the benefit of improving social perception, the financial services industry has also started investing heavily in “social projects” as well as environmental and cultural programs. Before the crisis, banks and other financial institutions generally did not consider environmental, social and governance problems relevant to their business operations. Recently, however, these aspects have increasingly taken centre stage, as various industry players began to realise their broad impact. As researchers point out, sustainable development has a significant influence on the ulterior development of the society, and consequently affects banks’ future value proposition (Raluca, 2012). In addition, overall materiality of social responsible investment (SRI) criteria is increasing, especially as a dimension rating agencies and analysts use to evaluate financial institutions (Laugel & Laszlo, 2009).
Investors should undertake careful due diligence on counterparties to manage assets, especially with regard to Know Your Customer (KYC) and due diligence procedures. Some investments and regions might be more prone to reputational issues than others. In assess-ing the asset class, investors should be aware of the dynamics. For example, leveraged loans might receive negative publicity as a result of short-term, shareholder-driven focus of financial sponsors. Though the investment is not in the financial sponsors themselves, there

75Guidebook: Alternative credit and its asset classes
might be an indirect reputation impact. The risk is not remote, even in developed regions. About 45% of US organisations report they have suffered some type of fraud over the last two years (PwC, 2014). Reputation issues are even more frequent in other regions.
The reputation risk can be present at several levels, for instance when the investor is part of a joint lender group with unwanted players, when financing in a region characterised by a high level of corruption or when dealing with people in asset management firms who might be engaged in unscrupulous business practices.
Key questions for investors to assess are:• What are the risks of dealing with the asset manager? Are the risks transparent?
Does the company have comprehensive policies and procedures to ensure checks and balances?
• How does the asset manager conduct the risk assessment and KYC assessment? • Who are the other parties financing these assets and transactions? • Are the existing lenders reputable players? • Is the manager able to understand and assess reputation risks? • Is the risk of “unwanted” players becoming co-lenders sufficiently mitigated?• What risks associated with the region are inherent and hard to mitigate (child labour,
corruption)? Can we bear the risk that this could happen? • How has the asset manager previously handled reputation issues? Are the interests
of the investor and asset manager aligned? Are there any potential agency problems?
ESG and “feel-good” elements The financial community today is under growing pressure to incorporate ESG factors into its decision-making process. “Business as usual” is seen as unsustainable (Laugel & Laszlo, 2009). Value creation is beyond the pre-crisis focus on shareholder value. The crisis taught the financial sector that there is a commercial value of having social support and complying with regulations. Misconduct and the sole focus on shareholder value have been penalised by fines, reduced social support and even significant outflows. Sustainable value creation implies finding a more appropriate balance of value creation among all stakeholders – not only shareholders, but also customers, suppliers, employees and society as a whole – while respecting laws and regulations. It should not be a trade-off and must lead to reasonable returns for shareholders. It is a delicate balance which neither the many incumbent players nor the fintech newcomers have yet found in practice. The industry is in a transition phase, and many questions on the interconnectivity of the role of stakeholders in value creation remain unanswered. There is an opportunity for shared value creation and only those players who can find a balance and create sustainable long-term value for all the different stakeholders will have a long-term future.
“Interest in ESG integration has grown considerably over the past few years, but some institutional investors remain concerned that the inclusion of ESG factors in their process may come at the cost of weaker risk-adjusted returns. Recent research papers find that this performance trade-off does not always occur and that ESG factors may add alpha.” (Lee & Moscardi, 2017).

76Guidebook: Alternative credit and its asset classes
Investment vision and practice should not stop at analysing business and financial risks. The value of a company is strongly determined by its culture, its governance practices and its sense of responsibility towards society. There is ample evidence that the quality of corporate governance affects investment performance. Conversely, companies with a history of environmental insensitivity can be harmful for investors and stakeholders. ESG factors should be thought of as a tool to decrease risk and enhance profitability. For example, they can enable lenders to evade investments vulnerable to defaults, credit rating downgrades, or widening credit spreads (Klein, 2015). ESG factors can directly affect the earnings and creditworthiness of a company and thus, their inclusion in the investment framework provides investors with a more comprehensive insight into the credit risk embedded in their investments.
Table 13. ESG factors affecting corporate creditworthinessEnvironmental Social Governance
Climate changeBiodiversityEnergy resources and managementBiocapacity and ecosystem qualityAir/water/physical pollutionRenewable and non-renewable natural resources
Employee relationsHuman rightsCommunity/stakeholder relationsProduct responsibilityHealth and safetyDiversityConsumer relationsAccess to skilled labour
Shareholder rightsIncentives structureAudit practicesBoard expertiseIndependent directorsTransparency/disclosureFinancial policyBusiness integrityTransparency and accountability
Source: PRI (2013)
Providing a framework for ESG ratings is not in the scope of this guide. Still, we believe investors should assess several key questions: • How do the underlying investments and the asset class contribute to sustainable global goals?• What are the practices the asset manager is undertaking to assess ESG criteria? How
objective are these?
Figure 33. The global goals for sustainable development
Source: WEF (2016)

77Guidebook: Alternative credit and its asset classes
8. How to incorporate alternative credit in the matching portfolio
There is growing demand for fixed-income investments that provide attractive returns, have good credit profiles and offer high durations. Structural demographic changes create a natural shift towards liability-matching investments, driven by dissaving and the reduction of retirement investment risk towards and during retirement.
Holding period returns on traditional matching assets are currently historically low, prompt-ing institutional investors to look for alternatives. Initiatives to increase the level of collater-alisation in the use of derivatives, such as the European Market Infrastructure Regulation (EMIR), increase required cash reserves. The low return on cash makes it desirable to limit the use of derivatives.
Alternative credit can provide a solution to these challenges by incorporating the asset class in a liability-matching portfolio. This chapter addresses several key questions that face investors who are considering adding private debt to a matching portfolio. How does private debt differ from liquid assets in the matching portfolio? What is the impact on the portfolio management strategy? What asset classes in the alternative credit universe are suitable for

78Guidebook: Alternative credit and its asset classes
a matching portfolio? What impact does replacing traditional matching assets with private debt have on the balance sheet return potential?
Private debt provides attractive return potential compared to liquid asset classes in the matching portfolio and can increase the risk/return efficiency of an institutional investor’s balance sheet. The heterogeneity of alternative credit allows for the inclusion of asset types that align with the portfolio management strategy. While illiquidity, repayment uncertainty and valuation are points of attention, they need not constrain the investor. A flexible approach towards portfolio management and appropriate mitigating action can make investing in private debt as part of a matching portfolio a manageable undertaking.
8.1 What is liability-driven investing?Liability-driven investing (LDI) is an investment strategy where the institutional investor’s liabilities – present and future commitments – take centre stage. Key to the nature of LDI is seeing liabilities as a benchmark and managing the balance sheet so that the liabilities can be met to the desired extent.
The type of liabilities can vary significantly between different types of institutional investors: from long-dated annuities for life insurers to short-dated claims for property and casualty insurers. In the case of a pension fund, the liabilities are promised pension payments. In this chapter, we shall consider liabilities as fixed, nominal payments that are certain to occur in the future. In reality, the situation can be more complex. The current value of the future cash flows is often determined by their net present value. The used discount curve and the frequency of valuation play important roles here. To measure economic risk, market rates such as the swap curve or government bond curves are often used. Regulatory and account-ing frameworks may also require other valuation methods.
The institutional investor takes a view on excess performance requirements and the extent to which the risk of not meeting its liabilities should be tolerated. The return requirement and risk appetite are then translated into an actual portfolio strategy, the “investing” part of liability-driven investing.6 This is a top-down process that can be initiated by determining the desired size of the matching portfolio and the return portfolio.
LDI pension fund advisors frequently take a market-value approach to asset allocation. This entails measuring the risk of not meeting current and future commitments by the mismatch between the fluctuations of the market value of assets and liabilities. A measure of risk appetite is the target hedge ratio, or the ratio of the market value change of assets to liabilities when the discount curve moves. Maintaining a hedge ratio close to 100% ensures that interest rate changes have a limited impact on the coverage ratio, which is the market value of assets divided by the market value of liabilities. The matching portfolio implements the desired interest rate hedge.
Key risk and return parameters are often formulated on a strategic level. To provide a sense of the figures involved, below are some realistic examples of key metrics for a hypothetical but realistic Dutch pension fund that is used as a recurring example in this chapter.
6 It is worth noting that institutional investors are not necessarily limited to asset management in managing their balance sheet position; other viable options include curtailing liabilities, increasing premium inflow or reinsurance, just to name a few.

79Guidebook: Alternative credit and its asset classes
Return target: Expected annual coverage ratio return of 2.5% (in the long run), implemented by a return portfolio of 60% of total assets and a matching portfolio of 40% of total assets.
Risk target: Maximum volatility of annual coverage ratio returns (tracking error) of 7.5% (in the long run) with a hedge ratio of 50%.
The market-value LDI approach mentioned above is performed by steering the interest rate sensitivity of the balance sheet to target risk and return levels. This can be a dynamic process that requires occasional rebalancing. A different approach to LDI is cash flow matching. In this approach, every (certain) cash flow that is to occur in the future is matched by a (sufficiently certain) cash flow generated by the assets.
Risk appetite can be formulated as the extent to which the investor can accept a future shortfall. Targeting positive coverage ratio returns might increase this risk.
Because there is often reliance on using cash investments to meet near-term cash outflows, the near-term interest rate sensitivity hedge might be poorer compared to a market-value approach that relies more on the use of derivatives. In the long term, both strategies could equally well protect the coverage ratio from interest rate fluctuations.
Cash flow matching is used in practice, for instance by investors with relatively short-term future commitments that are not projected to vary in size or timing. A defined-benefit pension fund with mostly retirees as participants that does not accept new participants (an “old” pension fund) is a good example of such an investor. Innovations in pension contracts might also require a more cash flow-based risk management approach. In the Netherlands, discussions are being held about a system in which the participant formulates the maximum acceptable income uncertainty. That uncertainty then translates into the maximum tolerable risk of not meeting income targets.
8.2 What does a liquid matching portfolio look like?A realistic matching portfolio of a generic Dutch pension fund7 combines cash investments in highly rated government bonds, money market investments and investment grade (IG) credits with interest rate swaps. IG credits and government bonds have interest rate sensitivity and can therefore be included in the matching portfolio. Cash and government bonds are used as swap collateral and related buffers. The swap portfolio can be tailored so the interest rate sensitivity of the liabilities is hedged up to the desired hedge ratio if the amount of available liquidity is sufficient.
Table 14. Composition of the matching portfolio of a hypothetical Dutch pension fund
% of assetsGovernment bonds, money market and swaps 26.7%
Investment grade credits 13.3%
Total matching portfolio 40.0%
7 Liabilities are denominated in euros. The market swap rate is a good approximation of the discount curve used.

80Guidebook: Alternative credit and its asset classes
Some key considerations that play a role in managing the assets in the liquid matching portfolio are mentioned below. These considerations will be revisited in the context of private debt in the matching portfolio.
Liquidity riskIn “normal” markets, liquidity of these instruments is not a concern. The composition of the matching portfolio can be changed to steer the portfolio towards its interest rate sensitivity targets or to rebalance to achieve a different risk/return trade-off. When the return portfolio is sufficiently liquid, the matching portfolio as a whole can be reduced or expanded to decrease balance sheet return potential. It should be assumed that the liquidity of the assets in the matching portfolio can drop. This was particularly relevant in the period after the financial crisis:
“Liquidity disappeared when we all needed it … The time duration to liquidate bond portfolios can increase significantly compared to pre-2008. This implies that the bond investments, which were previously considered to be a liquid investment, might become as illiquid as private instruments.” (Kindert, 2017).
When using derivatives in the matching portfolio, there could be a natural need for liquidity in the form of collateral and related buffers. This will be discussed further in Section 8.5.
Spread riskLiabilities are discounted using swap rates, so an investment in swaps and cash approxi-mates the risk-free investment strategy. The movement of the difference between swaps and cash on the one hand, and government bonds and credits on the other hand, is a source of risk that can affect the tracking error.
Uncertainty of future cash flows: default riskDefault risk is generally limited. Minimum rating requirements and exposure limits may apply. When credit quality falls below the acceptable threshold for the matching portfolio,8 trading out of the position and rebalancing the portfolio can improve credit quality to the desired level at the expense of a realised loss.
8.3 Specific characteristics of alternative credit and the impact on LDI strategiesChapters 7 and 9 of this book deal extensively with the particular characteristics of alternative credit. In this section, we highlight three of those characteristics that contrast with typical assets in the liquid matching portfolio:• Illiquidity• Expected and unexpected repayments• Valuation
These characteristics are relevant from an LDI perspective because of their impact on balance sheet management. They can have a beneficial impact, for instance when valuation
8 The acceptable threshold could be investment grade for credits. Investments that breach this limit could still be far from actually defaulting.

81Guidebook: Alternative credit and its asset classes
methods lead to low spread volatility. Other characteristics can have a negative impact on the financial performance, such as the reinvestment risk introduced by unexpected repay-ments. Mitigants that might be available are discussed in some detail in the following chapters. When there is no need or scope for mitigating action, the investor could still accept these risks outright. The premium offered by alternative credit acts as a compensation for that risk. Further analysis could give insight as to whether the compensation is sufficient.
8.4 IlliquidityInstitutional investors have several uses for liquidity. To be able to fulfil their duties towards their clients, pension funds and insurance companies must provide payments under pension contracts and insurance contracts. The liquidity needs can be significant: an “old” pension fund, as already discussed in the context of cash flow matching, could pay up to more than 5% of its asset base every year. Casualty insurance companies may have an annual cash need of more than 50% of their assets. Cash and other highly liquid assets are also required to effectuate balance sheet management. Firstly, cash and highly rated government bonds are needed to enter into and maintain derivative contracts for which collateralisation applies, such as exchange-traded derivatives. In the case of an interest rate swap, the cash require-ment takes the form of initial margin, the variation margin and a buffer that is maintained to reduce trading costs. The overall cash requirement can be significant and the lower return that this locked-up cash offers – the “cash drag” – should be taken into account. Secondly, rebalancing the portfolio requires buying and selling assets, which cannot be achieved using illiquid private debt investments.
The institutions have a constant inflow of cash via the receipt of dividends, coupons, rents and other income generated by assets. Liquid assets can, of course, be sold to release cash. Insurance companies and pension funds may also receive premium inflows. The liquidity needs described above therefore do not necessarily impact the liquidity of the investments on the balance sheet because cash inflow might surpass any outflows.
In the subsections below we highlight two aspects of illiquidity that can have spill-over effects at the balance sheet level: rebalancing and credit risk.
The impact of illiquidity on the balance sheet cannot be seen in isolation. As mentioned above, many different factors can mitigate or exacerbate the potential risk of a liquidity shortfall caused by the increase in illiquid assets. Also, an increase in illiquid assets does not necessarily have an impact on portfolio management.
We do not have general guidance on the maximum acceptable level of illiquid assets. In certain special cases the illiquidity tolerance might be high, for instance when using a cash flow matching strategy or when cash inflow more than surpasses cash outflows. We recommend a detailed liquidity analysis that takes the relevant factors into account and is tailored to the specific circumstances of the institutional investor to get a better understand-ing of illiquidity limits.
On illiquidity and rebalancingPortfolio rebalancing can be a risk management tool and a way to increase return. Rebal-ancing can be complicated by alternative credit for two reasons: firstly, the allocation to private debt cannot be immediately increased because building up a fully invested private debt portfolio can take time and secondly, the allocation to private debt cannot be lowered by a sale.

82Guidebook: Alternative credit and its asset classes
A common (strategic) rebalancing strategy involves periodic rebalancing to constant target weights, often using specified bandwidths. Maintaining constant weights can boost total balance sheet return and may reduce risk, such as concentration risk (Dubikovksy & Sussino, 2015). Private debt only offers a one-sided way to execute this strategy as the portfolio can be rebalanced only when the allocation to private debt is below target. When assets in the liquid matching portfolio and return portfolio drop in market value, such as when a stock market crash coincides with rising interest rates, the allocation to private debt may be well above target. For discussion of a particular case, see Monster & Sanders (2016). Mitigating action may consist of adopting broader rebalancing bandwidths, in particular for illiquid assets. The use of options can counteract market value declines that cause the allocation of private debt to be above target.
Constant target weights are often determined at the level of strategic asset allocation. On a tactical level, there could be room to deviate dynamically from target weights and profit from near-term market opportunities. Still, it is not practical to implement tactical strategies with private debt. Private debt does not necessarily constrain the execution of the desired tactical asset allocation strategy as derivatives may be employed. However, collateral and buffer requirements must be taken into account. The investor could also make the strategic decision to increase allocation to illiquid assets at the expense of scaling down tactical asset allocation. The additional return potential of private debt might be higher than the return opportunities from tactical asset allocation.
Rebalancing strategies that increase the allocation to low-risk assets when the coverage ratio decreases, such as constant-proportion portfolio insurance, could combine well with private debt. The allocation to private debt in the matching portfolio might not rise as fast as it would in the case of rebalancing to constant weights.
Specifically targeting private debt investments that have the desired amortisation speed could provide a solution when an over-allocation to private debt is undesirable. All other things being equal, the allocation to amortising private debt decreases over time so that it becomes more likely that the private debt allocation is not above target. The paid-down principal can be applied to buy additional private debt so that the allocation can be kept on target. Reinvestment risk can be a concern and will be discussed later.
On illiquidity and credit riskCredit risk and the positive credit profile of private debt is discussed at length in this book. We would now like to highlight three aspects of credit risk that affect portfolio management and liquidity management.
Firstly, it is worth mentioning that cash may be locked up for a longer period in defaulted investments. During this period, no cash is received and the maturity of the investment is unwillingly extended. In the case of liquid credits in the matching portfolio, a trade-out could have circumvented this situation.
Secondly, the (implied) credit rating of private debt with credit concerns might drop below what is otherwise considered acceptable in the matching portfolio. There should therefore be tolerance towards holding lower-graded credits.

83Guidebook: Alternative credit and its asset classes
Thirdly, the recovery on a defaulted loan could well be realised at a different time than the expected maturity. This introduces reinvestment risk.
8.5 Expected and unexpected repaymentLiquid assets in the matching portfolio often have a bullet redemption structure. Expected repayments on private debt, for instance an annuity loan or a loan with a redemption schedule, introduce additional reinvestment risk vis-à-vis their liquid counterparts. A possible mitigant for this reinvestment risk is to include forward-starting swaps. Note that the spread of private debt cannot be hedged in this way.
Unexpected repayment as discussed in Section 7.3 also leads to reinvestment risk. This type of reinvestment risk is challenging to deal with in a matching portfolio. Because it is unknown when repayment may occur, hedging with (forward-starting) swaps can be ineffective. Also, spread income may substantially differ from what is initially expected. Consider the example of a bullet loan that is expected to mature in ten years. In this example, market circumstanc-es are such that there is a significant spread term premium: assets with a longer tenor have higher spreads. If the asset unexpectedly repays in five years and there is no movement in the spread curve, the cash inflow could be reinvested in a 5-year bullet loan that carries a lower spread than the original 10-year loan. This leads to lower income compared to what would have been earned if the 10-year loan had not repaid unexpectedly.
A particularly risky factor is unexpected repayment that may arise if the borrower is permitted to repay the loan at will. The borrower has an incentive to refinance at a lower cost and has the opportunity to do so. From the perspective of the investor, this situation is similar to writing a put on interest rates. On a portfolio level, this can be damaging. Interest rate hedging, which is the purpose of the matching portfolio, might lose its effectiveness. In particular, this introduces tail riskiness to macro-economic circumstances: if a substantial part of the matching portfolio may refinance at lower rates, if rates are substantially lower and if the economy is in good shape so that many borrowers can refinance, a significant portion of the overall matching portfolio may refinance. This could lead to sizeable coverage ratio losses. Note that this effect should also be appreciated in the context of the behaviour of other investments under the previously sketched scenario.
From the perspective of cash flow matching, the risk of unexpected repayment can be clearly interpreted. If the loan repays earlier than expected, the money needs to be reinvest-ed at a possibly lower rate. If the loan repays later than expected, there is no cash inflow that was intended to match a cash outflow. This can lead to a potential shortfall.
A first line of defence would be to focus on private debt that cannot prepay or that features make-whole clauses in case of prepayment. As mentioned in Section 7.3, these might not be available to the desired extent. Private placements (see Section 9.6) are favourable in this regard. Secondly, the macro-economic circumstances suggest that prepayment rates are not likely to spike anytime soon; both risk-free rates and (public market) spreads are at relatively low levels. A significant drop in interest rates that may trigger a prepayment wave is very unlikely. Swaptions may be used to hedge unexpected prepayment, but there is a risk of buying too many or too few options. Another approach is to try to understand sources of unexpected repayment and improve prepayment forecasting quality. The gap between expected and actual tenor might be narrowed in this way.

84Guidebook: Alternative credit and its asset classes
8.6 Valuation of private debtThere is no observable market price for private debt. Nonetheless, price movements as a result of changing market circumstances can be estimated and can cause price fluctuations. It is important to realise that the way private debt price changes are measured over time can have an impact on balance sheet risk measures. There can be a possible mismatch between the market value of liabilities (that may continuously move with interest rates) and the reported value of private debt.
It should also be mentioned that private debt may be valued differently across different frameworks. This can be the case for liquid assets as well. And there might be differences between the way liquid assets and private debt are valued within the same framework. For economic risk measurement, market information might be used to price private debt, while the accounting framework may demand that private debt is recorded at amortised cost. Any potential mismatch should be taken into consideration when investing in private debt.
Below is a (non-exhaustive) list of several private debt valuation methods, which are discussed from a market value LDI perspective.• Amortised cost: The book value of the asset is independent of interest rate movements
so a large tracking error might be reported.• New-issuance yield: The yield of comparable private debt that is newly issued may reflect
interest rate changes to a certain extent, but other factors can also play a major role in the movement of the new-issuance yield over time.9 In addition, there may be time lags between changing interest rates and changing new-issuance spreads.
• Mark-to-model: There is more flexibility to incorporate changing interest rates into the valuation of private debt. A very attractive valuation method from the perspective of market value LDI would be to value private debt at constant or near-constant spreads. However, this is the potential drawback of ignoring important information that could affect the size of the spread.
Adopting an LDI framework that puts more emphasis on cash flows could be an effective way to mitigate the drawbacks of any pricing methodology mismatch between private debt and liabilities. In that respect, cash flow-based LDI seems to form a natural fit with private debt.
8.7 What private debt asset classes are suitable for a matching portfolio?It is difficult to describe in general terms what asset classes are suitable for the matching portfolio. The specific balance sheet situation and circumstances of the institutional investor should be taken into account in an integrated fashion. However, we can identify general characteristics that are favourable for the matching portfolio:• Low likelihood of default and high recovery rates;• Expected tenor of the loan and principal repayments can be estimated accurately or
make-whole clauses apply;• Amortisation profile that fits with tolerance for an over-allocation to private debt;• The estimation of the value of the asset moves in line with interest rates;• High risk-adjusted returns.
A high duration could be a bonus as this decreases the reliance on swaps and thereby the liquidity needs. Seeing that the term premium for very long-dated bonds in the public markets are flattening out, we can see demand for assets with higher yields and long durations.
9 See Section 9.4 regarding the interest rate dynamics of residential mortgages.

85Guidebook: Alternative credit and its asset classes
However, we cannot say in general that high-duration assets are always preferred. Short-duration private debt can also be combined with swaps. The relative merit of short-duration versus long-duration private debt should be evaluated in an integral balance sheet context.
These criteria exclude private debt asset classes that have moderate to high credit risk. A sensible approach would be to draw the line at the annual expected loss level of invest-ment grade credits, which we currently see at 25 bps. We therefore consider the following asset classes, for example, as potentially better suited in a return portfolio: • Microfinance• Leveraged loans• Direct lending• Mezzanine• Distressed debt• Factoring• Trade financeSimilarly, liquid alternatives to these private debt asset classes, such as high-yield bonds, are not natural candidates for the matching portfolio.
In this section, we compare private debt portfolios (consisting of ECA loans, private place-ments, project finance, residential mortgages and commercial mortgages) with similar liquid portfolios. We highlight some considerations concerning the suitability of the asset class in a matching portfolio. Please note that these asset classes may also be appropriate for a return portfolio.
ECA loansPros: same credit quality as high-quality government bonds. Considerations: possibly irregular amortisation schedule. Likely necessary to combine with swap or other high-duration assets.
Private placementPros: relatively long attainable tenors. Make-whole clause applies.Considerations: bullet repayment can mitigate reinvestment risk and have higher duration, but increases the chance of over-allocation to private debt.
Project financePros: long attainable tenors and possibility of fixed-rate loans. Considerations: in the case of floating rate, combination with swap or other high-duration assets may be necessary.Cons: risk-adjusted return not the most favourable.
Residential mortgagesPros: attractive risk-adjusted return. Relatively high attainable tenors and durations.Cons: prepayment risk.
CRE loansPros: attractive risk-adjusted return. Considerations: in the case of floating rate, combination with swap or other high-duration assets may be necessary. Cons: prepayment risk.

86Guidebook: Alternative credit and its asset classes
8.8 The impact of private debt on risk-adjusted net returnsPrivate debt has a higher return potential than liquid assets in the matching portfolio. This comes at the expense of less liquidity and other considerations we have already discussed. To appreciate the attractiveness from a portfolio perspective it is insightful to estimate this return potential. The estimation is done by comparing IG credits and government bonds with similar portfolios consisting of alternative credit. The alternative credit portfolios are tailored so that they match benchmark PD rating distribution, duration and spread duration as closely as possible.
The investment grade credit portfolio is compared to a portfolio of CRE loans, infrastructure loans and private placements, referred to as the alternative IG credit portfolio. The higher return potential of the alternative IG credit portfolio can be explained in terms of higher gross return and lower expected losses. For IG liquid credits, we project 25 bps annual losses.10 All three asset classes in the alternative IG credit portfolio have a lower expected loss of 15 bps, thereby boosting the relative performance by 10 bps. This difference is driven by, among other things, the higher recovery rates on private debt. However, the management costs of the alternative IG credit portfolio are expected to be 25 bps higher. The estimated net result approximates a 70 bps return pick-up.11
The liquid government bond portfolio contains a mix of AAA-rated and AA-rated European government bonds. Viewed in isolation, i.e. without any diversification across asset classes, the risk/return trade-off of government bonds does not seem spectacular. We expect a long-term tracking error of more than 2% and a negative excess return. The alternative risk-free portfolio consisting of ECA loans, residential mortgage loans and AA-rated fixed-rate infrastructure loans has an attractive return pick-up potential of 100 bps, in spite of management costs that we estimated to be 25 bps higher than that of the government bond portfolio.
The results of the comparison are displayed in Figure 34. To put the numbers in perspective, global IG credits are added. The estimation shows that alternative credit can make the portfolio more efficient. This is because there is potential to increase return while keeping the overall risk budget intact and because balance sheet risk could be lowered while maintaining return potential.
In order to appreciate the relative importance of the return pick-up on the return of the coverage ratio we integrate the estimated return pick-up with the sample portfolio in Table 15. For illustration purposes we replace one-third of the matching portfolio with the corresponding alternative credit counterpart. The allocation to illiquid assets is 13.3% of total assets, in addition to the possible allocation to illiquid assets in the return portfolio. For reasons described in Section 8.4, there might be limits to a prudent allocation to illiquid assets. Arguably, there is headroom to increase the allocation to illiquid assets beyond 13.3% and still withstand liquidity stress scenarios (Monster & Sanders, 2016).
10 Including market value losses due to downgrades, realised losses due to trading out of credits that are downgraded below BBB and actual defaults.
11 These figures heavily depend on the underlying assumptions, modelling methods, date of analysis and simplifications that are applied. A particularly relevant assumption is that the constructed alternative credit portfolios do not have higher tracking errors than their liquid counterparts. Several potential sources of risk of alternative credit, as discussed in Sections 8.4-7, are not taken into account in this analysis.

87Guidebook: Alternative credit and its asset classes
The improvement of approximately 12 bps in return potential results in a 5% increase in the coverage ratio return target, from 2.5% to 2.62%. A quick calculation12 indicates that the increase of the coverage ratio return is roughly the order of magnitude of allocating 4% more to equities. Such a shift in asset allocation would undoubtedly increase risk levels.
Figure 34. Illustration of the estimated long-term annual tracking error (horizontal axis) versus long-term expected excess return (vertical axis)
The solid dots represent liquid asset classes. The spotted dots are portfolios constructed from alternative credit that approximate characteristics of the corresponding liquid asset class: duration, PD rating and spread duration. Note that
the tracking error is calculated relative to swap rates with the same duration as the asset class benchmark, not vis-à-vis liabilities.
-0.5%
0.0%
0.5%
1.0%
1.5%
2.0%
0.0% 1.0% 2.0% 3.0% 4.0% 5.0% 6.0% 7.0% 8.0%
Alternative IG credit portfolio
Global IG credits
Euro government bonds
Euro IG credits
Alternative risk-free portfolio
The solid dots represent liquid asset classes. The spotted dots are portfolios constructed from alternative credit that approximate characteristics of the corresponding liquid asset class: duration, PD rating and spread duration. Note that the tracking error is calculated relative to swap rates with the same duration as the asset class benchmark, not vis-à-vis liabilities.
Table 15. Estimation of the impact of adding private debt to the matching portfolio on the return potential of the coverage ratio
Liquid matching portfolio, % of assets
Partly liquid matching portfolio, % of assets
Government bonds, money market and swaps 26.7 17.8
Alternative risk-free portfolio 0.0 8.9
Investment grade credits 13.3 8.9
Alternative IG credit portfolio 0.0 4.4
Total matching portfolio 40.0 40.0
Estimated coverage ratio return pick-up 0.12
Source: NN Investment Partners
12 Using a 3% expected equity risk premium; the additional allocation to equities is 4% = equity risk premium / 12 bps return pick-up of private debt.

88Guidebook: Alternative credit and its asset classes
9. Key sub-asset classes in alternative credit
This chapter delves deeper into the key sub-asset classes within alternative credit and provides further discussion on their return, liquidity and complexity characteristics in line with our triangle approach in Chapter 7. We also discuss major trends and developments currently observed for each individual strategy, as well as briefly evaluate their suitability for the matching portfolio.
On the following pages we consider the seven sub-classes below: • Government-Guaranteed Loans• Infrastructure Debt • Leveraged Loans• Residential Mortgages • European Commercial Mortgages • Private Placements • Direct Lending
This selection of strategies is based on our assessment of their current attractiveness. We will address these sub-classes, which at present remain the prime focus of investor interest or are widely considered to be the most representative of alternative credit as a whole. Although by no means exhaustive, this chapter should provide the reader with a helicopter view of what alternative credit has to offer.

89Guidebook: Alternative credit and its asset classes
9.1 Government-Guaranteed Loans
Executive Summary
Global/Europe
Market size EUR 840 billion / EUR 20 billion
Asset class summary This strategy enables investors to optimise their exposure to government debt by switching from traditional government bonds into higher-yielding government-guaranteed loans. These assets have the same credit risk and capital treatment as the original bonds but pay a significant positive pricing differential stemming from the private nature of the assets. Government-guaranteed investment opportunities are sought from various underlying markets, including those for export credit lending, supra-national guaranteed financings, and government-related assets.
Key trends Global trade markets require significant amounts of government-backed loan financing, but banks’ focus on increasing capital buffers restricts their ability to satisfy market needs. Income-generative aspects and the higher margin financing linked to the non-guaranteed portions of such loans, continue to be attractive, creating opportunities for investors to fill in the gap.
Suitability for the matching portfolio
Overview Very high. Low risk cash flows, available in fixed and floating format, in varying maturities across the entire term structure.
RETURN
Cash flow pattern Floating and fixed.
Legal tenor Long, 7-30 years, with amortising payment schedules. Possible prepayment.
Gross return 40-120 bps (mid spread plus).
Expected loss 0 bps (1-year horizon).
Risk adjusted return 40-120 bps (spread).
Management fee 15 bps.
Net return 25-105 bps.
Cost of holding the assets Low. 0% SCR under Standard Model for Solvency II.
LIQUIDITY
Liquidity Low. Transferable though illiquid. Private pricing differential is high versus government bonds (80-100 bps).
Volatility Low and stable.
Portfolio diversification High. Allows for efficient country diversification without costly FX hedging.
COMPLEXITY
Overall complexity Low.
Transparency High. Simple risk factors, highly probable cash flows.
ESG factors Medium.
Reputation risk Low.
Important disclosure: The compilation of the figures is based on the authors’ estimates and does not represent an official position. Readers should consult professional advice before making any decision or taking any action that may affect their finances or business or tax position.

90Guidebook: Alternative credit and its asset classes
Mechanics of government-guaranteed loansGovernment–guaranteed lending has become an essential element of numerous financing markets, including the multi-trillion-dollar global trade marketplace. It now offers institutional investors a unique opportunity to enhance their current allocations to highly rated assets.
Governments provide financing support to industry in a number of different ways. One common method is to provide credit guarantees via an export credit agency (ECA). These agencies are government-sponsored organisations which are set up to stimulate employ-ment by supporting a country’s domestic manufacturing. In helping buyers of the country’s exports finance their purchases at competitive rates, they facilitate sales and promote job creation in exporting industries. Support from ECAs typically takes the form of direct loans, payment guarantees or export insurance, and is usually extended to a range of sectors, including aviation, shipping, renewable energy, infrastructure and SMEs. ECA lending has traditionally been dominated by bank arrangers, but recent regulation has reduced banks’ capacity to lend in the volumes and for the tenors the market requires. This structural change in the dynamics of global lending now gives institutional investors a unique opportu-nity to participate in this essential component of global trade.
To illustrate the role of ECAs and the opportunity offered to institutional investors by the changing role of bank arrangers, a representative example of a transaction in the aviation sector is given in Figure 35.
Figure 35. How an ECA loan works
Investor
Loan
Aircraft manufacturer
Airline
Bank
ECA agency
Guarantee
Government
Arranges the loan Provides financing
Provides financing
Purchases an aircraft
Arranges a guarantee
Source: NN Investment Partners

91Guidebook: Alternative credit and its asset classes
Passenger planes are typically very expensive, often costing more than EUR 100 million, while airlines frequently have sub-investment-grade credit ratings, which can constrain their ability to borrow sufficient funds at sustainable rates to fund their fleet renewals. At the same time, governments have a strategic interest in promoting their countries’ aircraft industries. To support airplane sales, a government-established ECA can guarantee the loans that are financing the aircraft purchase. A loan with such a guarantee bears a higher interest than government debt, but is also significantly cheaper than senior unsecured borrowing the airline could otherwise access. Trade finance banks arrange the loan and have traditionally been the sole lenders, but now non-bank investors can also provide financing. This process is illustrated in Figure 35.
Return, liquidity and characteristics of ECA loansGovernment-guaranteed loans, which combine prospects of enhanced returns with low levels of risk, are attracting the attention of investors looking to optimise and diversify their government bond portfolios in the current low interest rate environment.Such loans offer a compelling risk-return proposition for investors willing to trade incremen-tal illiquidity for income upside, while otherwise maintaining the same risk profile of their bond portfolio. At the same time, moreover, the loans allow investors to take a defensive position against an investment backdrop increasingly characterised by high volatility of credit spreads and rising interest rates.Export loans are provided to importers to fund specific purchases. Although loan character-istics vary with the type of goods and services being financed (as illustrated later in this section), we can summarise the key features of the asset class as follows:
Table 16. Return, liquidity and characteristics of ECA loans
Characteristic Description Guarantee 100% principal and interest
Commitment Fully committed, scheduled draw-downs
Repayment Amortising
WAL 5-15 years
Interest Both floating and fixed possible. Paid on drawn amounts
Commitment fee Paid on undrawn amounts
Private pricing differential 80-100 bps over relevant government bond
Solvency II charge 0% SCR (Standard Formula)
Above, we introduced the mechanics of an ECA loan using an example from the aviation sector. Similar government-guaranteed loans are also common in the shipping, project finance and SME sectors, each of which exhibits different investment characteristics. The combination of these different underlying loan types within the government-guaranteed strategy not only supports more effective portfolio construction, but allows for a broader investment base from which to select attractive assets. As highlighted in Table 17, the specific return, liquidity and cash flow features of such loans vary with the type of the purchase being financed.

92Guidebook: Alternative credit and its asset classes
In general, ECA loans should be considered buy-and-hold investments. Despite the simple credit risk proposition of investing in 100% government-guaranteed loans, investors should be aware of the residual complexity in these instruments compared to traditional bonds.
A certain amount of legal/structural risk is associated with the asset class, although much of this risk can be obviated through proper due diligence and monitoring. For example, loans may draw and amortise in irregular ways and the legal nature of guarantees may differ subtly from one country to another. Although rare, prepayment risk may also be present.
Large and diverse marketplaceGlobal ECA-backed trade continues to grow. The total loan value has increased steadily from USD 20 billion in 2005 to over USD 80 billion in each of the last three years13. The market for ECA loans is large and diverse, with agencies from a variety of countries globally providing guarantees to exporters in a wide range of sectors. Loans are denomi-nated in the major global trade currencies (USD, EUR, GBP, JPY), and are independent of the local currency of the guaranteeing government. For example, the US government often guarantees loans directly in euros. This allows investors to diversify their exposure to global governments without expensive currency hedging.
Table 17. Examples of ECA loans
Aviation Shipping Project SMEMarket Very active global
market with most activity coming from the US, UK, France and Germany
Developed market; significant presence in the Netherlands
Rapidly growing market
Bank-dominated market; slowly opening up to investors
Loan structure Simple, with some level of standardisation
Simple Medium Can have complicated guarantee formats, mainly from supranational agencies
Spreads Low Medium Medium High
Tenure 7-10 years 10-15 years 10-30 years 10-30 years
Ticket size Medium Medium Large Small
Amortisation Yes Yes Yes Bullet loans
Cash flow schedules Simple Medium Medium Variable
Liquidity Relatively liquid, with emerging secondary market
Illiquid, with very limited secondary market
Illiquid, with very limited secondary market
Highly illiquid
13 Source: TXU

93Guidebook: Alternative credit and its asset classes
Guarantee mechanics and timelinesIn the event of a borrower default, claiming payment under ECA guarantee is simple and transparent. After the investment manager presents the government guarantor with a demand notice, the guarantor has 60-90 days to make the payment under the guarantee. The guarantor will usually take over the regular scheduled payments of the loan and keep the transaction alive, but can opt to pay the investor back in whole at once.
Figure 36. ECA loan timeline
Payment default Final demand date
Guarantor payment date
10 business days
60-90 calendar days
One day following non-payment
Guarantor to receive demand notice
Payment by guarantor shall be made no longer than 60-90 calendar days arerwards
Portfolio context and asset-liability matchingIn the current environment, investors with significant government bond holdings face a number of challenges in the effective management of their holdings. Government-guaran-teed loans can offer a range of different solutions to the various issues that have arisen in the instructional investment community.
For all investors, re-investment risk is challenging given the minimal or negative yields attainable in the current interest rate environment. Harvesting the additional yield available in government-guaranteed loans versus benchmark bonds can be a very effective tool in managing this risk.
At the same time, many investors are looking to reduce the capital volatility created by spread movements in long-duration government assets that are used to match long-dated liabilities. By allocating a portion of their bond holdings to shorter-dated, floating-rate ECA loans, they can materially increase returns for the same underlying sovereign risk (and associated minimal capital charge) without functionally impairing the overall liquidity position of the portfolio. And they can often simultaneously reduce market risk.
For investors less limited by spread duration concerns, or those actively seeking to increase longer-dated allocations, government-guaranteed loans of longer tenors and with fixed interest rates can provide a natural higher-yielding alternative for government bonds in matching/LDI portfolios, again without materially impacting strategic asset allocation or risk profile.

94Guidebook: Alternative credit and its asset classes
9.2 Infrastructure Debt
Executive Summary
Europe
Market size Ca. EUR 80 billion per annum.
Asset class summary Infrastructure debt investments are often classified as “project finance”, which can be broadly defined as a form of cash flow-based lending to a special purpose company or regulated entity for the construction and/or operation of a single project or a portfolio of assets. The infrastructure assets themselves may comprise physical assets or a legal right to cash flow in the case of government concessions.
Key trends Efficient solvency requirements for institutional investors.Positive ESG impact of “real assets” that deliver direct social and economic benefits.
Suitability for the matching portfolio
Overview High. Stable, long-term cash flows provide a good match for liabilities.
RETURN
Cash flow pattern Both fixed and floating.
Legal tenor Long. Average of 18 years (WAL 12 years), include risk of prepayment..
Gross return 210 bps (for BBB+ portfolio average; MSP).
Expected loss 10 bps (based on 1-year PD of 0.14% and LGD of 25%).
Risk-adjusted return 200 bps (MSP).
Management fee 30 bps.
Net return 170 bps (MSP).
Cost of holding the assets Medium. Capital charges, internal monitoring.
LIQUIDITY
Liquidity Low. Transferable though illiquid.
Volatility Low. Including low cyclicality.
Portfolio diversification High. Provides access to multiple issuers, sectors and jurisdictions.
COMPLEXITY
Overall complexity High.
Transparency Medium. Some public information available for large infrastructure projects.
ESG factors High. It involves significant social and economic benefits.
Reputation risk Medium. Important disclosure: The compilation of the figures is based on the authors’ estimates and does not represent an official position. Readers should consult professional advice before making any decision or taking any action that may affect their finances or business or tax position.

95Guidebook: Alternative credit and its asset classes
Investments in infrastructure can take various forms, ranging from private equity at one end of the risk spectrum to investment grade senior debt at the other. Some investors may be attracted by the higher returns offered by infrastructure equity and high-yield debt investments in higher-risk or higher-leverage projects. However, lower-risk senior debt investments are generally seen as the most suitable option for investors seeking to enhance cash flow matching portfolios.
Like many asset classes, infrastructure debt may also be categorised by sector. Typical infrastructure sectors include concession contracts with governments or government-related entities (such as public-private partnership projects for government buildings, schools, hospitals and roads), renewable energy, regulated utility assets and energy transmission, water and environment, telecoms, public transportation, ports and airports. In most cases, infrastructure projects are deemed to be “essential” by the host government or state because their operation directly benefits society and facilitates economic growth. For this reason, many infrastructure projects have highly positive ESG outcomes and can even yield reputational benefits for investors.
Figure 37. European infrastructure market growth in total transaction numbers and volumes (debt and equity)
0
50
100
150
200
250
300
350
0
10,000
20,000
30,000
40,000
50,000
60,000
70,000
80,000
H1 H2 H1 H2 H1 H2 H1 H2 H1 H2 H1 H2 H1 H2 H1
2009 2010 2011 2012 2013 2014 2015 2016
Total Value Deal Number
€ mln Deal no.
Source: InframationGroup
In 2015, the size of the European infrastructure market in terms of the total transaction volume was about EUR 140 billion,14 of which approximately 60% (EUR 80 billion) was financed by debt.
14 Source: InframationGroup

96Guidebook: Alternative credit and its asset classes
During 2015, commercial banks provided the majority of all infrastructure debt financing, with institutional investors accounting for around 20% of market share. Although the institutional contribution may seem relatively limited, particularly when compared to the North American market, the direct involvement of institutional investors in the European infrastructure debt market has largely only emerged during the last five years. This market shift is expected to continue as banking regulations (notably Basel III and IV) gradually erode the appetite of many banks to lend in large volumes and for the long tenors required for most infrastructure projects. Furthermore, many project sponsors, including major construction companies and equity funds, are becoming increasingly comfortable and willing to engage directly with non-bank institutional lenders.
Characteristics of infrastructure debtDefinitions of infrastructure debt, which may be referred to more generically as project finance, tend to be broad and can vary among different organisations and regulators. Therefore, it can be best described in simple terms as a form of cash flow-based lending to a special purpose company or regulated entity for the construction and/or operation of a single project or a portfolio of assets. The infrastructure assets themselves may comprise physical assets or a legal right to cash flow in the case of government concessions. Debt investments in infrastructure assets can be made either at the start of construction or later during the operating and maintenance phase. As a result, the returns to investors may vary from project to project depending on the specific risk profile as well as the sector and jurisdiction. Similarly, infrastructure debt financing parameters are usually tailored to the specific needs of the project and tend to vary with the type of asset or sector, although there are a number of common features of this asset class, as outlined in Table 18.
Table 18. Common features of infrastructure debt
Characteristic Description Borrower/issuer Either a bankruptcy remote SPV or regulated entity
Format Multiple formats: bonds (listed and unlisted), notes and loans
Commitment Fully committed, fixed draw-down schedule during construction
Repayment Mostly amortising
Tenor 5-30 years (WAL 5-15 years)
Interest Fixed or floating rate facilities available
Commitment fee Paid on undrawn amounts
Spread premium 70-100 bps above relevant corporate bond benchmarks
Solvency II Charge Qualifying Infrastructure 33% lower SCR (Standard Formula) than equivalent rated corporate bonds
Credit ratings Some project ratings available but mostly unrated
Debt capacity is similarly determined on a project-specific basis by reference to the stable portion of cash flows generated by operating the underlying asset(s). A detailed sensitivity analysis is also performed as a key part of the due diligence process by experienced infra - structure professionals to ensure that the debt service payments are sustainable over the entire life of the project and can withstand a wide range of potential downside scenarios, both in the macroeconomics as well as any future underperformance of the project.

97Guidebook: Alternative credit and its asset classes
Superior credit fundamentalsOne of the most striking attributes of infrastructure debt as an asset class concerns the risk profile, which generally improves over time as the assets mature. Moody’s Investors Service has compiled historical default and recovery data from the Data Consortium, an extensive group of infrastructure debt investors. The data set comprises 5,880 projects, accounting for some 62% of all project finance transactions that originated globally between 1983 and 2015. Interestingly, the historical data shows that the cumulative default rate for infrastructure debt is initially consistent with the default rates for corporate issuers of comparable credit quality up to five years, but thereafter trends significantly lower (see Figure 38).
This unique characteristic of infrastructure debt occurs as the risk profile generally improves over time once a project completes construction and commissioning, and enters into steady- state operations. It is also driven by the amortising debt profile of many infrastructure projects, which results in a gradual deleveraging effect over the life of the asset. For this reason, it is more common for infrastructure debt to experience credit rating upgrades than downgrades throughout the term of the investment.
Figure 38. Cumulative probability of default comparison
0.0%
2.0%
4.0%
6.0%
8.0%
10.0%
12.0%
14.0%
0 1 2 3 4 5 6 7 8 9 10 11 12 13 14 15
Cum
ula^
ve D
efau
lt Ra
te %
Years
EU Infrastructure Debt BBB Corporates BBB Corporates A
Source: Moody’s, S&P Global Market Intelligence
Another striking attribute of infrastructure debt concerns the high recovery rates following default. The historical data from the Moody’s Data Consortium reveals that infrastructure debt has significantly lower losses following default than observed in the corporate bond market (see Figure 39).

98Guidebook: Alternative credit and its asset classes
The higher level of recoveries in infrastructure debt is driven in part by the security provisions and finance documentation, which are usually based on the Loan Market Association (LMA) standard form for European infrastructure projects. Typically, such documentation includes extensive representations, warranties, financial and information covenants, equity distribu-tion lock-up conditions and events of default. In addition, many infrastructure projects include stand-by liquidity in the form of maintenance reserves and debt service reserves as well as comprehensive security packages with direct agreements and step-in rights that enable debt investors to take swift action in case material credit issues arise. In this context, it is not surprising that investors have recorded lower losses in infrastructure debt, although higher recoveries are generally obtained not by distressed sales but by following a detailed workout and restructuring process, which demands an experienced asset manager team with relevant experience.
Lastly, the majority of infrastructure debt investments exhibit very low cyclicality. This distinguishes infrastructure debt from many other asset classes and can help to reduce the portfolio impact of more cyclical markets, like commercial and residential real estate. During the credit crisis, many infrastructure debt portfolios proved to be very resilient and continued to perform well with no material increase in the number of defaults observed.
Figure 39. Loss given default comparison
64%
48%
80% 83%
80%
50%
37% 52% 20% 17% 20% 50%
00%
10%
20%
30%
40%
50%
60%
70%
80%
90%
100%
Corp Bonds Secured (non-
financials)
Corp Bonds Unsecured
(non-financials)
All Project Finance
PPP Workout Distressed Sale
Recovery Rate % LGD %
Corporate Bonds Infrastructure
Debt & PPP Ultimate Infrastructure Debt
Recoveries (postrestructuring)
Source: Moody’s, S&P Global Market Intelligence
However, infrastructure investments can show positive correlations within the same sector and jurisdiction. For example, the retrospective changes made to Spanish renewable energy tariffs during 2013 caused many such investments to become distressed at the time. This correlated risk effect highlights the importance of selecting an experienced asset manage-ment team to build a well-diversified infrastructure debt portfolio and to limit any potential risk concentrations.

99Guidebook: Alternative credit and its asset classes
Portfolio contextInstitutional investors with fixed-income portfolios may consider making an allocation to infrastructure debt in order to enhance returns when compared to traditional investment grade credits, and without materially increasing risk or associated capital charges. During the last few years, European infrastructure debt returns have exceeded the relevant corporate bond benchmarks by an average of 70 to 100 bps. However, such portfolio optimisation requires the investor to forego some liquidity since infrastructure debt, like other forms of private debt, is generally less liquid than traditional fixed-income securities. As a result, investors will need to evaluate the surplus portion of liquidity in their portfolios in advance. This exercise may prove worthwhile not just in terms of boosting returns but also increasing asset diversification by securing access to new markets as well as a broader universe of borrowers and issuers. On the other side of liquidity, many infrastructure debt portfolios, as well as other types of private debt, generally experience low market price volatility when compared to the daily market price fluctuations experienced by more liquid listed securities.
Figure 40. Relative asset value
0.00%
0.50%
1.00%
1.50%
2.00%
2.50%
Spre
ad o
ver E
UR
mid
swap
s (%
)
Year 2014 2015 2016 2017
EU Infrastructure BBB Spreads (average) 10-year Corporate Industrial BBB Bond Spreads
Source: Barclays
Figure 40 shows a pricing comparison between average spreads observed in the European infrastructure debt market versus average spreads for 10-year industrial corporate bonds rated BBB. During the last three years, European infrastructure debt pricing has generally exceeded the corporate bond benchmarks by an average of 70 to 100 bps. In addition, significantly lower price (spread) volatility has been observed in the infrastructure debt market.

100Guidebook: Alternative credit and its asset classes
An allocation to infrastructure debt may also significantly improve the ESG footprint of many portfolios. This is because many infrastructure projects are deemed to be essential real assets that provide major public and community benefits and facilitate local economic growth.
Solvency II defines infrastructure as a new asset class for insurersSolvency II came into effect on 1 January 2016. Under the initial regulations set out in the Delegated Act, risk charges for infrastructure investments were treated in line with corpo-rate exposures. There were essentially two problems with this approach: first, the specific credit characteristics of infrastructure debt were not properly reflected, in particular the unique characteristics observed by Moody’s Data Consortium; second, the capital charges increased significantly with duration, which was generally unfavourable for long-term investments like infrastructure debt.At the request of the European Commission, the European Insurance and Occupational Pension Authority (EIOPA) conducted a market consultation process on infrastructure investments and published its final report on 29 September 2015. Based on the advice of EIOPA, the European Commission adopted a number of changes to provide for more favourable treatment of infrastructure investments in terms of lower capital charges. The resulting amendment to the Delegated Act came into force on 1 April 2016. Subject to investments meeting specific detailed criteria set out in the new definition of “Qualifying Infrastructure Investments”, the capital charges in the standard model relating to infrastructure debt investments are an average of 33% lower than equivalent BBB rated corporate bonds, and more than 40% lower than unrated bonds (see Figure 41 below).
Figure 41. Comparison of Solvency II capital charges - qualifying infrastructure vs. corporates
Corporates BBB Unrated Corporates Infrastructure BBB & Unrated Infrastructure
0%
5%
10%
15%
20%
25%
30%
35%
40%
45%
1 2 3 4 5 6 7 8 9 10 11 12 13 14 15 16 17 18 19 20 21 22 23 24 25 26 27 28 29 30
Ch
arg
es (
%)
Duration (Years)
Source: NN Investment Partners

101Guidebook: Alternative credit and its asset classes
The definition of “qualifying infrastructure” is reasonably broad but excludes large infrastruc-ture corporates like airports. However, EIOPA has recently conducted a review of the existing definition with a view to a possible further expansion to include a broader range of corporate infrastructure assets in the near future.
Apart from lower capital charges, the new Solvency II regulations also set out minimum risk management requirements for infrastructure debt investors, including the performance of adequate due diligence, the validation of a base case financial model, performance of regular monitoring and active management of assets as well as the performance of portfolio stress testing. In addition, infrastructure debt investors are required to demonstrate satisfac-tory internal policies covering risk management, internal control and audit processes as well as adequate asset-liability management.
Overall, the European Commission’s aim for a consistent approach to the Capital Markets Union as well as an increased level of institutional investment in European infrastructure now seems to be making headway.
Issues to consider for institutional investorsInfrastructure debt should be considered as a buy-and-hold investment. Although there is an active market engaged in the trading of secondary infrastructure loans and bonds, it is a private bilateral market that is less visible and generally less liquid than listed investment grade credit. Investors should also be aware of the relative complexity of investing in infrastructure projects compared to other traditional fixed-income asset classes and the fact that it takes a relatively long time to complete each transaction.
The following factors provide insight into the key considerations for each infrastructure debt investment:• End-users: ensuring that there is a recognised need or public demand for the project, i.e.,
whether it can be considered an essential infrastructure asset;• Counterparty credit risk: assessing the credit strength of the host government,
municipality, public authority, end-users, and/or offtaker; • Credit risk of major project parties: checking to ensure the credit strength and relevant
experience of the project sponsors and equity investors, contractors, subcontractors and supply chain parties are sufficient for the size and scope of the project;
• Project scope: checking the availability and status of land and property, planning approvals, permits, environmental impact assessment, construction, technology, operations, maintenance, suppliers, insurance, handback and decommissioning conditions;
• Project economics: ensuring that the cash flows are sufficiently robust and stable as well as the base case assumptions, growth projections, financial ratios and covenants, reserve accounts, detailed downside sensitivity analysis and stress testing;
• Macro risks: this involves checking the stability of the political environment, legal, regulations, change in law risk, taxation, inflation, currency, interest rates, availability of skilled labour;
• Legal documentation: ensuring that there is adequate legal scope, structure, format, quality and complexity of contracts, guarantees, covenants and security package;
• Due diligence advisers: appointing advisers with appropriate experience, resources, track record, scope of services, professional indemnity insurance and liability limits;
• Risk-return profile and pricing: assessing the absolute and relative value of the infrastructure assets compared to other projects and other alternative and traditional fixed-income asset classes;

102Guidebook: Alternative credit and its asset classes
• Probability of success: minimising the opportunity cost for the asset manager and its clients by effective market positioning; efficient resource allocation and competitive bid process;
• Portfolio considerations: ensuring that the portfolio has sufficient asset diversification in terms of geography/jurisdictions, sectors, counterparty, sponsors, contractors and technologies.
Investing in infrastructure debt requires institutional investors to make a long-term strategic allocation decision that is best served by an experienced asset manager with a similar long-term commitment and stable platform. Maintaining regular dialogue, pipeline updates, periodic reporting and knowledge-sharing with institutional clients is essential throughout the entire investment process and lifetime of the infrastructure assets, particularly in a private market where there is often limited publicly available information.
ConclusionEuropean Infrastructure Debt represents an attractive alternative asset class for many institutional investors as a way to enhance returns and increase portfolio diversification while maintaining an Investment Grade portfolio risk profile with efficient solvency require-ments.

103Guidebook: Alternative credit and its asset classes
9.3 Leveraged Loans
Executive Summary
Europe
Market size Ca. EUR 350 billion.
Asset class summary Purpose of financing: LBO, refinancing existing (bank) debt, growth financing, M&A/bolt-on acquisitions, buy-out shareholders, dividends to shareholders (recap).
Key trends Increasing participation of institutional investors since 2008, resulting in more liquidity. Increasing percentage (60%) of the transactions are issued without covenants, and credit structure is converging towards high-yield bonds. Issuers of leveraged loans tap both markets.Provides a high level of current income, offering some transparency and some liquidity. Spreads are relatively stable but excess liquidity drives higher leverage multiples and borrower-friendly credit documentation.
Suitability for the matching portfolio
Overview Low. There could be high discrepancy between legal tenor and actual tenor. Many loans are refinanced during their lifetime to optimise the capital structure of the company and have very limited call protection.
RETURN
Cash flow pattern Floating.
Legal tenor Medium/long. 5-8-year legal tenor.
Gross return 400 bps-525 bps (MSP).
Expected loss 130 bps (2% PD, 65% recovery).
Risk-adjusted return 270-395 bps (MSP).
Management fee 50 bps.
Net return 220-345 bps (MSP).
Cost of holding the assets
High. Capital charges: Solvency 2 unrated bucket. Medium/high internal monitoring costs. High maintenance with frequent changes.
LIQUIDITY
Liquidity Medium. Some assets are highly liquid and widely traded; others less so.
Volatility High. Since the participation of institutional investors, increasing correlation with high-yield debt.
Portfolio diversification Medium.
COMPLEXITY
Overall complexity Very high. It involves complex structures and structuring features. Larger transactions can have multiple layers of financing, requiring expertise on inter-creditor issues.
Transparency Medium. Mostly involves high-quality external documentation.
ESG factors Low.
Reputation risk High. Most transactions involve financial sponsors. Event risk could be high.
Important disclosure: The compilation of the figures is based on the authors’ estimates and does not represent an official position. Readers should consult professional advice before making any decision or taking any action that may affect their finances or business or tax position.

104Guidebook: Alternative credit and its asset classes
IntroductionLeveraged loans are loans made to non-investment grade corporations to finance acquisi-tions, refinance existing debt, support business expansion, and for other general corporate purposes. The term “leveraged” is used because, by borrowing, a company is adding substantial leverage to its balance sheet, achieving levels not normally seen at investment grade companies. Another term which is often used is “senior” loan because the loan is generally secured by a borrower’s assets, pursuant to a first priority claim or “senior” lien, and it has the highest priority in receiving payments when a borrower is servicing its debts.
Roughly 75% of the leveraged loan market is driven by private equity activity, often following large mergers where corporates must divest divisions for regulatory reasons. Private equity houses then step in to buy these divested entities and come to the leveraged loan market for debt funding.
This dynamic also explains why the leveraged loan market went through a prolonged quiet period post-2008 as M&A volumes fell. It has recovered over recent years and deal flow has increased to normalised levels. However, there can still be quiet periods, as in the first half of 2015 when M&A activity was still going ahead but private equity houses were outbid by corporates eyeing the same assets. These buyers were doing deals with their own highly priced shares in a buoyant equity market, perhaps supplemented by cheap investment grade funding augmented by their synergy potential.
TrendsThe leveraged-loan market was particularly affected by the deleveraging of the European banking market following the 2007-2008 credit crunch. The result has been strongly positive for the market, both in terms of characteristics and returns, making it highly attractive for institutional investors. As such, alongside traditional bank lenders, both specialised institu-tional leveraged loan funds and the collateralised loan obligations (CLOs) are active in this segment of the market.
Figure 42. Default rate
0%
2%
4%
6%
8%
10%
12%
2007 2008 2009 2010 2011 2012 2013 2014 2015 2016 Q3
Source: Fitch High Yield Default Index

105Guidebook: Alternative credit and its asset classes
The interest can be seen in the gradually increasing spread since 2008. Whereas institu-tional loans generally averaged around EURIBOR plus 300 bps prior to the crunch, this has increased to around EURIBOR plus 450-525 bps currently. Nevertheless, given a decrease in EURIBOR during that same period, borrowing costs have stayed the same or are even lower.
On the supply side, European banks struggled to deleverage post-2008 under pressure from tightening regulation and central bank stress tests as well as from the commercial require-ment to reduce their balance sheet risk. And in the meantime, institutional investors have stepped in to replace banks in providing funding, attracted by the significantly higher returns on offer as a result of the shrinking lender base. Furthermore, as a result of record CLO issuance, reaching EUR 16 billion in 2016, liquidity remains very strong. In combination with relatively limited M&A deals, this abundance of liquidity has put pressure on yields and credit protection.
FeaturesLeveraged loans are generally large, and can range from EUR 50 million to over EUR 10 billion. Loans are primarily originated by large (investment) banks and other major financial institutions. When a loan is made, portions of it are typically sold or “syndicated” to many banks and institutional investors, including mutual funds.
Figure 43. Institutional loan spread versus overall borrowing costs
0
200
400
600
800
Spread Coupon
20002001
20022003
20042005
20062007
20082009
20102011
20122013
20142015
2016 Q3
Source: S&P LCD, Bloomberg, NN Investment Partners
The loans are privately issued and are not traded on any public exchange but directly among banks and institutional investors in a private secondary market. Leveraged loans are a relatively illiquid asset class when compared to publicly traded stocks, for example. However, over the past decade the loan market has become deeper and more orderly. This is due to an increased supply, a substantial rise in the number of participants in the market and the efforts of various participants to make trading more transparent, including a standardised approach to documentation. In Europe the LMA recommended form is used whereas the LSTA is the recommended approach in the US.

106Guidebook: Alternative credit and its asset classes
A leveraged loan can be compared to a high-yield bond in the sense that both are loans to sub-investment grade companies. One of the differences is that a loan is priced based on EURIBOR, and hence floating rate. The choice of interest period is at the discretion of the borrower, which opens the investor up to some short-term interest rate risk, which can also be seen as a natural hedge against rising interest rates and inflation.
Another difference compared to bonds is that these loans have the added benefit that some or all of the borrower’s assets are pledged to lender group. In a distressed scenario or bankruptcy, this will mean that the loans have preferential treatment over other unsecured creditors, such as high-yield bonds, and will be repaid first. This has resulted in significantly higher recoveries on defaulted loans (70% historically) in comparison to recoveries on defaulted high-yield bonds (45% historically).
Compared to bonds, leveraged loan contracts typically include more stringent limitations on a borrower’s business operations, which are designed to enhance the ability of the lenders to be repaid. These limitations, called covenants, are aimed at monitoring the financial health of a borrower and can limit the total amount of debt that a borrower may incur or restrict certain actions such as purchasing other companies or selling lines of business. In addition, these protective covenants typically require mandatory repayments to lenders upon certain events, such as the issuance of additional stock or the sale of significant company assets. If these restrictions are violated by the borrower, the credit agreement gives lenders the first right to take certain actions against the borrower, ranging from increasing the margin to calling the loan and requiring its immediate repayment in full.
Portfolio contextThe appeal for institutional investors is secured, low duration and relatively stable returns of EURIBOR plus 4-5%, excluding potential fees. Leveraged loans would typically be less suitable for a matching portfolio given their risk profile. Furthermore, in a high liquidity environment, investors are susceptible to early repayments, repricing or other amendments to make a loan more borrower-friendly, as can be seen in the surge in covenant-light loans (no financial maintenance covenants) in recent years. However, many loans are issued with a private rating and include external due diligence reports supporting the more rigorous analysis needed. This, combined with good credit structures, has led to relatively low default rates and high recovery rates.

107Guidebook: Alternative credit and its asset classes
9.4 European Residential Mortgages
Executive Summary
Europe
Market size Ca. EUR 7,000 billion.
Asset class summary Residential mortgage loans can offer an attractive yield pick-up versus liquid bonds with a similar credit profile. The relatively long duration and predictable cash flows also make a granular mortgage loan portfolio suitable for matching strategies, supported by favourable capital treatment under Solvency II.
Key trends Market indicators of economic developments are supportive for underlying fundamentals of the housing and mortgage markets.
Suitability for the matching portfolio
Overview Medium. The relatively long duration and predictable cash flows make a granular mortgage loan portfolio suitable for matching strategies. Prepayment risk must be taken into account.
RETURN
Cash flow pattern Fixed and floating, often depending on jurisdiction.
Legal tenor Long. 10-30 years, mainly amortising loans with selected early repayment options.
Gross return Euro swaps + 150-350 bps.
Expected loss 10-50 bps on an annual basis.
Risk-adjusted return Euro swaps + 140-300 bps.
Management fee 50 bps.
Net return Euro swaps + 90-250 bps.
Cost of holding the assets
Low. Solvency II Counterparty risk module, estimated SCR of 0% (60% LTV) to 6% (100% LTV) with duration of up to 7 years. Asset class is considered low maintenance. Challenge lies in getting access to prime mortgages.
LIQUIDITY
Liquidity Low. Generally, monthly liquidity against available cash. Liquidity premium hard to assess; no comparable liquid benchmark, as RMBS and covered bonds are structured differently and have shorter tenors.
Volatility Medium. Medium volatility when loans are valued against current mortgage offer rates, however long duration can result in larger price movements.
Portfolio diversification High. High diversification within portfolio as the holdings are very granular. Exposure to consumer risk instead of government or corporate risk.
COMPLEXITY
Overall complexity Medium, as fund structure is often non-standard.
Transparency High. Loan-level data available and extensive reporting on portfolio characteristics.
ESG factors Medium. Housing can play an important role in reducing CO2 through
financing of energy-friendly homes.
Reputation risk Low.
Important disclosure: The compilation of the figures is based on the authors’ estimates and does not represent an official position. Readers should consult professional advice before making any decision or taking any action that may affect their finances or business or tax position.

108Guidebook: Alternative credit and its asset classes
Heterogeneous marketsThe proportion of homeownership and average level of mortgage debt is very heterogene-ous in Europe. This is driven by both historical developments and cultural differences. For example, in Spain and Italy, homeownership is considered to be a major life achievement, whereas in other countries such as Germany, the split between consumers who own and those who rent is about 50/50. In Sweden and the Netherlands, the level of mortgage debt is relatively high, due to tax relief on mortgage interest. At the same time, in many Eastern European countries, homeownership is high while mortgage debt is relatively low, as during the post-communist privatisation, people obtained ownership of the properties they occupied.
Figure 44. Distribution of population by tenure status
0%
10%
20%
30%
40%
50%
60%
70%
80%
90%
100%
PL ES CZ PT IT FI BE SE IE NL FR UK DK DE
Owner, no mortgage Owner, mortgage Tenant
Source: Eurostat
European mortgage markets differ substantially in size, product offering, underwriting criteria, redemption types and interest types, among others. The UK and Germany represent almost half of the outstanding volume in Europe. There is no EU-wide mortgage credit market and mortgage lenders are often focused primarily on their home markets.
Geographically, there is significant dispersion in pricing. In some countries, borrowers prefer floating over fixed, while in others it is just the opposite. In the current low-rate environment, there is a market-wide shift to longer fixed interest periods. In terms of loan-to-value (LTV) and pricing, a higher LTV would result in a higher spread, although differences in perfor-mance and legal structure also contribute to this outcome.
Lenders often cross-sell products to borrowers whereby a smaller margin might be taken on a mortgage loan, which in turn is compensated in the accompanying insurance policy or other product sold to the borrower. The French market is a good example of this. Standalone margins would be too tight to make the mortgage economically attractive as a separate product, but the client relationship and cross selling make the product economically interesting as part of a combination.Ultimately, losses are driven by borrower payment morale, the loan-to-value, enforcement framework and the recourse to the borrowers, all of which differ from county to country.

109Guidebook: Alternative credit and its asset classes
Figure 45. Annual gross lending
1,528
1,314
884
662
366 377
555
241 215
94 34
90 97 108
307
201 153
108 81 62 38 37 36 29 10 10 5 5 0
200
400
600
800
1,000
1,200
1,400
1,600
1,800
UK DE FR NL IT SE ES DK BE FI CZ PL PT IE
€ bi
llion
Total outstanding residential mortgage lending (€ billion)
Gross residential mortgage lending (€ billion)
Source: Eurostat
Figure 46. Average mortgage interest rate spread by average term for new lending
BE CZ
DE
DK
ES
FI FR
IE
IT
NL PL PT
SE UK
0.0
0.5
1.0
1.5
2.0
2.5
3.0
3.5
4.0
0 5 10 15 20
Spre
ad (%
)
Term (years) Source: NN Investment Partners, EMF, Eurostat

110Guidebook: Alternative credit and its asset classes
Figure 47. Average mortgage interest rate spread by average loan-to-value for new lending
Figure 47
BE CZ
DE
DK
ES
FI FR
IE
IT
NL PL PT
SE UK
0.0
0.5
1.0
1.5
2.0
2.5
3.0
3.5
4.0
40% 50% 60% 70% 80% 90% 100%
Spre
ad (%
)
Loan-to-value Source: NN Investment Partners, EMF, Eurostat
Adding mortgage loans to your (matching) portfolioWhile most people have some personal experience with mortgage loans, investing in them with a full understanding of the important elements involved often requires a thorough education. For clients with long-dated liabilities, investing in mortgage loans can be a good match, as the term of residential mortgage loans is long. As is the case with most alternative credit assets, investors must be willing to give up some liquidity when investing in this asset class. The extent to which a portfolio of mortgage loans can offer liquidity depends on how it is structured and the type of provider. Investing in a fund provides a continuous source of liquidity, with the terms of exiting clearly stated in the prospectus. One can also often rely on the cash collected in the fund or on new participants wishing to enter. This is not the case for a mandate, where selling the portfolio requires finding a buyer on the secondary market, which often means selling the portfolio at a discount.
Investing in a fund also gives investors exposure to different “vintages”, which we believe is better from a credit risk and diversification perspective. For instance, looking at loans that originated in 2008, one sees that the credit performance of that vintage is the worst in the last decade. Mandates more often consist of a single acquisition of existing mortgage loans or are built up within a limited timeframe. Other characteristics may also differ depending on whether a fund or mandate investment is involved, or among providers. These include alignment of interest between investors and the originator, long-term commitment from the provider to stay in the market, pricing power and fees.
In addition to liquidity, valuation and predictable cash flows are elements to consider when allocating to a matching portfolio. Valuation for mortgage loans is executed via cash flow simulation, discounted against either a bottom-up constructed market-dependent curve or

111Guidebook: Alternative credit and its asset classes
Figure 48. Moody’s RMBS Indices – 60+/90+ days delinquency
0
1
2
3
4
5
6
7
8 Ja
n-04
Nov
-04
Sep-
05
Jul-0
6
May
-07
Mar
-08
Jan-
09
Nov
-09
Sep-
10
Jul-1
1
May
-12
Mar
-13
Jan-
14
Nov
-14
Sep-
15
Jul-1
6
BE (90+)
DE (90+)
ES (60+) FR (90+)
IT (60+)
NL (60+)
PT (60+) UK (90+)
0.00
5.00
10.00
15.00
20.00
25.00
Jan-
04
Nov
-04
Sep-
05
Jul-0
6 M
ay-0
7 M
ar-0
8 Ja
n-09
N
ov-0
9 Se
p-10
Ju
l-11
May
-12
Mar
-13
Jan-
14
Nov
-14
Sep-
15
Jul-1
6
IE (60+)
Source: Moody’s RMBS Index. Note data on Germany includes only high loan-to-value pools and is thus not reflective of the total market.
via retail interest rates offered to clients. The former will link the valuation more directly to financial markets, which creates higher valuation volatility. The latter results in smoother, less volatilve valuation, as most financial institutions only update their pricing on a weekly basis.
The predictability of cash flows for mortgage loans is strongly linked to a borrower’s ability to prepay. Certain jurisdictions have low prepayment penalties and hence more volatile prepayments. Generally, prepayment rules are determined via legislation. In some countries, therefore, longer fixed-rate loans are not offered to retail clients. Investing in the current low

112Guidebook: Alternative credit and its asset classes
interest rate environment nonetheless limits the value of this optionality for clients, which improves the reliability of cash flow predictions. In the Netherlands, which is an exception on the European continent, prepayment is subject to a make-whole clause with the exception of 10% of the original outstanding of the loan per year, or if the borrower moves house. Therefore prepayment behaviour of Dutch mortgage loans is more linked to activity in the Dutch housing market rather than mortgage interest rate levels. This complicates prepay-ment behaviour predictions, but also prevents a direct correlation between interest rates and prepayments (which does not benefit the investor).
PerformanceIn all countries, the crisis has had a strong impact on house price developments. Overall, the European housing markets have recovered from the crisis and house prices and mortgage volumes are increasing across the board at a moderate pace, supported by low rates and favourable demographics.
Historical defaults and losses vary across Europe, driven by the depth of the economic crisis per country. They are mainly impacted by unemployment and house price developments. In countries such as Ireland and Spain, where unemployment increased significantly and house prices fell sharply, arrears increased from 2007 with a delay of about two years. In Spain, losses crystallised in the wake of property foreclosures; in Ireland, difficult repossession procedures prevented immediate losses. This has, in fact, turned out to be beneficial because foreclosures did not lead to a massive increase in supply on the housing market, which helped to stabilise it. And most Irish banks are now writing back provisions as house prices are recovering and arrears are on the decrease.
Table 19. Population growth by country
2020 2030 2040 2050SE 5.6% 9.2% 6.7% 5.7%
IE 4.8% 6.1% 4.9% 5.5%
UK 3.6% 6.4% 4.8% 3.4%
BE 3.3% 5.9% 4.7% 3.3%
DK 4.0% 7.0% 4.2% 1.8%
NL 3.0% 5.6% 3.5% 1.0%
FR 2.1% 4.0% 3.4% 2.0%
ES 0.2% 1.2% 2.4% 2.1%
FI 1.6% 2.4% 0.4% -0.6%
DE 3.1% 1.0% -0.6% -1.7%
CZ 1.1% 0.4% -1.3% -0.7%
IT -0.1% -0.6% -0.6% -1.7%
PL -0.2% -1.9% -3.7% -4.1%
PT -1.6% -3.2% -3.3% -4.6%
Source: Eurostat

113Guidebook: Alternative credit and its asset classes
DemographicsMortgage and housing markets are strongly influenced by demographic developments, which ultimately determine where, how many and what type of properties need to be built. In many countries, there is more dispersion between the main urban areas and the more rural areas. There is also a strong bias towards the capital cities such as London, Frankfurt, Paris and Amsterdam, where price levels and price growth are much higher than elsewhere. Meanwhile, Europe’s population is not growing, but households are getting smaller, which increases demand for housing. And the ageing population is creating demand for different types of housing.
Geographically, population growth varies widely. Positive growth persists in the Northern and Western European countries while growth is negative in the eastern and southern countries.
RegulationFollowing the crisis, in which the housing and mortgage markets played a pivotal role, new regulations were introduced and existing regulations were tightened across Europe. Differences between the various countries remain and licensing requirements are based on local principles.
Historically, banks were the main mortgage lenders in Europe. Since the crisis, banks have been facing new regulations that require them to hold more capital and more liquidity. In an effort to strengthen the regulation, supervision and risk management of the banking sector, regulators introduced Basel III, a comprehensive set of reform measures developed by the Basel Committee on Banking Supervision. Basel III is focused on the quality and level of capital, with a stronger emphasis on common equity. The leverage ratio is a non-risk-based ratio that includes off-balance sheet exposures and will serve as a backstop to the risk-based capital requirement, helping to contain a system-wide build-up of leverage.
The common denominator of these measures is the aim to reduce risk. Mortgage loans that are granted now have a better risk profile than those granted in the past. This has created an attractive entry point in the cycle to start investing in mortgage loans.
Looking aheadThe European mortgage market is in transition. Despite significant differences between countries, it remains a value-adding asset class overall. The crisis and correction in house prices led to the repositioning of banks and new local and European regulation. Stronger underwriting standards are now used for originating mortgage loans, and a larger share of mortgages are originated by insurance and pension funds. Both changes create opportu-nities for investors who have the flexibility to invest in illiquid assets and are interested in investing in a longer-duration asset class. Mortgage loans also allow for diversification and yield enhancement of a fixed-income portfolio and are therefore an attractive asset class for pension funds, insurance companies and family offices. Regulatory requirements can give banks an incentive to hold fewer mortgages on the balance sheet, which can result in the sale of existing portfolios and new funding models for mortgages.

114Guidebook: Alternative credit and its asset classes
9.5 European Commercial Mortgages
Executive Summary
Europe
Market size Ca. EUR 1.2 trillion.
Asset class summary Providing mortgage-backed financing on European commercial real estate.Investing in commercial mortgages means investing in the real economy as rental income derived from the mortgaged properties, i.e. office buildings, rental residential, shopping centres and logistics assets, are paid for by corporates, retailers and private individuals.
Key trends The European commercial mortgages market has historically been dominated by banks. As a result of the Basel legislation, banks are now shrinking their balance sheets. Institutional investors, including insurance companies, pension funds and debt funds, are filling the gap and increasing their combined share of the market.
Suitability for the matching portfolio
Overview Medium. Prepayments and changes in cash flow patterns may appear.Commercial real estate loans are offered fixed or floating. The fixed-rate loans can be used in a matching portfolio, while floating rate loans can be used to cover receiver swap payments in a hedge accounting programme.
RETURN
Cash flow pattern Majority floating (floored 3 million EURIBOR plus spread).
Legal tenor Medium. Typically 5-7 years.
Gross return 150-250 bps (over floating 3 million EURIBOR).
Expected loss 10 bps.
Risk-adjusted return 140-240 bps (over floating 3 million EURIBOR).
Management fee 30 bps.
Net return 110-210 bps.
Cost of holding the assets Medium. Capital charges: Solvency II corporate loans submodule.
LIQUIDITY
Liquidity Medium. There is an active secondary market, however tailor-made documentation per loan means due diligence can be substantial and it may take 3 to 6 months before a loan is sold.
Volatility Low. Loans are not publicly traded and do not have daily quoted market prices.
Portfolio diversification High. Prices are driven by liquidity in the publicly traded market, but commercial real estate can mean locking in a price today that moves upward with the market while not moving downward with the market. This enables portfolio diversification.
COMPLEXITY
Overall complexity High. Documentation is tailor-made and substantial due diligence must be performed before a loan can be provided.
Transparency High. Loan-level data available and extensive reporting on portfolio characteristics.
ESG factors Medium. The market is non-transparent as each loan is tailor-made and not comparable to other loans. However, more market information is becoming avai lable on pricing and values of underlying collateral driven by big data information.
Reputation risk Low.
Important disclosure: The compilation of the figures is based on the authors’ estimates and does not represent an official position. Readers should consult professional advice before making any decision or taking any action that may affect their finances or business or tax position.

115Guidebook: Alternative credit and its asset classes
Changing role of banks and resulting financing gapIn the commercial mortgages market, a structural shift from a traditionally bank-led market (95%) to a bank- and institutional-shared market (65%/35%) has been taking place in recent years. This shift has already occurred in the US. Traditional bank roles are changing, mainly due to new regulations such as Basel III, which is resulting in a structurally different optimal use of banks’ balance sheets and allowing institutional investors to fill the resulting financing gap. Insurance companies, pension funds and debt funds are increasing their exposure to this asset class given the attractive return on similar credit risk compared to comparable public alternatives.
ReturnCommercial mortgages offer an attractive private pricing differential compared to public debt instruments with similar investment grade credit risk profiles. As the market is currently still dominated by banks, the majority of loans are floating, based on three-month EURIBOR plus spread, with tenors of five to seven years. The floating part, being three-month EURIBOR, is floored at zero, offering downside protection with the coupon always being the spread as a minimum. In addition to downside protection, full upside is maintained to benefit from increasing interest rates as these are highly correlated with increasing three-month EURIBOR. As such, floating commercial mortgages are considered to be a natural hedge against rising interest rates, which is a huge benefit compared to other products that lock in low fixed spreads.
For investors with a buy-and-hold focus who value the lower volatility of illiquid products and their mark-to-model nature, commercial mortgages can be a good replacement and diversifier for corporate bonds in an investment portfolio. They offer an attractive private pricing differential that is enhanced in negative interest rate environments by the floored floating interest.
Figure 49. Private pricing differential for commercial real estate loans
-1%
0%
1%
2%
3%
4%
5%
6%
7%
8%
9% YTM EUR IG BBB/A
CREL coupon
12-month moving avg. private pricing differential
100 bps average
Sovereign debt crisis Lehman Brothers collapse
Source: Bloomberg, Barclays Capital Live, NN Investment Partners

116Guidebook: Alternative credit and its asset classes
Figure 49 illustrates the resilient pricing at initiation of commercial mortgage coupons and evidence of the average 100 bps private pricing differential. The private pricing differential only fails to hold in times of market stress, such as the Lehman Brothers collapse and European sovereign debt crisis. Returns vary widely, depending on the location and quality of underlying properties and the quality of the tailor-made loan documentation, including the legal and structural framework. Mortgages can be prepaid and are protected in the initial years of the loans through prepayment fees. With regard to Solvency II, commercial mortgages are covered under the corporate loans submodule. Commercial mortgages offer a less capital cost-intensive way for insurers to gain exposure to real estate compared to direct equity investments.
LiquidityCommercial mortgages are actively traded on the secondary market, with banks having sizeable syndication teams in place to offload parts of the mortgages. The tailor-made documentation per mortgage means due diligence can be substantial and it may take three to six months before a mortgage is sold. Therefore, investors in commercial mortgages mainly have a buy-and-hold perspective. Commercial mortgages are less volatile than bonds, as they are not publicly traded and do not have daily quoted market prices. Like publicly traded loans, commercial mortgages are driven by liquidity. However, investing in commercial mortgages can mean locking in a price today that moves upward with the market but not downward, because of the floored floating rate feature. This enables portfolio diversification and a substantial benefit compared to fixed-rate investments.
Important aspectsCommercial mortgages are considered complex, given their tailor-made documentation and substantial due diligence requirement. The most important aspects to take into account when investing in commercial mortgages are: the location and quality of the underlying property, the securities and covenant structure, the quality of tenants providing the income stream, and the equity cushion and equity commitment from the owner.
Figure 50. Structural framework
Secured by tenant income and backed by a property
Tenants
EURIBOR + Margin
Rent Loan
Lenders (investors)
Property owner
Source: NN Investment Partners

117Guidebook: Alternative credit and its asset classes
1. Location and quality of the underlying propertyCertain locations are less sensitive to economic cycles and attract tenants because of their location and the surroundings. Having a sustainable property that appeals to tenants will ensure a more stable income stream while an up-to-date and energy-efficient property will keep maintenance and energy costs low.
2. Securities and covenant structureCommercial mortgages are considered to be the most secure way to finance properties. Securities are substantial: a first-ranking mortgage over the underlying property, a pledge over the holding entity’s shares, rental contracts, bank accounts, insurance receivables, cross-collat-eral provisions or financial and informational covenants. Financial covenants are often based on ratios such as the loan-to-value and debt service cover ratio (how many times debt can be serviced by the income stream). If certain financial covenant hurdles are breached, the lenders can be protected by sweeping all excess cash for loan repayment in order to decrease exposure.
3. Quality of tenants providing income streamThe certainty of a stable income stream is important for payment of the mortgage debt service. This implies a preference for more tenants to achieve diversification, high-quality tenants to ensure payment and longer lease contracts to cover the loan over its entire tenor.
4. Equity cushion and equity commitment from the ownerFor the commercial mortgage lender, it remains important to have a committed property owner who will actively manage and invest in the asset to maintain its value and to ensure a continued rental income stream. By maintaining the value of the asset, an equity cushion will remain in place for the lenders so that the value of the asset provides enough protection for loan repayment in case of an asset sale.
Alternative real estate debt productsAlternative products for investing in real estate debt include shares in real estate investment trusts (REITs) and commercial mortgage backed securities (CMBSs). REITs are more liquid, but also more volatile because they are publicly traded. REITs mitigate the risks of direct investments to a certain extent by offering more diversified exposure, but remain subject to market risk. CMBSs, on the other hand, often raise issues concerning the alignment of interests and control, and are subject to higher capital requirements. Investors can also gain exposure to the real estate market through direct real estate investments (equity investments), which are the most risky and capital intensive form of real estate investment.
Current lending environmentThe commercial mortgage market in its current form provides a better risk-return profile than before and during the global financial crisis. This reflects lenders’ ability to better price and structure risk, as well as the disappearance of much of the CMBS market. Before the crisis, the market showed a continuous rise in property prices and relatively loose lending policies with high LTVs, weak covenant levels and low margins. This was partly spurred by the boom of the CMBS market, which saw the entry of opportunistic lenders with loose underwriting standards competing with established mortgage lenders for the same deals in the areas of pricing and structure. The current market situation is different in all material aspects. Average LTVs for commercial mortgages have been between 50% and 70% since 2014, providing a cushion for value fluctuations. Covenant packages are stronger, with less room for deteriorating performance before lenders can intervene. Additionally, loan docu-mentation now includes more favourable prepayment, interest and waterfall protection.

118Guidebook: Alternative credit and its asset classes
9.6 Private Placements
Executive Summary
Europe
Market size Ca. EUR 40 billion.
Asset class summary Financings are primarily used for funding the general corporate purposes of the company and offer a diversification to banking debt.
Key trends Market is growing at the expense of the USPP market. More companies can obtain funding in the competitive European market.Still much variety in formats. Schuldschein market remains very much driven by banks.Various efforts to evolve towards an integrated market, but many differences still exist between the US and the EU.
Suitability for the matching portfolio
Overview High. It is a suitable solution due to high predictability of the cash flow. The company’s credit profile is generally (implied) investment grade and includes call protection (make-whole) for the investor.
RETURN
Cash flow pattern Fixed (occasionally floating).
Legal tenor Medium/Long. 5-15 years and, for certain assets, tenor over 20 years have been offered.
Gross return 200-350 bps.
Expected loss 20 bps.
Risk-adjusted return 180-300 bps.
Management fee 30 bps.
Net return 150-270 bps.
Cost of holding the assets Low/Medium. Capital charges, internal monitoring costs.
LIQUIDITY
Liquidity High.
Volatility Low.
Portfolio diversification High.
COMPLEXITY
Overall complexity Low.
Transparency High. High certainty, long-term record.
ESG factors Medium.
Reputation risk Low.
Important disclosure: The compilation of the figures is based on the authors’ estimates and does not represent an official position. Readers should consult professional advice before making any decision or taking any action that may affect their finances or business or tax position.

119Guidebook: Alternative credit and its asset classes
Enhanced returns with a comparable risk profileThe typical issuer of high-grade private placements is either a listed company, a cooperative, or a family-owned business. These companies’ investment-grade credit profiles mean they are often well-diversified and have conservative risk profiles. The reasons for not (yet) tapping the more liquid bond market is usually the fact that they are not large enough to be a frequent issuer. Other reasons are they would rather not share information publicly, as is required in the public bond market, or they prefer not to pay for an external credit rating. Therefore, overlap between these markets is negligible and private placements investments enhance diversification in the investment grade universe.
For investors who can accept a certain amount of illiquidity and complexity, private place-ments offer a compelling risk-return proposition versus benchmark investment-grade credit bonds.
Market trends supporting private placement growthPrivate placements have existed for decades, but in recent years the market has shown strong growth. Several trends in demand and supply support this increase. First of all, investors are looking for alternatives to government bonds or investment-grade credits as these traditional investments no longer provide sufficient return. Private placements can meet enhanced yield objectives without increasing the credit risk profile.
Part of the higher return on private placements is compensation for lower liquidity. However, this does not have to be a hurdle for investors. Obviously, it is important to be aware of the impact of lower liquidity on the portfolio. Still, most of the time, a portfolio does not require 100% liquidity. The trade-off between liquidity and return is often worthwhile.
Figure 51. Estimated size of selected EUPP markets
9 17 20 17 16
12 12
5
9
13
9 12 19 26
3
4 7
14
?
0
10
20
30
40
50
60
2010 2011 2012 2013 2014 2015 2016e
USPP x-border Schuldschein EUPP
Source: S&P (2016), NN Investment Partners

120Guidebook: Alternative credit and its asset classes
On the supply side, the main drivers of the increase in private placements involve regulatory developments. Banks are continuously withdrawing from the capital markets, offering institutional investors an opportunity to fill the gap.
Market is growing both in the US and in EuropeThe European market for private placements has grown substantially in recent years, with many issuers preferring Europe over the more institutionalised US market, which only showed issuance of around EUR 12 billion in 2016, according to S&P. An estimated EUR 45 billion was issued in Europe in 2015, up from EUR 33 billion in 2014, and 2016 is expected to have topped these amounts substantially. Issue sizes have been increasing and typically range from EUR 50 million to EUR 300 million. More sizable quantities up to EUR 600 million have been seen as well.
In the US, the market for private placements is in excess of USD 500 billion. Total market volume continues to grow. Prior to 2000, the vast majority of investments were in small transactions of less than USD 100 million. Since 2000, deal amounts have more than doubled, with most deals now exceeding USD 250 million. In addition, the sizes of companies that have approached the market have increased. Prior to 1999, most had less than USD 200 million in annual EBITDA. Since 2006, issuers’ EBITDA has risen, with most now exceeding USD 500 million a year. We expect the European market to grow at a similar pace.
Due to regulatory considerations, it makes sense that banks are moving towards an “originate and distribute” model in order to benefit from lower capital charges. The liquidity coverage and the net stable funding ratio of these so-called Basel regulations can put constraints on banks’ lending activities. This change will stimulate growth in the European private placement market for institutional investors, who provide a premium above the more liquid corporate bond market.
How does private credit compare to public bonds?In many ways, private placements are very similar to bonds in terms of tenor and fixed pricing, but there are some significant differences as well. Private placements tend to achieve a higher yield and total return than corporate public bonds of similar credit quality and duration. This is due to higher up-front yields, prepayment and amendment and waiver fees, and lower actual credit losses in the event of default. They also add diversification by providing access to a new group of companies, broadening the existing universe of issuers. We have listed the key aspects of private placements below.
Attractive returnMost private placements have a fixed-rate coupon. Compared with benchmark investment-grade bonds within a similar industry and a similar rating profile and tenor, private place-ments offer an illiquidity pick-up of 50 to 250 bps. The size of this premium depends largely on such factors as whether the issuer is listed and/or rated, the level of complexity of the transaction, and the responsiveness of bank pricing to public markets.

121Guidebook: Alternative credit and its asset classes
Additional income also comes from fees for early prepayment and fees for amendments and waivers, as will be explained below.
Contractual protections When making private placements, all negotiated terms are written down in a contract. This contract includes the interest rate to be paid by the borrower and such features as the tenor, as well as covenants that specify any limitations on a borrower’s business operations to enhance the probability that the lenders will be repaid.
Such covenants are designed to monitor the financial health of a borrower and limit the borrower’s ability to incur additional debt. Violations of these restrictions by the borrower give the lender the right to take certain actions, ranging from increasing the interest rate to calling the contract and requiring immediate repayment in full.
Covenants are unique to each transaction. They can vary widely, depending on the circum-stances, and are virtually non-existent in investment-grade public bonds. The covenants are designed to maintain pari passu (equal) treatment with other senior creditors and to trigger renegotiation while the company is still financeable.
When, in the case of a contractual covenant breach, exit is not possible, terms can be re-negotiated to improve recovery rates if payment default ultimately occurs and to increase the yield via fees and coupon rate increases.
Generally, there are three types of covenants: • those that protect the borrower’s position in the capital structure• those that protect against credit deterioration• those that protect against “event risk,” or the company favouring its equity holders over
its debt.
Private placements are callable at any time, however the call is at a “make-whole” price. The make-whole concept allows the investor to maintain the initial yield of the investment over the remaining term, regardless of whether interest rates have increased or decreased since funding.
Private placements can enhance returns and match liabilitiesWe have already addressed the additional returns that can be generated with private placements. They can also be used as a building block for liability-driven investments. Given the nature of private placements – fixed coupon, average duration of seven years, predictable cash flows – they can replace investment-grade credits or government bonds in a portfolio that aims to match liabilities. This can provide an interesting alternative for investors who are increasingly facing difficulties in finding suitable assets with a positive yield, such as pension funds and insurers with long-dated liabilities. It is obviously essential to determine the potential impact of the less liquid private placements on the overall liquidity profile of the portfolio. This offers buy-and-hold investors the opportunity to optimise the portfolio by increasing the returns on investment-grade credit exposure by foregoing surplus liquidity.

122Guidebook: Alternative credit and its asset classes
9.7 Direct Lending
Executive Summary
Europe
Market size 272 transactions in Europe over last 12 months (as of Q3-2016).
Asset class summary Purpose of financing: LBO, refinancing existing (bank) debt, growth financing, M&A/bolt-on acquisitions, buy-out shareholders, dividends to shareholders (recap).
Key trends Increasing number of non PE-owned (sponsor-less) companies are using direct lenders as an alternative to traditional bank lenders for financing growth.Unitranche sizes are becoming ever larger, as evidenced by the largest EUR unitranche ever (>EUR 600m), provided to Polynt and Reichhold by GSO in May 2016.Direct lending in Europe was primarily focused on the UK, but in recent years the number of deals in continental Europe is showing strong growth.
Suitability for the matching portfolio
Overview Low.
RETURN
Cash flow pattern Floating (EURIBOR/LIBOR plus spread).
Legal tenor 5-7 years (subordinated debt longer). Prepayment protection differs per deal.
Gross return Minimum spread 600 bps, up to 1,000 bps depending on issuer, leverage levels, structural flexibility and potential subordination.
Expected loss 250 bps.
Risk-adjusted return 350-750 bps.
Management fee 100 bps.
Net return 250-650 bps.
Cost of holding the assets High. Capital charges: Solvency II unrated bucket.
LIQUIDITY
Liquidity Low, no active secondary market. Illiquidity premium difficult to determine as (in most cases) there are no liquid comparables available.
Volatility Low, no quoted market prices.
Portfolio diversification Medium.
COMPLEXITY
Overall complexity High, in-depth credit due diligence, legal and structural analysis required.
Transparency Low.
ESG factors High, incorporated in credit due diligence process.
Reputation risk High, lower-rated companies increase default risk and subsequently reputational risks.
Important disclosure: The compilation of the figures is based on the authors’ estimates and does not represent an official position. Readers should consult professional advice before making any decision or taking any action that may affect their finances or business or tax position.

123Guidebook: Alternative credit and its asset classes
European banks are slowing lending activity, non-bank lenders stepping in As banks shed assets to meet tougher capital requirements imposed by Basel III and other regulations, non-bank lenders appear to be stepping in to fill the gap by providing loans directly to companies without the use of a bank as intermediary. This trend toward direct lending is seen as critical to Europe’s economic recovery as corporates and SMEs remain a primary source of economic growth.
The current environment has created more awareness of the need for non-bank lenders to offer financing for companies. SME businesses and corporates are increasingly aware of alternative funding options and turn to non-bank lenders for an alternative source of capital.
“As banks are slowing their lending activity in Europe, there is a huge gap to fill and that is coming to private lenders. It is a long-term opportunity.” (Brad Marshall, GSO Capital Partners)
Unlike the US, Europe has always been a bank-dominated market. However, since the crisis this has slowly been changing due to moves towards disintermediation by banks. Although the vast majority of loans are still provided by banks, direct lenders are increasing their stake in the total loan supply. The number of direct lending deals per quarter increased from 24 in Q4 2012 to about 70 per quarter in 2016. At the same time, debt sizes are also increasing. Since 2013, direct lenders raised close to USD 50 billion in funds for the European market, representing 43% of global direct lending funds raised.
Direct lenders are active in the sub-investment-grade spectrum from BB to CCC-rated transactions. Direct lending is seen as a private instrument and there is no active secondary market for these instruments, in contrast to bonds and senior bank loans (Deloitte, 2016b).
Debt sizes vary from EUR 10 million on the lower end to EUR 350 million on the higher end. Recently, even larger direct lending transactions of up to EUR 600 million have been seen. There is some overlap with lower rated private placements as well as with senior bank loans and smaller high-yield bonds. Direct lenders mainly compete with senior bank loan providers.
Leveraged loan banks operate in the 350-600 bps spread range, providing senior debt mainly to private equity-owned companies. However, direct lenders typically have hurdle spreads of at least 600 bps and are mostly providing unitranches, the deepest part of the private debt market. An overview of different structures is provided in the following section. Other direct lenders are active in higher yielding strategies such as story credit (companies that were involved in financial restructurings in the past and are perceived as riskier), subordinated/holdco debt, and growth capital (quasi-equity).
Direct lenders are typically large asset managers diversifying into alternative credit, as well as dedicated private debt funds. The limited partners in these funds are insurance compa-nies, pension funds, private wealth, banks or sovereign wealth funds.

124Guidebook: Alternative credit and its asset classes
Figure 52. How do direct lenders compare with traditional bank lenders?
15%
Bank club deals
Unitranche Story creditunitranche or
junior debt
Growth capitalor junior debt
Risk profile
10%
6%6% hurdle rate
AlternativeLenders
Banks5%
0%
Source: Deloitte (2016b)
The following benefits for issuers of direct lenders vs. bank lenders are observed:• Non-amortising (bullet) structures; • More structural flexibility (including covenants, headroom, dividends, portability in case of
change in ownership etc.);• Broader availability of debt across the capital structure including senior, second lien,
unitranche, mezzanine and quasi-equity;• Increased speed of execution, short credit process;• Larger hold sizes of direct lenders. About 86% of the direct lending transactions involve
only one lender.
There are also some disadvantages for issuers of direct lenders versus bank lenders, most notably the higher returns direct lenders are targeting for the increased flexibility and higher leverage they provide. Furthermore, direct lenders are not able to provide clearing and ancillary facilities or other bank products such as cash management and treasury services. However, this can be resolved by adding a relationship bank providing working capital facilities, where the direct lender provides the term debt.
Direct lending characteristics and structuresDirect lenders are mostly active via unitranches as they target a minimum hurdle spread of 600 bps, whereas leveraged loans or senior bank loans yield 350-600 bps. There are some funds targeting senior loans as well. In these cases, the loans have higher leverage (compared to traditional/bank senior loans) and hence higher returns. Furthermore, some of the direct lenders are also providing subordinated loans (second lien/holdco debt)

125Guidebook: Alternative credit and its asset classes
Key characteristics of direct loans (based on unitranche structure):• Interest: Floating (EURIBOR/LIBOR plus spread). In some cases, part of the interest is
PIK (rolled-up), negotiated on a deal-by-deal basis • Tenor: 5-7 years• Implied indicative rating: single B range • Leverage: Up to 6x net debt/EBITDA• Repayment: Predominantly bullet, call protection negotiated on a deal-by-deal basis • Financial covenants: Yes, negotiated on a deal-by-deal basis• Security: Yes, negotiated on a deal-by-deal basis • Spreads: 6%-10%, depending on credit profile, leverage level, structural flexibility and
potential subordination• Liquidity: Low, no active secondary market• Complexity: High, dedicated teams are required for initial deals assessment (credit due
diligence, legal and structural analysis) and monitoring during life of the loan• Investors: The unitranches are typically cut into a senior and a junior part by the direct
lenders and allocated to investors with different risk appetites and return requirements. Please note that the borrower does not see this “cut”; they have one debt facility.
Based on Deloitte’s Alternative Lender Tracker (2016b), the most common structures seen over the past 12 months in the direct lending market are:• Unitranches as most dominant structure, representing 52% of direct lending in the UK
and 33% in continental Europe. This is expected to grow in future. • Senior bank loans account for 25% of direct lending in the UK and 41% in continental
Europe. We note in this respect that these senior loans typically have higher leverage (stretched senior) compared to traditional bank-originated senior loans.
• Subordinated debt (Second Lien, Mezzanine, PIK) representing 20% of direct lending in the UK and 22% in continental Europe.
When is direct lending used?Direct loans are used for a wide variety of purposes:• LBO: loans to finance leveraged buy-outs by private equity. Direct lenders are able to
sustain more leverage, which requires lower equity contributions by shareholders. Furthermore, these loans are used to buy out (minority) shareholders.
• M&A /bolt-on acquisitions: loans to finance acquisitions, without the need for shareholders to contribute additional equity.
• Growth capital: loans to finance capex, without the need for shareholders to contribute additional equity.
• Recapitalisation: loans to enable dividend distributions to shareholders.• Refinancing existing debt: loans to refinance (bank) debt in case of i) maturing debt,
ii) refinancing over-levered bank debt, or iii) refinancing debt with more flexibility in covenants, headroom etc.
Deloitte’s Alternative Lender Tracker (2016b) shows that roughly 50% of the direct loans are used to finance M&A (LBO and bolt-on), while roughly 25% are used to refinance existing debt and about 15% to finance growth. It is interesting to note that in the UK, some 20% of direct loans are used to finance dividend distributions, compared to only 5% in continental Europe.

126Guidebook: Alternative credit and its asset classes
10. Conclusion
Our world is changing faster than ever. We are experiencing massive demographic changes and escalating geopolitical tensions. The increasing connectivity in our world is part of a digital industrial revolution that is ushering in unprecedented changes and disruptions. This upheaval implies a redistribution of wealth and power. This complex, interconnected world makes dependence on traditional investments challenging.
Alternative credit investments offer an interesting option to investors seeking uncorrelated asset classes and wishing to optimise their portfolio diversification while still aiming for yield. Many alternative credit investments also offer a natural hedge against inflation.
Navigating the world of alternative credit investment opportunities is not easy. Traditionally dominated by banks, the asset class is characterised by high information asymmetry and complexity. There are no easy, “fit-the-box” solutions.
Our Return-Liquidity-Complexity framework aims to offer investors a structure that facili-tates asking the right questions and finding the right products for an optimised investment solution.

127Guidebook: Alternative credit and its asset classes
Authors
Gabriella KindertHead of Alternative CreditGabriella is the Head of Alternative Credit at NN Investment Partners. She has over 20 years of international experience in banking, asset management and private equity. As the Head of Alternative Credit Boutique, encompassing several illiquid fixed-income strategies, she currently oversees EUR 17 billion of AUM. Gabriella has an MA in History, MA in Economics, and an MBA in Accounting and Finance. She is also currently completing her PhD studies at ISM.
Alistair PerkinsHead of Project FinanceAs the Head of Infrastructure & Project Finance Team at NN Investment Partners, Alistair is responsible for the origination, structuring, execution and portfolio management of infrastructure debt investments and project loans. He has over 22 years of international finance experience, including many of the early public-private partnerships, as well as many power, energy and renewables projects across North America and Europe. Alistair holds a BEng Bachelor’s degree in Civil Engineering and an MBA from the University of Nottingham.
Bart BakxHead of Residential Real EstateBart is the Head of the Residential Real Estate/Mortgage Loan team within the NN Investment Partners Alternative Credit Boutique. He joined NN Investment Partners in 2014, bringing 15 years of experience with leading financial institutions. He holds an MSc degree in Econometrics from Tilburg University.
Bart OldenkampManaging Director Strategic Business Development, Integrated Client SolutionsAs Managing Director of Integrated Client Solutions at NN Investment Partners, Bart is responsible for the fiduciary management proposition, with a focus on strategic advice and liability-driven investments. He has 24 years of experience in the pension fund industry in the Netherlands and abroad. He holds a PhD in Financial Econometrics from Erasmus University in Rotterdam.
Bas JonkerSenior Portfolio ManagerBas is the Senior Portfolio Manager of the Corporate Debt team within the Private Debt part of the NN Investment Partners Alternative Credit Boutique. He is responsible for origination and portfolio management of corporate loans and private placements. He has 13 years of experience in leveraged finance and restructuring and holds an MSc degree in Finance from Vrije Universiteit Amsterdam.
Dirk BekkersSenior Portfolio ManagerDirk is Senior Portfolio Manager in the Residential Real Estate team within the Alternative Credit Boutique of NN Investment Partners. He has 14 years of experience in real estate investments and banking. He is a CFA Charterholder.

128Guidebook: Alternative credit and its asset classes
Evelien van HiltenSenior Portfolio ManagerEvelien is Senior Portfolio Manager of the Residential Real Estate team within the NN Investment Partners Alternative Credit Boutique. She has ten years of experience in real estate investments and credit risk management. She has a MSc in Economics from Catholic University of Leuven and is a CFA Charterholder.
Kees-Jan van de KampSenior Portfolio ManagerKees-Jan is Senior Portfolio Manager in the Project Finance team within the Private Debt part of the NN Investment Partners Alternative Credit Boutique. He is responsible for the origination, structuring, execution and portfolio management of Infrastructure Debt / Project Finance. He has 15 years of international experience in Private Debt transactions with a focus on Infrastructure and Renewable Energy. He holds a Master’s Degree in International Financial Economics from the University of Amsterdam.
Lennart van MierloHead of Commercial Real Estate DebtLennart is the Head of the Commercial Real Estate Debt team within the Private Debt part of the of NN Investment Partners Alternative Credit Boutique. He is responsible for origination, portfolio management and analysis of the Commercial Real Estate portfolio. Lennart has nearly 10 years of experience in commercial real estate deals and holds an MSc degree in General Management.
Mark van de WielPortfolio ManagerMark is responsible for the origination, portfolio management and analysis of commercial real estate loans. In his career he has worked for ING in Amsterdam, Frankfurt, London and New York. He has extensive real estate knowledge and experience throughout multiple jurisdictions. Mark holds a Master’s Degree in Financial Management from Nyenrode Business Universiteit and is a CFA Charterholder.
Petra Stassen - van LochemClient Portfolio ManagerPetra is Client Portfolio Manager for the Alternative Credit Boutique of NN Investment Partners. She is responsible for maximising the commercial success of the boutique through attracting and retaining clients in partnership with sales, marketing and product management. As CPM, Petra has a bridging function between the investment engine, clients, client teams and distribution channels. She holds a CFA qualification and an MSc in Economics from Erasmus University in Rotterdam.
Richard Sanders Strategic Advice SpecialistAs a Strategic Advice Specialist at NN Investment Partners, Richard is responsible for providing advice on strategic balance sheet management for pension funds and insurance companies. He has extensive experience in financing and risk management. Richard holds an MSc degree in Mathematical Physics from Radboud University Nijmegen. He is also a CFA Charterholder.

129Guidebook: Alternative credit and its asset classes
Suresh HegdeHead of Insurance Solutions & Alternative RatesSuresh is Head of the Insurance Solutions & Alternatives Rates team within the Balance Sheet Management Boutique of NN Investment Partners. He is responsible for the origination and structuring of bespoke LDI solutions for insurance and pension clients within an accounting and regulatory capital-aware framework. In addition, he is Lead PM for Alternative Rates, including ECA loans, government-related loans and structured rates strategies. He holds a BSc in Politics from the University of Bristol.
Virginia WasikowskaTraineeVirginia is a Trainee in NN Investment Partners Traineeship Programme, currently placed within the Alternative Credit Boutique. She has an MSc degree in Finance and is currently a Level I Candidate in the CFA Program.
Acknowledgements We would like to thank the following people, without whom the creation of this guide would not have been possible:
John Buckley
Manno van den Berg
Ielse Reinders
Fabian Sieverdink
Kamila Paligova
Mathijs Koster

130Guidebook: Alternative credit and its asset classes
Appendix 1. Key legal documents in private debt
• Confidentiality Agreement and Reliance Letters: prepared by the arranger and due diligence providers, requiring the potential purchaser to keep the transaction information confidential, to refrain from engaging in front running, and to not rely on the information for an investment decision
• Term sheet: prepared by the arranger, this document, while not a formal legal document, describes in 5-50 pages the main terms and conditions of the facilities on offer. It is basically a summary of the Senior Facility Agreement (against which it is compared)
• Loan Documentation: Senior Facility Agreement/Mezzanine Facility Agreement, Intercreditor Agreement, Security Documents, Amendments/Waivers and Legal opinions (see next page)
• Settlement documents: standard templates arranging the purchase and settlement of the loans
- Trade email: email confirmation of the agreed trade - Commitment Letter/Trade Confirmation: formalising the purchase, describing the
facility agreement, precise facilities, amount, price (OID/upfront fee), etc. - Transfer Certificate/Accession Letter: constituting the formal transfer of the participa-
tion in the facilities to the purchaser, as well as accession of the purchaser to the syndicate, thus sharing in the security
- Pricing Letter: detailing the exact amount to be paid or received, including the par amount of the loans, discount/premium, fees, delayed interest, and transfer fee
Loan Documentation: prepared by the legal counsel of the arranger, consisting of:• Senior Facility Agreement/Mezzanine Facility Agreement: the formal loan agreement
describing all the terms and conditions of the facilities. The key elements reviewed are: - Borrowers and guarantors, legal jurisdictions, joint and several liability - Facility amounts, currency, maturity, repayment schedule, interest margins, margin
ratchets, commitment fee, toggle - Conditions to drawing under the RCF/CapEx facility, permitted additional indebtedness - Permitted acquisitions/disposals, mandatory (disposals, ECF) and voluntary prepayments - Financial covenant levels, definitions, frequency, first test date, equity cure - Financial reporting requirements, frequency and due dates - Transferability: minimum transfer amount, requirement for consent, transfer fee - Majority, super-majority and unanimous votes, yank-the-bank clause - Organogram, reply due dates, governing law, court• Intercreditor Agreement: governs the rights of the different debt holders (from senior up to
shareholder loans), including enforcement, ranking, loss sharing, and stand-still periods• Security Documents: detail the pledged asset, security provider, beneficiary, and jurisdiction• Amendments/Waivers: describe changes to/permitted violations of the loan documentation• Legal opinions: these opinions, which are not formal legal documents, are generally
provided for each jurisdiction of an obligor, or where material assets are located, and describe the limitations of the enforceability of the legal documents and security

131Guidebook: Alternative credit and its asset classes
Glossary of terms
Alternative assets – a class of assets typically considered as non-mainstream that have usually not been included in a conventional investment portfolio.
Alternative credit – see: Private debt.
Alternative fixed income – a subgroup of alternative assets encompassing both publicly traded alternative fixed-income assets (such as high-yield bonds or emerging market debt) as well as private alternative fixed-income assets (private debt).
Business development company (BDC) – an investment company (often publicly traded) established with the purpose of investing in small and medium-sized enterprises (SMEs). BDCs aid SMEs in their development, particularly during the early stages of growth, by providing them with capital.
Club deal – a form of syndicated lending in which all members of a syndicate are entitled to an equal share of service fees earned from extending the loan. (See also: Syndicated lending).
Crowdfunding or crowdsourcing – a form of financing whereby various online channels are employed to source funds from a large number of individuals in exchange for equity, debt (also known as P2P lending), or other rewards (e.g. first or limited editions of a product).
Direct lending – a form of debt financing whereby credit is extended by non-bank investors, such as asset management companies, without the use of intermediaries.
Distressed debt – debt securities issued by a company which is currently in financial distress or under bankruptcy. Such securities typically trade considerably below their face value.
Equity kicker – a type of equity incentive in a loan agreement whereby a lender agrees to charge lower interest rates in return for a right to purchase shares in the business or property for which the loan is advanced, at a set price (Owen, 2013).
Export credit agency (ECA) loan – a lending facility provided to an importer of goods or services in order to fund a specific purchase. A defining feature of an ECA loan is the involvement of an export credit agency, a government-sponsored entity established to promote its country’s industries by helping buyers of exported products and services to finance their deliveries at competitive rates. ECA support typically takes the form of direct loans, payment guarantees, or export insurance.
Factoring – a type of debtor finance whereby a firm sells its accounts receivable to a lender at a discount.
Fintech – (portmanteau of “financial technology”) an industry that focuses on technological innovations aimed at facilitating the development of financial services. The term is most commonly used in reference to start-ups, however in principle it can include any company operating on the intersection of finance and technology. The fintech ecosystem can be
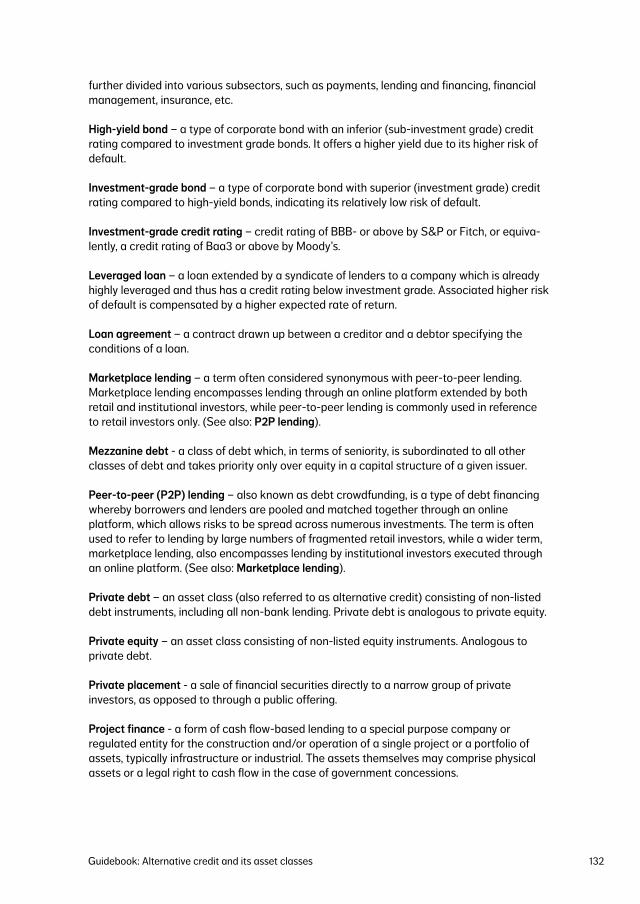
132Guidebook: Alternative credit and its asset classes
further divided into various subsectors, such as payments, lending and financing, financial management, insurance, etc.
High-yield bond – a type of corporate bond with an inferior (sub-investment grade) credit rating compared to investment grade bonds. It offers a higher yield due to its higher risk of default.
Investment-grade bond – a type of corporate bond with superior (investment grade) credit rating compared to high-yield bonds, indicating its relatively low risk of default.
Investment-grade credit rating – credit rating of BBB- or above by S&P or Fitch, or equiva-lently, a credit rating of Baa3 or above by Moody’s.
Leveraged loan – a loan extended by a syndicate of lenders to a company which is already highly leveraged and thus has a credit rating below investment grade. Associated higher risk of default is compensated by a higher expected rate of return.
Loan agreement – a contract drawn up between a creditor and a debtor specifying the conditions of a loan.
Marketplace lending – a term often considered synonymous with peer-to-peer lending. Marketplace lending encompasses lending through an online platform extended by both retail and institutional investors, while peer-to-peer lending is commonly used in reference to retail investors only. (See also: P2P lending).
Mezzanine debt - a class of debt which, in terms of seniority, is subordinated to all other classes of debt and takes priority only over equity in a capital structure of a given issuer.
Peer-to-peer (P2P) lending – also known as debt crowdfunding, is a type of debt financing whereby borrowers and lenders are pooled and matched together through an online platform, which allows risks to be spread across numerous investments. The term is often used to refer to lending by large numbers of fragmented retail investors, while a wider term, marketplace lending, also encompasses lending by institutional investors executed through an online platform. (See also: Marketplace lending).
Private debt – an asset class (also referred to as alternative credit) consisting of non-listed debt instruments, including all non-bank lending. Private debt is analogous to private equity.
Private equity – an asset class consisting of non-listed equity instruments. Analogous to private debt.
Private placement - a sale of financial securities directly to a narrow group of private investors, as opposed to through a public offering.
Project finance - a form of cash flow-based lending to a special purpose company or regulated entity for the construction and/or operation of a single project or a portfolio of assets, typically infrastructure or industrial. The assets themselves may comprise physical assets or a legal right to cash flow in the case of government concessions.

133Guidebook: Alternative credit and its asset classes
Ratchet – a term used in reference to various covenant-linked pricing mechanisms embed-ded in a loan document with a purpose of ensuring that the return is more reflective of the underlying risks.
Securitisation – a process of bundling cash flows from various types of assets and repackag-ing them to create new financial instruments (known as asset-backed securities). Cash flows from the underlying assets are subsequently redistributed throughout the capital structure of newly formed securities.
Senior debt – a class of debt which takes priority (seniority) over all other subordinated classes of debt and equity in a capital structure.
Sub-investment-grade credit rating – credit rating below BBB- by S&P or Fitch, or equiva-lently, a credit rating below Baa3 by Moody’s.
Sweat premium – (also known as complexity premium) a premium earned as a compensa-tion for taking the risk of miscalculating the complexity of the investment (Jaeger, 2002).
Syndicated lending – a process of extending a loan to a single borrower by a group (or a “syndicate”) of lenders, all of which are bound by a single loan agreement. (See also: Club deal).
Trade finance – a practice of financing (domestic and international) trade flows aimed at mitigating risks associated with such transactions. Trade finance typically involves various intermediaries, such as banks, insurers, Export Credit Agencies, etc., which facilitate the transactions. (See also: ECA loan and Commodity finance).
Unitranche debt – a loan structure that pools senior and subordinated classes of debt into a single debt instrument, allowing for significant simplification of a company’s debt profile. This is achieved by blending interest rates of senior and subordinated debt into a single rate, simplifying documentation, and reducing the number of counterparties. Unitranche debt is often used to streamline acquisition processes in leveraged buyout transactions. (See also: Senior debt and Mezzanine debt).
Venture debt – a form of debt financing provided to venture-backed companies as a supplement to equity financing. It enables venture capital to be raised with less ownership dilution compared to equity financing. Also referred to as venture lending or venture leasing.
Waterfall payment – a payment structure in which senior debtholders receive interest and principal repayments first, while subordinated debtholders receive interest and principal payments only after the senior ones are repaid in in full. (See also: Senior debt).

134Guidebook: Alternative credit and its asset classes
List of figures
Figure 1. Liability profiles of insurance companies and banks ..............................................9
Figure 2. Relative security across private and public debt markets ................................. 14
Figure 3. Loans can be classified across multiple dimensions ............................................ 15
Figure 4. Selected asset classes on the cash flow and risk-return spectrum ............... 16
Figure 5. Position of private debt within the broader investment universe .....................17
Figure 6. Changing financial landscape ...................................................................................... 20
Figure 7. The size of CLO markets ...................................................................................................21
Figure 8. Private debt dry powder (raised, not yet invested): North America-focused
vs. European-focused ........................................................................................................22
Figure 9. Business models impacted by digital transformation ..........................................23
Figure 10. Fintech start-ups: investment deals and amounts (USD billion) .....................24
Figure 11. The emerging fintech ecosystem .................................................................................25
Figure 12. Marketplace lending ..........................................................................................................25
Figure 13. P2P lending........................................................................................................................... 26
Figure 14. Fintech: three different models of lending ................................................................27
Figure 15. The total asset size of the European banking sector has been declining
since 2008 ............................................................................................................................ 30
Figure 16. The role of banks in arranging credit facilities ........................................................ 31
Figure 17. Markowitz Efficient Frontier .......................................................................................... 35
Figure 18. The transforming market will reduce information asymmetry......................... 36
Figure 19. The Private Pricing Differential (PPD) ........................................................................37
Figure 20. The triangle approach to alternative credit .............................................................44
Figure 21. Composition of loan coupon ......................................................................................... 46
Figure 22. Example of loan with hedging requirement ..............................................................47
Figure 23. Example of legal tenor ≠ actual tenor of the loan ................................................. 49
Figure 24. Original issue discount – example ............................................................................... 51
Figure 25. Diversification in debt investments – example ...................................................... 55
Figure 26. The credit analysis process - output in two words: PD and LGD ................... 58
Figure 27. Fixed-income strategies on an EBITDA-credit rating plane ............................. 59
Figure 28. US speculative grade default rate (%) ...................................................................... 60

135Guidebook: Alternative credit and its asset classes
Figure 29. Equity contribution: large corporate LBOs ............................................................... 61
Figure 30. Debt multiples, middle market loans .......................................................................... 62
Figure 31. European infrastructure market trends - bank debt vs. institutional debt ..... 63
Figure 32. Comparison of capital charges - qualifying infrastructure vs. corporates ......67
Figure 33. The global goals for sustainable development .......................................................76
Figure 34. Illustration of the estimated long-term annual tracking error (horizontal
axis) versus long-term expected excess return (vertical axis) .........................87
Figure 35. How an ECA loan works .................................................................................................. 90
Figure 36. ECA loan timeline ............................................................................................................... 93
Figure 37. European infrastructure market growth in total transaction numbers and
volumes (debt and equity) .............................................................................................. 95
Figure 38. Cumulative probability of default comparison ........................................................97
Figure 39. Loss given default comparison ..................................................................................... 98
Figure 40. Relative asset value .......................................................................................................... 99
Figure 41. Comparison of Solvency II capital charges - qualifying infrastructure
vs. corporates .................................................................................................................... 100
Figure 42. Default rate .........................................................................................................................104
Figure 43. Institutional loan spread versus overall borrowing costs ..................................105
Figure 44. Distribution of population by tenure status ............................................................108
Figure 45. Annual gross lending .......................................................................................................109
Figure 46. Average mortgage interest rate spread by average term for new lending ...109
Figure 47. Average mortgage interest rate spread by average loan-to-value for
new lending ..........................................................................................................................110
Figure 48. Moody’s RMBS Indices – 60+/90+ days delinquency .........................................111
Figure 49. Private pricing differential for commercial real estate loans ...........................115
Figure 50. Structural framework .......................................................................................................116
Figure 51. Estimated size of selected EUPP markets ...............................................................119
Figure 52. How do direct lenders compare with traditional bank lenders? .................... 124

136Guidebook: Alternative credit and its asset classes
List of tables
Table 1. Private debt strategies ...........................................................................................................17
Table 2. The segmentation of key players in corporate lending in 2017 ............................ 20
Table 3. Same underlying securities in new packaging .............................................................21
Table 4. Formats for investing in alternative credit .................................................................... 39
Table 5. Overview of key asset classes in alternative credit .................................................. 45
Table 6. Factors affecting loan return ............................................................................................. 50
Table 7. Calculation of the expected loss and risk-adjusted return ................................... 53
Table 8. Most important factors leading to default and how to circumvent them ........ 56
Table 9. Security in fixed-income investments ............................................................................ 58
Table 10. Performance of private debt and public assets (1999-2015) ................................ 68
Table 11. Measures of liquidity ...............................................................................................................71
Table 12. Factors increasing complexity of the investment .......................................................73
Table 13. ESG factors affecting corporate creditworthiness ....................................................76
Table 14. Composition of the matching portfolio of a hypothetical Dutch pension fund ....79
Table 15. Estimation of the impact of adding private debt to the matching portfolio
on the return potential of the coverage ratio ...............................................................87
Table 16. Return, liquidity and characteristics of ECA loans ..................................................... 91
Table 17. Examples of ECA loans .........................................................................................................92
Table 18. Common features of infrastructure debt ...................................................................... 96
Table 19. Population growth by country ...........................................................................................112

137Guidebook: Alternative credit and its asset classes
Bibliography
Amihud, Y., Mendelson, H., & Pedersen, L. (2005). Liquidity and Asset Prices. Foundations and Trends in Finance, 1(4), 269-364.
Anson, M. (2006). Debt as Private Equity. Handbook of Alternative Assets (2nd ed.). United States: John Wiley & Sons.
Arner, D., Barberis, J., & Buckley, R. (2015). The Evolution of Fintech: A New Post-Crisis Paradigm? (University of Hong Kong Faculty of Law Research Paper No. 2015/047). Retrieved from http:// ssrn. com/ abstract= 2676553
Bakker, T. (2015, August 17). Marketplace Lenders are a Systemic Risk. American Banker. Retrieved from https://www.americanbanker.com/opinion/marketplace-lenders-are-a-systemic-risk
Borello, G., De Crescenzo, V., & Pichler, F. (2015). The Funding Gap and The Role of Financial Return Crowdfunding: Some Evidence From European Platforms. Journal of Internet Banking and Commerce, 20(1), 1-20.
Damordan, A. (2015). The cost of Illiquidity [presentation slides]. New York: Stern. Retrieved from http://people.stern.nyu.edu/adamodar/pdfiles/country/illiquidity.pdf
Dapp, T. (2014, November 11). Fintech – The digital (r)evolution in the financial sector. Frankfurt am Main: DB Research Management. Retrieved from https://www.dbresearch.com/PROD/DBR_INTERNET_EN-PROD/PROD0000000000345837.pdf
Deloitte. (2016a). Deleveraging Europe 2015-2016. London: Deloitte. Retrieved from https://www2.deloitte.com/uk/en/pages/financial-advisory/articles/deleveraging-europe-market-update-h2-2015.html
Deloitte. (2016b). The Deloitte Alternative Lender Deal Tracker Q3 2016. London: Deloitte. Retrieved from https://www2.deloitte.com/content/dam/Deloitte/uk/Documents/corporate-finance/deloitte-uk-aldt-q3-2016.pdf
Deloitte. (2016c). A temporary phenomenon? Marketplace lending. London: Deloitte. Retrieved from https://www2.deloitte.com/uk/en/pages/financial-services/articles/marketplace-lending.html
Dubikovksy, V., & Sussino, G. (2015). Solving the Rebalancing Premium Puzzle. Risk-Based and Factor Investing (1st ed.). ISTE Press – Elsevier.
ESRB (2016). Market liquidity and market-making. Retrieved from https://www.esrb.europa.eu/pub/pdf/reports/20161005_market_liquidity_market_making.en.pdf
Frontier Economics. (2013). Exploring the impact of private equity on economic growth in Europe. London: Frontier Economics. Retrieved from https://www.investeurope.eu/media/12929/Frontier-Economics-Report.pdf
Hannappel, J. (2016, May 15). No exit? Illiquidity in corporate bond markets. Global Investor, Credit Suisse. Retrieved from https://www.credit-suisse.com/media/production/pb/docs/france/global-investor-en.pdf

138Guidebook: Alternative credit and its asset classes
IOPS. (2011). OECD/IOPS good practices for pension funds’ risk management systems. IOPS. Retrieved from http://www.iopsweb.org/principlesguidelines/46864307.pdf
Jaeger, L. (2002). The Universe of Alternative Investment Strategies. Managing Risk in Alternative Investment Strategies. London: FT Prentice Hall.
Kindert, G. (2017, February 8). How Private Debt/Alternative Credit Boosts Income and Risk-Adjusted Returns. Retrieved from: https://www.linkedin.com/pulse/how-private-debtalternative-credit-boosts-income-returns-kindert
Klein, C. (2015). Integrating ESG into the Fixed-Income Portfolio. CFA Institute Conference Proceedings Quarterly, 32(4), 46-53.
KPMG. (2017). The Pulse of Fintech Q4 2016. Retrieved from https://assets.kpmg.com/content/dam/kpmg/xx/pdf/2017/02/pulse-of-fintech-q4-2016.pdf
Laugel, J.-F., & Laszlo, C. (2009). Financial Crisis: The Opportunity for Sustainable Value Creation in Banking and Insurance. Journal of Corporate Citizenship, 35(1), 24-38.
Lee, L.-E., & Moscardi, M. (2017). 2017 ESG trends to watch. MSCI ESG Research. Retrieved from https://www.msci.com/documents/10199/cbc27309-8157-4589-9cc0-00734bca6a6b
M&G Investments. (2015). A guide to illiquid credit. Retrieved from http://www.mandg.co.uk/-/media/Literature/UK/Institutional/MG-Guide-to-illiquid-credit-January-2015.pdf
Meeker, M. (2016). Internet trends 2016 – code conference [presentation slides]. Retrieved from http://www.kpcb.com/internet-trends
Monster, A., & Sanders, R. (2016). Private debt in de matching portfolio. VBA Journaal, 32(128), 12-18.
Morse, A. (2015). Peer-to-peer crowdfunding: Information and the potential for disruption in consumer lending. The Annual Review of Financial Economics, 7(1), 463-479.
Owen, D. (2013). The Crunch (p. 31). NightHawk Publishing.
Poetz, M., & Schreier, M. (2012). The Value of Crowdsourcing: Can Users Really Compete with Professionals in Generating New Product Ideas? Journal of Product Innovation Management, 29(2), 245-246.
Porter, M. (2015). The Shared Value Opportunity Space for Banks. Banking on Shared Values (pp. 9-15). Retrieved from https://sharedvalue.org/sites/default/files/resource-files/FSG_Banking%20on%20Shared%20Value_0.pdf
Preqin. (2015). 2015 Preqin Global Private Equity & Venture Capital Report. London: Preqin.
Preqin. (2016). 2016 Preqin Global Private Debt Report. London: Preqin.
Preqin. (2017). Investor appetite for private debt in 2017. Private Debt Spotlight, 2(1), 2-3. Retrieved from: https://www.preqin.com/docs/newsletters/pd/Preqin-Private-Debt-Spotlight-February-2017.pdf
PRI. (2013). Corporate Bonds: Spotlight on ESG Risks. Retrieved from https://www.unpri.org/download_report/3829
PwC. (2014). Economic crime: a threat to business process. US Global Economic Crime Survey. Retrieved from https://www.pwc.com/us/en/forensic-services/assets/economic-crime-survey.pdf

139Guidebook: Alternative credit and its asset classes
Rajan, A. (2015). The Rise of Private Debt as an Institutional Asset Class. London: ICG. Retrieved from http://www.icgam.com/SiteCollectionDocuments/Rise%20of%20Private%20Debt%20as%20an%20institutional%20asset%20class%20Amin%20Rajan%20GENERIC.pdf
Raluca, O. (2012). Pathways to sustainable banking management. Annals of the University of Oradea, Economic Science Series., 21(2), 545-550.
S&P. (2016). European alternative lending markets take an ever-bigger slice of the cake. Retrieved from http://com.agefi.fr/PDF/EuropeanAlternativeLendingMarkets.pdf
Schwimmer, R. (2016). European direct loans: A familiar asset in a different currency. TAAI Global Asset Management. Retrieved from https://www.tiaa.org/public/pdf/C32050_european_direct_lending.pdf
SparkLabs Global Ventures. (2016). FinTech industry overview 2016 [presentation slides]. Retrieved from http://www.slideshare.net/bernardmoon/fintech-industry-report-2016
Stanworth, P. (2008). How valuable is liquidity? (FIERM Conference Working Paper). Retrieved from file://iresources.biz/homes/OF90KW/Home/My%20Documents/Downloads/liquidityworkingparty%20(2).pdf
Stein, P., Ventura, A., & Tufano, P. (2015). The Future of FinTech. A Paradigm Shift in Small Business Finance. World Economic Forum. Retrieved from http://www3.weforum.org/docs/IP/2015/FS/GAC15_The_Future_of_FinTech_Paradigm_Shift_Small_Business_ Finance_report_2015.pdf
The fintech revolution. (2015, May 9). The Economist. Retrieved from https://www.economist.com/news/leaders/21650546-wave-startups-changing-financefor-better-fintech- revolution
Towers Watson. (2012). Investing in Private Markets – The Right Strategy, the Right Geography, the Right Manager. Retrieved from https://www.towerswatson.com/DownloadMedia.aspx?media=%7B7435D17B-CC61-4B1A-9391-506ECB0F406D%7D
Towers Watson. (2015). Global Pensions Asset Study 2015. Retrieved from https://www.towerswatson.com/en-GB/Insights/IC-Types/Survey-Research-Results/2015/02/Global-Pensions-Asset-Study-2015
Towers Watson. (2016). Understanding and measuring the illiquidity risk premium. Retrieved from https://www.towerswatson.com/en-GB/Insights/IC-Types/Ad-hoc-Point-of-View/2016/05/Understanding-and-measuring-the-illiquidity-risk-premium
WEF. (2015). The Future of Financial Services (p. 88). Geneva: World Economic Forum. Retrieved from http://www3.weforum.org/docs/WEF_The_future__of_financial_services.pdf
WEF. (2016). Sustainable Development Goals. Retrieved from https://sustainabledevelopment.un.org/sdgs

DisclaimerThis publication is intended for MiFID professional investors only. This publication has been prepared solely for the purpose of information and does not constitute an offer, in particular a prospectus or any invitation to treat, buy or sell any security or to participate in any trading strategy or the provision of investment services. While particular attention has been paid to the contents of this publication, no guarantee, warranty or representation, express or implied, is given to the accuracy, correctness or completeness thereof. Any information given in this publication may be subject to change or update without notice. Neither NN Investment Partners B.V., NN Investment Partners Holdings N.V. nor any other company or unit belonging to the NN Group, nor any of its directors or employees can be held directly or indirectly liable or responsible with respect to this publication. Use of the information contained in this publication is at your own risk. This publication and information contained herein must not be copied, reproduced, distributed or passed to any person other than the recipient without NN Investment Partners B.V.’s prior written consent. Investment sustains risk. Please note that the value of any investment may rise or fall and that past performance is not indicative of future results and should in no event be deemed as such. This publication is not intended and may not be used to solicit sales of investments or subscription of securities in countries where this is prohibited by the relevant authorities or legislation. Any claims arising out of or in connection with the terms and conditions of this disclaimer are governed by Dutch law.
© 2017 NN Investment Partners is part of NN Group N.V. NN Group N.V. is a publicly traded corporation, and it and its subsidiaries are currently using trademarks including the “NN” name and associated trademarks of NN Group under license. All rights reserved.
For more information, please email [email protected] or visit our website at www.nnip.com.