Almond as a model to explore epigenetic signatures ...
375
Almond as a model to explore epigenetic signatures associated with aging in perennial plants Dissertation Presented in Partial Fulfillment of the Requirements for the Degree Doctor of Philosophy in the Graduate School of The Ohio State University By Katherine Mary D’Amico Willman, MS Graduate Program in Translational Plant Sciences The Ohio State University 2021 Dissertation Committee Dr. Jonathan Fresnedo Ramirez, Advisor Dr. Andrew Michel, Co-Advisor Dr. Eric Stockinger Dr. Leah McHale Dr. Tea Meulia Dr. Chad Niederhuth
-
Upload
khangminh22 -
Category
Documents
-
view
5 -
download
0
Transcript of Almond as a model to explore epigenetic signatures ...

Almond as a model to explore epigenetic signatures associated with aging in perennial
plants
Dissertation
Presented in Partial Fulfillment of the Requirements for the Degree Doctor of Philosophy
in the Graduate School of The Ohio State University
By
Katherine Mary D’Amico Willman, MS
Graduate Program in Translational Plant Sciences
The Ohio State University
2021
Dissertation Committee
Dr. Jonathan Fresnedo Ramirez, Advisor
Dr. Andrew Michel, Co-Advisor
Dr. Eric Stockinger
Dr. Leah McHale
Dr. Tea Meulia
Dr. Chad Niederhuth

Copyrighted by
Katherine M. D. Willman
2021

ii
Abstract
All organisms age; however, our knowledge of aging and the exhibition of the process
itself varies dramatically by species. While less is known about the aging process in
plants compared to other species, perennial plant species do age, resulting in reduced
physiological competence and leading to the development of aging-related disorders and
phenotypes. The effects of aging are of particular relevance to productive perennials,
such as fruit and nut crops, whose production represents a key economic sector in the US
and whose supply chain provides healthy food to consumers. Almond, an economically
important perennial nut-crop grown almost exclusively in the US, exhibits an aging-
related disorder called non-infectious bud-failure (BF). BF-exhibition makes almond an
ideal perennial system to test aging-related hypotheses and develop aging models since
this process is directly linked to the exhibition of a disorder with a quantifiable phenotype
that affects economic relevance in a primarily clonally propagated crop. Currently, little
information is available to track either age or BF-potential in almond germplasm. The
aim of this work is to test the hypotheses that quantifiable, differential genomic features
like telomere length, expression of the telomerase-associated gene, TERT, and epigenetic
signatures like DNA methylation in almond are associated with age and with BF-
exhibition. The research herein explores these features using quantitative PCR and
bisulfite and enzymatic sequencing approaches to test their suitability as potential

iii
biomarkers of age and BF-potential in almond. To test putative epigenetic signatures
associated with BF-potential, DNA methylome profiling was performed, utilizing a
unique monozygotic twin almond germplasm collection with sets of twins discordant for
BF-exhibition. In an effort to identify potential biomarkers of age in almond, DNA
methylation profiles were generated for ~70 almond breeding selections from three
distinct age cohorts. Finally, telomere length and TERT expression were measured over
two years of sampling almond breeding selections of known age. Results from this
collective work revealed a pattern of hypermethylation and a pattern of decreased
telomere length and TERT expression as trees age. Further, DNA demethylation was
found to be associated with BF-exhibition in the two sets of twin almonds analyzed. In
methylation studies, specific regions of the genome were identified with differential
methylation profiles associated with either age or BF-status. These regions and their
associated genetic features (i.e., genes, micro RNAs, etc.) are of interest to develop
biomarkers in almond and investigate the underlying mechanisms that contribute to BF-
development and regulate the aging process in this species. Taken together, the results
from this work represent a foundation upon which future work can be done to validate the
differential methylation and telomeric patterns observed in these studies. The suitability
of these patterns as potential biomarkers of age and/or BF-potential can also be assessed
in future studies, as well as the applicability of extending this approach to other perennial
crops. Expanding our knowledge of the aging process in perennial plants will benefit
breeders, growers, and consumers by ensuring a resilient supply chain of these crops and
will enhance our understanding of this complex process in plants.

iv
Dedication
To Bryan, I miss you always and hope you found some peace
To Matthew, the love and light of my life

v
Acknowledgments
When reflecting on my time as a PhD student, one word continues to come to mind:
unexpected. Nothing about my PhD has gone the way I expected, from loss and grief, to
love and marriage, from oaks to almonds, to a global pandemic, but through it all I have
had the unwavering support of my family, friends, and OSU colleagues for whom I am
eternally grateful. I first want to thank my advisor, Jonathan, for accepting me into his
lab, letting me take ownership of this crazy almond project, and for the hours of
stimulating and fun conversation. I genuinely appreciate all of his guidance, mentoring,
and encouragement. I also want to thank all my lab mates, past and present, including
David, Caterina, Beth, Cheri, Debbie, Elizabeth, and Daniel. It was truly a joy to be a
member of the Fresnedo Ramirez lab these past four years. A special thanks to Elizabeth
for being an incredible undergraduate mentee, lab manager, and friend. The work I
present in this document would not have been possible without her help.
I also want to thank my co-advisor, Andy, for all his advice and support
throughout my PhD program, as well as my student advisory committee for their
guidance. I would like to thank Leah for her comfort and kind words during a difficult
time. I would also like to thank Chad for teaching me so much about epigenetics and for
contributing his expertise to these projects. Additionally, a big thank you to the entire
Plant Pathology and Horticulture and Crop Science departments. Completing a degree is

vi
not possible without the fiscal associates, custodians, grant managers, greenhouse staff,
librarians, etc. who do so much to keep our work running smoothly. I would also like to
thank the staff, past and present, of the Center for Applied Plant Sciences for their
support, especially Mike Sovic for his bioinformatics and sequencing advice. I cannot
thank Courtney Price enough for everything she has done to guide the TPS program and
its students. She is an amazing graduate program coordinator, and I am happy to call her
my friend.
Finally, I would like to thank all my friends and family. I have been so fortunate
to meet such an amazing group of people during my PhD program. To my first and best
friend at OSU, Vivian, I will cherish our friendship, always. I am also so grateful that
living and working in Wooster has kept me so close to family. To my sister, my best
friend from birth and my constant confidante, you are my lifeline. And to my parents, I
am able to reach high because you are my foundation. And finally, to Matt, meeting you
and building our life together is the happiest, most wonderful thing to come from the past
six years.

vii
Vita
2008 B.S. Biology, John Carroll University
2012 M.S. Conservation Biology, SUNY College of
Environmental Science and Forestry
2012-2015 Molecular Biologist, USDA Agricultural Research Service
2015-2019 Translational Plant Sciences Graduate Fellow
2019-2021 USDA NIFA AFRI Education and Workforce
Development Predoctoral Fellow
Publications
D’Amico-Willman, K.M., Anderson, E.S., Gradziel, T.M., and Fresnedo Ramirez, J.
(2021) Telomere length and Telomerase Reverse Transcriptase (TERT) expression
are associated with age in almond (Prunus dulcis [Mill.] D.A.Webb). Plants 10.
Conrad, A.O., McPherson, B.A., Lopez-Nicora, H., D’Amico, K.M., Wood, D.L., and
Bonello, P. (2019). Disease incidence and spatial distribution of host resistance in
a coast live oak/sudden oak death pathosystem. Forest Ecology and Management
433, 618-624.
Chakravarthy, S., Butcher, B., Liu, Y., D’Amico, K., Coster, M., and Filiatrault, M.
(2017). Virulence of Pseudomonas syringae is modulated through the catabolite
repression control protein Crc. Molecular Plant-Microbe Interactions 30, 283-
294.
D’Amico, K., and Filiatrault, M. (2017). The conserved hypothetical protein
PSPTO_3957 is essential for virulence in the plant pathogen Pseudomonas
syringae pv. tomato DC3000. FEMS Microbiology Letters 364.

viii
Butcher, B., Chakravarthy, S., D’Amico, K., Stoos, K.B., and Filiatrault, M. (2016).
Disruption of the carA gene in Pseudomonas syringae results in reduced fitness
and alters motility. BMC Microbiology 12, 194-209.
D’Amico, K.M., Horton, T.R., Maynard, C.A., Stehman, S.V., Oakes, A.D. and Powell,
W.A. (2015). Assessing Ectomycorrhizal Associations on Transgenic American
Chestnut Compared to the Wild Type, a Conventionally-Bred Hybrid, and Related
Fagaceae Species. Applied and Environmental Microbiology 81, 100-108.
Park, S.H., Bao, Z., Butcher, B.G., D’Amico, K., Xu, Y., Stodghill, P., Schneider, D.J.,
Cartinhour, S., and Filiatrault, M.J. (2014). Analysis of the small RNA spf in the
plant pathogen Pseudomonas syringae pv. tomato strain DC3000. Microbiology
160 941-953.
Park, S.H., Butcher, B.G., Anderson, Z., Pellegrini, N., Bao, Z., D’Amico, K., and
Filiatrault, M.J. (2013). Analysis of the small RNA P16/RgsA in the plant
pathogen Pseudomonas syringae pv. tomato strain DC3000. Microbiology 159,
296-306.
D’Amico, K.M. (2012). Assessing Ectomycorrhizal Associations on Chestnut:
Comparing Transgenic, Wild-type, a Conventionally-bred Hybrid and Related
Fagaceae Species. Master’s Thesis. SUNY College of Environmental Science and
Forestry.
Fields of Study
Major Field: Graduate Program in Translational Plant Sciences

ix
Table of Contents
Abstract ............................................................................................................................... ii
Dedication .......................................................................................................................... iv
Acknowledgments............................................................................................................... v
Vita .................................................................................................................................... vii
List of Tables ................................................................................................................... xiv
List of Figures ................................................................................................................. xxii
Chapter 1 Introduction ..................................................................................................... 1
Almond (Prunus dulcis [Mill.] D.A. Webb) ................................................................... 1
Biology and production............................................................................................... 1
Meristem development, shoot development, and dormancy ...................................... 5
Non-infectious bud-failure history, research, and mitigation ................................... 10
Plant Epigenetics – DNA Methylation ......................................................................... 16
Mechanisms of DNA methylation ............................................................................ 16
Stress-induced DNA methylation and implications .................................................. 20
Methods for measuring DNA methylation ............................................................... 26
Plant Telomere Biology ................................................................................................ 31
Telomere function and mechanisms of maintenance ................................................ 31
Methods for measuring telomere length ................................................................... 33
Aging in Perennial Plants.............................................................................................. 35
Biological predictors of age ...................................................................................... 35

x
Aging-induced disorder development in plants ........................................................ 40
Dissertation Objectives ................................................................................................. 42
References ..................................................................................................................... 44
Chapter 2 Relative telomere length and telomerase reverse transcriptase (TERT)
expression are associated with age in almond (Prunus dulcis [Mill.] D.A. Webb) .......... 72
Katherine M. D’Amico-Willman1,2, Elizabeth S. Anderson3, Thomas M. Gradziel4,
Jonathan Fresnedo-Ramírez1,2, * .................................................................................... 72
Abstract ......................................................................................................................... 73
Introduction ................................................................................................................... 73
Materials and Methods .................................................................................................. 77
Plant Material ............................................................................................................ 77
DNA and RNA Extraction ........................................................................................ 77
Monochrome Multiplex Quantitative PCR (MMQPCR) to Measure Relative
Telomere Lengths ..................................................................................................... 80
cDNA Synthesis and Quantitative Reverse Transcriptase PCR (qRT-PCR) to
Measure Relative Expression of TERT .................................................................... 81
Statistical Analysis .................................................................................................... 82
Results ........................................................................................................................... 83
Association of Relative Telomere Length and Age in Almond ................................ 83
TERT Gene Expression Patterns Associated with Age in Almond .......................... 84
Discussion ..................................................................................................................... 84
Quantitative PCR Approaches Suggest an Association between Relative Telomere
Length and Age in Almond Leaf and Bud Tissues ................................................... 86
TERT Expression Measured by qRT-PCR is Putatively Associated with Age in
Almond Accessions .................................................................................................. 88
Acknowledgments......................................................................................................... 90
References ..................................................................................................................... 91
Chapter 3 Hypermethylation is associated with increased age in almond (Prunus dulcis
[Mill.] D.A.Webb) accessions ........................................................................................ 102
Abstract ....................................................................................................................... 102
Introduction ................................................................................................................. 103
Materials and Methods ................................................................................................ 105

xi
Plant Material .......................................................................................................... 105
DNA Extraction ...................................................................................................... 106
Enzymatic Methyl-Seq Library Preparation and Illumina Sequencing .................. 107
Processing and Alignment of Enzymatic Methyl-Seq Libraries ............................. 108
Weighted Genome-wide Methylation Analysis of Age-Cohorts ............................ 108
Differential Methylation Analysis of Age-Cohorts ................................................ 109
Classification and annotation of differentially methylated regions ........................ 109
Annotation of unknown protein sequences ............................................................. 112
Results ......................................................................................................................... 112
Genome-wide methylation analysis in almond accessions representing three age-
cohorts ..................................................................................................................... 112
Identification and classification of differentially methylated regions (DMRs)
between age cohorts ................................................................................................ 114
Classification of DMRs as hyper- or hypomethylated in the age cohort comparisons
................................................................................................................................. 115
Annotation of hyper- and hypomethylated differentially methylated regions (DMRs)
................................................................................................................................. 116
Annotation of genes associated with 17 hypermethylated DMRs identified across the
three age cohort age-contrasts ................................................................................. 117
Discussion ................................................................................................................... 118
DNA hypermethylation in the CG and CHH contexts is associated with increased
age in almond .......................................................................................................... 119
Differentially methylated regions (DMRs) in the CG and CHG contexts are enriched
on specific chromosomes in the almond genome ................................................... 121
DMRs as potential biomarkers of age in almond.................................................... 123
Acknowledgements ..................................................................................................... 127
References ................................................................................................................... 128
Chapter 4 Integrated analysis of the methylome and transcriptome of twin almonds
(Prunus dulcis [Mill.] D.A. Webb) reveals genomic features associated with non-
infectious bud-failure ...................................................................................................... 153
Abstract ....................................................................................................................... 153
Introduction ................................................................................................................. 155
Materials and Methods ................................................................................................ 158

xii
Plant Material .......................................................................................................... 158
DNA Extraction ...................................................................................................... 159
RNA Extraction ...................................................................................................... 160
Whole Genome Bisulfite Sequencing Library Preparation and Illumina Sequencing
................................................................................................................................. 160
Processing and Alignment of Bisulfite-Sequencing Libraries ................................ 161
Identification of Differentially Methylated Regions (DMRs) and Permutation Tests
................................................................................................................................. 162
Annotation of Genes Associated with Shared DMRs and Enrichment Analysis ... 164
mRNA Sequencing Library Preparation and Illumina Sequencing ........................ 165
Processing and Alignment of mRNA Sequencing Libraries .................................. 166
Identifying Differentially Expressed Genes and Integrating Expression Data with
DMR-Associated Genes.......................................................................................... 166
In silico Analysis of a Hypothetical Protein Identified in mRNA Sequencing ...... 167
Results ......................................................................................................................... 168
Contrasting genome-wide DNA methylation status in the ‘Stukey’ twins ............. 168
Identifying regions of differential methylation associated with bud-failure status 169
Annotation of DMR-associated genes identified in the ‘Stukey’ twins ................. 171
Transcriptomic analysis of ‘Stukey’ twin pairs ...................................................... 172
Differentially expressed transcripts associated with bud-failure exhibition ........... 172
Discussion ................................................................................................................... 173
A monozygotic (MZ) twin-based design enables identification of methylomic
signatures associated with BF ................................................................................. 174
Bud-failure exhibition is associated with genome-wide DNA hypomethylation in
almond..................................................................................................................... 174
Genes associated with DMRs are involved in meristem development, DNA
methylation, dormancy, and response to heat stress ............................................... 177
Patterns of differential expression identified in genes related to cell wall
maintenance and metal ion transport ...................................................................... 178
Ethylene responsive factor (ERF) transcription factor family binding sites are
enriched in DMRs ................................................................................................... 179
Acknowledgements ..................................................................................................... 181
References ................................................................................................................... 182
Chapter 5 Prospectives and Conclusions ..................................................................... 224
Overview of research findings in this dissertation ...................................................... 224

xiii
The effect of heat stress on the almond methylome ................................................... 225
Profiling DNA methylation during almond development .......................................... 227
Transgenerational inheritance of DNA methylation in almond .................................. 228
Inducing DNA demethylation in the almond genome ................................................ 229
Phenotyping approaches to characterize non-infectious bud-failure .......................... 230
Developing biomarkers of age in perennial plant species .......................................... 232
Conclusions ................................................................................................................. 233
References ................................................................................................................... 235
Complete Bibliography ................................................................................................... 239
Appendix A: Supplemental Tables and Files.................................................................. 280

xiv
List of Tables
Table 1.1 Number of chromosomes and estimated genome size of select members of the
Rosaceae family (adapted from Jung et al., 2019). ............................................... 71
Table 2.1 Sampling scheme for 2018 and 2019 almond age cohort collections. ............ 100
Table 2.2 Oligos used for all Monochrome Multiplex Quantitative PCR (MMQPCR) and
quantitative reverse transcriptase PCR (qRT-PCR) studies. ............................... 101
Table 3.1 Pairwise comparison of least squared means of weighted percent methylation in
the CG, CHG, and CHH contexts for each chromosome in the ‘Nonpareil’ almond
genome. Age cohort contrasts include the 2 – 11, 7 – 11, and 2 – 7-year contrasts.
Significant contrasts are represented in bold with an alpha = 0.05. ................... 144
Table 3.2 Number of identified differentially methylated regions (DMRs) in each
methylation-context when comparing the three age cohorts. DMRs were identified
with a threshold of p 0.0001. DMRs are classified as hypermethylated if the
percent methylation in that region is greater in the older age cohort compared to
the younger age cohort within each contrast. DMRs are classified as
hypomethylated if the percent methylation in that region is lesser in the older age
cohort compared to the younger age cohort within each contrast. Hypermethylated
DMR values in bold represent those with a cumulative binomial probability <
110-6. ................................................................................................................. 145
Table 3.3 Number of occurrences of overlap when comparing differentially methylated
regions (DMRs) identified in each contrast to those identified in the other
contrasts. The number of overlaps means the number of times a DMR in a
particular age-contrast (e.g. 11-2) overlaps the genomic region of a DMR in one
of the other age-contrasts (e.g. 11-7). The overall comparison indicates the
number of DMRs occurring in overlapping genomic regions in all three contrasts.

xv
DMRs are classified as either hyper- or hypomethylated in each methylation
context. ................................................................................................................ 146
Table 3.4 Genomic coordinates and length in base pairs for the 17 overlapping DMRs
occurring in each of the three age-contrasts. ...................................................... 147
Table 3.5 Annotation of hyper- and hypomethylated differentially methylated regions
(DMRs) in each methylation context and for each age-contrast. The ‘Nonpareil’
genome annotation was used to classify the DMRs into four categories: gene,
exon, five prime untranslated region (5’ UTR), and three prime untranslated
region (3’ UTR). The percentages under each classification represent the
percentage of DMRs from each methylation-context and contrast in each of the
four categories. .................................................................................................... 148
Table 3.6 Annotation of genes associated with 17 hypermethylated differentially
methylated regions (DMRs) occurring in all three age cohort contrasts. The
chromosome (chr) and genomic coordinates (start and end) of each gene are listed
along with the gene identification from the ‘Nonpareil’ genome annotation.
Protein identifiers from InterPro and Pfam databases are also included as well as
gene ontology (GO) terms associated with the gene. ......................................... 149
Table 3.7 Characterization of eight unknown proteins associated with the 17 shared DMR
sequences identified among the three age-contrasts. The unknown protein ID
corresponds to the unknown proteins associated with the shared DMR sequences.
The putative motifs identified within each protein sequence include the position
of the motif within the sequence and the e-value. The number of amino acids and
estimated molecular weight (kDa) are also included for each protein sequence.
Finally, the predicted localization of each protein is provided as well as the
calculated probability of this prediction. ............................................................ 151
Table 4.1 Combined sequencing results from Illumina MiSeq and NextSeq for ‘Stukey’
libraries. Library refers to the combined technical replicate libraries for each
‘Stukey’ individual. The associated SRA Biosample number is listed to access
raw data for this sample on the NCBI SRA repository. Total reads are the number
of reads produced in the MiSeq and NextSeq sequencing runs, and the depth of

xvi
coverage represents the coverage based on the size of the ‘Nonpareil’ genome
(~250 Mbp). Total aligned reads are the number of reads that aligned to the
‘Nonpareil’ almond genome and mapping efficiency is the percentage of total
reads that properly aligned. Coverage aligned represents the depth of coverage for
aligned reads based on the size of the ‘Nonpareil’ almond genome (~250 Mbp).
Finally, conversion efficiency was calculated based on the conversion rate of the
‘Nonpareil’ chloroplast genome, representing a fully unmethylated sequence. . 206
Table 4.2 Percent cytosine methylation in each methylation context (C = cytosine; G =
guanine; H = adenine, thymine, or cytosine) calculated for combined technical
replicate libraries for each ‘Stukey’ individual (individuals exhibiting BF are
represented in bold)............................................................................................. 207
Table 4.3 Contingency tables (a), (b), and (c) contain the number of observed methylated
and unmethylated cytosines in the CG, CHG, and CHH contexts, respectively, for
the BF and no-BF twins in each twin pair (Chi-squared statistic, p-value, and
effect size for effect size for each comparison is included in the table subtitles and
the Pearson’s residual for each count is included in the parentheses in each table).
............................................................................................................................. 208
Table 4.4 Number of DMRs in each methylation context for each ‘Stukey’ twin pair.
DMRs are classified by proximity relative to a gene: upstream (within 2,000 bp)
of a gene, intragenic, or downstream (within 2,000 bp) of a gene (significant
permutation tests are represented in bold). ......................................................... 210
Table 4.5 Number of identified DMRs per twin pair that are associated with the same
gene, are in the same proximity class relative to that gene, and are in the same
context in both ‘Stukey’ twin pair 1 and ‘Stukey’ twin pair 2 (significant
permutation tests are represented in bold). Values in parentheses represent the
number of DMRs from each twin pair that have overlapping genomic coordinates.
............................................................................................................................. 211
Table 4.6 Protein sequences in the UniProtKB Reviewed (Swiss-Prot) database
significantly aligning to genes associated with DMRs both hypermethylated and
hypomethylated in BF twins compared to No-BF twins (e-value 0.0001) ...... 212

xvii
Table 4.7 GO terms assigned to DMR-associated genes for each GO category: biological
process (a), molecular function (b), and cellular component (c). Significantly
enriched GO terms are represented in bold (alpha = 0.1). .................................. 215
Table 4.8 List of the significantly enriched (adjusted p-value < 0.05) transcription factor
family binding sites in the shared DMRs. ........................................................... 221
Table 4.9 Sequencing results from an RNASeq experiment performed on two ‘Stukey’
twin pairs displaying divergent bud-failure exhibition. ...................................... 222
Table 4.10 Annotation of significantly differentially expressed genes in the BF twins
compared to the no-BF twins (p-value < 0.1). .................................................... 223
Table A. 1 Data for the relative telomere length estimation of almond age cohort samples
collected in 2018. Included are the age of the individual in years, the calculated
T/S ratio for each individual, the calculated relative telomere length based on the
T/S ratio, and the calculated z-score for each relative telomere length. ............. 280
Table A. 2 Raw Cq values produced from the technical replicate wells in qPCR using
either the primer for the telomere amplicon or the primer for the PP2A amplicon
for each almond individual from the classified age. ........................................... 281
Table A. 3 Data for the relative telomere length estimation of almond age cohort leaf
samples collected in 2019. Included are the age of the individual in years, the
calculated T/S ratio for each individual, the calculated relative telomere length
based on the T/S ratio, the calculated z-score for each relative telomere length,
and the raw Cq values produced from the technical replicate wells in qPCR using
either the primer for the telomere amplicon or the primer for the PP2A amplicon.
............................................................................................................................. 283
Table A. 4 Raw Cq values produced from the technical replicate wells in qPCR using
either the primer for the telomere amplicon or the primer for the PP2A amplicon
for each almond individual leaf sample from the classified age. ........................ 284
Table A. 5 Data for the relative telomere length estimation of almond age cohort bud
samples collected in 2019. Included are the age of the individual in years, the
calculated T/S ratio for each individual, the calculated relative telomere length

xviii
based on the T/S ratio, the calculated z-score for each relative telomere length,
and the raw Cq values produced from the technical replicate wells in qPCR using
either the primer for the telomere amplicon or the primer for the PP2A amplicon.
............................................................................................................................. 285
Table A. 6 Raw Cq values produced from the technical replicate wells in qPCR using
either the primer for the telomere amplicon or the primer for the PP2A amplicon
for each almond individual bud sample from the classified age. ........................ 286
Table A. 7 Data for relative expression of TERT in almond age cohort samples collected
in 2018. Included are the age of each sample in years, the relative expression of
TERT in each sample calculated from Cq values for TERT and a reference gene,
RPII, the log2 expression for each sample, and raw Cq values for the technical
replicates for both the RPII amplicon and the TERT amplicon. ......................... 288
Table A. 8 Data for relative expression of TERT in almond age cohort samples collected
in 2019. Included are the age of each sample in years, the relative expression of
TERT in each sample calculated from Cq values for TERT and a reference gene,
RPII, the log2 expression for each sample, and raw Cq values for the technical
replicates for both the RPII amplicon and the TERT amplicon. ......................... 289
Table A. 9 Table containing sequencing statistics, conversion efficiencies, total percent
methylation, and percent methylation within each context (CG, CHG, CHH) for
almond accessions presented in this study. ......................................................... 291
Table A. 10 Number of CG hypermethylated DMR-associated genes associated with each
biological process (A), molecular function (B), and cellular component (C) gene
ontology (GO) terms for each of the three age-contrasts (i.e., 11 – 2 year, 11 – 7
year, and 7 – 2 year). Values in each column represent the number of DMR-
associated genes that are associated with each GO term. Black squares indicate no
genes associated with that contrast were assigned the particular GO term. ....... 295
Table A. 11 Number of CG hypomethylated DMR-associated genes associated with each
biological process (A), molecular function (B), and cellular component gene
ontology (GO) terms for each of the three age-contrasts (i.e. 11 – 2 year, 11 – 7
year, and 7 – 2 year). Values in each column represent the number of DMR-

xix
associated genes that are associated with each GO term. Black squares indicate no
genes associated with that contrast were assigned the particular GO term. ....... 301
Table A. 12 Number of CHG hypermethylated DMR-associated genes associated with
each biological process (A), molecular function (B), and cellular component gene
ontology (GO) terms for each of the three age-contrasts (i.e. 11 – 2 year, 11 – 7
year, and 7 – 2 year). Values in each column represent the number of DMR-
associated genes that are associated with each GO term. Black squares indicate no
genes associated with that contrast were assigned the particular GO term. ....... 305
Table A. 13 Number of CHG hypomethylated DMR-associated genes associated with
each biological process (A), molecular function (B), and cellular component gene
ontology (GO) terms for each of the three age-contrasts (i.e. 11 – 2 year, 11 – 7
year, and 7 – 2 year). Values in each column represent the number of DMR-
associated genes that are associated with each GO term. Black squares indicate no
genes associated with that contrast were assigned the particular GO term. ....... 309
Table A. 14 Number of CHH hypermethylated DMR-associated genes associated with
each biological process (A), molecular function (B), and cellular component gene
ontology (GO) terms for each of the three age-contrasts (i.e. 11 – 2 year, 11 – 7
year, and 7 – 2 year). Values in each column represent the number of DMR-
associated genes that are associated with each GO term. Black squares indicate no
genes associated with that contrast were assigned the particular GO term. ....... 313
Table A. 15 Number of CHH hypomethylated DMR-associated genes associated with
each biological process (A), molecular function (B), and cellular component gene
ontology (GO) terms for each of the three age-contrasts (i.e. 11 – 2 year, 11 – 7
year, and 7 – 2 year). Values in each column represent the number of DMR-
associated genes that are associated with each GO term. Black squares indicate no
genes associated with that contrast were assigned the particular GO term. ....... 319
Table A. 16 Genomic coordinates for CG hypermethylated (increased methylation in BF
twins compared to no-BF twins) DMRs identified in each twin pair and associated
with the same gene. Coordinates include scaffold number in the 'Nonpareil'
almond reference genome followed by start and end genomic positions. .......... 322

xx
Table A. 17 Genomic coordinates for CG hypomethylated (decreased methylation in BF
twins compared to no-BF twins) DMRs identified in each twin pair and associated
with the same gene. Coordinates include scaffold number in the 'Nonpareil'
almond reference genome followed by start and end genomic positions. .......... 323
Table A. 18 Genomic coordinates for CHG hypermethylated (increased methylation in
BF twins compared to no-BF twins) DMRs identified in each twin pair and
associated with the same gene. Coordinates include scaffold number in the
'Nonpareil' almond reference genome followed by start and end genomic
positions. ............................................................................................................. 326
Table A. 19 Genomic coordinates for CHG hypomethylated (decreased methylation in
BF twins compared to no-BF twins) DMRs identified in each twin pair and
associated with the same gene. Coordinates include scaffold number in the
'Nonpareil' almond reference genome followed by start and end genomic
positions. ............................................................................................................. 327
Table A. 20 Genomic coordinates for CHH hypermethylated (increased methylation in
BF twins compared to no-BF twins) DMRs identified in each twin pair and
associated with the same gene. Coordinates include scaffold number in the
'Nonpareil' almond reference genome followed by start and end genomic
positions. ............................................................................................................. 328
Table A. 21 Genomic coordinates for CHH hypomethylated (decreased methylation in
BF twins compared to no-BF twins) DMRs identified in each twin pair and
associated with the same gene. Coordinates include scaffold number in the
'Nonpareil' almond reference genome followed by start and end genomic
positions. ............................................................................................................. 329
Table A. 22 Genomic coordinates for CG DMRs identified in each twin pair and
associated with the same gene. Coordinates include scaffold number in 'Nonpareil'
almond reference genome followed by start and end genomic positions. .......... 330
Table A. 23 Genomic coordinates for all shared CHG DMRs identified in each twin pair
and associated with the same gene. Coordinates include scaffold number in

xxi
'Nonpareil' almond reference genome followed by start and end genomic
positions. ............................................................................................................. 335
Table A. 24 Genomic coordinates for all shared CHH DMRs identified in each twin pair
and associated with the same gene. Coordinates include scaffold number in
'Nonpareil' almond reference genome followed by start and end genomic
positions. ............................................................................................................. 337

xxii
List of Figures
Figure 1.1 Percentage of global almond production in each country or region 2019/20
(adapted from Almond Board of California, 2020). ............................................. 66
Figure 1.2 Shoot apical meristem (SAM) (A) zones including the central zone (yellow),
peripheral zone (purple), and rib zone (green), and (B) layers including the tunica
(L1 and L2 Cell layer – green and purple) and corpus (L3 Cell layers –pink) (from
Sharma & Fletcher, 2002). .................................................................................... 67
Figure 1.3 Timeline of almond growth and dormancy cycles in the California Central
Valley. ................................................................................................................... 68
Figure 1.4 Characteristic noninfectious bud-failure signs in an almond cultivar: including
bud death and erratic branching patterns. (Photo taken by K.M. D’Amico-
Willman; Davis, CA) ............................................................................................ 69
Figure 1.5 Acreage planted of the almond cultivar ‘Carmel’ from 1988 – 2017. High
incidence of bud-failure exhibition led to a dramatic decrease in planting in the
mid-2000’s. (Source: California Department of Agriculture, 2020) .................... 70
Figure 2.1 Image of the almond cultivar Nonpareil (photo taken by K. D’Amico-Willman
in May 2018). ........................................................................................................ 96
Figure 2.2 Boxplots depicting the calculated z-score of the T/S ratio for leaf samples
within the age cohorts tested. (A) Age cohort collected in 2018. (B) Age cohort
collected in 2019. Significant differences in z-scores between age cohorts based
on ANOVA followed by post hoc Fisher’s least significant difference (LSD) (α =
0.1) are denoted by letter groupings where differing letters indicate significant
differences following means separation analysis (ANOVA 2018 p-value = 0.1077;
ANOVA 2019 p-value = 0.06548). Bold dots represent outliers within each age
cohort. ................................................................................................................... 97

xxiii
Figure 2.3 Boxplot depicting calculated z-score for the T/S ratio for bud samples within
the age cohorts collected in 2019. Significant differences in z-scores between ages
cohorts based on ANOVA followed by post hoc Fisher’s LSD (α = 0.05) are
denoted by letter groupings where differing letters indicate significant differences
following means separation analysis (ANOVA p-value = 0.067). Bold dots
represent outliers within each age cohort.............................................................. 98
Figure 2.4 Normalized expression of TERT for almond samples within the age cohorts
tested. (A) Age cohort collected in 2018. (B) Age cohort collected in 2019.
Significant differences in relative expression between age cohorts based on
ANOVA followed by post hoc Tukey’s HSD (alpha = 0.1) are denoted by the
letter groupings where differing letters indicate significant differences following
means separation analysis (ANOVA 2018 p-value = 0.09087; ANOVA 2019 p-
value = 0.1414). .................................................................................................... 99
Figure 3.1 Proportion of weighted genome-wide methylation in the CG (a), CHG (b), and
CHH (c) methylation-contexts for each age cohort (2, 7, and 11 years-old). Letter
groups represent significant differences based on pairwise comparisons using
least squared means (alpha = 0.05). .................................................................... 135
Figure 3.2 Boxplots depicting the proportion of weighted methylation in each age cohort
(2 years old – red; 7 years old – grey; 11 years old – yellow) across the three
methylation contexts: (a) CG, (b) CHG, and (c) CHH. The black dots represent
outliers................................................................................................................. 136
Figure 3.3 Distribution of lengths in base pairs of differentially methylated regions
(DMRs) identified in each age contrast and methylation context. Panels a-c show
distribution of DMRs identified in the CG context, panels d-f show distribution in
the CHG context, and panels g-l show distribution in the CHH context. The
values listed next to the methylation context indicate the age-contrast (11 – 2 year,
11 – 7 year, and 7 – 2 year). ................................................................................ 137
Figure 3.4 Dot plots representing the number of significant (p < 0.0001) differentially
methylated regions (DMRs) identified in each of the contrasts (11 – 2 years: red;

xxiv
11 – 7 years: grey; 7 – 2 years: yellow) in each methylation-context: (a) CG, (b)
CHG, and (c) CHH. ............................................................................................ 138
Figure 3.5 Circos plots depicting individual hyper- (red) and hypo- (blue) methylated
differentially methylated regions (DMRs) identified in each contrast and
methylation-context. The outer ring of each plot gives the approximate location of
the individual DMRs on each of the eight ‘Nonpareil’ chromosomes represented
by red and blue dots. The middle ring of each plot represents enrichment of
hypermethylated DMRs across each chromosome, and the innermost ring of each
plot represents enrichment of hypomethylated DMRs across each chromosome.
Panel a shows the distribution of DMRs in the CG context, panel b shows
distribution of DMRs in the CHG context, and panel c shows distribution of
DMRs in the CHH context. ................................................................................. 139
Figure 3.6 Heatmaps displaying average percent DNA methylation across cytosines in the
11-year, 7-year, and 2-year age cohorts within the genomic range of 13
overlapping differentially methylated regions (DMRs) in the CG context
identified in the three age- contrasts. The regions correspond to CGDMR1-13 (a-
m; see Table S2) and the values to the right of each heatmap represent the
genomic position of each cytosine on the respective chromosome. ................... 140
Figure 3.7 Heatmaps displaying average percent DNA methylation across cytosines in the
11-year, 7-year, and 2-year age cohorts within the genomic range of 3 overlapping
differentially methylated regions (DMRs) in the CHG context identified in the
three age- contrasts. The regions correspond to CHGDMR1-3 (a-c; see Table S2)
and the values to the right of each heatmap represent the genomic position of each
cytosine on the respective chromosome. ............................................................ 142
Figure 3.8 Heatmap displaying average percent DNA methylation across cytosines in the
11-year, 7-year, and 2-year age cohorts within the genomic range of the
overlapping differentially methylated region (DMR) in the CHH context
identified in the three age-contrast. The regions correspond to CHHDMR1 (see
Table S2). ............................................................................................................ 143

xxv
Figure 4.1 Monozygotic twin almond ‘Stukey’ trees discordant for BF-exhibition; BF
twin (left). ........................................................................................................... 194
Figure 4.2 Percent methylation in the CG context across each of the eight ‘Nonpareil’
genome scaffolds representing the eight almond chromosomes. Chromosome
number is listed above each plot. The solid lines represent bud-failure (BF)
individuals and the dashed lines represent no-BF individuals. The gold lines
represent ‘Stukey’ twin pair 1, and the blue lines represent ‘Stukey’ twin pair 2.
............................................................................................................................. 195
Figure 4.3 Percent methylation in the CHG context across each of the eight ‘Nonpareil’
genome scaffolds representing the eight almond chromosomes. Chromosome
number is listed above each plot. The solid lines represent bud-failure (BF)
individuals, and the dashed lines represent no-BF individuals. The gold lines
represent ‘Stukey’ twin pair 1, and the blue lines represent ‘Stukey’ twin pair 2.
............................................................................................................................. 196
Figure 4.4 Percent methylation in the CHH context across each of the eight ‘Nonpareil’
genome scaffolds representing the eight almond chromosomes. Chromosome
number is listed above each plot. The solid lines represent bud-failure (BF)
individuals, and the dashed lines represent no-BF individuals. The gold lines
represent ‘Stukey’ twin pair 1, and the blue lines represent ‘Stukey’ twin pair 2.
............................................................................................................................. 197
Figure 4.5 Heatmap displaying percent methylated cytosines in each twin pair for the
DMRs in each methylation context: (a) CG methylation, (b) CHG methylation,
and (c) CHH methylation. ‘Stukey’ twins 1a and 2a exhibit BF while ‘Stukey’
twins 1b and 2b are BF-free. The Venn diagram represents the total number of
significant DMRs in both ‘Stukey’ twin pairs as well as the number of regions
shared between the pairs. Panel (a) represents the CG context, panel (b) represents
the CHG context, and panel (c) represents the CHH context. ............................ 198
Figure 4.6 Distribution of length of all DMRs found in each twin pair in all methylation
contexts. .............................................................................................................. 199

xxvi
Figure 4.7 Differential cytosine methylation in each DMR and expression of genes
associated with the DMR in almond twin pairs discordant for BF-exhibition. The
heatmap in red and blue represents the difference in percent methylation in the BF
twin compared to the no-BF twin for every significant shared DMR in each
context. The heatmaps in purple and yellow represent the differential expression
in the BF twins compared to the no-BF twins for the genes associated with each
DMR. Panel (a) represents the CG context DMRs, panel (b) represents CHG
context DMRs, and panel (c) represents CHH context DMRs. .......................... 200
Figure 4.8 Differential cytosine methylation in each DMR and expression of genes
associated with the DMR in almond twin pairs discordant for BF-exhibition. The
heatmap in red and blue represents the difference in percent methylation in the BF
twin compared to the no-BF twin for every significant shared DMR in each
proximity class. The heatmaps in purple and yellow represent the differential
expression in the BF twins compared to the no-BF twins for the genes associated
with each DMR. Panel (a) represents the DMRs upstream (within 2,000 bp) of a
gene, panel (b) represents the intragenic DMRs, and panel (c) represents the
DMRs downstream (within 2,000 bp) of a gene. ................................................ 201
Figure 4.9 Linear regression of percent methylation within shared regions with significant
differential cytosine methylation in no-BF ‘Stukey’ twins (a, c, e) and BF
‘Stukey’ twins (b, d, f). Panels a and b represent methylation in DMRs upstream
(within 2,000 bp) of a gene, panels c and d represent methylation in intragenic
DMRs, and panels e and f represent methylation in DMRs downstream (within
2,000 bp) of a gene. Each circle represents the percent methylation in each twin in
a single region that is significantly differentially methylated in both ‘Stukey’ twin
pairs. Red circles represent DMRs in the CG context, green triangles represent
DMRs in the CHG context, and blue squares represent DMRs in the CHH
context. ................................................................................................................ 202
Figure 4.10 Number of transcription factor binding sites identified in the shared DMRs in
all methylation contexts. ..................................................................................... 203

xxvii
Figure 4.11 Log2 fold change by normalized count means of genes observed in bud-
failure compared to no-bud-failure ‘Stukey’ twins. Red points represent those
defined as significantly differentially expressed in each contrast (p-value < 0.1).
............................................................................................................................. 204
Figure 4.12 Principal component analysis of differential gene expression data showing
separation by ‘Stukey’ twin pair and BF condition. ........................................... 205

1
Chapter 1 Introduction
Almond (Prunus dulcis [Mill.] D.A. Webb)
Biology and production
Almond (Prunus dulcis [Mill.] D.A. Webb) is a member of the Rosaceae family which
includes other related Prunus species such as peach (P. persica [L.] Batsch), sweet cherry
(P. avium L.), and apricot (P. armeniaca L.). Almond is diploid and its genome contains
a total of 16 chromosomes (Corredor et al., 2004) (Table 1.1). The almond genome is
relatively small, ~240 Mb (approximately twice as large as Arabidopsis thaliana (L.),
Heynh.), making genetic analyses in this species more feasible and simpler in comparison
to those with large genome sizes like gymnosperms (Jung et al., 2019; Soundararajan et
al., 2019) (Table 1.1). As a member of the Prunus genus, almond produces drupe or stone
fruits; however, unlike other Rosaceous crops, the edible seed or kernel is the commercial
part of the almond fruit, classifying almond as a nut crop. The domesticated almond
kernel is unique because of its sweetness (hence the species name dulcis), and this flavor
profile is an important trait in modern almond breeding and production efforts (Socias i
Company & Gradziel, 2017). The native range of almond is in central Asia where its wild
relatives are still present (Kester et al., 1991; Browicz & Zohary, 1996; Ladizinsky,
1999), and almond tends to grow best in Mediterranean climates where most modern-day
cultivation occurs (i.e. California’s Central Valley) (Kester & Asay, 1975).

2
Almond represents the oldest domesticated and cultivated nut crop, with evidence
of domestication dating back to as early as the 4th millennium B.C. (Spiegel-Roy, 1986).
Wild almond trees typically produce kernels high in cyanide and thus, with a bitter,
undesirable flavor, but some individual trees produce a sweet kernel resulting from a
genetic mutation and were identified by early domesticators and selected for cultivation
(Socias i Company & Gradziel, 2017; Sánchez-Pérez et al., 2019). In addition to the
flavor, almonds were a preferred food source because of their high fat content, noted
medicinal properties, size, and portability (Albala, 2009; Socias i Company & Gradziel,
2017). Early cultivation of almond occurred in two major stages: Asiatic and
Mediterranean, following movement of almond along major trade routes in Asia and
Europe including the old Silk Road (Socias i Company & Gradziel, 2017). In fact, traces
of almond were identified in the tomb of King Tutankahamun, suggesting almond
cultivation in the Mediterranean as early as the 2nd millennium B.C. (Zohary et al., 2012).
Asian and European cultivation resulted in development of local and regional cultivars
and landraces for specific horticultural and culinary characteristics (Socias i Company &
Gradziel, 2017).
Following early establishment of almond in Asia and Europe, new world
cultivation began in North America following colonization by Spanish missionaries
(Socias i Company et al., 2012). Attempts to grow almond in North America outside of
the Central Valley in California mostly failed; however, serious attempts to establish
almond orchards in the US began in the mid-1800s, with the first documented orchard in
the Sacramento Valley in 1843 (Micke, 1996). The foundation for the US almond
industry was set in 1879 when A. T. Hatch made four selections from an orchard of over

3
2,000 seedlings that he named ‘Nonpareil’, ‘IXL’, ‘Ne Plus Ultra’, and ‘La Prima’
(Micke, 1996). In 1923, a cooperative almond breeding program was established in
Davis, CA by the USDA and University of California, which is now the oldest
continuous breeding program for almond, releasing cultivars such as ‘Winters’,
‘Sweetheart’, ‘Avalon’, and ‘Morely’ (Socias i Company & Gradziel, 2017).
The US almond industry now represents approximately 78% of the world’s
production and contributes greatly to the US economy, with the value of production in
2017 equaling ~$5.6 billion (USDA NASS, 2019; Almond Board of California, 2020)
(Fig. 1.1). In 2020, approximately 500,000 hectares of almond were planted in the US
producing ~1.4 billion kilograms of almonds for domestic consumption and export
(Almond Board of California, 2020). The cultivar, ‘Nonpareil’, is still the most planted
cultivar representing 41% of US production, followed by ‘Monterey’, ‘Butte/Padre’,
‘Independence’, and ‘Carmel’ (Almond Board of California, 2020). Further, almonds are
the most consumed nut in the US, far exceeding any other nut crop (Almond Board of
California, 2020), and are used in a variety of commercial applications including
confectionaries, bakery, and alternative-milks and creamers (Socias i Company et al.,
2012; Socias i Company & Gradziel, 2017). Driving the consumption of almonds are the
health benefits afforded by the chemical composition of the kernel (Socias i Company &
Gradziel, 2017). Almond kernels are high in oleic and linoleic acids, phytosterols,
proteins (globulins & albumins), tocopherols (antioxidants, including vitamin E), and
dietary fiber, all contributing to the myriad of health benefits including reduced
cholesterol, heart disease, obesity, and diabetes among others (Socias i Company &
Gradziel, 2017).

4
The success of the almond industry in the US is due in part to technological
advances and mechanization of production (Micke, 1996; Socias i Company et al., 2012).
In certain almond growing regions, including the native range in Central Asia, almonds
are still produced via traditional methods of seedling establishment and rain-fed irrigation
(Micke, 1996). However, almond production in places like Europe and the US relies
heavily on irrigation systems in orchards and on clonal propagation by bud-wood grafting
onto established rootstocks (Micke, 1996; Socias i Company & Gradziel, 2017). Almond
is primarily self-incompatible (Socias i Company, 1990; Socias i Company et al., 2010),
meaning inbred lines cannot be created following establishment of desirable cultivars, as
self-fertilization does not produce viable offspring. Thus, clonal propagation is used to
maintain desirable characteristics (e.g., nut quality and growth habit) in select cultivars
while sexual reproduction and seedling establishment are reserved for breeding programs
(Micke, 1996). Most productive almond cultivars are self-incompatible, including
‘Nonpareil’, meaning that orchards must include selections solely for cross-pollination,
making self-compatibility a highly-sought after trait for most almond breeding efforts
(Socias i Company, 1990; Socias i Company, 2002; Ortega & Dicenta, 2003; Socias i
Company et al., 2010). A new almond cultivar called ‘Independence’ was recently
developed that is self-compatible, meaning it can self-pollinate without the need for
pollinator cultivars (Zaiger et al., 2009). ‘Independence’ is reported to come from a (P.
dulcis P. persica) P. dulcis cross and has a flavor profile similar to ‘Nonpareil’
(Zaiger et al., 2009).
Once cultivars are selected for orchard establishment, almond trees must be
continually managed throughout their commercial lifespans to maintain productivity

5
either by pruning or other cultural practices like fertilization and irrigation (Micke, 1996;
Socias i Company & Gradziel, 2017). Once a tree is planted, training and pruning are
required for the first three growing seasons in order to establish the tree’s shape by
defining the primary scaffolds or branches to anchor the tree for its remaining
commercial life (Socias i Company & Gradziel, 2017). Once a tree reaches maturity (~4
years after planting), pruning is only required to facilitate cultural practices like
harvesting and spraying, as research has shown that pruning mature almond does not
contribute to increased or maintained yield in orchards (Socias i Company & Gradziel,
2017). The average commercial lifespan of an almond tree in an orchard is ~20 years
following the three to four-year juvenile period when the tree is not productive (Boriss &
Brunke, 2005). Almond tree planting is thus cyclical with trees planted continuously to
maintain productivity as the orchard ages (Micke, 1996).
Meristem development, shoot development, and dormancy
As almond is primarily clonally propagated via bud-wood grafting, vegetative meristem
development is key to sustained almond production. Vegetative meristem or shoot apical
meristem (SAM) is defined as meristematic tissue resulting in organ initiation and above-
ground plant growth as opposed to root apical meristem which produces new root growth
(Kerstetter & Hake, 1997). SAM, which is formed during embryogenesis, is pluripotent
giving rise to cells that will form organs, including leaves and flowers, and axillary and
adventitious buds (Carles & Fletcher, 2003). SAM itself is comprised of three zones of
cells: the peripheral zone, the central zone, and the rib zone (Kerstetter & Hake, 1997;
Sharma & Fletcher, 2002; Carles & Fletcher, 2003) (Fig. 1.2a). The peripheral zone cells
become lateral organs including leaves while the rib zone cells become the interior of the

6
stem (Sharma & Fletcher, 2002). The central zone cells are akin to stem cells in humans,
remaining undifferentiated and pluripotent (Sharma & Fletcher, 2002). The SAM is
further classified into two cell layers: the tunica (cell layers L1 and L2) and the corpus
(cell layers L3), which are differentiated based on planal growth patterns where the tunica
grows in a single plane and the corpus grows in all planes (Sharma & Fletcher, 2002;
Carles & Fletcher, 2003) (Fig. 1.2b). The upper tunica layer (L1) contributes to formation
of the epidermis in plant organs and the L2 layer contributes to development of
mesophyll and germline cells (Sharma & Fletcher, 2002; Carles & Fletcher, 2003). The
corpus (L3) is involved in development of vascular tissues in the stem and leaves
(Kerstetter & Hake, 1997; Sharma & Fletcher, 2002).
Regions of vegetative meristematic tissue, or buds, are typically classified into
three types: apical, axillary, and adventitious. Apical buds are located at the actively
growing tips of plant branches and exhibit apical dominance over axillary buds,
inhibiting growth of these buds through hormonal cues (Cline, 1991). Axillary buds form
in the axials of leaves and are only reactivated following disruption of apical dominance
from the SAM, typically from pruning or herbivory, after which the axillary buds
transition to apical buds (Cline, 1991; Kerstetter & Hake, 1997). Finally, adventitious
buds form in other locations in a plant, sometimes representing former axillary buds
covered by bark, and remain dormant similarly to axillary buds unless released from
apical dominance (Stone & Stone, 1943; Cline, 1991; Kerstetter & Hake, 1997). Shoots
that grow from adventitious buds are often referred to as epicormic, and their initiation
and growth can result from a number of factors including environmental stimuli and
hormonal signals (Kerr, 2001; Gordon et al., 2006b; Meier et al., 2012). As epicormic

7
branching is generally considered undesirable in fruit tree production due to issues of
crowding out or shading by excessive growth (Tymoszuk et al., 1981; Day et al., 1989;
Myers, 1993), most research related to epicormic buds and meristem formation in Prunus
is focused on factors influencing initiation of epicormic buds including timing of pruning
and water stress (Gordon et al., 2006b; Costes et al., 2014; Negrón et al., 2014).
In addition to epicormic branches, almond (along with other fruit tree species
including peach) produces two types of shoots from axillary buds: proleptic and sylleptic
(Negrón et al., 2014; Prats-Llinàs et al., 2019). Proleptic shoots are produced from
axillary buds following a period of dormancy and are considered preformed, meaning the
number of nodes is already established within the bud and growth is just the result of cell
elongation between nodes (Wilson, 2000; Gordon et al., 2006a; DeJong et al., 2012).
Almond spurs are short, fruit-bearing proleptic shoots that form laterally on existing
proleptic shoots and are typically viable for 3-5 years, producing anywhere from 1-5
fruits (Micke, 1996; Lampinen et al., 2011). Spurs always contain vegetative apical buds
but also have the ability to produce up to 5 flower buds per growing season, though not
all of these flower buds produce fruit (Micke, 1996). Sylleptic shoots, however, are
shoots that form from axillary buds without a dormancy period and are considered both
preformed and neoformed. This means sylleptic shoots have a predetermined number of
nodes but can continue to grow, adding neoformed nodes as long as environmental
conditions remain favorable (Wilson, 2000; Dejong et al., 2012; Prats-Llinàs et al.,
2019). Epicormic shoots from adventitious buds (former axillary buds), as described
above, are completely neoformed and tend to have lower numbers of flower buds
compared to long, proleptic shoots (Gordon et al., 2006b; Prats-Llinàs et al., 2019).

8
As a perennial species, almond goes through cycles of growth, dormancy, and
reproduction. Dormancy, which represents a reduction of meristematic growth, occurs in
response to either environmental cues or internal stimuli (Anderson et al., 2001) and can
be classified based on regulation as: ecodormancy, paradormancy, or endodormancy
(Lang et al., 1987). Ecodormancy is regulated by environmental factors like water stress
or temperature, paradormancy is regulated by internal factors outside the structure (or
bud) being affected (e.g. apical dominance), and endodormancy is regulated by factors
coming from the structure (or bud) itself as a response to things like photoperiod or
chilling (Lang et al., 1987).
In almond, a cycle of dormancy occurs each season starting in early winter
(November – mid-December) with endodormancy resulting from response to cold
temperatures (Lang et al., 1987; Micke, 1996) (Fig. 1.3). Following the accumulation of
chilling hours, endodormancy is broken and almond trees enter ecodormancy (which is
then regulated by accumulation of heat units) (Freeman & Martin, 1981; Micke, 1996;
Alonso et al., 2005) (Fig. 1.3). Among the Prunus species, almond has the lowest chilling
requirement, meaning it requires accumulation of the fewest number of hours below a
critical temperature to break endodormancy (Egea et al., 2003; Alonso et al., 2005;
Benmoussa et al., 2017). Additionally, almond has a low heat requirement to release
ecodormancy in comparison to other Prunus species, though the number of chilling hours
and growing degree hours can vary dramatically by cultivar (Egea et al., 2003; Alonso et
al., 2005; Benmoussa et al., 2017). Following the break from ecodormancy, almond
flowers and then experiences a period of active vegetative growth lasting until late spring
(Micke, 1996) (Fig. 1.3). Vegetative buds form in early summer, followed by a period of

9
summer dormancy resulting from a combination of ecodormancy, caused by high
summer temperatures, and paradormancy, induced by apical dominance (Micke, 1996;
Balachowski et al., 2016). As temperatures begin to drop in the fall, endodormancy is
induced and the cycle begins again (Fig. 1.3).
In addition to environmental cues regulating dormancy, several genetic
mechanisms controlling these processes have been examined in Prunus species. In an
effort to identify genes or gene families involved in dormancy regulation, researchers
have utilized RNA sequencing to characterize the transcriptome in almond at various
stages of bud dormancy (Barros et al., 2012; Xu et al., 2014; Castède et al., 2015;
Falavigna et al., 2019; Yu et al., 2020; Prudencio et al., 2020). Initial results revealed a
link between the gene family Dormancy Associated MADS-BOX (DAM) and dormancy
and flowering time in almond (Bielenberg et al., 2008; Yamane et al., 2011; Xu et al.,
2014; Zhu et al., 2015; Prudencio et al., 2018a; Falavigna et al., 2019; Yu et al., 2020).
This family of genes is homologous to the Short Vegetative Phase (SVP) genes
characterized in Arabidopsis (Gregis et al., 2013; Falavigna et al., 2019). Later, C-repeat
binding factor (CBF) genes were found to be regulators of dormancy pathways in
response to chilling (Barros et al., 2012). The CBF family regulates DAM genes among
others to control dormancy processes (Barros et al., 2012; Zhao et al., 2018). Further
work has identified other genetic factors involved in regulating dormancy in almond,
including epigenetic mechanisms like DNA methylation and histone modifications
(Rothkegel et al., 2017; Prudencio et al., 2018c; Zhu et al., 2020). The interest in genetic
components of dormancy in almond is focused primarily on flowering time since this is a
particularly vulnerable time for the industry due to the risk of spring frosts (Micke, 1996;

10
Socias i Company & Gradziel, 2017). Late-blooming cultivars like ‘Butte’, ‘Texas’,
‘Lauranne’, and ‘Penta’ have been developed through almond breeding efforts in
attempts to mitigate this risk (Socias i Company & Gradziel, 2017; Prudencio et al.,
2018b).
Non-infectious bud-failure history, research, and mitigation
Non-infectious bud-failure (BF) is a genetic disorder of almond first described in 1944
(Wilson & Stout, 1944) but observed in the cultivars ‘Nonpareil’ and ‘Peerless’
beginning in the early 1900s (Wilson & Stout, 1944; Micke, 1996) (Fig. 1.4). The
disorder occurs when vegetative buds formed in the previous season fail to emerge in the
spring (Wilson & Schein, 1956). Typically, basal buds of BF shoots are less affected and
following the death of terminal buds, the unaffected buds break dormancy resulting in
lateral shoot growth and creating a “witch’s broom” like branching pattern that has led
some to refer to BF as ‘crazytop’ (Wilson & Schein, 1956; Kester, 1969; Hellali et al.,
1978). Affected buds tend to occur on shoots formed in warmer temperatures later in the
growing season (i.e. sylleptic shoots), while buds on proleptic and epicormic shoots seem
to be less affected (Micke, 1996). In addition to failed buds and erratic branching, rough
bark has also been described as a sign of the disorder in almond (Wilson & Schein, 1956;
Kester & Jones, 1970a). Since vegetative buds emerge after flowering, the season’s nut
set is not affected in the first year of BF-exhibition, but growth and subsequent floral bud
development is limited in subsequent years, sometimes causing dramatic yield losses
(Kester et al., 1969; Micke, 1996). While BF was initially hypothesized to be a viral
disease, no study to date has identified an infectious agent leading to development of

11
bud-failure (and thus fulfilling Koch’s postulates) (Wilson & Schein, 1956; Fenton et al.,
1988b).
Exhibition of BF became a serious threat to the almond industry beginning in the
1940s when the cultivar ‘Jordanolo’ began to exhibit the disorder (Wilson, 1950, 1952;
Wilson & Schein, 1956). Despite its popularity and promise as a productive cultivar,
‘Jordanolo’ was eventually abandoned due to the severe incidence of BF (Wilson, 1950).
This disorder is still a threat to the almond industry and cultivar development, with the
development and subsequent near abandonment of ‘Carmel’ in the early 2000s due to
widespread BF-exhibition among clones (Kester et al., 2004; California Department of
Food and Agriculture, 2020) (Fig. 1.5). Further, the unknown cause and lack of screening
methods make BF a threat to any future almond breeding and production efforts (Kester
& Jones, 1970a).
Early studies were undertaken to address four major aspects of the disorder: (1)
the morphology of affected buds, (2) inheritance patterns of BF, (3) variability in BF-
exhibition among almond cultivars, and (4) the influence of environment on BF
incidence. Morphological analysis was performed in two studies utilizing dormant buds
from almond clones with no known history of BF-exhibition and from clones with a
history of BF symptoms (Saikia et al., 1966; Hellali et al., 1978). Results from these
studies revealed that following initial vegetative bud development in May and into the
summer, BF and no-BF buds are nearly identical, with the only noted difference being
smaller, wider buds on BF trees (Saikia et al., 1966; Hellali et al., 1978). The size
difference became more pronounced in the winter months (Oct – Jan) when BF buds

12
were observed to be significantly smaller than no-BF buds (Saikia et al., 1966; Hellali et
al., 1978).
Examination of meristematic tissue by microscopy and Azure B staining revealed
meristematic abnormalities beginning in August in BF buds, where the tunica cells began
to collapse and there was an accumulation of tannins (Hellali et al., 1978). This was
followed by compression and distortion of dividing corpus cells in the early fall (Hellali
et al., 1978). A complementary study examining accumulation of abscisic acid (ABA)
and gibberellins (GA) in BF buds observed a large increase in ABA content in early fall
compared to no-BF buds, corresponding to the time when internal degradation begins to
occur (Hellali et al., 1978, 1979). While no difference in GA content was detected, BF
buds were found to be smaller in size and had a lower water content compared to the no-
BF buds (Hellali et al., 1979). Together, these results suggest that BF is initiated in the
summer after which internal symptoms become apparent involving a breakdown of the
meristematic tissue throughout the fall (Schein, 1952; Saikia et al., 1966; Hellali et al.,
1978, 1979).
Exhibition of BF is non-reversible and has been shown to be transmissible by
both vegetative propagation and sexual reproduction (Kester, 1967a). Several studies
have been conducted to examine inheritance patterns of BF following sexual
reproduction by performing crosses with parents of known BF-status and monitoring
symptom development in the progeny (Kester, 1967a,b, 1969; Kester & Jones, 1970b).
Results from this work show that severity of BF-exhibition in seedling progeny produced
from these crosses is directly proportional to the severity of BF in the parents (Kester,
1967a,b, 1969; Kester & Jones, 1970b). Further, vegetative propagation from progeny

13
result in a subsequent generation of clones with even greater levels of BF-exhibition
beginning at increasingly earlier ages (Kester, 1967a,b, 1969; Kester & Jones, 1970b).
These results were further corroborated in a study with the cultivar ‘Carmel’ where
subsequent generations of clones showed increasingly greater levels of BF-exhibition at
earlier ages (Kester et al., 2004). The association between a parent’s (i.e., sexual
reproduction) or source’s (i.e., vegetative propagation) BF-potential and the incidence of
BF in subsequent generations is of particular concern for almond breeders and producers
as there is currently no method to identify a tree’s BF-potential, it can only be inferred
based on parentage or source history and age (Kester, 1967b; Kester & Jones, 1970b;
Micke, 1996).
While BF is known to be inherited in almond, different cultivars do vary in the
level and severity of BF-exhibition in their clones (Kester et al., 1969; Micke, 1996). The
cultivar ‘Nonpareil’ has generally been observed to have moderate prevalence and
severity of BF-exhibition in orchards, while the cultivars ‘Jordanolo’ and ‘Carmel’ were
abandoned due to the high prevalence and severity in their exhibition (Kester et al., 1969;
Micke, 1996). BF-exhibition has not been observed in some modern productive cultivars
including ‘Monterey’ and ‘Butte/Padre’ (Micke, 1996), nor has BF been observed in
peach, a closely related Prunus species that can readily hybridize with almond (Socias i
Company & Gradziel, 2017). Since peach is not known to exhibit BF, crosses have been
performed to produce peach almond hybrids in an effort to uncover the genetic
components contributing to BF-development (Kester, 1978; T. M. Gradziel, pers.
comm.). Results from these crosses show a 50% segregation of the BF-phenotype in the

14
F1 hybrid generation, suggesting that a single locus in the almond parent may contribute
to the BF-genotype (Kester, 1978; T. M. Gradziel, pers. comm.).
The variability of BF-exhibition observed in different almond cultivars is
hypothesized to be due, in part, to environmental conditions based on the location of the
orchards (Kester, 1969; Micke, 1996; Kester et al., 2004). Research has shown that
‘Nonpareil’ clones planted in orchards in regions of California experiencing the highest
temperatures in July (during almond summer dormancy) had the highest percent of BF-
exhibition over a seven-year period (Kester & Asay, R. N., 1978). More recently, work in
‘Carmel’ demonstrated a positive linear correlation between the average day temperature
in the previous June and the yearly change in the percent of trees showing BF from 1991
– 1998 (Kester et al., 2004). In a controlled, growth chamber experiment, shoots of no-
BF ‘Nonpareil’ were grown at high temperatures after which they exhibited severe,
internal BF-symptoms in the meristematic tissues compared to the shoots grown at
normal temperatures that remained BF-free (Hellali & Kester, 1979). Additionally, this
study also showed an increase in ABA levels in those shoots grown in the high-
temperature growth chamber compared to the control (Hellali & Kester, 1979).
Collectively, these results all suggest a strong environmental component impacts the
exhibition of the BF-phenotype in almond, namely heat stress during a pivotal point in
bud development and dormancy.
Based on the characteristics of BF in almond, it has been long-hypothesized to be
a genetic disorder (Wilson & Schein, 1956); however, more recent work suggests this
disorder may have an epigenetic component involving differential DNA methylation
(Fresnedo-Ramírez et al., 2017). Results from this study support the association between
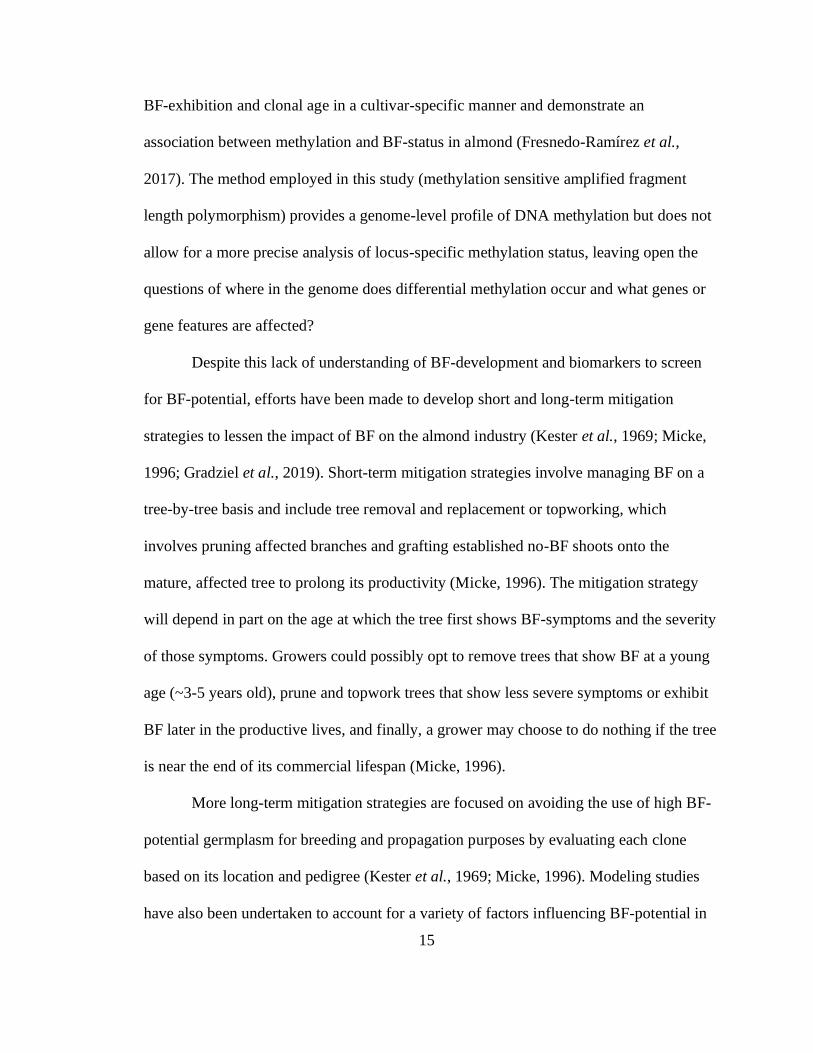
15
BF-exhibition and clonal age in a cultivar-specific manner and demonstrate an
association between methylation and BF-status in almond (Fresnedo-Ramírez et al.,
2017). The method employed in this study (methylation sensitive amplified fragment
length polymorphism) provides a genome-level profile of DNA methylation but does not
allow for a more precise analysis of locus-specific methylation status, leaving open the
questions of where in the genome does differential methylation occur and what genes or
gene features are affected?
Despite this lack of understanding of BF-development and biomarkers to screen
for BF-potential, efforts have been made to develop short and long-term mitigation
strategies to lessen the impact of BF on the almond industry (Kester et al., 1969; Micke,
1996; Gradziel et al., 2019). Short-term mitigation strategies involve managing BF on a
tree-by-tree basis and include tree removal and replacement or topworking, which
involves pruning affected branches and grafting established no-BF shoots onto the
mature, affected tree to prolong its productivity (Micke, 1996). The mitigation strategy
will depend in part on the age at which the tree first shows BF-symptoms and the severity
of those symptoms. Growers could possibly opt to remove trees that show BF at a young
age (~3-5 years old), prune and topwork trees that show less severe symptoms or exhibit
BF later in the productive lives, and finally, a grower may choose to do nothing if the tree
is near the end of its commercial lifespan (Micke, 1996).
More long-term mitigation strategies are focused on avoiding the use of high BF-
potential germplasm for breeding and propagation purposes by evaluating each clone
based on its location and pedigree (Kester et al., 1969; Micke, 1996). Modeling studies
have also been undertaken to account for a variety of factors influencing BF-potential in

16
an effort to establish more precise selection procedures when choosing germplasm
sources for propagation and breeding (Fenton et al., 1988a). Finally, a recent study tested
the use of basal epicormic or adventitious buds, representing ontogenetically young,
meristematic tissue, for use in propagation (Meier et al., 2012; Gradziel et al., 2019).
Since BF has been shown in several studies to be associated with advanced age,
particularly of the propagation source, Gradziel et al. (2019) proposes using basal
epicormic buds with lower BF-potential to establish commercial propagation stocks and
circumvent the impact of the advanced ontogenetic age of current propagation sources.
While this method could serve as an effective, long-term management strategy for BF in
almond, the question still remains as to the mechanisms underlying BF development in
this species.
Plant Epigenetics – DNA Methylation
Mechanisms of DNA methylation
The term “epigenetics” was first coined by Conrad Waddington in 1942 in a paper
focused on the connections between genotype and phenotype, particularly when
considering developmental processes and phenotypic plasticity (Waddington, 2012).
Later, Waddington conducted an experiment in Drosophila where he showed that an
acquired phenotype resulting from exposure to environmental stimuli could be inherited
(Waddington, 1956). We now consider this to be epigenetic inheritance and have since
defined the field of epigenetics as the study of stable and potentially heritable changes in
phenotype that occur without changes to the underlying DNA sequence (Waddington,
1956; Goldberg et al., 2007; Noble, 2015). These epigenetic phenomena include things

17
like paramutation, position effect variegation, and genomic imprinting (Goldberg et al.,
2007; Li & Sasaki, 2011; Elgin & Reuter, 2013; Hollick, 2017).
The molecular mechanisms underlying epigenetic phenomena are now being
uncovered including DNA methylation, histone modification, and expression of non-
coding RNAs (Goldberg et al., 2007). While the remainder of this review and dissertation
will focus on DNA methylation, it should be noted that epigenetic phenomena result from
a complex interaction of several mechanisms which are interdependent; thus, the bud-
failure phenotype in almond likely results not from one mechanism (i.e. DNA
methylation), but from a network of underlying, connected mechanisms (Goldberg et al.,
2007).
DNA methylation occurs when a methyl group is added to the fifth carbon of the
heterocyclic aromatic ring forming 5-methylcytosine and was first discovered by Rollin
Hotchkiss in 1948 (Hotchkiss, 1948; Moore et al., 2013). In plants, DNA methylation can
occur in one of three contexts: CG, CHG, and CHH, where H represents either a cytosine,
adenine, or thymine (Zhang et al., 2018). DNA methylation serves a variety of functions
in the plant genome, including silencing transposable elements and regulating gene
expression (Zhang et al., 2018).
The processes involved in regulating DNA methylation in plants include
establishment, maintenance, and removal of methylation at specific sites in the genome
(Moore et al., 2013; Zhang et al., 2018). DNA methylation is established de novo in
plants through a process known as RNA-directed DNA methylation (RdDM) (Law &
Jacobsen, 2010; Zhang & Zhu, 2011; Zhang et al., 2013; Matzke & Mosher, 2014). The
RdDM pathway is initiated through small interfering RNA (siRNA) production via either

18
RNA Polymerase IV (POL IV) or POL II and subsequent cleavage by a DICER-LIKE
PROTEIN (DCL2, DCL3, or DCL4) (Law & Jacobsen, 2010; Zhang et al., 2013; Matzke
& Mosher, 2014). Following this, siRNAs bind to ARGONAUTE 4 (AGO4) or AGO6
and pair to complementary scaffold RNAs produced by POL V (Law & Jacobsen, 2010;
Zhang et al., 2013; Matzke & Mosher, 2014). DNA methylation is then catalyzed by an
interaction between AGO4 and DOMAINS REARRANGED METHYLASE 2 (DRM2)
(Law & Jacobsen, 2010; Zhang et al., 2013; Matzke & Mosher, 2014). The process of
RdDM establishes new sites of DNA methylation in the plant genome in all methylation
contexts (Zhang et al., 2018).
Once DNA methylation is established, maintenance occurs through various
mechanisms depending on the context of methylation (Zhang et al., 2018). In the CG
context, methylation is maintained following replication by METHYLTRANSFERASE 1
(MET1) which recognizes hemi-methylated DNA (Kankel et al., 2003; Law & Jacobsen,
2010). DNA methylation is maintained in the CHG context by CHROMOMETHYLASE
3 (CMT3) which also binds to the histone mark H3K9me2 (Jackson et al., 2004; Du et
al., 2012; Stroud et al., 2014; Li et al., 2018a). Conversely, the methyltransferase
SUPPRESOR OF VARIEGATION 3-9 HOMOLOGE PROTEIN 4 (SUVH-4) binds
CHG methylation, recruiting the protein to methylatedH3K9 (Jackson et al., 2004; Du et
al., 2012; Stroud et al., 2014; Li et al., 2018a). This creates a positive feedback loop
between H3K9 and CHG methylation, where the presence of one reinforces the presence
of the other (Jackson et al., 2004; Du et al., 2012; Stroud et al., 2014; Li et al., 2018a).
Finally, CHH methylation is maintained by DRM2 via RdDM and by CMT2 in regions
where RdDM does not occur (Stroud et al., 2014).
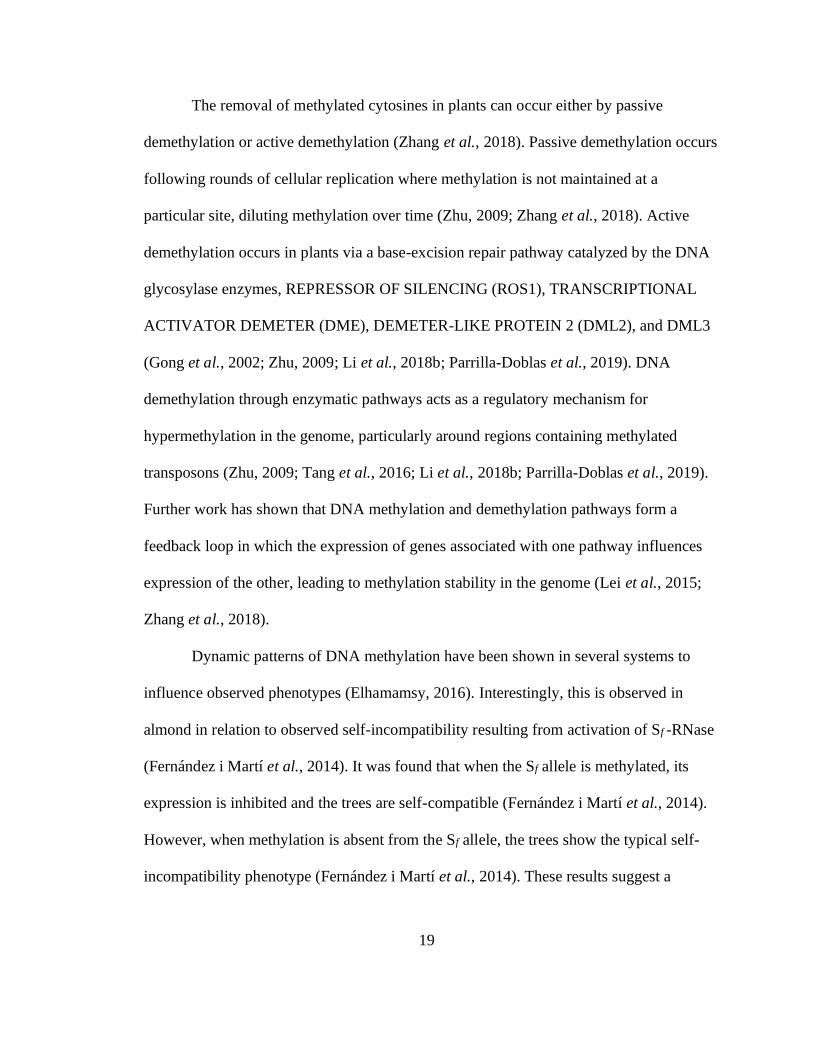
19
The removal of methylated cytosines in plants can occur either by passive
demethylation or active demethylation (Zhang et al., 2018). Passive demethylation occurs
following rounds of cellular replication where methylation is not maintained at a
particular site, diluting methylation over time (Zhu, 2009; Zhang et al., 2018). Active
demethylation occurs in plants via a base-excision repair pathway catalyzed by the DNA
glycosylase enzymes, REPRESSOR OF SILENCING (ROS1), TRANSCRIPTIONAL
ACTIVATOR DEMETER (DME), DEMETER-LIKE PROTEIN 2 (DML2), and DML3
(Gong et al., 2002; Zhu, 2009; Li et al., 2018b; Parrilla-Doblas et al., 2019). DNA
demethylation through enzymatic pathways acts as a regulatory mechanism for
hypermethylation in the genome, particularly around regions containing methylated
transposons (Zhu, 2009; Tang et al., 2016; Li et al., 2018b; Parrilla-Doblas et al., 2019).
Further work has shown that DNA methylation and demethylation pathways form a
feedback loop in which the expression of genes associated with one pathway influences
expression of the other, leading to methylation stability in the genome (Lei et al., 2015;
Zhang et al., 2018).
Dynamic patterns of DNA methylation have been shown in several systems to
influence observed phenotypes (Elhamamsy, 2016). Interestingly, this is observed in
almond in relation to observed self-incompatibility resulting from activation of Sf -RNase
(Fernández i Martí et al., 2014). It was found that when the Sf allele is methylated, its
expression is inhibited and the trees are self-compatible (Fernández i Martí et al., 2014).
However, when methylation is absent from the Sf allele, the trees show the typical self-
incompatibility phenotype (Fernández i Martí et al., 2014). These results suggest a

20
potential use for so called epialleles in plant breeding to produce plants with desirable
phenotypes like self-compatibility in almond (Quadrana et al., 2014).
Stress-induced DNA methylation and implications
Alterations in the DNA methylation patterns in plant genomes can occur for a variety of
reasons including as a response to biotic or abiotic stressors (Zogli & Libault, 2017;
Zhang et al., 2018; Alonso et al., 2019). Several studies have documented changes to the
plant methylome in response to exposure to a pathogen, including in both annual and
perennial plants (Zogli & Libault, 2017; Zhang et al., 2018; Alonso et al., 2019).
Hypomethylation mutants of the model plant, Arabidopsis, showed increased resistance
to the plant pathogen, Pseudomonas syringae pv. tomato DC3000 (Pst) (Dowen et al.,
2012). Further, an RNA sequencing experiment showed that those Arabidopsis mutants
exposed to the pathogen had a number of genes that were differentially expressed in
comparison to the un-exposed control, and those genes were associated with changes in
DNA methylation via their transcriptional networks (Dowen et al., 2012). Finally, a
global methylation profiling of wild-type Arabidopsis following infection with Pst
showed dynamic DNA methylation patterns at five days post infection at a number of loci
that are correlated with changes in gene expression (Dowen et al., 2012). Taken together,
these results show how important DNA methylation is in regulating defense-responses,
likely in an effort to modulate expression of defense-related genes when infections are
not present (Dowen et al., 2012). Additionally, this study shows the dynamic response
plants have once infection occurs, including not only changes in expression of defense-
related genes but also changes in patterns of DNA methylation across the genome
(Dowen et al., 2012).

21
Patterns of differential methylation were also observed in studies examining the
epigenome of Arabidopsis and soybean (Glycine max L.) after infection with the beet cyst
nematode (Heterodera schachtii A.Schmidt) and soybean cyst nematode (H. glycines
Ichinohe), respectively (Rambani et al., 2015; Hewezi et al., 2017). Results in the study
on Arabidopsis showed genome-wide hypomethylation patterns in response to nematode
infection (Hewezi et al., 2017). Similar results were observed in the soybean study where
hypomethylation was induced at a much greater rate compared to hypermethylation in the
genomes of infected plants (Rambani et al., 2015). A study in ash (Fraxinus excelsior L.)
revealed differential methylation patterns in clones showing high susceptibility to ash
dieback (ADB), a fungal disease, compared to clones showing low susceptibility (Sollars
& Buggs, 2018). When examining specific genes associated with susceptibility to ADB,
low susceptibility clones showed hypomethylation in those regions while high
susceptibility clones tend to be hypermethylated (Sollars & Buggs, 2018). Collectively,
the results from these studies suggest that DNA hypomethylation tends to be associated
with increased disease resistance, and that part of the defense response in plants involves
demethylation of genomic regions associated with defense-related genes (Zogli &
Libault, 2017; Alonso et al., 2019).
DNA methylation has also been implicated in plant response to abiotic stressors
including temperature, drought, salt, and UV radiation (Zhang et al., 2018; Chang et al.,
2020; Liu & He, 2020). Studies have been conducted on the impact of drought on DNA
methylation profiles in a number of plant species including Arabidopsis, rice (Oryza
sativa L.), poplar (Populus trichocarpa Torr. & A.Gray ex. Hook.), pea (Pisum sativum
L.), and barley (Hordeum vulgare L.) (Labra et al., 2002; Raj et al., 2011; Liang et al.,

22
2014; Wang et al., 2016; Chwialkowska et al., 2016; Ganguly et al., 2017). In rice, a
comparison of DNA methylation profiles generated from a drought-tolerant and a
drought-sensitive line under control conditions showed regions of differential hyper- and
hypomethylation associated with the drought tolerance, with DMR-associated genes
involved in processes related to drought stress tolerance (Wang et al., 2016). Each rice
line was also grown under drought conditions, and when comparing the methylome of the
drought-treated plants to those in the control treatment, more DMRs were detected in the
drought sensitive line compared to the drought tolerant line (Wang et al., 2016). Results
from the study in rice suggest that the drought tolerant line has a more stable methylome
compared to the drought sensitive line when exposed to drought stress, and subsequent
transcriptome analysis showed a correlation between these methylation patterns and
genes implicated in drought response (Wang et al., 2016).
Similarly, in studies in poplar and barley where DNA methylation profiles were
generated from plants under control conditions and drought stress, both hyper- and
hypomethylated regions of differential methylation were identified (Liang et al., 2014;
Chwialkowska et al., 2016). However, in pea root tissues, drought stress was associated
with genome-wide hypermethylation (Labra et al., 2002). A study in tobacco also showed
hypermethylation following osmotic stress; however, this experiment was performed
using a cell suspension rather than whole plants (Nagata et al., 1992; Kovar˘ik et al.,
1997). As in plant defense, it is clear that plants experience a dynamic, epigenetic
response to abiotic stress such as drought, and changes in DNA methylation patterns
likely affect expression of genes associated with these responses (Chang et al., 2020; Liu
& He, 2020).

23
In addition to studies on drought stress response, heat stress has been a focus of
research on epigenetic responses to abiotic stimuli (Liu et al., 2015; He et al., 2021). This
focus is due in part to increasing global temperatures occurring and predicted as a result
of climate change and an interest in developing resilient crops able to withstand these
perturbations (Liu et al., 2015; Saraswat et al., 2017). Several studies have been
conducted to analyze epigenetic changes resulting from exposure to heat stress that show
complex alterations similar to what is seen in response to other stressors (Liu et al.,
2015). In Arabidopsis, exposure to heat stress was found to upregulate genes involved in
the RdDM pathway, suggesting that heat stress prompts stabilization of methylation
levels throughout the genome (Naydenov et al., 2015). Additionally, methylation levels
increased in the promoter region of key stress response genes in wildtype Arabidopsis in
the presence of and following exposure to heat stress in comparison to a mutant line with
defective POL IV and POL V subunits (Naydenov et al., 2015). Interestingly, another
study in Arabidopsis showed increased genome-wide methylation in the progeny of
plants (parents) exposed to heat stress prior to crossing, suggesting that heat stress not
only induces hypermethylation but that this effect can be inherited at least to the first-
generation progeny (Boyko et al., 2010).
Research exploring epigenetic phenomena in response to heat stress has extended
into perennials including trees (Bräutigam et al., 2013; Amaral et al., 2020). A study in
cork oak (Quercus suber L.), where plants were artificially exposed to heat stress in a
controlled greenhouse setting, showed an increase in global methylation levels at high
temperatures (Correia et al., 2013). A landscape-level study in valley oak (Quercus
lobata Née) revealed a significant correlation between what are described as single-

24
methylation variants, akin to single nucleotide polymorphisms, and maximum
temperature (Gugger et al., 2016). Results from this study suggest that DNA methylation
may play a role in adaptation to climate and plant plasticity in response to temperature
changes (Gugger et al., 2016).
While results from studies on plant response to stress show a clear effect on or of
DNA methylation patterns, the question remains as to whether these changes are heritable
and how inheritance might influence a progeny’s response to the same stress (Avramova,
2015; Lämke & Bäurle, 2017; Sudan et al., 2018). Research in this area examines “stress
memory” or the ability of progeny to withstand the same stress that was previously
applied to their parents (Crisp et al., 2016; Lämke & Bäurle, 2017; Zheng et al., 2017). In
these studies, researchers aim to address questions like: are epigenetic alterations
resulting from exposure to stress stably inherited, and do these alterations extend some
benefit to subsequent generations when exposed to the same stress?
Two terms have been established to define the inheritance of epigenetic
modifications following stress: intergenerational and transgenerational (Lämke & Bäurle,
2017; Liu & He, 2020). Intergenerational refers to inheritance of profiles by the direct
progeny, while transgenerational refers to inheritance by at least two stress-free
generations (Lämke & Bäurle, 2017; Liu & He, 2020). Recent work in scots pine (Pinus
sylvestris L.) demonstrates intergenerational inheritance of “stress memory” using
offspring from trees either exposed to drought conditions or control conditions (Bose et
al., 2020). Results from this work showed that those offspring from the drought-exposed
parents performed better under drought conditions than those offspring from the control
parents, despite finding no significant genetic differentiation among the offspring (Bose

25
et al., 2020). The hypothesis is that this “stress memory” passed to the immediate
offspring may provide an adaptive advantage when those individuals are exposed to the
same stress as their progenitors (Crisp et al., 2016). The question remains as to how
durable this “priming” is in subsequent generations which is particularly relevant for
perennial species.
Despite the advantages imposed on the offspring in intergenerational inheritance
of “stress memory”, it is unclear whether the advantages continue for subsequent
generations via transgenerational inheritance or if the costs outweigh any potential
benefits (Crisp et al., 2016). A study in Arabidopsis showed that changes in DNA
methylation following hyperosmotic stress were inherited by first generation progeny of
exposed parents, but these changes were lost after one generation of no stress (Wibowo et
al., 2016; Ganguly et al., 2017). Methylation patterns were also shown to be transmitted
through the female germline (Wibowo et al., 2016). In rice, however, epi-mutations
observed following drought stress were maintained for the 11 generations examined in
the study, leading the authors to conclude that these epimutations are not only stable but
could contribute to long-term adaptation in rice (Zheng et al., 2017). Inheritance of
epigenetic alterations like changes in DNA methylation has implications for plant
phenotypic plasticity, evolution, and population structuring (Agrawal, 2011; Benayoun et
al., 2015; Quadrana & Colot, 2016; Wibowo et al., 2018).
While it is clear from the research that DNA methylation and epigenetic
phenomena are influenced by and influence responses to biotic and abiotic stressors,
many questions regarding the inheritance of these modifications remain unanswered
(Crisp et al., 2016). However, many researchers are motivated by the potential

26
applications of inter- and transgenerational inheritance of epigenetic alteration for plant
breeding and crop improvement efforts in the future (Saraswat et al., 2017; Varotto et al.,
2020). This work is driven in particular by the unknowns surrounding climate change and
the impacts of climate perturbations on agricultural production worldwide (Saraswat et
al., 2017; Varotto et al., 2020).
Methods for measuring DNA methylation
A variety of sequencing, PCR, and chromatography-based methods are currently
available to profile DNA methylation in plant genomes (Parle-Mcdermott & Harrison,
2011; Yong et al., 2016). Whole genome bisulfite sequencing (WGBS) is considered the
“gold standard” for measuring genome-wide methylation at the single nucleotide level
(Frommer et al., 1992; Grunau et al., 2001). This approach couples bisulfite treatment
with high-throughput sequencing (HTS) technology to produce a genome-wide profile of
DNA methylation (Yong et al., 2016). Prior to sequencing library preparation, DNA is
bisulfite treated, deaminating unmethylated cytosines to uracils while leaving 5-
methylcytosines intact (Frommer et al., 1992; Huang et al., 2010). Subsequent PCR
following bisulfite treatment converts uracils to thymines, producing thymine-cytosine
mismatches upon read alignment (Grunau et al., 2001; Huang et al., 2010). Once the
samples are bisulfite treated, sequencing libraries can be prepared through a variety of
kit-based or alternative methods, and libraires can be indexed for multiplexing prior to
sequencing on any HTS platform (Yong et al., 2016).
Limitations to WGBS include severe DNA degradation (up to 90%) at the
bisulfite treatment step, greatly reducing the amount of input DNA for library preparation
(Raizis et al., 1995; Tanaka & Okamoto, 2007). Additionally, incomplete conversion of

27
unmethylated cytosines to uracils can bias the results and lead to overestimates of
genome-wide methylation levels (Olova et al., 2018). Conversion efficiency can be
calculated either based on the amount of methylation detected in the chloroplast genome,
which is assumed to be completely unmethylated (Fojtová et al., 2001), or by spiking in
methylated or unmethylated control DNA prior to bisulfite treatment (Warnecke et al.,
2002). Another limitation of WGBS is low mapping efficiency following sequencing,
particularly in species with limited or less-developed genomic resources (Olova et al.,
2018). To overcome this issue, greater sequencing depth is required to ensure adequate
coverage of cytosines following alignment (Ziller et al., 2015).
While WGBS is the standard method to profile genome-wide methylation at the
single nucleotide level, a number of other methods are also available to profile DNA
methylation (Parle-Mcdermott & Harrison, 2011; Yong et al., 2016). Recently, an
enzymatic methylation sequencing approach was developed that couples conversion of
unmethylated cytosines to uracils by enzymatic reactions with HTS platforms (Vaisvila et
al., 2020). The enzymes TET2 and APOBEC catalyze the reactions necessary to convert
unmethylated cytosines without losing the integrity of the DNA sample (Vaisvila et al.,
2020). This method shows promise as an alternative to bisulfite treatment for profiling
DNA methylation at single-bases (Vaisvila et al., 2020; Feng et al., 2020). One limitation
of both the enzymatic methylation sequencing and WGBS is the cost and low throughput
nature of the approaches (Olova et al., 2018; Zhou et al., 2019). Reduced representation
bisulfite sequencing (RRBS) is a method that allows more targeted methylation profiling
by first performing a digestion and size selection on DNA samples prior to bisulfite
conversion and library preparation (Schmidt et al., 2017; Paun et al., 2019). Enzymes are

28
selected based on their sensitivity to the presence of 5-methylcytosine to enrich for
regions of the genome likely to contain high levels of methylation (Wang et al., 2013;
Schmidt et al., 2017). This approach can be applied in a more high-throughput manner
and thus, is desirable when a researcher would like to profile many samples at a reduced
cost (Wang et al., 2013; Schmidt et al., 2017; Paun et al., 2019). A modification of
RRBS was recently developed called epi-genotype by sequencing (epiGBS) where
methylation profiling via RRBS is coupled with a GBS approach to identify not only
epialleles but also potential single-nucleotide polymorphisms (Gurp et al., 2016).
Non-sequencing-based methods are also available to profile methylation levels
including chromatography, array-based, and PCR-based methods (Fraga & Esteller,
2002). Chromatography methods are used to quantify global DNA methylation levels and
are desirable because they are high-throughput and relatively inexpensive compared to
sequencing-based methods (Fraga & Esteller, 2002; Kurdyukov & Bullock, 2016). The
limitation to these approaches, however, is the loss of precision in determining where in
the genome differential methylation occurs when comparing samples (Fraga & Esteller,
2002; Kurdyukov & Bullock, 2016). Available chromatography methods include high
performance liquid chromatography (HPLC), capillary electrophoresis (CE), and liquid
chromatography-mass spectrometry (LC-MS) (Ramsahoye, 2002; Stach et al., 2003;
Song et al., 2005; Armstrong et al., 2011). One limitation to HPLC methods is that they
require large amounts of input DNA (up to 50 g), which can be difficult to obtain in
some plant species or with limited available tissue; however, alternative HPLC methods
are being developed that require lower DNA inputs (Armstrong et al., 2011; Yotani et al.,
2018). Both CE and LC-MS methods are more sensitive and thus require less input DNA

29
but can be time-consuming and require optimization for each tissue-type and species
(Stach et al., 2003; Song et al., 2005).
PCR-based methods are also available to profile and validate DNA methylation,
including methylation-sensitive amplified fragment length polymorphism (MS-AFLP)
and chop-PCR (Hernández et al., 2013; Šestáková et al., 2019). In MS-AFLP,
isoschizomers with different methylation sensitivities are used to perform digests on
DNA samples from the same individual (Xu et al., 2000). Following digestion and
adaptor ligation, PCR amplification is performed, and fragmentation patterns are
visualized to determine differences between the banding patterns of the two enzymes (Xu
et al., 2000). The difference in banding patterns between the isoschizomers provides
distinct methylation profiles for the individual tested (Xu et al., 2000). To analyze
methylation patterns at targeted loci, chop-PCR also utilizes methylation sensitive
restriction enzymes that cannot cut when methylated cytosines are present at the cut-site
(Dasgupta & Chaudhuri, 2019). Digests are performed followed by PCR with primers
specific to the regions of interest (Dasgupta & Chaudhuri, 2019). If methylation is
present at the region, the section of DNA will be maintained and amplicons produced via
PCR; however, if the region in unmethylated, the enzyme will cut and there will be no
template for PCR (Dasgupta & Chaudhuri, 2019). Visualization of the PCR product
compared to control reactions with no enzyme validate the presence or absence of DNA
methylation at the site (Dasgupta & Chaudhuri, 2019).
Several pipelines for analyzing methylation data, particularly those generated
through HTS approaches, have been developed (Krueger et al., 2012; Wreczycka et al.,
2017). These pipelines generally include the same initial steps, which are quality control

30
of sequencing data, aligning reads to the genome, and calling methylated and
unmethylated cytosines (Krueger et al., 2012). The first hurdle in the analysis of
methylation data compared to other types of sequencing data is alignment to the reference
genome. Due to the nature of methylation sequencing, which involves conversion of
unmethylated cytosines to uracils, traditional alignment algorithms will not work because
of the number of mismatches between the sequenced reads and the genome and the
resulting low complexity of the libraries (Krueger et al., 2012; Wreczycka et al., 2017).
Therefore, alignment algorithms have been adapted to work with converted and
unconverted versions of the genome (Krueger et al., 2012).
In these pipelines, two versions of the genome are created, one with a cytosine-to-
thymine conversion and one with a guanine-to-adenine conversion (Krueger et al., 2012).
This conversion is repeated for each read, and the pair of reads are aligned to each
version of the genome (Krueger et al., 2012). The best alignment is chosen from the four
possible alignments (Krueger et al., 2012). The software package Bismark (Krueger &
Andrews, 2011) is commonly used to perform this type of alignment, relying on bowtie2
(Langmead & Salzberg, 2012) with modifications included to generate the converted
version of the genome. Resulting mapping efficiencies have a tendency to be lower than
in traditional sequencing (i.e., RNA-seq or whole genome sequencing), due primarily to
mismatches and the low complexity of the methylation data (Krueger et al., 2012; Sun et
al., 2018).
Following alignment, methylation calls are generated based on the number of
reads associated with each cytosine and the methylation status of those reads (Krueger &
Andrews, 2011). Ideally, all reads associated with a cytosine are either methylated or
31
unmethylated; however, issues like incomplete conversion or a mixture of cell types can
result in noncorresponding reads for a single cytosine (Krueger et al., 2012). For this
reason, methylation is typically presented as a weighted percentage, taking into account
the total number of reads for each cytosine and the number of reads reported as
methylated (Krueger et al., 2012; Schultz et al., 2012). After methylation is called across
the genome for each library, these call or count files are used as input to software
packages designed to identify significantly differentially methylated regions (DMRs)
between two or more treatments (Krueger et al., 2012; Wreczycka et al., 2017). Several
software packages are available to call DMRs that rely on different statistical models
(Wreczycka et al., 2017). Common approaches used to identify DMRs include t-
tests/linear regression, logistic regression, and beta binomial regression (Wreczycka et
al., 2017). Selection of the appropriate model depends on the experimental design
including number of replicates and presence of covariates (Wreczycka et al., 2017).
Plant Telomere Biology
Telomere function and mechanisms of maintenance
Telomeres are nucleoproteins that cap the end of chromosomes, preventing premature
instability of genomic material and cellular senescence due to the end replication problem
(Blackburn, 2000; Hemann et al., 2001; Watson & Riha, 2010, 2011). The telomeric cap
is comprised of repeating, heptanucleotide telomeric DNA sequence and telomere
binding proteins (Kuchar, 2006; Procházková Schrumpfová et al., 2016). In most plants,
including Arabidopsis and Rosaceous species, the telomeric repeat sequence is
TTTAGGG (Fuchs et al., 1995); however, several exceptions exist including in members
of the Alliaceae (onion) (Pich et al., 1996) and the Solanaceae family (Sykorova et al.,

32
2003), as well as members of the order Asparagales (Fajkus et al., 2005). The total
average length of the telomeric DNA sequence can vary considerably between and even
within species, with the shortest telomeric sequence in plants reported in Physcomitrella
patens (Hedw.) Bruch & Schimp. at 500 bp and the longest in Nicotiana sylvestris Speg.
& Comes at 200 kb (Procházková Schrumpfová et al., 2016).
The associated proteins that bind to telomeric DNA are involved in stability and
maintenance of the telomeric sequence and include double-stranded DNA-associated
proteins, single-stranded DNA-associated proteins, and telomerase (Kuchar, 2006;
Procházková Schrumpfová et al., 2016). The double-stranded DNA-associated proteins
include Myb-like proteins with a Myb domain at either the C- or N-terminus (Kuchar,
2006; Procházková Schrumpfová et al., 2016). In addition to the observed function in
maintaining telomere length in several plant species, N-terminus Myb-like proteins have
also been found to be epigenetic regulators involved in controlling H3K27 methylation
(Procházková Schrumpfová et al., 2016; Zhou et al., 2016). In fact, several genes
involved in epigenetic regulation in plants, including DNA methyltransferases, play a
role in maintaining telomere lengths as has been shown in Arabidopsis (Ogrocká et al.,
2014; Vega-Vaquero et al., 2016; Xie & Shippen, 2018).
The specialized reverse transcriptase telomerase is likely the most well-studied of
the proteins involved in regulating telomere length, due in part to its potential human-
health applications (Fossel, 1998; Boccardi & Paolisso, 2014; Nagpal & Agarwal, 2020).
In animals, telomeres shorten over mitotic cellular divisions due to decreased activity or a
lack of telomerase; however, malignant cells seem to have increased telomerase activity,
thought to contribute to their longevity (Boccardi & Paolisso, 2014; Nagpal & Agarwal,

33
2020). Telomerase and its function in maintaining telomeres is conserved in plants;
however, the nature of telomerase expression and thus modulation of telomere length in
plants seems to differ from what is observed in animals (Procházková Schrumpfová et
al., 2019).
In plants, telomerase is made up of the catalytic subunit TERT (Oguchi et al.,
1999) and an RNA subunit that serves as a template for reverse transcription
(Procházková Schrumpfová et al., 2016, 2019). Expression of the TERT gene in
Arabidopsis was shown to be a marker of telomerase activity, and when TERT is
disrupted, there is a slow shortening of telomeres over multiple generations (Fitzgerald et
al., 1999). Telomerase activity and subsequent telomere shortening in plants appears to
be a much more dynamic and plastic process compared to that in animals (Fitzgerald et
al., 1996). Several studies have documented declining telomerase activity and telomere
length following cell differentiation and division in plants, but simultaneously observe
high levels of telomerase activity in meristematic and reproductive tissues (Fitzgerald et
al., 1996; Kilian et al., 1998; Zachová et al., 2013; Jurečková et al., 2017). Interestingly,
a study monitoring telomerase activity in cauliflower found that the DNA binding
requirement seen in other species was more relaxed, suggesting some plant telomerases
may be able to initiate telomere elongation on broken chromosomes or those missing
large segments of existing telomeric sequence (Fitzgerald et al., 1996).
Methods for measuring telomere length
Several methods have been developed to measure telomere lengths in plants and other
organisms (Aubert et al., 2012; Montpetit et al., 2014; Lai et al., 2018). Terminal
restriction fragment (TRF) analysis using Southern blot is considered the “gold standard”
34
of telomere length measurement (Kimura et al., 2010; Aubert et al., 2012). The TRF
method relies on an enzymatic digestion of genomic DNA that preserves the telomeric
sequence followed by resolution via gel electrophoresis (Kimura et al., 2010). The
telomere fragments are then detected by Southern blot using a labeled probe, and both the
length and intensity of the resulting smear are used to calculate telomere length in the
original sample (Kimura et al., 2010). The limitations of TRF analysis include low
sensitivity in detecting short telomeres and a high genomic DNA input requirement,
precluding this method from samples with low tissue availability (Aubert et al., 2012).
Recently, more sensitive methods have been developed to detect and measure
telomere lengths including quantitative PCR (qPCR)-based methods and in silico
approaches utilizing whole-genome sequencing data (Aubert et al., 2012; Lee et al.,
2017; Lin et al., 2019). The initial qPCR method was developed in 2002 and works by
amplifying telomeric sequence (T) using primers specially designed to avoid the
formation of primer dimers but still anneal to the repetitive sequence (Cawthon, 2002). A
single copy gene (S) is selected and amplified from the same sample to serve as a control
sequence (Cawthon, 2002). A relative T/S ratio is then calculated based on the cycle of
quantification (Cq) values detected for each primer pair reaction (Cawthon, 2002). This
T/S ratio was found to correlate with the telomere length calculated based on TRF
analysis, suggesting that qPCR is a robust method for measuring relative telomere lengths
(Cawthon, 2002; Lin et al., 2019). A modified version of this protocol called
monochrome multiplex qPCR (MMQPCR) was subsequently developed that allows
multiplexing of the T and S reactions in a single well to reduce technical variation
produced when separate reactions are prepared (Cawthon, 2009). Quantitative PCR-based

35
methods are increasingly used to measure telomere lengths, especially in clinical settings
where high throughput processing is necessary and samples may be limited (Montpetit et
al., 2014; Lin et al., 2019). The MMQPCR method has also been effectively
implemented in plant systems to produce telomere length measurements comparable to
the TRF method (Vaquero-Sedas & Vega-Palas, 2014).
Finally, tools to measure telomere lengths using whole-genome sequencing data
have recently been developed that show strong correlations with wet lab-based methods
(Lee et al., 2017). These in silico approaches typically require an input telomeric repeat
sequence (i.e., TTTAGGG for most plants) and a haploid chromosome number (Lee et
al., 2017). Additionally, the algorithms used to detect telomeric repeats in the aligned
sequencing reads account for possible issues like interstitial telomeric sequence that
might confound telomere length measurements (Lee et al., 2017). A limitation of these
methods is that they require whole-genome sequencing data aligned to a high-quality
reference genome. Availability of this type of genomic resource is limited for certain
species due to high-cost and/or biological issues preventing generation of high-quality
genome (Lee et al., 2017). However, this method could be used to address questions
related to telomere length using the abundance of whole-genome sequencing data already
available in public repositories.
Aging in Perennial Plants
Biological predictors of age
The ability to predict biological age (as opposed to chronological age) has been a focus of
aging research in humans for decades as biological age is associated with the
development of a myriad of conditions and disorders (e.g., Alzheimer’s, diabetes, cancer,

36
etc.) (Freude et al., 2010; Jylhävä et al., 2017). The rationale for establishing biological
predictors of age is that chronological age alone does not necessarily associate with the
development of certain disorders, and predisposition or likelihood of experiencing age-
related effects is better predicted by other factors (Freude et al., 2010; Jylhävä et al.,
2017). Efforts to uncover predictors of biological age in humans have led to several
proposed “biological clock” models including the use of telomere length, DNA
methylation, and protein glycosylation (Runov et al., 2015; Benayoun et al., 2015;
Jylhävä et al., 2017; Xiao et al., 2019). These models have been well-studied in humans
for their suitability to predict prevalence and severity of a wide-range of conditions,
including more recently, COVID-19 disease (Hillary et al., 2020; Lauc & Sinclair, 2020).
To date, little effort has been made to apply biological predictors of age or
develop “biological clock” models in plants despite the potential suitability for long-lived
perennials or clonally propagated species (Thomas, 2013; Brutovská et al., 2013). This is
due in part to complications in applying models of aging developed in animals to plants,
particularly those plants with multiple reproductive cycles or that can be clonally
propagated (Thomas, 2002; Van Dijk, 2009; Brutovská et al., 2013; Salguero-Gomez,
2018). Another issue in considering and developing models of aging in plants is that of
scale, as aging is often considered in the scope of a human lifetime which can be an order
of magnitude shorter than that of long-lived plants (Thomas, 2002, 2013; Ally et al.,
2010). With these caveats in mind, several published studies have attempted to uncover
patterns in plant aging and develop biomarkers of biological age in plants similar to those
developed in humans (Thomas, 2013; Brutovská et al., 2013).

37
One model of aging applied to plants is that of somatic DNA mutation
accumulation, where irreversible cell and tissue damage occurs as a result of the
accumulation of deleterious mutations over time (Brutovská et al., 2013; Jylhävä et al.,
2017; Schoen & Schultz, 2019). As in humans, the accumulation of mutations is thought
to occur as a result of a breakdown in the repair machinery in cells, where the energy cost
of repair is no longer worth the expense, and DNA mutations are allowed to accumulate
(Jylhävä et al., 2017; Schoen & Schultz, 2019). Several studies have addressed the
accumulation of somatic mutations in plants; however, many of these have focused on
annual plants with only one reproductive cycle where aging is synonymous with
senescence (Brutovská et al., 2013; Dubrovina & Kiselev, 2016; Schoen & Schultz,
2019). In Arabidopsis, somatic mutations were shown to accumulate at a rate of 7 x 10⁻⁹
base substitutions per generation (Ossowski et al., 2010), and the rate of point mutations
in individual plants increased substantially throughout development in studies where ages
ranged from 2-days-old to 12-weeks-old (Kovalchuk et al., 2000; Boyko et al., 2006;
Golubov et al., 2010; Kiselev et al., 2015). In long-lived perennials, however, the somatic
mutation rate has been found to be lower than that of annuals, suggesting these species
differ in their ability to maintain genomic integrity (Schoen & Schultz, 2019). For
example, a study profiling fixed-somatic mutations in the canopy of a 234-year-old oak
(Quercus robur L.) found a low number of mutations relative to what has been observed
in annual species (Schmid-Siegert et al., 2017). This trend has been observed in other
long-lived perennials, where the somatic mutation rate is lower than what is documented
in annual species (Orr et al., 2020; Hofmeister et al., 2020).

38
Another model of aging applied in plants is telomere length shortening, where the
nucleoprotein caps of chromosomes shorten over time, eventually leading to genome
instability and cell death (Watson & Riha, 2011; Sanders & Newman, 2013; Marioni et
al., 2016). Telomere length reduction has been demonstrated as a biomarker of aging and
predictor of several diseases and disorders, including cancers, in humans and is one of the
most well-studied biomarkers of age in plants (Watson & Riha, 2011; Sanders &
Newman, 2013; Marioni et al., 2016). Unlike animals, however, the relationship between
telomere length and age in plants is not as clear (Watson & Riha, 2011). Previous studies
in both Ginkgo biloba L. and Panax ginseng C.A.Mey showed a pattern of increased
telomere length with increased age (Liu et al., 2007; Liang et al., 2015). Work in apple
(Malus domestica Borkh.) and Prunus yedoensis Matsum, both members of the
Rosaceae family, showed no change in telomere lengths with increased plant age over a
five-year timespan (Moriguchi et al., 2007). In bristlecone pine (Pinus longaeva
D.K.Bailey), a long-lived perennial gymnosperm, telomere lengths measured in needle
and root tissues between 0–3500 years old showed a cyclical pattern of lengthening and
shortening with age (Flanary & Kletetschka, 2005). Further, when analyzing telomere
length in relation to tissue differentiation, studies in both barley and Scots pine showed
telomere shortening from embryo development to leaf or needle formation (Kilian et al.,
1995; Aronen & Ryynänen, 2012). Similarly, in silver birch (Betula pendula Roth),
telomeres shorten when plants are grown in tissue culture conditions compared to those
grown outdoors, suggesting abiotic stressors may also induce telomere shortening
(Aronen & Ryynänen, 2014). Taken together, results from these studies and others
suggest that a model of aging in plants that employs telomere length as a predictor will

39
likely be more complex than existing models developed for animals (Watson & Riha,
2011; Brutovská et al., 2013).
Finally, the model of aging related to the level of epigenetic alterations in the
genome has been more recently applied in plants showing not only a pattern associated
with age but also a heritable component to epigenetic changes that occur during a plant’s
lifetime (Ay et al., 2014; Quadrana & Colot, 2016; Dubrovina & Kiselev, 2016; Wibowo
et al., 2018; Xiao et al., 2019). In Arabidopsis, a measurement of methylation at two loci
in the genome revealed a decrease in methylation with increased age from 1 to 12 weeks
(Ogneva et al., 2016). This same study also showed a decrease in expression of key
methyltransferase genes, which are responsible for maintaining context-specific
methylation, with increased plant age (Ogneva et al., 2016). A similar pattern was
observed in other species including chicory (Cichorium intybus L.), Acacia mangium
Willd., chestnut (Castanea sativa Mill.), and giant sequoia (Sequoiadendron giganteum
(Lindl.) J.Buchh.), where methylation levels in juvenile tissues are higher compared to
levels in mature tissues (Demeulemeester et al., 1999; Baurens et al., 2004; Hasbún et al.,
2007; Monteuuis et al., 2008, 2009). However, several studies observed the opposite
trend, where juvenile tissues show lower levels of methylation in comparison to mature
tissues including in Monterey pine (Pinus radiata D.Don), peach, eucalyptus (Eucalyptus
urophylla E. grandis), coast redwood (Sequoia sempervirens (D.Don) Endl.), and Moso
bamboo (Phyllostachys heterocycle (Carrière) J.Houz.) (Bitonti et al., 2002; Fraga et al.,
2002; Valledor et al., 2010; Mankessi et al., 2011; Guo et al., 2011; Huang et al., 2012;
Yuan et al., 2014; Zhang et al., 2021). Results from these studies suggest that, similar to
telomere length, age-related changes in DNA methylation in plants do not follow the

40
same patterns previously seen in animals (Dubrovina & Kiselev, 2016). Thus, models of
plant aging that include DNA methylation will likely be complex and may need to take
additional factors into account (Dubrovina & Kiselev, 2016). Despite the seemingly
contradictory results in studies focused on the association between age and DNA
methylation in plants, it is clear that alterations in DNA methylation occurring over time
have impacts on processes including gene expression (Dubrovina & Kiselev, 2016).
Aging-induced disorder development in plants
While several studies have implicated aging in the development of disorders in humans,
research on the development of aging-induced disorders in plants is very limited
(Thomas, 2002; Gensous et al., 2017). The impact of aging on plants is particularly
important when considering productive perennials such as fruit and nut crops (Munné-
Bosch, 2007). Studies focused on perennial plant aging often ask the question: do these
species actually age, and if so, how does this aging occur? (Munné-Bosch, 2007, 2008).
Work addressing the questions surrounding perennial plant aging have shown that
perennials do age, and some of the impacts of this process can mirror what is observed in
other species (Munné-Bosch, 2007, 2008, 2020).
It has been noted in several studies that as perennials age, particularly long-lived
perennials, there is a reduction in photosynthetic capacity and reproductive success
(Munné-Bosch, 2007, 2020). There are several proposed theories for why this occurs,
including the size of the plant and the accumulation of oxidative stress, which could be
related to either somatic mutations or to changes in epigenetic profiles including DNA
methylation (Van Dijk, 2009; Ally et al., 2010). Two studies focused on aging in the
perennial shrub, romerina (Cistus clusii Dunal), showed markers of oxidative stress and
41
changes in abscisic acid with increased age (Munné-Bosch & Alegre, 2002; Munné-
Bosch & Lalueza, 2007). Accumulation of oxidative stress including reactive oxygen
species (ROS), also known as the “free radical theory” of aging, is well-studied in
animals and could be one explanation for the decrease in plant photosynthetic capacity as
plants age (Beckman & Ames, 1998; Munné-Bosch, 2007). This theory was tested in the
long-lived perennial herb, Borderea pyrenaica (Bubani et Bordère ex Gren.) Miegev.,
and no signs of age-dependent oxidative stress were found, suggesting accumulation of
oxidative stress may not occur universally in all perennials (Morales et al., 2013). The
presence of ROS has also been found to be involved in cell wall lignification processes,
which are of particularly relevance to perennial plant aging as most tree structures
become lignified as the tree ages (Thomas, 2013; Lee et al., 2018). Antioxidants such as
superoxide dismutases play a role in regulating ROS accumulation in plants, including
Rosaceous species (Li et al., 2021), however activity of these enzymes over time is still
not well understood. Additional work in other productive perennials, including fruit and
nut trees, would provide further insights into how oxidative stress impacts these species
and what impact that stress might have on production.
In almond, as was described above, non-infectious bud-failure is known to be
associated with age (Kester et al., 2004). The underlying mechanisms contributing to
development of this disorder, however, remain unknown (Kester et al., 2004). As a
clonally propagated crop, the biological ages of almond individuals are difficult to
determine (Salguero-Gomez, 2018). Further, DNA methylation has been shown to be
associated with development of the disorder (Fresnedo-Ramírez et al., 2017). The
exhibition of an aging-related disorder and its impact on production is likely not isolated

42
to almond, and the possibility exists for the exhibition of aging-related disorders in other
productive perennials. Therefore, it is necessary to develop biomarkers of age in almond
(applying either the aging model of telomere length or epigenetic alterations), and to
determine what, if any, impact changes in DNA methylation profiles might have on the
exhibition of bud-failure in this species.
Dissertation Objectives
1. Assess the suitability of telomere length and telomerase reverse transcriptase (TERT)
expression as biomarkers of age in almond.
a. Measure telomere length in cohorts of almond breeding selections of distinct
age over a two-year period using both leaf and bud tissue.
b. Measure TERT expression in cohorts of almond breeding selections of
distinct age over a two-year period using leaf tissue.
2. Profile DNA methylation in cohorts of almond breeding selections of distinct age to
determine the association of age and methylation in almond genomes.
a. Measure weighted genome-wide methylation in each of the three methylation
contexts in 70 almond methylomes representing three distinct age cohorts.
b. Identify regions of the genome exhibiting differential methylation patterns
(DMRs) when comparing the cohorts and annotate the identified regions to
determine what genetic components are associated with the differential
methylation patterns.
3. Profile DNA methylation in two sets of monozygotic twin almonds discordant for
non-infectious bud-failure exhibition.

43
a. Measure weighted genome-wide methylation in each of the three methylation
contexts in two sets of twin almonds to determine patterns of hypo- or
hypermethylation associated with non-infectious bud-failure exhibition.
b. Identify regions of the genome exhibiting differential methylation patterns
(DMRs) when comparing individuals within each twin pair.
c. Determine the proximity of each identified DMR to the closest gene
(upstream, intragenic, or downstream) and identify DMRs from each twin
pair comparison that are associated with the same gene.
d. Annotate genes associated with DMRs to identify possible processes or
mechanisms underlying non-infectious bud-failure exhibition in almond.
e. Profile gene expression in two sets of almond twins to determine patterns of
differential expression associated with non-infectious bud-failure exhibition
and with differentially methylated regions identified in objective 3b.

44
References
Agrawal AA. 2011. Current trends in the evolutionary ecology of plant defence.
Functional Ecology 25: 420–432.
Albala K. 2009. Almonds along the silk road: The exchange and adaptation of ideas from
West to East. Petits Propos Culinaires 88: 19–34.
Ally D, Ritland K, Otto SP. 2010. Aging in a long-lived clonal tree. PLOS Biology 8:
e1000454.
Almond Board of California. 2020. Almond almanac. Modesto, CA: Almond Board of
California.
Alonso JM, Ansón JM, Espiau MT, Socias i Company R. 2005. Determination of
endodormancy break in almond flower buds by a correlation model using the average
temperature of different day intervals and its application to the estimation of chill and
heat requirements and blooming date. Journal of the American Society for Horticultural
Science 130: 308–318.
Alonso C, Ramos‐Cruz D, Becker C. 2019. The role of plant epigenetics in biotic
interactions. New Phytologist 221: 731–737.
Amaral J, Ribeyre Z, Vigneaud J, Sow MD, Fichot R, Messier C, Pinto G, Nolet P,
Maury S. 2020. Advances and promises of epigenetics for forest trees. Forests 11: 976.
Anderson JV, Chao WS, Horvath DP. 2001. A current review on the regulation of
dormancy in vegetative buds. Weed Science 49: 581–589.
Armstrong KM, Bermingham EN, Bassett SA, Treloar BP, Roy NC, Barnett MPG.
2011. Global DNA methylation measurement by HPLC using low amounts of DNA.
Biotechnology Journal 6: 113–117.
Aronen T, Ryynänen L. 2012. Variation in telomeric repeats of Scots pine (Pinus
sylvestris L.). Tree Genetics & Genomes 8: 267–275.
Aronen T, Ryynänen L. 2014. Silver birch telomeres shorten in tissue culture. Tree
Genetics & Genomes 10: 67–74.
Aubert G, Hills M, Lansdorp PM. 2012. Telomere length measurement—Caveats and a
critical assessment of the available technologies and tools. Mutation
Research/Fundamental and Molecular Mechanisms of Mutagenesis 730: 59–67.
Avramova Z. 2015. Transcriptional ‘memory’ of a stress: transient chromatin and
memory (epigenetic) marks at stress-response genes. The Plant Journal 83: 149–159.

45
Ay N, Janack B, Humbeck K. 2014. Epigenetic control of plant senescence and linked
processes. Journal of Experimental Botany 65: 3875–3887.
Balachowski JA, Bristiel PM, Volaire FA. 2016. Summer dormancy, drought survival
and functional resource acquisition strategies in California perennial grasses. Annals of
Botany 118: 357–368.
Barros PM, Gonçalves N, Saibo NJM, Oliveira MM. 2012. Cold acclimation and
floral development in almond bud break: insights into the regulatory pathways. Journal
of Experimental Botany 63: 4585–4596.
Baurens F-C, Nicolleau J, Legavre T, Verdeil J-L, Monteuuis O. 2004. Genomic
DNA methylation of juvenile and mature Acacia mangium micropropagated in vitro with
reference to leaf morphology as a phase change marker. Tree Physiology 24: 401–407.
Beckman KB, Ames BN. 1998. The free radical theory of aging matures. Physiological
Reviews 78: 547–581.
Benayoun BA, Pollina EA, Brunet A. 2015. Epigenetic regulation of ageing: linking
environmental inputs to genomic stability. Nature Reviews Molecular Cell Biology 16:
593–610.
Benmoussa H, Ghrab M, Mimoun MB, Luedeling E. 2017. Chilling and heat
requirements for local and foreign almond (Prunus dulcis Mill.) cultivars in a warm
Mediterranean location based on 30 years of phenology records. Agricultural and Forest
Meteorology 239: 34–46.
Bielenberg DG, Wang Y (Eileen), Li Z, Zhebentyayeva T, Fan S, Reighard GL,
Scorza R, Abbott AG. 2008. Sequencing and annotation of the evergrowing locus in
peach [Prunus persica (L.) Batsch] reveals a cluster of six MADS-box transcription
factors as candidate genes for regulation of terminal bud formation. Tree Genetics &
Genomes 4: 495–507.
Bitonti MB, Cozza R, Chiappetta A, Giannino D, Castiglione MR, Dewitte W,
Mariotti D, Van Onckelen H, Innocenti AM. 2002. Distinct nuclear organization, DNA
methylation pattern and cytokinin distribution mark juvenile, juvenile‐like and adult
vegetative apical meristems in peach (Prunus persica (L.) Batsch). Journal of
Experimental Botany 53: 1047–1054.
Blackburn EH. 2000. Telomere states and cell fates. Nature 408: 53–56.
Boccardi V, Paolisso G. 2014. Telomerase activation: A potential key modulator for
human healthspan and longevity. Ageing Research Reviews 15: 1–5.
Boriss H, Brunke H. 2005. Commodity Profile: Almond. Agricultural Issues Center:
University of California.

46
Bose AK, Moser B, Rigling A, Lehmann MM, Milcu A, Peter M, Rellstab C,
Wohlgemuth T, Gessler A. 2020. Memory of environmental conditions across
generations affects the acclimation potential of scots pine. Plant, Cell & Environment 43:
1288–1299.
Boyko A, Blevins T, Yao Y, Golubov A, Bilichak A, Ilnytskyy Y, Hollander J, Jr
FM, Kovalchuk I. 2010. Transgenerational adaptation of Arabidopsis to stress requires
DNA methylation and the function of Dicer-like proteins. PLOS ONE 5: e9514.
Boyko A, Zemp F, Filkowski J, Kovalchuk I. 2006. Double-strand break repair in
plants is developmentally regulated. Plant Physiology 141: 488–497.
Bräutigam K, Vining KJ, Lafon-Placette C, Fossdal CG, Mirouze M, Marcos JG,
Fluch S, Fraga MF, Guevara MÁ, Abarca D, et al. 2013. Epigenetic regulation of
adaptive responses of forest tree species to the environment. Ecology and Evolution 3:
399–415.
Browicz K, Zohary D. 1996. The genus Amygdalus L. (Rosaceae): Species relationships,
distribution and evolution under domestication. Genetic Resources and Crop Evolution
43: 229–247.
Brutovská E, Sámelová A, Dušička J, Mičieta K. 2013. Ageing of trees: Application of
general ageing theories. Ageing Research Reviews 12: 855–866.
California Department of Food and Agriculture. 2020. 2019 California Almond
Acreage Report. USDA National Agricultural Statistics Service, Pacific Regional Office.
Carles CC, Fletcher JC. 2003. Shoot apical meristem maintenance: the art of a dynamic
balance. Trends in Plant Science 8: 394–401.
Castède S, Campoy JA, Dantec LL, Quero-García J, Barreneche T, Wenden B,
Dirlewanger E. 2015. Mapping of candidate genes involved in bud dormancy and
flowering time in sweet cherry (Prunus avium). PLOS ONE 10: e0143250.
Cawthon RM. 2002. Telomere measurement by quantitative PCR. Nucleic Acids
Research 30: e47.
Cawthon RM. 2009. Telomere length measurement by a novel monochrome multiplex
quantitative PCR method. Nucleic Acids Research 37: e21.
Chang Y-N, Zhu C, Jiang J, Zhang H, Zhu J-K, Duan C-G. 2020. Epigenetic
regulation in plant abiotic stress responses. Journal of Integrative Plant Biology 62: 563–
580.
Chwialkowska K, Nowakowska U, Mroziewicz A, Szarejko I, Kwasniewski M. 2016.
Water-deficiency conditions differently modulate the methylome of roots and leaves in
barley (Hordeum vulgare L.). Journal of Experimental Botany 67: 1109–1121.

47
Cline MJ. 1991. Apical dominance. The Botanical Review 57: 318–358.
Corredor E, Román M, García E, Perera E, Arús P, Naranjo T. 2004. Physical
mapping of rDNA genes establishes the karyotype of almond. Annals of Applied Biology
144: 219–222.
Correia B, Valledor L, Meijón M, Rodriguez JL, Dias MC, Santos C, Cañal MJ,
Rodriguez R, Pinto G. 2013. Is the interplay between epigenetic markers related to the
acclimation of cork oak plants to high temperatures? PLOS ONE 8: e53543.
Costes E, Crespel L, Denoyes B, Morel P, Demene M-N, Lauri P-E, Wenden B.
2014. Bud structure, position and fate generate various branching patterns along shoots of
closely related Rosaceae species: a review. Frontiers in Plant Science 5.
Crisp PA, Ganguly D, Eichten SR, Borevitz JO, Pogson BJ. 2016. Reconsidering
plant memory: Intersections between stress recovery, RNA turnover, and epigenetics.
Science Advances 2: e1501340.
Dasgupta P, Chaudhuri S. 2019. Analysis of DNA methylation profile in plants by
chop-PCR. In: Gassmann W, ed. Methods in molecular biology. Plant innate immunity:
Methods and protocols. New York, NY: Springer, 79–90.
Day KR, DeJong TM, Hewitt AA. 1989. Postharvest and preharvest summer pruning of
‘Firebrite’ nectarine trees. HortScience 24: 238-240.
Dejong TM, Negron CM, Favreau R, Day KR, Costes E, Lopez G, Guédon Y. 2012.
Using concepts of shoot growth and architecture to understand and predict responses of
peach trees to pruning. 7th International Peach Symposium, Lleida. Acta Horticulturae
225-232.
Demeulemeester MAC, Van Stallen N, De Proft MP. 1999. Degree of DNA
methylation in chicory (Cichorium intybus L.): influence of plant age and vernalization.
Plant Science 142: 101–108.
Dowen RH, Pelizzola M, Schmitz RJ, Lister R, Dowen JM, Nery JR, Dixon JE,
Ecker JR. 2012. Widespread dynamic DNA methylation in response to biotic stress.
Proceedings of the National Academy of Sciences 109: E2183–E2191.
Du J, Zhong X, Bernatavichute YV, Stroud H, Feng S, Caro E, Vashisht AA,
Terragni J, Chin HG, Tu A, et al. 2012. Dual binding of chromomethylase domains to
H3K9me2-containing nucleosomes directs DNA methylation in plants. Cell 151: 167–
180.
Dubrovina AS, Kiselev KV. 2016. Age-associated alterations in the somatic mutation
and DNA methylation levels in plants (A Weber, Ed.). Plant Biology 18: 185–196.

48
Egea J, Ortega E, Martinez-Gomez P, Dicenta F. 2003. Chilling and heat requirements
of almond cultivars for flowering. Environmental and Experimental Botany 50: 79–85.
Elgin SCR, Reuter G. 2013. Position-effect variegation, heterochromatin formation, and
gene silencing in Drosophila. Cold Spring Harbor Perspectives in Biology 5.
Elhamamsy AR. 2016. DNA methylation dynamics in plants and mammals: overview of
regulation and dysregulation. Cell Biochemistry and Function 34: 289–298.
Fajkus J, Sýkorová E, Leitch AR. 2005. Telomeres in evolution and evolution of
telomeres. Chromosome Research 13: 469–479.
Falavigna V da S, Guitton B, Costes E, Andrés F. 2019. I want to (bud) break free: the
potential role of DAM and SVP-like genes in regulating dormancy cycle in temperate
fruit trees. Frontiers in Plant Science 9.
Feng S, Zhong Z, Wang M, Jacobsen SE. 2020. Efficient and accurate determination of
genome-wide DNA methylation patterns in Arabidopsis thaliana with enzymatic methyl
sequencing. Epigenetics & Chromatin 13: 42.
Fenton CAL, Kester DE, Kuniyuki AH. 1988a. Models for noninfectious bud failure in
almond. Phytopathology 78: 139.
Fenton CAL, Kuniyuki AH, Kester DE. 1988b. Search for a viroid etiology for
noninfectious bud failure in almond. HortScience 23: 1050–1053.
Fernández i Martí A, Gradziel TM, Socias i Company R. 2014. Methylation of the Sf
locus in almond is associated with S-RNase loss of function. Plant Molecular Biology 86:
681–689.
Fitzgerald MS, McKnight TD, Shippen DE. 1996. Characterization and developmental
patterns of telomerase expression in plants. Proceedings of the National Academy of
Sciences 93: 14422–14427.
Fitzgerald MS, Riha K, Gao F, Ren S, McKnight TD, Shippen DE. 1999. Disruption
of the telomerase catalytic subunit gene from Arabidopsis inactivates telomerase and
leads to a slow loss of telomeric DNA. Proceedings of the National Academy of Sciences
96: 14813–14818.
Flanary BE, Kletetschka G. 2005. Analysis of telomere length and telomerase activity
in tree species of various life-spans, and with age in the bristlecone pine Pinus longaeva.
Biogerontology 6: 101–111.
Fojtová M, Kovařı́k A, Matyášek R. 2001. Cytosine methylation of plastid genome in
higher plants. Fact or artefact? Plant Science 160: 585–593.

49
Fossel M. 1998. Telomerase and the aging cell: Implications for human health. JAMA
279: 1732–1735.
Fraga MF, Esteller M. 2002. DNA methylation: A profile of methods and applications.
BioTechniques 33: 16.
Fraga MF, Rodríguez R, Cañal MJ. 2002. Genomic DNA methylation–demethylation
during aging and reinvigoration of Pinus radiata. Tree Physiology 22: 813–816.
Freeman MW, Martin GC. 1981. Peach floral bud break and abscisic content as
affected by mist, light, and temperature treatments during rest. Journal of the American
Society for Horticultural Science 106: 333–336.
Fresnedo-Ramírez J, Chan HM, Parfitt DE, Crisosto CH, Gradziel TM. 2017.
Genome-wide DNA-(de)methylation is associated with noninfectious bud-failure
exhibition in almond (Prunus dulcis [Mill.] D.A.Webb). Scientific Reports 7.
Freude G, Jakob O, Martus P, Rose U, Seibt R. 2010. Predictors of the discrepancy
between calendar and biological age. Occupational Medicine 60: 21–28.
Frommer M, McDonald LE, Millar DS, Collis CM, Watt F, Grigg GW, Molloy PL,
Paul CL. 1992. A genomic sequencing protocol that yields a positive display of 5-
methylcytosine residues in individual DNA strands. Proceedings of the National
Academy of Sciences of the United States of America 89: 1827–1831.
Fuchs J, Brandes A, Schubert I. 1995. Telomere sequence localization and karyotype
evolution in higher plants. Plant Systematics and Evolution 196: 227–241.
Ganguly DR, Crisp PA, Eichten SR, Pogson BJ. 2017. The Arabidopsis DNA
methylome is stable under transgenerational drought stress. Plant Physiology 175: 1893–
1912.
Gensous N, Bacalini MG, Pirazzini C, Marasco E, Giuliani C, Ravaioli F, Mengozzi
G, Bertarelli C, Palmas MG, Franceschi C, et al. 2017. The epigenetic landscape of
age-related diseases: the geroscience perspective. Biogerontology 18: 549–559.
Goldberg AD, Allis CD, Bernstein E. 2007. Epigenetics: A landscape takes shape. Cell
128: 635–638.
Golubov A, Yao Y, Maheshwari P, Bilichak A, Boyko A, Belzile F, Kovalchuk I.
2010. Microsatellite instability in Arabidopsis increases with plant development. Plant
Physiology 154: 1415–1427.
Gong Z, Morales-Ruiz T, Ariza RR, Roldán-Arjona T, David L, Zhu J-K. 2002.
ROS1, a Repressor of transcriptional gene silencing in Arabidopsis, encodes a DNA
glycosylase/lyase. Cell 111: 803–814.
50
Gordon D, Damiano C, DeJong TM. 2006a. Preformation in vegetative buds of Prunus
persica: factors influencing number of leaf primordia in overwintering buds. Tree
Physiology 26: 537–544.
Gordon D, Rosati A, Damiano C, Dejong TM. 2006b. Seasonal effects of light
exposure, temperature, trunk growth and plant carbohydrate status on the initiation and
growth of epicormic shoots in Prunus persica. The Journal of Horticultural Science and
Biotechnology 81: 421–428.
Gradziel T, Lampinen B, Preece JE. 2019. Propagation from basal epicormic
meristems remediates an aging-related disorder in almond clones. Horticulturae 5: 28.
Gregis V, Andrés F, Sessa A, Guerra RF, Simonini S, Mateos JL, Torti S, Zambelli
F, Prazzoli GM, Bjerkan KN, et al. 2013. Identification of pathways directly regulated
by SHORT VEGETATIVE PHASE during vegetative and reproductive development in
Arabidopsis. Genome Biology 14: R56.
Grunau C, Clark SJ, Rosenthal A. 2001. Bisulfite genomic sequencing: systematic
investigation of critical experimental parameters. Nucleic Acids Research 29: e65–e65.
Gugger PF, Fitz‐Gibbon S, PellEgrini M, Sork VL. 2016. Species-wide patterns of
DNA methylation variation in Quercus lobata and their association with climate
gradients. Molecular Ecology 25: 1665–1680.
Guo G-P, Gu X-P, Yuan J-L, Wu X-L. 2011. Research on the features of DNA
methylation in leaves of different chronological ages of Phyllostachys heterocycla var.
pubescens based on the method of MSAP. Hereditas 33: 794–800.
Gurp TP van, Wagemaker NCAM, Wouters B, Vergeer P, Ouborg JNJ, Verhoeven
KJF. 2016. epiGBS: reference-free reduced representation bisulfite sequencing. Nature
Methods 13: 322.
Hasbún R, Valledor L, Santamaría E, Cañal MJ, Rodríguez R. 2007. Dynamics of
DNA methylation in chestnut trees development. Acta Horticulturae: 563–566.
He K, Cao X, Deng X. 2021. Histone methylation in epigenetic regulation and
temperature responses. Current Opinion in Plant Biology 61: 102001.
Hellali R, Kester DE. 1979. High temperature induced bud-failure symptoms in
vegetative buds of almond plants in growth chambers. Journal of the American Society
for Horticultural Science 104: 375–378.
Hellali R, Kester DE, Martin GC. 1979. Seasonal changes in the physiology of
vegetative buds of normal and bud-failure affected ‘Nonpareil’ almond trees. Journal of
the American Society for Horticultural Science 104: 371–375.

51
Hellali R, Lin J, Kester DE. 1978. Morphology of noninfectious bud failure symptoms
in vegetative buds of almond (Prunus amygdalus Batch). Journal of the American Society
for Horticultural Science 103: 459–464.
Hemann MT, Strong MA, Hao L-Y, Greider CW. 2001. The shortest telomere, not
average telomere length, is critical for cell viability and chromosome stability. Cell 107:
67–77.
Hernández HG, Tse MY, Pang SC, Arboleda H, Forero DA. 2013. Optimizing
methodologies for PCR-based DNA methylation analysis. BioTechniques 55.
Hewezi T, Lane T, Piya S, Rambani A, Rice JH, Staton M. 2017. Cyst nematode
parasitism induces dynamic changes in the root epigenome. Plant Physiology 174: 405–
420.
Hillary RF, Stevenson AJ, McCartney DL, Campbell A, Walker RM, Howard DM,
Ritchie CW, Horvath S, Hayward C, McIntosh AM, et al. 2020. Epigenetic clocks
predict prevalence and incidence of leading causes of death and disease burden. bioRxiv:
2020.01.31.928648.
Hofmeister BT, Denkena J, Colomé-Tatché M, Shahryary Y, Hazarika R,
Grimwood J, Mamidi S, Jenkins J, Grabowski PP, Sreedasyam A, et al. 2020. A
genome assembly and the somatic genetic and epigenetic mutation rate in a wild long-
lived perennial Populus trichocarpa. Genome Biology 21: 259.
Hollick JB. 2017. Paramutation and related phenomena in diverse species. Nature
Reviews Genetics 18: 5–23.
Hotchkiss RD. 1948. The quantitative separation of purines, pyrimidines, and
nucleosides by paper chromatography. Journal of Biological Chemistry 175: 315–332.
Huang L-C, Hsiao L-J, Pu S-Y, Kuo C-I, Huang B-L, Tseng T-C, Huang H-J, Chen
Y-T. 2012. DNA methylation and genome rearrangement characteristics of phase change
in cultured shoots of Sequoia sempervirens. Physiologia Plantarum 145: 360–368.
Huang Y, Pastor WA, Shen Y, Tahiliani M, Liu DR, Rao A. 2010. The behaviour of
5-hydroxymethylcytosine in bisulfite sequencing. PLOS ONE 5: e8888.
Jackson J, Johnson L, Jasencakova Z, Zhang X, PerezBurgos L, Singh P, Cheng X,
Schubert I, Jenuwein T, Jacobsen S. 2004. Dimethylation of histone H3 lysine 9 is a
critical mark for DNA methylation and gene silencing in Arabidopsis thaliana.
Chromosoma 112: 308–315.
Jung S, Lee T, Cheng C-H, Buble K, Zheng P, Yu J, Humann J, Ficklin SP, Gasic
K, Scott K, et al. 2019. 15 years of GDR: New data and functionality in the Genome
Database for Rosaceae. Nucleic Acids Research 47: D1137–D1145.

52
Jurečková JF, Sýkorová E, Hafidh S, Honys D, Fajkus J, Fojtová M. 2017. Tissue-
specific expression of telomerase reverse transcriptase gene variants in Nicotiana
tabacum. Planta 245: 549–561.
Jylhävä J, Pedersen NL, Hägg S. 2017. Biological age predictors. EBioMedicine 21:
29–36.
Kankel MW, Ramsey DE, Stokes TL, Flowers SK, Haag JR, Jeddeloh JA, Riddle
NC, Verbsky ML, Richards EJ. 2003. Arabidopsis MET1 cytosine methyltransferase
mutants. Genetics 163: 1109–1122.
Kerr G. 2001. Production of epicormic shoots on oak (Quercus robur): effects of
frequency and time of pruning. Forestry 74: 467–477.
Kerstetter RA, Hake S. 1997. Shoot meristem formation in vegetative development. The
Plant Cell: 1001–1010.
Kester DE. 1967a. Noninfectious bud-failure, a nontransmissable inherited disorder in
almond. I. Pattern of phenotype inheritance. Journal of the American Society for
Horticultural Science 92: 7–15.
Kester DE. 1967b. Noninfectious bud-failure, a nontransmissible inherited disorder in
almond. II. Progeny tests for bud-failure. Journal of the American Society for
Horticultural Science 92: 16–28.
Kester DE. 1969. Noninfectious bud failure of almonds in California (1) The nature and
origin. California Agriculture 23: 12–14.
Kester DE. 1978. Comparative inheritance of noninfectious bud-failure (BF) in almond
× almond and almond × peach progenies. HortScience 13: 372(abstr.).
Kester DE, Asay R. 1975. Almonds. In: Janick J, Moore JN, eds. Advances in fruit
breeding. West Lafayette, IN, USA: Purdue University Press, 387–419.
Kester DE, Asay, R. N. 1978. Variability in noninfectious bud-failure of ‘Nonpareil’
almond. I. Location and environment. Journal of the American Society for Horticultural
Science 103: 377–382.
Kester DE, Gradziel TM, Grasselly C. 1991. Almonds (Prunus). Acta Horticulturae:
701–760.
Kester DE, Jones RW. 1970a. Non-infectious bud-failure from breeding programs of
almond (Prunus amygdalus Batsch). Journal of the American Society of Horticultural
Science 95: 492–96.
53
Kester DE, Jones RW. 1970b. Noninfectious bud-failure from breeding programs of
almond (Prunus amygdalus Batsch). Journal of the American Society for Horticultural
Science 95: 492–496.
Kester DE, Rizzi AD, Williams HE, Jones RW. 1969. Noninfectious bud failure of
almonds in California (2) Identification and control of bud failure in almond varieties.
California Agriculture 23: 14–16.
Kester DE, Shackel KA, Micke WC, Viveros M, Gradziel TM. 2004. Noninfectious
bud failure in ‘Carmel’ almond: I. Pattern of development in vegetative progeny trees.
Journal of the American Society for Horticultural Science 129: 244–249.
Kilian A, Heller K, Kleinhofs A. 1998. Development patterns of telomerase activity in
barley and maize. Plant Molecular Biology 37: 621–628.
Kilian A, Stiff C, Kleinhofs A. 1995. Barley telomeres shorten during differentiation but
grow in callus culture. Proceedings of the National Academy of Sciences 92: 9555.
Kimura M, Stone RC, Hunt SC, Skurnick J, Lu X, Cao X, Harley CB, Aviv A. 2010.
Measurement of telomere length by the Southern blot analysis of terminal restriction
fragment lengths. Nature Protocols 5: 1596–1607.
Kiselev KV, Tyunin AP, Ogneva ZV, Dubrovina AS. 2015. Age-associated alterations
in the somatic mutation level in Arabidopsis thaliana. Plant Growth Regulation 75: 493–
501.
Kovalchuk I, Kovalchuk O, Hohn B. 2000. Genome-wide variation of the somatic
mutation frequency in transgenic plants. The EMBO Journal 19: 4431–4438.
Kovar˘ik A, Koukalová B, Bezde˘k M, Opatrn´ Z. 1997. Hypermethylation of tobacco
heterochromatic loci in response to osmotic stress. Theoretical and Applied Genetics 95:
301–306.
Krueger F, Andrews SR. 2011. Bismark: a flexible aligner and methylation caller for
Bisulfite-Seq applications. Bioinformatics 27: 1571–1572.
Krueger F, Kreck B, Franke A, Andrews SR. 2012. DNA methylome analysis using
short bisulfite sequencing data. Nature Methods 9: 145–151.
Kuchar M. 2006. Plant telomere-binding proteins. Biologia Plantarum 50: 1–7.
Kurdyukov S, Bullock M. 2016. DNA methylation analysis: Choosing the right method.
Biology 5.
Labra M, Ghiani A, Citterio S, Sgorbati S, Sala F, Vannini C, Ruffini‐Castiglione
M, Bracale M. 2002. Analysis of cytosine methylation pattern in response to water
deficit in pea root tips. Plant Biology 4: 694–699.

54
Ladizinsky G. 1999. On the origin of almond. Genetic Resources and Crop Evolution
46: 143–147.
Lai T-P, Wright WE, Shay JW. 2018. Comparison of telomere length measurement
methods. Philosophical Transactions of the Royal Society B: Biological Sciences 373:
20160451.
Lämke J, Bäurle I. 2017. Epigenetic and chromatin-based mechanisms in environmental
stress adaptation and stress memory in plants. Genome Biology 18: 124.
Lampinen BD, Tombesi S, Metcalf SG, DeJong TM. 2011. Spur behaviour in almond
trees: relationships between previous year spur leaf area, fruit bearing and mortality. Tree
Physiology 31: 700–706.
Lang GA, Early JD, Martin GC, Darnell RL. 1987. Endo-, para- and ecodormancy:
physiological terminology and classification for dormancy research. HortScience 22:
371–377.
Langmead B, Salzberg SL. 2012. Fast gapped-read alignment with Bowtie 2. Nature
Methods 9: 357–359.
Lauc G, Sinclair D. 2020. Biomarkers of biological age as predictors of COVID-19
disease severity. Aging (Albany NY) 12: 6490–6491.
Law JA, Jacobsen SE. 2010. Establishing, maintaining and modifying DNA methylation
patterns in plants and animals. Nature Reviews Genetics 11: 204–220.
Lee M, Napier CE, Yang SF, Arthur JW, Reddel RR, Pickett HA. 2017. Comparative
analysis of whole genome sequencing-based telomere length measurement techniques.
Methods (San Diego, Calif.) 114: 4–15.
Lee Y, Yoon TH, Lee J, Jeon SY, Lee JH, Lee MK, Chen H, Yun J, Oh SY, Wen X,
et al. 2018. A lignin molecular brace controls precision processing of cell walls critical
for surface integrity in Arabidopsis. Cell 173: 1468-1480.e9.
Lei M, Zhang H, Julian R, Tang K, Xie S, Zhu J-K. 2015. Regulatory link between
DNA methylation and active demethylation in Arabidopsis. Proceedings of the National
Academy of Sciences of the United States of America 112: 3553–3557.
Li X, Harris CJ, Zhong Z, Chen W, Liu R, Jia B, Wang Z, Li S, Jacobsen SE, Du J.
2018a. Mechanistic insights into plant SUVH family H3K9 methyltransferases and their
binding to context-biased non-CG DNA methylation. Proceedings of the National
Academy of Sciences 115: E8793–E8802.
Li G, Hu F, Zhang Y, Zhao Y, Wang H, Chen T, Cheng X, Cai Y. 2021. Comparative
genomic analysis of superoxide dismutase (SOD) genes in three Rosaceae species and

55
expression analysis in Pyrus bretschneideri. Physiology and Molecular Biology of Plants
27: 39–52.
Li Y, Kumar S, Qian W. 2018b. Active DNA demethylation: mechanism and role in
plant development. Plant Cell Reports 37: 77–85.
Li Y, Sasaki H. 2011. Genomic imprinting in mammals: its life cycle, molecular
mechanisms and reprogramming. Cell Research 21: 466–473.
Liang J, Jiang C, Peng H, Shi Q, Guo X, Yuan Y, Huang L. 2015. Analysis of the age
of Panax ginseng based on telomere length and telomerase activity. Scientific Reports 5.
Liang D, Zhang Z, Wu H, Huang C, Shuai P, Ye C-Y, Tang S, Wang Y, Yang L,
Wang J, et al. 2014. Single-base-resolution methylomes of Populus trichocarpa reveal
the association between DNA methylation and drought stress. BMC genetics 15: S9.
Lin J, Smith DL, Esteves K, Drury S. 2019. Telomere length measurement by qPCR –
Summary of critical factors and recommendations for assay design.
Psychoneuroendocrinology 99: 271–278.
Liu J, Feng L, Li J, He Z. 2015. Genetic and epigenetic control of plant heat responses.
Frontiers in Plant Science 6.
Liu J, He Z. 2020. Small DNA methylation, big player in plant abiotic stress responses
and memory. Frontiers in Plant Science 11.
Liu D, Qiao N, Song H, Hua X, Du J, Lu H, Li F. 2007. Comparative analysis of
telomeric restriction fragment lengths in different tissues of Ginkgo biloba trees of
different age. Journal of Plant Research 120: 523–528.
Mankessi F, Saya AR, Favreau B, Doulbeau S, Conéjéro G, Lartaud M, Verdeil J-L,
Monteuuis O. 2011. Variations of DNA methylation in Eucalyptus
urophylla×Eucalyptus grandis shoot tips and apical meristems of different physiological
ages. Physiologia Plantarum 143: 178–187.
Marioni RE, Harris SE, Shah S, McRae AF, von Zglinicki T, Martin-Ruiz C, Wray
NR, Visscher PM, Deary IJ. 2016. The epigenetic clock and telomere length are
independently associated with chronological age and mortality. International Journal of
Epidemiology 45: 424–432.
Matzke MA, Mosher RA. 2014. RNA-directed DNA methylation: an epigenetic
pathway of increasing complexity. Nature Reviews. Genetics 15: 394–408.
Meier AR, Saunders MR, Michler CH. 2012. Epicormic buds in trees: a review of bud
establishment, development and dormancy release. Tree Physiology 32: 565–584.
Micke WC. 1996. Almond production manual. UCANR Publications.

56
Monteuuis O, Baurens FC, Goh DKS, Quimado M, Doulbeau S, Verdeil JL. 2009.
DNA Methylation in Acacia mangium in vitro and ex-vitro buds, in relation to their
within-shoot position, age and leaf morphology of the shoots. Silvae Genetica 58: 287–
292.
Monteuuis O, Doulbeau S, Verdeil J-L. 2008. DNA methylation in different origin
clonal offspring from a mature Sequoiadendron giganteum genotype. Trees 22: 779.
Montpetit AJ, Alhareeri AA, Montpetit M, Starkweather AR, Elmore LW, Filler K,
Mohanraj L, Burton CW, Menzies VS, Lyon DE, et al. 2014. Telomere length: A
review of methods for measurement. Nursing research 63: 289–299.
Moore LD, Le T, Fan G. 2013. DNA methylation and its basic function.
Neuropsychopharmacology 38: 23–38.
Morales M, Oñate M, García MB, Munné‐Bosch S. 2013. Photo-oxidative stress
markers reveal absence of physiological deterioration with ageing in Borderea pyrenaica,
an extraordinarily long-lived herb. Journal of Ecology 101: 555–565.
Moriguchi R, Kato K, Kanahama K, Kanayama Y, Kikuchi H. 2007. Analysis of
telomere lengths in apple and cherry trees. Acta Horticulturae: 389–395.
Munné-Bosch S. 2007. Aging in perennials. Critical Reviews in Plant Sciences 26: 123–
138.
Munné-Bosch S. 2008. Do perennials really senesce? Trends in Plant Science 13: 216–
220.
Munné-Bosch S. 2020. Long-lived trees are not immortal. Trends in Plant Science 25:
846–849.
Munné-Bosch S, Alegre L. 2002. Plant aging increases oxidative stress in chloroplasts.
Planta 214: 608–615.
Munné-Bosch S, Lalueza P. 2007. Age-related changes in oxidative stress markers and
abscisic acid levels in a drought-tolerant shrub, Cistus clusii grown under Mediterranean
field conditions. Planta 225: 1039–1049.
Myers SC. 1993. Preharvest watersprout removal influences canopy light relations, fruit
quality, and flower bud formation of ‘Redskin’ peach trees. Journal of the American
Society for Horticultural Science 118: 442–445.
Nagata T, Nemoto Y, Hasezawa S. 1992. Tobacco BY-2 cell line as the “HeLa” cell in
the cell biology of higher plants. In: Jeon KW, Friedlander M, eds. International Review
of Cytology. Academic Press, 1–30.

57
Nagpal N, Agarwal S. 2020. Telomerase RNA processing: Implications for human
health and disease. STEM CELLS 38: 1532–1543.
Naydenov M, Baev V, Apostolova E, Gospodinova N, Sablok G, Gozmanova M,
Yahubyan G. 2015. High-temperature effect on genes engaged in DNA methylation and
affected by DNA methylation in Arabidopsis. Plant Physiology and Biochemistry 87:
102–108.
Negrón C, Contador L, Lampinen BD, Metcalf SG, Guédon Y, Costes E, DeJong
TM. 2014. Differences in proleptic and epicormic shoot structures in relation to water
deficit and growth rate in almond trees (Prunus dulcis). Annals of Botany 113: 545–554.
Noble D. 2015. Conrad Waddington and the origin of epigenetics. Journal of
Experimental Biology 218: 816–818.
Ogneva ZV, Dubrovina AS, Kiselev KV. 2016. Age-associated alterations in DNA
methylation and expression of methyltransferase and demethylase genes in Arabidopsis
thaliana. Biologia Plantarum 60: 628–634.
Ogrocká A, Polanská P, Majerová E, Janeba Z, Fajkus J, Fojtová M. 2014.
Compromised telomere maintenance in hypomethylated Arabidopsis thaliana plants.
Nucleic Acids Research 42: 2919–2931.
Oguchi K, Liu H, Tamura K, Takahashi H. 1999. Molecular cloning and
characterization of AtTERT, a telomerase reverse transcriptase homolog in Arabidopsis
thaliana. FEBS Letters 457: 465–469.
Olova N, Krueger F, Andrews S, Oxley D, Berrens RV, Branco MR, Reik W. 2018.
Comparison of whole-genome bisulfite sequencing library preparation strategies
identifies sources of biases affecting DNA methylation data. Genome Biology 19: 33.
Orr AJ, Padovan A, Kainer D, Külheim C, Bromham L, Bustos-Segura C, Foley W,
Haff T, Hsieh J-F, Morales-Suarez A, et al. 2020. A phylogenomic approach reveals a
low somatic mutation rate in a long-lived plant. Proceedings of the Royal Society B:
Biological Sciences 287: 20192364.
Ortega E, Dicenta F. 2003. Inheritance of self-compatibility in almond: breeding
strategies to assure self-compatibility in the progeny. Theoretical and Applied Genetics
106: 904–911.
Ossowski S, Schneeberger K, Lucas-Lledo JI, Warthmann N, CLark RM, Shaw
RG, Weigel D, Lynch M. 2010. The rate and molecular spectrum of spontaneous
mutations in Arabidopsis thaliana. Science 327: 92–95.
Parle-Mcdermott A, Harrison A. 2011. DNA methylation: A timeline of methods and
applications. Frontiers in Genetics 2.

58
Parrilla-Doblas JT, Roldán-Arjona T, Ariza RR, Córdoba-Cañero D. 2019. Active
DNA demethylation in plants. International Journal of Molecular Sciences 20.
Paun O, Verhoeven KJF, Richards CL. 2019. Opportunities and limitations of reduced
representation bisulfite sequencing in plant ecological epigenomics. New Phytologist 221:
738–742.
Pich U, Fuchs J, Schubert I. 1996. How do Alliaceae stabilize their chromosome ends
in the absence of TTTAGGG sequences? Chromosome Research 4: 207–213.
Prats-Llinàs MT, López G, Fyhrie K, Pallas B, Guédon Y, Costes E, DeJong TM.
2019. Long proleptic and sylleptic shoots in peach (Prunus persica L. Batsch) trees have
similar, predetermined, maximum numbers of nodes and bud fate patterns. Annals of
Botany 123: 993–1004.
Procházková Schrumpfová P, Fojtová M, Fajkus J. 2019. Telomeres in plants and
humans: Not so different, not so similar. Cells 8.
Procházková Schrumpfová P, Schořová Š, Fajkus J. 2016. Telomere- and telomerase-
associated proteins and their functions in the plant cell. Frontiers in Plant Science 7.
Prudencio ÁS, Dicenta F, Martínez-Gómez P. 2018a. Monitoring dormancy transition
in almond [Prunus dulcis (Miller) Webb] during cold and warm Mediterranean seasons
through the analysis of a DAM (dormancy-associated MADS-box) gene. Horticulturae 4:
41.
Prudencio ÁS, Hoeberichts FA, Dicenta F, Martínez-Gómez P, Sánchez-Pérez R.
2020. Identification of early and late flowering time candidate genes in endodormant and
ecodormant almond flower buds. Tree Physiology tpaa151.
Prudencio ÁS, Martínez-Gómez P, Dicenta F. 2018b. Evaluation of breaking
dormancy, flowering and productivity of extra-late and ultra-late flowering almond
cultivars during cold and warm seasons in South-East of Spain. Scientia Horticulturae
235: 39–46.
Prudencio ÁS, Werner O, Martínez-García PJ, Dicenta F, Ros RM, Martínez-
Gómez P. 2018c. DNA methylation analysis of dormancy release in almond (Prunus
dulcis) flower buds using epi-genotyping by sequencing. International Journal of
Molecular Sciences 19.
Quadrana L, Almeida J, Asís R, Duffy T, Dominguez PG, Bermúdez L, Conti G,
Corrêa da Silva JV, Peralta IE, Colot V, et al. 2014. Natural occurring epialleles
determine vitamin E accumulation in tomato fruits. Nature Communications 5: 4027.
Quadrana L, Colot V. 2016. Plant transgenerational epigenetics. Annual Review of
Genetics 50: 467–491.

59
Raizis AM, Schmitt F, Jost JP. 1995. A bisulfite method of 5-methylcytosine mapping
that minimizes template degradation. Analytical Biochemistry 226: 161–166.
Raj S, Bräutigam K, Hamanishi ET, Wilkins O, Thomas BR, Schroeder W,
Mansfield SD, Plant AL, Campbell MM. 2011. Clone history shapes Populus drought
responses. Proceedings of the National Academy of Sciences 108: 12521–12526.
Rambani A, Rice JH, Liu J, Lane T, Ranjan P, Mazarei M, Pantalone V, Stewart
CN, Staton M, Hewezi T. 2015. The methylome of soybean roots during the compatible
interaction with the soybean cyst nematode. Plant Physiology 168: 1364–1377.
Ramsahoye BH. 2002. Measurement of genome wide DNA methylation by reversed-
phase high-performance liquid chromatography. Methods (San Diego, Calif.) 27: 156–
161.
Rothkegel K, Sánchez E, Montes C, Greve M, Tapia S, Bravo S, Prieto H, Almeida
AM. 2017. DNA methylation and small interference RNAs participate in the regulation
of MADS-box genes involved in dormancy in sweet cherry (Prunus avium L.). Tree
Physiology 37: 1739–1751.
Runov AL, Vonsky MS, Mikhelson VM. 2015. DNA methylation level and telomere
length as a basis for modeling of the biological aging clock. Cell and Tissue Biology 9:
261–264.
Saikia BN, Kester DE, Bradley MV. 1966. Dormant vegetative buds in normal and
bud-failure forms of almond (Prunus amygdalus Batsch.). Journal of the American
Society for Horticultural Science 89: 150–156.
Salguero-Gomez R. 2018. Implications of clonality for ageing research. Evolutionary
Ecology 32: 9–28.
Sánchez-Pérez R, Pavan S, Mazzeo R, Moldovan C, Cigliano RA, Cueto JD,
Ricciardi F, Lotti C, Ricciardi L, Dicenta F, et al. 2019. Mutation of a bHLH
transcription factor allowed almond domestication. Science 364: 1095–1098.
Sanders JL, Newman AB. 2013. Telomere length in epidemiology: A biomarker of
aging, age-related disease, both, or neither? Epidemiologic Reviews 35: 112–131.
Saraswat S, Yadav AK, Sirohi P, Singh NK. 2017. Role of epigenetics in crop
improvement: Water and heat stress. Journal of Plant Biology 60: 231–240.
Schein RD. 1952. Studies of the bud-failure disorders in almonds in California. PhD
thesis, University of California Davis, Davis, CA, USA.
Schmid-Siegert E, Sarkar N, Iseli C, Calderon S, Gouhier-Darimont C, Chrast J,
Cattaneo P, Schütz F, Farinelli L, Pagni M, et al. 2017. Low number of fixed somatic
mutations in a long-lived oak tree. Nature Plants 3: 926.

60
Schmidt M, Van Bel M, Woloszynska M, Slabbinck B, Martens C, De Block M,
Coppens F, Van Lijsebettens M. 2017. Plant-RRBS, a bisulfite and next-generation
sequencing-based methylome profiling method enriching for coverage of cytosine
positions. BMC Plant Biology 17: 115.
Schoen DJ, Schultz ST. 2019. Somatic mutation and evolution in plants. Annual Review
of Ecology, Evolution, and Systematics 50: 49–73.
Schultz MD, Schmitz RJ, Ecker JR. 2012. ‘Leveling’ the playing field for analyses of
single-base resolution DNA methylomes. Trends in Genetics 28: 583–585.
Šestáková Š, Šálek C, Remešová H. 2019. DNA methylation validation methods: A
coherent review with practical comparison. Biological Procedures Online 21: 19.
Sharma VK, Fletcher JC. 2002. Maintenance of shoot and floral meristem cell
proliferation and fate. Plant Physiology 129: 31–39.
Socias i Company R. 1990. Breeding self-compatible almonds. In: Plant breeding
reviews. John Wiley & Sons, Ltd, 313–338.
Socias i Company R. 2002. Latest advances in almond self-compatibility. Acta
Horticulturae: 205–212.
Socias i Company R, Alonso JM, Kodad O, Gradziel TM. 2012. Almond. In: Badenes
ML, Byrne DH, eds. Fruit breeding. Boston, MA: Springer US, 697–728.
Socias i Company R, Gradziel TM (Eds.). 2017. Almonds: botany, production and
uses. Wallingford: CABI.
Socias i Company R, Martí ÀF i, Kodad O, Alonso JM. 2010. Self-compatibility
evaluation in almond: strategies, achievements, and failures. HortScience 45: 1155–1159.
Sollars ESA, Buggs RJA. 2018. Genome-wide epigenetic variation among ash trees
differing in susceptibility to a fungal disease. BMC Genomics 19: 502.
Song L, James SR, Kazim L, Karpf AR. 2005. Specific method for the determination
of genomic DNA methylation by liquid chromatography-electrospray ionization tandem
mass spectrometry. Analytical Chemistry 77: 504–510.
Soundararajan P, Won SY, Kim JS. 2019. Insight on Rosaceae family with genome
sequencing and functional genomics perspective (N Gupta, Ed.). BioMed Research
International 2019: 7519687.
Spiegel-Roy P. 1986. Domestication of fruit trees. In: Barigozzi Claudio, ed. The origin
and domestication of cultivated plants: symposium. New York, N.Y., U.S.A.: Elsevier,
218.

61
Stach D, Schmitz OJ, Stilgenbauer S, Benner A, Döhner H, Wiessler M, Lyko F.
2003. Capillary electrophoretic analysis of genomic DNA methylation levels. Nucleic
Acids Research 31: E2.
Stone EL, Stone MH. 1943. ‘Dormant’ versus ‘adventitious’ buds. Science 98: 62–62.
Stroud H, Do T, Du J, Zhong X, Feng S, Johnson L, Patel DJ, Jacobsen SE. 2014.
Non-CG methylation patterns shape the epigenetic landscape in Arabidopsis. Nature
Structural & Molecular Biology 21: 64–72.
Sudan J, Raina M, Singh R. 2018. Plant epigenetic mechanisms: role in abiotic stress
and their generational heritability. 3 Biotech 8.
Sun X, Han Y, Zhou L, Chen E, Lu B, Liu Y, Pan X, Cowley AW Jr, Liang M, Wu
Q, et al. 2018. A comprehensive evaluation of alignment software for reduced
representation bisulfite sequencing data. Bioinformatics 34: 2715–2723.
Sykorova E, Lim KY, Chase MW, Knapp S, Leitch IJ, Leitch AR, Fajkus J. 2003.
The absence of Arabidopsis-type telomeres in Cestrum and closely related genera Vestia
and Sessea (Solanaceae): first evidence from eudicots. The Plant Journal 34: 283–291.
Tanaka K, Okamoto A. 2007. Degradation of DNA by bisulfite treatment. Bioorganic
& Medicinal Chemistry Letters 17: 1912–1915.
Tang K, Lang Z, Zhang H, Zhu J-K. 2016. The DNA demethylase ROS1 targets
genomic regions with distinct chromatin modifications. Nature Plants 2: 1–10.
Thomas H. 2002. Ageing in plants. Mechanisms of Ageing and Development 123: 747–
753.
Thomas H. 2013. Senescence, ageing and death of the whole plant. The New Phytologist
197: 696–711.
Tymoszuk S, Mika A, Antoszewski R. 1981. The role of water shoots in modifying
light climate within the apple tree canopy and in nutrition of fruits. Acta Horticulturae:
90–90.
USDA NASS. 2019. 2019 California Almond Forecast. USDA National Agricultural
Statistics Service, Pacific Regional Office.
Vaisvila R, Ponnaluri VKC, Sun Z, Langhorst BW, Saleh L, Guan S, Dai N,
Campbell MA, Sexton BS, Marks K, et al. 2020. EM-seq: Detection of DNA
methylation at single base resolution from picograms of DNA. bioRxiv:
2019.12.20.884692.
Valledor L, Meijón M, Hasbún R, Jesús Cañal M, Rodríguez R. 2010. Variations in
DNA methylation, acetylated histone H4, and methylated histone H3 during Pinus

62
radiata needle maturation in relation to the loss of in vitro organogenic capability.
Journal of Plant Physiology 167: 351–357.
Van Dijk H. 2009. Ageing effects in an iteroparous plant species with a variable life
span. Annals of Botany 104: 115–124.
Vaquero-Sedas MI, Vega-Palas MA. 2014. Determination of Arabidopsis thaliana
telomere length by PCR. Scientific Reports 4: srep05540.
Varotto S, Tani E, Abraham E, Krugman T, Kapazoglou A, Melzer R, Radanović A,
Miladinović D. 2020. Epigenetics: possible applications in climate-smart crop breeding.
Journal of Experimental Botany 71: 5223–5236.
Vega-Vaquero A, Bonora G, Morselli M, Vaquero-Sedas MI, Rubbi L, Pellegrini M,
Vega-Palas MA. 2016. Novel features of telomere biology revealed by the absence of
telomeric DNA methylation. Genome Research 26: 1047–1056.
Waddington CH. 1956. Genetic assimilation of the bithorax phenotype. Evolution 10: 1–
13.
Waddington CH. 2012. The epigenotype. International Journal of Epidemiology 41:
10–13.
Wang W, Qin Q, Sun F, Wang Y, Xu D, Li Z, Fu B. 2016. Genome-wide differences
in DNA methylation changes in two contrasting rice genotypes in response to drought
conditions. Frontiers in Plant Science 7.
Wang J, Xia Y, Li L, Gong D, Yao Y, Luo H, Lu H, Yi N, Wu H, Zhang X, et al.
2013. Double restriction-enzyme digestion improves the coverage and accuracy of
genome-wide CpG methylation profiling by reduced representation bisulfite sequencing.
BMC Genomics 14: 11.
Warnecke PM, Stirzaker C, Song J, Grunau C, Melki JR, Clark SJ. 2002.
Identification and resolution of artifacts in bisulfite sequencing. Methods (San Diego,
Calif.) 27: 101–107.
Watson JM, Riha K. 2010. Comparative biology of telomeres: Where plants stand. Febs
Letters 584: 3752–3759.
Watson JM, Riha K. 2011. Telomeres, aging, and plants: From weeds to Methuselah –
A mini-review. Gerontology 57: 129–136.
Wibowo A, Becker C, Durr J, Price J, Spaepen S, Hilton S, Putra H, Papareddy R,
Saintain Q, Harvey S, et al. 2018. Partial maintenance of organ-specific epigenetic
marks during plant asexual reproduction leads to heritable phenotypic variation.
Proceedings of the National Academy of Sciences 115: E9145–E9152.

63
Wibowo A, Becker C, Marconi G, Durr J, Price J, Hagmann J, Papareddy R, Putra
H, Kageyama J, Becker J, et al. 2016. Hyperosmotic stress memory in Arabidopsis is
mediated by distinct epigenetically labile sites in the genome and is restricted in the male
germline by DNA glycosylase activity. eLife 5: e13546.
Wilson EE. 1950. Observations on the bud-failure disorder in Jordanolo, a new variety of
almond. Phytopathology 40: 970.
Wilson EE. 1952. Development of bud-failure in the Jordanolo variety of almond.
Phytopathology 42: 520.
Wilson BF. 2000. Apical control of branch growth and angle in woody plants. American
Journal of Botany 87: 601–607.
Wilson EE, Schein RD. 1956. The nature and development of noninfectious bud failure
in almonds. Hilgardia 24: 519–542.
Wilson EE, Stout GL. 1944. A bud-failure disorder in almond trees. Bulletin of the
California Department of Agriculture 33: 60–64.
Wreczycka K, Gosdschan A, Yusuf D, Grüning B, Assenov Y, Akalin A. 2017.
Strategies for analyzing bisulfite sequencing data. Journal of Biotechnology 261: 105–
115.
Xiao F-H, Wang H-T, Kong Q-P. 2019. Dynamic DNA methylation during aging: A
“prophet” of age-related outcomes. Frontiers in Genetics 10.
Xie X, Shippen DE. 2018. DDM1 guards against telomere truncation in Arabidopsis.
Plant Cell Reports 37: 501–513.
Xu M, Li X, Korban SS. 2000. AFLP-based detection of DNA methylation. Plant
Molecular Biology Reporter 18: 361–368.
Xu Z, Zhang Q, Sun L, Du D, Cheng T, Pan H, Yang W, Wang J. 2014. Genome-
wide identification, characterisation and expression analysis of the MADS-box gene
family in Prunus mume. Molecular Genetics and Genomics 289: 903–920.
Yamane H, Ooka T, Jotatsu H, Hosaka Y, Sasaki R, Tao R. 2011. Expressional
regulation of PpDAM5 and PpDAM6, peach (Prunus persica) dormancy-associated
MADS-box genes, by low temperature and dormancy-breaking reagent treatment.
Journal of Experimental Botany 62: 3481–3488.
Yong W-S, Hsu F-M, Chen P-Y. 2016. Profiling genome-wide DNA methylation.
Epigenetics & Chromatin 9: 26.
Yotani T, Yamada Y, Arai E, Tian Y, Gotoh M, Komiyama M, Fujimoto H,
Sakamoto M, Kanai Y. 2018. Novel method for DNA methylation analysis using high‐

64
performance liquid chromatography and its clinical application. Cancer Science 109:
1690–1700.
Yu J, Conrad AO, Decroocq V, Zhebentyayeva T, Williams DE, Bennett D, Roch G,
Audergon J-M, Dardick C, Liu Z, et al. 2020. Distinctive gene expression patterns
define endodormancy to ecodormancy transition in apricot and peach. Frontiers in Plant
Science 11.
Yuan J-L, Sun H-M, Guo G-P, Yue J-J, Gu X-P. 2014. Correlation between DNA
methylation and chronological age of Moso bamboo (Phyllostachys heterocycla var.
pubescens). Botanical Studies 55: 4.
Zachová D, Fojtová M, Dvořáčková M, Mozgová I, Lermontova I, Peška V,
Schubert I, Fajkus J, Sýkorová E. 2013. Structure-function relationships during
transgenic telomerase expression in Arabidopsis. Physiologia Plantarum 149: 114–126.
Zaiger GN, Gardner LM, Zaiger GG. 2009. Interspecific almond tree named ‘Alm-21’.
U.S Patent USPP20295P2.
Zhang H, He X, Zhu J-K. 2013. RNA-directed DNA methylation in plants: Where to
start? RNA biology 10: 1593–1596.
Zhang H, Lang Z, Zhu J-K. 2018. Dynamics and function of DNA methylation in
plants. Nature Reviews Molecular Cell Biology 19: 489–506.
Zhang Z, Wang H, Wang Y, Xi F, Wang H, Kohnen MV, Gao P, Wei W, Chen K,
Liu X, et al. 2021. Whole genome characterization of chronological age-associated
changes in methylome and circular RNAs in moso bamboo (Phyllostachys edulis) from
vegetative to floral growth. The Plant Journal n/a.
Zhang H, Zhu J-K. 2011. RNA-directed DNA methylation. Current Opinion in Plant
Biology 14: 142–147.
Zhao K, Zhou Y, Li Y, Zhuo X, Ahmad S, Han Y, Yong X, Zhang Q. 2018. Crosstalk
of PmCBFs and PmDAMs based on the changes of phytohormones under seasonal cold
stress in the stem of Prunus mume. International Journal of Molecular Sciences 19: 15.
Zheng X, Chen L, Xia H, Wei H, Lou Q, Li M, Li T, Luo L. 2017. Transgenerational
epimutations induced by multi-generation drought imposition mediate rice plant’s
adaptation to drought condition. Scientific Reports 7: 39843.
Zhou Y, Hartwig B, James GV, Schneeberger K, Turck F. 2016. Complementary
activities of TELOMERE REPEAT BINDING proteins and polycomb group complexes
in transcriptional regulation of target genes. The Plant Cell 28: 87–101.

65
Zhou L, Ng HK, Drautz-Moses DI, Schuster SC, Beck S, Kim C, Chambers JC, Loh
M. 2019. Systematic evaluation of library preparation methods and sequencing platforms
for high-throughput whole genome bisulfite sequencing. Scientific Reports 9: 10383.
Zhu J-K. 2009. Active DNA demethylation mediated by DNA glycosylases. Annual
review of genetics 43: 143–166.
Zhu H, Chen P-Y, Zhong S, Dardick C, Callahan A, An Y-Q, van Knocker S, Yang
Y, Zhong G-Y, Abbott A, et al. 2020. Thermal-responsive genetic and epigenetic
regulation of DAM cluster controlling dormancy and chilling requirement in peach floral
buds. Horticulture Research 7: 1–14.
Zhu Y, Li Y, Xin D, Chen W, Shao X, Wang Y, Guo W. 2015. RNA-Seq-based
transcriptome analysis of dormant flower buds of Chinese cherry (Prunus
pseudocerasus). Gene 555: 362–376.
Ziller MJ, Hansen KD, Meissner A, Aryee MJ. 2015. Coverage recommendations for
methylation analysis by whole-genome bisulfite sequencing. Nature Methods 12: 230–
232.
Zogli P, Libault M. 2017. Plant response to biotic stress: Is there a common epigenetic
response during plant-pathogenic and symbiotic interactions? Plant Science 263: 89–93.
Zohary D, Weiss E, Hopf M. 2012. Fruit trees and nuts. In: Domestication of plants in
the old world: The origin and spread of domesticated plants in Southwest Asia, Europe,
and the Mediterranean Basin. Oxford, UK: Oxford University Press, 243.

66
Figure 1.1 Percentage of global almond production in each country or region 2019/20
(adapted from Almond Board of California, 2020).
United States78%
European Union8%
Australia7%
All Others2%
Tunisia1%
Iran1%
Chile1%
Turkey1%
Morocco1%

67
Figure 1.2 Shoot apical meristem (SAM) (A) zones including the central zone (yellow),
peripheral zone (purple), and rib zone (green), and (B) layers including the tunica (L1 and
L2 Cell layer – green and purple) and corpus (L3 Cell layers –pink) (from Sharma &
Fletcher, 2002).

68
Figure 1.3 Timeline of almond growth and dormancy cycles in the California Central
Valley.
Ecodormancy
(Dec – Feb)
Flowering
(mid-Feb to mid-March)
Active Vegetative
Growth
(March –April)
Flower & Vegetative Bud Development (mid-May to
June)
Summer Ecodormancy &
Paradormancy
(July – Sept)
Endodormancy
(Oct – Dec)
• Flowering occurs first, followed by vegetative bud burst
• Vegetative growth follows expansion and division of merstimatic cells to form shoot, leaf, and bud tissues
• Buds are held in ecodormany until accumulation of growing degree days
• Ecodormancy is consider broken once ~50% of flowers are in anthesis
• Flower and vegetative buds differentiate• Outer budscales become brown and
harden
• Summer dormancy is a combination of ecodormancyand paradormancy, induced in part by increased temperatures and apical dominance
• Buds enter endodormancy when temperatures begin to drop in the fall
• Buds are released from endodormancy following accumulation of chilling hours

69
Figure 1.4 Characteristic noninfectious bud-failure signs in an almond cultivar:
including bud death and erratic branching patterns. (Photo taken by K.M.
D’Amico-Willman; Davis, CA)

70
Figure 1.5 Acreage planted of the almond cultivar ‘Carmel’ from 1988 – 2017. High
incidence of bud-failure exhibition led to a dramatic decrease in planting in the mid-
2000’s. (Source: California Department of Agriculture, 2020)
0
1,000
2,000
3,000
4,000
5,000
1988 1993 1998 2003 2008 2013 2018
Ace
rgae
Pla
nte
d
'Carmel' Production by Acreage in California

71
Table 1.1 Number of chromosomes and estimated genome size of select members of
the Rosaceae family (adapted from Jung et al., 2019).
Species Name Chromosome Number Haploid Genome Size
Fragaria ananassa 2n=8x=56 240 Mb
Malus domestica 2n=34 750 Mb
Prunus armeniaca 2n=16 240 Mb
Prunus avium 2n=16 338 Mb
Prunus dulcis 2n=16 240 Mb
Prunus persica 2n=2x=16 265 Mb
Pyrus communis 2n=34 577 Mb
Rubus occidentalis 2n=14 240 Mb

72
Chapter 2 Relative telomere length and telomerase reverse transcriptase (TERT)
expression are associated with age in almond (Prunus dulcis [Mill.] D.A. Webb)
Katherine M. D’Amico-Willman1,2, Elizabeth S. Anderson3, Thomas M. Gradziel4,
Jonathan Fresnedo-Ramírez1,2, *
1 Department of Horticulture and Crop Science, Ohio Agricultural Research and
Development Center, The Ohio State University, Wooster, OH 44691, USA
2 Center for Applied Plant Sciences, The Ohio State University, Columbus, OH 43210,
USA
3 Department of Biology, College of Wooster, Wooster, OH 44691
4 Department of Plant Sciences, University of California, Davis, CA 95616, USA
* Author to whom correspondence should be addressed
Published in Plants:
D’Amico-Willman KM, Anderson ES, Gradziel TM, Fresnedo-Ramírez J. 2021.
Relative telomere length and telomerase reverse transcriptase (TERT) expression are
associated with age in almond (Prunus dulcis [Mill] D.A.Webb). 10: 189.
Author Contributions:
Conceptualization, K.M.D.-W., E.S.A., J.F.-R., and T.M.G.; methodology, K.M.D.-W.,
T.M.G., E.S.A., J.F.-R.; validation, K.M.D.-W. and E.S.A.; formal analysis, K.M.D.-W.
and J.F.-R.; investigation, K.M.D.-W. and E.S.A.; resources, T.M.G.; data curation,
K.M.D.-W. and J.F.-R.; writing—original draft preparation, K.M.D.-W. and E.S.A.;
writing—reviewing and editing, K.M.D.-W., E.S.A., and J.F.-R.; visualization, K.M.D.-
W.; supervision, J.F.-R. and T.M.G.; project administration, J.F.-R.; funding acquisition,

73
K.M.D.-W. and J.F.-R. All authors have read and agreed to the published version of this
manuscript.
Abstract
While all organisms age, our understanding of how aging occurs varies among species.
The aging process in perennial plants is not well-defined yet can have implications on
production and yield of valuable fruit and nut crops. Almond exhibits an age-related
disorder known as non-infectious bud-failure (BF) that affects vegetative bud
development, indirectly affecting kernel yield. This species and disorder present an
opportunity to address aging in a commercially relevant and vegetatively propagated
perennial crop. The hypothesis tested in this study was that relative telomere length
and/or telomerase reverse transcriptase (TERT) expression can serve as biomarkers of
aging in almond. Relative telomere lengths and expression of TERT, a subunit of the
enzyme telomerase, were measured via qPCR methods using bud and leaf samples
collected from distinct age cohorts over a two-year period. Results from this work show a
marginal but significant association between both relative telomere length and TERT
expression, and age, suggesting that as almonds age, telomeres shorten and TERT
expression decreases. This work provides information on potential biomarkers of
perennial plant aging, contributing to our knowledge of this process. In addition, these
results provide opportunities to address BF in almond breeding and nursery propagation.
Introduction
The current concept and study of aging is centered primarily around mammals with
research focused on circumventing deleterious impacts on health (Kirkwood, 2005;
Sanders & Newman, 2013). However, all eukaryotic organisms exhibit signals of aging,

74
resulting in the deterioration of key biological processes and subsequent decrease in
health, performance, and fitness of individuals. Perennial plants represent a unique model
to address the aging process and its impact since these species undergo cycles of
dormancy and growth, and they maintain the ability to reproduce for multiple years. The
aging process of perennial plants is relevant due to the longevity and economic
importance of perennial crops such as fruit and nut trees (Munné-Bosch, 2007; Brutovská
et al., 2013; Thomas, 2013). Individual trees can remain productive in orchards for
decades; however, aging in plants and its implications for growth and reproduction are
neglected areas of research with potential consequences for production, management,
conservation, and breeding.
The lack of understanding of aging in perennials is partly due to the complexity in
measuring and conceptualizing age in perennial plant species since chronologic and
ontogenetic age are inversely related (i.e., newly emerged tissues are the youngest
chronologically but the oldest ontogenetically) (Poethig, 2003). Chronologic age can be
defined as the amount of time since tissue/organ formation (e.g., human skin cells
replenish every few days, meaning each cell is typically a day or two days old), while
ontogenetic age refers more to developmental time and allows for the accumulation of
mutations or chromosomal alterations (e.g., two-day old skin cells at age six compared to
two-day old skin cells at age 60). Agriculturally relevant perennials are often vegetatively
propagated (i.e., cloned), blurring the distinction between ontogenetic and chronologic
age, and tend to be grown under intensive management. The difficulty in determining age
in perennials creates a need to identify biomarkers in these species that enable
ontogenetic age estimation.

75
Almond (Prunus dulcis [Mill.] D.A.Webb; Fig. 2.1) is an economically relevant,
Rosaceous crop subject to intense horticultural management to maintain maximum nut
production. In California, the almond industry is estimated to contribute ~$11 billion to
the state’s gross domestic product annually (Almond Board of California, 2020). Top-
producing almond cultivars, some of which were seedlings first obtained more than 100
years ago, are produced for commercial orchards via vegetative propagation (Wickson,
1914; Micke, 1996). As orchards age (after 20–25 years), trees are replaced with “new”
clones, typically of the same cultivar, to maintain high levels of production and
homogeneity in quality (Micke, 1996).
Almond exhibits an age-related disorder known as non-infectious bud-failure
(BF) affecting vegetative bud development in the spring (Wickson, 1914; Kester & Jones,
1970). Genotypes exhibiting this disorder show characteristic dieback at the top of the
canopy, and severe levels of BF can result in up to 50% yield loss (Gradziel et al., 2013).
Empirical evidence shows that BF is associated with age (Kester et al., 2004); however,
as almonds are produced primarily through vegetative propagation rather than by seed,
their true ontogenetic age and thus susceptibility to BF can be difficult to assess (Micke,
1996). Biomarkers indicative of age would be valuable to growers, breeders, and
producers to screen germplasm. Thus, the almond represents a potential model species for
the study of aging in perennials due to its economic relevance, the abundance of available
germplasm and breeding programs, and the exhibition of an age-related disorder.
Several biomarkers of aging have been studied in animals including protein
glycation (Bilova et al., 2017), DNA methylation (Dubrovina et al., 2016), and telomere
length (Sanders & Newman, 2013; Runov et al., 2015; Marioni et al., 2016). Telomeres
76
are nucleoproteins that cap the end of chromosomes, preventing premature instability of
genomic material and cellular senescence (Watson & Riha, 2011). Telomeres tend to
shorten over mitotic cellular divisions due to decreased levels of telomerase, an enzyme
that supports telomere replication during the S-phase of the cell cycle (Nelson et al.,
2014). This progressive shortening is proposed as a marker of aging in mammalian cells
and is linked to physiological deterioration and some age-related disorders (Watson &
Rhia, 2011; Sanders & Newman, 2013; Aviv & Shay, 2018). Given that telomerase
activity modulates telomere length, expression of genes involved in the telomerase
biosynthetic pathway could also serve as biomarkers for aging (Fitzgerald et al., 1996;
De la Fossel, 1998; Anchelin et al., 2011; Boccardi & Paolisso, 2014; Torre-Espinosa et
al., 2020). Telomerase reverse transcriptase (TERT) is the catalytic subunit of the
telomerase enzyme (Oguchi et al., 1999) and the RNA subunit functions as the template
for reverse transcription (Procházková Schrumpfová et al., 2019). Expression of TERT is
shown to affect telomerase activity (Jurečjivá et al., 2017; Sweetlove & Gutierrez, 2019).
This study tests the hypothesis that relative telomere length and TERT expression
in almond are associated with ontogenetic age and can thus be used to differentiate age
cohorts and serve as biomarkers of aging in this species. Both relative telomere length
and TERT expression show promise as diagnostic biomarkers since they can be measured
in a high-throughput manner by applying a variety of informative methods (Cawthon,
2009; Montpetit et al., 2014; Nersisyan & Arakelyan, 2015). These approaches build on
previous research examining the relationship between telomere lengths and age in
perennial plants (Flanary & Kletetschka, 2005; Moriguchi et al., 2007; Liu et al., 2007;
77
Liang et al., 2015). The goal of this work is to advance our understanding and provide a
model for the study of aging and its implications in perennial plant species.
Materials and Methods
Plant Material
Leaf samples for this study were collected in May 2018 and 2019 from almond breeding
selections located at the Wolfskill Experimental Orchards (Almond Breeding Program,
University of California—Davis, Winters, CA, USA). Leaf tissue was harvested from the
upper canopy of a total of 36 unique individuals representing distinct age cohorts (Table
2.1). Vegetative buds were sampled in May 2019 from the upper canopy stem segments
of the 18 unique individuals used for leaf sample collection (Table 2.1). Samples were
immediately frozen on ice and stored at −20 °C until shipment overnight on dry ice to the
Ohio Agricultural Research and Development Center (OARDC—Wooster, OH, USA).
Samples were stored at −20 °C until processing, and all subsequent experimental
procedures were conducted at the OARDC.
DNA and RNA Extraction
DNA was extracted from the leaf samples using the Omega E-Z 96® Plant DNA Kit
(Omega Bio-tek, Norcross, GA, USA) with slight modification. Briefly, 100 mg of leaf
material was weighed in 2.0 mL tubes containing two 1.6 mm steel beads and kept frozen
in liquid nitrogen. Samples were ground in a 2000 Geno/Grinder (SPEX SamplePrep,
Metuchen, NJ, USA) in two 48-well cryo-blocks frozen in liquid nitrogen. Following a
65 °C incubation, samples were incubated on ice for 20 min, treated with 10 μL of RNase
solution (2.5 μL RNase [Omega Bio-tek, Norcross, GA, USA] + 7.5 μL TE pH 8),
equilibrated through addition of 150 μL equilibration buffer (3 M NaOH), incubated at

78
room temperature for four minutes, and centrifuged at 4400 rpm for two minutes prior to
the addition of SP3 buffer. Concentration and quality were analyzed using a NanoDrop
1000 spectrophotometer and a Qubit 4 Fluorometer with a dsDNA HS Assay Kit
(ThermoFisher Scientific, Waltham, MA, USA).
DNA was extracted from bud samples following a modified version of the
protocol outlined in Vilanova et al. (2016). Briefly, 5 buds from each sample were
ground in a 2 mL microfuge tube with one 3.2 mm steel bead using a 2000
Geno/Grinder (SPEX SamplePrep, Metuchen, NJ, USA) set at 200 strokes per minute
for 5 min. Finely ground tissues were added to 1 mL of extraction buffer (2% w/v CTAB;
2% w/v PVP-40; 20 mmol/L EDTA; 100 mmol/L Tris-HCl [pH 8.0]; 1.4 mol/L NaCl),
14 μL beta-mercaptoethanol, and 2 μL RNase (10 mg/mL). The solution was incubated at
65 °C for 30 min and on ice for 5 min followed by a phase separation with 700 μL
chloroform:isoamyl alcohol (24:1). The aqueous phase (~800 μL) was recovered, and
480 μL binding buffer (2.5 mol/L NaCl; 20% w/v PEG 8000) was added followed by
720 μL 100% ice-cold ethanol.
Silica matrix buffer was prepared by adding 10 g silicon dioxide to 50 mL ultra-
pure water prior to incubation and centrifugation steps. Silica matrix buffer (20 μL) was
added to each sample, and samples were gently mixed for 5 min. Samples were spun for
10 s and supernatant was removed. To resuspend the remaining mucilaginous material
(but not the pellet), 500 μL cold 70% ethanol was used and supernatant was removed.
Another 500 μL cold 70% ethanol was added to resuspend the silica pellet, the tubes were
spun for 5 s, and the supernatant was removed. The pellet was allowed to dry at room
temperature for 5 min and was resuspended in 100 μL elution buffer (10 mmol/L Tris

79
HCl [pH 8.0]; 1 mmol/L EDTA [pH 8.0]) followed by a 5 min incubation at 65 °C.
Samples were centrifuged at 14,000 rpm for 10 min at room temperature and 90 μL of
supernatant was transferred to a new tube. DNA concentration was assessed by
fluorometry using a Qubit 4 and Qubit 1X dsDNA HS Assay Kit (ThermoFisher
Scientific, Waltham, MA, USA).
RNA was extracted from leaf tissue following the protocol outlined in Gambino et
al. (2008) with slight modifications. Briefly, leaf material was ground in liquid nitrogen
using a mortar and pestle, and 150 mg of tissue was weighed into a 2.0 mL microfuge
tube frozen in liquid nitrogen. To extract RNA, 900 μL CTAB extraction buffer (2%
CTAB, 2.5% PVP-40, 2 mol/L NaCl, 100 mmol/L Tris-HCl pH 8.0, 25 mmol/L EDTA
pH 8.0, 2% beta-mercaptoethanol added before use) was added to each tube and samples
were incubated at 65 °C for ten minutes. Following incubation, two phase separations
were performed using an equal volume of chloroform:isoamyl alcohol (24:1). RNA was
precipitated in 3 mol/L lithium chloride and incubated on ice for 30 min, and samples
were pelleted by centrifugation at 21,000× g for 15 min. Pellets were then resuspended in
500 μL pre-warmed SSTE buffer (10 mmol/L Tris-HCl pH 8.0, 1 mmol/L EDTA pH 8.0,
1% SDS, 1 mol/L NaCl) followed by a phase separation with an equal volume of
chloroform:isoamyl alcohol (24:1). A final precipitation was performed using 0.7 volume
chilled 100% isopropanol. RNA was pelleted and washed with 70% ethanol before being
resuspended in 30 μL nuclease-free water. A DNase treatment was performed using
DNA-free DNA Removal Kit (ThermoFisher Scientific) according to the
manufacturer’s instructions. All materials used for extraction were nuclease-free and
cleaned with RNaseZap RNase decontamination wipes (ThermoFisher Scientific) prior

80
to use. All centrifugation steps were performed at 4 °C. RNA quality and concentration
were assessed using a NanoDrop 1000 spectrophotometer and a Qubit 4 fluorometer
with an RNA HS Assay Kit (ThermoFisher Scientific).
Monochrome Multiplex Quantitative PCR (MMQPCR) to Measure Relative Telomere
Lengths
MMQPCR was conducted following the protocol outlined in Vaquero–Sedas & Vega–
Palas (2014) with minimal modifications. Primer sequences for genes used in this study
are shown in Table 2.2, including primers for the single copy gene, PP2A, and for the
telomere sequence [52,53]. Oligos were synthesized by MilliporeSigma (Burlington,
MA) and resuspended to a concentration of 100 μmol/L upon arrival. Standard curves
were created for each primer pair by pooling six aliquots of DNA isolated from a single
clone of the almond cultivar Nonpareil, and performing successive dilutions to 20 ng/μL,
10 ng/μL, 1 ng/μL, 0.5 ng/μL, and 0.25 ng/μL. Reactions were carried out in triplicate for
each primer by concentration combination.
Isolated DNA from the age cohort samples was diluted to 20 ng/μL. Multiplex
reactions were carried out in sextuplicate for each replicate within the age cohorts in a 10
μL volume using QuantaBio PerfeCTa SYBR® Green SuperMix (Quanta Biosciences,
Beverly, MA, USA) (2×), forward and reverse primers (100 nmol/L each), and 20 ng
template DNA according to the manufacturer’s instructions. Reactions were performed in
a Bio Rad C1000 Touch Thermal Cycler (Bio Rad Laboratories, Hercules, CA, USA)
using the following program: initial denaturation at 95 °C for 3 min followed by 2 cycles
of incubation at 94 °C for 15 s and annealing at 49 °C for 15 s; telomere and PP2A

81
amplicons were generated following 35 cycles at 95 °C for 30 s, 59 °C for 1 min, 72 °C
for 30 s, 84 °C for 15 s, and 85 °C for 15 s; final incubation at 72 °C for 1 min. Melting
curve analysis was performed at a temperature range of 74–85 °C for both primer pairs to
ensure no non-specific amplification.
cDNA Synthesis and Quantitative Reverse Transcriptase PCR (qRT-PCR) to Measure
Relative Expression of TERT
Reactions were carried out in a 20 μL volume using the Verso™ cDNA Synthesis Kit
(ThermoFisher Scientific). One reaction was prepared for each age cohort sample
according to the manufacturer’s instructions. Reactions were performed in an MJ
Research PTC-200 thermal cycler using the following program: 42 °C for 30 min
followed by 95 °C for 2 min. To quantify expression of TERT in age cohort individuals,
qRT-PCR was performed in triplicate for each sample. The gene RPII from peach was
used as a reference (Tong et al., 2009; Bastias et al., 2020), and the sequence for the
TERT gene was derived from the ‘Texas’ genome
(https://www.rosaceae.org/analysis/295) using the homologous peach gene sequence as a
reference (Alioto et al., 2020). Primer sequences are shown in Table 2.2, and all oligos
were synthesized by MilliporeSigma (Burlington, MA, USA) and resuspended to a
concentration of 100 μmol/L upon arrival.
To generate cDNA from the age cohort samples, 100 ng of RNA was used as
input in the Verso cDNA Synthesis Kit (ThermoFisher Scientific) according to the
manufacturer’s instructions. To test for relative expression of TERT, reactions were
carried out in triplicate for each biological replicate within the age cohorts in a 10 μL

82
volume using QuantaBio PerfeCTa SYBR® Green SuperMix (Quanta Biosciences) (1×),
forward and reverse primers (100 nmol/L), and cDNA (1 μL) according to the
manufacturer’s instructions. Reactions were performed in Bio Rad C1000 Touch Thermal
Cycler (Bio Rad Laboratories) using the following program: initial denaturation at 95 °C
for 3 min followed by 40 cycles at 95 °C for 15 s and 55 °C for 45 s. Melt curves were
generated at a temperature range of 74–85 °C for both primer pairs to ensure no non-
specific amplification.
Statistical Analysis
Using the standard curve generated with PP2A (S) and telomere (T) primers for a
reference almond sample, relative T/S ratios were calculated for each individual sample
based on Cq values for the telomere and PP2A products (Vaquero-Sedas & Vega-Palas,
2014). Z-scores were calculated from the T/S ratios as recommended in Verhulst (2020)
for each replicate within the age cohorts. Normality and homogeneity of variance were
confirmed using Shapiro–Wilks and Bartlett tests. Analysis of variance (ANOVA) was
performed for each age cohort followed by post hoc Fisher’s LSD and pairwise t-tests.
Gene expression data were analyzed according to guidelines in Bustin et al. (2009), first
by normalizing TERT expression to that of the reference gene, RPII. Following
normalization, data were log-transformed, and normality and homogeneity of variance
were confirmed using Shapiro-Wilks and Bartlett tests. ANOVA was performed for each
age cohort followed by post hoc analysis with Tukey’s HSD. Letter groupings indicate
significant means separation following significant ANOVA results. Shared letters
indicate that means did not significantly differ between groups, while different letters
indicate a significant difference between means when comparing groups. All analyses

83
were performed using R v. 3.6.1 and plots were generated using ggplot2 v. 3.3.0.
Calculated T/S ratios, relative telomere lengths, relative TERT expression and log-
transformed TERT expression as well as raw Cq values for each individual are listed in
Appendix Tables 1-8. All R code used to perform analyses is reported in Appendix File
1. Analyses were performed using the Ohio Supercomputer Center resources (Ohio
Supercomputer Center, 1987).
Results
Association of Relative Telomere Length and Age in Almond
Relative telomere lengths were generated for the almond individuals within each of the
age cohorts collected in 2018 (1, 5, 9, and 14 years) using leaf tissue and in 2019 (2, 7,
and 11 years old) using leaf and bud tissue following the monochrome multiplex
quantitative PCR (MMQPCR) approach. Normality of residuals and homogeneity of
variance of relative telomere lengths were confirmed using Shapiro–Wilks (2018: p-value
= 0.2578, n = 4–6; 2019 (leaf): p-value = 0.4682, n = 3; 2019 (bud): p-value = 0.0402, n
= 5–7) and Bartlett (2018: p-value = 0.1408; 2019 (leaf): p-value = 0.4613; 2019 (bud):
p-value = 0.1076) tests. ANOVA results based on leaf tissue analysis for the linear
model, z-score ~ age, were marginally significant in both 2018 and 2019, and subsequent
post hoc Fisher’s least significant difference (LSD) and pairwise t-tests revealed
significant differences between ages 1 and 14 years and 5 and 14 years (Fig. 2.2a) in the
2018 cohorts, and between ages 2 and 11 years old (Fig. 2.2b) in the 2019 cohorts. The
ANOVA result based on the bud tissue analysis for the linear model, z-score ~ age, was
significant at alpha = 0.1, and subsequent post hoc Fisher’s LSD and pairwise t-tests
showed significant differences between ages 2 and 11 years old (Fig. 2.3). Both bud and

84
leaf tissue showed similar patterns in decreased relative telomere length with increased
age.
TERT Gene Expression Patterns Associated with Age in Almond
Normalized expression of TERT was measured for almond samples among the age
cohorts collected in 2018 and 2019 for this study using PP2A as the reference gene.
Normality of residuals and homogeneity of variance were confirmed using Shapiro–
Wilks (2018: p-value = 0.694, n = 2–3; 2019: p-value = 0.09456, n = 4) and Bartlett
(2018: p-value = 0.6976; 2019: p-value = 0.3579) tests. ANOVA results comparing the
average log (expression) values for each age cohort revealed significant differences
between cohorts in both 2018 and 2019. Post hoc analysis with Tukey’s HSD revealed
significant differences in TERT expression between ages 1 and 14 years old in the 2018
cohorts (Fig. 2.4a) and between ages 2 and 11 years old in the 2019 age cohorts (Fig.
2.4b).
Discussion
Almond, an economically valuable nut crop, exhibits an aging-related disorder known as
non-infectious bud-failure that negatively impacts vegetative development and,
ultimately, yield. As a clonally propagated crop, tracking age and thus susceptibility to
bud-failure is difficult, making biomarkers of age a valuable resource to circumvent the
impacts of aging-related disorders in almond germplasm. Relative telomere length is used
as a biomarker of age and development of age-related disorders in mammals, but the
association between relative telomere length and age in plants is not well-defined
(Watson & Riha, 2011; Procházková Schrumpfová et al., 2019). Over mitotic cell
divisions, telomeres eventually reach a critical minimum length at which point the cell

85
senesces and dies due to genome instability resulting from single stranded DNA at the
ends of chromosomes (Hemann et al., 2001). Plant chromosomes also contain telomeres
with similar functions. While the relationship between telomeres and the aging process is
not as clearly defined in plants as in animals, previous work shows associations between
relative telomere length and various stages of plant development (Watson & Riha, 2011;
Zachová et al., 2013; Procházková Schrumpfová et al., 2019) suggesting relative
telomere length could be a suitable biomarker of age in plants. Additionally, telomerase
activity modulates telomere length, and thus expression of genes such as TERT, which
are involved in telomerase synthesis, could also serve as biomarkers of age. In
Arabidopsis, increased TERT expression is linked to proportional increases in telomerase
activity and telomere length (Fitzgerald et al., 1999; Zangi et al., 2019), which are in turn
linked to age. Since TERT is tied to telomere length in both plants and animals, its
expression may also serve as an indicator of age in plants (Watson & Riha, 2011).
The present study tests the hypothesis that relative telomere length and/or TERT
expression are associated with ontogenetic age in almond. To test this, a qPCR approach
was utilized to measure relative telomere length and estimate TERT expression in sets of
almond accessions of known chronological age. Leaf and bud samples were collected
from three and four sets of age cohorts over two years to test for an association between
relative telomere length and individual age using the MMQPCR method as well as
between TERT expression and age using qRT-PCR.

86
Quantitative PCR Approaches Suggest an Association between Relative Telomere Length
and Age in Almond Leaf and Bud Tissues
A pattern of decreased relative telomere length with increased age was shown utilizing
MMQPCR and almond leaf and bud samples collected from different almond age cohorts
in 2018 and 2019. The association demonstrated in this study adds to the growing body of
knowledge regarding the complex relationship between telomere length and plant aging.
Previous studies in both Ginkgo biloba and Panax ginseng showed a pattern of increased
telomere length with increased age, suggesting plants do not follow the same patterns of
telomere shortening as seen in mammals (Liu et al., 2007; Liang et al., 2015). Work in
apple (Malus domestica) and Prunus yedoensis, both members of the Rosaceae family
like almond, show no change in telomere lengths with increased plant age over a five-
year timespan (Moriguchi et al., 2007). In bristlecone pine (Pinus longaeva), a long-lived
perennial gymnosperm, telomere lengths measured in needle and root tissues between 0–
3500 years old showed a cyclical pattern of lengthening and shortening with age (Flanary
& Kletetschka, 2005). Further, when analyzing telomere length in relation to tissue
differentiation, studies in both barley (Hordeum vulgare) and Scots pine (Pinus
sylvestris) showed telomere shortening from embryo development to leaf or needle
formation (Kilian et al., 1995; Aronon & Ryynänen, 2012). Similarly, in silver birch
(Betula pendula), telomeres shorten when plants are grown in tissue culture conditions
compared to those grown outdoors, suggesting abiotic stressors may also induce telomere
shortening (Aronon & Ryynänen, 2014).

87
The results in almond suggest a pattern closest to what was observed in
bristlecone pine where telomere lengths shorten and lengthen throughout an individual’s
lifetime. This pattern could be unique to gymnosperms, however, and needs to be further
characterized in angiosperms including Rosaceous species. While the commercial
lifespan of productive almond clones is typically less than 30 years, almond seedlings can
live more than 150 years (Micke, 1996). In this study, the maximum age tested via qPCR
was 14 years old, suggesting that a wider age range of trees and a larger sample size
could produce a more refined model of telomere length patterns over time.
Current almond cultivars may also be ontogenetically old. Nonpareil, the most
relevant US cultivar representing ~40% of acreage, was first described almost 140 years
ago and has been propagated by budding since (Wickson, 1914; Almond Board of
California, 2020). The ontogenetic age of a cultivar may be a factor to consider in the
onset of aging-related disorders like bud-failure in almond. Additionally, it would be
interesting to track the change in telomere length following clonal propagation (through
budding) during which plants experience a rejuvenation process, reverting to a juvenile
state for a short period of time (Bonga, 1982). Interestingly, both bud and leaf tissue
showed similar patterns of decreased relative telomere length with increasing age in this
study. The bud tissue utilized in this study was excised from stems containing the leaves
that were also sampled. Based on their close proximity, it is possible that the telomere
profile of the bud would be reflected in the associated leaf tissues. It would be useful to
profile telomere lengths of buds throughout the tree to see if similar patterns of relative
telomere length were obtained. Further, Gradziel et al. (2019) found that propagating
almond from basal epicormic buds, potentially representing ontogenetically young

88
meristematic tissue, seemed to alleviate BF in resulting clones. Testing telomere lengths
in epicormic tissues could present another avenue to both track aging in almond and
develop biomarkers to predict BF potential in almond.
TERT Expression Measured by qRT-PCR is Putatively Associated with Age in Almond
Accessions
To test the hypothesis that TERT expression can serve as a biomarker of ontogenetic age
in almond, expression patterns were tested in cohorts representing either three or four
distinct ages over two years. Results from this work showed a consistent pattern of
marginally significant, decreased expression with increased ontogenetic age. Telomerase
was shown to be a modulator of longevity in humans and other mammals, but work
describing telomerase patterns in plants is limited (Fitzgerald et al., 1996; Boccardi &
Paolisso, 2014).
A comprehensive study examining telomerase protein activity in carrot (Daucus
carota), cauliflower (Brassica oleracea), soybean (Glycine max), Arabidopsis thaliana,
and rice (Oryza sativa) demonstrated that, like telomere lengths, protein activity tends to
be highest in undifferentiated tissues like meristematic tissues and is lower in
differentiated tissues such as leaves (Fitzgerald et al., 1996). This result was supported by
further work in barley and maize showing little activity in differentiated tissues (Kilian et
al., 1995). These studies were all performed in annuals or biennials, however, suggesting
that telomerase activity does in fact decrease with increased plant age in these crops.
Work in perennials including bristlecone pine, P. ginseng, and G. biloba showed an
association between telomerase activity and age, suggesting patterns unique to perennial

89
plant species (Flanary & Kletetschka, 2005; Liu et al., 2007; Song et al., 2011). A study
in almond could be performed using a wider age range and larger sample size to elucidate
the effect of age on telomerase activity, similar to what was referenced above for
telomere length measurements. Additionally, many of the studies performed in other
plants examining patterns of telomerase activity focused on protein activity rather than
gene expression. A future study will be necessary in almond to examine the telomerase
protein activity, potentially by Western blot or other proteomics approaches, to
corroborate the association between TERT expression and protein activity.
While a pattern was established in plants demonstrating a direct relationship
between telomerase activity and telomere length, regulation of telomerase is still not well
understood in the plant kingdom (Fitzgerald et al., 1996; Zachová et al., 2013; Jurečková
et al., 2017). Interestingly, work in Arabidopsis has shown a link between DNA
methylation and telomere length, suggesting that this epigenetic mark likely has a role in
regulating telomere lengths potentially by modulating telomerase activity (Ogrocká et al.,
2014; Vega-Vaquero et al., 2016; Lee & Cho, 2019). A study is ongoing in almond to
analyze DNA methylation patterns in a set of almond accessions representing three
distinct age cohorts to determine what, if any, impact age has on methylation profiles.
Despite the limited age range and small sample size used in this study, a
consistent pattern of both decreased relative telomere length and decreased TERT
expression with increased age was observed over two years of sampling, regardless of
whether the sample was taken from actively growing tissue like buds or a more static
tissue in terms of cell division, like leaves. These results provide a basis for future study
and exploration into the utility of relative telomere length measurement and/or TERT

90
expression or telomerase activity as biomarkers of aging in almond. Developing a robust
biomarker to track aging in almond, a primarily clonally propagated crop, would allow
growers, producers, and breeders to screen germplasm to eliminate selections or clones
with a high susceptibility to age-related disorders due to advanced ontogenetic age.
Acknowledgments
We would like to acknowledge Matthew Willman for his assistance with the statistical
analyses and Cheri Nemes for her assistance with wet lab portions of this project. We
would like to thank Daniel Williams for editing later versions of this manuscript. We
would also like to acknowledge the Ohio Supercomputer Center.

91
References
Alioto T, Alexiou KG, Bardil A, Barteri F, Castanera R, Cruz F, Dhingra A, Duval H, i Martí ÁF, Frias L, et al. 2020. Transposons played a major role in the diversification between the closely related almond and peach genomes: Results from the almond genome sequence. The Plant Journal 101: 455–472.
Almond Board of California. 2020. Almond almanac. Modesto, CA: Almond Board of California.
Anchelin M, Murcia L, Alcaraz-Pérez F, García-Navarro EM, Cayuela ML. 2011. Behaviour of telomere and telomerase during aging and regeneration in zebrafish. PLoS ONE 6.
Aronen T, Ryynänen L. 2012. Variation in telomeric repeats of Scots pine (Pinus sylvestris L.). Tree Genetics and Genomes 8: 267–275.
Aronen T, Ryynänen L. 2014. Silver birch telomeres shorten in tissue culture. Tree Genetics and Genomes 10: 67–74.
Aviv A, Shay JW. 2018. Reflections on telomere dynamics and ageing-related diseases in humans. Philosophical Transactions of the Royal Society B 373.
Bastias A, Oviedo K, Almada R, Correa F, Sagredo B. 2020. Identifying and validating housekeeping hybrid Prunus spp. genes for root gene-expression studies. PLOS ONE 15.
Bilova T, Paudel G, Shilyaev N, Schmidt R, Brauch D, Tarakhovskaya E, Milrud S, Smolikova G, Tissier A, Vogt T, et al. 2017. Global proteomic analysis of advanced glycation end products in the Arabidopsis proteome provides evidence for age-related glycation hot spots. Journal of Biological Chemistry 292: 15758–15776. Boccardi V, Paolisso G. 2014. Telomerase activation: A potential key modulator for human healthspan and longevity. Ageing Research Reviews 15: 1–5.
Bonga JM. 1982. Vegetative propagation in relation to juvenility, maturity, and rejuvenation. In: Bonga JM, Durzan DJ, eds. Tissue Culture in Forestry. Dordrecht, Netherlands: Springer, 387–412.
Brutovská E, Sámelová A, Dušička J, Mičieta K. 2013. Ageing of trees: Application of general ageing theories. Ageing Research Reviews 12: 855–866.
Bustin SA, Benes V, Garson JA, Hellemans J, Huggett J, Kubista M, Mueller R, Nolan T, Pfaffl MW, Shipley GL, et al. 2009. The MIQE guidelines: Minimum information for publication of quantitative real-time PCR experiments. Clinical Chemistry 55: 611–622.

92
Cawthon RM. 2009. Telomere length measurement by a novel monochrome multiplex quantitative PCR method. Nucleic Acids Research 37.
De la Torre-Espinosa ZY, Barredo-Pool F, Castaño de la Serna E, Sánchez-Teyer LF. 2020. Active telomerase during leaf growth and increase of age in plants from Agave tequilana var. Azul. Physiology and Molecular Biology of Plants 26: 639–647.
Dubrovina AS, Kiselev KV, Weber A. 2016. Age-associated alterations in the somatic mutation and DNA methylation levels in plants. Plant Biology 18: 185–196. Fitzgerald MS, McKnight TD, Shippen DE. 1996. Characterization and developmental patterns of telomerase expression in plants. Proceedings of the National Academy of Sciences 93 14422–14427.
Fitzgerald MS, Riha K, Gao F, Ren S, McKnight TD, Shippen DE. 1999. Disruption of the telomerase catalytic subunit gene from Arabidopsis inactivates telomerase and leads to a slow loss of telomeric DNA. Proceedings of the National Academy of Sciences 96: 14813–14818.
Flanary BE, Kletetschka G. 2005. Analysis of telomere length and telomerase activity in tree species of various life-spans, and with age in the bristlecone pine Pinus longaeva. Biogerontology 6: 101–111.
Fossel M. 1998. Telomerase and the aging cell: Implications for human health. JAMA The Journal of the American Medical Association 279: 1732–1735.
Gambino G, Perrone I, Gribaudo IA. 2008. Rapid and effective method for RNA extraction from different tissues of grapevine and other woody plants. Phytochemical Analysis 19: 520–525.
Gradziel T, Lampinen B, Preece JE. 2019. Propagation from basal epicormic meristems remediates an aging-related disorder in almond clones. Scientia Horticulturae
5: 28.
Gradziel TM, Thorpe MA, Fresnedo-Ramírez J, Ragas R, Lampinen B, Adaskaveg J, Connell J, Schrader P, Metcalf S, Duncan R, et al. 2013. Molecular Marker Based Diagnostics for Almond Non-Infectious Bud-Failure. Modesto, CA: Almond Board of California.
Hemann MT, Strong MA, Hao L-Y, Greider CW. 2001. The shortest telomere, not average telomere length, is critical for cell viability and chromosome stability. Cell 107: 67–77.
Jurečková JF, Sýkorová E, Hafidh S, Honys D, Fajkus J, Fojtová M. 2017. Tissue-specific expression of telomerase reverse transcriptase gene variants in Nicotiana tabacum. Planta 245: 549–561.

93
Kester DE, Jones RW. 1970. Non-infectious bud-failure from breeding programs of almond (Prunus amygdalus Batsch). Journal of the American Society for Horticultural Science 95: 492–496.
Kester DE, Shackel KA, Micke WC, Viveros M, Gradziel TM. 2004. Noninfectious bud failure in ‘Carmel’ almond: I. Pattern of development in vegetative progeny trees. Journal of the American Society for Horticultural Science 129: 244–249.
Kilian A, Heller K, Kleinhofs A. 1998. Development patterns of telomerase activity in barley and maize. Plant Molecular Biology 37: 621–628.
Kilian A, Stiff C, Kleinhofs A. 1995. Barley telomeres shorten during differentiation but grow in callus culture. Proceedings of the National Academy of Sciences 92: 9555.
Kirkwood TBL. 2005. Understanding the odd science of aging. Cell 120: 437–447.
Lee WK, Cho MH. 2019. Epigenetic aspects of telomeric chromatin in Arabidopsis thaliana. BMB Reports 52: 175–180.
Liang J, Jiang C, Peng H, Shi Q, Guo X, Yuan Y, Huang L. 2015. Analysis of the age of Panax ginseng based on telomere length and telomerase activity. Scientific Reports 5.
Liu D, Qiao N, Song H, Hua X, Du J, Lu H, Li F. 2007. Comparative analysis of telomeric restriction fragment lengths in different tissues of Ginkgo biloba trees of different age. Journal of Plant Research 120: 523–528.
Marioni RE, Harris SE, Shah S, McRae AF, von Zglinicki T, Martin-Ruiz,C, Wray NR, Visscher PM, Deary IJ. 2016. The epigenetic clock and telomere length are independently associated with chronological age and mortality. International Journal of Epidemiology 45: 424–432.
Micke WC. 1996. Almond Production Manual. UCANR Publications.
Montpetit AJ, Alhareeri AA, Montpetit M, Starkweather AR, Elmore LW, Filler K, Mohanraj L, Burton CW, Menzies VS, Lyon DE, et al. 2014. Telomere length: A review of methods for measurement. Nursing Research 63: 289–299.
Moriguchi R, Kato K, Kanahama K, Kanayama Y, Kikuchi H. 2007. Analysis of telomere lengths in apple and cherry trees. Acta Horticulturae 738: 389–395.
Munné-Bosch S. 2007. Aging in perennials. Critical Reviews in Plant Science 26: 123–138.
Nelson ADL, Beilstein MA, Shippen DE. 2014. Plant telomeres and telomerase. In Howell SH, ed. Molecular Biology. New York, NY: Springer, 25–49.
Nersisyan L, Arakelyan A. 2015. Computel: Computation of mean telomere length from whole-genome next-generation sequencing data. PLOS ONE 10.

94
Ogrocká A, Polanská P, Majerová E, Janeba Z, Fajkus J, Fojtová M. 2014. Compromised telomere maintenance in hypomethylated Arabidopsis thaliana plants. Nucleic Acids Research 42: 2919–2931.
Oguchi K, Liu H, Tamura K, Takahashi H. 1999. Molecular cloning and characterization of AtTERT, a telomerase reverse transcriptase homolog in Arabidopsis thaliana. FEBS Letters 457: 465–469.
Ohio Supercomputer Center. 1987. Columbus, OH, USA. Poethig RS. 2003. Phase change and the regulation of developmental timing in plants. Science 301: 334–336.
Procházková Schrumpfová P, Fojtová M, Fajkus J. 2019. Telomeres in plants and humans: Not so different, not so similar. Cells 8: 58.
Runov AL, Vonsky MS, Mikhelson VM. 2015. DNA methylation level and telomere length as a basis for modeling of the biological aging clock. Cell and Tissue Biology 9: 261–264.
Sanders JL, Newman AB. 2013. Telomere length in epidemiology: A biomarker of aging, age-related disease, both, or neither? Epidemiologic Reviews 35: 112–131.
Song H, Liu D, Li F, Lu H. 2011. Season- and age-associated telomerase activity in Ginkgo biloba L. Molecular Biology Reports 38: 1799–1805.
Sweetlove L, Gutierrez C. 2019. The journey to the end of the chromosome: Delivering active telomerase to telomeres in plants. The Plant Journal 98: 193–194.
Thomas H. 2013. Senescence, ageing and death of the whole plant. New Phytologist 197: 696–711.
Tong Z, Gao Z, Wang F, Zhou J, Zhang Z. 2009. Selection of reliable reference genes for gene expression studies in peach using real-time PCR. BMC Molecular Biology 10: 71.
Vaquero-Sedas MI, Vega-Palas MA. 2014. Determination of Arabidopsis thaliana telomere length by PCR. Scientific Reports 4.
Vega-Vaquero A, Bonora G, Morselli M, Vaquero-Sedas MI, Rubbi L, Pellegrini M, Vega-Palas MA. 2016. Novel features of telomere biology revealed by the absence of telomeric DNA methylation. Genome Research 26: 1047–1056.
Verhulst S. 2020. Improving comparability between qPCR-based telomere studies. Molecular Ecology Resources 20: 11–13.
Vilanova S, Alonso D, Gramazio P, Plazas M, García-Fortea E, Ferrante P, Schmidt M, Díez MJ, Usadel,B, Giuliano G, et al. 2020. SILEX: A fast and inexpensive high-
95
quality DNA extraction method suitable for multiple sequencing platforms and recalcitrant plant species. Plant Methods 16. Wang T, Hao R, Pan H, Cheng T, Zhang Q. 2014. Selection of suitable reference genes for quantitative real-time polymerase chain reaction in Prunus mume during flowering stages and under different abiotic stress conditions. Journal of the American Society for Horticultural Science 139: 113–122.
Watson JM, Riha K. 2011. Telomeres, aging, and plants: From weeds to Methuselah—A mini-review. Gerontology 57: 129–136.
Wickson EJ. 1914. The California Fruits and How to Grow Them. San Francisco, CA: Pacific rural.
Zachová D, Fojtová M, Dvořáčková M, Mozgová I, Lermontova I, Peška V, Schubert I, Fajkus J, Sýkorová E. 2013. Structure-function relationships during transgenic telomerase expression in Arabidopsis. Physiologia Plantarum 149: 114–126.
Zangi M, Bagherieh Najjar MB, Golalipour M, Aghdasi M. 2019. met1 DNA methyltransferase controls TERT gene expression: A new insight to the role of telomerase in development. Cell Journal 22.
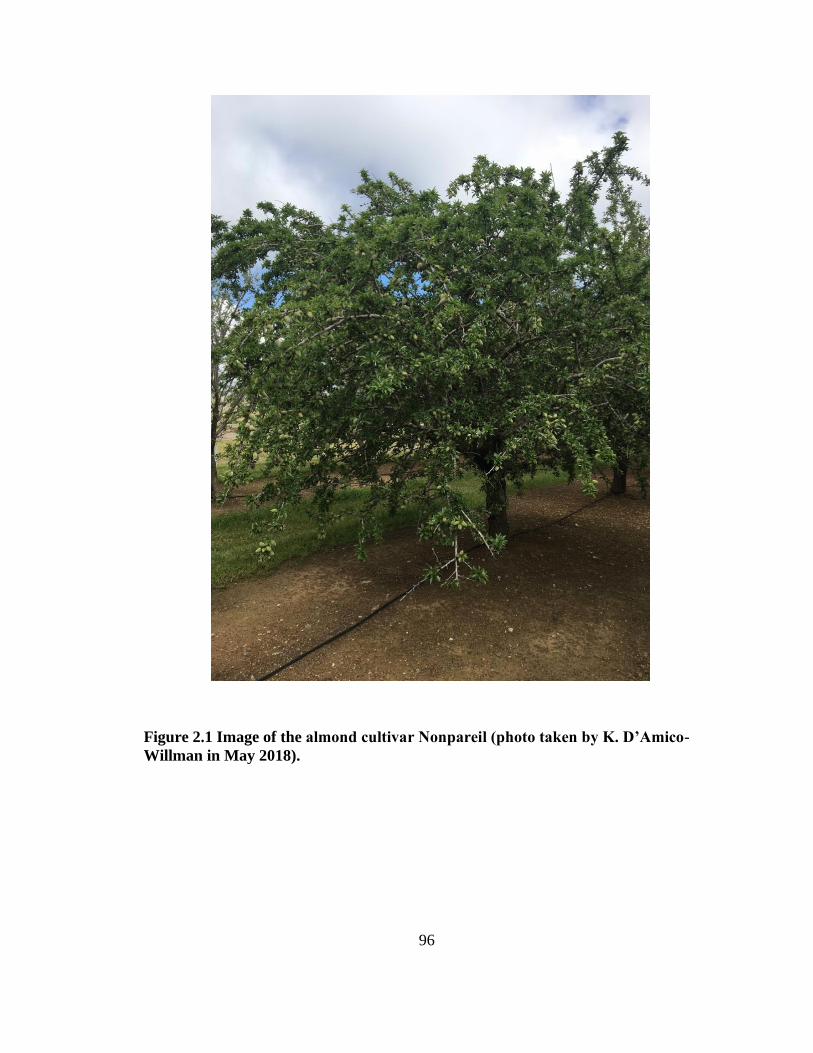
96
Figure 2.1 Image of the almond cultivar Nonpareil (photo taken by K. D’Amico-
Willman in May 2018).

97
Figure 2.2 Boxplots depicting the calculated z-score of the T/S ratio for leaf samples
within the age cohorts tested. (A) Age cohort collected in 2018. (B) Age cohort collected
in 2019. Significant differences in z-scores between age cohorts based on ANOVA
followed by post hoc Fisher’s least significant difference (LSD) (α = 0.1) are denoted by
letter groupings where differing letters indicate significant differences following means
separation analysis (ANOVA 2018 p-value = 0.1077; ANOVA 2019 p-value = 0.06548).
Bold dots represent outliers within each age cohort.
a
a
ab
b
−3
−2
−1
0
1
2
1 5 9 14
Chronological Age (Years)
Zsco
re R
ela
tive
Te
lom
ere
Le
ng
th
A
a
ab
b
−1
0
1
2 7 11
Chronological Age (Years)
Zscore
Rela
tive
Te
lom
ere
Le
ng
th
B

98
Figure 2.3 Boxplot depicting calculated z-score for the T/S ratio for bud samples within
the age cohorts collected in 2019. Significant differences in z-scores between ages
cohorts based on ANOVA followed by post hoc Fisher’s LSD (α = 0.05) are denoted by
letter groupings where differing letters indicate significant differences following means
separation analysis (ANOVA p-value = 0.067). Bold dots represent outliers within each
age cohort.
a ab b
−10
0
10
20
2 7 11
Chronological Age (Years)
Zsco
re R
ela
tive
Te
lom
ere
Le
ng
th

99
Figure 2.4 Normalized expression of TERT for almond samples within the age cohorts
tested. (A) Age cohort collected in 2018. (B) Age cohort collected in 2019. Significant
differences in relative expression between age cohorts based on ANOVA followed by
post hoc Tukey’s HSD (alpha = 0.1) are denoted by the letter groupings where differing
letters indicate significant differences following means separation analysis (ANOVA
2018 p-value = 0.09087; ANOVA 2019 p-value = 0.1414).

100
Table 2.1 Sampling scheme for 2018 and 2019 almond age cohort collections.
Sampling Year Age (Years) Leaf Sample Size Bud Sample Size
2018 1 6 N/A
2018 5 6 N/A
2018 9 6 N/A
2018 14 6 N/A
2019 2 4 6
2019 7 4 7
2019 11 4 5

101
Table 2.2 Oligos used for all Monochrome Multiplex Quantitative PCR (MMQPCR) and
quantitative reverse transcriptase PCR (qRT-PCR) studies.
Oligo Name Oligo Sequence (5′–3′)
PP2A
Forward CGGCGGCGGGCGGCGCGGGCAGGATAGACATTGGAGGGTTCGGCTCGCAA
PP2A
Reverse CGGCGGCGGGCGGCGCGGGACCACTGCATGCAAAGGGACCCAAGCTTAT
Telomere
Forward CCCCGGTTTTGGGTTTTGGGTTTTGGGTTTTGGGT
Telomere
Reverse GGGGCCCTAATCCCTAATCCCTAATCCCTAATCCCT
TERT
Forward GCATCAGAGAAGGGTCAGATT
TERT
Reverse CTCTGGCTCCTTGAATCGTATAG
RPII
Forward TGAAGCATACACCTATGATGATGAAG
RPII Reverse CTTTGACAGCACCAGTAGATTCC

102
Chapter 3 Hypermethylation is associated with increased age in almond (Prunus
dulcis [Mill.] D.A.Webb) accessions
Abstract
Almond (Prunus dulcis [Mill.] D.A.Webb) is a perennial crop produced primarily by
vegetative propagation and exhibits an age-related disorder known as non-infectious bud-
failure. As a vegetatively propagated crop, determining age and thus susceptibility of
bud-failure exhibition in almond clones is difficult. The focus of this study is to profile
changes in DNA methylation occurring with increased age in almond breeding
germplasm in an effort to identify possible biomarkers of age that can be used to assess
the potential individuals have to develop aging-related disorders in this productive
species. To profile DNA methylation in almond germplasm, 70 methylomes were
generated from almond individuals representing three age cohorts (11, 7, and 2-years old)
using an enzymatic methyl-seq approach followed by analysis to call differentially
methylated regions (DMRs) within these cohorts. Weighted chromosome-level
methylation analysis reveals hypermethylation in 11-year-old almond breeding selections
when compared to 2-year-old selections in the CG and CHH contexts. A total of 17
consensus DMRs were identified in all age-contrasts, and one of these DMRs contains
the sequence for miR156, a microRNA with known involvement in regulating the
juvenile-to-adult transition. Almond shows a pattern of hypermethylation with increased

103
age, and this increase in methylation may be involved in regulating the vegetative
transition in almond. The identified DMRs could function as putative biomarkers of age
in almond following validation in additional age groups.
Introduction
The study of aging has centered primarily around mammalian systems with a focus on
humans (Kirkwood, 2005; Ferrucci et al., 2020); however, the aging process has also
been shown to impact plants with emphasis placed on long-lived perennials (Munné-
Bosch, 2007; Thomas, 2013; Brutovská et al., 2013; Woo et al., 2018). These impacts
can include things like diminished growth, reduced flower and fruit production, and the
development of aging-related disorders (Kester & Jones, 1970; Van Dijk, 2009). In
perennial plants and in other organisms such as humans, causal mechanisms underlying
the development of age-related phenotypes include genetic alterations such as somatic
mutations or differential epigenetic marks (Jaligot et al., 2000; Dubrovina & Kiselev,
2016; Ogneva et al., 2016; Xiao et al., 2019; Wang et al., 2020). In fact, DNA
methylation in particular has been proposed as a biomarker of aging in many systems,
serving as a biological “clock” that can be used to track aging and predict aging outcomes
(Runov et al., 2015; Jylhävä et al., 2017; Xiao et al., 2019).
Studying epigenetic alterations like differential DNA methylation associated with
advanced age in perennial plant systems can (1) provide a means to track aging in these
systems and (2) lead to an increased understanding of the development of age-related
disorders or degeneration of important physiological processes. This information is
valuable to agricultural industries that rely on sustained production of perennial crops,

104
including fruit and nut trees. Almond (Prunus dulcis [Mill.] D.A. Webb) is an example of
a perennial nut crop that is negatively affected by the aging process through the
exhibition of non-infectious bud-failure, an aging associated disorder (Kester & Jones,
1970; Micke, 1996; Kester et al., 2004). Additionally, almond trees are primarily
produced by clonal propagation for orchard establishment, meaning age, and thus
susceptibility to age-related impacts is difficult to determine (Ally et al., 2010; de Witte
& Stöcklin, 2010; Salguero-Gomez, 2018). A means to track aging, particularly in crops
like almond which are produced by clonal propagation or shown to exhibit age-related
disorders, benefits growers, producers, and consumers by helping to protect the supply
chain of these valuable commodities.
Profiling genome-wide DNA methylation is one approach to quantify differential
epigenetic marks in an effort to model alterations associated with advanced age. Whole-
genome enzymatic methylation sequencing is equivalent to the “gold standard” bisulfite
sequencing approach to profile the methylome at the nucleotide level (Feng et al., 2020).
Utilizing this approach provides information on both genome-wide methylation in each
context (CG, CHG, and CHH [H = A, T, or C]) and allows for the identification of
differentially methylated regions (DMRs), pin-pointing regions of the genome showing
dynamic patterns of methylation associated with increased age (Vaisvila et al., 2020;
Feng et al., 2020). Identification of specific regions of the genome showing changes in
methylation associated with aging provides both the opportunity to develop biomarkers to
track aging and information on those genes or genic regions that might contribute to the
development of age-related phenotypes (Xiao et al., 2019).

105
In this study, we utilize almond breeding germplasm grown from seed following
pedigreed crosses as part of the almond breeding program at the University of California,
Davis. The individuals used in this study are, since grown from seed, of known age and
thus particularly useful to generate models to track aging in this species where clonal
propagation is standard. The goal of this study was to examine DNA methylation patterns
in the genome of a productive perennial crop by performing an exhaustive methylome
profiling of 70 almond individuals from three cohorts aged 2, 7, and 11-years. The
hypothesis is that the almond breeding selection cohorts will exhibit, on average,
divergent DNA methylation profiles associated with age. Our overall aim is to identify
variability in the almond methylome that could enable model development to track aging
in this clonally propagated crop and provide targets (i.e., differentially methylated
regions) for further investigation into mechanisms influencing age-related phenotypes
such as non-infectious bud-failure or the juvenile-to-adult transition. This work
additionally serves as a model to explore aging and its impacts in other important
perennial crops.
Materials and Methods
Plant Material
Almond leaf samples were collected in May 2019 from the canopy of 30 distinct breeding
selections planted in 2008, in 2012, and in 2017, totaling 90 individuals sampled. These
selections represent three almond age cohorts aged 11, 7, and 2-years at the time of
sampling. Almond breeding germplasm sampled for this study is maintained at the
Wolfskill Experimental Orchards (Almond Breeding Program, University of California –
Davis, Winters, CA). The pedigree of each sample collected was also documented,

106
including both the female and male parents of each individual. Leaf samples were
collected in the field and immediately stored on ice and then at -20 C until shipping.
Samples were shipped on ice to the Ohio Agricultural Research and Development Center
(OARDC; The Ohio State University, Wooster, OH, USA) and immediately stored at -20
C until sample processing.
DNA Extraction
High-quality DNA was extracted from leaves following a modified version of the
protocol outlined in Vilanova et al., 2020. Briefly, samples were ground to a fine powder
with a mortar and pestle in liquid nitrogen, and 50 mg of the ground material was added
to 1 mL of extraction buffer (2% w/v CTAB; 2% w/v PVP-40; 20 mM EDTA; 100 mM
Tris-HCl [pH 8.0]; 1.4 M NaCl), 14 L beta-mercaptoethanol, and 2 L RNase (10
mg/mL). The solution was incubated at 65 C for 30 mins and on ice for 5 mins followed
by a phase separation with 700 L chloroform:isoamyl alcohol (24:1). The aqueous phase
(~800 L) was recovered, and 480 L binding buffer (2.5 M NaCl; 20% w/v PEG 8000)
was added followed by 720 L 100% ice-cold ethanol.
A silica matrix buffer was prepared by adding 10 g silicon dioxide to 50 mL ultra-
pure water prior to incubation and centrifugation steps. Silica matrix buffer (20 L) was
added to each sample, and samples were gently mixed for 5 mins. Samples were spun for
10 secs and the supernatant was removed. To resuspend the remaining mucilaginous
material (but not the pellet), 500 L cold 70% ethanol was used, and the supernatant was
removed. Another 500 L cold 70% ethanol was added to resuspend the silica pellet, the
tubes were spun for 5 secs, and the supernatant was removed. The pellet was allowed to

107
dry at room temperature for 5 mins and was resuspended in 100 L elution buffer (10
mM Trish HCl [pH 8.0]; 1 mM EDTA [pH 8.0]) followed by a 5 min incubation at 65 C.
Samples were centrifuged at 14,000 rpm for 10 mins at room temperature and 90 L of
supernatant was transferred to a new tube. DNA concentration was assessed by
fluorometry using a Qubit 4 and Qubit 1X dsDNA HS Assay Kit (ThermoFisher
Scientific, Waltham, MA, USA).
Enzymatic Methyl-Seq Library Preparation and Illumina Sequencing
Whole-genome enzymatic methyl-seq libraries were prepared using the NEBNext
Enzymatic Methyl-seq kit (New England BioLabs Inc., Ipswich, MA, USA) following
the protocol for standard insert libraries (370-420 basepairs). Each sample was prepared
using 100 ng input DNA in 48 L TE buffer (1 mM Tris-HCl; 0.1 mM EDTA; pH 8.0)
with 1 L spikes of both the CpG unmethylated Lambda and CpG methylated pUC19
control DNA provided in the kit. The samples were sonicated using a Covaris S220
focused-ultrasonicator in microTUBE AFA Fiber Pre-Slit Snap-Cap 616 mm tubes
(Covaris, Woburn, MA, USA) with the following program parameters: peak incident
power (W) = 140; duty factor = 10%; cycles per burst = 200; treatment time (s) = 80.
Following library preparation, library concentration and quality were assessed by
fluorometry using a Qubit 4 and Qubit 1X dsDNA HS Assay Kit (ThermoFisher
Scientific) and by electrophoresis using a TapeStation (Agilent, Santa Clara, CA, USA).
Library concentration was further quantified by qPCR using the NEBNext Library
Quant Kit for Illumina (New England BioLabs Inc.). Libraries were equimolarly
pooled in batches of ~15 (five libraries per age cohort) and cleaned using an equal

108
volume of NEBNext Sample Purification Beads (New England BioLabs Inc.). The
library pools were eluted in 25 L TE buffer (1 mM Tris-HCl; 0.1 mM EDTA; pH 8.0),
and concentration and quality were assessed by fluorometry and electrophoresis as above.
Library pools were sequenced on two lanes of the Illumina HiSeq4000 platform to
generate 150-bp paired-end reads.
Processing and Alignment of Enzymatic Methyl-Seq Libraries
Methyl-Seq read quality was initially assessed using FastQC v. 0.11.7 (Andrews, 2010)
and reads were trimmed using TrimGalore v. 0.6.6 and Cutadapt v. 2.10 with default
parameters (Krueger, 2016). Forward read fastq and reverse read fastq files from the two
HiSeq4000 lanes were combined for each library to produce single fastq files for both
read one and read two. Reads were aligned to the ‘Nonpareil’ v. 2.0 almond reference
genome, deduplicated, and methylation calls were generated using Bismark v. 0.22.3
(Krueger & Andrews, 2011) with default parameters in paired-end mode. To test
conversion efficiency, reads were also aligned to both the Lambda and pUC19 nucleotide
sequence fasta files provided by NEB (https://www.neb.com/tools-and-
resources/interactive-tools/dna-sequences-and-maps-tool). All analyses were performed
using the Ohio Supercomputer Center computing resources (Ohio Supercomputer Center,
1987).
Weighted Genome-wide Methylation Analysis of Age-Cohorts
Weighted genome-wide percent methylation values were calculated for each individual
within each cohort by taking the total number of methylated reads at each cytosine and
dividing this by the total number of reads (methylated + unmethylated) at each cytosine.
Weighted values were calculated for each methylation context. These values were used as

109
input to R v. 4.0.2 (R Core Team, 2020) to perform beta regression using the package
betareg v. 3.1-3 (Cribari-Neto & Zeileis, 2010). Pairwise comparison of least squared
means were completed by the functions emmeans() and cld() from the R packages
emmeans v. 1.5.2-1 and multcomp v. 1.4-14 with an alpha = 0.05 and Sidak adjustment
(Hothorn et al., 2008). The R package ggplot2 v. 3.3.2 was used to create plots for
weighted percent methylation within each methylation-context (Wickham, 2016). Files
were then subset by chromosome (chr1 – chr8), and weighted percent methylation values
were calculated for all individuals by chromosome using the same formula as above for
each methylation context. These values were used as input in R v. 4.0.2 (R Core Team,
2020) to perform beta regression and subsequent pairwise comparison of least squared
means as performed above for the genome-wide weighted percent methylation values.
Differential Methylation Analysis of Age-Cohorts
Coverage files for each methylation context produced by Bismark were prepared for
input into the R package DSS (Dispersion Shrinkage for Sequencing Data) v. 2.38.0 (Wu
et al., 2013; Feng et al., 2014; Park & Wu, 2016). The functions DMLtest() and
callDMR() were used with a significance p.threshold set to 0.0001 to identify
differentially methylated regions (DMRs) through pairwise comparisons between the
three age cohorts. Comparisons were made relative to the oldest cohort in each DMR test
(i.e. 11-year old cohort relative to 2-year old cohort).
Classification and annotation of differentially methylated regions
Following identification of DMRs in each age-contrast (11 – 2 year; 11 – 7 year; 7 – 2
year) and methylation-context, DMRs were further characterized based on the
directionality of differential methylation. Hypermethylated DMRs are those that show

110
increased methylation in the oldest cohort in each contrast, and hypomethylated DMRs
are those that show decreased methylation in the oldest cohort in each contrast. The
cumulative binomial probability of identifying an equal or greater number of
hypermethylated DMRs in each age-contrast by methylation-context was calculated using
the R base package stats command pbinom() where x = the number of hypermethylated
DMRs in each age-contrast by methylation-context, size = the total number of DMRs
identified in each age-contrast/methylation-context, p = 0.5, and lower.tail = FALSE.
To visualize enrichment of DMRs across the eight chromosomes in the ‘Nonpareil’
genome, circos plots were generated with one track depicting each DMR classified as
either hyper- or hypomethylated and two additional tracks depicting DMR enrichment
across the genome. To create the circos plots, the R package circlize v. 0.41.2 (Gu et al.,
2014) was used along with the bed files for all hyper- and hypomethylated DMRs in each
methylation-context for all age-contrasts. The command circos.genomicRainfall() was
used to create the first track with dots representing each individual DMR (red –
hypermethylated, blue – hypomethylated) and positioned based on the number of DMRs
occurring in that location. The command circos.genomicDensity() was used to create the
two additional tracks representing enrichment of hyper- and hypomethylated DMRs on
each chromosome where the taller the peak, the higher the number of DMRs occurring in
the specific region (Gu et al., 2014).
Following classification into hyper- and hypomethylated regions, bed files were
generated for these DMRs using genomic coordinates. These bed files were used as input
along with the ‘Nonpareil’ genome annotation file into the R v. 4.0.2 (R Core Team,
2020) packages GenomicRanges v. 1.40.0 (Lawrence et al., 2013) and genomation v.

111
1.20.0 (Akalin et al., 2015) to prepare a GRanges object and annotate DMRs using the
command annotateWithFeatures(). Initial annotation of DMRs by features includes the
percentage of DMRs overlapping at least one of four features: gene, exon, 5’ untranslated
region (UTR), and 3’ UTR. The DMRs were further annotated, and gene ontology (GO)
enrichment was performed using the software HOMER v. 4.11 (Heinz et al., 2010) and
the R package topGO v. 2.40.0 (Alexa A, 2020). Initially, all DMRs were annotated by
assigning the gene with the closest transcriptional start site to each DMR using
annotatePeaks.pl -noann with the ‘Nonpareil’ genome and genome annotation files. This
produced a list of gene identifiers from the genome annotation file that are associated
with each DMR. The GO terms assigned to each DMR-associated gene were used as
input along with the ‘Nonpareil’ genomic annotation file to determine enrichment of GO
terms in each age-contrast DMR-associated gene set. The DMR-associated genes in each
methylation-context were classified based on biological process, molecular function, and
cellular component GO term to produce tables depicting the number of DMR-associated
genes assigned to each descriptor.
The DMRs were then further classified based on the occurrence of overlapping
genomic regions among DMRs when comparing age-contrasts. The bed files generated
above were used as input in the bedtools v. 2.29.2 (Quinlan & Hall, 2010) command
intersect -wao to identify overlaps in DMRs from each of the age-contrasts (i.e. 11-7
contrast compared to 11-2 contrast). Finally, genomic regions were identified that contain
significant DMRs in all three age-contrasts using bedtools intersect. These overlapping
DMRs were annotated using the annotatePeaks.pl script as above to find DMR-
associated genes as well as GO terms, Pfam identifiers, and Interpro identifiers associated

112
with each gene. The genomic DMR sequence was extracted from the ‘Nonpareil’ genome
fasta file, and individual DMR fasta files were searched against the miRbase database v.
22.1 (Kozomara et al., 2019) to identify any putative microRNAs (miRNAs) within those
regions. Searches were performed by sequence using an e-value cutoff of 10 and the
Prunus persica (L.) Batsch species filter.
Annotation of unknown protein sequences
Genes coding for proteins with unknown function and associated with the DMRs shared
across the three age-contrasts were interrogated using in silico approaches to characterize
the proteins. Several programs were used to annotate these protein sequences and
determine additional information about their putative functions. The program ProtParam
was used to characterize protein properties including molecular weight (Gasteiger et al.,
2005). To predict subcellular localization, the program YLoc was used (Briesemeister et
al., 2010a,b). Finally, the Motif tool on the GenomeNet website
(https://www.genome.jp/tools/motif/) was used to search a protein query against several
databases to identify putative alignments (Marchler-Bauer et al., 2013; Sigrist et al.,
2013; Finn et al., 2014).
Results
Genome-wide methylation analysis in almond accessions representing three age-cohorts
Following DNA isolation, library preparation, and Illumina sequencing, a total of 21
almond breeding selections were used for subsequent analysis in the 2-year-old age
cohort, 25 in the 7-year-old age cohort, and 24 in the 11-year-old age cohort. Sequencing
results show aligned coverage for almond accessions ranged from 3.85 – 50.41X with an

113
average mapping rate of 49.8 % (Appendix Table 9). Conversion rate ranged from 98.4 –
99.95% based on alignment to the Lambda reference sequence file (Appendix Table 9).
Analysis of weighted genome-wide percent methylation within all methylation-
contexts (CG, CHG, and CHH) revealed a significant increase in weighted methylation in
the 11-year-old age cohort compared to the 2-year-old in the CG (p-value = 0.0105) and
CHH (p-value = 0.0399) contexts, respectively (Fig. 3.1a, c). There was also a significant
increase in CG methylation in the 11-year-old age cohort compared to the 7-year-old age
cohort (p-value = 0.0115; Fig. 3.1a). There was not a significant difference in weighted
genome-wide methylation in the CHG context when comparing age cohorts (Fig. 3.1b) or
between the 2-year-old and 7-year-old age cohorts in any methylation context (Fig. 3.1).
To further analyze weighted methylation in these samples, methylation data for
each individual was processed per chromosome, and weighted methylation was analyzed
at the chromosome level for each methylation-context. (Fig. 3.2a-c). Pairwise
comparisons of DNA methylation within each chromosome revealed significant
differences in cytosine methylation on distinct chromosomes for each methylation-
context (Table 3.1a-c). In the CG context, both the 2 – 11 year and the 7 – 11-year age-
contrasts were significant on chromosomes 1, 3, 5, 7, and 8 (Table 3.1). In the CHG
context, both the 2 – 11 year and the 7 – 11-year age-contrasts were significant on
chromosome 5, the 7 – 11-year age-contrast was significant on chromosome 7, and the 2
– 11 year age-contrast was significant on chromosome 8 (Table 3.1). Finally, in the CHH
context, the 2 – 11-year age-contrast was significant on chromosomes 5, 7, and 8 (Table
3.1). Overall, significant differences in chromosome-level DNA methylation between age
cohorts tend to occur on chromosomes 5, 7, and 8.
114
Identification and classification of differentially methylated regions (DMRs) between age
cohorts
DMRs were identified based on comparisons between the age cohorts in each
methylation context. Most DMRs identified are in the CG context, followed by CHH and
CHG, respectively (Table 3.2). These DMRs were further classified as hyper- and
hypomethylated based on the amount of methylation in the older cohort compared to the
younger. Hypermethylated DMRs have a higher amount of methylation in the older
cohort, while hypomethylated DMRs have a higher amount of methylation in the younger
cohort for each comparison. In the CG context, 96%, 94%, and 64% of the identified
DMRs were hypermethylated in the 11 – 2 year, 11 – 7 year, and 7 – 2-year age-
contrasts, respectively (Table 3.2). In the CHG context, 68%, 52%, and 64% of DMRs
were hypermethylated in the 11 – 2 year, 11 – 7 year, and 7 – 2-year age-contrasts,
respectively (Table 3.2). Finally, in the CHH context, 82%, 38%, and 82% of DMRs
were hypermethylated in the 11 – 2 year, 11 – 7 year, and 7 – 2-year age-contrasts,
respectively (Table 3.2). The cumulative binomial probability of the occurrence of
hypermethylated DMRs was less than 110-6 for all age-contrasts except 11 – 7 year in
the CHG and CHH contexts, suggesting there are more hypermethylated DMRs than
would be expected given an equal probability of hyper- and hypomethylated DMRs in the
genome. Identified DMRs ranged in length from 51-4824 base pairs with an average
length of 195 base pairs, a median length of 134 base pairs, and a mode of 69 base pairs
(Fig. 3.3a-l). The average length of a gene in the ‘Nonpareil’ genome is 2,912 bp, so most
of the identified DMRs are much shorter than the average gene.
115
The distribution of CG-context DMRs showed a similar pattern across all
chromosomes, where the 11 – 2 year age-contrast has the highest number of DMRs per
chromosome, followed by the 11 – 7 year and 7 – 2 year age-contrasts (Fig. 3.4a). In the
CHG and CHH contexts, the distribution of DMRs showed greater variability, with the
11 – 7 year age-contrast typically showing the lowest number of DMRs across all
chromosomes, while the 11 – 2 and 11 – 7 year age-contrasts oscillate in number of
DMRs occurring on each chromosome across the genome (Fig. 3.4b,c).
Classification of DMRs as hyper- or hypomethylated in the age cohort comparisons
Using the classifications of hyper- and hypomethylated, DMRs were plotted across the
eight chromosomes of the ‘Nonpareil’ genome revealing unique distributions based on
both methylation-context and age-contrast, as well as indicating DMR enrichment in
specific chromosomes (Fig. 3.5). In the CG context, DMR enrichment occurs in the 11 –
2 year age-contrast, with predominantly hypermethylated DMRs, though enrichment of
hypomethylated DMRs appears on chromosome 5 (Fig. 3.5a). The CHG context
represents the lowest overall enrichment of DMRs compared to the other methylation-
contexts, with regions throughout the genome showing slight enrichment of DMRs (Fig.
3.5b). Finally, DMRs in the CHH context show similar patterns in enrichment for both
the 7 – 2 year and 11 – 2 year age-contrasts, with evident DMR enrichment occurring on
chromosomes 3 and 8 (Fig. 3.5c). The 11 – 7 year age-contrast in the CHH methylation-
context is the only contrast to have a higher number of hypomethylated DMRs compared
to hypermethylated (Table 3.2; Fig. 3.5c).
Following classification of DMRs as either hyper- or hypomethylated in each age-
contrast, DMRs were compared among age-contrasts to identify overlapping genomic

116
regions. This analysis revealed several overlapping DMRs from distinct age-contrasts.
The highest number of overlaps occurred in CG context hypermethylated DMRs,
particularly when comparing the 11 – 2 by 11 – 7 and 11 – 2 by 7 – 2 age-contrasts
(Table 3.3). Interestingly, the 11 – 7 by 7 – 2 age-contrast revealed very few overlaps in
hypermethylated DMRs, and no overlapping hypomethylated DMRs (Table 3.3). Finally,
a comparison was performed to identify DMRs with overlapping genomic regions among
all three age-contrasts, showing the 11 – 2 age-contrast contains DMRs that share a
genomic region with the overlapping DMRs in the 11 – 7 by 7 – 2 comparison (Table
3.3). This final analysis revealed 17 overlapping DMRs among the three age-contrasts,
meaning these DMRs share overlapping genomic coordinates (Table 3.4). These 17
DMRs are the longest (ranging from 106 – 1,504 base pairs) in the 11 – 2 age-contrast,
followed by the 11 – 7 (56 – 713 base pairs) and 7 – 2 (52 – 1,037 base pairs) age
contrasts (Table 3.4). Analysis of the average percent methylation of cytosines within the
genomic regions identified in the 11 – 7 age-contrasts shows that in the majority of these
regions, cytosines become more methylated with increased age across the three age
cohorts (Fig. 3.6a-m, 3.7a-c, 3.8).
Annotation of hyper- and hypomethylated differentially methylated regions (DMRs)
An annotation was performed classifying all hyper- and hypomethylated DMRs in each
methylation-context into four categories (gene, exon, 5’ untranslated region [UTR], and
3’ UTR) based on their association with features in the ‘Nonpareil’ genome annotation.
CG context DMRs generally tended to have higher associations with genes and exons
compared to the other methylation contexts, while CHG DMRs tended to have higher

117
associations with 5’ UTRs and CHH DMRs with 3’ UTRs compared to the other contexts
(Table 3.5).
Identified DMRs were then annotated using the ‘Nonpareil’ genome annotation
file to determine the closest gene associated with each DMR. Enrichment analysis was
performed for both hyper- and hypomethylated DMR-associated genes in all methylation
contexts for each age-contrast, revealing a suite of biological process, molecular function,
and cellular component gene ontology (GO) terms associated with each contrast
(Appendix Tables 10-15). Comparing annotations between age-contrasts identified GO
terms unique to each age-contrast in each methylation-context and degree of methylation
(i.e. hyper or hypo). For example, a subset of genes associated with hypermethylated
DMRs in the CG context from all three age-contrasts were assigned the molecular
function GO terms transmembrane transporter activity, protein serine/threonine kinase
activity, and DNA-binding transcription factor activity (Table S10b).
Annotation of genes associated with 17 hypermethylated DMRs identified across the
three age cohort age-contrasts
Of the DMRs identified in each age-contrast, 17 hypermethylated DMRs were found to
share genomic regions in all three age-contrasts, meaning these regions showed
consistent significant increases in methylation in the older age cohort relative to the
younger in each age-contrast. The 17 DMRs were annotated using the ‘Nonpareil’
genome annotation to identify the closest associated gene. In total, eight previously
annotated genes including FAR1-RELATED SEQUENCE 5 (FRS5), a receptor-interacting
serine/threonine-protein kinase 4 (Ripk4), and dCTP pyrophosphatase 1 (Dctpp1) were

118
identified as associated with nine of the DMRs (Table 3.6). One CG DMR and one CHG
DMR are both associated with the gene tryptophan aminotransferase-related protein 3
(TAR3) (Table 3.6). The remaining eight DMRs are associated with genes of unknown
function (Table 3.6). These eight unknown protein sequences were used as input into
three programs to determine properties including predicted motifs, localization, and
weight. Two of these unknown proteins contained transposase_24 motifs, and four are
predicted to be localized to the nucleus (Table 3.7).
In addition to identifying genes associated with these 17 shared DMRs, the DMR
genomic sequences (Appendix File 2) were searched against the miRBase database using
the Prunus persica species filter to identify any potential miRNAs within these regions.
Results from this analysis showed that two of the 17 DMRs contain miRNA sequence
including CGDMR8 and CHGDMR1. The miRNA identified in CGDMR8 is ppe-
miR6276 and ppe-miR156 in CHGDMR1.
Discussion
Perennial plant aging and the impacts of this process, particularly on productive fruit and
nut crops, is a neglected area of research with potential applications for agricultural
production and crop improvement. The ability to track age in clonally propagated crops
could aid in the mitigation of age-related disorders like non-infectious bud-failure (Kester
et al., 2004) and, more broadly, in overcoming the decrease in plant performance
resulting from intense production systems that affect orchard/vineyard longevity.
Biomarkers of age in these species, however, are lacking. The aim of this study was to
test the hypothesis that, on average, almond breeding selection cohorts will exhibit
divergent DNA methylation profiles associated with age. The long-terms goals of this

119
work are to develop biomarkers of age in almond, a clonally-propagated crop, and to
further our understanding of the aging process in perennial species. To address this,
whole-genome DNA methylation profiles were generated for ~70 almond individuals
from three distinct age cohorts, and comparisons were made between cohorts to identify
regions of interest for further study into their involvement in the aging process and utility
as biomarkers of age in almond.
DNA hypermethylation in the CG and CHH contexts is associated with increased age in
almond
The DNA methylation profiles generated for individuals in the three age cohorts (11, 7,
and 2-years old) were compared at the whole-genome and chromosome level, which
showed that hypermethylation in the CG and CHH methylation-contexts is associated
with increased age in almond. Further, the probability of identifying the number of
hypermethylated DMRs observed in this study was very low for most age-contrasts,
suggesting there was a disproportionately high number of hypermethylated DMRs
identified compared to hypomethylated DMRs. This result supports previous work
theorizing an increase in total genomic DNA methylation with increased age in plants
(Dubrovina & Kiselev, 2016). Previous studies have also shown that genome-wide
hypermethylation can result in a high number of identified hypermethylated DMRs in
subsequent analyses, as was reported in several species including Monterey pine (Pinus
radiata D.Don), peach (P. persica), and coast redwood (Sequoia sempervirens [D.Don]
Endl.) (Bitonti et al., 2002; Fraga et al., 2002b; Huang et al., 2012).

120
DNA methylation has been proposed as a “biological clock” capable of predicting
the true, ontogenetic age of an individual due to observed patterns of increased
methylation with increased age in a variety of species (Runov et al., 2015). Results in this
study suggest that almond fits this pattern of hypermethylation, and thus DNA
methylation may serve as a biomarker of age in this species. Whole-genome
hypermethylation with increased age represents an opportunity to develop high-
throughput screening methods that do not require whole-genome sequencing. These
methods could include high-performance liquid chromatography or capillary
electrophoresis (Stach et al., 2003; Armstrong et al., 2011).
Epigenetic regulation by DNA methylation, histone modifications, and chromatin
remodeling has also been shown to modulate the juvenile-to-adult phase transition in
plants, including in gymnosperms like Monterey pine and in angiosperms such as peach
(Bitonti et al., 2002; Fraga et al., 2002a; Xu et al., 2018). The juvenile period in almond
is approximately 3-4 years; thus, differential patterns of methylation observed in this
study between the 2-year cohort and the 7- and 11-year cohorts could be associated with
the juvenile-to-adult transition as has been documented in other plants (Dubrovina &
Kiselev, 2016). Patterns of differential methylation identified in this study and associated
with specific regions of the genome further demonstrate the potential involvement of
DNA methylation in regulating this transition in almond. Further investigation is needed
focusing on the involvement of DNA-methylation in the juvenile-to-adult transition in
almond and other perennial species, including those with available transgenic germplasm
exhibiting reduced juvenility, such as apple (Flachowsky et al., 2011; Kumar et al.,
2020).

121
Differentially methylated regions (DMRs) in the CG and CHG contexts are enriched on
specific chromosomes in the almond genome
Following identification of DMRs in the three age-contrasts, these regions were plotted
across the almond genome showing enrichment of DMRs on specific chromosomes,
particularly in the CG and CHH methylation-contexts. These so called “hotspots” of
differential DNA methylation could suggest loci in these regions are prone to epigenetic
alterations including methylation. Transposable elements (TEs) tend to be heavily
methylated and have been reported to have involvement in developmental processes in
almond, such as the juvenile-to-adult transition (Han et al., 2018; Corso-Díaz et al., 2020;
Wyler et al., 2020), suggesting the “hotspots” identified in almond in this study could
contain TE sequences. This type of pattern has been documented in other species such as
rice, where a study on salt tolerance identified DMRs that tended to cluster on specific
chromosomes and were typically associated with TEs on these chromosomes (Ferreira et
al., 2019).
In this study, hypermethylated DMRs were enriched on chromosome 8 in the CG
context, and on chromosomes 3 and 8 in the CHH context. As increased levels of
methylation tend to occur in regions rich in TEs, it is possible that regions enriched in
DMRs contain TEs which become increasingly methylated with age. Interestingly, a
study in Brachypodium distachyon (L.) P.Beauv. found that DMRs were highly
correlated with genetic diversity as classified by presence of single nucleotide
polymorphisms (SNPs) throughout the genome (Eichten et al., 2016). This genetic
diversity was found to be related to the presence of TEs at these sites, potentially

122
contributing to the formation of SNPs as well as leading to differential levels of
methylation between the lines tested (Eichten et al., 2016). Given the heterozygosity and
diversity in almond germplasm, it may be relevant to compare regions enriched in DMRs
from the age-contrasts to SNP data in almond to test for a correlation between increased
methylation and genetic diversity, particularly for traits associated with growth and
development and length of juvenility.
To identify genetic components involved in the juvenile-to-adult transition in
Prunus, a study utilizing two almond peach interspecific populations found a single
QTL on chromosome 6 associated with juvenility period, defined as the number of years
to first fruit (Donoso et al., 2016). However, this QTL only explained ~13% of the
variability in time to first fruit in these populations, suggesting there may be additional
regions influencing this trait (Donoso et al., 2016), as has been observed in other species
such as citrus (Raga et al., 2012). Additional work is necessary to explore the genetic
variability associated with juvenility in almond to see if chromosomes enriched in DMRs
based on age are associated with variation in these traits among almond populations.
Further, the TE landscape of regions enriched in DMRs could be characterized to
determine if there is an abundance of TEs at these locations, potentially explaining the
high number of DMRs observed in these regions. A recent study in almond characterized
the TE landscape in the ‘Texas’ cultivar and compared the distribution of TEs in the
genome to that of peach (Alioto et al., 2020). This study revealed not only an increased
involvement of TEs in trait diversity in almond compared to peach, but also showed
enrichment of TEs on almond chromosomes 3 and 8 (Alioto et al., 2020).

123
DMRs as potential biomarkers of age in almond
The DMRs identified in this study represent those regions in the genome that showed
either an increase or a decrease in cytosine methylation with increased age in almond.
The results herein suggest that DMRs tend to be hypermethylated in the age-contrasts,
meaning there is an increase in methylation in these regions with increased age in each
age-contrast. This pattern fits with the weighted genome-wide methylation patterns
showing significant increases in methylation in the CG and CHH contexts between the 2
and 11-year old age cohorts. Unique, hypermethylated DMRs were identified in each
age-contrast, providing information on DNA methylation dynamics associated with age.
Regions that show increased methylation in each age contrast are of particular interest
due to their potential suitability as biomarkers of age, since these regions show
incremental increases in methylation from 2-to-7 years and again from 7-to-11 years old.
Within the DMRs identified in each of the age-contrasts, 17 hypermethylated
DMRs were identified with overlapping genomic regions in all three contrasts. Once
these regions are validated via DNA methylation profiling in additional almond cohorts
of known age, a predictive model could be developed considering cytosine methylation
level. This model could be applied to clonal germplasm to predict ontogenetic age,
providing a basis to screen germplasm for susceptibility to undesirable, age-related
phenotypes. These tools may have implications for germplasm management in breeding,
production (orchard), propagation (nursery), and conservation (repository) settings.
The genetic features associated with these specific DMRs could also have
involvement in developmental processes, including the juvenile-to-adult transition. To
annotate these DMRs, genes were identified with transcriptional start sites close to or

124
overlapping the DMR. Of the 17 DMRs, nine were found to be associated with eight
annotated genes. These genes include FRS5, a FAR1-related protein in the FAR1 gene
family which is involved in light perception and was demonstrated to have involvement
in plant development and regulation of aging processes in Arabidopsis (Lin & Wang,
2004; Ma & Li, 2018; Xie et al., 2020). The gene TAR3 was found to be associated with
two of the 17 identified DMRs, one in the CG context and one in the CHG context. This
gene is part of a gene family known as TRYPTOPHAN AMINOTRANSFERASE (TAR),
whose members are a component of one of the major auxin biosynthetic pathways
(Hofmann, 2011). The TAR genes are involved in the first step of the pathway, in which
tryptophan is converted to indole-3-pyruvic acid, which is subsequently converted to
auxin (Brumos et al., 2014). Auxin is a well-known regulator of plant development and
senescence processes (Ljung, 2013; Khan et al., 2014; Mueller-Roeber & Balazadeh,
2014). While tryptophan-independent pathways for auxin biosynthesis are present in
plants, TAR genes are involved in the primary biosynthetic pathway, and disruption of
TAR3 expression could impede auxin production (Hofmann, 2011). These genes and the
others identified represent interesting targets for future study on their potential
involvement in aging processes in almond, including in the vegetative transition.
Additionally, eight proteins of unknown function were identified as associated with the
overlapping DMRs. Characterization of these proteins could reveal novel genes with
potential functions in plant development and aging in almond.
In addition to identifying nearby genes associated with these DMRs, microRNAs
(miRNAs) were also surveyed in these regions. Interestingly, two of the DMRs were
found to contain miRNA sequences, including one with the sequence for ppe-miR156, a

125
well-characterized miRNA known to be a major regulator of development and phase
transition in plants (Wu et al., 2009). Previous studies have shown that miR156 regulates
vegetative phase transition in plants by targeting SQUAMOSA-PROMOTER BINDING
PROTEIN-LIKE (SPL) genes, inhibiting their expression during juvenility (Wu et al.,
2009; Jia et al., 2017). As plants age, miR156 expression is repressed, allowing activation
of target genes and inducing the transition to adult (Wu et al., 2009). In fact, studies in
both Arabidopsis and maize show that mutants overexpressing miR156 experience
prolonged juvenility (Wu & Poethig, 2006; Chuck et al., 2007). A recent study in
Arabidopsis showed that light perception via FAR1-family genes may also interact with
miR156 in regulating plant development (Xie et al., 2020).
Previous work has shown 11 putative members of the miR156 family in peach,
suggesting that the miRNA identified in this study could be one of several in this family
in almond (Luo et al., 2013); work has shown that the function of miR156 in the aging
pathway is conserved in Prunus species (Bastías et al., 2016). It has also been proposed
that miR156 is regulated by epigenetic modifications (Xu et al., 2018), including DNA
methylation, however more work is needed to disentangle epigenetic regulation of
miR156 expression as well as to characterize and identify targets of miR156 in almond.
Additionally, expression of miR156 has been altered through transgenic approaches in
other crops to delay flowering, leading to increased plant biomass or abiotic stress
tolerance (Zheng et al., 2016; Kang et al., 2020). Manipulation of miR156 in Prunus
could lead to potential applications for crop improvement, including decreased juvenility,
which could greatly decrease breeding cycles for these crops. Results in this study
identified a hypermethylated DMR overlapping miR156 and associated with increased

126
age, suggesting cytosine methylation could be one mode of regulation for this miRNA.
Induced DNA methylation using gene-editing techniques could provide a potential
avenue for manipulation of miR156 in almond or other Prunus species, not only for crop
improvement applications, but also to further our understanding of this miRNA in plant
development and aging in these crops. Since almond is recalcitrant to tissue culture
methods, the application of gene-editing techniques in this species would first require
optimization of methods allowing propagation of modified material.
The second miRNA sequence identified was ppe-miR6276, which was first
identified as a novel miRNA in Japanese apricot (P. mume Sieb. et Zucc), and found to
have homology with a miRNA sequence in peach (Gao et al., 2012). This miRNA is
currently uncharacterized and could provide an interesting target for further investigation
in almond and other Prunus species to determine its potential role in the plant aging
process.
The study of aging in perennial plants is limited despite the potential applications
for agriculture and plant production, particularly for fruit and nut crops. Results from this
work show that DNA hypermethylation is associated with age in almond, and identifies
specific genomic regions that could serve as putative biomarkers of age for this species.
Biomarkers of age are valuable for clonally propagated crops, whose ontogenetic age can
be difficult to determine, to screen and select germplasm with low potential for
developing age-related disorders. Further, the DMRs identified in this study can be used
to guide future studies aimed at increasing our understanding of plant aging and
vegetative phase transition in perennials. Perennial plants, including almond, are known
for having long juvenile periods which can inhibit breeding and improvement efforts.

127
Epigenetic regulators of phase transition such as DNA methylation could provide another
tool for developing perennial crops with shorter juvenile periods, dramatically shortening
breeding cycles for these species.
Acknowledgements
We would like to acknowledge Matthew Willman for his assistance with the statistical
analysis and preparation of the scripts used to perform the computational analyses for this
manuscript. We would also like to acknowledge the Ohio Supercomputer Center for
access to computing resources and the Translational Plant Sciences Graduate Program for
the fellowship for KMDW. This work was supported by The Ohio State University
CFAES-SEEDS program grant # 2019-125, the Almond Board of California Grant
HORT35, the U.S. Department of Health and Human Services National Institutes of
Health - National Cancer Institute - Cancer Center Support Grant (CCSG)
P30CA016058, the USDA National Institute of Food and Agriculture AFRI-EWD
Predoctoral Fellowship 2019-67011-29558.

128
References
Akalin A, Franke V, Vlahoviček K, Mason CE, Schübeler D. 2015. Genomation: a
toolkit to summarize, annotate and visualize genomic intervals. Bioinformatics 31: 1127–
1129.
Alexa A RJ. 2020. topGO: Enrichment Analysis for Gene Ontology.
Alioto T, Alexiou KG, Bardil A, Barteri F, Castanera R, Cruz F, Dhingra A, Duval
H, Martí ÁF i, Frias L, et al. 2020. Transposons played a major role in the
diversification between the closely related almond and peach genomes: results from the
almond genome sequence. The Plant Journal 101: 455–472.
Ally D, Ritland K, Otto SP. 2010. Aging in a long-lived clonal tree. PLOS Biology 8:
e1000454.
Andrews S. 2010. FastQC: A quality control tool for high throughput sequence data.
Armstrong KM, Bermingham EN, Bassett SA, Treloar BP, Roy NC, Barnett MPG.
2011. Global DNA methylation measurement by HPLC using low amounts of DNA.
Biotechnology Journal 6: 113–117.
Bastías A, Almada R, Rojas P, Donoso JM, Hinrichsen P, Sagredo B. 2016. Aging
gene pathway of microRNAs 156/157 and 172 is altered in juvenile and adult plants from
in vitro propagated Prunus sp. Ciencia e investigación agraria 43: 429–441.
Bitonti MB, Cozza R, Chiappetta A, Giannino D, Castiglione MR, Dewitte W,
Mariotti D, Van Onckelen H, Innocenti AM. 2002. Distinct nuclear organization, DNA
methylation pattern and cytokinin distribution mark juvenile, juvenile‐like and adult
vegetative apical meristems in peach (Prunus persica (L.) Batsch). Journal of
Experimental Botany 53: 1047–1054.
Briesemeister S, Rahnenführer J, Kohlbacher O. 2010a. YLoc—an interpretable web
server for predicting subcellular localization. Nucleic Acids Research 38: W497–W502.
Briesemeister S, Rahnenführer J, Kohlbacher O. 2010b. Going from where to why—
interpretable prediction of protein subcellular localization. Bioinformatics 26: 1232–
1238.
Brumos J, Alonso JM, Stepanova AN. 2014. Genetic aspects of auxin biosynthesis and
its regulation. Physiologia Plantarum 151: 3–12.
Brutovská E, Sámelová A, Dušička J, Mičieta K. 2013. Ageing of trees: Application of
general ageing theories. Ageing Research Reviews 12: 855–866.

129
Chuck G, Cigan AM, Saeteurn K, Hake S. 2007. The heterochronic maize mutant
Corngrass1 results from overexpression of a tandem microRNA. Nature Genetics 39:
544–549.
Corso-Díaz X, Gentry J, Rebernick R, Jaeger C, Brooks MJ, van Asten F,
Kooragayala K, Gieser L, Nellissery J, Covian R, et al. 2020. Genome-wide profiling
identifies DNA methylation signatures of aging in rod photoreceptors associated with
alterations in energy metabolism. Cell reports 31: 107525.
Cribari-Neto F, Zeileis A. 2010. Beta regression in R. Journal of Statistical Software
34: 1–24.
Donoso JM, Picañol R, Serra O, Howad W, Alegre S, Arús P, Eduardo I. 2016.
Exploring almond genetic variability useful for peach improvement: Mapping major
genes and QTLs in two interspecific almond × peach populations. Molecular Breeding
36: 16.
Dubrovina AS, Kiselev KV. 2016. Age-associated alterations in the somatic mutation
and DNA methylation levels in plants (A Weber, Ed.). Plant Biology 18: 185–196.
Eichten SR, Stuart T, Srivastava A, Lister R, Borevitz JO. 2016. DNA methylation
profiles of diverse Brachypodium distachyon align with underlying genetic diversity.
Genome Research 26: 1520–1531.
Feng H, Conneely KN, Wu H. 2014. A Bayesian hierarchical model to detect
differentially methylated loci from single nucleotide resolution sequencing data. Nucleic
Acids Research 42: e69.
Feng S, Zhong Z, Wang M, Jacobsen SE. 2020. Efficient and accurate determination of
genome-wide DNA methylation patterns in Arabidopsis thaliana with enzymatic methyl
sequencing. Epigenetics & Chromatin 13: 42.
Ferreira LJ, Donoghue MTA, Barros P, Saibo NJ, Santos AP, Oliveira MM. 2019.
Uncovering differentially methylated regions (DMRs) in a salt-tolerant rice variety under
stress: One step towards new regulatory regions for enhanced salt tolerance. Epigenomes
3: 4.
Ferrucci L, Gonzalez‐Freire M, Fabbri E, Simonsick E, Tanaka T, Moore Z, Salimi
S, Sierra F, Cabo R de. 2020. Measuring biological aging in humans: A quest. Aging
Cell 19: e13080.
Finn RD, Bateman A, Clements J, Coggill P, Eberhardt RY, Eddy SR, Heger A,
Hetherington K, Holm L, Mistry J, et al. 2014. Pfam: the protein families database.
Nucleic Acids Research 42: D222-230.

130
Flachowsky H, Roux P-ML, Peil A, Patocchi A, Richter K, Hanke M-V. 2011.
Application of a high-speed breeding technology to apple (Malus × domestica) based on
transgenic early flowering plants and marker-assisted selection. New Phytologist 192:
364–377.
Fraga M, Cañal M, Rodríguez R. 2002a. Phase-change related epigenetic and
physiological changes in Pinus radiata D. Don. Planta 215: 672–678.
Fraga MF, Rodríguez R, Cañal MJ. 2002b. Genomic DNA methylation–demethylation
during aging and reinvigoration of Pinus radiata. Tree Physiology 22: 813–816.
Gao Z, Shi T, Luo X, Zhang Z, Zhuang W, Wang L. 2012. High-throughput
sequencing of small RNAs and analysis of differentially expressed microRNAs
associated with pistil development in Japanese apricot. BMC Genomics 13: 371.
Gasteiger E, Hoogland C, Gattiker A, Duvaud S, Wilkins MR, Appel RD, Bairoch
A. 2005. Protein identification and analysis tools on the ExPASy server. In: Walker JM,
ed. Springer Protocols handbooks. The proteomics protocols handbook. Totowa, NJ:
Humana Press, 571–607.
Gu Z, Gu L, Eils R, Schlesner M, Brors B. 2014. Circlize implements and enhances
circular visualization in R. Bioinformatics 30: 2811–2812.
Han Z, Crisp PA, Stelpflug S, Kaeppler SM, Li Q, Springer NM. 2018. Heritable
epigenomic changes to the maize methylome resulting from tissue culture. Genetics 209:
983–995.
Heinz S, Benner C, Spann N, Bertolino E, Lin YC, Laslo P, Cheng JX, Murre C,
Singh H, Glass CK. 2010. Simple combinations of lineage-determining transcription
factors prime cis-regulatory elements required for macrophage and B cell identities.
Molecular Cell 38: 576–589.
Hofmann NR. 2011. YUC and TAA1/TAR proteins function in the same pathway for
auxin biosynthesis. The Plant Cell 23: 3869.
Hothorn T, Bretz F, Westfall P. 2008. Simultaneous inference in general parametric
models. Biometrical Journal 50: 346–363.
Huang L-C, Hsiao L-J, Pu S-Y, Kuo C-I, Huang B-L, Tseng T-C, Huang H-J, Chen
Y-T. 2012. DNA methylation and genome rearrangement characteristics of phase change
in cultured shoots of Sequoia sempervirens. Physiologia Plantarum 145: 360–368.
Jaligot E, Rival A, Beulé T, Dussert S, Verdeil J-L. 2000. Somaclonal variation in oil
palm (Elaeis guineensis Jacq.): the DNA methylation hypothesis. Plant Cell Reports 19:
684–690.
131
Jia XL, Chen YK, Xu XZ, Shen F, Zheng QB, Du Z, Wang Y, Wu T, Xu XF, Han
ZH, et al. 2017. miR156 switches on vegetative phase change under the regulation of
redox signals in apple seedlings. Scientific Reports 7: 14223.
Jylhävä J, Pedersen NL, Hägg S. 2017. Biological age predictors. EBioMedicine 21:
29–36.
Kang T, Yu C-Y, Liu Y, Song W-M, Bao Y, Guo X-T, Li B, Zhang H-X. 2020. Subtly
manipulated expression of ZmmiR156 in tobacco improves drought and salt tolerance
without changing the architecture of transgenic plants. Frontiers in Plant Science 10.
Kester DE, Jones RW. 1970. Non-infectious bud-failure from breeding programs of
almond (Prunus amygdalas Batsch). Journal of the American Society of Horticultural
Science 95: 492–96.
Kester DE, Shackel KA, Micke WC, Viveros M, Gradziel TM. 2004. Noninfectious
bud failure in ‘Carmel’ almond: I. Pattern of development in vegetative progeny trees.
Journal of the American Society for Horticultural Science 129: 244–249.
Khan M, Rozhon W, Poppenberger B. 2014. The role of hormones in the aging of
plants - A mini-review. Gerontology 60: 49–55.
Kirkwood TBL. 2005. Understanding the odd science of aging. Cell 120: 437–447.
Kozomara A, Birgaoanu M, Griffiths-Jones S. 2019. miRBase: from microRNA
sequences to function. Nucleic Acids Research 47: D155–D162.
Krueger F. 2016. Taking appropriate QC measures or RBBS-type or other Seq-
applications with TrimGalore!
Krueger F, Andrews SR. 2011. Bismark: a flexible aligner and methylation caller for
Bisulfite-Seq applications. Bioinformatics 27: 1571–1572.
Kumar S, Hilario E, Deng CH, Molloy C. 2020. Turbocharging introgression breeding
of perennial fruit crops: a case study on apple. Horticulture Research 7: 1–7.
Lawrence M, Huber W, Pagès H, Aboyoun P, Carlson M, Gentleman R, Morgan
MT, Carey VJ. 2013. Software for computing and annotating genomic ranges. PLOS
Computational Biology 9: e1003118.
Lin R, Wang H. 2004. Arabidopsis FHY3/FAR1 gene family and distinct roles of its
members in light control of Arabidopsis development. Plant Physiology 136: 4010–4022.
Ljung K. 2013. Auxin metabolism and homeostasis during plant development.
Development 140: 943–950.

132
Luo X, Gao Z, Shi T, Cheng Z, Zhang Z, Ni Z. 2013. Identification of miRNAs and
their target genes in peach (Prunus persica L.) using high-throughput sequencing and
degradome analysis. PLOS ONE 8: e79090.
Ma L, Li G. 2018. FAR1-RELATED SEQUENCE (FRS) and FRS-RELATED
FACTOR (FRF) family proteins in Arabidopsis growth and development. Frontiers in
Plant Science 9.
Marchler-Bauer A, Zheng C, Chitsaz F, Derbyshire MK, Geer LY, Geer RC,
Gonzales NR, Gwadz M, Hurwitz DI, Lanczycki CJ, et al. 2013. CDD: conserved
domains and protein three-dimensional structure. Nucleic Acids Research 41: D348-352.
Micke WC. 1996. Almond production manual. UCANR Publications.
Mueller-Roeber B, Balazadeh S. 2014. Auxin and its role in plant senescence. Journal
of Plant Growth Regulation 33: 21–33.
Munné-Bosch S. 2007. Aging in perennials. Critical Reviews in Plant Sciences 26: 123–
138.
Ogneva ZV, Dubrovina AS, Kiselev KV. 2016. Age-associated alterations in DNA
methylation and expression of methyltransferase and demethylase genes in Arabidopsis
thaliana. Biologia Plantarum 60: 628–634.
Ohio Supercomputer Center. 1987. Ohio Supercomputer Center. Columbus OH: Ohio
Supercomputer Center. http://osc.edu/ark:/19495/f5s1ph73.
Park Y, Wu H. 2016. Differential methylation analysis for BS-seq data under general
experimental design. Bioinformatics 32: 1446–1453.
Quinlan AR, Hall IM. 2010. BEDTools: a flexible suite of utilities for comparing
genomic features. Bioinformatics 26: 841–842.
R Core Team. 2020. A Language and Environment for Statistical Computing. R
Foundation for Statistical Computing, Vienna, Austria https://www.R-project.org
Raga V, Bernet GP, Carbonell EA, Asins MJ. 2012. Segregation and linkage analyses
in two complex populations derived from the citrus rootstock Cleopatra mandarin.
Inheritance of seed reproductive traits. Tree Genetics & Genomes 8: 1061–1071.
Runov AL, Vonsky MS, Mikhelson VM. 2015. DNA methylation level and telomere
length as a basis for modeling of the biological aging clock. Cell and Tissue Biology 9:
261–264.
Salguero-Gomez R. 2018. Implications of clonality for ageing research. Evolutionary
Ecology 32: 9–28.

133
Sigrist CJA, de Castro E, Cerutti L, Cuche BA, Hulo N, Bridge A, Bougueleret L,
Xenarios I. 2013. New and continuing developments at PROSITE. Nucleic Acids
Research 41: D344-347.
Stach D, Schmitz OJ, Stilgenbauer S, Benner A, Döhner H, Wiessler M, Lyko F.
2003. Capillary electrophoretic analysis of genomic DNA methylation levels. Nucleic
Acids Research 31: E2.
Thomas H. 2013. Senescence, ageing and death of the whole plant. The New Phytologist
197: 696–711.
Vaisvila R, Ponnaluri VKC, Sun Z, Langhorst BW, Saleh L, Guan S, Dai N,
Campbell MA, Sexton BS, Marks K, et al. 2020. EM-seq: Detection of DNA
methylation at single base resolution from picograms of DNA. bioRxiv:
2019.12.20.884692.
Van Dijk H. 2009. Ageing effects in an iteroparous plant species with a variable life
span. Annals of Botany 104: 115–124.
Vilanova S, Alonso D, Gramazio P, Plazas M, García-Fortea E, Ferrante P, Schmidt
M, Díez MJ, Usadel B, Giuliano G, et al. 2020. SILEX: a fast and inexpensive high-
quality DNA extraction method suitable for multiple sequencing platforms and
recalcitrant plant species. Plant Methods 16: 110.
Wang T, Ma J, Hogan AN, Fong S, Licon K, Tsui B, Kreisberg JF, Adams PD,
Carvunis A-R, Bannasch DL, et al. 2020. Quantitative translation of dog-to-human
aging by conserved remodeling of the DNA methylome. Cell Systems 11: 176-185.e6.
Wickham H. 2016. ggplot2: Elegant graphics for data analysis. Springer-Verlag New
York.
de Witte LC, Stöcklin J. 2010. Longevity of clonal plants: why it matters and how to
measure it. Annals of Botany 106: 859–870.
Woo HR, Masclaux-Daubresse C, Lim PO. 2018. Plant senescence: how plants know
when and how to die. Journal of Experimental Botany 69: 715–718.
Wu G, Park MY, Conway SR, Wang J-W, Weigel D, Poethig RS. 2009. The
sequential action of miR156 and miR172 regulates developmental timing in Arabidopsis.
Cell 138: 750–759.
Wu G, Poethig RS. 2006. Temporal regulation of shoot development in Arabidopsis
thaliana by miR156 and its target SPL3. Development 133: 3539–3547.
Wu H, Wang C, Wu Z. 2013. A new shrinkage estimator for dispersion improves
differential expression detection in RNA-seq data. Biostatistics 14: 232–243.

134
Wyler M, Stritt C, Walser J-C, Baroux C, Roulin AC. 2020. Impact of transposable
elements on methylation and gene expression across natural accessions of Brachypodium
distachyon. Genome Biology and Evolution 12: 1994–2001.
Xiao F-H, Wang H-T, Kong Q-P. 2019. Dynamic DNA methylation during aging: A
“prophet” of age-related outcomes. Frontiers in Genetics 10.
Xie Y, Zhou Q, Zhao Y, Li Q, Liu Y, Ma M, Wang B, Shen R, Zheng Z, Wang H.
2020. FHY3 and FAR1 integrate light signals with the miR156-SPL module-mediated
aging pathway to regulate Arabidopsis flowering. Molecular Plant 13: 483–498.
Xu Y, Zhang L, Wu G. 2018. Epigenetic regulation of juvenile-to-adult transition in
plants. Frontiers in Plant Science 9.
Zheng Q, Liu J, Goff BM, Dinkins RD, Zhu H. 2016. Genetic manipulation of miR156
for improvement of biomass production and forage quality in red clover. Crop Science
56: 1199–1205.

135
Figure 3.1 Proportion of weighted genome-wide methylation in the CG (a), CHG (b),
and CHH (c) methylation-contexts for each age cohort (2, 7, and 11 years-old). Letter
groups represent significant differences based on pairwise comparisons using least
squared means (alpha = 0.05).

136
Figure 3.2 Boxplots depicting the proportion of weighted methylation in each age cohort
(2 years old – red; 7 years old – grey; 11 years old – yellow) across the three methylation
contexts: (a) CG, (b) CHG, and (c) CHH. The black dots represent outliers.
0.3
0.4
0.5
0.6
ch
r1
ch
r2
ch
r3
ch
r4
ch
r5
ch
r6
ch
r7
ch
r8
Pro
po
rta
tio
n W
eig
hte
d C
G M
eth
yla
tion
a
0.15
0.20
0.25
0.30
ch
r1
ch
r2
ch
r3
ch
r4
ch
r5
ch
r6
ch
r7
ch
r8
Pro
po
rta
tio
n W
eig
hte
d C
HG
Meth
yla
tion
b
0.02
0.03
0.04
0.05
ch
r1
ch
r2
ch
r3
ch
r4
ch
r5
ch
r6
ch
r7
ch
r8
Pro
port
ation
Weig
hte
d C
HH
Me
thyla
tio
n
c
Age
2
7
11

137
Figure 3.3 Distribution of lengths in base pairs of differentially methylated regions
(DMRs) identified in each age contrast and methylation context. Panels a-c show
distribution of DMRs identified in the CG context, panels d-f show distribution in the
CHG context, and panels g-l show distribution in the CHH context. The values listed next
to the methylation context indicate the age-contrast (11 – 2 year, 11 – 7 year, and 7 – 2
year).
0
200
400
600
800
0 1000 2000 3000 4000
Cou
nt
CG 11−2a
0
100
200
300
0 1000 2000 3000
CG 11−7b
0
50
100
150
0 1000 2000 3000 4000 5000
CG 7−2c
0
50
100
150
0 500 1000 1500
Cou
nt
CHG 11−2d
0
20
40
60
0 250 500 750 1000 1250
CHG 11−7e
0
25
50
75
100
125
0 500 1000 1500 2000
CHG 7−2f
0
50
100
150
200
0 1000 2000 3000
Co
un
t
CHH 11−2g
0
20
40
60
0 1000 2000 3000
DMR Length (base pairs)
CHH 11−7h
0
100
200
0 500 1000 1500 2000 2500
CHH 7−2i

138
Figure 3.4 Dot plots representing the number of significant (p < 0.0001) differentially
methylated regions (DMRs) identified in each of the contrasts (11 – 2 years: red; 11 – 7
years: grey; 7 – 2 years: yellow) in each methylation-context: (a) CG, (b) CHG, and (c)
CHH.

139
Figure 3.5 Circos plots depicting individual hyper- (red) and hypo- (blue) methylated
differentially methylated regions (DMRs) identified in each contrast and methylation-
context. The outer ring of each plot gives the approximate location of the individual
DMRs on each of the eight ‘Nonpareil’ chromosomes represented by red and blue dots.
The middle ring of each plot represents enrichment of hypermethylated DMRs across
each chromosome, and the innermost ring of each plot represents enrichment of
hypomethylated DMRs across each chromosome. Panel a shows the distribution of
DMRs in the CG context, panel b shows distribution of DMRs in the CHG context, and
panel c shows distribution of DMRs in the CHH context.
0M
b8Mb
16Mb
24Mb
32Mb
40Mb
48Mb
1
0Mb8Mb16Mb
24Mb
32Mb
2
0Mb
8Mb
16Mb
24Mb3
0Mb
16Mb
8Mb
24Mb
4
0Mb
8Mb
16Mb
5
0Mb
8Mb16Mb 24Mb 32Mb6
0Mb8Mb
16Mb
24Mb
7
0Mb
8Mb
16Mb24Mb
8
CHH DMRs 7 vs 2
0M
b8Mb
16Mb
24Mb
32Mb
40Mb
48Mb
1
0Mb8Mb16Mb
24Mb
32Mb
2
0Mb
8Mb
16Mb
24Mb3
0Mb
16
Mb
8Mb
24Mb
4
0Mb
8Mb
16Mb
5
0Mb
8Mb16Mb 24Mb 32Mb6
0Mb8Mb
16Mb
24Mb
70Mb
8Mb
16Mb24Mb
8
CHH DMRs 11 vs 2
0M
b8Mb
16Mb
24Mb
32Mb
40Mb
48Mb
1
0Mb8Mb16Mb
24Mb
32Mb
2
0Mb
8Mb
16Mb
24Mb3
0Mb
16
Mb
8Mb
24Mb
4
0Mb
8Mb
16Mb
5
0Mb
8Mb16Mb 24Mb 32Mb6
0Mb8Mb
16Mb
24Mb
7
0Mb
8Mb
16Mb24Mb
8
CHH DMRs 11 vs 7
0M
b8M
b
16Mb
24M
b
32M
b
40Mb
48Mb
1
0Mb8Mb16Mb
24Mb
32Mb
2
0Mb
8Mb
16Mb
24M
b3
0M
b
16
Mb
8M
b
24M
b
4
0M
b8M
b
16Mb
5
0Mb8Mb
16Mb 24Mb 32Mb6
0Mb8Mb
16Mb
24Mb
7
0Mb
8M
b16M
b2
4M
b8
CG DMRs 7 vs 2
0M
b8Mb
16Mb
24Mb
32Mb
40Mb
48Mb
1
0Mb8Mb16Mb
24Mb
32Mb
2
0Mb
8Mb
16Mb
24Mb3
0Mb
16Mb
8Mb
24M
b
4
0Mb
8Mb
16Mb
5
0Mb8Mb
16Mb 24Mb 32Mb6
0Mb8Mb
16Mb
24Mb
7
0Mb
8Mb
16M
b24Mb
8
CG DMRs 11 vs 7
0M
b8
Mb
16Mb
24M
b
32M
b
40Mb
48Mb
1
0Mb8Mb16Mb
24Mb
32Mb
2
0Mb
8Mb
16Mb
24M
b3
0M
b
16
Mb
8M
b
24M
b
4
0M
b8M
b
16Mb
5
0Mb8Mb
16Mb 24Mb 32Mb6
0Mb8Mb
16Mb
24Mb
7
0Mb
8M
b16M
b2
4M
b8
CG DMRs 11 vs 2
a
0M
b8Mb
16Mb
24Mb
32Mb
40Mb
48Mb
1
0Mb8Mb16Mb
24Mb
32Mb
2
0Mb
8Mb
16Mb
24Mb3
0Mb
16Mb
8Mb
24Mb
4
0Mb
8Mb
16Mb
5
0Mb
8Mb16Mb 24Mb 32Mb6
0Mb8Mb
16Mb
24Mb
7
0Mb
8Mb
16Mb24Mb
8
CHG DMRs 11 vs 7
0M
b8M
b
16Mb
24Mb
32Mb
40Mb
48Mb
1
0Mb8Mb16Mb
24Mb
32Mb
2
0Mb
8Mb
16Mb
24Mb3
0Mb
16
Mb
8M
b
24Mb
4
0Mb
8Mb
16Mb
5
0Mb
8Mb16Mb 24Mb 32Mb6
0Mb8Mb
16Mb
24Mb
7
0Mb
8Mb
16Mb2
4M
b8
CHG DMRs 7 vs 2
0M
b8M
b
16Mb
24Mb
32Mb
40Mb
48Mb
1
0Mb8Mb16Mb
24Mb
32Mb
2
0Mb
8Mb
16Mb
24Mb3
0Mb
16
Mb
8M
b
24Mb
4
0Mb
8Mb
16Mb
5
0Mb
8Mb16Mb 24Mb 32Mb6
0Mb8Mb
16Mb
24Mb
7
0Mb
8Mb
16Mb2
4M
b8
CHG DMRs 11 vs 2
a.
b.
c.

140
Figure 3.6 Heatmaps displaying average percent DNA methylation across cytosines in
the 11-year, 7-year, and 2-year age cohorts within the genomic range of 13 overlapping
differentially methylated regions (DMRs) in the CG context identified in the three age-
contrasts. The regions correspond to CGDMR1-13 (a-m; see Table S2) and the values to
the right of each heatmap represent the genomic position of each cytosine on the
respective chromosome.
(continued)
11 7 2 11 7 2 11 7 2 a b cchr6 chr8 chr8
11 7 2 11 7 2 11 7 2 d e fchr1 chr8 chr8

141
(Figure 3.6 continued)
11 7 2 11 7 2 11 7 2 g h ichr6 chr6 chr2
11 7 2 11 7 2 11 7 2 j k lchr7 chr8 chr1
11 7 2 m chr7

142
Figure 3.7 Heatmaps displaying average percent DNA methylation across cytosines in
the 11-year, 7-year, and 2-year age cohorts within the genomic range of 3 overlapping
differentially methylated regions (DMRs) in the CHG context identified in the three age-
contrasts. The regions correspond to CHGDMR1-3 (a-c; see Table S2) and the values to
the right of each heatmap represent the genomic position of each cytosine on the
respective chromosome.
11 7 2 11 7 2 11 7 2 a b cchr3 chr8 chr8

143
Figure 3.8 Heatmap displaying average percent DNA methylation across cytosines in the
11-year, 7-year, and 2-year age cohorts within the genomic range of the overlapping
differentially methylated region (DMR) in the CHH context identified in the three age-
contrast. The regions correspond to CHHDMR1 (see Table S2).
11 7 2 chr1

144
Table 3.1 Pairwise comparison of least squared means of weighted percent methylation
in the CG, CHG, and CHH contexts for each chromosome in the ‘Nonpareil’ almond
genome. Age cohort contrasts include the 2 – 11, 7 – 11, and 2 – 7-year contrasts.
Significant contrasts are represented in bold with an alpha = 0.05.
Chromosome Age-
Contrast
CG context
p-value
CHG context
p-value
CHH context
p-value
Chr1
11-2 0.0235 0.5329 0.0595
11-7 0.0422 0.4425 0.7068
7-2 0.9436 0.9949 0.2780
Chr2
11-2 0.9973 0.3587 0.1320
11-7 0.7356 0.9063 0.6008
7-2 0.7924 0.5948 0.5698
Chr3
11-2 0.0020 0.2137 0.0138
11-7 0.0046 0.1647 0.3543
7-2 0.9267 0.9980 0.2883
Chr4
11-2 0.6659 0.9917 0.0972
11-7 0.5390 0.8626 0.6030
7-2 0.9867 0.8071 0.4789
Chr5
11-2 <.0001 0.0056 0.0020
11-7 <.0001 0.0049 0.1935
7-2 0.8706 0.9954 0.1873
Chr6
11-2 0.3472 0.9922 0.0675
11-7 0.1645 0.7924 0.5824
7-2 0.9342 0.8679 0.4042
Chr7
11-2 0.0003 0.0658 0.0956
11-7 0.0002 0.0263 0.7183
7-2 0.9963 0.9676 0.3716
Chr8
11-2 0.0004 0.0163 0.0055
11-7 0.0295 0.1837 0.4246
7-2 0.3440 0.5279 0.1329

145
Table 3.2 Number of identified differentially methylated regions (DMRs) in each
methylation-context when comparing the three age cohorts. DMRs were identified with a
threshold of p 0.0001. DMRs are classified as hypermethylated if the percent
methylation in that region is greater in the older age cohort compared to the younger age
cohort within each contrast. DMRs are classified as hypomethylated if the percent
methylation in that region is lesser in the older age cohort compared to the younger age
cohort within each contrast. Hypermethylated DMR values in bold represent those with a
cumulative binomial probability < 110-6.
Methylation
Context Contrast
Number of
DMRs
Hypermethylated
DMRs
Hypomethylated
DMRs
CG
11-2 6479 6232 247
11-7 2105 1983 122
7-2 1211 985 226
CHG
11-2 1129 763 366
11-7 485 252 233
7-2 813 524 289
CHH
11-2 2059 1690 369
11-7 567 216 351
7-2 2259 1849 410

146
Table 3.3 Number of occurrences of overlap when comparing differentially methylated
regions (DMRs) identified in each contrast to those identified in the other contrasts. The
number of overlaps means the number of times a DMR in a particular age-contrast (e.g.
11-2) overlaps the genomic region of a DMR in one of the other age-contrasts (e.g. 11-7).
The overall comparison indicates the number of DMRs occurring in overlapping genomic
regions in all three contrasts. DMRs are classified as either hyper- or hypomethylated in
each methylation context.
Methylation
Context
Hyper
or Hypo 11-2 11-7 11-2 7-2 11-7 7-2 11-2 11-7 7-2
CG Hyper 677 646 13 13
Hypo 37 58 0 0
CHG Hyper 75 161 3 3
Hypo 74 62 0 0
CHH Hyper 95 607 1 1
Hypo 78 146 0 0
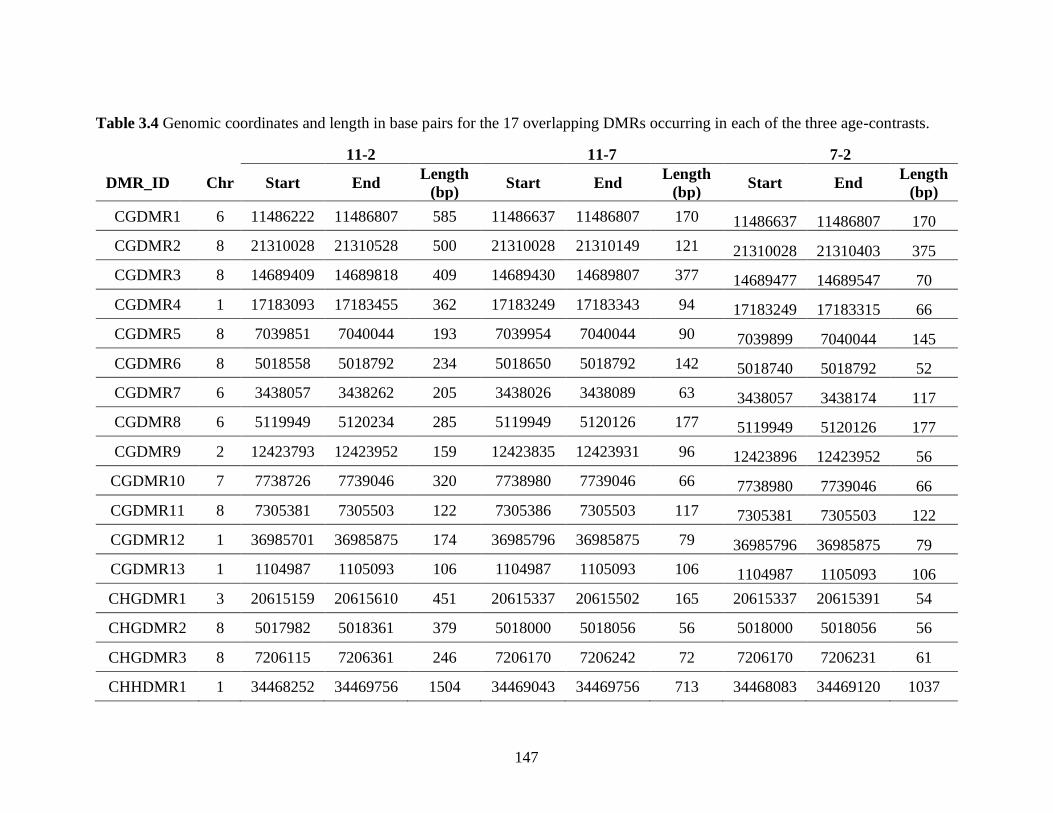
147
Table 3.4 Genomic coordinates and length in base pairs for the 17 overlapping DMRs occurring in each of the three age-contrasts.
11-2 11-7 7-2
DMR_ID Chr Start End Length
(bp) Start End
Length
(bp) Start End
Length
(bp)
CGDMR1 6 11486222 11486807 585 11486637 11486807 170 11486637 11486807 170
CGDMR2 8 21310028 21310528 500 21310028 21310149 121 21310028 21310403 375
CGDMR3 8 14689409 14689818 409 14689430 14689807 377 14689477 14689547 70
CGDMR4 1 17183093 17183455 362 17183249 17183343 94 17183249 17183315 66
CGDMR5 8 7039851 7040044 193 7039954 7040044 90 7039899 7040044 145
CGDMR6 8 5018558 5018792 234 5018650 5018792 142 5018740 5018792 52
CGDMR7 6 3438057 3438262 205 3438026 3438089 63 3438057 3438174 117
CGDMR8 6 5119949 5120234 285 5119949 5120126 177 5119949 5120126 177
CGDMR9 2 12423793 12423952 159 12423835 12423931 96 12423896 12423952 56
CGDMR10 7 7738726 7739046 320 7738980 7739046 66 7738980 7739046 66
CGDMR11 8 7305381 7305503 122 7305386 7305503 117 7305381 7305503 122
CGDMR12 1 36985701 36985875 174 36985796 36985875 79 36985796 36985875 79
CGDMR13 1 1104987 1105093 106 1104987 1105093 106 1104987 1105093 106
CHGDMR1 3 20615159 20615610 451 20615337 20615502 165 20615337 20615391 54
CHGDMR2 8 5017982 5018361 379 5018000 5018056 56 5018000 5018056 56
CHGDMR3 8 7206115 7206361 246 7206170 7206242 72 7206170 7206231 61
CHHDMR1 1 34468252 34469756 1504 34469043 34469756 713 34468083 34469120 1037

148
Table 3.5 Annotation of hyper- and hypomethylated differentially methylated regions
(DMRs) in each methylation context and for each age-contrast. The ‘Nonpareil’ genome
annotation was used to classify the DMRs into four categories: gene, exon, five prime
untranslated region (5’ UTR), and three prime untranslated region (3’ UTR). The
percentages under each classification represent the percentage of DMRs from each
methylation-context and contrast in each of the four categories.
Methylation
Context Hyper/Hypo Contrast %Gene %Exon %5’ UTR %3’ UTR
CG
Hyper
11 – 2 28.0 20.6 0.91 0.96
11 – 7 34.2 25.1 1.51 1.46
7 – 2 27.8 21.4 0.81 1.32
Hypo
11 – 2 39.7 31.2 7.29 1.21
11 – 7 22.1 14.8 0.82 3.28
7 – 2 29.2 22.1 2.65 0.88
CHG
Hyper
11 – 2 27.7 20.1 2.49 1.70
11 – 7 24.6 18.3 3.17 1.98
7 – 2 24.8 17.2 1.91 0.76
Hypo
11 – 2 23.5 17.8 3.28 1.37
11 – 7 27.9 18.5 3.00 2.58
7 – 2 19.4 13.8 2.77 0
CHH
Hyper
11 – 2 18.0 9.41 1.60 2.13
11 – 7 19.0 12.0 0.46 1.39
7 – 2 17.9 9.20 1.35 2.16
Hypo
11 – 2 27.4 14.6 3.25 1.63
11 – 7 24.5 14.0 3.99 1.99
7 – 2 24.4 14.2 1.22 1.22

149
Table 3.6 Annotation of genes associated with 17 hypermethylated differentially methylated regions (DMRs) occurring in all three
age cohort contrasts. The chromosome (chr) and genomic coordinates (start and end) of each gene are listed along with the gene
identification from the ‘Nonpareil’ genome annotation. Protein identifiers from InterPro and Pfam databases are also included as well
as gene ontology (GO) terms associated with the gene.
Methylation
Context Chr Start End GeneID InterPro Pfam GO
CG
chr6 11481648 11484599 BGLU12: Beta-glucosidase IPR001360 PF00232 GO:0004553
GO:0005975
chr6 5122822 5124703 At3g47570: Probable LRR receptor-like
serine/threonine-protein kinase
IPR001245
IPR001611
IPR013210
PF00560
PF07714
PF08263
GO:0004672
GO:0005515
GO:0006468
chr8 14686870 14697541 Protein of unknown function1
chr1 36988003 36989001 ESD4: Ubiquitin-like-specific protease IPR003653 PF02902 GO:0006508
GO:0008234
chr1 17181984 17183843 Protein of unknown function2 IPR004252 PF03004
chr7 7732940 7736793 Protein of unknown function3
chr2 12422670 12423066 Protein of unknown function4
chr6 3439053 3439763 Protein of unknown function5 IPR009769 PF07059
chr8 7299785 7304401 PS1: FHA domain-containing protein IPR000253
IPR002716
PF00498
PF13638 GO:0005515
chr8 21331964 21333852 Dctpp1: dCTP pyrophosphatase 1 IPR025984 PF12643 GO:0009143
GO:0047429
chr8 7041990 7043388 Protein of unknown function6
chr8 5019298 5021435 TAR3: Tryptophan aminotransferase-
related protein 3 IPR006948 PF04864 GO:0016846
chr1 1101269 1101943 Protein of unknown function7 (continued)
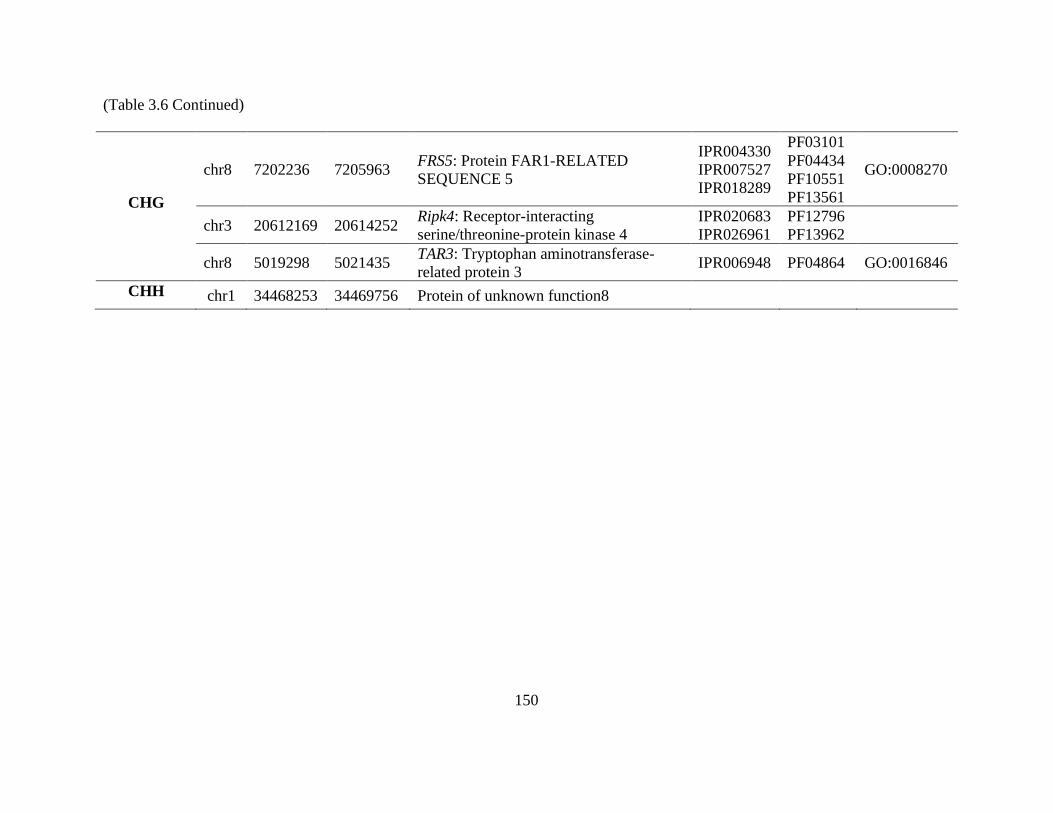
150
(Table 3.6 Continued)
CHG
chr8 7202236 7205963 FRS5: Protein FAR1-RELATED
SEQUENCE 5
IPR004330
IPR007527
IPR018289
PF03101
PF04434
PF10551
PF13561
GO:0008270
chr3 20612169 20614252 Ripk4: Receptor-interacting
serine/threonine-protein kinase 4
IPR020683
IPR026961
PF12796
PF13962
chr8 5019298 5021435 TAR3: Tryptophan aminotransferase-
related protein 3 IPR006948 PF04864 GO:0016846
CHH chr1 34468253 34469756 Protein of unknown function8

151
Table 3.7 Characterization of eight unknown proteins associated with the 17 shared DMR sequences identified among the three age-
contrasts. The unknown protein ID corresponds to the unknown proteins associated with the shared DMR sequences. The putative
motifs identified within each protein sequence include the position of the motif within the sequence and the e-value. The number of
amino acids and estimated molecular weight (kDa) are also included for each protein sequence. Finally, the predicted localization of
each protein is provided as well as the calculated probability of this prediction.
Protein ID Putative Motifs (amino acid position; e-value)
Number of
Amino
Acids
Estimated
Molecular
Weight
(kDa)
Predicted
Location
(probability)
unknown
protein1 none found 1,122 122,388.22
chloroplast
(98.98%)
unknown
protein2 o transposase_24 (213-319; 8e-7) 438 48,372.76 nucleus (50.2%)
unknown
protein3
o transposase_24 (186-312; 5e-11)
o AbiJ N-terminal domain 4 (114-226; 0.014) 610 69,422.01 nucleus (90.87%)
unknown
protein4 none found 100 11,346.45
mitochondrion
(89.43%)
unknown
protein5
o DUF1336 (15-106; 5e-9)
o DUF924 (22-89; 0.0093) 124 14,296.34
cytoplasm
(93.95%)
unknown
protein6 none found 339 38,963.80 nucleus (97.83%)
unknown
protein7 none found 86 9,893.82
secreted pathway
(85.92%)
(continued)

152
o
o
unknown
protein8
o GIT coiled-coil Rho guanine nucleotide exchange factor
(77-109; 0.0019)
o bZIP transcription factor (76-106; 0.0033)
o Fungal N-terminal domain of STAND proteins (54-111;
0.0084)
o Uncharacterised protein family (UPF0242) N-terminus
(54-121; 0.014)
o Leucine-rich repeats of kinetochore protein Cenp-
F/LEK1 (62-119; 0.028)
o DUF4514 (72-146; 0.019)
o Axonemal dynein light chain (47-115; 0.038)
o RNA polymerase II transcription mediator complex
subunit 9 (59-117; 0.067)
o EvpB/VC_A0108, tail sheath N-terminal domain (86-
141; 0.17)
o Centrosome localisation domain of PPC89 (76-111; 0.3)
o Septum formation initiator (71-105; 0.47)
158 17,972.46 nucleus (99.25%)
(Table 3.7 continued)

153
Chapter 4 Integrated analysis of the methylome and transcriptome of twin almonds
(Prunus dulcis [Mill.] D.A. Webb) reveals genomic features associated with non-
infectious bud-failure
Abstract
Almond (Prunus dulcis [Mill.] D.A.Webb) exhibits an age-related disorder called non-
infectious bud-failure (BF) affecting vegetative bud development and nut yield. The
underlying cause of BF remains unknown but is hypothesized to be associated with
heritable epigenetic mechanisms. To address this disorder and its epigenetic components,
we utilized a monozygotic twin study model profiling genome-wide DNA methylation
and gene expression in two sets of twin almonds discordant for BF-exhibition. Analysis
of DNA methylation patterns show that BF-exhibition and methylation, namely
hypomethylation, are not independent phenomena. Transcriptomic data generated from
the twin pairs also shows genome-wide differential gene expression associated with BF-
exhibition. After identifying differentially methylated regions (DMRs) in each twin pair,
a comparison revealed 170 shared DMRs between the two twin pairs. These DMRs and
the associated genetic components may play a role in BF-exhibition. A subset of 52
shared DMRs are in close proximity to genes involved in meristem maintenance, cell
cycle regulation, and response to heat stress. Annotation of specific genes included
involvement in processes like cell wall development, calcium ion signaling, and DNA

154
methylation. Results of this work support the hypothesis that BF-exhibition is associated
with hypomethylation in almond and identified DMRs and differentially expressed genes
can serve as potential biomarkers to assess BF-potential in almond germplasm. Our
results contribute to an understanding of the contribution of epigenetic disorders in
agricultural performance and biological fitness of perennials.

155
Introduction
Plant diseases and disorders are responsible for reductions in performance and fitness of
individuals and can be particularly devastating in crop production systems. While plant
diseases are typically attributed to pathogens, several disorders of plants have abiotic or
non-pathogenic origins (Kennelly et al., 2012). Non-pathogenic disorders in plants can
result from issues like nutrient deficiencies or unfavorable climatic conditions (Kennelly
et al., 2012), but these disorders can also result from genetic abnormalities leading to
genome instability (Tremblay et al., 1999; Henry et al., 2010). Information on the
development of (epi)genetic disorders in plants is currently lacking, but there is evidence
that genetic abnormalities, including chromatin modifications, can occur with increased
plant age and result in undesirable phenotypes (Watson and Riha, 2011; Dubrovina and
Kiselev, 2016).
Almond (Prunus dulcis [Mill.] D.A.Webb) is an economically-important nut-crop
that exhibits an age-related disorder called non-infectious bud-failure (BF) (Kester and
Jones, 1970; Almond Board of California, 2019). Exhibition of this disorder leads to
repression of vegetative meristem development in the spring, indirectly decreasing yield
(Wilson and Schein, 1956; Kester and Jones, 1970). BF is transmitted to both vegetative
propagules and sexual progeny without a pathogenic origin or epidemiological pattern of
dispersion, and the disorder is non-reversible, meaning a tree will always show the
phenotype following initial exhibition (Fenton et al., 1988). The severity of exhibition in
progeny, though not immediate, is proportional to severity in the parents (Kester et al.,
2004). Cultivars and breeding selections exhibiting this disorder show characteristic
156
dieback at the top of the canopy (Fig. 4.1), and severe levels of BF can be detrimental to
productive orchards with up to 50% yield loss in some cultivars (Gradziel et al., 2013).
For example, clones of the cultivar ‘Nonpareil’, representing ~40% of U.S. almond
production (Almond Board of California, 2019), exhibit BF, making this disorder a threat
to the U.S. agricultural economy. Further, BF led to abandonment of promising almond
cultivars including ‘Jordanolo’ (Wilson and Schein, 1956). BF-exhibition has also been
observed in other almond producing countries including Australia (M.G. Wirthensohn,
pers. comm.), Iran (B. Shiran, pers. comm), and Spain (P.J. Martínez-García, pers.
comm.). Our current understanding of BF is limited; to date, no biomarkers to screen for
early onset and prevent this disorder have been identified or described.
Given the sexual and asexual transmission along with the environmental cues
associated with BF, epigenetic mechanisms may play a role in its exhibition in almond
(Kester et al., 2004). DNA methylation is the most widely studied chromatin mark in
plants and has been implicated in phenotypic variation in several species including
almond (He et al., 2011; Fernández i Martí et al., 2014; Elhamamsy, 2016; Fresnedo-
Ramírez et al., 2017). Cytosine methylation occurs in three contexts in plants: CG, CHG,
and CHH (H = A, T, or G) and can impact gene expression due to inhibition of
transcription factors or transcription machinery binding (Zhang et al., 2010; He et al.,
2011). Alterations in DNA methylation have been shown to be associated with changes in
plant development, including in meristematic tissue, and can be induced as a response to
biotic or abiotic stress (Zhang et al., 2010; Bej and Basak, 2017; Seymour and Becker,
2017; Dolzblasz et al., 2018; Alonso et al., 2019). Changes in plant DNA methylation

157
can also be inherited (Richards, 2006; Holeski et al., 2012; Li et al., 2014; Tricker, 2015;
Köhler and Springer, 2017), though inheritance of epialleles may not follow the same
patterns found in other heritable genetic components (Kakutani, 2002).
Discordant monozygotic (MZ) twin-based studies are an effective tool to
precisely address, describe, and quantify DNA methylation mechanisms affecting
exhibition of traits within the same genotype. Such studies have been widely used in
humans and livestock to identify chromatin marks associated with various disorders
(Field and Suttle, 1979; Petronis, 2006; Bell and Spector, 2011; Svendsen et al., 2016).
To our knowledge, this framework has not yet been applied in plants despite its potential
and suitability in several outcrossing, perennial systems. Almond is an obligated
outcrosser (Ushijima et al., 2003) and recalcitrant to inbreeding (Alonso Segura and
Socias i Company, 2007; Martínez-García et al., 2012); however, almond can produce
fruit with multiple embryos due to post-fertilization embryo splitting resulting in MZ
twin almond genotypes (Martínez-Gómez et al., 2002; Martínez-Gómez and Gradziel,
2003). Post-fertilization embryo splitting, often called a double-seed trait, is well known
and characterized in the cultivar ‘Nonpareil’ (Martínez-Gómez et al., 2002; Martínez-
Gómez and Gradziel, 2003). Currently, almond germplasm derived from MZ twin pairs,
known commonly as the ‘Stukey’ collection, is available at the University of California,
Davis (Martínez-Gómez et al., 2002), and several twin pairs now exhibit BF. Twin pairs
discordant for BF-exhibition in this collection allow for the implementation of a MZ
twin-based study model to analyze potential chromatin alterations associated with the
disorder.

158
Fresnedo-Ramírez et al. (2017) postulated that DNA methylation interacts with
genotype and chronological age in BF-exhibition in almond. However, DNA methylation
signatures identified in the prior study were anonymous and qualitative (e.g., presence vs.
absence of bands), limiting a precise contrast and characterization of the features
influenced by methylation and the role they might play in BF development. Differential
DNA methylation signatures associated with BF-status between isogenic individuals may
suggest the methylome plays a role in BF-exhibition. Thus, identifying and quantifying
these signatures utilizing a MZ twin-based design and an annotated genome will enhance
elucidation of the role of DNA methylation in BF-exhibition in almond. In this study, we
tested this hypothesis by profiling DNA methylation and gene expression patterns in two
sets of MZ twin almonds with discordant BF-exhibition. To our knowledge, this is the
first study performed in an outcrossing plant species utilizing a twin-based model and a
bisulfite sequencing approach to address an age-related disorder. The DNA methylation
profiles generated will aid in further interrogation and subsequent design of strategies to
monitor and mitigate BF in almond germplasm.
Materials and Methods
Plant Material
The ‘Stukey’ almond twins are maintained at the Wolfskill Experimental Orchards
(Almond Breeding Program, University of California – Davis, Winters, CA) and are
comprised of eleven pairs of maternal half-sib (i.e., the father is unknown) MZ twin trees
grown from polyembryonic seed from the cultivar ‘Nonpareil’ (Martínez-Gómez et al.,
2002; Martínez-Gómez and Gradziel, 2003). The seeds were planted in 2000, and the

159
trees are monitored annually for BF-exhibition. Two pairs discordant for BF-exhibition
before May 2017 were selected for profiling in this study. Leaf samples were collected
for DNA extraction in May 2017 from the canopy of each tree and immediately stored in
desiccation beads until lyophilization. Samples were shipped on ice to the Ohio
Agricultural Research and Development Center (OARDC; The Ohio State University,
Wooster, OH, USA) and immediately processed for lyophilization. Following
lyophilization, samples were stored at -20 °C until DNA extraction. Leaf material from
the same two ‘Stukey’ pairs still showing diverged BF-exhibition was collected in April
2018 for RNA extraction. Leaf samples were harvested from two locations within the
canopy of each tree and immediately stored on ice. Samples were shipped on dry ice to
the OARDC and stored at -45 °C until sample processing.
DNA Extraction
High-quality DNA was extracted from leaves following a modified version of the
protocol outlined in Lodhi et. al (1994). Briefly, samples were ground with a mortar and
pestle in liquid nitrogen, and 100 mg of tissue was added to 1 mL of CTAB buffer
(20mM EDTA, 100mM Tris-HCl pH 8.0, 1.4M NaCl, 2.0% CTAB w/v, 2% beta-
mercaptoethanol v/v). Phase separation was performed using chloroform:isoamyl alcohol
(24:1 v/v) and DNA was ethanol precipitated. DNA was RNase (ThermoFisher Scientific
Waltham, MA) treated according to manufacturer’s instructions, and another phase
separation and precipitation was performed. DNA quality and concentration were
assessed by gel electrophoresis (1% agarose, 100 Volts, 45 minutes), fluorometry using a
Qubit 4, and spectrophotometry using a NanoDrop 1000 (ThermoFisher Scientific).

160
Two independent DNA extractions representing technical replicates were performed for
each ‘Stukey’ individual.
RNA Extraction
High-quality RNA was isolated from leaves following a modified version of the protocol
outlined in Gambino et. al (2008). Briefly, leaf tissue was ground in liquid nitrogen using
mortar and pestle pre-treated with RNaseZap Wipes (ThermoFisher Scientific,
Waltham, MA). Approximately 150 mg of ground material was added to 900 mL CTAB
extraction buffer (2% CTAB, 2.5% PVP-40, 2M NaCl, 100 mM Tris-HCl pH 8.0, 25 mM
EDTA pH 8.0, 2% beta-mercaptoethanol). Phase separation was performed using
chloroform:isoamyl alcohol (24:1), followed by precipitation with 3M lithium chloride.
The pellet was resuspended in 500 µL SSTE buffer (10 mM Tris-HCl pH 8.0, 1 mM
EDTA pH 8.0, 1% SDS, 1M NaCl) and an additional phase separation was performed.
RNA was precipitated with isopropanol and resuspended in 30 µL RNase-free water.
RNA was DNase-treated using the DNA-free DNA Removal Kit (ThermoFisher
Scientific) according to the manufacturer’s instructions. RNA quality and concentration
were assessed by fluorometry using a Qubit 4 RNA HS kit and by electrophoresis using
a TapeStation (Agilent, Santa Clara, CA).
Whole Genome Bisulfite Sequencing Library Preparation and Illumina Sequencing
Whole-genome bisulfite libraries were prepared using the Pico Methyl-Seq Library Prep
Kit (Zymo Research, Irvine, CA) following the protocol for standard insert libraries (370-
420 basepairs). Eight sequencing libraries were prepared, and each library was uniquely
barcoded for multiplexing. The kit provides barcodes for multiplexing six libraries, so

161
two compatible barcodes were synthesized by MilliporeSigma (St. Louis, MO). Library
concentration and quality were assessed by fluorometry using a Qubit 4 and
electrophoresis using a TapeStation (Agilent). Libraries were equimolarly pooled prior to
sequencing. Bisulfite libraries were sequenced on one lane of the Illumina® MiSeq
platform v. 3 to generate 100 bp single-end reads and re-sequenced on one lane of the
Illumina® NextSeq 550 platform to generate 75-bp single-end reads.
Processing and Alignment of Bisulfite-Sequencing Libraries
Bisulfite sequencing reads were assessed using FastQC v. 0.11.7 (Andrews, 2010) and
trimmed using TrimGalore v. 0.6.0 and Cutadapt v. 2.1 with default parameters and an
additional 10 base pair 3’ and 5’ prime clip (Krueger, 2016). Reads from the MiSeq and
NextSeq runs were then combined into single fasta files for each library. Reads were
aligned to the ‘Nonpareil’ almond reference genome, and methylation calls were
generated using Bismark v. 0.21.0 (Krueger and Andrews, 2011). Genome coverage,
mapping efficiency, and genome-wide methylation levels for each methylation context
(CHG, CHH, and CG) were calculated for each ‘Stukey’ individual by combining data
from the two technical replicate libraries.
The reference genome used in this study corresponds to the gene space of the
almond cultivar ‘Nonpareil’ developed using a combination of Illumina and Hi-C data
resulting in eight main scaffolds (N90 = 13.96 Mb) (Fresnedo-Ramírez, 2020). This
assembly was functionally annotated using short-read and long-read (Oxford Nanopore,
OX4 4DQ, United Kingdom) RNA-seq data and the MAKER pipeline, representing

162
28,637 gene models. The ‘Nonpareil’ plastid genome was produced by aligning reads to
the sequence of the plastid genome NC_034696.1 reported in NCBI.
Plots displaying percent methylation for each twin across each of the eight
almond chromosomes were generated using the R package ggplot2 v. 3.3.2 (Wicham
2016). To test for lack of independence between methylation status and bud-failure
exhibition, a Pearson’s Chi-squared test with Yates’s continuity correction was conducted
using the chisq.test() function in R to analyze the number of methylated and
unmethylated cytosines detected in each twin pair. An effect size, phi, was calculated for
each Pearson’s Chi-squared test using the function ES.chisq.assoc() from the package
powerAnalysis v. 0.2.1 in R. Finally, conversion efficiencies were calculated for each
library by aligning reads to the ‘Nonpareil’ almond chloroplast genome and calculating
the percent of methylated cytosines observed. Observed methylation in the chloroplast
genome represent non-converted, unmethylated cytosines since all chloroplast cytosines
are unmethylated (Fojtová et al., 2001). All analyses were performed using the Ohio
Supercomputer Center computing resources (Ohio Supercomputer Center, 1987).
Identification of Differentially Methylated Regions (DMRs) and Permutation Tests
Differentially methylated loci (DML) were identified for each twin pair and methylation
context using the R package DSS (Dispersion Shrinkage for Sequencing data) v. 2.36.0
function DMLtest() with smoothing (Wu et al., 2013; Feng et al., 2014; Wu et al., 2015;
Park and Wu, 2016). Identified DMLs were then used as input in the function callDMR()
to identify differentially methylated regions (DMRs) comprised of several DMLs with a
p-value threshold set to 0.01 for each twin pair and methylation context. DMR-gene
163
associations were defined by a DMR’s proximity to a nearby gene and classified as either
upstream, downstream, or intragenic. Bed files were generated containing the genomic
coordinates of almond genes throughout the genome and of all identified DMRs in each
twin pair. These files were input to the window function in bedtools v. 2.29.2 to identify
all DMRs within 2,000 base pairs upstream or downstream of a gene, including
intragenic DMRs (Quinlan and Hall, 2010). The observed frequency of DMR-gene
associations in each proximity class for each twin pair and methylation context
combination were analyzed using a two-tailed permutation test with 1,000 iterations.
Bedtools v 2.29.2 shuffle function was used to generate a null set of DMR coordinates for
each iteration based on observed DMRs and the current almond genome assembly. A
histogram of DMR lengths was generated using the R package ggplot2 v. 3.3.2
(Wickham, 2016).
DMRs were considered shared between the two twin pairs if they were associated
with the same gene in the same proximity class relative to that gene. The observed
frequency of shared DMRs in each methylation context and proximity class were
analyzed using a two-tailed permutation test with 1,000 iterations. The null DMR sets
generated for each twin pair in the previous permutation were compared to determine
frequency of shared DMRs within each set using the definition of shared DMR presented
above. Venn diagrams were constructed using the R package VennDiagram v. 1.6.20
displaying the number of identified DMRs in each methylation context in each twin pair
and the number of shared DMRs (Chen and Boutros, 2011). A heatmap representing the
degree of percent methylation within each shared DMR was generated for each twin in

164
each methylation context and in each proximity class using the R package
ComplexHeatmap v. 2.2.0 (Gu et al., 2016).
DMRs were further classified based on the percent methylation difference for
each twin pair, and only those with the same magnitude of methylation difference
(positive or negative) between the BF and no-BF twin in each twin pair were maintained.
Shared DMRs with a negative methylation difference were classified as hypomethylated
in the BF twins relative to the no-BF twins, and shared DMRs with a positive methylation
difference were classified as hypermethylated. Linear regression was performed in R v.
4.0.2 using lm() to test for significant correlation between the percent methylation of
shared DMRs for the BF twins and for the no-BF twins (R Core Team, 2020). An
adjusted R2 and p-value were calculated for each regression.
Annotation of Genes Associated with Shared DMRs and Enrichment Analysis
To obtain a fasta file containing the genomic sequence for genes associated with DMRs
in each methylation context and proximity class, samtools v. 1.9 faidx was used with both
the current almond genome and genomic coordinates for each gene (Li et al., 2009; Li,
2011). Fasta files were queried against a UniProtKB Reviewed (Swiss-Prot) database
using BLAST+ v. 2.4.0 with the routine blastx and an e-value cutoff of 1x10⁻⁶ to obtain a
list of gene entry identifiers (Camacho et al., 2009; The UniProt Consortium, 2019).
Identifiers were uploaded to the Retrieve/ID mapping tool on the UniProt website
(https://www.uniprot.org/uploadlists) with options from: UniProtKB AC/ID and to:
UniProtKB to obtain gene names and ontology (GO) terms. To perform enrichment
analysis of GO terms, a reference map was generated for genes in the current almond

165
genome using the same method described above. The R package clusterProfiler v. 3.16.1
function enricher() was used with the DMR-associated gene list and almond GO term
reference map, a p-value cutoff of 0.1, and a Benjamini-Hochberg correction (Yu et al.,
2012). Both the list of significantly enriched GO terms identified using enricher() and the
list of all GO terms present in the DMR-associated gene list were annotated using the
term() and termLabel() functions in the R package rols v. 2.16.4 (Gatto, 2020).
To identify putative transcription factor binding sites within shared DMR
sequences, fasta files containing genomic sequence for all shared DMRs were used as
input in the Transcription Factor Prediction tool on the Plant Transcription Factor
Database (PlantRegMap/PlantTFDB v 5.0;
https://planttfdb.cbi.pku.edu.cn/prediction.php) (Jin et al., 2017; Tian et al., 2019).
Enrichment analysis was based on the genome-wide frequency of transcription factor
binding sites for each family in a reference panel generated using the ‘Nonpareil’
reference genome. To test for significant enrichment, a Fisher’s exact test was performed
for each family in R v. 4.0.2 with a Bonferroni correction (R Core Team, 2020).
mRNA Sequencing Library Preparation and Illumina Sequencing
Ribosomal RNA was depleted from 1 mg of DNase-treated RNA from two technical
replicates of each ‘Stukey’ sample using the Invitrogen RiboMinus Plant Kit for RNA-
Seq (ThermoFisher Scientific) according to the manufacturer’s instructions. RNA
concentration was determined by fluorometry using a Qubit™ 4 RNA HS kit. To prepare
mRNA sequencing libraries, 100 ng of rRNA-depleted RNA from each technical
replicate was used as input in the NEBNext Ultra II Directional RNA Library Prep with

166
Sample Purification Beads kit (New England BioLabs Inc., Ipswich, MA) following
instructions provided in Section 5 in the kit manual. Each library was uniquely barcoded
using NEBNext Multiplex Oligos for Illumina® (Index Primers Set 1) (New England
BioLabs Inc.). Library concentration and quality were determined by fluorometry using a
Qubit™ 4 and electrophoresis using a TapeStation (Agilent). Libraries were then
equimolarly pooled and sequenced on one lane of the Illumina® NextSeq 550 platform to
generate 75-bp single-end reads.
Processing and Alignment of mRNA Sequencing Libraries
mRNA sequencing reads were assessed using FastQC v. 0.11.7 (Andrews, 2010). The
reference genome was prepared using STAR v. 2.6.0a with --runMode genomeGenerate
and --genomeSAindexNbases 12 (Dobin et al., 2013). Reads were aligned to the prepared
genome using STAR v. 2.6.0a with the following commands: --alignIntronMin 60 --
alignIntronMax 6000 --outFilterScoreMinOverLread 0.3 --
outFilterMatchNminOverLread 0.3. Gene counts were tallied for each library using
Subread v. 1.5.0 featureCounts with the reference ‘Nonpareil’ gff file (Liao et al., 2013).
Processing and alignment pipeline were executed on the Ohio Supercomputer Center
computing clusters (Ohio Supercomputer Center, 1987).
Identifying Differentially Expressed Genes and Integrating Expression Data with DMR-
Associated Genes
Differentially expressed genes were identified using a significance cutoff of adjusted p-
value < 0.1 in the R package DESeq2 v. 1.26.0 after fitting the model,
~Condition+TwinPair (Love et al., 2014). Shrunken log2 fold changes were generated for

167
the condition contrast using the ‘ashr’ shrinkage estimator (Stephens, 2017). Count data
were transformed using the varianceStabilizingTransformation() function prior to
principal component analysis (Anders and Huber, 2010). Heatmaps were generated using
the R package ComplexHeatmap v. 2.2.0 (Gu et al., 2016).
In silico Analysis of a Hypothetical Protein Identified in mRNA Sequencing
Nucleotide and amino acid sequences for an unidentified protein on chromosome 6 of the
‘Nonpareil’ almond genome with ~3 log2fold increase can be found in Appendix File 3.
A blastp was performed on the amino acid sequence using the UniprotKB reference
proteome plus Swiss-Prot with the default parameters (The Uniprot Consortium, 2019).
Protein motifs were determined within the sequence using ExPASy ScanProsite (release
2020_02) (Castro et al., 2006; Sigrist et al., 2013). The program SVMProt: Protein
Functional Family Prediction was used to predict protein functional families using
support vector machine and k-nearest neighbors algorithms (Cai et al., 2003). The
program ProtParam was used to characterize protein properties including predicted
charge, molecular weight, and stability (Gasteiger et al., 2005). To predict subcellular
localization, the program YLoc was used (Briesemeister, Rahnenführer, et al., 2010a;
Briesemeister, Rahnenüfhrer, et al., 2010b). TargetP-2.0 was used to identify putative
peptides (Almagro Armenteros et al., 2019). Finally, the Motif tool on the GenomeNet
website (https://www.genome.jp/tools/motif/) was used to search a protein query against
several databases to identify putative alignments (Marchler-Bauer et al., 2013; Sigrist et
al., 2013; Finn et al., 2014)

168
Results
Contrasting genome-wide DNA methylation status in the ‘Stukey’ twins
Whole-genome bisulfite sequencing was performed on four ‘Stukey’ individuals
representing two MZ twin pairs discordant for BF-exhibition. Twin 1a exhibits BF while
twin 1b is BF-free (i.e., no-BF), and in twin pair two, twin 2a exhibits BF while twin 2b
is BF-free. Genome-wide sequencing depth ranged from 70-110X for each individual,
and mapping efficiencies following alignment to the ‘Nonpareil’ reference genome
ranged 36.5-39.1% representing 25-43X genome-wide coverage (Table 4.1). Non-
methylated cytosine conversion efficiencies were >98% for each individual.
CG methylation is the most abundant genome-wide methylation context for all
twins, followed by CHG and CHH, respectively (Table 4.2). Percent methylation
calculations show that in both twin pairs, methylation is higher in the no-BF twin for the
CHG and CHH contexts (Table 4.2). A lack of independence between BF-exhibition
(represented as a binomial presence/absence) and DNA methylation in each methylation
context was demonstrated by Chi-squared (2) analysis with Yates’s continuity correction
(Table 4.3a-c; p-value < 2.2´10-16). While results showed a lack of independence between
methylation and BF-status in the CG context, there is an opposite relationship in twin pair
1 compared to twin pair 2 (Table 4.3a). Genome-wide cytosine methylation in each
context is shown across each of the eight scaffolds of the current ‘Nonpareil’ genome
assembly (representing the eight chromosomes of the almond genome) with evident
regions of higher overall methylation (Fig. 4.2, Fig. 4.3, Fig. 4.4).

169
Identifying regions of differential methylation associated with bud-failure status
Differentially methylated regions (DMRs) were identified and compared between the BF
and no-BF twins in both twin pair one and twin pair two. Significant DMRs were
identified in both twin pairs based on percent cytosine methylation comparisons in the
three methylation contexts in the respective regions (p-value < 0.01) (Fig. 4.5). The
DMRs identified in each twin pair methylation context combination were further
classified based on their proximity to a gene. The DMRs were classified as either within
2,000 base pairs upstream, within 2,000 base pairs downstream, or intragenic (Table 4.4).
Results of the two-tailed permutation test in the CG context show the frequency of DMRs
in the upstream and downstream proximity class are significantly higher, and the
frequency of DMRs in the intragenic class is significantly lower than in null DMR sets
randomly distributed throughout the almond genome (Table 4.4). Permutation testing
shows that significantly more DMRs occur in the upstream class for both the CHG and
CHH context, significantly fewer DMRs occur in the intragenic class for both contexts,
and the frequency of downstream DMRs in both contexts do not exhibit significant
deviance from a random frequency distribution of DMRs along the genome (Table 4.4).
Of the 1,007 significant DMRs identified in the CG context in twin pair one and
the 1,154 significant DMRs identified in the CG context in twin pair two, 82 DMRs were
associated with the same gene in the same proximity class (Appendix Tables 16-24, Fig.
4.5a). Of the 646 significant DMRs in the CHG context in twin pair one and the 838
significant DMRs in the CHG context in twin pair two, 34 were associated with the same
gene in the same proximity class (Appendix Tables 16-24, Fig. 4.5b). And of the 382
significant DMRs in the CHH context in twin pair one and the 533 significant DMRs in

170
the CHH context in twin pair two, 54 were associated with the same gene in the same
proximity class (Appendix Tables 16-24, Fig. 4.5c). Patterns of percent methylation
within each gene-associated DMR are similar for BF twins and no-BF twins (Fig.
4.5a,b,c). The DMRs range in length from 51 – 1,460 bp, the average length of the DMRs
in all contexts is ~173 bp, the median DMR length is 128 bp, and the most frequent DMR
length is 77 bp (Fig. 4.6).
The genomic coordinates of the DMRs associated with the same gene from each
twin pair were compared, and 121 of the 170 DMRs had overlapping genomic
coordinates. The DMRs associated with the same gene and proximity class were further
classified as either hyper- or hypomethylated in the BF twins compared to the no-BF
twins in each methylation context and proximity class. Of these 170 DMRs, 29 were
hypermethylated and 68 were hypomethylated. The remaining 73 DMRs were classified
as either hyper- or hypomethylated in one twin pair and had the opposite classification in
the other twin pair. Comparing percent methylation difference by methylation context in
hyper- and hypomethylated-DMRs associated with the same gene shows that most DMRs
in the CG context are hypermethylated in BF twins, while DMRs in the CHG and CHH
contexts tend to be hypomethylated in BF twins (Fig. 4.7a,b,c). Comparing percent
methylation by proximity class for the same set of DMRs shows that all intragenic DMRs
are hypermethylated in BF twins, while DMRs upstream and downstream are both hyper-
and hypomethylated in BF twins (Fig. 4.8a,b,c). Permutation testing revealed
significantly more shared DMRs in all methylation contexts and proximity classes with
the exception of intragenic CHG DMRs when comparing to null DMR sets (Table 4.5).

171
The magnitude of methylation difference in each DMR associated with the same
gene and proximity class showed a significant linear relationship when comparing
percent methylation for each DMR in no-BF twin 1b to the corresponding DMR in no-BF
twin 2b in the upstream and downstream proximity classes (Fig. 4.9a – upstream, Fig.
4.9c – intragenic, Fig. 4.9e – downstream). A significant linear relationship was also
shown when comparing percent methylation for each DMR in BF twin 1a to the
corresponding DMR in BF twin 2a for each proximity class (Fig. 4.9b – upstream, Fig.
4.9d – intragenic, Fig. 4.9f – downstream).
Annotation of DMR-associated genes identified in the ‘Stukey’ twins
The genomic sequence of 15 genes associated with hypermethylated DMRs significantly
aligned to previously identified genes in the UniProtKB database (Table 4.6). And the
genomic sequence of 37 genes associated with hypomethylated DMRs significantly
aligned to previously identified genes (Table 4.6). Gene ontology (GO) enrichment
analysis revealed significant enrichment in the biological process GO terms: regulation of
timing from vegetative to reproductive phase, protein sumoylation, and glucosinate
metabolic processes (Table 4.7a). Enrichment analysis also revealed enrichment of the
molecular function GO term, protein tag (Table 4.7b). GO terms assigned to all DMR-
associated genes are also reported (Table 4.7a, 4.7b, 4.7c).
A total of 92,188 transcription factor binding sites representing 43 transcription
factor families were identified in the hyper- and hypomethylated DMRs associated with
the same gene and proximity class using the PlantTFDB (Fig. 4.10). Significantly

172
enriched transcription factor family binding sites in the DMRs include ERF, Dof, and
BBR/BPC (Table 4.8).
Transcriptomic analysis of ‘Stukey’ twin pairs
Sequencing was performed to characterize the transcriptome of each ‘Stukey’ twin (Table
4.9). Of the 25,392 annotated, expressed transcripts detected in the ‘Stukey’ twin pairs
(out of the 27,487 annotated transcripts in the ‘Nonpareil’ genome), 16 were found to be
significantly differentially expressed with three downregulated in the BF twins and 13
upregulated in the BF twins compared to the no-BF twins (Table 4.10, Fig. 4.11).
Annotation of these genes revealed involvement in processes such as cell-wall synthesis
and metal-ion transport. Principal component analysis of expressed gene counts shows
Principal Component (PC) 1 explaining 49% of variance by the separation of twin pairs
and PC 2 explaining 45% of variance by the separation of BF condition (Fig. 4.12).
Differentially expressed transcripts associated with bud-failure exhibition
Expression analysis of DMR-associated genes in each proximity class and methylation
context revealed one significantly differentially expressed gene, CNGC1, associated with
CG hypomethylated intragenic DMRs in both twin pairs. Expression patterns
(Log2FoldChange) of DMR-associated genes in both twin pairs do not show a consistent
pattern of up- or downregulation separated either by methylation context (Fig. 4.7a,b,c)
or proximity class (Fig. 4.8a,b,c).
Interestingly, an uncharacterized protein of 72 amino acids in length showing the
highest log2fold change (2.97, Table 4.10) is located on chromosome 6 in the ‘Nonpareil’
genome. Results using several in silico approaches to further analyze this protein suggest

173
it is related to plant development and most likely localized in the nucleus. Three putative
motifs sites were identified within the amino acid sequence including one aspartic acid-
rich region (19-67) and two Casein kinase II phosphorylation sites (12-15 and 45-48).
The protein (C332H463N77O129S3) is composed mostly of aspartic acid (27.8%) and glycine
(11.1%) and is predicted to have an overall negative charge with an estimated molecular
weight of 7693 kDa. The aliphatic index is predicted to be 59.86 and the average
hydropathicity is -0.544. Results from Motif analysis on GenomeNet produced 14 motif
alignments, all to entries in the NCBI-CDD database. The most significant alignment (32
amino acids) was to a Cwf15/Cwf15 cell cycle protein from Schizosaccharomyces pombe
and S. cerevisiae (e-value = 0.028, score = 31.4).
Discussion
The goal of this study was to test the hypothesis that DNA methylation signatures are
associated with bud-failure (BF) exhibition in almond, and to identify and quantify
signatures that may have a role in BF-exhibition, emphasizing the almond genome gene
space. Previous work representing a first approach to deciphering the methylome
landscape in almond showed a lack of independence between BF and DNA methylation;
however, genes or genetic regions influenced by DNA methylation that may have a role
in BF-exhibition were not elucidated (Fresnedo-Ramírez et al., 2017). The current study
represents the first comprehensive scrutiny of the methylome landscape in almond with
the purpose of interrogating a nonpathogenic disorder.

174
A monozygotic (MZ) twin-based design enables identification of methylomic signatures
associated with BF
A MZ twin-based model (Bell and Spector, 2011; Tan et al., 2015) was used in this study
to profile DNA methylation in two twin almond pairs discordant for BF-exhibition. To
our knowledge, this is the first time this study model had been implemented in a plant
species. Using this model, methylation differences were distinguished between each twin
pair independently and then compared those differences to find shared divergence
between the two twin pairs. The existence of MZ twins in almond and other plant species
is documented (Ensign, 1919; Kenworthy et al., 1973; Litz et al., 1982; Martínez-Gómez
and Gradziel, 2003; Aleza et al., 2010) and is particularly useful in systems like almond
where the production of isogenic or inbred germplasm is complex, such as in obligated
outcrossers with systems of self-incompatibility, or when the number of individuals
available for sampling or resources are limited (Ushijima et al., 2003). MZ twins are also
advantageous over clonally propagated individuals because confounding variables
impacting epigenetic patterns, such as chronologic versus ontogenetic ages, are not a
factor (Gatsuk et al., 1980; Dubrovina and Kiselev, 2016).
Bud-failure exhibition is associated with genome-wide DNA hypomethylation in almond
Patterns discerned from the ‘Stukey’ twin pairs revealed a significant lack of
independence between BF-exhibition and DNA methylation, and suggest a putative
association between the BF phenotype and non-CG (i.e. CHG and CHH)
hypomethylation. This finding supports the hypothesis that epigenetics and chromatin-
based mechanisms contribute to the BF disorder and that DNA methylation patterns may

175
inform BF-exhibition (Fresnedo-Ramírez et al., 2017). Bisulfite sequencing enabled
quantification of percent methylation in each context (CG, CHG, and CHH) showing that
observed methylation falls within levels typically seen in other angiosperms including
peach (Niederhuth et al., 2016; Bartels et al., 2018). Observed genome-wide methylation
patterns show higher levels of methylation in conserved regions on each chromosome,
consistent with patterns in centromeric and pericentromeric regions in other plant species
(Fig. 4.1, Fig. 4.2, Fig. 4.3) (Lister et al., 2008; Yan et al., 2010).
There was significant hypomethylation in non-CG contexts in the BF twins, while
patterns of hyper- and hypomethylation in the CG context were not as clear. Non-CG
methylation is prevalent among plant genomes and can be highly variable, impacting
transposition and expression of transposons, early and late-stage plant development, and
response to stressors (Kenchanmane Raju et al., 2019). Levels of genome-wide CHH
methylation were found to vary seasonally in cotton, resulting in developmental changes
and impacting fiber production due to alterations in gene expression (Jin et al., 2013). In
the African oil palm, hypomethylation of transposons in the CHG context is associated
with the ‘mantling’ phenotype, resulting in desiccated fruit often not observed until the
sixth year of growth and causing dramatically reduced oil yields in tissue culture-derived
germplasm (Ong-Abdullah et al., 2015). Like mantling in the African oil palm, BF-
exhibition in almond can take several years to appear in afflicted trees.
DNA demethylation occurs actively and passively in plants throughout the aging
process or after exposure to abiotic and biotic stressors (Liu et al., 2015; Parrilla-Doblas
et al., 2019; Liu and Lang, 2020). For example, a study in Quercus robur L.

176
demonstrated genome-wide hypomethylation in seeds with advanced age and after
exposure to heat stress, resulting in reduced viability (Michalak et al., 2015). BF-
exhibition was previously linked to prolonged heat stress in almond (Hellali and Kester,
1979) which could have implications in triggering activation of DNA demethylation
mechanisms (Centomani et al., 2015; Liu et al., 2015; Naydenov et al., 2015; Harkess,
2018; Liu et al., 2018). Heat-induced hypomethylation can also result in heritable
alterations to DNA methylation profiles including reactivation of transposable elements,
as has been demonstrated in Arabidopsis (Lang-Mladek et al., 2010; Ito et al., 2011;
Sanchez and Paszkowski, 2014; Liu et al., 2015; Tricker, 2015; Yang et al., 2020),
though abiotic stressors do not always induce these heritable marks (Ganguly et al.,
2017). Since BF-exhibition can be transmitted by vegetative propagation and sexual
reproduction, epigenetic inheritance through chromatin modifications, such as changes in
DNA methylation patterns, could serve as a mode of transmission (Kester et al., 1975;
Kester et al., 2004). A pedigree study could also be performed to test the
inheritance/transmission of differentially methylated regions (DMRs) identified in this
study or other chromatin patterns found to be associated with BF-exhibition.
More than 70% of the identified DMRs were classified into one of three
proximity classes relative to a gene. Of these DMR-gene associations, permutation
testing revealed significantly more DMRs in the up- and downstream proximity classes
and significantly fewer in the intragenic proximity class relative to a gene. This result
supports previous findings showing gene body methylation in plants tends to be stable
over time (and even across multiple generations [Luo et al., 2020]), while methylation

177
occurring up- or downstream of genes tends to exhibit greater dynamism, particularly in
response to stressors (Bewick and Schmitz, 2017; Picard and Gehring, 2017; Ito et al.,
2019).
Genes associated with DMRs are involved in meristem development, DNA methylation,
dormancy, and response to heat stress
Of the DMR-associated genes, 52 showed significant similarity to previously annotated
genes in related species. These genes are significantly enriched in biological processes
including protein sumoylation and vegetative meristem development and transition.
Identified DMR-associated genes are also involved in meristem maintenance, cell-wall
biogenesis, dormancy, and cell-cycle regulation including a probable pectin
methylesterase (PME), tesmin (TCX5), a ribosomal protein (RPL27), an agamous-like
MADS-box (AGL14), and maintenance of meristems (MAIN). These genes and processes
represent interesting targets for further functional analysis in almond to explore what, if
any, impact they might have on BF development. Available antibodies for the DMR-
associated genes could also be used to identify their regulatory functions or to look for
active protein expression in key tissues such as meristems.
Empirical evidence suggests a relationship between dormancy processes in the
summer (i.e., summer dormancy) and BF-exhibition in almond (Micke, 1996; Kester et
al., 2004). Progression of BF results in necrosis of vegetative axillary buds following
summer dormancy and occurs by degradation of tunica cells followed by an overgrowth
and subsequent collapse of corpus tissues in the meristem (Hellali et al., 1978).
Meristems are complex structures with orchestrated growth cycles dependent on internal

178
and external cues (Barton, 2010; Paul et al., 2014; Lloret et al., 2018). Growth and
development of meristematic tissues, including dormancy processes, can be regulated by
chromatin marks including DNA methylation and histone modifications (Bitonti et al.,
2002; Conde et al., 2017; Le Gac et al., 2018; Conde et al., 2019). In poplar, changes in
DNA methylation following exposure to heat stress in the previous summer were still
present in meristems following winter dormancy, suggesting an epigenetic “memory” (Le
Gac et al., 2018). Results herein suggest dysregulation of cell wall biogenesis pathways
in almond meristematic tissues could contribute to disruption of dormancy initiation,
leading to the BF phenotype, and that this alteration could be initiated by abiotic stress
(i.e., heat) and maintained in the meristem. DMR-associated genes involved in dormancy
or meristem maintenance provide targets for further study to elucidate their involvement
in summer dormancy and putative role in the onset of BF in almond (Micke, 1996; Kester
et al., 2004; Santamaría et al., 2009; Ríos et al., 2014; Lloret et al., 2018; Fadón et al.,
2020).
Patterns of differential expression identified in genes related to cell wall maintenance
and metal ion transport
Callose synthase family gene, CSLG2 was identified as significantly differentially
expressed in this study. CSL family members are shown in other plant species to be
involved in synthesis of non-cellulosic polysaccharides such as hemicellulose (Richmond
and Somerville, 2000; Farrokhi et al., 2006). The DMR-associated gene encoding cyclic
nucleotide-gated ion channel 1 (CNGC1) was identified as both significantly upregulated
in BF twins and as containing an intragenic, shared DMR hypomethylated in BF twins

179
(Table 4.6; Table 4.10). Disruption of CNGC1 in A. thaliana resulted in a reduction of
calcium ion accumulation in cells (Ma et al., 2006). Proper regulation of calcium uptake
in plants is vital to several developmental processes including meristem organization and
cell wall biogenesis (Hepler, 2005; Li et al., 2019). Finally, the putative gene coding for
an uncharacterized protein was found to have the highest log2 fold change. Data produced
in silico surveying various databases and algorithms suggest this putative genomic
feature may be shared among other members of the Rosaceae. A highly similar (94.3%)
protein of unknown function is reported in the peach gene annotation, and the protein
identified in this study also shows a high degree of similarity (>70%) with undescribed
proteins in Malus and Pyrus. The three genes represent interesting targets for further
study to explore their involvement in BF-exhibition.
Ethylene responsive factor (ERF) transcription factor family binding sites are enriched in
DMRs
Transcription factors (TF) can be sensitive to the presence of DNA methylation at their
binding sites, potentially impacting regulation of target genes (Domcke et al., 2015;
Héberlé and Bardet, 2019). TF families enriched in DMRs include those with functions
related to cell cycle regulation, hormone signaling, plant organ identity, and meristem
development (as shown in Table 4.8). The ERF family represents approximately 25% of
the TF binding sites identified. The ERF TF family is involved in stress response and
hormone signaling, and members have been shown to regulate growth and development
in plants (Licausi et al., 2013; Xie et al., 2019). In pear, another Rosaceous crop, an ERF
family TF, which is itself regulated by chromatin marks, was found to be involved in

180
regulating budbreak by activating expression of genes associated with cell division in the
apex (Anh Tuan et al., 2016). Results from this work and other studies in apple and
poplar support the role of ERF family TFs in dormancy initiation and release in woody
perennials (Wisniewski et al., 2015; Busov et al., 2016).
The association between bud-failure status and DNA methylation signatures in
almond was assessed utilizing a monozygotic twin model with two sets of twin almonds
and a whole-genome bisulfite sequencing approach to provide the first comprehensive
survey of the almond methylome. The goal was to determine whether the methylome has
a role in bud-failure exhibition. Results from this work support the hypothesis that
genome-wide hypomethylation is associated with bud-failure exhibition. The approach
utilized in this study allowed identification of several differentially methylated regions
between bud-failure and bud-failure-free twins, providing targets for further
investigation. Relevant genomic features identified in this study include genes and
transcription factors involved in meristem maintenance, cell cycle control, dormancy, and
response to heat stress which might be impacted by chromatin alterations and contribute
to the bud-failure phenotype. These potential targets can be investigated to evaluate their
suitability as biomarkers for bud-failure exhibition potential. The availability of
biomarkers to screen almond germplasm for bud-failure susceptibility would be valuable
to breeders, producers, and growers to avoid transmission of the disorder to progeny
through breeding and propagation. Elucidation of the mechanisms underlying bud failure
development would also improve our understanding of this threatening disorder and

181
provide a basis for addressing and mitigating similar identified or undescribed disorders
in other plants.
Acknowledgements
We would like to acknowledge Cheri Nemes for her assistance with wet lab portions of
this project. We would also like to acknowledge Andrew Michel and Eric Stockinger for
providing edits to later versions of this manuscript. To the Ohio Supercomputer Center
for access to computing resources and the Translational Plant Sciences Graduate Program
for the fellowship for KMDW. This work was supported by The Ohio State University
CFAES-SEEDS program grant # 2019-125, the Almond Board of California Grant
HORT35, the U.S. Department of Health and Human Services National Institutes of
Health - National Cancer Institute - Cancer Center Support Grant (CCSG)
P30CA016058, the USDA National Institute of Food and Agriculture AFRI-EWD
Predoctoral Fellowship 2019-67011-29558.

182
References
Aleza P, Juárez J, Ollitrault P and Navarro L. 2010. Polyembryony in non-apomictic
citrus genotypes. Annals of Botany 106: 533–545.
Almagro Armenteros JJ, Salvatore M, Emanuelsson O, Winther O, Heijne G von,
Elofsson A and Nielsen H. 2019. Detecting sequence signals in targeting peptides using
deep learning. Life Science Alliance 2: e201900429.
Almond Board of California. 2019. Almond Almanac. Modesto, CA, USA: Almond
Board of California.
Alonso C, Ramos‐Cruz D, Becker, C. 2019. The role of plant epigenetics in biotic
interactions. New Phytologist 221: 731–737.
Alonso Segura JM, Socias i Company R. 2007. Negative inbreeding effects in tree fruit
breeding: self-compatibility transmission in almond. Theoretical and Applied Genetics
115: 151–158.
Anders S, Huber W. 2010. Differential expression analysis for sequence count data.
Genome Biology 11: R106.
Andrews S. 2010. FastQC: A quality control tool for high throughput sequence data.
Available at: https://www.bioinformatics.babraham.ac.uk/projects/fastqc/.
Anh Tuan P, Bai S, Saito T, Imai T, Ito A, Moriguchi T. 2016. Involvement of
EARLY BUD-BREAK, an AP2/ERF transcription factor gene, in bud break in Japanese
pear (Pyrus pyrifolia Nakai) lateral flower buds: Expression, histone modifications and
possible target genes. Plant Cell and Physiology 57: 1038–1047.
Bartels A, Han Q, Nair P, Stacey L, Gaynier H, Mosley M, Huang QQ, Pearson, JK,
Hsieh TF, An YQC et al. 2018. Dynamic DNA methylation in plant growth and
development. International Journal of Molecular Sciences 19: 2144.
Barton MK. 2010. Twenty years on: The inner workings of the shoot apical meristem, a
developmental dynamo. Developmental Biology 341: 95–113.
Bej S, Basak J. 2017. Abiotic stress induced epigenetic modifications in plants: How
much do we know? In: Rajewsky N, Jurga S, Barciszewski J, eds. Plant Epigenetics.
Cham, Switzerland: Springer, 493–512.
Bell JT, Spector TD. 2011. A twin approach to unraveling epigenetics. Trends in
Genetics 27: 116–125.
Bewick AJ, Schmitz RJ. 2017. Gene body DNA methylation in plants. Current Opinion
in Plant Biology 36: 103–110.

183
Bitonti MB, Cozza R, Chiappetta A, Giannino D, Castiglione MR, Dewitte W,
Mariotti D, Van Onckelen H, Innocenti AM. 2002. Distinct nuclear organization, DNA
methylation pattern and cytokinin distribution mark juvenile, juvenile‐like and adult
vegetative apical meristems in peach (Prunus persica (L.) Batsch). Journal of
Experimental Botany 53: 1047–1054.
Briesemeister S, Rahnenführer J, Kohlbacher O. 2010a. YLoc—an interpretable web
server for predicting subcellular localization. Nucleic Acids Research 38: W497–W502.
Briesemeister S, Rahnenführer J, Kohlbacher O. 2010b. Going from where to why—
interpretable prediction of protein subcellular localization. Bioinformatics 26: 1232–
1238.
Busov V, Carneros E, Yakovlev I. 2016. EARLY BUD-BREAK1 (EBB1) defines a
conserved mechanism for control of bud-break in woody perennials. Plant Signaling &
Behavior 11: e1073873.
Cai CZ, Han LY, Ji ZL, Chen X, Chen YZ. 2003. SVM-Prot: Web-based support
vector machine software for functional classification of a protein from its primary
sequence. Nucleic Acids Research 31: 3692–3697.
Camacho C, Coulouris G, Avagyan V, Ma N, Papadopoulos J, Bealer K, Madden
TL. 2009. BLAST+: architecture and applications. BMC Bioinformatics 10: 421.
Castro E de, Sigrist CJA, Gattiker A, Bulliard V, Langendijk-Genevaux PS,
Gasteiger E, Bairoch A, Hulo N. 2006. ScanProsite: detection of PROSITE signature
matches and ProRule-associated functional and structural residues in proteins. Nucleic
Acids Research 34: W362-365.
Centomani I, Sgobba A, D’Addabbo P, Dipierro N, Paradiso A, De Gara L, Dipierro
S, Viggiano L, Pinto MC de. 2015. Involvement of DNA methylation in the control of
cell growth during heat stress in tobacco BY-2 cells. Protoplasma 252: 1451–1459.
Chen H, Boutros PC. 2011. VennDiagram: a package for the generation of highly-
customizable Venn and Euler diagrams in R. BMC Bioinformatics 12: 35.
Chen Z, Gallie DR. 2012. Induction of monozygotic twinning by ascorbic acid in
tobacco. PLOS One 7: e39147.
Conde D, Perales M, Gac ALL, Dervinis C, Kirst M, Maury S, González-Melendi P,
Allona I. 2017. Chilling-responsive DEMETER-LIKE DNA demethylase mediates
poplar bud break. Plant, Cell and Environment 40: 2236-2249.
Conde D, Perales M, Sreedasyam A, Tuskan GA, Lloret A, Badenes ML, González-
Melendi P, Ríos G, Allona I. 2019. Engineering tree seasonal cycles of growth through
chromatin modification. Fronters in Plant Science 10: 412.

184
Curaba J, Herzog M, Vachon G. 2003. GeBP, the first member of a new gene family in
Arabidopsis, encodes a nuclear protein with DNA-binding activity and is regulated by
KNAT1. The Plant Journal 33: 305–317.
Danisman S. 2016. TCP transcription factors at the interface between environmental
challenges and the plant’s growth responses. Frontiers in Plant Science 7: 1930.
Dobin A, Davis CA, Schlesinger F, Drenkow J, Zaleski C, Jha S, Batut P, Chaisson
M, Gingeras TR. 2013. STAR: ultrafast universal RNA-seq aligner. Bioinformatics 29:
15–21.
Dolzblasz A, Gola EM, Sokołowska K, Smakowska-Luzan E, Twardawska A,
Janska H. 2018. Impairment of meristem proliferation in plants lacking the
mitochondrial protease AtFTSH4. International Journal of Molecular Sciences 19: 853.
Domcke S, Bardet AF, Adrian Ginno P, Hartl D, Burger L, Schübeler D. 2015.
Competition between DNA methylation and transcription factors determines binding of
NRF1. Nature 528: 575–579.
Dubrovina AS, Kiselev KV. 2016. Age-associated alterations in the somatic mutation
and DNA methylation levels in plants. Plant Biology 18: 185–196.
Duek PD, Fankhauser C. 2005. bHLH class transcription factors take center stage in
phytochrome signaling. Trends in Plant Science 10: 51–54.
Elhamamsy AR. 2016. DNA methylation dynamics in plants and mammals: overview of
regulation and dysregulation. Cell Biochemistry and Function 34: 289–298.
Ensign MR. 1919. Venation and senescence of polyembryonic citrus plants. American
Journal of Botany 6: 311–329.
Fadón E, Fernandez E, Behn H, Luedeling E. 2020. A conceptual framework for
winter dormancy in deciduous trees. Agronomy 10: 241.
Farrokhi N, Burton RA, Brownfield L, Hrmova M, Wilson SM, Bacic A, Fincher
GB. 2006. Plant cell wall biosynthesis: genetic, biochemical and functional genomics
approaches to the identification of key genes. Plant Biotechnology Journal 4: 145–167.
Feng H, Conneely KN, Wu H. 2014. A Bayesian hierarchical model to detect
differentially methylated loci from single nucleotide resolution sequencing data. Nucleic
Acids Research 42: e69.
Fenton CAL, Kuniyuki AH, Kester DE. 1988. Search for a viroid etiology for
noninfectious bud failure in almond. HortScience 23: 1050–1053.

185
Fernández i Martí A, Gradziel TM, Socias i Company R. 2014. Methylation of the Sf
locus in almond is associated with S-RNase loss of function. Plant Molecular Biology 86:
681–689.
Field AC, Suttle NF. 1979. Effect of high potassium and low magnesium intakes on the
mineral metabolism of monozygotic twin cows. Journal of Comparative Pathology 89:
431–439.
Finn RD, Bateman A, Clements J, Coggill P, Eberhardt RY, Eddy SR, Heger A,
Hetherington K, Holm L, Mistry J et al. 2014. Pfam: the protein families database.
Nucleic Acids Research 42: D222-230.
Fojtová M, Kovařı́k A, Matyášek R. 2001. Cytosine methylation of plastid genome in
higher plants. Fact or artifact? Plant Science 160: 585–593.
Fresnedo-Ramírez J. 2020. Gene prediction and genome functional annotation of
‘Nonpareil’. Almond Board of California 2020 Research Report HORT25.
Fresnedo-Ramírez J, Chan HM, Parfitt DE, Crisosto CH, Gradziel TM. 2017.
Genome-wide DNA-(de)methylation is associated with noninfectious bud-failure
exhibition in almond (Prunus dulcis [Mill.] D.A.Webb). Scientific Reports 7: 42686.
Gambino G, Perrone I, Gribaudo I. 2008. A rapid and effective method for RNA
extraction from different tissues of grapevine and other woody plants. Phytochemical
Analysis 19: 520-525.
Ganguly DR, Crisp PA, Eichten SR, Pogson BJ. 2017. The Arabidopsis DNA
methylome is stable under transgenerational drought stress. Plant Physiology 175: 1893–
1912.
Gasteiger E, Hoogland C, Gattiker A, Duvaud S, Wilkins MR, Appel RD, Bairoch
A. 2005. Protein identification and analysis tools on the ExPASy server. In: J. M. Walker,
ed. The Proteomics Protocols Handbook. Totowa, NJ: Humana Press, 571–607.
Gatsuk LE, Smirnova OV, Vorontzova LI, Zaugolnova LB, Zhukova LA. 1980. Age
states of plants of various growth forms: A review. Journal of Ecology 68: 675–696.
Gatto L. 2020. rols: An R interface to the Ontology Lookup Service. Available at:
https://lgatto.github.com/rols.
Gradziel TM, Thorpe MA, Fresnedo-Ramírez J, Ragas R, Lampinen B, Adaskaveg
J, Connell J, Schrader P, Metcalf S, Duncan R et al. 2013. Molecular Marker Based
Diagnostics for Almond Non-Infectious Bud-Failure. Almond Board of California
013.2014 Annual Research Report 13-HORT7.

186
Gu Z, Eils R, Schlesner M. 2016. Complex heatmaps reveal patterns and correlations in
multidimensional genomic data. Bioinformatics 32: 2847–2849.
Gupta P, Nutan KK, Singla-Pareek SL, Pareek A. 2017. Abiotic stresses cause
differential regulation of alternative splice forms of GATA transcription factor in rice.
Frontiers in Plant Science 8: 1944.
Harkess A. 2018. Handling the heat: Methylome variation underlying heat tolerance in
cotton. The Plant Cell 30: 1947–1948.
He XJ, Chen T, Zhu JK. 2011. Regulation and function of DNA methylation in plants
and animals. Cell Research 21: 442–465.
Héberlé É, Bardet AF. 2019. Sensitivity of transcription factors to DNA methylation.
Essays in Biochemistry 63: 727–741.
Hellali R, Kester DE. 1979. High temperature induced bud-failure symptoms in
vegetative buds of almond plants in growth chambers. Journal of the American Society
for Horticultural Science 104: 375–378.
Hellali, R., Lin, J. and Kester, D.E. (1978) Morphology of noninfectious bud failure
symptoms in vegetative buds of almond (Prunus amygdalus Batch). Journal of the
American Society for Horticultural Science, 103, 459–464.
Henry IM, Dilkes BP, Miller ES, Burkart-Waco D, Comai L. 2010. Phenotypic
consequences of aneuploidy in Arabidopsis thaliana. Genetics 186: 1231–1245.
Hepler PK. 2005. Calcium: A central regulator of plant growth and development. Plant
Cell 17: 2142–2155.
Hofmann NR. 2016. A structure for plant-specific transcription factors: The GRAS
domain revealed. The Plant Cell 28: 993–994.
Holeski, L.M., Jander, G. and Agrawal, A.A. (2012) Transgenerational defense
induction and epigenetic inheritance in plants. Trends in Ecology & Evolution, 27, 618–
626.
Ito H, Gaubert H, Bucher E, Mirouze M, Vaillant I, Paszkowski J. 2011. An siRNA
pathway prevents transgenerational retrotransposition in plants subjected to stress. Nature
472: 115-119.
Ito T, Nishio H, Tarutani Y, Emura N, Honjo MN, Toyoda A, Fujiyama A,
Kakutani T, Kudoh H. 2019. Seasonal stability and dynamics of DNA methylation in
plants in a natural environment. Genes (Basel) 10: 544.

187
Jiang AL, Xu ZS, Zhao GY, Cui XY, Chen M, Li LC, Ma YZ. 2014. Genome-wide
analysis of the C3H zinc finger transcription factor family and drought responses of
members in Aegilops tauschii. Plant Molecular Biology Reporter 32: 1241–1256.
Jin J, Tian F, Yang DC, Meng YQ, Kong L, Luo J, Gao G. 2017. PlantTFDB 4.0:
toward a central hub for transcription factors and regulatory interactions in plants.
Nucleic Acids Research 45: D1040–D1045.
Jin X, Pang Y, Jia F, Xiao G, Li Q, Zhu Y. 2013. A potential role for CHH DNA
methylation in cotton fiber growth patterns. PLOS One 8: e60547.
Kakutani T. 2002. Epi-alleles in plants: Inheritance of epigenetic information over
generations. Plant and Cell Physiology 43: 1106–1111.
Kenchanmane Raju SK, Ritter EJ, Niederhuth CE. 2019. Establishment,
maintenance, and biological roles of non-CG methylation in plants. Essays in
Biochemistry 63: 743–755.
Kennelly M, O’Mara J, Rivard C, Miller GL, Smith D. 2012. Introduction to abiotic
disorders in plants. The Plant Health Instructor.
Kenworthy WJ, Brim CA, Wernsman EA. 1973. Polyembryony in soybeans. Crop
Science 13: 637-639.
Kester D, Hellali R, Asay R. 1975. Bud failure in almonds: Variability of bud failure in
Nonpareil almonds. California Agriculture 29: 10–12.
Kester DE, Jones RW. 1970. Non-infectious bud-failure from breeding programs of
almond (Prunus amygdalas Batsch). Journal of the American Society of Horticultural
Science 95: 492–96.
Kester DE, Shackel KA, Micke WC, Viveros M, Gradziel TM. 2004. Noninfectious
bud failure in ‘Carmel’ almond: I. Pattern of development in vegetative progeny trees.
Journal of the American Society of Horticultural Science 129: 244–249.
Köhler C, Springer N. 2017. Plant epigenomics—deciphering the mechanisms of
epigenetic inheritance and plasticity in plants. Genome Biology 18: 132.
Krueger F. 2016. Taking appropriate QC measures or RBBS-type or other Seq-
applications with TrimGalore! Available at:
https://github.com/FelixKrueger/TrimGalore.
Krueger F, Andrews SR. 2011. Bismark: a flexible aligner and methylation caller for
Bisulfite-Seq applications. Bioinformatics 27: 1571–1572.

188
Lang-Mladek C, Popova O, Kiok K, Berlinger M, Rakic B, Aufsatz W, Jonak C,
Hauser MT, Luschnig C. 2010. Transgenerational inheritance and resetting of stress-
induced loss of epigenetic gene silencing in Arabidopsis. Molecular Plant 3: 594–602.
Le Gac AL, Lafon-Placette C, Chauveau D, Segura V, Delaunay A, Fichot R,
Marron N, Le Jan I, Berthelot A, Bodineau G et al. 2018. Winter-dormant shoot
apical meristem in poplar trees shows environmental epigenetic memory. Journal of
Experimental Botany 69: 4821–4837.
Li H. 2011. A statistical framework for SNP calling, mutation discovery, association
mapping and population genetical parameter estimation from sequencing data.
Bioinformatics 27: 2987–2993.
Li H, Handsaker B, Wysoker A, Fennel T, Ruan J, Homer N, Marth G, Abecasis G,
Durbin R, 1000 Genome Project Data Processing Subgroup. 2009. The Sequence
Alignment/Map format and SAMtools. Bioinformatics 25: 2078–2079.
Li Q, Eichten SR, Hermanson PJ, Springer NM. 2014. Inheritance patterns and
stability of DNA methylation variation in maize near-isogenic lines. Genetics 196: 667–
676.
Liao Y, Smyth GK, Shi W. 2013. The Subread aligner: fast, accurate and scalable read
mapping by seed-and-vote. Nucleic Acids Research 41: e108.
Licausi F, Ohme‐Takagi M, Perata P. 2013. APETALA2/Ethylene Responsive Factor
(AP2/ERF) transcription factors: mediators of stress responses and developmental
programs. New Phytologist 199: 639–649.
Lister R, O’Malley RC, Tonti-Filippini J, Gregory BD, Berry CC, Millar AH, Ecker
JR. 2008. Highly integrated single-base resolution maps of the epigenome in
Arabidopsis. Cell 133: 523–536.
Litz RE, Knight RL, Gazit S. 1982. Somatic embryos from culture ovules of
polyembryonic Mangifera indica L. Plant Cell Reports 1: 264–266.
Liu G, Xia Y, Liu T, Dai S, Hou X. 2018. The DNA methylome and association of
differentially methylated regions with differential gene expression during heat stress in
Brassica rapa. International Journal of Molecular Science 19: 1414.
Liu J, Feng L, Li J, He Z. 2015. Genetic and epigenetic control of plant heat responses.
Frontiers in Plant Science 6: 267.
Liu R, Lang Z. 2020. The mechanism and function of active DNA demethylation in
plants. Journal of Integrative Plant Biology 62: 148–159.

189
Lloret A, Badenes ML, Ríos G. 2018. Modulation of dormancy and growth responses in
reproductive buds of temperate trees. Frontiers in Plant Science 9: 1638.
Lodhi MA, Ye GN, Weeden NF, Reisch BI. 1994. A simple and effective method for
DNA extraction from grapevine cultivars and Vitis species. Plant Molecular Biology
Reporter 12: 6-13.
Love MI, Huber W, Anders S. 2014. Moderated estimation of fold change and
dispersion for RNA-seq data with DESeq2. Genome Biology 15: 550.
Luo X, Ou Y, Li R, He Y. 2020. Maternal transmission of the epigenetic ‘memory of
winter cold’ in Arabidopsis. Nature Plants 6: 1211-1218.
Ma W, Ali R, Berkowitz GA. 2006. Characterization of plant phenotypes associated
with loss-of-function of AtCNGC1, a plant cyclic nucleotide gated cation channel. Plant
Physiology and Biochemistry 44: 494–505.
Majer C, Hochholdinger F. 2011. Defining the boundaries: structure and function of
LOB domain proteins. Trends in Plant Science 16: 47–52.
Marchler-Bauer A, Zheng C, Chitsaz F, Derbyshire MK, Geer LY, Geer RC,
Gonzales NR, Gwadz M, Hurwitz DI, Lanczycki CJ et al. 2013. CDD: conserved
domains and protein three-dimensional structure. Nucleic Acids Research 41: D348-352.
Martínez-García PJ, Dicenta F, Ortega E. 2012. Anomalous embryo sac development
and fruit abortion caused by inbreeding depression in almond (Prunus dulcis). Scientia
Horticulturae 133: 23–30.
Martínez-Gómez P, Arulsekar S, Gradziel TM. 2002. Characterization of twin
embryos in almond. Acta Horticulturae 591: 257–262.
Martínez-Gómez P, Gradziel TM. 2003. Sexual polyembryony in almond. Sexual Plant
Reproduction 16: 135–139.
Matías-Hernández L, Aguilar-Jaramillo AE, Marín-González E, Suárez-López P,
Pelaz S. 2014. RAV genes: regulation of floral induction and beyond. Annals of Botany
114: 1459–1470.
Michalak M, Plitta-Michalak BP, Naskręt-Barciszewska M, Barciszewski J,
Bujarska-Borkowska B, Chmielarz P. 2015. Global 5-methylcytosine alterations in
DNA during ageing of Quercus robur seeds. Annals of Botany 116: 369–376.
Micke WC. 1996. Almond Production Manual. Davis, CA, USA: UCANR Publications.
Naydenov M, Baev V, Apostolova E, Gospodinova N, Sablok G, Gozmanova M,
Yahubyan G. 2015. High-temperature effect on genes engaged in DNA methylation and

190
affected by DNA methylation in Arabidopsis. Plant Physiology and Biochemistry 87:
102–108.
Niederhuth CE, Bewick AJ, Ji L, Alabady MS, Kim KD, Li Q, Rohr NA, Rambani
A, Burke JM, Udall JA et al. 2016. Widespread natural variation of DNA methylation
within angiosperms. Genome Biology 17: 194.
Ohio Supercomputer Center. 1987. Ohio Supercomputer Center. Columbus OH: Ohio
Supercomputer Center. http://osc.edu/ark:/19495/f5s1ph73.
Okamuro JK, Caster B, Villarroel R, Montagu MV, Jofuku KD. 1997. The AP2
domain of APETALA2 defines a large new family of DNA binding proteins in
Arabidopsis. PNAS 94: 7076–7081.
Omidbakhshfard MA, Proost S, Fujikura U, Mueller-Roeber B. 2015. Growth-
Regulating Factors (GRFs): A small transcription factor family with important functions
in plant biology. Molecular Plant 8: 998–1010.
Ong-Abdullah M, Ordway JM, Jiang N, Ooi SE, Kok SY, Sarpan N, Azimi N,
Hashim AT, Ishak Z, Rosli SK et al. 2015. Loss of Karma transposon methylation
underlies the mantled somaclonal variant of oil palm. Nature 525: 533–537.
Park Y, Wu H. 2016. Differential methylation analysis for BS-seq data under general
experimental design. Bioinformatics 32: 1446–1453.
Parrilla-Doblas JT, Roldán-Arjona T, Ariza RR, Córdoba-Cañero D. 2019. Active
DNA demethylation in plants. International Journal of Molecular Sciences 20: 4683.
Paul LK, Rinne PL, van der Schoot C. 2014. Shoot meristems of deciduous woody
perennials: self-organization and morphogenetic transitions. Current Opinion in Plant
Biology 17: 86–95.
Peng FY, Weselake RJ. 2013. Genome-wide identification and analysis of the B3
superfamily of transcription factors in Brassicaceae and major crop plants. Theoretical
and Applied Genetics 126: 1305–1319.
Petronis A. 2006. Epigenetics and twins: three variations on the theme. Trends in
Genetics 22: 347–350.
Picard CL, Gehring M. 2017. Proximal methylation features associated with
nonrandom changes in gene body methylation. Genome Biology 18: 73.
Quinlan AR, Hall IM. 2010. BEDTools: a flexible suite of utilities for comparing
genomic features. Bioinformatics 26: 841–842.
191
R Core Team. 2020. A Language and Environment for Statistical Computing. R
Foundation for Statistical Computing, Vienna, Austria https://www.R-project.org
Richards EJ. 2006. Inherited epigenetic variation — revisiting soft inheritance. Nature
Reviews Genetics 7: 395–401.
Richmond TA, Somerville CR. 2000. The cellulose synthase superfamily. Plant
Physiology 124: 495–498.
Ríos G, Leida C, Conejero A, Badenes ML. 2014. Epigenetic regulation of bud
dormancy events in perennial plants. Frontiers in Plant Science 5: 247.
Sanchez DH, Paszkowski J. 2014. Heat-induced release of epigenetic silencing reveals
the concealed role of an imprinted plant gene. PLOS Genetics 10: e1004806.
Santamaría ME, Hasbún R, Valera MJ, Meijón M, Valledor L, Rodríguez JL,
Toorop PE, Cañal MJ, Rodríguez R. 2009. Acetylated H4 histone and genomic DNA
methylation patterns during bud set and bud burst in Castanea sativa. Journal of Plant
Physiology 166: 1360–1369.
Seymour DK, Becker C. 2017. The causes and consequences of DNA methylome
variation in plants. Current Opinion in Plant Biology 36: 56–63.
Sigrist CJA, de Castro E, Cerutti L, Cuche BA, Hulo N, Bridge A, Bougueleret L,
Xenarios I. 2013. New and continuing developments at PROSITE. Nucleic Acids
Research 41: D344-347.
Song X, Ma X, Li C, Hu J, Yang Q, Wang T, Wang L, Wang J, Guo D, Ge W et al.
2018. Comprehensive analyses of the BES1 gene family in Brassica napus and
examination of their evolutionary pattern in representative species. BMC Genomics 19:
346.
Stephens M. 2017. False discovery rates: a new deal. Biostatistics 18: 275–294.
Svendsen AJ, Gervin K, Lyle R, Christiansen L, Kyvik K, Junker P, Nielsen C,
Houen G, Tan Q. 2016. Differentially methylated DNA regions in monozygotic twin
pairs discordant for rheumatoid arthritis: An epigenome-wide study. Frontiers in
Immunology 7: 510.
Swaminathan K, Peterson K, Jack T. 2008. The plant B3 superfamily. Trends in Plant
Science 13: 647–655.
Tan Q, Christiansen L, von Bornemann Hjelmborg J, and Christensen K. 2015.
Twin methodology in epigenetic studies. Journal of Experimental Biology 218: 134–139.

192
The Uniprot Consortium. 2019. Uniprot: a worldwide hub of protein knowledge.
Nucleic Acids Research 47: D506-D515.
Theune ML, Bloss U, Brand LH, Ladwig F, Wanke D. 2019. Phylogenetic analyses
and GAGA-motif binding studies of BBR/BPC proteins lend to clues in GAGA-motif
recognition and a regulatory role in brassinosteroid signaling. Frontiers in Plant Science
10: 466.
Tian F, Yang DC, Meng YQ, Jin J, Gao G. 2019. PlantRegMap: charting functional
regulatory maps in plants. Nucleic Acids Research 48: D1104-D1113.
Tremblay L, Levasseur C, Tremblay FM. 1999. Frequency of somaclonal variation in
plants of black spruce (Picea mariana, Pinaceae) and white spruce (P. glauca, Pinaceae)
derived from somatic embryogenesis and identification of some factors involved in
genetic instability. American Journal of Botany 86: 1373–1381.
Tricker PJ. 2015. Transgenerational inheritance or resetting of stress-induced epigenetic
modifications: two sides of the same coin. Frontiers in Plant Science 6: 699.
Ushijima K, Sassa H, Dandekar AM, Gradziel TM, Tao R, Hirano H. 2003.
Structural and transcriptional analysis of the self-incompatibility locus of almond:
Identification of a pollen-expressed F-box gene with haplotype-specific polymorphism.
The Plant Cell 15: 771–781.
Vandepoele K, Vlieghe K, Florquin K, Hennig L, Beemster GTS, Gruissem W, Van
de Peer Y, Inzé D, De Veylder L. 2005. Genome-wide identification of potential plant
E2F target genes. Plant Physiology 139: 316–328.
Watson JM, Riha K. 2011. Telomeres, aging, and plants: From weeds to Methuselah – a
mini-review. Gerontology 57: 129–136.
Wickham H. (2016) ggplot2: Elegant Graphics for Data Analysis. Springer-Verlag New
York. Available at: https://ggplot2.tidyverse.org.
Wilson EE, Schein RD. 1956. The nature and development of noninfectious bud failure
in almonds. Hilgardia, 24: 519–542.
Wisniewski M, Norelli J, Artlip T. 2015. Overexpression of a peach CBF gene in apple:
a model for understanding the integration of growth, dormancy, and cold hardiness in
woody plants. Frontiers in Plant Science 6: 85.
Wu H, Wang C, Wu Z. 2013. A new shrinkage estimator for dispersion improves
differential expression detection in RNA-seq data. Biostatistics 14: 232–243.

193
Wu H, Xu T, Feng H, Chen L, Li B, Yao B, Qin Z, Jin P, Conneely KN. 2015.
Detection of differentially methylated regions from whole-genome bisulfite sequencing
data without replicates. Nucleic Acids Research 43: e141.
Xie M, Chen H, Huang L, O’Neil RC, Shokhirev MN, Ecker JR. 2018. A B-ARR-
mediated cytokinin transcriptional network directs hormone cross-regulation and shoot
development. Nature Communications 9: 1604.
Xie Z, Nolan TM, Jiang H, Yin Y. 2019. AP2/ERF transcription factor regulatory
networks in hormone and abiotic stress responses in Arabidopsis. Frontiers Plant Science
10: 228.
Yan H, Kikuchi S, Neumann P, Zhang W, Wu Y, Chen F, Jiang J. 2010. Genome-
wide mapping of cytosine methylation revealed dynamic DNA methylation patterns
associated with genes and centromeres in rice. The Plant Journal 63: 353–365.
Yanagisawa S. 2016. Chapter 12 - Structure, Function, and Evolution of the Dof
Transcription Factor Family. In: D. H. Gonzalez, ed. Plant Transcription Factors.
Boston: Academic Press, 183–197.
Yang X, Sanchez R, Kundariya H, Maher T, Dopp I, Schwegel R, Virdi K, Axtell
MJ, Mackenzie SA. 2020. Segregation of an MSH1 RNAi transgene produces heritable
non-genetic memory in association with methylome reprogramming. Nature
Communications 11: 2214.
Yu G, Wang LG, Han Y, He QY. 2012. clusterProfiler: an R package for comparing
biological themes among gene clusters. OMICS: A Journal of Integrative Biology 16:
284–287.
Zhang M, Kimatu JN, Xu K, Liu, B. 2010. DNA cytosine methylation in plant
development. Journal of Genetics and Genomics 37: 1–12.
Zhao Y, Medrano L, Ohashi K, Fletcher JC, Yu H, Sakai H, Meyerowitz EM. 2004.
HANABA TARANU is a GATA transcription factor that regulates shoot apical meristem
and flower development in Arabidopsis. The Plant Cell 16: 2586–2600.
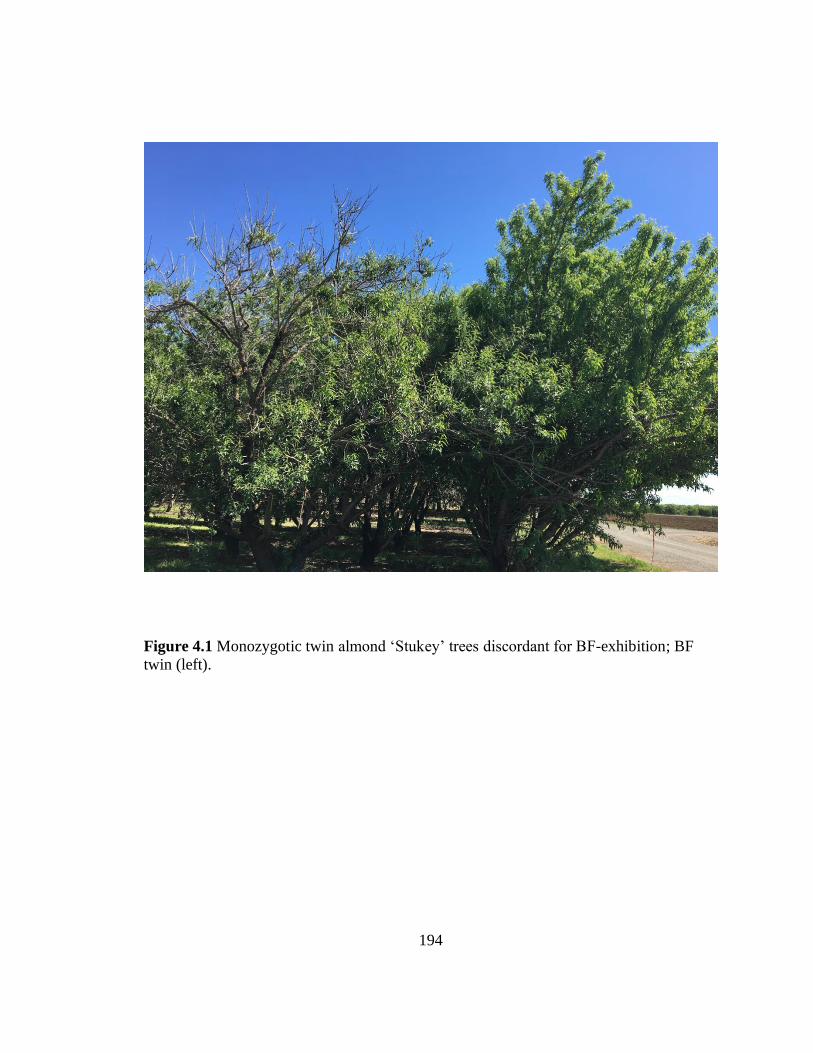
194
Figure 4.1 Monozygotic twin almond ‘Stukey’ trees discordant for BF-exhibition; BF
twin (left).

195
Figure 4.2 Percent methylation in the CG context across each of the eight ‘Nonpareil’ genome scaffolds representing the eight
almond chromosomes. Chromosome number is listed above each plot. The solid lines represent bud-failure (BF) individuals and
the dashed lines represent no-BF individuals. The gold lines represent ‘Stukey’ twin pair 1, and the blue lines represent ‘Stukey’
twin pair 2.
20
40
60
80
0 10 20 30
Genomic Position (Mbp)
% M
ethy
lati
on
Chr 1
20
40
60
80
0 5 10 15 20
Genomic Position (Mbp)
% M
ethy
lati
on
Chr 2
20
40
60
80
0 5 10 15
Genomic Position (Mbp)
% M
ethy
lati
on
Chr 3
20
40
60
80
0 5 10 15
Genomic Position (Mbp)
% M
ethy
lati
on
Chr 4
20
40
60
80
0 5 10 15
Genomic Position (Mbp)
% M
ethy
lati
on
Chr 5
25
50
75
0 5 10 15
Genomic Position (Mbp)%
Met
hy
lati
on
Chr 6
20
40
60
0 5 10 15
Genomic Position (Mbp)
% M
ethy
lati
on
Chr 7
20
40
60
0 5 10
Genomic Position (Mbp)
% M
ethy
lati
on
Chr 8

196
Figure 4.3 Percent methylation in the CHG context across each of the eight ‘Nonpareil’ genome scaffolds representing the eight
almond chromosomes. Chromosome number is listed above each plot. The solid lines represent bud-failure (BF) individuals, and
the dashed lines represent no-BF individuals. The gold lines represent ‘Stukey’ twin pair 1, and the blue lines represent ‘Stukey’
twin pair 2.
0
20
40
60
0 10 20 30
Genomic Position (Mbp)
% M
ethy
lati
on
Chr 1
0
20
40
60
0 5 10 15 20
Genomic Position (Mbp)
% M
ethy
lati
on
Chr 2
0
20
40
0 5 10 15
Genomic Position (Mbp)
% M
ethy
lati
on
Chr 3
0
20
40
60
0 5 10 15
Genomic Position (Mbp)
% M
ethy
lati
on
Chr 4
0
20
40
60
0 5 10 15
Genomic Position (Mbp)
% M
ethy
lati
on
Chr 5
0
20
40
60
0 5 10 15
Genomic Position (Mbp)%
Met
hy
lati
on
Chr 6
0
20
40
0 5 10 15
Genomic Position (Mbp)
% M
ethy
lati
on
Chr 7
0
10
20
30
40
0 5 10
Genomic Position (Mbp)
% M
ethy
lati
on
Chr 8

197
Figure 4.4 Percent methylation in the CHH context across each of the eight ‘Nonpareil’ genome scaffolds representing the eight
almond chromosomes. Chromosome number is listed above each plot. The solid lines represent bud-failure (BF) individuals, and
the dashed lines represent no-BF individuals. The gold lines represent ‘Stukey’ twin pair 1, and the blue lines represent ‘Stukey’
twin pair 2.
2
3
4
5
0 10 20 30
Genomic Position (Mbp)
% M
ethy
lati
on
Chr 1
2
3
4
5
0 5 10 15 20
Genomic Position (Mbp)
% M
ethy
lati
on
Chr 2
2
3
4
5
0 5 10 15
Genomic Position (Mbp)
% M
ethy
lati
on
Chr 3
2
3
4
5
0 5 10 15
Genomic Position (Mbp)
% M
ethy
lati
on
Chr 4
2
3
4
0 5 10 15
Genomic Position (Mbp)
% M
ethy
lati
on
Chr 5
2
3
4
5
0 5 10 15
Genomic Position (Mbp)%
Met
hy
lati
on
Chr 6
2
3
4
5
0 5 10 15
Genomic Position (Mbp)
% M
ethy
lati
on
Chr 7
2
3
4
5
0 5 10
Genomic Position (Mbp)
% M
ethy
lati
on
Chr 8

198
Figure 4.5 Heatmap displaying percent methylated cytosines in each twin pair for the
DMRs in each methylation context: (a) CG methylation, (b) CHG methylation, and (c)
CHH methylation. ‘Stukey’ twins 1a and 2a exhibit BF while ‘Stukey’ twins 1b and 2b
are BF-free. The Venn diagram represents the total number of significant DMRs in both
‘Stukey’ twin pairs as well as the number of regions shared between the pairs. Panel (a)
represents the CG context, panel (b) represents the CHG context, and panel (c) represents
the CHH context.
Stu
key1a
Stu
key1b
Stu
key2a
Stu
key2b
% CG DNA Methylation
0
50
100
Stu
key1a
Stu
key1b
Stu
key2a
Stu
key2b
% CHG DNA Methylation
0
50
100
Stu
key1
a
Stu
key1
b
Stu
key2
a
Stu
key2
b
% CHH DNA Methylation
0
50
100
1072965 82
Stukey2Stukey1
804612 34
Stukey2Stukey1
479328 54
Stukey2Stukey1
a
b
c

199
Figure 4.6 Distribution of length of all DMRs found in each twin pair in all methylation
contexts.
0
100
200
300
400
0 500 1000 1500
DMR Length (basepairs)
Co
un
t

200
Figure 4.7 Differential cytosine methylation in each DMR and expression of genes
associated with the DMR in almond twin pairs discordant for BF-exhibition. The
heatmap in red and blue represents the difference in percent methylation in the BF twin
compared to the no-BF twin for every significant shared DMR in each context. The
heatmaps in purple and yellow represent the differential expression in the BF twins
compared to the no-BF twins for the genes associated with each DMR. Panel (a)
represents the CG context DMRs, panel (b) represents CHG context DMRs, and panel (c)
represents CHH context DMRs.
Stu
key
Tw
inp
air
1
Stu
key
Tw
inp
air
2
Methylation Diff
−50%
−100%
0
50%
Log2FoldChange
−0.002
−0.004
0
0.002
0.004
a
Stu
key
Tw
inp
air
1
Stu
key
Tw
inp
air
2
Methylation Diff
−50%
0
50%
Log2FoldChange
−0.01
−0.02
−0.03
0
0.01
b
Stu
key
Tw
inpai
r 1
Stu
key
Tw
inpai
r 2
Methylation Diff
−20%
−40%
0
20%
40%
Log2FoldChange
−0.005
0
0.005
0.01
0.015
c

201
Figure 4.8 Differential cytosine methylation in each DMR and expression of genes
associated with the DMR in almond twin pairs discordant for BF-exhibition. The
heatmap in red and blue represents the difference in percent methylation in the BF twin
compared to the no-BF twin for every significant shared DMR in each proximity class.
The heatmaps in purple and yellow represent the differential expression in the BF twins
compared to the no-BF twins for the genes associated with each DMR. Panel (a)
represents the DMRs upstream (within 2,000 bp) of a gene, panel (b) represents the
intragenic DMRs, and panel (c) represents the DMRs downstream (within 2,000 bp) of a
gene.
Stu
key
Tw
inp
air
1
Stu
key
Tw
inp
air
2
Methylation Diff
−50%
−100%
100%
50%
0
Log2FoldChange
−0.005
0
0.005
0.01
0.015
a
Stu
key
Tw
inp
air
1
Stu
key
Tw
inp
air
2
Methylation Diff
−50%
−100%
0
50%
Log2FoldChange
−0.002
−0.004
0
0.002
0.004
b
Stu
key
Tw
inpai
r 1
Stu
key
Tw
inpai
r 2
Methylation Diff
−50%
−100%
50%
0
Log2FoldChange
−0.01
−0.02
−0.03
0
0.01
c

202
Figure 4.9 Linear regression of percent methylation within shared regions with
significant differential cytosine methylation in no-BF ‘Stukey’ twins (a, c, e) and BF
‘Stukey’ twins (b, d, f). Panels a and b represent methylation in DMRs upstream (within
2,000 bp) of a gene, panels c and d represent methylation in intragenic DMRs, and panels
e and f represent methylation in DMRs downstream (within 2,000 bp) of a gene. Each
circle represents the percent methylation in each twin in a single region that is
significantly differentially methylated in both ‘Stukey’ twin pairs. Red circles represent
DMRs in the CG context, green triangles represent DMRs in the CHG context, and blue
squares represent DMRs in the CHH context.
40
60
80
100
20 40 60 80 100% Methylation Twin 1b
% M
ethyla
tion
Tw
in 2
bContext
CG
CHG
CHH
Adj R2 = 0.5761 p−value < 0.001
a
20
40
60
80
100
25 50 75 100% Methylation Twin 1a
% M
eth
yla
tio
n T
win
2a
Context
CG
CHG
CHH
Adj R2 = 0.6782 p−value < 0.001
b
40
60
80
100
50 60 70 80 90% Methylation Twin 1b
% M
ethy
lati
on
Tw
in 2
b
Context
CG
CHH
Adj R2 = −0.1262 p−value = 0.7573
c
0
25
50
75
100
20 40 60 80% Methylation Twin 1a
% M
ethy
lati
on
Tw
in 2
a
Context
CG
CHH
Adj R2 = 0.6583 p−value < 0.01
d
20
40
60
80
100
40 60 80 100% Methylation Twin 1b
% M
eth
yla
tio
n T
win
2b
Context
CG
CHG
CHH
Adj R2 = 0.6371 p−value < 0.001
e
25
50
75
100
25 50 75 100% Methylation Twin 1a
% M
ethyla
tion
Tw
in 2
a
Context
CG
CHG
CHH
Adj R2 = 0.812 p−value < 0.001
f

203
Figure 4.10 Number of transcription factor binding sites identified in the shared DMRs
in all methylation contexts.
0
5000
10000
15000
20000E
RF
Do
fM
YB
NA
CC
2H
2M
IKC
_M
AD
SB
BR
−B
PC
bH
LH
WR
KY
bZ
IPT
CP
B3
LB
DG
AT
AA
P2
MY
B_
rela
ted
G2
−li
ke
GR
AS
Tri
hel
ixH
SF
HD
−Z
IPN
in−
like
BE
S1
E2F
/DP
SB
PR
AV
AR
FC
PP
C3
HZ
F−
HD
GeB
PA
RR
−B
WO
XS
RS
NF
−Y
BE
ILC
AM
TA
FA
R1
S1
Fa−
like
LF
YG
RF
YA
BB
YV
OZ
Transcription Factor Family
Num
ber
of
Bin
din
g S
ites

204
Figure 4.11 Log2 fold change by normalized count means of genes observed in bud-
failure compared to no-bud-failure ‘Stukey’ twins. Red points represent those defined as
significantly differentially expressed in each contrast (p-value < 0.1).
−2
−1
0
1
2
3
1e+02 1e+04 1e+06mean of normalized counts
log
fo
ld c
han
ge
q−value
Significant
NA

205
Figure 4.12 Principal component analysis of differential gene expression data showing
separation by ‘Stukey’ twin pair and BF condition.
−10
0
10
20
−20 −10 0 10PC1: 49% variance
PC
2:
45%
var
ian
ce
TwinPair
1
2
Condition
BF
no−BF

206
Table 4.1 Combined sequencing results from Illumina MiSeq and NextSeq for ‘Stukey’ libraries. Library refers to the combined
technical replicate libraries for each ‘Stukey’ individual. The associated SRA Biosample number is listed to access raw data for this
sample on the NCBI SRA repository. Total reads are the number of reads produced in the MiSeq and NextSeq sequencing runs, and
the depth of coverage represents the coverage based on the size of the ‘Nonpareil’ genome (~250 Mbp). Total aligned reads are the
number of reads that aligned to the ‘Nonpareil’ almond genome and mapping efficiency is the percentage of total reads that properly
aligned. Coverage aligned represents the depth of coverage for aligned reads based on the size of the ‘Nonpareil’ almond genome
(~250 Mbp). Finally, conversion efficiency was calculated based on the conversion rate of the ‘Nonpareil’ chloroplast genome,
representing a fully unmethylated sequence.
Library
SRA
Biosample
Number
Total Reads
(Depth)
Total
Aligned
Reads
Mapping
Efficiency
Coverage
Aligned
Conversion
Efficiency
‘Stukey’ 1a
SAMN1640- 3998
116,099,290 (104X)
42,474,875 36.7% 38X 98.8%
‘Stukey’ 1b SAMN1640- 3999 123,115,678
(110X) 47,998,414 39.1% 43X 98.8%
‘Stukey’ 2a
SAMN1640- 4000
112,172,115 (100X)
43,716,467 38.9% 39X 98.9%
‘Stukey’ 2b
SAMN1640- 4001
78,347,132 (70X)
28,476,583 36.5% 25X 98.7%

207
Table 4.2 Percent cytosine methylation in each methylation context (C = cytosine; G =
guanine; H = adenine, thymine, or cytosine) calculated for combined technical replicate
libraries for each ‘Stukey’ individual (individuals exhibiting BF are represented in bold).
‘Stukey’
Twin BF-
Exhibition %CG
Methylation %CHG
Methylation %CHH
Methylation
1a Yes 39.3% 18.8% 2.7%
1b No 37.2% 19.6% 3.1%
2a Yes 37.2% 16.8% 2.6%
2b No 41.7% 21.1% 3.1%
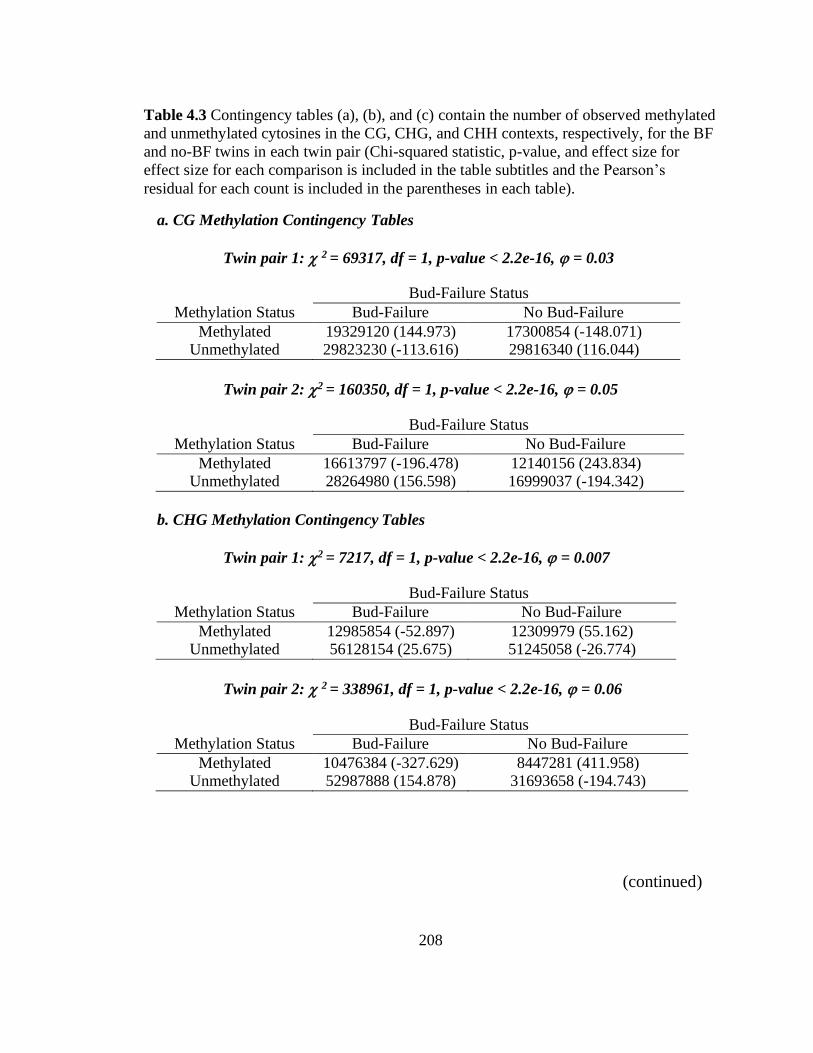
208
Table 4.3 Contingency tables (a), (b), and (c) contain the number of observed methylated
and unmethylated cytosines in the CG, CHG, and CHH contexts, respectively, for the BF
and no-BF twins in each twin pair (Chi-squared statistic, p-value, and effect size for
effect size for each comparison is included in the table subtitles and the Pearson’s
residual for each count is included in the parentheses in each table).
a. CG Methylation Contingency Tables
Twin pair 1: 2 = 69317, df = 1, p-value < 2.2e-16, = 0.03
Bud-Failure Status
Methylation Status Bud-Failure No Bud-Failure
Methylated 19329120 (144.973) 17300854 (-148.071) Unmethylated 29823230 (-113.616) 29816340 (116.044)
Twin pair 2: 2 = 160350, df = 1, p-value < 2.2e-16, = 0.05
Bud-Failure Status
Methylation Status Bud-Failure No Bud-Failure
Methylated 16613797 (-196.478) 12140156 (243.834) Unmethylated 28264980 (156.598) 16999037 (-194.342)
b. CHG Methylation Contingency Tables
Twin pair 1: 2 = 7217, df = 1, p-value < 2.2e-16, = 0.007
Bud-Failure Status
Methylation Status Bud-Failure No Bud-Failure
Methylated 12985854 (-52.897) 12309979 (55.162) Unmethylated 56128154 (25.675) 51245058 (-26.774)
Twin pair 2: 2 = 338961, df = 1, p-value < 2.2e-16, = 0.06
Bud-Failure Status
Methylation Status Bud-Failure No Bud-Failure
Methylated 10476384 (-327.629) 8447281 (411.958) Unmethylated 52987888 (154.878) 31693658 (-194.743)
(continued)

209
(Table 4.3 continued)
c. CHH Methylation Contingency Tables
Twin pair 1: 2 = 71429, df = 1, p-value < 2.2e-16, = 0.01
Bud-Failure Status
Methylation Status Bud-Failure No Bud-Failure
Methylated 7834422 (-181.572) 8095252 (190.801) Unmethylated 282594547 (31.258) 254917657 (-32.847)
Twin pair 2: 2 = 93059, df = 1, p-value < 2.2e-16, = 0.01
Bud-Failure Status
Methylation Status Bud-Failure No Bud-Failure
Methylated 6918272 (-186.087) 5111718 (236.308) Unmethylated 259909182 (31.484) 160354398 (-39.981)

210
Table 4.4 Number of DMRs in each methylation context for each ‘Stukey’ twin pair.
DMRs are classified by proximity relative to a gene: upstream (within 2,000 bp) of a
gene, intragenic, or downstream (within 2,000 bp) of a gene (significant permutation tests
are represented in bold).
Methylation
Context
Twin
pair Proximity
Number of
DMRs
Permutation
Result
p-
value
CG
1
Upstream 441 more < 0.001
Intragenic 154 less < 0.001
Downstream 339 more < 0.001
2
Upstream 452 more < 0.001
Intragenic 175 less < 0.001
Downstream 368 more < 0.001
CHG
1
Upstream 278 more < 0.001
Intragenic 41 less < 0.001
Downstream 191 more 0.086
2
Upstream 328 more < 0.001
Intragenic 79 less < 0.001
Downstream 219 more 0.427
CHH
1
Upstream 166 more < 0.001
Intragenic 23 less < 0.001
Downstream 104 more 0.258
2
Upstream 229 more < 0.001
Intragenic 52 less < 0.001
Downstream 150 more 0.200

211
Table 4.5 Number of identified DMRs per twin pair that are associated with the same
gene, are in the same proximity class relative to that gene, and are in the same context in
both ‘Stukey’ twin pair 1 and ‘Stukey’ twin pair 2 (significant permutation tests are
represented in bold). Values in parentheses represent the number of DMRs from each
twin pair that have overlapping genomic coordinates.
Methylation
Context Proximity
Number of DMRs
Per Twin Pair
Permutation Result p-value
CG
Upstream 42 (36) more < 0.001
Intragenic 10 (6) more 0.006
Downstream 30 (24) more < 0.001
CHG
Upstream 18 (12) more < 0.001
Intragenic 2 (1) more 0.179
Downstream 14 (7) more < 0.001
CHH
Upstream 34 (22) more < 0.001
Intragenic 3 (2) more < 0.001
Downstream 17 (11) more < 0.001

212
Table 4.6 Protein sequences in the UniProtKB Reviewed (Swiss-Prot) database significantly aligning to genes associated with
DMRs both hypermethylated and hypomethylated in BF twins compared to No-BF twins (e-value 0.0001)
Methylation
Level
Proximity Context Identifier Entry Name Protein Name
Hyper Upstream CG Q05609 CTR1_ARATH Serine/threonine-protein kinase CTR1
Hyper Upstream CG & CHG Q9SZD1 TCX5_ARATH Protein tesmin/TSO1-like CXC 5 TCX5
Hyper Upstream CG A9YF60 SGR_CAPAN Protein STAY-GREEN homolog,
chloroplastic SGR
Hyper Upstream CHG Q9FLP6 TCX5_ARATH Small ubiquitin-related modifier 2 SUMO2
Hyper Upstream CHG Q9XIM8 SUMO2_ARATH Pentatricopeptide repeat-containing protein
At2g15980
Hyper Upstream CHH Q40392 PP155_ARATH TMV resistance protein N
Hyper Upstream CHH P34284 TMVRN_NICGU F-box/LRR-repeat protein fbxl-1
Hyper Upstream CHH Q07346 FBXL_CAEEL Glutamate decarboxylase GAD
Hyper Downstream CG Q9ZW20 TRNHD_ARATH Tropinone reductase homolog At2g29370
Hyper Downstream CG Q38838 AGL14_ARATH Agamous-like MADS-box protein
AGL14/XAANTAL 2
Hyper Downstream CHG Q94A09 TRM9_ARATH TRM9
Hyper Downstream CHG P55857 SUMO1_ORYSJ Small ubiquitin-related modifier 1
SUMO1/SMT3
Hyper Downstream CHH A0A075F7E9 LERK1_ORYSI G-type lectin S-receptor-like
serine/threonine-protein kinase LECRK1
Hyper Downstream CHH P24465 C71A1_PERAE Cytochrome P450 71A1 CYP71A1
Hypo Upstream CG Q9LK37 RLF24_ARATH Protein RALF-like 24 RALFL24
Hypo Upstream CG & CHH Q9SND9 Y3028_ARATH Uncharacterized acetyltransferase
At3g50280
Hypo Upstream CG Q653H7 ARFR_ORYSJ Auxin response factor 18 ARF18 (continued)

213
Hypo Upstream CG Q9LMT7 MAIN_ARATH Protein MAINTENANCE OF MERISTEMS
Hypo Upstream CG Q8RWR2 LRP1B_ARATH La-related protein 1B LARP1B
Hypo Upstream CG Q9SD53 Y3720_ARATH UPF0481 protein At3g47200
Hypo Upstream CG Q9TL56 NU5C_CARCG NAD(P)H-quinone oxidoreductase subunit
5, chloroplastic ndhF
Hypo Upstream CG Q5RJC5 C3H67_ARATH Zinc finger CCCH domain-containing
protein 67 At5g63260
Hypo Upstream CG F4JCQ3 DG783_ARATH Putative DNA glycosylase At3g47830
Hypo Upstream CG Q9LN86 DRE1F_ARATH Dehydration-responsive element-binding
protein 1F DREB1F
Hypo Upstream CHG Q3E6Y3 Y1869_ARATH Uncharacterized protein At1g28695
Hypo Upstream CHG P30155 RK27_TOBAC RPL27
Hypo Upstream CHG F4KE63 SYVM2_ARATH Valine RNA ligase,
chloroplastic/mitochondrial EMB2247
Hypo Upstream CHH Q8LFD1 LPP3_ARATH Putative lipid phosphate phosphatase 3,
chloroplastic LPP3
Hypo Upstream CHH Q8H0Z6 IP5P3_ARATH Type IV inositol polyphosphate 5-
phosphatase 3 5PTase3
Hypo Upstream CHH Q8GYA6 PS13B_ARATH 26S proteasome non-ATPase regulatory
subunit 13 homolog B RPN9B
Hypo Intragenic CG O50048 MDL2_PRUSE (R)-mandelonitrile lyase 2 MDL2
Hypo Intragenic CG O65717 CNGC1_ARATH Cyclic nucleotide-gated ion channel 1
CNGC1
Hypo Intragenic CG Q6NMR9 GDL84_ARATH GDSL esterase/lipase At5g45920
Hypo Intragenic &
Upstream CG & CHG Q9LES4 L2HDH_ARATH
L-2-hydroxyglutarate dehydrogenase,
mitochondrial L2HGDH
Hypo Intragenic CHH P42731 PABP2_ARATH Polyadenylate-binding protein 2 PAB2 (continued)
(Table 4.6 continued)

214
Hypo Downstream CG Q06077 ABRB_ABRPR Abrin-b
Hypo Downstream CG Q0WUQ1 BAG1_ARATH BAG family molecular chaperone regulator
1
Hypo Downstream CG Q9LY17 PME50_ARATH Probable pectinesterase 50 AtPME50
Hypo Downstream CG O81832 Y4729_ARATH G-type lectin S-receptor-like
serine/threonine-protein kinase At4g27290
Hypo Downstream CG P83332 TLP1_PRUPE Thaumatin-like protein 1 PpAZ44
Hypo Downstream CG Q8W453 DIRL1_ARATH Putative lipid-transfer protein DIR1
Hypo Downstream CG Q9FJP6 PUB38_ARATH U-box domain-containing protein 38 PUB38
Hypo Downstream CG Q9FJ93 DRE1D_ARATH Dehydration-responsive element-binding
protein 1D DREB1D
Hypo Downstream CHG O23393 BIA1_ARATH BAHD acyltransferase BIA1 ABS1
Hypo Downstream CHG O23254 GLYC4_ARATH Serine hydroxymethyltransferase 4 SHMT4
Hypo Downstream CHG Q93WI9 HD3A_ORYSJ Protein HEADING DATE 3A HD3A
Hypo Downstream CHG Q94CD1 HHT1_ARATH Omega-hydroxypalmitate O-feruloyl
transferase HHT1 ASFT
Hypo Downstream CHH Q8LSN3 FYPP_PEA Phytochrome-associated serine/threonine-
protein phosphatase FyPP
Hypo Downstream CHH Q9C516 XLG3_ARATH Extra-large guanine nucleotide-binding
protein 3 XGL3
(Table 4.6 continued)

215
Table 4.7 GO terms assigned to DMR-associated genes for each GO category: biological
process (a), molecular function (b), and cellular component (c). Significantly enriched
GO terms are represented in bold (alpha = 0.1).
(a) Biological Process Number of
Genes
regulation of timing of transition from vegetative to reproductive phase
3
defense response 3
ubiquitin-dependent protein catabolic process 2
protein sumoylation 2
response to ethylene 2
regulation of transcription, DNA-templated 2
multicellular organism development 2 flower development 2
vegetative to reproductive phase transition of meristem 2
glucosinolate metabolic process 2
brassinosteroid mediated signaling pathway 1
regulation of flavonoid biosynthetic process 1
regulation of brassinosteroid biosynthetic process 1
response to absence of light 1
brassinosteroid metabolic process 1
brassinosteroid homeostasis 1
response to brassinosteroid 1
cell-cell signaling 1
calcium-mediated signaling 1
SCF-dependent proteasomal ubiquitin-dependent protein catabolic process
1
lipid transport 1
systemic acquired resistance 1
systemic acquired resistance, salicylic acid mediated signaling pathway
1
protein ubiquitination 1
signal transduction 1
plant-type hypersensitive response 1
circadian rhythm 1
tetrahydrofolate interconversion 1 glycine metabolic process 1
glycine biosynthetic process from serine 1
one-carbon metabolic process 1
L-serine catabolic process 1
folic acid metabolic process 1
cellular response to tetrahydrofolate 1
(continued)

216
response to cadmium ion 1
tetrahydrofolate metabolic process 1
negative regulation of ethylene-activated signaling pathway 1
protein autophosphorylation 1 regulation of post-embryonic root development 1 sugar mediated signaling pathway 1 response to hypoxia 1 response to fructose 1 ethylene-activated signaling pathway 1 regulation of stem cell division 1 gibberellin biosynthetic process 1 response to sucrose 1 tRNA wobble uridine modification 1 regulation of nuclear-transcribed mRNA poly(A) tail shortening 1 regulation of nuclear-transcribed mRNA catabolic process, deadenylation- dependent decay
1
regulation of translational initiation 1 translational initiation 1 viral process 1 nuclear-transcribed mRNA catabolic process, nonsense-mediated decay
1
negative regulation of translation 1 short-day photoperiodism 1 regulation of flower development 1 cell differentiation 1 inflorescence development 1 short-day photoperiodism, flowering 1 suberin biosynthetic process 1 cell wall pectin biosynthetic process 1 auxin-activated signaling pathway 1 cytoplasm protein quality control by the ubiquitin-proteasome system
1
cell wall modification 1 pectin catabolic process 1 translation 1 fruit ripening 1 lipid catabolic process 1 recognition of pollen 1 protein phosphorylation 1 glutamate metabolic process 1 valyl-tRNA aminoacylation 1 embryo development ending in seed dormancy 1 tRNA aminoacylation for protein translation 1 phospholipid metabolic process 1
(Table 4.7 continued)
(continued)

217
leaf senescence 1 ATP synthesis coupled electron transport 1 phosphatidylinositol dephosphorylation 1 chlorophyll catabolic process 1 abscisic acid-activated signaling pathway 1 base-excision repair 1 protein catabolic process 1 proteasome assembly 1 regulation of root development 1 response to bacterium 1 adenylate cyclase-modulating G protein-coupled receptor signaling pathway
1
positive regulation of transcription by RNA polymerase II 1 regulation of root meristem growth 1 maintenance of floral meristem identity 1 regulation of auxin polar transport 1 meristem development 1 regulation of growth 1 regulation of gibberellin biosynthetic process 1 response to freezing 1 response to heat 1 regulation of unidimensional cell growth 1 response to water deprivation 1
(b) Molecular Function Number of
Genes ATP binding 5
metal ion binding 4
protein serine/threonine kinase activity 3
mRNA binding 3
carbohydrate binding 3
DNA-binding transcription factor activity 3
DNA binding 3
calmodulin binding 3
transferase activity, transferring acyl groups other than amino-acyl groups 2
ubiquitin-like protein ligase binding 2
protein tag 2
zinc ion binding 2
pyridoxal phosphate binding 2
RNA polymerase II transcription regulatory region sequence-specific DNA binding
2
sequence-specific DNA binding 2
hormone activity 1
(continued)
(Table 4.7 continued)

218
protein self-association 1
fatty acid binding 1
transmembrane receptor protein serine/threonine kinase binding 1
ubiquitin-protein transferase activity 1
phosphoprotein phosphatase activity 1
ADP binding 1
NAD+ nucleotidase, cyclic ADP-ribose generating 1
NAD(P)+ nucleosidase activity 1
cobalt ion binding 1
amino acid binding 1
glycine hydroxymethyltransferase activity 1
serine binding 1
protein serine/threonine/tyrosine kinase activity 1 protein kinase activity 1 tRNA methyltransferase activity 1
tRNA (uracil) methyltransferase activity 1
translation initiation factor activity 1
mRNA 3'-UTR binding 1
poly(U) RNA binding 1
RNA binding 1
poly(A) binding 1
toxin activity 1
rRNA N-glycosylase activity 1
oxidoreductase activity, acting on CH-OH group of donors 1
flavin adenine dinucleotide binding 1
mandelonitrile lyase activity 1
oxidoreductase activity 1
phosphatidylethanolamine binding 1
hydroxycinnamoyltransferase activity 1
omega-hydroxypalmitate O-sinapoyl transferase activity 1
chaperone binding 1
pectinesterase activity 1
carboxylic ester hydrolase activity 1
aspartyl esterase activity 1
cAMP binding 1
ion channel activity 1
cGMP binding 1
structural constituent of ribosome 1
monooxygenase activity 1
iron ion binding 1
heme binding 1
oxidoreductase activity, acting on paired donors, with incorporation or reduction of molecular oxygen
1
(continued)
(Table 4.7 continued)

219
hydrolase activity, acting on ester bonds 1
glutamate decarboxylase activity 1
valine-tRNA ligase activity 1
aminoacyl-tRNA editing activity 1
phosphatidate phosphatase activity 1
FAD binding 1
2-hydroxyglutarate dehydrogenase activity 1
(S)-2-hydroxy-acid oxidase activity 1
quinone binding 1
NADH dehydrogenase (ubiquinone) activity 1
phosphatidylinositol-4,5-bisphosphate 5-phosphatase activity 1
phosphatidylinositol-3,4,5-trisphosphate 5-phosphatase activity 1
hydrolase activity, acting on glycosyl bonds 1
structural molecule activity 1
GTP binding 1
GTPase activity 1 G protein-coupled receptor binding 1 G-protein beta/gamma-subunit complex binding 1
DNA-binding transcription factor activity, RNA polymerase II-specific 1
protein dimerization activity 1
transcription factor binding 1
transcription regulatory region sequence-specific DNA binding 1
transaminase activity 1
DNA-binding transcription factor activity 1
(c) Cellular Component Number of Genes
nucleus 16
cytoplasm 10
cytosol 7
plasma membrane 6
integral component of membrane 5
plasmodesma 3
mitochondrion 3
chloroplast 3
apoplast 2
endoplasmic reticulum membrane 2
extracellular region 2
SCF ubiquitin ligase complex 1
endoplasmic reticulum 1
secretory vesicle 1 ribonucleoprotein complex 1
aleurone grain 1
(continued)
(Table 4.7 continued)

220
vacuole 1
peroxisome 1
cell wall 1
ribosome 1
chloroplast stroma 1
integral component of plasma membrane 1
chloroplast membrane 1
polysome 1
chloroplast thylakoid membrane 1
proteasome complex 1
proteasome regulatory particle, lid subcomplex 1 heterotrimeric G-protein complex 1
(Table 4.7 continued)

221
Table 4.8 List of the significantly enriched (adjusted p-value < 0.05) transcription factor
family binding sites in the shared DMRs.
Transcription
Factor Family
Binding sites in
DMRs Description
ERF 23,245 Hormone regulation; stress response1
Dof 7,629 Metabolism; phytohormone response;
photoperiodic regulation2
BBR/BPC 4,014 Flower development; stem cell size;
seed development3
bHLH 3,886 Phytochrome signaling4
TCP 3,231 Branching; flower development; leaf
development; cell cycle regulation5
B3 2,518 Vegetative and reproductive
development6,7
LBD 2,272 Leaf, flower, and root development;
auxin response8
GATA 2,245
Nitrogen metabolism; stress response;
hormonal signaling9; meristem
development10
AP2 2,061 Flower development11
GRAS 1,209 Gibberellin signaling; root patterning;
light signaling; nodule formation12
BES1 523 Brassinosteroid regulation13
E2F/DP 499 Cell cycle regulation14
RAV 464 Regulation of flowering; gibberellin
regulation15
C3H 353 Plant organ identity; embryogenesis;
leaf senescence16
GeBP 233 Leaf primordia development17
ARR-B 229 Cytokinin regulation; shoot
development18
GRF 80 Leaf and stem development; flowering;
plant longevity19
1Xie et al., 2019; 2Yanagisawa, 2016;3Theune et al., 2019; 4Duek and Fankhauser, 2005; 5Danisman, 2016; 6Peng and Weselake, 2013; 7Swaminathan et al., 2008; 8Majer and
Hochholdinger, 2011; 9Gupta et al., 2017; 10Zhao et al., 2004; 11Okamuro et al., 1997; 12Hofmann, 2016; 13Song et al., 2018; 14Vandepoele et al., 2005; 15Matías-Hernández et
al., 2014; 16Jiang et al., 2014; 17Curaba et al., 2003; 18Xie et al., 2018; 19Omidbakhshfard
et al., 2015

222
Table 4.9 Sequencing results from an RNA-seq experiment performed on two ‘Stukey’
twin pairs displaying divergent bud-failure exhibition.
Library SRA Biosample
Number
Total Reads
Generated
Total Reads
Aligned
Mapping
Efficiency
‘Stukey’ 1a SAMN1640-3998 84,640,142 56,935,045 67.3%
‘Stukey’ 1b SAMN1640-3999 103,419,251 69,651,011 67.3%
‘Stukey’ 2a SAMN1640-4000 99,578,512 66,298,129 66.6%
‘Stukey’ 2b SAMN1640-4001 85,576,260 60,312,161 70.5%

223
Table 4.10 Annotation of significantly differentially expressed genes in the BF twins
compared to the no-BF twins (p-value < 0.1).
Log2
Fold
Change
p-
adjusted Protein ID Gene Name
2.97 4.66E-10 Undescribed protein
2.34 0.011 Oligopeptide transporter 1 OPT1 (At5g55930)
1.94 2.04E-04 ABC transporter C family
member 5
ABCC5/MRP5
(At1g04120)
1.14 0.058 Putative mediator of RNA
polymerase II
1.06 0.058 Rust resistance kinase Lr10 LRK10
1.05 0.058 Cyclic nucleotide-gated ion
channel 1 CNGC1 (At5g53130)
1.05 0.058 Cellulose synthase-like protein G2 CSLG2
0.92 0.058 Early nodulin-like protein 2 AT4G27520
0.81 0.079 Cytochrome P450 82A3 CYP82A3
0.68 0.090 Protein SAR DEFICIENT 1 SARD1 (At1g73805)
0.64 0.090 Beta-glucosidase 12 BGLU12 (OsI_16288)
0.47 0.100 Methionine gamma-lyase MGL (At1g64660)
0.32 0.090 DMR6-LIKE OXYGENASE 1 DLO1/SAG108
(At4g10500)
-0.59 0.090 Polygalacturonase PGLR_PRUPE
-0.81 0.058 GDSL esterase/lipase At2g04570
-0.93 0.058 Proline-rich protein 4-like

224
Chapter 5 Prospectives and Conclusions
Overview of research findings in this dissertation
The primary focus of this dissertation is exploring epigenetic modifications underlying
the development of an aging-related disorder in almond, and more broadly, how those
modifications are associated with increased age. This research fits into a body of work
characterizing the impacts of perennial plant aging in an effort to enhance our
understanding of this process and to develop direct applications for crop improvement.
Following review of the literature, the first research chapter describes the relationship
between age, telomere length, and expression of a previously described telomerase-
associated gene (TERT) in distinct age cohorts of almond breeding selections. Results
from this work show decreased telomere length and TERT expression with increased age
over two years of sampling almond leaf tissue (D’Amico-Willman et al., 2021). This
pattern is reflected in one year of sampling bud tissue from the same age cohorts
(D’Amico-Willman et al., 2021).
The second research chapter characterizes the methylome of 70 almond breeding
selections from three distinct age cohorts, showing a pattern of genome-wide
hypermethylation with increased age. Regions of differential methylation in these
selections were identified and annotated to explore those genomic features impacted by
changes in DNA methylation and to discern pathways whose expression patterns might
be regulated by those changes. This annotation includes the microRNA, miR156, which
is a well-known regulator of the juvenile-to-adult phase transition in plants. The final
research chapter focuses specifically on non-infectious bud-failure in almond by
characterizing the methylome of two pairs of monozygotic twin almonds discordant for
bud-failure exhibition. Results from this work show a pattern of hypomethylation
associated with bud-failure exhibition in almond and identify specific genes associated

225
with regions of differential methylation. These identified genes represent targets for
future study into biomarkers of bud-failure potential in almond and into the molecular
mechanisms that underlie bud-failure development.
Taken together, the results from these research chapters support the models of
aging developed in other species, including decreased telomere length and increased
DNA methylation (Runov et al., 2015). Further, the dysregulation of methylation
observed in non-infectious bud-failure trees reflects what is documented in other crops
such as in oil palm (Elaeis guineensis Jacq.) exhibiting the mantling phenotype (Ong-
Abdullah et al., 2015), and demonstrates that this disorder likely occurs as a result of
interacting factors including aging and exposure to abiotic stress. Several questions
remain, however, and several more were generated as a result of the analyses presented in
this document, including questions related to heat stress response, metabolomic profiles,
chromatin structure, and transgenerational heritability of DNA methylation. Addressing
these questions would build on the knowledge generated in this dissertation and on the
existing work described in the review of the literature. In the following paragraphs,
several potential future projects are outlined which would add to the growing body of
knowledge on bud-failure development in almond and aging in perennial plants. These
projects consider aspects such as the role of abiotic stressors, developmental profiling,
inheritance of epigenetic marks, epigenome editing, and phenotyping approaches to
dissect aging related disorders such as noninfectious bud-failure.
The effect of heat stress on the almond methylome
The first proposed project explores the impact of heat stress on the almond methylome.
Previous work in almond revealed impacts of artificial heat stress on both the internal
structure of vegetative buds and on specific hormone profiles in an attempt to link heat
stress to bud-failure development (Hellali & Kester, 1979). We now have the tools
available to develop a robust profiling of almond responses to heat stress, including
genetic resources like the sequenced ‘Nonpareil’ genome and methodology developed in
this dissertation to profile DNA methylation in almond. A project could then be
developed to test the hypothesis that exposure to heat stress leads to a dysregulation of
DNA methylation in the almond genome and results in the non-infectious bud-failure

226
phenotype. The methodology employed in this project could include both a controlled,
growth chamber experiment as well as a field-based, long-term experiment including
multiple, commercially relevant cultivars.
The growth chamber experiment would involve acquiring propagated clones, all
from the same propagation source for each cultivar, and exposing a set of those clones to
heat stress within a controlled growth chamber. Similar experiments have been conducted
in other species including Arabidopsis, Brassica rapa L., maize, the perennial herb
Ranunculus kuepferi Greuter & Burdet, Monterey pine (Pinus radiata D.Don), and poplar
(Populus euramericana (Dode) Guinier) to determine the effects of heat or abiotic
stress on methylation profiles (Sanchez & Paszkowski, 2014; Liu et al., 2018; Le Gac et
al., 2018; Qian et al., 2019; Syngelaki et al., 2020; Lamelas et al., 2020). Both bud and
leaf tissue samples could be collected at either one or several time points to compare the
methylomes of clones under heat stress to those under optimal temperature conditions. A
parallel field-based experiment could be conducted where a set of propagated clones from
the same source are grown in field plots in different regions of California representing a
range of maximum summer temperatures. In this experiment, leaf and bud samples could
again be collected across this range to profile DNA methylation either at one or several
time points. The field-based experiment also represents an opportunity to establish a
long-term study where these trees could be revisited over several years. This type of
project might also be coupled with the cultivar and breeding selection trials supported by
the Almond Board of California.
Results from this work would provide information on changes in DNA
methylation in response to heat stress in almond and if/how these patterns differ based on
genetic background (i.e. cultivar). Comparisons could be made between DNA
methylation patterns observed following heat stress to those in almond trees exhibiting
bud-failure to look for commonality either in regions of differential methylation or
downstream pathways. This work would have further implications for issues like climate
change and the anticipated increase in maximum temperatures expected in almond
growing regions (Luedeling et al., 2009; Mera et al., 2015; Parker & Abatzoglou, 2018).

227
Profiling DNA methylation during almond development
In addition to monitoring alterations in DNA methylation patterns in response to heat
stress, it would also be interesting to profile DNA methylation over developmental time
in almond. Chapter 3 of this dissertation shows hypermethylation associated with age in
almond; however, this study was conducted using almond breeding selections
representing different ages at a single timepoint. A potential study could be performed to
profile DNA methylation changes in the same individuals over developmental time to test
the hypothesis that the methylome is dynamic in early development in almond and that
this dynamism contributes to regulating developmental pathways. This project would
involve acquiring seed from a single cross using commercially relevant cultivars and
establishing greenhouse plantings to profile DNA methylation. Select seed from the cross
could also be sampled to establish baseline DNA methylation profiles prior to planting.
Seedlings could be grown in the greenhouse and sampled at several time points for DNA
methylation profiling, including multiple tissue types (i.e., leaf, bud, root, flowers). In
addition to planting seeds in the greenhouse, individual breeding selections could be
monitored and sampled over time in the field to assess DNA methylation profiles in a
natural environment and over a potentially longer time period.
Results from this study would contribute to a more basic understanding of
epigenetic modifications that occur during almond development. The ability to profile
several tissue-types including root tissue in the greenhouse, which can be difficult to
acquire as commercial almond is usually grafted onto peach or Prunus hybrid rootstock,
would also provide a unique perspective on how epigenetic alterations like DNA
methylation influence and potentially regulate developmental processes in almond. One
limitation of the greenhouse study is that, due to logistics, it would likely only be feasible
to run this experiment for a limited time (possibly 1-2 years). The field-based portion of
this study could account for longer developmental time; however, it might be difficult to
sample as frequently and other confounding factors would need to be considered (i.e.,
environmental conditions).
The data generated from these projects would provide valuable insight into
processes regulating development in almond, which is currently lacking. Time course

228
studies have also been employed in other systems to analyze patterns of epigenetic
change, including in perennials like poplar (Populus tomentosa Carrière) and sweet
orange (Citrus sinensis (L.) Osbeck.) (Song et al., 2013; Huang et al., 2019). Both
studies show changes in the methylome correlated with altered expression of genes
involved in maintenance or resetting of DNA methylation and associated with
developmental processes like fruit and flower development (Song et al., 2013; Huang et
al., 2019). While the proposed study focuses on DNA methylation, it would also be
possible to extend this analysis into other epigenetic marks including histone
modifications or chromatin structure using the same sampling scheme and tissues.
Results from this additional profiling could be integrated with the DNA methylation
analysis, creating a broad picture of the epigenetic landscape over developmental time in
almond.
Transgenerational inheritance of DNA methylation in almond
Exploring heritability of methylation in almond is another relevant future project that
could be pursued, particularly in light of the heritability of non-infectious bud-failure and
the possibilities for epigenetic crop improvement (Köhler & Springer, 2017). To date,
few studies have addressed heritability of DNA methylation in perennial species, in part
because developing multiple generations for profiling is a time-consuming process due to
their long juvenile period. In almond, it would be possible to take advantage of the
breeding germplasm at UC Davis to select pedigrees of breeding selections for profiling
to ensure relatedness among individuals and test the hypothesis that DNA methylation
patterns are stably heritable in almond across multiple generations.
These pedigrees could be further extended by performing select crosses using
almond accessions with divergent methylomes and profiling the progeny to determine
which methylation profiles are preferentially inherited. The proposed project would
utilize lineages of almond breeding selections with a minimum of three generations
available for profiling. Ideally, two parents would be selected for DNA methylation
profiling whose progeny (F1) are also available to sample and sequence. Select F1
individuals would be used to perform crosses with both full-siblings and unrelated
individuals to create an F2 generation that would also be sequenced. DNA methylation

229
profiles over three generations could then be compared to analyze inheritance patterns
and determine which DNA signatures are passed to subsequent generations. This type of
project could also provide an interesting framework to implement unsupervised machine
learning and artificial neural network techniques to unveil hidden patterns of inheritance
of methylomic signatures (Harfouche et al., 2019).
The proposed sampling scheme would produce germplasm suitable to study
transgenerational rather than intergenerational inheritance, providing a robust analysis of
inheritance patterns in almond. Several studies have profiled both intergenerational and
transgenerational inheritance in various plant species; however, this work has primarily
been performed in annual species like Arabidopsis and rice (Ou et al., 2012; Zhong et al.,
2013). This study would contribute to an understanding of transgenerational inheritance
in a productive perennial with implications for breeding efforts and remediating
deleterious phenotypes like non-infectious bud-failure.
Inducing DNA demethylation in the almond genome
A final proposed methylation study in almond involves artificial demethylation to
observe the induced phenotypic changes occurring as a result. This study tests the
hypothesis that induced DNA demethylation results in vegetative bud morphology
observed in trees exhibiting non-infectious bud-failure. Previous work in plants has
utilized the chemical 5-azacytidine, which induces DNA demethylation, to monitor the
effects of demethylation on various phenotypes including biotic and abiotic resistance
(Griffin et al., 2016; Ogneva et al., 2019; Fan et al., 2020; Browne et al., 2020). In a
recent study on valley oak (Quercus lobata Née), seedlings were treated with 5-
azacytidine, and the authors observed genome-wide decreases in methylation in all
contexts as well as reductions in growth of treated trees (Browne et al., 2020). To
perform a similar study in almond, seeds could be harvested following a planned cross
utilizing two parents of cultivars with documented low bud-failure potential, two parents
of cultivars with documented high bud-failure potential, and an intermediary cross (i.e.,
one parent with high and one parent with low bud-failure potential).
The seeds could be planted in a common greenhouse, and following germination
and establishment (~6 months), samples could be collected from all seedlings (leaf and

230
bud), and a subset of seedlings treated with a foliar application of 5-azacytidine. Control
seedlings would be sprayed using a formulation that does not contain 5-azacytidine.
Following this, plants could be monitored for alterations in phenotypes including changes
in growth or any other physiological measurements (i.e., photosynthetic capacity, etc.).
Samples of newly formed bud and leaf tissue could also be collected to profile DNA
methylation with comparisons including treated and control seedlings from each
individual cross, treated seedlings from all crosses, as well as to baseline DNA
methylation levels prior to treatment.
Interesting results from this project would include observing phenotypes of non-
infectious bud-failure in seedlings derived from the low bud-failure-potential cross and
treated with 5-azacytidine. It would also be interesting to observe how buds develop in
each of the three crosses, comparing bud morphology across all control seedlings and
across all treated seedlings from each cross. Dissection of newly formed bud tissue in
treated seedlings could also reveal disruption in meristem cell layers as was seen in
previous work analyzing buds harvested from bud-failure-affected trees (Hellali et al.,
1978). An artificial demethylation study in almond provides an opportunity to study
demethylation in a controlled environment, eliminating confounding factors like abiotic
or biotic stress, and allows analysis of phenotypes in full sibling seedlings, reducing the
potential impacts of genetic variability outside of epigenetic alterations.
Phenotyping approaches to characterize non-infectious bud-failure
In addition to studies profiling DNA methylation, projects could be developed examining
other aspects of non-infectious bud-failure development in almond such as metabolomic
and anatomical characterizations. Previous work on bud-failure development in almond
revealed changes in abscisic acid (ABA) levels associated with the disorder; however,
since this study was published, little work has been done to characterize the metabolome
of affected buds (Hellali et al., 1978; Hellali & Kester, 1979). A potential study could
include profiling the metabolome of buds from multiple cultivars exhibiting bud-failure
and comparing those profiles to trees that are bud-failure free. This study could focus on
specific hormones like ABA and gibberellins (GA) in a targeted approach to test
hypotheses based on previous work including that ABA levels will be higher in buds

231
from trees exhibiting bud-failure compared to those that are bud-failure free, and that GA
levels will not differ when comparing buds from trees with bud-failure to those that are
bud-failure free. An untargeted metabolomic approach could be used to capture a broader
picture of the metabolomic profile, generating new hypotheses and potential projects
based on comparing profiles from bud-failure and bud-failure-free trees.
A recent study describes characterization of metabolites in almond buds related to
endodormancy release in an effort to develop biomarkers (Guillamón et al., 2020),
suggesting this approach could work well to profile the metabolome associated with bud-
failure and even potentially produce additional biomarkers to predict development of the
disorder. This work could also be integrated with the methylation profiling described
above to examine potential underlying epigenetic modifications impacting metabolite
production.
As non-infectious bud-failure represents a failure of vegetative bud development,
previous work has been done to describe the anatomical features of failing buds at
different time points (Hellali et al., 1978); however, this work was performed more than
40 years ago using a dissecting microscope, and microscopy capabilities have since
improved dramatically. Scanning electron microscopy (SEM) is an approach previously
used to visualize morphology of meristematic tissues in other plant species (Routier-
Kierzkowska & Kwiatkowska, 2008; Jerominek et al., 2014; Haberman et al., 2017) and
could be used to more precisely characterize the morphology of bud-failure-affected buds
in almond. This approach could be applied in a study using field-sampled buds from trees
exhibiting bud-failure compared to those that are bud-failure free. Additionally, this
approach could be used to examine buds from heat-stressed trees in the experiment
utilizing clones in a controlled growth chamber setting.
Monitoring changes in meristem structure in a time-course study could also
provide insight into how buds fail and help to identify the cell layers within the meristem
corpus and/or tunica that show initial signs of degradation. This type of anatomical study
could also be used to inform future studies utilizing single-cell sequencing approaches. In
a recent study published in maize, single-cell analysis was used to examine the
transcriptome of meristematic cells (Satterlee et al., 2020). A similar approach could be

232
applied in almond to examine DNA methylation or other epigenetic marks at the single
cell level in the shoot apical meristem. Additionally, it might be possible to utilize an
approach such as in situ genome sequencing where information at the nucleotide level is
integrated with 3D chromatin structure data at the single-cell level, providing a more
complete analysis of the epigenetic landscape at a given time point or in a specific cell
type (Payne et al., 2020).
Developing biomarkers of age in perennial plant species
A primary aim of the research presented herein is to provide a foundation for developing
biomarkers of age in almond that could be extended to other perennial plant species. The
results presented suggest that DNA methylation could serve as a putative biomarker of
age as patterns of hypermethylation were found with increased age. Interestingly,
methylation patterns at 17 distinct loci showed consecutive, significant increases in
methylation at each age transition (2-to-7 years and 7-to-11 years), providing specific
genomic targets for developing these biomarkers. However, biomarker validation is
necessary to confirm the suitability of these regions as predictors of age in almond.
Therefore, a project could be developed to test these regions in additional almond trees of
known age and pedigree with a wider age range represented (i.e., beyond 11-years-old).
Based on results from this work, a model could be developed taking methylation status
into account at these particular regions as well as other potential factors such as pedigree
to predict age of sexual and clonal progeny.
In humans, an age “clock” was developed based on a multivariate model using the
methylation status of 353 CG loci (Horvath, 2013). A similar type of model could be
developed in almond using the methylation status either of individual methylated
cytosines or of regions exhibiting differential methylation patterns. This model could then
be employed to predict age of clonally propagated germplasm to determine an
appropriate ontogenetic age for those individuals and to assess their potential to develop
negative phenotypes such as bud-failure. Currently, no such model exists for plants; thus,
this would represent a novel avenue of research in the field of plant aging, with practical
applications for crop management and improvement for perennial crops.

233
Conclusions
The studies proposed herein would build on the body of knowledge presented in this
dissertation both in regard to non-infectious bud-failure development in almond and more
generally, to the implementation of epigenetic profiling in crop improvement and
development of models for perennial plant aging.
The translational goal of the work on non-infectious bud-failure is to develop
biomarkers that can be used to screen almond germplasm for bud-failure potential. To
date, there are no biomarkers or predictors of bud-failure development, leaving the
almond industry to depend solely on pedigree information to infer bud-failure potential
and pruning techniques to mitigate the effects of bud-failure exhibition. Presented in this
dissertation is a first analysis to identify specific regions of the genome showing
differential levels of methylation in trees exhibiting bud-failure. However, in order to
fully develop and implement this type of biomarker, further work is necessary to validate
the regions identified in this study in other germplasm, particularly in other cultivars
known to exhibit bud-failure such as ‘Carmel’. In addition to validating or developing
cultivar specific biomarkers for bud-failure, a high-throughput screening method would
need to be developed to quickly screen hundreds or thousands of individual trees for the
presence of the biomarker(s). This method would need to use tissue easily sampled by
growers or producers (i.e., leaf), and would require an inexpensive, targeted methylation
assay such as the multiplex biomarker panel described in Lam et al. (2020). These
biomarkers would give breeders, producers, and growers increased certainty in their
germplasm and security in their financial investments. Additionally, this work helps to
ensure sustained production of almond, protecting the valuable supply chain and
maintaining consumer access to a healthy food option.
Perennial crops like almond represent valuable commodities often neglected in
basic research despite their suitability to serve as models in studies on plant aging and
response and adaptation to biotic and abiotic stress (Rankenberg et al., 2021). Perennial
plant species, however, represent a unique opportunity to develop the field of plant
gerontology outside of the work focused on annuals. In comparison with annual species,
perennials can be profiled across distinct geographical regions over multiple growing

234
seasons. Additionally, their phenology is well-established and ample germplasm is
available through various breeding programs to develop studies on these species.
Our current knowledge on perennial plant aging is lacking, and even the concept
of aging in perennials remains unclear (Munné-Bosch, 2008). Aging in plants is often
considered synonymous with senescence, since in annuals, these processes occur
simultaneously. Perennials can go through a senescence process each year, but this
process is organ-specific (i.e., leaves) and is distinct from the aging process affecting
pluripotent meristematic tissues. Whether and how perennials experience whole-plant
senescence is still debated (Munné-Bosch, 2008, 2020). Developing better models of
plant aging not only satisfies scientific curiosity in this complex and fascinating field, but
will lead to increased understanding of how aging contributes to the development of both
advantageous and deleterious phenotypes in productive crops. This work is particularly
relevant given the ever-changing and uncertain stressors perennial plants face as they age,
including introduced pests and pathogens as well as the environmental perturbations
resulting from a changing climate. How to incorporate models of plant aging into facets
of plant research and production will continue to develop as we expand our knowledge of
this topic.
Recent advances in omics technologies and in our understanding of epigenetic
regulation in plants is leading to a revolution in how we consider crop improvement,
particularly in light of phenomena like climate change (Varotto et al., 2020).
Incorporating epigenetics into crop improvement strategies and platforms via methods
like induced demethylation or even gene-editing (Lee et al., 2020) provides a new tool to
ensure sustained and resilient production of our most valuable crop species. However,
efforts to introduce these methods into perennial crop production lags far behind that of
annual crops, in part due to a lack of understanding of epigenetic mechanisms in these
species. Continued research like the projects proposed in this chapter would contribute to
our understanding of basic epigenetic mechanisms in a valuable, perennial crop which
could be extended to address other issues in almond, such as leaf-failing recently
observed in the cultivar ‘Monterey’ (Milliron et al., 2020), and towards improvement
efforts in other Rosaceous crops (Gogorcena et al., 2020).

235
References
Browne L, Mead A, Horn C, Chang K, A. Celikkol Z, L. Henriquez C, Ma F, Beraut
E, S. Meyer R, Sork VL. 2020. Experimental DNA demethylation associates with
changes in growth and gene expression of oak tree seedlings. G3: Genes, Genomes,
Genetics 10: 1019–1028.
D’Amico-Willman KM, Anderson ES, Gradziel TM, Fresnedo-Ramírez J. 2021.
Relative telomere length and telomerase reverse transcriptase (TERT) expression are
associated with age in almond (Prunus dulcis [Mill.] D.A.Webb). Plants 10: 189.
Fan SK, Ye JY, Zhang LL, Chen HS, Zhang HH, Zhu YX, Liu XX, Jin CW. 2020.
Inhibition of DNA demethylation enhances plant tolerance to cadmium toxicity by
improving iron nutrition. Plant, Cell & Environment 43: 275–291.
Gogorcena Y, Sánchez G, Moreno-Vázquez S, Pérez S, Ksouri N. 2020. Genomic-
based breeding for climate-smart peach varieties. In: Kole C, ed. Genomic designing of
climate-smart fruit crops. Cham: Springer International Publishing, 271–331.
Griffin PT, Niederhuth CE, Schmitz RJ. 2016. A comparative analysis of 5-
azacytidine- and zebularine-induced DNA demethylation. G3: Genes, Genomes, Genetics
6: 2773–2780.
Guillamón JG, Prudencio ÁS, Yuste JE, Dicenta F, Sánchez-Pérez R. 2020. Ascorbic
acid and prunasin, two candidate biomarkers for endodormancy release in almond flower
buds identified by a nontargeted metabolomic study. Horticulture Research 7: 1–13.
Haberman A, Zelinger E, Samach A. 2017. Scanning electron microscope (SEM)
imaging to determine inflorescence initiation and development in olive. Bio-protocol 7:
e2575–e2575.
Harfouche AL, Jacobson DA, Kainer D, Romero JC, Harfouche AH, Scarascia
Mugnozza G, Moshelion M, Tuskan GA, Keurentjes JJB, Altman A. 2019.
Accelerating climate resilient plant breeding by applying next-generation artificial
intelligence. Trends in Biotechnology 37: 1217–1235.
Hellali R, Kester DE. 1979. High temperature induced bud-failure symptoms in
vegetative buds of almond plants in growth chambers. Journal of the American Society
for Horticultural Science 104: 375–378.
Hellali R, Lin J, Kester DE. 1978. Morphology of noninfectious bud failure symptoms
in vegetative buds of almond (Prunus amygdalus Batch). Journal of the American Society
for Horticultural Science 103: 459–464.
Horvath S. 2013. DNA methylation age of human tissues and cell types. Genome
Biology 14: 1-19.

236
Huang H, Liu R, Niu Q, Tang K, Zhang B, Zhang H, Chen K, Zhu J-K, Lang Z.
2019. Global increase in DNA methylation during orange fruit development and ripening.
Proceedings of the National Academy of Sciences 116: 1430–1436.
Jerominek M, Bull-Hereñu K, Arndt M, Claßen-Bockhoff R. 2014. Live imaging of
developmental processes in a living meristem of Davidia involucrata (Nyssaceae).
Frontiers in Plant Science 5.
Köhler C, Springer N. 2017. Plant epigenomics—deciphering the mechanisms of
epigenetic inheritance and plasticity in plants. Genome Biology 18: 132.
Lam D, Luu P-L, Song JZ, Qu W, Risbridger GP, Lawrence MG, Lu J, Trau M,
Korbie D, Clark SJ, et al. 2020. Comprehensive evaluation of targeted multiplex
bisulphite PCR sequencing for validation of DNA methylation biomarker panels. Clinical
Epigenetics 12: 90.
Lamelas L, Valledor L, Escandón M, Pinto G, Cañal MJ, Meijón M. 2020.
Integrative analysis of the nuclear proteome in Pinus radiata reveals thermopriming
coupled to epigenetic regulation. Journal of Experimental Botany 71: 2040–2057.
Le Gac A-L, Lafon-Placette C, Chauveau D, Segura V, Delaunay A, Fichot R,
Marron N, Le Jan I, Berthelot A, Bodineau G, et al. 2018. Winter-dormant shoot
apical meristem in poplar trees shows environmental epigenetic memory. Journal of
Experimental Botany 69: 4821–4837.
Lee JH, Mazarei M, Pfotenhauer AC, Dorrough AB, Poindexter MR, Hewezi T,
Lenaghan SC, Graham DE, Stewart CNJ. 2020. Epigenetic footprints of
CRISPR/Cas9-mediated genome editing in plants. Frontiers in Plant Science 10.
Liu G, Xia Y, Liu T, Dai S, Hou X. 2018. The DNA methylome and association of
differentially methylated regions with differential gene expression during heat stress in
Brassica rapa. International Journal of Molecular Sciences 19.
Luedeling E, Zhang M, Luedeling V, Girvetz EH. 2009. Sensitivity of winter chill
models for fruit and nut trees to climatic changes expected in California’s Central Valley.
Agriculture, Ecosystems & Environment 133: 23–31.
Mera R, Massey N, Rupp DE, Mote P, Allen M, Frumhoff PC. 2015. Climate change,
climate justice and the application of probabilistic event attribution to summer heat
extremes in the California Central Valley. Climatic Change 133: 427–438.
Milliron L, Gradziel TM, Jarvis-Shean K. 2020. Monterey and the Leafing Failure
2020: What are we seeing? University of California Davis: Fruit & Nut Research and
Information Center.

237
Munné-Bosch S. 2008. Do perennials really senesce? Trends in Plant Science 13: 216–
220.
Munné-Bosch S. 2020. Long-lived trees are not immortal. Trends in Plant Science 25:
846–849.
Ogneva ZV, Suprun AR, Dubrovina AS, Kiselev KV. 2019. Effect of 5-azacytidine
induced DNA demethylation on abiotic stress tolerance in Arabidopsis thaliana. Plant
Protection Science 55 (2019): 73–80.
Ong-Abdullah M, Ordway JM, Jiang N, Ooi S-E, Kok S-Y, Sarpan N, Azimi N,
Hashim AT, Ishak Z, Rosli SK, et al. 2015. Loss of Karma transposon methylation
underlies the mantled somaclonal variant of oil palm. Nature 525: 533–537.
Ou X, Zhang Y, Xu C, Lin X, Zang Q, Zhuang T, Jiang L, Wettstein D von, Liu B.
2012. Transgenerational inheritance of modified DNA methylation patterns and enhanced
tolerance induced by heavy metal stress in rice (Oryza sativa L.). PLOS ONE 7: e41143.
Parker LE, Abatzoglou JT. 2018. Shifts in the thermal niche of almond under climate
change. Climatic Change 147: 211–224.
Payne AC, Chiang ZD, Reginato PL, Mangiameli SM, Murray EM, Yao C-C,
Markoulaki S, Earl AS, Labade AS, Jaenisch R, et al. 2020. In situ genome
sequencing resolves DNA sequence and structure in intact biological samples. Science:
eaay3446.
Qian Y, Hu W, Liao J, Zhang J, Ren Q. 2019. The Dynamics of DNA methylation in
the maize (Zea mays L.) inbred line B73 response to heat stress at the seedling stage.
Biochemical and Biophysical Research Communications 512: 742–749.
Rankenberg T, Geldhof B, van Veen H, Holsteens K, Van de Poel B, Sasidharan R.
2021. Age-dependent abiotic stress resilience in plants. Trends in Plant Science:
10.1016/j.tplants.2020.12.016
Routier-Kierzkowska A-L, Kwiatkowska D. 2008. New stereoscopic reconstruction
protocol for scanning electron microscope images and its application to in vivo replicas
of the shoot apical meristem. Functional plant biology: FPB 35: 1034–1046.
Runov AL, Vonsky MS, Mikhelson VM. 2015. DNA methylation level and telomere
length as a basis for modeling of the biological aging clock. Cell and Tissue Biology 9:
261–264.
Sanchez DH, Paszkowski J. 2014. Heat-induced release of epigenetic silencing reveals
the concealed role of an imprinted plant gene. PLOS Genetics 10: e1004806.

238
Satterlee JW, Strable J, Scanlon MJ. 2020. Plant stem-cell organization and
differentiation at single-cell resolution. Proceedings of the National Academy of Sciences
117: 33689–33699.
Song Y, Ma K, Ci D, Chen Q, Tian J, Zhang D. 2013. Sexual dimorphic floral
development in dioecious plants revealed by transcriptome, phytohormone, and DNA
methylation analysis in Populus tomentosa. Plant Molecular Biology 83: 559–576.
Syngelaki E, Schinkel CCF, Klatt S, Hörandl E. 2020. Effects of temperature
treatments on cytosine-methylation profiles of diploid and autotetraploid plants of the
alpine species Ranunculus kuepferi (Ranunculaceae). Frontiers in Plant Science 11.
Varotto S, Tani E, Abraham E, Krugman T, Kapazoglou A, Melzer R, Radanović A,
Miladinović D. 2020. Epigenetics: possible applications in climate-smart crop breeding
(A Probst, Ed.). Journal of Experimental Botany 71: 5223–5236.
Zhong S-H, Liu J-Z, Jin H, Lin L, Li Q, Chen Y, Yuan Y-X, Wang Z-Y, Huang H,
Qi Y-J, et al. 2013. Warm temperatures induce transgenerational epigenetic release of
RNA silencing by inhibiting siRNA biogenesis in Arabidopsis. Proceedings of the
National Academy of Sciences 110: 9171–9176.

239
Complete Bibliography
Agrawal AA. 2011. Current trends in the evolutionary ecology of plant defence.
Functional Ecology 25: 420–432.
Akalin A, Franke V, Vlahoviček K, Mason CE, Schübeler D. 2015. Genomation: a
toolkit to summarize, annotate and visualize genomic intervals. Bioinformatics 31: 1127–
1129.
Albala K. 2009. Almonds along the silk road: The exchange and adaptation of ideas from
West to East. Petits Propos Culinaires 88: 19–34.
Alexa A RJ. 2020. topGO: Enrichment Analysis for Gene Ontology.
Aleza P, Juárez J, Ollitrault P and Navarro L. 2010. Polyembryony in non-apomictic
citrus genotypes. Annals of Botany 106: 533–545.
Alioto T, Alexiou KG, Bardil A, Barteri F, Castanera R, Cruz F, Dhingra A, Duval
H, Martí ÁF, i Frias L, et al. 2020. Transposons played a major role in the
diversification between the closely related almond and peach genomes: results from the
almond genome sequence. The Plant Journal 101: 455–472.
Ally D, Ritland K, Otto SP. 2010. Aging in a long-lived clonal tree. PLOS Biology 8:
e1000454.
Almagro Armenteros JJ, Salvatore M, Emanuelsson O, Winther O, Heijne G von,
Elofsson A and Nielsen H. 2019. Detecting sequence signals in targeting peptides using
deep learning. Life Science Alliance 2: e201900429.
Almond Board of California. 2020. Almond almanac. Modesto, CA: Almond Board of
California.
Alonso C, Ramos‐Cruz D, Becker C. 2019. The role of plant epigenetics in biotic
interactions. New Phytologist 221: 731–737.
Alonso JM, Ansón JM, Espiau MT, Socia i Company R. 2005. Determination of
endodormancy break in almond flower buds by a correlation model using the average
temperature of different day intervals and its application to the estimation of chill and
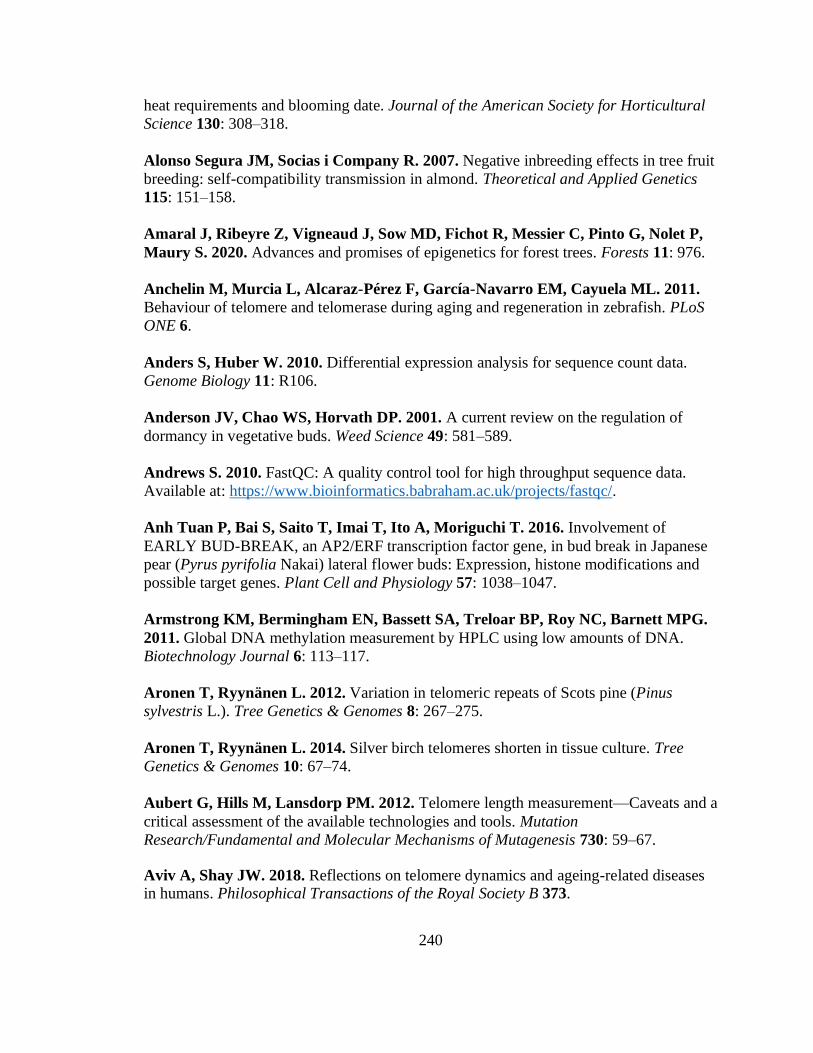
240
heat requirements and blooming date. Journal of the American Society for Horticultural
Science 130: 308–318.
Alonso Segura JM, Socias i Company R. 2007. Negative inbreeding effects in tree fruit
breeding: self-compatibility transmission in almond. Theoretical and Applied Genetics
115: 151–158.
Amaral J, Ribeyre Z, Vigneaud J, Sow MD, Fichot R, Messier C, Pinto G, Nolet P,
Maury S. 2020. Advances and promises of epigenetics for forest trees. Forests 11: 976.
Anchelin M, Murcia L, Alcaraz-Pérez F, García-Navarro EM, Cayuela ML. 2011.
Behaviour of telomere and telomerase during aging and regeneration in zebrafish. PLoS
ONE 6.
Anders S, Huber W. 2010. Differential expression analysis for sequence count data.
Genome Biology 11: R106.
Anderson JV, Chao WS, Horvath DP. 2001. A current review on the regulation of
dormancy in vegetative buds. Weed Science 49: 581–589.
Andrews S. 2010. FastQC: A quality control tool for high throughput sequence data.
Available at: https://www.bioinformatics.babraham.ac.uk/projects/fastqc/.
Anh Tuan P, Bai S, Saito T, Imai T, Ito A, Moriguchi T. 2016. Involvement of
EARLY BUD-BREAK, an AP2/ERF transcription factor gene, in bud break in Japanese
pear (Pyrus pyrifolia Nakai) lateral flower buds: Expression, histone modifications and
possible target genes. Plant Cell and Physiology 57: 1038–1047.
Armstrong KM, Bermingham EN, Bassett SA, Treloar BP, Roy NC, Barnett MPG.
2011. Global DNA methylation measurement by HPLC using low amounts of DNA.
Biotechnology Journal 6: 113–117.
Aronen T, Ryynänen L. 2012. Variation in telomeric repeats of Scots pine (Pinus
sylvestris L.). Tree Genetics & Genomes 8: 267–275.
Aronen T, Ryynänen L. 2014. Silver birch telomeres shorten in tissue culture. Tree
Genetics & Genomes 10: 67–74.
Aubert G, Hills M, Lansdorp PM. 2012. Telomere length measurement—Caveats and a
critical assessment of the available technologies and tools. Mutation
Research/Fundamental and Molecular Mechanisms of Mutagenesis 730: 59–67.
Aviv A, Shay JW. 2018. Reflections on telomere dynamics and ageing-related diseases in humans. Philosophical Transactions of the Royal Society B 373.

241
Avramova Z. 2015. Transcriptional ‘memory’ of a stress: transient chromatin and
memory (epigenetic) marks at stress-response genes. The Plant Journal 83: 149–159.
Ay N, Janack B, Humbeck K. 2014. Epigenetic control of plant senescence and linked
processes. Journal of Experimental Botany 65: 3875–3887.
Balachowski JA, Bristiel PM, Volaire FA. 2016. Summer dormancy, drought survival
and functional resource acquisition strategies in California perennial grasses. Annals of
Botany 118: 357–368.
Barros PM, Gonçalves N, Saibo NJM, Oliveira MM. 2012. Cold acclimation and
floral development in almond bud break: insights into the regulatory pathways. Journal
of Experimental Botany 63: 4585–4596.
Bartels A, Han Q, Nair P, Stacey L, Gaynier H, Mosley M, Huang QQ, Pearson, JK,
Hsieh TF, An YQC et al. 2018. Dynamic DNA methylation in plant growth and
development. International Journal of Molecular Sciences 19: 2144.
Barton MK. 2010. Twenty years on: The inner workings of the shoot apical meristem, a
developmental dynamo. Developmental Biology 341: 95–113.
Bastias A, Oviedo K, Almada R, Correa F, Sagredo B. 2020. Identifying and
validating housekeeping hybrid Prunus spp. genes for root gene-expression studies.
PLOS ONE 15.
Bastías A, Almada R, Rojas P, Donoso JM, Hinrichsen P, Sagredo B. 2016. Aging
gene pathway of microRNAs 156/157 and 172 is altered in juvenile and adult plants from
in vitro propagated Prunus sp. Ciencia e investigación agraria 43: 429–441.
Baurens F-C, Nicolleau J, Legavre T, Verdeil J-L, Monteuuis O. 2004. Genomic
DNA methylation of juvenile and mature Acacia mangium micropropagated in vitro with
reference to leaf morphology as a phase change marker. Tree Physiology 24: 401–407.
Beckman KB, Ames BN. 1998. The free radical theory of aging matures. Physiological
Reviews 78: 547–581.
Bej S, Basak J. 2017. Abiotic stress induced epigenetic modifications in plants: How
much do we know? In: Rajewsky N, Jurga S, Barciszewski J, eds. Plant Epigenetics.
Cham, Switzerland: Springer, 493–512.
Bell JT, Spector TD. 2011. A twin approach to unraveling epigenetics. Trends in
Genetics 27: 116–125.

242
Benayoun BA, Pollina EA, Brunet A. 2015. Epigenetic regulation of ageing: linking
environmental inputs to genomic stability. Nature Reviews Molecular Cell Biology 16:
593–610.
Benmoussa H, Ghrab M, Mimoun MB, Luedeling E. 2017. Chilling and heat
requirements for local and foreign almond (Prunus dulcis Mill.) cultivars in a warm
Mediterranean location based on 30 years of phenology records. Agricultural and Forest
Meteorology 239: 34–46.
Bewick AJ, Schmitz RJ. 2017. Gene body DNA methylation in plants. Current Opinion
in Plant Biology 36: 103–110.
Bielenberg DG, Wang Y (Eileen), Li Z, Zhebentyayeva T, Fan S, Reighard GL,
Scorza R, Abbott AG. 2008. Sequencing and annotation of the evergrowing locus in
peach [Prunus persica (L.) Batsch] reveals a cluster of six MADS-box transcription
factors as candidate genes for regulation of terminal bud formation. Tree Genetics &
Genomes 4: 495–507.
Bilova T, Paudel G, Shilyaev N, Schmidt R, Brauch D, Tarakhovskaya E, Milrud S,
Smolikova G, Tissier A, Vogt T, et al. 2017. Global proteomic analysis of advanced
glycation end products in the Arabidopsis proteome provides evidence for age-related
glycation hot spots. Journal of Biological Chemistry 292: 15758–15776
Bitonti MB, Cozza R, Chiappetta A, Giannino D, Castiglione MR, Dewitte W,
Mariotti D, Van Onckelen H, Innocenti AM. 2002. Distinct nuclear organization, DNA
methylation pattern and cytokinin distribution mark juvenile, juvenile‐like and adult
vegetative apical meristems in peach (Prunus persica (L.) Batsch). Journal of
Experimental Botany 53: 1047–1054.
Blackburn EH. 2000. Telomere states and cell fates. Nature 408: 53–56.
Boccardi V, Paolisso G. 2014. Telomerase activation: A potential key modulator for
human healthspan and longevity. Ageing Research Reviews 15: 1–5.
Bonga JM. 1982. Vegetative propagation in relation to juvenility, maturity, and
rejuvenation. In: Bonga JM, Durzan DJ, eds. Tissue Culture in Forestry. Dordrecht,
Netherlands: Springer, 387–412.
Boriss H, Brunke H. 2005. Commodity profile: Almond. Agricultural Issues Center:
University of California.
Bose AK, Moser B, Rigling A, Lehmann MM, Milcu A, Peter M, Rellstab C,
Wohlgemuth T, Gessler A. 2020. Memory of environmental conditions across
generations affects the acclimation potential of scots pine. Plant, Cell & Environment 43:
1288–1299.

243
Boyko A, Blevins T, Yao Y, Golubov A, Bilichak A, Ilnytskyy Y, Hollander J, Jr
FM, Kovalchuk I. 2010. Transgenerational adaptation of Arabidopsis to stress requires
DNA methylation and the function of Dicer-like proteins. PLOS ONE 5: e9514.
Boyko A, Zemp F, Filkowski J, Kovalchuk I. 2006. Double-strand break repair in
plants is developmentally regulated. Plant Physiology 141: 488–497.
Briesemeister S, Rahnenführer J, Kohlbacher O. 2010a. YLoc—an interpretable web
server for predicting subcellular localization. Nucleic Acids Research 38: W497–W502.
Briesemeister S, Rahnenführer J, Kohlbacher O. 2010b. Going from where to why—
interpretable prediction of protein subcellular localization. Bioinformatics 26: 1232–
1238.
Browicz K, Zohary D. 1996. The genus Amygdalus L. (Rosaceae): Species relationships,
distribution and evolution under domestication. Genetic Resources and Crop Evolution
43: 229–247.
Browne L, Mead A, Horn C, Chang K, A. Celikkol Z, L. Henriquez C, Ma F, Beraut
E, S. Meyer R, Sork VL. 2020. Experimental DNA demethylation associates with
changes in growth and gene expression of oak tree seedlings. G3: Genes, Genomes,
Genetics 10: 1019–1028.
Brumos J, Alonso JM, Stepanova AN. 2014. Genetic aspects of auxin biosynthesis and
its regulation. Physiologia Plantarum 151: 3–12.
Brutovská E, Sámelová A, Dušička J, Mičieta K. 2013. Ageing of trees: Application of
general ageing theories. Ageing Research Reviews 12: 855–866.
Bräutigam K, Vining KJ, Lafon-Placette C, Fossdal CG, Mirouze M, Marcos JG,
Fluch S, Fraga MF, Guevara MÁ, Abarca D, et al. 2013. Epigenetic regulation of
adaptive responses of forest tree species to the environment. Ecology and Evolution 3:
399–415.
Busov V, Carneros E, Yakovlev I. 2016. EARLY BUD-BREAK1 (EBB1) defines a
conserved mechanism for control of bud-break in woody perennials. Plant Signaling &
Behavior 11: e1073873.
Bustin SA, Benes V, Garson JA, Hellemans J, Huggett J, Kubista M, Mueller R,
Nolan T, Pfaffl MW, Shipley GL, et al. 2009. The MIQE guidelines: Minimum
information for publication of quantitative real-time PCR experiments. Clinical
Chemistry 55: 611–622.

244
Cai CZ, Han LY, Ji ZL, Chen X, Chen YZ. 2003. SVM-Prot: Web-based support
vector machine software for functional classification of a protein from its primary
sequence. Nucleic Acids Research 31: 3692–3697.
California Department of Food and Agriculture. 2020. 2019 California Almond
Acreage Report. USDA National Agricultural Statistics Service, Pacific Regional Office.
Camacho C, Coulouris G, Avagyan V, Ma N, Papadopoulos J, Bealer K, Madden
TL. 2009. BLAST+: architecture and applications. BMC Bioinformatics 10: 421.
Carles CC, Fletcher JC. 2003. Shoot apical meristem maintenance: the art of a dynamic
balance. Trends in Plant Science 8: 394–401.
Castro E de, Sigrist CJA, Gattiker A, Bulliard V, Langendijk-Genevaux PS,
Gasteiger E, Bairoch A, Hulo N. 2006. ScanProsite: detection of PROSITE signature
matches and ProRule-associated functional and structural residues in proteins. Nucleic
Acids Research 34: W362-365.
Castède S, Campoy JA, Dantec LL, Quero-García J, Barreneche T, Wenden B,
Dirlewanger E. 2015. Mapping of candidate genes involved in bud dormancy and
flowering time in sweet cherry (Prunus avium). PLOS ONE 10: e0143250.
Cawthon RM. 2002. Telomere measurement by quantitative PCR. Nucleic Acids
Research 30: e47.
Cawthon RM. 2009. Telomere length measurement by a novel monochrome multiplex
quantitative PCR method. Nucleic Acids Research 37: e21.
Centomani I, Sgobba A, D’Addabbo P, Dipierro N, Paradiso A, De Gara L, Dipierro
S, Viggiano L, Pinto MC de. 2015. Involvement of DNA methylation in the control of
cell growth during heat stress in tobacco BY-2 cells. Protoplasma 252: 1451–1459.
Chang Y-N, Zhu C, Jiang J, Zhang H, Zhu J-K, Duan C-G. 2020. Epigenetic
regulation in plant abiotic stress responses. Journal of Integrative Plant Biology 62: 563–
580.
Chen H, Boutros PC. 2011. VennDiagram: a package for the generation of highly-
customizable Venn and Euler diagrams in R. BMC Bioinformatics 12: 35.
Chen Z, Gallie DR. 2012. Induction of monozygotic twinning by ascorbic acid in
tobacco. PLOS One 7: e39147.
Chuck G, Cigan AM, Saeteurn K, Hake S. 2007. The heterochronic maize mutant
Corngrass1 results from overexpression of a tandem microRNA. Nature Genetics 39:
544–549.

245
Chwialkowska K, Nowakowska U, Mroziewicz A, Szarejko I, Kwasniewski M. 2016.
Water-deficiency conditions differently modulate the methylome of roots and leaves in
barley (Hordeum vulgare L.). Journal of Experimental Botany 67: 1109–1121.
Cline MJ. 1991. Apical dominance. The Botanical Review 57: 318–358.
Conde D, Perales M, Gac ALL, Dervinis C, Kirst M, Maury S, González-Melendi P,
Allona I. 2017. Chilling-responsive DEMETER-LIKE DNA demethylase mediates
poplar bud break. Plant, Cell and Environment 40: 2236-2249.
Conde D, Perales M, Sreedasyam A, Tuskan GA, Lloret A, Badenes ML, González-
Melendi P, Ríos G, Allona I. 2019. Engineering tree seasonal cycles of growth through
chromatin modification. Fronters in Plant Science 10: 412.
Corredor E, Román M, García E, Perera E, Arús P, Naranjo T. 2004. Physical
mapping of rDNA genes establishes the karyotype of almond. Annals of Applied Biology
144: 219–222.
Correia B, Valledor L, Meijón M, Rodriguez JL, Dias MC, Santos C, Cañal MJ,
Rodriguez R, Pinto G. 2013. Is the interplay between epigenetic markers related to the
acclimation of cork oak plants to high temperatures? PLOS ONE 8: e53543.
Corso-Díaz X, Gentry J, Rebernick R, Jaeger C, Brooks MJ, van Asten F,
Kooragayala K, Gieser L, Nellissery J, Covian R, et al. 2020. Genome-wide profiling
identifies DNA methylation signatures of aging in rod photoreceptors associated with
alterations in energy metabolism. Cell reports 31: 107525.
Costes E, Crespel L, Denoyes B, Morel P, Demene M-N, Lauri P-E, Wenden B.
2014. Bud structure, position and fate generate various branching patterns along shoots of
closely related Rosaceae species: A review. Frontiers in Plant Science 5.
Cribari-Neto F, Zeileis A. 2010. Beta regression in R. Journal of Statistical Software
34: 1–24.
Crisp PA, Ganguly D, Eichten SR, Borevitz JO, Pogson BJ. 2016. Reconsidering
plant memory: Intersections between stress recovery, RNA turnover, and epigenetics.
Science Advances 2: e1501340.
Curaba J, Herzog M, Vachon G. 2003. GeBP, the first member of a new gene family in
Arabidopsis, encodes a nuclear protein with DNA-binding activity and is regulated by
KNAT1. The Plant Journal 33: 305–317.
Danisman S. 2016. TCP transcription factors at the interface between environmental
challenges and the plant’s growth responses. Frontiers in Plant Science 7: 1930.

246
Dasgupta P, Chaudhuri S. 2019. Analysis of DNA methylation profile in plants by
chop-PCR. In: Gassmann W, ed. Methods in molecular biology. Plant innate immunity:
Methods and protocols. New York, NY: Springer, 79–90.
Day KR, DeJong TM, Hewitt AA. 1989. Postharvest and preharvest summer pruning of
‘Firebrite’ nectarine trees. HortScience 24: 238-240.
De la Torre-Espinosa ZY, Barredo-Pool F, Castaño de la Serna E, Sánchez-Teyer
LF. 2020. Active telomerase during leaf growth and increase of age in plants from Agave
tequilana var. Azul. Physiology and Molecular Biology of Plants 26: 639–647.
de Witte LC, Stöcklin J. 2010. Longevity of clonal plants: why it matters and how to
measure it. Annals of Botany 106: 859–870.
Dejong TM, Negron CM, Favreau R, Day KR, Costes E, Lopez G, Guédon Y. 2012.
Using concepts of shoot growth and architecture to understand and predict responses of
peach trees to pruning. 7th International Peach Symposium, Lleida. Acta Horticulturae
225-232.
Demeulemeester MAC, Van Stallen N, De Proft MP. 1999. Degree of DNA
methylation in chicory (Cichorium intybus L.): Influence of plant age and vernalization.
Plant Science 142: 101–108.
Dobin A, Davis CA, Schlesinger F, Drenkow J, Zaleski C, Jha S, Batut P, Chaisson
M, Gingeras TR. 2013. STAR: ultrafast universal RNA-seq aligner. Bioinformatics 29:
15–21.
Dolzblasz A, Gola EM, Sokołowska K, Smakowska-Luzan E, Twardawska A,
Janska H. 2018. Impairment of meristem proliferation in plants lacking the
mitochondrial protease AtFTSH4. International Journal of Molecular Sciences 19: 853.
Domcke S, Bardet AF, Adrian Ginno P, Hartl D, Burger L, Schübeler D. 2015.
Competition between DNA methylation and transcription factors determines binding of
NRF1. Nature 528: 575–579.
Donoso JM, Picañol R, Serra O, Howad W, Alegre S, Arús P, Eduardo I. 2016.
Exploring almond genetic variability useful for peach improvement: mapping major
genes and QTLs in two interspecific almond × peach populations. Molecular Breeding
36: 16.
Dowen RH, Pelizzola M, Schmitz RJ, Lister R, Dowen JM, Nery JR, Dixon JE,
Ecker JR. 2012. Widespread dynamic DNA methylation in response to biotic stress.
Proceedings of the National Academy of Sciences 109: E2183–E2191.

247
Du J, Zhong X, Bernatavichute YV, Stroud H, Feng S, Caro E, Vashisht AA,
Terragni J, Chin HG, Tu A, et al. 2012. Dual binding of chromomethylase domains to
H3K9me2-containing nucleosomes directs DNA methylation in plants. Cell 151: 167–
180.
Dubrovina AS, Kiselev KV. 2016. Age-associated alterations in the somatic mutation
and DNA methylation levels in plants. Plant Biology 18: 185–196.
Duek PD, Fankhauser C. 2005. bHLH class transcription factors take center stage in
phytochrome signaling. Trends in Plant Science 10: 51–54.
D’Amico-Willman KM, Anderson ES, Gradziel TM, Fresnedo-Ramírez J. 2021.
Relative telomere length and telomerase reverse transcriptase (TERT) expression are
associated with age in almond (Prunus dulcis [Mill.] D.A.Webb). Plants 10: 189.
Egea J, Ortega E, Martinez-Gomez P, Dicenta F. 2003. Chilling and heat requirements
of almond cultivars for flowering. Environmental and Experimental Botany 50: 79–85.
Eichten SR, Stuart T, Srivastava A, Lister R, Borevitz JO. 2016. DNA methylation
profiles of diverse Brachypodium distachyon align with underlying genetic diversity.
Genome Research 26: 1520–1531.
Elgin SCR, Reuter G. 2013. Position-effect variegation, heterochromatin formation, and
gene silencing in Drosophila. Cold Spring Harbor Perspectives in Biology 5.
Elhamamsy AR. 2016. DNA methylation dynamics in plants and mammals: Overview
of regulation and dysregulation. Cell Biochemistry and Function 34: 289–298.
Ensign MR. 1919. Venation and senescence of polyembryonic citrus plants. American
Journal of Botany 6: 311–329.
Fadón E, Fernandez E, Behn H, Luedeling E. 2020. A conceptual framework for
winter dormancy in deciduous trees. Agronomy 10: 241.
Fajkus J, Sýkorová E, Leitch AR. 2005. Telomeres in evolution and evolution of
telomeres. Chromosome Research 13: 469–479.
Falavigna V da S, Guitton B, Costes E, Andrés F. 2019. I want to (bud) break free: the
potential role of DAM and SVP-like genes in regulating dormancy cycle in temperate fruit
trees. Frontiers in Plant Science 9.
Fan SK, Ye JY, Zhang LL, Chen HS, Zhang HH, Zhu YX, Liu XX, Jin CW. 2020.
Inhibition of DNA demethylation enhances plant tolerance to cadmium toxicity by
improving iron nutrition. Plant, Cell & Environment 43: 275–291.

248
Farrokhi N, Burton RA, Brownfield L, Hrmova M, Wilson SM, Bacic A, Fincher
GB. 2006. Plant cell wall biosynthesis: Genetic, biochemical and functional genomics
approaches to the identification of key genes. Plant Biotechnology Journal 4: 145–167.
Feng H, Conneely KN, Wu H. 2014. A Bayesian hierarchical model to detect
differentially methylated loci from single nucleotide resolution sequencing data. Nucleic
Acids Research 42: e69.
Feng S, Zhong Z, Wang M, Jacobsen SE. 2020. Efficient and accurate determination of
genome-wide DNA methylation patterns in Arabidopsis thaliana with enzymatic methyl
sequencing. Epigenetics & Chromatin 13: 42.
Fenton CAL, Kester DE, Kuniyuki AH. 1988a. Models for noninfectious bud failure in
almond. Phytopathology 78: 139.
Fenton CAL, Kuniyuki AH, Kester DE. 1988b. Search for a viroid etiology for
noninfectious bud failure in almond. HortScience 23: 1050–1053.
Fernández i Martí A, Gradziel TM, Socias i Company R. 2014. Methylation of the Sf
locus in almond is associated with S-RNase loss of function. Plant Molecular Biology 86:
681–689.
Ferreira LJ, Donoghue MTA, Barros P, Saibo NJ, Santos AP, Oliveira MM. 2019.
Uncovering differentially methylated regions (DMRs) in a salt-tolerant rice variety under
stress: One step towards new regulatory regions for enhanced salt tolerance. Epigenomes
3: 4.
Ferrucci L, Gonzalez‐Freire M, Fabbri E, Simonsick E, Tanaka T, Moore Z, Salimi
S, Sierra F, Cabo R de. 2020. Measuring biological aging in humans: A quest. Aging
Cell 19: e13080.
Field AC, Suttle NF. 1979. Effect of high potassium and low magnesium intakes on the
mineral metabolism of monozygotic twin cows. Journal of Comparative Pathology 89:
431–439.
Finn RD, Bateman A, Clements J, Coggill P, Eberhardt RY, Eddy SR, Heger A,
Hetherington K, Holm L, Mistry J, et al. 2014. Pfam: The protein families database.
Nucleic Acids Research 42: D222-230.
Fitzgerald MS, McKnight TD, Shippen DE. 1996. Characterization and developmental
patterns of telomerase expression in plants. Proceedings of the National Academy of
Sciences 93: 14422–14427.
Fitzgerald MS, Riha K, Gao F, Ren S, McKnight TD, Shippen DE. 1999. Disruption
of the telomerase catalytic subunit gene from Arabidopsis inactivates telomerase and

249
leads to a slow loss of telomeric DNA. Proceedings of the National Academy of Sciences
96: 14813–14818.
Flachowsky H, Roux P-ML, Peil A, Patocchi A, Richter K, Hanke M-V. 2011.
Application of a high-speed breeding technology to apple (Malus × domestica) based on
transgenic early flowering plants and marker-assisted selection. New Phytologist 192:
364–377.
Flanary BE, Kletetschka G. 2005. Analysis of telomere length and telomerase activity
in tree species of various life-spans, and with age in the bristlecone pine Pinus longaeva.
Biogerontology 6: 101–111.
Fojtová M, Kovařı́k A, Matyášek R. 2001. Cytosine methylation of plastid genome in
higher plants. Fact or artifact? Plant Science 160: 585–593.
Fossel M. 1998. Telomerase and the aging cell: Implications for human health. JAMA
The Journal of the American Medical Association 279: 1732–1735.
Fraga M, Cañal M, Rodríguez R. 2002a. Phase-change related epigenetic and
physiological changes in Pinus radiata D. Don. Planta 215: 672–678.
Fraga MF, Esteller M. 2002. DNA methylation: A profile of methods and applications.
BioTechniques 33: 16.
Fraga MF, Rodríguez R, Cañal MJ. 2002b. Genomic DNA methylation–demethylation
during aging and reinvigoration of Pinus radiata. Tree Physiology 22: 813–816.
Freeman MW, Martin GC. 1981. Peach floral bud break and abscisic content as
affected by mist, light, and temperature treatments during rest. Journal of the American
Society for Horticultural Science 106: 333–336.
Fresnedo-Ramírez J, Chan HM, Parfitt DE, Crisosto CH, Gradziel TM. 2017.
Genome-wide DNA-(de)methylation is associated with noninfectious bud-failure
exhibition in almond (Prunus dulcis [Mill.] D.A.Webb). Scientific Reports 7: 42686.
Fresnedo-Ramírez J. 2020. Gene prediction and genome functional annotation of
‘Nonpareil’. Almond Board of California 2020 Research Report HORT25. Modesto, CA:
Almond Board of California.
Freude G, Jakob O, Martus P, Rose U, Seibt R. 2010. Predictors of the discrepancy
between calendar and biological age. Occupational Medicine 60: 21–28.
Frommer M, McDonald LE, Millar DS, Collis CM, Watt F, Grigg GW, Molloy PL,
Paul CL. 1992. A genomic sequencing protocol that yields a positive display of 5-

250
methylcytosine residues in individual DNA strands. Proceedings of the National
Academy of Sciences 89: 1827–1831.
Fuchs J, Brandes A, Schubert I. 1995. Telomere sequence localization and karyotype
evolution in higher plants. Plant Systematics and Evolution 196: 227–241.
Gambino G, Perrone I, Gribaudo IA. 2008. Rapid and effective method for RNA
extraction from different tissues of grapevine and other woody plants. Phytochemical
Analysis 19: 520–525.
Ganguly DR, Crisp PA, Eichten SR, Pogson BJ. 2017. The Arabidopsis DNA
methylome is stable under transgenerational drought stress. Plant Physiology 175: 1893–
1912.
Gao Z, Shi T, Luo X, Zhang Z, Zhuang W, Wang L. 2012. High-throughput
sequencing of small RNAs and analysis of differentially expressed microRNAs
associated with pistil development in Japanese apricot. BMC Genomics 13: 371.
Gasteiger E, Hoogland C, Gattiker A, Duvaud S, Wilkins MR, Appel RD, Bairoch
A. 2005. Protein identification and analysis tools on the ExPASy server. In: Walker JM,
ed. Springer Protocols handbooks. The proteomics protocols handbook. Totowa, NJ:
Humana Press, 571–607.
Gatsuk LE, Smirnova OV, Vorontzova LI, Zaugolnova LB, Zhukova LA. 1980. Age
states of plants of various growth forms: A review. Journal of Ecology 68: 675–696.
Gatto L. 2020. rols: An R interface to the Ontology Lookup Service. Available at:
https://lgatto.github.com/rols.
Gensous N, Bacalini MG, Pirazzini C, Marasco E, Giuliani C, Ravaioli F, Mengozzi
G, Bertarelli C, Palmas MG, Franceschi C, et al. 2017. The epigenetic landscape of
age-related diseases: The geroscience perspective. Biogerontology 18: 549–559.
Gogorcena Y, Sánchez G, Moreno-Vázquez S, Pérez S, Ksouri N. 2020. Genomic-
based breeding for climate-smart peach varieties. In: Kole C, ed. Genomic designing of
climate-smart fruit crops. Cham: Springer International Publishing, 271–331.
Goldberg AD, Allis CD, Bernstein E. 2007. Epigenetics: A landscape takes shape. Cell
128: 635–638.
Golubov A, Yao Y, Maheshwari P, Bilichak A, Boyko A, Belzile F, Kovalchuk I.
2010. Microsatellite instability in Arabidopsis increases with plant development. Plant
Physiology 154: 1415–1427.

251
Gong Z, Morales-Ruiz T, Ariza RR, Roldán-Arjona T, David L, Zhu J-K. 2002.
ROS1, a Repressor of transcriptional gene silencing in Arabidopsis, encodes a DNA
glycosylase/lyase. Cell 111: 803–814.
Gordon D, Damiano C, DeJong TM. 2006a. Preformation in vegetative buds of Prunus
persica: Factors influencing number of leaf primordia in overwintering buds. Tree
Physiology 26: 537–544.
Gordon D, Rosati A, Damiano C, Dejong TM. 2006b. Seasonal effects of light
exposure, temperature, trunk growth and plant carbohydrate status on the initiation and
growth of epicormic shoots in Prunus persica. The Journal of Horticultural Science and
Biotechnology 81: 421–428.
Gradziel T, Lampinen B, Preece JE. 2019. Propagation from basal epicormic
meristems remediates an aging-related disorder in almond clones. Scientia Horticulturae
5: 28.
Gradziel TM, Thorpe MA, Fresnedo-Ramírez J, Ragas R, Lampinen B, Adaskaveg
J, Connell J, Schrader P, Metcalf S, Duncan R, et al. 2013. Molecular marker based
diagnostics for almond non-infectious bud-failure. Modesto, CA: Almond Board of
California.
Gregis V, Andrés F, Sessa A, Guerra RF, Simonini S, Mateos JL, Torti S, Zambelli
F, Prazzoli GM, Bjerkan KN, et al. 2013. Identification of pathways directly regulated
by SHORT VEGETATIVE PHASE during vegetative and reproductive development in
Arabidopsis. Genome Biology 14: R56.
Griffin PT, Niederhuth CE, Schmitz RJ. 2016. A comparative analysis of 5-
azacytidine- and zebularine-induced DNA demethylation. G3: Genes, Genomes, Genetics
6: 2773–2780.
Grunau C, Clark SJ, Rosenthal A. 2001. Bisulfite genomic sequencing: systematic
investigation of critical experimental parameters. Nucleic Acids Research 29: e65–e65.
Gu Z, Eils R, Schlesner M. 2016. Complex heatmaps reveal patterns and correlations in
multidimensional genomic data. Bioinformatics 32: 2847–2849.
Gu Z, Gu L, Eils R, Schlesner M, Brors B. 2014. Circlize implements and enhances
circular visualization in R. Bioinformatics 30: 2811–2812.
Gugger PF, Fitz‐Gibbon S, Pellegrini M, Sork VL. 2016. Species-wide patterns of
DNA methylation variation in Quercus lobata and their association with climate
gradients. Molecular Ecology 25: 1665–1680.

252
Guillamón JG, Prudencio ÁS, Yuste JE, Dicenta F, Sánchez-Pérez R. 2020. Ascorbic
acid and prunasin, two candidate biomarkers for endodormancy release in almond flower
buds identified by a nontargeted metabolomic study. Horticulture Research 7: 1–13.
Guo G-P, Gu X-P, Yuan J-L, Wu X-L. 2011. Research on the features of DNA
methylation in leaves of different chronological ages of Phyllostachys heterocycla var.
pubescens based on the method of MSAP. Hereditas 33: 794–800.
Gupta P, Nutan KK, Singla-Pareek SL, Pareek A. 2017. Abiotic stresses cause
differential regulation of alternative splice forms of GATA transcription factor in rice.
Frontiers in Plant Science 8: 1944.
Gurp TP van, Wagemaker NCAM, Wouters B, Vergeer P, Ouborg JNJ, Verhoeven
KJF. 2016. epiGBS: Reference-free reduced representation bisulfite sequencing. Nature
Methods 13: 322.
Haberman A, Zelinger E, Samach A. 2017. Scanning electron microscope (SEM)
imaging to determine inflorescence initiation and development in olive. Bio-protocol 7:
e2575–e2575.
Han Z, Crisp PA, Stelpflug S, Kaeppler SM, Li Q, Springer NM. 2018. Heritable
epigenomic changes to the maize methylome resulting from tissue culture. Genetics 209:
983–995.
Harfouche AL, Jacobson DA, Kainer D, Romero JC, Harfouche AH, Scarascia
Mugnozza G, Moshelion M, Tuskan GA, Keurentjes JJB, Altman A. 2019.
Accelerating climate resilient plant breeding by applying next-generation artificial
intelligence. Trends in Biotechnology 37: 1217–1235.
Harkess A. 2018. Handling the heat: Methylome variation underlying heat tolerance in
cotton. The Plant Cell 30: 1947–1948.
Hasbún R, Valledor L, Santamaría E, Cañal MJ, Rodríguez R. 2007. Dynamics of
DNA methylation in chestnut trees development. Acta Horticulturae 563–566.
He K, Cao X, Deng X. 2021. Histone methylation in epigenetic regulation and
temperature responses. Current Opinion in Plant Biology 61: 102001.
He XJ, Chen T, Zhu JK. 2011. Regulation and function of DNA methylation in plants
and animals. Cell Research 21: 442–465.
Heinz S, Benner C, Spann N, Bertolino E, Lin YC, Laslo P, Cheng JX, Murre C,
Singh H, Glass CK. 2010. Simple combinations of lineage-determining transcription
factors prime cis-regulatory elements required for macrophage and B cell identities.
Molecular Cell 38: 576–589.

253
Hellali R, Kester DE, Martin GC. 1979. Seasonal changes in the physiology of
vegetative buds of normal and bud-failure affected ‘Nonpareil’ almond trees. Journal of
the American Society for Horticultural Science 104: 371–375.
Hellali R, Kester DE. 1979. High temperature induced bud-failure symptoms in
vegetative buds of almond plants in growth chambers. Journal of the American Society
for Horticultural Science 104: 375–378.
Hellali R, Lin J, Kester DE. 1978. Morphology of noninfectious bud failure symptoms
in vegetative buds of almond (Prunus amygdalus Batch). Journal of the American Society
for Horticultural Science 103: 459–464.
Hemann MT, Strong MA, Hao L-Y, Greider CW. 2001. The shortest telomere, not
average telomere length, is critical for cell viability and chromosome stability. Cell 107:
67–77.
Henry IM, Dilkes BP, Miller ES, Burkart-Waco D, Comai L. 2010. Phenotypic
consequences of aneuploidy in Arabidopsis thaliana. Genetics 186: 1231–1245.
Hepler PK. 2005. Calcium: A central regulator of plant growth and development. Plant
Cell 17: 2142–2155.
Hernández HG, Tse MY, Pang SC, Arboleda H, Forero DA. 2013. Optimizing
methodologies for PCR-based DNA methylation analysis. BioTechniques 55.
Hewezi T, Lane T, Piya S, Rambani A, Rice JH, Staton M. 2017. Cyst nematode
parasitism induces dynamic changes in the root epigenome. Plant Physiology 174: 405–
420.
Hillary RF, Stevenson AJ, McCartney DL, Campbell A, Walker RM, Howard DM,
Ritchie CW, Horvath S, Hayward C, McIntosh AM, et al. 2020. Epigenetic clocks
predict prevalence and incidence of leading causes of death and disease burden. bioRxiv:
2020.01.31.928648.
Hofmann NR. 2011. YUC and TAA1/TAR proteins function in the same pathway for
auxin biosynthesis. The Plant Cell 23: 3869.
Hofmann NR. 2016. A structure for plant-specific transcription factors: The GRAS
domain revealed. The Plant Cell 28: 993–994.
Hofmeister BT, Denkena J, Colomé-Tatché M, Shahryary Y, Hazarika R,
Grimwood J, Mamidi S, Jenkins J, Grabowski PP, Sreedasyam A, et al. 2020. A
genome assembly and the somatic genetic and epigenetic mutation rate in a wild long-
lived perennial Populus trichocarpa. Genome Biology 21: 259.

254
Holeski LM, Jander G, Agrawal AA. 2012. Transgenerational defense induction and
epigenetic inheritance in plants. Trends in Ecology & Evolution 27: 618–626.
Hollick JB. 2017. Paramutation and related phenomena in diverse species. Nature
Reviews Genetics 18: 5–23.
Horvath S. 2013. DNA methylation age of human tissues and cell types. Genome
Biology 14: 1-19.
Hotchkiss RD. 1948. The quantitative separation of purines, pyrimidines, and
nucleosides by paper chromatography. Journal of Biological Chemistry 175: 315–332.
Hothorn T, Bretz F, Westfall P. 2008. Simultaneous inference in general parametric
models. Biometrical Journal 50: 346–363.
Huang H, Liu R, Niu Q, Tang K, Zhang B, Zhang H, Chen K, Zhu J-K, Lang Z.
2019. Global increase in DNA methylation during orange fruit development and ripening.
Proceedings of the National Academy of Sciences 116: 1430–1436.
Huang L-C, Hsiao L-J, Pu S-Y, Kuo C-I, Huang B-L, Tseng T-C, Huang H-J, Chen
Y-T. 2012. DNA methylation and genome rearrangement characteristics of phase change
in cultured shoots of Sequoia sempervirens. Physiologia Plantarum 145: 360–368.
Huang Y, Pastor WA, Shen Y, Tahiliani M, Liu DR, Rao A. 2010. The behaviour of
5-hydroxymethylcytosine in bisulfite sequencing. PLOS ONE 5: e8888.
Héberlé É, Bardet AF. 2019. Sensitivity of transcription factors to DNA methylation.
Essays in Biochemistry 63: 727–741.
Ito H, Gaubert H, Bucher E, Mirouze M, Vaillant I, Paszkowski J. 2011. An siRNA
pathway prevents transgenerational retrotransposition in plants subjected to stress. Nature
472: 115-119.
Ito T, Nishio H, Tarutani Y, Emura N, Honjo MN, Toyoda A, Fujiyama A,
Kakutani T, Kudoh H. 2019. Seasonal stability and dynamics of DNA methylation in
plants in a natural environment. Genes (Basel) 10: 544.
Jackson J, Johnson L, Jasencakova Z, Zhang X, PerezBurgos L, Singh P, Cheng X,
Schubert I, Jenuwein T, Jacobsen S. 2004. Dimethylation of histone H3 lysine 9 is a
critical mark for DNA methylation and gene silencing in Arabidopsis thaliana.
Chromosoma 112: 308–315.

255
Jaligot E, Rival A, Beulé T, Dussert S, Verdeil J-L. 2000. Somaclonal variation in oil
palm (Elaeis guineensis Jacq.): The DNA methylation hypothesis. Plant Cell Reports 19:
684–690.
Jerominek M, Bull-Hereñu K, Arndt M, Claßen-Bockhoff R. 2014. Live imaging of
developmental processes in a living meristem of Davidia involucrata (Nyssaceae).
Frontiers in Plant Science 5.
Jia XL, Chen YK, Xu XZ, Shen F, Zheng QB, Du Z, Wang Y, Wu T, Xu XF, Han
ZH, et al. 2017. miR156 switches on vegetative phase change under the regulation of
redox signals in apple seedlings. Scientific Reports 7: 14223.
Jiang AL, Xu ZS, Zhao GY, Cui XY, Chen M, Li LC, Ma YZ. 2014. Genome-wide
analysis of the C3H zinc finger transcription factor family and drought responses of
members in Aegilops tauschii. Plant Molecular Biology Reporter 32: 1241–1256.
Jin J, Tian F, Yang DC, Meng YQ, Kong L, Luo J, Gao G. 2017. PlantTFDB 4.0:
Toward a central hub for transcription factors and regulatory interactions in plants.
Nucleic Acids Research 45: D1040–D1045.
Jin X, Pang Y, Jia F, Xiao G, Li Q, Zhu Y. 2013. A potential role for CHH DNA
methylation in cotton fiber growth patterns. PLOS One 8: e60547.
Jung S, Lee T, Cheng C-H, Buble K, Zheng P, Yu J, Humann J, Ficklin SP, Gasic
K, Scott K, et al. 2019. 15 years of GDR: New data and functionality in the Genome
Database for Rosaceae. Nucleic Acids Research 47: D1137–D1145.
Jurečková JF, Sýkorová E, Hafidh S, Honys D, Fajkus J, Fojtová M. 2017. Tissue-
specific expression of telomerase reverse transcriptase gene variants in Nicotiana
tabacum. Planta 245: 549–561.
Jylhävä J, Pedersen NL, Hägg S. 2017. Biological age predictors. EBioMedicine 21:
29–36.
Kakutani T. 2002. Epi-alleles in plants: Inheritance of epigenetic information over
generations. Plant and Cell Physiology 43: 1106–1111.
Kang T, Yu C-Y, Liu Y, Song W-M, Bao Y, Guo X-T, Li B, Zhang H-X. 2020. Subtly
manipulated expression of ZmmiR156 in tobacco improves drought and salt tolerance
without changing the architecture of transgenic plants. Frontiers in Plant Science 10.
Kankel MW, Ramsey DE, Stokes TL, Flowers SK, Haag JR, Jeddeloh JA, Riddle
NC, Verbsky ML, Richards EJ. 2003. Arabidopsis MET1 cytosine methyltransferase
mutants. Genetics 163: 1109–1122.

256
Kenchanmane Raju SK, Ritter EJ, Niederhuth CE. 2019. Establishment,
maintenance, and biological roles of non-CG methylation in plants. Essays in
Biochemistry 63: 743–755.
Kennelly M, O’Mara J, Rivard C, Miller GL, Smith D. 2012. Introduction to abiotic
disorders in plants. The Plant Health Instructor.
Kenworthy WJ, Brim CA, Wernsman EA. 1973. Polyembryony in soybeans. Crop
Science 13: 637-639.
Kerr G. 2001. Production of epicormic shoots on oak (Quercus robur): Effects of
frequency and time of pruning. Forestry 74: 467–477.
Kerstetter RA, Hake S. 1997. Shoot meristem formation in vegetative development. The
Plant Cell 1001–1010.
Kester D, Hellali R, Asay R. 1975. Bud failure in almonds: Variability of bud failure in
Nonpareil almonds. California Agriculture 29: 10–12.
Kester DE, Asay R. 1975. Almonds. In: Janick J, Moore JN, eds. Advances in fruit
breeding. West Lafayette, IN, USA: Purdue University Press, 387–419.
Kester DE, Asay, R. N. 1978. Variability in noninfectious bud-failure of ‘Nonpareil’
almond. I. Location and environment. Journal of the American Society for Horticultural
Science 103: 377–382.
Kester DE, Gradziel TM, Grasselly C. 1991. Almonds (Prunus). Acta Horticulturae
701–760.
Kester DE, Jones RW. 1970. Non-infectious bud-failure from breeding programs of
almond (Prunus amygdalus Batsch). Journal of the American Society for Horticultural
Science 95: 492–496.
Kester DE, Rizzi AD, Williams HE, Jones RW. 1969. Noninfectious bud failure of
almonds in California (2) Identification and control of bud failure in almond varieties.
California Agriculture 23: 14–16.
Kester DE, Shackel KA, Micke WC, Viveros M, Gradziel TM. 2004. Noninfectious
bud failure in ‘Carmel’ almond: I. Pattern of development in vegetative progeny trees.
Journal of the American Society for Horticultural Science 129: 244–249.
Kester DE. 1967a. Noninfectious bud-failure, a nontransmissable inherited disorder in
almond. I. Pattern of phenotype inheritance. Journal of the American Society for
Horticultural Science 92: 7–15.

257
Kester DE. 1967b. Noninfectious bud-failure, a nontransmissible inherited disorder in
almond. II. Progeny tests for bud-failure. Journal of the American Society for
Horticultural Science 92: 16–28.
Kester DE. 1969. Noninfectious bud failure of almonds in California (1) The nature and
origin. California Agriculture 23: 12–14.
Kester DE. 1978. Comparative inheritance of noninfectious bud-failure (BF) in almond
× almond and almond × peach progenies. HortScience 13: 372(abstr.).
Khan M, Rozhon W, Poppenberger B. 2014. The role of hormones in the aging of
plants - A mini-review. Gerontology 60: 49–55.
Kilian A, Heller K, Kleinhofs A. 1998. Development patterns of telomerase activity in
barley and maize. Plant Molecular Biology 37: 621–628.
Kilian A, Stiff C, Kleinhofs A. 1995. Barley telomeres shorten during differentiation but
grow in callus culture. Proceedings of the National Academy of Sciences 92: 9555.
Kimura M, Stone RC, Hunt SC, Skurnick J, Lu X, Cao X, Harley CB, Aviv A. 2010.
Measurement of telomere length by the Southern blot analysis of terminal restriction
fragment lengths. Nature Protocols 5: 1596–1607.
Kirkwood TBL. 2005. Understanding the odd science of aging. Cell 120: 437–447.
Kiselev KV, Tyunin AP, Ogneva ZV, Dubrovina AS. 2015. Age-associated alterations
in the somatic mutation level in Arabidopsis thaliana. Plant Growth Regulation 75: 493–
501.
Kovalchuk I, Kovalchuk O, Hohn B. 2000. Genome-wide variation of the somatic
mutation frequency in transgenic plants. The EMBO Journal 19: 4431–4438.
Kovar˘ik A, Koukalová B, Bezde˘k M, Opatrn´ Z. 1997. Hypermethylation of tobacco
heterochromatic loci in response to osmotic stress. Theoretical and Applied Genetics 95:
301–306.
Kozomara A, Birgaoanu M, Griffiths-Jones S. 2019. miRBase: from microRNA
sequences to function. Nucleic Acids Research 47: D155–D162.
Krueger F, Andrews SR. 2011. Bismark: A flexible aligner and methylation caller for
Bisulfite-Seq applications. Bioinformatics 27: 1571–1572.
Krueger F, Kreck B, Franke A, Andrews SR. 2012. DNA methylome analysis using
short bisulfite sequencing data. Nature Methods 9: 145–151.

258
Krueger F. 2016. Taking appropriate QC measures or RBBS-type or other Seq-
applications with TrimGalore! Available at: https://github.com/FelixKrueger/TrimGalore.
Kuchar M. 2006. Plant telomere-binding proteins. Biologia Plantarum 50: 1–7.
Kumar S, Hilario E, Deng CH, Molloy C. 2020. Turbocharging introgression breeding
of perennial fruit crops: A case study on apple. Horticulture Research 7: 1–7.
Kurdyukov S, Bullock M. 2016. DNA methylation analysis: Choosing the right method.
Biology 5.
Köhler C, Springer N. 2017. Plant epigenomics—deciphering the mechanisms of
epigenetic inheritance and plasticity in plants. Genome Biology 18: 132.
Labra M, Ghiani A, Citterio S, Sgorbati S, Sala F, Vannini C, Ruffini‐Castiglione
M, Bracale M. 2002. Analysis of cytosine methylation pattern in response to water
deficit in pea root tips. Plant Biology 4: 694–699.
Ladizinsky G. 1999. On the origin of almond. Genetic Resources and Crop Evolution
46: 143–147.
Lai T-P, Wright WE, Shay JW. 2018. Comparison of telomere length measurement
methods. Philosophical Transactions of the Royal Society B: Biological Sciences 373:
20160451.
Lam D, Luu P-L, Song JZ, Qu W, Risbridger GP, Lawrence MG, Lu J, Trau M,
Korbie D, Clark SJ, et al. 2020. Comprehensive evaluation of targeted multiplex
bisulphite PCR sequencing for validation of DNA methylation biomarker panels. Clinical
Epigenetics 12: 90.
Lamelas L, Valledor L, Escandón M, Pinto G, Cañal MJ, Meijón M. 2020.
Integrative analysis of the nuclear proteome in Pinus radiata reveals thermopriming
coupled to epigenetic regulation. Journal of Experimental Botany 71: 2040–2057.
Lampinen BD, Tombesi S, Metcalf SG, DeJong TM. 2011. Spur behaviour in almond
trees: Relationships between previous year spur leaf area, fruit bearing and mortality.
Tree Physiology 31: 700–706.
Lang GA, Early JD, Martin GC, Darnell RL. 1987. Endo-, para- and ecodormancy:
physiological terminology and classification for dormancy research. HortScience 22:
371–377.
Lang-Mladek C, Popova O, Kiok K, Berlinger M, Rakic B, Aufsatz W, Jonak C,
Hauser MT, Luschnig C. 2010. Transgenerational inheritance and resetting of stress-
induced loss of epigenetic gene silencing in Arabidopsis. Molecular Plant 3: 594–602.

259
Langmead B, Salzberg SL. 2012. Fast gapped-read alignment with Bowtie 2. Nature
Methods 9: 357–359.
Lauc G, Sinclair D. 2020. Biomarkers of biological age as predictors of COVID-19
disease severity. Aging (Albany NY) 12: 6490–6491.
Law JA, Jacobsen SE. 2010. Establishing, maintaining and modifying DNA methylation
patterns in plants and animals. Nature Reviews Genetics 11: 204–220.
Lawrence M, Huber W, Pagès H, Aboyoun P, Carlson M, Gentleman R, Morgan
MT, Carey VJ. 2013. Software for computing and annotating genomic ranges. PLOS
Computational Biology 9: e1003118.
Le Gac A-L, Lafon-Placette C, Chauveau D, Segura V, Delaunay A, Fichot R,
Marron N, Le Jan I, Berthelot A, Bodineau G, et al. 2018. Winter-dormant shoot
apical meristem in poplar trees shows environmental epigenetic memory. Journal of
Experimental Botany 69: 4821–4837.
Lee JH, Mazarei M, Pfotenhauer AC, Dorrough AB, Poindexter MR, Hewezi T,
Lenaghan SC, Graham DE, Stewart CNJ. 2020. Epigenetic footprints of
CRISPR/Cas9-mediated genome editing in plants. Frontiers in Plant Science 10.
Lee M, Napier CE, Yang SF, Arthur JW, Reddel RR, Pickett HA. 2017. Comparative
analysis of whole genome sequencing-based telomere length measurement techniques.
Methods (San Diego, Calif.) 114: 4–15.
Lee WK, Cho MH. 2019. Epigenetic aspects of telomeric chromatin in Arabidopsis
thaliana. BMB Reports 52: 175–180.
Lee Y, Yoon TH, Lee J, Jeon SY, Lee JH, Lee MK, Chen H, Yun J, Oh SY, Wen X,
et al. 2018. A Lignin molecular brace controls precision processing of cell walls critical
for surface integrity in Arabidopsis. Cell 173: 1468-1480.e9.
Lei M, Zhang H, Julian R, Tang K, Xie S, Zhu J-K. 2015. Regulatory link between
DNA methylation and active demethylation in Arabidopsis. Proceedings of the National
Academy of Sciences 112: 3553–3557.
Li G, Hu F, Zhang Y, Zhao Y, Wang H, Chen T, Cheng X, Cai Y. 2021. Comparative
genomic analysis of superoxide dismutase (SOD) genes in three Rosaceae species and
expression analysis in Pyrus bretschneideri. Physiology and Molecular Biology of Plants
27: 39–52.

260
Li H, Handsaker B, Wysoker A, Fennel T, Ruan J, Homer N, Marth G, Abecasis G,
Durbin R, 1000 Genome Project Data Processing Subgroup. 2009. The Sequence
Alignment/Map format and SAMtools. Bioinformatics 25: 2078–2079.
Li H. 2011. A statistical framework for SNP calling, mutation discovery, association
mapping and population genetical parameter estimation from sequencing data.
Bioinformatics 27: 2987–2993.
Li Q, Eichten SR, Hermanson PJ, Springer NM. 2014. Inheritance patterns and
stability of DNA methylation variation in maize near-isogenic lines. Genetics 196: 667–
676.
Li X, Harris CJ, Zhong Z, Chen W, Liu R, Jia B, Wang Z, Li S, Jacobsen SE, Du J.
2018a. Mechanistic insights into plant SUVH family H3K9 methyltransferases and their
binding to context-biased non-CG DNA methylation. Proceedings of the National
Academy of Sciences 115: E8793–E8802.
Li Y, Kumar S, Qian W. 2018b. Active DNA demethylation: Mechanism and role in
plant development. Plant Cell Reports 37: 77–85.
Li Y, Sasaki H. 2011. Genomic imprinting in mammals: Its life cycle, molecular
mechanisms and reprogramming. Cell Research 21: 466–473.
Liang D, Zhang Z, Wu H, Huang C, Shuai P, Ye C-Y, Tang S, Wang Y, Yang L,
Wang J, et al. 2014. Single-base-resolution methylomes of Populus trichocarpa reveal
the association between DNA methylation and drought stress. BMC Genetics 15: S9.
Liang J, Jiang C, Peng H, Shi Q, Guo X, Yuan Y, Huang L. 2015. Analysis of the age
of Panax ginseng based on telomere length and telomerase activity. Scientific Reports 5.
Liao Y, Smyth GK, Shi W. 2013. The Subread aligner: Fast, accurate and scalable read
mapping by seed-and-vote. Nucleic Acids Research 41: e108.
Licausi F, Ohme‐Takagi M, Perata P. 2013. APETALA2/Ethylene Responsive Factor
(AP2/ERF) transcription factors: Mediators of stress responses and developmental
programs. New Phytologist 199: 639–649.
Lin J, Smith DL, Esteves K, Drury S. 2019. Telomere length measurement by qPCR –
Summary of critical factors and recommendations for assay design.
Psychoneuroendocrinology 99: 271–278.
Lin R, Wang H. 2004. Arabidopsis FHY3/FAR1 gene family and distinct roles of its
members in light control of Arabidopsis development. Plant Physiology 136: 4010–4022.

261
Lister R, O’Malley RC, Tonti-Filippini J, Gregory BD, Berry CC, Millar AH, Ecker
JR. 2008. Highly integrated single-base resolution maps of the epigenome in
Arabidopsis. Cell 133: 523–536.
Litz RE, Knight RL, Gazit S. 1982. Somatic embryos from culture ovules of
polyembryonic Mangifera indica L. Plant Cell Reports 1: 264–266.
Liu D, Qiao N, Song H, Hua X, Du J, Lu H, Li F. 2007. Comparative analysis of
telomeric restriction fragment lengths in different tissues of Ginkgo biloba trees of
different age. Journal of Plant Research 120: 523–528.
Liu G, Xia Y, Liu T, Dai S, Hou X. 2018. The DNA methylome and association of
differentially methylated regions with differential gene expression during heat stress in
Brassica rapa. International Journal of Molecular Science 19: 1414.
Liu J, Feng L, Li J, He Z. 2015. Genetic and epigenetic control of plant heat responses.
Frontiers in Plant Science 6: 267.
Liu J, He Z. 2020. Small DNA methylation, big player in plant abiotic stress responses
and memory. Frontiers in Plant Science 11.
Liu R, Lang Z. 2020. The mechanism and function of active DNA demethylation in
plants. Journal of Integrative Plant Biology 62: 148–159.
Ljung K. 2013. Auxin metabolism and homeostasis during plant development.
Development 140: 943–950.
Lloret A, Badenes ML, Ríos G. 2018. Modulation of dormancy and growth responses in
reproductive buds of temperate trees. Frontiers in Plant Science 9: 1638.
Lodhi MA, Ye GN, Weeden NF, Reisch BI. 1994. A simple and effective method for
DNA extraction from grapevine cultivars and Vitis species. Plant Molecular Biology
Reporter 12: 6-13.
Love MI, Huber W, Anders S. 2014. Moderated estimation of fold change and
dispersion for RNA-seq data with DESeq2. Genome Biology 15: 550.
Luedeling E, Zhang M, Luedeling V, Girvetz EH. 2009. Sensitivity of winter chill
models for fruit and nut trees to climatic changes expected in California’s Central Valley.
Agriculture, Ecosystems & Environment 133: 23–31.
Luo X, Gao Z, Shi T, Cheng Z, Zhang Z, Ni Z. 2013. Identification of miRNAs and
their target genes in peach (Prunus persica L.) using high-throughput sequencing and
degradome analysis. PLOS ONE 8: e79090.

262
Luo X, Ou Y, Li R, He Y. 2020. Maternal transmission of the epigenetic ‘memory of
winter cold’ in Arabidopsis. Nature Plants 6: 1211-1218.
Lämke J, Bäurle I. 2017. Epigenetic and chromatin-based mechanisms in environmental
stress adaptation and stress memory in plants. Genome Biology 18: 124.
Ma L, Li G. 2018. FAR1-RELATED SEQUENCE (FRS) and FRS-RELATED
FACTOR (FRF) family proteins in Arabidopsis growth and development. Frontiers in
Plant Science 9.
Ma W, Ali R, Berkowitz GA. 2006. Characterization of plant phenotypes associated
with loss-of-function of AtCNGC1, a plant cyclic nucleotide gated cation channel. Plant
Physiology and Biochemistry 44: 494–505.
Majer C, Hochholdinger F. 2011. Defining the boundaries: Structure and function of
LOB domain proteins. Trends in Plant Science 16: 47–52.
Mankessi F, Saya AR, Favreau B, Doulbeau S, Conéjéro G, Lartaud M, Verdeil J-L,
Monteuuis O. 2011. Variations of DNA methylation in Eucalyptus
urophylla×Eucalyptus grandis shoot tips and apical meristems of different physiological
ages. Physiologia Plantarum 143: 178–187.
Marchler-Bauer A, Zheng C, Chitsaz F, Derbyshire MK, Geer LY, Geer RC,
Gonzales NR, Gwadz M, Hurwitz DI, Lanczycki CJ, et al. 2013. CDD: Conserved
domains and protein three-dimensional structure. Nucleic Acids Research 41: D348-352.
Marioni RE, Harris SE, Shah S, McRae AF, von Zglinicki T, Martin-Ruiz C, Wray
NR, Visscher PM, Deary IJ. 2016. The epigenetic clock and telomere length are
independently associated with chronological age and mortality. International Journal of
Epidemiology 45: 424–432.
Martínez-García PJ, Dicenta F, Ortega E. 2012. Anomalous embryo sac development
and fruit abortion caused by inbreeding depression in almond (Prunus dulcis). Scientia
Horticulturae 133: 23–30.
Martínez-Gómez P, Arulsekar S, Gradziel TM. 2002. Characterization of twin
embryos in almond. Acta Horticulturae 591: 257–262.
Martínez-Gómez P, Gradziel TM. 2003. Sexual polyembryony in almond. Sexual Plant
Reproduction 16: 135–139.
Matzke MA, Mosher RA. 2014. RNA-directed DNA methylation: An epigenetic
pathway of increasing complexity. Nature Reviews Genetics 15: 394–408.

263
Matías-Hernández L, Aguilar-Jaramillo AE, Marín-González E, Suárez-López P,
Pelaz S. 2014. RAV genes: Regulation of floral induction and beyond. Annals of Botany
114: 1459–1470.
Meier AR, Saunders MR, Michler CH. 2012. Epicormic buds in trees: A review of bud
establishment, development and dormancy release. Tree Physiology 32: 565–584.
Mera R, Massey N, Rupp DE, Mote P, Allen M, Frumhoff PC. 2015. Climate change,
climate justice and the application of probabilistic event attribution to summer heat
extremes in the California Central Valley. Climatic Change 133: 427–438.
Michalak M, Plitta-Michalak BP, Naskręt-Barciszewska M, Barciszewski J,
Bujarska-Borkowska B, Chmielarz P. 2015. Global 5-methylcytosine alterations in
DNA during ageing of Quercus robur seeds. Annals of Botany 116: 369–376.
Micke WC. 1996. Almond Production Manual. Davis, CA, USA: UCANR Publications.
Milliron L, Gradziel TM, Jarvis-Shean K. 2020. Monterey and the Leafing Failure
2020: What are we seeing? University of California Davis: Fruit & Nut Research and
Information Center.
Monteuuis O, Baurens FC, Goh DKS, Quimado M, Doulbeau S, Verdeil JL. 2009.
DNA methylation in Acacia mangium in vitro and ex-vitro buds, in relation to their
within-shoot position, age and leaf morphology of the shoots. Silvae Genetica 58: 287–
292.
Monteuuis O, Doulbeau S, Verdeil J-L. 2008. DNA methylation in different origin
clonal offspring from a mature Sequoiadendron giganteum genotype. Trees 22: 779.
Montpetit AJ, Alhareeri AA, Montpetit M, Starkweather AR, Elmore LW, Filler K,
Mohanraj L, Burton CW, Menzies VS, Lyon DE, et al. 2014. Telomere length: A
review of methods for measurement. Nursing Research 63: 289–299.
Moore LD, Le T, Fan G. 2013. DNA methylation and its basic function.
Neuropsychopharmacology 38: 23–38.
Morales M, Oñate M, García MB, Munné‐Bosch S. 2013. Photo-oxidative stress
markers reveal absence of physiological deterioration with ageing in Borderea pyrenaica,
an extraordinarily long-lived herb. Journal of Ecology 101: 555–565.
Moriguchi R, Kato K, Kanahama K, Kanayama Y, Kikuchi H. 2007. Analysis of
telomere lengths in apple and cherry trees. Acta Horticulturae 738: 389–395.
Mueller-Roeber B, Balazadeh S. 2014. Auxin and its role in plant senescence. Journal
of Plant Growth Regulation 33: 21–33.

264
Munné-Bosch S, Alegre L. 2002. Plant aging increases oxidative stress in chloroplasts.
Planta 214: 608–615.
Munné-Bosch S, Lalueza P. 2007. Age-related changes in oxidative stress markers and
abscisic acid levels in a drought-tolerant shrub, Cistus clusii grown under Mediterranean
field conditions. Planta 225: 1039–1049.
Munné-Bosch S. 2007. Aging in perennials. Critical Reviews in Plant Science 26: 123–
138.
Munné-Bosch S. 2008. Do perennials really senesce? Trends in Plant Science 13: 216–
220.
Munné-Bosch S. 2020. Long-lived trees are not immortal. Trends in Plant Science 25:
846–849.
Myers SC. 1993. Preharvest watersprout removal influences canopy light relations, fruit
quality, and flower bud formation of ‘Redskin’ peach trees. Journal of the American
Society for Horticultural Science 118: 442–445.
Nagata T, Nemoto Y, Hasezawa S. 1992. Tobacco BY-2 cell line as the “HeLa” cell in
the cell biology of higher plants. In: Jeon KW, Friedlander M, eds. International Review
of Cytology. Academic Press, 1–30.
Nagpal N, Agarwal S. 2020. Telomerase RNA processing: Implications for human
health and disease. STEM CELLS 38: 1532–1543.
Naydenov M, Baev V, Apostolova E, Gospodinova N, Sablok G, Gozmanova M,
Yahubyan G. 2015. High-temperature effect on genes engaged in DNA methylation and
affected by DNA methylation in Arabidopsis. Plant Physiology and Biochemistry 87:
102–108.
Negrón C, Contador L, Lampinen BD, Metcalf SG, Guédon Y, Costes E, DeJong
TM. 2014. Differences in proleptic and epicormic shoot structures in relation to water
deficit and growth rate in almond trees (Prunus dulcis). Annals of Botany 113: 545–554.
Nelson ADL, Beilstein MA, Shippen DE. 2014. Plant telomeres and telomerase. In
Howell SH, ed. Molecular Biology. New York, NY: Springer, 25–49.
Nersisyan L, Arakelyan A. 2015. Computel: Computation of mean telomere length from
whole-genome next-generation sequencing data. PLOS ONE 10.

265
Niederhuth CE, Bewick AJ, Ji L, Alabady MS, Kim KD, Li Q, Rohr NA, Rambani
A, Burke JM, Udall JA et al. 2016. Widespread natural variation of DNA methylation
within angiosperms. Genome Biology 17: 194.
Noble D. 2015. Conrad Waddington and the origin of epigenetics. Journal of
Experimental Biology 218: 816–818.
Ogneva ZV, Dubrovina AS, Kiselev KV. 2016. Age-associated alterations in DNA
methylation and expression of methyltransferase and demethylase genes in Arabidopsis
thaliana. Biologia Plantarum 60: 628–634.
Ogneva ZV, Suprun AR, Dubrovina AS, Kiselev KV. 2019. Effect of 5-azacytidine
induced DNA demethylation on abiotic stress tolerance in Arabidopsis thaliana. Plant
Protection Science 55: 73–80.
Ogrocká A, Polanská P, Majerová E, Janeba Z, Fajkus J, Fojtová M. 2014.
Compromised telomere maintenance in hypomethylated Arabidopsis thaliana plants.
Nucleic Acids Research 42: 2919–2931.
Oguchi K, Liu H, Tamura K, Takahashi H. 1999. Molecular cloning and
characterization of AtTERT, a telomerase reverse transcriptase homolog in Arabidopsis
thaliana. FEBS Letters 457: 465–469.
Ohio Supercomputer Center. 1987. Ohio Supercomputer Center. Columbus OH: Ohio
Supercomputer Center. http://osc.edu/ark:/19495/f5s1ph73.
Okamuro JK, Caster B, Villarroel R, Montagu MV, Jofuku KD. 1997. The AP2
domain of APETALA2 defines a large new family of DNA binding proteins in
Arabidopsis. PNAS 94: 7076–7081.
Olova N, Krueger F, Andrews S, Oxley D, Berrens RV, Branco MR, Reik W. 2018.
Comparison of whole-genome bisulfite sequencing library preparation strategies
identifies sources of biases affecting DNA methylation data. Genome Biology 19: 33.
Omidbakhshfard MA, Proost S, Fujikura U, Mueller-Roeber B. 2015. Growth-
Regulating Factors (GRFs): A small transcription factor family with important functions
in plant biology. Molecular Plant 8: 998–1010.
Ong-Abdullah M, Ordway JM, Jiang N, Ooi S-E, Kok S-Y, Sarpan N, Azimi N,
Hashim AT, Ishak Z, Rosli SK, et al. 2015. Loss of Karma transposon methylation
underlies the mantled somaclonal variant of oil palm. Nature 525: 533–537.
Orr AJ, Padovan A, Kainer D, Külheim C, Bromham L, Bustos-Segura C, Foley W,
Haff T, Hsieh J-F, Morales-Suarez A, et al. 2020. A phylogenomic approach reveals a

266
low somatic mutation rate in a long-lived plant. Proceedings of the Royal Society B:
Biological Sciences 287: 20192364.
Ortega E, Dicenta F. 2003. Inheritance of self-compatibility in almond: Breeding
strategies to assure self-compatibility in the progeny. Theoretical and Applied Genetics
106: 904–911.
Ossowski S, Schneeberger K, Lucas-Lledo JI, Warthmann N, CLark RM, Shaw
RG, Weigel D, Lynch M. 2010. The rate and molecular spectrum of spontaneous
mutations in Arabidopsis thaliana. Science 327: 92–95.
Ou X, Zhang Y, Xu C, Lin X, Zang Q, Zhuang T, Jiang L, Wettstein D von, Liu B.
2012. Transgenerational inheritance of modified DNA methylation patterns and enhanced
tolerance induced by heavy metal stress in rice (Oryza sativa L.). PLOS ONE 7: e41143.
Park Y, Wu H. 2016. Differential methylation analysis for BS-seq data under general
experimental design. Bioinformatics 32: 1446–1453.
Parker LE, Abatzoglou JT. 2018. Shifts in the thermal niche of almond under climate
change. Climatic Change 147: 211–224.
Parle-Mcdermott A, Harrison A. 2011. DNA methylation: A timeline of methods and
applications. Frontiers in Genetics 2.
Parrilla-Doblas JT, Roldán-Arjona T, Ariza RR, Córdoba-Cañero D. 2019. Active
DNA demethylation in plants. International Journal of Molecular Sciences 20: 4683.
Paul LK, Rinne PL, van der Schoot C. 2014. Shoot meristems of deciduous woody
perennials: Self-organization and morphogenetic transitions. Current Opinion in Plant
Biology 17: 86–95.
Paun O, Verhoeven KJF, Richards CL. 2019. Opportunities and limitations of reduced
representation bisulfite sequencing in plant ecological epigenomics. New Phytologist 221:
738–742.
Payne AC, Chiang ZD, Reginato PL, Mangiameli SM, Murray EM, Yao C-C,
Markoulaki S, Earl AS, Labade AS, Jaenisch R, et al. 2020. In situ genome
sequencing resolves DNA sequence and structure in intact biological samples. Science
eaay3446.
Peng FY, Weselake RJ. 2013. Genome-wide identification and analysis of the B3
superfamily of transcription factors in Brassicaceae and major crop plants. Theoretical
and Applied Genetics 126: 1305–1319.

267
Petronis A. 2006. Epigenetics and twins: three variations on the theme. Trends in
Genetics 22: 347–350.
Picard CL, Gehring M. 2017. Proximal methylation features associated with
nonrandom changes in gene body methylation. Genome Biology 18: 73.
Pich U, Fuchs J, Schubert I. 1996. How do Alliaceae stabilize their chromosome ends
in the absence of TTTAGGG sequences? Chromosome Research 4: 207–213.
Poethig RS. 2003. Phase change and the regulation of developmental timing in plants.
Science 301: 334–336.
Prats-Llinàs MT, López G, Fyhrie K, Pallas B, Guédon Y, Costes E, DeJong TM.
2019. Long proleptic and sylleptic shoots in peach (Prunus persica L. Batsch) trees have
similar, predetermined, maximum numbers of nodes and bud fate patterns. Annals of
Botany 123: 993–1004.
Procházková Schrumpfová P, Fojtová M, Fajkus J. 2019. Telomeres in plants and
humans: Not so different, not so similar. Cells 8: 58.
Procházková Schrumpfová P, Schořová Š, Fajkus J. 2016. Telomere- and telomerase-
associated proteins and their functions in the plant cell. Frontiers in Plant Science 7.
Prudencio ÁS, Dicenta F, Martínez-Gómez P. 2018a. Monitoring dormancy transition
in almond [Prunus dulcis (Miller) Webb] during cold and warm Mediterranean seasons
through the analysis of a DAM (dormancy-associated MADS-box) gene. Horticulturae 4:
41.
Prudencio ÁS, Hoeberichts FA, Dicenta F, Martínez-Gómez P, Sánchez-Pérez R.
2020. Identification of early and late flowering time candidate genes in endodormant and
ecodormant almond flower buds. Tree Physiology tpaa151.
Prudencio ÁS, Martínez-Gómez P, Dicenta F. 2018b. Evaluation of breaking
dormancy, flowering and productivity of extra-late and ultra-late flowering almond
cultivars during cold and warm seasons in South-East of Spain. Scientia Horticulturae
235: 39–46.
Prudencio ÁS, Werner O, Martínez-García PJ, Dicenta F, Ros RM, Martínez-
Gómez P. 2018c. DNA methylation analysis of dormancy release in almond (Prunus
dulcis) flower buds using epi-genotyping by sequencing. International Journal of
Molecular Sciences 19.
Qian Y, Hu W, Liao J, Zhang J, Ren Q. 2019. The Dynamics of DNA methylation in
the maize (Zea mays L.) inbred line B73 response to heat stress at the seedling stage.
Biochemical and Biophysical Research Communications 512: 742–749.

268
Quadrana L, Almeida J, Asís R, Duffy T, Dominguez PG, Bermúdez L, Conti G,
Corrêa da Silva JV, Peralta IE, Colot V, et al. 2014. Natural occurring epialleles
determine vitamin E accumulation in tomato fruits. Nature Communications 5: 4027.
Quadrana L, Colot V. 2016. Plant transgenerational epigenetics. Annual Review of
Genetics 50: 467–491.
Quinlan AR, Hall IM. 2010. BEDTools: A flexible suite of utilities for comparing
genomic features. Bioinformatics 26: 841–842.
R Core Team. 2020. A Language and Environment for Statistical Computing. R
Foundation for Statistical Computing, Vienna, Austria https://www.R-project.org
Raga V, Bernet GP, Carbonell EA, Asins MJ. 2012. Segregation and linkage analyses
in two complex populations derived from the citrus rootstock Cleopatra mandarin.
Inheritance of seed reproductive traits. Tree Genetics & Genomes 8: 1061–1071.
Raizis AM, Schmitt F, Jost JP. 1995. A bisulfite method of 5-methylcytosine mapping
that minimizes template degradation. Analytical Biochemistry 226: 161–166.
Raj S, Bräutigam K, Hamanishi ET, Wilkins O, Thomas BR, Schroeder W,
Mansfield SD, Plant AL, Campbell MM. 2011. Clone history shapes Populus drought
responses. Proceedings of the National Academy of Sciences 108: 12521–12526.
Rambani A, Rice JH, Liu J, Lane T, Ranjan P, Mazarei M, Pantalone V, Stewart
CN, Staton M, Hewezi T. 2015. The methylome of soybean roots during the compatible
interaction with the soybean cyst nematode. Plant Physiology 168: 1364–1377.
Ramsahoye BH. 2002. Measurement of genome wide DNA methylation by reversed-
phase high-performance liquid chromatography. Methods (San Diego, Calif.) 27: 156–
161.
Rankenberg T, Geldhof B, van Veen H, Holsteens K, Van de Poel B, Sasidharan R.
2021. Age-dependent abiotic stress resilience in plants. Trends in Plant Science
10.1016/j.tplants.2020.12.016
Richards EJ. 2006. Inherited epigenetic variation — revisiting soft inheritance. Nature
Reviews Genetics 7: 395–401.
Richmond TA, Somerville CR. 2000. The cellulose synthase superfamily. Plant
Physiology 124: 495–498.
Rothkegel K, Sánchez E, Montes C, Greve M, Tapia S, Bravo S, Prieto H, Almeida
AM. 2017. DNA methylation and small interference RNAs participate in the regulation

269
of MADS-box genes involved in dormancy in sweet cherry (Prunus avium L.). Tree
Physiology 37: 1739–1751.
Routier-Kierzkowska A-L, Kwiatkowska D. 2008. New stereoscopic reconstruction
protocol for scanning electron microscope images and its application to in vivo replicas of
the shoot apical meristem. Functional Plant Biology: FPB 35: 1034–1046.
Runov AL, Vonsky MS, Mikhelson VM. 2015. DNA methylation level and telomere
length as a basis for modeling of the biological aging clock. Cell and Tissue Biology 9:
261–264.
Ríos G, Leida C, Conejero A, Badenes ML. 2014. Epigenetic regulation of bud
dormancy events in perennial plants. Frontiers in Plant Science 5: 247.
Saikia BN, Kester DE, Bradley MV. 1966. Dormant vegetative buds in normal and
bud-failure forms of almond (Prunus amygdalus Batsch.). Journal of the American
Society for Horticultural Science 89: 150–156.
Salguero-Gomez R. 2018. Implications of clonality for ageing research. Evolutionary
Ecology 32: 9–28.
Sanchez DH, Paszkowski J. 2014. Heat-induced release of epigenetic silencing reveals
the concealed role of an imprinted plant gene. PLOS Genetics 10: e1004806.
Sanders JL, Newman AB. 2013. Telomere length in epidemiology: A biomarker of
aging, age-related disease, both, or neither? Epidemiologic Reviews 35: 112–131.
Santamaría ME, Hasbún R, Valera MJ, Meijón M, Valledor L, Rodríguez JL,
Toorop PE, Cañal MJ, Rodríguez R. 2009. Acetylated H4 histone and genomic DNA
methylation patterns during bud set and bud burst in Castanea sativa. Journal of Plant
Physiology 166: 1360–1369.
Saraswat S, Yadav AK, Sirohi P, Singh NK. 2017. Role of epigenetics in crop
improvement: Water and heat stress. Journal of Plant Biology 60: 231–240.
Satterlee JW, Strable J, Scanlon MJ. 2020. Plant stem-cell organization and
differentiation at single-cell resolution. Proceedings of the National Academy of Sciences
117: 33689–33699.
Schein RD. 1952. Studies of the bud-failure disorders in almonds in California. PhD
thesis, University of California Davis, Davis, CA, USA.
Schmid-Siegert E, Sarkar N, Iseli C, Calderon S, Gouhier-Darimont C, Chrast J,
Cattaneo P, Schütz F, Farinelli L, Pagni M, et al. 2017. Low number of fixed somatic
mutations in a long-lived oak tree. Nature Plants 3: 926.

270
Schmidt M, Van Bel M, Woloszynska M, Slabbinck B, Martens C, De Block M,
Coppens F, Van Lijsebettens M. 2017. Plant-RRBS, a bisulfite and next-generation
sequencing-based methylome profiling method enriching for coverage of cytosine
positions. BMC Plant Biology 17: 115.
Schoen DJ, Schultz ST. 2019. Somatic mutation and evolution in plants. Annual Review
of Ecology, Evolution, and Systematics 50: 49–73.
Schultz MD, Schmitz RJ, Ecker JR. 2012. ‘Leveling’ the playing field for analyses of
single-base resolution DNA methylomes. Trends in Genetics 28: 583–585.
Šestáková Š, Šálek C, Remešová H. 2019. DNA methylation validation methods: A
coherent review with practical comparison. Biological Procedures Online 21: 19.
Seymour DK, Becker C. 2017. The causes and consequences of DNA methylome
variation in plants. Current Opinion in Plant Biology 36: 56–63.
Sharma VK, Fletcher JC. 2002. Maintenance of shoot and floral meristem cell
proliferation and fate. Plant Physiology 129: 31–39.
Sigrist CJA, de Castro E, Cerutti L, Cuche BA, Hulo N, Bridge A, Bougueleret L,
Xenarios I. 2013. New and continuing developments at PROSITE. Nucleic Acids
Research 41: D344-347.
Socias i Company R, Alonso JM, Kodad O, Gradziel TM. 2012. Almond. In: Badenes
ML, Byrne DH, eds. Fruit breeding. Boston, MA: Springer US, 697–728.
Socias i Company R, Gradziel TM. 2017. Almonds: botany, production and uses.
Wallingford: CABI.
Socias i Company R, Martí ÀF i, Kodad O, Alonso JM. 2010. Self-compatibility
evaluation in almond: Strategies, achievements, and failures. HortScience 45: 1155–
1159.
Socias i Company R. 1990. Breeding self-compatible almonds. In: Plant breeding
reviews. John Wiley & Sons, Ltd, 313–338.
Socias i Company R. 2002. Latest advances in almond self-compatibility. Acta
Horticulturae 205–212.
Sollars ESA, Buggs RJA. 2018. Genome-wide epigenetic variation among ash trees
differing in susceptibility to a fungal disease. BMC Genomics 19: 502.
Song H, Liu D, Li F, Lu H. 2011. Season- and age-associated telomerase activity in
Ginkgo biloba L. Molecular Biology Reports 38: 1799–1805.

271
Song L, James SR, Kazim L, Karpf AR. 2005. Specific method for the determination
of genomic DNA methylation by liquid chromatography-electrospray ionization tandem
mass spectrometry. Analytical Chemistry 77: 504–510.
Song X, Ma X, Li C, Hu J, Yang Q, Wang T, Wang L, Wang J, Guo D, Ge W et al.
2018. Comprehensive analyses of the BES1 gene family in Brassica napus and
examination of their evolutionary pattern in representative species. BMC Genomics 19:
346.
Song Y, Ma K, Ci D, Chen Q, Tian J, Zhang D. 2013. Sexual dimorphic floral
development in dioecious plants revealed by transcriptome, phytohormone, and DNA
methylation analysis in Populus tomentosa. Plant Molecular Biology 83: 559–576.
Soundararajan P, Won SY, Kim JS. 2019. Insight on Rosaceae family with genome
sequencing and functional genomics perspective (N Gupta, Ed.). BioMed Research
International 2019 7519687.
Spiegel-Roy P. 1986. Domestication of fruit trees. In: Barigozzi Claudio, ed. The origin
and domestication of cultivated plants: Symposium. New York, N.Y., U.S.A.: Elsevier,
218.
Stach D, Schmitz OJ, Stilgenbauer S, Benner A, Döhner H, Wiessler M, Lyko F.
2003. Capillary electrophoretic analysis of genomic DNA methylation levels. Nucleic
Acids Research 31: E2.
Stephens M. 2017. False discovery rates: A new deal. Biostatistics 18: 275–294.
Stone EL, Stone MH. 1943. ‘Dormant’ versus ‘adventitious’ buds. Science 98: 62–62.
Stroud H, Do T, Du J, Zhong X, Feng S, Johnson L, Patel DJ, Jacobsen SE. 2014.
Non-CG methylation patterns shape the epigenetic landscape in Arabidopsis. Nature
Structural & Molecular Biology 21: 64–72.
Sudan J, Raina M, Singh R. 2018. Plant epigenetic mechanisms: role in abiotic stress
and their generational heritability. 3 Biotech 8.
Sun X, Han Y, Zhou L, Chen E, Lu B, Liu Y, Pan X, Cowley AW Jr, Liang M, Wu
Q, et al. 2018. A comprehensive evaluation of alignment software for reduced
representation bisulfite sequencing data. Bioinformatics 34: 2715–2723.
Svendsen AJ, Gervin K, Lyle R, Christiansen L, Kyvik K, Junker P, Nielsen C,
Houen G, Tan Q. 2016. Differentially methylated DNA regions in monozygotic twin
pairs discordant for rheumatoid arthritis: An epigenome-wide study. Frontiers in
Immunology 7: 510.

272
Swaminathan K, Peterson K, Jack T. 2008. The plant B3 superfamily. Trends in Plant
Science 13: 647–655.
Sweetlove L, Gutierrez C. 2019. The journey to the end of the chromosome: Delivering
active telomerase to telomeres in plants. The Plant Journal 98: 193–194.
Sykorova E, Lim KY, Chase MW, Knapp S, Leitch IJ, Leitch AR, Fajkus J. 2003.
The absence of Arabidopsis-type telomeres in Cestrum and closely related genera Vestia
and Sessea (Solanaceae): First evidence from eudicots. The Plant Journal 34: 283–291.
Syngelaki E, Schinkel CCF, Klatt S, Hörandl E. 2020. Effects of temperature
treatments on cytosine-methylation profiles of diploid and autotetraploid plants of the
alpine species Ranunculus kuepferi (Ranunculaceae). Frontiers in Plant Science 11.
Sánchez-Pérez R, Pavan S, Mazzeo R, Moldovan C, Cigliano RA, Cueto JD,
Ricciardi F, Lotti C, Ricciardi L, Dicenta F, et al. 2019. Mutation of a bHLH
transcription factor allowed almond domestication. Science 364: 1095–1098.
Tan Q, Christiansen L, von Bornemann Hjelmborg J, and Christensen K. 2015.
Twin methodology in epigenetic studies. Journal of Experimental Biology 218: 134–139.
Tanaka K, Okamoto A. 2007. Degradation of DNA by bisulfite treatment. Bioorganic
& Medicinal Chemistry Letters 17: 1912–1915.
Tang K, Lang Z, Zhang H, Zhu J-K. 2016. The DNA demethylase ROS1 targets
genomic regions with distinct chromatin modifications. Nature Plants 2: 1–10.
The Uniprot Consortium. 2019. Uniprot: a worldwide hub of protein knowledge.
Nucleic Acids Research 47: D506-D515.
Theune ML, Bloss U, Brand LH, Ladwig F, Wanke D. 2019. Phylogenetic analyses
and GAGA-motif binding studies of BBR/BPC proteins lend to clues in GAGA-motif
recognition and a regulatory role in brassinosteroid signaling. Frontiers in Plant Science
10: 466.
Thomas H. 2002. Ageing in plants. Mechanisms of Ageing and Development 123: 747–
753.
Thomas H. 2013. Senescence, ageing and death of the whole plant. The New Phytologist
197: 696–711.
Tian F, Yang DC, Meng YQ, Jin J, Gao G. 2019. PlantRegMap: Charting functional
regulatory maps in plants. Nucleic Acids Research 48: D1104-D1113.

273
Tong Z, Gao Z, Wang F, Zhou J, Zhang Z. 2009. Selection of reliable reference genes
for gene expression studies in peach using real-time PCR. BMC Molecular Biology 10:
71.
Tremblay L, Levasseur C, Tremblay FM. 1999. Frequency of somaclonal variation in
plants of black spruce (Picea mariana, Pinaceae) and white spruce (P. glauca, Pinaceae)
derived from somatic embryogenesis and identification of some factors involved in
genetic instability. American Journal of Botany 86: 1373–1381.
Tricker PJ. 2015. Transgenerational inheritance or resetting of stress-induced epigenetic
modifications: Two sides of the same coin. Frontiers in Plant Science 6: 699.
Tymoszuk S, Mika A, Antoszewski R. 1981. The role of water shoots in modifying
light climate within the apple tree canopy and in nutrition of fruits. Acta Horticulturae
90–90.
USDA NASS. 2019. 2019 California Almond Forecast. USDA National Agricultural
Statistics Service, Pacific Regional Office.
Ushijima K, Sassa H, Dandekar AM, Gradziel TM, Tao R, Hirano H. 2003.
Structural and transcriptional analysis of the self-incompatibility locus of almond:
Identification of a pollen-expressed F-box gene with haplotype-specific polymorphism.
The Plant Cell 15: 771–781.
Vaisvila R, Ponnaluri VKC, Sun Z, Langhorst BW, Saleh L, Guan S, Dai N,
Campbell MA, Sexton BS, Marks K, et al. 2020. EM-seq: Detection of DNA
methylation at single base resolution from picograms of DNA. bioRxiv:
2019.12.20.884692.
Valledor L, Meijón M, Hasbún R, Jesús Cañal M, Rodríguez R. 2010. Variations in
DNA methylation, acetylated histone H4, and methylated histone H3 during Pinus
radiata needle maturation in relation to the loss of in vitro organogenic capability.
Journal of Plant Physiology 167: 351–357.
Van Dijk H. 2009. Ageing effects in an iteroparous plant species with a variable life
span. Annals of Botany 104: 115–124.
Vandepoele K, Vlieghe K, Florquin K, Hennig L, Beemster GTS, Gruissem W, Van
de Peer Y, Inzé D, De Veylder L. 2005. Genome-wide identification of potential plant
E2F target genes. Plant Physiology 139: 316–328.
Vaquero-Sedas MI, Vega-Palas MA. 2014. Determination of Arabidopsis thaliana
telomere length by PCR. Scientific Reports 4.

274
Varotto S, Tani E, Abraham E, Krugman T, Kapazoglou A, Melzer R, Radanović A,
Miladinović D. 2020. Epigenetics: Possible applications in climate-smart crop breeding.
Journal of Experimental Botany 71: 5223–5236.
Vega-Vaquero A, Bonora G, Morselli M, Vaquero-Sedas MI, Rubbi L, Pellegrini M,
Vega-Palas MA. 2016. Novel features of telomere biology revealed by the absence of
telomeric DNA methylation. Genome Research 26: 1047–1056.
Verhulst S. 2020. Improving comparability between qPCR-based telomere studies.
Molecular Ecology Resources 20: 11–13.
Vilanova S, Alonso D, Gramazio P, Plazas M, García-Fortea E, Ferrante P, Schmidt
M, Díez MJ, Usadel B, Giuliano G, et al. 2020. SILEX: a fast and inexpensive high-
quality DNA extraction method suitable for multiple sequencing platforms and
recalcitrant plant species. Plant Methods 16: 110.
Waddington CH. 1956. Genetic assimilation of the bithorax phenotype. Evolution 10: 1–
13.
Waddington CH. 2012. The epigenotype. International Journal of Epidemiology 41:
10–13.
Wang J, Xia Y, Li L, Gong D, Yao Y, Luo H, Lu H, Yi N, Wu H, Zhang X, et al.
2013. Double restriction-enzyme digestion improves the coverage and accuracy of
genome-wide CpG methylation profiling by reduced representation bisulfite sequencing.
BMC Genomics 14: 11.
Wang T, Hao R, Pan H, Cheng T, Zhang Q. 2014. Selection of suitable reference
genes for quantitative real-time polymerase chain reaction in Prunus mume during
flowering stages and under different abiotic stress conditions. Journal of the American
Society for Horticultural Science 139: 113–122.
Wang T, Ma J, Hogan AN, Fong S, Licon K, Tsui B, Kreisberg JF, Adams PD,
Carvunis A-R, Bannasch DL, et al. 2020. Quantitative translation of dog-to-human
aging by conserved remodeling of the DNA methylome. Cell Systems 11: 176-185.e6.
Wang W, Qin Q, Sun F, Wang Y, Xu D, Li Z, Fu B. 2016. Genome-wide differences
in DNA methylation changes in two contrasting rice genotypes in response to drought
conditions. Frontiers in Plant Science 7.
Warnecke PM, Stirzaker C, Song J, Grunau C, Melki JR, Clark SJ. 2002.
Identification and resolution of artifacts in bisulfite sequencing. Methods (San Diego,
Calif.) 27: 101–107.

275
Watson JM, Riha K. 2010. Comparative biology of telomeres: Where plants stand.
FEBS Letters 584: 3752–3759.
Watson JM, Riha K. 2011. Telomeres, aging, and plants: From weeds to Methuselah –
A mini-review. Gerontology 57: 129–136.
Wibowo A, Becker C, Durr J, Price J, Spaepen S, Hilton S, Putra H, Papareddy R,
Saintain Q, Harvey S, et al. 2018. Partial maintenance of organ-specific epigenetic
marks during plant asexual reproduction leads to heritable phenotypic variation.
Proceedings of the National Academy of Sciences 115: E9145–E9152.
Wibowo A, Becker C, Marconi G, Durr J, Price J, Hagmann J, Papareddy R, Putra
H, Kageyama J, Becker J, et al. 2016. Hyperosmotic stress memory in Arabidopsis is
mediated by distinct epigenetically labile sites in the genome and is restricted in the male
germline by DNA glycosylase activity. eLife 5: e13546.
Wickham H. 2016. ggplot2: Elegant Graphics for Data Analysis. Springer-Verlag New
York. Available at: https://ggplot2.tidyverse.org.
Wickson EJ. 1914. The California Fruits and How to Grow Them. San Francisco, CA:
Pacific Rural.
Wilson BF. 2000. Apical control of branch growth and angle in woody plants. American
Journal of Botany 87: 601–607.
Wilson EE, Schein RD. 1956. The nature and development of noninfectious bud failure
in almonds. Hilgardia 24: 519–542.
Wilson EE, Stout GL. 1944. A bud-failure disorder in almond trees. Bulletin of the
California Department of Agriculture 33: 60–64.
Wilson EE. 1950. Observations on the bud-failure disorder in Jordanolo, a new variety of
almond. Phytopathology 40: 970.
Wilson EE. 1952. Development of bud-failure in the Jordanolo variety of almond.
Phytopathology 42: 520.
Wisniewski M, Norelli J, Artlip T. 2015. Overexpression of a peach CBF gene in apple:
a model for understanding the integration of growth, dormancy, and cold hardiness in
woody plants. Frontiers in Plant Science 6: 85.
Woo HR, Masclaux-Daubresse C, Lim PO. 2018. Plant senescence: How plants know
when and how to die. Journal of Experimental Botany 69: 715–718.

276
Wreczycka K, Gosdschan A, Yusuf D, Grüning B, Assenov Y, Akalin A. 2017.
Strategies for analyzing bisulfite sequencing data. Journal of Biotechnology 261: 105–
115.
Wu G, Park MY, Conway SR, Wang J-W, Weigel D, Poethig RS. 2009. The
sequential action of miR156 and miR172 regulates developmental timing in Arabidopsis.
Cell 138: 750–759.
Wu G, Poethig RS. 2006. Temporal regulation of shoot development in Arabidopsis
thaliana by miR156 and its target SPL3. Development 133: 3539–3547.
Wu H, Wang C, Wu Z. 2013. A new shrinkage estimator for dispersion improves
differential expression detection in RNA-seq data. Biostatistics 14: 232–243.
Wu H, Xu T, Feng H, Chen L, Li B, Yao B, Qin Z, Jin P, Conneely KN. 2015.
Detection of differentially methylated regions from whole-genome bisulfite sequencing
data without replicates. Nucleic Acids Research 43: e141.
Wyler M, Stritt C, Walser J-C, Baroux C, Roulin AC. 2020. Impact of transposable
elements on methylation and gene expression across natural accessions of Brachypodium
distachyon. Genome Biology and Evolution 12: 1994–2001.
Xiao F-H, Wang H-T, Kong Q-P. 2019. Dynamic DNA methylation during aging: A
“prophet” of age-related outcomes. Frontiers in Genetics 10.
Xie M, Chen H, Huang L, O’Neil RC, Shokhirev MN, Ecker JR. 2018. A B-ARR-
mediated cytokinin transcriptional network directs hormone cross-regulation and shoot
development. Nature Communications 9: 1604.
Xie X, Shippen DE. 2018. DDM1 guards against telomere truncation in Arabidopsis.
Plant Cell Reports 37: 501–513.
Xie Y, Zhou Q, Zhao Y, Li Q, Liu Y, Ma M, Wang B, Shen R, Zheng Z, Wang H.
2020. FHY3 and FAR1 integrate light signals with the miR156-SPL module-mediated
aging pathway to regulate Arabidopsis flowering. Molecular Plant 13: 483–498.
Xie Z, Nolan TM, Jiang H, Yin Y. 2019. AP2/ERF transcription factor regulatory
networks in hormone and abiotic stress responses in Arabidopsis. Frontiers Plant Science
10: 228.
Xu M, Li X, Korban SS. 2000. AFLP-based detection of DNA methylation. Plant
Molecular Biology Reporter 18: 361–368.
Xu Y, Zhang L, Wu G. 2018. Epigenetic regulation of juvenile-to-adult transition in
plants. Frontiers in Plant Science 9.

277
Xu Z, Zhang Q, Sun L, Du D, Cheng T, Pan H, Yang W, Wang J. 2014. Genome-
wide identification, characterisation and expression analysis of the MADS-box gene
family in Prunus mume. Molecular Genetics and Genomics 289: 903–920.
Yamane H, Ooka T, Jotatsu H, Hosaka Y, Sasaki R, Tao R. 2011. Expressional
regulation of PpDAM5 and PpDAM6, peach (Prunus persica) dormancy-associated
MADS-box genes, by low temperature and dormancy-breaking reagent treatment.
Journal of Experimental Botany 62: 3481–3488.
Yan H, Kikuchi S, Neumann P, Zhang W, Wu Y, Chen F, Jiang J. 2010. Genome-
wide mapping of cytosine methylation revealed dynamic DNA methylation patterns
associated with genes and centromeres in rice. The Plant Journal 63: 353–365.
Yanagisawa S. 2016. Chapter 12 - Structure, Function, and Evolution of the Dof
Transcription Factor Family. In: D. H. Gonzalez, ed. Plant Transcription Factors.
Boston: Academic Press, 183–197.
Yang X, Sanchez R, Kundariya H, Maher T, Dopp I, Schwegel R, Virdi K, Axtell
MJ, Mackenzie SA. 2020. Segregation of an MSH1 RNAi transgene produces heritable
non-genetic memory in association with methylome reprogramming. Nature
Communications 11: 2214.
Yong W-S, Hsu F-M, Chen P-Y. 2016. Profiling genome-wide DNA methylation.
Epigenetics & Chromatin 9: 26.
Yotani T, Yamada Y, Arai E, Tian Y, Gotoh M, Komiyama M, Fujimoto H,
Sakamoto M, Kanai Y. 2018. Novel method for DNA methylation analysis using high‐
performance liquid chromatography and its clinical application. Cancer Science 109:
1690–1700.
Yu G, Wang LG, Han Y, He QY. 2012. clusterProfiler: an R package for comparing
biological themes among gene clusters. OMICS: A Journal of Integrative Biology 16:
284–287.
Yu J, Conrad AO, Decroocq V, Zhebentyayeva T, Williams DE, Bennett D, Roch G,
Audergon J-M, Dardick C, Liu Z, et al. 2020. Distinctive gene expression patterns
define endodormancy to ecodormancy transition in apricot and peach. Frontiers in Plant
Science 11.
Yuan J-L, Sun H-M, Guo G-P, Yue J-J, Gu X-P. 2014. Correlation between DNA
methylation and chronological age of Moso bamboo (Phyllostachys heterocycla var.
pubescens). Botanical Studies 55: 4.
278
Zachová D, Fojtová M, Dvořáčková M, Mozgová I, Lermontova I, Peška V,
Schubert I, Fajkus J, Sýkorová E. 2013. Structure-function relationships during
transgenic telomerase expression in Arabidopsis. Physiologia Plantarum 149: 114–126.
Zaiger GN, Gardner LM, Zaiger GG. 2009. Interspecific almond tree named ‘Alm-21’.
U.S Patent USPP20295P2.
Zangi M, Bagherieh Najjar MB, Golalipour M, Aghdasi M. 2019. met1 DNA
methyltransferase controls TERT gene expression: A new insight to the role of telomerase
in development. Cell Journal 22.
Zhang H, He X, Zhu J-K. 2013. RNA-directed DNA methylation in plants: Where to
start? RNA biology 10: 1593–1596.
Zhang H, Lang Z, Zhu J-K. 2018. Dynamics and function of DNA methylation in
plants. Nature Reviews Molecular Cell Biology 19: 489–506.
Zhang H, Zhu J-K. 2011. RNA-directed DNA methylation. Current Opinion in Plant
Biology 14: 142–147.
Zhang M, Kimatu JN, Xu K, Liu, B. 2010. DNA cytosine methylation in plant
development. Journal of Genetics and Genomics 37: 1–12.
Zhang Z, Wang H, Wang Y, Xi F, Wang H, Kohnen MV, Gao P, Wei W, Chen K,
Liu X, et al. 2021. Whole genome characterization of chronological age-associated
changes in methylome and circular RNAs in moso bamboo (Phyllostachys edulis) from
vegetative to floral growth. The Plant Journal.
Zhao K, Zhou Y, Li Y, Zhuo X, Ahmad S, Han Y, Yong X, Zhang Q. 2018. Crosstalk
of PmCBFs and PmDAMs based on the changes of phytohormones under seasonal cold
stress in the stem of Prunus mume. International Journal of Molecular Sciences 19: 15.
Zhao Y, Medrano L, Ohashi K, Fletcher JC, Yu H, Sakai H, Meyerowitz EM. 2004.
HANABA TARANU is a GATA transcription factor that regulates shoot apical meristem
and flower development in Arabidopsis. The Plant Cell 16: 2586–2600.
Zheng Q, Liu J, Goff BM, Dinkins RD, Zhu H. 2016. Genetic manipulation of miR156
for improvement of biomass production and forage quality in red clover. Crop Science
56: 1199–1205.
Zheng X, Chen L, Xia H, Wei H, Lou Q, Li M, Li T, Luo L. 2017. Transgenerational
epimutations induced by multi-generation drought imposition mediate rice plant’s
adaptation to drought condition. Scientific Reports 7: 39843.

279
Zhong S-H, Liu J-Z, Jin H, Lin L, Li Q, Chen Y, Yuan Y-X, Wang Z-Y, Huang H,
Qi Y-J, et al. 2013. Warm temperatures induce transgenerational epigenetic release of
RNA silencing by inhibiting siRNA biogenesis in Arabidopsis. Proceedings of the
National Academy of Sciences 110: 9171–9176.
Zhou L, Ng HK, Drautz-Moses DI, Schuster SC, Beck S, Kim C, Chambers JC, Loh
M. 2019. Systematic evaluation of library preparation methods and sequencing platforms
for high-throughput whole genome bisulfite sequencing. Scientific Reports 9: 10383.
Zhou Y, Hartwig B, James GV, Schneeberger K, Turck F. 2016. Complementary
activities of TELOMERE REPEAT BINDING proteins and polycomb group complexes
in transcriptional regulation of target genes. The Plant Cell 28: 87–101.
Zhu H, Chen P-Y, Zhong S, Dardick C, Callahan A, An Y-Q, van Knocker S, Yang
Y, Zhong G-Y, Abbott A, et al. 2020. Thermal-responsive genetic and epigenetic
regulation of DAM cluster controlling dormancy and chilling requirement in peach floral
buds. Horticulture Research 7: 1–14.
Zhu J-K. 2009. Active DNA demethylation mediated by DNA glycosylases. Annual
review of genetics 43: 143–166.
Zhu Y, Li Y, Xin D, Chen W, Shao X, Wang Y, Guo W. 2015. RNA-Seq-based
transcriptome analysis of dormant flower buds of Chinese cherry (Prunus
pseudocerasus). Gene 555: 362–376.
Ziller MJ, Hansen KD, Meissner A, Aryee MJ. 2015. Coverage recommendations for
methylation analysis by whole-genome bisulfite sequencing. Nature Methods 12: 230–
232.
Zogli P, Libault M. 2017. Plant response to biotic stress: Is there a common epigenetic
response during plant-pathogenic and symbiotic interactions? Plant Science 263: 89–93.
Zohary D, Weiss E, Hopf M. 2012. Fruit trees and nuts. In: Domestication of plants in
the old world: The origin and spread of domesticated plants in Southwest Asia, Europe,
and the Mediterranean Basin. Oxford, UK: Oxford University Press, 243.

280
Appendix A: Supplemental Tables and Files
Table A. 1 Data for the relative telomere length estimation of almond age cohort samples
collected in 2018. Included are the age of the individual in years, the calculated T/S ratio
for each individual, the calculated relative telomere length based on the T/S ratio, and the
calculated z-score for each relative telomere length.
Age (years) T/S ratio relativeTeloLength zScore_TeloLength
14 -0.49 -0.70 -2.77
14 0.16 0.24 -1.07
14 0.71 1.03 0.36
14 0.38 0.55 -0.51
14 0.75 1.08 0.45
9 0.27 0.40 -0.79
9 0.33 0.48 -0.63
9 0.48 0.70 -0.24
9 0.48 0.70 -0.24
5 0.54 0.78 -0.09
5 1.41 2.02 2.17
5 0.51 0.73 -0.18
5 0.58 0.83 0.01
5 0.66 0.95 0.21
5 0.76 1.10 0.48
1 0.27 0.40 -0.79
1 0.86 1.24 0.75
1 1.16 1.68 1.54
1 0.68 0.99 0.28
1 0.90 1.30 0.85
1 0.65 0.94 0.19

281
Table A. 2 Raw Cq values produced from the technical replicate wells in qPCR using either the primer for the telomere
amplicon or the primer for the PP2A amplicon for each almond individual from the classified age.
(continued)
Age (years) TeloCq_Rep1 TeloCq_Rep2 TeloCq_Rep3 TeloCq_Rep4 TeloCq_Rep5 TeloCq_Rep6
14 17.89 17.94 18.20 18.37 18.49 18.18
14 14.09 16.23 18.75 14.70 19.00 16.51
14 18.41 14.70 15.22 18.94 14.22 17.31
14 13.27 13.75 14.21 16.79 16.08 N/A
14 17.38 14.13 14.20 13.79 13.49 13.65
9 14.23 14.05 14.04 16.10 14.55 14.41
9 15.70 15.31 15.78 15.29 14.33 14.20
9 14.49 14.79 14.89 14.58 14.75 15.22
9 14.25 14.18 14.18 14.21 14.18 14.32
5 13.47 13.21 13.62 13.04 13.34 13.27
5 15.74 12.86 13.87 14.11 14.01 14.31
5 14.46 16.52 13.58 14.80 14.18 14.13
5 14.46 16.52 13.58 14.80 14.18 14.13
5 13.91 13.43 13.72 13.26 13.49 13.56
5 12.74 12.99 13.58 13.16 13.00 18.19
1 13.75 13.45 13.97 14.10 13.58 14.32
1 12.99 13.58 12.96 12.85 N/A N/A
1 20.41 19.23 20.77 19.44 20.79 20.15
1 13.17 15.80 14.01 16.83 14.22 13.42
1 15.58 14.59 14.33 13.70 18.45 N/A
1 12.91 14.83 12.91 12.94 13.56 N/A

282
(Table A.2 continued)
PP2ACq_Rep1 PP2ACq_Rep2 PP2ACq_Rep3 PP2ACq_Rep4 PP2ACq_Rep5 PP2ACq_Rep6
18.31 18.01 21.13 20.24 20.74 21.01
17.57 18.55 19.07 18.67 19.20 18.58
17.51 14.92 21.82 18.18 18.28 23.77
21.84 16.85 15.47 17.00 18.28 N/A
17.33 21.62 22.10 20.99 20.22 20.44
19.42 23.17 22.30 19.25 20.07 21.89
24.66 23.34 N/A 27.52 19.87 20.20
16.73 21.21 21.23 17.30 21.16 22.23
19.71 19.68 20.13 19.38 19.30 19.79
19.59 22.04 23.91 21.60 23.28 21.94
22.56 18.50 18.60 18.83 18.73 20.52
23.48 19.52 23.47 15.70 16.09 N/A
23.48 19.52 23.47 15.70 16.09 N/A
20.39 19.26 20.04 19.15 19.50 21.01
18.91 18.17 17.62 17.60 18.28 20.41
19.06 17.82 19.88 19.08 19.48 18.97
21.88 24.76 21.55 21.41 N/A N/A
29.24 26.10 30.51 27.10 30.36 28.52
22.73 26.51 27.78 23.14 N/A N/A
25.15 24.07 22.45 20.28 27.81 N/A
20.39 17.07 20.16 19.06 15.20 N/A

283
Table A. 3 Data for the relative telomere length estimation of almond age cohort leaf
samples collected in 2019. Included are the age of the individual in years, the calculated
T/S ratio for each individual, the calculated relative telomere length based on the T/S
ratio, the calculated z-score for each relative telomere length, and the raw Cq values
produced from the technical replicate wells in qPCR using either the primer for the
telomere amplicon or the primer for the PP2A amplicon.
Age (years) T/S ratio relativeTeloLength zScore_TeloLength
2 1.94 2.78 0.86
2 0.93 1.33 -0.59
2 1.47 2.10 0.18
7 0.96 1.37 -0.55
7 0.99 1.41 -0.51
7 0.66 0.95 -0.97
11 0.76 1.09 -0.83
11 0.77 1.11 -0.81
11 0.17 0.25 -1.67

284
Table A. 4 Raw Cq values produced from the technical replicate wells in qPCR using either the primer for the telomere amplicon or
the primer for the PP2A amplicon for each almond individual leaf sample from the classified age.
Age (years) TeloCq_Rep1 TeloCq_Rep2 TeloCq_Rep3 TeloCq_Rep4 TeloCq_Rep5 TeloCq_Rep6 PP2ACq_Rep1
2 15.77 17.97 18.33 19.13 19.33 n/a 21.49
2 13.51 13.42 14.36 14.22 15.31 15.88 18.13
2 15.11 16.25 17.00 15.55 16.83 n/a 22.59
7 16.23 17.28 19.11 21.50 19.23 19.37 21.89
7 19.18 18.79 20.71 24.15 19.92 n/a 26.45
7 24.14 20.21 23.23 19.64 19.62 n/a 29.65
11 16.44 17.25 17.70 22.66 22.00 18.28 23.40
11 18.27 21.42 22.37 20.07 19.13 19.29 26.85
11 17.70 18.04 18.27 19.29 22.54 18.69 34.46
Age (years) PP2ACq_Rep2 PP2ACq_Rep3 PP2ACq_Rep4 PP2ACq_Rep5 PP2ACq_Rep6
2 24.44 24.40 25.36 26.05 n/a
2 19.52 20.98 19.61 20.38 20.78
2 23.47 23.46 22.61 22.35 n/a
7 22.84 27.19 29.24 27.78 25.12
7 25.05 28.93 27.01 n/a n/a
7 34.64 28.68 26.88 n/a n/a
11 23.13 24.36 34.39 25.95 n/a
11 30.90 32.68 28.30 27.45 27.88
11 29.60 30.69 30.52 29.55 n/a

285
Table A. 5 Data for the relative telomere length estimation of almond age cohort bud
samples collected in 2019. Included are the age of the individual in years, the calculated
T/S ratio for each individual, the calculated relative telomere length based on the T/S
ratio, the calculated z-score for each relative telomere length, and the raw Cq values
produced from the technical replicate wells in qPCR using either the primer for the
telomere amplicon or the primer for the PP2A amplicon.
Age (years) T/S ratio relativeTeloLength zScore_TeloLength
2 3.88589374 5.570538103 5.247081148
2 13.3921252 19.19798865 18.87453169
2 2.2738748 3.259663551 2.936206596
2 3.51609083 5.040415219 4.716958263
2 0.67809726 0.972071518 0.648614563
2 1.96560757 2.817753808 2.494296852
7 5.08929065 7.295641452 6.972184497
7 0.36461136 0.522680647 0.199223692
7 -0.1717277 -0.246176442 -0.569633398
7 2.7074387 3.881189612 3.557732656
7 1.54037715 2.208174021 1.884717065
7 -0.8122108 -1.1643271 -1.487784056
7 1.57670774 2.26025495 1.936797995
11 -0.7472457 -1.071197726 -1.394654681
11 -6.2162948 -8.911233693 -9.234690648
11 4.22102429 6.050957174 5.727500218
11 -8.4900828 -12.17077279 -12.49422974
11 1.57742136 2.261277936 1.93782098

286
Table A. 6 Raw Cq values produced from the technical replicate wells in qPCR using either the primer for the telomere amplicon or
the primer for the PP2A amplicon for each almond individual bud sample from the classified age.
(continued)
Age
(years)
TeloCq_Rep
1
TeloCq_Rep
2
TeloCq_Rep
3
TeloCq_Rep
4
TeloCq_Rep
5
PP2ACq_Rep
1
PP2ACq_Rep
2
2 14.12 14.43 13.99 14.22 14.32 23.82 22.24
2 14.79 14.92 14.96 14.62 14.51 24.57 24.47
2 13.92 14.53 14.64 14.39 15.03 22.23 23.04
2 15.03 15.47 15.10 15.12 15.46 22.91 22.77
2 15.37 15.42 15.22 15.58 15.19 22.25 13.30
2 14.73 14.49 14.76 14.59 14.96 21.30 20.34
7 14.75 14.60 14.46 13.98 13.95 23.31 22.19
7 14.15 14.34 14.28 14.59 14.32 22.08 23.57
7 16.58 17.50 16.61 16.96 16.62 1.49 31.95
7 15.39 15.07 14.81 14.56 14.50 20.94 21.37
7 14.20 14.38 14.16 14.25 14.52 20.58 18.27
7 15.06 14.65 14.94 15.21 14.96 30.37 21.90
7 14.46 14.68 14.50 14.45 14.37 20.90 19.83
11 14.77 14.86 15.37 14.94 14.72 25.90 27.74
11 14.36 14.61 14.69 N/A N/A 25.14 25.39
11 14.50 14.44 14.69 14.97 N/A 24.11 21.48
11 15.10 15.48 15.32 N/A N/A 23.47 24.43
11 15.35 14.23 14.32 14.59 14.41 19.81 18.82

287
(Table A.6 continued)
Age (years) PP2ACq_Rep3 PP2ACq_Rep4 PP2ACq_Rep5
2 22.87 23.48 23.10
2 23.12 25.01 22.62
2 22.38 22.48 21.95
2 22.42 27.12 24.18
2 31.79 19.40 30.17
2 21.67 21.29 20.79
7 24.28 23.15 22.94
7 22.93 22.07 25.18
7 34.00 33.15 33.35
7 22.37 20.93 22.12
7 21.39 19.59 19.54
7 24.67 26.33 24.53
7 19.43 20.14 21.23
11 33.13 23.22 28.70
11 27.89 N/A N/A
11 23.53 22.60 N/A
11 23.69 N/A N/A
11 21.44 20.24 20.94

288
Table A. 7 Data for relative expression of TERT in almond age cohort samples collected in 2018. Included are the age of each sample
in years, the relative expression of TERT in each sample calculated from Cq values for TERT and a reference gene, RPII, the log2
expression for each sample, and raw Cq values for the technical replicates for both the RPII amplicon and the TERT amplicon.
Age (years) RelativeTERTExpression Log2Expression TERTCq_Rep1 TERTCq_Rep2 TERTCq_Rep2
5 2.25 0.81 35.5 37.0 N/A
5 1.04 0.04 34.8 39.0 N/A
5 0.90 -0.11 31.2 29.9 30.6
1 1.47 0.38 34.0 34.1 34.1
1 3.36 1.21 33.9 33.6 33.6
1 1.48 0.39 33.9 33.6 34.5
14 0.51 -0.67 36.3 37.2 N/A
14 0.71 -0.345 36.3 37.5 37.5
14 1.04 0.04 35.9 36.5 N/A
9 0.93 -0.07 31.2 31.0 31.4
9 0.78 -0.25 31.2 31.2 30.5
RPIICq_Rep1 RPIICq_Rep2 RPIICq_Rep3
32.5 29.0 N/A
30.8 31.3 N/A
26.5 26.4 N/A
30.6 31.7 31.2
32.3 31.8 31.8
30.7 31.1 31.4
32.3 32.2 32.4
32.7 33.3 33.3
33.1 32.4 32.7
26.9 26.7 28.8

289
Table A. 8 Data for relative expression of TERT in almond age cohort samples collected in 2019. Included are the age of each sample
in years, the relative expression of TERT in each sample calculated from Cq values for TERT and a reference gene, RPII, the log2
expression for each sample, and raw Cq values for the technical replicates for both the RPII amplicon and the TERT amplicon.
Age (years) RelativeTERTExpression Log2Expression TERTCq_Rep1 TERTCq_Rep2 TERTCq_Rep3
11 1.24 0.21 36.2 35.2 35.1
11 0.29 -1.24 34.5 34.9 34.8
11 0.41 -0.89 34.9 37.2 38.3
11 1.79 0.58 35.0 36.5 N/A
7 1.79 0.58 30.2 31.4 31.0
7 1.50 0.40 36.3 35.2 N/A
7 1.22 0.20 36.2 36.7 N/A
7 0.62 -0.48 36.0 36.0 N/A
2 1.78 0.58 35.8 36.9 N/A
2 2.47 0.90 35.3 N/A N/A
2 2.47 0.90 35.0 36.2 35.4
2 1.10 0.098 35.2 34.3 35.8
(continued)

290
(Table A.8 continued)
Age (years) RPIICq_Rep1 RPIICq_Rep2 RPIICq_Rep3
11 34.2 31.3 33.6
11 32.8 32.8 32.3
11 33.4 33.7 34.1
11 35.2 34.9 34.7
7 30.4 30.5 30.4
7 36.8 35.5 N/A
7 34.4 34.1 34.4
7 34.4 33.1 33.5
2 34.0 37.2 N/A
2 34.5 34.0 35.2
2 35.1 33.3 34.0
2 33.3 33.5 34.0

291
Table A. 9 Table containing sequencing statistics, conversion efficiencies, total percent methylation, and percent methylation within
each context (CG, CHG, CHH) for almond accessions presented in this study.
samp_ID age num_reads cov_seq num_reads_align cov_align per_align per_CG per_CHG per_meth per_lambda per_puc19
51 2 31297380 18.8 13749685 8.2 0.439 0.512 0.211 0.116 0.002 0.976
55 2 26341622 15.8 12252616 7.4 0.465 0.487 0.228 0.103 0.003 0.942
56 2 28016948 16.8 12329600 7.4 0.44 0.515 0.224 0.112 0.003 0.981
46 2 32861503 19.72 17661490 10.6 0.537 0.475 0.229 0.108 0.003 0.967
45 2 44230441 26.54 23808875 14.3 0.538 0.479 0.227 0.111 0.001 0.975
49 2 48170341 28.9 25501433 15.3 0.529 0.409 0.182 0.098 0.001 0.909
52 2 41430789 24.86 20859398 12.5 0.503 0.508 0.225 0.115 0.002 0.976
54 2 48531019 29.12 23620182 14.2 0.487 0.441 0.202 0.095 0.002 0.921
57 2 37613337 22.57 20384490 12.2 0.542 0.417 0.176 0.092 0.002 0.802
35 2 50541320 30.32 24043007 14.4 0.476 0.435 0.201 0.096 0.004 0.904
39 2 52674838 31.6 25747370 15.5 0.489 0.49 0.235 0.11 0.002 0.978
41 2 41279612 24.8 20377533 12.2 0.494 0.514 0.226 0.113 0.002 1
42 2 16534210 9.9 6438416 3.86 0.389 0.556 0.278 0.139 0.002 0.967
44 2 49540541 29.7 26723876 16.0 0.539 0.456 0.193 0.104 0.001 0.968
40 2 20246774 12.1 9225312 5.54 0.456 0.431 0.192 0.1 0.002 0.975
38 2 23618228 14.2 12251103 7.35 0.519 0.501 0.227 0.116 0.002 0.956
36 2 34890738 20.9 17723383 10.6 0.508 0.527 0.244 0.121 0.002 0.981
37 2 28345188 17 12636660 7.58 0.446 0.437 0.2 0.095 0.003 0.985
47 2 98319896 59 50290060 30.2 0.511 0.503 0.236 0.116 0.002 0.972
48 2 55093356 33.1 27736869 16.6 0.503 0.524 0.248 0.121 0.002 0.984
50 2 33033951 19.8 16544985 9.93 0.501 0.506 0.227 0.115 0.003 0.977
124 7 35055353 21 15277723 9.2 0.436 0.528 0.231 0.116 0.001 0.987
(continued)
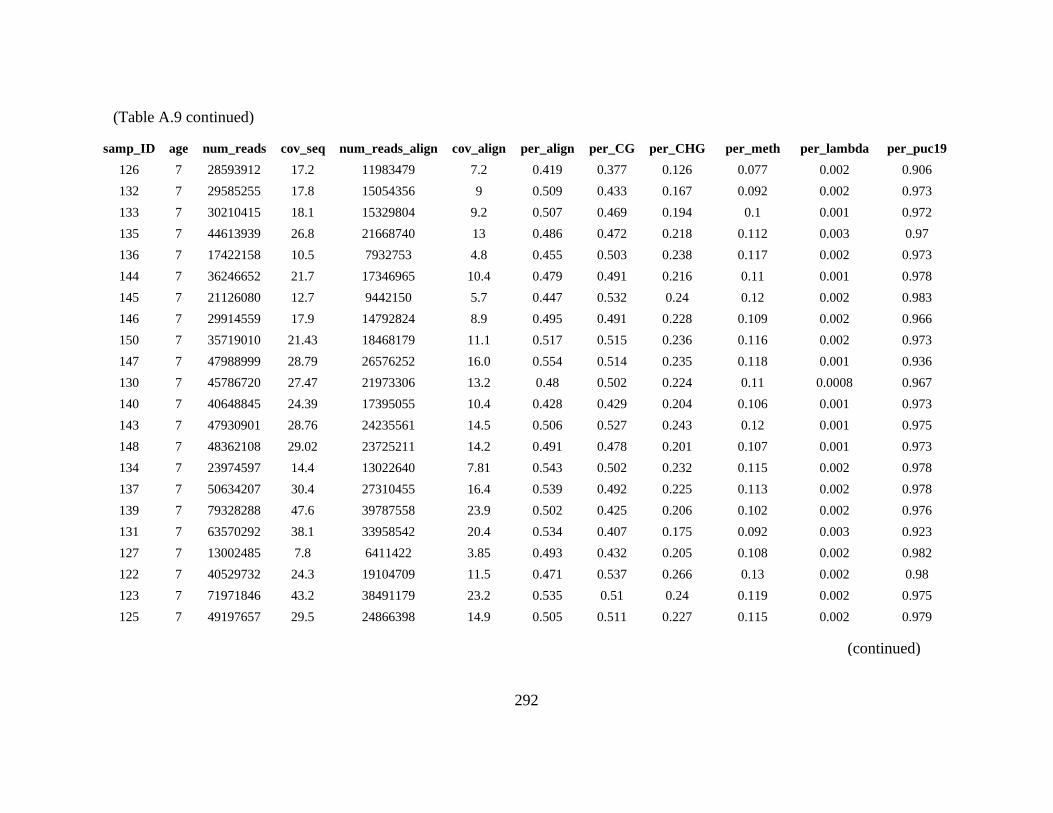
292
samp_ID age num_reads cov_seq num_reads_align cov_align per_align per_CG per_CHG per_meth per_lambda per_puc19
126 7 28593912 17.2 11983479 7.2 0.419 0.377 0.126 0.077 0.002 0.906
132 7 29585255 17.8 15054356 9 0.509 0.433 0.167 0.092 0.002 0.973
133 7 30210415 18.1 15329804 9.2 0.507 0.469 0.194 0.1 0.001 0.972
135 7 44613939 26.8 21668740 13 0.486 0.472 0.218 0.112 0.003 0.97
136 7 17422158 10.5 7932753 4.8 0.455 0.503 0.238 0.117 0.002 0.973
144 7 36246652 21.7 17346965 10.4 0.479 0.491 0.216 0.11 0.001 0.978
145 7 21126080 12.7 9442150 5.7 0.447 0.532 0.24 0.12 0.002 0.983
146 7 29914559 17.9 14792824 8.9 0.495 0.491 0.228 0.109 0.002 0.966
150 7 35719010 21.43 18468179 11.1 0.517 0.515 0.236 0.116 0.002 0.973
147 7 47988999 28.79 26576252 16.0 0.554 0.514 0.235 0.118 0.001 0.936
130 7 45786720 27.47 21973306 13.2 0.48 0.502 0.224 0.11 0.0008 0.967
140 7 40648845 24.39 17395055 10.4 0.428 0.429 0.204 0.106 0.001 0.973
143 7 47930901 28.76 24235561 14.5 0.506 0.527 0.243 0.12 0.001 0.975
148 7 48362108 29.02 23725211 14.2 0.491 0.478 0.201 0.107 0.001 0.973
134 7 23974597 14.4 13022640 7.81 0.543 0.502 0.232 0.115 0.002 0.978
137 7 50634207 30.4 27310455 16.4 0.539 0.492 0.225 0.113 0.002 0.978
139 7 79328288 47.6 39787558 23.9 0.502 0.425 0.206 0.102 0.002 0.976
131 7 63570292 38.1 33958542 20.4 0.534 0.407 0.175 0.092 0.003 0.923
127 7 13002485 7.8 6411422 3.85 0.493 0.432 0.205 0.108 0.002 0.982
122 7 40529732 24.3 19104709 11.5 0.471 0.537 0.266 0.13 0.002 0.98
123 7 71971846 43.2 38491179 23.2 0.535 0.51 0.24 0.119 0.002 0.975
125 7 49197657 29.5 24866398 14.9 0.505 0.511 0.227 0.115 0.002 0.979
(Table A.9 continued)
(continued)
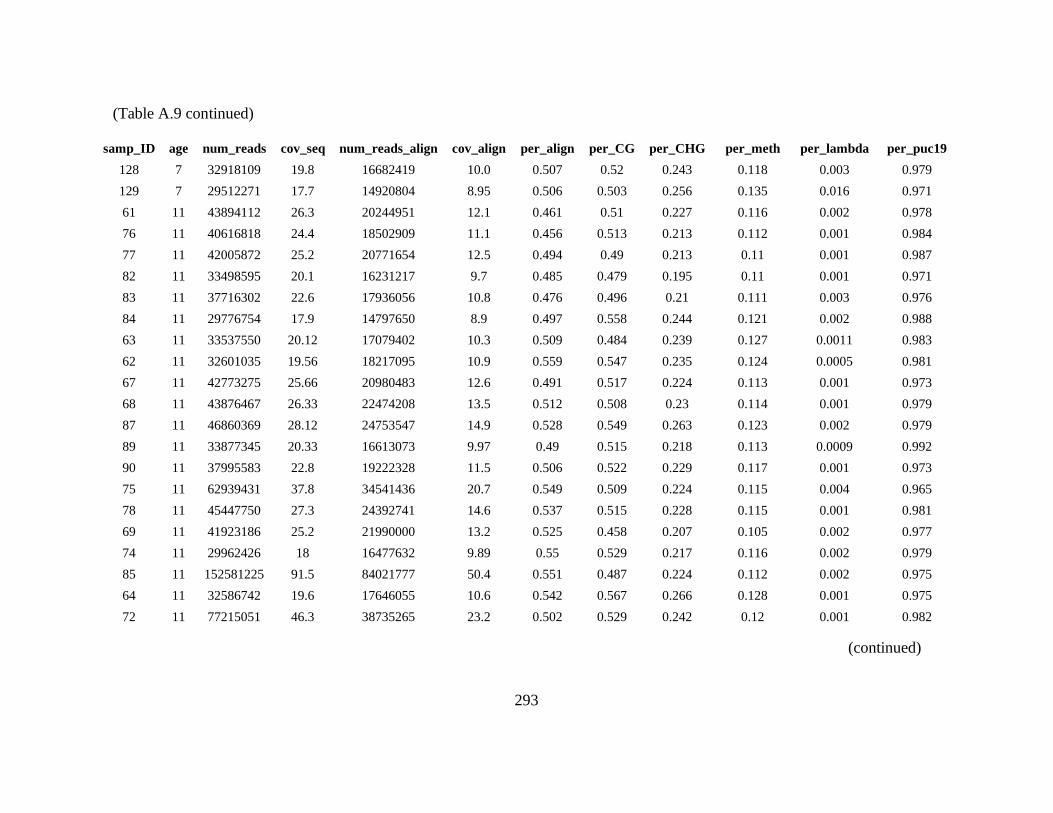
293
samp_ID age num_reads cov_seq num_reads_align cov_align per_align per_CG per_CHG per_meth per_lambda per_puc19
128 7 32918109 19.8 16682419 10.0 0.507 0.52 0.243 0.118 0.003 0.979
129 7 29512271 17.7 14920804 8.95 0.506 0.503 0.256 0.135 0.016 0.971
61 11 43894112 26.3 20244951 12.1 0.461 0.51 0.227 0.116 0.002 0.978
76 11 40616818 24.4 18502909 11.1 0.456 0.513 0.213 0.112 0.001 0.984
77 11 42005872 25.2 20771654 12.5 0.494 0.49 0.213 0.11 0.001 0.987
82 11 33498595 20.1 16231217 9.7 0.485 0.479 0.195 0.11 0.001 0.971
83 11 37716302 22.6 17936056 10.8 0.476 0.496 0.21 0.111 0.003 0.976
84 11 29776754 17.9 14797650 8.9 0.497 0.558 0.244 0.121 0.002 0.988
63 11 33537550 20.12 17079402 10.3 0.509 0.484 0.239 0.127 0.0011 0.983
62 11 32601035 19.56 18217095 10.9 0.559 0.547 0.235 0.124 0.0005 0.981
67 11 42773275 25.66 20980483 12.6 0.491 0.517 0.224 0.113 0.001 0.973
68 11 43876467 26.33 22474208 13.5 0.512 0.508 0.23 0.114 0.001 0.979
87 11 46860369 28.12 24753547 14.9 0.528 0.549 0.263 0.123 0.002 0.979
89 11 33877345 20.33 16613073 9.97 0.49 0.515 0.218 0.113 0.0009 0.992
90 11 37995583 22.8 19222328 11.5 0.506 0.522 0.229 0.117 0.001 0.973
75 11 62939431 37.8 34541436 20.7 0.549 0.509 0.224 0.115 0.004 0.965
78 11 45447750 27.3 24392741 14.6 0.537 0.515 0.228 0.115 0.001 0.981
69 11 41923186 25.2 21990000 13.2 0.525 0.458 0.207 0.105 0.002 0.977
74 11 29962426 18 16477632 9.89 0.55 0.529 0.217 0.116 0.002 0.979
85 11 152581225 91.5 84021777 50.4 0.551 0.487 0.224 0.112 0.002 0.975
64 11 32586742 19.6 17646055 10.6 0.542 0.567 0.266 0.128 0.001 0.975
72 11 77215051 46.3 38735265 23.2 0.502 0.529 0.242 0.12 0.001 0.982
(Table A.9 continued)
(continued)

294
samp_ID age num_reads cov_seq num_reads_align cov_align per_align per_CG per_CHG per_meth per_lambda per_puc19
79 11 14657373 8.8 7194411 4.32 0.491 0.498 0.23 0.113 0.002 0.986
80 11 56648577 34 28375628 17.0 0.501 0.504 0.225 0.112 0.002 0.972
81 11 35066675 21 17503781 10.5 0.499 0.521 0.23 0.117 0.003 0.978
(continued)
(Table A.9 continued)

295
Table A. 10 Number of CG hypermethylated DMR-associated genes associated with
each biological process (A), molecular function (B), and cellular component (C) gene
ontology (GO) terms for each of the three age-contrasts (i.e., 11 – 2 year, 11 – 7 year, and
7 – 2 year). Values in each column represent the number of DMR-associated genes that
are associated with each GO term. Black squares indicate no genes associated with that
contrast were assigned the particular GO term.
A. Biological Process GO Term 11-2 11-7 7-2
proteolysis 37 36 8
protein phosphorylation 29 28 7
obsolete oxidation-reduction process 28 22 4
transmembrane transport 18 16 4
regulation of transcription, DNA-templated 9 13 2
carbohydrate metabolic process 10 11 4
steroid biosynthetic process 5 N/A N/A
tRNA aminoacylation for protein translation 3 N/A N/A
signal transduction 1 8 N/A
translation 2 8 N/A
biosynthetic process 1 7 N/A
transcription, DNA-templated 1 7 1
DNA topological change N/A 6 N/A
cation transport 2 4 N/A
endoplasmic reticulum to Golgi vesicle-mediated transport N/A 3 N/A
nitrogen compound metabolic process N/A 3 1
proteolysis involved in cellular protein catabolic process N/A 3 N/A
tRNA processing 3 3 N/A
ATP synthesis coupled proton transport N/A 2 N/A
attachment of GPI anchor to protein N/A 2 N/A
cell redox homeostasis N/A 2 N/A
cell wall modification N/A 2 N/A
defense response N/A 2 N/A
fatty acid biosynthetic process N/A 2 N/A
histone lysine methylation 2 N/A N/A
lipid metabolic process 1 2 N/A
metal ion transport N/A 2 N/A
nucleotide-excision repair 2 N/A N/A
proteasome-mediated ubiquitin-dependent protein catabolic
process 2 N/A
recognition of pollen 2
translational initiation 2
cell wall macromolecule catabolic process 1
cellular glucan metabolic process 1
cellular modified amino acid biosynthetic process 1 1
cellulose biosynthetic process 1 N/A 1
(continued)

296
chitin catabolic process 1
dephosphorylation 1
DNA replication 1
DNA-templated transcription, termination 1 N/A
drug transmembrane transport 1
endoplasmic reticulum organization 1
fatty acid beta-oxidation 2 1
glutamine biosynthetic process 1
intermembrane lipid transfer 1
intracellular protein transport 1
intracellular transport 1
ion transport 1
malate transport 1 N/A
mitochondrial pyruvate transmembrane transport 1
mRNA processing 1
nucleobase-containing compound metabolic process 1
nucleotide transmembrane transport 1
nucleotide transport 1
nucleosome assembly 1
phosphatidylserine biosynthetic process 1
photosynthesis 1 N/A
photosynthesis, light reaction 1
photosynthetic electron transport in photosystem II 1
phytochromobilin biosynthetic process 1
potassium ion transport 1
protein folding 2 1
protein kinase C-activating G protein-coupled receptor signaling
pathway 1 N/A
protein neddylation 1
protein ubiquitination 1 1
proton transmembrane transport 1 N/A
pseudouridine synthesis 1
pyrimidine nucleotide-sugar transmembrane transport 1
regulation of translational fidelity 1 N/A
response to auxin 1
response to hormone 1
RNA modification 1
RNA processing 1
rRNA processing 1
sucrose metabolic process 1 1
translation termination 1
(continued)
(Table A.10 continued)

297
terpenoid biosynthetic process 1 N/A
trehalose biosynthetic process 1 N/A
tRNA wobble uridine modification 1
B. Molecular Function GO Term 11-2 11-7 7-2
ATP binding 41 33 11
cysteine-type peptidase activity 36 32 8
hydrolase activity, acting on ester bonds 26 28 4
protein binding 35 27 10
protein kinase activity 18 26 5
DNA binding 13 20 5
zinc ion binding 20 20 7
ADP binding 3 18
nucleic acid binding 18 16 3
oxidoreductase activity 3 13 1
transferase activity, transferring hexosyl groups 11 3
catalytic activity 4 9
DNA-binding transcription factor activity 7 8 1
structural constituent of ribosome 2 8
DNA topoisomerase activity 6
transmembrane transporter activity 3 6 1
hydrolase activity, hydrolyzing O-glycosyl compounds 6 5 2
polygalacturonase activity 4 5 2
RNA binding 1 5 1
sequence-specific DNA binding 1 5
transferase activity, transferring acyl groups other than amino-acyl
groups 3 5 1
acetylglucosaminyltransferase activity 1 4
aminoacyl-tRNA ligase activity 3
DNA-directed 5'-3' RNA polymerase activity 1 4 1
heme binding 10 4
iron ion binding 10 4
lyase activity 4 4
magnesium ion binding 4 4
nucleotide binding 3
oxidoreductase activity, acting on paired donors, with
incorporation or reduction of molecular oxygen 9 4
phosphatidylinositol binding 4
protein dimerization activity 4 4 1
RNA-DNA hybrid ribonuclease activity 10 4 2
solute:proton antiporter activity 1 4
(Table A.10 continued)
(continued)
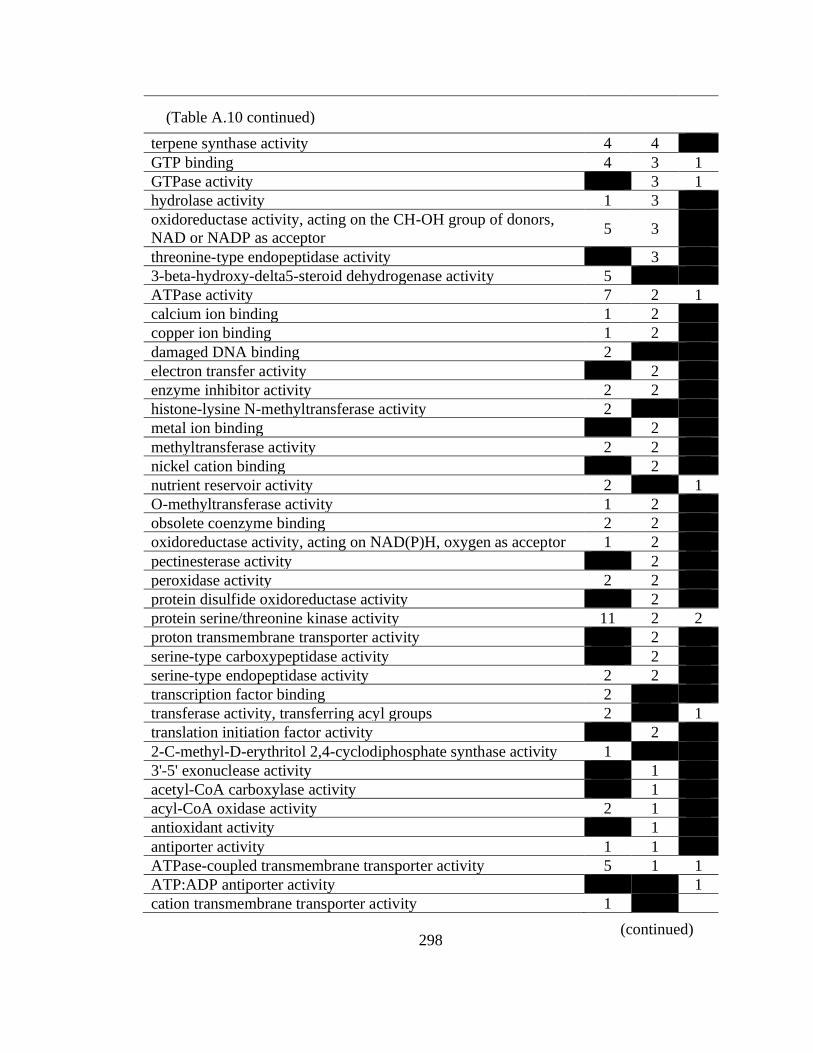
298
terpene synthase activity 4 4
GTP binding 4 3 1
GTPase activity 3 1
hydrolase activity 1 3
oxidoreductase activity, acting on the CH-OH group of donors,
NAD or NADP as acceptor 5 3
threonine-type endopeptidase activity 3
3-beta-hydroxy-delta5-steroid dehydrogenase activity 5
ATPase activity 7 2 1
calcium ion binding 1 2
copper ion binding 1 2
damaged DNA binding 2
electron transfer activity 2
enzyme inhibitor activity 2 2
histone-lysine N-methyltransferase activity 2
metal ion binding 2
methyltransferase activity 2 2
nickel cation binding 2
nutrient reservoir activity 2 1
O-methyltransferase activity 1 2
obsolete coenzyme binding 2 2
oxidoreductase activity, acting on NAD(P)H, oxygen as acceptor 1 2
pectinesterase activity 2
peroxidase activity 2 2
protein disulfide oxidoreductase activity 2
protein serine/threonine kinase activity 11 2 2
proton transmembrane transporter activity 2
serine-type carboxypeptidase activity 2
serine-type endopeptidase activity 2 2
transcription factor binding 2
transferase activity, transferring acyl groups 2 1
translation initiation factor activity 2
2-C-methyl-D-erythritol 2,4-cyclodiphosphate synthase activity 1
3'-5' exonuclease activity 1
acetyl-CoA carboxylase activity 1
acyl-CoA oxidase activity 2 1
antioxidant activity 1
antiporter activity 1 1
ATPase-coupled transmembrane transporter activity 5 1 1
ATP:ADP antiporter activity 1
cation transmembrane transporter activity 1
(Table A.10 continued)
(continued)

299
cellulose synthase (UDP-forming) activity 1 1
channel activity 1 1
chitin binding 1
chitinase activity 1
cobalt ion binding 1
diacylglycerol kinase activity 1
DNA-directed DNA polymerase activity 1
electron transporter, transferring electrons within the cyclic
electron transport pathway of photosynthesis activity 1
endonuclease activity 1
endopeptidase inhibitor activity 1 1
FAD binding 1
glutamate-ammonia ligase activity 1
glutamate-cysteine ligase activity 1 1
glycerol-3-phosphate O-acyltransferase activity 1
GTPase activator activity 1 1
helicase activity 1
inorganic diphosphatase activity 1
intramolecular lyase activity 1
intramolecular transferase activity, phosphotransferases 1
ion channel activity 1
lipid binding 1
lipid transfer activity 1
iron-sulfur cluster binding 1
malate dehydrogenase (decarboxylating) (NAD+) activity 1
metal ion transmembrane transporter activity 1
metallopeptidase activity 1
NAD binding 1
NEDD8 activating enzyme activity 1
nucleoside transmembrane transporter activity 1
oxidoreductase activity, acting on single donors with
incorporation of molecular oxygen, incorporation of two atoms of
oxygen
1
oxidoreductase activity, acting on the CH-CH group of donors 2 1
oxidoreductase activity, acting on the CH-CH group of donors,
iron-sulfur protein as acceptor 1
peptide-methionine (S)-S-oxide reductase activity 4 1
peptidyl-prolyl cis-trans isomerase activity 1
phospho-N-acetylmuramoyl-pentapeptide-transferase activity 1
polysaccharide binding 1
protein tyrosine/serine/threonine phosphatase activity 1
(Table A.10 continued)
(continued)

300
pseudouridine synthase activity 1
pyridoxal phosphate binding 1 1
pyrimidine nucleotide-sugar transmembrane transporter activity 1
pyrophosphate hydrolysis-driven proton transmembrane
transporter activity 1
racemase activity, acting on amino acids and derivatives 1
strictosidine synthase activity 1
sucrose synthase activity 1 1
translation release factor activity 1
ubiquitin-like modifier activating enzyme activity 1
ubiquitin-protein transferase activity 1 1
unfolded protein binding 2 1
uridylyltransferase activity 1
xyloglucan:xyloglucosyl transferase activity 1
C. Cellular Component GO Term 11-2 11-7 7-2
integral component of membrane 16 18 4
membrane 10 16 4
nucleus 5 9 2
ribosome 2 8
endoplasmic reticulum 2
endoplasmic reticulum membrane 4
proteasome core complex 3
cytoplasm 2
GPI-anchor transamidase complex 2
mitochondrial proton-transporting ATP synthase complex,
coupling factor F(o) 2
nucleolus 2
nucleosome 2
acetyl-CoA carboxylase complex 1
apoplast 1
cell wall 1
chromosome 1
elongator holoenzyme complex 1
Golgi membrane 1
Las1 complex 1
mitochondrial inner membrane 1
nuclear pore 1
peroxisome 2 1
photosystem I 1
photosystem I reaction center 1
(Table A.10 continued)

301
Table A. 11 Number of CG hypomethylated DMR-associated genes associated with each
biological process (A), molecular function (B), and cellular component gene ontology
(GO) terms for each of the three age-contrasts (i.e. 11 – 2 year, 11 – 7 year, and 7 – 2
year). Values in each column represent the number of DMR-associated genes that are
associated with each GO term. Black squares indicate no genes associated with that
contrast were assigned the particular GO term.
A. Biological Process GO Term 11-2 11-7 7-2
protein phosphorylation 5 1 8
proteolysis 4 7
cell redox homeostasis 3 1
regulation of transcription, DNA-templated 3 2 7
cellulose biosynthetic process 2 1
obsolete oxidation-reduction process 2 2 12
signal transduction 2
translational elongation 2
transmembrane transport 2 1
tRNA aminoacylation for protein translation 2 1
ubiquitin-dependent protein catabolic process 2
ATP synthesis coupled proton transport 1
biosynthetic process 1 1
carbohydrate metabolic process 1 1 4
carboxylic acid metabolic process 1
cell wall modification 1
defense response 1
detection of visible light 1
dolichol-linked oligosaccharide biosynthetic process 1 1
glutaminyl-tRNA aminoacylation 1
Golgi vesicle transport 1 1
histone lysine methylation 1
intracellular protein transport 1
photosynthesis 1
protein-chromophore linkage 1
protein ubiquitination 1
proteolysis involved in cellular protein catabolic process 1
response to oxidative stress 1
transcription, DNA-templated 1
translation 1 2 3
trehalose biosynthetic process 1 1
tRNA aminoacylation 1
tRNA aminoacylation for protein translation 1
(continued)

302
B. Molecular Function GO Term 11-2 11-7 7-2
protein binding 13 3 14
ATP binding 8 4 9
protein kinase activity 5 1 8
cysteine-type peptidase activity 4 7
heme binding 1 2 7
DNA binding 1 2 6
iron ion binding 1 2 6
oxidoreductase activity, acting on paired donors, with
incorporation or reduction of molecular oxygen 1 2 6
transferase activity, transferring hexosyl groups 1 1 5
zinc ion binding 5 1 5
catalytic activity 4 3 4
DNA-binding transcription factor activity 1 1 4
hydrolase activity, hydrolyzing O-glycosyl compounds 4
electron transfer activity 3 1
nucleic acid binding 4 1 3
oxidoreductase activity 1 3
protein disulfide oxidoreductase activity 3
sequence-specific DNA binding 1 3
structural constituent of ribosome 1 2 3
acetylglucosaminyltransferase activity 2
ADP binding 1 1 2
carbohydrate binding 2 1
GTP binding 1 2
pyridoxal phosphate binding 1 2
RNA-DNA hybrid ribonuclease activity 2
translation elongation factor activity 2
transmembrane transporter activity 1 2
actin binding 1
aminoacyl-tRNA ligase activity 2 1 1
ATPase activity 1 1
ATPase-coupled transmembrane transporter activity 1 1
calcium ion binding 1
carbon-sulfur lyase activity 1
carbonate dehydratase activity 1 1
carboxy-lyase activity 1
cellulose synthase (UDP-forming) activity 2 1
channel activity 1
copper ion binding 1
DNA-directed 5'-3' RNA polymerase activity 1
(Table A.11 continued)
(continued)

303
double-stranded DNA binding 1
endopeptidase activity 1
enzyme inhibitor activity 1
flavin adenine dinucleotide binding 1
galactose binding 1
glutamine-tRNA ligase activity 1
GTPase activity 1
histone-lysine N-methyltransferase activity 1
hydrolase activity 1
hydrolase activity, acting on ester bonds 1
kinase activity 1
Lys48-specific deubiquitinase activity 1
lyase activity 1 2
magnesium ion binding 1 2
manganese ion binding 1
metal ion binding 1
metallopeptidase activity 1
methyltransferase activity 1 1
nucleotide binding 2 1 1
obsolete coenzyme binding 1
oxidoreductase activity, acting on CH-OH group of donors 1
oxidoreductase activity, acting on single donors with
incorporation of molecular oxygen, incorporation of two atoms of
oxygen
1 1
pectinesterase activity 1
peroxidase activity 1
phospho-N-acetylmuramoyl-pentapeptide-transferase activity 1
phospholipid bidning 1
phosphorelay sensor kinase activity 1
polygalacturonase activity 1 1 1
protein dimerization activity 1 1
protein-containing complex binding 1
proton-transporting ATP synthase activity, rotational mechanism 1
RNA binding 1 1
serine-type endopeptidase activity 1
terpene synthase activity 1 2
thiol-dependent ubiquitin-specific protease activity 1
threonine-type endopeptidase activity 1
transferase activity, transferring acyl groups other than amino-acyl
groups 1 2
translation initiation factor activity 1
(continued)
(Table A.11 continued)

304
ubiquitin-ubiquitin ligase activity 1
uridylyltransferase activity 1 1
C. Cellular Component GO Term 11-2 11-7 7-2
membrane 6 2 6
integral component of membrane 5 1 3
ribosome 1 2 3
cytoplasm 2
nucleus 2 1 2
eukaryotic translation initiation factor 3 complex 1
mitochondrial proton-transporting ATP synthase complex,
catalytic sector F(1) 1
mitochondrion 1 1
photosystem II 1
proteasome core complex 1
proteasome core complex, alpha-subunit complex 1
ubiquitin ligase complex 1
(Table A.11 continued)

305
Table A. 12 Number of CHG hypermethylated DMR-associated genes associated with
each biological process (A), molecular function (B), and cellular component gene
ontology (GO) terms for each of the three age-contrasts (i.e. 11 – 2 year, 11 – 7 year, and
7 – 2 year). Values in each column represent the number of DMR-associated genes that
are associated with each GO term. Black squares indicate no genes associated with that
contrast were assigned the particular GO term.
A. Biological Process GO Term 11-2 11-7 7-2
proteolysis 16 16 4
obsolete oxidation-reduction process 7 13 2
protein phosphorylation 5 11 5
carbohydrate metabolic process 4 4
regulation of transcription, DNA-templated 4 4 2
transmembrane transport 5 4 2
positive regulation of stomatal complex development 3
biosynthetic process 1 2 1
fatty acid biosynthetic process 2
nitrogen compound metabolic process 2 1
protein ubiquitination 2
response to auxin 2
signal transduction 5 2 1
translational termination 2 1
cation transport 1
cell population proliferation 1
cell redox homeostasis 1 1
cell wall modification 1 1
DNA topological change 1
drug transmembrane transport 1
glycerolipid biosynthetic process 1
intracellular protein transport 1
intracellular signal transduction 1 1
ion transport 1
lipid metabolic process 1 1
mistmatch repair 1
nucleoside metabolic process 1 1
nucleosome assembly 1
potassium ion transport 1
recognition of pollen 1
response to oxidative stress 1 2
terpenoid biosynthetic process 1
transcription, DNA-templated 1 1
translation 2 1 1
vesicle-mediated transport 1
(continued)

306
B. Molecular Function GO Term 11-2 11-7 7-2
cysteine-type peptidase activity 14 15 2
protein binding 14 9 7
ATP binding 10 7 8
zinc ion binding 8 3 6
nucleic acid binding 7 4 1
ADP binding 5 5 1
protein kinase activity 5 11 5
hydrolase activity, hydrolyzing O-glycosyl compounds 4
catalytic activity 3 2
copper ion binding 3
DNA binding 3 2 6
RNA-DNA hybrid ribonuclease activity 3 1
transmembrane transporter activity 3 3 1
actin binding 2 1
endopeptidase inhibitor activity 2 2
GTP binding 2
heme binding 2 5 2
hydrolase activity, acting on ester bonds 2 8 2
hydrolase activity, acting on glycosyl bonds 2
iron ion binding 2 4
nickel cation binding 2
oxidoreductase activity, acting on paired donors, with
incorporation or reduction of molecular oxygen 2 4
polygalacturonase activity 2
protein dimerization activity 2 3
RNA binding 2
sequence-specific DNA binding 2 2
serine-type endopeptidase activity 2 1
structural constituent of ribosome 2 1 1
translation release factor activity 2 1
ubiquitin-protein transferase activity 2
2-C-methyl-D-erythritol 2,4-cyclodiphosphate synthase activity 1
acid phosphatase activity 1
alpha-amylase activity 1
antioxidant activity 1
ATP-dependent peptidase activity 1
ATPase activity 1
calcium ion binding 1 1
diacylglycerol O-acyltransferase activity 1
DNA topoisomerase activity 1
(Table A.12 continued)
(continued)

307
DNA-binding transcription factor activity 1 1 1
DNA-directed 5'-3' RNA polymerase activity 1
double-stranded DNA binding 1
electron transfer activity 1 1
endonuclease activity 1
enzyme inhibitor activity 1 1
flavin adenine dinucleotide binding 1
growth factor activity 1
GTPase activator activity 1 1
hydrolase activity 1 2
ion channel activity 1
ionotropic glutamate receptor activity 1
lyase activity 1
magnesium ion binding 1
malonyl-CoA decarboxylase activity 1
metal ion binding 1 2
mismatched DNA binding 1
NAD binding 1
nutrient reservoir activity 1
oxidoreductase activity 1 6
oxidoreductase activity, acting on CH-OH group of donors 1
oxidoreductase activity, acting on the aldehyde or oxo group of
donors, NAD or NADP as acceptor 1
oxidoreductase activity, acting on the CH-CH group of donors,
NAD or NADP as acceptor 1
pectinesterase activity 1 1
peptide-methionine (S)-S-oxide reductase activity 1 1
peroxidase activity 1 2
phosphotransferase activity, alcohol group as acceptor 1
polysaccharide binding 1
protein disulfide oxidoreductase activity 1 1
protein phosphatase regulator activity 1 1
racemase activity, acting on amino acids and derivatives 1
ribonuclease activity 1
serine-type carboxypeptidase activity 1 2
solute:proton antiporter activity 1
strictosidine synthase activity 1
terpene synthase activity 1
transferase activity, transferring acyl groups 1 1
transferase activity, transferring acyl groups other than amino-acyl
groups 1 2 2
(continued)
(Table A.12 continued)

308
transferase activity, transferring hexosyl groups 1 1
ubiquitin-like modifier activating enzyme activity 1 1
C. Cellular Component GO Term 11-2 11-7 7-2
membrane 5 4 1
integral component of membrane 1 3 1
AP-5 adaptor complex 1
COPI vesicle coat 1
extracellular region 1
membrane coat 1
nucleus 2 1 4
protein phosphatase type 2A complex 1 1
proton-transporting two-sector ATPase complex, catalytic domain 1
ribosome 2 1 1
membrane 4
(Table A.12 continued)

309
Table A. 13 Number of CHG hypomethylated DMR-associated genes associated with
each biological process (A), molecular function (B), and cellular component gene
ontology (GO) terms for each of the three age-contrasts (i.e. 11 – 2 year, 11 – 7 year, and
7 – 2 year). Values in each column represent the number of DMR-associated genes that
are associated with each GO term. Black squares indicate no genes associated with that
contrast were assigned the particular GO term.
A. Biological Process GO Term 11-2 11-7 7-2
obsolete oxidation-reduction process 5 3 9
protein phosphorylation 5 5 6
proteolysis 5 8 8
regulation of transcription, DNA-templated 4 5 2
carbohydrate metabolic process 2 2
cysteinyl-tRNA aminoacylation 2
phospholipid biosynthetic process 2
response to auxin 2 1
transmembrane transport 2 1 5
amine metabolic process 1 1
ATP metabolic process 1
autophagy 1
base-excision repair 1
cell redox homeostasis 1
defense response 1
drug transmembrane transport 1 1
G protein-coupled receptor signaling pathway 1
intracellular protein transport 1
lipid biosynthetic process 1 1
magnesium ion transport 1
metal ion transport 1 1
mistmatch repair 1
nucleobase-containing compound metabolic process 1
nucleosome assembly 1
organic substance metabolic process 1
proton transmembrane transport 1
purine nucleobase biosynthetic process 1 1
regulation of cyclin-dependent protein serine/threonine kinase
activity 1
response to oxidative stress 1
rRNA processing 1
steroid biosynthetic process 1
transcription, DNA-templated 1
translation 1 2 2
translational elongation 1 1
trehalose biosynthetic process 1

310
tRNA processing 1
ubiquitin-dependent protein catabolic process 1
B. Molecular Function GO Term 11-2 11-7 7-2
ATP binding 10 5 10
protein binding 9 3 9
zinc ion binding 8 5 8
cysteine-type peptidase activity 5 7 7
DNA binding 5 5 1
protein kinase activity 5 5 6
iron ion binding 4 2 5
heme binding 3 2 5
nucleic acid binding 3 2 5
oxidoreductase activity, acting on paired donors, with
incorporation or reduction of molecular oxygen 3 2 4
transferase activity, transferring acyl groups other than amino-acyl
groups 3
3'-5' exonuclease activity 1
catalytic activity 2 3 2
cysteine-tRNA ligase activity 2
DNA-binding transcription factor activity 2 2 1
hydrolase activity 2 2 1
hydrolase activity, hydrolyzing O-glycosyl compounds 2 1
Lys48-specific deubiquitinase activity 2
metal ion binding 2 4
methyltransferase activity 2
nucleotide binding 2
phosphatidylserine decarboxylase activity 2
sequence-specific DNA binding 2 1 1
serine-type endopeptidase activity 2
thiol-dependent ubiquitin-specific protease activity 2
acid phosphatase activity 1 2
ADP binding 1 1 2
aminopeptidase activity 1
ATPase activity 1
calcium ion binding 1 1
calcium-dependent phospholipid binding 1 1
carbohydrate binding 1 1
carbon-sulfur lyase activity 1
chromatin binding 1
copper ion binding 1 1
(continued)
(Table A.13 continued)

311
DNA-3-methyladenine glycosylase activity 1
DNA-directed 5'-3' RNA polymerase activity 1
electron transfer activity 1
endopeptidase inhibitor activity 1
enzyme inhibitor activity 1
flavin adenine dinucleotide binding 1
glycopeptide alpha-N-acetylgalactosaminidase activity 1
GTPase activity 1
hydrolase activity, acting on ester bonds 1 1
intramolecular transferase activity, phosphotransferases 1
ionotropic glutamate receptor activity 1 1
lyase activity 1 2
magnesium ion binding 1 2
magnesium ion transmembrane transporter activity 1
mismatched DNA binding 1
oxidoreductase activity 1 1 2
peroxidase activity 1
phospholipid binding 1 1
phosphoribosylamine-glycine ligase activity 1 1
polysaccharide binding 1
primary amine oxidase activity 1 1
protein dimerization activity 1 2
protein disulfide oxidoreductase activity 1
protein kinase binding 1
protein serine/threonine kinase activity 1 1
quinone binding 1 1
RNA-DNA hybrid ribonuclease activity 1 1 2
RNA binding 1
serine-type carboxypeptidase activity 1
structural constituent of ribosome 1 2 2
terpene synthase activity 1 2
transferase activity, transferring glycosyl groups 1
transferase activity, transferring hexosyl groups 1 1
translation elongation factor activity 1 1
transmembrane transporter activity 1 3
tRNA dihydrouridine synthase activity 1
ubiquitin protein ligase binding 1
C. Cellular Component GO Term 11-2 11-7 7-2
integral component of membrane 4 1 3
cytoplasm 3
(Table A.13 continued)
(continued)
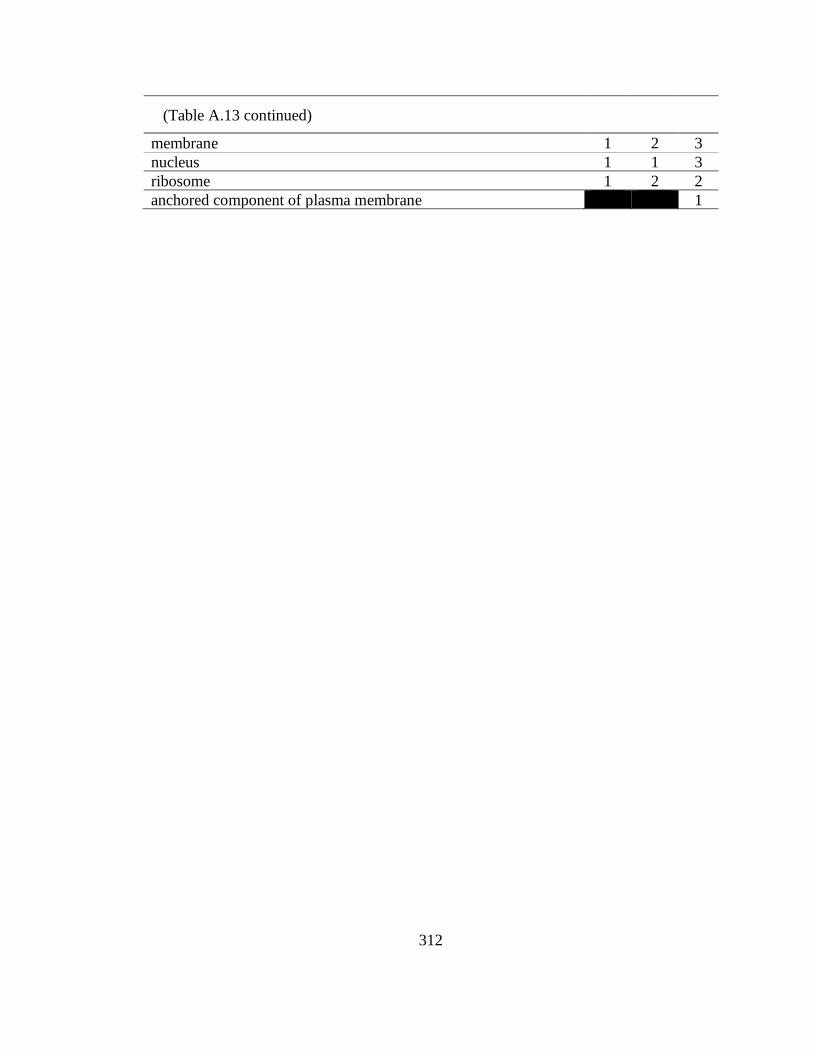
312
membrane 1 2 3
nucleus 1 1 3
ribosome 1 2 2
anchored component of plasma membrane 1
(Table A.13 continued)

313
Table A. 14 Number of CHH hypermethylated DMR-associated genes associated with
each biological process (A), molecular function (B), and cellular component gene
ontology (GO) terms for each of the three age-contrasts (i.e. 11 – 2 year, 11 – 7 year, and
7 – 2 year). Values in each column represent the number of DMR-associated genes that
are associated with each GO term. Black squares indicate no genes associated with that
contrast were assigned the particular GO term.
A. Biological Process GO Term 11-2 11-7 7-2
protein phosphorylation 14 7 28
proteolysis 13 6 21
obsolete oxidation-reduction process 8 4 20
regulation of transcription, DNA-templated 7 2 15
translation 1 2 8
transmembrane transport 5 4 8
signal transduction 3 1 6
carbohydrate metabolic process 2 2 4
defense response 1 3
tRNA aminoacylation for protein translation 1 3
cation transport 2
cell redox homeostasis 1 2
cell wall modification 1 2
DNA topological change 2
exocytosis 2
fatty acid beta-oxidation 2
histone lysine methylation 2
lipid metabolic process 2 2
nitrate assimilation 3 2
positive regulation of Notch signaling pathway 2
protein ubiquitination 2
pyrimidine nucleotide biosynthetic process 2
transcription, DNA-templated 2
ATP metabolic process 1
biosynthetic process 1 1
carboxylic acid metabolic process 1
cell wall biogenesis 1
cell wall macromolecule catabolic process 1
cellular amino acid metabolic process 1
cellular glucan metabolic process 1
cellulose biosynthetic process 1
cellulose microfibril organization 1 1
chitin catabolic process 1
DNA-templated transcription, initiation 1
drug transmembrane transport 1
endocytosis 1

314
fatty acid biosynthetic process 1 1
glutathione biosynthetic process 1
glycolytic process 1 1
glycyl-tRNA aminoacylation 1
guanosine tetraphosphate metabolic process 1
intermembrane lipid transfer 1
intracellular protein transport 1 1
intracellular signal transduction 1
ion transport 1 1
lipid catabolic process 2 1
malate transport 1
mannose metabolic process 2 1
mRNA export from nucleus 2 1
nucleobase-containing compound metabolic process 1
nucleosome assembly 1
phosphatidylinositol metabolic process 1 1
phospholipid biosynthetic process 1
photosynthesis 1
proteasome assembly 2 1
protein kinase C-activating G protein-coupled receptor signaling
pathway 1
protein neddylation 1
protein peptidyl-prolyl isomerization 1
proteolysis involved in cellular protein catabolic process 1
proton transmembrane transport 1
regulation of systemic acquired resistance 1
RNA processing 1
response to oxidative stress 1
retrograde vesicle-mediated transport, Golgi to endoplasmic
reticulum
1
ribosome biogenesis 1 1
rRNA processing 1
sulfate transport 1
terpenoid biosynthetic process 1
transcription by RNA polymerase II 1
transcription initiation from RNA polymerase II promoter 1 1 1
translational elongation 1
tryptophan catabolic process to kynurenine 1
tryptophan metabolic process 1
ubiquitin-dependent protein catabolic process 1 1
valyl-tRNA aminoacylation 1
(continued)
(Table A.14 continued)

315
vesicle docking involved in exocytosis 1
vesicle-mediated transport 1 1
B. Molecular Function GO Term 11-2 11-7 7-2
protein binding 20 6 42
ATP binding 21 10 37
protein kinase activity 14 7 28
cysteine-type peptidase activity 12 4 20
DNA binding 8 1 19
ADP binding 5 3 16
nucleic acid binding 11 5 15
zinc ion binding 8 2 14
hydrolase activity, acting on ester bonds 5 4 13
protein dimerization activity 5 1 13
structural constituent of ribosome 1 2 8
oxidoreductase activity 7 1 7
DNA-binding transcription factor activity 2 1 6
RNA binding 1 6
acetylglucosaminyltransferase activity 2 1 5
RNA-DNA hybrid ribonuclease activity 4 5
3-hydroxyisobutyryl-CoA hydrolase activity 4
heme binding 2 1 4
iron ion binding 1 1 4
nucleotide binding 1 4
oxidoreductase activity, acting on paired donors, with
incorporation or reduction of molecular oxygen 1 1 4
polysaccharide binding 1 2 4
sequence-specific DNA binding 2 1 4
transferase activity, transferring acyl groups 2 4
aminoacyl-tRNA ligase activity 1 3
ATPase activity 5 1 3
calcium ion binding 1 3
catalytic activity 4 3 3
electron transfer activity 1 3
GTPase activity 3
hydrolase activity 3
oxidoreductase activity, acting on the CH-CH group of donors 3
serine-type endopeptidase activity 1 1 3
transferase activity, transferring hexosyl groups 4 1 3
ubiquitin-like modifier activating enzyme activity 1 3
(continued)
(Table A.14 continued)

316
acyl-CoA oxidase activity 2
DNA topoisomerase activity 2
flavin adenine dinucleotide binding 2
GTP binding 5 1 2
helicase activity 2
histone-lysine N-methyltransferase activity 2
hydrolase activity, hydrolyzing O-glycosyl compounds 1 2
metal ion binding 2 2
methyltransferase activity 2
molybdenum ion binding 3 2
nutrient reservoir activity 2
oxidoreductase activity, acting on CH-OH group of donors 2
pectinesterase activity 1 2
protein disulfide oxidoreductase activity 1 2
solute:proton antiporter activity 2
transferase activity, transferring glycosyl groups 2
ubiquitin-protein transferase activity 2
1-deoxy-D-xylulose-5-phosphate synthase activity 1
3'-5' exonuclease activity 1
alpha-amylase activity 1
alpha-mannosidase activity 2 1
antioxidant activity 1
arylformamidase activity 1
ATPase-coupled transmembrane transporter activity 1
calcium-dependent phospholipid binding 1
carboxy-lyase activity 1
cellulose synthase (UDP-forming) activity 1
channel activity 1 1
chitin binding 1
chitinase activity 1
chromatin binding 2 1
copper ion binding 1 1
cysteine-type endopeptidase inhibitor activity 1
diacylglycerol kinase activity 1
DNA topoisomerase type II (double strand cut, ATP-hydrolyzing)
activity 1
DNA-directed 5'-3' RNA polymerase activity 1
endopeptidase activity 1
enzyme inhibitor activity 2 1
galactoside 2-alpha-L-fucosyltransferase activity 1
glutathione synthase activity 1
(continued)
(Table A.14 continued)

317
glycine-tRNA ligase activity 1
glycopeptide alpha-N-acetylgalactosaminidase activity 1
heat shock protein binding 1
ion channel activity 1 1
lipid transfer activity 1
magnesium ion binding 2 1
mannosyl-glycoprotein endo-beta-N-acetylglucosaminidase
activity 1
microtubule minus-end binding 1
NEDD8 activating enzyme activity 1
O-methyltransferase activity 1
obsolete coenzyme binding 1 1
peptidyl-prolyl cis-trans isomerase activity 1
peroxidase activity 1
phosphatidylinositol binding 1
phosphatidylinositol phosphate kinase activity 1 1
phosphatidylserine decarboxylase activity 1
polygalacturonase activity 1
potassium ion binding 1 1
protein serine/threonine kinase activity 1
proton-transporting ATPase activity, rotational mechanism 1
pyridoxal phosphate binding 1 1
pyruvate kinase activity 1 1
ribonuclease T2 activity 1
serine-type carboxypeptidase activity 1 1
serine-type exopeptidase activity 1
serine-type peptidase activity 1
sulfate transmembrane transporter activity 1
TBP-class protein binding 1
threonine-type endopeptidase activity 1
thiamine pyrophosphate binding 1
thiolester hydrolase activity 1
transaminase activity 1
transferase activity, transferring acyl groups other than amino-acyl
groups 1 2 1
translation elongation factor activity 1
transmembrane transporter activity 2 1 1
tRNA binding 1
tryptophan synthase activity 1
unfolded protein binding 1
valine-tRNA ligase activity 1
(Table A.14 continued)
(continued)

318
xyloglucan:xyloglucosyl transferase activity 1
C. Cellular Component GO Term 11-2 11-7 7-2
integral component of membrane 3 5 15
membrane 10 4 14
ribosome 1 2 8
nucleus 1 7
cytoplasm 4
chloroplast 2
chromosome 2
exocyst 2
peroxisome 2
anchored component of membrane 1 1
apoplast 1
cell wall 1
endoplasmic reticulum membrane 1
extrinsic component of membrane 1
Golgi transport complex 1
nucleolus 1
nucleosome 1
photosystem II 1
photosystem II oxygen evolving complex 1
proteasome core complex 1
proteasome core complex, alpha-subunit complex 1
proteasome regulatory particle, lid subcomplex 2 1
proton-transporting two-sector ATPase complex, catalytic domain 1
transcription factor TFIIA complex 1 1
(continued)
(Appendix Table 14 continued)
(Table A.14 continued)

319
Table A. 15 Number of CHH hypomethylated DMR-associated genes associated with
each biological process (A), molecular function (B), and cellular component gene
ontology (GO) terms for each of the three age-contrasts (i.e. 11 – 2 year, 11 – 7 year, and
7 – 2 year). Values in each column represent the number of DMR-associated genes that
are associated with each GO term. Black squares indicate no genes associated with that
contrast were assigned the particular GO term.
A. Biological Process GO Term 11-2 11-7 7-2
protein phosphorylation 2 9 1
regulation of transcription, DNA-templated 6 9
proteolysis 2 5 4
transmembrane transport 2 5
carbohydrate metabolic process 3 1
obsolete oxidation-reduction process 5 3 6
translation 1 3
ATP metabolic process 2
base-excision repair 1 2
nucleobase-containing compound metabolic process 2
proton transmembrane transport 2
response to hormone 2
response to oxidative stress 2 2
cell redox homeostasis 1
cell wall macromolecule catabolic process 1
chitin catabolic process 1
defense response 1
DNA repair 1
DNA topological change 1
exocytosis 1
intermembrane lipid transfer 1
intracellular protein transport 1 1
lipid metabolic process 1 1
metal ion transport 1 1 1
nitrogen compound metabolic process 1
phytochromobilin biosynthetic process 1
protein folding 1
rRNA processing 1
signal transduction 1
steroid biosynthetic process 1
sucrose metabolic process 1
superoxide metabolic process 1
translational initiation 1
B. Molecular Function GO Term 11-2 11-7 7-2
ATP binding 3 14 3
(continued)

320
DNA binding 5 13 2
protein binding 4 9 3
protein kinase activity 2 9 1
zinc ion binding 6 2
cysteine-type peptidase activity 2 5 4
RNA binding 5
sequence-specific DNA binding 4 5
DNA-binding transcription factor activity 5 4
metal ion binding 1 4
ATPase activity 3
ATPase-coupled transmembrane transporter activity 3
protein dimerization activity 1 3 1
structural constituent of ribosome 1 3
3'-5' exonuclease activity 2
ADP binding 1 2
DNA-3-methyladenine glycosylase activity 1 2
glutathione peroxidase activity 2 2
heme binding 2
hydrolase activity 1 2 2
hydrolase activity, acting on ester bonds 2 3
iron ion binding 2
nucleic acid binding 2 4
oxidoreductase activity, acting on paired donors, with
incorporation or reduction of molecular oxygen
2
polygalacturonase activity 2
pyridoxal phosphate binding 2
transaminase activity 2
3-beta-hydroxy-delta5-steroid dehydrogenase activity 1
acetylglucosaminyltransferase activity 1 1 2
acid phosphatase activity 1
carbohydrate binding 1
catalytic activity 1 1 2
chitin binding 1
chitinase activity 1
cobalt ion binding 1
DNA topoisomerase activity 1
flavin adenine dinucleotide binding 1
hydrolase activity, hydrolyzing O-glycosyl compounds 1 1
intramolecular lyase activity 1
lipid transfer activity 1
Lys48-specific deubiquitinase activity 1
(continued)
(Table A.15 continued)
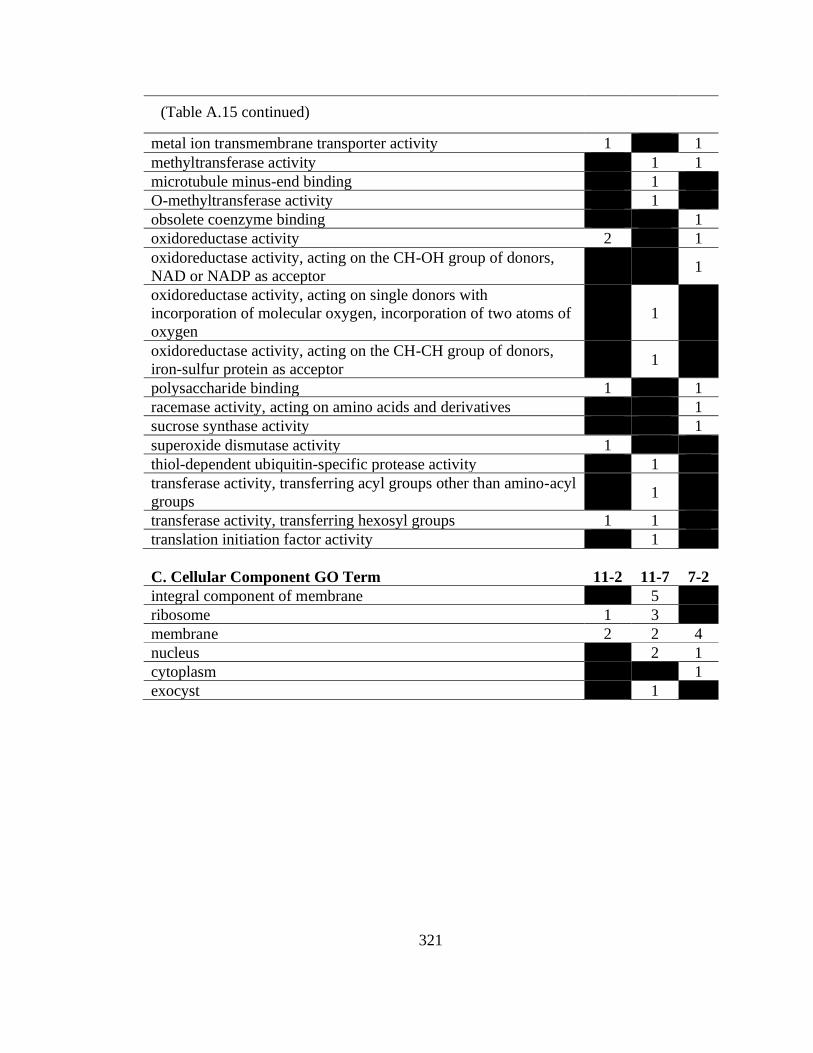
321
metal ion transmembrane transporter activity 1 1
methyltransferase activity 1 1
microtubule minus-end binding 1
O-methyltransferase activity 1
obsolete coenzyme binding 1
oxidoreductase activity 2 1
oxidoreductase activity, acting on the CH-OH group of donors,
NAD or NADP as acceptor
1
oxidoreductase activity, acting on single donors with
incorporation of molecular oxygen, incorporation of two atoms of
oxygen
1
oxidoreductase activity, acting on the CH-CH group of donors,
iron-sulfur protein as acceptor 1
polysaccharide binding 1 1
racemase activity, acting on amino acids and derivatives 1
sucrose synthase activity 1
superoxide dismutase activity 1
thiol-dependent ubiquitin-specific protease activity 1
transferase activity, transferring acyl groups other than amino-acyl
groups 1
transferase activity, transferring hexosyl groups 1 1
translation initiation factor activity 1
C. Cellular Component GO Term 11-2 11-7 7-2
integral component of membrane 5
ribosome 1 3
membrane 2 2 4
nucleus 2 1
cytoplasm 1
exocyst 1
(Table A.15 continued)

322
Table A. 16 Genomic coordinates for CG hypermethylated (increased methylation in BF
twins compared to no-BF twins) DMRs identified in each twin pair and associated with
the same gene. Coordinates include scaffold number in the 'Nonpareil' almond reference
genome followed by start and end genomic positions.
Scaffold_Twinpair1 Start_Twinpair1 End_Twinpair1
Scaffold_1 3419653 3419752
Scaffold_1 8059989 8060276
Scaffold_2 18128474 18128620
Scaffold_7 11904989 11905049
Scaffold_8 6245472 6245538
Scaffold_Twinpair2 Start_Twinpair2 End_Twinpair2
Scaffold_1 3419277 3419771
Scaffold_1 8059989 8060276
Scaffold_2 18128260 18128390
Scaffold_7 11904846 11904989
Scaffold_8 6245472 6245538

323
Table A. 17 Genomic coordinates for CG hypomethylated (decreased methylation in BF
twins compared to no-BF twins) DMRs identified in each twin pair and associated with
the same gene. Coordinates include scaffold number in the 'Nonpareil' almond reference
genome followed by start and end genomic positions.
Scaffold_Twinpair1 Start_Twinpair1 End_Twinpair1
Scaffold_1 11884461 11884811
Scaffold_1 15917452 15917574
Scaffold_1 20726710 20726864
Scaffold_1 25363504 25363612
Scaffold_1 8564186 8564249
Scaffold_1 8933829 8933947
Scaffold_1 29913157 29913520
Scaffold_1 29913157 29913520
Scaffold_1 11884461 11884811
Scaffold_1 15917452 15917574
Scaffold_2 16212723 16212785
Scaffold_2 18967168 18967288
Scaffold_2 18966307 18967105
Scaffold_3 13774533 13774879
Scaffold_3 15850588 15850648
Scaffold_4 12981996 12982334
Scaffold_4 7317194 7317317
Scaffold_4 15608941 15609210
Scaffold_4 7317194 7317317
Scaffold_4 8230345 8230738
Scaffold_5 10998025 10998269
Scaffold_5 597044 597114
Scaffold_5 10170509 10170710
Scaffold_5 9317289 9317394
Scaffold_6 13025959 13026053
Scaffold_6 5482642 5482727
Scaffold_6 800907 801252
Scaffold_6 9339285 9339513
Scaffold_6 2906640 2906739
Scaffold_6 2906640 2906739
Scaffold_6 2906640 2906739
Scaffold_6 13025959 13026053
Scaffold_6 4949523 4949907

324
Scaffold_7 3382055 3382636
Scaffold_7 1164446 1164513
Scaffold_7 7242481 7242824
Scaffold_8 10028830 10029044
Scaffold_8 10980855 10981083
Scaffold_8 6480510 6480854
Scaffold_8 10028830 10029044
Scaffold_8 10975444 10975556
Scaffold_8 10980855 10981083
Scaffold_8 6480510 6480854
Scaffold_Twinpair2 Start_Twinpair2 End_Twinpair2
Scaffold_1 11884793 11885010
Scaffold_1 15917452 15917574
Scaffold_1 20726736 20726864
Scaffold_1 25363505 25363756
Scaffold_1 8564098 8564249
Scaffold_1 8932194 8932408
Scaffold_1 29913157 29913269
Scaffold_1 29913349 29913520
Scaffold_1 11884793 11885010
Scaffold_1 15917452 15917574
Scaffold_2 16212723 16212838
Scaffold_2 18967078 18967288
Scaffold_2 18967078 18967288
Scaffold_3 13772397 13772452
Scaffold_3 15850588 15850648
Scaffold_4 12981893 12982334
Scaffold_4 7317194 7317317
Scaffold_4 15608941 15609383
Scaffold_4 7317194 7317317
Scaffold_4 8230657 8230738
Scaffold_5 10998190 10998269
Scaffold_5 596925 597115
Scaffold_5 10173025 10173112
(Table A.17 continued)
(continued)

325
Scaffold_5 9317185 9317505
Scaffold_6 13025921 13026053
Scaffold_6 5481728 5482066
Scaffold_6 800907 801147
Scaffold_6 9339285 9339513
Scaffold_6 2906640 2906953
Scaffold_6 2907470 2907550
Scaffold_6 2905695 2906297
Scaffold_6 13025921 13026053
Scaffold_6 4949523 4949907
Scaffold_7 3382055 3382501
Scaffold_7 1162910 1163088
Scaffold_7 7242481 7242768
Scaffold_8 10028900 10029017
Scaffold_8 10980834 10981136
Scaffold_8 6480510 6480854
Scaffold_8 10028900 10029017
Scaffold_8 10974761 10975128
Scaffold_8 10980834 10981136
Scaffold_8 6480510 6480854
(Table A.17 continued)

326
Table A. 18 Genomic coordinates for CHG hypermethylated (increased methylation in
BF twins compared to no-BF twins) DMRs identified in each twin pair and associated
with the same gene. Coordinates include scaffold number in the 'Nonpareil' almond
reference genome followed by start and end genomic positions.
Scaffold_Twinpair1 Start_Twinpair1 End_Twinpair1
Scaffold_1 8059746 8060077
Scaffold_1 4964340 4964455
Scaffold_4 6600104 6600281
Scaffold_4 6600104 6600281
Scaffold_5 5549592 5549887
Scaffold_5 9118290 9118528
Scaffold_7 7447805 7447905
Scaffold_Twinpair2 Start_Twinpair2 End_Twinpair2
Scaffold_1 8060219 8060286
Scaffold_1 4963966 4964023
Scaffold_4 6599702 6599778
Scaffold_4 6599290 6599651
Scaffold_5 5549889 5550233
Scaffold_5 9118412 9118483
Scaffold_7 7447905 7448002

327
Table A. 19 Genomic coordinates for CHG hypomethylated (decreased methylation in
BF twins compared to no-BF twins) DMRs identified in each twin pair and associated
with the same gene. Coordinates include scaffold number in the 'Nonpareil' almond
reference genome followed by start and end genomic positions.
Scaffold_Twinpair1 Start_Twinpair1 End_Twinpair1
Scaffold_3 8140284 8141197
Scaffold_4 12982231 12982335
Scaffold_4 3842627 3842792
Scaffold_4 6149929 6150020
Scaffold_5 10452544 10452667
Scaffold_6 2905673 2905728
Scaffold_7 3382094 3382308
Scaffold_1 19246437 19246534
Scaffold_1 25391309 25391550
Scaffold_2 121095 121310
Scaffold_Twinpair2 Start_Twinpair2 End_Twinpair2
Scaffold_3 8141033 8141199
Scaffold_4 12982868 12982970
Scaffold_4 3842778 3843036
Scaffold_4 6149929 6150020
Scaffold_5 10452662 10453755
Scaffold_6 2905673 2905882
Scaffold_7 3381836 3382156
Scaffold_1 19246503 19246556
Scaffold_1 25391309 25391550
Scaffold_2 121262 121364

328
Table A. 20 Genomic coordinates for CHH hypermethylated (increased methylation in
BF twins compared to no-BF twins) DMRs identified in each twin pair and associated
with the same gene. Coordinates include scaffold number in the 'Nonpareil' almond
reference genome followed by start and end genomic positions.
Scaffold_Twinpair1 Start_Twinpair1 End_Twinpair1
Scaffold_1 2140020 2140090
Scaffold_1 22622072 22622175
Scaffold_1 35411377 35411614
Scaffold_1 8189707 8189777
Scaffold_2 1328127 1328224
Scaffold_4 16280111 16280595
Scaffold_5 862690 862805
Scaffold_8 4938307 4938600
Scaffold_1 35411377 35411614
Scaffold_2 11655183 11655520
Scaffold_4 7910059 7910413
Scaffold_8 4938307 4938600
Scaffold_Twinpair2 Start_Twinpair2 End_Twinpair2
Scaffold_1 2139004 2139218
Scaffold_1 22621920 22622170
Scaffold_1 35411541 35411651
Scaffold_1 8189519 8189569
Scaffold_2 1328551 1328626
Scaffold_4 16279081 16279200
Scaffold_5 862748 862866
Scaffold_8 4938099 4938155
Scaffold_1 35411541 35411651
Scaffold_2 11655173 11655457
Scaffold_4 7910555 7910967
Scaffold_8 4938099 4938155

329
Table A. 21 Genomic coordinates for CHH hypomethylated (decreased methylation in
BF twins compared to no-BF twins) DMRs identified in each twin pair and associated
with the same gene. Coordinates include scaffold number in the 'Nonpareil' almond
reference genome followed by start and end genomic positions.
Scaffold_Twinpair1 Start_Twinpair1 End_Twinpair1
Scaffold_1 8933739 8933838
Scaffold_1 12942419 12942547
Scaffold_5 9682862 9683084
Scaffold_7 2298460 2298518
Scaffold_8 1925515 1925718
Scaffold_Twinpair2 Start_Twinpair2 End_Twinpair2
Scaffold_1 8933426 8933648
Scaffold_1 12942412 12942538
Scaffold_5 9682643 9682974
Scaffold_7 2298463 2298716
Scaffold_8 1925402 1925659

330
Table A. 22 Genomic coordinates for CG DMRs identified in each twin pair and
associated with the same gene. Coordinates include scaffold number in 'Nonpareil'
almond reference genome followed by start and end genomic positions.
Scaffold_Twinpair1 Start_Twinpair1 End_Twinpair1
Scaffold_1 11884461 11884811
Scaffold_1 15917452 15917574
Scaffold_1 20726710 20726864
Scaffold_1 25363504 25363612
Scaffold_1 32880472 32880690
Scaffold_1 3419653 3419752
Scaffold_1 8059989 8060276
Scaffold_1 8564186 8564249
Scaffold_1 8933829 8933947
Scaffold_1 1673137 1673199
Scaffold_1 29913157 29913520
Scaffold_1 29913157 29913520
Scaffold_1 30123171 30123232
Scaffold_1 11884461 11884811
Scaffold_1 15917452 15917574
Scaffold_2 16212723 16212785
Scaffold_2 3304147 3304437
Scaffold_2 18128474 18128620
Scaffold_2 18128984 18129083
Scaffold_2 18967168 18967288
Scaffold_2 18966307 18967105
Scaffold_2 3304147 3304437
Scaffold_3 13774533 13774879
Scaffold_3 15850588 15850648
Scaffold_3 454216 454315
Scaffold_3 454216 454315
Scaffold_4 12981996 12982334
Scaffold_4 2275376 2275458
Scaffold_4 4646516 4646633
Scaffold_4 4646516 4646633
Scaffold_4 6735391 6735493
Scaffold_4 7317194 7317317
Scaffold_4 15608941 15609210
Scaffold_4 6735391 6735493
(continued)

331
Scaffold_4 7317194 7317317
Scaffold_4 8230345 8230738
Scaffold_5 10998025 10998269
Scaffold_5 14907545 14907606
Scaffold_5 597044 597114
Scaffold_5 9770872 9770965
Scaffold_5 10170509 10170710
Scaffold_5 14907545 14907606
Scaffold_5 9317289 9317394
Scaffold_5 9813110 9813170
Scaffold_6 13025959 13026053
Scaffold_6 5482642 5482727
Scaffold_6 800907 801252
Scaffold_6 9339285 9339513
Scaffold_6 2906640 2906739
Scaffold_6 2906640 2906739
Scaffold_6 2906640 2906739
Scaffold_6 13025959 13026053
Scaffold_6 4949523 4949907
Scaffold_7 11904989 11905049
Scaffold_7 1219287 1219428
Scaffold_7 3382055 3382636
Scaffold_7 1164446 1164513
Scaffold_7 7242481 7242824
Scaffold_8 10028830 10029044
Scaffold_8 10980855 10981083
Scaffold_8 3393987 3394258
Scaffold_8 6245472 6245538
Scaffold_8 6480510 6480854
Scaffold_8 6874777 6874853
Scaffold_8 8602495 8602548
Scaffold_8 10028830 10029044
Scaffold_8 10975444 10975556
Scaffold_8 10980855 10981083
Scaffold_8 12891092 12891397
Scaffold_8 6245472 6245538
Scaffold_8 6480510 6480854
(Table A.22 continued)
(continued)

332
Scaffold_8 6874777 6874853
Scaffold_Twinpair2 Start_Twinpair2 End_Twinpair2
Scaffold_1 11884793 11885010
Scaffold_1 15917452 15917574
Scaffold_1 20726736 20726864
Scaffold_1 25363505 25363756
Scaffold_1 32880690 32881152
Scaffold_1 3419277 3419771
Scaffold_1 8059989 8060276
Scaffold_1 8564098 8564249
Scaffold_1 8932194 8932408
Scaffold_1 1673047 1673139
Scaffold_1 29913157 29913269
Scaffold_1 29913349 29913520
Scaffold_1 30123172 30123232
Scaffold_1 11884793 11885010
Scaffold_1 15917452 15917574
Scaffold_2 16212723 16212838
Scaffold_2 3304342 3304437
Scaffold_2 18128260 18128390
Scaffold_2 18128260 18128390
Scaffold_2 18967078 18967288
Scaffold_2 18967078 18967288
Scaffold_2 3304342 3304437
Scaffold_3 13772397 13772452
Scaffold_3 15850588 15850648
Scaffold_3 453821 454315
Scaffold_3 453505 453736
Scaffold_4 12981893 12982334
Scaffold_4 2275004 2275231
Scaffold_4 4645041 4645266
Scaffold_4 4644811 4644889
Scaffold_4 6735391 6735493
Scaffold_4 7317194 7317317
Scaffold_4 15608941 15609383
Scaffold_4 6735391 6735493
(Table A.22 continued)
(continued)

333
Scaffold_4 7317194 7317317
Scaffold_4 8230657 8230738
Scaffold_5 10998190 10998269
Scaffold_5 14907545 14907606
Scaffold_5 596925 597115
Scaffold_5 9771288 9771381
Scaffold_5 10173025 10173112
Scaffold_5 14907545 14907606
Scaffold_5 9317185 9317505
Scaffold_5 9812319 9812400
Scaffold_6 13025921 13026053
Scaffold_6 5481728 5482066
Scaffold_6 800907 801147
Scaffold_6 9339285 9339513
Scaffold_6 2906640 2906953
Scaffold_6 2907470 2907550
Scaffold_6 2905695 2906297
Scaffold_6 13025921 13026053
Scaffold_6 4949523 4949907
Scaffold_7 11904846 11904989
Scaffold_7 1219342 1219428
Scaffold_7 3382055 3382501
Scaffold_7 1162910 1163088
Scaffold_7 7242481 7242768
Scaffold_8 10028900 10029017
Scaffold_8 10980834 10981136
Scaffold_8 3393960 3394010
Scaffold_8 6245472 6245538
Scaffold_8 6480510 6480854
Scaffold_8 6874777 6874901
Scaffold_8 8602452 8602549
Scaffold_8 10028900 10029017
Scaffold_8 10974761 10975128
Scaffold_8 10980834 10981136
Scaffold_8 12891304 12891418
Scaffold_8 6245472 6245538
Scaffold_8 6480510 6480854
(Table A.22 continued)
(continued)

334
Scaffold_8 6874777 6874901
(Table A.22 continued)

335
Table A. 23 Genomic coordinates for all shared CHG DMRs identified in each twin pair
and associated with the same gene. Coordinates include scaffold number in 'Nonpareil'
almond reference genome followed by start and end genomic positions.
Scaffold_Twinpair1 Start_Twinpair1 End_Twinpair1
Scaffold_1 8059746 8060077
Scaffold_1 19246437 19246534
Scaffold_1 25391309 25391550
Scaffold_1 29053934 29053988
Scaffold_1 4964340 4964455
Scaffold_2 121095 121310
Scaffold_3 3422937 3423106
Scaffold_3 8140284 8141197
Scaffold_4 12982231 12982335
Scaffold_4 3842627 3842792
Scaffold_4 6149929 6150020
Scaffold_4 6600104 6600281
Scaffold_4 7117732 7118094
Scaffold_4 7117732 7118094
Scaffold_4 6600104 6600281
Scaffold_4 6600104 6600281
Scaffold_4 7117732 7118094
Scaffold_4 7117732 7118094
Scaffold_5 10452544 10452667
Scaffold_5 5549592 5549887
Scaffold_5 14614175 14614254
Scaffold_5 9118290 9118528
Scaffold_6 2905673 2905728
Scaffold_6 5842466 5842610
Scaffold_6 8280724 8280781
Scaffold_7 2283024 2283314
Scaffold_7 3382094 3382308
Scaffold_7 7447805 7447905
Scaffold_7 2283024 2283314
Scaffold_8 2553435 2553800
Scaffold_Twinpair2 Start_Twinpair2 End_Twinpair2
Scaffold_1 8060219 8060286
Scaffold_1 19246503 19246556
Scaffold_1 25391309 25391550
(continued)

336
Scaffold_1 29053551 29053651
Scaffold_1 4963966 4964023
Scaffold_2 121262 121364
Scaffold_3 3422935 3423106
Scaffold_3 8141033 8141199
Scaffold_4 12982868 12982970
Scaffold_4 3842778 3843036
Scaffold_4 6149929 6150020
Scaffold_4 6599702 6599778
Scaffold_4 7117732 7118068
Scaffold_4 7115317 7115534
Scaffold_4 6599290 6599651
Scaffold_4 6599702 6599778
Scaffold_4 7118617 7118985
Scaffold_4 7117732 7118068
Scaffold_5 10452662 10453755
Scaffold_5 5549889 5550233
Scaffold_5 14613240 14613334
Scaffold_5 9118412 9118483
Scaffold_6 2905673 2905882
Scaffold_6 5841737 5841916
Scaffold_6 8280724 8280779
Scaffold_7 2283024 2283084
Scaffold_7 3381836 3382156
Scaffold_7 7447905 7448002
Scaffold_7 2283024 2283084
Scaffold_8 2552780 2552891
(Table A.23 continued)

337
Table A. 24 Genomic coordinates for all shared CHH DMRs identified in each twin pair
and associated with the same gene. Coordinates include scaffold number in 'Nonpareil'
almond reference genome followed by start and end genomic positions.
Scaffold_Twinpair1 Start_Twinpair1 End_Twinpair1
Scaffold_1 1042904 1042997
Scaffold_1 10858835 10858902
Scaffold_1 2140020 2140090
Scaffold_1 22622072 22622175
Scaffold_1 27827614 27827671
Scaffold_1 27827614 27827671
Scaffold_1 27827227 27827453
Scaffold_1 27827227 27827453
Scaffold_1 27827614 27827671
Scaffold_1 33067850 33068113
Scaffold_1 34577665 34577780
Scaffold_1 35411377 35411614
Scaffold_1 4474523 4474738
Scaffold_1 8189707 8189777
Scaffold_1 8933739 8933838
Scaffold_1 34577665 34577780
Scaffold_1 12942419 12942547
Scaffold_1 35411377 35411614
Scaffold_1 4474523 4474738
Scaffold_2 1328127 1328224
Scaffold_2 4181614 4181671
Scaffold_2 4181614 4181671
Scaffold_2 11655755 11655873
Scaffold_3 17094563 17094659
Scaffold_3 4787220 4787382
Scaffold_3 11748087 11748362
Scaffold_4 16280111 16280595
Scaffold_4 9092984 9093051
Scaffold_4 7588812 7588909
Scaffold_4 7910059 7910413
Scaffold_4 7910059 7910413
Scaffold_4 9116076 9116160
Scaffold_5 11651796 11652001
Scaffold_5 3334753 3334999
(continued)

338
Scaffold_5 862690 862805
Scaffold_5 9682862 9683084
Scaffold_5 13879149 13879208
Scaffold_7 2298460 2298518
Scaffold_7 7781678 7781747
Scaffold_8 1925515 1925718
Scaffold_8 4938307 4938600
Scaffold_8 6164429 6164558
Scaffold_Twinpair2 Start_Twinpair2 End_Twinpair2
Scaffold_1 1042785 1042982
Scaffold_1 10858672 10858992
Scaffold_1 2139004 2139218
Scaffold_1 22621920 22622170
Scaffold_1 27827614 27827671
Scaffold_1 27827227 27827403
Scaffold_1 27827614 27827671
Scaffold_1 27827227 27827403
Scaffold_1 27827227 27827403
Scaffold_1 33067815 33068092
Scaffold_1 34577489 34577786
Scaffold_1 35411541 35411651
Scaffold_1 4474670 4474770
Scaffold_1 8189519 8189569
Scaffold_1 8933426 8933648
Scaffold_1 34577489 34577786
Scaffold_1 12942412 12942538
Scaffold_1 35411541 35411651
Scaffold_1 4474670 4474770
Scaffold_2 1328551 1328626
Scaffold_2 4181840 4181940
Scaffold_2 4181604 4181696
Scaffold_2 11655173 11655457
Scaffold_3 17094574 17094627
Scaffold_3 4787220 4787301
Scaffold_3 11748202 11748308
Scaffold_4 16279081 16279200
(continued)
(Appendix Table 24 continued)

339
Scaffold_4 9092902 9093051
Scaffold_4 7589128 7589354
Scaffold_4 7910555 7910967
Scaffold_4 7910140 7910211
Scaffold_4 9116094 9116225
Scaffold_5 11651019 11651115
Scaffold_5 3334967 3335027
Scaffold_5 862748 862866
Scaffold_5 9682643 9682974
Scaffold_5 13879218 13879290
Scaffold_7 2298463 2298716
Scaffold_7 7781662 7781770
Scaffold_8 1925402 1925659
Scaffold_8 4938099 4938155
Scaffold_8 6164424 6164493
(Appendix Table 24 continued)

340
File A.1 R script to perform analysis described in Chapter 2.
#Analysis of relative telomere lengths generated by monochrome multiplex qPCR comparing distinct almond age cohorts collected in 2018 and 2019 #Load required packages require(agricolae) require(ggplot2) require(wesanderson) require(multipanelfigure) require(grid) #Read in relative telomere length data from file 'TelomereData.csv'; file headers: Year (year planted), Replicate (biological replicate number), T.S (estimated T/S ratio genearted from standard curve using telomere and PP2A Cq values) telo_data <- read.csv("TelomereData.csv") #Convert variable 'Replicate' to a factor for analysis telo_data$Replicate <- as.factor(telo_data$Replicate) #Calculate the average T/S ratio for the reference almond sample to use to calculate relative telomere lengths for each almond indivdiual referenceAverage <- mean(c(0.4758955, 0.8377413, 0.779102)) #Create a relative telomere length variable (rTL) telo_data$rTL <- telo_data$T.S/referenceAverage #Create a z-score variable (zscore_rTL) by calculating the z-score for each almond sample telo_data$zscore_rTL <- (telo_data$rTL - mean(telo_data$rTL)/sd(telo_data$rTL)) #Create a variable called age listed the chronological age of each almond in years; make this variable a factor #Example is for data collected in 2019 telo_data$age <- c(2,2,2,7,7,7,11,11,11) telo_data$age <- as.factor(telo_data$age) #Perform Shapiro-Wilk normality test on zscore_rTL assess test normality assumption
(continued)

341
shapiro.test(telo_data$zscore_rTL) #Perform Bartlett test to assess homogeneity of variance assumption bartlett.test(zscore_rTL ~ age, data = telo_data) #Regress zscore_rTL on almond age fit <- lm(telo_data$zscore_rTL ~ telo_data$age) #Perform ANOVA to generate p-value on linear model anova(fit) #Perform post-hoc Fisher's LSD for means separation LSD_output <- LSD.test(fit6, "telo_data$age", alpha = 0.1, p.adj = "none") LSD_output #Create coords variable to display letter groupings based on means separation results #Example is for data collected in 2019 coords <- data.frame("x" = c(1,2,3), "y" = c(1.5,0,-0.5), "sig" = c("a", "ab", "b")) #Create boxplot displaying the zscore of relative telomere lenght (zscore_rTL) for each almond age cohort, including the means separation groupings #Example is for data collected in 2019 Telo19 <- ggplot(telo_data, aes(x=age, y=zscore_rTL, fill = age)) + geom_boxplot() + labs(x = "Chronological Age (Years)", y = "Zscore Relative Telomere Length") + theme_bw()+ theme(legend.position = "none", text = element_text(size = 12)) + geom_text(data = coords, mapping = aes(x=x, y=y, label = sig, size = 12), inherit.aes = FALSE) + scale_fill_manual(values=wes_palette(name="Royal2")) #Create a multipanel figure (figure1) combining boxplot produced with 2018 data and boxplot produced with 2019 data figure1 <- multi_panel_figure(width = 180, height = 180, columns = 1, rows = 2) figure1 %<>% fill_panel(Telo18) figure1 %<>% fill_panel(Telo19)
(continued)
(File A.1 continued)
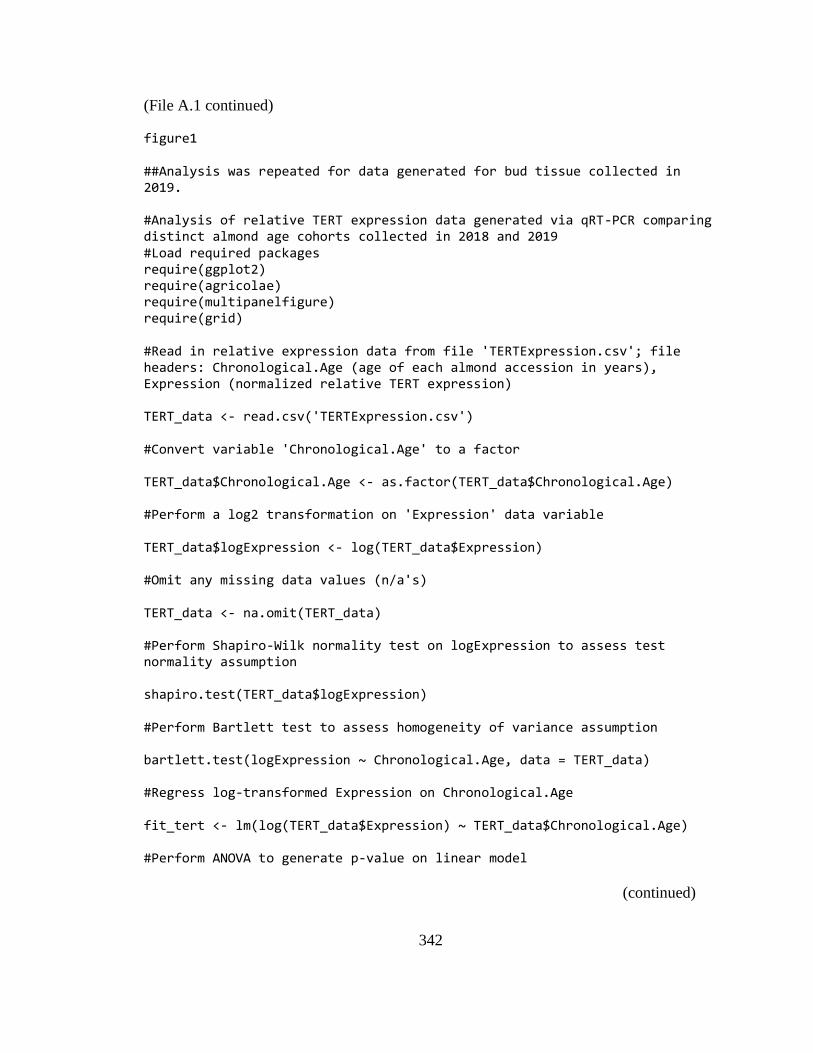
342
(File A.1 continued) figure1 ##Analysis was repeated for data generated for bud tissue collected in 2019. #Analysis of relative TERT expression data generated via qRT-PCR comparing distinct almond age cohorts collected in 2018 and 2019 #Load required packages require(ggplot2) require(agricolae) require(multipanelfigure) require(grid) #Read in relative expression data from file 'TERTExpression.csv'; file headers: Chronological.Age (age of each almond accession in years), Expression (normalized relative TERT expression) TERT_data <- read.csv('TERTExpression.csv') #Convert variable 'Chronological.Age' to a factor TERT_data$Chronological.Age <- as.factor(TERT_data$Chronological.Age) #Perform a log2 transformation on 'Expression' data variable TERT_data$logExpression <- log(TERT_data$Expression) #Omit any missing data values (n/a's) TERT_data <- na.omit(TERT_data) #Perform Shapiro-Wilk normality test on logExpression to assess test normality assumption shapiro.test(TERT_data$logExpression) #Perform Bartlett test to assess homogeneity of variance assumption bartlett.test(logExpression ~ Chronological.Age, data = TERT_data) #Regress log-transformed Expression on Chronological.Age fit_tert <- lm(log(TERT_data$Expression) ~ TERT_data$Chronological.Age) #Perform ANOVA to generate p-value on linear model
(continued)

343
(File A.1 continued) anova(fit_tert) Perform post-hoc Tukey's HSD for means separation HSD_tert <- HSD.test(fit_tert, "TERT_data$Chronological.Age", alpha = 0.1) HSD_tert #Create coords variable to display letter groupings based on means separation results #Example is for data collected in 2018 tert_coords <- data.frame("x" = c(1,2,3,4), "y" = c(1.5,1,0.25,0.25), "sig" = c("a", "ab", "ab", "b")) #Create boxplot displaying the zscore of relative telomere lenght (zscore_rTL) for each almond age cohort, including the means separation groupings #Example is for data collected in 2018 TERT2018 <- ggplot(TERT_data, aes(x=Chronological.Age, y=logExpression, fill = Chronological.Age)) + geom_boxplot() + labs(x = "Chronological Age (Years)", y = "Relative TERT Expression") + theme_bw()+ theme(legend.position = "none", text = element_text(size = 12)) + geom_text(data = tert_coords, mapping = aes(x=x, y=y, label = sig, size = 12), inherit.aes = FALSE) + scale_fill_manual(values=wes_palette(name="Royal2")) #Create a multipanel figure (figure2) combining boxplot produced with 2018 data and boxplot produced with 2019 data figure2 <- multi_panel_figure(width = 180, height = 180, columns = 1, rows = 2) figure2 %<>% fill_panel(TERT2018) figure2 %<>% fill_panel(TERT2019) figure2

344
File A.2 Genomic sequence of 17 differentially methylated regions (DMRs) shared
across the three age-contrats (11 - 2 year, 11 - 7 year, and 7 - 2 year).
>CGDMR1 CGCCGTTAAATATAATTTTCACGACGTTATGGAAAACTACTCTGTCTCTTATTGAAAACTACTACGTCTTTAAATACATGAGAAGACGACGTTATTGAAAACTACTACGTCTCTTATTTACAAAAGACCGTCGTGAAATAAGTTTTCCACTTCGATTGGTCTAAAAAAGATGACGTAGATATAGCTGTCTGTGTCATTATTTACGACGTATGTATTTATGTTGTTGACGTTGAAATGCGAAACAACGTCGGTGGCATTTATATAGTCGACGTTGTATTTATATGTATTCAGTACTCACGACGTACTTATTAATGTAGACGACGTTGAACTTCTAAACAACGTCAATATTTACGACGCATTTAATAAACCACGTCGGTTCTAAATTAATGTTCAGATATTTAATCTCATTTTTAGACGTCGGTATTATGGGATTGGAGTCGTGTTATTTTGGATTACATGGCTGTTCTTAATCCTTCCCCGACGTGATATCCTGGATAATTGCTTCACAATAGCGTCGTGGTTCTTCATTGTTACGTTGCTTTAAGACGTCGGTAAATATGCTGAATAAATGGTTAACCATAACGTC >CGDMR2 CGCGCGGCTATACTATTTGTAAATATAAAAAGCCCAGCCCACAGAGCAGGTACCACGTGTCAAAGAGGTACAGCCGGGCGGCTGTACTATTTTTTTAAAAGATAACACGAGTATAGCCGCGCGGCTATACTATTGCTTGGAAAAAAAAAAAAAAAAAAAAAAGAGAATCTGGTATAGCCCGGCCCAGGCGCCATGTGCGCCACGTGGCAAACAAGTAGAGCCGAACGGCTATACTATTTTTAAAAGCAATTAAGGGAAAAATGAGTATAGCCGCACGGCTATACTATTTCTTTAAAAAAGAAAAAGAAAAAAAGGATCTGGTACAGCCCGGCCCAGGCGCCATGTGCGCCACGTGGCAAGCAAGTAGAGCCGAACGGCTACTCTATTTTTAAAAAGCAATTAAAGGAAAACTGAGTATAGCCGCACGGCTATACTATTCCTTGAAAGAAAAAAAAAATCTGGTTCAGCCCGTGCGCGCCACGTGGCAAACAAGTAGAGCCG >CGDMR3 CGATCGATTTGGTGGAGAAACGAAGGAGAATTTCGAGCTGGAAGTTCGGGTGGCTTTGCAGGAACCTCCGTCGGAAAACATGGTTTTCCGGCCAACTCAGAGCGGCCCCGGGGTTGAGATCTGTCAGGTTGTGACGGCGACACGAAGGCGGACCCGTAGGTACCAACGGCGGAGATCGGCTCGGGCCTGTGGTGGCCGGGCCGTCCCTTGGAAGGCGAAGGGTCGCACGACCCCAAATCGCGCGAAGGAGAGAGAGGGAGGAGAGAGAAAGTGACGGGGAGAAGAGAGAGAGGGGGTATAAAATCTGACTTTTTGGCCAAATTACCATTTTGCCCTTCGCGGTTTTTAGACCATAACTTCTTCGTTACTGCTCCGATTCGGGCCTACTCCGTGTCTACGAACTCCTTTCG >CGDMR4 CGTCAACGACTCTTCGTCGAGATCCTCCAAGTTATAGTTCGTCTGCAATCAATTAATTAGATACGTTAAGTAATAGAAATATACACAATTTTAAAGAAAAATAATGAAAATGTAAGGTACATACCGACAACTGGCCGCGAACCTCCGCCTTGATCTCGTCAGGCATGACCCTCCAAGACTTCCATTGCATCGGGCAATGGGTCCGCACGACGTGGCCAATGTCGTGGGCCAAGGAGCTATGCAACTCCGCCGTCGGTGCAGCCCGATGGCGCTCGTCGTATCCGATGCTAATACGACTGTTGGTCACCCGGGTGACCTTCGCCGTCTTCAGCTGACGACACGGTCCCCGGGTGTTCTTCTTCG >CGDMR5 GCGGGGTGCCCCTGATTTTTCAGGGTAAAGTTGGGTGTACTCTTTCTTCGAGTTTGACCAATTAAATTAATTAAAATTAATATAATAGAAAATTATTTCCCTGCGAAACTGCCGCAGCTTCTTCTATTTTCCTGCGAGTTTGACACCCGCCGCTTCTTCTCTATTTTCCTGCGAAACTGCCGCAGCTGGAGGCG >CGDMR6 CGCTCGTAAGGAGTCCTATTGAAACCAAGAAATATAGGCCTGTCTGCCATCCACACCAGAATAAATGAAGTTTTTTTTACTCTAACCCTTTTCGAAATAATTACAGTTTTGCCATTGATAATGTTTTGATCACCAAATCTTCGTTACAACTCCGTTTCAAGCCTACCGCGTGTCTACAAATTCGTCTTAGTACCACCTACCTAAAAATACCAATCGTGTTCCCAAAATCCTTCCG >CGDMR7 CGTCGACTATATAAATGCCACCGACGTTGTTTCGCATTTCAACGTCAACAACATAAATACATACGTCGTAAATAATGACACAGACAGCTATATCTACGTCATCTTTTTTAGACAAATCGAAGTGGAAAACTTATTTCACGACGGTCGTTTGTAAATAAGAGACGTAGTAGTTTTCAATAACGTCGTCTTCTCATGTATTTAAAGAC >CGDMR8 CGTTTTGCCCTCATTCGCAGCAGCAGGCAATCGATTAATGAGATGGCTTGCATAAGTAATCGCCTCAGCCCAAAACGCCTTGCCTAAACCAGCATTAGACAACATACACCGAACTTTCTCAAGCAAAGTACGGTTCATGCGCTCTGCC
(continued)

345
(File A.2 continued) ACCCCATTCTGTTGCGGTGTCTCCCTAACCGTGAAGTGCCTCACAATACCCTCATCTTGACAAACTTTCAAGAAAGGATCAGACTTATATTCACCACCATTGTCTGATCTGAGAGTCTTGATCTTTCGACCGCTTTGC >CGDMR9 CGTTCCTCGTCAAGTATTAGGGTTAAGGGTGACTGTGGGTATCGCAAGAGAGAAGAAAGGGAGTTTGAAGGTGAGAAGGATGAGAGTAACTATGACTGGGTATCGCAAGAGAGAAGAGAGGGAGTCTGAAATATTCACGAGGGAGTGAAATTTTTCAGCG >CGDMR10 GTGCAGCTTTTAATGGGAAACCTGAATATGGCATACCTCCCGAGCCATTAACCGGAGAAGAAGTGCTGCATATGGTTGAAAATGGTGACAGAGTTTGTTGGAAGAAGAAATCAATATTCTTTGATCTCGAGTATTGGAAATACCTTCCTGTGAGGCATGCCCTAGATGTTATGCATATTGAGAAGAATGTTTGCGATAGTATCATTGGTACATTGCTGGAGATCCCTGGAAAAAATAAAGATGGGATTGCTGCTCGATTAGATTTATTGAACATGGGGGTCAAAACTGATTTGCAACCCGAGTATGGAGAAAGACGTACTC >CGDMR11 CGGCCCGATAAGTAATATATTTATTTTTAAGTAGTTTATAATATAATATAACCATGTATGATTATAGGGTTTTAATGTCCTCAAACTTCGAGTTGTATTTTGGTCCCTCAACTAAATTATTCG >CGDMR12 CGTAGTTGTATGACGTCACAAGGAGGCCGGAGTAATTTTCGGGGCATTTGTAGGAATTTCCTACTATTTATTACCTATTATCAAGGATTTTTCCACGAAAATAGCCAACCCTAATTGCAAAAACACACCTGGCGCAATCTCAGCAGGTAACCTTTCAGCACTTGCACAAGTGTAC >CGDMR13 CGAGGGTTTGTCTATATTTCAATATAGAGTATTCAAATAAGCATGTAAAAATCTACTGATGACTGTGCTTGTATAACTGAACAAATATGTAAAGATATAAATGTACG >CHGDMR1 CAGTAACAAAAAAAAGGGAGAAGGCTTCCACTGAAAAGAAAACAAACGGAAGAAGAGTAAAAAAAAAAGGAAAGTGGCGTCAGCCACTTTGTTTCAAAAGGAAGAAGAAAGCGTCAGCCACTTTGTTTCAAAAGGAAGAAGAAATTCAAAGAAGAAAAAAAAAGAGAAGAGAGTGGCTGATGCCATTTTGCTGAAATTGGAAGAAAAGCAAAGCAAAGGACTTGGTGTTGCAGATCAAGAAGAAGAAAAAGAAAAGTCAAAACAAGGACAAAAAAGAACAAGGTGGCTGACGCCACTTTTGGAGTTGGAAGAAAAAAAGGGACACAAGAGACTTGCTGTTGCAGAGAAAAAATGAGGAAAAGGACAAAAAAAAAAGTCTGAAACCTCTTGGGTGTTGCGGCAGTTTTTCTCTCTTTCTTCTGGCTTTCTTTTCTTCTTGTTTGCAAAGGCTG >CHGDMR2 CTGGCTTGTGCTTTTTGGCAGCTATCTGGTATTGGGTGTATTGGGATCTAGAAATATTTATTGATGAACATACAGGAAAACCCTCTTTGAATTTGCCTAAGATCTTTGGAATTCATTTATTTCTATCCGGGGTGGCTTGCTTTGGTTTTGGTGCATTTCATGTAACAGGATTGTATGGTCCTGGAAGGTTCTACCTCCTATTTTTTATGAAGAGAATGAATCTTTTTATGGAAGGATCAGAAAAAAATGGGTCCGGACCTCCTGCGAGAATGATTTGGAAGATCCAAAACCAAAAATAGTGGTATTTGCTAGCAACAACATAGTTAGTAAGAGGGATCTTGAACTAAGAAATAGATTCTAGAAGCTAAAAAAGGGTATCC >CHGDMR3 GCACCTTCTATAGTGCACCAGGTGCATCCATGCATCATTTGTCATTTATAATTGACAGGACCCAACCCAATTTCCACTTTGAAATTCGAGCCAAGTCCTGCGCGTGTCCGACACCTGGCGAATGTCGGGCACAATTGTCCTTTTTACCCTTCTTACTTCAATTCTTCTTTAAAATTGCCTTAGACTTCTGCCGAAAATTCGGCAGAGTCTCCCCTGTATTTTTGACTTATCCCAAAATTTTCACCTG >CHHDMR1 GTTTGGCGTCCATCCTTTGTATCCCAAAATCGTCATCTCACAGTTAATGATTCTGTGATGATGAATGATGCTACTGCTGTCACAGTAGCTAGGAATTTCATTATTCCAATGGATGAAATGCTGTTGACAGGGAGGTCTGAAGAAGAGGCTATTGAGGACTCAATGGCTTTTAGCATTCAGAGTGCTGCTTCTGTTTCTAACATGGCTGATCGTTTGCGTGCTAGAGCAAACGAGGTTCAGAAGCTAACAACGAAAAATTCGTCTCTCCAAAGAATACTTCATGAGTCTCAAAAAGAGGTTGAGAAACTTAAAGGAGAGAATAATTCCTTGTTGAAACTGGTGAGTTCGTATTCTGTTGATACACAGAGGA
(continued)

346
(File A.2 continued) AGCTAGACATGCTGCAGGTCTCAAATGAAAGAATTTTGGGAGACCACGAGAGGCTCATGGCTAGGCTTAAGAAGCGCCGTCCTCTTCCTTCAGAGGCTTCCAGAACATAATGTAATTTTATAGATTTTACAGGGCCTGCACCTTCATTGCAGGTGGAAAAATCTATCTGTTGTATGTTCATTTGCTGTTATAATAATTGTACATGTTCTTAAACTTGCATCTGTGGTTTTTACGTCTTTTCAAAATGACGGTTTGGAACCTTGTGCCTTATAGGTTCAAATAACCACATCAAATCT CTCATATTTCCATGCATATGAGCCCAGAGCTTTTGGTCTGGGTTAAACCCAAACACATAATTAATTCGCCATTTTCAAATGGAGAGCATTAACTACAATGTACCCACAACTTCAAGTTTTAGGATCTCTCATATATTTGGATCCATGGGCTTCCGGCCCAGATATAACAAAATATGTGGGGAGCCTCAATTCATTATTTGAGGTTTATATTGATATTATCCATTTCGCGGTGTATTCTTAACAACCGGAATTCACAAAATATATTTCTTCCTTGAGGTGTCGATTATAACAGAA TCGAACTTCATTAAATTCATCATCTTCTTATGCCAAAGAAATATGTGGCATATCACAATTTGCAATAATACCTCAAGGGTTGTCCATTTAATTGTTGGAACTTCAGGTTCTCAATACTGTTAGATTTTGAACTTCGGGCCAAAATCACATATTCTCATGGTATGGACATTTTTACAATTTTCTGTACATATTTTGGGACTTCAAGTCCTTACATAATTGTCCATATTTTGAGGAACTTCTGGCATCTCATTTAATTGCTCATCCATGAGTGTAAGGAACTGCAGGTTCCCTTTTGTATATAGTGACAGTTTACCCAAAATGGTTAATATTTATGCATACGTCACTATTCATGTGAATAGTACTATTCATCAATCATGAATACATATCTATTCATATGTGCAGTACATTTGCCAGTACAGTTATTATTCATGTGTACGGCACTTTTAACCAATACGGTACTGTTACATCATTAAGGAAACCCAGGTCCTTATTCACATGTCAGGGATCAAGGACCCTTAAGTCCGATCACATGTTTACAAATATAG

347
File A.3 Nucleotide and protein sequence of unidentified protein identified as most
significantly differentially expressed between the twin pairs in Chapter 4.
>Scaffold_6_UnidentifiedProtein TCATGCAGCTGGAGCATAATCATAACCACCATCATCATCGTCATCGTCATCCCCTTCCATGGCTGCTGGAGCATAGTCAT AGTCTGAATCATCGTCGTCGCCGTCGCCTTCTATACATGCTGCCAGGGCAAATATATCATCACCGTTGAAGTCGTCGACT CCATCGCCATGCACCTCGTACCATGAGGCACTGATGATCAACTTGGAAAGGGGAAACAT >Scaffold_6_UnidentifiedProtein MFPLSKLIISASWYEVHGDGVDDFNGDDIFALAACIEGDGDDDDSDYDYAPAAMEGDDDDDDDGGYDYAPAA