Chemical Composition and Protein Antigenicity â•fi Almond ...
181
Florida State University Libraries Electronic Theses, Treatises and Dissertations The Graduate School 2008 Chemical Composition and Protein Antigenicity Almond (Prunus Dulcis) and Macadamia Nut (Macadamia Integrifolia) Seeds Erin Kelly Monaghan Follow this and additional works at the FSU Digital Library. For more information, please contact [email protected]
-
Upload
khangminh22 -
Category
Documents
-
view
3 -
download
0
Transcript of Chemical Composition and Protein Antigenicity â•fi Almond ...

Florida State University Libraries
Electronic Theses, Treatises and Dissertations The Graduate School
2008
Chemical Composition and ProteinAntigenicity Almond (Prunus Dulcis) andMacadamia Nut (Macadamia Integrifolia)SeedsErin Kelly Monaghan
Follow this and additional works at the FSU Digital Library. For more information, please contact [email protected]
FLORIDA STATE UNIVERSITY
COLLEGE OF HUMAN SCIENCES
CHEMICAL COMPOSITION AND PROTEIN ANTIGENICITY – ALMOND (Prunus
dulcis) AND MACADAMIA NUT (Macadamia integrifolia) SEEDS
By
Erin Kelly Monaghan
A Dissertation submitted to the Department of Nutrition, Food and Exercise Sciences
in partial fulfillment of the requirements for the degree of
Doctor of Philosophy
Degree Awarded: Summer Semester, 2008
ii
The members of the Committee approve the dissertation of Erin Kelly Monaghan defended on June 24, 2008.
________________________________ Bahram Arjmandi Professor Directing Dissertation
________________________________ Kenneth H. Roux Outside Committee Member
________________________________ Yun-Hwa Peggy Hsieh Committee Member
Approved: ________________________________________________________________ Bahram Arjmandi (Chair, Department of Nutrition, Food, and Exercise Sciences) ________________________________________________________________ Billie Collier (Dean, College of Human Sciences) The Office of Graduate Studies has verified and approved the above named Committee members.

iii
ACKNOWLEDGMENTS
I would like to express my deepest appreciation to my committee members, Dr. Bahram Arjmandi, Dr. Kenneth Roux, and Dr. Peggy Hsieh for their unwavering support and encouragement throughout my graduate program. Without their wisdom and guidance this dissertation would never have come to fruition.
I owe a special thanks to my major advisor Dr. Bahram Arjmandi for his willingness to
“adopt” me and help me reach the finish line. His infectious enthusiasm and dedication to his students defines a true and trustworthy mentor.
A special thanks to Dr. Mary Ann Moore, a wise and caring advisor, who gave me much-
needed reassurance and guidance. I would like to offer my heartfelt gratitude to Dr. Jason Robotham and Dr. Kenneth Roux.
I am indebted to them for their assistance and guidance. They are extraordinary individuals who I admire tremendously.
I would like to thank all faculty and staff from the Department of Nutrition, Food, and
Exercise Science for their assistance, guidance, and encouragement over the years.
A special thanks to Margaret Seavy for her continuous support, compassion, and understanding.
I am thankful for all my past and present lab mates for making everyday life in the
laboratory enjoyable. It has been a true pleasure to work with each and every one of you and I wish you all the best.
I have been very blessed in my life, particularly in my friendships. In all of the ups and
downs that came my way during the “dissertation years”, I knew I always had the support and love of friends. In particular, I am grateful to Terry Love, April Hambrecht, Jennifer Hura, Debbie Iarossi, Gina Pitisci, Molly Carey, Jenny Hansen, Brent Stoney, David Krum, Mary Susan Gerber, and Elizabeth Ibbotson for always being there when I needed support. A very special thanks to Grant Cotner for being incredibly supportive, patient, and constantly bringing a smile to my face.

iv
I would like to thank my grandparents, aunts, uncles, cousins, and close family friends for their enthusiasm and support throughout my graduate education.
I am forever grateful to Mallary and Rayleigh, my loyal fans and my greatest comforts, who have blessed my life with their presence and brought it so much joy and pleasure.
I am extremely thankful to Ian Monaghan, who is not only my big brother but also my
oldest and closest friend. His support and humor has enriched my life more than he will ever know.
Finally, I dedicate this dissertation to my parents, Patrick and Mary Monaghan. Words
alone cannot express the thanks I owe to my parents who have guided me, inspired me, and encouraged me throughout my entire life. Their unwavering faith and confidence in me has shaped me into the woman I am today. I am eternally grateful and blessed to have two of the greatest people I have even known as my parents.
"I believe that everything happens for a reason. People change so that you can learn to
let go, things go wrong so that you learn to appreciate them when they're right. You believe lies
so you eventually learn to trust no one but yourself...and sometimes good things fall apart so
better things can fall together." ~ Marilyn Monroe ~
“Everyone who has even done a kind deed for us, or spoken one word of encouragement
to us, has entered into the make-up of our character and of our thoughts, as well as our success.” ~ George Burton Adams ~
“The future belongs to those who believe in the beauty of their dreams.”
~ Eleanor Roosevelt ~ “People grow through experience if they meet life honestly and courageously. This is how
character is built.” ~ Eleanor Roosevelt ~

v
TABLE OF CONTENTS
List of Tables vii List of Figures ix Abbreviations xii Abstract xiv
INTRODUCTION 1 Background 1 Statement of the Problem 4 Research Hypothesis 8 Significance of the Study 9 Limitations of the Study 9
REVIEW OF LITERATURE 10 Almond Cultivars 10 Macadamia Nut Cultivars 10 Physical Seed Characteristics 13 Chemical Composition 14 Tree Nut Allergies 23 Detection Methods for Tree Nut Allergens 25 Almond and Macadamia Nut Allergens 25 Cross-Reactivity 26
Allergen Stability 27
MATERIALS AND METHODS 29 Materials 29 Methods 30
Physical Seed Characteristics 30 Individual seed weight 30 Seed dimension 30
Preparation of Nut Seed Flours 30 Chemical Composition 30 Moisture 30 Lipid 30 Protein 31 Amino Acid Composition 31 Total amino acids 31 Free amino acids 32 Ash 33 Total soluble sugars 33 Tannins 33 Soluble Protein Estimation 34
SDS-PAGE 34 Polyclonal Antibody Production and Characterization 35
Monoclonal Antibody 4C10 Production and Characterization 35 Protein G Purification of Rabbit anti-Macadamia Nut Protein IgG 36
vi
Competitive Inhibition ELISA Development 36 Almond Protein Detection 36 Macadamia Nut Protein Detection 36 Sandwich ELISA Development 38 Western Blot Analysis 38 Dot Blot Analysis 39
Densitometric Quantification 40 Cross-Reactivity Studies 40
Thermal Processing of Almond and Macadamia Nut Seeds 41 Autoclaving 41 Blanching 41 Dry Roasting 41 Frying 41 Microwave Heating 41 pH Treatments 42 Spiking Studies 42 Data and Statistical Analysis Procedures 42
RESULTS AND DISCUSSION 49 Environmental Conditions 49
Physical Seed Characteristics 49 Individual seed weight 49 Seed dimension 50 Chemical Composition 51 Moisture 51 Lipid 52 Protein 53 Ash 54 Total soluble sugars 54 Tannins 55 Amino Acid Composition 60 Total amino acids 60 Free amino acids 61 Electrophoretic Analysis 82 ELISA 82 Western and Dot Blotting 92 Cross-Reactivity Studies 92 Stability Studies 96 Spiking Studies 96
CONCLUSION 97 APPENDIX A 105 ANOVA Tables 105 APPENDIX B 142 Animal Research Approval 142 REFERENCES 145 BIOGRAPHICAL SKETCH 164
vii
LIST OF TABLES
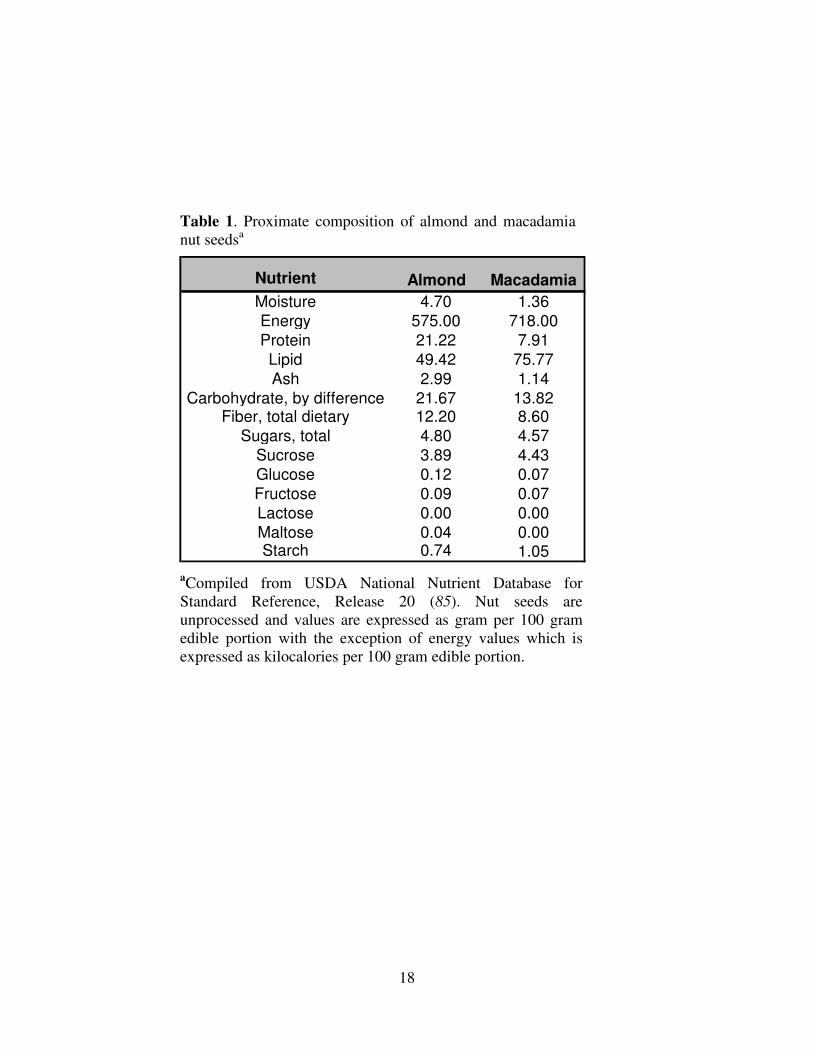
Table 1. Proximate composition of almond and macadamia nut seeds 18
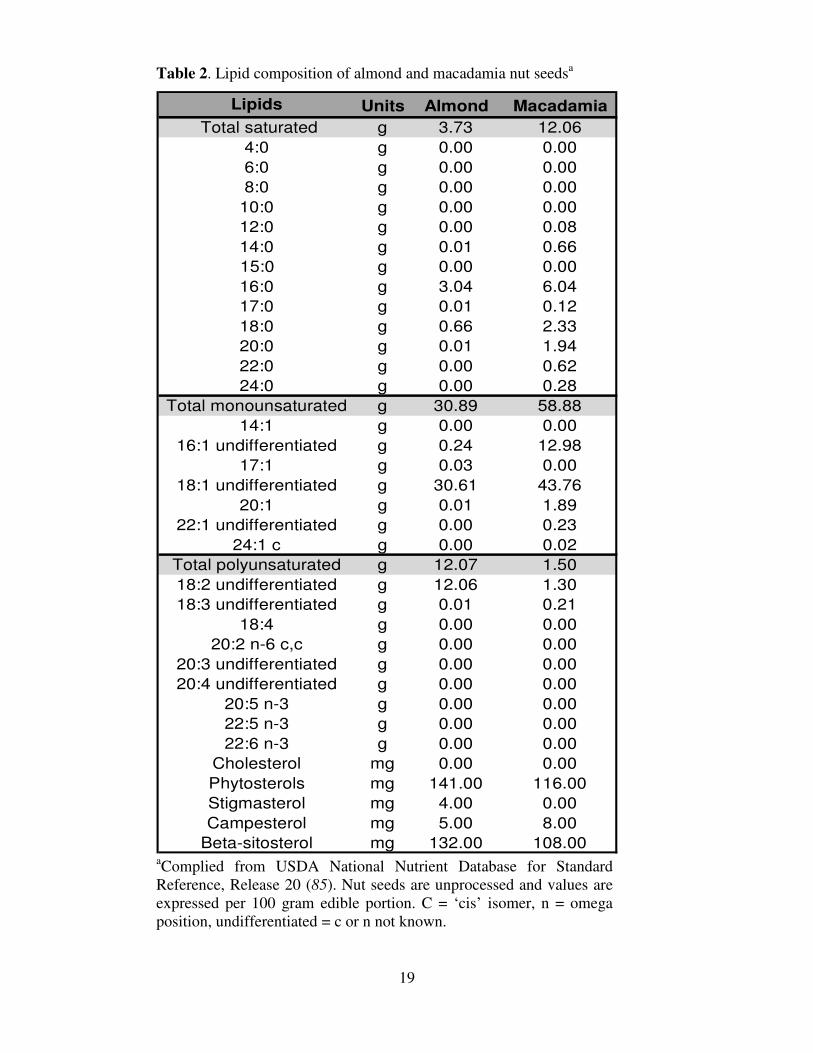
Table 2. Lipid composition of almond and macadamia nut seeds 19 Table 3. Mineral and vitamin content of almond and macadamia nut seeds 20
Table 4. Amino acid composition of almond and macadamia nut seeds 21
Table 5. Immunoassays for tree nut protein detection 28
Table 6. Cross-reactivity testing matrices 40 Table 7. Almond cultivars and history of origin 44
Table 8. Average climatic conditions in select California counties during 46
2003/2004 and 2005/2006 almond seasons
Table 9. Cultivar, geographic location, and harvest year variation on the 56 physical characteristics and chemical composition of select almond seeds
Table 10. Interaction of cultivar and geographic location on the physical 57
characteristics and chemical composition of select almond seeds
Table 11. Physical characteristics and chemical composition of select 59 macadamia nut seeds
Table 12. Cultivar, geographic location, and harvest year variation on the 63
essential amino acid composition of select almond seeds
Table 13. Cultivar, geographic location, and harvest year variation on the 64 non-essential amino acid composition of select almond seeds
Table 14. Interaction of cultivar and geographic location on the essential 65
amino acid composition of select almond seeds
Table 15. Interaction of cultivar and geographic location on the non-essential 67 amino acid composition of select almond seeds
Table 16. Amino acid composition of select macadamia nut seeds 69
Table 17. Correlation coefficients among various physical and chemical 70
parameters of select almond seeds

viii
Table 18. Correlation coefficients among various physical and chemical 71 parameters of select macadamia nut seeds
Table 19. Cultivar, geographic location, and harvest year variation on the 75
free (essential) amino acid composition of select almond seeds
Table 20. Cultivar, geographic location, and harvest year variation on the 76 free (non-essential) amino acid composition of select almond seeds
Table 21. Interaction of cultivar and geographic location on the free 77
(essential) amino acid composition of select almond seeds
Table 22. Interaction of cultivar and geographic location on the free 79 (non-essential) amino acid composition of select almond seeds
Table 23. Correlation coefficients among free amino acids of select almond 81
seeds Table 24. Effect of geographic location on the immunoreactivity of select 86
almond cultivars assessed by ELISA
Table 25. Interaction of cultivar and geographic location on the 87 immunoreactivity of select almond cultivars assessed by ELISA
Table 26. IgG purified macadamia nut pAb titer optimization 90
Table 27. Cross-reactivity of select foods/ingredients with Protein G purified 95
rabbit anti-macadamia nut IgG assessed by inhibition ELISA
Table 28. Detection of AMP in 100 mg of food matrices spiked with 102 almond seed protein extract or defatted almond seed flour
Table 29. Detection of macadamia nut protein in 100 mg of food matrices spiked 103
with macadamia nut protein extract or defatted macadamia nut flour Table 30. Detection of almond and macadamia nut in commercially prepared 104
foods using ELISA
ix
LIST OF FIGURES
Figure 1. 45
Figure 2. 47 Figure 3. 48 Figure 4. 72 Figure 5. 73 Figure 6. 74
Figure 7. 84 Figure 8. 85
Location of almond seed samples included in the current investigation. Estimated timeline for California almond seed production. ** Season varies according to region, variety and weather conditions. Climatic conditions in Fresno (A), Kern (B), and Stanislaus (C) counties during the 2003/2004 and 2005/2006 almond season. Daily weather measurements recorded by the California Irrigation Management Information System (CIMIS) and the National Climatic Data Center (NCDC) of the National Oceanic and Atmospheric Administration (NOAA) were used to calculate county averages. Weather stations: CIMIS #2 and #80 for Fresno County, NCDC #0442 for Kern County, and NCDC #6168 and #5738 for Stanislaus
County. Tmax = maximum temperature and Tmin = minimum temperature. Relationship between (A) seed weight and seed length, and (B) seed weight and seed width in 58 almond seed samples. Relationship between (C) seed weight and seed diameter in 7 macadamia nut seed samples. Data are expressed in grams (seed weight) and millimeters (length, width, and diameter). Relationship between (A) lipid and protein, (B) protein and total soluble sugars, and (C) lipid and total soluble sugars in 58 almond seed samples. Relationship between (D) protein and total soluble sugars in 7 macadamia nut seed samples. Data are expressed in gram per 100 gram edible portion. Relationship between (A) glutamic acid and aspartic acid, (B) glutamic acid and arginine, and (C) arginine and lysine in 58 almond seed samples. Relationship between (D) arginine and lysine in 7 macadamia nut seed samples. Data are expressed in gram per 100 gram protein. Polypeptide profile and AMP antigenicity of select almond cultivars assessed by (A) SDS-PAGE stained with Coomassie stain; protein load = 30�g, (B) Western blot probed with mAb 4C10; protein load = 30�g, (C) Dot blot probed with mAb 4C10; protein load = 500 ng. SDS-PAGE analysis of macadamia nut cultivars. A. Coomassie stain; protein load = 30 �g. B. Silver stain; protein load = 10 �g. C. Glycoprotein stain; protein load = 200 �g. D. Western blot; protein load = 30 �g. Primary Ab = Protein G purified rabbit anti- macadamia nut IgG (1:16,000 v/v). Secondary Ab = HRP-labeled goat anti-rabbit pAb (1:40,000 v/v).

x
Figure 9. 89
Figure 10. 90
Figure 11. 91 Figure 12. 91 Figure 13. 93
Figure 14. 94
Figure 15. 98 Figure 16. 99
Checkerboard titration for optimization of coating buffer in non-competitive ELISA. Protein G purified rabbit anti-macadamia nut IgG dilution was 1:4,000 v/v. Data are expressed as mean ± SEM (n = 4). Checkerboard titration using PBS coating buffer in non-competitive ELISA to optimize macadamia nut protein (antigen) coating concentration. Protein G purified rabbit anti-macadamia nut IgG dilutions are indicated in figure legend (X = 1,000). Data are expressed as mean ± SEM (n = 4). Representative competitive inhibition ELISA standard curve for macadamia nut. The IC50 (mean ± SEM) for soluble macadamia nut protein was 21.75 ± 0.94 ng/ml (n = 70). Immunoreactivity (%) of macadamia nut varieties assessed by inhibition ELISA (n= 3). * = significantly different compared to control (Blue Diamond, p � 0.05, LSD = 23.18) Cross-reactivity of mAb 4C10 with select foods/ingredients assessed by (A) Western blot; protein load = 20 �g, (B) Dot blot; protein load = 500 ng for almond and 2 �g for test samples, and (C) sandwich ELISA; values are % cross-reactivity and are expressed as mean ± SEM (n = 3). Cross-reactivity of select foods/ingredients with Protein G purified rabbit anti-macadamia nut IgG (1:16,000 v/v) assessed by Western blotting. Protein loads: 10 �g macadamia and 30 �g for all test samples. Effect of thermal processing on antigenicity of AMP assessed by (A) SDS-PAGE stained with Ponceu S stain; protein load = 30�g, (B) Western blot probed with mAb 4C10; protein load = 30�g, (C) mAb 4C10 sandwich ELISA; values are % immunoreactivity [(IC50 of processed sample/IC50 of unprocessed sample) x 100] and are expressed as mean ± SEM (n = 3, p � 0.05). Effect of pH on the antigenicity of AMP assessed by (A) SDS-PAGE stained with Ponceu S stain and (D) Coomassie stain; protein load = 20 �g, (B and E) Western blot probed with mAb 4C10; protein load = 20 �g, and (C and F) mAb 4C10 sandwich ELISA; values are % immunoreactivity [(IC50 of processed sample/IC50 of unprocessed sample) x 100] and are expressed as mean ± SEM (n = 3, p � 0.05). A,
B, C: Defatted almond seed flour exposed to desired pH value and neutralized prior to analysis. D, E, F: Defatted almond seed flour exposed to desired pH value and analyzed directly (not neutralized).

xi
Figure 17. 100 Figure 18. 101
Effect of thermal processing on immunoreactivity of macadamia nut proteins assessed by ELISA and Dot blot, (A) SDS-PAGE stained with Coomassie stain; protein load = 30 �g, and (B) Western blot probed with Protein G purified rabbit anti-macadamia nut IgG; protein load = 30 �g. ELISA values are % immunoreactivity [(IC50 of processed sample/IC50 of unprocessed sample) x 100] and are expressed as mean ± SEM (n = 3, p � 0.05). Effect of pH on immunoreactivity of macadamia nut proteins assessed by (A and D) SDS-PAGE stained with Coomassie stain; protein load = 20 �g, (B and E) Western blot probed with Protein G purified rabbit anti-macadamia nut IgG; protein load = 20 �g, and (C and F) inhibition ELISA; values are % immunoreactivity [(IC50 of processed sample/IC50 of unprocessed sample) x 100] and are expressed as mean ± SEM (n = 3, p � 0.05). A, B, C: Defatted macadamia nut flour exposed to desired pH value and analyzed directly (not neutralized). D,
E, F: Defatted macadamia nut flour exposed to desired pH value and neutralized prior to analysis.

xii
ABBREVATIONS
ABC Almond Board of California ADD Amino acid distribution AMP Almond major protein or amandin ANOVA Analysis of variance AP Alkaline phosphatase �-ME �-mercaptoethanol BSA Bovine serum albumin BSB Borate saline buffer (0.1 M H3BO3, 0.025 M Na2B4O7, 0.075 M NaCl, pH 8.45) CIMIS California Irrigation Management Information System CBBR Coomassie brilliant blue R DI water Distilled, deionized water DMSO Dimethyl sulfoxide ELISA Enzyme-linked immunosorbent assay E/T Essential-to-total amino acid ratio FALCPA Food Allergen Labeling and Consumer Protection Act GC Gas chromatography HAES Hawaii Agricultural Experiment Station HCN Hydrogen cyanide HDL High density lipoproteins HPLC High performance liquid chromatography HRP Horseradish peroxidase IgE Immunoglobulin E IgG Immunoglobulin G IU International unit kDa Kilo Dalton kGy Kilo Gray LDL Low density lipoproteins LEAA Limiting essential amino acid LSD Fisher’s least significant difference mAb Monoclonal antibodies MUFA Monounsaturated fatty acid MW Molecular weight NC Nitrocellulose NCDC National Climatic Data Center ND Not determined NFDM Nonfat dry milk NOAA National Oceanic and Atmospheric Administration pAb Polyclonal antibodies PBS Phosphate buffered saline (0.1 M sodium phosphate buffer containing 0.85% w/v
NaCl, pH 7.2) PCR Polymerase chain reaction pI Isoelectric precipitation PITC Phenyl isothiocyanate

xiii
PNPP p-nitrophenyl phosphate ppm parts per million PUFA Polyunsaturated fatty acid RAE Retinol equivalent RT Room temperature, ~25 °C SEM Standard error of mean SFA Saturated fatty acid SPT Skin prick test TBS-T Tris buffered saline (10 mM Tris, 0.9% w/v NaCl, 0.05% v/v, 0.2% Tween 20,
pH 7.2) TEA Triethylamine 1° Ab Primary antibody 2° Ab Secondary antibody

xiv
ABSTRACT
Almond and macadamia nut cultivars were analyzed for physical seed characteristics,
chemical composition, and protein antigenicity. The effect of environmental conditions
(geographic location and harvest year) on almond seed composition was also investigated.
Almond samples ranged from 0.78-1.44 g in individual seed weight, 18.3-27.8 mm in length,
9.8-13.8 mm in width, and 6.9-10.2 mm in thickness. Macadamia nut samples ranged from 2.41-
3.36 g in individual seed weight, 18.7-20.1 mm in diameter, and 14.4-15.9 mm in thickness.
Moisture, lipid, protein, ash, soluble sugars, and tannins ranged from 2.9-5.6%, 50.9-66.7%,
15.7-26.7%, 2.6-3.5%, 3.0-6.5%, and 0.07-0.36% in almond seeds and 1.7-2.6%, 60.0-66.2%,
5.6-7.1%, 1.0-1.4%, 5.3-8.7%, and 0.03-0.04% in macadamia nut seeds, respectively. The acidic
amino acids (glutamic acid and aspartic acid) were the dominate amino acids in almond and
macadamia nut proteins, accounting for 24.4-43.3% and 35.1-40.8% of total amino acids.
Almond and macadamia nut seed proteins have essential-to-total amino acid ratio ranges of 25.4-
33.8% and 22.5-26.1% and are also rich sources of arginine with ranges of 7.3-11.9% and 9.4-
11.5%, respectively. Total free amino acids in almond seeds ranged from 172.3-723.2 mg/100 g
dry weight, with free asparagine accounting for 14.9-44.9% of total free amino acids. A
monoclonal-based sandwich ELISA and a polyclonal-based inhibition ELISA were developed
for detecting and evaluating the antigenicity of almond and macadamia nut proteins,
respectively. ELISAs, in combination with Western and Dot blot analyses, were used to
investigate the antigenic stability of almond and macadamia nut proteins to various processing
(thermal and pH) treatments and to quantify these proteins in complex food matrices. The
ELISAs were able to detect almond major protein (AMP) and macadamia nut proteins at levels
as low as 19.2 ± 1.3 ng/ml and 21.8 ± 0.9 ng/ml and were able to detect AMP and macadamia
nut proteins at or below 10 ppm in majority of tested food matrices.

INTRODUCTION
Background Almond Seeds
Almond seeds are included in the family Rosaceae in addition to Pomoideae (apples,
pears), Prunoideae (apricot, cherry, peach, and plum) and Rosoideae (blackberry, strawberry)
fruits. Almond seeds (Prunus amygdalus) are of 2 types: 1) sweet almonds (Prunus amygdalus
‘dulcis’) used mainly for culinary purposes and 2) bitter almonds (Prunus amygdalus ‘amara’)
used mainly in the making of oils and flavorings. The bitterness of the latter type is based on the
presence of cyanogenic glycosides which can be degraded by �-glycosidases (present in the seed
or produced by microorganism in the digestive tract of mammals) to generate hydrogen cyanide
(HCN) which may potentially cause cyanide poisoning (1). Prior to their use in the
manufacturing of oils and flavorings, bitter almond seeds are processed by grinding to release the
generated HCN making them safe for consumption (1). Almond seeds, believed to be native to
the Middle East, were domesticated as early as 3000 BC and perhaps much earlier as wild
almond seeds were unearthed in Greek archeological sites dating back to 8000 BC. Spanish
missionaries (specifically Franciscan Padres) are credited for bringing the almond seed to
California in the mid-1700s. Research and cross-breeding of almond seeds began in the 1870’s,
where several of the almond seed cultivars used today were originally developed and selected
(2). The California almond industry was established in the Central Valley of California
(Sacramento and San Joaquin counties) by the turn of the 20th century (2) and grew at a moderate
pace and around 1960 California became the world’s leader in almond seed production. In
2006/2007, worldwide almond seed production totaled 600,884 metric tons (shelled-basis), with
the U.S. (primarily California) producing 82.7%, followed by Spain (11.3%), Greece (2.5%),
Turkey (2.3%), Italy (1.0%), and India (0.2%) (3). California produced 1,117.3 million pounds
of almond seeds in 2006/2007 with the largest production in Kern (22.2%), Fresno (20.8%),
Stanislaus (14.6%) and Merced (11.2%) counties (4). Worldwide (2006/2007), exports of
almond seeds totaled 445,800 metric tons (shelled-basis) with the U.S. (84.1%), Spain (13.7%),
Greece (10.8%), Italy (10.1%), and Turkey (0.1%) the chief exporters (3). Major importers
worldwide (2006/2007) were Spain (35.0%), Italy (22.3%), India (21.8%), the U.S. (11.8%),
Greece (8.0%), and Turkey (1.2%) with imports totaling 125,710 metric tons (shelled-basis) (3).
2
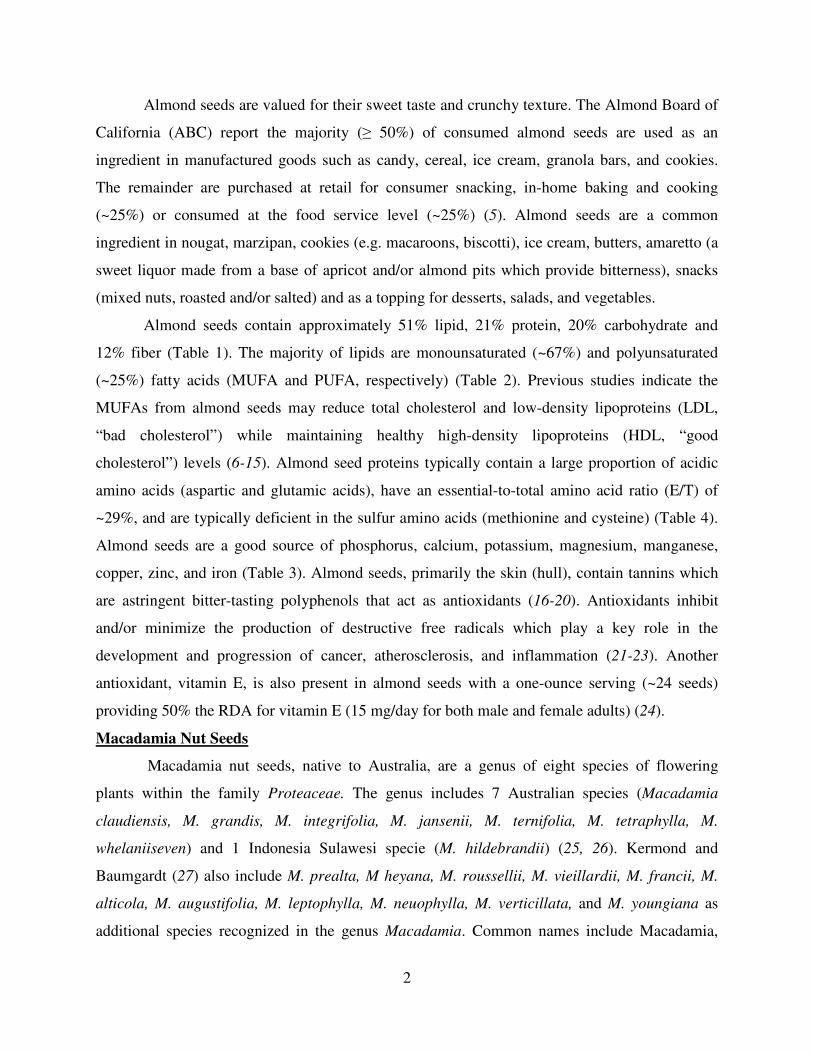
Almond seeds are valued for their sweet taste and crunchy texture. The Almond Board of
California (ABC) report the majority (� 50%) of consumed almond seeds are used as an
ingredient in manufactured goods such as candy, cereal, ice cream, granola bars, and cookies.
The remainder are purchased at retail for consumer snacking, in-home baking and cooking
(~25%) or consumed at the food service level (~25%) (5). Almond seeds are a common
ingredient in nougat, marzipan, cookies (e.g. macaroons, biscotti), ice cream, butters, amaretto (a
sweet liquor made from a base of apricot and/or almond pits which provide bitterness), snacks
(mixed nuts, roasted and/or salted) and as a topping for desserts, salads, and vegetables.
Almond seeds contain approximately 51% lipid, 21% protein, 20% carbohydrate and
12% fiber (Table 1). The majority of lipids are monounsaturated (~67%) and polyunsaturated
(~25%) fatty acids (MUFA and PUFA, respectively) (Table 2). Previous studies indicate the
MUFAs from almond seeds may reduce total cholesterol and low-density lipoproteins (LDL,
“bad cholesterol”) while maintaining healthy high-density lipoproteins (HDL, “good
cholesterol”) levels (6-15). Almond seed proteins typically contain a large proportion of acidic
amino acids (aspartic and glutamic acids), have an essential-to-total amino acid ratio (E/T) of
~29%, and are typically deficient in the sulfur amino acids (methionine and cysteine) (Table 4).
Almond seeds are a good source of phosphorus, calcium, potassium, magnesium, manganese,
copper, zinc, and iron (Table 3). Almond seeds, primarily the skin (hull), contain tannins which
are astringent bitter-tasting polyphenols that act as antioxidants (16-20). Antioxidants inhibit
and/or minimize the production of destructive free radicals which play a key role in the
development and progression of cancer, atherosclerosis, and inflammation (21-23). Another
antioxidant, vitamin E, is also present in almond seeds with a one-ounce serving (~24 seeds)
providing 50% the RDA for vitamin E (15 mg/day for both male and female adults) (24).
Macadamia Nut Seeds
Macadamia nut seeds, native to Australia, are a genus of eight species of flowering
plants within the family Proteaceae. The genus includes 7 Australian species (Macadamia
claudiensis, M. grandis, M. integrifolia, M. jansenii, M. ternifolia, M. tetraphylla, M.
whelaniiseven) and 1 Indonesia Sulawesi specie (M. hildebrandii) (25, 26). Kermond and
Baumgardt (27) also include M. prealta, M heyana, M. roussellii, M. vieillardii, M. francii, M.
alticola, M. augustifolia, M. leptophylla, M. neuophylla, M. verticillata, and M. youngiana as
additional species recognized in the genus Macadamia. Common names include Macadamia,
3
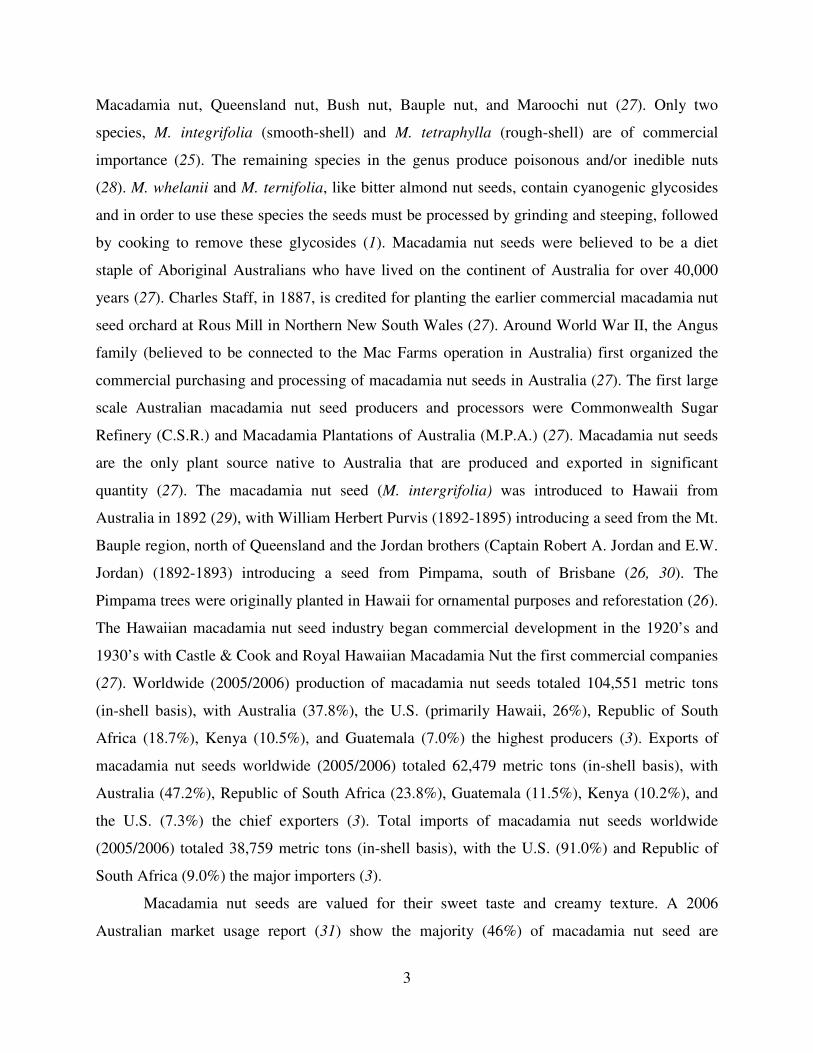
Macadamia nut, Queensland nut, Bush nut, Bauple nut, and Maroochi nut (27). Only two
species, M. integrifolia (smooth-shell) and M. tetraphylla (rough-shell) are of commercial
importance (25). The remaining species in the genus produce poisonous and/or inedible nuts
(28). M. whelanii and M. ternifolia, like bitter almond nut seeds, contain cyanogenic glycosides
and in order to use these species the seeds must be processed by grinding and steeping, followed
by cooking to remove these glycosides (1). Macadamia nut seeds were believed to be a diet
staple of Aboriginal Australians who have lived on the continent of Australia for over 40,000
years (27). Charles Staff, in 1887, is credited for planting the earlier commercial macadamia nut
seed orchard at Rous Mill in Northern New South Wales (27). Around World War II, the Angus
family (believed to be connected to the Mac Farms operation in Australia) first organized the
commercial purchasing and processing of macadamia nut seeds in Australia (27). The first large
scale Australian macadamia nut seed producers and processors were Commonwealth Sugar
Refinery (C.S.R.) and Macadamia Plantations of Australia (M.P.A.) (27). Macadamia nut seeds
are the only plant source native to Australia that are produced and exported in significant
quantity (27). The macadamia nut seed (M. intergrifolia) was introduced to Hawaii from
Australia in 1892 (29), with William Herbert Purvis (1892-1895) introducing a seed from the Mt.
Bauple region, north of Queensland and the Jordan brothers (Captain Robert A. Jordan and E.W.
Jordan) (1892-1893) introducing a seed from Pimpama, south of Brisbane (26, 30). The
Pimpama trees were originally planted in Hawaii for ornamental purposes and reforestation (26).
The Hawaiian macadamia nut seed industry began commercial development in the 1920’s and
1930’s with Castle & Cook and Royal Hawaiian Macadamia Nut the first commercial companies
(27). Worldwide (2005/2006) production of macadamia nut seeds totaled 104,551 metric tons
(in-shell basis), with Australia (37.8%), the U.S. (primarily Hawaii, 26%), Republic of South
Africa (18.7%), Kenya (10.5%), and Guatemala (7.0%) the highest producers (3). Exports of
macadamia nut seeds worldwide (2005/2006) totaled 62,479 metric tons (in-shell basis), with
Australia (47.2%), Republic of South Africa (23.8%), Guatemala (11.5%), Kenya (10.2%), and
the U.S. (7.3%) the chief exporters (3). Total imports of macadamia nut seeds worldwide
(2005/2006) totaled 38,759 metric tons (in-shell basis), with the U.S. (91.0%) and Republic of
South Africa (9.0%) the major importers (3).
Macadamia nut seeds are valued for their sweet taste and creamy texture. A 2006
Australian market usage report (31) show the majority (46%) of macadamia nut seed are

4
consumed in snack packs (roasted and salted seeds) and the remainder used in confectionary
(chocolate covered macadamias, 35%), bakery (macadamia nut cookies and biscuits, 15%) and
ice cream (4%) products.
Macadamia nut seeds contain approximately 76% lipid, 14% carbohydrate, 9% fiber, and
8% protein (Table 1). Considered gourmet oil, macadamia nut seed oil is used in cooking, baking
and a wide variety of cosmetic products, especially skin creams, moisturizers, soaps, lotions and
massage oils (32). The oil is high in MUFAs (~81.3%), mainly oleic (60.4%) and palmitoleic
acids (~17.9%), make it an excellent olive oil substitute (Table 2). Similar to almond seeds,
several clinical studies suggest incorporating macadamia nut seeds into a healthy diet may
protect against coronary artery disease (6, 9, 33-36). When compared to a typical American diet
[37% total fat (16% SFA, 7% PUFA, and 14% MUFA)] over 30 days, a macadamia nut-based
diet [37% total fat (9% SFA, 7% PUFA, and 21% MUFA)] significantly lowered total
cholesterol by 4.8% (p < 0.01), LDL cholesterol by 4.5% (p < 0.05), and total triglycerides by
9.2% (p < 0.05) in 30 healthy men and women (36). However, a significant decrease in HDL
cholesterol by 4.2% (p < 0.01) was also observed (dietary cholesterol was the same for both test
diets, 300 mg/day). Another study where 17 hypercholesterolemic men consumed 40-90 g/day of
macadamia nut seeds over a 4 week period had a significant reduction in total (3.2%, p < 0.05)
and LDL cholesterol (6.0%, p < 0.05) (35). Interestingly unlike the previous study, a significant
increase in HDL cholesterol (6.3%, p < 0.05) was observed (no significant difference in
triglyceride levels were observed). A recent study under similar conditions (17
hypercholesterolemic men consumed 40-90 g/day of macadamia nut seeds over a 4 week period)
reported a significant reduction in leukotriene (23.9%, p = 0.024) and 8-isoprostane (22.5%, p =
0.032), both are plasma markers of inflammation and oxidative stress (33).
Macadamia nut seed proteins, like almond seed proteins, also contain a large amount of
acidic amino acids, have an essential-to-total amino acid (E/T) ratio of ~27%, and are typically
deficient in lysine and the sulfur amino acids (Table 4). Additionally, macadamia nut seeds are
low in sodium and are a good source of thiamin, manganese, calcium, and iron (Table 3).
STATEMENT OF THE PROBLEM
Worldwide, the U.S. is a major producer of almond and macadamia nut seeds with
California and Hawaii leading the production, respectively (3). Almond cultivars, although

5
produced in different geographic regions of California, have limited published literature on the
genetic, geographic, and annual variations on seed composition. Published data to date are also
limited on the compositional differences of macadamia nut seed cultivars. As published data on
these topics are lacking the current investigation on compositional differences in almond and
macadamia nut seeds as affected by various parameters (cultivar, geography, and/or harvest year)
will therefore be useful to almond and macadamia nut seed producers, food manufacturers and
consumers. The current study analyzed and compared the physical characteristics (seed weight
and seed size) and chemical composition (moisture, lipid, proteins, ash, total soluble sugars, and
tannins) of select nut seed samples. The study also evaluated the protein amino acid composition
of these select seed samples to assess the nutritional quality and the free amino acid composition
of select almond seed samples mainly to assess the free asparagine content. Analyzing almond
seeds for free asparagine is important as almonds are typically enjoyed roasted and are reported
to contain high levels of free asparagine (37-39), two factors believed to contribute to acrylamide
formation (40-43). Therefore, evaluating the free asparagine content is of importance as
acrylamide is a known carcinogen (37).
Recent reports suggesting the health and nutritional benefits of almond (8, 10-15, 44) and
macadamia nut (33-36) seeds have lead to their increased consumption and use in processed
foods. However, there is a cause for concern as tree nuts are one of the “big 8” most allergenic
foods and the prevalence of food allergies in industrialized counties has risen (45). Their
increased use in the food industry may result in greater risk of accidental exposure (e.g. improper
labeling or cross-contamination) and pose a danger of severe allergic reactions in individuals
sensitive to almond and macadamia nut seed proteins. The risk of accidental exposure has
resulted in several large food recalls due to improper labeling and cross-contamination of known
food allergens (45). Several commercial kits are available for almond seed protein detection (e.g.
Neogen Veratox ® for almond, Tepnel BioKits Rapid 3-D™ Almond test kit, and R-Biopharm
RIDASCREEN®FAST Mandel / Almond) detection limits of 1.0-1.7 ppm, however most are
cross-reactive with non-almond seed proteins which may increase the possibility of improper
detection and labeling. For instance, the R-Biopharm website report significant cross-reactivity
of the RIDASCREEN®FAST Mandel/Almond detection kit with apricot stone (> 100%) and
lower levels of cross-reactivity with hazelnut, pecan, sunflower, sesame, and lima bean (�
0.073%). A monoclonal antibody (mAb)-based immunoassay (46) for peanut seed protein (Ara h

6
1) is reported to have a higher sensitivity range (0.015-0.02 ppm) and limited cross-reactivity.
Although both polyclonal (pAbs) and monoclonal (mAbs) antibodies are useful in developing
immunoassays for protein detection, several differences such as production, consistency,
specificity, and stability should be considered when choosing the appropriate antibody.
Producing pAbs is typically less expensive, more rapid (several months) and requires less
technical skill than mAb production which is more costly, time-consuming (typically a year or
longer), and demanding (47). However, once a hybridoma is generated a mAb can be produced
repeatedly with the same specificity and affinity (47, 48). Whereas, pAb production is dependent
on the size and life span of the chosen animal model. In addition, the concentration and
specificity of the generated pAbs vary from one animal to another (47, 48). The ability of mAbs
to identify a specific epitope (either linear or conformational) on a protein is desirable for
detecting targeted proteins in a complex food mixture. However, changes in the configuration of
a protein due to processing may significantly alter the function of the mAbs by destroying the
epitope, hiding the epitope, exposing a hidden epitope, or creating a new epitope. On the other
hand, pAbs recognize numerous epitopes on a protein(s) and can be useful when trying to
identify several antigenic proteins or a single protein under different conditions and/or in an
altered state (47). Typically, pAbs remain stable over a wide range of pH and salt concentrations
whereas mAbs are less stable (47). The mAb 4C10 produced and described previously by Sathe
et al. (49) is specific to the 63 kDa polypeptide of almond major protein (AMP) and is not cross-
reactive with several tested seed proteins. Therefore, mAb 4C10 was used to develop sensitive
mAb-based immunoassays for the specific detection of AMP. To date, no commercial
macadamia nut seed detection kits are available. For that reason, producing anti-macadamia nut
seed protein rabbit pAbs and utilizing these pAbs to develop sensitive detection immunoassays
would prove useful for food manufacturers and macadamia nut sensitive consumers.
Finally, almond and macadamia nut seeds typically endure some degree of food
processing and/or are incorporated into numerous food ingredients forming complex food
matrices that may alter the detection of these antigenic proteins (by either blocking or exposing
allergenic epitopes). Therefore, examining the stability of these nut seed proteins to various food
processing treatments and their interaction with other food components is important for the
detection of these antigenic proteins in processed or combined food matrices using the developed
immunoassays.

7
The following are the specific experiments performed in the current study:
I. Analysis of Physical Characteristics and Chemical Composition
1. Determined the physical characteristics (seed weight and seed size) of select
almond and macadamia nut seeds.
2. Determined the chemical composition (moisture, lipid, protein, ash, total soluble
sugars, and tannins) of select almond and macadamia nut seeds.
3. Evaluated polypeptide profiles of select almond and macadamia nut seeds using
gel electrophoresis.
4. Determined the amino acid composition of defatted select almond and macadamia
nut seed flours.
5. Determined the free amino acid composition, in particular free asparagine, of
defatted select almond seed flours.
II. Antigenic Protein Detection and Stability
1. Produced rabbit pAbs against total soluble macadamia nut seed proteins.
2. Investigated the effect of cultivar, geography, and harvest year on AMP detection
using a sandwich ELISA where rabbit pAb was used for capture and mAb 4C10
for AMP detection.
3. Investigated different variables (e.g. coating buffer, coating concentration, pAb
concentration) for the development of a sensitive pAb-based competitive
inhibition ELISA for macadamia nut seed protein detection in foods.
4. Examined the specificity of mAb 4C10 and anti-macadamia nut seed protein
pAbs by evaluating their cross-reactivity with select tree nut, legume, cereal, and
other food proteins.
5. Assessed the effects of the following on AMP and macadamia nut seed protein
detection.
a. Thermal processing: subjected whole, raw almond and macadamia nut
seeds to autoclaving, blanching, dry roasting, frying, and microwaving.
b. pH treatment: exposed defatted almond and macadamia nut flours to
distilled, deionzed water (DI water) and then adjusted to pH 1, 3, 5, 7, 9,
11, and 13.
8
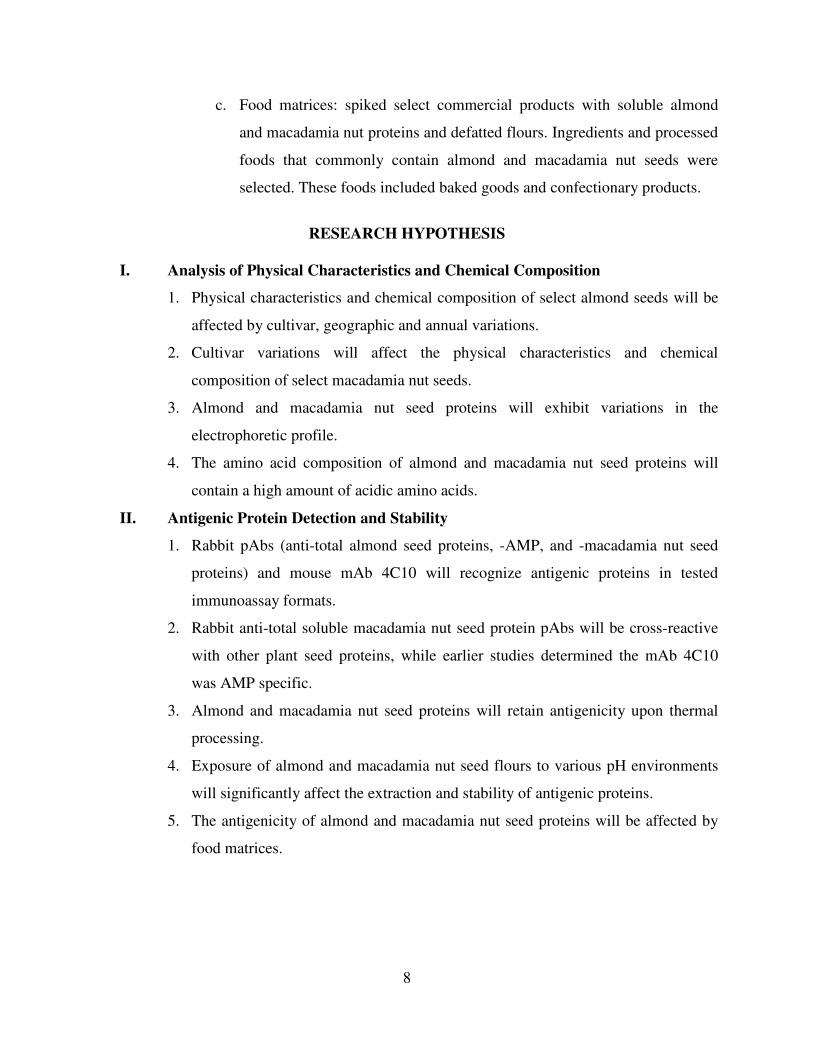
c. Food matrices: spiked select commercial products with soluble almond
and macadamia nut proteins and defatted flours. Ingredients and processed
foods that commonly contain almond and macadamia nut seeds were
selected. These foods included baked goods and confectionary products.
RESEARCH HYPOTHESIS
I. Analysis of Physical Characteristics and Chemical Composition
1. Physical characteristics and chemical composition of select almond seeds will be
affected by cultivar, geographic and annual variations.
2. Cultivar variations will affect the physical characteristics and chemical
composition of select macadamia nut seeds.
3. Almond and macadamia nut seed proteins will exhibit variations in the
electrophoretic profile.
4. The amino acid composition of almond and macadamia nut seed proteins will
contain a high amount of acidic amino acids.
II. Antigenic Protein Detection and Stability
1. Rabbit pAbs (anti-total almond seed proteins, -AMP, and -macadamia nut seed
proteins) and mouse mAb 4C10 will recognize antigenic proteins in tested
immunoassay formats.
2. Rabbit anti-total soluble macadamia nut seed protein pAbs will be cross-reactive
with other plant seed proteins, while earlier studies determined the mAb 4C10
was AMP specific.
3. Almond and macadamia nut seed proteins will retain antigenicity upon thermal
processing.
4. Exposure of almond and macadamia nut seed flours to various pH environments
will significantly affect the extraction and stability of antigenic proteins.
5. The antigenicity of almond and macadamia nut seed proteins will be affected by
food matrices.

9
SIGNIFICANCE OF THE STUDY
1. The compositional analysis of select almond seeds will contribute to the existing
database on almond seed composition in addition to supplying new information on
compositional variation as affected by cultivar, geography, and harvest year.
2. Exploring cultivar variations within different geographic regions of California may be
useful in the selection of cultivars for regional breeding purposes.
3. The compositional analysis of macadamia nut seed varieties will add new information to
the sparsely existing macadamia nut seed composition database, in addition
immunoassay results will add new information.
4. Amino acid composition of almond and macadamia nut seed proteins will be useful in
evaluating their nutritional quality.
5. Free amino acid composition, particularly free asparagine, of almond seed flours will be
useful in evaluating the risk associated with roasting and acrylamide formation.
6. Application of immunoassays for detection of trace amounts of almond and macadamia
nut proteins will be useful for the food industry.
LIMITATIONS OF THE STUDY
1. Only select almond seed cultivars and select geographic regions in California were
studied, thus comparisons were not made between all known almond cultivars and
geographic growth regions outside California.
2. Only select macadamia nut varieties, grown in Hawaii or purchased commercially,
were studied.
3. Cross-reactivity and recovery studies were limited to select tree nuts, oilseeds, legumes,
cereals, spices, and processed foods.
4. The pAbs used in the study exhibited cross-reactivity with other food proteins.
5. In vitro immunoassays using IgG antibodies from rabbit and mouse may not be
clinically relevant.
10
REVIEW OF THE LITERATURE
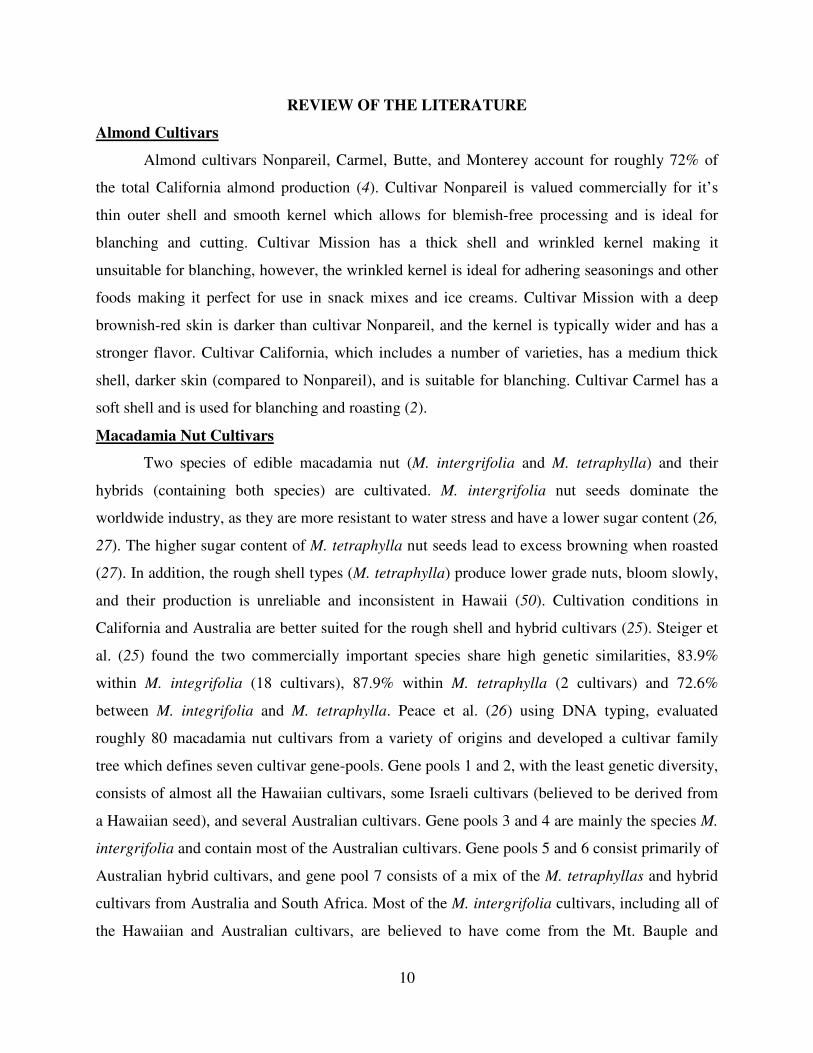
Almond Cultivars
Almond cultivars Nonpareil, Carmel, Butte, and Monterey account for roughly 72% of
the total California almond production (4). Cultivar Nonpareil is valued commercially for it’s
thin outer shell and smooth kernel which allows for blemish-free processing and is ideal for
blanching and cutting. Cultivar Mission has a thick shell and wrinkled kernel making it
unsuitable for blanching, however, the wrinkled kernel is ideal for adhering seasonings and other
foods making it perfect for use in snack mixes and ice creams. Cultivar Mission with a deep
brownish-red skin is darker than cultivar Nonpareil, and the kernel is typically wider and has a
stronger flavor. Cultivar California, which includes a number of varieties, has a medium thick
shell, darker skin (compared to Nonpareil), and is suitable for blanching. Cultivar Carmel has a
soft shell and is used for blanching and roasting (2).
Macadamia Nut Cultivars
Two species of edible macadamia nut (M. intergrifolia and M. tetraphylla) and their
hybrids (containing both species) are cultivated. M. intergrifolia nut seeds dominate the
worldwide industry, as they are more resistant to water stress and have a lower sugar content (26,
27). The higher sugar content of M. tetraphylla nut seeds lead to excess browning when roasted
(27). In addition, the rough shell types (M. tetraphylla) produce lower grade nuts, bloom slowly,
and their production is unreliable and inconsistent in Hawaii (50). Cultivation conditions in
California and Australia are better suited for the rough shell and hybrid cultivars (25). Steiger et
al. (25) found the two commercially important species share high genetic similarities, 83.9%
within M. integrifolia (18 cultivars), 87.9% within M. tetraphylla (2 cultivars) and 72.6%
between M. integrifolia and M. tetraphylla. Peace et al. (26) using DNA typing, evaluated
roughly 80 macadamia nut cultivars from a variety of origins and developed a cultivar family
tree which defines seven cultivar gene-pools. Gene pools 1 and 2, with the least genetic diversity,
consists of almost all the Hawaiian cultivars, some Israeli cultivars (believed to be derived from
a Hawaiian seed), and several Australian cultivars. Gene pools 3 and 4 are mainly the species M.
intergrifolia and contain most of the Australian cultivars. Gene pools 5 and 6 consist primarily of
Australian hybrid cultivars, and gene pool 7 consists of a mix of the M. tetraphyllas and hybrid
cultivars from Australia and South Africa. Most of the M. intergrifolia cultivars, including all of
the Hawaiian and Australian cultivars, are believed to have come from the Mt. Bauple and
11
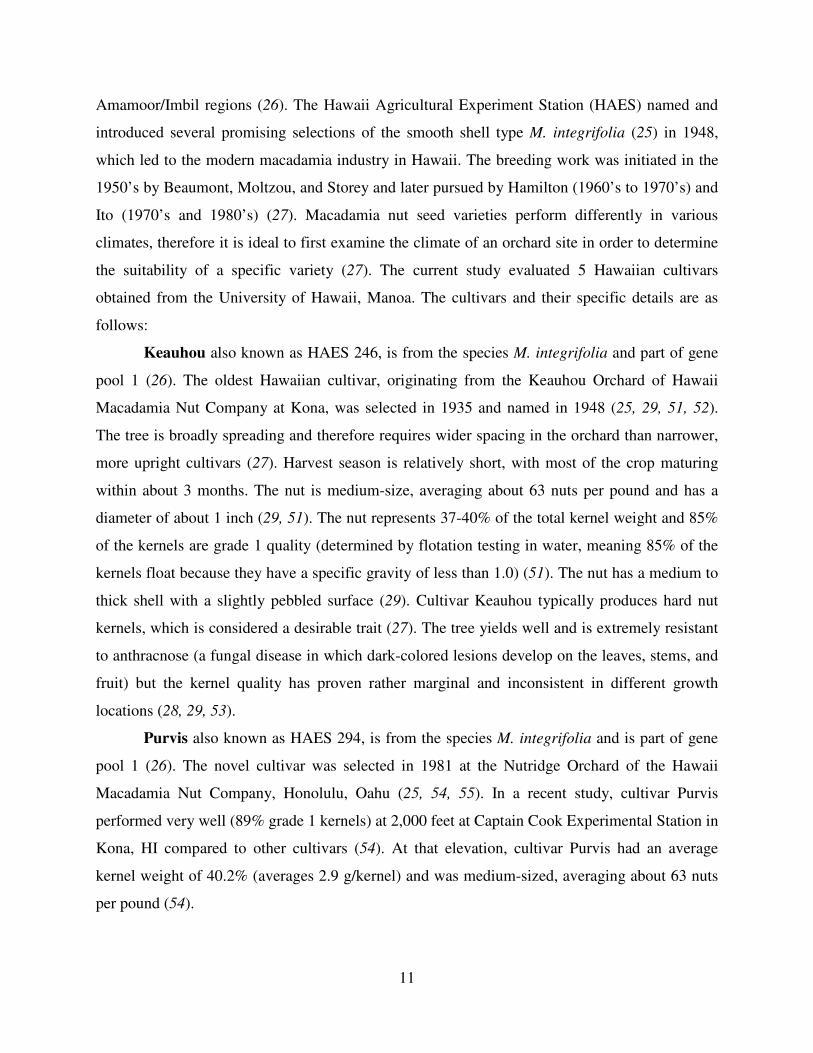
Amamoor/Imbil regions (26). The Hawaii Agricultural Experiment Station (HAES) named and
introduced several promising selections of the smooth shell type M. integrifolia (25) in 1948,
which led to the modern macadamia industry in Hawaii. The breeding work was initiated in the
1950’s by Beaumont, Moltzou, and Storey and later pursued by Hamilton (1960’s to 1970’s) and
Ito (1970’s and 1980’s) (27). Macadamia nut seed varieties perform differently in various
climates, therefore it is ideal to first examine the climate of an orchard site in order to determine
the suitability of a specific variety (27). The current study evaluated 5 Hawaiian cultivars
obtained from the University of Hawaii, Manoa. The cultivars and their specific details are as
follows:
Keauhou also known as HAES 246, is from the species M. integrifolia and part of gene
pool 1 (26). The oldest Hawaiian cultivar, originating from the Keauhou Orchard of Hawaii
Macadamia Nut Company at Kona, was selected in 1935 and named in 1948 (25, 29, 51, 52).
The tree is broadly spreading and therefore requires wider spacing in the orchard than narrower,
more upright cultivars (27). Harvest season is relatively short, with most of the crop maturing
within about 3 months. The nut is medium-size, averaging about 63 nuts per pound and has a
diameter of about 1 inch (29, 51). The nut represents 37-40% of the total kernel weight and 85%
of the kernels are grade 1 quality (determined by flotation testing in water, meaning 85% of the
kernels float because they have a specific gravity of less than 1.0) (51). The nut has a medium to
thick shell with a slightly pebbled surface (29). Cultivar Keauhou typically produces hard nut
kernels, which is considered a desirable trait (27). The tree yields well and is extremely resistant
to anthracnose (a fungal disease in which dark-colored lesions develop on the leaves, stems, and
fruit) but the kernel quality has proven rather marginal and inconsistent in different growth
locations (28, 29, 53).
Purvis also known as HAES 294, is from the species M. integrifolia and is part of gene
pool 1 (26). The novel cultivar was selected in 1981 at the Nutridge Orchard of the Hawaii
Macadamia Nut Company, Honolulu, Oahu (25, 54, 55). In a recent study, cultivar Purvis
performed very well (89% grade 1 kernels) at 2,000 feet at Captain Cook Experimental Station in
Kona, HI compared to other cultivars (54). At that elevation, cultivar Purvis had an average
kernel weight of 40.2% (averages 2.9 g/kernel) and was medium-sized, averaging about 63 nuts
per pound (54).

12
Kakea also known as HAES 508, is from the species M. integrifolia and belongs to gene
pool 1 (25). The cultivar was selected in 1936 and named in 1948 after the hill, Puu Kakea Oahu,
on which the Nutridge Orchard of the Hawaii Macadamia Nut Company is situated (25, 29, 51,
52). The tree is reasonably robust, producing kernels of excellent commercial quality and has
been a consistently productive, long-lived variety in Poamoho, Waikea and Kona experimental
farms (29, 51). The tree has a more upright growth habit than cultivar Keauhou and the younger
trees often need to be topped. Nurserymen consider cultivar Kakea harder to graft than other
varieties but skilled propagators are able to get a high percentage of takes. It has a kernel weight
of 36% (averages 2.5 g/kernel) and 90% of the kernels are of grade 1 quality (51). The nut is
medium-sized, averaging about 65 nuts per pound (51). Cultivar Kakea was originally believed
to be one of the best and most reliable varieties for commercial planting in Hawaii (29), however
is no longer recommended for commercial use (56).
Keaau also known as HAES 660, is from the species M. integrifolia and is part of gene
pool 2 (26). The cultivar originated at the Deschwanden Orchard, Lawai Valley on Kauai and
was selected in 1948 and named in 1966 (25, 29, 51, 57). The tree has an upright growth habit
permitting somewhat closer planting than most other cultivars without undue crowding (27).
Cultivar Keaau performs best at elevations between 300 to 1,000 feet where there is adequate
rainfall (54) and harvest season is typically August to November. Cultivar Keaau has a kernel
weight of 42-46% (averages 2.8 g/kernel) and more than 95% of the kernels are of grade 1
quality. Cultivar Keaau has lost popularity among growers as it produces nuts that are small in
size, averaging about 80 nuts per pound, however these nuts are ideal for the confectionery
industry (27). The nut has a light cream color flesh and a medium brown, thin, smooth shell. The
nuts are excellent for processing and the trees have performed well and have been very
productive during the limited period that this variety has been tested (57).
Mauka also known as HAES 741, is from the species M. integrifolia and is part of gene
pool 2 (26). The cultivar was selected in 1957 at the Glaisyer Orchard, Lawai Valley on Kauai
(25) and named in 1977 (54). Steiger et al. (25) found cultivars Mauka and Keaau share the
highest genetic similarity (98.5%) of the 26 macadamia nut seeds tested. An earlier study also
reported high (> 98%) genetic similarity between cultivars Mauka and Keaau when evaluating
45 Macadamia species (30). Like cultivar Keaau, cultivar Mauka has an upright growing habit,
and therefore is more suited for closer planting (27). Cultivar Mauka has a kernel weight of 43%
13
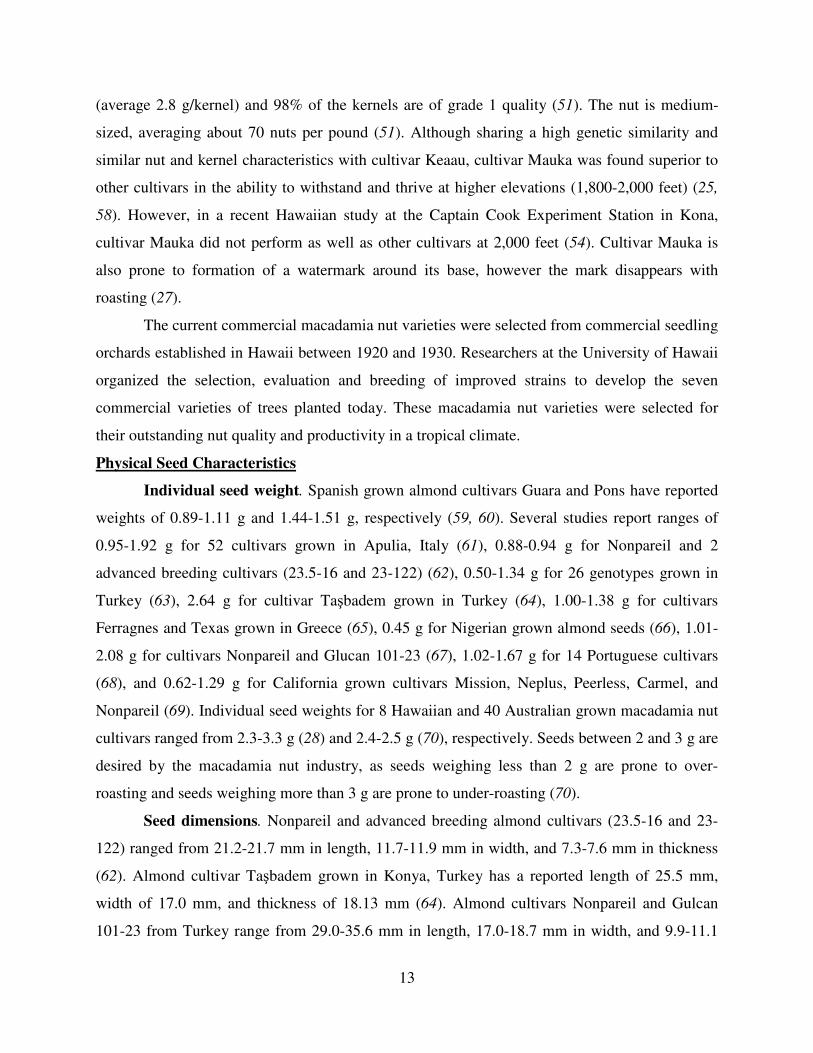
(average 2.8 g/kernel) and 98% of the kernels are of grade 1 quality (51). The nut is medium-
sized, averaging about 70 nuts per pound (51). Although sharing a high genetic similarity and
similar nut and kernel characteristics with cultivar Keaau, cultivar Mauka was found superior to
other cultivars in the ability to withstand and thrive at higher elevations (1,800-2,000 feet) (25,
58). However, in a recent Hawaiian study at the Captain Cook Experiment Station in Kona,
cultivar Mauka did not perform as well as other cultivars at 2,000 feet (54). Cultivar Mauka is
also prone to formation of a watermark around its base, however the mark disappears with
roasting (27).
The current commercial macadamia nut varieties were selected from commercial seedling
orchards established in Hawaii between 1920 and 1930. Researchers at the University of Hawaii
organized the selection, evaluation and breeding of improved strains to develop the seven
commercial varieties of trees planted today. These macadamia nut varieties were selected for
their outstanding nut quality and productivity in a tropical climate.
Physical Seed Characteristics
Individual seed weight. Spanish grown almond cultivars Guara and Pons have reported
weights of 0.89-1.11 g and 1.44-1.51 g, respectively (59, 60). Several studies report ranges of
0.95-1.92 g for 52 cultivars grown in Apulia, Italy (61), 0.88-0.94 g for Nonpareil and 2
advanced breeding cultivars (23.5-16 and 23-122) (62), 0.50-1.34 g for 26 genotypes grown in
Turkey (63), 2.64 g for cultivar Ta�badem grown in Turkey (64), 1.00-1.38 g for cultivars
Ferragnes and Texas grown in Greece (65), 0.45 g for Nigerian grown almond seeds (66), 1.01-
2.08 g for cultivars Nonpareil and Glucan 101-23 (67), 1.02-1.67 g for 14 Portuguese cultivars
(68), and 0.62-1.29 g for California grown cultivars Mission, Neplus, Peerless, Carmel, and
Nonpareil (69). Individual seed weights for 8 Hawaiian and 40 Australian grown macadamia nut
cultivars ranged from 2.3-3.3 g (28) and 2.4-2.5 g (70), respectively. Seeds between 2 and 3 g are
desired by the macadamia nut industry, as seeds weighing less than 2 g are prone to over-
roasting and seeds weighing more than 3 g are prone to under-roasting (70).
Seed dimensions. Nonpareil and advanced breeding almond cultivars (23.5-16 and 23-
122) ranged from 21.2-21.7 mm in length, 11.7-11.9 mm in width, and 7.3-7.6 mm in thickness
(62). Almond cultivar Ta�badem grown in Konya, Turkey has a reported length of 25.5 mm,
width of 17.0 mm, and thickness of 18.13 mm (64). Almond cultivars Nonpareil and Gulcan
101-23 from Turkey range from 29.0-35.6 mm in length, 17.0-18.7 mm in width, and 9.9-11.1
14
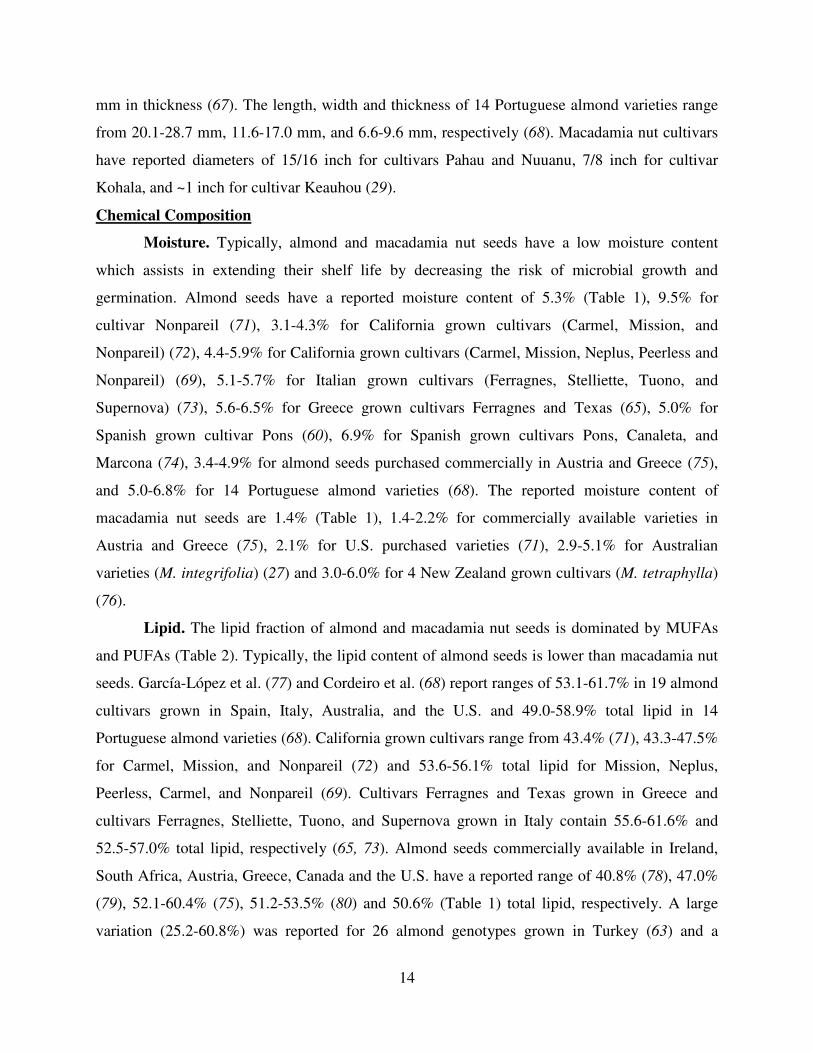
mm in thickness (67). The length, width and thickness of 14 Portuguese almond varieties range
from 20.1-28.7 mm, 11.6-17.0 mm, and 6.6-9.6 mm, respectively (68). Macadamia nut cultivars
have reported diameters of 15/16 inch for cultivars Pahau and Nuuanu, 7/8 inch for cultivar
Kohala, and ~1 inch for cultivar Keauhou (29).
Chemical Composition
Moisture. Typically, almond and macadamia nut seeds have a low moisture content
which assists in extending their shelf life by decreasing the risk of microbial growth and
germination. Almond seeds have a reported moisture content of 5.3% (Table 1), 9.5% for
cultivar Nonpareil (71), 3.1-4.3% for California grown cultivars (Carmel, Mission, and
Nonpareil) (72), 4.4-5.9% for California grown cultivars (Carmel, Mission, Neplus, Peerless and
Nonpareil) (69), 5.1-5.7% for Italian grown cultivars (Ferragnes, Stelliette, Tuono, and
Supernova) (73), 5.6-6.5% for Greece grown cultivars Ferragnes and Texas (65), 5.0% for
Spanish grown cultivar Pons (60), 6.9% for Spanish grown cultivars Pons, Canaleta, and
Marcona (74), 3.4-4.9% for almond seeds purchased commercially in Austria and Greece (75),
and 5.0-6.8% for 14 Portuguese almond varieties (68). The reported moisture content of
macadamia nut seeds are 1.4% (Table 1), 1.4-2.2% for commercially available varieties in
Austria and Greece (75), 2.1% for U.S. purchased varieties (71), 2.9-5.1% for Australian
varieties (M. integrifolia) (27) and 3.0-6.0% for 4 New Zealand grown cultivars (M. tetraphylla)
(76).
Lipid. The lipid fraction of almond and macadamia nut seeds is dominated by MUFAs
and PUFAs (Table 2). Typically, the lipid content of almond seeds is lower than macadamia nut
seeds. García-López et al. (77) and Cordeiro et al. (68) report ranges of 53.1-61.7% in 19 almond
cultivars grown in Spain, Italy, Australia, and the U.S. and 49.0-58.9% total lipid in 14
Portuguese almond varieties (68). California grown cultivars range from 43.4% (71), 43.3-47.5%
for Carmel, Mission, and Nonpareil (72) and 53.6-56.1% total lipid for Mission, Neplus,
Peerless, Carmel, and Nonpareil (69). Cultivars Ferragnes and Texas grown in Greece and
cultivars Ferragnes, Stelliette, Tuono, and Supernova grown in Italy contain 55.6-61.6% and
52.5-57.0% total lipid, respectively (65, 73). Almond seeds commercially available in Ireland,
South Africa, Austria, Greece, Canada and the U.S. have a reported range of 40.8% (78), 47.0%
(79), 52.1-60.4% (75), 51.2-53.5% (80) and 50.6% (Table 1) total lipid, respectively. A large
variation (25.2-60.8%) was reported for 26 almond genotypes grown in Turkey (63) and a
15
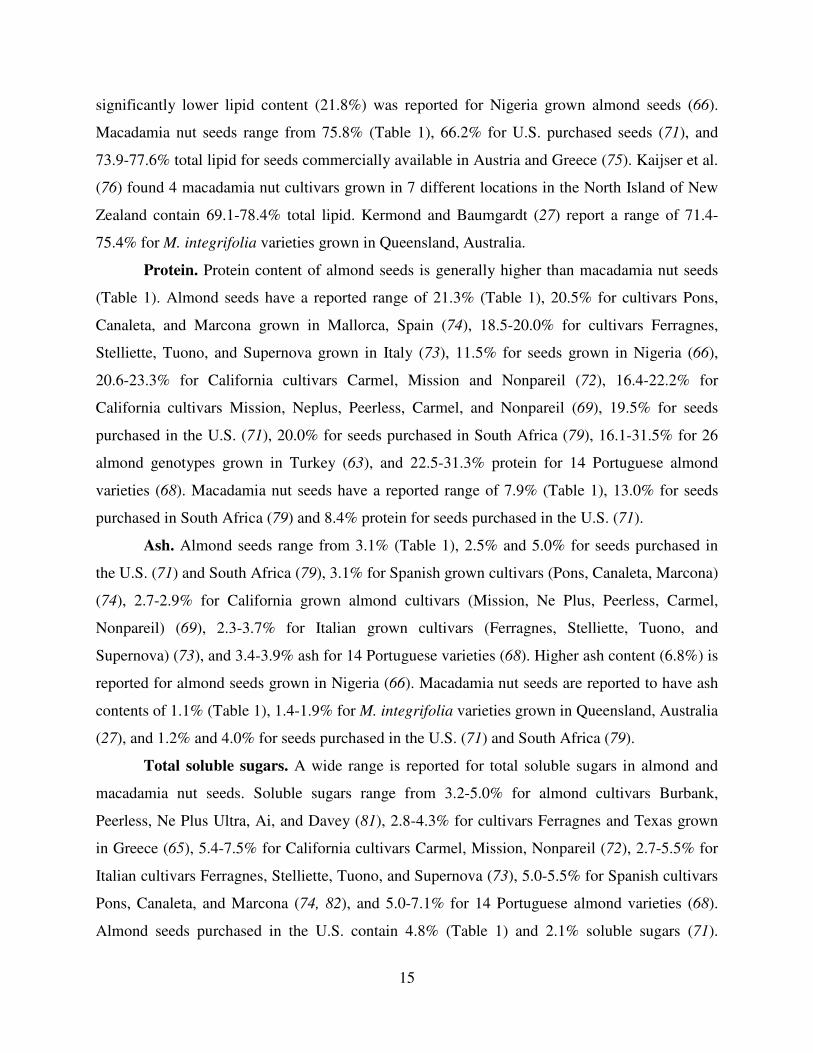
significantly lower lipid content (21.8%) was reported for Nigeria grown almond seeds (66).
Macadamia nut seeds range from 75.8% (Table 1), 66.2% for U.S. purchased seeds (71), and
73.9-77.6% total lipid for seeds commercially available in Austria and Greece (75). Kaijser et al.
(76) found 4 macadamia nut cultivars grown in 7 different locations in the North Island of New
Zealand contain 69.1-78.4% total lipid. Kermond and Baumgardt (27) report a range of 71.4-
75.4% for M. integrifolia varieties grown in Queensland, Australia.
Protein. Protein content of almond seeds is generally higher than macadamia nut seeds
(Table 1). Almond seeds have a reported range of 21.3% (Table 1), 20.5% for cultivars Pons,
Canaleta, and Marcona grown in Mallorca, Spain (74), 18.5-20.0% for cultivars Ferragnes,
Stelliette, Tuono, and Supernova grown in Italy (73), 11.5% for seeds grown in Nigeria (66),
20.6-23.3% for California cultivars Carmel, Mission and Nonpareil (72), 16.4-22.2% for
California cultivars Mission, Neplus, Peerless, Carmel, and Nonpareil (69), 19.5% for seeds
purchased in the U.S. (71), 20.0% for seeds purchased in South Africa (79), 16.1-31.5% for 26
almond genotypes grown in Turkey (63), and 22.5-31.3% protein for 14 Portuguese almond
varieties (68). Macadamia nut seeds have a reported range of 7.9% (Table 1), 13.0% for seeds
purchased in South Africa (79) and 8.4% protein for seeds purchased in the U.S. (71).
Ash. Almond seeds range from 3.1% (Table 1), 2.5% and 5.0% for seeds purchased in
the U.S. (71) and South Africa (79), 3.1% for Spanish grown cultivars (Pons, Canaleta, Marcona)
(74), 2.7-2.9% for California grown almond cultivars (Mission, Ne Plus, Peerless, Carmel,
Nonpareil) (69), 2.3-3.7% for Italian grown cultivars (Ferragnes, Stelliette, Tuono, and
Supernova) (73), and 3.4-3.9% ash for 14 Portuguese varieties (68). Higher ash content (6.8%) is
reported for almond seeds grown in Nigeria (66). Macadamia nut seeds are reported to have ash
contents of 1.1% (Table 1), 1.4-1.9% for M. integrifolia varieties grown in Queensland, Australia
(27), and 1.2% and 4.0% for seeds purchased in the U.S. (71) and South Africa (79).
Total soluble sugars. A wide range is reported for total soluble sugars in almond and
macadamia nut seeds. Soluble sugars range from 3.2-5.0% for almond cultivars Burbank,
Peerless, Ne Plus Ultra, Ai, and Davey (81), 2.8-4.3% for cultivars Ferragnes and Texas grown
in Greece (65), 5.4-7.5% for California cultivars Carmel, Mission, Nonpareil (72), 2.7-5.5% for
Italian cultivars Ferragnes, Stelliette, Tuono, and Supernova (73), 5.0-5.5% for Spanish cultivars
Pons, Canaleta, and Marcona (74, 82), and 5.0-7.1% for 14 Portuguese almond varieties (68).
Almond seeds purchased in the U.S. contain 4.8% (Table 1) and 2.1% soluble sugars (71).

16
Macadamia nut seeds grown in the U.S. and Australia contain 1.4% (71), 4.6% (Table 1), and
3.7-6.5% total soluble sugars (27), respectively. Macadamia nut cultivars, Kau, Keaau, Keauhou,
Kakea, and Nelmar, have a reported range of 2.9-5.6% soluble sugars (81, 83).
Tannins. Limited data is available on the tannin content of almond and macadamia nut
seeds. Venkatachalam and Sathe (71) report 0.29% and 0.01% tannins in almond cultivar
Nonpareil and macadamia nut seed, respectively. Ahrens et al. (72) reported a range of 0.12-
0.18% tannins in almond cultivars Carmel, Mission and Nonpareil. A significantly higher tannin
content (1.82%) is reported for Nigeria grown almond seeds (66). Kornsteiner et al. (75) report
0.13-0.46% and 0.05% tannins for almond and macadamia nut seeds purchased commercially in
Austria and Greece. The latter study found a higher content of total phenolics (11-35% more) in
almond seeds with skin (0.13-0.46%) compared to without skin (0.05%). Milbury et al. (84) also
report 0.13-0.24% total phenolics in California almond cultivars (Butte, Carmel, Fritz, Mission,
Monterey, Nonpareil, Padre, and Price) with the majority (47.5-72.7%) concentrated in the
almond skin. These findings support earlier studies reporting a high amount of phenolics in
almond skins (16-20).
Amino Acid Composition
Total amino acids. Almond and macadamia nut seed proteins are dominated by
hydrophobic and acidic amino acids, accounting for 65.8-79.4% and 69.5-69.7%, respectively
(60, 71, 72, 74, 85). When compared with the FAO/WHO recommended essential amino acid
amounts for pre-school children (2-5 years), the sulfur amino acids (methionine and cysteine)
were the first limiting essential amino acids in almond seeds, while lysine was the first limiting
amino acid in macadamia nut seeds (Table 4). Earlier studies report lysine as the first limiting
amino acid in Spanish and Italian grown almond seeds (60, 73). Almond and macadamia nut
seeds are also a rich source of arginine, containing 11.2 g and 14.56 g per 100 g protein,
respectively (Table 4). The essential-to-total (E/T) amino acid ratio for almond and macadamia
nut seeds range from 28.9-31.0% and 27.2-29.5%, respectively (60, 71, 72, 74, 85).
Free amino acids. Spanish and French almond cultivars contain 98.1 to 1,507.0 mg total
free amino acids per 100 g dry weight (39, 60). Aspartic acid, glutamic acid, and asparagine
dominate (� 60%) the total free amino acid composition of almond seeds (39, 86). The free
asparagine content of raw almond seeds is of importance as free asparagine is reported to be a
precursor for acrylamide formation (37, 42). Acrylamide is formed during the Maillard reaction

17
by the reaction of free asparagine and reactive carbonyls (e.g. reducing sugars) at temperatures
above 120 °C (38, 40, 41). In fact, studies show the backbone of the formed acrylamide
originates directly from asparagine (38, 40, 43). Acrylamide formation in foods is a public health
concern as acrylamide has neurotoxic and carcinogenic properties (37, 38, 42, 87). However,
several human studies found no significant evidence that dietary acrylamide increases the risk of
developing colorectal (88), renal (89), breast (90), pharynx, larynx, esophagus, ovary, and
prostate cancers (87, 91). Asparagine was the major free amino acid in almonds of U.S. and
European origin, ranging from 500-2,760 mg/kg (38). Surprisingly, European almonds contained
significantly less (2.7 times) free asparagine and formed significantly less acrylamide (3.0 times)
during roasting than U.S. almonds (38), indicating the possible role of environmental influences
on free asparagine content. Almond seeds with high levels of free asparagine and natural sugars
may pose a health concern as they are typically enjoyed roasted (38). The acrylamide content of
roasted almonds is reported to range from 260-2,000 �g/kg (38, 92). Researchers proposed
several ways to decrease acrylamide formation in almond seeds, which include selecting almond
cultivars low in free asparagine and reducing roasting temperatures (37, 38, 42). Commercially,
almonds are typically roasted at 145 °C for up to 20 min and 165 °C for up to 15 min (92). Lukac
et al. (92) report acrylamide formation in roasted almonds began when the kernel temperature
reached 134 °C and 153 °C at roasting temperature of 145 °C and 165 °C, respectively. The
latter study also report a positive correlation (R2 = 0.982) between development of roast color
(measured by the redness) and acrylamide formation in roasted almonds (92). Reducing the
roasting temperature of almonds may decrease acrylamide formation, however the roast color
and over-all sensory quality of almonds may be negatively affected.
18
Nutrient Almond Macadamia
Moisture 4.70 1.36
Energy 575.00 718.00
Protein 21.22 7.91
Lipid 49.42 75.77
Ash 2.99 1.14
Carbohydrate, by difference 21.67 13.82Fiber, total dietary 12.20 8.60
Sugars, total 4.80 4.57
Sucrose 3.89 4.43
Glucose 0.12 0.07
Fructose 0.09 0.07
Lactose 0.00 0.00
Maltose 0.04 0.00Starch 0.74 1.05
Table 1. Proximate composition of almond and macadamia nut seedsa
aCompiled from USDA National Nutrient Database for Standard Reference, Release 20 (85). Nut seeds are unprocessed and values are expressed as gram per 100 gram edible portion with the exception of energy values which is expressed as kilocalories per 100 gram edible portion.
19
Lipids Units Almond Macadamia
Total saturated g 3.73 12.06
4:0 g 0.00 0.00
6:0 g 0.00 0.00
8:0 g 0.00 0.00
10:0 g 0.00 0.00
12:0 g 0.00 0.08
14:0 g 0.01 0.66
15:0 g 0.00 0.00
16:0 g 3.04 6.04
17:0 g 0.01 0.12
18:0 g 0.66 2.33
20:0 g 0.01 1.94
22:0 g 0.00 0.62
24:0 g 0.00 0.28
Total monounsaturated g 30.89 58.88
14:1 g 0.00 0.00
16:1 undifferentiated g 0.24 12.98
17:1 g 0.03 0.00
18:1 undifferentiated g 30.61 43.76
20:1 g 0.01 1.89
22:1 undifferentiated g 0.00 0.23
24:1 c g 0.00 0.02
Total polyunsaturated g 12.07 1.50
18:2 undifferentiated g 12.06 1.30
18:3 undifferentiated g 0.01 0.21
18:4 g 0.00 0.00
20:2 n-6 c,c g 0.00 0.00
20:3 undifferentiated g 0.00 0.00
20:4 undifferentiated g 0.00 0.00
20:5 n-3 g 0.00 0.00
22:5 n-3 g 0.00 0.00
22:6 n-3 g 0.00 0.00
Cholesterol mg 0.00 0.00
Phytosterols mg 141.00 116.00
Stigmasterol mg 4.00 0.00
Campesterol mg 5.00 8.00
Beta-sitosterol mg 132.00 108.00
Table 2. Lipid composition of almond and macadamia nut seedsa
aComplied from USDA National Nutrient Database for Standard Reference, Release 20 (85). Nut seeds are unprocessed and values are expressed per 100 gram edible portion. C = ‘cis’ isomer, n = omega position, undifferentiated = c or n not known.

20
Minerals Units Almond Macadamia
Calcium, Ca mg 264.00 85.00
Iron, Fe mg 3.72 3.69
Magnesium, Mg mg 268.00 130.00
Phosphorus, P mg 484.00 188.00
Potassium, K mg 705.00 368.00
Sodium, Na mg 1.00 5.00
Zinc, Zn mg 3.08 1.30
Copper, Cu mg 1.00 0.76
Manganese, Mn mg 2.29 4.13
Selenium, Se �g 2.50 3.60
Vitamins Units Almond Macadamia
Vitamin C mg 0.00 1.20
Thiamin mg 0.21 1.20
Riboflavin mg 1.01 0.16
Niacin mg 3.39 2.47
Pantothenic acid mg 0.47 0.76
Vitamin B-6 mg 0.14 0.28
Folate, total �g 50.00 11.00
Choline, total mg 52.10 0.00
Betaine mg 0.50 0.00
Vitamin B-12 �g 0.00 0.00
Vitamin A, IU IU 1.00 0.00
Vitamin A, RAE �g_RAE 0.00 0.00
Retinol �g 0.00 0.00
Tocopherol, � mg 26.22 0.54
Tocopherol, � mg 0.29 0.00
Tocopherol, � mg 0.65 0.00
Tocopherol, � mg 0.05 0.00
Table 3. Mineral and vitamin content of almond and macadamia nut seedsa
aComplied from USDA National Nutrient Database for Standard Reference, Release 20 (85). Nut seeds are unprocessed and values are expressed per 100 gram edible portion. IU = International Unit, RAE = Retinol Equivalent.

21
Amino Acid Almond Macadamia
Tryptophan 0.91 0.70
Threonine 2.54 3.84
Isoleucine 2.99 3.26
Leucine 6.33 6.25
Lysine 2.47 0.19
Methionine 0.64 0.24
Cystine 0.80 0.06
Phenylalanine 4.76 6.90
Tyrosine 1.92 5.31
Valine 3.47 3.77
Arginine 10.40 14.56
Histidine 2.37 2.02
Alanine 4.37 4.03
Aspartic acid 12.38 11.41
Glutamic acid 28.97 23.54
Glycine 6.25 4.71
Proline 4.39 4.86
Serine 4.03 4.35
ADD (%)b
Almond Macadamia
Hydrophobic 34.11 34.72
Hydrophilic 9.29 13.56
Acidic 41.35 34.95
Basic 15.24 16.77
LEAAc
Almond Macadamia
first Lys Lys
second Met/Cys Met/Cys
third Trp Trp
LEAAd
Almond Macadamia
first Met/Cys Lys
second Met/Cys
thirdE/T (%) 26.48 27.17
Table 4. Amino acid composition of almond and macadamia nut seedsa
aAll amino acid values are expressed as gram per 100 gram protein. Data Source: USDA National Nutrient Database for Standard Reference, Release 20 (85). bADD (amino acid distribution). LEAA (limiting essential amino acid) for cpre-school child (2-5 years) and dadult recommended by the report of a joint WHO/FAO expert consultation (93). E/T (%) represents essential-to-total amino acid ratio.

22
Climactic, Geographic and Genetic Effects on Composition
Physical seed characteristics and chemical composition of tree nuts can be affected by
environmental conditions, harvest year, geographic location as well as genetic variations.
Evaluating these variations are important as superior cultivars with high production yields and
desired quality can be selected for commercial production.
Almond cultivars (52 total) from the Apulia region in Southern Italy differed significantly
in kernel yield (kg of almonds per tree), shelling percentage (shell weight representing total
weight of almond nut), number of double kernels (presence of 2 kernels in a single shell), kernel
weight, almond nut weight, total lipid content, and �-tocopherol content (61). Kodad and Socias i
Company (94) also found bloom density, fruit set, fruit density and productivity were highly
dependent on genotype and harvest year when studying 9 almond genotypes over 2 consecutive
years (2003 and 2004). Pereira-Lorenzo et al. (95) report 47 chestnut cultivars grown in 6
Spanish regions differed significantly in chemical composition. Cultivar and geographic location
significantly affected moisture, starch, total sugars, ash, phosphorus, and magnesium content but
had no affect on crude fiber, sodium, zinc, copper, and iron content. Crude protein, fat,
manganese and calcium only varied by cultivar but not by geographic location and potassium
only varied by geographic location but not by cultivar. Cultivar variation significantly influenced
the proximate composition of 24 pecan cultivars (96). Additionally, the proximate composition
of 2 pecan cultivars (Desirable and Choctaw) was affected by growth location (Georgia or
Texas) (96). Harvest year and cultivar had no significant influence on lipid, fiber, vitamin C,
fatty acid, mineral, and protein content of Australian grown pecan cultivars Wichita and Western
Schley from 1995-1997 (97). However, sugar content was significantly affected by harvest year
with pecans harvested in 1997 containing 44-56% less sugar than pecans harvested in 1995 and
1996 (97). Severe weather conditions (e.g. flooding) during 1997 were believed to be a
contributing factor to the reported variation in sugar content (97). Growth location was reported
to significantly affect the protein content of pecans, with U.S. grown pecans containing more
protein (~42%) than Australian grown pecans (97). Effect of irrigation regime (non-irrigated or
irrigated soil), fertilizer treatment (inorganic or organic), and harvest year (2002 and 2003) on
the physical properties of almond cultivar Guara were reported (59). Non-irrigated soil produced
almond seeds of greater mass, width, and geometric mean diameter, while irrigated soil produced
longer and more spherical seeds. The physical properties of almond seeds were significantly
23
affected by harvest year, but not by fertilizer treatments. Elevation significantly influenced shell
thickness and ash content of hazelnut cultivar Tombul grown at 4 elevations (0-50, 100-150,
200-250, and 300-350 m) in Persembe, Turkey (98). Cultivar and harvest year but not
geographic location significantly affected the lipid content of 17 chestnut (Castanea sativa Mill)
cultivars grown in 3 regions of Portugal (Terra Frai, Padrela and Soutos da Lapa) over 2 crop
years (2001 and 2002) (99). In a recent study, Borges et al. (100) also report cultivar and
geographic location significantly affected moisture, starch, crude protein, reducing sugars, crude
fat, ash, phosphorus, potassium, calcium, magnesium, copper, iron, manganese, and zinc content
of 17 chestnut cultivars grown in 3 regions of Portugal. Cultivar variation (Uzun, Kirmizi, Halebi
and Sirrt) was not found to significantly affect the total fat and protein content of pistachio nuts
(101). In another study, significant differences were reported in moisture, protein, ash,
potassium, magnesium, and sodium content of 5 pistachio cultivars (Uzun, Kirmizi, Siirt, Ohadi,
and Halebi), while no difference was observed in total fat and copper content (102). Soil
composition was found to influence total protein in 15 Spanish chestnuts, with significantly
higher protein in chestnuts grown in schists-based [consisting largely of micas, chlorite, talc,
hornblende (calcium-rich), graphite, and other minerals] soil than those from granite-based soil
(103). The same Spanish chestnuts also varied significantly in moisture, sucrose, glucose,
fructose, fiber, protein, lipids, and mineral content but not in starch content. Another study report
cultivar, [‘Emka’, ‘Kora’ (both from Poland), ‘Pyra (Czech Republic), and ‘Krupinka (Ukraine)],
geographic location (�eské Bud�jovice and Humpolec in the Czech Republic) and harvest year
(1999 and 2000) had a significant influence on the crude protein content of buckwheat flour
(104). The authors report soil in Humpolec contained a higher quantity of mineral nitrogen than
soil in �eské Bud�jovice, which partly explained the significant impact on crude protein content.
Soil with a higher supply of plant available nitrogen is reported to increase the crude protein
content of rapeseed (105), lupine seed (106), pearl millet (107), and rice (108). Cultivar and
geographic location influenced the free amino acid composition of almond seeds with serine,
asparagine, and glutamic acid varying by cultivar and arginine and glycine varying by
geographic location (39, 109).
Tree Nut Allergies
Tree nuts are one of the “big 8” common food allergens, in addition to eggs, shellfish,
fish, wheat, soy, milk, and peanuts (110, 111). Proteins present in these foods are responsible for
24
over 90% of all food-related allergic reactions (112, 113). An estimated 6% of children and 3.7%
of adults in the U.S. have food allergies, of which tree nut allergies affect 0.2% of the children
and 0.5% of the adults (111). Allergies to peanuts and tree nuts tend to be more severe, causing
life-threatening and sometimes fatal reactions (111, 114). In fact Bock et al. (114) found of the
32 food induced anaphylaxis fatalities evaluated in the U.S., peanuts (62.5%) and tree nuts
(31.3%) were responsible for 94% (111). A more recent report by Bock et al. (115) found 80.6%
of the 31 food induced anaphylaxis fatalities evaluated in the U.S. from 2001-2006 were also
caused by peanuts (54.8%) and tree nuts (25.8%). Allergic reactions to tree nuts and peanuts are
classified as type I reaction (often referred to as acute or immediate hypersensitivity reactions),
in which symptoms are mediated by allergen-specific immunoglobulin E (IgE) antibodies (Abs).
Mast cells and basophils in tissue have a high affinity for the Fc region of IgE Abs, and become
sensitized and triggered when bound with IgE. Upon subsequent exposure to the antigen/allergen
IgE-bound mast cells or basophils will cross-link and release (referred to as ‘mast cell
degranulation’) histamine and other inflammatory mediators. Symptoms generally appear within
minutes up to 2 h following ingestion of the antigen and depend on the location of these
degranulated cells, in the skin (hives, urticaria), respiratory (rhinitis, asthma), GI tract (diarrhea),
or combined systems (anaphylactic shock). An estimated 1-2% of the U.S. population is allergic
to peanuts, tree nuts, or both (116, 117). Over a 5 year period (1997-2002), Sicherer et al. (117)
reported a 100% increase in the rate of nut allergies. The most frequently reported tree nut
allergies are to walnut (34% of respondents), followed by cashew (20%), almond (15%), pecan
(9%), pistachio (7%), and other tree nuts (less than 5% each) (116). In the U.S. and the U.K.,
fatal cases of anaphylaxis to food are caused primarily by tree nuts and peanuts with tree nuts
accounting for 15-30% of fatalities and peanuts accounting for 50-62% of fatalities (114, 118-
121). Until recently, it was believed that children did not out grow allergies to tree nuts and
suffered a life-long challenge. However, Fleisher et al. (122) report 9% of children do out grow
nut allergies. The new Food Allergen Labeling and Consumer Protection Act of 2004 (FALCPA)
which took effect January 1, 2006, mandates that foods containing the “big 8” common food
allergens must declare the food in plain language on the ingredient list (123, 124). The Act was
passed to protect atopic consumers from the potential risk of a severe allergic reaction from
offending foods that may contain a “hidden” or undeclared allergen (124). The presence of
undeclared allergens in food has lead to several published reports of serious anaphylactic
25
reactions (125-131) as well as several large scale food recalls (45, 127). The occurrence of these
undeclared allergens in food that lead to food recalls are typically caused by inaccurate labeling
through ingredient omissions and/or errors and cross-contamination of manufacturing equipment
(127). In order for the food industry to fully comply with the new law, there must be accurate,
sensitive, and robust detection methods to test for trace amounts of these allergens in processed
foods.
Detection Methods for Tree Nut Allergens
Currently, immunochemical techniques, such as ELISA, have been developed and are
available commercially to detect potential allergenic proteins (132-134). Molecular biological
techniques, such as polymerase chain reaction (PCR), have also been introduced as an alternative
and suitable detection method for hidden allergens (135-138). Immunoassays and their level of
sensitivity are listed in Table 5. However, immunochemical detection methods are lacking for
several tree nuts and several of the previously developed methods are not sufficiently sensitive
(1-100 ppm or mg allergenic protein/kg food) to detect trace amounts of these allergens (137,
165, 166).
Almond and Macadamia Nut Allergens
Almond major protein (AMP), a 14S globulin, also referred to as amandin is the major
allergen recognized by � 50% of the almond-sensitive patient sera IgE tested (49, 139, 167, 168).
AMP, with an estimated MW of 379-475 kDa, represents 65-70% of the aqueous solvent
extractable proteins in almond seed (49). AMP is composed of 2 major types of polypeptides, an
acidic (42-64 kDa range) and basic (20-27 kDa range) subunit, linked by disulfide bonds (49,
169, 170) and also contains several additional polypeptides (49). Corresponding Western blots of
AMP probed with almond sensitive human sera show strong reactivity with the 42-44 kDa
polypeptide bands (139, 167). Bargman et al. (171) had earlier reported IgE from almond
sensitive patients to react with two polypeptides, 70 kDa and 45-50 kDa. Other IgE reactive
proteins from almond seed (45, 37, 30 and 12 kDa) have also been identified (172, 173). N-
terminal amino acid sequence analysis indicated the 45 and 30 kDa bands had 60% homology to
the conglutin-γ heavy chain from lupine seed (Lupinus albus) and the basic 7S globulin from
soybean (Glycine max), while the 12 kDa band showed good homology to the 2S albumin from
English walnut (Jug r 1) (172). Tawde et al. (174) reported nearly half of the almond sensitive
26
patient sera reacted to a profilin (designated Pru du 4) protein with a molecular weight of 12-16
kDa.
Allergic reactions to macadamia nut, although not as common as other tree nuts have
been reported (121, 169, 175-181). However, no allergens from macadamia nut have been fully
characterized to date. Sutherland et al. (177) report IgE from a macadamia sensitive patient
reacted strongly with a 17.4 kDa polypeptide, with also a weaker reactivity to several higher
molecular weight polypeptides (kDa not given) in raw and roasted macadamia nuts. In addition,
macadamia nut oil was reported to contain IgE reactive proteins when probed with macadamia
sensitive patient sera (182). A vicilin from macadamia nut seed with anti-bacterial properties has
been isolated, but its allergenicity was not determined (183).
Cross-Reactivity
Evaluating the cross-reactivity of Abs used for immunoassays is of importance as many
foods containing almond and macadamia nut seeds may also contain other ingredients/foods
which may interfere and possibly cause errors with accurate detection and labeling.
Earlier studies report cross-reactivity of rabbit anti-total soluble almond proteins and
rabbit anti-AMP pAbs with other plant seed proteins from basmati rice, Brazil nut, cashew and
purified Ana o 2, Great Northern bean, hazelnut, macadamia nut, pistachio, black walnut,
sesame, and tepary bean (110, 134, 140, 141, 184). Lee et al. (185) found rabbit anti-AMP pAbs
and human IgE from almond sensitive patients to cross-react with the 50 kDa maize -zein
protein. Human IgE from almond sensitive patients has also been found to cross-react with rye
grass pollen profilin (174), which is not surprising as pollen profilins are believed to sensitize
individuals to food profilins (111, 186, 187). Cross-reactivity of human IgE is reported in foods
of the same botanical family, such as walnut and pecan (Juglandaceae family), cashew,
pistachio, and mango (Anacardiaceae family), and apricot, almond, cherry, plum, strawberry,
apple, peach, and pear (Rosaceae family) (184, 188-191). Fink et al. (189) report one patient
with an earlier reported allergic reaction to cherries later developed anaphylaxis to almond seeds.
Kewalraman et al. (192) also reported human IgE from almond allergenic patients to cross-react
with apricot seed, sunflower, pine nut, walnut, and pecan (192). Tawde et al. (193) report 33% of
tested almond and walnut sensitive patient IgE (26 total) cross-reacted with Fus c 1, a fungal 60S
RP aeroallergen from Fusarium culmorum. Sera IgE from patients with sensitivity to several tree
27
nuts (almond, Brazil nut, cashew, and hazelnut) were found to cross-react with peanut proteins
(194).
One macadamia nut sensitive patient’s sera was found to cross-react with a ~60 kDa
polypeptide from raw and roasted hazelnut and the patient also had positive skin prick tests
(SPT) to rye grass pollen and house dust mites (177). Lerch et al. (176) reported two macadamia
nut sensitive patients with positive SPTs to tree pollens (birch, alder, hazel, ash, beech, oak), rye
grass, plantain pollen, sorrel pollen, latex and hazelnut.
Allergen Stability
Tree nuts are typically subjected to a variety of processing conditions (e.g. roasting and
frying) in order to improve their sensory qualities (e.g. flavor, taste, appearance, and texture).
Since several Salmonella outbreaks in 2001 and 2004 were traced back to raw almond seeds
grown in California, ABC and the USDA have created a mandatory program requiring
pasteurization of all raw almond seeds. The final rule was published in the Federal Register on
March 30, 2007 and mandatory compliance with this rule began September 1, 2007 (195).
A rabbit pAb-based inhibition ELISA found almond seed proteins stable to various
thermal processing treatments (139, 140, 196, 197). Su et al. (198) using pAb rabbit anti-AMP
immunoassays report the stability of AMP to -irradiation alone (1, 5, 10, 25 kGy) or in
combination with various thermal processing treatments (pressure cooking, blanching, frying,
microwaving, and dry roasting). Binding of human IgE from patients with sensitivity to several
tree nuts (almond, Brazil nut, cashew, and hazelnut) to almond seed proteins did not significantly
differ between the raw and roasted (180 °C for 15 min) almond seed samples (194). However,
Venkatachalam et al. (196) report a loss of IgE binding to a low molecular weight polypeptide
(~18.8-20.6 kDa) in commercially purchased dry roasted almonds.
A decrease in the antigenicity of AMP as a result of acidic pH exposure has been reported
(140, 167).
To date, stability of macadamia nut proteins to thermal processing treatments and
extreme pH conditions has yet to be investigated.

28
Table 5. Immunoassays for tree nut protein detection
Limit of Detection
(LOD) in food matrix
Limit of Detection
(LOD) of pure allergen
Competitive Inhibition ELISA (rabbit IgG) 5-37 ppm 0.087 ± 0.016 ppm 139
Competitive Inhibition ELISA (rabbit IgG) NA 0.3 ppm 140
Western blotting (rabbit IgG) 5 ppm NA 134
Sandwich ELISA (rabbit and sheep IgG) NA 1 ppm 141
Brazil nut 2S protein Competitive Inhibition ELISA (rabbit IgG) NA 1 ppm 142
Cashew major protein (CMP, Ana o 2)
Sandwich ELISA (goat and rabbit IgG) 1-31 ppm 0.02 ppm 143
Time-resolved floroimmunoassay (rabbit IgG, sandwich) 0.1-0.33 ppm 0.005-0.16 ppm 144
Sandwich ELISA (rabbit and sheep IgG) 10 ppm NA 145
Competitive Inhibition ELISA (chicken pAb IgY) 0.01-0.03 ppm NA 146
Competitive Inhibition ELISA (rabbit IgG) 0.25-0.45 ppm 0.002-0.008 ppm 147
Biosensor-based Assay (rabbit IgG) 10 ppm NA 148
Competitive Inhibition ELISA (human IgE) 6 ppm 0.03-1 ppm 149
Sandwich ELISA (mAb IgG1 and rabbit IgG) 0.2-1.2 ppm 0.006 ppm 150
Sandwich ELISA (rabbit IgG) 0.5-1 ppm 0.0007 ppm 151
Sandwich EIA (chicken pAb IgY) 0.12-1 ppm 0.03 ppm 152
Sandwich ELISA (pAb IgG) 1 ppm 0.005-1 ppm 149
Sandwich ELISA (rabbit IgG) 120-200 ppb 60-110 ppb 153
Western blotting (rabbit IgG) 5 ppm NA 134
Rocket Immunoelectrophoresis Assay 20 ppm NA 154
Pecan proteins Competitive Inhibition ELISA (rabbit IgG) NA 0.03-0.8 ppm 155
Competitive Inhibition ELISA (rabbit IgG) 0.8-2 ppm 0.14 ppm 156
Competitive Inhibition ELISA 0.4 ppm NA 157
Sandwich ELISA (mAb IgG1 and rabbit IgG) 0.2-0.8 ppm 0.007 ppm 150
Sandwich ELISA 0.15 ppm 0.07 ppm 136
Prolisa Peanut PAK (Pro-Lab Diagnostics, Inc.,Neston, UK)
1.6 ppm NA
Ridascreen Peanut (R-Biopharm, Darmstadt, Germany) 2.5 ppm NAVeratox Peanut
Protein Test Kit (Neogen, Lansing, MI, USA)0.875 ppm NA
mAb Ara h 1 ELISA (INDOOR Biotechnologies, Charlottesville, VA.)
30-2000 ng/ml NA 159
Surface Plasmon Resonance (SPR) Immunoassays 7 ppm NA 160
Sandwich ELISA (mAb IgM and rabbit IgG) 40-2000 ppm NA 161
Walnut proteins Sandwich ELISA (sheep and rabbit IgG) 1 ppm NA 162
0.003 ppm (almond)0.006 ppm (Brazil nut)
0.011 ppm (cashew)0.008 ppm (hazelnut)
0.04 ppm (peanut)0.1-0.5 ppm (Brazil nut) 0.03 ppm (Brazil nut)
0.1-1 ppm (hazelnut) 0.03 ppm (hazelnut)0.1 ppm (peanut) 0.01 ppm (peanut)
Hazelnut proteins
Almond proteins
Allergen Method Reference
Almond major protein (AMP, amandin)
Sensitivity
158Peanut proteins
Reverse dot blot EIA (chicken IgY)Combined (Brazil nut,
hazelnut, peanut) proteins
164
Combined (almond, Brazil nut, cashew, hazelnut, peanut)
proteins
Competitive Inhibition ELISA (rabbit IgG) at least 1 ppm 163
29
MATERIALS AND METHODS
Materials
Almond seed samples (Table 7) were provided by ABC (Modesto, CA). Macadamia nut
seed samples were provided by Dr. Catherine G. Cavaletto of the University of Hawaii (Manoa,
HI).
Raw, unprocessed Nonpareil Supreme almond seeds (major commercial cultivar) and
commercially available macadamia nut seeds purchased in a retail store (Tallahassee, FL) were
used as the source of proteins for raising antibodies and as a control in all immunoassays. Whole
almond and macadamia nut seeds were flushed with nitrogen and stored in air-tight plastic
screw-top bottles at 4 °C to inhibit microbial spoilage and rancidity.
Sources of chemicals were as follows: Electrophoresis grade acrylamide was from
Polsciences, Inc., Warrington, PA. TEMED (N,N,N’N’-tetramethylenediamhe) and bis (N,N ‘-
methylene bis-acrylamide) were from Bio-Rad Laboratories, Richmond, CA. Cellulose
extraction thimbles (25 mm x 100 mm) and filter paper #4 were from Whatman International
Ltd., Maidstone, UK. Coomassie Brilliant Blue R (CBBR), glycerol, bovine serum albumin
(BSA), alkaline phosphatase (AP)-labeled goat anti-rabbit IgG and goat anti-mouse IgG,
horseradish perioxidase (HRP)-labeled goat anti-rabbit IgG and goat anti-mouse IgG, Ponceau S,
phosphatase substrate [p-nitrophenyl phosphate, disodium (PNPP)], methylene blue, methylene
red, luminol (97.0%), and standard low molecular weight marker kit [phosphorylase b (97.4
kDa), bovine serum albumin (66 kDa), ovalbumin (45 kDa), carbonic anhydrase (29 kDa),
soybean Kunitz trypsin inhibitor (20.1 kDa), �-lactalbumin (14.2 kDa), myoglobin backbone
polypeptide (16.95 kDa), rnyoglobin fragment I + II (14.4 kDa)] were from Sigma Chemical
Company, St. Louis, MO. Nitrocellulose membrane (NC, 0.2 �m) was purchased from
Schleicher and Schuell, Inc., Keene, NH. RIBI adjuvant system (RIBI ImmunoChem Research,
Inc., product code R-730) for rabbit immunization was purchased from Corixa Corporation,
Hamilton, MT. Microtiter ELISA plates (96-well, round bottom) was purchased from Costar,
Cambridge, MA. Tris [trisfiyroxymethyl aminomethane], glycine sulfate (99.0%), boric acid,
glycine, �-mercaptoethanol (�-ME), sodium hydroxide, sodium chloride, ethanol, methanol,
petroleum ether, Tween 20, lead acetate, formaldehyde, bromophenol blue, vanillin, sodium
thiosulfate, sodium azide, magnesium chloride, hydrogen peroxide (30%), SDS (sodium dodecyl
sulfate), acetic acid, sulfuric acid, hydrochloric acid, ammonium persulfate and all other

30
chemicals and supplies (reagent or better grade) were purchased from Fisher Chemical Co.,
Orlando, FL. Several specific chemical, reagent, and equipment sources are indicated along with
the methods.
Methods
Physical Seed Characteristics
Individual seed weight. All nut seeds (total 100 seeds) were weighed using a balance
(Mettler Toledo PB balance, 5-5,100 g range, 0.01 g sensitivity, Model Number PB5001,
Greifensee, Switzerland) and the mean of triplicate readings was calculated and analyzed for
total seed weight.
Seed dimensions. The length, width, and thickness of almond seed varieties and the
diameter of macadamia nut seed varieties (total of 10 from each sample set) were measured (in
mm) using a digital vernier caliper (Guogen®, 0-150 mm range, Shanghai, China) with 0.01 mm
sensitivity. The mean of the readings was calculated and analyzed for seed dimensions.
Preparation of Nut Seed Flours
All nut seeds were ground in an Osterizer blender (Galaxie Model Number 869-18R,
Jaden Consumer Solutions, Boca Raton, FL) with setting ‘grind’ until homogenous flour (~40
mesh) was obtained. The full fat flours were stored in airtight containers (under nitrogen) at -20
ºC until further use.
Chemical Composition
Moisture. (AOAC Official Method 925.40): A known weight of full fat nut seed flour
(~1 g) was placed in an aluminum pan and dried in a previously heated vacuum oven (95-100 ºC,
25 inch Hg) to a constant weight (199).
Lipid. (AOAC Official Method 948.22): Full fat nut seed flours (~10 g/ thimble) were
defatted in a Soxhlet apparatus using petroleum ether (boiling point range 39.0-53.8 ºC) as the
solvent (flour to solvent ratio of 1:10 w/v) for 6-8 h. Defatted flours were dried overnight (~10-
12 h) at room temperature (RT, ~25 °C) in a fume hood to remove petroleum ether and then
weighed to calculate lipid content (199).
Lipid content (%) = [Initial wt. of full fat flour (g) - final wt. of defatted flour (g)] x100
Initial wt. of full fat flour (g)

31
**Note: Defatted flours were powdered using either a mortar and pestle or Osterizer blender to
obtain homogenous flour sample (~40 mesh) and stored in plastic screw-capped bottles at 4 ºC
until further analysis.
Protein. (AOAC Official Method 950.48): A known weight of full fat nut seed flour
(~0.2-0.25 g) was placed in a micro-Kjeldahl flask. The catalyst [mixture of 0.42 g CuSO4 + 9.0
g K2 SO4], with a few glass beads (to prevent sample bumping), and 15 ml concentrated H2SO4
(36 N) was added to each sample. Sample digestion was done at 410 ºC for 45 min [or until clear
green solution was obtained which ensures complete oxidation of all organic matter]. The digest
was diluted with 50 ml of distilled, deionized water (DI water) and the micro-Kjeldahl flask was
attached to the distillation unit. After adding 45 ml of 15 N NaOH, sample distillation was done
to collect released ammonia into a boric acid solution (2% w/v) containing the indicators
methylene blue (0.0006% w/v) and methyl red (0.0013% w/v). Borate anion (proportional to the
amount of nitrogen) was titrated with standardized with 0.1 N H2SO4 (standardized using 0.1 N
Na2CO3 as primary standard). A reagent blank was run simultaneously with all sample sets.
Sample nitrogen content was calculated using the following formula:
% N = (ml H2SO4 for sample - ml of H2SO4 for blank) x Normality of H2SO4 x 1.4007 weight of sample (g)
Protein (%) = N (%) x 5.18 (almond seed) and 5.32 (macadamia nut seed) (199).
Amino Acid Composition.
Amino acid composition of defatted almond and macadamia nut seed flours was
determined using a Pico-Tag Column Amino Acid Analyzer (Waters Chromatograph Division,
Milford, MA). PITC (phenyl isothiocyanate, 99.9%) derivatization protocol and HPLC
conditions were the same for both hydrolyzed and free amino acid analysis (details stated
below).
Total amino acids. A known weight of defatted seed flour (~10 mg) was hydrolyzed in a
CEM microwave digestion system (CEM Corporation, Matthews, NC. Model # 920150) using
30 �l of 6 N HCl (constant boil, sequanal grade, Pierce, Rockford, IL) and sample was then
dried. To the dried sample, 125 µl of 10-2 norleucine (internal standard to calculate % recovery
for each amino acid.) was added and all amino acids were derivatized as described below under
‘PITC derivatization’ protocol. The derivatized sample was re-suspended in 1 ml of suspension
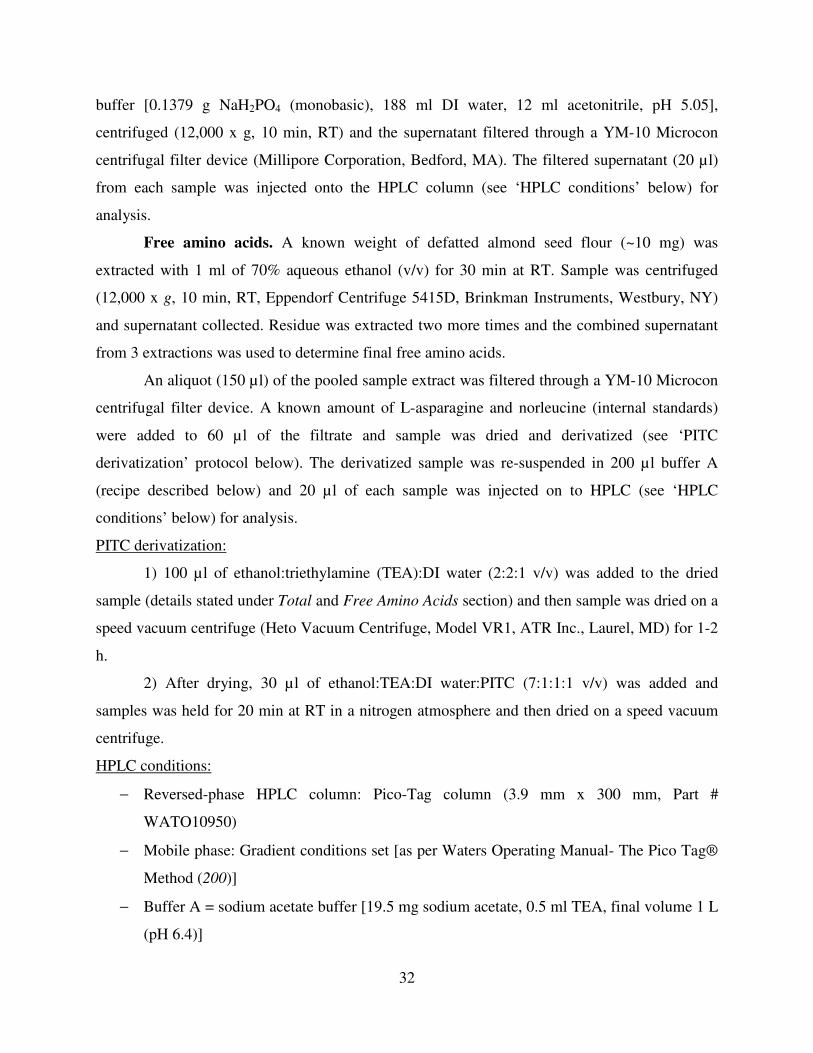
32
buffer [0.1379 g NaH2PO4 (monobasic), 188 ml DI water, 12 ml acetonitrile, pH 5.05],
centrifuged (12,000 x g, 10 min, RT) and the supernatant filtered through a YM-10 Microcon
centrifugal filter device (Millipore Corporation, Bedford, MA). The filtered supernatant (20 µl)
from each sample was injected onto the HPLC column (see ‘HPLC conditions’ below) for
analysis.
Free amino acids. A known weight of defatted almond seed flour (~10 mg) was
extracted with 1 ml of 70% aqueous ethanol (v/v) for 30 min at RT. Sample was centrifuged
(12,000 x g, 10 min, RT, Eppendorf Centrifuge 5415D, Brinkman Instruments, Westbury, NY)
and supernatant collected. Residue was extracted two more times and the combined supernatant
from 3 extractions was used to determine final free amino acids.
An aliquot (150 µl) of the pooled sample extract was filtered through a YM-10 Microcon
centrifugal filter device. A known amount of L-asparagine and norleucine (internal standards)
were added to 60 µl of the filtrate and sample was dried and derivatized (see ‘PITC
derivatization’ protocol below). The derivatized sample was re-suspended in 200 µl buffer A
(recipe described below) and 20 µl of each sample was injected on to HPLC (see ‘HPLC
conditions’ below) for analysis.
PITC derivatization:
1) 100 µl of ethanol:triethylamine (TEA):DI water (2:2:1 v/v) was added to the dried
sample (details stated under Total and Free Amino Acids section) and then sample was dried on a
speed vacuum centrifuge (Heto Vacuum Centrifuge, Model VR1, ATR Inc., Laurel, MD) for 1-2
h.
2) After drying, 30 µl of ethanol:TEA:DI water:PITC (7:1:1:1 v/v) was added and
samples was held for 20 min at RT in a nitrogen atmosphere and then dried on a speed vacuum
centrifuge.
HPLC conditions:
− Reversed-phase HPLC column: Pico-Tag column (3.9 mm x 300 mm, Part #
WATO10950)
− Mobile phase: Gradient conditions set [as per Waters Operating Manual- The Pico Tag®
Method (200)]
− Buffer A = sodium acetate buffer [19.5 mg sodium acetate, 0.5 ml TEA, final volume 1 L
(pH 6.4)]

33
− Buffer B = 60% acetonitrile and 40% water (v/v)
− Flow rate: 1 ml/min
− Temperature: 38 °C
Tryptophan content was determined by the colorimetric method (No. 3) of Spies and
Chambers (201). Total amino acid composition is reported as g of amino acid per 100 g of
protein and free amino acid composition as mg of amino acid per 100 g edible portion.
Ash. (AOAC Official Method 923.03): Full fat nut seed flour (~0.1 g) was accurately
weighed in a ceramic crucible (previously heated and cooled till constant weight was obtained)
and heated in a muffle furnace maintained at 550 ºC till a constant weight was obtained (199).
Total soluble sugars. Soluble sugars were analyzed by the method of Dubois et al. (202).
A known weight of the defatted nut seed flour (~0.1 g) was extracted with 1 ml DI water
containing 1 mM NaN3 for 1 hr at RT, centrifuged (16,100 x g, 10 min, RT) and the supernatant
collected. To one hundred �l of the supernatant, 100 �l of DI water followed by 200 �l of lead
acetate (20% w/v) was added and vortexed to thoroughly mix the contents. To this mixture 200
�l Na2SO4 (20% w/v) was added, vortexed and then centrifuged (16,100 x g, 10 min, RT). The
supernatant was diluted (10-fold for almond seeds and 100-fold for macadamia nut seeds) prior
to sugar analysis. Forty �l of the diluted supernatant was made to 400 �l with DI water and 10 �l
of 80% w/v phenol and 1 ml concentrated H2SO4 were added. Sample was vortexed to
thoroughly mix the contents and cooled to RT prior to reading the absorbance. Absorbance was
read at 490 nm. A glucose standard curve (0-70 �g glucose) was prepared simultaneously. Total
soluble sugars are expressed as glucose equivalents.
Tannins. Tannin analysis of all nut seeds were done using vanillin assay as described by
Deshpande and Cheryan (203) with some modifications. Full fat nut seed flour (0.1 g) was
extracted with 1.5 ml of 1% v/v HCl in absolute methanol and vortexed continuously at RT for 1
h and then centrifuged (16,100 x g, 10 min, RT). An aliquot of the supernatant was immediately
analyzed for tannins using the 2% vanillin assay. To 100 µl of supernatant, 100 µl of acidified
methanol was added and then color developed by addition of 1.0 ml vanillin reagent (2% vanillin
in acetified methanol). Color was read after desired incubation time at 500 nm. Sample readings
were corrected for background color due to the sample or solvent by taking appropriate blanks
(solvent blank: vanillin reagent, sample blank: acidified methanol). A catechin standard curve (0
to 1 mg/ml) was prepared simultaneously. Tannin content is expressed as catechin equivalents.

34
Soluble Protein Preparation and Estimation
Defatted flours were extracted (1:10 v/v) with borate saline buffer (BSB, 0.1 M H3BO3,
0.025 M Na2B4O7, 0.075 M NaCl, pH 8.45) for 1 h at RT and then samples were centrifuged (15
min at 16,000 x g, RT) and the supernatants collected. Estimation of soluble protein content of
the supernatants was determined by the protein determination assays of Lowry et al. (204) and
Bradford (205). Standard curves were simultaneously prepared in respective buffers using BSA
as the standard protein (0-200 µg range for Lowry and 0-6 �g range for Bradford). The Bradford
assay was modified to a microtiter plate assay as described by Bio-Rad Protein Assay (Bio-Rad
Laboratories, Hercules, CA).
SDS-PAGE (Sodium Dodecyl Sulfate Polyacrylamide Gel Electrophoresis)
SDS-PAGE was done by the method of Fling and Gregerson (206) and Hoefer (207) as
described by Sathe (69). Typically, samples were electrophoresed on an 8-25% linear monomer
acrylamide gradient separating gel (14.5 cm x 16.5 cm x 1.5 mm) and 4% stacking gel (1.0 cm x
16.5 cm x 1.5 mm). The linear acrylamide gradient of the separating gel was prepared by mixing
8% and 25% acrylamide solutions (15 ml each) using a gradient maker (Hoefer SG100, Hoefer
Scientific Instruments, San Francisco, CA) and a peristaltic pump (Model 7014.20, 6-600 RPM,
Cole-Parmer Instruments Co., Chicago, IL).
Proteins were mixed with suitable volumes of SDS-PAGE sample buffer (0.05 M Tris-
HCl, pH 6.8; 1% (w/v) SDS; 0.01% (w/v) bromophenol blue as the tracking dye; and 30% (v/v)
glycerol) containing 2% (v/v) β-ME (for reducing gels when required) and heated for 10 min in a
boiling water bath (95-100 °C). Suitable aliquots of protein samples were loaded on the gels.
Standard low molecular weight (MW) marker kit (vial content reconstituted in 300 µl and 10 µl
were used, name and kDa of specific proteins are listed under ‘Materials’) were included in each
gel run. All gels were run at a constant current for each application (15-20 mA/gel) until the
tracking dye reached the gel edge. Gels were cooled by running cold tap water (~15 ºC) during
the gel run. All gels were stained with Coomassie Brilliant Blue R (CBBR) unless otherwise
indicated. Typically, gels were stained in 50% (v/v) methanol containing 10% (v/v) acetic acid
and 0.25% (w/v) CBBR overnight. Gels were then destained with 50% (v/v) methanol containing
10% (v/v) acetic acid for 4 h followed by 25% (v/v) methanol containing 5% (v/v) acetic acid
until blue background was removed. Glycoprotein staining was done on SDS-PAGE gels using

35
the Gelcode Glycoprotein staining (Pierce Chemical Co., Rockford, IL) procedure as per the
manufacturer’s instructions with suitable modifications.
Polyclonal Antibody Production and Characterization
Rabbit anti-almond seed and anti-AMP was produced and characterized previously as
described by Acosta et al. (140) and Sathe et al. (49). Rabbit anti-total soluble macadamia nut
seed proteins pAb production was done as per the recommendations of Animal Care and Use
Committee, Florida State University (FSU, Approved Protocol #0207) and is described by
Acosta et al. (140). Five hundred �l of a 1 mg/ml stock solution of total soluble macadamia nut
seed proteins extracted with BSB (pH 8.45) was mixed with 500 �l of RIBI adjuvant
(reconstituted in 0.9% w/v saline per the recommendation of the manufacturer). The final
mixture (1 ml dose, 500 �g total macadamia nut seed proteins) was administered in a white New
Zealand rabbit (as per the recommendation of the manufacturer), 100 �l intradermal at 6 sites,
300 �l intramuscular into the hind leg, and 100 �l subcutaneous into the loose skin around the
neck and shoulder region. Following the primary immunization, 5 booster doses (in RIBI
adjuvant as described for primary immunization) were administered at 4-week intervals. Pre- and
post-immunization blood samples were drawn from the marginal ear vein of the immunized
rabbit and collected in glass tubes. Blood was allowed to clot overnight at 4 °C and clear serum
collected. ELISA (direct binding format) and Western blots were used to determine the pAb
serum titer and to assess the specific reactivity of the pAb with macadamia nut seed proteins.
Serum aliquots for immediate use were stored at 4 °C and at -20 °C for long-term storage.
Monoclonal Antibody 4C10 Production and Characterization
Mouse mAb 4C10 was raised previously using standard techniques (208) in the core
Hybridoma Facility at FSU as described by Sathe et al. (49). Briefly, pairs of mice were each
immunized with 40 �g of AMP (column purified) in RIBI adjuvant (RIBI ImmunoChem
Research, Inc., Hamilton, MT) equally split between intravenous and subcutaneous routes. After
the primary immunization, mice were boosted with 20 �g of AMP (in RIBI adjuvant as described
for primary immunization) at 3 week intervals and given a final injection of 25 �g of AMP in
saline (0.9% w/v). Following fusion, the resultant hybridomas were screened and assayed for
relative strength (titer) and specificity to AMP by noncompetitive ELISA (207) and Western
blotting. Serum aliquots for immediate use were stored at 4 °C and at -20 °C for long-term
storage.

36
Protein G Purification of Rabbit anti-Macadamia Nut Protein IgG
A modified protocol previously standardized for purification of rabbit and goat anti-
cashew sera was followed (143). Briefly, IgG (2.5 ml of original, undiluted rabbit serum) was
bound to and eluted from a protein G affinity column (Protein G Sepharose® 4B fast flow resin,
Sigma, St. Louis, MO, Product # P-3296) using 0.2 M glycine sulfate (pH 2.3) as the elution
buffer. The eluate was immediately neutralized with 1.0 M TRIS (pH 9.0). The purified IgG was
dialyzed against coupling buffer (0.1 M NaHCO3 and 0.5 M NaCl, pH 8.5) to remove any
amines present in the buffers. The purified IgG fraction was concentrated (~5-fold) using a YM-
10 Microcon ® centrifugal filter unit (Millipore Corp., Billerica, MA) to a total volume of 478
�l. Bradford protein determination assay estimated 2.23 mg protein/ml in the purified IgG
fraction.
Competitive Inhibition pAb-based Enzyme Linked Immuno-Sorbent Assay (ELISA)
Development
Almond Protein Detection. Competitive inhibition pAb-based ELISAs (rabbit anti-AMP
and anti-soluble almond seed proteins) were previously standardized and described by Acosta et
al. (140), Sathe et al. (49), Roux et al. (139) and Venkatachalam et al. (196) with a few
modifications. The summarized conditions of the two standardized assays are as follows:
Coating 500 ng/well of either AMP or almond seed proteins in ELISA coating buffer (citrate/phosphate, pH 5.0)
Blocking 200 �l/well of blocking solution; 5% w/v of non-fat dry milk (NFDM) in Tris-buffered saline (TBS-T; 10 mM Tris, 0.9% w/v NaCl, 0.05% v/v Tween 20, pH 7.2]
Dilution of Primary (1°) Ab
Rabbit anti-AMP pAbs (50.5 mg protein/ml) and anti-almond seed protein pAbs (41.9 mg protein/ml) diluted 1:100,000 v/v in 1% w/v NFDM in TBS-T
Inhibitory Antigen Concentrations
10-fold antigen titration beginning with 100,000 ng/ml
Dilution of Secondary (2°) Ab
AP-labeled goat anti-rabbit IgG diluted 1:5,000 v/v in 1% w/v NFDM in TBS-T
Macadamia Nut Protein Detection. Competitive inhibition pAb-based ELISA was
performed to standardize a macadamia nut seed protein inhibition curve as described by Acosta
et al. (140). Direct binding ELISA using checkerboard titration format was used for optimization

37
(210) by evaluating the signal strength. Macadamia nut seed proteins extracted in BSB were
coated at different concentrations using several coating buffers, citrate/phosphate (pH 5.0), PBS
(pH 7.2), BSB (pH 8.45), and carbonate buffer (pH 9.8) to assess the optimum coating
concentration and buffer. Optimization of Protein G purified rabbit anti-macadamia nut protein
IgG was done by evaluating the IC50 values of several purified IgG dilutions (1:102 to 1:106, 2.23
mg protein/ml in purified IgG fraction). The optimized competitive inhibition ELISA protocol is
as follows:
Microtiter plates (96-well, round bottom, Costar® 2797, Corning Incorporated, Corning,
NY) were coated with 125 ng/well of soluble macadamia nut proteins diluted in PBS. Plates
were incubated (1 h, 37 °C), washed (3X with TBS-T), then patted dry on paper towels. Two
hundred �l of blocking solution per well (5% w/v NFDM in TBS-T) was added and plates were
again incubated (1 h, 37 °C). Blocking solution was removed, plates were patted dry with paper
towels, covered with Parafilm (American National Can™, Neenah, WI) and stored frozen (-20
°C) until further use. Eighty �l/well of diluted Protein G purified rabbit anti-macadamia nut
protein IgG (1:25,000 v/v in 1% w/v NFDM, approximately 7.14 ng/well) was added to separate
uncoated microtiter plates. To the top row, 20 �l of a standard protein solution (0.5 mg/ml of
macadamia total protein) or an inhibitory test protein solution was added and serially diluted 10-
fold in successive wells and discarded before last row (positive control, only pAb). Plates were
incubated, washed, and dried as described above. Fifty �l of solution from the inhibitor plate was
then transferred to the appropriate wells of a previously washed and dried coated plate. Plates
were incubated, washed, and dried as stated above. Fifty �l/well of diluted AP-labeled goat anti-
rabbit IgG (2° Ab, 1:5,000 v/v in 1% NFDM w/v in TBS-T) was added and the plates were
incubated, washed, and dried as stated above. Color was developed by the addition of 50 �l/well
of phosphatase substrate [one (p-nitrophenyl phosphate PNPP) tablet dissolved in 5 ml of
alkaline phosphatase substrate buffer (0.0049% w/v MgCl2, 0.096% v/v diethanolamine in DI
water with pH adjusted to 9.8 with 3 M HCl)]. Plates were incubated at RT (in the dark) for 17-
20 min then color development was stopped by adding 50 �l of 3.0 M NaOH per well. Plates
were read at 405 nm using a Bio-Tek ELISA reader (Model Power Wave 200, Biotek
Instruments, Inc., Winooski, VT).

38
Sandwich mAb-based ELISA Development for AMP Detection
A sandwich ELISA was developed to standardize an AMP standard curve. The
optimization of pAb coating dilution was done by coating several dilutions of rabbit anti-total
soluble almond seed protein pAb [1:50 to 1:100,000 v/v of original, unpurified sera, (41.9 mg
protein/ml)] on a microtiter plate with ELISA coating buffer, (citrate/phosphate, pH 5.0) and
using the direct binding ELISA checkerboard titration format (210) to determine optimum pAb
coating dilution by evaluating the signal strength. Optimization of almond seed protein
concentration and titration fold were done by evaluating the standard curve of different standard
almond seed protein solutions (10 �g/ml to 100 �g/ml) titrated at different folds (2- to 10-fold)
using the direct binding ELISA format. Finally, optimization of mAb 4C10 (unpurified
supernatant, 10.3 mg protein/ml) was done by evaluating the signal strength of several Ab
dilutions with fixed coating and almond seed protein titration concentrations. The standardized
procedure for the AMP sandwich ELISA is as follows:
Coating
50 �l/well of 1:5,000 v/v diluted unpurified rabbit anti-total almond seed protein pAbs (41.9 mg protein/ml) in ELISA coating buffer (citrate/phosphate, pH 5.0). Plates were incubated, washed, and dried as stated above.
Blocking 200 �l/well of blocking solution (5% w/v NFDM in TBS-T). Plates were incubated, washed, and dried as stated above.
Incubation of Ag
80 �l/well (except top row which contains 98 �l/well) of 1% w/v NFDM in TBS-T. To the top row, 2.5 �l of a 1.0 mg/ml AMP (control) or inhibitory test protein solution was added and serially diluted 5-fold in successive wells and discarded before the last row (positive control, no antigen). Protein titration concentration were 25,000, 5,000, 1,000, 200, 40, 8, and 1.6 ng/ml. Plates were incubated, washed, and dried as stated above.
Incubation of 1°Ab
50 �l/well of mAb 4C10 supernatant (10.3 mg protein/ml) diluted 1:500 v/v in 1% w/v NFDM in TBS-T. Plates were incubated, washed, and dried as stated above.
Incubation of 2°Ab
50 �l/well of AP-labeled goat anti-mouse IgG diluted 1:5,000 v/v in 1% w/v NFDM in TBS-T. Plates were incubated, washed, and dried as stated above.
Color development and ELISA analysis are described under ‘Macadamia Nut Protein
Detection’.
Western Blot Analysis
Western blotting was done as described by Acosta et al. (140). Proteins from SDS-PAGE
gels were transferred onto NC membrane as described by Towbin et al. (211). Transferred
proteins were stained with 0.1% w/v Ponceau S in DI water to ensure proper transfer. Stained
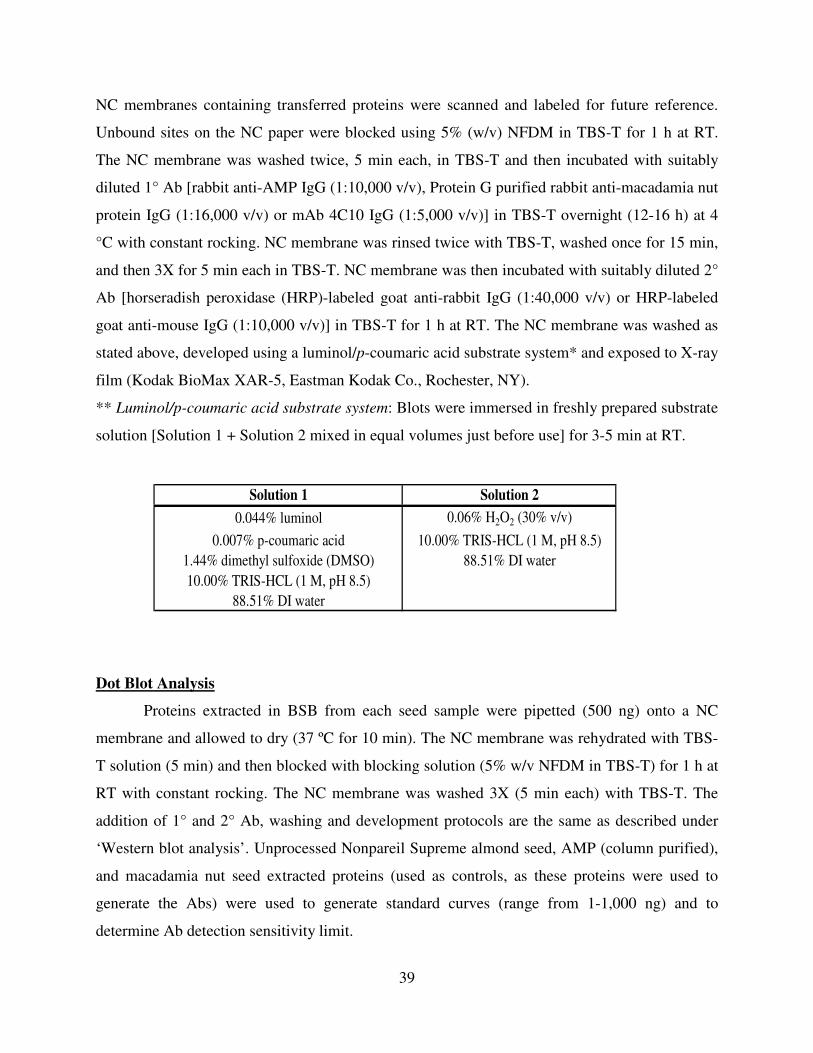
39
Solution 1 Solution 2
0.044% luminol 0.06% H2O2 (30% v/v)
0.007% p-coumaric acid 10.00% TRIS-HCL (1 M, pH 8.5)1.44% dimethyl sulfoxide (DMSO) 88.51% DI water10.00% TRIS-HCL (1 M, pH 8.5)
88.51% DI water
NC membranes containing transferred proteins were scanned and labeled for future reference.
Unbound sites on the NC paper were blocked using 5% (w/v) NFDM in TBS-T for 1 h at RT.
The NC membrane was washed twice, 5 min each, in TBS-T and then incubated with suitably
diluted 1° Ab [rabbit anti-AMP IgG (1:10,000 v/v), Protein G purified rabbit anti-macadamia nut
protein IgG (1:16,000 v/v) or mAb 4C10 IgG (1:5,000 v/v)] in TBS-T overnight (12-16 h) at 4
°C with constant rocking. NC membrane was rinsed twice with TBS-T, washed once for 15 min,
and then 3X for 5 min each in TBS-T. NC membrane was then incubated with suitably diluted 2°
Ab [horseradish peroxidase (HRP)-labeled goat anti-rabbit IgG (1:40,000 v/v) or HRP-labeled
goat anti-mouse IgG (1:10,000 v/v)] in TBS-T for 1 h at RT. The NC membrane was washed as
stated above, developed using a luminol/p-coumaric acid substrate system* and exposed to X-ray
film (Kodak BioMax XAR-5, Eastman Kodak Co., Rochester, NY).
** Luminol/p-coumaric acid substrate system: Blots were immersed in freshly prepared substrate
solution [Solution 1 + Solution 2 mixed in equal volumes just before use] for 3-5 min at RT.
Dot Blot Analysis
Proteins extracted in BSB from each seed sample were pipetted (500 ng) onto a NC
membrane and allowed to dry (37 ºC for 10 min). The NC membrane was rehydrated with TBS-
T solution (5 min) and then blocked with blocking solution (5% w/v NFDM in TBS-T) for 1 h at
RT with constant rocking. The NC membrane was washed 3X (5 min each) with TBS-T. The
addition of 1° and 2° Ab, washing and development protocols are the same as described under
‘Western blot analysis’. Unprocessed Nonpareil Supreme almond seed, AMP (column purified),
and macadamia nut seed extracted proteins (used as controls, as these proteins were used to
generate the Abs) were used to generate standard curves (range from 1-1,000 ng) and to
determine Ab detection sensitivity limit.
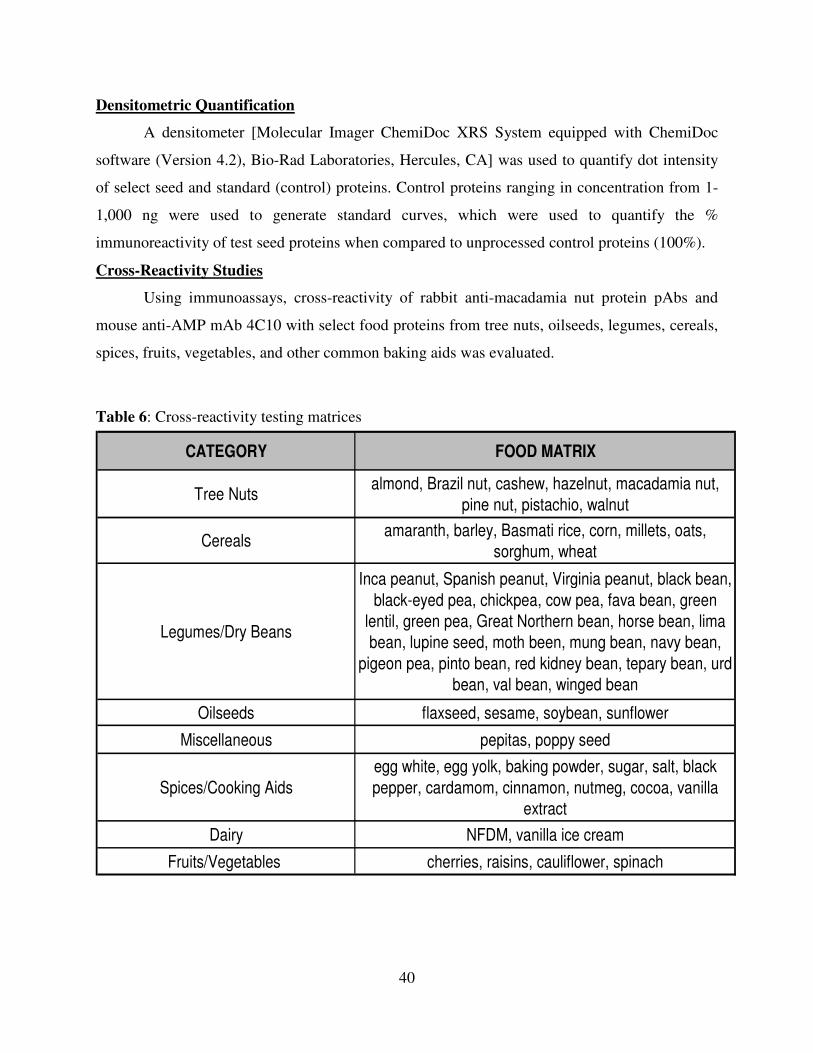
40
CATEGORY FOOD MATRIX
Tree Nutsalmond, Brazil nut, cashew, hazelnut, macadamia nut,
pine nut, pistachio, walnut
Cerealsamaranth, barley, Basmati rice, corn, millets, oats,
sorghum, wheat
Legumes/Dry Beans
Inca peanut, Spanish peanut, Virginia peanut, black bean,
black-eyed pea, chickpea, cow pea, fava bean, green
lentil, green pea, Great Northern bean, horse bean, lima
bean, lupine seed, moth been, mung bean, navy bean,
pigeon pea, pinto bean, red kidney bean, tepary bean, urd
bean, val bean, winged bean
Oilseeds flaxseed, sesame, soybean, sunflower
Miscellaneous pepitas, poppy seed
Spices/Cooking Aids
egg white, egg yolk, baking powder, sugar, salt, black
pepper, cardamom, cinnamon, nutmeg, cocoa, vanilla
extract
Dairy NFDM, vanilla ice cream
Fruits/Vegetables cherries, raisins, cauliflower, spinach
Densitometric Quantification
A densitometer [Molecular Imager ChemiDoc XRS System equipped with ChemiDoc
software (Version 4.2), Bio-Rad Laboratories, Hercules, CA] was used to quantify dot intensity
of select seed and standard (control) proteins. Control proteins ranging in concentration from 1-
1,000 ng were used to generate standard curves, which were used to quantify the %
immunoreactivity of test seed proteins when compared to unprocessed control proteins (100%).
Cross-Reactivity Studies
Using immunoassays, cross-reactivity of rabbit anti-macadamia nut protein pAbs and
mouse anti-AMP mAb 4C10 with select food proteins from tree nuts, oilseeds, legumes, cereals,
spices, fruits, vegetables, and other common baking aids was evaluated.
Table 6: Cross-reactivity testing matrices

41
All food samples were defatted as described under the ‘Lipid’ section (Chemical
Composition), with the exception of spices and common baking aids which contain a trivial
amount of fat and vanilla ice cream which was first lyophilized and then defatted. Proteins were
extracted from defatted flours using BSB (1:10 w/v), analyzed for soluble proteins using
Bradford protein determination assay (205), and evaluated for cross-reactivity using the
immunoassays (ELISA, Western and Dot blotting).
Thermal Processing of Almond and Macadamia Nut Seeds
Whole unprocessed nut seeds (~5 g) were subjected to thermal processing methods as
described by Venkatachalam et al. (196) with some modifications. The treatments used and the
preparation details are:
1. Autoclaving at 121 °C, 15 psi for 5 and 30 min each for almond seeds and 5, 10, 20, and
30 min each for macadamia nut seeds. Samples were placed in an aluminum dish and
autoclaved (Consolidated Stills and Sterilizers, Boston, MA). Following completion of
the autoclave treatment, samples were removed, cooled to RT and air-dried at RT in a
fume hood until constant weight was achieved.
2. Blanching in boiling water (95-100 °C) for 3 and 10 min each for almond seeds and 1, 4,
7, and 10 min each for macadamia nut seeds. The ratio of nut seed to water was 1:10 w/v.
After moist heat treatment, samples were patted dry with paper towels and air-dried at RT
in a fume hood until constant weight was achieved.
3. Dry Roasting at 140 °C for 30 min, 160 °C for 30 min, 168 °C for 12 min, and 177 °C
for 12 min for almond seeds and at 140 °C for 20 and 30 min each, 170 °C for 15 and 20
min each, and 200 °C for 10 and 15 min each for macadamia nut seeds. Sample were
placed in an aluminum dish and subjected to roasting in an oven (Thermolyne
Corporation, Dubuque, IA).
4. Frying in vegetable oil (191 °C) for 1 and 2 min each for almond seeds only. The ratio of
nut seed to oil was 1:10 w/v. After frying, samples were patted dry with paper towels and
air-dried at RT in a fume hood until constant weight was achieved.
5. Microwave Heating at 50% power (500 Watts) for 1 and 3 min each for almond seeds
and at 50% power (500 Watts) for 1 and 2 min each, and at 100% power (1000 Watts) for

42
1 and 2 min each for macadamia nut seed in a Panasonic microwave oven (Panasonic
Company, Secaucus, NJ)
Unprocessed almond and macadamia nut seed samples were used as controls. All samples,
processed and unprocessed, were stored at 4 °C in air-tight plastic bottles until further use.
pH Treatments
Defatted almond and macadamia nut seed flours were dispersed in DI water (flour-to-
water ratio of 1:10 w/v), pH was adjusted to the desired value (pH 1, 3, 5, 7, 9, 11, and 13) with
1.0 M HCl and/or NaOH and magnetically stirred for 3 h at RT. Flour slurries (either analyzed
directly or neutralized to pH 7.0) were centrifuged (16,100 x g, RT, 20 min), and the
supernatants were collected and stored in air tight containers until further use.
Spiking Analysis
Almond and macadamia nut-spiked food samples were made by mixing appropriate
ratios of either defatted nut seed flour or nut seed proteins extracted (in BSB) with selected food.
The spiking levels were 100, 10, and 1 ppm (parts per million). The selected food matrices for
the sandwich mAb 4C10-based ELISA were Hershey’s dark chocolate, Nestle white chocolate,
Hershey’s milk chocolate, sweetened coconut, Green Giant frozen green beans with or without
slivered almonds, Honey Bunches of Oats with or without slivered almonds, Almond Joy candy
bar, Mounds candy bar, Planter’s trail mix (containing peanuts, raisins, banana chips, cashews,
pineapple, cranberries, and papaya), vanilla extract, almond extract, vanilla ice cream, almond
praline ice cream, all-purpose wheat flour, salt and sugar. The selected food matrices for the
inhibition pAb anti-macadamia nut based ELISA were Hershey’s dark chocolate, Nestle white
chocolate, Hershey’s milk chocolate, Godiva Milk Chocolate bar with coconut and macadamia
nuts, sweetened coconut, Pepperidge Farms chocolate chip cookie with or without macadamia
nuts, Planter’s trail mix, all-purpose wheat flour, vanilla ice cream, vanilla extract, salt, and
sugar.
Data Analysis and Statistical Procedures
Statistical analyses were done using one-way ANOVA procedures provided by SPSS
statistical software (SPSS for Windows 2006, Microsoft Corporation, Version 15.0, Chicago, IL)
and Fisher’s Least Significant Difference (LSD, p � 0.05) as described by Ott (212). All
experiments were performed at least in duplicate and data expressed as mean ± SEM. When
necessary, data plots and regression analysis were done using Microsoft Office Excel (Windows

43
Vista, 2007). For correlation analyses between sample sets, Pearson’s correlation coefficient (r
value) and p-value (two-tailed) were calculated. Almond cultivars, Carmel and Nonpareil, from
the 12 California counties were analyzed to assess the effect of growth location on seed physical
characteristics, chemical composition and protein antigenicity. Similarly, to assess the effect of
harvest year only certain cultivars from the same California counties were included.

44
1 California County Cultivar (# of accessions per cultivar in parenthesis) Total # of samples
Butte Butte (1), Carmel (1), Mission (1), Nonpareil (1), Padre (1), Price (1) 6
Colusa Carmel (1), Mission (1), Nonpareil (1) 3
Fresno Butte (3), Carmel (3), Mission (1), Nonpareil (2), Padre (1), Price (1) 11
Glenn Carmel (1), Mission (1), Nonpareil (1) 3
Kern Butte (2), Carmel (1), Mission (1), Nonpareil (1), Padre (1), Price (1) 7
Madera Butte (1), Carmel (1), Nonpareil (1) 3
Merced Butte (1), Carmel (1), Mission (1), Nonpareil (1), Padre (1), Price (1) 6
Sacramento Butte (1), Carmel (3), Nonpareil (3) 7
San Joaquin Butte (1), Carmel (2), Mission (1), Nonpareil (1), Padre (1), Price (1) 7
Stanislaus Butte (1), Carmel (1), Mission (2), Monterey (1), Nonpareil (3), Padre (1), Price (1), Sonora (1) 11
Tulare Butte (1), Carmel (1), Nonpareil (1), Padre (1), Price (1) 5
Yolo Butte (1), Carmel (1), Mission (1), Nonpareil (2) 5
Total 74
Table 7. Almond cultivar and history of origin

45
2
Figure 1. Location of almond seed samples included in the current investigation.

46
3
Table 8. Average climatic conditions in select California counties during the 2003/2004 and 2005/2006 almond seasona
Annual
PRCP (in)
Tmax
(°F)Tmin
(°F)PRCP
(in)Tmax
(°F)Tmin
(°F)PRCP
(in)Tmax
(°F)Tmin
(°F)PRCP
(in)Tmax
(°F)Tmin
(°F)PRCP
(in)
NORTH VALLEY
Butte 14.7 57.0 39.1 6.6 72.9 47.9 0.0 89.4 59.7 3.9 74.4 46.9 25.3Colusa 13.7 56.8 39.5 5.0 72.8 47.3 0.0 92.9 58.9 3.0 75.6 48.3 21.7Glenn 11.8 56.8 38.8 9.8 73.9 49.8 0.1 90.2 59.0 2.9 74.4 48.1 24.5
Sacramento 14.1 57.9 41.3 6.0 72.8 48.2 0.0 91.2 59.4 3.9 74.8 49.7 24.1Yolo 14.2 57.0 40.5 5.1 73.3 48.6 0.1 92.0 58.3 3.6 75.1 49.6 23.0
Average 13.7 57.1 39.8 6.5 73.1 48.4 0.0 91.1 59.0 3.4 74.9 48.5 23.7
SOUTH VALLEY
Fresno 5.4 58.1 37.9 3.7 74.7 47.5 0.0 93.5 61.4 1.8 75.8 48.1 10.9Kern 2.8 61.6 41.5 2.4 77.2 52.4 0.0 95.7 68.9 1.0 76.7 53.2 6.2
Madera 6.0 57.4 39.3 3.9 74.4 47.9 0.0 94.4 62.6 3.0 74.2 48.7 12.9Merced 7.6 58.9 40.0 4.6 76.7 47.9 0.0 95.9 61.4 3.2 77.2 47.7 15.4
San Joaquin 8.2 58.3 39.9 4.6 72.8 46.8 0.1 88.3 57.2 1.7 73.9 47.0 14.7Stanislaus 7.1 58.5 39.7 3.3 77.0 48.6 0.0 95.2 61.1 2.1 76.9 49.4 12.5
Tulare 5.6 59.5 38.6 5.6 76.8 49.6 0.0 95.5 63.6 1.5 76.9 49.4 12.7Average 6.1 58.9 39.6 4.0 75.6 48.7 0.0 94.1 62.3 2.0 75.9 49.1 12.2
Winter Spring Summer Fall
California Counties
aPRCP = precipitation, Tmax = maximum temperature, and Tmin = minimum temperature. Seasons: Winter [December (2003 and 2005), January (2004 and 2006), and February (2004 and 2006)], Spring [March, April, and May (2004 and 2006)], Summer [June, July, and August (2004 and 2006)], and Fall [September, October, and November (2004 and 2006)]. Daily weather measurements recorded by the California Irrigation Management Information System (CIMIS) and the National Climatic Data Center (NCDC) of the National Oceanic and Atmospheric Administration (NOAA) were used to calculate county averages. California county weather stations: CIMIS #12 for Butte, CIMIS #32 for Colusa, CIMIS #61 for Glenn, CIMIS #131 for Sacramento, NCDC #9781 and CIMIS #6 for Yolo, CIMIS #2 and #80 for Fresno, NCDC #0442 for Kern, NCDC #5233 for Madera, NCDC #5532 for Merced, CIMIS #70 for San Joaquin, NCDC #6168 and #5738 for Stanislaus, and NCDC #4957 and #9367 for Tulare.
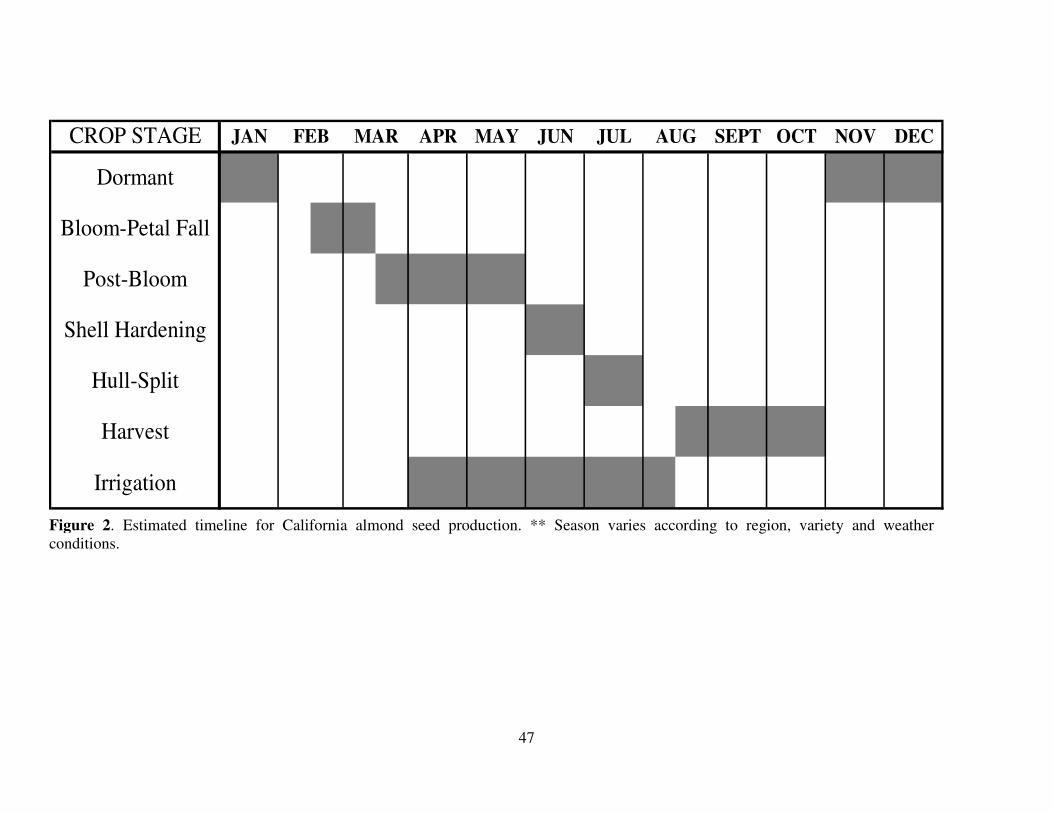
47
4
Figure 2. Estimated timeline for California almond seed production. ** Season varies according to region, variety and weather conditions.
CROP STAGE JAN APR MAY JUN JUL SEPT OCT NOV DECFEB MAR AUG
Irrigation
Dormant
Bloom-Petal Fall
Post-Bloom
Shell Hardening
Hull-Split
Harvest
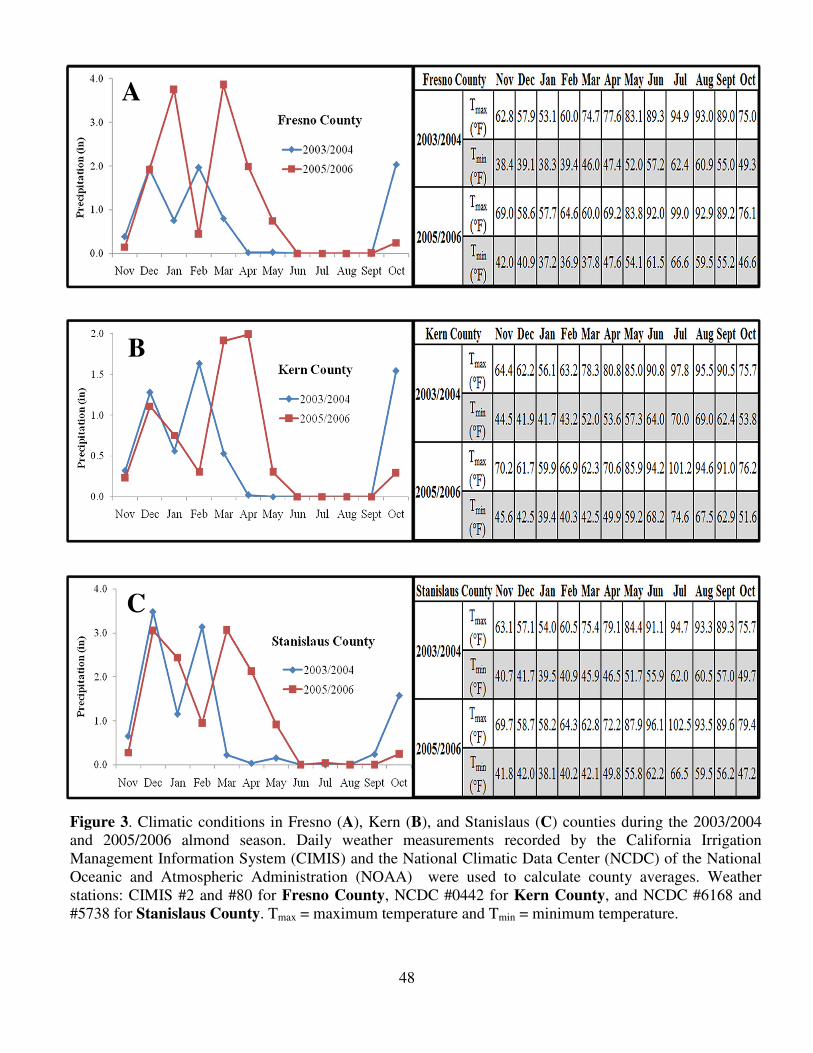
48
Figure 3. Climatic conditions in Fresno (A), Kern (B), and Stanislaus (C) counties during the 2003/2004 and 2005/2006 almond season. Daily weather measurements recorded by the California Irrigation Management Information System (CIMIS) and the National Climatic Data Center (NCDC) of the National Oceanic and Atmospheric Administration (NOAA) were used to calculate county averages. Weather stations: CIMIS #2 and #80 for Fresno County, NCDC #0442 for Kern County, and NCDC #6168 and #5738 for Stanislaus County. Tmax = maximum temperature and Tmin = minimum temperature.
A
B
C

49
RESULTS AND DISCUSSION
Environmental Conditions
California’s Central Valley extends roughly 400 miles (Figure 1, area stretching from
Shasta County to Kern County) and is one of the most productive agricultural regions in the
world. The Central Valley’s northern region (also known as the Sacramento Valley or North
Valley) encompasses 10 counties and the southern region (also known as the San Joaquin Valley
or South Valley) encompasses 8 counties. The almond seed samples analyzed in the current
investigation were produced in both the North Valley (Butte, Glenn, Colusa, Yolo, and
Sacramento counties) and South Valley (San Joaquin, Stanislaus, Merced, Madera, Fresno,
Tulare, and Kern counties) (Figure 1 and Table 7). Climatic conditions in California vary greatly
from region to region and from year to year. In general, northern California has lower
temperatures and greater precipitation than southern California. Annual precipitation during the
2003/2004 and 2005/2006 almond season varied greatly, with precipitation in the North Valley
almost double the amount received in the South Valley (Table 8). Drought is rarely a problem as
majority of California almond seeds are produced in orchards with irrigated soil. Majority of
precipitation in California typically occurs from late September through April. Almond trees are
dormant from November through January, but begin to bloom in February (Figure 2). Flowers
begin to lose their petals in March and the post-bloom period (April through May) is when
almond seeds grow and develop. By June almond shells hardens and in July the hull (a grayish-
green coat surrounding the shell) splits open and depending on the region almond harvest occurs
in mid-August through October (Figure 2).
Physical Seed Characteristics
Individual seed weight. The tested almond and macadamia nut seeds had individual seed
weights of 0.78-1.44 g and 2.41-3.36 g, respectively (Tables 9-11). Results found in the current
investigation compare favorably with several published studies reporting ranges of 0.45-2.64 g
for almond (59-69) and 2.3-3.3 g for macadamia nut seeds (54, 70). Seed weight varied
significantly by cultivar with almond cultivars Monterey (1.41 g) and Sonora (1.43 g) and the
two commercial macadamia nut varieties [Blue Diamond (3.16 g) and Trader Joe’s (3.36 g)]
weighing more than all other tested cultivars (Tables 9 and 11). Seed weight variation by cultivar
is reported for almonds (59-63, 65, 67-69), hazelnuts (213, 214), macadamia nuts (54), sunflower
seeds (215) and walnuts (216). Almond seeds from the North and South Valley did not differ in

50
weight; however seed weight did vary by county and by cultivar x county interaction (Tables 9
and 10). Generally classified as medium-small seeds (25-30 nuts/oz), cultivars Butte, Mission,
and Padre grown in Stanislaus County were above average size (medium size, 20-25 nuts/oz).
However, cultivar Carmel (medium size) and Price (medium-small size) grown in Stanislaus
County were below average size. Similarly, Merced County grown cultivars Carmel, Butte, and
Padre were above average size, while cultivar Mission was below average. Influence of
geographic location on seed weight is reported in macadamia nut (70), pistachio (217), and
soybean (218). Harvest year did not significantly influence individual seed weight of tested
almond samples.
Seed dimensions. Almond seed samples ranged from 18.3-27.8 mm in length, 9.8-13.8
mm in width, and 6.9-10.2 mm in thickness and macadamia nut seeds ranged from 18.7-20.1 mm
in diameter and 14.4-15.9 mm in thickness (Tables 9-11). Results of the current investigation are
consistent with reported ranges of 20.1-35.6 mm in length, 11.6-18.7 mm in width, and 6.6-18.1
mm in thickness for almond seeds (62, 64, 67, 68) and 22.2-25.4 mm in diameter for Hawaiian
macadamia nut cultivars (29). The seed dimensions of almond and macadamia nut seed samples
varied by cultivar. Of tested almond cultivars, Monterey and Sonora were the longest while
Butte, Mission, and Padre were the shortest (Table 9). The widest almond cultivars were
Mission, Monterey, and Sonora, while cultivar Price was the most narrow (Table 9). The thickest
almond cultivars were Mission, Monterey, and Padre and the thinnest cultivars were Sonora,
Price, and Nonpareil (Table 9). Although similar in weight, length, and width, the thickness of
almond cultivars Monterey and Sonora differed considerably. Cultivar Monterey was one of the
thickest (9.41 mm) almond seeds, while Sonora was one of the thinnest (7.77 mm) seeds.
Overall, the largest almond cultivars were Monterey and Sonora and the smallest was cultivar
Price. Almond seed weight was positively correlated with seed length (r = 0.61, p � 0.05, Figure
4A) and seed width (r = 0.79, p � 0.05, Figure 4B) (Table 17). Commercial macadamia nut
samples were larger than tested Hawaiian cultivars and a positive correlation (r = 0.93, p � 0.05,
Figure 4C) was observed between seed weight and seed diameter (Table 18). Influence of
cultivar variation on seed dimension is reported for almond (62), hazelnut (214), pistachio (219),
and walnut (220). Almond seeds grown in either North or South Valley did not differ in length,
width, or thickness, however seed dimensions varied by county and cultivar x county interaction.
Most noticeably, majority of tested cultivars (Butte, Carmel, Mission, Padre, and Price) grew

51
largest in Fresno County while Nonpareil grew largest in Colusa County. In contrast, majority of
tested cultivars grew smallest in Kern (Butte, Mission, and Price) and Merced (Butte, Carmel,
and Padre) counties while Nonpareil grew smallest in Glenn and Tulare counties (Table 10).
Since Kern and Fresno counties have similar weather conditions (Table 8 and Figure 3), the
observed difference in seed size may be influenced by other factors (i.e. soil composition and
elevation). Annual variations in Kern, Fresno, and Stanislaus counties during the 2003/2004 and
2005/2006 almond season had an influence on seed length and thickness. Almond seeds from the
2005/2006 season were longer (8.4%) and thinner (4.2%) than seeds from the 2003/2004 season
(Table 9). Although almond orchards are irrigated during periods of limited precipitation, the
2003/2004 almond season was unusually dry during the spring months (March, April, and May)
and may partly explain the change in seed size as almond seed growth and development occur
during these months (Figure 2). Influence of geographic location and annual variation on seed
dimension is also reported for pistachio nut (217).
Chemical Composition
Moisture. Tested almond and macadamia nut seeds ranged from 2.9-5.6% and 1.7-2.6%
moisture, respectively (Tables 9-11). Similar ranges of 3.1-6.9% moisture for almond seeds (60,
65, 71-75) and 1.4-6.0% moisture for macadamia nut seeds (27, 71, 75, 76) are reported. The
present investigation found the moisture content of the tested seeds varied by cultivar. Almond
cultivar Mission had the highest moisture content (4.6%), while cultivar Monterey had the lowest
(3.8%) of all the tested cultivars. Interestingly, commercial macadamia nut variety, Trader Joe’s,
had the highest moisture content (2.6%), while the other commercial variety, Blue Diamond, had
the lowest (1.7%) amount of moisture (Table 11). Cultivar influence on moisture content is not
surprising as seed moisture is known to vary in several tree nut cultivars including almonds (65,
68, 72-77), chestnuts (95, 100, 103), hazelnuts (214, 221, 222) macadamia nuts (27, 76, 83),
pecans (96), pistachios (102, 219), and walnuts (73, 220, 224). Seeds with low moisture content
are at reduced risk of microbial growth, enzyme activity, and spoilage and are therefore desired
by the food industry (83). Geographic location and cultivar x county interaction had a significant
influence on the moisture content of almond cultivars (Tables 9 and 10). Not surprisingly, seeds
from the North Valley (average precipitation of 23.7 inches/year) were higher in moisture
(~9.0% more) than seeds from the South Valley (average precipitation of 12.2 inches/year, Table
8). Similarly, another study found macadamia nut cultivars grown in the Kau district (annual
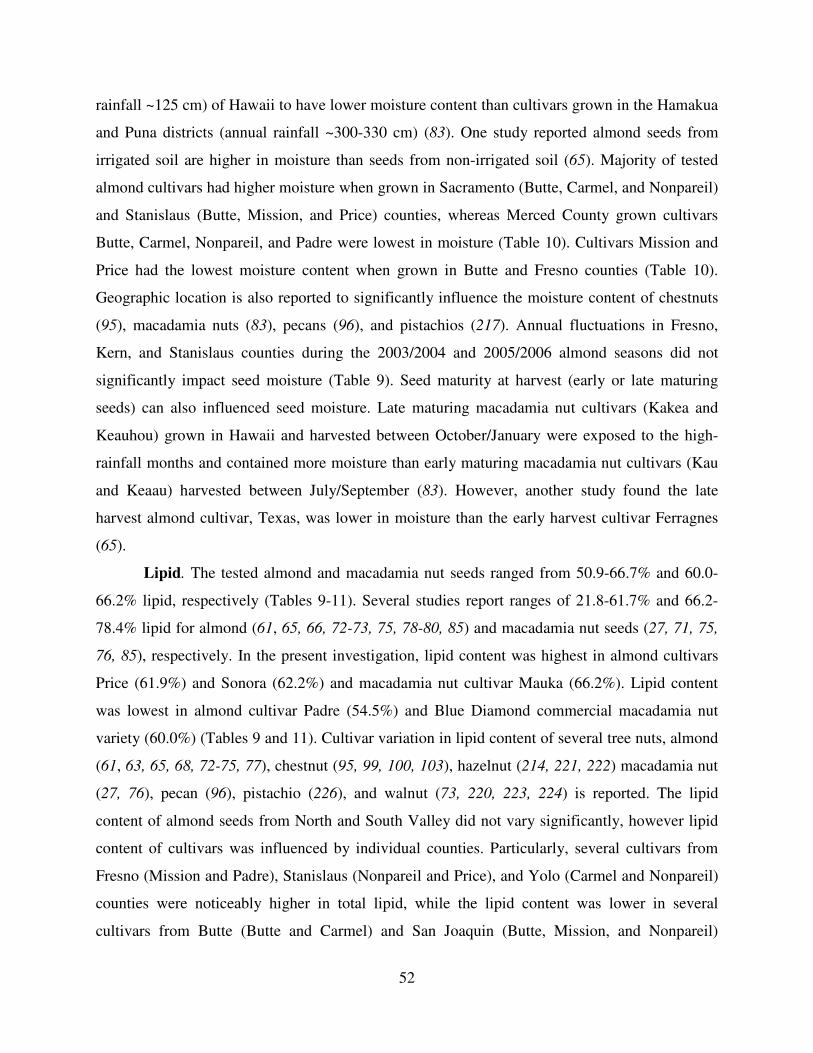
52
rainfall ~125 cm) of Hawaii to have lower moisture content than cultivars grown in the Hamakua
and Puna districts (annual rainfall ~300-330 cm) (83). One study reported almond seeds from
irrigated soil are higher in moisture than seeds from non-irrigated soil (65). Majority of tested
almond cultivars had higher moisture when grown in Sacramento (Butte, Carmel, and Nonpareil)
and Stanislaus (Butte, Mission, and Price) counties, whereas Merced County grown cultivars
Butte, Carmel, Nonpareil, and Padre were lowest in moisture (Table 10). Cultivars Mission and
Price had the lowest moisture content when grown in Butte and Fresno counties (Table 10).
Geographic location is also reported to significantly influence the moisture content of chestnuts
(95), macadamia nuts (83), pecans (96), and pistachios (217). Annual fluctuations in Fresno,
Kern, and Stanislaus counties during the 2003/2004 and 2005/2006 almond seasons did not
significantly impact seed moisture (Table 9). Seed maturity at harvest (early or late maturing
seeds) can also influenced seed moisture. Late maturing macadamia nut cultivars (Kakea and
Keauhou) grown in Hawaii and harvested between October/January were exposed to the high-
rainfall months and contained more moisture than early maturing macadamia nut cultivars (Kau
and Keaau) harvested between July/September (83). However, another study found the late
harvest almond cultivar, Texas, was lower in moisture than the early harvest cultivar Ferragnes
(65).
Lipid. The tested almond and macadamia nut seeds ranged from 50.9-66.7% and 60.0-
66.2% lipid, respectively (Tables 9-11). Several studies report ranges of 21.8-61.7% and 66.2-
78.4% lipid for almond (61, 65, 66, 72-73, 75, 78-80, 85) and macadamia nut seeds (27, 71, 75,
76, 85), respectively. In the present investigation, lipid content was highest in almond cultivars
Price (61.9%) and Sonora (62.2%) and macadamia nut cultivar Mauka (66.2%). Lipid content
was lowest in almond cultivar Padre (54.5%) and Blue Diamond commercial macadamia nut
variety (60.0%) (Tables 9 and 11). Cultivar variation in lipid content of several tree nuts, almond
(61, 63, 65, 68, 72-75, 77), chestnut (95, 99, 100, 103), hazelnut (214, 221, 222) macadamia nut
(27, 76), pecan (96), pistachio (226), and walnut (73, 220, 223, 224) is reported. The lipid
content of almond seeds from North and South Valley did not vary significantly, however lipid
content of cultivars was influenced by individual counties. Particularly, several cultivars from
Fresno (Mission and Padre), Stanislaus (Nonpareil and Price), and Yolo (Carmel and Nonpareil)
counties were noticeably higher in total lipid, while the lipid content was lower in several
cultivars from Butte (Butte and Carmel) and San Joaquin (Butte, Mission, and Nonpareil)

53
counties (Table 10). Geographic location is also reported to influence the lipid content of lupine
seed (227), pecan (94), pistachio (217), cowpea (228), and soybean (218). Lipid content was also
affected by harvest year with a 9.8% higher lipid content in almond seeds from the 2005/2006
season compared to seeds from the 2003/2004 season (Table 9). The lipid content of chestnuts
(99) and oat seeds (225) is also reported to differ significantly between harvest years.
Protein. The tested almond and macadamia nut seeds ranged from 15.7-26.7% and 5.6-
7.1% protein, respectively (Tables 9-11). Results of the current investigation compare favorably
with the reported range of 11.5-31.5% for almond seeds (63, 66, 68, 71-74, 79, 85) and 7.9-
13.0% protein for macadamia nut seeds (71, 79, 85). A positive correlation between protein and
lipid content (r = 0.646, p � 0.05, Figure 5A) of almond seeds was observed (Table 17). Of
tested almond cultivars, protein content was higher in Monterey (25.6%) and Price (24.8%) and
the lower in Padre (20.4%) (Table 9). Similarly, protein content was higher in Trader Joe’s
commercial macadamia nut variety and cultivar Keauhou (both 7.1%) and lower in cultivar
Keaau (5.6%) (Table 11). Cultivar influence on protein content of several tree nuts, almond (63,
68, 72-74), chestnut (95, 100, 103), hazelnut (214, 221, 222), pecan (96), pistachio (100, 226),
and walnut (73, 220, 223, 224) is reported. Almond seed protein also varied by geographic
location, most notably seeds grown in San Joaquin County were significantly lower in protein
(~10.4-23.5%) compared to seeds from all other tested locations (Table 9). However, no
difference in seed protein was observed in seeds from North and South Valley (Table 9).
Interaction of almond cultivar x county influenced almond seed protein, most noticeably protein
content was higher in cultivars Carmel, Mission, Nonpareil, and Padre from Fresno County and
lower in cultivars Butte, Carmel, and Nonpareil from San Joaquin County (Table 10).
Geographic location is also reported to significantly impact the protein content of buckwheat
flour (87), cowpea (228), durum wheat (229), pistachio (217), and soybean (218). Several reports
suggest the nitrogen composition of soil influences protein content with high quantities of
nitrogen increasing protein content in buckwheat (87), rapeseed (88) lupine seed (89), pearl
millet (90), and rice (91). Additionally, higher protein was reported in chestnuts produced in
schist-based soil compared to chestnuts from granite-based soil (92). Harvest year also impacted
the protein content of almond seeds with 7.1% more protein in seeds from the 2005/2006 season
compared to seeds from the 2003/2004 season (Table 9). Influence of harvest year on protein
content is reported for buckwheat (87), oat seed (225), and rye (230).

54
Ash. The tested almond and macadamia nut seeds ranged from 2.6-3.5% and 1.0-1.4%
ash, respectively (Tables 9-11). Results in the current investigation are consistent with the
reported ranges of 2.3-6.8% for almond seeds (68, 71-74, 79, 85) and 1.1-4.0% ash for
macadamia nut seeds (27, 71, 79, 85). Cultivar variation had a significant influence on the ash
content of tested almond and macadamia nut seeds. Ash content was highest in almond cultivar
Mission (3.3%) and macadamia nut cultivar Keaau (1.4%) and lowest in almond cultivar Sonora
(3.1%) and macadamia nut cultivar Purvis (1.0%). Ash content is reported to vary by cultivar in
almonds (68, 72-74), chestnuts (95, 100, 103), hazelnuts (214, 221, 222), pecans (96), pistachios
(102), and walnuts (73, 210, 223, 224). The ash content of tested almond seeds was found to vary
by geographic location, in particular ash content was higher in almond seeds from the North
Valley (3.23%) compared to South Valley seeds (3.09%). The interaction of almond cultivar x
county was also significant for ash content. Interestingly, ash content was higher in cultivars
Butte and Padre from San Joaquin County but lower in cultivars Carmel and Price from the same
county (Table 10). Similarly, Fresno County produced higher ash in cultivars Mission and Price,
but lower ash in cultivars Nonpareil and Padre (Table 10). Interaction of cultivar and county
factors such as soil composition, irrigation practices, and fertilization regimes may partly explain
the observed variation. Influence of geographic location on ash content of chestnut (95, 100),
hazelnut (98), lupine seed (227), oat seed (225), pecan (96), pistachio (217), and rye (230) is
reported. Harvest year was not found to significantly influence ash content of tested almond seed
samples (Table 9).
Total soluble sugars. Almond and macadamia nut seeds ranged from 3.0-6.5% and 5.3-
8.7% soluble sugars, respectively (Tables 9-11). Ranges of 2.1-7.5% for almond seeds (65, 66,
68, 70, 71, 73, 81, 82, 85) and 1.4-6.5% soluble sugars for macadamia nut seeds (27, 71, 81, 83,
85) are reported. Soluble sugars were negatively correlated with protein content of almond (r = -
0.61, p � 0.05, Figure 5B) and macadamia nut seed samples (r = -0.78, p � 0.05, Figure 5D) and
lipid content of almond seed samples (r = -0.61, p � 0.05, Figure 5B and Table 17). Soluble
sugars varied by cultivar with sugars significantly lower in almond cultivars Monterey (3.0%)
and Sonora (3.4%) and macadamia nut cultivar Mauka (5.3%). In contrast, almond cultivar Padre
(5.1%) and macadamia nut cultivar Keaau (8.7%) had the highest content of soluble sugars
(Tables 9 and 11). Cultivar influence on sugar content is reported in almonds (65, 68, 72-74, 81,
82), chestnuts (100, 103), macadamia nuts (83), pecans (96), and walnuts (73). Soluble sugars
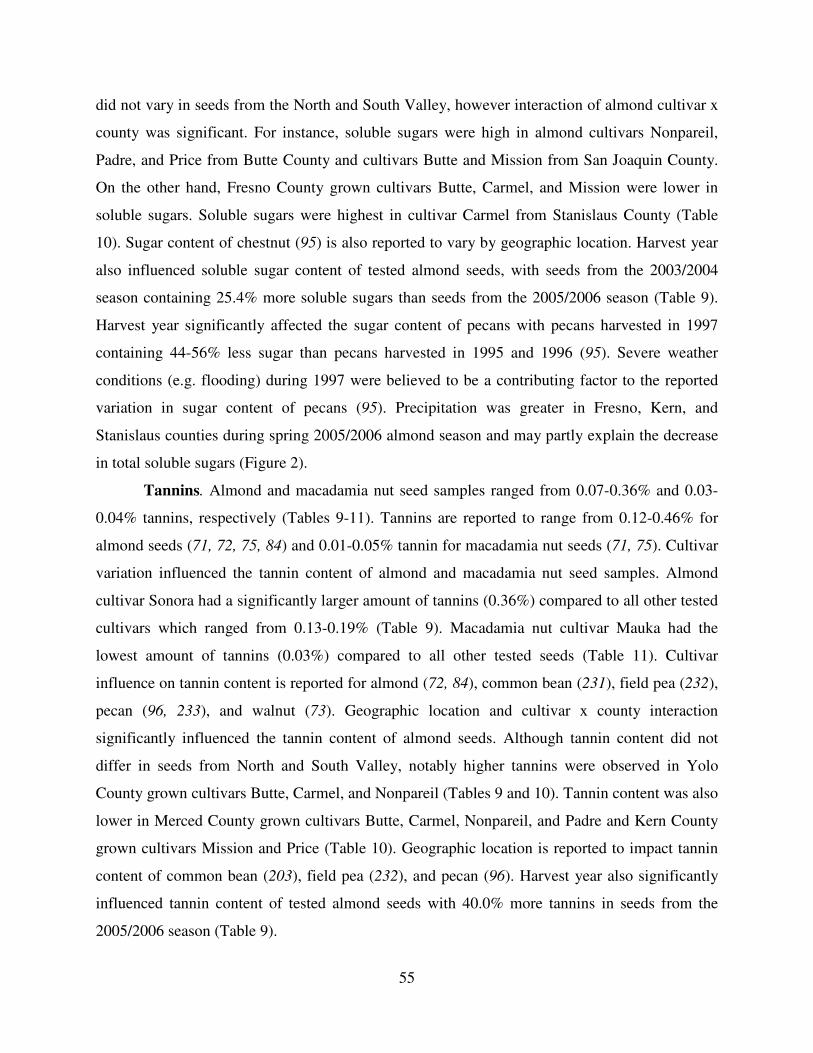
55
did not vary in seeds from the North and South Valley, however interaction of almond cultivar x
county was significant. For instance, soluble sugars were high in almond cultivars Nonpareil,
Padre, and Price from Butte County and cultivars Butte and Mission from San Joaquin County.
On the other hand, Fresno County grown cultivars Butte, Carmel, and Mission were lower in
soluble sugars. Soluble sugars were highest in cultivar Carmel from Stanislaus County (Table
10). Sugar content of chestnut (95) is also reported to vary by geographic location. Harvest year
also influenced soluble sugar content of tested almond seeds, with seeds from the 2003/2004
season containing 25.4% more soluble sugars than seeds from the 2005/2006 season (Table 9).
Harvest year significantly affected the sugar content of pecans with pecans harvested in 1997
containing 44-56% less sugar than pecans harvested in 1995 and 1996 (95). Severe weather
conditions (e.g. flooding) during 1997 were believed to be a contributing factor to the reported
variation in sugar content of pecans (95). Precipitation was greater in Fresno, Kern, and
Stanislaus counties during spring 2005/2006 almond season and may partly explain the decrease
in total soluble sugars (Figure 2).
Tannins. Almond and macadamia nut seed samples ranged from 0.07-0.36% and 0.03-
0.04% tannins, respectively (Tables 9-11). Tannins are reported to range from 0.12-0.46% for
almond seeds (71, 72, 75, 84) and 0.01-0.05% tannin for macadamia nut seeds (71, 75). Cultivar
variation influenced the tannin content of almond and macadamia nut seed samples. Almond
cultivar Sonora had a significantly larger amount of tannins (0.36%) compared to all other tested
cultivars which ranged from 0.13-0.19% (Table 9). Macadamia nut cultivar Mauka had the
lowest amount of tannins (0.03%) compared to all other tested seeds (Table 11). Cultivar
influence on tannin content is reported for almond (72, 84), common bean (231), field pea (232),
pecan (96, 233), and walnut (73). Geographic location and cultivar x county interaction
significantly influenced the tannin content of almond seeds. Although tannin content did not
differ in seeds from North and South Valley, notably higher tannins were observed in Yolo
County grown cultivars Butte, Carmel, and Nonpareil (Tables 9 and 10). Tannin content was also
lower in Merced County grown cultivars Butte, Carmel, Nonpareil, and Padre and Kern County
grown cultivars Mission and Price (Table 10). Geographic location is reported to impact tannin
content of common bean (203), field pea (232), and pecan (96). Harvest year also significantly
influenced tannin content of tested almond seeds with 40.0% more tannins in seeds from the
2005/2006 season (Table 9).

56
1
Table 9. Cultivar, geographic location, and harvest year variation on the physical characteristics and chemical composition of select almond seedsa
aData are expressed as mean ± SEM (n = 3). For each column, means with different letters are significantly different (p � 0.05) according to Fisher’s LSD test. Lipid, protein, ash, total soluble sugars, and tannins are expressed as gram per 100 gram dry weight.
Cultivar
Butte 1.03 ± 0.02 d 20.05 ± 0.15 e 11.98 ± 0.06 c 9.00 ± 0.06 b 4.14 ± 0.11 bc 57.21 ± 0.61 b 21.61 ± 0.27 cd 3.10 ± 0.03 bc 4.50 ± 0.12 bc 0.15 ± 0.01 cd
Carmel 1.14 ± 0.02 bc 23.52 ± 0.16 c 11.75 ± 0.07 c 8.18 ± 0.06 c 4.04 ± 0.09 bcd 57.28 ± 0.58 b 21.34 ± 0.29 d 3.20 ± 0.04 ab 4.23 ± 0.11 bcd 0.13 ± 0.01 d
Mission 1.14 ± 0.03 bc 20.01 ± 0.17 e 12.80 ± 0.08 a 9.54 ± 0.09 a 4.58 ± 0.16 a 58.28 ± 0.48 b 23.24 ± 0.23 b 3.26 ± 0.02 a 4.03 ± 0.14 d 0.15 ± 0.01 cd
Nonpareil 1.17 ± 0.02 b 23.17 ± 0.16 c 12.42 ± 0.07 b 7.95 ± 0.05 d 3.96 ± 0.08 cd 57.63 ± 0.72 b 20.91 ± 0.27 de 3.12 ± 0.03 bc 4.64 ± 0.16 b 0.19 ± 0.01 b
Padre 1.10 ± 0.03 cd 19.63 ± 0.18 e 12.38 ± 0.11 b 9.53 ± 0.07 a 3.88 ± 0.09 cd 54.53 ± 0.47 c 20.37 ± 0.13 e 3.18 ± 0.02 abc 5.14 ± 0.16 a 0.17 ± 0.01 bc
Price 0.99 ± 0.02 d 21.47 ± 0.18 d 11.46 ± 0.09 d 7.88 ± 0.09 d 4.12 ± 0.13 bcd 61.92 ± 0.72 a 24.84 ± 0.34 a 3.17 ± 0.07 abc 4.09 ± 0.15 cd 0.18 ± 0.01 b
Monterey 1.41 ± 0.02 a 26.51 ± 0.57 b 12.76 ± 0.13 a 9.41 ± 0.24 a 3.79 ± 0.07 d 57.49 ± 0.83 b 25.55 ± 0.16 a 3.19 ± 0.02 abc 3.00 ± 0.02 e 0.14 ± 0.01 d
Sonora 1.43 ± 0.00 a 27.75 ± 0.39 a 12.83 ± 0.21 a 7.77 ± 0.19 d 4.30 ± 0.09 ab 62.23 ± 0.32 a 22.50 ± 1.08 bc 3.08 ± 0.03 c 3.40 ± 0.02 e 0.36 ± 0.02 a
LSD
County
Butte 1.22 ± 0.02 ab 22.51 ± 0.46 bc 12.37 ± 0.20 ab 8.38 ± 0.16 a 3.73 ± 0.10 cd 55.07 ± 1.00 c 21.19 ± 0.43 bcd 3.21 ± 0.04 abc 5.20 ± 0.61 ab 0.18 ± 0.01 b
Colusa 1.27 ± 0.08 a 23.46 ± 0.30 ab 12.71 ± 0.24 a 8.35 ± 0.14 ab 3.70 ± 0.06 cd 56.19 ± 0.70 bc 21.20 ± 0.23 bcd 3.19 ± 0.07 abc 4.81 ± 0.29 bc 0.12 ± 0.01 ef
Fresno 1.16 ± 0.03 abcd 23.95 ± 0.32 a 12.06 ± 0.11 bc 8.22 ± 0.09 ab 4.13 ± 0.14 bc 59.66 ± 1.25 ab 23.14 ± 0.64 a 3.01 ± 0.09 cd 3.89 ± 0.29 de 0.15 ± 0.01 bcde
Glenn 1.11 ± 0.04 bcd 21.10 ± 0.46 d 11.71 ± 0.19 cd 8.21 ± 0.11 ab 4.20 ± 0.13 b 55.21 ± 0.56 c 19.75 ± 0.15 d 3.19 ± 0.07 abc 4.60 ± 0.09 bcd 0.17 ± 0.02 bc
Kern 1.17 ± 0.02 abcd 23.15 ± 0.38 b 12.51 ± 0.23 ab 7.77 ± 0.17 d 3.50 ± 0.16 d 55.17 ± 0.31 c 21.46 ± 0.24 bc 3.33 ± 0.05 a 4.82 ± 0.13 abc 0.13 ± 0.02 def
Madera 1.20 ± 0.07 abc 23.28 ± 0.42 b 12.49 ± 0.26 ab 8.12 ± 0.10 abc 4.03 ± 0.25 bc 56.26 ± 1.15 bc 19.93 ± 0.58 d 3.16 ± 0.04 abc 5.69 ± 0.30 a 0.15 ± 0.02 bcde
Merced 1.07 ± 0.04 d 21.90 ± 0.30 cd 11.50 ± 0.11 d 8.29 ± 0.15 ab 2.97 ± 0.04 e 54.08 ± 0.54 c 21.02 ± 0.25 bcd 3.31 ± 0.12 ab 4.70 ± 0.44 bcd 0.10 ± 0.01 f
Sacramento 1.10 ± 0.03 cd 23.73 ± 0.23 a 11.56 ± 0.09 d 8.02 ± 0.09 bcd 4.73 ± 0.11 a 56.74 ± 0.39 bc 21.74 ± 0.45 abc 3.30 ± 0.02 ab 4.49 ± 0.06 bcd 0.15 ± 0.01 bcde
San Joaquin 1.16 ± 0.02 abcd 23.67 ± 0.40 a 12.44 ± 0.18 ab 8.05 ± 0.15 abcd 3.86 ± 0.24 bcd 54.19 ± 1.77 c 17.70 ± 0.58 e 2.90 ± 0.11 d 4.67 ± 0.35 bcd 0.16 ± 0.02 bcd
Stanislaus 1.17 ± 0.07 abcd 23.73 ± 0.40 a 12.07 ± 0.24 bc 7.85 ± 0.11 cd 3.97 ± 0.17 bc 60.63 ± 1.82 a 20.40 ± 0.32 cd 3.10 ± 0.08 bcd 4.19 ± 0.35 cde 0.22 ± 0.02 a
Tulare 1.06 ± 0.03 d 22.57 ± 0.35 bc 12.26 ± 0.20 ab 7.53 ± 0.20 cd 3.82 ± 0.06 bcd 56.63 ± 0.67 bc 21.57 ± 0.41 bc 3.19 ± 0.09 abc 4.24 ± 0.19 cde 0.14 ± 0.02 cde
Yolo 1.20 ± 0.02 abc 24.30 ± 0.25 a 12.31 ± 0.10 ab 8.05 ± 0.12 abcd 3.87 ± 0.09 bcd 58.96 ± 1.96 ab 22.06 ± 0.22 ab 3.14 ± 0.07 abc 3.41 ± 0.39 e 0.24 ± 0.01 a
LSD
Region
North Valley 1.16 ± 0.02 a 23.29 ± 0.16 a 11.99 ± 0.07 a 8.14 ± 0.05 a 4.22 ± 0.08 a 56.68 ± 0.48 a 21.39 ± 0.22 a 3.23 ± 0.02 a 4.43 ± 0.14 a 0.17 ± 0.01 a
South Valley 1.15 ± 0.02 a 23.37 ± 0.15 a 12.17 ± 0.08 a 8.00 ± 0.05 a 3.84 ± 0.08 b 57.38 ± 0.64 a 20.92 ± 0.30 a 3.09 ± 0.04 b 4.46 ± 0.14 a 0.16 ± 0.01 a
LSD
Year
2003-2004 1.11 ± 0.05 a 21.28 ± 0.28 b 12.23 ± 0.13 a 8.89 ± 0.13 a 4.21 ± 0.25 a 55.71 ± 0.63 b 21.26 ± 0.44 b 3.18 ± 0.04 a 4.61 ± 0.13 a 0.12 ± 0.01 b
2005-2006 1.19 ± 0.02 a 23.22 ± 0.29 a 12.47 ± 0.08 a 8.52 ± 0.10 b 4.43 ± 0.12 a 61.73 ± 0.89 a 22.89 ± 0.37 a 3.08 ± 0.05 a 3.44 ± 0.13 b 0.20 ± 0.01 a
LSD 0.10
0.07
0.12
0.05
0.030.460.120.912.11
0.44 0.21 0.15
0.340.210.250.54
1.00 0.48 0.35 0.44 3.74 1.45 0.23 0.88 0.04
0.24 1.65 0.77 0.10 0.39 0.02
0.030.370.151.152.390.490.310.290.81
Weight
(g)
Length
(mm)
Width
(mm)
Thickness
(mm)
Moisture
(g/100 g)
Lipid
(g/100 g)
Tannins
(g/100 g)
Protein
(g/100 g)
Ash
(g/100 g)
Sugars
(g/100 g)

57
2
Table 10. Interaction of cultivar and geographic location on the physical characteristics and chemical composition of select almond seedsa
aData are expressed as mean ± SEM (n = 3). For each column, means with different letters are significantly different (p � 0.05) according to Fisher’s LSD test. Lipid, protein, ash, total soluble sugars, and tannins are expressed as gram per 100 gram dry weight.
Cultivar County
Butte 1.11 ± 0.01 a 19.25 ± 0.75 cd 12.04 ± 0.18 bc 9.04 ± 0.16 abc 3.67 ± 0.39 bc 53.99 ± 0.92 d 21.40 ± 0.27 bc 3.06 ± 0.02 bcde 4.82 ± 0.10 b 0.08 ± 0.00 e
Fresno 1.11 ± 0.02 a 20.72 ± 0.20 b 12.50 ± 0.07 a 9.17 ± 0.09 ab 4.37 ± 0.26 ab 58.58 ± 1.63 bc 21.18 ± 0.63 cd 3.02 ± 0.07 de 4.05 ± 0.25 c 0.14 ± 0.03 cd
Kern 0.88 ± 0.05 c 19.26 ± 0.37 cd 11.38 ± 0.18 d 8.59 ± 0.15 c 3.98 ± 0.23 bc 55.37 ± 0.27 bcd 22.15 ± 0.27 abc 3.16 ± 0.05 abcd 4.25 ± 0.16 bc 0.15 ± 0.01 bcd
Madera 1.00 ± 0.02 b 22.90 ± 0.76 a 12.03 ± 0.17 bc 8.08 ± 0.18 d 4.23 ± 0.05 b 65.23 ± 0.14 a 23.49 ± 0.24 a 2.89 ± 0.03 e 4.14 ± 0.21 bc 0.19 ± 0.01 abc
Merced 0.91 ± 0.01 c 18.98 ± 0.29 cd 11.10 ± 0.10 d 9.19 ± 0.10 ab 3.37 ± 0.08 c 54.60 ± 0.96 cd 19.15 ± 0.20 e 3.23 ± 0.01 abc 5.86 ± 0.32 a 0.07 ± 0.01 e
Sacramento 1.17 ± 0.01 a 20.41 ± 0.38 b 12.40 ± 0.11 ab 9.10 ± 0.20 ab 5.14 ± 0.12 a 57.77 ± 0.40 bcd 23.66 ± 0.39 a 3.18 ± 0.01 abcd 4.47 ± 0.13 bc 0.20 ± 0.01 ab
San Joaquin 1.02 ± 0.03 b 19.15 ± 0.65 cd 11.80 ± 0.16 c 9.37 ± 0.27 a 3.69 ± 0.05 bc 53.84 ± 1.21 d 19.35 ± 0.24 e 3.25 ± 0.03 ab 5.87 ± 0.17 a 0.10 ± 0.02 de
Stanislaus 1.14 ± 0.01 a 20.04 ± 0.28 bc 12.38 ± 0.13 ab 9.38 ± 0.26 a 5.12 ± 0.06 a 54.43 ± 0.56 d 19.65 ± 0.29 de 3.06 ± 0.00 bcde 5.02 ± 0.24 b 0.12 ± 0.02 de
Tulare 0.84 ± 0.02 c 18.27 ± 0.43 d 11.32 ± 0.29 d 9.47 ± 0.19 a 3.95 ± 0.03 bc 56.47 ± 0.51 bcd 22.85 ± 0.50 ab 3.29 ± 0.02 a 3.90 ± 0.04 c 0.11 ± 0.01 de
Yolo 1.07 ± 0.01 ab 20.50 ± 0.24 b 12.17 ± 0.08 abc 8.83 ± 0.15 bc 3.85 ± 0.31 bc 59.10 ± 1.39 b 22.58 ± 0.57 abc 3.03 ± 0.05 de 4.13 ± 0.28 bc 0.22 ± 0.01 a
Butte 1.21 ± 0.03 a 22.12 ± 0.65 d 12.11 ± 0.25 ab 8.82 ± 0.14 a 3.55 ± 0.12 cde 53.00 ± 0.13 d 22.00 ± 0.46 bc 3.28 ± 0.00 ab 3.87 ± 0.16 de 0.16 ± 0.01 b
Colusa 1.10 ± 0.02 cd 22.82 ± 0.37 d 11.95 ± 0.19 abc 8.13 ± 0.18 b 3.73 ± 0.02 bcde 57.59 ± 0.14 bc 21.15 ± 0.38 cd 3.31 ± 0.02 ab 4.20 ± 0.18 cde 0.12 ± 0.01 cd
Fresno 1.20 ± 0.02 ab 24.74 ± 0.32 a 12.18 ± 0.14 ab 8.31 ± 0.12 ab 4.26 ± 0.23 ab 60.36 ± 1.26 b 23.63 ± 0.73 a 3.17 ± 0.09 b 3.65 ± 0.31 ef 0.12 ± 0.01 cd
Glenn 1.18 ± 0.02 ab 22.28 ± 0.65 d 12.07 ± 0.16 abc 8.37 ± 0.13 ab 3.94 ± 0.09 bcd 56.04 ± 0.83 cd 19.82 ± 0.30 def 3.31 ± 0.02 ab 4.62 ± 0.04 bc 0.12 ± 0.00 cd
Kern 1.21 ± 0.02 a 22.95 ± 0.26 d 12.16 ± 0.32 ab 7.92 ± 0.31 bc 3.82 ± 0.15 bcd 55.38 ± 0.66 cd 21.07 ± 0.28 cd 3.25 ± 0.01 ab 4.72 ± 0.21 bc 0.10 ± 0.03 de
Madera 1.06 ± 0.02 d 23.18 ± 0.71 cd 11.54 ± 0.16 cde 7.87 ± 0.12 bc 3.46 ± 0.04 de 53.75 ± 0.51 cd 18.67 ± 0.15 f 3.22 ± 0.00 b 5.06 ± 0.17 b 0.13 ± 0.02 c
Merced 0.98 ± 0.02 e 21.99 ± 0.35 d 11.13 ± 0.09 e 8.04 ± 0.17 bc 3.06 ± 0.02 e 53.98 ± 0.04 cd 20.74 ± 0.19 cde 3.52 ± 0.02 a 3.76 ± 0.07 de 0.07 ± 0.01 e
Sacramento 1.15 ± 0.02 bc 24.45 ± 0.28 ab 11.28 ± 0.12 de 8.26 ± 0.13 b 4.89 ± 0.17 a 57.35 ± 0.47 bc 23.08 ± 0.27 ab 3.37 ± 0.02 ab 4.43 ± 0.09 bcd 0.13 ± 0.01 c
San Joaquin 1.19 ± 0.02 ab 24.22 ± 0.51 ac 12.37 ± 0.23 a 8.13 ± 0.22 b 4.03 ± 0.34 bcd 55.83 ± 2.42 cd 18.72 ± 0.40 f 2.82 ± 0.15 c 4.09 ± 0.28 cde 0.13 ± 0.02 c
Stanislaus 0.78 ± 0.02 f 20.50 ± 0.44 e 9.84 ± 0.12 f 7.56 ± 0.13 c 3.55 ± 0.12 cde 56.71 ± 1.25 bcd 19.28 ± 0.26 ef 2.62 ± 0.01 c 5.92 ± 0.17 a 0.21 ± 0.02 a
Tulare 1.12 ± 0.02 c 23.20 ± 0.53 bcd 12.04 ± 0.21 abc 8.12 ± 0.26 b 3.87 ± 0.07 bcd 55.86 ± 1.24 cd 20.76 ± 0.35 cde 3.35 ± 0.02 ab 4.43 ± 0.34 bcd 0.10 ± 0.01 de
Yolo 1.22 ± 0.01 a 24.76 ± 0.32 a 11.78 ± 0.08 bcd 8.35 ± 0.22 ab 4.16 ± 0.02 bc 66.69 ± 0.79 a 21.83 ± 0.31 bc 3.25 ± 0.14 ab 2.96 ± 0.05 f 0.22 ± 0.01 a
Butte 1.03 ± 0.03 cd 19.86 ± 0.51 bc 12.83 ± 0.34 ab 8.82 ± 0.25 e 3.67 ± 0.05 e 57.52 ± 0.10 c 22.43 ± 0.09 c 3.33 ± 0.01 a 4.30 ± 0.14 bc 0.15 ± 0.00 abc
Colusa 1.12 ± 0.01 bc 20.45 ± 0.29 b 12.64 ± 0.20 b 9.39 ± 0.23 bcde 3.87 ± 0.08 de 56.84 ± 0.81 c 24.37 ± 0.27 a 3.06 ± 0.01 d 3.34 ± 0.12 d 0.16 ± 0.01 ab
Fresno 1.33 ± 0.01 a 21.55 ± 0.29 a 13.31 ± 0.15 a 9.54 ± 0.19 bcd 4.61 ± 0.08 bcd 61.28 ± 0.77 a 24.07 ± 0.32 ab 3.37 ± 0.09 a 3.42 ± 0.02 d 0.13 ± 0.01 bc
Glenn 0.91 ± 0.01 e 19.85 ± 0.37 bc 12.41 ± 0.17 bc 8.93 ± 0.19 de 5.27 ± 0.08 ab 57.94 ± 0.16 bc 20.80 ± 0.39 d 3.28 ± 0.01 abc 4.83 ± 0.07 ab 0.21 ± 0.02 a
Kern 1.00 ± 0.03 de 18.43 ± 0.40 d 12.02 ± 0.23 c 9.25 ± 0.25 cde 4.03 ± 0.12 cde 60.36 ± 0.46 a 23.81 ± 0.18 ab 3.17 ± 0.02 cd 3.46 ± 0.15 d 0.09 ± 0.00 c
Merced 1.14 ± 0.02 b 19.04 ± 0.48 cd 12.89 ± 0.06 ab 9.98 ± 0.13 ab 4.64 ± 0.07 bc 57.83 ± 0.47 bc 22.69 ± 0.24 c 3.32 ± 0.00 ab 3.92 ± 0.13 cd 0.14 ± 0.01 bc
San Joaquin 1.14 ± 0.05 b 19.13 ± 0.58 cd 12.43 ± 0.24 bc 9.59 ± 0.39 abc 4.02 ± 0.07 cde 53.44 ± 0.85 d 23.27 ± 0.33 bc 3.19 ± 0.03 bcd 5.28 ± 0.19 a 0.12 ± 0.01 bc
Stanislaus 1.30 ± 0.04 a 20.89 ± 0.24 ab 13.32 ± 0.12 a 10.20 ± 0.15 a 5.56 ± 0.37 a 59.65 ± 0.76 ab 23.85 ± 0.29 ab 3.27 ± 0.04 abc 3.86 ± 0.27 cd 0.16 ± 0.03 ab
0.87 0.14 0.61 0.07
0.20 0.75 0.06
0.030.740.30
(g/100 g)(g/100 g)(mm)(mm)(mm)
Protein Ash Sugars
(g/100 g)(g/100 g)(g/100 g)
Length Width Thickness Moisture Lipid Tannins
(g/100 g)
LSD
LSD 0.08 1.11 0.40 0.46 0.80 4.08 1.65
1.614.030.690.510.531.260.06
0.10 1.08 0.54 0.62 0.76 2.06
(g)
Mission
LSD
Carmel
Butte
Weight

58
3
aData are expressed as mean ± SEM (n = 3). For each column, means with different letters are significantly different (p � 0.05) according to Fisher’s LSD test. Lipid, protein, ash, total soluble sugars, and tannins are expressed as gram per 100 gram dry weight.
Table 10 continued. Interaction of cultivar and geographic location on the physical characteristics and chemical composition of select almond seedsa
Cultivar County
Butte 1.23 ± 0.03 c 22.91 ± 0.67 abc 12.62 ± 0.31 b 7.95 ± 0.20 cd 3.92 ± 0.02 cd 57.15 ± 0.84 abc 20.37 ± 0.25 bc 3.13 ± 0.01 bc 6.52 ± 0.27 a 0.20 ± 0.01 bc
Colusa 1.44 ± 0.04 a 24.10 ± 0.38 a 13.47 ± 0.26 a 8.57 ± 0.20 a 3.66 ± 0.13 d 54.79 ± 0.69 bc 21.26 ± 0.36 abc 3.08 ± 0.00 bc 5.42 ± 0.11 bcd 0.11 ± 0.01 f
Fresno 1.10 ± 0.06 defg 22.77 ± 0.55 abc 11.87 ± 0.17 c 8.07 ± 0.13 bcd 3.94 ± 0.07 cd 58.60 ± 2.60 ab 22.41 ± 1.19 a 2.76 ± 0.11 d 4.26 ± 0.57 ef 0.20 ± 0.01 bc
Glenn 1.03 ± 0.01 fg 19.93 ± 0.41 d 11.35 ± 0.31 c 8.06 ± 0.17 bcd 4.46 ± 0.09 ab 54.38 ± 0.46 bc 19.67 ± 0.15 c 3.08 ± 0.03 bc 4.58 ± 0.20 def 0.23 ± 0.01 ab
Kern 1.13 ± 0.02 def 23.35 ± 0.72 ab 12.86 ± 0.31 ab 7.63 ± 0.15 d 3.17 ± 0.08 ef 54.97 ± 0.03 bc 21.84 ± 0.23 ab 3.40 ± 0.00 a 4.91 ± 0.19 cde 0.16 ± 0.01 de
Madera 1.35 ± 0.02 ab 23.38 ± 0.50 ab 13.45 ± 0.25 a 8.37 ± 0.12 abc 4.59 ± 0.04 a 58.76 ± 0.26 ab 21.20 ± 0.22 abc 3.09 ± 0.00 bc 6.32 ± 0.13 ab 0.17 ± 0.02 de
Merced 1.15 ± 0.00 de 21.81 ± 0.50 c 11.86 ± 0.10 c 8.53 ± 0.23 ab 2.89 ± 0.04 f 54.18 ± 1.20 bc 21.30 ± 0.46 abc 3.10 ± 0.04 bc 5.65 ± 0.24 abc 0.13 ± 0.01 ef
Sacramento 1.05 ± 0.04 efg 23.00 ± 0.32 abc 11.84 ± 0.12 c 7.78 ± 0.12 d 4.57 ± 0.11 a 56.13 ± 0.57 abc 20.41 ± 0.59 bc 3.23 ± 0.02 ab 4.56 ± 0.08 def 0.16 ± 0.01 de
San Joaquin 1.12 ± 0.00 def 22.56 ± 0.50 bc 12.59 ± 0.27 b 7.88 ± 0.16 d 3.54 ± 0.03 de 50.90 ± 0.61 c 15.65 ± 0.33 d 3.08 ± 0.01 bc 5.84 ± 0.22 abc 0.24 ± 0.02 ab
Stanislaus 1.30 ± 0.02 bc 24.07 ± 0.33 a 12.82 ± 0.15 b 7.95 ± 0.13 cd 4.11 ± 0.20 bc 61.94 ± 2.26 a 20.78 ± 0.33 abc 3.22 ± 0.04 ab 3.61 ± 0.24 f 0.23 ± 0.01 ab
Tulare 1.00 ± 0.02 g 21.93 ± 0.38 c 12.49 ± 0.34 b 6.93 ± 0.16 e 3.77 ± 0.09 cd 57.40 ± 0.29 ab 22.38 ± 0.24 a 3.04 ± 0.02 c 4.06 ± 0.16 ef 0.18 ± 0.00 cd
Yolo 1.19 ± 0.02 cd 24.07 ± 0.33 a 12.58 ± 0.10 b 7.90 ± 0.12 cd 3.72 ± 0.08 cd 61.67 ± 3.25 a 22.18 ± 0.31 ab 3.09 ± 0.08 bc 3.63 ± 0.57 f 0.25 ± 0.02 a
Butte 1.13 ± 0.01 c 19.63 ± 0.63 bc 11.97 ± 0.23 c 9.09 ± 0.20 b 3.76 ± 0.05 c 54.64 ± 0.68 cd 20.84 ± 0.04 a 3.13 ± 0.01 cd 6.15 ± 0.24 a 0.16 ± 0.02 b
Fresno 1.32 ± 0.00 a 21.40 ± 0.30 a 13.80 ± 0.13 a 9.23 ± 0.20 b 3.66 ± 0.06 c 57.27 ± 0.44 a 20.98 ± 0.21 a 3.09 ± 0.00 d 5.56 ± 0.29 ab 0.24 ± 0.02 a
Kern 1.03 ± 0.03 d 19.54 ± 0.41 bcd 12.04 ± 0.15 c 9.71 ± 0.13 a 3.68 ± 0.06 c 52.29 ± 0.38 e 19.82 ± 0.12 b 3.23 ± 0.05 b 5.00 ± 0.23 c 0.14 ± 0.01 b
Merced 0.91 ± 0.02 e 18.45 ± 0.34 d 11.40 ± 0.12 d 9.21 ± 0.09 b 3.58 ± 0.10 c 56.79 ± 0.43 ab 20.36 ± 0.23 ab 3.12 ± 0.01 cd 4.34 ± 0.05 d 0.21 ± 0.00 a
San Joaquin 1.05 ± 0.01 d 19.19 ± 0.44 bcd 11.99 ± 0.17 c 9.72 ± 0.11 a 4.72 ± 0.10 a 55.56 ± 0.68 bc 20.82 ± 0.33 a 3.34 ± 0.02 a 4.09 ± 0.08 d 0.17 ± 0.00 b
Stanislaus 1.22 ± 0.01 b 20.21 ± 0.25 b 13.23 ± 0.15 b 10.06 ± 0.22 a 4.22 ± 0.15 b 53.23 ± 0.60 de 19.72 ± 0.03 b 3.17 ± 0.01 c 5.77 ± 0.08 a 0.15 ± 0.01 b
Tulare 1.07 ± 0.01 d 19.01 ± 0.28 cd 12.23 ± 0.24 c 9.73 ± 0.13 a 3.57 ± 0.07 c 51.91 ± 0.12 e 20.05 ± 0.38 b 3.17 ± 0.00 c 5.09 ± 0.11 bc 0.14 ± 0.01 b
Butte 0.92 ± 0.02 c 21.69 ± 0.59 ab 11.34 ± 0.28 bcd 7.83 ± 0.23 bc 3.83 ± 0.10 bc 59.23 ± 0.98 bc 22.70 ± 0.51 e 2.85 ± 0.05 d 4.92 ± 0.14 a 0.25 ± 0.01 a
Fresno 1.07 ± 0.01 a 21.30 ± 0.56 b 11.74 ± 0.25 abc 8.74 ± 0.10 a 3.40 ± 0.13 d 56.77 ± 0.51 c 24.24 ± 0.04 cd 3.45 ± 0.02 a 4.86 ± 0.20 a 0.13 ± 0.00 de
Kern 0.83 ± 0.01 d 21.16 ± 0.31 b 11.14 ± 0.22 cd 7.50 ± 0.25 c 4.05 ± 0.16 b 60.97 ± 1.31 b 25.65 ± 0.32 b 3.54 ± 0.04 a 3.99 ± 0.04 b 0.11 ± 0.02 e
Merced 1.10 ± 0.02 a 22.67 ± 0.67 a 12.20 ± 0.19 a 8.03 ± 0.13 bc 5.04 ± 0.05 a 64.80 ± 0.83 a 26.74 ± 0.16 a 3.27 ± 0.00 b 3.50 ± 0.22 cd 0.20 ± 0.01 c
San Joaquin 1.12 ± 0.01 a 21.69 ± 0.36 ab 11.76 ± 0.22 ab 8.33 ± 0.18 ab 3.61 ± 0.06 cd 61.79 ± 0.29 b 24.68 ± 0.08 c 2.91 ± 0.00 cd 4.04 ± 0.09 bc 0.23 ± 0.01 ab
Stanislaus 0.90 ± 0.01 c 20.89 ± 0.33 b 10.78 ± 0.14 d 7.29 ± 0.16 c 4.88 ± 0.08 a 65.38 ± 1.23 a 23.35 ± 0.31 de 3.20 ± 0.04 b 4.25 ± 0.30 b 0.22 ± 0.01 bc
Tulare 0.99 ± 0.03 b 20.86 ± 0.31 b 11.27 ± 0.22 bcd 7.45 ± 0.25 c 4.06 ± 0.12 b 64.53 ± 0.50 a 26.54 ± 0.45 ab 2.97 ± 0.01 c 3.07 ± 0.18 d 0.14 ± 0.01 d
0.55 0.030.06 1.30 0.61 0.54 0.31
0.270.450.491.100.05
Lipid Protein Ash Sugars TanninsWeight Length Width Thickness Moisture
(g) (mm) (mm) (mm) (g/100 g) (g/100 g) (g/100 g) (g/100 g) (g/100 g) (g/100 g)
LSD
LSD
Price
Padre
0.12 1.41
0.040.530.060.671.50
2.60 0.93 0.10
Nonpareil
LSD
0.61 0.48 0.43 6.28 1.87 0.19 1.05 0.05

59
4 Table 11. Physical characteristics and chemical composition of select macadamia nut seedsa
aData are expressed as mean ± SEM (n = 3). For each column, means with different letters are significantly different (p � 0.05) according to Fisher’s LSD test. Lipid, protein, ash, total soluble sugars, and tannins are expressed as gram per 100 gram dry weight.
3.16 ± 0.05 a 20.04 ± 0.35 a 15.19 ± 0.31 ab 1.67 ± 0.01 f 60.01 ± 0.39 b 6.41 ± 0.23 ab 1.12 ± 0.01 cd 7.28 ± 0.12 c 0.04 ± 0.00 a
3.36 ± 0.22 a 20.10 ± 0.41 a 15.49 ± 0.41 a 2.64 ± 0.01 a 61.65 ± 0.63 b 7.07 ± 0.24 a 1.12 ± 0.03 cd 6.28 ± 0.01 f 0.04 ± 0.00 a
2.71 ± 0.05 bc 19.39 ± 0.38 ab 15.46 ± 0.32 a 2.33 ± 0.06 b 60.99 ± 0.45 b 7.08 ± 0.52 a 1.16 ± 0.02 c 6.61 ± 0.13 e 0.04 ± 0.00 a
2.77 ± 0.07 b 19.51 ± 0.49 ab 15.59 ± 0.38 a 1.79 ± 0.02 e 63.04 ± 0.39 ab 6.29 ± 0.23 ab 1.01 ± 0.01 e 6.84 ± 0.03 d 0.04 ± 0.00 a
2.41 ± 0.06 c 18.68 ± 0.41 b 14.46 ± 0.49 b 1.91 ± 0.02 d 61.81 ± 1.47 b 6.27 ± 0.48 ab 1.28 ± 0.00 b 8.34 ± 0.05 b 0.04 ± 0.01 a
2.41 ± 0.10 c 18.73 ± 0.17 b 14.44 ± 0.16 b 1.83 ± 0.02 e 60.32 ± 1.26 b 5.56 ± 0.65 b 1.40 ± 0.02 a 8.68 ± 0.02 a 0.04 ± 0.00 a
2.64 ± 0.12 bc 19.60 ± 0.45 ab 15.87 ± 0.32 a 2.04 ± 0.02 c 66.16 ± 2.91 a 6.76 ± 0.25 ab 1.11 ± 0.01 d 5.25 ± 0.01 g 0.03 ± 0.00 b
Moisture
(g/100 g)
Lipid
(g/100 g)
Protein
(g/100 g)
4.14
Ash
(g/100 g)
# 246 Keauhou# 294 Purvis # 508 Kakea# 660 Keaau# 741 Mauka
LSD
Macadamia nut
Blue DiamondTrader Joe's
Weight
(g)
Diameter
(mm)
Thickness
(mm)
0.081.001.110.34
Sugars
(g/100 g)
Tannins
(g/100 g)
0.010.210.051.22
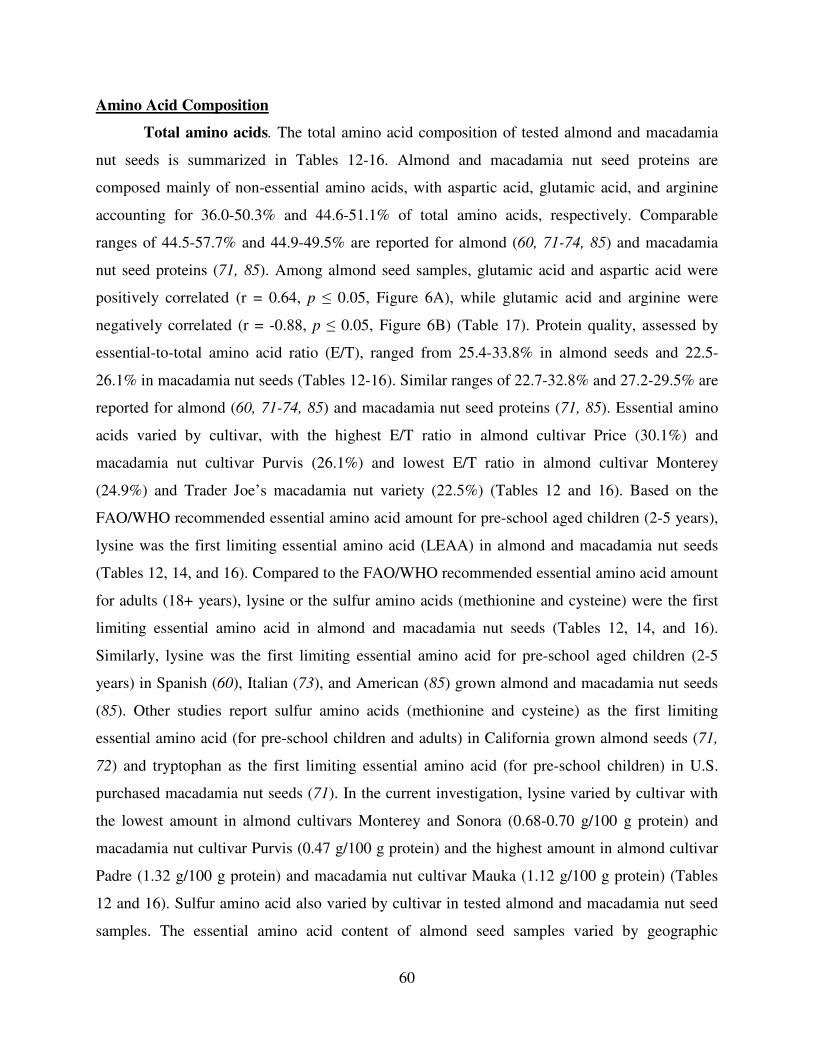
60
Amino Acid Composition
Total amino acids. The total amino acid composition of tested almond and macadamia
nut seeds is summarized in Tables 12-16. Almond and macadamia nut seed proteins are
composed mainly of non-essential amino acids, with aspartic acid, glutamic acid, and arginine
accounting for 36.0-50.3% and 44.6-51.1% of total amino acids, respectively. Comparable
ranges of 44.5-57.7% and 44.9-49.5% are reported for almond (60, 71-74, 85) and macadamia
nut seed proteins (71, 85). Among almond seed samples, glutamic acid and aspartic acid were
positively correlated (r = 0.64, p � 0.05, Figure 6A), while glutamic acid and arginine were
negatively correlated (r = -0.88, p � 0.05, Figure 6B) (Table 17). Protein quality, assessed by
essential-to-total amino acid ratio (E/T), ranged from 25.4-33.8% in almond seeds and 22.5-
26.1% in macadamia nut seeds (Tables 12-16). Similar ranges of 22.7-32.8% and 27.2-29.5% are
reported for almond (60, 71-74, 85) and macadamia nut seed proteins (71, 85). Essential amino
acids varied by cultivar, with the highest E/T ratio in almond cultivar Price (30.1%) and
macadamia nut cultivar Purvis (26.1%) and lowest E/T ratio in almond cultivar Monterey
(24.9%) and Trader Joe’s macadamia nut variety (22.5%) (Tables 12 and 16). Based on the
FAO/WHO recommended essential amino acid amount for pre-school aged children (2-5 years),
lysine was the first limiting essential amino acid (LEAA) in almond and macadamia nut seeds
(Tables 12, 14, and 16). Compared to the FAO/WHO recommended essential amino acid amount
for adults (18+ years), lysine or the sulfur amino acids (methionine and cysteine) were the first
limiting essential amino acid in almond and macadamia nut seeds (Tables 12, 14, and 16).
Similarly, lysine was the first limiting essential amino acid for pre-school aged children (2-5
years) in Spanish (60), Italian (73), and American (85) grown almond and macadamia nut seeds
(85). Other studies report sulfur amino acids (methionine and cysteine) as the first limiting
essential amino acid (for pre-school children and adults) in California grown almond seeds (71,
72) and tryptophan as the first limiting essential amino acid (for pre-school children) in U.S.
purchased macadamia nut seeds (71). In the current investigation, lysine varied by cultivar with
the lowest amount in almond cultivars Monterey and Sonora (0.68-0.70 g/100 g protein) and
macadamia nut cultivar Purvis (0.47 g/100 g protein) and the highest amount in almond cultivar
Padre (1.32 g/100 g protein) and macadamia nut cultivar Mauka (1.12 g/100 g protein) (Tables
12 and 16). Sulfur amino acid also varied by cultivar in tested almond and macadamia nut seed
samples. The essential amino acid content of almond seed samples varied by geographic

61
location, with a significantly higher E/T ratio in seeds from the South Valley compared to seeds
from the North Valley (Table 12). Low E/T ratios were observed in almond cultivars Butte,
Carmel, and Mission from Fresno County, cultivars Butte, Carmel, and Nonpareil from Yolo
County, and cultivars Padre and Price from Merced County.
Almond and macadamia nut seed proteins are also rich in arginine containing 7.3-11.9%
and 9.4-11.5%, respectively (Tables 12-16). An arginine-rich diet may reduce the risk of
cardiovascular disease as arginine can be converted to nitric oxide, a potent vasodilator and
antioxidant (234). Additionally almond and macadamia nut seed samples were low in lysine,
which foods high in lysine are believed to decrease the bioavailability of arginine, and had
lysine-to-arginine ratios of 0.08-0.18 and 0.05-0.10, respectively. Lysine and arginine were
positively correlated in both almond (r = 0.67, p � 0.05, Figure 6C) and macadamia nut (r = 0.84,
p � 0.05, Figure 6D) seed proteins (Tables 17 and 18). Similarly, a positive correlation was
reported between lysine and arginine in cowpea proteins (228). Arginine significantly varied by
cultivar, geographic location, and harvest year. In particular, arginine was significantly higher in
almond cultivars Price and Padre and macadamia nut cultivar Mauka and lowest in almond
cultivars Monterey and Sonora. Cultivar variation is also reported to significantly impact
individual amino acids from peanut (235). Almond seeds from the 2003/2004 season contained
~21.0% more arginine than seeds from the 2005/2006 season.
Free amino acids. Free amino acid composition of select almond seeds are summarized
in Tables 19-22. Total free amino acids in tested almond seeds ranged from 172.3 to 723.2 mg
per 100 g dry weight, comparable with the large variation (98.1-1,507.0 mg per 100 g)
previously reported (39, 109). Soler et al. (60) found the highest free amino acid content in
almond seeds occur 85 days after fruit set and as seeds mature and develop the amount
decreases. Thus, the large variation in total free amino acids observed in the tested almond seeds
may be dependent on time of harvest and seed maturity. Asparagine, aspartic acid, glutamic acid,
and arginine dominate (49.0-79.1%) the total free amino acid composition of tested almond
seeds, similar to the reported range of 57.0-81.9% (86, 109). The current investigation, like
previous studies (39, 86, 109), found a large variation in free arginine which accounted for ~6-
24% of total free amino acids. Alanine, proline, tyrosine, and isoleucine account for less than
10% each and the remaining free amino acids (Ser, Gln, Gly, His, Thr, Val, Met, Cys, Leu, Phe,
and Lys) amount for less than 5% each. Total free amino acids in almond cultivars ranged from

62
237.5-604.9 mg for Butte, 296.8-723.2 mg for Carmel, 353.9-483.0 mg for Mission, 476.5 mg
for Monterey, 219.5-491.6 mg for Nonpareil, 278.8-479.3 mg for Padre, 172.3-573.2 mg for
Price, and 260.6 mg/100 g dry weight for Sonora. Martín Carratalá et al. (39) developed a
decision tree to identify almond cultivars based on their free amino acid composition, however
cultivars Mission and Nonpareil in the current study were incorrectly identified.
The free asparagine content of raw almond seeds is of importance as free asparagine is
reported to be a precursor for acrylamide formation (37, 42). Free asparagine in tested almond
seeds ranged from 38.7-325.0 mg/100 g dry weight and accounted for 14.9-44.9% of total amino
acids. A positive correlation was observed between free asparagine and majority of free amino
acids (Asp, Glu, Gln, Gly, His, Arg, Thr, Ala, Pro, Val, and Lys) (Table 22). The free asparagine
content of tested almond cultivars differ significantly, with the highest amount in cultivar Carmel
(163.9 mg/100 g) and lowest amount in cultivar Sonora (38.7 mg/100g) (Table 20). Free
asparagine content of tested almond seeds varied by geographic location, with 18.3% more free
asparagine in almond seeds from the North Valley compared to seeds from the South Valley
(Table 20). Interaction of cultivar x county also influenced the free asparagine content of tested
almond seeds, with the exception of cultivar Mission. Most notably cultivars Butte from Tulare
County, Carmel from Madera County and cultivar Padre from Kern County were significantly
higher in free asparagine, whereas San Joaquin County produced less free asparagine in cultivars
Butte, Carmel, and Nonpareil (Table 22). Influence of harvest year on free asparagine content
was also significant, with 45.6% more free asparagine in almond seeds from the 2003/2004
season (Table 20).

63
1
Table 12. Cultivar, geographic location, and harvest year variation on the essential amino acid composition of select almond seedsa
aAmino acid values are expressed as gram per 100 g protein and data are expressed as mean ± SEM (n = 3). For each column, means with different letters are significantly different (p � 0.05) according to Fisher’s LSD test. E/T (%) represents essential-to-total amino acid ratio and LEAA represents limiting essential amino acids based on the recommended pattern report of a joint FAO/WHO expert consultation (93) for bpre-school child (2-5 years) and cadult (18+ years).
LEAAb
LEAAc
Cultivar
Butte 4.02 ± 0.16 bc 2.39 ± 0.02 b 4.31 ± 0.06 bc 0.97 ± 0.04 b 2.92 ± 0.06 c 5.59 ± 0.07 c 6.23 ± 0.18 a 0.99 ± 0.04 c 1.19 ± 0.07 bc 28.62 bc Lys LysCarmel 3.35 ± 0.14 d 2.46 ± 0.04 ab 4.39 ± 0.05 b 1.13 ± 0.06 ab 2.99 ± 0.04 bc 5.93 ± 0.08 b 5.97 ± 0.14 ab 1.00 ± 0.03 c 1.05 ± 0.05 c 28.29 c Lys LysMission 3.36 ± 0.22 d 2.60 ± 0.06 a 4.80 ± 0.06 a 1.69 ± 0.13 a 3.20 ± 0.06 a 6.34 ± 0.08 a 5.18 ± 0.06 c 1.12 ± 0.04 bc 1.07 ± 0.05 c 29.35 ab Lys Lys
Monterey 2.44 ± 0.06 e 2.38 ± 0.03 b 3.95 ± 0.08 d 1.12 ± 0.05 ab 2.49 ± 0.03 e 5.17 ± 0.05 d 5.46 ± 0.09 c 0.70 ± 0.05 d 1.18 ± 0.02 bc 24.89 e Lys LysNonpareil 3.55 ± 0.14 cd 2.51 ± 0.05 ab 4.39 ± 0.06 b 1.13 ± 0.04 ab 2.94 ± 0.04 c 5.73 ± 0.07 bc 5.98 ± 0.14 ab 1.03 ± 0.04 bc 1.12 ± 0.04 bc 28.37 bc Lys Lys
Padre 4.49 ± 0.11 ab 2.37 ± 0.06 b 4.43 ± 0.03 b 1.12 ± 0.03 ab 3.14 ± 0.08 ab 5.85 ± 0.14 bc 5.35 ± 0.09 c 1.32 ± 0.09 a 1.30 ± 0.14 b 29.36 ab Lys LysPrice 4.72 ± 0.06 a 2.45 ± 0.04 b 4.44 ± 0.06 b 0.96 ± 0.02 b 3.21 ± 0.05 a 5.91 ± 0.09 b 5.60 ± 0.09 bc 1.17 ± 0.03 b 1.65 ± 0.07 a 30.10 a Lys Lys
Sonora 2.42 ± 0.02 e 2.45 ± 0.02 b 4.16 ± 0.07 c 1.15 ± 0.14 ab 2.72 ± 0.08 d 5.68 ± 0.18 bc 5.42 ± 0.15 c 0.68 ± 0.03 d 1.29 ± 0.07 b 25.96 d Lys LysLSD
County
Butte 3.66 ± 0.55 bc 2.26 ± 0.11 d 4.36 ± 0.02 de 0.99 ± 0.01 de 3.06 ± 0.02 bcde 5.89 ± 0.18 c 5.44 ± 0.09 def 1.00 ± 0.05 cd 0.78 ± 0.14 e 27.43 ef Lys LysColusa 3.81 ± 0.65 b 3.09 ± 0.13 a 4.90 ± 0.17 ab 1.86 ± 0.33 a 3.14 ± 0.10 bcd 6.09 ± 0.15 bc 5.02 ± 0.21 f 1.16 ± 0.06 bc 1.21 ± 0.20 abc 30.27 ab Lys LysFresno 2.96 ± 0.13 c 2.38 ± 0.05 c 4.28 ± 0.09 de 1.16 ± 0.08 cd 2.86 ± 0.08 ef 5.79 ± 0.17 c 5.95 ± 0.23 bc 0.96 ± 0.05 d 1.11 ± 0.06 bcd 27.46 def Lys LysGlenn 3.77 ± 0.06 bc 2.46 ± 0.08 cd 4.39 ± 0.01 cde 1.36 ± 0.02 bc 2.96 ± 0.03 de 5.82 ± 0.09 c 5.61 ± 0.10 cde 1.22 ± 0.08 b 0.78 ± 0.05 e 28.37 cde Lys LysKern 3.70 ± 0.51 bc 2.62 ± 0.17 bc 4.55 ± 0.11 cd 1.12 ± 0.04 cd 3.20 ± 0.07 abc 6.11 ± 0.05 bc 5.57 ± 0.13 cde 1.05 ± 0.04 cd 1.30 ± 0.24 ab 29.23 abc Lys Lys
Madera 4.07 ± 0.24 ab 2.44 ± 0.17 cd 4.53 ± 0.12 cd 1.32 ± 0.13 bc 3.08 ± 0.04 bcd 5.94 ± 0.01 c 5.06 ± 0.16 f 1.47 ± 0.07 a 0.99 ± 0.03 cde 28.91 bcde Lys LysMerced 4.90 ± 0.07 a 2.27 ± 0.06 d 4.66 ± 0.13 bc 0.99 ± 0.02 de 3.24 ± 0.05 ab 5.95 ± 0.07 c 5.87 ± 0.03 bcd 1.24 ± 0.08 b 1.47 ± 0.09 a 30.59 a Lys Met/Cys
Sacramento 2.97 ± 0.04 c 2.49 ± 0.04 bcd 4.17 ± 0.04 ef 0.72 ± 0.02 e 2.66 ± 0.06 fg 5.37 ± 0.14 d 7.77 ± 0.05 a 0.73 ± 0.04 e 0.91 ± 0.05 de 27.79 cde Lys LysSan Joaquin 3.33 ± 0.39 bc 2.73 ± 0.14 b 4.51 ± 0.17 cd 1.22 ± 0.06 bcd 3.17 ± 0.06 bc 6.39 ± 0.12 ab 5.61 ± 0.07 cde 1.06 ± 0.06 cd 1.07 ± 0.11 bcd 29.08 abcd Lys LysStanislaus 3.68 ± 0.36 bc 2.35 ± 0.05 d 4.20 ± 0.08 ef 1.12 ± 0.05 cd 3.00 ± 0.07 cde 5.82 ± 0.07 c 5.41 ± 0.08 def 1.09 ± 0.06 bcd 1.24 ± 0.04 abc 27.92 cde Lys Lys
Tulare 3.73 ± 0.50 bc 2.58 ± 0.17 bc 5.12 ± 0.11 a 1.44 ± 0.20 b 3.40 ± 0.12 a 6.59 ± 0.08 a 5.21 ± 0.12 ef 1.11 ± 0.05 bcd 1.41 ± 0.22 a 30.58 a Lys LysYolo 2.80 ± 0.08 c 2.37 ± 0.06 c 3.98 ± 0.03 f 1.01 ± 0.06 d 2.58 ± 0.03 g 5.21 ± 0.08 d 6.27 ± 0.37 b 0.75 ± 0.03 e 0.97 ± 0.05 cde 25.93 f Lys LysLSD
Region
North Valley 3.24 ± 0.12 b 2.51 ± 0.05 a 4.28 ± 0.05 b 1.05 ± 0.07 b 2.80 ± 0.04 b 5.56 ± 0.08 b 6.50 ± 0.18 a 0.89 ± 0.04 b 0.93 ± 0.04 b 27.78 b Lys LysSouth Valley 3.62 ± 0.14 a 2.47 ± 0.12 a 4.47 ± 0.05 a 1.19 ± 0.04 a 3.08 ± 0.04 a 6.03 ± 0.06 a 5.58 ± 0.07 b 1.10 ± 0.03 a 1.20 ± 0.04 a 28.74 a Lys Lys
LSD
Year
2003-2004 4.23 ± 0.23 a 2.43 ± 0.04 a 4.62 ± 0.07 a 1.24 ± 0.06 a 3.15 ± 0.07 a 6.08 ± 0.14 a 5.43 ± 0.11 b 1.18 ± 0.05 a 1.03 ± 0.06 a 29.39 a Lys Lys2005-2006 2.75 ± 0.05 b 2.35 ± 0.03 a 4.00 ± 0.03 b 1.01 ± 0.06 b 2.64 ± 0.03 b 5.35 ± 0.07 b 6.24 ± 0.23 a 0.80 ± 0.03 b 1.14 ± 0.05 a 26.29 b Lys Lys
LSD
0.15 0.19 0.61 0.17
0.37
0.29 0.58 0.11 0.160.39 0.10 0.14 0.18 0.14
0.190.110.140.150.12
His Thr Val Met Ile Leu Phe Lys Trp E/T
1.05
0.84 0.26 0.28 0.27 0.21 0.40 0.50 0.16 0.28 1.65
0.27 0.47 0.14 0.200.49
0.74
0.780.120.090.35

64
2
Table 13. Cultivar, geographic location, and harvest year variation on the non-essential amino acid composition of select almond seedsa
aAmino acid values are expressed as gram per 100 g protein and data are expressed as mean ± SEM (n = 3). For each column, means with different letters are significantly different (p � 0.05) according to Fisher’s LSD test.
Cultivar
Butte 8.06 ± 0.23 c 27.32 ± 0.43 bc 3.07 ± 0.04 abc 9.36 ± 0.24 b 7.59 ± 0.06 a 4.96 ± 0.07 b 7.87 ± 0.22 ab 2.86 ± 0.05 b 0.29 ± 0.01 b
Carmel 8.03 ± 0.21 c 28.24 ± 0.40 b 3.00 ± 0.04 c 8.94 ± 0.18 b 7.30 ± 0.08 bc 5.11 ± 0.07 ab 7.91 ± 0.16 ab 2.93 ± 0.09 b 0.25 ± 0.01 b
Mission 7.00 ± 0.33 d 26.94 ± 0.47 c 3.02 ± 0.06 c 9.57 ± 0.30 b 6.91 ± 0.09 d 5.16 ± 0.07 ab 8.06 ± 0.21 a 3.63 ± 0.21 a 0.36 ± 0.02 a
Monterey 11.49 ± 0.26 a 31.94 ± 0.12 a 3.02 ± 0.04 c 7.55 ± 0.07 c 6.30 ± 0.12 f 4.86 ± 0.05 c 7.01 ± 0.09 cd 2.75 ± 0.01 b 0.18 ± 0.01 c
Nonpareil 8.27 ± 0.27 c 28.49 ± 0.46 b 3.11 ± 0.04 abc 8.95 ± 0.19 b 7.20 ± 0.09 bc 5.01 ± 0.06 bc 7.63 ± 0.19 abc 2.69 ± 0.05 b 0.29 ± 0.01 b
Padre 7.96 ± 0.39 c 26.38 ± 0.38 c 3.19 ± 0.13 ab 10.47 ± 0.24 a 7.40 ± 0.11 ab 5.30 ± 0.15 a 6.79 ± 0.19 d 2.78 ± 0.04 b 0.36 ± 0.02 a
Price 7.72 ± 0.38 cd 26.12 ± 0.26 c 3.23 ± 0.06 a 10.50 ± 0.15 a 7.04 ± 0.09 cd 4.81 ± 0.06 c 7.40 ± 0.19 bcd 2.73 ± 0.04 b 0.37 ± 0.01 a
Sonora 9.75 ± 0.45 b 31.96 ± 0.18 a 3.05 ± 0.06 bc 7.31 ± 0.38 c 6.60 ± 0.10 e 5.11 ± 0.11 ab 7.37 ± 0.13 bcd 2.70 ± 0.05 b 0.19 ± 0.03 c
LSD
County
Butte 9.14 ± 0.26 ab 30.28 ± 1.18 ab 2.90 ± 0.13 c 8.86 ± 0.28 def 7.00 ± 0.05 bc 5.21 ± 0.08 bcd 6.31 ± 0.22 d 2.58 ± 0.08 de 0.30 ± 0.03 a
Colusa 5.28 ± 0.78 g 24.68 ± 1.71 e 3.43 ± 0.19 a 9.91 ± 0.74 abc 7.86 ± 0.66 a 4.61 ± 0.10 f 9.56 ± 0.47 a 4.08 ± 0.39 a 0.32 ± 0.01 a
Fresno 8.79 ± 0.24 abc 29.43 ± 0.69 abc 2.93 ± 0.07 c 8.31 ± 0.18 efg 6.99 ± 0.14 bc 5.24 ± 0.10 bcd 7.72 ± 0.19 b 2.89 ± 0.04 bcd 0.24 ± 0.01 bc
Glenn 8.96 ± 0.08 abc 27.23 ± 0.13 cde 3.11 ± 0.07 bc 9.35 ± 0.14 bcd 7.39 ± 0.17 abc 5.27 ± 0.19 bc 7.15 ± 0.25 bcd 2.85 ± 0.08 bcd 0.31 ± 0.01 a
Kern 6.79 ± 0.70 ef 28.36 ± 2.34 bcd 3.16 ± 0.14 abc 9.26 ± 0.71 cde 7.48 ± 0.33 ab 4.90 ± 0.06 def 7.79 ± 0.52 b 2.72 ± 0.18 de 0.31 ± 0.03 a
Madera 8.16 ± 0.70 bcd 26.21 ± 0.35 de 3.03 ± 0.12 bc 10.61 ± 0.26 a 7.30 ± 0.29 bc 5.49 ± 0.13 ab 7.28 ± 0.70 bc 2.70 ± 0.16 de 0.33 ± 0.04 a
Merced 7.39 ± 0.43 de 25.89 ± 0.25 de 2.95 ± 0.08 c 10.31 ± 0.18 ab 7.37 ± 0.06 abc 5.06 ± 0.07 cd 7.32 ± 0.16 bc 2.82 ± 0.02 cd 0.31 ± 0.01 a
Sacramento 8.08 ± 0.17 bcd 29.01 ± 0.28 abc 2.99 ± 0.05 c 8.16 ± 0.14 fg 7.53 ± 0.07 ab 4.69 ± 0.07 ef 9.12 ± 0.14 a 2.43 ± 0.05 e 0.21 ± 0.01 c
San Joaquin 7.75 ± 0.63 cde 27.77 ± 1.17 bcd 3.26 ± 0.10 ab 8.69 ± 0.48 defg 7.12 ± 0.14 bc 5.08 ± 0.04 cd 7.80 ± 0.21 b 3.17 ± 0.27 bc 0.29 ± 0.04 ab
Stanislaus 9.34 ± 0.52 ab 29.28 ± 0.91 abc 3.11 ± 0.07 bc 9.17 ± 0.41 cdef 6.85 ± 0.13 c 5.00 ± 0.08 cde 6.47 ± 0.27 cd 2.55 ± 0.05 de 0.30 ± 0.03 a
Tulare 5.71 ± 0.23 fg 26.00 ± 1.38 de 2.95 ± 0.21 c 9.95 ± 0.84 abc 7.46 ± 0.25 ab 5.76 ± 0.39 a 8.03 ± 0.21 b 3.21 ± 0.26 b 0.34 ± 0.01 a
Yolo 9.82 ± 0.54 a 31.35 ± 0.42 a 3.01 ± 0.05 bc 7.72 ± 0.13 g 7.02 ± 0.10 bc 4.95 ± 0.17 cdef 7.47 ± 0.53 b 2.51 ± 0.04 de 0.22 ± 0.02 c
LSD
Region
North Valley 8.32 ± 0.26 a 28.83 ± 0.42 a 3.06 ± 0.04 a 8.56 ± 0.16 b 7.38 ± 0.10 a 4.87 ± 0.06 b 8.21 ± 0.22 a 2.74 ± 0.10 a 0.25 ± 0.01 b
South Valley 8.03 ± 0.23 a 28.03 ± 0.43 a 3.05 ± 0.04 a 9.23 ± 0.19 a 7.15 ± 0.07 a 5.19 ± 0.06 a 7.43 ± 0.13 b 2.85 ± 0.06 a 0.29 ± 0.01 a
LSD
Year
2003-2004 7.39 ± 0.34 b 26.34 ± 0.59 b 3.06 ± 0.06 a 10.02 ± 0.34 a 7.53 ± 0.11 a 5.22 ± 0.08 a 7.81 ± 0.17 a 2.88 ± 0.03 a 0.35 ± 0.02 a
2005-2006 9.46 ± 0.21 a 30.74 ± 0.34 a 2.97 ± 0.05 a 7.92 ± 0.11 b 6.99 ± 0.10 b 4.96 ± 0.09 b 7.71 ± 0.30 a 2.75 ± 0.06 a 0.21 ± 0.01 b
LSD
0.24
Asx Glx Ser Arg Gly Ala
0.89 1.43 0.17 0.70 0.28
0.17 0.47
1.26 2.61 0.27 0.89 0.39 0.061.04 0.55 0.36
Pro Tyr Cys
0.64 0.29 0.05
0.21 0.03
0.75 1.26 0.15 0.61 0.30 0.25 0.77 0.16 0.04
0.67 1.20 0.12 0.49 0.23

65
3
aAmino acid values are expressed as gram per 100 g protein and data are expressed as mean ± SEM (n = 3). For each column, means with different letters are significantly different (p � 0.05) according to Fisher’s LSD test. E/T (%) represents essential-to-total amino acid ratio and LEAA represents limiting essential amino acids based on the recommended pattern report of a joint FAO/WHO expert consultation (93) for bpre-school child (2-5 years) and cadult (18+ years).
Table 14. Interaction of cultivar and geographic location on the essential amino acid composition of select almond seedsa
Cultivar County LEAAb
LEAAc
Butte 4.54 ± 0.03 bc 2.21 ± 0.01 d 4.19 ± 0.01 bcd 0.87 ± 0.02 ab 2.98 ± 0.03 c 5.55 ± 0.01 cd 5.36 ± 0.02 c 1.05 ± 0.02 bc 1.50 ± 0.02 b 28.26 d Lys LysFresno 3.27 ± 0.16 de 2.41 ± 0.03 bc 4.03 ± 0.11 cd 1.10 ± 0.15 a 2.54 ± 0.06 e 5.09 ± 0.11 e 6.23 ± 0.52 bc 0.91 ± 0.08 cd 0.95 ± 0.13 d 26.53 e Lys LysKern 4.06 ± 0.56 cd 2.48 ± 0.06 b 4.25 ± 0.09 bc 0.79 ± 0.08 ab 2.83 ± 0.09 cd 5.41 ± 0.14 de 6.84 ± 0.38 ab 0.69 ± 0.09 d 0.92 ± 0.08 d 28.27 d Lys Lys
Madera 5.22 ± 0.03 ab 2.34 ± 0.01 c 4.91 ± 0.00 a 1.00 ± 0.00 a 3.55 ± 0.01 a 6.10 ± 0.00 b 6.26 ± 0.01 bc 1.00 ± 0.00 c 1.09 ± 0.01 cd 31.45 ab Lys LysMerced 5.44 ± 0.03 a 2.42 ± 0.01 bc 4.39 ± 0.03 b 1.07 ± 0.06 a 2.98 ± 0.01 c 5.79 ± 0.06 bc 5.39 ± 0.03 c 1.26 ± 0.01 ab 2.06 ± 0.04 a 30.79 bc Lys Lys
Sacramento 3.04 ± 0.10 e 2.18 ± 0.04 d 3.98 ± 0.02 d 0.64 ± 0.00 b 2.66 ± 0.05 de 5.37 ± 0.05 de 7.73 ± 0.10 a 0.87 ± 0.16 cd 0.92 ± 0.09 d 27.38 de Lys Met/CysSan Joaquin 4.93 ± 0.03 ab 2.74 ± 0.02 a 5.00 ± 0.03 a 1.05 ± 0.04 a 3.23 ± 0.03 b 5.94 ± 0.02 b 5.37 ± 0.01 c 1.05 ± 0.01 bc 1.42 ± 0.04 b 30.73 bc Lys LysStanislaus 4.52 ± 0.03 bc 2.17 ± 0.02 d 4.44 ± 0.01 b 1.06 ± 0.00 a 3.31 ± 0.02 b 6.03 ± 0.03 b 5.58 ± 0.15 bc 1.42 ± 0.01 a 1.33 ± 0.04 bc 29.86 c Lys Lys
Tulare 4.91 ± 0.03 ab 2.45 ± 0.00 bc 4.83 ± 0.00 a 1.08 ± 0.00 a 3.56 ± 0.02 a 6.55 ± 0.02 a 5.64 ± 0.01 bc 1.41 ± 0.01 a 1.87 ± 0.02 a 32.31 a Lys Met/CysYolo 2.86 ± 0.13 e 2.36 ± 0.04 c 4.00 ± 0.05 cd 0.99 ± 0.08 ab 2.66 ± 0.06 de 5.44 ± 0.17 cde 6.76 ± 0.54 abc 0.86 ± 0.05 cd 0.93 ± 0.08 d 26.87 e Lys LysLSD
Butte 2.43 ± 0.04 gh 2.02 ± 0.01 g 4.31 ± 0.01 de 1.00 ± 0.03 d 3.10 ± 0.00 bcde 6.30 ± 0.02 abc 5.23 ± 0.01 cd 1.11 ± 0.00 bcde 0.47 ± 0.01 g 25.97 e Lys LysColusa 2.37 ± 0.05 h 2.81 ± 0.05 b 4.51 ± 0.02 cd 2.60 ± 0.03 a 2.92 ± 0.02 def 6.42 ± 0.03 ab 4.56 ± 0.01 d 1.29 ± 0.03 ab 0.76 ± 0.00 ef 28.24 c Lys LysFresno 2.72 ± 0.07 f 2.27 ± 0.05 ef 4.16 ± 0.06 ef 1.01 ± 0.08 d 2.87 ± 0.11 efg 5.86 ± 0.26 bcde 6.10 ± 0.37 b 0.99 ± 0.09 def 1.06 ± 0.09 bcd 27.04 d Lys LysGlenn 3.89 ± 0.06 c 2.65 ± 0.02 c 4.38 ± 0.00 de 1.40 ± 0.01 c 2.89 ± 0.01 defg 5.62 ± 0.01 de 5.76 ± 0.00 bc 1.03 ± 0.01 cde 0.66 ± 0.01 fg 28.28 c Lys LysKern 4.83 ± 0.04 b 3.00 ± 0.00 a 4.78 ± 0.01 bc 1.06 ± 0.01 d 3.34 ± 0.02 b 6.00 ± 0.04 bcd 5.87 ± 0.02 bc 1.14 ± 0.02 abcd 1.84 ± 0.01 a 31.86 a Lys Lys
Madera 3.54 ± 0.01 d 2.82 ± 0.01 b 4.79 ± 0.00 b 1.62 ± 0.02 b 3.00 ± 0.01 cde 5.96 ± 0.02 bcde 5.41 ± 0.01 bc 1.31 ± 0.01 a 0.93 ± 0.03 de 29.37 b Lys LysMerced 5.03 ± 0.04 a 2.39 ± 0.01 de 4.37 ± 0.00 de 0.98 ± 0.01 d 3.14 ± 0.01 bcd 5.80 ± 0.01 cde 5.82 ± 0.04 bc 1.06 ± 0.00 cde 1.28 ± 0.02 b 29.88 b Lys Lys
Sacramento 3.01 ± 0.03 e 2.49 ± 0.04 d 4.26 ± 0.05 de 0.67 ± 0.04 e 2.72 ± 0.07 fg 5.46 ± 0.16 de 7.71 ± 0.08 a 0.69 ± 0.06 g 0.98 ± 0.06 cde 27.99 cd Lys LysSan Joaquin 2.56 ± 0.04 fg 2.46 ± 0.07 d 4.28 ± 0.19 de 1.27 ± 0.08 c 3.09 ± 0.07 bcde 6.44 ± 0.19 ab 5.51 ± 0.07 bc 0.94 ± 0.03 ef 0.89 ± 0.09 de 27.44 cd Lys LysStanislaus 5.10 ± 0.03 a 2.49 ± 0.02 d 4.47 ± 0.00 d 0.94 ± 0.00 d 3.21 ± 0.01 bc 5.85 ± 0.01 bcde 5.42 ± 0.00 bc 1.06 ± 0.00 cde 1.16 ± 0.03 bc 29.70 b Lys Lys
Tulare 4.85 ± 0.04 b 2.20 ± 0.01 f 5.32 ± 0.05 a 1.03 ± 0.04 d 3.65 ± 0.03 a 6.74 ± 0.03 a 5.39 ± 0.01 bc 1.22 ± 0.01 abc 1.89 ± 0.04 a 32.28 a Lys LysYolo 2.66 ± 0.11 f 2.30 ± 0.04 ef 3.93 ± 0.01 f 1.00 ± 0.02 d 2.65 ± 0.04 g 5.36 ± 0.11 e 5.62 ± 0.05 bc 0.83 ± 0.03 fg 1.04 ± 0.04 cd 25.39 e Lys LysLSD
Butte 2.24 ± 0.02 d 3.05 ± 0.03 a 4.95 ± 0.02 ab 2.39 ± 0.05 b 3.03 ± 0.03 b 6.39 ± 0.01 ab 4.96 ± 0.01 cd 1.00 ± 0.01 b 0.77 ± 0.00 e 28.78 ab Lys LysColusa 2.45 ± 0.07 cd 3.08 ± 0.05 a 5.20 ± 0.03 a 2.69 ± 0.04 a 3.03 ± 0.02 b 6.42 ± 0.04 ab 4.72 ± 0.01 d 0.89 ± 0.01 b 0.96 ± 0.04 d 29.44 ab Lys LysFresno 2.43 ± 0.14 cd 2.44 ± 0.04 c 4.73 ± 0.08 bc 1.95 ± 0.08 c 3.15 ± 0.18 b 6.47 ± 0.12 ab 4.95 ± 0.09 cd 1.13 ± 0.01 ab 0.76 ± 0.01 e 28.02 b Lys LysGlenn 3.57 ± 0.06 bc 2.34 ± 0.01 c 4.51 ± 0.00 c 1.45 ± 0.01 d 3.04 ± 0.02 b 6.26 ± 0.03 ab 5.68 ± 0.13 a 1.34 ± 0.00 a 0.90 ± 0.02 d 29.09 ab Lys LysKern 2.35 ± 0.07 d 2.77 ± 0.05 b 4.93 ± 0.02 ab 2.40 ± 0.04 b 3.29 ± 0.02 ab 6.41 ± 0.04 ab 5.24 ± 0.02 bc 1.16 ± 0.01 ab 0.98 ± 0.01 d 29.52 ab Lys Lys
Merced 4.86 ± 0.02 a 2.72 ± 0.01 b 4.85 ± 0.01 abc 1.01 ± 0.01 f 3.35 ± 0.03 ab 6.06 ± 0.07 b 5.21 ± 0.02 bc 1.04 ± 0.01 b 1.33 ± 0.02 b 30.42 ab Lys LysSan Joaquin 4.58 ± 0.03 ab 2.29 ± 0.00 c 4.64 ± 0.01 bc 1.00 ± 0.01 f 3.63 ± 0.04 a 6.87 ± 0.09 a 5.46 ± 0.20 ab 1.37 ± 0.01 a 1.45 ± 0.04 a 31.29 a Lys Met/CysStanislaus 3.86 ± 0.59 ab 2.37 ± 0.08 c 4.69 ± 0.20 bc 1.17 ± 0.04 e 3.12 ± 0.22 b 6.09 ± 0.31 b 5.21 ± 0.10 bc 1.06 ± 0.14 b 1.23 ± 0.04 c 28.80 ab Lys Lys
LSD 0.130.420.191.21
0.62 0.73
0.310.640.48
0.19
0.26
0.360.270.12
0.15 0.28 0.20
Leu Phe Lys Trp
0.38
His Thr Val Met Ile
Mission
Carmel
Butte
0.86
0.18
E/T
1.260.320.241.43
0.20 0.23 0.97
2.650.100.28

66
4
Table 14 continued. Interaction of cultivar and geographic location on the essential amino acid composition of select almond seedsa
aAmino acid values are expressed as gram per 100 g protein and data are expressed as mean ± SEM (n = 3). For each column, means with different letters are significantly different (p � 0.05) according to Fisher’s LSD test. E/T (%) represents essential-to-total amino acid ratio and LEAA represents limiting essential amino acids based on the recommended pattern report of a joint FAO/WHO expert consultation (93) for bpre-school child (2-5 years) and cadult (18+ years).
Cultivar County LEAAb
LEAAc
Butte 4.88 ± 0.02 a 2.50 ± 0.01 cd 4.41 ± 0.00 cd 0.98 ± 0.01 d 3.02 ± 0.01 bc 5.48 ± 0.00 efg 5.64 ± 0.01 cde 0.90 ± 0.01 de 1.09 ± 0.01 cde 28.89 b Lys LysColusa 5.25 ± 0.09 a 3.36 ± 0.03 a 5.29 ± 0.01 a 1.13 ± 0.01 cd 3.35 ± 0.03 a 5.75 ± 0.01 cdef 5.48 ± 0.02 cde 1.02 ± 0.02 cd 1.66 ± 0.07 a 32.29 a Lys LysFresno 3.31 ± 0.26 bc 2.56 ± 0.07 c 4.46 ± 0.19 c 1.39 ± 0.11 b 2.86 ± 0.11 cd 5.69 ± 0.17 def 5.72 ± 0.04 cd 0.92 ± 0.03 de 1.20 ± 0.07 cd 28.11 bcd Lys LysGlenn 3.65 ± 0.04 b 2.27 ± 0.01 ef 4.41 ± 0.01 cd 1.32 ± 0.01 bc 3.04 ± 0.03 bc 6.03 ± 0.05 abcd 5.45 ± 0.15 cde 1.40 ± 0.00 b 0.90 ± 0.02 fg 28.46 bc Lys LysKern 2.57 ± 0.04 d 2.25 ± 0.00 efg 4.31 ± 0.00 cde 1.18 ± 0.06 cd 3.05 ± 0.01 bc 6.22 ± 0.02 abc 5.27 ± 0.01 def 0.96 ± 0.02 cd 0.76 ± 0.01 g 26.59 cd Lys Lys
Madera 4.60 ± 0.01 a 2.06 ± 0.01 g 4.26 ± 0.00 cdef 1.03 ± 0.00 d 3.16 ± 0.01 ab 5.92 ± 0.00 bcde 4.71 ± 0.01 f 1.64 ± 0.00 a 1.06 ± 0.00 def 28.44 bc Lys Met/CysMerced 4.76 ± 0.09 a 2.14 ± 0.01 fg 4.96 ± 0.02 b 1.01 ± 0.03 d 3.34 ± 0.03 a 6.11 ± 0.01 abcd 5.92 ± 0.01 c 1.42 ± 0.00 b 1.66 ± 0.07 a 31.30 a Lys Met/Cys
Sacramento 2.93 ± 0.08 bcd 2.49 ± 0.08 cd 4.08 ± 0.05 ef 0.76 ± 0.02 e 2.60 ± 0.10 de 5.28 ± 0.23 fg 7.83 ± 0.07 a 0.78 ± 0.04 ef 0.84 ± 0.07 g 27.59 bcd Lys LysSan Joaquin 4.88 ± 0.05 a 3.28 ± 0.01 a 4.96 ± 0.07 b 1.12 ± 0.04 cd 3.34 ± 0.03 a 6.29 ± 0.02 ab 5.81 ± 0.00 cd 1.30 ± 0.01 b 1.43 ± 0.05 b 32.40 a Lys LysStanislaus 3.21 ± 0.36 bcd 2.30 ± 0.05 def 4.12 ± 0.10 def 1.18 ± 0.06 cd 2.93 ± 0.08 bc 5.80 ± 0.09 bcde 5.41 ± 0.10 cde 1.10 ± 0.09 c 1.27 ± 0.05 bc 27.32 bcd Lys Lys
Tulare 2.60 ± 0.07 cd 2.96 ± 0.01 b 4.93 ± 0.13 b 1.85 ± 0.15 a 3.15 ± 0.12 ab 6.44 ± 0.10 a 5.02 ± 0.21 ef 1.01 ± 0.00 cd 0.92 ± 0.01 efg 28.88 b Lys LysYolo 2.87 ± 0.10 cd 2.41 ± 0.09 cde 4.00 ± 0.05 f 1.02 ± 0.09 d 2.54 ± 0.04 e 5.13 ± 0.10 g 6.60 ± 0.51 b 0.71 ± 0.04 f 0.93 ± 0.06 efg 26.20 d Lys LysLSD
Butte 4.48 ± 0.01 d 2.46 ± 0.00 c 4.22 ± 0.00 d 0.97 ± 0.01 f 2.98 ± 0.00 c 5.54 ± 0.01 d 5.27 ± 0.01 a 1.07 ± 0.00 d 1.07 ± 0.02 c 28.05 d Lys LysFresno 4.75 ± 0.03 c 1.90 ± 0.01 f 4.69 ± 0.04 a 0.99 ± 0.01 ef 3.31 ± 0.02 b 5.90 ± 0.09 c 5.17 ± 0.14 a 1.43 ± 0.00 c 1.42 ± 0.01 b 29.55 c Lys Met/CysKern 3.86 ± 0.09 f 2.23 ± 0.02 d 4.51 ± 0.04 b 1.37 ± 0.01 a 2.83 ± 0.01 e 5.45 ± 0.06 d 5.00 ± 0.61 a 1.03 ± 0.00 e 0.73 ± 0.00 d 27.02 e Lys Lys
Merced 4.12 ± 0.03 e 2.63 ± 0.02 a 4.27 ± 0.00 d 1.22 ± 0.02 b 2.73 ± 0.00 f 5.31 ± 0.01 e 5.53 ± 0.00 a 0.87 ± 0.00 f 0.74 ± 0.01 d 27.43 e Lys LysSan Joaquin 5.01 ± 0.05 b 2.07 ± 0.01 e 4.40 ± 0.00 c 1.02 ± 0.02 e 3.32 ± 0.05 b 6.17 ± 0.02 b 5.34 ± 0.01 a 1.54 ± 0.01 b 1.44 ± 0.03 b 30.30 b Lys Met/CysStanislaus 3.99 ± 0.04 ef 2.66 ± 0.03 a 4.50 ± 0.01 b 1.16 ± 0.02 c 3.90 ± 0.02 a 7.25 ± 0.03 a 5.51 ± 0.04 a 2.19 ± 0.01 a 2.65 ± 0.00 a 33.82 a Lys
Tulare 5.24 ± 0.05 a 2.61 ± 0.01 b 4.42 ± 0.00 c 1.11 ± 0.01 d 2.91 ± 0.01 d 5.31 ± 0.01 e 5.60 ± 0.02 a 1.08 ± 0.00 d 1.08 ± 0.04 c 29.35 c Lys LysLSD
Butte 4.94 ± 0.03 a 2.65 ± 0.02 a 4.63 ± 0.00 b 0.96 ± 0.01 c 3.19 ± 0.01 d 5.56 ± 0.01 e 5.88 ± 0.01 c 1.15 ± 0.01 cd 1.77 ± 0.02 c 30.72 c Lys LysFresno 4.86 ± 0.02 ab 2.65 ± 0.03 a 4.85 ± 0.01 a 0.96 ± 0.01 c 3.56 ± 0.02 a 6.33 ± 0.03 a 6.04 ± 0.02 b 1.18 ± 0.01 c 2.22 ± 0.05 a 32.65 a Lys LysKern 4.76 ± 0.03 b 2.55 ± 0.01 b 4.48 ± 0.00 c 0.97 ± 0.00 c 3.40 ± 0.01 b 6.32 ± 0.01 a 6.17 ± 0.01 a 1.11 ± 0.01 d 1.41 ± 0.03 e 31.19 b Lys Lys
Merced 4.16 ± 0.10 d 2.12 ± 0.03 e 4.43 ± 0.00 d 1.05 ± 0.00 a 3.28 ± 0.01 c 6.17 ± 0.02 b 4.95 ± 0.03 f 1.35 ± 0.05 a 1.49 ± 0.08 e 29.01 f Lys LysSan Joaquin 4.98 ± 0.05 a 2.37 ± 0.01 c 4.01 ± 0.00 g 0.83 ± 0.00 e 2.84 ± 0.01 f 5.21 ± 0.01 f 5.65 ± 0.01 d 0.85 ± 0.00 e 1.12 ± 0.01 f 27.85 g Lys LysStanislaus 4.55 ± 0.03 c 2.58 ± 0.01 b 4.40 ± 0.00 e 1.03 ± 0.01 b 2.95 ± 0.03 e 5.69 ± 0.01 d 5.26 ± 0.00 e 1.27 ± 0.01 b 1.62 ± 0.04 d 29.35 e Lys Lys
Tulare 4.78 ± 0.04 b 2.23 ± 0.02 d 4.26 ± 0.01 f 0.93 ± 0.01 d 3.24 ± 0.00 c 6.05 ± 0.02 c 5.28 ± 0.01 e 1.27 ± 0.01 b 1.90 ± 0.04 b 29.94 d Lys Met/CysLSD 0.05 0.05 0.04
Price
0.15 0.06 0.02 0.02
Nonpareil
Padre
0.040.070.050.15
His Thr Val Met Ile Leu Phe Lys Trp E/T
0.72
0.73 0.21 0.31 0.21 0.27 0.50 0.64
0.130.07
0.20
1.98
0.620.060.02
0.18 0.19
0.06 0.13
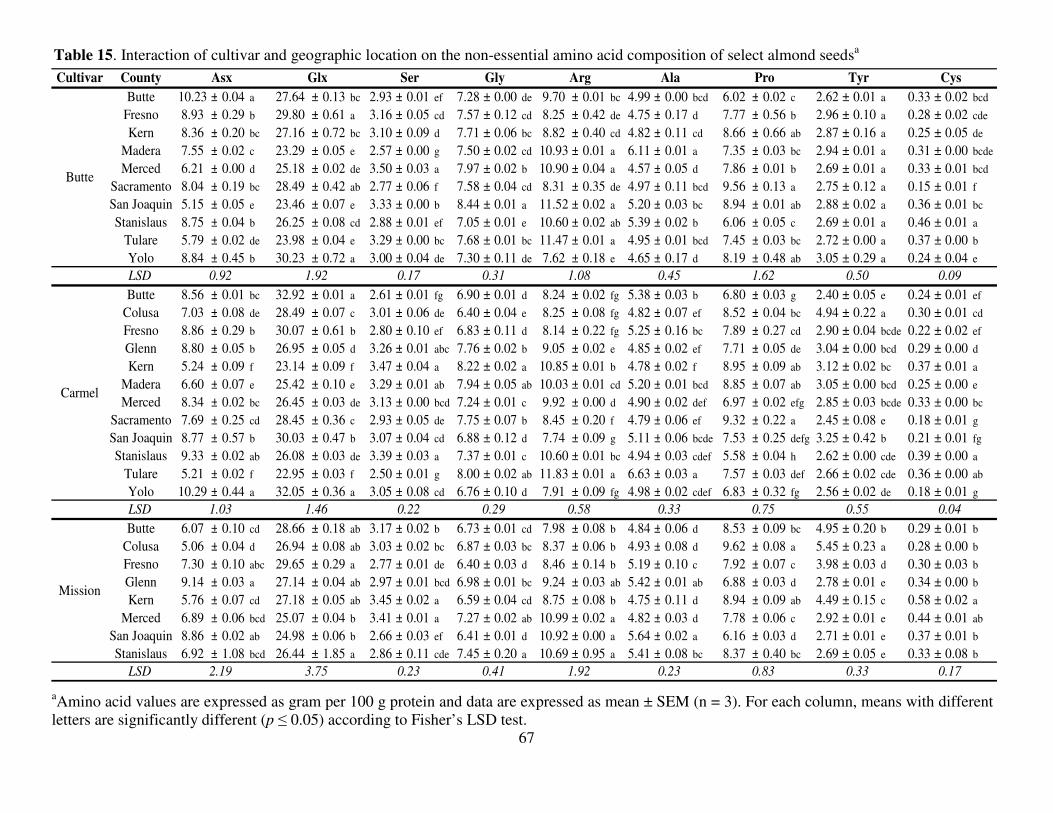
67
5
Table 15. Interaction of cultivar and geographic location on the non-essential amino acid composition of select almond seedsa
aAmino acid values are expressed as gram per 100 g protein and data are expressed as mean ± SEM (n = 3). For each column, means with different letters are significantly different (p � 0.05) according to Fisher’s LSD test.
Cultivar County
Butte 10.23 ± 0.04 a 27.64 ± 0.13 bc 2.93 ± 0.01 ef 7.28 ± 0.00 de 9.70 ± 0.01 bc 4.99 ± 0.00 bcd 6.02 ± 0.02 c 2.62 ± 0.01 a 0.33 ± 0.02 bcd
Fresno 8.93 ± 0.29 b 29.80 ± 0.61 a 3.16 ± 0.05 cd 7.57 ± 0.12 cd 8.25 ± 0.42 de 4.75 ± 0.17 d 7.77 ± 0.56 b 2.96 ± 0.10 a 0.28 ± 0.02 cde
Kern 8.36 ± 0.20 bc 27.16 ± 0.72 bc 3.10 ± 0.09 d 7.71 ± 0.06 bc 8.82 ± 0.40 cd 4.82 ± 0.11 cd 8.66 ± 0.66 ab 2.87 ± 0.16 a 0.25 ± 0.05 de
Madera 7.55 ± 0.02 c 23.29 ± 0.05 e 2.57 ± 0.00 g 7.50 ± 0.02 cd 10.93 ± 0.01 a 6.11 ± 0.01 a 7.35 ± 0.03 bc 2.94 ± 0.01 a 0.31 ± 0.00 bcde
Merced 6.21 ± 0.00 d 25.18 ± 0.02 de 3.50 ± 0.03 a 7.97 ± 0.02 b 10.90 ± 0.04 a 4.57 ± 0.05 d 7.86 ± 0.01 b 2.69 ± 0.01 a 0.33 ± 0.01 bcd
Sacramento 8.04 ± 0.19 bc 28.49 ± 0.42 ab 2.77 ± 0.06 f 7.58 ± 0.04 cd 8.31 ± 0.35 de 4.97 ± 0.11 bcd 9.56 ± 0.13 a 2.75 ± 0.12 a 0.15 ± 0.01 f
San Joaquin 5.15 ± 0.05 e 23.46 ± 0.07 e 3.33 ± 0.00 b 8.44 ± 0.01 a 11.52 ± 0.02 a 5.20 ± 0.03 bc 8.94 ± 0.01 ab 2.88 ± 0.02 a 0.36 ± 0.01 bc
Stanislaus 8.75 ± 0.04 b 26.25 ± 0.08 cd 2.88 ± 0.01 ef 7.05 ± 0.01 e 10.60 ± 0.02 ab 5.39 ± 0.02 b 6.06 ± 0.05 c 2.69 ± 0.01 a 0.46 ± 0.01 a
Tulare 5.79 ± 0.02 de 23.98 ± 0.04 e 3.29 ± 0.00 bc 7.68 ± 0.01 bc 11.47 ± 0.01 a 4.95 ± 0.01 bcd 7.45 ± 0.03 bc 2.72 ± 0.00 a 0.37 ± 0.00 b
Yolo 8.84 ± 0.45 b 30.23 ± 0.72 a 3.00 ± 0.04 de 7.30 ± 0.11 de 7.62 ± 0.18 e 4.65 ± 0.17 d 8.19 ± 0.48 ab 3.05 ± 0.29 a 0.24 ± 0.04 e
LSD
Butte 8.56 ± 0.01 bc 32.92 ± 0.01 a 2.61 ± 0.01 fg 6.90 ± 0.01 d 8.24 ± 0.02 fg 5.38 ± 0.03 b 6.80 ± 0.03 g 2.40 ± 0.05 e 0.24 ± 0.01 ef
Colusa 7.03 ± 0.08 de 28.49 ± 0.07 c 3.01 ± 0.06 de 6.40 ± 0.04 e 8.25 ± 0.08 fg 4.82 ± 0.07 ef 8.52 ± 0.04 bc 4.94 ± 0.22 a 0.30 ± 0.01 cd
Fresno 8.86 ± 0.29 b 30.07 ± 0.61 b 2.80 ± 0.10 ef 6.83 ± 0.11 d 8.14 ± 0.22 fg 5.25 ± 0.16 bc 7.89 ± 0.27 cd 2.90 ± 0.04 bcde 0.22 ± 0.02 ef
Glenn 8.80 ± 0.05 b 26.95 ± 0.05 d 3.26 ± 0.01 abc 7.76 ± 0.02 b 9.05 ± 0.02 e 4.85 ± 0.02 ef 7.71 ± 0.05 de 3.04 ± 0.00 bcd 0.29 ± 0.00 d
Kern 5.24 ± 0.09 f 23.14 ± 0.09 f 3.47 ± 0.04 a 8.22 ± 0.02 a 10.85 ± 0.01 b 4.78 ± 0.02 f 8.95 ± 0.09 ab 3.12 ± 0.02 bc 0.37 ± 0.01 a
Madera 6.60 ± 0.07 e 25.42 ± 0.10 e 3.29 ± 0.01 ab 7.94 ± 0.05 ab 10.03 ± 0.01 cd 5.20 ± 0.01 bcd 8.85 ± 0.07 ab 3.05 ± 0.00 bcd 0.25 ± 0.00 e
Merced 8.34 ± 0.02 bc 26.45 ± 0.03 de 3.13 ± 0.00 bcd 7.24 ± 0.01 c 9.92 ± 0.00 d 4.90 ± 0.02 def 6.97 ± 0.02 efg 2.85 ± 0.03 bcde 0.33 ± 0.00 bc
Sacramento 7.69 ± 0.25 cd 28.45 ± 0.36 c 2.93 ± 0.05 de 7.75 ± 0.07 b 8.45 ± 0.20 f 4.79 ± 0.06 ef 9.32 ± 0.22 a 2.45 ± 0.08 e 0.18 ± 0.01 g
San Joaquin 8.77 ± 0.57 b 30.03 ± 0.47 b 3.07 ± 0.04 cd 6.88 ± 0.12 d 7.74 ± 0.09 g 5.11 ± 0.06 bcde 7.53 ± 0.25 defg 3.25 ± 0.42 b 0.21 ± 0.01 fg
Stanislaus 9.33 ± 0.02 ab 26.08 ± 0.03 de 3.39 ± 0.03 a 7.37 ± 0.01 c 10.60 ± 0.01 bc 4.94 ± 0.03 cdef 5.58 ± 0.04 h 2.62 ± 0.00 cde 0.39 ± 0.00 a
Tulare 5.21 ± 0.02 f 22.95 ± 0.03 f 2.50 ± 0.01 g 8.00 ± 0.02 ab 11.83 ± 0.01 a 6.63 ± 0.03 a 7.57 ± 0.03 def 2.66 ± 0.02 cde 0.36 ± 0.00 ab
Yolo 10.29 ± 0.44 a 32.05 ± 0.36 a 3.05 ± 0.08 cd 6.76 ± 0.10 d 7.91 ± 0.09 fg 4.98 ± 0.02 cdef 6.83 ± 0.32 fg 2.56 ± 0.02 de 0.18 ± 0.01 g
LSD
Butte 6.07 ± 0.10 cd 28.66 ± 0.18 ab 3.17 ± 0.02 b 6.73 ± 0.01 cd 7.98 ± 0.08 b 4.84 ± 0.06 d 8.53 ± 0.09 bc 4.95 ± 0.20 b 0.29 ± 0.01 b
Colusa 5.06 ± 0.04 d 26.94 ± 0.08 ab 3.03 ± 0.02 bc 6.87 ± 0.03 bc 8.37 ± 0.06 b 4.93 ± 0.08 d 9.62 ± 0.08 a 5.45 ± 0.23 a 0.28 ± 0.00 b
Fresno 7.30 ± 0.10 abc 29.65 ± 0.29 a 2.77 ± 0.01 de 6.40 ± 0.03 d 8.46 ± 0.14 b 5.19 ± 0.10 c 7.92 ± 0.07 c 3.98 ± 0.03 d 0.30 ± 0.03 b
Glenn 9.14 ± 0.03 a 27.14 ± 0.04 ab 2.97 ± 0.01 bcd 6.98 ± 0.01 bc 9.24 ± 0.03 ab 5.42 ± 0.01 ab 6.88 ± 0.03 d 2.78 ± 0.01 e 0.34 ± 0.00 b
Kern 5.76 ± 0.07 cd 27.18 ± 0.05 ab 3.45 ± 0.02 a 6.59 ± 0.04 cd 8.75 ± 0.08 b 4.75 ± 0.11 d 8.94 ± 0.09 ab 4.49 ± 0.15 c 0.58 ± 0.02 a
Merced 6.89 ± 0.06 bcd 25.07 ± 0.04 b 3.41 ± 0.01 a 7.27 ± 0.02 ab 10.99 ± 0.02 a 4.82 ± 0.03 d 7.78 ± 0.06 c 2.92 ± 0.01 e 0.44 ± 0.01 ab
San Joaquin 8.86 ± 0.02 ab 24.98 ± 0.06 b 2.66 ± 0.03 ef 6.41 ± 0.01 d 10.92 ± 0.00 a 5.64 ± 0.02 a 6.16 ± 0.03 d 2.71 ± 0.01 e 0.37 ± 0.01 b
Stanislaus 6.92 ± 1.08 bcd 26.44 ± 1.85 a 2.86 ± 0.11 cde 7.45 ± 0.20 a 10.69 ± 0.95 a 5.41 ± 0.08 bc 8.37 ± 0.40 bc 2.69 ± 0.05 e 0.33 ± 0.08 b
LSD
0.04
0.17
Mission
Butte
Carmel
0.550.750.331.461.03
2.19 3.75 0.23
Gly Arg
0.580.290.22
Ala Pro Tyr Cys
0.92 1.92 0.17 0.31 1.08 0.45 1.62 0.50 0.09
Asx Glx Ser
0.41 1.92 0.23 0.83 0.33

68
6
Table 15 continued. Interaction of cultivar and geographic location on the non-essential amino acid composition of select almond seedsa
aAmino acid values are expressed as gram per 100 g protein and data are expressed as mean ± SEM (n = 3). For each column, means with different letters are significantly different (p � 0.05) according to Fisher’s LSD test.
Cultivar County
Butte 9.73 ± 0.03 a 27.64 ± 0.04 cde 3.19 ± 0.00 c 7.10 ± 0.01 cdef 9.48 ± 0.01 cd 5.04 ± 0.02 b 5.81 ± 0.02 g 2.76 ± 0.00 de 0.37 ± 0.00 bc
Colusa 3.54 ± 0.05 e 20.86 ± 0.10 g 3.84 ± 0.01 a 9.33 ± 0.00 a 11.57 ± 0.04 a 4.39 ± 0.04 d 10.60 ± 0.07 a 3.23 ± 0.01 b 0.34 ± 0.01 cd
Fresno 8.70 ± 0.44 ab 28.46 ± 1.46 bcd 3.13 ± 0.04 cd 7.24 ± 0.29 bcd 8.56 ± 0.28 ef 5.23 ± 0.10 b 7.45 ± 0.22 cdef 2.88 ± 0.09 cd 0.26 ± 0.02 ef
Glenn 9.12 ± 0.04 a 27.51 ± 0.09 cde 2.97 ± 0.01 def 7.01 ± 0.01 defg 9.65 ± 0.04 c 5.68 ± 0.04 a 6.58 ± 0.05 fg 2.67 ± 0.00 ef 0.34 ± 0.01 cd
Kern 8.35 ± 0.05 ab 33.59 ± 0.08 a 2.84 ± 0.01 ef 6.74 ± 0.01 efg 7.67 ± 0.07 fg 5.03 ± 0.01 b 6.64 ± 0.06 efg 2.31 ± 0.02 h 0.25 ± 0.00 f
Madera 9.72 ± 0.03 a 27.00 ± 0.03 de 2.77 ± 0.00 f 6.66 ± 0.01 g 11.19 ± 0.00 ab 5.77 ± 0.02 a 5.70 ± 0.02 g 2.34 ± 0.00 gh 0.41 ± 0.00 ab
Merced 6.43 ± 0.05 cd 25.34 ± 0.08 ef 2.78 ± 0.00 f 7.50 ± 0.03 bc 10.71 ± 0.01 ab 5.22 ± 0.01 b 7.67 ± 0.02 cde 2.78 ± 0.00 de 0.28 ± 0.01 def
Sacramento 8.48 ± 0.15 ab 29.56 ± 0.35 bc 3.04 ± 0.09 cde 7.30 ± 0.06 bcd 7.87 ± 0.13 efg 4.58 ± 0.12 cd 8.92 ± 0.15 b 2.40 ± 0.05 gh 0.25 ± 0.01 f
San Joaquin 5.70 ± 0.02 d 23.26 ± 0.06 fg 3.64 ± 0.00 a 7.60 ± 0.01 b 10.58 ± 0.03 b 5.02 ± 0.01 b 8.34 ± 0.03 bc 3.01 ± 0.01 c 0.44 ± 0.01 a
Stanislaus 7.34 ± 0.70 bc 30.35 ± 0.98 b 3.02 ± 0.07 cde 6.68 ± 0.14 fg 8.70 ± 0.44 de 5.02 ± 0.11 b 6.76 ± 0.31 defg 2.53 ± 0.06 fg 0.27 ± 0.03 ef
Tulare 6.21 ± 0.11 cd 29.06 ± 0.37 bcd 3.41 ± 0.09 b 6.91 ± 0.10 defg 8.06 ± 0.12 efg 4.89 ± 0.08 bc 8.49 ± 0.08 bc 3.77 ± 0.15 a 0.32 ± 0.00 cde
Yolo 9.58 ± 0.80 a 31.00 ± 0.58 b 3.00 ± 0.07 cde 7.15 ± 0.10 cde 7.63 ± 0.18 g 4.93 ± 0.27 bc 7.78 ± 0.77 cd 2.49 ± 0.05 fgh 0.23 ± 0.02 f
LSD
Butte 10.61 ± 0.04 a 28.07 ± 0.03 a 3.47 ± 0.00 c 6.55 ± 0.01 f 9.91 ± 0.01 e 4.74 ± 0.00 e 5.50 ± 0.03 f 2.67 ± 0.00 d 0.43 ± 0.01 b
Fresno 8.67 ± 0.01 c 25.34 ± 0.02 c 2.04 ± 0.00 f 6.91 ± 0.02 e 11.70 ± 0.01 b 6.79 ± 0.03 a 6.16 ± 0.00 e 2.57 ± 0.00 f 0.27 ± 0.00 e
Kern 8.35 ± 0.14 d 27.83 ± 0.29 a 2.97 ± 0.02 d 8.12 ± 0.07 a 9.34 ± 0.05 f 5.45 ± 0.02 b 7.70 ± 0.04 b 2.99 ± 0.02 a 0.23 ± 0.00 f
Merced 9.08 ± 0.04 b 28.17 ± 0.03 a 3.67 ± 0.01 b 7.79 ± 0.02 b 8.97 ± 0.04 g 4.81 ± 0.04 e 7.01 ± 0.04 d 2.78 ± 0.00 c 0.29 ± 0.00 e
San Joaquin 6.73 ± 0.04 f 25.37 ± 0.10 c 2.93 ± 0.02 e 7.43 ± 0.01 c 11.21 ± 0.01 c 5.17 ± 0.03 d 7.87 ± 0.05 a 2.61 ± 0.01 e 0.40 ± 0.01 c
Stanislaus 4.71 ± 0.03 g 23.22 ± 0.02 d 3.83 ± 0.00 a 7.70 ± 0.01 b 11.94 ± 0.02 a 5.37 ± 0.04 c 6.02 ± 0.03 e 2.84 ± 0.02 b 0.55 ± 0.02 a
Tulare 7.55 ± 0.13 e 26.67 ± 0.06 b 3.46 ± 0.01 c 7.32 ± 0.03 d 10.23 ± 0.03 d 4.78 ± 0.03 e 7.26 ± 0.12 c 3.02 ± 0.01 a 0.37 ± 0.01 d
LSD
Butte 6.90 ± 0.02 d 25.83 ± 0.02 c 3.42 ± 0.01 b 7.31 ± 0.02 b 10.23 ± 0.00 c 4.57 ± 0.03 e 7.89 ± 0.03 b 2.79 ± 0.00 c 0.34 ± 0.01 d
Fresno 5.34 ± 0.04 g 24.34 ± 0.08 e 3.01 ± 0.01 ef 7.61 ± 0.02 a 10.90 ± 0.02 b 4.97 ± 0.02 b 7.88 ± 0.05 b 2.96 ± 0.00 b 0.33 ± 0.01 de
Kern 6.41 ± 0.02 f 25.25 ± 0.01 d 3.30 ± 0.01 c 7.36 ± 0.00 b 9.92 ± 0.01 d 4.88 ± 0.02 c 8.29 ± 0.01 a 3.03 ± 0.00 a 0.36 ± 0.01 c
Merced 9.25 ± 0.06 b 27.29 ± 0.10 b 2.97 ± 0.03 f 6.47 ± 0.03 f 10.92 ± 0.04 b 5.20 ± 0.04 a 6.02 ± 0.02 d 2.46 ± 0.00 g 0.41 ± 0.00 b
San Joaquin 10.35 ± 0.02 a 27.69 ± 0.02 a 3.10 ± 0.01 d 6.82 ± 0.02 d 9.85 ± 0.01 e 4.65 ± 0.02 d 6.74 ± 0.03 c 2.63 ± 0.00 e 0.33 ± 0.00 de
Stanislaus 9.07 ± 0.02 c 27.16 ± 0.04 b 3.72 ± 0.02 a 6.54 ± 0.01 e 9.95 ± 0.01 d 4.43 ± 0.01 f 6.67 ± 0.02 c 2.64 ± 0.00 d 0.48 ± 0.01 a
Tulare 6.71 ± 0.00 e 25.26 ± 0.05 d 3.05 ± 0.02 e 7.19 ± 0.01 c 11.71 ± 0.01 a 4.94 ± 0.04 b 8.28 ± 0.02 a 2.59 ± 0.00 f 0.32 ± 0.01 e
LSD 0.10 0.17
Nonpareil
Padre
Price
1.64 2.56
0.360.23
0.05 0.02
0.20 0.07
0.030.040.170.08
0.22 0.44 0.90
0.090.100.04
Ala Pro Tyr Cys
0.43 1.09
Asx Glx Ser Gly Arg
0.06 0.06 0.08 0.08 0.01

69
7
Table 16. Amino acid composition of select macadamia nut seedsa
aAmino acid values are expressed as gram per 100 g protein and data are reported as mean ± SEM (n = 3). For each row, means with different letters are significantly different (p � 0.05) according to Fisher’s LSD test. LEAA represents limiting essential amino acids based on the recommended pattern report of a joint FAO/WHO expert consultation (93) for bpre-school child (2-5 years) and cadult (18+ years). E/T (%) represents essential-to-total amino acid ratio. dAmino acid distribution.
Amino Acid LSD
Asx 8.93 ± 0.05 a 8.19 ± 0.15 cd 8.79 ± 0.06 ab 7.80 ± 0.10 d 8.51 ± 0.25 abc 8.28 ± 0.35 bc 8.01 ± 0.24 cd 0.58
Glx 31.56 ± 0.21 a 32.00 ± 0.34 a 31.29 ± 0.04 a 27.48 ± 0.19 c 28.18 ± 0.42 bc 28.80 ± 0.63 b 31.05 ± 0.46 a 1.09
Ser 3.77 ± 0.13 c 4.11 ± 0.09 bc 4.19 ± 0.14 ab 4.55 ± 0.03 a 4.09 ± 0.13 bc 3.79 ± 0.17 bc 3.34 ± 0.22 d 0.42
Gly 5.10 ± 0.04 c 5.51 ± 0.01 b 5.50 ± 0.09 b 6.32 ± 0.07 a 5.67 ± 0.17 b 5.75 ± 0.18 b 5.00 ± 0.10 c 0.32
His 2.94 ± 0.14 b 2.93 ± 0.05 b 2.98 ± 0.15 b 3.34 ± 0.06 a 3.12 ± 0.14 ab 3.05 ± 0.09 abc 2.80 ± 0.06 c 0.32
Arg 10.52 ± 0.11 b 10.51 ± 0.32 b 10.23 ± 0.14 bc 9.44 ± 0.08 c 10.59 ± 0.25 b 10.48 ± 0.55 b 11.53 ± 0.46 a 0.93
Thr 2.77 ± 0.11 b 2.97 ± 0.07 b 3.12 ± 0.15 b 4.07 ± 0.07 a 3.73 ± 0.20 a 3.64 ± 0.16 a 2.71 ± 0.26 b 0.46
Ala 4.69 ± 0.13 ab 4.29 ± 0.02 b 4.71 ± 0.14 ab 4.83 ± 0.08 ab 4.97 ± 0.22 a 4.59 ± 0.38 ab 4.97 ± 0.21 a 0.58
Pro 7.30 ± 0.04 b 7.23 ± 0.22 b 7.03 ± 0.37 b 8.31 ± 0.12 a 7.19 ± 0.21 b 8.12 ± 0.41 a 6.93 ± 0.33 b 0.80
Tyr 3.81 ± 0.03 b 4.75 ± 0.11 a 4.28 ± 0.08 ab 4.37 ± 0.14 ab 4.21 ± 0.28 ab 4.03 ± 0.31 ab 4.29 ± 0.54 ab 0.78
Val 4.07 ± 0.04 d 4.01 ± 0.03 d 4.08 ± 0.07 d 4.69 ± 0.02 a 4.48 ± 0.08 b 4.59 ± 0.03 ab 4.23 ± 0.06 c 0.15
Met 1.78 ± 0.05 b 1.78 ± 0.02 b 1.79 ± 0.01 b 2.11 ± 0.03 a 2.10 ± 0.04 a 2.13 ± 0.05 a 1.92 ± 0.10 b 0.15
Cys 0.72 ± 0.07 abc 0.88 ± 0.02 a 0.80 ± 0.08 ab 0.76 ± 0.01 ab 0.73 ± 0.10 ab 0.53 ± 0.07 c 0.66 ± 0.07 bc 0.20
Ile 2.40 ± 0.09 a 2.15 ± 0.02 b 2.20 ± 0.07 b 2.42 ± 0.03 a 2.47 ± 0.05 a 2.56 ± 0.07 a 2.56 ± 0.08 a 0.18
Leu 5.08 ± 0.18 ab 4.48 ± 0.08 d 4.63 ± 0.10 cd 4.73 ± 0.06 bcd 4.96 ± 0.12 abc 5.06 ± 0.16 ab 5.12 ± 0.13 a 0.36
Phe 2.99 ± 0.03 d 3.08 ± 0.01 cd 3.08 ± 0.07 cd 3.58 ± 0.03 a 3.40 ± 0.16 ab 3.28 ± 0.18 bc 3.16 ± 0.05 bcd 0.29
Lys 1.08 ± 0.06 ab 0.69 ± 0.10 c 0.70 ± 0.06 c 0.47 ± 0.02 c 0.75 ± 0.13 bc 0.76 ± 0.19 bc 1.12 ± 0.17 a 0.35
Trp 0.47 ± 0.03 c 0.45 ± 0.02 c 0.60 ± 0.05 b 0.74 ± 0.00 a 0.83 ± 0.06 a 0.54 ± 0.00 bc 0.60 ± 0.04 b 0.10
LEAAb (2-5 yr)
First
Second
Third
LEAAc (18+ yr)
First
Second
Third
AADd (%)
Hydrophobic
Hydrophilic
Acidic
Basic
E/T c d c a a a b 0.61
LysTrpLeu
#508
'Kakea'
#660
'Keaau'
#741
'Mauka'
Blue
Diamond
Trader
Joe's
#246
'Keauhou'
#294
'Purvis'
LysTrpLeu
LysTrpLeu
LysTrpLeu
LysLeuTrp
LysTrpLeu
LysTrpLeu
41.02
LysTrp
LysTrp
Lys Lys
40.1914.13
Lys Lys Lys
38.426.5540.49
38.697.31
42.858.63
35.2813.2526.14
14.5423.58 22.53
38.607.08 7.43
37.0814.3025.62
13.9223.18
40.09
39.446.0539.0615.4524.23
7.8236.7014.4625.84
41.19
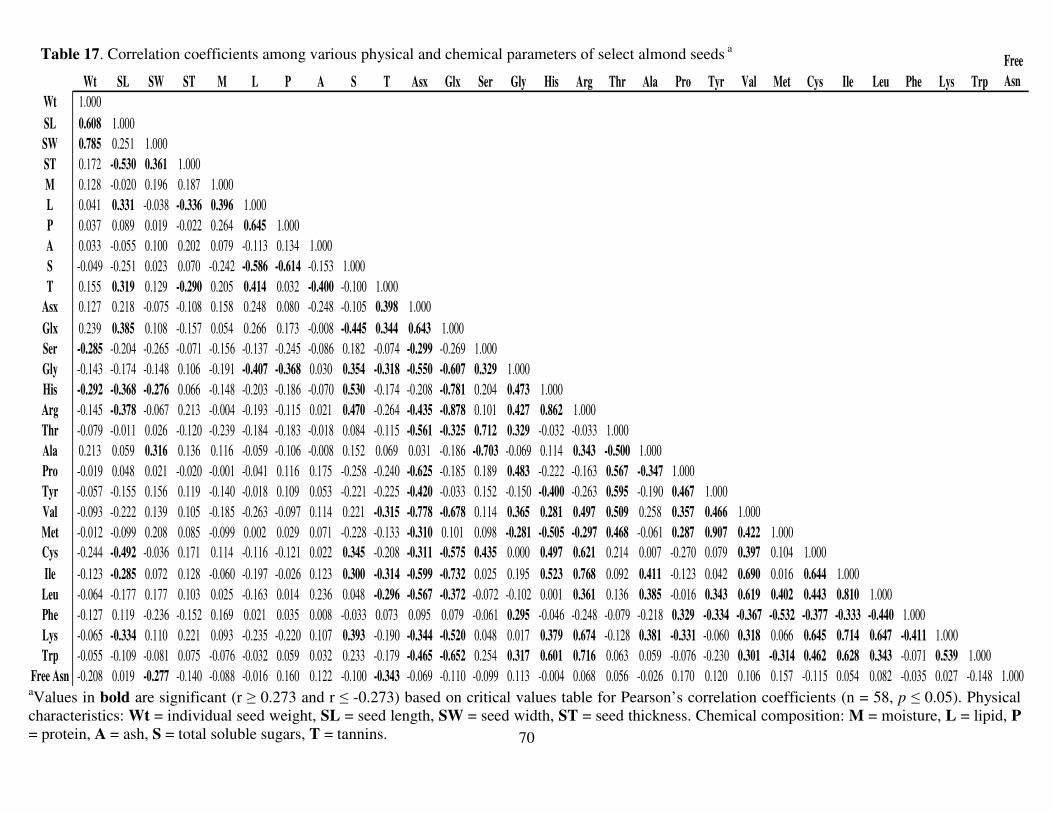
70
8
aValues in bold are significant (r � 0.273 and r � -0.273) based on critical values table for Pearson’s correlation coefficients (n = 58, p � 0.05). Physical characteristics: Wt = individual seed weight, SL = seed length, SW = seed width, ST = seed thickness. Chemical composition: M = moisture, L = lipid, P = protein, A = ash, S = total soluble sugars, T = tannins.
Wt SL SW ST M L P A S T Asx Glx Ser Gly His Arg Thr Ala Pro Tyr Val Met Cys Ile Leu Phe Lys Trp
Free
Asn
Wt 1.000SL 0.608 1.000SW 0.785 0.251 1.000ST 0.172 -0.530 0.361 1.000M 0.128 -0.020 0.196 0.187 1.000L 0.041 0.331 -0.038 -0.336 0.396 1.000P 0.037 0.089 0.019 -0.022 0.264 0.645 1.000A 0.033 -0.055 0.100 0.202 0.079 -0.113 0.134 1.000S -0.049 -0.251 0.023 0.070 -0.242 -0.586 -0.614 -0.153 1.000T 0.155 0.319 0.129 -0.290 0.205 0.414 0.032 -0.400 -0.100 1.000
Asx 0.127 0.218 -0.075 -0.108 0.158 0.248 0.080 -0.248 -0.105 0.398 1.000Glx 0.239 0.385 0.108 -0.157 0.054 0.266 0.173 -0.008 -0.445 0.344 0.643 1.000Ser -0.285 -0.204 -0.265 -0.071 -0.156 -0.137 -0.245 -0.086 0.182 -0.074 -0.299 -0.269 1.000Gly -0.143 -0.174 -0.148 0.106 -0.191 -0.407 -0.368 0.030 0.354 -0.318 -0.550 -0.607 0.329 1.000His -0.292 -0.368 -0.276 0.066 -0.148 -0.203 -0.186 -0.070 0.530 -0.174 -0.208 -0.781 0.204 0.473 1.000Arg -0.145 -0.378 -0.067 0.213 -0.004 -0.193 -0.115 0.021 0.470 -0.264 -0.435 -0.878 0.101 0.427 0.862 1.000Thr -0.079 -0.011 0.026 -0.120 -0.239 -0.184 -0.183 -0.018 0.084 -0.115 -0.561 -0.325 0.712 0.329 -0.032 -0.033 1.000Ala 0.213 0.059 0.316 0.136 0.116 -0.059 -0.106 -0.008 0.152 0.069 0.031 -0.186 -0.703 -0.069 0.114 0.343 -0.500 1.000Pro -0.019 0.048 0.021 -0.020 -0.001 -0.041 0.116 0.175 -0.258 -0.240 -0.625 -0.185 0.189 0.483 -0.222 -0.163 0.567 -0.347 1.000Tyr -0.057 -0.155 0.156 0.119 -0.140 -0.018 0.109 0.053 -0.221 -0.225 -0.420 -0.033 0.152 -0.150 -0.400 -0.263 0.595 -0.190 0.467 1.000Val -0.093 -0.222 0.139 0.105 -0.185 -0.263 -0.097 0.114 0.221 -0.315 -0.778 -0.678 0.114 0.365 0.281 0.497 0.509 0.258 0.357 0.466 1.000Met -0.012 -0.099 0.208 0.085 -0.099 0.002 0.029 0.071 -0.228 -0.133 -0.310 0.101 0.098 -0.281 -0.505 -0.297 0.468 -0.061 0.287 0.907 0.422 1.000Cys -0.244 -0.492 -0.036 0.171 0.114 -0.116 -0.121 0.022 0.345 -0.208 -0.311 -0.575 0.435 0.000 0.497 0.621 0.214 0.007 -0.270 0.079 0.397 0.104 1.000Ile -0.123 -0.285 0.072 0.128 -0.060 -0.197 -0.026 0.123 0.300 -0.314 -0.599 -0.732 0.025 0.195 0.523 0.768 0.092 0.411 -0.123 0.042 0.690 0.016 0.644 1.000
Leu -0.064 -0.177 0.177 0.103 0.025 -0.163 0.014 0.236 0.048 -0.296 -0.567 -0.372 -0.072 -0.102 0.001 0.361 0.136 0.385 -0.016 0.343 0.619 0.402 0.443 0.810 1.000Phe -0.127 0.119 -0.236 -0.152 0.169 0.021 0.035 0.008 -0.033 0.073 0.095 0.079 -0.061 0.295 -0.046 -0.248 -0.079 -0.218 0.329 -0.334 -0.367 -0.532 -0.377 -0.333 -0.440 1.000Lys -0.065 -0.334 0.110 0.221 0.093 -0.235 -0.220 0.107 0.393 -0.190 -0.344 -0.520 0.048 0.017 0.379 0.674 -0.128 0.381 -0.331 -0.060 0.318 0.066 0.645 0.714 0.647 -0.411 1.000Trp -0.055 -0.109 -0.081 0.075 -0.076 -0.032 0.059 0.032 0.233 -0.179 -0.465 -0.652 0.254 0.317 0.601 0.716 0.063 0.059 -0.076 -0.230 0.301 -0.314 0.462 0.628 0.343 -0.071 0.539 1.000
Free Asn -0.208 0.019 -0.277 -0.140 -0.088 -0.016 0.160 0.122 -0.100 -0.343 -0.069 -0.110 -0.099 0.113 -0.004 0.068 0.056 -0.026 0.170 0.120 0.106 0.157 -0.115 0.054 0.082 -0.035 0.027 -0.148 1.000
Table 17. Correlation coefficients among various physical and chemical parameters of select almond seeds a

71
9
Table 18. Correlation coefficients among various physical and chemical parameters of select macadamia nut seeds a
aValues in bold are significant (r � 0.754 and r � -0.754) based on critical values table for Pearson’s correlation coefficients (n = 7, p � 0.05). Physical characteristics: Wt = individual seed weight, SD = seed diameter, ST = seed thickness. Chemical composition: M = moisture, L = lipid, P = protein, A = ash, S = total soluble sugars, T = tannins.
Wt SD ST M L P A S T Asx Glx Ser Gly His Arg Thr Ala Pro Tyr Val Met Cys Ile Leu Phe Lys Trp
Wt 1.000SD 0.932 1.000ST 0.500 0.741 1.000M 0.427 0.336 0.363 1.000L -0.173 0.099 0.607 0.080 1.000P 0.569 0.642 0.724 0.753 0.277 1.000A -0.587 -0.755 -0.863 -0.127 -0.419 -0.600 1.000S -0.454 -0.695 -0.959 -0.465 -0.699 -0.779 0.741 1.000T -0.497 -0.700 -0.585 -0.029 -0.412 -0.352 0.397 0.673 1.000
Asx 0.134 0.041 -0.323 -0.053 -0.669 0.132 0.265 0.301 -0.024 1.000Glx 0.672 0.710 0.463 0.564 -0.044 0.696 -0.219 -0.566 -0.694 0.438 1.000Ser 0.110 -0.049 -0.035 0.123 -0.336 0.068 -0.288 0.231 0.725 -0.114 -0.441 1.000Gly -0.255 -0.379 -0.223 -0.140 -0.166 -0.378 -0.028 0.408 0.797 -0.466 -0.789 0.833 1.000His -0.284 -0.383 -0.279 -0.391 -0.200 -0.452 -0.085 0.483 0.754 -0.320 -0.855 0.813 0.942 1.000Arg -0.094 0.033 0.073 0.141 0.442 0.167 0.259 -0.328 -0.645 0.094 0.492 -0.924 -0.850 -0.862 1.000Thr -0.522 -0.637 -0.454 -0.353 -0.144 -0.583 0.191 0.594 0.849 -0.397 -0.942 0.680 0.936 0.941 -0.701 1.000Ala -0.663 -0.437 -0.007 -0.584 0.511 -0.197 -0.059 -0.014 0.031 -0.081 -0.472 -0.176 -0.030 0.178 0.185 0.214 1.000Pro -0.209 -0.282 -0.278 -0.471 -0.226 -0.712 0.086 0.475 0.461 -0.467 -0.711 0.458 0.801 0.773 -0.686 0.767 -0.103 1.000Tyr 0.330 0.266 0.437 0.818 0.369 0.578 -0.342 -0.483 0.102 -0.548 0.133 0.351 0.250 0.013 -0.082 0.038 -0.392 -0.121 1.000Val -0.689 -0.689 -0.414 -0.596 0.114 -0.774 0.252 0.513 0.578 -0.541 -0.969 0.298 0.741 0.773 -0.409 0.886 0.432 0.785 -0.164 1.000Met -0.766 -0.790 -0.527 -0.543 0.131 -0.794 0.409 0.566 0.581 -0.513 -0.946 0.180 0.649 0.667 -0.248 0.841 0.442 0.678 -0.148 0.974 1.000Cys 0.674 0.592 0.489 0.652 -0.014 0.817 -0.636 -0.452 0.011 0.077 0.377 0.538 0.064 0.025 -0.294 -0.171 -0.341 -0.365 0.654 -0.532 -0.588 1.000Ile -0.690 -0.549 -0.350 -0.764 0.333 -0.749 0.380 0.303 -0.079 -0.280 -0.538 -0.501 -0.028 0.091 0.330 0.248 0.646 0.304 -0.557 0.648 0.702 -0.875 1.000
Leu -0.499 -0.352 -0.333 -0.771 0.170 -0.609 0.375 0.258 -0.325 0.103 -0.205 -0.703 -0.388 -0.203 0.509 -0.102 0.593 0.019 -0.777 0.299 0.363 -0.828 0.898 1.000Phe -0.541 -0.545 -0.215 -0.400 0.247 -0.496 -0.017 0.323 0.621 -0.634 -0.953 0.517 0.829 0.858 -0.512 0.914 0.446 0.672 0.121 0.920 0.877 -0.178 0.416 0.029 1.000Lys 0.087 0.253 0.119 -0.205 0.224 0.079 0.075 -0.278 -0.816 0.361 0.558 -0.916 -0.931 -0.808 0.838 -0.793 0.232 -0.590 -0.482 -0.476 -0.397 -0.338 0.358 0.680 -0.638 1.000Trp -0.674 -0.641 -0.247 -0.341 0.284 -0.238 0.031 0.272 0.602 -0.250 -0.792 0.391 0.516 0.635 -0.259 0.699 0.750 0.168 0.002 0.666 0.680 -0.054 0.359 0.117 0.805 -0.398 1.000

72
y = 8.701x + 11.96R² = 0.369
15.00
17.00
19.00
21.00
23.00
25.00
27.00
29.00
0.80 0.90 1.00 1.10 1.20 1.30 1.40 1.50
Alm
on
d s
eed
len
gth
(m
m)
Almond seed weight (g)
y = 3.906x + 7.808R² = 0.616
9.00
10.00
11.00
12.00
13.00
14.00
0.70 0.90 1.10 1.30 1.50
Alm
on
d s
eed
wid
th (
mm
)
Almond seed weight (g)
y = 1.466x + 15.36R² = 0.868
18.40
18.80
19.20
19.60
20.00
20.40
2.25 2.75 3.25Ma
cad
am
ia n
ut
seed
dia
met
er
(mm
)
Macadamia nut seed weight (g)
A
B
C
Figure 4. Relationship between (A) seed weight and seed length, and (B) seed weight and seed width in 58 almond seed samples. Relationship between (C) seed weight and seed diameter in 7 macadamia nut seed samples. Data are expressed in grams (seed weight) and millimeters (length, width, and diameter).
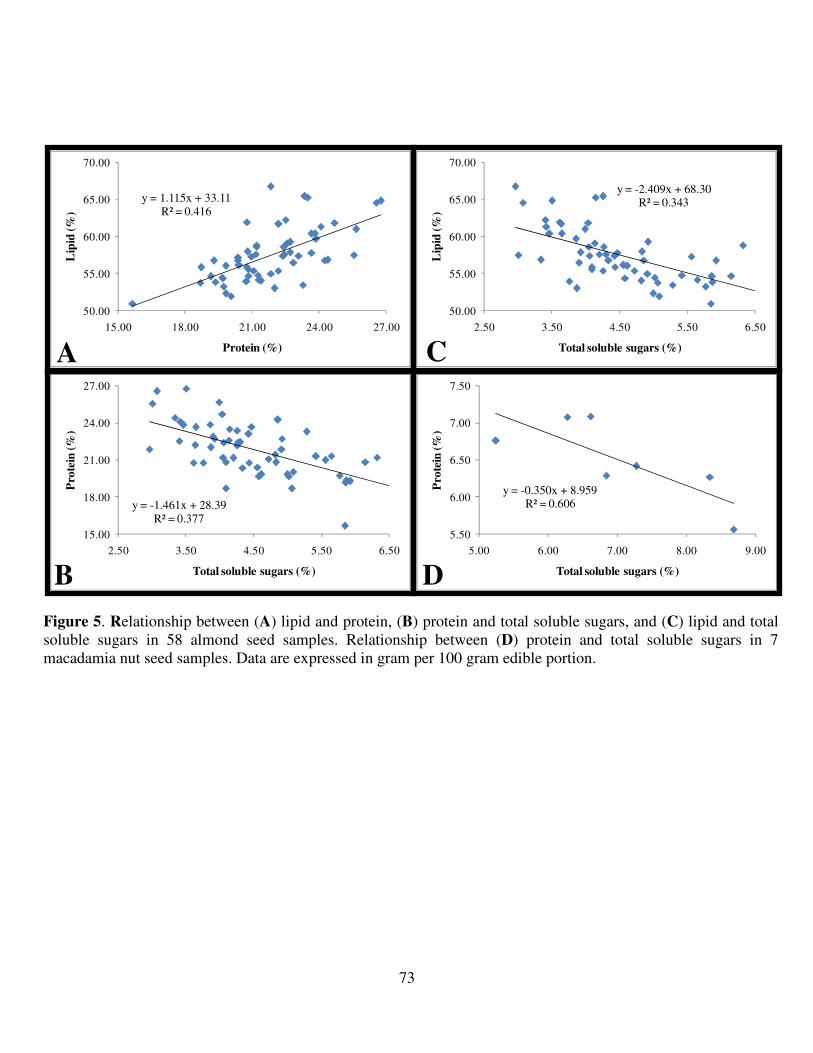
73
y = 1.115x + 33.11R² = 0.416
50.00
55.00
60.00
65.00
70.00
15.00 18.00 21.00 24.00 27.00
Lip
id (%
)
Protein (%)A
y = -2.409x + 68.30R² = 0.343
50.00
55.00
60.00
65.00
70.00
2.50 3.50 4.50 5.50 6.50
Lip
id (%
)
Total soluble sugars (%)C
y = -1.461x + 28.39R² = 0.377
15.00
18.00
21.00
24.00
27.00
2.50 3.50 4.50 5.50 6.50
Pro
tein
(%
)
Total soluble sugars (%)B
y = -0.350x + 8.959R² = 0.606
5.50
6.00
6.50
7.00
7.50
5.00 6.00 7.00 8.00 9.00
Pro
tein
(%
)
Total soluble sugars (%)D
Figure 5. Relationship between (A) lipid and protein, (B) protein and total soluble sugars, and (C) lipid and total soluble sugars in 58 almond seed samples. Relationship between (D) protein and total soluble sugars in 7 macadamia nut seed samples. Data are expressed in gram per 100 gram edible portion.

74
y = 1.032x + 19.14R² = 0.438
18.00
22.00
26.00
30.00
34.00
3.00 5.00 7.00 9.00 11.00 13.00
Glu
tam
ic a
cid
Aspartic acidA
y = -1.735x + 43.92R² = 0.770
18.00
22.00
26.00
30.00
34.00
7.00 8.00 9.00 10.00 11.00 12.00
Glu
tam
ic a
cid
Arginine B
y = 3.345x + 5.887R² = 0.400
7.00
8.00
9.00
10.00
11.00
12.00
0.60 1.00 1.40 1.80 2.20
Arg
inin
e
LysineC
y = 2.236x + 8.693R² = 0.702
9.00
10.00
11.00
12.00
0.40 0.60 0.80 1.00 1.20
Arg
inin
e
LysineD
Figure 6. Relationship between (A) glutamic acid and aspartic acid, (B) glutamic acid and arginine, and (C) arginine and lysine in 58 almond seed samples. Relationship between (D) arginine and lysine in 7 macadamia nut seed samples. Data are expressed in gram per 100 gram protein.
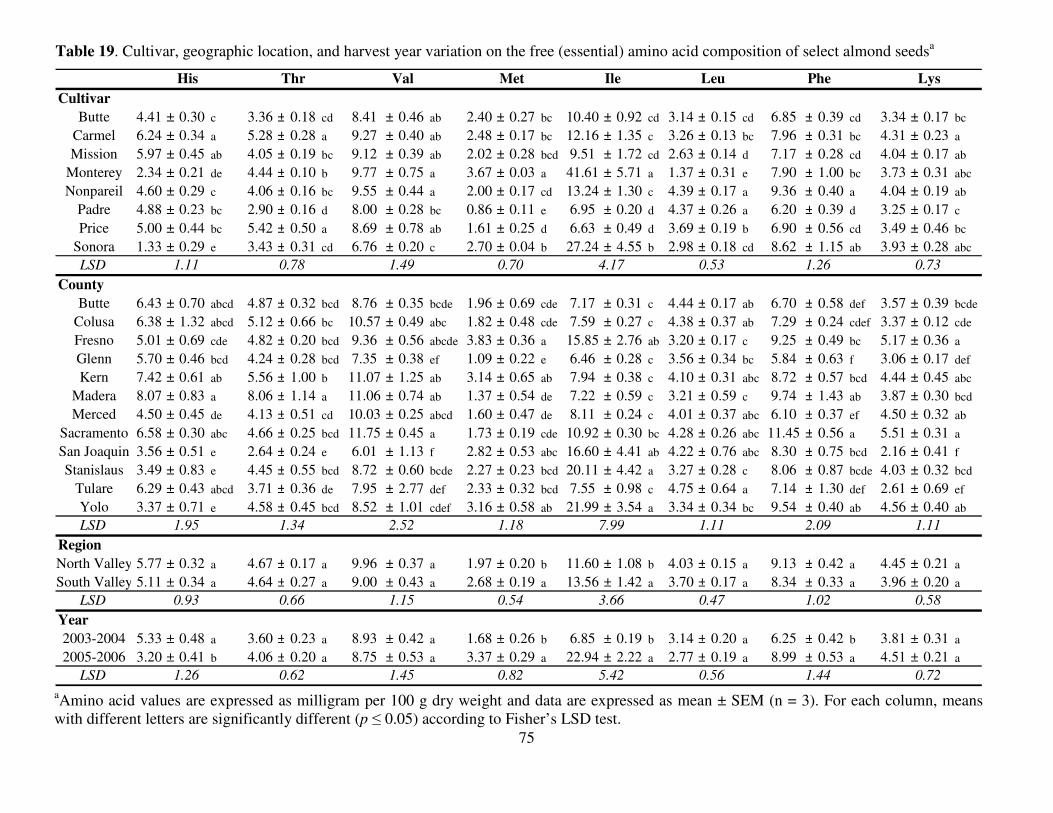
75
1
Table 19. Cultivar, geographic location, and harvest year variation on the free (essential) amino acid composition of select almond seedsa
aAmino acid values are expressed as milligram per 100 g dry weight and data are expressed as mean ± SEM (n = 3). For each column, means with different letters are significantly different (p � 0.05) according to Fisher’s LSD test.
Cultivar
Butte 4.41 ± 0.30 c 3.36 ± 0.18 cd 8.41 ± 0.46 ab 2.40 ± 0.27 bc 10.40 ± 0.92 cd 3.14 ± 0.15 cd 6.85 ± 0.39 cd 3.34 ± 0.17 bc
Carmel 6.24 ± 0.34 a 5.28 ± 0.28 a 9.27 ± 0.40 ab 2.48 ± 0.17 bc 12.16 ± 1.35 c 3.26 ± 0.13 bc 7.96 ± 0.31 bc 4.31 ± 0.23 a
Mission 5.97 ± 0.45 ab 4.05 ± 0.19 bc 9.12 ± 0.39 ab 2.02 ± 0.28 bcd 9.51 ± 1.72 cd 2.63 ± 0.14 d 7.17 ± 0.28 cd 4.04 ± 0.17 ab
Monterey 2.34 ± 0.21 de 4.44 ± 0.10 b 9.77 ± 0.75 a 3.67 ± 0.03 a 41.61 ± 5.71 a 1.37 ± 0.31 e 7.90 ± 1.00 bc 3.73 ± 0.31 abc
Nonpareil 4.60 ± 0.29 c 4.06 ± 0.16 bc 9.55 ± 0.44 a 2.00 ± 0.17 cd 13.24 ± 1.30 c 4.39 ± 0.17 a 9.36 ± 0.40 a 4.04 ± 0.19 ab
Padre 4.88 ± 0.23 bc 2.90 ± 0.16 d 8.00 ± 0.28 bc 0.86 ± 0.11 e 6.95 ± 0.20 d 4.37 ± 0.26 a 6.20 ± 0.39 d 3.25 ± 0.17 c
Price 5.00 ± 0.44 bc 5.42 ± 0.50 a 8.69 ± 0.78 ab 1.61 ± 0.25 d 6.63 ± 0.49 d 3.69 ± 0.19 b 6.90 ± 0.56 cd 3.49 ± 0.46 bc
Sonora 1.33 ± 0.29 e 3.43 ± 0.31 cd 6.76 ± 0.20 c 2.70 ± 0.04 b 27.24 ± 4.55 b 2.98 ± 0.18 cd 8.62 ± 1.15 ab 3.93 ± 0.28 abc
LSD
County
Butte 6.43 ± 0.70 abcd 4.87 ± 0.32 bcd 8.76 ± 0.35 bcde 1.96 ± 0.69 cde 7.17 ± 0.31 c 4.44 ± 0.17 ab 6.70 ± 0.58 def 3.57 ± 0.39 bcde
Colusa 6.38 ± 1.32 abcd 5.12 ± 0.66 bc 10.57 ± 0.49 abc 1.82 ± 0.48 cde 7.59 ± 0.27 c 4.38 ± 0.37 ab 7.29 ± 0.24 cdef 3.37 ± 0.12 cde
Fresno 5.01 ± 0.69 cde 4.82 ± 0.20 bcd 9.36 ± 0.56 abcde 3.83 ± 0.36 a 15.85 ± 2.76 ab 3.20 ± 0.17 c 9.25 ± 0.49 bc 5.17 ± 0.36 a
Glenn 5.70 ± 0.46 bcd 4.24 ± 0.28 bcd 7.35 ± 0.38 ef 1.09 ± 0.22 e 6.46 ± 0.28 c 3.56 ± 0.34 bc 5.84 ± 0.63 f 3.06 ± 0.17 def
Kern 7.42 ± 0.61 ab 5.56 ± 1.00 b 11.07 ± 1.25 ab 3.14 ± 0.65 ab 7.94 ± 0.38 c 4.10 ± 0.31 abc 8.72 ± 0.57 bcd 4.44 ± 0.45 abc
Madera 8.07 ± 0.83 a 8.06 ± 1.14 a 11.06 ± 0.74 ab 1.37 ± 0.54 de 7.22 ± 0.59 c 3.21 ± 0.59 c 9.74 ± 1.43 ab 3.87 ± 0.30 bcd
Merced 4.50 ± 0.45 de 4.13 ± 0.51 cd 10.03 ± 0.25 abcd 1.60 ± 0.47 de 8.11 ± 0.24 c 4.01 ± 0.37 abc 6.10 ± 0.37 ef 4.50 ± 0.32 ab
Sacramento 6.58 ± 0.30 abc 4.66 ± 0.25 bcd 11.75 ± 0.45 a 1.73 ± 0.19 cde 10.92 ± 0.30 bc 4.28 ± 0.26 abc 11.45 ± 0.56 a 5.51 ± 0.31 a
San Joaquin 3.56 ± 0.51 e 2.64 ± 0.24 e 6.01 ± 1.13 f 2.82 ± 0.53 abc 16.60 ± 4.41 ab 4.22 ± 0.76 abc 8.30 ± 0.75 bcd 2.16 ± 0.41 f
Stanislaus 3.49 ± 0.83 e 4.45 ± 0.55 bcd 8.72 ± 0.60 bcde 2.27 ± 0.23 bcd 20.11 ± 4.42 a 3.27 ± 0.28 c 8.06 ± 0.87 bcde 4.03 ± 0.32 bcd
Tulare 6.29 ± 0.43 abcd 3.71 ± 0.36 de 7.95 ± 2.77 def 2.33 ± 0.32 bcd 7.55 ± 0.98 c 4.75 ± 0.64 a 7.14 ± 1.30 def 2.61 ± 0.69 ef
Yolo 3.37 ± 0.71 e 4.58 ± 0.45 bcd 8.52 ± 1.01 cdef 3.16 ± 0.58 ab 21.99 ± 3.54 a 3.34 ± 0.34 bc 9.54 ± 0.40 ab 4.56 ± 0.40 ab
LSD
Region
North Valley 5.77 ± 0.32 a 4.67 ± 0.17 a 9.96 ± 0.37 a 1.97 ± 0.20 b 11.60 ± 1.08 b 4.03 ± 0.15 a 9.13 ± 0.42 a 4.45 ± 0.21 a
South Valley 5.11 ± 0.34 a 4.64 ± 0.27 a 9.00 ± 0.43 a 2.68 ± 0.19 a 13.56 ± 1.42 a 3.70 ± 0.17 a 8.34 ± 0.33 a 3.96 ± 0.20 a
LSD
Year
2003-2004 5.33 ± 0.48 a 3.60 ± 0.23 a 8.93 ± 0.42 a 1.68 ± 0.26 b 6.85 ± 0.19 b 3.14 ± 0.20 a 6.25 ± 0.42 b 3.81 ± 0.31 a
2005-2006 3.20 ± 0.41 b 4.06 ± 0.20 a 8.75 ± 0.53 a 3.37 ± 0.29 a 22.94 ± 2.22 a 2.77 ± 0.19 a 8.99 ± 0.53 a 4.51 ± 0.21 a
LSD 0.56 1.441.26 0.62 1.45 0.82 5.42
2.09
0.93 0.66 1.15 0.54 3.66 0.47 1.02
1.34 2.52 1.18 7.99 1.11
0.72
His Thr Val Met Ile Leu Phe
1.11 0.78 1.49 0.70 4.17 0.53 1.26
1.95
Lys
0.73
1.11
0.58
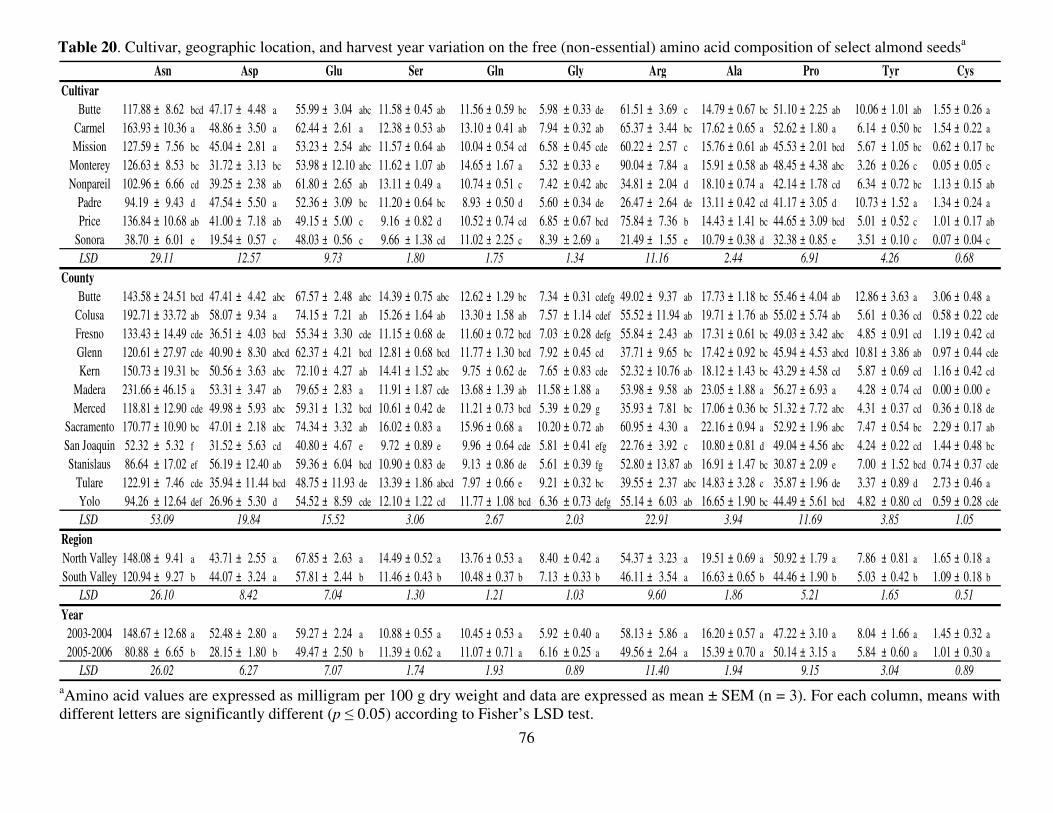
76
2
Table 20. Cultivar, geographic location, and harvest year variation on the free (non-essential) amino acid composition of select almond seedsa
aAmino acid values are expressed as milligram per 100 g dry weight and data are expressed as mean ± SEM (n = 3). For each column, means with different letters are significantly different (p � 0.05) according to Fisher’s LSD test.
Cultivar
Butte 117.88 ± 8.62 bcd 47.17 ± 4.48 a 55.99 ± 3.04 abc 11.58 ± 0.45 ab 11.56 ± 0.59 bc 5.98 ± 0.33 de 61.51 ± 3.69 c 14.79 ± 0.67 bc 51.10 ± 2.25 ab 10.06 ± 1.01 ab 1.55 ± 0.26 a
Carmel 163.93 ± 10.36 a 48.86 ± 3.50 a 62.44 ± 2.61 a 12.38 ± 0.53 ab 13.10 ± 0.41 ab 7.94 ± 0.32 ab 65.37 ± 3.44 bc 17.62 ± 0.65 a 52.62 ± 1.80 a 6.14 ± 0.50 bc 1.54 ± 0.22 a
Mission 127.59 ± 7.56 bc 45.04 ± 2.81 a 53.23 ± 2.54 abc 11.57 ± 0.64 ab 10.04 ± 0.54 cd 6.58 ± 0.45 cde 60.22 ± 2.57 c 15.76 ± 0.61 ab 45.53 ± 2.01 bcd 5.67 ± 1.05 bc 0.62 ± 0.17 bc
Monterey 126.63 ± 8.53 bc 31.72 ± 3.13 bc 53.98 ± 12.10 abc 11.62 ± 1.07 ab 14.65 ± 1.67 a 5.32 ± 0.33 e 90.04 ± 7.84 a 15.91 ± 0.58 ab 48.45 ± 4.38 abc 3.26 ± 0.26 c 0.05 ± 0.05 c
Nonpareil 102.96 ± 6.66 cd 39.25 ± 2.38 ab 61.80 ± 2.65 ab 13.11 ± 0.49 a 10.74 ± 0.51 c 7.42 ± 0.42 abc 34.81 ± 2.04 d 18.10 ± 0.74 a 42.14 ± 1.78 cd 6.34 ± 0.72 bc 1.13 ± 0.15 ab
Padre 94.19 ± 9.43 d 47.54 ± 5.50 a 52.36 ± 3.09 bc 11.20 ± 0.64 bc 8.93 ± 0.50 d 5.60 ± 0.34 de 26.47 ± 2.64 de 13.11 ± 0.42 cd 41.17 ± 3.05 d 10.73 ± 1.52 a 1.34 ± 0.24 a
Price 136.84 ± 10.68 ab 41.00 ± 7.18 ab 49.15 ± 5.00 c 9.16 ± 0.82 d 10.52 ± 0.74 cd 6.85 ± 0.67 bcd 75.84 ± 7.36 b 14.43 ± 1.41 bc 44.65 ± 3.09 bcd 5.01 ± 0.52 c 1.01 ± 0.17 ab
Sonora 38.70 ± 6.01 e 19.54 ± 0.57 c 48.03 ± 0.56 c 9.66 ± 1.38 cd 11.02 ± 2.25 c 8.39 ± 2.69 a 21.49 ± 1.55 e 10.79 ± 0.38 d 32.38 ± 0.85 e 3.51 ± 0.10 c 0.07 ± 0.04 c
LSD
County
Butte 143.58 ± 24.51 bcd 47.41 ± 4.42 abc 67.57 ± 2.48 abc 14.39 ± 0.75 abc 12.62 ± 1.29 bc 7.34 ± 0.31 cdefg 49.02 ± 9.37 ab 17.73 ± 1.18 bc 55.46 ± 4.04 ab 12.86 ± 3.63 a 3.06 ± 0.48 a
Colusa 192.71 ± 33.72 ab 58.07 ± 9.34 a 74.15 ± 7.21 ab 15.26 ± 1.64 ab 13.30 ± 1.58 ab 7.57 ± 1.14 cdef 55.52 ± 11.94 ab 19.71 ± 1.76 ab 55.02 ± 5.74 ab 5.61 ± 0.36 cd 0.58 ± 0.22 cde
Fresno 133.43 ± 14.49 cde 36.51 ± 4.03 bcd 55.34 ± 3.30 cde 11.15 ± 0.68 de 11.60 ± 0.72 bcd 7.03 ± 0.28 defg 55.84 ± 2.43 ab 17.31 ± 0.61 bc 49.03 ± 3.42 abc 4.85 ± 0.91 cd 1.19 ± 0.42 cd
Glenn 120.61 ± 27.97 cde 40.90 ± 8.30 abcd 62.37 ± 4.21 bcd 12.81 ± 0.68 bcd 11.77 ± 1.30 bcd 7.92 ± 0.45 cd 37.71 ± 9.65 bc 17.42 ± 0.92 bc 45.94 ± 4.53 abcd 10.81 ± 3.86 ab 0.97 ± 0.44 cde
Kern 150.73 ± 19.31 bc 50.56 ± 3.63 abc 72.10 ± 4.27 ab 14.41 ± 1.52 abc 9.75 ± 0.62 de 7.65 ± 0.83 cde 52.32 ± 10.76 ab 18.12 ± 1.43 bc 43.29 ± 4.58 cd 5.87 ± 0.69 cd 1.16 ± 0.42 cd
Madera 231.66 ± 46.15 a 53.31 ± 3.47 ab 79.65 ± 2.83 a 11.91 ± 1.87 cde 13.68 ± 1.39 ab 11.58 ± 1.88 a 53.98 ± 9.58 ab 23.05 ± 1.88 a 56.27 ± 6.93 a 4.28 ± 0.74 cd 0.00 ± 0.00 e
Merced 118.81 ± 12.90 cde 49.98 ± 5.93 abc 59.31 ± 1.32 bcd 10.61 ± 0.42 de 11.21 ± 0.73 bcd 5.39 ± 0.29 g 35.93 ± 7.81 bc 17.06 ± 0.36 bc 51.32 ± 7.72 abc 4.31 ± 0.37 cd 0.36 ± 0.18 de
Sacramento 170.77 ± 10.90 bc 47.01 ± 2.18 abc 74.34 ± 3.32 ab 16.02 ± 0.83 a 15.96 ± 0.68 a 10.20 ± 0.72 ab 60.95 ± 4.30 a 22.16 ± 0.94 a 52.92 ± 1.96 abc 7.47 ± 0.54 bc 2.29 ± 0.17 ab
San Joaquin 52.32 ± 5.32 f 31.52 ± 5.63 cd 40.80 ± 4.67 e 9.72 ± 0.89 e 9.96 ± 0.64 cde 5.81 ± 0.41 efg 22.76 ± 3.92 c 10.80 ± 0.81 d 49.04 ± 4.56 abc 4.24 ± 0.22 cd 1.44 ± 0.48 bc
Stanislaus 86.64 ± 17.02 ef 56.19 ± 12.40 ab 59.36 ± 6.04 bcd 10.90 ± 0.83 de 9.13 ± 0.86 de 5.61 ± 0.39 fg 52.80 ± 13.87 ab 16.91 ± 1.47 bc 30.87 ± 2.09 e 7.00 ± 1.52 bcd 0.74 ± 0.37 cde
Tulare 122.91 ± 7.46 cde 35.94 ± 11.44 bcd 48.75 ± 11.93 de 13.39 ± 1.86 abcd 7.97 ± 0.66 e 9.21 ± 0.32 bc 39.55 ± 2.37 abc 14.83 ± 3.28 c 35.87 ± 1.96 de 3.37 ± 0.89 d 2.73 ± 0.46 a
Yolo 94.26 ± 12.64 def 26.96 ± 5.30 d 54.52 ± 8.59 cde 12.10 ± 1.22 cd 11.77 ± 1.08 bcd 6.36 ± 0.73 defg 55.14 ± 6.03 ab 16.65 ± 1.90 bc 44.49 ± 5.61 bcd 4.82 ± 0.80 cd 0.59 ± 0.28 cde
LSD
Region
North Valley 148.08 ± 9.41 a 43.71 ± 2.55 a 67.85 ± 2.63 a 14.49 ± 0.52 a 13.76 ± 0.53 a 8.40 ± 0.42 a 54.37 ± 3.23 a 19.51 ± 0.69 a 50.92 ± 1.79 a 7.86 ± 0.81 a 1.65 ± 0.18 a
South Valley 120.94 ± 9.27 b 44.07 ± 3.24 a 57.81 ± 2.44 b 11.46 ± 0.43 b 10.48 ± 0.37 b 7.13 ± 0.33 b 46.11 ± 3.54 a 16.63 ± 0.65 b 44.46 ± 1.90 b 5.03 ± 0.42 b 1.09 ± 0.18 b
LSD
Year
2003-2004 148.67 ± 12.68 a 52.48 ± 2.80 a 59.27 ± 2.24 a 10.88 ± 0.55 a 10.45 ± 0.53 a 5.92 ± 0.40 a 58.13 ± 5.86 a 16.20 ± 0.57 a 47.22 ± 3.10 a 8.04 ± 1.66 a 1.45 ± 0.32 a
2005-2006 80.88 ± 6.65 b 28.15 ± 1.80 b 49.47 ± 2.50 b 11.39 ± 0.62 a 11.07 ± 0.71 a 6.16 ± 0.25 a 49.56 ± 2.64 a 15.39 ± 0.70 a 50.14 ± 3.15 a 5.84 ± 0.60 a 1.01 ± 0.30 a
LSD 26.02 0.891.931.747.076.27
1.03 9.60 1.86 5.21 1.65
53.09
26.10 8.42 7.04 1.30
2.032.673.0615.5219.84
1.75 1.34 11.16 2.44 6.91
Asn
29.11 12.57 9.73 1.80
GlyGlnSerGluAsp
0.89
TyrProAlaArg
4.26
3.8511.693.9422.91
3.049.151.9411.40
Cys
0.68
1.05
0.511.21

77
3
Table 21. Interaction of cultivar and geographic location on the free (essential) amino acid composition of select almond seedsa
aAmino acid values are expressed as milligram per 100 g dry weight and data are expressed as mean ± SEM (n = 3). For each column, means with different letters are significantly different (p � 0.05) according to Fisher’s LSD test.
Cultivar County
Butte 5.63 ± 0.24 a 5.45 ± 0.67 a 8.42 ± 0.43 b 0.96 ± 0.06 bc 6.45 ± 0.29 b 3.80 ± 0.25 ab 6.27 ± 0.34 abc 3.42 ± 0.15 ab
Fresno 4.60 ± 0.83 ab 3.11 ± 0.25 cd 7.71 ± 1.14 b 3.29 ± 0.88 ab 12.42 ± 2.42 ab 2.53 ± 0.21 cd 5.94 ± 1.12 abc 3.61 ± 0.24 ab
Kern 4.30 ± 0.10 ab 3.21 ± 0.22 cd 9.60 ± 0.49 b 2.34 ± 0.35 abc 8.39 ± 0.65 b 3.47 ± 0.15 bc 7.89 ± 0.15 ab 3.61 ± 0.25 ab
Madera 5.85 ± 0.35 a 5.32 ± 0.29 a 8.66 ± 0.45 b 0.73 ± 0.49 c 6.41 ± 0.32 b 3.32 ± 0.18 bc 7.02 ± 0.44 ab 4.45 ± 0.34 a
Merced 2.95 ± 0.71 b 4.18 ± 0.14 b 13.01 ± 1.43 a 1.20 ± 0.18 abc 10.39 ± 0.38 b 4.52 ± 0.44 a 7.70 ± 0.44 ab 4.23 ± 0.24 ab
Sacramento 5.78 ± 0.86 a 2.77 ± 0.50 d 9.44 ± 0.98 b 3.37 ± 1.12 a 10.08 ± 0.63 b 3.68 ± 0.03 ab 8.15 ± 0.03 ab 3.52 ± 0.35 ab
San Joaquin 3.84 ± 0.89 ab 1.71 ± 0.03 e 2.65 ± 0.47 c 2.41 ± 0.34 abc 7.71 ± 0.34 b 3.06 ± 0.15 bc 3.66 ± 0.37 c 0.87 ± 0.07 d
Stanislaus 4.36 ± 0.08 ab 1.99 ± 0.06 e 7.55 ± 0.28 b 1.01 ± 0.13 bc 5.73 ± 0.17 b 3.88 ± 0.03 ab 6.30 ± 0.12 abc 2.25 ± 0.02 c
Tulare 2.22 ± 0.33 b 3.79 ± 0.48 bc 9.38 ± 0.38 b 2.81 ± 0.47 abc 6.83 ± 0.38 b 3.51 ± 0.24 b 5.09 ± 0.24 bc 3.68 ± 0.42 ab
Yolo 4.37 ± 1.34 ab 3.07 ± 0.32 cd 8.11 ± 1.28 b 3.26 ± 0.80 ab 19.02 ± 3.15 a 1.81 ± 0.56 d 9.05 ± 1.60 a 3.17 ± 0.59 bc
LSD
Butte 7.92 ± 0.21 ab 5.40 ± 0.14 c 8.83 ± 0.47 cde 3.47 ± 0.29 a 7.37 ± 0.63 c 4.32 ± 0.32 ab 6.80 ± 1.25 bc 3.92 ± 0.79 bcd
Colusa 9.19 ± 0.84 a 5.93 ± 0.79 bc 11.35 ± 0.59 ab 2.85 ± 0.30 ab 7.81 ± 0.31 c 3.62 ± 0.14 bc 7.21 ± 0.24 bc 3.37 ± 0.27 cd
Fresno 5.13 ± 0.83 c 4.84 ± 0.17 c 9.30 ± 0.88 bcd 3.43 ± 0.24 a 14.71 ± 3.52 bc 2.78 ± 0.15 cde 9.27 ± 0.53 a 5.19 ± 0.29 ab
Glenn 6.47 ± 0.35 bc 4.69 ± 0.25 cd 6.77 ± 0.06 e 1.57 ± 0.01 bcd 6.00 ± 0.10 c 2.86 ± 0.02 cde 4.59 ± 0.09 d 2.92 ± 0.19 cd
Kern 8.32 ± 0.90 ab 7.37 ± 1.24 b 12.48 ± 2.32 a 2.51 ± 0.84 abc 8.04 ± 0.83 c 3.59 ± 0.26 bc 8.38 ± 1.19 ab 5.14 ± 0.55 ab
Madera 9.65 ± 0.73 a 9.95 ± 1.66 a 10.56 ± 1.39 abcd 0.49 ± 0.09 d 6.29 ± 0.86 c 2.06 ± 0.62 e 6.81 ± 0.74 bc 3.48 ± 0.55 cd
Merced 5.50 ± 0.08 c 5.27 ± 0.11 c 9.62 ± 0.13 bcd 1.36 ± 0.66 cd 8.03 ± 0.48 c 3.20 ± 0.19 cd 5.40 ± 0.41 cd 5.17 ± 0.18 ab
Sacramento 6.84 ± 0.26 bc 4.98 ± 0.30 c 11.23 ± 0.46 abc 1.96 ± 0.33 bc 10.38 ± 0.30 c 3.31 ± 0.15 cd 9.81 ± 0.34 a 5.90 ± 0.49 a
San Joaquin 2.82 ± 0.46 d 2.64 ± 0.35 e 8.19 ± 0.45 de 3.51 ± 0.61 a 21.12 ± 5.87 b 3.54 ± 0.21 bc 9.26 ± 0.85 a 2.72 ± 0.46 d
Stanislaus 8.16 ± 0.64 ab 7.23 ± 0.54 b 9.81 ± 0.61 bcd 2.37 ± 0.74 abc 7.00 ± 0.39 c 3.02 ± 0.09 cde 6.64 ± 0.34 bc 4.24 ± 0.35 bc
Tulare 6.82 ± 0.42 bc 3.24 ± 0.31 de 1.95 ± 0.19 f 1.74 ± 0.35 bcd 5.53 ± 0.63 c 4.86 ± 1.42 a 4.43 ± 0.82 d 1.18 ± 0.16 e
Yolo 2.44 ± 0.13 d 5.91 ± 0.76 bc 8.16 ± 0.34 de 2.65 ± 0.22 abc 33.12 ± 4.89 a 2.55 ± 0.09 de 9.25 ± 0.76 a 5.14 ± 0.21 ab
LSD
Butte 8.81 ± 0.13 ab 4.93 ± 0.12 a 10.80 ± 0.58 a 2.71 ± 0.72 abc 7.07 ± 0.31 b 3.72 ± 0.13 a 8.81 ± 0.25 a 4.99 ± 0.19 ab
Colusa 6.29 ± 0.75 bcd 4.30 ± 0.47 ab 9.50 ± 0.70 ab 2.15 ± 0.53 bcd 6.86 ± 0.26 b 3.12 ± 0.18 ab 7.87 ± 0.31 ab 3.65 ± 0.12 cd
Fresno 6.83 ± 0.79 abc 3.84 ± 0.24 bc 9.50 ± 0.66 ab 1.55 ± 0.25 cd 6.29 ± 0.23 b 2.74 ± 0.11 b 7.81 ± 0.44 ab 4.28 ± 0.25 bcd
Glenn 8.83 ± 1.51 a 5.27 ± 0.64 a 11.48 ± 1.86 a 3.56 ± 1.54 ab 6.77 ± 0.22 b 2.69 ± 0.10 b 7.37 ± 0.39 ab 4.44 ± 0.57 abc
Kern 5.50 ± 0.39 cde 2.85 ± 0.01 c 8.10 ± 0.22 bc 4.13 ± 0.47 a 5.72 ± 0.16 b 2.55 ± 0.07 b 7.06 ± 0.27 b 3.50 ± 0.32 de
Merced 3.73 ± 0.12 e 2.99 ± 0.35 c 6.70 ± 0.62 c 0.94 ± 0.25 d 4.93 ± 0.20 b 2.88 ± 0.40 b 4.82 ± 0.45 c 2.71 ± 0.22 e
San Joaquin 6.15 ± 0.41 cde 4.52 ± 0.27 ab 7.83 ± 0.39 bc 0.84 ± 0.09 d 7.07 ± 0.28 b 2.71 ± 0.13 b 7.85 ± 0.31 ab 5.21 ± 0.40 a
Stanislaus 3.78 ± 0.93 de 3.86 ± 0.33 bc 9.07 ± 0.84 abc 1.17 ± 0.17 cd 20.44 ± 6.15 a 1.61 ± 0.25 c 6.49 ± 0.77 bc 3.81 ± 0.18 cd
LSD
Lys
2.67 0.97 3.25 2.34 6.70 0.97 3.23 1.08
Val Met Ile Leu Phe
0.841.06 2.63 1.70 12.20 0.68 1.75
Mission
10.041.312.481.531.94
2.53
Carmel
1.381.980.99
Butte
His Thr

78
4
Table 21 continued. Interaction of cultivar and geographic location on the free (essential) amino acid composition of select almond seedsa
aAmino acid values are expressed as milligram per 100 g dry weight and data are expressed as mean ± SEM (n = 3). For each column, means with different letters are significantly different (p � 0.05) according to Fisher’s LSD test.
Cultivar County
Butte 4.93 ± 0.44 abc 4.33 ± 0.45 b 8.69 ± 0.62 c 0.46 ± 0.04 g 6.96 ± 0.16 b 4.56 ± 0.15 abcd 6.61 ± 0.37 cd 3.22 ± 0.10 b
Colusa 3.57 ± 0.32 bcd 4.30 ± 0.96 b 9.79 ± 0.47 bc 0.79 ± 0.10 efg 7.37 ± 0.45 b 5.14 ± 0.30 abc 7.36 ± 0.48 bcd 3.38 ± 0.02 b
Fresno 4.84 ± 1.29 abc 4.79 ± 0.45 b 9.44 ± 0.60 bc 3.25 ± 0.72 ab 17.56 ± 4.76 ab 3.84 ± 0.11 bcd 9.22 ± 1.01 bc 5.14 ± 0.84 a
Glenn 4.92 ± 0.58 abc 3.78 ± 0.34 bcd 7.94 ± 0.61 c 0.61 ± 0.08 fg 6.92 ± 0.42 b 4.27 ± 0.28 abcd 7.09 ± 0.63 bcd 3.19 ± 0.30 b
Kern 6.51 ± 0.48 a 3.76 ± 0.45 bcd 9.66 ± 0.68 bc 3.78 ± 1.01 a 7.83 ± 0.16 b 4.61 ± 0.40 abcd 9.06 ± 0.26 bcd 3.75 ± 0.50 ab
Madera 6.48 ± 0.61 a 6.18 ± 0.40 a 11.57 ± 0.74 ab 2.25 ± 0.84 bcd 8.14 ± 0.40 b 4.36 ± 0.19 abcd 12.67 ± 1.06 a 4.25 ± 0.12 ab
Merced 3.50 ± 0.16 cd 2.99 ± 0.13 cd 10.44 ± 0.36 bc 1.84 ± 0.78 cdef 8.19 ± 0.25 b 4.81 ± 0.07 abcd 6.80 ± 0.12 cd 3.83 ± 0.16 ab
Sacramento 6.31 ± 0.54 a 4.33 ± 0.39 b 12.27 ± 0.76 ab 1.49 ± 0.19 defg 11.46 ± 0.48 b 5.26 ± 0.19 ab 13.09 ± 0.74 a 5.11 ± 0.36 a
San Joaquin 5.02 ± 0.70 abc 2.63 ± 0.26 d 1.64 ± 0.40 d 1.46 ± 0.24 defg 7.58 ± 0.39 b 5.59 ± 2.29 a 6.40 ± 0.67 d 1.04 ± 0.05 c
Stanislaus 1.93 ± 0.15 d 3.52 ± 0.32 bcd 8.35 ± 0.75 c 2.23 ± 0.22 bcd 24.48 ± 5.12 a 3.35 ± 0.38 d 8.53 ± 1.12 bcd 3.96 ± 0.42 ab
Tulare 5.76 ± 0.70 ab 4.18 ± 0.58 bc 13.96 ± 1.54 a 2.92 ± 0.16 abc 9.56 ± 0.56 b 4.65 ± 0.20 abcd 9.84 ± 0.65 b 4.04 ± 0.53 ab
Yolo 3.84 ± 1.03 bcd 3.91 ± 0.32 bcd 8.70 ± 1.56 c 2.08 ± 0.33 bcde 16.43 ± 2.60 ab 3.73 ± 0.43 cd 9.69 ± 0.51 b 4.27 ± 0.58 ab
LSD
Butte 4.56 ± 0.08 a 2.83 ± 0.06 b 5.89 ± 0.11 d 0.58 ± 0.06 b 5.66 ± 0.13 e 3.07 ± 0.03 c 5.08 ± 0.19 cd 3.21 ± 0.06 ab
Fresno 4.08 ± 0.12 a 2.34 ± 0.08 b 8.57 ± 0.16 ab 0.51 ± 0.00 b 7.48 ± 0.08 b 4.74 ± 0.06 b 10.10 ± 0.45 a 3.32 ± 0.02 ab
Kern 5.81 ± 1.61 a 3.09 ± 0.81 ab 6.92 ± 0.95 cd 0.68 ± 0.40 b 6.06 ± 0.09 d 3.11 ± 0.05 c 4.37 ± 0.47 d 3.75 ± 1.01 a
Merced 4.78 ± 0.27 a 2.69 ± 0.29 b 7.79 ± 0.14 bc 1.00 ± 0.15 ab 7.91 ± 0.18 a 4.39 ± 0.10 b 5.60 ± 0.00 bc 3.36 ± 0.19 ab
San Joaquin 5.12 ± 0.19 a 4.06 ± 0.18 a 8.78 ± 0.08 ab 1.10 ± 0.31 ab 6.34 ± 0.03 d 4.46 ± 0.04 b 6.02 ± 0.21 b 2.44 ± 0.08 b
Stanislaus 5.05 ± 0.33 a 2.91 ± 0.23 b 8.98 ± 0.15 a 1.56 ± 0.26 a 8.06 ± 0.04 a 4.48 ± 0.05 b 6.16 ± 0.30 b 2.81 ± 0.26 ab
Tulare 4.75 ± 0.26 a 2.40 ± 0.13 b 9.07 ± 0.10 a 0.60 ± 0.09 b 7.13 ± 0.08 c 6.33 ± 0.97 a 6.05 ± 0.27 b 3.86 ± 0.21 a
LSD
Butte 4.76 ± 1.12 b 7.00 ± 0.54 ab 11.21 ± 0.38 a 0.76 ± 0.04 c 8.28 ± 0.22 a 4.90 ± 0.26 a 8.73 ± 0.17 a 4.49 ± 0.33 b
Fresno 3.82 ± 0.16 b 5.18 ± 0.37 c 8.59 ± 0.24 b 1.16 ± 0.24 c 7.28 ± 0.17 a 3.69 ± 0.25 bc 7.50 ± 0.40 a 4.67 ± 0.74 ab
Kern 4.27 ± 0.21 bc 6.77 ± 0.37 ab 11.57 ± 1.30 a 1.16 ± 0.15 c 7.57 ± 0.60 a 3.36 ± 0.24 c 8.13 ± 1.14 a 4.15 ± 0.38 b
Merced 4.57 ± 0.56 b 3.44 ± 0.62 d 2.24 ± 0.18 d 3.93 ± 0.37 a 5.72 ± 1.87 ab 3.51 ± 0.43 bc 5.02 ± 0.63 b 0.68 ± 0.14 c
San Joaquin 6.86 ± 0.29 a 6.09 ± 0.59 bc 9.68 ± 1.27 ab 0.62 ± 0.16 c 7.43 ± 0.72 a 4.32 ± 0.48 ab 7.99 ± 0.92 a 4.38 ± 0.46 b
Stanislaus 2.54 ± 0.72 c 1.42 ± 0.63 e 5.64 ± 0.69 c 2.22 ± 0.53 b 2.99 ± 1.62 b 2.32 ± 0.12 d 2.05 ± 0.57 c 0.22 ± 0.06 c
Tulare 8.19 ± 0.50 a 8.00 ± 0.50 a 11.87 ± 0.44 a 1.39 ± 0.11 c 7.15 ± 0.08 a 3.72 ± 0.07 bc 8.85 ± 0.44 a 5.83 ± 0.47 a
LSD
Phe Lys
2.24 1.29 2.86 1.30 10.87 1.50 2.81 1.55
Thr Val Met Ile Leu
Nonpareil
Padre
His
Price
1.200.901.090.300.661.111.02
2.28 0.82 2.96 0.88 2.00 1.25
1.89
1.76 1.55

79
5
Table 22. Interaction of cultivar and geographic location on the free (non-essential) amino acid composition of select almond seedsa
aAmino acid values are expressed as milligram per 100 g dry weight and data are expressed as mean ± SEM (n = 3). For each column, means with different letters are significantly different (p � 0.05) according to Fisher’s LSD test.
Cultivar County
Butte 182.67 ± 10.60 b 113.48 ± 5.13 a 74.37 ± 4.15 a 12.99 ± 0.89 ab 14.35 ± 0.13 abc 4.93 ± 0.22 bc 62.71 ± 3.75 bc 18.60 ± 0.91 a 38.54 ± 2.02 bc 14.87 ± 0.88 abc 0.06 ± 0.00 d
Fresno 92.84 ± 12.51 c 30.83 ± 2.43 e 45.50 ± 4.67 c 11.14 ± 1.33 ab 11.83 ± 0.97 abcd 5.43 ± 0.66 bc 66.35 ± 6.72 b 12.97 ± 1.17 c 59.20 ± 4.85 a 10.75 ± 2.57 bcd 1.75 ± 0.52 abcd
Kern 119.88 ± 5.19 c 43.97 ± 2.72 d 61.59 ± 2.92 abc 12.03 ± 0.75 ab 11.26 ± 1.94 abcd 6.33 ± 0.32 abc 52.02 ± 2.73 bc 16.74 ± 0.71 abc 57.03 ± 4.87 a 11.20 ± 1.18 bcd 2.97 ± 0.10 ab
Madera 175.20 ± 2.90 b 33.80 ± 0.87 de 53.16 ± 2.28 bc 10.87 ± 1.21 b 15.63 ± 0.87 a 6.35 ± 0.21 abc 97.56 ± 6.27 a 13.30 ± 0.35 c 50.35 ± 1.44 ab 2.16 ± 0.16 f 0.00 ± 0.00 d
Merced 88.44 ± 5.59 c 70.55 ± 5.49 c 72.60 ± 2.97 a 12.12 ± 0.83 ab 8.00 ± 0.67 d 6.61 ± 0.50 abc 46.83 ± 5.07 bcd 17.93 ± 0.80 ab 28.73 ± 1.59 c 6.18 ± 0.28 def 0.53 ± 0.05 cd
Sacramento 98.43 ± 8.66 c 29.86 ± 2.70 e 64.30 ± 4.12 ab 12.85 ± 0.21 ab 13.77 ± 0.90 ab 8.27 ± 0.80 a 52.11 ± 2.27 bc 17.99 ± 0.44 ab 62.17 ± 0.87 a 18.61 ± 1.61 a 3.16 ± 0.10 a
San Joaquin 77.08 ± 3.68 c 9.38 ± 0.49 f 13.16 ± 1.09 d 6.30 ± 0.52 c 7.94 ± 0.74 d 3.93 ± 0.82 c 27.68 ± 2.11 d 5.70 ± 0.07 d 55.68 ± 1.10 a 3.60 ± 0.19 ef 1.13 ± 0.01 bcd
Stanislaus 91.72 ± 5.14 c 93.90 ± 4.98 b 68.93 ± 5.59 ab 14.57 ± 0.34 a 9.80 ± 0.29 bcd 5.26 ± 0.37 bc 40.92 ± 5.50 cd 14.36 ± 0.44 bc 32.22 ± 1.56 c 17.15 ± 0.87 ab 0.34 ± 0.16 cd
Tulare 242.37 ± 22.63 a 67.05 ± 3.74 c 72.44 ± 4.56 a 11.40 ± 0.62 ab 8.60 ± 1.19 cd 4.42 ± 0.41 c 96.66 ± 16.55 a 19.95 ± 1.51 a 39.63 ± 3.16 bc 4.36 ± 0.23 def 0.71 ± 0.20 cd
Yolo 88.05 ± 26.17 c 30.98 ± 5.67 e 52.58 ± 10.47 bc 11.75 ± 1.29 ab 12.88 ± 2.46 abc 7.50 ± 1.64 ab 66.80 ± 10.70 b 13.45 ± 2.02 c 58.18 ± 6.35 a 9.60 ± 3.11 cde 2.31 ± 1.24 abc
LSD
Butte 198.23 ± 2.44 c 50.95 ± 2.58 cd 66.93 ± 4.87 cde 13.86 ± 0.66 bcd 15.18 ± 0.63 ab 7.98 ± 0.24 bcd 69.88 ± 1.22 bcd 15.28 ± 0.52 e 54.27 ± 4.70 bcd 4.76 ± 0.38 cd 4.08 ± 0.27 a
Colusa 266.22 ± 11.48 b 78.09 ± 4.66 b 87.01 ± 8.80 a 18.14 ± 1.84 a 16.30 ± 0.41 a 9.77 ± 1.06 ab 80.45 ± 8.80 b 22.77 ± 2.28 ab 43.31 ± 3.12 de 5.04 ± 0.44 cd 0.13 ± 0.13 de
Fresno 123.84 ± 12.73 e 38.28 ± 5.14 de 54.19 ± 3.98 efg 11.09 ± 1.05 cdef 12.01 ± 0.90 de 6.76 ± 0.34 cde 58.15 ± 2.68 de 17.30 ± 0.54 cde 48.00 ± 3.62 cde 5.69 ± 1.47 bcd 1.99 ± 0.56 bc
Glenn 182.32 ± 8.20 cd 58.94 ± 3.85 c 70.93 ± 2.04 cd 12.54 ± 1.18 bcde 14.45 ± 0.44 abc 8.78 ± 0.39 b 59.02 ± 2.68 cde 15.62 ± 0.53 e 55.62 ± 0.96 bc 2.31 ± 0.02 d 0.00 ± 0.00 e
Kern 189.64 ± 16.71 c 50.11 ± 6.91 cde 65.93 ± 5.64 cde 14.66 ± 3.38 abc 10.79 ± 0.53 e 8.56 ± 1.60 bc 75.16 ± 7.18 b 20.00 ± 2.12 bc 51.44 ± 6.01 cd 6.63 ± 1.02 bc 0.69 ± 0.06 cde
Madera 325.02 ± 41.61 a 60.70 ± 2.10 c 84.64 ± 3.71 ab 8.40 ± 1.14 f 16.00 ± 1.12 a 11.52 ± 1.00 a 71.46 ± 8.68 bc 19.12 ± 1.09 cd 71.64 ± 1.93 a 5.44 ± 1.17 bcd 0.00 ± 0.00 e
Merced 147.22 ± 1.32 de 37.24 ± 1.13 e 58.38 ± 1.03 def 9.94 ± 0.65 def 12.55 ± 0.88 cde 6.02 ± 0.06 e 53.06 ± 3.13 e 16.76 ± 0.51 de 68.28 ± 3.07 a 4.01 ± 0.75 cd 0.00 ± 0.00 e
Sacramento 201.14 ± 10.33 c 49.04 ± 2.00 cde 71.96 ± 2.74 bc 15.28 ± 1.10 ab 15.60 ± 0.48 ab 9.90 ± 0.73 ab 76.29 ± 2.26 b 22.15 ± 0.91 ab 55.16 ± 1.94 bc 9.16 ± 0.53 b 2.23 ± 0.26 bc
San Joaquin 50.33 ± 7.23 f 40.41 ± 5.15 de 46.47 ± 3.33 fg 9.26 ± 1.29 ef 10.79 ± 0.70 e 5.06 ± 0.16 e 27.95 ± 4.50 f 12.18 ± 0.55 f 55.35 ± 5.00 bc 4.10 ± 0.17 cd 1.63 ± 0.73 bcd
Stanislaus 180.16 ± 11.06 cd 120.95 ± 5.16 a 87.66 ± 6.31 a 14.05 ± 0.50 bc 12.72 ± 0.60 cde 6.24 ± 0.31 de 129.43 ± 8.06 a 23.19 ± 1.26 a 25.14 ± 1.80 f 13.69 ± 3.69 a 2.86 ± 0.05 ab
Tulare 114.90 ± 4.08 e 11.20 ± 1.94 f 23.91 ± 6.57 h 9.40 ± 0.83 ef 6.75 ± 0.12 f 9.71 ± 0.20 ab 36.63 ± 2.73 f 7.73 ± 0.77 g 39.44 ± 2.31 e 4.96 ± 1.19 cd 2.40 ± 0.95 b
Yolo 107.45 ± 7.64 e 19.66 ± 1.46 f 44.72 ± 3.11 g 11.85 ± 0.88 bcdef 13.60 ± 0.69 bcd 6.28 ± 0.34 de 77.03 ± 4.19 b 16.41 ± 0.96 de 65.29 ± 2.59 ab 4.76 ± 0.14 cd 0.06 ± 0.06 e
LSD
Butte 130.70 ± 6.61 a 57.50 ± 3.74 ab 62.68 ± 10.96 ab 15.63 ± 0.41 ab 9.62 ± 0.26 bc 10.22 ± 0.87 a 57.77 ± 4.45 ab 19.17 ± 1.18 a 38.75 ± 0.75 b 4.06 ± 0.32 c 0.00 ± 0.00 d
Colusa 103.43 ± 12.39 a 44.68 ± 3.82 bcd 53.67 ± 8.04 bcd 11.29 ± 0.98 cd 9.57 ± 1.06 bc 5.93 ± 0.48 bc 47.84 ± 4.74 b 18.68 ± 1.67 a 43.60 ± 3.86 b 3.94 ± 0.26 c 1.03 ± 0.76 bc
Fresno 136.82 ± 17.42 a 32.13 ± 4.06 d 38.95 ± 4.82 d 8.30 ± 0.53 d 5.27 ± 0.50 d 7.17 ± 0.90 b 71.14 ± 6.80 a 14.80 ± 1.96 b 44.55 ± 2.82 b 3.21 ± 0.19 c 0.25 ± 0.13 cd
Glenn 147.11 ± 19.05 a 64.02 ± 4.83 a 72.87 ± 3.39 a 16.15 ± 2.24 a 12.09 ± 1.56 ab 10.18 ± 1.32 a 51.44 ± 2.61 ab 14.66 ± 0.54 b 40.92 ± 0.86 b 3.19 ± 0.31 c 0.00 ± 0.00 d
Kern 113.38 ± 5.78 a 37.89 ± 1.52 cd 43.60 ± 3.07 c 8.52 ± 0.37 d 7.33 ± 0.83 cd 5.60 ± 0.30 bc 68.33 ± 11.53 ab 13.47 ± 0.36 bc 38.79 ± 2.08 b 6.62 ± 0.10 b 2.10 ± 0.20 a
Merced 124.87 ± 9.17 a 29.59 ± 1.20 d 41.02 ± 2.40 d 9.20 ± 0.70 d 10.86 ± 1.30 ab 4.30 ± 0.29 c 51.80 ± 6.34 ab 10.58 ± 0.82 c 40.29 ± 3.21 b 1.70 ± 0.22 d 0.00 ± 0.00 d
San Joaquin 123.86 ± 8.78 a 38.12 ± 1.37 cd 51.57 ± 1.84 bcd 10.03 ± 0.50 cd 13.20 ± 0.90 a 5.10 ± 0.37 c 62.93 ± 2.87 ab 18.17 ± 0.90 a 63.41 ± 3.40 a 20.25 ± 0.51 a 1.71 ± 0.32 ab
Stanislaus 134.06 ± 31.42 a 50.72 ± 7.87 abc 57.37 ± 2.79 bc 12.50 ± 1.14 bc 11.22 ± 0.73 ab 5.33 ± 0.23 c 65.38 ± 6.67 ab 16.15 ± 0.85 ab 49.73 ± 5.87 b 4.03 ± 0.65 c 0.24 ± 0.10 d
LSD
Carmel
Mission
2.78
Asn Asp Glu Ser
Butte
Gln Gly
18.6511.6547.59
41.34 13.47 12.96
13.24
3.9923.72
3.2619.81
11.08
Cys
2.00
1.55
0.79
Tyr
7.12
3.73
1.47
Arg Ala Pro
4.853.63 15.10
4.04 2.33 1.94 12.76 2.93
68.67 1.802.773.2914.7617.37

80
6
Table 22 continued. Interaction of cultivar and geographic location on the free (non-essential) amino acid composition of select almond seedsa
aAmino acid values are expressed as milligram per 100 g dry weight and data are expressed as mean ± SEM (n = 3). For each column, means with different letters are significantly different (p � 0.05) according to Fisher’s LSD test.
Cultivar County
Butte 88.93 ± 3.14 cde 43.87 ± 8.86 abc 68.21 ± 2.57 abc 14.92 ± 1.45 abcd 10.06 ± 1.16 b 6.71 ± 0.19 cd 28.17 ± 1.58 def 20.18 ± 0.81 bcd 56.64 ± 7.62 ab 20.96 ± 0.08 a 2.03 ± 0.07 b
Colusa 119.20 ± 12.20 abcd 38.04 ± 3.67 bcd 61.28 ± 4.08 abc 12.37 ± 1.32 cdef 10.31 ± 1.82 b 5.38 ± 0.72 cd 30.60 ± 3.70 cde 16.64 ± 0.94 cd 66.74 ± 4.23 a 6.18 ± 0.34 b 1.03 ± 0.16 cd
Fresno 147.82 ± 31.82 a 33.85 ± 6.90 bcd 57.05 ± 6.12 abc 11.24 ± 0.77 def 11.00 ± 1.25 b 7.43 ± 0.46 bcd 52.38 ± 4.48 a 17.32 ± 1.40 bcd 50.56 ± 7.03 bc 3.59 ± 0.27 cde 0.00 ± 0.00 e
Glenn 58.89 ± 5.99 e 22.85 ± 1.93 de 53.81 ± 3.36 bc 13.07 ± 0.93 bcdef 9.10 ± 1.02 b 7.06 ± 0.32 bcd 16.40 ± 1.99 fg 19.23 ± 0.84 bcd 36.27 ± 2.81 d 19.31 ± 1.50 a 1.94 ± 0.12 b
Kern 111.83 ± 8.50 abcd 51.02 ± 4.23 ab 78.27 ± 4.63 a 14.17 ± 0.31 abcde 8.70 ± 0.73 b 6.74 ± 0.21 cd 29.48 ± 2.38 cdef 16.23 ± 1.49 d 35.14 ± 1.59 d 5.12 ± 0.86 bcd 1.63 ± 0.82 bc
Madera 138.31 ± 14.31 abc 45.92 ± 1.10 abc 74.67 ± 1.24 ab 15.41 ± 1.98 abc 11.35 ± 1.75 b 11.64 ± 4.08 a 36.50 ± 8.81 bcd 26.98 ± 0.98 a 40.89 ± 0.33 cd 3.12 ± 0.09 de 0.00 ± 0.00 e
Merced 90.40 ± 4.82 bcde 62.72 ± 3.50 a 60.24 ± 2.61 abc 11.28 ± 0.07 def 9.87 ± 0.30 b 4.76 ± 0.13 d 18.79 ± 1.17 efg 17.37 ± 0.53 bcd 34.35 ± 1.06 d 4.61 ± 0.11 bcd 0.73 ± 0.18 de
Sacramento 140.39 ± 12.94 ab 44.97 ± 3.89 abc 76.72 ± 6.16 a 16.76 ± 1.26 ab 16.31 ± 1.30 a 10.50 ± 1.28 ab 45.61 ± 3.83 ab 22.17 ± 1.72 ab 50.68 ± 3.36 bc 5.78 ± 0.47 bc 2.34 ± 0.23 ab
San Joaquin 56.31 ± 8.14 e 13.74 ± 3.17 e 29.44 ± 10.45 d 10.64 ± 0.72 ef 8.29 ± 0.65 b 7.31 ± 0.48 bcd 12.38 ± 1.66 g 8.02 ± 0.73 e 36.41 ± 2.33 d 4.50 ± 0.64 bcd 1.08 ± 0.10 cd
Stanislaus 55.46 ± 5.94 e 34.61 ± 6.83 bcd 49.93 ± 4.38 cd 9.84 ± 0.84 f 7.93 ± 0.79 b 5.39 ± 0.49 cd 27.25 ± 4.60 def 14.82 ± 1.28 d 32.78 ± 2.43 d 4.77 ± 0.80 bcd 0.03 ± 0.02 e
Tulare 130.92 ± 14.05 abcd 60.67 ± 6.24 a 73.60 ± 7.15 ab 17.37 ± 0.87 a 9.18 ± 0.82 b 8.71 ± 0.48 abc 42.47 ± 3.47 abc 21.92 ± 1.70 abc 32.29 ± 1.06 d 1.78 ± 0.03 e 3.06 ± 0.18 a
Yolo 87.66 ± 18.60 de 30.61 ± 7.68 cde 59.42 ± 12.67 abc 12.22 ± 1.85 cdef 10.86 ± 1.49 b 6.40 ± 1.13 cd 44.20 ± 3.44 ab 16.77 ± 2.91 bcd 34.10 ± 3.06 d 4.85 ± 1.23 bcd 0.86 ± 0.39 d
LSD
Butte 96.53 ± 3.49 b 31.43 ± 1.15 c 53.56 ± 1.21 abc 13.20 ± 0.69 a 11.02 ± 0.53 a 5.45 ± 0.03 ab 34.92 ± 3.61 ab 12.28 ± 0.37 ab 36.29 ± 2.09 b 19.43 ± 1.90 a 2.05 ± 0.13 b
Fresno 86.94 ± 3.27 b 42.21 ± 0.65 bc 53.47 ± 0.52 abc 12.03 ± 0.29 a 10.86 ± 0.58 a 4.93 ± 0.09 b 23.71 ± 2.99 bc 13.96 ± 0.40 ab 42.24 ± 0.77 b 2.17 ± 0.04 c 0.00 ± 0.00 d
Kern 173.53 ± 44.35 a 52.91 ± 13.88 b 64.10 ± 17.00 ab 9.52 ± 4.25 a 8.78 ± 2.37 abc 7.69 ± 2.13 a 43.97 ± 13.56 a 11.82 ± 2.56 b 66.23 ± 13.38 a 6.94 ± 1.87 b 0.00 ± 0.00 d
Merced 63.14 ± 2.94 b 30.88 ± 1.71 c 38.31 ± 1.61 c 11.07 ± 0.83 a 5.89 ± 0.37 c 6.14 ± 0.38 ab 20.70 ± 2.45 bc 14.06 ± 0.63 ab 31.09 ± 0.52 b 18.05 ± 0.54 a 1.93 ± 0.06 b
San Joaquin 97.40 ± 2.75 b 101.86 ± 2.42 a 68.44 ± 0.41 a 13.40 ± 0.42 a 8.77 ± 0.08 abc 4.81 ± 0.05 b 24.83 ± 1.18 bc 14.97 ± 0.08 a 28.33 ± 0.55 b 6.78 ± 2.05 b 2.97 ± 0.17 a
Stanislaus 70.83 ± 3.13 b 40.79 ± 2.06 bc 43.27 ± 2.76 c 9.74 ± 0.44 a 9.96 ± 0.60 ab 4.60 ± 0.26 b 19.21 ± 0.69 bc 12.66 ± 0.59 ab 40.79 ± 1.52 b 5.07 ± 0.57 bc 0.60 ± 0.04 c
Tulare 70.98 ± 1.45 b 32.68 ± 1.81 c 45.32 ± 2.25 bc 9.47 ± 0.36 a 7.24 ± 0.47 bc 5.61 ± 0.29 ab 17.94 ± 0.61 c 12.07 ± 0.45 ab 43.23 ± 1.15 b 16.69 ± 0.25 a 1.83 ± 0.22 b
LSD
Butte 144.17 ± 11.25 a 40.92 ± 0.97 bc 68.67 ± 3.94 a 14.34 ± 0.58 a 13.64 ± 0.27 ab 8.30 ± 0.52 ab 60.23 ± 3.00 cd 18.19 ± 0.55 abc 49.86 ± 2.81 b 9.27 ± 1.65 a 0.57 ± 0.07 c
Fresno 91.72 ± 2.55 b 34.50 ± 0.66 c 51.98 ± 2.03 b 7.22 ± 0.39 c 9.20 ± 0.37 cd 5.07 ± 0.42 bc 45.99 ± 3.77 cd 15.87 ± 0.41 c 57.48 ± 2.12 ab 5.05 ± 0.19 bc 0.87 ± 0.05 c
Kern 162.95 ± 17.77 a 46.15 ± 1.73 b 62.06 ± 3.64 a 9.99 ± 0.81 bc 8.91 ± 1.58 de 7.21 ± 0.17 abc 65.74 ± 8.20 bc 16.88 ± 0.57 b 48.76 ± 2.51 b 5.71 ± 0.92 b 0.85 ± 0.14 c
Merced 139.99 ± 29.92 a 10.45 ± 0.54 d 22.30 ± 3.54 c 7.81 ± 1.30 c 9.02 ± 0.94 cd 10.17 ± 3.93 a 84.52 ± 17.60 b 7.18 ± 1.60 d 33.56 ± 4.66 c 4.76 ± 0.62 bcd 1.43 ± 0.11 b
San Joaquin 182.57 ± 7.84 a 39.71 ± 3.50 bc 65.11 ± 2.03 a 12.83 ± 1.88 ab 15.17 ± 0.76 a 8.15 ± 0.30 ab 115.60 ± 1.12 a 19.27 ± 1.31 ab 62.31 ± 5.28 a 2.63 ± 0.23 d 2.54 ± 0.14 a
Stanislaus 57.19 ± 4.41 b 4.81 ± 1.10 d 9.22 ± 0.34 d 3.48 ± 0.98 d 5.73 ± 1.65 e 3.47 ± 0.28 c 36.24 ± 7.44 d 3.04 ± 0.94 e 26.14 ± 7.29 c 2.81 ± 0.27 cd 0.74 ± 0.37 c
Tulare 179.33 ± 6.86 a 110.44 ± 4.55 a 64.70 ± 3.94 a 8.47 ± 0.32 c 11.98 ± 0.64 bc 5.56 ± 0.31 bc 122.57 ± 3.76 a 20.56 ± 0.82 a 34.42 ± 1.32 c 4.81 ± 0.10 bcd 0.05 ± 0.00 d
LSD
0.363.8515.25
2.26 0.49
Tyr Cys
12.29 2.36 0.75
Padre
3.81 3.48
Price
42.66 6.93 8.97 3.03
2.934.9519.4516.1449.94
3.00 4.47
2.44
Nonpareil
50.35 19.19 21.97 3.82
24.12 2.87 12.34
Asn Asp Glu Ser Gln Pro
3.1116.27
Gly Arg Ala
13.42 5.43

81
7
aValues in bold are significant (r � 0.273 and r � -0.273) based on critical values table for Pearson’s correlation coefficients (n = 58, p � 0.05)
Table 23. Correlation coefficients among free amino acids of select almond seeds a
Asn Asp Glu Ser Gln Gly His Arg Thr Ala Pro Tyr Val Met Cys Ile Leu Phe Lys
Asn 1.000Asp 0.449 1.000Glu 0.584 0.732 1.000Ser 0.265 0.433 0.737 1.000Gln 0.560 0.254 0.547 0.447 1.000Gly 0.454 -0.010 0.372 0.467 0.358 1.000His 0.626 0.402 0.452 0.399 0.352 0.601 1.000Arg 0.678 0.359 0.309 0.076 0.496 0.164 0.374 1.000Thr 0.726 0.436 0.599 0.275 0.545 0.466 0.569 0.602 1.000Ala 0.484 0.554 0.836 0.689 0.471 0.371 0.418 0.356 0.637 1.000Pro 0.320 -0.245 0.101 -0.052 0.482 0.153 0.128 0.179 0.262 0.120 1.000Tyr -0.192 0.115 0.107 0.174 -0.015 -0.138 0.021 -0.150 -0.142 0.131 0.019 1.000Val 0.370 0.502 0.745 0.545 0.333 0.232 0.299 0.269 0.542 0.800 0.069 -0.071 1.000Met -0.022 -0.123 -0.076 0.064 0.023 0.168 0.001 0.183 -0.108 -0.052 -0.097 -0.293 0.009 1.000Cys -0.132 -0.037 0.020 0.195 0.004 0.044 0.123 -0.019 -0.177 0.049 0.009 0.397 -0.051 0.185 1.000Ile -0.230 -0.221 -0.068 0.004 0.217 -0.075 -0.486 0.057 -0.013 0.011 0.123 -0.183 0.060 0.369 -0.181 1.000
Leu -0.208 0.063 0.103 0.277 -0.211 0.093 0.056 -0.439 -0.119 0.115 -0.232 0.141 0.069 -0.316 0.253 -0.376 1.000Phe 0.022 0.096 0.444 0.497 0.351 0.401 0.120 0.063 0.330 0.633 0.081 -0.131 0.605 0.185 0.036 0.354 0.175 1.000Lys 0.326 0.297 0.572 0.383 0.428 0.210 0.271 0.383 0.570 0.713 0.280 0.001 0.745 -0.020 -0.106 0.219 -0.060 0.632 1.000

82
Electrophoresis Analysis
SDS-PAGE in the presence of 2% �-ME electrophoretic profiles of almond and
macadamia nut seed proteins are shown in Figures 7A and 8A.
Almond. SDS-PAGE analysis of almond seed proteins stained with Coomassie revealed
a range of polypeptides between 10-80 kDa with the 2 major subunits of AMP (estimated MWs
of 42-46 and 20-22 kDa) present in all tested almond seeds. Polypeptide profiles of tested
almond seeds were consistent with profiles previously reported for cultivar Nonpareil (170) and
almond genotypes (49). In select almond seeds, several prominent polypeptides were present
between 22 and 42 kDa. For instance, cultivar Mission (Figure 7A, labeled 3A-J) regardless of
growth location and/or harvest year has a prominent polypeptide with an estimated MW of 37-39
kDa that is not consistently present in the other tested cultivars. Several dominate polypeptides
are also present between 25 and 27 kDa in select almond seeds (i.e. 4E and 4J in Figure 7A).
Macadamia nut. Cultivar variation was also observed in Coomassie and silver stained
SDS-PAGE profiles of macadamia nut cultivars (Figure 8, A and B). The polypeptide profile of
macadamia nut proteins reveal a range of polypeptides between 6-80 kDa with several major
polypeptides with estimated MWs of 48-51, 20-21, 17-18, 14-15, and 6-10 kDa (Figure 8A).
Cultivar profiles differed mainly in the low molecular weight peptides, in particular the 22 kDa
polypeptide in Blue Diamond variety and the 17-18 kDa polypeptide in cultivars Keaau and
Mauka (Figure 8, A and B). The predominate polypeptide at 48-51 kDa stained with the
glycoprotein staining procedure, indicating the polypeptide is a glycoprotein (Figure 8C). All
tested macadamia nut cultivars appear to contain this glycoprotein. A glycoprotein is a protein
that attaches to a carbohydrate usually during a co- or post-translational modification. The
carbohydrate group may assist in the folding or improved stability of the protein. Glycoproteins
in several tree nuts, the 27 and 55 kDa polypeptides in almonds (236) and the 48 kDa
polypeptide in hazelnut (237), have also been identified.
ELISA
Almond. In order to assess immunoreactivity of almond seed proteins an anti-AMP mAb
(4C10)-based sandwich ELISA was developed to standardize an AMP standard curve and
previously standardized pAb-based inhibition ELISAs (137, 138, 194) for detection of AMP and
total soluble almond proteins were used.

83
The ELISA results suggested the major commercial almond cultivar Nonpareil Supreme
(the source of proteins for antibody production) had ~52.8% AMP (mAb 4C10 sandwich ELISA)
and ~63.7% AMP (rabbit anti-AMP inhibition ELISA). Immunoreactivity of AMP (assessed by
mAb 4C10 sandwich ELISA) was influenced by cultivar, with cultivars Butte, Carmel,
Nonpareil, and Monterey ranged from 49.1-69.8%, while cultivars Mission, Padre, Price, and
Sonora had a lower range of 22.2-29.6% (Table 24). Similar immunoreactivities were found
using the rabbit anti-AMP inhibition ELISA, 58.4-88.8% for cultivars Butte, Carmel, Nonpareil,
and Monterey and 28.3-46.1% for cultivars Mission, Padre, Price, and Sonora (Table 24).
Consistent with the average AMP immunoreactivity (74.0 ± 14.0%) reported in almond cultivars
Carmel, Mission, Neplus, Nonpareil, and Peerless using rabbit anti-AMP inhibition ELISA
(139). Geographic location and cultivar x county interaction influenced the immunoreactivity of
AMP in tested almond cultivars. The mAb 4C10 sandwich ELISA found AMP immunoreactivity
was higher in South Valley grown almond seeds (~63.2%) and in majority of the tested cultivars
from Butte County (cultivars Butte, Mission, Padre, and Price) and Kern County (cultivars Butte,
Carmel, Mission, and Nonpareil) (Table 25). The increase in AMP immunoreactivity for
cultivars Butte, Mission, and Padre from Butte County and cultivars Carmel and Mission from
Kern County was also detected using rabbit anti-AMP inhibition ELISA. Similarly, both ELISAs
detected a decrease in AMP immunoreactivity for cultivars Butte, Mission, and Padre grown in
San Joaquin County (Table 25). Influence of harvest year on immunoreactivity of AMP in tested
almond cultivars was not significant (Table 24).
Total soluble protein immunoreactivity of tested almond seeds (assessed by rabbit anti-
total soluble almond protein inhibition ELISA) varied by cultivar (Table 24). Judged against the
major commercial almond cultivar Nonpareil Supreme (100%), the immunoreactivity of tested
almond cultivars was 120.4% for Butte, 133.6% for Carmel, 114.1% for Mission, 147.8% for
Monterey, 112.0% for Nonpareil, 88.1% for Padre, 84.8% for Price, and 54.8% for Sonora
(Table 24). Geographic location also influenced total protein immunoreactivity of tested almond
cultivars, with noteworthy increases in cultivars grown in Butte County (cultivars Butte,
Mission, and Padre) and Fresno County (cultivars Carmel, Mission, and Nonpareil). Similarly,
decreased immunoreactivity was detected in cultivars Carmel, Mission, and Nonpareil grown in
Colusa County (Table 25). Harvest year was not found to significantly influence the total soluble
protein immunoreactivity of tested almond seed samples (Table 24).

84
Figure 7. Polypeptide profile and AMP antigenicity of select almond cultivars assessed by (A) SDS-PAGE stained with Coomassie stain; protein load = 30�g, (B) Western blot probed with mAb 4C10; protein load = 30�g, (C) Dot blot probed with mAb 4C10; protein load = 500 ng.

85
1
Figure 8. SDS-PAGE analysis of macadamia nut cultivars. A. Coomassie stain; protein load = 30 �g. B. Silver stain; protein load = 10 �g. C. Glycoprotein stain; protein load = 200 �g. D. Western blot; protein load = 30 �g. Primary Ab = Protein G purified rabbit anti- macadamia nut IgG (1:16,000 v/v). Secondary Ab = HRP-labeled goat anti-rabbit pAb (1:40,000 v/v).
A B D C

86
Table 24. Effect of cultivar, geographic location, and harvest year on the immunoreactivity of select almond cultivars assessed by ELISAa
aAlmond proteins were assessed by bmAb 4C10 sandwich ELISA, crabbit anti-AMP inhibition ELISA and danti-total soluble almond proteins pAb inhibition ELISA and all IC50 values are expressed as ng protein per 1 ml (ng/ml). Data are expressed as mean ± SEM (n = 3). For each column, means with different letters are significantly different (p � 0.05) according to Fisher’s LSD test. AMP (%) = (AMP IC50 value / IC50 value for test sample) x 100.
Cultivar
Butte 28.47 ± 1.64 c 91.09 ± 5.35 ef 48.99 ± 2.31 cd
Carmel 27.48 ± 1.59 c 66.27 ± 2.71 f 44.12 ± 2.30 cd
Mission 85.52 ± 8.46 a 207.68 ± 17.98 a 51.69 ± 5.04 cd
Monterey 33.36 ± 3.81 c 94.53 ± 4.07 ef 39.88 ± 4.01 d
Nonpareil 39.09 ± 2.55 c 100.74 ± 5.88 de 52.64 ± 2.18 c
Padre 64.81 ± 4.18 b 127.78 ± 12.67 cd 66.93 ± 5.18 b
Price 77.29 ± 10.08 ab 156.53 ± 10.59 bc 69.54 ± 3.77 b
Sonora 86.51 ± 5.16 a 184.83 ± 5.75 ab 107.49 ± 5.63 a
LSD
County
Butte 48.78 ± 5.69 abc 89.16 ± 10.48 cde 69.76 ± 7.61 a
Colusa 56.46 ± 7.41 a 116.43 ± 19.12 abc 69.78 ± 5.01 a
Fresno 25.38 ± 2.67 d 80.50 ± 2.67 de 36.35 ± 1.37 d
Glenn 51.23 ± 13.94 ab 137.72 ± 25.08 a 45.99 ± 7.09 cd
Kern 24.59 ± 2.88 d 71.18 ± 11.88 de 47.98 ± 7.40 cd
Madera 37.72 ± 6.36 bcd 120.13 ± 32.84 ab 65.38 ± 6.88 a
Merced 27.04 ± 1.12 d 71.89 ± 8.09 de 44.93 ± 1.84 cd
Sacramento 25.63 ± 2.55 d 58.79 ± 1.93 e 36.77 ± 2.45 d
San Joaquin 34.91 ± 5.39 d 66.67 ± 4.90 de 61.91 ± 4.12 ab
Stanislaus 30.65 ± 4.19 d 91.41 ± 10.45 bcd 47.78 ± 4.46 cd
Tulare 36.84 ± 4.52 cd 67.65 ± 9.53 de 50.36 ± 7.20 bc
Yolo 32.51 ± 2.86 d 90.28 ± 8.45 bcd 43.34 ± 2.35 cd
LSD
Region
North Valley 37.62 ± 3.00 a 87.35 ± 6.13 a 48.11 ± 2.70 a
South Valley 30.33 ± 1.63 b 81.49 ± 4.55 a 48.79 ± 2.03 a
LSD
Year
2003-2004 32.03 ± 6.34 a 101.83 ± 11.05 a 50.45 ± 2.95 a
2005-2006 35.85 ± 4.33 a 101.88 ± 9.02 a 48.16 ± 4.92 a
LSD
Nonpareil Supreme 36.33 ± 5.32 92.32 ± 3.21 58.98 ± 2.79
AMP 19.18 ± 1.25 58.85 ± 2.34
14.64 28.23 12.87
4C10 mAbb
Rabbit anti-AMP
pAbc
Rabbit anti-
almond pAbd
15.90 31.42 11.80
13.61 30.93 12.16
6.4214.496.22
ND

87
Table 25. Interaction of cultivar and geographic location on the immunoreactivity of select almond cultivars assessed by ELISAa
Cultivar County
Butte 17.04 ± 1.26 b 66.97 ± 6.41 cd 41.92 ± 3.43 b
Fresno 25.77 ± 2.95 ab 73.47 ± 6.19 cd 49.93 ± 4.19 ab
Kern 24.82 ± 2.37 ab 93.56 ± 9.64 bcd 46.79 ± 6.40 ab
Madera 25.25 ± 3.07 ab 88.34 ± 11.40 cd 53.56 ± 11.65 ab
Merced 27.66 ± 2.83 ab 104.04 ± 7.78 bc 39.05 ± 7.53 b
Sacramento 27.55 ± 0.72 ab 55.05 ± 0.76 d 42.41 ± 2.81 ab
San Joaquin 34.47 ± 3.92 a 148.55 ± 14.04 a 63.64 ± 11.37 a
Stanislaus 27.73 ± 2.88 ab 81.47 ± 7.10 cd 53.06 ± 9.06 ab
Tulare 36.91 ± 2.20 a 128.71 ± 14.30 ab 44.78 ± 4.75 ab
Yolo 37.53 ± 8.50 a 97.33 ± 23.09 bc 52.06 ± 9.23 ab
LSD
Butte 44.38 ± 10.84 a 66.81 ± 1.82 cd 68.38 ± 15.33 a
Colusa 46.10 ± 8.41 a 75.86 ± 6.57 bc 68.03 ± 10.51 a
Fresno 20.01 ± 2.26 c 77.82 ± 3.29 bc 35.52 ± 2.05 cd
Glenn 31.51 ± 8.57 bc 82.62 ± 6.84 b 34.09 ± 2.23 cd
Kern 21.86 ± 5.41 c 45.82 ± 6.03 g 50.44 ± 14.72 bc
Madera 23.95 ± 3.05 c 47.50 ± 7.78 efg 53.77 ± 7.18 ab
Merced 28.81 ± 0.42 bc 55.42 ± 5.29 defg 42.00 ± 2.14 bcd
Sacramento 20.09 ± 1.79 c 60.91 ± 2.40 def 29.77 ± 2.35 d
San Joaquin 27.62 ± 2.92 bc 59.27 ± 4.85 def 55.55 ± 3.93 ab
Stanislaus 31.47 ± 6.71 bc 53.54 ± 3.71 defg 41.53 ± 9.29 bcd
Tulare 27.14 ± 2.06 bc 46.98 ± 3.85 fg 35.68 ± 6.40 cd
Yolo 36.40 ± 4.40 ab 117.37 ± 7.77 a 49.21 ± 3.15 bc
LSD
Butte 39.55 ± 1.55 de 93.28 ± 5.13 e 46.19 ± 13.80 b
Colusa 76.55 ± 17.27 c 178.91 ± 9.62 c 58.26 ± 6.48 ab
Fresno 72.52 ± 13.17 cd 171.34 ± 10.75 c 31.37 ± 6.14 b
Glenn 81.84 ± 6.53 c 169.21 ± 7.50 c 31.62 ± 6.33 b
Kern 32.75 ± 11.02 e 131.66 ± 11.39 d 28.61 ± 6.10 b
Merced 128.43 ± 9.44 b 316.67 ± 21.22 b 54.72 ± 0.73 ab
San Joaquin 168.17 ± 13.00 a 402.28 ± 17.86 a 53.06 ± 1.99 ab
Stanislaus 84.94 ± 10.54 c 202.89 ± 10.07 c 80.70 ± 14.57 a
LSD
14.05 39.46 21.66
Carmel
4C10 mAbb
Rabbit anti-AMP
pAbc
Rabbit anti-
almond pAbd
12.17 13.45 16.63
Butte
Mission
33.79 36.53 33.33
aAlmond proteins were assessed by bmAb 4C10 sandwich ELISA, crabbit anti-AMP inhibition ELISA and danti-total soluble almond proteins pAb inhibition ELISA and all IC50 values are expressed as ng protein per 1 ml (ng/ml). Data are expressed as mean ± SEM (n = 3). For each column, means with different letters are significantly different (p � 0.05) according to Fisher’s LSD test.

88
aAlmond proteins were assessed by bmAb 4C10 sandwich ELISA, crabbit anti-AMP inhibition ELISA and danti-total soluble almond proteins pAb inhibition ELISA and all IC50 values are expressed as ng protein per 1 ml (ng/ml). Data are expressed as mean ± SEM (n = 3). For each column, means with different letters are significantly different (p � 0.05) according to Fisher’s LSD test.
Table 25 continued. Interaction of cultivar and geographic location on the immunoreactivity of select almond cultivars assessed by ELISAa
Cultivar County
Butte 53.17 ± 5.03 abc 111.50 ± 6.81 c 71.14 ± 7.25 ab
Colusa 66.82 ± 9.82 ab 157.00 ± 11.77 b 71.53 ± 3.44 ab
Fresno 33.44 ± 4.02 defg 84.51 ± 4.30 d 37.60 ± 1.58 d
Glenn 70.94 ± 22.57 a 192.82 ± 7.89 a 57.88 ± 10.26 bc
Kern 27.33 ± 2.16 fg 96.54 ± 5.10 cd 45.51 ± 7.13 cd
Madera 51.49 ± 1.86 bcd 192.75 ± 7.64 a 76.98 ± 7.09 a
Merced 25.27 ± 1.72 g 88.35 ± 5.28 cd 47.86 ± 1.93 cd
Sacramento 31.17 ± 4.08 efg 56.68 ± 2.98 e 43.76 ± 2.79 d
San Joaquin 49.48 ± 12.11 bcde 81.47 ± 2.42 d 74.64 ± 2.28 a
Stanislaus 30.38 ± 5.33 efg 84.51 ± 4.30 d 49.86 ± 5.21 cd
Tulare 46.54 ± 1.95 cdef 88.32 ± 3.52 cd 65.04 ± 1.61 ab
Yolo 30.57 ± 3.67 efg 76.74 ± 7.03 de 40.40 ± 2.47 d
LSD
Butte 51.98 ± 10.72 cd 81.19 ± 5.89 bc 56.33 ± 6.01 bc
Fresno 72.67 ± 12.28 b 114.45 ± 18.24 abc 81.10 ± 8.18 ab
Kern 70.23 ± 3.07 bc 118.12 ± 21.36 abc 58.29 ± 2.67 bc
Merced 92.23 ± 2.78 a 163.67 ± 17.54 ab 107.31 ± 17.26 a
San Joaquin 74.29 ± 3.69 ab 164.35 ± 66.06 ab 60.51 ± 3.04 bc
Stanislaus 41.14 ± 1.29 d 71.86 ± 4.05 c 43.65 ± 4.31 c
Tulare 51.14 ± 2.08 cd 180.80 ± 15.11 a 61.29 ± 11.17 bc
LSD
Butte 50.99 ± 4.50 bc 154.13 ± 2.95 bc 77.99 ± 2.61 a
Fresno 43.71 ± 0.71 bc 210.50 ± 35.07 a 79.67 ± 6.96 a
Kern 96.01 ± 6.28 ab 203.57 ± 5.08 ab 77.30 ± 10.78 a
Merced 77.43 ± 18.02 bc 133.29 ± 28.86 cd 69.94 ± 12.16 ab
San Joaquin 90.62 ± 28.04 b 162.93 ± 12.60 abc 49.56 ± 5.68 bc
Stanislaus 149.56 ± 33.88 a 145.10 ± 12.66 c 83.79 ± 2.60 a
Tulare 32.70 ± 3.37 c 86.20 ± 5.75 d 48.54 ± 0.47 c
LSD 53.67 55.03 21.06
19.40 23.93 13.76
19.33 84.24 26.32
Rabbit anti-AMP
pAbc
Rabbit anti-
almond pAbd
Price
Nonpareil
Padre
4C10 mAbb

89
Macadamia nut. A competitive inhibition ELISA with good sensitivity and a wide
detection range (5-1,000 ng/ml) was developed and optimized for coating buffer (Figure 9),
antigen coating concentration (Figure 10), and Protein G purified rabbit anti-macadamia nut IgG
dilution (Table 26). Of the 4 tested coating buffers, plates coated with macadamia nut proteins
diluted in PBS gave a superior protein binding signal (Figure 9). Coating of macadamia nut
proteins above 125 ng/well did not significantly increase the binding signal (Figure 9 and 10),
therefore plates were coated at this concentration. The IC50 values obtained from diluting Protein
G purified rabbit anti-macadamia nut IgG from 1:8,000 to 1:80,000 (v/v) were not significantly
different (Table 27), however diluting the pAb 1:25,000 (v/v) obtained the lowest IC50 value
while also providing a strong signal after 20 min of color development. Therefore, the optimized
ELISA conditions included coating 125 ng/well of total soluble macadamia nut proteins diluted
in PBS buffer and diluting Protein G purified rabbit anti-macadamia nut IgG to 1:25,000 (v/v). A
representative standard curve from the optimized assay is depicted in Figure 11.
Figure 9. Checkerboard titration for optimization of coating buffer in non-competitive ELISA. Protein G purified rabbit anti-macadamia nut IgG dilution was 1:4,000 v/v. Data are expressed as mean ± SEM (n = 4).
0
0.1
0.2
0.3
0.4
0.5
0.6
0.7
0.8
0.9
1
1.1
1.2
0 50 100 150 200 250 300 350 400 450 500
Ab
sorb
ance
405
nm
Coated Macadamia nut protein (ng)
BSB
Citrate
Carbonate
PBS
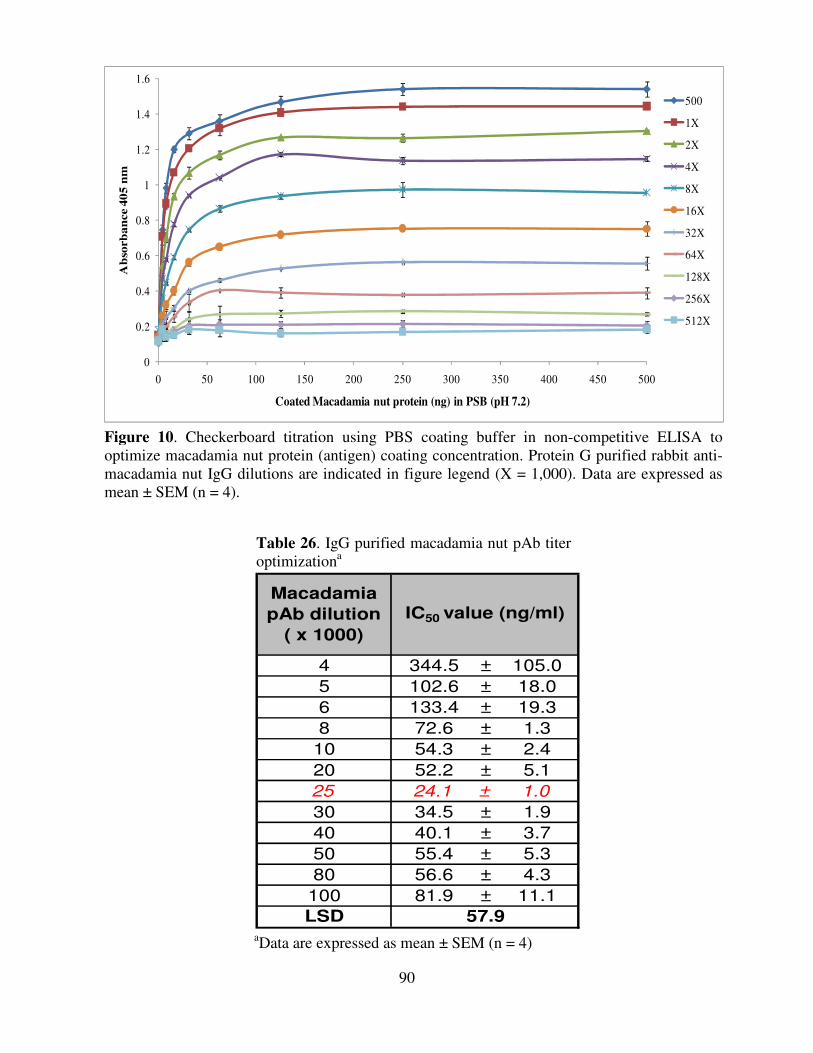
90
Table 26. IgG purified macadamia nut pAb titer optimizationa
aData are expressed as mean ± SEM (n = 4)
344.5 ± 105.0
102.6 ± 18.0
133.4 ± 19.3
72.6 ± 1.3
54.3 ± 2.4
52.2 ± 5.1
24.1 ± 1.0
34.5 ± 1.9
40.1 ± 3.7
55.4 ± 5.3
56.6 ± 4.3
81.9 ± 11.1
8
Macadamia
pAb dilution
( x 1000)
IC50 value (ng/ml)
4
5
6
80
100
LSD 57.9
10
20
25
30
40
50
Figure 10. Checkerboard titration using PBS coating buffer in non-competitive ELISA to optimize macadamia nut protein (antigen) coating concentration. Protein G purified rabbit anti-macadamia nut IgG dilutions are indicated in figure legend (X = 1,000). Data are expressed as mean ± SEM (n = 4).
0
0.2
0.4
0.6
0.8
1
1.2
1.4
1.6
0 50 100 150 200 250 300 350 400 450 500
Ab
sorb
an
ce 4
05 n
m
Coated Macadamia nut protein (ng) in PSB (pH 7.2)
500
1X
2X
4X
8X
16X
32X
64X
128X
256X
512X

91
The average IC50 value for the major macadamia nut commercial variety (Blue Diamond)
was 21.75 ± 0.94 ng/ml (mean ± SEM, n= 70). The Blue Diamond variety was used as the
reference as this variety was the source of protein (antigen) for rabbit pAb production.
Immunoreactivity of Blue Diamond variety and cultivars Keauhou, Purvis, and Kakea was
similar, however immunoreactivity of Trader Joe’s variety and cultivars Keaau and Mauka was
significantly lower (34.3%, 52.4%, and 37.5%, respectively) (Figure 12).
Figure 11. Representative competitive inhibition ELISA standard curve for macadamia nut. The IC50 value (mean ± SEM) for soluble macadamia nut protein was 21.75 ± 0.94 ng/ml (n = 70).
Figure 12. Immunoreactivity (%) of macadamia nut varieties assessed by inhibition ELISA (n= 4). * = significantly different compared to control (Blue Diamond, p � 0.05, LSD = 23.18).
0
20
40
60
80
100
120
140
Blue
Diamond
Trader
Joe's
#246
'Keauhou'
#294
'Purvis'
#508
'Kakea'
#660
'Keaau'
#741
'Mauka'
% Im
mu
no
rea
cti
vit
y
Macadamia nut seed varieties
** *

92
Western and Dot blots
Almond. Western blots probed with mAb 4C10 detected a significant variation in AMP
antigenicity among the tested almond seeds (Figure 7B). Similar to the reported variation
observed between almond genotypes probed with mAb 4C10 (49). The intensity of the AMP
polypeptide (63 kDa) recognized by mAb 4C10 varied by cultivar and geographic location. Dot
blotting experiments further confirmed the variation, as shown by the difference in signal
intensities (Figure 7C).
Macadamia nut. Western blotting analysis identified nine sets of immunoreactive
polypeptides with estimated MWs of 94-96, 59-62, 48-51, 37-39, 31-33, 26-28, 20-21, 17-19 and
6-10 kDa (Figure 8D) among which 48-50 and 17-19 kDa polypeptides exhibited the strongest
reactivity. Significant differences with respect to band intensity in the polypeptide masses of 6-
10 kDa and 20-21 kDa were seen among the tested macadamia nut seed samples. Polypeptides
59-62, 48-51, 37-39, 31-33, 26-28, and 17-19 kDa did not appear to show significant variations
in antigenicity among the the tested macadamia nut seed samples.
Cross-reactivity Studies
Determining antibody cross-reactivity is of importance as foods containing almond and
macadamia nut seeds may also contain other tree nuts, oilseeds, legumes, cereals, or additional
ingredients which if recognized by the antibody could cause problems with accurate detection
and labeling.
Almond. The anti-AMP mAb 4C10 was analyzed for cross-reactivity using Western
blotting, Dot blotting, and ELISA (Figure 13, A-C). Western and Dot blotting assays did not
detect any cross-reactivity between mAb 4C10 and 17 seed proteins. Similarly, the sandwich
ELISA only detected a range of 0.00-0.15% cross-reactivity for 51 foods/ingredients (Figure
13C).
Macadamia nut. Protein G purified rabbit anti-macadamia nut IgG was also analyzed for
cross-reactivity using Western blotting (Figure 14) and inhibition ELISA (Table 27). Western
blotting analysis found cross-reactivity of Protein G purified rabbit anti-macadamia nut IgG with
majority of the 62 tested samples. However, inhibition ELISA found only 0.00-0.11% cross-
reactivity with 68 different foods/ingredients and 1.46% cross-reactivity cinnamon (Table 27).

93
Figure 13. Cross-reactivity of mAb 4C10 with select foods/ingredients assessed by (A) Western blot; protein load = 20 �g, (B) Dot blot; protein load = 500 ng for almond and 2 �g for test samples, and (C) sandwich ELISA; values are % cross-reactivity and are expressed as mean ± SEM (n = 3).

94
1
Figure 14. Cross-reactivity of select foods/ingredients with Protein G purified rabbit anti-macadamia nut IgG (1:16,000 v/v) assessed by Western blotting. Protein loads: 10 �g macadamia and 30 �g for all test samples.

95
Table 27. Cross-reactivity of select foods/ingredients with Protein G purified rabbit anti-macadamia nut IgG assessed by inhibition ELISAa
aData are reported as mean ± SEM (n = 3).
Sample Sample
Almond 0.001 ± 0.000 Poppy Seed 0.012 ± 0.000Brazil Nut 0.003 ± 0.002 Barley 0.002 ± 0.000
Cashew 0.000 ± 0.000 Corn 0.005 ± 0.001Hazelnut 0.002 ± 0.001 Wheat 0.005 ± 0.000
Pecan 0.000 ± 0.000 Egg White 0.007 ± 0.001Pistachio 0.001 ± 0.001 Egg Yolk 0.001 ± 0.000Pinenut 0.006 ± 0.001 Raisin 0.007 ± 0.001Walnut 0.016 ± 0.002 Cocoa 0.006 ± 0.000
Inca Peanut 0.001 ± 0.001 Non-fat Dry Milk 0.002 ± 0.000Spanish Peanut 0.000 ± 0.000 Vanilla Icecream 0.005 ± 0.001Virginia Peanut 0.005 ± 0.001 Rice 0.000 ± 0.000
Black Bean 0.007 ± 0.000 Spinach 0.002 ± 0.000Black-eye Pea 0.005 ± 0.001 Cauliflower 0.001 ± 0.000
Chickpea 0.003 ± 0.003 Sesame 0.002 ± 0.000Cow Pea 0.004 ± 0.004 Pepitas 0.000 ± 0.000
Fava Bean 0.008 ± 0.004 Black Pepper 0.008 ± 0.001Green Lentil 0.008 ± 0.002 Cardamom 0.015 ± 0.001Green Pea 0.009 ± 0.002 Cinnamon 1.458 ± 0.989
Red Kidney 0.014 ± 0.000 Nutmeg 0.078 ± 0.001Horse Bean 0.026 ± 0.001 Cherries 0.014 ± 0.001Lima Bean 0.005 ± 0.002 Oats 0.014 ± 0.002
Lupine Seed 0.006 ± 0.000 Millet 0.016 ± 0.001Moth Bean 0.004 ± 0.001 Sorghum 0.016 ± 0.001Mung Bean 0.004 ± 0.002 Salt 0.024 ± 0.002Navy Bean 0.003 ± 0.001 Sugar 0.012 ± 0.001Pigeon Pea 0.003 ± 0.000 Baking Powder 0.006 ± 0.000Pinto Bean 0.005 ± 0.002 Vanilla Extract 0.110 ± 0.012
Soybean 0.003 ± 0.001 Chocolate Chip Cookie 0.009 ± 0.001Tepary Bean 0.005 ± 0.000 Coconut 0.006 ± 0.000
Urd 0.024 ± 0.003 Milk Chocolate 0.012 ± 0.001Val 0.000 ± 0.000 White Chocolate 0.002 ± 0.000
Winged Bean 0.000 ± 0.000 Dark Chocolate 0.002 ± 0.000Flaxseed 0.000 ± 0.000 Trail Mix 0.000 ± 0.000
Sunflower 0.000 ± 0.000 All-purpose Wheat Flour 0.002 ± 0.001Amaranth 0.000 ± 0.000
%
Crossreactivity
%
Crossreactivity
LSD = 0.334

96
Stability Studies
Almond and macadamia nut seeds are often subjected to a variety of processing
treatments (i.e. roasting and blanching) which may alter the protein structure. The structural
changes, as a result of processing treatments, may alter protein detection by destroying epitopes,
exposing previously hidden epitopes and/or creating new epitopes (197). Therefore, antigenic
stability of almond and macadamia nut seed proteins exposed to various processing treatments
(pH exposure and thermal processing) was assessed using immunoassays.
Almond. Regardless of the thermal processing treatment, the 63 kDa AMP polypeptide
retained its antigenicity (Figure 15). The stability of almond seed proteins, assessed by rabbit
pAb-based inhibition ELISA, to various thermal processing treatments and/or -irradiation is
reported (139, 140, 196-198). Exposure to pH 3 and 13 caused loss of detection by mAb 4C10 in
Western blotting (Figure 16, B and E), however the mAb-based sandwich ELISA weakly
detected the polypeptide in pH treated samples that were neutralized prior to analysis. A decrease
in AMP antigenicity as a result of acid pH exposure has been reported (140, 167).
Macadamia nut. Assessing the stability of macadamia nut proteins to thermal processing
found that dry heat methods, microwaving and dry roasting, had the most impact on decreasing
the antigenicity of these proteins (Figure 17). However regardless of the thermal processing
treatment, macadamia nut proteins retained their antigenicity and were detected by the
immunoassays. Western blotting detected macadamia nut proteins in all tested pH exposed
samples (Figure 18, B and E), however antigenicity was significantly decreased in proteins
exposed to pH 1, 3 and 5 that were not neutralized prior to analysis (Figure 18B). Inhibition
ELISA also detected macadamia nut proteins in the tested pH exposed samples (Figure 18, C and
F), however a significant decrease in the detection of proteins exposed to pH 1, 3 and 13 (not
neutralized) and exposed to pH 1 and 13 (neutralized) was observed. Differences in protein
solubility could explain the variation observed between pH exposed samples neutralized prior to
analysis and those not neutralized, as the proteins in samples not neutralized prior to analysis
may have precipitated under the normal assay conditions.
Spiking Studies
Processed foods containing almond and macadamia nut seeds may also contain other
ingredients that may interfere or alter detection of almond and macadamia nut proteins.
Therefore, foods/ingredients commonly found in processed foods containing almond and

97
macadamia nut seeds were spiked with BSB extracted proteins or defatted flour and recovery
was assessed by ELISA.
Almond. Assuming ~60% AMP in the BSB protein extract, the assay was able to detect
10 �g almond seed protein (or 6 �g AMP) in 100 mg food matrix (equivalent to 100 ppm) in the
majority (10 out of 16) of tested food matrices (Table 28). The assay also detected defatted
almond seed flour at 100 ppm (equivalent to 100 �g defatted almond seed flour per 100 g food
matrix) in 6 of the 10 tested food matrices (Table 28). Four commercial products with almond
seeds as one of the declared ingredients were found to contain 4.1-26.3% almond seed (w/w) on
as is basis (Table 30).
Macadamia nut. The rabbit anti-macadamia nut inhibition ELISA successfully detected
1 �g macadamia nut protein in 100 mg (equivalent to 10 ppm) in all 13 tested food matrices and
as low as 1 ppm macadamia nut protein in 5 of the 13 tested food matrices. The assay also
detected 10 �g of defatted macadamia nut flour in 100 mg (10 ppm) in 6 of the 8 tested food
matrices (Table 29). Two commercial products with macadamia nut seeds as one of the declared
ingredients were found to contain 22.6-34.0% macadamia nut seed (w/w) on as is basis (Table
30).
CONCLUSION
Both almond and macadamia nut seed samples differed significantly in physical
characteristics, chemical composition, and protein antigenicity. Growth location and harvest year
also significantly affected physical characteristics, chemical composition, and protein
antigenicity of the tested almond cultivars.
The sensitive immunoassays developed in this study successfully detected almond and
macadamia nut proteins at concentrations applicable for the food industry and may contribute to
safer consumer products.

98
Figure 15. Effect of thermal processing on antigenicity of AMP assessed by (A) SDS-PAGE stained with Ponceu S stain; protein load = 30�g, (B) Western blot probed with mAb 4C10; protein load = 30�g, (C) mAb 4C10 sandwich ELISA; values are % immunoreactivity [(IC50 of processed sample/IC50 of unprocessed sample) x 100] and are expressed as mean ± SEM (n = 3, p � 0.05).

99
Figure 16. Effect of pH on the antigenicity of AMP assessed by (A) SDS-PAGE stained with Ponceu S stain and (D) Coomassie stain; protein load = 20 �g, (B and E) Western blot probed with mAb 4C10; protein load = 20 �g, and (C and F) mAb 4C10 sandwich ELISA, values are % immunoreactivity [(IC50 of processed sample/IC50 of unprocessed sample) x 100] and are expressed as mean ± SEM (n = 3, p � 0.05). A, B, C: Defatted almond seed flour exposed to desired pH value and neutralized prior to analysis. D, E, F: Defatted almond seed flour exposed to desired pH value and analyzed directly (not neutralized).
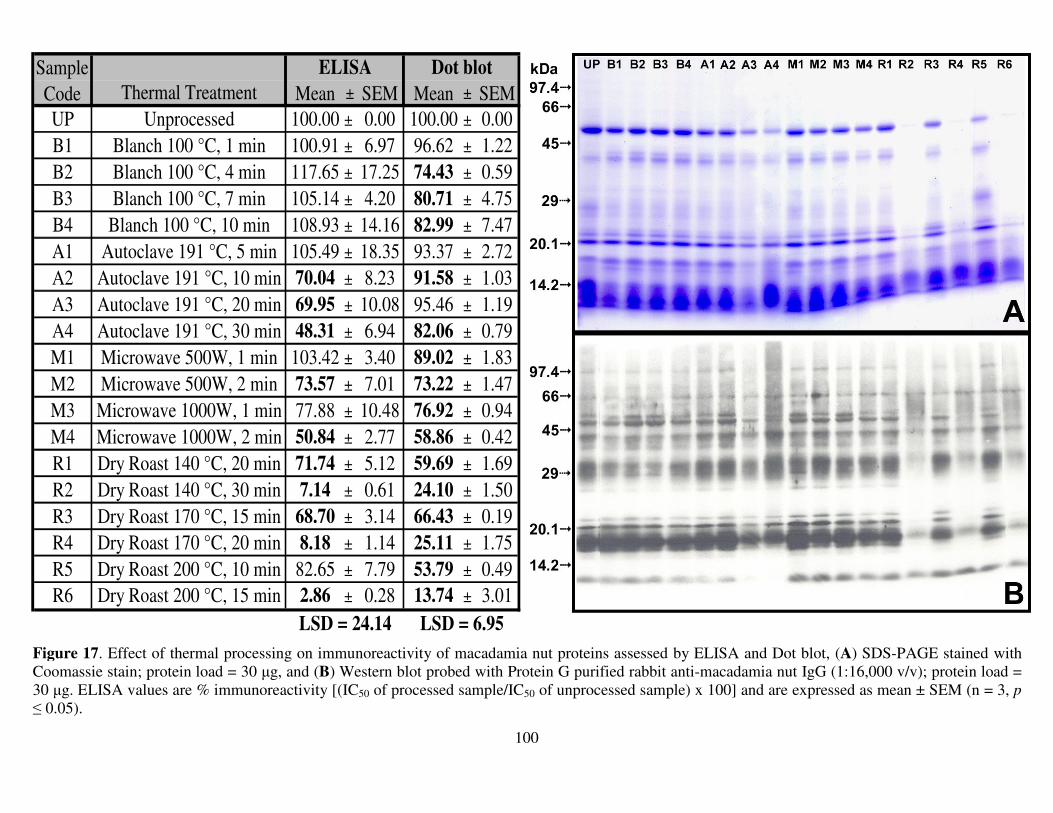
100
1
Figure 17. Effect of thermal processing on immunoreactivity of macadamia nut proteins assessed by ELISA and Dot blot, (A) SDS-PAGE stained with Coomassie stain; protein load = 30 �g, and (B) Western blot probed with Protein G purified rabbit anti-macadamia nut IgG (1:16,000 v/v); protein load = 30 �g. ELISA values are % immunoreactivity [(IC50 of processed sample/IC50 of unprocessed sample) x 100] and are expressed as mean ± SEM (n = 3, p � 0.05).
Mean ± SEM Mean ± SEMUP Unprocessed 100.00 ± 0.00 100.00 ± 0.00B1 Blanch 100 °C, 1 min 100.91 ± 6.97 96.62 ± 1.22B2 Blanch 100 °C, 4 min 117.65 ± 17.25 74.43 ± 0.59B3 Blanch 100 °C, 7 min 105.14 ± 4.20 80.71 ± 4.75B4 Blanch 100 °C, 10 min 108.93 ± 14.16 82.99 ± 7.47A1 Autoclave 191 °C, 5 min 105.49 ± 18.35 93.37 ± 2.72A2 Autoclave 191 °C, 10 min 70.04 ± 8.23 91.58 ± 1.03A3 Autoclave 191 °C, 20 min 69.95 ± 10.08 95.46 ± 1.19A4 Autoclave 191 °C, 30 min 48.31 ± 6.94 82.06 ± 0.79M1 Microwave 500W, 1 min 103.42 ± 3.40 89.02 ± 1.83M2 Microwave 500W, 2 min 73.57 ± 7.01 73.22 ± 1.47M3 Microwave 1000W, 1 min 77.88 ± 10.48 76.92 ± 0.94M4 Microwave 1000W, 2 min 50.84 ± 2.77 58.86 ± 0.42R1 Dry Roast 140 °C, 20 min 71.74 ± 5.12 59.69 ± 1.69R2 Dry Roast 140 °C, 30 min 7.14 ± 0.61 24.10 ± 1.50R3 Dry Roast 170 °C, 15 min 68.70 ± 3.14 66.43 ± 0.19R4 Dry Roast 170 °C, 20 min 8.18 ± 1.14 25.11 ± 1.75R5 Dry Roast 200 °C, 10 min 82.65 ± 7.79 53.79 ± 0.49R6 Dry Roast 200 °C, 15 min 2.86 ± 0.28 13.74 ± 3.01
ELISA
LSD = 24.14
Dot blot
LSD = 6.95
Sample Code Thermal Treatment

101
2
Figure 18. Effect of pH on immunoreactivity of macadamia nut proteins assessed by (A and D) SDS-PAGE stained with Coomassie stain; protein load = 20 �g, (B and E) Western blot probed with Protein G purified rabbit anti-macadamia nut IgG (1:16,000 v/v); protein load = 20 �g, and (C and F) inhibition ELISA, values are % immunoreactivity [(IC50 of processed sample/IC50 of unprocessed sample) x 100] and are expressed as mean ± SEM (n = 3, p � 0.05). A, B, C: Defatted macadamia nut flour exposed to desired pH value and analyzed directly (not neutralized). D, E, F: Defatted macadamia nut flour exposed to desired pH value and neutralized prior to analysis.
A
B
C
D
E
F pH Mean ± SEM pH Mean ± SEMBSB 100.00 ± 0.00 BSB 100.00 ± 0.00
1 0.01 ± 0.00 1 0.07 ± 0.003 0.06 ± 0.01 3 106.05 ± 11.685 63.14 ± 7.42 5 117.25 ± 10.197 98.26 ± 8.85 7 94.08 ± 4.339 93.47 ± 2.68 9 113.18 ± 5.43
11 74.65 ± 4.57 11 64.19 ± 4.5913 0.01 ± 0.00 13 2.88 ± 0.35
LSD = 15.27 LSD = 19.41
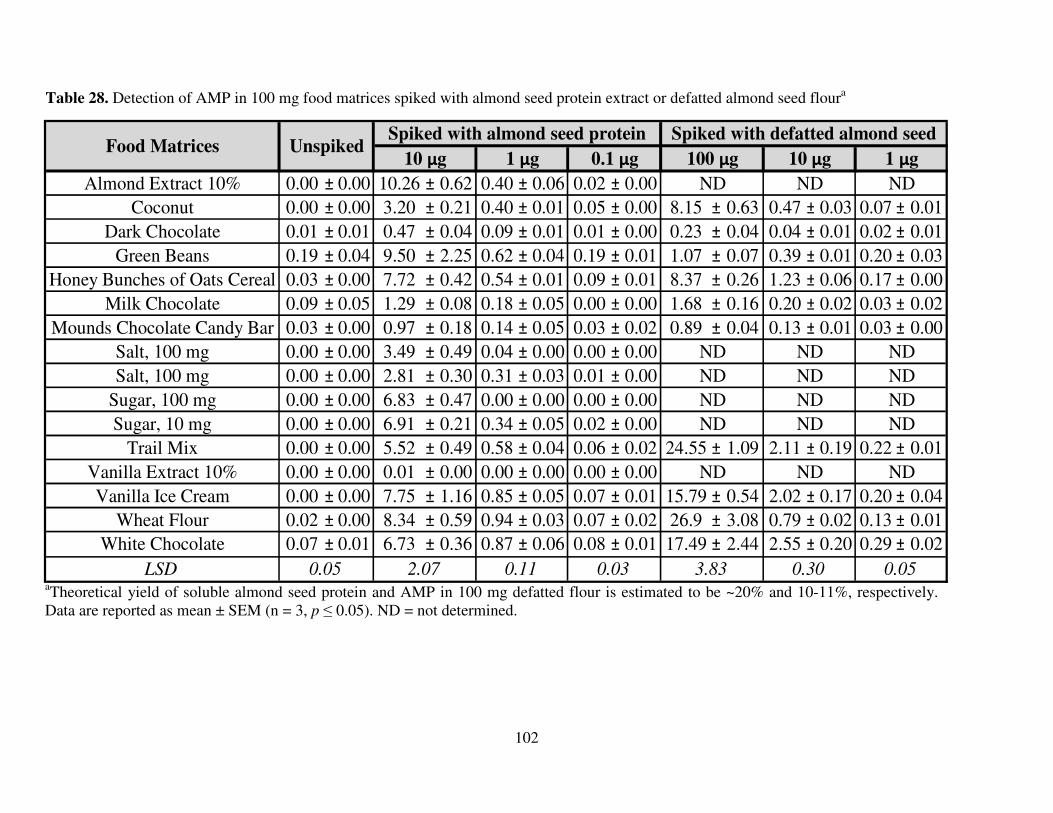
102
Table 28. Detection of AMP in 100 mg food matrices spiked with almond seed protein extract or defatted almond seed floura
aTheoretical yield of soluble almond seed protein and AMP in 100 mg defatted flour is estimated to be ~20% and 10-11%, respectively. Data are reported as mean ± SEM (n = 3, p � 0.05). ND = not determined.
Almond Extract 10% 0.00 ± 0.00 10.26 ± 0.62 0.40 ± 0.06 0.02 ± 0.00Coconut 0.00 ± 0.00 3.20 ± 0.21 0.40 ± 0.01 0.05 ± 0.00 8.15 ± 0.63 0.47 ± 0.03 0.07 ± 0.01
Dark Chocolate 0.01 ± 0.01 0.47 ± 0.04 0.09 ± 0.01 0.01 ± 0.00 0.23 ± 0.04 0.04 ± 0.01 0.02 ± 0.01Green Beans 0.19 ± 0.04 9.50 ± 2.25 0.62 ± 0.04 0.19 ± 0.01 1.07 ± 0.07 0.39 ± 0.01 0.20 ± 0.03
Honey Bunches of Oats Cereal 0.03 ± 0.00 7.72 ± 0.42 0.54 ± 0.01 0.09 ± 0.01 8.37 ± 0.26 1.23 ± 0.06 0.17 ± 0.00Milk Chocolate 0.09 ± 0.05 1.29 ± 0.08 0.18 ± 0.05 0.00 ± 0.00 1.68 ± 0.16 0.20 ± 0.02 0.03 ± 0.02
Mounds Chocolate Candy Bar 0.03 ± 0.00 0.97 ± 0.18 0.14 ± 0.05 0.03 ± 0.02 0.89 ± 0.04 0.13 ± 0.01 0.03 ± 0.00Salt, 100 mg 0.00 ± 0.00 3.49 ± 0.49 0.04 ± 0.00 0.00 ± 0.00Salt, 100 mg 0.00 ± 0.00 2.81 ± 0.30 0.31 ± 0.03 0.01 ± 0.00
Sugar, 100 mg 0.00 ± 0.00 6.83 ± 0.47 0.00 ± 0.00 0.00 ± 0.00Sugar, 10 mg 0.00 ± 0.00 6.91 ± 0.21 0.34 ± 0.05 0.02 ± 0.00
Trail Mix 0.00 ± 0.00 5.52 ± 0.49 0.58 ± 0.04 0.06 ± 0.02 24.55 ± 1.09 2.11 ± 0.19 0.22 ± 0.01Vanilla Extract 10% 0.00 ± 0.00 0.01 ± 0.00 0.00 ± 0.00 0.00 ± 0.00Vanilla Ice Cream 0.00 ± 0.00 7.75 ± 1.16 0.85 ± 0.05 0.07 ± 0.01 15.79 ± 0.54 2.02 ± 0.17 0.20 ± 0.04
Wheat Flour 0.02 ± 0.00 8.34 ± 0.59 0.94 ± 0.03 0.07 ± 0.02 26.9 ± 3.08 0.79 ± 0.02 0.13 ± 0.01White Chocolate 0.07 ± 0.01 6.73 ± 0.36 0.87 ± 0.06 0.08 ± 0.01 17.49 ± 2.44 2.55 ± 0.20 0.29 ± 0.02
LSD
ND ND ND
0.05 2.07 0.11 0.03 3.83 0.30 0.05
ND ND NDND ND ND
ND ND NDND ND ND
10 μg 1 μg 0.1 μg
Spiked with defatted almond seed
100 μg 10 μg 1 μgFood Matrices Unspiked
Spiked with almond seed protein
ND ND ND

103
1 Table 29. Detection of macadamia nut protein in 100 mg of food matrices spiked with macadamia nut protein extract or defatted macadamia nut floura
aTheoretical yield of soluble macadamia nut protein in 100 mg defatted flour is estimated to be ~14%. Data are reported as mean ± SEM (n = 3). ND = not determined.
10 μg 1 μg 0.1 μg 100 μg 10 μg 1 μg
Chocolate Chip Cookie 0.14 ± 0.02 8.99 ± 0.33 0.55 ± 0.04 0.15 ± 0.00 8.65 ± 1.88 0.73 ± 0.04 0.08 ± 0.00Coconut 0.07 ± 0.01 9.89 ± 0.28 1.52 ± 0.16 0.05 ± 0.01 8.90 ± 0.87 1.92 ± 0.07 0.36 ± 0.04
Dark Chocolate 0.02 ± 0.00 2.68 ± 0.38 0.25 ± 0.00 0.03 ± 0.00 2.61 ± 0.29 0.16 ± 0.00 0.03 ± 0.00Milk Chocolate 0.34 ± 0.04 11.07 ± 1.43 0.98 ± 0.07 0.13 ± 0.01 18.51 ± 0.83 1.37 ± 0.20 0.30 ± 0.02
White Chocolate 0.03 ± 0.00 5.40 ± 0.56 0.40 ± 0.05 0.06 ± 0.00 19.81 ± 1.20 0.93 ± 0.01 0.04 ± 0.01Trail Mix 0.01 ± 0.00 10.02 ± 1.09 0.86 ± 0.05 0.04 ± 0.00 9.20 ± 0.34 0.22 ± 0.02 0.04 ± 0.00
Wheat Flour 0.04 ± 0.01 9.05 ± 0.33 1.20 ± 0.08 0.15 ± 0.01 25.56 ± 2.63 1.64 ± 0.14 0.37 ± 0.07Vanilla Icecream 0.12 ± 0.03 15.74 ± 0.77 1.25 ± 0.02 0.21 ± 0.01 14.40 ± 1.23 1.54 ± 0.32 0.16 ± 0.02
Salt (100 mg) 0.01 ± 0.00 4.55 ± 0.80 0.17 ± 0.02 0.01 ± 0.00 ND ND NDSalt (10 mg) 0.01 ± 0.00 10.12 ± 0.16 1.01 ± 0.09 0.07 ± 0.01 ND ND ND
Sugar (100 mg) 0.00 ± 0.00 6.75 ± 0.07 0.08 ± 0.00 0.00 ± 0.00 ND ND NDSugar (10 mg) 0.00 ± 0.00 8.70 ± 1.23 0.96 ± 0.04 0.06 ± 0.00 ND ND ND
Vanilla Extract (10%) 0.03 ± 0.00 9.66 ± 0.95 0.88 ± 0.02 0.10 ± 0.00 ND ND NDLSD (p = 0.05) 0.05 2.24 0.19 0.02 4.11 0.43 0.08
Unspiked
Spiked with macadamia nut
protein extract
Spiked with defatted macadamia
nut flourFood Matrices

104
Commercial Foods containing
Almond Mean ± SEM
Almond Joy candy bar 26.34 ± 1.06Almond Praline ice cream 12.68 ± 1.01
Honey Bunches of Oats with slivered almonds breakfast cereal 25.83 ± 7.47
Green beans with slivered almonds 4.11 ± 0.29Commercial Foods containing
Macadamia nut Mean ± SEM
Chocolate chip and macadamia nut cookie
22.58 ± 0.45
Godiva chocolate bar with macadamia nut and coconut 33.95 ± 3.12
aData are reported as gram per 100 gram edible portion and are expressed as mean ± SEM (n = 4).
Table 30. Detection of almond and macadamia nut in commercially prepared foods using ELISAa

105
Sum of Squares df
Mean Square F Sig.
Cultivar Between Groups 1.399 7 0.200 12.102 0.000Within Groups 3.535 214 0.017
Total 4.935 221
County Between Groups 0.316 11 0.029 1.773 0.070Within Groups 1.506 93 0.016
Total 1.822 104
Region Between Groups 0.004 1 0.004 0.198 0.657Within Groups 1.819 103 0.018
Total 1.823 104
Harvest year Between Groups 0.082 1 0.082 3.278 0.077Within Groups 1.076 43 0.025
Total 1.158 44
cv. Butte x county Between Groups 44.971 9 4.997 1385.218 0.000Within Groups 0.115 32 0.004
Total 45.087 41
cv. Carmel x county Between Groups 66.364 11 6.033 3656.726 0.000Within Groups 0.064 39 0.002
Total 66.428 50
cv. Mission x county Between Groups 35.665 7 5.095 1189.454 0.000Within Groups 0.081 19 0.004
Total 35.746 26
cv. Nonpareil x county Between Groups 74.880 11 6.807 885.310 0.000Within Groups 0.323 42 0.008
Total 75.203 53
cv. Padre x county Between Groups 25.839 6 4.307 5927.549 0.000Within Groups 0.010 14 0.001
Total 25.849 20
cv. Price x county Between Groups 20.751 6 3.458 3217.790 0.000Within Groups 0.015 14 0.001
Total 20.766 20
Seed Weight
APPENDIX A
ANOVA Tables
Tables 9 and 10. Individual seed weight of select almond seeds
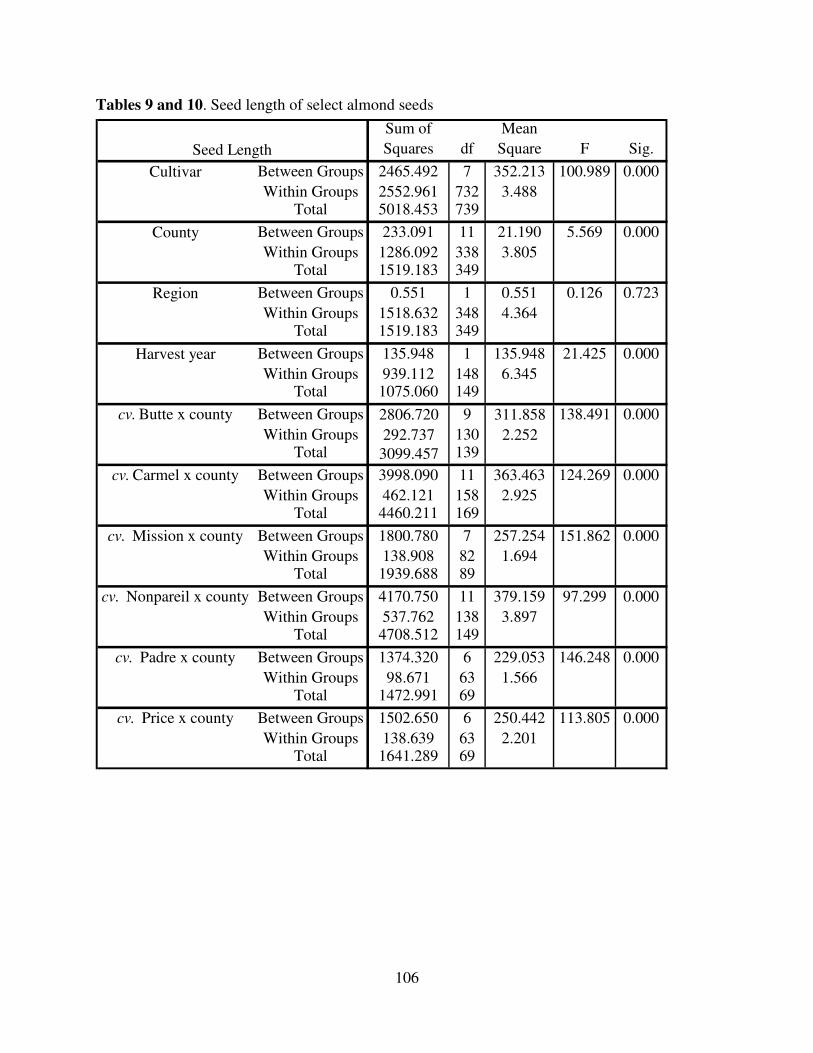
106
Sum of Squares df
Mean Square F Sig.
Cultivar Between Groups 2465.492 7 352.213 100.989 0.000Within Groups 2552.961 732 3.488
Total 5018.453 739
County Between Groups 233.091 11 21.190 5.569 0.000Within Groups 1286.092 338 3.805
Total 1519.183 349
Region Between Groups 0.551 1 0.551 0.126 0.723Within Groups 1518.632 348 4.364
Total 1519.183 349
Harvest year Between Groups 135.948 1 135.948 21.425 0.000Within Groups 939.112 148 6.345
Total 1075.060 149
cv. Butte x county Between Groups 2806.720 9 311.858 138.491 0.000Within Groups 292.737 130 2.252
Total 3099.457 139
cv. Carmel x county Between Groups 3998.090 11 363.463 124.269 0.000Within Groups 462.121 158 2.925
Total 4460.211 169
cv. Mission x county Between Groups 1800.780 7 257.254 151.862 0.000Within Groups 138.908 82 1.694
Total 1939.688 89
cv. Nonpareil x county Between Groups 4170.750 11 379.159 97.299 0.000Within Groups 537.762 138 3.897
Total 4708.512 149
cv. Padre x county Between Groups 1374.320 6 229.053 146.248 0.000Within Groups 98.671 63 1.566
Total 1472.991 69
cv. Price x county Between Groups 1502.650 6 250.442 113.805 0.000Within Groups 138.639 63 2.201
Total 1641.289 69
Seed Length
Tables 9 and 10. Seed length of select almond seeds

107
Sum of Squares df
Mean Square F Sig.
Cultivar Between Groups 127.280 7 18.183 24.749 0.000Within Groups 537.798 732 0.735
Total 665.078 739
County Between Groups 48.592 11 4.417 5.024 0.000Within Groups 297.185 338 0.879
Total 345.776 349
Region Between Groups 2.772 1 2.772 2.813 0.094Within Groups 343.004 348 0.986
Total 345.776 349
Harvest year Between Groups 2.067 1 2.067 2.615 0.108Within Groups 117.000 148 0.791
Total 119.066 149
cv. Butte x county Between Groups 1676.790 9 186.310 648.260 0.000Within Groups 37.362 130 0.287
Total 1714.152 139
cv. Carmel x county Between Groups 1997.490 11 181.590 357.494 0.000Within Groups 80.256 158 0.508
Total 2077.746 169
cv. Mission x county Between Groups 1151.600 7 164.514 390.921 0.000Within Groups 34.509 82 0.421
Total 1186.109 89
cv. Nonpareil x county Between Groups 2235.700 11 203.245 279.769 0.000Within Groups 100.254 138 0.726
Total 2335.954 149
cv. Padre x county Between Groups 866.440 6 144.407 470.522 0.000Within Groups 19.335 63 0.307
Total 885.775 69
cv. Price x county Between Groups 802.210 6 133.702 279.300 0.000Within Groups 30.158 63 0.479
Total 832.368 69
Seed Width
Tables 9 and 10. Seed width of select almond seeds

108
Sum of Squares df
Mean Square F Sig.
Cultivar Between Groups 317.648 7 45.378 87.325 0.000Within Groups 380.384 732 0.520
Total 698.033 739
County Between Groups 15.756 11 1.432 3.005 0.001Within Groups 161.108 338 0.477
Total 176.865 349
Region Between Groups 1.749 1 1.749 3.475 0.063Within Groups 175.116 348 0.503
Total 176.865 349
Harvest year Between Groups 4.799 1 4.799 5.265 0.023Within Groups 134.897 148 0.911
Total 139.696 149
cv. Butte x county Between Groups 1259.610 9 139.957 359.342 0.000Within Groups 50.632 130 0.389
Total 1310.242 139
cv. Carmel x county Between Groups 1391.215 11 126.474 262.579 0.000Within Groups 76.103 158 0.482
Total 1467.318 169
cv. Mission x county Between Groups 858.870 7 122.696 219.264 0.000Within Groups 45.886 82 0.560
Total 904.756 89
cv. Nonpareil x county Between Groups 1430.560 11 130.051 285.729 0.000Within Groups 62.811 138 0.455
Total 1493.371 149
cv. Padre x county Between Groups 667.390 6 111.232 421.276 0.000Within Groups 16.634 63 0.264
Total 684.024 69
cv. Price x county Between Groups 551.540 6 91.923 243.607 0.000Within Groups 23.773 63 0.377
Total 575.313 69
Seed Thickness
Tables 9 and 10. Seed thickness of select almond seeds

109
Sum of Squares df
Mean Square F Sig.
Cultivar Between Groups 8.890 7 1.270 3.080 0.004Within Groups 88.240 214 0.412
Total 97.131 221
County Between Groups 19.370 11 1.761 8.309 0.000Within Groups 19.710 93 0.212
Total 39.080 104
Region Between Groups 3.655 1 3.655 9.464 0.003Within Groups 39.783 103 0.386
Total 43.438 104
Harvest year Between Groups 0.553 1 0.553 0.852 0.361Within Groups 27.914 43 0.649
Total 28.467 44
cv. Butte x county Between Groups 10.312 9 1.146 3.505 0.004Within Groups 10.461 32 0.327
Total 20.773 41
cv. Carmel x county Between Groups 13.052 11 1.187 4.760 0.000Within Groups 9.721 39 0.249
Total 22.773 50
cv. Mission x county Between Groups 19.241 7 2.749 11.916 0.000Within Groups 4.383 19 0.231
Total 23.623 26
cv. Nonpareil x county Between Groups 13.002 11 1.182 11.360 0.000Within Groups 4.370 42 0.104
Total 17.372 53
cv. Padre x county Between Groups 4.351 6 0.725 29.413 0.000Within Groups 0.345 14 0.025
Total 4.696 20
cv. Price x county Between Groups 6.954 6 1.159 35.825 0.000Within Groups 0.453 14 0.032
Total 7.407 20
Moisture content
Tables 9 and 10. Moisture content of select almond seeds
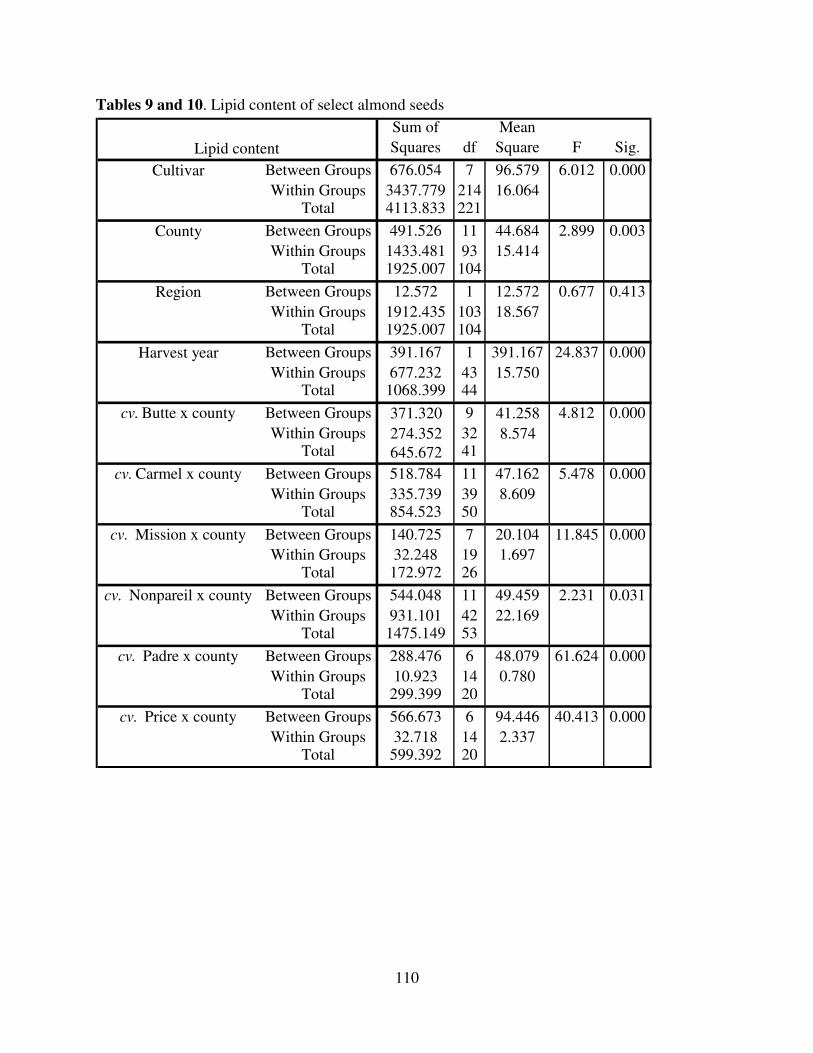
110
Sum of Squares df
Mean Square F Sig.
Cultivar Between Groups 676.054 7 96.579 6.012 0.000Within Groups 3437.779 214 16.064
Total 4113.833 221
County Between Groups 491.526 11 44.684 2.899 0.003Within Groups 1433.481 93 15.414
Total 1925.007 104
Region Between Groups 12.572 1 12.572 0.677 0.413Within Groups 1912.435 103 18.567
Total 1925.007 104
Harvest year Between Groups 391.167 1 391.167 24.837 0.000Within Groups 677.232 43 15.750
Total 1068.399 44
cv. Butte x county Between Groups 371.320 9 41.258 4.812 0.000Within Groups 274.352 32 8.574
Total 645.672 41
cv. Carmel x county Between Groups 518.784 11 47.162 5.478 0.000Within Groups 335.739 39 8.609
Total 854.523 50
cv. Mission x county Between Groups 140.725 7 20.104 11.845 0.000Within Groups 32.248 19 1.697
Total 172.972 26
cv. Nonpareil x county Between Groups 544.048 11 49.459 2.231 0.031Within Groups 931.101 42 22.169
Total 1475.149 53
cv. Padre x county Between Groups 288.476 6 48.079 61.624 0.000Within Groups 10.923 14 0.780
Total 299.399 20
cv. Price x county Between Groups 566.673 6 94.446 40.413 0.000Within Groups 32.718 14 2.337
Total 599.392 20
Lipid content
Tables 9 and 10. Lipid content of select almond seeds

111
Sum of Squares df
Mean Square F Sig.
Cultivar Between Groups 391.256 7 55.894 18.554 0.000Within Groups 644.675 214 3.013
Total 1035.931 221
County Between Groups 209.628 11 19.057 8.198 0.000Within Groups 216.195 93 2.325
Total 425.823 104
Region Between Groups 5.861 1 5.861 1.438 0.233Within Groups 419.962 103 4.077
Total 425.823 104
Harvest year Between Groups 28.585 1 28.585 7.901 0.007Within Groups 155.569 43 3.618
Total 184.154 44
cv. Butte x county Between Groups 84.017 9 9.335 6.681 0.000Within Groups 44.715 32 1.397
Total 128.731 41
cv. Carmel x county Between Groups 173.066 11 15.733 11.470 0.000Within Groups 53.497 39 1.372
Total 226.563 50
cv. Mission x county Between Groups 83.313 7 11.902 39.350 0.000Within Groups 5.747 19 0.302
Total 89.060 26
cv. Nonpareil x county Between Groups 169.868 11 15.443 7.894 0.000Within Groups 82.157 42 1.956
Total 252.025 53
cv. Padre x county Between Groups 49.693 6 8.282 52.759 0.000Within Groups 2.198 14 0.157
Total 51.890 20
cv. Price x county Between Groups 233.519 6 38.920 131.321 0.000Within Groups 4.149 14 0.296
Total 237.669 20
Protein content
Tables 9 and 10. Protein content of select almond seeds

112
Sum of Squares df
Mean Square F Sig.
Cultivar Between Groups 0.485 7 0.069 1.694 0.114Within Groups 6.582 161 0.041
Total 7.067 168
County Between Groups 1.382 11 0.126 2.705 0.006Within Groups 3.391 73 0.046
Total 4.773 84
Region Between Groups 0.399 1 0.399 7.824 0.006Within Groups 4.373 86 0.051
Total 4.773 87
Harvest year Between Groups 0.089 1 0.089 1.651 0.207Within Groups 1.989 37 0.054
Total 2.077 38
cv. Butte x county Between Groups 0.537 9 0.060 3.600 0.006Within Groups 0.398 24 0.017
Total 0.935 33
cv. Carmel x county Between Groups 2.024 11 0.184 4.823 0.000Within Groups 1.106 29 0.038
Total 3.131 40
cv. Mission x county Between Groups 0.291 7 0.042 8.139 0.001Within Groups 0.056 11 0.005
Total 0.348 18
cv. Nonpareil x county Between Groups 1.124 11 0.102 6.202 0.000Within Groups 0.527 32 0.016
Total 1.651 43
cv. Padre x county Between Groups 0.089 6 0.015 19.567 0.001Within Groups 0.005 7 0.001
Total 0.094 13
cv. Price x county Between Groups 0.885 6 0.147 72.529 0.000Within Groups 0.014 7 0.002
Total 0.899 13
Ash content
Tables 9 and 10. Ash content of select almond seeds

113
Sum of Squares df
Mean Square F Sig.
Cultivar Between Groups 31.188 7 4.455 5.765 0.000Within Groups 165.378 214 0.773
Total 196.565 221
County Between Groups 30.601 11 2.782 3.277 0.001Within Groups 78.955 93 0.849
Total 109.556 104
Region Between Groups 0.026 1 0.026 0.024 0.877Within Groups 109.531 103 1.063
Total 109.556 104
Harvest year Between Groups 14.716 1 14.716 38.065 0.000Within Groups 16.624 43 0.387
Total 31.340 44
cv. Butte x county Between Groups 16.925 9 1.881 6.564 0.000Within Groups 9.168 32 0.286
Total 26.093 41
cv. Carmel x county Between Groups 23.445 11 2.131 7.238 0.000Within Groups 11.484 39 0.294
Total 34.929 50
cv. Mission x county Between Groups 15.018 7 2.145 14.369 0.000Within Groups 2.837 19 0.149
Total 17.854 26
cv. Nonpareil x county Between Groups 48.410 11 4.401 7.048 0.000Within Groups 26.224 42 0.624
Total 74.634 53
cv. Padre x county Between Groups 20.509 6 3.418 35.808 0.000Within Groups 1.336 14 0.095
Total 21.845 20
cv. Price x county Between Groups 10.631 6 1.772 17.002 0.000Within Groups 1.459 14 0.104
Total 12.090 20
Total soluble sugar content
Tables 9 and 10. Total soluble sugar content of select almond seeds
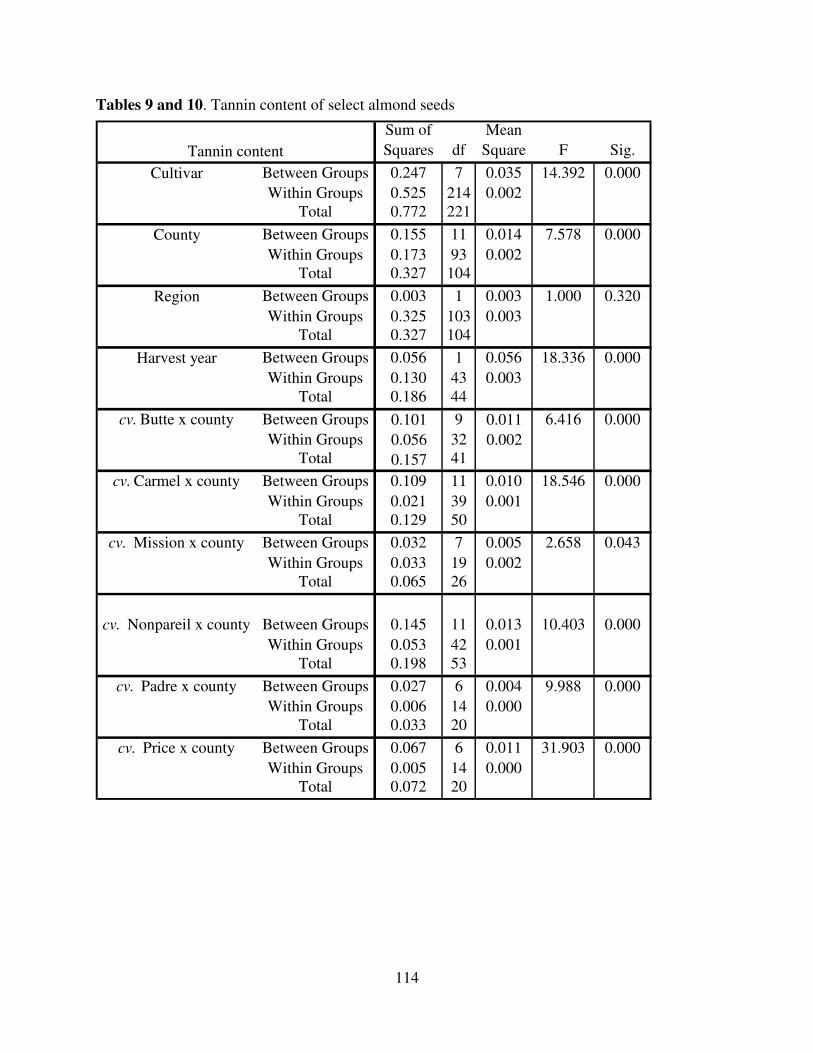
114
Sum of Squares df
Mean Square F Sig.
Cultivar Between Groups 0.247 7 0.035 14.392 0.000Within Groups 0.525 214 0.002
Total 0.772 221
County Between Groups 0.155 11 0.014 7.578 0.000Within Groups 0.173 93 0.002
Total 0.327 104
Region Between Groups 0.003 1 0.003 1.000 0.320Within Groups 0.325 103 0.003
Total 0.327 104
Harvest year Between Groups 0.056 1 0.056 18.336 0.000Within Groups 0.130 43 0.003
Total 0.186 44
cv. Butte x county Between Groups 0.101 9 0.011 6.416 0.000Within Groups 0.056 32 0.002
Total 0.157 41
cv. Carmel x county Between Groups 0.109 11 0.010 18.546 0.000Within Groups 0.021 39 0.001
Total 0.129 50
cv. Mission x county Between Groups 0.032 7 0.005 2.658 0.043Within Groups 0.033 19 0.002
Total 0.065 26
cv. Nonpareil x county Between Groups 0.145 11 0.013 10.403 0.000Within Groups 0.053 42 0.001
Total 0.198 53
cv. Padre x county Between Groups 0.027 6 0.004 9.988 0.000Within Groups 0.006 14 0.000
Total 0.033 20
cv. Price x county Between Groups 0.067 6 0.011 31.903 0.000Within Groups 0.005 14 0.000
Total 0.072 20
Tannin content
Tables 9 and 10. Tannin content of select almond seeds

115
Sum of Squares df
Mean Square F Sig.
Seed weight Between Groups 2.323 6 0.387 10.386 0.000Within Groups 0.522 14 0.037
Total 2.844 20
Seed diameter Between Groups 19.159 6 3.193 2.073 0.069Within Groups 97.057 63 1.541
Total 116.217 69
Seed thickness Between Groups 18.763 6 3.127 2.482 0.032Within Groups 79.362 63 1.260
Total 98.125 69
Moisture Between Groups 2.116 6 3.53E-01 158.412 0.000Within Groups 3.12E-02 14 2.23E-03
Total 2.147 20
Lipid Between Groups 79.025 6 13.171 2.350 0.088Within Groups 78.481 14 5.606
Total 157.506 20
Protein Between Groups 5.139 6 8.57E-01 1.744 0.183Within Groups 6.876 14 4.91E-01
Total 12.016 20
Ash Between Groups 3.09E-01 6 5.15E-02 60.437 0.000Within Groups 1.19E-02 14 8.53E-04
Total 3.21E-01 20
Sugars Between Groups 25.393 6 4.232 282.739 0.000Within Groups 2.10E-01 14 1.50E-02
Total 25.602 20
Tannins Between Groups 2.34E-04 6 3.90E-05 1.299 0.320Within Groups 4.20E-04 14 3.00E-05
Total 6.55E-04 20
Macadamia nut seed varieties
Table 11. Physical characteristics and chemical composition of macadamia nut seeds

116
Sum of Squares df
Mean Square F Sig.
Sum of Squares df
Mean Square F Sig.
His Between Groups 59.046 7 8.435 9.637 0.000 29.722 11 2.702 3.500 0.000Within Groups 187.311 214 0.875 71.793 93 0.772
Total 246.357 221 101.515 104Thr Between Groups 1.099 7 0.157 1.979 0.059 3.981 11 0.362 4.844 0.000
Within Groups 16.975 214 0.079 6.949 93 0.075Total 18.074 221 10.930 104
Val Between Groups 5.358 7 0.765 6.115 0.000 8.635 11 0.785 9.352 0.000Within Groups 26.788 214 0.125 7.806 93 0.084
Total 32.146 221 16.441 104Met Between Groups 10.081 7 1.440 1.072 0.383 7.876 11 0.716 9.020 0.000
Within Groups 287.607 214 1.344 7.382 93 0.079Total 297.688 221 15.258 104
Ile Between Groups 3.824 7 0.546 5.154 0.000 5.777 11 0.525 11.040 0.000Within Groups 22.679 214 0.106 4.424 93 0.048
Total 26.503 221 10.202 104Leu Between Groups 11.945 7 1.706 6.462 0.000 14.634 11 1.330 7.560 0.000
Within Groups 56.513 214 0.264 16.366 93 0.176Total 68.458 221 31.000 104
Phe Between Groups 27.199 7 3.886 4.895 0.000 81.412 11 7.401 26.501 0.000Within Groups 169.878 214 0.794 25.973 93 0.279
Total 197.077 221 107.385 104Lys Between Groups 2.955 7 0.422 5.923 0.000 4.213 11 0.383 13.022 0.000
Within Groups 15.253 214 0.071 2.735 93 0.029Total 18.208 221 6.948 104
Trp Between Groups 6.322 7 0.903 6.207 0.000 4.032 11 0.367 4.288 0.000Within Groups 31.135 214 0.145 7.949 93 0.085
Total 37.457 221 11.981 104
Cultivars
Total amino acids
County
Table 12. Cultivar, geographic location, and harvest year variation on the essential amino acid composition of select almond seeds
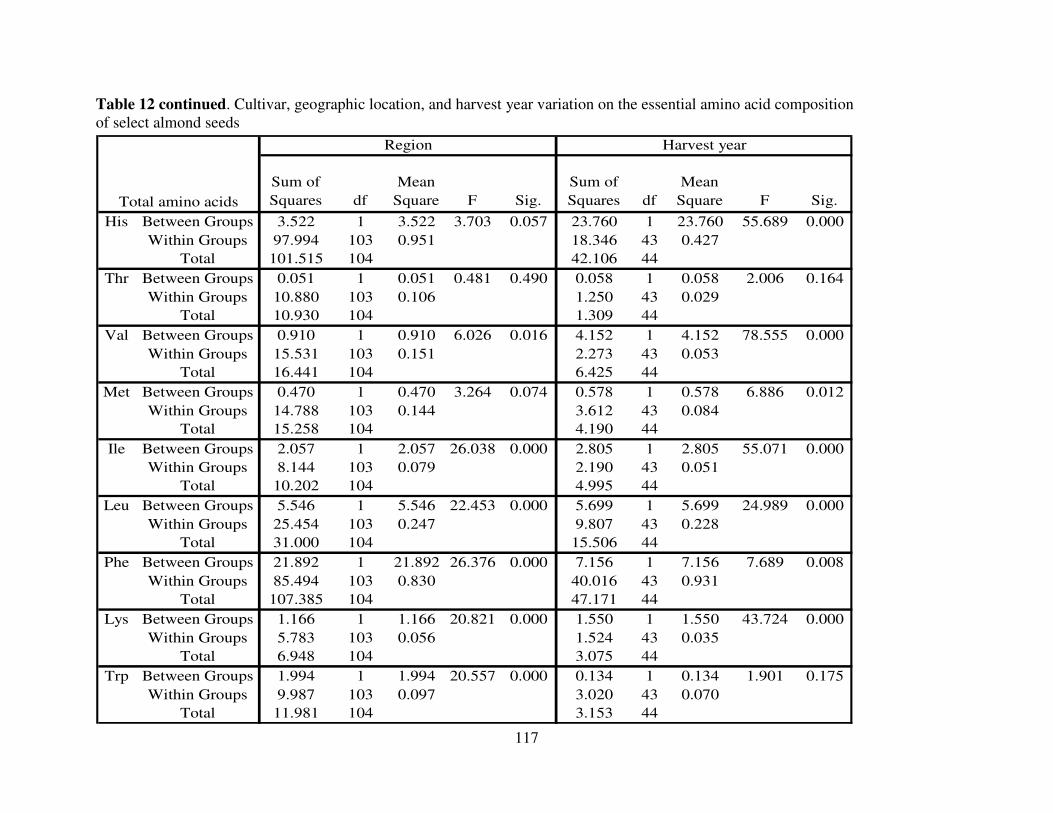
117
Sum of Squares df
Mean Square F Sig.
Sum of Squares df
Mean Square F Sig.
His Between Groups 3.522 1 3.522 3.703 0.057 23.760 1 23.760 55.689 0.000Within Groups 97.994 103 0.951 18.346 43 0.427
Total 101.515 104 42.106 44Thr Between Groups 0.051 1 0.051 0.481 0.490 0.058 1 0.058 2.006 0.164
Within Groups 10.880 103 0.106 1.250 43 0.029Total 10.930 104 1.309 44
Val Between Groups 0.910 1 0.910 6.026 0.016 4.152 1 4.152 78.555 0.000Within Groups 15.531 103 0.151 2.273 43 0.053
Total 16.441 104 6.425 44Met Between Groups 0.470 1 0.470 3.264 0.074 0.578 1 0.578 6.886 0.012
Within Groups 14.788 103 0.144 3.612 43 0.084Total 15.258 104 4.190 44
Ile Between Groups 2.057 1 2.057 26.038 0.000 2.805 1 2.805 55.071 0.000Within Groups 8.144 103 0.079 2.190 43 0.051
Total 10.202 104 4.995 44Leu Between Groups 5.546 1 5.546 22.453 0.000 5.699 1 5.699 24.989 0.000
Within Groups 25.454 103 0.247 9.807 43 0.228Total 31.000 104 15.506 44
Phe Between Groups 21.892 1 21.892 26.376 0.000 7.156 1 7.156 7.689 0.008Within Groups 85.494 103 0.830 40.016 43 0.931
Total 107.385 104 47.171 44Lys Between Groups 1.166 1 1.166 20.821 0.000 1.550 1 1.550 43.724 0.000
Within Groups 5.783 103 0.056 1.524 43 0.035Total 6.948 104 3.075 44
Trp Between Groups 1.994 1 1.994 20.557 0.000 0.134 1 0.134 1.901 0.175Within Groups 9.987 103 0.097 3.020 43 0.070
Total 11.981 104 3.153 44
Harvest year
Total amino acids
Region
Table 12 continued. Cultivar, geographic location, and harvest year variation on the essential amino acid composition of select almond seeds
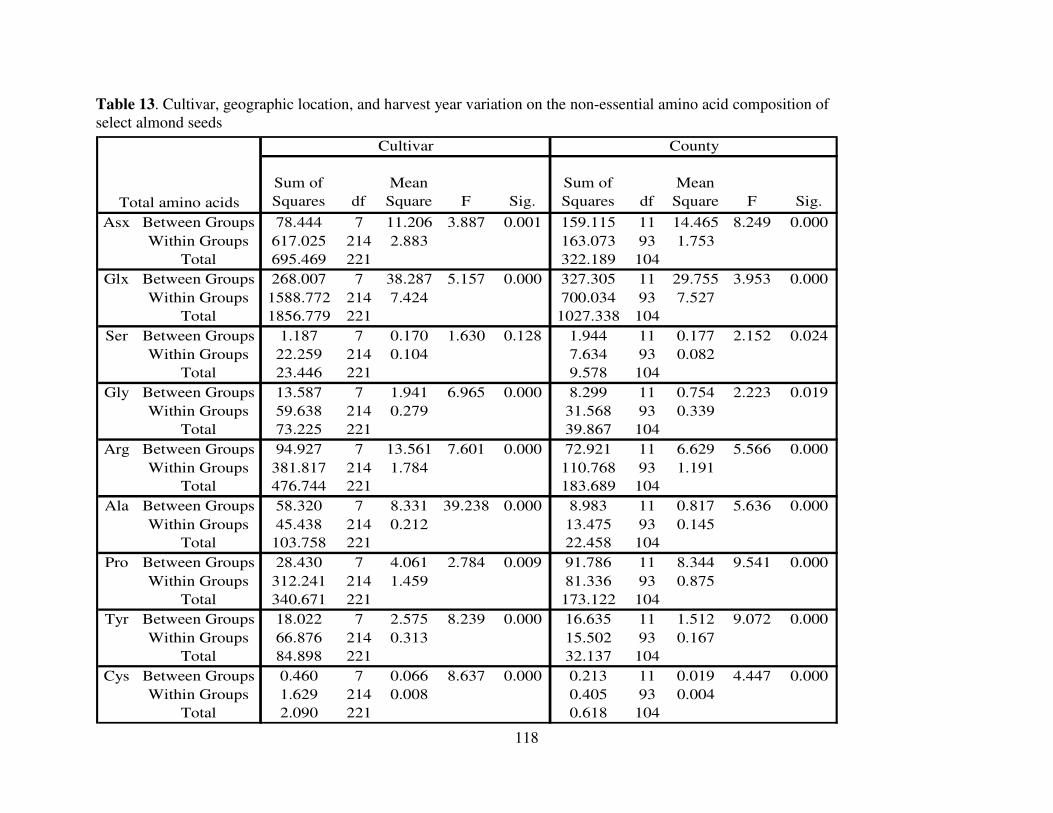
118
Sum of Squares df
Mean Square F Sig.
Sum of Squares df
Mean Square F Sig.
Asx Between Groups 78.444 7 11.206 3.887 0.001 159.115 11 14.465 8.249 0.000Within Groups 617.025 214 2.883 163.073 93 1.753
Total 695.469 221 322.189 104Glx Between Groups 268.007 7 38.287 5.157 0.000 327.305 11 29.755 3.953 0.000
Within Groups 1588.772 214 7.424 700.034 93 7.527Total 1856.779 221 1027.338 104
Ser Between Groups 1.187 7 0.170 1.630 0.128 1.944 11 0.177 2.152 0.024Within Groups 22.259 214 0.104 7.634 93 0.082
Total 23.446 221 9.578 104Gly Between Groups 13.587 7 1.941 6.965 0.000 8.299 11 0.754 2.223 0.019
Within Groups 59.638 214 0.279 31.568 93 0.339Total 73.225 221 39.867 104
Arg Between Groups 94.927 7 13.561 7.601 0.000 72.921 11 6.629 5.566 0.000Within Groups 381.817 214 1.784 110.768 93 1.191
Total 476.744 221 183.689 104Ala Between Groups 58.320 7 8.331 39.238 0.000 8.983 11 0.817 5.636 0.000
Within Groups 45.438 214 0.212 13.475 93 0.145Total 103.758 221 22.458 104
Pro Between Groups 28.430 7 4.061 2.784 0.009 91.786 11 8.344 9.541 0.000Within Groups 312.241 214 1.459 81.336 93 0.875
Total 340.671 221 173.122 104Tyr Between Groups 18.022 7 2.575 8.239 0.000 16.635 11 1.512 9.072 0.000
Within Groups 66.876 214 0.313 15.502 93 0.167Total 84.898 221 32.137 104
Cys Between Groups 0.460 7 0.066 8.637 0.000 0.213 11 0.019 4.447 0.000Within Groups 1.629 214 0.008 0.405 93 0.004
Total 2.090 221 0.618 104
Total amino acids
Cultivar County
Table 13. Cultivar, geographic location, and harvest year variation on the non-essential amino acid composition of select almond seeds

119
Sum of Squares df
Mean Square F Sig.
Sum of Squares df
Mean Square F Sig.
Asx Between Groups 2.076 1 2.076 0.668 0.416 46.161 1 46.161 29.975 0.000Within Groups 320.112 103 3.108 66.220 43 1.540
Total 322.189 104 112.381 44Glx Between Groups 16.665 1 16.665 1.698 0.196 209.139 1 209.139 47.756 0.000
Within Groups 1010.674 103 9.812 188.312 43 4.379Total 1027.338 104 397.451 44
Ser Between Groups 0.000 1 0.000 0.000 1.000 0.083 1 0.083 1.348 0.252Within Groups 9.578 103 0.093 2.643 43 0.061
Total 9.578 104 2.726 44Gly Between Groups 1.392 1 1.392 3.722 0.057 3.114 1 3.114 12.429 0.001
Within Groups 38.475 103 0.374 10.775 43 0.251Total 39.867 104 13.889 44
Arg Between Groups 11.501 1 11.501 6.879 0.010 47.837 1 47.837 46.406 0.000Within Groups 172.188 103 1.672 44.326 43 1.031
Total 183.689 104 92.163 44Ala Between Groups 2.615 1 2.615 13.549 0.000 0.733 1 0.733 4.422 0.041
Within Groups 19.843 103 0.193 7.130 43 0.166Total 22.458 104 7.863 44
Pro Between Groups 15.519 1 15.519 10.143 0.002 0.114 1 0.114 0.070 0.793Within Groups 157.603 103 1.530 70.575 43 1.641
Total 173.122 104 70.689 44Tyr Between Groups 0.315 1 0.315 1.019 0.315 0.196 1 0.196 2.714 0.107
Within Groups 31.822 103 0.309 3.097 43 0.072Total 32.137 104 3.293 44
Cys Between Groups 0.034 1 0.034 5.667 0.019 0.220 1 0.220 46.171 0.000Within Groups 0.584 103 0.006 0.205 43 0.005
Total 0.618 104 0.425 44
Total amino acids
Region Harvest year
Table 13 continued. Cultivar, geographic location, and harvest year variation on the non-essential amino acid composition of select almond seeds

120
Sum of Squares df
Mean Square F Sig.
Sum of Squares df
Mean Square F Sig.
Sum of Squares df
Mean Square F Sig.
His Between Groups 35.220 9 3.913 10.527 0.000 56.325 11 5.120 306.429 0.000 29.487 7 4.212 7.404 0.000Within Groups 11.896 32 0.372 0.652 39 0.017 10.809 19 0.569
Total 47.116 41 56.977 50 40.297 26Thr Between Groups 1.075 9 0.119 15.640 0.000 2.942 11 0.267 22.751 0.000 2.794 7 0.399 30.131 0.000
Within Groups 0.244 32 0.008 0.459 39 0.012 0.252 19 0.013Total 1.319 41 3.401 50 3.046 26
Val Between Groups 5.708 9 0.634 17.609 0.000 5.063 11 0.460 11.447 0.000 4.634 7 0.662 9.885 0.000Within Groups 1.152 32 0.036 1.568 39 0.040 1.272 19 0.067
Total 6.860 41 6.631 50 5.906 26Met Between Groups 2.134 9 0.237 3.671 0.003 9.935 11 0.903 45.512 0.000 18.762 7 2.680 409.819 0.000
Within Groups 2.067 32 0.065 0.774 39 0.020 0.124 19 0.007Total 4.201 41 10.709 50 18.886 26
Ile Between Groups 5.611 9 0.623 32.676 0.000 3.190 11 0.290 7.982 0.000 1.723 7 0.246 2.750 0.038Within Groups 0.611 32 0.019 1.417 39 0.036 1.701 19 0.090
Total 6.221 41 4.607 50 3.425 26Leu Between Groups 10.272 9 1.141 15.975 0.000 8.359 11 0.760 3.760 0.001 7.926 7 1.132 7.067 0.000
Within Groups 2.286 32 0.071 7.883 39 0.202 3.044 19 0.160Total 12.558 41 16.243 50 10.970 26
Phe Between Groups 26.262 9 2.918 2.811 0.015 40.817 11 3.711 13.529 0.000 13.286 7 1.898 51.966 0.000Within Groups 33.216 32 1.038 10.697 39 0.274 0.694 19 0.037
Total 59.478 41 51.514 50 13.980 26Lys Between Groups 2.288 9 0.254 8.808 0.000 2.027 11 0.184 8.935 0.000 0.650 7 0.093 3.094 0.024
Within Groups 0.924 32 0.029 0.804 39 0.021 0.570 19 0.030Total 3.212 41 2.831 50 1.220 26
Trp Between Groups 5.825 9 0.647 12.525 0.000 6.969 11 0.634 23.229 0.000 1.826 7 0.261 65.403 0.000Within Groups 1.654 32 0.052 1.064 39 0.027 0.076 19 0.004
Total 7.479 41 8.033 50 1.902 26
Total amino acids
cv. Butte x county cv. Carmel x county cv. Mission x county
Table 14. Interaction of cultivar and geographic location on the essential amino acid composition of select almond seeds
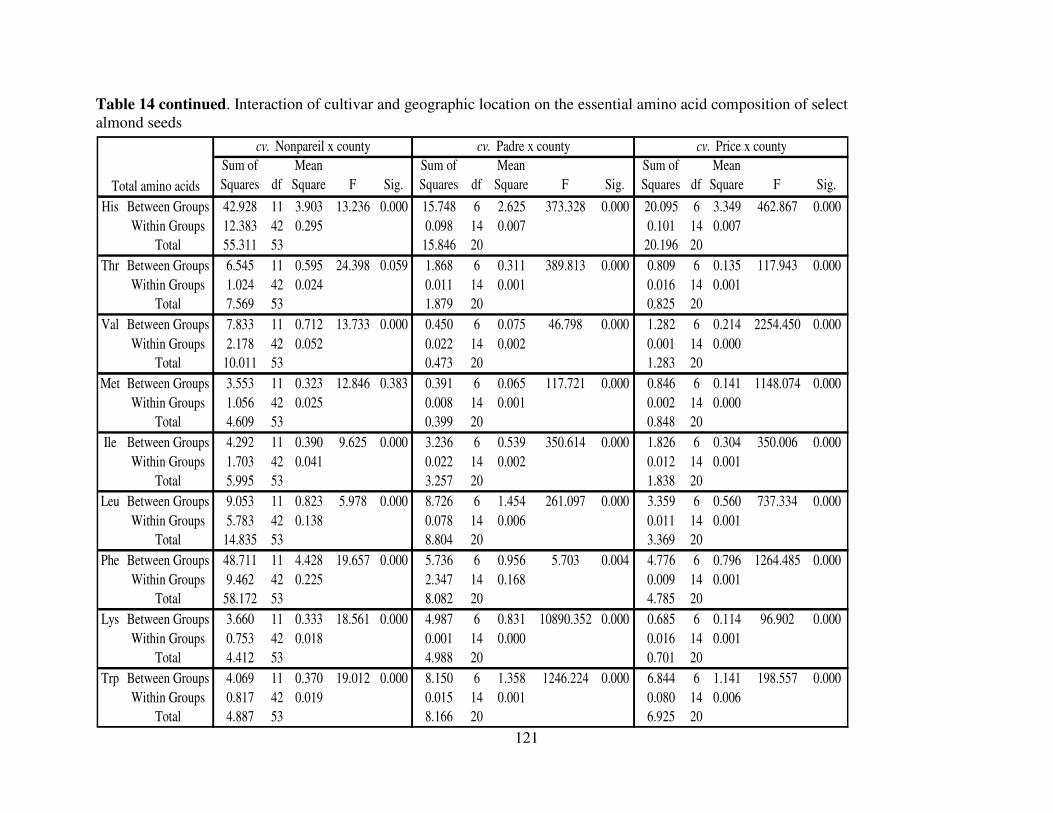
121
Sum of Squares df
Mean Square F Sig.
Sum of Squares df
Mean Square F Sig.
Sum of Squares df
Mean Square F Sig.
His Between Groups 42.928 11 3.903 13.236 0.000 15.748 6 2.625 373.328 0.000 20.095 6 3.349 462.867 0.000Within Groups 12.383 42 0.295 0.098 14 0.007 0.101 14 0.007
Total 55.311 53 15.846 20 20.196 20Thr Between Groups 6.545 11 0.595 24.398 0.059 1.868 6 0.311 389.813 0.000 0.809 6 0.135 117.943 0.000
Within Groups 1.024 42 0.024 0.011 14 0.001 0.016 14 0.001Total 7.569 53 1.879 20 0.825 20
Val Between Groups 7.833 11 0.712 13.733 0.000 0.450 6 0.075 46.798 0.000 1.282 6 0.214 2254.450 0.000Within Groups 2.178 42 0.052 0.022 14 0.002 0.001 14 0.000
Total 10.011 53 0.473 20 1.283 20Met Between Groups 3.553 11 0.323 12.846 0.383 0.391 6 0.065 117.721 0.000 0.846 6 0.141 1148.074 0.000
Within Groups 1.056 42 0.025 0.008 14 0.001 0.002 14 0.000Total 4.609 53 0.399 20 0.848 20
Ile Between Groups 4.292 11 0.390 9.625 0.000 3.236 6 0.539 350.614 0.000 1.826 6 0.304 350.006 0.000Within Groups 1.703 42 0.041 0.022 14 0.002 0.012 14 0.001
Total 5.995 53 3.257 20 1.838 20Leu Between Groups 9.053 11 0.823 5.978 0.000 8.726 6 1.454 261.097 0.000 3.359 6 0.560 737.334 0.000
Within Groups 5.783 42 0.138 0.078 14 0.006 0.011 14 0.001Total 14.835 53 8.804 20 3.369 20
Phe Between Groups 48.711 11 4.428 19.657 0.000 5.736 6 0.956 5.703 0.004 4.776 6 0.796 1264.485 0.000Within Groups 9.462 42 0.225 2.347 14 0.168 0.009 14 0.001
Total 58.172 53 8.082 20 4.785 20Lys Between Groups 3.660 11 0.333 18.561 0.000 4.987 6 0.831 10890.352 0.000 0.685 6 0.114 96.902 0.000
Within Groups 0.753 42 0.018 0.001 14 0.000 0.016 14 0.001Total 4.412 53 4.988 20 0.701 20
Trp Between Groups 4.069 11 0.370 19.012 0.000 8.150 6 1.358 1246.224 0.000 6.844 6 1.141 198.557 0.000Within Groups 0.817 42 0.019 0.015 14 0.001 0.080 14 0.006
Total 4.887 53 8.166 20 6.925 20
Total amino acids
cv. Nonpareil x county cv. Padre x county cv. Price x county
Table 14 continued. Interaction of cultivar and geographic location on the essential amino acid composition of select almond seeds

122
Sum of Squares df
Mean Square F Sig.
Sum of Squares df
Mean Square F Sig.
Sum of Squares df
Mean Square F Sig.
Asx Between Groups 79.289 9 8.810 20.484 0.000 90.616 11 8.238 14.785 0.000 66.119 7 9.446 5.105 0.002Within Groups 13.763 32 0.430 21.729 39 0.557 35.156 19 1.850
Total 93.052 41 112.345 50 101.275 26Glx Between Groups 257.378 9 28.598 15.417 0.000 396.307 11 36.028 32.450 0.000 65.564 7 9.366 1.722 0.164
Within Groups 59.358 32 1.855 43.301 39 1.110 103.370 19 5.441Total 316.735 41 439.608 50 168.934 26
Ser Between Groups 2.212 9 0.246 16.121 0.000 3.623 11 0.329 13.253 0.000 1.922 7 0.275 13.121 0.000Within Groups 0.488 32 0.015 0.969 39 0.025 0.398 19 0.021
Total 2.700 41 4.593 50 2.320 26Gly Between Groups 8.725 9 0.969 19.910 0.000 14.687 11 1.335 30.795 0.000 7.577 7 1.082 17.026 0.000
Within Groups 1.558 32 0.049 1.691 39 0.043 1.208 19 0.064Total 10.283 41 16.378 50 8.785 26
Arg Between Groups 81.134 9 9.015 15.220 0.000 84.435 11 7.676 44.332 0.000 37.586 7 5.369 3.760 0.010Within Groups 18.953 32 0.592 6.753 39 0.173 27.135 19 1.428
Total 100.087 41 91.188 50 64.721 26Ala Between Groups 6.609 9 0.734 7.117 0.000 9.479 11 0.862 15.420 0.000 2.902 7 0.415 20.756 0.000
Within Groups 3.301 32 0.103 2.180 39 0.056 0.379 19 0.020Total 9.910 41 11.659 50 3.281 26
Pro Between Groups 39.187 9 4.354 3.291 0.006 54.775 11 4.980 16.999 0.000 29.776 7 4.254 15.919 0.000Within Groups 42.343 32 1.323 11.424 39 0.293 5.077 19 0.267
Total 81.530 41 66.199 50 34.854 26Tyr Between Groups 0.891 9 0.099 0.793 0.625 16.720 11 1.520 9.781 0.000 43.383 7 6.198 151.154 0.000
Within Groups 3.998 32 0.125 6.061 39 0.155 0.779 19 0.041Total 4.889 41 22.781 50 44.162 26
Cys Between Groups 0.225 9 0.025 5.729 0.000 0.383 11 0.035 47.788 0.000 0.294 7 0.042 4.020 0.007Within Groups 0.140 32 0.004 0.028 39 0.001 0.199 19 0.010
Total 0.365 41 0.411 50 0.493 26
Total amino acids
cv. Butte x county cv. Carmel x county cv. Mission x county
Table 15. Interaction of cultivar and geographic location on the non-essential amino acid composition of select almond seeds

123
Sum of Squares df
Mean Square F Sig.
Sum of Squares df
Mean Square F Sig.
Sum of Squares df
Mean Square F Sig.
Asx Between Groups 152.896 11 13.900 9.391 0.001 63.568 6 10.595 597.517 0.000 61.439 6 10.240 3032.561 0.000Within Groups 62.163 42 1.480 0.248 14 0.018 0.047 14 0.003
Total 215.058 53 63.816 20 61.486 20Glx Between Groups 502.053 11 45.641 12.602 0.000 91.033 6 15.172 357.496 0.000 73.484 6 12.247 1336.511 0.000
Within Groups 152.118 42 3.622 0.594 14 0.042 0.128 14 0.009Total 654.171 53 91.628 20 73.612 20
Ser Between Groups 3.923 11 0.357 13.063 0.128 6.936 6 1.156 2933.940 0.000 1.766 6 0.294 385.515 0.000Within Groups 1.147 42 0.027 0.006 14 0.000 0.011 14 0.001
Total 5.070 53 6.941 20 1.777 20Gly Between Groups 18.981 11 1.726 15.950 0.000 5.561 6 0.927 296.929 0.000 4.470 6 0.745 654.746 0.000
Within Groups 4.544 42 0.108 0.044 14 0.003 0.016 14 0.001Total 23.525 53 5.605 20 4.486 20
Arg Between Groups 96.136 11 8.740 19.762 0.000 48.353 6 8.059 3222.252 0.000 34.052 6 5.675 5714.934 0.000Within Groups 18.574 42 0.442 0.035 14 0.003 0.014 14 0.001
Total 114.710 53 48.388 20 34.066 20Ala Between Groups 6.477 11 0.589 5.713 0.000 10.616 6 1.769 724.356 0.000 2.538 6 0.423 185.073 0.000
Within Groups 4.329 42 0.103 0.034 14 0.002 0.032 14 0.002Total 10.806 53 10.650 20 2.570 20
Pro Between Groups 79.887 11 7.262 11.050 0.009 31.966 6 5.328 575.738 0.000 16.633 6 2.772 1186.350 0.000Within Groups 27.605 42 0.657 0.130 14 0.009 0.033 14 0.002
Total 107.491 53 32.096 20 16.666 20Tyr Between Groups 9.559 11 0.869 39.124 0.000 0.909 6 0.152 340.437 0.000 1.444 6 0.241 5894.375 0.000
Within Groups 0.933 42 0.022 0.006 14 0.000 0.001 14 0.000Total 10.491 53 0.916 20 1.444 20
Cys Between Groups 0.209 11 0.019 7.615 0.000 0.278 6 0.046 175.400 0.000 0.132 6 0.022 145.765 0.000Within Groups 0.105 42 0.002 0.004 14 0.000 0.002 14 0.000
Total 0.314 53 0.282 20 0.134 20
Total amino acids
cv. Nonpareil x county cv. Padre x county cv. Price x county
Table 15 continued. Interaction of cultivar and geographic location on the non-essential amino acid composition of select almond seeds

124
Sum of Squares df
Mean Square F Sig.
Asx Between Groups 3.010 6 0.502 4.195 0.013Within Groups 1.674 14 0.120
Total 4.683 20Glx Between Groups 60.872 6 10.145 24.257 0.000
Within Groups 5.856 14 0.418Total 66.727 20
Ser Between Groups 2.692 6 0.449 7.287 0.000Within Groups 0.862 14 0.062
Total 3.554 20Gly Between Groups 3.470 6 0.578 15.619 0.000
Within Groups 0.518 14 0.037Total 3.988 20
His Between Groups 0.534 6 0.089 2.513 0.073Within Groups 0.496 14 0.035
Total 1.030 20Arg Between Groups 6.750 6 1.125 3.680 0.021
Within Groups 4.280 14 0.306Total 11.030 20
Thr Between Groups 4.996 6 0.833 11.197 0.000Within Groups 1.041 14 0.074
Total 6.038 20Ala Between Groups 1.010 6 0.168 1.392 0.285
Within Groups 1.693 14 0.121Total 2.704 20
Total amino acids
Table 16. Amino acid composition of select macadamia nut seeds

125
Sum of Squares df
Mean Square F Sig.
Pro Between Groups 5.311 6 0.885 3.911 0.017Within Groups 3.168 14 0.226
Total 8.480 20Tyr Between Groups 1.507 6 0.251 1.155 0.383
Within Groups 3.044 14 0.217Total 4.551 20
Val Between Groups 1.354 6 0.226 27.413 0.000Within Groups 0.115 14 0.008
Total 1.469 20Met Between Groups 0.479 6 0.080 10.429 0.000
Within Groups 0.107 14 0.008Total 0.586 20
Cys Between Groups 0.222 6 0.037 2.659 0.062Within Groups 0.194 14 0.014
Total 0.416 20Ile Between Groups 0.474 6 0.079 6.675 0.000
Within Groups 0.166 14 0.012Total 0.640 20
Leu Between Groups 1.158 6 0.193 4.119 0.014Within Groups 0.656 14 0.047
Total 1.814 20Phe Between Groups 0.792 6 0.132 4.585 0.009
Within Groups 0.403 14 0.029Total 1.195 20
Lys Between Groups 0.948 6 0.158 3.683 0.021Within Groups 0.600 14 0.043
Total 1.548 20Trp Between Groups 0.347 6 0.058 14.899 0.000
Within Groups 0.054 14 0.004Total 0.401 20
Total amino acids
Table 16 continued. Amino acid composition of select macadamia nut seeds
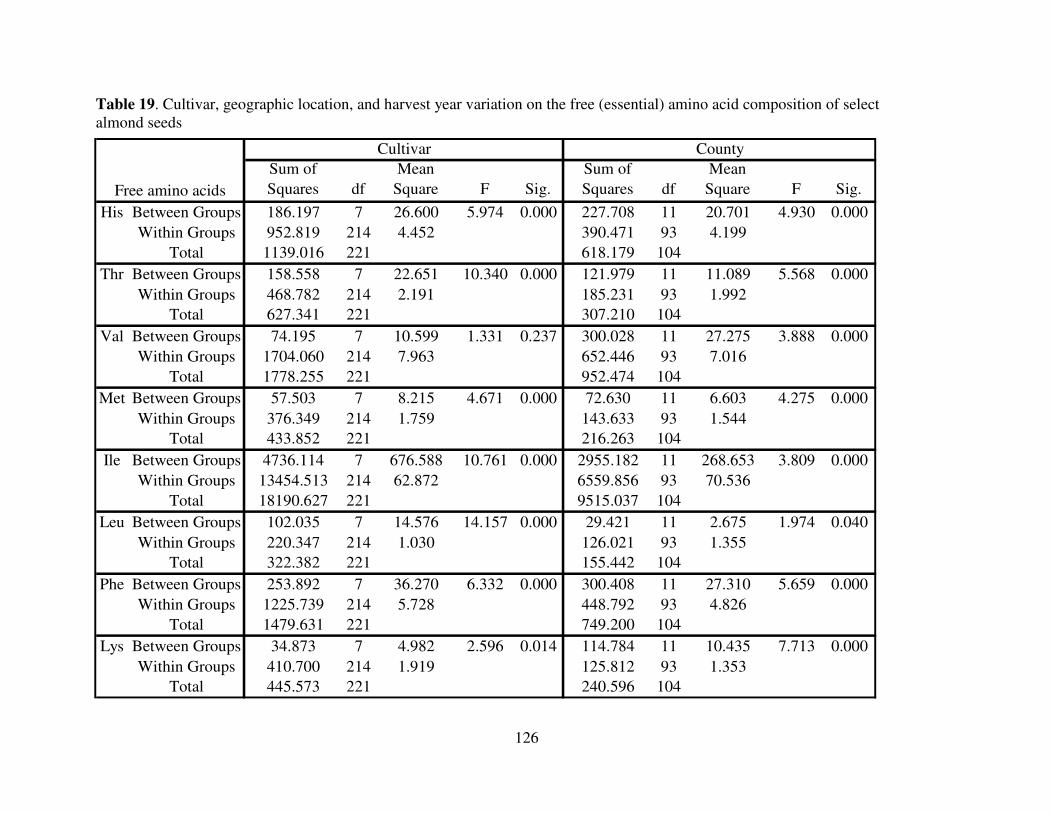
126
Sum of Squares df
Mean Square F Sig.
Sum of Squares df
Mean Square F Sig.
His Between Groups 186.197 7 26.600 5.974 0.000 227.708 11 20.701 4.930 0.000Within Groups 952.819 214 4.452 390.471 93 4.199
Total 1139.016 221 618.179 104Thr Between Groups 158.558 7 22.651 10.340 0.000 121.979 11 11.089 5.568 0.000
Within Groups 468.782 214 2.191 185.231 93 1.992Total 627.341 221 307.210 104
Val Between Groups 74.195 7 10.599 1.331 0.237 300.028 11 27.275 3.888 0.000Within Groups 1704.060 214 7.963 652.446 93 7.016
Total 1778.255 221 952.474 104Met Between Groups 57.503 7 8.215 4.671 0.000 72.630 11 6.603 4.275 0.000
Within Groups 376.349 214 1.759 143.633 93 1.544Total 433.852 221 216.263 104
Ile Between Groups 4736.114 7 676.588 10.761 0.000 2955.182 11 268.653 3.809 0.000Within Groups 13454.513 214 62.872 6559.856 93 70.536
Total 18190.627 221 9515.037 104Leu Between Groups 102.035 7 14.576 14.157 0.000 29.421 11 2.675 1.974 0.040
Within Groups 220.347 214 1.030 126.021 93 1.355Total 322.382 221 155.442 104
Phe Between Groups 253.892 7 36.270 6.332 0.000 300.408 11 27.310 5.659 0.000Within Groups 1225.739 214 5.728 448.792 93 4.826
Total 1479.631 221 749.200 104Lys Between Groups 34.873 7 4.982 2.596 0.014 114.784 11 10.435 7.713 0.000
Within Groups 410.700 214 1.919 125.812 93 1.353Total 445.573 221 240.596 104
Free amino acids
Cultivar County
Table 19. Cultivar, geographic location, and harvest year variation on the free (essential) amino acid composition of select almond seeds
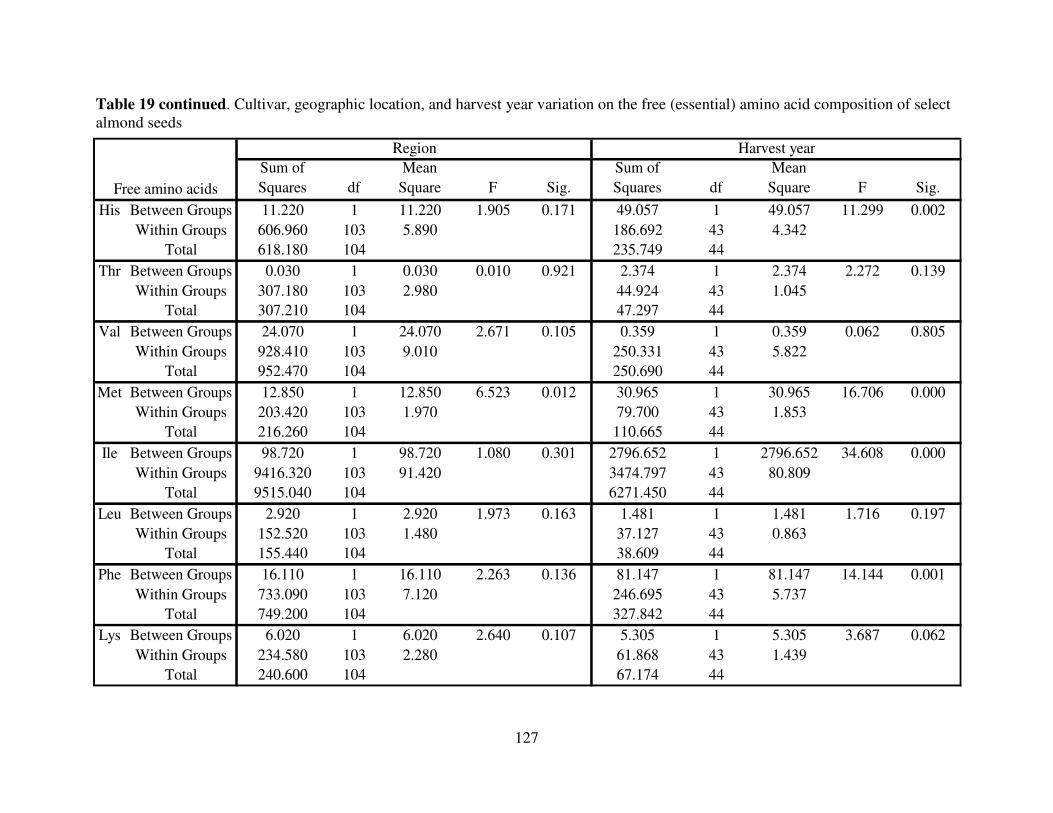
127
Sum of Squares df
Mean Square F Sig.
Sum of Squares df
Mean Square F Sig.
His Between Groups 11.220 1 11.220 1.905 0.171 49.057 1 49.057 11.299 0.002Within Groups 606.960 103 5.890 186.692 43 4.342
Total 618.180 104 235.749 44Thr Between Groups 0.030 1 0.030 0.010 0.921 2.374 1 2.374 2.272 0.139
Within Groups 307.180 103 2.980 44.924 43 1.045Total 307.210 104 47.297 44
Val Between Groups 24.070 1 24.070 2.671 0.105 0.359 1 0.359 0.062 0.805Within Groups 928.410 103 9.010 250.331 43 5.822
Total 952.470 104 250.690 44Met Between Groups 12.850 1 12.850 6.523 0.012 30.965 1 30.965 16.706 0.000
Within Groups 203.420 103 1.970 79.700 43 1.853Total 216.260 104 110.665 44
Ile Between Groups 98.720 1 98.720 1.080 0.301 2796.652 1 2796.652 34.608 0.000Within Groups 9416.320 103 91.420 3474.797 43 80.809
Total 9515.040 104 6271.450 44Leu Between Groups 2.920 1 2.920 1.973 0.163 1.481 1 1.481 1.716 0.197
Within Groups 152.520 103 1.480 37.127 43 0.863Total 155.440 104 38.609 44
Phe Between Groups 16.110 1 16.110 2.263 0.136 81.147 1 81.147 14.144 0.001Within Groups 733.090 103 7.120 246.695 43 5.737
Total 749.200 104 327.842 44Lys Between Groups 6.020 1 6.020 2.640 0.107 5.305 1 5.305 3.687 0.062
Within Groups 234.580 103 2.280 61.868 43 1.439Total 240.600 104 67.174 44
Harvest year
Free amino acids
Region
Table 19 continued. Cultivar, geographic location, and harvest year variation on the free (essential) amino acid composition of select almond seeds
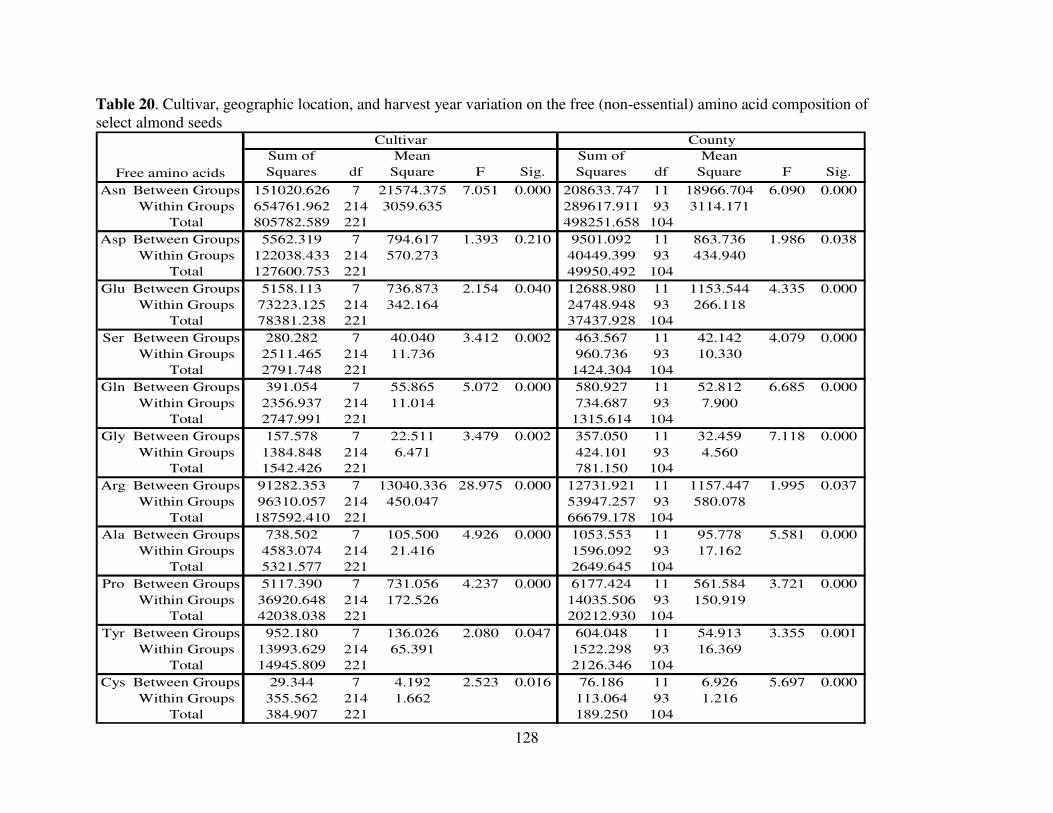
128
Sum of Squares df
Mean Square F Sig.
Sum of Squares df
Mean Square F Sig.
Asn Between Groups 151020.626 7 21574.375 7.051 0.000 208633.747 11 18966.704 6.090 0.000Within Groups 654761.962 214 3059.635 289617.911 93 3114.171
Total 805782.589 221 498251.658 104Asp Between Groups 5562.319 7 794.617 1.393 0.210 9501.092 11 863.736 1.986 0.038
Within Groups 122038.433 214 570.273 40449.399 93 434.940Total 127600.753 221 49950.492 104
Glu Between Groups 5158.113 7 736.873 2.154 0.040 12688.980 11 1153.544 4.335 0.000Within Groups 73223.125 214 342.164 24748.948 93 266.118
Total 78381.238 221 37437.928 104Ser Between Groups 280.282 7 40.040 3.412 0.002 463.567 11 42.142 4.079 0.000
Within Groups 2511.465 214 11.736 960.736 93 10.330Total 2791.748 221 1424.304 104
Gln Between Groups 391.054 7 55.865 5.072 0.000 580.927 11 52.812 6.685 0.000Within Groups 2356.937 214 11.014 734.687 93 7.900
Total 2747.991 221 1315.614 104Gly Between Groups 157.578 7 22.511 3.479 0.002 357.050 11 32.459 7.118 0.000
Within Groups 1384.848 214 6.471 424.101 93 4.560Total 1542.426 221 781.150 104
Arg Between Groups 91282.353 7 13040.336 28.975 0.000 12731.921 11 1157.447 1.995 0.037Within Groups 96310.057 214 450.047 53947.257 93 580.078
Total 187592.410 221 66679.178 104Ala Between Groups 738.502 7 105.500 4.926 0.000 1053.553 11 95.778 5.581 0.000
Within Groups 4583.074 214 21.416 1596.092 93 17.162Total 5321.577 221 2649.645 104
Pro Between Groups 5117.390 7 731.056 4.237 0.000 6177.424 11 561.584 3.721 0.000Within Groups 36920.648 214 172.526 14035.506 93 150.919
Total 42038.038 221 20212.930 104Tyr Between Groups 952.180 7 136.026 2.080 0.047 604.048 11 54.913 3.355 0.001
Within Groups 13993.629 214 65.391 1522.298 93 16.369Total 14945.809 221 2126.346 104
Cys Between Groups 29.344 7 4.192 2.523 0.016 76.186 11 6.926 5.697 0.000Within Groups 355.562 214 1.662 113.064 93 1.216
Total 384.907 221 189.250 104
Free amino acids
Cultivar County
Table 20. Cultivar, geographic location, and harvest year variation on the free (non-essential) amino acid composition of select almond seeds

129
Sum of Squares df
Mean Square F Sig.
Sum of Squares df
Mean Square F Sig.
Asn Between Groups 18930.330 1 18930.330 4.068 0.046 49626.988 1 49626.988 26.589 0.000Within Groups 479321.330 103 4653.610 80257.792 43 1866.460
Total 498251.660 104 129884.780 44Asp Between Groups 3.350 1 3.350 0.007 0.934 6390.569 1 6390.569 58.996 0.000
Within Groups 49947.140 103 484.920 4657.878 43 108.323Total 49950.490 104 11048.447 44
Glu Between Groups 2594.550 1 2594.550 7.670 0.007 1037.144 1 1037.144 7.532 0.009Within Groups 34843.380 103 338.290 5920.852 43 137.694
Total 37437.930 104 6957.996 44Ser Between Groups 236.460 1 236.460 20.508 0.000 2.841 1 2.841 0.340 0.563
Within Groups 1187.850 103 11.530 359.238 43 8.354Total 1424.300 104 362.079 44
Gln Between Groups 276.930 1 276.930 27.610 0.000 4.138 1 4.138 0.403 0.529Within Groups 1038.680 103 10.030 441.491 43 10.267
Total 1315.610 104 445.628 44Gly Between Groups 41.050 1 41.500 5.772 0.018 0.613 1 0.613 0.280 0.599
Within Groups 740.100 103 7.190 94.250 43 2.192Total 781.150 104 94.863 44
Arg Between Groups 1755.850 1 1755.850 2.786 0.098 793.224 1 793.224 2.216 0.144Within Groups 64923.330 103 630.320 15393.462 43 357.987
Total 66679.180 104 16186.686 44Ala Between Groups 212.610 1 212.610 8.986 0.003 7.098 1 7.098 0.684 0.413
Within Groups 2437.040 103 23.660 446.164 43 10.376Total 2649.650 104 453.263 44
Pro Between Groups 1073.880 1 1073.880 5.779 0.018 92.018 1 92.018 0.399 0.531Within Groups 19139.050 103 185.820 9919.383 43 230.683
Total 20212.930 104 10011.401 44Tyr Between Groups 205.210 1 205.210 11.003 0.001 49.843 1 49.843 1.953 0.169
Within Groups 1921.130 103 18.650 1097.439 43 25.522Total 2126.350 104 1147.282 44
Cys Between Groups 8.010 1 8.010 4.551 0.035 2.132 1 2.132 0.970 0.330Within Groups 181.240 103 1.760 94.482 43 2.197
Total 189.250 104 96.614 44
Harvest year
Free amino acids
Region
Table 20 continued. Cultivar, geographic location, and harvest year variation on the free (non-essential) amino acid composition of select almond seeds

130
Sum of Squares df
Mean Square F Sig.
Sum of Squares df
Mean Square F Sig.
Sum of Squares df
Mean Square F Sig.
His Between Groups 58.213 9 6.468 1.762 0.115 290.028 11 26.366 13.163 0.000 116.413 7 16.630 6.453 0.001Within Groups 117.496 32 3.672 78.117 39 2.003 48.970 19 2.577
Total 175.709 41 368.145 50 165.383 26Thr Between Groups 74.184 9 8.243 17.124 0.000 207.105 11 18.828 15.149 0.000 16.538 7 2.363 5.241 0.002
Within Groups 15.404 32 0.481 48.472 39 1.243 8.565 19 0.451Total 89.587 41 255.576 50 25.102 26
Val Between Groups 197.323 9 21.925 4.043 0.002 280.734 11 25.521 7.830 0.000 52.437 7 7.491 2.694 0.041Within Groups 173.541 32 5.423 127.113 39 3.259 52.832 19 2.781
Total 370.864 41 407.847 50 105.269 26Met Between Groups 43.938 9 4.882 1.730 0.123 48.464 11 4.406 4.814 0.000 34.641 7 4.949 4.262 0.006
Within Groups 90.301 32 2.822 35.692 39 0.915 22.061 19 1.161Total 134.239 41 84.156 50 56.702 26
Ile Between Groups 764.517 9 84.946 3.679 0.003 2575.757 11 234.160 4.369 0.000 1024.642 7 146.377 2.449 0.057Within Groups 738.907 32 23.091 2090.024 39 53.590 1135.732 19 59.775
Total 1503.424 41 4665.781 50 2160.374 26Leu Between Groups 31.817 9 3.535 7.323 0.000 25.003 11 2.273 4.338 0.000 33.843 7 4.835 26.354 0.000
Within Groups 15.447 32 0.483 20.435 39 0.524 3.486 19 0.183Total 47.264 41 45.438 50 37.328 26
Phe Between Groups 124.878 9 13.875 2.588 0.023 170.418 11 15.493 7.435 0.000 40.281 7 5.754 4.689 0.003Within Groups 171.555 32 5.361 81.263 39 2.084 23.320 19 1.227
Total 296.433 41 251.681 50 63.601 26Lys Between Groups 39.933 9 4.437 7.332 0.000 102.955 11 9.360 9.314 0.000 15.609 7 2.230 7.819 0.000
Within Groups 19.366 32 0.605 39.191 39 1.005 5.419 19 0.285Total 59.298 41 142.147 50 21.027 26
Free amino acids
cv. Butte x county cv. Carmel x county cv. Mission x countyTable 21. Interaction of cultivar and geographic location on the free (essential) amino acid composition of select almond seeds

131
Sum of Squares df
Mean Square F Sig.
Sum of Squares df
Mean Square F Sig.
Sum of Squares df
Mean Square F Sig.
His Between Groups 141.230 11 12.839 4.564 0.000 6.155 6 1.026 0.830 0.566 65.738 6 10.956 10.232 0.000Within Groups 118.154 42 2.813 17.302 14 1.236 14.991 14 1.071
Total 259.384 53 23.457 20 80.729 20Thr Between Groups 31.940 11 2.904 3.112 0.004 42.605 6 7.101 19.517 0.000 123.990 6 20.665 24.894 0.000
Within Groups 39.184 42 0.933 5.094 14 0.364 11.622 14 0.830Total 71.124 53 47.698 20 135.612 20
Val Between Groups 373.752 11 33.977 7.398 0.000 45.042 6 7.507 17.609 0.000 231.273 6 38.545 21.309 0.000Within Groups 192.896 42 4.593 5.968 14 0.426 25.324 14 1.809
Total 566.648 53 51.010 20 256.597 20Met Between Groups 43.026 11 3.911 4.141 0.000 33.482 6 5.580 36.475 0.000 28.357 6 4.726 20.298 0.000
Within Groups 39.671 42 0.945 2.142 14 0.153 3.260 14 0.233Total 82.698 53 35.624 20 31.616 20
Ile Between Groups 2252.055 11 204.732 3.080 0.004 423.599 6 70.600 2278.337 0.000 525.664 6 87.611 28.901 0.000Within Groups 2792.008 42 66.476 0.434 14 0.031 42.440 14 3.031
Total 5044.063 53 424.033 20 568.104 20Leu Between Groups 65.862 11 5.987 4.747 0.000 35.918 6 5.986 14.419 0.000 12.024 6 2.004 7.521 0.001
Within Groups 52.972 42 1.261 5.812 14 0.415 3.730 14 0.266Total 118.835 53 41.731 20 15.754 20
Phe Between Groups 405.242 11 36.840 8.319 0.000 110.487 6 18.414 65.006 0.000 126.506 6 21.084 15.160 0.000Within Groups 185.986 42 4.428 3.966 14 0.283 19.471 14 1.391
Total 591.228 53 114.453 20 145.977 20Lys Between Groups 53.204 11 4.837 3.570 0.001 11.718 6 1.953 3.890 0.017 85.508 6 14.251 26.151 0.000
Within Groups 56.900 42 1.355 7.029 14 0.502 7.630 14 0.545Total 110.104 53 18.747 20 93.137 20
Free amino acids
cv. Nonpareil x county cv. Padre x county cv. Price x county
Table 21 continued. Interaction of cultivar and geographic location on the free (essential) amino acid composition of select almond seeds

132
Sum of Squares df
Mean Square F Sig.
Sum of Squares df
Mean Square F Sig.
Sum of Squares df
Mean Square F Sig.
Asn Between Groups 92638.935 9 10293.215 8.831 0.000 317363.107 11 28851.192 31.775 0.000 4339.499 7 619.928 0.327 0.932Within Groups 37297.063 32 1165.533 35411.919 39 907.998 35975.351 19 1893.440
Total 129935.998 41 352775.026 50 40314.849 26Asp Between Groups 32685.905 9 3631.767 52.017 0.000 28638.449 11 2603.495 27.001 0.000 3272.309 7 467.473 3.859 0.009
Within Groups 2234.209 32 69.819 3760.484 39 96.423 2301.460 19 121.129Total 34920.114 41 32398.933 50 5573.769 26
Glu Between Groups 10224.551 9 1136.061 6.349 0.000 15198.314 11 1381.665 15.493 0.000 3348.058 7 478.294 5.468 0.002Within Groups 5726.162 32 178.943 3478.070 39 89.181 1661.893 19 87.468
Total 15950.713 41 18676.384 50 5009.950 26Ser Between Groups 130.013 9 14.446 2.124 0.057 387.105 11 35.191 4.069 0.000 203.791 7 29.113 6.682 0.000
Within Groups 217.598 32 6.800 337.333 39 8.650 82.783 19 4.357Total 347.611 41 724.437 50 286.574 26
Gln Between Groups 217.253 9 24.139 1.996 0.073 493.495 11 44.863 15.536 0.000 181.831 7 25.976 8.459 0.000Within Groups 387.047 32 12.095 112.618 39 2.888 58.343 19 3.071
Total 604.300 41 606.113 50 240.173 26Gly Between Groups 96.811 9 10.757 2.707 0.018 238.521 11 21.684 10.879 0.000 118.568 7 16.938 13.072 0.000
Within Groups 127.156 32 3.974 77.733 39 1.993 24.620 19 1.296Total 223.967 41 316.254 50 143.188 26
Arg Between Groups 16755.059 9 1861.673 6.429 0.000 33888.229 11 3080.748 35.643 0.000 2830.794 7 404.399 2.565 0.049Within Groups 9266.360 32 289.574 3370.869 39 86.433 2995.188 19 157.641
Total 26021.420 41 37259.097 50 5825.982 26Ala Between Groups 577.521 9 64.169 7.838 0.000 1001.383 11 91.035 20.015 0.000 185.264 7 26.466 6.206 0.001
Within Groups 261.972 32 8.187 177.384 39 4.548 81.026 19 4.265Total 839.493 41 1178.767 50 266.290 26
Pro Between Groups 5765.520 9 640.613 5.460 0.000 7440.866 11 676.442 10.367 0.000 1539.268 7 219.895 3.126 0.023Within Groups 3754.267 32 117.321 2544.802 39 65.251 1336.433 19 70.339
Total 9519.787 41 9985.668 50 2875.701 26Tyr Between Groups 1268.214 9 140.913 5.405 0.000 408.270 11 37.115 5.031 0.000 814.200 7 116.314 134.248 0.000
Within Groups 834.199 32 26.069 287.707 39 7.377 16.462 19 0.866Total 2102.413 41 695.977 50 830.662 26
Cys Between Groups 52.425 9 5.825 2.820 0.015 74.119 11 6.738 5.279 0.000 25.125 7 3.589 14.498 0.000Within Groups 66.109 32 2.066 49.781 39 1.276 4.704 19 0.248
Total 118.534 41 123.900 50 29.829 26
Free amino acids
cv. Butte x county cv. Carmel x county cv. Mission x county
Table 22. Interaction of cultivar and geographic location on the free (non-essential) amino acid composition of select almond seeds

133
Sum of Squares df
Mean Square F Sig.
Sum of Squares df
Mean Square F Sig.
Sum of Squares df
Mean Square F Sig.
Asn Between Groups 92239.777 11 8385.434 5.880 0.000 44667.206 6 7444.534 8.608 0.001 42207.438 6 7034.573 11.151 0.000Within Groups 59893.111 42 1426.026 12107.317 14 864.808 8831.593 14 630.828
Total 152132.887 53 56774.523 20 51039.031 20Asp Between Groups 8863.876 11 805.807 3.891 0.001 11661.431 6 1943.572 21.518 0.000 21625.017 6 3604.169 216.751 0.000
Within Groups 8698.759 42 207.113 1264.548 14 90.325 232.794 14 16.628Total 17562.635 53 12925.979 20 21857.810 20
Glu Between Groups 9666.915 11 878.810 3.237 0.003 2725.661 6 454.277 3.463 0.026 11540.278 6 1923.380 68.881 0.000Within Groups 11402.826 42 271.496 1836.756 14 131.197 390.928 14 27.923
Total 21069.741 53 4562.417 20 11931.206 20Ser Between Groups 441.518 11 40.138 4.879 0.000 60.984 6 10.164 1.197 0.363 388.874 6 64.812 20.309 0.000
Within Groups 345.518 42 8.227 118.830 14 8.488 44.678 14 3.191Total 787.036 53 179.815 20 433.552 20
Gln Between Groups 413.893 11 37.627 4.613 0.000 173.521 6 28.920 9.696 0.000 199.464 6 33.244 10.656 0.000Within Groups 342.593 42 8.157 41.756 14 2.983 43.678 14 3.120
Total 756.486 53 215.277 20 243.141 20Gly Between Groups 237.446 11 21.586 3.164 0.003 56.806 6 9.468 4.572 0.009 93.850 6 15.642 2.258 0.098
Within Groups 286.557 42 6.823 28.994 14 2.071 96.964 14 6.926Total 524.003 53 85.800 20 190.814 20
Arg Between Groups 26828.225 11 2438.930 24.081 0.000 17134.273 6 2855.712 31.127 0.000 30291.950 6 5048.658 25.020 0.000Within Groups 4253.781 42 101.280 1284.394 14 91.742 2824.946 14 201.782
Total 31082.005 53 18418.667 20 33116.896 20Ala Between Groups 1089.378 11 99.034 5.966 0.000 217.377 6 36.229 10.823 0.000 857.610 6 142.935 50.180 0.000
Within Groups 697.219 42 16.600 46.863 14 3.347 39.878 14 2.848Total 1786.597 53 264.240 20 897.488 20
Pro Between Groups 6683.308 11 607.573 7.152 0.000 3425.329 6 570.888 7.083 0.001 3364.989 6 560.832 10.618 0.000Within Groups 3567.864 42 84.949 1128.433 14 80.602 739.431 14 52.816
Total 10251.172 53 4553.763 20 4104.420 20Tyr Between Groups 1380.708 11 125.519 40.117 0.000 1173.702 6 195.617 38.082 0.000 182.159 6 30.360 17.207 0.000
Within Groups 131.410 42 3.129 71.915 14 5.137 24.701 14 1.764Total 1512.118 53 1245.617 20 206.860 20
Cys Between Groups 53.353 11 4.850 15.445 0.000 23.992 6 3.999 90.641 0.000 12.240 6 2.040 24.525 0.000Within Groups 13.190 42 0.314 0.618 14 0.044 1.165 14 0.083
Total 66.543 53 24.609 20 13.405 20
Free amino acids
cv. Nonpareil x county cv. Padre x county cv. Price x county
Table 22 continued. Interaction of cultivar and geographic location on the free (non-essential) amino acid composition of select almond seeds
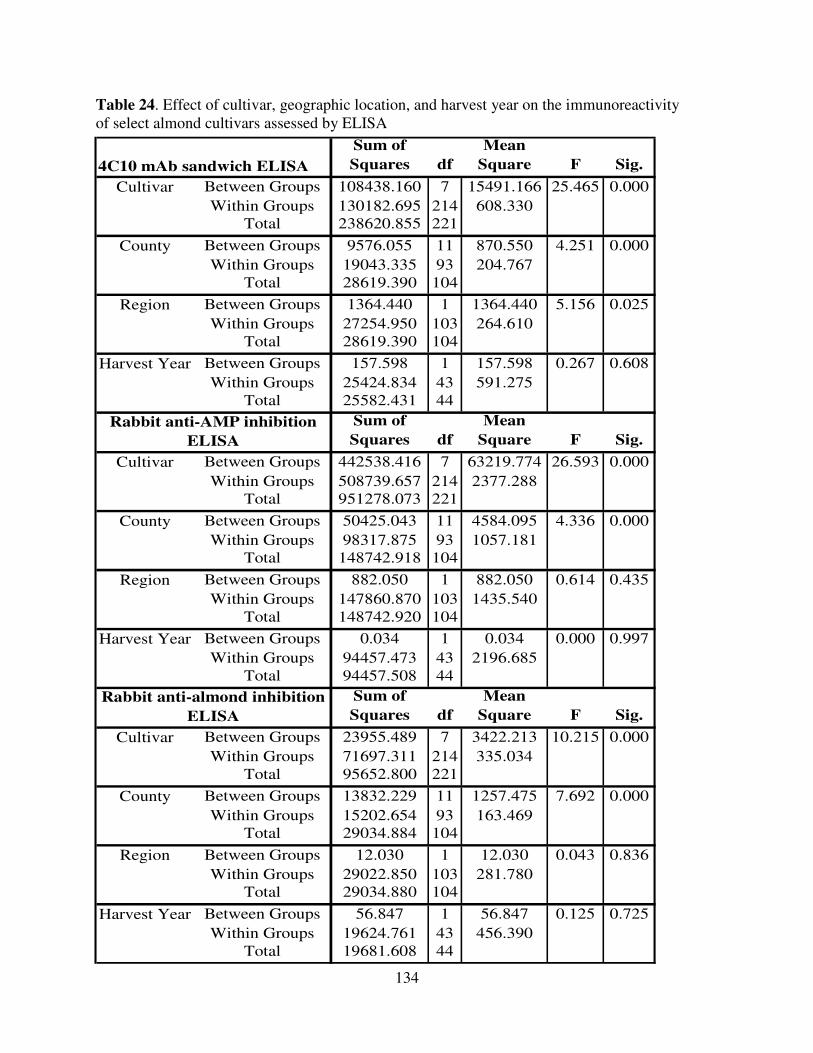
134
4C10 mAb sandwich ELISA
Sum of
Squares df
Mean
Square F Sig.
Cultivar Between Groups 108438.160 7 15491.166 25.465 0.000Within Groups 130182.695 214 608.330
Total 238620.855 221
County Between Groups 9576.055 11 870.550 4.251 0.000Within Groups 19043.335 93 204.767
Total 28619.390 104
Region Between Groups 1364.440 1 1364.440 5.156 0.025Within Groups 27254.950 103 264.610
Total 28619.390 104
Harvest Year Between Groups 157.598 1 157.598 0.267 0.608Within Groups 25424.834 43 591.275
Total 25582.431 44Sum of
Squares df
Mean
Square F Sig.
Cultivar Between Groups 442538.416 7 63219.774 26.593 0.000Within Groups 508739.657 214 2377.288
Total 951278.073 221
County Between Groups 50425.043 11 4584.095 4.336 0.000Within Groups 98317.875 93 1057.181
Total 148742.918 104
Region Between Groups 882.050 1 882.050 0.614 0.435Within Groups 147860.870 103 1435.540
Total 148742.920 104
Harvest Year Between Groups 0.034 1 0.034 0.000 0.997Within Groups 94457.473 43 2196.685
Total 94457.508 44Sum of
Squares df
Mean
Square F Sig.
Cultivar Between Groups 23955.489 7 3422.213 10.215 0.000Within Groups 71697.311 214 335.034
Total 95652.800 221
County Between Groups 13832.229 11 1257.475 7.692 0.000Within Groups 15202.654 93 163.469
Total 29034.884 104
Region Between Groups 12.030 1 12.030 0.043 0.836Within Groups 29022.850 103 281.780
Total 29034.880 104
Harvest Year Between Groups 56.847 1 56.847 0.125 0.725Within Groups 19624.761 43 456.390
Total 19681.608 44
Rabbit anti-AMP inhibition
ELISA
Rabbit anti-almond inhibition
ELISA
Table 24. Effect of cultivar, geographic location, and harvest year on the immunoreactivity of select almond cultivars assessed by ELISA

135
ELISA cv. Butte x countySum of Squares df Mean Square F Sig.
4C10 mAb Between Groups 14550.175 9 1616.686 15.919 0.000Within Groups 3249.914 32 101.560
Total 17800.089 41
R anti-AMP pAb Between Groups 41859.623 9 4651.069 5.804 0.000Within Groups 25645.209 32 801.413
Total 67504.832 41
R anti-almond pAb Between Groups 2321.193 9 257.910 1.068 0.412Within Groups 7729.421 32 241.544
Total 10050.615 41
ELISAcv. Carmel x
countySum of Squares df Mean Square F Sig.
4C10 mAb Between Groups 21187.695 11 1926.154 24.492 0.000Within Groups 3067.116 39 78.644
Total 24254.811 50
R anti-AMP pAb Between Groups 121153.853 11 11013.987 114.696 0.000Within Groups 3745.064 39 96.027
Total 124898.917 50
R anti-almond pAb Between Groups 12263.361 11 1114.851 7.590 0.000Within Groups 5728.444 39 146.883
Total 17991.806 50
ELISA cv. Mission x
countySum of Squares df Mean Square F Sig.
4C10 mAb Between Groups 83302.597 7 11900.371 25.963 0.000Within Groups 8708.727 19 458.354
Total 92011.324 26
R anti-AMP pAb Between Groups 464498.533 7 66356.933 123.836 0.000Within Groups 10181.086 19 535.847
Total 474679.619 26
R anti-almond pAb Between Groups 9431.911 7 1347.416 3.021 0.026Within Groups 8475.542 19 446.081
Total 17907.453 26
Table 25. Interaction of cultivar and geographic location on the immunoreactivity of select almond cultivars assessed by ELISA

136
ELISA cv. Nonpareil x
countySum of Squares df Mean Square F Sig.
4C10 mAb Between Groups 12467.092 11 1133.372 5.354 0.000Within Groups 8890.403 42 211.676
Total 21357.495 53
R anti-AMP pAb Between Groups 92106.820 11 8373.347 26.007 0.000Within Groups 13522.692 42 321.969
Total 105629.511 53
R anti-almond pAb Between Groups 9166.187 11 833.290 7.830 0.000Within Groups 4470.035 42 106.429
Total 13636.222 53
ELISA cv. Padre x
countySum of Squares df Mean Square F Sig.
4C10 mAb Between Groups 12829.119 6 2138.187 16.500 0.000Within Groups 1814.194 14 129.585
Total 14643.313 20
R anti-AMP pAb Between Groups 38301.974 6 6383.662 2.595 0.066Within Groups 34443.215 14 2460.230
Total 72745.189 20
R anti-almond pAb Between Groups 11700.641 6 1950.107 8.119 0.001Within Groups 3362.760 14 240.197
Total 15063.402 20
ELISA cv. Price x countySum of Squares df Mean Square F Sig.
4C10 mAb Between Groups 49006.740 6 8167.790 8.178 0.001Within Groups 13982.265 14 998.733
Total 62989.005 20
R anti-AMP pAb Between Groups 74180.226 6 12363.371 11.776 0.000Within Groups 14698.032 14 1049.859
Total 88878.258 20
R anti-almond pAb Between Groups 9256.903 6 1542.817 10.038 0.000Within Groups 2151.821 14 153.702
Total 11408.724 20
Table 25 continued. Interaction of cultivar and geographic location on the immunoreactivity of select almond cultivars assessed by ELISA
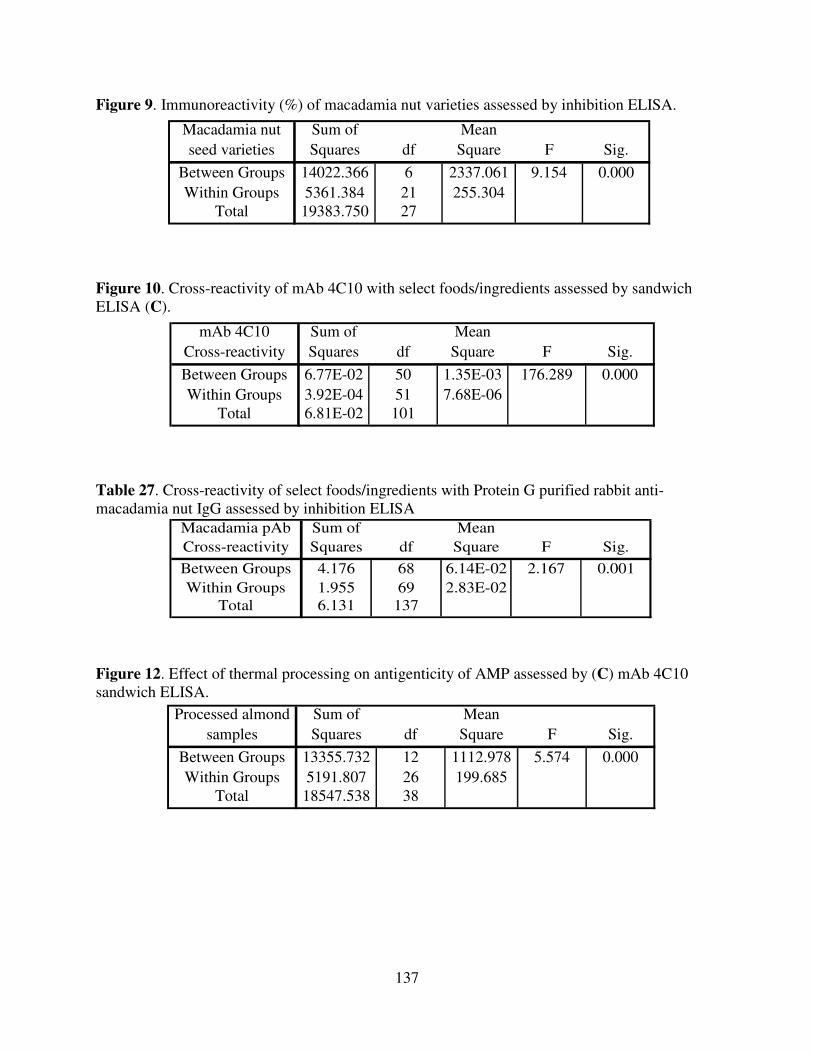
137
mAb 4C10 Cross-reactivity
Sum of Squares df
Mean Square F Sig.
Between Groups 6.77E-02 50 1.35E-03 176.289 0.000Within Groups 3.92E-04 51 7.68E-06
Total 6.81E-02 101
Macadamia nut seed varieties
Sum of Squares df
Mean Square F Sig.
Between Groups 14022.366 6 2337.061 9.154 0.000Within Groups 5361.384 21 255.304
Total 19383.750 27
Macadamia pAb Cross-reactivity
Sum of Squares df
Mean Square F Sig.
Between Groups 4.176 68 6.14E-02 2.167 0.001Within Groups 1.955 69 2.83E-02
Total 6.131 137
Processed almond samples
Sum of Squares df
Mean Square F Sig.
Between Groups 13355.732 12 1112.978 5.574 0.000Within Groups 5191.807 26 199.685
Total 18547.538 38
Figure 9. Immunoreactivity (%) of macadamia nut varieties assessed by inhibition ELISA.
Figure 10. Cross-reactivity of mAb 4C10 with select foods/ingredients assessed by sandwich ELISA (C).
Table 27. Cross-reactivity of select foods/ingredients with Protein G purified rabbit anti-macadamia nut IgG assessed by inhibition ELISA
Figure 12. Effect of thermal processing on antigenticity of AMP assessed by (C) mAb 4C10 sandwich ELISA.

138
pH exposed almond flour (neutralized)
Sum of Squares df
Mean Square F Sig.
Between Groups 31502.546 7 4500.364 23.914 0.000Within Groups 1505.532 8 188.191
Total 33008.077 15
pH exposed almond flour (not
neutralized)Sum of Squares df
Mean Square F Sig.
Between Groups 44808.879 7 6401.268 81.067 0.000Within Groups 1263.409 16 78.963
Total 46072.288 23
Figure 13. Effect of pH on the antigenicity of AMP assessed by (C and F) mAb 4C10 sandwich ELISA. C: Defatted almond seed flour exposed to desired pH value and neutralized prior to analysis. F: Defatted almond seed flour exposed to desired pH value and analyzed directly (not neutralized). Figure 14. Effect of thermal processing on immunoreactivity of macadamia nut proteins assessed by ELISA and Dot blot.
Sum of Squares df
Mean Square F Sig.
ELISA Between Groups 90048.507 18 5002.695 17.035 0.000Within Groups 16739.717 57 293.679
Total 106788.223 75
Dot blot Between Groups 47702.256 18 2650.125 109.686 0.000Within Groups 1377.175 57 24.161
Total 49079.432 75
Processed macadamia nut samples

139
pH exposed macadamia nut flour
(not neutralized)Sum of Squares df
Mean Square F Sig.
Between Groups 46352.762 7 6621.823 68.358 0.000Within Groups 1937.397 20 96.870
Total 48290.159 27
pH exposed macadamia nut flour
(neutralized)Sum of Squares df
Mean Square F Sig.
Between Groups 52626.237 7 7518.034 44.514 0.000Within Groups 3715.624 22 168.892
Total 56341.862 29
Figure 15. Effect of pH on immunoreactivity of macadamia nut proteins assessed by (C and F) inhibition ELISA. C: Defatted macadamia nut flour exposed to desired pH value and analyzed directly (not neutralized). F: Defatted macadamia nut flour exposed to desired pH value and neutralized prior to analysis.

140
Sum of Squares df
Mean Square F Sig.
Unspiked Between Groups 1.16E-01 15 7.74E-03 9.590 0.000Within Groups 2.58E-02 32 8.08E-04
Total 1.42E-01 47
10 �g extract Between Groups 509.361 15 33.957 21.614 0.000Within Groups 50.274 32 1.571
Total 559.635 47
1 �g extract Between Groups 4.454 15 2.97E-01 67.892 0.000Within Groups 1.40E-01 32 4.37E-03
Total 4.594 47
0.1 �g extract Between Groups 1.56E-01 15 1.04E-02 15.194 0.000Within Groups 2.19E-02 32 6.84E-04
Total 1.93E-01 47
100 �g flour Between Groups 2778.873 9 308.764 58.467 0.000Within Groups 105.619 20 5.281
Total 2884.492 29
10 �g flour Between Groups 22.624 9 2.514 76.416 0.000Within Groups 6.58E-01 20 3.29E-02
Total 23.282 29
1 �g flour Between Groups 2.26E-01 9 2.51E-02 12.448 0.000Within Groups 4.04E-02 20 2.02E-03
Total 2.66E-01 29
Almond mAb 4C10 ELISA
Table 28. Detection of AMP in foods spiked with almond seed protein extract or defatted almond seed flour
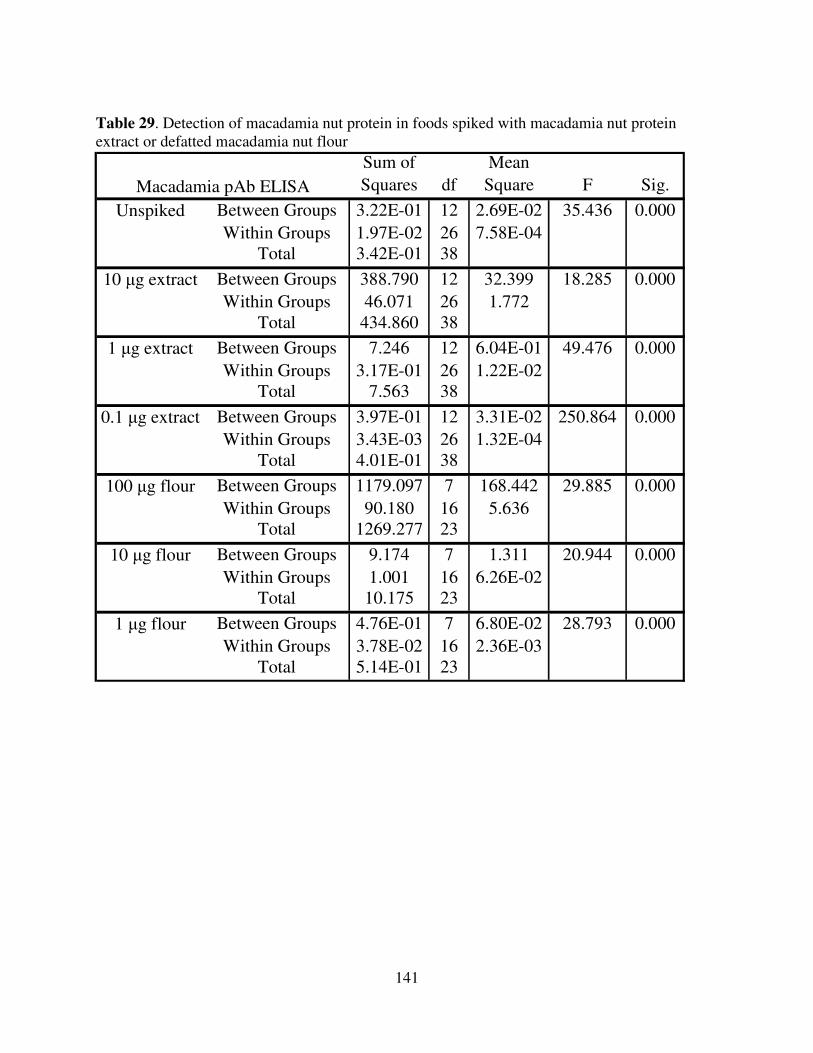
141
Sum of Squares df
Mean Square F Sig.
Unspiked Between Groups 3.22E-01 12 2.69E-02 35.436 0.000Within Groups 1.97E-02 26 7.58E-04
Total 3.42E-01 38
10 �g extract Between Groups 388.790 12 32.399 18.285 0.000Within Groups 46.071 26 1.772
Total 434.860 38
1 �g extract Between Groups 7.246 12 6.04E-01 49.476 0.000Within Groups 3.17E-01 26 1.22E-02
Total 7.563 38
0.1 �g extract Between Groups 3.97E-01 12 3.31E-02 250.864 0.000Within Groups 3.43E-03 26 1.32E-04
Total 4.01E-01 38
100 �g flour Between Groups 1179.097 7 168.442 29.885 0.000Within Groups 90.180 16 5.636
Total 1269.277 23
10 �g flour Between Groups 9.174 7 1.311 20.944 0.000Within Groups 1.001 16 6.26E-02
Total 10.175 23
1 �g flour Between Groups 4.76E-01 7 6.80E-02 28.793 0.000Within Groups 3.78E-02 16 2.36E-03
Total 5.14E-01 23
Macadamia pAb ELISA
Table 29. Detection of macadamia nut protein in foods spiked with macadamia nut protein extract or defatted macadamia nut flour

142
APPENDIX B
Animal Research Approval

143

144

145
REFERENCES
1. Jones, D.A. 1998. Why are so many food plants cyanogenic? Phytochem., 47:155-162.
2. Almond Industry Website (www.almondsarein.com). 2006. Almond Board of California, Modesto, CA.
3. USDA. Market and Trade Data, Foreign Agricultural Service; (www.fas.usda.gov), U.S. Department of Agriculture; Washington, DC, 2006.
4. Almond Almanac. 2007. Almond Board of California, Modesto, CA. pp. 48.
5. Almond Almanac. 2006. Almond Board of California, Modesto, CA. pp. 48.
6. Griel, A.E., and Kris-Etherton, P.M. 2006. Tree nuts and the lipid profile: a review of clinical studies. British J. Nutr., 96:S68-S78.
7. Mukuddem-Petersen, J., Oosthuizen, W., and Jerling, J.C. 2005. A systematic review of the effects of nuts on blood lipid profiles in humans. J. Nutr., 135:2082-2089.
8. Jambazian, P.R., Haddad, E., Rajaram, S., Tanzman, J., and Sabaté, J. 2005. Almonds in the diet simultaneously improve plasma alpha-tocopherol concentrations and reduce plasma lipids. J. Am. Diet. Assoc., 105:449-454.
9. Nash, S.D., and Westpfal, M. 2005. Cardiovascular benefits of nuts. Am. J. Cardiol., 95:963-965.
10. Spiller, G.A., Miller, A., Olivera, K., Reynolds, J., Miller, B., Morse, S.J., Dewell, A., and Farquhar, J.W. 2003. Effects of plant-based diets high in raw or roasted almonds or roasted almond butter on serum lipoproteins in humans. J. Am. Coll. Nutr., 22:195-200.
11. Sabaté, J., Haddad, E., Tanzman, J.S., Jambazian, P., and Rajaram, S. 2003. Serum lipid response to the graduated enrichment of a Step I diet with almonds: a randomized feeding trial. Am. J. Clin. Nutr., 77:1379-1384.
12. Jenkins, D.J., Kendall, C.W., Marchie, A., Parker, T.L., Connelly, P.W., Qian, W., Haight, J.S., Faulkner, D., Vidgen, E., Lapsley, K.G., and Spiller, G.A. 2002. Dose response of almonds on coronary heart disease risk factors: blood lipids, oxidized low-density lipoproteins, lipoprotein (a), homocysteine, and pulmonary nitric oxide: a randomized, controlled, crossover trial. Circulation, 106:1327-1332.
13. Hyson, D.A., Schneeman, B.O., and Davis, P.A. 2002. Almonds and almond oil have similar effects on plasma lipids and LDL oxidation in healthy men and women. J. Nutr., 132:703-707.
146
14. Lovejoy, J.C., Most, M.M., Lefevre, M., Greenway, F.L., and Rood, J.C. 2002. Effect of diets enriched in almonds on insulin action and serum lipids in adults with normal glucose tolerance or type 2 diabetes. Am. J. Clin. Nutr., 76:1000-1006.
15. Spiller, G.A., Jenkins, D.A., Bosello, O., Gates, J.E., Cragen, L.N., and Bruce, B. 1998. Nuts and plasma lipids: an almond-based diet lowers LDL-C while preserving HDL-C. J.
Am. Coll. Nutr., 17:285-290.
16. Monagas, M., Garrido, I., Lebrón-Aguilar, R., Bartolome, B., and Gómez-Cordovés, C. 2007. Almond (Prunus dulcis (Mill.) D.A. Webb) skins as a potential source of bioactive polyphenols. J. Agric. Food Chem., 55:8498-8507.
17. Amarowicz, R., Troszyn’ska, A., and Shahidi, F. 2005. Antioxidant activity of almond seed extract and it’s fractions. J. Food Lipids, 12:344-358.
18. Pinelo, M., Rubilar, M., Sineiro, J., and Núñez, M.J. 2004. Extraction of antioxidant phenolics from almond hull (Prunus amygdalus) and pine sawdust (Pinus pinaster). Food
Chem., 85:267-273.
19. Sang, S., Lapsley, K., Jeong, W.S., Lachance, P.A., Ho, C.T., and Rosen, R.T. 2002. Antioxidant phenolic compounds isolated from almond skin (Prunus amygdalus Batsch). J. Agric. Food Chem., 50:2459-2463.
20. Takeoka, G.R., and Dao, L.T. 2003. Antioxidant constituents of almond [Prunus dulcis
(Mill) D.A. Webb] hulls. J. Agric. Food Chem., 51:496-501.
21. Dietrich, M., Traber, M.G., Jacques, P.F., Cross, C.E., Hu, Y., and Block, G. 2006. Does gamma-tocopherol play a role in the primary prevention of heart disease and cancer? A review. J. Am. Coll. Nutr., 25:292-299.
22. Tucker, J.M., and Townsend, D.M. 2005. Alpha-tocopherol: roles in prevention and therapy of human disease. Biomed. Pharmacother., 59:380-387.
23. Scalbert, A., and Williamson, G. 2000. Dietary intake and bioavailability of polyphenols. J. Nutr., 10:2073S-2085S.
24. Otten, J.J., Hellwig, J.P., and Meyers, L.D. Eds. 2006. The dietary reference intakes: the essential guide to nutrient requirement. The National Academies Press, Washington, DC.
25. Steiger, D.L., Moore, P.H., Zee, F., Liu, Z., and Ming, R. 2003. Genetic relationships of macadamia cultivars and species revealed by AFLP markers. Euphytica, 132:269-277.
26. Peace, C., Hardner, C., O’Connor, K., Vithanage, V., Turnbull, C., and Carroll, B.J. 2002. The diversity and origins of macadamia cultivars. The Association, Subiaco, WA, Australia, WANATCA Yearbook, 26:19-25.
147
27. Kermond, P., and Baumgart, B. 1996. The macadamia: from the seed to the supermarket. Australia, ISBN 0 646 28866 0, pp. 79.
28. Nagao, M.A., and Hirae, H.H. 1992. Macadamia: cultivation and physiology. Crit. Rev.
Plant Sci., 10:441-470.
29. Storey, W.B. 1948. Varieties of the macadamia nut for planting in Hawaii. Hawaii Agricultural Experiment Station Progress Notes No. 51, pp. 4.
30. Aradhya, M.K., Yee, L.K., Zee, F.T., and Manshardt, R.M. 1998. Genetic variability in Macadamia. Genet. Resour. Crop Ev., 45:19-32.
31. The International Food Institute of Queensland (IFIQ). 2006. Market profiles & strategies for the macadamia industry. Division of the Department of Primary Industries, Queensland, Australia.
32. Klein, K. 1991. Kukui and macadamia nut oils: cosmetic applications. Cosmet. Toiletries, 106:87-89.
33. Garg, M.L., Blake, R.J., Wills, R.B., and Clayton, E.H. 2007. Macadamia nut consumption modulates favourably risk factors for coronary artery disease in hypercholesterolemic subjects. Lipids, 42:583-587.
34. Hiraoka-Yamamoto, J., Ikeda, K., Negishi, H., Mori, M., Hirose, A., Sawada, S.,
Onobayashi, Y., Kitamori, K., Kitano, S., Tashiro, M., Miki, T., and Yamori, Y. 2004. Serum lipid effects of a monounsaturated (palmitoleic) fatty acid-rich diet based on macadamia nuts in healthy, young Japanese women. Clin. Exp. Pharmacol. Physiol., 31:37-38.
35. Garg, M.L., Blake, R.J., and Wills, R.B. 2003. Macadamia nut consumption lowers plasma total and LDL cholesterol levels in hypercholesterolemic men. J. Nutr., 133:1060-1063.
36. Curb, J.D., Wergowske, G., Dobbs, J.C., Abbott, R.D., and Huang, B. 2000. Serum lipid effects of a high-monounsaturated fat diet based on macadamia nuts. Arch. Intern. Med., 160:1154-1158.
37. Amrein, T.M., Andres, L., Escher, F., and Amadò, R. 2007. Occurrence of acrylamide in selected foods and mitigation options. Food Addit. Contam., 24:13-25.
38. Amrein, T.M., Lukac, H., Andres, L., Perren, R., Escher, F., and Amadò, R. 2005. Acrylamide in roasted almonds and hazelnuts. J. Agric. Food Chem., 53:7819-7825.
39. Martín Carratalá, M.L., Prats Moya, M.S., Grané Teruel, N., and Berenguer Navarro, V. 2002. Discriminating significance of the free amino acid profile in almond seeds. J.
Agric. Food Chem., 50:6841-6846.

148
40. Mottram, D.S., Wedzicha, B.L., and Dodson, A.T. 2002. Acrylamide is formed in the
Maillard reaction. Nature, 419:448-449.
41. Stadler, R.H., Blank, I., Varga, N., Robert, F., Hau, J., Guy, P.A., Robert, M.C., and Riediker, S. 2002. Acrylamide from Maillard reaction products. Nature, 419:449-450.
42. Zhang, Y., and Zhang, Y. 2007. Formation and reduction of acrylamide in Maillard reaction: a review based on the current state of knowledge. Cri. Rev. Food Sci. Nutr., 47:521-542.
43. Zyzak, D.V., Sanders, R.A., Stojanovic, M., Tallmadge, D.H., Eberhart, B.L., Ewald, D.K., Gruber, D.C., Morsch, T.R., Strothers, M.A., Rizzi, G.P., and Villagran, M.D. 2003. Acrylamide formation mechanism in heated foods. J. Agric. Food Chem., 51:4782-4787.
44. Davis, P.A., and Iwahashi, C.K. 2001. Whole almonds and almond fractions reduce aberrant crypt foci in a rat model of colon carcinogenesis. Cancer Lett., 165:27-33.
45. Hefle, S.L., and Taylor, S.L. 2004. Food allergy and the food industry. Curr. Allergy
Asthma Rep., 4:55-59.
46. Pomés, A., Helm, R.M., Bannon, G.A., Burks, A.W., Tsay, A., and Chapman, M.D. 2003. Monitoring peanut allergen in food products by measuring Ara h 1. J. Allergy Clin.
Immunol., 111:640-645.
47. Lipman, N.S., Jackson, L.R., Trudel, L.J., and Weis-Garcia, F. 2005. Monoclonal versus polyclonal antibodies: distinguishing characteristics, applications, and information resources. ILAR J., 46:258-268.
48. Asensio, L., González, I., Garcıá, T., and Martín, R. 2008. Review: Determination of food authenticity by enzyme-linked immunosorbent assay (ELISA). Food Control, 19:1-8.
49. Sathe, S.K., Teuber, S.S., Gadziel, T.M., and Roux, K.H. 2001. Electrophoretic and immunological analyses of almond (Prunus dulcis L.) genotypes and hybrids. J. Agric.
Food Chem., 49:2043-2052.
50. Hamilton, R.A., and Fukunaga, E.T. 1973. Development and evaluation of macadamia nut varieties. Calif. Macadamia Soc. Yearb., 19:32-39.
51. Hamilton, R.A., and Ito, P.J. 1976. Development of macadamia nut cultivars in Hawaii. Calif. Macadamia Soc. Yearb., 22:94-100.
149
52. Hamilton, R.A., Storey, W.B., and Fukunaga, E.T. 1952. Two new macadamia varieties and an appraisal of the HAES named varieties. Hawaii Agricultural Experiment Station
Circular 36, pp. 5.
53. Hamilton, R.A., Radspinner, A.L., and Ito, P.J. 1975. A study of variation of Keauhou in percent kernel and grade 1 kernels at several locations. Hawaii Macadamia Producers Association 15th annual proceedings. pp. 34-47.
54. Nagao, M.A., Ito, P.J., Meisner, M., and Kawabata, A.M. 2006. Performance of macadamia selections at Captain Cook-Kona. Hawaii Macadamia Nut Association 46th Annual Conference Proceedings. pp. 26-30.
55. Hamilton, R.A., Ito, P.J., and Cavaletto, C.G. 1981. ‘Purvis’ macadamia named for the first importer of M. integrifolia nuts into Hawaii. Calif. Macadamia Soc. Yearb., 27:83-91.
56. Malo, S.E., and Campbell, C.W. 2005. The macadamia. This document is FC9, one of a series of the Horticultural Sciences Department, Florida Cooperative Extension Service, Institute of Food and Agricultural Sciences, University of Florida. Gainesville FL Original publication date April 1994. Reviewed November 2005. Visit the EDIS website at http://edis.ifas.ufl.edu.
57. Hamilton, R.A., and Ooka, H. 1966. Keaau - A new commercial macadamia. Hawaii Macadamia Producers Association 6th annual proceedings. pp. 10-14.
58. Hamilton, R.A., and Ito, P.J. 1977. Mauka and Makai, two new macadamia cultivars suitable for high and low elevations. Hawaii Macadamia Producers Association 17th annual proceedings, pp. 34-40.
59. Valverde, M., Madrid, R., and García, A.L. 2006. Effects of the irrigation regime, type of fertilization, and culture year on the physical properties of almond (cv. Guara). J. Food
Eng., 76:584-593.
60. Soler, L., Canellas, J., and Saura-Calixto, F. 1989. Changes in carbohydrate and protein content and composition of developing almond seeds. J. Agric. Food Chem., 37:1400-1404.
61. De Giorgio, D., Leo, L., Zacheo, G., and Lamascese, N. 2007. Evaluation of 52 almond (Prunus amygdalus Batsch) cultivars from the Apulia region in southern Italy. J. Hort.
Sci. Biotechnol., 82:541-546.
62. Ledbetter, C.A., and Palmquist, D.E. 2006. Comparing physical measures and mechanical cracking products of ‘Nonpareil’ almond (Prunus dulcis [Mill.] D.A. Webb) with two advanced breeding selections. J. Food Eng., 76:232-237.

150
63. Askin, M.A., Balta, M.F., Tekintas, F.E., Kazankaya, A., and Balta, F. 2007. Fatty acid composition affected by kernel weight in almond [Prunus dulcis (Mill.) D.A. Webb] genetic resources. J. Food Comp. Anal., 20:7-12.
64. Aydin, C. 2003. Physical properties of almond nut and kernel. J. Food Eng., 60:315-320.
65. Nanos, G.D., Kazantzis, I., Kefalas, P., Petrakis, C., and Stavroulakis, G.G. 2002. Irrigation and harvest time affect almond kernel quality and composition. Sci. Hortic., 96:249-256.
66. Agunbiade, S.O., and Olanlokun, J.O. 2006. Evaluation of some nutritional characteristics of Indian almond (Prunus amygdalus) nut. Pakistan J. Nutr., 5:316-318.
67. Aktas, T., Polat, R., and Atay, U. 2007. Comparison of mechanical properties of some selected almond cultivars with hard and soft shell under compression loading. J. Food
Process. Eng., 30:773-789.
68. Cordeiro, V., Oliveira, M., Ventura, J., and Monteiro, A. 2001. Study of some physical characters and nutritive composition of the Portuguese's (local) almond varieties. In: XI GREMPA seminar on pistachios and almonds; Proceedings of the XI GREMPA seminar organized by the University of Harran with the collaboration of the FAO-CIHEAM inter-regional cooperative research and development network on nuts, Sanliurfa (Turkey), 1-4 September 1999; Cahiers Options Mediterraneennes (France) , v. 56 Ak, B. E. (ed.) / International Centre for Advanced Mediterranean Agronomic Studies, Zaragoza (Spain). Mediterranean Agronomic Inst.; FAO, Rome (Italy). Plant Production and Protection Div., 2001, pp. 333-337 Accession No: 407659, ISSN 1022-1379.
69. Sathe, S.K. 1993. Solubilization, electrophoretic characterization and in vitro digestibility of almond (Prunus amygdalus) proteins. J. Food Biochem., 16:249-264.
70. Hardner, C., Winks, C., Stephenson, R., and Gallagher, E. 2001. Genetic parameters for nut and kernel traits in macadamia. Euphytica, 117:151-161.
71. Venkatachalam, M., and Sathe, S.K. 2006. Chemical composition of select edible nut seeds. J. Agric. Food Chem., 54:4705-4714.
72. Ahrens, S., Venkatachalam, M., Mistry, A.M., Lapsley, K., and Sathe S.K. 2005. Almond (Prunus dulcis L.) protein quality. Plant Foods Hum. Nutr., 60:123-128.
73. Ruggeri, S., Cappelloni, M., Gambeli, L., and Carnovale, E. 1998. Chemical composition and nutritive value of nuts grown in Italy. Italian J. Food Sci., 10:243-252.
74. Calixto, F.S., Bauza, M., de Toda, F.M., and Argamenteria, A. 1981. Amino acids, sugars, and inorganic elements in the sweet almond (Prunus amygdalus). J. Agric. Food
Chem., 29:509-511.
151
75. Kornsteiner, M.K., Wagner, K.H., and Elmadfa, I. 2006. Tocopherols and total phenolics in 10 different nut types. Food Chem., 98:381-387.
76. Kaijser, A., Dutta, P., and Savage, G. 2000. Oxidative stability and lipid composition of macadamia nuts grown in New Zealand. Food Chem., 71:67-70.
77. García-López, C., Grané-Teruel, N., Berenguer-Navarro, V., García-García, J.E., and Martín Carratalá, M.L. 1996. Major fatty acid composition of 19 almond cultivars of different origins. A chemometric approach. J. Agric. Food Chem., 44:1751-1755.
78. Maguire, L.S., O'Sullivan, S.M., Galvin, K., O'Connor, T.P., and O'Brien, N.M. 2004. Fatty acid profile, tocopherol, squalene and phytosterol content of walnuts, almonds, peanuts, hazelnuts and the macadamia nut. Int. J. Food Sci. Nutr., 55:171-178.
79. Moodley, R., Kindness, A., and Jonnalagadda, S.B. 2007. Elemental composition and chemical characteristics of five edible nuts (almond, Brazil, pecan, macadamia and walnut) consumed in Southern Africa. J. Environ. Sci. Health, 42:585-591.
80. Miraliakbari, H., and Shahidi, F. 2008. Lipid class compositions, tocopherols and sterols of tree nut oils extracted with different solvents. J. Food Lipids, 15:81-96.
81. Fourie, P.C., and Basson, D.S. 1990. Sugar content of almond, pecan, and macadamia nuts. J. Agric. Food Chem., 38:101-104.
82. Calixto, F.S., Canellas, J., and Raso, A.G. 1984. Gas chromatographic analysis of sugars and sugar alcohols in the mesocarp, endocarp and kernel of almond fruit. J. Agric. Food
Chem., 32:1018-1021.
83. Wall, M.M., and Gentry, T.S. 2007. Carbohydrate composition and color development during drying and roasting of macadamia nuts (Macadamia integrifolia). Food Sci.
Technol.-LEB, 40:587-593.
84. Milbury, P.E., Chen, C.Y., Dolnikowski, G.G., and Blumberg, J.B. 2006. Determination of flavonoids and phenolics and their distribution in almonds. J. Agric. Food Chem., 54:5027-5033.
85. USDA. National Nutrient Database for Standard Reference, Release 20; Agricultural Research Service, U.S. Department of Agriculture; Washington, DC, 2007.
86. Grané-Teruel, N., Luna-Amador, M.C., Prats-Moya, M.S., Berenguer-Navarro, V., and Martín-Carratalá, M.L. 1999. Statistical comparative study of free amino acid HPLC data from a selected almond set. Food Chem., 65:23-28.
87. Parzefall, W. 2008. Minireview on the toxicity of dietary acrylamide. Food Chem.
Toxicol., 46:1360-1364.
152
88. Mucci, L.A., Adami, H.O., and Wolk, A., 2006. Prospective study of dietary acrylamide and risk of colorectal cancer among women. Int. J. Cancer, 118:169-173.
89. Mucci, L.A., Lindblad, P., Steineck, G., and Adami, H.O. 2004. Dietary acrylamide and risk of renal cell cancer. Int. J. Cancer, 109:774-776.
90. Mucci, L.A., Sandin, S., Balter, K., Adami, H.O., Magnusson, C., and Weiderpass, E. 2005. Acrylamide intake and breast cancer risk in Swedish women. JAMA, 293:1326-1327.
91. Pelucchi, C., Galeone, C., Levi, F., Negri, E., Franceschi, S., Talamini, R., Bosetti, C., Giacosa, A., and La Vecchia, C. 2006. Dietary acrylamide and human cancer. Int. J.
Cancer, 118:467-471.
92. Lukac, H., Amrein, T.M., Perren, R., Conde-Petit, B., Amadò, R., and Escher, F. 2007. Influence of roasting conditions on the acrylamide content and the color of roasted almonds. J. Food Sci., 72:C33-C38.
93. Report of a Joint WHO/FAO Expert Consultation. 2003. Diet, Nutrition and the Prevention of Chronic Diseases. WHO Technical Report Series No. 916. Geneva: World Health Organization.
94. Kodad, O., and Socias i Company, R. 2006. Influence of genotype, year and type of fruiting branches on the productive behavior of almonds. Sci. Hort., 109:297-302.
95. Pereira-Lorenzo, S., Ramos-Cabrer, A.M., Díaz-Hernández, M.B., Ciordia-Ara, M., and Ríos-Mesa, D. 2006. Chemical composition of chestnut cultivars from Spain. Sci. Hort., 107:306-314.
96. Venkatachalam, M., Kshirsagar, H.H., Seeram, N.P., Heber, D., Thompson, T.E., Roux, K.H., and Sathe, S.K. 2007. Biochemical composition and immunological comparison of select pecan [Carya illinoinensis (Wangenh.) K. Koch] cultivars. J. Agric. Food Chem., 55:9899-9907.
97. Wakeling, L.T., Mason, R.L., D’Arcy, B.R., and Caffin, N.A. 2001. Composition of pecan cultivars Wichita and Western Schley [Carya illinoinensis (Wangenh.) K. Koch] grown in Australia. J. Agric. Food Chem., 49:1277-1281.
98. Bostan, S.Z. 2003. Important chemical and physical traits and variation in these traits in ‘Tombul’ hazelnut cultivar at different elevations. Grasas Aceites, 54:234-239.
99. Borges, O.P., Carvalho, J.S., Correia, P.R., and Silva, A.P. 2007. Lipid and fatty acid profiles of Castanea sativa Mill. Chestnuts of 17 native Portuguese cultivars. J. Food
Comp. Anal., 20:80-89.

153
100. Borges, O., Gonçalves, B., Soeiro de Carvalho, J.L., Correia, P., and Silva, A.P. 2008. Nutritional quality of chestnut (Castanea sativa Mill.) cultivars from Portugal. Food
Chem., 106:976-984.
101. Okay, Y. 2002. The comparison of some pistachio cultivars regarding their fat, fatty acids and protein content. Gartenbauwissenschaft, 67:107-113.
102. Küçüköner, E., and Yurt, B. 2003. Some chemical characteristics of Pistacia vera varieties produced in Turkey. Eur. Food Res. Technol., 217:308-310.
103. De La Montaña Míguelez, J., Míguez Bernárdez, M., and García Queijeiro, J.M. 2004. Composition of varieties of chestnuts from Galicia (Spain). Food Chem., 84:401-404.
104. Bárta, J., Kalinová, J., Moudry, J., and �urn, V. 2004. Effects of environmental factors on protein content and composition in buckwheat flour. Cereal Res. Commun., 32:541-548.
105. Brennan, R.F., and Bolland, M.D.A. 2007. Effect of fertiliser phosphorus and nitrogen on the concentrations of oil and protein in grain and the grain yield of canola (Brassica
napus L.) grown in south-western Australia. Australian J. Exp. Agric., 47:984-991.
106. Ciesiolka, D., Muzquiz, M., Burbano, C., Altares, P., Pedrosa, M.M., Wysocki, W., Folkman, W., Popenda, M., and Gulewicz, K. 2005. An effect of various nitrogen forms used as fertilizer on Lupinus albus L. yield and protein, alkaloid and alpha-galactosides content. J. Agro. Crop Sci., 191:458-463.
107. Rathore, B.S., Singh, V.P., and Hooda, R.S. 2004. Effect of mixed bio-fertilizers in association with different levels of nitrogen application on nutrient content-and uptake by pearl millet (Pennisetum glaucum). Crop Res., 28:39-41.
108. Leesawatwong, M., Jamjod, S., Kuo, J., Dell, B., and Rerkasem, B. 2005. Nitrogen fertilizer increases seed protein and milling quality of rice. Cereal Chem., 82:588-593.
109. Helena Seron, L., Prats Moya, M.S., Martín Carratalá, M.L., Berenguer Navarro, V., and Grané Teruel, N. 1998. Characterization of 19 almond cultivars on the basis of their free amino acid composition. Food Chem., 61:455-459.
110. Sathe, S.K., Kshirsagar, H.H., and Roux, K.H. 2005. Advances in seed protein research: a perspective on seed allergens. J. Food Sci., 70:93-120.
111. Sampson, H.A. 2004. Update on food allergy. J. Allergy Clin. Immunol., 113:805-819.
112. Hefle, S.L., Nordlee, J.A., and Taylor, S.L. 1996. Allergenic foods. Crit. Rev. Food Sci.
Nutr., 36:69-89.
154
113. Ellman, L.K., Chatchatee, P., Sicherer, S.H., and Sampson, H.A. 2002. Food hypersensitivity in two groups of children and young adults with atopic dermatitis evaluated a decade apart. Pediatr. Allergy Immunol., 13:295-298.
114. Bock, S.A., Munoz-Furlong, A., and Sampson, H.A. 2001. Fatalities due to anaphylactic reactions to foods. J. Allergy Clin. Immunol., 107:191-193.
115. Bock, S.A., Muñoz-Furlong, A., and Sampson, H.A. 2007. Further fatalities caused by anaphylactic reactions to food, 2001-2006. J. Allergy Clin. Immunol., 119:1016-1018.
116. Sicherer, S.H., Furlong, T.J., Munz-Furlong, A., Burks, A.W., and Sampson, H.A. 2001. A voluntary registry for peanut and tree nut allergy: characteristics of the first 5149 registrants. J. Allergy Clin. Immunol., 108:128-132.
117. Sicherer, S.H., Munõz-Furlong, A., and Sampson, H.A. 2003. Prevalence of peanut and tree nut allergy in the United States determined by means of a random digit dial telephone survey: a 5-year follow-up study. J. Allergy Clin. Immunol., 112:1203-1207.
118. Keet, C.A., and Wood, R.A. 2007. Food allergy and anaphylaxis. Immunol. Allergy Clin.
N. Am., 27:193-212.
119. Pumphrey, R.S., and Roberts, I.S. 2000. Postmortem findings after fatal anaphylactic reactions. J. Clin. Pathol., 53:273-276.
120. Sampson, H.A., Mendelson, L., and Rosen, J. 1992. Fatal and near-fatal anaphylactic reactions to foods in children and adolescents. New Engl. J. Med., 327:380-384.
121. Yunginger, J.W., Sweeney, K.G., and Sturner, W.Q. 1988. Fatal food-induced anaphylaxis. J. Am. Med. Assoc., 260:1450-1452.
122. Fleischer, D.M., Conover-Walker, M.K., Matsui, E.C., and Wood, R.A. 2005. The natural history of tree nut allergy. J. Allergy Clin. Immunol., 116:1087-1093.
123. Food Allergen Labeling and Consumer Protection Act of 2004. Title II of Public Law 108-282. www.cfsan.fda.gov.
124. Taylor, S.L., and Hefle, S.L. 2006. Food allergen labeling in the USA and Europe. Curr.
Opin. Allergy Clin. Immunol., 6:186-190.
125. Yu, J.W., Kagan, R., Verreault, N., Nicolas, N., Joseph, L., St. Pierre, Y., and Clarke, A. 2006. Accidental ingestions in children with peanut allergy. J. Allergy Clin. Immunol., 118:466-472.
126. Yman, I.M. 2004. Detection of inadequate labelling and contamination as causes of allergic reactions to food. Acta. Aliment. Hung., 33:347-357.
155
127. Vierk, K., Falci, K., Wolyniak, C., and Klontz, K.C. 2002. Recalls of foods containing undeclared allergens reported to the US Food and Drug Administration, fiscal year 1999. J. Allergy Clin. Immunol., 109:1022-1026.
128. Furlong, T.J., DeSimonea, J., and Sicherer, S.H. 2001. Peanut and tree nut allergic reactions in restaurants and other food establishments. J. Allergy Clin. Immunol., 108:867-870.
129. McKenna, C., and Klontz, K.C. 1997. Systemic allergic reaction following ingestion of undeclared peanut flour in a peanut-sensitive woman. Ann. Allergy Asthma Immunol., 79:234-236.
130. Jones, R.T., Squillace, D.L., and Yunginger, J.W. 1992. Anaphylaxis in a milk-allergic child after ingestion of milk-contaminated kosher-pareve-labeled "dairy-free" dessert. Ann. Allergy, 68:223-227.
131. Gern, J.E., Yang, E., Evrard, H.M., and Sampson, H.A. 1991. Allergic reactions to milk-contaminated "nondairy" products. N. Engl. J. Med., 324:976-979.
132. Popping, B., and Holzhauser, T. 2004. Methods for detection of allergenic foods. Deut.
Lebensm-Rundsch, 100:285-293.
133. Stephan, O., Moller, N., Lehmann, S., Holzhauser, T., and Vieths, S. 2002. Development and validation of two dipstick type immunoassays for determination of trace amounts of peanut and hazelnut in processed foods. Eur. Food Res. Technol., 215:431-436.
134. Scheibe, B., Weiss, W., Ruëff, F., Przybilla, B., and Görg, A. 2001. Detection of trace amounts of hidden allergens: hazelnut and almond proteins in chocolate. J. Chromatogr.
B. Biomed. Sci. Appl., 756:229-237.
135. Engler-Blum, G., Raiss, C., and Burgmaier-Thielert, E. 2007. Detection of allergens in food using real-time polymerase chain reaction and immunoassays: Sensitive methods for detection of peanut and hazelnut - A comparative approach. Deut. Lebensm-Rundsch, 103:101-108.
136. Stephan, O., and Vieths, S. 2004. Development of a real-time PCR and a sandwich ELISA for detection of potentially allergenic trace amounts of peanut (Arachis hypogaea) in processed foods. J. Agric Food Chem., 52:3754-3760.
137. Krska, R., Welzig, E., and Baumgartner, S. 2004. Immunoanalytical detection of allergenic proteins in food. Anal. Bioanal. Chem., 378:63-65.
138. Holzhauser, T., Wangorsch, A., and Vieths, S. 2000. Polymerase chain reaction (PCR) for the detection of potentially allergenic hazelnut residues in complex food matrices. Eur. Food Res. Technol., 211:360-365.

156
139. Roux, K.H., Teuber, S.S., Robotham, J.M., and Sathe, S.K. 2001. Detection and stability of the major almond allergen in foods. J. Agric. Food Chem., 49:2131-2136.
140. Acosta, M.R., Roux, K.H., Teuber, S.S. and Sathe, S.K. 1999. Production and characterization of rabbit polyclonal antibodies to almond (Prunus dulcis L.) major storage protein. J. Agric. Food Chem., 47:4053-4059.
141. Hlywka, J.J., Hefle, S.L., and Taylor, S.L. 2000. A sandwich enzyme-linked immunosorbent assay for the detection of almonds in food. J. Food Prot., 63:252-257.
142. Clemente, A., Chambers, S.J., Lodi, F., Nicoletti, C., and Brett, G.M. 2004. Use of the indirect competitive ELISA for the detection of Brazil nut in food products. Food
Control, 15:65-69.
143. Wei, Y., Sathe, S.K., Teuber, S.S., and Roux, K.H. 2003. A sensitive sandwich ELISA for the detection of trace amounts of cashew (Anacardium occidental) nut in foods. J.
Agric. Food Chem., 51:3215-3221.
144. Fæste, C.K., Holden, L., Plassen, C., and Almli, B. 2006. Sensitive time-resolved fluoroimmunoassay for the detection of hazelnut (Corylus avellana) protein traces in food matrices. J. Immunol. Methods, 314:114-122.
145. Holzhauser, T., Stephan, O., and Vieths, S. 2002. Detection of potentially allergenic hazelnut (Corylus avellana) residues in food: a comparative study with DNA PCR-ELISA and protein sandwich-ELISA. J. Agric. Food Chem., 50:5808-5815.
146. Baumgartner, S., Bremer, M., Kemmers-Voncken, A., Smits, N., Haasnoot, W., Banks, J., Reece, P., Danks, C., Tomkies, V., Immer, U., Schmitt, K., and Krska, R. 2004. Detection of hidden hazelnut protein in food by IgY-based indirect competitive enzyme-immunoassay. Anal. Chim. Acta., 520:223-228.
147. Rejeb, S.B., Abbott, M., Davies, D., Querry, J., Cléroux, C., Streng, C., Delahaut, P., and Yeung, J.M. 2003. Immunochemical-based method for detection of hazelnut proteins in processed foods. J. AOAC Int., 86:557-563.
148. Jonsson, H. 2002. Sensitive and specific biosensor detection of hazelnut proteins and other allergens in food. Proc. TNO Int. Food Allergy Forum. Noordwijerhout, The Netherlands, p. 61.
149. Koppelman, S.J., Knulst, A.C., Koers, W.J., Penninks, A.H., Peppelman, H., Vlooswijk, R., Pigmans, I., van Duijn, G., and Hessing, M. 1999. Comparison of different immunochemical methods for the detection and quantification of hazelnut proteins in food products. J. Immunol. Methods, 229:107-120.
150. Kiening, M., Niessner, R., Baumgartner, S., Krska, R., Bremer, M., Tomkies, V., Reece, P., Danks, C., Immer, U., and Weller, M.G. 2005. Sandwich immunoassays for the

157
determination of peanut and hazelnut traces in foods. J. Agric. Food Chem., 53:3321-3327.
151. Akkerdaas, J.H., Wensing, M., Knulst, A.C., Stephan, O., Hefle, S.L., Aalberse, R.C., and van Ree, R. 2004. A novel approach for the detection of potentially hazardous pepsin stable hazelnut proteins as contaminants in chocolate-based food. J. Agric. Food Chem., 52:7726-7731.
152. Blais, B.W., and Phillippe, L.M. 2001. Detection of hazelnut proteins in foods by enzyme immunoassay using egg yolk antibodies. J. Food Prot., 64:895-898.
153. Holzhauser, T., and Vieths, S. 1999. Quantitative sandwich ELISA for determination of traces of hazelnut (Corylus avellana) protein in complex food matrices. J. Agric. Food
Chem., 47:4209-4218.
154. Malmheden Yman, I., Eriksson, A., Everitt, G., Yman, L., and Karlsson, T. 1994. Analysis of food proteins for verification of contamination of mislabelling. Food Agric.
Immunol., 6:167-172.
155. Venkatachalam, M., Teuber, S.S., Peterson, W.R., Roux, K.H., and Sathe, S.K. 2006. Antigenic stability of pecan [Carya illinoinensis (Wangenh.) K. Koch] proteins: effects of thermal treatments and in vitro digestion. J. Agric. Food Chem., 54:1449-1458.
156. Holzhauser, T., and Vieths, S. 1999. Indirect competitive ELISA for determination of traces of peanut (Arachia hypogaea L.) protein in complex food matrices. J. Agric. Food
Chem., 47:603-611.
157. Yeung, J.M., and Collins, P.G. 1996. Enzyme immunoassay for determination of peanut proteins in food products. J. AOAC Int., 79:1411-1416.
158. Koch, P., Schäppi, G.F., Poms, R.E., Wüthrich, B., Anklam, E., and Battaglia, R. 2003. Comparison of commercially available ELISA kits with human sera-based detection methods for peanut allergens in foods. Food Addit. Contam., 20:797-803.
159. Pomés, A., Vinton, R., and Chapman, M.D. 2004. Peanut allergen (Ara h 1) detection in foods containing chocolate. J. Food Prot., 67:793-798.
160. Mohammed, I., Mullett, W.M., Lai, E.P.C., and Yeung, J.M. 2001. Is biosensor a viable method for food allergen detection? Anal. Chim. Acta, 444:97-102.
161. Hefle, S.L., Bush, R.K., Yunginger, J.W., and Chu, F.S. 1994. A sandwich enzyme-linked immunosorbent assay (ELISA) for the quantification of selected peanut proteins in foods. J. Food Prot., 57:419-423.
162. Niemann, L., and Hefle, S.L. 2003. Detection of undeclared walnut residues in food. J.
Allergy Clin. Immunol., 111:248.

158
163. Rejeb, S.B., Abbott, M., Davies, D., Cléroux, C., and Delahaut, P. 2005. Multi-allergen
screening immunoassay for the detection of protein markers of peanut and four tree nuts in chocolate. Food Addit. Contam., 22:709-715.
164. Blais, B.W., Gaudreault, M., and Phillippe, L.M. 2003. Multiplex enzyme immunoassay system for the simultaneous detection of multiple allergens in foods. Food Control, 14:43-47.
165. Goodwin, P.R. 2004. Food allergen detection methods: a coordinated approach. J. AOAC
Int., 87:1383-1390.
166. Poms, R.E., Klein, C.L., and Anklam, E. 2004. Methods for allergen analysis in food: a review. Food Addit. Contam., 21:1-31.
167. Sathe, S.K., Wolf, W.J., Roux, K.H., Teuber, S.S., Venkatachalam, M., and Sze-Tao, K. 2002. Biochemical characterization of amandin, the major storage protein in almond (Prunus dulcis L.). J. Agric. Food Chem., 50:4333-4341.
168. Roux, K.H., Sathe, S.K., Peterson, W.R., and Teuber, S.S. 1999. The major seed storage protein of almond (Almond Major Protein) is an allergen. J. Allergy Clin. Immunol.,
103:S66.
169. Roux, K.H., Teuber, S.S., and Sathe, S.K. 2003. Tree nut allergens. Int. Arch. Allergy
Immunol., 131:234-244.
170. Wolf, W.J., and Sathe S.K. 1998. Ultracentrifugal and polyacrylamide gel electrophoretic studies of extractability and stability of almond meal proteins. J. Sci. Food Agric., 78:511-521.
171. Bargman, T., Rupnow, J., and Taylor, S. 1992. IgE-binding protein in almonds (Prunus
amygdalus): identification by immunoblotting with sera from almond allergic adults. J.
Food Sci., 57:717-720.
172. Poltronieri, P., Cappello, M.S., Dohmae, N., Conti, A., Fortunato, D., Pastorello, E.A., Ortolani, C., and Zacheo, G. 2002. Identification and characterization of the IgE-binding proteins 2S albumin and conglutin gamma in almond (Prunus dulcis) seeds. Int. Arch.
Allergy Immunol., 128:97-104.
173. Pasini, G., Simonato, B., Giannattasio, M., Gemignani, C., and Curioni, A. 2000. IgE binding to almond proteins in two CAP-FEIA-negative patients with allergic symptoms to almond as compared to three CAP-FEIA-false-positive subjects. Allergy, 55:955-958.
174. Tawde, P., Venkatesh, Y.P., Wang, F., Teuber, S.S., Sathe, S.K., and Roux, K.H. 2006. Cloning and characterization of profilin (Pru du 4), a cross-reactive almond (Prunus
dulcis) allergen. J. Allergy Clin. Immunol., 118:915-922.

159
175. Haeberle, M., and Hausen, B.M. 2006. Immediate-type allergic reaction due to
macadamia, the king of nuts. Allergologie, 29:103-108.
176. Lerch, M., Egger, C., and Bircher, A.J. 2005. Allergic reactions to macadamia nut. Allergy, 60:130-131.
177. Sutherland, M.F., O’Hehir, R.E., Czarny, D., and Suphioglu, C. 1999. Macadamia nut anaphylaxis: demonstration of specific IgE reactivity and partial cross-reactivity with hazelnut. J. Allergy Clin. Immunol., 104:889-890.
178. Pallares, D.E. 2000. Allergy to macadamia nut. Ann. Allergy Asthma Immunol., 85:385-386.
179. Falk, M., Katelaris, C.H., and Fulcher, D.A. 2000. Macadamia allergy. ACI Int., 12:240-242.
180. Harris, R.M., and Johnson, M. 2000. Macadamia nut induced anaphylaxis: a case report. Abstract presented at the AAAAI 56th Annual Meeting.
181. Inaba, Y., Yagami, A., Suzuki, K., and Matsunaga, K. 2007. Allergy to macadamia nut. Arerugi, 56:699-702.
182. Teuber, S.S., Brown, R.L., and Haapanen, L.A. 1997. Allergenicity of gourmet nut oils processed by different methods. J. Allergy Clin. Immunol., 99:502-507.
183. Marcus, J.P., Green, J.L., Goulter, K.C., and Manners, J.M. 1999. A family of antimicrobial peptides is produced by processing of a 7S globulin protein in Macadamia
integrifolia kernels. Plant J., 19:699-710.
184. Goetz, D.W., Whisman, B.A., and Goetz, A.D. 2005. Cross-reactivity among edible nuts: double immunodiffusion, crossed immunoelectrophoresis, and human specific IgE serologic surveys. Ann. Allergy Asthma Immunol., 95:45-52.
185. Lee, S.H., Benmoussa, M., Sathe, S.K., Roux, K.H., Teuber, S.S., and Hamaker, B.R. 2005. A 50 kDa maize gamma-zein has marked cross-reactivity with the almond major protein. J. Agric. Food Chem., 53:7965-7970.
186. Radauer, C., and Hoffmann-Sommergruber, K. 2004. Profilins. In: Mills, E.N.C., Shewry, P.R., Eds. Plant food allergens. Blackwell Publishing: London, pp. 105-124.
187. Wensing, M., Akkerdaas, J.H., van Leeuwen, W.A., Stapel, S.O., Bruijnzeel-Koomen,
C.A., Aalberse, R.C., Bast, B.J.E.G, Knulst, A.C., and van Ree, R. 2002. IgE to Bet v 1 and profilin: cross-reactivity patterns and clinical relevance. J. Allergy Clin. Immunol., 110:435-442.
160
188. Barre, A., Jacquet, G., Sordet, C., Culerrier, R., and Rougé, P. 2007. Homology modelling and conformational analysis of IgE-binding epitopes of Ara h 3 and other legumin allergens with a cupin fold from tree nuts. Mol. Immunol., 44:3243-3255.
189. Fink, J.N., Levy, M.B., and Ho, M.B. 2002. Anaphylaxis to cherry and almond. J. Allergy
Clin. Immunol., 109:S336.
190. Rodriguez, J., Crespo, J.F., Lopez-Rubio, A., de la Cruz-Bertolo, J., Ferrando-Vivas, P., Vives, R., and Daroca, P. 2000. Clinical cross-reactivity among foods of the Rosaceae family. J. Allergy Clin. Immunol., 106:183-189.
191. Fernandez, C., Fiandor, A., Martinez-Garate, A., and Martinez Quesada, J. 1995. Allergy to pistachio: crossreactivity between pistachio nut and other Anacardiaceae. Clin. Exp.
Allergy, 25:1254-1259.
192. Kewalramani, A., Maleki, S.J., Cheng, H., and Teuber, S.S. 2006. Cross-reactivity among almond, peanut and other tree nuts in almond allergic patients. J. Allergy Clin. Immunol., 117:S32.
193. Tawde, P., Abolhassani, M., Seamon, V., Teuber, S.S., Wang, F., Uratsu, S., Dandekar, A., Vieths, S., Sathe, S.K., and Roux, K.H. 2007. IgE-reactive 60S ribosomal protein P2 in almond (Prunus dulcis) and walnut (Juglans regia), a new class of food allergen cross-reactive with fungal aeroallergens. Clin. Immunol., 123:S79.
194. de Leon, M.P., Glaspole, I.N., Drew, A.C., Rolland, J.M., O’Hehir, R.E., and Suphioglu, C. 2003. Immunological analysis of allergenic cross-reactivity between peanut and tree nuts. Clin. Exp. Allergy, 33:1273-1280.
195. Federal Register. Friday, March 30, 2007, vol. 72, no. 6, pp. 15021-15036. http://www.archives.gov/federal-register.
196. Venkatachalam, M., Teuber, S.S., Roux, K.H., and Sathe, S.K. 2002. Effects of roasting, blanching, autoclaving, and microwave heating on antigenicity of almond (Prunus dulcis L.) proteins. J. Agric. Food Chem., 50:3544-3548.
197. Sathe, S.K., Teuber, S.S., and Roux, K.H. 2005. Effects of food processing on the stability of food allergens. Biotechnol. Adv., 23:423-429.
198. Su, M., Venkatachalam, M., Teuber, S.S., Roux, K.H., and Sathe, S.K. 2004. Impact of gamma-irradiation and thermal processing on the antigenicity of almond, cashew nut and walnut proteins. J. Sci. Food Agric., 84:1119-1125.
199. AOAC Official Methods of Analysis. 1995. Association of Official Analytical Chemists, 16th edition. Arlington, VA, USA. Methods 925.40, 948.22, 950.48, and 923.03.

161
200. Cohen, S.A., Meys, M., and Tarvin, T.L. 2002. Waters Operating Manual- The Pico Tag® Method. A Manual of Advanced Techniques for Amino Acid Analysis. Waters Chromatography Division, Milford, MA.
201. Spies, J.R., and Chambers, D.C. 1948. Chemical determination of tryptophan. Anal.
Chem., 10:30-39.
202. Dubois, M., Gilles, K.A., Hamilton, J.K., Rebers, P.A., and Smith, F. 1956. Colorimetric method for determination of sugars and related substances. Anal. Chem., 28:350-356.
203. Deshpande, S.S., and Cheryan, M. 1985. Evaluation of vanillin assay for tannin analysis of dry beans. J. Food Sci., 50:905-910.
204. Lowry, O.H., Rosebrough, N.J., Farr, A.L. and Randall, R.J. 1951. Protein measurement with Folin phenol reagent. J. Biol. Chem., 193:265-275.
205. Bradford, M.M. 1976. A rapid and sensitive method for the quantitation of microgram quantities of protein utilizing the principle of protein-dye binding. Anal. Biochem.,
72:248-254.
206. Fling, S.P., and Gregerson, D.S. 1986. Peptide and protein molecular weight determination by electrophoresis using a high-molarity tris buffer system without urea. Anal. Biochem., 155:83-88.
207. Hoefer, 1992. Protein Electrophoresis: Applications Guide, Hoefer Scientific Instruments, San Francisco, CA.
208. McCullough, K.C., and Spier, R.E., Eds. 1990. Monoclonal antibodies in biotechnology: theoretical and practical aspects. Cambridge University Press: New York, NY, pp 90.
209. Kemeny, D.M. 1991. A practical guide to ELISA. Pergamin Press, NY, pp. 115.
210. Deshpande, S.S. 1996. Enzyme immunoassays: from concept to product development. Chapman & Hall, New York, NY.
211. Towbin, H., Staehlin, T., and Gordon, J. 1979. Electrophoretic transfer of proteins from polyacrylamide gels to nitrocellulose sheets: procedures and some applications. Proc.
Natl. Acad. Sci. U.S.A., 76:4350-4354.
212. Ott, L. 1977. An Introduction to Statistical Methods and Data Analysis, Duxbury Press, A Division of Wadsworth Publishing Company, Belmont, CA.
213. Balta, M.F., Yarılgaç, T., A�kın, M.A., Kuçuk, M., Balta, F., and Özrenka, K. 2006. Determination of fatty acid compositions, oil contents and some quality traits of hazelnut genetic resources grown in eastern Anatolia of Turkey. J. Food Comp. Anal., 19:681-686.

162
214. Ozdemir, F., and Akinci, I. 2004. Physical and nutritional properties of four major commercial Turkish hazelnut varieties. J. Food Eng., 63:341-347.
215. Roche, J., Essahat, A., Bouniols, A., El Asri, M., Mouloungui, Z., Mondiès, M., and Alghoum, M. 2004. Diversified composition of sunflower (Helianthus annuus L.) seeds within cultural practices and genotypes (hybrids and populations). Helia, 27:73-98.
216. Ozkan, G., and Koyuncu, M.A. 2005. Physical and chemical composition of some walnut (Juglans regia L) genotypes grown in Turkey. Grasas Aceites, 56:141-146.
217. Seferoglu, S., Seferoglu, H.G., Tekintas, F.E., and Balta, F. 2006. Biochemical composition influenced by different locations in Uzun pistachio cv. (Pistacia vera L.) grown in Turkey. J. Food Comp Anal., 19:461-465.
218. Kumar, V., Rani, A., Solanki, S., and Hussain, S.M. 2006. Influence of growing environment on the biochemical composition and physical characteristics of soybean seed. J. Food Comp Anal., 19:188-195.
219. Razavi, S.M.A, Emadzadeha, B., Rafea, A., and Mohammad Aminia, A. 2007. The physical properties of pistachio nut and its kernel as a function of moisture content and variety: Part I. Geometrical properties. J. Food Eng., 81:209-217.
220. Ça�alarırmak, N. 2003. Biochemical and physical properties of some walnut genotypes (Juglans regia L.). Nahrung/Food, 47:28-32.
221. Köksal, A.I., Artik, N., �im�ek, S., and Güne�, N. 2006. Nutrient composition of hazelnut (Corylus avellana L.) varieties cultivated in Turkey. Food Chem., 99:509-515.
222. Amaral, J.S., Casal, S., Citová, I., Santos, A., Seabra, R.M., and Oliveira, B.P.P. 2006. Characterization of several hazelnut (Corylus avellana L.) cultivars based in chemical, fatty acid and sterol composition. Eur. Food Res. Technol., 222: 274-280.
223. Savage, G.P. 2001. Chemical composition of walnuts (Juglans regia L.) grown in New Zealand. Plant Foods Hum. Nutr., 56:75-82.
224. Pereira, J.A., Oliveira, I., Sousa, A., Ferreira, I.C.F.R., Bento, A., and Estevinho, L. 2008. Bioactive properties and chemical composition of six walnut (Juglans regia L.) cultivars. Food Chem. Toxicol., 46:2103-2111.
225. Warchalewski, J.R., Doli ska, R., Zabielski, J., and Klockiewicz-Kami ska, E. 2003. Chemical composition and biological activity of oat seeds new lines in relation to agro-environmental factors in 1997-1999. Technologia Alimentaria, 2:5-20.
226. Chahed, T., Bellila, A., Dhifi, W., Hamrouni, I., M’hamdi, B., Kchouk, M.E., and Marzouk, B. 2008. Pistachio (Pistacia vera) seed oil composition: geographic situation and variety effects. Grasas Aceites, 59:51-56.

163
227. Bhardwaj, H.L., Hamama, A.A., and Merrick, L.C. 1998. Genotypic and environmental
effects on lupin seed composition. Plant Foods Hum. Nutr., 53:1-13.
228. Oluwatosin, O.B. 1997. Genetic and environmental variation for seed yield, protein, lipid and amino acid composition in cowpea (Vigna unguiculata (L) Walp). J. Sci. Food
Agric., 74:107-116.
229. Rharrabti, Y., Elhani, S., Martos-Núñez, V., and García del Moral, L.F. 2001. Protein and lysine content, grain yield, and other technological traits in durum wheat under Mediterranean conditions. J. Agric. Food Chem., 49:3802-3807.
230. Hansen, H.B., Møller, B., Andersen, S.B., Jørgensen, J.R., and Hansen, Å. 2004. Grain characteristics, chemical composition, and functional properties of rye (Secale cereal L.) as influenced by genotype and harvest year. J. Agric. Food Chem., 52:2282-2291.
231. De Mejiä, E.G., Guzmán-Maldonado, S.H., Acosta-Gallegos, J.A., Reynoso-Camacho, R., Ramiarez-Rodriaguez, E., Pons-Hernández, J.L., Gonzälez-Chavira, M.M., Castellanos, J.Z., and Kelly, J.D. 2003. Effect of cultivar and growing location on the trypsin inhibitors, tannins, and lectins of common beans (Phaseolus vulgaris L.) grown in the semiarid highlands of Mexico. J. Agric. Food Chem., 51:5962-5966.
232. Wang, X., Warkentin, T.D., Briggs, C.J., Oomah, B.D., Campbell, C.G., and Woods, S. 1998. Total phenolics and condensed tannins in field pea (Pisum sativum L.) and grass pea (Lathyrus sativus L.). Euphytica, 101:97-102.
233. Polles, S.G., Hanny, B.W., and Harvey, A.J. 1981. Condensed tannins in kernels of thirty-one pecan [Carya illinoensis (Wangenh) K. Koch] cultivars. J. Agric. Food Chem., 29:196-197.
234. Wells, B.J., Mainous III, A.G., and Everett, C.J. 2005. Association between dietary arginine and C-reactive protein. Nutr., 21:125-130.
235. Andersen, P.C., Hill, K., Gorbet, D.W., and Brodbeck, B.V. 1998. Fatty acid and amino acid profiles of selected peanut cultivars and breeding lines. J. Food Comp. Anal., 11:100-111.
236. Altmann, F., Paschinger, K., Dalik, T., and Vorauer, K. 1998. Characterisation of peptide-N4-(N-acetyl-beta-glucosaminyl) asparagine amidase A and its N-glycans. Eur.
J. Biochem., 252:118-123.
237. Lauer, I., Foetisch, K., Kolarich, D., Ballmer-Weber, B.K., Conti, A., Altmann, F., Vieths, S., and Scheurer, S. 2004. Hazelnut vicilin Cor a 11: molecular characterisation of a glycoprotein and its allergenic activity. Biochem. J., 383:327-334.

164
BIOGRAPHICAL SKETCH
EDUCATION Doctor of Philosophy, Food Science May 2003-August 2008 Florida State University, Tallahassee, Florida Master of Science, Nutrition & Food Science August 2001-May 2003 Florida State University, Tallahassee, Florida Bachelor of Science, Nutrition & Food Science August 1997-April 2001 Florida State University, Tallahassee, Florida RESEARCH EXPERIENCE Food Science Research Laboratory August 2001-April 2008 Florida State University, Tallahassee, Florida Toxicology Laboratory Fall 2000 Florida Department of Agriculture, Tallahassee, Florida TEACHING EXPERIENCE Graduate Teaching Assistant August 2001-April 2008 Florida State University, Tallahassee, Florida Total of 17 semesters teaching approximately 800 students Courses taught:
- Foods (FOS 3026) - Wellness/Risk Reduction (HSC 4711) - Food Science Laboratory (FOS 4114C) - Foods Laboratory (FOS 3026L) - Food and Society (HUN 2125)
WORK EXPERIENCE Johnny G. Certified Spinning Instructor March 2004-August 2008 Women’s World Aerobic Fitness and Weight Loss Center Tallahassee, Florida Nutrition Instructor January 2003-July 2006 Women’s World Aerobic Fitness and Weight Loss Center Tallahassee, Florida PUBLICATIONS
- Shridhar K. Sathe, Erin K. Monaghan, Harshal H. Kshrisagar, Mahesh Venkatachalam. (2008) Chemical Composition of Edible Nut Seeds and its Implications in Human Health. In: Shahidi, F. and Alasalvar, C. (Eds.), Tree Nut Nutraceuticals and Phytochemicals. CRC Press Inc., Boca Raton, FL. ISBN: 0849337356, In press.
- Enzyme Linked ImmunoSorbent Assay (ELISA) for Sulfur-Rich Protein (SRP) in Soybean (Glycine max L.) and Certain Other Edible Plant Seeds. Erin K. Monaghan, Mahesh Venkatachalam, Margaret Seavy, Kenneth H. Roux, and Shridhar K. Sathe, Journal of
Agricultural and Food Chemistry, 2008, Volume 56, Issue 3, pp. 765-777.
165
- Effects of Processing on Antigenic Stability of Cashew Nut (Anacardium occidentale L.) Proteins. Mahesh Venkatachalam, Erin K. Monaghan, Harshal H. Kshrisagar, Kenneth H. Roux, and Shridhar K. Sathe. Journal of Agricultural and Food Chemistry, In Press.
- A Sensitive Enzyme Linked Immuno-Sorbent Assay (ELISA) for Macadamia (Macadamia
integrifolia) Nut Detection. Erin K. Monaghan, Kenneth H. Roux, and Shridhar K. Sathe. In
preparation.
- Chemical Composition of Almond (Prunus dulcis L.) Cultivars Grown in California. Erin K.
Monaghan, Kenneth H. Roux, and Shridhar K. Sathe. In preparation. INSTITUTE OF FOOD TECHNOLOGISTS (IFT) PRESENTATIONS - Competitive Inhibition Enzyme Linked Immuno-Sorbent Assay (ELISA) for Brazil
(Bertholletia excelsa) Nut Detection. Girdhari M. Sharma, Erin K. Monaghan, Kenneth H. Roux, and Shridhar K. Sathe. New Orleans, Louisiana, June 28-July 1, 2008, Accepted into
Food Safety & Toxicology Division Student Paper Competition - A Sensitive and Specific Monoclonal Antibody (mAb)-based Immunoassay for Detection of a
Stable 63 kDa Almond Major Protein (AMP) Polypeptide in Almonds (Prunus dulcis L.), Abstract #193-29. Erin K. Monaghan, Kenneth H. Roux and Shridhar K. Sathe. Chicago, Illinois, July 28-August 2, 2007, Accepted into Food Safety & Toxicology Division Student
Paper Competition - A Sensitive Enzyme Linked Immuno-Sorbent Assay (ELISA) for Macadamia (Macadamia
integrifolia) Nut Detection, Abstract #187-32. Erin K. Monaghan, Kenneth H. Roux and Shridhar K. Sathe. Chicago, Illinois, July 28-August 2, 2007
- Immunoaffinity Purification of SRP-like Proteins from Plant Seeds using Anti-Soybean
(Glycine max L.) Sulfur-Rich Protein Rabbit Polyclonal Antibodies (pAbs), Abstract #007-19. Erin K. Monaghan, Kenneth H. Roux and Shridhar K. Sathe. Chicago, Illinois, July 28-August 2, 2007
- Effects of Environmental Factors on Almond (Prunus dulcis L.) Fatty Acid Composition,
Abstract #188-28. Shridhar K. Sathe, Navindra Seeram, Erin K. Monaghan, Harshal H. Kshirsagar, David Heber, and Karen Lapsley. Chicago, Illinois, July 28-August 2, 2007
- Monoclonal Antibody (mAb)-Based Immunoassay for Quantification of the Major Storage
Protein (AMP) in California Grown Almonds (Prunus dulcis L.), Abstract #091-14. Erin K.
Monaghan, Jason Robotham, Kenneth H. Roux and Shridhar K. Sathe. Orlando, Florida, June 24-28, 2006, Orally presented as part of ‘Food Allergens Pavilion’
- Monoclonal Antibody (mAb)-Based Immunoassay to Assess the Impact of Thermal Processing
on Cashew Nut (Anacardium occidentale L.) Allergens Ana o 1, Ana o 2, and Ana o 3, Abstract #091-13. Erin K. Monaghan, Mahesh Venkatachalam, Harshal H. Kshirsagar, Jason Robotham, Kenneth H. Roux and Shridhar K. Sathe. Orlando, Florida, June 24-28, 2006,
Orally presented as part of ‘Food Allergens Pavilion’
- Chemical Composition of Macadamia (Macadamia intergrifolia) Cultivars Grown in Hawaii, Abstract #039F-26. Erin K. Monaghan, Kenneth H. Roux and Shridhar K. Sathe. Orlando, Florida, June 24-28, 2006

166
- Chemical Composition of Almond (Prunus dulcis L.) Cultivars Grown in Various California Counties, Abstract #18C-27. Erin K. Monaghan and Shridhar K. Sathe. New Orleans, Louisiana, July 15-20, 2005
- Chemical Composition of Tree Nuts, Abstract #67C-22. Mahesh Venkatachalam, Erin K.
Monaghan, Harshal H. Kshirsagar, and Shridhar K. Sathe. Las Vegas, Nevada, July 12-16, 2004
- Detection of Cross Reactive Proteins in various Plant Seeds to the Sulfur-Rich Protein in
Soybeans (Glycine max L.), Abstract #60B-6. Erin K. Monaghan, Mahesh Venkatachalam, Kenneth H. Roux, and Shridhar K. Sathe. Chicago, Illinois, July 12-16, 2003
- Enzyme Linked ImmunoSorbent Assay (ELISA) for Sulfur-Rich Protein (SRP) in Soybeans
(Glycine max L.), Abstract #30C-12. Erin K. Monaghan, Mahesh Venkatachalam, Suzanne S. Teuber, Kenneth H. Roux, and Shirdhar K. Sathe. Anaheim, California, June 30-July 3, 2002
PROFESSIONAL DEVELOPMENT ACTIVITIES
- Trained/Supervised undergraduate recruits and junior colleagues, 2006-2008
- Developed Nutrition & Health chapter as part of the Palm Beach Law Enforcement Academy fitness manual, November 2007
- Attended “Assessing the Effects of Food Processing on Allergenic Potential Workshop” in Estoril, Portugal. Organized by ILSI Health and Environmental Sciences Institute (HESI), June 2006
- Volunteer for College of Human Science’s Centennial Celebration, Spring 2006 - Presenter for College of Human Science’s Research & Creativity Day, February 2005 & 2006
- Nutrition, Food and Exercise Science Representative for the Graduate Student Advisory Council (GSAC), 2003-2006
- Certificate in College Teaching from the Department of Educational Leadership and Policy Studies, 2003-2005
- Developed Nutrition & Health manual for Women’s World Aerobic Fitness and Weight Loss Center, Spring 2004
- Judge for the 2004 Capital Regional Science & Engineering Fair, February 2004
- Teaching Certificate from the Program for Instructional Excellence (PIE), August 2003 - Member of Institute of Food Technologists, Fall 2000-present HONORS AND AWARDS
- Awarded 1st place in the Food Safety & Toxicology Division Student Paper Competition, IFT National Conference, Chicago, Illinois, July 28-August 2, 2007
- Outstanding Teaching Assistant Award nominee, Spring 2003 and Spring 2004 - Department of Nutrition, Food and Exercise Science speaker for College of Human Science’s
Student Convocation, Spring 2001