All-cause mortality among young children in western Kenya. VI: The Asembo Bay Cohort Project
10
18 Am. J. Trop. Med. Hyg., 64(1, 2)S, 2001, pp. 18–27 Copyright 2001 by The American Society of Tropical Medicine and Hygiene ALL-CAUSE MORTALITY AMONG YOUNG CHILDREN IN WESTERN KENYA. VI: THE ASEMBO BAY COHORT PROJECT PETER D. MCELROY, FEIKO O. TER KUILE, ALLEN W. HIGHTOWER, WILLIAM A. HAWLEY, PENELOPE A. PHILLIPS-HOWARD, AGGREY J. OLOO, ALTAF A. LAL, AND BERNARD L. NAHLEN Division of Parasitic Diseases, National Center for Infectious Diseases, Centers for Disease Control and Prevention, Atlanta, Georgia; Division of Infectious Disease, Tropical Medicine and AIDS, Academic Medical Centre, University of Amsterdam, The Netherlands; Vector Biology and Control Research Centre, Kenya Medical Research Institute, Kisumu, Kenya Abstract. Although all-cause mortality has been used as an indicator of the health status of childhood populations, such data are sparse for most rural areas of sub-Saharan Africa, particularly community-based estimates of infant mortality rates. The longitudinal follow-up of more than 1,500 children enrolled at birth into the Asembo Bay Cohort Project (ABCP) in western Kenya between 1992 and 1996 has provided a fixed birth cohort for estimating all-cause mortality over the first 5 yr of life. We surveyed mothers and guardians of cohort children in early 1999 to determine survival status. A total of 1,260 households were surveyed to determine the survival status of 1,556 live births (99.2% of original cohort, n 1,570). Most mothers (66%) still resided but 27.5% had migrated, and 5.5% had died. In early 1999, the overall cumulative incidence of all-cause mortality for the entire 1992–1996 birth cohort was 26.5% (95% confidence interval, 24.1–28.9%). Neonatal and infant mortality were 32 and 176 per 1,000 live births, respec- tively. These community-based estimates of mortality in the ABCP area are substantially higher than for Kenya overall (nationally, infant mortality is 75 per 1,000 live births). The results provide a baseline description of all-cause mortality among children in an area with intense Plasmodium falciparum transmission and will be useful in future efforts to monitor changes in death rates attributable to control programs for specific diseases (e.g., malaria and HIV/ AIDS) in Africa. INTRODUCTION Descriptions of early childhood mortality rates are critical for planning public health strategies in sub-Saharan Africa. Studies of mortality and disease-specific case fatality rates in African children are most often conducted in hospitals. However, in many African settings, most children do not die in medical facilities and their deaths may not be represented by hospital-based studies or recorded in any manner. 1,2 The scarcity of community-based childhood mortality rates often leads to assumptions that hospital-based estimates mirror mortality in the surrounding communities. 3 These data defi- ciencies impede health ministries’ abilities to direct resourc- es to highest-risk communities and to evaluate the effective- ness of their prevention programs. Evaluations of interventions to prevent mortality from ma- laria, such as permethrin-treated bed nets, have depended on measuring reductions in all-cause child mortality. 4–6 Efforts are now under way via the Roll Back Malaria initiative to reduce the burden of malaria mortality in African children by 50% by the year 2010. Simultaneously, the increasing incidence of HIV/AIDS among the same population may hamper our ability to detect such a reduction. Thus, descrip- tive reviews of mortality in rural communities are needed as part of implementing programs and monitoring the impact of promising interventions. 8 Disease-specific mortality rates are most sensitive for de- tecting the protective effect of a specific intervention. Un- fortunately, in rural areas of developing countries reliable numerators for disease-specific deaths and at-risk denomi- nator data are generally unavailable. 2 Furthermore, in ma- laria-endemic areas, Plasmodium falciparum contributes to different syndromes (e.g., respiratory distress and anemia) that often lead to death, even though the cause of death may be classified as nonmalarial. 9,10 This report presents a community-based evaluation of age- specific and temporal trends in all-cause child mortality in a large, well-characterized cohort of children born in rural western Kenya between 1992 and 1996, before the imple- mentation of a randomized controlled trial of insecticide- treated bed nets. These results are part of an ongoing lon- gitudinal study of the epidemiologic and immunologic de- terminants of P. falciparum infection and malaria-associated morbidity and mortality known as the Asembo Bay Cohort Project (ABCP). The initial report in this series describes the overall study design and population 11 and is followed by a description of P. falciparum and anemia prevalence 12 and an analytic approach for repeated hemoglobin measures. 13 Re- ports concerning the effect of parasitemia density on ane- mia 14 and development of antibodies to a merozoite surface protein (MSP-1 19kD) 15 have also recently been published. METHODS Asembo Bay Cohort Project. The ABCP has been re- cently described in detail. 11,13 Between June 1992 and August 1996, pregnant women in the 15-village study area were en- rolled and monitored at monthly intervals until the final month of gestation, when weekly visits were conducted. Pregnancy was determined by asking date of last menstrual period. Women with neither evidence of a miscarriage nor stillbirth were classified as having had a false pregnancy. Traditional birth attendants monitored each birth and com- pleted a data collection form detailing each birth event. Pres- ence/absence of a delivery complication, location of birth (home/hospital/clinic), number of infants born, birth status (alive or stillborn), and sex were recorded. Capillary blood films were obtained from the mother and from the maternal side of the placenta. Birth weight was obtained within 24 hr after delivery. Specially trained staff recorded gestational age within 48 hr after delivery using a modified Dubowitz scoring system. 16 Intrauterine growth retardation was defined as having a sex-specific birth weight less than the 10th per-
-
Upload
independent -
Category
Documents
-
view
3 -
download
0
Transcript of All-cause mortality among young children in western Kenya. VI: The Asembo Bay Cohort Project

18
Am. J. Trop. Med. Hyg., 64(1, 2)S, 2001, pp. 18–27Copyright� 2001 by The American Society of Tropical Medicine and Hygiene
ALL-CAUSE MORTALITY AMONG YOUNG CHILDREN IN WESTERN KENYA.VI: THE ASEMBO BAY COHORT PROJECT
PETER D. MCELROY, FEIKO O. TER KUILE, ALLEN W. HIGHTOWER, WILLIAM A. HAWLEY,PENELOPE A. PHILLIPS-HOWARD, AGGREY J. OLOO, ALTAF A. LAL,AND BERNARD L. NAHLEN
Division of Parasitic Diseases, National Center for Infectious Diseases, Centers for Disease Control and Prevention, Atlanta,Georgia; Division of Infectious Disease, Tropical Medicine and AIDS, Academic Medical Centre, University of Amsterdam,
The Netherlands; Vector Biology and Control Research Centre, Kenya Medical Research Institute, Kisumu, Kenya
Abstract. Although all-cause mortality has been used as an indicator of the health status of childhood populations,such data are sparse for most rural areas of sub-Saharan Africa, particularly community-based estimates of infantmortality rates. The longitudinal follow-up of more than 1,500 children enrolled at birth into the Asembo Bay CohortProject (ABCP) in western Kenya between 1992 and 1996 has provided a fixed birth cohort for estimating all-causemortality over the first 5 yr of life. We surveyed mothers and guardians of cohort children in early 1999 to determinesurvival status. A total of 1,260 households were surveyed to determine the survival status of 1,556 live births (99.2%of original cohort, n� 1,570). Most mothers (66%) still resided but 27.5% had migrated, and 5.5% had died. Inearly 1999, the overall cumulative incidence of all-cause mortality for the entire 1992–1996 birth cohort was 26.5%(95% confidence interval, 24.1–28.9%). Neonatal and infant mortality were 32 and 176 per 1,000 live births, respec-tively. These community-based estimates of mortality in the ABCP area are substantially higher than for Kenyaoverall (nationally, infant mortality is 75 per 1,000 live births). The results provide a baseline description of all-causemortality among children in an area with intensePlasmodium falciparum transmission and will be useful in futureefforts to monitor changes in death rates attributable to control programs for specific diseases (e.g., malaria and HIV/AIDS) in Africa.
INTRODUCTION
Descriptions of early childhood mortality rates are criticalfor planning public health strategies in sub-Saharan Africa.Studies of mortality and disease-specific case fatality ratesin African children are most often conducted in hospitals.However, in many African settings, most children do not diein medical facilities and their deaths may not be representedby hospital-based studies or recorded in any manner.1,2 Thescarcity of community-based childhood mortality rates oftenleads to assumptions that hospital-based estimates mirrormortality in the surrounding communities.3 These data defi-ciencies impede health ministries’ abilities to direct resourc-es to highest-risk communities and to evaluate the effective-ness of their prevention programs.
Evaluations of interventions to prevent mortality from ma-laria, such as permethrin-treated bed nets, have depended onmeasuring reductions in all-cause child mortality.4–6 Effortsare now under way via the Roll Back Malaria initiative toreduce the burden of malaria mortality in African childrenby 50% by the year 2010. Simultaneously, the increasingincidence of HIV/AIDS among the same population mayhamper our ability to detect such a reduction. Thus, descrip-tive reviews of mortality in rural communities are needed aspart of implementing programs and monitoring the impactof promising interventions.8
Disease-specific mortality rates are most sensitive for de-tecting the protective effect of a specific intervention. Un-fortunately, in rural areas of developing countries reliablenumerators for disease-specific deaths and at-risk denomi-nator data are generally unavailable.2 Furthermore, in ma-laria-endemic areas,Plasmodium falciparum contributes todifferent syndromes (e.g., respiratory distress and anemia)that often lead to death, even though the cause of death maybe classified as nonmalarial.9,10
This report presents a community-based evaluation of age-specific and temporal trends in all-cause child mortality in a
large, well-characterized cohort of children born in ruralwestern Kenya between 1992 and 1996, before the imple-mentation of a randomized controlled trial of insecticide-treated bed nets. These results are part of an ongoing lon-gitudinal study of the epidemiologic and immunologic de-terminants ofP. falciparum infection and malaria-associatedmorbidity and mortality known as the Asembo Bay CohortProject (ABCP). The initial report in this series describes theoverall study design and population11 and is followed by adescription ofP. falciparum and anemia prevalence12 and ananalytic approach for repeated hemoglobin measures.13 Re-ports concerning the effect of parasitemia density on ane-mia14 and development of antibodies to a merozoite surfaceprotein (MSP-1 19kD)15 have also recently been published.
METHODS
Asembo Bay Cohort Project. The ABCP has been re-cently described in detail.11,13Between June 1992 and August1996, pregnant women in the 15-village study area were en-rolled and monitored at monthly intervals until the finalmonth of gestation, when weekly visits were conducted.Pregnancy was determined by asking date of last menstrualperiod. Women with neither evidence of a miscarriage norstillbirth were classified as having had a false pregnancy.Traditional birth attendants monitored each birth and com-pleted a data collection form detailing each birth event. Pres-ence/absence of a delivery complication, location of birth(home/hospital/clinic), number of infants born, birth status(alive or stillborn), and sex were recorded. Capillary bloodfilms were obtained from the mother and from the maternalside of the placenta. Birth weight was obtained within 24 hrafter delivery. Specially trained staff recorded gestationalage within 48 hr after delivery using a modified Dubowitzscoring system.16 Intrauterine growth retardation was definedas having a sex-specific birth weight less than the 10th per-

19ALL-CAUSE MORTALITY AMONG YOUNG CHILDREN
centile of weight-for-gestational-age of an international ref-erence group.17 Informed consent was obtained from all adultparticipants and from parents or legal guardians of minors.Institutional review boards from the Centers for DiseaseControl and Prevention and the Kenya Medical ResearchInstitute approved the study protocol.
During the longitudinal follow-up between 1992 and1996, each child was visited every 2 wk. If measured fever(� 37.5�C) was present, a thick blood film was obtained.Sulphadoxine-pyrimethamine (SP), known to be highly ef-fective against P. falciparum in this area (ter Kuile FO, un-published data), was given when measured fever was accom-panied by any detectable level of parasitemia. A mother/guardian could request a body temperature measurement bya study staff member from the community at any time. Asthis was principally a malaria investigation, malaria treat-ment was provided as noted for uncomplicated malaria, butchildren with severe malaria or other illnesses were referredto local health care facilities.
Mortality survey of the 1992–1996 birth cohort. Fol-low-up of the cohort during the original enrollment period(1992–1996) included recording the deaths of children whoremained in the study through 1996. However, the complete-ness of the recording procedures used during this period wasnever verified, and deaths among children of mothers whodeclined to continue participation in the study were missed.In early 1999, we conducted a retrospective mortality surveyof children born into the 1992–1996 ABCP birth cohort. Aprecoded structured questionnaire was designed to interviewthe child’s mother or other surviving family member (usuallythe father or another of his wives) regarding the current sur-vival status of the cohort child.
The questionnaire first established whether the mother wasalive, and if so, whether she still resided at the originalhousehold or had relocated. If the study mother had died orrelocated, date of death or relocation was elicited from thefamily member. In instances of relocation, the name of thegeopolitical district and location was obtained. After the in-terviewer stated the full name of the enrolled child, the re-spondent was asked to recall the child’s exact date of birth.If the respondent was unable to recall the child’s birth datewithin 30 d of the date in the ABCP records, the interviewerasked to see the child’s birth record or vaccination card. Thishelped establish mutual understanding between the inter-viewer and respondent regarding which child the survey wasinquiring about. These steps were particularly critical for sit-uations where the respondent was someone other than themother and in cases of multiple births. For purposes of de-termining validity of the survey, each interview establishedwhether or not the respondent successfully confirmed thechild’s date of birth (based upon study records).
Definitions of mortality rates. Neonatal mortality rate isdefined as the number of deaths before the 28th day of lifeper 1,000 live births. Post-neonatal mortality includes thenumber of deaths between Day 28 and Day 365 of life per1,000 live births, after subtraction of the neonatal deathsfrom the denominator. Infant mortality rate is the number ofdeaths on or before Day 365 of life per 1,000 live births.Postinfant mortality rate is the number of deaths per 1,000survivors of infancy. Except where indicated, all 3 rates use
the standard convention of including both singleton and mul-tiple live births in the denominator.18
Analysis. To maintain statistical independence, all mor-tality rates were calculated using the first live birth enrolledinto the cohort by each mother (N.B., first birth enrolled isnot necessarily a primigravidae woman). Year of birth wascategorized according to 12-mo intervals beginning in June1992 (initial delivery) and ending May 1996 (final delivery).Later in the study, because we followed only the pregnanciesof previously enrolled women, the number of live births inthe 4th study year (June 1995–May 1996) were markedlylower than the previous 3 yr.
Calculation of 95% confidence intervals (CI) was basedon a Poisson distribution for rates � 50 per 1,000 live birthsand on a normal distribution for rates � 50 per 1,000.19 Tocontrol for the possibility of either a harmful effect of mov-ing away from the study site (e.g., no regular SP therapyavailable) or a beneficial effect (e.g., moving to an area ofless intense P. falciparum exposure), we also calculateddeath rates among study participants who had not migratedfrom the study area between 1992 and 1999.
Validity of the survey results was evaluated by stratifyingthe data according to which family member was interviewedfor the survey (e.g., mother versus other family member).Because of sample size restrictions, this evaluation was per-formed for infant mortality rates only.
Geographic information system. The mapping of thestudy area using a differential global positioning system(GPS) has been described.20 Briefly, all family compounds(including households within the compounds), market areas,schools, health facilities, roads, streams, the shore of LakeVictoria, and potential mosquito breeding sites (dams andburrow pits) were mapped with Trimble Pro XRS GPS Units(Trimble Navigation Limited, Sunnyvale, CA). Estimatedarea mortality rates were computed using the Spatial AnalystExtension version 1.1 for ArcView. The methodology usesthe mortality experiences for households within a distanceof the user’s choice (half a mile in this case) to produce anestimate for that particular area. The resulting smoothed es-timates are then used to produce shaded or contoured mapsthat are easier to interpret than the maps showing the mor-tality experience of the individual households or villages.
RESULTS
Enrollment period (1992–1996) and birth outcomes.Atotal of 1,847 pregnancies were recorded during the 4-yrenrollment period (Figure 1). After accounting for womenwho either relocated before delivery, declined to continueparticipating in the study, were not actually pregnant, orwere lost to follow-up before delivery, the cohort included1,600 pregnancy events among 1,332 enrolled women. Dur-ing the 4-yr enrollment, 2 and 3 pregnancies were recordedfor 255 (19%) and 12 (1%) women, respectively. Among allpregnancies, 70 (4%) miscarriages or stillbirths were record-ed. The remaining birth cohort included 1,570 live birthscontributed by 1,274 pregnant women, and included 1,497singleton and 73 twin live births. Descriptive data for theselive births are presented in Table 1. Most (85%) births oc-curred at home. Birth weight was recorded for 94% of thelive births, with low-birth-weight (� 2,500 g) and very-low-

20 MCELROY AND OTHERS
FIGURE 1. Pregnancy events included in the Asembo Bay Cohort Project and outcome of these pregnancy contributions during the 4-yr(1992–1996) enrollment period.
birth-weight (� 1,500 g) children accounting for 11.5%(95% CI, 9.9–13.1%) and 0.3% (95% CI, 0.0–0.6%) of allbirths, respectively. Gestational age was measured for 92%of the live births, with preterm delivery (gestational age �37 wk) occurring in 4.1% (95% CI, 0.0–9.0%) of the births.
Maternal status in 1999. In early 1999, the mortalitysurvey was successfully conducted for 1,260 (98.9%) of the1,274 mothers who originally contributed a live birth to thecohort between 1992 and 1996. Most (66.0%) of the motherswere alive and still living in the ABCP study area, but 350(27.5%) had moved away from the study site and were re-ported by a family member to be currently alive. Most (78%)of this migration took place after January 1996, a time aftermost infant mortality had already occurred. Seventy (5.5%)of the mothers were reported to be deceased, and status wasnot determined for 14 (1.0%) women.
Characteristics of these mothers at time of enrollment in1992–1996 and their subsequent status at time of the 1999survey are presented in Table 2. No significant differenceswere observed according to year of enrollment in the study.Women who were older at time of enrollment or had lesseducation were significantly more likely to still reside in the
ABCP study area in 1999 (P � 0.001). However, these 2sociodemographic factors were not associated with survivalstatus of the mothers.
Overall status of children in 1999. The survey was suc-cessfully conducted for 1,556 (99.2%) of the 1,570 livebirths in the ABCP birth registry. Interviews regarding theremaining 14 children were not conducted. The respondentproviding information (71.0% of whom were mothers) re-garding the study child was able to verify the child’s date ofbirth in 1,292 (83.0%) of the 1,556 interviews. Among the1,556 interviews conducted, 922 (59.3%) children were pre-sent and accounted for, 403 (25.9%) were deceased, and 225(14.5%) were currently alive but were not residing withinthe ABCP study area. Two of the 14 children not success-fully surveyed in early 1999 were known to have died duringthe 1992–1996 follow-up period. Among these 405 totaldeaths, the number of deaths in the neonatal period (� 28d), postneonatal period (28–365 d), second year, and post–second year of life was 47, 217, 71, and 57, respectively(age of death missing for 13 children).
After exclusion of the second and third children born intothe cohort by the same mother (for statistical independence),
21ALL-CAUSE MORTALITY AMONG YOUNG CHILDREN
TABLE 1Distribution of birth weight, gestational age, and intrauterine growth
retardation among all 1,570 live births contributed by 1,274 wom-en enrolled in the Asembo Bay Cohort Project, 1992–1996, ac-cording to birth order into the Cohort
Delivery by a particularcohort mother
First(n � 1,303)
Second(n � 254)
Third(n � 12)
All livebirths
(n � 1,569)
Singleton births 1,245 239 12 1,497Birth weight (g)
� 2,5001,500–2,500� 1,500Missing
1,039108
494
2211404
12000
1,273122
498
Gestational age (wks)� 37� 37Missing
1,1044596
2231
15
1200
1,34046
111IUGR*
YesNoMissing
220885140
44180
15
2100
2671,075
155
Twin births 58 15 0 73Birth weight (g)
� 2,5001,500–2,500� 1,500Missing
223402
5811
0000
2742
13
Gestational age (wk)� 37� 37Missing
40135
1410
000
5414
5IUGR*
YesNoMissing
38155
1221
000
5017
6
* Small-for-gestational age.
TABLE 2Status of the 1,274 mothers at the 1999 mortality survey who were
originally enrolled into the Asembo Bay Cohort Project and con-tributed a live birth, 1992–1996
Maternalcharacteristic No.
Maternal Status inEarly 1999
Surveyed(%)
Moved(%)
De-ceased
(%)
Un-known
(%)
Year of 1st birth to cohort6/92–5/936/93–5/946/94–5/956/95–5/96
426428287133
67.166.663.865.4
26.325.930.330.1
5.66.14.94.5
0.91.41.00.0
Age at enrollment (yrs)15–1920–29� 30
290611373
43.465.384.7
49.328.09.7
6.65.25.1
0.71.50.5
Education (yr)� 34–7� 8
155676442
81.368.257.2
12.324.936.9
5.25.85.2
1.31.20.7
Delivery � 2,500 gYesNoMissing
1281,051
95
46.169.850.5
47.724.038.9
4.75.29.5
1.61.01.1
Delivery � 37 wksYesNoMissing
521,124
98
53.867.852.6
40.425.938.1
5.85.29.3
0.01.21.0
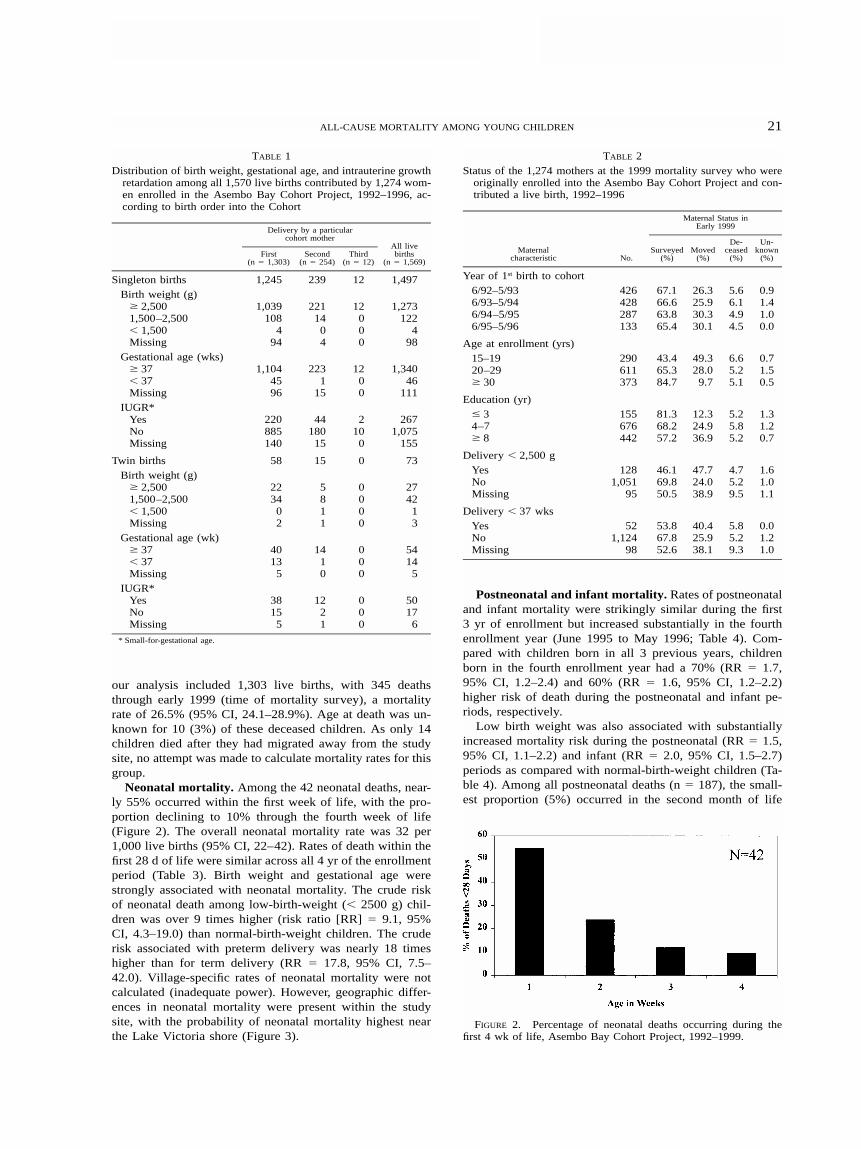
FIGURE 2. Percentage of neonatal deaths occurring during thefirst 4 wk of life, Asembo Bay Cohort Project, 1992–1999.
our analysis included 1,303 live births, with 345 deathsthrough early 1999 (time of mortality survey), a mortalityrate of 26.5% (95% CI, 24.1–28.9%). Age at death was un-known for 10 (3%) of these deceased children. As only 14children died after they had migrated away from the studysite, no attempt was made to calculate mortality rates for thisgroup.
Neonatal mortality. Among the 42 neonatal deaths, near-ly 55% occurred within the first week of life, with the pro-portion declining to 10% through the fourth week of life(Figure 2). The overall neonatal mortality rate was 32 per1,000 live births (95% CI, 22–42). Rates of death within thefirst 28 d of life were similar across all 4 yr of the enrollmentperiod (Table 3). Birth weight and gestational age werestrongly associated with neonatal mortality. The crude riskof neonatal death among low-birth-weight (� 2500 g) chil-dren was over 9 times higher (risk ratio [RR] � 9.1, 95%CI, 4.3–19.0) than normal-birth-weight children. The cruderisk associated with preterm delivery was nearly 18 timeshigher than for term delivery (RR � 17.8, 95% CI, 7.5–42.0). Village-specific rates of neonatal mortality were notcalculated (inadequate power). However, geographic differ-ences in neonatal mortality were present within the studysite, with the probability of neonatal mortality highest nearthe Lake Victoria shore (Figure 3).
Postneonatal and infant mortality. Rates of postneonataland infant mortality were strikingly similar during the first3 yr of enrollment but increased substantially in the fourthenrollment year (June 1995 to May 1996; Table 4). Com-pared with children born in all 3 previous years, childrenborn in the fourth enrollment year had a 70% (RR � 1.7,95% CI, 1.2–2.4) and 60% (RR � 1.6, 95% CI, 1.2–2.2)higher risk of death during the postneonatal and infant pe-riods, respectively.
Low birth weight was also associated with substantiallyincreased mortality risk during the postneonatal (RR � 1.5,95% CI, 1.1–2.2) and infant (RR � 2.0, 95% CI, 1.5–2.7)periods as compared with normal-birth-weight children (Ta-ble 4). Among all postneonatal deaths (n � 187), the small-est proportion (5%) occurred in the second month of life

22 MCELROY AND OTHERS
TABLE 3Neonatal mortality according to birth weight, gestational age, and
small-for-gestational age (intrauterine growth retardation [IUGR])
Birth outcomeLivebirths
Neonataldeaths
Neonatal mortalityrate (95% CI)
Birth weight (g)� 2,500� 2,500Missing
1,061146
96
121515
11 (5–18)103 (53–152)156 (84–229)
Gestational age (wk)� 37� 37Missing
1,14458
101
109
23
9 (3–14)155 (62–248)228 (146–310)
IUGR*NormalPresentMissing
900258145
81123
9 (3–15)43 (18–67)
160 (100–220)
Year of birth6/92–5/936/93–5/946/94–5/956/95–5/96
435439292137
131410
5
30 (14–46)32 (15–49)34 (13–55)36 (5–68)
Overall 1,303 42 32 (22–42)
* Defined as birth weight less than 10th percentile weight-for-gestational age by sex, basedon an international reference group.
FIGURE 3. Geographic locations of neonatal deaths within the 15-village study area, 1992–1999.
(Figure 4A), and the highest proportion (16%) in the fourthmonth, followed by a continued significant (P � 0.001)downward trend through the end of the first year of life.When all deaths within the first 365 d of life are consideredtogether (n � 229), the highest proportion (18.8%) of infantdeaths occurred in the first month and the lowest proportion(4.4%) in the second month (P � 0.001; Figure 4B).
Village-specific estimates of infant mortality reflect
marked differences in the force of mortality within the rel-atively small geographic area of the ABCP study site (Table5). After controlling for low birth weight, village-specificinfant mortality rates ranged from 58 per 1,000 live births(95% CI, 0–121 per 1,000 live births) to 253 per 1,000 livebirths (95% CI, 157–349). The variation in village-specificinfant mortality rates was not explained by intervillage dif-ferences in maternal age, education, maternal survival, ornumber of living children (data not shown).
In contrast to postneonatal and infant mortality, postinfantmortality was not significantly associated with year of birth(RR � 1.4, 95% CI, 0.8–2.3) or birth weight (RR � 1.3,95% CI, 0.8–2.3). The highest proportion (37%) of deathsin the postinfant period (n � 106) occurred in the 6-moperiod following infancy (13–18 mo), with less than 10% ofpostinfant deaths occurring after 42 mo of age (Figure 4C).
Figure 5 shows geographic variation in risk of postneo-natal mortality. In general, risk of postneonatal mortality washighest among children residing closer to the shore of LakeVictoria. Areas with postneonatal mortality risk exceeding0.4 were frequently close (� 1 mile) to other areas with riskof 0.1 or lower.
Finally, we examined death rates exclusively among studyparticipants who had not migrated away from the study areabetween 1992 and 1999. These neonatal (30 per 1,000, 95%CI, 19–41), postneonatal (150 per 1,000, 95% CI, 127–173),infant (175 per 1,000, 95% CI, 151–199), and postinfant (82per 1,000, 95% CI, 63–101) mortality rates were not signif-icantly different from the rates for the cohort overall, re-gardless of migratory status. Only 1 mother had moved awayfrom the study site during the neonatal period, and only 14deaths occurred in the postmigration period of the mother-

23ALL-CAUSE MORTALITY AMONG YOUNG CHILDREN
TABLE 4Birth-weight specific postneonatal, infant, and postinfant mortality rates, Asembo Bay Cohort Project
LiveBirths
Postneonatal†
Deaths Rate* (95% CI)
Infant
Deaths Rate (95% CI)
Postinfant
Deaths Rate (95% CI)
Birth weight (g)� 2,500� 2,500Missing
1,061146
96
1422718
135 (115–156)206 (137–275)222 (132–313)
1544233
145 (124–167)288 (214–361)344 (249–439)
8613
7
95 (76–114)125 (61–189)111 (34–189)
Year of birth6/92–5/936/93–5/946/94–5/956/95–5/96
435439292137
59583931
140 (107–173)136 (104–169)138 (98–179)235 (163–307)
72724936
166 (131–200)164 (129–199)168 (125–211)263 (189–336)
34352413
94 (64–124)95 (65–125)99 (61–136)
129 (63–194)
Overall 1,303 187 148 (129–168) 229 176 (155–196) 106 99 (81–117)
* To preserve statistical independence, data exclude outcomes from the second (n � 254) and third (n � 12) live births contributed by the same mother. Date of death (and thus age) wasunknown for 10 deceased children.
† Postneonatal mortality rates exclude neonatal deaths from denominator.
TABLE 5Infant deaths and mortality rates according to village of residence
and birth weight, Asembo Bay Cohort Project
Village
� 2,500 g
Births Died
� 2,500 gInfant mortalityrate† (95% CI)
All births
Births Died
All birthsInfant mortalityrate† (95% CI)
12345678
886777
10478526777
1268
1113
36
19
136 (65–208)90 (21–158)
104 (36–172)106 (47–165)167 (84–249)
58 (0–121)90 (21–158)
247 (150–343)
1028594
13097619497
19141821183
1324
186 (111–262)165 (86–244)191 (112–271)162 (98–225)186 (108–263)49 (0–103)
138 (69–208)247 (162–333)
9101112131415
37628579754370
75
132017
410
189 (63–315)81 (13–148)
153 (76–229)253 (157–349)227 (132–321)
93 (6–180)143 (61–225)
477495
102954882
108
1431195
12
213 (96–330)108 (37–179)147 (76–219)304 (215–393)200 (120–280)104 (18–191)146 (70–223)
Total 1,061 154 145 (124–166) 1,303 229 176 (155–196)
* Insufficient data to calculate rates among children with missing birth weight or birthweight �2,500 g.
† Rates based on fewer than 10 deaths are unstable and should be interpreted with caution.B � births and D � deaths.
FIGURE 4. Percentage of postneonatal, infant, and postinfantdeaths according to age, Asembo Bay Cohort Project, 1992–1999.
child pairs, precluding the calculation of rates for these ob-servations.
DISCUSSION
In this longitudinal study of mortality in rural westernKenya during the mid- and late 1990s, we observed highneonatal mortality (32 per 1,000 live births), high postneo-natal mortality (148 per 1,000 neonatal survivors), high in-fant mortality (176 per 1,000 live births), high postinfantmortality for children under 5 yr of age (99 per 1,000 infantsurvivors), high mortality for children under 5 yr of age (257per 1,000), and high maternal mortality (10 per 1,000 per-son-years). These high mortality rates were variable by year,birth weight, gestational age, and geographic location, andthere is evidence that mortality is increasing in this setting.
The overall neonatal mortality rate observed in the ABCP(32.0 per 1,000 live births) is 2–3 times higher than esti-mates from several other districts within Kenya. Neonatal

24 MCELROY AND OTHERS
FIGURE 5. Geographic locations of postneonatal deaths within the 15-village area, 1992–1999.
TABLE 6Infant and under age 5 mortality rates (per 1,000) for selected Af-
rican countries in 1978 and 1998 as compared with Kenya andAsembo Bay Cohort Project (ABCP) populations
Country
Infant mortality rate
1978 1998� 5 yr mortality rate
1998
AngolaBurundiThe GambiaGuineaGuinea-BissauLiberiaMalawiMaliRwandaSierra Leone
161127167167176167177180133192
125119122124130116138118124170
208179203208203174220236202263
KenyaABCP
88–
66176
104257
mortality rates in Kisii (10 per 1,000), Meru (16 per 1,000),Kilifi (21 per 1,000), and Tana River (23 per 1,000) Districtsare all less than the rate in Asembo Bay.21–23 However, onlythe point estimate of neonatal mortality in Kisii (10 per1,000, 95% CI, 5–15) included 95% confidence limits thatdid not overlap with the ABCP estimate. The neonatal mor-tality rate in the ABCP population is significantly lower thanthe rate reported from a similarly designed study in ruralMalawi (49 per 1,000, 95% CI, 42–57).24 The higher prev-alence of low-birth-weight delivery in Mangochi (17%) rel-ative to Asembo Bay (12%) likely contributes to this differ-ence.
The infant and under-5 mortality rates observed amongABCP children (176 and 257 per 1,000, respectively) aresubstantially higher than the most recent estimates in Kenya
(75 and 104 per 1,000 live births, respectively).25 Similarly,our observed infant and under-5 mortality rates are consid-erably higher than current World Health Organization(WHO) estimates (1998 data) for the 10 African countrieswith the highest estimated infant mortality, but they are con-sistent with the infant mortality estimates in these countries2 decades earlier26 (Table 6). However, WHO mortality es-timates are based on data from entire countries, and childmortality rates in smaller jurisdictions are often substantiallydifferent.27
In this area of western Kenya, there has been no apparentsubstantial improvement in neonatal or infant mortality de-spite increases in vaccination coverage for early childhoodillnesses. Spencer and colleagues28 reported a pre-interven-tion neonatal mortality rate in the early 1980s of 37 per1,000 live births among children in Saradidi, Kenya (� 5km from the ABCP study site), a community-based estimatealmost exactly the same as the current neonatal mortality ratein the ABCP (Table 3). Further, based on data from the samereport by Spencer and others,28 postneonatal mortality in theearly 1980s (pre-intervention) was estimated at 72.8 per1,000 live births; our estimate of postneonatal mortality forAsembo Bay was more than twice as high (148 per 1,000).
The infant mortality rate in the ABCP area is higher thanpublished rates from several other malaria-endemic sites ineast Africa. In the late 1980s, infant mortality in Kilifi dis-trict on the Kenya coast was estimated at 50 per 1,000 livebirths,21 a rate more consistent with the national rate reportedby WHO. In the early 1990s, infant mortality for 5 villagesin northeast Tanzania was 133 per 1,000 live births (95%CI, 98–168).29 One of the few published infant mortality es-timates to approach the rate of Asembo Bay comes fromdata collected in Mangochi District in Malawi in the late

25ALL-CAUSE MORTALITY AMONG YOUNG CHILDREN
1980s, where infant mortality was 157 per 1,000 live births,a rate more consistent with the national rate in Malawi.24
The high rate of maternal mortality in the ABCP (10 per1,000 person-years) was comparable to other estimates ineast Africa.30,31 In both settings, high maternal human im-munodeficiency virus (HIV) infection rates may contributeto the high maternal mortality. Since maternal death is oftena risk factor for subsequent infant and child death,32 andbecause mother-to-infant transmission of HIV can be sub-stantial in the absence of prevention efforts,33 HIV-associatedmortality among children can be expected to increase inparts of sub-Saharan Africa.
The high rates of all-cause mortality raise the question ofdisease-specific causes of mortality, particularly malaria-spe-cific mortality. Plasmodium falciparum transmission in thisarea is known to be intense and perennial, with entomologicinoculation rates of approximately 200 infective bites perperson annually.34 Seventy-five percent of children are in-fected with malaria by their fourth month of life, and morethan 90% are infected by 6 mo of age.12,14 The maternal HIVseroprevalence among pregnant women in the ABCP studyarea was 24% in 1999, a 78% increase in overall HIV se-roprevalence since 1994 (ter Kuile F, unpublished data). Dataon HIV infection among infants and children in the ABCPis not available. However, because as many as one-third ofHIV-infected pregnant women in this population will trans-mit HIV to their infants,35,36 it is possible that up to 7–8%of the children born in the ABCP study area were infectedwith HIV and would have experienced a substantially higherrate of mortality than their non–HIV-infected counterparts.
As part of this study, children were seen on a twice-monthly basis, and early detection of clinical malaria epi-sodes resulted in treatment with sulfadoxine-pyrimethamine.This access to effective antimalarial treatment likely resultedin subsequent periods of aparasitemia with hematologic re-covery leading to increases in hemoglobin concentration.13,37
Thus, this cohort of children may have had some advantagecompared to similar populations with more limited access toantimalarial treatment and lack of early referral for severeillness. Although this specific malaria care may have hadsome effect on reducing mortality, it was applied universallyto the cohort population, thus precluding any assessment ofits impact.
Striking differences in infant mortality existed within the15-village study area and also within small geographic fociafter the removal of artificial boundaries. The differences ininfant mortality among villages remained even after con-trolling for low birth weight. Whether children closer to thelakeshore are at increased risk for infectious diseases com-pared with children farther inland has not been evaluated inthe study area. The added benefit of more food and waternearer the lake may have been undermined by higher, morecontinuous exposure to pathogens among the lakeside resi-dents. This variation in village-specific infant mortality ratesmay be related to overall variations in a variety of infectiousdiseases, particularly maternal HIV infection. In 1994, Ni-coll and colleagues predicted a substantial increase in childmortality as HIV seroprevalence increased among adults.38
In 1998, a review of several African studies by Boerma andcolleagues showed a 2–5 times greater infant mortality rateamong children born to HIV-infected mothers.39 In a recent
meta-analysis of 31 studies, maternal HIV infection was notassociated with neonatal mortality but was significantly as-sociated with an increase in infant mortality (odds ratio �3.7, 95% CI, 3.1–4.5).33 For our study, stratification of theHIV data according to village resulted in unstable estimatesof HIV seroprevalence (data not presented), precluding anevaluation of the effect on infant mortality.
The final months of this cohort study were conducted aspermethrin-treated bed nets were distributed to half of thevillages in the ABCP area as part of a randomized controlledefficacy trial (Phillips-Howard PA, unpublished data). Weinvestigated the ‘‘ randomization’’ status of births and deathsto ascertain if they were potentially altered by their inclusionin the bed-net study. Live births were equally distributedamong villages randomized into intervention or control vil-lage clusters. We evaluated dates of death among the 229infant deaths recorded in the ABCP and found that noneoccurred in children after December 31, 1996, because en-rollment of pregnant mothers into the cohort was discontin-ued in December 1995. Among 25 deaths in older childrenregistered as deceased since January 1, 1997, deaths weredivided equally between bed-net intervention and controlvillages. Thus, we feel confident that bed-net implementationat the tail end of the ABCP study did not adversely affectthe validity of these mortality estimates.
The data collection methods used in this study wereunique, and numerous limitations to the interpretation ofthese mortality rates must be considered. First, mothers inthis study were enrolled and closely followed during theirpregnancies. Treatment with antimalarials during pregnancymay have reduced the prevalence of placental parasitemia,thereby reducing the likelihood of preterm delivery and lowbirth weight, 2 major risk factors for neonatal and infantmortality.40,41 Such a treatment effect is unlikely, because atthe time of the study only chloroquine was available at thecommunity level, and chloroquine would have had low ef-ficacy based on the high level of chloroquine resistance inthis area. Most malaria in pregnant women in this area isasymptomatic and therefore does not result in treatment.42
Likewise, because 15% of pregnant women within the studyarea did not consent to participate, there is the possibilitythat these results may not represent all pregnancy outcomesin Asembo Bay, particularly high-risk pregnancies. Womenwho were more mobile (and therefore not at home duringenrollment procedures) on a regular basis may have had ac-cess to better antenatal and infant health services. However,where complete follow-up of all enrolled study participantswas not possible, and where information on infant survivalstatus was dependent upon reports from family membersother than the study mother, analysis of the mortality ratesdid not reveal differences according to whether the motherwas present in early 1999 or had moved away. The man-ageable size of the cohort permitted extended follow-up overan average of 5 yr. Although this likely resulted in estimationof more valid mortality estimates than other methods, theprecision around these mortality estimates (width of confi-dence intervals) is reduced by the relatively smaller samplesize than would be available through analysis of a largedeath registry or a hospital-based study.
These results can provide a backdrop for future interven-tion work, including efforts such as Roll Back Malaria. If

26 MCELROY AND OTHERS
malaria accounts for 10–25% of infant/childhood mortality,as several studies suggest,43–45 there are many deaths (in ab-solute numbers) in this malarious area of western Kenya thatare available for prevention. Whether a large-scale interven-tion against malaria, such as use of permethrin-treated bednets, can achieve substantial reductions in early childhoodmortality in this area with intense, perennial P. falciparumtransmission will soon be known.
Acknowledgments: The authors wish to thank the many membersof the Asembo Bay Cohort Project staff, particularly Mr. MichaelOnyango. We are also thankful to the Director of KEMRI, Dr. DavyKoech, for permission to publish this report. Dr. Richard W. Steketeeand Dr. Laurence Slutsker provided assistance in preparing this man-uscript.
Financial support: Peter D. McElroy received financial support in1999 from a Becton-Dickinson/ASTMH Fellowship in TropicalMedicine. The Asembo Bay Cohort Project was partially funded bythe U.S. Agency for International Development (HRN 6001-A-00-4010-00).
Authors’ addresses: Peter D. McElroy, Division of TuberculosisElimination, Mailstop E-10, Centers for Disease Control and Pre-vention, 1600 Clifton Road, Atlanta, GA 30333, Telephone: 404-639-8117, Fax: 404-639-8959 (e-mail: [email protected]). Feiko O.ter Kuile, Penelope A. Phillips-Howard, and Aggrey J. Oloo, CDC/KEMRI, P. O. Box 1578, Kisumu, Kenya, Telephone: 254-35-22959,Fax: 254-35-21442. Allen W. Hightower, William A. Hawley, andAltaf A. Lal, Division of Parasitic Diseases, Mailstop F-12, Centersfor Disease Control and Prevention, 4770 Buford Highway, Cham-blee, GA 30341. Bernard L. Nahlen, WHO/RBM, 20 Avenue Appia,1211 Geneva, Switzerland, Telephone: 41-22-791-2869, Fax: 41-22-791-4824.
Reprint requests: Altaf Lal, Division of Parasitic Diseases, MailstopF-12, Centers for Disease Control and Prevention, 4770 BufordHighway, Chamblee, GA 30341.
REFERENCES
1. Greenwood B, 1999. Malaria mortality and morbidity in Africa,1999. Bull World Health Organ 77: 617–618.
2. Cooper RS, Osotimehin B, Kaufman JS, Forrester T, 1998. Dis-ease burden in sub-Saharan Africa: what should we concludein the absence of data? Lancet 351: 208–210.
3. Snow RW, Schellenberg JR, Forster D, Mung’ala VO, Marsh K,1994. Factors influencing admission to hospital during ter-minal childhood illnesses in Kenya. Int J Epidemiol 23:1013–1019.
4. Alonso PL, Lindsay SW, Armstrong JRM, Conteh M, Hill AG,David PH, Fegan G, De Francisco A, Hall AJ, Shenton FC,Cham K, Greenwood BM, 1991. The effect of insecticide-treated bed nets on mortality of Gambian children. Lancet337: 1499–1502.
5. Nevill CG, Some ES, Mung’ala VO, Mutemi W, New L, MarshK, Lengeler C, Snow RW, 1996. Insecticide-treated bednetsreduce mortality and severe morbidity from malaria amongchildren on the Kenyan coast. Trop Med Int Health 1: 139–146.
6. Binka FN, Kubaje A, Adjuik M, Williams LA, Lengeler C,Maude GH, Armah GE, Kajihara B, Adiamah JH, Smith PG,1996. Impact of permethrin impregnated bednets on childmortality in Kassena-Nankana district, Ghana: a randomizedcontrolled trial. Trop Med Int Health 1: 147–154.
7. Nabarro D, 1999. Roll back malaria. Parassitologia 41: 501–504.
8. World Health Report, 1999. Rolling Back Malaria. Geneva,Switzerland: World Health Organization.
9. Molineaux L, 1997. Malaria and mortality: some epidemiolog-ical considerations. Ann Trop Med Parasitol 91: 811–825.
10. Marsh K, English M, Crawley J, Peshu N, 1996. The pathogen-
esis of severe malaria in African children. Ann Trop MedParasitol 90: 395–402.
11. Bloland PB, Ruebush TK, McCormick JB, Ayisi J, Boriga DA,Oloo AJ, Beach R, Hawley W, Lal A, Nahlen B, Udhayaku-mar V, Campbell CC, 1999. Longitudinal cohort study of theepidemiology of malaria infections in an area of intense ma-laria transmission. I: Description of study site, general meth-odology, and study population. Am J Trop Med Hyg 60: 635–640.
12. Bloland PB, Boriga DA, Ruebush TK, McCormick JB, RobertsJM, Oloo AJ, Hawley W, Lal A, Nahlen B, Campbell CC,1999. Longitudinal cohort study of the epidemiology of ma-laria infections in an area of intense malaria transmission. II:Descriptive epidemiology of malaria infection and diseaseamong children. Am J Trop Med Hyg 60: 641–648.
13. McElroy PD, Lal AA, Hawley WA, Bloland PB, ter Kuile FO,Oloo AJ, Harlow SD, Lin X, Nahlen BL, 1999. Analysis ofrepeated hemoglobin measures in full-term, normal birthweight Kenyan children between birth and four years of age.III: The Asembo Bay Cohort Project. Am J Trop Med Hyg61: 932–940.
14. McElroy PD, ter Kuile FO, Lal AA, Bloland PB, Hawley WA,Oloo AJ, Monto AS, Meshnick SR, Nahlen BL, 2000. Effectof Plasmodium falciparum parasitemia density on hemoglobinconcentrations among full-term, normal birth weight childrenin western Kenya. IV: The Asembo Bay Cohort Project. AmJ Trop Med Hyg 62: 504–512.
15. Branch OH, Oloo AJ, Nahlen BL, Kaslow D, Lal AA, 2000.Anti-merozoite surface protein-1 19-kDa IgG in mother-infantpairs naturally exposed to Plasmodium falciparum: subclassanalysis with age, exposure to asexual parasitemia, and pro-tection against malaria. V: The Asembo Bay Cohort Project.J Infect Dis 181: 1746–1752.
16. Eregie CO, Muogbo DC, 1991. A simplified method of esti-mating gestational age in an African population. Dev MedChild Neurol 33: 146–152.
17. Williams RL, Creasy RK, Cunningham GC, Hawes WE, NorrisFD, Tashiro M, 1982. Fetal growth and perinatal viability inCalifornia. Obstet Gynecol 59: 624–632.
18. Grundy E, 1997. Populations and population dynamics. DetelsR, Holland WW, McEwen J, Omenn GS, eds. Oxford Text-book of Public Health. New York: Oxford University Press,75–94.
19. Riffenburgh RH, 1999. Statistics in Medicine. San Diego, CA:Academic Press, 227–229.
20. Hightower AW, Ombok M, Otieno R, Odhiambo R, Oloo AJ,Lal AA, Nahlen BL, Hawley WA, 1998. A geographic infor-mation system applied to a malaria field study in westernKenya. Am J Trop Med Hyg 58: 266–272.
21. Bjerregaard P, Steinglass R, Mutie DM, Kimani G, Mjomba M,Orinda V, 1993. Neonatal tetanus mortality in coastal Kenya:a community survey. Int J Epidemiol 22: 163–169.
22. Melgaard B, Kimani G, Mutie DM, 1987. A community studyof neonatal tetanus in Kenya. East Afr Med J 64: 458–463.
23. Melgaard B, Mutie DM, Kimani G, 1988. A cluster survey ofmortality due to neonatal tetanus in Kenya. Int J Epidemiol17: 174–177.
24. Bloland P, Slutsker L, Steketee RW, Wirima JJ, Heymann DL,Breman JG, 1996. Rates and risk factors for mortality duringthe first two years of life in rural Malawi. Am J Trop MedHyg 55(suppl 1): 82–86.
25. UNICEF, 1999. United Nations Population Division, United Na-tions Statistical Division.
26. The World Health Report 1999: Making a Difference. Geneva,Switzerland: World Health Organization.
27. Brockerhoff M, Hewitt P, 2000. Inequality of child mortalityamong ethnic groups in sub-Saharan Africa. Bull WorldHealth Organ 78: 30–41.
28. Spencer HC, Kaseje DC, Mosley WH, Sempebwa EK, HuongAY, Roberts JM, 1987. Impact on mortality and fertility of acommunity-based malaria control programme in Saradidi,Kenya. Ann Trop Med Parasitol 81(suppl 1): 36–45.
29. Salum FM, Wilkes TJ, Kivumbi K, Curtis CF, 1994. Mortality

27ALL-CAUSE MORTALITY AMONG YOUNG CHILDREN
of under-fives in a rural area of holoendemic malaria trans-mission. Acta Tropica 58: 29–34.
30. Leroy V, Msellati P, Lepage P, Batungwanayo J, Hitimana DG,Taelman H, Bogaerts J, Boineau F, Van de Perre P, SimononA, Salamon R, Dabis F, 1995. Four years of natural historyof HIV-1 infection in African women: a prospective cohortstudy in Kigali (Rwanda), 1988–1993. J AIDS 9: 415–421.
31. Lindan CP, Allen S, Serufilira A, Lifson AR, Van de Perre P,Chen-Rundle A, Batungwanayo J, Nsengumuremyi F, Bo-gaerts J, Hulley S, 1992. Predictors of mortality among HIV-infected women in Kigali, Rwanda. Ann Intern Med 116:320–328.
32. Preble EA, 1990. Impact of HIV/AIDS on African children. SocSci Med 31: 671–680.
33. Brocklehurst P, French R, 1998. The association between HIVinfection and perinatal outcome: a systematic review of theliterature and meta-analysis. Br J Obstet Gynecol 105: 836–848.
34. Beier JC, Perkins PV, Onyango FK, Gargan TP, Oster CN, Whit-mire RE, Koech DK, Roberts CR, 1990. Characterization ofmalaria transmission by Anopheles (Diptera: Culicidae) inwestern Kenya in preparation for malaria vaccine trials. J MedEntomol 27: 570–577.
35. Ryder RW, Nsa W, Hassig SE, Behets F, Rayfield M, EkungolaB, Nelson AM, Mulenda U, Francis H, Mwandagalirwa K,Davachi F, Rogers M, Nzilambi N, Greenberg A, Mann J,Quinn TC, Piot P, Curran JW, 1989. Perinatal transmission ofhuman immunodeficiency virus type 1 to infants of seropos-itive women in Zaire. N Engl J Med 320: 1637–1642.
36. Aiken CGA, 1992. HIV-1 infection and perinatal mortality inZimbabwe. Arch Dis Child 67: 595–599.
37. Bloland PB, Lackritz EM, Kazembe PN, Were JBO, SteketeeR, Campbell CC, 1993. Beyond chloroquine: implications ofdrug resistance for evaluating malaria therapy and treatmentpolicy in Africa. J Infect Dis 167: 932–937.
38. Nicoll A, Timaeus I, Kigadye RM, Walraven G, Killewo J,1994. The impact of HIV-1 infection on mortality in childrenunder 5 years of age in sub-Saharan Africa: a demographicand epidemiologic analysis. AIDS 8: 995–1005.
39. Boerma JT, Nunn AJ, Whitworth JA, 1998. Mortality impact ofthe AIDS epidemic: evidence from community studies in lessdeveloped countries. AIDS 12(suppl 1): S3–S14.
40. Steketee RW, Wirima JJ, Hightower AW, Slutsker L, HeymannDL, Breman JG, 1996. The effect of malaria and malaria pre-vention in pregnancy on offspring birthweight, prematurity,and intrauterine growth retardation in rural Malawi. Am JTrop Med Hyg 55(suppl 1): 33–41.
41. Slutsker L, Bloland P, Steketee RW, Wirima JJ, Heymann DL,Breman JG, 1996. Infant and second-year mortality in ruralMalawi: causes and descriptive epidemiology. Am J Trop MedHyg 55(suppl 1): 77–81.
42. Parise ME, Ayisi JG, Nahlen BL, Schultz LJ, Roberts JM, Mi-sore A, Muga R, Oloo AJ, Steketee RW, 1998. Efficacy ofsulfadoxine-pyrimethamine for prevention of placental malar-ia in an area of Kenya with a high prevalence of malaria andhuman immunodeficiency virus infection. Am J Trop MedHyg 59: 813–822.
43. Jaffar S, Leach A, Greenwood AM, Jepson A, Muller O, OtaMO, Bojang K, Obaro S, Greenwood BM, 1997. Changes inthe pattern of infant and childhood mortality in upper riverdivision, The Gambia, from 1989 to 1993. Trop Med IntHealth 2: 28–37.
44. Greenwood BM, Bradley AK, Greenwood AM, Byass P, Jam-meh K, Marsh K, Tulloch S, Oldfield FSJ, Hayes R, 1987.Mortality and morbidity from malaria among children in arural area of The Gambia, West Africa. Trans R Soc TropMed Hyg 81: 478–486.
45. Binka FN, Morris SS, Ross DA, Arthur P, Aryeetey ME, 1994.Patterns of malaria morbidity and mortality in children innorthern Ghana. Trans R Soc Trop Med Hyg 88: 381–385.