Socioeconomic Factors and All Cause and Cause-Specific Mortality among Older People in Latin...
14
Socioeconomic Factors and All Cause and Cause-Specific Mortality among Older People in Latin America, India, and China: A Population-Based Cohort Study Cleusa P. Ferri 1 *, Daisy Acosta 2 , Mariella Guerra 1,3 , Yueqin Huang 4 , Juan J. Llibre-Rodriguez 1,5 , Aquiles Salas 6,7 , Ana Luisa Sosa 1,8 , Joseph D. Williams 9 , Ciro Gaona 10 , Zhaorui Liu 4 , Lisseth Noriega- Fernandez 11 , A. T. Jotheeswaran 12 , Martin J. Prince 1 1 King’s College London Institute of Psychiatry, Section of Epidemiology, Health Service and Population Research Department, London, United Kingdom, 2 Internal Medicine Department, Universidad Nacional Pedro Henriquez Uren ˜ a, Santo Domingo, Dominican Republic, 3 Department of Psychiatry, Universidad Peruana Cayetano Heredia, Lima, Peru, 4 Peking University, Institute of Mental Health, Beijing, China, 5 Medical University of Havana, Havana, Cuba, 6 Medicine Department, Caracas University Hospital, Caracas, Venezuela, 7 Faculty of Medicine, Universidad Central de Venezuela, Caracas, Venezuela, 8 National Institute of Neurology and Neurosurgery of Mexico, Autonomous National University of Mexico, Mexico City, Mexico, 9 Community Health Department, Voluntary Health Services, Chennai, India, 10 Clinica Loira, Caracas, Venezuela, 11 Mental Health Community Centre of Marianao, Havana, Cuba, 12 Indian Institute of Public Health, Hyderabad, India Abstract Background: Even in low and middle income countries most deaths occur in older adults. In Europe, the effects of better education and home ownership upon mortality seem to persist into old age, but these effects may not generalise to LMICs. Reliable data on causes and determinants of mortality are lacking. Methods and Findings: The vital status of 12,373 people aged 65 y and over was determined 3–5 y after baseline survey in sites in Latin America, India, and China. We report crude and standardised mortality rates, standardized mortality ratios comparing mortality experience with that in the United States, and estimated associations with socioeconomic factors using Cox’s proportional hazards regression. Cause-specific mortality fractions were estimated using the InterVA algorithm. Crude mortality rates varied from 27.3 to 70.0 per 1,000 person-years, a 3-fold variation persisting after standardisation for demographic and economic factors. Compared with the US, mortality was much higher in urban India and rural China, much lower in Peru, Venezuela, and urban Mexico, and similar in other sites. Mortality rates were higher among men, and increased with age. Adjusting for these effects, it was found that education, occupational attainment, assets, and pension receipt were all inversely associated with mortality, and food insecurity positively associated. Mutually adjusted, only education remained protective (pooled hazard ratio 0.93, 95% CI 0.89–0.98). Most deaths occurred at home, but, except in India, most individuals received medical attention during their final illness. Chronic diseases were the main causes of death, together with tuberculosis and liver disease, with stroke the leading cause in nearly all sites. Conclusions: Education seems to have an important latent effect on mortality into late life. However, compositional differences in socioeconomic position do not explain differences in mortality between sites. Social protection for older people, and the effectiveness of health systems in preventing and treating chronic disease, may be as important as economic and human development. Please see later in the article for the Editors’ Summary. Citation: Ferri CP, Acosta D, Guerra M, Huang Y, Llibre-Rodriguez JJ, et al. (2012) Socioeconomic Factors and All Cause and Cause-Specific Mortality among Older People in Latin America, India, and China: A Population-Based Cohort Study. PLoS Med 9(2): e1001179. doi:10.1371/journal.pmed.1001179 Academic Editor: Peter Byass, Umea ˚ Centre for Global Health Research, Sweden Received June 3, 2011; Accepted January 19, 2012; Published February 28, 2012 Copyright: ß 2012 Ferri et al. This is an open-access article distributed under the terms of the Creative Commons Attribution License, which permits unrestricted use, distribution, and reproduction in any medium, provided the original author and source are credited. Funding: The 10/66 Dementia Research Group’s research has been funded by the Wellcome Trust Health Consequences of Population Change Programme (GR066133, Prevalence phase in Cuba and Brazil; GR08002, Incidence phase in Peru, Mexico, Argentina, Cuba, Dominican Republic, Venezuela, and China), the World Health Organization (India, Dominican Republic, and China), the US Alzheimer’s Association (IIRG-04-1286, Peru, Mexico, and Argentina), and FONACIT/ CDCH/UCV (Venezuela). The Rockefeller Foundation supported our dissemination meeting at their Bellagio Centre. Alzheimer’s Disease International has provided support for networking and infrastructure. The funders had no role in study design, data collection and analysis, decision to publish, or preparation of the manuscript. Competing Interests: The authors have declared that no competing interests exist. Abbreviations: HR, hazard ratio; LMICs, low and middle income countries; SMR, standardized mortality ratio; VA, verbal autopsy * E-mail: [email protected] PLoS Medicine | www.plosmedicine.org 1 February 2012 | Volume 9 | Issue 2 | e1001179
-
Upload
independent -
Category
Documents
-
view
3 -
download
0
Transcript of Socioeconomic Factors and All Cause and Cause-Specific Mortality among Older People in Latin...
Socioeconomic Factors and All Cause and Cause-SpecificMortality among Older People in Latin America, India,and China: A Population-Based Cohort StudyCleusa P. Ferri1*, Daisy Acosta2, Mariella Guerra1,3, Yueqin Huang4, Juan J. Llibre-Rodriguez1,5, Aquiles
Salas6,7, Ana Luisa Sosa1,8, Joseph D. Williams9, Ciro Gaona10, Zhaorui Liu4, Lisseth Noriega-
Fernandez11, A. T. Jotheeswaran12, Martin J. Prince1
1 King’s College London Institute of Psychiatry, Section of Epidemiology, Health Service and Population Research Department, London, United Kingdom, 2 Internal
Medicine Department, Universidad Nacional Pedro Henriquez Urena, Santo Domingo, Dominican Republic, 3 Department of Psychiatry, Universidad Peruana Cayetano
Heredia, Lima, Peru, 4 Peking University, Institute of Mental Health, Beijing, China, 5 Medical University of Havana, Havana, Cuba, 6 Medicine Department, Caracas
University Hospital, Caracas, Venezuela, 7 Faculty of Medicine, Universidad Central de Venezuela, Caracas, Venezuela, 8 National Institute of Neurology and Neurosurgery
of Mexico, Autonomous National University of Mexico, Mexico City, Mexico, 9 Community Health Department, Voluntary Health Services, Chennai, India, 10 Clinica Loira,
Caracas, Venezuela, 11 Mental Health Community Centre of Marianao, Havana, Cuba, 12 Indian Institute of Public Health, Hyderabad, India
Abstract
Background: Even in low and middle income countries most deaths occur in older adults. In Europe, the effects of bettereducation and home ownership upon mortality seem to persist into old age, but these effects may not generalise to LMICs.Reliable data on causes and determinants of mortality are lacking.
Methods and Findings: The vital status of 12,373 people aged 65 y and over was determined 3–5 y after baseline survey insites in Latin America, India, and China. We report crude and standardised mortality rates, standardized mortality ratioscomparing mortality experience with that in the United States, and estimated associations with socioeconomic factors usingCox’s proportional hazards regression. Cause-specific mortality fractions were estimated using the InterVA algorithm. Crudemortality rates varied from 27.3 to 70.0 per 1,000 person-years, a 3-fold variation persisting after standardisation fordemographic and economic factors. Compared with the US, mortality was much higher in urban India and rural China,much lower in Peru, Venezuela, and urban Mexico, and similar in other sites. Mortality rates were higher among men, andincreased with age. Adjusting for these effects, it was found that education, occupational attainment, assets, and pensionreceipt were all inversely associated with mortality, and food insecurity positively associated. Mutually adjusted, onlyeducation remained protective (pooled hazard ratio 0.93, 95% CI 0.89–0.98). Most deaths occurred at home, but, except inIndia, most individuals received medical attention during their final illness. Chronic diseases were the main causes of death,together with tuberculosis and liver disease, with stroke the leading cause in nearly all sites.
Conclusions: Education seems to have an important latent effect on mortality into late life. However, compositionaldifferences in socioeconomic position do not explain differences in mortality between sites. Social protection for olderpeople, and the effectiveness of health systems in preventing and treating chronic disease, may be as important aseconomic and human development.
Please see later in the article for the Editors’ Summary.
Citation: Ferri CP, Acosta D, Guerra M, Huang Y, Llibre-Rodriguez JJ, et al. (2012) Socioeconomic Factors and All Cause and Cause-Specific Mortality among OlderPeople in Latin America, India, and China: A Population-Based Cohort Study. PLoS Med 9(2): e1001179. doi:10.1371/journal.pmed.1001179
Academic Editor: Peter Byass, Umea Centre for Global Health Research, Sweden
Received June 3, 2011; Accepted January 19, 2012; Published February 28, 2012
Copyright: � 2012 Ferri et al. This is an open-access article distributed under the terms of the Creative Commons Attribution License, which permits unrestricteduse, distribution, and reproduction in any medium, provided the original author and source are credited.
Funding: The 10/66 Dementia Research Group’s research has been funded by the Wellcome Trust Health Consequences of Population Change Programme(GR066133, Prevalence phase in Cuba and Brazil; GR08002, Incidence phase in Peru, Mexico, Argentina, Cuba, Dominican Republic, Venezuela, and China), theWorld Health Organization (India, Dominican Republic, and China), the US Alzheimer’s Association (IIRG-04-1286, Peru, Mexico, and Argentina), and FONACIT/CDCH/UCV (Venezuela). The Rockefeller Foundation supported our dissemination meeting at their Bellagio Centre. Alzheimer’s Disease International has providedsupport for networking and infrastructure. The funders had no role in study design, data collection and analysis, decision to publish, or preparation of themanuscript.
Competing Interests: The authors have declared that no competing interests exist.
Abbreviations: HR, hazard ratio; LMICs, low and middle income countries; SMR, standardized mortality ratio; VA, verbal autopsy
* E-mail: [email protected]
PLoS Medicine | www.plosmedicine.org 1 February 2012 | Volume 9 | Issue 2 | e1001179
Introduction
Mortality among older people is a neglected topic in global
health. In 2005, 30.2 million of the 58.8 million deaths worldwide
occurred in people aged 60 y and older, accounting for 84% of
deaths in high income countries, 61% in middle income countries,
and 33% in low income countries [1]. Seventy-six percent of the
deaths among older people occurred in low and middle income
countries (LMICs) [1], where chronic diseases are fast replacing
communicable diseases as the leading causes of death and
disability [2]. For these countries, the study of old-age mortality
trends and their life course determinants is becoming increasingly
relevant [3].
In Europe, the protective effects of better education and home
ownership upon mortality seem to persist into old age, although
with attenuation of the gradient from middle into late life [4]. These
findings may not generalise to LMICs, where the social patterning
of disease is complex, and evolving rapidly with the epidemiologic
and demographic transitions. In settings in the early stages of
transition, cardiometabolic risk factors are often found to be more
prevalent among the better educated and most affluent [5]. The
inversion of social gradients as the less advantaged become more
exposed is likely to be an important driver of the epidemic of chronic
diseases [6,7]. On the other hand, inequities in access to health care,
which are particularly pronounced for older people in many LMICs
[8], favour those with higher status and more resources. Findings
from the few population-based studies of determinants of mortality
among older people in LMICs are somewhat inconsistent. In
Wuhan, China [9], less education, fewer household assets, and
financial strain were univariately associated with mortality risk, but
only education was significantly associated in the fully adjusted
model. In the China Healthy Longevity Longitudinal Survey
neither parental occupational status nor the index older person’s
educational level or occupational attainment was associated with
mortality [10]. However, ‘‘economic independence’’ in late life
(adequacy of personal economic resources) was strongly inversely
associated. In Bambui, Brazil, educational level was inversely
associated with mortality risk [11]. In Matlab, Bangladesh, having
at least some education and having some household assets were
independently associated with lower mortality for both sexes [12].
In the 1998–1999 Indian National Family Health Survey, in
contrast to the pattern observed for younger adults, caste had a
stronger effect on mortality rates for those aged 65 y and over than
did standard of living [13].
In most countries, particularly those with low and middle
incomes, death registration is incomplete, and the quality of
information on cause of death is highly variable [14]. This is an
important limitation to the development and implementation of
policy to improve health, and the use of surveys has been
advocated to complement official registration procedures [14].
Verbal autopsy (VA) interviews with key informants (family
members, carers, or friends) are an important part of this
approach, particularly when medical help-seeking is infrequent,
and a high proportion of deaths occur at home [15,16].
Methodologies for VA have been increasingly refined with a
focus on harmonisation, and the World Health Organization
recommendations now advocate a more standard and structured
interview approach, although the recommendations lack specific
guidance on timing, respondent characteristics, and interpretation
[17]. While assigning cause of death is still complex and
problematic, computer-based probabilistic models that generate
cause-specific mortality fractions at the population-level provide a
faster, cheaper, and more internally consistent alternative to case-
by-case physician interpretation [15,18].
In this paper we aim to provide a comprehensive overview of
patterns of mortality among older people as observed through the
follow-up period between baseline and incidence waves of the
10/66 Dementia Research Group catchment area studies in Latin
America, India, and China. Specifically, we set out to compare
mortality rates; to describe the circumstances and antecedents of
death; to analyse, from a life course perspective, the effects of
socioeconomic conditions (education, mid-life occupational attain-
ment, and late-life household assets and food insecurity) on
mortality risk; and, finally, to describe cause-specific mortality
fractions and rank the five main causes of death for each site.
Methods
Ethics StatementThe study was approved by local ethical committees in each
country and by the King’s College London Research Ethics
Committee. Participants were recruited following informed signed
consent. Those who were unable to provide consent themselves
were recruited on the basis of a relative’s signed agreement.
Illiterate persons were read the information sheet and consent
form, and invited to express their consent verbally, which was
witnessed.
SampleThe protocol for the 10/66 Dementia Research Group baseline
and incidence waves is described in detail in an open-access
publication [19]. One-phase population-based surveys were
carried out between 2003 and 2005 of all people aged 65 y and
over living in seven urban and three rural sites in seven LMICs.
Each site comprised one or more geographically defined
catchment areas, chosen purposively and door-knocked to identify
all eligible participants aged 65 y and over. Urban sites were
selected to comprise mixed or mainly lower socioeconomic status
households; exclusively high income or professional districts were
excluded. Urban sites were located in Cuba (Havana and
Matanzas), Dominican Republic (Santo Domingo), Venezuela
(Caracas), Peru (Lima), Mexico (Mexico City), China (Xicheng,
Beijing), and India (Chennai). Rural sites—selected to be remote
from major population centres, with agriculture and related trades
as the main local employment—were located in Peru (Canete
Province), Mexico (Morelos State), and China (Daxing, Beijing
Province). The original target sample size for each country was
between 2,000 and 3,000 individuals. The 10/66 Dementia
Research Group protocol for the baseline survey included a
clinical interview, an informant interview, and a physical
examination. In the incidence wave we sought to trace and re-
interview all baseline survey participants. We first called on their
residence at baseline, revisiting on up to four occasions. Where the
participant was no longer resident, we sought information
regarding their vital status (if known) and/or current residence,
assisted by having recorded at baseline the names and addresses of
three non-coresident friends or family members. Where partici-
pants had moved away, we sought to re-interview them, even if
they had moved out of the original catchment area, by telephone if
necessary. Where a participant had died, we recorded date of
death, and completed a VA interview with a suitable key
informant.
MeasuresSociodemographic information was collected at baseline on all
participants. For the current analysis we use information on age
in years, sex, educational level (coded 1 = none, 2 = did not com-
plete primary, 3 = completed primary, 4 = completed secondary,
Mortality among Older People in LMIC
PLoS Medicine | www.plosmedicine.org 2 February 2012 | Volume 9 | Issue 2 | e1001179
5 = completed tertiary education; interviewers coded the highest
level applicable), and number of household assets (car, television,
refrigerator, telephone, mains electricity, mains water, plumbed
toilet). Occupational attainment was ascertained from the answer
to the question ‘‘What is the best (highest level) job you have ever
had?’’ This was coded into four summary categories from nine
possible codings: 1 = professional (manager/administrator, profes-
sional, associate professional), 2 = clerical or trade (clerical worker
or shop keeper), 3 = skilled or semi-skilled manual worker,
4 = unskilled labourer (labourer or agricultural worker). The
occupational attainment of the spouse was substituted if that of
the index participant was not coded, or coded at a lower level.
Food insecurity was assessed through response to the question ‘‘Do
you ever go hungry because there is not enough food to eat?’’
Receipt of an occupational or government pension was ascer-
tained by asking participants to report all sources of income and
the amounts received.
Death/Cause of DeathTo obtain information on circumstances of death, and likely
cause, we used the World Health Organization’s ‘‘Standard
Verbal Autopsy Questionnaire 3: Death of a Person Aged 15
Years and Above’’ [20] to interview a key informant, usually a
family member of the deceased. The fully structured interview
covers information regarding the date and place of death, and
medical help-seeking for the final illness, and includes 95 questions
concerning signs and symptoms noted during the final illness.
Responses to these questions were used to compile a data input file
(comprising yes/no indicators) for the InterVA model (version 3.2;
http://www.interva.net). InterVA’s Bayesian algorithm [15,21]
calculates probabilities that a particular death was due to
particular causes, given a set of symptoms and circumstances of
death. The model, developed by an expert panel, generates up to
three likely causes of death from 35 intentionally relatively broad
categories, with probabilities attached [15].
AnalysesWe used the 10/66 Dementia Research Group data archive
(mortality 3.4) and Stata 11.0. For each site, we describe the
number and proportions of baseline participants for whom vital
status was determined, the number of deaths, and the number and
proportion of those for whom VA interviews were completed. We
calculated crude mortality rates per 1,000 person-years at risk.
Age- and sex-specific mortality rates were estimated for each
country, by sex and age in 5-y bands, by dividing number of
deaths by number of person-years contributed in each age band.
Direct standardisation (for age, sex, education, occupational
attainment, number of assets, and food insecurity) was used to
compare mortality rates among sites, with the whole sample as the
standard population. We conducted direct standardisation for age,
sex, education, assets, occupational class, and food insecurity by
weighting each participant with a sampling probability weight
equal to the ratio of the frequency of the occurrence of the
combination of standardisation variable strata recorded for that
participant in the standard population (all sites combined) and
the frequency of the occurrence of this combination in the
participant’s site. We then estimated the mortality rate per 1,000
person-years for each site, applying weights when summing the
numerator and denominator. We used indirect standardisation
against US Centers for Disease Control and Prevention national
mortality data (applying age- and sex-specific US national
mortality rates) [22] to age- and sex-specific person-years of
follow-up for each 10/66 Dementia Research Group site to
compare the burden of late-life mortality in our samples with that
currently experienced in the US, reporting standardised mortality
ratios (SMRs) with 95% CIs.
We attempted to assess the possible extent and direction of bias
arising from non-ascertainment of vital status at follow-up, by
assessing univariate associations between baseline characteristics
(age, sex, education, WHODAS 2.0 disability score, and dementia
status—all likely mortality risk indicators) and vital status not being
ascertained. We then used the same predictors of mortality to
predict from a multivariate logistic model the probability of death
for each individual (including those whose vital status was not
ascertained) during the follow-up period. We then compared the
distribution of these probabilities in each site between those whose
vital status was and was not ascertained at follow-up.
We used Cox’s proportional hazards regression to estimate the
effects of age (per 5-y band), sex (men compared with women),
education (per level), occupational attainment (per level), number
of household assets, food insecurity, and pension receipt (yes versus
no) on all cause mortality. We ran two sets of models, one
adjusting only for age and sex, and the second mutually adjusting
for all seven covariates, separately for each site, and then using a
fixed effects meta-analysis to combine coefficients, and Higgin’s I2
to estimate the degree of heterogeneity, with approximate 95%
CIs. Where heterogeneity was statistically significant we also
present pooled estimates from random effects models. Given
previous evidence for attenuation of socioeconomic gradients with
increasing age, we tested for interactions with age for all
socioeconomic indicators. We also tested for interactions of sex
by education and sex by occupational attainment, since these
exposures might have different life course implications for men
and women. All estimates were adjusted for household clustering
and accompanied by robust 95% CIs.
We compared cause-specific mortality fractions for the InterVA
causes relevant to older people, by site, describing the estimated
numbers and proportions of deaths by cause. For this purpose, we
generated a ‘‘cause level’’ output data file in which each deceased
person had up to four records, up to three for each cause and a
residual ‘‘indeterminate’’ category, with a weight corresponding to
their estimated probability. Thus, the sum of the weights equalled
the number of cases, and all descriptive analyses on cause of death
were weighted appropriately. To compare the five leading causes
of death across sites we further aggregated causes, guided by
International Classification of Diseases 10 categories [18],
combining acute with chronic cardiac death (heart disease),
pneumonia/sepsis with acute respiratory disease (respiratory
infection), and suicide with homicide, transport-related accident,
and other fatal accident (external causes).
Results
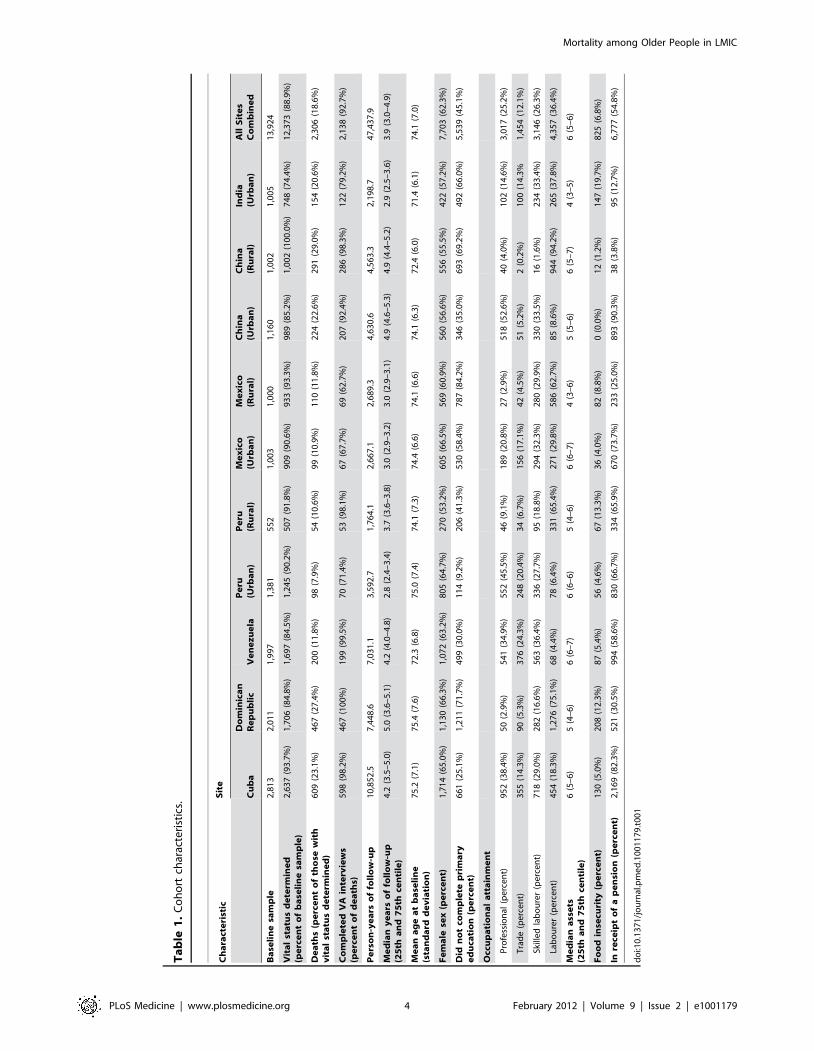
The cohort at baseline comprised 13,924 participants at risk
(Tables 1 and S1). The median follow-up period ranged from 2.8
to 5.0 y by site, with a total of 47,438 person-years of observation.
The vital status of 12,373 participants (88.9%) was determined,
with 2,306 deaths occurring during the follow-up period, for which
2,138 VA interviews were completed. The proportion deceased at
follow-up was higher in China, the Dominican Republic, and
Cuba than in other countries (in part a function of the longer
follow-up interval in those sites). The mean age at baseline was
lower in the sites in Venezuela, rural China, and urban India.
Women preponderated in all sites. Levels of education were
notably lower in the sites in the Dominican Republic, Mexico,
India, and rural China, where half to three-quarters had not
completed primary education. Occupational attainment was
lowest in the Dominican Republic, and in the rural sites in Peru,
Mortality among Older People in LMIC
PLoS Medicine | www.plosmedicine.org 3 February 2012 | Volume 9 | Issue 2 | e1001179
Ta
ble
1.
Co
ho
rtch
arac
teri
stic
s.
Ch
ara
cte
rist
icS
ite
Cu
ba
Do
min
ica
nR
ep
ub
lic
Ve
ne
zu
ela
Pe
ru(U
rba
n)
Pe
ru(R
ura
l)M
ex
ico
(Urb
an
)M
ex
ico
(Ru
ral)
Ch
ina
(Urb
an
)C
hin
a(R
ura
l)In
dia
(Urb
an
)A
llS
ite
sC
om
bin
ed
Ba
seli
ne
sam
ple
2,8
13
2,0
11
1,9
97
1,3
81
55
21
,00
31
,00
01
,16
01
,00
21
,00
51
3,9
24
Vit
al
sta
tus
de
term
ine
d(p
erc
en
to
fb
ase
lin
esa
mp
le)
2,6
37
(93
.7%
)1
,70
6(8
4.8
%)
1,6
97
(84
.5%
)1
,24
5(9
0.2
%)
50
7(9
1.8
%)
90
9(9
0.6
%)
93
3(9
3.3
%)
98
9(8
5.2
%)
1,0
02
(10
0.0
%)
74
8(7
4.4
%)
12
,37
3(8
8.9
%)
De
ath
s(p
erc
en
to
fth
ose
wit
hv
ita
lst
atu
sd
ete
rmin
ed
)6
09
(23
.1%
)4
67
(27
.4%
)2
00
(11
.8%
)9
8(7
.9%
)5
4(1
0.6
%)
99
(10
.9%
)1
10
(11
.8%
)2
24
(22
.6%
)2
91
(29
.0%
)1
54
(20
.6%
)2
,30
6(1
8.6
%)
Co
mp
lete
dV
Ain
terv
iew
s(p
erc
en
to
fd
ea
ths)
59
8(9
8.2
%)
46
7(1
00
%)
19
9(9
9.5
%)
70
(71
.4%
)5
3(9
8.1
%)
67
(67
.7%
)6
9(6
2.7
%)
20
7(9
2.4
%)
28
6(9
8.3
%)
12
2(7
9.2
%)
2,1
38
(92
.7%
)
Pe
rso
n-y
ea
rso
ffo
llo
w-u
p1
0,8
52
.57
,44
8.6
7,0
31
.13
,59
2.7
1,7
64
.12
,66
7.1
2,6
89
.34
,63
0.6
4,5
63
.32
,19
8.7
47
,43
7.9
Me
dia
ny
ea
rso
ffo
llo
w-u
p(2
5th
an
d7
5th
cen
tile
)4
.2(3
.5–
5.0
)5
.0(3
.6–
5.1
)4
.2(4
.0–
4.8
)2
.8(2
.4–
3.4
)3
.7(3
.6–
3.8
)3
.0(2
.9–
3.2
)3
.0(2
.9–
3.1
)4
.9(4
.6–
5.3
)4
.9(4
.4–
5.2
)2
.9(2
.5–
3.6
)3
.9(3
.0–
4.9
)
Me
an
ag
ea
tb
ase
lin
e(s
tan
da
rdd
ev
iati
on
)7
5.2
(7.1
)7
5.4
(7.6
)7
2.3
(6.8
)7
5.0
(7.4
)7
4.1
(7.3
)7
4.4
(6.6
)7
4.1
(6.6
)7
4.1
(6.3
)7
2.4
(6.0
)7
1.4
(6.1
)7
4.1
(7.0
)
Fe
ma
lese
x(p
erc
en
t)1
,71
4(6
5.0
%)
1,1
30
(66
.3%
)1
,07
2(6
3.2
%)
80
5(6
4.7
%)
27
0(5
3.2
%)
60
5(6
6.5
%)
56
9(6
0.9
%)
56
0(5
6.6
%)
55
6(5
5.5
%)
42
2(5
7.2
%)
7,7
03
(62
.3%
)
Did
no
tco
mp
lete
pri
ma
rye
du
cati
on
(pe
rce
nt)
66
1(2
5.1
%)
1,2
11
(71
.7%
)4
99
(30
.0%
)1
14
(9.2
%)
20
6(4
1.3
%)
53
0(5
8.4
%)
78
7(8
4.2
%)
34
6(3
5.0
%)
69
3(6
9.2
%)
49
2(6
6.0
%)
5,5
39
(45
.1%
)
Occ
up
ati
on
al
att
ain
me
nt
Pro
fess
ion
al(p
erc
en
t)9
52
(38
.4%
)5
0(2
.9%
)5
41
(34
.9%
)5
52
(45
.5%
)4
6(9
.1%
)1
89
(20
.8%
)2
7(2
.9%
)5
18
(52
.6%
)4
0(4
.0%
)1
02
(14
.6%
)3
,01
7(2
5.2
%)
Tra
de
(pe
rce
nt)
35
5(1
4.3
%)
90
(5.3
%)
37
6(2
4.3
%)
24
8(2
0.4
%)
34
(6.7
%)
15
6(1
7.1
%)
42
(4.5
%)
51
(5.2
%)
2(0
.2%
)1
00
(14
.3%
1,4
54
(12
.1%
)
Skill
ed
lab
ou
rer
(pe
rce
nt)
71
8(2
9.0
%)
28
2(1
6.6
%)
56
3(3
6.4
%)
33
6(2
7.7
%)
95
(18
.8%
)2
94
(32
.3%
)2
80
(29
.9%
)3
30
(33
.5%
)1
6(1
.6%
)2
34
(33
.4%
)3
,14
6(2
6.3
%)
Lab
ou
rer
(pe
rce
nt)
45
4(1
8.3
%)
1,2
76
(75
.1%
)6
8(4
.4%
)7
8(6
.4%
)3
31
(65
.4%
)2
71
(29
.8%
)5
86
(62
.7%
)8
5(8
.6%
)9
44
(94
.2%
)2
65
(37
.8%
)4
,35
7(3
6.4
%)
Me
dia
na
sse
ts(2
5th
an
d7
5th
cen
tile
)6
(5–
6)
5(4
–6
)6
(6–
7)
6(6
–6
)5
(4–
6)
6(6
–7
)4
(3–
6)
5(5
–6
)6
(5–
7)
4(3
–5
)6
(5–
6)
Fo
od
inse
curi
ty(p
erc
en
t)1
30
(5.0
%)
20
8(1
2.3
%)
87
(5.4
%)
56
(4.6
%)
67
(13
.3%
)3
6(4
.0%
)8
2(8
.8%
)0
(0.0
%)
12
(1.2
%)
14
7(1
9.7
%)
82
5(6
.8%
)
Inre
ceip
to
fa
pe
nsi
on
(pe
rce
nt)
2,1
69
(82
.3%
)5
21
(30
.5%
)9
94
(58
.6%
)8
30
(66
.7%
)3
34
(65
.9%
)6
70
(73
.7%
)2
33
(25
.0%
)8
93
(90
.3%
)3
8(3
.8%
)9
5(1
2.7
%)
6,7
77
(54
.8%
)
do
i:10
.13
71
/jo
urn
al.p
me
d.1
00
11
79
.t0
01
Mortality among Older People in LMIC
PLoS Medicine | www.plosmedicine.org 4 February 2012 | Volume 9 | Issue 2 | e1001179
Mexico, and China. The prevalence of food insecurity was highest
in the sites in the Dominican Republic, rural Peru, rural Mexico,
and India, and pension coverage was particularly limited in the
sites in the Dominican Republic, rural Mexico, rural China, and
urban India.
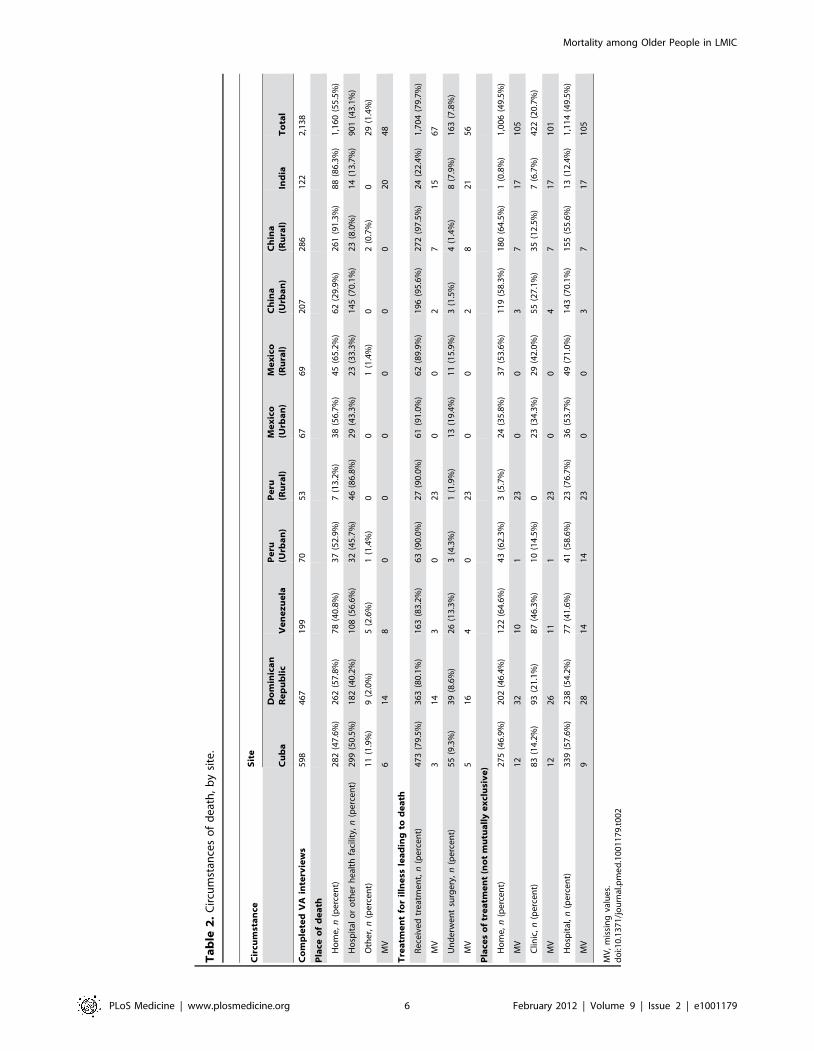
Circumstances of DeathIn the sites in rural Peru and urban China, most deaths (86.8%
and 70.1%, respectively) occurred in hospital, whereas in rural
China, India, and rural Mexico, the large majority of deaths
occurred at home (91.3%, 86.3%, and 65.2%, respectively); in
other sites deaths were more evenly distributed between home and
health care settings (Table 2). Other than in the India site, the
large majority of individuals had received some treatment for their
terminal illness (79.5% to 97.5%, by site). Other than for sites in
rural Peru and India, home was nearly as frequently, if not more
frequently, mentioned as hospital, as a venue for medical care.
Community clinics were comparatively rarely used.
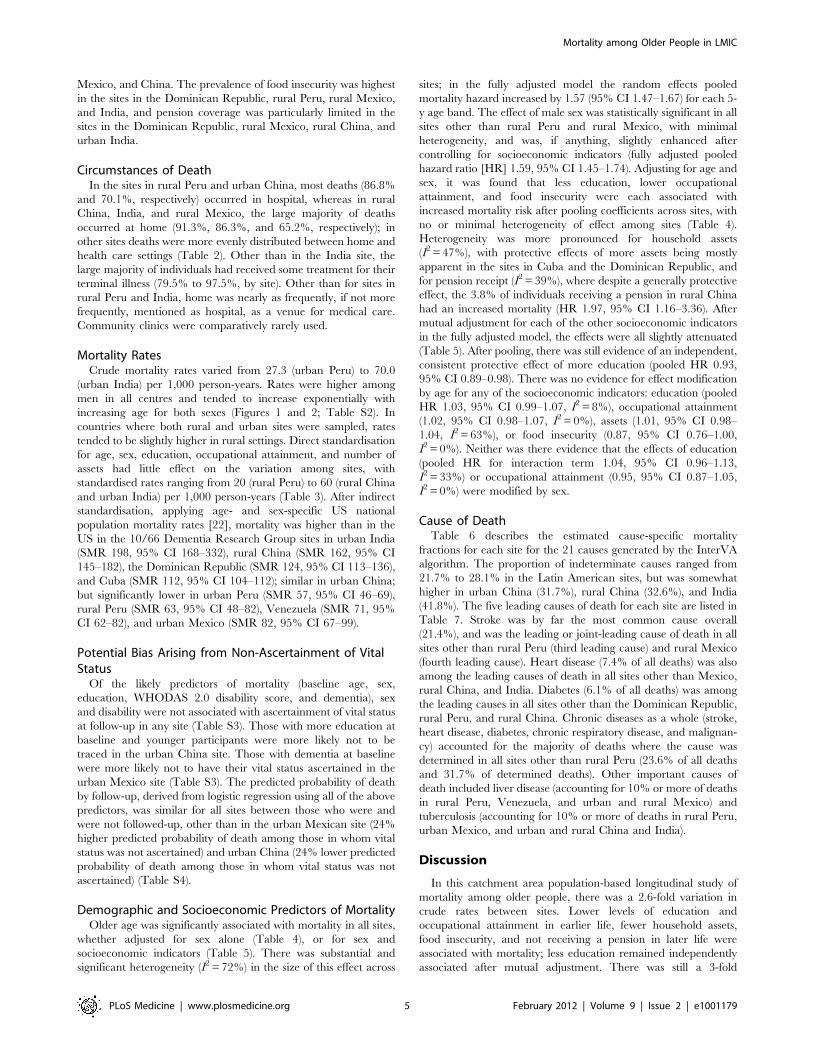
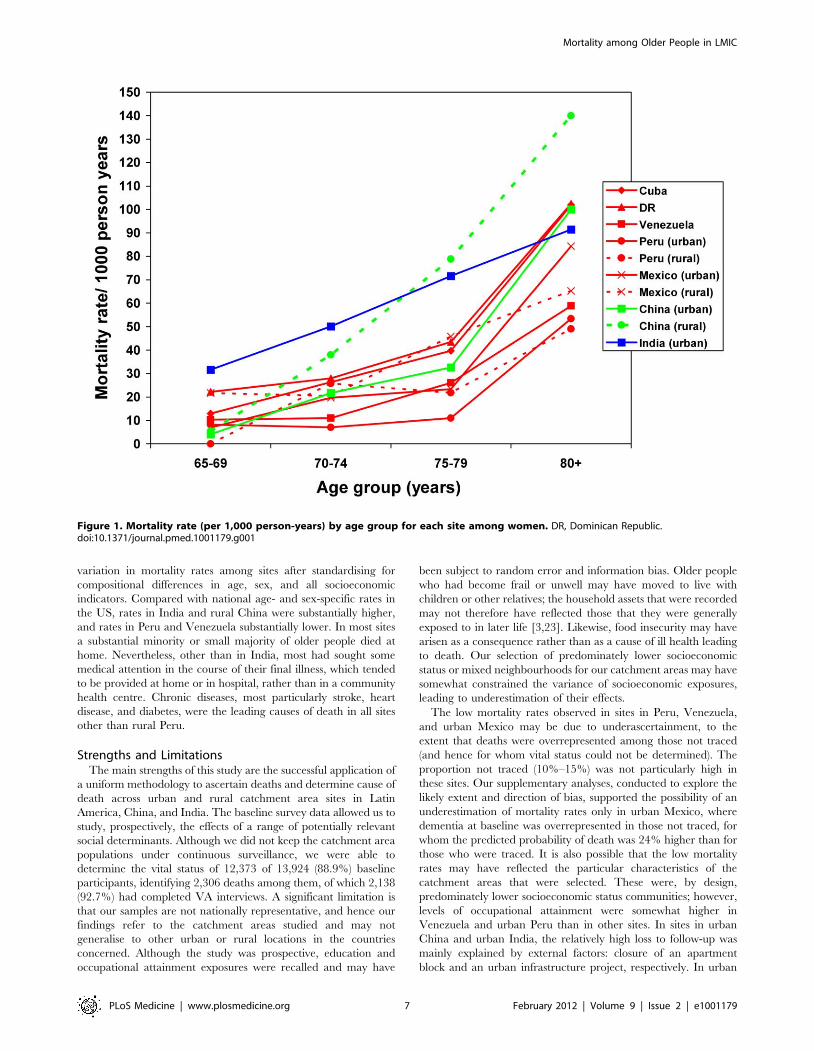
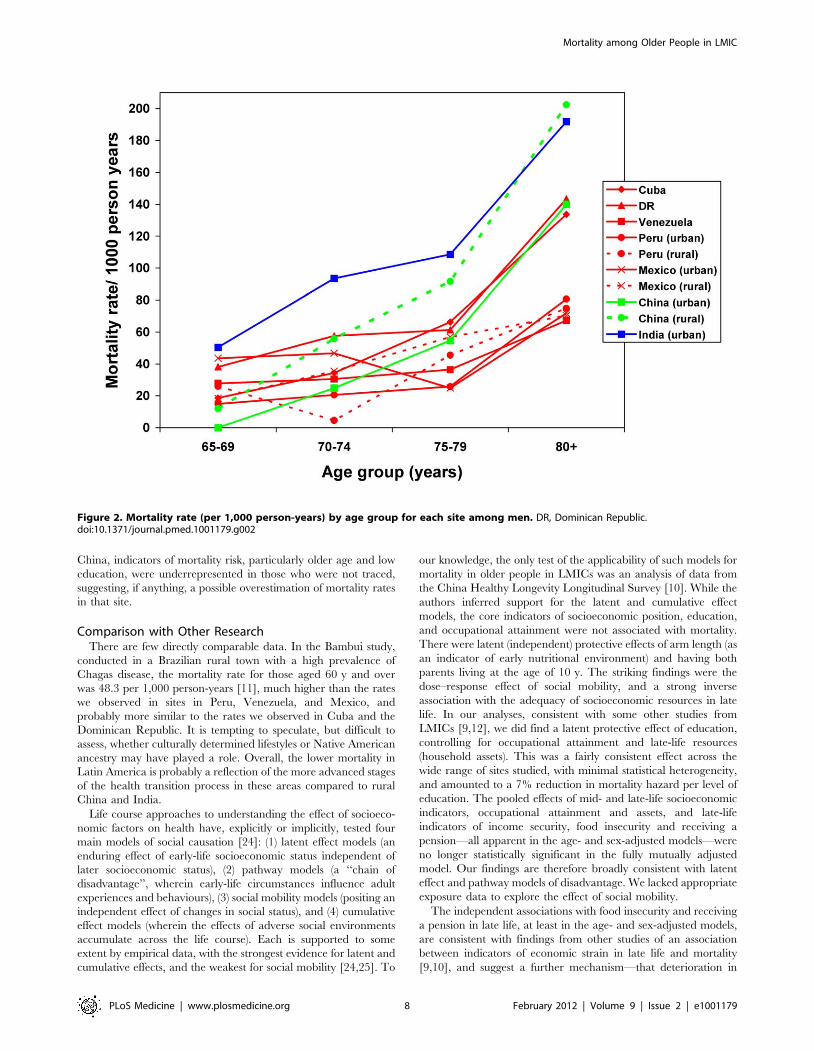
Mortality RatesCrude mortality rates varied from 27.3 (urban Peru) to 70.0
(urban India) per 1,000 person-years. Rates were higher among
men in all centres and tended to increase exponentially with
increasing age for both sexes (Figures 1 and 2; Table S2). In
countries where both rural and urban sites were sampled, rates
tended to be slightly higher in rural settings. Direct standardisation
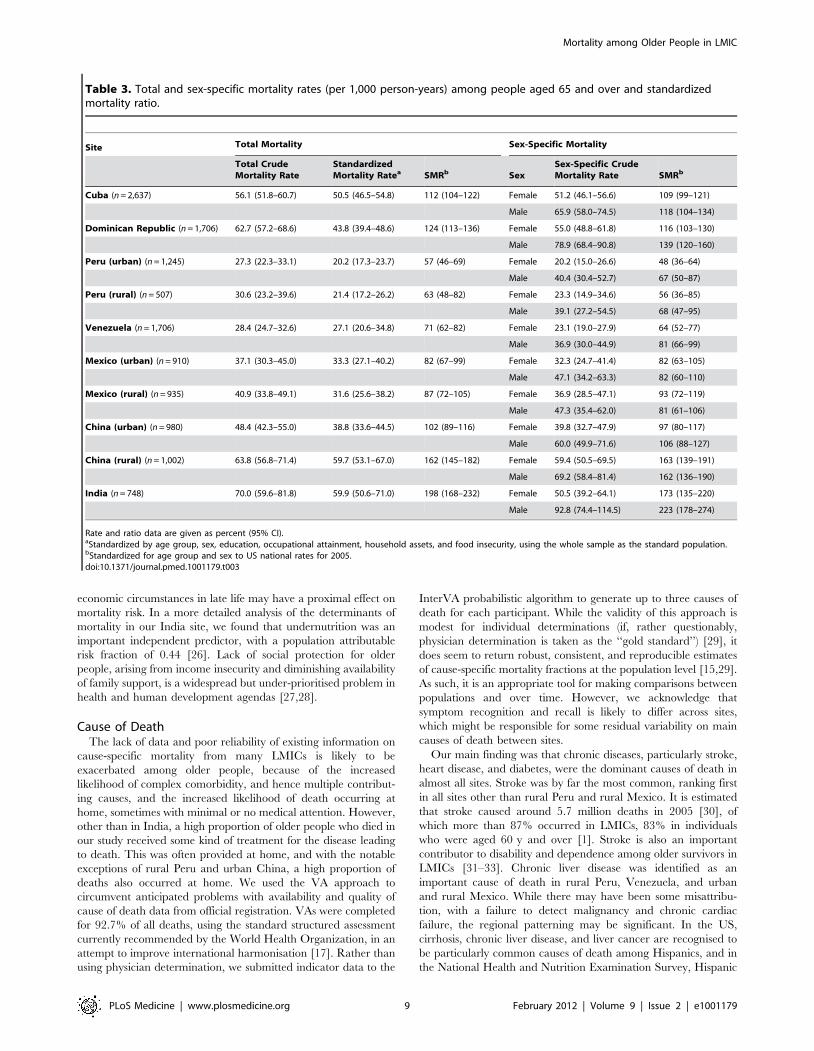
for age, sex, education, occupational attainment, and number of
assets had little effect on the variation among sites, with
standardised rates ranging from 20 (rural Peru) to 60 (rural China
and urban India) per 1,000 person-years (Table 3). After indirect
standardisation, applying age- and sex-specific US national
population mortality rates [22], mortality was higher than in the
US in the 10/66 Dementia Research Group sites in urban India
(SMR 198, 95% CI 168–332), rural China (SMR 162, 95% CI
145–182), the Dominican Republic (SMR 124, 95% CI 113–136),
and Cuba (SMR 112, 95% CI 104–112); similar in urban China;
but significantly lower in urban Peru (SMR 57, 95% CI 46–69),
rural Peru (SMR 63, 95% CI 48–82), Venezuela (SMR 71, 95%
CI 62–82), and urban Mexico (SMR 82, 95% CI 67–99).
Potential Bias Arising from Non-Ascertainment of VitalStatus
Of the likely predictors of mortality (baseline age, sex,
education, WHODAS 2.0 disability score, and dementia), sex
and disability were not associated with ascertainment of vital status
at follow-up in any site (Table S3). Those with more education at
baseline and younger participants were more likely not to be
traced in the urban China site. Those with dementia at baseline
were more likely not to have their vital status ascertained in the
urban Mexico site (Table S3). The predicted probability of death
by follow-up, derived from logistic regression using all of the above
predictors, was similar for all sites between those who were and
were not followed-up, other than in the urban Mexican site (24%
higher predicted probability of death among those in whom vital
status was not ascertained) and urban China (24% lower predicted
probability of death among those in whom vital status was not
ascertained) (Table S4).
Demographic and Socioeconomic Predictors of MortalityOlder age was significantly associated with mortality in all sites,
whether adjusted for sex alone (Table 4), or for sex and
socioeconomic indicators (Table 5). There was substantial and
significant heterogeneity (I2 = 72%) in the size of this effect across
sites; in the fully adjusted model the random effects pooled
mortality hazard increased by 1.57 (95% CI 1.47–1.67) for each 5-
y age band. The effect of male sex was statistically significant in all
sites other than rural Peru and rural Mexico, with minimal
heterogeneity, and was, if anything, slightly enhanced after
controlling for socioeconomic indicators (fully adjusted pooled
hazard ratio [HR] 1.59, 95% CI 1.45–1.74). Adjusting for age and
sex, it was found that less education, lower occupational
attainment, and food insecurity were each associated with
increased mortality risk after pooling coefficients across sites, with
no or minimal heterogeneity of effect among sites (Table 4).
Heterogeneity was more pronounced for household assets
(I2 = 47%), with protective effects of more assets being mostly
apparent in the sites in Cuba and the Dominican Republic, and
for pension receipt (I2 = 39%), where despite a generally protective
effect, the 3.8% of individuals receiving a pension in rural China
had an increased mortality (HR 1.97, 95% CI 1.16–3.36). After
mutual adjustment for each of the other socioeconomic indicators
in the fully adjusted model, the effects were all slightly attenuated
(Table 5). After pooling, there was still evidence of an independent,
consistent protective effect of more education (pooled HR 0.93,
95% CI 0.89–0.98). There was no evidence for effect modification
by age for any of the socioeconomic indicators: education (pooled
HR 1.03, 95% CI 0.99–1.07, I2 = 8%), occupational attainment
(1.02, 95% CI 0.98–1.07, I2 = 0%), assets (1.01, 95% CI 0.98–
1.04, I2 = 63%), or food insecurity (0.87, 95% CI 0.76–1.00,
I2 = 0%). Neither was there evidence that the effects of education
(pooled HR for interaction term 1.04, 95% CI 0.96–1.13,
I2 = 33%) or occupational attainment (0.95, 95% CI 0.87–1.05,
I2 = 0%) were modified by sex.
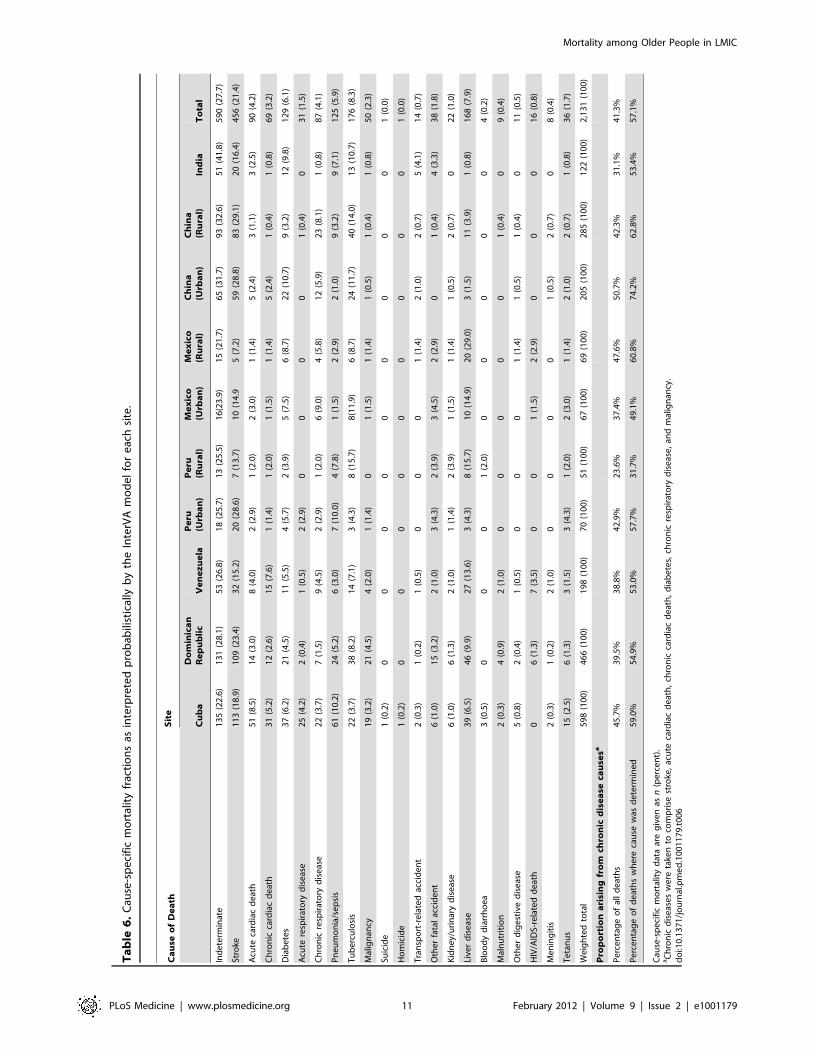
Cause of DeathTable 6 describes the estimated cause-specific mortality
fractions for each site for the 21 causes generated by the InterVA
algorithm. The proportion of indeterminate causes ranged from
21.7% to 28.1% in the Latin American sites, but was somewhat
higher in urban China (31.7%), rural China (32.6%), and India
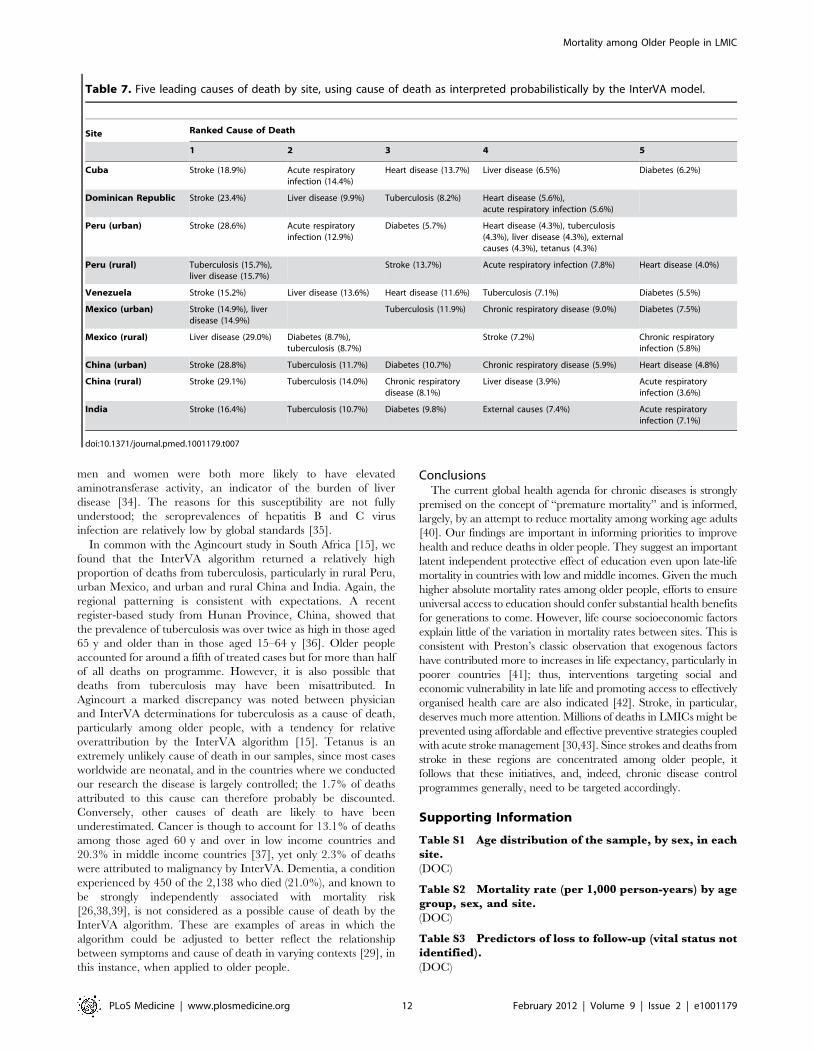
(41.8%). The five leading causes of death for each site are listed in
Table 7. Stroke was by far the most common cause overall
(21.4%), and was the leading or joint-leading cause of death in all
sites other than rural Peru (third leading cause) and rural Mexico
(fourth leading cause). Heart disease (7.4% of all deaths) was also
among the leading causes of death in all sites other than Mexico,
rural China, and India. Diabetes (6.1% of all deaths) was among
the leading causes in all sites other than the Dominican Republic,
rural Peru, and rural China. Chronic diseases as a whole (stroke,
heart disease, diabetes, chronic respiratory disease, and malignan-
cy) accounted for the majority of deaths where the cause was
determined in all sites other than rural Peru (23.6% of all deaths
and 31.7% of determined deaths). Other important causes of
death included liver disease (accounting for 10% or more of deaths
in rural Peru, Venezuela, and urban and rural Mexico) and
tuberculosis (accounting for 10% or more of deaths in rural Peru,
urban Mexico, and urban and rural China and India).
Discussion
In this catchment area population-based longitudinal study of
mortality among older people, there was a 2.6-fold variation in
crude rates between sites. Lower levels of education and
occupational attainment in earlier life, fewer household assets,
food insecurity, and not receiving a pension in later life were
associated with mortality; less education remained independently
associated after mutual adjustment. There was still a 3-fold
Mortality among Older People in LMIC
PLoS Medicine | www.plosmedicine.org 5 February 2012 | Volume 9 | Issue 2 | e1001179
Ta
ble
2.
Cir
cum
stan
ces
of
de
ath
,b
ysi
te.
Cir
cum
sta
nce
Sit
e
Cu
ba
Do
min
ica
nR
ep
ub
lic
Ve
ne
zu
ela
Pe
ru(U
rba
n)
Pe
ru(R
ura
l)M
ex
ico
(Urb
an
)M
ex
ico
(Ru
ral)
Ch
ina
(Urb
an
)C
hin
a(R
ura
l)In
dia
To
tal
Co
mp
lete
dV
Ain
terv
iew
s5
98
46
71
99
70
53
67
69
20
72
86
12
22
,13
8
Pla
ceo
fd
ea
th
Ho
me
,n
(pe
rce
nt)
28
2(4
7.6
%)
26
2(5
7.8
%)
78
(40
.8%
)3
7(5
2.9
%)
7(1
3.2
%)
38
(56
.7%
)4
5(6
5.2
%)
62
(29
.9%
)2
61
(91
.3%
)8
8(8
6.3
%)
1,1
60
(55
.5%
)
Ho
spit
alo
ro
the
rh
eal
thfa
cilit
y,n
(pe
rce
nt)
29
9(5
0.5
%)
18
2(4
0.2
%)
10
8(5
6.6
%)
32
(45
.7%
)4
6(8
6.8
%)
29
(43
.3%
)2
3(3
3.3
%)
14
5(7
0.1
%)
23
(8.0
%)
14
(13
.7%
)9
01
(43
.1%
)
Oth
er,
n(p
erc
en
t)1
1(1
.9%
)9
(2.0
%)
5(2
.6%
)1
(1.4
%)
00
1(1
.4%
)0
2(0
.7%
)0
29
(1.4
%)
MV
61
48
00
00
00
20
48
Tre
atm
en
tfo
ril
lne
ssle
ad
ing
tod
ea
th
Re
ceiv
ed
tre
atm
en
t,n
(pe
rce
nt)
47
3(7
9.5
%)
36
3(8
0.1
%)
16
3(8
3.2
%)
63
(90
.0%
)2
7(9
0.0
%)
61
(91
.0%
)6
2(8
9.9
%)
19
6(9
5.6
%)
27
2(9
7.5
%)
24
(22
.4%
)1
,70
4(7
9.7
%)
MV
31
43
02
30
02
71
56
7
Un
de
rwe
nt
surg
ery
,n
(pe
rce
nt)
55
(9.3
%)
39
(8.6
%)
26
(13
.3%
)3
(4.3
%)
1(1
.9%
)1
3(1
9.4
%)
11
(15
.9%
)3
(1.5
%)
4(1
.4%
)8
(7.9
%)
16
3(7
.8%
)
MV
51
64
02
30
02
82
15
6
Pla
ces
of
tre
atm
en
t(n
ot
mu
tua
lly
ex
clu
siv
e)
Ho
me
,n
(pe
rce
nt)
27
5(4
6.9
%)
20
2(4
6.4
%)
12
2(6
4.6
%)
43
(62
.3%
)3
(5.7
%)
24
(35
.8%
)3
7(5
3.6
%)
11
9(5
8.3
%)
18
0(6
4.5
%)
1(0
.8%
)1
,00
6(4
9.5
%)
MV
12
32
10
12
30
03
71
71
05
Clin
ic,
n(p
erc
en
t)8
3(1
4.2
%)
93
(21
.1%
)8
7(4
6.3
%)
10
(14
.5%
)0
23
(34
.3%
)2
9(4
2.0
%)
55
(27
.1%
)3
5(1
2.5
%)
7(6
.7%
)4
22
(20
.7%
)
MV
12
26
11
12
30
04
71
71
01
Ho
spit
al,
n(p
erc
en
t)3
39
(57
.6%
)2
38
(54
.2%
)7
7(4
1.6
%)
41
(58
.6%
)2
3(7
6.7
%)
36
(53
.7%
)4
9(7
1.0
%)
14
3(7
0.1
%)
15
5(5
5.6
%)
13
(12
.4%
)1
,11
4(4
9.5
%)
MV
92
81
41
42
30
03
71
71
05
MV
,m
issi
ng
valu
es.
do
i:10
.13
71
/jo
urn
al.p
me
d.1
00
11
79
.t0
02
Mortality among Older People in LMIC
PLoS Medicine | www.plosmedicine.org 6 February 2012 | Volume 9 | Issue 2 | e1001179
variation in mortality rates among sites after standardising for
compositional differences in age, sex, and all socioeconomic
indicators. Compared with national age- and sex-specific rates in
the US, rates in India and rural China were substantially higher,
and rates in Peru and Venezuela substantially lower. In most sites
a substantial minority or small majority of older people died at
home. Nevertheless, other than in India, most had sought some
medical attention in the course of their final illness, which tended
to be provided at home or in hospital, rather than in a community
health centre. Chronic diseases, most particularly stroke, heart
disease, and diabetes, were the leading causes of death in all sites
other than rural Peru.
Strengths and LimitationsThe main strengths of this study are the successful application of
a uniform methodology to ascertain deaths and determine cause of
death across urban and rural catchment area sites in Latin
America, China, and India. The baseline survey data allowed us to
study, prospectively, the effects of a range of potentially relevant
social determinants. Although we did not keep the catchment area
populations under continuous surveillance, we were able to
determine the vital status of 12,373 of 13,924 (88.9%) baseline
participants, identifying 2,306 deaths among them, of which 2,138
(92.7%) had completed VA interviews. A significant limitation is
that our samples are not nationally representative, and hence our
findings refer to the catchment areas studied and may not
generalise to other urban or rural locations in the countries
concerned. Although the study was prospective, education and
occupational attainment exposures were recalled and may have
been subject to random error and information bias. Older people
who had become frail or unwell may have moved to live with
children or other relatives; the household assets that were recorded
may not therefore have reflected those that they were generally
exposed to in later life [3,23]. Likewise, food insecurity may have
arisen as a consequence rather than as a cause of ill health leading
to death. Our selection of predominately lower socioeconomic
status or mixed neighbourhoods for our catchment areas may have
somewhat constrained the variance of socioeconomic exposures,
leading to underestimation of their effects.
The low mortality rates observed in sites in Peru, Venezuela,
and urban Mexico may be due to underascertainment, to the
extent that deaths were overrepresented among those not traced
(and hence for whom vital status could not be determined). The
proportion not traced (10%–15%) was not particularly high in
these sites. Our supplementary analyses, conducted to explore the
likely extent and direction of bias, supported the possibility of an
underestimation of mortality rates only in urban Mexico, where
dementia at baseline was overrepresented in those not traced, for
whom the predicted probability of death was 24% higher than for
those who were traced. It is also possible that the low mortality
rates may have reflected the particular characteristics of the
catchment areas that were selected. These were, by design,
predominately lower socioeconomic status communities; however,
levels of occupational attainment were somewhat higher in
Venezuela and urban Peru than in other sites. In sites in urban
China and urban India, the relatively high loss to follow-up was
mainly explained by external factors: closure of an apartment
block and an urban infrastructure project, respectively. In urban
Figure 1. Mortality rate (per 1,000 person-years) by age group for each site among women. DR, Dominican Republic.doi:10.1371/journal.pmed.1001179.g001
Mortality among Older People in LMIC
PLoS Medicine | www.plosmedicine.org 7 February 2012 | Volume 9 | Issue 2 | e1001179
China, indicators of mortality risk, particularly older age and low
education, were underrepresented in those who were not traced,
suggesting, if anything, a possible overestimation of mortality rates
in that site.
Comparison with Other ResearchThere are few directly comparable data. In the Bambui study,
conducted in a Brazilian rural town with a high prevalence of
Chagas disease, the mortality rate for those aged 60 y and over
was 48.3 per 1,000 person-years [11], much higher than the rates
we observed in sites in Peru, Venezuela, and Mexico, and
probably more similar to the rates we observed in Cuba and the
Dominican Republic. It is tempting to speculate, but difficult to
assess, whether culturally determined lifestyles or Native American
ancestry may have played a role. Overall, the lower mortality in
Latin America is probably a reflection of the more advanced stages
of the health transition process in these areas compared to rural
China and India.
Life course approaches to understanding the effect of socioeco-
nomic factors on health have, explicitly or implicitly, tested four
main models of social causation [24]: (1) latent effect models (an
enduring effect of early-life socioeconomic status independent of
later socioeconomic status), (2) pathway models (a ‘‘chain of
disadvantage’’, wherein early-life circumstances influence adult
experiences and behaviours), (3) social mobility models (positing an
independent effect of changes in social status), and (4) cumulative
effect models (wherein the effects of adverse social environments
accumulate across the life course). Each is supported to some
extent by empirical data, with the strongest evidence for latent and
cumulative effects, and the weakest for social mobility [24,25]. To
our knowledge, the only test of the applicability of such models for
mortality in older people in LMICs was an analysis of data from
the China Healthy Longevity Longitudinal Survey [10]. While the
authors inferred support for the latent and cumulative effect
models, the core indicators of socioeconomic position, education,
and occupational attainment were not associated with mortality.
There were latent (independent) protective effects of arm length (as
an indicator of early nutritional environment) and having both
parents living at the age of 10 y. The striking findings were the
dose–response effect of social mobility, and a strong inverse
association with the adequacy of socioeconomic resources in late
life. In our analyses, consistent with some other studies from
LMICs [9,12], we did find a latent protective effect of education,
controlling for occupational attainment and late-life resources
(household assets). This was a fairly consistent effect across the
wide range of sites studied, with minimal statistical heterogeneity,
and amounted to a 7% reduction in mortality hazard per level of
education. The pooled effects of mid- and late-life socioeconomic
indicators, occupational attainment and assets, and late-life
indicators of income security, food insecurity and receiving a
pension—all apparent in the age- and sex-adjusted models—were
no longer statistically significant in the fully mutually adjusted
model. Our findings are therefore broadly consistent with latent
effect and pathway models of disadvantage. We lacked appropriate
exposure data to explore the effect of social mobility.
The independent associations with food insecurity and receiving
a pension in late life, at least in the age- and sex-adjusted models,
are consistent with findings from other studies of an association
between indicators of economic strain in late life and mortality
[9,10], and suggest a further mechanism—that deterioration in
Figure 2. Mortality rate (per 1,000 person-years) by age group for each site among men. DR, Dominican Republic.doi:10.1371/journal.pmed.1001179.g002
Mortality among Older People in LMIC
PLoS Medicine | www.plosmedicine.org 8 February 2012 | Volume 9 | Issue 2 | e1001179
economic circumstances in late life may have a proximal effect on
mortality risk. In a more detailed analysis of the determinants of
mortality in our India site, we found that undernutrition was an
important independent predictor, with a population attributable
risk fraction of 0.44 [26]. Lack of social protection for older
people, arising from income insecurity and diminishing availability
of family support, is a widespread but under-prioritised problem in
health and human development agendas [27,28].
Cause of DeathThe lack of data and poor reliability of existing information on
cause-specific mortality from many LMICs is likely to be
exacerbated among older people, because of the increased
likelihood of complex comorbidity, and hence multiple contribut-
ing causes, and the increased likelihood of death occurring at
home, sometimes with minimal or no medical attention. However,
other than in India, a high proportion of older people who died in
our study received some kind of treatment for the disease leading
to death. This was often provided at home, and with the notable
exceptions of rural Peru and urban China, a high proportion of
deaths also occurred at home. We used the VA approach to
circumvent anticipated problems with availability and quality of
cause of death data from official registration. VAs were completed
for 92.7% of all deaths, using the standard structured assessment
currently recommended by the World Health Organization, in an
attempt to improve international harmonisation [17]. Rather than
using physician determination, we submitted indicator data to the
InterVA probabilistic algorithm to generate up to three causes of
death for each participant. While the validity of this approach is
modest for individual determinations (if, rather questionably,
physician determination is taken as the ‘‘gold standard’’) [29], it
does seem to return robust, consistent, and reproducible estimates
of cause-specific mortality fractions at the population level [15,29].
As such, it is an appropriate tool for making comparisons between
populations and over time. However, we acknowledge that
symptom recognition and recall is likely to differ across sites,
which might be responsible for some residual variability on main
causes of death between sites.
Our main finding was that chronic diseases, particularly stroke,
heart disease, and diabetes, were the dominant causes of death in
almost all sites. Stroke was by far the most common, ranking first
in all sites other than rural Peru and rural Mexico. It is estimated
that stroke caused around 5.7 million deaths in 2005 [30], of
which more than 87% occurred in LMICs, 83% in individuals
who were aged 60 y and over [1]. Stroke is also an important
contributor to disability and dependence among older survivors in
LMICs [31–33]. Chronic liver disease was identified as an
important cause of death in rural Peru, Venezuela, and urban
and rural Mexico. While there may have been some misattribu-
tion, with a failure to detect malignancy and chronic cardiac
failure, the regional patterning may be significant. In the US,
cirrhosis, chronic liver disease, and liver cancer are recognised to
be particularly common causes of death among Hispanics, and in
the National Health and Nutrition Examination Survey, Hispanic
Table 3. Total and sex-specific mortality rates (per 1,000 person-years) among people aged 65 and over and standardizedmortality ratio.
Site Total Mortality Sex-Specific Mortality
Total CrudeMortality Rate
StandardizedMortality Ratea SMRb Sex
Sex-Specific CrudeMortality Rate SMRb
Cuba (n = 2,637) 56.1 (51.8–60.7) 50.5 (46.5–54.8) 112 (104–122) Female 51.2 (46.1–56.6) 109 (99–121)
Male 65.9 (58.0–74.5) 118 (104–134)
Dominican Republic (n = 1,706) 62.7 (57.2–68.6) 43.8 (39.4–48.6) 124 (113–136) Female 55.0 (48.8–61.8) 116 (103–130)
Male 78.9 (68.4–90.8) 139 (120–160)
Peru (urban) (n = 1,245) 27.3 (22.3–33.1) 20.2 (17.3–23.7) 57 (46–69) Female 20.2 (15.0–26.6) 48 (36–64)
Male 40.4 (30.4–52.7) 67 (50–87)
Peru (rural) (n = 507) 30.6 (23.2–39.6) 21.4 (17.2–26.2) 63 (48–82) Female 23.3 (14.9–34.6) 56 (36–85)
Male 39.1 (27.2–54.5) 68 (47–95)
Venezuela (n = 1,706) 28.4 (24.7–32.6) 27.1 (20.6–34.8) 71 (62–82) Female 23.1 (19.0–27.9) 64 (52–77)
Male 36.9 (30.0–44.9) 81 (66–99)
Mexico (urban) (n = 910) 37.1 (30.3–45.0) 33.3 (27.1–40.2) 82 (67–99) Female 32.3 (24.7–41.4) 82 (63–105)
Male 47.1 (34.2–63.3) 82 (60–110)
Mexico (rural) (n = 935) 40.9 (33.8–49.1) 31.6 (25.6–38.2) 87 (72–105) Female 36.9 (28.5–47.1) 93 (72–119)
Male 47.3 (35.4–62.0) 81 (61–106)
China (urban) (n = 980) 48.4 (42.3–55.0) 38.8 (33.6–44.5) 102 (89–116) Female 39.8 (32.7–47.9) 97 (80–117)
Male 60.0 (49.9–71.6) 106 (88–127)
China (rural) (n = 1,002) 63.8 (56.8–71.4) 59.7 (53.1–67.0) 162 (145–182) Female 59.4 (50.5–69.5) 163 (139–191)
Male 69.2 (58.4–81.4) 162 (136–190)
India (n = 748) 70.0 (59.6–81.8) 59.9 (50.6–71.0) 198 (168–232) Female 50.5 (39.2–64.1) 173 (135–220)
Male 92.8 (74.4–114.5) 223 (178–274)
Rate and ratio data are given as percent (95% CI).aStandardized by age group, sex, education, occupational attainment, household assets, and food insecurity, using the whole sample as the standard population.bStandardized for age group and sex to US national rates for 2005.doi:10.1371/journal.pmed.1001179.t003
Mortality among Older People in LMIC
PLoS Medicine | www.plosmedicine.org 9 February 2012 | Volume 9 | Issue 2 | e1001179
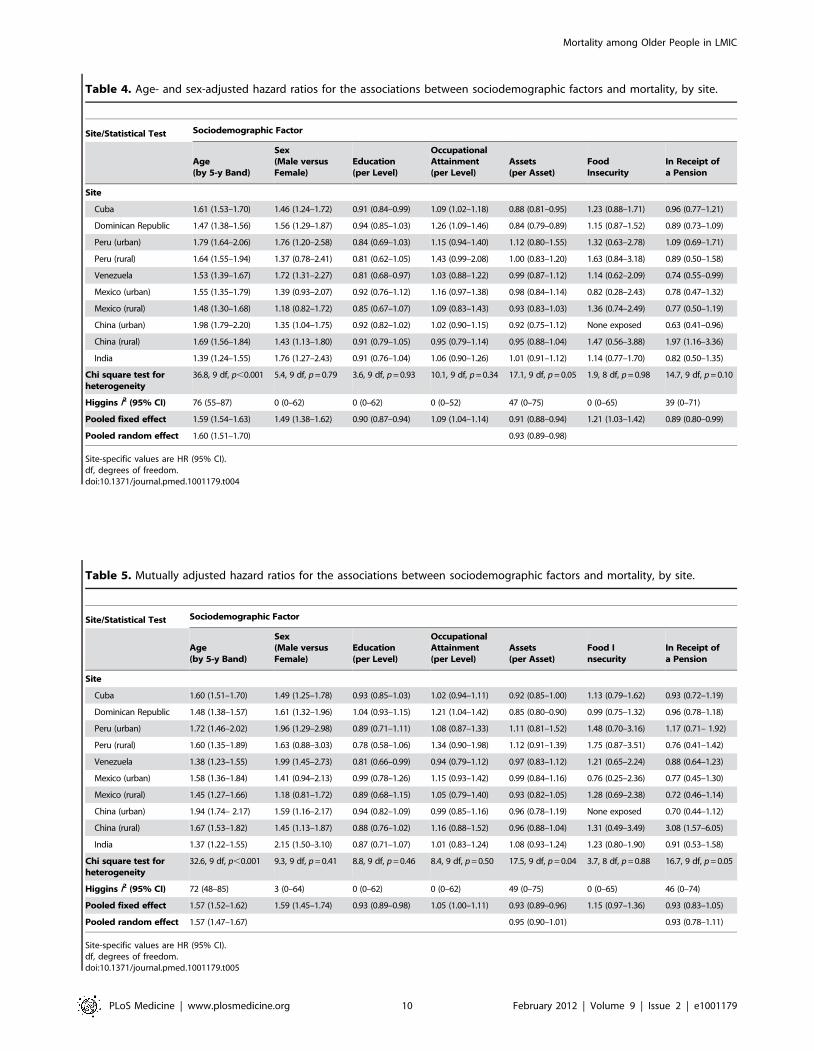
Table 4. Age- and sex-adjusted hazard ratios for the associations between sociodemographic factors and mortality, by site.
Site/Statistical Test Sociodemographic Factor
Age(by 5-y Band)
Sex(Male versusFemale)
Education(per Level)
OccupationalAttainment(per Level)
Assets(per Asset)
FoodInsecurity
In Receipt ofa Pension
Site
Cuba 1.61 (1.53–1.70) 1.46 (1.24–1.72) 0.91 (0.84–0.99) 1.09 (1.02–1.18) 0.88 (0.81–0.95) 1.23 (0.88–1.71) 0.96 (0.77–1.21)
Dominican Republic 1.47 (1.38–1.56) 1.56 (1.29–1.87) 0.94 (0.85–1.03) 1.26 (1.09–1.46) 0.84 (0.79–0.89) 1.15 (0.87–1.52) 0.89 (0.73–1.09)
Peru (urban) 1.79 (1.64–2.06) 1.76 (1.20–2.58) 0.84 (0.69–1.03) 1.15 (0.94–1.40) 1.12 (0.80–1.55) 1.32 (0.63–2.78) 1.09 (0.69–1.71)
Peru (rural) 1.64 (1.55–1.94) 1.37 (0.78–2.41) 0.81 (0.62–1.05) 1.43 (0.99–2.08) 1.00 (0.83–1.20) 1.63 (0.84–3.18) 0.89 (0.50–1.58)
Venezuela 1.53 (1.39–1.67) 1.72 (1.31–2.27) 0.81 (0.68–0.97) 1.03 (0.88–1.22) 0.99 (0.87–1.12) 1.14 (0.62–2.09) 0.74 (0.55–0.99)
Mexico (urban) 1.55 (1.35–1.79) 1.39 (0.93–2.07) 0.92 (0.76–1.12) 1.16 (0.97–1.38) 0.98 (0.84–1.14) 0.82 (0.28–2.43) 0.78 (0.47–1.32)
Mexico (rural) 1.48 (1.30–1.68) 1.18 (0.82–1.72) 0.85 (0.67–1.07) 1.09 (0.83–1.43) 0.93 (0.83–1.03) 1.36 (0.74–2.49) 0.77 (0.50–1.19)
China (urban) 1.98 (1.79–2.20) 1.35 (1.04–1.75) 0.92 (0.82–1.02) 1.02 (0.90–1.15) 0.92 (0.75–1.12) None exposed 0.63 (0.41–0.96)
China (rural) 1.69 (1.56–1.84) 1.43 (1.13–1.80) 0.91 (0.79–1.05) 0.95 (0.79–1.14) 0.95 (0.88–1.04) 1.47 (0.56–3.88) 1.97 (1.16–3.36)
India 1.39 (1.24–1.55) 1.76 (1.27–2.43) 0.91 (0.76–1.04) 1.06 (0.90–1.26) 1.01 (0.91–1.12) 1.14 (0.77–1.70) 0.82 (0.50–1.35)
Chi square test forheterogeneity
36.8, 9 df, p,0.001 5.4, 9 df, p = 0.79 3.6, 9 df, p = 0.93 10.1, 9 df, p = 0.34 17.1, 9 df, p = 0.05 1.9, 8 df, p = 0.98 14.7, 9 df, p = 0.10
Higgins I2 (95% CI) 76 (55–87) 0 (0–62) 0 (0–62) 0 (0–52) 47 (0–75) 0 (0–65) 39 (0–71)
Pooled fixed effect 1.59 (1.54–1.63) 1.49 (1.38–1.62) 0.90 (0.87–0.94) 1.09 (1.04–1.14) 0.91 (0.88–0.94) 1.21 (1.03–1.42) 0.89 (0.80–0.99)
Pooled random effect 1.60 (1.51–1.70) 0.93 (0.89–0.98)
Site-specific values are HR (95% CI).df, degrees of freedom.doi:10.1371/journal.pmed.1001179.t004
Table 5. Mutually adjusted hazard ratios for the associations between sociodemographic factors and mortality, by site.
Site/Statistical Test Sociodemographic Factor
Age(by 5-y Band)
Sex(Male versusFemale)
Education(per Level)
OccupationalAttainment(per Level)
Assets(per Asset)
Food Insecurity
In Receipt ofa Pension
Site
Cuba 1.60 (1.51–1.70) 1.49 (1.25–1.78) 0.93 (0.85–1.03) 1.02 (0.94–1.11) 0.92 (0.85–1.00) 1.13 (0.79–1.62) 0.93 (0.72–1.19)
Dominican Republic 1.48 (1.38–1.57) 1.61 (1.32–1.96) 1.04 (0.93–1.15) 1.21 (1.04–1.42) 0.85 (0.80–0.90) 0.99 (0.75–1.32) 0.96 (0.78–1.18)
Peru (urban) 1.72 (1.46–2.02) 1.96 (1.29–2.98) 0.89 (0.71–1.11) 1.08 (0.87–1.33) 1.11 (0.81–1.52) 1.48 (0.70–3.16) 1.17 (0.71– 1.92)
Peru (rural) 1.60 (1.35–1.89) 1.63 (0.88–3.03) 0.78 (0.58–1.06) 1.34 (0.90–1.98) 1.12 (0.91–1.39) 1.75 (0.87–3.51) 0.76 (0.41–1.42)
Venezuela 1.38 (1.23–1.55) 1.99 (1.45–2.73) 0.81 (0.66–0.99) 0.94 (0.79–1.12) 0.97 (0.83–1.12) 1.21 (0.65–2.24) 0.88 (0.64–1.23)
Mexico (urban) 1.58 (1.36–1.84) 1.41 (0.94–2.13) 0.99 (0.78–1.26) 1.15 (0.93–1.42) 0.99 (0.84–1.16) 0.76 (0.25–2.36) 0.77 (0.45–1.30)
Mexico (rural) 1.45 (1.27–1.66) 1.18 (0.81–1.72) 0.89 (0.68–1.15) 1.05 (0.79–1.40) 0.93 (0.82–1.05) 1.28 (0.69–2.38) 0.72 (0.46–1.14)
China (urban) 1.94 (1.74– 2.17) 1.59 (1.16–2.17) 0.94 (0.82–1.09) 0.99 (0.85–1.16) 0.96 (0.78–1.19) None exposed 0.70 (0.44–1.12)
China (rural) 1.67 (1.53–1.82) 1.45 (1.13–1.87) 0.88 (0.76–1.02) 1.16 (0.88–1.52) 0.96 (0.88–1.04) 1.31 (0.49–3.49) 3.08 (1.57–6.05)
India 1.37 (1.22–1.55) 2.15 (1.50–3.10) 0.87 (0.71–1.07) 1.01 (0.83–1.24) 1.08 (0.93–1.24) 1.23 (0.80–1.90) 0.91 (0.53–1.58)
Chi square test forheterogeneity
32.6, 9 df, p,0.001 9.3, 9 df, p = 0.41 8.8, 9 df, p = 0.46 8.4, 9 df, p = 0.50 17.5, 9 df, p = 0.04 3.7, 8 df, p = 0.88 16.7, 9 df, p = 0.05
Higgins I2 (95% CI) 72 (48–85) 3 (0–64) 0 (0–62) 0 (0–62) 49 (0–75) 0 (0–65) 46 (0–74)
Pooled fixed effect 1.57 (1.52–1.62) 1.59 (1.45–1.74) 0.93 (0.89–0.98) 1.05 (1.00–1.11) 0.93 (0.89–0.96) 1.15 (0.97–1.36) 0.93 (0.83–1.05)
Pooled random effect 1.57 (1.47–1.67) 0.95 (0.90–1.01) 0.93 (0.78–1.11)
Site-specific values are HR (95% CI).df, degrees of freedom.doi:10.1371/journal.pmed.1001179.t005
Mortality among Older People in LMIC
PLoS Medicine | www.plosmedicine.org 10 February 2012 | Volume 9 | Issue 2 | e1001179
Ta
ble
6.
Cau
se-s
pe
cifi
cm
ort
alit
yfr
acti
on
sas
inte
rpre
ted
pro
bab
ilist
ical
lyb
yth
eIn
terV
Am
od
el
for
eac
hsi
te.
Ca
use
of
De
ath
Sit
e
Cu
ba
Do
min
ica
nR
ep
ub
lic
Ve
ne
zu
ela
Pe
ru(U
rba
n)
Pe
ru(R
ura
l)M
ex
ico
(Urb
an
)M
ex
ico
(Ru
ral)
Ch
ina
(Urb
an
)C
hin
a(R
ura
l)In
dia
To
tal
Ind
ete
rmin
ate
13
5(2
2.6
)1
31
(28
.1)
53
(26
.8)
18
(25
.7)
13
(25
.5)
16
(23
.9)
15
(21
.7)
65
(31
.7)
93
(32
.6)
51
(41
.8)
59
0(2
7.7
)
Stro
ke1
13
(18
.9)
10
9(2
3.4
)3
2(1
5.2
)2
0(2
8.6
)7
(13
.7)
10
(14
.95
(7.2
)5
9(2
8.8
)8
3(2
9.1
)2
0(1
6.4
)4
56
(21
.4)
Acu
teca
rdia
cd
eat
h5
1(8
.5)
14
(3.0
)8
(4.0
)2
(2.9
)1
(2.0
)2
(3.0
)1
(1.4
)5
(2.4
)3
(1.1
)3
(2.5
)9
0(4
.2)
Ch
ron
icca
rdia
cd
eat
h3
1(5
.2)
12
(2.6
)1
5(7
.6)
1(1
.4)
1(2
.0)
1(1
.5)
1(1
.4)
5(2
.4)
1(0
.4)
1(0
.8)
69
(3.2
)
Dia
be
tes
37
(6.2
)2
1(4
.5)
11
(5.5
)4
(5.7
)2
(3.9
)5
(7.5
)6
(8.7
)2
2(1
0.7
)9
(3.2
)1
2(9
.8)
12
9(6
.1)
Acu
tere
spir
ato
ryd
ise
ase
25
(4.2
)2
(0.4
)1
(0.5
)2
(2.9
)0
00
01
(0.4
)0
31
(1.5
)
Ch
ron
icre
spir
ato
ryd
ise
ase
22
(3.7
)7
(1.5
)9
(4.5
)2
(2.9
)1
(2.0
)6
(9.0
)4
(5.8
)1
2(5
.9)
23
(8.1
)1
(0.8
)8
7(4
.1)
Pn
eu
mo
nia
/se
psi
s6
1(1
0.2
)2
4(5
.2)
6(3
.0)
7(1
0.0
)4
(7.8
)1
(1.5
)2
(2.9
)2
(1.0
)9
(3.2
)9
(7.1
)1
25
(5.9
)
Tu
be
rcu
losi
s2
2(3
.7)
38
(8.2
)1
4(7
.1)
3(4
.3)
8(1
5.7
)8
(11
.9)
6(8
.7)
24
(11
.7)
40
(14
.0)
13
(10
.7)
17
6(8
.3)
Mal
ign
ancy
19
(3.2
)2
1(4
.5)
4(2
.0)
1(1
.4)
01
(1.5
)1
(1.4
)1
(0.5
)1
(0.4
)1
(0.8
)5
0(2
.3)
Suic
ide
1(0
.2)
00
00
00
00
01
(0.0
)
Ho
mic
ide
1(0
.2)
00
00
00
00
01
(0.0
)
Tra
nsp
ort
-re
late
dac
cid
en
t2
(0.3
)1
(0.2
)1
(0.5
)0
00
1(1
.4)
2(1
.0)
2(0
.7)
5(4
.1)
14
(0.7
)
Oth
er
fata
lac
cid
en
t6
(1.0
)1
5(3
.2)
2(1
.0)
3(4
.3)
2(3
.9)
3(4
.5)
2(2
.9)
01
(0.4
)4
(3.3
)3
8(1
.8)
Kid
ne
y/u
rin
ary
dis
eas
e6
(1.0
)6
(1.3
)2
(1.0
)1
(1.4
)2
(3.9
)1
(1.5
)1
(1.4
)1
(0.5
)2
(0.7
)0
22
(1.0
)
Live
rd
ise
ase
39
(6.5
)4
6(9
.9)
27
(13
.6)
3(4
.3)
8(1
5.7
)1
0(1
4.9
)2
0(2
9.0
)3
(1.5
)1
1(3
.9)
1(0
.8)
16
8(7
.9)
Blo
od
yd
iarr
ho
ea
3(0
.5)
00
01
(2.0
)0
00
00
4(0
.2)
Mal
nu
trit
ion
2(0
.3)
4(0
.9)
2(1
.0)
00
00
01
(0.4
)0
9(0
.4)
Oth
er
dig
est
ive
dis
eas
e5
(0.8
)2
(0.4
)1
(0.5
)0
00
1(1
.4)
1(0
.5)
1(0
.4)
01
1(0
.5)
HIV
/AID
S-re
late
dd
eat
h0
6(1
.3)
7(3
.5)
00
1(1
.5)
2(2
.9)
00
01
6(0
.8)
Me
nin
git
is2
(0.3
)1
(0.2
)2
(1.0
)0
00
01
(0.5
)2
(0.7
)0
8(0
.4)
Te
tan
us
15
(2.5
)6
(1.3
)3
(1.5
)3
(4.3
)1
(2.0
)2
(3.0
)1
(1.4
)2
(1.0
)2
(0.7
)1
(0.8
)3
6(1
.7)
We
igh
ted
tota
l5
98
(10
0)
46
6(1
00
)1
98
(10
0)
70
(10
0)
51
(10
0)
67
(10
0)
69
(10
0)
20
5(1
00
)2
85
(10
0)
12
2(1
00
)2
,13
1(1
00
)
Pro
po
rtio
na
risi
ng
fro
mch
ron
icd
ise
ase
cau
sesa
Pe
rce
nta
ge
of
all
de
ath
s4
5.7
%3
9.5
%3
8.8
%4
2.9
%2
3.6
%3
7.4
%4
7.6
%5
0.7
%4
2.3
%3
1.1
%4
1.3
%
Pe
rce
nta
ge
of
de
ath
sw
he
reca
use
was
de
term
ine
d5
9.0
%5
4.9
%5
3.0
%5
7.7
%3
1.7
%4
9.1
%6
0.8
%7
4.2
%6
2.8
%5
3.4
%5
7.1
%
Cau
se-s
pe
cifi
cm
ort
alit
yd
ata
are
giv
en
asn
(pe
rce
nt)
.aC
hro
nic
dis
eas
es
we
reta
ken
toco
mp
rise
stro
ke,
acu
teca
rdia
cd
eat
h,
chro
nic
card
iac
de
ath
,d
iab
ete
s,ch
ron
icre
spir
ato
ryd
ise
ase
,an
dm
alig
nan
cy.
do
i:10
.13
71
/jo
urn
al.p
me
d.1
00
11
79
.t0
06
Mortality among Older People in LMIC
PLoS Medicine | www.plosmedicine.org 11 February 2012 | Volume 9 | Issue 2 | e1001179
men and women were both more likely to have elevated
aminotransferase activity, an indicator of the burden of liver
disease [34]. The reasons for this susceptibility are not fully
understood; the seroprevalences of hepatitis B and C virus
infection are relatively low by global standards [35].
In common with the Agincourt study in South Africa [15], we
found that the InterVA algorithm returned a relatively high
proportion of deaths from tuberculosis, particularly in rural Peru,
urban Mexico, and urban and rural China and India. Again, the
regional patterning is consistent with expectations. A recent
register-based study from Hunan Province, China, showed that
the prevalence of tuberculosis was over twice as high in those aged
65 y and older than in those aged 15–64 y [36]. Older people
accounted for around a fifth of treated cases but for more than half
of all deaths on programme. However, it is also possible that
deaths from tuberculosis may have been misattributed. In
Agincourt a marked discrepancy was noted between physician
and InterVA determinations for tuberculosis as a cause of death,
particularly among older people, with a tendency for relative
overattribution by the InterVA algorithm [15]. Tetanus is an
extremely unlikely cause of death in our samples, since most cases
worldwide are neonatal, and in the countries where we conducted
our research the disease is largely controlled; the 1.7% of deaths
attributed to this cause can therefore probably be discounted.
Conversely, other causes of death are likely to have been
underestimated. Cancer is though to account for 13.1% of deaths
among those aged 60 y and over in low income countries and
20.3% in middle income countries [37], yet only 2.3% of deaths
were attributed to malignancy by InterVA. Dementia, a condition
experienced by 450 of the 2,138 who died (21.0%), and known to
be strongly independently associated with mortality risk
[26,38,39], is not considered as a possible cause of death by the
InterVA algorithm. These are examples of areas in which the
algorithm could be adjusted to better reflect the relationship
between symptoms and cause of death in varying contexts [29], in
this instance, when applied to older people.
ConclusionsThe current global health agenda for chronic diseases is strongly
premised on the concept of ‘‘premature mortality’’ and is informed,
largely, by an attempt to reduce mortality among working age adults
[40]. Our findings are important in informing priorities to improve
health and reduce deaths in older people. They suggest an important
latent independent protective effect of education even upon late-life
mortality in countries with low and middle incomes. Given the much
higher absolute mortality rates among older people, efforts to ensure
universal access to education should confer substantial health benefits
for generations to come. However, life course socioeconomic factors
explain little of the variation in mortality rates between sites. This is
consistent with Preston’s classic observation that exogenous factors
have contributed more to increases in life expectancy, particularly in
poorer countries [41]; thus, interventions targeting social and
economic vulnerability in late life and promoting access to effectively
organised health care are also indicated [42]. Stroke, in particular,
deserves much more attention. Millions of deaths in LMICs might be
prevented using affordable and effective preventive strategies coupled
with acute stroke management [30,43]. Since strokes and deaths from
stroke in these regions are concentrated among older people, it
follows that these initiatives, and, indeed, chronic disease control
programmes generally, need to be targeted accordingly.
Supporting Information
Table S1 Age distribution of the sample, by sex, in eachsite.
(DOC)
Table S2 Mortality rate (per 1,000 person-years) by agegroup, sex, and site.
(DOC)
Table S3 Predictors of loss to follow-up (vital status notidentified).
(DOC)
Table 7. Five leading causes of death by site, using cause of death as interpreted probabilistically by the InterVA model.
Site Ranked Cause of Death
1 2 3 4 5
Cuba Stroke (18.9%) Acute respiratoryinfection (14.4%)
Heart disease (13.7%) Liver disease (6.5%) Diabetes (6.2%)
Dominican Republic Stroke (23.4%) Liver disease (9.9%) Tuberculosis (8.2%) Heart disease (5.6%),acute respiratory infection (5.6%)
Peru (urban) Stroke (28.6%) Acute respiratoryinfection (12.9%)
Diabetes (5.7%) Heart disease (4.3%), tuberculosis(4.3%), liver disease (4.3%), externalcauses (4.3%), tetanus (4.3%)
Peru (rural) Tuberculosis (15.7%),liver disease (15.7%)
Stroke (13.7%) Acute respiratory infection (7.8%) Heart disease (4.0%)
Venezuela Stroke (15.2%) Liver disease (13.6%) Heart disease (11.6%) Tuberculosis (7.1%) Diabetes (5.5%)
Mexico (urban) Stroke (14.9%), liverdisease (14.9%)
Tuberculosis (11.9%) Chronic respiratory disease (9.0%) Diabetes (7.5%)
Mexico (rural) Liver disease (29.0%) Diabetes (8.7%),tuberculosis (8.7%)
Stroke (7.2%) Chronic respiratoryinfection (5.8%)
China (urban) Stroke (28.8%) Tuberculosis (11.7%) Diabetes (10.7%) Chronic respiratory disease (5.9%) Heart disease (4.8%)
China (rural) Stroke (29.1%) Tuberculosis (14.0%) Chronic respiratorydisease (8.1%)
Liver disease (3.9%) Acute respiratoryinfection (3.6%)
India Stroke (16.4%) Tuberculosis (10.7%) Diabetes (9.8%) External causes (7.4%) Acute respiratoryinfection (7.1%)
doi:10.1371/journal.pmed.1001179.t007
Mortality among Older People in LMIC
PLoS Medicine | www.plosmedicine.org 12 February 2012 | Volume 9 | Issue 2 | e1001179
Table S4 Predicted probability of death before follow-up compared between groups, according to vital statusascertainment.
(DOC)
Author Contributions
Conceived and designed the experiments: CPF MJP. Performed the
experiments: CPF DA MG YH JJLR AS ALS JDW CG ZL LNF ATJ
MJP. Analyzed the data: CPF MJP. Wrote the first draft of the manuscript:
CPF MJP. Contributed to the writing of the manuscript: CPF DA MG YH
JJLR AS ALS JDW CG ZL LNF ATJ MJP. ICMJE criteria for authorship
read and met: CPF DA MG YH JJLR AS ALS JDW CG ZL LNF ATJ
MJP. Agree with manuscript results and conclusions: CPF DA MG YH
JJLR AS ALS JDW CG ZL LNF ATJ MJP.
References
1. World Health Organization (2008) The global burden of disease. 2004 update.
Geneva: World Health Organization.
2. Mathers CD, Loncar D (2006) Projections of global mortality and burden of
disease from 2002 to 2030. PLoS Med 3: e442. doi:10.1371/journal.pmed.
0030442.
3. Bowling A (2004) Socioeconomic differentials in mortality among older people.
J Epidemiol Community Health 58: 438–440.
4. Huisman M, Kunst AE, Andersen O, Bopp M, Borgan JK, et al. (2004)
Socioeconomic inequalities in mortality among elderly people in 11 European
populations. J Epidemiol Community Health 58: 468–475.
5. Hypertension Study Group (2001) Prevalence, awareness, treatment and control
of hypertension among the elderly in Bangladesh and India: a multicentre study.
Bull World Health Organ 79: 490–500.
6. Monteiro CA, Conde WL, Popkin BM (2007) Income-specific trends in obesity
in Brazil: 1975–2003. Am J Public Health 97: 1808–1812.
7. Acosta D, Rottbeck R, Rodriguez JG, Gonzalez LM, Almanzar MR, et al.
(2010) The prevalence and social patterning of chronic diseases among older
people in a population undergoing health transition. A 10/66 Group cross-
sectional population-based survey in the Dominican Republic. BMC Public
Health 10: 344.
8. Albanese E, Liu Z, Acosta D, Guerra M, Huang Y, et al. (2011) Equity in the
delivery of community healthcare to older people: findings from 10/66
Dementia Research Group cross-sectional surveys in Latin America, China,
India and Nigeria. BMC Health Serv Res 11: 153.
9. Liang J, McCarthy JF, Jain A, Krause N, Bennett JM, et al. (2000) Socioeconomic
gradient in old age mortality in Wuhan, China. J Gerontol B Psychol Sci Soc Sci
55: S222–S233.
10. Wen M, Gu D (2011) The effects of childhood, adult, and community
socioeconomic conditions on health and mortality among older adults in China.
Demography 48: 153–181.
11. Lima-Costa MF, Peixoto SV, Matos DL, Firmo JO, Uchoa E (2011) Predictors
of 10-year mortality in a population of community-dwelling Brazilian elderly: the
Bambui cohort study of aging. Cad Saude Publica 27(Suppl 3): s360–s369.
12. Mostafa G, van Ginneken JK (2000) Trends in and determinants of mortality in
the elderly population of Matlab, Bangladesh. Soc Sci Med 50: 763–771.
13. Subramanian SV, Nandy S, Irving M, Gordon D, Lambert H, et al. (2006) The
mortality divide in India: the differential contributions of gender, caste, and
standard of living across the life course. Am J Public Health 96: 818–825.
14. Mathers CD, Fat DM, Inoue M, Rao C, Lopez AD (2005) Counting the dead
and what they died from: an assessment of the global status of cause of death
data. Bull World Health Organ 83: 171–177.
15. Byass P, Kahn K, Fottrell E, Collinson MA, Tollman SM (2010) Moving from
data on deaths to public health policy in Agincourt, South Africa: approaches to
analysing and understanding verbal autopsy findings. PLoS Med 7: e1000325.
doi:10.1371/journal.pmed.1000325.
16. Jha P, Gajalakshmi V, Gupta PC, Kumar R, Mony P, et al. (2006) Prospective
study of one million deaths in India: rationale, design, and validation results.
PLoS Med 3: e18. doi:10.1371/journal.pmed.0030018.
17. Baiden F, Bawah A, Biai S, Binka F, Boerma T, et al. (2007) Setting
international standards for verbal autopsy. Bull World Health Organ 85:
570–571.
18. Fottrell E, Byass P (2010) Verbal autopsy: methods in transition. Epidemiol Rev
32: 38–55.
19. Prince M, Ferri CP, Acosta D, Albanese E, Arizaga R, et al. (2007) The
protocols for the 10/66 Dementia Research Group population-based research
programme. BMC Public Health 7: 165.
20. World Health Organization (2007) Verbal autopsy standards: ascertaining and
attributing cause of death. Geneva: World Health Organization.
21. Fantahun M, Fottrell E, Berhane Y, Wall S, Hogberg U, et al. (2006) Assessing a
new approach to verbal autopsy interpretation in a rural Ethiopian community:
the InterVA model. Bull World Health Organ 84: 204–210.
22. US Centers for Disease Control and Prevention (2010) Number of deaths anddeath rates, by age, race, and sex: United States, 2005. Atlanta (Georgia): US
Centers for Disease Control and Prevention.23. Grundy E, Holt G (2001) The socioeconomic status of older adults: how should
we measure it in studies of health inequalities? J Epidemiol Community Health
55: 895–904.24. Pollitt RA, Rose KM, Kaufman JS (2005) Evaluating the evidence for models of
life course socioeconomic factors and cardiovascular outcomes: a systematicreview. BMC Public Health 5: 7.
25. Smith GD, Hart C, Blane D, Gillis C, Hawthorne V (1997) Lifetimesocioeconomic position and mortality: prospective observational study. BMJ
314: 547–552.
26. Jotheeswaran AT, Williams JD, Prince MJ (2010) Predictors of mortality amongelderly people living in a south Indian urban community; a 10/66 Dementia
Research Group prospective population-based cohort study. BMC PublicHealth 10: 366.
27. United Nations (2002) Report of the Second World Assembly on Ageing,
Madrid 8–12 April 2002. A/CONF.197/9. New York: United Nations.28. Prince M, Acosta D, Albanese E, Arizaga R, Ferri CP, et al. (2008) Ageing and
dementia in low and middle income countries—using research to engage withpublic and policy makers. Int Rev Psychiatry 20: 332–343.
29. Oti SO, Kyobutungi C (2010) Verbal autopsy interpretation: a comparative
analysis of the InterVA model versus physician review in determining causes ofdeath in the Nairobi DSS. Popul Health Metr 8: 21.
30. Strong K, Mathers C, Bonita R (2007) Preventing stroke: saving lives around theworld. Lancet Neurol 6: 182–187.
31. Sousa RM, Ferri CP, Acosta D, Albanese E, Guerra M, et al. (2009)Contribution of chronic diseases to disability in elderly people in countries with
low and middle incomes: a 10/66 Dementia Research Group population-based
survey. Lancet 374: 1821–1830.32. Sousa RM, Ferri CP, Acosta D, Guerra M, Huang Y, et al. (2010) The
contribution of chronic diseases to the prevalence of dependence among olderpeople in Latin America, China and India: a 10/66 Dementia Research Group
population-based survey. BMC Geriatr 10: 53.
33. Ferri CP, Schoenborn C, Kalra L, Acosta D, Guerra M, et al. (2011) Prevalenceof stroke and related burden among older people living in Latin America, India
and China. J Neurol Neurosurg Psychiatry 82: 1074–1082.34. Flores YN, Yee HF, Jr., Leng M, Escarce JJ, Bastani R, et al. (2008) Risk factors
for chronic liver disease in Blacks, Mexican Americans, and Whites in theUnited States: results from NHANES IV, 1999–2004. Am J Gastroenterol 103:
2231–2238.
35. Mendez-Sanchez N, Gutierrez-Grobe Y, Kobashi-Margain RA (2010) Epide-miology of HCV infection in Latin America. Ann Hepatol 9(Suppl): 27–29.
36. Abuaku B, Tan H, Li X, Chen M, Huang X (2010) Treatment default and deathamong tuberculosis patients in Hunan, China. Scand J Infect Dis 42: 281–287.
37. World Health Organization (2011) Health statistics and health information
systems: projections of mortality and burden of disease, 2002–2030. Available:http://www.who.int/healthinfo/global_burden_disease/projections2002/en/
index.html. Accessed 2 May 2011.38. Perkins AJ, Hui SL, Ogunniyi A, Gureje O, Baiyewu O, et al. (2002) Risk of
mortality for dementia in a developing country: the Yoruba in Nigeria.Int J Geriatr Psychiatry 17: 566–573.
39. Nitrini R, Caramelli P, Herrera E, Jr., de Castro I, Bahia VS, et al. (2005)
Mortality from dementia in a community-dwelling Brazilian population.Int J Geriatr Psychiatry 20: 247–253.
40. Beaglehole R, Ebrahim S, Reddy S, Voute J, Leeder S (2007) Prevention ofchronic diseases: a call to action. Lancet 370: 2152–2157.
41. Preston SH (1975) The changing relation between mortality and level of
economic development. Popul Stud (Camb) 29: 231–248.42. Leon DA, Walt G, Gilson L (2001) Recent advances: international perspectives
on health inequalities and policy. BMJ 322: 591–594.43. Feigin VL (2007) Stroke in developing countries: can the epidemic be stopped
and outcomes improved? Lancet Neurol 6: 94–97.
Mortality among Older People in LMIC
PLoS Medicine | www.plosmedicine.org 13 February 2012 | Volume 9 | Issue 2 | e1001179
Editors’ Summary
Background. Worldwide, half of all deaths occur in peopleaged 60 or older. Yet mortality among older people is aneglected topic in global health. In high income countries,where 84% of people do not die until they are aged 65 yearsor older, the causes of death among older people and thefactors (determinants) that affect their risk of dying are welldocumented. In Europe, for example, the leading causes ofdeath among older people are heart disease, stroke, andother chronic (long-term) diseases. Moreover, as in youngerage groups, having a better education and owning a housereduces the risk of death among older people. By contrast, inlow and middle income countries (LMICs), where three-quarters of deaths of older people occur, reliable data on thecauses and determinants of death among older people arelacking, in part because many LMICs have inadequate vitalregistration systems—official records of all births and deaths.
Why Was This Study Done? In many LMICs, chronicdiseases are replacing communicable (infectious) diseases asthe leading causes of death and disability—health expertscall this the epidemiological transition (epidemiology is thestudy of the distribution and causes of disease inpopulations)—and the average age of the population isincreasing (the demographic transition). Faced with thesechanges, which occur when countries move from a pre-industrial to an industrial economy, policy makers in LMICsneed to introduce measures to improve health and reducedeaths among older people. However, to do this, they needreliable data on the causes and determinants of death in thissection of the population. In this longitudinal population-based cohort study (a type of study that follows a group ofpeople from a defined population over time), researchersfrom the 10/66 Dementia Research Group, which is carryingout population-based research on dementia, aging, and non-communicable diseases in LMICs, investigate the patterns ofmortality among older people living in Latin America, India,and China.
What Did the Researchers Do and Find? Between 2003and 2005, the researchers completed a baseline survey ofpeople aged 65 years or older living in six Latin American LMICs,China, and India. Three to five years later, they determined thevital status of 12,373 of the study participants (that is, theydetermined whether the individual was alive or dead) andinterviewed a key informant (usually a relative) about eachdeath using a standardized ‘‘verbal autopsy’’ questionnaire thatincludes questions about date and place of death, and aboutmedical help-seeking and signs and symptoms noted duringthe final illness. Finally, they used a tool called the InterVAalgorithm to calculate the most likely causes of death from theverbal autopsies. Crude mortality rates varied from 27.3 per1,000 person-years in urban Peru to 70.0 per 1,000 person-years
in urban India, a three-fold difference in mortality rates thatpersisted even after allowing for differences in age, sex,education, occupational attainment, and number of assetsamong the study sites. Compared to the US, mortality rateswere much higher in urban India and rural China; much lower inurban and rural Peru, Venezuela, and urban Mexico; but similarelsewhere. Although several socioeconomic factors wereassociated with mortality, only a higher education statusprovided consistent independent protection against death instatistical analyses. Finally, chronic diseases were the maincauses of death; stroke was the leading cause of death at all thesites except those in rural Peru and Mexico.
What Do These Findings Mean? These findings identifythe main causes of death among older adults in a range ofLMICs and suggest that there is an association of educationwith mortality that extends into later life. However, thesefindings may not be generalizable to other LMICs or even toother sites in the LMICs studied, and because some of theinformation provided by key informants may have beenaffected by recall error, the accuracy of the findings may belimited. Nevertheless, these findings suggest how health andmortality might be improved in elderly people in LMICs.Specifically, they suggest that efforts to ensure universalaccess to education should confer substantial health benefitsand that interventions that target social and economicvulnerability in later life and promote access to effectivelyorganized health care (particularly for stroke) should beconsidered.
Additional Information. Please access these websites viathe online version of this summary at http://dx.doi.org/10.1371/journal.pmed.1001179.
N The World Health Organization provides information onmortality around the world and projections of globalmortality up to 2030
N The 10/66 Dementia Research Group is building anevidence base to inform the development and implemen-tation of policies for improving the health and socialwelfare of older people in LMICs, particularly people withdementia; its website includes background informationabout demographic and epidemiological aging in LMICs
N Wikipedia has a page on the demographic transition (note:Wikipedia is a free online encyclopedia that anyone canedit; available in several languages)
N Information about the InterVA tool for interpreting verbalautopsy data is available
N The US Centers for Disease Control and Prevention hasinformation about healthy aging
Mortality among Older People in LMIC
PLoS Medicine | www.plosmedicine.org 14 February 2012 | Volume 9 | Issue 2 | e1001179