ALK in the pathogenesis of cancer - repository.cam.ac.uk
183
ALK in the pathogenesis of cancer A thesis submitted for the degree of Doctor of Philosophy Nina Prokoph University of Cambridge Newnham College August 2020 This project has received funding from the European Union’s Horizon 2020 Marie Skłodowska-Curie Innovative Training Networks (ITN-ETN) under grant agreement No.: 675712
-
Upload
khangminh22 -
Category
Documents
-
view
0 -
download
0
Transcript of ALK in the pathogenesis of cancer - repository.cam.ac.uk

ALK in the pathogenesis of cancer
A thesis submitted for the degree of
Doctor of Philosophy
Nina Prokoph
University of Cambridge
Newnham College
August 2020
This project has received funding from the European Union’s Horizon 2020
Marie Skłodowska-Curie Innovative Training Networks (ITN-ETN) under grant agreement No.: 675712


I
Declaration
I hereby declare that this thesis is the result of my own work and includes nothing which is the outcome
of work done in collaboration except as declared in the preface and specified in the text.
It is not substantially the same as any that I have submitted, or, is being concurrently submitted for a
degree or diploma or other qualification at the University of Cambridge or any other University or similar
institution except as declared in the preface and specified in the text. I further state that no substantial
part of my dissertation has already been submitted, or, is being concurrently submitted for any such
degree, diploma or other qualification at the University of Cambridge or any other University of similar
institution except as declared in the preface and specified in the text.
It does not exceed the prescribed word limit (60,000 words) for the Biology Degree Committee.
Nina Prokoph

II
Abstract
ALK in the pathogenesis of cancer1
Nina Prokoph
Anaplastic Lymphoma Kinase (ALK) has been implicated in the pathogenesis of many types of cancer
including Anaplastic Large Cell Lymphoma (ALCL) and neuroblastoma (NB). ALK is an ideal drug target
as its endogenous expression is limited to neuronal cells during neonatal development, although
resistance to ALK-targeted therapy has been observed. In this thesis I explore potential mechanisms of
resistance to the ALK inhibitors that have been approved for ALK+ non-small cell lung cancer (NSCLC)
including crizotinib, alectinib, ceritinib, brigatinib and lorlatinib.
To define a global landscape of resistance mechanisms, patient-centric studies require many pre- and
post-treatment tumour specimens taken from a sufficient number of patients, which is not possible for a
rare cancer such as ALK+ ALCL or ALK driven NB. Hence, genome-wide CRISPR overexpression
screens were conducted in ALCL and NB cell lines.
We show that resistance to ALK inhibition by crizotinib in ALCL can be driven by aberrant upregulation
of interleukin-10 receptor alpha (IL10RA). Elevated IL10RA expression rewires the STAT3 signalling
pathway bypassing otherwise critical phosphorylation of STAT3 by NPM1-ALK. IL-10RA expression
does not correlate with response to standard chemotherapy in paediatric patients suggesting that a
combination of crizotinib with chemotherapy could prevent ALK-inhibitor resistance-specific relapse.
In the case of ALK-driven NB resistance to ALK inhibition is associated with expression of the
serine/threonine-protein kinase PIM1. While both ALK-driven and ALK-negative NB cells were
insensitive to several small-molecule pan-PIM kinase inhibitors, knockdown of PIM1 by RNA
interference sensitized cells to ALK inhibition and the combination of ALK inhibitors with the PIM1
inhibitor AZD1208 demonstrated mild synergy. Therefore, our data suggest the potential for combined
pharmacological inhibition of ALK and PIM1 in patients with ALK-driven NB.
Finally, given the above investigations largely focused on cell line-based models whereby in vitro
culture conditions may cause rapid phenotypic and genotypic divergence of patient-derived cells from
the originating tumour, we developed two paediatric ALK+ ALCL patient-derived xenograft (PDX)
models from liquid biopsy samples of chemotherapy-refractory and crizotinib resistant patients. In
vivo investigation showed that second generation ALK inhibitor brigatinib led to a reduction in the
mean tumour volume relative to either vehicle or crizotinib treatment. This suggests brigatinib as a
treatment option for crizotinib resistant ALCL patients.
In summary, this study has identified potential mechanisms of ALK inhibitor resistance particularly in
NPM1-ALK positive ALCL and ALK-driven NB.

III
Acknowledgements
I have been extremely lucky to meet wonderful people, who have guided and supported me on my
scientific journey. I will name them in the order that they crossed my way.
Ralf Jauch opened the door for my research adventure when he invited me to join Prasana Kolatkar’s
lab in Singapore. Eight years later he remains my untouchable role model of a supervisor. He has an
indescribable talent to create the most encouraging and collaborative work environment one can dream
of:
Kamesh Narasimhan taught me that there is nothing wrong about feeling stupid.
Calista Keow Leng Ng’s heartily guidance taught me all the wet-lab knowledge that I still cherish from.
Elena Haas worked alongside me when I moved back to Germany to continue with my Master’s.
Together we learned to acknowledge negative results as important results.
Jianming Liu accepted me for my final Master thesis project and this way set the ground stone for two
fruitful years at AstraZeneca. He was the most caring of my supervisors.
Neil Henderson introduced me into the world of biomarkers and clinical samples and helped me
tremendously to develop better documentation techniques.
John Steele played a major part in my overall happiness and development when he supported me to
move from Gothenburg to Shanghai. I am immensely grateful for his encouragement, suggestions, and
perspective. I always experience an energetic happiness even days after meeting him. Although not
superman, John is my hero.
Xiaolin Zhang was a wonderful host and allowed me to play in his research paradise. He is bursting
with energy – if I would have only met him once in my life, his image would still have stayed in my
memory. But what made the most impression on me was his modesty.
Qiuli Guo’s natural cheerfulness, and her mode of interaction with scientific colleagues completed my
experience in the Middle Kingdom.
Suzanne Turner attracted me to move to the United Kingdom and provided me with complete
independence and freedom. I am thankful for everything I could learn that way.
Nicola Probst has been the most important person during my PhD. She was my sunshine during an
extremely work-intensive time in the lab.
Isaia Barbieri infected me with fresh enthusiasm and energy. It is such a pleasure to show him new
results as his creative mind finds new avenues in a matter of seconds and his feedback is the most
encouraging that I have ever encountered.
There are three people that inspired me without their knowledge: Katarina Höll, Donatella Luciani and
Sofia Chen.

IV
The labs based at the Addenbrooke’s hospital have been filled with people, past and present, that made
sure I kept the same level of sanity. Specifically, Jamie Matthews and Rogier ten Hoopen shared
kindness and laughter with me; Hugo Larose was irreplaceable as he called out when I was getting
demotivated, working too hard or being not rational or focused; Jun Mun Liew was a calm anchor;
Sorcha Forde was my companion while carrying out the CRISPR screens and this way halved my
suffering; Liam Lee established numerous methods that I hugely profited from.
The biggest joy of my PhD has been to work alongside my undergraduate students Tu Truong, Nicola
Probst, Guido Lewik, Tugce Gül and Klaas Bahnsen. They have been great teachers.
In this context, I would like to thank the German Academic Exchange Service (Deutscher Akademischer
Austauschdienst, DAAD), the Bayer Science and Education Foundation, Erasmus+, the German
Academic Scholarship Foundation (Studienstiftung des deutschen Volkes) and Research Internships in
Science and Engineering (RISE) worldwide for supporting my students financially. Both DAAD and RISE
worldwide are funded by the German Federal Ministry of Education and Research.
In addition, I would like to thank the European Union for their generous financial support under the
Horizon 2020 Marie Skłodowska-Curie Innovative Training Network with grant agreement no. 675712.
Being part of a group of 15 PhD students across Europe taught me a great deal about the value of
collaboration in science. Most importantly, I would like to thank Stephen Ducray, Huan-Chang Liang,
Ivonne Montes-Mojarro, Cosimo Lobello, Geeta Sharma and Serena Stadler for their support and
Roberto Chiarle and Luca Mologni for been fantastic role models.
The first part of my PhD I spend at Cambridge Life Sciences in Ely: Special thanks goes to Keith
Rawson and Danielle Mack for their time and patience.
It feels like I have spent a decade in a dark tissue culture room, which I could not have endured without
music from the Red Hot Chili Peppers, Kurt Vile, Bon Iver, Hozier, Cigarettes After Sex, Mumford &
Sons, Of Monsters and Men, The Lumineers, The Decemberists, and Hollow Coves.
Finally, I would like to thank the patients and families that have provided samples.

V
Declaration of Assistance Received
The following people contributed to the success of my PhD projects. I thank each of you for your time
and friendliness.
Experiments or data analysis carried out by students that worked under my supervision:
1) Klaas Bahnsen (University of Dresden, Germany):
• Analysis of all microarray data
2) Tugce Gül (University of Bonn, Germany):
• Construction and validation of NSCLC cell line H3122 stably expressing lenti dCAS-VP64_Blast
and lenti MS2-P65-HSF1_Hygro
• Design and introduction of guide sequences into lenti sgRNA(MS2)_Puro backbone vector for
the following genes: KIT, MET, EGFR, ABCB1, KRAS, HER-2, IGF-1R
3) Guido Lewik (University of Bochum, Germany):
• RT-qPCR based validation of CRISPR hits using TKI-resistant ALCL cell lines
4) Nicola Probst (University of Applied Sciences Biberach, Germany):
• Establishment of alectinib-resistant and crizotinib-resistant SUDHL-1 cell line
• RT-qPCR based validation of CRISPR hits using TKI-resistant ALCL cell lines
• Design and introduction of guide sequences into lenti sgRNA(MS2)_Zeo backbone vector for the
following genes: STAT3, NPM1, MYC, MKNK1, IL10RA, IL10, P2RY6, SH2D2A, FOXN2,
HELZ2, HOXD8, RORC, GPR161, PRKACA, ADORA2A, PGBD1, HDAC8, ABCB1, EGFR,
KRAS, ALK, HER-2, IGF-1R, KIT, MET
• Functional validation of candidates identified from the screens in SU-DHL-1 and Mac-2A.
5) Tu Truong (University of Applied Sciences Biberach, Germany):
• Construction and validation of Mac-2A and SU-DHL-1 cell lines stably expressing lenti dCAS-
VP64_Blast and lenti MS2-P65-HSF1_Hygro
• Optimization of Golden Gate Cloning using BsmbI for the introduction of guide sequences into
lenti sgRNA(MS2)_Zeo backbone vector
Experiments or data analysis carried out by collaborators:
1) Liam Lee (University of Cambridge, UK)
• Design and introduction of guide sequences into lenti sgRNA(MS2)_Zeo backbone vector coding
for the following genes: ARHGEF9, BCL10, BDNF, COPZ2, CRK, CLYBL, EGR4, EML2, EREG,
ETV1, FAIM2, FOS, FOXP1, KRAS, MET, MFSD2A, MYC, NIN, NKX2-4, NPY, NR4A2,
PIK3CD, PIM1, PLEKHG6, PRKACA, PRRX2, PSD2, PTGES, RORC, RRAS, SAGE1,
SAMD4A, SEMA4A, SLC7A3, SPDEF, SSBP3, SURF2, UBIAD1, UTF1, YAP1.
• Transformation and amplification of the human CRISPR activation library
• Quantification of isolated amplicons by qPCR reactions using KAPA Library Quantification Kit
• Cell-titre blue based validation of CRISPR dCas9 overexpression screen hits in SH-SY5Y

VI
2) Martin Zimmerman (Hannover Medical School, Germany), Jamie D. Matthews (Univerity of
Cambridge, UK):
• Survival analysis
3) Serena Stadler (University of Giessen, Germany):
• Analysis of 94 BFM samples with immunoperoxidase labelling technique
4) Jack Monahan (EMBL-EBI, Cambridge, UK):
• RNA-seq analysis
5) Huan-Chang Liang (Medical University of Vienna, Austria):
• Immunohistochemistry staining for IL-10RA & IL-10RB
6) Vikas Malik (Columbia University Irving Medical Center, USA):
• ChIP-seq analysis
7) Luca Pandolfini (University of Cambridge, UK):
• Analysis of Human Protein Atlas RNA-seq datasets
8) Shi-Lu Luan (University of Cambridge, UK):
• Design and introduction of guide sequences into the lentiCRISPR v2 backbone vector coding for
IL10RA
9) Stephen P. Ducray, Hugo Larose (University of Cambridge):
• RT-qPCR based investigation of ALK knockdown with an inducible shRNA/crizotinib inhibition
on IL10, IL10RA and IL10RB mRNA expression
10) Geeta Sharma (University of Milano-Bicocca, Italy):
• RT-qPCR of lorlatinib-resistant K299 xenograft tumours
11) Ricky Trigg (University of Cambridge, UK):
• Illustrations: Figure 1, Figure 4, Figure 14, Figure 19A, Figure 21, Figure 29J, Figure 31B
• Cell-titre blue based PIM1 inhibitor validation in several NB cell lines.
12) Ivonne Montes-Mojarro (Tübingen University Hospital, Germany), Lakshmi Venkatraman (Royal
Belfast Hospital for Sick Children, UK), Sandra Högler (Medical University of Vienna, Austria),
Simone Tangermann (Medical University of Vienna, Austria), Lukas Kenner (Medical University of
Vienna, Austria), Liz Hook (University of Cambridge, UK), Olivier Giger (University of Cambridge,
UK):
• Pathological assessment, quantification and image generation of tissue microarrays
13) Elif Karaca & Qi Wang (Boston Children’s Hospital and Harvard Medical School, USA)
• Genome-wide Cas9 mini knockout screen and analysis
14) Jamie Matthews, Ricky Trigg, Harriet Kendrick-Thomas, Fallon Miller, Laura O'Reilly and Holly Bloy
(University of Cambridge, UK):
• Mouse handling
Collaborators that generously provided patient samples, reagents, equipment and/or data:
1) Andishe Attarbaschi (St Anna Children's Hospital, Vienna, Austria)
2) AstraZeneca
3) Isaia Barbieri (University of Cambridge, UK)

VII
4) Assaf C. Bester (Beth Israel Deaconess Medical Center, USA)
5) Laurence Brugières (Gustave Roussy Cancer Center, France)
6) G.A. Amos Burke (Addenbrooke’s Hospital, UK)
7) David R. Camidge (University of Colorado Cancer Center, USA)
8) Roberto Chiarle (University of Torino, Italy)
9) Ming-Qing Du (University of Cambridge, UK)
10) Falko Fend (Tübingen University Hospital, Germany)
11) F. Hoffmann-La Roche: Johannes Noe, Eveline Nüesch, Malgorzata Nowicka
12) Carlo Gambacorti-Passerini (University of Milano-Bicocca, Monza, Italy)
13) Birgit Geoerger (Gustave Roussy Cancer Center, France)
14) Inflection Biosciences
15) Andrea Janíková (University Hospital Brno, Czech Republic)
16) Robert Johnston (Royal Belfast Hospital for Sick Children, UK)
17) Wolfram Klapper (UKSH Campus Kiel, Germany)
18) Anne Lambilliotte (Hôpital Jeanne de Flandre, France)
19) Judith Landman-Parker (Hospital Armand Trousseau, France)
20) Olaf Merkel (Medical University of Vienna, Austria)
21) Luca Mologni (University of Milano-Bicocca, Monza, Italy)
22) Matthew J. Murray (Addenbrooke’s Hospital, UK)
23) Hélène Pacquement (Institut Curie, France)
24) Shahid Pervez (Aga Khan University Hospital, Pakistan)
25) Pfizer
26) Šárka Pospíšilová (CEITEC, Czech Republic)
27) Gudrun Schleiermacher (Institut Curie, France)
28) Owen Smith (Our Lady’s Children’s Hospital, Ireland)
29) Gilles Vassal (Gustave Roussy Cancer Center, France)
30) Wilhelm Woessmann (University Hospital Hamburg-Eppendorf, Germany)
31) Kent Yip (Ipswich Hospital NHS Trust, UK)
Technical service providers used:
1) DNA Sequencing Facility (Department of Biochemistry, University of Cambridge, UK):
• Sanger Sequencing reactions of PCR amplicons or plasmids
2) NIHR BRC Cell Phenotyping Hub (Department of Medicine, University of Cambridge, UK):
• FACS cell sorting on an FACSAria™ Fusion 2 (BD Biosciences)
3) Massachusetts General Hospital Next Generation Sequencing Facility (Department of Molecular
Biology, Harvard University, USA):
• HiSeq RapidRun reactions
4) Human Research Tissue Bank team (Addenbrooke’s Hospital, Cambridge, UK):
• Embedding of formalin-fixed tissue & sectioning of FFPE-blocks
• Staining of FFPE tissue sections for ALK and CD30

VIII
Table of Content
DECLARATION ........................................................................................................................................ I
ABSTRACT ............................................................................................................................................. II
ACKNOWLEDGEMENTS ....................................................................................................................... III
DECLARATION OF ASSISTANCE RECEIVED...................................................................................... V
LIST OF FIGURES ............................................................................................................................... XIII
LIST OF TABLES ................................................................................................................................. XV
ABBREVIATIONS ............................................................................................................................... XVII
CHAPTER 1 INTRODUCTION ........................................................................................................... 1
1.1 ANAPLASTIC LYMPHOMA KINASE (ALK) IN THE PATHOGENESIS OF CANCER .................................. 2
1.2 ALK+ ALCL ............................................................................................................................. 5
1.2.1 Clinical Features of Paediatric ALCL ................................................................................. 5
1.2.2 Frontline Treatment for Paediatric ALCL ........................................................................... 7
1.2.3 Treatment of Refractory/Relapsed Disease .................................................................... 14
1.3 ALK-DRIVEN NB ..................................................................................................................... 19
1.3.1 Clinical Features of NB .................................................................................................... 19
1.3.2 ALK in NB ........................................................................................................................ 19
1.3.3 Targeting ALK in ALK-driven NB ..................................................................................... 20
1.4 ALK+ NSCLC ....................................................................................................................... 22
1.4.1 Clinical Features of ALK+ NSCLC ................................................................................... 22
1.4.2 Targeting ALK in ALK+ NSCLC ....................................................................................... 22
1.5 RESISTANCE MECHANISMS TO ALK INHIBITORS ........................................................................ 23
1.5.1 ALK-dependent resistance mechanisms ......................................................................... 23
1.5.2 ALK-independent resistance mechanisms ...................................................................... 25
1.6 APPROACHES TO IDENTIFYING ACQUIRED RESISTANCE MECHANISMS TO TKIS ............................ 25
1.6.1 CRISPR-based genome-wide screens ............................................................................ 27
1.7 AIMS OF THE PHD .................................................................................................................. 30
CHAPTER 2 MATERIALS & METHODS .......................................................................................... 31
2.1 KEY REAGENTS AND RESOURCES ........................................................................................... 32
2.2 PATIENT SAMPLES .................................................................................................................. 40
2.2.1 NHL-BFM90 trial cohort ................................................................................................... 40
2.2.2 NHL-BFM95 trial cohort ................................................................................................... 41
2.2.3 ALCL99 trial cohort .......................................................................................................... 42
2.2.4 UK cohort ......................................................................................................................... 43
2.2.5 MAPPYACTS trial cohort ................................................................................................. 44
2.2.6 Brno cohort ...................................................................................................................... 45

IX
2.2.7 Pakistan cohort ................................................................................................................ 46
2.2.8 Vienna cohort ................................................................................................................... 46
2.3 ANIMAL STUDIES .................................................................................................................... 47
2.3.1 Generation of lorlatinib-resistant K299 xenografts .......................................................... 47
2.3.2 Generation of ALCL PDX ................................................................................................. 48
2.4 IMMUNOPEROXIDASE LABELLING TECHNIQUE FOR ANTI-ALK AUTOANTIBODY DETECTION ........... 49
2.4.1 Preparation of COS-1 NPM1-ALK transfectants ............................................................. 49
2.4.2 Immunostaining of COS-1 NPM1-ALK transfectants....................................................... 49
2.5 PROTEIN MICROARRAY ASSAY FOR ALK AUTOANTIBODY DETECTION ....................................... 50
2.5.1 Antigen spotting process ................................................................................................. 50
2.5.2 Processing of microarray slides ....................................................................................... 50
2.6 CELL LINES AND CELL CULTURE ............................................................................................... 51
2.7 IC50 DETERMINATION .............................................................................................................. 51
2.8 CELLULAR PROLIFERATION ...................................................................................................... 51
2.9 APOPTOSIS ANALYSIS ............................................................................................................. 51
2.10 GENERATION OF TKI-RESISTANT ALCL CELL LINES .................................................................. 51
2.11 SEQUENCING OF THE NPM1-ALK KINASE DOMAIN REGION ....................................................... 52
2.12 RT-QPCR ............................................................................................................................. 52
2.13 WESTERN BLOT ..................................................................................................................... 54
2.14 SGRNA CLONING .................................................................................................................... 55
2.15 GENOME-SCALE CAS9 TRANSCRIPTIONAL ACTIVATION SCREEN ................................................. 57
2.15.1 Genome-scale Cas9 transcriptional activation screen design .................................... 57
2.15.2 Generation of dCas9 and MS2 expressing cell lines .................................................. 59
2.15.3 Transformation, amplification and preparation of lentiviral sgRNA libraries ............... 59
2.15.4 Transduction of ALCL cell lines using lentiviral CRISPR libraries .............................. 60
2.15.5 Preparation of HiSeq libraries for the screen readout ................................................. 60
2.16 GENOME-SCALE CAS9 MINI KNOCKOUT SCREEN ....................................................................... 62
2.16.1 Genome-scale Cas9 knockout screen design ............................................................. 62
2.16.2 CRISPR Mini Knockout Screen ................................................................................... 63
2.17 SHORT-HAIRPIN RNA (SHRNA) KNOCKDOWN .......................................................................... 66
2.18 DRUG SYNERGY EXPERIMENTS ............................................................................................... 66
2.19 IMMUNOHISTOCHEMISTRY (IHC) .............................................................................................. 66
2.20 CHROMATIN IMMUNOPRECIPITATION (CHIP) QPCR .................................................................. 67
2.21 ENFORCED IL10RA OVEREXPRESSION .................................................................................... 68
2.22 MRNA SEQUENCING ............................................................................................................... 68
2.23 BIOINFORMATICS ANALYSIS ..................................................................................................... 68
2.23.1 ChIP-seq Data Analysis .............................................................................................. 68
2.23.2 Survival Analysis ......................................................................................................... 68
2.23.3 CRISPR Overexpression Screen Deconvolution and Analysis ................................... 69
2.23.4 CRISPR Mini Knockout Screen Deconvolution and Analysis ..................................... 69

X
2.23.5 mRNA-Seq Data Analysis ........................................................................................... 69
2.23.6 Gene Set Enrichment Analysis (GSEA) and Gene Ontology (GO) Analysis .............. 69
2.23.7 Gene Expression Analysis .......................................................................................... 69
2.23.8 Co-Expression Analysis .............................................................................................. 70
2.23.9 Analysis of Public Gene Expression Datasets ............................................................ 70
2.23.10 Waterfall Plot ................................................................................................................... 70
CHAPTER 3 BYPASS RESISTANCE LANDSCAPE TO CRIZOTINIB INHIBITION IN ALCL......... 71
3.1 INTRODUCTION ....................................................................................................................... 72
3.1.1 Aims ................................................................................................................................. 73
3.2 VALIDATION OF THE DCAS9-VP64 INDUCED OVEREXPRESSION PHENOTYPE .............................. 73
3.3 CRISPR OVEREXPRESSION SCREENS IDENTIFY GENES MODULATING CRIZOTINIB SENSITIVITY IN
ALCL CELL LINES ............................................................................................................................... 74
3.4 VALIDATION OF CANDIDATE GENES IDENTIFIED IN THE SCREEN .................................................. 76
3.4.1 Overexpression-based validation of Candidate Genes Modulating ALK TKI Sensitivity in
ALCL Cell Lines ............................................................................................................................ 76
3.4.2 Knockout-based validation of Candidate Genes Modulating ALK TKI Sensitivity in ALCL
Cell Lines ...................................................................................................................................... 79
3.4.3 Validation of Candidate Genes Modulating ALK TKI Sensitivity in Resistant ALCL Cell
Lines……………………………………………………………………………………………………….81
3.4.4 Validation of Candidate Genes Modulating ALK TKI Sensitivity in a Resistant Orthotopic
ALCL Cell Line Xenograft Model .................................................................................................. 81
3.4.5 Validation of Candidate Genes Modulating ALK TKI Sensitivity in ALCL Patients ......... 82
3.5 DISCUSSION ........................................................................................................................... 86
CHAPTER 4 IL10RA MODULATES ALK TKI SENSITIVITY IN ALK+ ALCL ................................... 87
4.1 INTRODUCTION ....................................................................................................................... 88
4.1.1 Aims ................................................................................................................................. 89
4.2 IL10RA IS EXPRESSED IN ALCL IN AN NPM1-ALK-INDEPENDENT MANNER .............................. 89
4.3 IL10RA OVEREXPRESSION MODULATES SENSITIVITY TO ALK INHIBITION ................................. 92
4.4 KNOCKOUT OF IL10RA/IL10RB/IL10 FURTHER SENSITIZES ALCL CELLS TO ALK INHIBITION ..... 97
4.5 STAT3 IS ACTIVATED INDEPENDENTLY OF NPM1-ALK THROUGH THE IL10/IL10R SIGNALING
PATHWAY ON CRIZOTINIB INHIBITION .................................................................................................... 97
4.6 HIGH EXPRESSION OF IL10RA AT DIAGNOSIS IS NOT PREDICTIVE OF CLINICAL OUTCOME FOR
PATIENTS TREATED WITH STANDARD CHEMOTHERAPY ........................................................................ 101
4.7 DISCUSSION ......................................................................................................................... 103
CHAPTER 5 BRIGATINIB IS EFFECTIVE IN A PDX OF CRIZOTINIB-RESISTANT ALK+ ALCL 104
5.1 INTRODUCTION ..................................................................................................................... 105
5.1.1 Aims ............................................................................................................................... 106
5.2 PATIENT TREATMENT HISTORY AND SAMPLE COLLECTION ........................................................ 107
5.3 BRIGATINIB IS EFFECTIVE IN A PDX OF CRIZOTINIB-RESISTANT ALK+ ALCL ............................ 107

XI
5.4 DISCUSSION ......................................................................................................................... 109
CHAPTER 6 OVEREXPRESSION OF PIM1 IN ALK+ MALIGNANCIES DECREASES
SENSITIVITY TO BRIGATINIB AND CERITINIB................................................................................ 113
6.1 INTRODUCTION ..................................................................................................................... 114
6.1.1 Aims ............................................................................................................................... 115
6.2 VALIDATION OF CANDIDATE RESISTANCE GENES IN ALK-DRIVEN NB CELLS EXPOSED TO ALK
INHIBITORS IDENTIFIED IN A GENOME-WIDE CRISPR-CAS9 OVEREXPRESSION SCREEN ......................... 115
6.3 PIM1 INHIBITION ENHANCES THE SENSITIVITY OF HIGH-RISK ABERRANT ALK-EXPRESSING NB TO
ALK INHIBITION REGARDLESS OF MYCN STATUS ................................................................................ 117
6.3.1 High expression of PIM1 in NB is associated with advanced, high risk disease
independent of MYCN amplification ........................................................................................... 117
6.3.2 Inhibition of PIM1 alone lacks potency in ALK-expressing NB but enhances the efficacy
of ALK inhibitors .......................................................................................................................... 117
6.3.3 Knockdown of PIM1 sensitizes NB cells to ALK inhibitors ............................................ 119
6.4 OVEREXPRESSION OF PIM1 IN ALK+ ALCL CELL LINES DECREASES SENSITIVITY TO ALK
INHIBITORS ........................................................................................................................................ 119
6.5 DISCUSSION ......................................................................................................................... 120
CHAPTER 7 DETECTION AND CLINICAL SIGNIFICANCE OF ANTI-ALK AUTOANTIBODIES . 122
7.1 INTRODUCTION ..................................................................................................................... 123
7.1.1 Humoral Immune Response against ALK in ALK+ ALCL .............................................. 123
7.1.2 Humoral Immune Response against ALK in ALK+ NSCLC .......................................... 124
7.1.3 Aims ............................................................................................................................... 124
7.2 A PIPELINE TO QUANTIFY ALK AUTOANTIBODY TITRES IN ALK+ MALIGNANCIES ........................ 125
7.2.1 2D-Epoxy is the best slide activation chemistry for antigen binding.............................. 126
7.2.2 A reduced teflon mask increases the signal intensity .................................................... 127
7.2.3 Evaluation of ALK and control proteins ......................................................................... 127
7.2.4 Final slide layout ............................................................................................................ 129
7.3 PROTEIN MICROARRAY ASSAY CROSS-VALIDATION .................................................................. 130
7.4 DISCUSSION ......................................................................................................................... 134
CHAPTER 8 DISCUSSION ............................................................................................................ 135
8.1 INTRODUCTION ..................................................................................................................... 136
8.2 THE USE OF ALK INHIBITORS FOR THE TREATMENT OF PAEDIATRIC ALK+ ALCL ...................... 136
8.2.1 Crizotinib in combination with multi-agent chemotherapy could be used as a
consolidation therapy before allogenic SCT for paediatric ALK+ ALCL patients after relapse .. 136
8.2.2 Brigatinib could offer a bridge to transplant for paediatric ALK+ ALCL patients after CNS
relapse…………………………………………………………………………………………………...137
8.3 THE USE OF ALK INHIBITORS FOR THE TREATMENT OF ALK-DRIVEN NB .................................. 137
8.4 A COLLABORATIVE APPROACH TO COLLATE AND INTEGRATE DATA WILL BE CRUCIAL TO MAKING
PROGRESS IN THE TREATMENT OF PAEDIATRIC CANCERS ..................................................................... 138

XII
CHAPTER 9 APPENDIX ................................................................................................................ 139
9.1 APPENDIX 1: LIST OF PEER-REVIEWED PAPERS AND REVIEWS ................................................. 140
9.1.1 Primary research articles ............................................................................................... 140
9.1.2 Review article................................................................................................................. 140
REFERENCE LIST .............................................................................................................................. 141

XIII
List of Figures
Figure 1 Domain structure and aberrant forms of Anaplastic Lymphoma Kinase (ALK) .................... 2
Figure 2 Different categories of ALK+ malignancies ........................................................................... 3
Figure 3 Management of childhood ALCL ......................................................................................... 17
Figure 4 ALK in NB ............................................................................................................................ 20
Figure 5 ALK-dependent or ALK-independent resistance mechanisms in ALK+ NSCLC ............... 23
Figure 6 Types of in vitro experimental designs to identify putative TKI resistance mechanisms .... 27
Figure 7 Technologies to perturb gene function in mammalian cells for pooled genetic screens .... 28
Figure 8 The genome-scale Cas9 transcriptional activation screen employed to identify bypass
resistance mechanisms to ALK TKIs ..................................................................................................... 58
Figure 9 The genome-scale Cas9 knockout screen employed to identify bypass resistance
mechanisms to ALK TKIs ...................................................................................................................... 62
Figure 10 ABCB1 overexpression induces resistance to crizotinib ................................................. 74
Figure 11 The dCas9-VP64-based CRISPR activation system induces overexpression of various
genes in different ALCL cell lines .......................................................................................................... 74
Figure 12 CRISPR Overexpression Screens Identify Genes Modulating Crizotinib Sensitivity in
ALCL Cell Lines ..................................................................................................................................... 75
Figure 13 CRISPR Overexpression Screens Identified STAT3 and NPM1 to Modulate Crizotinib
Sensitivity in ALCL Cell Lines ................................................................................................................ 76
Figure 14 Overexpression of candidate genes identified from the SAM screen induce resistance to
crizotinib …………………………………………………………………………………………………………78
Figure 15 Overexpression-based validation of candidate genes ..................................................... 78
Figure 16 CRISPR knockout screen dataset by Ng et al. identifies MYC and RORC as vulnerabilities
in ALK+ and ALK- ALCL ........................................................................................................................ 79
Figure 17 Knockout-based analysis ................................................................................................. 80
Figure 18 Hit validation in resistant ALCL cell lines ......................................................................... 81
Figure 19 Hit validation in a resistant orthotopic ALCL cell line xenograft model ............................ 82
Figure 20 Validation of Candidate Genes Modulating ALK TKI Sensitivity in ALCL Patients ......... 84
Figure 21 Schematic of the IL10 signalling pathway ....................................................................... 88
Figure 22 IL10RA is Expressed in ALCL Patient Tumour Tissue .................................................... 90
Figure 23 IL10 signaling is represented in ALCL cell lines .............................................................. 91
Figure 24 Transcription of IL10RA is independent of NPM1-ALK expression and activity .............. 92
Figure 25 IL10RA Overexpression Modulates Sensitivity to ALK Inhibition .................................... 94
Figure 26 IL10 Overexpression does not Modulate Sensitivity to ALK Inhibition ............................ 96
Figure 27 Plasmid-based IL10RA Overexpression Modulates Sensitivity to Crizotinib Inhibition ... 96
Figure 28 CRISPR-based knockout of IL10RA/IL10RB/IL10 is not lethal, but sensitizes ALCL cell
lines to ALK inhibition ............................................................................................................................ 98

XIV
Figure 29 STAT3 is Activated Independently of NPM1-ALK through the IL10/IL10R Signaling
Pathway on Crizotinib Inhibition .......................................................................................................... 101
Figure 30 Initial High Expression of IL10RA is not Predictive of Clinical Outcome for Patients Treated
with Chemotherapy .............................................................................................................................. 102
Figure 31 Established cell lines maintain crizotinib responsiveness of the original tumour .......... 108
Figure 32 Tumour volume over time in MGS-A-x PDX mice ......................................................... 110
Figure 33 Brigatinib is effective in the treatment of a PDX of crizotinib-resistant ALK+ ALCL ...... 111
Figure 34 Validation of CRISPR dCas9 overexpression screen hits in SH-SY5Y and CHLA-20 cells
…………………………………………………………………………………………………………………..116
Figure 35 High expression of PIM1 in NB is associated with advanced, high risk disease independent
of MYCN amplification ......................................................................................................................... 117
Figure 36 Response of ALK+ and ALK- NB cell lines to PIM inhibition ......................................... 118
Figure 37 ALK inhibitors and AZD1208 exhibit mild synergism in KELLY cell lines ...................... 118
Figure 38 Knockdown of PIM1 sensitizes NB cells to ALK inhibitors ............................................ 119
Figure 39 Overexpression of PIM1 in ALK+ ALCL cell lines decreases sensitivity to ALK inhibitors
…………………………………………………………………………………………………………………..120
Figure 40 Production, quality control (QC) and processing of microarray slides ........................... 125
Figure 41 Effect of slide activation chemistry ................................................................................ 126
Figure 42 Effect of the Teflon mask ............................................................................................... 127
Figure 43 Antigens utilized in the microarray assay ...................................................................... 128
Figure 44 A typical slide layout ...................................................................................................... 129
Figure 45 Correlation between anti-ALK autoantibody titre and anti-ALK autoantibody concentration
levels in paediatric ALK-positive ALCL patients enrolled in the ALCL-99 trial .................................... 131
Figure 46 Outcomes of paediatric ALK+ ALCL patients according to the magnitude of the antibody
response to ALK .................................................................................................................................. 132
Figure 47 Outcomes of paediatric ALK+ ALCL patients according to the magnitude of the antibody
response against ALK in combination with their minimal disseminated disease (MDD) status .......... 133
XV
List of Tables
Table 1 ALK+ NSCLC inhibitor landscape ......................................................................................... 4
Table 2 Definition of clinical terms in NHL .......................................................................................... 6
Table 3 Treatment outcomes for paediatric patients with ALCL after frontline multi-agent
chemotherapy with or without methotrexate (MTX) or vinblastine (VBL) ................................................ 7
Table 4 Treatment strategies for childhood ALCL ............................................................................. 8
Table 5 Past, ongoing and planned clinical trials for paediatric ALCL ............................................. 10
Table 6 Factors used for stratification of paediatric ALK+ ALCL patients into different risk groups 11
Table 7 Clinical trials evaluating ALK inhibitors in NB ..................................................................... 21
Table 8 Sensitizing (S) and resistance (R) mutations to ALK inhibitors .......................................... 24
Table 9 Previously published CRISPRn screens on drug resistance using GeCKO A v2 and B
libraries…………………………………………………………………………………………………………. 29
Table 10 Previously published CRISPRa screens on drug resistance ............................................... 30
Table 11 Key Reagents and Resources ............................................................................................. 32
Table 12 Clinical trials from which samples have been acquired ....................................................... 40
Table 13 Clinical Information of Paediatric ALCL Patients Recruited onto the NHL-BFM90 Trial...... 41
Table 14 Clinical Information of Paediatric ALCL Patients Recruited onto the NHL-BFM95 Trial...... 42
Table 15 Clinical Information of Paediatric ALCL Patients Recruited onto the ALCL99 Trial that
provided FFPE tissue specimens .......................................................................................................... 43
Table 16 Clinical Information of the Paediatric ALCL Patient from the UK Cohort ............................. 44
Table 17 Clinical Information of Paediatric ALCL Patients Recruited onto the MAPPYACTS Trial ... 44
Table 18 Clinical Information of T-cell Lymphoma Patients from the Brno Cohort ............................. 45
Table 19 Clinical Information of T-cell Lymphoma Patients from the Pakistan Cohort ....................... 46
Table 20 Clinical Information of T-cell Lymphoma Patients from the Vienna Cohort ......................... 47
Table 21 Starting and final TKI concentrations used to generate TKI resistant ALCL cell lines......... 52
Table 22 PCR Using Q5 High-Fidelity DNA Polymerase .................................................................... 52
Table 23 PCR cycle conditions used to amplify the NPM1-ALK kinase domain region ..................... 52
Table 24 RT-qPCR primers ................................................................................................................. 53
Table 25 List of antibodies used to detect proteins by Western blot .................................................. 54
Table 26 Oligonucleotides used to generate dsDNA fragments containing the 20 bp target
sequence……………………………………………………………………………………………………….. 55
Table 27 Phosphorylation and annealing of single-stranded sgRNA oligonucleotides ...................... 57
Table 28 Golden Gate assembly ......................................................................................................... 57
Table 29 PCR cycle conditions used for Golden Gate assembly ....................................................... 57
Table 30 Antibiotic concentrations that were used for the selection of the transduced cell lines ....... 59
Table 31 PCR amplification of virally integrated guides ...................................................................... 60
Table 32 Oligonucleotides used for HiSeq library preparation ........................................................... 61

XVI
Table 33 PCR cycle conditions used to amplify the sgRNAs’ guide sequence region and to append the
Illumina (HiSeq) compatible adapters and barcodes ............................................................................ 61
Table 34 sgRNAs cloned for the CRISPR Mini Knockout Screen ...................................................... 63
Table 35 Oligonucleotides used for HiSeq library preparation ........................................................... 65
Table 36 Oligonucleotides used to generate dsDNA fragments containing the target shRNA sequence
that were cloned into pLKO.1-puro ........................................................................................................ 66
Table 37 Antibodies used to detect proteins by IHC ........................................................................... 67
Table 38 ChIP-qPCR Sequencing Primers ......................................................................................... 68
Table 39 Candidate genes and their relevance in ALCL and other cancers ...................................... 77
Table 40 Baseline characteristics of Paediatric ALCL Patients Recruited to the ALCL99 Trial ....... 130

XVII
Abbreviations
AITL Angioimmunoblastic T-cell lymphoma
ALCL Anaplastic large cell lymphoma
ALK Anaplastic lymphoma kinase
ANOVA Analysis of variance
ATC Anaplastic thyroid cancer
b.i.d. bis in die (lat), twice a day
BSA Bovine serum albumin
BV Brentuximab vedotin
CAS9 CRISPR-associated protein 9
CNS Central Nervous System
COG Children’s Oncology Group
CR Complete response
CRISPR Clustered regularly interspaced short palindromic repeats
CRISPRa CRISPR activation
CRISPRi CRISPR interference
CRISPRn CRISPR nuclease
DLBCL Diffuse large B cell lymphoma
dCAS9 Dead Cas9
ECACC European collection of authenticated cell cultures
ED50 Median effective dose
EDTA Ethylenediaminetetraacetic acid
EFS Event-free survival
EICNHL European Inter-group for Childhood Non-Hodgkin Lymphoma
EML4 Echninoderm microtubule-associated protein-like 4
ESCC Oesophageal squamous cell carcinoma
FBS Fetal bovine serum
gDNA Genomic DNA
GeCKO Genome-Scale CRISPR Knock-Out
GOF Gain-of-function
GSEA Gene set enrichment analysis
HL Hodgkin Lymphoma
HR Hazard ratio
HSF1 Heat shock transcription factor 1
ICE Ifosfamide, carboplatin and etoposide
IHC Immunohistochemistry
IMT Inflammatory myofibroblastic tumour
InDels Insertions or deletions

XVIII
IRC Independent review committee
ITCC Innovative Therapies for Children with Cancer
JAK-STAT Janus kinase-signal transducer and activator of transcription
JUN Jun proto-oncogene
KO Knockout
KRAB Krüppel-associated box
LB Lysogeny broth
LOF Loss-of-function
MAGeCK Model-based analysis of genome-wide CRISPR/Cas9 knockout
MAPPYACTS Molecular Profiling for Pediatric and Young Adult Cancer Treatment Stratification
MDD Minimal disseminated disease
MLE Maximum likelihood estimation
MOI Multiplicity of Infection
MRD Minimal residual disease
MTX Methotrexate
NB Neuroblastoma
NCBI National Center for Biotechnology Information
NHEJ Non-homologous end joining
NHL Non-Hodgkin Lymphoma
NHL-BFM Non-Hodgkin Lymphoma-Berlin-Frankfurt-Münster
NMD Non-sense-mediated decay
NPM Nucleophosmin
NSCLC Non-small cell lung cancer
NT Non-targeting
ORF Open reading frame
ORR Overall response rate
OS Overall survival
PAM Photospacer adjacent motif
PBS Phosphate-buffered saline
PCA Principle component analysis
PD Progressive Disease
PD-L1 Programmed death-ligand 1
PDX Patient-derived xenograft
PFS Progression-Free Survival
PI Propidium iodide
PR Partial Response
PTC Premature termination codon
PTCL-NOS Peripheral T-cell lymphoma not otherwise specified
QC Quality control
RCC Renal cell carcinoma

XIX
RIPA Radioimmunoprecipitation assay
RMC Renal medulla carcinoma
RNAi RNA interference
RTK Receptor tyrosine kinase
SAM Synergistic activation mediator
SCT Stem Cell Transplantation
SD Standard deviation
SFOP French Society for Paediatric oncology
sgRNA Single guide RNA
shRNA short-hairpin RNA
SOC Serous ovarian carcinoma
TAE Tris-acetate-EDTA
TKI Tyrosine kinase inhibitor
tracrRNA trans-activating CRISPR RNA
TSS Transcription start site
VBL Vinblastine
WES Whole exome sequencing
WGS Whole genome sequencing
WT Wild type

1
CHAPTER 1 Introduction

2
1.1 Anaplastic lymphoma kinase (ALK) in the pathogenesis of cancer
The ALK gene encodes a receptor tyrosine kinase (RTK), which consists of an intracellular tyrosine
kinase domain, a trans-membrane domain and an extracellular ligand-binding domain2 (Figure 1A-B).
As a gene first discovered from the investigation of the t(2;5) chromosomal translocation, generating
nucleophosmin (NPM)-ALK, in anaplastic large cell lymphoma (ALCL)3 (Figure 1B), ALK has been
thoroughly investigated for its oncogenic capacity2.
ALK regulates cellular proliferation, apoptosis and differentiation by activation of multiple pathways4,
including rat sarcoma (RAS)/mitogen-activated protein kinase (MAPK), phosphoinositide 3-kinase
(PI3K)/AKT/molecular target of rapamycin (mTOR), Janus kinase (JAK)-signal transducer and activator
of transcription (STAT), phospholipase Cγ (PLCγ), sonic hedgehog (SHH) and jun proto-oncogene
(JUN)1-5 (Figure 1C).
Figure 1 Domain structure and aberrant forms of Anaplastic Lymphoma Kinase (ALK) (A). The N-terminal extracellular domain comprises two MAM domains flanked by a low-density lipoprotein class A (LDLa) domain, and a glycine-rich (GR) domain. The C-terminal intracellular region comprises the tyrosine kinase (TK) domain. (B) In the wild-type receptor, ligand-induced dimerisation of the extracellular region permits auto- and transphosphorylation of the kinase domain and subsequent recruitment of signal transducers. Aberrant forms of ALK expressed in cancer are ligand-independent due to point mutations in the kinase domain, gene amplification, or gene fusion. (C) NPM1-ALK signals through the PLCγ/PKC, MEK/ERK, PI3K/AKT and JAK/STAT pathways. Modified from Trigg et al.6.
MAM1
LDLa
MAM2
GR
TK
TM
extr
acel
lula
rin
trac
ellu
lar
0 (NH2)
1620 (COOH)
P
P
P
P
wild-typepoint
mutationamplification translocation/
inversion
P
P
P
P
e.g. NPM
P
P
P
P
MEK PI3K
AKT
mTOR
PCLγ
IP3
JAK
STAT5B
ERK
BA
STAT3
PKC
Oncogenic pathways
C

3
Thus, ALK has been implicated in the pathogenesis of many types of cancers that can be categorized
by the specific types of alteration (Figure 2): translocations, overexpression and point mutations of ALK2
(Figure 1B).
Figure 2 Different categories of ALK+ malignancies ALK-related malignancies that are studied in this thesis are highlighted in white. DLBCL: diffuse large B cell lymphoma; ATC: anaplastic thyroid cancer; ESCC: oesophageal squamous cell carcinoma; IMT: inflammatory myofibroblastic tumour; RCC: renal cell carcinoma; RMC: renal medulla carcinoma; SOC: serous ovarian carcinoma.
Overexpression of ALK and amplification of the ALK gene have been reported in various types of cancer
cell lines and patient samples, including inflammatory myofibroblastic tumour (IMT)7, neuroblastoma
(NB)8, melanoma9, non-small cell lung cancer (NSCLC)10, rhabdomyosarcoma, glioblastoma2, breast
cancer11, oesophageal cancer12, retinoblastoma, Ewing’s sarcoma and astrocytoma2.
Point mutations and focal deletion of ALK, without translocation, have been identified in relatively limited
types of cancer to date including anaplastic thyroid cancer13, NSCLC14, and in both familial15 and
sporadic NB16 (Figure 4).
In contrast, ALK is frequently translocated in human cancers with twenty-two fusion partner genes17
including Nucleophosmin 1 (NPM1)3, ring finger protein 213 (RNF213), 5-aminoimidazole-4-
carboxamide ribonucleotide formyltransferase/IMP cyclohydrolase (ATIC), TRK-fused gene (TFG),
moesin (MSN), tropomyosin 3/4 (TPM3/4), myosin heavy chain 9 (MYH9) and clathrin heavy chain
(CLTC)2 in ALCL, and echninoderm microtubule-associated protein-like 4 (EML4)18, Kif5b kinesin family
member 5B (KIF5B), TRK-fused gene (TFG), Kinesin light chain 1 (KLC1), protein tyrosine phosphatase
non-receptor type 3 (PTPN3) and striatin (STRN) in NSCLC2. To add to the complexity, within the
different ALK fusions there are examples of several breakpoint variants, as illustrated by the EML4–ALK
translocations observed in NSCLC, by which multiple EML4 exon breakpoints fuse in‑frame with exon
20 of ALK19. Comparisons of the different ALK fusion proteins suggest that they display differences in
ALK+
ALK
mutation
ALK
overexpression
ALK
fusion-
protein

4
signalling and in transforming tumourigenic potential17. The fusion partner of ALK generally determines
the initiation of transcription, subcellular localization, dimerization, activation2 and therefore the
molecular and physiological function of ALK. Several pharmaceutical companies have developed potent
ALK inhibitors (Table 1).
Table 1 ALK+ NSCLC inhibitor landscape
Name Chemical structure Company Global Status
Crizotinib
Pfizer FDA approval for advanced NSCLC whose tumours are ALK+ (26/08/2011) or ROS1+ (11/03/2016)
Ceritinib
Novartis FDA approval (29/04/2014) for advanced ALK-rearranged NSCLC patients who experience disease progression on or who are intolerant to crizotinib. FDA broadens ceritinib approval to firstline treatment for ALK+ metastatic NSCLC (30/05/2017).
Alectinib
Hoffmann-La Roche
FDA approval (11/12/2015) EU approval (21/02/2017) for advanced NSCLC whose tumours are ALK+.
Lorlatinib
Pfizer FDA approval (02/11/2018) for patients with ALK+ metastatic NSCLC whose disease has progressed on crizotinib and at least one other ALK inhibitor for metastatic disease or whose disease has progressed on alectinib or ceritinib as the first ALK inhibitor therapy for metastatic disease
Brigatinib
Takeda FDA approval (28/04/2017) for ALK+ metastatic NSCLC patients who have progressed on or are intolerant to crizotinib and lorlatinib.

5
The following paragraphs largely from sections of a review published in Cancers (Prokoph & Larose et
al.)20, which can be found in Appendix 1.
1.2 ALK+ ALCL
1.2.1 Clinical Features of Paediatric ALCL
In 1982, Stein and colleagues19 described tumours formed of neoplastic cells of unknown origin found
in Hodgkin’s Lymphoma (HL), expressing the CD30 antigen (Ki-1, Ber-H2)21-22. Approximately 77% of
these tumours also expressed a T cell antigen, 20% showed B cell antigens and the rest were of a null-
cell phenotype expressing neither B nor T cell-distinguishing cell surface proteins. In 1988, the entity
was for the first time described as ALCL, which is the name used to this day23. In 1989, a French group
identified a translocation (t(2;5)(p23;q35)) in a subset of ALCL24-25, breakpoints of which were
successfully cloned by Steve Morris and Tom Look in 1994, revealing the fusion of the nucleolar
phosphoprotein gene NPM1 with that of a newly described gene, ALK3. However, it was not until 2008
that ALCL was split into two provisional entities; ALK+ ALCL and ALK- ALCL, which were confirmed in
the 2017 version of the WHO classification of tumours of haemopoietic and lymphoid tissues.
ALCL is primarily a paediatric tumour, accounting for 15% of all paediatric Non-Hodgkin Lymphoma
(NHL) with an annual incidence ranging from 1.2 per million in children under 15 years to approximately
2 per million in young adults between 25-34 years26, with approximately 80 new paediatric cases
diagnosed in Europe each year27. ALCL shows a bimodal age distribution; whilst the majority of
paediatric cases are ALK+, about 50-60% of adult ALCL cases are ALK-. It is estimated that 90% of
paediatric ALCL show aberrant expression of ALK fusion proteins and of those, approximately 75%
express NPM-ALK28. ALK+ ALCL cases show improved survival rates over ALK- ones, although this
could be due to the skewed age distribution with ALK- disease largely diagnosed in an adult population29.
However, considering only paediatric cases, overall survival (OS) rates (see Table 2 for clinical terms)
are still higher for ALK+ paediatric patients than for ALK- ones, with an event-free survival (EFS) of 65-
75% for ALK+ ALCL depending on the treatment regimen compared to 15-46% for ALK- ALCL30–33.

6
Table 2 Definition of clinical terms in NHL The first received response criteria for NHL were published in 199934, updated in 200735 by an International Working Group and 201336 termed as the Lugano Classification. The definition of response criteria in this table is based on the Lugano Classification36 and the refinement of the Lugano classification in the era of immunotherapy37. (*) 5-point scale according to Lugano Classification36: 1, no uptake above background; 2, uptake ≤ mediastinum; 3, uptake > mediastinum but ≤ liver; 4, uptake > liver; 5, uptake markedly > liver and/or new lesions.
Clinical term Definition
Overall survival (OS) The length of time from either the date of diagnosis or the start of cancer treatment that a patient is still alive38.
Event-free survival (EFS) The length of time after primary cancer treatment ends that the patient remains free of complications/events that the treatment was intended to prevent/delay38.
Progression-free survival (PFS)
The length of time during and after cancer treatment that a patient lives with the disease but it does not get worse38.
Complete Response (CR), Complete Remission (CR)
A complete metabolic response measured by positron emission tomography-computed tomography (PET-CT) or a complete radiological response measured by CT36. Lymph nodes: on PET-CT, score 1, 2, or 3 with/without a residual mass on 5-point scale*; on CT, target nodes/nodal masses must regress to ≤ 1.5 cm in longest diameter37. No bone marrow involvement or extralymphatic sites involved36.
Partial Response (PR), Partial Remision (PR)
A partical metabolic response measured by positron PET-CT or a complete radiological response measured by CT36. On PET-CT score 4 or 5 with reduced uptake compared with baseline and residual mass(es) of any size. On CT ≥ 50% decrease in SPD (sum of the product of the perpendicular diameters for multiple lesions) of up to 6 target measurable nodes and extranodal sites36-37.
Progressive Disease (PD) A progressive metabolic disease measured by positron PET-CT or a progressive disease measured by CT36. On PET-CT, score 4 or 5 with an increase in intensity of uptake from baseline and/or new fluorodeoxyglucose-avid foci consistent with lymphoma at preliminary or end-of-treatment assessment37. On CT, an individual node/lesion must be abnormal with: longest diameter > 1.5 cm and increase by ≥ 50% from product of the perpendicular diameters lowest point and an increase in longest diameter or short diameter from the lowest point (0.5 cm for lesions ≤2 cm / 1.0 cm for lesions >2 cm)37. New/clear progression of preexisiting nonmeasured lesions or regrowth of resolved lesions37. A new node > 1.5 cm or a new extranodal site > 1.0 cm (both in any axis) or < 1.0 cm in any axis or assessable disease of any size that must be unequivocal attributable to lymphoma37. New/recurrent bone marrow involvement37.
Stable Disease (SD) No metabolic disease measured by positron PET-CT or a stable disease measured by CT36. Target nodes, extranodal lesions: on PET-CT, score 4 or 5 with no significant change in fluorodeoxyglucose uptake from baseline at interim or end of treatment; on CT: < 50% decrease from baseline in SPD (sum of the product of the perpendicular diameters for multiple lesions) of up to 6 measurable nodes and extranodal sites36.
Allogenic SCT Stem cell transplantation that uses stem cells from a donor whose human leukocyte antigens (HLA) are acceptable matches to the patient’s.
Autologous SCT Stem cell transplantation that uses a person’s own stem cells.
Intrathecal injection A route of administration for drugs via an injection into the spinal canal, or into the subarachnoid space so that it reaches the cerebrospinal fluid (CSF). This way the drug is not stopped by the blood brain barrier38.
Minimal disseminated disease (MDD)
Detection of NPM-ALK transcript via e.g. RT-qPCR in bone marrow or peripheral blood samples from an ALK+ ALCL patient at diagnosis39.
Recommended phase II dose (RP2D)
Identified in phase I clinical trials, the RP2D is defined as the highest dose with acceptable toxicity40.
Reduced Intensity Conditioning (RIC)
RIC conditioning as tested by Fukano et al.41 in ALK+ ALCL is composed of (i) total body irradiation of ≤ 500 cGy as a single fraction or ≤ 800 cGy fractionated, (ii) < 9 mg/kg of busulfan, (iii) ≤ 140 mg/m2 melphalan,(vi) < 10 mg/kg thiotepa.
BEAM conditioning Carmustine [bis-chloroethylnitrosourea=BCNU]-etoposide-cytarabine [Ara-C]-melphalan
7
1.2.2 Frontline Treatment for Paediatric ALCL
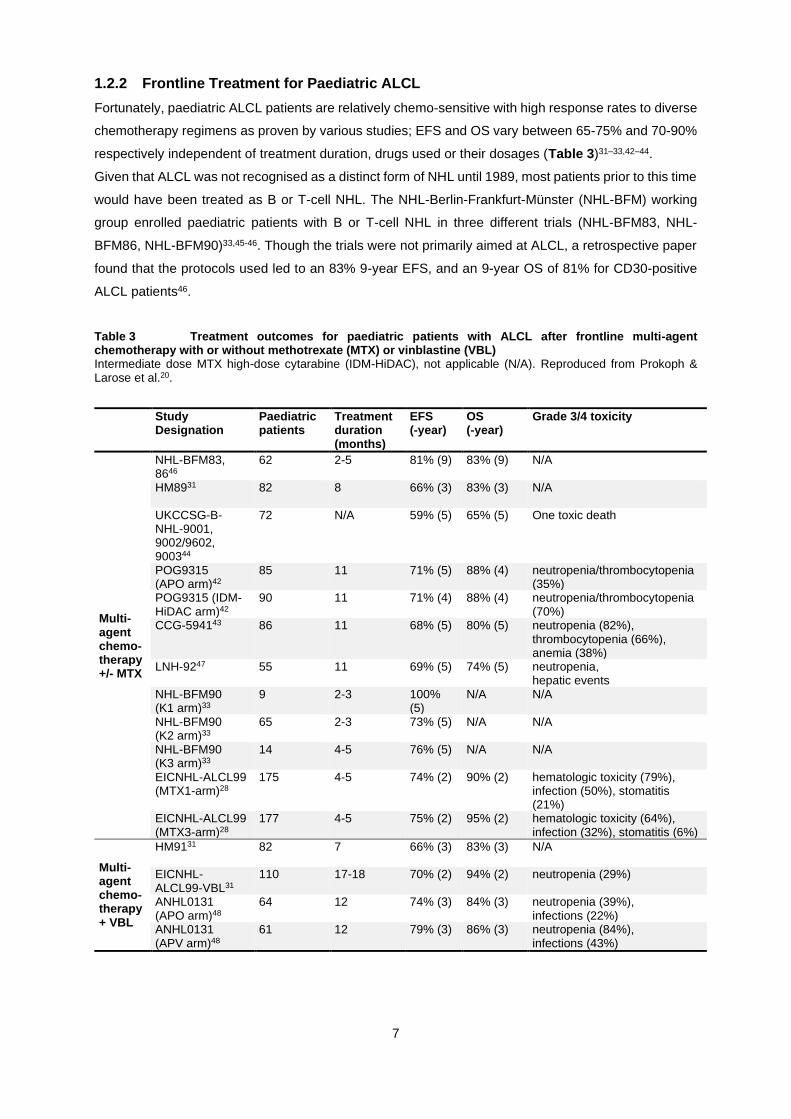
Fortunately, paediatric ALCL patients are relatively chemo-sensitive with high response rates to diverse
chemotherapy regimens as proven by various studies; EFS and OS vary between 65-75% and 70-90%
respectively independent of treatment duration, drugs used or their dosages (Table 3)31–33,42–44.
Given that ALCL was not recognised as a distinct form of NHL until 1989, most patients prior to this time
would have been treated as B or T-cell NHL. The NHL-Berlin-Frankfurt-Münster (NHL-BFM) working
group enrolled paediatric patients with B or T-cell NHL in three different trials (NHL-BFM83, NHL-
BFM86, NHL-BFM90)33,45-46. Though the trials were not primarily aimed at ALCL, a retrospective paper
found that the protocols used led to an 83% 9-year EFS, and an 9-year OS of 81% for CD30-positive
ALCL patients46.
Table 3 Treatment outcomes for paediatric patients with ALCL after frontline multi-agent chemotherapy with or without methotrexate (MTX) or vinblastine (VBL) Intermediate dose MTX high-dose cytarabine (IDM-HiDAC), not applicable (N/A). Reproduced from Prokoph & Larose et al.20.
Study Designation
Paediatric patients
Treatment duration (months)
EFS (-year)
OS (-year)
Grade 3/4 toxicity
Multi-agent chemo-therapy +/- MTX
NHL-BFM83, 8646
62 2-5 81% (9) 83% (9) N/A
HM8931 82 8 66% (3) 83% (3) N/A
UKCCSG-B-NHL-9001, 9002/9602, 900344
72 N/A 59% (5) 65% (5) One toxic death
POG9315 (APO arm)42
85 11 71% (5) 88% (4) neutropenia/thrombocytopenia (35%)
POG9315 (IDM-HiDAC arm)42
90 11 71% (4) 88% (4) neutropenia/thrombocytopenia (70%)
CCG-594143 86 11 68% (5) 80% (5) neutropenia (82%), thrombocytopenia (66%), anemia (38%)
LNH-9247 55 11 69% (5) 74% (5) neutropenia, hepatic events
NHL-BFM90 (K1 arm)33
9 2-3 100% (5)
N/A N/A
NHL-BFM90 (K2 arm)33
65 2-3 73% (5) N/A N/A
NHL-BFM90 (K3 arm)33
14 4-5 76% (5) N/A N/A
EICNHL-ALCL99 (MTX1-arm)28
175 4-5 74% (2) 90% (2) hematologic toxicity (79%), infection (50%), stomatitis (21%)
EICNHL-ALCL99 (MTX3-arm)28
177 4-5 75% (2) 95% (2) hematologic toxicity (64%), infection (32%), stomatitis (6%)
Multi-agent chemo-therapy + VBL
HM9131 82 7 66% (3) 83% (3) N/A
EICNHL-ALCL99-VBL31
110 17-18 70% (2) 94% (2) neutropenia (29%)
ANHL0131 (APO arm)48
64 12 74% (3) 84% (3) neutropenia (39%), infections (22%)
ANHL0131 (APV arm)48
61 12 79% (3) 86% (3) neutropenia (84%), infections (43%)

8
NHL-BFM90 was the first trial to sort 89 paediatric ALCL patients into independent arms of the study
(Table 3), although presence of the ALK translocation was not used as inclusion criteria for this trial33.
The treatment protocol (Table 4) was based on the previous NHL-BFM studies, using retrospective
results of ALCL patients enrolled in these studies. ALCL patients were enrolled into one of three arms
according to disease severity: arm K1 for stages I and II if completely resected (9 patients), K2 for stage
II non-resected and stage III (65 patients), and K3 for stage IV (14 patients). Because CD30-positive
ALCL resembled B-cell NHL closely, the first protocol trialled was that used for B-cell NHL, which used
methotrexate. Thus, the arms K1 to K3 tested increasing doses of methotrexate. NHL-BFM90 led to a
5-year EFS of 100%, 73% and 79% respectively for arms K1, K2 and K3. The treatment regimen lasted
between 2 to 5 months compared to 7 or 8 months respectively for HM89 and HM91 (Table 4), which
are both protocols that were tested by the French Society for Paediatric oncology (SFOP) at that time.
As a result, and because the drug doses were comparatively lower – all with comparable EFS rates –
the NHL-BFM working group recommended its NHL-BFM90 protocol as a gold standard31,33,49-50.
Table 4 Treatment strategies for childhood ALCL Treatment strategies for childhood ALCL. ARA-C, cytarabine; BV, Brentuximab vedotin; Cyc, cyclophosphamide; CZ, crizotinib; Daun, daunorobicin; Doxo, doxorubicin; Eto, etoposide; IDM-HiDAC, intermediate dose MTX high-dose Cytarabine; Ifo, ifosfamide; I/T, intrathecal; IV, Intravenous; MTX, methotrexate; TT, topotecan; VBL, vinblastine; VCR, vincristine; VND, Vindesine. Not detailed: prednisone, prednisolone, dexamethasone and food supplements. (*) Randomized into MTX1 or MTX3 arm. Reproduced from Prokoph & Larose et al.20.
Trial Acronym
Oth
er
Cyc
Ifo
Do
xo
Eto
MT
X (
I/T
)
MT
X (
IV)
AR
A-C
(IV
)
AR
A-C
(I/
T)
VC
R
VN
D
VB
L
HM8931
HM9131
NHL-BFM90 (K1/2 arm)33
NHL-BFM90 (K3 arm)33
POG9315 (APO arm)42
POG9315 (IDM-HiDAC arm)42
CCG-594143
LNH-9247 +Daun
NHL-BFM95 (R1/2)51
NHL-BFM95 (R3/4)51
EICNHL-ALCL99 (MTX1-arm)28
EICNHL-ALCL99 (MTX3-arm)28
EICNHL-ALCL99-VBL52 *
ANHL0131 (APO arm)48
ANHL0131 (APV arm)
COG-ADVL1212 (Course A/C/D) +CZ +TT
COG-ADVL1212 (Course B) +CZ
COG-ANHL12P1 (Course A) +CZ/BV
COG-ANHL12P1 (Course B) +CZ/BV
9
Given the high risk of short-term side effects associated with methotrexate such as oral and
gastrointestinal mucositis, sometimes leading to sepsis and toxic death51, lower concentrations of
methotrexate administered in shorter pulses were applied in a subsequent NHL-BFM trial in 1995 (NHL-
BFM 95, Table 4). NHL-BFM95 stratified patients into lower risk (stages I and II, arms R1 and R2) and
high-risk patients (stages III and IV, arms R3 and R4). Patients in arms R1/R2 and R3/R4 were treated
with 1 g/m² and 5 g/m² methotrexate infusions respectively. In both cases, half the patients were
randomized to be given the infusion over 4 hours, while the other half were given the infusion over 24
hours. The trial found that the 4-hour infusion and the 1 g/m² dose were not inferior but were less toxic
than the 24-hour infusion and 5 g/m² injection.
The European Inter-group for Childhood Non-Hodgkin Lymphoma (EICNHL) launched the first
randomized trial for ALCL patients under 22 years of age (Table 5), regardless of ALK status in 1999 –
the ALCL99 trial (NCT00006455)28,53-54. ALCL99 enrolled 352 children over 7 years in 11 European
countries and Japan. The trial tested four different protocols aiming to achieve three main goals: to lower
the amount of methotrexate required, to rid the protocol of intrathecal injections and to test whether
vinblastine could be a valuable addition to the protocol. Patients were randomly enrolled into arms
methotrexate (MTX)1 and MTX3, which tested the NHL-BFM90 backbone with a 24-hour low-dose (1
g/m²) methotrexate infusion or a high-dose (3 g/m²) 3-hour methotrexate infusion (both without
intrathecal injections) respectively. The trial achieved a 2-year EFS of 74.1% and a 2-year OS of 92.5%,
and found that the MTX3 arm using a higher dose, but a shorter infusion time for methotrexate was
overall less toxic than the MTX1 arm28,30–33,55. Thus, the investigators recommended using short-pulse,
high-dose methotrexate without intrathecal injections for reduced toxicity and improved quality of life. In
addition, given the comparatively lower dose of anthracycline and alkylating agent employed, it was
hoped that the long-term side-effects such as obesity and metabolic syndrome would be reduced28,55-56.
Besides the observed short-term toxicity, relapse compared to previous trials (HM89, HM91, NHL-
BFM83, NHL-BFM86, and NHL-BFM90) averaging at 20-40% with some children experiencing multiple
events28. Whilst these children tend to remain chemo-sensitive, they still suffer the long-term side effects
of toxic chemotherapy55.

10
Table 5 Past, ongoing and planned clinical trials for paediatric ALCL Allo, allogeneic; AC, alectinib; auto, autologous; BV, Brentuximab vedotin; CR, ceritinib; CZ, crizotinib; Cyc, cyclophosphamide; ARA¬C, cytarabine; Dexa, Dexamethasone; Doxo, doxorubicin; Eto, etoposide; Ifo, ifosfamide; MTX, methotrexate; SCT, stem cell transplantation; TT, topotecan; VBL, vinblastine; VCR, vincristine. (*) as stated on ClinicalTrials.gov webpage. Reproduced from Prokoph & Larose et al.20.
ClinicalTrials.gov Identifier
Trial Acronym Treatment Phase Time frame*
Location No (ALCL)*
Fro
ntl
ine
NCT00006455 EICNHL-ALCL9952,55
ALCL99 (Cyc, MTX, Ifo, Eto, ARA-C, Doxo) +/- VBL
III 1999-2005
Europe, Japan
487
NCT00059839 COG-ANHL013157 APO (Doxo, MTX, VCR) +/- VBL
III 2003-2014
USA 125
NCT01979536 COG-ANHL12P158 CZ/BV + (Dexa, Ifo, MTX, ARA-C, Eto)/(Dexa, MTX, Cyc, Doxo)
II 2013-2020
USA 140
NCT02729961 NCI-2016-0039659 BV+CR I/II 2017-2023
USA 30
N/A EICNHL-ALCL-VBL ALCL99/VBL N/A Planned
Europe 106
Rela
ps
e
NCT00317408 EICNHL-ALCL-RELAPSE60
allo SCT/BEAM-conditioning + auto SCT/VBL
N/A 2004-2014
Europe 96
NCT00354107 COG-ANHL06P161 SGN-30, Ifo, Carboplatin, Eto
I/II 2007-2010
USA 5
NCT01492088 C2500262 BV I/II 2012-2018
Worldwide 36
NCT00939770 COG-ADVL091263,64 CZ I 2009-2020
USA 26
NCT01606878 COG-ADVL121265 CZ + (Cyc, TT)/ I 2013-2018
USA 65
NCT02034981 AcSé66 CZ Il 2013-2022
France 24
N/A UMIN00001699167,68 (VCR,Dexa, Doxo) II 2015-2020
Japan 10
N/A UMIN00002807569 AC I/II 2017-2022
Japan 23
N/A ITCC053/CRISP70 CZ IB 2016-2021*
Europe 82
NCT03703050 ALCL-Nivo Nivolumab II 2018-2026
Europe 38
NCT01742286 N/A CR I 2013-2019
Europe 8
N/A JPLSG-ALCL-RIC18 SCT N/A 2017-2026
Japan 18
1.2.2.1 Vinblastine: Adjusting Frontline Therapy to Reduce Relapse and Toxicity
Two small retrospective studies conducted by the SFOP showed that vinblastine could reduce the risk
of treatment failure, even for patients who had relapsed on chemotherapy71-72. Hence, as part of the
ALCL99 protocol, vinblastine was trialled in high-risk patients (those with mediastinal, lung, liver or
spleen involvement, or biopsy-proven skin lesions) who were eligible for the sub-trial, ALCL99-VBL
(Table 3, Table 4). High-risk patients were first randomized into either the MTX1-VBL or MTX3-VBL
arms, and then half were randomly selected to receive weekly Vinblastine at 6 mg/m², in addition to the
MTX1 or MTX3 protocol they were already in, followed by weekly vinblastine only injections for 1 year
on its own as a maintenance treatment52. Results showed a significant improvement over the first year
of treatment with regards to EFS, but no significant difference overall with relapse being delayed rather
than prevented52. Vinblastine was further trialled as a frontline therapy in the Children’s Oncology Group

11
(COG) trial ANHL0131 (NCT00059839), in addition to the chemotherapy backbone, which used low-
dose methotrexate infusions – vinblastine replaced vincristine. Similar to the European trial, it did not
find any significant difference between the 3-year OS or EFS as compared to standard chemotherapy,
but did show that weekly vinblastine administration was more toxic than the ‘no vinblastine’ arm48. For
both ANHL0131 and ALCL99-VBL, the vinblastine dose started at 6 mg/m2, but had to be reduced to 4
mg/m² due to toxicity in 41 of 61 patients.
The experience with single agent vinblastine in relapse therapy (discussed below) suggested that low-
dose, long-term single agent vinblastine could be as effective as is standard short-term multi-agent
chemotherapy in low risk patients (see Table 6 for criteria used to stratify patients into risk groups).
Therefore, a new EICNHL trial, ALCL-VBL, will investigate Vinblastine as a single-agent frontline
treatment (administered weekly for 18 months, then every other week for 6 months, at 6 mg/m2), in
patients negative for minimal disseminated disease (MDD), a prognostic factor previously associated
with a lower risk of treatment failure73-74. The goal will be to assess whether vinblastine could replace
the ALCL99 protocol, at least for low risk patients – though it may not improve the OS and EFS rates,
the hope is that it will be less toxic overall. Patients who can be cured by vinblastine are spared both
acute (stomatitis, neutropenia, infections, 1 – 2% treatment related mortality) and late (risk of secondary
malignancies, infertility, cardiac toxicity, obesity, metabolic syndrome) toxicity of the multi-agent
chemotherapy which includes etoposide, alkylators and anthracyclines. A further advantage for single
agent vinblastine therapy is that patients can be treated as outpatients. Unfortunately, the long duration
of the treatment protocol with weekly hospital visits for 2 years may prove to be a logistical barrier. In
addition, this could provide a low toxicity chemotherapy backbone forming a new basis to study the
addition of targeted therapies.
Table 6 Factors used for stratification of paediatric ALK+ ALCL patients into different risk groups AIEOP, Associazione Italiana di Ematologia e Oncologia Pediatrica; BFM, Berlin-Frankfurt-Münster; MDD, minimal disseminated disease; MRD, minimal residual disease; UKCCSG, UK Children’s Cancer and Study group; SFOP, Société Française d'Oncologie Pédiatrique.
Factor Relevance for risk stratification
Mediastinal involvement
Although in disagreement with results from the NHL-BFM-30 trial33, four independent studies by the SFOP31, the UKCCSG44, the BFM75 as well as a combined study by the three76 found mediastinal involvement to be predictive of a high risk of treatment failure. Based on those results, the ALCL99 trial used mediastinal involvement for risk stratification28,52.
Visceral involvement (liver, spleen, lung)
Although in disagreement with results from the NHL-BFM-30 trial33, four independent studies by the SFOP31, the UKCCSG44, the BFM75 as well as a combined study by the three76 found visceral involvement to be predictive of a high risk of treatment failure. Based on those results, the ALCL99 trial used visceral involvement for risk stratification28,52.
Skin involvement Skin involvement is described as a negative prognostic marker in two BFM group studies46,75. Skin lesions were associated with increased relapse risk in a combined follow-up study of BFM, SFOP and UKCCSG76. Based on those results, the ALCL99 trial used skin involvement for risk stratification28,52.
Histopathology Lymphohistiocytic subtype correlated with lower EFS in two clinical trials (HM89 and HM91)31. Small cell or lymphohistiocytic subtype was associated with increased relapse risk in the ALCL99 trial77,78 and an independent BFM group study79. Additional histology based prognostic factors were described, but not yet validated in an independent study80–86.

12
Factor Relevance for risk stratification
Small cell or lymphohistiocytic subtype (SC/LC) + MDD
Patients can be stratified into three biological/pathological risk groups (bpRG): high risk (bpHR): MDD+ with SC/LC subtype, low risk (bpLR): MDD- without SC/LC subtype, intermediate risk (bpIR): all remaining patients. 10-year PFS was 40%, 75% and 86% for bpHR, bpIR and bpLR, respectively78.
Quantitative detection of NPM1-ALK in the bone marrow or peripheral blood at diagnosis (MDD)
MDD (detected by RT-qPCR) in bone marrow samples was associated with lower 5-year PFS (41 ± 11% for MDD+ patients compared to 100% for MDD- patients)73, reduced 5-year EFS (38 ± 9% MDD+ patients compared to 82 ± 7% for MDD- patients)79 and lower 5-year OS (60 ± 9% MDD+ patients compared to 86 ± 7% for MDD- patients)79. MDD (detected by RT-qPCR) in bone marrow and peripheral blood samples was associated with lower 5-year PFS (54 ± 6% for MDD+ patients compared to 87 ± 5% for MDD- patients)39, reduced 5-year EFS (51 ± 5% MDD+ patients compared to 83 ± 5% for MDD- patients)74 and lower 5-year OS (79 ± 4% MDD+ patients compared to 91 ± 3% for MDD- patients)74. Those results were confirmed in a 10-year follow-up study of the ALCL99 trial78.
Quantitative detection of NPM1-ALK in the bone marrow or peripheral blood at diagnosis during treatment course (MRD)
MRD (detected by RT-qPCR) in bone marrow and peripheral blood samples before the second course of chemotherapy was associated with reduced 5-year EFS (69% MDD+ patients compared to 19% for MDD- patients)74 and lower 5-year OS (65 ± 9% MDD+ patients compared to 92 ± 5% for MDD- patients)74 and increased cumulative incidence of relapse (81 ± 8% MDD+ patients compared to 31 ± 9% for MDD- patients)74. This had first been explored in a small cohort of relapsed patients that presented with NPM1-ALK transcript level increase in bone marrow samples87.
Anti-ALK autoantibody titre
Anti-ALK autoantibodies can be detected in >90% of paediatric ALK+ ALCL patients at diagnosis39,88–93. Patients can be stratified into risk groups according to the anti-ALK autoantibody titre at diagnosis with cut-off at ≤ 1/750. Two studies combining patients recruited onto NHL-BFM9033/NHL-BFM9594 and NHL-BFM9594/AIEOP LNH‐9795/ALCL9928 described that titres inversely correlated with relapse risk91,92. Those results were confirmed by an independent study in Japanese children93.
Course of anti-ALK autoantibody titre
Patients can be stratified into risk groups according to the decrease in the anti-ALK
autoantibody titre from diagnosis to the end of therapy: patients who showed a titre‐decrease
of maximal two dilution steps (≤2) or patients who showed a titre‐decrease of more than two dilution steps (>2). 10-year EFS was 91 ± 5% or 70 ± 6% for patients in the ≤2 or >2 group92.
Anti-ALK autoantibody titre + MDD
Patients can be stratified into three biological risk groups (bRG): high risk (bHR): MDD+ and anti-ALK autoantibody titre ≤ 1/750, low risk (bLR): MDD- and anti-ALK autoantibody titre >1/750, intermediate risk (bIR): all remaining patients. 5-year PFS was 28%, 68% and 93% for bHR, bIR and bLR, respectively. 5-year OS was 71%, 83% and 98% for bHR, bIR and bLR39. Those results were confirmed by an independent study in Japanese children93.
Time to relapse, failure or progression
Relapsed patients can reach a second remission by chemotherapy and allogenic SCT71,96–98. Time to relapse/failure/progression serves as prognostic factor71,97,98 whereby shorter time to first relapse is an indicator for another relapse with 50% of patients that progress during first-line therapy experiencing another relapse98.
Infiltration of the CNS
Only a low number of patients presents with CNS infiltration95,97,99,100; in the biggest cohort analyzed so far, 26/618 (4%) patients were CNS positive100. In this study, 3-year OS after CNS relapse was 49%100.
CD3 CD3+ patients that were treated with autologous SCT had lower 5-year EFS (18 ± 12% for CD3+ patients compared to 72 ± 9% for CD3- patients)97. However, no further relapse occurred in patients with CD3+ first relapse that were treated with allogenic SCT97. Based on those results, the ALCL-Relapse trial used C3 positivity for risk stratification77,98. In this study, 5/6 CD3+ patients that progressed during first-line therapy experienced another relapse compared to 3/11 CD3- patients. However, for other patient groups this effect was not pronouced98.
Bone marrow involvement
Depending on the analysis method used bone marrow involvement ranges from uncommon28,31–33,44,101,102 to common73,79. Due to high concordance between NPM1-ALK transcripts by RT-qPCR of bone marrow and peripheral blood samples79, Damm-Welk et al. hypothesized that this is due to circulating tumours cell rather than true bone marrow infiltration103. Bone marrow involvement (detected by RT-qPCR) was associated with a higher relapse risk (50 ± 10% for patients with bone marrow involvement compared to 15 ± 7% for patients without)79, lower 5-year PFS (41 ± 11% for patients with bone marrow involvement compared to 100% for patients without)73 and reduced OS97.

13
1.2.2.2 Development of Targeted Agents for Frontline Therapy
1.2.2.2.1 Targeting ALK
With EFS and OS rates having barely changed since the NHL-BFM first tested its B-cell NHL protocol
on ALCL patients in the 1980s, there is a clear need for new, less toxic therapies for patients in all risk
groups. For ALCL, ALK provides an ideal drug target for those cases that are ALK+ particularly as
endogenous ALK expression is limited to neuronal cells during neonatal development104 which should
limit toxic side-effects. However, initial interest in the development of ALK inhibitors was largely non-
existent amongst pharmaceutical companies due not only to the favourable survival rates of these
patients, but also its orphan disease status. Over a decade later in 2007, ALK was identified to be fused
to EML4 in 6.7% of NSCLC patients as a result of a chromosomal inversion18 and subsequently the first
phase I clinical trial of Pfizer’s ALK/MET/ROS1 inhibitor crizotinib was initiated in 2008105. Other ALK
inhibitors have followed and since crizotinib’s FDA approval in 2011 for advanced ALK+ NSCLC,
ceritinib (Novartis) and alectinib (Hoffmann-La Roche) were likewise approved in 2014 and 2015
respectively106–108. Two more ALK inhibitors – lorlatinib (Pfizer) and brigatinib (Takeda) – have recently
been granted breakthrough therapy designation and FDA accelerated approval respectively109. These
drugs have been slowly filtering through to the treatment of ALCL and other ALK-related malignancies
in children.
Although, ALK inhibitors have been tested mainly in pediatric relapsed and refractory ALK+ ALCL
patients (discussed below), the safety of crizotinib and combination chemotherapy have already been
shown in a phase I trial in children with ALK-related malignancies (NCT01606878), and final data will
soon be available from the phase II frontline trial of crizotinib administered in combination with ALCL99
in the USA (NCT01979536).
Interestingly, a phase I/II open-label dose-finding study of ceritinib combined with Brentuximab vedotin
(BV, SGN-35; discussed below) for frontline treatment of ALK+ ALCL patients 12 years and older
opened recruitment in 2018 (NCT02729961). This trial will provide important information regarding new
targeted agent combination strategies not involving standard chemotherapy.
1.2.2.2.2 Targeting CD30
The consistent expression of CD30 (a protein expressed almost exclusively on activated B and T cells)
on ALCL provides another therapeutic target110-111. The first mouse-human chimeric anti-CD30 antibody
SGN-30 was developed by Seattle Genetics and tested in a phase I/II pilot study in combination with
ifosfamide, carboplatin and etoposide (ICE) in five children with recurrent ALCL (COG-ANHL06P1,
NCT00354107). However, serious adverse events (pleural effusion, ascites, neutrophil count decrease,
capillary leak syndrome, skin and subcutaneous tissue disorders) led to the termination of the study61.
Sometime after, the activity of SGN-30 was further improved by conjugation with the antimicrotubule
agent monomethyl auristatin E (MMAE). The resulting antibody-drug conjugate BV binds to CD30 on
the cell surface initiating its internalization, followed by trafficking to the lysosomal compartment with
eventual release of MMAE via proteolytic cleavage112. Binding of MMAE to tubulin disrupts the
microtubule network, induces cell cycle arrest, and results in apoptotic death of the CD30-expressing
cell113. An initial phase I clinical trial of BV (NCT00430846) was conducted in adults with CD30-positive
14
lymphomas that had failed systemic chemotherapy. The two adult patients with ALCL enrolled into the
study both achieved complete remission (CR)114. Following this, a phase II study of BV in adults with
relapsed or refractory systemic ALK+ and ALK- ALCL was initiated (NCT00866047)115 and in 2011 BV
was approved by the FDA for the treatment of relapsed ALCL following failure of at least one multi-agent
chemotherapy protocol for adults. An update to this pivotal study provided 4-year follow-up of patients
included in the phase 2 study, the median Progression-Free Survival (PFS) was 20 months (25.5 months
for ALK+ ALCL patients) and the 4-year OS was 64%116.
Both crizotinib and BV have since been studied in adults with HL (NCT02243436, NCT01578967,
NCT02098512, NCT01874054, NCT00848926 NCT02298283, NCT02227433, NCT02939014,
NCT01716806) and NHL (NCT01805037, NCT02462538, NCT01657331, NCT01909934,
NCT01352520, NCT01950364, NCT02139592, NCT02419287, NCT02939014, NCT00866047,
NCT02280785) in a frontline setting with promising results. Additionally, BV and combination
chemotherapy has been trialled in young patients with newly diagnosed HL (NCT02166463).
This has encouraged a randomized phase II COG study for paediatric ALCL (COG-ANHL12P1,
NCT01979536) that compares the use of BV to the ALK inhibitor crizotinib administered with a common
chemotherapy backbone (ALCL99). This study is the first frontline trial of these targeted agents
specifically for children with ALCL. The trial enrolled its first patient in 2013 and results will be available
by the end of 2020; to date, 110 patients have been enrolled and updated study results were presented
at the EICNHL meeting in November 2017. The BV arm has been closed, as recruitment is now
complete; the crizotinib arm re-opened following an FDA-imposed clinical hold in March 2017 due to the
occurrence of thrombosis. Catheter-related clots and pulmonary emboli occurred in 10 patients, after
which the study committee initially closed the crizotinib arm, but temporarily reopened enrolment after
the DSMC reviewed the cases. This is surprising as the robust and sustained activity observed in the
Phase I/II COG-ADVL0912 trial (discussed below) provided the rationale for combining crizotinib at 165
mg/m2 with conventional chemotherapy. The only grade 3 or 4 drug-related adverse event was a
decrease in neutrophil count occurring in 83% patients treated with 165 mg/m2 crizotinib117. In future,
single agent vinblastine may provide a lower toxicity chemotherapy backbone as mentioned above.
1.2.3 Treatment of Refractory/Relapsed Disease
1.2.3.1 Stem Cell Transplantation (SCT)
Some retrospective studies suggest that OS is over 50% for ALK+ ALCL relapse cases when treated
with SCT or continued multi-agent chemotherapy71,118-97, the former being the standard of care for
children or adolescents with some other forms of relapsed or refractory NHL (except ALCL)119-120.
Therefore, one treatment option for relapsed or refractory ALCL is SCT and five retrospective studies
have been conducted to assess its efficacy.
The NHL-BFM working group were the first to report that SCT is a viable option for relapsed ALCL
looking back at ALCL patients treated in the 1990s97,121. Two retrospective Japanese studies also found
that relapsed or refractory ALCL patients who received SCT did better than those who did not118,122. For
all cases, the risk profile was acceptably low, but this approach was reserved for high-risk ALCL patients
who had already relapsed at least once. One of the Japanese studies in particular, showed that 30% of

15
relapsed patients treated with chemotherapy alone relapsed a second time, which is similar to the 37.5%
of patients treated with autologous SCT who relapsed a second time118. However, the patient group was
small with only 10 and 8 patients treated in each arm, respectively. Allogenic SCT was more successful,
with all 6 patients entering remission118. Collectively, these limited data suggest that allogenic SCT is
superior to autologous SCT122. A retrospective French trial also showed mixed results, with 45% of
patients treated with autologous SCT entering remission, as opposed to 52% treated with chemotherapy
alone71. EICNHL-ALCL-RELAPSE (NCT00317408), which between 2004 and 2011, enrolled ~105
relapsed paediatric ALCL patients sorted into three arms depending on CD3 expression and time to
relapse, tested allogenic SCT and autologous SCT with and without BEAM-conditioning in comparison
to single agent weekly vinblastine. For early relapsed ALCL (within the first year after initial diagnosis)
autologous SCT was not effective with relapses observed in 70% of patients treated with autologous
SCT in comparison to 20% of patients treated with allogeneic SCT98. Fortunately, patients that relapsed
during autologous SCT could be rescued by allogeneic SCT or maintenance therapy achieving an OS
rate of 80%98. Therefore, the trial established allogeneic SCT as standard consolidation therapy for
ALCL patients with progression during frontline multi-agent chemotherapy or relapse after completion
of multi-agent chemotherapy98. A Japanese study found 5-year EFS rates of 100% and 49%,
respectively, in relapsed/refractory ALK+ ALCL patients treated with Reduced Intensity Conditioning
(RIC) compared to myeloablative conditioning (MAC) regimens41. One clinical trial, JPSLG-ALCL-RIC-
18, is still ongoing and will specifically test the efficacy of RIC to prepare for allogenic SCT.
1.2.3.2 Vinblastine
One arm of the EICNHL-ALCL-RELAPSE trial recruited patients with late relapse (more than 12 months
from initial diagnosis) and CD3-negative ALCL to be treated with single agent weekly vinblastine for 24
months. The trial established that vinblastine achieved both high survival rates and a long-term
remission rate of 81%98,123. However, vinblastine was not effective in patients that experienced a relapse
within the first year after initial diagnosis98. Therefore, the authors suggest that vinblastine should only
be tested in low-risk patients defined by CD3-negative relapse with more than one year after initial
diagnosis98.
1.2.3.3 Development of Future Treatments for Relapsed/Refractory ALCL
1.2.3.3.1 Targeting ALK
As mentioned above, COG was the first group to open a phase I dose-escalation study of an ALK
inhibitor (ADVL0912, NCT00939770)63. In this trial, crizotinib was administered orally, twice daily in 28-
day cycles, as a single agent for an indefinite duration to paediatric patients with ALK+ relapsed or
refractory ALCL that had received at least one course of chemotherapy64. Those with relapsed ALCL
achieved an objective response rate of 90%117 when treated with the recommended phase II dose
(RP2D) of 280 mg/m2 63. The 10 patients treated at the RP2D in phase I of the study were included in
the phase II study. The additional 10 patients that were treated at the RP2D were specifically enrolled
in the phase II expansion cohort. Of the 20 patients included in the phase II expansion cohort, 13
responded within 4 weeks of initiating treatment and the remaining 7 within 5 to 8 weeks with CR in

16
18/20 patients. Two patients came off therapy after experiencing adverse events (AEs), 3 after
experiencing disease progression, 12 proceeded to SCT and two continued on crizotinib117.
Three years later a phase I study was also initiated by COG (COG-ADVL1212, NCT01606878)
combining crizotinib with conventional chemotherapy for relapsed or refractory paediatric ALCL patients
which provided the requisite safety and tolerability data for eventually integrating crizotinib into frontline
treatment regimens for children with ALCL (NCT01979536).
In Japan, the trials UMIN000016991 and UMIN000028075 are investigating the efficacy and safety of
alectinib or crizotinib respectively as monotherapies for children with recurrent or refractory ALK+
ALCL67–69. UMIN000016991 was the first trial to test an ALK inhibitor, other than crizotinib, for paediatric
ALCL patients. Based on this stuy the Ministry of Health, Labour and Welfare in Japan has approved
alectinib for the treatment of recurrent or refractory ALK+ ALCL in 2020124. In addition, a first case report
described the successful treatment of a girl, who suffered from a CNS relapse, with alectinib125. Results
for UMIN000028075 are expected in 2022.
In Europe, an Innovative Therapies for Children with Cancer (ITCC) trial is in progress to treat relapsed
patients with ALK-, ROS1- or MET-positive malignancies (not limited to ALCL) with crizotinib either as
a single agent or in combination with vinblastine in a phase IB safety study. The trial (ITCC053, CRISP)
will determine the RP2D of vinblastine in combination with crizotinib by dose escalation of vinblastine
with a fixed dose of 150 mg/m2 crizotinib. Patients will receive a maximum of 24 cycles corresponding
to two years of therapy. Salvage of non-responding patients is anticipated by transfer of patients to the
ALCL-Nivo trial discussed below (Figure 3). In France, the trans-tumoural, multicentric phase II trial
AcSé (NCT02034981) investigates the efficacy and safety of single agent crizotinib in paediatric ALK+
ALCL patients that relapsed from chemotherapy. Although final results are eagerly awaited, preliminary
results showed that 5/15 patients progressed and that all cases of progression on crizotinib occurred
during the first 3 months following treatment initiation126. In addition, the EICNHL is planning to trial an
ALK inhibitor in combination with the ALCL99 backbone in paediatric patients with ALK+ relapsed or
refractory ALCL (personal communication with Dr. Suzanne Turner).
Even though the final results from the ALK inhibitor trials are still to come, single-agent crizotinib has
not yet proven curative since abrupt relapses following crizotinib discontinuation have been described
in isolated cases127. Hence, crizotinib is currently used to induce second remission as shown in adult
relapsed/refractory ALK+ ALCL patients before allogeneic or autologous SCT128 (Figure 3).

17
Figure 3 Management of childhood ALCL AA, auto-antibody; BV, Brentuximab vedotin; MDD, minimal disseminated disease, SCT, stem cell transplantation; TKI, tyrosine kinase inhibitor; VBL, vinblastine. Reproduced from Prokoph & Larose et al.20.
1.2.3.3.2 Targeting CD30
As mentioned earlier, following encouraging results from adult ALCL trials (NCT00430846,
NCT00866047), a company-sponsored international phase I/II study of BV in paediatric patients with
relapsed or refractory systemic ALCL (NCT01492088) was opened in 2012. Participants received BV
1.4 mg/kg in Phase I and 1.8 mg/kg in Phase II, on day 1 of every 21-day cycle for up to 16 cycles. Of
the 17 ALCL patients recruited into the phase II expansion cohort of the trial, the Overall Response Rate
(ORR) was 53% and time to progression was 6.3 months. However, 13 patients did not complete the
study; 1 patient died, and 12 patients dropped out for unspecified reasons. The most common reported
drug-related AE was a decrease in neutrophil and lymphocyte counts with 1 patient experiencing pyrexia
and 4 of 17 patients developing neutralizing anti-therapeutic antibodies129. Additionally, a major clinical
consideration is cumulative peripheral neuropathy that was observed in 36% of patients recruited onto
the dose finding study of BV for adults with CD30-positive hematologic malignancies (NCT00430846)130.
Given the neurologic side effect of BV, prolonged treatment may be difficult to manage in paediatric
patients. Thus, this drug is currently mostly used as a bridge to transplant in relapsed ALK+ ALCL
patients (Figure 3).
MDD-negative
ALK AA high
ALK-positive ALK-negative
VBL ALCL99 ALCL99 + TKI ALCL99 + BV
Low-risk patient High-risk patient
No response Remission Relapse
MDD-positive
ALK AA low
BV TKI TKI + VBL
ALK-negative
Remission
SCT
Progression
PDL-1
BV
ALK-positive
low
medium
high
Toxicity level
PDL-1
treatment strategy
disease state
gold standard
Legend
No response
SCT
Diagnosis:
Paediatric ALCL

18
1.2.3.3.3 Immunotherapy
Accumulating evidence indicates that the immune system plays a major role in the pathogenesis of
ALK+ ALCL88-91. Indeed, it has been shown that ALK+ ALCL cell lines strongly express the cell surface
protein, Programmed Cell-Death Ligand 1 (PD-L1; CD274, B7-H1), as determined at both the mRNA
and protein levels131. Furthermore, results of PD-L1 immunostaining of ALK+ ALCL primary patient
tumours showed strong PD-L1 expression132. Analysis revealed that PD-L1 expression is induced by
the chimeric NPM1-ALK tyrosine kinase, via STAT3, confirming a unique function for NPM1-ALK as a
promoter of immune evasion by inducing PD-L1132. PD-1 and its ligands, PDL-1 and PDL-2, have been
shown to be involved in immune suppression with increased expression of PD-1 leading to decreased
activation of reactive T-cells inhibiting the PI3K/AKT pathway on ligation by ligand133–135.
These observations provided a strong rationale to use consolidative anti-PD1/PD-L1 immunotherapy for
relapsed or refractory ALK+ ALCL. Indeed, three case reports describe a dramatic and durable response
using the anti-PD1 monoclonal antibodies pembrolizumab (Merck) or nivolumab (Bristol-Myers Squibb)
for ALCL patients136–138. The first, an adult with ALK- ALCL was treated with pembrolizumab following
chemotherapy, BV and SCT136. The second, a 19-year old ALK+ ALCL patient was treated with
nivolumab, following chemotherapy, BV, crizotinib and SCT137. Finally, a case report observed a similar
dramatic response to Nivolumab in a relapsed 17-year old patient with ALK+ ALCL after two lines of
treatment including chemotherapy and crizotinib138. While the 19-year old developed grade 2
pneumonitis, there are no reports of adverse events for the other two patients, pointing towards an
acceptable toxicity profile. Interestingly, only the 17-year old patient was tested for PD-1 expression on
tumour cells by immunostaining showing strong expression throughout the tumour. It should be noted
that several publications have shown both that PD-1 inhibitors can provoke a response even in tumours
which do not have strong PD-1 expression, but also that they sometimes fail in tumours which do show
strong PD-1 expression139. The lack of an obvious biomarker for PD-1 inhibitor efficacy may make
clinical decisions difficult when assessing therapeutic approaches for relapsed disease.
With a clear need for a randomized trial of anti-PD-1 monoclonal antibodies in refractory or relapsed
ALCL, ALCL-Nivo has been designed as a phase II trial of nivolumab in paediatric and adult relapsed
or refractory ALK+ ALCL patients. The trial is testing the objective response to nivolumab at 24 weeks,
for patients which have already relapsed on chemotherapy and either an ALK inhibitor or BV. Should
there be sufficient response in this first cohort, the trial also plans to test nivolumab as a consolidation
therapy after CR of at least two months as a replacement to SCT. Patients in both cohorts will be treated
with 24 months of Nivolumab at 3 mg/kg every two weeks, and every four weeks after the first eight
weeks for patients in the second cohort (personal communication with Laurence Brugières).
Another potential immunotherapy under investigation, potentially of therapeutic use for ALCL at all
stages, is the application of cancer vaccines. Strong expression of the ALK chimera in the majority of
ALCL cases combined with near-absent expression of ALK in healthy tissues makes it an ideal
candidate for vaccine development. Autoantibodies against ALK as well as cytotoxic and helper T cell
responses to ALK have been detected in patients with ALK+ ALCL both at diagnosis and during
remission with a significant inverse correlation between ALK-antibody titres and the incidence of
relapse140-39. Vaccination using a truncated cDNA of ALK has been reported to induce potent and long-

19
lasting protection from local and systemic lymphoma growth in mice141-142. This has yet to be trialled in
ALCL patients, but as mentioned, pre-clinical models show promising results.
1.3 ALK-driven NB
1.3.1 Clinical Features of NB
NB is an embryonal tumour of the sympathetic peripheral nervous system143 accounting for 7–10% of
paediatric cancers and representing 15% of all paediatric cancer deaths144–146,6. Deriving from the
sympathoadrenal lineage of the neural crest, it presents along the sympathoadrenal axis147. NB is a
complex disease and ranges from regression to treatment-resistant progression, metastasis and
death147,6. As such, there has been a substantial collaborative effort to develop accurate risk-
classification systems that will assist in determining the appropriate treatment regimen143. The COG
categorizes NB patients into three prognostic groups according to the risk of death: low, intermediate,
and high risk148,149. Patients are assigned to each risk group based mainly on the patient’s age at
diagnosis, biological features of the tumour (e.g. tumour karyotype, MYCN amplification status,
International NB Pathology Classification (INPC histopathology classification), and the stage of tumour
defined by the International NB Staging System (INSS)150. Whereas low- and intermediate-risk disease
is highly curable, with 5-year survival >90%, high-risk disease is associated with frequent relapse and a
5-year survival of 40–50%151,6. Considering that the majority of newly diagnosed NB patients are high-
risk cases (45%) compared to 37% low risk and 18% intermediate risk cases152,153, current research
efforts focus on identifying novel therapeutic approaches that will improve the survival rates and long-
term effects associated with therapy for high-risk NB patients153.
1.3.2 ALK in NB
To identify novel therapeutic approaches that not only achieve superior long-term survival rates but also
reduce treatment-induced toxicities, many of the NB research efforts have focused on enhancing our
understanding of the molecular basis of high-risk NB143.
In 2013, Pugh et al. published a large (n=240) sequencing study applying a combination of whole exome
sequencing (WES) (n=221), Whole genome sequencing (WGS) (n=18), or both (n=1) with all samples
collected from high-risk NB patients as part of the Therapeutically Applicable Research to Generate
Effective Treatments (TARGET) Initiative154. The three most frequently altered genes from the TARGET
study cohort were genes with previously confirmed pathogenic roles in NB16,155–158: MYCN (amplified;
>20%), ALK (missense point mutations; 9%), and ATRX (multi-exon focal deletions; 7.1%). Among
those genes, ALK currently represents the only directly druggable target as MYCN (transcription factor)
and ATRX (chromatin remodeler) both belong to classes of proteins, which are difficult to inhibit
directly159,160.
Most ALK-driven NBs express full-length ALK161,162,6. In ALK-driven NB, single-base missense mutations
cluster in the ALK kinase domain and promote ligand-independent signaling by disruption of the auto-
inhibited conformation of the kinase163,6 (Figure 4). Mutations at three positions (R1275, F1174, and
F1245) account for ~85% of ALK mutations in ALK-driven NB and are hotspots for lower frequency
mutations164,6 (Figure 4B).

20
Figure 4 ALK in NB (A) Full-length ALK signals through the Ras/MAPK, PI3K/AKT and JAK/STAT pathways. In NB, MYCN expression is activated in a pathway mediated by ALK, PI3K/AKT, MEKK3, MEK5 and ERK5 (dashed lines). (B) Gain-of-function mutations cluster in the kinase domain of ALK. Modified from Trigg et al.6.
NB with ALK mutations are distributed amongst all of the clinical stages155,157,165–168. However, a study
of 1596 NB samples found that ALK mutations were associated with poorer survival in high- and
intermediate-risk patients164,6. ALK mutations correlate with MYCN amplification and the cooperative
activity of these two oncogenes as been shown to drive NB in mouse and zebrafish models169,6.
Interestingly, ALK has been shown to induce transcription of MYC in NB cell lines, which could explain
the poor prognosis of NB patients harbouring both MYCN amplification and ALK mutations170,6.
Sequencing of matched primary and relapsed NB patient tumour samples showed an increased
frequency of ALK mutations at relapse171–173,6. Some mutations were found to undergo clonal expansion
at relapse, whereas others were confirmed to arise de novo174,6. These observations highlight ALK as a
driver oncogene in primary and relapsed NB6.
Gene amplification is a less common mechanism of ALK activation in NB (2–3% cases) leading to
increased protein expression and constitutive kinase activity175,176,6 (Figure 1B). While ALK is almost
always co-amplified with MYCN and therefore tumours harbouring ALK amplification tend to afford a
poor prognosis158,164,177, mutation and amplification of ALK is rare in NB174,6.
1.3.3 Targeting ALK in ALK-driven NB
The results of ALK inhibitor trials in ALK+ NSCLC provided the rationale for further evaluation in ALK-
driven NB. In 2009, the COG initiated a phase I–II trial of crizotinib in paediatric patients with relapsed
or refractory ALK+ solid tumours or ALCL (NCT00939770) (Table 7)63-64. Results from NB patients in
this trial were discouraging63,6; only 1/11 had a CR and 2/11 had stable disease63. However, this is
understandable, since 3/7 tumours from ALK+driven NB patients with progressive disease (PD)
P
P
P
P
wild-type point mutation
Ras
ERK1/2
Raf PI3K
AKT
mTOR
JAK
STAT3
MEKK3
MEK5
ERK5
MYCN
MEK
1116
1383
F1174C
F1174I
F1174L
F1174S
F1174V
30%
F1245C
F1245I
F1245L
F1245V
12%
R1275L
R1275Q 43%
TK
BA

21
harboured the resistance conferring ALK F1174L mutation63,6. In 2011, a phase I trial of crizotinib was
launched for patients aged ≥15 years with any ALK+ malignancy other than NSCLC (NCT01121588).
In addition, in 2013, COG initiated a phase I trial of crizotinib with combination chemotherapy for patients
with high-risk NB and ALCL (NCT01606878)6. Encouraging results from this trial provided the rationale
for a COG phase III trial evaluating the addition of crizotinib to standard therapy in high-risk NB patients
with ALK mutations (NCT03126916)6.
Table 7 Clinical trials evaluating ALK inhibitors in NB ALK inhibitors: Crizotinib, Ceritinib, Entrectinib, Lorlatinib; Cyclin-dependent kinase (CDK)4/6 inhibitor: Ribociclib. (*) as stated on ClinicalTrials.gov webpage. Updated from Trigg et al.6.
ClinicalTrials.gov Identifier
Trial Acronym Treatment Phase Time frame* Location Ref
NCT00939770 COG-ADVL0912 Crizotinib I/II 2009-2018 USA 64,178
NCT01121588 PROFILE 1013 Crizotinib I 2011-2019 Worldwide 179
NCT01606878 COG-ADVL1212 Crizotinib + chemotherapy
I 2013-2018 USA 180
NCT01742286 N/A Ceritinib I 2013-2019 Worldwide 181
NCT02034981 AcSé Crizotinib Il 2013-2022 France 66
NCT02650401 N/A Entrectinib I/Ib 2016-2023 USA 182
NCT02780128 NEPENTHE Ceritinib + Ribociclib I 2016-2026 USA 183
NCT03213652 N/A Ensartinib II 2017-2024 USA 184
NCT03107988 NANT2015-02 Lorlatinib +/- chemotherapy
I 2017-2020 USA 185
NCT03126916 COG-ANBL1531 Crizotinib + chemotherapy
III 2018-2026 USA 186
Other trials are evaluating second and third generation ALK inhibitors alone or in combination with
chemotherapy and targeted agents in patients with ALK+driven NB (Table 7)6:
Ceritinib187,188 is undergoing phase I assessment as a monotherapy in relapsed or refractory ALK+
paediatric cancers including NB (NCT01742286). In addition, the Next Generation Personalized
Neuroblastoma Therapy (NEPENTHE) trial (NCT02780128) is recruiting patients with relapsed or
refractory NB into treatment arms based on actionable genetic alterations. Patients with ALK mutations
are treated with ceritinib in combination with ribociclib. The National Cancer Institute (NCI)-COG
Peadiatric Molecular Analysis for Therapy Choice (MATCH) is a phase II study that involves the
stratification of patients into targeted treatments based on genetic profiling (NCT03155620)189. The ALK
inhibitor ensartinib is under assessment for patients with relapsed or refractory NB among other solid
tumours, NHL, and histiocytic disorders with genetic alteration of ALK or ROS1 (NCT03213652). A
phase I trial is assessing the TRK, ROS1 and ALK inhibitor entrectinib in paediatric patients with
relapsed or refractory solid and central nervous system (CNS) tumours with and without TRK, ROS1
and ALK fusions (NCT02650401). Moreover, the New Approaches to Neuroblastoma Therapy
consortium opened a phase I trial of lorlatinib in combination with chemotherapy in patients with high-
risk NB (NCT03107988)6.

22
1.4 ALK+ NSCLC
1.4.1 Clinical Features of ALK+ NSCLC
Based on GLOBOCAN estimates190, lung cancer is the leading cause of cancer death in both men and
women worldwide191. NSCLC accounts for about 85% of lung cancer cases and remains difficult to treat,
particularly in the metastatic setting192. Approximately 57% of NSCLC patients are diagnosed with
metastatic, or advanced disease with a 5-year survival rate of only 5%193. Epidemiology studies suggest
that approximately 3-5% of NSCLC tumours are ALK+194, which translates to approximately 75,000
newly diagnosed cases worldwide per year191. This means that NSCLC contributes by far the largest
ALK fusion-positive patient population195 – the EML4–ALK fusion being the most common – with an
urgent need for early disease detection. ALK+ NSCLC is associated with a younger age at diagnosis
and a non-smoking history196.
1.4.2 Targeting ALK in ALK+ NSCLC
Surgery remains the treatment of choice if patients are diagnosed at an early disease stage, because
NSCLC patients do not respond well to chemotherapy. However, with the discovery of driver mutations,
targeted therapies gave new hope to NSCLC patients with advanced and metastatic disease. After ALK
was identified to be fused to EML418 in NSCLC patients, the first phase I clinical trial was initiated in
2008197. This phase I clinical trial with Pfizer’s crizotinib19,198 encouraged the initiation of a phase III,
open-label trial to compare the efficacy of crizotinib to that of traditional chemotherapeutics (pemetrexed
or docetaxel) in a larger NSCLC patient cohort. The ORR to crizotinib treatment was 65% (vs. 20% with
chemotherapy), increasing the median PFS period to 7.7 months for the crizotinib treatment group (vs.
3 months for the chemotherapy treatment group)199,200.
Crizotinib’s FDA approval in 2011 was followed by Novartis’s ceritininb in 2014 and Hoffmann-La
Roche’s alectinib in 2015 (Table 1). Ceritinib was the first FDA approved drug for patients who have
experienced progression on or are intolerant to crizotinib201. Ceritinib provided ORR of around 60%
across the ASCEND trials in crizotinib-pretreated patients with or without brain metastases (BM)202–204.
Alectinib was the first ALK-inhibitor that demonstrated superior efficacy against crizotinib in a
randomized, open-label phase III trial (J-ALEX; JapicCTI-132316) in ALK+ NSCLC patients who had
received a prior chemotherapy regimen. Moreover, alectinib was superior as an initial treatment
compared to crizotinib in chemotherapy naïve ALK+ NSCLC patients in the global phase III ALEX trial
(NCT02075840). Additionally, alectinib reduced the risk of progression by 92% compared with crizotinib
in patients with brain metastases at baseline (HR =0.08; 95% CI, 0.01–0.61)205.
Two more ALK inhibitors – brigatinib (Takeda, 2017) and lorlatinib (Pfizer, 2018) – have been granted
breakthrough therapy designation and FDA accelerated approval. Lorlatinib – a third-generation ALK
and ROS1 inhibitor – was specifically designed to increase tumour and central CNS penetration, as up
to 50% of patients with ALK+ NSCLC develop CNS metastases during the course of their disease206.
Brigatinib is of major interest, as it exhibited a superior inhibitory profile compared to crizotinib, ceritinib,
and alectinib207 and demonstrated high activity in crizotinib/ceritinib/alectinib-refractory ALK+ NSCLC
patients208.

23
1.5 Resistance mechanisms to ALK inhibitors
Despite the success of ALK inhibitors, resistance inevitably develops209. For example, the median PFS
after treatment with crizotinib in advanced ALK+ NSCLC patients is generally less than one year197,210–
212. Resistance to targeted therapies can be either primary/intrinsic, adaptive or acquired213. Primary
resistance to a targeted therapy implies an intrinsic lack of response to the treatment. Adaptive
resistance denotes disease progression after an initial response when the tumour cells undergo early
adaptive changes214. Acquired resistance arises from a selection of therapy-resistant clones within a
heterogeneous tumour combined with the acquisition of new alterations213.
Resistance mechanisms can be classified as ALK-dependent/'on-target' or ALK-independent/'off-target'
(Figure 5). On-target resistance arises, when the initial target – for example ALK – is altered, off-target
resistance arises when collateral signalling events are activated214.
Figure 5 ALK-dependent or ALK-independent resistance mechanisms in ALK+ NSCLC IGF1R, insulin-like growth factor 1 receptor; HER3, human epidermal growth factor receptor 3; HER2, human epidermal growth factor receptor 2; MET, hepatocyte growth factor receptor; EGFR, epidermal growth factor receptor activate downstream signals through the JAK/STAT, MEK/ERK, and PI3K/AKT and pathways. Modified from Rotow et al.214.
1.5.1 ALK-dependent resistance mechanisms
ALK-dependent mechanisms can be induced by secondary mutations in ALK itself impeding the binding
of the ALK inhibitor (Table 8). The prototypical mutations leading to ALK TKI resistance are gatekeeper
mutations. The first one - L1196M - was reported in a crizotinib resistant EML4-ALK+ NSCLC patient215.
This mutation was found to occur in 7% of ALK+ NSCLC in a first case series216. A further gatekeeper
mutation - L1196Q - was initially identified in crizotinib-resistant ALCL cells in vitro217. The same paper
described a I1171N mutant, which was later identified in an adult ALK+ ALCL patient progressing on
crizotinib128 as well as an alectinib resistant ALK+ NSCLC patient218. Sasaki et al. described an F1174L

24
mutation in the RANBP2-ALK kinase domain of an ALK+ IMT patient219. This mutation had earlier been
detected in a NB patient220 and has been shown to reduce ALK sensitivity to crizotinib by increasing
ATP binding affinity221. Another mutant variant at the same position, F1174V, was also found in an ALK+
NSCLC patient resistant to crizotinib218. The secondary mutation L1152R was reported in a cell line
established from a crizotinib resistant ALK+ NSCLC patient222. A number of other secondary mutations
such as S1206Y, G1202R, 1151Tins or G1269A were also found in crizotinib-refractory ALK+ NSCLC
patients210,223. Both, S1206Y and G1202R, are located at the solvent front of the kinase domain and
interfere with inhibitor binding due to steric hindrance and conformational changes of the kinase. The
G1202R mutant is only seen in ∼2% of ALK+ NSCLC patients at resistance to early-generation ALK
TKIs, but it is the most common resistance mutation (21–43% of cases) in patients treated with later-
generation ALK TKIs216,224. G1269A is situated at the end of the ATP-binding pocket of ALK and leads
to a decrease in the binding of crizotinib to ALK due to steric hindrance223. 1151Tins, F1174C, L1152R
and C1156Y near the αC helix do not directly interact with ALK TKI binding and cause resistance via
conformational changes that alter kinase activity214.
Another ALK-dependent resistance mechanism is amplification of ALK. Katayama et al. reported wild
type EML4-ALK gene amplification in 1/15 patients that progressed on crizotinib210. Likewise, Doebele
et al. documented wild type EML4-ALK gene amplification in 2/12 crizotinib resistant patients223.
Genomic amplification of the ALK locus has also been described to mediate ALK TKI resistance in ALCL
cell lines225,226. However, this resistance can be overcome by using increased doses of crizotinib and
has not been reported as a resistance mechanism to more potent second-line ALK inhibitors227.
Table 8 Sensitizing (S) and resistance (R) mutations to ALK inhibitors
Mutation Biological function Crizotinib Alectinib Certinib Lorlatinib Brigatinib
G1123S Steric hindrance R S R N/A N/A
F1127L Decreased stability of ALK-crizotinib complex
R S R N/A N/A
1151Tins Increased ATP affinity for ALK R S R N/A N/A
L1152P/R Loop N-terminal of alpha C R S R S S
C1156Y Loop N-terminal of alpha C, increased kinase activity
R S R S S
I1171T/N/S Steric hindrance R R S N/A N/A
F1174V/C/L Conformational changes in the catalytic domain
R S R S S
V1180L Gatekeeper residue R R S N/A N/A
L1196M/Q Gatekeeper residue R S S S S
L1198F Near ATP-binding site, steric hindrance
S R R R S
G1202R Solvent front, steric hindrance R R R S S
D1203N Solvent front R S S R S
S1206C/Y/F Solvent front R S S S R
E1210K N/A R S S S S
F1245C Near the kinase motif R N/A S N/A N/A
G1269A/S ATP-binding pocket R S S S S
R1275Q ATP-binding pocket N/A N/A R N/A N/A

25
1.5.2 ALK-independent resistance mechanisms
However, ALK-dependent mechanisms described in the previous section account for only approximately
30% of acquired resistance mechanisms noted in relapsed ALK+ NSCLC patients with the rest of the
patients relapsing with various ALK-independent mechanisms (Figure 5)228–230. ALK-independent
resistance is achieved by either activation of alternative RTKs or by triggering downstream signalling
components231. These alterations bypass the requirement for ALK activity in the tumour cells2. Bypass
mechanisms identified thus far, associated with ALK TKI resistance in NSCLC patients, include
activation of EGFR227, HER2232, KRAS223, IGF-1R233, SRC210 and amplification of KIT227. Aberrantly
activated ALK regulates several downstream pathways, including RAS/MAPK234, PI3K/AKT235,
JAK/STAT225, PLC/PKC236 and CRKL/RAP1237 pathways.
1.6 Approaches to identifying acquired resistance mechanisms to TKIs
Acquired resistance mechanisms to TKIs can be identified by three types of samples or models: 1)
Patient tumour samples taken throughout a patients treatment most importantly at diagnosis and after
therapy relapse, 2) mouse cancer models or 3) cancer cell lines established from patient tumour
tissue238.
As a gold standard, putative resistance inducers are identified most often by WES coupled with RNA-
Seq, while previously identified biomarkers can be identified by targeted-seq of tumour tissue238.
However, defining a global landscape of resistance mechanisms requires matched presentation-relapse
tumour specimens from a sufficiently large number of patients238,230,239. For instance, the cataloguing of
epidermal growth factor receptor TKI resistance in NSCLC patients with an incidence rate of 18,252–
54,756 newly diagnosed cases per year in the USA is still incomplete with around 30% of relapsed
patients currently presenting with ‘unknown’ resistance mechanisms228–230. This problem is intensified
for peadiatric malignancies, such as ALK+ ALCL with an incidence rate of approximately 80 newly
diagnosed and 16 relapse cases per year in children and adolescents in Europe27 or ALK-driven high-
risk NB with an incidence rate of approximately 30 newly diagnosed cases per year240.
This has spurred the development of in vivo and in vitro experimental approaches that facilitate the
proactive identification of resistance mechanisms238, validation of putative resistance mechanisms or
investigation of therapeutic strategies that can re-sensitize the relapsed patients’ tumour cells to
treatment241–243.
The laboratory mouse (Mus musculus) is one of the best in vivo models to study disease biology
including cancer. In general, three types of mouse models exist: 1) Cell line xenografts, 2) patient-
derived xenografts (PDX) derived from tumour explants and 3) genetically engineered mouse models
(GEMMs), which can either be transgenic or endogenous244.
With the identification of the importance that tumour heterogeneity and the microenvironment play on
acquired resistance to TKIs241,245–248, GEMMs have many advantages compared to cell line xenografts
or cell lines238. GEMMs are also superior to PDXs in terms of microenvironment, as the human stromal
components in PDXs are replaced by murine elements and PDXs lack the interaction between immune
cells and tumour cells244. However, all GEMMs described to date also exhibit certain shortcomings in
mimicking human malignancy arising from the fact that the biology of humans and mice is different249.
For example differences in xenobiotic receptor (XR) and cytochrome P450 (CYP) expression levels,

26
tissue distribution, enzymatic activities, substrate preferences and ligand affinities lead to different rates
of drug absorption, distribution, metabolism and excretion in mice and men244,250. In addition, human
cells in comparison to mouse cells have decreased cancer susceptibility251. Furthermore, there is a
species-specific difference in tissue-specific cancer incidence. While mice tend to develop cancer in
mesenchymal tissues, most age-related cancers in humans develop in epithelial tissues249. One
possible explanation is the replacement of human telomere components with murine ones since
telomere dysfunction has an important role in oncogenesis and telomeres maintain chromosomal
integrity244.
The most artificial model, which is nevertheless predominantly used, are established cancer cell lines.
Even though cancer cell lines are derived from a patient’s tumour, those cells that survive the initial
culturing process represent only a small proportion of the tumour indicated by the lack of intra-
heterogeneity in cell lines252–254. In addition, extended culture can induce genetic and epigenetic
modifications with the eventual risk of altering cellular phenotypes255. However, cell line models require
far less financial and time commitment compared to in vivo models. In addition, the patient population
diversity may be better represented in vitro as there are typically far more cell lines than PDXs for each
disease. For example, while only one peadiatric ALK+ ALCL PDX has been described in the literature256,
12 ALK+ ALCL cell lines had been listed by the German Collection of Microorganisms and Cell Cultures
(DSMZ) by 2004257; while only two experimentally validated ALK-driven NB PDX models – COG-N-
426x (ALKF1245C; MYCN-WT) and COG-N-453x (ALKF1174L; MYCN-amplified) – have been described in
the literature, >110 NB cell lines with variable ALK mutation status, had been detailed by 1998258.
In vitro investigations can be further separated into three different types (Figure 6) of experimental
designs 238. The first type of design involves culturing established cancer cell lines for an extended
period of time during which TKI concentrations are gradually increased until resistant clones form
(Figure 6A). These resistant clones are then compared to the parental TKI sensitive cells to identify
potential resistance drivers via molecular and biochemical profiling procedures238.
The second approach actively generates secondary mutations in the target kinase via random
mutagenesis by error-prone PCR259 or by cloning the target kinase cDNA in a mutator strain of
competent bacteria260 (Figure 6B). Ideally, this process will generate the full spectrum of potential
secondary mutations in the target kinase gene. This mixed population of mutant kinase cDNAs should
then be transfected or transduced into TKI-sensitive cancer cell lines and cDNAs that induce kinase-
dependent resistance will be enriched when the cells are cultured with the respective TKI238.
The last method focuses on kinase-independent (bypass) mechanisms by individually manipulating the
expression level of each gene within the genome via systemic gain- or loss-of-function screen libraries
(Figure 6C, Figure 7). The main advantages of this approach are the comprehensive scope of the
investigation and the unbiased nature of the experiment238. It relies on pooled cDNA261, RNAi262 or
Clustered Regularly Interspaced Short Palindromic Repeats (CRISPR)/CRISPR-associated protein 9
(Cas9) libraries263 (Figure 7).

27
Figure 6 Types of in vitro experimental designs to identify putative TKI resistance mechanisms (A) Cancer cells are cultured with gradually increasing concentrations of TKI until TKI resistant cells dominate the population. (B) The target kinase (e.g., ALK) is amplified via error-prone PCR to generate a spectrum of mutated cDNAs that are transfected or transduced into neoplastic cells, which are then exposed to TKIs to select for TKI-resistant clones. (C) Unbiased genome-wide screens can be conducted to artificially induce or repress expression of genes individually to identify those that can induce resistance. See also Figure 7.
1.6.1 CRISPR-based genome-wide screens
CRISPR/Cas9 is a gene-editing platform derived from a microbial adaptive immune system264. Several
types of CRISPR/Cas systems have been investigated, but the type II system quickly gained popularity
as it required only one protein – Cas9, derived from Streptococcus pyogenes – to achieve CRISPR
RNA-guided DNA recognition and cleavage265-266. The first milestone was the discovery that RNA-
guided DNA cleavage was only possible when the target DNA sequence was complementary to the
CRISPR RNA and possessed a short photospacer adjacent motif (PAM) sequence (5’-NGG for
Cas9)265. The second milestone was the discovery that a trans-activating CRISPR RNA (tracrRNA) was
essential for CRISPR RNA maturation in the Cas9 system267. The final milestone was the development
of a synthetic single guide RNA (sgRNA) that combined the tracrRNA and CRISPR RNA by the addition
of a linker loop sequence between the two RNAs265. Soon after CRISPR/Cas9-based loss-of-function
(LOF) and gain-of-function (GOF) technologies were developed268–271 (Figure 7).
CRISPR/Cas9-based LOF technologies include CRISPR/Cas9 knockout (CRISPR nuclease =
CRISPRn) and CRISPR/dCas9-Krüppel272-associated box (KRAB) knockdown (CRISPR interference =
CRISPRi) technologies (Figure 7A). For CRISPR/Cas9-based knockout the Cas9–sgRNA complex is
targeted to a specific sequence in the coding region of a gene and cleaves both strands of the DNA273,274.
The DNA double-strand break is repaired by non-homologous end joining (NHEJ), an error-prone
pathway introducing insertion or deletion mutations that can lead to frameshifts275 and a premature
termination codon (PTC) in the expressed transcript, resulting in nonsense-mediated decay (NMD) of
the mRNA and aberrant peptide products that are degraded276.
The CRISPR/dCas9-KRAB knockdown system (Figure 7A) is based on a catalytically dead Cas9
(dCas9), which is generated when Cas9’s two nuclease domains – HNH277 and RuvC-like278 – are
mutated264. dCas9 is further fused to a repressor domain such as KRAB. As a result, transcriptional
repression is achieved by directly blocking RNA polymerase activity (dCas9) and through effector
domain-mediated transcriptional silencing via dCas9-KRAB279,280. The KRAB domain of Kox1, VP16 and
p65AD mediates recruitment of Kap1 and HP1 proteins finally leading to transcription silencing through
heterochromatin spreading281.
library of
cDNAs, shRNAs, sgRNAs
covering genome-wide CDS
DMSO
TKITKI
A B C
Prolonged
exposure to
gradually
increasing levels
of TKI
TKI
sensitive
cells
TKI
resistant
cells
TKI
sensitive
cells transduced
cells
Mutated target
kinase (ALK)
cDNAs
TKI
sensitive
cells
TKI
resistant
cells
TKI
resistant
cells
Compare
Compare

28
Figure 7 Technologies to perturb gene function in mammalian cells for pooled genetic screens (A) LOF technologies include RNA interference (RNAi); CRISPR nuclease (CRISPRn), in which Cas9-mediated DNA cleavage directed to the coding region of a gene by a single guide RNA (sgRNA) results in error-prone repair by cellular non-homologous end joining (NHEJ) pathways, thereby disrupting gene function; and CRISPR interference (CRISPRi), in which catalytically dead Cas9 (dCas9) fused to a transcriptional repressor domain (e.g. KRAB) is recruited to the TSS of an endogenous gene, as specified by an sgRNA, to repress transcription. (B) GOF technologies include overexpression of Open Reading Frames (ORFs) as transgenes; and CRISPR activation (CRISPRa), in which transcriptional activators are recruited via sgRNAs and dCas9 to TSSs of endogenous genes to induce their overexpression. To achieve high levels of overexpression with a single sgRNA, CRISPRa methods recruit more than one transcriptional activator to a given TSS. Multiple activator domains are either directly fused to dCas9 (e.g. VP64, p65 and RTA in the VPR system282), recruited to a protein scaffold fused to dCas9 (e.g. VP64 fused to superfolder GFP (sfGFP) and an antibody single-chain variable fragment (scFv) targeting a GCN4 epitope, which are recruited to a tandem array of 10 copies of the GCN4 epitope in the SunCas system269,283), or recruited to an RNA scaffold fused to the sgRNA (e.g. p65 and HSF1 transcriptional activation domains fused to MS2 coat protein (MCP), dimers of which are recruited to MS2 RNA hairpins in the Synergistic Activation Mediator (SAM) system271. Modified from Kampmann et al.284
shRNA
Pre
-CR
ISP
R
Loss-of-function technologies Gain-of-function technologiesBA
RNAi ORF expression
Dicer
processing
siRNA
mRNA degradation and
translational inhibition
RN
A s
ca
ffo
ldin
g
SA
MP
rote
in s
ca
ffo
ldin
g
dC
as
9-S
un
Ta
g
Dir
ect
fus
ion
dC
as
9-V
PR
CR
ISP
Ri
dC
as
9-K
RA
B k
no
ck
do
wn
CR
ISP
Rn
Ca
s9
kn
oc
ko
ut
CR
ISP
R-b
as
ed
CR
ISP
Ra
sgRNA
DNA
target
Genomic
locus
Cas9 PAM
VP64
sgRNA
MS2-P65-HSF1
DNA
target
Genomic
locus
dCas9 PAM
MS2
hairpins
VP64
DNA
target
Genomic
locus
dCas9 PAM
p65
RTA
DNA
target
Genomic
locus
dCas9 PAM
VP64
sfGFP
scFv-GCN4
10xGCN4
sgRNA
sgRNA
mRNA downregulation
KRAB
Pol II
Transcriptional silencing
DNA
target
Genomic
locus
dCas9 PAM
Heterochromatin
spreading
Kap1 & HP1
recruitment
NHEJ
Premature
stop codon
Indel mutation

29
CRISPR/Cas9-based GOF technologies include CRISPR activation (CRISPRa) systems such as the
CRISPR/dCas9-VP64 overexpression (Synergistic Activation Mediator = SAM) system271.
Transcriptional activation is achieved by fusion of activator domains such as a tetrameric VP16
(VP64)268 to dCas9, which recruits transcriptional complexes to the TSS of target transcripts as well as
an altered sgRNA to recruit accessory transcriptional co-activators (MS2-p65-HSF1) to synergistically
interact with the transcriptional complex. Specifically, a hairpin aptamer that selectively binds to the MS2
phage protein was appended to the tetraloop and stem loop no. 2 regions285. Then a separate vector
was constructed to express MS2 protein fused to the p65 transcription factor and heat shock
transcription factor 1 (HSF1). This allows for additional recruitment of transcriptional activators to the
TSS, leading to >500-fold enhanced overexpression in target mRNA levels compared to dCas9-VP64
alone271.
The ability to multiplex sgRNAs, and Cas9’s capacity to modulate expression of various endogenous
genes, inspired the development of CRISPR screen libraries286. The Genome-Scale CRISPR Knock-
Out (GeCKO) library was the first genome-wide CRISPR/Cas9-based KO screen library to be
published287. As it was demonstrated to be superior compared to RNAi LOF screens (Figure 7A),
specifically in a TKI resistance research setting, as it identified novel resistance mechanisms against
the BRAF inhibitor vemurafenib previously not identified with an RNAi screen263, many groups have
since used it to identify putative drug resistance mechanisms (Table 9).
Table 9 Previously published CRISPRn screens on drug resistance using GeCKO A v2 and B libraries288
Selection Organism Reference
Vemurafenib A375 Genome-scale CRISPR-Cas9 knockout screening in human cells263 Etoposide HL60, KBM70 Genetic screens in human cells using the CRISPR-Cas9 system289 Clostridium septicum α-toxin
mouse embryonic stem cells
Genome-wide recessive genetic screening in mammalian cells with a lentiviral CRISPR-guide RNA library290
Diphtheria toxin HeLa High-throughput screening of a CRISPR/Cas9 library for functional genomics in human cells291
Vemurafenib A375, HEK293T, BV2
Optimized sgRNA design to maximize activity and minimize off-target effects of CRISPR-Cas9292
Ricin K562 Genome-Scale CRISPR-Mediated Control of Gene Repression and Activation269
Sorafenib Huh7 Genome-wide CRISPR screen reveals SGOL1 as a druggable target of sorafenib-treated hepatocellular carcinoma293
Cisplatin SKOV3, A2780 Loss of ZNF587B and SULF1 contributed to cisplatin resistance in ovarian cancer cell lines based on Genome-scale CRISPR/Cas9 screening294
Rigosertib K562 Combined CRISPRi/a-Based Chemical Genetic Screens Reveal that Rigosertib Is a Microtubule-Destabilizing Agent295

30
The Weissman group combined CRISPR/Cas9-based KO with CRISPR/dCas9-based activation
screens showing accurate complementarity269. A subsequent study by Feng Zhang’s group identified
mediators of resistance to PLX-4720271 by validating CRISPR/dCas9-based activation screens (Table
10). This eventually led to the replacement of Open Reading Frame (ORF) overexpression screen
technologies (Figure 7A), as CRISPR/dCas9-based activation screens hold two key advantages: First,
ORF libraries do not replicate the transcript isoform variance. In contrast, guiding dCas9-VP64 upstream
of the TSS of genes can induce overexpression of several transcript variants with a single sgRNA271.
Second, ORF libraries suffer from selection bias as large cDNAs are packaged into lentiviral particles
at a much lower efficiency, leading to an overrepresentation of genes with smaller ORFs271,296. In
contrast, dCas9-VP64 induces the overexpression of different genes by the 20 bp guide sequence
present in the sgRNA.
Table 10 Previously published CRISPRa screens on drug resistance
Selection Organism Reference
Cytarabine MOLM14 An Integrated Genome-wide CRISPRa Approach to Functionalize lncRNAs in Drug Resistance297
Rigosertib K562 Combined CRISPRi/a-Based Chemical Genetic Screens Reveal that Rigosertib Is a Microtubule-Destabilizing Agent295
Vemurafenib A375 Dual direction CRISPR transcriptional regulation screening uncovers gene networks driving drug resistance298
Vemurafenib A375 Genome-scale activation screen identifies a lncRNA locus regulating a gene neighbourhood299
BRAF inhibitor PLX-4720
A375 Genome-scale transcriptional activation by an engineered CRISPR-Cas9 complex271
1.7 Aims of the PhD
This PhD aims to:
• Determine a bypass resistance landscape to ALK inhibition in ALK+ ALCL
• Explore the mechanism by which IL10RA mediates resistance to ALK inhibition in ALK+ ALCL
• Generate and characterize PDX models of ALK+ ALCL
• Explore if PIM1 overexpression mediates resistance to ALK inhibition in ALK-driven NB/ALK+ ALCL
• Establish and validate an assay for the detection of anti-ALK autoantibodies in ALK+ malignancies

31
CHAPTER 2 Materials & Methods

32
2.1 Key Reagents and Resources
The reagents or resources (Table 11) and methods described in this chapter of the thesis partly form
sections of two separate publications (Trigg, Lee & Prokoph et al.300, Prokoph et al.301), which can be
found in Appendix 1.
Table 11 Key Reagents and Resources
Reagent or Resource Source Identifier
Antibodies
Anti-GFP antibody Abcam Cat#: ab290
Polyclonal anti-Cas9 antibody Abcam Cat#: ab204448, 1:2000 dilution
Goat anti-rabbit immunoglobulin/HRP Agilent technologies Cat#: P0448, 1:10000 dilution
Rabbit anti-mouse immunoglobulins/HRP Agilent technologies Cat#: P0161, 1:10000 dilution
Rabbit anti-human immunoglobulins/HRP Agilent technologies Cat#: P0214, 1:100 dilution
Rabbit ALK (D5F3®) XP® antibody Cell Signalling Cat#: 3633, 1:1000 dilution
Rabbit Phospho-ALK (Tyr1604) antibody Cell Signalling Cat#: 3341, 1:1000 dilution
Rabbit Phospho-STAT3 (Tyr705) antibody Cell Signalling Cat#: 9145S, 1:1000 dilution
Rabbit STAT3 antibody Cell Signalling Cat#: 4904S, 1:1000 dilution
Rabbit STAT1 antibody Cell Signalling Cat#: 9172 S, 1:1000 dilution
Rabbit Phospho-STAT1 (Tyr701) antibody Cell Signalling Cat#: 14994 S, 1:1000 dilution
Rabbit Phospho-STAT5 (Tyr694) antibody Cell Signalling Cat#: 9359 S, 1:1000 dilution
Mouse STAT5A (4H1) antibody Cell Signalling Cat#: 4807 S, 1:1000 dilution
Bond™ Ready-to-Use Primary Antibody Anaplastic Lymphoma Kinase (5A4)
Leica Biosystems Newcastle Ltd
Cat#: PA0306
BOND™ Ready-to-Use Primary Antibody CD30 (JCM182)
Leica Biosystems Newcastle Ltd
Cat#: PA0790
Mouse anti-α-Tubulin Sigma Aldrich Cat#: T9026, 1:10000 dilution
Mouse anti-GAPDH Cell Signalling Cat#: 97166S, 1:10000 dilution
ALK monoclonal antibody Thermo Fisher Scientific Cat#: 35-4300, 1:1000 dilution
Rabbit IL10RA antibody Abcam Cat#: ab94811, 1:100 dilution
Rabbit IL10RB antibody Abcam Cat#: ab106282, 1:100 dilution
Rabbit IL10 antibody Abcam Cat#: ab34843 1:200 dilution
Monoclonal anti-human IgG (Fc specific) antibody Sigma-Aldrich Cat#: I6260
Human IgG Sigma-Aldrich Cat#: I4506
goat anti-human IgG (H&L) – Affinity Pure, DyLight550 Conjugate
ImmunoReagents Cat#: GtxMu-003-E2550NHSX
anti-GST antibody Abcam Cat#: ab117484
Anti-STAT3 (124H6) antibody Cell Signalling Cat#: 9139
Bacteria and Virus Strains
lenti dCAS-VP64_Blast 271, a gift from Feng Zhang RRID: Addgene_61425

33
Reagent or Resource Source Identifier
lenti MS2-P65-HSF1_Hygro 271, a gift from Feng Zhang RRID: Addgene_61426
lenti sgRNA(MS2)_zeo backbone 271, a gift from Feng Zhang RRID: Addgene_61427
lenti sgRNA(MS2)_puro backbone 271, a gift from Feng Zhang RRID: Addgene_73795
Human CRISPR Activation Library 271, a gift from Feng Zhang RRID: Addgene_1000000057
lentiCRISPR v2 288, a gift from Feng Zhang RRID: Addgene_52961
pMD2.G A gift from Didier Trono RRID: Addgene_12259
psPAX2 A gift from Didier Trono RRID: Addgene_12260
pRSV-Rev A gift from Didier Trono RRID: Addgene_12253
pCMVR8.74 A gift from Didier Trono RRID: Addgene_22036
pLKO.1-puro 302, a gift from Prof. Bob Weinberg
RRID: Addgene_8453
non-targeting shRNA 303, a gift from David
Sabatini
RRID: Addgene_1864
pLKO.1 STAT3 shRNA #1 304, a gift from Roberto Chiarle
TRCN0000020842
pLKO.1 STAT3 shRNA #2 304, a gift from Roberto Chiarle
TRCN0000020840
pLKO.1_PIM1 shRNA #1 300 TRCN0000010118
pLKO.1_PIM1 shRNA #2 300 TRCN0000199011
FgH1tUTG 305, a gift from Marco
Herold
RRID: Addgene_70183
pHR-SFFV-KRAB-dCas9-P2A-mCherry 269, a gift from Jonathan
Weissman
RRID: Addgene_60954
pSB700 Cerulean-Zhang2.0 306, a gift from George
Church
RRID: Addgene_79378
pSB700 Cerulean-Zhang2.0 puro 297 N/A
pSB700 Cerulean-Zhang2.0 BFP 297 N/A
pSB700 Cerulean-Zhang2.0 RFP 297 N/A
pLVUT-tTR-KRAB 307, a gift from Patrick Aebischer & Didier Trono
RRID: Addgene_11651
pLVTHM 308, a gift from Didier Trono RRID: Addgene_12247
pLVTHM vector containing the H1 promoter ALK-shRNA (A5) cassette
309 N/A
pLX302 310, a gift from David Root RRID: Addgene_25896
pLX302 IL10RA-V5 puro 311, a gift from Kevin Janes RRID: Addgene_47552
pcDNA™ 3.1 vector Invitrogen Cat#: V79020
pcDNA NPM-ALK a kind gift from Steve Morris
N/A
NEB Stable Competent E. coli (High Efficiency) New England Biolabs (NEB)
Cat#: C3040I
ElectroMAX Stbl4 Competent Cells Thermo Fisher Cat#: 11635018
Chemicals, Peptides, and Recombinant Proteins
T4 PNK NEB Cat#: M0201S
10X T4 Ligation Buffer NEB Cat#: M0541
BsmB1 NEB Cat#: R05805
T4 DNA Ligase NEB Cat#: M0202S
Pfu DNA Polymerase Thermo Fisher Scientific Cat#: EP0571
FastDigest® DpnI NEB Cat#: FD1703

34
Reagent or Resource Source Identifier
AgeI-HF NEB Cat#: R0552S
EcoRI-HF NEB Cat#: R0101S
DTT ThermoFisher Cat#: 707265ML
SOC Outgrowth Medium NEB Cat#: B9020
TransIT-293 MirusBio Cat#: MIR 2700
Xfect™ Transfection Reagent Takara Bio Cat#: 631318
Lipofectamine® 3000 Transfection Reagent Thermo Fisher Scientific Cat#: L3000001
Zeocin InvivoGen Cat#: Ant-zn-1
Puromycin Gibco Cat#: A1113803
Blasticidin Thermo Fisher Scientific Cat#: R21001
Hygromycin B Thermo Fisher Scientific Cat#: 10687010
Dubbecco’s phosphate buffered saline (DPBS) Sigma-Aldrich Cat#: D8537
Fetal bovine serum (FBS) Labtech Cat#: FCS-SA/500
Dulbecco’s Modified Eagle Medium (DMEM), Hi Gluc, pyruvate
Thermo Fisher Scientific Cat#: 41966029
Roswell Park Memorial Institute (RPMI) 1640 Thermo Fisher Scientific Cat#: 21875091
Iscove's Modified Dulbecco's Medium (IMDM) Thermo Fisher Scientific Cat#: 21980032
Opti-MEM® I Reduced Serum Medium Thermo Fisher Scientific Cat#: 51985026
Penicillin/Streptomycin Solution Thermo Fisher Scientific Cat#: 15140122
1 x Trypsin- Ethylenediaminetetraacetic acid (EDTA) Life Technologies Cat#: 25300054
Insulin-transferrin-selenium Thermo Fisher Scientific Cat#: 41400045
Trypan blue Thermo Fisher Scientific Cat#: 15250061
Q5® High-Fidelity DNA Polymerase New England Biolabs Cat#: M0491S
Herculase II Fusion DNA Polymerase Agilent Cat#: 600677
APC-Annexin V BioLegend Cat#: 640920
Annexin V Binding Buffer Thermo Fisher Scientific Cat#: V13246
Propidium Iodide (PI) Sigma-Aldrich Cat#: P4170-10MG
Power SYBR Green PCR Master Mix ThermoFisher Scientific Cat#: A25741
PierceTM RIPA buffer Thermo Scientific Cat#: 89900
Immobilon Western Chemiluminescent HRP Substrate Merck Millipore Cat#: WBKLS0050
Dimethyl sulfoxide (DMSO) Sigma-Aldrich Cat#: D8418
Crizotinib MedChemExpress Cat#: HY-50878
Alectinib MedChemExpress Cat#: CH5424802
Lorlatinib MedChemExpress Cat#: HY-12215
Ceritinib MedChemExpress Cat#HY-15656
Brigatinib MedChemExpress Cat#: HY-12857
Vinblastine Sigma-Aldrich V1377
AZD1208 AstraZeneca N/A
IBL-101 Inflection Biosciences N/A
Stattic MedChemExpress Cat#: HY-13818
Interleukin-10 human Sigma-Aldrich Cat#: H7541-10UG
PhiX Sequencing Control v3 Illumina Cat#: FC-110-3001
HaltTM Protease Inhibitor Cocktail Thermo Scientific Cat#: 87786
HaltTM Phosphatase Inhibitor Cocktail Thermo Scientific Cat#: 78420
RestoreTM PLUS Western Blot Stripping Buffer Thermo Scientific Cat#: 46430
IDetect Super Stain System – HRP Empire Genomics Cat#: IDST1007
Target Retrieval Solution, Citrate pH6.1 (10X) Agilent Dako Cat#: S2369
Hematoxylin Solution, Gill No. 3 Sigma-Aldrich Cat#: GHS332
3,3’-Diaminobenzidine (DAB) substrate Sigma-Aldrich Cat#: D4293
Aquatex Merck Cat#: 108562
Faramount mounting medium Dako Cat#: S302580
StabilGuard® Choice SurModics Cat#: SG02
DY-633 carboxylic acid carrier dye Dyomics Cat#: 633-00

35
Reagent or Resource Source Identifier
ALK protein Thermo Fisher Scientific Cat#: PR7396B
Glutathione S-Transferase (GST) GeneScript Cat#: Z02039
RNase A Roche Cat#: 10109169001
DNAse I Thermo Scientific Cat#: 18068015
Proteinase K Thermo Scientific Cat#: EO0491
Dynabeads™ Protein G Thermo Scientific Cat#: 10004D
Lymphoprep STEMCELL TECHNOLOGIES
Cat#: 07801
cOmplete™ Mini EDTA-free Protease Inhibitor Cocktail Roche Cat#: 11836170001
Matrigel matrix Corning Cat#: 354277
Critical Commercial Assays
QIAprep Spin Plasmid Kit Qiagen Cat#: 27104
EndoFree Plasmid Maxi Kit Qiagen Cat#: 12362
RNeasy Plus Mini Kit Qiagen Cat#: 74134
High-Capacity RNA-to-cDNA™ Kit Applied Biosystems Cat#: 4387406
Q5 High-Fidelity PCR Kit NEB Cat#: E0555S
CellTiter-Glo Promega Cat#: G7572
CellTiter-Blue® Cell Viability Assay Promega Cat#: G8081
PierceTM BCA Protein Assay Kit Thermo Scientific Cat#: 23225
QIAamp DNA Blood Maxi Kit Qiagen Cat#: 51194
QIAamp DNA Mini Kit Qiagen Cat#: 51304
Q5 High-Fidelity PCR Kit NEB Cat#: E0555S
Zymo DNA Clean and Concentrator-5 Zymo research Cat#: D4003
KAPA Library Quantification Kit Kapa Biosystems Cat#: Q32850
TruSeq Stranded mRNA kit Illumina Cat#: 20020595
AEC Substrate Kit BDPharmingen Cat#: 551015
Avidin/Biotin Blocking Kit Vector Laboratories Cat#: SP2001
QIAquick PCR Purification Kit Qiagen Cat#: 28106
AMIDot™ Activation Diluent Cambridge Life Sciences Cat#: N7214D
AUTOZYME™ RF Wash Buffer Cambridge Life Sciences Cat#: N7206D
AUTOZYME™ RF Sample Diluent Cambridge Life Sciences Cat#: N7015D
Deposited Data
CRISPR overexpression screens sgRNA Counts in ALCL cells treated with DMSO or crizotinib
(Prokoph et al.)301 Table S9
CRISPR knockout screens sgRNA Counts in ALCL cells treated with DMSO or crizotinib
(Prokoph et al.)301 Table S10
CRISPR overexpression screens sgRNA Counts in NB cells treated with DMSO, brigatinib or ceritinib
(Trigg, Lee & Prokoph et al.)300
Supplementary Data 1, Supplementary Data 2
CRISPR knockout screens sgRNA Counts in ALCL cells
312 Supplementary Data 5 Supplementary Data 6
RNA-seq from 2 ALK inhibitor resistant and 2 chemotherapy relapsed ALK+ ALCL patients
(Prokoph et al.)301 N/A
STAT3 ChIP-seq for CD4+ T-cells 313 GEO: GSE21669
STAT3 ChIP-seq for ALCL cell lines 304 GEO: GSE117164
Expression profiling by array from 23 ALK+ ALCL patients, 12 reactive lymph nodes
314 GEO: GSE78513
Expression profiling by array from 67 AITL, 73 PTCL-NOS, 17 ALK+ and 18 ALK- ALCL patients; as well as T cells from 9 healthy individuals.
315 GEO: GSE58445
Expression profiling by array from 6 AITL, 28 PTCL-NOS, 2 ALK+ and 4 ALK- ALCL patients; as well as T cells from 10 healthy individuals.
316 GEO: GSE6338

36
Reagent or Resource Source Identifier
Expression profiling by array from 5 ALK+ and 4 ALK- ALCL patients, 23 T cells and 3 ALK+ ALCL cell lines.
317 GEO: GSE14879
Expression profiling by array from 36 AITL, 45 PTCL-NOS, 20 ALK+, 9 ALK- ALCL patients; as well as 10 T cells and 3 T-cell control cell lines.
318 GEO: GSE19069
Expression profiling by array from 8 PTCL-NOS, 10 ALK+ and 13 ALK- ALCL patients
319 GEO: GSE65823
Expression profiling by array from 61 lymphoma cell lines
320 GEO: GSE94669
Expression profiling by array from 4 ALK+, 2 ALK- and 4 T-cell control cell lines
321 GEO: GSE107951
Expression profiling by array from doxycycline induced or non-induced TS and SU-DHL-1 cells. Expression profiling by array from ALK inhibitor treated TS cells.
322 GEO: GSE6184
Experimental Models: Cell Lines
Human: DEL (Male, 12 years) Deutsche Sammlung von Mikroorganismen und Zellkulturen (DSMZ)
Cat#: ACC 338, RRID: CVCL_1170
Human: KARPAS-299 (Male, 25 years) European Collection of Authenticated Cell Cultures (ECACC)
Cat#: 06072604, RRID: CVCL_1324
Human: SU-DHL-1 (Male, 10 years) DSMZ Cat#: ACC 356, RRID: CVCL_0538
Human: SUP-M2 (Female, 5 years) DSMZ Cat#: ACC 509, RRID: CVCL_2209
Human: COST (Male, 4 years) a gift from Roberto Chiarle RRID: CVCL_9491
Human: TS (Female, 5 years) 323, a gift from Roberto Chiarle
RRID: CVCL_B228
Human: JB6 (Male, 12 years) a gift from Roberto Chiarle RRID: CVCL_H633
Human: ManGoSteen = MGS (Female, 7 years) (Prokoph & Matthews et al., unpublished)
RRID: N/A
Human: MaToKe = MTK (Male, 5 years) (Prokoph & Matthews et al., unpublished)
RRID: N/A
Human: Mac-2A (Male, 47 years) 324, a gift from Olaf Merkel RRID: CVCL_H637
Human: FE-PD (Female, 46 years) DSMZ RRID: CVCL_H614
Human: CHLA-20 (Female, 2 years) COG RRID: CVCL_6602
Human: CHLA-90 (Male, 6 years) COG RRID: CVCL_6610
Human: CHLA-95 (Female) COG RRID: CVCL_6611
Human: CHLA-171 (Male, 8 years) COG RRID: CVCL_6597
Human: COG-N-426 (Felix-CL, Male) COG RRID: CVCL_LF58
Human: GI-ME-N (Female, 3 years) DSMZ Cat#: ACC654; RRID: CVCL_1232
Human: KELLY (Female, 1 year) ECACC Cat#: 92110411; RRID: CVCL_2092
Human: LAN-5 (Male, 4 months) COG RRID: CVCL_0389
Human: LAN-6 (Male, 6 years) COG RRID: CVCL_1363
Human: NB-1643 (Male, 3 years) COG RRID: CVCL_5627
Human: NBL-S (Male, 3 years) DSMZ Cat#: ACC656; RRID: CVCL_2136
Human: NGP (Male, 2 years) DSMZ Cat#: ACC676; RRID: CVCL_2141
Human: SH-SY5Y (Female, 4 years) ECACC Cat#: 94030304; RRID: CVCL_0019
Human: LM1 (Female, 13 years) 325 N/A
Human: HEK293T (Female) Invitrogen Cat#: R70007, RRID: CVCL_6911
Monkey: COS-1 (Male) DSMZ Cat#: ACC63, RRID: CVCL_0223
Human: DEL CR (Male, 12 years) (Prokoph et al.)301 N/A
Human: DEL AR (Male, 12 years) (Prokoph et al.)301 N/A

37
Reagent or Resource Source Identifier
Human: KARPAS-299 CR (Male, 25 years) 217, a gift from Luca Mologni
RRID: CVCL_V404
Human: KARPAS-299 AR (Male, 25 years) 326, a gift from Luca Mologni
N/A
Human: KARPAS-299 BR (Male, 25 years) 327, a gift from Luca Mologni
N/A
Human: KARPAS-299 LR (Male, 25 years) 328, a gift from Luca Mologni
N/A
Human: SU-DHL-1 CR (Male, 10 years) (Prokoph et al.)301 N/A
Human: SU-DHL-1 AR (Male, 10 years) (Prokoph et al.)301 N/A
Human: SUP-M2 CR (Female, 5 years) 217, a gift from Luca Mologni
RRID: CVCL_V405
Human: SUP-M2 AR (Female, 5 years) (Prokoph et al.)301 N/A
Human: SUP-M2 BR (Female, 5 years) 327 N/A
Human: SUP-M2 LR (Female, 5 years) 328, a gift from Luca Mologni
N/A
Human: stable doxycycline inducible NPM1-ALK shRNA TS (Female, 5 years)
323, a gift from Roberto Chiarle
N/A
Human: stable doxycycline inducible NPM1-ALK shRNA SU-DHL-1 (Male, 10 years)
323, a gift from Roberto Chiarle
N/A
Experimental Models: Organisms/Strains
C.B.17/IcrHanHsd-Prkdc (Mus musculus) Envigo Cat#: 88304F
NOD.Cg-Prkdcscid Il2rgtm1WjI/SzJ (Mus musculus) Charles River Cat#005557; RRID: IMSR_ARC:NSG
MGS-A-x (Prokoph & Matthews et al., unpublished)
RRID: N/A
Software and Algorithms
FlowJo 10 Treestar https://www.flowjo.com/
R Statistical Software 3.6 N/A https://www.r-project.org/
Inkscape 0.92.4 N/A https://inkscape.org/
MAGeCK 329 https://sourceforge.net/p/mageck/ wiki/Home/
MAGeCK-VISPR 329 http://bitbucket.org/liulab/mageck-vispr
Salmon 330 https://github.com/COMBINE-lab/salmon
tximport 331 https://bioconductor.org/packages/release/bioc/html/tximport.html
edgeR 332 https://bioconductor.org/packages/release/bioc/html/edgeR.html
DESeq2 333 http://bioconductor.org/packages/ release/bioc/html/DESeq2.html
biomaRt 334 http://bioconductor.org/packages/ release/bioc/html/biomaRt.html
fgsea 335 http://bioconductor. org/packages/release/bioc/html/ fgsea.html
topGO 336 https://bioconductor.org/packages/release/bioc/html/topGO.html

38
Reagent or Resource Source Identifier
SAM Cas9 activator tool Zhang lab http://sam.genome-engineering.org/database/
CRAN: survminer 337 https://cran.r-project.org/web/ packages/survminer/index.html
CRAN: survival package in R 338 https://cran.r-project.org/web/ packages/survival/index.html
GraphPad Prism 8.2 GraphPad www.graphpad.com
SRA toolkit National Center for Biotechnology Information (NCBI)
https://github.com/ncbi/sra-tools
SAMtools 339 http://samtools.sourceforge.net/
Bowtie2 340 http://bowtie-bio.sourceforge.net/bowtie2/index.shtml
BEDTools 341 https://sourceforge.net/projects/bedtools/
IGV 342,343 http://software.broadinstitute.org/software/igv/
GEOquery 344 https://bioconductor.org/packages/release/bioc/html/GEOquery.html
oligo 345 https://www.bioconductor.org/packages/release/bioc/html/oligo.html
arrayQualityMetrics 346 https://bioconductor.org/packages/release/bioc/html/arrayQualityMetrics.html
AnnotationDbi 347 https://bioconductor.org/packages/release/bioc/html/AnnotationDbi.html
limma 348 https://bioconductor.org/packages/release/bioc/html/limma.html
beadarray 349 https://www.bioconductor.org/packages/release/bioc/html/beadarray.html
illuminaHumanv4.db 350 http://bioconductor.org/packages/release/data/annotation/html/illuminaHumanv4.db.html
Human Reference Genome (GRCh38.p12) Genome Reference Consortium
https://www.ncbi.nlm.nih.gov/assembly/GCF_000001405.38
GENCODE transcriptome annotation version v29 351 https://www.gencodegenes.org/human/release_29.html
Human Reference Genome (hg19) Genome Reference Consortium
https://www.ncbi.nlm.nih.gov/grc/human
Mouse Reference Genome (mm10) Genome Reference Consortium
https://www.ncbi.nlm.nih.gov/grc/mouse
KEGG: Kyoto Encyclopedia of Genes and Genomes 352 https://ww.genome.jp/kegg

39
Reagent or Resource Source Identifier
PrimerBLAST NCBI https://www.ncbi.nlm.nih.gov/tools/primer-blast/
PrimerBank 353 https://pga.mgh.harvard.edu/primerbank/
Other
FACSAria™ Fusion 2 flow cytometer BD Bioscience N/A
2100 BioAnalyzer System Agilent N/A
Illumina NextSeq500 Illumina N/A
QuantStudio™ 6 Flex Real-Time PCR System ThermoFisher N/A
Accuri C6 flow cytometer BD Bioscience N/A
ABI Veriti Thermal Cycler Applied Biosystems N/A
30-gauge hypodermic AganiTM needle VWR Cat#: 613-5373
Plastic feeding tubes (22ga (black) x 38mm) Instech Laboratories Cat#: FTP-22-38
70 M nylon Falcon™ cell strainer Thermo Fisher Scientific Cat#: 352350
5 mL Plastipak™ syringe Thermo Fisher Scientific Cat#: 302187
Minisart filters (0.45 μm pore size) Merck Millipore Cat#: 16555K
Minisart filters (0.2 μm pore size) Sartorius Stedim Biotech Cat#: 17823K
Vivaspin centrifugal filter column with a molecular weight cut-off of 3 kDa
Sartorius Stedim Biotech Cat#: VS0191
SpectraMax i3 Molecular Devices N/A
Mini-Protean TGX Precast Gels Bio-Rad Cat#: 4561033
Trans-Blot Turbo Transfer Pack Bio-Rad Cat#: 1704156
Trans-Blot Turbo Transfer System Bio-Rad N/A
Gene Pulser II Electroporation System Bio-Rad N/A
Flat-bottom 96-well plates Corning Cat#: 167008
96 well V-bottom plates Greiner bio-one Cat#: 651201
Black 96-well Cellstar plate Greiner bio-one Cat#: 655090
2D-Epoxy functionalized glass slide PolyAN Molecular Surface Engineering
Cat#: 10400221
3D-Epoxy functionalized glass slide PolyAN Molecular Surface Engineering
Cat#: 10400205
3D-NHS functionalized glass slide PolyAN Molecular Surface Engineering
Cat#: 10400405
2D-Aldehyde functionalized glass slide PolyAN Molecular Surface Engineering
Cat#: 10400325
3D-Aldehyde functionalized glass slide PolyAN Molecular Surface Engineering
Cat#: 10400305
Dako Pen Dako Cat#: S2002
Superfrost™ microscope slides Thermo Fisher Scientific Cat#: 10143560W90
Cytocentrifuge Shandon N/A
Automated slide processor ZenitUP A. Menarini Diagnostics N/A
Port Array 5000TM Aurora Photonics N/A
Nano-PlotterTM NP2.1 GeSiM N/A
AIRWIN ultrasonic humidifier BOGA Gerätetechnik N/A
programmable temperature controller PolyScience N/A
Bioruptor® Pico Diagenode N/A
Nanodrop 1000 ThermoFisher N/A
LAS-4000 Image Analyzer Fujifilm/Raytek N/A
Water-sensitive paper Quantifoil Instruments Cat#: 3100-0011
15-mL polypropylene centrifuge tubes Sarstedt Cat#: CEN255
Sonication beads Diagenode Cat#:C03070001
High sensitivity D1000 ScreenTape Agilent N/A

40
2.2 Patient samples
Patient samples utilized in this thesis include samples collected from patients enrolled to clinical trials
(Table 12).
Table 12 Clinical trials from which samples have been acquired (*) as stated on the ClinicalTrials.gov webpage.
NIH study trial registration no.
Description Study timeframe*
Disease Patients Experiment purpose
NCT00006455 ALCL99: Combination chemo-therapy in treating children with ALCL
Dec 1999 – N/A
ALCL 42 TMA
N/A NHL-BFM95 N/A ALCL 24 TMA
N/A NHL-BFM90 N/A ALCL 26 TMA
NCT02613962 MAPPYACTS: Proof -of -concept study to stratify targeted therapies adapted to molecular profiling
Dec 2005 – Dec 2020
ALCL 4 RNA-seq
2.2.1 NHL-BFM90 trial cohort
The BFM group study NHL-BFM9033 enrolled paediatric patients with B or T-cell NHL, including
paediatric ALCL patients, to test increasing doses of methotrexate. From this study, archival paraffin-
embedded tissue blocks were used to create tissue microarrays (TMAs) containing cores selected from
representative tumour areas as determined by a consultant histopathologist from hematoxylin and
eosin–stained sections.
FFPE tissue specimens from individuals with ALK+ ALCL treated in the NHL-BFM9033 trial were
obtained from both male (n = 19) and female (n = 7) peadiatric subjects (Table 13) with informed consent
and in accordance with the Declaration of Helsinki. The study was approved by the institutional ethics
committee of the primary investigator of the NHL-BFM study group. Patients with completely resected
Stage 1 disease were treated with different chemotherapy regimens and as such were excluded from
this study. Eligibility was confirmed by demonstration of NPM1-ALK positivity of the tumour either by
NPM1-ALK polymerase chain reaction, two-color fluorescence in situ hybridization for the t(2;5) or
nuclear and cytoplasmic staining for ALK. Staging procedures included bone marrow aspiration cytology
and a spinal tap. Bone marrow involvement was defined by cytologically detectable ALCL cells,
irrespective of their number. The patient’s treatment consisted of a cytoreductive prephase followed by
six chemotherapy courses, as previously described33.

41
Table 13 Clinical Information of Paediatric ALCL Patients Recruited onto the NHL-BFM90 Trial
Case no.
Sex Age group (in years)
Diagnosis Study Relapse Death
1 F >= 10 ALCL, ALK+ NHL-BFM90 no no
2 M < 10 ALCL, ALK+ NHL-BFM90 no no
3 M < 10 ALCL, ALK+ NHL-BFM90 no no
4 M < 10 ALCL, ALK+ NHL-BFM90 no no
5 M >= 10 ALCL, ALK+ NHL-BFM90 no no
6 M >= 10 ALCL, ALK+ NHL-BFM90 no no
7 F >= 10 ALCL, ALK+ NHL-BFM90 no no
8 F >= 10 ALCL, ALK+ NHL-BFM90 no no
9 M < 10 ALCL, ALK+ NHL-BFM90 no no
10 M >= 10 ALCL, ALK+ NHL-BFM90 no no
11 M >= 10 ALCL, ALK+ NHL-BFM90 no no
12 F >= 10 ALCL, ALK+ NHL-BFM90 no no
13 M < 10 ALCL, ALK+ NHL-BFM90 no no
14 M < 10 ALCL, ALK+ NHL-BFM90 no no
15 M < 10 ALCL, ALK+ NHL-BFM90 no no
16 F >= 10 ALCL, ALK+ NHL-BFM90 no no
17 M < 10 ALCL, ALK+ NHL-BFM90 no no
18 F < 10 ALCL, ALK+ NHL-BFM90 yes yes
19 M >= 10 ALCL, ALK+ NHL-BFM90 no no
20 M < 10 ALCL, ALK+ NHL-BFM90 no no
21 M >= 10 ALCL, ALK+ NHL-BFM90 yes no
22 F < 10 ALCL, ALK+ NHL-BFM90 yes no
23 M < 10 ALCL, ALK+ NHL-BFM90 no no
24 M >= 10 ALCL, ALK+ NHL-BFM90 yes no
25 M >= 10 ALCL, ALK+ NHL-BFM90 no no
26 M < 10 ALCL, ALK+ NHL-BFM90 yes no
2.2.2 NHL-BFM95 trial cohort
Given the high risk of short-term side effects associated with methotrexate51, lower concentrations of
methotrexate administered in shorter pulses were applied in a subsequent BFM group study, NHL-
BFM9594. From this study, archival paraffin-embedded tissue blocks were used to create TMAs
containing cores selected from representative tumour areas as determined by a consultant
histopathologist, from hematoxylin and eosin–stained sections.
FFPE tissue specimens from individuals with ALK+ ALCL treated in the NHL-BFM9594 trial were
obtained from both male (n = 20) and female (n = 4) paediatric subjects (Table 14) with informed consent
and in accordance with the Declaration of Helsinki. The study was approved by the institutional ethics
committee of the primary investigator of the NHL-BFM study group. Patients with completely resected
Stage 1 disease were treated with different chemotherapy-regimens and as such were excluded from
this study. Eligibility was confirmed by demonstration of NPM1-ALK positivity of the tumour either by
NPM1-ALK polymerase chain reaction, two-color fluorescence in situ hybridization for the t(2;5) or
nuclear and cytoplasmic staining for ALK. Staging procedures included bone marrow aspiration cytology
and a spinal tap. Bone marrow involvement was defined by cytologically detectable ALCL cells,
irrespective of their number. The patient’s treatment consisted of a cytoreductive prephase followed by
six chemotherapy courses, as previously described33.

42
Table 14 Clinical Information of Paediatric ALCL Patients Recruited onto the NHL-BFM95 Trial
Case no.
Sex Age group (in years)
Diagnosis Study Relapse Death
1 M >= 10 ALCL, ALK+ NHL-BFM95 no no
2 M < 10 ALCL, ALK+ NHL-BFM95 no no
3 M >= 10 ALCL, ALK+ NHL-BFM95 no no
4 M < 10 ALCL, ALK+ NHL-BFM95 yes no
5 M >= 10 ALCL, ALK+ NHL-BFM95 no no
6 M < 10 ALCL, ALK+ NHL-BFM95 no no
7 F >= 10 ALCL, ALK+ NHL-BFM95 no no
8 M < 10 ALCL, ALK+ NHL-BFM95 yes no
9 M < 10 ALCL, ALK+ NHL-BFM95 yes no
10 M >= 10 ALCL, ALK+ NHL-BFM95 no no
11 M < 10 ALCL, ALK+ NHL-BFM95 yes yes
12 M >= 10 ALCL, ALK+ NHL-BFM95 no no
13 M >= 10 ALCL, ALK+ NHL-BFM95 yes no
14 M >= 10 ALCL, ALK+ NHL-BFM95 no no
15 M < 10 ALCL, ALK+ NHL-BFM95 no no
16 M >= 10 ALCL, ALK+ NHL-BFM95 no no
17 F < 10 ALCL, ALK+ NHL-BFM95 yes yes
18 M < 10 ALCL, ALK+ NHL-BFM95 no yes
19 M < 10 ALCL, ALK+ NHL-BFM95 no no
20 M >= 10 ALCL, ALK+ NHL-BFM95 yes no
21 M < 10 ALCL, ALK+ NHL-BFMV95 yes no
22 F >= 10 ALCL, ALK+ NHL-BFMV95 no no
23 F < 10 ALCL, ALK+ NHL-BFMV95 yes no
24 M >= 10 ALCL, ALK+ NHL-BFMV95 no no
2.2.3 ALCL99 trial cohort
The European intergroup trial ALCL9928 (NCT00006455) is a randomized phase III trial that is studying
several different regimens of combination chemotherapy to compare how well they work in treating
children with ALCL. The study was approved by the institutional ethics committee of the primary
investigator of the NHL-BFM study group. Patients with completely resected Stage 1 disease were
treated with different chemotherapy-regimens and as such were excluded from this study. Eligibility was
confirmed by demonstration of NPM1-ALK positivity of the tumour either by NPM1-ALK polymerase
chain reaction, two-color fluorescence in situ hybridization for the t(2;5) or nuclear and cytoplasmic
staining for ALK. Staging procedures included bone marrow aspiration cytology and a spinal tap. Bone
marrow involvement was defined by cytologically detectable ALCL cells, irrespective of their number.
The patient’s treatment consisted of a cytoreductive prephase followed by six chemotherapy courses,
as previously described33.
From this study, archival paraffin-embedded tissue blocks were used to create TMAs containing cores
selected from representative tumour areas as determined by a consultant histopathologist, from
hematoxylin and eosin–stained sections. FFPE tissue specimens from individuals with ALK+ ALCL
treated in the ALCL99 trial were obtained from both male (n = 28) and female (n = 14) paediatric subjects
(Table 15) with informed consent and in accordance with the Declaration of Helsinki.
In addition, serum or plasma samples from individuals with ALK+ ALCL treated in the ALCL99 trial were
obtained from both male (n = 53) and female (n = 40) paediatric subjects (Table 40) with informed
consent and in accordance with the Declaration of Helsinki.

43
Table 15 Clinical Information of Paediatric ALCL Patients Recruited onto the ALCL99 Trial that provided FFPE tissue specimens
Case no.
Sex Age group (in years)
Diagnosis Study Relapse Death
1 M >= 10 ALCL, ALK+ ALCL99 yes no
2 M >= 10 ALCL, ALK+ ALCL99 yes no
3 F >= 10 ALCL, ALK+ ALCL99 no no
4 M >= 10 ALCL, ALK+ ALCL99 no no
5 M < 10 ALCL, ALK+ ALCL99 yes no
6 M >= 10 ALCL, ALK+ ALCL99 yes no
7 F >= 10 ALCL, ALK+ ALCL99 no no
8 M >= 10 ALCL, ALK+ ALCL99 no no
9 M >= 10 ALCL, ALK+ ALCL99 no no
10 M < 10 ALCL, ALK+ ALCL99 yes no
11 M >= 10 ALCL, ALK+ ALCL99 no no
12 M >= 10 ALCL, ALK+ ALCL99 yes no
13 M >= 10 ALCL, ALK+ ALCL99 no no
14 M >= 10 ALCL, ALK+ ALCL99 no no
15 M >= 10 ALCL, ALK+ ALCL99 yes no
16 F >= 10 ALCL, ALK+ ALCL99 yes no
17 F >= 10 ALCL, ALK+ ALCL99 no no
18 M >= 10 ALCL, ALK+ ALCL99 no no
19 M < 10 ALCL, ALK+ ALCL99 yes no
20 M >= 10 ALCL, ALK+ ALCL99 no no
21 M >= 10 ALCL, ALK+ ALCL99 yes yes
22 M >= 10 ALCL, ALK+ ALCL99 no no
23 F < 10 ALCL, ALK+ ALCL99 no no
24 F >= 10 ALCL, ALK+ ALCL99 no no
25 F >= 10 ALCL, ALK+ ALCL99 no no
26 M >= 10 ALCL, ALK+ ALCL99 no no
27 F >= 10 ALCL, ALK+ ALCL99 no no
28 M < 10 ALCL, ALK+ ALCL99 no no
29 F >= 10 ALCL, ALK+ ALCL99 no no
30 M >= 10 ALCL, ALK+ ALCL99 no no
31 M < 10 ALCL, ALK+ ALCL99 no no
32 M >= 10 ALCL, ALK+ ALCL99 yes no
33 F >= 10 ALCL, ALK+ ALCL99 yes yes
34 F >= 10 ALCL, ALK+ ALCL99 no yes
35 F >= 10 ALCL, ALK+ ALCL99 yes no
36 M >= 10 ALCL, ALK+ ALCL99 no no
37 F < 10 ALCL, ALK+ ALCL99 no no
38 M >= 10 ALCL, ALK+ ALCL99 no yes
39 F >= 10 ALCL, ALK+ ALCL99 yes yes
40 M >= 10 ALCL, ALK+ ALCL99 yes no
41 M < 10 ALCL, ALK+ ALCL99 no no
42 M < 10 ALCL, ALK+ ALCL99 yes no
2.2.4 UK cohort
FFPE tissues, bone marrow, peripheral blood and related clinical information from a female (n = 1)
paediatric patient with ALK+ ALCL (Table 16) were obtained after written informed parental consent and
according to the Declaration of Helsinki. The study was approved by the Huntington research ethics
committee (no. 07/Q0104/16).

44
Table 16 Clinical Information of the Paediatric ALCL Patient from the UK Cohort ALCL99 = cyclophosphamide, methotrexate, ifosfamide, etoposide, cytarabine, doxorubicin; CYVE354 = cytarabine, etoposide; N/A = not applicable; VBL = vinblastine.
Characteristics Patient 1 Patient 2
Sex F M Age at diagnosis 6 years 5 years Stage at diagnosis 4 4 CNS involvement at diagnosis No No CNS involvement at chemotherapy relapse/refractoriness
Yes No
CNS involvement at crizotinib relapse/refractoriness
Yes Yes
1st-line treatment ALCL99 ALCL99 2nd-line treatment VBL CYVE 3rd-line treatment VBL + iv cytarabine/etoposide with
intrathecal hydrocortisone/methotrexate/cytarabine
Crizotinib + intrathecal chemotherapy
4th-line treatment VBL + Crizotinib + intrathecal hydrocortisone / methotrexate / cytarabine
CYVE
5th-line treatment SCT Vinblastine + steroids 6th-line treatment Crizotinib N/A 7th-line treatment Brentuximab vedotin + VBL N/A Samples used for engraftment into NSG mice
Bone marrow taken after 7th treatment line
Pleural effusion taken before 3rd treatment line
2.2.5 MAPPYACTS trial cohort
Molecular Profiling for Pediatric and Young Adult Cancer Treatment Stratification (MAPPYACTS,
NCT02613962) is a prospective, international, multicentric clinical proof-of-concept study to stratify
targeted therapies adapted to molecular profiling of relapsed or refractory paediatric tumours. Molecular
screening is carried out on newly biopsied or resected tumour samples obtained at the time of
relapse/progression, using high-throughput technologies, primarily WES and RNA Sequencing.
Clinical and molecular data of samples from individuals with ALK+ ALCL treated with crizotinib (n = 2)
or combination chemotherapy (n = 2) were obtained from both male (n = 3) and female (n = 1) pediatric
subjects included in the MAPPYACTS trial (Table 17) with informed consent. The MAPPYACTS trial
protocol, amendments and informed consent were approved by the ethics committee and complied with
local regulations and the Declaration of Helsinki (no. 2015-A00464-45).
Table 17 Clinical Information of Paediatric ALCL Patients Recruited onto the MAPPYACTS Trial ALCL99 = cyclophosphamide, methotrexate, ifosfamide, etoposide, cytarabine, doxorubicin; ALCL99* = patient was treated according to ALCL99 recommendations for patients with CNS involvement as specified in Williams et al., 201399; BV = Brentuximab vedotin; CR = Crizotinib; LR = Lorlatinib; Nivo = Nivolumab; VBL = vinblastine. Biopsy sample for RNA-seq was taken at relapse during or after the highlighted treatment line.
Characteristics Patient 1 Patient 2 Patient 3 Patient 4
Sex M M F M Age at diagnosis 16 16 10 11 ALK fusion partner NPM1-ALK+ NPM1-ALK+ TFG-ALK+ NPM1-ALK+ 1st-line treatment ALCL99 ALCL99* ALCL99 ALCL99 2nd-line treatment VBL CR CR CR 3rd-line treatment CR Nivo N/A N/A 4th line treatment BV N/A N/A N/A 5th line treatment LR N/A N/A N/A 6th line treatment Nivo N/A N/A N/A CR resistant (R) R R N/A N/A ALK mutation status L1196M not detected not detected not detected

45
2.2.6 Brno cohort
FFPE tissue specimens from individuals with angioimmunoblastic T-cell lymphoma (AITL, n = 3),
peripheral T-cell lymphoma not otherwise specified (PTCL-NOS, n = 4), ALK+ (n = 16) or ALK- (n = 6)
ALCL were obtained from both male (n = 19) and female (n = 10) adult subjects (Table 18) with informed
consent and in accordance with the Declaration of Helsinki. The study was approved by the ethics
committee of the University Hospital of Brno, Czech Republic (no. 4-306/13/1). From this cohort, archival
paraffin-embedded tissue blocks were used to create TMAs containing cores selected from
representative tumour areas as determined by a consultant histopathologist, from hematoxylin and
eosin–stained sections.
Table 18 Clinical Information of T-cell Lymphoma Patients from the Brno Cohort Angioimmunoblastic T-cell lymphoma (AITL), peripheral T-cell lymphomas not otherwise specified (PTCL-NOS).
Case no. Sex Age at diagnosis
Diagnosis Biopsy (Tissue origin) Relapse Death
1 M 21 ALCL, ALK+ lymph node no no
2 M 46 ALCL, ALK+ infiltrate, subhepatal no no
3 M 58 ALCL, ALK+ lymph node, axilla no no
4 M 28 ALCL, ALK+ tumour, axilla no no
5 M 28 ALCL, ALK+ lymp node yes yes
6 F 30 ALCL, ALK+ lymph node, neck no no
7 F 66 ALCL, ALK- skin yes no
8 F 81 ALCL, ALK- lymph node, neck no yes
9 M 71 ALCL, ALK- infiltrate, inguina no yes
10 M 61 ALCL, ALK- nasopharynx no yes
11 M 60 ALCL, ALK- lymph nodes, inguina no no
12 M 57 ALCL, ALK- lymph node, supraclavicula no no
13 F 54 ALCL, ALK- lymph node yes no
14 M 51 ALCL, ALK- lymph node, inguina no no
15 M 89 ALCL, ALK- mandibula yes yes
16 M 51 ALCL, ALK- lymph node, retroperitoneum no yes
17 M 56 ALCL, ALK- lymph node, inguina no no
18 F 44 ALCL, ALK- mesenterium and retroperitoneum with pancreas
no yes
19 F 60 ALCL, ALK- lymph node, supraclavicula no no
20 M 57 ALCL, ALK- lymph node no no
21 M 66 ALCL, ALK- lymph node, neck no yes
22 M 61 ALCL, ALK- lymph node, neck no yes
23 F 57 AITL lymph node, neck yes yes
24 M 62 AITL lymph node, axilla yes yes
25 F 60 AITL N/A yes yes
26 F 76 PTCL-NOS lymph node,mesenteric no yes
27 M 77 PTCL-NOS lymph node, neck no no
28 M 80 PTCL-NOS lymph node, groin yes yes
29 F 70 PTCL-NOS lymph node, neck yes yes

46
2.2.7 Pakistan cohort
FFPE tissue specimens from individuals with ALK+ (n = 15) or ALK- (n = 9) ALCL were obtained from
both male (n = 19) and female (n = 10) subjects with informed consent and in accordance with the
Declaration of Helsinki. The study was approved by the ethics committee of the Huntington research
ethics committee (no. 07/Q0104/16). From this cohort, archival paraffin-embedded tissue blocks were
used to create TMAs containing cores selected from representative tumour areas as determined by a
consultant histopathologist, from hematoxylin and eosin–stained sections.
Table 19 Clinical Information of T-cell Lymphoma Patients from the Pakistan Cohort
Case no.
Sex Age at diagnosis
Diagnosis Biopsy (Tissue origin)
1 M 57 ALCL, ALK+ inguinal lymph node
2 M 19 ALCL, ALK+ cervical lymph node
3 F 17 ALCL, ALK+ cervical lymph node
4 M 53 ALCL, ALK+ cervical lymph node
5 M 19 ALCL, ALK+ cervical lymph node
6 M 12 ALCL, ALK+ buccal mucosa
7 M 35 ALCL, ALK+ abdominal mass
8 M 38 ALCL, ALK+ mass right axilla
9 M 12 ALCL, ALK+ paravertebral soft tissue
10 M 2 ALCL, ALK+ cervical lymph node
11 M 59 ALCL, ALK+ groin mass
12 F 20 ALCL, ALK+ right side neck swelling
13 F 61 ALCL, ALK+ mesenteric lymph node
14 M 35 ALCL, ALK+ cervical lymph node
15 M 25 ALCL, ALK+ mesenteric nodule & nodulae anterior part of stomach
16 F 27 ALCL, ALK- supraclavicular lymph node
17 M 38 ALCL, ALK- mesenteric lymph node
18 M 67 ALCL, ALK- left arm swelling
19 M 35 ALCL, ALK- cervical lymph node
20 M 75 ALCL, ALK- right supraclavicular
21 M 21 ALCL, ALK- skin lesion - thigh
22 F 20 ALCL, ALK- axillary lymph node
23 M 60 ALCL, ALK- cervical lymph node
24 M 14 ALCL, ALK- inguinal lymph node
2.2.8 Vienna cohort
FFPE tissue specimens from individuals with AITL (n = 4) or PTCL-NOS (n = 17) were obtained from
both male (n = 9) and female (n = 12) adult subjects (Table 20) with informed consent and in accordance
with the Declaration of Helsinki. The study was approved by the ethics committee of the Medical
University of Vienna, Austria (no. 1437/2016). From this cohort, archival paraffin-embedded tissue
blocks were used to create TMAs containing cores selected from representative tumour areas as
determined by a consultant histopathologist from hematoxylin and eosin–stained sections.

47
Table 20 Clinical Information of T-cell Lymphoma Patients from the Vienna Cohort Angioimmunoblastic T-cell lymphoma (AITL), peripheral T-cell lymphomas not otherwise specified (PTCL-NOS).
Case no.
Sex Age at diagnosis
Diagnosis Biopsy (Tissue origin)
1 M 54 AITL inguinal lymph node
2 F 85 AITL lymph node
3 M 58 AITL cervical lymph node
4 F 82 AITL inguinal lymph node
5 F 64 PTCL-NOS axillary lymph node
6 F 70 PTCL-NOS lymph node
7 M 67 PTCL-NOS cervical lymph node
8 F 62 PTCL-NOS peritoneum
9 M 58 PTCL-NOS inguinal lymph node
10 M 54 PTCL-NOS supraclavicular lymph node
11 F 73 PTCL-NOS skin
12 F 87 PTCL-NOS skin
13 F 89 PTCL-NOS skin
14 M 76 PTCL-NOS preauricular lymph node
15 M 63 PTCL-NOS axillary lymph node
16 M 43 PTCL-NOS inguinal lymph node
17 F 78 PTCL-NOS inguinal lymph node
18 F 77 PTCL-NOS axillary lymph node
19 F 65 PTCL-NOS inguinal lymph node
20 M 55 PTCL-NOS inguinal lymph node
21 F 77 PTCL-NOS inguinal lymph node
2.3 Animal Studies
2.3.1 Generation of lorlatinib-resistant K299 xenografts
For the generation of lorlatinib-resistant K299 xenografts, experiments were carried out as previously
described328. Adult female Severe combined immunodeficiency (SCID) (6 weeks old) mice
(C.B.17/IcrHanHsd-Prkdc) were kept under standard conditions following the guidelines of the University
of Milano-Bicocca ethical committee for animal welfare. The protocol (no. 006/2014) was approved by
the Italian Ministry of Health and by the Institutional Committee for Animal Welfare. Lorlatinib was
suspended in 0.5% carboxymethylcellulose/0.1% Tween 80. Ten million K299 cells were injected
subcutaneously into the left flank of the mice. Once tumours reached an average size of 200 mm3, mice
were randomized to receive vehicle alone (n = 3) or lorlatinib (n = 10, starting dose 0.1 mg/kg), orally,
twice daily (b.i.d.). Tumour size was evaluated three times per week with calipers, using the formula:
tumour volume (mm3) = (d2 × D/2), where D is the longest and d is the shortest diameter. After 21 days,
the dose was increased to 0.25 mg/kg b.i.d. and on day 37, to 0.5 mg/kg b.i.d. Each mouse was
monitored for tumour growth and the dosage was increased every time the tumour relapsed or on
stabilization after partial regression. Treatment was suspended at three different doses: 0.5 mg/kg (n =
4), 1 mg/kg (n = 3) or 2 mg/kg (n = 3).

48
2.3.2 Generation of ALCL PDX
NOD scid gamma (NSG) mice were obtained from Charles River and housed in individually ventilated
cages (IVCs) under sterile pathogen-free conditions at the University of Cambridge, Central Biomedical
Services (CBS) animal facilities, Addenbrooke’s Hospital, Cambridge in groups of 2–5. At the end of
procedures, mice were culled by the Schedule 1 method of cervical dislocation in accordance with UK
Home Office guidelines. Animal work was carried out under UK Home Office project licence number
P4DBEFF63, and personal licence numbers I27A881AC and IF74BBA96 according to the Animals
(Scientific Procedures) Act 1986 and were approved by the University of Cambridge Animal Welfare
and Ethical Review Body (AWERB). We have complied with all relevant ethical regulations for animal
testing and research in the UK.
For ALCL PDX establishment, MCs were isolated from a bone marrow (Patient 1) or pleural effusion
(Patient 2) sample by gradient centrifugation at 800 x g for 20 minutes at room temperature with brakes
off using Lymphoprep according to the standard protocol. Afterwards, MCs were washed once in PBS
containing 2% FBS. MCs were suspended in Matrigel diluted 1:2 with PBS and a total volume of 300 µL
was injected subcutaneously into the left flank of NSG mice at 6-8 weeks of age using a 30-gauge
hypodermic AganiTM needle. Mice were euthanized once tumours reached 15 mm in any direction,
tumours were disaggregated and tumour cells vially frozen in 90% FBS, 10% DMSO.
For cell line establishment from ALCL PDX tumours, tumours were disaggregated in a petri dish using
a 70 M nylon Falcon™ cell strainer and the plunger of a 5 mL Plastipak™ syringe, applying light to
medium mechanical force. Afterwards, limiting dilutions were prepared in IMDM supplemented with 20%
FBS and 100 U/mL penicillin/streptomycin to establish cell lines.
For in vivo ALCL PDX studies, viably frozen PDX cells were thawed, washed in PBS containing 2% FBS
and suspended in Matrigel diluted 1:2 with PBS before 0.5 × 10⁶ cells per mouse in a total volume of
300 µL were injected subcutaneously into the left flank of NSG mice at 6-8 weeks of age using a 30-
gauge hypodermic AganiTM needle. Mice were monitored for health and tumour size by animal
technicians daily. Animals were shaved around the tumour area to assist with precision of measurement
and callipers used to measure both the length and width of the tumour. Tumours were measured with
manual calipers and tumour volumes estimated using the modified ellipsoid formula: V = ab2/2, where
a and b (a > b) are length and width measurements. Once tumours reached 400 mm3, mice were
randomly split into three treatment groups and treated daily with the following agents by oral gavage
using 22 gauge plastic feeding tubes at 10 µL per gram body weight: vehicle (PBS, 10% DMSO; n = 8),
crizotinib (100 mg/kg; n = 8) or brigatinib (25 mg/kg; n = 8). Mice were euthanized once tumours reached
15 mm in any direction.
For immunohistochemistry (IHC), tumours were fixed in 10% neutral-buffered formalin for 24 hours, then
paraffin-embedded and 3 µm sections cut from central regions. To generate blocks of the established
cell lines, 2x10⁷ cells were embedded in 0.5 mL of 1% agar diluted in PBS and processed as above.
Tissue sections were stained with hematoxylin and eosin or with antibodies against ALK and CD30.

49
2.4 Immunoperoxidase labelling technique for Anti-ALK Autoantibody
Detection
2.4.1 Preparation of COS-1 NPM1-ALK transfectants
COS-1 cells were seeded to approx. 1 x 10⁶ cells/mL in 20 mL Dulbecco’s Modified Eagle Medium
(DMEM) containing 10% FBS in a T75 cell culture flask at 37 °C in a 5% CO2 cell culture incubator.
When the cells reached 50-60% confluence, they were transfected with pcDNA3 NPM1-ALK or
pcDNA™ 3.1 vector as negative control using Lipofectamine® 3000 Transfection Reagent following the
manufacturers protocol.
After 24 hours, the cell culture medium from the transfected COS-1 cells was discarded and the cells
washed three times with Dubbecco’s phosphate buffered saline. After washing, the cells were harvested
with 10 mL of 1 x trypsin-EDTA for 2 min at 37 °C in a 5% CO2 cell culture incubator. The trypsin was
inactivated by adding an equal volume of DMEM containing 10% FBS, the cell suspension subject to
centrifugation for 5 minutes at 290 x g and the cell pellet re-suspended in DMEM containing 10% FBS
to reach a final concentration of 6-8 x 10⁵ cells/mL. The cell suspension was kept on ice thereafter.
Test slides were prepared by varying the volume from 50 – 200 µL cell suspension to each well of the
cytocentrifuge. After centrifugation, the Superfrost™ microscope slides were air-died for 5 minutes and
subsequently stained in Hematoxylin Solution, Gill No. 3. A volume of cells resulting in an appropriate
cell density on the slides were chosen to prepare a large batch of cytocentrifuge slides. The slides were
air-dried for 1 hour before fixation in 100% acetone for 10 minutes. After the fixation step the slides were
air-dried for another hour until wrapping them back-to-back in pairs in aluminium foil for long-term
storage at -20 °C. Several slides were immunostained at this stage to find the efficiency of transfection
as described below.
2.4.2 Immunostaining of COS-1 NPM1-ALK transfectants
COS-1 NPM1-ALK transfectants were equilibrated at room temperature for 15 minutes before opening
the cover foil and the cell spots circled using a Dako wax pen. 100 μL of each serum dilution (1:50,
1:100, 1:250, 1:750, 1:2250, 1:6750, 1:20250, 1:60750 in PBS) were added to a single spot of COS-1
NPM1-ALK transfectants. PBS was used as negative control, and ALK monoclonal antibody (1:1000
dilution) as a positive control. The highest dilution (1:50) was used to check for any background signal
on COS-1 pcDNA™ 3.1 vector only transfectants.
Slides were incubated for 1 hour at room temperature in a humidified chamber until washing in PBS for
5 minutes. Afterwards, the cell spots were incubated with 100 μL of polyclonal rabbit anti-human
IgG/HRP (1:100 dilution in PBS) for 30 minutes. The slides were then washed in PBS for 5 minutes
before 3,3’-Diaminobenzidine (DAB) substrate was applied and incubated for eight minutes. After
another wash in PBS, slides were counterstained in hematoxylin solution, Gill No. 3, rinsed with tap
water, dried and the cover slide mounted with faramount mounting medium.
The highest dilution of the serum/plasma sample at which staining of the NPM1-ALK transfectants was
still observed was taken as the titre of the antibody.

50
2.5 Protein Microarray Assay for ALK Autoantibody Detection
In collaboration with Cambridge Life Sciences (Keith Rawson and Danielle Mack, Ely, UK), a protein
microarray assay was developed to determine the presence of ALK autoantibodies in patient serum,
plasma, or frozen whole blood.
2.5.1 Antigen spotting process
The ALK protein solution was prepared by buffer exchange with a Vivaspin centrifugal filter column with
a molecular weight cut-off of 3 kDa in TrisT (50 mM Tris, 0.01% Tween 20, pH 7.4). The concentrated
protein solution was diluted to a final concentration of 150 µg/mL with TrisT containing DY-633
carboxylic acid carrier dye (2 µg/mL final) that was filtered with a Minisart NML 0.2 μm hydrophilic filter
and transferred into a 96 well V-bottom plate. The dye was used to subsequently monitor the spotting
process with Port Array 5000TM. 7.5 pL of triplicate droplets of recombinant ALK (150, 75, 37.5,
18,75 µg/mL) were spotted onto functionalized glass slides with the Nano-PlotterTM NP2.1 controlled
by NPC16 NP2/E software. Functionalized glass slides were kind gifts from PolyAN Molecular Surface
Engineering, Germany. 2D-Epoxy, 3D-Epoxy, 3D-NHS, 2D-Aldehyde and 3D-Aldehyde functionalized
glass slides were tested for their suitability to bind the antigens during the optimization process. 2D-
Epoxy glass slides were used in the final assay. Glutathione S-Transferase (150 µg/mL in PBS buffer),
and monoclonal anti-human IgG (Fc specific) antibody were spotted as negative and positive controls.
Human IgG was spotted to generate a standard curve (200, 100, 50, 25, 12.5 µg/mL). Humidity during
the spotting process was kept at 65% with an AIRWIN ultrasonic humidifier controlled by a
microprocessor controller CT-1. The protein solutions were cooled to 15 °C by using a programmable
temperature controller connected to the microplate holder in the Nano-Plotter. The glass slides were
dried for 2 hours before coating of the protein spots with triplicate spots of 7.5 pL microarray stabilizer
StabilGuard® Choice. During the spotting process, antigen spotting was monitored with water-sensitive
paper glued onto plain glass slides. After spotting, slides were scanned using a Port Array 5000TM and
visually quality checked for separation of spots. Two slides from each print run were tested in a
microarray assay as described in the section below with anti-GST antibody (1:200 dilution), healthy
human plasma controls and positive human patient plasma controls, while remaining slides were stored
at 4 °C until usage.
2.5.2 Processing of microarray slides
Microarray slides were pre-warmed for 1 hour at room temperature before they were processed using
the automated slide processor ZenitUP controlled by the ZenitUP 2.12.51 software package. The slides
were blocked with 50 μL of AMIDot™ Activation Diluent and incubated for 30 minutes at room
temperature before the plates were washed six times with 50 μL of AUTOZYME™ RF Wash Buffer.
Sample (50 μL) diluted in AUTOZYME™ RF Sample Diluent was then transferred to the well and
incubated for 30 minutes at room temperature before the plates were washed with 50 μL of
AUTOZYME™ RF Wash Buffer. After six washes, a goat anti-human IgG (H&L) – Affinity Pure,
DyLight550 Conjugate (1:200 dilution) was used as a reporter. Readings were taken using the Port
Array 5000TM.

51
2.6 Cell lines and cell culture
The ALCL cell lines DEL355, Karpas 299 (K299)24, SU-DHL-1356, SUP-M2357, Mac-2A and TS (SUP-M2
derived) were cultured in Roswell Park Memorial Institute (RPMI) 1640 medium supplemented with 10%
FBS and 1% penicillin and streptomycin (PS).
The NB cell lines CHLA-15, CHLA-20, CHLA-42, CHLA-90, CHLA-95, CHLA-171, COG-N-426 (Felix),
NB-1643, NB-EBC1, NBL-S and the ALCL cell lines MGS and MTK were cultured in IMDM
supplemented with 20% FBS, 1% insulin-transferrin-selenium and 1% PS. CHP-134, GI-ME-N, IMR-32,
KELLY, LA-N-1, LA-N-5, LA-N-6, NGP, SK-N-BE(1), SK-N-BE(2), SK-N-FI, SMS-KAN, SMS-KCNR and
SMS-LHN cells were cultured in RPMI 1640 supplemented with 10% FBS, 1% ITS and 1% PS.
SH-SY5Y and 293FT cells were cultured in DMEM supplemented with 10% FBS and 1% PS.
All cells were grown at 37°C in a humidified incubator with 5% CO2. All cells were mycoplasma-free and
subjected to periodic in-house testing.
2.7 IC50 determination
For IC50 determination, ALCL cell lines were seeded in flat-bottom 96-well plates at approximately 0.5 x
105 cells/mL, treated with decreasing concentrations of ALK TKIs and cultured for 48 hours. Crizotinib,
alectinib, lorlatinib and brigatinib were obtained from MedChemExpress and dissolved in 100% dimethyl
sulfoxide (DMSO) at a concentration of 1 mM and stored at -20 ⁰C until usage. The end-point viability
for each condition was measured with the CellTiter-Blue® Cell Viability Assay in a black 96-well Cellstar
plate following the manufacturer’s protocol and analyzed on a SpectraMax i3.
2.8 Cellular proliferation
To determine cellular proliferation rates, 0.25 x 10⁵ cells/mL were plated in 6-well plates. Each day, 100
μL of cell suspension was transferred to a well of a 96-well plate, and the cell titre was measured by the
CellTiter-Blue Cell Viability Assay. The signal was measured using a SpectraMax i3 plate reader.
2.9 Apoptosis analysis
Approximately 500,000 cells were collected, washed with cold PBS, then washed once with and
resuspended in 100 μL of the binding buffer provided with the Annexin V Apoptosis Detection Kit APC
following the manufacturer’s protocol. Fluorochrome-conjugated Annexin V (5 μL/reaction) was added
to the 100 μL cell suspension. Cells were incubated for 30 minutes at room temperature. Afterwards,
APC-Annexin V was removed from the cells by centrifugation, washed once in 1 x Annexin V Binding
Buffer, then cells were resuspended in 100 μL of 1 x Annexin V Binding Buffer containing 1 mg/mL
propidium iodide (PI). The cells were stored in an ice box in the dark until analysis with an Accuri C6
flow cytometer. At least 20,000 events were collected per sample and these data were analyzed with
FlowJo software.
2.10 Generation of TKI-resistant ALCL cell lines
ALK inhibitor resistant cell lines were established as described previously217. Briefly, ALCL cells were
seeded at approximately 0.5 x 10⁶ cells/mL. Crizotinib or alectinib were added at a starting concentration
(Table 21), and cells were maintained in fresh drug containing medium changed every 48-72 hours.

52
Cells were passaged once they reached confluence. After every two passages at a given concentration
of drug, the concentration of ALK TKI was increased in half-log intervals until a final concentration (Table
21) was achieved. The resulting pool of resistant cells was maintained in TKI containing media
thereafter.
Table 21 Starting and final TKI concentrations used to generate TKI resistant ALCL cell lines
Cell line Crizotinib Alectinib
Starting concentration Final concentration Starting concentration Final concentration
DEL 25 nM 200 nM 5 nM 100 nM
K299 50 nM 300 nM 5 nM 80 nM
SU-DHL-1 10 nM 100 nM 5 nM 50 nM
SUP-M2 50 nM 600 nM 5 nM 100 nM
2.11 Sequencing of the NPM1-ALK kinase domain region
For mutation analyses, genomic DNA was isolated from each of the resistant ALCL cell lines with the
QIAamp DNA Mini Kit. The NPM1-ALK kinase domain region was amplified by PCR with the Q5 High-
Fidelity PCR Kit from genomic DNA (gDNA) extracts as described in Table 22 using cycle numbers
specified in Table 23. Primers were used as described previously358: NPM1-ALK_seq_F
5′-TGCATATTAGTGGACAGCAC-3′ and NPM1-ALK_seq_R 5′-GACTCGAACAGAGATCTCTG-3′.
Amplicons were purified with the Zymo DNA Clean and Concentrator-5 kit and then Sanger sequenced
by the DNA Sequencing Facility service (University of Cambridge).
Table 22 PCR Using Q5 High-Fidelity DNA Polymerase
Component Start conc. Amount [µL] Final conc.
5X Q5 Reaction Buffer 10x 5 1x dNTPs 10 mM 0.5 200 µM Forward Primer 10 µM 1.25 0.5 µM Reverse Primer 10 µM 1.25 0.5 µM Template DNA variable variable < 1,000 ng Q5 High-Fidelity DNA Polymerase 2,000 units/ml 0.25 0.02 U/µl Nuclease-free water variable
Total 25
Table 23 PCR cycle conditions used to amplify the NPM1-ALK kinase domain region
Cycle number Denature Anneal Extend
1 98 °C, 30 sec N/A N/A
2-25 98 °C, 10 sec 65 °C, 30 sec 72 °C, 30 sec
26 N/A N/A 72 °C, 2 min
2.12 RT-qPCR
Total RNA was extracted with the RNeasy Plus Mini Kit and quantified using a Nanodrop 1000. RNA (1
µg per cell line) was then reverse transcribed using the High-Capacity RNA-to-cDNA™ Kit. Reverse
transcription (RT) reactions were diluted 1/10 and 10 ng (equivalent to the input RNA amount) was used
as the template DNA for qPCR using the Power SYBR Green PCR Master Mix with standard reaction
conditions on the QuantStudio™ 6 Flex Real-Time PCR System. Double delta Ct (∆∆Ct) analysis was

53
conducted with normalization to GAPDH (∆Ct) and then relative expression level comparison to the
negative control expressing scrambled sgRNA (∆∆Ct). All qPCR reactions were performed in technical
triplicates. RT-qPCR primers used are listed in Table 24.
Table 24 RT-qPCR primers All primers were retrieved from PrimerBank353,359 and synthesized by Sigma-Aldrich.
Gene Forward primer Reverse primer
ADORA2A CGCTCCGGTACAATGGCTT TTGTTCCAACCTAGCATGGGA
ARHGEF9 AATGAGCACTGAGCGTCACTA AGCAGGGTCCTATCTCGCTG
BCL10 TCTGGACACCCTTGTTGAATCT TGGAAAAGGTTCACAACTGCTAC
BDNF CTACGAGACCAAGTGCAATCC AATCGCCAGCCAATTCTCTTT
COPZ2 ATTGTGGATGGCGGTGTGATT TCCTTGGCAGACTGAAGAACC
CRK GCGGAGTAGCTGGTACTGG GCGCGAGTTCTCTGAGACG
CLYBL GAAGGTCGGGCCTCAAGTAG TTGCCGGGCGTAGAGAATATC
EGR4 TCCTCGTCAAGTCCACTGAAG CAGGAGTCGGCTAAGTCCC
EML2 GTGGCGGGAACCACTAAGG CCACACCGAGAGCATGTGA
EREG GTGATTCCATCATGTATCCCAGG GCCATTCATGTCAGAGCTACACT
ETV1 TGGCAGTTTTTGGTAGCTCTTC CGGAGTGAACGGCTAAGTTTATC
FAIM2 AGTTCGTCGAGTCTTTGTCAGA TGGGTCCAGAACAGCAAGC
FOS GGGGCAAGGTGGAACAGTTAT CGGCTTGGAGTGTATCAGTCA
FOXP1 ATGATGCAAGAATCTGGGACTG AGCTGGTTGTTTGTCATTCCTC
KRAS GAGTACAGTGCAATGAGGGAC CCTGAGCCTGTTTTGTGTCTAC
MET AGCAATGGGGAGTGTAAAGAGG CCCAGTCTTGTACTCAGCAAC
MFSD2A GGGAGCAGAGAGAACCCTATG AGGTGTAGGTGCAAAACAAGAC
MYC GTCAAGAGGCGAACACACAAC TTGGACGGACAGGATGTATGC
NIN CGTGATGGTCACCTGAACCG CGTCCACTCTCATCGAAAGACT
NKX2-4 ACCCACGCTACTCGTCAATCT CCTGCCGTTTCATCTTGTACC
NPY CGCTGCGACACTACATCAAC CTCTGGGCTGG ATCGTTTTCC
NR4A2 ACCACTCTTCGGGAGAATACA GGCATTTGGTACAAGCAAGGT
PIK3CD TCAACTCACAGATCAGCCTCC CGCGAAAGTCGTTCACTTCT
PIM1 GAGAAGGACCGGATTTCCGAC CAGTCCAGGAGCCTAATGACG
PLEKHG6 CCGCCCTACAGAAGCTGAAG GGATAATGGTCGAGAACTCAGGA
PRKACA ACCCTGAATGAAAAGCGCATC CGTAGGTGTGAGAACATCTCCC
PRRX2 GCACCACGTTCAACAGCAG TCCTTGGCCTTGAGACGGA
PSD2 GGATGGCCTGTCAGACTCAGA CAGCCTGCTAAACTCGTTGTT
PTGES TCCTAACCCTTTTGTCGCCTG CGCTTCCCAGAGGATCTGC
RORC GTGGGGACAAGTCGTCTGG AGTGCTGGCATCGGTTTCG
RRAS GACCCCACTATTGAGGACTCC CGGTCGTTAATGGCGAACAC
SAGE1 TACCAGGGATCTGCATTCTACC CTGTGGGACCAGTT GACAAGA
SAMD4A TCGAGGCTTTGGGCAATCC GAGCTGACGAATCCACTGGT
SEMA4A AGCCAGCGAGTTTGACTTCTT CGTGGCGGATGACGTTGAA
SLC7A3 GCCATCCATTGTGATCTGCTT GTGGTTCCCAATCAGGTTGTC
SPDEF CAGTGCCCGGTCATTGACA CAGCCGGTATTGGTGCTCT
SSBP3 GGAACACCCATTATGCCCAGT GACCCATCGGGAAGTTGGAC
SURF2 GGGAGCTGCAAGTGATGACAG CGGTACACGGTCGTCTCTCT
UBIAD1 AGTGTGCCTCCTACGTGTTG CAGGACACCGTGGGATCTG
UTF1 CGCCGCTACAAGTTCCTTAAA GGATCTGCTCGTCGAAGGG
YAP1 TAGCCCTGCGTAGCCAGTTA TCATGCTTAGTCCACTGTCTGT
GAPDH GGAGCGAGATCCCTCCAAAAT GGCTGTTGTCATACTTCTCATGG
NPM1 GGAGGTGGTAGCAAGGTTCC TTCACTGGCGCTTTTTCTTCA
MKNK1 AGATGGGCAGTAGCGAACC AGCAATTCAGAGGTCAGCTTG
SH2D2A GACTTTCCCTGAGGACCGAAG GCTTGCCCCTGTTTGATGATTG
HELZ2 ATCTACATCCGGGAGTATTTCCA TCGTCGGTCAGGCAACAGTA
IL10RA CCTCCGTCTGTGTGGTTTGAA CACTGCGGTAAGGTCATAGGA
PGBD1 TGCCTGGGATAACCACCCT ATGAGCTGATCCGTGGGGAA
GPR161 TGGATCTTTGGTGTAGTGTGGT ATGACCCCGAGGGTTAGCAT
P2RY6 GTGTCTACCGCGAGAACTTCA CCAGAGCAAGGTTTAGGGTGTA
NPM-ALK CTGTACAGCCAACGGTTTCC GGCCCAGACCCGAATGAGG

54
2.13 Western Blot
Protein lysates were prepared by lysing 1 million cells in 40 µL radioimmunoprecipitation assay (RIPA,
25mM Tris HCL pH 7.6, 150mM NaCL, 1% NP-40, 1% sodium deoxycholate, 0.1% SDS) buffer
supplemented with Halt Protease and Phosphatase Inhibitor Cocktail for 30 minutes on ice. Cellular
debris were removed by centrifugation at 16,000 x g for 20 minutes at 4 °C and the supernatant stored
at -20 °C until usage. Proteins were quantified with a PierceTM BCA Protein Assay Kit following the
manufacturer’s protocol and analyzed on a SpectraMax i3. Protein lysate (50 µg) were solubilized in
Laemmli buffer containing 5% β-mercaptoethanol (250 mM Tris pH 6.8, 10% SDS, 5% beta-
mercaptoethanol, 0.02% bromophenol blue, 30% Glycerol) and boiled for 5 minutes at 95 °C. Samples
were resolved by SDS-PAGE with a Bio-Rad Mini-Protean TGX 10% gel for 2 hours at 100 V in running
buffer (25 mM Tris, 190 mM glycine, 0.1% SDS). Proteins were transferred to a 0.2 μM PVDF membrane
using a Trans-Blot Turbo Transfer Pack with a Trans-Blot Turbo Transfer System at 27 V for 7 minutes.
Following transfer, membranes were first blocked in blocking buffer (5% Bovine serum albumin (BSA)
in TBST (20 mM Tris-HCl pH 8, 150 mM NaCl, 0.1% Tween-20)) for 1 hour at room temperature and
subsequently incubated with the the primary antibody diluted in blocking buffer (see Table 25 for
antibody dilutions) at 4 °C overnight. Afterwards, the membrane was incubated with the secondary
immunoglobulin/HRP diluted in washing buffer (see Table 25 for dilution) for 1 hour at room temperature.
Washing was performed with TBST, protein bands were visualized with Immobilon Western
Chemiluminescent HRP Substrate and detected by a LAS-4000 Image Analyzer (Fujifilm/Raytek).
Table 25 List of antibodies used to detect proteins by Western blot
Protein Antibody Antibody name Dilution Company Cat. no.
Cas9 1st Anti-Cas9 1:2000 Abcam ab204448
2nd Goat anti-rabbit 1:10000 Agilent technologies P0448
ALK
1st Rabbit ALK (D5F3®) XP® antibody 1:1000
Cell Signalling 3633
2nd Goat anti-rabbit 1:10000 Agilent technologies P0448
pALK
1st Rabbit Phospho-ALK (Tyr1604) antibody 1:1000
Cell Signalling 3341
2nd Goat anti-rabbit 1:10000 Agilent technologies P0448
STAT3 1st Rabbit STAT3 antibody 1:1000 Cell Signalling 4904S
2nd Goat anti-rabbit 1:10000 Agilent technologies P0448
STAT1 1st Rabbit STAT1 antibody 1:1000 Cell Signalling 9172
2nd Goat anti-rabbit 1:10000 Agilent technologies P0448
pSTAT3
1st Rabbit Phospho-STAT3 (Tyr705) antibody 1:1000
Cell Signalling 9145
2nd Goat anti-rabbit 1:10000 Agilent technologies P0448
pSTAT1
1st Rabbit Phospho-STAT1 (Tyr701) antibody 1:1000
Cell Signalling 14994
2nd Goat anti-rabbit 1:10000 Agilent technologies P0448
STAT5A
1st Mouse STAT5A (4H1) antibody 1:1000
Cell Signalling 4807
2nd Goat anti-mouse 1:10000 Agilent technologies P0161
pSTAT5A
1st Rabbit Phospho-STAT5 (Tyr694) antibody 1:1000
Cell Signalling 9359
2nd Goat anti-rabbit 1:10000 Agilent technologies P0448
α-Tubulin 1st Mouse anti-α-Tubulin 1:10000 Sigma Aldrich T9026
2nd Goat anti-mouse 1:10000 Agilent technologies P0161

55
2.14 sgRNA cloning
To clone individual sgRNAs into lenti sgRNA(MS2)_zeo/lenti sgRNA(MS2)_puro, guide sequences
(Table 26) were designed with the Cas9 activator tool360 and synthesized at Sigma Aldrich. They
included a 4-bp overhang for the forward (CACC) and complementary reverse (AAAC) oligos to enable
cloning into the Bsmb-I site of the lentiviral construct. On-target scoring was performed using the "Rule
Set 2" method292. The Microsoft implementation of the scoring model used was Azimuth 2.0. Off-target
sites were evaluated using the Cutting Frequency Determination score.
Table 26 Oligonucleotides used to generate dsDNA fragments containing the 20 bp target sequence NT is a scrambled 20 bp sequence that is predicted to not target any region of the human genome. Gray nucleotides indicate the overhangs while black nucleotides represent the target sequence.
Gene sgRNA Forward ssDNA element Reverse ssDNA element
ARHGEF9 1 CACCgCGCAAGCGCCCGCAGTCGCT AAACAGCGACTGCGGGCGCTTGCGc
2 CACCgGGCGGGTATGTCAGTGGCTC AAACGAGCCACTGACATACCCGCCc
BCL10 1 CACCgAGGTACTGACAAGCCCAGAC AAACGTCTGGGCTTGTCAGTACCTc
2 CACCgGCAGGGTCTGGGAAAAGGGG AAACCCCCTTTTCCCAGACCCTGCc
CRK 1 CACCgACGCGCTCCCTGCCCGAGGG AAACCCCTCGGGCAGGGAGCGCGTc
2 CACCgGGCTGCCGGGAAGGGGCCCG AAACCGGGCCCCTTCCCGGCAGCCc
EREG 1 CACCgGGTGCTGCGAACTTTATACT AAACAGTATAAAGTTCGCAGCACCc
2 CACCgGAGCCCCTCCCGGGCCCTAA AAACTTAGGGCCCGGGAGGGGCTCc
FOS 1 CACCgAAACGTCACGGGCTCAACCA AAACTGGTTGAGCCCGTGACGTTTc
2 CACCgGGCGCCAGAGGGGTGGCGCG AAACCGCGCCACCCCTCTGGCGCCc
NR4A2 1 CACCgCAGCGCGGCGATTGGGCGGC AAACGCCGCCCAATCGCCGCGCTGc
2 CACCgGGCCAGGAGTCCAGGGAGCG AAACCGCTCCCTGGACTCCTGGCCc
PLEKHG6 1 CACCgCAGTAATGAGGGCTGAGTAA AAACTTACTCAGCCCTCATTACTGc
2 CACCgGGGCGGGGCGCCGCCGGGGG AAACCCCCCGGCGGCGCCCCGCCCc
PRKACA 1 CACCgTGCGGGGGCGTCACAGACAG AAACCTGTCTGTGACGCCCCCGCAc
2 CACCgGGCCTAGGCCAATGAGCGGC AAACGCCGCTCATTGGCCTAGGCCc
PSD2 1 CACCgGGGACGGACGGCAGGAGGGA AAACTCCCTCCTGCCGTCCGTCCCc
2 CACCgGGAGCGGAGCCGTGAGCTGG AAACCCAGCTCACGGCTCCGCTCCc
PTGES 1 CACCgCTGCAGGGAAAGCACAAAGT AAACACTTTGTGCTTTCCCTGCAGc
2 CACCgGGGCGGTGCTGGCTGCAGGA AAACTCCTGCAGCCAGCACCGCCCc
RORC
1 CACCgCCCCCAGTGCTTCTGGACTG AAACCAGTCCAGAAGCACTGGGGGc
2 CACCgGTTTAAGCTCTGCACCACAC AAACGTGTGGTGCAGAGCTTAAACc
3 CACCgGGGAGGGGCAGCCAATCGTA AAACTACGATTGGCTGCCCCTCCCc
4 CACCgCCCCAAGGGGTGCAGTGAGT AAACACTCACTGCACCCCTTGGGGc
SAMD4A 1 CACCgCTCCCCCCTTCTTGCAGCTT AAACAAGCTGCAAGAAGGGGGGAGc
2 CACCgGATGGTGATTTCCGGCGTCC AAACGGACGCCGGAAATCACCATCc
SPDEF 1 CACCgTATAATGGGAAATCAGGCCC AAACGGGCCTGATTTCCCATTATAc
2 CACCgTTTGTTCAGGTAAATAAGGA AAACTCCTTATTTACCTGAACAAAc
UBIAD1 1 CACCgGCCGGCGGCGCGGGCTGGAC AAACGTCCAGCCCGCGCCGCCGGCc
2 CACCgCCGCCCTCCAGCCCACCCTC AAACGAGGGTGGGCTGGAGGGCGGc
YAP1 1 CACCgGGCGAGTTTCTGTCTCAGTC AAACGACTGAGACAGAAACTCGCCc
2 CACCgCAAACGCCAAAACTAAAGTT AAACAACTTTAGTTTTGGCGTTTGc
ABCB1 1 CACCgGGATAAGTTTGGGTGGAGGA AAACTCCTCCACCCAAACTTATCCc
2 CACCgCACTAATCAGTGAAAACCCA AAACTGGGTTTTCACTGATTAGTGc
NMP1
1 CACCgCTGCGCAGACTCTTGGCGGG AAACCCCGCCAAGAGTCTGCGCAGc
2 CACCgTGGAAAGCACGCGTGCGCAC AAACGTGCGCACGCGTGCTTTCCAc
3 CACCgCCGGCGCGCTTGAGCGGGAG AAACCTCCCGCTCAAGCGCGCCGGc
MYC 1 CACCgGGTGGGGAGGAGACTCAGCC AAACGGCTGAGTCTCCTCCCCACCc
2 CACCgGAACCCGGGAGGGGCGCTTA AAACTAAGCGCCCCTCCCGGGTTCc
MKNK1 1 CACCgGGCGTGACAGGGAAGAGGCG AAACCGCCTCTTCCCTGTCACGCCc
2 CACCgGAGCTGCGCCTGCGCCCTGA AAACTCAGGGCGCAGGCGCAGCTCc
IL10RA 1/49 CACCgTAGCGCCCCAGGACAGCCTC AAACGAGGCTGTCCTGGGGCGCTAc
2/50 CACCgGCCCCAGGCGGTAGCCCTGT AAACACAGGGCTACCGCCTGGGGCc

56
Gene sgRNA Forward ssDNA element Reverse ssDNA element
3/72 CACCgGGACAGTGGTTCCCCGTCCG AAACCGGACGGGGAACCACTGTCCc
P2RY6 1 CACCgGGCAGCAATGAGCAGAAGCA AAACTGCTTCTGCTCATTGCTGCCc
2 CACCgACTCCAGAGAAGCCAGGAGA AAACTCTCCTGGCTTCTCTGGAGTc
SH2D2A 1 CACCgATCTGTGTCACTCTGTGTTT AAACAAACACAGAGTGACACAGATc
2 CACCgTGAAGGTCAGGCAGCAGTAA AAACTTACTGCTGCCTGACCTTCAc
HELZ2 1 CACCgCAGCTCGGCCCCCGCTGCGA AAACTCGCAGCGGGGGCCGAGCTGc
2 CACCgCTGCTCGCTGGCGCTTCCCG AAACCGGGAAGCGCCAGCGAGCAGc
NT CACCgGGTCCCTCAGGGTGCAACTT AAACAAGTTGCACCCTGAGGGACCc
GPR161 1 CACCgGGCCGCAGGGGAGGGGCGCG AAACCGCGCCCCTCCCCTGCGGCCc
2 CACCgTGCGCCTTGCTTTGGAGAGC AAACGCTCTCCAAAGCAAGGCGCAc
ADORA2A 1 CACCgTCACTGCAACCTCCACCTCC AAACGGAGGTGGAGGTTGCAGTGAc
2 CACCgCCCAGCTACTCGGGAGGCTG AAACCAGCCTCCCGAGTAGCTGGGc
PGBD1 1 CACCgAGTGACCTGGGCGGGGCAGG AAACCCTGCCCCGCCCAGGTCACTc
2 CACCgATGGGCCTGGGGTCCGGCGG AAACCCGCCGGACCCCAGGCCCATc
BDNF 1 CACCgGATTCATTTTTTTGTGTTGG AAACCCAACACAAAAAAATGAATCc
2 CACCgTGTGCGGTGGGGAGAGGAGG AAACCCTCCTCTCCCCACCGCACAc
CLYBL 1 CACCgGAAGGAGGGCGTGGCTGGCG AAACCGCCAGCCACGCCCTCCTTCc
2 CACCgGTCCTAAGCCCTGGCCGGGA AAACTCCCGGCCAGGGCTTAGGACc
COPZ2 1 CACCgACGGGGCCCCGAGGAAAGGG AAACCCCTTTCCTCGGGGCCCCGTc
2 CACCgGATGGGGGAGAACGAGCAAG AAACCTTGCTCGTTCTCCCCCATCc
EGR4 1 CACCgCAGGTGGGAAGCGCATCTAC AAACGTAGATGCGCTTCCCACCTGc
2 CACCgGCCTCACCGGGCCGACCGTC AAACGACGGTCGGCCCGGTGAGGCc
EML2 1 CACCgCTCCCGATCCCAGGTTCTTT AAACAAAGAACCTGGGATCGGGAGc
2 CACCgGGGGAGAGTGGTTGAGAACA AAACTGTTCTCAACCACTCTCCCCc
ETV1 1 CACCgGGGGATTTACGGCTCGTTAT AAACATAACGAGCCGTAAATCCCCc
2 CACCgGGTTACCCTGGATACCCGTC AAACGACGGGTATCCAGGGTAACCc
FAIM2 1 CACCgGCGCTGCGGAGCAACCCCAG AAACCTGGGGTTGCTCCGCAGCGCc
2 CACCgTCCCGGGGGAGGGCTAAGGG AAACCCCTTAGCCCTCCCCCGGGAc
FOXP1 1 CACCgGCGCCCCGGCCCCCTCCGCG AAACCGCGGAGGGGGCCGGGGCGCc
2 CACCgGTGTGGGGCGCGGCGCGGCG AAACCGCCGCGCCGCGCCCCACACc
MFSD2A 1 CACCgCTCCTAGCAATCCGAGAAGC AAACGCTTCTCGGATTGCTAGGAGc
2 CACCgGCTTGGAGAACGTGGCTCGG AAACCCGAGCCACGTTCTCCAAGCc
NIN 1 CACCgGGCCCGCGCGGCTCAGGCAG AAACCTGCCTGAGCCGCGCGGGCCc
2 CACCgGGCGGGCGCTCGGAGCGGGA AAACTCCCGCCCGAGCGCCCGCCc
NKX2-4 1 CACCgCGTCACAGGCTCAGCTGCCG AAACCGGCAGCTGAGCCTGTGACGc
2 CACCgGTCTGTCGTAAACCTGGCGC AAACGCGCCAGGTTTACGACAGACc
NPY 1 CACCgAGGGGCGGGAAGTGGCGGGT AAACACCCGCCACTTCCCGCCCCTc
2 CACCgCGGGAGGGTTGGGGTGTGGG AAACCCCACACCCCAACCCTCCCGc
PIK3CD 1 CACCgGATGATGCCCCTCTAGCGGT AAACACCGCTAGAGGGGCATCATCc
2 CACCgGGAAAAACAACAGGTCCTCC AAACGGAGGACCTGTTGTTTTTCCc
PIM1 1 CACCgCGGGACTGGGCGACTCCCCT AAACAGGGGAGTCGCCCAGTCCCGc
2 CACCgGGGGAGCAGGGCTGCCGGGC AAACGCCCGGCAGCCCTGCTCCCCc
PRRX2 1 CACCgGGATGGAAAACGACAAAACA AAACTGTTTTGTCGTTTTCCATCCc
2 CACCgTGGGTGGGGAGGGTGAAGGG AAACCCCTTCACCCTCCCCACCCAc
RRAS 1 CACCgGGACACTTAAGGAGGGGGAC AAACGTCCCCCTCCTTAAGTGTCCc
2 CACCgCGGGAATTCCGAATGAGGCG AAACCGCCTCATTCGGAATTCCCCc
SAGE1 1 CACCgCTCAAGGCGGATGGAAGGAA AAACTTCCTTCCATCCGCCTTGAGc
2 CACCgTGGGAGTGATGCTCATGGGG AAACCCCCATGAGCATCACTCCCAc
SEMA4A 1 CACCgCAGTATAACCAGCCTAGCAG AAACCTGCTAGGCTGGTTATACTGc
2 CACCgGTGACATGATGGAGAGGCAG AAACCTGCCTCTCCATCATGTCACc
SLC7A3 1 CACCgGGCTTTGCAAAAGGATTGCG AAACCGCAATCCTTTTGCAAAGCCc
2 CACCgTGAGGATGGGACGCAGTCTC AAACGAGACTGCGTCCCATCCTCAc
SSBP3 1 CACCgGAGCCGCTGCCTGCTCCTGC AAACGCAGGAGCAGGCAGCGGCTCc
2 CACCgTGCCGCGGCCGGCGCTGTCA AAACTGACAGCGCCGGCCGCGGCAc
SURF2 1 CACCgGGGCTGGGACGGGTGAGCGC AAACGCGCTCACCCGTCCCAGCCCc
2 CACCgGTTGCAGCTGGGGCTGCGGG AAACCCCGCAGCCCCAGCTGCAACc
UTF1 1 CACCgAGGACCCGGCGGGCGGGGCG AAACCGCCCCGCCCGCCGGGTCCTc
2 CACCgAGGGGTCGGTCCTGGCGCTG AAACCAGCGCCAGGACCGACCCCTc
IL10 1/86 CACCgAAAGGGGGACAGAGAGGTGA AAACTCACCTCTCTGTCCCCCTTTc
2/87 CACCgTGGCTTTTTAATGAATGAAG AAACCTTCATTCATTAAAAAGCCAc

57
First, dsDNA fragments were generated to be used as the inserts to be ligated into the lenti
sgRNA(MS2)_zeo/lenti sgRNA(MS2)_puro backbone vector. Therefore, each oligonucleotide mix
(Table 27) was phosphorylated and annealed in a thermocycler using the following conditions: 37 °C
for 30 min; 95 °C for 5 min; and ramped down to 25 °C at 5 °C/min.
Table 27 Phosphorylation and annealing of single-stranded sgRNA oligonucleotides
Component Amount (µL) Final concentration
Forward sgRNA 1 10 µM Reverse sgRNA 1 10 µM T4 Ligation buffer, 10x 1 1x T4 PNK 0.5 N/A Nuclease-free water 6.5 N/A
Total 10
After the thermocycler run, the annealed dsDNA was diluted 1:10 and the Golden Gate assembly
reaction for each sgRNA was set-up as described in Table 28 with cycle conditions specified in Table
29. The ligated products were transformed into NEB High Efficiency Stable Competent E. coli using the
manufacturer’s protocol. The constructs were then extracted from bacteria with the QIAprep Spin
Plasmid Kit, plasmid DNA was quantified using a Nanodrop 1000 (ThermoFisher) and the sequence
verified by standard Sanger sequencing using a U6_promoter_F oligonucleotide (Sigma-Aldrich) 5’-
AATGGACTATCATATGCTTACCG-3’ at the DNA Sequencing Facility service (University of
Cambridge).
Table 28 Golden Gate assembly
Component Start conc. Amount [µL] Final conc.
T4 Ligase buffer (NEB, cat. no.: B0202S) 10x 2.5 1x DTT (ThermoFisher, cat. no.: 707265ML) 10 mM 2.5 1 mM BSA 2 mg/mL 1.25 0.1 mg/mL Annealed sgRNA 1 µM 1 0.04 µM lenti sgRNA(MS2)_zeo (Addgene, cat. no.: 70183) N/A N/A 1 ng/µL BsmB1 (NEB, cat. no.: R05805) 10,000 U/mL 1 10 U T4 DNA Ligase (NEB, cat. no.: M0202S) 40,000 U/mL 1 N/A Nuclease-free water N/A
Total 25
Table 29 PCR cycle conditions used for Golden Gate assembly
Cycle number Condition
1-15 37 °C for 5 min, 20 °C for 5 min
2.15 Genome-scale Cas9 transcriptional activation screen
2.15.1 Genome-scale Cas9 transcriptional activation screen design
For genome-scale Cas9 transcriptional activation screens, a three plasmid (Figure 8B-D) system –
human CRISPR activation library v1– was used271.
This library is based on a dCas9-VP64 fusion protein (Figure 8B) that recruits transcriptional complexes
to the TSS of target transcripts as well as an altered sgRNA (Figure 8D) to recruit accessory
transcriptional co-activators (MS2-p65-HSF1) (Figure 8C) to synergistically interact with the

58
transcriptional complex. Specifically, a hairpin aptamer that selectively binds to the MS2 phage protein
was appended to the tetraloop and stem loop no. 2 regions285. Then a separate vector (Figure 8C) was
constructed to express MS2 protein fused to the p65 transcription factor and HSF1. This allows for
additional recruitment of transcriptional activators to the TSS, leading to >500-fold enhanced
overexpression in targeted mRNA levels compared to dCas9-VP64 alone271.
Figure 8 The genome-scale Cas9 transcriptional activation screen employed to identify bypass resistance mechanisms to ALK TKIs (A) Programmable transcriptional activation can be achieved using dCas9 and activation domains (e.g., VP64/p65/HSF1) to recruit transcriptional machinery to the transcription start site of the desired gene target, resulting in upregulation of the target transcript. PAM: protospacer adjacent motif, Pol II: RNA polymerase II. (B-D) The vector-system used for the genome-scale Cas9 transcriptional activation screen. The library (lenti sgRNA(MS2)_Zeo) must be combined with additional SAM effectors in a 3-vector format. Blast: Blasticidin, Hygro: Hygromycin, Zeo: Zeocin. (E) Genome-scale Cas9 transcriptional activation screens begin with the construction of a plasmid library encoding the effector protein and sgRNAs. SAM libraries target the 200-bp region upstream of the transcription start site of 23,430 human RefSeq coding isoforms with 3 sgRNAs per isoform. These plasmid libraries are packaged into lentivirus and then transduced into the cell type of interest to generate stably expressing lines for the screen, along with an accessory transcriptional activator complex. A selection pressure –e.g. the ALK TKI crizotinib– is applied and genomic DNA is harvested. Surviving sgRNA sequences (coloured bars) are amplified from genomic DNA and then analyzed by deep sequencing to identify candidate genes. Figure modified from Joung et al., 2017286.
AB
mRNA upregulation
VP64
MS2 sgRNA
MS2-P65-HSF1
Pol II
Transcriptional
activation
DNA
target
Genomic
locus
dCas9 PAM
dCas9
VP64Blasticidin
HygromycinHSF1P65MS2
MS2 sgRNA Zeocin
lenti dCas-VP64_Blast
lenti MS2-P65-HSF1_Hygro
lenti sgRNA(MS2)_Zeo
C
D
MS2-P65-HSF1
lentivirus
Naïve ALCL
cell line
Blasticidin and
Hygromycin
selection
dCas9 and
MS2-expressing
ALCL cell line
Lentiviral sgRNA-
expression library
Zeocin
selection
sgRNA-
expressing
ALCL cell library
ALK TKI-
resistant
ALCL cells
ALK TKI
selection
gDNA
isolation
sgRNA
amplification
dCas9-VP64
lentivirus
Deep
sequencing
EGFR
KRAS
KIT
IGF-1R
HER
Candidate genes
E

59
2.15.2 Generation of dCas9 and MS2 expressing cell lines
To conduct genome-scale Cas9 transcriptional activation screens, cell lines stably expressing lenti
dCAS-VP64_Blast and lenti MS2-P65-HSF1_Hygro were engineered (Figure 8E)271. Briefly, the
lentiviral plasmids were individually packaged into lentiviruses and subsequently used for viral
transduction in cell lines. First, the expression plasmids were co-transfected into log-phase 293FT cells
with second-generation lentiviral packaging plasmids – psPAX2 and pMD2.G at a ratio of 1:1:1 with
TransIT-293 in OptiMEM reduced serum medium at 32 °C. After 24 hours the medium was replaced
with fresh Dulbecco’s Modified Eagle Medium supplemented with 10% FBS, DNAse I, 20 mM HEPES
pH 7.4 and 5 mM MgCl2. Viral supernatant was collected 48 and 72 hr post-transfection, pooled,
centrifuged at 360 x g for 5 min, with the resulting supernatant filtered and stored at -80 ⁰C if not used
directly.
Afterwards, cells were first transduced with viral particles of lenti dCAS-VP64_Blast at a multiplicity of
infection (MOI) of < 0.7 then selected in blasticidin S HCl (see Table 30 for concentration) 24 hr post
viral transduction for seven days to completion (defined as 0% survival in uninfected cells). Then lenti
MS2-P65-HSF1_Hygro particles at an MOI of < 0.7 were applied and stable cells were selected in
hygromycin B (see Table 30 for concentration) 24 hr post viral transduction for seven days to
completion.
Table 30 Antibiotic concentrations that were used for the selection of the transduced cell lines (*) indicates the presence/absence of the pathognomonic translocation t(2;5)(p32;q35) and/or of the fusion gene NPM-ALK.
Cell line Diagnosis t(2;5) NPM-ALK* Hygromycin Blasticidin Zeocin Puromycin
DEL ALCL cryptic t(2;5) NPM-ALK
200 µg/mL 10 μg/mL 100 μg/mL 500 ng/mL
Karpas 299 ALCL (refractory, terminal)
t(2;5) NPM-ALK 200 µg/mL 10 μg/mL 100 μg/mL 1 μg/mL
SU-DHL-1 ALCL t(2;5) NPM-ALK 125 μg/mL 5 μg/mL 80 μg/mL 1 μg/mL
SUP-M2 ALCL (refractory) t(2;5) NPM-ALK 200 µg/mL 10 μg/mL 100 μg/mL 1 μg/mL
Mac-2A ALCL, cutaneous (terminal)
N/A 125 μg/mL 10 μg/mL 100 μg/mL 1 μg/mL
SHSY5Y NB N/A 300 μg/mL 10 μg/mL 750 μg/mL 1 μg/mL
CHLA-20 NB N/A 300 μg/mL 10 μg/mL 300 μg/mL 1 μg/mL
2.15.3 Transformation, amplification and preparation of lentiviral sgRNA libraries
Aliquots (~1000 ng (50 ng/μl)) of the Human CRISPR Activation Library v1 (SAM - 3 plasmid system)
were acquired. Each library (100 ng) was transformed into ElectroMAX Stbl4 Competent Cells via
electroporation with the Gene Pulser II Electroporation System according to the protocol supplied with
the Stbl4 cells. This process was carried out with 4 replicate reactions. Cells were recovered in SOC
Outgrowth Medium and cultured for 1.5 hours at 30 °C before being plated onto ampicillin lysogeny
broth (LB) agarose bioassay dishes, which were incubated overnight at 30 °C. The bacterial colonies
were then harvested, and the CRISPR plasmid libraries were isolated using the EndoFree Plasmid Maxi
Kit. To prepare lentivirus libraries, log-phase HEK293FT cells were seeded at ~50% confluence the day
before transfection in reduced (5%) FBS supplemented DMEM to obtain ~80% confluence for
transfection. For each T175 flask, 18 μg of sgRNA plasmid library, 16 μg of psPAX2, and 10 μg of

60
pMD2.G were incubated in 4.5 mL of Opti-MEM/TransIT-293 (110 µL of TransIT-293) for 15 minutes at
room temperature. 60 hours after transfection, the media was collected and centrifuged at 500 x g at
4 °C for 15 minutes to remove the cellular debris. Aliquots of the supernatant were stored at –80 °C.
2.15.4 Transduction of ALCL cell lines using lentiviral CRISPR libraries
To determine optimal virus volumes for achieving a MOI of 0.3, trial infections to determine the effective
MOI were set up using ALCL cell lines (specifically DEL, SUP-M2 and K299). Briefly, 1 million cells per
well were seeded into a 6-well plate in 10% FBS RPMI 1640. Afterwards, the virus libraries, mixed with
fresh media, were added to the cells. Each well received different volumes of viruses (10 μl up to 500
μl) along with a mock (no virus) transduction control. Cells were incubated with the virus for 24 hours
and cells from each well were then split into 2 wells in a 6-well plate. One well received 100 μg/mL of
zeocin depending on the cell type (Table 30). After 5 days, when no viable cells remained in the no-
transduction control duplicate wells incubated with zeocin, viable cells were counted following trypan
blue exclusion. The effective MOI was calculated as the average cell count from the triplicate wells
incubated with zeocin divided by the average cell count from the triplicates with no selection reagent.
The virus volume yielding a MOI of 0.3 was selected to be scaled up for the screens. The virus
transduction protocol for the actual screens was scaled up to 20 million cells per T175 flask with a total
of 500 million cells being transduced.
Stable DEL/SUP-M2/K299 SAM cells were infected with the library at a MOI of 0.3 and a ratio of at least
500 cells/sgRNA were then incubated with zeocin (100 μg/mL) for 7 days. Two separate infections were
performed and for each condition 500 cells/sgRNA were collected as input control. The remaining cell
pools were subsequently cultured with crizotinib (120/150/300 nM for DEL/SUP-M2/K299) or DMSO for
14 days and harvested for DNA extraction.
2.15.5 Preparation of HiSeq libraries for the screen readout
Frozen cell pellets were lysed and their gDNA was extracted with the QIAamp DNA Blood Maxi Kit. PCR
of the virally integrated guides was performed on gDNA at the equivalent of 500 cells per guide using
Herculase II Fusion DNA Polymerase (Table 31). Oligonucleotides included the Illumina adapters,
staggered region and the barcodes (Table 32). The amount of input gDNA for each sample to achieve
500 x coverage of the SAM library was calculated to be approximately 230 μg DNA per replicate,
assuming 6.6 μg of gDNA is the yield of 1 million cells. Therefore, 23 parallel 100 μl PCR reactions with
10 μg of input genomic DNA in each reaction were completed in an ABI Veriti Thermal Cycler in a single-
step reaction of 24 cycles (Table 33).
Table 31 PCR amplification of virally integrated guides
Component Amount per reaction (μl) Final concentration
UltraPure water 61
5 x Buffer 20 1x
100% DMSO 2 2%
100 mM dNTP 1 1 mM
10 μM F Primer Mix 2.5 0.25 μM
10 μM R Primer 2.5 0.25 μM
Herculase II Fusion DNA Polymerase 1 N/A
1 μg/mL gDNA 10 0.1 μg/mL

61
Table 32 Oligonucleotides used for HiSeq library preparation All forward oligonucleotides were mixed at equal molar concentrations, introducing artificial diversity to the library from the varied staggered sequences, then used with one reverse primer (unique 8 bp molecular barcode) per sample. Illumina P5 adaptor, Illumina P7 adaptor, sequencing forward, sequencing reverse, stagger (varied) sequence, index barcode, priming site. A maximum of nine samples were run on one flow cell.
Primer Sequence
F1 AATGATACGGCGACCACCGAGATCTACACTCTTTCCCTACACGACGCTCTTCCGATCTTAAGTAGAGGCTTTATATATCTTGTGGAAAGGACGAAACACC
F2 AATGATACGGCGACCACCGAGATCTACACTCTTTCCCTACACGACGCTCTTCCGATCTATCATGCTTAGCTTTATATATCTTGTGGAAAGGACGAAACACC
F3 AATGATACGGCGACCACCGAGATCTACACTCTTTCCCTACACGACGCTCTTCCGATCTGATGCACATCTGCTTTATATATCTTGTGGAAAGGACGAAACACC
F4 AATGATACGGCGACCACCGAGATCTACACTCTTTCCCTACACGACGCTCTTCCGATCTCGATTGCTCGACGCTTTATATATCTTGTGGAAAGGACGAAACACC
F5 AATGATACGGCGACCACCGAGATCTACACTCTTTCCCTACACGACGCTCTTCCGATCTTCGATAGCAATTCGCTTTATATATCTTGTGGAAAGGACGAAACACC
F6 AATGATACGGCGACCACCGAGATCTACACTCTTTCCCTACACGACGCTCTTCCGATCTATCGATAGTTGCTTGCTTTATATATCTTGTGGAAAGGACGAAACACC
F7 AATGATACGGCGACCACCGAGATCTACACTCTTTCCCTACACGACGCTCTTCCGATCTGATCGATCCAGTTAGGCTTTATATATCTTGTGGAAAGGACGAAACACC
F8 AATGATACGGCGACCACCGAGATCTACACTCTTTCCCTACACGACGCTCTTCCGATCTCGATCGATTTGAGCCTGCTTTATATATCTTGTGGAAAGGACGAAACACC
F9 AATGATACGGCGACCACCGAGATCTACACTCTTTCCCTACACGACGCTCTTCCGATCTACGATCGATACACGATCGCTTTATATATCTTGTGGAAAGGACGAAACACC
F10 AATGATACGGCGACCACCGAGATCTACACTCTTTCCCTACACGACGCTCTTCCGATCTTACGATCGATGGTCCAGAGCTTTATATATCTTGTGGAAAGGACGAAACACC
R1 CAAGCAGAAGACGGCATACGAGATGAAGAAGTGTGACTGGAGTTCAGACGTGTGCTCTTCCGATCTGCCAAGTTGATAACGGACTAGCCTT
R2 CAAGCAGAAGACGGCATACGAGATCGTTACCAGTGACTGGAGTTCAGACGTGTGCTCTTCCGATCTGCCAAGTTGATAACGGACTAGCCTT
R3 CAAGCAGAAGACGGCATACGAGATGTCTGATGGTGACTGGAGTTCAGACGTGTGCTCTTCCGATCTGCCAAGTTGATAACGGACTAGCCTT
R4 CAAGCAGAAGACGGCATACGAGATTTACGCACGTGACTGGAGTTCAGACGTGTGCTCTTCCGATCTGCCAAGTTGATAACGGACTAGCCTT
R5 CAAGCAGAAGACGGCATACGAGATTTGAATAGGTGACTGGAGTTCAGACGTGTGCTCTTCCGATCTGCCAAGTTGATAACGGACTAGCCTT
R6 CAAGCAGAAGACGGCATACGAGATTCCTTGGTGTGACTGGAGTTCAGACGTGTGCTCTTCCGATCTGCCAAGTTGATAACGGACTAGCCTT
R7 CAAGCAGAAGACGGCATACGAGATACAGGTATGTGACTGGAGTTCAGACGTGTGCTCTTCCGATCTGCCAAGTTGATAACGGACTAGCCTT
R8 CAAGCAGAAGACGGCATACGAGATAGGTAAGGGTGACTGGAGTTCAGACGTGTGCTCTTCCGATCTGCCAAGTTGATAACGGACTAGCCTT
R9 CAAGCAGAAGACGGCATACGAGATAACAATGGGTGACTGGAGTTCAGACGTGTGCTCTTCCGATCTGCCAAGTTGATAACGGACTAGCCTT
Table 33 PCR cycle conditions used to amplify the sgRNAs’ guide sequence region and to append the Illumina (HiSeq) compatible adapters and barcodes
Cycle number Denature Anneal Extend
1 95 °C, 20 sec N/A N/A
2-25 95 °C, 20 sec 60 °C, 20 sec 72 °C, 40 sec
26 N/A N/A 72 °C, 3 min
PCR products from all 23 reactions were pooled, purified using the Zymo DNA Clean and Concentrator-
5 kit and a small amount of sample separated on a 2% agarose in 1 x Tris-acetate-EDTA (TAE) gel at
100 V for 2.5 hours to confirm the removal of excess primers. The isolated amplicons were then
quantified by qPCR reactions using the KAPA Library Quantification Kit, fragments were analyzed using
the 2100 BioAnalyzer System and the 2200 Tape Station, mixed at equal molar concentrations and
submitted for HiSeq High Output v4 on 1 x 100 bp mode with 10% PhiX spike at the Bauer Core (Harvard
University).
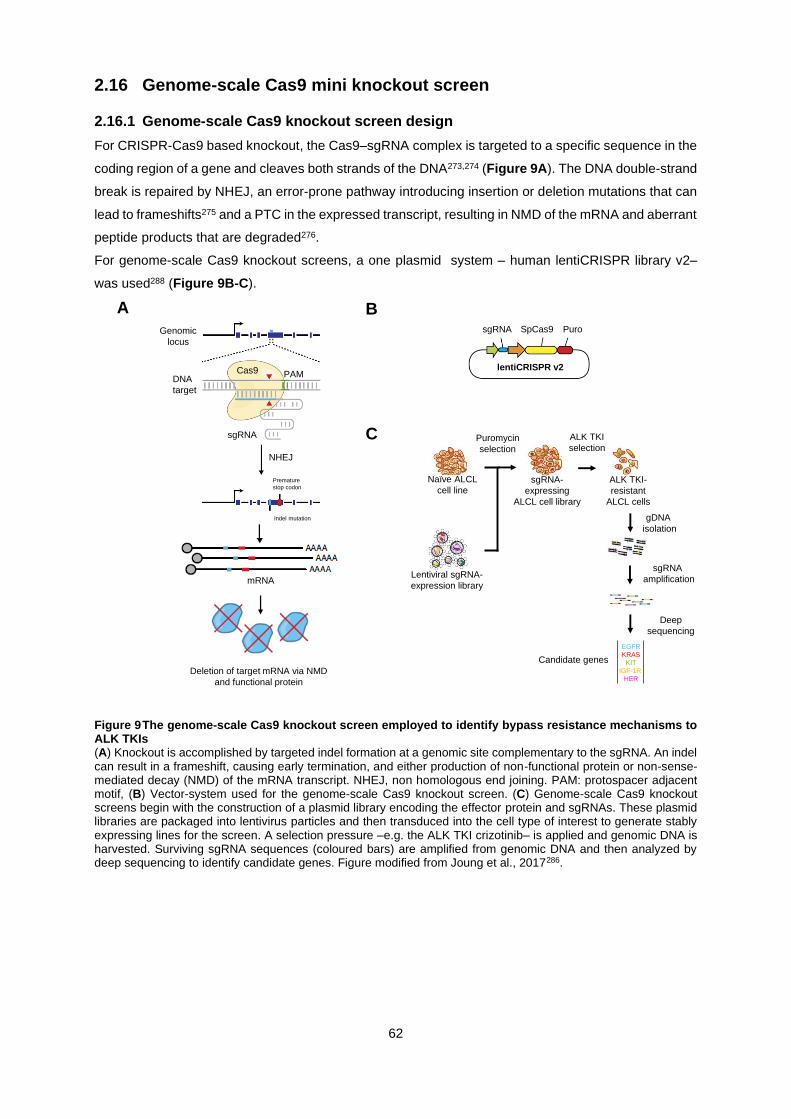
62
2.16 Genome-scale Cas9 mini knockout screen
2.16.1 Genome-scale Cas9 knockout screen design
For CRISPR-Cas9 based knockout, the Cas9–sgRNA complex is targeted to a specific sequence in the
coding region of a gene and cleaves both strands of the DNA273,274 (Figure 9A). The DNA double-strand
break is repaired by NHEJ, an error-prone pathway introducing insertion or deletion mutations that can
lead to frameshifts275 and a PTC in the expressed transcript, resulting in NMD of the mRNA and aberrant
peptide products that are degraded276.
For genome-scale Cas9 knockout screens, a one plasmid system – human lentiCRISPR library v2–
was used288 (Figure 9B-C).
Figure 9 The genome-scale Cas9 knockout screen employed to identify bypass resistance mechanisms to ALK TKIs (A) Knockout is accomplished by targeted indel formation at a genomic site complementary to the sgRNA. An indel can result in a frameshift, causing early termination, and either production of non-functional protein or non-sense-mediated decay (NMD) of the mRNA transcript. NHEJ, non homologous end joining. PAM: protospacer adjacent motif, (B) Vector-system used for the genome-scale Cas9 knockout screen. (C) Genome-scale Cas9 knockout screens begin with the construction of a plasmid library encoding the effector protein and sgRNAs. These plasmid libraries are packaged into lentivirus particles and then transduced into the cell type of interest to generate stably expressing lines for the screen. A selection pressure –e.g. the ALK TKI crizotinib– is applied and genomic DNA is harvested. Surviving sgRNA sequences (coloured bars) are amplified from genomic DNA and then analyzed by deep sequencing to identify candidate genes. Figure modified from Joung et al., 2017286.
BA
sgRNA
NHEJ
Premature
stop codon
DNA
target
Genomic
locus
Cas9 PAM
Indel mutation
mRNA
Deletion of target mRNA via NMD
and functional protein
Puro
lentiCRISPR v2
sgRNA SpCas9
Naïve ALCL
cell line
Lentiviral sgRNA-
expression library
Puromycin
selection
sgRNA-
expressing
ALCL cell library
ALK TKI-
resistant
ALCL cells
ALK TKI
selection
gDNA
isolation
sgRNA
amplification
Deep
sequencing
EGFR
KRAS
KIT
IGF-1R
HER
Candidate genes
C

63
2.16.2 CRISPR Mini Knockout Screen
A CRISPR targeted knockout screen was performed using a mini screen library (Table 34) based on
the commercially available GeCKO v2 A or B libraries as described previously288.
Table 34 sgRNAs cloned for the CRISPR Mini Knockout Screen Oligonucleotides used to generate dsDNA fragments containing the 20 bp target sequence that were cloned into lentiCRISPR v2. Grey nucleotides indicate the overhangs. NT = non-targeting. UID = unique ID for Addgene # 1000000048.
Gene sgRNA UID Forward ssDNA element Reverse ssDNA element
ADORA2A
1 HGLibA_01012 CACCgTCTGGCGGAACTCGCGGATA AAACTATCCGCGAGTTCCGCCAGAc
2 HGLibA_01013 CACCgCTCCTCGGTGTACATCACGG AAACCCGTGATGTACACCGAGGAGc
3 HGLibA_01014 CACCgCGTGGCTGCGAATGATCTTG AAACCAAGATCATTCGCAGCCACGc
4 HGLibB_01010 CACCgCTCCACCGTGATGTACACCG AAACCGGTGTACATCACGGTGGAGc
5 HGLibB_01011 CACCgTAGCCATTGGGCCTCCGCTC AAACGAGCGGAGGCCCAATGGCTAc
6 HGLibB_01012 CACCgGAAGGGATTCACAACCGAAT AAACATTCGGTTGTGAATCCCTTCc
MYC
1 HGLibA_30663 CACCgAACGTTGAGGGGCATCGTCG AAACCGACGATGCCCCTCAACGTTc
2 HGLibA_30664 CACCgGCCGTATTTCTACTGCGACG AAACCGTCGCAGTAGAAATACGGCc
3 HGLibA_30665 CACCgTGCGTAGTTGTGCTGATGTG AAACCACATCAGCACAACTACGCAc
4 HGLibB_30621 CACCgACAACGTCTTGGAGCGCCAG AAACCTGGCGCTCCAAGACGTTGTc
5 HGLibB_30622 CACCgCGCCGTCGTTGTCTCCCCGA AAACTCGGGGAGACAACGACGGCGc
6 HGLibB_30623 CACCgTCGCTTACCAGAGTCGCTGC AAACGCAGCGACTCTGGTAAGCGAc
GPR161
1 HGLibA_19956 CACCgCCCCTCGGCTGGAATCCGTG AAACCACGGATTCCAGCCGAGGGGc
2 HGLibA_19957 CACCgCTATGGCTTCATCTTCCGCG AAACCGCGGAAGATGAAGCCATAGc
3 HGLibA_19958 CACCgCACAGTCGTCATCGTGGAGG AAACCCTCCACGATGACGACTGTGc
4 HGLibB_19928 CACCgCACCTGCCATGAGCGCAGTG AAACCACTGCGCTCATGGCAGGTGc
5 HGLibB_19929 CACCgAGAGACTCCACGTCCCGCTC AAACGAGCGGGACGTGGAGTCTCTc
6 HGLibB_19930 CACCgCCCACACCTCACTGCGCTCA AAACTGAGCGCAGTGAGGTGTGGGc
HELZ2
1 HGLibA_21125 CACCgGACGGGCGCACGGCCCCCCT AAACAGGGGGGCCGTGCGCCCGTCc
2 HGLibA_21126 CACCgGCCGTGCGCCCGTCGCCATC AAACGATGGCGACGGGCGCACGGCc
3 HGLibA_21127 CACCgGGAGTGGGTCCGGCGCACGC AAACGCGTGCGCCGGACCCACTCCc
4 HGLibB_21097 CACCgCAACCAGCCCCTGATGTACC AAACGGTACATCAGGGGCTGGTTGc
5 HGLibB_21098 CACCgTCCGCTCACCTCAGAGTGGA AAACTCCACTCTGAGGTGAGCGGAc
6 HGLibB_21099 CACCgGCTCCACAGCCTGCGTGCGC AAACGCGCACGCAGGCTGTGGAGCc
IL10
1 HGLibA_22943 CACCgGTTGTTAAAGGAGTCCTTGC AAACGCAAGGACTCCTTTAACAACc
2 HGLibA_22944 CACCgAGCGCCGTAGCCTCAGCCTG AAACCAGGCTGAGGCTACGGCGCTc
3 HGLibA_22945 CACCgTTCACATGCGCCTTGATGTC AAACGACATCAAGGCGCATGTGAAc
4 HGLibB_22912 CACCgCACCTTAAAGTCCTCCAGCA AAACTGCTGGAGGACTTTAAGGTGc
5 HGLibB_22913 CACCgTCGTATCTTCATTGTCATGT AAACACATGACAATGAAGATACGAc
6 HGLibB_22914 CACCgGAAGATGTCAAACTCACTCA AAACTGAGTGAGTTTGACATCTTCc
IL10RA
1 HGLibA_22946 CACCgTTCGGCGCCGCACATACAGC AAACGCTGTATGTGCGGCGCCGAAc
2 HGLibA_22947 CACCgGGTCACTGCGGTAAGGTCAT AAACATGACCTTACCGCAGTGACCc
3 HGLibA_22948 CACCgGTATGAGATTGCCATTCGCA AAACTGCGAATGGCAATCTCATACc
4 HGLibB_22915 CACCgTGGGTAGCTGAATCTTCCCG AAACCGGGAAGATTCAGCTACCCAc
5 HGLibB_22916 CACCgCAGGAGCGCCACTTCATAGC AAACGCTATGAAGTGGCGCTCCTGc
6 HGLibB_22917 CACCgTGACGGTCCAGTTGGAGTGC AAACGCACTCCAACTGGACCGTCAc
IL10RB
1 HGLibA_22949 CACCgACTTATTGTGTTCAAGTTCG AAACCGAACTTGAACACAATAAGTc
2 HGLibA_22950 CACCgTTAGCCATTATTGGACCCCC AAACGGGGGTCCAATAATGGCTAAc
3 HGLibA_22951 CACCgCTTTCACAGCTCAGTACCTA AAACTAGGTACTGAGCTGTGAAAGc
4 HGLibB_22918 CACCgCTTCCTGATCGGAACAAAGC AAACGCTTTGTTCCGATCAGGAAGc
5 HGLibB_22919 CACCgTGAGAAATCACATTCCGTCA AAACTGACGGAATGTGATTTCTCAc
6 HGLibB_22920 CACCgTTGAGAATGAATACGAAACT AAACAGTTTCGTATTCATTCTCAAc
MKNK1
1 HGLibA_29341 CACCgGGAGACGCTGTATCAGTGTC AAACGACACTGATACAGCGTCTCCc
2 HGLibA_29342 CACCgTCGGAGTAGGGTGTTTCGAG AAACCTCGAAACACCCTACTCCGAc
3 HGLibA_29343 CACCgGGCACCTTGAACTTTGGCAT AAACATGCCAAAGTTCAAGGTGCCc
4 HGLibB_29300 CACCgGAACCCCTTCCCATCGCAGA AAACTCTGCGATGGGAAGGGGTTCc
5 HGLibB_29301 CACCgCCTCCTGTCACCATCTGCGA AAACTCGCAGATGGTGACAGGAGGc
6 HGLibB_29302 CACCgGGAGCCTATGCCAAAGTTCA AAACTGAACTTTGGCATAGGCTCCc
P2RY6
1 HGLibA_34890 CACCgCGGCAGGCGAAGTCGCCAAA AAACTTTGGCGACTTCGCCTGCCGc
2 HGLibA_34891 CACCgGCCAGCACCGCCGAATACAC AAACGTGTATTCGGCGGTGCTGGCc
3 HGLibA_34892 CACCgAAACGGCCGCGTGCCTTTGT AAACACAAAGGCACGCGGCCGTTTc
4 HGLibB_34844 CACCgCCGGCGTCGAGCGCACTGCC AAACGGCAGTGCGCTCGACGCCGGc
5 HGLibB_34845 CACCgTCACCCAGAAGAAGTTCCGC AAACGCGGAACTTCTTCTGGGTGAc
6 HGLibB_34846 CACCgTCGCCGGCGGAACTTCTTCT AAACAGAAGAAGTTCCGCCGGCGAc
PGBD1 1 HGLibA_36215 CACCgCCTGGAGATGAGCTGATCCG AAACCGGATCAGCTCATCTCCAGGc
2 HGLibA_36216 CACCgCACTTCAGGGTGGTTATCCC AAACGGGATAACCACCCTGAAGTGc
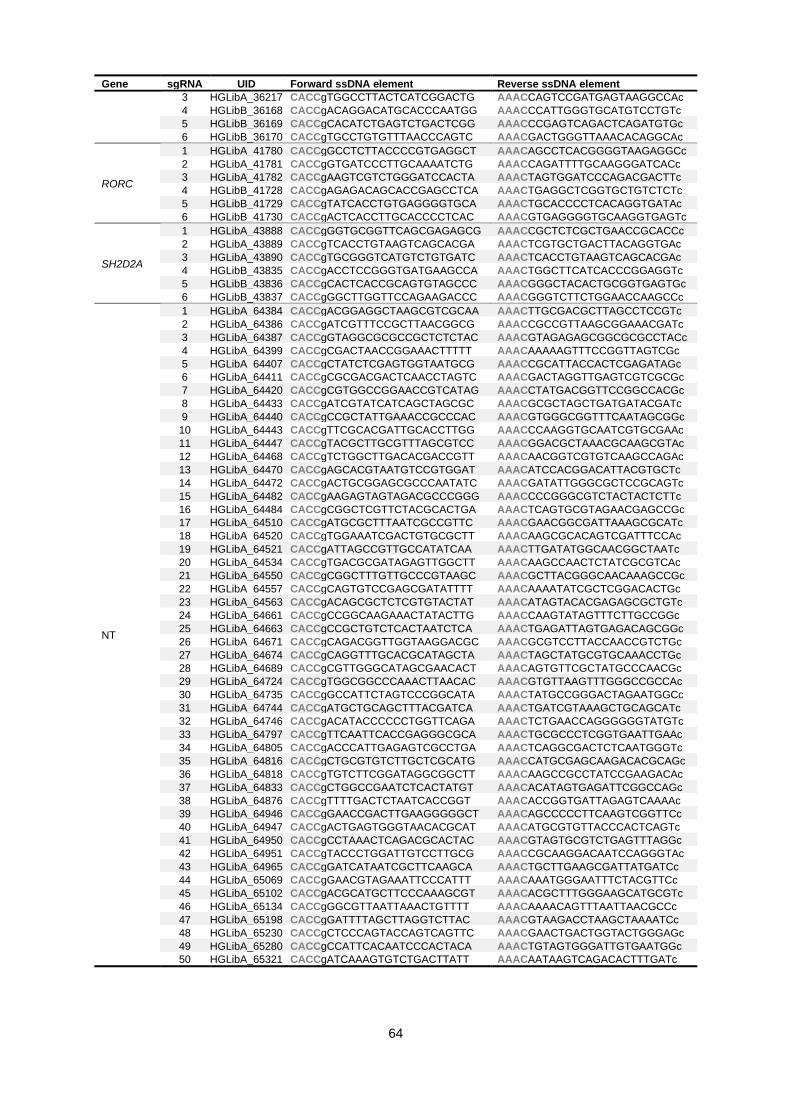
64
Gene sgRNA UID Forward ssDNA element Reverse ssDNA element
3 HGLibA_36217 CACCgTGGCCTTACTCATCGGACTG AAACCAGTCCGATGAGTAAGGCCAc
4 HGLibB_36168 CACCgACAGGACATGCACCCAATGG AAACCCATTGGGTGCATGTCCTGTc
5 HGLibB_36169 CACCgCACATCTGAGTCTGACTCGG AAACCCGAGTCAGACTCAGATGTGc
6 HGLibB_36170 CACCgTGCCTGTGTTTAACCCAGTC AAACGACTGGGTTAAACACAGGCAc
RORC
1 HGLibA_41780 CACCgGCCTCTTACCCCGTGAGGCT AAACAGCCTCACGGGGTAAGAGGCc
2 HGLibA_41781 CACCgGTGATCCCTTGCAAAATCTG AAACCAGATTTTGCAAGGGATCACc
3 HGLibA_41782 CACCgAAGTCGTCTGGGATCCACTA AAACTAGTGGATCCCAGACGACTTc
4 HGLibB_41728 CACCgAGAGACAGCACCGAGCCTCA AAACTGAGGCTCGGTGCTGTCTCTc
5 HGLibB_41729 CACCgTATCACCTGTGAGGGGTGCA AAACTGCACCCCTCACAGGTGATAc
6 HGLibB_41730 CACCgACTCACCTTGCACCCCTCAC AAACGTGAGGGGTGCAAGGTGAGTc
SH2D2A
1 HGLibA_43888 CACCgGGTGCGGTTCAGCGAGAGCG AAACCGCTCTCGCTGAACCGCACCc
2 HGLibA_43889 CACCgTCACCTGTAAGTCAGCACGA AAACTCGTGCTGACTTACAGGTGAc
3 HGLibA_43890 CACCgTGCGGGTCATGTCTGTGATC AAACTCACCTGTAAGTCAGCACGAc
4 HGLibB_43835 CACCgACCTCCGGGTGATGAAGCCA AAACTGGCTTCATCACCCGGAGGTc
5 HGLibB_43836 CACCgCACTCACCGCAGTGTAGCCC AAACGGGCTACACTGCGGTGAGTGc
6 HGLibB_43837 CACCgGGCTTGGTTCCAGAAGACCC AAACGGGTCTTCTGGAACCAAGCCc
NT
1 HGLibA_64384 CACCgACGGAGGCTAAGCGTCGCAA AAACTTGCGACGCTTAGCCTCCGTc
2 HGLibA_64386 CACCgATCGTTTCCGCTTAACGGCG AAACCGCCGTTAAGCGGAAACGATc
3 HGLibA_64387 CACCgGTAGGCGCGCCGCTCTCTAC AAACGTAGAGAGCGGCGCGCCTACc
4 HGLibA_64399 CACCgCGACTAACCGGAAACTTTTT AAACAAAAAGTTTCCGGTTAGTCGc
5 HGLibA_64407 CACCgCTATCTCGAGTGGTAATGCG AAACCGCATTACCACTCGAGATAGc
6 HGLibA_64411 CACCgCGCGACGACTCAACCTAGTC AAACGACTAGGTTGAGTCGTCGCGc
7 HGLibA_64420 CACCgCGTGGCCGGAACCGTCATAG AAACCTATGACGGTTCCGGCCACGc
8 HGLibA_64433 CACCgATCGTATCATCAGCTAGCGC AAACGCGCTAGCTGATGATACGATc
9 HGLibA_64440 CACCgCCGCTATTGAAACCGCCCAC AAACGTGGGCGGTTTCAATAGCGGc
10 HGLibA_64443 CACCgTTCGCACGATTGCACCTTGG AAACCCAAGGTGCAATCGTGCGAAc
11 HGLibA_64447 CACCgTACGCTTGCGTTTAGCGTCC AAACGGACGCTAAACGCAAGCGTAc
12 HGLibA_64468 CACCgTCTGGCTTGACACGACCGTT AAACAACGGTCGTGTCAAGCCAGAc
13 HGLibA_64470 CACCgAGCACGTAATGTCCGTGGAT AAACATCCACGGACATTACGTGCTc
14 HGLibA_64472 CACCgACTGCGGAGCGCCCAATATC AAACGATATTGGGCGCTCCGCAGTc
15 HGLibA_64482 CACCgAAGAGTAGTAGACGCCCGGG AAACCCCGGGCGTCTACTACTCTTc
16 HGLibA_64484 CACCgCGGCTCGTTCTACGCACTGA AAACTCAGTGCGTAGAACGAGCCGc
17 HGLibA_64510 CACCgATGCGCTTTAATCGCCGTTC AAACGAACGGCGATTAAAGCGCATc
18 HGLibA_64520 CACCgTGGAAATCGACTGTGCGCTT AAACAAGCGCACAGTCGATTTCCAc
19 HGLibA_64521 CACCgATTAGCCGTTGCCATATCAA AAACTTGATATGGCAACGGCTAATc
20 HGLibA_64534 CACCgTGACGCGATAGAGTTGGCTT AAACAAGCCAACTCTATCGCGTCAc
21 HGLibA_64550 CACCgCGGCTTTGTTGCCCGTAAGC AAACGCTTACGGGCAACAAAGCCGc
22 HGLibA_64557 CACCgCAGTGTCCGAGCGATATTTT AAACAAAATATCGCTCGGACACTGc
23 HGLibA_64563 CACCgACAGCGCTCTCGTGTACTAT AAACATAGTACACGAGAGCGCTGTc
24 HGLibA_64661 CACCgCCGGCAAGAAACTATACTTG AAACCAAGTATAGTTTCTTGCCGGc
25 HGLibA_64663 CACCgCCGCTGTCTCACTAATCTCA AAACTGAGATTAGTGAGACAGCGGc
26 HGLibA_64671 CACCgCAGACGGTTGGTAAGGACGC AAACGCGTCCTTACCAACCGTCTGc
27 HGLibA_64674 CACCgCAGGTTTGCACGCATAGCTA AAACTAGCTATGCGTGCAAACCTGc
28 HGLibA_64689 CACCgCGTTGGGCATAGCGAACACT AAACAGTGTTCGCTATGCCCAACGc
29 HGLibA_64724 CACCgTGGCGGCCCAAACTTAACAC AAACGTGTTAAGTTTGGGCCGCCAc
30 HGLibA_64735 CACCgGCCATTCTAGTCCCGGCATA AAACTATGCCGGGACTAGAATGGCc
31 HGLibA_64744 CACCgATGCTGCAGCTTTACGATCA AAACTGATCGTAAAGCTGCAGCATc
32 HGLibA_64746 CACCgACATACCCCCCTGGTTCAGA AAACTCTGAACCAGGGGGGTATGTc
33 HGLibA_64797 CACCgTTCAATTCACCGAGGGCGCA AAACTGCGCCCTCGGTGAATTGAAc
34 HGLibA_64805 CACCgACCCATTGAGAGTCGCCTGA AAACTCAGGCGACTCTCAATGGGTc
35 HGLibA_64816 CACCgCTGCGTGTCTTGCTCGCATG AAACCATGCGAGCAAGACACGCAGc
36 HGLibA_64818 CACCgTGTCTTCGGATAGGCGGCTT AAACAAGCCGCCTATCCGAAGACAc
37 HGLibA_64833 CACCgCTGGCCGAATCTCACTATGT AAACACATAGTGAGATTCGGCCAGc
38 HGLibA_64876 CACCgTTTTGACTCTAATCACCGGT AAACACCGGTGATTAGAGTCAAAAc
39 HGLibA_64946 CACCgGAACCGACTTGAAGGGGGCT AAACAGCCCCCTTCAAGTCGGTTCc
40 HGLibA_64947 CACCgACTGAGTGGGTAACACGCAT AAACATGCGTGTTACCCACTCAGTc
41 HGLibA_64950 CACCgCCTAAACTCAGACGCACTAC AAACGTAGTGCGTCTGAGTTTAGGc
42 HGLibA_64951 CACCgTACCCTGGATTGTCCTTGCG AAACCGCAAGGACAATCCAGGGTAc
43 HGLibA_64965 CACCgGATCATAATCGCTTCAAGCA AAACTGCTTGAAGCGATTATGATCc
44 HGLibA_65069 CACCgGAACGTAGAAATTCCCATTT AAACAAATGGGAATTTCTACGTTCc
45 HGLibA_65102 CACCgACGCATGCTTCCCAAAGCGT AAACACGCTTTGGGAAGCATGCGTc
46 HGLibA_65134 CACCgGGCGTTAATTAAACTGTTTT AAACAAAACAGTTTAATTAACGCCc
47 HGLibA_65198 CACCgGATTTTAGCTTAGGTCTTAC AAACGTAAGACCTAAGCTAAAATCc
48 HGLibA_65230 CACCgCTCCCAGTACCAGTCAGTTC AAACGAACTGACTGGTACTGGGAGc
49 HGLibA_65280 CACCgCCATTCACAATCCCACTACA AAACTGTAGTGGGATTGTGAATGGc
50 HGLibA_65321 CACCgATCAAAGTGTCTGACTTATT AAACAATAAGTCAGACACTTTGATc

65
The mini screen library consisted of 6 sgRNAs for each gene and 50 non-targeting sgRNAs. sgRNA
cloning is described above. The lentiviral library was generated in HEK293T cells by seeding 5x10⁶ cells
in a 10 cm dish one day before transfection. For each dish, 15 µg of the targeted screen plasmid library
was co-transfected with 5 µg of pMD2.G, 5 µg of pRSV-Rev and 5 µg of pCMVR8.74 in 600 µL of
reaction buffer supplemented with 9 µL of Xfect™ Transfection Reagent. Supernatant containing virus
was collected 60 hours after transfection and ultra-centrifuged at 24,000 rpm for 2 hours at 4 °C to
concentrate the virus. Aliquots were stored at –80 °C. SUP-M2 derived TS and K299 cells were infected
with the library at a MOI of 0.3 and a ratio of at least 500 cells/sgRNA and selected with puromycin (0.2-
0.3 μg/mL) for 7 days. Separate infections were conducted for the GeCKO v2 A and B mini libraries.
After 7 days, 500 cells/sgRNA were collected as the input control (D0), and genomic DNA was extracted
with the Phenol/Chloroform protocol. The remaining cell pools, at a density of 500 cells/sgRNA, were
subsequently cultured with crizotinib (80 nM for TS, 100 nM for K299) or DMSO for 14 days and
harvested for DNA extraction with the Phenol/Chloroform protocol. Amplification of the specific sgRNAs
was performed in a 2-step PCR reaction. First, priming site to lentiCRISPR GeCKO v2 was added using
v2Adaptor_F AATGGACTATCATATGCTTACCGTAACTTGAAAGTATTTCG and v2Adaptor_R
TCTACTATTCTTTCCCCTGCACTGTTGTGGGCGATGTGCGCTCTG in 13 separate 100 μL reactions
with 10 μg genomic DNA per reaction as the input. Next, amplicons were pooled and a second PCR
performed in a 100 μL reaction volume with 5 μL of input of the pooled first PCR reaction, each amplified
with a reverse primer and forward primer (Table 35). The resulting amplicons were gel extracted.
Products were tested for their concentration and specificity using High sensitivity D1000 ScreenTape
and qPCR using the KAPA Library Quantification Kit. Libraries were pooled and sequenced using an
Illumina NextSeq500 SE on 35bp mode with 150 cycles and with a 20% PhiX spike.
Table 35 Oligonucleotides used for HiSeq library preparation Illumina P5 adaptor, Illumina P7 adaptor, sequencing forward, sequencing reverse, stagger (varied) sequence, index barcode, priming site. One forward oligonucleotide was used with one reverse primer per sample. A maximum of ten samples were run on one flow cell.
Primer Sequence
F1 AATGATACGGCGACCACCGAGATCTACACTCTTTCCCTACACGACGCTCTTCCGATCTTTCTTGTGGAAAGGACGAAACACCG
F2 AATGATACGGCGACCACCGAGATCTACACTCTTTCCCTACACGACGCTCTTCCGATCTATTCTTGTGGAAAGGACGAAACACCG
F3 AATGATACGGCGACCACCGAGATCTACACTCTTTCCCTACACGACGCTCTTCCGATCTGATTCTTGTGGAAAGGACGAAACACCG
F4 AATGATACGGCGACCACCGAGATCTACACTCTTTCCCTACACGACGCTCTTCCGATCTCGATTCTTGTGGAAAGGACGAAACACCG
F5 AATGATACGGCGACCACCGAGATCTACACTCTTTCCCTACACGACGCTCTTCCGATCTTCGATTCTTGTGGAAAGGACGAAACACCG
F6 AATGATACGGCGACCACCGAGATCTACACTCTTTCCCTACACGACGCTCTTCCGATCTATCGATTCTTGTGGAAAGGACGAAACACCG
R1 CAAGCAGAAGACGGCATACGAGATAAGTAGAGGTGACTGGAGTTCAGACGTGTGCTCTTCCGATCTTTCTACTATTCTTTCCCCTGCACTGT
R2 CAAGCAGAAGACGGCATACGAGATACACGATCGTGACTGGAGTTCAGACGTGTGCTCTTCCGATCTATTCTACTATTCTTTCCCCTGCACTGT
R3 CAAGCAGAAGACGGCATACGAGATCGCGCGGTGTGACTGGAGTTCAGACGTGTGCTCTTCCGATCTGATTCTACTATTCTTTCCCCTGCACTGT
R4 CAAGCAGAAGACGGCATACGAGATCATGATCGGTGACTGGAGTTCAGACGTGTGCTCTTCCGATCTCGATTCTACTATTCTTTCCCCTGCACTGT

66
2.17 Short-hairpin RNA (shRNA) Knockdown
pLKO.1-puro shRNA302,303 constructs targeting the gene of interest were constructed using the standard
Broad Institute protocol361. First, two oligonucleotides were synthesized to be annealed (Table 36).
Using T4 DNA Ligase, the annealed dsDNA was then ligated into the pLKO.1-puro vector, which had
been digested with AgeI-HF and EcoRI-HF. The ligated constructs were then transformed in NEB Stable
Competent E. coli using the manufacturer’s protocol, the plasmids isolated with the QIAprep Spin
Miniprep Kit, plasmid DNA quantified using a Nanodrop 1000 and the sequence verified by standard
Sanger sequencing using a LKO.1_F oligonucleotide 5’-GACTATCATATGCTTACCGT-3’.
Table 36 Oligonucleotides used to generate dsDNA fragments containing the target shRNA sequence that were cloned into pLKO.1-puro All primers were synthesized by Sigma-Aldrich. Red (Sense), Blue (Loop), Antisense (Green), Black (Term).
Gene # Primer sequence (5’ - 3’)
STAT3 1 CCGGGCACAATCTACGAAGAATCAACTCGAGTTGATTCTTCGTAGATTGTGCTTTTT
2 CCGGGCTGACCAACAATCCCAAGAACTCGAGTTCTTGGGATTGTTGGTCAGCTTTTT
PIM1 1 CCGGACATCCTTATCGACCTCAATCCTCGAGGATTGAGGTCGATAAGGATGTTTTT
2 CCGGCATCCGCGTCTCCGACAACTTCTCGAGAAGTTGTCGGAGACGCGGATGTTTTTTG
All pLKO.1-puro constructs were packaged into lentiviral particles by co-transfection of pLKO.1-puro
vectors with psPax2 and pMD2.G into 293FT cells as described above. Viruses were harvested 60
hours after transfection and stored in -80 °C. ALCL cells were transduced with viral particles of pLKO.1-
puro at an MOI of < 0.7 then incubated with puromycin (see Table 30 for concentration) 24 hours post
viral transduction for three days to completion (defined as 0% survival in uninfected cells).
2.18 Drug Synergy Experiments
For dose-response curves, cells were treated with log-scale concentrations of ALK inhibitors as
previously described, in addition to fixed concentrations of AZD1208 as indicated. Potential synergy
between ALK inhibitors and AZD1208 was evaluated by calculating the combination index (CI) based
on the Bliss Independence model362. The CI was calculated with the following equation: CI= (Ea+Eb-
((Ea*Eb))/Eab, where Ea indicates the viability effect of drug A (ALK inhibitor) and Eb indicates the
viability effect of drug B (AZD1208) and Eab indicates the viability effect of the drug combination. CI <
1 indicates synergism, CI = 1 indicates additivity and CI > 1 indicates antagonism. For dose-response
matrices, cells were treated with log-scale concentrations of each compound in 8x8 grids and the DMSO
concentration was maintained at 0.3%. Cell viability was measured with CellTiter-Blue as previously
described and data were normalized to the average of all untreated wells on the plate (n = 17). All
synergy experiments were performed in technical triplicates.
2.19 Immunohistochemistry (IHC)
IHC was performed on FFPE sections with the conventional avidin–biotin–peroxidase method. Heat
antigen retrieval was performed using citrate buffer pH 6.1 and endogenous peroxidases were
quenched by incubating sections in 3% H2O2 in PBS for 10 minutes. First, sections were blocked using
the Avidin/Biotin blocking kit. Then, the indicated primary antibodies were added in 1% BSA/PBS and
incubated at 4°C overnight. Finally, slides were incubated with biotin-conjugated secondary antibodies

67
using the IDtect Super Stain System – Horseradish peroxidase (HRP) and developed using the AEC
substrate kit. Next, the sections were washed with PBS 3 times between each step. The stained slides
were mounted with Aquatex and assessed by an experienced pathologist (blindly in respect to
clinicopathological parameters and patient outcome) for both the intensity and percentage of positively
stained cells: 0 negative, 1+ weak, 2+ moderate and 3+ strong staining. Positive staining was considered
if present in >1% of cells.
Table 37 Antibodies used to detect proteins by IHC
Antibody Dilution Company Cat. no.
IL10RA antibody 1:100 Abcam ab94811
IL10RB antibody 1:100 Abcam ab106282
IL10 antibody 1:200 Abcam ab34843
2.20 Chromatin Immunoprecipitation (ChIP) qPCR
ChIP-qPCR analysis for IL10, IL10RA, IL10RB and IRF4 was performed on 10 x 106 ALCL cells per
sample using an anti-STAT3 (124H6) or anti-GFP antibody. Following treatment with 1000 nM crizotinib
or DMSO for 3 hours in growth medium, 10 x 106 cells were fixed with 0.75% formaldehyde for 15
minutes with orbital shaking at room temperature. Subsequently, glycine was added to a final
concentration of 125 nM and the reaction was incubated for 5 minutes at room temperature. Next, cells
were washed twice with cold PBS, collected by centrifugation then flash frozen in dry ice/isopropanol
and stored at -80 °C until use.
Cross-linked cell pellets were lysed in 650 μL ChIP lysis buffer (50 mM HEPES-KOH pH7.5, 140 mM
NaCL, 1 mM EDTA pH8, 1% Triton X-100, 0.1% sodium deoxycholate, 0.1% SDS) supplemented with
cOmplete™ Mini EDTA-free protease inhibitor cocktail per 20 x 106 cells, followed by sonication for a
total of 10 minutes with 30 seconds pulses on followed by 30 seconds off, with a Bioruptor® Pico in 15
mL polypropylene centrifuge tubes utilizing sonication beads. Immunoprecipitation reactions were
performed by incubating the sonicated samples overnight with 3 μg STAT3 (Cat#: 9139, Cell Signalling)
or green fluorescent protein (GFP, Cat#: ab290, Abcam) antibodies at 4 °C. Next, antibodies and
chromatin were captured using 50 μL of Protein G Dynabeads per sample for 2 hours at 4 °C. Beads
were first washed three times with low salt buffer (0.1% SDS, 1% Triton X-100, 2 mM EDTA, 20 mM
Tris-HCL pH 8.0, 150 mM NaCL), followed by three washes with high salt buffer (0.1% SDS, 1% Triton
X-100, 2 mM EDTA, 20 mM Tris-HCl pH 8.0, 500 mM NaCL), two washes with LiCL wash buffer (0.25
M LiCL, 1% NP-40, 1% Sodium Deoxycholate, 1 mM EDTA, 10 mM Tris-HCl pH 8.0) and two final
washes with TE buffer (10 mM Tris pH 8.0, 1 mM EDTA). DNA was eluted in 200 μL elution buffer (1%
SDS, 100mM NaHCO3), the RNA was then digested using 2 μL RNase A (10 mg/mL) at 37 °C for 30
minutes, before cross-links were reversed following incubation at 65 °C for 2 hours with 2 μL proteinase
K (20 mg/mL).
De-crosslinked DNA was purified with a Zymo DNA Clean and Concentrator-5 kit. ChIP and input DNA
were analyzed with SYBR-Green qPCR analysis performed using the QuantStudio™ 6 Flex Real-Time
PCR System in accordance with the manufacturer’s protocol using qPCR primers (Table 38) designed
based on ChIP-seq dataset GSE117164.

68
Table 38 ChIP-qPCR Sequencing Primers
Gene Forward primer sequence Reverse primer sequence
IL10 TSS CGGGAAACCTTGATTGTGGC TTCACCTCTCTGTCCCCCTT
IL10RA TSS up AGGTGCGAGAGACTGAGGAT GGTTTCCCTTGCTTGCTTGAA
IL10RB TSS GGTCGTGTGCTTGGAGGAAG CCTCACCTGACACCAGCAG
Control region ATTCCACCTTGTCCAGCCCT GGTTTTATCCCTCTCCCCGAC
IRF4 CTCTAAACACCGCGGAGAGG CTTTGCAGAGCGTGTAACGG
2.21 Enforced IL10RA overexpression
For enforced IL10RA overexpression, ALCL cells were selected 24 hours after infection with lentivirus
particles of pLX302 IL10RA-V5 puro or pLX302 control constructs with 1 μg/mL puromycin before being
plated for an experiment.
2.22 mRNA sequencing
Libraries were prepared with the TruSeq Stranded mRNA kit protocol according to the supplier’s
recommendations. Each transcriptome library was sequenced on an Illumina NextSeq500 as paired-
end 75 bp reads.
2.23 Bioinformatics analysis
2.23.1 ChIP-seq Data Analysis
ChIP-seq data were converted to the FASTQ format using the fastq-dump tool (v2.8.2; part of SRA
toolkit). ChIP-seq reads were aligned to the human genome (hg19) or mouse genome (MM10) with
Bowtie2 with settings ‘end-to-end’, ‘very-sensitive’, and ‘no-unal’340. Reads with a mapping quality < 35
(samtools view q = 35) and PCR duplicates (samtools rmdup) were filtered with SAMtools339. Output
BAM files were sorted using BEDTools341 “sort” function and converted into BigWig track files using
genomeCoverageBed followed by UCSC utility “bedgraphToBigWig”343. The genome browser tracks
were visualized in IGV v2.3.92342,343.
2.23.2 Survival Analysis
Survival analysis was conducted using the Kaplan-Meier method, with the p-value determined by a log-
rank test. PFS was defined as the time to recurrence or relapse, or if a patient had died without
recurrence, the time to death. OS was determined as cancer-specific death. Hazard ratio (HR) and
multivariate analysis adjusting for clinical parameters including sex, age, disease stage, CNS
involvement, MDD/MRD status and ALK-autoantibody status was determined through a Cox
proportional hazards model using the ‘‘coxph’’ function in the survival package in R338.
In building Kaplan-Meier curves, thresholds for the binary classification of intensity levels were
determined using the ‘‘surv_cutpoint’’ function, survival analysis was performed with the ‘‘survfit’’
function, and visualizations were obtained using the ‘‘ggsurvplot’’ function, all in the survminer package
in R337.

69
2.23.3 CRISPR Overexpression Screen Deconvolution and Analysis
Raw FASTQ sequencing files were demultiplexed with bcl2fastq2 v2.2 allowing for 0 bases mismatch,
then matched to the guide sequences from the library files using the Model-based analysis of genome-
wide CRISPR/Cas9 knockout (MAGeCK) count function329. Per-sgRNA read counts were then
subjected to MAGeCK-MLE analysis, modelling each experimental iteration as a separate batch, as
suggested by principal component analysis. MAGeCK-VISPR was used for quality control and
visualization, specifically to obtain p-values and to test false discovery rates (FDR). Corresponding gene
IDs were mapped to corresponding gene symbols using the biomaRt package in R334. Due to the
absence of NT guides in this library, an analysis to control the empirical false positive rate could not be
performed.
2.23.4 CRISPR Mini Knockout Screen Deconvolution and Analysis
The sgRNA sequences from the mini library files were aligned to the FASTQ file of each sample using
BLAST aligner, allowing for a maximum of 2 bases of mismatch. The number of uniquely aligned reads
for each sgRNA were counted and the number of reads for each unique sgRNA for a given sample were
RPM (Reads Per Million mapped reads) normalized. Boxplots were generated by R boxplot function
based on the log2 (RPM normalized sgRNA counts) value, showing the difference of sgRNA
representation at different time points, without (vehicle = DMSO) and with crizotinib treatment. The box
extends from the first to the third quartile with the whiskers denoting 1.5 times the interquartile range.
2.23.5 mRNA-Seq Data Analysis
Data were provided under the MAPPYACTS protocol. Raw paired-end FASTQ files were mapped
against the human reference genome (GRCh38.p12) and GENCODE transcriptome annotation version
v29351 using Salmon330 (version 0.14.0) with the default parameters. Strand-specific transcript counts
were converted into gene counts with the tximport package in R331. Differential gene expression analysis
and normalization were performed using the edgeR package in R332.
2.23.6 Gene Set Enrichment Analysis (GSEA) and Gene Ontology (GO) Analysis
GSEA was performed with the fgsea package335 in R using pathway annotations from the Kyoto
Encyclopedia of Genes and genomes (KEGG)352. GO analysis was performed with the topGO
package336 in R.
2.23.7 Gene Expression Analysis
Published gene expression data from T-cell lymphoma patients (GSE78513, GSE65823, GSE6338,
GSE14879, GSE19069, GSE58445) and lymphoma cell lines (GSE107951, GSE6338, GSE14879,
GSE19069, GSE6184, GSE94669) were analyzed to better understand the biological relevance of
IL10RA. For GSE78513, GSE65823, GSE6338, GSE14879, GSE19069, GSE58445 and GSE107951,
gene expression profiling was performed using the HG-U133-plus2.0 arrays (Affymetrix Inc., Santa
Clara, CA). For GSE6184, gene expression profiling was performed using the HG-U133A Array
(Affymetrix Inc., Santa Clara, CA). For GSE94669, gene expression profiling was performed using the
Illumina HumanHT-12 V4.0 expression beadchip (Illumina Inc., San Diego, CA).

70
The final study consisted of 78 ALK+ ALCL and 48 ALK- ALCL, 159 PTCL-NOS, 110 AITL patients, and
12 reactive Lymphnodes; as well as 64 lymphoma cell lines, 5 ALL cell lines and 1 CLL cell line.
Raw CEL files were loaded with the GEOquery package344 and subsequently subject to quality control
using the arrayQualityMetrics package346, both in R. Background correction, normalisation and
expression calculation were performed using the rma method with the oligo package in R345.
Annotation of the transcript clusters was added using the AnnotationDbi package347 in R. The analysis
of differential expression using a linear model as well as the correction for multiple testing were
conducted using the limma package348 in R.
For GSE94669, the raw Illumina text files were loaded then quality assessment and low-level analysis
performed with the beadarray package349 in R. Annotations were added using the illuminaHumanv4.db
package350 in R.
2.23.8 Co-Expression Analysis
Data used for co-expression analyses between IL10RA and IL10 in different cancer types were obtained
from the Human Protein Atlas RNA-seq datasets portal. Pearson correlation coefficients to quantify co-
expression between genes were assessed using VST-transformed gene expression levels. The
threshold for significant Pearson correlation between gene pairs was determined as the Pearson
correlation coefficient associated with the 99th percentile among 5,000 random protein-
coding/noncoding gene pairs.
2.23.9 Analysis of Public Gene Expression Datasets
PIM1 was investigated by Kaplan-Meier EFS analysis with microarray data from primary NB patient
cohorts using R2: Genomics Analysis and Visualization Platform (http://r2.amc.nl). The following cohorts
were analysed: Kocak (n = 476) (accession: GSE45547)363 and SEQC (n = 498) (accession:
GSE49710)364. The cut-off method was selected as ‘scan’ to determine the optimal threshold for each
gene, and significance was assessed by the log-rank test. The p-values were corrected for multiple
testing using the Bonferroni method. The HR was determined through a Cox proportional hazards model
using the ‘‘coxph’’ function in the survival package in R338.
2.23.10 Waterfall Plot
The response to crizotinib/brigatinib/vehicle was determined by comparing tumour volume change at
time t of study end point or censorship to its baseline: % tumour volume change = ΔVol =
((Vt−Vbaseline)/Vbaseline) × 100%. Tumour volumes were estimated using the modified ellipsoid formula: V
= ab2/2, where a and b (a > b) are length and width measurements. The study end point was reached
once tumours reached 15 mm diameter in any direction or after 21 days of consecutive treatment. Mice
were censored due to tumour ulceration, sudden death, self-mutilation, sickness or if mice remained
tumour-free after 21 days of consecutive treatment.

71
CHAPTER 3 Bypass resistance landscape to
crizotinib inhibition in ALK+ ALCL

72
3.1 Introduction
The first chemotherapy protocol was introduced to paediatric ALCL patients in the 1980s, but EFS and
OS rates have scarcely improved and there is a clear need for new, less toxic and more effective
therapies in the relapse setting20. The NPM1-ALK fusion protein is the oncogenic driver in 75% of ALK+
ALCL28. A chromosomal translocation gives rise to NPM1-ALK, leading to ectopic expression of this
constitutively-active kinase, in turn up-regulating effectors of cell survival and proliferation, including the
crucially important JAK/STAT pathway225,365.
ALK is an ideal drug target particularly as endogenous expression is limited to neuronal cells during
neonatal development104. Therefore, three trials in the USA (COG-ANHL12P1, NCT01979536), France
(AcSé CRIZOTINIB, NCT02034981) and Japan (UMIN000028075) have investigated the
ALK/MET/ROS1 inhibitor crizotinib in paediatric ALK+ ALCL patients. Though the final results from these
trials are yet to come, abrupt relapses following crizotinib discontinuation have been described126,127
suggesting that ALK inhibitors may have to be taken indefinitely and cases of crizotinib resistance have
been reported138. Preliminary results from the AcSé CRIZOTINIB trial showed that 5/15 patients
progressed and that all cases of progression on crizotinib occurred during the first 3 months following
treatment initiation126.
An understanding of the molecular pathways enabling tumours to harbor primary drug resistance or to
acquire resistance to targeted therapies is critical for precisely predicting patient responses and for the
identification of additional targetable pathways to maximize clinical benefit238. The consensus gold
standard for identifying ALK inhibitor resistance mechanisms involves WES coupled with RNA-seq of
tumour tissues obtained from patients via multiple biopsies throughout their treatment238. Until now fewer
than 130 paediatric ALCL patients (NCT01979536, n = 103; NCT02034981, n = 11; UMIN000028075,
n = 10) have been treated with crizotinib in a clinical trial setting and the majority of these patients (all
those recruited to NCT01979536) have not been re-biopsied at relapse due to ethical constraints and/or
the health status of the patient.
However, defining a global landscape of resistance mechanisms requires matched presentation-relapse
tumour specimens from a sufficiently large number of patients238 230,239. For instance, the cataloguing of
epidermal growth factor receptor (EGFR) inhibitor resistance in NSCLC patients with an incidence rate
of 18,252 – 54,756 newly diagnosed cases per year in the USA is still incomplete with around 30% of
relapsed patients currently presenting with ‘unknown’ resistance mechanisms228–230. This problem is
intensified for paediatric malignancies, such as ALK+ ALCL with an incidence rate of approximately 80
newly diagnosed and 16 relapse cases per year in children and adolescents in Europe27. Such an
extended discovery phase of resistance mechanisms leads to a deadly lag in the development of
salvage therapeutic strategies. To counteract this, we employed genome-wide CRISPR overexpression
and knockout screens combined with RNA-seq data from ALK inhibitor relapsed patient tumours to
identify biological pathways involved in primary or acquired resistance to ALK-targeted therapy in ALK+
ALCL.
The data presented in this chapter of the thesis largely forms sections of a publication in Blood (Prokoph
et al.)301, which can be found in Appendix 1.

73
3.1.1 Aims
This chapter aims to:
• Validate CRISPR/dCas9-VP64 activity in the ALCL cell lines of interest
• Apply the validated CRISPR activation platform to screen for potential drivers of resistance to
crizotinib inhibition using a genome wide sgRNA library
• Obtain a list of candidates that may induce resistance to crizotinib
• Perform individual validation assays for each of the candidate genes to confirm their capability to
induce resistance to crizotinib
• Determine the overexpression levels of candidates in TKI resistant cell lines and an orthotopic
xenograft model
• Determine which targets identified by the CRISPR screens are of potential clinical relevance by
RNA-seq of ALK inhibitor relapse compared to sensitive patient tumours
3.2 Validation of the dCas9-VP64 induced overexpression phenotype
In order to comprehensively define potential mechanisms driving resistance to crizotinib in a high-
throughput manner, we established a CRISPR-based overexpression system in ALCL cell lines271,286.
Transcriptional upregulation is achieved by directly fusing VP64 to catalytically inactive Cas9 (dCas9)
and further recruiting the transcriptional activation domains p65 and HSF1, eventually recruiting the
transcriptional machinery to the transcription start site (TSS) of the desired target genes.
Using this system, we first upregulated expression of the ATP binding cassette subfamily B member 1
(ABCB1) (Figure 10A), a transporter expressed in the liver and blood-brain barrier to efflux toxic
agents366, that was previously shown to mediate crizotinib resistance in ALK+ NSCLC367. In doing so,
we were able to increase the IC50 of crizotinib for 3 of 4 ALK+ ALCL cell lines (SU-DHL-1/K299/DEL)
but not for an ALK- ALCL cell line (Mac-2A) (Figure 10B), confirming that sensitivity to crizotinib can be
readily manipulated.
(legend on next page)
-2 0 2
0
50
100
Log10 [Crizotinib], (nM)
Norm
aliz
ed v
iabili
ty (
%)
NT sgRNA
ABCB1 sgRNA 1-2 0 2
0
50
100
Log10 [Crizotinib], (nM)
Norm
aliz
ed v
iabili
ty (
%)
NT sgRNA
ABCB1 sgRNA 2
-2 0 2
0
50
100
Log10 [Crizotinib], (nM)
Norm
aliz
ed v
iabili
ty (
%)
NT sgRNA
ABCB1 sgRNA 2
-2 0 2
0
50
100
Log10 [Crizotinib], (nM)
Norm
aliz
ed v
iabili
ty (
%)
ABCB1 sgRNA 1
-2 0 2
0
50
100
Log10 [Crizotinib], (nM)
Norm
aliz
ed v
iabili
ty (
%)
NT sgRNA
ABCB1 sgRNA 1
-2 0 2
0
50
100
Log10 [Crizotinib], (nM)
Norm
aliz
ed v
iabili
ty (
%)
NT sgRNA
ABCB1 sgRNA 1
-2 0 2
0
50
100
Log10 [Crizotinib], (nM)
Norm
aliz
ed v
iabili
ty (
%)
NT sgRNA
ABCB1 sgRNA 1
Norm
aliz
ed V
iabili
ty (
%)
Log10 (Crizotinib), [nM]
Mac-2A, ALK-K299, ALK+A B
SU-D
HL-
1
K29
9
SUP-M
2DEL
Mac
-2A
050
100150200
500
1000
1500
2000
Fold
Change E
xpre
ssio
n
(rela
tive t
o N
T s
gR
NA
)
ABCB1 sgRNA 1ABCB1 sgRNA 2
SU-DHL-1, ALK+ SUP-M2, ALK+ DEL, ALK+
-2 0 2
0
50
100
Log10 [Crizotinib], (nM)
Norm
aliz
ed v
iabili
ty (
%)
NT sgRNA
ABCB1 sgRNA 2
-2 0 2
0
50
100
Log10 [Crizotinib], (nM)
Norm
aliz
ed v
iabili
ty (
%)
NT sgRNA
ABCB1 sgRNA 2
-2 0 2
0
50
100
Log10 [Crizotinib], (nM)
Norm
aliz
ed v
iabili
ty (
%)
NT sgRNA
ABCB1 sgRNA 2
-2 0 2
0
50
100
Log10 [Crizotinib], (nM)
Norm
aliz
ed v
iabili
ty (
%)
NT sgRNA
ABCB1 sgRNA 2
**
***
-2 0 2
0
50
100
Log10 [Crizotinib], (nM)
Norm
aliz
ed v
iabili
ty (
%)
NT sgRNA
ABCB1 sgRNA 2
-2 0 2
0
50
100
Log10 [Crizotinib], (nM)
Norm
aliz
ed v
iabili
ty (
%)
NT sgRNA
ABCB1 sgRNA 2
-2 0 2
0
50
100
Log10 [Crizotinib], (nM)
Norm
aliz
ed v
iabili
ty (
%)
ABCB1 sgRNA 2
-2 0 2
0
50
100
Log10 [Crizotinib], (nM)
Norm
aliz
ed v
iabili
ty (
%)
NT sgRNA
ABCB1 sgRNA 2
-2 0 2
0
50
100
Log10 [Crizotinib], (nM)
Norm
aliz
ed v
iabili
ty (
%)
NT sgRNA
ABCB1 sgRNA 2
-2 0 2
0
50
100
Log10 [Crizotinib], (nM)
Norm
aliz
ed v
iabili
ty (
%)
NT sgRNA
ABCB1 sgRNA 2
-2 0 2
0
50
100
Log10 [Crizotinib], (nM)
Norm
aliz
ed v
iabili
ty (
%)
NT sgRNA
ABCB1 sgRNA 2
-2 0 2
0
50
100
Log10 [Crizotinib], (nM)
Norm
aliz
ed v
iabili
ty (
%)
NT sgRNA
ABCB1 sgRNA 2
***
******
***
***
**
***
-2 0 2
0
50
100
Log10 [Crizotinib], (nM)
Norm
aliz
ed v
iabili
ty (
%)
NT sgRNA
ABCB1 sgRNA 2
IC50 (nM)
SU-
DHL-
1
K299 DEL
NT
sgRNA1.5 16.2 22.3
ABCB1
sgRNA 14.4 23.1 36.3
ABCB1
sgRNA 219.0 57.4 137.5
-2 0 2
0
50
100
Log10 [Crizotinib], (nM)
Norm
aliz
ed v
iabili
ty (
%)
ABCB1 sgRNA 1
-2 0 2
0
50
100
Log10 [Crizotinib], (nM)
Norm
aliz
ed v
iabili
ty (
%)
ABCB1 sgRNA 1
-2 0 2
0
50
100
Log10 [Crizotinib], (nM)
Norm
aliz
ed v
iabili
ty (
%)
ABCB1 sgRNA 1
-2 0 2
0
50
100
Log10 [Crizotinib], (nM)
Norm
aliz
ed v
iabili
ty (
%)
ABCB1 sgRNA 1
-2 0 2
0
50
100
Log10 [Crizotinib], (nM)
Norm
aliz
ed v
iabili
ty (
%)
ABCB1 sgRNA 1

74
Figure 10 ABCB1 overexpression induces resistance to crizotinib (A) Fold change in expression levels of ABCB1 modulated by CRISPR overexpression for two sgRNAs in the indicated ALCL cell lines. Data are represented as means ± SD of technical replicates, n = 3. (B) Overexpression of ABCB1 modified sensitivity to crizotinib in SUDHL-1, K299 and DEL, but not SUP-M2 or Mac-2A cell lines. Viability of the indicated ALCL cell lines based on normalized CellTiter-Blue fluorescence reads on exposure to increasing concentrations of crizotinib for 48 hours when expressing 1 of 2 of the indicated sgRNAs inducing overexpression of ABCB1. Data are represented as means ± SD, n = 3. Two-sample t test: *p < 0.05. **p < 0.01, ***p < 0.001. Reproduced from Prokoph et al.301.
Next, to test the efficiency of the CRISPR overexpression system in ALCL cell lines, we used a panel of
validated sgRNAs300 targeting the promoters of 15 genes, which were previously shown to lead to
crizotinib resistance in EML4-ALK+ NSCLC232. We found that the ability of most sgRNAs to achieve
significant overexpression was highly cell line dependent. Specifically, we observed the highest
activation of expression in SUP-M2 and DEL and the lowest in K299 cell lines (Figure 11).
Figure 11 The dCas9-VP64-based CRISPR activation system induces overexpression of various genes in different ALCL cell lines Fold change in expression levels modulated by CRISPR overexpression for two sgRNAs per gene versus non-targeting (NT) control sgRNA in ALCL cell lines. Data are represented as means of technical replicates, n = 3. An absolute log fold change of 2.5 is indicated by dashed lines. Reproduced from Prokoph et al.301.
3.3 CRISPR Overexpression Screens Identify Genes Modulating
Crizotinib Sensitivity in ALCL Cell Lines
To account for this inter-cell line variability, we applied our CRISPR-based overexpression platform to
screen for potential drivers of resistance to crizotinib in three different ALCL cell lines using a genome
wide sgRNA library containing 70,290 sgRNAs targeting 23,430 protein-coding genes271 (Figure 12A).
dCas9-VP64/MS2-P65-HSF1-expressing K299, DEL and SUP-M2 cells were transduced with the library
and selected in zeocin for 7 days (day 0). For library screening, we exposed the selected cells to
crizotinib or DMSO for 14 days (day 14). Genomic DNA was isolated from the cells on days 0 and 14,
and deep-sequenced to measure read counts for each sgRNA. Following treatment, changes in
abundance of each sgRNA were assessed using the MAGeCK count function329 and analyzed for quality
control (Figure 12B-D). We identified a host of genes enriched in cells exposed to crizotinib compared
-2 0 2
0
50
100
Log10 [Crizotinib], (nM)
Norm
aliz
ed v
iabili
ty (
%)
NT sgRNA
ABCB1 sgRNA 2N
orm
aliz
ed V
iabili
ty (
%)
Log10 (Crizotinib), [nM]
K299, ALK+SU-DHL-1, ALK+ SUP-M2, ALK+ DEL, ALK+ Mac-2A, ALK-
Mac-2A, ALK-K299, ALK+A B
Fold Change Expression
(relative to NT sgRNA)
Fold Change Expression
(relative to NT sgRNA)Fold Change Expression
(relative to NT sgRNA)
Fold Change Expression
(relative to NT sgRNA)
Fold Change Expression
(relative to NT sgRNA)
SU-D
HL-
1
K29
9
SUP-M
2DEL
Mac
-2A
050
100150200
500
1000
1500
2000
Fold
Change E
xpre
ssio
n
(rela
tive t
o N
T s
gR
NA
)
ABCB1 sgRNA 1ABCB1 sgRNA 2
SU-DHL-1, ALK+
-2 0 2
0
50
100
Log10 [Crizotinib], (nM)
Norm
aliz
ed v
iabili
ty (
%)
ABCB1 sgRNA 2SUP-M2, ALK+ DEL, ALK+
-2 0 2
0
50
100
Log10 [Crizotinib], (nM)
Norm
aliz
ed v
iabili
ty (
%)
NT sgRNA
ABCB1 sgRNA 2
-2 0 2
0
50
100
Log10 [Crizotinib], (nM)
Norm
aliz
ed v
iabili
ty (
%)
NT sgRNA
ABCB1 sgRNA 2
-2 0 2
0
50
100
Log10 [Crizotinib], (nM)
Norm
aliz
ed v
iabili
ty (
%)
NT sgRNA
ABCB1 sgRNA 2
-2 0 2
0
50
100
Log10 [Crizotinib], (nM)
Norm
aliz
ed v
iabili
ty (
%)
NT sgRNA
ABCB1 sgRNA 2
-2 0 2
0
50
100
Log10 [Crizotinib], (nM)
Norm
aliz
ed v
iabili
ty (
%)
NT sgRNA
ABCB1 sgRNA 2
-2 0 2
0
50
100
Log10 [Crizotinib], (nM)
Norm
aliz
ed v
iabili
ty (
%)
NT sgRNA
ABCB1 sgRNA 2
-2 0 2
0
50
100
Log10 [Crizotinib], (nM)
Norm
aliz
ed v
iabili
ty (
%)
NT sgRNA
ABCB1 sgRNA 2
***
******
***
***
**
***
-2 0 2
0
50
100
Log10 [Crizotinib], (nM)
Norm
aliz
ed v
iabili
ty (
%)
NT sgRNA
ABCB1 sgRNA 2

75
to D0, including genes with known relevance to ALCL disease biology, such as STAT3225,365, RORC321,
MYC368 and IRF4321,368,369 (Figure 12E).
Figure 12 CRISPR Overexpression Screens Identify Genes Modulating Crizotinib Sensitivity in ALCL Cell Lines (A) Schematic of the CRISPR-dCas9-based overexpression screen for the identification of genes whose activation modifies sensitivity to crizotinib in ALCL cell lines: Transcriptional activation is achieved by fusing/recruiting catalytically inactive Cas9 (dCas9) to transcriptional activation domains (VP64/p65, HSF1) to recruit the transcriptional machinery to the transcription start site of the desired target genes. As a first step a SAM (synergistic activation mediator) complex composed of catalytically inactive Cas9 (dCas9) fused to the transcriptional activator VP64 and further activation domains (p65, HSF1) are transduced into ALCL cell lines to generate stably expressing lines for the screen. Afterwards ALCL cell lines are transduced with the sgRNA library and selected with zeocin for 7 days (day 0). Next, crizotinib/DMSO selection pressure is applied, and genomic DNA is harvested on day 0 and after 14 days of treatment. The sgRNA regions are amplified from genomic DNA and then analyzed by next-generation sequencing followed by statistical analyses to identify candidate genes. (B) Correlation of sgRNA read counts across seperate infection replicates for the indicated ALCL cell lines. ρ, Spearmann correlation coefficient. (C) Principle Component (PC) analysis of sgRNA read counts across the sequencing libraries for the indicated ALCL cell lines. D = day, rep = separate infection replicate. (D) Distributions of sgRNA read counts across the CRISPR overexpression sequencing library for the indicated ALCL cell lines. D = day, rep = separate infection replicate. (E) Global changes in sgRNA representation of genes before and after 14 days of treatment with (120/150/300 nM for DEL/SUP-M2/K299) crizotinib, detected in at least two of the three ALCL cell lines tested. Reproduced from Prokoph et al.301.
STAT3, a well-known downstream mediator of NPM1-ALK225,365, was the most significantly enriched
gene in all three CRISPR overexpression screens (Figure 12E, Figure 13A), thereby confirming the
validity of this approach. In addition, NPM1 was also significantly enriched in the screens (Figure 12E,
Figure 13B). Transcription of NPM1-ALK is driven by the NPM1 promoter3. It is therefore likely that
1 2 3 4 5 6 7 81
2
3
4
5
6
Log2 normalized sgRNA enrichment
-Log
10 p
-valu
e
RORC
NPM1
STAT3
SH2D2A
MKNK1HELZ2
IL10RA
P2RY6
ADORA2AMYCIRF4
GPR161
PGBD1
EAMS2-P65-HSF1
dCas9-VP64
library of
70,290 sgRNAs
naïve ALCL
cell line
crizotinib
resistant
ALCL cells
ALCL SAM
cell line
day 0 day 14
DMSO
crizotinib
gDNA
isolation
sgRNA
amplification
deep
sequencing
identification
of surviving
sgRNA
sequences
Log2 normalized sgRNA enrichment
-Lo
g10
p v
alu
e
D14 DMSO rep2
0.1 1 10 10
0
1000
1000
0
1000
00
0.1
1
10
100
1000
10000
100000
0.1 1 10 10
0
1000
1000
0
1000
00
0.1
1
10
100
1000
10000
100000
sgRNA read count for rep1
sg
RN
A r
ead
cou
nt
for
rep2
0.1 1 10 10
0
1000
1000
0
1000
00
1000
000
0.1
1
10
100
1000
10000
100000
1000000
B CDELSUP-M2K299
sgRNA read counts for rep1
sgR
NA
read c
ounts
for
rep2
ρ=0.9462 ρ=0.9624 ρ=0.9023
PC1P
C2
DELSUP-M2K299
DSUP-M2K299 DEL
sgR
NA
read c
ounts
(x10e3)
sgR
NA
read c
ounts
(x10e3)
sgR
NA
read c
ounts
(x10e3)
D14 DMSO rep1
D14 Crizotinib rep1
D0 rep 2D0 rep1
D14 Crizotinib rep 2

76
overexpression of NPM1 could mediate sensitivity to ALK inhibition by driving overexpression of NPM1-
ALK. Indeed, sgRNA-mediated overexpression of NPM1 in 3 ALK+ ALCL cell lines confirmed co-
overexpression of NPM1 and NPM1-ALK in these cell lines (Figure 13C). These data are consistent
with previous studies that show overexpression of EML4-ALK or NPM1-ALK as a resistance mechanism
to ALK TKIs in ALK+ NSCLC and ALCL respectively210,226,327,370,371.
Figure 13 CRISPR Overexpression Screens Identified STAT3 and NPM1 to Modulate Crizotinib Sensitivity in ALCL Cell Lines (A) Read counts of sgRNAs targeting STAT3 before and after a 14-day incubation with crizotinib (upper panel, 120/150/300 nM for DEL/SUP-M2/K299) or DMSO (lower panel) in the indicated ALCL cell lines. Data are presented as means, n = 2. The p values were calculated using a Wilcoxon matched pairs signed rank test. D = day. (B) Read counts of sgRNAs inducing overexpression of NPM1 before and after a 14-day incubation with crizotinib (upper panel, 120/150/300 nM for DEL/SUP-M2/K299) or DMSO (lower panel) in the indicated ALCL cell lines. Data are presented as means, n = 2. The p values were calculated using a Wilcoxon matched pairs signed rank test. D = day. (C) Fold change in expression levels of NPM1 (bottom panel) and NPM1-ALK (top panel) expression level for each of the 3 sgRNAs inducing overexpression of NPM1 versus non-targeting (NT) control sgRNA in ALCL cells. Data are represented as means ± SD, n = 3. Reproduced from Prokoph et al.301.
3.4 Validation of candidate genes identified in the screen
3.4.1 Overexpression-based validation of Candidate Genes Modulating ALK TKI
Sensitivity in ALCL Cell Lines
We selected the 10 most significantly enriched genes that were shared between at least two ALK+ ALCL
cell lines for further validation (Figure 12E,Table 39). First, we overexpressed these genes as well as
NPM1 (positive control), using 2 sgRNAs per gene, in the 3 ALCL cell lines previously employed for the
screens as well as additional ALK+ (SU-DHL-1) and ALK- (Mac-2A) cell lines. After confirming
overexpression levels, growth inhibition in the presence of crizotinib was assessed (Figure 14).
NPM
1 sg
RNA 1
NPM
1 sg
RNA 2
NPM
1 sg
RNA 3
0
2
4
6
8
10
NPM1 sgRNA 1
NPM1 sgRNA 2
Fold Change Expression(relative to NT sgRNA)
NPM1 sgRNA 3
NPM
1 sg
RNA 1
NPM
1 sg
RNA 2
NPM
1 sg
RNA 3
0
1
2
3
4
5
Fold Change Expression(relative to NT sgRNA)
NPM1 sgRNA 1
NPM1 sgRNA 2
NPM1 sgRNA 3
NPM
1 sg
RNA 1
NPM
1 sg
RNA 2
NPM
1 sg
RNA 3
0
1
2
3
4
5
NPM1 sgRNA 1
NPM1 sgRNA 2
Fold Change Expression(relative to NT sgRNA)
NPM1 sgRNA 3
NPM
1 sg
RNA 4
4
NPM
1 sg
RNA 4
5
NPM
1 sg
RNA 4
6
0
1
2
3
4
5
NPM1 sgRNA 44
NPM1 sgRNA 45
NPM1 sgRNA 46
NPM
1 sg
RNA 4
4
NPM
1 sg
RNA 4
5
NPM
1 sg
RNA 4
6
0
1
2
3
4
5
NPM1 sgRNA 44
NPM1 sgRNA 45
NPM1 sgRNA 46
NPM
1 sg
RNA 4
4
NPM
1 sg
RNA 4
5
NPM
1 sg
RNA 4
6
0
2
4
6
8
10
NPM1 sgRNA 44
NPM1 sgRNA 45
NPM1 sgRNA 46CSUP-M2SU-DHL-1
Fold
Change E
xpre
ssio
n
(norm
aliz
ed t
o N
T s
gR
NA
)
DEL
Fold
Change E
xpre
ssio
n
(norm
aliz
ed t
o N
T s
gR
NA
)
Fold
Change E
xpre
ssio
n
(norm
aliz
ed t
o N
T s
gR
NA
)
NP
M1-A
LK
NP
M1
NP
M1-A
LK
NP
M1
NP
M1-A
LK
NP
M1
A B
sgR
NA
counts
DELSUP-M2K299
sgR
NA
counts
DELSUP-M2K299
p < 0.05 p < 0.05 p < 0.05 p < 0.05 p < 0.05 p < 0.05
sgR
NA
counts
DMSO DMSO DMSO DMSO DMSO DMSO
Crizotinib Crizotinib Crizotinib Crizotinib Crizotinib Crizotinib
ns ns ns ns ns ns
sgR
NA
counts

77
Table 39 Candidate genes and their relevance in ALCL and other cancers To the best of our knowledge this information is currently publicly not available (N/A).
Gene Protein Relevance in ALCL disease biology
Role in cancer progression/ treatment resistance
IL10RA Interleukin-10 receptor subunit alpha
Merkel and colleagues372 showed that knockdown of IL10RA with shRNA in K299 cells led to increased cell death.
Béguelin et al.373 identified that IL10RA is amplified in 21% of DLBCLs and its expression is a predictor for patient survival.
GPR161 G-protein coupled receptor 161
N/A Feigin et al.374 identified that GPR161 overexpression in Triple-negative breast cancer (TNBC) correlates with poor prognosis by promoting cell proliferation.
ADORA2A Adenosine receptor A2a N/A Merighi et al.375 summarized the role of ADORA2A in cancer progression and therapy resistance, as well as presented clinical candidates that are tested as single agents or in combination with immunotherapeutic agents.
P2RY6 P2Y purinoceptor 6 N/A Wilson et al.232 identified P2RY6 as a putative resistance driver in crizotinib resistant ALK+ NSCLC
MKNK1 MAP kinase-interacting serine/threonine-protein kinase 1
N/A Xie et al.376, Hou et al.377 and Dreas et al.378 summarized the role of MKNK1 in cancer including mantle cell lymphoma, chronic lymphocytic leukemia (CLL) and DLBCL379.
RORC Nuclear receptor ROR-gamma
Mathas and colleagues321 have shown that pharmacological inhibition of RORC as single treatment leads to a reduction in cell viability that is significantly enhanced when RORC inhibitors (SR2211, SR1903 or GSK805) are used in combination with crizotinib. Ng et al.312 performed CRISPR knockout screens in ALCL cell lines and confirmed RORC as vulnerability in ALK+ and ALK- ALCL.
Wilson et al.232 identified RORC as a putative resistance driver in crizotinib resistant ALK+ NSCLC
PGBD1 PiggyBac transposable element-derived protein 1
N/A N/A
SH2D2A SH2 domain-containing protein 2A
N/A N/A
HELZ2 Helicase with zinc finger domain 2
N/A N/A
MYC Myc proto-oncogene protein Lenz and colleagues368 have shown that MYC is essential for ALCL survival, as both knockdown of MYC and pharmacologic inhibition of MYC signaling were toxic to ALCL cell lines. Ng et al.312 performed CRISPR knockout screens in ALCL cell lines and confirmed MYC as vulnerability in ALK+ and ALK- ALCL.
Lyapichev at al.380 identified that MYC expression was associated with a shorter overall survival in ALK+ ALCL.

78
Figure 14 Overexpression of candidate genes identified from the SAM screen induce resistance to crizotinib Dragonfly plots of crizotinib efficacy measurements in the indicated ALCL cell lines expressing sgRNAs targeting the indicated genes based on normalized CellTiter-Blue fluorescence reads following 48 hours of treatment with crizotinib. Six-point dose response curve experiments were performed as described in Figure 10B. An sgRNA was defined as modifying the sensitivity to crizotinib treatment when the difference between the sgRNA to non-targeting (NT) control sgRNA in a two-sample t test was p =/< 0.05. Data are represented as means, n = 3. Fold change of expression levels (blue-gray) modulated by CRISPR overexpression for two sgRNAs relative to non-targeting (NT) control sgRNA was determined at baseline. Data are represented as means ± SD of technical replicates, n = 3. Ctrl = control. Reproduced from Prokoph et al.301.
The most consistent targets, modifying crizotinib sensitivity in all ALK positive cell lines were IL10RA
and ADORA2A (Figure 15).
Figure 15 Overexpression-based validation of candidate genes Fold change of expression levels of the CRISPR screen candidate genes modulated by CRISPR overexpression for two sgRNAs relative to non-targeting (NT) control sgRNA in 4 ALK+ ALCL cell lines (K299/DEL/SUP-M2/SU-DHL-1) plotted against the total number of gene specific sgRNAs that modified sensitivity to crizotinib in 48-hour CellTiter-Blue assays. Reproduced from Prokoph et al.301.
0
10
10
0
50
00
sg 2
Normalized fold difference
010
100
5000
sg1
Normalized fold difference
0
10
10
0
50
00
sg2
Normalized fold difference
Ctr
l
IL10RA
GPR161
ADORA2A
P2RY6
MKNK1
RORC
PGBD1
SH2D2A
HELZ2
MYC
NPM1-ALK
K299, ALK+
0 10 100 5000101005000 0sg2 fold change expression
(relative to NT sgRNA)
sg1 fold change expression
(relative to NT sgRNA)
010
100
5000
sg2
N o rm a liz e d fo ld d iffe re n c e
0
10
10
0
50
00
sg
2
Normalized fold difference
A
0 10 100 5000
SUP-M2, ALK+
101005000 0sg2 fold change expression
(relative to NT sgRNA)sg1 fold change expression
(relative to NT sgRNA)
010
100
5000
sg2
N o rm a liz e d fo ld d iffe re n c e
0
10
10
0
50
00
sg
2
Normalized fold difference
DEL, ALK+
0 10 100 5000101005000 0sg2 fold change expression
(relative to NT sgRNA)
sg1 fold change expression
(relative to NT sgRNA)
010
100
5000
sg2
N o rm a liz e d fo ld d iffe re n c e
0
10
10
0
50
00
sg
2
Normalized fold difference
IL10RAIL10RA
Ctr
l
GPR161
ADORA2A
P2RY6
MKNK1
RORC
PGBD1
SH2D2A
HELZ2
MYC
NPM1-ALK
Ctr
l
GPR161
ADORA2A
P2RY6
MKNK1
RORC
PGBD1
SH2D2A
HELZ2
MYC
NPM1-ALK
010
100
5000
sg 1
Normalized fold difference
0
10
10
0
50
00
sg2
Normalized fold difference
010
100
5000
sg2
Normalized fold difference
IL10RA
GPR161
ADORA2A
P2RY6
MKNK1
RORC
PGBD1
SH2D2A
HELZ2
MYC
NPM1
sg
10 1 2
IL10RA
GPR161
ADORA2A
P2RY6
MKNK1
RORC
PGBD1
SH2D2A
HELZ2
MYC
NPM1
sg
10 1 2
IL10RA
GPR161
ADORA2A
P2RY6
MKNK1
RORC
PGBD1
SH2D2A
HELZ2
MYC
NPM1
sg
10 1 2
010
100
5000
sg1
Normalized fold difference
0
10
10
0
50
00
sg2
Normalized fold difference
0
10
10
0
50
00
sg2
Normalized fold difference
010
100
5000
sg1
Normalized fold difference
The colors of the body segments indicate how many
sgRNAs modified sensitivity to each gene. The width of the
wings indicates the gene expression fold change achieved
with sgRNA1 (left wings) and sgRNA2 (right wings).
2 sgRNAs modified sensitivity to crizotinib
1 sgRNA modified sensitivity to crizotinib
Insufficient increase in gene expression
0 sgRNAs modified sensitivity to crizotinib
Gene expression fold change by sgRNA1
Gene expression fold change
by sgRNA2
SU-DHL-1, ALK+ Mac-2A, ALK-
0 10 100 5000101005000 0sg2 fold change expression
(relative to NT sgRNA)
sg1 fold change expression
(relative to NT sgRNA)
010
100
5000
sg2
N o rm a liz e d fo ld d iffe re n c e
0
10
10
0
50
00
sg
2
Normalized fold difference
0 10 100 5000101005000 0sg2 fold change expression
(relative to NT sgRNA)
sg1 fold change expression
(relative to NT sgRNA)
010
100
5000
sg2
N o rm a liz e d fo ld d iffe re n c e
0
10
10
0
50
00
sg
2
Normalized fold difference
IL10RAIL10RA
Ctr
lGPR161
ADORA2A
P2RY6
MKNK1
RORC
PGBD1
SH2D2A
HELZ2
MYC
NPM1-ALK
Ctr
l
GPR161
ADORA2A
P2RY6
MKNK1
RORC
PGBD1
SH2D2A
HELZ2
MYC
NPM1-ALK
IL10RA
GPR161
ADORA2A
P2RY6
MKNK1
RORC
PGBD1
SH2D2A
HELZ2
MYC
NPM1
sg1
012
IL10RA
GPR161
ADORA2A
P2RY6
MKNK1
RORC
PGBD1
SH2D2A
HELZ2
MYC
NPM1
sg1
012
0 2 4 6 8 10 12 14
0
1
2
3
4
5
log2 normalized median fold change expression
(relative to NT sgRNA)
tota
l num
ber
of
sgR
NA
s
modula
ting s
ensitiv
ity t
o c
rizotinib
GPR161
IL10RA
RORC
ADORA2A
PGBD1
P2RY6
MKNK1
HELZ2
MYC
SH2D2A
NPM1
To
tal num
ber
of
gene s
pecific
sgR
NA
s
modula
tin
g s
ensitiv
ity to c
rizotin
ib
Log2 normalized median fold change expression
(relative to NT sgRNA)

79
3.4.2 Knockout-based validation of Candidate Genes Modulating ALK TKI Sensitivity
in ALCL Cell Lines
We next reasoned that if overexpression of a gene would decrease sensitivity to crizotinib, then knockout
of the same gene should increase sensitivity to crizotinib. To address this, we first analyzed a publicly
available CRISPR knockout screen dataset312 by Ng et al. of 5 ALK+ and 1 ALK- ALCL cell line. While
MYC and RORC were identified as vulnerabilities in ALK+ ALCL, knockout of the other 8 gene hits did
not induce cell death.
Figure 16 CRISPR knockout screen dataset by Ng et al. identifies MYC and RORC as vulnerabilities in ALK+ and ALK- ALCL (A) Genes ranked by Z-score. (B) Corresponding false-discovery rate (FDR) q-values. (C) Corresponding gene expression level; RPKM, reads per kilobase of transcript, per million mapped reads. (D) Combined gene expression levels and FDRs identify vulnerabilities as true or false.
Having established that ADORA2A, GPR161, HELZ2, IL10RA, MKNK1, P2RY6, PGBD1 and SH2D2A
are non-essential genes in ALK+ ALCL, we next performed a mini CRISPR knockout screen in two
ALCL cell lines targeting the same 10 candidate genes. K299/SUP-M2 cells were transduced with a
GeCKO v2 mini library containing 6 sgRNAs per gene plus 50 NT sgRNAs and selected with puromycin
for 7 days (day 0) before exposure to crizotinib or DMSO for 14 days (day 14) and processing as
previously conducted for the activation screen (Figure 17A). Knockout of IL10RA, P2RY6 and PGBD1
rendered cells more sensitive to crizotinib in all SUP-M2, but not K299, cell lines (Figure 17B-C).
A B C D E F
1
2
3
4
5
6
7
8
9
10
-5 0 5
A B C D E F
1
2
3
4
5
6
7
8
9
100
0.2
0.4
0.6
0.8
1.0
A B C D E F
1
2
3
4
5
6
7
8
9
10
-10 -5 0 5 10
A B C D E F
1
2
3
4
5
6
7
8
9
10 0.05
0.25
0.45
0.65
0.85
ALK+ ALCL ALK-
ALCL
A
SH2D2A
ADORA2A
GPR161
HELZ2
IL10RA
MKNK1
MYC
P2RY6
PGBD1
RORC
ALK+ ALCL ALK-
ALCL
B
ALK+ ALCL ALK-
ALCL
C
ALK+ ALCL ALK-
ALCL
D
Log2(PRKM) Log2(PRKM)>1 & FDR<0.05Z-score
<0.05 <0.001
FDR
TRUE FALSE
A B C D E F
1
2
3
4
5
6
7
8
9
10
-5 0 5-5 0 5 -10 0 105-5

80
Figure 17 Knockout-based analysis (A) Schematic of the CRISPR-Cas9-based mini knockout screen for the identification of genes whose knockout modifies sensitivity to crizotinib in ALCL cell lines. A crizotinib/DMSO selection pressure is applied, and genomic DNA is harvested on day 0 and after 14 days of treatment. The sgRNA regions are amplified from genomic DNA and then analyzed by next-generation sequencing followed by statistical analyses. (B-C) Read counts of 6 sgRNAs targeting the indicated genes before and after a 14-day incubation with DMSO or (80 nM for SUP-M2, 100 nM for K299) crizotinib in the indicated ALCL cell lines. Data are represented as boxplot with individual points representing each sgRNA (n = 6). Unpaired t test: *p < 0.05. **p < 0.01, ***p < 0.001. RPM = Reads Per Million mapped reads. Reproduced from Prokoph et al.301.
A
crizotinib
DMSO
day 14
MYC/IL10RA/ADORA2A/GPR161/MKNK1/
PGBD1/SH2D2A/RORC/P2RY6/HELZ2
GeCKO v2 sgRNAs
naïve ALCL
cell line
day 0
gDNA isolation
& sgRNA
amplification
deep
sequencing
identification of depleted
sgRNA sequences
identification of depleted
sgRNA sequences
BSUP-M2
C

81
3.4.3 Validation of Candidate Genes Modulating ALK TKI Sensitivity in Resistant ALCL
Cell Lines
In parallel, the same 10 candidate genes were analyzed for their expression levels in cells that had been
chronically exposed to ALK TKIs (crizotinib, alectinib, brigatinib or lorlatinib) to render them resistant,
and were compared with transcript levels in parental (treatment naïve) cells (Figure 18). Among the
genes assessed, IL10RA was overexpressed in 30% of resistant cell lines (4/12). This suggests that
upregulation of IL10RA is a common mechanism of resistance in ALCL cell lines. Interestingly,
overexpression of IL10RA was largely mutually exclusive with overexpression of NPM1-ALK (Figure
18).
Figure 18 Hit validation in resistant ALCL cell lines Fold change expression of the indicated genes in crizotinib resistant (CR), alectinib resistant (AR), brigatinib resistant (BR) and lorlatinib resistant (LR) ALCL cell lines compared to parental cell lines. Genes with a fold change expression of > 2 were classified as overexpressed in resistant compared to parental cell lines. White indicates downregulated genes. Data are represented as means, n = 3. Reproduced from Prokoph et al.301.
3.4.4 Validation of Candidate Genes Modulating ALK TKI Sensitivity in a Resistant
Orthotopic ALCL Cell Line Xenograft Model
Next, we analyzed publically available RNA-seq data328 of lorlatinib-resistant tumours compared to
vehicle control treated tumours from cell line-derived orthotopic xenografts (Figure 19A-B). HELZ2 and
IL10RA were upregulated in 3 lorlatinib-resistant tumours compared to 3 vehicle control treated tumours
from cell line-derived orthotopic xenografts (Figure 19B).
Specifically, IL10RA was significantly upregulated in 3/10 lorlatinib-resistant tumours compared to 3
vehicle control treated tumours from cell line-derived orthotopic xenografts328 (Figure 19C).
Fold change
expression
(relative to
parental cells)
IL10RA
GPR161
ADORA2A
P2RY6
MKNK1
RORC
PGPD1
SH2D2A
HELZ2
MYC
NPM1-ALK
10
8
6
4
2

82
Figure 19 Hit validation in a resistant orthotopic ALCL cell line xenograft model (A) Schematic of orthotopic xenograft treatment. K299 cells were injected subcutaneously and vehicle control or lorlatinib treatment initiated once tumours reached an average size of 200 mm3. (B) Volcano plot summarizing the global changes in gene expression levels between lorlatinib resistant tumours (T1, T5, T7) and vehicle control treated tumours (V1-3). Red: genes enriched in the lorlatinib resistant tumours vs vehicle control treated tumours. Blue: genes depleted in the lorlatinib resistant tumours vs vehicle control treated tumours. (C) mRNA expression levels of IL10RA normalized to GAPDH and relative to K299 cells in lorlatinib resistant tumours (T1-T10) compared to vehicle control treated tumours (V1-3). b.i.d.: orally, twice a day. Data are represented as means ± SD of technical replicates, n = 3. Welch two sample t test: *p < 0.05. **p < 0.01, ***p < 0.001. Reproduced from Prokoph et al.301.
3.4.5 Validation of Candidate Genes Modulating ALK TKI Sensitivity in ALCL Patients
To determine which targets identified by the screen are of potential clinical relevance, we analyzed data
obtained from samples of resistant tumours from 4 patients with ALK+ ALCL recruited to the
MAPPYACTS trial (NCT02613962), who had relapsed on ALK TKIs or chemotherapy (Figure 20A,
Table 17). Patient 2 was treated with the standard ALCL99 chemotherapy protocol but progressed at 6
months following treatment initiation at which point crizotinib treatment was started, which only lasted
for 2 months due to disease progression and then a biopsy was taken. Patient 1, having a more complex
treatment history, had been treated with the ALCL99 chemotherapy protocol and remained in remission
for 34 months until progression at which point multiple sequential therapies including crizotinib and
lorlatinib were administered with short-term responses. The biopsy of this case was taken at the time of
relapse on lorlatinib treatment while patients 3 and 4 were biopsied at the time of relapse from standard
ALCL99 chemotherapy (Figure 20A). In contrast to patients 1 and 2, patients 3 and 4 responded to
crizotinib and hence were classified as ALK TKI sensitive patients.
In order to identify resistance drivers and associated pathways that might play a role in clinical resistance
to ALK TKIs, we performed RNA-seq to compare gene expression profiles between ALK+ ALCL tumours
with acquired resistance to ALK TKIs compared to those that relapsed on standard ALCL99
chemotherapy but were ALK TKI sensitive (Figure 20B-C). Using GSEA, we identified positive
enrichment for autoimmune disease signaling pathways including autoimmune thyroid disease, type I
diabetes mellitus, systemic lupus erythematosus and asthma pathways in the ALK TKI sensitive
compared to the ALK TKI resistant patient tumours. As expected, the T cell receptor pathway was
lorlatinib
V 1 V 2 V 3 T1 T2 T3 T4 T5 T6 T7 T8 T9 T10
05
101520
30
40
50
1 mg/kg b.i.d
vehicle control
Lorlatinib
treatment
0.5 mg/kg b.i.d
A
Relapse/Analysis
K299
Lorlatinib
sensitive
tumor
Transplantation Remission
Lorlatinib
resistant
tumor
Treatment start
(200 mm3)
2 mg/kg b.i.d
IL10R
A m
RN
A e
xpre
ssio
n le
vels
K299
**
***
C
B

83
enriched in ALK TKI sensitive patients381 (Figure 20D, Table 17). In agreement, the genes enriched in
ALK TKI sensitive patients show specific gene ontology (GO) features such as T cell activation and
differentiation (Figure 20E). Using GSEA, we identified positive enrichment for focal adhesion in ALK
TKI resistant compared to ALK TKI sensitive patient tumours (Figure 20D). In agreement, the genes
enriched in ALK TKI resistant patients showed GO features such as biological adhesion and cell
adhesion (Figure 20E). Cell-cell adhesion is required for tissue invasion and metastasis of a tumour –
one of the hallmarks of cancer251. Interestingly, Ott et al. developed a dual ALK and focal adhesion
kinase (FAK) inhibitor, which they successfully validated in cell line xenografts of ALK+ ALCL and
NSCLC382. Since FAK plays a role in cell-extracellular matrix signaling events as well as cell-cell junction
regulation383, in future work FAK inhibitors could be tested in ALK inhibitor resistant settings.
Notably, while the global gene expression profiles of both ALK TKI sensitive patients (patients 3 and 4)
clustered together, the ALK TKI resistant patients (patients 1 and 2) did not (Figure 20F).
To further investigate this difference in clustering, we determined whether any of the resistant patients
had developed mutations in the ALK kinase domain. Patient 1 harbored a missense mutation (ALK
L1196M, COSM99137) near the adenosine triphosphate (ATP)–binding pocket, which has previously
been shown to mediate resistance to crizotinib in ALK+ NSCLC227, most likely accounting for the rapid
relapse within 1 month of crizotinib initiation (Table 17, Figure 20A). In contrast, whilst we confirmed
the presence of the NPM1-ALK rearrangement at crizotinib relapse for patient 2, no ALK mutation was
detected. As expected, neither of the patients that relapsed after the standard ALCL99 chemotherapy
(patients 3 and 4) had an ALK mutation at relapse (Table 17). These data allowed us to compare
presumed ALK mutation-driven resistance (patient 1) to ALK mutation-independent resistance (patient
2).
We therefore integrated our RNA-seq analysis with the CRISPR overexpression screen results (Figure
20G). Of the 10 candidate genes identified by the CRISPR screens, 6/10 genes (PGBD1, GPR161,
HELZ2, MKNK1, IL10RA and RORC) were more highly expressed in the ALK wild-type tumour of patient
2 compared to the ALKL1196M tumour of patient 1 (Figure 20G). Of the 6 more highly expressed genes,
IL10RA was selected for further analysis as it showed the highest expression levels among the 5 genes
in tumours from both patients 1 and 2.

84
Figure 20 Validation of Candidate Genes Modulating ALK TKI Sensitivity in ALCL Patients (A) Schema of the treatment history of ALK+ ALCL patients who relapsed on ALK targeted therapy (patients 1 and 2) or chemotherapy (patients 3 and 4). ALCL99* patient was treated according to ALCL99 recommendations for patients with central nervous system involvement as specified in Williams et al.99. (B) Unsupervised clustering of RNA-seq data from chemotherapy-relapsed (patient 3, patient 4) and ALK TKI resistant (patients 1 and 2) patients. CPM = counts per million. (C) Top panel: Venn diagram of genes unchanged (gray) or differentially expressed genes (blue/red) between chemotherapy-relapsed (patients 3 and 4) and ALK TKI (patients 1 and 2) resistant patients. Bottom panel: Volcano plot summarizing the global changes in gene expression levels between chemotherapy-relapsed (patients 3 and 4) and ALK TKI resistant (patients 1 and 2) patients. Red: genes enriched in the ALK TKI resistant patient vs chemotherapy-relapsed patients. Blue: genes depleted in the ALK TKI resistant patient vs chemotherapy-relapsed patients. An absolute log fold change of 1 is indicated by dashed lines. Reproduced from Prokoph et al.301.
(figure continued on next page)
A
ALK TKI
resistant
ALCL patients
AL
Kw
t
AL
KL1196
M
AL
Kw
tA
LK
wt
Bpatient 3 patient 4patient 1 patient 2
ALK TKI resistant
CPM
patient 1
patient 2
patient 3
patient 4
0
2
4
6
8
10
Chemotherapy-
relapsed
ALCL patients
Chemotherapy-relapsed
Log2 Fold Change
-Log10 (
p-v
alu
e)
-10 -5 0 5 10
0
5
15
10
no. of genes depleted in
ALK TKI resistant patientsno. of genes enriched in
ALK TKI resistant patients
15428
142 135
no. of unchanged genesC

85
Figure 20 Validation of Candidate Genes Modulating ALK TKI Sensitivity in ALCL Patients (D) Gene ontology analysis of differential gene expression between chemotherapy-relapsed and ALK TKI resistant patients. BP = biological process; MF = molecular function. (E) Summary of GSEA of genes ranked by fold change in differential gene expression between chemotherapy-relapsed and ALK TKI resistant patients annotated KEGG pathways. (F) Principal component (PC) analysis of gene expression levels across the 4 ALCL patient samples. (G) Candidate genes identified by the CRISPR screens are analyzed for differential expression between ALK TKI resistant patients with wild-type or mutated ALK. CPM = counts per million. Reproduced from Prokoph et al.301.
BP depletion in ALK TKI resistant patients BP enrichment in ALK TKI resistant patients
MF depletion in ALK TKI resistant patients MF enrichment in ALK TKI resistant patients
D
E
Norm
aliz
ed E
nrichm
ent S
core
Significant KEGG Pathways
Enriched in ALK TKI resistant patientsDepleted in ALK TKI resistant patients
G
patient 2 ALKwt
patient 1 ALKL1196M
CPM
ALK TKI
resistant
7
6
5
4
3
2PC1: 48%
PC
2:
38%
Chemotherapy-relapsed
F

86
3.5 Discussion
In the relapse setting, patients with ALK-rearranged ALCL are commonly treated with ALK inhibitors
including crizotinib63,117 and the second-generation inhibitors ceritinib384 and alectinib67. Two patient
groups can be identified: Patients who i) achieved a CR and ii) present with disease progression during
the first few months after treatment initiation. An understanding of the mechanisms leading to drug
resistance in the second group is essential for designing therapeutic strategies to improve efficacy and
prevent relapse. Previous work on ALK-rearranged NSCLC suggests that the most common
mechanisms of resistance to ALK inhibition involve bypass signaling through functionally-related
pathways385.
Here we present findings from a systematic large-scale functional study of resistance to ALK inhibition
in NPM1-ALK+ ALCL, with the aim to inform future therapeutic approaches that prevent relapse or
provide salvage options. We conducted the screens in three cell lines to enhance physiological
relevance and avoid fundamental caveats of specific cell line models, such as the distinct genetic
backgrounds and consequently cell line-specific resistance mechanisms inherently present in each cell
line model.
Our CRISPR activation screens identified several new targets but were biased by the fold change gene
expression achieved for a particular gene and sgRNA. While we have accounted for fold change gene
expression in our validation process by excluding genes, which were not sufficiently overexpressed by
either of the 2 tested sgRNAs (out of the 6 sgRNAs utilized in the CRISPR activation screens). We were
not able to account for the level of overexpression due to the following reasons: Firstly, we do not know
which level of overexpression for a specific gene – given that this gene can induce resistance - is
sufficient to modify sensitivity to a drug. For example, P2RY6 was the most highly overexpressed gene
in all 4 ALK+ ALCL cell lines, but its overexpression only induces resistance in K299. Secondly, if one
accounts for the level of fold change gene expression, then genes that are more highly expressed than
needed to modify sensitivity to a drug are discriminated against.
To narrow down targets identified in the screen to those which may be clinically relevant, results were
compared to RNA-seq data of relapse biopsy specimens of 2 ALCL patients resistant to ALK TKIs.
A target identified by the screen was STAT3, a prime candidate being activated in inflammatory cells by
a number of cytokines and previously shown to be central to ALCL biology downstream of NPM1-ALK
activity225,365. Together with detection of the STAT3 target genes MYC and IRF4 by the screen, these
data were suggestive of a potential NPM1-ALK bypass track which could be activated by a protein
upstream of STAT3 and independent of NPM1-ALK. Indeed, IL10RA, a cell surface receptor usually
upstream of STAT3, was also consistently detected and validated as mediating decreased sensitivity to
crizotinib. Importantly, we also show that IL10RA overexpression decreases cell sensitivity to other ALK
TKIs besides crizotinib including lorlatinib, alectinib and brigatinib. Given that IL10RA can mediate
activation of STAT3 activity on ligand binding together with IL10RB, we further investigated the role of
IL10RA in the following chapter.

87
CHAPTER 4 IL10RA Modulates ALK TKI
Sensitivity in ALK+ ALCL

88
4.1 Introduction
The Interleukin 10 receptor (IL10R) was discovered by Ho et al. in 1993 on the basis of its specific
binding of interleukin 10 (IL10)386. IL10R is structurally related to the interferon receptor (INFR) family
and is mainly expressed by hematopoietic cells including B cells, T cells, natural killer cells, monocytes,
and macrophages386,387. In its functional form the IL10R is a tetramer, consisting of two IL10RA
polypeptide chains and two interleukin 10 receptor subunit beta (IL10RB) chains387. Signaling most likely
proceeds by JAK/STAT activation (Figure 21). Binding of the IL10 homodimer, to both extracellular
domains of IL10RA, induces phosphorylation of janus kinase 1 (JAK1) and tyrosine kinase 2 (TYK2).
Following this, two intracellular domain tyrosine residues (Y446 and Y496) in the IL10RA chains, act as
temporary docking sites for the latent transcription factor STAT3. STAT3 is then phosphorylated by
JAK1 and TYK2, and translocates to the nucleus, controlling the expression of downstream genes by
binding STAT-binding-elements (SBE) motifs387–391. SBE motifs can be found in the promoter region of
different genes388. Besides IL10-induced activation of STAT3, other STAT proteins have been reported
to be involved in IL10 signaling, such as STAT1 and STAT5389,392.
Figure 21 Schematic of the IL10 signalling pathway
IL10 signaling has previously been shown to play a crucial role in ALCL. For example, IL10 benefits
ALCL cells directly by enhancing their viability and indirectly by suppressing the immune response393.
In addition, IL10 is already known to be one of the most abundant cytokines secreted by ALCL cell
lines372 and is prevalent in the peripheral blood of children with ALCL394. Moreover, knockdown of
IL10RA in the ALK+ cell line K299 resulted in reduced cell growth372, whereas the roles and functions
of IL10RA in drug resistance have not yet been fully elucidated.
In the previous chapter we show that overexpression of IL10RA, the IL10R-specific subunit, decreases
sensitivity to ALK inhibitors in ALCL cell lines, whereas knockdown of IL10RA increases sensitivity to
IL10RA
IL10RA
IL10RB
IL10RB
JAK1 JAK1
TYK2 TYK2
STAT3P
STAT3P
STAT3P
STAT3P
IL10 IL10

89
crizotinib in ALCL cell lines. These results were further confirmed in ALK inhibitor resistant cell lines and
in a cell line-derived orthotopic xenograft model. Furthermore, RNA-seq performed on a relapse biopsy
of an ALK inhibitor-resistant ALCL patient with wild-type NPM1-ALK showed higher expression of
IL10RA compared to an ALK inhibitor-resistant ALCL patient that harbored an ALK L1196M mutation at
relapse, suggesting these results may be translationally relevant. Hence, we further investigated the
mechanism of how overexpression of IL10RA modifies sensitivity to ALK inhibition.
The majority of the work presented in this chapter forms the basis of a publication in Blood (Prokoph et
al.)301, which can be found in Appendix 1.
4.1.1 Aims
This chapter aims to:
• Determine the IL10RA expression levels in ALCL patient tumour tissue
• Determine the effect of IL10RA overexpression on sensitivity to alectinib, brigatinib and lorlatinib
• Determine the effect of IL10RA overexpression on apoptosis
• Validate on-target effects of the CRISPR-based overexpression tool by reversing the resistant
phenotype against IL10RA
• Identify ALCL context-specific downstream effector(s) of IL10RA responsible for the inhibition of
apoptosis in ALCL cells in response to ALK inhibtors
• Determine whether IL10RA expression is predictive of clinical responses to standard chemotherapy
in paediatric ALCL patients
4.2 IL10RA is Expressed in ALCL in an NPM1-ALK-Independent Manner
The IL10R is a tetrameric cell surface protein composed of 2 A and 2 B subunits that bind IL10 leading
to activation of JAK1/TYK2 and STAT3. To characterize the importance of IL10/IL10R signaling in ALCL,
we measured the expression levels of IL10RA and IL10RB by immunostaining of T-cell lymphoma tissue
microarrays (TMAs) from adult patients (Table 18, Table 19, Table 20). We determined that IL10RA
was expressed in 100% of ALK+ ALCLs, 92% of ALK- ALCLs, 43% AITL and 30% of PTCL-NOS (Figure
22A-B). In contrast, IL10RB was in general expressed at a higher level in ALCL than other peripheral T
cell lymphomas but there was no difference in the percentage of tumour cells positive for this protein
(Figure 22B). We further confirmed IL10RA and IL10RB expression by immunostaining of TMAs80
comprising an independent cohort of 92 paediatric ALK+ ALCL patients (Figure 22C, Table 15, Table
13, Table 14) that were recruited onto three paediatric ALCL trials (NHL-BFM90/NHL-
BFM95/NCT00006455). These data are consistent with existing gene expression data314–319 from 75
ALK+ ALCL compared to 40 ALK- ALCL patients, 160 PTCL-NOS patients, 100 AITL patients and 12
reactive lymph nodes from healthy donors (Figure 22D).

90
Figure 22 IL10RA is Expressed in ALCL Patient Tumour Tissue (A) Representative hematoxylin and eosin staining with corresponding IL10RA IHC staining performed on tissue microarrays from different human T cell lymphoma subtypes: ALK+ and ALK- ALCL, angioimmunoblastic T-cell lymphoma (AITL) and peripheral T-cell lymphoma not otherwise specified (PTCL-NOS). (B) Intensity of staining or percentage of tumour cells expressing IL10RA or IL10RB determined by IHC of a tissue microarray (TMA) of formalin fixed paraffin embedded (FFPE) T cell lymphoma patient samples: n (ALK+ ALCL) = 25, n (ALK- ALCL) = 25, n (AITL) = 7, n (PTCL-NOS) = 21. Data are represented as means ± SD. Welch two sample t test: *p < 0.05. **p < 0.01, ***p < 0.001. (C) Intensity of staining or percentage of tumour cells expressing IL10RA (n=92) or IL10RB (n=89) determined by IHC of a TMA of FFPE paediatric ALK+ ALCL patient samples. Data are presented as a violin plot with means indicated. Welch two sample t test: *p < 0.05. **p < 0.01, ***p < 0.001. (D) Microarray data (GSE58445, GSE6338, GSE65823, GSE78513, GSE14879, GSE19069) were analyzed for IL10, IL10RA and IL10RB expression in ALK+ ALCL (n = 75), ALK- ALCL (n = 45), PTCL-NOS (n = 160, peripheral T-cell lymphomas not otherwise specified), AITL (n = 100, angioimmunoblastic T-cell lymphomas) patients compared to reactive lymph nodes (LN, n = 12). Reproduced from Prokoph et al.301.
To examine if IL10 signaling is represented in ALCL cell lines, we analyzed existing microarray data 316–
318,320,321 of a panel of lymphoma cell lines, including ALK+ and ALK- ALCL cell lines compared to other
T- and B-cell lymphoma cell lines as well as normal T-cell controls (Figure 23A-B). In agreement with
the patient data above, ALK+ ALCL cell lines showed robust mRNA expression of IL10RA, IL10RB and
IL10.
A
IL10RA
H&E
ALCL, ALK+ ALCL, ALK- AITL PTCL-NOS
ALC
L, A
LK+
ALC
L, A
LK-
AIT
L
PTC
L-NOS
0
25
50
75
100
Perc
enta
ge
ALC
L, A
LK+
ALC
L, A
LK-
AIT
L
PTC
L-NOS
0
25
50
75
100
Perc
enta
ge
ALCL, ALK+
ALCL, ALK-
AITL
PTCL-NOS
ALC
L, A
LK+
ALC
L, A
LK-
AIT
L
PTC
L-NOS
0
1
2
3
IL10R
B inte
nsi
ty
ALC
L, A
LK+
ALC
L, A
LK-
AIT
L
PTC
L-NOS
0
1
2
3
IL10R
A inte
nsity
*******
B
**
IL10R
B s
tain
ing in
tensity
IL10R
A s
tain
ing in
tensity
***
Perc
enta
ge o
f tu
mor
cells
with
positiv
e I
L10R
A s
tain
ing
Perc
enta
ge o
f tu
mor
cells
with
positiv
e I
L10R
B s
tain
ing
**
***
IL10
RA
IL10
RB
0
25
50
75
100
Perc
enta
ge
IL10RA
IL10RB
IL10
RA
IL10
RB
0
1
2
3
Inte
nsity
IL10RA
IL10RB
C
Sta
inin
g in
tensity
Perc
enta
ge
of
positiv
ely
sta
ined t
um
or
cells
ALC
L, A
LK+
ALC
L, A
LK-
AIT
L
PTC
L-NOS
reac
tive
LN
0
5
10
15
IL10RB
Exp
ressio
n L
evel
ALC
L, A
LK+
ALC
L, A
LK-
AIT
L
PTC
L-NOS
reac
tive
LN
0
5
10
15
IL10RA
Exp
ressio
n L
evel
ALC
L, A
LK+
ALC
L, A
LK-
AIT
L
PTC
L-NOS
reac
tive
LN
0
5
10
15
IL10
Exp
ressio
n L
evel
DIL10 IL10RA IL10RB

91
Figure 23 IL10 signaling is represented in ALCL cell lines (A) Microarray data (GSE6338, GSE107951, GSE14879, GSE19069) were analyzed for IL10, IL10RA and IL10RB expression in ALK+ ALCL (n = 5) and ALK- ALCL (n = 2) cell lines compared to other lymphoma cell lines (n = 5), CD8+T cells, CD4+T cells, Treg cells, NK cells and NK T cells. (B) Microarray data (GSE94669) were analyzed for IL10, IL10RA and IL10RB expression in ALK+ ALCL (n = 7) and ALK- ALCL (n = 2) cell lines compared to other T cell (n = 3; H9, HuT78, HH) and B cell (n = 48) lymphoma cell lines. Reproduced from Prokoph et al.301.
To determine whether IL10R signaling is mediated by NPM1-ALK, we examined whether IL10RA,
IL10RB and IL10 expression were directly controlled by NPM1-ALK activity. Knockdown of ALK with an
inducible shRNA led to decreased IL10, but not IL10RA nor IL10RB mRNA expression (Figure 24A),
which is in agreement with existing microarray data322 of ALK shRNA transduced ALCL cell lines (Figure
24B). Consistent with this, crizotinib inhibition of NPM1-ALK activity also resulted in decreased IL10,
but not IL10RA or IL10RB mRNA expression (Figure 24C). Again, our results are in agreement with
existing microarray data322 from ALK TKI treated compared to untreated ALCL cell lines (Figure 24D).
Hence, transcription of IL10RA is independent of NPM1-ALK expression and activity, suggesting
IL10RA is a prime candidate for bypass signaling in response to ALK inhibition.
DELJB
6
K29
9
SU-D
HL-
1
SR78
6
FE-P
D
Mac
-2A
JURKAT
KE-3
7
MOLT
-14
MOLT
-3
PEER
CD4+
T cel
ls (r
estin
g)
CD4+
T c
ells (a
ctivat
ed)
Treg
cells
CD8+
T cel
ls (r
estin
g)
CD8+
T c
ells (a
ctivat
ed)
NK c
ells
NK T
cel
ls
0
2
4
6
8
10
12
IL10RB
Exp
ressio
n L
evel
DELJB
6
K29
9
SU-D
HL-
1
SR78
6
FE-P
D
Mac
-2A
JURKAT
KE-3
7
MOLT
-14
MOLT
-3
PEER
CD4+
T cel
ls (r
estin
g)
CD4+
T c
ells (a
ctivat
ed)
Treg
cells
CD8+
T cel
ls (r
estin
g)
CD8+
T c
ells (a
ctivat
ed)
NK c
ells
NK T
cel
ls
0
2
4
6
8
10
12
IL10RA
Exp
ressio
n L
evel
DELJB
6
K29
9
SU-D
HL-
1
SR78
6
FE-P
D
Mac
-2A
JURKAT
KE-3
7
MOLT
-14
MOLT
-3
PEER
CD4+
T cel
ls (r
estin
g)
CD4+
T c
ells (a
ctivat
ed)
Treg
cells
CD8+
T cel
ls (r
estin
g)
CD8+
T c
ells (a
ctivat
ed)
NK c
ells
NK T
cel
ls
0
2
4
6
8
10
12
IL10E
xp
ressio
n L
evel
controls
ALK+
ALCL
ALK-
ALCL
ALK-
ALCL
ALK+
ALCL
ALK-
ALCL controls
AIL10 IL10RA
ALK+
ALCL controls
IL10RB
controls
SUP-M
2TS
KI-J
KL8
2JB
6
K29
9
SU-D
HL-
1
FE-P
D
Mac
-1
T-cel
l NHL
cell lin
es
B-c
ell lym
phom
a ce
ll lin
es
0
2
4
6
8
10
IL10RAE
xp
ressio
n L
evel
SUP-M
2TS
KI-J
KL8
2JB
6
K29
9
SU-D
HL-
1
FE-P
D
Mac
-1
T-cel
l NHL
cell lin
es
B-c
ell lym
phom
a ce
ll lin
es
0
2
4
6
8
10
IL10
Exp
ressio
n L
evel
SUP-M
2TS
KI-J
KL8
2JB
6
K29
9
SU-D
HL-
1
FE-P
D
Mac
-1
T-cel
l NHL
cell lin
es
B-c
ell lym
phom
a ce
ll lin
es
0
2
4
6
8
10
IL10RB
Exp
ressio
n L
evel
ALK-
ALCL
ALK+
ALCL
BIL10 IL10RA IL10RB
ALK-
ALCL
ALK+
ALCLALK-
ALCL
ALK+
ALCLcontrols controls

92
Figure 24 Transcription of IL10RA is independent of NPM1-ALK expression and activity (A) Fold change in IL10, IL10RA and IL10RB mRNA expression levels in SUP-M2 derived TS or SU-DHL-1 cell lines transduced with a doxycycline dependent ALK shRNA. Doxycycline-induced cells were compared to non-induced cells and were normalized to GAPDH. Data are represented as means ± SD, n = 3. (B) Microarray data (GSE6184) were analyzed for IL10, IL10RA and IL10RB expression changes with or without ALK shRNA induction in SU-DHL-1 cells. Volcano plot summarizing the global changes in gene expression of ALK shRNA transduced ALCL cell lines with or without doxycycline induction. Red: downregulated, Dark gray: unchanged. (C) Fold change in IL10, IL10RA and IL10RB mRNA expression levels in crizotinib treated (300 nM for 6 hours) ALCL cell lines normalized to GAPDH and relative DMSO control. Data are represented as means ± SD, n = 3. (D) Microarray data (GSE6184) were analyzed for IL10, IL10RA and IL10RB expression changes after 6 hours treatment with 300 nM ALK inhibitor (CEP-14083) or DMSO treatment in SUP-M2 derived TS cells. Volcano plot summarizing the global changes in gene expression of SUP-M2 derived TS cells after 6 hours treatment with 300 nM CEP-14083 or DMSO. Red: downregulated, Dark gray: unchanged. Reproduced from Prokoph et al.301.
4.3 IL10RA Overexpression Modulates Sensitivity to ALK Inhibition
To further characterize the effects of elevated IL10RA expression on ALK TKI induced cytotoxicity, we
expressed 3 different sgRNAs activating IL10RA expression in 3 ALK+ ALCL cell lines (SU-DHL-1/SUP-
M2/DEL) (Figure 25A). Expression of each sgRNA resulted in decreased crizotinib sensitivity especially
on supplementation of IL10 (Figure 25C-E). As expected, the majority of these sgRNAs also promoted
decreased sensitivity to the second generation ALK TKIs alectinib, brigatinib and lorlatinib.
To investigate how IL10RA overexpression may be enabling cell survival in the presence of ALK TKIs,
we assessed cell proliferation and apoptosis. None of the three IL10RA-targeting sgRNAs promoted
proliferation in the absence of crizotinib (Figure 25B), suggesting that cell survival is not facilitated by
increased proliferation. On the other hand, most IL10RA sgRNAs were able to prevent apoptosis to
some extent when cells were treated with crizotinib (Figure 25F), all three IL10RA-targeting sgRNAs
C
IL10
IL10
RA
IL10
RB
-20
-15
-10
-5
0IL
10
IL10
RA
IL10
RB
-20
-15
-10
-5
0
IL10
IL10RA
IL10RB
NPM
1-ALK
IL10
IL10
RA
IL10
RB
-20
-15
-10
-5
0
ANPM1-ALK shRNA
SU
P-M
2S
U-D
HL-1
Fold
Change E
xpre
ssio
n
(dox-induced r
ela
tive t
o -
non-induced c
ells
)
NPM
1-ALK
IL10
IL10
RA
IL10
RB
-25
-20
-15
-10
-5
0
NPM1-ALK
IL10
IL10RA
IL10RB Crizotinib
SU
P-M
2S
U-D
HL-1
Fold
Change E
xpre
ssio
n
(rela
tive t
o D
MS
O)
BNPM-ALK shRNA
D
SU-DHL-1
ALK inhibitor (CEP-14083)
SUP-M2
Log2 Fold Change Log2 Fold Change
-Log10 (
padj)
-Log10 (
padj)
-4 -2 0 2 4
0
2
4
6
-4 -2 0 2 4
0
1
2
3

93
demonstrated a significant ability to diminish apoptosis in the presence of crizotinib particularly when
IL10 was supplemented to the growth media (Figure 25G).
(legend on next page)
SU-D
HL-
1
SUP-M
2DEL
0
50
100
150
500
1000
10000
20000
30000
Fold
Change E
xpre
ssio
n
(rela
tive
to N
T s
gR
NA
)
IL10RA sgRNA 49
IL10RA sgRNA 50
IL10RA sgRNA 72
1 2 3 4
0
2×10⁸
4×10⁸
6×10⁸ NT sgRNA
IL10RA sgRNA 49
IL10RA sgRNA 50
IL10RA sgRNA 72
1 2 3 4
0
2×10⁸
4×10⁸
6×10⁸ NT sgRNA
IL10RA sgRNA 49
IL10RA sgRNA 50
IL10RA sgRNA 72
1 2 3 4
0
2×10⁸
4×10⁸
6×10⁸ NT sgRNA
IL10RA sgRNA 49
IL10RA sgRNA 50
IL10RA sgRNA 72
15678399.
80
0
50
100
Lorlatinib [nM]No
rmalized
via
bilit
y [
%]
Control
Control + IL10
IL10RA_72
IL10RA_72 + IL10
15678399.
80
0
50
100
Lorlatinib [nM]No
rmalized
via
bilit
y [
%]
Control
Control + IL10
IL10RA_49
IL10RA_49 + IL10
1250
312.
5399.80
0
50
100
Log(Crizotinib), nMNo
rmalized
via
bilit
y [
%]
NT sgRNA
NT sgRNA + IL10
IL10RA sgRNA 72
IL10RA sgRNA 72 + IL10
1250
312.
5399.80
0
50
100
Log(Crizotinib), nMNo
rmalized
via
bilit
y [
%]
NT sgRNA
NT sgRNA + IL10
IL10RA sgRNA 50
IL10RA sgRNA 50 + IL10
1250
312.
5399.80
0
50
100
Log(Crizotinib), nMNo
rmalized
via
bilit
y [
%]
NT sgRNA
NT sgRNA + IL10
IL10RA sgRNA 49
IL10RA sgRNA 49 + IL10
15678399.
80
0
50
100
Lorlatinib [nM]No
rmalized
via
bilit
y [
%]
Control
Control + IL10
IL10RA_50
IL10RA_50 + IL1015678399.
80
0
50
100
Brigatinib [nM]No
rmalized
via
bilit
y [
%]
NT sgRNA
NT sgRNA + IL10
IL10RA sgRNA 49
IL10RA sgRNA 49 + IL10
15678399.
80
0
50
100
Brigatinib [nM]No
rmalized
via
bilit
y [
%]
NT sgRNA
NT sgRNA + IL10
IL10RA sgRNA 50
IL10RA sgRNA 50 + IL10
15678399.
80
0
50
100
Brigatinib [nM]No
rmalized
via
bilit
y [
%]
sgRNA
sgRNA + IL10
IL10RA sgRNA 72
IL10RA sgRNA 72 + IL10
125031
215
69.
80
0
50
100
Alectinib [nM]No
rmalized
via
bilit
y [
%]
Control
Control + IL10
IL10RA_49
IL10RA_49 + IL10
125031
215
69.
80
0
50
100
Alectinib [nM]No
rmalized
via
bilit
y [
%]
Control
Control + IL10
IL10RA_50
IL10RA_50 + IL10
125031
215
69.
80
0
50
100
Alectinib [nM]No
rmalized
via
bilit
y [
%]
Control
Control + IL10
IL10RA_72
IL10RA_72 + IL10
1250
312.
5399.80
0
50
100
Log(Crizotinib), nMNo
rmalized
via
bilit
y [
%]
NT sgRNA
NT sgRNA + IL10
IL10RA sgRNA 72
IL10RA sgRNA 72 + IL10
1250
312.
5399.80
0
50
100
Log(Crizotinib), nMNo
rmalized
via
bilit
y [
%]
NT sgRNA
NT sgRNA + IL10
IL10RA sgRNA 50
IL10RA sgRNA 50 + IL10
1250
312.
5399.80
0
50
100
Log(Crizotinib), nMNo
rmalized
via
bilit
y [
%]
NT sgRNA
NT sgRNA + IL10
IL10RA sgRNA 49
IL10RA sgRNA 49 + IL10
[Crizotinib], (nM)
Norm
aliz
ed
Via
bili
ty (
%)
A
C
SU-DHL-1 SUP-M2 DEL
B
Time, (Days)
Flu
ore
scence (
560/5
90 n
m)
[Alectinib], (nM) [Brigatinib], (nM) [Lorlatinib], (nM)
SUP-M2
****
***
****
**
**
*****
****
****
**
**
**
***
*
***
***
*
**
**
******
******
****
******
**
******
****
15639
19.59.
80
0
50
100
Lorlatinib [nM]No
rmalized
via
bilit
y [
%]
Control
Control + IL10
IL10RA_72
IL10RA_72 + IL1015639
19.59.
80
0
50
100
Lorlatinib [nM]No
rmalized
via
bilit
y [
%]
Control
Control + IL10
IL10RA_50
IL10RA_50 + IL1015639
19.59.
80
0
50
100
Lorlatinib [nM]No
rmalized
via
bilit
y [
%]
Control
Control + IL10
IL10RA_49
IL10RA_49 + IL10
62.5
41.6
31.2
515
.60
0
50
100
Lorlatinib [nM]No
rmalized
via
bilit
y [
%]
Control
Control + IL10
IL10RA_72
IL10RA_72 + IL1062.5
41.6
31.2
515
.60
0
50
100
Lorlatinib [nM]No
rmalized
via
bilit
y [
%]
Control
Control + IL10
IL10RA_50
IL10RA_50 + IL1062.5
41.6
31.2
515
.60
0
50
100
Lorlatinib [nM]No
rmalized
via
bilit
y [
%]
Control
Control + IL10
IL10RA_49
IL10RA_49 + IL10
62578399.
80
0
50
100
Alectinib [nM]No
rmalized
via
bilit
y [
%]
Control
Control + IL10
IL10RA_72
IL10RA_72 + IL1062578399.
80
0
50
100
Alectinib [nM]No
rmalized
via
bilit
y [
%]
Control
Control + IL10
IL10RA_50
IL10RA_50 + IL1062578399.
80
0
50
100
Alectinib [nM]No
rmalized
via
bilit
y [
%]
Control
Control + IL10
IL10RA_49
IL10RA_49 + IL10
250
125
62.5
31.2
50
0
50
100
Crizotinib [nM]No
rmalized
via
bilit
y [
%]
Control
Control + IL10
IL10RA_49
IL10RA_49 + IL10
250
125
62.5
31.2
50
0
50
100
Crizotinib [nM]No
rmalized
via
bilit
y [
%]
Control
Control + IL10
IL10RA_50
IL10RA_50 + IL10
250
125
62.5
31.2
50
0
50
100
Crizotinib [nM]No
rmalized
via
bilit
y [
%]
Control
Control + IL10
IL10RA_72
IL10RA_72 + IL10
1250
312.
5399.80
0
50
100
Log(Crizotinib), nMNo
rmalized
via
bilit
y [
%]
NT sgRNA
NT sgRNA + IL10
IL10RA sgRNA 72
IL10RA sgRNA 72 + IL10
1250
312.
5399.80
0
50
100
Log(Crizotinib), nMNo
rmalized
via
bilit
y [
%]
NT sgRNA
NT sgRNA + IL10
IL10RA sgRNA 50
IL10RA sgRNA 50 + IL10
1250
312.
5399.80
0
50
100
Log(Crizotinib), nMNo
rmalized
via
bilit
y [
%]
NT sgRNA
NT sgRNA + IL10
IL10RA sgRNA 49
IL10RA sgRNA 49 + IL10
Norm
aliz
ed V
iabili
ty (
%)
D
[Crizotinib], (nM) [Alectinib], (nM) [Brigatinib], (nM) [Lorlatinib], (nM)
SU-DHL-1
**
*
*
**
**
****
**
****
****
****
**
*
***
**
******
**

94
Figure 25 IL10RA Overexpression Modulates Sensitivity to ALK Inhibition (A) Fold change in expression levels of IL10RA for each of the 3 sgRNAs targeting IL10RA versus non-targeting (NT) control sgRNA in the indicated ALCL cell lines. Data are represented as means ± SD, n = 3. (B) Proliferation of ALCL cell lines expressing sgRNAs inducing overexpression of IL10RA over 4 days (D1–D4). Data are represented as means ± SD, n = 3. Welch two-sample t test: *p < 0.05. **p < 0.01, ***p < 0.001. (C-E) Viability of (C) SUP-M2, (D) SU-DHL-1 or (E) DEL cells based on normalized CellTiter-Blue reads on exposure to increasing concentrations of crizotinib, alectinib, brigatinib or lorlatinib for 48 hours when expressing 1 of 3 of the indicated sgRNAs inducing overexpression of IL10RA in the presence or absence of 10 ng/mL IL10. Data are represented as means ± SD, n = 3. Welch two-sample t test: *p < 0.05. **p < 0.01, ***p < 0.001. (F) Modulation of apoptosis upon expression of sgRNAs inducing overexpression of IL10RA in the indicated ALCL cell line. The percentage of apoptotic cells is determined by annexin V and propidium iodide (PI) staining of ALCL cells treated with 125 (SU-DHL-1), 312.5 (SUP-M2) or 1250 (DEL) nM crizotinib for 48 hours. Data are represented as means ± SD of technical replicates, experiments performed independently three times. Welch two sample t test: *p < 0.05. **p < 0.01, ***p < 0.001. Right panel: Representative flow cytometry plots of annexin V/PI staining intensities corresponding to IL10RA sgRNA promoting survival versus non-targeting (NT) control sgRNA in SUP-M2 cells. (G) Modulation of apoptotic response upon expression of sgRNAs inducing overexpression of IL10RA in the indicated ALCL cell lines. The percentage of apoptotic cells is determined by annexin V and propidium iodide (PI) staining of ALCL cells treated with 125 (SU-DHL-1), 312.5 (SUP-M2) or 1250 (DEL) nM crizotinib in the presence of 10 ng/mL IL10 for 48 hours. Data are represented as means ± SD of technical replicates, experiments performed independently three times. Welch two sample t test: *p < 0.05. **p < 0.01, ***p < 0.001. Reproduced from Prokoph et al.301.
Since these data hint towards the possibility that IL10RA-mediated crizotinib resistance is dependent
on IL10, we next assessed whether IL10 overexpression alone could drive crizotinib resistance. Neither
decreased crizotinib sensitivity nor a reduction in apoptosis was observed in ALK+ and ALK- ALCL cell
lines when the growth media was supplemented with IL10 (Figure 26A-B). Consistent with this
observation, overexpression of two different IL10-targeting sgRNAs in the same ALCL cell lines (Figure
26C) neither promoted proliferation in the absence of crizotinib (Figure 26D), nor increased survival in
5000
315.
578399.80
0
50
100
150
Lorlatinib [nM]No
rmalized
via
bilit
y [
%]
Control
Control + IL10
IL10RA_72
IL10RA_72 + IL105000
315.
578399.80
0
50
100
150
Lorlatinib [nM]No
rmalized
via
bilit
y [
%]
NT
NT + IL10
50
50 + IL105000
315.
578399.80
0
50
100
150
Lorlatinib [nM]No
rmalized
via
bilit
y [
%]
NT
NT + IL10
49
49 + IL10
5000
125031
3789.80
0
50
100
150
Brigatinib [nM]No
rmalized
via
bilit
y [
%]
Control
Control + IL10
IL10RA_72
IL10RA_72 + IL105000
125031
3789.80
0
50
100
150
Brigatinib [nM]No
rmalized
via
bilit
y [
%]
Control
Control + IL10
IL10RA_50
IL10RA_50 + IL105000
125031
3789.80
0
50
100
150
Brigatinib [nM]No
rmalized
via
bilit
y [
%]
Control
Control + IL10
IL10RA_49
IL10RA_49 + IL10
5000
2500
1250
312.
59.
80
0
50
100
150
Alectinib [nM]No
rmalized
via
bilit
y [
%]
NT sgRNA
NT sgRNA + IL10
IL10RA sgRNA 72
IL10RA sgRNA 72 + IL10
5000
2500
1250
312.
59.
80
0
50
100
150
Alectinib [nM]No
rmalized
via
bilit
y [
%]
NT sgRNA
NT sgRNA + IL10
IL10RA sgRNA 50
IL10RA sgRNA 50 + IL10
5000
2500
1250
312.
59.
80
0
50
100
150
Alectinib [nM]No
rmalized
via
bilit
y [
%]
NT sgRNA
NT sgRNA + IL10
IL10RA sgRNA 49
IL10RA sgRNA 49 + IL10
2500
1250
312.
59.
80
0
50
100
150
Crizotinib [nM]No
rmalized
via
bilit
y [
%]
NT sgRNA
NT sgRNA + IL10
IL10RA sgRNA 72
IL10RA sgRNA 72 + IL102500
1250
312.
59.
80
0
50
100
150
Crizotinib [nM]No
rmalized
via
bilit
y [
%]
NT sgRNA
NT sgRNA + IL10
IL10RA sgRNA 50
IL10RA sgRNA 50 + IL102500
1250
312.
59.
80
0
50
100
150
Crizotinib [nM]No
rmalized
via
bilit
y [
%]
NT sgRNA
NT sgRNA + IL10
IL10RA sgRNA 49
IL10RA sgRNA 49 + IL10
1250
312.
5399.80
0
50
100
Log(Crizotinib), nMNo
rmalized
via
bilit
y [
%]
NT sgRNA
NT sgRNA + IL10
IL10RA sgRNA 72
IL10RA sgRNA 72 + IL10
1250
312.
5399.80
0
50
100
Log(Crizotinib), nMNo
rmalized
via
bilit
y [
%]
NT sgRNA
NT sgRNA + IL10
IL10RA sgRNA 50
IL10RA sgRNA 50 + IL10
1250
312.
5399.80
0
50
100
Log(Crizotinib), nMNo
rmalized
via
bilit
y [
%]
NT sgRNA
NT sgRNA + IL10
IL10RA sgRNA 49
IL10RA sgRNA 49 + IL10
[Crizotinib], (nM) [Alectinib], (nM) [Brigatinib], (nM) [Lorlatinib], (nM)
EDEL
Norm
aliz
ed V
iabili
ty (
%)
5000
2500
1250
312.
59.
80
0
50
100
150
Alectinib [nM]No
rmalized
via
bilit
y [
%]
NT sgRNA
NT sgRNA + IL10
IL10RA sgRNA 72
IL10RA sgRNA 72 + IL10
***
***
*
***
***
*** *****
****
*
** * * *
* *
* ** ** *
**
*** *** *** **
* * ****
**
* ** **
**
******
**** **
**
SUP-M2
SU-D
HL-
1
SUP-M
2DEL
0
20
40
60
80
Ap
op
tosis
(%
)
IL10RA sgRNA 49
IL10RA sgRNA 50
IL10RA sgRNA 72
NT sgRNA
SU-D
HL-
1
SUP-M
2DEL
0
20
40
60
80
Ap
op
tosis
(%
)
IL10RA sgRNA 49
IL10RA sgRNA 50
IL10RA sgRNA 72
NT sgRNA
FCrizotinib + IL10
Q4
27.9%
Q1
39.3%
Q2
15.2%Q1
15.8%
NT sgRNA IL10RA sgRNA 49
Q2
30.3%
Q3
5.67%Q4
65.7%
Q3
3.28%
PI
APC-Annexin V
****** ***
******
**
*****
* ******** **
Crizotinib
G

95
the presence of crizotinib (Figure 26E). This observation highlights the fact that expression of IL10RA
is the limiting factor for IL10 signaling in these cell lines.
(legend on next page)
-2 0 2 4
0
50
100
Log (Crizotinib) [nM]No
rmalized
via
bilit
y [
%]
PBS IL10
-2 0 2 4
0
50
100
Log (Crizotinib) [nM]No
rmalized
via
bilit
y [
%]
PBS IL10
-2 0 2 4
0
50
100
Log (Crizotinib) [nM]No
rmalized
via
bilit
y [
%]
PBS IL10
-2 0 2 4
0
50
100
Log (Crizotinib) [nM]No
rmalized
via
bilit
y [
%]
PBS IL10
-2 0 2 4
0
50
100
Log(Crizotinib), nMNo
rmalized
via
bilit
y [
%]
PBS IL10
SU-D
HL-
1
SUP-M
2DEL
0
10
20
30
40
+ 10 ng/mL IL10
PBS control
Log [Crizotinib], (nM)
A
Norm
aliz
ed V
iabili
ty (
%)
PB
S c
ontr
ol
Q4
38.1%
Q1
26.8%
Q1
37.0%Q2
26.3%
B SU-DHL-1 SUP-M2
PI
APC-Annexin V
DEL
Q2
32.1%
Q3
2.97%Q4
30.6%
Q3
6.19%
Q1
15.1%
Q2
38.8%
Q4
29.9%
Q3
16.2%
Q1
29.0%Q2
29.8%
Q4
38.6%Q3
2.62%
Q1
33.6%
Q2
26.7%
Q4
31.8%
Q3
7.88%
Q1
12.1%
Q2
36.1%
Q4
30.7%
Q3
21.0%+
10 n
g/m
L IL10
Healthy c
ells
(%
)
n.s. n.s. n.s.
K299, ALK+ DEL, ALK+SU-DHL-1, ALK+ SUP-M2, ALK+ Mac-2A, ALK-
SU-D
HL-
1
K29
9
SUP-M
2DEL
Mac
-2A
0
2
4
50
100
500
1000
1500
Fold
Change E
xpre
ssio
n
(rela
tive
to N
T s
gR
NA
)
IL10 sgRNA 86
IL10 sgRNA 87
-2 0 2 4
0
50
100
Log (Crizotinib) [nM]No
rmalized
via
bilit
y [
%]
NT sgRNAIL10 sgRNA 86IL10 sgRNA 87
-2 0 2 4
0
50
100
Log (Crizotinib) [nM]No
rmalized
via
bilit
y [
%]
NT sgRNAIL10 sgRNA 86IL10 sgRNA 87
-2 0 2 4
0
50
100
Log (Crizotinib) [nM]No
rmalized
via
bilit
y [
%]
NT sgRNAIL10 sgRNA 86IL10 sgRNA 87
-2 0 2 4
0
50
100
Log (Crizotinib) [nM]No
rmalized
via
bilit
y [
%]
NT sgRNAIL10 sgRNA 86IL10 sgRNA 87
1 2 3 4
0
2×10⁸
4×10⁸
6×10⁸
No
rmalized
Flu
ore
scen
ce
(560
/590 n
m)
NT sgRNA
IL10 sgRNA 86
IL10 sgRNA 87
1 2 3 4
0
2×10⁸
4×10⁸
6×10⁸
No
rmalized
Flu
ore
scen
ce
(560
/590 n
m)
NT sgRNA
IL10 sgRNA 86
IL10 sgRNA 87
1 2 3 4
0
2×10⁸
4×10⁸
6×10⁸
No
rmalized
Flu
ore
scen
ce
(560
/590 n
m)
NT sgRNA
IL10 sgRNA 86
IL10 sgRNA 87
1 2 3 4
0
2×10⁸
4×10⁸
6×10⁸
No
rmalized
Flu
ore
scen
ce
(560
/590 n
m)
NT sgRNA
IL10 sgRNA 86
IL10 sgRNA 87
1 2 3 4
0
2×10⁸
4×10⁸
6×10⁸
No
rmalized
Flu
ore
scen
ce
(560
/590 n
m)
NT sgRNA
IL10 sgRNA 86
IL10 sgRNA 87
-2 0 2 4
0
50
100
Log(Crizotinib), nMNo
rmalized
via
bilit
y [
%]
ControlIL10_86IL10_87
-2 0 2 4
0
50
100
Log(Crizotinib), nMNo
rmalized
via
bilit
y [
%]
Control8084
-2 0 2 4
0
50
100
Log (Crizotinib) [nM]No
rmalized
via
bilit
y [
%]
ControlIL10_86IL10_87
-2 0 2 4
0
50
100
Log (Crizotinib) [nM]No
rmalized
via
bilit
y [
%]
NT sgRNAIL10 sgRNA 86IL10 sgRNA 87
-2 0 2 4
0
50
100
Log(Crizotinib), nMNo
rmalized
via
bilit
y [
%] Control
8084
Norm
aliz
ed F
luore
scence
(560/5
90 n
m)
Norm
aliz
ed V
iabili
ty (
%)
Time (Days)
Log [Crizotinib], (nM)
EK299, ALK+ DEL, ALK+SU-DHL-1, ALK+ SUP-M2, ALK+ Mac-2A, ALK-
C
Fold
Change E
xpre
ssio
n
(rela
tive t
o N
T s
gR
NA
)
-2 0 2 4
0
50
100
Log (Crizotinib) [nM]No
rmalized
via
bilit
y [
%]
NT sgRNAIL10 sgRNA 86IL10 sgRNA 87
-2 0 2 4
0
50
100
Log (Crizotinib) [nM]No
rmalized
via
bilit
y [
%]
NT sgRNAIL10 sgRNA 86IL10 sgRNA 87
-2 0 2 4
0
50
100
Log (Crizotinib) [nM]No
rmalized
via
bilit
y [
%]
NT sgRNAIL10 sgRNA 86IL10 sgRNA 87
-2 0 2 4
0
50
100
Log (Crizotinib) [nM]No
rmalized
via
bilit
y [
%]
NT sgRNAIL10 sgRNA 86IL10 sgRNA 87
-2 0 2 4
0
50
100
Log (Crizotinib) [nM]No
rmalized
via
bilit
y [
%]
NT sgRNAIL10 sgRNA 86IL10 sgRNA 87
DK299, ALK+ DEL, ALK+SU-DHL-1, ALK+ SUP-M2, ALK+ Mac-2A, ALK-
-2 0 2 4
0
50
100
Log (Crizotinib) [nM]No
rmalized
via
bilit
y [
%]
NT sgRNAIL10 sgRNA 86IL10 sgRNA 87

96
Figure 26 IL10 Overexpression does not Modulate Sensitivity to ALK Inhibition (A) Viability of the indicated ALCL cell lines based on normalized CellTiter-Blue fluorescence reads on exposure to increasing concentrations of crizotinib for 48 hours in the presence or absence of 10 ng/mL IL10. Data are represented as means ± SD of technical replicates, n = 3; experiment performed independently three times. Welch two-sample t test: *p < 0.05. **p < 0.01, ***p < 0.001. (B) Left panel: Representative distributions of annexin V and propidium iodide co-staining intensities of the indicated ALCL cells treated with 1250 (DEL), 312.5 (SUP-M2), 156.25 (SU-DHL-1) nM crizotinib with or without 10 ng/mL IL10 for 48 hours as determined by flow cytometry. Right panel: The percentage of healthy cells as determined by annexin V and propidium iodide (PI) staining of ALCL cells treated with 125 (SU-DHL-1), 312.5 (SUP-M2), 1250 (DEL) nM crizotinib with or without 10 ng/mL IL10 for 48 hr. Data are represented as means ± SD, n = 3. Welch two sample t test: *p < 0.05. **p < 0.01, ***p < 0.001. (C) Fold change in expression levels of IL10 modulated by CRISPR overexpression for two sgRNAs relative to non-targeting (NT) control sgRNA in the indicated ALCL cell lines. Data are represented as means ± SD of technical replicates, n = 3. (D) Proliferation of unchallenged ALCL cells expressing sgRNAs inducing overexpression of IL10. Proliferation was quantified over 4 days (D1–D4). Data are represented as means ± SD, n = 3. Welch two-sample t test: *p < 0.05. **p < 0.01, ***p < 0.001. (E) Viability of the indicated ALCL cell lines based on normalized CellTiter-Blue fluorescence reads on exposure to increasing concentrations of crizotinib for 48 hours when expressing 1 of 3 of the indicated sgRNAs inducing overexpression of IL10. Data are represented as means ± SD of technical replicates, n = 3; experiment performed independently three times. Welch two-sample t test: *p < 0.05. **p < 0.01, ***p < 0.001. Reproduced from Prokoph et al.301.
Next, we overexpressed IL10RA with a puromycin selectable plasmid311 and could confirm the results
achieved with sgRNA mediated CRISPR overexpression (Figure 27A-D). Plasmid-based IL10RA
overexpression was induced in ALCL cell lines (Figure 27A), which was able to desensitize ALCL cell
lines to crizotinib treatment (Figure 27B) and rescue the phosphorylation of STAT3 in the presence of
crizotinib (Figure 27D). Furthermore, the addition of the STAT3 inhibitor stattic395–397 resensitized
IL10RA overexpressing cells to crizotinib inhibition (Figure 27C).
Figure 27 Plasmid-based IL10RA Overexpression Modulates Sensitivity to Crizotinib Inhibition (A) Fold change in expression levels of IL10RA in the indicated ALCL cell lines after transfection with pLX302 IL10RA-V5 puro versus pLX302 control plasmid. Data are represented as means ± SD, n = 3. (B) Viability of ALCL cells based on normalized CellTiter-Blue fluorescence reads on exposure to 312.5 nM crizotinib for 48 hours when expressing pLX302 IL10RA-V5 puro versus pLX302 control plasmid. Data are represented as means ± SD, n = 3. Welch two-sample t test: *p < 0.05. **p < 0.01, ***p < 0.001. (C) Viability of ALCL cells based on normalized CellTiter-Blue fluorescence reads on exposure to 312.5 nM crizotinib and 2500 nM (SUP-M2) or 3000 nM (DEL) stattic for 48 hours when expressing pLX302 IL10RA-V5 puro versus pLX302 control plasmid. Data are represented as means ± SD, n = 3. Welch two-sample t test: *p < 0.05. **p < 0.01, ***p < 0.001. (D) Western blot analysis of differential JAK/STAT signaling activation in the indicated ALCL cells when expressing pLX302 IL10RA-V5 puro versus pLX302 control plasmid. Cells were treated with DMSO or 1000 nM crizotinib for 1 hour. This blot is representative of three independent experiments. Lines indicate different blots. Reproduced from Prokoph et al.301.
SUP-M
2DEL
0
20
40
60
80
100
Norm
aliz
ed v
iabili
ty (
%)
pLX302 IL10RA-V5 puropLX302
SUP-M
2DEL
0
20
40
60
80
100
Norm
aliz
ed v
iabili
ty (
%)
pLX302 IL10RA-V5 puropLX302
A B C DCrizotinib
pLX
302
pLX
302 I
L10R
A-V
5
pLX
302
pLX
302 I
L10R
A-V
5
pNPM-ALK
NPM-ALK
pSTAT3
STAT3
GAPDH
DMSO
SUP-M2
**
***
SUP-M
2DEL
0
1000
2000
3000
50000100000150000200000
IL10R
A F
old
Change E
xpre
ssio
n
(rela
tive t
o p
LX
302)
Crizotinib Crizotinib + Stattic
Crizotinib
pLX
302
pLX
302 I
L10R
A-V
5
pLX
302
pLX
302 I
L10R
A-V
5
DMSO
DEL
*****

97
4.4 Knockout of IL10RA/IL10RB/IL10 further sensitizes ALCL cells to
ALK inhibition
To understand if inhibition of any component of the IL10/IL10R complex would render cells sensitive to
crizotinib treatment, we carried out a CRISPR-Cas9-based knockout of IL10, IL10RA and IL10RB in
K299/SUP-M2 cells as described above using 6 sgRNAs per gene (Figure 17A) of which we validated
2 sgRNAs targeting IL10RA for their knockout efficiency (Figure 28B). We found sgRNAs targeting IL10,
IL10RA and IL10RB significantly depleted in SUP-M2 cells that were treated with crizotinib for 14 days
(D14 Crizotinib) in comparison to DMSO treatment (D14 DMSO) (Figure 28A). This is in agreement
with a publicly available CRISPR knockout screen dataset by Ng et al.312 on 5 ALK+ and 1 ALK- ALCL
cell lines that confirms that neither IL10RA, nor IL10 or IL10RB were found to be essential genes in the
absence of ALK inhibition (Figure 28C-F).This suggests that the IL10R signaling pathway is not
essential for the survival of ALCL cell lines, but becomes essential when ALCL cell lines are exposed to
crizotinib. However, sgRNAs targeting IL10 were significantly depleted in K299 cells that were treated
with crizotinib or DMSO in comparison to input control cells, suggesting that K299 cells are dependent
on IL10 even without being challenged with crizotinib (Figure 28A). Moreover, in contrast to SUP-M2
cells, we did not find sgRNAs targeting IL10, IL10RA and IL10RB significantly depleted in K299 cells
that were treated with crizotinib for 14 days (D14) in comparison to DMSO treatment (Figure 28A).
4.5 STAT3 is Activated Independently of NPM1-ALK through the
IL10/IL10R Signaling Pathway on Crizotinib Inhibition
We next explored the mechanism by which IL10RA mediates resistance to ALK inhibition. Oncogenic
ALK-fusions activate several signaling pathways, with STAT3 representing a key downstream
effector225,365. In agreement with previous publications395,398, ALK inhibition through crizotinib treatment
led to a complete loss of STAT3 phosphorylation (Figure 29A).
Activation of JAK/STAT signaling is also highly cytokine-dependent in lymphoid cells, with IL10 being a
prominent activator373. To determine whether this also applies in ALCL, IL10RA overexpression was
induced in ALCL cell lines using three different sgRNAs, which was able to rescue the phosphorylation
of STAT3, but not STAT1, in the presence of crizotinib (Figure 29A). This indicates that IL10RA
overexpression can mediate STAT3 phosphorylation independently of NPM1-ALK activity and that this
mechanism can successfully reverse the effects of crizotinib-mediated inhibition on STAT3 activity.
To understand how transcriptional targets of STAT3 are affected by IL10RA overexpression, we
examined their expression levels by RT-qPCR. Consistent with this, overexpression of IL10RA led to
increased mRNA levels of the known STAT3 target genes including MYC, IRF4 and CD30 in crizotinib-
treated cells (Figure 29B). These data are in keeping with the CRISPR overexpression screen results
whereby sgRNA mediated overexpression of both MYC and IRF4 enabled cell survival in the presence
of crizotinib (Figure 12E).

98
Figure 28 CRISPR-based knockout of IL10RA/IL10RB/IL10 is not lethal, but sensitizes ALCL cell lines to ALK inhibition (A) Read counts of 6 sgRNAs targeting IL10/IL10RA/IL10RB before and after a 14-day incubation with DMSO or (80 nM for SUP-M2, 100 nM for K299) crizotinib in the indicated ALCL cell lines. Data are represented as boxplot with individual points representing each sgRNA (n = 6). Unpaired t test: *p < 0.05. **p < 0.01, ***p < 0.001. RPM = Reads Per Million mapped reads. (B) Western blot analysis of the indicated ALCL cell lines upon expression of sgRNAs inducing knockout of IL10RA versus non-targeting (NT) control sgRNA. Cells were harvested 7 days after infection. Tubulin was used as a loading control. This blot is representative of two independent experiments. Reproduced from Prokoph et al.301. (C-F) The CRISPR knockout screen dataset312 by Ng et al. identifies that IL10RA, IL10 and IL10RB are non essential genes in ALK+ and ALK- ALCL in the absence of ALK inhibition. MYC served as the positive control. (C) Genes ranked by Z-score. (D) Corresponding false-discovery rate (FDR) q-values. (E) Corresponding gene expression level; RPKM, reads per kilobase of transcript, per million mapped reads. (F) Combined gene expression level and FDR identifies vulnerabilities as true or false.
A
IL10RA
Tubulin
NT
sg
RN
A
IL10R
A s
gR
NA
2
IL10R
A s
gR
NA
4
SUP-M2
NT
sgR
NA
IL10R
A s
gR
NA
2
IL10R
A s
gR
NA
4
IL10RA
Tubulin
K299B
SUP-M2
IL10 IL10RA IL10RB
*** ns
**
ns
***
***ns
***
**
D0 D14
DMSO
D14
CrizotinibD0 D14
DMSOD14
CrizotinibD0 D14
DMSOD14
Crizotinib
K299
IL10 IL10RA IL10RB
ns ns
*
ns
ns
ns*
***
ns
D0 D14
DMSO
D14
CrizotinibD0 D14
DMSOD14
CrizotinibD0 D14
DMSOD14
Crizotinib
A
IL10RA
Tubulin
NT
sg
RN
A
IL10R
A s
gR
NA
2
IL10R
A s
gR
NA
4
SUP-M2
NT
sgR
NA
IL10R
A s
gR
NA
2
IL10R
A s
gR
NA
4
IL10RA
Tubulin
K299B
A B C D E F
1
2
3
4
5
6
7
8
9
10
-10 -5 0 5 10
ALK+ ALCL ALK-
ALCL
C
IL10RA
IL10RB
IL10
MYC
ALK+ ALCL ALK-
ALCL
D
ALK+ ALCL ALK-
ALCL
E
ALK+ ALCL ALK-
ALCL
F
<0.05 <0.001 TRUE FALSE
A B C D E F
1
2
3
4
5
6
7
8
9
10
-5 0 5-5 0 5 -10 0 105-5
A B C D E F
1
2
3
4
5
6
7
8
9
10
-10 -5 0 5 10
A B C D E F
1
2
3
4
5
6
7
8
9
10 0.05
0.25
0.45
0.65
0.85
A B C D E F
1
2
3
4
5
6
7
8
9
100
0.2
0.4
0.6
0.8
1.0
A B C D E F
1
2
3
4
5
6
7
8
9
10
-5 0 5
Z-score FDR Log2(PRKM) Log2(PRKM)>1 & FDR<0.05

99
We also observed a strong correlation between IL10RA and IL10 mRNA expression levels across
publicly available Human Protein Atlas RNA-seq datasets (Spearman ρ = 0.754, p < 1.68e-9) (Figure
29C) and an overexpression of IL10RA led to an increase in IL10 mRNA expression in crizotinib treated
cells (Figure 29D). These results suggest that when IL10RA is expressed in ALK+ ALCL, it may function
by creating an autocrine positive feedback loop via activation of STAT3.
To investigate if STAT3 might directly regulate the transcription of IL10, IL10RA and IL10RB genes, we
analyzed publicly available ChIP-seq data of two ALCL cell lines treated with crizotinib/DMSO304 and
compared them to existing STAT3 ChIP-seq data on mouse CD4+ T cells313. We found STAT3 binding
upstream of the TSSs of IL10/IL10RA/IL10RB in both ALCL cell lines (Figure 29E), but not in naïve
CD4+ T cells (Figure 29F). Strikingly, when ALK activity was inhibited by crizotinib the STAT3 binding
was abrogated (Figure 29E). In addition, using IRF4 as a positive control we validated several STAT3
peaks by ChIP followed by quantitative PCR (ChIP–qPCR) using a STAT3-specific antibody, confirming
STAT3 binding to the TSSs of IL10/IL10RA/IL10RB in SUP-M2 cells (Figure 29G). Furthermore, we
confirmed that IL10RA overexpression rescued STAT3 binding to the TSS of IL10/IL10RB/IRF4 in the
presence of crizotinib (Figure 29H). Consistent with this, STAT3 depletion was found to diminish the
expression of IL10 mRNA in ALCL cell lines expressing sgRNAs targeting IL10RA (Figure 29I).
Thus, our data support a model whereby increased expression of IL10RA promotes upregulation of the
IL10 ligand, ultimately reversing crizotinib-mediated inhibition of STAT3 phosphorylation. This
mechanism promotes cellular survival and resistance to ALK TKI treatment in ALK+ ALCL (Figure 29J).

100
(legend on next page)
IL10
IL10
RA
IL10
RB
Ctrl
IRF4
0.0
0.1
0.2
0.3 STAT3
GFP
IL10
IL10
RA
IL10
RB
Ctrl
IRF4
0.0
0.1
0.2
0.3
GFP
STAT3
0 5 10 15 20
DEL
SUP-M2
SU-DHL-1
IL10RA sgRNA 49IL10RA sgRNA 50
IL10 Fold Change Expression(relative to NT sgRNA)
IL10RA sgRNA 72
0 2 4 6
CD30
IRF4
cMYC
IL10RA sgRNA 49
IL10RA sgRNA 50
Fold Change Expression
(relative to NT sgRNA)
IL10RA sgRNA 72
Crizotinib
NT
sgR
NA
IL10R
A s
gR
NA
49
IL10R
A s
gR
NA
50
IL1
0R
A s
gR
NA
72
pNPM-ALK
NPM-ALK
pSTAT3
STAT3
Tubulin
NT
sgR
NA
IL1
0R
A s
gR
NA
49
IL10R
A s
gR
NA
50
IL10R
A s
gR
NA
72
pSTAT1
STAT1
A
E
B C
Fold Change Expression
(normalized to NT sgRNA)
DMSO
Crizotinib
Input
DMSO
Crizotinib
Input
IL10 IL10RA IL10RB
SU
-DH
L-1
JB
6
ST
AT
3 C
hIP
-seq
D
IL10 Fold Change Expression
(normalized to NT sgRNA)
DMSO
chr1: 206,935-206,950 kb chr11: 117,850-117,875 kb chr21: 34,636-34,671 kb
SUP-M2
DMSO
% o
f to
tal in
put
Crizotinib
SUP-M2
p=1.68e−09
p=2.71e−08
IL10
IL10RA
G
0 2 4 6
CD30
IRF4
cMYC
IL10RA sgRNA 49
IL10RA sgRNA 50
Fold Change Expression
(relative to NT sgRNA)
IL10RA sgRNA 72
-4 -2 0 2 4 6
-4
-2
0
2
ρ=0.754
FIL10 IL10RA IL10RB
STAT3 ChIP
H3K4me3 ChIP
H3K4me3 ChIPSTAT3-deficient CD4+ T cells
STAT3-WT CD4+ T cells
chr1: 131,018-131,028 kb chr9: 45,252-45,272 kb chr16: 91,400-91,430 kb
IL10
IL10
RA
IL10
RB
Ctrl
IRF4
0.0
0.1
0.2
0.3 STAT3
GFP
IL10
IL10
RA
IL10
RB
Ctrl
IRF4
0.0
0.2
0.4
0.6
GFP
STAT3
IL10
IL10
RA
IL10
RB
Ctrl
IRF4
0.0
0.1
0.2
0.3
GFP
STAT3
IL10
IL10
RA
IL10
RB
Ctrl
IRF4
0.0
0.2
0.4
0.6 STAT3
GFP
DEL pLX302
% o
f to
tal in
put
DEL pLX302 IL10RA-V5 puro
Crizotinib
SUP-M2 pLX302
% o
f to
tal in
put
SUP-M2 pLX302 IL10RA-V5 puro
Crizotinib
H
IL10
RA
IL10
RA
IL10
RB
IL10
RB
JAK1 JAK1
TYK2 TYK2
NPM ALK
IL-10
STAT3 target genes including
IRF4IL10RBIL10
STAT3P
STAT3P
STAT3P
STAT3P
IL10 IL10
ALKi
IL10
RB
STAT3STAT3
IL10
-10
-5
0
STAT3 shRNA 191
STAT3 shRNA 192
STA
T3 sh
RNA 1
91
STA
T3 sh
RNA 1
92
-10
-5
0
STAT3 shRNA 191
STAT3 shRNA 192
Fold Change Expression(relative to NT sgRNA)
STA
T3 sh
RNA 1
91
STA
T3 sh
RNA 1
92
-20
-15
-10
-5
0
STAT3 shRNA 191
STAT3 shRNA 192
STA
T3 sh
RNA 1
91
STA
T3 sh
RNA 1
92
-20
-15
-10
-5
0
STAT3 shRNA 191
STAT3 shRNA 192
Fold Change Expression(relative to NT sgRNA)
STA
T3 sh
RNA 1
91
STA
T3 sh
RNA 1
92
-15
-10
-5
0
STAT3 shRNA 191
STAT3 shRNA 192
STA
T3 sh
RNA 1
91
STA
T3 sh
RNA 1
92
-15
-10
-5
0
STAT3 shRNA 191
STAT3 shRNA 192
Fold Change Expression(relative to NT sgRNA)
J
SUP-M2
IL10RA sgRNA 50
SU-DHL-1
IL10RA sgRNA 72
I
Fold
Change E
xpre
ssio
n
(norm
aliz
ed t
o N
T s
hR
NA
)
ST
AT
3IL
10
DEL
IL10RA sgRNA 72
Fold
Change E
xpre
ssio
n
(norm
aliz
ed t
o N
T s
hR
NA
)
ST
AT
3IL
10
Fold
Change E
xpre
ssio
n
(norm
aliz
ed t
o N
T s
hR
NA
)
ST
AT
3IL
10

101
Figure 29 STAT3 is Activated Independently of NPM1-ALK through the IL10/IL10R Signaling Pathway on Crizotinib Inhibition (A) Western blot analysis of differential JAK/STAT signaling activation in response to individual NT sgRNA control or IL10RA sgRNA overexpression in SUP-M2 cells treated with DMSO or 1000 nM crizotinib for 1 hour. This blot is representative of three independent experiments. Lines indicate different blots. (B) Fold change in transcript level of the indicated STAT3 target genes relative to GAPDH and relative to NT sgRNA in SUP-M2 cells expressing sgRNAs targeting IL10RA and treated with 1000 nM crizotinib for 1 hour. Data are represented as means ± SD, n = 3. (C) Correlation between IL10RA and IL10 mRNA expression levels in the Human Protein Atlas RNA-seq datasets, including non-transformed (red) and cancer (gray) cell lines. ρ, Spearman correlation coefficient. (D) Fold change in IL10 mRNA expression levels in crizotinib treated ALCL cell lines expressing sgRNAs inducing expression of IL10RA. Data are represented as means ± SD, n = 3. (E) STAT3 ChIP-seq tracks near the IL10/IL10RB/IL10RA loci in ALCL cell lines treated for 3 hours with crizotinib (300 nM) or DMSO. (F) STAT3 ChIP–seq validation by ChIP–qPCR of the IL10/IL10RA/IL10RB and IRF4 TSS in SUP-M2 cells treated for 3 hours with crizotinib (1000 nM) or DMSO. Data are represented as means ± SD of technical replicates; experiment was performed independently three times. IRF4 served as a positive control. (G) STAT3 and H3K4me3 ChIP-seq tracks near the IL10, IL10RA and IL10RB loci in STAT3 wild type (WT) or STAT3-deficient mouse CD4+CD44-CD62L+ T cells. (H) STAT3 ChIP–qPCR of the IL10/IL10RA/IL10RB and IRF4 TSS in the indicated ALCL cell lines when expressing pLX302 IL10RA-V5 puro versus pLX302 control plasmid treated for 3 hours with crizotinib (1000 nM). Data are represented as means ± SD of technical replicates; experiment was performed independently three times. (I) Fold change in expression levels of STAT3 and IL10 on STAT3 shRNA induction in the indicated ALCL cell lines compared to non-targeting (NT) control shRNA and simultaneous expression of sgRNAs inducing overexpression of IL10RA. Data are represented as means ± SD, n = 3. (J) Model summarizing the mechanism by which IL10RA overexpression leads to ALK TKI resistance. Reproduced from Prokoph et al.301.
4.6 High Expression of IL10RA at Diagnosis is not Predictive of Clinical
Outcome for Patients Treated with Standard Chemotherapy
To determine whether IL10RA is an ALK TKI-specific resistance driver in ALK+ ALCL, we evaluated
IL10RA protein expression levels in ALK+ ALCL patients treated with standard ALCL99 chemotherapy
(n = 97, Table 15, Table 13, Table 14).
To determine whether high IL10RA protein expression levels at diagnosis confer chemotherapy
resistance, we analyzed IL10RA expression levels in tumour samples collected before treatment
initiation, and divided chemotherapy-treated patients into “relapse” and “no relapse” cases. Patients who
showed no evidence of disease for over 10 years after chemotherapy were classified as “no relapse”
cases and patients with disease recurrence within 10 years were considered “relapse” cases (Figure
30A). Samples from cancer patients who relapsed after standard ALCL99 chemotherapy did not show
significantly higher IL10RA protein expression levels at diagnosis compared to patients that remained
in remission (Figure 30B). Furthermore, IL10RA expression had no influence on EFS or OS in patients
treated with chemotherapy (Figure 30C-F). Collectively, these results indicate that IL10RA expression
does not correlate with response or resistance to standard ALCL99 chemotherapy. Whether IL10RA
overexpression because of ALK TKI therapy re-sensitizes tumour cells to chemotherapy, and
furthermore if co-treatment with an ALK TKI and chemotherapy could overcome resistance remains to
be determined.

102
Figure 30 Initial High Expression of IL10RA is not Predictive of Clinical Outcome for Patients Treated with Chemotherapy (A) Schematic summary of diagnostic biopsy specimens of ALK+ ALCL patient tumours analyzed by IHC. Numbers of standard ALCL99 chemotherapy treated patients that presented with a “relapse” or “no relapse” are indicated below each chart. (B) Percentage of tumour cells expressing IL10RA in diagnostic biopsy specimens of patients presented in (A) (n = 98) that were treated with standard ALCL99 chemotherapy. Individual quantifications are plotted with means ± SD indicated. (C,D) Paediatric patients (n = 92) treated with standard ALCL99 chemotherapy as part of the NHL-BFM90, NHL-BFM95 and ALCL99 trials were divided into two groups (low < 50%, high >= 50%) according to the percentage of tumour cells expressing IL10RA and the difference in median (C) EFS or (D) OS (log-rank test) was analyzed using the Kaplan–Meier estimator. P value determined by Cox proportional HR and the 95% CI is shown. pts, patients. (E,F) Forest plot assessing the effects of the indicated clinical parameter on (E) EFS or (F) OS. P values determined by Cox proportional HR with 95% CI are shown. Reproduced from Prokoph et al.301.
C
no relapse relapse
0
25
50
75
100
IL10R
A s
tain
ing p
erc
enta
ge
(n = 64) (n = 34)
ns
Chemotherapy (CT)
relapse
n = 34 cases
no relapse
n = 64 cases
Chemotherapy (CT)
EF
S p
robabili
ty o
f A
LC
L p
atients
on C
T
Time (years)
IL10RA percentage low
IL10RA percentage high
No.
at risk
Legend
Pediatric ALCL patients
Adult ALCL patients
Perc
enta
ge o
f tu
mor
cells
with p
ositiv
e IL10R
A s
tain
ing
no relapse relapse
A B
D
Time (years)
OS
pro
babili
ty o
f A
LC
L p
atients
on C
T IL10RA percentage high
IL10RA percentage low
No.
at risk
E F

103
4.7 Discussion
Among PTCLs, ALCL has been associated with the highest level of IL10 expression399. In addition, IL10
together with IL22 are known to be the most abundant cytokines secreted by ALCL cell lines372 and their
expression is mediated by NPM1-ALK393,400. Both cytokines form autocrine loops to activate the IL10R
(IL10RA/IL10RB) and the IL22R (IL22RA1 or IL22RA2/IL10RB)401, respectively, that ultimately mediate
a pro-proliferative effect via JAK/STAT signaling pathway activation393,400. Although this illustrates that
both cytokines and their receptors play a pivotal role in ALCL, only IL10RA, the IL10R specific subunit,
was detected in the CRISPR overexpression screen. Furthermore, our study provides evidence that
IL10RA and IL10RB expression are independent of NPM1-ALK expression, while IL22RA1 expression
has been shown to be induced by NPM1-ALK400. Thus, we reasoned that IL10R subunits can be highly
expressed even in the presence of crizotinib-mediated ALK inhibition, representing a bypass signaling
pathway.
In future work it will be interesting to investigate how IL10RA overexpression is achieved. This could be
either through decreased recycling of IL10RA or its increased transcription, perhaps driven by a
transcription factor such as CEBPB, whose activity is not affected by ALK inhibition304. However, it is
also possible that tumour cell sub-clones with higher IL10RA expression levels already exist and are
selected with ALK TKI therapy.
Interestingly, two lorlatinib-resistant samples carrying an ALK L1196M mutation (patient 1 and mouse
xenograft T5) showed high levels of IL10RA expression, suggesting that IL10 signaling might cooperate
with mutant NPM1-ALK to provide a drug resistance phenotype, thus allowing expansion of an otherwise
lorlatinib-sensitive NPM1-ALK mutant tumour.
IL10 binding results in autophosphorylation of the IL10RA subunit, which in turn leads to the activation
of Janus kinase 1 (JAK1) or non-receptor tyrosine-protein kinase (TYK2). The activation of these two
kinases further gives rise to the downstream activation of STAT family members402, with IL10
preferentially signaling via STAT3393. Our data demonstrate that crizotinib inactivates STAT3 signaling
by inhibiting NPM1-ALK-induced phosphorylation, whereas IL10RA expression leads to phosphorylation
of STAT3 accounting for renewed signal transduction downstream of STAT3. Therefore, STAT3, pan-
JAK or TYK2 inhibitors are rational candidates for combination with ALK TKIs to overcome or prevent
therapy resistance372,403. Although targeting STAT3 has proven difficult404, the STAT3 antisense
oligonucleotide AZD9150 may potentially provide another effective option405. Alternatively, several pan-
JAK or TYK2 inhibitors have been successfully validated in ALCL cell lines as efficacious single
agents372.
Furthermore, our results indicate that IL10RA expression does not correlate with response or resistance
to standard chemotherapy, suggesting that resistance mechanisms, such as elevated IL10RA
expression developing as a consequence of single agent crizotinib therapy, could be overcome by a
combination of ALK-targeted therapy with chemotherapy. Hence, a combination of crizotinib with
chemotherapy could prevent ALK-inhibitor resistance-specific relapse.

104
CHAPTER 5 Brigatinib is effective in a PDX
of crizotinib-resistant ALK+ ALCL

105
5.1 Introduction
The relapse rate for paediatric ALK+ ALCL reaches 50% independent of the chemotherapy
regimen20,52,72,406,407. Unfortunately, shorter time to relapse is the strongest predictor for a subsequent
relapse with approximately 50% of children who had progression during frontline therapy experiencing
progression again during reinduction98. In addition, three-year OS for patients after CNS relapse is
48.7%100. The rarity of the disease combined with the fact that re-biopsy at relapse is not a routine
procedure has meant that genomic and expression analysis of relapse and refractory ALK+ ALCL has
not been extensively conducted. Beyond a recent study by Lobello et al., which compared tumour
samples at diagnosis versus relapse in 4 adult patients and identified TP53 as well as EPHA5 mutated
clones as possible drivers of relapse84,408, little knowledge exists regarding the drivers of chemo-relapse
in paediatric ALK+ ALCL.
The ALK inhibitor crizotinib has been trialled as a salvage therapy in paediatric ALK+ ALCL patients that
relapsed from chemotherapy63,64,66,70,117, but preliminary results from the AcSé CRIZOTINIB trial showed
5/15 patients progressed126. Until now fewer than 130 paediatric ALK+ ALCL patients (NCT01979536,
n = 103; NCT02034981, n = 11; UMIN000028075, n = 10) have been treated with crizotinib in a clinical
trial setting. None of the 103 patients recruited to NCT01979536 have been re-biopsied at relapse due
to ethical constraints and/or the health status of the patient. Of the 11 paediatric patients recruited to
NCT02034981, several remained in complete remission or went on to receive a SCT and were therefore
not re-biopsied126. Therefore, our current knowledge of ALK-dependent resistance mechanisms is
based so far on just 4 patients. Gambacorti Passerini et al. amplified the kinase domain of NPM1-ALK
from peripheral blood samples from two adult ALK+ ALCL patients and identified the presence of
ALKQ1064R, ALKI1171N and ALKM1328I through deep sequencing after crizotinib relapse128. In addition, in
section 3.4.5, we recently identified an ALKL1196M mutation by WES of tumour tissue from a crizotinib
and lorlatinib resistant paediatric ALK+ ALCL patient, while a further crizotinib resistant paediatric ALK+
ALCL patient did not have an ALK mutation nor a NPM1-ALK amplification hinting towards the possibility
of an existing bypass resistance mechanism301.
Beside those three studies, mechanistic investigations into treatment regimens for relapsed disease
have been focused on cell line-based models mostly established from tumour cells obtained from the
diagnostic biopsy of patients (COST, DEL, Ki-JK, SU-DHL-1)257 and cell lines or cell line xenografts
chronically exposed to ALK TKIs to render them resistant217,301,326–328,358,371,395,409,410–412. However, in vitro
culture conditions may cause rapid phenotypic and genotypic divergence of patient-derived cells from
the originating tumour413, and mouse xenografts utilising these cell lines have demonstrated limited
predictive power in translational research414,415. PDX models have evolved as powerful pre-clinical tools;
by maintaining the heterogeneity of patient tumours, PDX models allow for more clinically-relevant
insights into responses to treatment and development of therapy resistance416. For instance, the
Paediatric Preclinical Testing Program of the National Cancer Institute has shown improved prediction
of clinical response with PDX models as opposed to cell line xenografts417. Immunodeficient mice
including athymic nude mice, severe combined immunodeficiency (SCID), nonobese diabetic (NOD)-
SCID, and recombination-activating gene 2 (Rag2)-knockout mice have been used to establish
xenograft models418. The use of NOD/SCID mice with interleukin-2 receptor subunit gamma (IL2RG)

106
mutations (NSG) has proven to be effective across a range of cancers including those of lymphoid
origin413. However, the replacement of human stromal components by murine elements as well as the
lack of interaction between immune cells and tumour cells are major disadvantages249.
Although transgenic mouse models would provide these tumour-stroma-immune interactions, they are
not of human origin413. In addition, the development of genetically engineered mouse models
representing ALK+ ALCL has been challenging. Transgenic murine models which express NPM1-ALK
driven by vav419/CD2420 promoters or conditionally express ALK using the tetracycline system driven by
the EμSRα promoter421 developed B-cell lymphomas.. Chiarle et al. developed a murine model which
expressed NPM1-ALK under the CD4 promoter, therefore restricting NPM1-ALK to T cells422. This model
still did not fully mimic ALK+ ALCL, with largely thymic-restricted tumours although cells did express
CD30422. A cre-lck promoter chimeric model produced thymic T-cell lymphomas with CD30
expression423,424. However, this model relies on ex vivo retroviral transduction; accordingly new mice
have to be generated for each study with this model424. The closest ALCL mimic to date was developed
in the Turner lab again expressing NPM1-ALK from the T cell specific CD4 promoter, but backcrossed
to the class I-restricted Ova-specific T-cell receptor (TCR) transgenic line OT1425. As in human ALCL,
tumours arising in these mice lack cell surface expression of the TCR complex. However, NPM1-ALK
is expressed at all stages of thymocyte development and is therefore not exclusive to CD4 single positive
T cells. In addition, tumours arising in these mice variably express CD4, CD8 or CD4 in combination
with CD8425. Therefore, until the use of humanized PDX models becomes cost-effective, the use of
PDXs in NSG mice offers the best platform for discovery and testing of targeted therapies for tumours
showing poor responses to multi-agent chemotherapy and allogenic SCT.
The first PDX model of paediatric ALK+ ALCL was developed by Kadin and colleagues256. Here we add
to this by developing a unique PDX and cell line resource from ALK+ ALCL patients at or before CNS
relapse compromising a subgroup of patients with unmet clinical need where no models currently exist
to the best of our knowledge256,312.
5.1.1 Aims
This chapter aims to:
• Establish PDXs of liquid biopsy samples obtained from crizotinib resistant and chemotherapy
relapsed/refractory ALCL patients.
• Establish cell lines from the PDX tumours
• Determine whether the PDX model that was established from a crizotinib resistant patient maintains
its crizotinib resistance in vivo
• Determine whether the crizotinib resistant PDX model and/or cell line is sensitive to second
generation ALK inhibitors

107
5.2 Patient treatment history and sample collection
Two paediatric ALK+ ALCL patient experienced relapse/refractory disease during frontline ALCL99
chemotherapy (Figure 31A, Table 16). Patient 1 further progressed with CNS involvement on
vinblastine treatment combined with intravenous and intrathecal chemotherapy. This is in line with a
previous publication, which reported that shorter time to relapse was the strongest predictor of
subsequent relapse98. Since this treatment was poorly tolerated and only an incomplete response
achieved, the patient commenced crizotinib treatment alongside intrathecal chemotherapy, achieving a
complete remission (CR). The patient then received an allogenic SCT but progressed rapidly thereafter.
The patient was re-treated with crizotinib until eventual progression, at which time we isolated
mononuclear cells (MCs) from a bone marrow sample and injected them subcutaneously into NSG mice
(Figure 31B, MGS-A-x). In line with a previous publication, which reported a three-year OS after CNS
relapse of 48.70% for paediatric ALK+ ALCL patients100, the patient sadly passed away 13 months after
diagnosis.
Patient 2 commenced crizotinib treatment with intrathecal chemotherapy due to continued refractory
disease, despite treatment including ALCL99 chemotherapy (Figure 31A, Table 16). We isolated MCs
from a pleural effusion sample obtained early in the disease course, before crizotinib initiation, and
injected them subcutaneously into NSG mice to establish a PDX model (Figure 31B, MTK-A-x).
Unfortunately, despite excellent initial response to crizotinib, with CR confirmed on imaging seven weeks
after initiation, Patient 2 relapsed with aggressive isolated CNS involvement shortly afterwards and sadly
died despite further intensive conventional intravenous chemotherapy (Figure 31A).
5.3 Brigatinib is effective in a PDX of crizotinib-resistant ALK+ ALCL
Tumours were established in the mice from the MCs within 3 months and were confirmed by IHC to be
positive for ALK and CD30 expression (Figure 31C). Next, to test the response of PDX tumours to ALK
inhibitors in a high-throughput manner, we established cell lines from the PDX tumours of patients 1
(MGS) and 2 (MTK) (Figure 31B). In line with the clinical characteristics of the patients (Figure 31A,
Table 16), MGS was less sensitive to crizotinib as compared to MTK (Figure 31D). In addition, while
MGS was also less sensitive to ceritinib, the second generation ALK inhibitors alectinib, brigatinib and
lorlatinib were effective (Figure 31D).

108
Figure 31 Established cell lines maintain crizotinib responsiveness of the original tumour (A) Schema of the treatment history of the ALK+ ALCL patient with refractory disease on ALCL99 chemotherapy (Patient 2) or on ALCL99 chemotherapy and ALK targeted therapy (Patient 1). BV = Brentuximab vedotin, VBL = vinblastine. See Table 16 for further patient details. (B) Schema of the PDX and cell line generation. Mononuclear cells (MCs) were isolated from bone marrow (Patient 1) or pleural effusion (Patient 2) samples and injected subcutaneously into NSG mice to establish a PDX model of ALK+ ALCL. Cell lines were established from the PDX tumours. (C) Representative haematoxylin and eosin staining (400×) with corresponding ALK and CD30 IHC (400×) performed on sections of the diagnostic tumour compared with the PDX tumour (passage ≤3) and the corresponding established cell line (passage ≤10). (D) Viability of indicated cell lines based on normalized CellTiter-Blue fluorescence reads on exposure to increasing concentrations of ALK inhibitors for 48 hours. Data are means ± SD of technical replicates. Reproduced from Prokoph & Matthews et al. (unpublished).

109
Since brigatinib is due to be tested in the next EICNHL trial (personal communication with Dr. Suzanne
Turner) and crizotinib has been trialled63,64,66,70,117 in paediatric ALK+ ALCL patients that relapsed from
chemotherapy (NCT00939770, NCT01606878, NCT01979536, NCT02304809, UMIN000028075,
ITCC053) we selected the two ALK inhibitors for in vivo investigation (Figure 32).
Tumour-bearing MGS-A-x NSG mice were treated daily by oral gavage with either vehicle (PBS, 10%
DMSO), crizotinib (100 mg/kg), or brigatinib (25 mg/kg). To better simulate an advanced disease stage,
we started treatment when tumours reached 400 mm3 in volume.
The ALK inhibitor concentrations used were based on the findings of previous in vivo studies carried out
by the European Medicines Agency 426. The crizotinib dose used converts to a human equivalent dose
of 301,8 mg/m2 using conversion formulars based on Freireich et al.427 and assuming a child weight of
20 kg and a mouse weight of 0.033 kg, as recommended by the FDA428. This dose is comparable to
165 mg/m2 used in the ongoing AcSé trial126 (NCT02034981), COG-ANHL12P1 trial (NCT01979536)
and the completed COG-ADVL0912 trial (NCT00939770). Mice were euthanized once tumours reached
15 mm in any direction. The study was stopped after 21 days of consecutive treatment.
Brigatinib led to a reduction in the mean tumour volume compared to the baseline level, and relative to
either vehicle or crizotinib treatment (Figure 33A). While 5/8 mice that were treated with brigatinib
showed a CR, 7/8 mice that were treated with crizotinib presented with tumour progression (Figure
33B). Survival analysis showed a significant increase in EFS for animals treated with brigatinib relative
to vehicle (HR 0.07, p = 0.0179), but not for animals treated with crizotinib relative to vehicle (HR 1.09,
p = 0.882) (Figure 33C), where an event was defined as a tumour reaching 15 mm in any one direction.
Brigatinib was well-tolerated, with no significant decrease in body weight or lethal toxicity observed
compared to either vehicle (p = 0.4263) or crizotinib (p = 0.6407, Figure 33D).
5.4 Discussion
There are two ways in which PDX models can be used to investigate treatment-resistant cancer: (i) PDX
models can be derived from patient samples at the time of treatment resistance or (ii) PDX models can
be developed from pretreatment tumour samples and resistance can be modelled in the PDX via artificial
exposure to the drug429. Here we successfully established two PDX models from liquid biopsies of multi-
agent chemotherapy-refractory (Patient 2, MTK-A-x), and both multi-agent chemotherapy-refractory and
crizotinib resistant (Patient 1, MGS-A-x) paediatric ALK+ ALCL patients.
PDX models have been shown to retain the drug-sensitivity of the engrafted patient tumour, although
PDX models of melanoma430,431 and lung adenocarcinoma242 became sensitive after xenografting due
to the imposed 'drug holiday'. While this may suggest that treatment-resistant PDXs should be
propagated under the continuous selective pressure of treatment, this might on the other hand lead to
the selection of subclones ultimately resulting in genetic differences between the PDX tumour and the
original patient tumour429. Here, we show that although the MGS-A-x PDX model was established under
a 'drug holiday' it retained the crizotinib-resistance profile of the corresponding patient tumour.

110
Figure 32 Tumour volume over time in MGS-A-x PDX mice Tumour volume over time in MGS-A-x PDX mice administered with brigatinib (25 mg/kg; n = 8; mice D1-D8), crizotinib (100 mg/kg; n = 8; ,mice E1-8) or vehicle (PBS, 10% DMSO; n = 8; mice F1-F8) daily by oral gavage once tumours reached 400 mm3 in volume. Tumours were measured daily with manual calipers and tumour volumes estimated using the modified ellipsoid formula: V = ab2/2, where a and b (a > b) are length and width measurements. Mice were euthanized once tumours reached the ethical limit of 15 mm in any direction. The study was stopped after 21 days of consecutive treatment. Mice were censored (*) due to tumour ulceration (mice E2, F5), sudden death (mice D3), self-mutilation (E8), sickness (D1) or if mice remained tumour-free after 21 days of consecutive treatment (D4-8). Modified from Prokoph & Matthews et al. (unpublished).

111
Figure 33 Brigatinib is effective in the treatment of a PDX of crizotinib-resistant ALK+ ALCL (A) Tumour volume over time in MGS-A-x PDX mice administered with vehicle (PBS, 10% DMSO; n = 8), crizotinib (100 mg/kg; n = 8) or brigatinib (25 mg/kg; n = 8) daily by oral gavage once tumours reached 400 mm3 in volume. Tumours were measured daily with manual calipers and tumour volumes estimated using the modified ellipsoid formula: V = ab2/2, where a and b (a > b) are length and width measurements. Mice were euthanised once tumours reached 15 mm in any direction. The study was stopped after 21 days of consecutive treatment. Data points represent mean ± SEM. (B) Percentage change of the tumour volume at the study endpoint against the baseline for individual tumour-bearing MGS-A-x mice (n = 8) represented as bars according to each treatment specified in (A). The study end point was reached once tumours reached 15 mm diameter in any direction or after 21 days of consecutive treatment. (C) Kaplan–Meier event-free survival according to each treatment group specified in (A) for tumour-bearing MGS-A-x mice, where survival is defined as the time taken for tumours to reach 15 mm diameter. The study endpoint was reached once tumours reached 15 mm diameter in any direction or after 21 days of consecutive treatment. P value determined by Cox proportional HR: Brigatinib vs vehicle (HR 0.07, p = 0.0179), crizotinib vs vehicle (HR 1.09, p = 0.882). See Figure 32 for MGS-A-x PDX mice that were censored. (D) MGS-A-x mouse body weight at the experiment end-point relative to the baseline per treatment group specified in (A). Data are represented as box plots with individual points representing each mouse (n = 8). P-values were determined by two-sample t-test. Modified from Prokoph & Matthews et al. (unpublished).
We utilised immunodeficient NSG mice for PDX establishment. Despite the importance of an absent
immune system to enable tumour engraftment, this is also one of the major limitations of NSG mouse
models given the important role the tumour microenvironment (TME) plays in cancer. It will be necessary
for ALK+ ALCL PDX models to possess a human immune system to facilitate the study of immune-
cancer cell interactions and preclinical assessment of cancer immune therapies for the following
reasons. Firstly, the anti-CD30 antibody armed with the antimicrotubule agent monomethyl auristatin E
(MMAE) - BV – may be introduced as a frontline treatment either in combination with crizotinib
(NCT02729961) or with the ALCL99 chemotherapy backbone (NCT01979536). Both multi-agent
chemotherapy432,433,434,435 and ALK inhibitors436,437 have been shown to have immune stimulatory
potential. Secondly, Nivolumab is being investigated as a treatment option for ALK+ ALCL patients that
have failed both chemotherapy and ALK inhibitor treatment (NCT03703050).

112
Humanized mice are immunocompromised mice in which a competent human immune system has been
introduced. They can be developed by transplantation of (i) total peripheral blood from human healthy
donors or patients, (ii) transplantation of tumour-infiltrating lymphocytes into immunodeficient mice or
(iii) the transplant of CD34-positive human hematopoietic stem cells or precursors, either alone or in
combination with additional human immune tissues into immunodeficient mice429,438. However, they are
not in common use as they are highly expensive.
Therefore, until the use of humanized PDX models becomes cost-effective, we propose MGS-A-x as a
model of a multi-agent chemotherapy-refractory and crizotinib-resistant paediatric ALK+ ALCL to
examine responses to novel therapies and the development of therapeutic resistance.
We established the PDX via subcutaneous injection of MCs isolated from a bone marrow sample of a
patient after CNS relapse and this sub-group of patients comprises the most difficult to treat cases with
the 3-year OS for patients after CNS relapse being 48.7%100. Therefore, as a next step in the validation
process of the PDX model, it will be important to test whether metastasis can be detected in the brain
of the MGS-A-x mice. Subcutaneous PDX models are known to rarely metastasize439. Hence, IV
injections could be attempted in the future.
In vivo investigation of MGS-A-x showed that second generation ALK inhibitor brigatinib led to a
reduction in the mean tumour volume relative to crizotinib treatment. In future work, it will be interesting
to investigate the genetic and/or transcriptomic reasons why MGS-A-x shows resistance to crizotinib,
but sensitivity to brigatinib. Most likely, MGS-A-x harbours an ALK mutations, which renders ALK+ ALCL
tumour cells resistant to crizotinib, but not brigatinib. Based on published ALK-dependent resistance
mechanisms in ALK+ NSCLC, L1152P/R214, C1156Y214, F1174V/C/L214,218, G1123S, F1127L or
1151Tins214,210,223 are possible ALK mutations likely to be detected. Hence, the FDA-approved second
generation ALK inhibitor brigatinib could represent a treatment option for crizotinib-resistant ALK+ ALCL
patients harbouring this ALK mutation.

113
CHAPTER 6 Overexpression of PIM1 in
ALK+ malignancies decreases sensitivity to
brigatinib and ceritinib

114
6.1 Introduction
Deriving from precursor cells of the sympathetic nervous system, NB is the most common and deadly
extracranial solid tumour in children440,441. NB presents at various sites along the sympathoadrenal axis,
most commonly in the adrenal medulla or paraspinal ganglia442. Characterized by heterogeneous
biological and clinical features ranging from spontaneous regression to aggressive treatment-resistant
disease, NB is often referred to as a ‘clinical enigma’. While low- and intermediate-risk forms of NB are
highly curable, over half of patients with high-risk disease suffer relapse and five-year survival is 40–
50%443. Therefore, novel treatment strategies aimed at providing long-term disease remission are
urgently sought.
ALK is the most commonly mutated gene in NB, where gain-of-function mutations in the kinase domain
are found in 8-10% of cases overall177,444 (Figure 4B). An additional 2-3% of patients harbor focal
amplification of ALK, and this feature correlates with poor survival177,444,445. Given the plethora of interest
in the development of ALK inhibitors in NSCLC, the assessment of these compounds in ALK-driven NB
quickly followed (Table 7). Numerous recent studies have demonstrated the efficacy of ALK inhibitors
against ALK-driven NB cell lines and PDXs446–448. Several of these studies have documented the de
novo resistance of the ALKF1174L mutation to crizotinib and ceritinib, and have devised combinatorial
treatment strategies to enhance efficacy221,446,449–451.
In patients with ALK+ NSCLC, acquired resistance has been shown to arise with first, second and third-
generation ALK inhibitors, presenting a major challenge in the long-term use of these compounds452.
The most common mechanisms of resistance to ALK inhibition in NSCLC are reported to involve bypass
signaling through functionally-related pathways385.
To identify mechanisms of resistance to ALK inhibitors in ALK-driven NB that involve bypass signaling,
Liam C. Lee and Ricky M. Trigg conducted genome-wide CRISPR overexpression screens271 in the NB
cell lines SH-SY5Y (ALKF1174L) and CHLA-20 (ALKR1275Q) under treatment with brigatinib or ceritinib for
14 days (Figure 8E). They identified putative resistance genes, of which the serine/threonine-protein
kinase PIM1 was chosen for further investigation.
PIM1 is a stress-response kinase with two isoforms being produced from alternative start codons453.
PIM1 expression is normally regulated by a wide variety of cytokines, including those involved in JAK-
STAT and NF-kB pathways454–456. Several oncogenic pathways have been identified as PIM1 targets457
including three pathways that facilitate inhibition of apoptosis457. Specifically, PIM1 phosphorylates the
pro-apoptotic protein BCL2 associated agonist of cell death (BAD), thereby decreasing its interaction
with the anti-apoptotic proteins B-cell lymphoma 2 (BCL2) and B-cell lymphoma extra-large (BCL-XL)458.
In addition, PIM1 phosphorylates apoptosis signal-regulating kinase 1 (ASK1), which reduces its kinase
activity. Inactivation of ASK1 leads to reduced phosphorylation of Jun N-terminal kinase (JNK) and p38,
which in turn results in reduced caspase 3 activation459. Finally, PIM1 phosphorylates proline-rich Akt
substrate of 40 kDa (PRAS40) inducing dissociation of PRAS40 from the mTOR complex (mTORC),
thereby upregulating mTOR and unbound PRAS40 activity460,461.
PIM1 expression has been associated with resistance to chemotherapy462–464 as well as molecularly
targeted agents465,466, but not previously for NB. Hence, we further investigated if overexpression of
PIM1 modifies sensitivity to ALK inhibition in ALK-related malignancies including NB and ALCL.

115
The data presented in this chapter of the thesis form sections of a publication in Nature Communications
(Trigg, Lee & Prokoph et al.)300, which can be found in Appendix 1.
6.1.1 Aims
This chapter aims to:
• Perform individual validation assays for each of the 25 candidate genes to confirm their capability
to induce resistance to ceritinib and brigatinib in SH-SY5Y/CHLA-20 cells
• Determine whether PIM1 expression is predictive of OS in NB patients
• Determine the clinical utility of pharmacologic inhibition of PIM1 alone or in combination with ALK
inhibitors
• Validate on-target effects of the CRISPR-based overexpression tool by reversing the resistant
phenotype with RNAi against PIM1
• Determine the effect of PIM1 overexpression on sensitivity of ALK+ ALCL cell lines to brigatinib and
ceritinib
6.2 Validation of candidate resistance genes in ALK-driven NB cells
exposed to ALK inhibitors identified in a genome-wide CRISPR-Cas9
overexpression screen
A genome wide sgRNA library containing 70,290 sgRNAs targeting 23,430 protein-coding genes271 was
used for an overexpression screen conducted by Liam C. Lee and Ricky M. Trigg. SH-SY5Y/CHLA-20
cells were transduced with the sgRNA library, selected in zeocin for 7 days (day 0) and then cultured
for 14 days (day 14) with brigatinib, ceritinib or DMSO, maintaining > 500 cells per sgRNA. Genomic
DNA was extracted from cells at days 0 and 14, and deep sequencing conducted to identify enriched
sgRNAs (Figure 8E). The read counts of two biological replicates were normalized for each sgRNA and
candidate resistance genes were defined as those targeted by at least two sgRNAs showing >1.5-fold
enrichment in ALK inhibitor-treated cells relative to DMSO treated cells300.
Afterwards, all 25 candidates identified from the genome-wide CRISPR-Cas9 overexpression screens
were functionally validated by transducing SH-SY5Y/CHLA-20 cells with two enriched sgRNAs
individually and by assessing their response to brigatinib or ceritinib (Figure 34). First, levels of gene
overexpression were assessed for all candidate genes by RT-qPCR (Figure 34A,D). Of the sgRNAs
targeting 25 different genes, 76% (38/50) induced a significant increase in the ED50 concentration for
both brigatinib and ceritinib in SH-SY5Y (p < 0.05) (Figure 34B-C), and 24 genes were validated. Similar
data were obtained for the CHLA-20 cell line (Figure 34E-F), while MET was the top-ranking resistance
gene. Five druggable genes were identified that may be amenable to either direct targeting (PIM1,
PIK3CD and MET) or indirect targeting (KRAS and MYC). Given substantial evidence in the literature
that PIM1 mediates resistance to standard chemotherapy462–464 as well as molecularly targeted
agents465,466 and that high expression of PIM1 is a poor prognostic indicator in multiple cancers467–469,
this gene was explored further.

116
Figure 34 Validation of CRISPR dCas9 overexpression screen hits in SH-SY5Y and CHLA-20 cells (A, D) RT-qPCR based gene expression in SH-SY5Y/CHLA-20 cells transduced with sgRNAs targeting candidate resistance inducing genes. Data were normalized to cells treated with NT sgRNA. Data represent mean ± SEM of technical triplicates. (B, E) Log10 transformed ED50 values from 96-hour dose response curves of (B) SH-SY5Y or (E) CHLA-20 cells treated with brigatinib or ceritinib five days post transduction with sgRNA molecules targeting
each indicated candidate gene, ns = not significant, *p< 0 05, **p< 0 001, ***p< 0 0001 (one-way ANOVA). Data
points represent mean SD of triplicates. (C, F) Representative 96-hour dose response curves of (C) SH-SY5Y or (F) CHLA-20 cells transduced with MET or non targeting sgRNAs. Data were analyzed for significance by one-way ANOVA. Data represent means +/- SEM of technical triplicates. Reproduced from Trigg, Lee & Prokoph et al.300.
PIM
1
BDNF
CO
PZ2
CYBL
EG
R4
EM
L2
ETV
1
FAIM2
FOXP
1
KRAS
MET
MFSD
2A
MYC
NIN
NKX2-
4
NPY
PIK
3CD
PRRX2
RRAS
SAG
E1
SEM
A4A
SLC
7A3
SSBP3
SURF2
UTF1
non-
targ
eting
2.0
2.5
3.0 sgRNA 1
sgRNA 2
sgRNA-targeted candidate genes, brigatinib
Lo
g1
0 E
D5
0 (
nM
)
***
*** **
*n
s
***
*n
sn
s
***
***
***
***
***
*
***
ns
***
***
***
***
***
***
***
***
** ***
ns
ns
***
***
***
***
ns
*
*** ***
***
***
***
****
* ***
ns
***
***
ns
***
***
ns
***
PIM
1
BDNF
CO
PZ2
CYBL
EG
R4
EM
L2
ETV
1
FAIM2
FOXP
1
KRAS
MET
MFSD
2A
MYC
NIN
NKX2-
4
NPY
PIK
3CD
PRRX2
RRAS
SAG
E1
SEM
A4A
SLC
7A3
SSBP3
SURF2
UTF1
non-
targ
eting
2.0
2.5
3.0
sgRNA 1
sgRNA 2
sgRNA-targeted candidate genes, ceritinib
Log
10 E
D50
(nM
)
ns
***
***
***
***
***
ns
ns
***
ns
***
*** **
***
* ***
ns
***
*
***
***
***
***
***
***
***
**n
s
* *n
s
*
***
***
***
***
***
ns
ns
ns
ns
***
***
ns
ns
ns*
***
**
***
*
PIM
1
BDNF
CO
PZ2
CLY
BL
EG
R4
EM
L2
ETV
1
FAIM2
FOXP
1
KRAS
MET
MFSD
2A
MYC
NIN
NKX2-
4
NPY
PIK
3CD
PRRX2
RRAS
SAG
E1
SEM
A4A
SLC
7A3
SSBP3
SURF2
UTF1
0
2
4
6
8
10
100
200
300
20000
40000
60000
80000
100000 sgRNA 1F
old
-chan
ge
gen
e e
xpre
ssio
n
(rela
tive t
o n
on-t
arg
eting
sg
RN
A)
sgRNA 2
A
B
0 1 2 3
0
50
100
p < 0.0001
MET sgRNA
NT sgRNA
Log10 [ceritinib], (nM)
Cell
viabili
ty (
%)
0 1 2 3
0
50
100
p < 0.0001
MET sgRNA
NT sgRNA
Log10 [brigatinib], (nM)
Cell
viabili
ty (
%)
C
SH
-SY
5Y
PIM
1
BDNF
CO
PZ2
CLY
BL
EG
R4
EM
L2
ETV
1
FAIM2
FOXP
1
KRAS
MET
MFSD
2A
MYC
NIN
NKX2-
4
NPY
PIK
3CD
PRRX2
RRAS
SAG
E1
SEM
A4A
SLC
7A3
SSBP3
SURF2
UTF1
non-
targ
eting
0
1
2
3
4 sgRNA 1
sgRNA 2
sgRNA-targeted candidate genes, brigatinib
Lo
g1
0 E
D5
0 (
nM
) ***
***
***
ns
ns
ns
*
***
***
***
ns
***
***
***
***
***
*** **
*
******
nsn
s
***
***
ns
****
*** **
*
*** **
****
ns
***
ns
***
ns
***
*** **
* ***
***
ns
***
***
ns n
s ns
ns
ns
D
PIM
1
BDNF
CO
PZ2
CLY
BL
EG
R4
EM
L2
ETV
1
FAIM2
FOXP
1
KRAS
MET
MFSD
2A
MYC
NIN
NKX2-
4
NPY
PIK
3CD
PRRX2
RRAS
SAG
E1
SEM
A4A
SLC
7A3
SSBP3
SURF2
UTF1
02468
1012
200
400
600
800
1000
100000
200000
300000
400000
500000 sgRNA 1
Fold
-chan
ge
gen
e e
xpre
ssio
n
(rela
tive t
o n
on-t
arg
eting
sg
RN
A)
sgRNA 2
E
PIM
1
BDNF
CO
PZ2
CYBL
EG
R4
EM
L2
ETV
1
FAIM2
FOXP
1
KRAS
MET
MFSD
2A
MYC
NIN
NKX2-
4
NPY
PIK
3CD
PRRX2
RRAS
SAG
E1
SEM
A4A
SLC
7A3
SSBP3
SURF2
UTF1
non-
targ
eting
0
1
2
3
4
5 sgRNA 1
sgRNA 2
sgRNA-targeted candidate genes, ceritinib
Log
10 E
D50
(nM
)
ns **
*
***
***
***
ns
ns
***
ns **
****
***
***
***
***
* ** ***
***
***
*** **
*
***
ns
*
ns
***
***
***
*****
nsn
s
ns
ns
***
ns
ns ns
*
*
ns
ns
***
ns ns
ns **
*
ns
ns
0 1 2 3
0
50
100
Log10 [ceritinib], (nM)
Cell
viabili
ty (
%)
NT sgRNA
MET sgRNA
p < 0.0001
0 1 2 3
0
50
100
Log10 [brigatinib], (nM)
Cell
viabili
ty (
%)
NT sgRNA
MET sgRNA
p < 0.0001
F
CH
LA
-20

117
6.3 PIM1 inhibition enhances the sensitivity of high-risk aberrant ALK-
expressing NB to ALK inhibition regardless of MYCN status
6.3.1 High expression of PIM1 in NB is associated with advanced, high risk disease
independent of MYCN amplification
Recently, Brunen et al.470 identified PIM kinases as potential therapeutic targets in NF1 wild-type NB
and demonstrated that high PIM expression is associated with poorer OS in NB patients. In support of
PIM1 as a prognostic biomarker, we found its high expression to be significantly associated with worse
OS in an independent cohort of NB patients (n = 498) (Figure 35A)364. Interestingly, PIM1 transcript
level serves as a prognostic biomarker independent of MYCN status in this cohort (Figure 35B-D).
However, as reported by Brunen et al.470, we also found MYCN amplification to be a stronger predictor
of poor prognosis than PIM1 (Figure 35A-B).
Figure 35 High expression of PIM1 in NB is associated with advanced, high risk disease independent of MYCN amplification (A-D) NB patients (n = 498) were divided into two groups according to (A) PIM 1 expression, (B) MYCN amplification status, (C) PIM1 expression in MYCN- patients or (D) PIM1 expression in MYCN+ patients and the difference in median OS (log-rank test, Bonferroni corrected) was analyzed using the Kaplan–Meier estimator. Reproduced from Trigg, Lee & Prokoph et al.300.
6.3.2 Inhibition of PIM1 alone lacks potency in ALK-expressing NB but enhances the
efficacy of ALK inhibitors
The activity of the pan-PIM inhibitor AZD1208471 (with greatest potency for PIM1) was then determined
in ALK-driven NB cell lines by 72-hour dose-response assays (Figure 36A-B). Consistent with data
reported by Brunen et al.470, cell lines were relatively insensitive to AZD1208471 at clinically-relevant
concentrations, with predicted ED50 values exceeding 10 µM in 8/8 NB cell lines expressing a range of
ALK mutants (Figure 36A). Similar results were noted in response to treatment with IBL-PIMi, another
small-molecule pan-PIM kinase inhibitor in preclinical development (Figure 36B), suggesting that
pharmacological inhibition of PIM kinases alone is not a viable therapeutic strategy. The response of
ALK- NB cell lines to AZD1208 and IBL-PIMi was likewise analyzed and a similar response was
observed, indicating that the response to PIM inhibitors is independent of ALK status (Figure 36C-D).
0 50 100 150
0
20
40
60
80
100
Follow up (months)
Ove
rall
su
rviv
al (%
)
low (n = 70)
high (n = 22)
p = 0.15
MYCN+
0 50 100 150 200 250
0
20
40
60
80
100
Follow up (months)
Ove
rall
su
rviv
al (%
) low (n = 300)
high (n = 101)
p = 0.0018
MYCN-
BA
0 50 100 150 200 250
0
20
40
60
80
100
Follow up (months)
Ove
rall
su
rviv
al (%
)
low (n = 383)
high (n = 115)
p = 0.00062
0 50 100 150 200 250
0
20
40
60
80
100
Follow up (months)
Ove
rall
su
rviv
al (%
)
MYCN-
MYCN+
p < 0.0001
DC
PIM1
PIM1
PIM1
PIM1
PIM1
PIM1

118
Figure 36 Response of ALK+ and ALK- NB cell lines to PIM inhibition (A, B) 72-hour dose-response assays for (A) ALK+ or (B) ALK- NB cell lines treated with AZD 1208 or IBL-PIMi.
Data represent means +/- SEM of technical triplicates. Reproduced from Trigg, Lee & Prokoph et al.300.
Recent human dose-escalation studies have displayed general tolerability for the PIM inhibitor
AZD1208471, which prompted the assessment of combined ALK and PIM1 inhibition in our study. To this
end, cell viability following 72 hours exposure to AZD1208 in combination with brigatinib or ceritinib in
KELLY (MYCN-amplified) cells using dose-response matrices in a log-scale format was analysed. The
drug interactions were characterized using the Bliss Independence model362. A wide range of Bliss
combination index (CI) values were determined across the concentration ranges for both ALK inhibitors,
but for the most part CI values were <1, indicative of mild synergy between ALK and PIM inhibition
(Figure 37).
Figure 37 ALK inhibitors and AZD1208 exhibit mild synergism in KELLY cell lines Heat maps representing the viability of KELLY cell lines based on normalized CellTiter-Blue fuorescent reads on exposure to log scale (0, 1, 3, 10, 30, 100, 300, 1000, 3000 nM) concentrations of AZD1208 and ALK inhibitors (brigatinib, ceritinib) for 72 hours. Drug doses used span upon and below the publicly available EC50 values of the individual drugs used446. Numbers indicate the Bliss combination index (CI) values for each dose pair. The Bliss independence model362 was used to calculate CI values. CI= (Ea+Eb-((Ea*Eb))/Eab, where Ea indicates the viability effect of drug A (ALK inhibitor), Eb indicates the viability effect of drug B (AZD1208) and Eab indicates the viability effect of the drug combination. CI < 1 indicates synergism, CI = 1 indicates additivity and CI > 1 indicates
antagonism. Synergistic dose combinations (threshold ≤ 0 95) are shown in italic. Data points are representative of
two independent experiments. Reproduced from Trigg, Lee & Prokoph et al.300.
B
A
ALK+
0 1 2 3 4
50
60
70
80
90
100
110
Log10 [AZD1208] (nM)
Cell
viabili
ty (
%)
SH-SY5Y
CHLA-90CHLA-20
COG-N-426KELLYLAN-5
CHLA-95
NB-1643
0 1 2 3 4
50
60
70
80
90
100
110
Log10 [IBL-PIMi] (nM)
Cell
viabili
ty (
%)
CHLA-90
COG-N-426
CHLA-20
KELLYLAN-5
CHLA-95
SH-SY5YNB-1643
0 1 2 3 4
50
60
70
80
90
100
110
Log10 [AZD1208] (nM)
Cell
viabili
ty (
%)
CHLA-171GIMENLAN-6NBL-SNGP
0 1 2 3 4
50
60
70
80
90
100
110
Log10 [IBL-PIMi] (nM)
Cell
viabili
ty (
%)
CHLA-171GIMENLAN-6NBL-SNGP
ALK-
1000 - 0.94 0.89 0.94 0.99 1.02 1.01 0.99
600 - 1.00 0.95 0.97 1.00 1.03 1.01 0.99
300 - 1.00 0.93 0.96 1.00 1.04 1.01 0.99
100 - 0.99 1.04 1.01 1.07 1.06 1.01 0.98
60 - 1.22 0.96 0.96 1.03 1.04 1.02 0.98
30 - 1.21 0.91 1.05 1.02 1.03 1.02 1.00
10 - 0.80 0.83 1.00 0.95 1.01 1.00 1.00
0 - - - - - - - -
0 10 30 60 100 300 600 1000
1000 - 0.91 0.92 0.93 0.98 1.01 1.00 0.99
600 - 0.92 0.92 0.95 1.00 1.02 1.01 0.99
300 - 0.89 0.89 0.92 0.97 1.02 1.00 0.99
100 - 1.19 0.95 0.92 0.97 1.06 1.02 0.98
60 - 1.29 1.18 1.05 1.14 1.15 1.12 1.00
30 - 1.02 1.18 1.03 1.06 1.08 1.02 1.00
10 - 0.87 0.94 0.91 0.99 1.04 0.99 0.97
0 - - - - - - - -
0 10 30 60 100 300 600 1000
AZ
D1208 (
nM
)
Brigatinib (nM)
AZ
D1208 (
nM
)
Ceritinib (nM)
Cell
viability
100%
0%

119
6.3.3 Knockdown of PIM1 sensitizes NB cells to ALK inhibitors
As AZD1208 is a pan-PIM kinase inhibitor, KELLY (MYCN-amplified) cells were transduced with a PIM1-
targeting shRNA to confirm the specificity of the potentiation effects described above. We achieved an
approximate 50% reduction in PIM1 expression as confirmed by RT-qPCR (Figure 38A). PIM1
knockdown increased the sensitivity of cells to brigatinib and ceritinib, indicated by a significant decrease
in ED50 concentrations after 72 hours of treatment (p < 0.0005) (Figure 38B).
Figure 38 Knockdown of PIM1 sensitizes NB cells to ALK inhibitors (A) Analysis of PIM1 levels by RT-qPCR in KELLY cells with shRNA-mediated knockdown of PIM1. NT=non-targeting. RT-qPCR data represents the means + SD of triplicate experiments. (B) 72-hour dose-response assays following brigatinib or ceritinib exposure in KELLY cells treated with PIM1-targeting and non-targeting (NT) shRNA. Data points represent the mean of triplicate experiments. ED50 values were compared by an unpaired Student’s t-test. Reproduced from Trigg, Lee & Prokoph et al.300.
6.4 Overexpression of PIM1 in ALK+ ALCL cell lines decreases
sensitivity to ALK inhibitors
Given that a strong synergistic effect was previously shown on simultaneous inhibition of ALK and PIM
kinases in ALK+ ALCL cell lines472, overexpression of PIM1 was induced and sensitivity to ALK inhibitors
monitored in ALK+ ALCL cell lines. K299 and SU-DHL-1 cells were transduced to express the dCas9-
VP64/MS2-P65-HSF1 components whose activity was confirmed (Figure 11) before assessing their
responses to brigatinib or ceritinib upon overexpression of PIM1. Indeed, overexpression of PIM1 led to
drug resistance, evidenced by significant increases in the brigatinib ED50 (p < 0.01) and ceritinib ED50
(p < 0.001) (Figure 39). Therefore, PIM1 is a potential ALK inhibitor-resistance driver in ALCL and is
worthy of further exploration.
BA
0 1 2 3 4
0
50
100 NT shRNA
PIM1 shRNA
IC50
Non-targeting shRNA
297.1
PIM1 shRNA
81.55
p < 0.0001
Log10 [ceritinib], (nM)
Cell
viabili
ty (
%)
NT s
hRNA
PIM
1 shR
NA 1
PIM
1 shR
NA 2
0.0
0.5
1.0
Fold
-change
PIM
1 e
xp
ressio
n
CA
0 1 2 3 4
0
20
40
60
80
100
Log10 [brigatinib], (nM)
Cell
viabili
ty (
%)
PIM1 shRNA 1NT shRNA
PIM1 shRNA 2
***
**p = 0.0004
**p < 0.0001
0 1 2 3 4
0
20
40
60
80
100
Log10 [ceritinib], (nM)
Cell
viabili
ty (
%)
PIM1 shRNA 1NT shRNA
PIM1 shRNA 2
p < 0.0001
NT s
hRNA
PIM
1 shR
NA 1
0.0
0.5
1.0
Fold
-change
PIM
1 e
xp
ressio
n
0 1 2 3 4
0
50
100NT shRNA
PIM1 shRNA
IC50
Non-targeting shRNA
295.8
PIM1 shRNA
99.51
p < 0.0005
Log10 [brigatinib], (nM)
Cell
via
bili
ty (
%)
CHLA-20
KELLY
DB

120
Figure 39 Overexpression of PIM1 in ALK+ ALCL cell lines decreases sensitivity to ALK inhibitors (A) Expression of PIM1 in K299 and SU-DHL-1 cells 5 days post-transduction with PIM1-targeted sgRNA relative to NT sgRNA, as determined by RT-qPCR. Data points represent the mean +/- SEM of triplicate experiments. (B) 48-hour dose-response assay of brigatinib or ceritinib in K299 and SU-DHL-1 cells treated with PIM1-targeting and NTsgRNA. Data points represent the mean +/- SEM of triplicate experiments. ED50 values were compared by unpaired Student’s t-test. Reproduced from Trigg, Lee & Prokoph et al.300.
6.5 Discussion
This work has expanded on the findings of previous publications investigating ALK inhibitor resistance
mechanisms in NB446,473,474; AXL activation was identified by a phospho-proteomic assay in NB cell lines
rendered resistant to ALK inhibitors through continuous exposure to increasing concentrations of
drugs473, whereas MYCN overexpression was noted as a resistance mechanism in another study446. Of
note, neither MYCN nor AXL were among the resistance driver candidates identified. This may be due
to insufficient overexpression of MYCN or AXL induced by the CRISPR-dCas9-VP64 platform as
variable overexpression levels were observed for different genes. Ultimately, the in vitro studies
conducted to date are potentially predictive of resistance mechanisms in patients but until more children
with NB have been treated with ALK inhibitors and biopsy material is taken for study at relapse, CRISPR
screens, whilst having their caveats offer the best approach for global, unbiased screening for resistance
mechanisms. Among the validated genes mediating sensitivity to ALK inhibition in the two tested NB
cells were genes known to mediate resistance in other ALK+ malignancies. Activation of MET has
previously been shown to confer resistance to alectinib in ALK+ NSCLC475. Two are known to be
activated downstream of ALK, namely KRAS and PIK3CD. Copy number gain and mutational activation
of KRAS at codon 12 has been shown to confer resistance to crizotinib and ceritinib in ALK+
NSCLC234,370. Similarly, mutational activation of PIK3CA is reported as a resistance mechanism to
alectinib and ceritinib in these patients216,243. Interestingly, we identified a resistance gene (MFSD2A)476
encoding a sodium-dependent transporter of fatty acids expressed in brain endothelium, in both SH-
SY5Y and CHLA-20 cells treated with brigatinib or ceritinib, most likely functioning as an efflux pump for
ALK inhibitors although this remains to be investigated further.
BA
K29
9
SU-D
HL-
1
0
2
4
6
8
Fold
-in
cre
ase
PIM
1 e
xp
ressio
n
0 1 2 3 4
0
50
100
Log10 [brigatinib], (nM)
Cell
viabili
ty (
%)
NT sgRNA
PIM1 sgRNA
p < 0.01
0 1 2 3 4
0
50
100
Log10 [brigatinib], (nM)
Cell
viabili
ty (
%)
PIM1 gRNA
NT sgRNA
p < 0.0001
0 1 2 3 4
0
50
100
Log10 [ceritinib], (nM)
Cell
viabili
ty (
%)
NT sgRNA
PIM1 gRNA
p < 0.001
0 1 2 3 4
0
50
100
Log10 [ceritinib], (nM)
Cell
via
bili
ty (
%)
NT sgRNA
PIM1 sgRNA
p < 0.0001
K299
SU-DHL-1

121
MET was the only putative resistant gene common to all ALK inhibitors. Given that crizotinib is a potent
inhibitor of MET475 and can overcome ALK inhibitor resistance driven by activation of MET in NSCLC477,
we chose to focus instead on PIM1 whereby high PIM1 gene expression levels were found to be
associated with advanced, high-risk disease and poor survival outcomes on analysis of published
datasets363,364.
In addition to validating PIM1 as a resistance gene in NB cell lines, we sought to determine whether
PIM1 induces resistance to ALK inhibition in another ALK-driven paediatric cancer, namely ALCL. Of
the transgenic mice expressing PIM1 and MYC under control of the immunoglobulin heavy chain
enhancer that were cross-bred, the double transgenic mice developed T-lymphomas around birth. This
established the oncogenic nature of PIM1 and its cooperation with MYC in the formation of lymphoid
tumours478. Indeed, overexpression of PIM1 in ALK+ ALCL cell lines decreased sensitivity to brigatinib
and ceritinib, consistent with results published previously demonstrating robust synergy between a
small-molecule pan-PIM inhibitor and crizotinib in ALCL cell lines472. Therefore, further studies
investigating the potential for combined PIM and ALK inhibition in other ALK+ malignancies are
warranted.
We assessed the in vitro responses of both ALK-driven and ALK-negative NB cells to several small-
molecule pan-PIM kinase inhibitors and found that cells were relatively insensitive after 72 hours of
exposure. However, knockdown of PIM1 by RNAi sensitized cells to ALK inhibition and the combination
of ALK inhibitors with AZD1208 demonstrated mild synergy. Therefore, our data suggest that PIM1
induces resistance to ALK inhibitors in NB cell lines and demonstrate the potential for combined
pharmacological inhibition of ALK and PIM1 in patients with ALK-driven, high-risk NB.
However, the mechanism of how overexpression of PIM1 modifies sensitivity to ALK inhibition remains
to be determined. Published studies on PIM1 overexpression in other cancer types provide possible
suggestions. Studies of hematological malignancies479, gastric cancer480 and head and neck cancer481
have demonstrated that aberrant expression of PIM1 was associated with poor survival. PIM1
overexpression associated with LN metastasis, histology and poor clinical outcome in both lung
adenocarcinoma and squamous cell carcinoma482, while it appeared to be a favorable prognostic factor
in pancreatic cancer483. Furthermore, PIM1 has emerged as a driver of drug resistance in various cancer
types478,484 including T-cell lymphomas (TCLs) and EBV positive lymphomas 485,486, DLBCL466, acute
myeloid leukemia (AML)463,487, breast cancer488,489, prostate cancer490 and ovarian cancer491. More
specifically, three studies on lung adenocarcinoma492, prostate cancer490 and adult T-cell leukemia
(ATL)493 found that PIM1 is a central mediator of STAT3 signaling, two studies on chronic lymphocytic
leukaemia (CLL)494 and myeloproliferative neoplasms495 found that PIM1 triggered mTOR pathway
activity, three studies on lung adenocarcinoma492, breast cancer489 and prostate cancer496 found that
PIM1 potentiated PI3K/AKT signaling and one study on lung adenocarcinoma492 found that PIM1
potentiated RAS/ERK signaling. Furthermore, PIM1 overexpression in TCLs485 and ovarian cancer497
lead to upregulation of MYC. In addition, PIM1 affected NF-κB signaling in the ABC subtype of DLBCL466
and in prostate cancer490, while phosphorylation of MET was observed in lung adenocarcinoma492 and
prostate cancer496. Future investigations will tell which pathways are involved in mediating ALK inhibitor
resistance in ALK-driven, high-risk NB.

122
CHAPTER 7 Detection and clinical
significance of anti-ALK autoantibodies

123
7.1 Introduction
7.1.1 Humoral Immune Response against ALK in ALK+ ALCL
While ALK is highly expressed in the nervous system during embryogenesis3,498, it is almost absent in
developed tissues except in a few neurons within the CNS and in the spinal cord499. Aberrant expression
of tumour antigens that are not expressed in healthy tissue can induce the production of
autoantibodies500. Therfore, Karen Pulford and colleagues investigated whether a humoral immune
response against ALK in ALK+ ALCL patients exists88. An immunoperoxidase labelling technique for
NPM1-ALK transfectants (section 2.4) was used as a detection method. All analyzed (100%; 11/11
patients) ALK+ ALCL patients, but not healthy controls (n=5), had detectable anti-ALK antibodies
specific for the oncoantigen88. In a subsequent analysis by the same group, the presence of anti-ALK
autoantibodies in ALK+ ALCL patients was further confirmed at different time points after diagnosis89.
These results were confirmed by an independent group, which detected anti-ALK autoantibodies in
ALK+ ALCL patients (>80%, 25/28 patients)90. Importantly, patients who presented with higher anti-ALK
antibodies antibody levels prior to and after chemotherapy treatment, had a trend toward a reduced
relapse risk90. These results raised the possibility that the favorable prognosis of ALK+ ALCL could be
contributed to the activation of the immune system88.
This spurred an investigation into the clinical significance of anti-ALK autoantibody titres in a larger
patient cohort. In a combined effort, Woessmann and Pulford analyzed anti-ALK autoantibodies in 95
paediatric ALK+ ALCL patients that were recruited onto comparable short-pulse chemotherapy trials
(NHL-BFM9033/NHL-BFM9594) prior to treatment initiation. They confirmed that >90% of the ALK+ ALCL
patients had measurable anti-ALK autoantibody titers at diagnosis compared to 1/99 controls91. They
further categorized patients into low (≤1/750), intermediate (1/750 to <1/60,750) and high (≥1/60,750)
anti-ALK autoantibody titre groups. Interestingly, the magnitude of the antibody response inversely
correlated with relapse risk91. The cumulative incidence of relapse was 11 ± 6%/31 ± 8%/63 ± 10% for
patients in the high/intermediate/low titre group91.
Next, Woessmann and colleagues combined anti-ALK autoantibody titre and MDD39. This way ALK+
ALCL patients could be stratified into three biological risk groups (bRG): high risk (bHR): MDD-positive
and antibody titre ≤ 1/750, low risk (bLR): MDD negative and antibody titre >1/750, intermediate risk
(bIR): all remaining patients. PFS was 28%, 68% and 93% for bHR, bIR and bLR, respectively. Five
year OS was 71%, 83% and 98% for bHR, bIR and bLR39.
Finally, a systematic analysis of the course of anti-ALK autoantibody titres during treatment was
performed in 122 paediatric ALK+ ALCL patients that were recruited onto comparable short-pulse
chemotherapy studies (NHL-BFM9594/Associazione Italiana di Ematologia e Oncologia Pediatrica
(AIEOP) LNH‐9795/ALCL9928/NHL‐BFM 2012 registry)92. The EFS of paediatric ALK+ ALCL patients
with anti-ALK autoantibody titres of >1/750 at the end of therapy was 93 ± 5% compared to 65 ± 5% for
patients with anti-ALK autoantibody titres below this cut‐off92. They further categorized paediatric ALK+
ALCL patients according to the decrease in the anti-ALK autoantibody titre from diagnosis to the end of
therapy: patients with very low initial titres (≤1/250), patients who showed a titre‐decrease of maximal

124
two dilution steps (≤2) or patients who showed a titre‐decrease of more than two dilution steps (>2). 10-
year EFS was 52 ± 9%, 91 ± 5% or 70 ± 6% for patients in the ≤1/250, ≤2 or >2 group92.
7.1.2 Humoral Immune Response against ALK in ALK+ NSCLC
As ALK rearrangement and ALK upregulation have been described in other cancers, ALK might serve
as an embryonal tumour-associated antigen in other ALK+ malignancies. The first indication was
published by Chiarle and colleagues who demonstrated that ALK vaccination is not only effective in
preventing disease relapse in a murine tumour model of NPM1-ALK+ ALCL, but also in a murine tumour
model of EML4-ALK+ NSCLC142,501. One year later, a pilot study showed the presence of ALK
autoantibodies in the sera of 13/21 ALK+ NSCLC patients502. This observation was confirmed in an
independent study that detected anti-ALK autoantibodies in 9/53 ALK+ NSCLC patients, but not in 0/38
ALK- NSCLC patients503. The first study502 utilized an immunoperoxidase labelling technique for NPM1-
ALK transfectants (section 2.4) as the detection method, while the second study503 developed an
enzyme-linked immunosorbent assay (ELISA) to measure anti-ALK autoantibody levels in a mixed
population of treatment-naïve and ALK inhibitor/chemotherapy treated patients and detected anti-ALK
autoantibodies in 62%502 and 17%503 of ALK+ NSCLC patients, respectively. Although highly variable,
these data indicate that an ALK-specific immune response exists in a fraction of ALK+ NSCLC patients
with possible prognostic application. Although statistically not significant, ALK+ NSCLC patients with
higher anti-ALK autoantibody levels showed a trend towards more favorable OS outcomes503. However,
whether the presence of anti-ALK autoantibodies in ALK+ NSCLC patients confers a more favorable
prognosis warrants further investigation.
7.1.3 Aims
This chapter aims to:
• Develop a protein microarray assay to determine circulating anti-ALK autoantibody levels in serum,
plasma, and frozen whole blood
• Cross-validate the newly developed protein microarray with the old immunoperoxidase labelling
technique for NPM1-ALK transfectants using samples from treatment-naïve paediatric ALK+ ALCL
enrolled onto the ALCL-99 (NCT00006455) trial

125
7.2 A pipeline to quantify ALK autoantibody titres in ALK+ malignancies
Circulating ALK antibody titres have so far been evaluated using an immunoperoxidase labelling
technique for NPM1-ALK transfectants. However, the assay is labour-intensive, difficult to standardize
amongst multiple labs and subjective in interpretation leading to false positive results. Therefore, in
collaboration with Cambridge Life Sciences, a protein microarray assay was developed that can be fully
automated (Figure 40). The printing of the teflon mask and the functionalization of the glass slides were
outsourced. The antigen spotting took place at Cambridge Life Sciences. The analysis of microarray
slides was optimized for both an automated slide processor commonly available in hospitals and for
manual handling in research laboratories.
Figure 40 Production, quality control (QC) and processing of microarray slides Glass slides are masked with Teflon, the surface is functionalized for antigen binding with a 2-D Epoxy surface and labelled. Antigens are spotted with a picolitre droplet dispenser. In-process controls monitor the angle of the droplet dispersion before and after each individually dispensed antigen (QC1), and the successful spotting with water-sensitive slides that turn from yellow to blue (QC2). After the droplets are dispensed, the even distribution of the antigens is confirmed by scanning for a fluorescent dye that was included in the antigen dilution buffer (QC3). Two slides out of each print run are processed (QC4) either with an automated slide processor (e.g. ZENIT UP) or handled manually and scanned for fluorescent intensity (e.g. with a Zenit AmiDot reader) before the final product is used to evaluate patient samples.
water-sensitive
slides
Plane
glass slide
Glass slide
with teflon mask
Functionalized
glass slide
Functionalization
with 2-D Epoxy
surface
barcode
labellingPrinting of antigens
In-process
control
In-process
control
Scann for
fluorescent dye
included in
antigen dilution
bufferMonitoring of
droplet dispersion
with camera
Automated slide
processing
Scanning
Printing
of teflon
mask
Outsourced
Final
Product
QC2QC3 QC1
QC1-3
passedManual handling
QC4

126
7.2.1 2D-Epoxy is the best slide activation chemistry for antigen binding
As a first step in the optimization process, 2-dimensional (2D)-Epoxy, 3-dimensional (3D)-Epoxy, 3D-
N-Hydroxy succinimide (NHS), 2D-Aldehyde and 3D-Aldehyde functionalized glass slides were
evaluated for their ability to form covalent bonds with DyLight550 conjugated human IgG that was used
as a detection antibody in the final assay set-up (Figure 41). 2D-Epoxy surfaces showed the best
binding properties (Figure 41C) for coupling of biochemical species via nucleophilic groups such as
amines, thiols and hydroxyl groups via formation of a covalent bond (Figure 41B). Additionally, Epoxy
surfaces show better stability than NHS and Aldehyde surfaces as they are stable to temperatures of
40 °C and to humid conditions rendering them ideal for commercial production of slides. Unspecific
binding to surfaces with printed PBS blank (data not shown) occurred for 3D sides. Therefore, 2D-Epoxy
slides were chosen for further optimization.
Figure 41 Effect of slide activation chemistry (A) A cartoon demonstrating the 2-dimensional (2D) and 3-dimensional (3D) functional matrices that were tested. (B) Visual representation of the Epoxy (violet, orange), NHS (blue) and Aldehyde (green, red) functional groups that were tested. (C) Increasing concentrations of DyLight550 conjugated Hu-IgG were printed on 2D-Epoxy, 3D-Epoxy, 3D-NHS, 2D-Aldehyde, and 3D-Aldehyde functionalized glass slides. Coupling properties were evaluated via the signal intensity of the printed antigen.
5 0 1 0 0 1 5 0 2 0 0
0
5 0 0 0 0 0
1 0 0 0 0 0 0
1 5 0 0 0 0 0
2 0 0 0 0 0 0
D y L ig h t5 5 0 c o n ju g a te d H u -Ig G (U /m L )
Sig
na
l In
ten
sit
y
2 D E p o x y
3 D N H S
3 D A ld e h y d e
3 D E p o x y
2 D A ld e h y d e
3-dimensional (3D)
functional matrix
2-dimensional (2D)
functional matrixFunctional group
Antifouling Matrix
Spacer
Glass
A B
C
+ H2NBiochemical
Species
Biochemical
Species
Biochemical
Species
Biochemical
Species+ H2N
+ H2N
NH
NH
NH
2D Epoxy
3D NHS
3D Aldehyde
2D Aldehyde
3D Epoxy
Biochemical
Species
Biochemical
Species

127
7.2.2 A reduced teflon mask increases the signal intensity
For evaluation of slide activation chemistry, glass slides without a mask (Figure 42A) were utilized.
Next, a Teflon mask was introduced so that the slides could be processed with an automated slide
processor. First, we tested a full mask. However, we observed a 3-fold decrease in signal intensity
(Figure 42B) that might have occurred due to interference of the Teflon mask with the functionalization
of the surface with 2D-Epoxy. Therefore, a reduced mask was designed leading to increased signal
intensity as compared to the use of a full mask (Figure 42B).
Figure 42 Effect of the Teflon mask (A) The illustrated Teflon masks needed for automated processing of glass slides were coated with a 2D-Epoxy surface and analysed for their assay performance. (B) Effect of the Teflon mask on the signal intensity of DyLight550 conjugated human IgG.
7.2.3 Evaluation of ALK and control proteins
Damm-Welk et al. showed that sera or plasma from ALK+ NSCLC patients stained both EML4-ALK and
NPM1-ALK transfectants, and sera or plasma from ALK+ ALCL patients reacted to NPM1-ALK, TPM3-
ALK and full-length-ALK transfected COS cells502. In addition, epitopes within the intracytoplasmic
domain of ALK recognized by ALK autoantibodies have been described in sera or plasma from nine
ALK+ NSCLC503 and 129 ALK+ ALCL504 patients. Collectively, these results suggest that anti-ALK
autoantibodies target the ALK-portion of the fusion proteins502. Hence, we used commercially available
full-length ALK protein for the microarray. Full-length ALK protein is insoluble at concentrations utilized
in the microarray assay (data not shown), therefore an ALK protein with an uncleaved GST-tag was
purchased.
Besides ALK-GST, several control proteins were chosen (Figure 43A). GST protein was used to detect
unspecific binding of autoantibodies. Anti-human IgG was spotted as a positive control that binds all
human IgG antibodies. Human IgG was utilized for use in standard curve measurements. DyLight550
conjugated IgG served as a recognition spot for the scanner during QC3 (Figure 40) before slides where
processed and incubated with the detection antibody.
12
34 5
67
8 12
34 5
67
8
A B
C D
No mask Reduced
maskFull mask
0 5 0 1 0 0 1 5 0 2 0 0
0
2 5 0 0 0 0
5 0 0 0 0 0
7 5 0 0 0 0
1 0 0 0 0 0 0
1 2 5 0 0 0 0
D y L ig h t5 5 0 c o n ju g a te d H u -Ig G (U /m L )
Sig
na
l In
ten
sit
y
n o m a s k
fu ll m a s k E 3 8 8 6 -0 1 9
re d u c e d m a s k E 3 9 0 3 -0 0 2
0 2 5 5 0 7 5 1 0 0
0
2 5 0 0 0 0
5 0 0 0 0 0
7 5 0 0 0 0
1 0 0 0 0 0 0
1 2 5 0 0 0 0
1 5 0 0 0 0 0
A n ti H u -Ig G C o n c (U /m L )
Sig
na
l In
ten
sit
y
n o m a s k
fu ll m a s k E 3 8 8 6 -0 1 9
re d u c e d m a s k E 3 9 0 3 -0 0 2
0 2 5 5 0 7 5 1 0 0
0
2 5 0 0 0 0
5 0 0 0 0 0
7 5 0 0 0 0
1 0 0 0 0 0 0
1 2 5 0 0 0 0
1 5 0 0 0 0 0
H u -Ig G C o n c (U /m L )
Sig
na
l In
ten
sit
y
n o m a s k
fu ll m a s k E 3 8 8 6 -0 1 9
re d u c e d m a s k E 3 9 0 3 -0 0 2
No mask
Full mask
Reduced mask

128
To investigate the ability of the microarray to detect ALK autoantibodies in patient samples, we
measured sera from two ALK+ ALCL patients (Figure 43B) that had previously tested positive using the
immunoperoxidase labelling technique of NPM1-ALK transfectants. Unspecific binding was not
observed for frozen whole blood or plasma from one healthy individual and serum from a pool of 100
healthy individuals. Therefore, as opposed to the immunoperoxidase labelling technique for NPM1-ALK
transfectants, this assay enables the detection of ALK autoantibodies in not only serum and plasma but
also frozen whole blood.
Figure 43 Antigens utilized in the microarray assay (A) Autoantibodies specific for human ALK bind and are detected with DyLight 550 conjugated IgG. GST protein serves as a control for unspecific binding of circulating autoantibodies to the GST-tag of the ALK protein. Human IgG serves as a control to confirm activity of the secondary antibody and is utilized for a standard curve. Anti-human IgG detects whether saturating levels of patient samples are used. (B) Binding of circulating autoantibodies in donor samples to the indicated antigens on the microarray.
ALK
Fluoro
phore
Human IgG Anti-human IgG
Anti-ALK
autoantibody
Fluoro
phore
IgG
DyLight 550
conjugated IgG
Fluoro
phore
A
Fluoro
phore
GST
B
healthy plasma
healthy serum
healthy frozen whole blood
ALK+ ALCL serum sample 1
ALK+ ALCL serum sample 2
ALK-GST human IgG anti-human IgG

129
7.2.4 Final slide layout
A final slide layout with 8 wells (Figure 44) was chosen to enable a high throughput analysis of clinical
trial samples. However, in the future the number of wells could be adjusted to reflect the low incidence
of ALK+ ALCL patients. Each well is able to accommodate 81 antigen spots (Figure 44B-C) with 29
spots being occupied by control antigens leaving space for 17 different antigens in triplicates.
Figure 44 A typical slide layout (A) Position of the barcode. (B) The pattern of 9x9 possible antigen spots per well. (C) The grid with antigen positions used in the final microarray indicated.
43896 ALK 8-well
2018-09-E3904 004
Cambridge Life Science Ltd.
B
2.5
cm
B
B
B
B
B
B
B
7.5 cm
A
0.9
cm
1 2 3 4
5678
A B
C1 2 3 4 5 6 7 8 9
1 200 ug/mL
DyLight conj
12.5 ug/mL
Anti-Hu IgG
25 ug/mL
Anti-Hu IgG
50 ug/mL
Anti-Hu IgG
100 ug/mL
Anti-Hu IgG
200 ug/mL
Anti-Hu IgG
200 ug/mL
DyLight conj
2 100 ug/mL
Hu IgG
100 ug/mL
Hu IgG
100 ug/mL
Hu IgG
12.5 ug/mL
Anti-Hu IgG
25 ug/mL
Anti-Hu IgG
50 ug/mL
Anti-Hu IgG
100 ug/mL
Anti-Hu IgG
200 ug/mL
Anti-Hu IgG
3 12.5 ug/mL
Anti-Hu IgG
25 ug/mL
Anti-Hu IgG
50 ug/mL
Anti-Hu IgG
100 ug/mL
Anti-Hu IgG
200 ug/mL
Anti-Hu IgG
4 150 ug/mL
ALK
150 ug/mL
ALK
150 ug/mL
ALK
200 ug/mL
DyLight conj
5 75 ug/mL
ALK
75 ug/mL
ALK
75 ug/mL
ALK
Buffer blank
6 37.5 ug/mL
ALK
37.5 ug/mL
ALK
37.5 ug/mL
ALK
Buffer blank
7 18.75 ug/mL
ALK
18.75 ug/mL
ALK
18.75 ug/mL
ALK
Buffer blank
8 150 ug/mL
GST
150 ug/mL
GST
150 ug/mL
GST
9 200 ug/mL
DyLight conj
200 ug/mL
DyLight conj
C

130
7.3 Protein microarray assay cross-validation
To cross-validate the microarray assay with the immunoperoxidase labelling technique we determined
the presence of anti-ALK antibodies in plasma or serum samples of 93 paediatric ALK-positive ALCL
patients at diagnosis. The patients were included in the ALCL-99 trial (NCT00006455)28. The patient’s
treatment consisted of a cytoreductive prephase followed by six chemotherapy courses, as previously
described33. The patient cohort consisted of 57% male, 89.2% CNS negative and 41.9% MDD positive
patients. The majority of patients showed no bone marrow (94.6%), bone (82.8%) or skin (81.7)
involvement at diagnosis (Table 40).
Table 40 Baseline characteristics of Paediatric ALCL Patients Recruited to the ALCL99 Trial MDD = Minimal disseminated disease.
Characteristic Classification Number of patients
% of total
Total 93 Gender Male 53 57
Female 40 43
St Jude Stage N/A 4 4.3
I 6 6.5
II 19 20.4
III 59 63.4
IV 5 5.4
Age < 10 years 27 29
>= 10 years 66 71
Histological subtype Common 53 57
Small cell, lymphohistiocytic, mixed, giant, not further classified
40 43
CNS N/A 9 9.7
negative 83 89.2
positive 1 1.1
Bone marrow No 88 94.6
Yes 5 5.4
Bone No 77 82.8
Yes 16 17.2
Skin No 76 81.7
Yes 17 18.3
MDD N/A 18 19.4
negative 36 38.7
positive 39 41.9
ALK antibodies in plasma or serum were assessed using both an immunocytochemical approach (anti-
ALK autoantibody titre) as well as the newly developed microarray approach (anti-ALK autoantibody
concentration). Anti-ALK autoantibodies were detected in 92.4% (86/93) and 93.5% (87/93) of patients
using the immunocytochemical approach and the microarray approach, respectively. We also observed
a strong correlation (ρ = 0.68, Spearman) between anti-ALK autoantibody titre and anti-ALK
autoantibody concentration levels across the paediatric ALK-positive ALCL patient cohort (Figure 45).
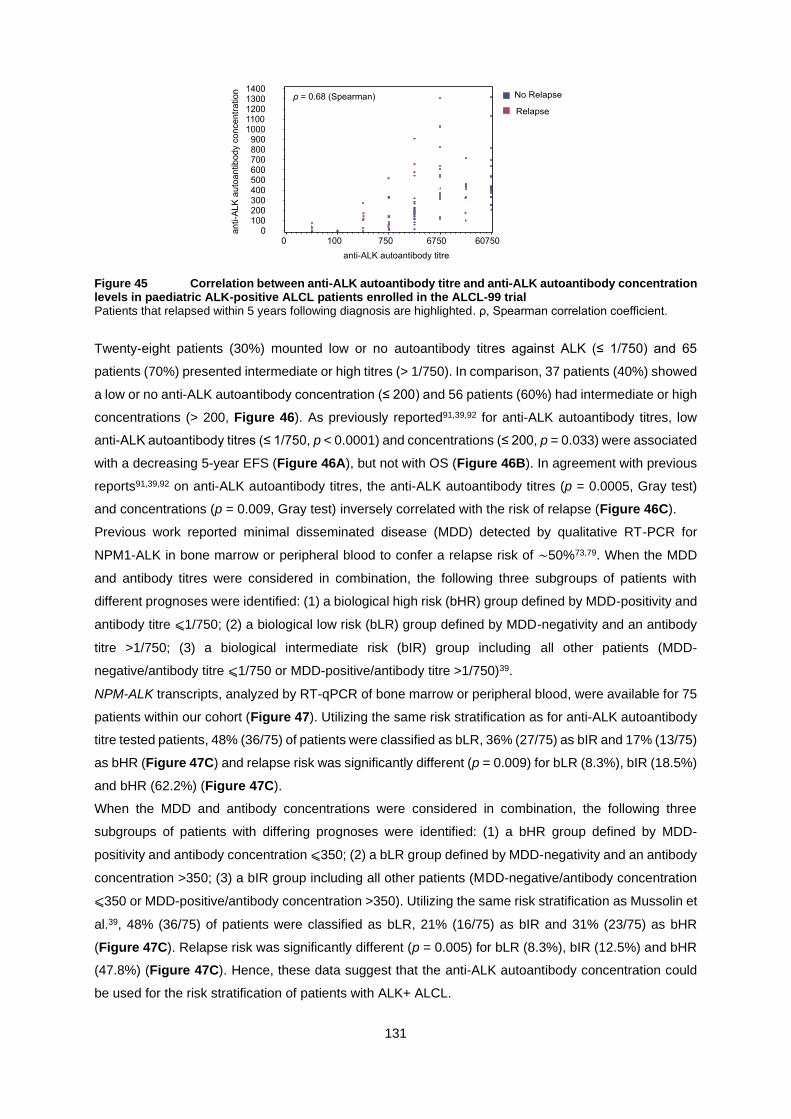
131
Figure 45 Correlation between anti-ALK autoantibody titre and anti-ALK autoantibody concentration levels in paediatric ALK-positive ALCL patients enrolled in the ALCL-99 trial Patients that relapsed within 5 years following diagnosis are highlighted. ρ, Spearman correlation coefficient.
Twenty-eight patients (30%) mounted low or no autoantibody titres against ALK (≤ 1/750) and 65
patients (70%) presented intermediate or high titres (> 1/750). In comparison, 37 patients (40%) showed
a low or no anti-ALK autoantibody concentration (≤ 200) and 56 patients (60%) had intermediate or high
concentrations (> 200, Figure 46). As previously reported91,39,92 for anti-ALK autoantibody titres, low
anti-ALK autoantibody titres (≤ 1/750, p < 0.0001) and concentrations (≤ 200, p = 0.033) were associated
with a decreasing 5-year EFS (Figure 46A), but not with OS (Figure 46B). In agreement with previous
reports91,39,92 on anti-ALK autoantibody titres, the anti-ALK autoantibody titres (p = 0.0005, Gray test)
and concentrations (p = 0.009, Gray test) inversely correlated with the risk of relapse (Figure 46C).
Previous work reported minimal disseminated disease (MDD) detected by qualitative RT-PCR for
NPM1-ALK in bone marrow or peripheral blood to confer a relapse risk of ∼50%73,79. When the MDD
and antibody titres were considered in combination, the following three subgroups of patients with
different prognoses were identified: (1) a biological high risk (bHR) group defined by MDD-positivity and
antibody titre ⩽1/750; (2) a biological low risk (bLR) group defined by MDD-negativity and an antibody
titre >1/750; (3) a biological intermediate risk (bIR) group including all other patients (MDD-
negative/antibody titre ⩽1/750 or MDD-positive/antibody titre >1/750)39.
NPM-ALK transcripts, analyzed by RT-qPCR of bone marrow or peripheral blood, were available for 75
patients within our cohort (Figure 47). Utilizing the same risk stratification as for anti-ALK autoantibody
titre tested patients, 48% (36/75) of patients were classified as bLR, 36% (27/75) as bIR and 17% (13/75)
as bHR (Figure 47C) and relapse risk was significantly different (p = 0.009) for bLR (8.3%), bIR (18.5%)
and bHR (62.2%) (Figure 47C).
When the MDD and antibody concentrations were considered in combination, the following three
subgroups of patients with differing prognoses were identified: (1) a bHR group defined by MDD-
positivity and antibody concentration ⩽350; (2) a bLR group defined by MDD-negativity and an antibody
concentration >350; (3) a bIR group including all other patients (MDD-negative/antibody concentration
⩽350 or MDD-positive/antibody concentration >350). Utilizing the same risk stratification as Mussolin et
al.39, 48% (36/75) of patients were classified as bLR, 21% (16/75) as bIR and 31% (23/75) as bHR
(Figure 47C). Relapse risk was significantly different (p = 0.005) for bLR (8.3%), bIR (12.5%) and bHR
(47.8%) (Figure 47C). Hence, these data suggest that the anti-ALK autoantibody concentration could
be used for the risk stratification of patients with ALK+ ALCL.

132
Figure 46 Outcomes of paediatric ALK+ ALCL patients according to the magnitude of the antibody response to ALK (A,B) Paediatric patients (n = 93) treated with standard ALCL99 chemotherapy within the ALCL99 trial were divided into two groups according to the anti-ALK autoantibody titre (left) or the anti-ALK autoantibody concentration (right) and the difference in median (A) EFS or (B) OS (log-rank test) was analyzed using the Kaplan-Meier estimator. (C) Cumulative incidence of relapse in paediatric patients (n = 94) treated with standard ALCL99 chemotherapy within the ALCL99 trial that were divided into two groups according to the anti-ALK autoantibody titre (left) or the anti-ALK autoantibody concentration (right). P-values were determined by a Gray test.

133
Figure 47 Outcomes of paediatric ALK+ ALCL patients according to the magnitude of the antibody response against ALK in combination with their minimal disseminated disease (MDD) status (A) Cumulative incidence of relapse in MDD-negative paediatric patients (n = 36) treated with standard ALCL99 chemotherapy within the ALCL99 trial were divided into two groups according to the anti-ALK autoantibody titre (left) or the anti-ALK autoantibody concentration (right). P-values were determined by a Gray test. (B) The cumulative incidence of relapse in MDD-positive paediatric patients (n = 40) treated with standard ALCL99 chemotherapy within the ALCL99 trial were divided into two groups according to the anti-ALK autoantibody titre (left) or the anti-ALK autoantibody concentration (right). P-values were determined by a Gray test. (C) The cumulative incidence of relapse in paediatric patients (n = 76) treated with standard ALCL99 chemotherapy within the ALCL99 trial were divided into three groups according to the anti-ALK autoantibody titre (left) or the anti-ALK autoantibody concentration (right) combined with the MDD status and anti-ALK autoantibody titre or concentration of the patients. P-values were determined by a Gray test.

134
7.4 Discussion
Biomarkers that predict a patient’s prognosis and/or response to therapy are informative in devising
therapeutic protocols, particularly in this era of personalised medicine. Previous reports have described
that the magnitude of the autoantibody response to the oncoantigen ALK is inversely correlated with
lymphoma dissemination and relapse risk in ALK-positive ALCL, and that by combining MDD and
antibody titer, patients could be stratified into three different groups with significantly different PFS
probabilities39,91. The present study validates that the preexisting antibody response to ALK correlates
inversely with tumour dissemination and has prognostic value for patients with this malignancy. The
automated assay we have developed could allow for a non-subjective assessment of this biomarker for
incorporation into future ALCL clinical trials. However, whether this biomarker remains predictive when
children with ALK+ ALCL are treated with targeted agents such as ALK inhibitors and anti-CD30
antibody therapy remains to be seen.
The increased risk of relapse in patients with low antibody titers against ALK did not translate into a
significant difference in OS. One explanation for this may be the availability of an effective salvage
therapy for most relapsing ALK+ ALCL patients435.
In addition, our data support published data88,89,91,90,39,92 that an immune response to ALK is implicated
in the control of ALK+ ALCL. Together with the observation of ALK-specific cellular immune responses
in patients undergoing multi-agent chemotherapy treatment92 and in long-term survivors of ALK+
ALCL89, these data further support the idea of a specific immunostimulatory approach for the
consolidation of remission in patients with ALK+ ALCL435. There is a growing body of evidence to support
the potential development of an ALK targeting vaccine503; ALK ranked fourth in a list of 75 tumour
antigens evaluated by the National Cancer Institute505.
The combination of a vaccination against ALK with either immune stimulatory multi-agent
chemotherapy432,433,434,435 or ALK TKIs436,437 protected against relapse in murine models of ALK+ ALCL
and ALK+ NSCLC, respectively142,501. In support of this, anti-HER2 autoantibodies were found to
suppress the activity of HER2 in HER2+ breast or ovarian cancer patients after vaccination with HER2
specific peptides435,506. Therefore, vaccination to boost a pre-existing anti-ALK immune response for
ALK+ ALCL or NSCLC patients with a pre-existing ALK immune response could provide a promising
approach435 without the risks associated with unspecific immunostimulatory therapies like nivolumab138,
resistance-prone ALK inhibitor therapy126 or in the case of ALCL highly toxic SCT and BV.
In addition, a direct anti-tumour effect of recombinant anti-ALK autoantibodies has been described in
ALK-driven NB507,508 and glioblastoma509. These data suggest that recombinant anti-ALK antibodies
might provide a therapeutic effect in other ALK+ cancer patients. While the anti-ALK antibody titre in
ALK+ ALCL or NSCLC appears to be associated with the anti-tumour immune response435,142,140,89,510–
512, it is not clear whether they are functional against tumour cells435. Although, ALK fusion proteins in
ALK+ ALCL and NSCLC patients are expressed exclusively intracellularly371,513–519, future studies by
Chiarle and Woessmann will shed light on this unanswered question.
Finally, as part of this chapter, we analyzed anti-ALK autoantibody titres in 124 ALK+ NSLCL patients
recruited onto the ALEX trial (NCT02075840) as well as 103 ALK+ ALCL patients recruited onto the
ANHL12P1 trial (NCT01979536), which will be made available once the trials have been completed.

135
CHAPTER 8 Discussion

136
8.1 Introduction
Throughout this thesis, genome wide CRISPR overexpression screens in ALK+ ALCL and ALK driven
NB cell lines have yielded insights into potential mechanisms of ALK inhibitor resistance. Finally, the
development of a paediatric ALK+ ALCL PDX model has allowed the in vivo investigation of brigatinib
treatment in a chemotherapy-refractory and crizotinib-resistant setting.
In this chapter, potential future directions and the clinical implications of these findings are discussed in
the context of the current literature.
8.2 The use of ALK inhibitors for the treatment of paediatric ALK+ ALCL
8.2.1 Crizotinib in combination with multi-agent chemotherapy could be used as a
consolidation therapy before allogenic SCT for paediatric ALK+ ALCL patients after
relapse
Fortunately, paediatric ALK+ ALCL patients are relatively chemo-sensitive with an OS varying between
70-90% dependent on treatment duration, drugs used and their dosages (Table 3)31–33,42–44. In addition,
four independent retrospective analyses found that approximately 75% of relapsed patients reached a
second remission by reinduction chemotherapy71,97,98,118. The response rate was dependent on the time
to relapse, with approximately 85% of children with relapse after completion of frontline therapy reaching
a remission by any chemotherapy71,97,98,118, but approximately 50% of children who experienced
progression during frontline therapy undergoing progression again during reinduction98. Fortunately, for
this patient group, 5-year EFS and OS rates of 81% and 83%, respectively, can be achieved by allogenic
SCT98.
Crizotinib and BV are targeted therapies inducing remission in up to 90% of patients with relapsed ALK+
ALCL63,115,117,126,128,520 that could offer an alternative to highly toxic multi-agent chemotherapy protocols,
but there is no consensus as to whether these drugs should be administered as single agents, for how
long and for which patients.
Our investigation into possible resistance mechanisms to ALK inhibitor treatment including crizotinib
showed multiple options via which an ALK+ ALCL cell can acquire resistance to single agent ALK
inhibitors301,521. Specifically, our results indicate that IL10RA expression does not correlate with
response or resistance to standard chemotherapy, suggesting that resistance mechanisms, such as
elevated IL10RA expression developing as a consequence of single agent crizotinib therapy, could be
overcome by a combination of ALK-targeted therapy with chemotherapy.
Single agent crizotinib could be used to induce second remission98,522 as already established in adult
relapsed ALK+ ALCL patients before allogeneic SCT128. However, while single agent crizotinib
represents a low toxicity option98, a combination of crizotinib with chemotherapy could be advisable to
prevent ALK-inhibitor resistance-specific relapse if crizotinib has to be given for an extended time to
achieve remission. This is especially important as CNS progession in crizotinib treated patients has
been observed and CNS prophylaxis during re-induction therapy before SCT is highly recommended523.
Low-risk patients defined by relapse at more than one year after initial diagnosis might better be treated
with multi-agent chemotherapy for which many years of experience exists98.

137
8.2.2 Brigatinib could offer a bridge to transplant for paediatric ALK+ ALCL patients
after CNS relapse
Since the 5-year cumulative CNS relapse risk in paediatric ALK+ ALCL patients is only 4% and the
3-year OS for patients after CNS relapse is 48.7% with median survival being 23.5 months100, this sub-
group of patients comprises the most difficult to treat cases with the least treatment experience.
Early identification of ALK+ ALCL patients with a risk of CNS relapse is an important future goal that will
enable tailored treatment strategies100. For example, lorlatinib and brigatinib have shown promising
results in ALK+ NSCLC but have not yet been sufficiently tested in the paediatric setting125,524. The
advantage of these ALK inhibitors over crizotinib and ceritinib is that they are able to cross the blood-
brain-barrier and as such are active or preventive against CNS disease525–528. In Japan, crizotinib is
being trialled as a monotherapy for children with recurrent or refractory ALK+ ALCL (UMIN000028075)
and in the USA, crizotinib is being investigated in combination with multi-agent chemotherapy
(NCT01979536) and might therefore not present a viable option for patients with CNS involvement366.
However, in Japan, alectinib (UMIN000016991)67–69 has been approved for children with recurrent or
refractory ALK+ ALCL in 2020124 and the EICNHL is planning to trial brigatinib in combination with the
ALCL99 backbone (personal communication with Dr. Suzanne Turner) offering hope for paediatric ALK+
ALCL patients with CNS involvement at diagnosis or experiencing a CNS relapse. In addition, a first
case report described the successful treatment of a girl, who suffered from a CNS relapse, with
alectinib125.
While limited to a CNS relapsed patient who achieved a CR during initial crizotinib treatment but
relapsed after allogenic SCT, our in vivo investigation indicates that brigatinib was effective in a PDX
model of this CNS relapsed chemotherapy-refractory and crizotinib-resistant ALK+ ALCL patient. The
investigation of brigatinib in clinical trials will have to prove whether this can be translated to the clinic.
8.3 The use of ALK inhibitors for the treatment of ALK-driven NB
Our investigation into possible resistance mechanisms against ALK inhibitor treatment including ceritinib
and brigatinib highlighted multiple pathways through which ALK-driven NB cells can acquire resistance
to single agent ALK inhibition300. Trigg et al. identified PIM1 overexpression as one of the main
resistance mechanisms to ceritinib and brigatinib and further explored PIM1 as a therapeutic target after
observing that its overexpression led to evasion of apoptosis300,529. While treatment with the PIM1
inhibitor AZD1208 was not sufficient to kill ALK-driven NB cells, reduction of PIM1 mRNA sensitized NB
cells to ALK inhibitors and combination of AZD1208 with ALK inhibitors showed mild synergism. To
examine the clinical relevance of this drug combination, Trigg et al. employed two patient-derived
models of high-risk NB harboring ALKF1245C or ALKF1174L mutations, respectively300. The authors
observed a significant delay in tumour growth with the combination treatment relative to single-agent
treatments in both models300. PIM inhibition sensitized both MYCN-amplified and wild-type, ALK-driven
NB cells to ALK inhibitors in vivo. It has previously been shown that ALK and MYCN are part of a positive
feedback loop whereby ALK regulates expression of MYCN through repression of HPB1530. However,
Trigg et al. suggest that combined PIM1 and ALK inhibition is effective independent of MYCN status300.

138
Moreover, PIM1 mRNA levels were significantly elevated in tumours treated with ceritinib relative to the
vehicle at the experimental end-point, thus providing in vivo evidence of PIM1 as a resistance gene300.
8.4 A collaborative approach to collate and integrate data will be crucial
to making progress in the treatment of paediatric cancers
The low incidence of paediatric cancer cases has been a key factor in the limited collection of clinical
and biological data, and the difficulties encountered in conducting clinical trials. Given this, utilizing in
vitro screening of relatively uncommon paediatric tumours such as ALK+ ALCL and ALK-driven NB is
currently the only approach to characterize ALK inhibitor resistance mechanisms. However, it remains
unclear what proportion of clinical cases of ALK inhibitor resistance involve IL10RA in ALK+ ALCL or
PIM1 in ALK-driven NB. Moreover, it remains to be elucidated what level of IL10RA expression in ALK+
ALCL or PIM1 expression in ALK-driven NB are needed in vivo for induction of these resistance
mechanisms531. In our studies, IL10RA and PIM1 were artificially overexpressed in vitro and in the case
of IL10RA with or without IL-10 supplementation. Ultimately, further clinical samples of matched
diagnostic and relapse tumours are required to assess the degree to which IL10RA or PIM1
overexpression represents a predominant resistance mechanism to the investigated or other ALK
inhibitors. The full diversity of ALK-independent escape mechanisms also remains unknown531; survival
pathways other than IL10 signaling or PIM1-induced apoptosis evasion may exist and resistance could
be induced by other gene candidates identified by our screening approach. This will require extensive
functional follow-up studies with validation in patient tumours.
Additionally, Turner532 and other groups533–560 have identified a distinct population of cells – called
cancer stem cells561, tumour-initiating cells562, leukaemia-initiating cells561 or tumour-propagating cells563
– within cell lines derived from haematopoietic (including ALK+ ALCL532) and solid tumours (including
NB564) that by definitions of Clarke et al.565 and Nguyen et al.566 can be isolated and were shown to have
self-renewal capacity561. In future work it will be interesting to test whether the cancer stem cell
population of ALK+ ALCL and NB cell lines overexpress IL10RA and PIM1, respectively, or other
candidates identified by the screens.
Furthermore, the factors underlying the diversity of resistance mechanisms that develop in patients with
the same cancer receiving the same treatment remain unclear. Considering the annual 300,000
European childhood cancer survivors, many are at risk of relapse and of the 35,000 newly diagnosed
paediatric cancer cases in Europe each year many present with refractory disease (Pilot Project &
Preparation Action Grant, European Commission). Therefore, several national clinical sequencing
studies aimed at identifying treatment targets in children or adolescents are based on tumour biopsies
taken at relapse/refractory disease439: Individualized Therapy for Relapsed Malignancies in Childhood
(INFORM, Germany), Individualized Therapies for Children with Relapsed/Refractory Malignancies
using Molecular Profiling (iTHER, The Netherlands), MAPPYACTS, Zero Childhood Cancer (ZERO,
Australia), Precision Oncology for Young People Program (PROFYLE, Canada) and Pediatric Molecular
Analysis for Therapy Choice (Pediatric MATCH, USA). Since paediatric cancers are rare diseases,
going forward, a collaborative approach to collate and integrate the collected data will be crucial and
must be compared to robust biological functional validation studies as described here.

139
CHAPTER 9 Appendix

140
9.1 Appendix 1: List of peer-reviewed papers and reviews
9.1.1 Primary research articles
10 Lobello C., Boris T., Bystry V., Radova L., Filip D., Marz M., Montes-Mojarro I.A., Prokoph N., Larose H., Liang H.C., Sharma G.G., Mologni L., Belada D., Kamaradova K., Fend F., Gambacorti-Passerini C., Merkel O., Turner S.D., Janikova A., Pospisilova S. (2020) STAT3 and TP53 Mutations Associate with Poor Prognosis in Anaplastic Large Cell Lymphoma. Leukemia.
9 Forde S.D., Matthews J.D., Jahangiri L., Lee L.C., Prokoph N., Malcolm T.I.M., Giger O.T., Bell N., Blair H., O’Marcaigh A., Smith O., Kenner L., Bomken S., Burke G.A.A., Turner S.D. (2020) Paediatric burkitt lymphoma patient-derived xenografts capture disease characteristics over time and are a model for therapy. British Journal of Haematology.
8 Prokoph N., Probst N.A., Lee L.C., Monahan J.M., Matthews J.D., Liang H-C., Bahnsen K., Montes-Mojarro I.A., Karaca-Atabay E., Sharma G.G., Malik V., Larose H., Forde S.D., Ducray S.P., Lobello C., Wang Q., Pospisilova S., Gambacorti-Passerini C., Burke G.A.A., Pervez S., Attarbaschi A., Janikova A., Parquement H., Landman-Parker J., Lambilliotte A., Schleiermacher G., Klapper W., Jauch R., Woessmann W., Vassal G., Kenner L., Merkel O., Mologni L., Chiarle R., Brugières L., Geoerger B., Barbieri I., Turner S.D. (2020) IL10RA modulates crizotinib sensitivity in NPM1-ALK+ anaplastic large cell lymphoma. Blood. 136(14):1657-1669. Cover page & Invited commentary by the editor: Hu G. & Feldman A.L. (2020) Drivers of crizotinib resistance in ALK+ ALCL. Blood. 136(14):1573-1575.
7 Larose H., Prokoph N., Matthews J.D., Schlederer M., Högler S., Alsulami A.F., Ducray S.P., Nuglozeh E., Fazaludeen F.M.S., Elmouna A., Ceccon M., Mologni L., Gambacorti-Passerini C., Hoefler G., Lobello C., Pospisilova S., Janikova A., Woessmann W., Damm-Welk C., Zimmermann M., Fedorova A., Malone A., Smith O., Wasik M., Inghirami G., Lamant L., Blundell TL., Klapper W., Merkel O., Burke G.A.A., Mian S., Ashankyty I., Kenner L., Turner S.D. (2020) Whole Exome Sequencing reveals NOTCH1 mutations in Anaplastic Large Cell Lymphoma and points to Notch both as a key pathway and a potential therapeutic target. Haematologica.
6 Trigg R.*, Lee L.C.*, Prokoph N.*, Jahangiri L., Reynolds P., Burke G.A.A., Probst N.A., Han M., Matthews J.D., Lim H.K., Manners E., Martínez Gonzalez S., Pastor Fernandez J., Blanco-Aparicio C., Merkel O., Garces de los Fayos Alonso I., Kodajova P., Tangermann S., Högler S., Luo J., Kenner L., Turner S.D. (2019) The targetable kinase PIM1 drives ALK inhibitor resistance in high-risk neuroblastoma independent of MYCN status. Nat Commun. 10(1):5428. *joint first Editors’ choice: Malone J. (2019) A new hope for neuroblastoma treatment? Science Transl. Med. 11(523), eaaz9769.
5 Russell M., Prokoph N., Henderson N., Eketjäll S., Balendran C., Michaëlsson E., Fidock M., Hughes G. (2017) Determining myeloperoxidase activity and protein concentration in a single assay: utility in biomarker and therapeutic studies. Journal of Immunological Methods. 449:76-79.
4 Fontaine F., Overman J., Moustaqil M., Mamidyala S., Salim A., Narasimhan K., Prokoph N., Robertson AAB., Lua L., Alexandrov K., Koopman P., Capon RJ., Sierecki E., Gambin Y., Jauch R., Cooper MA., Zuegg J., Francois M. (2017) Small molecule inhibitors of the Sox18 transcription factor. Cell Chemical Biology. 24(3):346-359.
3 Prokoph N., Ormö M., O’Mahony G., Hogner A., McPheat J., Karlsson U., Holmberg Schiavone L., Liu J. (2016) Development of an ELISA assay for high throughput screening of Inhibitors of the CDK5-mediated PPARγ phosphorylation. Assay Drug Dev Techn. 14(4):261-72.
2 Klaus M.*, Prokoph N.*, Wang X., Huang Y.-H., Girbig M., Srivastava Y., Hou L., Narasimhan K., Kolatkar P., Francois M., Jauch R. (2016) Structure and decoy-mediated inhibition of the SOX18/Prox1-DNA interaction. Nucleic Acids Res. 44(8):3922-35. *joint first
1 Paul A.J., Schwab K., Prokoph N., Haas E., Handrick R., Hesse F. (2015) Fluorescence dye-based detection of mAb aggregates in CHO culture supernatants. Anal. Bioanal. Chem. 407(16):4849-56.
9.1.2 Review article
1 Prokoph N.*, Larose H.*, Lim M.S., Burke G.A.A., Turner S.D. (2018) Treatment Options for Paediatric Anaplastic Large Cell Lymphoma (ALCL): Current Standard and beyond. Cancers. 10(4):99. *joint first

141
Reference List
1. Chiarle R, Voena C, Ambrogio C, Piva R, Inghirami G. The anaplastic lymphoma kinase in the pathogenesis of cancer. Nat Rev Cancer. 2008;8(1):11-23. doi:10.1038/nrc2291
2. Hallberg B, Palmer RH. Mechanistic insight into ALK receptor tyrosine kinase in human cancer biology. Nat Rev Cancer. 2013;13(10):685-700. doi:10.1038/nrc3580
3. Morris SW, Kirstein MN, Valentine MB, et al. Fusion of a kinase gene, ALK, to a nucleolar protein gene, NPM, in non-Hodgkin’s lymphoma. Science (80- ). 1994;263(5151):1281-1284. doi:10.1126/science.8122112
4. Lemmon MA, Schlessinger J. Cell Signaling by Receptor Tyrosine Kinases. Cell. 2010;141(7):1117-1134. doi:10.1016/j.cell.2010.06.011
5. Barreca A, Lasorsa E, Riera L, et al. Anaplastic lymphoma kinase in human cancer. J Mol Endocrinol. 2011;47(1):R11-R23. doi:10.1530/JME-11-0004
6. Trigg RM, Turner SD. ALK in Neuroblastoma: Biological and Therapeutic Implications. Cancers (Basel). 2018;10(4). doi:10.3390/cancers10040113
7. Cessna MH, Zhou H, Sanger WG, et al. Expression of ALK1 and p80 in Inflammatory Myofibroblastic Tumor and Its Mesenchymal Mimics: A Study of 135 Cases. Mod Pathol. 2002;15(9):931-938. doi:10.1097/01.MP.0000026615.04130.1F
8. Passoni L, Longo L, Collini P, et al. Mutation-Independent Anaplastic Lymphoma Kinase Overexpression in Poor Prognosis Neuroblastoma Patients. Cancer Res. 2009;69(18):7338-7346. doi:10.1158/0008-5472.CAN-08-4419
9. Weissinger SE, Keil P, Silvers DN, et al. A diagnostic algorithm to distinguish desmoplastic from spindle cell melanoma. Mod Pathol. 2014;27(4):524-534. doi:10.1038/modpathol.2013.162
10. Salido M, Pijuan L, Martínez-Avilés L, et al. Increased ALK Gene Copy Number and Amplification are Frequent in Non-small Cell Lung Cancer. J Thorac Oncol. 2011;6(1):21-27. doi:10.1097/JTO.0b013e3181fb7cd6
11. Tuma RS. ALK Gene Amplified in Most Inflammatory Breast Cancers. JNCI J Natl Cancer Inst. 2012;104(2):87-88. doi:10.1093/jnci/djr553
12. Schoppmann SF, Streubel B, Birner P. Amplification but not translocation of anaplastic lymphoma kinase is a frequent event in oesophageal cancer. Eur J Cancer. 2013;49(8):1876-1881. doi:10.1016/j.ejca.2013.02.005
13. Murugan AK, Xing M. Anaplastic thyroid cancers harbor novel oncogenic mutations of the ALK gene. Cancer Res. 2011;71(13):4403-4411. doi:10.1158/0008-5472.CAN-10-4041
14. Wang Y-W, Tu P-H, Lin K-T, Lin S-C, Ko J-Y, Jou Y-S. Identification of oncogenic point mutations and hyperphosphorylation of anaplastic lymphoma kinase in lung cancer. Neoplasia. 2011;13(8):704-715. Accessed January 23, 2018. http://www.ncbi.nlm.nih.gov/pubmed/21847362
15. Mossé YP, Laudenslager M, Longo L, et al. Identification of ALK as a major familial neuroblastoma predisposition gene. Nature. 2008;455(7215):930-935. doi:10.1038/nature07261
16. Carén H, Abel F, Kogner P, Martinsson T. High incidence of DNA mutations and gene amplifications of the ALK gene in advanced sporadic neuroblastoma tumours. Biochem J. 2008;416(2):153-159. doi:10.1042/bj20081834
17. Armstrong F, Duplantier M-M, Trempat P, et al. Differential effects of X-ALK fusion proteins on proliferation, transformation and invasion properties of NIH3T3 cells. Oncogene. 2004;23(36):6071-6082. doi:10.1038/sj.onc.1207813
18. Soda M, Choi YL, Enomoto M, et al. Identification of the transforming EML4–ALK fusion gene in non-small-cell lung cancer. Nature. 2007;448(7153):561-566. doi:10.1038/nature05945
19. Ou S-HI, Kwak EL, Siwak-Tapp C, et al. Activity of Crizotinib (PF02341066), a Dual Mesenchymal-Epithelial Transition (MET) and Anaplastic Lymphoma Kinase (ALK) Inhibitor, in a Non-small Cell Lung Cancer Patient with De Novo MET Amplification. J Thorac Oncol. 2011;6(5):942-946. doi:10.1097/JTO.0b013e31821528d3
20. Prokoph N, Larose H, Lim M, Burke G, Turner S. Treatment Options for Paediatric Anaplastic Large Cell Lymphoma (ALCL): Current Standard and beyond. Cancers (Basel). 2018;10(4):99. doi:10.3390/cancers10040099
21. Stein H, Gerdes J, Schwab U, et al. Identification of Hodgkin and sternberg-reed cells as a unique cell type derived from a newly-detected small-cell population. Int J Cancer. 1982;30(4):445-459. doi:10.1002/ijc.2910300411
22. Schwab U, Stein H, Gerdes J, et al. Production of a monoclonal antibody specific for Hodgkin and Sternberg–Reed cells of Hodgkin’s disease and a subset of normal lymphoid cells. Nature. 1982;299(5878):65-67. doi:10.1038/299065a0
23. Delsol G, Al Saati T, Gatter KC, et al. Coexpression of epithelial membrane antigen (EMA), Ki-1, and interleukin-2 receptor by anaplastic large cell lymphomas. Diagnostic value in so-called malignant histiocytosis. Am J Pathol. 1988;130(1):59-70. http://www.ncbi.nlm.nih.gov/pmc/articles/PMC1880552/
24. Fischer P, Nacheva E, Mason DY, et al. A Ki-1 (CD30)-positive human cell line (Karpas 299) established from a high-grade non-Hodgkin’s lymphoma, showing a 2;5 translocation and rearrangement of the T-cell receptor beta-chain gene. Blood. 1988;72(1):234-240. http://www.bloodjournal.org/content/72/1/234.abstract

142
25. Rimokh R, Magaud JP, Berger F, et al. A translocation involving a specific breakpoint (q35) on chromosome 5 is characteristic of anaplastic large cell lymphoma ('Ki-1 lymphoma’). Br J Haematol. 1989;71(1):31—36. doi:10.1111/j.1365-2141.1989.tb06270.x
26. Alessandri AJ, Pritchard SL, Schultz KR, Massing BG. A population-based study of pediatric anaplastic large cell lymphoma. Cancer. 2002;94(6):1830-1835. doi:10.1002/cncr.10396
27. Shiramizu B, Mussolin L, Woessmann W, Klapper W. Paediatric non-Hodgkin lymphoma - perspectives in translational biology. Br J Haematol. 2016;173(4):617-624. doi:10.1111/bjh.14009
28. Brugières L, Le Deley M-C, Rosolen A, et al. Impact of the Methotrexate Administration Dose on the Need for Intrathecal Treatment in Children and Adolescents With Anaplastic Large-Cell Lymphoma: Results of a Randomized Trial of the EICNHL Group. J Clin Oncol. 2009;27(6):897-903. doi:10.1200/JCO.2008.18.1487
29. Boi M, Zucca E, Inghirami G, Bertoni F. Advances in understanding the pathogenesis of systemic anaplastic large cell lymphomas. Br J Haematol. 2015;168(6):771-783. doi:10.1111/bjh.13265
30. Falini B, Pileri S, Zinzani PL, et al. ALK+ lymphoma: clinico-pathological findings and outcome. Blood. 1999;93(8):2697-2706.
31. Brugières L, Deley MC, Pacquement H, et al. CD30(+) anaplastic large-cell lymphoma in children: analysis of 82 patients enrolled in two consecutive studies of the French Society of Pediatric Oncology. Blood. 1998;92(10):3591-3598.
32. Rosolen A, Pillon M, Garaventa A, et al. Anaplastic large cell lymphoma treated with a leukemia-like therapy: report of the Italian Association of Pediatric Hematology and Oncology (AIEOP) LNH-92 protocol. Cancer. 2005;104(10):2133-2140. doi:10.1002/cncr.21438
33. Seidemann K, Tiemann M, Schrappe M, et al. Short-pulse B-non-Hodgkin lymphoma-type chemotherapy is efficacious treatment for pediatric anaplastic large cell lymphoma: a report of the Berlin-Frankfurt-Münster Group Trial NHL-BFM 90. Blood. 2001;97(12):3699-3706. doi:10.1182/blood.V97.12.3699
34. Cheson BD, Horning SJ, Coiffier B, et al. Report of an International Workshop to Standardize Response Criteria for Non-Hodgkin’s Lymphomas. J Clin Oncol. 1999;17(4):1244. doi:10.1200/JCO.1999.17.4.1244
35. Cheson BD, Pfistner B, Juweid ME, et al. Revised response criteria for malignant lymphoma. J Clin Oncol. 2007;25(5):579-586. doi:10.1200/JCO.2006.09.2403
36. Cheson BD, Fisher RI, Barrington SF, et al. Recommendations for Initial Evaluation, Staging, and Response Assessment of Hodgkin and Non-Hodgkin Lymphoma: The Lugano Classification. J Clin Oncol. 2014;32(27):3059-3067. doi:10.1200/JCO.2013.54.8800
37. Cheson BD, Ansell S, Schwartz L, et al. Refinement of the Lugano Classification lymphoma response criteria in the era of immunomodulatory therapy. Blood. 2016;128(21):2489-2496. doi:10.1182/blood-2016-05-718528
38. NCI. NCI Dictonary of Cancer Terms. Accessed October 15, 2020. https://www.cancer.gov/publications/dictionaries/cancer-terms
39. Mussolin L, Damm-Welk C, Pillon M, et al. Use of minimal disseminated disease and immunity to NPM-ALK antigen to stratify ALK-positive ALCL patients with different prognosis. Leukemia. 2012;27(2):416-422. doi:10.1038/leu.2012.205
40. Le Tourneau C, Gan HK, Razak ARA, Paoletti X. Efficiency of new dose escalation designs in dose-finding phase I trials of molecularly targeted agents. PLoS One. 2012;7(12):e51039. doi:10.1371/journal.pone.0051039
41. Fukano R, Mori T, Fujita N, et al. Successful outcome with reduced-intensity condition regimen followed by allogeneic hematopoietic stem cell transplantation for relapsed or refractory anaplastic large-cell lymphoma. Int J Hematol. 2019;110(6):723-728. doi:10.1007/s12185-019-02748-1
42. Laver JH, Kraveka JM, Hutchison RE, et al. Advanced-Stage Large-Cell Lymphoma in Children and Adolescents: Results of a Randomized Trial Incorporating Intermediate-Dose Methotrexate and High-Dose Cytarabine in the Maintenance Phase of the APO Regimen: A Pediatric Oncology Group Phase III Trial. J Clin Oncol. 2005;23(3):541-547. doi:10.1200/JCO.2005.11.075
43. Lowe EJ, Sposto R, Perkins SL, et al. Intensive Chemotherapy for Systemic Anaplastic Large Cell Lymphoma in Children and Adolescents: Final Results of Children’s Cancer Group Study 5941. Pediatr Blood Cancer. 2009;52(3):335-339. doi:10.1002/pbc.21817
44. Williams DM, Hobson R, Imeson J, Gerrard M, McCarthy K, Pinkerton CR. Anaplastic large cell lymphoma in childhood: analysis of 72 patients treated on The United Kingdom Children’s Cancer Study Group chemotherapy regimens. Br J Haematol. 2002;117(4):812-820. doi:10.1046/j.1365-2141.2002.03482.x
45. Reiter A, Schrappe M, Parwaresch R, et al. Non-Hodgkin’s lymphomas of childhood and adolescence: results of a treatment stratified for biologic subtypes and stage-a report of the Berlin-Frankfurt-Münster Group. J Clin Oncol. 1995;13(2):359-372. doi:10.1200/JCO.1995.13.2.359
46. Reiter A, Schrappe M, Tiemann M, et al. Successful treatment strategy for Ki-1 anaplastic large-cell lymphoma of childhood: a prospective analysis of 62 patients enrolled in three consecutive Berlin-Frankfurt-Munster group studies. J Clin Oncol. 1994;12(5):899-908. doi:10.1200/JCO.1994.12.5.899
47. Pillon M, Piglione M, Garaventa A, et al. Long-term results of AIEOP LNH-92 protocol for the treatment of pediatric lymphoblastic lymphoma: a report of the Italian Association of Pediatric Hematology and Oncology. Pediatr Blood Cancer. 2009;53(6):953-959. doi:10.1002/pbc.22162
48. Alexander S, Kraveka JM, Weitzman S, et al. Advanced Stage Anaplastic Large Cell Lymphoma in Children and Adolescents: Results of ANHL0131, a Randomized Phase III Trial of APO Versus a Modified Regimen with Vinblastine: A Report from the Children’s Oncology Group. Pediatr Blood Cancer. 2014;61(12):2236-2242. doi:10.1002/pbc.25187

143
49. Sandlund JT, Pui CH, Roberts WM, et al. Clinicopathologic features and treatment outcome of children with large-cell lymphoma and the t(2;5)(p23;q35). Blood. 1994;84(8):2467-2471. http://www.bloodjournal.org/content/84/8/2467.abstract
50. Vecchi V, Burnelli R, Pileri S, et al. Anaplastic large cell lymphoma (Ki-1+/CD30+) in childhood. Med Pediatr Oncol. 1993;21(6):402—410. doi:10.1002/mpo.2950210603
51. Woessmann W, Seidemann K, Mann G, et al. The impact of the methotrexate administration schedule and dose in the treatment of children and adolescents with B-cell neoplasms: a report of the BFM Group Study NHL-BFM95. Blood. 2005;105(3):948-958. doi:10.1182/blood-2004-03-0973
52. Le Deley MC, Rosolen A, Williams DM, et al. Vinblastine in children and adolescents with high-risk anaplastic large-cell lymphoma: Results of the randomized ALCL99-vinblastine trial. J Clin Oncol. 2010;28(25):3987-3993. doi:10.1200/JCO.2010.28.5999
53. Attarbaschi A, Mann G, Rosolen A, et al. Limited stage I disease is not necessarily indicative of an excellent prognosis in childhood anaplastic large cell lymphoma. Blood. 2011;117(21):5616-5619. doi:10.1182/blood-2010-12-324012
54. Mori T, Fukano R, Saito A, et al. Analysis of Japanese registration from the randomized international trial for childhood anaplastic large cell lymphoma (ALCL99-R1). Rinsho Ketsueki. 2014;55(5):526—533. doi:DN/JST.JSTAGE/rinketsu/55.526
55. Wrobel G, Mauguen A, Rosolen A, et al. Safety assessment of intensive induction therapy in childhood anaplastic large cell lymphoma: report of the ALCL99 randomised trial. Pediatr Blood Cancer. 2011;56(7):1071—1077. doi:10.1002/pbc.22940
56. Oeffinger KC, Mertens AC, Sklar CA, et al. Chronic Health Conditions in Adult Survivors of Childhood Cancer. N Engl J Med. 2006;355(15):1572-1582. doi:10.1056/NEJMsa060185
57. Alexander S, Kraveka JM, Weitzman S, et al. Advanced stage anaplastic large cell lymphoma in children and adolescents: results of ANHL0131, a randomized phase III trial of APO versus a modified regimen with vinblastine: a report from the children’s oncology group. Pediatr Blood Cancer. 2014;61(12):2236-2242. doi:10.1002/pbc.25187
58. Brentuximab Vedotin or Crizotinib and Combination Chemotherapy in Treating Patients With Newly Diagnosed Stage II-IV Anaplastic Large Cell Lymphoma. Accessed January 8, 2018. https://clinicaltrials.gov/ct2/show/NCT01979536
59. Ceritinib With Brentuximab Vedotin in Treating Patients With ALK-Positive Anaplastic Large Cell Lymphoma. Accessed January 8, 2018. https://clinicaltrials.gov/ct2/show/NCT02729961
60. Combination Chemotherapy Followed By Stem Cell Transplant in Treating Young Patients With Progressive or Relapsed Anaplastic Large Cell Lymphoma. Accessed January 10, 2018. https://clinicaltrials.gov/ct2/show/NCT00317408
61. Ifosfamide, Carboplatin, Etoposide, and SGN-30 in Treating Young Patients With Recurrent Anaplastic Large Cell Lymphoma. Accessed January 8, 2018. https://clinicaltrials.gov/ct2/show/results/NCT00354107
62. Study of Brentuximab Vedotin (SGN-35) in Pediatric Participants With Relapsed or Refractory (r/r) Systemic Anaplastic Large-Cell Lymphoma or Hodgkin Lymphoma. Accessed January 10, 2018. https://clinicaltrials.gov/ct2/show/NCT01492088
63. Mossé YP, Lim MS, Voss SD, et al. Safety and activity of crizotinib for paediatric patients with refractory solid tumours or anaplastic large-cell lymphoma: a Children’s Oncology Group phase 1 consortium study. Lancet Oncol. 2013;14(6):472-480. doi:10.1016/S1470-2045(13)70095-0
64. Balis FM, Thompson PA, Mosse YP, et al. First-dose and steady-state pharmacokinetics of orally administered crizotinib in children with solid tumors: a report on ADVL0912 from the Children’s Oncology Group Phase 1/Pilot Consortium. Cancer Chemother Pharmacol. 2017;79(1):181-187. doi:10.1007/s00280-016-3220-6
65. Crizotinib and Combination Chemotherapy in Treating Younger Patients With Relapsed or Refractory Solid Tumors or Anaplastic Large Cell Lymphoma. Accessed January 10, 2018. https://clinicaltrials.gov/ct2/show/NCT01606878
66. ClinicalTrials.gov. National Library of Medicine. Phase 2 Study Assessing Efficacy and Safety of Crizotinib in Patients Harboring an Alteration on ALK, MET or ROS1 (AcSé). Identifier: NCT02034981. Accessed March 20, 2019. https://clinicaltrials.gov/ct2/show/NCT02034981
67. Nagai H, Fukano R, Sekimizu M, et al. Phase II trial of CH5424802 (alectinib hydrochloride) for recurrent or refractory ALK-positive anaplastic large cell lymphoma: Study protocol for a non-randomized non-controlled trial. Nagoya J Med Sci. 2017;79(3):407-413. doi:10.18999/nagjms.79.3.407
68. UMIN-CTR Clinical Trial Information for UMIN000016991. Accessed January 8, 2018. https://upload.umin.ac.jp/cgi-open-bin/ctr_e/ctr_view.cgi?recptno=R000019718
69. UMIN-CTR Clinical Trial Information for UMIN000028075. Accessed January 8, 2018. https://upload.umin.ac.jp/cgi-open-bin/ctr/ctr_view.cgi?recptno=R000031711
70. ITCC-053 trial information, Nederlands trial register. Accessed January 10, 2018. http://www.trialregister.nl/trialreg/admin/rctview.asp?TC=5584
71. Brugières L, Quartier P, Le Deley MC, et al. Relapses of childhood anaplastic large-cell lymphoma: treatment results in a series of 41 children-a report from the French Society of Pediatric Oncology. Ann Oncol. 2000;11(1):53-58. doi:10.1023/A:1008352726155
72. Brugières L, Pacquement H, Le Deley M-C, et al. Single-Drug Vinblastine As Salvage Treatment for Refractory or Relapsed Anaplastic Large-Cell Lymphoma: A Report From the French Society of Pediatric Oncology. J Clin Oncol. 2009;27(30):5056-5061. doi:10.1200/JCO.2008.20.1764

144
73. Mussolin L, Pillon M, D’Amore ES, et al. Prevalence and clinical implications of bone marrow involvement in pediatric anaplastic large cell lymphoma. Leukemia. 2005;19(9):1643-1647. doi:10.1038/sj.leu.2403888
74. Damm-Welk C, Mussolin L, Zimmermann M, et al. Early assessment of minimal residual disease identifies patients at very high relapse risk in NPM-ALK–positive anaplastic large-cell lymphoma. Blood. 2014;123(3):334-337. doi:10.1182/blood-2013-09-526202
75. Burkhardt B, Zimmermann M, Oschlies I, et al. The impact of age and gender on biology, clinical features and treatment outcome of non-Hodgkin lymphoma in childhood and adolescence. Br J Haematol. 2005;131(1):39-49. doi:10.1111/j.1365-2141.2005.05735.x
76. Le Deley M-C, Reiter A, Williams D, et al. Prognostic factors in childhood anaplastic large cell lymphoma: results of a large European intergroup study. Blood. 2008;111(3):1560-1566. doi:10.1182/blood-2007-07-100958
77. Lamant L, McCarthy K, d’Amore E, et al. Prognostic impact of morphologic and phenotypic features of childhood ALK-positive anaplastic large-cell lymphoma: results of the ALCL99 study. J Clin Oncol Off J Am Soc Clin Oncol. 2011;29(35):4669-4676. doi:10.1200/JCO.2011.36.5411
78. Mussolin L, Le Deley M-C, Carraro E, et al. Prognostic Factors in Childhood Anaplastic Large Cell Lymphoma: Long Term Results of the International ALCL99 Trial. Cancers (Basel). 2020;12(10). doi:10.3390/cancers12102747
79. Damm-Welk C, Busch K, Burkhardt B, et al. Prognostic significance of circulating tumor cells in bone marrow or peripheral blood as detected by qualitative and quantitative PCR in pediatric NPM-ALK-positive anaplastic large-cell lymphoma. Blood. 2007;110(2):670-677. doi:10.1182/blood-2007-02-066852
80. Abramov D, Oschlies I, Zimmermann M, et al. Expression of CD8 is associated with non-common type morphology and outcome in pediatric anaplastic lymphoma kinase-positive anaplastic large cell lymphoma. Haematologica. 2013;98(10):1547-1553. doi:10.3324/haematol.2013.085837
81. Suzuki R, Kagami Y, Takeuchi K, et al. Prognostic significance of CD56 expression for ALK-positive and ALK-negative anaplastic large-cell lymphoma of T/null cell phenotype. Blood. 2000;96(9):2993-3000. doi:10.1182/blood.V96.9.2993
82. Nasr MR, Laver JH, Chang M, Hutchison RE. Expression of anaplastic lymphoma kinase, tyrosine-phosphorylated STAT3, and associated factors in pediatric anaplastic large cell lymphoma: A report from the children’s oncology group. Am J Clin Pathol. 2007;127(5):770-778. doi:10.1309/FNY8Y4H6PK1V2MGE
83. Larose H, Prokoph N, Matthews JD, et al. Whole Exome Sequencing reveals NOTCH1 mutations in anaplastic large cell lymphoma and points to Notch both as a key pathway and a potential therapeutic target. Haematologica. Published online April 23, 2020:haematol.2019.238766. doi:10.3324/haematol.2019.238766
84. Lobello C, Tichy B, Bystry V, et al. STAT3 and TP53 mutations associate with poor prognosis in anaplastic large cell lymphoma. Leukemia. Published online November 2020. doi:10.1038/s41375-020-01093-1
85. Schlette EJ, Medeiros LJ, Goy A, Lai R, Rassidakis GZ. Survivin expression predicts poorer prognosis in anaplastic large-cell lymphoma. J Clin Oncol Off J Am Soc Clin Oncol. 2004;22(9):1682-1688. doi:10.1200/JCO.2004.10.172
86. ten Berge RL, Meijer CJLM, Dukers DF, et al. Expression levels of apoptosis-related proteins predict clinical outcome in anaplastic large cell lymphoma. Blood. 2002;99(12):4540-4546. doi:10.1182/blood.v99.12.4540
87. Kalinova M, Krskova L, Brizova H, Kabickova E, Kepak T, Kodet R. Quantitative PCR detection of NPM/ALK fusion gene and CD30 gene expression in patients with anaplastic large cell lymphoma--residual disease monitoring and a correlation with the disease status. Leuk Res. 2008;32(1):25-32. doi:10.1016/j.leukres.2007.01.002
88. Pulford K, Falini B, Banham AH, et al. Immune response to the ALK oncogenic tyrosine kinase in patients with anaplastic large-cell lymphoma. Blood. 2000;96(4):1605-1607.
89. Ait-Tahar K, Cerundolo V, Banham AH, et al. B and CTL responses to the ALK protein in patients with ALK-positive ALCL. Int J cancer. 2006;118(3):688-695. doi:10.1002/ijc.21410
90. Mussolin L, Bonvini P, Ait-Tahar K, et al. Kinetics of humoral response to ALK and its relationship with minimal residual disease in pediatric ALCL. Leukemia. 2009;23(2):400-402. doi:10.1038/leu.2008.184
91. Ait-Tahar K, Damm-Welk C, Burkhardt B, et al. Correlation of the autoantibody response to the ALK oncoantigen in pediatric anaplastic lymphoma kinase–positive anaplastic large cell lymphoma with tumor dissemination and relapse risk. Blood. 2010;115(16):3314-3319. doi:10.1182/blood-2009-11-251892
92. Mussolin L, Pillon M, Zimmermann M, et al. Course of anti-ALK antibody titres during chemotherapy in children with anaplastic large cell lymphoma. Br J Haematol. 2018;182(5):733-735. doi:10.1111/bjh.14864
93. Iijima-Yamashita Y, Mori T, Nakazawa A, et al. Prognostic impact of minimal disseminated disease and immune response to NPM-ALK in Japanese children with ALK-positive anaplastic large cell lymphoma. Int J Hematol. 2018;107(2):244-250. doi:10.1007/s12185-017-2338-6
94. Woessmann W, Oschlies I MG. Intensification with HD-MTX, HD-Arac/VP-16 did not improve the outcome of high risk pediatric ALCL - results from the trial NHL-BFM95. J Pediatr Hematol Oncol. Published online 2003:25:S4.
95. Pillon M, Gregucci F, Lombardi A, et al. Results of AIEOP LNH-97 protocol for the treatment of anaplastic large cell lymphoma of childhood. Pediatr Blood Cancer. 2012;59(5):828-833. doi:10.1002/pbc.24125
96. Mori T, Kiyokawa N, Shimada H, Miyauchi J, Fujimoto J. Anaplastic large cell lymphoma in Japanese children: retrospective analysis of 34 patients diagnosed at the National Research Institute for Child Health and Development. Br J Haematol. 2003;121(1):94-96. doi:10.1046/j.1365-2141.2003.04249.x

145
97. Woessmann W, Zimmermann M, Lenhard M, et al. Relapsed or Refractory Anaplastic Large-Cell Lymphoma in Children and Adolescents After Berlin-Frankfurt-Muenster (BFM)–Type First-Line Therapy: A BFM-Group Study. J Clin Oncol. 2011;29(22):3065-3071. doi:10.1200/JCO.2011.34.8417
98. Knörr F, Brugières L, Pillon M, et al. Stem Cell Transplantation and Vinblastine Monotherapy for Relapsed Pediatric Anaplastic Large Cell Lymphoma: Results of the International, Prospective ALCL-Relapse Trial. J Clin Oncol Off J Am Soc Clin Oncol. Published online July 2020:JCO2000157. doi:10.1200/JCO.20.00157
99. Williams D, Mori T, Reiter A, et al. Central nervous system involvement in anaplastic large cell lymphoma in childhood: Results from a multicentre European and Japanese study. Pediatr Blood Cancer. 2013;60(10):E118-E121. doi:10.1002/pbc.24591
100. Del Baldo G, Abbas R, Woessmann W, et al. Neuro-meningeal relapse in anaplastic large-cell lymphoma: incidence, risk factors and prognosis - a report from the European intergroup for childhood non-Hodgkin lymphoma. Br J Haematol. Published online July 2020. doi:10.1111/bjh.16755
101. Lowe EJ, Sposto R, Perkins SL, et al. Intensive chemotherapy for systemic anaplastic large cell lymphoma in children and adolescents: final results of Children’s Cancer Group Study 5941. Pediatr Blood Cancer. 2009;52(3):335-339. doi:10.1002/pbc.21817
102. Fraga M, Brousset P, Schlaifer D, et al. Bone Marrow Involvement in Anaplastic Large Cell Lymphoma: Immunohistochemical Detection of Minimal Disease and Its Prognostic Significance. Am J Clin Pathol. 1995;103(1):82-89. doi:10.1093/ajcp/103.1.82
103. Damm-Welk C, Pillon M, Woessmann W, Mussolin L. Prognostic factors in paediatric anaplastic large cell lymphoma: role of ALK. Front Biosci (Schol Ed). 2015;7:205-216.
104. Morris SW, Naeve C, Mathew P, et al. ALK, the chromosome 2 gene locus altered by the t(2;5) in non-Hodgkin’s lymphoma, encodes a novel neural receptor tyrosine kinase that is highly related to leukocyte tyrosine kinase (LTK). Oncogene. 1997;14(18):2175-2188. doi:10.1038/sj.onc.1201062
105. Camidge DR, Bang Y-J, Kwak EL, et al. Activity and safety of crizotinib in patients with ALK-positive non-small-cell lung cancer: updated results from a phase 1 study. Lancet Oncol. 2012;13(10):1011-1019. doi:10.1016/S1470-2045(12)70344-3
106. FDA Approved Drug Products Information for Xalori. Accessed January 8, 2018. https://www.accessdata.fda.gov/scripts/cder/daf/index.cfm?event=overview.process&applno=202570
107. FDA Approved Drug Products Information for Zykadia. Accessed January 8, 2018. https://www.accessdata.fda.gov/scripts/cder/daf/index.cfm?event=overview.process&applno=205755
108. FDA Approved Drug Products Information for Alecensa. Accessed January 8, 2018. https://www.accessdata.fda.gov/scripts/cder/daf/index.cfm?event=overview.process&applno=208434
109. FDA Approved Drug Products Information for Alunbrig. Accessed January 8, 2018. https://www.accessdata.fda.gov/scripts/cder/daf/index.cfm?event=overview.process&applno=208772
110. Swerdlow, SH, Campo, E, Harris N. WHO Classification of Tumours of Haematopoietic and Lymphoid Tissues. 4th ed. International Agency for Research on Cancer; 2008.
111. Turner SD, Lamant L, Kenner L, Brugières L. Anaplastic large cell lymphoma in paediatric and young adult patients. Br J Haematol. 2016;173(4):560-572. doi:10.1111/bjh.13958
112. Kung Sutherland MS, Sanderson RJ, Gordon KA, et al. Lysosomal trafficking and cysteine protease metabolism confer target-specific cytotoxicity by peptide-linked anti-CD30-auristatin conjugates. J Biol Chem. 2006;281(15):10540-10547. doi:10.1074/jbc.M510026200
113. Francisco JA, Cerveny CG, Meyer DL, et al. cAC10-vcMMAE, an anti-CD30–monomethyl auristatin E conjugate with potent and selective antitumor activity. Blood. 2003;102(4):1458-1465. doi:10.1182/blood-2003-01-0039
114. Younes A, Bartlett NL, Leonard JP, et al. Brentuximab Vedotin (SGN-35) for Relapsed CD30-Positive Lymphomas. N Engl J Med. 2010;363(19):1812-1821. doi:10.1056/NEJMoa1002965
115. Pro B, Advani R, Brice P, et al. Brentuximab vedotin (SGN-35) in patients with relapsed or refractory systemic anaplastic large-cell lymphoma: Results of a phase II study. J Clin Oncol. 2012;30(18):2190-2196. doi:10.1200/JCO.2011.38.0402
116. Pro B, Advani R, Brice P, et al. Four-Year Survival Data from an Ongoing Pivotal Phase 2 Study of Brentuximab Vedotin in Patients with Relapsed or Refractory Systemic Anaplastic Large Cell Lymphoma. Blood. 2014;124(21):3095. http://www.bloodjournal.org/content/124/21/3095.abstract
117. Mossé YP, Voss SD, Lim MS, et al. Targeting ALK with crizotinib in pediatric anaplastic large cell lymphoma and inflammatory myofibroblastic tumor: A Children’s Oncology Group study. J Clin Oncol. 2017;35(28):3215-3221. doi:10.1200/JCO.2017.73.4830
118. Mori T, Takimoto T, Katano N, et al. Recurrent childhood anaplastic large cell lymphoma: A retrospective analysis of registered cases in Japan. Br J Haematol. 2006;132(5):594-597. doi:10.1111/j.1365-2141.2005.05910.x
119. Zinzani PL, Sasse S, Radford J, Gautam A, Bonthapally V. Brentuximab vedotin in relapsed/refractory Hodgkin lymphoma: An updated review of published data from the named patient program. Crit Rev Oncol / Hematol. 2018;104:65-70. doi:10.1016/j.critrevonc.2016.04.019
120. Hapgood G, Savage KJ. The biology and management of systemic anaplastic large cell lymphoma. Blood. 2015;126(1):17-25. doi:10.1182/blood-2014-10-567461
121. Woessmann W, Peters C, Lenhard M, et al. Allogeneic haematopoietic stem cell transplantation in relapsed or refractory anaplastic large cell lymphoma of children and adolescents--a Berlin-Frankfurt-Münster group report. Br J Haematol. 2006;133(2):176-182. doi:10.1111/j.1365-2141.2006.06004.x

146
122. Fukano R, Mori T, Kobayashi R, et al. Haematopoietic stem cell transplantation for relapsed or refractory anaplastic large cell lymphoma: A study of children and adolescents in Japan. Br J Haematol. 2015;168(4):557-563. doi:10.1111/bjh.13167
123. Woessmann, W ; Brugieres, L; Rosolen, A; Zimmermann, M; Attarbaschi, A; Mellgren, K ; Williams, D; Uyttebroeck, A ; Wrobel, G; Reiter A. Risk-adapted therapy for patients with relapsed or refractory ALCL - interim-results of the prospective EICNHL-Trial ALCL-relapse. Br J Haematol. 2012;159(74):41.
124. Fukano R, Mori T, Sekimizu M, et al. Alectinib for relapsed or refractory ALK-positive anaplastic large cell lymphoma: an open label phase 2 trial. Cancer Sci. Published online October 2020. doi:10.1111/cas.14671
125. Yang J, Li J, Gu W-Y, et al. Central nervous system relapse in a pediatric anaplastic large cell lymphoma patient with CLTC/ALK translocation treated with alectinib: A case report. World J Clin cases. 2020;8(9):1685-1692. doi:10.12998/wjcc.v8.i9.1685
126. Brugières L, Houot R, Cozic N, et al. Crizotinib in Advanced ALK+ Anaplastic Large Cell Lymphoma in Children and Adults: Results of the Acs© Phase II Trial. Blood. 2017;130(Suppl 1).
127. Gambacorti-Passerini C, Mussolin L, Brugieres L. Abrupt Relapse of ALK-Positive Lymphoma after Discontinuation of Crizotinib. N Engl J Med. 2016;374(1):95-96. doi:10.1056/NEJMc1511045
128. Gambacorti-Passerini C, Farina F, Stasia A, et al. Crizotinib in advanced, chemoresistant anaplastic lymphoma kinase-positive lymphoma patients. J Natl Cancer Inst. 2014;106(2):2-5. doi:10.1093/jnci/djt378
129. Study of Brentuximab Vedotin (SGN-35) in Pediatric Participants With Relapsed or Refractory (r/r) Systemic Anaplastic Large-Cell Lymphoma or Hodgkin Lymphoma. Accessed January 8, 2018. https://clinicaltrials.gov/ct2/show/results/NCT01492088?sect=X4301256&view=record
130. Vaklavas C, Forero-Torres A. Safety and efficacy of brentuximab vedotin in patients with Hodgkin lymphoma or systemic anaplastic large cell lymphoma. Ther Adv Hematol. 2012;3(4):209-225. doi:10.1177/2040620712443076
131. Yamamoto R, Nishikori M, Tashima M, et al. B7-H1 expression is regulated by MEK/ERK signaling pathway in anaplastic large cell lymphoma and Hodgkin lymphoma. Cancer Sci. 2009;100(11):2093-2100. doi:10.1111/j.1349-7006.2009.01302.x
132. Marzec M, Zhang Q, Goradia A, et al. Oncogenic kinase NPM/ALK induces through STAT3 expression of immunosuppressive protein CD274 (PD-L1, B7-H1). Proc Natl Acad Sci U S A. 2008;105(52):20852-20857. doi:10.1073/pnas.0810958105
133. Parry R V, Chemnitz JM, Frauwirth KA, et al. CTLA-4 and PD-1 Receptors Inhibit T-Cell Activation by Distinct Mechanisms . Mol Cell Biol. 2005;25(21):9543-9553. doi:10.1128/MCB.25.21.9543-9553.2005
134. Dong H, Strome SE, Salomao DR, et al. Tumor-associated B7-H1 promotes T-cell apoptosis: A potential mechanism of immune evasion. Nat Med. 2002;8(8):793-800. doi:10.1038/nm730
135. Curiel TJ, Wei S, Dong H, et al. Blockade of B7-H1 improves myeloid dendritic cell–mediated antitumor immunity. Nat Med. 2003;9(5):562-567. doi:10.1038/nm863
136. Chan TSY, Khong P-L, Kwong Y-L. Pembrolizumab for relapsed anaplastic large cell lymphoma after allogeneic haematopoietic stem cell transplantation: efficacy and safety. Ann Hematol. 2016;95(11):1913-1915. doi:10.1007/s00277-016-2764-1
137. Hebart H, Lang P, Woessmann W. Nivolumab for refractory anaplastic large cell lymphoma: A case report. Ann Intern Med. 2016;165(8):607-608. doi:10.7326/L16-0037
138. Rigaud C, Abbou S, Minard-Colin V, et al. Efficacy of nivolumab in a patient with systemic refractory ALK+ anaplastic large cell lymphoma. Pediatr Blood Cancer. Published online November 28, 2017:e26902. doi:10.1002/pbc.26902
139. Grigg C, Rizvi NA. PD-L1 biomarker testing for non-small cell lung cancer: truth or fiction? J Immunother Cancer. 2016;4:48. doi:10.1186/s40425-016-0153-x
140. Ait-Tahar K, Barnardo MCN, Pulford K. CD4 T-Helper Responses to the Anaplastic Lymphoma Kinase (ALK) Protein in Patients with ALK-Positive Anaplastic Large-Cell Lymphoma. Cancer Res. 2007;67(5):1898-1901. doi:10.1158/0008-5472.CAN-06-4427
141. Merkel O, Hamacher F, Sifft E, Kenner L, Greil R. Novel Therapeutic Options in Anaplastic Large Cell Lymphoma: Molecular Targets and Immunological Tools. Mol Cancer Ther. 2011;10(7):1127-1136. doi:10.1158/1535-7163.MCT-11-0042
142. Chiarle R, Martinengo C, Mastini C, et al. The anaplastic lymphoma kinase is an effective oncoantigen for lymphoma vaccination. Nat Med. 2008;14(6):676-680. doi:10.1038/nm1769
143. Maris JM. Recent Advances in Neuroblastoma. N Engl J Med. 2010;362(23):2202-2211. doi:10.1056/NEJMra0804577
144. Brodeur GM. Neuroblastoma: biological insights into a clinical enigma. Nat Rev Cancer. 2003;3(3):203-216. doi:10.1038/nrc1014
145. Smith MA, Seibel NL, Altekruse SF, et al. Outcomes for Children and Adolescents With Cancer: Challenges for the Twenty-First Century. J Clin Oncol. 2010;28(15):2625-2634. doi:10.1200/JCO.2009.27.0421
146. Spix C, Pastore G, Sankila R, Stiller CA, Steliarova-Foucher E. Neuroblastoma incidence and survival in European children (1978–1997): Report from the Automated Childhood Cancer Information System project. Eur J Cancer. 2006;42(13):2081-2091. doi:10.1016/j.ejca.2006.05.008
147. Isaacs H. FETAL AND NEONATAL NEUROBLASTOMA: RETROSPECTIVE REVIEW OF 271 CASES. Fetal Pediatr Pathol. 2007;26(4):177-184. doi:10.1080/15513810701696890
148. Diede SJ. Spontaneous regression of metastatic cancer: learning from neuroblastoma. Nat Rev Cancer. 2014;14(2):71-72. doi:10.1038/nrc3656
149. Maris JM, Hogarty MD, Bagatell R, Cohn SL. Neuroblastoma. Lancet. 2007;369(9579):2106-2120.

147
doi:10.1016/S0140-6736(07)60983-0 150. PDQ Pediatric Treatment Editorial Board. Neuroblastoma Treatment (PDQ®): Health Professional Version.;
2002. 151. Park JR, Bagatell R, London WB, et al. Children’s Oncology Group’s 2013 blueprint for research:
Neuroblastoma. Pediatr Blood Cancer. 2013;60(6):985-993. doi:10.1002/pbc.24433 152. Smith L, Minter S, O’Brien P, Kraveka JM, Medina AM, Lazarchick J. Neuroblastoma in an adult: case
presentation and literature review. Ann Clin Lab Sci. 2013;43(1):81-84. 153. Joshi S, R. A, L.R. L, Zulcic M, Ahn H, L. D. Novel Therapeutic Approaches for Neuroblastoma. In:
Neuroblastoma. InTech; 2013. doi:10.5772/55451 154. Pugh TJ, Morozova O, Attiyeh EF, et al. The genetic landscape of high-risk neuroblastoma. Nat Genet.
2013;45(3):279-284. doi:10.1038/ng.2529 155. Mossé YP, Laudenslager M, Longo L, et al. Identification of ALK as a major familial neuroblastoma
predisposition gene. Nature. 2008;455(7215):930-935. doi:10.1038/nature07261 156. Janoueix-Lerosey I, Lequin D, Brugières L, et al. Somatic and germline activating mutations of the ALK
kinase receptor in neuroblastoma. Nature. 2008;455(7215):967-970. doi:10.1038/nature07398 157. Chen Y, Takita J, Choi YL, et al. Oncogenic mutations of ALK kinase in neuroblastoma. Nature.
2008;455(7215):971-974. doi:10.1038/nature07399 158. George RE, Sanda T, Hanna M, et al. Activating mutations in ALK provide a therapeutic target in
neuroblastoma. Nature. 2008;455(7215):975-978. doi:10.1038/nature07397 159. Krause DS, Van Etten RA. Tyrosine kinases as targets for cancer therapy. N Engl J Med. 2005;353(2):172-
187. doi:10.1056/NEJMra044389 160. Klaus M, Prokoph N, Girbig M, et al. Structure and decoy-mediated inhibition of the SOX18/Prox1-DNA
interaction. Nucleic Acids Res. 2016;44(8):3922-3935. doi:10.1093/nar/gkw130 161. Lamant L, Pulford K, Bischof D, et al. Expression of the ALK Tyrosine Kinase Gene in Neuroblastoma. Am
J Pathol. 2000;156(5):1711-1721. doi:10.1016/S0002-9440(10)65042-0 162. Dirks WG, Fähnrich S, Lis Y, Becker E, MacLeod RAF, Drexler HG. Expression and functional analysis of
the anaplastic lymphoma kinase (ALK) gene in tumor cell lines. Int J Cancer. 2002;100(1):49-56. doi:10.1002/ijc.10435
163. Lee CC, Jia Y, Li N, et al. Crystal structure of the ALK (anaplastic lymphoma kinase) catalytic domain. Biochem J. 2010;430(3):425-437. doi:10.1042/BJ20100609
164. Bresler SC, Weiser DA, Huwe PJ, et al. ALK mutations confer differential oncogenic activation and sensitivity to ALK inhibition therapy in neuroblastoma. Cancer Cell. 2014;26(5):682. doi:10.1016/J.CCELL.2014.09.019
165. Sausen M, Leary RJ, Jones S, et al. Integrated genomic analyses identify ARID1A and ARID1B alterations in the childhood cancer neuroblastoma. Nat Genet. 2013;45(1):12-17. doi:10.1038/ng.2493
166. Pugh TJ, Morozova O, Attiyeh EF, et al. The genetic landscape of high-risk neuroblastoma. Nat Genet. 2013;45(3):279-284. doi:10.1038/ng.2529
167. Cheung N-K V. Association of Age at Diagnosis and Genetic Mutations in Patients With Neuroblastoma. JAMA. 2012;307(10):1062. doi:10.1001/jama.2012.228
168. Carpenter EL, Mossé YP. Targeting ALK in neuroblastoma—preclinical and clinical advancements. Nat Rev Clin Oncol. 2012;9(7):391-399. doi:10.1038/nrclinonc.2012.72
169. Zhu S, Lee J-S, Guo F, et al. Activated ALK Collaborates with MYCN in Neuroblastoma Pathogenesis. Cancer Cell. 2012;21(3):362-373. doi:10.1016/j.ccr.2012.02.010
170. Schönherr C, Ruuth K, Kamaraj S, et al. Anaplastic Lymphoma Kinase (ALK) regulates initiation of transcription of MYCN in neuroblastoma cells. Oncogene. 2012;31(50):5193-5200. doi:10.1038/onc.2012.12
171. Schleiermacher G, Javanmardi N, Bernard V, et al. Emergence of new ALK mutations at relapse of neuroblastoma. J Clin Oncol. 2014;32(25):2727-2734. doi:10.1200/JCO.2013.54.0674
172. Eleveld TF, Oldridge DA, Bernard V, et al. Relapsed neuroblastomas show frequent RAS-MAPK pathway mutations. Nat Genet. 2015;47(8):864-871. doi:10.1038/ng.3333
173. Padovan-Merhar OM, Raman P, Ostrovnaya I, et al. Enrichment of Targetable Mutations in the Relapsed Neuroblastoma Genome. PLoS Genet. 2016;12(12):e1006501. doi:10.1371/journal.pgen.1006501
174. Bellini A, Bernard V, Leroy Q, et al. Deep Sequencing Reveals Occurrence of Subclonal ALK Mutations in Neuroblastoma at Diagnosis. Clin Cancer Res. 2015;21(21):4913-4921. doi:10.1158/1078-0432.CCR-15-0423
175. Osajima-Hakomori Y, Miyake I, Ohira M, Nakagawara A, Nakagawa A, Sakai R. Biological Role of Anaplastic Lymphoma Kinase in Neuroblastoma. Am J Pathol. 2005;167(1):213-222. doi:10.1016/S0002-9440(10)62966-5
176. Miyake I, Hakomori Y, Shinohara A, et al. Activation of anaplastic lymphoma kinase is responsible for hyperphosphorylation of ShcC in neuroblastoma cell lines. Oncogene. 2002;21(38):5823-5834. doi:10.1038/sj.onc.1205735
177. De Brouwer S, De Preter K, Kumps C, et al. Meta-analysis of Neuroblastomas Reveals a Skewed ALK Mutation Spectrum in Tumors with MYCN Amplification. Clin Cancer Res. 2010;16(17):4353-4362. doi:10.1158/1078-0432.CCR-09-2660
178. ClinicalTrials.gov. National Library of Medicine. Crizotinib in Treating Young Patients with Relapsed or Refractory Solid Tumors or Anaplastic Large Cell Lymphoma. Identifier: NCT00939770. Accessed March 20, 2019. https://clinicaltrials.gov/ct2/show/NCT00939770

148
179. ClinicalTrials.gov. National Library of Medicine. An Investigational Drug, Crizotinib (PF-02341066), Is Being Studied In Tumors, Except Non-Small Cell Lung Cancer, That Are Positive For Anaplastic Lymphoma Kinase (ALK). Identifier: NCT01121588. Accessed March 20, 2019. https://clinicaltrials.gov/ct2/show/NCT01121588
180. ClinicalTrials.gov. National Library of Medicine. Crizotinib and Combination Chemotherapy in Treating Younger Patients with Relapsed or Refractory Solid Tumors or Anaplastic Large Cell Lymphoma. Identifier: NCT01606878. Accessed March 20, 2019. https://clinicaltrials.gov/ct2/show/NCT01606878
181. ClinicalTrials.gov. National Library of Medicine. Phase I Study of LDK378 in Pediatric, Malignancies with a Genetic Alteration in Anaplastic Lymphoma Kinase (ALK). Identifier: NCT01742286. Accessed March 20, 2019. https://clinicaltrials.gov/ct2/show/NCT01742286
182. ClinicalTrials.gov. National Library of Medicine. Study of RXDX-101 in Children with Recurrent or Refractory Solid Tumors and Primary CNS Tumors, With or Without TRK, ROS1, or ALK Fusions. Identifier: NCT02650401. Accessed March 20, 2019. https://clinicaltrials.gov/ct2/show/NCT02650401
183. ClinicalTrials.gov. National Library of Medicine. Next Generation Personalized Neuroblastoma Therapy (NEPENTHE). Identifier: NCT02780128. Accessed March 20, 2019. https://clinicaltrials.gov/ct2/show/NCT02780128
184. ClinicalTrials.gov. National Library of Medicine. Ensartinib in Treating Patients with Relapsed or Refractory Advanced Solid Tumors, Non-Hodgkin Lymphoma, or Histiocytic Disorders with ALK or ROS1 Genomic Alterations (A Pediatric MATCH Treatment Trial). I. Accessed March 20, 2019. https://clinicaltrials.gov/ct2/show/NCT03213652
185. ClinicalTrials.gov. National Library of Medicine. Study of Lorlatinib (PF-06463922). Identifier: NCT03107988. Accessed March 20, 2019. https://clinicaltrials.gov/ct2/show/NCT03107988
186. ClinicalTrials.gov. National Library of Medicine. Iobenguane I-131 or Crizotinib and Standard Therapy in Treating Younger Patients with Newly-Diagnosed High-Risk Neuroblastoma or Ganglioneuroblastoma. Identifier: NCT03126916. Accessed March 20, 2019. https://clinicaltrials.gov/ct2/show/NCT03126916
187. Shaw AT, Engelman JA. Ceritinib in ALK -Rearranged Non–Small-Cell Lung Cancer. N Engl J Med. 2014;370(26):2537-2539. doi:10.1056/NEJMc1404894
188. Khozin S, Blumenthal GM, Zhang L, et al. FDA Approval: Ceritinib for the Treatment of Metastatic Anaplastic Lymphoma Kinase–Positive Non–Small Cell Lung Cancer. Clin Cancer Res. 2015;21(11):2436-2439. doi:10.1158/1078-0432.CCR-14-3157
189. Allen CE, Laetsch TW, Mody R, et al. Target and Agent Prioritization for the Children’s Oncology Group—National Cancer Institute Pediatric MATCH Trial. JNCI J Natl Cancer Inst. 2017;109(5). doi:10.1093/jnci/djw274
190. The International Agency for Research on Cancer, the World Health Organization. Accessed February 15, 2018. http://globocan.iarc.fr/Pages/fact_sheets_cancer.aspx
191. Torre LA, Bray F, Siegel RL, Ferlay J, Lortet-Tieulent J, Jemal A. Global cancer statistics, 2012. CA Cancer J Clin. 2015;65(2):87-108. doi:10.3322/caac.21262
192. Reade CA, Ganti AK. EGFR targeted therapy in non-small cell lung cancer: potential role of cetuximab. Biologics. 2009;3:215-224. Accessed January 23, 2018. http://www.ncbi.nlm.nih.gov/pubmed/19707410
193. Surveillance, Epidemiology, and End Results Program; National Cancer Institute. Accessed February 15, 2018. https://seer.cancer.gov/statfacts/html/lungb.html
194. Garber K. ALK, Lung Cancer, and Personalized Therapy: Portent of the Future? JNCI J Natl Cancer Inst. 2010;102(10):672-675. doi:10.1093/jnci/djq184
195. Jemal A, Clegg LX, Ward E, et al. Annual report to the nation on the status of cancer, 1975-2001, with a special feature regarding survival. Cancer. 2004;101(1):3-27. doi:10.1002/cncr.20288
196. Shaw AT, Yeap BY, Mino-Kenudson M, et al. Clinical Features and Outcome of Patients With Non–Small-Cell Lung Cancer Who Harbor EML4-ALK. J Clin Oncol. 2009;27(26):4247-4253. doi:10.1200/JCO.2009.22.6993
197. Kwak EL, Bang Y-J, Camidge DR, et al. Anaplastic Lymphoma Kinase Inhibition in Non–Small-Cell Lung Cancer. N Engl J Med. 2010;363(18):1693-1703. doi:10.1056/NEJMoa1006448
198. Bergethon K, Shaw AT, Ignatius Ou S-H, et al. ROS1 Rearrangements Define a Unique Molecular Class of Lung Cancers. J Clin Oncol. 2012;30(8):863-870. doi:10.1200/JCO.2011.35.6345
199. Shaw AT, Kim D-W, Nakagawa K, et al. Crizotinib versus Chemotherapy in Advanced ALK-Positive Lung Cancer. N Engl J Med. 2013;368(25):2385-2394. doi:10.1056/NEJMoa1214886
200. Solomon BJ, Mok T, Kim D-W, et al. First-Line Crizotinib versus Chemotherapy in ALK-Positive Lung Cancer. N Engl J Med. 2014;371(23):2167-2177. doi:10.1056/NEJMoa1408440
201. Shaw AT, Kim D-W, Mehra R, et al. Ceritinib in ALK-Rearranged Non–Small-Cell Lung Cancer. N Engl J Med. 2014;370(13):1189-1197. doi:10.1056/NEJMoa1311107
202. Kim D-W, Mehra R, Tan DSW, et al. Activity and safety of ceritinib in patients with ALK-rearranged non-small-cell lung cancer (ASCEND-1): updated results from the multicentre, open-label, phase 1 trial. Lancet Oncol. 2016;17(4):452-463. doi:10.1016/S1470-2045(15)00614-2
203. Mok T, Spigel D, Felip E, et al. ASCEND-2: A single-arm, open-label, multicenter phase II study of ceritinib in adult patients (pts) with ALK-rearranged (ALK+) non-small cell lung cancer (NSCLC) previously treated with chemotherapy and crizotinib (CRZ). J Clin Oncol. 2015;33(15_suppl):8059. doi:10.1200/jco.2015.33.15_suppl.8059
204. Felip E, Orlov S, Park K, et al. ASCEND-3: A single-arm, open-label, multicenter phase II study of ceritinib in ALKi-naïve adult patients (pts) with ALK-rearranged (ALK+) non-small cell lung cancer (NSCLC). J Clin

149
Oncol. 2015;33(15_suppl):8060. doi:10.1200/jco.2015.33.15_suppl.8060 205. Nokihara H, Hida T, Kondo M, et al. Alectinib (ALC) versus crizotinib (CRZ) in ALK-inhibitor naive ALK-
positive non-small cell lung cancer (ALK+ NSCLC): Primary results from the J-ALEX study. J Clin Oncol. 2016;34(15_suppl):9008. doi:10.1200/JCO.2016.34.15_suppl.9008
206. Camidge DR. Taking aim at ALK across the blood-brain barrier. J Thorac Oncol. 2013;8(4):389-390. doi:10.1097/JTO.0b013e3182864e7c
207. Zhang S, Anjum R, Squillace R, et al. The Potent ALK Inhibitor Brigatinib (AP26113) Overcomes Mechanisms of Resistance to First- and Second-Generation ALK Inhibitors in Preclinical Models. Clin Cancer Res. 2016;22(22):5527-5538. doi:10.1158/1078-0432.CCR-16-0569
208. Sullivan I, Planchard D. Editorial on the article entitled "brigatinib efficacy and safety in patients with anaplastic lymphoma kinase (ALK)-positive non-small cell lung cancer in a phase I/II trial". J Thorac Dis. 2016;8(10):E1287-E1292. doi:10.21037/jtd.2016.10.57
209. Chen Y, Fu L. Mechanisms of acquired resistance to tyrosine kinase inhibitors. Acta Pharm Sin B. 2011;1(4):197-207. doi:10.1016/J.APSB.2011.10.007
210. Katayama R, Shaw AT, Khan TM, et al. Mechanisms of Acquired Crizotinib Resistance in ALK-Rearranged Lung Cancers. Sci Transl Med. 2012;4(120):120ra17-120ra17. doi:10.1126/scitranslmed.3003316
211. Camidge DR, Bang Y-J, Kwak EL, et al. Activity and safety of crizotinib in patients with ALK-positive non-small-cell lung cancer: updated results from a phase 1 study. Lancet Oncol. 2012;13(10):1011-1019. doi:10.1016/S1470-2045(12)70344-3
212. Kim D-W, Ahn M-J, Shi Y, et al. Results of a global phase II study with crizotinib in advanced ALK-positive non-small cell lung cancer (NSCLC). J Clin Oncol. 2012;30(15_suppl):7533. doi:10.1200/jco.2012.30.15_suppl.7533
213. Bivona TG, Doebele RC. A framework for understanding and targeting residual disease in oncogene-driven solid cancers. Nat Med. 2016;22(5):472-478. doi:10.1038/nm.4091
214. Rotow J, Bivona TG. Understanding and targeting resistance mechanisms in NSCLC. Nat Rev Cancer. 2017;17(11):637-658. doi:10.1038/nrc.2017.84
215. Choi YL, Soda M, Yamashita Y, et al. EML4-ALK Mutations in Lung Cancer That Confer Resistance to ALK Inhibitors. N Engl J Med. 2010;363(18):1734-1739. doi:10.1056/NEJMoa1007478
216. Gainor JF, Dardaei L, Yoda S, et al. Molecular Mechanisms of Resistance to First- and Second-Generation ALK Inhibitors in ALK-Rearranged Lung Cancer. Cancer Discov. 2016;6(10):1118-1133. doi:10.1158/2159-8290.CD-16-0596
217. Ceccon M, Mologni L, Bisson W, Scapozza L, Gambacorti-Passerini C. Crizotinib-Resistant NPM-ALK Mutants Confer Differential Sensitivity to Unrelated Alk Inhibitors. Mol Cancer Res. 2013;11(2):122-132. doi:10.1158/1541-7786.MCR-12-0569
218. Ou S-HI, Klempner SJ, Greenbowe JR, et al. Identification of a Novel HIP1-ALK Fusion Variant in Non–Small-Cell Lung Cancer (NSCLC) and Discovery of ALK I1171 (I1171N/S) Mutations in Two ALK-Rearranged NSCLC Patients with Resistance to Alectinib. J Thorac Oncol. 2014;9(12):1821-1825. doi:10.1097/JTO.0000000000000368
219. Sasaki T, Okuda K, Zheng W, et al. The Neuroblastoma-Associated F1174L ALK Mutation Causes Resistance to an ALK Kinase Inhibitor in ALK-Translocated Cancers. Cancer Res. 2010;70(24):10038-10043. doi:10.1158/0008-5472.CAN-10-2956
220. Chen Y, Takita J, Choi YL, et al. Oncogenic mutations of ALK kinase in neuroblastoma. doi:10.1038/nature07399
221. Bresler SC, Wood AC, Haglund EA, et al. Differential Inhibitor Sensitivity of Anaplastic Lymphoma Kinase Variants Found in Neuroblastoma. Sci Transl Med. 2011;3(108):108ra114-108ra114. doi:10.1126/scitranslmed.3002950
222. Sasaki T, Koivunen J, Ogino A, et al. A Novel ALK Secondary Mutation and EGFR Signaling Cause Resistance to ALK Kinase Inhibitors. Cancer Res. 2011;71(18):6051-6060. doi:10.1158/0008-5472.CAN-11-1340
223. Doebele RC, Pilling AB, Aisner DL, et al. Mechanisms of resistance to crizotinib in patients with ALK gene rearranged non-small cell lung cancer. Clin Cancer Res. 2012;18(5):1472-1482. doi:10.1158/1078-0432.CCR-11-2906
224. Heuckmann JM, Hölzel M, Sos ML, et al. ALK Mutations Conferring Differential Resistance to Structurally Diverse ALK Inhibitors. Clin Cancer Res. 2011;17(23):7394 LP - 7401. doi:10.1158/1078-0432.CCR-11-1648
225. Zamo A, Chiarle R, Piva R, et al. Anaplastic lymphoma kinase (ALK) activates Stat3 and protects hematopoietic cells from cell death. Oncogene. 2002;21(7):1038-1047. doi:10.1038/sj.onc.1205152
226. Amin AD, Rajan SS, Liang WS, et al. Evidence Suggesting That Discontinuous Dosing of ALK Kinase Inhibitors May Prolong Control of ALK+ Tumors. Cancer Res. 2015;75(14):2916-2927. doi:10.1158/0008-5472.CAN-14-3437
227. Katayama R, Khan TM, Benes C, et al. Therapeutic strategies to overcome crizotinib resistance in non-small cell lung cancers harboring the fusion oncogene EML4-ALK. Proc Natl Acad Sci. 2011;108(18):7535-7540. doi:10.1073/pnas.1019559108
228. Siegel RL, Miller KD, Jemal A. Cancer statistics, 2019. CA Cancer J Clin. 2019;69(1):7-34. doi:10.3322/caac.21551
229. Travis WD, Brambilla E, Nicholson AG, et al. The 2015 World Health Organization Classification of Lung Tumors. J Thorac Oncol. 2015;10(9):1243-1260. doi:10.1097/JTO.0000000000000630

150
230. Stewart EL, Tan SZ, Liu G, Tsao M-S. Known and putative mechanisms of resistance to EGFR targeted therapies in NSCLC patients with EGFR mutations-a review. Transl lung cancer Res. 2015;4(1):67-81. doi:10.3978/j.issn.2218-6751.2014.11.06
231. Gainor JF, Shaw AT. Emerging Paradigms in the Development of Resistance to Tyrosine Kinase Inhibitors in Lung Cancer. J Clin Oncol. 2013;31(31):3987-3996. doi:10.1200/JCO.2012.45.2029
232. Wilson FH, Johannessen CM, Piccioni F, et al. A Functional Landscape of Resistance to ALK Inhibition in Lung Cancer. Cancer Cell. 2015;27(3):397-408. doi:10.1016/j.ccell.2015.02.005
233. Lovly CM, McDonald NT, Chen H, et al. Rationale for co-targeting IGF-1R and ALK in ALK fusion–positive lung cancer. Nat Med. 2014;20(9):1027-1034. doi:10.1038/nm.3667
234. Hrustanovic G, Olivas V, Pazarentzos E, et al. RAS-MAPK dependence underlies a rational polytherapy strategy in EML4-ALK-positive lung cancer. Nat Med. 2015;21(9):1038-1047. doi:10.1038/nm.3930
235. Bai RY, Ouyang T, Miething C, Morris SW, Peschel C, Duyster J. Nucleophosmin-anaplastic lymphoma kinase associated with anaplastic large-cell lymphoma activates the phosphatidylinositol 3-kinase/Akt antiapoptotic signaling pathway. Blood. 2000;96(13):4319-4327. Accessed January 24, 2018. http://www.ncbi.nlm.nih.gov/pubmed/11110708
236. Bai RY, Dieter P, Peschel C, Morris SW, Duyster J. Nucleophosmin-anaplastic lymphoma kinase of large-cell anaplastic lymphoma is a constitutively active tyrosine kinase that utilizes phospholipase C-gamma to mediate its mitogenicity. Mol Cell Biol. 1998;18(12):6951-6961. doi:10.1128/mcb.18.12.6951
237. Schönherr C, Yang H-L, Vigny M, Palmer RH, Hallberg B. Anaplastic lymphoma kinase activates the small GTPase Rap1 via the Rap1-specific GEF C3G in both neuroblastoma and PC12 cells. Oncogene. 2010;29(19):2817-2830. doi:10.1038/onc.2010.27
238. Garraway LA, Jänne PA. Circumventing Cancer Drug Resistance in the Era of Personalized Medicine. Cancer Discov. 2012;2(3):214-226. doi:10.1158/2159-8290.CD-12-0012
239. Davies HT, Crombie IK. Bias in cohort studies. Hosp Med. 2000;61(2):133-135. 240. Horner MJ, Ries LAG, Krapcho M, Neyman N, Aminou R, Howlader N, Altekruse SF, Feuer EJ, Huang L,
Mariotto A, Miller BA, Lewis DR, Eisner MP, Stinchcomb DG EB. SEER Cancer Statistics Review, 1975-2006, National Cancer Institute.; 2009.
241. Wood KC. Mapping the Pathways of Resistance to Targeted Therapies. Cancer Res. 2015;75(20):4247-4251. doi:10.1158/0008-5472.CAN-15-1248
242. Stewart EL, Mascaux C, Pham N-A, et al. Clinical Utility of Patient-Derived Xenografts to Determine Biomarkers of Prognosis and Map Resistance Pathways in EGFR-Mutant Lung Adenocarcinoma. J Clin Oncol. 2015;33(22):2472-2480. doi:10.1200/JCO.2014.60.1492
243. Crystal AS, Shaw AT, Sequist L V., et al. Patient-derived models of acquired resistance can identify effective drug combinations for cancer. Science (80- ). 2014;346(6216):1480-1486. doi:10.1126/science.1254721
244. Frese KK, Tuveson DA. Maximizing mouse cancer models. Nat Rev Cancer. 2007;7(9):654-658. doi:10.1038/nrc2192
245. Wang J, Wang B, Chu H, Yao Y. Intrinsic resistance to EGFR tyrosine kinase inhibitors in advanced non-small-cell lung cancer with activating EGFR mutations. Onco Targets Ther. 2016;9:3711-3726. doi:10.2147/OTT.S106399
246. Tabe Y, Jin L, Yixin Z, et al. Role of Stromal Microenvironment In Non-Pharmacological Resistance of CML to Tyrosine Kinase Inhibitors through Lyn/CXCR4 Interactions In Lipid Rafts. Blood. 2015;116(21). doi:10.1038/leu.2011.291
247. Klemm F, Joyce JA. Microenvironmental regulation of therapeutic response in cancer. Trends Cell Biol. 2015;25(4):198-213. doi:10.1016/j.tcb.2014.11.006
248. Cheng X, Chen H. Tumor heterogeneity and resistance to EGFR-targeted therapy in advanced nonsmall cell lung cancer: challenges and perspectives. Onco Targets Ther. 2014;7:1689-1704. doi:10.2147/OTT.S66502
249. Rangarajan A, Weinberg RA. Comparative biology of mouse versus human cells: modelling human cancer in mice. Nat Rev Cancer. 2003;3(12):952-959. doi:10.1038/nrc1235
250. Gonzalez FJ, Kimura S. Study of P450 function using gene knockout and transgenic mice. Arch Biochem Biophys. 2003;409(1):153-158. doi:10.1016/s0003-9861(02)00364-8
251. Hanahan D, Weinberg RA. The Hallmarks of Cancer. Cell. 2000;100(1):57-70. doi:10.1016/S0092-8674(00)81683-9
252. Holliday DL, Speirs V. Choosing the right cell line for breast cancer research. Breast Cancer Res. 2011;13(4):215. doi:10.1186/bcr2889
253. Brodaczewska KK, Szczylik C, Fiedorowicz M, Porta C, Czarnecka AM. Choosing the right cell line for renal cell cancer research. Mol Cancer. 2016;15(1):83. doi:10.1186/s12943-016-0565-8
254. Auman JT, McLeod HL. Colorectal Cancer Cell Lines Lack the Molecular Heterogeneity of Clinical Colorectal Tumors. Clin Colorectal Cancer. 2010;9(1):40-47. doi:10.3816/CCC.2010.n.005
255. Hughes P, Marshall D, Reid Y, Parkes H, Gelber C. The costs of using unauthenticated, over-passaged cell lines: how much more data do we need? Biotechniques. 2007;43(5):575, 577-578, 581-2 passim. doi:10.2144/000112598
256. Pfeifer W, Levi E, Petrogiannis-Haliotis T, Lehmann L, Wang Z, Kadin ME. A Murine Xenograft Model for Human CD30+ Anaplastic Large Cell Lymphoma: Successful Growth Inhibition with an Anti-CD30 Antibody (HeFi-1). Am J Pathol. 1999;155(4):1353-1359. doi:10.1016/S0002-9440(10)65237-6
257. Drexler HG, MacLeod RAF. Malignant hematopoietic cell lines: in vitro models for the study of anaplastic large-cell lymphoma. Leukemia. 2004;18(10):1569-1571. doi:10.1038/sj.leu.2403465

151
258. Thiele CJ. Neuroblastoma Cell Lines. J Hum Cell Cult. 1998;1:21-53. 259. McCullum EO, Williams BAR, Zhang J, Chaput JC. Random Mutagenesis by Error-Prone PCR. In: Methods
in Molecular Biology (Clifton, N.J.). Vol 634. ; 2010:103-109. doi:10.1007/978-1-60761-652-8_7 260. Muteeb G, Sen R. Random Mutagenesis Using a Mutator Strain. In: Methods in Molecular Biology (Clifton,
N.J.). Vol 634. ; 2010:411-419. doi:10.1007/978-1-60761-652-8_29 261. Sharifnia T, Rusu V, Piccioni F, et al. Genetic modifiers of EGFR dependence in non-small cell lung cancer.
Proc Natl Acad Sci U S A. 2014;111(52):18661-18666. doi:10.1073/pnas.1412228112 262. Diehl P, Tedesco D, Chenchik A. Use of RNAi screens to uncover resistance mechanisms in cancer cells
and identify synthetic lethal interactions. Drug Discov Today Technol. 2014;11:11-18. doi:10.1016/j.ddtec.2013.12.002
263. Shalem O, Sanjana NE, Hartenian E, et al. Genome-scale CRISPR-Cas9 knockout screening in human cells. Science. 2014;343(6166):84-87. doi:10.1126/science.1247005
264. Doudna JA, Charpentier E. Genome editing. The new frontier of genome engineering with CRISPR-Cas9. Science (80- ). 2014;346(6213):1258096. doi:10.1126/science.1258096
265. Jinek M, Chylinski K, Fonfara I, Hauer M, Doudna JA, Charpentier E. A programmable dual-RNA-guided DNA endonuclease in adaptive bacterial immunity. Science. 2012;337(6096):816-821. doi:10.1126/science.1225829
266. Hale CR, Zhao P, Olson S, et al. RNA-guided RNA cleavage by a CRISPR RNA-Cas protein complex. Cell. 2009;139(5):945-956. doi:10.1016/j.cell.2009.07.040
267. Deltcheva E, Chylinski K, Sharma CM, et al. CRISPR RNA maturation by trans-encoded small RNA and host factor RNase III. Nature. 2011;471(7340):602-607. doi:10.1038/nature09886
268. Gilbert LA, Larson MH, Morsut L, et al. CRISPR-Mediated Modular RNA-Guided Regulation of Transcription in Eukaryotes. Cell. 2013;154(2):442-451. doi:10.1016/j.cell.2013.06.044
269. Gilbert LA, Horlbeck MA, Adamson B, et al. Genome-Scale CRISPR-Mediated Control of Gene Repression and Activation. Cell. 2014;159(3):647-661. doi:10.1016/j.cell.2014.09.029
270. Ran FA, Hsu PD, Wright J, Agarwala V, Scott DA, Zhang F. Genome engineering using the CRISPR-Cas9 system. Nat Protoc. 2013;8(11):2281-2308. doi:10.1038/nprot.2013.143
271. Konermann S, Brigham MD, Trevino AE, et al. Genome-scale transcriptional activation by an engineered CRISPR-Cas9 complex. Nature. 2015;517(7536):583-588. doi:10.1038/nature14136
272. Wieschaus E, Nusslein-Volhard C, Kluding H. Krüppel, a gene whose activity is required early in the zygotic genome for normal embryonic segmentation. Dev Biol. 1984;104(1):172-186. Accessed January 25, 2018. http://www.ncbi.nlm.nih.gov/pubmed/6428949
273. Jinek M, East A, Cheng A, Lin S, Ma E, Doudna J. RNA-programmed genome editing in human cells. Elife. 2013;2013(2). doi:10.7554/eLife.00471
274. Mali P, Yang L, Esvelt KM, et al. RNA-guided human genome engineering via Cas9. Science (80- ). 2013;339(6121):823-826. doi:10.1126/science.1232033
275. Lieber MR. The Mechanism of Double-Strand DNA Break Repair by the Nonhomologous DNA End-Joining Pathway. Annu Rev Biochem. 2010;79(1):181-211. doi:10.1146/annurev.biochem.052308.093131
276. Lykke-Andersen J, Bennett EJ. Protecting the proteome: Eukaryotic cotranslational quality control pathways. J Cell Biol. 2014;204(4):467-476. doi:10.1083/jcb.201311103
277. Bolotin A, Quinquis B, Sorokin A, Ehrlich SD. Clustered regularly interspaced short palindrome repeats (CRISPRs) have spacers of extrachromosomal origin. Microbiology. 2005;151(Pt 8):2551-2561. doi:10.1099/mic.0.28048-0
278. Makarova KS, Grishin N V, Shabalina SA, Wolf YI, Koonin E V. A putative RNA-interference-based immune system in prokaryotes: computational analysis of the predicted enzymatic machinery, functional analogies with eukaryotic RNAi, and hypothetical mechanisms of action. Biol Direct. 2006;1(1):7. doi:10.1186/1745-6150-1-7
279. Gilbert LA, Larson MH, Morsut L, et al. CRISPR-mediated modular RNA-guided regulation of transcription in eukaryotes. Cell. 2013;154(2):442-451. doi:10.1016/j.cell.2013.06.044
280. Qi LS, Larson MH, Gilbert LA, et al. Repurposing CRISPR as an RNA-guided platform for sequence-specific control of gene expression. Cell. 2013;152(5):1173-1183. doi:10.1016/j.cell.2013.02.022
281. Groner AC, Meylan S, Ciuffi A, et al. KRAB–Zinc Finger Proteins and KAP1 Can Mediate Long-Range Transcriptional Repression through Heterochromatin Spreading. PLoS Genet. 2010;6(3). doi:10.1371/journal.pgen.1000869
282. Chavez A, Scheiman J, Vora S, et al. Highly efficient Cas9-mediated transcriptional programming. Nat Methods. 2015;12(4):326-328. doi:10.1038/nmeth.3312
283. Tanenbaum ME, Gilbert LA, Qi LS, Weissman JS, Vale RD. A protein-tagging system for signal amplification in gene expression and fluorescence imaging. Cell. 2014;159(3):635-646. doi:10.1016/j.cell.2014.09.039
284. Kampmann M. CRISPRi and CRISPRa Screens in Mammalian Cells for Precision Biology and Medicine. ACS Chem Biol. 2018;13(2):406-416. doi:10.1021/acschembio.7b00657
285. Nishimasu H, Ran FA, Hsu PD, et al. Crystal structure of Cas9 in complex with guide RNA and target DNA. Cell. 2014;156(5):935-949. doi:10.1016/j.cell.2014.02.001
286. Joung J, Konermann S, Gootenberg JS, et al. Genome-scale CRISPR-Cas9 knockout and transcriptional activation screening. Nat Protoc. 2017;12(4):828-863. doi:10.1038/nprot.2017.016
287. Shalem O, Sanjana NE, Zhang F. High-throughput functional genomics using CRISPR-Cas9. Nat Rev Genet. 2015;16(5):299-311. doi:10.1038/nrg3899

152
288. Sanjana NE, Shalem O, Zhang F. Improved vectors and genome-wide libraries for CRISPR screening. Nat Methods. 2014;11(8):783-784. doi:10.1038/nmeth.3047
289. Wang T, Wei JJ, Sabatini DM, Lander ES. Genetic screens in human cells using the CRISPR-Cas9 system. Science. 2014;343(6166):80-84. doi:10.1126/science.1246981
290. Koike-Yusa H, Li Y, Tan E-P, Velasco-Herrera MDC, Yusa K. Genome-wide recessive genetic screening in mammalian cells with a lentiviral CRISPR-guide RNA library. Nat Biotechnol. 2014;32(3):267-273. doi:10.1038/nbt.2800
291. Zhou Y, Zhu S, Cai C, et al. High-throughput screening of a CRISPR/Cas9 library for functional genomics in human cells. Nature. 2014;509(7501):487-491. doi:10.1038/nature13166
292. Doench JG, Fusi N, Sullender M, et al. Optimized sgRNA design to maximize activity and minimize off-target effects of CRISPR-Cas9. Nat Biotechnol. 2016;34(2):184-191. doi:10.1038/nbt.3437
293. Sun W, He B, Yang B, et al. Genome-wide CRISPR screen reveals SGOL1 as a druggable target of sorafenib-treated hepatocellular carcinoma. Lab Investig. 2018;98(6):734-744. doi:10.1038/s41374-018-0027-6
294. Ouyang Q, Liu Y, Tan J, et al. Loss of ZNF587B and SULF1 contributed to cisplatin resistance in ovarian cancer cell lines based on Genome-scale CRISPR/Cas9 screening. Am J Cancer Res. 2019;9(5):988-998. Accessed December 15, 2019. http://www.ncbi.nlm.nih.gov/pubmed/31218106
295. Jost M, Chen Y, Gilbert LA, et al. Combined CRISPRi/a-Based Chemical Genetic Screens Reveal that Rigosertib Is a Microtubule-Destabilizing Agent. Mol Cell. 2017;68(1):210-223.e6. doi:10.1016/j.molcel.2017.09.012
296. Kumar M, Keller B, Makalou N, Sutton RE. Systematic Determination of the Packaging Limit of Lentiviral Vectors. Hum Gene Ther. 2001;12(15):1893-1905. doi:10.1089/104303401753153947
297. Bester AC, Lee JD, Chavez A, et al. An Integrated Genome-wide CRISPRa Approach to Functionalize lncRNAs in Drug Resistance. Cell. 2018;173(3):649-664.e20. doi:10.1016/j.cell.2018.03.052
298. le Sage C, Lawo S, Panicker P, et al. Dual direction CRISPR transcriptional regulation screening uncovers gene networks driving drug resistance. Sci Rep. 2017;7(1):17693. doi:10.1038/s41598-017-18172-6
299. Joung J, Engreitz JM, Konermann S, et al. Genome-scale activation screen identifies a lncRNA locus regulating a gene neighbourhood. Nature. 2017;548(7667):343-346. doi:10.1038/nature23451
300. Trigg RM, Lee LC, Prokoph N, et al. The targetable kinase PIM1 drives ALK inhibitor resistance in high-risk neuroblastoma independent of MYCN status. Nat Commun. 2019;10(1):5428. doi:10.1038/s41467-019-13315-x
301. Prokoph N, Probst NA, Lee LC, et al. IL10RA modulates crizotinib sensitivity in NPM1-ALK+ anaplastic large cell lymphoma. Blood. 2020;136(14):1657-1669. doi:10.1182/blood.2019003793
302. Stewart SA, Dykxhoorn DM, Palliser D, et al. Lentivirus-delivered stable gene silencing by RNAi in primary cells. RNA. 2003;9(4):493-501. doi:10.1261/RNA.2192803
303. Sarbassov DD, Guertin DA, Ali SM, Sabatini DM. Phosphorylation and Regulation of Akt/PKB by the Rictor-mTOR Complex. Science (80- ). 2005;307(5712):1098-1101. doi:10.1126/science.1106148
304. Menotti M, Ambrogio C, Cheong T-C, et al. Wiskott–Aldrich syndrome protein (WASP) is a tumor suppressor in T cell lymphoma. Nat Med. Published online December 3, 2018. doi:10.1038/s41591-018-0262-9
305. Aubrey BJ, Kelly GL, Kueh AJ, et al. An Inducible Lentiviral Guide RNA Platform Enables the Identification of Tumor-Essential Genes and Tumor-Promoting Mutations InVivo. Cell Rep. 2015;10(8):1422-1432. doi:10.1016/j.celrep.2015.02.002
306. Chavez A, Tuttle M, Pruitt BW, et al. Comparison of Cas9 activators in multiple species. Nat Methods. 2016;13(7):563-567. doi:10.1038/nmeth.3871
307. Szulc J, Wiznerowicz M, Sauvain M-O, Trono D, Aebischer P. A versatile tool for conditional gene expression and knockdown. Nat Methods. 2006;3(2):109-116. doi:10.1038/nmeth846
308. Wiznerowicz M, Trono D. Conditional suppression of cellular genes: lentivirus vector-mediated drug-inducible RNA interference. J Virol. 2003;77(16):8957-8961. doi:10.1128/JVI.77.16.8957-8961.2003
309. Piva R, Chiarle R, Manazza AD, et al. Ablation of oncogenic ALK is a viable therapeutic approach for anaplastic large-cell lymphomas. Blood. 2006;107(2):689-697. doi:10.1182/blood-2005-05-2125
310. Yang X, Boehm JS, Yang X, et al. A public genome-scale lentiviral expression library of human ORFs. Nat Methods. 2011;8(8):659-661. doi:10.1038/nmeth.1638
311. Kang BH, Jensen KJ, Hatch JA, Janes KA. Simultaneous Profiling of 194 Distinct Receptor Transcripts in Human Cells. Sci Signal. 2013;6(287):rs13-rs13. doi:10.1126/scisignal.2003624
312. Ng SY, Yoshida N, Christie AL, et al. Targetable vulnerabilities in T- and NK-cell lymphomas identified through preclinical models. Nat Commun. 2018;9(1):2024. doi:10.1038/s41467-018-04356-9
313. Durant L, Watford WT, Ramos HL, et al. Diverse Targets of the Transcription Factor STAT3 Contribute to T Cell Pathogenicity and Homeostasis. Immunity. 2010;32(5):605-615. doi:10.1016/J.IMMUNI.2010.05.003
314. Pomari E, Basso G, Bresolin S, et al. NPM-ALK expression levels identify two distinct subtypes of paediatric anaplastic large cell lymphoma. Leukemia. 2017;31(2):498-501. doi:10.1038/leu.2016.292
315. Iqbal J, Wright G, Wang C, et al. Gene expression signatures delineate biological and prognostic subgroups in peripheral T-cell lymphoma. Blood. 2014;123(19):2915-2923. doi:10.1182/blood-2013-11-536359
316. Piccaluga PP, Agostinelli C, Califano A, et al. Gene expression analysis of peripheral T cell lymphoma, unspecified, reveals distinct profiles and new potential therapeutic targets. J Clin Invest. 2007;117(3):823-834. doi:10.1172/JCI26833
317. Eckerle S, Brune V, Döring C, et al. Gene expression profiling of isolated tumour cells from anaplastic large

153
cell lymphomas: insights into its cellular origin, pathogenesis and relation to Hodgkin lymphoma. Leukemia. 2009;23(11):2129-2138. doi:10.1038/leu.2009.161
318. Iqbal J, Weisenburger DD, Greiner TC, et al. Molecular signatures to improve diagnosis in peripheral T-cell lymphoma and prognostication in angioimmunoblastic T-cell lymphoma. Blood. 2010;115(5):1026-1036. doi:10.1182/blood-2009-06-227579
319. Scarfo I, Pellegrino E, Mereu E, et al. Identification of a new subclass of ALK-negative ALCL expressing aberrant levels of ERBB4 transcripts. Blood. 2016;127(2):221-232. doi:10.1182/blood-2014-12-614503
320. Tarantelli C, Gaudio E, Arribas AJ, et al. PQR309 Is a Novel Dual PI3K/mTOR Inhibitor with Preclinical Antitumor Activity in Lymphomas as a Single Agent and in Combination Therapy. Clin Cancer Res. 2018;24(1):120-129. doi:10.1158/1078-0432.CCR-17-1041
321. Schleussner N, Merkel O, Costanza M, et al. The AP-1-BATF and -BATF3 module is essential for growth, survival and TH17/ILC3 skewing of anaplastic large cell lymphoma. Leukemia. 2018;32(9):1994-2007. doi:10.1038/s41375-018-0045-9
322. Piva R, Pellegrino E, Mattioli M, et al. Functional validation of the anaplastic lymphoma kinase signature identifies CEBPB and BCL2A1 as critical target genes. J Clin Invest. 2006;116(12):3171-3182. doi:10.1172/JCI29401
323. Voena C, Conte C, Ambrogio C, et al. The Tyrosine Phosphatase Shp2 Interacts with NPM-ALK and Regulates Anaplastic Lymphoma Cell Growth and Migration. Cancer Res. 2007;67(9):4278-4286. doi:10.1158/0008-5472.CAN-06-4350
324. Gruss H, Boiani N, Williams D, Armitage R, Smith C, Goodwin R. Pleiotropic effects of the CD30 ligand on CD30-expressing cells and lymphoma cell lines. Blood. 1994;83(8).
325. Cerchietti L, Damm-Welk C, Vater I, et al. Inhibition of Anaplastic Lymphoma Kinase (ALK) Activity Provides a Therapeutic Approach for CLTC-ALK-Positive Human Diffuse Large B Cell Lymphomas. Wutz A, ed. PLoS One. 2011;6(4):e18436. doi:10.1371/journal.pone.0018436
326. Redaelli S, Ceccon M, Antolini L, et al. Synergistic activity of ALK and mTOR inhibitors for the treatment of NPM-ALK positive lymphoma. Oncotarget. 2016;7(45):72886-72897. doi:10.18632/oncotarget.12128
327. Ceccon M, Mologni L, Giudici G, et al. Treatment Efficacy and Resistance Mechanisms Using the Second-Generation ALK Inhibitor AP26113 in Human NPM-ALK–Positive Anaplastic Large Cell Lymphoma. Mol Cancer Res. 2015;13(4):775-783. doi:10.1158/1541-7786.MCR-14-0157
328. Redaelli S, Ceccon M, Zappa M, et al. Lorlatinib treatment elicits multiple on- and off-target mechanisms of resistance in ALK-driven cancer. Cancer Res. Published online October 15, 2018:canres.1867.2018. doi:10.1158/0008-5472.CAN-18-1867
329. Li W, Xu H, Xiao T, et al. MAGeCK enables robust identification of essential genes from genome-scale CRISPR/Cas9 knockout screens. Genome Biol. 2014;15(12):554. doi:10.1186/s13059-014-0554-4
330. Patro R, Duggal G, Love MI, Irizarry RA, Kingsford C. Salmon provides fast and bias-aware quantification of transcript expression. Nat Methods. 2017;14(4):417-419. doi:10.1038/nmeth.4197
331. Soneson C, Love MI, Robinson MD. Differential analyses for RNA-seq: transcript-level estimates improve gene-level inferences. F1000Research. 2016;4:1521. doi:10.12688/f1000research.7563.2
332. McCarthy DJ, Chen Y, Smyth GK. Differential expression analysis of multifactor RNA-Seq experiments with respect to biological variation. Nucleic Acids Res. 2012;40(10):4288-4297. doi:10.1093/nar/gks042
333. Love, M., Anders, S., Huber W. Differential analysis of count data–the deseq2 package. Genome Biol. 2014;15:550.
334. Durinck S, Spellman PT, Birney E, Huber W. Mapping identifiers for the integration of genomic datasets with the R/Bioconductor package biomaRt. Nat Protoc. 2009;4(8):1184-1191. doi:10.1038/nprot.2009.97
335. Sergushichev A. An algorithm for fast preranked gene set enrichment analysis using cumulative statistic calculation. bioRxiv. Published online June 20, 2016:060012. doi:10.1101/060012
336. Alexa A, Rahnenführer J. topGO: Enrichment Analysis for Gene Ontology. doi:10.18129/B9.bioc.topGO 337. Kassambara A. Survminer: Drawing Survival Curves using “ggplot2.” Published 2018. https://cran.r-
project.org/web/packages/survminer/index.html 338. Therneau TM. Survival: Survival Analysis. Published 2018. https://cran.r-
project.org/web/packages/survival/index.html 339. Li H, Handsaker B, Wysoker A, et al. The Sequence Alignment/Map format and SAMtools. Bioinformatics.
2009;25(16):2078-2079. doi:10.1093/bioinformatics/btp352 340. Langmead B, Salzberg SL. Fast gapped-read alignment with Bowtie 2. Nat Methods. 2012;9(4):357-359.
doi:10.1038/nmeth.1923 341. Quinlan AR, Hall IM. BEDTools: a flexible suite of utilities for comparing genomic features. Bioinformatics.
2010;26(6):841-842. doi:10.1093/bioinformatics/btq033 342. Robinson JT, Thorvaldsdóttir H, Winckler W, et al. Integrative genomics viewer. Nat Biotechnol.
2011;29(1):24-26. doi:10.1038/nbt.1754 343. Kuhn RM, Haussler D, Kent WJ. The UCSC genome browser and associated tools. Brief Bioinform.
2013;14(2):144-161. doi:10.1093/bib/bbs038 344. Sean D, Meltzer PS. GEOquery: A bridge between the Gene Expression Omnibus (GEO) and
BioConductor. Bioinformatics. 2007;23(14):1846-1847. doi:10.1093/bioinformatics/btm254 345. Carvalho BS, Irizarry RA. A framework for oligonucleotide microarray preprocessing. Bioinformatics.
2010;26(19):2363-2367. doi:10.1093/bioinformatics/btq431 346. Kauffmann A, Gentleman R, Huber W. arrayQualityMetrics - A bioconductor package for quality
assessment of microarray data. Bioinformatics. 2009;25(3):415-416. doi:10.1093/bioinformatics/btn647

154
347. Pagès H, Carlson M, Falcon S LN. AnnotationDbi: Manipulation of SQLite-based annotations in Bioconductor. R package version 1.46.0. Published online 2019. https://bioconductor.org/packages/release/bioc/html/AnnotationDbi.html
348. Ritchie ME, Phipson B, Wu D, et al. Limma powers differential expression analyses for RNA-sequencing and microarray studies. Nucleic Acids Res. 2015;43(7):e47. doi:10.1093/nar/gkv007
349. Dunning MJ, Smith ML, Ritchie ME, Tavaré S. beadarray: R classes and methods for Illumina bead-based data. 2007;23(16):2183-2184. doi:10.1093/bioinformatics/btm311
350. Dunning M, Lynch A, Eldridge M. illuminaHumanv4.db: Illumina HumanHT12v4 annotation data (chip illuminaHumanv4). Published online 2015.
351. Frankish A, Diekhans M, Ferreira AM, et al. GENCODE reference annotation for the human and mouse genomes. Nucleic Acids Res. 2019;47(D1):D766-D773. doi:10.1093/nar/gky955
352. Kanehisa M, Goto S. KEGG: Kyoto Encyclopedia of Genes and Genomes. Nucleic Acids Res. 2000;28(1):27-30. doi:10.1093/nar/28.1.27
353. Wang X, Spandidos A, Wang H, Seed B. PrimerBank: a PCR primer database for quantitative gene expression analysis, 2012 update. Nucleic Acids Res. 2012;40(D1):D1144-D1149. doi:10.1093/nar/gkr1013
354. How J, Warner M, Shustik C, Laneuville P. Cytarabine and Etoposide (CYVE) as First-Line Therapy for Primary Central Nervous System Lymphoma. Blood. 2010;116(21):4895. doi:10.1182/blood.V116.21.4895.4895
355. Barbey S, Gogusev J, Mouly H, et al. DEL cell line: a "malignant histiocytosis" CD30+ t(5;6)(q35;p21) cell line. Int J cancer. 1990;45(3):546-553. Accessed January 27, 2018. http://www.ncbi.nlm.nih.gov/pubmed/2307542
356. Epstein AL, Kaplan HS. Biology of the human malignant lymphomas. I. Establishment in continuous cell culture and heterotransplantation of diffuse histiocytic lymphomas. Cancer. 1974;34(6):1851-1872. Accessed January 27, 2018. http://www.ncbi.nlm.nih.gov/pubmed/4140017
357. Morgan R, Smith SD, Hecht BK, et al. Lack of involvement of the c-fms and N-myc genes by chromosomal translocation t(2;5)(p23;q35) common to malignancies with features of so-called malignant histiocytosis. Blood. 1989;73(8):2155-2164. Accessed January 27, 2018. http://www.ncbi.nlm.nih.gov/pubmed/2525056
358. Mologni L, Ceccon M, Pirola A, et al. NPM/ALK mutants resistant to ASP3026 display variable sensitivity to alternative ALK inhibitors but succumb to the novel compound PF-06463922. Oncotarget. 2015;6(8):5720-5734. doi:10.18632/oncotarget.3122
359. PrimerBank. Accessed January 27, 2018. https://pga.mgh.harvard.edu/primerbank/ 360. Cas9 Activator Tool. Accessed January 27, 2018. http://sam.genome-engineering.org/database/ 361. pLKO.1-puro shRNA protocol. Accessed August 16, 2020.
https://www.addgene.org/tools/protocols/plko/#C 362. Foucquier J, Guedj M. Analysis of drug combinations: current methodological landscape. Pharmacol Res
Perspect. 2015;3(3):e00149. doi:10.1002/prp2.149 363. Kocak H, Ackermann S, Hero B, et al. Hox-C9 activates the intrinsic pathway of apoptosis and is associated
with spontaneous regression in neuroblastoma. Cell Death Dis. 2013;4(4):e586. doi:10.1038/cddis.2013.84 364. Zhang W, Yu Y, Hertwig F, et al. Comparison of RNA-seq and microarray-based models for clinical endpoint
prediction. Genome Biol. 2015;16:133. doi:10.1186/s13059-015-0694-1 365. Chiarle R, Simmons WJ, Cai H, et al. Stat3 is required for ALK-mediated lymphomagenesis and provides
a possible therapeutic target. Nat Med. 2005;11(6):623-629. doi:10.1038/nm1249 366. Costa DB, Kobayashi S, Pandya SS, et al. CSF concentration of the anaplastic lymphoma kinase inhibitor
crizotinib. J Clin Oncol. 2011;29(15):e443-5. doi:10.1200/JCO.2010.34.1313 367. Katayama R, Sakashita T, Yanagitani N, et al. P-glycoprotein Mediates Ceritinib Resistance in Anaplastic
Lymphoma Kinase-rearranged Non-small Cell Lung Cancer. EBioMedicine. Published online 2016. doi:10.1016/j.ebiom.2015.12.009
368. Weilemann A, Grau M, Erdmann T, et al. Essential role of IRF4 and MYC signaling for survival of anaplastic large cell lymphoma. Blood. 2015;125(1):124-132. doi:10.1182/blood-2014-08-594507
369. Bandini C, Pupuleku A, Spaccarotella E, et al. IRF4 Mediates the Oncogenic Effects of STAT3 in Anaplastic Large Cell Lymphomas. Cancers (Basel). 2018;10(1):21. doi:10.3390/cancers10010021
370. Doebele RC, Pilling AB, Aisner DL, et al. Mechanisms of Resistance to Crizotinib in Patients with ALK Gene Rearranged Non–Small Cell Lung Cancer. Clin Cancer Res. 2012;18(5):1472-1482. doi:10.1158/1078-0432.CCR-11-2906
371. Ceccon M, Merlo MEB, Mologni L, et al. Excess of NPM-ALK oncogenic signaling promotes cellular apoptosis and drug dependency. Oncogene. 2016;35(29):3854-3865. doi:10.1038/onc.2015.456
372. Prutsch N, Gurnhofer E, Suske T, et al. Dependency on the TYK2/STAT1/MCL1 axis in anaplastic large cell lymphoma. Leukemia. Published online August 21, 2018. doi:10.1038/s41375-018-0239-1
373. Béguelin W, Sawh S, Chambwe N, et al. IL10 receptor is a novel therapeutic target in DLBCLs. Leukemia. 2015;29(8):1684-1694. doi:10.1038/leu.2015.57
374. Feigin ME, Xue B, Hammell MC, Muthuswamy SK. G-protein-coupled receptor GPR161 is overexpressed in breast cancer and is a promoter of cell proliferation and invasion. Proc Natl Acad Sci U S A. 2014;111(11):4191-4196. doi:10.1073/pnas.1320239111
375. Merighi S, Battistello E, Giacomelli L, et al. Targeting A3 and A2A adenosine receptors in the fight against cancer. Expert Opin Ther Targets. 2019;23(8):669-678. doi:10.1080/14728222.2019.1630380
376. Xie J, Merrett JE, Jensen KB, Proud CG. The MAP kinase-interacting kinases (MNKs) as targets in

155
oncology. Expert Opin Ther Targets. 2019;23(3):187-199. doi:10.1080/14728222.2019.1571043 377. Hou J, Lam F, Proud C, Wang S. Targeting Mnks for cancer therapy. Oncotarget. 2012;3(2):118-131.
doi:10.18632/oncotarget.453 378. Dreas A, Mikulski M, Milik M, Fabritius C-H, Brzózka K, Rzymski T. Mitogen-activated Protein Kinase
(MAPK) Interacting Kinases 1 and 2 (MNK1 and MNK2) as Targets for Cancer Therapy: Recent Progress in the Development of MNK Inhibitors. Curr Med Chem. 2017;24(28):3025-3053. doi:10.2174/0929867324666170203123427
379. Wu H, Hu C, Wang A, et al. Discovery of a BTK/MNK dual inhibitor for lymphoma and leukemia. Leukemia. 2016;30(1):173-181. doi:10.1038/leu.2015.180
380. Lyapichev KA, Tang G, Li S, et al. MYC expression is associated with older age, common morphology, increased MYC copy number, and poorer prognosis in patients with ALK+ anaplastic large cell lymphoma. Hum Pathol. Published online November 2020. doi:10.1016/j.humpath.2020.11.002
381. Turner SD, Yeung D, Hadfield K, Cook SJ, Alexander DR. The NPM-ALK tyrosine kinase mimics TCR signalling pathways, inducing NFAT and AP-1 by RAS-dependent mechanisms. Cell Signal. 2007;19(4):740-747. doi:10.1016/j.cellsig.2006.09.007
382. Ott GR, Cheng M, Learn KS, et al. Discovery of Clinical Candidate CEP-37440, a Selective Inhibitor of Focal Adhesion Kinase (FAK) and Anaplastic Lymphoma Kinase (ALK). J Med Chem. 2016;59(16):7478-7496. doi:10.1021/acs.jmedchem.6b00487
383. Schaller MD. Cellular functions of FAK kinases: insight into molecular mechanisms and novel functions. J Cell Sci. 2010;123(7):1007 LP - 1013. doi:10.1242/jcs.045112
384. Geoerger B, Schulte J, Zwaan CM, et al. Phase I study of ceritinib in pediatric patients (Pts) with malignancies harboring a genetic alteration in ALK (ALK+): Safety, pharmacokinetic (PK), and efficacy results. J Clin Oncol. 2015;33(15_suppl):10005. doi:10.1200/jco.2015.33.15_suppl.10005
385. Dagogo-Jack I, Shaw AT. Crizotinib resistance: implications for therapeutic strategies. Ann Oncol. 2016;27(suppl_3):iii42-iii50. doi:10.1093/annonc/mdw305
386. Ho AS, Liu Y, Khan TA, Hsu DH, Bazan JF, Moore KW. A receptor for interleukin 10 is related to interferon receptors. Proc Natl Acad Sci U S A. 1993;90(23):11267-11271. doi:10.1073/pnas.90.23.11267
387. Donnelly RP, Dickensheets H, Finbloom DS. The Interleukin-10 Signal Transduction Pathway and Regulation of Gene Expression in Mononuclear Phagocytes. J Interf Cytokine Res. 1999;19(6):563-573. doi:10.1089/107999099313695
388. Berti FCB, Pereira APL, Cebinelli GCM, Trugilo KP, Brajão de Oliveira K. The role of interleukin 10 in human papilloma virus infection and progression to cervical carcinoma. Cytokine Growth Factor Rev. 2017;34:1-13. doi:10.1016/J.CYTOGFR.2017.03.002
389. Finbloom’ DS, Winestock KD. IL-10 Induces the Tyrosine Phosphorylation of Tyk2 and Jakl and the Differential Assembly of STAT1 a and STAT3 Complexes in Human T Cells and Monocytes.; 1995.
390. Weber-Nordt RM, Riley JK, Greenlund AC, Moore KW, Darnell JE, Schreiber RD. Stat3 recruitment by two distinct ligand-induced, tyrosine-phosphorylated docking sites in the interleukin-10 receptor intracellular domain. J Biol Chem. 1996;271(44):27954-27961. doi:10.1074/JBC.271.44.27954
391. S-y AH, H-y Wei S, L-f Mui A, Miyajima A, Moore KW. Functional Regions of the Mouse Interleukin-10 Receptor Cytoplasmic Domain. Mol Cell Biol. 1995;15(9):5043-5053. doi:10.1128/mcb.15.9.5043
392. Wehinger J, Gouilleux F, Groner B, Finke J, Mertelsmann R, Weber-Nordt RM. IL-10 induces DNA binding activity of three STAT proteins (Stat1, Stat3, and Stat5) and their distinct combinatorial assembly in the promoters of selected genes. FEBS Lett. 1996;394(3):365-370. doi:10.1016/0014-5793(96)00990-8
393. Kasprzycka M, Marzec M, Liu X, Zhang Q, Wasik MA. Nucleophosmin/anaplastic lymphoma kinase (NPM/ALK) oncoprotein induces the T regulatory cell phenotype by activating STAT3. Proc Natl Acad Sci. 2006;103(26):9964-9969. doi:10.1073/pnas.0603507103
394. Knörr F, Damm-Welk C, Ruf S, et al. Blood cytokine concentrations in pediatric patients with anaplastic lymphoma kinase-positive anaplastic large cell lymphoma. Haematologica. 2018;103(3):477-485. doi:10.3324/haematol.2017.177972
395. Hoareau-Aveilla C, Valentin T, Daugrois C, et al. Reversal of microRNA-150 silencing disadvantages crizotinib-resistant NPM-ALK(+) cell growth. J Clin Invest. 2015;125(9):3505-3518. doi:10.1172/JCI78488
396. Song TL, Nairismägi M-L, Laurensia Y, et al. Oncogenic activation of the STAT3 pathway drives PD-L1 expression in natural killer/T-cell lymphoma. Blood. 2018;132(11):1146-1158. doi:10.1182/blood-2018-01-829424
397. Spaccarotella E, Pellegrino E, Ferracin M, et al. STAT3-mediated activation of microRNA cluster 17~92 promotes proliferation and survival of ALK-positive anaplastic large cell lymphoma. Haematologica. 2014;99(1):116-124. doi:10.3324/haematol.2013.088286
398. Hamedani FS, Cinar M, Mo Z, Cervania MA, Amin HM, Alkan S. Crizotinib (PF-2341066) induces apoptosis due to downregulation of pSTAT3 and BCL-2 family proteins in NPM-ALK+ anaplastic large cell lymphoma. Leuk Res. 2014;38(4):503-508. doi:10.1016/j.leukres.2013.12.027
399. Boulland M-L, Meignin V, Leroy-Viard K, et al. Human Interleukin-10 Expression in T/Natural Killer-Cell Lymphomas. Am J Pathol. 1998;153(4):1229-1237. doi:10.1016/S0002-9440(10)65667-2
400. Bard JD, Gelebart P, Anand M, Amin HM, Lai R. Aberrant expression of IL-22 receptor 1 and autocrine IL-22 stimulation contribute to tumorigenicity in ALK+ anaplastic large cell lymphoma. Leukemia. 2008;22(8):1595-1603. doi:10.1038/leu.2008.129
401. Yoon S, Jones BC, Logsdon NJ, et al. Structure and Mechanism of Receptor Sharing by the IL-10R2 Common Chain. Structure. 2010;18(5):638-648. doi:10.1016/j.str.2010.02.009

156
402. Moore KW, de Waal Malefyt R, Coffman RL, O’Garra A. INTERLEUKIN-10 AND THE INTERLEUKIN-10 RECEPTOR. Annu Rev Immunol. 2001;19(1):683-765. doi:10.1146/annurev.immunol.19.1.683
403. Werner MT, Zhang Q, Wasik MA. From Pathology to Precision Medicine in Anaplastic Large Cell Lymphoma Expressing Anaplastic Lymphoma Kinase (ALK+ ALCL). Cancers (Basel). 2017;9(12):138. doi:10.3390/cancers9100138
404. Furtek SL, Backos DS, Matheson CJ, Reigan P. Strategies and Approaches of Targeting STAT3 for Cancer Treatment. ACS Chem Biol. 2016;11(2):308-318. doi:10.1021/acschembio.5b00945
405. Reilley MJ, McCoon P, Cook C, et al. STAT3 antisense oligonucleotide AZD9150 in a subset of patients with heavily pretreated lymphoma: results of a phase 1b trial. J Immunother Cancer. 2018;6(1):119. doi:10.1186/s40425-018-0436-5
406. Minard-Colin V, Brugières L, Reiter A, et al. Non-Hodgkin Lymphoma in Children and Adolescents: Progress Through Effective Collaboration, Current Knowledge, and Challenges Ahead. J Clin Oncol. 2015;33(27):2963-2974. doi:10.1200/JCO.2014.59.5827
407. Gritti G, Boschini C, Rossi A, et al. Primary treatment response rather than front line stem cell transplantation is crucial for long term outcome of peripheral T-cell lymphomas. PLoS One. 2015;10(3):e0121822. doi:10.1371/journal.pone.0121822
408. Lobello C, Tichý B, Bystrý V, et al. Analysis of Mutational Landscape in Systemic Anaplastic Large Cell Lymphoma Identifies Novel Prognostic Markers. Blood. 2019;134(Supplement_1):1490. doi:10.1182/blood-2019-126501
409. Torossian A, Broin N, Frentzel J, et al. Blockade of crizotinib-induced BCL2 elevation in ALK-positive anaplastic large cell lymphoma triggers autophagy associated with cell death. Haematologica. 2019;104(7):1428-1439. doi:10.3324/haematol.2017.181966
410. Fontana D, Ceccon M, Gambacorti-Passerini C, Mologni L. Activity of second-generation ALK inhibitors against crizotinib-resistant mutants in an NPM-ALK model compared to EML4-ALK. Cancer Med. 2015;4(7):953-965. doi:10.1002/cam4.413
411. Li Y, Wang K, Song N, et al. Activation of IGF-1R pathway and NPM-ALK G1269A mutation confer resistance to crizotinib treatment in NPM-ALK positive lymphoma. Invest New Drugs. 2020;38(3):599-609. doi:10.1007/s10637-019-00802-7
412. Zdzalik D, Dymek B, Grygielewicz P, et al. Activating mutations in ALK kinase domain confer resistance to structurally unrelated ALK inhibitors in NPM-ALK-positive anaplastic large-cell lymphoma. J Cancer Res Clin Oncol. 2014;140(4):589-598. doi:10.1007/s00432-014-1589-3
413. Forde S, Matthews JD, Jahangiri L, et al. Paediatric Burkitt lymphoma patient-derived xenografts capture disease characteristics over time and are a model for therapy. Br J Haematol. n/a(n/a). doi:10.1111/bjh.17043
414. Gillet J-P, Varma S, Gottesman MM. The Clinical Relevance of Cancer Cell Lines. JNCI J Natl Cancer Inst. 2013;105(7):452-458. doi:10.1093/jnci/djt007
415. Sausville EA, Burger AM. Contributions of Human Tumor Xenografts to Anticancer Drug Development. Cancer Res. 2006;66(7):3351-3354. doi:10.1158/0008-5472.CAN-05-3627
416. Cassidy JW, Caldas C, Bruna A. Maintaining Tumor Heterogeneity in Patient-Derived Tumor Xenografts. Cancer Res. 2015;75(15):2963 LP - 2968. doi:10.1158/0008-5472.CAN-15-0727
417. Houghton PJ, Morton CL, Tucker C, et al. The pediatric preclinical testing program: Description of models and early testing results. Pediatr Blood Cancer. 2007;49(7):928-940. doi:10.1002/pbc.21078
418. Shultz LD, Lyons BL, Burzenski LM, et al. Human lymphoid and myeloid cell development in NOD/LtSz-scid IL2R gamma null mice engrafted with mobilized human hemopoietic stem cells. J Immunol. 2005;174(10):6477-6489. doi:10.4049/jimmunol.174.10.6477
419. Turner SD, Tooze R, Maclennan K, Alexander DR. Vav-promoter regulated oncogenic fusion protein NPM-ALK in transgenic mice causes B-cell lymphomas with hyperactive Jun kinase. Oncogene. 2003;22(49):7750-7761. doi:10.1038/sj.onc.1207048
420. Turner SD, Merz H, Yeung D, Alexander DR. CD2 promoter regulated nucleophosmin-anaplastic lymphoma kinase in transgenic mice causes B lymphoid malignancy. Anticancer Res. 2006;26(5A):3275—3279. http://europepmc.org/abstract/MED/17094440
421. Giuriato S, Foisseau M, Dejean E, et al. Conditional TPM3-ALK and NPM-ALK transgenic mice develop reversible ALK-positive early B-cell lymphoma/leukemia. Blood. 2010;115(20):4061-4070. doi:10.1182/blood-2008-06-163386
422. Chiarle R, Gong JZ, Guasparri I, et al. NPM-ALK transgenic mice spontaneously develop T-cell lymphomas and plasma cell tumors. Blood. 2003;101(5):1919-1927. doi:10.1182/blood-2002-05-1343
423. Illert AL, Kreutmair S, Klingeberg C, et al. IDENTIFICATION AND CHARACTERISATION OF THE LYMPHOMA-INITIATING CELL (LIC) POPULATION IN AN ALCL MOUSE MODEL. Hematol Oncol. 2017;35(S2):163. doi:10.1002/hon.2438_19
424. Shoumariyeh K, Schneider N, Poggio T, et al. A novel conditional NPM-ALK-driven model of CD30+ T-cell lymphoma mediated by a translational stop cassette. Oncogene. 2020;39(9):1904-1913. doi:10.1038/s41388-019-1058-1
425. Malcolm TIM, Villarese P, Fairbairn CJ, et al. Anaplastic large cell lymphoma arises in thymocytes and requires transient TCR expression for thymic egress. Nat Commun. 2016;7:10087. doi:10.1038/ncomms10087
426. European Medicines Agency Assessment Report Alunbrig Procedure No. EMEA/H/C/004248/0000.; 2018. https://www.ema.europa.eu/en/documents/assessment-report/alunbrig-epar-public-assessment-

157
report_en.pdf 427. Freireich EJ, Gehan EA, Rall DP, Schmidt LH, Skipper HE. Quantitative comparison of toxicity of anticancer
agents in mouse, rat, hamster, dog, monkey, and man. Cancer Chemother reports. 1966;50(4):219-244. 428. U.S. Department of Health and Human Services Food and Drug Administration Center for Drug Evaluation
and Research (CDER). Guidance for Industry Estimating the Maximum Safe Starting Dose in Initial Clinical Trials for Therapeutics in Adult Healthy Volunteers. Published 2005. Accessed October 9, 2020. https://www.fda.gov/media/72309/download
429. Byrne AT, Alférez DG, Amant F, et al. Interrogating open issues in cancer precision medicine with patient-derived xenografts. Nat Rev Cancer. 2017;17(4):254-268. doi:10.1038/nrc.2016.140
430. Sun C, Wang L, Huang S, et al. Reversible and adaptive resistance to BRAF(V600E) inhibition in melanoma. Nature. 2014;508(7494):118-122. doi:10.1038/nature13121
431. Das Thakur M, Salangsang F, Landman AS, et al. Modelling vemurafenib resistance in melanoma reveals a strategy to forestall drug resistance. Nature. 2013;494(7436):251-255. doi:10.1038/nature11814
432. Zitvogel L, Kepp O, Kroemer G. Immune parameters affecting the efficacy of chemotherapeutic regimens. Nat Rev Clin Oncol. 2011;8(3):151-160. doi:10.1038/nrclinonc.2010.223
433. Tanaka H, Matsushima H, Nishibu A, Clausen BE, Takashima A. Dual therapeutic efficacy of vinblastine as a unique chemotherapeutic agent capable of inducing dendritic cell maturation. Cancer Res. 2009;69(17):6987-6994. doi:10.1158/0008-5472.CAN-09-1106
434. Tanaka H, Matsushima H, Mizumoto N, Takashima A. Classification of chemotherapeutic agents based on their differential in vitro effects on dendritic cells. Cancer Res. 2009;69(17):6978-6986. doi:10.1158/0008-5472.CAN-09-1101
435. Stadler S, Singh VK, Knorr F, Damm-Welk C, Woessmann W. Immune Response against ALK in Children with ALK-Positive Anaplastic Large Cell Lymphoma. Cancers (Basel). 2018;10(4). doi:10.3390/cancers10040114
436. Liu P, Zhao L, Kepp O, Kroemer G. Crizotinib - a tyrosine kinase inhibitor that stimulates immunogenic cell death. Oncoimmunology. 2019;8(7):1596652. doi:10.1080/2162402X.2019.1596652
437. Liu P, Zhao L, Pol J, et al. Crizotinib-induced immunogenic cell death in non-small cell lung cancer. Nat Commun. 2019;10(1):1486. doi:10.1038/s41467-019-09415-3
438. Theocharides APA, Rongvaux A, Fritsch K, Flavell RA, Manz MG. Humanized hemato-lymphoid system mice. Haematologica. 2016;101(1):5-19. doi:10.3324/haematol.2014.115212
439. Jones DTW, Banito A, Grünewald TGP, et al. Molecular characteristics and therapeutic vulnerabilities across paediatric solid tumours. Nat Rev Cancer. 2019;19(8):420-438. doi:10.1038/s41568-019-0169-x
440. Spix C, Pastore G, Sankila R, Stiller CA, Steliarova-Foucher E. Neuroblastoma incidence and survival in European children (1978-1997): report from the Automated Childhood Cancer Information System project. Eur J Cancer. 2006;42(13):2081-2091. doi:10.1016/j.ejca.2006.05.008
441. Smith MA, Seibel NL, Altekruse SF, et al. Outcomes for children and adolescents with cancer: challenges for the twenty-first century. J Clin Oncol. 2010;28(15):2625-2634. doi:10.1200/JCO.2009.27.0421
442. Maris JM, Hogarty MD, Bagatell R, Cohn SL. Neuroblastoma. Lancet. 2007;369(9579):2106-2120. doi:10.1016/S0140-6736(07)60983-0
443. Park JR, Bagatell R, London WB, et al. Children’s Oncology Group’s 2013 blueprint for research: neuroblastoma. Pediatr Blood Cancer. 2013;60(6):985-993. doi:10.1002/pbc.24433
444. Bresler SC, Weiser DA, Huwe PJ, et al. ALK mutations confer differential oncogenic activation and sensitivity to ALK inhibition therapy in neuroblastoma. Cancer Cell. 2014;26(5):682-694. doi:10.1016/j.ccell.2014.09.019
445. George RE, Sanda T, Hanna M, et al. Activating mutations in ALK provide a therapeutic target in neuroblastoma. Nature. 2008;455(7215):975-978. doi:10.1038/nature07397
446. Wang HQ, Halilovic E, Li X, et al. Combined ALK and MDM2 inhibition increases antitumor activity and overcomes resistance in human ALK mutant neuroblastoma cell lines and xenograft models. Elife. 2017;6. doi:10.7554/eLife.17137
447. Guan J, Tucker ER, Wan H, et al. The ALK inhibitor PF-06463922 is effective as a single agent in neuroblastoma driven by expression of ALK and MYCN. Dis Model Mech. 2016;9(9):941-952. doi:10.1242/dmm.024448
448. Siaw JT, Wan H, Pfeifer K, et al. Brigatinib, an anaplastic lymphoma kinase inhibitor, abrogates activity and growth in ALK-positive neuroblastoma cells, Drosophila and mice. Oncotarget. 2016;7(20):29011-29022. doi:10.18632/oncotarget.8508
449. Friboulet L, Li N, Katayama R, et al. The ALK inhibitor ceritinib overcomes crizotinib resistance in non-small cell lung cancer. Cancer Discov. 2014;4(6):662-673. doi:10.1158/2159-8290.CD-13-0846
450. Xu F, Li H, Sun Y. Inhibition of Axl improves the targeted therapy against ALK-mutated neuroblastoma. Biochem Biophys Res Commun. 2014;454(4):566-571. doi:10.1016/j.bbrc.2014.10.126
451. Wood AC, Krytska K, Ryles HT, et al. Dual ALK and CDK4/6 Inhibition Demonstrates Synergy against Neuroblastoma. Clin Cancer Res. 2017;23(11):2856-2868. doi:10.1158/1078-0432.CCR-16-1114
452. Sharma GG, Mota I, Mologni L, Patrucco E, Gambacorti-Passerini C, Chiarle R. Tumor Resistance against ALK Targeted Therapy-Where It Comes From and Where It Goes. Cancers (Basel). 2018;10(3). doi:10.3390/cancers10030062
453. Saris CJ, Domen J, Berns A. The pim-1 oncogene encodes two related protein-serine/threonine kinases by alternative initiation at AUG and CUG. EMBO J. 1991;10(3):655-664.
454. Wang Z, Bhattacharya N, Weaver M, et al. Pim-1: a serine/threonine kinase with a role in cell survival,

158
proliferation, differentiation and tumorigenesis. J Vet Sci. 2001;2(3):167-179. 455. Zhu N, Ramirez LM, Lee RL, Magnuson NS, Bishop GA, Gold MR. CD40 signaling in B cells regulates the
expression of the Pim-1 kinase via the NF-kappa B pathway. J Immunol. 2002;168(2):744-754. doi:10.4049/jimmunol.168.2.744
456. Miura O, Miura Y, Nakamura N, et al. Induction of tyrosine phosphorylation of Vav and expression of Pim-1 correlates with Jak2-mediated growth signaling from the erythropoietin receptor. Blood. 1994;84(12):4135-4141.
457. Merkel AL, Meggers E, Ocker M. PIM1 kinase as a target for cancer therapy. Expert Opin Investig Drugs. 2012;21(4):425-436. doi:10.1517/13543784.2012.668527
458. Zha J, Harada H, Yang E, Jockel J, Korsmeyer SJ. Serine phosphorylation of death agonist BAD in response to survival factor results in binding to 14-3-3 not BCL-X(L). Cell. 1996;87(4):619-628.
459. Gu JJ, Wang Z, Reeves R, Magnuson NS. PIM1 phosphorylates and negatively regulates ASK1-mediated apoptosis. Oncogene. 2009;28(48):4261-4271. doi:10.1038/onc.2009.276
460. Madhunapantula S V., Sharma A, Robertson GP. PRAS40 Deregulates Apoptosis in Malignant Melanoma. Cancer Res. 2007;67(8):3626-3636. doi:10.1158/0008-5472.CAN-06-4234
461. Zhang F, Beharry ZM, Harris TE, et al. PIM1 protein kinase regulates PRAS40 phosphorylation and mTOR activity in FDCP1 cells. Cancer Biol Ther. 2009;8(9):846-853. doi:10.4161/cbt.8.9.8210
462. Xie Y, Xu K, Dai B, et al. The 44 kDa Pim-1 kinase directly interacts with tyrosine kinase Etk/BMX and protects human prostate cancer cells from apoptosis induced by chemotherapeutic drugs. Oncogene. 2006;25(1):70-78. doi:10.1038/sj.onc.1209058
463. Natarajan K, Bhullar J, Shukla S, et al. The Pim kinase inhibitor SGI-1776 decreases cell surface expression of P-glycoprotein (ABCB1) and breast cancer resistance protein (ABCG2) and drug transport by Pim-1-dependent and -independent mechanisms. Biochem Pharmacol. 2013;85(4):514-524. doi:10.1016/j.bcp.2012.12.006
464. Chen J, Kobayashi M, Darmanin S, et al. Pim-1 plays a pivotal role in hypoxia-induced chemoresistance. Oncogene. 2009;28(28):2581-2592. doi:10.1038/onc.2009.124
465. Xu J, Xiong G, Cao Z, et al. PIM-1 contributes to the malignancy of pancreatic cancer and displays diagnostic and prognostic value. J Exp Clin Cancer Res. 2016;35(1):133. doi:10.1186/s13046-016-0406-z
466. Kuo H-P, Ezell SA, Hsieh S, et al. The role of PIM1 in the ibrutinib-resistant ABC subtype of diffuse large B-cell lymphoma. Am J Cancer Res. 2016;6(11):2489-2501. Accessed March 28, 2019. http://www.ncbi.nlm.nih.gov/pubmed/27904766
467. Cheng H, Huang C, Xu X, et al. PIM-1 mRNA expression is a potential prognostic biomarker in acute myeloid leukemia. J Transl Med. 2017;15(1):179. doi:10.1186/s12967-017-1287-4
468. Liao Y, Feng Y, Shen J, et al. Clinical and biological significance of PIM1 kinase in osteosarcoma. J Orthop Res. 2016;34(7):1185-1194. doi:10.1002/jor.23134
469. Mahadevan D, Spier C, Della Croce K, et al. Transcript profiling in peripheral T-cell lymphoma, not otherwise specified, and diffuse large B-cell lymphoma identifies distinct tumor profile signatures. Mol Cancer Ther. 2005;4(12):1867-1879. doi:10.1158/1535-7163.MCT-05-0146
470. Brunen D, de Vries RC, Lieftink C, Beijersbergen RL, Bernards R. PIM Kinases Are a Potential Prognostic Biomarker and Therapeutic Target in Neuroblastoma. Mol Cancer Ther. 2018;17(4):849-857. doi:10.1158/1535-7163.MCT-17-0868
471. Cortes J, Tamura K, DeAngelo DJ, et al. Phase I studies of AZD1208, a proviral integration Moloney virus kinase inhibitor in solid and haematological cancers. Br J Cancer. 2018;118(11):1425-1433. doi:10.1038/s41416-018-0082-1
472. Martin-Sanchez E, Odqvist L, Rodriguez-Pinilla SM, et al. PIM kinases as potential therapeutic targets in a subset of peripheral T cell lymphoma cases. PLoS One. 2014;9(11):e112148. doi:10.1371/journal.pone.0112148
473. Debruyne DN, Bhatnagar N, Sharma B, et al. ALK inhibitor resistance in ALKF1174L-driven neuroblastoma is associated with AXL activation and induction of EMT. Oncogene. 2016;35(28):3681-3691. doi:10.1038/onc.2015.434
474. Debruyne DN, Dries R, Sengupta S, et al. BORIS promotes chromatin regulatory interactions in treatment-resistant cancer cells. Nature. 2019;572(7771):676-680. doi:10.1038/s41586-019-1472-0
475. Kogita A, Togashi Y, Hayashi H, et al. Activated MET acts as a salvage signal after treatment with alectinib, a selective ALK inhibitor, in ALK-positive non-small cell lung cancer. Int J Oncol. 2015;46(3):1025-1030. doi:10.3892/ijo.2014.2797
476. Nguyen LN, Ma D, Shui G, et al. Mfsd2a is a transporter for the essential omega-3 fatty acid docosahexaenoic acid. Nature. 2014;509(7501):503-506. doi:10.1038/nature13241
477. Toyokawa G, Takenoyama M, Watanabe S, et al. Dramatic response to crizotinib in an ALK-positive adenocarcinoma patient with disseminated intravascular coagulation. J Thorac Oncol. 2013;8(11):e96-8. doi:10.1097/JTO.0b013e3182a008ed
478. Isaac M, Siu A, Jongstra J. The oncogenic PIM kinase family regulates drug resistance through multiple mechanisms. Drug Resist Updat. 2011;14(4-5):203-211. doi:10.1016/j.drup.2011.04.002
479. Hsi ED, Jung S-H, Lai R, et al. Ki67 and PIM1 expression predict outcome in mantle cell lymphoma treated with high dose therapy, stem cell transplantation and rituximab: a Cancer and Leukemia Group B 59909 correlative science study. Leuk Lymphoma. 2008;49(11):2081-2090. doi:10.1080/10428190802419640
480. Warnecke-Eberz U, Bollschweiler E, Drebber U, et al. Prognostic impact of protein overexpression of the proto-oncogene PIM-1 in gastric cancer. Anticancer Res. 2009;29(11):4451-4455. Accessed March 28,

159
2019. http://www.ncbi.nlm.nih.gov/pubmed/20032391 481. Peltola K, Hollmen M, Maula S-M, et al. Pim-1 Kinase Expression Predicts Radiation Response in
Squamocellular Carcinoma of Head and Neck and Is under the Control of Epidermal Growth Factor Receptor. Neoplasia. 2009;11(7):629-IN1. doi:10.1593/NEO.81038
482. Jiang R, Wang X, Jin Z, Li K. Association of Nuclear PIM1 Expression with Lymph Node Metastasis and Poor Prognosis in Patients with Lung Adenocarcinoma and Squamous Cell Carcinoma. J Cancer. 2016;7(3):324-334. doi:10.7150/jca.13422
483. Reiser-Erkan C, Erkan M, Pan Z, et al. Hypoxia-inducible proto-oncogene Pim-1 is a prognostic marker in pancreatic ductal adenocarcinoma. Cancer Biol Ther. 2008;7(9):1352-1359. doi:10.4161/cbt.7.9.6418
484. Tursynbay Y, Zhang J, Li Z, et al. Pim-1 kinase as cancer drug target: An update. Biomed reports. 2016;4(2):140-146. doi:10.3892/br.2015.561
485. Xiang X, Yuan D, Liu Y, et al. PIM1 overexpression in T-cell lymphomas protects tumor cells from apoptosis and confers doxorubicin resistance by upregulating c-myc expression. Acta Biochim Biophys Sin (Shanghai). 2018;50(8):800-806. doi:10.1093/abbs/gmy076
486. Kim JH, Kim WS, Yun Y, Park C. Epstein–Barr virus latent membrane protein 1 increases chemo-resistance of cancer cells via cytoplasmic sequestration of Pim-1. Cell Signal. 2010;22(12):1858-1863. doi:10.1016/j.cellsig.2010.07.013
487. Yuan LL, Green AS, Bertoli S, et al. Pim kinases phosphorylate Chk1 and regulate its functions in acute myeloid leukemia. Leukemia. 2014;28(2):293-301. doi:10.1038/leu.2013.168
488. Wein L, Loi S. Mechanisms of resistance of chemotherapy in early-stage triple negative breast cancer (TNBC). The Breast. 2017;34:S27-S30. doi:10.1016/j.breast.2017.06.023
489. Le X, Antony R, Razavi P, et al. Systematic Functional Characterization of Resistance to PI3K Inhibition in Breast Cancer. Cancer Discov. 2016;6(10):1134-1147. doi:10.1158/2159-8290.CD-16-0305
490. Zemskova M, Sahakian E, Bashkirova S, Lilly M. The PIM1 Kinase Is a Critical Component of a Survival Pathway Activated by Docetaxel and Promotes Survival of Docetaxel-treated Prostate Cancer Cells. J Biol Chem. 2008;283(30):20635-20644. doi:10.1074/jbc.M709479200
491. Xie Y, Burcu M, Linn DE, Qiu Y, Baer MR. Pim-1 Kinase Protects P-Glycoprotein from Degradation and Enables Its Glycosylation and Cell Surface Expression. Mol Pharmacol. 2010;78(2):310-318. doi:10.1124/mol.109.061713
492. Cao L, Wang F, Li S, Wang X, Huang D, Jiang R. PIM1 kinase promotes cell proliferation, metastasis and tumor growth of lung adenocarcinoma by potentiating the c-MET signaling pathway. Cancer Lett. 2019;444:116-126. doi:10.1016/j.canlet.2018.12.015
493. Bellon M, Lu L, Nicot C. Constitutive activation of Pim1 kinase is a therapeutic target for adult T-cell leukemia. Blood. 2016;127(20):2439-2450. doi:10.1182/BLOOD-2015-11-685032
494. Białopiotrowicz E, Górniak P, Noyszewska-Kania M, et al. Microenvironment-induced PIM kinases promote CXCR4-triggered mTOR pathway required for chronic lymphocytic leukaemia cell migration. J Cell Mol Med. 2018;22(7):3548-3559. doi:10.1111/jcmm.13632
495. Mazzacurati L, Lambert QT, Pradhan A, Griner LN, Huszar D, Reuther GW. The PIM inhibitor AZD1208 synergizes with ruxolitinib to induce apoptosis of ruxolitinib sensitive and resistant JAK2-V617F-driven cells and inhibit colony formation of primary MPN cells. Oncotarget. 2015;6(37):40141-40157. doi:10.18632/oncotarget.5653
496. Cen B, Xiong Y, Song JH, et al. The Pim-1 Protein Kinase Is an Important Regulator of MET Receptor Tyrosine Kinase Levels and Signaling. Mol Cell Biol. 2014;34(13):2517-2532. doi:10.1128/MCB.00147-14
497. Wu Y, Deng Y, Zhu J, Duan Y, Weng W, Wu X. Pim1 promotes cell proliferation and regulates glycolysis via interaction with MYC in ovarian cancer. Onco Targets Ther. 2018;11:6647. doi:10.2147/OTT.S180520
498. Iwahara T, Fujimoto J, Wen D, et al. Molecular characterization of ALK, a receptor tyrosine kinase expressed specifically in the nervous system. Oncogene. 1997;14(4):439-449. doi:10.1038/sj.onc.1200849
499. Vernersson E, Khoo NKS, Henriksson ML, Roos G, Palmer RH, Hallberg B. Characterization of the expression of the ALK receptor tyrosine kinase in mice. Gene Expr Patterns. 2006;6(5):448-461. doi:https://doi.org/10.1016/j.modgep.2005.11.006
500. Zaenker P, Gray ES, Ziman MR. Autoantibody Production in Cancer—The Humoral Immune Response toward Autologous Antigens in Cancer Patients. Autoimmun Rev. 2016;15(5):477-483. doi:https://doi.org/10.1016/j.autrev.2016.01.017
501. Voena C, Menotti M, Mastini C, et al. Efficacy of a Cancer Vaccine against ALK-Rearranged Lung Tumors. Cancer Immunol Res. 2015;3(12):1333-1343. doi:10.1158/2326-6066.CIR-15-0089
502. Damm-Welk C, Siddiqi F, Fischer M, et al. Anti-ALK Antibodies in Patients with ALK-Positive Malignancies Not Expressing NPM-ALK. J Cancer. 2016;7(11):1383-1387. doi:10.7150/jca.15238
503. Awad MM, Mastini C, Blasco RB, et al. Epitope mapping of spontaneous autoantibodies to anaplastic lymphoma kinase (ALK) in non-small cell lung cancer. Oncotarget. 2017;8(54):92265-92274. doi:10.18632/oncotarget.21182
504. Knörr F, Weber S, Singh VK, et al. Epitope mapping of anti-ALK antibodies in children with anaplastic large cell lymphoma. Clin Immunol. 2018;195:77-81. doi:10.1016/j.clim.2018.07.008
505. Cheever MA, Allison JP, Ferris AS, et al. The Prioritization of Cancer Antigens: A National Cancer Institute Pilot Project for the Acceleration of Translational Research. Clin Cancer Res. 2009;15(17):5323 LP - 5337. doi:10.1158/1078-0432.CCR-09-0737
506. Montgomery RB, Makary E, Schiffman K, Goodell V, Disis ML. Endogenous anti-HER2 antibodies block HER2 phosphorylation and signaling through extracellular signal-regulated kinase. Cancer Res.

160
2005;65(2):650-656. 507. Carpenter EL, Haglund EA, Mace EM, et al. Antibody targeting of anaplastic lymphoma kinase induces
cytotoxicity of human neuroblastoma. Oncogene. 2012;31(46):4859-4867. doi:10.1038/onc.2011.647 508. Sano R, Krytska K, Larmour CE, et al. An antibody-drug conjugate directed to the ALK receptor
demonstrates efficacy in preclinical models of neuroblastoma. Sci Transl Med. 2019;11(483). doi:10.1126/scitranslmed.aau9732
509. Stylianou DC, Auf der Maur A, Kodack DP, et al. Effect of single-chain antibody targeting of the ligand-binding domain in the anaplastic lymphoma kinase receptor. Oncogene. 2009;28(37):3296-3306. doi:10.1038/onc.2009.184
510. Passoni L. ALK as a novel lymphoma-associated tumor antigen: identification of 2 HLA-A2.1-restricted CD8+ T-cell epitopes. Blood. 2002;99(6):2100-2106. doi:10.1182/blood.V99.6.2100
511. Passoni L, Gallo B, Biganzoli E, et al. In vivo T-cell immune response against anaplastic lymphoma kinase in patients with anaplastic large cell lymphomas. Haematologica. 2006;91(1):48-55. Accessed June 30, 2019. http://www.ncbi.nlm.nih.gov/pubmed/16434370
512. K Singh V, Werner S, Hackstein H, et al. Analysis of nucleophosmin-anaplastic lymphoma kinase (NPM-ALK)-reactive CD8(+) T cell responses in children with NPM-ALK(+) anaplastic large cell lymphoma. Clin Exp Immunol. 2016;186(1):96-105. doi:10.1111/cei.12842
513. Duyster J, Bai R-Y, Morris SW. Translocations involving anaplastic lymphoma kinase (ALK). Oncogene. 2001;20(40):5623-5637. doi:10.1038/sj.onc.1204594
514. Ducray SP, Natarajan K, Garland GD, Turner SD, Egger G. The Transcriptional Roles of ALK Fusion Proteins in Tumorigenesis. Cancers (Basel). 2019;11(8). doi:10.3390/cancers11081074
515. Pulford K, Lamant L, Morris SW, et al. Detection of anaplastic lymphoma kinase (ALK) and nucleolar protein nucleophosmin (NPM)-ALK proteins in normal and neoplastic cells with the monoclonal antibody ALK1. Blood. 1997;89(4):1394-1404.
516. Delsol G, Lamant L, Mariame B, et al. A New Subtype of Large B-Cell Lymphoma Expressing the ALK Kinase and Lacking the 2; 5 Translocation. Blood. 1997;89(5):1483-1490. doi:10.1182/blood.V89.5.1483
517. Tort F, Pinyol M, Pulford K, et al. Molecular characterization of a new ALK translocation involving moesin (MSN-ALK) in anaplastic large cell lymphoma. Lab Invest. 2001;81(3):419—426. doi:10.1038/labinvest.3780249
518. Honorat J-F, Ragab A, Lamant L, Delsol G, Ragab-Thomas J. SHP1 tyrosine phosphatase negatively regulates NPM-ALK tyrosine kinase signaling. Blood. 2006;107(10):4130-4138. doi:10.1182/blood-2005-06-2421
519. Falini B, Pulford K, Pucciarini A, et al. Lymphomas expressing ALK fusion protein(s) other than NPM-ALK. Blood. 1999;94(10):3509-3515.
520. Locatelli F, Mauz-Koerholz C, Neville K, et al. Brentuximab vedotin for paediatric relapsed or refractory Hodgkin’s lymphoma and anaplastic large-cell lymphoma: a multicentre, open-label, phase 1/2 study. Lancet Haematol. 2018;5(10):e450-e461. doi:10.1016/S2352-3026(18)30153-4
521. Atabay E, Wang Q, Chiara A, et al. Identifying Novel Mechanisms of Resistance to Tyrosine Kinase Inhibitors in Anaplastic Large Cell Lymphoma. Blood. 2019;134(Supplement_1):5060-5060. doi:10.1182/blood-2019-132188
522. John TD, Naik S, Leung K, Sasa G, Martinez C, Krance RA. Allogeneic hematopoietic cell transplant following crizotinib monotherapy for relapsed/refractory anaplastic large cell lymphoma. Pediatr Transplant. 2018;22(5):e13210. doi:10.1111/petr.13210
523. Ruf S, Hebart H, Hjalgrim LL, et al. CNS progression during vinblastine or targeted therapies for high-risk relapsed ALK-positive anaplastic large cell lymphoma: A case series. Pediatr Blood Cancer. 2018;65(6):e27003. doi:10.1002/pbc.27003
524. Nakai R, Fukuhara S, Maeshima AM, et al. Alectinib, an anaplastic lymphoma kinase (ALK) inhibitor, as a bridge to allogeneic stem cell transplantation in a patient with ALK-positive anaplastic large-cell lymphoma refractory to chemotherapy and brentuximab vedotin. Clin case reports. 2019;7(12):2500-2504. doi:10.1002/ccr3.2543
525. Shaw AT, Felip E, Bauer TM, et al. Lorlatinib in non-small-cell lung cancer with ALK or ROS1 rearrangement: an international, multicentre, open-label, single-arm first-in-man phase 1 trial. Lancet Oncol. 2017;18(12):1590-1599. doi:10.1016/S1470-2045(17)30680-0
526. Kim D-W, Tiseo M, Ahn M-J, et al. Brigatinib in Patients With Crizotinib-Refractory Anaplastic Lymphoma Kinase–Positive Non–Small-Cell Lung Cancer: A Randomized, Multicenter Phase II Trial. J Clin Oncol. 2017;35(22):2490-2498. doi:10.1200/JCO.2016.71.5904
527. Peters S, Camidge DR, Shaw AT, et al. Alectinib versus Crizotinib in Untreated ALK -Positive Non–Small-Cell Lung Cancer. N Engl J Med. Published online 2017:NEJMoa1704795. doi:10.1056/NEJMoa1704795
528. Hida T, Nokihara H, Kondo M, et al. Alectinib versus crizotinib in patients with <em>ALK</em>-positive non-small-cell lung cancer (J-ALEX): an open-label, randomised phase 3 trial. Lancet. 2018;390(10089):29-39. doi:10.1016/S0140-6736(17)30565-2
529. Montero J. A new hope for neuroblastoma treatment? Sci Transl Med. 2019;11(523):eaaz9769. doi:10.1126/scitranslmed.aaz9769
530. Claeys S, Denecker G, Durinck K, et al. ALK positively regulates MYCN activity through repression of HBP1 expression. Oncogene. 2019;38(15):2690-2705. doi:10.1038/s41388-018-0595-3
531. Hu G, Feldman AL. Drivers of crizotinib resistance in ALK+ ALCL. Blood. 2020;136(14):1573-1575. doi:10.1182/blood.2020007226

161
532. Moti N, Malcolm T, Hamoudi R, et al. Anaplastic large cell lymphoma-propagating cells are detectable by side population analysis and possess an expression profile reflective of a primitive origin. Oncogene. 2015;34(14):1843-1852. doi:10.1038/onc.2014.112
533. Boesch M, Zeimet AG, Fiegl H, et al. High prevalence of side population in human cancer cell lines. Oncoscience. 2016;3(3-4):85-87. doi:10.18632/oncoscience.300
534. WANG Y, YIN C, FENG L, MA L, WEI Y, SHENG G. Sorting, identification and enrichment of side population cells in THP-1 acute monocytic leukemia cells. Oncol Rep. 2013;29(5):1923-1931. doi:10.3892/or.2013.2316
535. Huang B, Huang YJ, Yao ZJ, et al. Cancer Stem Cell-Like Side Population Cells in Clear Cell Renal Cell Carcinoma Cell Line 769P. Bhowmick NA, ed. PLoS One. 2013;8(7):e68293. doi:10.1371/journal.pone.0068293
536. Kim KH, Cheong H-J, Kim S-J, et al. Side Population of Multiple Myeloma and Multiple Myeloma Stem Cell. Blood. 2014;124(21). doi:10.1182/blood.V124.21.5786.5786
537. Pelekanou V, Notas G, Athanasouli P, et al. APRIL and BAFF increase breast cancer cell stemness. bioRxiv. Published online October 2017:151902. doi:10.1101/151902
538. Bertolini G, Roz L, Perego P, et al. Highly tumorigenic lung cancer CD133+ cells display stem-like features and are spared by cisplatin treatment. Proc Natl Acad Sci U S A. 2009;106(38):16281-16286. doi:10.1073/pnas.0905653106
539. Dallas NA, Xia L, Fan F, et al. Chemoresistant Colorectal Cancer Cells, the Cancer Stem Cell Phenotype, and Increased Sensitivity to Insulin-like Growth Factor-I Receptor Inhibition. Cancer Res. 2009;69(5):1951-1957. doi:10.1158/0008-5472.CAN-08-2023
540. Huang B, Fu SJ, Fan WZ, et al. PKCε inhibits isolation and stemness of side population cells via the suppression of ABCB1 transporter and PI3K/Akt, MAPK/ERK signaling in renal cell carcinoma cell line 769P. Cancer Lett. 2016;376(1):148-154. doi:10.1016/j.canlet.2016.03.041
541. Fukunaga-Kalabis M, Herlyn M. Beyond ABC: Another Mechanism of Drug Resistance in Melanoma Side Population. J Invest Dermatol. 2012;132(10):2317-2319. doi:10.1038/JID.2012.220
542. Gross E, L’Faqihi-Olive F-E, Ysebaert L, et al. B-chronic lymphocytic leukemia chemoresistance involves innate and acquired leukemic side population cells. Leukemia. 2010;24(11):1885-1892. doi:10.1038/leu.2010.176
543. Abel E V., Kim EJ, Wu J, et al. The Notch Pathway Is Important in Maintaining the Cancer Stem Cell Population in Pancreatic Cancer. Fernandez-Zapico M, ed. PLoS One. 2014;9(3):e91983. doi:10.1371/journal.pone.0091983
544. Zhang C, Li C, He F, Cai Y, Yang H. Identification of CD44+CD24+ gastric cancer stem cells. J Cancer Res Clin Oncol. 2011;137(11):1679-1686. doi:10.1007/s00432-011-1038-5
545. Zhou J, Wang H, Cannon V, Wolcott K, Song H, Yates C. Side population rather than CD133+ cells distinguishes enriched tumorigenicity in hTERT-immortalized primary prostate cancer cells. Mol Cancer. 2011;10(1):112. doi:10.1186/1476-4598-10-112
546. Yamazaki H, Wilson Xu C, Naito M, et al. Regulation of cancer stem cell properties by CD9 in human B-acute lymphoblastic leukemia. Biochem Biophys Res Commun. 2011;409(1):14-21. doi:10.1016/j.bbrc.2011.04.098
547. Lau WM, Teng E, Chong HS, et al. CD44v8-10 Is a Cancer-Specific Marker for Gastric Cancer Stem Cells. Cancer Res. 2014;74(9):2630-2641. doi:10.1158/0008-5472.CAN-13-2309
548. Huang F-F, Wu D-S, Zhang L, et al. Inactivation of PTEN increases ABCG2 expression and the side population through the PI3K/Akt pathway in adult acute leukemia. Cancer Lett. 2013;336(1):96-105. doi:10.1016/J.CANLET.2013.04.006
549. Teshima K, Nara M, Watanabe A, et al. Dysregulation of BMI1 and microRNA-16 collaborate to enhance an anti-apoptotic potential in the side population of refractory mantle cell lymphoma. Oncogene. 2014;33(17):2191-2203. doi:10.1038/onc.2013.177
550. Chen W, Zhang X, Chu C, et al. Identification of CD44+ cancer stem cells in human gastric cancer. Hepatogastroenterology. 2013;60(124):949-954. doi:10.5754/hge12881
551. El-Khattouti A, Selimovic D, Haïkel Y, Megahed M, Gomez CR, Hassan M. Identification and analysis of CD133+ melanoma stem-like cells conferring resistance to taxol: An insight into the mechanisms of their resistance and response. Cancer Lett. 2014;343(1):123-133. doi:10.1016/j.canlet.2013.09.024
552. Bleau A-M, Hambardzumyan D, Ozawa T, et al. PTEN/PI3K/Akt pathway regulates the side population phenotype and ABCG2 activity in glioma tumor stem-like cells. Cell Stem Cell. 2009;4(3):226-235. doi:10.1016/j.stem.2009.01.007
553. Lessard J, Sauvageau G. Bmi-1 determines the proliferative capacity of normal and leukaemic stem cells. Nature. 2003;423(6937):255-260. doi:10.1038/nature01572
554. Salcido CD, Larochelle A, Taylor BJ, Dunbar CE, Varticovski L. Molecular characterisation of side population cells with cancer stem cell-like characteristics in small-cell lung cancer. Br J Cancer. 2010;102(11):1636-1644. doi:10.1038/sj.bjc.6605668
555. Xia H, Cao J, Li Q, et al. Hepatocellular Carcinoma-propagating Cells are Detectable by Side Population Analysis and Possess an Expression Profile Reflective of a Primitive Origin. Sci Rep. 2016;6(1):34856. doi:10.1038/srep34856
556. Wu C-P, Zhou L, Xie M, et al. Identification of Cancer Stem-Like Side Population Cells in Purified Primary Cultured Human Laryngeal Squamous Cell Carcinoma Epithelia. Cao J, ed. PLoS One. 2013;8(6):e65750. doi:10.1371/journal.pone.0065750

162
557. Hoe SLL, Tan LP, Jamal J, et al. Evaluation of stem-like side population cells in a recurrent nasopharyngeal carcinoma cell line. Cancer Cell Int. 2014;14(1):101. doi:10.1186/s12935-014-0101-0
558. Yi X-J, Zhao Y-H, Qiao L-X, Jin C-L, Tian J, Li Q-S. Aberrant Wnt/β-catenin signaling and elevated expression of stem cell proteins are associated with osteosarcoma side population cells of high tumorigenicity. Mol Med Rep. 2015;12(4):5042-5048. doi:10.3892/mmr.2015.4025
559. Marhold M, Tomasich E, El-Gazzar A, et al. HIF1α Regulates mTOR Signaling and Viability of Prostate Cancer Stem Cells. Mol Cancer Res. 2015;13(3):556-564. doi:10.1158/1541-7786.MCR-14-0153-T
560. Murase M, Kano M, Tsukahara T, et al. Side population cells have the characteristics of cancer stem-like cells/cancer-initiating cells in bone sarcomas. Br J Cancer. 2009;101(8):1425-1432. doi:10.1038/sj.bjc.6605330
561. Kreso A, Dick JE. Evolution of the Cancer Stem Cell Model. Cell Stem Cell. 2014;14(3):275-291. doi:10.1016/j.stem.2014.02.006
562. Dieter SM, Ball CR, Hoffmann CM, et al. Distinct Types of Tumor-Initiating Cells Form Human Colon Cancer Tumors and Metastases. Cell Stem Cell. 2011;9(4):357-365. doi:10.1016/j.stem.2011.08.010
563. Quintana E, Shackleton M, Foster HR, et al. Phenotypic Heterogeneity among Tumorigenic Melanoma Cells from Patients that Is Reversible and Not Hierarchically Organized. Cancer Cell. 2010;18(5):510-523. doi:10.1016/j.ccr.2010.10.012
564. Newton TC, Wolcott K, Roberts SS. Comparison of the side populations in pretreatment and postrelapse neuroblastoma cell lines. Transl Oncol. 2010;3(4):246-251. doi:10.1593/tlo.09301
565. Clarke MF, Dick JE, Dirks PB, et al. Cancer Stem Cells—Perspectives on Current Status and Future Directions: AACR Workshop on Cancer Stem Cells. Cancer Res. 2006;66(19):9339-9344. doi:10.1158/0008-5472.CAN-06-3126
566. Nguyen L V., Vanner R, Dirks P, Eaves CJ. Cancer stem cells: an evolving concept. Nat Rev Cancer. 2012;12(2):133-143. doi:10.1038/nrc3184