AlignGraph: algorithm for secondary de novo genome assembly guided by closely related references
10
Vol. 30 ISMB 2014, pages i319–i328 BIOINFORMATICS doi:10.1093/bioinformatics/btu291 AlignGraph: algorithm for secondary de novo genome assembly guided by closely related references Ergude Bao 1 , Tao Jiang 1 and Thomas Girke 2, * 1 Department of Computer Science and Engineering and 2 Department of Botany and Plant Sciences, University of California, Riverside, CA 92521, USA ABSTRACT Motivation: De novo assemblies of genomes remain one of the most challenging applications in next-generation sequencing. Usually, their results are incomplete and fragmented into hundreds of contigs. Repeats in genomes and sequencing errors are the main reasons for these complications. With the rapidly growing number of sequenced genomes, it is now feasible to improve assemblies by guiding them with genomes from related species. Results: Here we introduce AlignGraph, an algorithm for extending and joining de novo-assembled contigs or scaffolds guided by closely related reference genomes. It aligns paired-end (PE) reads and pre- assembled contigs or scaffolds to a close reference. From the ob- tained alignments, it builds a novel data structure, called the PE multipositional de Bruijn graph. The incorporated positional informa- tion from the alignments and PE reads allows us to extend the initial assemblies, while avoiding incorrect extensions and early termin- ations. In our performance tests, AlignGraph was able to substantially improve the contigs and scaffolds from several assemblers. For in- stance, 28.7–62.3% of the contigs of Arabidopsis thaliana and human could be extended, resulting in improvements of common assembly metrics, such as an increase of the N50 of the extendable contigs by 89.9–94.5% and 80.3–165.8%, respectively. In another test, AlignGraph was able to improve the assembly of a published genome (Arabidopsis strain Landsberg) by increasing the N50 of its extendable scaffolds by 86.6%. These results demonstrate AlignGraph’s efficiency in improving genome assemblies by taking advantage of closely related references. Availability and implementation: The AlignGraph software can be downloaded for free from this site: https://github.com/baoe/ AlignGraph. Contact: [email protected] 1 INTRODUCTION Recent advances in next-generation sequencing (NGS) have made it possible to sequence new genomes at a fraction of the time and cost required only a few years ago. These improvements now allow experimental scientists to integrate genome sequen- cing approaches into their daily research. In the absence of a close reference genome, whole-genome shotgun NGS sequencing is the most common approach where a de novo assembly algo- rithm is used to join reads into longer continuous contigs and scaffolds. Most NGS de novo assemblers create a string or de Bruijn graph representing the connections among the reads and output the paths in the graph as assembled contigs. Examples of these algorithms include Edena (Hernandez et al., 2008), Velvet (Zerbino and Birney, 2008), ABySS (Simpson et al., 2009), ALLPATHS-LG (Gnerre et al., 2011), SOAPdenovo (Li et al., 2010; Luo et al., 2012), MaSuRCA (Zimin et al., 2013), CABOG (Miller et al., 2008), Euler-USR (Chaisson et al., 2009) and IDBA (Peng et al., 2010). This de novo assembly approach fun- damentally differs from alignment-based resequencing approaches, where the NGS reads are not assembled but aligned against a similar reference genome using a variant tolerant short read aligner and structural variant detection algorithms (Ossowski et al., 2008; Zeitouni et al., 2010). Large parts of the sequence of the target genome can then be reconstructed from the mismatches, indels and rearrangements observed in the align- ment results. De novo assemblies tend to be computationally more challenging than alignment-based approaches. Additional limitations include (i) the assembly results are often fragmented into large numbers of contigs, (ii) the genome covered by the assembled contigs/scaffolds is commonly incomplete and (iii) the frequency of falsely assembled contigs can be high because of chimeric joins. The most important reasons for these compli- cations are usually sequencing errors, repeat sequences in the target genome, non-uniform sequencing depth and limited read length of NGS data. These error sources result in false-positive, incomplete and branched paths in the assembly graph, and thus greatly limit the lengths and completeness of the final contigs (Chaisson and Pevzner, 2008; Peng et al., 2010; Zerbino and Birney, 2008). Combining both de novo assembly and align- ment-based approaches presents a powerful alternative when a closely related reference genome sequence is available, but its genetic differences relative to the target genome are too pro- nounced to resolve them with an alignment approach alone (Phillippy et al., 2008; Schatz et al., 2013; Schneeberger et al., 2011). In this case, one can first assemble the reads into contigs and then align them together with the reads to the reference. The much longer contigs facilitate the identification of complex re- arrangements, whereas the read alignments are useful for detect- ing smaller variations in regions that are not covered by contigs. Because of the rapidly increasing number of reference genomes becoming available for most organism groups, this reference- assisted assembly approach will soon become the default option for many genome sequencing projects. Compared with de novo assemblies, reference-assisted assemblies have many advantages. First, the alignments of the contigs and reads against the close reference provide valuable proximity information that can be used to extend contigs with additional reads and to join contigs even if they overlap only by a few nucleotides. Second, the prox- imity information in the alignment can also be used to orient and order contigs along the reference to build a scaffold map of the entire assembly. Third, the alignment map can be used to evalu- ate the quality of contigs and pinpoint potential misassemblies. *To whom correspondence should be addressed. ß The Author 2014. Published by Oxford University Press. This is an Open Access article distributed under the terms of the Creative Commons Attribution Non-Commercial License (http://creativecommons.org/licenses/by-nc/3.0/), which permits non-commercial re-use, distribution, and reproduction in any medium, provided the original work is properly cited. For commercial re-use, please contact [email protected] by guest on July 31, 2014 http://bioinformatics.oxfordjournals.org/ Downloaded from
-
Upload
independent -
Category
Documents
-
view
1 -
download
0
Transcript of AlignGraph: algorithm for secondary de novo genome assembly guided by closely related references

Vol. 30 ISMB 2014, pages i319–i328BIOINFORMATICS doi:10.1093/bioinformatics/btu291
AlignGraph: algorithm for secondary de novo genome assembly
guided by closely related referencesErgude Bao1, Tao Jiang1 and Thomas Girke2,*1Department of Computer Science and Engineering and 2Department of Botany and Plant Sciences, University ofCalifornia, Riverside, CA 92521, USA
ABSTRACT
Motivation: De novo assemblies of genomes remain one of the most
challenging applications in next-generation sequencing. Usually, their
results are incomplete and fragmented into hundreds of contigs.
Repeats in genomes and sequencing errors are the main reasons
for these complications. With the rapidly growing number of
sequenced genomes, it is now feasible to improve assemblies by
guiding them with genomes from related species.
Results: Here we introduce AlignGraph, an algorithm for extending
and joining de novo-assembled contigs or scaffolds guided by closely
related reference genomes. It aligns paired-end (PE) reads and pre-
assembled contigs or scaffolds to a close reference. From the ob-
tained alignments, it builds a novel data structure, called the PE
multipositional de Bruijn graph. The incorporated positional informa-
tion from the alignments and PE reads allows us to extend the initial
assemblies, while avoiding incorrect extensions and early termin-
ations. In our performance tests, AlignGraph was able to substantially
improve the contigs and scaffolds from several assemblers. For in-
stance, 28.7–62.3% of the contigs of Arabidopsis thaliana and human
could be extended, resulting in improvements of common assembly
metrics, such as an increase of the N50 of the extendable contigs by
89.9–94.5% and 80.3–165.8%, respectively. In another test,
AlignGraph was able to improve the assembly of a published
genome (Arabidopsis strain Landsberg) by increasing the N50 of its
extendable scaffolds by 86.6%. These results demonstrate
AlignGraph’s efficiency in improving genome assemblies by taking
advantage of closely related references.
Availability and implementation: The AlignGraph software can be
downloaded for free from this site: https://github.com/baoe/
AlignGraph.
Contact: [email protected]
1 INTRODUCTION
Recent advances in next-generation sequencing (NGS) have
made it possible to sequence new genomes at a fraction of the
time and cost required only a few years ago. These improvements
now allow experimental scientists to integrate genome sequen-
cing approaches into their daily research. In the absence of a
close reference genome, whole-genome shotgun NGS sequencing
is the most common approach where a de novo assembly algo-
rithm is used to join reads into longer continuous contigs and
scaffolds. Most NGS de novo assemblers create a string or de
Bruijn graph representing the connections among the reads and
output the paths in the graph as assembled contigs. Examples of
these algorithms include Edena (Hernandez et al., 2008), Velvet
(Zerbino and Birney, 2008), ABySS (Simpson et al., 2009),ALLPATHS-LG (Gnerre et al., 2011), SOAPdenovo (Li et al.,
2010; Luo et al., 2012), MaSuRCA (Zimin et al., 2013), CABOG(Miller et al., 2008), Euler-USR (Chaisson et al., 2009) and
IDBA (Peng et al., 2010). This de novo assembly approach fun-damentally differs from alignment-based resequencing
approaches, where the NGS reads are not assembled but alignedagainst a similar reference genome using a variant tolerant short
read aligner and structural variant detection algorithms(Ossowski et al., 2008; Zeitouni et al., 2010). Large parts of the
sequence of the target genome can then be reconstructed fromthe mismatches, indels and rearrangements observed in the align-
ment results. De novo assemblies tend to be computationallymore challenging than alignment-based approaches. Additional
limitations include (i) the assembly results are often fragmentedinto large numbers of contigs, (ii) the genome covered by the
assembled contigs/scaffolds is commonly incomplete and (iii)the frequency of falsely assembled contigs can be high because
of chimeric joins. The most important reasons for these compli-cations are usually sequencing errors, repeat sequences in the
target genome, non-uniform sequencing depth and limited readlength of NGS data. These error sources result in false-positive,
incomplete and branched paths in the assembly graph, and thusgreatly limit the lengths and completeness of the final contigs
(Chaisson and Pevzner, 2008; Peng et al., 2010; Zerbino andBirney, 2008). Combining both de novo assembly and align-
ment-based approaches presents a powerful alternative when aclosely related reference genome sequence is available, but its
genetic differences relative to the target genome are too pro-nounced to resolve them with an alignment approach alone
(Phillippy et al., 2008; Schatz et al., 2013; Schneeberger et al.,2011). In this case, one can first assemble the reads into contigs
and then align them together with the reads to the reference. Themuch longer contigs facilitate the identification of complex re-
arrangements, whereas the read alignments are useful for detect-ing smaller variations in regions that are not covered by contigs.
Because of the rapidly increasing number of reference genomesbecoming available for most organism groups, this reference-
assisted assembly approach will soon become the default optionfor many genome sequencing projects. Compared with de novo
assemblies, reference-assisted assemblies have many advantages.First, the alignments of the contigs and reads against the close
reference provide valuable proximity information that can beused to extend contigs with additional reads and to join contigs
even if they overlap only by a few nucleotides. Second, the prox-imity information in the alignment can also be used to orient and
order contigs along the reference to build a scaffold map of theentire assembly. Third, the alignment map can be used to evalu-
ate the quality of contigs and pinpoint potential misassemblies.*To whom correspondence should be addressed.
� The Author 2014. Published by Oxford University Press.
This is an Open Access article distributed under the terms of the Creative Commons Attribution Non-Commercial License (http://creativecommons.org/licenses/by-nc/3.0/),
which permits non-commercial re-use, distribution, and reproduction in any medium, provided the original work is properly cited. For commercial re-use, please contact
by guest on July 31, 2014http://bioinform
atics.oxfordjournals.org/D
ownloaded from

Previous studies on reference-assisted assemblies include theAMOScmp software (Pop et al., 2004a), an add-on tool for theARACHNE assembler (Gnerre et al., 2009) and custom work-
flows largely based on existing assembly software (e.g.Schneeberger et al., 2011). The first two were designed primarilyfor Sanger reads, whereas the latter has been used for NGS
genome assembly. Downstream of the primary assembly, scaf-folding algorithms, such as RACA (Kim et al., 2013), can beused to order and orient preassembled contigs to a connection
map by incorporating additional sequence information frommate pair or PE reads and/or from closely related genomes(Boetzer et al., 2011; Dayarian et al., 2010; Gao et al., 2011;
Gritsenko et al., 2012; Pop et al., 2004b; Salmela et al., 2011).The resulting scaffolds often contain gaps, which are unresolvedsequence areas between the original contigs. Dedicated gap-
filling algorithms can be used to partially fill these gaps(Boetzer and Pirovano, 2012; Luo et al., 2012; Tsai et al.,2010). More recently, components of reference-based strategieshave also been incorporated into some of the de novo assembly
suites themselves such as the cheat mode option of ALLPATHS-LG (Gnerre et al., 2011) and IDBA-hybrid (unpublished).This study proposes a novel algorithm, called AlignGraph, for
improving the lengths and completeness of contigs or scaffoldsby reassembling them with help provided by a reference genomeof a closely related organism. In contrast to existing reference-
assisted methods, AlignGraph is a secondary assembly algorithmthat loads the alignment information of PE reads and pre-assembled contigs/scaffolds against the reference into a novel
assembly graph, called the PE multipositional de Bruijn graph,that we specifically designed for facilitating secondary assem-blies. By traversing this graph, the contigs or scaffolds of the
primary assembly can be extended and joined. AlignGraph dif-fers from most scaffolding algorithms by extending contigs ex-clusively with resolved rather than unresolved bases (Ns) and by
acting either upstream and/or downstream of them.AlignGraph’s functionalities are unique by solving several
challenges in improving assembly results. As a de Bruijn
graph-based method, it solves limitations typical for many heur-istic extension methods that are often used in the de novo assem-bly area (Dohm et al., 2007; Jeck et al., 2007; Warren et al.,
2007). For instance, if there are multiple solutions for how toextend a contig, then finding the correct one can be challengingwith most heuristic methods. Those ambiguous solutions, which
correspond to branched paths in the de Bruijn graph, are usuallycaused by repetitive sequences in genomes and frequently lead toearly terminations of the contig extension process. The de Bruijn
graph method is often more efficient than heuristic methods infinding the correct solution here because the contextual informa-tion, required for resolving these ambiguities, is maintained in
the graph (Chaisson and Pevzner, 2008; Zerbino and Birney,2008). This issue is not as pronounced in assemblies with muchlonger Sanger reads, as those are more likely to span non-repeti-
tive regions with repetitive regions in between (Gnerre et al.,2009). Thus, it is particularly important to address this problemin assemblies with short reads. In comparison with the conven-
tional de Bruijn graph, our PE multipositional de Bruijn graphhas several additional advantages. First, many branched pathscan be eliminated directly in the graph with the help of the add-
itional PE read and alignment information. This simplifies the
identification of correct paths. Second, many false-positive paths,caused by sequencing errors, can be eliminated by correctingerroneous reads with correct reads that align to the same position
in the reference genome. Third, guided by the alignment infor-mation to the reference genome, the PE multipositional de Bruijn
graph is less affected by regionally low read coverage that oftengives rise to incomplete paths in the conventional de Bruijn
graph. As a result, many incorrect extensions and early termin-ations can be avoided.
2 METHODS
2.1 AlignGraph algorithm
This section describes the AlignGraph algorithm. Its workflow can be
divided into the following three major steps. Figure 1B illustrates these
steps with an example.
(i) Alignment maps. The PE reads are aligned against both the pre-
assembled contigs and the close reference genome; the contigs
are aligned against the reference.
(ii) Contig reassembly. The alignment mapping results are used to
construct a positional variant of the de Bruijn graph, called the
PE multipositional de Bruijn graph.
(iii) Graph traversal. The resulting graph is edited and traversed to
obtain extended contigs.
Throughout the text, the source genome of the PE reads and the pre-
assembled contigs is referred to as the target genome, whereas the genome
of the closely related species for guiding the contig improvement steps is
referred to as the reference genome. For simplicity, the following descrip-
tion of AlignGraph refers mostly to contigs, but it also applies to scaf-
folds containing a limited amount gaps.
Prerequisites Before the above steps, the user is expected to generate
genomic PE reads for the target genome of interest and to assemble them
with a de novoNGS genome assembler. Because most genome assemblers
perform better with PE than single-end data, AlignGraph also depends
on this sequence type. A major advantage of AlignGraph is its design to
work with most genome assemblers, but the quality of the initial de novo
assembled contigs is expected to impact the final results (see Section 3.2).
For optimal results, it is also important to follow the recommendations of
the chosen de novo assembler with respect to insert length of the sequen-
cing library, minimum coverage of the target genome with PE reads and
other recommendations. If scaffolds are inputted, it is usually beneficial
to fill them with a gap-filling algorithm before processing them with
AlignGraph (e.g. Boetzer and Pirovano, 2012). Another requirement
for AlignGraph is the availability of a closely related reference genome
sequence. Nearly complete reference genomes of high quality will yield
the best results, but partially sequenced genomes can be used as well.
(i) Alignment maps In the initial preprocessing step of AlignGraph,
the PE reads, used for the de novo assembly in the Prerequisite section, are
aligned to the contigs and to the reference genome, and the contigs are
also aligned to the reference genome. Aligning the reads to the contigs
simplifies their alignments to the reference by guiding them with the much
longer contigs as backbone (see below). Generating reliable alignments
among the PE reads and the contigs is relatively straightforward because
both are from the same genetic background, thus requiring a low level of
variant tolerance in the alignments. Aligning the contigs to the reference
genome demands a higher level of variant tolerance. However, because of
the relatively large length of the contigs, their alignments to the reference
can also be generated reliably, as long as the evolutionary distance be-
tween the target and reference genome is not too large. The current im-
plementation of AlignGraph uses Bowtie2 and BLAT for these two
i320
E.Bao et al.
by guest on July 31, 2014http://bioinform
atics.oxfordjournals.org/D
ownloaded from
alignment steps, respectively (Kent, 2002; Langmead and Salzberg, 2012).
In contrast to this, aligning the relatively short PE reads to the reference
genome is a more challenging task owing to the difficulty of generating
reliable short alignments containing larger numbers of mismatches and
gaps. This problem does not apply to the reads aligning to the contigs
because their alignment positions to the reference genome can be inferred
from the more robust contig alignments. For the PE read to reference
genome alignment, it is important to choose a highly variant tolerant
short read aligner that is able to reliably align most of the short reads
to their true source locations in the reference genome while minimizing
the number of false-positive read placements. Clearly, the latter would
negatively impact the precision performance of AlignGraph by leading to
chimeric joins in the downstream contig extension steps. Although a wide
range of short read aligners has been developed over the past years (Li
and Homer, 2010), none of them has been specifically designed or opti-
mized for aligning short reads against reference genomes with sequence
differences more pronounced than those observed among genomes within
the same species. To minimize the above challenges, we have chosen for
this critical step the highly tunable Bowtie2 aligner with parameter set-
tings that we optimized for aligning PE reads from a target genome to a
reference genome sharing variable degrees of sequence similarity. The use
of PE read alignments in this step is also important because the additional
sequence information, provided by the second read in a PE, increases the
specificity of the alignment process compared with single-end reads, and
thus reduces the number of false read placements. To account for re-
arrangements among the two genomes, we use for the alignments of
the PE reads against the reference genome more relaxed insert length
variation settings than in the alignments against the contigs.
(ii) Contig reassembly with PE multipositional de Bruijngraph The core functionality of AlignGraph is the extension of the
contigs by reassembling them using the alignment results obtained in
the previous step. To achieve this efficiently, we build from the alignment
maps a variant of the de Bruijn graph, here called the PE multipositional
de Bruijn graph. This method combines the PE de Bruijn graph
(Medvedev et al., 2011) and the positional de Bruijn graph (Ronen
et al., 2012), where we incorporate both PE read information and align-
ment positions into the graph (Pevzner et al., 2001). The former was
designed to generate more complete contigs in de novo assemblies and
the latter to correct contig errors in secondary assemblies. Our approach
solves several problems in improving assembly results that we briefly
discussed in Section 1 (see also Table 1). The following describes our
modified de Bruijn graph in more details, where we first introduce im-
portant concepts of conventional de Bruijn graph-based assembly
methods.
Background The most widely used method for genome assemblies
from short reads is the de Bruijn graph method (Pevzner et al., 2001).
A de Bruijn graph is a directed graph: two connected nodes represent
k+1 bases, where the first node represents the first k bases, and the
second node the second k bases (called k-mer). To construct a de
Bruijn graph, l� k+1 connected nodes are constructed from each read
of length l, and two nodes from different reads are joined if they share the
same k-mers. In theory, the graph contains a walk representing the full
sequence of the genome if traversed properly. However, this walk is hard
to obtain in practice because of false-positive, incomplete and branched
connections in the graph that are caused by errors in the reads and
A
B
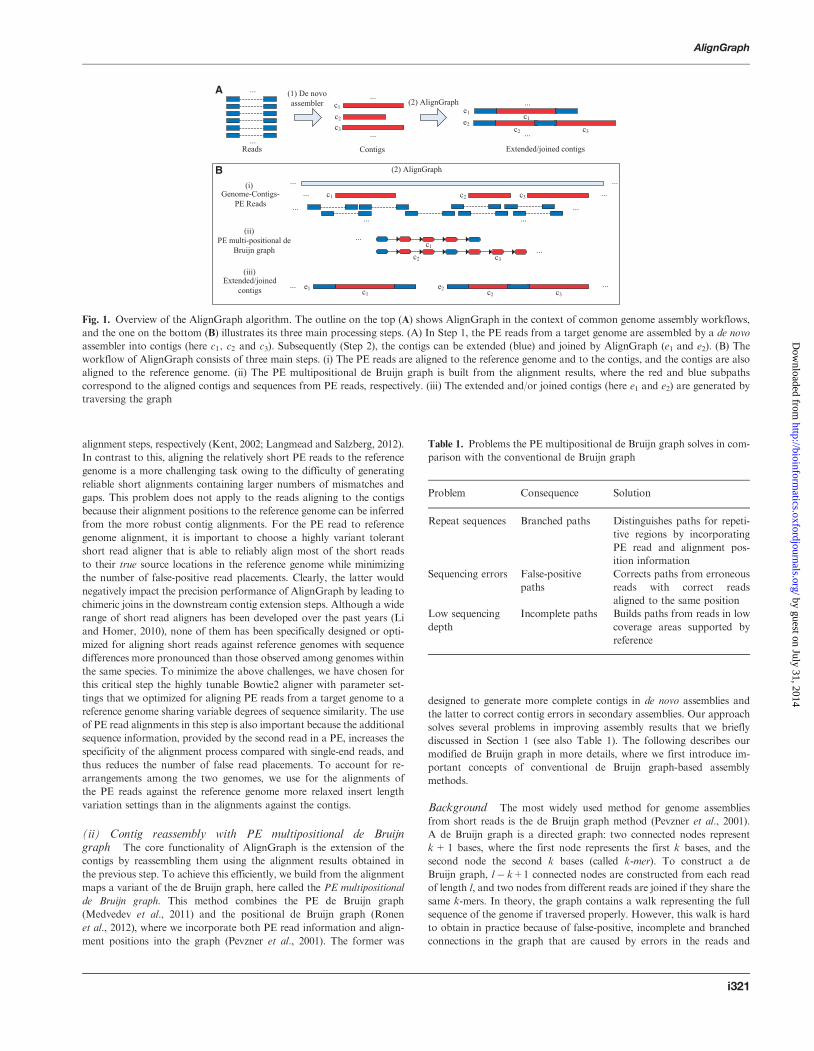
Fig. 1. Overview of the AlignGraph algorithm. The outline on the top (A) shows AlignGraph in the context of common genome assembly workflows,
and the one on the bottom (B) illustrates its three main processing steps. (A) In Step 1, the PE reads from a target genome are assembled by a de novo
assembler into contigs (here c1; c2 and c3). Subsequently (Step 2), the contigs can be extended (blue) and joined by AlignGraph (e1 and e2). (B) The
workflow of AlignGraph consists of three main steps. (i) The PE reads are aligned to the reference genome and to the contigs, and the contigs are also
aligned to the reference genome. (ii) The PE multipositional de Bruijn graph is built from the alignment results, where the red and blue subpaths
correspond to the aligned contigs and sequences from PE reads, respectively. (iii) The extended and/or joined contigs (here e1 and e2) are generated by
traversing the graph
Table 1. Problems the PE multipositional de Bruijn graph solves in com-
parison with the conventional de Bruijn graph
Problem Consequence Solution
Repeat sequences Branched paths Distinguishes paths for repeti-
tive regions by incorporating
PE read and alignment pos-
ition information
Sequencing errors False-positive
paths
Corrects paths from erroneous
reads with correct reads
aligned to the same position
Low sequencing
depth
Incomplete paths Builds paths from reads in low
coverage areas supported by
reference
i321
AlignGraph
by guest on July 31, 2014http://bioinform
atics.oxfordjournals.org/D
ownloaded from

repeats in the genome. The false-positive and incomplete paths are due to
false-positive k-mers with sequencing errors and missing k-mers from
regions of low sequencing depth, respectively. The branched paths are
caused by joins of k-mers from repetitive regions. Several variations of the
de Bruijn graph have been proposed to solve these limitations, especially
the branched paths, while preserving all of its genome information
(Medvedev et al., 2011; Peng et al., 2010; Ronen et al., 2012). The PE
de Bruijn graph (Medvedev et al., 2011) is built from PE reads, where
each k-mer contains k bases from the left pair plus its corresponding k
bases from the right pair. In contrast to this, the positional de Bruijn
graph (Ronen et al., 2012) incorporates read alignment information by
including in each k-mer the k bases plus its alignment position. With the
additional information assigned to the k-mers, k-mers from repetitive
regions can often be distinguished, and thus the number of branches in
the graph can be reduced. In addition, because the positional de Bruijn
graph is built from read alignments, false-positive and incomplete paths
can be largely avoided. We emphasize that the PE de Bruijn graph re-
quires the left pair forward-strand read and the right pair reverse-strand
read or vice versa, but it is difficult to know their orientation. This prob-
lem can be resolved if the PE de Bruijn graph is built from aligned reads,
where their orientation can be obtained from the alignments.
PE multipositional de Bruijn graph We derive the PE multipos-
itional de Bruijn graph as a combination of the PE de Bruijn graph and
the positional de Bruijn graph. Each k-mer of the PE multipositional de
Bruijn graph is composed of three left/right element pairs: the k bases of
each the left and the right read pair (called left or right k bases), the
alignment position of each the left and the right k bases to the contigs
and the alignment position of each the left and the right k bases to the
reference genome. Two k-mers can be joined if they have similar k bases
and close alignment positions within the constraints defined in the for-
mulas below. Formally, let s be the k bases from the left read pair and s0
the corresponding k bases from the right read pair, then the k-mer of PE
multipositional de Bruijn graph is a 6 tuple (s; s0; c; g, c0; g0), where c is
the alignment position of s to the contigs, g is the alignment position of s
to the reference genome, c0 is the alignment position of s0 to the contigs
and g0 is the alignment position of s0 to the reference genome. Two k-mers
(si; si0; ci; gi; ci
0; gi0) and (sj; sj
0; cj; gj; cj0; gj
0) can be joined if con-
strains (1)–(6) are met:
mismatchðsi; sjÞ5� ð1Þ
mismatchðsi0; sj0Þ5� ð2Þ
jci � cjj5� or ci=� 1 or cj=� 1 ð3Þ
jgi � gjj5� ð4Þ
jci0 � cj
0j5�+2D or ci0=� 1 or cj
0=� 1 ð5Þ
jgi0 � gj
0j5�+2D ð6Þ
where � and " are small numbers with the default values 5 and 25, re-
spectively, and D is the variability of the insert length I of the PE reads.
The variability D is equal to max fIu � I; I� Ilg, where Iu and Il are the
upper and lower limits of I, respectively. The variables in the above for-
mulas are explained below.
�: To join two k-mers and tolerate sequencing errors, we allow a
small number of mismatches � between si and sj and between si0
and sj0 in (1) and (2), respectively.
": We allow a small shift " between each pair of alignment positions
in (3)–(6) because the same k bases si and sj (or si0 and sj
0) from
different reads may align to different but close positions in the con-
tigs or genome, as discussed in Ronen et al. (2012).
2D: We allow a shift 2D of si0 and sj
0’s alignment positions to the
contigs in (5) and to the reference genome in (6). The maximum and
minimum alignment distances between a read pair are I� l+D and
I� l�D, respectively, where l is the read length, assuming the same
read length for bothmembers in a pair. Thus, themaximumalignment
distance of two right reads with left reads aligned at the same position
is ðI� l+DÞ � ðI� l�DÞ=2D. This distance is equal to the distance
between any two k-mers from the sameposition in the right read pairs,
so the maximum distance between si0 and sj
0 will be 2D.
–1: si and sj (or si0 and sj
0) can be joined if one or both of them are
aligned directly to the reference genome rather than guided by the de
novo contigs. In those cases, we assign –1 as alignment position to the
contigs. This is important because we allow contig extensions only if
the alignable and unalignable bases to contigs can be joined.
It is important to guarantee that each k-mer corresponding to an inser-
tion of a read alignment has a position in the reference genome. To
achieve this, we append the inserted k-mer to the end of the genome
sequence. In our implementation of the PE multipositional de Bruijn
graph, we first iteratively load sections of the reference genome into
memory. Then we perform the following operation. We test for each
k-mer in each aligned read at genome position g, whether there is already
a k-mer at g and whether the new k-mer can be joined with it. If so then
we join the two k-mers; otherwise, we attach the new k-mer to position g.
The connection between two k-mers is recorded by using pointers, and
the read coverage for each k-mer is stored along with it. Figure 2 illus-
trates the main advantages of the PE multipositional de Bruijn graph
compared with the positional de Bruijn graph with several examples
(see also Table 1). This includes the contig-guided PE read alignment
against the reference genome resulting in a larger number of alignable
reads, and thus a more complete de Bruijn graph (Fig. 2B), as well as the
reduction of branched paths in the graph by distinguishing reads from
different repetitive regions (Fig. 2C and D). For space reasons, the ad-
vantages over the conventional de Bruijn graph in reducing false-positive
and incomplete paths are not shown. The PE multipositional de Bruijn
graph can converge to the positional de Bruijn graph by relaxing the
above constraints (2), (3), (5) and (6). In our tests, the former shows
usually an up to 5% better performance than the latter with respect to
several sensitivity measures (see below for definitions). This improvement
is considerable because the number of branches that are only resolvable
by the PE multipositional de Bruijn graph is usually not large.
(iii) Graph traversal returns extended contigs To remove errors,
the de Bruijn graph needs to be edited before its traversal. The three
major types of errors are tips, bubbles and erroneous connections
(Chaisson and Pevzner, 2008; Peng et al., 2010; Zerbino and Birney,
2008). Most of them are caused by errors in the reads. A tip is a short
path with a dead end, whereas a bubble consists of two short paths
sharing the same start and end nodes. Most of the tips and bubbles can
be corrected by joining k-mers with 5� mismatches. The remaining
errors can be removed by applying a coverage cut-off filter similar to
the strategies used by most de novo assemblers. Because of the add-
itional information encoded in the modified de Bruijn graph, one can
use here a relatively small coverage threshold. After these error removal
steps, the PE multipositional de Bruijn graph is traversed, using a
breadth-first strategy, to generate the final contigs. Each traversal
stops at a branch position and an extended contig is returned. After
returning the extended contigs, the remaining unextended contigs (iden-
tical with initial de novo contigs) are provided to the user in a separate
file. Finally, contigs with sufficient PE read connections and a path
between them can be joined. Occasionally, those connections can be
missed by the above filtering step because of too low read coverage
in local areas of the connecting path.
i322
E.Bao et al.
by guest on July 31, 2014http://bioinform
atics.oxfordjournals.org/D
ownloaded from

A
B
C
D
Fig. 2. Advantages of the PE multipositional de Bruijn graph compared with the positional de Bruijn graph. In the target genome given on the top, A
and A0; C and C0; E and E0; G and G0 are repetitive regions. Each PE read of length 2� 4bp is sequenced with one pair from region ABCDA0C0 and the
other from the corresponding position of region EFGHE0G0 (the pair from EFGHE0G0 is omitted for simplicity). In comparison with the target genome,
the reference genome has a repeat-free region ABC similar toABCDA0C0 and a region EFGHE0 similar to EFGHE0G0. The reads from regionABCDA0C0
are assembled with a de novo assembler into a contig starting from CDA0C0, but regions A and B are not assembled because of low sequencing depth,
repeats or other problems. When aligning the contig to the reference genome, the repetitive regions C and C0 are both aligned to C in the reference
genome, and the insertion D is assigned to the end of the reference. In (A) reads are aligned directly to the reference genome to build the initial positional
de Bruijn graph, and in (B–D) the reads are aligned to the preassembled contigs and then aligned to the reference to build first the extended positional de
Bruijn graph and then the PE multipositional de Bruijn graph. (A) The initial positional de Bruijn graph is built here with 3-mers. Some reads cannot be
aligned to the reference genome because of sequence differences in the target genome, as indicated here by 3-mers with –1 as alignment position.
The repetitive regions A and A0 (or C and C0) are collapsed into one path in red in the graph. (B) The initial positional de Bruijn graph is constructed with
help from the read-to-contig alignment information. The read-to-reference genome alignment information yields a more complete positional de Bruijn
graph, but the repetitive regions A and A0 (or C and C0) are still collapsed resulting in branch points. (C) An extended positional de Bruijn graph is built
by incorporating into each 3-mer the read alignment position to the contig. As a result of this operation, the repetitive regions C and C0 can be
distinguished into two paths, where the 3-mers have different alignment positions in the contig, but A and A0 are still collapsed. (D) The PE multi-
positional de Bruijn graph is constructed by incorporating into each 3-mer their PE read alignment positions to the reference genome (the right three
bases and their alignment position to the contig is omitted here). With this information the repeats A and A0 can be distinguished into two paths, as the
3-mers have different PE alignment positions in the reference genome. The final graph contains only one single path allowing to output an extended
contig corresponding to the region ABCDA0C0 in the target genome
i323
AlignGraph
by guest on July 31, 2014http://bioinform
atics.oxfordjournals.org/D
ownloaded from
2.2 Software implementation
AlignGraph is implemented in C++ for Linux operating systems. Its
required input includes the PE reads, the preassembled de novo contigs
and the reference genome. Its output includes the extended contigs as well
as the remaining non-extended contigs. AlignGraph runs the alignment
steps with BLAT and Bowtie2 automatically, but both need to be in-
stalled on the system. AlignGraph’s run time is currently 23–57min per
million aligned reads. In the performance tests of this study, the memory
usage was 36–50GB, and it stays5100GB even for entire mammalian
genomes. These requirements are more moderate than those of most de
novo assemblers (Luo et al., 2012).
3 EVALUATION
3.1 Experimental design
Background To evaluate AlignGraph’s efficiency in improving
genome assemblies, we performed a series of systematic perform-
ance tests. For this, we downloaded publicly available assemblies
and/or assembled genomic PE read sets from organisms of vari-
able genome complexity with seven widely used de novo assem-
blers, extended the resulting contigs with AlignGraph, and then
evaluated the improvements with a set of standard metrics for
comparing assembly results (Table 2). In these tests, it was im-
portant to choose the NGS read samples from organisms where
the genome sequence of both the target genome and a close ref-
erence genome are known. This way one can evaluate the com-
pleteness and correctness of the results against a true result rather
than one that is unknown or only partially known. To also
assure the improvements obtained by AlignGraph are not
simply the result of insufficient optimizations of the upstream
de novo assembly, we included preassembled contig and scaffold
sets that are widely accepted by the community as benchmark
datasets for evaluating assembly software. Today’s requirements
for assembling genomes from NGS were met by choosing read
samples with �75bp and PE read information. In total, we per-
formed assembly tests on the following three sample sets.
3.1.1 Arabidopsis thaliana sample The first sample set was fromthe model organism Arabidopsis thaliana, which is a flowering
plant with a compact genome of 130Mb in size. The PE read set
chosen for this test is from a genomic Illumina NGS library with
a read length of 2� 75bp. As de novo assemblers, we included in
this test Velvet and ABySS, which we chose here as software
representatives performing well on single library data and be-
cause of their good sensitivity and precision performance (Lin
et al., 2011). The VelvetOptimiser tool was used to optimize the
parameter settings for the Velvet assembly. ABySS was run with
the same k-mer length as Velvet, whereas the remaining param-
eters were set to their defaults. To extend the preassembled con-
tigs with AlignGraph, we used the publicly available genome
sequence from the related Arabidopsis lyrata species as reference
[Table 2(a)]. The latter was chosen because it constitutes a more
challenging reference genome for testing AlignGraph’s perform-
ance in improving genome assemblies than the references used in
the other tests below. This is the case for the following reasons
(Hu et al., 2011): A.lyrata and A.thaliana diverged410 million
years ago; their genomes differ by many regional rearrange-
ments; the sequence similarity in the common regions of their
genomes is only 80%; and the A.lyrata genome sequence is stillincomplete and fragmented into many scaffolds.
3.1.2 Human sample from Genome Assembly Gold-standardEvaluations The second sample set is from the community pro-
ject GAGE (Genome Assembly Gold-standard Evaluations),from which we selected the sample for the human chromosome
14 (Salzberg et al., 2012). Its Illumina sequences consist of PEreads with a length of 76–101bp from three different libraries.We downloaded the preassembled contig sets provided by the
GAGE project for the five assemblers that ranked highest inthe benchmark tests by Salzberg et al. (2012) in assemblies
from multiple genome libraries with variable insert lengths.Those included ALLPATHS-LG, SOAPdenovo, MaSuRCA,CABOG and Bambus2. As reference sequence for guiding
AlignGraph, we used the chimpanzee genome. ForALLPATH-LG in its cheat mode, we reassembled the contigs
ourselves because this assembler exhibits a better sensitivity andprecision performance when providing a closely related referencegenome. Here it was important to compare the performance of
ALLPATHS-LG with AlignGraph when both are guided by thesame reference genome.In addition to contigs, we evaluated AlignGraph’s perform-
ance in improving the scaffold sets provided by the GAGE pro-ject for the same human sample set. Before their reassembly with
AlignGraph, we reduced the number of unresolved sequence re-gions (gaps filled with ambiguous N bases) in the scaffolds by
applying the GapFiller algorithm, which is currently one of themost efficient gap-filling methods (Boetzer and Pirovano, 2012).To also evaluate the influence of the similarity shared among
the reference and target genomes on AlignGraph’s performance,we included tests with four reference genomes of variable simi-larity to the human genome. The reference genomes chosen for
this test were from gorilla, orangutan, gibbon and macaque. Thegenome sequence from gibbon was the only one that is still in-
complete containing scaffolds rather than fully assembledchromosomes.
3.1.3 Published genome In addition to the tests above, we were
interested in evaluating to what extent AlignGraph can improvethe genome sequence generated with another reference assistedassembly approach. For this test, we chose the published genome
sequence from Landsberg erecta (Ler-1; Schneeberger et al.,2011). The latter is a strain of A.thaliana, which is too diverged
from the known references to resolve its genome sequence with asimple resequencing approach. Thus, Schneeberger et al. (2011)assembled its genome with a reference-assisted pipeline approach
that included ALLPATHS-LG and several refinement steps.
3.1.4 Data sources The genome sequences used in the abovetests were downloaded from the following community sites:
A.thaliana from TAIR, A.lyrata from JGI, Landsberg erectafrom 1001 Genomes and human and other primates fromEnsembl. From the GAGE site, we downloaded the PE read
sets and the preassembled contigs and scaffolds for the humanchromosome 14 sample (Salzberg et al., 2012). The PE read sets
from A.thaliana and Landsberg erecta were downloaded fromNCBI’s Sequence Read Archive and the 1001 Genome site, re-spectively. The A.thaliana read set contained 32 million 2� 75bp
PE reads (accession: SRR073127), the human read set contained
i324
E.Bao et al.
by guest on July 31, 2014http://bioinform
atics.oxfordjournals.org/D
ownloaded from

62 million 2� 76–101bp PE reads and the Ler-1 read set con-
tained 73 million 2� 40–101bp PE reads.
3.1.5 Performance measurements Most of the performance
measures used by this study are adapted from the GAGE project
(Salzberg et al., 2012). To evaluate the completeness of the con-
tigs, we aligned them to the target genome with BLAT. If a
contig could not be aligned as a single global alignment, it was
split according to the local alignment results into the smallest
possible number of subcontigs. The resulting contigs are called
true contigs. The precision measures include the number of mis-
assemblies per million base pairs (MPMB) and the average iden-
tity between contigs and target genome. Misassemblies caused by
misjoin errors result in chimeric contigs. Their number can be
calculated as the number of splits necessary to obtain the true
contigs. Thus, MPMB = mL � 106, where m is the numbers of
Table 2. Performance evaluation of AlignGraph
Upstream
assembler
Contig set N Contigs4 N505 N covered
bases6Average
length7Maximum
length8MPMB9 Average
identity10 (%)
(a) Contigs of A.thaliana genome
Velvet All1 30 037 3515 82 844 417 2668 27 792 22.2 95.2
Extendable2 8615 4148 28 007 451 3262 27 398 0.3 97.6
Extendable+AlignGraph3 5751 7876 32 467 110 5521 49 768 1.6 94.8
ABySS All 30 972 2559 69 432 667 2206 29 760 13.4 97.2
Extendable 11 693 2820 28 885 212 2454 16 343 0.5 98.7
Extendable+AlignGraph 8427 5484 35 859 786 4151 25 321 1.1 95.8
(b) Contigs of human chromosome 14
ALLPATHS-LG All 4383 38590 83 849 397 19 201 240 764 0.3 98.9
Extendable 1674 39851 35 746 095 20 806 200 495 0.1 98.9
Extendable+AlignGraph 785 71847 36 441 001 45 358 305 880 0.0 97.5
ALLPATHS-LGc All 3856 43856 83 860 939 21 818 275 446 0.2 99.3
Extendable 1296 45719 31 457 201 24 346 275 446 0.1 99.5
Extendable+AlignGraph 608 86613 34 614 465 54 406 294 615 0.0 96.9
SOAPdenovo All 10 865 16855 80 135 941 7623 147 494 5.9 94.9
Extendable 5613 17412 45 246 077 8223 141 981 0.9 96.4
Extendable+AlignGraph 3469 32881 52 861 640 15 271 219 841 0.5 95.0
MaSuRCA All 19 034 5767 75 497 302 3802 53 837 13.9 98.9
Extendable 9241 6047 38 842 517 4199 51 249 0.2 99.2
Extendable+AlignGraph 5665 11590 43 930 184 7666 66 758 0.4 98.1
CABOG All 3118 46523 84 989 190 27 401 296 888 0.3 97.3
Extendable 1692 45669 46 499 763 27 089 296 888 0.0 98.7
Extendable+AlignGraph 701 101907 50 527 605 70 362 443 952 0.1 97.6
Bambus2 All 11 219 8378 64 011 072 5764 449 449 3.1 89.9
Extendable 6995 7521 37 857 989 5439 62 798 0.3 97.6
Extendable+AlignGraph 2722 19989 39 147 357 14 176 86 154 0.5 96.5
(c) Scaffolds of human chromosome 14
SOAPdenovo All 3902 391693 85 417 248 24 397 1 852 152 1.0 82.9
Extendable 901 387309 40 296 035 47 526 1 019 659 0.1 84.5
Extendable+AlignGraph 767 544209 47 823 279 63 525 2 246 638 0.1 81.0
MaSuRCA All 721 580822 65 433 305 63 876 2 943 966 1.3 57.2
Extendable 101 289703 5 554 781 52 820 1 516 804 0.0 81.9
Extendable+AlignGraph 78 316946 6 986 224 86 552 1 573 741 0.0 83.4
CABOG All 471 387876 81 163 688 176 590 1 944 475 0.1 91.9
Extendable 146 358688 29 372 033 200 539 1 905 529 0.0 98.2
Extendable+AlignGraph 67 906407 33 708 925 481 712 2 051 503 0.0 94.1
Bambus2 All 569 319334 64 378 693 116 582 1 477 847 0.1 77.4
Extendable 66 272436 6 949 338 119 858 641 463 0.0 92.0
Extendable+AlignGraph 80 377905 8 963 132 114 852 812 353 0.1 85.4
(a) Genomic PE reads from A.thaliana were assembled with Velvet and ABySS. The resulting contigs were extended with AlignGraph using as reference the genome sequence
from A.lyrata. (b–c) The subsequent panels contain assembly results for the human chromosome 14 sample from the GAGE project where the chimpanzee genome served as
reference. (b) Contig assembly results are given for the de novo assemblers ALLPATHS-LG, ALLPATHS-LGc (in cheat mode), SOAPdenovo, MaSuRCA, CABOG and
Bambus2. (c) Scaffolded assembly results are given for SOAPdenovo, MaSuRCA, CABOG and Bambus2. The results are organized row-wise as follows: the number of initial
contigs obtained by each de novo assembler1, the ‘extendable’ subset of the initial contigs that AlignGraph was able to improve2, and the extension results obtained with
AlignGraph3. The additional columns give the number of contigs4, N50 values5, the number of covered bases6, the average7, and maximum8 length of the contigs, the number
of misassemblies per million base pairs (MPMB)9, and the average identity among the true contigs and the target genome10. More details on these performance criteria are
provided in Section 3.1.5.
i325
AlignGraph
by guest on July 31, 2014http://bioinform
atics.oxfordjournals.org/D
ownloaded from

misassemblies, and L is the cumulative length of the contigs. The
average identity between true contigs and the target genome is
calculated as
Pn ti � liP
n liwhere ti is the identity for contig i, and li
is the length of contig i (05i � n). In this formula, the identity tiof the true contigs i is calculated as the number of aligned bases
over the length of the alignment. The sensitivity measures include
the N50 value and the number of covered bases. The former
is the contig size at 50% of the total number of contig bases,
and the latter is the total number of genome bases covered by the
contigs. Two additional measures are the average length and
maximum length of the true contigs. In all tests, we considered
only contigs with a length of at least 1000 bp but used the entire
set (including the shorter ones) in AlignGraph’s extension steps.
3.2 Results
3.2.1 Extension of A.thaliana contigs The performance test re-sults for the A.thaliana dataset are given in Table 2(a). In com-
parison with the initial contig sets assembled by Velvet or
ABySS, AlignGraph extends 28.7–37.8% of them when guided
by the A.lyrata genome as reference. The resulting set of ex-
tended contigs contains 27.9–33.2% less sequences because
AlignGraph has joined many of the initial contigs. This leads
to improvements of the N50, the number of covered bases, aver-
age contig length and maximum contig length for the extendable
contig set by 89.9–94.5%, 15.9–24.1%, 69.3–69.2% and 54.9–
81.6%, respectively. These improvements are accompanied
only by minor increases of MPMB errors. The MPMB values
of the extendable and extended contigs are usually much lower
than for the complete set because of their pre-filtered nature that
improves their quality. As expected the average identity also
drops slightly (2.8–2.9%) because with increased length of the
assembled sequences, internal sequence variations accumulate
and complicate the alignment of the extended contigs against
the target genome. A similar trend can be seen in the results
below for the much longer scaffolds where the average identity
is always lower for all of the tested assemblers [Table 2(c)]. For
all three sample sets (Sections 3.2.1–3.2.4), the AlignGraph re-
sults contain a comparable number of sequence variations to the
target genomes as the results of de novo assemblers (data not
shown). This indicates a high sequence quality of the reassembled
contigs.
3.2.2 Extension of human contigs and scaffolds from GAGE Thetest results for the human chromosome 14 contigs are given in
Table 2(b). Of the contigs assembled by ALLPATHS-LG, 38.2%
can be extended and the extension result contains 53.1% less
contigs because of the joins generated by AlignGraph. These
improvements are more pronounced than in the above experi-
ment with A.lyrata as reference because the genomes of human
and chimpanzee share a much higher sequence similarity than the
genomes of A.thaliana and A.lyrata. The N50, the number of
covered bases, average contig length and maximum contig
length for the extendable contig set consistently improve by
80.3, 1.9, 118.0 and 52.6%, respectively. Similar results could
be obtained with the other de novo assemblers SOAPdenovo,
MaSuRCA, CABOG and Bambus2. After AlignGraph process-
ing, their extendable contigs improved for the same four
evaluation metrics by 88.8–165.8, 3.4–16.8, 82.6–160.6 and
30.3–54.8%, respectively. If ALLPATHS-LG is run in its cheat
mode by guiding it with the same reference genome as
AlignGraph, then both the sensitivity and precision measures
of the ALLPATHS-LGc contigs improve compared with the
assembly without a reference. Nevertheless, AlignGraph is still
able to extend 33.6% of the ALLPATHS-LGc contigs, and the
extension results contain 53.1% less contigs, whereas the four
evaluation metrics improve by 89.4, 10.0, 123.5 and 7.0%, re-
spectively. These improvements indicate that the reference-as-
sisted approach used by AlignGraph is more efficient than the
one from ALLPATHS-LG in its cheat mode at the contig as-
sembly stage.
AlignGraph’s performance results on the scaffolds from the
same human chromosome 14 dataset are given in Table 2(c). The
scaffold sets from SOAPdenovo, MaSuRCA, CABOG and
Bambus2 contain much smaller numbers of sequences than
their corresponding contig sets. Nevertheless, AlignGraph is
able to extend 11.6–31.0% of them and improve the N50 value
and the number of covered bases by 9.4–152.7 and 14.8–29.0%,
respectively. The extension results for the scaffold set of
Bambus2 contain a slightly larger number of sequences (14)
than the extendable set. The reason for this is that many of
them are short, and AlignGraph extends them often to scaffolds
with a length above the 1000 bp requirement, thus increasing the
number of reported scaffolds (see Section 3.1.5). This trend also
explains the slightly lower average length of the extended scaffold
set from Bambus2.
3.2.3 Influence of similarity of reference genome To assessAlignGraph’s performance with reference genomes of variable
similarity to the target genome, we post-processed the de novo
assemblies of the human dataset with AlignGraph using as ref-
erence the genome sequences from five different primates. The
columns in Table 3 list these organisms according to their evo-
lutionary distances to the human genome (increasing from left to
right). To avoid confusions, exact sequence similarity values to
the human genome are not provided because there are many
possibilities to calculate them, which can lead to different results.
As expected, the performance measures degrade with the evolu-
tionary distance between the target and reference genomes.
Although the first four reference genomes show respectable im-
provements, the macaque genome seems to be too diverged from
Table 3. Performance with reference genomes of variable similarity
Percentage of Chimpanzee Gorilla Orangutan Gibbon Macaque
Aligned readsa 94.5% 91.6% 88.9% 49.9% 24.9%
Extendable contigsb 51.0% 36.4% 24.9% 6.7% —
Improved N50c 109.9% 84.0% 73.2% 65.3% —
The tests were performed on the human chromosome 14 sample where the listed
primate genomes served as reference. The results include the percentage values ofaalignable reads, bExtendable contigs relative to the initial set cImprovements of the
N50 values relative to the extendable contigs. Because of space limitations, the latter
two rows contain averaged percentage values for the five assemblers ALLPATHS-
LG, SOAPdenovo, MaSuRCA, CABOG and Bambus2.
i326
E.Bao et al.
by guest on July 31, 2014http://bioinform
atics.oxfordjournals.org/D
ownloaded from

human to achieve any major improvements. However, this per-
formance drop is mainly due to the difficulty of aligning short
reads to a highly diverged reference. Future improvements in
NGS read length and alignment algorithms are likely to enhance
AlignGraph’s performance in this regard.
3.2.4 Improvements to published genome The test results for the
published Landsberg erecta genome are shown in Table 4. The
initial scaffold set used in this test consisted of 1676 sequences.
AlignGraph extended 27.6% of these scaffolds, whereas the ex-
tended set contains 20.3% fewer scaffolds. In addition,
AlignGraph improves the N50 value, the number of covered
bases, the average contig length and maximum length values
for the extendable scaffolds by 86.6, 8.1, 35.7 and 8.1%, respect-
ively. These improvements demonstrate AlignGraph’s usefulness
in improving published genome sequences, even for those that
have been carefully curated by their authors.
In summary, the above performance tests demonstrate
AlignGraph’s efficiency in improving the results of a variety of
de novo assemblers and species with variable genome complexity
by taking advantage of closely related reference genomes.
4 CONCLUSIONS AND FUTURE WORK
This study introduces a novel de Bruijn graph-based algorithm
for improving de novo genome assemblies guided by sequence
information from a closely related species. The chosen PE
multipositional de Bruijn graph approach provides an elegant
and efficient solution to this problem. Our performance results
demonstrate that the implemented AlignGraph software is able
to improve the results of a wide range of de novo assemblers for
complex genomes even with relatively diverse and suboptimal
guide sequences as reference. Moreover, our results demonstrate
AlignGraph’s usefulness for improving unfinished genome
assemblies. Another advantage is that AlignGraph can be used
in combination with most existing de novo assemblers. In the
future, we will expand AlignGraph in the following areas: (i)
we will provide support for additional variant-aware alignment
tools for both PE read and contig data, such as GSNAP and
GMAP, respectively, (ii) de novo assembly functionality will be
added to AlignGraph to further optimize assemblies at many
stages of the reference-assisted workflow, (iii) utilities will be
incorporated for detecting and resolving misassemblies either in
the initial contigs or in the extensions and (iv) the processing of
scaffolds with large gaps will be improved.
ACKNOWLEDGEMENT
The authors acknowledge the support of the core facilities at the
Institute for Integrative Genome Biology (IIGB) at University of
California (UC), Riverside.
Funding: The USDANational Institute for Food and Agriculture
(NIFA-2010-65106-20675 to T.G.) and the National Science
Foundation (ABI-0957099 to T.G., IOB-0420152 to T.G.,
MCB-1021969 to T.G. and DBI-1262107 to T.J.).
Conflict of interest: none declared.
REFERENCES
Boetzer,M. and Pirovano,W. (2012) Toward almost closed genomes with gapfiller.
Genome Biol., 13, R56.
Boetzer,M. et al. (2011) Scaffolding pre-assembled contigs using sspace.
Bioinformatics, 27, 578–579.
Chaisson,M.J. and Pevzner,P.A. (2008) Short read fragment assembly of bacterial
genomes. Genome Res., 18, 324–330.
Chaisson,M.J. et al. (2009) De novo fragment assembly with short mate-paired
reads: does the read length matter? Genome Res., 19, 336–346.
Dayarian,A. et al. (2010) Sopra: scaffolding algorithm for paired reads via statistical
optimization. BMC Bioinformatics, 11, 345.
Dohm,J.C. et al. (2007) Sharcgs, a fast and highly accurate short-read assembly
algorithm for de novo genomic sequencing. Genome Res., 17, 1697–1706.
Gao,S. et al. (2011) Opera: reconstructing optimal genomic scaffolds with high-
throughput paired-end sequences. J. Comput. Biol., 18, 1681–1691.
Gnerre,S. et al. (2009) Assisted assembly: how to improve a de novo genome assem-
bly by using related species. Genome Biol., 10, R88.
Gnerre,S. et al. (2011) High-quality draft assemblies of mammalian genomes from
massively parallel sequence data. Proc. Natl Acad. Sci. USA, 108, 1513–1518.
Gritsenko,A.A. et al. (2012) Grass: a generic algorithm for scaffolding next-gener-
ation sequencing assemblies. Bioinformatics, 28, 1429–1437.
Hernandez,D. et al. (2008) De novo bacterial genome sequencing: millions of very
short reads assembled on a desktop computer. Genome Res., 18, 802–809.
Hu,T.T. et al. (2011) The Arabidopsis lyrata genome sequence and the basis of rapid
genome size change. Nat. Genet., 43, 476–481.
Jeck,W.R. et al. (2007) Extending assembly of short DNA sequences to handle
error. Bioinformatics, 23, 2942–2944.
Kent,W. (2002) Blatthe blast-like alignment tool. Genome Res., 12, 656–664.
Kim,J. et al. (2013) Reference-assisted chromosome assembly. Proc. Natl Acad. Sci.
USA, 110, 1785–1790.
Langmead,B. and Salzberg,S.L. (2012) Fast gapped-read alignment with bowtie 2.
Nat. Methods, 9, 357–359.
Li,H. and Homer,N. (2010) A survey of sequence alignment algorithms for next-
generation sequencing. Brief. Bioinform., 11, 473–483.
Li,R. et al. (2010) De novo assembly of human genomes with massively parallel
short read sequencing. Genome Res., 20, 265–272.
Lin,Y. et al. (2011) Comparative studies of de novo assembly tools for next-gener-
ation sequencing technologies. Bioinformatics, 27, 2031–2037.
Luo,R. et al. (2012) Soapdenovo2: an empirically improved memory-efficient short-
read de novo assembler. Gigascience, 1, 18.
Medvedev,P. et al. (2011) Paired de bruijn graphs: a novel approach for incorpor-
ating mate pair information into genome assemblers. J. Comput. Biol., 18,
1625–1634.
Miller,J.R. et al. (2008) Aggressive assembly of pyrosequencing reads with mates.
Bioinformatics, 24, 2818–2824.
Ossowski,S. et al. (2008) Sequencing of natural strains of Arabidopsis thaliana with
short reads. Genome Res., 18, 2024–2033.
Peng,Y. et al. (2010) Idba–a practical iterative de bruijn graph de novo assembler. In:
Research in Computational Molecular Biology. Springer, Berlin Heidelberg,
pp. 426–440.
Table 4. Improvements to published genome
Contig set N
contigs
N50 N total
basesaAverage
length
Maximum
length
All 1676 341 653 112578 343 67 170 2 930180
Extendable 462 448 682 57574 961 124 621 2 930180
Extendable+
AlignGraph
368 837 458 62216 675 169 067 3 168537
The published scaffolds from Landsberg erecta were extended with AlignGraph
using the A.thaliana genome as reference. The rows and columns are arranged the
same way as in Table 2, but several columns are missing here because it is not
possible to compute the corresponding performance measures in a meaningful
manner without having access to a ‘true’ target genome sequence. aIn addition,
we report here the total number of bases in the contigs.
i327
AlignGraph
by guest on July 31, 2014http://bioinform
atics.oxfordjournals.org/D
ownloaded from

Pevzner,P. et al. (2001) An eulerian path approach to dna fragment assembly. Proc.
Natl Acad. Sci. USA, 98, 9748.
Phillippy,A.M. et al. (2008) Genome assembly forensics: finding the elusive mis-
assembly. Genome Biol., 9, R55.
Pop,M. et al. (2004a) Comparative genome assembly. Brief. Bioinform., 5, 237–248.
Pop,M. et al. (2004b) Hierarchical scaffolding with bambus. Genome Res., 14,
149–159.
Ronen,R. et al. (2012) Sequel: improving the accuracy of genome assemblies.
Bioinformatics, 28, i188–i196.
Salmela,L. et al. (2011) Fast scaffolding with small independent mixed integer pro-
grams. Bioinformatics, 27, 3259–3265.
Salzberg,S.L. et al. (2012) Gage: a critical evaluation of genome assemblies and
assembly algorithms. Genome Res., 22, 557–567.
Schatz,M.C. et al. (2013) Hawkeye and AMOS: visualizing and assessing the quality
of genome assemblies. Brief. Bioinform., 14, 213–224.
Schneeberger,K. et al. (2011) Reference-guided assembly of four diverse Arabidopsis
thaliana genomes. Proc. Natl Acad. Sci. USA, 108, 10249–10254.
Simpson,J. et al. (2009) Abyss: a parallel assembler for short read sequence data.
Genome Res., 19, 1117–1123.
Tsai,I.J. et al. (2010) Method improving draft assemblies by iterative mapping and
assembly of short reads to eliminate gaps. Genome Biol., 11, R41.
Warren,R.L. et al. (2007) Assembling millions of short DNA sequences using ssake.
Bioinformatics, 23, 500–501.
Zeitouni,B. et al. (2010) SVDetect: a tool to identify genomic structural vari-
ations from paired-end and mate-pair sequencing data. Bioinformatics, 26,
1895–1896.
Zerbino,D. and Birney,E. (2008) Velvet: algorithms for de novo short read assembly
using de Bruijn graphs. Genome Res., 18, 821–829.
Zimin,A.V. et al. (2013) The masurca genome assembler. Bioinformatics, 29,
2669–2677.
i328
E.Bao et al.
by guest on July 31, 2014http://bioinform
atics.oxfordjournals.org/D
ownloaded from