Alberta Transmission System Cost Causation Study
91
London Economics International LLC 1 contact: 717 Atlantic Ave., Suite 1A Amit Pinjani/Ian Chow Boston, MA 02111 416-643-6621 www.londoneconomics.com [email protected] Alberta Transmission System Cost Causation Study 1 prepared for Alberta Electric System Operator by London Economics 2 International LLC 1 3 July 3 rd , 2013 4 5 London Economics International (“LEI”) was retained by the Alberta Electric System Operator 6 (“AESO”) to perform a transmission cost causation study. In order to reflect cost causation in 7 rate design, transmission costs are separated into categories utilizing methods of 8 functionalization and classification, which can then be allocated to be paid by the appropriate 9 beneficiaries. LEI performed functionalization of transmission costs into bulk, regional, and 10 point-of-delivery (“POD”) functions using three methods: by voltage, by economics, and by 11 megawatt-kilometer (“MW-km”). LEI recommends using functionalization by voltage, due to 12 weaknesses in the economics and MW-km approaches. The 2012 Long-term Transmission Plan 13 (“LTP”) lays out substantial investment in the bulk system (i.e., high voltage systems carrying 14 large amounts of electricity over longer distances). Classification into demand and energy 15 related costs has been performed using the minimum system approach. For implementation, LEI 16 recommends that 2014, 2016 and 2016 functionalization results be applied independently to 17 each of the three years. 18 Table of contents 19 1 EXECUTIVE SUMMARY ................................................................................................................................ 5 20 2 LIST OF ACRONYMS .................................................................................................................................... 10 21 3 SCOPE AND INFORMATION UTILIZED................................................................................................... 13 22 3.1 SCOPE ......................................................................................................................................................... 13 23 3.2 DATA UTILIZED AND LIMITATIONS .............................................................................................................. 13 24 3.3 SUMMARY OF DATA USED ........................................................................................................................... 14 25 4 AESO’S PREVIOUS COST CAUSATION STUDIES AND BOARD DECISIONS .................................. 16 26 4.1 2005 CAPITAL COST CAUSATION STUDY ...................................................................................................... 16 27 4.1.1 Summary of key issues ............................................................................................................................... 16 28 4.1.2 Board decision 2005-096 ........................................................................................................................... 17 29 4.2 2006 COST CAUSATION UPDATE .................................................................................................................. 18 30 4.2.1 Summary of key issues ............................................................................................................................... 18 31 4.2.2 Board decision 2007-106 ........................................................................................................................... 19 32 4.3 2009 OPERATION AND MAINTENANCE COST CAUSATION STUDY.................................................................. 19 33 4.3.1 Summary of key issues ............................................................................................................................... 19 34 4.3.2 Board decision 2010-606 ........................................................................................................................... 20 35 4.4 POTENTIAL IMPLICATIONS OF PREVIOUS DECISIONS FOR CURRENT STUDY .................................................. 20 36 5 DEFINITION OF TRANSMISSION FUNCTIONS ...................................................................................... 22 37 1 The development of this report was supervised by Mr. A.J. Goulding, President, LEI. Mr. Gary Tarplee of Utility System Efficiencies Consulting assisted LEI on engineering and technical matters.
-
Upload
khangminh22 -
Category
Documents
-
view
0 -
download
0
Transcript of Alberta Transmission System Cost Causation Study

London Economics International LLC 1 contact: 717 Atlantic Ave., Suite 1A Amit Pinjani/Ian Chow Boston, MA 02111 416-643-6621 www.londoneconomics.com [email protected]
Alberta Transmission System Cost Causation Study 1
prepared for Alberta Electric System Operator by London Economics 2
International LLC1 3
July 3rd, 2013 4
5
London Economics International (“LEI”) was retained by the Alberta Electric System Operator 6
(“AESO”) to perform a transmission cost causation study. In order to reflect cost causation in 7
rate design, transmission costs are separated into categories utilizing methods of 8
functionalization and classification, which can then be allocated to be paid by the appropriate 9
beneficiaries. LEI performed functionalization of transmission costs into bulk, regional, and 10
point-of-delivery (“POD”) functions using three methods: by voltage, by economics, and by 11
megawatt-kilometer (“MW-km”). LEI recommends using functionalization by voltage, due to 12
weaknesses in the economics and MW-km approaches. The 2012 Long-term Transmission Plan 13
(“LTP”) lays out substantial investment in the bulk system (i.e., high voltage systems carrying 14
large amounts of electricity over longer distances). Classification into demand and energy 15
related costs has been performed using the minimum system approach. For implementation, LEI 16
recommends that 2014, 2016 and 2016 functionalization results be applied independently to 17
each of the three years. 18
Table of contents 19
1 EXECUTIVE SUMMARY ................................................................................................................................ 5 20
2 LIST OF ACRONYMS .................................................................................................................................... 10 21
3 SCOPE AND INFORMATION UTILIZED................................................................................................... 13 22
3.1 SCOPE ......................................................................................................................................................... 13 23
3.2 DATA UTILIZED AND LIMITATIONS .............................................................................................................. 13 24
3.3 SUMMARY OF DATA USED ........................................................................................................................... 14 25
4 AESO’S PREVIOUS COST CAUSATION STUDIES AND BOARD DECISIONS .................................. 16 26
4.1 2005 CAPITAL COST CAUSATION STUDY ...................................................................................................... 16 27
4.1.1 Summary of key issues ............................................................................................................................... 16 28
4.1.2 Board decision 2005-096 ........................................................................................................................... 17 29
4.2 2006 COST CAUSATION UPDATE .................................................................................................................. 18 30
4.2.1 Summary of key issues ............................................................................................................................... 18 31
4.2.2 Board decision 2007-106 ........................................................................................................................... 19 32
4.3 2009 OPERATION AND MAINTENANCE COST CAUSATION STUDY .................................................................. 19 33
4.3.1 Summary of key issues ............................................................................................................................... 19 34
4.3.2 Board decision 2010-606 ........................................................................................................................... 20 35
4.4 POTENTIAL IMPLICATIONS OF PREVIOUS DECISIONS FOR CURRENT STUDY .................................................. 20 36
5 DEFINITION OF TRANSMISSION FUNCTIONS ...................................................................................... 22 37
1 The development of this report was supervised by Mr. A.J. Goulding, President, LEI. Mr. Gary Tarplee of Utility System Efficiencies Consulting assisted LEI on engineering and technical matters.

London Economics International LLC 2 contact: 717 Atlantic Ave., Suite 1A Amit Pinjani/Ian Chow Boston, MA 02111 416-643-6621 www.londoneconomics.com [email protected]
6 COST CAUSATION METHODOLOGIES ................................................................................................... 23 38
6.1 OVERVIEW OF FUNCTIONALIZATION METHODOLOGIES ............................................................................... 24 39
6.1.1 Functionalization by voltage ..................................................................................................................... 25 40
6.1.2 Functionalization by economics ................................................................................................................ 25 41
6.1.3 Functionalization by megawatt-kilometer ................................................................................................. 26 42
6.1.4 Functionalization by MVA-kilometer ......................................................................................................... 26 43
6.2 OVERVIEW OF CLASSIFICATION METHODOLOGIES ....................................................................................... 27 44
6.2.1 Minimum system approach ........................................................................................................................ 28 45
6.2.2 Classification by minimum intercept ......................................................................................................... 28 46
6.2.3 Classification by marginal cost approach ................................................................................................. 29 47
6.2.4 Classification by average and excess approach ........................................................................................ 29 48
7 INTERNATIONAL CASE STUDIES ............................................................................................................. 30 49
7.1 ONTARIO, CANADA - HYDRO ONE NETWORKS INC. (HYDRO ONE) TRANSMISSION RATES CASE ................ 31 50
7.1.1 Functionalization of assets ........................................................................................................................ 31 51
7.1.2 Allocation of revenue requirements to rate pools ...................................................................................... 34 52
7.2 CALIFORNIA, USA ...................................................................................................................................... 35 53
7.2.1 Network transmission facilities – PTO cost recovery ................................................................................ 35 54
7.2.2 LCRIF – cost recovery ............................................................................................................................... 36 55
7.3 AUSTRALIA ................................................................................................................................................. 36 56
7.4 GREAT BRITAIN .......................................................................................................................................... 38 57
7.5 APPLICABILITY TO ALBERTA ...................................................................................................................... 40 58
8 FUNCTIONALIZATION OF CAPITAL COSTS ......................................................................................... 41 59
8.1 TFO COST DATA ......................................................................................................................................... 41 60
8.1.1 Depreciation .............................................................................................................................................. 41 61
8.1.2 Existing asset data ..................................................................................................................................... 42 62
8.1.3 Future projects........................................................................................................................................... 44 63
8.2 FUNCTIONALIZATION BY INTENTION, CURRENT USE AND FUTURE USE ........................................................ 47 64
8.3 FUNCTIONALIZATION .................................................................................................................................. 48 65
8.3.1 Option 1: defined by voltage level ............................................................................................................. 48 66
8.3.2 Option 2: defined by economics ................................................................................................................. 49 67
8.3.3 Option 3: defined by MW-km ..................................................................................................................... 52 68
8.3.4 Summary of capital cost functionalization results ..................................................................................... 55 69
8.3.5 Recommendation for capital cost functionalization ................................................................................... 55 70
9 FUNCTIONALIZATION OF O&M COSTS ................................................................................................. 59 71
9.1 TFO COST INFORMATION ............................................................................................................................ 59 72
9.2 BREAKDOWN OF REVENUE REQUIREMENT .................................................................................................. 61 73
9.3 O&M FUNCTIONALIZATION ........................................................................................................................ 62 74
10 COMBINED O&M AND CAPITAL COST FUNCTIONALIZATION ...................................................... 67 75
10.1 FINAL FUNCTIONALIZATION RESULTS ......................................................................................................... 67 76
10.2 ANALYSIS OF FUNCTIONALIZATION RESULTS .............................................................................................. 68 77
11 CLASSIFICATION OF BULK AND REGIONAL COSTS ......................................................................... 70 78
11.1 CONDUCTOR CLASSIFICATION ..................................................................................................................... 70 79
11.2 SUBSTATION CLASSIFICATION ..................................................................................................................... 74 80
11.3 CLASSIFICATION RESULTS ........................................................................................................................... 75 81
12 IMPLEMENTATION CONSIDERATIONS ................................................................................................. 76 82
13 APPENDIX A: SPECIAL PROJECTS FUNCTIONALIZED SEPARATELY .......................................... 79 83
13.1 SPECIAL PROJECTS NOT PRIMARILY DRIVEN BY LOAD ................................................................................. 79 84

London Economics International LLC 3 contact: 717 Atlantic Ave., Suite 1A Amit Pinjani/Ian Chow Boston, MA 02111 416-643-6621 www.londoneconomics.com [email protected]
13.1.1 Identified special projects.................................................................................................................. 80 85
13.1.2 Critical Transmission Infrastructure Project Analysis ...................................................................... 81 86
13.2 SPECIAL PROJECT FUNCTIONALIZATION RESULTS ....................................................................................... 82 87
14 APPENDIX B: WORKS CONSULTED ......................................................................................................... 84 88
14.1 WORKS CONSULTED ................................................................................................................................... 84 89
14.2 ADDITIONAL DOCUMENTS PROVIDED BY AESO ......................................................................................... 85 90
15 APPENDIX C: BACKGROUND ON LEI ...................................................................................................... 86 91
15.1 BACKGROUND ON THE FIRM ........................................................................................................................ 86 92
15.2 ALBERTA-SPECIFIC EXPERIENCE ................................................................................................................. 87 93
15.3 COST CAUSATION STUDY EXPERIENCE ........................................................................................................ 89 94
15.4 TRANSMISSION RELATED EXPERIENCE ........................................................................................................ 90 95
96
Table of figures 97
FIGURE 1. CAPITAL COST FUNCTIONALIZATION RESULTS AS OF 2016 ......................................................................... 6 98
FIGURE 2. FUTURE CAPITAL COST FUNCTIONALIZATION RESULTS BY VOLTAGE ......................................................... 6 99
FIGURE 3.COMBINED (EXISTING AND FUTURE) CAPITAL COST FUNCTIONALIZATION RESULTS BY VOLTAGE ............ 6 100
FIGURE 4. O&M FUNCTIONALIZATION RESULTS ......................................................................................................... 7 101
FIGURE 5. RATIO OF NON-CAPITAL TO CAPITAL COSTS FOR TFOS IN 2016 ................................................................. 7 102
FIGURE 6. RECOMMENDED COMBINED O&M AND CAPITAL COST FUNCTIONALIZATION ......................................... 7 103
FIGURE 7. CLASSIFICATION RESULTS ............................................................................................................................ 8 104
FIGURE 8. REVENUE REQUIREMENT BREAKDOWN USING COMBINED FUNCTIONALIZATION AND CLASSIFICATION 105
RESULTS ................................................................................................................................................................ 8 106
FIGURE 9. REVENUE REQUIREMENT BREAKDOWN USING CAPITAL COST FUNCTIONALIZATION ONLY ...................... 8 107
FIGURE 10. TIMELINE OF PREVIOUS TRANSMISSION COST CAUSATION STUDIES ........................................................ 16 108
FIGURE 11. 2005 FUNCTIONALIZATION RESULTS BY METHOD ................................................................................... 16 109
FIGURE 12. 2005 FUNCTIONALIZATION AND CLASSIFICATION RESULTS.................................................................... 17 110
FIGURE 13. TCCU FUNCTIONALIZATION AND CLASSIFICATION RESULTS ................................................................ 18 111
FIGURE 14. BOARD-APPROVED FUNCTIONALIZATION AND CLASSIFICATION RESULTS............................................. 19 112
FIGURE 15. TRANSMISSION FUNCTIONS ..................................................................................................................... 22 113
FIGURE 16. TRANSMISSION PLANNING AND PRICING STEPS AND FOCUS OF THIS STUDY .......................................... 23 114
FIGURE 17. SUMMARY OF FUNCTIONALIZATION METHODOLOGIES .......................................................................... 24 115
FIGURE 18. SUMMARY OF CLASSIFICATION METHODOLOGIES ................................................................................... 27 116
FIGURE 19. INTRODUCTION TO CASE STUDY JURISDICTIONS ...................................................................................... 30 117
FIGURE 20. ONTARIO TRANSMISSION ASSET CATEGORIES ......................................................................................... 33 118
FIGURE 21. ONTARIO COSTS-TO-REVENUE REQUIREMENT PROCESS .......................................................................... 34 119
FIGURE 22. GREAT BRITAIN DEMAND USE OF TARIFF ZONES ..................................................................................... 38 120
FIGURE 23. SCHEDULE OF TRANSMISSION NETWORK USE OF SYSTEM DEMAND CHARGES (£/KW) AND ENERGY 121
CONSUMPTION CHARGES (P/KWH) FOR 2013/14* .......................................................................................... 39 122
FIGURE 24. CALCULATED TFO TRANSMISSION LINE AND SUBSTATION DEPRECIATION RATES ................................ 41 123
FIGURE 25. SUMMARY OF DATA RECEIVED BY EACH TFO ......................................................................................... 42 124
FIGURE 26. TFO EXISTING ASSET NET BOOK VALUES DEPRECIATED TO 2016 ............................................................ 43 125
FIGURE 27. UTILIZATION AND REFINEMENT OF DATA ............................................................................................... 45 126
FIGURE 28. FORWARD LOOKING DATA-PROCESSING SUMMARY (NON-DEPRECIATED COSTS) .................................. 46 127
FIGURE 29. EXISTING ASSET FUNCTIONALIZATION RESULTS BY VOLTAGE, AS OF DECEMBER 2016 .......................... 49 128
FIGURE 30. FUTURE PROJECT FUNCTIONALIZATION RESULTS BY VOLTAGE, AS OF DECEMBER 2016 ........................ 49 129
FIGURE 31. OVERALL FUNCTIONALIZATION RESULTS BY VOLTAGE, AS OF DECEMBER 2016 .................................... 49 130
FIGURE 32. FUNCTIONALIZATION BY ECONOMICS ILLUSTRATION ............................................................................ 49 131
London Economics International LLC 4 contact: 717 Atlantic Ave., Suite 1A Amit Pinjani/Ian Chow Boston, MA 02111 416-643-6621 www.londoneconomics.com [email protected]
FIGURE 33. TYPICAL 240 KV SUBSTATION AND POD DESIGN ................................................................................... 50 132
FIGURE 34. FUNCTIONALIZATION BY ECONOMICS SHOWING NUMBER OF PODS – 240 KV ..................................... 51 133
FIGURE 35. FUNCTIONALIZATION BY ECONOMICS SHOWING DISTANCE BETWEEN PODS – 240 KV ........................ 51 134
FIGURE 36. EXISTING ASSET FUNCTIONALIZATION RESULTS BY ECONOMICS, AS OF DECEMBER 2016 ..................... 52 135
FIGURE 37. FUTURE ASSET FUNCTIONALIZATION RESULTS BY ECONOMICS, AS OF DECEMBER 2016 ........................ 52 136
FIGURE 38. OVERALL FUNCTIONALIZATION RESULTS BY ECONOMICS, AS OF DECEMBER 2016 ............................... 52 137
FIGURE 39. RANGES OF MW-KM RATINGS OF DIFFERENT VOLTAGES ........................................................................ 53 138
FIGURE 40. SCATTERPLOT OF MW-KM RATINGS ........................................................................................................ 53 139
FIGURE 41. SCATTERPLOT OF MW-KM RATINGS (EXPANDED 0 TO 5,000 MW-KM).................................................. 54 140
FIGURE 42. EXISTING ASSET FUNCTIONALIZATION RESULTS BY MW-KM, AS OF DECEMBER 2016 ........................... 54 141
FIGURE 43. FUTURE PROJECT FUNCTIONALIZATION RESULTS BY MW-KM, AS OF DECEMBER 2016 ......................... 54 142
FIGURE 44. OVERALL FUNCTIONALIZATION RESULTS BY MW-KM, AS OF DECEMBER 2016 ..................................... 54 143
FIGURE 45. SUMMARY OF EXISTING ASSETS FUNCTIONALIZATION RESULTS, AS OF DECEMBER 2016 ...................... 55 144
FIGURE 46. SUMMARY OF FUTURE PROJECT FUNCTIONALIZATION RESULTS, AS OF DECEMBER 2016 ...................... 55 145
FIGURE 47. SUMMARY OF CAPITAL COST FUNCTIONALIZATION RESULTS, AS OF DECEMBER 2016 .......................... 55 146
FIGURE 48. LTP CUT-PLANES AND CLEARLY IDENTIFIED BULK PROJECTS ................................................................. 57 147
FIGURE 49. FUNCTIONALIZATION IN AESO 2007 GTA ............................................................................................ 58 148
FIGURE 50. LEI SUGGESTED CAPITAL COST FUNCTIONALIZATION ............................................................................ 58 149
FIGURE 51. TFO REVENUE REQUIREMENT, 2006-2014 ............................................................................................... 59 150
FIGURE 52. INDIVIDUAL TFO SHARE (%) IN COMBINED REVENUE REQUIREMENT ................................................... 60 151
FIGURE 53. HISTORICAL AND PROJECTED GROWTH PATTERNS OF TFO REVENUE REQUIREMENTS .......................... 60 152
FIGURE 54. TFO NON-CAPITAL COSTS ($) .................................................................................................................. 61 153
FIGURE 55. TFO NON-CAPITAL COSTS AS A % OF REVENUE REQUIREMENT .............................................................. 62 154
FIGURE 56. TFO NON-CAPITAL COST SHARE - TREND AND PROJECTION ................................................................... 62 155
FIGURE 57. ALTALINK FUNCTIONALIZATION RESULTS (NON-CAPITAL COSTS) ........................................................ 64 156
FIGURE 58. ATCO FUNCTIONALIZATION RESULTS (NON-CAPITAL COSTS)............................................................... 65 157
FIGURE 59. ENMAX FUNCTIONALIZATION RESULTS (NON-CAPITAL COSTS) ........................................................... 65 158
FIGURE 60. EPCOR FUNCTIONALIZATION RESULTS (NON-CAPITAL COSTS)............................................................. 66 159
FIGURE 61. COMBINED FUNCTIONALIZATION RESULTS (NON-CAPITAL COSTS) ........................................................ 66 160
FIGURE 62. RATIO OF TFOS NON-CAPITAL TO CAPITAL COSTS ................................................................................. 67 161
FIGURE 63. COMBINED O&M AND CAPITAL COST FUNCTIONALIZATION (NOT ACCOUNTING FOR RGUCC) ........ 67 162
FIGURE 64. ACCOUNTING FOR RGUCC IN COMBINED O&M AND CAPITAL COST FUNCTIONALIZATION - 2016 163
EXAMPLE ............................................................................................................................................................. 68 164
FIGURE 65. COMBINED O&M AND CAPITAL COST FUNCTIONALIZATION (NET OF RGUCC) .................................. 68 165
FIGURE 66. AESO 2007 GTA FUNCTIONALIZATION ................................................................................................. 69 166
FIGURE 67. CAPITAL COSTS FUNCTIONALIZED ($ MILLIONS) ..................................................................................... 69 167
FIGURE 68. 240 KV - MINIMUM AND OPTIMAL CONDUCTOR SIZE COSTS ................................................................... 71 168
FIGURE 69. TEST CASE - CALCULATION FOR COMPARABLE MINIMUM AND OPTIMAL 240 KV LINES ........................ 72 169
FIGURE 70. 500 KV - MINIMUM AND OPTIMAL CONDUCTOR SIZE COSTS ................................................................... 73 170
FIGURE 71. REGIONAL - MINIMUM AND OPTIMAL CONDUCTOR SIZE COSTS ............................................................. 73 171
FIGURE 72. SUBSTATION CLASSIFICATION RESULTS ................................................................................................... 74 172
FIGURE 73. CLASSIFICATION RESULTS BY FUNCTIONAL GROUP ................................................................................. 75 173
FIGURE 74. COMBINED FUNCTIONALIZATION AND CLASSIFICATION RESULTS ......................................................... 76 174
FIGURE 75. REVENUE REQUIREMENT BREAKDOWN USING COMBINED RESULTS ....................................................... 76 175
FIGURE 76. REVENUE REQUIREMENT BREAKDOWN USING CAPITAL COST FUNCTIONALIZATION ONLY .................. 77 176
FIGURE 77. CAPITAL COST FUNCTIONALIZATION RESULTS ........................................................................................ 77 177
FIGURE 83. SUMMARY OF FUTURE PROJECT FUNCTIONALIZATION RESULTS SEPARATING SPECIAL PROJECTS ......... 82 178
FIGURE 84. SUMMARY OF CAPITAL COST FUNCTIONALIZATION RESULTS, SEPARATING SPECIAL PROJECTS ............ 82 179
FIGURE 85. FINAL COMBINED O&M AND CAPITAL COST FUNCTIONALIZATION, SEPARATING SPECIAL PROJECTS . 83 180
FIGURE 86. LEI CLIENTS THROUGHOUT THE WORLD ................................................................................................. 86 181
182

London Economics International LLC 5 contact: 717 Atlantic Ave., Suite 1A Amit Pinjani/Ian Chow Boston, MA 02111 416-643-6621 www.londoneconomics.com [email protected]
1 Executive Summary 183
The scope of this transmission cost causation study involves analysis in four key areas: (i) 184
functionalization of transmission facility owner (“TFO”) related capital costs, for both existing 185
and planned assets (until 2016), (ii) functionalization of related operations and maintenance 186
(“O&M”) costs, (iii) classification of all costs functionalized as bulk and regional, and (iv) 187
implementation considerations, i.e., discussion of the potential impact of implementing 188
functionalization and classification results on rates/recovery of the revenue requirement. 189
LEI first reviewed AESO’s previous cost causation studies and relevant Alberta Energy and 190
Utilities Board (“AEUB” or “Board”) decisions, summarizing key elements of each 191
study/decision. LEI has made note of the Board’s decisions and comments, as well as their 192
implications for the current study. 193
Prior to conducting functionalization analysis, it is important to clearly define the three 194
transmission functions: bulk, regional and POD. A high voltage system carrying large amounts 195
of electricity over long distances is defined as serving the bulk function. A regional system 196
transmits electricity from the bulk system to load centers with numerous points of delivery. 197
Finally, a POD system serves distribution utilities or industrial customers that connect directly 198
to the transmission system. 199
Following the definition of transmission functions, LEI presents a review of various cost 200
causation methodologies/approaches, related to both functionalization and classification. LEI 201
explored four methods of functionalization: voltage, economics, megawatt-kilometer (“MW-202
km”) and MVA-km, and strengths and weaknesses for all four methodologies are presented. 203
Similarly, LEI presents four options for classification methodologies along with their 204
strengths/weaknesses. The methods reviewed are minimum system approach, minimum/zero 205
intercept approach, marginal cost approach and average and excess (“A&E”) approach. 206
The discussion of functionalization and classification methodologies is supplemented with a 207
review of case studies presenting cost causation methodologies in Ontario, California, Australia 208
and Great Britain. It is observed that although no two jurisdictions are the same in terms of their 209
methodologies, elements of functionalization by voltage can be observed across most 210
jurisdictions. 211
In order to functionalize capital costs, LEI performed analysis using the following three 212
methods of functionalization: voltage, economics, and MW-km. After reviewing strengths and 213
weaknesses of the different approaches, LEI recommends using the voltage method. The 214
voltage method is the most straightforward and simple to understand. The MW-km approach 215
was deemed to be overly dependent on forecast assumptions and a subjective method of setting 216
the breakpoint, while the economics approach was considered to be overly dependent on cost 217
assumptions and a subjective methodology for setting line length. 218
Figure 1 presents the 2016 capital cost functionalization results using the three approaches. The 219
average of the three approaches provides very similar results to the voltage approach, but 220

London Economics International LLC 6 contact: 717 Atlantic Ave., Suite 1A Amit Pinjani/Ian Chow Boston, MA 02111 416-643-6621 www.londoneconomics.com [email protected]
significant reliance on assumptions in the MW-km and economics approach, in LEI’s view, may 221
not be defensible. 222
Figure 1. Capital cost functionalization results as of 2016 223
224
Capital cost functionalization results for the filing period, 2014-2016, using the voltage method 225
are presented in the figures below. 226
Figure 2. Future capital cost functionalization results by voltage 227
228
Figure 3.Combined (existing and future) capital cost functionalization results by voltage 229
230
In addition to capital cost functionalization, LEI has functionalized related O&M costs for the 231
TFOs given available data. Figure 4 presents O&M functionalization results for the combined 232
TFOs until 2014. The results include information from ENMAX up until 2011 and for EPCOR 233
until 2012. Information for the two largest TFOs, AltaLink and ATCO Electric, is incorporated 234
up until 2014. 235
Method Bulk System Regional System POD
Voltage 10,174,593,886$ 2,676,825,574$ 2,396,604,055$
Economics 10,866,752,488$ 1,984,666,972$ 2,396,604,055$
MW-km 9,522,501,818$ 3,328,917,643$ 2,396,604,055$
Method Bulk System Regional System POD
Voltage 66.7% 17.6% 15.7%
Economics 71.3% 13.0% 15.7%
MW-km 62.5% 21.8% 15.7%
Average 66.8% 17.5% 15.7%
Future capital cost functionalization (by value) 2014 2015 2016
Bulk 3,257,271,419$ 5,446,373,445$ 5,884,908,333$
Regional 528,483,048$ 778,735,290$ 861,632,964$
POD 88,054,830$ 97,265,394$ 94,545,243$
Future capital cost functionalization 2014 2015 2016
Bulk 84.1% 86.1% 86.0%
Regional 13.6% 12.3% 12.6%
POD 2.3% 1.5% 1.4%
Capital cost functionalization (by value) 2014 2015 2016
Bulk 6,681,289,875$ 9,684,685,012$ 10,174,593,886$
Regional 2,214,899,613$ 2,561,372,083$ 2,676,825,574$
POD 2,123,557,889$ 2,261,395,958$ 2,396,604,055$
Capital cost functionalization 2014 2015 2016
Bulk 60.6% 66.8% 66.7%
Regional 20.1% 17.7% 17.6%
POD 19.3% 15.6% 15.7%

London Economics International LLC 7 contact: 717 Atlantic Ave., Suite 1A Amit Pinjani/Ian Chow Boston, MA 02111 416-643-6621 www.londoneconomics.com [email protected]
Because the current study is reviewing functionalization for 2014-2016, and 2015-2016 236
projections are not available, LEI has decided to use 2014 results for functionalization purposes. 237
Despite significant bulk investment in 2014, the O&M functionalization ratios have not changed 238
significantly in 2014 as compared to 2012-2013. Moreover, given that future capital cost 239
functionalization ratios (presented in Figure 2) do not change materially between 2014 and 2016, 240
a material change in O&M functionalization ratios over the 2014-2016 period is unlikely. 241
Figure 4. O&M functionalization results 242
243
244
After separately functionalizing capital and O&M costs, the results were combined using TFOs’ 245
non-capital to capital ratios in respective years (as presented in Figure 5). 246
Figure 5. Ratio of non-capital to capital costs for TFOs in 2016 247
248
Figure 6. Recommended combined O&M and capital cost functionalization2 249
250
The combined functionalization results show a higher proportion functionalized as bulk, 251
compared to approved functionalization in AESO 2007 GTA (bulk: 41.7%, regional: 17.4%, POD: 252
40.9%) by the Board. This is sensible given the significant amount of bulk and regional (and 253
insignificant POD) investment planned to come online in the 2012 LTP. 254
With regards to classification, both demand and energy cost classification is important, as 255
together they provide a mechanism to reduce system peak even when the system peak is not 256
2 The combined functionalization results also took into account Regulated Generating Unit Connection Costs (“RGUCC”), which is an annual revenue portion of wires costs arising from TFO-owned facilities providing system access to previously-regulated generators, further discussed in Section 10.1.
Combined TFOs ($) 2010 2011 2012 2013 2014
Bulk 26,863,018 30,145,225 34,185,637 32,739,337 36,327,705
Regional 39,275,117 42,375,975 40,558,554 38,703,641 42,240,991
POD 50,063,798 54,566,075 47,370,320 42,147,702 46,106,796
Total 116,201,933 127,087,276 122,114,510 113,590,680 124,675,492
Combined TFOs (%) 2010 2011 2012 2013 2014
Bulk 23.1% 23.7% 28.0% 28.8% 29.1%
Regional 33.8% 33.3% 33.2% 34.1% 33.9%
POD 43.1% 42.9% 38.8% 37.1% 37.0%
Total 100.0% 100.0% 100.0% 100.0% 100.0%
Non-Capital to Capital Costs 2014 2015 2016
Non-Capital 16.0% 14.2% 12.3%
Capital 84.0% 85.8% 87.7%
Combined cost functionalization (net of RGUCC) 2014 2015 2016
Bulk 55.2% 61.2% 62.0%
Regional 22.5% 20.1% 19.6%
POD 22.3% 18.7% 18.4%

London Economics International LLC 8 contact: 717 Atlantic Ave., Suite 1A Amit Pinjani/Ian Chow Boston, MA 02111 416-643-6621 www.londoneconomics.com [email protected]
coincident with any customer’s individual peak. Having an energy component incentivizes 257
customers to reduce load even when they are not at the peak. After reviewing strengths and 258
weaknesses of classification methodologies, the minimum system approach has been utilized. 259
The following figure presents LEI’s recommended classification percentages. 260
Figure 7. Classification results 261
262
Finally, LEI has made three observations with regards to implementation of recommended 263
functionalization and classification results. First, as presented in Figure 8, by using the 264
functionalization and classification results discussed above, the revenue requirement across 265
each of the rate components (bulk-demand, bulk-energy, regional-demand, regional-energy and 266
POD) increases on an annual basis, indicating no reversing trends that may otherwise result in 267
erratic pricing signals. 268
Figure 8. Revenue requirement breakdown using combined functionalization and 269
classification results 270
271
Second, the impact of applying combined capital and O&M cost functionalization results 272
instead of applying only capital cost functionalization results (as presented in Figure 9) is not in 273
opposing directions, i.e., revenue requirement trend remains positive and increasing across 274
most of the rate components (with the exception of POD, where revenue requirement dips in 275
2015 before increasing in 2016). For consistency with cost causation, LEI recommends applying 276
combined capital and O&M functionalization results. 277
Figure 9. Revenue requirement breakdown using capital cost functionalization only 278
279
Classification results Bulk Regional
Demand 92.4% 87.7%
Energy 7.6% 12.3%
Revenue Requirement Split - net of RGUCC ($ million) 2014 2015 2016
Bulk - Demand 764 1,011 1,136
Bulk - Energy 63 83 93
Regional - Demand 295 315 342
Regional - Energy 41 44 48
POD 333 335 365
Total 1,497 1,787 1,984
Revenue Requirement Split - net of RGUCC ($ million) 2014 2015 2016
Bulk - Demand 834 1,100 1,221
Bulk - Energy 69 90 100
Regional - Demand 266 278 307
Regional - Energy 37 39 43
POD 291 280 313
Total 1,497 1,787 1,984

London Economics International LLC 9 contact: 717 Atlantic Ave., Suite 1A Amit Pinjani/Ian Chow Boston, MA 02111 416-643-6621 www.londoneconomics.com [email protected]
Third, for consistency with cost causation, LEI recommends applying separate 2014, 2015 and 280
2016 functionalization results (as presented in Figure 6) for each of the three years. Cost 281
causation has also been given considerable weight by the Board in its previous decision: “The 282
Board maintains that cost causation … remains the primary consideration when evaluating a rate design 283
proposal”.3 284
3 AEUB. Decision 2007-106: AESO 2007 General Tariff Application. December 21, 2007. Page 14.

London Economics International LLC 10 contact: 717 Atlantic Ave., Suite 1A Amit Pinjani/Ian Chow Boston, MA 02111 416-643-6621 www.londoneconomics.com [email protected]
2 List of acronyms 285
ACSR: Aluminum Conductor Steel Reinforced 286
AESO: Alberta Electric System Operator 287
AEUB: Alberta Energy and Utilities Board 288
AIL: Alberta Internal Load 289
AUC: Alberta Utilities Commission 290
AER: Australian Energy Regulator 291
AFUDC: Allowance for Funds Used During Construction 292
A&E: Average & Excess 293
BEGA: Bilateral Embedded Generation Agreement 294
CAISO: California Independent System Operator 295
CIBP: Clearly Identified Bulk Projects 296
CTI: Critical Transmission Infrastructure 297
CWIP: Construction Work in Progress 298
DCC: Distribution Customer Connections 299
DFL: Dual Function Line 300
DTS: Demand Transmission Service 301
FA: Facility Application 302
FERC: Federal Energy Regulatory Commission 303
FTE: Full time Equivalent 304
GTA: General Tariff Application 305
GMC: Grid Management Charge 306
G&A: General and administrative 307
HH: Half-hourly 308

London Economics International LLC 11 contact: 717 Atlantic Ave., Suite 1A Amit Pinjani/Ian Chow Boston, MA 02111 416-643-6621 www.londoneconomics.com [email protected]
HVDC: High Voltage Direct Current 309
ICRP: Investment Cost Related Pricing 310
LGIA: Large Generator Interconnection Agreements 311
LCRIF: Location Constrained Resource Interconnection Facilities 312
LEI: London Economics International LLC 313
LTP: Long-term Transmission Plan 314
MCM: Thousand circular mils 315
MVA: Megavolt amperes 316
MW-km: Megawatt-kilometer 317
NARUC: National Association of Regulatory Utility Commissioners 318
NBV: Net Book Value 319
NER: National Electricity Rules 320
NHH: Non-half-hourly 321
NID: Needs Identification Document 322
OEB: Ontario Energy Board 323
OM&A: Operation, Maintenance, and Administrative 324
OPA: Ontario Power Authority 325
O&M: Operations and Maintenance 326
POD: Point-of-Delivery 327
POS: Point-of-Supply 328
PSTI: PS Technologies Inc. 329
PTO: Participating Transmission Owners 330
RCN: Replacement cost new 331
RGUCC: Regulated Generating Unit Connection Cost 332
ROW: Right of Way 333

London Economics International LLC 12 contact: 717 Atlantic Ave., Suite 1A Amit Pinjani/Ian Chow Boston, MA 02111 416-643-6621 www.londoneconomics.com [email protected]
SATR: South Area Transmission Reinforcement 334
STS: Supply Transmission Service 335
TAC: Transmission Access Charge 336
TCCS: Transmission Cost Causation Study 337
TCCU: Transmission Cost Causation Update 338
TCCWG: Transmission Cost Causation Working Group 339
TFCMC: Transmission Facility Cost Monitoring Committee 340
TFO: Transmission Facility Owner 341
TNUoS: Transmission Network Use of System 342
TRIP: Transmission Rate Impact Projection 343
TRR: Transmission Revenue Requirement 344
TUOS: Transmission Use of System 345
WAC: Wheeling Access Charge 346

London Economics International LLC 13 contact: 717 Atlantic Ave., Suite 1A Amit Pinjani/Ian Chow Boston, MA 02111 416-643-6621 www.londoneconomics.com [email protected]
3 Scope and information utilized 347
LEI was engaged to prepare a transmission cost causation study for the AESO. The study will 348
be incorporated into, and filed with, the AESO’s 2014 tariff application, which is expected to be 349
submitted to the Alberta Utilities Commission (“AUC” or “Commission”) on June 30th, 2013. 350
3.1 Scope 351
The scope of the transmission cost causation study includes the following key areas: 352
Functionalization of capital costs: The study provides results for functionalization of TFO 353
capital-related costs into bulk, regional and POD functions. The results take into account both 354
existing and planned transmission facilities that will give rise to capital-related costs up until 355
2016, albeit with data limitations, as discussed in the study. 356
Functionalization of O&M costs: The study provides results for the functionalization of TFO 357
O&M costs into bulk system, regional system and point of delivery functions. The 358
recommended approach takes into account information received from the TFOs via AESO. 359
TFOs do not project their O&M costs up to 2016. ATCO and AltaLink have projected costs up to 360
2014, EPCOR has projections until 2012, and certain ENMAX projections up until 2011 were 361
derived from their annual finances and operations reports filed under AUC Rule 005. 362
Classification of bulk system and regional system costs: Following functionalization of capital 363
and O&M costs, the study provides results for the classification of bulk system and regional 364
system costs into demand-related and energy-related costs. Classification of POD costs is not in 365
the scope of the current study. 366
Implementation considerations: Finally, the study discusses the potential impact of 367
implementing recommended functionalization and classification results on rates/breakdown of 368
revenue requirement to be recovered. 369
Given that LEI’s scope is limited to cost causation analysis, this report does not delve into rate 370
design issues. 371
3.2 Data utilized and limitations 372
The AESO provided over two hundred documents (totaling over five hundred megabytes), 373
which aided in the development of this analysis (see Section 14: Appendix of works consulted 374
for a comprehensive list). However, challenges were encountered in obtaining adequate data for 375
the analysis. 376

London Economics International LLC 14 contact: 717 Atlantic Ave., Suite 1A Amit Pinjani/Ian Chow Boston, MA 02111 416-643-6621 www.londoneconomics.com [email protected]
In terms of existing asset information, EPCOR’s asset information, net book values, voltages, 377
and line lengths have not been received.4 378
For future/planned projects, as data was provided from multiple sources which were not fully 379
cross-referenced, manual data matching was undertaken by LEI. Furthermore, documents such 380
as the project progress reports provided varying levels of detail. Although LEI completed the 381
analysis on a best effort basis, it is not possible to guarantee 100% completeness of the data. 382
For similar studies in the future, it may be useful to make the TFOs aware of the specific data 383
requirements in advance, and decisions for new accounting systems may take these 384
requirements into account. Adding a few fields to line and substation records kept by the TFOs 385
could reduce the effort required for future cost causation studies or regulatory proceedings by 386
the TFOs and the AESO. 387
3.3 Summary of data used 388
The following is a high level summary of where data was sourced and how it was used in the 389
analysis: 390
Capital costs 391
o Existing assets: 2013 asset net book values have been provided by TFOs and 392
depreciated to 2016. Ongoing connection and maintenance costs have been 393
assumed 394
o Planned projects: costs of planned projects for 2014, 2015 and 2016 are sourced 395
from Long Term Transmission Plan, AESO Cost Benchmarking Data, and 396
progress reports. Costs are depreciated to 2016 397
398
Underlying data for capital cost functionalization 399
o Voltage approach: does not depend on additional underlying data 400
o MW-km approach: uses the 2015 AESO Base Case forecast, published in 2013 401
o Economics approach: uses the 2011 AESO Unit Cost Guide 402
403
Underlying data for O&M cost functionalization 404
o Revenue requirement and operating cost data provided by TFOs (ATCO and 405
AltaLink up until 2014, ENMAX and EPCOR until 2011 and 2012 respectively) 406
407
Capital and O&M functionalization results for each of the years, 2014-2016, are weighted 408
based on respective capital/non-capital cost ratios. 2015 and 2016 ratios extrapolated 409
from capital/non-capital trend of 2010-2014 using TFO filing data 410
4 Due to changes with EPCOR systems and personnel, it was not possible to confirm that the categories provided contain the exact same accounts as the accounts used in the 2005 Transmission Cost Causation Study.

London Economics International LLC 15 contact: 717 Atlantic Ave., Suite 1A Amit Pinjani/Ian Chow Boston, MA 02111 416-643-6621 www.londoneconomics.com [email protected]
411
Underlying data for classification 412
o Minimum system approach uses line costs from 2005 to 2013 and substation costs 413
from 2010 for 138 kV and 240 kV conductors 414
o 500 kV conductor costs have been sourced from California ISO 415
416

London Economics International LLC 16 contact: 717 Atlantic Ave., Suite 1A Amit Pinjani/Ian Chow Boston, MA 02111 416-643-6621 www.londoneconomics.com [email protected]
4 AESO’s previous cost causation studies and Board decisions 417
This section briefly summarizes key areas of discussion in previous relevant cost causation 418
work performed in Alberta, associated decisions by the AEUB/AUC, and potential implications 419
of those decisions for current study. 420
For previous work on this matter, the AESO commissioned PS Technologies Inc. (“PSTI”) over 421
the period 2004 to 2010 to provide guidance for Alberta transmission cost causation and rate 422
design review and analysis. Information was analyzed for the four largest TFOs: (i) AltaLink, 423
(ii) ATCO Power, (iii) EPCOR, and (iv) ENMAX. 424
Figure 10. Timeline of previous transmission cost causation studies 425
426
4.1 2005 capital cost causation study 427
4.1.1 Summary of key issues 428
PSTI submitted its first study on January 25, 2005, entitled “Alberta Transmission System Wires 429
Only – Cost Causation Study”, which has been referred to as the Transmission Cost Causation 430
Study (“TCCS”) in other AESO documents. PSTI analyzed the capital cost information for the 431
TFOs first functionalizing them into bulk, local and point of delivery (“POD”) system costs, and 432
then classifying them into demand, energy and POD costs. To functionalize the costs, PSTI 433
utilized three methods: (i) voltage level, (ii) economics, and (iii) MW-km, discussed in Section 434
6.1. 435
Although PSTI considered MW-km to be the strongest method among the three, the results 436
between the three methods were similar, and they recommended a simple average of all three 437
methodologies. Figure 11 presents the functionalization results in the TCCS. 438
Figure 11. 2005 functionalization results by method 439
440
Source: PSTI. Alberta Transmission System Wires Only – Cost Causation Study. January 25, 2005. Page 33 441
For classification purposes, the functional groups were classified into three categories: demand, 442
energy, or customer-related. For bulk and local functional groups, there was no customer-443
2005
2005 Transmission (Capital) Cost
Causation Study
2005
Board Decision 2005-096
2006
2006 Transmission (Capital) Cost
Causation Update
2007
Board Decision 2007-106
2009
2009 Operating and Maintenance
Cost Study
2010
Board Decision 2010-606
TFO Bulk System Local System POD
Voltage Level 42.7% 18.8% 38.6%
Economics 52.0% 9.5% 38.6%
MW-kM 42.6% 18.9% 38.6%
Recommendation 45.7% 15.7% 38.6%

London Economics International LLC 17 contact: 717 Atlantic Ave., Suite 1A Amit Pinjani/Ian Chow Boston, MA 02111 416-643-6621 www.londoneconomics.com [email protected]
related classification, and the minimum system approach was used to differentiate between 444
demand and energy related costs. 445
The minimum system approach compares a minimum system to an optimal system, whereby 446
the minimum system reflects system costs assuming the lowest construction costs and an 447
optimized system minimizes the total cost of capital and losses. The ratio between the two 448
provides the classification results, where the minimum system cost is considered demand 449
related and the incremental cost increase for the optimized system is considered energy related. 450
For the POD functional group, the zero-intercept method was used, whereby a linear regression 451
is applied to substation net book value and capacity (in megavolt amperes (“MVA”)). The zero 452
intercept of the linear regression was used to determine the fixed cost of a POD substation, 453
while all further costs were broken down by the minimum system approach. POD cost 454
classification is outside the scope of LEI’s current study. 455
Figure 12. 2005 functionalization and classification results 456
457
Source: PSTI. Alberta Transmission System Wires Only – Cost Causation Study. January 25, 2005. Page 45 458
4.1.2 Board decision 2005-096 459
Though the TCCS was considered to be a “good first step” by the Board,5 the following 460
improvements were suggested for future studies: 461
First, a reasonable portion of TFO costs were related to O&M and a material percentage 462
of these could be energy-related. The O&M costs were analyzed by PSTI in the 2009 463
Electric Transmission Operating and Maintenance Cost Study, summarized later in 464
Section 4.3. 465
Second, the Board noted that the TCCS appeared to have studied only two of many bulk 466
lines in its analysis; in future studies, AESO was asked to conduct a more thorough 467
review of all those lines comprising the bulk system, in order to provide a more accurate 468
indication as to the exact portion of costs that are energy related. 469
Third, wires costs should be classified as 20% energy to be collected evenly over all 470
hours; the balance of wires costs should be collected through two demand charges – one 471
related to the bulk system and the second relating to local system and POD related costs. 472
5 AEUB. Decision 2005-096: AESO 2005/2006 General Tariff Application. August 28, 2005. Page 24.
Classification Bulk System Local System POD
Demand (CLMS-NCP) 81.5% 82.5% 43.1%
Energy 18.5% 17.5% 0.7%
POD/Cust 56.2%

London Economics International LLC 18 contact: 717 Atlantic Ave., Suite 1A Amit Pinjani/Ian Chow Boston, MA 02111 416-643-6621 www.londoneconomics.com [email protected]
Finally, the Board noted that the costs related to the bulk system, and therefore the percentage 473
of costs allocated to bulk system costs, had the potential to increase in the future. This has been 474
observed in the existing long-tern transmission plan, whereby projects over $13.5 billion are 475
planned to come online. 476
4.2 2006 cost causation update 477
4.2.1 Summary of key issues 478
Following the Board’s recommendation in Decision 2005-096 that a ‘more thorough review of all 479
those lines comprising the bulk system’ be conducted, PSTI submitted its second study on 480
September 15, 2006, entitled “Alberta Transmission System 2006 Transmission Cost Causation 481
Update,” which has been commonly referred to as the Transmission Cost Causation Update 482
(“TCCU”). 483
PSTI’s qualitative analysis included interviewing AESO system planners regarding 484
transmission paths, upgrades to the bulk transmission system, and causes of maximum stress 485
on bulk transmission lines. The study found that transmission planning is a complex process, 486
and instead of being dominated by any one simple factor such as serving peak load, it is driven 487
by various independent factors such as the location and daily/seasonal profiles of load and 488
generation and the configuration of the electric transmission system. 489
Quantitative analysis was performed to assess the correlation between the time of maximum 490
stress on the bulk system and the time of Alberta Internal Load (“AIL”) peak load, which 491
showed a correlation of only 1% (in 2004) and 8% (in 2005) between individual bulk line loads 492
(weighted by line length) and AIL peak load. Analysis was based on metered data for the 8,760 493
hours and individual bulk line loads over seventy nine 240 kV bulk transmission lines, and the 494
TCCU acknowledged a shortcoming: transmission planning is conducted without including 495
opportunity sales, while actual meter data includes actual imports and exports (opportunity 496
sales). The AESO however maintained that the total amount of exports was small in comparison 497
to the Alberta load (1.5%) and therefore any adjustment for exports would have only a minimal 498
impact on the circuit loading data. No provision was made for adjustments to the meter data to 499
account for abnormal conditions, such as transmission contingencies or generator outages. 500
Figure 13. TCCU functionalization and classification results 501
502
503
Source: PSTI. Alberta Transmission System 2006 Transmission Cost Causation Update. September 15, 2006. Page 53 504
% of NBV Property Bulk System Local System POD
Functionalization 46.3% 16.0% 37.7%
Classification Bulk System Local System POD
Demand (CLMS-NCP) 81.5% 82.5% 43.1%
Energy 18.5% 17.5% 0.7%
POD/Cust 56.2%

London Economics International LLC 19 contact: 717 Atlantic Ave., Suite 1A Amit Pinjani/Ian Chow Boston, MA 02111 416-643-6621 www.londoneconomics.com [email protected]
As a result of the TCCU, final functionalization and classification results were revised, as 505
presented in Figure 13. Changes were insignificant compared to Decision 2005-096. 506
4.2.2 Board decision 2007-106 507
The quantitative analysis presented by TCCU was criticized by the interveners and the Board. 508
The Board rejected the hypothesis presented by TCCU that peak load did not correlate to 509
maximum stress on the system and that it was load in all hours that mattered. The Board 510
maintained that system peak is more important than load in every hour. 511
The AESO also proposed to use the average & excess methodology to classify wires costs, an 512
alternative to the minimum system analysis presented in the TCCS. In the A&E approach, the 513
average component is determined by the average system load factor, which determines the 514
energy-related classification of transmission costs (estimated at 48.6%); the excess component 515
represents the amount of system load above the average (estimated as 1 - 48.6% = 51.4%). The 516
Board rejected this approach, maintaining that transmission assets represent a long-term fixed 517
investment, and vary little based on usage. Classifying 48.5% of costs as energy-related, in the 518
Board’s view, provided a poor price signal to customers to shift their load away from peak 519
hours to reduce demand at the system peak. 520
The Board recommended continuing using the minimum system approach to classify wires 521
costs. The Board also noted that it does not consider that significant adjustments should be 522
necessary in the foreseeable future. 523
The Board considered that the portion of wires costs classified as energy-related should remain 524
fairly low and be determined by the cost of service study, and it approved the functionalization 525
and classification ratios, as presented in Figure 14. 526
Figure 14. Board-approved functionalization and classification results 527
528
Source: AEUB. Decision 2007-106: 2007 General Tariff Application. December 21, 2007. Pages 25, 60 529
4.3 2009 operation and maintenance cost causation study 530
4.3.1 Summary of key issues 531
Following the Board’s recommendation in Decision 2005-096 to analyze O&M costs and their 532
effect on classification of energy-related costs (as discussed earlier in Section 4.1.2), PSTI 533
submitted its third study on December 10, 2009 titled “AESO Electric Transmission Operating 534
Cost Causation Study.” 535
% of NBV Property Bulk System Local System POD
Functionalization 41.7% 17.4% 40.9%
Classification Bulk System Local System
Demand 82.0% 82.0%
Energy 18.0% 18.0%
London Economics International LLC 20 contact: 717 Atlantic Ave., Suite 1A Amit Pinjani/Ian Chow Boston, MA 02111 416-643-6621 www.londoneconomics.com [email protected]
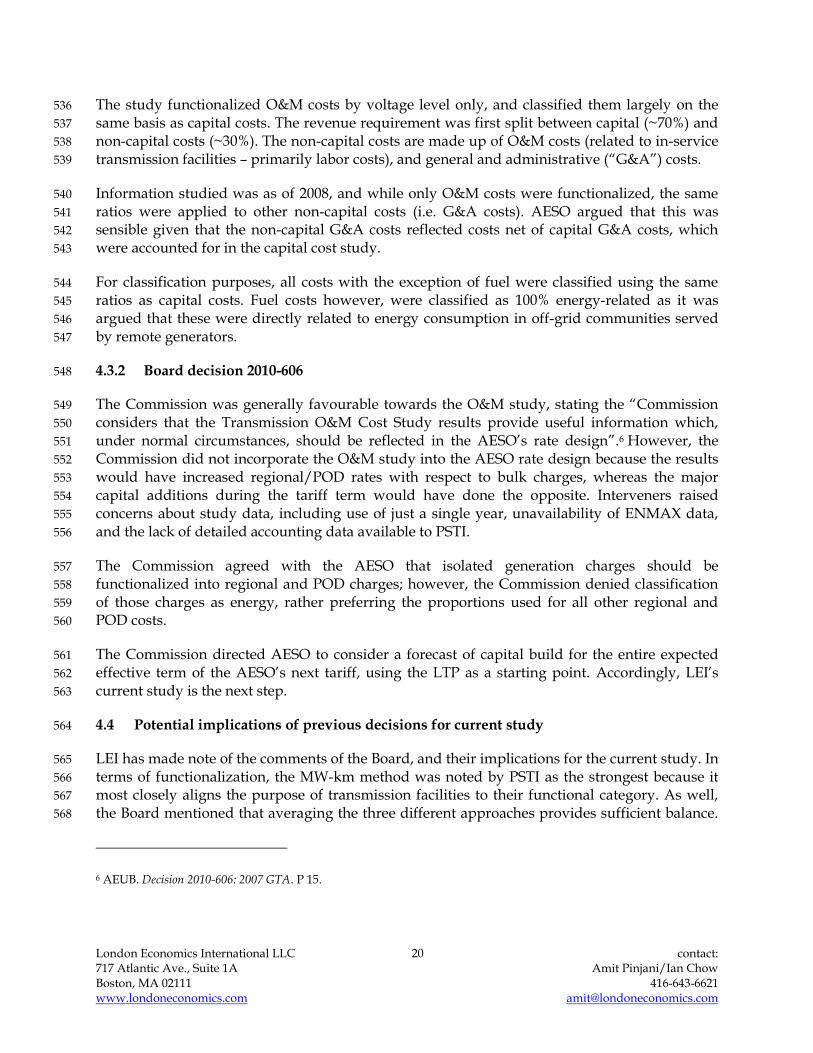
The study functionalized O&M costs by voltage level only, and classified them largely on the 536
same basis as capital costs. The revenue requirement was first split between capital (~70%) and 537
non-capital costs (~30%). The non-capital costs are made up of O&M costs (related to in-service 538
transmission facilities – primarily labor costs), and general and administrative (“G&A”) costs. 539
Information studied was as of 2008, and while only O&M costs were functionalized, the same 540
ratios were applied to other non-capital costs (i.e. G&A costs). AESO argued that this was 541
sensible given that the non-capital G&A costs reflected costs net of capital G&A costs, which 542
were accounted for in the capital cost study. 543
For classification purposes, all costs with the exception of fuel were classified using the same 544
ratios as capital costs. Fuel costs however, were classified as 100% energy-related as it was 545
argued that these were directly related to energy consumption in off-grid communities served 546
by remote generators. 547
4.3.2 Board decision 2010-606 548
The Commission was generally favourable towards the O&M study, stating the “Commission 549
considers that the Transmission O&M Cost Study results provide useful information which, 550
under normal circumstances, should be reflected in the AESO’s rate design”.6 However, the 551
Commission did not incorporate the O&M study into the AESO rate design because the results 552
would have increased regional/POD rates with respect to bulk charges, whereas the major 553
capital additions during the tariff term would have done the opposite. Interveners raised 554
concerns about study data, including use of just a single year, unavailability of ENMAX data, 555
and the lack of detailed accounting data available to PSTI. 556
The Commission agreed with the AESO that isolated generation charges should be 557
functionalized into regional and POD charges; however, the Commission denied classification 558
of those charges as energy, rather preferring the proportions used for all other regional and 559
POD costs. 560
The Commission directed AESO to consider a forecast of capital build for the entire expected 561
effective term of the AESO’s next tariff, using the LTP as a starting point. Accordingly, LEI’s 562
current study is the next step. 563
4.4 Potential implications of previous decisions for current study 564
LEI has made note of the comments of the Board, and their implications for the current study. In 565
terms of functionalization, the MW-km method was noted by PSTI as the strongest because it 566
most closely aligns the purpose of transmission facilities to their functional category. As well, 567
the Board mentioned that averaging the three different approaches provides sufficient balance. 568
6 AEUB. Decision 2010-606: 2007 GTA. P 15.

London Economics International LLC 21 contact: 717 Atlantic Ave., Suite 1A Amit Pinjani/Ian Chow Boston, MA 02111 416-643-6621 www.londoneconomics.com [email protected]
LEI believes that performing the different methods provides a valuable sanity check and has 569
applied the three methods. However, as discussed later in Section 8.3.5, LEI has recommended 570
using the voltage approach. 571
Although certain interveners recommended using derived replacement cost new (“RCN”) 572
values in future studies, LEI believes that net book value (“NBV”) should be sufficient, 573
especially given significant investment in projects coming online in recent years. The RCN 574
analysis may be significantly assumptions-driven and may produce arbitrary results. LEI also 575
notes that the Board considered NBV to be an appropriate basis upon which to base the 576
functionalization of costs, given NBV drives the return, tax and depreciation calculations of the 577
TFO revenue requirements. LEI utilized asset NBVs provided by the TFOs for its analysis. 578
For classification of O&M costs, consistent with Board’s 2010 Decision, both isolated generation 579
charges (including fuel and related variable O&M costs) and other O&M costs have been 580
classified on the same basis as capital costs. 581
Interveners noted in 2010 that there is likely to be a significant increase in the proportion of bulk 582
transmission facilities built for reasons other than providing reliable delivery at times of peak 583
load and, as a result, there is a strong possibility that the classification of bulk transmission 584
facilities will change to a more energy-intensive classification. LEI has divided planned system 585
additions between conventional and special planned projects, whereby special projects are 586
those that are primarily designed for purposes other than meeting peak load needs. A 587
discussion about special projects and their identification is presented later in Section 13.1. 588

London Economics International LLC 22 contact: 717 Atlantic Ave., Suite 1A Amit Pinjani/Ian Chow Boston, MA 02111 416-643-6621 www.londoneconomics.com [email protected]
5 Definition of transmission functions 589
The process of functionalization allocates costs into three functional groups: bulk, regional and 590
POD. These three functions do not have universally accepted definitions, however, LEI has 591
defined them here generally, based on understanding of the Alberta transmission system, the 592
results of prior cost causation studies, and experience in other jurisdictions. 593
Traditionally, large-scale generators produce electricity, which is transferred by the bulk, high 594
voltage system over long distances to reach regional systems, and eventually reach loads at the 595
point of delivery. The bulk system represents the backbone of the transmission system, and 596
although in recent years, some generation has been located closer to load, the traditional model 597
generally still holds true. As such, the bulk system is defined as high voltage, which typically 598
carries large amounts of electricity over long distances. Bulk transmission lines also provide 599
high capacity interconnections between adjacent utilities or concentrated load centers 600
geographically separated. These bulk power lines typically operate at 500 kV and 240 kV AC or 601
as High Voltage Direct Current (“HVDC”). Point-of-supply (“POS”) substations which are used 602
to connect generation are also considered bulk. 603
The system which transmits electricity from the bulk system to load centers with numerous 604
PODs is known as regional. The lines are typically lower in capacity and shorter in length than 605
bulk power lines and typically operate at 138 kV and 69 kV. 606
The point of delivery system serves distribution utilities or industrial customers that connect 607
directly to the transmission system. As such, the POD function is the most obvious to identify – 608
point of delivery substations, radial transmission lines which serve these substations, or radial 609
transmission lines directly serving a customer can be considered POD. 610
The definition used by LEI is consistent with prior cost causation studies. A summary of the 611
three definitions is presented in the figure below. 612
Figure 15. Transmission functions 613
614
Transmission functions Definition
Bulk systemHigh voltage system typically carrying large amounts of electricity over long
distances, as well as substations serving generators
Regional systemSystem that transmits electricity from the bulk system to load centers with
numerous PODs
POD systemSystem serving distribution utilities or industrial customers that connect directly
to the transmission system

London Economics International LLC 23 contact: 717 Atlantic Ave., Suite 1A Amit Pinjani/Ian Chow Boston, MA 02111 416-643-6621 www.londoneconomics.com [email protected]
6 Cost causation methodologies 615
AESO has identified the following five rate design principles based on Principles of Public Utility 616
Rates by Bonbright et al:7 617
i. recovery of total revenue requirement; 618
ii. provision of appropriate price signals that reflect all costs and benefits; 619
iii. fairness, objectivity and equity that avoids undue discrimination and minimizes inter-620
customer subsidies; 621
iv. stability and predictability of rates and revenue; and 622
v. practicality, such that rates are appropriately simple, convenient, understandable, 623
acceptable and billable. 624
Within the scope of this study, LEI has considered all of the above principles. It is important 625
that revenue requirements are met, and that the burden of fulfilling these requirements is 626
shared fairly amongst users. LEI paid particular attention to the third principle, which closely 627
ties with cost allocation and cost causation, such that where possible, costs need to be allocated 628
to customers that are specifically responsible for particular capital investments, operation and 629
maintenance costs, and costs that need to be socialized. 630
As presented in Figure 16, cost allocation exists at the boundary between transmission planning 631
and pricing. Three main steps of the cost allocation process are functionalization, classification 632
and allocation. 633
Figure 16. Transmission planning and pricing steps and focus of this study 634
Current study focus 635
636
In order to reflect cost causation in rate design, transmission costs are separated into a number 637
of categories utilizing methods of functionalization and classification, which can then be 638
allocated to appropriate beneficiaries. Functionalization is the process through which costs are 639
divided into functional categories, such as bulk, regional, and point of delivery costs in Alberta. 640
7 Bonbright, James, Albert L. Danielsen and David R. Kamerschen. Principles of Public Utility Rates, Second Edition. Public Utilities Reports; 2 Sub edition (March 1988).
Identify potential projects
Evaluate project net benefits
Select projects to pursue
Allocate costs/benefits across customers
Develop set of customer charges
Planning Pricing

London Economics International LLC 24 contact: 717 Atlantic Ave., Suite 1A Amit Pinjani/Ian Chow Boston, MA 02111 416-643-6621 www.londoneconomics.com [email protected]
Each function is then studied and costs are further classified into categories such as demand-641
related, energy-related and customer-related costs. 642
6.1 Overview of functionalization methodologies 643
Functionalization is defined as grouping costs together with other costs that perform similar 644
functions. Typical functions for the entire system include: (i) production or purchased power; 645
(ii) transmission; (iii) distribution; (iv) customer service and facilities; and (v) general and 646
administrative functions. 647
When a transmission system is functionalized into only one transmission cost group, it is 648
referred to as the ‘rolled-in method’ and when placed into multiple groups, it is referred to as 649
the ‘sub-functionalized method’. 650
The rolled-in method is used for highly integrated transmission facilities (where the 651
network allows many alternative flows for power to flow). It is treated as a single system 652
as all elements are considered to contribute to the economic and reliable operation of the 653
overall system; and 654
The sub-functionalized method is used to further distinguish the network. It can be based 655
on line configuration, geography, or voltage, as well as other features. Due to higher 656
data requirements, this method is usually used for categories which have different cost 657
consequences. 658
Figure 17. Summary of functionalization methodologies 659
660
Method Strengths Weaknesses
Voltage • simple and easy to understand• used across various jurisdictions• results reflect cost causation• results similar to other methodologies
• less sensitive to evolving functions as compared to MW-km (that uses current loading forecasts)
• high voltage projects serving a regional purpose and low voltage projects serving bulk purposes may not be taken into account properly
Economics • unique and measurable metric • results reflect cost causation
• biased in functionalizing more costs as bulk• may not reflect evolving functions over time• may not be appropriate to apply current
economics to past projects • setting theoretical line length is subjective
MW-km • reflects evolving functions over time• more representative of study period,
using forecasted flows• multiple metrics used• results reflect cost causation
• subject to error in line loading forecasts• forecast is a single point in time and may not be
representative of all hours and years• setting breakpoint is subjective
MVA-km • avoids errors in line loading forecasts byusing rating capacity
• multiple metrics used
• may not reflect evolving functions over time• setting breakpoint is subjective

London Economics International LLC 25 contact: 717 Atlantic Ave., Suite 1A Amit Pinjani/Ian Chow Boston, MA 02111 416-643-6621 www.londoneconomics.com [email protected]
Figure 17 presents a summary of strengths and weaknesses of functionalization approaches 661
utilizing different concepts, which are further discussed in the following sub-sections. The 662
functionalization approach chosen by LEI and the rationale is discussed later in Section 8.3.5. 663
6.1.1 Functionalization by voltage 664
Functionalization by voltage uses voltage levels of lines and substations to categorize costs. The 665
theory is that higher voltage lines are designed to carry more power and act as the backbone of 666
the system, thus higher voltages are considered to be bulk. It is a common method, and 667
elements of this method are seen in multiple case studies discussed by LEI in Section 7. 668
Benefits include simplicity and the fact that on the whole, it provides a realistic breakdown of 669
the transmission system. This was observed in the 2005 TCCS in Alberta, where 670
functionalization by voltage gave similar results to other methodologies. Although simply 671
functionalizing by voltage may not account for exceptional projects, and does not view the 672
system dynamically, this challenge exists for other functionalization methods as well. 673
Because functions change over time, cost causation studies need to be revised periodically. 674
However, this is not a weakness of any particular functionalization method. While a higher 675
voltage line may have originally been designed to carry more power and be part of the bulk 676
system, an evolving system may change the function of the same line over time. An example of 677
this is the changes in the Alberta system, in which the addition of 500 kV and 240 kV lines has 678
shifted 138 kV lines (initially considered bulk) to serve more regional functions. Alternatively, a 679
138 kV line may be built to serve a regional function in the future, but current system conditions 680
could have it serving more of a bulk role.8 This, however, may mean that the voltages 681
associated with a particular function may need to change as studies are updated. 682
6.1.2 Functionalization by economics 683
Functionalization by economics determines functional categories by assessing the economics of 684
the transmission line, specifically assessing whether it makes more economic sense, for instance, 685
to build a 240 kV line versus a 138 kV line. When considering economics, it would generally be 686
cheaper to build a 240 kV line for energy delivery over longer distances, but if many points of 687
delivery are required, the cheaper option might be to build a 240/138 kV transformer substation 688
and connect the points of delivery to a 138 kV line. 689
The economics approach assumes a high voltage line exists, and additional points of delivery 690
are added, reducing line length between PODs. The relative cost of components determines the 691
breakpoint at which it would become economical to build the transformer and lower voltage 692
line in comparison to a higher voltage line. Lines that are below that breakpoint, measured in 693
line length, are considered regional, and lines above the breakpoint are considered bulk. A 694
similar process determines bulk and regional breakdown between 138 kV lines. Line length is a 695
8 LEI identified at least twenty 138 kV lines that are functionalized as regional by the voltage approach, but are functionalized as serving bulk by the MW-km approach, as discussed in Section 6.1.3.

London Economics International LLC 26 contact: 717 Atlantic Ave., Suite 1A Amit Pinjani/Ian Chow Boston, MA 02111 416-643-6621 www.londoneconomics.com [email protected]
key factor in functionalizing using this method, whereby longer lines will be expected to be 696
functionalized as bulk, while shorter lines are functionalized as regional. 697
An advantage of this method can be that it provides a unique measurable metric to determine 698
functionalization. Utilizing this method provided reasonable results in the TCCS, where results 699
were similar to other approaches. 700
However, as discussed by PSTI in the TCCS itself, this method is biased towards functionalizing 701
more towards the bulk system, and may not reflect evolving functions of certain facilities over 702
time. Moreover, as economics of the transmission system (POD and substation costs) change 703
over time, it is questionable whether current economics can be applied to older transmission 704
projects, given the differing market conditions at the time of their construction. Finally, there is 705
an element of subjectivity in setting the length of the hypothetical line. The line length impacts 706
the breakpoint, and hence the functionalization results. 707
6.1.3 Functionalization by megawatt-kilometer 708
Functionalization by MW-km is based on the concept that bulk lines carry large amounts of 709
power over long distances. The loading (in MW) of each line in the system is forecast and 710
multiplied by its line length to get its MW-km rating. By comparing MW-km values to a 711
breakpoint, this method is able to quantify what percentage of lines at each voltage level is bulk 712
and regional. Lines with high MW-km ratings are either carrying large amounts of power, or 713
are very long, or both, and are therefore bulk. 714
The primary benefit of this method is taking into account the dynamic nature of the 715
transmission system since it takes into account forecasted flows, which can change on updated 716
assumptions about system conditions. Furthermore, the flows are forecasted for a year that is 717
within the study period, which could lead to results which are more representative than 718
methods which use current or past data. This method also takes into account two metrics 719
(voltage and distance), which may lead to more reliable results. By taking into account distance, 720
this approach will give a lower MW-km rating to a line in a subsequent study, if for example, a 721
POD is built and halves the distance of the line. This is consistent with the logic behind the MW-722
km approach, which is to take into account the distance that power is carried. 723
However, one weakness is the possible error in the flow forecast. Changing baseline 724
assumptions could mean the forecast is not accurate. As well, the forecast is a single point in 725
time in the future, which may not be indicative of all hours in a year. The forecast of a single 726
year also may not be indicative of all years in a study period. Moreover, setting the breakpoint 727
is a challenging exercise and can be viewed as subjective. Validating breakpoints using clearly 728
identifiable projects can mitigate some subjectivity if appropriate data is available. 729
6.1.4 Functionalization by MVA-kilometer 730
An alternative approach would be to consider the MVA capacity of a transmission line as a key 731
indication of its purpose. The changing dynamics of the transmission system, such as a new 500 732
kV line serving a bulk power function that was once provided by a 240 kV line or a short or 733
radial 240 kV line now serving in a regional or POD role, can be recognized in different ways. 734
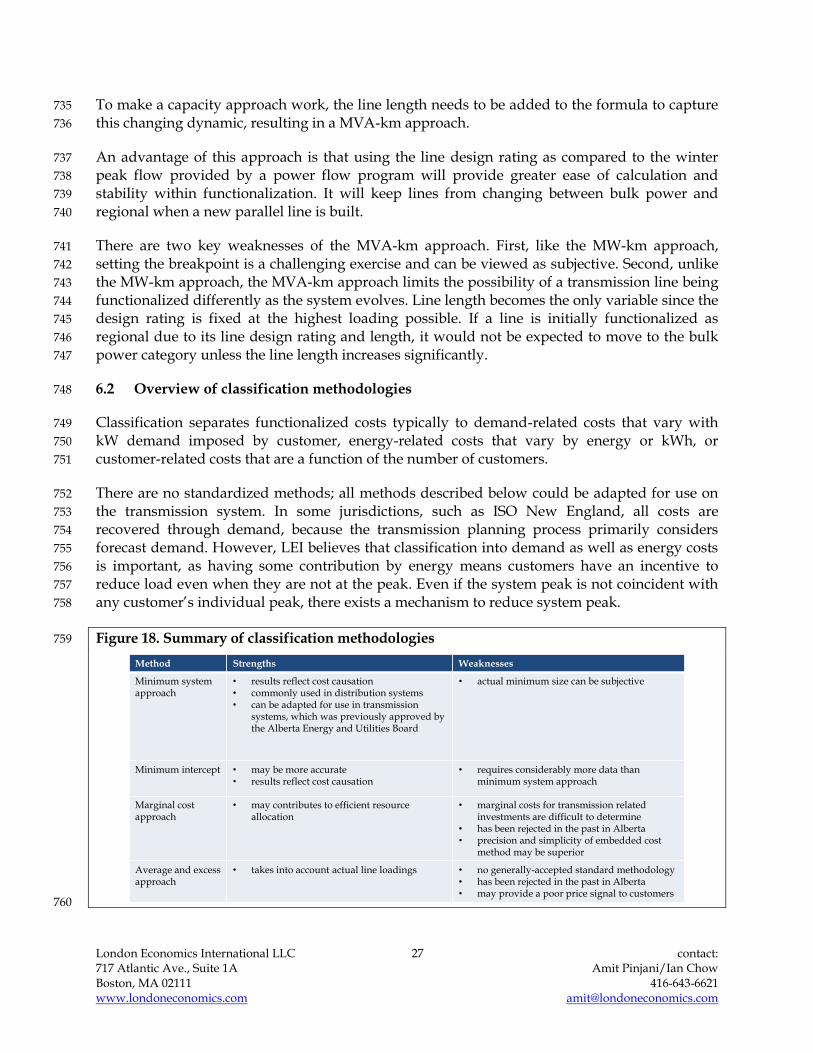
London Economics International LLC 27 contact: 717 Atlantic Ave., Suite 1A Amit Pinjani/Ian Chow Boston, MA 02111 416-643-6621 www.londoneconomics.com [email protected]
To make a capacity approach work, the line length needs to be added to the formula to capture 735
this changing dynamic, resulting in a MVA-km approach. 736
An advantage of this approach is that using the line design rating as compared to the winter 737
peak flow provided by a power flow program will provide greater ease of calculation and 738
stability within functionalization. It will keep lines from changing between bulk power and 739
regional when a new parallel line is built. 740
There are two key weaknesses of the MVA-km approach. First, like the MW-km approach, 741
setting the breakpoint is a challenging exercise and can be viewed as subjective. Second, unlike 742
the MW-km approach, the MVA-km approach limits the possibility of a transmission line being 743
functionalized differently as the system evolves. Line length becomes the only variable since the 744
design rating is fixed at the highest loading possible. If a line is initially functionalized as 745
regional due to its line design rating and length, it would not be expected to move to the bulk 746
power category unless the line length increases significantly. 747
6.2 Overview of classification methodologies 748
Classification separates functionalized costs typically to demand-related costs that vary with 749
kW demand imposed by customer, energy-related costs that vary by energy or kWh, or 750
customer-related costs that are a function of the number of customers. 751
There are no standardized methods; all methods described below could be adapted for use on 752
the transmission system. In some jurisdictions, such as ISO New England, all costs are 753
recovered through demand, because the transmission planning process primarily considers 754
forecast demand. However, LEI believes that classification into demand as well as energy costs 755
is important, as having some contribution by energy means customers have an incentive to 756
reduce load even when they are not at the peak. Even if the system peak is not coincident with 757
any customer’s individual peak, there exists a mechanism to reduce system peak. 758
Figure 18. Summary of classification methodologies 759
760
Method Strengths Weaknesses
Minimum system approach
• results reflect cost causation • commonly used in distribution systems• can be adapted for use in transmission
systems, which was previously approved by the Alberta Energy and Utilities Board
• actual minimum size can be subjective
Minimum intercept • may be more accurate • results reflect cost causation
• requires considerably more data than minimum system approach
Marginal cost approach
• may contributes to efficient resource allocation
• marginal costs for transmission related investments are difficult to determine
• has been rejected in the past in Alberta• precision and simplicity of embedded cost
method may be superior
Average and excess approach
• takes into account actual line loadings • no generally-accepted standard methodology• has been rejected in the past in Alberta• may provide a poor price signal to customers
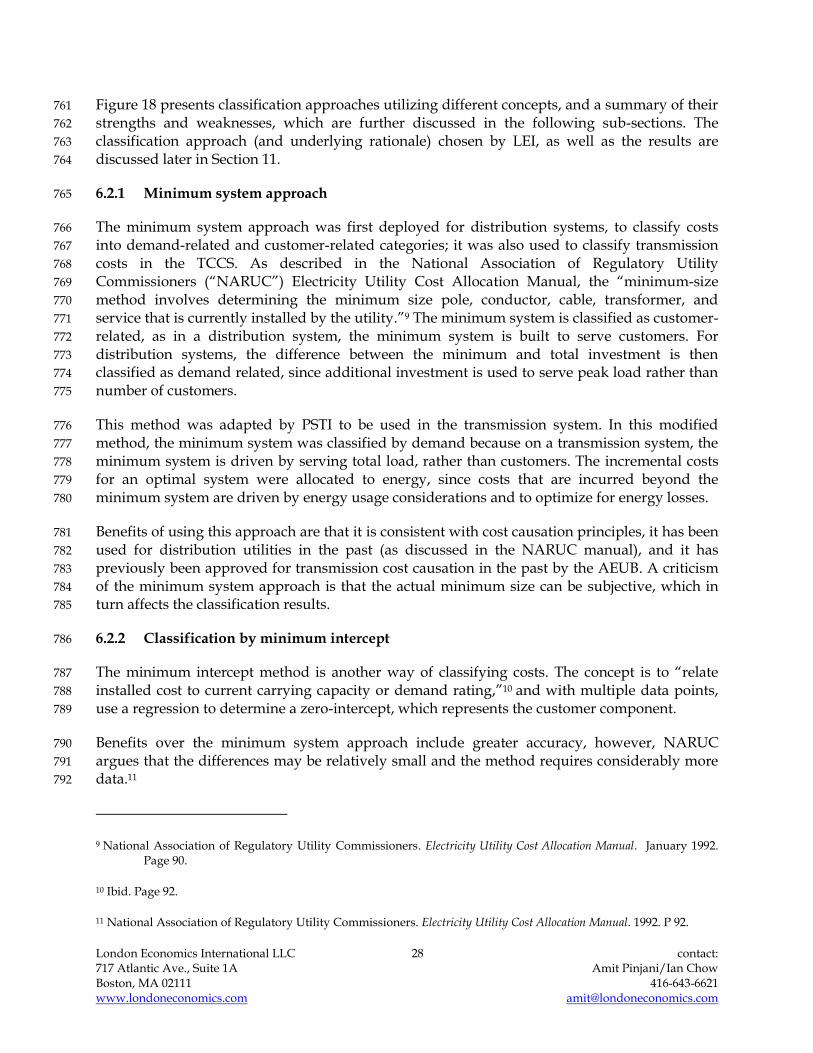
London Economics International LLC 28 contact: 717 Atlantic Ave., Suite 1A Amit Pinjani/Ian Chow Boston, MA 02111 416-643-6621 www.londoneconomics.com [email protected]
Figure 18 presents classification approaches utilizing different concepts, and a summary of their 761
strengths and weaknesses, which are further discussed in the following sub-sections. The 762
classification approach (and underlying rationale) chosen by LEI, as well as the results are 763
discussed later in Section 11. 764
6.2.1 Minimum system approach 765
The minimum system approach was first deployed for distribution systems, to classify costs 766
into demand-related and customer-related categories; it was also used to classify transmission 767
costs in the TCCS. As described in the National Association of Regulatory Utility 768
Commissioners (“NARUC”) Electricity Utility Cost Allocation Manual, the “minimum-size 769
method involves determining the minimum size pole, conductor, cable, transformer, and 770
service that is currently installed by the utility.”9 The minimum system is classified as customer-771
related, as in a distribution system, the minimum system is built to serve customers. For 772
distribution systems, the difference between the minimum and total investment is then 773
classified as demand related, since additional investment is used to serve peak load rather than 774
number of customers. 775
This method was adapted by PSTI to be used in the transmission system. In this modified 776
method, the minimum system was classified by demand because on a transmission system, the 777
minimum system is driven by serving total load, rather than customers. The incremental costs 778
for an optimal system were allocated to energy, since costs that are incurred beyond the 779
minimum system are driven by energy usage considerations and to optimize for energy losses. 780
Benefits of using this approach are that it is consistent with cost causation principles, it has been 781
used for distribution utilities in the past (as discussed in the NARUC manual), and it has 782
previously been approved for transmission cost causation in the past by the AEUB. A criticism 783
of the minimum system approach is that the actual minimum size can be subjective, which in 784
turn affects the classification results. 785
6.2.2 Classification by minimum intercept 786
The minimum intercept method is another way of classifying costs. The concept is to “relate 787
installed cost to current carrying capacity or demand rating,”10 and with multiple data points, 788
use a regression to determine a zero-intercept, which represents the customer component. 789
Benefits over the minimum system approach include greater accuracy, however, NARUC 790
argues that the differences may be relatively small and the method requires considerably more 791
data.11 792
9 National Association of Regulatory Utility Commissioners. Electricity Utility Cost Allocation Manual. January 1992. Page 90.
10 Ibid. Page 92.
11 National Association of Regulatory Utility Commissioners. Electricity Utility Cost Allocation Manual. 1992. P 92.

London Economics International LLC 29 contact: 717 Atlantic Ave., Suite 1A Amit Pinjani/Ian Chow Boston, MA 02111 416-643-6621 www.londoneconomics.com [email protected]
6.2.3 Classification by marginal cost approach 793
Marginal cost classification is mainly used for production costing. Marginal cost studies use the 794
theory that the market is at equilibrium when the producer’s cost of the last unit of a good is 795
equal to the amount consumers are willing to pay for it. The regulator attempts to achieve the 796
same equilibrium by accepting a particular level of service, and setting rates equal to the 797
utilities’ marginal cost at that level. 798
Supporters claim this method contributes to efficient resource allocation, while detractors claim 799
the precision and simplicity of the embedded cost method is superior. Marginal costs for 800
transmission related investments are difficult to determine and may be imprecise, and the 801
marginal cost approaches have been rejected by the regulator in Alberta in the past (when the 802
industry was vertically-integrated). 12 Alberta has consistently used an embedded cost 803
approach.13 804
6.2.4 Classification by average and excess approach 805
In order to classify by the A&E methodology, the average component is determined by the 806
average system load factor, which determines the energy-related classification of transmission 807
costs, and the excess component represents the amount of system load above the average. 808
As discussed earlier in Section 4.2.2, the Alberta regulator rejected this approach in 2007,14 809
maintaining that transmission assets represent a long-term fixed investment, and varied less 810
based on usage. Poor price signals may be provided to customers if a significant proportion of 811
costs are classified as energy-related.15 812
12 Public Utilities Board, Alberta. Decision E94076 re: TransAlta Utilities Corporation, November 4, 1994. P 29.
13 Alberta Energy. Transmission Development: The Right Path for Alberta. December 22, 2003.
14 Alberta Energy And Utilities Board. Alberta Electric System Operator: 2007 General Tariff Application. December 21, 2007. P 30.
15 AEUB. Decision 2007-106: AESO 2007 General Tariff Application. December 21, 2007. Pages 29-30.

London Economics International LLC 30 contact: 717 Atlantic Ave., Suite 1A Amit Pinjani/Ian Chow Boston, MA 02111 416-643-6621 www.londoneconomics.com [email protected]
7 International case studies 813
This section discusses methodologies utilized by selected international jurisdictions (Ontario, 814
California, Australia and Great Britain) to identify cost causation. These jurisdictions were 815
chosen in light of some of the following reasons: Ontario represents a geographically large 816
Canadian province with significant industrial load; California because of its importance within 817
the western interconnection of which Alberta is a part; Australia because it is also 818
geographically large, sparsely populated, and has an advanced regulatory regime; and finally 819
Great Britain to provide an example that performs cost causation differently from North 820
American jurisdictions. 821
Figure 19. Introduction to case study jurisdictions 822
823
Sources: AESO, Alberta Energy, IESO, Australian Energy Regulator, NEM, CAISO, UK Department of Energy & Climate 824 Change, National Grid; * National Grid only 825
Jurisdiction2012 Peak
Load (MW)Transmission
Lines (km)Voltages
UsedDegree of
Unbundling
Most Recent Tariff Decision
PeriodDate of
DecisionEntity Regulator
Alberta
10,609 21,000
500kV 240kV
138/144 kV 115/70 kV
Transmissioncharge
unbundled2011-2013
December2010
AESO
AlbertaUtilities
Commission (“AUC”)
Australia
31,084 40,000
500 kV 330 kV275 kV 132 kV
Transmissioncharge
unbundled2012-13 to
2016-17April 2012
Powerlink
Australian Energy
Regulator (“AER”)
California
25,865 41,600
500 kV230 kV115 kV70 kV
Transmissioncharge
unbundled
September 2012
onwards
December 2011
San Diego Gas & Electric Company
FERC
Ontario
23,954 30,000500 kV 230 kV115 kV
Transmissioncharge
unbundled2012
November2011
Hydro OneOntario
Energy Board (“OEB”)
Great Britain
57,086 7,200 *400 kV275 kV132 kV
Transmissioncharge
unbundled2011-2012
March 2011
National Grid Electricity
Transmission
Office of Gas and
Electricity Markets (Ofgem)

London Economics International LLC 31 contact: 717 Atlantic Ave., Suite 1A Amit Pinjani/Ian Chow Boston, MA 02111 416-643-6621 www.londoneconomics.com [email protected]
7.1 Ontario, Canada - Hydro One Networks Inc. (Hydro One) transmission rates case 826
Hydro One’s most recent transmission rate case presents 827
the methodology deployed by the Ontario Energy Board 828
(“OEB”) to functionalize transmission assets and thereby 829
determine transmission revenue requirements.16,17 830
Transmission assets and costs associated with these assets 831
are first assigned to various functional categories. Next, 832
the values assigned to each functional category are 833
allocated to various Rate Pools in order to calculate the 834
revenue requirements associated with each of the pools.18 835
In certain cases, parameter(s) must be used to calculate 836
the proportion of the costs associated with a given asset 837
that will go to more than one functional category/Rate 838
Pool. 839
The three basic elements of the revenue requirements 840
assigned to the four pools are: (i) operation, maintenance, 841
and administrative (“OM&A”) costs; (ii) expenses 842
associated with fixed assets such as depreciation, asset removal costs, return on capital, income 843
taxes, capital taxes, property taxes and amortization costs; and (iii) other components such as 844
non-rate revenues and export revenue credit. 845
7.1.1 Functionalization of assets 846
In order to determine its revenue requirement for each Rate Pool, Hydro One must first assign 847
the physical transmission assets that it owns (or a portion thereof) to the various functional 848
categories defined below. This assignment process is based on ‘load forecast data for each 849
delivery point, the fixed asset financial database and the electrical system connectivity database 850
that identifies the connectivity between transmission assets (e.g. lines and stations) to which 851
customers are connected.’19 852
16 Hydro One filed its initial application on May 28, 2012. On December 20, 2012, OEB approved total
transmission revenue requirements of $1,390.8 million for 2013 and $1,439.5 million for 2014. Of these amounts, $440.3 million in 2013 and $449.7 million in 2014, constituted OEB-approved OM&A expenses. $982.4 million in 2013 and $1,121.5 million in 2014, constituted capital expenditures. OEB. EB-2012-0031. Decision in the matter of an application by Hydro One Networks Inc. for an approving of new transmission revenue requirements and rates for the transmission of electricity in 2013 and 2014. Decision issued on December 20, 2012.
17 This methodology was initially approved by the OEB in the Decision on Rate Order in Proceeding EB-2010-0002.
18 The methodology involves four Rate Pools: the Network Pool, the Line Connection Pool, the Transformation Connection Pool, and the Wholesale Meter Pool.
19 Hydro One. EB-2012-0031 Exhibit G1. Tab 2. Schedule 1. Filed May 28, 2012. Page 1 of 20.
Ontario - Hydro One transmission
Functional groups: Network, Line Connection, Dual Function Line, Transformation Connection, Generation Station Switchyards, Wholesale meter, Common, Other
Classification groups: Network Pool, Line Connection Pool, Transformation Connection Pool, and Wholesale Meter Pool (referred to as Rate Pools)
Allocation method: based on Coincident or Non-Coincident Peak demand

London Economics International LLC 32 contact: 717 Atlantic Ave., Suite 1A Amit Pinjani/Ian Chow Boston, MA 02111 416-643-6621 www.londoneconomics.com [email protected]
As presented in Figure 20 and the following table, the functional categories to which Hydro 853
One assigned its assets in the context of its latest transmission revenue requirements and rate 854
determinants application were the following: (i) network lines, (ii) dual function line, (iii) line 855
connection, (iv) transformation connection, (v) generation station switchyards, (vi) wholesale 856
meter, (vii) common assets and (viii) other assets. 857
20 Hydro One. EB-2012-0031 Exhibit G1. Tab 2. Schedule 1. Filed May 28, 2012. Page 3 of 20.
21 Ibid. Page 4 of 20.
22 Further details on how these allocation factors are estimated can be found in Hydro One’s EB-2012-0031 Exhibit G1. Tab 2. Schedule 1. PP.10-18.
23 Hydro One. EB-2012-0031 Exhibit G1. Tab 2. Schedule 1. Filed May 28, 2012. Page 5 of 20.
Hydro One - Functional categories
Description
Network Assets
Assigned are those “transmission facilities that are used for the benefit of all customers, or have been approved by the OEB as being for the benefit of all customers
in the province.”20 Generally comprises facilities operating at 230 kV or above and that link major load centers together with major generation resources. These assets provide
reliability to the system and enhanced market efficiency.
Dual Function Line (“DFL”) Assets
Assigned are those “transmission circuits that are used for both the common benefit of all customers and for providing a connection between a network station and load
supply point(s) for one or more customers.”21 Allocation factors are further determined to assign the various costs components to two subcategories of the DFL category: the
line connection DFL sub-category and the network DFL sub-category.22
Line Connection Assets
Assigned are those “transmission circuits and intermediate stations operating at 230 kV or 115 kV that are used to provide a connection between a network station and load supply point(s) for one or more customers and one or more generating stations.”23 The
category also includes the transmission circuits that connect transmission circuits categorized as DFL to load supply point(s) for one customer / generating station or
more. 230 kV or 115 kV radial stations serving one customer or more are also included in this category.
Transformation Connection Assets
This category includes transformer stations used to step down the voltage from above 50 kV to below 50 kV.
Generating Station This category includes switchyards used to connect generating stations to the

London Economics International LLC 33 contact: 717 Atlantic Ave., Suite 1A Amit Pinjani/Ian Chow Boston, MA 02111 416-643-6621 www.londoneconomics.com [email protected]
Figure 20. Ontario transmission asset categories 858
859
Source: Hydro One. EB-2012-0031 Exhibit G1. Tab 2. Schedule 1. Filed May 28, 2012. Page 2 of 2025 860
24 Ibid. Page 7 of 20.
25 All Exhibits related to Hydro One’s 2013-2014 Transmission Revenue Requirement and Rates Application, <http://www.hydroone.com/RegulatoryAffairs/Pages/2013-2014Tx.aspx#g>
500 kV or 115kV
230 kV or 115kV
C
C
C
Station
C Customer
Generation
Generation Station Switchyards
Network line
Dual function line
Line connection
Transformation connection assets
Switchyard Assets transmission system.
Wholesale Meter Assets
This category encompasses metering-related facilities that are “used for billing and settlement in respect of transmission and/or wholesale energy charges. These facilities include the recorders, physical meters and related instrument transformers, wiring,
and panels that can be separately identified as being used solely for revenue metering purposes.”24
Common Assets
This category encompasses facilities that serve the operation of the overall provincial transmission system such as: telecommunication and control equipment,
administration buildings and control rooms, minor fixed assets (such as office computers and equipment) and electrical equipment held in reserve.
Other Assets This category encompasses all remaining transmission facilities that could not be
assigned to any functional categories listed above.

London Economics International LLC 34 contact: 717 Atlantic Ave., Suite 1A Amit Pinjani/Ian Chow Boston, MA 02111 416-643-6621 www.londoneconomics.com [email protected]
7.1.2 Allocation of revenue requirements to rate pools 861
The second step is to attribute the transmission revenue requirements to each of the Rate Pools. 862
Figure 21 below presents the process by which transmission revenue requirements are allocated 863
to various Rate Pools.26 864
Figure 21. Ontario costs-to-revenue requirement process 865
866
Source: HONI. EB-2012-0031 Exhibit G1. Tab 2. Schedule 1. Filed May 28, 2012. Page 1 of 20 867
The costs are assigned as follows: 868
costs associated with the Network, Line Connection, and Transformation Connection 869
functional categories, as a result of the prior assignment process, are directly assigned to 870
the correspondingly-named Rate Pools; 871
aggregate costs associated with the Generator Line Connection and Generator Station 872
Connection functional categories are both assigned to the Network Pool; 873
costs associated with the Wholesale Meter functional category are directly assigned to 874
the Wholesale Meter Pool; 875
costs associated with the Dual Function Lines are assigned to either the Network Pool or 876
the Line Connection Pool; and 877
26 “The term “Assigned” refers to a value that is designated to a particular Functional Category or Rate Pool (e.g. Export Revenues are directly assigned to the Network Rate Pool). The term “Allocated” indicates that a parameter(s) is used to calculate the proportion of the values that are designated to more than one Functional Category or Rate Pool (e.g. load forecast data is applied to the value of Dual Function Line assets to determine the proportion of its value that is allocated to the Network Functional Category and to the Line Connection Functional Category).” Source: Hydro One. EB-2012-0031 Exhibit G1. Tab 2. Schedule 1. Filed May 28, 2012. Page 9 of 20.
REVENUE REQUIREMENT
Operations, Maintenance and Administration
Fixed Asset- Total Depreciation- Asset Removal Costs- Return on Capital- Income & Capital
Taxes- Property Taxes- Amortization Costs
FUNCTIONAL CATEGORIES
RATE POOLSOTHER RATES
REVENUE REQUIREMENT
Functional Categories
Assigned
Allocated
Functional Categories
Assigned
Allocated
Network Pool
AssignedLine Connection
Pool
Transformation Connection Pool
Assigned
Allocated
Export Revenues
Low Voltage Switchgear
Non-Rate Revenues
Tx Riders (if applicable)

London Economics International LLC 35 contact: 717 Atlantic Ave., Suite 1A Amit Pinjani/Ian Chow Boston, MA 02111 416-643-6621 www.londoneconomics.com [email protected]
costs associated with the functional categories “Common” and “Other” are allocated to 878
either Network, Line Connection or Transformation Connection Rate Pools in 879
proportion to amounts of costs that have already been assigned to those Rate Pools 880
based on other functional categories. For instance, “Common” and “Other” OM&A costs 881
are allocated to each Rate Pool in proportion of the relative share of OM&A costs 882
already assigned to that Rate Pool. 883
7.2 California, USA 884
The California ISO (“CAISO”) tariff defines transmission 885
cost determination and responsibility. 27 There are two 886
general cost categories that are determined by the tariff: the 887
Grid Management Charge (“GMC”) and the Transmission 888
Access Charge (“TAC”). The GMC is a charge for managing 889
the markets, operating the grid, settlements and 890
administration. It does not include transmission asset costs. 891
The cost responsibility for the various GMC cost buckets is 892
allocated primarily to the users of the services. 893
The TAC includes transmission facilities that have had their 894
operational control turned over to the CAISO by 895
Participating Transmission Owners (“PTO”s). The TAC 896
segments the transmission function into network 897
transmission facilities and Location Constrained Resource 898
Interconnection Facilities (“LCRIF”). The network transmission facilities are further 899
functionalized into high voltage facilities which are facilities that operate at 200 kV and above 900
and low voltage facilities which are operating below 200 kV. 901
The cost of the PTOs’ facilities that are not under the operational control of the CAISO such as 902
low voltage distribution facilities and radial generator interconnect lines, regardless of voltage, 903
are recovered by the PTO from its load and generator customers respectively. 904
Revenue generated by wheeling services is collected through the Wheeling Access Charge 905
(“WAC”) and is credited to the TAC. 906
7.2.1 Network transmission facilities – PTO cost recovery 907
A PTO’s cost recovery for facilities turned over to the ISO Operational Control begins with its 908
Transmission Revenue Requirement (“TRR”) approved by Federal Energy Regulatory 909
Commission (“FERC”). The TRR is comprised of the total annual revenue requirement 910
associated with such network facilities. The high voltage TRR costs are recovered through a 911
High Voltage Access Charge on a uniform basis from the PTO’s load. Summing all PTOs’ TRR 912
27 California Independent System Operator Corporation. Fifth Replacement CAISO Tariff. Mar 20, 2013.
California ISO
Functional groups: Network Transmission Facility, Location Constrained Resource Interconnection Facilities
Classification groups: High Voltage, Low Voltage (referred to as further functionalization)
Allocation method: Based on locational and uniform $/MWh rates

London Economics International LLC 36 contact: 717 Atlantic Ave., Suite 1A Amit Pinjani/Ian Chow Boston, MA 02111 416-643-6621 www.londoneconomics.com [email protected]
and dividing by the sum of the PTOs’ gross load in MWh results in calculating the High Voltage 913
Access Charge. The High Voltage Access Charge is a uniform $/MWh rate for all PTO loads. 914
The low voltage TRR portion of the TAC is PTO-specific and is based on the TRR associated 915
only with its own low voltage transmission facilities. A calculation similar to the High Voltage 916
Access Charge is performed but it produces a unique Low Voltage Access Charge for each PTO. 917
The total TAC is paid by entities serving load on the transmission and distributions systems of 918
the PTOs under the ISO’s operational control. 919
7.2.2 LCRIF – cost recovery 920
Typically, the cost of transmission infrastructure is allocated to load in the United States,28 but 921
interconnecting generators pay for direct interconnection facilities. However, in the California 922
ISO, a special case is made for interconnection facilities of renewable resources, primarily wind. 923
LCRIF costs are allocated to load until the resource interconnects; once it interconnects, the 924
resource pays for its contribution to the LCRIF (determined by its capacity).29 925
In order to construct transmission facilities of adequate capacity to deliver generation located in 926
transmission constrained resource rich areas, the LCRIF rate methodology was developed and 927
approved by FERC. Eligibility for LCRIF rate treatment requires a demonstration of adequate 928
subscription through large generator interconnection agreements (“LGIA”) of at least 25% of the 929
line’s capacity and a documented interest for at least an additional 25%. 930
If a transmission line is eligible for LCRIF rate treatment, the PTO will fund the cost of 931
construction upfront. The recovery of costs comes from two sources. The first is the subscribing 932
generators, and second is the cost of unsubscribed capacity added to the TAC similar to a 933
network upgrade. As generation projects are developed and interconnected to the LCRIF, cost 934
recovery is transferred on a going-forward pro rata basis to the new generation owners and the 935
LCRIF costs included in the TAC are reduced accordingly. Once the anticipated generation is 936
fully developed and the LCRIF capacity fully subscribed, the going forward costs for the LCRIF 937
are borne entirely by the generation owners and are not included in the TAC. 938
7.3 Australia 939
All transmission companies operating in the National Electricity Market (Australian Capital 940
Territory, New South Wales, Queensland, South Australia, Tasmania and Victoria) must cost 941
and price their transmission services in accordance with the principles set out in Chapter 6A of 942
28 PJM. A Survey of Transmission Cost Allocation Issues, Methods and Practices. March 10, 2010. P 23.
29 Ibid.

London Economics International LLC 37 contact: 717 Atlantic Ave., Suite 1A Amit Pinjani/Ian Chow Boston, MA 02111 416-643-6621 www.londoneconomics.com [email protected]
the National Electricity Rules (“NER”).30 The NER focus is on 943
the type of service provided rather than the customer types, 944
and NER operates on the following principles: 945
generators should pay the costs directly resulting from 946
their connection, that is a ‘shallow connection’ 947
approach is applied, and do not contribute towards the 948
costs of the shared network, which are covered 949
through prescribed generator transmission use of 950
system (“TUOS”) charges; and 951
network pricing should be cost reflective. 952
Under the cost allocation principles, allocation of costs must 953
be determined according to the substance of a transaction or event rather than its legal form. 954
Also, costs may be allocated to a particular category of services so long as they are directly 955
attributable. Where costs are not directly attributable, such costs should be allocated in 956
accordance with an appropriate methodology. In practice, each transmission network service 957
provider will develop its own cost allocation methodology consistent with these principles. 958
The Australian Energy Regulator (“AER”) is also currently developing a range of guidelines, 959
including Shared Asset Guidelines, to clarify cost allocation and other revenue matters. The 960
pricing principles are set out in Section 6A.23 of the NER and generally reflect the notion that 961
prices should be cost reflective. Separate prices are to be developed for each category of 962
prescribed transmission services including: 963
prescribed entry services include services provided by assets that can be attributed to 964
one or more generator(s) at a single point of connection - must be a fixed annual 965
amount; 966
prescribed exit services include services provided by assets that can be attributed to one 967
or more transmission customer(s) at a single point of connection - must be a fixed annual 968
amount; 969
prescribed common transmission services include services provided by assets that 970
cannot be reasonably assigned on a locational basis and that provide equivalent benefits 971
to all transmission customers - postage-stamp basis; and 972
prescribed TUOS services cover the costs of shared network assets and non-asset related 973
grid support. They are separated into locational and non-locational components. The 974
locational component must be based on demand whereas the non-locational component 975
30 The current version of the National Electricity Rules can be found at http://www.aemc.gov.au/Electricity/National-Electricity-Rules/Current-Rules.html. Chapter 6A focuses on transmission revenue and pricing frameworks.
Australia
Functional and
classification groups: Entry Service, Exit Service, Transmission Use of System Service, Common Transmission Service
Allocation method: Based on fixed $/day and $/MW/day maximum demand rates

London Economics International LLC 38 contact: 717 Atlantic Ave., Suite 1A Amit Pinjani/Ian Chow Boston, MA 02111 416-643-6621 www.londoneconomics.com [email protected]
is postage-stamp based. Costs for prescribed TUOS services are generally split 50:50 976
between locational and non-locational components. Prices for prescribed TUOS services 977
must not change by more than 2% per annum compared with the load weighted average 978
price for this component for the relevant region. This cap can be exceeded if load at the 979
connection point has materially changed and the customer requested a renegotiation of 980
the connection agreement and AER has approved the price change. 981
A transmission company can offer discounted rates to a customer for TUOS and common 982
transmission services where the actual costs of providing transmission services to that customer 983
(e.g. a smelter) may be lower. Discounts can be recovered from the remainder of the customer 984
base. 985
7.4 Great Britain 986
In Great Britain, National Grid charges for the use of the transmission system on behalf of 987
National Grid Electricity Transmission, Scottish Power Transmission and Scottish Hydro-988
Electric Transmission, using the Transmission Network Use of System (“TNUoS”) tariff. Unlike 989
the majority of North America, the TNUoS is paid for by both generation and demand 990
resources, where generation pays for 27% and demand pays for 73% of the costs. 991
Figure 22. Great Britain demand use of tariff zones 992
993
Source: National Grid. TNUoS Demand Zones Map (Geographical). April 22, 2010 994

London Economics International LLC 39 contact: 717 Atlantic Ave., Suite 1A Amit Pinjani/Ian Chow Boston, MA 02111 416-643-6621 www.londoneconomics.com [email protected]
The TNUoS is composed of two components: a locational charge and a residual charge. The 995
locational charge is calculated separately, using a marginal cost classification method, for 996
twenty-one generation zones and fourteen demand zones. Generally, tariffs are higher for 997
generators in the north and consumers in the south. The locational component is classified 998
using a marginal cost methodology known as the Investment Cost Related Pricing (“ICRP”). 999
The ICRP estimates long run marginal costs of investment required for the transmission system, 1000
caused by an increase in demand or generation at each connection point or node. Hence, 1001
different costs are calculated for different locations in the market.31 1002
Figure 23. Schedule of Transmission Network Use of System Demand Charges (£/kW) and 1003
Energy Consumption Charges (p/kWh) for 2013/14* 1004
1005
Source: National Grid. The Statement of Use of System Charges. Effective from April 1, 2013. * Rounded to 3 decimal places 1006
The residual, non-locational component of the TNUoS tariff is meant to recover the remaining 1007
amount of the revenue requirement that is not recovered by the locational component. This 1008
portion exists because the marginal cost model used in the locational component assumes 1009
smooth, incremental investment can be made in transmission. However, in reality this capital 1010
investment is “lumpy”; large investments can be made for future requirements, which mean the 1011
system becomes non-optimal. The difference between the actual, non-optimal system is 1012
accounted for by the residual component. 1013
31 A metric used to measure investment costs is MW-km, which is unrelated to the MW-km method described for functionalization. In the context of the TNUoS, marginal costs are estimated in terms of increases or decreases in units of kilometers of the transmission system, for a 1 MW injection to the system.
Demand Zone Zone Area Demand Tariff (£/kW) Energy Consumption Tariff (p/kWh)
1 Northern Scotland 11.049 1.515
2 Southern Scotland 16.790 2.363
3 Northern 22.347 3.080
4 North West 25.184 3.651
5 Yorkshire 25.485 3.509
6 N Wales & Mersey 25.631 3.665
7 East Midlands 28.213 3.957
8 Midlands 29.201 4.149
9 Eastern 29.892 4.153
10 South Wales 27.542 3.685
11 South East 32.827 4.564
12 London 34.083 4.601
13 Southern 33.752 4.741
14 South Western 33.552 4.598
London Economics International LLC 40 contact: 717 Atlantic Ave., Suite 1A Amit Pinjani/Ian Chow Boston, MA 02111 416-643-6621 www.londoneconomics.com [email protected]
Generators that directly connect to the transmission system or embedded generators with a 1014
Bilateral Embedded Generation Agreement (“BEGA”), and those that are equal to 100 MW or 1015
larger are liable to pay TNUoS charges. These charges are paid with respect to their maximum 1016
installed capacity (kW), and are comprised of wider and local charges. Local charges include 1017
substation charges as well as circuit charges. 1018
Loads that pay the TNUoS can be differentiated into half-hourly (“HH”) metered, which have 1019
peak loads larger than 100 kW, and non-half-hourly (“NHH”) metered, which are smaller than 1020
100 kW. HH metered loads are charged the average “triad” demand multiplied by the zonal 1021
demand tariff (£/kW), where triad means the three half-hours between November and 1022
February (inclusive) with the highest peak system demand. The triad half-hours must be 1023
separated from system demand peak and each other by at least ten days. NHH metered loads 1024
are charged actual energy consumption (kWh) for the hours of 16:00 to 19:00 inclusive, 1025
multiplied by the energy zonal energy consumption tariff (p/kWh). 1026
7.5 Applicability to Alberta 1027
The purpose of LEI’s review of other jurisdictions was to introduce how transmission costs are 1028
allocated elsewhere. It was observed that there is no single template or standard transmission 1029
cost causation methodology. Alberta’s methodologies may seem unique, however no two 1030
jurisdictions are the same in their methodologies. 1031
Despite the differences, LEI noted that elements of functionalization by voltage can be observed 1032
across numerous jurisdictions. For example, in Ontario, 230 kV and higher assets are generally 1033
functionalized as network assets, which link major load centers, while line connection assets are 1034
generally 230 kV or 115 kV. In California, network transmission facilities are functionalized into 1035
high and low voltage facilities around a 200 kV breakpoint, which are recovered through 1036
different charges. LEI believes functionalization by voltage is more common because it is 1037
perceived as being simple and easy to understand. 1038
An interesting feature of the California system is the existence of LCRIF, which creates a special 1039
category for projects that are built specifically to interconnect renewable generation. Definition 1040
of this separate category is related to the distinction of “special projects” which was requested 1041
by Transmission Cost Causation Working Group (“TCCWG”) members, which is addressed in 1042
greater detail in Section 13.1. 1043

London Economics International LLC 41 contact: 717 Atlantic Ave., Suite 1A Amit Pinjani/Ian Chow Boston, MA 02111 416-643-6621 www.londoneconomics.com [email protected]
8 Functionalization of capital costs 1044
LEI performed three methods of functionalization: by voltage, economics, and megawatt-1045
kilometer. These three approaches were used in the TCCS, which were well-understood and 1046
approved by the AUC, and so represent a good starting point.32 However, while LEI is informed 1047
by the previous studies, we have not been constrained by them. After reviewing the strengths 1048
and weaknesses of the different approaches, and considering the rate design principles 1049
discussed earlier in Section 5, LEI recommends functionalization by voltage as the method 1050
going forward. 1051
8.1 TFO cost data 1052
The following section specifies data sources used by LEI in the capital cost functionalization 1053
analysis, and describes the data utilization approach. This section also specifies data limitations 1054
and any reasonable assumptions made consequently. 1055
8.1.1 Depreciation 1056
Given that LEI incorporated both existing assets as well as future projects with differing in-1057
service dates, it was important to take into account depreciation rates of the various 1058
transmission assets. All net book values were depreciated to December 2016 prior to 1059
functionalization. LEI utilized TFO tariff application schedules in order to determine 1060
appropriate levels of depreciation to use for AltaLink and ATCO. ENMAX depreciation rates 1061
were determined using a confidential data request. 1062
Figure 24. Calculated TFO transmission line and substation depreciation rates 1063
1064
32 Although LEI considered the MVA-km approach, it was not chosen for analysis, due to the subjective nature of setting a breakpoint, an inability to reflect evolution of the system, and lack of prior use in Alberta or elsewhere.
Lines
2013 2014 2015 2016
Altalink 2.71% 2.84% 2.84% 2.84%
Epcor 2.90% 2.95% 2.95% 2.95%
ENMAX 2.01% 1.83% 1.83% 1.83%
ATCO 3.10% 3.07% 3.07% 3.07%
Substations
2013 2014 2015 2016
Altalink 3.47% 3.56% 3.56% 3.56%
Epcor 2.95% 2.90% 2.90% 2.90%
ENMAX 2.66% 2.64% 2.64% 2.64%
ATCO 2.29% 2.31% 2.31% 2.31%

London Economics International LLC 42 contact: 717 Atlantic Ave., Suite 1A Amit Pinjani/Ian Chow Boston, MA 02111 416-643-6621 www.londoneconomics.com [email protected]
For AltaLink lines, LEI utilized an asset-weighted average of land rights, towers and fixtures, 1065
overhead conductors and poles and fixtures. For AltaLink substations, an asset-weighted 1066
average of land rights, station equipment and system communication and control was used.33 1067
For ATCO lines, an asset-weighted average of total land rights, towers and fixtures, overhead 1068
conductor towers, poles and fixtures, and overhead conductor poles was used. For ATCO 1069
substations, LEI used an asset-weighted average of land rights, and substation equipment.34 1070
For ENMAX lines, an asset-weighted average of land rights, wood poles, steel towers, steel 1071
poles, insulators, overhead aluminum conductor, overhead aluminum conductor steel 1072
reinforced (“ACSR”), and overhead self-damp conductor was used. For ENMAX substations, 1073
LEI used an asset-weighted average of land, buildings, site development, substation 1074
transformers, substation switchgear, substation structures, substation protection, telecontrol 1075
and supervisory costs. 1076
The EPCOR depreciation forecast was not found in its tariff application, and therefore, was 1077
depreciated at a weighted-average of AltaLink, ATCO and ENMAX depreciation rates. Given 1078
2015 and 2016 depreciation forecasts were not available through the tariff applications, and 1079
depreciation rates were seen not to vary significantly from year to year, each TFO’s 2014 1080
depreciation rate was used for 2015 and 2016. 1081
8.1.2 Existing asset data 1082
LEI has received asset data from all four TFOs with various levels of detail. In order to perform 1083
the various functionalization methods, line and substation-level details on net book values, 1084
voltages and line lengths were required. 1085
Figure 25. Summary of data received by each TFO 1086
1087
33 AltaLink Tariff Application. Schedule 6-3 and Schedule 10-2
34 ATCO Tariff Application. Schedule 6-6 and Schedule 6-7
TFO Data Received Missing Data
AltaLink • Line and substation-level details on net book values, voltages and line lengths
• Substation secondary voltages
ATCO • Original costs for lines and substations• Line and substation-level details on
voltages and line lengths• Accumulated depreciation aggregated to
line and substation totals
• Line and substation-level details on net book values
ENMAX • Net book values aggregated to substation and transmission totals
• Line and substation-level details on voltages and line lengths
• Line and substation-level details on net book values
EPCOR • Net book values and accumulated depreciation up to 2011, aggregated to Genesee Switchyard, transmission, and substation totals
• Line and substation-level details on net book values, voltages and line lengths
• Net book values and accumulated depreciation for 2012

London Economics International LLC 43 contact: 717 Atlantic Ave., Suite 1A Amit Pinjani/Ian Chow Boston, MA 02111 416-643-6621 www.londoneconomics.com [email protected]
AltaLink provided existing asset data with the necessary detail to perform functionalization by 1088
voltage, economics and MW-km.35 ATCO provided voltages and line lengths for most lines and 1089
substations, 36 however, net book values for individual assets were not received. Total 1090
accumulated depreciation for all assets was provided, which was proportioned by LEI to each 1091
asset using cost and years of service. Although this is an approximation, it represents a best 1092
effort given the data available. 1093
Figure 26. TFO existing asset net book values depreciated to 2016 1094
1095
ENMAX provided data aggregated to the level of total substation and total transmission, which 1096
were assumed to be completely functionalized as POD and regional, respectively. LEI has been 1097
able to validate these assumptions through a confidential data request received from ENMAX. 1098
All ENMAX lines are 138 kV and 69 kV, and would be functionalized as regional using both the 1099
economics and voltage approaches. Over 95% of ENMAX substations will be POD after projects 1100
currently in progress are complete. 1101
EPCOR provided total installed assets under three categories: Genesee Switchyard, total 1102
transmission, and total substations, which were functionalized as bulk, regional, and POD 1103
respectively. EPCOR data was provided for 2011, but not for 2012 or 2013. It was noted that due 1104
to changes within EPCOR systems and personnel, it was not possible to confirm that the 1105
categories provided contain the exact same accounts as the accounts used in the 2005 TCCS. 1106
35 AltaLink identified 27 substations which are switching stations or are substations for which the customer owns the transformer. Switching stations have equal primary and secondary voltages, so the secondary voltages apply. Substations which connect directly to customers are functionalized as POD (or according to their substation fraction, described in Section 8.3.1).
36 ATCO voltage and line lengths for over 94% (by value) of existing line data and over 87% (by value) of substation data was available. Any assets lacking data were functionalized in proportion to other ATCO assets. Secondary voltages for ATCO substations were occasionally provided for multiple years, and for a few substations multiple secondary voltages were given. As it was not possible to identify which subsequent capital investments belonged to which voltage, LEI assumed the secondary voltage of the largest capital investment.
AltaLink Lines, $723,137,770 ,
18%
AltaLink Substations,
$968,840,796 , 25%
ATCO Lines, $1,010,524,351 ,
26%
ATCO Substations,
$755,227,860 , 19%
ENMAX, $173,508,876 ,
4%
EPCOR, $313,909,892 ,
8%

London Economics International LLC 44 contact: 717 Atlantic Ave., Suite 1A Amit Pinjani/Ian Chow Boston, MA 02111 416-643-6621 www.londoneconomics.com [email protected]
Ongoing capital maintenance for existing projects is assumed to be $253 million per year 1107
(sourced from TFO GTAs) and POD connection projects are assumed to be $90 million37 per 1108
year (sourced from AESO 2012 Construction Contribution Policy Application), beginning in 1109
2013. 38 When depreciated to 2016, the total net book value of existing assets equals 1110
approximately $5.2 billion. 1111
8.1.3 Future projects 1112
In Decision 2010-606, the AUC instructed the AESO to consider a forecast of capital build for the 1113
entire expected effective term of the AESO’s next tariff, using the LTP as a starting point. The 1114
LTP, filed June 2012, is a report produced by the AESO that forecasts investment in the 1115
transmission system for the next 20 years, and makes recommendations on upgrades needed to 1116
“reliably and efficiently serve expanding demand, reduce transmission congestion and related congestion 1117
cost and facilitate a competitive market.”39 The LTP’s total cost estimate for projects in service by 1118
2020 is $13.5 billion. The LTP also reconfirmed the need for four CTI projects, which have an 1119
estimated cost of $5.2 billion. 1120
8.1.3.1 Future project data sources 1121
AESO provided LEI with additional data sources beyond the data contained in the LTP. An 1122
important source of data, particularly for future line data, was the AESO cost benchmarking 1123
data file provided by the AESO. The AESO cost benchmarking data file contained 434 rows of 1124
line information, mostly manually extracted from Proposal to Provide Services documents, 1125
which are usually included with Needs Identification Documents (“NID”s) and/or Facility 1126
Applications (“FA”s). Although this information is more up to date than the LTP data, it is 1127
subject to wide confidence intervals. LEI understands that NID level documents have a cost 1128
estimate which is of a +30%/-30% quality, while FAs are of a +20%/-10% or better quality. As 1129
well, the database was not necessarily comprehensive in nature, though AESO expects that it 1130
covers 95% of all projects. 1131
Given limitations in AESO cost benchmarking data file data, LEI also reviewed 62 individual 1132
project progress report files provided by AESO (referred to as “progress reports”), which are 1133
reports submitted to the Transmission Facility Cost Monitoring Committee (“TFCMC”). The 1134
reports used were published in November 2012, and represent the most up to date information 1135
received by LEI. LEI attempted to match all progress reports with the AESO cost benchmarking 1136
data file and LTP projects using project descriptions as well as AESO reference numbers, and 1137
37 $90 million is net of customer contributions. Note that POS capital additions are fully funded by customer contributions. (AESO. AESO 2012 Construction Contribution Policy Application)
38 Note that although ongoing capital maintenance costs and POD connection projects occur in the future, they are distinct from future project functionalization, as the costs will generally be attributable to existing assets. These costs are not allocated to a particular TFO, but are included in overall functionalization results.
39 AESO. AESO Long-term Transmission Plan. Filed June 2012.

London Economics International LLC 45 contact: 717 Atlantic Ave., Suite 1A Amit Pinjani/Ian Chow Boston, MA 02111 416-643-6621 www.londoneconomics.com [email protected]
data was updated to match the progress report values. The progress reports were particularly 1138
useful in determining future substation costs. 1139
In addition to the LTP, the AESO cost benchmarking data file and progress reports, LEI 1140
identified missing data to the AESO, and information for specific projects was provided and 1141
taken into account. This included about $2 billion of projects which are still in the planning 1142
stage and have not progressed to the point where further details are available. Specifically, $1 1143
billion of these costs can be attributed to the South Area Transmission Reinforcement (“SATR”), 1144
which is a staged project meaning some stages are contingent on reaching particular milestones 1145
– therefore, detailed cost data is not available.40 AESO planners provided voltage information 1146
for these projects, and they have been directly functionalized. 1147
8.1.3.2 Process to refine future data 1148
The process that LEI utilized to refine the required data from the given data sources is described 1149
in Figure 27. 1150
Figure 27. Utilization and refinement of data 1151
1152
40 Other projects that have not progressed sufficiently in order to have detailed costs are: Thickwood, North Calgary Stage 1, Distribution Customer Connections (“DCC”) for Central, DCC for Edmonton, DCC for Northeast, DCC for Northwest, Heartland 240 kV Loop, South Alberta 69 kV Conversion, North Edmonton, Big Rock, Athabasca Telecommunications Upgrade, Northeast Reactive Power Reinforcement, Fort Saskatchewan, Hotchkiss Reactor Banks Addition, and 9L66 240kV Line Relocation (Project 943).

London Economics International LLC 46 contact: 717 Atlantic Ave., Suite 1A Amit Pinjani/Ian Chow Boston, MA 02111 416-643-6621 www.londoneconomics.com [email protected]
A summary of the available data from each data source is found in Figure 28.41 The data sources 1153
are shown on the left, and through the process explained above, data was matched and 1154
organized into data that is usable. 1155
Figure 28. Forward looking data-processing summary (non-depreciated costs)42 1156
1157
Note: For projects that come into service after 2016 as per the 2012 LTP (approximately $1.8 billion), no construction 1158 work in progress (“CWIP”) costs are in the revenue requirement in and before 2016. Source: AESO. Draft Transmission 1159 Rate Impact Projection Model 1160
41 Information without cost data cannot be quantified and has not been included. For lines, there is approximately $100 million of lines which contain voltage information, but no length information. These lines were functionalized by voltage across all three methods.
42 For large projects/sub-projects with a construction duration of more than one year and that come into service between 2013 and 2016 (Hanna, Foothills, SATR, East/West HVDC), we account for allowance for funds used during construction (“AFUDC”) by applying AFUDC assumptions in the AESO Draft Transmission Rate Impact Projection Model.
Data Source Data
Progress Reports
$8.0B
Cost Bench-
marking Data$4.2B
LTP$13.5B
$13.5B
By 2016: $11.7B
$8.0B
After 2016$1.8B
$5.6B
Substations $2.0B
Line$3.6B
Final Substation
Data$1.6B
Final Line Data$4.6B
Lacking voltage data $0.4B
Lacking voltage data $0.4B
Matched (not exact)
Cancelled projects$.2B
Main source of data
Projects with AESO Estimated Voltage
$2.0B
Other Costs$2.4B

London Economics International LLC 47 contact: 717 Atlantic Ave., Suite 1A Amit Pinjani/Ian Chow Boston, MA 02111 416-643-6621 www.londoneconomics.com [email protected]
Note, although “Other costs” and data with missing details do not have enough information to 1161
be functionalized by the various methods, their values are taken into account when calculating 1162
the weighted final functionalization results. This data is represented using turquoise boxes and 1163
text in Figure 28. 1164
“Other Costs” are comprised of distributed costs,43 owners’ costs,44 allowance for funds used 1165
during construction (“AFUDC”), salvage,45 and engineering & supervision costs. Typically, 1166
distributed costs make up a large proportion of other costs. These costs do not obviously fit into 1167
a specific functional group or asset class. They have been functionalized based on overall 1168
planned project functionalization results, which is a good approximation of individual project 1169
functionalization. 1170
LEI believes that the data set produced by matching data between the three data sources and 1171
updating to the latest information represents a reasonable best effort, given challenges with 1172
data availability. In total, net book value of future lines and substations that are analyzed using 1173
detailed, direct, and proportional functionalization equals $11.4 billion (non-depreciated). 1174
8.2 Functionalization by intention, current use and future use 1175
In choosing a sensible approach for functionalizing costs, it is important to consider if cost 1176
causation should reflect original identified need, current use of facilities, or future need for 1177
facilities. LEI believes that original identified need is not appropriate for indefinite use, as the 1178
transmission system is dynamic and evolving over time. For example, before 138 kV and 240 kV 1179
lines were constructed in the mid-1900s,46 Alberta’s 69 kV would have been considered a bulk 1180
system, but in today’s system, they clearly do not serve a bulk function. Originally identified 1181
need may therefore not be an appropriate way to consider cost causation. LEI is of the opinion 1182
that the current use of facilities is the most appropriate way to consider cost causation. All 1183
methods of functionalization and classification applied in this section are considered to reflect 1184
current use by LEI.47 Furthermore, future cost causation studies will reflect future use of 1185
facilities, allowing for periodic adjustment and addressing intergenerational equity issues. 1186
43 Procurement, project management, construction management and contingency costs distributed over the whole project
44 Costs related to Proposal to Provide Services, Facility Application, land rights, easement costs, land damage claims costs and land acquisition costs
45 Cost to remove/salvage and remediate
46 The first 240 KV line was built in the 1950s: http://www.altalink.ca/about/history.cfm
47 The voltage approach is consistent with current use at it does not functionalize certain 69 kV lines as bulk going forward, though these lines may have initially been built to serve bulk system. MW-km approach uses current line loading and the economics approach uses current economics of transmission system as inputs.

London Economics International LLC 48 contact: 717 Atlantic Ave., Suite 1A Amit Pinjani/Ian Chow Boston, MA 02111 416-643-6621 www.londoneconomics.com [email protected]
8.3 Functionalization 1187
8.3.1 Option 1: defined by voltage level 1188
Functionalization by voltage uses voltage levels of lines and substations to categorize costs. For 1189
lines, firstly radial lines serving a single point of delivery are considered POD, and radial lines 1190
serving a generator are POS, and considered bulk. Then, all lines with voltages 240 kV and 1191
higher are functionalized as bulk, which is mostly made up of 240 kV and 500 kV lines.48 1192
Finally, 138/144 kV and 69/72 kV lines are considered regional. This method of 1193
functionalization by voltage was applied to both existing assets and future lines. 1194
Although substations operate at both a high and low voltage level, for the purposes of 1195
functionalization by voltage, LEI functionalized whole substations based on secondary voltages, 1196
where data was available. Substations with a secondary voltage of 240 kV or higher are 1197
considered bulk, a secondary voltage of 138/144 kV or 69 kV is considered regional, and 25 kV 1198
or lower is considered POD. LEI functionalized all future substations in this manner. 1199
Existing substations are also functionalized using the AESO POD database, which identifies the 1200
contracted capacity for Demand Transmission Service (“DTS”) and Supply Transmission 1201
Service (“STS”). Substations with only DTS contracts are functionalized as POD, while 1202
substations with only STS contracts are considered point-of-supply (“POS”) and thus 1203
functionalized as bulk. Finally, substations with both DTS and STS contracts are allocated to 1204
POD and bulk, respectively, allocated by their contract capacity.49 1205
Although the voltage approach does not differentiate between functions within a voltage level, 1206
LEI believes that the distortions are few during the rate term (2014-2016), and that this 1207
definition will be durable in the long term. An example would be if the 500 kV system were 1208
expanded to the point of replacing the function of the 240 kV system. Even in this situation, 1209
there will still be a place for 240 kV bulk power lines to fulfill lower capacity and shorter 1210
distance requirements at a lower cost compared to 500 kV lines. LEI estimates such an evolution 1211
would occur over a period of more than fifteen years, and would thus be captured in 1212
subsequent studies. 1213
The results below show functionalization by voltage for existing assets, future assets, and the 1214
NBV-weighted overall functionalization results. Note that ENMAX and EPCOR are directly 1215
functionalized as described earlier in Section 8.1.2. 1216
48 240 kV lines have different capacities and lengths but need not be differentiated when functionalizing by voltage. It is likely that both single-circuit and double-circuit 240 kV lines will be serving the bulk system, i.e., typically carrying at least four times the amounts of electricity than 138 kV lines.
49 The allocation ratio is known as the substation fraction. The formula for calculating a POD SF would be: (sum of all DTS contracts) / (sum of all DTS contracts + Sum of all STS contracts). There were no AltaLink or ATCO substations with a substation fraction of 0%, which indicates only generation is connected. However, there were 14 AltaLink or ATCO substations with substation fractions of less than 1%.

London Economics International LLC 49 contact: 717 Atlantic Ave., Suite 1A Amit Pinjani/Ian Chow Boston, MA 02111 416-643-6621 www.londoneconomics.com [email protected]
Figure 29. Existing asset functionalization results by voltage, as of December 2016 1217
1218
Figure 30. Future project functionalization results by voltage, as of December 2016 1219
1220
Figure 31. Overall functionalization results by voltage, as of December 2016 1221
1222
8.3.2 Option 2: defined by economics 1223
Figure 32. Functionalization by economics illustration 1224
1225
Functionalization by economics maintains some similarities to functionalization by voltage, in 1226
that radial lines serving load are still considered POD, radial lines serving generators are bulk, 1227
500 kV lines are still considered bulk, and 69/72 kV lines are considered regional. Substations 1228
are also functionalized in the same way, with substations having a secondary voltage of 240 kV 1229
TFO Bulk System Regional System POD
AltaLink 28.0% 34.0% 38.0%
Atco Electric 39.9% 25.9% 34.2%
ENMAX 0.0% 41.5% 58.5%
EPCOR 30.0% 20.4% 49.5%
All TFOs 29.7% 27.3% 43.0%
Method Bulk System Regional System POD
Voltage 86.0% 12.6% 1.4%
Method Bulk System Regional System POD
Voltage 66.7% 17.6% 15.7%
240 kV system with 240 kV PODs
240 kV
240 kVPODs
240 kV
138 kV
138 kVPODs
240-138 kVSubstation
240-138 kV substation with 138 kV PODs

London Economics International LLC 50 contact: 717 Atlantic Ave., Suite 1A Amit Pinjani/Ian Chow Boston, MA 02111 416-643-6621 www.londoneconomics.com [email protected]
or higher considered bulk, a secondary voltage of 138/144 kV or 69 kV considered regional, and 1230
25 kV or lower considered POD.50 POS substations are considered bulk. 1231
The method differs in how it functionalizes 138 kV and 240 kV lines, by considering the 1232
economics of building a high voltage line and high voltage PODs, as compared to the cost of 1233
building a step down transformer and lower voltage PODs. The point at which the economics 1234
are the same between the two options represents the breakpoint, which is measured in length of 1235
the line. Lines longer than the breakpoint are economic as a bulk line, and lines shorter than the 1236
breakpoint are more suited to regional systems. 1237
The economic analysis was performed on a hypothetical 240 kV line with 240 kV PODs, 1238
compared against the cost of a 240-138 kV substation, 138 kV line and 138 kV PODs. The 1239
hypothetical lines are both 150 km long, which is the distance between Calgary and Red Deer, 1240
or Red Deer to Edmonton. 1241
Figure 33. Typical 240 kV substation and POD design 1242
1243
Source: LEI analysis; AESO Unit Cost Guide 2011 1244
LEI first worked with AESO planners to determine typical substation and POD design in 1245
Alberta (as seen in Figure 33), and consequently applied the costs of the AESO 2011 Unit Cost 1246
Guide to the designs.51 Costs found in the 2011 Unit Cost Guide were then validated against 1247
50 There was insufficient data to match individual substations to their respective secondary voltage lines, making it difficult to functionalize substations by the economics approach.
51 AESO. 2011 Unit Cost Estimates. <www.aeso.ca/downloads/2011_Unit_Cost_Estimates.pdf>
Cost $16.82 Million
240 kV 25 MVA POD
Cost $14.7 Million
138 kV 25 MVA POD
Cost $7.77 Million
240/138 kV Substation

London Economics International LLC 51 contact: 717 Atlantic Ave., Suite 1A Amit Pinjani/Ian Chow Boston, MA 02111 416-643-6621 www.londoneconomics.com [email protected]
AESO Benchmarking Database for Alberta Transmission Projects.52 Using this data, the two 1248
options were compared for a range of PODs; as observed in Figure 34, for a low number of 1249
PODs, the 240 kV POD system is more economic. However, as more PODs are required, the 138 1250
kV system becomes more economic, which is consistent with theory. 1251
Figure 34. Functionalization by economics showing number of PODs – 240 kV 1252
1253
Figure 35. Functionalization by economics showing distance between PODs – 240 kV 1254
1255
Another method of considering this is by assuming the PODs are equal distance from one 1256
another, and plotting the same data against distance between PODs, as seen in Figure 35. 1257
Considering Figure 35, the point at which the systems are the same cost, or the breakpoint, is at 1258
13.8 km. In this system, 240 kV lines are economic when they are longer than 13.8 km, and thus, 1259
should be treated as bulk; 240 kV lines shorter than 13.8 km are actually more economic as 138 1260
kV systems, and therefore should be considered regional. 1261
52 AESO. Reasonableness Assessment of Transmission Cost Using Benchmarking Methodology. March 28, 2013. <www.aeso.ca/downloads/Reasonableness_Assessment_of_Transmission_Cost_Using_Benchmarking_Methodology.pdf>
$0
$100,000,000
$200,000,000
$300,000,000
$400,000,000
$500,000,000
$600,000,000
0 5 10 15 20 25 30 35
Co
st
Number of PODs
240 kV PODs 138 kV system
$0
$100,000,000
$200,000,000
$300,000,000
$400,000,000
$500,000,000
$600,000,000
0 5 10 15 20
Co
st
km between PODs
138 kV system 240 kV PODs

London Economics International LLC 52 contact: 717 Atlantic Ave., Suite 1A Amit Pinjani/Ian Chow Boston, MA 02111 416-643-6621 www.londoneconomics.com [email protected]
Similarly, for a 138 kV line, the same breakpoint and analysis applies. 138 kV lines are economic 1262
when they are shorter than 13.8 km, and thus, should be treated as regional; 138 kV lines longer 1263
than 13.8 km are actually more economic as 240 kV systems, and therefore should be considered 1264
bulk. The economics approach uses this theoretical breakpoint of 13.8 km to functionalize both 1265
240 kV and 138 kV lines in Alberta as bulk or regional. 1266
The figures below present results of functionalization by economics for existing assets, future 1267
assets, and for combined NBV-weighted existing and future assets. 1268
Figure 36. Existing asset functionalization results by economics, as of December 2016 1269
1270
Figure 37. Future asset functionalization results by economics, as of December 2016 1271
1272
Figure 38. Overall functionalization results by economics, as of December 2016 1273
1274
8.3.3 Option 3: defined by MW-km 1275
Functionalization by MW-km is based on the definition that bulk lines carry large amounts of 1276
power over long distances. Therefore, lines with high MW-km ratings are considered bulk, 1277
while lines with lower MW-km ratings are considered regional. 1278
In order to perform this analysis, line lengths were obtained from the data sources described in 1279
Section 8.1. Forecasted line loadings were also required, and LEI utilized the AESO 2013 1280
Planning Base Case Suite, specifically using the 2015 winter peak case.53 The 2015 case was 1281
chosen in the absence of a 2016 case, as it lies within the rate period of 2014-2016, and would 1282
thus be representative of system conditions during that time. The winter peak case was chosen, 1283
because in peak conditions, the system would be heavily loaded, which would emphasize the 1284
function of transmission components. 1285
The MW-km method analyzes the MW-km ratings of lines for each voltage, and determines 1286
what percentage of lines are bulk versus regional. The percentage is determined based on what 1287
53 AESO. 2013 Planning Base Case Suite. January 24, 2013. http://www.aeso.ca/transmission/261.html
TFO Bulk System Regional System POD
AltaLink 36.1% 25.9% 38.0%
Atco Electric 55.9% 9.9% 34.2%
ENMAX 0.0% 41.5% 58.5%
EPCOR 30.0% 20.4% 49.5%
All TFOs 39.5% 17.5% 43.0%
Method Bulk System Regional System POD
Economics 87.9% 10.8% 1.4%
Method Bulk System Regional System POD
Economics 71.3% 13.0% 15.7%

London Economics International LLC 53 contact: 717 Atlantic Ave., Suite 1A Amit Pinjani/Ian Chow Boston, MA 02111 416-643-6621 www.londoneconomics.com [email protected]
percentages of lines (by line length) are higher or lower than a breakpoint, which differentiates 1288
the bulk system and regional system; lines with a higher MW-km rating than the breakpoint are 1289
functionalized as bulk and lines which are lower are functionalized as regional. 1290
One of the challenges with the MW-km approach is setting an appropriate breakpoint. In the 1291
voltage approach, 240 kV lines are considered to be bulk, while 138 kV lines are considered to 1292
be regional. As seen in Figure 39, the average MW-km of 138 kV lines is 466 MW-km, while the 1293
average of 240 kV lines is 3,662 MW-km; the breakpoint was chosen to be the midpoint of the 1294
two, at 2,000 MW-km. 1295
Figure 39. Ranges of MW-km ratings of different voltages 1296
1297
Note: Minimum ratings exclude lines < 1km in length 1298
Figure 40. Scatterplot of MW-km ratings 1299
1300
This breakpoint was validated by ensuring it is higher than the maximum 69 kV MW-km rating 1301
observed (1,614 MW-km), which ensures no 69 kV lines will be functionalized as bulk. 1302
Furthermore, it was validated as being lower than the minimum 500 kV line rating observed 1303
(2,484 MW-km), which ensures no 500 kV lines will be functionalized as regional. 1304
1305
Min Average Max
69 kV 0.3 87.2 1,614.0
138 kV 0.1 466.2 8,150.0
240 kV 4.4 3,661.5 27,570.8
500 kV 2,484.4 9,970.4 40,138.8
MW-km RatingVoltage
0
5,000
10,000
15,000
20,000
25,000
30,000
35,000
40,000
45,000
0 100 200 300 400 500 600 700
MW
-km
Ra
tin
g
MW
500 kV 240 kV 138 kV 69 kV

London Economics International LLC 54 contact: 717 Atlantic Ave., Suite 1A Amit Pinjani/Ian Chow Boston, MA 02111 416-643-6621 www.londoneconomics.com [email protected]
Figure 41. Scatterplot of MW-km ratings (expanded 0 to 5,000 MW-km) 1306
1307
Functionalizing substations occurs by voltage, with substations having a secondary voltage of 1308
240 kV or higher considered bulk, a secondary voltage of 138/144 kV or 69 kV considered 1309
regional, and 25 kV or lower considered POD.54 POS substations are considered bulk. 1310
The figures below show the results of functionalization by MW-km for existing assets, future 1311
assets, and for combined NBV-weighted existing and future assets. 1312
Figure 42. Existing asset functionalization results by MW-km, as of December 2016 1313
1314
Figure 43. Future project functionalization results by MW-km, as of December 2016 1315
1316
Figure 44. Overall functionalization results by MW-km, as of December 2016 1317
1318
54 There was insufficient data to match individual substations to their respective secondary voltage lines, making it difficult to functionalize substations by the MW-km approach.
0
500
1,000
1,500
2,000
2,500
3,000
3,500
4,000
4,500
5,000
0 100 200 300 400 500 600 700
MW
-km
Ra
tin
g
MW
500 kV 240 kV 138 kV 69 kV
TFO Bulk System Regional System POD
AltaLink 27.3% 34.7% 38.0%
Atco Electric 35.5% 30.3% 34.2%
ENMAX 0.0% 41.5% 58.5%
EPCOR 30.0% 20.4% 49.5%
All TFOs 27.6% 29.4% 43.0%
Method Bulk System Regional System POD
MW-km 80.5% 18.1% 1.4%
Method Bulk System Regional System POD
MW-km 62.5% 21.8% 15.7%

London Economics International LLC 55 contact: 717 Atlantic Ave., Suite 1A Amit Pinjani/Ian Chow Boston, MA 02111 416-643-6621 www.londoneconomics.com [email protected]
8.3.4 Summary of capital cost functionalization results 1319
The following figures summarize results of capital cost functionalization by the three methods 1320
for existing assets, future/planned assets and combined (existing and future assets) 1321
respectively. 1322
Figure 45. Summary of existing assets functionalization results, as of December 2016 1323
1324
1325
Figure 46. Summary of future project functionalization results, as of December 2016 1326
1327
1328
Figure 47. Summary of capital cost functionalization results, as of December 2016 1329
1330
1331
8.3.5 Recommendation for capital cost functionalization 1332
LEI has considered all three approaches, and suggests using the results of the voltage approach 1333
in this study and going forward, given the strengths and weaknesses identified below and 1334
summarized earlier in Section 6.1. The average of the three approaches provide very similar 1335
Method Bulk System Regional System POD
Voltage 1,552,206,569$ 1,425,643,547$ 2,243,050,758$
Economics 2,063,639,815$ 914,210,301$ 2,243,050,758$
MW-km 1,442,430,045$ 1,535,420,070$ 2,243,050,758$
Method Bulk System Regional System POD
Voltage 29.7% 27.3% 43.0%
Economics 39.5% 17.5% 43.0%
MW-km 27.6% 29.4% 43.0%
Method Bulk System Regional System POD
Voltage 8,622,387,317$ 1,251,182,028$ 153,553,297$
Economics 8,803,112,673$ 1,070,456,672$ 153,553,297$
MW-km 8,080,071,772$ 1,793,497,572$ 153,553,297$
Method Bulk System Regional System POD
Voltage 86.0% 12.6% 1.4%
Economics 87.9% 10.8% 1.4%
MW-km 80.5% 18.1% 1.4%
Method Bulk System Regional System POD
Voltage 10,174,593,886$ 2,676,825,574$ 2,396,604,055$
Economics 10,866,752,488$ 1,984,666,972$ 2,396,604,055$
MW-km 9,522,501,818$ 3,328,917,643$ 2,396,604,055$
Method Bulk System Regional System POD
Voltage 66.7% 17.6% 15.7%
Economics 71.3% 13.0% 15.7%
MW-km 62.5% 21.8% 15.7%
Average 66.8% 17.5% 15.7%

London Economics International LLC 56 contact: 717 Atlantic Ave., Suite 1A Amit Pinjani/Ian Chow Boston, MA 02111 416-643-6621 www.londoneconomics.com [email protected]
results, but significant reliance on assumptions in the MW-km and economics approach, in 1336
LEI’s view, may not be defensible. 1337
The voltage approach is the simplest to understand and implement, and therefore best satisfies 1338
the rate design principle of practicality, which states that “rates are appropriately simple, 1339
convenient, [and] understandable.” LEI believes that a functionalization method which is easily 1340
comprehensible contributes to transparency within the rate design process. Furthermore, the 1341
voltage approach requires less data than the other methods, which allowed more costs to be 1342
included in the analysis. The simplicity of the voltage approach explains why elements of 1343
voltage are used to functionalize transmission systems in other jurisdictions, such as Ontario, 1344
California, and Australia. 1345
The MW-km approach depends considerably on assumptions and subjective decisions. The 1346
primary weakness is that the MW-km breakpoint, which has a significant impact on results, 1347
could not be validated in a rigorous way with the data provided. The MW-km approach is also 1348
dependent on the output and accuracy of the AESO Base Case forecast. Furthermore, the Base 1349
Case only represents single points in time, and the winter peak was chosen because the system 1350
would be heavily loaded. However, not all regions and system assets reach peak usage at the 1351
same time, and the winter peak cannot be assumed to represent the peak usage of all parts of 1352
the system. Finally, the Base Case was only available for 2015, so one year’s MW flows were 1353
used to determine results for all years, despite the fact flows may differ from year to year. 1354
The economics approach also depends considerably on assumptions and subjective decisions. 1355
Specifically, LEI is doubtful that costs of current projects can be applied to older transmission 1356
projects, as economics of the transmission system can change over time. As well, setting the 1357
length of the theoretical line, which was set to 150 km, is a subjective process and can 1358
significantly change results. The dependence on subjective decisions implies that the MW-km 1359
and economics approaches do not fully satisfy the rate design principle of “fairness, objectivity 1360
and equity that avoids undue discrimination.” The voltage approach, due to its transparency, 1361
avoids these subjective decisions. 1362
Finally, LEI acknowledges that the voltage approach may be less sensitive to evolving functions 1363
of system. The MW-km approach could theoretically be more sensitive, however, similar results 1364
achieved using functionalization by voltage indicates that the results are reasonable. The two 1365
methods are in fact similar: 240 kV lines are considered bulk by voltage, while 81% are bulk by 1366
MW-km; 138 kV lines are considered regional by voltage, while 86% are regional by MW-km. In 1367
fact, the average of all three methods, as seen in Figure 47 is very similar to the results of the 1368
voltage approach. Due to the weaknesses of the other approaches discussed above, LEI believes 1369
the voltage approach satisfies rate design principles the best. 1370
As a method of comparing the functionalization approaches, LEI also determined Clearly 1371
Identified Bulk Projects (“CIBP”), which are defined as LTP projects which cross LTP bulk cut-1372
planes. Assuming that all lines built within each clearly identified bulk project are bulk, it is 1373
possible to compare the functionalization of the voltage and economics methods. 1374
1375

London Economics International LLC 57 contact: 717 Atlantic Ave., Suite 1A Amit Pinjani/Ian Chow Boston, MA 02111 416-643-6621 www.londoneconomics.com [email protected]
Figure 48. LTP cut-planes and clearly identified bulk projects 1376
1377
1378
Source: AESO. AESO Long-term Transmission Plan. Filed June 2012. 1379
As an example, within the Foothills project, which is a bulk project, a 240 kV line was built to 1380
connect Janet 74S to ENMAX No. 25. The voltage approach classified this line as bulk, whereas 1381
the economics method classified this line as regional. On aggregate, the available line data 1382
showed that the voltage approach functionalized 2% of CIBP as regional, while the economics 1383
approach functionalized 4% of CIBP as regional. This comparison highlights the limitations for 1384
utilizing functionalization by economics. Data that would allow LEI to determine performance 1385
of the MW-km approach in functionalizing CIBP was not available.55 1386
55 The MW-km approach utilizes the 2015 AESO Base Case, which identifies lines by bus, but does not indicate the LTP project to which each line belongs.
Project Name
LTP Value (2011 $
millions) Cutplane Crossed
East/West HVDC 2,951 SOK Cutplane
West Fort McMurray 500 kV
Stage 1a1,649 Northeast Cutplane
Foothills (FATD) 711 South Cutplane
Heartland 500 kV 537 Northeast Cutplane
Bickerdike to Little Smoky 205 Northwest Cutplane

London Economics International LLC 58 contact: 717 Atlantic Ave., Suite 1A Amit Pinjani/Ian Chow Boston, MA 02111 416-643-6621 www.londoneconomics.com [email protected]
LEI’s suggested functionalization proportions are presented in Figure 50, while the AEUB-1387
approved functionalization in AESO 2007 GTA is shown in Figure 49. The comparison shows a 1388
significantly higher proportion functionalized as bulk under LEI recommended approach, 1389
which is consistent with expectations, given the amount of bulk projects in the 2012 LTP. 1390
Figure 49. Functionalization in AESO 2007 GTA 1391
1392
Figure 50. LEI suggested capital cost functionalization 1393
1394
Functionalization - 2007 GTA
Bulk 41.7%
Regional 17.4%
POD 40.9%
Capital cost functionalization (by value) 2014 2015 2016
Bulk 6,681,289,875$ 9,684,685,012$ 10,174,593,886$
Regional 2,214,899,613$ 2,561,372,083$ 2,676,825,574$
POD 2,123,557,889$ 2,261,395,958$ 2,396,604,055$
Capital cost functionalization 2014 2015 2016
Bulk 60.6% 66.8% 66.7%
Regional 20.1% 17.7% 17.6%
POD 19.3% 15.6% 15.7%

London Economics International LLC 59 contact: 717 Atlantic Ave., Suite 1A Amit Pinjani/Ian Chow Boston, MA 02111 416-643-6621 www.londoneconomics.com [email protected]
9 Functionalization of O&M costs 1395
9.1 TFO cost information 1396
The information utilized for functionalization of O&M costs was obtained from the TFO 1397
General Tariff Applications (“GTA”s) and other TFO filings with the AUC. Information was 1398
collected from the four largest TFOs including ATCO, AltaLink, ENMAX and EPCOR. In 1399
addition to requesting specific data from the TFOs, the following sources (provided by the 1400
AESO) were used for obtaining information: 1401
ATCO Electric: GTA 2013-2014 1402
AltaLink: GTA 2013-2014 Schedules 1403
ENMAX Power: Transmission AUC Rule 005 report: Annual Operations Financial and 1404
Operating reporting for the year ended December 31st, 2011 1405
EPCOR: 2012 Phase I DTA & TFO TA Refiling 1406
TFOs revenue requirement information was compiled for the years 2010 through 2014 where 1407
available,56 and LEI had access to data from 2006 through to 2009 from the previous PSTI O&M 1408
study performed in 2009.57 TFO revenue requirements are presented in Figure 51. 1409
Figure 51. TFO revenue requirement, 2006-2014 1410
1411
Source: TFO GTA and other filings with AUC; Other TFO-provided data 1412
It is notable that 80-85% of combined transmission revenue requirement is attributable to ATCO 1413
and AltaLink over the period 2006-2011, as presented in Figure 52. 1414
1415
1416
56 ATCO Electric and AltaLink have projected costs up until 2014; EPCOR has projections until 2012; ENMAX costs (up until 2011) have been derived from their annual finance and operations reports filed under AUC Rule 005. ENMAX has been under a formula-based rate regime since 2007, and has accordingly not filed cost-based tariff applications.
57 The PSTI O&M study did not include 2009 data for ENMAX Power, which LEI obtained from previous transmission Rule 005 reports filed by ENMAX Power.
Revenue Requirement ($) 2006 2007 2008 2009 2010 2011 2012 2013 2014
AltaLink 189,319,502 202,767,328 214,445,660 246,511,157 283,515,889 351,752,644 410,861,853 525,390,710 683,546,041
ATCO Electric 167,852,071 168,207,126 178,600,826 206,959,891 244,278,000 313,295,000 406,672,300 544,007,448 680,342,105
ENMAX 30,901,470 31,867,568 32,248,072 36,253,000 37,924,000 40,574,000 N.A. N.A. N.A.
EPCOR 41,099,490 35,231,806 45,045,806 52,843,915 55,136,688 58,660,364 65,447,452 N.A. N.A.

London Economics International LLC 60 contact: 717 Atlantic Ave., Suite 1A Amit Pinjani/Ian Chow Boston, MA 02111 416-643-6621 www.londoneconomics.com [email protected]
Figure 52. Individual TFO share (%) in combined revenue requirement 1417
1418
Source: TFO GTA and other filings with AUC. 1419
LEI considered projecting the revenue requirement for ENMAX and EPCOR up to 2014 by 1420
observing their cost growth patterns relative to ATCO and AltaLink historically, and 1421
extrapolating for the future. However, as presented in Figure 53, there are no clear linkages 1422
between their respective revenue requirement growth rates, and any such forecasts would be 1423
highly assumptions-driven. 1424
Figure 53. Historical and projected growth patterns of TFO revenue requirements 1425
1426
Source: TFO GTA and other filings with AUC. 1427
LEI also reviewed cost information in project progress reports received from AESO to observe 1428
the project cost split between the four TFOs; over 95%58 of costs are attributable to projects 1429
owned by ATCO and AltaLink. 1430
58 Out of approximately $8 billion worth of projects, almost $7.6 billion are owned by AltaLink and ATCO Electric.
44%46% 46% 45% 46% 46%
39% 38% 38% 38% 39%41%
7% 7% 7% 7% 6% 5%
10%8%
10% 10% 9% 8%
0%
5%
10%
15%
20%
25%
30%
35%
40%
45%
50%
2006 2007 2008 2009 2010 2011
AltaLink ATCO Electric ENMAX EPCOR
-20%
-10%
0%
10%
20%
30%
40%
2006-07 2007-08 2008-09 2009-10 2010-11 2011-12 2012-13 2013-14
AltaLink ATCO Electric ENMAX EPCOR

London Economics International LLC 61 contact: 717 Atlantic Ave., Suite 1A Amit Pinjani/Ian Chow Boston, MA 02111 416-643-6621 www.londoneconomics.com [email protected]
Given the small share of ENMAX and EPCOR in existing and future projected costs, LEI 1431
believes that assumptions-driven revenue requirement forecasts may be unnecessary, as they 1432
will have an immaterial impact on functionalization results. 1433
9.2 Breakdown of revenue requirement 1434
After obtaining revenue requirement information, the first step performed was to identify costs 1435
that are capital-related and non-capital related. 1436
Capital costs include depreciation, return and income tax associated with TFO assets, annual 1437
structure payments, linear and property taxes, and capital-related revenue offsets. 1438
Non-capital costs include O&M costs directly associated with the electric transmission system 1439
such as labor costs, G&A costs associated with the operation the overall business of the TFOs, 1440
fuel and variable O&M costs associated with isolated generation serving remote communities59 1441
and affiliate revenue offsets, i.e., revenues that offset labor costs. 1442
Figure 54 and Figure 55 present the breakdown of non-capitalized costs by TFOs, and as a 1443
percentage of total revenue requirements for the four TFOs. Since 2009, although the actual 1444
amount of non-capital costs has been increasing, the percentage of non-capital costs has been 1445
gradually declining steadily (particularly for the two largest TFOs, ATCO and AltaLink), 1446
reducing projected overall share of non-capital costs to 16.01% by 2014.60,61 1447
Figure 54. TFO non-capital costs ($) 1448
1449
Source: TFO GTA and other filings with AUC 1450
59 ATCO Electric is the only TFO that reports fuel costs. The underlying rationale is as follows: instead of building transmission facilities (i.e. extending the regional and POD system) to serve certain remote areas, it is more economical to operate isolated generation facilities to serve these areas.
60 A slight increase in non-capital cost proportions has been observed for ENMAX and EPCOR between 2009 and 2011-2012. However, because their overall costs are a minor portion of combined TFO costs, a consistent decline in the non-capital cost share of the combined revenue requirement can be observed.
61 The extent of reduction in the share of non-capital costs to 16.01% is not a significant deviation from the fall in share projected by AESO in 2010. “In response to AUC-AESO-21(d) … AESO prepared an estimate of the relative weighting of capital and non-capital (O&M plus G&A) costs in 2014. The estimate suggests non-capital costs as a percentage of total costs could decrease to half the present level [2010] by 2014 [at 13.8%].” Source: AESO. Previous Submissions on Transmission Operating and Maintenance Cost Study Filed as Part of AESO 2010 ISO Tariff Application. Page 4.
Non Capital Costs 2006 2007 2008 2009 2010 2011 2012 2013 2014
AltaLink 47,672,495 48,124,444 51,354,438 63,230,001 80,346,474 84,551,219 100,207,059 107,336,440 118,860,960
ATCO Electric 44,349,900 47,200,000 53,800,000 62,000,000 61,962,863 72,583,190 85,167,268 91,799,633 99,502,033
ENMAX 15,757,662 17,859,224 17,710,624 20,309,000 20,881,000 23,234,000 N.A. N.A. N.A.
EPCOR 11,806,397 13,233,813 14,127,220 14,723,524 18,073,084 19,055,546 20,094,570 N.A. N.A.
Sum of Four TFO 119,586,453 126,417,481 136,992,282 160,262,525 181,263,421 199,423,955 205,468,898 199,136,073 218,362,993

London Economics International LLC 62 contact: 717 Atlantic Ave., Suite 1A Amit Pinjani/Ian Chow Boston, MA 02111 416-643-6621 www.londoneconomics.com [email protected]
Figure 55. TFO non-capital costs as a % of revenue requirement 1451
1452
Source: TFO GTA and other filings with AUC 1453
Given the significant capital investment plan in the LTP and a high proportion of investment 1454
related to ATCO and AltaLink, it can be reasonably argued that this trend will continue and the 1455
non-capital cost share would further decline by 2016. However, if O&M costs associated with 1456
existing older transmission facilities increase over this period, they may have an offsetting 1457
effect, although potentially insignificant. 1458
In order to estimate the non-capital cost share for 2015, first the year-on-year changes in the 1459
non-capital cost ratio for the period 2010-2014 were averaged. The 5-yr average change was 1460
applied to the 2014 non-capital cost share to arrive at 14.2% for 2015. Similarly, the 5-yr average 1461
for 2011-2015 is applied to 2015 non-capital cost ratio, and the resulting 2016 non-capital cost 1462
share is estimated to decline to 12.3% in 2016, as presented in the figure below. 1463
Figure 56. TFO non-capital cost share - trend and projection 1464
1465
Source: TFO GTA and other filings with AUC 1466
9.3 O&M functionalization 1467
Similar to capital cost functionalization, O&M costs have been functionalized into three 1468
functional categories: bulk system, regional system and POD. Where useful, O&M cost 1469
functionalization utilizes lines and substations capital cost information split between bulk, 1470
regional and POD functions (results of capital cost functionalization amounts by the voltage 1471
Non Capital Costs/Rev Req 2006 2007 2008 2009 2010 2011 2012 2013 2014
AltaLink 25.2% 23.7% 23.9% 25.6% 28.3% 24.0% 24.4% 20.4% 17.4%
ATCO Electric 26.4% 28.1% 30.1% 30.0% 25.4% 23.2% 20.9% 16.9% 14.6%
ENMAX 51.0% 56.0% 54.9% 56.0% 55.1% 57.3% N.A N.A N.A
EPCOR 28.7% 37.6% 31.4% 27.9% 32.8% 32.5% 30.7% N.A N.A
Combined for TFOs 27.9% 28.9% 29.1% 29.5% 29.2% 26.1% 23.3% 18.62% 16.01%
0%
5%
10%
15%
20%
25%
30%
35%
2010 2011 2012 2013 2014 2015f 2016f
Actual Forecast

London Economics International LLC 63 contact: 717 Atlantic Ave., Suite 1A Amit Pinjani/Ian Chow Boston, MA 02111 416-643-6621 www.londoneconomics.com [email protected]
method). Such costs have been used to set allocators for related O&M costs, as discussed further 1472
below. 1473
It should be noted that not all non-capital costs have been functionalized. G&A costs, which are 1474
not directly associated with the operations of electric transmission system, but assist in overall 1475
operation of the business, such as expenses associated with the maintenance of the corporate 1476
head office, have not been functionalized. Instead O&M functionalization results have been 1477
applied to these costs. A portion of G&A costs are allocated to capital projects as part of the 1478
distributed costs discussed in Section 8.1.3.2. The remaining G&A costs are related to non-1479
capital activities and are wholly considered O&M. Given that the G&A costs utilized via tariff 1480
filings are not all G&A costs but rather the allocated share of G&A costs to O&M expenses, this 1481
approach is reasonable. 1482
With regards to functionalization of other non-capital costs (other than G&A costs), the 1483
following approach has been taken. Fuel costs and variable O&M costs associated with isolated 1484
generation have been functionalized as regional or POD because any transmission system 1485
otherwise being built to serve these small remote areas would likely be regional or POD.62 The 1486
allocation between regional and POD is based on results of overall capital cost functionalization 1487
ratio of regional to POD. LEI understands that interveners in the previous study had questioned 1488
including isolated generation costs in the cost causation study. LEI believes that this is 1489
appropriate and consistent with AESO’s response argument that “the inclusion of isolated 1490
generation costs in ATCO Electric’s TFO tariff is established by the Isolated Generating Units and 1491
Customer Choice Regulation. The AESO submits it is accordingly reasonable to treat isolated generation 1492
as wires costs, consistent with the treatment of all other TFO tariff costs.”63 1493
Other O&M costs were allocated to functions on their individual basis of cost causation, where 1494
appropriate. For example: 1495
net salaries and wages have been allocated to various groups (such as control center 1496
operations, station equipment maintenance, overhead line expenses etc.) using 1497
proportion of full time equivalents (“FTE”) in each group, where provided, and further 1498
allocated between bulk/regional/POD using allocators discussed below 1499
62 As part of the written arguments related to the previous study, AESO stated: “The Isolated Generating Units and Customer Choice Regulation shows that the largest generator is 3.3 MW (in Jasper) and the smallest is 0.024 MW (in Peace Point), with the average size being less than 1 MW. If the electric system were extended to serve one of these isolated communities, this magnitude of load would not cause an expansion of the 240 kV bulk system. It would more likely be served through an extension of the distribution system, a radial transmission line (functionalized as point of delivery), or an expansion of the local transmission system. Therefore, the fuel costs associated with isolated generation and recovered through the ISO tariff are appropriately functionalized as local system and POD.” Source: AESO 2010 ISO Tariff Application (1605961 - ID 530): AESO Written Argument: September 14, 2010; Page 14.
63 AESO 2010 ISO Tariff Application (1605961 - ID 530): AESO Written Argument: September 14, 2010; Page 14.

London Economics International LLC 64 contact: 717 Atlantic Ave., Suite 1A Amit Pinjani/Ian Chow Boston, MA 02111 416-643-6621 www.londoneconomics.com [email protected]
costs associated with control centre operations and miscellaneous transmission expenses 1500
have been allocated based on combined line and substation costs split between bulk, 1501
regional and POD64 1502
vegetation management 65 expenses have been allocated based on a line brushing 1503
allocator, estimated using square kilometers of relevant vegetation management area 1504
split between bulk/regional/POD. The split is estimated by multiplying the line length 1505
by voltage within bulk/regional/POD by the width of the right of way for brushing 1506
substation expenses have been allocated based on substation cost split between bulk, 1507
regional and POD 1508
overhead line expenses have been allocated based on line costs, i.e., line costs split 1509
between bulk, regional and POD 1510
LEI has information for AltaLink and ATCO (up until 2014), EPCOR (up until 2012) and 1511
ENMAX (until 2011) to functionalize their O&M costs for the respective years. The 1512
functionalization results for AltaLink and ATCO Electric are presented in Figure 57 and Figure 1513
58. 1514
Figure 57. AltaLink functionalization results (non-capital costs) 1515
1516
1517
Source: TFO GTA and other filings with AUC 1518
64 For EPCOR, as line and substation cost information was not comprehensive, O&M cost allocators have been estimated based on length and number and of lines and number of substations split by voltage, instead of line and substation costs.
65 As described in the PSTI O&M study, vegetation management occurs in various cycles from grass cutting twice per year around substations and telecommunications sites to every 10 years for base mowing. Vegetation management includes trimming, mowing, spraying and slashing and removal, and these activities are priced in terms of area cleared.
AltaLink ($) 2010 2011 2012 2013 2014
Bulk 14,951,501 15,753,221 17,150,610 18,971,921 20,743,092
Regional 16,076,836 17,069,925 18,759,659 20,781,095 22,713,870
POD 16,718,324 17,742,335 19,666,909 21,694,378 23,796,713
Total 47,746,661 50,565,481 55,577,179 61,447,394 67,253,675
AltaLink (%) 2010 2011 2012 2013 2014
Bulk 31.3% 31.2% 30.9% 30.9% 30.8%
Regional 33.7% 33.8% 33.8% 33.8% 33.8%
POD 35.0% 35.1% 35.4% 35.3% 35.4%
Total 100.0% 100.0% 100.0% 100.0% 100.0%

London Economics International LLC 65 contact: 717 Atlantic Ave., Suite 1A Amit Pinjani/Ian Chow Boston, MA 02111 416-643-6621 www.londoneconomics.com [email protected]
Figure 58. ATCO functionalization results (non-capital costs)66 1519
1520
1521
Source: TFO GTA and other filings with AUC 1522
Given the significant transmission investment in the current decade, an increase in 1523
functionalization of bulk costs can be observed for AltaLink and ATCO, as compared to 1524
previous O&M study performed by PSTI in 2009. However, functionalization results are 1525
consistent with AESO’s following observation made in 2010: “The bulk system function has less 1526
than average operating and maintenance costs in proportion to capital than the local system and point of 1527
delivery functions, which each have more than average operating and maintenance costs in proportion to 1528
capital. No participant has disputed this finding, and it would be inappropriate to ignore this when 1529
transmission costs will continue to include a substantial component of non-capital costs in the future.”67 1530
ENMAX and EPCOR information is available only until 2011 and 2012 respectively, and their 1531
functionalization results are presented in Figure 59 and Figure 60. 1532
Figure 59. ENMAX functionalization results (non-capital costs) 1533
1534
1535
66 Note that the bulk proportion for O&M costs is generally lower for ATCO as compared to AltaLink, mainly due to fuel and O&M costs associated with isolated generation, which are functionalized only as regional and POD.
67 AESO 2010 ISO Tariff Application (1605961 - ID 530): AESO Written Argument: September 14, 2010; Page 13.
ATCO Electric ($) 2010 2011 2012 2013 2014
Bulk 9,996,803 12,447,252 14,767,415 13,767,416 15,584,613
Regional 14,217,464 15,488,657 17,619,328 17,922,546 19,527,121
POD 15,938,656 17,559,443 20,269,314 20,453,324 22,310,083
Total 40,152,922 45,495,352 52,656,057 52,143,286 57,421,817
ATCO Electric (%) 2010 2011 2012 2013 2014
Bulk 24.9% 27.4% 28.0% 26.4% 27.1%
Regional 35.4% 34.0% 33.5% 34.4% 34.0%
POD 39.7% 38.6% 38.5% 39.2% 38.9%
Total 100.0% 100.0% 100.0% 100.0% 100.0%
ENMAX ($) 2010 2011
Bulk 0 0
Regional 5,423,642 6,153,662
POD 11,086,062 12,578,241
Total 16,509,704 18,731,903
ENMAX (%) 2010 2011
Bulk 0.0% 0.0%
Regional 32.9% 32.9%
POD 67.1% 67.1%
Total 100.0% 100.0%

London Economics International LLC 66 contact: 717 Atlantic Ave., Suite 1A Amit Pinjani/Ian Chow Boston, MA 02111 416-643-6621 www.londoneconomics.com [email protected]
Figure 60. EPCOR functionalization results (non-capital costs) 1536
1537
1538
Figure 61 presents the functionalization results for combined TFOs for 2010-2014. Although this 1539
includes ENMAX and EPCOR information until 2011 and 2012 respectively, it is notable that the 1540
difference in results since 2012 is not material. 1541
Figure 61. Combined functionalization results (non-capital costs) 1542
1543
1544
Source: TFO GTA and other filings with AUC 1545
As the current study is reviewing functionalization for 2014-2016, given 2015 and 2016 1546
projections are not available, LEI has decided to use 2014 results for functionalization purposes. 1547
Despite significant bulk investment in 2014, the O&M functionalization ratios have not changed 1548
significantly in 2014 as compared to 2012-2013. Furthermore, given that there is no material 1549
change in future capital cost functionalization ratios between 2014 and 2016 (as presented 1550
earlier in Figure 2), LEI does not anticipate a material change in O&M functionalization ratios 1551
over the 2014-2016 period. 1552
EPCOR ($) 2010 2011 2012
Bulk 1,914,714 1,944,752 2,267,611
Regional 3,557,175 3,663,731 4,179,567
POD 6,320,756 6,686,056 7,434,097
Total 11,792,645 12,294,540 13,881,275
EPCOR (%) 2010 2011 2012
Bulk 16.2% 15.8% 16.3%
Regional 30.2% 29.8% 30.1%
POD 53.6% 54.4% 53.6%
Total 100.0% 100.0% 100.0%
Combined TFOs ($) 2010 2011 2012 2013 2014
Bulk 26,863,018 30,145,225 34,185,637 32,739,337 36,327,705
Regional 39,275,117 42,375,975 40,558,554 38,703,641 42,240,991
POD 50,063,798 54,566,075 47,370,320 42,147,702 46,106,796
Total 116,201,933 127,087,276 122,114,510 113,590,680 124,675,492
Combined TFOs (%) 2010 2011 2012 2013 2014
Bulk 23.1% 23.7% 28.0% 28.8% 29.1%
Regional 33.8% 33.3% 33.2% 34.1% 33.9%
POD 43.1% 42.9% 38.8% 37.1% 37.0%
Total 100.0% 100.0% 100.0% 100.0% 100.0%

London Economics International LLC 67 contact: 717 Atlantic Ave., Suite 1A Amit Pinjani/Ian Chow Boston, MA 02111 416-643-6621 www.londoneconomics.com [email protected]
10 Combined O&M and capital cost functionalization 1553
10.1 Final functionalization results 1554
Capital cost and O&M cost functionalization results were combined using weights derived from 1555
TFOs non-capital to capital costs, estimated for 2014 to 2016 (as presented in figures below). 1556
Figure 62. Ratio of TFOs non-capital to capital costs68 1557
1558
Figure 63. Combined O&M and capital cost functionalization (not accounting for RGUCC) 1559
1560
However, before applying these combined results to the wires revenue requirement in order to 1561
estimate the amounts needed to be recovered through the different components of the AESO’s 1562
Rate DTS, one portion of wires costs recovered from generators needs to be accounted for. This 1563
is known as the Regulated Generating Unit Connection Cost (“RGUCC”), which is only 1564
available as an annual revenue amount and does not relate to specific property. RGUCC 1565
gradually declines over time until it expires in 2020. Since it arises from TFO-owned facilities 1566
providing system access to previously-regulated generators, annual revenue is deducted from 1567
68 We explored the sensitivity of non-capital to capital cost ratio on functionalization results (before accounting for RGUCC). For instance, by reducing the non-capital cost share by 1% (to 11.3%) in 2016, combined cost functionalization results for 2016 change to bulk 62.5% (vs. 62.1%), regional 19.4% (vs. 19.6%) and POD 18.1% (vs. 18.3%). Alternatively, by increasing the non-capital cost share by 1% (to 13.3%) in 2016, combined cost functionalization results for 2016 change to bulk 61.7% (vs. 62.1%), regional 19.7% (vs. 19.6%) and POD 18.5% (vs. 18.3%). Thus, a 1% change in non-capital cost share may result in functionalization ratios changing by approximately 0.1%-0.4%.
Non-Capital to Capital Costs 2014 2015 2016
Non-Capital 16.0% 14.2% 12.3%
Capital 84.0% 85.8% 87.7%
Capital cost functionalization 2014 2015 2016
Bulk 60.6% 66.8% 66.7%
Regional 20.1% 17.7% 17.6%
POD 19.3% 15.6% 15.7%
O&M cost functionalization 2014 2015 2016
Bulk 29.1% 29.1% 29.1%
Regional 33.9% 33.9% 33.9%
POD 37.0% 37.0% 37.0%
Combined cost functionalization 2014 2015 2016
Bulk 55.6% 61.4% 62.1%
Regional 22.3% 20.0% 19.6%
POD 22.1% 18.6% 18.3%

London Economics International LLC 68 contact: 717 Atlantic Ave., Suite 1A Amit Pinjani/Ian Chow Boston, MA 02111 416-643-6621 www.londoneconomics.com [email protected]
the bulk system annual revenue requirement. The RGUCC is $11.4 million, $9.6 million, and 1568
$7.9 million for 2014, 2015, and 2016 respectively.69 1569
Figure 64 presents an example of how RGUCC has been taken into account for 2016 1570
functionalization. Note that the amount functionalized to bulk system (after accounting for 1571
RGUCC) is slightly lower than the same amount before accounting for RGUCC. The ratio of the 1572
revised amounts presents the final combined O&M and capital cost functionalization (presented 1573
only for 2016 in Figure 64). 1574
Figure 64. Accounting for RGUCC in combined O&M and capital cost functionalization - 2016 1575
example 1576
1577
Figure 65 represents the final recommended functionalization, including both capital and O&M 1578
costs for 2014, 2015 and 2016. 1579
Figure 65. Combined O&M and capital cost functionalization (net of RGUCC) 1580
1581
10.2 Analysis of functionalization results 1582
The combined functionalization results show a higher proportion functionalized as bulk, as 1583
compared to AEUB-approved functionalization in AESO 2007 GTA, presented in Figure 66. This 1584
is sensible given the significant amount of bulk and regional investment planned to come online 1585
in the 2012 LTP, as discussed in earlier sections. 1586
69 AESO. TCE.AESO-004 (a-d) Revised. February 14, 2007.
Revenue Requirement (nominal $ million) $1,992
Functionalization Results (before RGUCC, in $ millions)
Method Bulk System Regional System POD
Voltage 1,237.01$ 389.68$ 365.18$
RGUCC (to deduct from bulk, in $ millions) $7.89
Functionalization Results (net of RGUCC, in $ millions)
Method Bulk System Regional System POD
Voltage 1,229.12$ 389.68$ 365.18$
Final Functionalization (%)
Method Bulk System Regional System POD
Voltage 62.0% 19.6% 18.4%
Combined cost functionalization (net of RGUCC) 2014 2015 2016
Bulk 55.2% 61.2% 62.0%
Regional 22.5% 20.1% 19.6%
POD 22.3% 18.7% 18.4%

London Economics International LLC 69 contact: 717 Atlantic Ave., Suite 1A Amit Pinjani/Ian Chow Boston, MA 02111 416-643-6621 www.londoneconomics.com [email protected]
Figure 66. AESO 2007 GTA functionalization 1587
1588
The decline in POD functionalization since the 2007 GTA is due to this bulk and regional 1589
investment, and minimal POD investment, which can be observed in the figure below. Between 1590
2007 and 2016, bulk system costs have increased just under $9.5 billion, regional system costs 1591
have increased by approximately $2.4 billion, while POD costs increased by around $1.8 billion. 1592
Figure 67. Capital costs functionalized ($ millions) 1593
1594
Source: 2007 AESO GTA; LEI analysis (existing and planned project costs) 1595
Functionalization
Bulk 41.7%
Regional 17.4%
POD 40.9%
Capital costs functionalized 2007 GTA 2014 2015 2016 Increase (2016 vs. 2007)
Bulk 678 6,681 9,685 10,175 9,497
Regional 233 2,215 2,561 2,677 2,444
POD 572 2,124 2,261 2,397 1,825
Total 1,482 11,020 14,507 15,248 13,766

London Economics International LLC 70 contact: 717 Atlantic Ave., Suite 1A Amit Pinjani/Ian Chow Boston, MA 02111 416-643-6621 www.londoneconomics.com [email protected]
11 Classification of bulk and regional costs 1596
Classification is the process by which costs for each function are separated into demand or 1597
energy or customer related. As briefly discussed in Section 6.2, while some argue for demand 1598
only costs, LEI believes an energy component is important as it incentivizes customers to reduce 1599
load even when they are not at peak. 1600
LEI’s scope of work targets specifically the classification of bulk and regional functions. Earlier 1601
in Section 6.2, the following classification approaches were discussed: minimum system, 1602
minimum intercept, marginal cost, and average and excess approach. 1603
LEI believes that the most appropriate approach is the minimum system approach because it is 1604
consistent with cost causation and principles discussed in Section 5. The minimum system 1605
approach adapted for the transmission system uses the ratio between a minimum transmission 1606
system and an optimized system in order to determine the demand component, since minimum 1607
system costs are driven by serving total load. Additional costs are allocated to energy since costs 1608
incurred beyond the minimum system are driven by energy usage considerations. 1609
LEI considered acceptability of these approaches to the regulator. The simplicity of the 1610
minimum system approach made it a more suitable option than the zero intercept approach, 1611
which requires considerably more data. LEI further believes that the minimum system 1612
approach is reflective of cost causation and is a reasonable method to classify costs into both 1613
demand and energy-related categories. Finally, it is commonly used in the distribution system, 1614
and has been previously approved by the Board for use in transmission in its adapted form. 1615
11.1 Conductor classification 1616
In order to perform the minimum system approach, a minimum line and optimized line must 1617
be identified. In defining minimum and optimum lines, LEI takes into account that the 1618
minimum system in a transmission system is not necessarily the minimum size conductor that 1619
can be constructed. The transmission system is inherently not serving minimum loading 1620
requirements like the distribution system, and TFOs are required to perform a conductor 1621
optimization study to determine the most economic conductor size, considering both capital 1622
costs and line losses, for all lines above 100 kV and longer than 10 km. All 240 kV lines greater 1623
than 50 km in length must conduct a “full bulk transmission line optimization study”70 which 1624
includes costs of structures. Therefore, in a practical sense, it can be argued that there is no 1625
minimum system for a transmission line. However in LEI’s analysis, in order to approximate 1626
demand versus energy related costs, LEI has defined “minimum” and “optimal” conductor 1627
sizes as comparable lines that TFOs would consider, where the optimized line minimizes losses 1628
over the minimum line. 1629
Cost information for various conductor sizes was sourced from the AESO cost benchmarking 1630
data file, which was also used to determine future line details, as discussed in Section 8.1.3.1. 1631
70 AESO. ISO Rules, Section 502.2 Bulk Transmission Technical Requirements. January 1, 2012. P 5.

London Economics International LLC 71 contact: 717 Atlantic Ave., Suite 1A Amit Pinjani/Ian Chow Boston, MA 02111 416-643-6621 www.londoneconomics.com [email protected]
The AESO cost benchmarking data file is estimated to contain 95% of the projects since 2005,71 1632
and was filtered for new projects with no missing conductor size or voltage data. From this data 1633
set, conductor costs per kilometer were determined for the minimum and commonly used 1634
conductor sizes, using a length-weighted average (longer conductors are assumed to provide 1635
more indicative results). As well, the data set contained double circuit, single circuit, and a 1636
double circuit line with one circuit installed – all costs were normalized in order for them to be 1637
comparable. 1638
For bulk classification, the minimum and optimized system was determined for 240 kV and 500 1639
kV lines separately, and results were weighted using their relative costs to arrive at a final bulk 1640
classification. After discussion with AESO staff, LEI was able to determine the commonly used 1641
conductor sizes in Alberta - for the 240 kV system, the two most commonly constructed 1642
conductor sizes are 2x795 and 2x1033 thousand circular mils (“MCM”) ACSR. These two 1643
conductor sizes could be compared by a TFO designing a 240 kV line, where the 2x795 MCM 1644
ACSR conductor is the less expensive “minimum” option, and the 2x1033 MCM ACSR 1645
conductor would be more expensive while minimizing losses, as the “optimized” option. Costs 1646
were normalized to a double circuit line strung both sides, which is a common configuration in 1647
Alberta. 1648
Figure 68. 240 kV - minimum and optimal conductor size costs 1649
1650
A test case (presented in Figure 69) was analyzed for a 240 kV transmission line comparing the 1651
minimum system conductor to the optimal system conductor, in order to demonstrate that it is 1652
reasonable for a TFO to be comparing the minimum and optimal conductor sizes. A 50 km line 1653
length was assumed since a bulk transmission line optimization study is required for 240 kV 1654
lines that are 50 km or greater in length. The present value of conductor losses was determined 1655
71 After discussions with AESO, LEI’s understanding is that NID/PSS costs/details for the remaining 5% could not be located and that these 5% are similar in nature to 95%.
1,460,991
1,591,085
0
200,000
400,000
600,000
800,000
1,000,000
1,200,000
1,400,000
1,600,000
1,800,000
240 kV Line - 2 X 795 240 kV Line - 2 x 1033
Minimum System Optimal System
Co
st o
f C
on
du
cto
r ($
/km
)

London Economics International LLC 72 contact: 717 Atlantic Ave., Suite 1A Amit Pinjani/Ian Chow Boston, MA 02111 416-643-6621 www.londoneconomics.com [email protected]
for the minimum system (2 X 795) and the optimal system (2 X 1033) for a 65 year conductor 1656
life72 using simplifying assumptions for average annual energy cost73 and a nominal discount 1657
rate.74 The capital costs of both lines were added to the losses, and the two were compared. 1658
Figure 69. Test case - calculation for comparable minimum and optimal 240 kV lines 1659
1660
1661
In the test case, the optimal system is economically justified if the line capacity factor was at 1662
least 34%. Consequently, lines which deliver higher levels of energy will benefit from an 1663
optimal design that reduces transmission line losses. Since reasonable assumptions can lead to a 1664
minimum and optimal system with comparable costs, LEI concludes that these are comparable 1665
conductor sizes and valid choices for minimum and optimal systems. The 240 kV conductor 1666
classification results in a ratio of 91.8% demand to 8.2% energy. 1667
500 kV conductors were also classified using the minimum system approach. Limited data was 1668
found for 500 kV conductors in Alberta, so costs were sourced from the CAISO 1669
jurisdiction.75 The minimum was defined to be a 2x2156 MCM ACSR conductor, with a cost of 1670
72 “AltaLink 2013-2014 General Tariff Application, Appendix 8 – Depreciation Study” dated July 30, 2012 was the basis for the life of the conductors.
73 “Chase Power Fundamental Report for the Alberta Energy Industry” dated June 10, 2013 was used as the basis for determining the average lifetime energy costs used in the test case.
74 AESO document “Information Document Discount Rates for 2011 Tariff ID No. 2011-115T” dated October 7, 2011 was used as the basis for the discount rate.
75 Costs do not include engineering, right of way (“ROW”) or G&A costs.
Assumptions
Line length (km) 50
Annual Discount Rate % 6
Average lifetime Energy Price $/MWh 68
Life of overhead conductors in years 65
2x1033 MCM AC resistance @ 75 C in ohms / km 0.03462
2x795 MCM AC resistance @ 75 C in ohms / km 0.04315
Cost of 2x1033 MCM overhead transmission $/km $1,591,058
Cost of 2x795 MCM overhead transmission $/km $1,460,991
Lines capacity factor % 40
2x1033 ampacity @ 75 C, amps 2094
2x795 ampacity @75 C, amps 1814
Minimum System Optimal System
Annual power losses (MWh) 29,852 Annual power losses (MWh) 23,951
Annual cost of losses (2,029,923)$ Annual cost of losses (1,628,643)$
Present Value 33,065,670$ Present Value 26,529,165$
Line cost $73,049,550 Line cost $79,552,900
Total PV $106,115,220 Total PV $106,082,065

London Economics International LLC 73 contact: 717 Atlantic Ave., Suite 1A Amit Pinjani/Ian Chow Boston, MA 02111 416-643-6621 www.londoneconomics.com [email protected]
$1.9 million per km, and the optimal was defined to be a 3x1590 MCM ACSR conductor, with a 1671
cost of $2.1 million per km. The 500 kV conductor classification results in a ratio of 90.5% 1672
demand to 9.5% energy. 1673
Figure 70. 500 kV - minimum and optimal conductor size costs 1674
1675
The final bulk classification was determined by weighting 500 kV and 240 kV classifications 1676
together, using their respective 2016 line asset costs. The bulk conductor classification results in 1677
a ratio of 91.6% demand to 8.4% energy. 1678
In order to determine regional classification, the minimum and optimized system was 1679
determined for a 138 kV line. 1680
Figure 71. Regional - minimum and optimal conductor size costs 1681
1682
For the regional system, the two most commonly constructed conductor sizes are 266 and 477 1683
MCM ACSR. These two conductor sizes could be compared by a TFO designing a 138 kV line, 1684
where the 266 MCM conductor is the less expensive “minimum” option, and the 477 MCM 1685
conductor would be the more expensive “optimized” option minimizing losses. Costs were 1686
$1,900,000
$2,100,000
$-
$500,000
$1,000,000
$1,500,000
$2,000,000
$2,500,000
500 kV Line - 2 X 2156 500 kV Line - 3 X 1590
Minimum System Optimal System
Co
st o
f C
on
du
cto
r ($
/km
)
$345,492
$416,963
$-
$50,000
$100,000
$150,000
$200,000
$250,000
$300,000
$350,000
$400,000
$450,000
138 kV Line - 266 138 kV Line - 477
Minimum System Optimal Lines
Co
st o
f C
on
du
cto
r ($
/km
)

London Economics International LLC 74 contact: 717 Atlantic Ave., Suite 1A Amit Pinjani/Ian Chow Boston, MA 02111 416-643-6621 www.londoneconomics.com [email protected]
normalized to single circuit lines in order for them to be comparable. The regional conductor 1687
classification results in a ratio of 82.9% demand to 17.1% energy. 1688
11.2 Substation classification 1689
LEI defines the optimized substation as one which minimizes losses over a minimum 1690
substation. LEI was able to obtain a quote for a POD transformer which included both a 1691
“Standard Losses and Sound Level” transformer, which LEI has considered a minimum system, 1692
and a “Lower NLL & Sound Level” transformer,76 which given its lower loss characteristic, LEI 1693
considers the optimal system.77 1694
These quotes indicate that the "minimum system" POD transformer is approximately 2.8% less 1695
expensive than an "optimal system" POD transformer. It was assumed that regional and bulk 1696
power transformers would also have a similar percentage cost increase in material and 1697
manufacturing costs for an "optimal system" transformer.78 Consequently, this percentage cost 1698
increase was also applied to regional and bulk power transformers. 1699
Figure 72. Substation classification results 1700
1701
76 NLL stands for No-Load Loss.
77 The quote, from November 2010, was obtained from a TFO. LEI requested additional quotes from the TFOs, through the AESO, but did not receive additional data. Given that the results of substation classification are similar to the TCCS and correspond with expectations based on experience, LEI believes they are suitable.
78 Analyzing HVDC systems in terms of minimum and optimal systems is challenging, as each component is individually optimized, i.e., there may be no “minimum” system. However, converter stations would likely have a similar percentage cost increase in material and manufacturing costs for an "optimal system" transformer compared to a hypothetical “minimum” system.
97.2%
2.8%
0%
10%
20%
30%
40%
50%
60%
70%
80%
90%
100%
Substation Costs
Cla
ssif
ica
tio
n P
erc
en
tag
e
Demand Related Costs Energy Related Costs

London Economics International LLC 75 contact: 717 Atlantic Ave., Suite 1A Amit Pinjani/Ian Chow Boston, MA 02111 416-643-6621 www.londoneconomics.com [email protected]
11.3 Classification results 1702
To obtain the final bulk and regional classification results, the line classification results were 1703
weighted with substation classification results using line and substation asset values. 1704
Figure 73 presents LEI’s recommended classification results for both bulk and regional systems, 1705
which as one would expect, have significantly higher proportions for demand-related costs as 1706
compared to energy-related costs. 1707
Figure 73. Classification results by functional group 1708
1709
92.4% 87.7%
7.6% 12.3%
0%
10%
20%
30%
40%
50%
60%
70%
80%
90%
100%
Bulk Regional
Cla
ssif
ica
tio
n P
erc
en
tag
e
Demand Related Costs Energy Related Costs

London Economics International LLC 76 contact: 717 Atlantic Ave., Suite 1A Amit Pinjani/Ian Chow Boston, MA 02111 416-643-6621 www.londoneconomics.com [email protected]
12 Implementation considerations 1710
In order to assess the impact of implementing the functionalization and classification results, 1711
LEI was specifically asked to comment on the following three considerations, which it analyzed 1712
by studying the resulting revenue requirement breakdown: 1713
whether results from the study would result in reversing trends in rates that could give 1714
confusing price signals; 1715
if one part of the study would result in a change that was opposite to a change from 1716
another part of the study; and 1717
whether functionalization and classification recommendations justify averaging or 1718
trending results in order to improve stability of rates. 1719
Functionalization and classification results of the study have been discussed in detail in earlier 1720
sections and are presented below in Figure 74. 1721
Figure 74. Combined functionalization and classification results 1722
1723
In order to comment on any reversing trends, it is important to review the revenue requirement 1724
breakdown79 after implementing functionalization and classification results. 1725
Figure 75. Revenue requirement breakdown using combined results 1726
1727
79 Total revenue requirement ($ million) projections for 2104, 2015 and 2016 were provided by AESO’s “Draft Transmission Rate Impact Projection Model” and LEI deducted RGUCC amounts as discussed earlier in Section 10.1.
Combined cost functionalization (net of RGUCC) 2014 2015 2016
Bulk 55.2% 61.2% 62.0%
Regional 22.5% 20.1% 19.6%
POD 22.3% 18.7% 18.4%
Classification results Bulk Regional
Demand 92.4% 87.7%
Energy 7.6% 12.3%
Revenue Requirement Split - net of RGUCC ($ million) 2014 2015 2016
Bulk - Demand 764 1,011 1,136
Bulk - Energy 63 83 93
Regional - Demand 295 315 342
Regional - Energy 41 44 48
POD 333 335 365
Total 1,497 1,787 1,984

London Economics International LLC 77 contact: 717 Atlantic Ave., Suite 1A Amit Pinjani/Ian Chow Boston, MA 02111 416-643-6621 www.londoneconomics.com [email protected]
The resulting revenue requirement breakdown (as presented in Figure 75) shows that the 1728
requirements across bulk and regional rate components (bulk-demand, bulk-energy, regional-1729
demand and regional-energy) is increasing on an annual basis, indicating no reversing trends 1730
and thus providing consistent price signals. 1731
LEI also reviewed the impact on revenue requirement breakdown if only capital cost 1732
functionalization results were applied, versus applying combined capital and O&M cost 1733
functionalization results, as discussed above. LEI understands that this issue arose in AESO’s 1734
2010 tariff proceeding, where implementing the O&M study results would decrease bulk 1735
system charges. 1736
If only capital cost functionalization results are applied (ignoring O&M cost functionalization 1737
results), the resulting revenue requirement breakdown is presented in Figure 76. Although the 1738
impact is not in opposing directions, i.e., revenue requirement trend remains positive and 1739
increasing across most of the rate components (with the exception of POD where revenue 1740
requirement reduces slightly in 2015), it is important to note that applying only capital cost 1741
functionalization results will result in more costs being functionalized as bulk. 1742
Figure 76. Revenue requirement breakdown using capital cost functionalization only 1743
1744
This can be observed by comparing capital cost functionalization results (presented below in 1745
Figure 77) to combined capital and O&M cost functionalization results presented earlier in 1746
Figure 74.80 Proportion of costs functionalized as bulk is approximately 4%-6% lower in the 1747
combined results. 1748
Figure 77. Capital cost functionalization results 1749
1750
This is sensible given that the bulk system function has less than average associated O&M costs 1751
in proportion to capital costs, as compared to the regional and POD functions, as discussed 1752
earlier in Section 9.3. LEI recommends applying combined capital and O&M functionalization 1753
80 Note that the classification results remain the same.
Revenue Requirement Split - net of RGUCC ($ million) 2014 2015 2016
Bulk - Demand 834 1,100 1,221
Bulk - Energy 69 90 100
Regional - Demand 266 278 307
Regional - Energy 37 39 43
POD 291 280 313
Total 1,497 1,787 1,984
Capital cost functionalization 2014 2015 2016
Bulk 60.6% 66.8% 66.7%
Regional 20.1% 17.7% 17.6%
POD 19.3% 15.6% 15.7%

London Economics International LLC 78 contact: 717 Atlantic Ave., Suite 1A Amit Pinjani/Ian Chow Boston, MA 02111 416-643-6621 www.londoneconomics.com [email protected]
results as they are consistent with cost causation, and they do not pose an issue of declining 1754
bulk charges in the face of extensive bulk investment planned. 1755
Finally, LEI analyzed whether resulting functionalization results change significantly year-on-1756
year, warranting changes during the filing period. To be consistent with cost causation, LEI 1757
recommends applying 2014, 2015 and 2016 functionalization results separately to each of the 1758
three years (as presented in Figure 74).81 1759
81 As referenced in footnote 3, the Board has previously maintained that cost causation remains a primary consideration when evaluating rate design principles.

London Economics International LLC 79 contact: 717 Atlantic Ave., Suite 1A Amit Pinjani/Ian Chow Boston, MA 02111 416-643-6621 www.londoneconomics.com [email protected]
13 Appendix A: Special projects functionalized separately 1760
13.1 Special projects not primarily driven by load 1761
Discussions with the TCCWG 82 indicated that members desired a distinction between 1762
“conventional” transmission projects in the LTP, which are primarily driven by load, and 1763
“special” projects. LEI has defined “special” projects as projects which are clearly driven to 1764
interconnect renewable energy or driven by reliability purposes, but not primarily driven by 1765
load. 1766
Of note, there is precedent of treating renewable generation interconnection as special in 1767
California, which was discussed earlier in Section 7.2.2. The OEB also developed a framework 1768
for transmission project development plans, and proposed filing requirements for firms seeking 1769
to develop transmission projects in Ontario that are required for connecting renewable 1770
generation, as identified by the Ontario Power Authority (“OPA”).83 Specifically, OEB stated: 1771
“The Board’s goal in developing a policy for transmission project development planning is to facilitate the 1772
timely development of the transmission system to accommodate renewable generation.”84 1773
NIDs and details from the 2012 LTP have been used for identification of special projects. LEI 1774
reviewed all 2012 LTP projects with costs greater than $100 million, accounting for $12.3 billion 1775
(approximately 91% of all planned projects by value in the 2012 LTP). 1776
In the main body of the report, LEI has not functionalized or classified special projects any 1777
differently than conventional projects. At the request of AESO/TCCWG, functionalization 1778
results with special projects separated out have been presented in Section 13.2. 1779
LEI believes that special transmission projects are triggered as a result of public policy, and 1780
despite distinct purposes, arguably have similar cost causation drivers to the rest of the system. 1781
The costs of special projects may be recovered in one of two ways: 1782
treating it broadly as a social good, and recovering it as a tax (i.e. taxing every MWh 1783
equally); or 1784
recovering it consistent with purpose or key driver 1785
82 TCCWG participants include: Alberta Direct Connect Consumers Association, AltaLink, Athabasca Oil Corp. and Dover Operating Corp, ATCO Electric, Devon Canada, Dual Use Customers, ENMAX, EPCOR, Industrial Power Consumers Association of Alberta, Powerex, Suncor Energy, TransAlta Corporation, TransCanada Energy and the Office of the Utilities Consumer Advocate. Source: AESO. 2013-01-17 AESO 2014 Cost Causation Working Group - Meeting #1 Presentation. Posted January 22, 2013.
83 Ontario Energy Board. Filing Requirements: Transmission Project Development Plans; August 26, 2010.
84 Ontario Energy Board. Board Policy: Framework for Transmission project Development Plans; August 26, 2010.

London Economics International LLC 80 contact: 717 Atlantic Ave., Suite 1A Amit Pinjani/Ian Chow Boston, MA 02111 416-643-6621 www.londoneconomics.com [email protected]
Note, however, that ‘purpose’ may not necessarily be the same as the ‘cost causation driver’. For 1786
instance, for grid strengthening related to emissions-free projects, it may be considered prudent 1787
to recover costs from customers who are causing some environmental impact. Peak use likely 1788
causes greater emissions, which in turn drives demand for zero-emitting resources. While a 1789
line’s purpose may be to serve renewables, ultimately the needs for it may be driven by peak 1790
users. 1791
Furthermore, although a project may be built for the purposes of interconnecting renewable 1792
energy, significant portions of the project are likely to serve peak load as well. Similarly, 1793
projects which are built for reliability purposes may not be primarily serving peak, but in 1794
practice, are likely to still serve load in some capacity. 1795
13.1.1 Identified special projects 1796
LEI identified two special projects with a total value of $2.5 billion, out of a total of $11.7 billion 1797
LTP projects, coming in-service by 2016. 1798
13.1.1.1 South Area Transmission Reinforcement 1799
LTP Value: $2,287 million 1800
SATR was identified as a special project because its NID clearly states that: 1801
“the proposed reinforcements are required to principally respond to the anticipated development 1802
of wind generation in Southern Alberta” and goes on to say the "need for transmission 1803
reinforcement in southern Alberta is driven predominantly by the forecast development of wind 1804
generation… it is anticipated that between 1,700 and 3,200 MW of the provincial totals will be 1805
located in southern Alberta”.85 1806
As LEI has defined special projects as those that interconnect renewable entry, rather than 1807
primarily serving peak load, SATR qualifies as a special project. 1808
13.1.1.2 Bickerdike to Little Smoky 1809
LTP Value: $205 million 1810
Although Bickerdike to Little Smoky has not yet progressed to the NID stage, the description of 1811
the project in the LTP identifies it as primarily driven by non-load related reliability reasons. 1812
The LTP states: 1813
“The Northwest region is primarily a load area and relies heavily on power transfers from the 1814
Wabamun Lake area and, under certain conditions, from the northeast. As a result, a major 1815
transmission outage between Wabamun Lake and the Northwest region could cause a 1816
phenomenon called voltage collapse, which could cause a sustained outage. To mitigate the 1817
85 AESO. South Area Transmission Reinforcement Needs Identification Document. December 15, 2008.

London Economics International LLC 81 contact: 717 Atlantic Ave., Suite 1A Amit Pinjani/Ian Chow Boston, MA 02111 416-643-6621 www.londoneconomics.com [email protected]
potential voltage collapse, the AESO is proposing two new projects. The first is a double circuit 1818
240 kV line from Bickerdike (near Edson) to Little Smoky”86 1819
From this description, the driver behind Bickerdike to Little Smoky is to mitigate voltage 1820
collapse in the Northwest region, caused by a transmission outage. This is not a reliability 1821
situation which is related directly to peak load, rather, this project has been primarily planned 1822
to serve the system under abnormal system conditions. Therefore, Bickerdike to Little Smoky 1823
also qualifies as a special project, although it should be re-evaluated once an NID is published.87 1824
13.1.2 Critical Transmission Infrastructure Project Analysis 1825
LEI reviewed Critical Transmission Infrastructure 1826
(“CTI”) projects as part of the special project 1827
review; however none were categorized as special. 1828
Given the heightened interest in these projects, this 1829
section describes the reasons for not treating them 1830
as special projects. Note, given that they are CTIs, 1831
NIDs have not been filed for these projects and all 1832
information is from the LTP. CTI projects have an 1833
estimated total cost of $5.2 billion, or 39% of total 1834
LTP projects. 1835
13.1.2.1 East/West HVDC 1836
LTP Value: $2,951 million 1837
The LTP specifies that the East/West HVDC is 1838
required to address reliability issues, improve 1839
efficiency, accommodate long-term growth, support the energy market, as well as provide 1840
access to renewable generation. Although access to renewable generation is one of the drivers, it 1841
is not the primary driver, and because one of the drivers is stated to be ‘accommodating long-1842
term growth’, it is not qualified as a special project. 1843
13.1.2.2 West Fort McMurray 500 kV Stage 1a 1844
LTP Value: $1,649 million 1845
According to the LTP, West Fort McMurray 500 kV Stage 1a is driven by “oilsands 1846
development,” which is load growth, and is as well “required for Northeast load.” Therefore, it 1847
is not special. 1848
86 AESO. AESO Long-term Transmission Plan. Filed June 2012. Page 93.
87 In the June 2013 AESO Draft Transmission Rate Impact Projection, Bickerdike to Little Smoky is scheduled to be in service in 2017.
Critical Transmission Infrastructure
Electric Statutes Amendment Act, 2009 (known as Bill 50) passed in fall of 2009
Government of Alberta gave provincial cabinet the authority to designate future transmission facilities as critical transmission infrastructure
The Electric Utilities Amendment Act (known as Bill 8) effective December 2012
Removed cabinet authority
Future transmission projects must pass a needs assessment process before the Alberta Utilities Commission

London Economics International LLC 82 contact: 717 Atlantic Ave., Suite 1A Amit Pinjani/Ian Chow Boston, MA 02111 416-643-6621 www.londoneconomics.com [email protected]
13.1.2.3 Heartland 500 kV 1849
LTP Value: $537 million 1850
The LTP states Heartland is required to serve Northeast load, which is primarily driven by the 1851
oilsands industry, as well as supplying Heartland load. Therefore, it is also not special. 1852
13.1.2.4 South Calgary Source 1853
LTP Value: $39 million 1854
South Calgary Source is a relatively small project at only $39 million, however due to its status 1855
as a CTI, LEI reviewed it for special status. The underlying rationale for the project is that “City 1856
of Calgary peak load is expected to reach approximately 2,000 MW by 2020… the south part of 1857
the city in particular is expected to continue to grow.” South Calgary Source is required for load 1858
and reliability; therefore, it is, again, not special. 1859
13.2 Special project functionalization results 1860
At the specific request of stakeholders/AESO, this section presents key functionalization results 1861
with special projects separated in a different functional group. Existing assets and O&M 1862
functionalization results do not change – special projects are only planned projects. 1863
Figure 78. Summary of future project functionalization results separating special projects 1864
1865
Figure 79. Summary of capital cost functionalization results, separating special projects 1866
1867
Future capital cost functionalization (by value) 2014 2015 2016
Bulk 2,900,582,661$ 4,982,405,725$ 5,181,182,788$
Regional 488,990,895$ 738,927,693$ 794,904,249$
POD 88,054,830$ 97,265,394$ 94,545,243$
Special 396,180,911$ 503,775,316$ 770,454,260$
Future capital cost functionalization 2014 2015 2016
Bulk 74.9% 78.8% 75.7%
Regional 12.6% 11.7% 11.6%
POD 2.3% 1.5% 1.4%
Special 10.2% 8.0% 11.3%
Capital cost functionalization (by value) 2014 2015 2016
Bulk 6,324,601,117$ 9,220,717,292$ 9,470,868,342$
Regional 2,175,407,460$ 2,521,564,487$ 2,610,096,859$
POD 2,123,557,889$ 2,261,395,958$ 2,396,604,055$
Special 396,180,911$ 503,775,316$ 770,454,260$
Capital cost functionalization 2014 2015 2016
Bulk 57.4% 63.6% 62.1%
Regional 19.7% 17.4% 17.1%
POD 19.3% 15.6% 15.7%
Special 3.6% 3.5% 5.1%

London Economics International LLC 83 contact: 717 Atlantic Ave., Suite 1A Amit Pinjani/Ian Chow Boston, MA 02111 416-643-6621 www.londoneconomics.com [email protected]
Figure 80. Final combined O&M and capital cost functionalization, separating special projects 1868
1869
Note: Results utilize the voltage approach 1870
Comparing functionalization results (Figure 50 and Figure 79) shows that special projects 1871
include costs that are primarily functionalized as bulk, with a minor proportion of regional 1872
costs and none of them functionalized as POD. Implications of separating out special projects 1873
will depend on how these projects are classified and incorporated into rates, if in a different 1874
manner, compared to other projects. 1875
Combined cost functionalization (net of RGUCC) 2014 2015 2016
Bulk 52.5% 58.4% 57.9%
Regional 22.2% 19.8% 19.2%
POD 22.3% 18.7% 18.4%
Special 3.0% 3.0% 4.4%

London Economics International LLC 84 contact: 717 Atlantic Ave., Suite 1A Amit Pinjani/Ian Chow Boston, MA 02111 416-643-6621 www.londoneconomics.com [email protected]
14 Appendix B: Works consulted 1876
14.1 Works Consulted 1877
AESO. AESO 2010 ISO Tariff Application (1605961 - ID 530): AESO Written Argument. September 1878
14, 2010 1879
AESO. 2011 Unit Cost Estimates. <www.aeso.ca/downloads/2011_Unit_Cost_Estimates.pdf> 1880
AESO. 2013 Planning Base Case Suite. January 24, 2013. 1881
AESO. 2013-01-17 AESO 2014 Cost Causation Working Group - Meeting #1 Presentation. 1882
AESO. AESO Long-term Transmission Plan. Filed June 2012. 1883
AESO. Reasonableness Assessment of Transmission Cost Using Benchmarking Methodology. March 28, 1884
2013. 1885
<www.aeso.ca/downloads/Reasonableness_Assessment_of_Transmission_Cost_Using_B1886
enchmarking_Methodology.pdf> 1887
AESO. TCE.AESO-004 (a-d) Revised. February 14, 2007 1888
AEUB. Decision 2005-096: 2007 GTA. 1889
AEUB. Decision 2007-106: 2007 GTA. 1890
AEUB. Decision 2010-606: 2007 GTA. 1891
Alberta Energy. Transmission Development: The Right Path for Alberta. December 22, 2003. 1892
Bonbright, James, Albert L. Danielsen and David R. Kamerschen. Principles of Public Utility 1893
Rates, Second Edition. March 1988. Print. 1894
California Independent System Operator Corporation. Fifth Replacement CAISO Tariff. Mar 20, 1895
2013. 1896
Hydro One. EB-2012-0031 Exhibit G1. Tab 2. Schedule 1. Filed May 28, 2012. 1897
National Association of Regulatory Utility Commissioners. Electricity Utility Cost Allocation 1898
Manual. January 1992. 1899
OEB. EB-2012-0031. Decision in the matter of an application by Hydro One Networks Inc. for an 1900
approving of new transmission revenue requirements and rates for the transmission of electricity 1901
in 2013 and 2014. Decision issued on December 20, 2012. 1902
Ontario Energy Board. Filing Requirements: Transmission Project Development Plans; August 26, 1903
2010. 1904

London Economics International LLC 85 contact: 717 Atlantic Ave., Suite 1A Amit Pinjani/Ian Chow Boston, MA 02111 416-643-6621 www.londoneconomics.com [email protected]
Ontario Energy Board. Board Policy: Framework for Transmission project Development Plans; August 1905
26, 2010. 1906
PS Technologies Inc. Alberta Transmission System Wires Only – Cost Causation Study. January 25, 1907
2005. 1908
PS Technologies Inc. Alberta Transmission System 2006 Transmission Cost Causation Update. 1909
September 15, 2006 1910
PS Technologies Inc. Electric Transmission Operating and Maintenance Cost Study. December 10, 1911
2009 1912
14.2 Additional documents provided by AESO 1913
AESO Point of Delivery database 1914
AESO Draft Transmission Rate Impact Projection Model 1915
ATCO quotes for transformer 1916
Alberta Interconnected Electric System Map 1917
Interveners’ submissions on Transmission O&M study 1918
Need Identification Documents for Planned Projects 1919
Planning Base Case - 2015 data files 1920
Project Progress reports – cost and schedule information (approx. 62 files) 1921
Rule 005 Annual Reports 1922
TCWG meeting notes and underlying AESO analysis 1923
TFO depreciation studies 1924
TFO Asset Data for Capital Cost Study 1925
TFO Data for O&M Study 1926
TFOs tariff applications and underlying Excel files 1927
London Economics International LLC 86 contact: 717 Atlantic Ave., Suite 1A Amit Pinjani/Ian Chow Boston, MA 02111 416-643-6621 www.londoneconomics.com [email protected]
15 Appendix C: Background on LEI 1928
LEI has been actively involved in the Alberta market since its inception. The firm has worked 1929
with clients across the electricity sector value chain on a range of issues associated with both 1930
regulated and competitive assets in Alberta. In addition to the AESO, the Balancing Pool, and 1931
the Alberta Department of Energy, LEI has worked with generators, transmission companies, 1932
distributors, and industry associations in Alberta. This broad experience provides LEI with a 1933
significant depth of understanding of the Alberta market. 1934
The firm also maintains a continuously updated model of the Alberta competitive wholesale 1935
market, and produces twice yearly off the shelf Alberta forecasts. LEI has the ability to perform 1936
quantitative analysis of the Alberta market both prospectively and retrospectively across time 1937
scales of a client’s choosing, and to do so on a relatively quick turnaround basis. 1938
15.1 Background on the firm 1939
LEI is a global economic, financial and strategic advisory professional services firm specializing 1940
in energy and infrastructure. The firm combines detailed understanding of specific network 1941
and commodity industries, such as electricity generation and distribution, with a suite of 1942
proprietary quantitative models to produce reliable and comprehensive results. LEI is involved 1943
in strategic consultancy, with a key differentiating factor from its competitors in combining 1944
strategic analysis with an in depth focus and understanding of the dynamics of the energy 1945
sector. The firm has advised private sector clients, market institutions, and governments on 1946
privatization, asset valuation, deregulation, tariff design, market power, and strategy in 1947
virtually all deregulated markets worldwide. 1948
Figure 81. LEI clients throughout the world 1949
1950
2

London Economics International LLC 87 contact: 717 Atlantic Ave., Suite 1A Amit Pinjani/Ian Chow Boston, MA 02111 416-643-6621 www.londoneconomics.com [email protected]
15.2 Alberta-specific experience 1951
LEI has considerable experience advising governments, arms-length government agencies, and 1952
private companies on a range of issues related to the Alberta electricity sector. The following 1953
are a sample of those engagements. 1954
Cost-benefit analysis of potential transmission projects in Alberta: LEI was retained by 1955
Alberta's electricity transmission regulator to conduct a cost-benefit analysis of potential 1956
transmission projects in the province to demonstrate the techniques of our VITAL methodology. 1957
LEI's team focused on the North-South interconnector and examined the impact of new 1958
generation, retirements, intertie expansion, and load growth on the value of the line. 1959
Advice on the selection of a sale process for strip contracts: LEI was retained by the Alberta 1960
Electric System Operator to advise on the selection of a sale process for strip contracts. After 1961
reviewing the theoretical arguments and relevant case studies, LEI concluded that a 1962
discriminatory sealed-bid sale process was preferred. 1963
Develop holding restrictions for PPA auctions: LEI proprietary model of strategic behavior in 1964
electricity markets, known as CUSTOMBid. As a result of our analysis, a series of holding 1965
restrictions were developed which allowed for sale of capacity into the market without 1966
increasing the potential for strategic bidding. 1967
Devise holding restrictions for Alberta’s ancillary services market: LEI was engaged by 1968
Alberta's Balancing Pool to devise relevant holding restrictions for the Canadian province's 1969
ancillary services market. LEI's work included a survey of generators capable of providing 1970
ancillary services, technical and rules-based restrictions on the provision of these services, as 1971
well as stipulations regarding ESBI's procurement policies. LEI's report focused on regulating 1972
and operating reserves, and assessed the mechanisms associated with the other ancillary 1973
services required in Alberta. This included transmission must-run ("TMR") status, black start, 1974
reactive power and voltage control. 1975
Devise regulatory strategy for an Alberta transmission company: LEI designed for one of 1976
Canada's largest electricity transmission companies a regulatory strategy for its interaction with 1977
the relevant provincial utilities board regarding PBR methods. LEI utilized the capital asset 1978
pricing model (“CAPM”) to independently develop a range of ROEs, and suggested an 1979
"earnings sharing" (shared savings) approach to rate design based on the need to demonstrate a 1980
transition to incentive rates while maintaining simplicity and predictability in rate design. 1981
Workshop in incentive regulation for transmission companies: For North America's first 1982
independent transmission company, LEI facilitated a workshop on how to dovetail company 1983
attributes with the type of PBR advocated for, on specific examples of areas of cost declines as a 1984
result of incentive regulation, and on the impact of performance standards for transmission 1985
companies. 1986
Real option-based valuation for a Alberta generating unit: LEI was retained by the Balancing 1987
Pool of Alberta to conduct a real options-based valuation of the Clover Bar unit so as to provide 1988
a realistic, market-based foundation for determining the reservation price of the Clover Bar unit 1989

London Economics International LLC 88 contact: 717 Atlantic Ave., Suite 1A Amit Pinjani/Ian Chow Boston, MA 02111 416-643-6621 www.londoneconomics.com [email protected]
contracts. LEI's analysis suggested that the value of Clover Bar is intimately related to the 1990
flexibility of the plant. 1991
Long-term Alberta electricity power pool price forecasts: LEI was retained by a Canadian 1992
power utility to develop several forecasts of the long-term Alberta electricity power pool prices 1993
(2010 to 2030) based on different market parameters and offer recommendations for strategic 1994
action. The forecast also made special note of the effect on the market, if any, of the following 1995
conditions: (i) greenhouse gas legislation; (ii) increase in unconventional (shale) natural gas 1996
production; (iii) effect of the enactment of Bill 50; and (iv) effect on the market by external 1997
jurisdictions. 1998
Assess costs and benefits associate with output from coal fired power stations in Alberta: LEI 1999
was retained by a Canadian power utility to assess costs and benefits associated with output 2000
from coal fired power stations in Alberta. This engagement involved considering only 2001
information known as of 2000, to be used in a tax litigation case. LEI created pro forma 2002
valuation of contracts as of 2000, including forecast costs and revenues, and rendered an 2003
opinion on the appropriate cost of capital to be used. 2004
Comprehensive review of Alberta’s electricity market: LEI performed for the Alberta Provincial 2005
Government a comprehensive review of the province's electricity market, which included 2006
analysis of the roles of the Power Pool, the Transmission Administrator, the Market 2007
Surveillance Administrator, the Balancing Pool, and the System Controller. LEI performed 2008
extensive stakeholder consultation, and prepared an analysis of how these roles are performed 2009
in ten competitive wholesale markets worldwide. LEI then created a series of models for the 2010
evolution of all of the entities studied and the industry as a whole. Based on further 2011
stakeholder and government input, these models were distilled into final recommendations 2012
regarding how the industry components should be structured in the future. 2013
Study to further deregulate Alberta’s retail electricity market: LEI supported the Alberta 2014
Department of Energy (“ADOE”) in an attempt to select the most appropriate way to further 2015
deregulate its retail market. LEI's team analyzed the economic impact of five different options 2016
being considered by ADOE on customer bills by using historical data as well as developing a 2017
cost benefit analysis model that looked at both quantitative and qualitative issues that were 2018
prioritized by the ADOE. We provided a ranking of options and recommendations as to which 2019
would best meet ADOE needs. 2020
Theoretical analyses and quantitative simulation modeling for Alberta regulatory regime: LEI 2021
was retained by the Alberta Provincial Government to conduct theoretical analyses and 2022
quantitative simulation modeling in the design and testing of recommended new regulatory 2023
regimes in Alberta on the eve of the existing regime's expiration. 2024
Study of the Alberta electricity market with special focus on wind power: LEI produced for a 2025
major Canadian financial institution a complete study of the Alberta electricity market, with a 2026
special focus on the market for wind power. The study analyzed the prevailing regulatory 2027
status and expected regulatory changes, evaluated the market participants, discussed 2028
impending developments and gauged the current and future direction of the market. Using 2029

London Economics International LLC 89 contact: 717 Atlantic Ave., Suite 1A Amit Pinjani/Ian Chow Boston, MA 02111 416-643-6621 www.londoneconomics.com [email protected]
proprietary forecasting tool POOLMod, LEI developed 10-year price projections and analyzed 2030
the sensitivity of prices to changes in underlying market conditions. Finally, LEI reported on the 2031
special potential for wind power, including government incentives and the possibility for sales 2032
at above market prices. 2033
Estimate impact of Alberta power price changes for a litigation-related project: LEI was 2034
retained by a Canadian industrial conglomerate to estimate damages incurred because of power 2035
price changes during the life of a five-year swap agreement, which obligated the client to pay a 2036
fixed price in exchange for a floating-rate payment based on an hourly average pool price. LEI 2037
first investigated whether a material change in the determination of market-clearing prices in 2038
the Power Pool of Alberta had occurred on a specific date in 2001 and then estimated the 2039
magnitude of the price shift attributable to the change in the Clover Bar's pricing strategy over 2040
the term of the swap agreement and the amount of the resulting damages. 2041
Review of reasonableness of the proposed penalty by Alberta’s Market Surveillance 2042
Administrator (“MSA”): LEI conducted an independent review and provided a professional 2043
opinion regarding the reasonableness of the proposed penalty included in the Settlement 2044
Agreement between client and Alberta’s MSA related to export scheduling activities in 2045
November 2010. The MSA has requested that the Settlement Agreement be approved by the 2046
AUC. LEI reviewed relevant cases of asserted market manipulation in other jurisdictions, 2047
reviewed Alberta’s power market and its specific market rules, studied relevant economic and 2048
legal theory, and conducted quantitative analyses involving the manipulation of wholesale and 2049
retail market prices and loads. We presented our overall findings in a written testimony. 2050
15.3 Cost causation study experience 2051
LEI has conducted cost causation studies in the past along with counseling governments and 2052
regulators to design tariffs that allocate costs in an economically efficient manner. 2053
Self-funding tariff for ISO New England including cost causation study: LEI provided support 2054
for ISO New England throughout the design and submission to FERC of ISO New England’s 2055
self-funding tariff. LEI first defined the basic underlying economic principles for specifying the 2056
tariff, then undertook to show how the tariff should be applied to various system users. The 2057
engagement involved an intensive financial modeling effort, frequent interaction with 2058
stakeholders, and written testimony before FERC. 2059
Economic advice on cost causation and tariff regime: LEI provided Australia's former power 2060
market regulator, NEMMCO, economic advice on the appropriate regime for charging market 2061
participants for the costs incurred by the client in providing its services, in accordance with the 2062
National Electricity Code. In making its recommendation on participant fees, LEI considered 2063
the criteria specified by the National Electricity Code. LEI also considered the issues and 2064
arguments raised in submissions provided by participants in response to the issues paper 2065
released in December 1999. 2066
Methodologies for transmission cost allocation: LEI advised a state public utilities commission 2067
on methodologies for transmission cost allocation by comparing and contrasting alternative 2068
planning approaches and pricing models employed within the US and one international 2069

London Economics International LLC 90 contact: 717 Atlantic Ave., Suite 1A Amit Pinjani/Ian Chow Boston, MA 02111 416-643-6621 www.londoneconomics.com [email protected]
jurisdiction, the United Kingdom. The final report provided a ‘strawman’ recommendation for 2070
an effective cost allocation methodology. 2071
Distribution cost allocation and customer class definition: LEI, in consortium with an 2072
engineering firm, analyzed the customer density and distribution service costs for one of 2073
Ontario's largest utility. This engagement had three specific objectives: (i) evaluate the 2074
relationship between customer density and distribution service costs; (ii) assess whether 2075
utility’s existing density-based rate classes and density weighting factors appropriately reflect 2076
this relationship; and (iii) consider, qualitatively, the appropriateness and feasibility of 2077
establishing alternative customer class definitions. 2078
Cost of service tariff design for electricity, water and wastewater services in Saudi Arabia: On 2079
behalf of a utility serving industrial areas in Saudi Arabia, LEI developed a regulatory 2080
framework for power and water utilities not regulated by the government, developed a charter 2081
for a new regulatory body, established and recommended cost of service (and alternative 2082
incentive regulation) based tariff structure and accompanying tariff model for all business 2083
activities, and assisted filing of tariff petitions with the applicable regulatory authorities for 2084
approval. 2085
Design of wheeling tariff and pilot program for Saudi Arabia: For the Saudi regulator, 2086
developed proposed plan for wheeling of power in Saudi Arabia, including proposed pilot 2087
program, assessment of impact on incumbent, relative economics of wheeling versus the 2088
industrial tariff, and review of associated commercial and regulatory issues. 2089
Tariff design for Kingdom of Saudi Arabia: Led engagement with international team assessing 2090
tariff design, modeling, and electricity market evolution in Saudi Arabia; engagement resulted 2091
in a revised tariff system, including performance based rates, tolling agreements for generation, 2092
and an open access tariff. Included holding workshops for regulator in explaining cost of 2093
capital, tariff design, and other regulatory issues. 2094
15.4 Transmission related experience 2095
LEI has also advised transmission developers on a wide range of additional issues including: 2096
Analyzing elasticity of demand for transmission services: LEI was retained by a Canadian 2097
consortium to analyze the elasticity of demand for electricity transmission services between the 2098
province of Quebec and surrounding markets. This project was undertaken in the context of a 2099
rate filing by a Quebec transmission company for a rate increase, based on an assumption that 2100
demand for electricity transmission service is inelastic. 2101
Potential economic benefits of a proposed transmission project: LEI was commissioned by a 2102
Northeastern utility to determine the potential economic benefits of a proposed transmission 2103
project. Using detailed hourly simulation modeling of future power market conditions, LEI 2104
studied the potential market implications of the project for ten years from a notional expected 2105
date of commercial operation of 2014. LEI reached the following conclusions: New England 2106
ratepayers could expect cumulative energy cost savings attributable to the project over ten years 2107
under normal operating conditions; the transmission project would create regional energy 2108

London Economics International LLC 91 contact: 717 Atlantic Ave., Suite 1A Amit Pinjani/Ian Chow Boston, MA 02111 416-643-6621 www.londoneconomics.com [email protected]
market impacts; each phase of the project would create energy market benefits over the ten-year 2109
modeling horizon; the project would provide an insurance hedge against stressed system 2110
events; and NEEWS would offer market access to renewable resources in Northern New 2111
England/Canada. 2112
Analysis of customer benefits from expansion of market through new transmission: LEI 2113
performed a fifteen (15) year simulation analysis to estimate the market impacts resulting from 2114
a new transmission interconnection (covering the timeframe 2015-2029) and project the impact 2115
on Maine customers (including Northern Maine customers). LEI evaluated the market 2116
evolution with and without the interconnection and described the potential ramifications for 2117
purchasing electricity for Northern Maine customers. The analysis also estimated the potential 2118
impact on ratepayers from the re-allocation of the ISO-NE Pool Transmission Facility rate to 2119
incorporate the Northern Maine load and franchise area under a pro forma 10-year transitional 2120
agreement. LEI performed the modeling using our up-to-date ISO-NE simulation model (which 2121
covers the energy and capacity markets), extended to represent in detail the Maritimes control 2122
area. 2123
Project evaluation for a HVDC transmission line in the Northeast market in US: LEI advised 2124
Transmission Developers Inc. on the financial implications of a proposed new HVDC 2125
transmission line to New York City from Quebec, Canada. LEI analyzed the impact of new 2126
transmission, given its goal of delivering 100% carbon-free energy, on electricity prices and 2127
emissions levels in New York. We evaluated both the congestion rents in support of analyzing 2128
the economic potential for the project and their negotiations with anchor tenants (buyers of the 2129
transmission rights) and we also looked at market impacts and provided testimony on market 2130
benefits to ratepayers. LEI then testified at the NY Public Service Commission regarding this 2131
project in July 2012. 2132
Market analysis in support of Northern Pass: LEI prepared a presentation that discusses the 2133
electricity market impacts and benefits of Northern Pass Transmission project for New 2134
Hampshire and New England consumers. In May 2011, LEI staff also assisted in the 2135
preparation of an op-ed piece for dissemination to New Hampshire press outlets. LEI staff also 2136
testified before state regulators regarding the project. 2137