Oracle Audit Vault Administrator's Guide - Oracle Help Center
Upload
khangminh22Category
view
3download
0
Oracle® CommunicationsEAGLE Application ProcessorAlarms on T1200 Platform
910-6688-001 Revision B
February 2014

Oracle® Communications Alarms on T1200 PlatformCopyright © 2000, 2014, Oracle and/or its affiliates. All rights reserved.
This software and related documentation are provided under a license agreement containing restrictionson use and disclosure and are protected by intellectual property laws. Except as expressly permitted in yourlicense agreement or allowed by law, you may not use, copy, reproduce, translate, broadcast, modify, license,transmit, distribute, exhibit, perform, publish, or display any part, in any form, or by any means. Reverseengineering, disassembly, or decompilation of this software, unless required by law for interoperability, isprohibited.
The information contained herein is subject to change without notice and is not warranted to be error-free.If you find any errors, please report them to us in writing.
If this is software or related documentation that is delivered to the U.S. Government or anyone licensing iton behalf of the U.S. Government, the following notice is applicable:
U.S. GOVERNMENT RIGHTS Programs, software, databases, and related documentation and technicaldata delivered to U.S. Government customers are "commercial computer software" or "commercial technicaldata" pursuant to the applicable Federal Acquisition Regulation and agency-specific supplemental regulations.As such, the use, duplication, disclosure, modification, and adaptation shall be subject to the restrictionsand license terms set forth in the applicable Government contract, and, to the extent applicable by the termsof the Government contract, the additional rights set forth in FAR 52.227-19, Commercial Computer SoftwareLicense (December 2007). Oracle America, Inc., 500 Oracle Parkway, Redwood City, CA 94065.
This software or hardware is developed for general use in a variety of information management applications.It is not developed or intended for use in any inherently dangerous applications, including applicationsthat may create a risk of personal injury. If you use this software or hardware in dangerous applications,then you shall be responsible to take all appropriate fail-safe, backup, redundancy, and other measures toensure its safe use. Oracle Corporation and its affiliates disclaim any liability for any damages caused byuse of this software or hardware in dangerous applications.
Oracle and Java are registered trademarks of Oracle and/or its affiliates. Other names may be trademarksof their respective owners.
Intel and Intel Xeon are trademarks or registered trademarks of Intel Corporation. All SPARC trademarksare used under license and are trademarks or registered trademarks of SPARC International, Inc. AMD,Opteron, the AMD logo, and the AMD Opteron logo are trademarks or registered trademarks of AdvancedMicro Devices. UNIX is a registered trademark of The Open Group.
This software or hardware and documentation may provide access to or information on content, products,and services from third parties. Oracle Corporation and its affiliates are not responsible for and expresslydisclaim all warranties of any kind with respect to third-party content, products, and services. OracleCorporation and its affiliates will not be responsible for any loss, costs, or damages incurred due to youraccess to or use of third-party content, products, or services.

Table of Contents
Chapter 1: Introduction...............................................................................11Overview...............................................................................................................................................12Scope and Audience............................................................................................................................12Manual Organization...........................................................................................................................12Documentation Admonishments.......................................................................................................12Customer Care Center.........................................................................................................................13Emergency Response...........................................................................................................................15Related Publications............................................................................................................................16Documentation Availability, Packaging, and Updates..................................................................16Locate Product Documentation on the Customer Support Site....................................................17
Chapter 2: Problem Detection and Reporting........................................18Detecting and Reporting Problems...................................................................................................19T1200 Application Server LEDs.........................................................................................................19Displaying Errors on EPAP GUI........................................................................................................23Unsolicited Alarm and Information Messages................................................................................24
Chapter 3: Recovery Support.....................................................................26Daily Maintenace Procedures.............................................................................................................27
Backing Up the RTDB..............................................................................................................27Backing Up the PDB.................................................................................................................31Transferring RTDB and PDB Backup Files ..........................................................................33
System Health Check Overview........................................................................................................33Health Check Outputs.............................................................................................................35
Running the System Health Check....................................................................................................38Running syscheck Through the EPAP GUI..........................................................................38Running syscheck Using the syscheck Login.......................................................................39
Restoring Databases from Backup Files............................................................................................39Recovering From Alarms....................................................................................................................43
Decode Alarm Strings..............................................................................................................44Determine Alarm Cause..........................................................................................................45
iii910-6688-001 Revision B, February 2014

Chapter 4: Alarms........................................................................................46Alarms Overview.................................................................................................................................47Alarm Recovery Procedures...............................................................................................................50Critical Platform Alarms.....................................................................................................................50
1000000000002000 - Uncorrectable ECC memory error......................................................501000000000004000 - SNMP get failure...................................................................................50
Critical Application Alarms................................................................................................................50Major Platform Alarms........................................................................................................................50
3000000000000001 – Server fan failure..................................................................................503000000000000002 - Server internal disk error.....................................................................513000000000000004 – Server RAID disk error........................................................................513000000000000008 - Server Platform error............................................................................513000000000000010 - Server file system error........................................................................513000000000000020 - Server Platform process error.............................................................513000000000000040 – Server RAM shortage error.................................................................523000000000000080 - Server swap space shortage failure....................................................523000000000000100 - Server provisioning network error.....................................................523000000000000200 – Server Eagle Network A error............................................................523000000000000400 – Server Eagle Network B error............................................................533000000000000800 – Server Sync network error..................................................................543000000000001000 - Server disk space shortage error.........................................................553000000000002000 - Server default route network error....................................................553000000000004000 - Server temperature error.....................................................................563000000000008000 – Server mainboard voltage error.........................................................573000000000010000 – Server power feed error......................................................................573000000000020000 - Server disk health test error................................................................583000000000040000 - Server disk unavailable error..............................................................583000000000080000 – Device error...........................................................................................583000000000100000 – Device interface error..........................................................................583000000000200000 – Correctable ECC memory error.........................................................583000000000400000 – Power Supply A error..........................................................................583000000000800000 – Power Supply B error..........................................................................593000000001000000 – Breaker panel feed error......................................................................593000000002000000 – Breaker panel breaker error................................................................593000000004000000 – Breaker panel monitoring error.........................................................623000000008000000 – Server HA Keepalive error.................................................................623000000080000000 – HP disk problem..................................................................................623000000100000000 – HP Smart Array controller problem..................................................633000000200000000 – HP hpacucliStatus utility problem....................................................63
iv910-6688-001 Revision B, February 2014

3000000400000000 - Multipath device access link problem...............................................63Major Application Alarms..................................................................................................................63
4000000000000001 - Mate EPAP Unavailable.......................................................................634000000000000002 - RTDB Mate Unavailable......................................................................644000000000000004 - Congestion.............................................................................................654000000000000020 - RMTP Channels Down.........................................................................654000000000000040 - Fatal Software Error..............................................................................664000000000000080 - RTDB Corrupt.......................................................................................664000000000000100 - RTDB Inconsistent................................................................................664000000000000200 - RTDB Incoherent...................................................................................684000000000001000 - RTDB 100% Full....................................................................................684000000000002000 - RTDB Resynchronization in Progress................................................694000000000004000 - RTDB Reload Is Required....................................................................694000000000008000 - Mate PDBA Unreachable.....................................................................724000000000010000 - PDBA Connection Failure...................................................................744000000000020000 - PDBA Replication Failure....................................................................754000000000040000 - RTDB DSM Over-Allocation...............................................................754000000000080000 - RTDB Maximum Depth Reached.......................................................764000000000100000 - No PDBA Proxy to Remote PDBA Connection................................764000000000200000 - DSM Provisioning Error......................................................................774000000004000000 - RTDB MPS Over-Allocation................................................................774000000008000000 - PDB 100% Full.......................................................................................77
Minor Platform Alarms.......................................................................................................................775000000000000001 – Server disk space shortage warning..................................................775000000000000002 – Server application process error........................................................785000000000000004 – Server hardware configuration error................................................795000000000000020 – Server swap space shortage warning................................................795000000000000040 – Server default router not defined......................................................795000000000000080 – Server temperature warning...............................................................815000000000000100 – Server core file detected......................................................................825000000000000200 – Server NTP Daemon not synchronized............................................825000000000000400 – CMOS battery voltage low..................................................................825000000000000800 – Server disk self test warning...............................................................835000000000001000 – Device warning.....................................................................................835000000000002000 – Device interface warning....................................................................835000000000004000 – Server reboot watchdog initiated.......................................................835000000000008000 – Server HA failover inhibited..............................................................835000000000010000 – Server HA Active to Standby transition...........................................845000000000020000 – Server HA Standby to Active transition...........................................845000000000040000 – Platform Health Check failure............................................................845000000000080000 – NTP Offset Check failure....................................................................84
v910-6688-001 Revision B, February 2014

5000000000100000 – NTP Stratum Check failure.................................................................845000000000200000 – SAS Presence Sensor Missing.............................................................845000000000400000 – SAS Drive Missing...............................................................................855000000001000000 – HP disk resync......................................................................................855000000010000000 – Invalid BIOS value...............................................................................855000000020000000 – Server Kernel Dump File Detected....................................................855000000040000000 – TPD Upgrade Failed............................................................................85
Minor Application Alarms..................................................................................................................866000000000000001 - RMTP Channel A Down......................................................................866000000000000002 - RMTP Channel B Down.......................................................................866000000000000008 - RTDB 80% Full......................................................................................866000000000000020 - Standby PDBA Falling Behind............................................................876000000000000040 - RTDB Tree Error...................................................................................886000000000000080 - PDB Backup failed................................................................................886000000000000100 - Automatic PDB Backup failed............................................................886000000000000200 - RTDB Backup failed.............................................................................896000000000000400 - Automatic RTDB Backup failed..........................................................906000000000001000 - SSH tunnel not established..................................................................916000000000002000 - RTDB 90% Full......................................................................................916000000000004000 - PDB 90% Full.........................................................................................916000000000008000 - PDB 80% Full.........................................................................................916000000000010000 - PDB InnoDB Space 90% Full...............................................................92
Appendix A: General Procedures.............................................................93Accessing the EPAP GUI Interface....................................................................................................94Connecting the Local Access Terminal.............................................................................................95Accessing the EPAP Text Interface....................................................................................................96Restarting the EPAP and PDBA.........................................................................................................96Restarting the EPAP Software............................................................................................................99Saving Logs Using the EPAP GUI...................................................................................................101
Glossary.............................................................................................................................104
vi910-6688-001 Revision B, February 2014

List of Figures
Figure 1: T1200 Application Server LEDs.....................................................................................................20
Figure 2: T1200 AS Ethernet Connectors......................................................................................................22
Figure 3: Power Supply LED..........................................................................................................................22
Figure 4: Errors Displayed on EPAP GUI.....................................................................................................23
Figure 5: Viewing Alarm Details...................................................................................................................24
Figure 6: Stop EPAP Software........................................................................................................................28
Figure 7: EPAP Software Successfully Stopped...........................................................................................28
Figure 8: Backup the RTDB.............................................................................................................................29
Figure 9: Backup the RTDB Confirmation....................................................................................................29
Figure 10: Backup the RTDB - Success..........................................................................................................30
Figure 11: Start EPAP Software......................................................................................................................30
Figure 12: Start EPAP Software - Success.....................................................................................................30
Figure 13: Backup the PDB.............................................................................................................................31
Figure 14: Backup PDB Confirmation...........................................................................................................32
Figure 15: Backup the PDB - Success.............................................................................................................32
Figure 16: Run Health Check..........................................................................................................................38
Figure 17: Displaying System Health Check on EPAP GUI......................................................................39
Figure 18: Stop EPAP Software......................................................................................................................40
Figure 19: Stop EPAP Software - Success.....................................................................................................40
Figure 20: Restoring the RTDB.......................................................................................................................41
Figure 21: Restore the RTDB Confirm...........................................................................................................41
Figure 22: Restore the RTDB - Success..........................................................................................................41
vii910-6688-001 Revision B, February 2014

Figure 23: Stop EPAP Software......................................................................................................................42
Figure 24: Stop EPAP Software - Success.....................................................................................................43
Figure 25: Restoring the PDB..........................................................................................................................43
Figure 26: Decode MPS Alarm Screen...........................................................................................................44
Figure 27: Decoded MPS Alarm Information..............................................................................................45
Figure 28: Breaker Panel LEDs.......................................................................................................................60
Figure 29: Breaker Panel Setting....................................................................................................................60
Figure 30: Coherent RTDB Status..................................................................................................................65
Figure 31: RTDB Status....................................................................................................................................67
Figure 32: Reload RTDB from PDBA............................................................................................................68
Figure 33: RTDB Status....................................................................................................................................70
Figure 34: Reload RTDB from Mate EPAP...................................................................................................71
Figure 35: Changing Transaction Log Parameters......................................................................................72
Figure 36: PDBA Down...................................................................................................................................73
Figure 37: Start PDBA......................................................................................................................................73
Figure 38: PDBA Started.................................................................................................................................74
Figure 39: Determining the Homing Policy.................................................................................................75
Figure 40: View PDBA Status Screen............................................................................................................76
Figure 41: Manage Logs and Backups...........................................................................................................78
Figure 42: View PDBA Status.........................................................................................................................87
Figure 43: EPAP User Interface Screen.........................................................................................................94
Figure 44: DB44 to DB9 (X4) Cable................................................................................................................95
Figure 45: Stop Software Confirmation.........................................................................................................97
Figure 46: Stop Software.................................................................................................................................97
Figure 47: Stop Software Completion Screen...............................................................................................98
viii910-6688-001 Revision B, February 2014

Figure 48: Start EPAP Software......................................................................................................................98
Figure 49: Start Software Completion Screen...............................................................................................99
Figure 50: Stop Software Confirmation.......................................................................................................100
Figure 51: Stop Software Completion Screen.............................................................................................100
Figure 52: Start EPAP Software....................................................................................................................100
Figure 53: Start Software Completion Screen.............................................................................................101
Figure 54: Capture Logs File Screen............................................................................................................101
Figure 55: Capture Logs Success..................................................................................................................102
Figure 56: Deleting Captured Log Files......................................................................................................102
Figure 57: Delete Log Files Success.............................................................................................................103
ix910-6688-001 Revision B, February 2014

List of Tables
Table 1: Admonishments................................................................................................................................12
Table 2: Front Panel LED Descriptions (T1200 AS).....................................................................................20
Table 3: DC Power Supply LED Indicators..................................................................................................22
Table 4: System Health Check Operation.....................................................................................................34
Table 5: Platform and Application Alarms...................................................................................................47
Table 6: Server Environmental Conditions..................................................................................................56
Table 7: Server Environmental Conditions..................................................................................................81
Table 8: Usernames..........................................................................................................................................94
x910-6688-001 Revision B, February 2014

Chapter
1Introduction
This chapter provides general information aboutmanual organization, the scope of this manual, its
Topics:
• Overview.....12 targeted audience, how to get technical assistance,• Scope and Audience.....12 and how to locate customer documentation on the
Customer Support Site.• Manual Organization.....12• Documentation Admonishments.....12• Customer Care Center.....13• Emergency Response.....15• Related Publications.....16• Documentation Availability, Packaging, and
Updates.....16• Locate Product Documentation on the Customer
Support Site.....17
11910-6688-001 Revision B, February 2014

Overview
This manual describes all available alarms and provides their recovery procedures.
Scope and Audience
This manual describes platform and application alarms.
This manual is for maintenance personnel that are responsible for alarm resolution. When instructedby the application, use this manual to locate the platform alarm number and its recovery procedure.This manual also describes the System Healthcheck Utility, which generates a log file that can beprovided to the Tekelec Customer Care Center for alarm resolution.
Manual Organization
This manual is organized into the following chapters:
Introduction contains general information about manual organization, scope and audience, relateddocumentation, how to locate customer documentation on the Customer Support site, how to gettechnical assistance, and RMA requirements.
Problem Detection and Reporting provides information about problem detection and reporting.
Recovery Support describes the recommended backing up of the RTDB and presents additional recoverysupport procedures that may be referred to by alarms recovery actions.
Alarms provides recovery procedures for platform and application alarms.
General Procedures contains miscellaneous general procedures that are referred to within this manual
Documentation Admonishments
Admonishments are icons and text throughout this manual that alert the reader to assure personalsafety, to minimize possible service interruptions, and to warn of the potential for equipment damage.
Table 1: Admonishments
DescriptionIcon
Danger:
(This icon and text indicate the possibility ofpersonal injury.)
12910-6688-001 Revision B, February 2014
IntroductionAlarms on the T1200 Platform

DescriptionIcon
Warning:
(This icon and text indicate the possibility ofequipment damage.)
Caution:
(This icon and text indicate the possibility ofservice interruption.)
Topple:
(This icon and text indicate the possibility ofpersonal injury and equipment damage.)
Customer Care Center
The Tekelec Customer Care Center is your initial point of contact for all product support needs. Arepresentative takes your call or email, creates a Customer Service Request (CSR) and directs yourrequests to the Tekelec Technical Assistance Center (TAC). Each CSR includes an individual trackingnumber. Together with TAC Engineers, the representative will help you resolve your request.
The Customer Care Center is available 24 hours a day, 7 days a week, 365 days a year, and is linkedto TAC Engineers around the globe.
Tekelec TAC Engineers are available to provide solutions to your technical questions and issues 7days a week, 24 hours a day. After a CSR is issued, the TAC Engineer determines the classification ofthe trouble. If a critical problem exists, emergency procedures are initiated. If the problem is not critical,normal support procedures apply. A primary Technical Engineer is assigned to work on the CSR andprovide a solution to the problem. The CSR is closed when the problem is resolved.
Tekelec Technical Assistance Centers are located around the globe in the following locations:
Tekelec - Global
Email (All Regions): [email protected]
• USA and Canada
Phone:
1-888-367-8552 (toll-free, within continental USA and Canada)
1-919-460-2150 (outside continental USA and Canada)
TAC Regional Support Office Hours:
8:00 a.m. through 5:00 p.m. (GMT minus 5 hours), Monday through Friday, excluding holidays
• Caribbean and Latin America (CALA)
Phone:
+1-919-460-2150
13910-6688-001 Revision B, February 2014
IntroductionAlarms on the T1200 Platform

TAC Regional Support Office Hours (except Brazil):
10:00 a.m. through 7:00 p.m. (GMT minus 6 hours), Monday through Friday, excluding holidays
• Argentina
Phone:
0-800-555-5246 (toll-free)
• Brazil
Phone:
0-800-891-4341 (toll-free)
TAC Regional Support Office Hours:
8:00 a.m. through 5:48 p.m. (GMT minus 3 hours), Monday through Friday, excluding holidays
• Chile
Phone:
1230-020-555-5468
• Colombia
Phone:
01-800-912-0537
• Dominican Republic
Phone:
1-888-367-8552
• Mexico
Phone:
001-888-367-8552
• Peru
Phone:
0800-53-087
• Puerto Rico
Phone:
1-888-367-8552
• Venezuela
Phone:
0800-176-6497
• Europe, Middle East, and Africa
Regional Office Hours:
14910-6688-001 Revision B, February 2014
IntroductionAlarms on the T1200 Platform

8:30 a.m. through 5:00 p.m. (GMT), Monday through Friday, excluding holidays
• Signaling
Phone:
+44 1784 467 804 (within UK)
• Software Solutions
Phone:
+33 3 89 33 54 00
• Asia
• India
Phone:
+91-124-465-5098 or +1-919-460-2150
TAC Regional Support Office Hours:
10:00 a.m. through 7:00 p.m. (GMT plus 5 1/2 hours), Monday through Saturday, excludingholidays
• Singapore
Phone:
+65 6796 2288
TAC Regional Support Office Hours:
9:00 a.m. through 6:00 p.m. (GMT plus 8 hours), Monday through Friday, excluding holidays
Emergency Response
In the event of a critical service situation, emergency response is offered by the Tekelec Customer CareCenter 24 hours a day, 7 days a week. The emergency response provides immediate coverage, automaticescalation, and other features to ensure that the critical situation is resolved as rapidly as possible.
A critical situation is defined as a problem with the installed equipment that severely affects service,traffic, or maintenance capabilities, and requires immediate corrective action. Critical situations affectservice and/or system operation resulting in one or several of these situations:
• A total system failure that results in loss of all transaction processing capability• Significant reduction in system capacity or traffic handling capability• Loss of the system’s ability to perform automatic system reconfiguration• Inability to restart a processor or the system• Corruption of system databases that requires service affecting corrective actions• Loss of access for maintenance or recovery operations• Loss of the system ability to provide any required critical or major trouble notification
15910-6688-001 Revision B, February 2014
IntroductionAlarms on the T1200 Platform

Any other problem severely affecting service, capacity/traffic, billing, and maintenance capabilitiesmay be defined as critical by prior discussion and agreement with the Tekelec Customer Care Center.
Related Publications
For information about additional publications that are related to this document, refer to the RelatedPublications document. The Related Publications document is published as a part of the ReleaseDocumentation and is also published as a separate document on the Tekelec Customer Support Site.
Documentation Availability, Packaging, and Updates
Tekelec provides documentation with each system and in accordance with contractual agreements.For General Availability (GA) releases, Tekelec publishes a complete EAGLE 5 ISS documentation set.For Limited Availability (LA) releases, Tekelec may publish a documentation subset tailored to specificfeature content or hardware requirements. Documentation Bulletins announce a new or updatedrelease.
The Tekelec EAGLE 5 ISS documentation set is released on an optical disc. This format allows for easysearches through all parts of the documentation set.
The electronic file of each manual is also available from the Tekelec Customer Support site. This siteallows for 24-hour access to the most up-to-date documentation, including the latest versions of FeatureNotices.
Printed documentation is available for GA releases on request only and with a lead time of six weeks.The printed documentation set includes pocket guides for commands and alarms. Pocket guides mayalso be ordered separately. Exceptions to printed documentation are:
• Hardware or Installation manuals are printed without the linked attachments found in the electronicversion of the manuals.
• The Release Notice is available only on the Customer Support site.
Note: Customers may print a reasonable number of each manual for their own use.
Documentation is updated when significant changes are made that affect system operation. Updatesresulting from Severity 1 and 2 Problem Reports (PRs) are made to existing manuals. Other changesare included in the documentation for the next scheduled release. Updates are made by re-issuing anelectronic file to the customer support site. Customers with printed documentation should contacttheir Sales Representative for an addendum. Occasionally, changes are communicated first with aDocumentation Bulletin to provide customers with an advanced notice of the issue until officiallyreleased in the documentation. Documentation Bulletins are posted on the Customer Support site andcan be viewed per product and release.
16910-6688-001 Revision B, February 2014
IntroductionAlarms on the T1200 Platform

Locate Product Documentation on the Customer Support Site
Access to Tekelec's Customer Support site is restricted to current Tekelec customers only. This sectiondescribes how to log into the Tekelec Customer Support site and locate a document. Viewing thedocument requires Adobe Acrobat Reader, which can be downloaded at www.adobe.com.
1. Log into the Tekelec Customer Support site.
Note: If you have not registered for this new site, click the Register Here link. Have your customernumber available. The response time for registration requests is 24 to 48 hours.
2. Click the Product Support tab.3. Use the Search field to locate a document by its part number, release number, document name, or
document type. The Search field accepts both full and partial entries.4. Click a subject folder to browse through a list of related files.5. To download a file to your location, right-click the file name and select Save Target As.
17910-6688-001 Revision B, February 2014
IntroductionAlarms on the T1200 Platform

Chapter
2Problem Detection and Reporting
This chapter provides information about problemdetection and reporting by the platform operatingsystem and the EPAP application.
Topics:
• Detecting and Reporting Problems.....19• T1200 Application Server LEDs.....19• Displaying Errors on EPAP GUI.....23• Unsolicited Alarm and Information Messages...24
18910-6688-001 Revision B, February 2014

Detecting and Reporting Problems
Problems are detected and reported by the platform operating system and the EPAP application.
• The platform constantly monitors its operational status using the System Health Check utilitysyscheck. This utility can be initiated also by the user. For more details about syscheck, seeSystem Health Check Overview.
If syscheck detects a fault or error, the user is notified by:
• The appropriate alarm LED illuminated on the front of the server (see T1200 Application ServerLEDs).
• An alarm message sent to the application which:
• displays the alarm on the application GUI (see Displaying Errors on EPAP GUI).
• sends the alarm message to the EAGLE 5 ISS which sends a UAM to the operator screen tonotify the user (see Unsolicited Alarm and Information Messages).
• The syscheck test results logged to a file available for the Customer Care Center. If logs are tobe saved to send to the Customer Care Center, see Saving Logs Using the EPAP GUI.
• The EPAP application running on the server can detect application errors. If an application problemis detected, the user is notified by:
• The appropriate alarm LED illuminated on the front of the (see T1200 Application Server LEDs).
• An error displayed on the graphical user interface (GUI) banner (see Displaying Errors on EPAPGUI).
• An error sent to to the EAGLE 5 ISS, which reports the error as a UAM alarm (see UnsolicitedAlarm and Information Messages).
• The error recorded in an application log file. If logs are to be saved to send to the Customer CareCenter, see Saving Logs Using the EPAP GUI.
T1200 Application Server LEDs
This section describes the LEDs found on the front and rear of the application server.
Server Panel LEDs
Figure 1: T1200 Application Server LEDs shows the T1200 application sever LEDs on the front panel
19910-6688-001 Revision B, February 2014
Problem Detection and ReportingAlarms on the T1200 Platform

Figure 1: T1200 Application Server LEDs
Table 2: Front Panel LED Descriptions (T1200 AS)
DescriptionFeatureItem
Front Panel Switches
Toggles the system powerPower switchA
Resets the systemReset switchB
Toggles the system ID LEDID switchK
Asserts NMI to the server boardNMI switchL
Front Panel Alarms LEDs
When continuously lit, thisindicates the presence of a
Critical (yellow or reda)C
Critical System Fault, which isan error or event with a fatalsystem impact. In this case, thesystem cannot continue tooperate. An example is the lossof a large section of memory, orother corruption that renders thesystem not operational.
When continuously lit, thisindicates the presence of a Major
Major (yellow or reda)D
System Fault, which is an erroror event which has a discerniblesystem impact. In this case, thesystem can continue to operatebut in a degraded fashion(reduced performance or loss ofnon-fatal feature reduction). Anexample is the loss of one or twomirrored disks.
20910-6688-001 Revision B, February 2014
Problem Detection and ReportingAlarms on the T1200 Platform

DescriptionFeatureItem
When continuously lit, thisindicates the presence of a Minor
Minor (yellow)E
System Fault, which is an erroror event that has little impact toactual system operation. Anexample is a correctable ECCerror.
When continuously lit, thisindicates the presence of a Power
Power (yellow)F
System Fault, which is an erroror event that has little impact toactual system operation. Anexample is a correctable ECCerror.
Front Panel Status LEDs
Indicates hard drive activitywhen green, or a hard drive fault
Disk Activity / Fault LED (greenor amber)
G
when amber. This is an OR’eddisplay for all three internaldrives.
Remove the front bezel toobserve the individual harddrive LEDs and identify a faultydrive.
When continuously lit, thisindicates the presence of DC
Main Power LED (green)H
power in the server. The LEDgoes out when the power switchis turned off (standby mode) orthe power source is disrupted.
Indicates NIC activityNIC activity LED (green)I
This LED can be toggledremotely or by front panel ID
NIC activity LED (green)J
switch for identificationpurposes.
aCritical and major alarm indicators are bi-color LEDs that can eb configured to be yellow or red.
Yellow is the default.
Ethernet Connector LEDs
For each Ethernet connector, there are two status indicator LEDs integrated into the connector assembly,a green LED to the left of the connector and a bi-color LED to the right of the connector. The sameLEDs are used for the RMM port.
21910-6688-001 Revision B, February 2014
Problem Detection and ReportingAlarms on the T1200 Platform

Figure 2: T1200 AS Ethernet Connectors
The green LED indicates the connection status for each port. If the port is connected to a network butthere is no current activity, the green LED is continuously illuminated. When there is activity on theconnected network, the green LED blinks.
The bi-color LED indicates the connection speed. If the green LED indicates a network connection butthe bi-color LED is not lit, then the connection speed is 10 Mbps. If the bi-color LED shows a solidgreen indication, then the connection speed is 100 Mbps. If the bi-color LED is solid amber, then theconnection speed is 1 Gbps.
DC Power Supply LEDs
The power supply provides a single, external, bi-color LED to indicate its status. Figure 3: Power SupplyLED shows the power supply LEDs on the rear.
Figure 3: Power Supply LED
The LED blinks green when DC is applied to the PSU and standby voltages are available. The LEDdisplays solid green when all the power outputs are available. The LED displays solid amber whenthe PSU has failed or shut down due to over-current or over-temperature.
See Table 3: DC Power Supply LED Indicators for LED conditions
Table 3: DC Power Supply LED Indicators
Bi-color LED IndicationPower Supply Condition
OFFNo DC power to all power supplies
AmberNo DC power to this power supply (for 1+1configuration)
OR
22910-6688-001 Revision B, February 2014
Problem Detection and ReportingAlarms on the T1200 Platform
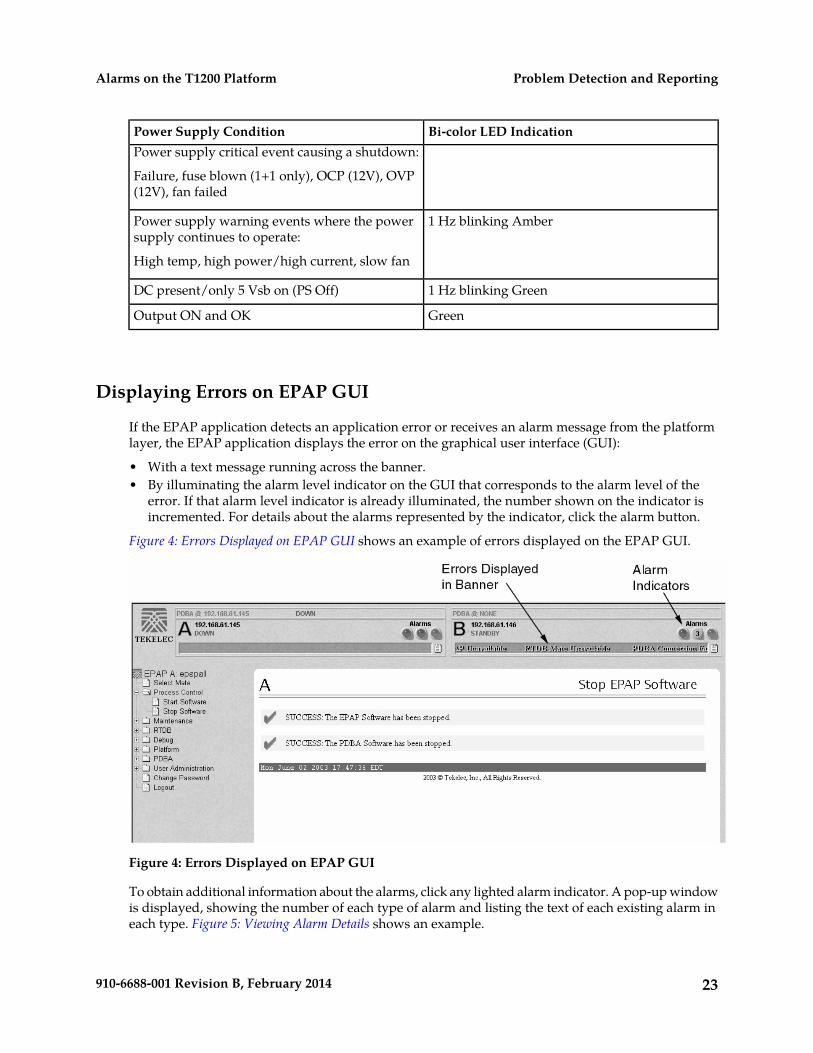
Bi-color LED IndicationPower Supply ConditionPower supply critical event causing a shutdown:
Failure, fuse blown (1+1 only), OCP (12V), OVP(12V), fan failed
1 Hz blinking AmberPower supply warning events where the powersupply continues to operate:
High temp, high power/high current, slow fan
1 Hz blinking GreenDC present/only 5 Vsb on (PS Off)
GreenOutput ON and OK
Displaying Errors on EPAP GUI
If the EPAP application detects an application error or receives an alarm message from the platformlayer, the EPAP application displays the error on the graphical user interface (GUI):
• With a text message running across the banner.• By illuminating the alarm level indicator on the GUI that corresponds to the alarm level of the
error. If that alarm level indicator is already illuminated, the number shown on the indicator isincremented. For details about the alarms represented by the indicator, click the alarm button.
Figure 4: Errors Displayed on EPAP GUI shows an example of errors displayed on the EPAP GUI.
Figure 4: Errors Displayed on EPAP GUI
To obtain additional information about the alarms, click any lighted alarm indicator. A pop-up windowis displayed, showing the number of each type of alarm and listing the text of each existing alarm ineach type. Figure 5: Viewing Alarm Details shows an example.
23910-6688-001 Revision B, February 2014
Problem Detection and ReportingAlarms on the T1200 Platform

Figure 5: Viewing Alarm Details
When an alarm value in the Alarm View popup window represents multiple alarms, as shown inFigure 5: Viewing Alarm Details, the text of each of the alarms being reported is displayed. The individualalarm text is found in Alarms Overview. To correct the alarm condition, perform the associated proceduredescribed in Alarm Recovery Procedures.
Unsolicited Alarm and Information Messages
The EAGLE 5 ISS displays only one alarm per EPAP at a time based on the highest priority. If a singleerror is detected, the EPAP application sends an error message to the EAGLE 5 ISS terminal to reportthe active alarm category. If multiple errors are detected, the EPAP application sends an error messageto the EAGLE 5 ISS terminal to report the most severe active alarm category.
If multiple alarms of the same severity exist and their severity is the highest alarm severity currentlyactive, a combination alarm code is sent to the EAGLE 5 ISS. The EAGLE 5 ISS issues the appropriateUAM to the operator.
Errors detected in the hardware and software are reported by the following UAMs, which are describedin greater detail in the EAGLE 5 ISS Unsolicited Alarm and Information Messages. manual.
• Critical Platform Alarms are reported by the EAGLE 5 ISS in UAM 0370.• Critical Application Alarms are reported to the EAGLE 5 ISS in UAM 0371.
• Major Platform Alarms are reported to the EAGLE 5 ISS in UAM 0372.
• Major Application Alarms are reported to the EAGLE 5 ISS in UAM 0373.
• Minor Platform Alarms are reported to the EAGLE 5 ISS in UAM 0374.
• Minor Application Alarms are reported to the EAGLE 5 ISS in UAM 0375.
24910-6688-001 Revision B, February 2014
Problem Detection and ReportingAlarms on the T1200 Platform

When all error conditions are corrected for all platform and application errors, the operator receivesthis UAM:
UAM 0250 MPS available.
For information about the alarm data contained in UAMs, see Alarms Overview.
25910-6688-001 Revision B, February 2014
Problem Detection and ReportingAlarms on the T1200 Platform

Chapter
3Recovery Support
The information in this section describes therecommended backing up of the RTDB and presents
Topics:
• Daily Maintenace Procedures.....27 additional recovery support procedures that maybe referred to by alarms recovery actions.• System Health Check Overview.....33
• Running the System Health Check.....38• Restoring Databases from Backup Files.....39• Recovering From Alarms.....43
26910-6688-001 Revision B, February 2014

Daily Maintenace Procedures
Tekelec recommends that the Automatic PDB/RTDB Backup feature be used to backup all data storedin the PDB/RTDB. The manual backup procedures are included in this section if the database backupneeds to be performed manually. Storing database backups in a secure off-site location ensures theability to recover from system failures.
This section describes the following recommended daily maintenance procedures:
• Backing Up the RTDB
• Backing Up the PDB
• Transferring RTDB and PDB Backup Files
Backing Up the RTDB
Perform this procedure once each day. The estimated time required to complete this procedure is onehour.
1. Log in to the EPAPGUI on server A as the epapall user.
For information about how to log in to the EPAP GUI, refer to Accessing the EPAP GUI Interface.
2. If you are not logged in to EPAP A, select the Select Mate option.3. From the EPAP Menu, select Process Control>Stop Software.4. In the Stop EPAP Software screen as shown in Figure 6: Stop EPAP Software, click Stop EPAP
Software.
Note: DO NOT select the option to stop the PDB along with the EPAP software.
27910-6688-001 Revision B, February 2014
Recovery SupportAlarms on the T1200 Platform

Figure 6: Stop EPAP Software
After the EPAP software has stopped successfully, the screen shown in Figure 7: EPAP SoftwareSuccessfully Stopped is displayed.
Figure 7: EPAP Software Successfully Stopped
5. From the EPAP menu, select RTDB>Maintenance>Backup RTDB.
The screen shown in Figure 8: Backup the RTDB is displayed.
28910-6688-001 Revision B, February 2014
Recovery SupportAlarms on the T1200 Platform

Figure 8: Backup the RTDB
6. Record the file name as shown in this example:
/var/TKLC/epap/free/rtdbBackup_naples-a20050322082516.tar.gz
7. Click Backup RTDB.
The screen shown in Figure 9: Backup the RTDB Confirmation displays a request for confirmation.
Figure 9: Backup the RTDB Confirmation
8. Click Confirm RTDB Backup.
If the backup starts successfully, the following message scrolls through the GUI banner:
Backup RTDB in progress.
After the backup completes successfully, the screen shown in Figure 10: Backup the RTDB - Successis displayed.
29910-6688-001 Revision B, February 2014
Recovery SupportAlarms on the T1200 Platform
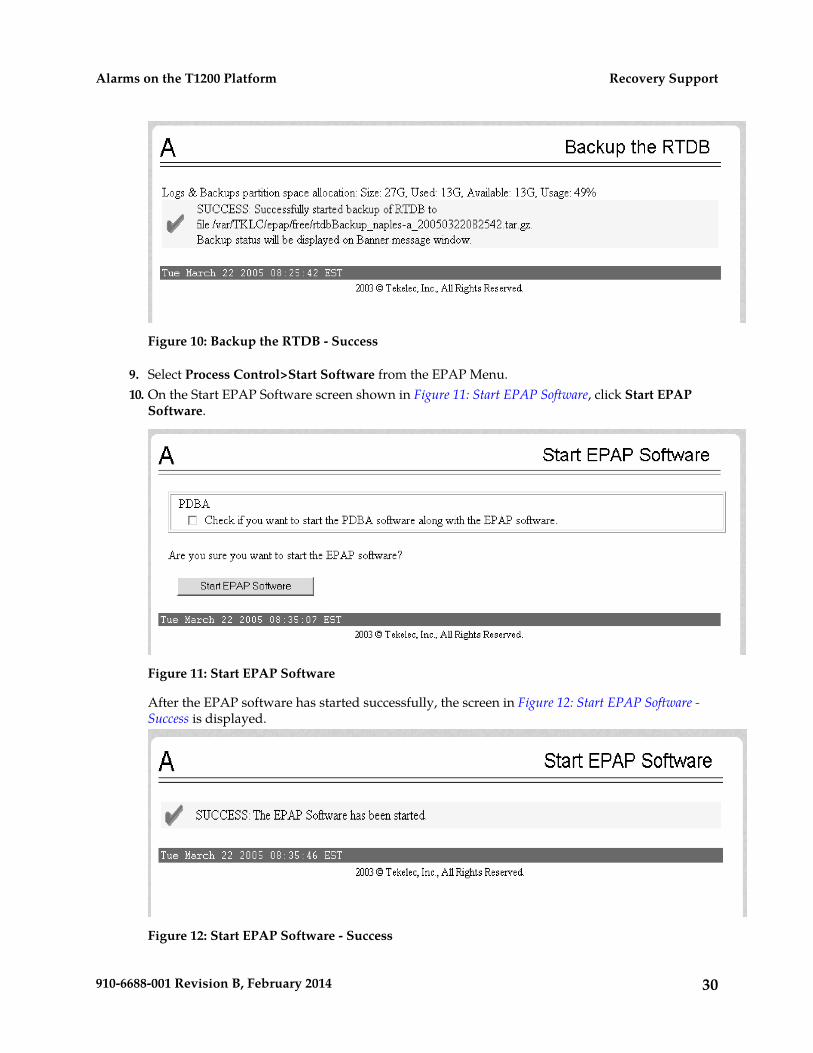
Figure 10: Backup the RTDB - Success
9. Select Process Control>Start Software from the EPAP Menu.10. On the Start EPAP Software screen shown in Figure 11: Start EPAP Software, click Start EPAP
Software.
Figure 11: Start EPAP Software
After the EPAP software has started successfully, the screen in Figure 12: Start EPAP Software -Success is displayed.
Figure 12: Start EPAP Software - Success
30910-6688-001 Revision B, February 2014
Recovery SupportAlarms on the T1200 Platform

11. This procedure is complete. Continue to Backing Up the PDB.
Backing Up the PDB
Perform this procedure once each day. The estimated time required to complete this procedure is onehour. PDB provisioning can take place while this procedure is being performed.
Note: Make sure that you perform this procedure on the same server on which you performed BackingUp the RTDB. Make sure that you performed Backing Up the RTDB first so that the RTDB backup levelwill be lower than the associated PDB backup level.
1. Log in to the EPAP GUI on server A as the epapall user.For information about how to log in to the EPAP GUI, refer to Accessing the EPAP GUI Interface.
2. If you are not logged in to EPAP A, select the Select Mate option.3. From the EPAP Menu, select PDBA>Maintenance>Backup>Backup the PDB.4. In the Backup the PDB screen shown in Figure 13: Backup the PDB, click Backup PDB.
Figure 13: Backup the PDB
The resulting screen, shown in Figure 14: Backup PDB Confirmation, displays a button to confirmthe request to backup the PDB and the file name.
31910-6688-001 Revision B, February 2014
Recovery SupportAlarms on the T1200 Platform

Figure 14: Backup PDB Confirmation
.
5. Record the file name.
In this example, the file name is:
/var/TKLC/epap/free/pdbBackup_naples-a_20050322082900_DBBirthdate_20050317204336GMT_DBLevel_16939.bkp
6. Click Confirm Backup PDB.
While the backup is running, the following message scrolls through the GUI banner:
Backup PDB in progress.
After the backup completes successfully, the screen shown in Figure 15: Backup the PDB - Successis displayed:
Figure 15: Backup the PDB - Success
7. This procedure is complete. Continue to Transferring RTDB and PDB Backup Files .
32910-6688-001 Revision B, February 2014
Recovery SupportAlarms on the T1200 Platform

Transferring RTDB and PDB Backup Files
Perform this procedure once each day. The time required to complete this procedure depends onnetwork bandwidth. File sizes can be several gigabytes for each database.
1. Log in to the EPAP command line interface with user name epapdev and the password associatedwith that user name.
2. Use the Secure File Transfer Protocol (sftp) to transfer the following files to a remote, safe location:a) The RTDB backup file, whose name was recorded in Step 6 of Backing Up the RTDBb) The PDB backup file, whose name was recorded in Step 5 of Backing Up the PDB
System Health Check Overview
The server runs a self-diagnostic utility program called syscheck to monitor itself. The system healthcheck utility syscheck tests the server hardware and platform software. Checks and balances verifythe health of the server and platform software for each test, and verify the presence of requiredapplication software.
If the syscheck utility detects a problem, an alarm code is generated. The alarm code is a 16-characterdata string in hexadecimal format. All alarm codes are ranked by severity: critical, major, and minor.Alarms Overview lists the platform alarms and their alarm codes.
The syscheck output can be in either of the following forms (see Health Check Outputs for outputexamples):
• Normal— results summary of the checks performed by syscheck• Verbose—detailed results for each check performed by syscheck
The syscheck utility can be run in the following ways:
• The operator can invoke syscheck :
• From the EPAPGUI Platform Menu (see Accessing the EPAP GUI Interface). The user can requestNormal or Verbose output.
• By logging in as a syscheck user (see Running syscheck Using the syscheck Login). Only Normaloutput is produced.
• syscheck runs automatically by timer at the following frequencies:
• Tests for critical platform errors run automatically every 30 seconds.• Tests for major and minor platform errors run automatically every 60 seconds.
Functions Checked by syscheck
Table 4: System Health Check Operation summarizes the functions checked by syscheck.
33910-6688-001 Revision B, February 2014
Recovery SupportAlarms on the T1200 Platform

Table 4: System Health Check Operation
FunctionSystem Check
Verify disk read and write functions continue tobe operable. This test attempts to write test data
Disk Access
in the file system to verify disk operability. If thetest shows the disk is not usable, an alarm isreported to indicate the file system cannot bewritten to.
Verify that the smartd service has not reportedany problems.
Smart
Verify the file systems have space available tooperate. Determine what file systems are currently
File System
mounted and perform checks accordingly.Failures in the file system are reported if certainthresholds are exceeded, if the file system size isincorrect, or if the partition could not be found.Alarm thresholds are reported in a similarmanner.
Verify that disk swap space is sufficient forefficient operation.
Swap Space
Verify that 2 GB of RAM is installed.Memory
Verify that all ports are functioning by pingingeach network connection (provisioning, sync, and
Network
DSM networks). Check the configuration of thedefault route.
Verify that the following critical processes arerunning. If a program is not running the minimum
Process
required number of processes, an alarm isreported. If more than the recommendedprocesses are running, an alarm is also reported.
• sshd (Secure Shelldaemon)• ntpd (NTPdaemon)• syscheck (System Health Check daemon)
Verify that the processor is running at anappropriate speed and that the processor matches
Hardware Configuration
what is required on the server. Alarms arereported when a processor is not available asexpected.
Verify that all fans are running within theexpected revolutions per minute (rpm) range.
Cooling Fans
Cooling fans ensure that the components on theserver operate at the optimum temperature. Eachserver has six fans. All cooling fans are checkedfor fan failure.
34910-6688-001 Revision B, February 2014
Recovery SupportAlarms on the T1200 Platform

FunctionSystem Check
Verify that:Main Power Feeds
• Main power is supplied to both server powerinputs.
• Power supplies are working properly.
Verify that all configured power feeds are withinspecification. Verify that no breakers have opened(tripped).
The breaker panel has a set of relays that allowinformation about the breaker panel status to be
Power Relay Unit
sent to all attached servers. The syscheck utilitymonitors this information.
The following error conditions can be detected:
• Breaker Panel Breaker Error: To recover, verifyall breakers and power feeds (see3000000002000000 – Breaker panel breaker error).
• Breaker Panel Feed Error: To recover, verifythat the breaker panel monitoring cable isinstalled correctly and is not damaged (see3000000001000000 – Breaker panel feed error).
Measure all monitored voltages on the servermainboard. Verify that all monitored voltages arewithin the expected operating range.
Voltages
Measure the following temperatures and verifythat they are within a specified range.
Temperature
• Air temperature• Processors internal temperature
Provide alarm if internal diagnostics detect anyother error, such as server syscheck scriptfailures.
MPS Platform
Health Check Outputs
System health check utility syscheck output can be Normal (brief) or Verbose (detailed), dependingupon how syscheck was initiated. The following examples show Normal and Verbose output formats.
Normal Output
Following is an example of Normal output:
Running modules in class disk... OKRunning modules in class hardware...
35910-6688-001 Revision B, February 2014
Recovery SupportAlarms on the T1200 Platform

OKRunning modules in class net... OKRunning modules in class proc... OKRunning modules in class system... OKThe log is available at: -->/var/TKLC/log/syscheck/fail_log
Verbose Output Containing Errors
If an error occurs, the system health check utility syscheck provides alarm data strings and diagnosticinformation for platform errors in its output. The following portion of Verbose output contains detectederrors with the breaker panel and the numbers of running modules.
Running modules in class disk... fs: Current file space use in "/" is 38%. fs: Current Inode used in "/" is 38%. fs: Current file space use in "/boot" is 12%. fs: Current Inode used in "/boot" is 1%. fs: Current file space use in "/usr" is 25%. fs: Current Inode used in "/usr" is 9%. fs: Current file space use in "/var" is 20%. fs: Current Inode used in "/var" is 4%. fs: Current file space use in "/var/TKLC" is 21%. fs: Current Inode used in "/var/TKLC" is 1%. fs: Current file space use in "/tmp" is 4%. fs: Current Inode used in "/tmp" is 1%. fs: Current file space use in "/var/TKLC/epap/rt" is 3%. fs: Current Inode used in "/var/TKLC/epap/rt" is 1%. fs: Current file space use in "/var/TKLC/epap/db" is 65%. fs: Current Inode used in "/var/TKLC/epap/db" is 1%. fs: Current file space use in "/var/TKLC/epap/logs" is 2%. fs: Current Inode used in "/var/TKLC/epap/logs" is 1%. fs: Current file space use in "/var/TKLC/epap/free" is 1%. fs: Current Inode used in "/var/TKLC/epap/free" is 1%. fs: Return string: "OK" meta: Checking md status on system. meta: md Status OK, with 11 active volumes. meta: Checking md configuration on system. meta: Server md configuration OK. meta: Return string: "OK" swap: Checking amount of swap space on server. swap: Swap space is OK. swap: Swap available: 16736200 swap: /sbin/swapon -s output -> swap: FilenameTypeSizeUsedPriority swap: /dev/md3 partition205624801000 swap: /var/TKLC/swap/swap.1 file209713601 swap: /var/TKLC/swap/swap.2 file209713602 swap: /var/TKLC/swap/swap.3 file209713603 swap: /var/TKLC/swap/swap.4 file209713604 swap: /var/TKLC/swap/swap.5 file209713605 swap: /var/TKLC/swap/swap.6 file209713606 swap: /var/TKLC/swap/swap.7 file209713607 swap: Return string: "OK" write: Successfully read from file system "/". write: Successfully read from file system "/boot". write: Successfully read from file system "/usr".
36910-6688-001 Revision B, February 2014
Recovery SupportAlarms on the T1200 Platform

write: Successfully read from file system "/var". write: Successfully read from file system "/var/TKLC". write: Successfully read from file system "/var/TKLC/swap". write: Successfully read from file system "/tmp". write: Successfully read from file system "/var/TKLC/epap/rt". write: Successfully read from file system "/var/TKLC/epap/db". write: Successfully read from file system "/var/TKLC/epap/logs". write: Successfully read from file system "/var/TKLC/epap/free". write: Return string: "OK" smart: Finished examining logs for disk: hdc. smart: Finished examining logs for disk: hda. smart: SMART status OK. smart: Return string: "OK" OKRunning modules in class hardware... fancontrol: Return string: "OK"breaker: Module is disabled.cmosbattery: Return string: "OK" fan: Server Fan Status OK. fan: Return string: "OK" powera: Return string: "OK" powerb: Return string: "OK" temp: Return string: "OK" voltage: Return string: "OK" OKRunning modules in class net... defaultroute: Module is disabled.ping: Module is disabled. OKRunning modules in class proc... ntp: *mate LOCAL(0) 14 u 14 64 377 0.229 0.579 0.062 ntp: Return string: "OK" run: Checking smartd... run: Found 1 instance(s) of the smartd process. run: Checking atd... run: Found 1 instance(s) of the atd process. run: Checking crond... run: Found 1 instance(s) of the crond process. run: Checking sshd... run: Found 3 instance(s) of the sshd process. run: Checking syscheck... run: Found 1 instance(s) of the syscheck process. run: Checking syslogd... run: Found 1 instance(s) of the syslogd process. run: Checking maint... run: Found 1 instance(s) of the maint process. run: Checking rtdb... run: Found 1 instance(s) of the rtdb process. run: Checking topnode... run: Found 2 instance(s) of the topnode process. run: Checking prov... run: Found 1 instance(s) of the prov process. run: Checking provRMTP... run: Found 4 instance(s) of the provRMTP process. run: Checking provRcvr... run: Found 4 instance(s) of the provRcvr process. run: Checking pdba... * run: ::MINOR:: 5000000000000002 -- Server Application Process Error run: Only 0 instance(s) of pdba running. 1 instance(s) required! run: Checking exinit... run: Found 1 instance(s) of the exinit process. run: Checking gs... run: Found 1 instance(s) of the gs process.
37910-6688-001 Revision B, February 2014
Recovery SupportAlarms on the T1200 Platform

run: Checking mysqld... run: Found 16 instance(s) of the mysqld process. run: Checking httpd... run: Found 1 instance(s) of the httpd process. run: Return string: "Absolute threshold of running processes was not met."One or more module in class "proc" FAILEDRunning modules in class system... cpu: Found "4" CPU(s)... OK cpu: CPU 0 is on-line... OK cpu: CPU 0 speed: 1999.800 MHz... OK cpu: CPU 1 is on-line... OK cpu: CPU 1 speed: 1999.800 MHz... OK cpu: CPU 2 is on-line... OK cpu: CPU 2 speed: 1999.800 MHz... OK cpu: CPU 3 is on-line... OK cpu: CPU 3 speed: 1999.800 MHz... OK cpu: Return string: "OK" mem: Expected memory found mem: Skipping minimum expected memory check. mem: 2111262720 bytes (~2013.45703125 Mb) of RAM installed. mem: Return string: "OK" OKFailures occured during system check. The failure log is available at: -->/var/TKLC/log/syscheck/fail_log
Note: For the explanation of alarm codes in the alarm strings and how to respond to them, refer toAlarms.
Running the System Health Check
The operator can run syscheck to obtain the operational platform status with one of the followingprocedures:
• Running syscheck Through the EPAP GUI
• Running syscheck Using the syscheck Login
Running syscheck Through the EPAP GUI
Refer to EPAP Administration and LNP Feature Activation for more details and information about loginsand permissions.
1. Log in to the User Interface of the EPAPGUI (see ).2. Check the banner information above the menu to verify that the EPAP about which system health
information is sought is the one that is logged into.
3. If it is necessary to switch to the other EPAP, click the Select Mate menu item.4. When the GUI shows you are logged into the EPAP about which you want system health
information, select Platform>Run Health Check. as shown in the following window.Figure 16: Run Health Check
38910-6688-001 Revision B, February 2014
Recovery SupportAlarms on the T1200 Platform

5. On the Run Health Check window, use the pull-down menu to select Normal or Verbose for theOutput detail level desired.
6. Click the Perform Check button to run the system health check on the selected server.
The system health check output data is displayed. The example shown in Figure 17: DisplayingSystem Health Check on EPAP GUI shows Normal output with errors.Figure 17: Displaying System Health Check on EPAP GUI
Running syscheck Using the syscheck Login
If the EPAP application has not been installed on the server or you are unable to log in to the EPAPuser interface, you cannot run syscheck through the GUI. Instead, you can run syscheck from thesyscheck login, and report the results to the Customer Care Center.
1. Connect the Local Access Terminal to the server whose status you want to check (see Connectingthe Local Access Terminal ).
2. Log in as the syscheck user.
Login: syscheckPassword: syscheck
The syscheck utility runs and its output is displayed to the screen.
Restoring Databases from Backup Files
This section describes how restore the RTDB or PDB or both from backup files.
Restoring the RTDB from Backup Files
To restore the EPAP’s RTDB from a backup file, contact Technical Services and Support, see CustomerCare Center.
Note: Back up the RTDB daily (see Backing Up the RTDB).
Use the following procedure to restore the RTDB from a previously prepared backup file.
Caution: Contact the Customer Care Center before performing this procedure.
Text inset.
1. Log into the EPAP command line interface with user name epapdev and the password associatedwith that name.
2. Use the Secure File Transfer Protocol (sftp) to transfer the RTDB backup file (whose name wasrecorded in Step 6) to the following location:
/var/TKLC/epap/free/
39910-6688-001 Revision B, February 2014
Recovery SupportAlarms on the T1200 Platform

3. Log into the EPAP GUI (see Accessing the EPAP GUI Interface).
4. Select Process Control>Stop Software to ensure that no other updates are occurring. The screenin Figure 18: Stop EPAP Software displays:
Figure 18: Stop EPAP Software
5. When you stopped the software on the selected EPAP, the screen in Figure 19: Stop EPAP Software- Success displays:
Figure 19: Stop EPAP Software - Success
6. Select RTDB>Maintenance>Restore RTDB. The screen shown in Figure 20: Restoring the RTDBdisplays:
40910-6688-001 Revision B, February 2014
Recovery SupportAlarms on the T1200 Platform

Figure 20: Restoring the RTDB
7. On the screen shown in Figure 20: Restoring the RTDB, select the file that was transferred in Step 2.Click Restore the RTDB from the Selected File.
8. To confirm restoring a file, click Confirm RTDB Restore shown in the screen for RTDB in Figure21: Restore the RTDB Confirm:
Figure 21: Restore the RTDB Confirm
9. When restoring the file is successful, the screen shown in Figure 22: Restore the RTDB - Successdisplays:
Figure 22: Restore the RTDB - Success
10. This procedure is complete.
41910-6688-001 Revision B, February 2014
Recovery SupportAlarms on the T1200 Platform
Restoring the PDB from Backup Files
To restore the EPAP’s PDB from a backup file, contact Technical Services and Support, see CustomerCare Center.
Note: Back up the PDB daily (see Backing Up the PDB).
Use the following procedure to restore the PDB from a previously prepared backup file.
Caution: Contact the Customer Care Center before performing this procedure.
Text inset.
1. Log into the EPAP command line interface with user name epapdev and the password associatedwith that name.
2. Use the Secure File Transfer Protocol (sftp) to transfer the PDB backup file (whose name wasrecorded in Step 7) to the following location:
/var/TKLC/epap/free/
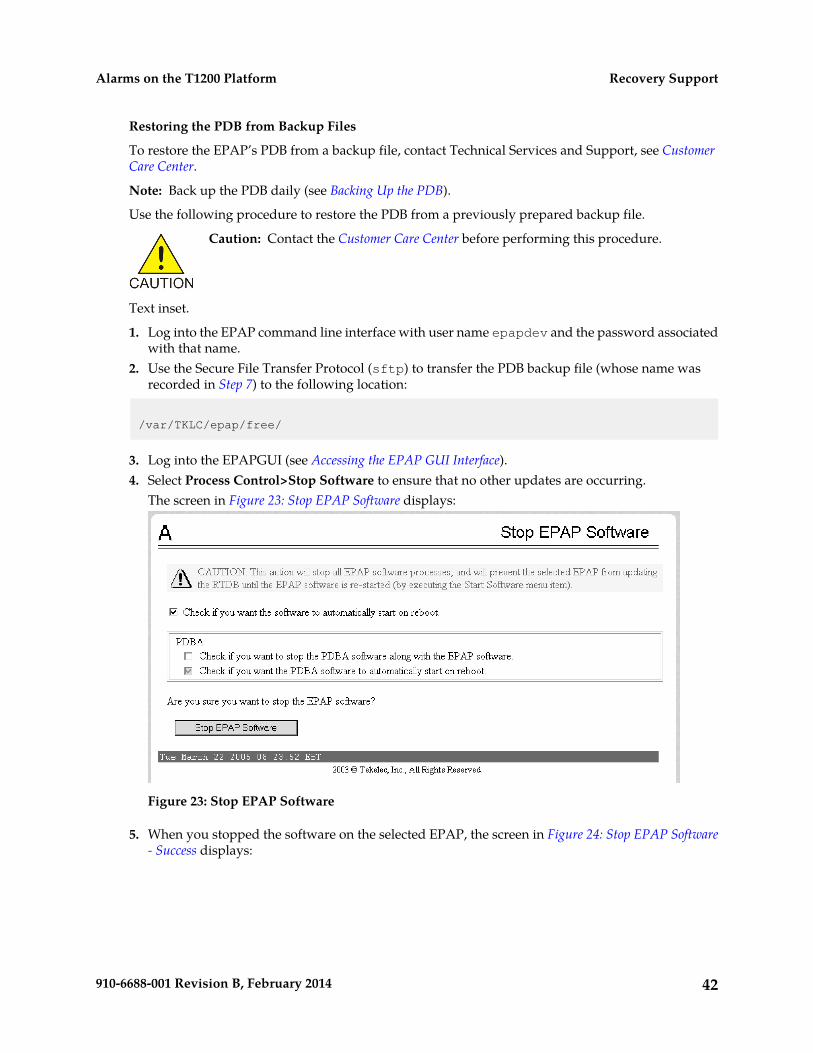
3. Log into the EPAPGUI (see Accessing the EPAP GUI Interface).4. Select Process Control>Stop Software to ensure that no other updates are occurring.
The screen in Figure 23: Stop EPAP Software displays:
Figure 23: Stop EPAP Software
5. When you stopped the software on the selected EPAP, the screen in Figure 24: Stop EPAP Software- Success displays:
42910-6688-001 Revision B, February 2014
Recovery SupportAlarms on the T1200 Platform

Figure 24: Stop EPAP Software - Success
6. Select PDBA>Maintenance>Backup>Restore the PDB.The screen shown in Figure 25: Restoring the PDB displays:
Figure 25: Restoring the PDB
7. On the screen shown in Figure 25: Restoring the PDB, select the file that was transferred in Step 2.Click Restore the PDB from the Selected File.
8. Click Confirm PDB Restore.9. When restoring the file is successful, the screen displays a message about success.10. This procedure is complete.
Recovering From Alarms
Alarms are resolved in order of severity level from highest to lowest. When combination alarms aredecoded into their individual component alarms, the customer can decide in which order to resolvethe alarms because all alarms are of equal severity. For assistance in deciding which alarm to resolvefirst or how to perform a recovery procedure, contact the Customer Care Center.
Evaluate the following problems to find the appropriate recovery procedure as follows:
• If the problem being investigated is no longer displayed on the EPAP GUI, perform the following:
1. Procedure Decode Alarm Strings2. Procedure Determine Alarm Cause
43910-6688-001 Revision B, February 2014
Recovery SupportAlarms on the T1200 Platform

3. Recovery procedure to which you are directed by procedure Determine Alarm Cause
• If the problem being investigated is being reported currently on the EPAP GUI, perform thefollowing:
1. Procedure Determine Alarm Cause2. Recovery procedure to which you are directed by procedure Determine Alarm Cause
Decode Alarm Strings
Use the following procedure to decode alarm strings that consist of multiple alarms.
1. Log in to the User Interface screen of the EPAP GUI (see Accessing the EPAP GUI Interface).2. After logging in to the EPAP, select Maintenance>Decode MPSAlarm from the menu.3. Enter the 16-digit alarm string into the window on the Decode MPSAlarm screen, as shown in
Figure 26: Decode MPS Alarm Screen.
Figure 26: Decode MPS Alarm Screen
4. Click the Decode button.
The system returns information on the Alarm Category (Critical Application, Major Platform) anderror text, as shown in Figure 27: Decoded MPS Alarm Information.
44910-6688-001 Revision B, February 2014
Recovery SupportAlarms on the T1200 Platform

Figure 27: Decoded MPS Alarm Information
5. Find the alarm text string shown on the GUI in Alarms Overview. Note the corresponding alarmnumber change. Perform procedure Determine Alarm Cause.
Note: For combination errors, multiple procedures may be required to resolve the problem.
Determine Alarm Cause
Use this procedure to find information about recovering from an alarm.
1. Record the alarm data string shown in the banner or the Alarm View on the EPAPGUI , or asdecoded from Decode Alarm Strings.
2. Run syscheck in Verbose mode (see Running syscheck Through the EPAP GUI).3. Examine the syscheck output for specific details about the alarm.4. Find the recovery procedure for the alarm in the procedures shown in Alarms. The alarms are
ordered by ascending alarm number.Other procedures may be required to complete an alarm recovery procedure:
• Refer to procedures for replacing Field Replaceable Units (FRUs) in Alarms if instructed by analarm recovery procedure to replace a FRU.
• Refer to general procedures used in a number of alarm recovery procedures in Alarms
5. If the alarm persists after performing the appropriate procedure, call the Customer Care Center.
45910-6688-001 Revision B, February 2014
Recovery SupportAlarms on the T1200 Platform

Chapter
4Alarms
This chapter provides recovery procedures forplatform and application alarms.
Topics:
• Alarms Overview.....47• Alarm Recovery Procedures.....50• Critical Platform Alarms.....50• Critical Application Alarms.....50• Major Platform Alarms.....50• Major Application Alarms.....63• Minor Platform Alarms.....77• Minor Application Alarms.....86
46910-6688-001 Revision B, February 2014

Alarms Overview
This chapter describes recovery procedures to use when an alarm condition or other problem existson the server. For information about how and when alarm conditions are detected and reported, seeDetecting and Reporting Problems.
When an alarm code is reported, locate the alarm in Table 5: Platform and Application Alarms. Theprocedures for correcting alarm conditions are described in Alarm Recovery Procedures.
Note: Sometimes the alarm string may consist of multiple alarms and must be decoded in order touse the Alarm Recovery Procedures in this manual. If the alarm code is not listed in , see .
Platform and application errors are grouped by category and severity. The categories are listed frommost to least severe:
• Critical Platform Alarms
• Critical Application Alarms
• Major Platform Alarms
• Major Application Alarms
• Minor Platform Alarms
• Minor Application Alarms
Table 5: Platform and Application Alarms shows the alarm numbers and alarm text for all alarms generatedby the platform and the EPAP application. The order within a category is not significant.
Table 5: Platform and Application Alarms
UAM NumberAlarm Codes and Error Descriptor
Critical Platform Errors(There is only one critical EPAP Platform Alarm)
Major Platform Errors
03723000000000000001 – Server fan failure
03723000000000000002 - Server internal disk error
03723000000000000008 - Server Platform error
03723000000000000010 - Server file system error
03723000000000000020 - Server Platform process error
03723000000000000080 - Server swap space shortagefailure
03723000000000000100 - Server provisioning networkerror
03723000000000000200 – Server Eagle Network A error
03723000000000000400 – Server Eagle Network B error
47910-6688-001 Revision B, February 2014
AlarmsAlarms on the T1200 Platform

UAM NumberAlarm Codes and Error Descriptor
03723000000000000800 – Server Sync network error
03723000000000001000 - Server disk space shortage error
03723000000000001000 - Server disk space shortage error
03723000000000004000 - Server temperature error
03723000000000008000 – Server mainboard voltage error
03723000000000010000 – Server power feed error
03723000000000020000 - Server disk health test error
03723000000000040000 - Server disk unavailable error
03723000000001000000 – Breaker panel feed error
03723000000002000000 – Breaker panel breaker error
03723000000004000000 – Breaker panel monitoring error
Major Application Errors
03734000000000000001 - Mate EPAP Unavailable
03734000000000000002 - RTDB Mate Unavailable
03734000000000000004 - Congestion
03734000000000000020 - RMTP Channels Down
03734000000000000040 - Fatal Software Error
03734000000000000080 - RTDB Corrupt
0373
03734000000000000200 - RTDB Incoherent
03734000000000001000 - RTDB 100% Full
03734000000000002000 - RTDB Resynchronization inProgress
03734000000000004000 - RTDB Reload Is Required
03734000000000008000 - Mate PDBA Unreachable
03734000000000010000 - PDBA Connection Failure
03734000000000020000 - PDBA Replication Failure
03754000000000040000 - RTDB DSM Over-Allocation
03754000000000080000 - RTDB Maximum Depth Reached
03754000000000100000 - No PDBA Proxy to RemotePDBA Connection
03754000000000200000 - DSM Provisioning Error
48910-6688-001 Revision B, February 2014
AlarmsAlarms on the T1200 Platform

UAM NumberAlarm Codes and Error Descriptor
Minor Platform Errors
03745000000000000001 – Server disk space shortagewarning
03745000000000000002 – Server application process error
03745000000000000004 – Server hardware configurationerror
03745000000000000020 – Server swap space shortagewarning
03745000000000000040 – Server default router not defined
03745000000000000080 – Server temperature warning
03745000000000000100 – Server core file detected
03745000000000000200 – Server NTP Daemon notsynchronized
03745000000000000400 – CMOS battery voltage low
03745000000000000800 – Server disk self test warning
03745000000000004000 – Server reboot watchdog initiated
Minor Application Errors
03756000000000000001 - RMTP Channel A Down
03756000000000000002 - RMTP Channel B Down
03756000000000000008 - RTDB 80% Full
03756000000000000020 - Standby PDBA Falling Behind
03756000000000000040 - RTDB Tree Error
03756000000000000080 - PDB Backup failed
03756000000000000100 - Automatic PDB Backup failed
03756000000000000200 - RTDB Backup failed
03756000000000000400 - Automatic RTDB Backup failed
03756000000000001000 - SSH tunnel not established
NOTE: The order within a category is not significant.
49910-6688-001 Revision B, February 2014
AlarmsAlarms on the T1200 Platform

Alarm Recovery Procedures
This section provides recovery procedures for platform and application alarms. The alarm categoriesare listed by severity.
Critical Platform Alarms
1000000000002000 - Uncorrectable ECC memory error
This alarm indicates that chipset has detected an uncorrectable (multiple-bit) memory error that theECC (Error-Correcting Code) circuitry in the memory is unable to correct.
Recovery
Contact the Tekelec Customer Care Center to request hardware replacement.
1000000000004000 - SNMP get failure
The server failed to receive SNMP information from the switch.
Recovery
1. Use the following command to verify the switch is active: ping switch1A/B (this requirescommand line access).
2. If the problem persists, contact the Tekelec Customer Care Center.
Critical Application Alarms
No critical EPAP alarms are generated.
Major Platform Alarms
Major platform alarms involve hardware components, memory, and network connections.
3000000000000001 – Server fan failure
This alarm indicates that a fan on the application server is either failing or has failed completely. Ineither case, there is a danger of component failure due to overheating.
Recovery
50910-6688-001 Revision B, February 2014
AlarmsAlarms on the T1200 Platform

Contact the Tekelec Customer Care Center.
3000000000000002 - Server internal disk error
This alarm indicates the server is experiencing issues replicating data to one or more of its mirroreddisk drives. This could indicate that one of the server’s disks has either failed or is approaching failure.
Recovery
1. Run syscheck in Verbose mode (see procedure Running the System Health Check.).2. Contact the Customer Care Center and provide the system health check output.
Note: Refer to the E5-APP-B Card Hardware and Installation Manual, Field Replaceablue Units (FRUs)section for information about installing a hard disk drive.
3000000000000004 – Server RAID disk error
This alarm indicates that the offboard storage server had a problem with its hardware disks.
Recovery
Contact the Tekelec Customer Care Center and provide the system health check output.
3000000000000008 - Server Platform error
This alarm indicates an error such as a corrupt system configuration or missing files, or indicates thatsyscheck itself is corrupt.
Recovery
1. Run syscheck in Verbose mode (see procedure Running the System Health Check.).2. Contact the Customer Care Center and provide the system health check output.
3000000000000010 - Server file system error
This alarm indicates that syscheck was unsuccessful in writing to at least one of the server’s file systems.
Recovery
1. Run syscheck in Verbose mode (see procedure Running the System Health Check).2. Contact the Customer Care Center and provide the system health check output.
3000000000000020 - Server Platform process error
This alarm indicates that either the minimum number of instances for a required process are notcurrently running or too many instances of a required process are running.
Recovery
Rerun syscheck in verbose mode (see procedure Running the System Health Check).
• If the alarm has been cleared, the problem is solved.
51910-6688-001 Revision B, February 2014
AlarmsAlarms on the T1200 Platform

• If the alarm has not been cleared, contact the Customer Care Center.
3000000000000040 – Server RAM shortage error
Not Implemented.
3000000000000080 - Server swap space shortage failure
This alarm indicates that the server’s swap space is in danger of being depleted. This is usually causedby a process that has allocated a very large amount of memory over time.
Note: The interface identified as eth01 on the hardware is identified as eth91 by the software (insyscheck output, for example).
Recovery
Contact the Tekelec Customer Care Center.
3000000000000100 - Server provisioning network error
This alarm indicates that the connection between the server’s eth0 interface and the customer networkis not functioning properly. The eth0 interface is at the lower right port on the rear of the server.
Note: The interface identified as eth01 on the hardware is identified as eth91 by the software (insyscheck output, for example).
Recovery
1. Verify that a customer-supplied cable labeled TO CUSTOMER NETWORK is securely connectedto the lower right port on the rear of the server. Follow the cable to its connection point on the localnetwork and verify this connection is also secure.
2. Test the customer-supplied cable labeled TO CUSTOMER NETWORK with an Ethernet Line Tester.If the cable does not test positive, replace it.
3. Have your network administrator verify that the network is functioning properly.4. If no other nodes on the local network are experiencing problems and the fault has been isolated
to the server or the network administrator is unable to determine the exact origin of the problem,contact the Tekelec Customer Care Center.
3000000000000200 – Server Eagle Network A error
Note: If these three alarms exist, the probable cause is a failed mate server.
• 3000000000000200-Server Eagle Network A Error
• 3000000000000400-Server Eagle Network B Error
• 3000000000000800-Server Sync Network Error
This alarm indicates an error in the Main DSM network, which connects to the DSM A ports. The errormay be caused by one or more of the following conditions:
52910-6688-001 Revision B, February 2014
AlarmsAlarms on the T1200 Platform
• One or both of the servers is not operational.
• One or both of the switches is not powered on.
• The link between the switches is not working.
• The connection between server A and server B is not working.
Some of the connections between the servers and the hubs of the DSM networks (main and backup).
• The eth01 interface (lower right port on the rear of the server A) connects to customer uplink.
• The eth02 interface (upper right port on the rear of the server A) connects to port 3 of switch A.
• The eth03 interface (upper left port on the rear of the server A) connects to port 3 of switch B.
• The eth04 interface (lower left port on the rear of the server A) is an optional backup to the customeruplink.
• The interfaces on the switch are ports 1 through 20 (from left to ritght) located on the front of theswitch.
• Ports 1 and 2 of switch A connect to ports 1 and 2 of switch B.
• Ports 5 through 21 of switch A can be used for links to the Main DSM ports (DSM A ports) on theEAGLE 5 ISS.
Recovery
1. Perform the following:a) Verify that both servers are powered on by confirming that the POWER LEDs on both servers
are illuminated green.b) Verify that the hub is powered on.c) Verify that the switch does not have any fault lights illuminated.d) Verify that the eth01 cable is securely connected to the lower right port on the server that is
reporting the error.e) Trace the eth01 cable to the switch. Verify that the eth01 cable is securely connected at correct
point of the customer uplink.f) Verify that the cable connecting the switches is securely connected at both switches.
2. Run syscheck (see Running the System Health Check).a) If the alarm is cleared, the problem is resolved.b) If the alarm is not cleared, continue with the next step.
3. Verify that the cable from eth01 to the switch tests positive with an Ethernet Line Tester. Replaceany faulty cables.
4. If the problem persists, call the Customer Care Center.
3000000000000400 – Server Eagle Network B error
Note: If these three alarms exist, the probable cause is a failed mate server.
• 3000000000000200-Server Eagle Network A Error
• 3000000000000400-Server Eagle Network B Error
53910-6688-001 Revision B, February 2014
AlarmsAlarms on the T1200 Platform

• 3000000000000800-Server Sync Network Error
This alarm indicates an error in the Backup DSM network, which connects to the DSM B ports. Theerror may be caused by one or more of the following conditions:
• One or both of the servers is not operational.
• One or both of the switches is not powered on.
• The link between the switches is not working.
• The connection between server A and server B is not working.
Some of the connections between the servers and the hubs of the DSM networks (main and backup).
• The eth01 interface (lower right port on the rear of the server B) connects to customer uplink.
• The eth02 interface (upper right port on the rear of the server B) connects to port 4 of switch A.
• The eth03 interface (upper left port on the rear of the server B) connects to port 4 of switch B.
• The eth04 interface (lower left port on the rear of the server B) is an optional backup to the customeruplink.
• The interfaces on the switch are ports 1 through 20 (from left to ritght) located on the front of theswitch.
• Ports 1 and 2 of switch A connect to ports 1 and 2 of switch B.
• Ports 5 through 21 of switch B can be used for links to the Backup DSM ports (DSM B ports) on theEAGLE 5 ISS.
Recovery
1. Perform the following:a) Verify that both servers are powered on by confirming that the POWER LEDs on both servers
are illuminated green.b) Verify that the switch is powered on.c) Verify that the switch does not have any fault lights illuminated.d) Verify that the eth01 cable is securely connected to the server that is reporting the error.e) Trace the eth01 cable to the switch. Verify that the eth01 cable is securely connected to the correct
point of the customer uplink.f) Verify that the cable connecting the switches is securely connected at both switches.
2. Run syscheck (see Running the System Health Check).a) If the alarm is cleared, the problem is resolved.b) If the alarm is not cleared, continue with the next step.
3. Verify that the cable from eth1B to the hub tests positive with an Ethernet Line Tester. Replace anyfaulty cables.
4. If the problem persists, call the Customer Care Center for assistance.
3000000000000800 – Server Sync network error
Note: If these three alarms exist, the probable cause is a failed mate server.
54910-6688-001 Revision B, February 2014
AlarmsAlarms on the T1200 Platform

• 3000000000000200-Server Eagle Network A Error
• 3000000000000400-Server Eagle Network B Error
• 3000000000000800-Server Sync Network Error
This alarm indicates that the eth03 connection between the two servers is not functioning properly.The eth03 connection provides a network path over which the servers synchronize data with oneanother. The eth03 interface is the upper left port on the rear of the server.
Note: The sync interface uses eth03 and goes through switch B. All pairs are required.
Recovery
1. Verify that both servers are powered on by confirming that the POWER LEDs on both servers areilluminated green.
2. Verify that the eth03 cable is securely connected to the upper left port on both Server A and ServerB.
3. Test the eth03 cable with an Ethernet Line Tester that is set to test a straight-through cable.4. If the cable does not test positive, replace it.5. If the problem persists, call the Customer Care Center for assistance.
3000000000001000 - Server disk space shortage error
This alarm indicates that one of the following conditions has occurred:
• A filesystem has exceeded a failure threshold, which means that more than 90% of the availabledisk storage has been used on the filesystem.
• More than 90% of the total number of available files have been allocated on the filesystem.
• A filesystem has a different number of blocks than it had when installed.
Recovery
1. Run syscheck in Verbose mode.2. Contact the Tekelec Customer Care Center.
3000000000002000 - Server default route network error
This alarm indicates that the default network route of the server is experiencing a problem. Runningsyscheck in Verbose mode will provide information about which type of problem is occurring.
Caution: When changing the network routing configuration of the server, verify thatthe modifications will not impact the method of connectivity for the current login session.The route information must be entered correctly and set to the correct values. Incorrectlymodifying the routing configuration of the server may result in total loss of remotenetwork access.
Recovery
1. Run syscheck in Verbose mode.
55910-6688-001 Revision B, February 2014
AlarmsAlarms on the T1200 Platform
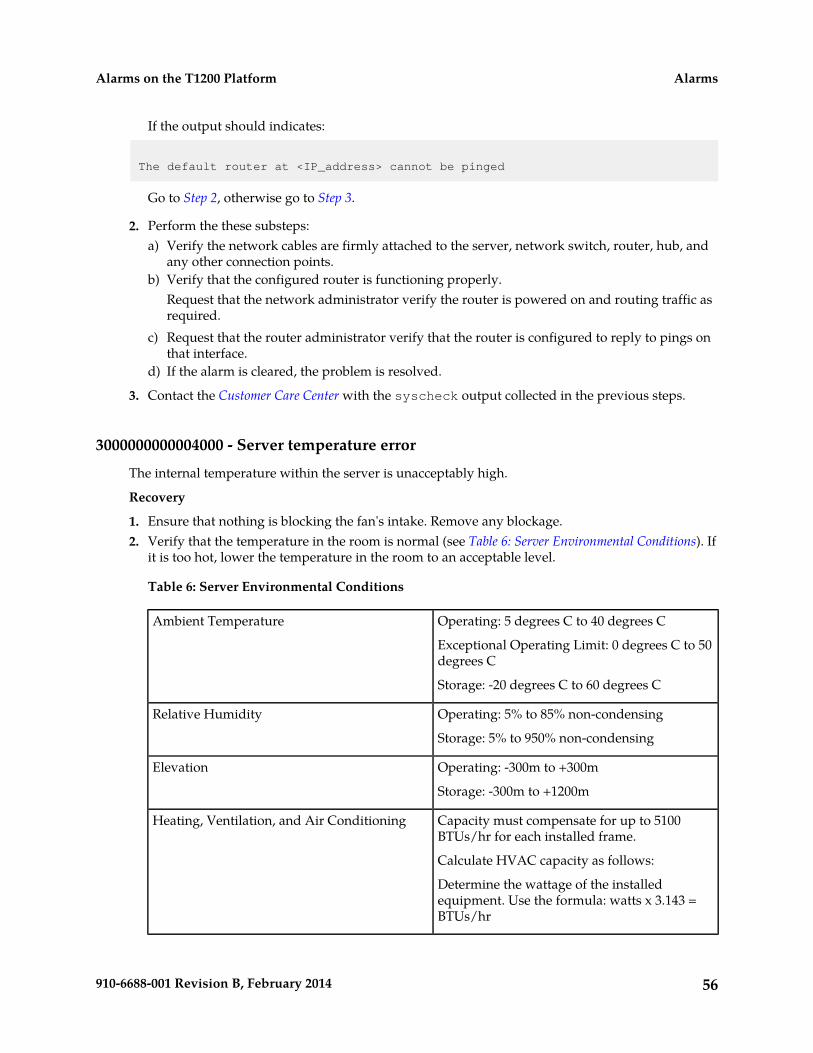
If the output should indicates:
The default router at <IP_address> cannot be pinged
Go to Step 2, otherwise go to Step 3.
2. Perform the these substeps:a) Verify the network cables are firmly attached to the server, network switch, router, hub, and
any other connection points.b) Verify that the configured router is functioning properly.
Request that the network administrator verify the router is powered on and routing traffic asrequired.
c) Request that the router administrator verify that the router is configured to reply to pings onthat interface.
d) If the alarm is cleared, the problem is resolved.
3. Contact the Customer Care Center with the syscheck output collected in the previous steps.
3000000000004000 - Server temperature error
The internal temperature within the server is unacceptably high.
Recovery
1. Ensure that nothing is blocking the fan's intake. Remove any blockage.2. Verify that the temperature in the room is normal (see Table 6: Server Environmental Conditions). If
it is too hot, lower the temperature in the room to an acceptable level.
Table 6: Server Environmental Conditions
Operating: 5 degrees C to 40 degrees CAmbient Temperature
Exceptional Operating Limit: 0 degrees C to 50degrees C
Storage: -20 degrees C to 60 degrees C
Operating: 5% to 85% non-condensingRelative Humidity
Storage: 5% to 950% non-condensing
Operating: -300m to +300mElevation
Storage: -300m to +1200m
Capacity must compensate for up to 5100BTUs/hr for each installed frame.
Heating, Ventilation, and Air Conditioning
Calculate HVAC capacity as follows:
Determine the wattage of the installedequipment. Use the formula: watts x 3.143 =BTUs/hr
56910-6688-001 Revision B, February 2014
AlarmsAlarms on the T1200 Platform

Note: Be prepared to wait the appropriate period of time before continuing with the next step.Conditions need to be below alarm thresholds consistently for the alarm to clear. The alarm maytake up to five minutes to clear after conditions improve. It may take about ten minutes after theroom returns to an acceptable temperature before syscheck shows the alarm cleared.
3. Run syscheck (see Running the System Health Check).
• If the alarm has been cleared, the problem is resolved.• If the alarm has not been cleared, continue with the next step.
4. If the problem has not been resolved, contact the Tekelec Customer Care Center.
3000000000008000 – Server mainboard voltage error
This alarm indicates that one or more of the monitored voltages on the server mainboard have beendetected to be out of the normal expected operating range.
Recovery
Contact the Tekelec Customer Care Center.
3000000000010000 – Server power feed error
This alarm indicates that one of the power feeds to the server has failed. If this alarm occurs inconjunction with any Breaker Panel alarm, there might be a problem with the breaker panel.
Recovery
1. Verify that all the server power feed cables to the server that is reporting the error are securelyconnected.
2. Run syscheck
• If the alarm has been cleared, the problem is resolved.• If the alarm has not been cleared, continue with the next step.
3. Follow the power feed to its connection on the power source. Ensure that the power source is ONand that the power feed is properly secured.
4. Run syscheck
• If the alarm has been cleared, the problem is resolved.• If the alarm has not been cleared, continue with the next step.
5. If the power source is functioning properly and the wires are all secure, have an electrician checkthe voltage on the power feed.
6. Run syscheck
• If the alarm has been cleared, the problem is resolved.• If the alarm has not been cleared, continue with the next step.
7. If the problem has not been resolved, contact the Tekelec Customer Care Center.
57910-6688-001 Revision B, February 2014
AlarmsAlarms on the T1200 Platform

3000000000020000 - Server disk health test error
Either the hard drive has failed or failure is imminent.
Recovery
Immediately contact the Customer Care Center for assistance with a disk replacement.
3000000000040000 - Server disk unavailable error
The smartd service is not able to read the disk status because the disk has other problems that arereported by other alarms. This alarm appears only while a server is booting.
Recovery
Contact the Tekelec Customer Care Center.
3000000000080000 – Device error
This alarm indicates that the offboard storage server had a problem with its disk volume filling up.
Recovery
Contact the Tekelec Customer Care Center.
3000000000100000 – Device interface error
This alarm indicates that the IP bond is either not configured or down.
Recovery
Contact the Tekelec Customer Care Center.
3000000000200000 – Correctable ECC memory error
This alarm indicates that chipset has detected a correctable (single-bit) memory error that has beencorrected by the ECC (Error-Correcting Code) circuitry in the memory.
Recovery
No recovery necessary. If the condition persists, contact the Tekelec Customer Care Center to requesthardware replacement.
3000000000400000 – Power Supply A error
This alarm indicates that power supply 1 (feed A) has failed.
Recovery
1. Verify that nothing is obstructing the airflow to the fans of the power supply.2. Run syscheck in verbose mode (see procedure Running the System Health Check). The output will
provide details about what is wrong with the power supply.
58910-6688-001 Revision B, February 2014
AlarmsAlarms on the T1200 Platform

3. Contact the Tekelec Customer Care Center and provide them the syscheck verbose output. Powersupply 1 (feed A) may need to be replaced.
3000000000800000 – Power Supply B error
This alarm indicates that power supply 2 (feed B) has failed.
Recovery
1. Verify that nothing is obstructing the airflow to the fans of the power supply.2. Run syscheck in verbose mode (see procedure Running the System Health Check). The output will
provide details about what is wrong with the power supply.3. Contact the Tekelec Customer Care Center and provide them the syscheck verbose output. Power
supply 2 (feed B) may need to be replaced.
3000000001000000 – Breaker panel feed error
This alarm indicates that the server is not receiving information from the breaker panel relays.
Recovery
1. Verify that the same alarm is displayed by both servers (the single breaker panel normally sendsalarm information to both servers):
• If this alarm is displayed by only one server, the problem is most likely to be with the cable orthe server itself. Look for other alarms that indicate a problem with the server and perform therecovery procedures for those alarms first.
• If this alarm is displayed by both servers, go to the next step.
2. Verify that the cables that connect the servers to the breaker panel are not damaged and are securelyfastened to both the Alarm Interface ports on the breaker panel and to the serial ports on bothservers.
3. If the problem has not been resolved, call the Tekelec Customer Care Center to request that thebreaker panel be replaced.
3000000002000000 – Breaker panel breaker error
This alarm indicates that a power fault has been identified by the breaker panel. The LEDs on thecenter of the breaker panel (see Figure 28: Breaker Panel LEDs) identify whether the fault occurred onthe input power or the output power, as follows:
• A power fault on input power (power from site source to the breaker panel) is indicated by one ofthe LEDs in the PWR BUS A or PWR BUS B group illuminated Red. In general, a fault in the inputpower means that power has been lost to the input power circuit.
Note: LEDs in the PWR BUS A or PWR BUS B group that correspond to unused feeds are notilluminated; LEDs in these groups that are not illuminated do not indicate problems.
• A power fault on output power (power from the breaker panel to other frame equipment) isindicated by either BRK FAIL BUS A or BRK FAIL BUS B illuminated RED. This type of fault canbe caused by a surge or some sort of power degradation or spike that causes one of the circuitbreakers to trip.
59910-6688-001 Revision B, February 2014
AlarmsAlarms on the T1200 Platform

Figure 28: Breaker Panel LEDs
This alarm indicates that a power fault has been identified by the breaker panel.
Recovery
1. Verify that the same alarm is displayed by multiple serversboth servers (the single breaker panelnormally sends alarm information to both servers):
• If this alarm is displayed by only one server, the problem is most likely to be with the cable orthe server itself. Look for other alarms that indicate a problem with the server and perform therecovery procedures for those alarms first.
• If this alarm is displayed by both serversmultiple servers, go to the next step.
2. Look at the breaker panel assignments in Figure 29: Breaker Panel Setting. For each breaker assignment,and verify that the corresponding LED in the PWR BUS A group and the PWR BUS B group isilluminated Green.
Figure 29: Breaker Panel Setting
If one of the LEDs in the PWR BUS A group or the PWR BUS B group is illuminated Red, a problemhas been detected with the corresponding input power feed. Contact the Tekelec Customer CareCenter
60910-6688-001 Revision B, February 2014
AlarmsAlarms on the T1200 Platform

a) Verify that the customer provided source for the affected power feed is operational. If the powersource is properly functioning, have an electrician remove the plastic cover from the rear of thebreaker panel and verify the power source is indeed connected to the input power feed connectoron the rear of the breaker panel. Correct any issues found.
b) Check the LEDs in the PWR BUS A group and the PWR BUS B group again.
• If the LEDs are now illuminated Green, the issue has been resolved.• Proceed to Substep c to verify that the alarm has been cleared.• If the LEDs are still illuminated Red, continue to the next sub-step.
c) Have the electrician verify the integrity of the input power feed. The input voltage shouldmeasure nominally -48VDC (that is, between -41VDC and -60VDC). If the supplied voltage isnot within the acceptable range, the input power source must be repaired or replaced.
Note: Be sure the voltmeter is connected properly. The locations of the BAT and RTN connectionsare in mirror image on either side of the breaker panel.
If the measured voltage is within the acceptable range, the breaker panel may be malfunctioning.The breaker panel must be replaced.
d) Check the LEDs in the PWR BUS A group and the PWR BUS B group again after the necessaryactions have been taken to correct any issues found.
• If the LEDs are now illuminated Green, the issue has been resolved. Proceed to Step 3 toverify that the alarm has been cleared.
• If the LEDs are still illuminated Red, skip to Step 4
3. Check the BRK FAIL LEDs for BUS A and for BUS B.
• If one of the BRK FAIL LEDs is illuminated Red, then one or more of the respective InputBreakers has tripped. (A tripped breaker is indicated by the toggle located in the center position.)Perform the following steps to repair this issue:
a) For all tripped breakers, move the breaker down to the open (OFF) position and then back upto the closed (ON) position.
b) After all the tripped breakers have been reset, check the BRK FAIL LEDs again. If one of theBRK FAIL LEDs is still illuminated Red, skip to Step 5
• If all of the BRK FAIL LEDs and all the LEDs in the PWR BUS A group and the PWR BUS Bgroup are illuminated Green, continue with the next step.
• If all of the BRK FAIL LEDs and all the LEDs in the PWR BUS A group and the PWR BUS Bgroup are illuminated Green, there is most likely a problem with the serial connection betweenthe server and the breaker panel. This connection is used by the system health check to monitorthe breaker panel for failures. Verify that both ends of the labeled serial cables are properlysecured. If any issues are discovered with these cable connections, make the necessary correctionsand continue to the next step to verify that the alarm has been cleared, otherwise contact theTekelec Customer Care Center
4. Run syscheck .
• If the alarm has been cleared, the problem is resolved.• If the alarm has not been cleared, continue with the next step.
5. If the problem has not been resolved, contact the Tekelec Customer Care Center
61910-6688-001 Revision B, February 2014
AlarmsAlarms on the T1200 Platform

3000000004000000 – Breaker panel monitoring error
This alarm indicates a failure in the hardware and/or software that monitors the breaker panel. Thiscould mean there is a problem with the file I/O libraries, the serial device drivers, or the serial hardwareitself.
Note: When this alarm occurs, the system health check is unable to monitor the breaker panel forfaults. Thus, if this alarm is detected, it is imperative that the breaker panel be carefully examined forthe existence of faults. The LEDs on the breaker panel will be the only indication of the occurrence ofeither alarm
until the Breaker Panel Monitoring Error has been corrected.
Recovery
1. Verify that the same alarm is displayed by both servers (the single breaker panel normally sendsalarm information to both servers):
• If this alarm is displayed by only one server, the problem is most likely to be with the cable orthe server itself. Look for other alarms that indicate a problem with the server and perform therecovery procedures for those alarms first.
• If this alarm is displayed by both servers, go to the next step.
2. Verify that both ends of the labeled serial cables are secured properly (for locations of serial cables,see the appropriate hardware manual).
3. Run syscheck
• If the alarm has been cleared, the problem is resolved.• If the alarm has not been cleared, continue with the next step.
4. Contact the Tekelec Customer Care Center and provide the system health check output.
3000000008000000 – Server HA Keepalive error
This alarm indicates that heartbeat process has detected that it has failed to receive a heartbeat packetwithin the timeout period.
Recovery
1. Determine if the mate server is currently down and bring it up if possible.2. Determine if the keepalive interface is down.3. Determine if heartbeart is running (service TKLCha status).
Note: This step may require command line ability.
4. Contact the Tekelec Customer Care Center.
3000000080000000 – HP disk problem
This major alarm indicates that there is an issue with either a physical or logical disk in the HP disksubsystem. The message will include the drive type, location, slot and status of the drive that has theerror.
62910-6688-001 Revision B, February 2014
AlarmsAlarms on the T1200 Platform
Recovery
1. Run syscheck in verbose mode (see procedure Running the System Health Check).2. Contact the Customer Care Center and provide the system health check output.
3000000100000000 – HP Smart Array controller problem
This major alarm indicates that there is an issue with an HP disk controller. The message will includethe slot location, the component on the controller that has failed, and status of the controller that hasthe error.
Recovery
1. Run syscheck in verbose mode (see procedure Running the System Health Check).2. Contact the Customer Care Center and provide the system health check output.
3000000200000000 – HP hpacucliStatus utility problem
This major alarm indicates that there is an issue with the process that caches the HP disk subsystemstatus for syscheck. This usually means that the hpacucliStatus daemon is either not running, or hung.
Recovery
1. Run syscheck in verbose mode (see procedure Running the System Health Check).2. Contact the Customer Care Center and provide the system health check output.
3000000400000000 - Multipath device access link problem
One or more "access paths" of a multipath device are failing or are not healthy, or the multipath devicedoes not exist.
Recovery
Major Application Alarms
The major application alarms involve the EPAP software, RTDBs, file system and logs.
4000000000000001 - Mate EPAP Unavailable
One EPAP has reported that the other EPAP is unreachable.
Recovery
1. Log in to the EPAPGUI (see Accessing the EPAP GUI Interface).2. View the EPAP status on the banner.
• If the mate EPAP status is DOWN, go to Step 4 .• If the mate EPAP status is ACTIVE or STANDBY, go to Step 7.
63910-6688-001 Revision B, February 2014
AlarmsAlarms on the T1200 Platform
3. Select the Select Mate menu item to change to the mate EPAP.4. Select Process Control>Start Software to start the mate EPAP software.5. View the EPAP status on the banner.
• If the mate EPAP status is ACTIVE or STANDBY, the problem is resolved.• If the mate EPAP status is still DOWN, continue with Step 6.
6. Select the Select Mate menu item to change back to the side that reported the alarm.7. Stop and start the software on the side that is reporting the alarm (see ).8. If the problem persists, run savelogs to gather system information for further troubleshooting
(see Saving Logs Using the EPAP GUI), and contact the Customer Care Center.
4000000000000002 - RTDB Mate Unavailable
The local EPAP cannot use the direct link to the Standby for RTDB database synchronization.
Recovery
1. Log in to the EPAPGUI (see Accessing the ELAP GUI Interface).2. View the EPAP status on the banner.
• If the mate EPAP status is DOWN, go to Step 4.• If the mate EPAP status is ACTIVE or STANDBY, go to Step 7.
3. Select the Select Mate menu item to change to the mate EPAP.4. Select Process Control>Start Software to start the mate EPAP software.5. Determine whether the alarm has cleared by verifying whether it is still being displayed in the
banner or in the Alarm View window.
• If the alarm has cleared, the problem is resolved.• If the alarm has not yet cleared, continue with Step 6.
6. Ensure that you are logged into the side opposite from the side reporting the alarm.
If it is necessary to change sides, select the Select Mate menu item to change to the side oppositethe side that reported the alarm.
7. Stop and start the software on the side that is reporting the alarm (see ).8. Select RTDB>View RTDB Status to verify that the RTDB status on both sides is coherent, as shown
in Figure 30: Coherent RTDB Status.
64910-6688-001 Revision B, February 2014
AlarmsAlarms on the T1200 Platform

Figure 30: Coherent RTDB Status
9. If the problem persists, run savelogs to gather system information for further troubleshooting(see Saving Logs Using the EPAP GUI), and contact the Customer Care Center.
4000000000000004 - Congestion
The EPAP RTDB database record cache used to keep updates currently being provisioned is above80% capacity.
Recovery
1. At the EAGLE 5 ISS input terminal, enter the rept-stat-mps command to verify the status.
Refer to the Commands Manual to interpret the output.
2. If the problem does not clear within 2 hours with an "EPAP Available" notice, capture the log fileson both EPAPs (see Saving Logs Using the EPAP GUI) and contact the Customer Care Center.
4000000000000020 - RMTP Channels Down
Both IP multicast mechanisms are down.
Recovery
1. Check the physical connections between the local server and the Service Module cards on theEAGLE 5 ISS.
Make sure the connectors are firmly seated.
65910-6688-001 Revision B, February 2014
AlarmsAlarms on the T1200 Platform

2. Stop and restart the software on the side that is reporting the alarm (see Restarting the EPAP Software).3. Capture the log files on both EPAPs (see Saving Logs Using the EPAP GUI) and contact the Customer
Care Center.
4000000000000040 - Fatal Software Error
A major software component on the EPAP has failed.
Recovery
1. Perform2. Capture the log files on both EPAPs (see Saving Logs Using the EPAP GUI) and contact the Customer
Care Center.
4000000000000080 - RTDB Corrupt
A real-time database is corrupt. The calculated checksum did not match the checksum value storedfor one or more records.
Recovery
Capture the log files on both EPAPs (see Saving Logs Using the EPAP GUI) and contact the CustomerCare Center.
4000000000000100 - RTDB Inconsistent
This message indicates one or more of the following conditions:
• The real-time database for one or more Service Module cards is inconsistent with the currentreal-time database on the Active EPAP fixed disks
• RTDBs detect that it is ahead of an ACTIVE PDBA that it just connected to (probably a PDBAswitchover has occurred, or a restore from a backup of PDB with a previous db level)
• RTDB timestamp of most recent level does not match the PDBAs record of that timestamp.
Recovery
1. Log in to the User Interface screen of EPAP A (see Accessing the EPAP GUI Interface)2. Check the banner information above the menu to verify that you are logged into the EPAP A that
is reporting the problem.If it is necessary to switch to EPAP A, click the Select Mate menu item.
3. From the menu, select RTDB>View RTDB Status to display status information about the RTDBs.
#t_4000000000000100_mps_appl_alarms_t1000mps_maintmanual/v865167 shows an example.
66910-6688-001 Revision B, February 2014
AlarmsAlarms on the T1200 Platform

Figure 31: RTDB Status
4. Verify the PDB information on the RTDB Status view is correct before continuing.5. Before attempting to copy the RTDB, the EPAP A software must be stopped by doing the following:
Caution: If the software is not stopped as directed in#unique_121/unique_121_Connect_42_v5149405 through#unique_121/unique_121_Connect_42_v5149413, the RTDB will become corrupted.
a) Select Process Control > Stop Software to stop the software.
The following warning appears:
CAUTION: This action will stop all EPAP software processes, and will prevent the selected EPAP from updating the RTDB until the EPAP software is re-started (by executing the Start Software menu item).
b) On the Stop EPAP Software screen, make sure that the following item on the screen is checked:Check if you want the software to automatically start on reboot.
c) Select the Stop EPAP Software button to stop the software.
6. Select RTDB> Maintenance > Reload RTDB from PDBA.The screen shown in #t_4000000000000100_mps_appl_alarms_t1000mps_maintmanual/v865197 isdisplayed.
67910-6688-001 Revision B, February 2014
AlarmsAlarms on the T1200 Platform

Figure 32: Reload RTDB from PDBA
7. Click the Reload button as shown in#t_4000000000000100_mps_appl_alarms_t1000mps_maintmanual/v865197.
8. When the reload has completed, start the software on EPAP A by doing the following:a) Select Process Control>Start Software to start the software again.
Make sure the following item on the screen is checked:
Check if you want to start the PDBA software along with the EPAP software
b) Select the Start EPAP Software button to start the software.
9. If the problem persists, capture the log files on both EPAPs (see Saving Logs Using the EPAP GUI)and contact the Customer Care Center.
4000000000000200 - RTDB Incoherent
This message usually indicates that the RTDB database download is in progress.
When the download is complete, the following UIM message will appear:
0452 - RTDB reload complete
Recovery
1. If this alarm displays while an RTDB download is in progress, no further action is necessary.2. If this alarm displays when an RTDB download is not in progress, capture the log files on both
EPAPs (see Saving Logs Using the EPAP GUI) and contact the Customer Care Center.
4000000000001000 - RTDB 100% Full
The RTDB on the EPAP is at capacity. The EPAP RTDB is not updating.
You may be able to free up space by deleting unnecessary data in the database. The EPAP must beupgraded in order to add disk capacity.
Recovery
Contact the Customer Care Center for assistance.
68910-6688-001 Revision B, February 2014
AlarmsAlarms on the T1200 Platform

4000000000002000 - RTDB Resynchronization in Progress
This message indicates that the RTDB resynchronization is in progress.
Recovery
No further action is necessary.
4000000000004000 - RTDB Reload Is Required
This message indicates that the RTDB reload is required for one of the following reasons:
• The PDB Birthday on the EPAP reporting the error does not match the mate EPAP’s PDB Birthday.
• The transaction logs did not contain enough information to resynchronize the databases (thetransaction logs may be too small).
Caution:
If both sides are reporting this error, contact the Customer Care Center.
If only one side is reporting this error, use the following procedure.
Recovery
1. Log in to the User Interface screen of the EPAP (see Accessing the EPAP GUI Interface)2. Check the banner information above the menu to verify that you are logged into the EPAP that is
reporting the problem.If it is necessary to switch to the problem EPAP, click the Select Mate menu item.
3. From the menu, select RTDB>View RTDB Status to display status information about the RTDBs.Figure 33: RTDB Status shows an example.
69910-6688-001 Revision B, February 2014
AlarmsAlarms on the T1200 Platform

Figure 33: RTDB Status
4. If the RTDB birthdays for both the local RTDB and the mate RTDB are the same, you can copy themate’s RTDB to the local RTDB.If the RTDB birthdays are not the same, go to step Step 11.
5. Before attempting to copy the RTDB, you must stop the software on both sides by doing thefollowing:
Caution: If you do not stop the software on both sides, as directed in substeps 5athrough 5c, the RTDBs will become corrupted.
a) Select Process Control > Stop Software to stop the software.The following warning appears:
CAUTION: This action will stop all EPAP software processes, and will prevent the selected EPAP from updating the RTDB until the EPAP software is re-started (by executing the Start Software menu item).
b) On the Stop EPAP Software screen, make sure the following item on the screen is checked:Check if you want the software to automatically start on reboot.
c) Select the Stop EPAP Software button to stop the software.d) Select Select Mate from the menu.e) Repeat substeps Substep a through Substep c on the other side.f) Select Select Mate from the menu to return to the EPAP that is reporting the problem.
70910-6688-001 Revision B, February 2014
AlarmsAlarms on the T1200 Platform
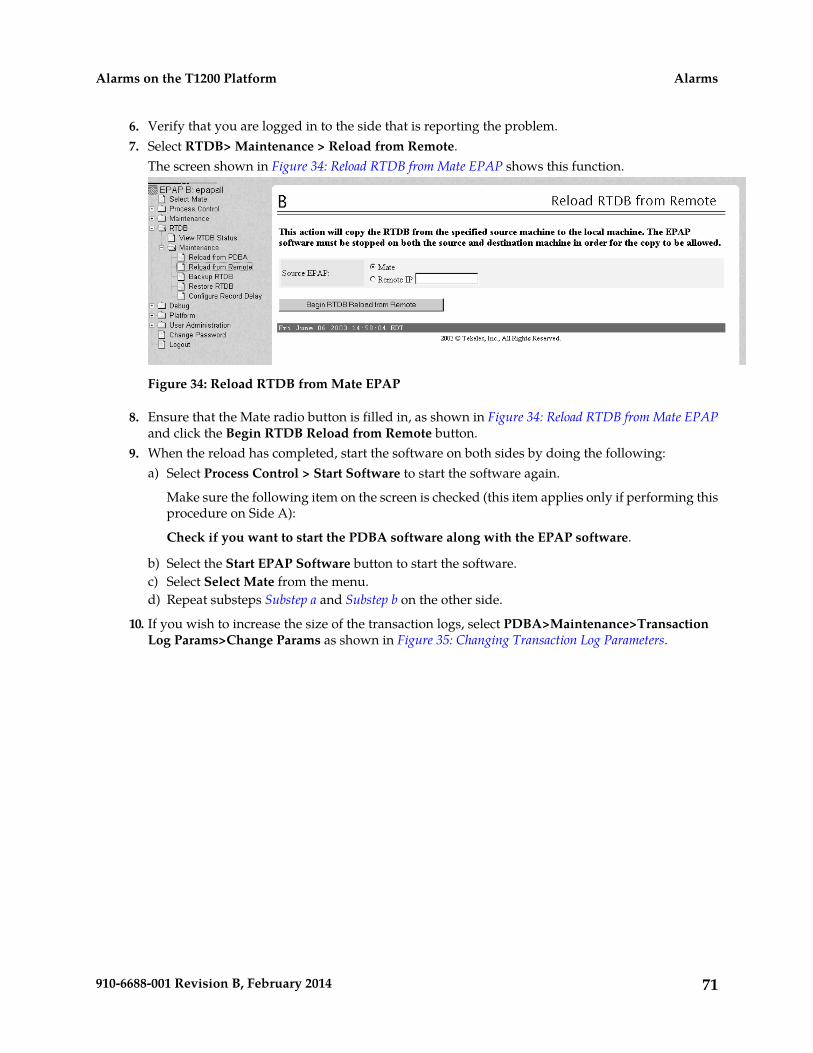
6. Verify that you are logged in to the side that is reporting the problem.7. Select RTDB> Maintenance > Reload from Remote.
The screen shown in Figure 34: Reload RTDB from Mate EPAP shows this function.
Figure 34: Reload RTDB from Mate EPAP
8. Ensure that the Mate radio button is filled in, as shown in Figure 34: Reload RTDB from Mate EPAPand click the Begin RTDB Reload from Remote button.
9. When the reload has completed, start the software on both sides by doing the following:a) Select Process Control > Start Software to start the software again.
Make sure the following item on the screen is checked (this item applies only if performing thisprocedure on Side A):
Check if you want to start the PDBA software along with the EPAP software.
b) Select the Start EPAP Software button to start the software.c) Select Select Mate from the menu.d) Repeat substeps Substep a and Substep b on the other side.
10. If you wish to increase the size of the transaction logs, select PDBA>Maintenance>TransactionLog Params>Change Params as shown in Figure 35: Changing Transaction Log Parameters.
71910-6688-001 Revision B, February 2014
AlarmsAlarms on the T1200 Platform

Figure 35: Changing Transaction Log Parameters
11. If the problem persists, contact the Customer Care Center.
4000000000008000 - Mate PDBA Unreachable
This message indicates that the other PDBA is unreachable.
Recovery
1. Log in to the User Interface screen of the EPAP GUI (see Accessing the EPAP GUI Interface).2. Check the banner information above the menu for the PDBA status.
a) If neither PDBA status is DOWN, go to Step 7.b) If status of one of the PDBAs is DOWN, continue with Step 3.Figure 36: PDBA Down shows an example in which the PDBA on EPAP B is DOWN.
72910-6688-001 Revision B, February 2014
AlarmsAlarms on the T1200 Platform
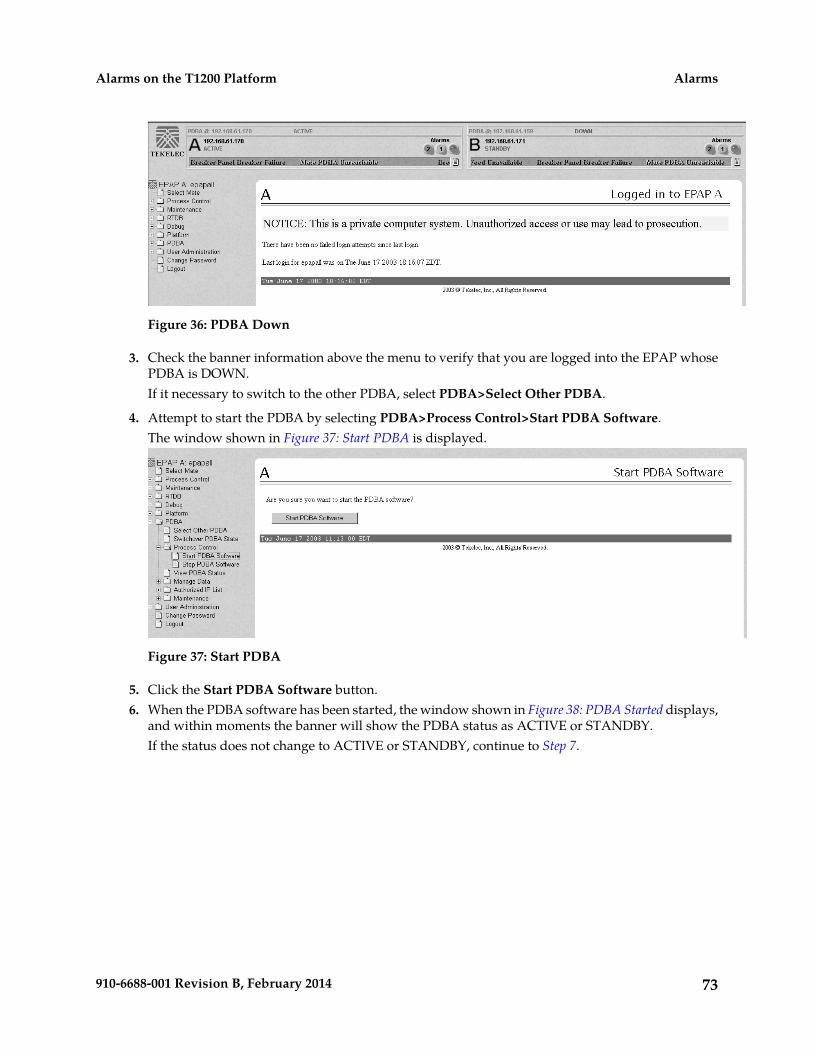
Figure 36: PDBA Down
3. Check the banner information above the menu to verify that you are logged into the EPAP whosePDBA is DOWN.If it necessary to switch to the other PDBA, select PDBA>Select Other PDBA.
4. Attempt to start the PDBA by selecting PDBA>Process Control>Start PDBA Software.The window shown in Figure 37: Start PDBA is displayed.
Figure 37: Start PDBA
5. Click the Start PDBA Software button.6. When the PDBA software has been started, the window shown in Figure 38: PDBA Started displays,
and within moments the banner will show the PDBA status as ACTIVE or STANDBY.If the status does not change to ACTIVE or STANDBY, continue to Step 7.
73910-6688-001 Revision B, February 2014
AlarmsAlarms on the T1200 Platform

Figure 38: PDBA Started
7. Check the status of the provisioning network.If problems exist in the provisioning network, fix them.
8. If the problem persists, run savelogs (see Saving Logs Using the EPAP GUI), and contact theCustomer Care Center.
4000000000010000 - PDBA Connection Failure
The local EPAP RTDB process cannot connect to the local PDBA.
Recovery
1. Log in to the User Interface screen of the EPAP (see Accessing the EPAP GUI Interface).2. Check the banner information above the menu to verify that you are logged into the problem EPAP
indicated in the UAM.Select Select Mate if necessary to switch to the problem EPAP.
3. Perform Restarting the EPAP and PDBA.4. Select RTDB>View RTDB Status and determine the homing policy for the PDBA.
In the example shown in Figure 39: Determining the Homing Policy, the Homing Policy shows thatthe Standby PDB is preferred for homing.
74910-6688-001 Revision B, February 2014
AlarmsAlarms on the T1200 Platform

Figure 39: Determining the Homing Policy
5. At the EPAP indicated by the Homing Policy, repeat Step 3 and Step 4 to restart the PDBA.6. If the problem persists, run savelogs (see Saving Logs Using the EPAP GUI), and contact the
Customer Care Center.
4000000000020000 - PDBA Replication Failure
Provisioning data is no longer being exchanged from the Active PDB to the Standby PDB.
1. Run savelogs (see Saving Logs Using the EPAP GUI).2. Contact the Customer Care Center.
4000000000040000 - RTDB DSM Over-Allocation
At least one Service Module card in the attached EAGLE 5 ISS has insufficient memory to provisionthe RTDB entry. No more provisioning will be allowed to the RTDB until this issue is resolved.
Recovery
Install Service Module cards in the attached EAGLE 5 ISS with sufficient memory to accommodatethe expected size of the RTDB.
75910-6688-001 Revision B, February 2014
AlarmsAlarms on the T1200 Platform

4000000000080000 - RTDB Maximum Depth Reached
This alarm indicates that the maximum depth has been reached for a tree. If the alarm was initiatedduring a data update, the update will continually fail until there is manual intervention. RTDB datais stored as inverse tree structures. The trees have a maximum depth allowed.
Recovery
Contact the Customer Care Center.
4000000000100000 - No PDBA Proxy to Remote PDBA Connection
This message indicates that the PDBA Proxy feature is disabled or the software is down.
Recovery
1. Log in to the User Interface screen of EPAP A (see Accessing the EPAP GUI Interface)2. Select PDBA>View PDBA Status to verify that the PDBA proxy feature is enabled.
The Local Proxy Status items only appear if the PDBA Proxy feature is enabled (See Figure 40: ViewPDBA Status Screen).
Figure 40: View PDBA Status Screen
76910-6688-001 Revision B, February 2014
AlarmsAlarms on the T1200 Platform

3. Refer to Restarting the EPAP and PDBA to restart the PDBA.4. If the problem persists, capture the log files on both EPAPs (see Saving Logs Using the EPAP GUI)
and contact the Customer Care Center.
4000000000200000 - DSM Provisioning Error
A coherent DSM RTDB is more than 1000 levels behind the EPAP RTDB.
Recovery
Monitor this situation.If it does not improve, contact the Customer Care Center for guidance.
4000000004000000 - RTDB MPS Over-Allocation
At least one Service Module card in the attached EAGLE 5 ISS has insufficient memory to provisionthe RTDB entry. No more provisioning will be allowed to the RTDB until this issue is resolved.
Recovery
1. Install Service Module cards in the attached EAGLE 5 ISS with sufficient memory to accommodatethe expected size of the RTDB.
If this did not clear the error, continue to the next step.
2. Contact the Customer Care Center .
4000000008000000 - PDB 100% Full
The PDB on the EPAP is at capacity. The EPAP PDB is not updating.
Note: This may be an indication to immediately make plans for an EPAP upgrade to increment datacapacity of the PDB database.
You may be able to free up space by deleting unnecessary data in the PDB database.
Recovery
Contact the Customer Care Center.
Minor Platform Alarms
Minor platform alarms involve disk space, application processes, RAM, and configuration errors.
5000000000000001 – Server disk space shortage warning
This alarm indicates that one of the following conditions has occurred:
• A file system has exceeded a warning threshold, which means that more than 80% (but less than90%) of the available disk storage has been used on the file system.
77910-6688-001 Revision B, February 2014
AlarmsAlarms on the T1200 Platform

• More than 80% (but less than 90%) of the total number of available files have been allocated on thefile system.
Recovery
1. Run syscheck (see Running syscheck Using the syscheck Login)2. Examine the syscheck output to determine if the filesystem /var/TKLC/epap/free is the one
that is low on space, if so, continue to Step 3; otherwise skip to Step 4.3. You may be able to free up space on the free partition by deleting unnecessary files, as follows:
a) Log in to the EPAPGUI (see Accessing the EPAP GUI Interface)b) Select Debug>Manage Logs & Backups.
A screen similar to Figure 41: Manage Logs and Backups displays. This screen displays theinformation about the total amount of space allocated for, and the amount of space currentlyused by logs and backups, and it lists logs and backup files that you might choose to delete,freeing up additional disk space.
Figure 41: Manage Logs and Backups
c) Click the checkbox of each file that you want to delete and then click Delete Selected File(s).
4. Contact the Tekelec Customer Care Center and provide the system health check output.
5000000000000002 – Server application process error
This alarm indicates that either the minimum number of instances for a required process are notcurrently running or too many instances of a required process are running.
Recovery
78910-6688-001 Revision B, February 2014
AlarmsAlarms on the T1200 Platform

1. If a 3000000000000020 - Server Platform process error alarm is also present, execute the recoveryprocedure associated with that alarm before proceeding.
2. Log in to the User Interface screen of the EPAPGUI (see Accessing the EPAP GUI Interface)3. Check the banner information above the menu to verify that you are logged into the problem EPAP
indicated in the UAM.
If it is necessary to switch to the other side, select Select Mate.
4. Open the Process Control folder, and select the Stop Software menu item.5. Open the Process Control folder, and select the Start Software menu item.6. Capture the log files on both EPAPs (see Saving Logs Using the EPAP GUI) and contact the Customer
Care Center.
5000000000000004 – Server hardware configuration error
This alarm indicates that one or more of the server’s hardware components are not in compliance withTekelec specifications (refer to the appropriate hardware manual).
Recovery
1. Run syscheck in verbose mode (see procedure Running syscheck Through the EPAP GUI )2. Contact the Customer Care Center and provide the system health check output.
5000000000000020 – Server swap space shortage warning
This alarm indicates that the swap space available on the server is less than expected. This is usuallycaused by a process that has allocated a very large amount of memory over time.
Note: For this alarm to clear, the underlying failure condition must be consistently undetected for anumber of polling intervals. Therefore, the alarm may continue to be reported for several minutesafter corrective actions are completed.
Recovery
Contact the Tekelec Customer Care Center.
5000000000000040 – Server default router not defined
This alarm indicates that the default network route is either not configured or the current configurationcontains an invalid IP address or hostname.
Caution: When changing the server’s network routing configuration it is important toverify that the modifications will not impact the method of connectivity for the currentlogin session. It is also crucial that this information not be entered incorrectly or set toimproper values. Incorrectly modifying the server’s routing configuration may result intotal loss of remote network access.
Recovery
1. Perform the following substeps to define the default router:
79910-6688-001 Revision B, February 2014
AlarmsAlarms on the T1200 Platform

a) Obtain the proper Provisioning Network netmask and the IP address of the appropriate DefaultRoute on the provisioning network.These are maintained by the customer network administrators.
b) Log in to the server with username epapconfig (see Accessing the EPAP GUI Interface).
The server designation at this site is displayed, as well as hostname, hostid, Platform Version,Software Version, and the date. Ensure that the side displayed is the server that is reportingthe problem. In the following example, it is server A.
c) Enter option 2, Configure Network Interfaces Menu, from the EPAP ConfigurationMenu.
MPS Side A: hostname: mpsa-d1a8f8 hostid: 80d1a8f8 Platform Version: x.x.x-x.x.x Software Version: EPAP x.x.x-x.x.x Wed Jul 17 09:51:47 EST 2002 /-----EPAP Configuration Menu----------\/----------------------------------------\| 1 | Display Configuration ||----|-----------------------------------|| 2 | Configure Network Interfaces Menu ||----|-----------------------------------|| 3 | Set Time Zone ||----|-----------------------------------|| 4 | Exchange Secure Shell Keys ||----|-----------------------------------|| 5 | Change Password ||----|-----------------------------------|| 6 | Platform Menu ||----|-----------------------------------|| 7 | Configure NTP Server ||----|-----------------------------------|| 8 | PDB Configuration Menu ||----|-----------------------------------|| e | Exit |\----------------------------------------/Enter Choice: 2
d) Enter option 1, Configure Provisioning Network from the Configure NetworkInterfaces Menu.This displays the following submenu for configuring communications networks and otherinformation.
/----Configure Network Interfaces Menu-----\/--------------------------------------------\| 1 | Configure Provisioning Network ||----|---------------------------------------|| 2 | Configure Sync Network ||----|---------------------------------------|| 3 | Configure DSM Network ||----|---------------------------------------|| 4 | Configure Backup Provisioning Network ||----|---------------------------------------|| 5 | Configure Forwarded Ports ||----|---------------------------------------|| 6 | Configure Static NAT Addresses ||----|---------------------------------------|| 7 | Configure Provisioning VIP Addresses |
80910-6688-001 Revision B, February 2014
AlarmsAlarms on the T1200 Platform

|----|---------------------------------------|| e | Exit |\--------------------------------------------/Enter choice: 1
The following warning appears:
EPAP software and PDBA are running. Stop them? [N]
e) Type Y and press Enter.The EPAP A provisioning network IP address displays:
Verifying connectivity with mate ...Enter the EPAP A provisioning network IP Address [192.168.61.90]:
f) Press Enter after each address is displayed until the Default Route address displays:
Verifying connectivity with mate ...Enter the EPAP A provisioning network IP Address [192.168.61.90]: Enter the EPAP B provisioning network IP Address [192.168.61.91]: Enter the EPAP provisioning network netmask [255.255.255.0]: Enter the EPAP provisioning network default router IP Address: 192.168.61.250
g) If the default router IP address is incorrect, correct it, and press Enter.h) After you have verifying or correcting the Provisioning Network configuration information,
enter e to return to the Configure Network Interfaces Menu.i) Enter e again to return to the EPAP Configuration Menu.
2. Rerun syscheck. If the alarm has not been cleared, go to Step 33. Contact the Tekelec Customer Care Center.
5000000000000080 – Server temperature warning
This alarm indicates that the internal temperature within the server is outside of the normal operatingrange. A server Fan Failure may also exist along with the Server Temperature Warning.
Recovery
1. Ensure that nothing is blocking the fan's intake. Remove any blockage.2. Verify that the temperature in the room is normal. If it is too hot, lower the temperature in the room
to an acceptable level.
Table 7: Server Environmental Conditions
Operating: 5 degrees C to 40 degrees CAmbient Temperature
Exceptional Operating Limit: 0 degrees C to 50degrees C
Storage: -20 degrees C to 60 degrees C
Operating: 5% to 85% non-condensingRelative Humidity
81910-6688-001 Revision B, February 2014
AlarmsAlarms on the T1200 Platform

Storage: 5% to 950% non-condensing
Operating: -300m to +300mElevation
Storage: -300m to +1200m
Capacity must compensate for up to 5100BTUs/hr for each installed frame.
Heating, Ventilation, and Air Conditioning
Calculate HVAC capacity as follows:
Determine the wattage of the installedequipment. Use the formula: watts x 3.143 =BTUs/hr
Note: Be prepared to wait the appropriate period of time before continuing with the next step.Conditions need to be below alarm thresholds consistently for the alarm to clear. The alarm maytake up to five minutes to clear after conditions improve. It may take about ten minutes after theroom returns to an acceptable temperature before syscheck shows the alarm cleared.
3. Replace the filter (refer to the appropriate hardware manual).
Note: Be prepared to wait the appropriate period of time before continuing with the next step.Conditions need to be below alarm thresholds consistently for the alarm to clear. The alarm maytake up to five minutes to clear after conditions improve. It may take about ten minutes after thefilter is replaced before syscheck shows the alarm cleared.
4. If the problem has not been resolved, contact the Tekelec Customer Care Center and provide thesystem health check output.
5000000000000100 – Server core file detected
This alarm indicates that an application process has failed and debug information is available.
Recovery
5000000000000200 – Server NTP Daemon not synchronized
This alarm indicates that the NTP daemon (background process) has been unable to locate a server toprovide an acceptable time reference for synchronization.
Recovery
Contact the Tekelec Customer Care Center.
5000000000000400 – CMOS battery voltage low
The presence of this alarm indicates that the CMOS battery voltage has been detected to be below theexpected value. This alarm is an early warning indicator of CMOS battery end-of-life failure whichwill cause problems in the event the server is powered off.
Recovery
Contact the Tekelec Customer Care Center.
82910-6688-001 Revision B, February 2014
AlarmsAlarms on the T1200 Platform
5000000000000800 – Server disk self test warning
A non-fatal disk issue (such as a sector cannot be read) exists.
Recovery
Contact the Tekelec Customer Care Center.
5000000000001000 – Device warning
This alarm indicates that either we are unable to perform an snmpget command on the configuredSNMP OID or the value returned failed the specified comparison operation.
Recovery
1. Run syscheck in Verbose mode (see procedure Running the System Health Check ).2. Contact the Customer Care Center and provide the system health check output.
5000000000002000 – Device interface warning
This alarm can be generated by either an SNMP trap or an IP bond error. If syscheck is configured toreceive SNMP traps, this alarm indicates that a SNMP trap was received with the “set” state. If syscheckis configured for IP bond monitoring, this alarm can mean a slave device is not up, a primary deviceis not active or syscheck is unable to read bonding information from interface configuration files.
Recovery
1. Run syscheck in Verbose mode (see procedure Running the System Health Check ).2. Contact the Customer Care Center and provide the system health check output.
5000000000004000 – Server reboot watchdog initiated
This alarm indicates that the hardware watchdog was not strobed by the software and so the serverrebooted the server. This applies to only the last reboot and is only supported on a T1100 applicationserver.
Recovery
Contact the Tekelec Customer Care Center.
5000000000008000 – Server HA failover inhibited
This alarm indicates that the server has been inhibited and therefore HA failover is prevented fromoccurring.
Recovery
Contact the Tekelec Customer Care Center.
83910-6688-001 Revision B, February 2014
AlarmsAlarms on the T1200 Platform

5000000000010000 – Server HA Active to Standby transition
This alarm indicates that the server is in the process of transitioning HA state from Active to Standby.
Recovery
Contact the Tekelec Customer Care Center.
5000000000020000 – Server HA Standby to Active transition
This alarm indicates that the server is in the process of transitioning HA state from Standby to Active.
Recovery
Contact the Tekelec Customer Care Center.
5000000000040000 – Platform Health Check failure
This alarm is used to indicate a syscheck configuration error.
Recovery
Contact the Tekelec Customer Care Center.
5000000000080000 – NTP Offset Check failure
This minor alarm indicates that time on the server is outside the acceptable range (or offset) from theNTP server. The Alarm message will provide the offset value of the server from the NTP server andthe offset limit that the application has set for the system.
Recovery
Contact the Tekelec Customer Care Center.
5000000000100000 – NTP Stratum Check failure
This alarm indicates that NTP is syncing to a server, but the stratum level of the NTP server is outsideof the acceptable limit. The Alarm message will provide the stratum value of the NTP server and thestratum limit that the application has set for the system.
Recovery
Contact the Tekelec Customer Care Center.
5000000000200000 – SAS Presence Sensor Missing
This alarm indicates that the T1200 server drive sensor is not working.
Recovery
Contact the Tekelec Customer Care Center to get a replacement server.
84910-6688-001 Revision B, February 2014
AlarmsAlarms on the T1200 Platform

5000000000400000 – SAS Drive Missing
This alarm indicates that the number of drives configured for this server is not being detected.
Recovery
Contact the Tekelec Customer Care Center to determine whether the issue is with a failed drive orfailed configuration.
5000000001000000 – HP disk resync
This minor alarm indicates that the HP disk subsystem is currently resynchronizing after a failed orreplaced drive, or some other change in the configuration of the HP disk subsystem. The output ofthe message will include the disk that is resynchronizing and the percentage complete. This alarmshould eventually clear once the resync of the disk is completed. The time it takes for this is dependanton the size of the disk and the amount of activity on the system.
Recovery
1. Run syscheck in Verbose mode (see Saving Logs Using the EPAP GUI).2. If the percent recovering is not updating, wait at least 5 minutes between subsequent runs of
syscheck, then contact the Customer Care Center and provide the system health check output.
5000000010000000 – Invalid BIOS value
This alarm indicates that the HP server has detected that one of the setting for either the embeddedserial port or the virtual serial port is incorrect.
Recovery
Contact the Tekelec Customer Care Center.
5000000020000000 – Server Kernel Dump File Detected
This alarm indicates that the kernel has crashed and debug information is available.
Recovery
1. Run syscheck in Verbose mode (see Running the System Health Check).2. Contact the Tekelec Customer Care Center.
5000000040000000 – TPD Upgrade Failed
This alarm indicates that a TPD upgrade has failed.
Recovery
1. Run the following command to clear the alarm./usr/TKLC/plat/bin/alarmMgr –clear TKSPLATMI31
2. Contact the Tekelec Customer Care Center.
85910-6688-001 Revision B, February 2014
AlarmsAlarms on the T1200 Platform

Minor Application Alarms
Minor application alarms involve the EPAP RMTP channels, RTDB capacity, and software errors.
6000000000000001 - RMTP Channel A Down
Channel A of the IP multicast mechanism is not available.
Recovery
1. Check the physical connections between the local EPAP(s), and the EPAP(s) and the Service Modulecards on the EAGLE 5 ISS. Make sure the connectors are firmly seated.
2. Run syscheck (see Running syscheck Through the EPAP GUI)
If you cannot log in, go to Step 5.
3. Perform Restarting the EPAP Software.4. Capture the log files on both EPAPs (see Saving Logs Using the EPAP GUI”)5. Contact the Customer Care Center.
6000000000000002 - RMTP Channel B Down
Channel B of the IP multicast mechanism is not available.
Recovery
1. Check the physical connections between the local EPAP(s), and the EPAP(s) and the Service Modulecards on the EAGLE 5 ISS.
Make sure the connectors are firmly seated.
2. Run syscheck (see Running syscheck Through the EPAP GUI).
If you cannot log in, go to Step 5.
3. Perform Restarting the EPAP Software.4. Capture the log files on both EPAPs (see Saving Logs Using the EPAP GUI).5. Contact the Customer Care Center.
6000000000000008 - RTDB 80% Full
The RTDB on the EPAP or DSM is approaching capacity (80%).
Note: This is an indication to the user to immediately make plans for an EPAP upgrade or upgradethe Service Module card to add more memory.
Recovery
1. At the EAGLE 5 ISS input terminal, enter the rept-stat-mps command.2. Refer to the output to determine which specific database (for an EPAP or for a Service Module
card) is approaching its capacity.
86910-6688-001 Revision B, February 2014
AlarmsAlarms on the T1200 Platform

3. Run savelogs on each EPAP (see Saving Logs Using the EPAP GUI), and contact the Customer CareCenter.
6000000000000020 - Standby PDBA Falling Behind
This is an indication that there is a congestion condition affecting updates to the standby PDBA. Theamount of time between an update being committed in the Active PDB and the same update beingcommitted in the Standby PDB has reached an unacceptable level.
The EPAP attempts to automatically recover from this situation. This error can result from one of thefollowing conditions:
• Provisioning activity is very heavy
• The provisioning network is experiencing errors or latency
• Server maintenance functions (such as backups, restores, imports, exports, etc) are occurring
Recovery
1. Periodically, verify that the level of the standby PDBA is catching up by selecting PDBA>ViewPDBA Status and comparing the Level of the Standby PDBA (on EPAP A in the example shownin Figure 42: View PDBA Status) to the Level of the Active PDBA (on EPAP B in the example).
Figure 42: View PDBA Status
2. If the problem persists for more than two hours, run savelogs (see Saving Logs Using the EPAPGUI), and contact Customer Care Center for assistance.
87910-6688-001 Revision B, February 2014
AlarmsAlarms on the T1200 Platform

6000000000000040 - RTDB Tree Error
This alarm indicates either that the depth is greater than the theoretical maximum or that some othergeneral problem has been found with a tree. RTDB data is stored as inverse tree structures. The treeshave maximum theoretical depths based on the number of records in the tree.
Recovery
Contact the Customer Care Center.
6000000000000080 - PDB Backup failed
The PDB backup failed because of at least one of the following conditions:
• A manual backup script was not able to create PDB backup successfully
• A PDB backup was already in progress when Automatic PDB backup attempted to start
• A PDB restore was in progress when the Automatic PDB backup attempted to start
To verify the exact failure condition, refer to the error string in the log file.
Note: This alarm will also clear if the Automatic PDB/RTDB backup executes successfully duringthe next scheduled backup time.
Recovery
To clear this alarm immediately, perform one of the following:
• Cancel the Automatic PDB / RTDB backup via the EPAP GUI as follows:
Note: Automatic PDB / RTDB Backup will have to be rescheduled if it is cancelled.
1. Log in to the User Interface screen of the EPAP GUI (see Accessing the EPAP GUI Interface).
2. From the menu, select Maintenance>Automatic PDB/RTDB Backup to display the automaticbackup screen.
3. From the Automatic PDB/RTDB Backup screen, select None as the Backup Type.
4. Select the Schedule Backup button to complete the cancellation.
Automatic PDB/RTDB Backup will have to be rescheduled. Refer to the EPAP AdministrationManual to reschedule the Automatic PDB / RTDB Backup.
• Perform a manual backup via the EPAPGUI (see Backing Up the RTDB).
6000000000000100 - Automatic PDB Backup failed
The PDB backup failed because of at least one of the following conditions:
• The mate machine was not reachable.
• The SCP command to transfer of PDB backup file to mate fails
• The transfer of Automatic PDB Backup to Mate fails
88910-6688-001 Revision B, February 2014
AlarmsAlarms on the T1200 Platform

• The transfer of Automatic PDB Backup to mate failed due to disk space shortage on mate
• The remote machine was not reachable
• The connection to remote host failed for SFTP of the PDB Backup file
• The SFTP to the remote host failed for Automatic PDB Backup
• The login or password configured for the Remote machine is wrong for the configured user
• The Destination File Path to store the PDB Backup file in Remote machine configured by the userdoes not exist
• The transfer of the Automatic PDB Backup to the remote failed due to disk space shortage on theremote
To verify the exact failure condition, refer to the error string in the log file.
Note: This alarm will clear if the Automatic PDB / RTDB backup executes successfully during thenext scheduled backup time.
Recovery
To clear this alarm immediately, cancel the Automatic PDB/RTDB backup via the EPAPGUI, asdescribed in Substep a through Substep d.
Note: Automatic PDB/RTDB Backup will have to be rescheduled if it is cancelled.
a) Log in to the User Interface screen of the EPAP GUI (see Accessing the EPAP GUI Interface).b) From the menu, select Maintenance>Automatic PDB/RTDB Backup to display the Automatic
PDB/RTDB Backup screen.c) From the Automatic PDB/RTDB Backup screen, select None as the Backup Type.d) Select the Schedule Backup button to complete the cancellation.
Note: Automatic PDB/RTDB Backup will have to be rescheduled. Refer to the EPAPAdministration Manual to reschedule the Automatic PDB/RTDB Backup.
6000000000000200 - RTDB Backup failed
The RTDB backup failed because of at least one of the following conditions:
• The manual backup script (backupRtdb.pl) was not able to create RTDB Backup successfully.
• The EPAP software could not be successfully stopped in order for Automatic RTDB Backup tostart.
• Another user has already stopped the EPAP Software before the script stops the EPAP Softwarefor Automatic RTDB Backup
• Another user is currently stopping the EPAP Software. The Automatic RTDB Backup script cannotstop the EPAP Software.
• The GUI Server returned an error when trying to get a lock from it for Automatic RTDB Backup.
• Not able to connect to GUI server for Automatic RTDB Backup
• The EPAP software was not running when it was to be stopped for Automatic RTDB Backup
89910-6688-001 Revision B, February 2014
AlarmsAlarms on the T1200 Platform
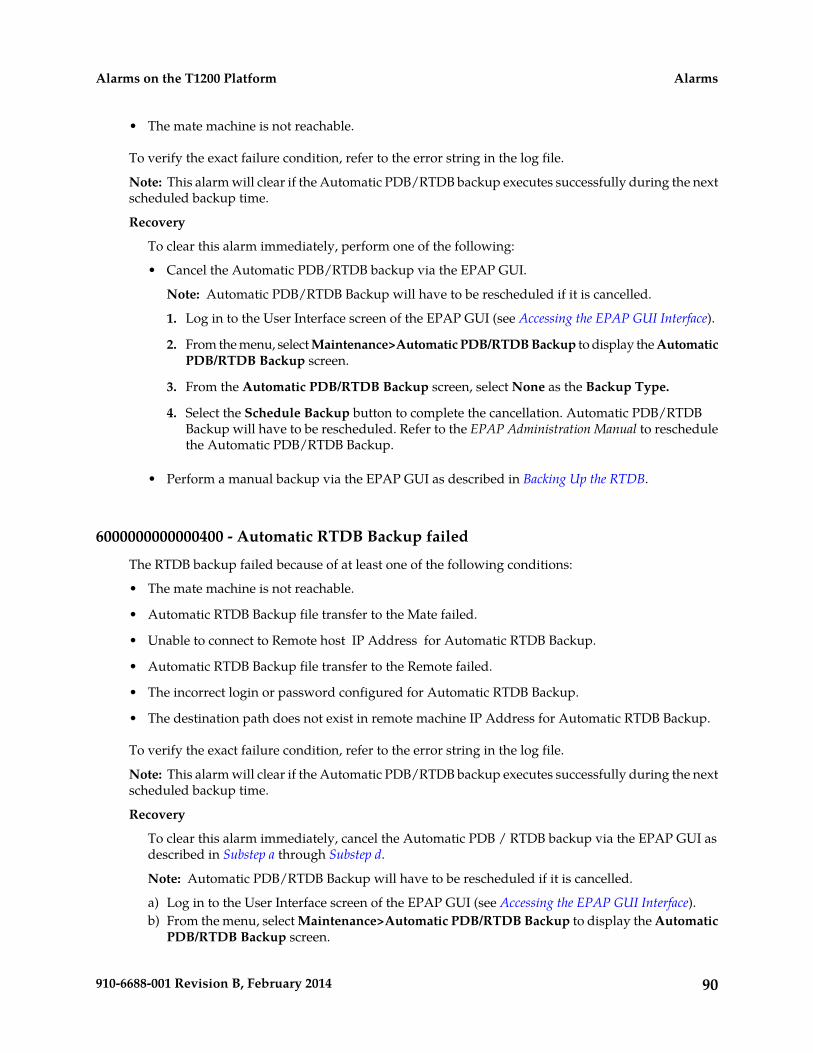
• The mate machine is not reachable.
To verify the exact failure condition, refer to the error string in the log file.
Note: This alarm will clear if the Automatic PDB/RTDB backup executes successfully during the nextscheduled backup time.
Recovery
To clear this alarm immediately, perform one of the following:
• Cancel the Automatic PDB/RTDB backup via the EPAP GUI.
Note: Automatic PDB/RTDB Backup will have to be rescheduled if it is cancelled.
1. Log in to the User Interface screen of the EPAP GUI (see Accessing the EPAP GUI Interface).
2. From the menu, select Maintenance>Automatic PDB/RTDB Backup to display the AutomaticPDB/RTDB Backup screen.
3. From the Automatic PDB/RTDB Backup screen, select None as the Backup Type.
4. Select the Schedule Backup button to complete the cancellation. Automatic PDB/RTDBBackup will have to be rescheduled. Refer to the EPAP Administration Manual to reschedulethe Automatic PDB/RTDB Backup.
• Perform a manual backup via the EPAP GUI as described in Backing Up the RTDB.
6000000000000400 - Automatic RTDB Backup failed
The RTDB backup failed because of at least one of the following conditions:
• The mate machine is not reachable.
• Automatic RTDB Backup file transfer to the Mate failed.
• Unable to connect to Remote host IP Address for Automatic RTDB Backup.
• Automatic RTDB Backup file transfer to the Remote failed.
• The incorrect login or password configured for Automatic RTDB Backup.
• The destination path does not exist in remote machine IP Address for Automatic RTDB Backup.
To verify the exact failure condition, refer to the error string in the log file.
Note: This alarm will clear if the Automatic PDB/RTDB backup executes successfully during the nextscheduled backup time.
Recovery
To clear this alarm immediately, cancel the Automatic PDB / RTDB backup via the EPAP GUI asdescribed in Substep a through Substep d.
Note: Automatic PDB/RTDB Backup will have to be rescheduled if it is cancelled.
a) Log in to the User Interface screen of the EPAP GUI (see Accessing the EPAP GUI Interface).b) From the menu, select Maintenance>Automatic PDB/RTDB Backup to display the Automatic
PDB/RTDB Backup screen.
90910-6688-001 Revision B, February 2014
AlarmsAlarms on the T1200 Platform

c) From the Automatic PDB/RTDB Backup screen, select None as the Backup Type.d) Select the Schedule Backup button to complete the cancellation. Automatic PDB/RTDB Backup
will have to be rescheduled. Refer to the EPAP Administration Manual to reschedule the AutomaticPDB/RTDB Backup.
6000000000001000 - SSH tunnel not established
One or more SSH tunnels has been enabled in the past, but the cron job was not able to re-establishthe SSH tunnel with all of the Authorized PDBA Client IP addresses.
Recovery
• Verify that the Customer Provisioning Application (CPA) machine is up and running.
• If the CPA machine is not running, restart it and wait for the alarm to clear.• If the CPA machine is running, or if the alarm does not clear, contact Customer Care Center.
6000000000002000 - RTDB 90% Full
The RTDB on the EPAP is approaching capacity (90%).
Note: This may be an indication to immediately make plans for an EPAP upgrade.
Recovery
1. At the EAGLE 5 ISS input terminal, enter the command rept-stat-mps.2. Run savelogs on each EPAP (see Saving Logs Using the EPAP GUI).3. Contact the Customer Care Center.
6000000000004000 - PDB 90% Full
The PDB on the EPAP is approaching capacity (90%).
Note: This may be an indication to immediately make plans for an EPAP upgrade.
Recovery
1. At the EAGLE 5 ISS input terminal, enter the command rept-stat-mps.2. Run savelogs on each EPAP (see Saving Logs Using the EPAP GUI).3. Contact the Customer Care Center.
6000000000008000 - PDB 80% Full
The PDB on the EPAP is approaching capacity (80%).
Note: This may be an indication to the user to immediately make plans for an EPAP upgrade.
Recovery
1. At the EAGLE 5 ISS input terminal, enter the command rept-stat-mps.2. Run savelogs on each EPAP (see Saving Logs Using the EPAP GUI).
91910-6688-001 Revision B, February 2014
AlarmsAlarms on the T1200 Platform

3. Contact the Customer Care Center.
6000000000010000 - PDB InnoDB Space 90% Full
The storage space in InnoDB Engine on the EPAP is approaching capacity (90%).
Note: This may be an indication to immediately make plans for an EPAP upgrade to allocate moreInnoDB space.
Recovery
1. At the EAGLE 5 ISS input terminal, enter the command rept-stat-mps.2. Run savelogs on each EPAP (see Saving Logs Using the EPAP GUI).3. Contact the Customer Care Center.
92910-6688-001 Revision B, February 2014
AlarmsAlarms on the T1200 Platform

Appendix
AGeneral Procedures
This chapter contains miscellaneous generalprocedures that are referred to within this manual.
Topics:
• Accessing the EPAP GUI Interface.....94• Connecting the Local Access Terminal.....95• Accessing the EPAP Text Interface.....96• Restarting the EPAP and PDBA.....96• Restarting the EPAP Software.....99• Saving Logs Using the EPAP GUI.....101
93910-6688-001 Revision B, February 2014

Accessing the EPAP GUI Interface
EPAP employs a web-based user interface. It uses the typical client-server paradigm. The front endappears on an Internet browser. The back end operates on the platform. The front end is officiallysupported on Microsoft® Internet Explorer, versions 8.0 or 9.0, and on Mozilla® Firefox®, version 3.0.0or later.
CAUTION: The User Interface may not function correctly with the browser you are using.Microsoft® Internet Explorer, versions 8.0 and 9.0, have been certified for this application
Use the following procedure to access the main screen of the EPAP GUI interface.
1. Using the selected browser (Microsoft® Internet Explorer 8.0 or 9.0, or Mozilla® Firefox® 3.0.0 orlater), type the IP address for your EPAP application into the URL field.
The login screen shown in Figure 43: EPAP User Interface Screen appears.
Figure 43: EPAP User Interface Screen
If using Firefox, the following message will be displayed when logging into the EPAP GUI:
CAUTION: The User Interface may not function correctly with the browser you are using. Microsoft® Internet Explorer, versions 8.0 and 9.0, have been certified for this application
Note: #unique_34/unique_34_Connect_42_v5405805 does not show the release number that appearson the EPAP User Interface Login window because this manual covers multiple EPAP releases.
2. Enter the appropriate username and password.Specify a username that has permission to access the menu items indicated in the procedure to beperformed. Table 8: Usernames shows the default usernames. Additional usernames can be definedby selecting the User Administration menu item. For more information about assigning usernames,refer to the EPAP Administration Manual.
Table 8: Usernames
Access GrantedEPAP UI Login Name
Maintenance menu and all sub menusepapmaint
Database menu and all sub menusepappdba
94910-6688-001 Revision B, February 2014
General ProceduresAlarms on the T1200 Platform

Access GrantedEPAP UI Login Name
Debug menu and all sub menusepapdebug
Platform menu and all sub menusepapplatform
User Administration menuuiadmin
All of the menus in this Tableepapall
3. Continue with the procedure that invoked this procedure.
Connecting the Local Access Terminal
The Local Access Terminal can be used for the following purposes:
• Accessing the EPAP text interface
• Running syscheck
Use the following procedure to connect the Local Access Terminal.
1. Connect the workstation you will use as the Local Access Terminal to Port 3 of the DB44 to DB9(X4) cable (P/N 830-0972-01), shown in Figure 44: DB44 to DB9 (X4) Cable.Port 0 of this cable connects to PCI card 8. (For more information about the location of PCI card 8,refer to the Tekelec 1000 Application Server Hardware Manual; for more information about this cable,refer to the Signaling Products Integrated Applications Installation Manual.
Figure 44: DB44 to DB9 (X4) Cable
2. When the prompt appears on the Local Access Terminal, enter either of the following usernamesand associated passwords:a) To access the EPAP text interface, enter the epapconfig username and the password provided
by your system administrator.
95910-6688-001 Revision B, February 2014
General ProceduresAlarms on the T1200 Platform

For more information about the EPAP text interface, see Accessing the EPAP Text Interface.b) To run the syscheck utility, enter syscheck as the username and syscheck as the password.
For more information about running syscheck from this interface, see Running syscheck Usingthe syscheck Login.
Accessing the EPAP Text Interface
The EPAP text-based user interface is accessed through the Local Access Terminal. The text-baseduser interface is used for initial configuration of the EPAP application. Some errors described in thismanual result from errors in the initial configuration, and recovery from them requires that you accessthe text interface.
For information about the initial configuration of the EPAP application, refer to EPAP Administrationand LNP Feature Activation.
1. Connect the Local Access Terminal to the server you need to access (see ).2. Log in with username and the password provided by your system administrator.3. Continue with the procedure that invoked this procedure.
Restarting the EPAP and PDBA
This procedure is invoked by procedures in Alarms.
Caution: Perform this procedure only when directed to by one of the procedures inAlarms. This is not a standalone procedure.
1. Log in to the User Interface screen of the EPAP GUI (see Accessing the EPAP GUI Interface).2. Check the banner information above the menu to verify that you are logged into the problem EPAP
indicated in the UAM.If it is necessary to switch to the problem EPAP, select Select Mate.
3. From the epapmaint screen, select Process Control>Stop Software.The screen shown in Figure 45: Stop Software Confirmation appears:
96910-6688-001 Revision B, February 2014
General ProceduresAlarms on the T1200 Platform

Figure 45: Stop Software Confirmation
4. On the Stop EPAP Software screen, make sure the following checkboxes are all checked, so thatthe PDBA software is stopped along with the EPAP software and so that both the PDBA and EPAPsoftware are automatically restarted on reboot (see Figure 46: Stop Software for an example):a) Check to cause the software to automatically start on reboot
This checkbox causes the EPAP software to automatically reboot.b) Check to stop the PDBA software along with the EPAP softwarec) Check to cause the PDBA software to automatically start on reboot
Figure 46: Stop Software
5. Click the Stop EPAP Software button to stop the software.The screen shown in Figure 47: Stop Software Completion Screen appears (the PDBA item appearsonly if performing this procedure on Side A).
97910-6688-001 Revision B, February 2014
General ProceduresAlarms on the T1200 Platform

Figure 47: Stop Software Completion Screen
6. Select Process Control>Start Software.7. From the Start EPAP Software screen, make sure the checkboxes are checked as shown in Figure
48: Start EPAP Software (this item applies only if performing this procedure on Side A):
Figure 48: Start EPAP Software
8. Click the Start EPAP Software button to start the software.The screen shown in Figure 49: Start Software Completion Screen confirms that the software has started(the PDBA item appears only if performing this procedure on Side A):
98910-6688-001 Revision B, February 2014
General ProceduresAlarms on the T1200 Platform

Figure 49: Start Software Completion Screen
Restarting the EPAP Software
This procedure is used when referenced by one of the procedures in Alarms.
Caution: Perform this procedure only when directed to by one of the procedures inAlarms. This is not a standalone procedure.
1. Log in to the User Interface screen of the EPAPGUI (see Accessing the EPAP GUI Interface).2. Check the banner information above the menu to verify that you are logged into the problem EPAP
indicated in the UAM.If it is necessary to switch to the problem EPAP, select Select Mate.
3. From the epapmaint screen, select Process Control>Stop Software.The screen shown in Figure 50: Stop Software Confirmation appears:
99910-6688-001 Revision B, February 2014
General ProceduresAlarms on the T1200 Platform
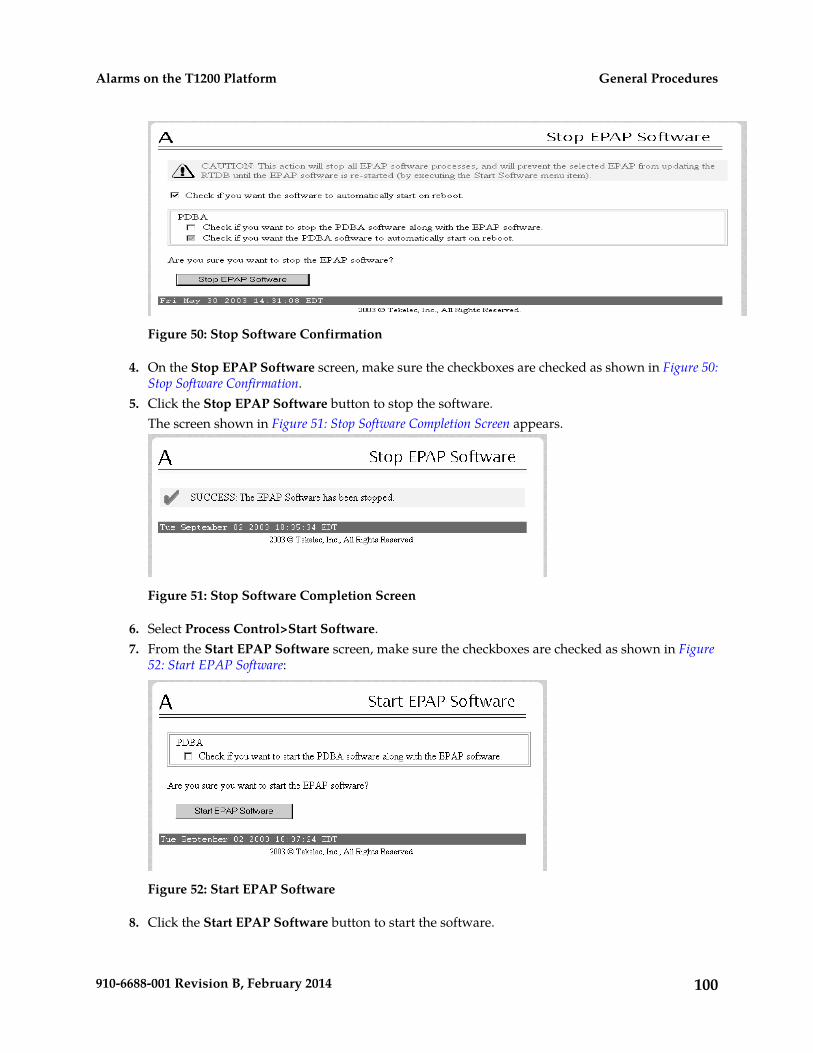
Figure 50: Stop Software Confirmation
4. On the Stop EPAP Software screen, make sure the checkboxes are checked as shown in Figure 50:Stop Software Confirmation.
5. Click the Stop EPAP Software button to stop the software.The screen shown in Figure 51: Stop Software Completion Screen appears.
Figure 51: Stop Software Completion Screen
6. Select Process Control>Start Software.7. From the Start EPAP Software screen, make sure the checkboxes are checked as shown in Figure
52: Start EPAP Software:
Figure 52: Start EPAP Software
8. Click the Start EPAP Software button to start the software.
100910-6688-001 Revision B, February 2014
General ProceduresAlarms on the T1200 Platform

The screen shown in Figure 53: Start Software Completion Screen confirms that the software hasstarted:
Figure 53: Start Software Completion Screen
Saving Logs Using the EPAP GUI
During some corrective procedures, it may be necessary to provide Tekelec with information aboutthe EPAP for help in clearing an alarm. These log files are used to aid the Customer Care Center whentroubleshooting the EPAP.
Use the following procedure to save logs using menu selections from the EPAP GUI.
1. Log in to the User Interface screen of the EPAP GUI (see Accessing the ELAP GUI Interface).2. Check the banner information above the menu to verify that you are logged into the problem EPAP
indicated in the UAM.
If it is necessary to switch to the problem EPAP, click the Select Mate menu item.
3. From the menu, select Debug>Capture Log Files.4. Deselect (if necessary) the box labeled Check if you want to capture core files with
the Logs, as shown in Figure 54: Capture Logs File Screen.
Note: Contact the Customer Care Center for assistance before capturing core files with the log files.
Figure 54: Capture Logs File Screen
5. Click the Capture Logs button to capture the log files.
101910-6688-001 Revision B, February 2014
General ProceduresAlarms on the T1200 Platform

After completion, verify the following response:
Figure 55: Capture Logs Success
6. Contact the Customer Care Center to analyze and check the log files.7. When the Customer Care Center has finished analyzing the logs files, delete them from the server
by selecting Debug>Manage Logs Files and Backups to open the Manage Logs and BackupsScreen.
8. Click the checkboxes for the files you want to delete and then click the Delete Selected File(s)button.
An example is shown in Figure 56: Deleting Captured Log Files.
Figure 56: Deleting Captured Log Files
.
When the log files have been deleted, the GUI displays confirmation, as shown in Figure 57: DeleteLog Files Success.
102910-6688-001 Revision B, February 2014
General ProceduresAlarms on the T1200 Platform

Figure 57: Delete Log Files Success
103910-6688-001 Revision B, February 2014
General ProceduresAlarms on the T1200 Platform

Glossary
B
Basic Input-Output SystemBIOS
Firmware on the CPU blade that isexecuted prior to executing an OS.
C
A singleTime-Division-Multiplexed (TDM)
Channel
timeslot within a channelizedE1/T1 port. Generically, channelscan be used for transportingsignaling, digitized voice, or datainformation. Unused channelstypically are filled with defined idlecodes designed to maintainsufficient ones density to ensureframe-level synchronization.
Complementary Metal OxideSemiconductor
CMOS
CMOS semiconductors use bothNMOS (negative polarity) andPMOS (positive polarity) circuits.Since only one of the circuit typesis on at any given time, CMOSchips require less power than chipsusing just one type of transistor.
D
A process that runs in thebackground (rather than under the
daemon
direct control of a user) andperforms a specified operation atpredefined times or in response tocertain events. Generally speaking,daemons are assigned names thatend with the letter "d.” Forexample, sentryd is the daemonthat runs the Sentry utility.
104910-6688-001 Revision B, February 2014

D
Derived ObjectDO
Database Service Module.DSM
The DSM provides large capacitySCCP/database functionality. TheDSM is an application card thatsupports network specific functionssuch as EAGLE ProvisioningApplication Processor (EPAP),Global System for MobileCommunications (GSM), EAGLELocal Number Portability (ELAP),and interface to Local ServiceManagement System (LSMS).
E
EAGLE Provisioning ApplicationProcessor
EPAP
F
Field Replaceable UnitFRU
A circuit board or part that can bequickly and easily removed andreplaced by the user or by atechnician without having to sendthe entire product or system to arepair facility.
G
Gigabyte — 1,073,741,824 bytesGB
Graphical User InterfaceGUI
The term given to that set of itemsand facilities which provide theuser with a graphic means formanipulating screen data ratherthan being limited to characterbased commands.
105910-6688-001 Revision B, February 2014
GlossaryAlarms on the T1200 Platform

H
High AvailabilityHA
High Availability refers to a systemor component that operates on acontinuous basis by utilizingredundant connectivity, therebycircumventing unplanned outages.
Hewlett-PackardHP
I
Intelligent PeripheralIP
Internet Protocol
IP specifies the format of packets,also called datagrams, and theaddressing scheme. The networklayer for the TCP/IP protocol suitewidely used on Ethernet networks,defined in STD 5, RFC 791. IP is aconnectionless, best-effort packetswitching protocol. It providespacket routing, fragmentation andre-assembly through the data linklayer.
The location of a device on aTCP/IP network. The IP Address
IP Address
is either a number in dotteddecimal notation which lookssomething like (IPv4), or a 128-bithexadecimal string such as (IPv6).
L
Light Emitting DiodeLED
An electrical device that glows aparticular color when a specifiedvoltage is applied to it.
M
Multi-Purpose ServerMPS
106910-6688-001 Revision B, February 2014
GlossaryAlarms on the T1200 Platform

M
The Multi-Purpose Server providesdatabase/reload functionality anda variety of high capacity/highspeed offboard database functionsfor applications. The MPS residesin the General Purpose Frame.
Messages Per Second
A measure of a message processor’sperformance capacity. A messageis any Diameter message (Requestor Answer) which is received andprocessed by a message processor.
N
Network Time ProtocolNTP
P
Peripheral Component InterfacePCI
Point Code InternationalProtocol Control InformationPeripheral ComponentInterconnect
Provisioning DatabasePDB
Provisioning Database ApplicationPDBA
There are two ProvisioningDatabase Applications (PDBAs),one in EPAP A on each EAGLE 5ISS. They follow anActive/Standby model. Theseprocesses are responsible forupdating and maintaining theProvisioning Database (PDB).
R
Random Access MemoryRAM
A type of computer memory thatcan be accessed randomly; that is,
107910-6688-001 Revision B, February 2014
GlossaryAlarms on the T1200 Platform

R
any byte of memory can beaccessed without touching thepreceding bytes.
Reliable Multicast TransportProtocol
RMTP
A signaling path from an LSP to anRSP using a specified Link Set
Route
Real Time DatabaseRTDB
S
Service Control PointSCP
Service Control Points (SCP) arenetwork intelligence centers wheredatabases or call processinginformation is stored. The primaryfunction of SCPs is to respond toqueries from other SPs byretrieving the requestedinformation from the appropriatedatabase, and sending it back to theoriginator of the request.
Secure Copy
SSH File Transfer Protocol(sometimes also called Secure FileTransfer Protocol)
SFTP
A client-server protocol that allowsa user on one computer to transferfiles to and from another computerover a TCP/IP network over anyreliable data stream. It is typicallyused over typically used withversion two of the SSH protocol.
Simple Network ManagementProtocol.
SNMP
108910-6688-001 Revision B, February 2014
GlossaryAlarms on the T1200 Platform

S
An industry-wide standardprotocol used for networkmanagement. The SNMP agentmaintains data variables thatrepresent aspects of the network.These variables are called managedobjects and are stored in amanagement information base(MIB). The SNMP protocolarranges managed objects intogroups.
U
Unsolicited Alarm MessageUAM
A message sent to a user interfacewhenever there is a fault that isservice-affecting or when aprevious problem is corrected. Eachmessage has a trouble code and textassociated with the troublecondition.
User InterfaceUI
Unsolicited Information MessageUIM
A message sent to a user interfacewhenever there is a fault that is notservice-affecting or when aprevious problem is corrected. Eachmessage has a trouble code and textassociated with the troublecondition.
109910-6688-001 Revision B, February 2014
GlossaryAlarms on the T1200 Platform
Copyright © 2022 FDOKUMEN