Alan Hégron
231
Implication des récepteurs de la mélatonine dans les troubles neurologiques et le diabète de type 2 et identification de régions clés du récepteur MT1 responsables de sa sélectivité fonctionnelle Thèse présentée en vue de l’obtention du grade de Docteur de l’Université Paris Saclay et de l’Université de Montréal École doctorale 568 Signalisation et réseaux intégratifs en biologie Sciences de la vie et de la santé, Université Paris Saclay Et Département de Biologie moléculaire, Université de Montréal Thèse présentée et soutenue à Paris, le 12 Décembre, par Alan Hégron Composition du Jury : Dr. Mohammed TAOUIS Président Dr. Angélique LEVOYE Rapporteur Dr. Jacques PANTEL Rapporteur Dr. Stéphane DOLY Examinateur Dr. Sylvain CHEMTOB Examinateur Dr. Ralf JOCKERS Directeur de thèse Dr. Michel BOUVIER Co-directeur de thèse © Alan Hégron, 2018 NNT : 2018SACLS555
-
Upload
khangminh22 -
Category
Documents
-
view
0 -
download
0
Transcript of Alan Hégron
Implication des récepteurs de la mélatonine dans les troubles
neurologiques et le diabète de type 2 et identification de régions
clés du récepteur MT1 responsables de sa sélectivité fonctionnelle
Thèse présentée en vue de l’obtention du grade de Docteur de l’Université Paris Saclay et de l’Université de Montréal
École doctorale 568 Signalisation et réseaux intégratifs en biologie
Sciences de la vie et de la santé, Université Paris Saclay
Et
Département de Biologie moléculaire, Université de Montréal
Thèse présentée et soutenue à Paris, le 12 Décembre, par
Alan Hégron
Composition du Jury :
Dr. Mohammed TAOUIS Président
Dr. Angélique LEVOYE Rapporteur
Dr. Jacques PANTEL Rapporteur
Dr. Stéphane DOLY Examinateur
Dr. Sylvain CHEMTOB Examinateur
Dr. Ralf JOCKERS Directeur de thèse
Dr. Michel BOUVIER Co-directeur de thèse
© Alan Hégron, 2018
NN
T :
20
18
SA
CLS
555

Université Paris-Saclay Espace Technologique / Immeuble Discovery Route de l’Orme aux Merisiers RD 128 / 91190 Saint-Aubin, France

Implication des récepteurs de la mélatonine dans les troubles
neurologiques et le diabète de type 2 et identification de régions clés du
récepteur MT1 responsables de sa sélectivité fonctionnelle
par Alan HÉGRON
École doctorale 568 Signalisation et réseaux intégratifs en biologie
Sciences de la vie et de la santé
Université Paris Saclay
Et
Département de Biologie moléculaire
Université de Montréal
Thèse présentée en vue de l’obtention du grade de Docteur
de l’Université Paris Saclay et de l’Université de Montréal
12 Décembre 2018
Directeur de thèse : Dr. Ralf JOCKERS
Co-Directeur de thèse : Dr. Michel BOUVIER
JURY
Dr. Mohammed TAOUIS Président
Dr. Angélique LEVOYE Rapporteur
Dr. Jacques PANTEL Rapporteur
Dr. Stéphane DOLY Examinateur
Dr. Sylvain CHEMTOB Examinateur
Dr. Ralf JOCKERS Examinateur
Dr. Michel BOUVIER Examinateur
© Alan Hégron, 2018

2
I. Résumé
La mélatonine est une neurohormone produite principalement par la glande pinéale de
manière circadienne et agissant par l’activation de deux récepteurs couplés aux protéines G
(RCPGs) appelés MT1 et MT2. La mélatonine régule de nombreuses fonctions
physiologiques importantes. La régulation des niveaux de dopamine (DA) et de glucose en
font partie mais nous ne savons pas clairement comment la mélatonine les régule.
Les niveaux de DA extracellulaire sont principalement régulés par son transporteur (DAT)
responsable de sa recapture dans les neurones présynaptiques afin de prévenir d’une
hyperactivation des récepteurs dopaminergiques. Par conséquent, nous avons vérifié le rôle
de DAT dans la régulation du système dopaminergique par le système mélatoninergique.
Nous avons montré qu’en interagissant avec la forme immature non-glycosylée de DAT,
MT1 et MT2 le retiennent dans le réticulum endoplasmique régulant ainsi son expression à
la surface cellulaire et donc la recapture de la DA. De la même manière, les souris déficientes
en MT1 ou MT2 ont montré une augmentation de la recapture de la DA dans les
synaptosomes de striatum et une baisse de l’hypermotilité induite par l’amphétamine. Dans
ce projet nous avons ainsi révélé un nouveau lien entre les systèmes mélatoninergiques et
dopaminergiques basé sur la formation de complexes moléculaires entre les récepteurs de la
mélatonine et DAT.
Afin de mieux comprendre le rôle de la mélatonine dans la régulation des niveaux de glucose,
nous avons ensuite étudié l’implication de variants génétiques de MT2 dans le
développement du diabète de type 2 (DT2). Des études antérieures avaient montré que des
variants naturels défectueux fonctionnellement étaient associés à un risque de développer le
DT2. Afin de déterminer plus précisément les propriétés défectueuses en lien avec le DT2,
nous avons mesuré l’activation spontanée et celle induite par la mélatonine de 40 variants
MT2. Nous avons ainsi montré que des défauts d’activation des protéines Gαi et Gαz induite
par la mélatonine et de recrutement spontané de la βarrestine-2 sont significativement reliés
à un risque de développer le DT2. Les résultats expérimentaux corrélaient avec les
prédictions de l’analyse sur le score d’évolution. Ce travail permettra de nouvelles avancées
dans la recherche de traitements personnalisés pour les personnes portants les mutations sur
MT2 afin qu’il retrouve une réponse non défectueuse.
Le séquençage du gène codant pour MT1 chez 9393 personnes a permis l’identification de
32 variants naturels de ce récepteur. Le récepteur MT1 sauvage et les variants ont ainsi été
3
caractérisés grâce aux techniques de transfert d’énergie par résonnance de bioluminescence
(BRET). Nous avons montré que MT1 active les protéines Gαi/o, Gα12 et Gα15 et recrute la
βarrestine-2. L’analyse des résultats par factorisation matricielle non linéaire a révélé
l’existence de 5 clusters caractérisés par différents profils de signalisation. La modélisation
3D par homologie de MT1 a permis de déterminer l’impact de chaque variant sur l’activation
du récepteur et ses interactions avec les protéines G et la βarrestine-2. Ce projet a ainsi
permis de démontrer que des variants naturels sont très intéressant afin de comprendre les
mécanismes d’action des RCPGs.
En résumé, ce travail contribue à la compréhension des fonctions des récepteurs à la
mélatonine et souligne leur importance dans la régulation du système dopaminergique et de
l’homéostasie glucidique. Nos résultats offrent de nouvelles perspectives dans la recherche
de nouveaux traitements personnalisés pour les patients souffrant d’un dérèglement du
système dopaminergique ou de DT2.
Mots-clés : Mélatonine, récepteurs couplés aux protéines G, dopamine, transporteur,
neurobiologie, diabète de type 2, variant génétique, structure, signalisation

4
II. Abstract
Melatonin is a neurohormone mainly released from the pineal gland in a circadian manner
acting through two G protein-coupled receptors (GPCRs) called MT1 and MT2. Melatonin
regulates many important physiological functions. Regulation of dopamine (DA) and
glucose levels are two of them but how they do this is not clear.
Extracellular DA levels are mainly regulated by its transporter (DAT) which mediates DA
re-uptake into presynaptic nerve termini to prevent DA receptor hyperactivation in the
presynaptic cleft. Consequently, we verified the role of DAT in the regulation of the DA
system by melatonin. We showed that MT1 and MT2, by interacting with the immature non-
glycosylated form of DAT retain DAT in the endoplasmic reticulum thus regulating DAT
cell surface expression and DA reuptake. Consistently, mice with targeted deletion of MT1
and MT2 show markedly enhanced DA uptake in striatal synaptosomes and decreased
amphetamine-induced locomotor activity. Collectively, we revealed here a molecular link
between the melatonin and DA systems, which is based on the formation of a molecular
complex between melatonin receptors and DAT.
To better understand the role of melatonin on the regulation of glucose levels, we studied
the involvement of genetic variants of MT2 in the development of type 2 diabetes (T2D).
Previous studies showed that natural loss-of-function variants of MT2 associate with T2D
risk. To determine more precisely the defective properties linked to T2D risk we monitored
spontaneous and melatonin-induced activation of different signaling pathways by 40 MT2
variants. We show that defects in melatonin-induced Gαi and Gαz activation and
spontaneous βarrestin-2 recruitment are most significantly associated to T2D risk.
Experimental results correlated well with those predicted by evolutionary lineage analysis.
This work will help to propose personalized treatments for MT2 variant carriers to recover
their defective responses.
Sequencing of MT1 gene of 9393 individuals resulted in the identification of 32 natural MT1
variants. MT1 wild-type and variants were functionally characterized in bioluminescence
resonance energy transfer (BRET) assays. We showed that MT1 activates Gαi/o, Gα12 and
Gα15 proteins and recruits βarrestin-2. Analyzes of results by non-linear matrix factorization
revealed the existence of 5 clusters characterized by different signaling profiles.
Computational homology modeling of the 3D model of MT1 helped to determine the impact
of each variant on receptor activation and interaction with G proteins and βarrestin-2.

5
Collectively, our data illustrate that natural variants are powerful tools to understand the
molecular basis of GPCR function.
Overall, this work contributes to our understanding of the function of melatonin receptors
and highlights their importance in the regulation of the DA system and glucose homeostasis.
Our results will open new, personalized therapeutic options for patient suffering from a
defective DA system or T2D.
Keywords : Melatonin, G protein-coupled receptors, dopamine, transporter, neurobiology,
type 2 diabetes, genetic variant, structure, signaling
6
III. Table des matières
I. Résumé ........................................................................................................................... 2
II. Abstract .......................................................................................................................... 4
III. Table des matières...................................................................................................... 6
IV. Liste des tableaux ..................................................................................................... 10
V. Liste des figures ........................................................................................................... 11
VI. Liste des abréviations ............................................................................................... 14
VII. Remerciements ......................................................................................................... 18
Chapitre 1 ............................................................................................................................. 20
I. Le système mélatoninergique ...................................................................................... 21
A. La mélatonine........................................................................................................... 21
1. Historique de la mélatonine ................................................................................. 21
2. Synthèse et régulation de la mélatonine ............................................................... 21
a. Synthèse et libération de la mélatonine ........................................................... 21
b. Le métabolisme de la mélatonine .................................................................... 23
B. Les récepteurs couplés aux protéines G ................................................................... 24
1. Introduction des récepteurs couplés aux protéines G .......................................... 24
2. Structure et classification des RCPGs .................................................................. 26
3. Signalisations protéines G dépendantes et indépendantes ................................... 27
4. Mécanismes d’internalisation et de trafic ............................................................ 28
5. Signalisation biaisée............................................................................................. 31
C. Les récepteurs de la mélatonine ............................................................................... 31
1. Découverte des récepteurs de la mélatonine ........................................................ 31
2. Structure des récepteurs de la mélatonine ............................................................ 32
3. Localisation tissulaire des MTRs ......................................................................... 34
a. Les MTRs dans la rétine .................................................................................. 34
b. Les MTRs dans le cerveau ............................................................................... 35
c. Les MTRs dans le pancréas ............................................................................. 37
d. Les MTRs dans le système immunitaire .......................................................... 38
4. Régulation de l’expression des MTRs ................................................................. 39
5. Signalisation des MTRs ....................................................................................... 40
a. Signalisation du récepteur MT1 ....................................................................... 40

7
b. Signalisation du récepteur MT2 ....................................................................... 40
c. Signalisation des MTRs dans le pancréas murin ............................................. 42
II. Rôles et implications de la mélatonine ........................................................................ 42
A. Propriétés chronobiotiques et régulation saisonnière de la mélatonine ................... 42
1. Rôle de la mélatonine endogène .......................................................................... 42
2. Rôle de la mélatonine exogène ............................................................................ 43
B. Implication de la MLT dans les maladies métaboliques .......................................... 44
1. Introduction au métabolisme du glucose ............................................................. 44
2. Introduction sur le diabète ................................................................................... 44
a. Le diabète de type 1 ......................................................................................... 45
b. Le diabète de type 2 ......................................................................................... 45
3. Les facteurs génétiques du diabète de type 2 ....................................................... 45
4. Le diabète de type 2 en lien avec la mélatonine .................................................. 46
C. Implication du système mélatoninergique dans les maladies neurologiques et les
troubles du comportement................................................................................................ 47
D. Lien entre systèmes mélatoninergiques et dopaminergiques ................................... 49
III. Le système dopaminergique .................................................................................... 51
A. Historique de la dopamine ....................................................................................... 51
B. Synthèse et métabolisme de la dopamine ................................................................ 51
C. Les récepteurs de la dopamine ................................................................................. 52
D. Localisation du système dopaminergique ................................................................ 53
1. Le système dopaminergique dans la rétine .......................................................... 53
2. Le système dopaminergique dans le système nerveux central ............................. 53
3. Le système dopaminergique dans le système sanguin ......................................... 54
4. Le système dopaminergique dans le pancréas ..................................................... 55
5. Le système dopaminergique dans le système immunitaire .................................. 55
6. Le système dopaminergique dans le rein ............................................................. 56
E. Introduction aux transporteurs neuronaux plasmiques ............................................ 56
F. Le transporteur de la dopamine ................................................................................ 56
G. Effet neurotoxique de la dopamine cytosolique ....................................................... 59
H. Implication dans les maladies neurologiques et les troubles du comportement ...... 60
1. Implication dans la maladie de Parkinson ........................................................... 60
2. Implication dans le trouble de déficit d’attention avec hyperactivité .................. 60

8
3. Implication dans la dépression ............................................................................. 61
4. Les drogues psychostimulantes............................................................................ 61
IV. Objectifs de la thèse ................................................................................................. 63
Chapitre 2 ............................................................................................................................. 65
Abstract ............................................................................................................................ 68
Introduction ...................................................................................................................... 69
Results .............................................................................................................................. 76
Figures.............................................................................................................................. 92
Résumé du chapitre 2 – Article 1 ....................................................................................... 102
Chapitre 3 ........................................................................................................................... 103
Abstract .......................................................................................................................... 105
Introduction .................................................................................................................... 106
Results ............................................................................................................................ 109
Figures............................................................................................................................ 139
Résumé du chapitre 3 – Article 2 ....................................................................................... 159
Chapitre 4 ........................................................................................................................... 160
Abstract .......................................................................................................................... 164
Introduction .................................................................................................................... 165
Results ............................................................................................................................ 171
Supplementary material ................................................................................................. 183
Résumé du chapitre 4 – Article 3 ....................................................................................... 190
Chapitre 5 ........................................................................................................................... 191
I. Discussion sur le premier projet de la thèse ............................................................... 192
A. Discussion sur les interactions entre DAT et les MTRs ........................................ 192
B. Discussion sur les effets in vivo des interactions entre DAT et les MTRs ............ 194
C. Intérêt de cette découverte pour le traitement de la MP ........................................ 194
D. Discussion sur la régulation des interactions entre DAT et les MTRs dans le corps ..
................................................................................................................................ 195
E. Utilisation de nouveaux anticorps anti-MTRs de souris ........................................ 195
II. Discussion sur le second projet de la thèse ................................................................ 196
A. Caractérisation du récepteur sauvage MT2 ............................................................ 196
B. Caractérisation des variants naturels MT2 et lien avec le DT2 .............................. 196
III. Discussion sur le troisième projet de la thèse ........................................................ 197

9
A. Caractérisation du récepteur sauvage MT1 ............................................................ 197
B. Caractérisation des variants naturels MT1 ............................................................. 198
C. Discussion sur les limites de l’analyse de corrélation entre effets phénotypiques et
prédictions informatiques............................................................................................... 199
IV. Discussion sur les liens entre les projets 2 et 3 ...................................................... 199
A. Discussion sur la comparaison des profils de signalisation des récepteurs MT1 et MT2
................................................................................................................................ 199
B. Discussion sur la comparaison des mécanismes d’activation des récepteurs MT1 et
MT2 ................................................................................................................................ 200
V. Conclusion générale ................................................................................................... 202
VI. Bibliographie.......................................................................................................... 203

10
IV. Liste des tableaux
Chapitre 1
Tableau I. Présence des récepteurs de la mélatonine dans différentes parties du cerveau
de mammifères ..................................................................................................................... 36
Chapitre 3
Table S1. Summary of the functional profiling of Gαi1 activation by WT-MT2 and MT2
variants. .............................................................................................................................. 154
Table S2. Summary of the functional profiling of Gαz activation by WT-MT2 and MT2
variants. .............................................................................................................................. 155
Table S3. Summary of the functional profiling of β-arrestin2 recruitment to WT-MT2 and
MT2 variants....................................................................................................................... 156
Table S4. Summary of the functional profiling of cAMP inhibition by WT-MT2 and MT2
variants. .............................................................................................................................. 157
Table S5. Summary of the functional profiling of ERK activation by WT-MT2 and MT2
variants. .............................................................................................................................. 158
Chapitre 4
Supplementary table 1. Data from the functional characterization of variants. ........... 189

11
V. Liste des figures
Chapitre 1
Figure 1. Synthèse de la mélatonine ................................................................................ 22
Figure 2. Amplitude de sécrétion de la mélatonine selon l’âge ...................................... 23
Figure 3. Métabolisme de la MLT................................................................................... 24
Figure 4. La grande diversité des ligands des RCPGs et des voies de signalisation
associées .......................................................................................................................... 25
Figure 5. Modèle d’un récepteur couplé aux protéines G ............................................... 26
Figure 6. Classification GRAFS des RCPGs. ................................................................. 27
Figure 7. Exemples de signalisations dépendantes et indépendantes des protéines G .... 29
Figure 8. Internalisation des RCPGs par la voie dépendante des β-arrestines et leur trafic
dans la cellule. ...................................................................................................................... 30
Figure 9. Superposition des récepteurs MT1 et MT2 et leur séquence en acides aminés.
...................................................................................................................... 32
Figure 10. Signalisation des MTRs et leur rôle dans les cellules β-pancréatiques murines
...................................................................................................................... 41
Figure 11. Inhibition de la libération de dopamine par la mélatonine .......................... 50
Figure 12. Synthèse et dégradation de la dopamine ...................................................... 52
Figure 13. Mécanisme d’action du transporteur de la dopamine .................................. 57
Figure 14. Effets de la cocaïne et de l’amphétamine sur le système dopaminergique .. 62
Chapitre 2
Figure 1: DAT is expressed in the striatum, hypothalamus and cortex and interacts with MT1
and MT2 in mice striatal synaptosomes. .............................................................................. 92
Figure 2. DAT interacts and colocalizes with MT1 and MT2 in transfected cells. .............. 93
Figure 3. MT1 and MT2 constitutively decrease DA uptake in HEK293T cells and striatal
synaptosomes. ...................................................................................................................... 94
Figure 4. MT1 and MT2 do not affect the affinity of DAT for DA but decrease DAT cell
surface expression. ............................................................................................................... 95
Figure 5. Melatonin receptor KO mice are less sensitive to amphetamine than wild type mice.
.............................................................................................................................................. 96
Supplementary Figure 1. Melatonin receptors decrease DA uptake.................................... 98

12
Supplementary Figure 2. DAT does not colocalizes with Golgi marker proteins in the
presence of melatonin receptors......................................................................................... 100
Supplementary Figure 3. Presence of 58K and calnexine in synaptosome preparation. ... 101
Chapitre 3
Fig. 1. Functional profiling of MT2 variants for spontaneous receptor activity. ............... 139
Fig. 2. MLT concentration-response curves for the MT2-mediated signaling of variants
representing each signaling profile. ................................................................................... 140
Fig. 3. Relationships between spontaneous and MLT-induced MT2 variant activation,
between G protein– and β-arrestin2–dependent events, and between different G protein
signaling events. ................................................................................................................. 141
Fig. 4. Graphical representation of the signaling signatures of MT2 variants. .................. 142
Fig. 5. Evolutionary Action analysis of MT2 variants and correlation with signaling
impairment. ........................................................................................................................ 143
Fig. S1. Screening for G proteins and detection of pathways activated by WT-MT2. ...... 145
Fig. S2. Predicted topology and distribution of the 40 MT2 variants. ............................... 146
Fig. S3. Detection of MT2 variants at the cell surface. ...................................................... 147
Fig. S4. MLT dose-response curves for Gαi1 and Gαz activation, β-arrestin2 recruitment,
cAMP inhibition, and ERK activation by MT2 variants. .................................................... 151
Fig. S5. G protein–dependent but β-arrestin–independent MLT-mediated ERK
phosphorylation by MT2. ................................................................................................... 152
Fig. S6. Correlations between the effects of the mutations on spontaneous and agonist-
promoted activity for G proteins and β-arrestin signaling parameters performed pairwise.
............................................................................................................................................ 153
Chapitre 4
Figure 1. WT-MT1 activates Gαi/o, Gα12, Gα15 and recruits βarrestin-2. .................. 171
Figure 2. MT1 receptors cell surface expression. .......................................................... 172
Figure 3. Melatonin concentration-response curves for G protein activations and
βarrestin-2 recruitment of the WT and representative receptor variants with distinct signaling
profiles. ........................................................................................................................ 173
Figure 4. Radial graph representation of the different variant profiles compiled in 5
clusters. ........................................................................................................................ 175
Figure 5. MT1 variant receptors bind to melatonin as well as the WT-MT1, except P80L.
........................................................................................................................ 175

13
Figure 6. Evolutionary Action of MT1 variants and correlation with signaling
impairment. .................................................................................................................... 176
Figure 7. Three-dimensional representation of residues of interest within MT1 and
βarrestin-2. ........................................................................................................................ 180
Supplementary figure 1. Melatonin concentration-response curves for G protein
activations and β-arrestin 2 recruitment of the WT and the different variant profiles grouped
in 5 clusters. ............................................................................................ 184
Supplementary figure 2. Radial graph representation of the different variant profiles
grouped in 5 clusters. .............................................................................................. 186
Supplementary Figure 3. Snake plot representation of WT-MT1 with the position of the
different variants. ............................................................................................. 187
Chapitre 5
Figure 1. Modèle de régulation du système dopaminergique par les récepteurs de la
mélatonine. ........................................................................................................................ 193
Figure 2. Score d’effet phénotypique en fonction du score d’action d’évolution. ........ 199
Figure 3. Variants MT1 et MT2 ayant un défaut de recrutement de la βarrestine-2. ..... 201

14
VI. Liste des abréviations
3D : 3 Dimensions
3-MT : 3-méthoxytyramine
4P-PDOT : Cis-4-Phenyl-2-propionamidotetralin
AA-DC : Décarboxylase des acides aminés aromatiques
AA-NAT : Sérotonine N-acétyl transférase
AC : Adénylate cyclase
AD : Aldéhyde déhydrogénase
ADN : Acide désoxyribonucléique
AMPc : Adénosine monophosphate cyclique
AMPH : Amphétamine
AP2 : Protéine adaptatrice 2
Arg : Arginine
ARNm : Acide ribonucléique messager
ASMT : Acétyl sérotonine O-méthyltransférase
ATP : Adénosine triphosphate
ATV : Aire tegmentale ventrale
βarr : βarrestine
BRET : Transfert d’énergie par résonnance de bioluminescence
Ca : Calcium
CaMK : Protéine kinase Calcium/Calmoduline dépendante
CHO : Ovaires de hamster de Chine
Cl : Chlore
COMT : Catéchol-O-méthyltransférase
CREB : Protéine se fixant à l’élément de réponse à l’AMPc
CRISPR : Courtes répétitions en palindrome regroupées et régulièrement espacées
D1 : Récepteur 1 à la dopamine
D2 : Récepteur 2 à la dopamine
D3 : Récepteur 3 à la dopamine
D4 : Récepteur 4 à la dopamine
D5 : Récepteur 5 à la dopamine
DAG : Diacylglycérol

15
DAT : Transporteur de la dopamine
DBH : Dopamine bêta-hydroxylase
DDC : Dopa décarboxylase
DT2 : Diabète de type 2
DOPAC : Acide 3,4-dihydrophénylacétique
DOPAL : 3,4-Dihydroxyphényl-acétaldéhyde
DRD1 : Gène codant pour le récepteur 1 à la dopamine
DRD2 : Gène codant pour le récepteur 2 à la dopamine
DRD3 : Gène codant pour le récepteur 3 à la dopamine
DRD4 : Gène codant pour le récepteur 4 à la dopamine
DRD5 : Gène codant pour le récepteur 5 à la dopamine
EA : Action d’évolution
EC50 : Concentration efficace médiane
ECL : Boucle extracellulaire
ERK : Kinase régulée par des signaux extracellulaires
GDP : Guanosine diphosphate
GMPc : Guanosine monophosphate cyclique
GTP : Guanosine triphosphate
GRAFS : Système de classification basé sur 5 familles nommées glutamate, rhodopsine,
adhésion, ‘’frizzled/taste2’’ et sécrétine
GRK : Kinases de RCPGs
H8 : Hélice 8
HEK : Cellules de rein d’embryon humain
HeLa : Lignée cellulaire issue de métastase prélevée chez Henrietta Lacks atteinte d’un
cancer du col de l’utérus
HTRF : Fluorescence en temps résolu
HVA : Acide homovanillique
ICL : Boucle intracellulaire
IGF-R : Récepteur au facteur de croissance ressemblant à l’insuline
insulin growth factor receptor
INS1 : Lignée cellulaire dérivée des cellules β pancréatiques sécrétant l’insuline
IL-2 : Interleukine 2
IP3 : Inositol 1, 4, 5-triphsophate

16
IUPHAR : International Union of Basic and Clinical Pharmacology Database
K : Potassium
L-DOPA : Levodopa
MA : Maladie d’Alzheimer
MAO : Monoamine-oxydase
MAPK : Protéine Kinase activée par les mitogènes
MDMA : 3,4-Méthylènedioxy-N-méthylamphétamine
MEK : MAPK-kinase régulée par un signal extracellulaire
Mel1a : Gène codant pour le récepteur MT1
Mel1b : Gène codant pour le récepteur MT2
Mel1c : Gène codant pour le récepteur Mel1c
METH : Métamphétamine
MHPA : Méthoxy-4-hydroxyphénylacétaldéhyde
MLT : Mélatonine
MT1 : Récepteur à la mélatonine de type 1
MT2 : Récepteur à la mélatonine de type 2
MT3 : Récepteur à la mélatonine de type 3
MTR : Récepteur à la mélatonine
MP : Maladie de Parkinson
Na : Sodium
NAc : Noyau accumbens
NIH3T3 : Lignée cellulaire de fibroblastes d’embryon de souris
NSC : Noyau suprachiasmatique
PDZ : Protéine de densité postsynaptique 95/Disque large/ Zona occludens 1
PI3K : Phosphoinositide 3-kinase
PICK-1 : Protéine interagissant avec la kinase C 1
PKA : Protéine kinase A
PKB : Protéine kinase B
PKC : Protéine kinase C
PLC : Phospholipase C
PTX : Toxine Pertussis
RCPG : Récepteurs couplés aux protéines G
RE : Réticulum endoplasmique

17
ROS : Espèces réactives de l’oxygène
RT-PCR : Réaction en chaîne par polymérase après transcription inverse
siARN : Petit acide ribonucléique interférent
SNC : Système nerveux central
TDAH : Trouble de déficit de l'attention avec ou sans hyperactivité
TH : Tyrosine hydroxylase
TPH : tryptophane hydroxylase
TM : Domaine transmembranaire
UVB : Ultraviolet B
VMAT : Transporteur vésiculaire des monoamines

18
VII. Remerciements
Je tiens à exprimer toute ma reconnaissance aux Docteurs Ralf Jockers et Michel Bouvier
pour m’avoir accueilli dans leurs laboratoires et pour les conseils qu’ils m’ont prodigués au
cours de ces quatre années de thèse. Ils m’ont permis de voir deux environnements de
recherche différents mais liés par leur qualité d’exception. Qu’ils trouvent ici l’expression
de mon plus grand respect.
Je remercie le Docteur Mohammed Taouis qui me fait l’honneur de présider mon jury.
Toute ma gratitude au Docteur Jacques Pantel pour avoir accepté de juger ce travail et de
faire partie de mon jury.
Je remercie les Docteurs Stéphane Doly et Sylvain Chemtob d’avoir accepté d’être
examinateurs au sein de mon jury.
Je remercie tout particulièrement la Docteure Angélique Levoye qui m’a enseigné la biologie
moléculaire durant mon Master et qui m’a fait confiance en me mettant en contact avec les
Docteurs Michel Bouvier et Ralf Jockers afin de mener cette thèse dans deux remarquables
laboratoires. Merci également d’avoir accepté de juger ce travail et de siéger parmi les
membres de mon jury.
Mes vifs remerciements à la Docteure Bianca Plouffe qui m’a énormément appris, conseillé
et encouragé pendant mes deux années à Montréal. Nous avons traversé de nombreuses
situations oppressantes et stressantes, mais tu m’as toujours permis de les traverser de la
meilleure façon qui soit.

19
Je remercie l’ensemble des membres de mon équipe de Cochin, notamment mon voisin de
bureau, Romain, qui a le chic pour prendre les mauvaises photos au mauvais moment, Clara
(dit BritBrit) et Johanna les reines des larmes, Marine la Franco-Allemande, Atsuro et nos
innombrables dimanches au labo avec le lunch ‘’poulet rôti’’, Flo la mouk ma voisine et la
reine du zouk, Delphine la chef des souris, Arturo le spanish, Julie mon acolyte du Québec,
Angeliki et nos voisines de palier et partenaires de rock, Aurore et Cécile.
Je remercie de la même manière les membres de mon équipe de l’IRIC, et particulièrement
Charlotte, Pierre et Justine pour comprendre les références françaises de mes blagues, Badr,
Khadija, Nick, Ruth, Diego, Shane et Franziska pour nos nombreuses soirées animées afin
de découvrir les charmes de Montréal, Christian, Mireille et André pour leurs conseils et
bien sûr Monique pour avoir fait en sorte que tout se passe bien pendant mes deux années à
Montréal malgré les déboires de l’immigration et de l’université; sans oublier Albert le
mousquetaire et la troupe brésiliano-espagnole de l’IRIC.
Bien évidemment, je remercie ma famille, mes parents et mes 2 frères pour avoir soutenu
mes ambitions, pour leurs encouragements et leur affection, nécessaires afin de ne pas
craquer sous la pression de ces années de travail intense. Ma réussite vous revient en partie.

20
Chapitre 1
Introduction générale

I. Le système mélatoninergique
A. La mélatonine
1. Historique de la mélatonine
La mélatonine (MLT) fut découverte et isolée en 1958 par le dermatologue Aaron Lerner (1)
lorsqu’il travaillait sur le vitiligo et qu’il tentait d’inhiber l’hyperpigmentation. Elle fut alors
identifiée comme N-acétyl-5-métoxytryptamine (2, 3). Les chercheurs ont ensuite découvert
qu’elle permettait l’agrégation des granules de mélanine sur les mélanophores dermiques de
la grenouille et qu’elle était sécrétée principalement pendant la nuit et provoquait la fatigue
et le sommeil chez certains mammifères.
2. Synthèse et régulation de la mélatonine
a. Synthèse et libération de la mélatonine
La MLT, également appelée hormone du sommeil, est principalement synthétisée par les
pinéalocytes localisés dans la glande pinéale des mammifères. Ces cellules utilisent l’acide
aminé tryptophane pour le transformer dans un premier temps en 5-hydroxytryptophane par
l'enzyme tryptophane hydroxylase (TH) puis en sérotonine grâce à l'enzyme décarboxylase
des acides aminés aromatiques (AA-DC). Cette sérotonine est produite de manière
constitutive dans le cerveau et transformée dans la glande pinéale pendant la nuit, en N-
acétyl sérotonine (ou N-acétyl-5 hydroxytryptamine) par l’enzyme sérotonine N-acétyl
transférase (AA-NAT). L’acétyl sérotonine O-méthyltransférase (ASMT) transforme
finalement ce composé en MLT (ou N-acétyl-5 méthoxytryptamine) (Figure 1).

22
Figure 1. Synthèse de la mélatonine
Il est intéressant de noter que la synthèse de la MLT est faible durant la journée et élevée
durant la nuit et se déroule de la même manière indépendamment si l’organisme est nocturne
ou diurne. Ce rythme est imposé par l’alternance de lumière et d’obscurité, l’exposition à la
lumière pendant la nuit supprimant sa production. Par ailleurs, il est observé que la durée et
l’amplitude de la sécrétion par la glande pinéale sont directement liées à la durée de la
période obscure (4). Aussitôt après sa synthèse, la MLT n’est pas stockée mais sécrétée dans
le sang et le liquide céphalorachidien (5). La lumière perçue par la rétine déclenche un signal
transmis au noyau suprachiasmatique (NSC) de l’hypothalamus (l’horloge biologique),
lequel inhibe la transmission du signal à la glande pinéale. Durant la phase obscure, il y a
levée de l’inhibition et libération de noradrénaline activant la synthèse de l’AA-NAT et
générant ainsi le rythme nycthéméral (6-8).
Chez les personnes jeunes et d’âge moyen, la MLT est sécrétée de manière circadienne avec
une grande amplitude et un pic maximal durant la nuit. Cette amplitude diminue néanmoins
avec l’âge (Figure 2). La concentration en MLT sécrétée par les sites extrapinéaux oscille
souvent avec de plus faibles amplitudes. Certains de ces sites sont très importants en terme
de quantité, comme le tract gastrointestinal contenant plusieurs centaines de fois plus de
MLT que la glande pinéale (9, 10), certaines parties du système nerveux central (SNC) (9,
11) ou encore les leucocytes (9).

23
Figure 2. Amplitude de sécrétion de la mélatonine selon l’âge (D’après Karasek,
2004 (12)).
b. Le métabolisme de la mélatonine
Il existe plusieurs voies pour le métabolisme de la MLT (Figure 3).
La première est la voie principale qui a lieu dans le foie et élimine environ 80% de la MLT
circulante. Dans les hépatocytes, la MLT est hydroxylée par le cytochrome P450 pour
conduire à la 6-hydroxymélatonine qui est ensuite éliminée dans les urines par les reins après
sulfo ou glucuronoconjugaison (13) par la sulfotransférase ou l’UDP-glucuronosyl-
transférase respectivement.
La deuxième voie est la voie kynurique. Elle consiste en l’ouverture du cycle indolique par
des processus oxydatifs. Cette voie peut être spontanée sans nécessiter l’intervention d’une
enzyme mais implique l’action de radicaux libres ou d’ultraviolet B (UVB) (14-17). Elle
peut également se produire dans le cerveau et être due à l’action de l’indoléamine-2,3-
dioxygénase qui permet la déformylation du composé par la myélopéroxydase pour donner
le catabolite N-acétyl-5-méthoxykynurénamine (18, 19).

24
Figure 3. Métabolisme de la MLT (D’après Cardinali, 1981 (20))
B. Les récepteurs couplés aux protéines G
La majorité des actions et des effets de la MLT est transmise par ses récepteurs
membranaires exprimés à la surface cellulaire et faisant partie de la superfamille des RCPGs.
1. Introduction des récepteurs couplés aux protéines G
Les récepteurs couplés aux protéines G (RCPGs) forment le plus grand et le plus varié des
groupes de récepteurs membranaires chez les eucaryotes. Ces récepteurs de surface cellulaire
permettent la réception de nombreux messagers comme la lumière, des peptides, des lipides,
des sucres ou encore des protéines. Ce genre de messager informe les cellules sur la présence
ou l’absence de lumière et de nutriments nécessaires à la vie dans l’environnement ou alors
transmettent des informations envoyées par d’autres cellules.
Les RCPGs jouent un rôle important dans de nombreuses fonctions biologiques dans le corps
humain et la compréhension de ces récepteurs a beaucoup affecté la médecine moderne. En
effet, environ 30% des médicaments sur le marché sont des molécules liant les RCPGs.

25
Les RCPGs lient une grande variété de molécules de signalisation (Figure 4) mais ils
partagent une architecture commune conservée tout au long de l’évolution. De nombreux
eucaryotes actuels, incluant les animaux, les plantes, les champignons et les protozoaires,
utilisent ces récepteurs afin de recevoir les informations de leur environnement. Par exemple,
de simples eucaryotes comme les levures ont des RCPGs détectant le glucose et des facteurs
de reproduction. Les RCPGs sont également impliqués dans de nombreuses autres fonctions
dans les organismes pluricellulaires. Les humains à eux seuls ont environ 1000 RCPGs
différents.
Figure 4. La grande diversité des ligands des RCPGs et des voies de
signalisation associées. (D’après Dorsam, 2007 (21))

26
2. Structure et classification des RCPGs
Les RCPGs sont des polypeptides en conformation globulaire incrustés dans la membrane
plasmique. Sept segments de ces protéines traversent entièrement la membrane (Figure 5),
expliquant pourquoi les RCPGs sont également appelés ‘’récepteurs à 7 domaines
transmembranaires’’ qui sont reliés entre eux par des boucles intracellulaires (ICL1, ICL2 et
ICL3) et extracellulaires (ECL1, ECL2 et ECL3). Les boucles extracellulaires et les
domaines transmembranaires forment la poche liant les ligands. Les RCPGs modulent une
grande diversité de processus physiologiques et les mutations dans les gènes codant pour ces
récepteurs sont impliquées dans de très nombreuses maladies.
Figure 5. Modèle d’un récepteur couplé aux protéines G
Plusieurs systèmes de classification ont été utilisés afin de décomposer cette superfamille.
Certains systèmes ont regroupé les récepteurs selon la manière dont le ligand lie son
récepteur et d’autres ont utilisé leurs caractéristiques physiologiques et structurales. Un des
systèmes les plus fréquents est le système utilisant les classes A, B, C, D, E et F avec des
sous-classes utilisant les chiffres romains (22, 23). Ce système couvre l’ensemble des
RCPGs à la fois chez les vertébrés et chez les invertébrés. Plus tard, Robert Fredriksson
classifia les différents RCPGs en 5 familles nommées glutamate, rhodopsine, adhésion,
‘’frizzled/taste2’’ et sécrétine formant le système de classification GRAFS (24), la famille
de la rhodopsine étant la plus grande et comprenant les récepteurs MT1 et MT2 (Figure 6).

27
Figure 6. Classification GRAFS des RCPGs.
3. Signalisations protéines G dépendantes et indépendantes
Comme leur nom l’indique, les RCPGs interagissent avec les protéines G au niveau de la
membrane plasmique. Lorsqu’un agoniste se lie à un RCPG, cela entraine un changement
conformationnel du récepteur entrainant des interactions avec les protéines G à proximité.
Les protéines G sont des protéines spécialisées avec la capacité de lier la guanosine
triphosphate (GTP) et la guanosine diphosphate (GDP). Les protéines G s’associant avec les
RCPGs sont hétérotrimériques et contiennent donc trois sous unités différentes : une sous
unité alpha, une béta et une gamma (Figure 4). Les sous unités alpha et gamma sont liées à
la membrane plasmique par des ancrages au niveau des lipides. La sous unité alpha peut lier
le GTP ou le GDP dépendamment de sa conformation active (GTP) ou inactive (GDP) (25).
En absence de signal, le GDP est lié à la sous unité alpha et ce complexe est lui-même lié au
RCPG. Cette conformation persiste jusqu’à ce qu’une molécule de signalisation se lie au
RCPG. A ce moment, un changement conformationnel du récepteur active la protéine G et
le GDP de la sous unité alpha est physiquement remplacé par le GTP entrainant la
dissociation du complexe hétérotrimérique en deux parties : la sous unité alpha liée au GTP
et le dimer béta-gamma (26). Ces deux parties restent ancrées à la membrane plasmique mais
elles ne sont plus liées au RCPG leur permettant d’interagir avec d’autres protéines
membranaires. Les protéines restent actives tant que la sous unité est liée au GTP.
Néanmoins, lorsque ce GTP est hydrolysé en GDP, les sous unités reprennent leur forme
inactive de trimère et le complexe se réassocie au RCPG devenu lui aussi inactif (27). De

28
cette manière, les protéines G fonctionnent à la manière d’un interrupteur qui s’active et se
désactive à la réception de molécules de signalisation interagissant avec le RCPG.
Quel que soit le moment, une sous unité alpha liée au GTP ou encore un dimer béta-gamma
peuvent activer d’autres protéines membranaires impliquées dans la voie de signalisation.
Les cibles spécifiques des protéines G incluent différentes enzymes qui produisent différents
messagers secondaires comme certains canaux ioniques qui permettent aux ions d’agir en
tant que messagers secondaires. Certaines protéines G stimulent l’activité de ces cibles, alors
que d’autres vont les inhiber (28, 29).
L’activation d’une seule protéine G peut affecter la production de centaines de seconds
messagers comme l’AMP cyclique (AMPc), le diacylglycérol (DAG), l’inositol 1, 4, 5-
triphsophate (IP3), qui coordonnent les voies de signalisation intracellulaires (28, 29). Une
cible fréquente des protéines G activées est l’adénylate cyclase, une enzyme associée à la
membrane qui, lorsqu’elle est activée, catalyse la synthèse du second messager AMPc à
partir d’ATP. Chez l’être humain, l’AMPc est notamment impliqué dans la réponse aux
stimuli sensoriels, aux hormones ou encore à la transmission nerveuse.
La phospholipase C est une autre cible courante des protéines G activées. Cette enzyme
associée à la membrane catalyse la synthèse de deux messagers secondaires, le DAG et l’IP3
à partir du phosphatidyl inositol (30). Cette voie particulière est nécessaire dans de nombreux
processus du corps humain.
4. Mécanismes d’internalisation et de trafic
La capacité à réguler les interactions entre les cellules et leur environnement extracellulaire
est essentielle pour la maintenance des fonctions physiologiques appropriées. Pour les
RCPGs, cette régulation se produit à travers de multiples mécanismes permettant un contrôle
spatial et temporel de la transduction du signal (31). Un des mécanismes principaux de la
régulation des RCPGs implique le trafic endocytique qui permet l’internalisation des
récepteurs depuis la membrane plasmique atténuant ainsi la signalisation dépendante des
protéines G (32, 33). Il y a de plus en plus de preuves que les RCPGs peuvent signaliser de
manière indépendante aux protéines G (Figure 7) et depuis les compartiments
intracellulaires, dont les endosomes (34, 35). Dans ce contexte, l’internalisation des
récepteurs et le trafic intracellulaire attirent de plus en plus l’intérêt des chercheurs.

29
Figure 7. Exemples de signalisations dépendantes et indépendantes des
protéines G
Le modèle principal de la signalisation des RCPGs postule que, suite à la stimulation par
l’agoniste du RCPG et à la génération du second messager, la protéine G est physiquement
découplée du récepteur afin d’éviter les effets négatifs d’une stimulation prolongée du
récepteur dans la cellule. Ce processus de désensibilisation du RCPG est principalement
initié par les kinases de RCPGs (GRKs) (36) et d’autres kinases qui phosphorylent les
résidus sérine et thréonine situés dans les boucles intracellulaires et au niveau C-terminal
des récepteurs activés (Figure 8). Les récepteurs phosphorylés vont alors recruter les
protéines β-arrestines situées dans le cytoplasme vers la membrane plasmique, entrainant la
fin de la signalisation dépendante des protéines G. A son tour, la β-arrestine peut agir comme
protéine d’échafaudage pour recruter de nouvelles protéines qui vont médier d’autres
cascades de signalisation comme celles impliquées dans la signalisation des kinases comme
ERK1/2, ou encore celles impliquées dans l’internalisation du récepteur par l’endocytose.
La voie la mieux décrite pour l’internalisation des RCPGs implique la liaison de la clathrine
et de sa protéine adaptatrice (AP2) au récepteur lié à la βarrestine (37-41). Les récepteurs
sont alors internalisés via des vésicules entourées de clathrine vers les endosomes, d’où ils
seront dirigés vers les lysosomes pour la dégradation ou recyclés vers la membrane
plasmique (42, 43). Ces études ont engendré un système de classification basé sur les
différences d’affinités pour les isoformes d’arrestines (44). D’après ce système, les RCPGs

30
de classe A lient préférentiellement et de manière transitoire la βarrestine-2 et sont
rapidement déphosphorylés et recyclés. Au contraire, les récepteurs de classe B lient les
βarrestines-1 et -2 avec une affinité similaire et forment des complexes stables entrainant
leur rétention, leur recyclage et leur dégradation (45).
Étant donné la taille de la famille des RCPGs, il n’est pas étonnant que certains récepteurs
ne suivent pas la voie d’endocytose classique de βarrestine-AP2-clathrine. Par exemple,
certains récepteurs interagissent directement avec AP2 par leur partie C-terminale, ce qui
permet leur interaction directe avec les puits recouverts de clathrine (46-49). D’autres
récepteurs peuvent également être internalisés via des voies d’endocytose alternatives (50).
Ces mécanismes impliquent des microdomaines spécifiques de la membrane, comme les
radeaux lipidiques ou les cavéoles. Bien que ces voies d’endocytose soient moins bien
comprises, de nombreux récepteurs ont été reportés comme étant associés aux cavéolines
(51-54). Plus récemment, une nouvelle voie d’endocytose a été identifiée comme étant
dépendante de la protéine endophiline (55, 56).
Figure 8. Internalisation des RCPGs par la voie dépendante des β-arrestines et
leur trafic dans la cellule.

31
5. Signalisation biaisée
La reconnaissance que les RCPGs puissent signaliser via des voies dépendantes ou
indépendantes des protéines G a été importante. Dans la continuité de ce concept, la capacité
d’un ligand à activer préférentiellement une voie de signalisation plutôt qu’une autre est de
plus en plus étudiée. C’est ce qu’on appelle la signalisation biaisée (57) ou la sélectivité
fonctionnelle. Avec la perspective attrayante de favoriser l’activation de voies de
signalisation favorables plutôt que non favorables ou nocives, les agonistes biaisés
pourraient s’avérer être des molécules thérapeutiques prometteuses. En effet, des composés
biaisés ont déjà été développés par exemple pour le récepteur de type 1 à l’angiotensine II
(58) ou le récepteur μ-opioïde (59). Cette voie de recherche reste très prometteuse pour
l’avenir dans le domaine des RCPGs (60).
C. Les récepteurs de la mélatonine
1. Découverte des récepteurs de la mélatonine
La majorité des actions de la MLT sur la cellule sont exercées grâce à ses 2 récepteurs
membranaires MT1 et MT2. Ces 2 récepteurs partagent 55% d’homologie et 70% dans les
domaines transmembranaires (Figure 9) et sont exprimés en faible quantité dans de
nombreux organes et types cellulaires (61) excepté dans l’hypophyse pars tuburalis,
impliqué dans la transmission des effets saisonniers, où le récepteur MT1 est présent en plus
grande quantité (62, 63).
Initialement, les études de caractérisation des sites de liaison de la MLT utilisaient la forme
tritiée ([3H]-MLT) comme radioligand marqué permettant ainsi de localiser des sites de
liaison dans de nombreux tissus notamment au niveau du cerveau de bovin (64) ou de la
rétine du lapin (65). L’introduction en 1984 d’un nouveau ligand radioactif, la 2-[125I]- iodo
MLT (66), qui présente par rapport à la [3H]-MLT une meilleure stabilité a permis de
localiser et de caractériser divers sites mélatoninergiques dans des tissus neuronaux et non
neuronaux (67). Deux types de sites ont été découverts : un de forte affinité (pM) appelé
ML1 et un de faible affinité (nM) appelé ML2 (68).
En 1994, l’équipe de Reppert a cloné le premier récepteur mélatoninergique de type ML1
chez le Xénope (69). Deux autres sous types de ML1 furent clonés chez l’homme. Les

32
récepteurs humains sont alors appelés Mel1a, Mel1b alors que le récepteur du Xénope est
appelé Mel1c (7, 8). En 1998 la nomenclature internationale IUPHAR désigne Mel1a par
MT1 et Mel1b par MT2. Le site de faible affinité ML2 prend le nom de MT3 alors que le site
Mel1c qui n'a pour l'instant pas été mis en évidence chez les mammifères conserve son
appellation originale (70).
Figure 9. Superposition des récepteurs MT1 et MT2 et leur séquence en acides
aminés.
2. Structure des récepteurs de la mélatonine
La prédiction de la structure tridimensionnelle (3D) des récepteurs de la MLT (MTRs)
représente une issue complexe, notamment avec le manque de modèles de structure ou le
33
manque de motifs validés d’interactions entre le ligand et le récepteur. La première issue est
relative aux disparités entre le nombre de séquences de RCPGs et le nombre de structures
validées. Les structures des RCPGs découvertes par les rayons X couvrent seulement une
faible partie des 800 séquences de RCPGs identifiées dans le génome humain. Comme
conséquence, des modèles proches sont disponibles seulement pour un petit groupe de
récepteurs, alors que la majorité des RCPGs doit encore être modélisée de manière
personnalisée en assemblant différentes parties de modèles validés. Des études récentes sur
l’homologie des modèles de RCPGs montrent clairement que la ressemblance entre un
modèle de récepteur et le récepteur d’intérêt dépend fortement de leur degré d’identité. Par
conséquent, lorsque la structure d’un RCPG est déterminée par modélisation par rapport à
une séquence identique entre 30% et 35%, elle est considérée comme étant fiable. Les
récepteurs MT1 et MT2 partagent une homologie de séquence inférieure à 30% avec les
RCPGs cristallisés, ce qui rend leur modélisation possible mais difficile. Plusieurs modèles
3D de MT1 et MT2 ont déjà été proposés et différents modes de liaison à différents ligands
ont été proposés. La plupart de ces modèles de récepteurs ont été construits avant 2007
lorsque la première structure rayons-X du RCPG activé β2-adrénergique fut découverte. En
conséquence, la majorité de ces modèles ont été construit à partir de la structure de la
rhodopsine bovine qui était le seul modèle validé. Seulement récemment, des modèles par
homologie ont été construit basés sur les nouvelles structures aux rayons X de récepteurs
aminergiques ou de structures de RCPGs cristallisés dans leur forme activée. Les avancées
récentes en informatique ainsi que le nombre croissant d’informations sur les différents
ligands permettent de prédire les relations entre structure et activité. De plus, les modèles de
récepteurs basés sur les mutations ont été appliqués à la fois pour décrire la liaison du ligand
au niveau moléculaire ou pour évaluer la sélectivité de certains ligands (71, 72).
Malgré de grands progrès ces dernières années dans le domaine de la biologie structurale des
RCPGs, la modélisation des MTRs est toujours considérée comme un challenge (73-75).
Néanmoins, les simulations de modélisation sur de plus longues périodes ont montré leur
intérêt dans les systèmes membrane-récepteurs, permettant un raffinement supplémentaire
de la structure modélisée du récepteur et apportant la possibilité de décrire les changements
conformationnels se produisant lors de la liaison du ligand (76).

34
3. Localisation tissulaire des MTRs
a. Les MTRs dans la rétine
Chez les mammifères le système de régulation du rythme circadien facilite l’adaptation de
l’organisme aux changements environnementaux à travers la régulation des processus
physiologiques. La synchronisation de l’horloge circadienne endogène à la période de 24h
est possible grâce à la combinaison des actions internes, comme la production de la MLT et
des stimuli externes comme la lumière (77) qui est perçue par la rétine puis transmise au
noyau suprachiasmatique (78). Chez les mammifères, la rétine produit de la MLT localement
et exprime les récepteurs MT1 et MT2 (79, 80). Il a notamment été montré que même après
une pinéalectomie, la rétine de rat continue de produire de la MLT de manière circadienne
(81). La mélatonine influence également l’électrorétinogramme lui suggérant un rôle dans
la régulation du rythme jour/nuit de l’activité de la rétine (82, 83).
Outre son implication dans la régulation de l’horloge circadienne rétinienne, un des rôles
majeurs de la MLT dans la rétine est son action sur le système dopaminergique. Plusieurs
études ont montré que la MLT et la dopamine avaient des rôles opposés sur la physiologie
de la rétine (84). La MLT permet l’adaptation de la rétine à la nuit, alors que la dopamine
lui permet de s’adapter à la lumière. La MLT inhibe la libération de la dopamine de manière
dépendante au calcium par l’activation de ses récepteurs au niveau présynaptique (85).
Dubocovich a également montré que le luzindole et d’autres inhibiteurs sélectifs du
récepteur MT2 bloquaient l’inhibition de la libération de la dopamine causée par la MLT
démontrant l’implication du récepteur MT2 dans ce processus (85). Le rythme circadien de
la libération de la dopamine semble ainsi être dépendant du système mélatoninergique.
Les ligands ciblant les MTRs n’étant pas très spécifiques de l’un ou l’autre des récepteurs,
une des techniques utilisées afin de connaitre le rôle d’un récepteur sur le phénotype des
souris est d’utiliser des modèles murins génétiquement modifiés n’exprimant pas le
récepteur d’intérêt. Dans le cadre des MTRs, plusieurs études ont déjà utilisé ces modèles
déficients en MT1 et/ou MT2 afin de connaitre les effets sur la physiologie de la souris.
Au niveau de la rétine, des études ont montré que les souris déficientes en MT1 ou en MT2
avaient les mêmes effets dans cet organe, à savoir, son activité ne suit plus un rythme
35
circadien (86, 87). En plus de ce dérèglement, les ganglions rétiniens et les photorécepteurs
des souris déficientes en MT1 se dégraderaient plus rapidement avec l’âge (88).
b. Les MTRs dans le cerveau
Grace à son caractère amphiphile, la mélatonine peut facilement traverser la barrière hémato-
encéphalique (89) lui permettant ainsi de pénétrer dans le cerveau. Mais il reste difficile de
connaitre à quel point la MLT exogène est importante pour le cerveau puisque celui-ci
produit également de la mélatonine. En effet, l‘enzyme limitante à la synthèse de mélatonine,
l’AA-NAT, est également exprimée dans plusieurs parties du cerveau comme
l’hypothalamus, le cervelet, le bulbe olfactif, le cortex préfrontal, l’hippocampe ou encore
le striatum. Mais s’il est clair que l’hypothalamus produit la mélatonine, il n’est pas encore
évident que tous les autres sites soient réellement capables de produire cette hormone. Il a
également été reporté que les MTRs sont présents en plus ou moins grandes quantités dans
de nombreuses parties du cerveau de mammifères (Tableau 1). Dans le noyau
suprachiasmatique (NSC) par exemple, situé dans l’hypothalamus, ces récepteurs sont très
exprimés. La grande sensibilité du NSC à la signalisation mélatoninergique est d’une grande
importance physiologique puisqu’il s’agit de la base pour le réajustement du rythme
circadien par le signal jour/nuit, un effet qui a ensuite de grandes répercussions dans le corps
et est également responsable de la diminution d’activité des neurones en réponse à la MLT.
Il a notamment été démontré que, chez les souris déficientes en MT1, la MLT n’induisait
plus de diminution d’activité neuronale mais elle permettait toujours de réguler le rythme
circadien (90), suggérant que MT2 serait responsable de ce phénomène. Au contraire, les
souris déficientes en MT2 ont montré une activité neuronale induite par la MLT normale
(91). Quelques études ont également rapporté la présence de MTRs dans le cortex,
notamment MT1 qui serait présent en plus grande quantité que MT2 (92). Néanmoins, le rôle
des MTRs dans le cortex n’est pas clair. Dans le mésencéphale, MT1 et MT2 ont été identifiés
dans le striatum et la substance noire (92-94) qui jouent des rôles importants pour les
mouvements du corps. Ces 2 régions sont connectées par la voie nigro-striée, l’une des voies
dopaminergiques les plus importantes du cerveau. La présence des MTRs dans ces régions
suggère ainsi un rôle dans le mouvement, notamment en agissant sur le système
dopaminergique (95). Cet aspect est renforcé par le fait que la sous-expression des MTRs a
pu être observée chez des patients parkinsoniens (96) ayant par conséquent des troubles du
mouvement.

36
Tableau I. Présence des récepteurs de la mélatonine dans différentes parties du
cerveau de mammifères (D’après Ng et al. 2017 (97)).
Néanmoins, chacune des méthodes utilisées pour détecter les MTRs a ses propres limites.
En effet, dans les années 90 la principale technique utilisée était la liaison non sélective du
radioligand 2-[125l]Iodomélatonine aux récepteurs MT1 et MT2 (98, 99). Mais cette
technique n’est pas très sensible et incapable de dissocier le récepteur MT1 du MT2. Plus
récemment, d’autres techniques ont été développées, notamment l’immunodétection, la
réaction en chaine par polymérase (PCR) ou encore l’hybridation in-situ qui s’avèrent être
plus précises, même si le développement d’anticorps fiables et spécifiques reste crucial pour
la détection de ces 2 récepteurs.
De manière générale, les MTRs présents dans le cerveau (100) régulent le cycle circadien,
inhibent l’activité cérébrale en initiant le sommeil et agissent sur le système dopaminergique.
De plus, dans le SNC, la mélatonine a également un effet neuroprotecteur grâce à son
caractère anti-oxydant et agit contre la neurodégénérescence, l’apoptose et l’ischémie (101),
favorise la formation de dendrites (102) et stimule la neurogénèse (103).

37
c. Les MTRs dans le pancréas
Les premières informations concernant la présence du récepteur MT1 dans les ilots
pancréatiques de rats nouveaux-nés ont été publiées en 2000 (104) puis en 2002 (105, 106).
Certains des effets biologiques de la MLT sont réalisés grâce à ses 2 récepteurs spécifiques
et de haute affinité présents dans les ilots pancréatiques et qui peuvent être bloqués par le
luzindole. Afin de localiser de potentiels MTRs dans les ilots du pancréas, des études
autoradiographiques ont été réalisées. Ces investigations ont montré une liaison spécifique
de la 2-[125I]iodomélatonine dans les ilots pouvant être inhibée en présence de MLT non
radiomarquée (104). De la même manière, les résultats de RT-PCR utilisant des amorces
spécifiques du récepteur MT1 de rat ont révélé la présence d’ARNm de ce récepteur dans les
tissus pancréatiques de rats nouveaux nés (104) et dans des cellules INS1 d’insulinome de
rat (105). Plusieurs années plus tard, le récepteur MT2 fut également détecté dans les ilots
pancréatiques de rat et dans les cellules β (107, 108). Il a également été montré que les
niveaux d’ARNm de ces récepteurs étaient plus élevés chez les patients DT2 (108). Bien que
la MLT soit considérée comme une molécule lipophile, les chercheurs s’accordent à dire que
cette molécule médie ses effets en activant les récepteurs exprimés à la surface des cellules
de mammifères (7, 8). Alors que la présence d’ARNm de MT1 dans les ilots pancréatiques
de rats ait été établie relativement tôt, la présence d’ARNm de MT2 est devenue évidente
que bien plus tard, due à ses faibles quantités produites (107-112).
Depuis quelques années, plusieurs études d’associations pangénomiques dans plusieurs
populations ont révélé que des variations génétiques des récepteurs MT1 et MT2 sont
associées à un plus grand risque de développer des perturbations du métabolisme du glucose
(109, 110, 112-114). Cette association peut être expliquée par l’inhibition de la production
d’insuline par la MLT et ses récepteurs, mais également par l’augmentation de la sécrétion
du glucagon par la MLT dans les cellules α pancréatiques (115).
La MLT est sécrétée durant la nuit chez tous les mammifères, ce qui conduit à quelques
incertitudes sur son rôle sur la sécrétion d’insuline ou de glucagon chez les animaux diurnes
et nocturnes. Mais comme la MLT augmente les effets du glucagon dans les ilots de rat, de
souris et d’humain (115-118), cela semble indiquer que la MLT joue un rôle dans le maintien
de l’homéostasie glucidique chez les mammifères. Globalement, les données existantes
montrent clairement que la MLT agit de manière stimulante à la fois sur la sécrétion du

38
glucagon par les cellules α pancréatiques et sur l’action du glucagon hépatique. De plus, les
données sur les rats atteints de diabète de type 2 (DT2) indiquent des modifications de ces
effets lors du développement du diabète (118). Il est bien connu que des problèmes de rythme
circadien causés par des problèmes de sommeil ou de travail à horaires décalés sont associés
à un risque accru de tolérance au glucose et de développement de DT2 (119, 120). De plus,
il a été observé que des patients diabétiques ont également des niveaux faibles de MLT
pouvant affecter la fonction du pancréas (121, 122). Les cellules des ilots pancréatiques
humains et murins ont également une activité circadienne (123-125). Ce concept donne de
l’importance à la présence d’une régulation circadienne des fonctions du pancréas. L’analyse
de la MLT sur les ilots pancréatiques par immunoprécipitation et immunotransfert ont
montré que la MLT régule la croissance et la différenciation des cellules pancréatiques en
stimulant la phosphorylation du récepteur IGF-R (insulin growth factor receptor) et des
récepteurs à l’insuline (126). Ces actions activent deux voies de signalisation
intracellulaires : PI3K/AKT, impliquée dans le métabolisme cellulaire, et MEK/ERK,
impliquée dans la prolifération, la croissance et la différenciation cellulaires (126). De plus,
la baisse des niveaux de MLT augmente la sécrétion d’insuline chez le rat pendant la journée
alors que pendant la nuit, des bas niveaux en insuline ainsi que des hauts niveaux de glucose
ont été enregistrés lorsque les niveaux de MLT étaient élevés (127, 128).
Quelques études utilisant des souris déficientes en MTRs ont également été utilisées afin de
mieux comprendre le rôle de la mélatonine sur la sécrétion d’insuline et du glucagon régulant
l’homéostasie glucidique. Les études ont ainsi montré que les souris déficientes en MT1
souffraient d’hyperglycémie, d’intolérance au glucose et de résistance à l’insuline
comparativement aux souris sauvages et déficientes en MT2 (114) (129). En revanche, ce
sont les ilots pancréatiques de souris déficientes en MT2 et MT1/2 qui ont une diminution de
la sécrétion basale de glucagon en présence de MLT comparativement aux souris sauvages
et déficientes en MT1 (130).
d. Les MTRs dans le système immunitaire
En 1975 Csaba et Barath (131) ont montré que la pinéalectomie entrainait une involution
thymique et supprimait l’immunité. Ils établissaient alors une relation entre la glande pinéale
et le système immunitaire. Chez certains mammifères les fonctions immunitaires suivent des
rythmes saisonniers avec une augmentation durant les jours courts, au moins au laboratoire,
concordant avec les durées de sécrétion de la MLT (132). La MLT est synthétisée dans les

39
lymphocytes humains suggérant un rôle autocrine et/ou paracrine de ces cellules (133). De
plus, la MLT exogène semble stimuler le système immunitaire à la fois lors d’expériences
in vitro et in vivo (134). Les récepteurs membranaires de la MLT sont exprimés dans les
cellules lymphoïdes et sont impliqués dans la régulation de la réponse immunitaire (134,
135). L’antagoniste des MTRs, le luzindole, a été capable de diminuer significativement
l’augmentation de la prolifération des lymphocytes de souris médiée par la MLT (136). La
MLT réduit l’inflammation chez le rat en inhibant les leucocytes dans la microvasculature à
travers l’activation des récepteurs MT2 (137). Chez l’humain, la MLT produite par les
lymphocytes régule la réponse immunitaire en induisant la production d’IL-2 et de
récepteurs à l’IL-2 (133, 138). De manière intéressante, les rythmes journaliers de production
de MLT et d’IL-2 sont perdus chez l’homme dans des conditions inflammatoires non
infectieuses puis, lors du retour à la normale du rythme de la MLT, le rythme de l’IL-2
revient à la normale à son tour (139).
4. Régulation de l’expression des MTRs
L’étude de Gerdin (140) démontre que des concentrations physiologiques de MLT imitant
la hausse nocturne in vivo, désensibilisent les récepteurs MT2 endogènes exprimés dans le
NSC de rat ainsi que dans des cellules CHO exprimant les récepteurs MT2, possiblement par
leur internalisation. Suite à la liaison de la MLT, cette internalisation des récepteurs MT2
exprimés dans les cellules de mammifère est dépendante de la durée et de la concentration
en MLT contribuant ainsi à la spécificité temporelle de cette hormone à réguler les rythmes
circadiens. Cette diminution du nombre de récepteurs MT2 est compensée en partie par les
nouveaux récepteurs synthétisés par la cellule suggérant que certains des récepteurs
internalisés sont ciblés pour la dégradation alors qu’une autre portion est dirigée vers la voie
de recyclage.
En plus de désensibiliser les récepteurs MT2, il a également été observé qu’un prétraitement
à la MLT désensibilisait les récepteurs MT1 dans les cellules pars tuberalis (141), dans les
cellules CHO (142, 143) ou dans les cellules NIH3T3 (144) transfectées avec le récepteur
MT1 humain.
Ainsi, ces études suggèrent qu’à la suite de la production nocturne de MLT et donc à la
stimulation de ses récepteurs, ces derniers sont internalisés entrainant une désensibilisation

40
à cette hormone. Le nombre de récepteurs à la surface cellulaire revient graduellement à la
normale au fur et à mesure que les récepteurs sont recyclés et synthétisés par la cellule.
5. Signalisation des MTRs
a. Signalisation du récepteur MT1
Par l’activation du récepteur MT1, la MLT provoque de multiples réponses cellulaires grâce
à l’activation des protéines G sensibles (Gαi2 et Gαi3) ou insensibles au PTX (Gαq/11)
(Figure 10) (145, 146). L’activation du récepteur MT1 inhibe la formation d’AMPc stimulée
par la forskoline (7, 146, 147), l’activité de la PKA (Protéine kinas A) et la phosphorylation
de CREB (C-AMP Response Element-binding protein) (143). L’activation du récepteur MT1
augmente la phosphorylation des protéines MEK1 et MEK2 (Mitogen-activated protein
kinase ou extracellular signal-regulated kinase kinase 1 et 2) et de ERK1/2 (Extracellular
signal-regulated kinase kinase 1 et 2). Le récepteur MT1 peut également activer une
signalisation par le complexe des sous-unités βγ (148). Plusieurs réponses fonctionnelles de
la MLT sont également obtenues par la régulation de canaux ioniques (Figure 10). Par
exemple, la MLT augmente la quantité de calcium intracellulaire par l’activation des
protéines G insensibles au PTX dans les cellules du pars tuberalis exprimant le récepteur
endogène MT1 (146) mais inhibe l’entrée de calcium dans la cellule grâce à l’activation des
protéines G sensibles au PTX (149, 150). Des effets qui peuvent sembler contradictoires
mais qui suggèrent une régulation contextuelle des fonctions de la MLT.
b. Signalisation du récepteur MT2
Les niveaux à la fois d’AMPc et de guanosine 3’-5’ monophosphate (GMPc) peuvent être
modulés par l’activation des récepteurs MT2 (Figure 10). De la même manière que le
récepteur MT1, l’activation du récepteur MT2 par la MLT inhibe la formation d’AMPc
stimulée par la forskoline, un activateur de l’adénylate cyclase (8, 147) mais, contrairement
à la réponse du récepteur MT1, son activation entraine l’inhibition de la formation de GMPc
(147). Dans le SNC, la MLT augmente l’activité de la protéine kinase C (PKC) par
l’activation du récepteur MT2; réponse bloquée par l’antagoniste spécifique de MT2, le 4P-
PDOT (151), suggérant que le récepteur MT2 puisse stimuler la voie de la phospholipase C
et du diacylglycérol (DAG).

41
Figure 10. Signalisation des MTRs et leur rôle dans les cellules β-pancréatiques
murines (D’après Peschke et al. 2010 (152))

42
c. Signalisation des MTRs dans le pancréas murin
Les voies de signalisation intracellulaires dans les cellules β-pancréatiques influencées par
les récepteurs MT1 et MT2 incluent les voies de signalisation AMPc, GMPc et IP3 comme
indiquées dans la figure 10. La MLT entraine une réduction de la production d’AMPc dans
les ilots pancréatiques et dans les cellules β INS1 d’insulinomes de rats (104-106). Les
niveaux d’insuline et d’AMPc sont augmentés lors d’ajout de forskoline (105) mais diminués
par le luzindole (104). L’inhibiteur de protéines Gαi, le PTX, abolit lui aussi l’effet de la
MLT sur les niveaux d’AMPc et d’insuline (105) démontrant l’implication de cette voie de
signalisation dans la régulation des niveaux d’insuline. La MLT active également le
récepteur MT2 qui inhibe le second messager GMPc et stoppe la sécrétion d’insuline par les
cellules β pancréatiques (130, 153).
De plus, lors d’expériences sur des cellules INS1, la libération d’IP3 (154) induite par la
MLT entraine l’entrée de CA2+ dans la cellule depuis les compartiments intracellulaires la
stockant (154), un mécanisme connu pour déclencher la sécrétion de l’insuline par les
cellules β pancréatiques (146, 148, 155).
II. Rôles et implications de la mélatonine
A. Propriétés chronobiotiques et régulation saisonnière de la
mélatonine
Un agent chronobiotique permet l’ajustement de l’horloge biologique. Ainsi, cet agent
permet de remettre à l’heure le rythme circadien désynchronisé des mammifères ou de
prévenir sa perturbation, par exemple lors de voyages rapides à travers différents fuseaux
horaires, en agissant directement sur cette horloge ou sur d’autres systèmes biologiques
participant à son contrôle.
1. Rôle de la mélatonine endogène
La relation entre la production circadienne de la MLT endogène et le cycle sommeil-veille
est telle que durant les 16h de la journée, un niveau stable de fonctions
neurocomportementales est maintenu grâce à l’horloge biologique qui oppose la diminution
de ces fonctions conduisant au sommeil et un état d’éveil soutenu. Une extension de la

43
période d’éveil au niveau de la nuit biologique est associée à une baisse des fonctions
neurocomportementales car l’horloge biologique privilégie le sommeil dans cette phase
circadienne (156). Ainsi, après l’heure habituelle du coucher, une nette augmentation de
somnolence et de ses effets physiologiques se fait ressentir (157). En parallèle, la cascade
thermorégulatrice (baisse de production de chaleur et augmentation de perte de chaleur
conduisant à la baisse de température corporelle) commence avec l’augmentation des
niveaux de MLT endogène durant la nuit (158). Ainsi, la MLT semble être le signal
hormonal indiquant le début du sommeil. L’association du sommeil avec le rythme de la
MLT fut confirmée chez des personnes aveugles et chez qui l’horloge biologique n’est pas
synchronisée (159, 160) et n’a pas de cycle de 24h alternant sommeil et éveil (161, 162).
La MLT est également le signal principal du système circadien des mammifères fœtaux et
néonataux (163). Des expositions quotidiennes à la MLT circulante endogène permet aux
fœtus d’être synchronisés avec la mère bien avant de pouvoir directement percevoir le cycle
jour/nuit de l’environnement par eux-mêmes.
2. Rôle de la mélatonine exogène
La MLT exogène induit tous les effets physiologiques ayant lieu durant la nuit, pendant la
sécrétion de la MLT endogène comme les effets soporifiques (164) et hypothermiques avec
une augmentation de la perte de chaleur (165, 166).
De manière intéressante, il a été montré que l’exposition à la lumière pendant la nuit
empêchait la diminution de la température corporelle, le sommeil et la sécrétion de MLT et
que cette inhibition pouvait être levée par la prise de 5mg de MLT exogène (167, 168).
Dans de nombreuses espèces animales la MLT est un ‘’zeitgeber’’ induisant un décalage
horaire de l’horloge circadienne sous-jacent l’expression des rythmes de 24h (169). En
condition de vie normale, la MLT exogène ne serait pas capable d’annuler l’effet du plus
important ‘’zeitbeger’’, la lumière. Une approche intéressante afin d’élaborer la capacité de
décalage de phase de la MLT a été d’étudier des personnes totalement aveugles chez qui
l’information jour/nuit est défaillante et ne peut donc pas réguler l’horloge circadienne.
Leurs rythmes circadiens ne sont donc pas synchronisés sur l’environnement et elles ont
souvent une période supérieure à 24h. Néanmoins, il a été montré qu’un traitement à des

44
temps appropriés de 0.5 à 10mg de MLT permettait parfois de resynchroniser leur système
circadien (170, 171).
B. Implication de la MLT dans les maladies métaboliques
1. Introduction au métabolisme du glucose
Le métabolisme du glucose est régulé par l’interaction des hormones des ilots cellulaires
pancréatiques avec le foie, les muscles et les tissus adipeux. Une altération par des facteurs
génétiques et/ou environnementaux dans la fonction d’un seul de ces éléments participant à
ce système complexe d’homéostasie glucidique entraine une réponse compensatrice des
autres éléments afin de conserver l’homéostasie du système. Les éléments clés régulant ce
système sont l’insuline et le glucagon qui sont deux hormones pancréatiques régulées par les
niveaux de nutriments et par les incrétines, des hormones gastrointestinales. L’insuline
promeut la capture du glucose hépatique, stimule la glycogénèse dans les muscles, le
métabolisme et la capture du glucose dans les tissus adipeux afin de diminuer la
concentration sanguine en glucose. Le glucagon stimule quant à lui la glycogénolyse et la
gluconéogenèse hépatiques afin d’augmenter la concentration sanguine en glucose.
Le maintien de la concentration normale de glucose dans le sang requiert une coordination
précise entre l’utilisation du glucose, la production de glucose endogène et son apport par
l’alimentation. Par exemple, en période de jeûne, les concentrations de glucose dans le sang
sont relativement stables, indiquant que la quantité de glucose produite et son utilisation sont
égales. Après un repas, l’absorption du glucose résulte en une augmentation de sa
concentration dans le sang. Comme le glucose est absorbé, la production de glucose
endogène est supprimée et l’utilisation du glucose par le foie, les muscles et la graisse est
accélérée (172), notamment par l’insuline (173). Ainsi, le glucose exogène est assimilé et la
concentration du glucose sanguin retourne au niveau de la période de jeûne.
2. Introduction sur le diabète
Le diabète est un trouble de l’organisme dû soit à un déficit en insuline, soit à une résistance
anormale à cette hormone entrainant une hausse de la glycémie. Toute personne ayant une
glycémie supérieure à 1,26g par litre de sang (7mmol/L) est considérée comme diabétique.
Le type de diabète sera alors à confirmer par des examens complémentaires.

45
a. Le diabète de type 1
Le diabète de type 1, aussi appelé diabète insulino-dépendant ou diabète juvénile. Ce diabète
apparait le plus souvent pendant l'enfance, à l'adolescence ou au début de l'âge adulte,
rarement chez les personnes plus âgées. Il touche environ 10 % des personnes diabétiques et
est dû à la destruction des cellules béta des îlots de Langerhans par le système immunitaire
entraînant une absence totale de production d'insuline par le pancréas nécessaire au
fonctionnement cellulaire, d'où une augmentation de sucre dans le sang. Le processus de
destruction évolue habituellement sur plusieurs années. Il débute bien avant l’apparition des
premiers symptômes de la maladie.
b. Le diabète de type 2
Le DT2 ou non insulino-dépendant. Ce diabète est découvert le plus souvent à l’âge adulte,
après 40 ans, et sa prévalence augmente avec l’âge. Il touche environ 90% des personnes
diabétiques et est dû à une sécrétion d'insuline normale mais peu active. Les personnes à
risque sont les personnes obèses, présentant une anomalie du métabolisme glucidique, ayant
des antécédents familiaux de DT2. L’insulinorésistance se caractérise par l’incapacité de
l’insuline à obtenir une réponse maximale au niveau de ses organes cibles. Par exemple au
niveau du muscle, lors de la charge en glucose, cette résistance aboutit à un défaut de
captation musculaire du glucose, ou encore au niveau hépatique où apparait un
accroissement de la production hépatique de glucose, à l’origine de l’hyperglycémie à jeun.
Il existe également une insulinorésistance adipocytaire. L’insulinopénie relative est
caractérisée par une insuffisance de sécrétion d’insuline, compte tenu du niveau de la
glycémie. Ce trouble, qui est présent dès le début de la maladie, est évolutif, inéluctable et
s’aggrave avec l’âge et la durée du diabète, jusqu’à conduire finalement au diabète insulino-
dépendant.
3. Les facteurs génétiques du diabète de type 2
Actuellement, nous ne connaissons que peu de choses sur les causes génétiques du DT2.
Toutefois, il est couramment admis que les facteurs génétiques jouent un rôle important dans
son développement (174) mais sa base génétique est complexe. En effet, les causes
génétiques des diabètes monogéniques sont relativement bien établies. En revanche, les

46
causes polygénétiques du DT2 rendent les recherches beaucoup plus complexes à cause de
l’hétérogénéité phénotypique de cette pathologie.
La définition de sous-groupes à l’aide de la génétique moléculaire reste très compliquée à
cause de la prédisposition polygénique et du fait que le phénotype clinique dépend autant de
la génétique que de l’environnement du patient (175). Il serait possible de définir des sous-
groupes en se basant sur certains traits physiologiques comme la résistance à l’insuline ou
encore l’incapacité des cellules β à produire de l’insuline, mais ces caractéristiques changent
au cours de la pathologie (176). Il est important de noter que l’incapacité à définir clairement
des sous-groupes dans le DT2 a un impact majeur sur l’optimisation des traitements.
4. Le diabète de type 2 en lien avec la mélatonine
En 1939 Constantin Parhon publia le premier texte faisant un lien entre la glande pinéale et
les carbohydrates (177). S’ensuivit plusieurs années d’études faisant état de rôles
contradictoires d’extraits de glandes pinéales sur le métabolisme du glucose (178-183).
Même après l’isolement (184) et l’identification de la structure moléculaire de la MLT (5-
methoxy-N-acetyltryptamine) par Aron Lerner (2), cette discussion controversée a continué.
Les résultats de l’équipe de Parhon a ainsi montré qu’un peptide pinéal, nommé ‘’pinéaline’’
décrit comme étant similaire à l’insuline car ayant des caractéristiques hypoglycémiantes,
anaboliques et anti-cholestérolémiques (181). La pinéaline augmente la tolérance au glucose
alors que la pinéalectomie diminue la sécrétion d’insuline et la tolérance au glucose (182,
185, 186). Ces résultats concordent avec les découvertes faites plus tard par l’équipe de
Blásques (187-189) qui ont découvert que la pinéalectomie réduit significativement les
niveaux d’insuline et augmente les niveaux de glucose dans le sang (190-193). Ils ont
également observé que ces effets pouvaient être annulés par l’ajout de MLT exogène (194).
Plus tard, d’autres observations ont indiqué que la MLT prévient le diabète de type 1 alors
que la pinéalectomie entraine le développement de maladies métaboliques (195, 196). En
revanche, plusieurs études ont montré par la suite que des hauts niveaux de MLT, dus à la
cécité (197) ou à l’ajout de MLT, augmentent les niveaux de glucose dans le sang (198),
alors qu’une diminution des niveaux sanguins de glucose (131, 199) et une augmentation
des niveaux d’insuline ont été observés après pinéalectomie (177-179). Néanmoins, la
majorité des auteurs s’accordent sur le fait que la glande pinéale a un effet suppressif sur la
production d’insuline des cellules β-pancréatiques parce que la MLT réduit les niveaux

47
d’insuline (180-182) et la tolérance au glucose chez le rat (200, 201). Les résultats montrent
ainsi un antagonisme fonctionnel entre l’insuline et la MLT puisqu’une augmentation des
niveaux d’insuline entraine un effet inhibiteur sur la synthèse de MLT par la glande pinéale
(202, 203). Cet antagonisme est concordant avec le fait que chez l’homme, les faibles
niveaux d’insuline durant la nuit et hauts niveaux durant la journée coïncident avec les
niveaux élevés de MLT durant la nuit et réduits durant la journée (204). De plus, les patients
diabétiques ont un rythme circadien très perturbé (122, 205). En résumé, ces découvertes
indiquent clairement que les interactions MLT-insuline (206-212) jouent un rôle important
dans le métabolisme du glucose.
Plusieurs études dans lesquelles les gènes codant pour les MTRs ont été séquencés chez un
grand nombre de patients diabétiques ou normoglycémiques ont tenté de lier des variations
génétiques de ces gènes au DT2. Il a notamment été trouvé un lien entre des variations du
gène MTNR1B codant pour le récepteur MT2 à la MLT (213) ou encore un variant du gène
MTNR1A (114) et un risque accru de développer le DT2 mettant en avant un premier lien
génétique entre le système mélatoninergique et le DT2.
Le DT2 est une pathologie multifactorielle et l’environnement joue un rôle important dans
son développement. Il a ainsi été démontré que le travail à horaires décalés (214),
l’exposition à la lumière pendant la nuit (215), des dérèglements du rythme circadien (216)
ou encore un sommeil insuffisant (217) augmentent le risque de développer le DT2. Ce
rapport entre MLT et DT2 est à double sens puisqu’une personne développant le DT2 aura
à son tour des risques d’avoir une surexpression des récepteurs MT1 et MT2 dans le pancréas
(108), une baisse de la sécrétion de la MLT (202) ou encore un dérèglement des cycles de
sécrétion de la MLT (122).
C. Implication du système mélatoninergique dans les maladies
neurologiques et les troubles du comportement
Une altération de la production de MLT et de l’expression des MTRs a été fréquemment
reportée dans les maladies neurodégénératives et les troubles psychiatriques comme la
maladie d’Alzheimer (MA) (218), la maladie de Parkinson (MP) (96), ou encore la
dépression (219). Chez les patients MA, l’expression du récepteur MT1 dans le SNC et
l’expression du récepteur MT2 dans l’hippocampe est réduite (218), mais curieusement, des

48
concentrations plus élevées en MT1 ont été détectées dans l’hippocampe (220), suggérant
une réponse compensatrice à la faible quantité de MT2 dans cette région du cerveau et de
MLT circulante chez ces patients (221). Ces observations suggèrent que l’expression des
MTRs sous certaines conditions pathologiques peut être régulée différemment
dépendamment de la région du cerveau. Chez les patients MP, il a été observé une baisse de
l’expression des récepteurs MT1 et MT2 dans la substance noire et l’amygdale, deux des
régions les plus touchées lors du développement de la MP (96). Une étude a également
montré une surexpression du récepteur MT1 chez des patients souffrant de dépression,
suggérant l’implication de ce récepteur dans la pathogénèse de cette maladie (219).
Néanmoins, des études menées chez la souris ont montré que les souris déficientes en MTRs,
notamment MT1, avaient un comportement dépressif (222, 223), posant un doute sur le rôle
des MTRs dans le développement de la dépression.
De plus en plus d’évidences confirment que des dysfonctions des MTRs favorisent le
développement et la progression des maladies neurodégénératives. L’effet neuroprotecteur
de la MLT endogène ou exogène a été démontrée dans différents systèmes (224). Dans un
modèle neuroinflammatoire murin, la mort neuronale a été observée seulement chez les
souris traitées avec du luzindole, un antagoniste des MTRs (225). De manière similaire, la
déplétion de la MLT endogène par pinéalectomie entraine une perte neuronale spontanée
dans l’hippocampe qui peut être évitée par traitement à l’agomélatonine, un agoniste des
MTRs (226). La nécessité des MTRs pour l’action neuroprotectrice de la MLT a également
été montré lors d’expériences in-vitro au cours desquelles un traitement au luzindole ou
l’utilisation de siARN pour engendrer une sous-expression de MT1 ont augmenté la mort
cellulaire des neurones (94).
Plusieurs études ont tenté d’identifier le rôle de la MLT sur la cognition et l’apprentissage
en utilisant des souris déficientes en MTRs. Néanmoins, même si toutes s’accordent à dire
que la MLT est importante dans cette fonction, les résultats démontrent des effets
contradictoires. En effet Moffit (227) a pu observer que les souris déficientes en MTRs
avaient des facultés cognitives augmentées comparativement aux souris sauvages, alors que
d’autres chercheurs comme Wang (228), Larson (229) ou Comai (230) ont montré une
diminution de ces facultés chez les souris déficientes en MT2 mais pas MT1. Des études
complémentaires sont donc nécessaires afin de clarifier le rôle du système mélatoninergique
dans les fonctions cognitives.

49
L’utilisation de la MLT en tant que traitement thérapeutique a été proposée et testée chez
plusieurs modèles murins et lors d’essais cliniques dans des conditions de
neurodégénérescence sévère, notamment chez des patients MP (231, 232). L’utilisation
thérapeutique de la MLT est associée à une amélioration du sommeil, un meilleur alignement
des paramètres circadiens et ses effets bénéfiques sur la neuroprotection commencent à être
reconnus (233, 234).
En résumé, la localisation cellulaire et le rôle des MTRs dans les fonctions neuronales et leur
participation dans les maladies neurodégénératives commencent à être comprises et
suggèrent un rôle de modulation de la MLT dans les fonctions, la plasticité et le
développement neuronaux. Néanmoins, son rôle exact n’est pas clairement défini.
D. Lien entre systèmes mélatoninergiques et dopaminergiques
Des observations ont indiqué que la dopamine n’est pas seulement le précurseur de la
norépinephrine mais est également un neurotransmetteur pinéal avec la découverte de fibres
dopaminergiques dans la glande pinéale (235). De plus, les concentrations en dopamine
varient selon un rythme journalier avec des concentrations plus élevées pendant le jour chez
plusieurs mammifères (236-239). La présence des récepteurs dopaminergiques D1 et D2
dans la glande pinéale bovine suggère un rôle important de la dopamine dans la régulation
de l’activité pinéale (240, 241). Des études biochimiques sur cette glande ont également
révélé un effet inhibiteur de la dopamine à faible concentration et un effet stimulateur à plus
forte concentration sur l’activité de la AA-NAT et sur la sécrétion de MLT (237, 242)
probablement grâce à la présence de ses deux récepteurs dopaminergiques. La dopamine
semble ainsi être un neurotransmetteur pinéal mais son rôle physiologique reste toujours à
établir.
En plus de l’effet de la dopamine sur la sécrétion de la MLT, cette dernière exerce également
un effet inhibiteur sur la libération de la dopamine dans l’hippocampe ventral, le bulbe
rachidien, l’aire préoptique médiane et l’hypothalamus postérieur (243), sites déjà connus
pour l’effet de la MLT sur la modulation des fonctions neuroendocrines (244-246). En
revanche, la MLT n’a aucun effet sur la libération de la dopamine dans le cortex cérébral, le
cervelet, l’hippocampe dorsal et le striatum (243) (Figure 11).

50
Figure 11. Inhibition de la libération de dopamine par la mélatonine (D’après
Zisapel et al. 1982 (243))
Les interactions entre les systèmes dopaminergiques et mélatoninergiques peuvent
également s’observer de manière plus indirecte par les maladies et troubles que leurs
disfonctionnements engendrent. En effet, des liens entre ces deux systèmes et le
développement de troubles neurodégénératifs et neuropsychiatriques ont déjà été établis
comme pour la maladie de Parkinson (96, 247, 248), la schizophrénie (249-251), le trouble
du déficit d’attention avec hyperactivité (TDAH) (252, 253) ou encore la dépression (219,
254).

51
III. Le système dopaminergique
A. Historique de la dopamine
En 1958, Carlsson a découvert le rôle de la dopamine en tant que neuromédiateur et sa
participation à un grand nombre de fonctions du système nerveux telles que l’activité motrice,
l’éveil, les fonctions d’apprentissage et de mémoire, les émotions et les processus de
récompense. Des perturbations du système dopaminergique sont à l’origine de la MP et ont
également été observées ou présumées dans des maladies psychiatriques telles que la
schizophrénie, le TDAH, la dépression et la dépendance aux drogues.
B. Synthèse et métabolisme de la dopamine
La dopamine appartient à la famille des catécholamines qui comprend également la
noradrénaline et l’adrénaline et comme tous les neuromédiateurs, elle ne franchit pas la barrière
hémato-encéphalique. En revanche, ses précurseurs, les acides aminés phénylalanine et tyrosine
la traversent. La synthèse neuronale de la dopamine se déroule dans le cytoplasme,
essentiellement au niveau des terminaisons axonales, mais aussi au niveau des corps cellulaires
et des dendrites. La L-tyrosine captée par le neurone est transformée en L-DOPA par la tyrosine
hydroxylase (TH), enzyme limitante de cette voie de synthèse, puis en dopamine par la DOPA
décarboxylase (Figure 12). La dopamine synthétisée est alors concentrée dans des vésicules
présynaptiques au niveau des terminaisons neuronales grâce au transporteur vésiculaire des
monoamines VMAT-2. Ce stockage protège la dopamine de la dégradation enzymatique
intracellulaire réalisée par les monoamine-oxydases (MAO), au sein des mitochondries et de
l’oxydation générant des radicaux libres, toxiques pour la cellule. La dopamine libérée dans
l’espace synaptique est catabolisée par une enzyme gliale, la catéchol-O-méthyltransférase
(COMT) et par la MAO, aboutissant aux métabolites finaux : acide 3,4-dihydrophénylacétique
(DOPAC), 3-méthoxytyramine (3-MT) et acide homovanillique (HVA).

52
Figure 12. Synthèse et dégradation de la dopamine (Modifié de Laatikainen et al.,
2013 (255))
C. Les récepteurs de la dopamine
Cinq sous-types de récepteurs à la dopamine (les récepteurs D1, D2, D3, D4 et D5 codés par
leurs gènes respectifs DRD1, DRD2, DRD3, DRD4 et DRD5) sont connus pour médier
l’ensemble des fonctions physiologiques de la dopamine, notamment les mouvements
volontaires, la récompense, la régulation du sommeil, l’émotion, l’attention, les fonctions
cognitives, la vision et la régulation hormonale. De tous les sous-types de récepteurs à la
dopamine, les sous-types D1 et D2 sont les plus abondants dans le cerveau (256, 257). Les
récepteurs de la dopamine sont également connus pour influencer le système immunitaire ainsi
que les fonctions cardiovasculaires, rénales et gastrointestinales. En tant que membre de la
superfamille des RCPGs, les récepteurs de la dopamine signalent grâce à des voies dépendantes
et indépendantes des protéines G. Les récepteurs de la dopamine sont classés en deux
catégories : les récepteurs de la classe D1 (D1 et D5) et de la classe D2 (D2, D3 et D4) selon
leur capacité à activer les protéines Gαs/olf ou Gαi/o respectivement (258, 259).
Les récepteurs de la dopamine sont des cibles bien établies des composés pharmacologiques
lors de nombreux troubles et conditions comme la schizophrénie, la MP, les troubles de

53
bipolarité, la dépression ou encore l’hypertension. C’est pourquoi un grand intérêt est porté sur
le système dopaminergique et des efforts considérables ont été fait afin de développer des
méthodes afin de mesurer les niveaux de dopamine cérébrale dans les différents compartiments
du cerveau, ainsi que la libération de la dopamine dans le striatum, la substance noire, les
régions limbiques et le cortex.
D. Localisation du système dopaminergique
1. Le système dopaminergique dans la rétine
La présence des récepteurs à la dopamine dans la rétine a été bien établie (260-262). La
dopamine représente la catécholamine majeure de la rétine des vertébrés.
Plusieurs études ont montré des perturbations des neurones dopaminergiques dans la rétine chez
des patients atteints de MP (263, 264) et donc que la rétine pourrait contribuer aux symptômes
visuels des patients. Ainsi, la compréhension du rôle joué par la dopamine de la rétine saine
dans la vision est clé pour comprendre les mécanismes pathophysiologiques des disfonctions
de la rétine malade. Malgré la découverte des cellules dopaminergiques de la rétine il y a
environ 30 ans, de nombreux aspects sur leur fonction dans cet organe restent énigmatiques.
Certains chercheurs pensent que la dopamine est un messager chimique pour l’adaptation de la
rétine à la lumière (262) mais cette hypothèse n’a jamais été testée.
La dopamine remplit la plupart des critères nécessaires pour être considérée comme étant un
neurotransmetteur dans la rétine. Elle est présente en forte concentration dans certains neurones
de la rétine qui ont une forte activité tyrosine hydroxylase et un système de recapture de haute
affinité pour la dopamine afin de terminer sa transmission. Ces neurones libèrent la dopamine
pendant la dépolarisation ou en réponse à certains stimuli, dont la lumière.
2. Le système dopaminergique dans le système nerveux central
L’élément majeur du circuit dopaminergique dans le système nerveux central consiste en des
projections depuis l’aire tegmentale ventrale (ATV) et la substance noire jusqu’au striatum
ventral, au noyau accumbens (NAc), à l’amygdale, au tubercule olfactif et au cortex frontal et
limbique (265). L’intégrité de ces voies spécifiques est cruciale afin de fournir une réponse
adéquate aux stimuli internes et externes. Le NAc comporte deux régions distinctes : le cœur
(partie dorsale) et la coquille (partie ventrale) qui sont innervées par des neurones

54
dopaminergiques provenant de l’ATV (266, 267). Alors que le striatum ventral est impliqué
dans la motivation et la récompense, le striatum dorsal quant à lui joue un rôle majeur dans la
formation des habitudes. La recapture de la dopamine nécessite la présence de DAT à la
membrane plasmique et donc le trafic et la localisation corrects de ce transporteur sont
primordiaux pour sa fonction.
3. Le système dopaminergique dans le système sanguin
En dehors du système nerveux central, la dopamine fonctionne en tant que messager chimique
local. Dans les vaisseaux sanguins, la dopamine inhibe la libération de la norépinéphrine qui
agit comme vasodilatateur.
La dopamine ne passe pas la barrière hémato-encéphalique, donc sa synthèse et ses fonctions
dans les différentes zones périphériques sont indépendantes de celles dans le cerveau. Une
quantité considérable de dopamine circule dans le système sanguin, mais sa fonction n’est pas
totalement claire (268). La dopamine a été trouvée dans le plasma sanguin à des niveaux
comparables à ceux de l’épinéphrine. Mais chez l’homme, plus de 95% de la dopamine dans le
plasma est sous la forme de sulfate de dopamine, un conjugué produit par l’enzyme
sulfotransférase et agissant comme de la dopamine libre (268). La majorité de ce sulfate de
dopamine est produite dans le mésentère qui entoure une partie du système digestif (268). La
production du sulfate de dopamine servirait à détoxifier le corps de la dopamine qui est ingérée
dans la nourriture ou produite lors de la digestion avec des niveaux dans le plasma étant jusqu’à
50 fois supérieurs après les repas (268). La fonction du sulfate de dopamine n’est néanmoins
pas encore bien définie.
La faible quantité de dopamine non conjuguée dans le sang pourrait être produite par le système
nerveux sympathique, le système digestif ou encore d’autres organes (268). Elle pourrait agir
sur les récepteurs situés dans des tissus périphériques ou encore être métabolisée ou convertie
en norépinéphrine. Les récepteurs à la dopamine sont également présents sur les parois des
artères où ils agissent comme vasodilatateurs et inhibiteurs de la libération de norépinéphrine
(269).
En dehors de ses rôles sur la modulation du flux sanguin, la dopamine circule dans d’autres
systèmes périphériques ou elle agit dans une zone restreinte en ayant des fonctions exocrines
ou paracrines (268). Parmi ces systèmes, la dopamine joue un rôle important dans l’immunité,
55
les reins et le pancréas, trois systèmes dans lesquels la MLT joue un rôle important et a ses
récepteurs.
4. Le système dopaminergique dans le pancréas
Le traitement de personnes par le précurseur de la dopamine, la L-dopa, entraine une diminution
de la sécrétion d’insuline lors de la consommation de glucose (270). Chez la souris, une simple
injection de L-dopa entraine une accumulation de dopamine dans les cellules β-pancréatiques
ainsi que l’inhibition de la sécrétion d’insuline (271, 272).
Néanmoins, la littérature contient des rapports contradictoires à propos des effets d’analogues
de la dopamine sur la sécrétion d’insuline stimulée par le glucose dans des ilots isolés. Certains
chercheurs ont remarqué que des analogues de la dopamine inhibaient la libération d’insuline
(273), alors que d’autres ont rapporté une augmentation de la sécrétion d’insuline lors de
l’accumulation de dopamine (274). Ces contradictions peuvent être expliquées par le fait que
différentes doses de dopamine peuvent induire des effets opposés sur la sécrétion d’insuline
(275).
Les cellules β pancréatiques contiennent les enzymes responsables de la synthèse, la
dégradation et le stockage de la dopamine (TH, DOPA, MAO et VMAT-2) (276-279) suggérant
que les cellules β elles-mêmes peuvent produire leur propre dopamine qui exercerait une
régulation auto-paracrine de la sécrétion d’insuline dans ces cellules. Les cellules des ilots
pancréatiques expriment les récepteurs dopaminergiques D2, D3 et D4 sur lesquels la dopamine
agit et par lesquels elle pourrait exercer ces effets (280-284).
L’absence d’effet inhibiteur de la dopamine sur la sécrétion de l’insuline chez la souris
déficiente en récepteurs D2 induit une réduction de la masse des cellules β pancréatiques et
diminue leur réplication chez la souris (282) suggérant que la variation dopaminergique des
cellules β pancréatiques peut moduler la prolifération cellulaire et/ou l’apoptose de ces cellules.
5. Le système dopaminergique dans le système immunitaire
Dans le système immunitaire, la dopamine agit grâce à ses récepteurs présents sur les cellules
immunitaires, notamment les lymphocytes (285), la dopamine pouvant être elle-même être
synthétisée et libérée par ces cellules (285). L’effet principal de la dopamine sur le système
immunitaire est la réduction des niveaux d’activation des lymphocytes et pourrait donc jouer
un rôle contre le développement des maladies auto-immunes (286).

56
6. Le système dopaminergique dans le rein
La dopamine remplit d’importantes fonctions physiologiques dans les reins de mammifères.
Elle y augmente le débit sanguin et régule la concentration en sels et en eau dans l’urine (287).
Les reins servent de source majeure de production de dopamine. La dopamine circulante est
généralement de l’ordre du picomolaire alors que les niveaux de dopamine dans les reins
peuvent atteindre des concentrations de l’ordre du nanomolaire (288). Le précurseur de la
dopamine, la L-DOPA, est prélevé de la circulation sanguine et est ensuite converti en
dopamine dans les reins où il va ensuite être métabolisé principalement par la catéchol-O-
méthyl-transférase (COMT) et plus faiblement par la monoamine oxydase A.
Dans chacun de ces systèmes périphériques et à l’exception des vaisseaux sanguins, la
dopamine est synthétisée localement et agit dans l’environnement proche des cellules la
sécrétant.
E. Introduction aux transporteurs neuronaux plasmiques
Lors de la libération des neurotransmetteurs dans l’espace intersynaptique par un neurone,
ceux-ci vont activer leurs récepteurs. Afin d’assurer une neurotransmission correcte, il est
important que le signal soit bref. C’est pourquoi les transporteurs plasmiques présynaptiques
ou gliaux jouent un rôle primordial en éliminant la majeure partie des neurotransmetteurs de
l’espace intersynaptique afin que sa concentration retourne rapidement à son niveau basal,
régulant ainsi la durée et l’amplitude du signal. Ces neurotransmetteurs recaptés seront alors
recyclés et internalisés dans des vésicules afin de constituer un stock de neurotransmetteurs
dans le neurone, ou bien dégradés par la monoamine oxydase. C’est pourquoi les transporteurs
plasmiques des monoamines jouent un rôle prépondérant dans la régulation de la
neurotransmission. Cette importance est notamment illustrée par le fait que toute molécule qui
les cible en modifiant leur activité a des effets psychotropes majeurs (289).
F. Le transporteur de la dopamine
La biodisponibilité de la dopamine est régulée principalement par son transporteur (DAT), une
protéine située à la membrane plasmique et qui transporte le transmetteur de l’espace
intersynaptique vers la partie interne du neurone présynaptique. DAT est une cible de drogues

57
addictives comme la cocaïne, l’amphétamine (AMPH) et la métamphétamine (METH) et de
certains agents comme Adderall™, Ritalin™ et Wellbutrin™ prescrit pour le traitement du
TDAH, de la dépression et d’autres problèmes de déséquilibre de la dopamine. Ces drogues
affectent DAT de 2 manières; certaines inhibant le transport en se liant au transporteur, comme
la cocaïne, d’autres en stimulant le transport inverse (efflux) de la dopamine comme l’AMPH
et la METH. Ces 2 processus induisent un excédent de dopamine dans l’espace intersynaptique
entrainant une suractivation de ses récepteurs lors de la prise de ces drogues.
Il existe deux familles de transporteurs plasmiques neuronaux à haute affinité : les transporteurs
Na/Cl dépendants dont fait partie DAT et les transporteurs Na/K dépendants. Chacune de ces 2
familles inclue des transporteurs pour différents substrats. DAT est un symporteur qui nécessite
une liaison séquentielle pour co-transporter 2 ions NA+ et un ion Cl- avec la dopamine (Figure
13). Le gradient de concentration des ions intracellulaires générés par la membrane plasmique
guide la recapture de la dopamine (290-292). Dans un premier temps, le Na+ se lie au
transporteur puis la dopamine se lie à DAT suivi par le Cl-. Les ions chlorure ne sont néanmoins
pas nécessaires pour la liaison de la dopamine à DAT mais sont nécessaires pour que le transport
s’initie. Le complexe dopamine, Na+ et Cl- crée un changement conformationnel de DAT. Le
transporteur qui faisait alors face à l’extérieur va alors faire face à l’intérieur du neurone où le
neurotransmetteur et les ions seront libérés. La dopamine sera ainsi libérée dans le cytoplasme
de la cellule puis dégradée ou stockée dans des vésicules comme expliqué précédemment.
Figure 13. Mécanisme d’action du transporteur de la dopamine (D’après German
et al., 2015 (293))

58
Il est maintenant bien établi que ces activités de transporteur sont régulées par des mécanismes
qui permettent aux neurones de moduler les niveaux de recapture de la dopamine extracellulaire
en réponse à des demandes physiologiques à court ou long terme (294, 295). Plusieurs de ces
processus interagissent entre eux ou se chevauchent et sont affectés par des substrats ou des
inhibiteurs. La régulation est achevée par des modifications post-traductionnelles. De plus en
plus d’évidences indiquent que beaucoup de ces processus sont dérégulés dans les troubles de
déséquilibre de dopamine, suggérant qu’ils sont des facteurs importants dans le développement
de ces maladies et donc des cibles thérapeutiques potentielles.
DAT contient de long domaines N et C-terminaux du côté cytoplasmique de la cellule. Il s’agit
de sites de modifications post-traductionnelles, d’interactions avec des partenaires de liaison et
des motifs de régulation. Le domaine intracellulaire N-terminal contient le résidu Arg60 qui
stabilise la conformation ouverte vers l’extérieure du transporteur et qui serait impliqué dans le
contrôle du transport en influençant la conformation du domaine TM1 qui entraine un
réarrangement structural durant la transition de conformation extérieure/intérieure (296-298).
Le domaine N-terminal subit de nombreuses modifications par phosphorylation et
ubiquitylation. Les phosphorylations peuvent être catalysées par différentes classes de kinases.
Par exemple les sérines en position 2, 4, 7, 12 et 13 sont phosphorylées par la protéine kinase
C (PKC) ou lors de l’exposition à l’amphétamine ou à la méthamphétamine (299, 300).
Le domaine C-terminal subit également des modifications post-traductionnelles. Par exemple,
la cystéine en position 580 est un site de palmitoylation (301). A proximité de ce site, plusieurs
motifs permettent l’interaction avec d’autres protéines comme la Protéine Kinase
Calcium/Calmoduline dépendante (CaMK) qui lie DAT en position 612 à 617 (302), l’α-
synucléine qui lie les résidus 606 à 620 (303) ou la protéine Parkin (304).
Lors de sa maturation, DAT est également N-glycosylé sur 3 sites au niveau de la deuxième
boucle extracellulaire (305, 306). Il est connu que les glycosylations, notamment les N-
glycosylations, jouent un rôle déterminant dans le repliement, le trafic et l’expression à la
surface cellulaire des protéines membranaires (307, 308). Des études in-vitro ont montré que
l’activité de DAT dépend de ces glycosylations. Ainsi, la forme glycosylée de DAT transporte
la dopamine plus efficacement que la forme non-glycosylée (309, 310).
DAT est régulé par plusieurs systèmes de signalisation, dont les voies PKC et ERK sont parmi
les mieux caractérisées (295). De nombreux systèmes de réception de neurotransmetteurs dont

59
la dopamine, les opioïdes et le glutamate qui influencent la recapture de dopamine, la
signalisation dopaminergique et les caractéristiques lors de la consommation de drogues
pourraient passer par ces voies de signalisation (294, 311). Bien que la mécanistique des
interactions ne soit pas toujours bien connue, des interactions fonctionnelles ont été identifiées
notamment entre DAT et le récepteur D2 à la dopamine, ou encore avec les protéines G β et γ
(312, 313). La régulation de DAT médiée par les systèmes de signalisation est complexe, avec
certaines fonctions régulées par plusieurs voies de signalisation et certaines voies de
signalisation régulant plusieurs fonctions à la fois.
G. Effet neurotoxique de la dopamine cytosolique
Plusieurs études ont montré que l’accumulation de dopamine dans l’espace cytosolique peut
entrainer des conséquences délétères pour la cellule (314-317). Une étude de Mosharov a
montré en 2009 que l’augmentation des niveaux cytosoliques de dopamine augmente la toxicité
cellulaire alors que la diminution de ces niveaux par l’inhibition de la L-DOPA est protectrice
et augmente la survie cellulaire (317). Cette étude suggère donc que les niveaux de dopamine
cytosolique déterminent la toxicité des cellules dopaminergiques.
La dopamine cytosolique est très réactive et entraine la toxicité par deux mécanismes : la
déamination par des enzymes cytosoliques ou l’auto-oxydation. La dopamine peut être
désaminée par la monoamine oxydase (MAO) qui convertit la dopamine cytosolique en
DOPAL (Figure 12), un aldéhyde intermédiaire réactif, et en peroxyde d’hydrogène (268, 318,
319). Heureusement, la DOPAL est généralement convertie en DOPAC, un métabolite bénin,
par l’aldéhyde déshydrogénase. Néanmoins, la DOPAL peut être oxydée, créant des dérivés
réactifs de l’oxygène (268). La DOPAL serait toxique pour les neurones in-vitro mais
également dans un modèle de souris déficientes en aldéhyde déshydrogénase (319-322). De
plus, la quantité de DOPAL est augmentée dans le cerveau d’individus MP, suggérant son
implication dans cette maladie (323).
La dopamine cytosolique peut également être auto-oxydée formant ainsi des dérivés réactifs de
l’oxygène comme des radicaux hydroxylés, du superoxyde ou encore du peroxyde d’hydrogène
(324, 325).

60
H. Implication dans les maladies neurologiques et les troubles du
comportement
1. Implication dans la maladie de Parkinson
La maladie neurodégénérative la plus répandue chez l’homme est la maladie de Parkinson. Les
symptômes moteurs de la maladie de Parkinson sont caractérisés par une rigidité musculaire,
une posture instable, un tremblement de repos et une bradykinésie (326). Ces troubles moteurs
sont causés par une dégénérescence des neurones dopaminergiques nigrostriataux entrainant la
réduction du tonus dopaminergique (327). Malheureusement, il n’y pas encore de réelles
preuves concrètes de lien entre des mutations de DAT et la maladie de Parkinson, probablement
parce qu’il s’agit d’une maladie à l’étiologie multifactorielle et que des mutations génétiques
ne sont retrouvées que dans très peu de cas (5 à 10%) (327). Le rôle potentiel de DAT dans
l’augmentation de la vulnérabilité des neurones dopaminergiques dans la maladie de Parkinson
pourrait être d’augmenter la quantité de dopamine cytosolique qui est très réactive. L’activité
de DAT pourrait ainsi sensibiliser les neurones dopaminergiques au stress oxydatif intrinsèque.
2. Implication dans le trouble de déficit d’attention avec hyperactivité
Depuis plus de 20 ans, le disfonctionnement de DAT a été beaucoup étudié lors de recherches
sur le TDAH (328). En 1995, Cook et ses collègues ont rapporté qu’un polymorphisme sur la
partie non codante du gène de DAT entrainait un risque accru de développer le TDAH (329).
Par la suite, d’autres études ont confirmé ces résultats (329-331). Alors que les bases
moléculaires de cette association ne sont pas claires, il a été démontré que ce polymorphisme
peut impacter l’expression du gène de DAT (332, 333). Mise à part les polymorphismes sur la
partie non codante de DAT, des mutations de la séquence codante du gène de DAT ont
également été découvertes chez des patients atteints de TDAH. Certaines de ces mutations ont
pour conséquence in-vitro un efflux de dopamine à travers DAT (334) entrainant une
augmentation de dopamine extracellulaire chez la souris portant ces mutations (335) et par
conséquent une hyperactivité de celles-ci. D’autres mutations entrainent quant à elles un
recyclage constitutif de DAT (336) perturbant fortement sa localisation et son trafic.
En résumé, ces études ont montré qu’une altération dans l’expression ou la fonction de DAT
peut entrainer un risque accru de développement du TDAH, un trouble lié à une signalisation
aberrante de la dopamine (337, 338).

61
3. Implication dans la dépression
Généralement, c’est la sérotonine qui est tenue responsable de la dépression et qui est ciblée
par les traitements pharmacologiques actuels contre cette pathologie. Néanmoins, de plus en
plus d’études révèlent des liens entre des dérégulations du système dopaminergique et la
pathophysiologie de la dépression. En effet, plusieurs symptômes observés chez des patients et
des animaux souffrant de dépression, comme l’anhédonie ou l’amotivation, ont été associés à
des dysfonctions du système dopaminergique (339-341).
Les modèles animaux utilisés pour étudier la dépression sont basés sur la présentation de
facteurs de stress (342). La durée d’action du facteur de stress impacte sur la magnitude et la
durée de la réponse dépressive (343, 344).
L’activation aigue du système dopaminergique par l’amphétamine ou par l’activation des
neurones dopaminergiques induite par le stress est suivie par une période de dépression (345).
De plus, si ces facteurs sont présentés sur une période plus longue, l’état dépressif observé est
également maintenu plus longtemps. Des expériences in vivo ont également révélé que des rats
rendu dépressifs pouvaient retrouver un état normal en suractivant les neurones
dopaminergiques de l’ATV (346, 347).
Ainsi, la dopamine semble jouer un rôle important dans le développement de la dépression,
mais les mécanismes cellulaires et moléculaires du système dopaminergique impliqués dans
son développement restent peu connus.
4. Les drogues psychostimulantes
DAT est la cible principale de nombreux composés, notamment les psychostimulants, les
médicaments et les substances neurotoxiques (290, 348). DAT étant le responsable majeur de
la recapture de la dopamine, la manipulation pharmacologique de ce transporteur peut entrainer
des effets majeurs sur la neurotransmission de la dopamine. Deux psychostimulants classiques
qui opèrent en altérant la fonction de DAT sont la cocaïne et l’amphétamine (Figure 14). La
cocaïne lie DAT et bloque le transport de la dopamine de l’espace extracellulaire vers le
neurone présynaptique (349). La cocaïne est un inhibiteur par compétition du transport de la
dopamine car son domaine de liaison chevauche celui de la dopamine (350) résultant au fait
que la dopamine s’accumule alors dans l’espace intersynaptique et active de manière aberrante
ses récepteurs. A l’inverse, les amphétamines (amphétamine, métamphétamine, MDMA)
entrent en compétition avec la dopamine pour entrer dans les cellules dopaminergiques, agissant
ainsi comme un substrat pour DAT (351). Une fois à l’intérieur de la cellule, l’amphétamine

62
perturbe le gradient de protons nécessaire pour le stockage de la dopamine dans les vésicules
(352). Ceci entraine alors une perte de la dopamine depuis les vésicules vers le cytoplasme des
neurones présynaptiques. Finalement, l’accumulation de la dopamine cytosolique combinée
avec les actions de l’amphétamine sur DAT entraine un transport inversé de la dopamine,
résultant en un efflux de la dopamine intracellulaire vers l’espace extracellulaire. Cette
libération de la dopamine par DAT entraine une augmentation de signalisation de la voie
dopaminergique en réponse à l’amphétamine. Alors que la cocaïne et l’amphétamine peuvent
occasionner d’autres effets sur le système nerveux central, c’est la perturbation des fonctions
de DAT qui augmente la neurotransmission dopaminergique et qui est possiblement à la base
des effets psychostimulants (353, 354).
Les drogues modulant l’activité de DAT sont également utilisées pour des usages
thérapeutiques dans le traitement de maladies comme le TDAH (328, 355), la dépression (356)
et la narcolepsie (357).
Figure 14. Effets de la cocaïne et de l’amphétamine sur le système dopaminergique
(D’après Korpi et al. 2015 (358))

63
IV. Objectifs de la thèse
L’importance de la MLT n’est plus à démontrer tant elle a de fonctions dans le corps.
Néanmoins, nombreux sont les mécanismes les régulant qui restent flous. C’est pourquoi
l’objectif général de ma thèse était de préciser les mécanismes d’action du système
mélatoninergique lui permettant de réguler les systèmes dopaminergiques et la glycémie.
Comme expliqué dans l’introduction de cette thèse, des liens existent déjà entre les systèmes
mélatoninergiques et dopaminergiques mais ils sont mal compris. La mélatonine agissant
principalement par l’activation de ses 2 récepteurs MT1 et MT2 et les niveaux de dopamine
extracellulaire étant régulés en majorité par DAT, nous avons émis comme première
hypothèse de cette thèse que le système mélatoninergique régule le système dopaminergique
par l’interaction des récepteurs MT1 et MT2 avec le transporteur DAT.
Dans le but de dévoiler de nouveaux mécanismes d’action du système mélatoninergique nous
nous sommes intéressés à sa capacité à réguler les niveaux glycémiques dans le sang. Un
polymorphisme positionné au niveau de l’intron du gène MTNR1B codant pour MT2 avait déjà
été identifié comme responsable de la dérégulation de l’homéostasie glycémique, augmentant
ainsi le risque de développer le DT2. Par conséquent notre groupe avait émis l’hypothèse que
des variations de la partie codante pour le récepteur MT2 pouvaient également entrainer un
risque accru de développer le DT2. Le gène codant pour MT2 chez des personnes
normoglycémiques et DT2 avait alors été séquencé et différents variants génétiques de MT2
avaient été découverts dont certains avaient été reliés avec un risque accru de développer le
DT2 avant ma thèse (213). Cette découverte nous a alors mené à la seconde hypothèse de ma
thèse que la défectuosité de certaines voies de signalisation spécifiques du récepteur MT2
augmente le risque de développer le DT2.
Nous avons ensuite décidé de comprendre les mécanismes d’action du récepteur MT1. En effet,
les informations rapportées dans la littérature quant à son profil de signalisation sont parfois
contradictoires et ses mécanismes d’action restent flous. Nous avons alors émis la troisième
hypothèse de ma thèse que des variants génétiques naturels de MT1 permettent de révéler ses
mécanismes d’action.
Afin de tester ces 3 hypothèses, nous avons formulé les différents objectifs spécifiques suivants
que nous traiterons dans cet ordre :
1) Révéler les interactions physiques entre les MTRs et DAT et étudier leur impact sur la
fonction du transporteur et le comportement d’animaux.

64
2) Caractériser fonctionnellement les variants génétiques de MT2 préalablement identifiés et
relier la perte de certaines voies de signalisation à un risque accru de développer le DT2.
3) Identifier et caractériser des variants génétiques naturels de MT1 afin de révéler des régions
du récepteur spécifiques à l’activation de certaines voies de signalisation.

65
Chapitre 2
Article 1

66
Melatonin receptors limit dopamine reuptake by regulating
dopamine transporter cell‑surface exposure
Abla Benleulmi‑Chaachoua*, Alan Hegron*, Marine Le Boulch, Angeliki
Karamitri, Marta Wierzbicka, Victoria Wong, Igor Stagljar, Philippe
Delagrange, Raise Ahmad, Ralf Jockers
Cellular and Molecular Life Sciences (2018)

67
Melatonin receptors limit dopamine reuptake by regulating
dopamine transporter cell surface exposure
Abla Benleulmi-Chaachoua a,b,c,1, Alan Hegron a,b,c,1, Marine Le Boulch a,b,c, Angeliki
Karamitri a,b,c, Marta Wierzbicka d, Victoria Wong d, Igor Stagljar d, Philippe Delagrange e, Raise Ahmada,b,c and Ralf Jockers a,b,c,2
a Inserm, U1016, Institut Cochin, 22 Rue Mechain, 75014 Paris, France
b CNRS UMR 8104, 22 Rue Mechain, 75014 Paris, France
c Univ. Paris Descartes, Sorbonne Paris Cité, 12 Rue de l'École de Médecine, 75006 Paris,
France
d Donnelly Centre, Department of Biochemistry, Department of Molecular Genetics, Faculty of
Medicine, University of Toronto, 160 College Street, University of Toronto, ON, Canada, M5S
3E1
e Pôle d’Innovation Thérapeutique Neuropsychiatrie, Institut de Recherches Servier, 125
Chemin de Ronde, 78290 Croissy, France
1 These authors contributed equally
2 Correspondence should be addressed to:
Dr. Ralf Jockers, Institut Cochin, 22 rue Méchain, 75014 Paris.
Phone: +331 40 51 64 34; Fax: +331 40 51 64 30; e-mail: [email protected]
Running title
Melatonin receptors limit dopamine reuptake

68
Abstract
Melatonin, a neurohormone released by the pineal gland, has multiple effects in the central
nervous system including the regulation of dopamine (DA) levels, but how melatonin
accomplishes this task is not clear. Here, we show that melatonin MT1 and MT2 receptors co-
immunoprecipitate with the DA transporter (DAT) in mouse striatal synaptosomes. Increased
DA re-uptake and decreased amphetamine-induced locomotor activity was observed in the
striatum of mice with targeted deletion of MT1 or MT2 receptors. In vitro experiments
confirmed the interactions and recapitulated the inhibitory effect of melatonin receptors on DA
re-uptake. Melatonin receptors retained DAT in the endoplasmic reticulum in its immature non-
glycosylated form. In conclusion, we reveal one of the first molecular complexes between G
protein-coupled receptors (MT1 and MT2) and transporters (DAT) in which melatonin receptors
regulate the availability of DAT at the plasma membrane thus limiting the striatal DA re-uptake
capacity in mice.
Keywords: melatonin/ dopamine/ melatonin receptor/ DAT/ synaptosome

69
Introduction
The dopamine (DA) transporter DAT is a key regulator of the extrasynaptic DA availability.
This transporter mediates DA re-uptake into the nerve terminals, thus preventing dopaminergic
hyperactivation. DAT is located on dopaminergic neurons of the ventral tegmental area, the
limbic system, in the prefrontal cortex, and highly expressed in substantia nigra projections
ending in the striatum formation [1]. DAT is the unique transporter responsible of DA clearance
from the synaptic cleft.
DAT is down-regulated by addictive compounds such as cocaine and amphetamine analogues
that cause an over-activation of the dopaminergic circuit, accompanied by enhanced locomotion
and reward feelings [2]. Moreover, disruptions of dopamine clearance is associated with a broad
spectrum of neuropsychiatric disorders such as Parkinson’s disease (PD), schizophrenia and
attention-deficit hyperactivity disorder [3-5].
DAT surface expression is one of the limiting factors of the rate of DA uptake. At the level of
nerve terminals, DAT expression is maintained in equilibrium between the cell surface and
endosomal vesicles [6]. This equilibrium may be modulated by post-translational modifications
as well as by protein-protein interactions [7]. Reduced DAT expression has been associated
with schizophrenia [8] and is observed in the dopamine transporter deficiency syndrome that is
characterized by early infantile-onset progressive parkinsonism dystonia [9].
DAT is known to be phosphorylated in response to the activation of several kinases such as
PKC, PI3K, MEK1/2, and p38. DAT also undergoes ubiquitination prior to its down regulation
via endocytosis downstream of PKC activation. The target residues of phosphorylation and
ubiquitination are mainly located in the N-terminal domain of DAT, the main regulatory
domain of the transporter [10-12]. Moreover, DAT activity can be reversed into DA efflux at
the cell surface prior to endocytosis as a result of the phosphorylation of N-terminal serine
70
residues upon PKC activation [13], which can be mediated by amphetamine treatment [14] [15].
Furthermore, DAT was reported to interact with several membrane and cytosolic proteins [16]
[17-19]. Some proteins such as GPR37 diminish DA uptake by decreasing the cell surface
expression of DAT in mouse synaptosomes [20], others, like the Parkin protein and the DA D2
receptor and the kappa-opioid receptor, increase the uptake by enhancing the cell surface
expression of DAT [21,22] [23].
The DA availability at the synaptic cleft is a result of a release and uptake process. Several
studies report the role of the neurohormone melatonin in the regulation of DA availability at
different regions in the brain [24,25]. Melatonin is a neuro-hormone synthesized by the pineal
gland during the night phase and has been shown to regulate various processes including
neuronal functions [26,27]. Most of these effects are mediated by two melatonin receptors MT1
and MT2 belonging to the G protein-coupled receptor (GPCR) super-family [28]. Melatonin
deregulations either at the level of hormone secretion, receptor polymorphisms or expression
are associated with a large spectrum of diseases and disorders such as circadian rhythm
abnormalities, Parkinson’s and Alzheimer’s diseases [29,30], attention-deficit hyperactivity
disorder [31], schizophrenia [32], and type 2 diabetes [33].
In this study, we evaluate the possible functional and physical interaction between the
melatonin and the dopamine system on the level of two membrane-bound components of these
systems, namely the melatonin receptors and DAT. Experiments were performed in vitro by
transfection the different protein components and in vivo by detecting DA uptake in striatal
synaptosomes and monitoring amphetamine-induced locomotor activity.

71
Materials and Methods
Compounds
Dihydroxyphenylethylamine-[2,5,6,7,8-3H]-dopamineNET116000), [N-methyl-3H]WIN-
35428 (NET10330) and 2-[125I]-iodomelatonin (NEX2360) were purchased from Perkin Elmer,
S77834 was a generous gift from Servier, Nitrocefin (484400) and melatonin (CAS 73-31-4)
from Calbiochem, dopamine (H8502) and Nomifensine (N1530) from Sigma-Aldrich.
Cell culture and transfection
HEK293T cells were grown in complete medium (Dulbecco’s modified Eagle’s medium
supplemented with 10% fetal bovine serum, 4.5g/L glucose, 100 U/mL penicillin, 0.1mg/mL
streptomycin and 1mM glutamine) (Invitrogen, CA). Transient transfections were performed
using JetPEI (Polyplus Transfection, France), according to manufacturer’s instructions.
DNA constructs
Myc- and Flag-hDAT were kindly donated from Dr M.E.A. Reith laboratory from New York
University School of Medicine - USA [34]; ΔN1-55-Flag-hDAT and YFP-hDAT from Dr T.S.
Shippenberg laboratory from the National Institute on Drug Abuse; Baltimore –USA [35]; and
β-Lac-hDAT plasmid was from Dr A. Salahpour (University of Toronto) [36].
Membrane Yeast two-hybrid (MYTH) screen
The MYTH screens were done as outlined previously [37]. In short, baits were transformed into
a Saccharomyces cerevisiae strain by the lithium acetate/single-stranded carrier
DNA/polyethylene glycol method as described by [38]. Subsequently, a prey cDNA library in
the NubG-X orientation was transformed into these yeast strains containing MT1 receptors by
the same method. Putative interactors were selected by growth on synthetic dropout media

72
lacking the amino acids tryptophan, leucine, adenine and histidine (SD-WLAH). Prey plasmids
were isolated using a commercial DNA isolation kit modified for yeast, followed by
transformation and additional amplification in Escherichia coli. Final purified plasmids were
subjected to sequencing and BLAST analysis, to identify specific interactors. To eliminate
spurious interactors, the prey plasmids were once again transformed into yeast harboring MT1
or an artificial bait (the transmembrane segment of the human T-cell surface glycoprotein CD4
linked to Cub-TF) and interaction was assessed. Any preys that also interacted with the artificial
bait were deemed promiscuous and discarded.
Immunoprecipitation and Western blot
Striata from male mice (8-12 weeks old) were homogenized in 7 ml ice-cold 5 mM HEPES,
0.32 M sucrose, pH 7.4 supplemented with protease inhibitors: leupeptine (1 mg/ml), pepstatin
(1 mg/ml), benzamidine (2 mg/ml), AEBSF (1 mg/ml); and phosphatase inhibitor: 2 mM
Na3VO4, 10 mM NaF (buffer H) and grind in a potter and centrifuged (800xg; 7 min; 4° C).
The supernatant was then centrifuged (9,200xg; 10 min; 4° C). The resultant pellet was
resuspended in and then centrifuged (10,000xg; 17 min; 4°C). The pellet obtained contained
synaptosomes and was solubilised 4h in the same buffer with 0,5% Brij 96 (Sigma, P6136) at
4° C on wheel and centrifuged (14,000xg; 1h; 4°C). The soluble fraction was subjected to
immunoprecipitation using G protein sepharose beads (Sigma) with monoclonal antibodies (2
μg/ml) raised against the carboxyl-terminal tail of mMT1 or mMT2 (manuscript in preparation).
Pull-down experiments were performed with streptavidin beads (GE Healthcare Life Sciences)
in IP buffer (TEM buffer supplemented with 75 mM Tris pH 7.5, 2mM EDTA, 12 mM MgCl2
with protease inhibitors) overnight. Samples were denatured overnight at room temperature in
SDS-PAGE loading buffer (62.5 mM Tris/HCl, pH 6.8, 5% SDS, 10% glycerol, 0.5%
bromophenol blue) and the protein separated by SDS-PAGE. Immunoblot analysis were

73
performed with the indicated antibodies (rabbit anti-DAT antibody (1:800) (AB5802)
Millipore preferentially recognizing the mature DAT form and rabbit (H-80) Santa-Cruz
(SC14002) preferentially recognizing the immature form and immunoreactivity was revealed
using secondary antibodies coupled to 680 or 800 nm fluorophores using the Odyssey LI-COR
infrared fluorescent scanner (ScienceTec, France).
BRET measurement
For BRET donor saturation curves, 30000 HEK293T cells were seeded in 96-well white
Optiplates (Perkin Elmer Life Sciences) with 0.125 ng of MT1-Rluc or 1.25 ng of MT2-Rluc or
0.083 ng of CCR5-Rluc and 0 to 125 ng of DAT-YFP plasmids. Cells were then incubated 48h
at 37°C before BRET measurements. Luminescence and fluorescence were measured
simultaneously using Plates were read on the Mithras LB 940 with 480±10 nm (Rluc) and
540±20 nm (YFP) emission filters and BRET ratios calculated as above.
Synaptosomal preparation
Synaptosomes from striatum, hypothalamus and cortex of male mice (8-12 weeks old) were
prepared as described in [39]. Briefly, tissues were homogenized in a buffer containing 320
mM sucrose, 5 mM HEPES, and protease inhibitors. After centrifugation at 2,000xg for 8
minutes, the supernatant was centrifuged at 30,000 g for 30 minutes. The resulting
synaptosomal pellet was kept at 4°C and used for subsequent analysis within 4 hours.
DA uptake and β-CFT binding
HEK293T cells were transfected in poly-L-Lysine coated 24 well plates. 48 h post-transfection,
cells were washed with uptake buffer (5 mM Tris-HC1, 7.5 mM HEPES, 120 mM NaC1, 5.4
mM KCI, 1.2 mM CaC12, 1.2 mM MgSO4, 5 mM D-glucose, and 1 mM ascorbic acid; pH 7.2)

74
and incubated for 5 minutes with 20 nM of [3H]-Dopamine. The uptake was terminated by two
washes with ice-cold uptake buffer, and lysed in 0.5 ml of 1% SDS. Measurement was
performed using scintillation counter. For synaptosomal DA uptake, 100 µg of proteins were
subjected to DA uptake test for 5 min, Uptake was stopped by addition of 3 ml of ice-cold
uptake buffer, followed by rapid filtration through Whatman filters and two additional rinses.
The DA uptake kinetic test was performed in the presence of a fixed concentration of [3H]-
dopamine (20 nM) and increasing DA concentrations as indicated. β-CFT binding was
performed in the presence of 4 nM of [3H]WIN-35428 for 30 min at room temperature.
Nonspecific binding was assessed with 25 nM of nomifensine.
B-lactamase assay
The β-lactamase assay was performed as previously described in (33) with minor modifications.
Briefly, cells were plated into individual wells of a poly-D-lysine-coated 96-well plate. The
assay was performed 24h after plating. Cells were treated or not with PMA (1µM) for 30min at
37°C and then incubated with the β-lactamase substrate nitrocefin. Absorbance at 492 nm was
measured immediately and then every 5 minutes for 30 min in a microplate spectrophotometer.
The reaction rate (slope of the curve in the linear range) was taken as the readout for this assay.
125I-MLT binding
The assay was performed as previously described [40].
Homogeneous time-resolved fluorescence (HTRF)-based cAMP assay
cAMP levels were determined in HEK293T cells by HTRF using the “cAMP femto2” kit
(Cisbio, Bagnols-sur-Cèze, France) as previously described [41].

75
Hyperactivity induced by D-Amphetamine
Activity of male mice (8-12 weeks old) was measured in eight open-fields (actimeters) which
are Plexiglas transparent open-box (42 cm L, 42 cm W, 40 cm H). The distance travelled
(horizontal activity) was recorded with infrared photobeams detection systems (Acti-track, LSI
Leticca, Panlab). Open-fields were placed in four independent compartments, under a dim light
(10 Lux). Within each compartment, open-fields were visually isolated from the experimental
room.
Animals were individually placed in the open-fields and allowed to move freely for a 90-min
session. Their distance travelled was recorded all long and at T30 min, D-Amphetamine
(3mg/kg) or vehicle were injected intraperitoneally to mice. The data collected was the
spontaneous locomotor activity (SLA) taking in account the distance travelled during the 30
min period before the injection of D-Amphetamine or its vehicle and the distance travelled
during the 60 min period following the injection.
Immunofluorescence
HeLa cells were fixed with 4% formaldehyde and permeabilized with 0.2% Triton X-100. Cells
were incubated with anti-myc rabbit polyclonal (Santa-Cruz sc-789) or anti-myc mouse
monoclonal (Santa-Cruz sc-40) antibodies or anti-HA mouse monoclonal (Biolegend MMS-
101P) or anti-HA rabbit polyclonal (Cell Signaling #3724) antibodies, followed by staining
with TRITC or FITC-conjugated secondary antibodies (Biotium) in the presence of DAPI.
Images were taken with a microscope ZEISS Observer Z1 with the lense PLAN FLUOR 100x
and analysed by Image J software.

76
Statistical analysis
Results were analyzed by PRISM (GraphPad Software). Data are expressed as mean ± SEM of
at least 3 experiments. One sample t test and one way ANOVA test with Dunnett’s multiple
comparisons test were applied for statistical analysis.
Results
Identification of DAT/ melatonin MT1 receptor complexes with MYTH
In order to identify proteins interacting with the human melatonin MT1 receptor, we applied the
recently modified split-ubiquitin Membrane Yeast Two-Hybrid (MYTH) technique [37]. Full-
length receptors were N-terminally tagged with the yeast mating factor α to encourage plasma
membrane localization and C-terminally tagged with half of ubiquitin (Cub) fused to an
artificial transcription factor comprising LexA and VP16. Successful cell surface expression of
melatonin receptors in yeast was monitored by immunofluorescence microscopy. Screens were
performed in duplicate against recombinant NubG-prey of human fetal brain cDNA library, a
tissue know to express MT1 receptors [42]. Forty-seven high-quality interactions were retained
after deleting false positive candidates interacting with an artificial bait, the transmembrane
segment of the human T-cell surface glycoprotein CD4 linked to Cub-TF [43]. Among these
proteins was DAT that interacted with MT1 receptors (2 clones with 330/620 amino acids)
(Table 1).
Melatonin MT1 and MT2 receptors interact with DAT in mouse striatum and HEK293T
cells
To confirm the existence of DAT/melatonin receptor complexes in the mouse brain, we isolated
the synaptosomal fraction of the hypothalamus, striatum and cortex from C57BL/6 mice. In
agreement with previous reports, our pilot experiments showed highest DAT expression and

77
3H-DA uptake in the striatum followed by the cortex and hypothalamus (Figure 1A-B) [44].
Expression of melatonin receptors was monitored in 2-[125I]-iodomelatonin (125I-MLT) binding
experiments and found to be highest in the hypothalamic followed by the striatal and the cortical
synaptosomes (Figure 1C). Based on these findings, the striatum was used for the following
experiments. Immunoprecipitation of MT1 and MT2 from lysates of striatal synaptosomes with
monoclonal antibodies recognizing specifically the mouse MT1 and MT2 revealed the presence
of both receptors in precipitates of WT but not mice with targeted deletion of MT1 or MT2
(MT1-KO; MT2-KO), respectively (Figure 1D-E, middle panels). Western blotting of
precipitates with anti-DAT antibodies, recognizing predominantly the mature form migrating
at a molecular weight of 80 kDa over the immature non-glycosylated 55 kDa form [21] showed
a strong band at 55 kDa but none at 80 kDa suggesting an enrichment of the immature form of
DAT in MT1 precipitates and to a lesser extend in MT2 precipitates (Figure 1D-E, left upper
panels). As the 55 kDa form of DAT was largely undetectable in lysates with this antibody, we
wanted to confirm the identity of the DAT band in precipitates with a second antibody
recognizing predominantly the immature form (anti n.g. DAT) (SC14002). The 55 kDa band
was once again detected with this antibody in MT1 precipitates validating the interaction of
MT1 with the immature form of DAT (Figure 1D, right upper panel). We were unable to confirm
the 55 kDa band in MT2 precipitates, most likely because the amount of precipitated DAT was
below the detection limit of this antibody (Figure 1E, right upper panel).
To further confirm these interactions, we performed bioluminescence resonance energy transfer
(BRET) donor saturation experiments in cells transfected with the Renilla luciferase (Rluc)
energy donor fused to the C-terminus of MT1 and MT2 and the yellow fluorescent protein (YFP)
energy acceptor fused to the N-terminus of DAT. The chemokine receptor CCR5-Rluc fusion
protein was included as a negative control and the respective MT1 and MT2 homodimer
combinations as positive controls. The co-expression of a fixed amount of Rluc fusion proteins

78
and increasing amounts of YFP-DAT resulted in the expected hyperbolic curve [45,46]
reaching an asymptote indicating specific interactions between DAT and MT1 and MT2,
similarly to the previously reported MT1 and MT2 homodimers [47] (Figure 2A, B).
Colocalization of DAT with MT1 and MT2 in transfected HeLa cells further confirmed the close
proximity of DAT and melatonin receptors (Figure 2C; Supplementary Figure 1A). Taken
together, co-IP, BRET and colocalization experiments provide evidence that DAT interacts
with MT1 and MT2 in striatal synaptosomes and transfected cells.
Melatonin receptors decrease dopamine uptake through DAT
In order to explore potential consequences of melatonin receptors on DAT function, we
measured DA uptake in HEK293T cells expressing DAT in the absence or presence of
receptors. Expression of MT1 and MT2 decreased DA uptake by 595.9 and 262.8 % (n=3),
respectively (Figure 3A). In agreement with previous reports, co-expression of GPR37
decreased DA uptake by 141.6 % (n=3) [20], while the presence of another GPCR, the CCR5
receptor, and the 4-transmembrane-spanning endospanin-1 protein, known to regulate the cell
surface expression of other membrane receptors [48], did not affect the DAT-promoted DA
uptake (Figure 3A). Expression of comparable quantities of DAT and successful expression of
the various GPCRs and endospanin-1 was confirmed in total cell lysates by (Figure 3A inset,
Supplementary Figure 1B). Pre-incubation with melatonin (1 µM) for 30 minutes did not
modulate the inhibitory effect of MT1 and MT2 receptors on DA uptake in HEK293T cells and
striatial synaptosomes (Figure 3B,C). The absence of effect of melatonin was confirmed in
concentration-response experiments in striatial synaptosomes (Supplementary Figure 1C).
Shorter or longer pre-incubation times with melatonin (1 µM) were also without effect (not
shown).

79
Inactivation of Gi/o and Gq/11 proteins, known to be activated by melatonin receptors [49], with
pertussis toxin (PTX) or YM-254890, respectively, was unable to abolish the inhibitory effect
of melatonin receptors on DA uptake arguing against the involvement of constitutive receptor
activity in this effect (Supplementary Figure 1D,E). This was further confirmed by treating
HEK293 cells with the melatonin receptor inverse agonist S77834 [50], which was also unable
to elevate the inhibition of DA uptake (Figure 3B). S77834 was similarly ineffective in
modifying the basal DA uptake in striatal synaptosomes of WT mice (Figure 3C). Successful
inhibition of constitutive MT1 and MT2 receptor activity by S77834 under these conditions was
shown in the cAMP accumulation assay (Supplementary Figure 1F).
The N-terminus of DAT (amino acids 1-62) plays a key role in DAT function because it
undergoes various post-translational modifications leading to DAT down-regulation [10,12]. It
serves as a protein-protein interaction platform for syntaxin 1A [51], synaptogrin-3 [52] and
possibly also for dopamine D2 receptors [22,35]. Pull-down experiments between MT1 and
MT2 receptors and a DAT mutant deleted of the first 55 amino acids [35] (ΔN-Flag-DAT)
showed that the N-terminal DAT domain is not necessary for the interaction with melatonin
receptors (Supplementary Figure 1G). Consistently, a similar inhibition pattern of DA uptake
by melatonin receptors was also observed for the ΔN-Flag-DAT mutant at similar DAT
expression levels (Figure 3D, Supplementary Figure 1H).
To confirm our in vitro finding we measured DA uptake in striatal synaptosomes of MT1-KO
and MT2-KO mice. DA uptake was readily measurable in synaptosomal preparations of WT
mice containing all the necessary elements for the transport of neurotransmitters thus reliably
reflecting in vivo conditions [39]. DA uptake was doubled in MT1-KO and in MT2-KO mice
(Figure 3E). This enhanced DA transport capacity is not accompanied by increased DAT
expression levels as monitored by western blot in synaptosomal lysates (Figure 3E).

80
Altogether, these results show that melatonin receptors inhibit DA uptake through DAT in
transfected HEK293T cells and mice striatal synaptosomes and that this effect is not regulated
by melatonin receptor activation or constitutive activity and does not involve the regulatory N-
terminal domain of DAT.
Melatonin receptors decrease DAT cell surface expression
Regulation of DAT-promoted DA uptake may be due to either a modulation of the affinity of
DA for DAT or to a modification of DAT cell surface expression [21]. Kinetic analysis of DAT-
mediated DA uptake showed that Km values were similar in HEK293T cells expressing DAT
alone (1.57 ± 0.15 µM) or coexpressing DAT and MT1 (1.07 ± 0.49 µM) or MT2 (1.49 ± 0.31
µM) (Figure 4A). Km values were comparable to those measured in previous studies [53].
Maximal DA uptake rates (Vmax) were significantly decreased in cells coexpressing DAT with
MT1 (78.39 ±14.17 fmol/mg/min) or MT2 (138.20 ±12.43 fmol/mg/min) as compared to cells
expressing DAT alone as expected (222.20 ±9.38 fmol/mg/min) (N=3; p-value <0.001).
Altogether, these results exclude an effect of melatonin receptors on the affinity of DA for
DAT.
To assess the impact of melatonin receptors on DAT cell surface expression, we determined
the number of DAT at the cell surface with the radiolabeled cocaine analogue β-CFT [N-
methyl-3H]WIN-35428. A drop of 50-70% in WIN-35428 binding sites was observed in cells
coexpressing either MT1 or MT2 (Figure 4B). Similar effects were observed in cells
coexpressing DAT and GPR37 recapitulating previously reported results (Figure 4B) [20].
Expression of the negative control receptor CCR5 had no influence on the number of WIN-
35428 binding sites (Figure 4B). For all conditions, the total amount of expressed DAT did not
change (Figure 4B, inset). Collectively, these data suggest that melatonin receptors limit the
number of DAT expressed at the cell surface.
81
Melatonin receptors retain DAT in the biosynthetic pathway
Decreased DAT cell surface expression might result from higher internalization or lower export
of DAT in the presence of melatonin receptors. DAT internalization is known to be dependent
on protein kinase C (PKC) activation, directly by phosphorylating DAT or indirectly by
mediating its ubiquitination [7]. Treatment of HEK293T cells for 30 minutes with the potent
PKC activator, phorbol myristate ester (PMA) [54] caused the expected decrease of DAT cell
surface expression of 60% and this effect was not significantly modified by the coexpression
of melatonin receptors (Figure 4C).
To explore the influence of melatonin receptors on the retention of DAT in the biosynthetic
pathway, cell lysates were analyzed by western blot for the presence of the immature,
intracellular (55kDa) DAT form and the mature, cell surface located (80kDa) form. In the
presence of melatonin receptors, an enrichment of the immature DAT form was observed,
consistent with the retention of DAT in intracellular compartments under this condition (Figure
4D). Before further investigations on where this retention occurs, we checked the presence of
Golgi and endoplasmic reticulum in our synaptosomal preparations using antibodies against
58K marker and calnexine, respectively (Supplementary Figure 3). Then colocalization of DAT
with calnexine was only observed in cells expressing MT1 or MT2 further confirmed the
intracellular retention of DAT in the presence of melatonin receptors (Figure 4E). No
colocalization was observed with the 58K Golgi marker and the GM130 cis-Golgi marker
(Supplementary Figure 2A, B).
Taken together, co-expression of melatonin receptors with DAT decreases its cell surface
expression by retaining DAT in the endoplasmatic reticulum of the biosynthesis pathway. This
observation is also consistent with the co-immunoprecipitation of the immature, intracellular
form of DAT with melatonin receptors in the striatum.

82
Mice lacking melatonin receptors are less sensitive to amphetamine-induced locomotion
MT1-KO and MT2-KO mice show increased DA uptake capacity in striatal synaptosomes.
Therefore, we predicted decreased synaptic DA concentrations and decreased locomotor
activity in these mice. Thus, we measured amphetamine-induced locomotor activity in WT and
KO mice (Figure 5A-C). Whereas basal locomotor activity in all three mouse strains was
similar, amphetamine-induced locomotor activity was decreased by half in MT1-KO and MT2-
KO mice compared to WT mice. Amphetamine showed a similar affinity for DAT in striatal
synaptosomes prepared from WT and MT1-KO and MT2-KO mice excluding the possibility
that reduced amphetamine-induced locomotor activity is not due to decreased affinity of
amphetamine for DAT (Figure 5D).
Discussion
In this study, we report that melatonin receptors inhibit DA uptake by diminishing the cell
surface expression of DAT in a complex containing melatonin receptors and DAT. This
conclusion is supported by in vitro studies in HEK293T cells and in vivo studies in melatonin
receptor KO mice including co-immunoprecipitations, DA uptake and locomotor activity.
Initially, DAT was identified as a potential binding partner of the MT1 receptor in a MYTH
screen suggesting the binary character of the interaction and arguing towards the complex
formed between MT1 and DAT. The high sequence homology of MT1 with MT2 prompted us
to consider also the second melatonin receptor for which we observed indeed similar results as
for MT1 receptors: formation of protein complexes and a decrease in DA uptake, although to a
lesser extent. Km values for DA were similar suggesting unmodified DA transport capacity of
DAT in the presence of melatonin receptors. In contrast, maximal transport levels were
significantly reduced. Stimulation of MT1 and MT2 with a saturating concentration of melatonin
did not modify this effect. The inability of the melatonin receptor inverse agonist S77834 to

83
prevent the inhibitory effect of MT1 and MT2 on DA uptake excludes also the involvement of
constitutive receptor activity in this effect. Both, melatonin and S77834 were also ineffective
in altering the DA uptake in isolated striatal synaptosomes. Similarly, the absence of effect of
melatonin and S77834 argues against a direct allosteric effect of melatonin receptors in the
common complex. Taken together, melatonin receptors inhibit the maximal DA uptake capacity
of the DAT independently of the activation state of melatonin receptors.
Regulation of DAT surface expression has been previously identified as a limiting parameter
that regulates DA uptake. Our results indicate that the decreased DA uptake capacity in the
presence of MT1 and MT2 is caused by the retention of DAT in intracellular compartments.
This is supported by the retention of DAT in the ER of HEK293T cells co-expressing MT1 or
MT2, the enrichment of the immature, intracellular form of DAT under these conditions and the
co-immmunoprecipitation of the immature 55 kDa form of DAT with melatonin receptors in
the striatum. Although the precise molecular species of DAT engaged with its interacting
partners was not always reported, in many cases the mature form of DAT seems to be involved.
Interestingly, co-immunoprecipitation experiments between snapin and DAT in the striatum
suggest the involvement of the immature form of DAT, similar to our findings [55]. The
interaction with the non-glycosylated form of DAT is interesting as DAT activity depends not
only on its membrane expression but also on its glycosylation status as shown in vitro and by
the differential vulnerability of midbrain DA cells in Parkinson’s disease [56].
The dopamine D2 receptor has been shown to increase DA uptake as a consequence of
enhanced DAT cell surface expression possibly involving reduced membrane endocytosis and
increased in membrane exocytosis [22,35]. Furthermore, in striatum, activation of the kappa-
opioid receptor increased the Vmax for DAT mediated DA transport and DAT surface expression
most likely by forming a molecular protein complex [23]. In the case of the ubiquitine ligase
E3 Parkin increased DAT cell surface localization is achieved but by an alternative mechanism.

84
Actually, correctly folded DAT is stabilized by oligomerization during biosynthesis in the
endoplasmic reticulum, a process that is also necessary for efficient translocation of DAT to
the cell surface [57]. Importantly, incorrectly folded DAT protomers have dominant negative
effects on the WT in these oligomers and inhibit the cell surface delivery of DAT. Parkin is
shown to enhance the selective ubiquitination (and thus degradation) of the miss-folded and/or
unglycosylated DAT and cause the increase in the cell surface expression of mature forms of
DAT.
The striatum expresses abundant amounts of DAT. The expression and function of melatonin
receptors is much less established in this brain region. Uz et al. demonstrated in single-cell PCR
experiments that the mRNA coding for the MT1 receptor localizes all over the central
dopaminergic system including the ventral tegmental area, the substantia nigra and the striatum.
Localization of mRNA in the substantia nigra strongly suggests that the protein is expressed in
the neuron terminals projecting in the striatum confirming our result [58]. Our finding of 125I-
MLT binding sites in the striatum (this report and [59]) confirms these results on the protein
level. Interestingly, MT1 is part of a presynaptic protein network including synapsin, SNAP25
and 47, the voltage-gated calcium channel Cav2.2, Munc-18, rabphilin and snapin to which
DAT has now to be added [59].
Our study shows that MT1 and MT2 have a negative role on the capacity of DAT for DA
reuptake. The presence of melatonin receptors could thus protect neurons from intensive DA
reuptake. DA is known to form reactive oxygen species through enzymatic degradation.
Elevated rate of intra-neuronal DA would thus increase the degeneration of the dopaminergic
neurons characterized in several neurodegenerative illnesses as in Parkinson’s disease where
melatonin receptors are concomitantly down-regulated [29,60]. Intriguingly, the effect of MT1
and MT2 on DA uptake appears to be completely independent on stimulation of these receptors
by melatonin or any constitutive receptor activity. This conclusion is further supported by the

85
observation that ip injection of melatonin had no significant effect on amphetamine-induced
locomotor activity in rats [61].
Melatonin represents the most reliable readout of the circadian rhythm of the biological master
clock. According to our results, variation of melatonin levels along the circadian cycle are
unlikely to impact on DAT function and the formation of the melatonin receptor DAT complex.
In contrast, variation of MT1 and MT2 receptor levels might be important as they are submitted
to a circadian regulation due to a negative feed-back loop that exists between melatonin and the
expression of its receptors [62]. This regulatory mechanism might be just one component of a
complex network of circadian regulation of the dopaminergic system that involves circadian
variation of DA levels itself, dopamine D2 and D4 receptors and diurnal rhythms in quinpirole-
induced locomotor behaviors [63-65]. In turn, DA has also been shown to regulate major
components of the central circadian clock mechanism like Per2 expression in the dorsal striatum
[66]. Melatonin has been suggested to modify the dopaminergic system through additional,
receptor-independent, mechanisms. Long-term treatment with melatonin prevented DAT
down-regulation in a rotenone-induced PD model [67] and a model of amphetamine-induced
hippocampal damage [68], most likely through its antioxidant properties.
Taken together, our findings establish a new relationship between melatonin receptors and the
control of extracellular DA levels by regulating the DA transport capacity of DAT, particularly
in the striatum, as indicated by the enhanced DA uptake in striatal synaptosomes of MT1-KO
and MT2-KO mice. Given the fact that DAT activity is considered to reflect the general state of
dopaminergic circuit, and DAT alterations go together with dopaminergic deregulations in
many diseases such as Parkinson’s disease [3] and depression [69], our findings warrant further
investigation.

86
Acknowledgments
We thank Drs. Michel Bouvier and Bianca Plouffe (University of Montréal) for continues
support and advice in BRET experiments, respectively, Anne-Sophie Journé (Institut Cochin)
for her implication in mice breeding and expert advice in BRET and Dr. S. Doly (Institut
Cochin) for critical comments on the manuscript. This work was supported by grants from the
Fondation Recherche Médicale (Equipe FRM FRM DEQ20130326503 to R.J.), Inserm, CNRS
and the Who am I? laboratory of excellence No.ANR-11-LABX-0071 funded by the French
Gouvernement through its “Investments for the Future” program operated by The French
National Research Agency (ANR) under grant No.ANR-11-IDEX-0005-01.
Author Contributions
A.B., A.H., M.L.B., A.K., M.W., V.W. and R.J. performed research and/or analyzed data, R.J.,
A.B. and A.H. wrote the manuscript; I.S. and P.D. reviewed and/or edited the manuscript and
contributed to discussion; P.D. and R.J. managed the project.
Conflict of interest
The authors declare no conflict of interest.

87
References
1. Bjorklund A, and Dunnett SB (2007) Fifty years of dopamine research. Trends Neurosci
30:185-187
2. O'Neill B, Tilley MR, Han DD, Thirtamara-Rajamani K, Hill ER, Bishop GA, Zhou
FM, During MJ, and Gu HH (2014) Behavior of knock-in mice with a cocaine-
insensitive dopamine transporter after virogenetic restoration of cocaine sensitivity in
the striatum. Neuropharmacology 79:626-633
3. Ishibashi K, Oda K, Ishiwata K, and Ishii K (2014) Comparison of dopamine transporter
decline in a patient with Parkinson's disease and normal aging effect. J Neurol Sci
339:207-209
4. Laakso A, Bergman J, Haaparanta M, Vilkman H, Solin O, Syvalahti E, and Hietala J
(2001) Decreased striatal dopamine transporter binding in vivo in chronic
schizophrenia. Schizophr Res 52:115-120
5. Dougherty DD, Bonab AA, Spencer TJ, Rauch SL, Madras BK, and Fischman AJ
(1999) Dopamine transporter density in patients with attention deficit hyperactivity
disorder. Lancet 354:2132-2133
6. German CL, Hanson GR, and Fleckenstein AE (2012) Amphetamine and
methamphetamine reduce striatal dopamine transporter function without concurrent
dopamine transporter relocalization. J Neurochem 123:288-297
7. Eriksen J, Jorgensen TN, and Gether U (2010) Regulation of dopamine transporter
function by protein-protein interactions: new discoveries and methodological
challenges. J Neurochem 113:27-41
8. Markota M, Sin J, Pantazopoulos H, Jonilionis R, and Berretta S (2014) Reduced
dopamine transporter expression in the amygdala of subjects diagnosed with
schizophrenia. Schizophr Bull 40:984-991
9. Ng J, Zhen J, Meyer E, Erreger K, Li Y, Kakar N, Ahmad J, Thiele H, Kubisch C, Rider
NL, Morton DH, Strauss KA, Puffenberger EG, D'Agnano D, Anikster Y, Carducci C,
Hyland K, Rotstein M, Leuzzi V, Borck G, Reith ME, and Kurian MA (2014) Dopamine
transporter deficiency syndrome: phenotypic spectrum from infancy to adulthood. Brain
137:1107-1119
10. Lin Z, Zhang PW, Zhu X, Melgari JM, Huff R, Spieldoch RL, and Uhl GR (2003)
Phosphatidylinositol 3-kinase, protein kinase C, and MEK1/2 kinase regulation of
dopamine transporters (DAT) require N-terminal DAT phosphoacceptor sites. J Biol
Chem 278:20162-20170
11. Miranda M, Wu CC, Sorkina T, Korstjens DR, and Sorkin A (2005) Enhanced
ubiquitylation and accelerated degradation of the dopamine transporter mediated by
protein kinase C. J Biol Chem 280:35617-35624
12. Miranda M, Dionne KR, Sorkina T, and Sorkin A (2007) Three ubiquitin conjugation
sites in the amino terminus of the dopamine transporter mediate protein kinase C-
dependent endocytosis of the transporter. Mol Biol Cell 18:313-323
13. Cowell RM, Kantor L, Hewlett GH, Frey KA, and Gnegy ME (2000) Dopamine
transporter antagonists block phorbol ester-induced dopamine release and dopamine
transporter phosphorylation in striatal synaptosomes. Eur J Pharmacol 389:59-65
14. Khoshbouei H, Sen N, Guptaroy B, Johnson L, Lund D, Gnegy ME, Galli A, and Javitch
JA (2004) N-terminal phosphorylation of the dopamine transporter is required for
amphetamine-induced efflux. PLoS Biol 2:E78

88
15. Sitte HH, and Freissmuth M (2015) Amphetamines, new psychoactive drugs and the
monoamine transporter cycle. Trends Pharmacol Sci 36:41-50
16. Torres GE (2006) The dopamine transporter proteome. J Neurochem 97 Suppl 1:3-10
17. Kivell BM, Kahlig K, Galli A, Javitch JA, and Shippenberg TS. (2004) Regulation of
Dopamine Transporter Function and Cell Surface Expression by Kappa Opioid
Receptors. . in 34th Annual meeting of the Society for Neuroscience, San Diego
18. Bolan EA, Shan L, Devi LA, Javitch JA, and Shippenberg TS. (2004) Regulation of
Dopamine Transporter Function by Kappa-Opioid Receptors: Role of Protein
Trafficking. in 34th Annual meeting of the Society for Neuroscience, San Diego
19. Pei L, Lee F, Mirecki A, Zou S, Zhang H, Vukusic B, and Liu F. (2004) Regulation of
Dopamine Transporter Function by Dopamine D2 Receptors. . in 34th Annual meeting
of the Society for Neuroscience, San Diego
20. Marazziti D, Mandillo S, Di Pietro C, Golini E, Matteoni R, and Tocchini-Valentini GP
(2007) GPR37 associates with the dopamine transporter to modulate dopamine uptake
and behavioral responses to dopaminergic drugs. Proc Natl Acad Sci U S A 104:9846-
9851
21. Jiang H, Jiang Q, and Feng J (2004) Parkin increases dopamine uptake by enhancing
the cell surface expression of dopamine transporter. J Biol Chem 279:54380-54386
22. Lee FJ, Pei L, Moszczynska A, Vukusic B, Fletcher PJ, and Liu F (2007) Dopamine
transporter cell surface localization facilitated by a direct interaction with the dopamine
D2 receptor. EMBO J 26:2127-2136
23. Kivell B, Uzelac Z, Sundaramurthy S, Rajamanickam J, Ewald A, Chefer V, Jaligam
V, Bolan E, Simonson B, Annamalai B, Mannangatti P, Prisinzano TE, Gomes I, Devi
LA, Jayanthi LD, Sitte HH, Ramamoorthy S, and Shippenberg TS (2014) Salvinorin A
regulates dopamine transporter function via a kappa opioid receptor and ERK1/2-
dependent mechanism. Neuropharmacology 86:228-240
24. Zisapel N, Egozi Y, and Laudon M (1982) Inhibition of dopamine release by melatonin:
regional distribution in the rat brain. Brain Res 246:161-163
25. Escames G, Acuna Castroviejo D, and Vives F (1996) Melatonin-dopamine interaction
in the striatal projection area of sensorimotor cortex in the rat. Neuroreport 7:597-600
26. Dubocovich ML, Delagrange P, Krause DN, Sugden D, Cardinali DP, and Olcese J
(2010) International Union of Basic and Clinical Pharmacology. LXXV. Nomenclature,
classification, and pharmacology of G protein-coupled melatonin receptors. Pharmacol
Rev 62:343-380
27. Jockers R, Delagrange P, Dubocovich ML, Markus RP, Renault N, Tosini G, Cecon E,
and Zlotos DP (2016) Update on Melatonin Receptors. IUPHAR Review. Br J
Pharmacol 173:2702-2725
28. Zlotos DP, Jockers R, Cecon E, Rivara S, and Witt-Enderby PA (2014) MT1 and MT2
Melatonin Receptors: Ligands, Models, Oligomers, and Therapeutic Potential. J Med
Chem 57:3161-3185
29. Adi N, Mash DC, Ali Y, Singer C, Shehadeh L, and Papapetropoulos S (2010)
Melatonin MT1 and MT2 receptor expression in Parkinson's disease. Med Sci Monit
16:BR61-67
30. Brunner P, Sozer-Topcular N, Jockers R, Ravid R, Angeloni D, Fraschini F, Eckert A,
Muller-Spahn F, and Savaskan E (2006) Pineal and cortical melatonin receptors MT1
and MT2 are decreased in Alzheimer's disease. Eur J Histochem 50:311-316
31. Bendz LM, and Scates AC (2010) Melatonin treatment for insomnia in pediatric patients
with attention-deficit/hyperactivity disorder. Ann Pharmacother 44:185-191

89
32. Monteleone P, Natale M, La Rocca A, and Maj M (1997) Decreased nocturnal secretion
of melatonin in drug-free schizophrenics: no change after subchronic treatment with
antipsychotics. Neuropsychobiology 36:159-163
33. Karamitri A, Renault N, Clement N, Guillaume JL, and Jockers R (2013) Minireview:
Toward the establishment of a link between melatonin and glucose homeostasis:
association of melatonin MT2 receptor variants with type 2 diabetes. Mol Endocrinol
27:1217-1233
34. Chen N, and Reith ME (2008) Substrates dissociate dopamine transporter oligomers. J
Neurochem 105:910-920
35. Bolan EA, Kivell B, Jaligam V, Oz M, Jayanthi LD, Han Y, Sen N, Urizar E, Gomes I,
Devi LA, Ramamoorthy S, Javitch JA, Zapata A, and Shippenberg TS (2007) D2
receptors regulate dopamine transporter function via an extracellular signal-regulated
kinases 1 and 2-dependent and phosphoinositide 3 kinase-independent mechanism. Mol
Pharmacol 71:1222-1232
36. Lam VM, Beerepoot P, Angers S, and Salahpour A (2013) A novel assay for
measurement of membrane-protein surface expression using a beta-lactamase. Traffic
14:778-784
37. Snider J, Kittanakom S, Damjanovic D, Curak J, Wong V, and Stagljar I (2010)
Detecting interactions with membrane proteins using a membrane two-hybrid assay in
yeast. Nat Protoc 5:1281-1293
38. Gietz RD, and Woods RA (2006) Yeast transformation by the LiAc/SS Carrier
DNA/PEG method. Methods Mol Biol 313:107-120
39. Gainetdinov RR, Fumagalli F, Wang YM, Jones SR, Levey AI, Miller GW, and Caron
MG (1998) Increased MPTP neurotoxicity in vesicular monoamine transporter 2
heterozygote knockout mice. J Neurochem 70:1973-1978
40. Guillaume JL, Daulat AM, Maurice P, Levoye A, Migaud M, Brydon L, Malpaux B,
Borg-Capra C, and Jockers R (2008) The PDZ protein mupp1 promotes Gi coupling
and signaling of the Mt1 melatonin receptor. J Biol Chem 283:16762-16771
41. Cecon E, Chen M, Marcola M, Fernandes PA, Jockers R, and Markus RP (2015)
Amyloid beta peptide directly impairs pineal gland melatonin synthesis and melatonin
receptor signaling through the ERK pathway. FASEB J 29:2566-2582
42. Thomas L, Purvis CC, Drew JE, Abramovich DR, and Williams LM (2002) Melatonin
receptors in human fetal brain: 2-[I-125] iodomelatonin binding and MT1 gene
expression. Journal Of Pineal Research 33:218-224
43. Huang X, Dai FF, Gaisano G, Giglou K, Han J, Zhang M, Kittanakom S, Wong V, Wei
L, Showalter AD, Sloop KW, Stagljar I, and Wheeler MB (2013) The identification of
novel proteins that interact with the GLP-1 receptor and restrain its activity. Mol
Endocrinol 27:1550-1563
44. Meister B, and Elde R (1993) Dopamine transporter mRNA in neurons of the rat
hypothalamus. Neuroendocrinology 58:388-395
45. Mercier JF, Salahpour A, Angers S, Breit A, and Bouvier M (2002) Quantitative
assessment of beta 1 and beta 2-adrenergic receptor homo and hetero-dimerization by
bioluminescence resonance energy transfer. J Biol Chem 277:44925-44931
46. Couturier C, and Jockers R (2003) Activation of the leptin receptor by a ligand-induced
conformational change of constitutive receptor dimers. J Biol Chem 278:26604-26611
47. Ayoub MA, Levoye A, Delagrange P, and Jockers R (2004) Preferential formation of
MT1/MT2 melatonin receptor heterodimers with distinct ligand interaction properties
compared with MT2 homodimers. Mol Pharmacol 66:312-321
48. Couturier C, Sarkis C, Seron K, Belouzard S, Chen P, Lenain A, Corset L, Dam J,
Vauthier V, Dubart A, Mallet J, Froguel P, Rouille Y, and Jockers R (2007) Silencing

90
of OB-RGRP in mouse hypothalamic arcuate nucleus increases leptin receptor signaling
and prevents diet-induced obesity. Proc Natl Acad Sci U S A 104:19476-19481
49. Brydon L, Roka F, Petit L, deCoppet P, Tissot M, Barrett P, Morgan PJ, Nanoff C,
Strosberg AD, and Jockers R (1999) Dual signaling of human Mel1a melatonin
receptors via G(I2), G(I3), and G(Q/11) proteins. Mol Endocrinol 13:2025-2038
50. Devavry S, Legros C, Brasseur C, Delagrange P, Spadoni G, Cohen W, Malpaux B,
Boutin JA, and Nosjean O (2012) Description of the constitutive activity of cloned
human melatonin receptors hMT(1) and hMT(2) and discovery of inverse agonists. J
Pineal Res 53:29-37
51. Binda F, Dipace C, Bowton E, Robertson SD, Lute BJ, Fog JU, Zhang M, Sen N,
Colbran RJ, Gnegy ME, Gether U, Javitch JA, Erreger K, and Galli A (2008) Syntaxin
1A interaction with the dopamine transporter promotes amphetamine-induced
dopamine efflux. Mol Pharmacol 74:1101-1108
52. Egana LA, Cuevas RA, Baust TB, Parra LA, Leak RK, Hochendoner S, Pena K, Quiroz
M, Hong WC, Dorostkar MM, Janz R, Sitte HH, and Torres GE (2009) Physical and
functional interaction between the dopamine transporter and the synaptic vesicle protein
synaptogyrin-3. J Neurosci 29:4592-4604
53. Giros B, el Mestikawy S, Godinot N, Zheng K, Han H, Yang-Feng T, and Caron MG
(1992) Cloning, pharmacological characterization, and chromosome assignment of the
human dopamine transporter. Mol Pharmacol 42:383-390
54. Huff RA, Vaughan RA, Kuhar MJ, and Uhl GR (1997) Phorbol esters increase
dopamine transporter phosphorylation and decrease transport Vmax. J Neurochem
68:225-232
55. Erdozain AM, De Gois S, Bernard V, Gorgievski V, Pietrancosta N, Dumas S, Macedo
CE, Vanhoutte P, Ortega JE, Meana JJ, Tzavara ET, Vialou V, and Giros B (2018)
Structural and Functional Characterization of the Interaction of Snapin with the
Dopamine Transporter: Differential Modulation of Psychostimulant Actions.
Neuropsychopharmacology 43:1041-1051
56. Afonso-Oramas D, Cruz-Muros I, Alvarez de la Rosa D, Abreu P, Giraldez T, Castro-
Hernandez J, Salas-Hernandez J, Lanciego JL, Rodriguez M, and Gonzalez-Hernandez
T (2009) Dopamine transporter glycosylation correlates with the vulnerability of
midbrain dopaminergic cells in Parkinson's disease. Neurobiol Dis 36:494-508
57. Sorkina T, Doolen S, Galperin E, Zahniser NR, and Sorkin A (2003) Oligomerization
of dopamine transporters visualized in living cells by fluorescence resonance energy
transfer microscopy. J Biol Chem 278:28274-28283
58. Uz T, Arslan AD, Kurtuncu M, Imbesi M, Akhisaroglu M, Dwivedi Y, Pandey GN, and
Manev H (2005) The regional and cellular expression profile of the melatonin receptor
MT1 in the central dopaminergic system. Brain Res Mol Brain Res 136:45-53
59. Benleulmi-Chaachoua A, Chen L, Sokolina K, Wong V, Jurisica I, Emerit MB, Darmon
M, Espin A, Stagljar I, Tafelmeyer P, Zamponi GW, Delagrange P, Maurice P, and
Jockers R (2016) Protein interactome mining defines melatonin MT1 receptors as
integral component of presynaptic protein complexes of neurons. J Pineal Res 60:95-
108
60. Haavik J, Almas B, and Flatmark T (1997) Generation of reactive oxygen species by
tyrosine hydroxylase: a possible contribution to the degeneration of dopaminergic
neurons? J Neurochem 68:328-332
61. Palaoglu S, Palaoglu O, Akarsu ES, Ayhan IH, Ozgen T, and Erbengi A (1994)
Behavioural assessment of pinealectomy and foetal pineal gland transplantation in rats:
Part II. Acta Neurochir (Wien) 128:8-12
91
62. Poirel VJ, Masson-Pevet M, Pevet P, and Gauer F (2002) MT1 melatonin receptor
mRNA expression exhibits a circadian variation in the rat suprachiasmatic nuclei. Brain
Res 946:64-71
63. Akhisaroglu M, Kurtuncu M, Manev H, and Uz T (2005) Diurnal rhythms in quinpirole-
induced locomotor behaviors and striatal D2/D3 receptor levels in mice. Pharmacol
Biochem Behav 80:371-377
64. Ikeda E, Matsunaga N, Kakimoto K, Hamamura K, Hayashi A, Koyanagi S, and Ohdo
S (2013) Molecular mechanism regulating 24-hour rhythm of dopamine D3 receptor
expression in mouse ventral striatum. Mol Pharmacol 83:959-967
65. Gonzalez S, Moreno-Delgado D, Moreno E, Perez-Capote K, Franco R, Mallol J, Cortes
A, Casado V, Lluis C, Ortiz J, Ferre S, Canela E, and McCormick PJ (2012) Circadian-
related heteromerization of adrenergic and dopamine D(4) receptors modulates
melatonin synthesis and release in the pineal gland. PLoS Biol 10:e1001347
66. Hood S, Cassidy P, Cossette MP, Weigl Y, Verwey M, Robinson B, Stewart J, and Amir
S (2010) Endogenous dopamine regulates the rhythm of expression of the clock protein
PER2 in the rat dorsal striatum via daily activation of D2 dopamine receptors. J
Neurosci 30:14046-14058
67. Lin CH, Huang JY, Ching CH, and Chuang JI (2008) Melatonin reduces the neuronal
loss, downregulation of dopamine transporter, and upregulation of D2 receptor in
rotenone-induced parkinsonian rats. J Pineal Res 44:205-213
68. Leeboonngam T, Pramong R, Sae-Ung K, Govitrapong P, and Phansuwan-Pujito P
(2018) Neuroprotective effects of melatonin on amphetamine-induced dopaminergic
fiber degeneration in the hippocampus of postnatal rats. J Pineal Res 64
69. Hsiao MC, Lin KJ, Liu CY, and Schatz DB (2013) The interaction between dopamine
transporter function, gender differences, and possible laterality in depression.
Psychiatry Res 211:72-77

Figures
Figure 1: DAT is expressed in the striatum, hypothalamus and cortex and interacts
with MT1 and MT2 in mice striatal synaptosomes.
(A) Western blot analysis on 30 µg of synaptosomal fraction of mice striatum, cortex and
hypothalamus using anti-DAT antibodies. The blot shows that the mature (black arrow head)
and the immature (white arrow head) forms of DAT are present at various levels in all three
brain regions.
(B) 3H-DA uptake assay on 100 µg of synaptosomes from different brain regions as
indicated, in the presence or absence of 25 nM of nomifensine to define the non-specific
uptake.
(C) Number of specific 2-[125I]-iodomelatonin binding sites in presynaptic membranes from
rat striatum, hypothalamus and cortex.
(D, E) Co-IP between MT1 and DAT in striatal synaptosomes of WT and MT1-KO (D) or
MT2-KO (E) mice using anti-MT1 (D) or anti-MT2 (E) antibodies for IP and antibodies
against DAT (left panels) or non-glycosylated DAT (n.g. DAT) (right panels) for WB
detection. Similar results were obtained in two additional experiments. Black arrow head,
mature form of DAT; white arrow head, immature form of DAT.
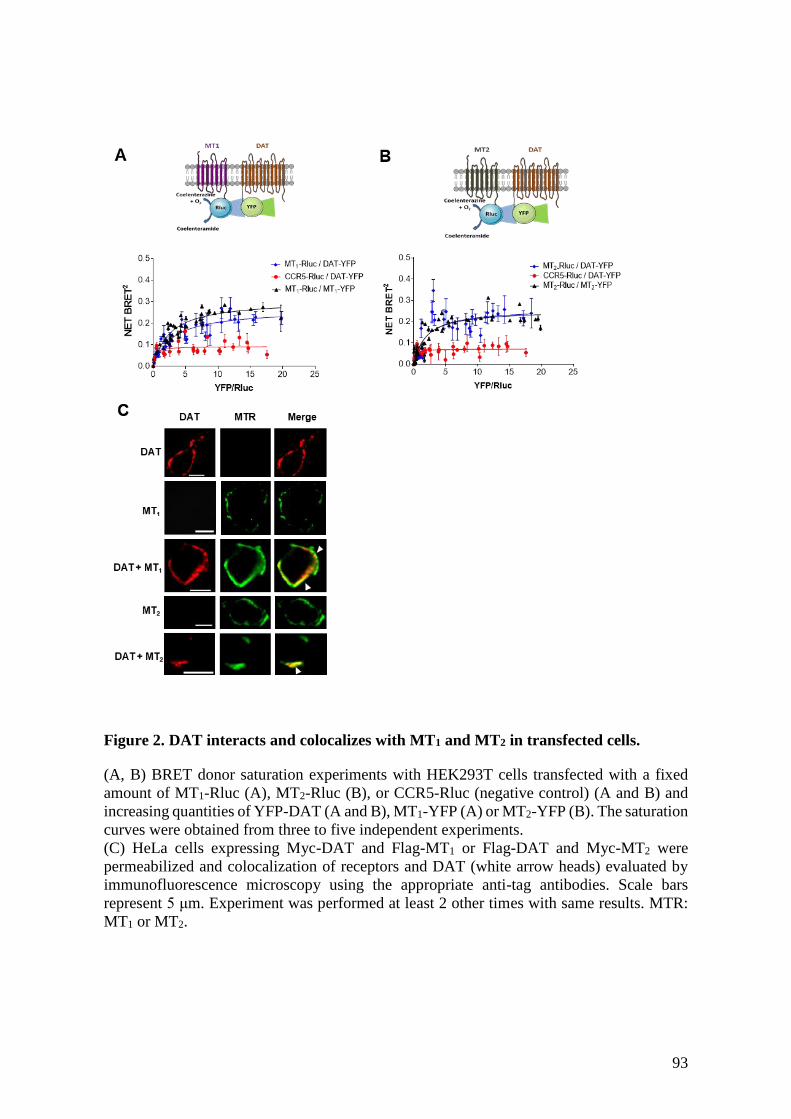
93
Figure 2. DAT interacts and colocalizes with MT1 and MT2 in transfected cells.
(A, B) BRET donor saturation experiments with HEK293T cells transfected with a fixed
amount of MT1-Rluc (A), MT2-Rluc (B), or CCR5-Rluc (negative control) (A and B) and
increasing quantities of YFP-DAT (A and B), MT1-YFP (A) or MT2-YFP (B). The saturation
curves were obtained from three to five independent experiments.
(C) HeLa cells expressing Myc-DAT and Flag-MT1 or Flag-DAT and Myc-MT2 were
permeabilized and colocalization of receptors and DAT (white arrow heads) evaluated by
immunofluorescence microscopy using the appropriate anti-tag antibodies. Scale bars
represent 5 μm. Experiment was performed at least 2 other times with same results. MTR:
MT1 or MT2.

94
Figure 3. MT1 and MT2 constitutively decrease DA uptake in HEK293T cells and
striatal synaptosomes.
(A) DA uptake in HEK293T cells expressing Flag-DAT alone or with Flag-MT1, Myc-MT2,
Myc-GPR37, HA-CCR5 or Myc-Endospanin1 (Endo1). Inset: dot-blot analysis of DAT
expression with anti-DAT antibodies.
(B and C) DA uptake in HEK293T cells expressing Flag-MT1 or Myc-MT2 (B) or on 100
µg of striatal synaptosomes of WT-mice (C) pre-incubated or not with melatonin or the
inverse agonist S77834-1 (1 µM each, 30 min).
(D) DA uptake in HEK293T cells expressing ΔN-Flag-DAT alone or with Flag-MT1 or Myc-
MT2.
(E) DA uptake on 100 µg of striatal synaptosomes of the indicated mice strains. Dot-Blot
analysis of the synaptosomal fractions using anti-DAT antibodies.
Data are expressed as relative specific uptake compared to DAT alone and are presented as
mean SEM; n=3 (A-C) or n=5 (D). NS not statistically different. *P < 0.05, **P < 0.01
and ***P < 0.005, with respect to vehicle (one-way ANOVA followed by multiple
comparison post-hoc test).
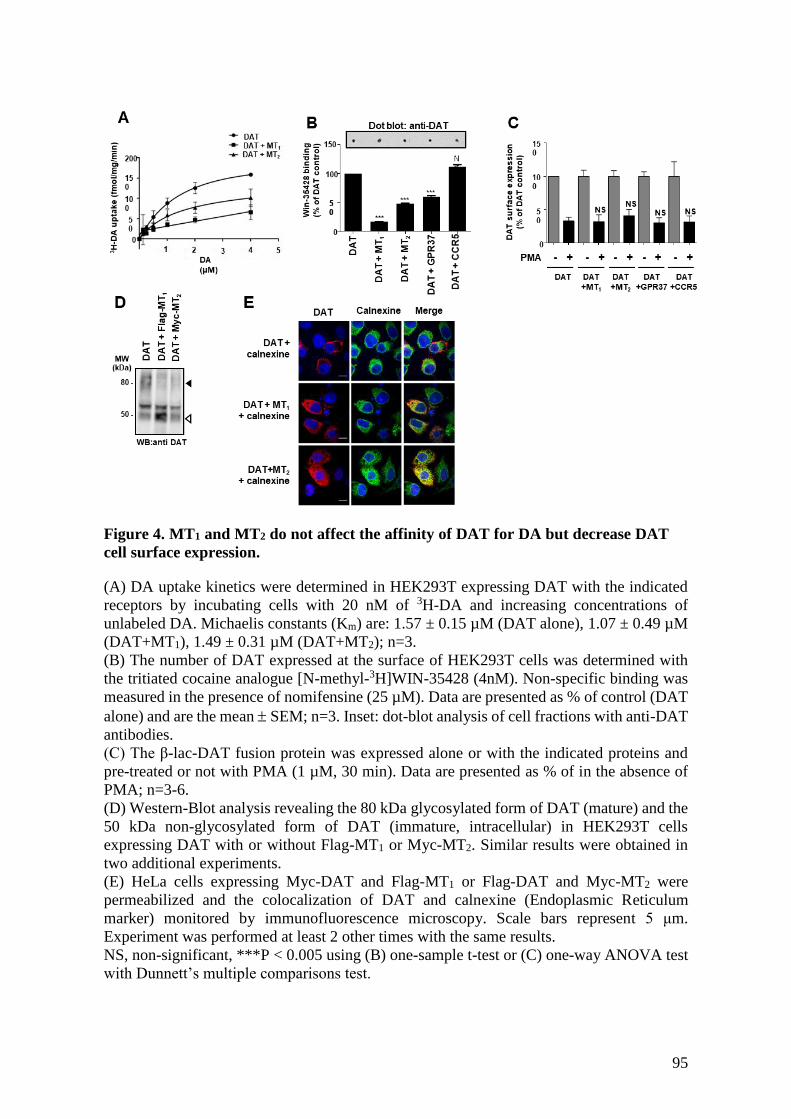
95
Figure 4. MT1 and MT2 do not affect the affinity of DAT for DA but decrease DAT
cell surface expression.
(A) DA uptake kinetics were determined in HEK293T expressing DAT with the indicated
receptors by incubating cells with 20 nM of 3H-DA and increasing concentrations of
unlabeled DA. Michaelis constants (Km) are: 1.57 ± 0.15 µM (DAT alone), 1.07 ± 0.49 µM
(DAT+MT1), 1.49 ± 0.31 µM (DAT+MT2); n=3.
(B) The number of DAT expressed at the surface of HEK293T cells was determined with
the tritiated cocaine analogue [N-methyl-3H]WIN-35428 (4nM). Non-specific binding was
measured in the presence of nomifensine (25 µM). Data are presented as % of control (DAT
alone) and are the mean SEM; n=3. Inset: dot-blot analysis of cell fractions with anti-DAT
antibodies.
(C) The β-lac-DAT fusion protein was expressed alone or with the indicated proteins and
pre-treated or not with PMA (1 µM, 30 min). Data are presented as % of in the absence of
PMA; n=3-6.
(D) Western-Blot analysis revealing the 80 kDa glycosylated form of DAT (mature) and the
50 kDa non-glycosylated form of DAT (immature, intracellular) in HEK293T cells
expressing DAT with or without Flag-MT1 or Myc-MT2. Similar results were obtained in
two additional experiments.
(E) HeLa cells expressing Myc-DAT and Flag-MT1 or Flag-DAT and Myc-MT2 were
permeabilized and the colocalization of DAT and calnexine (Endoplasmic Reticulum
marker) monitored by immunofluorescence microscopy. Scale bars represent 5 μm.
Experiment was performed at least 2 other times with the same results.
NS, non-significant, ***P < 0.005 using (B) one-sample t-test or (C) one-way ANOVA test
with Dunnett’s multiple comparisons test.

96
Figure 5. Melatonin receptor KO mice are less sensitive to amphetamine than wild
type mice.
(A-C) D-amphetamine was injected (3mg/kg) in WT, MT1-KO or MT2-KO mice (arrow on
the graph) and the distance traveled by the mice was recorded during 60 minutes. Panel C
presents cumulative distance travelled during 60 minutes after D-amphetamine injection.
Data are presented as mean SEM; N=3.
(D) 3H-DA (20nM) uptake in striatal synaptosomes of the indicated mice strains in the
presence of increasing D-amphetamine concentrations. LogIC50 values are -4,32 ± 0,10
(WT), -4,03 ± 0,15 (MT1-KO), -3,87 ± 0,14 (MT2-KO); N=3. **P < 0.01, using one way
ANOVA test with Dunnett’s multiple comparisons test.
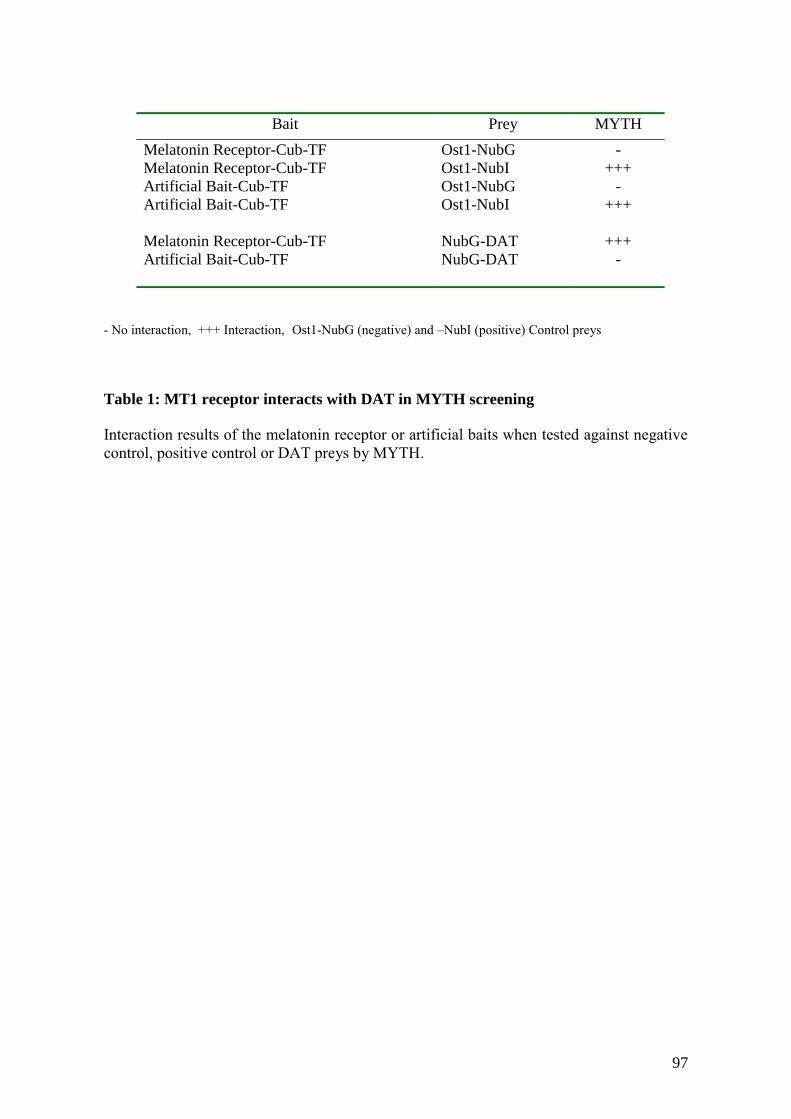
97
- No interaction, +++ Interaction, Ost1-NubG (negative) and –NubI (positive) Control preys
Table 1: MT1 receptor interacts with DAT in MYTH screening
Interaction results of the melatonin receptor or artificial baits when tested against negative
control, positive control or DAT preys by MYTH.
Bait Prey MYTH
Melatonin Receptor-Cub-TF Ost1-NubG -
Melatonin Receptor-Cub-TF Ost1-NubI +++
Artificial Bait-Cub-TF Ost1-NubG -
Artificial Bait-Cub-TF Ost1-NubI +++
Melatonin Receptor-Cub-TF NubG-DAT +++
Artificial Bait-Cub-TF NubG-DAT -

98
Supplementary material:
Supplementary Figure 1. Melatonin receptors decrease DA uptake.
(A) HeLa cells expressing Myc-DAT and Flag-MT1 or Flag-DAT and Myc-MT2 were
permeabilized and the colocalization of DAT and MT1 or MT2 was monitored by
immunofluorescence microscopy. Scale bars represent 5 μm. Experiment was performed at
least 2 other times with the same results.
(B) Western-blot detection of proteins co-expressed with DAT in HEK293T cell lysates of
the DA uptake experiment shown in Figure 3A.

99
(C) DA uptake on 100 µg of striatal synaptosomes of WT-mice (C) pre-incubated or not with
increasing melatonin concentrations for 30 min. Data are expressed as relative specific
uptake compared to DAT alone and are presented as mean SEM; n=3.
(D and E) DA uptake in HEK293T cells expressing DAT and Flag-MT1 (D) or Myc-MT2
(E) in HEK293T cells treated or not with the Gai protein inhibitor pertussis toxin (PTX,
10ng/mL, ON) or the Gaq protein inhibitor YM-254890 (YM, 25µM, 1h). Data are
expressed as % of DA uptake in the absence of inhibitor and are presented as mean SEM;
n=3.
(F) Effect of melatonin (closed symbols) and S77834-1 (open symbols) on forskolin (Fsk)-
stimulated cAMP production in HEK293T cells expressing MT1 or MT2 receptors.
Data represent the mean ± SEM of three independent experiments performed in triplicates.
(G) Pull-down of ΔN-Flag-DAT with HA-SBD-MT1 and HA-SBD-MT2 (SBD =
streptavidin binding domain) on streptavidin coated beads. Data are representative of three
experiments. (H) Western-blot detection of Flag-MT1 and Myc-MT2 in HEK293T cell
lysates of the DA uptake experiment shown in Figure 3C.
NS not statistically different. *P < 0.05, **P < 0.01 and ***P < 0.005, with respect to vehicle
(one way ANOVA test).

100
Supplementary Figure 2. DAT does not colocalizes with Golgi marker proteins in
the presence of melatonin receptors.
(A, B) HeLa cells expressing Myc-DAT and Flag-MT1 or Flag-DAT and Myc-MT2 were
permeabilized and the colocalization of DAT and 58K (Golgi marker) (A) or GM130 (cis-
Golgi marker) (B) was evaluated by immunofluorescence microscopy. Scale bars represent
5 μm. Experiment was performed at least 2 other times with same results.

101
Supplementary Figure 3. Presence of 58K and calnexine in synaptosome
preparation.
Western blot analysis on 30 µg of mice striatal synaptosome fractions using anti-58K (Golgi
marker) and anti-calnexine (Endoplasmic Reticulum marker) antibodies. The western-blot
shows that 58K and calnexine are still present in synaptosome preparations.

102
Résumé du chapitre 2 – Article 1
Dans ce manuscrit, nous avons démontré les points suivants :
-Les MTRs interagissent physiquement avec DAT.
-Les MTRs diminuent l’expression à la surface cellulaire de DAT.
-Les MTRs diminuent l’activité de recapture de la dopamine de DAT.
-Les MTRs retiennent DAT dans le réticulum endoplasmique.
-En absence de MTRs, les souris sont moins sensibles à l’amphétamine.
La découverte d’interactions entre DAT et les MTRs ainsi que la régulation de la recapture
par ces derniers offrent de nouvelles perspectives dans la compréhension et le traitement de
maladies neurodégénératives comme la MP ainsi que le traitement des personnes souffrant
de TDAH ou addictes aux drogues agissant sur le système dopaminergique.
Après avoir découvert un nouveau mécanisme impliquant la régulation du système
dopaminergique par le système mélatoninergique, nous nous sommes intéressés à
l’implication de ce dernier dans le développement de maladies métaboliques, notamment le
DT2.

103
Chapitre 3
Article 2

104
Type 2 diabetes–associated variants of the MT2
melatonin receptor affect distinct modes of signaling
Angeliki Karamitri*, Bianca Plouffe*, Amélie Bonnefond*, Min Chen,
Jonathan Gallion, Jean-Luc Guillaume, Alan Hegron, Mathilde Boissel,
Mickaël Canouil, Claudia Langenberg, Nicholas J. Wareham, Christian Le
Gouill, Viktoria Lukasheva, Olivier Lichtarge, Philippe Froguel,
Michel Bouvier, Ralf Jockers
Science Signaling (2018)

105
Type 2 diabetes–associated variants of the MT2 melatonin
receptor affect distinct modes of signaling
Angeliki Karamitri1,2,3*, Bianca Plouffe4*, Amélie Bonnefond5*, Min Chen1,2,3, Jonathan
Gallion6, Jean-Luc Guillaume1,2,3, Alan Hegron1,2,3, Mathilde Boissel5, Mickaël Canouil5,
Claudia Langenberg7, Nicholas J. Wareham7, Christian Le Gouill4, Viktoria Lukashova4,
Olivier Lichtarge6, Philippe Froguel5,8†, Michel Bouvier4†‡, Ralf Jockers1,2,3*†‡
1Inserm, U1016, Institut Cochin, Paris, France. 2CNRS UMR 8104, Paris, France. 3Univ.
Paris Descartes, Paris, France. 4Institute for Research in Immunology and Cancer &
Department of Biochemistry and Molecular Medicine, Université de Montréal, Montreal,
QC H3C 3J7, Canada. 5Univ. Lille, CNRS UMR 8199 - EGID, Institut Pasteur de Lille,
Lille, France. 6Structural Computational Biology and Molecular Biophysics, Baylor College
of Medicine, Houston, TX 77030, USA. 7Medical Research Council (MRC) Epidemiology
Unit, University of Cambridge School of Clinical, Cambridge, CB2 0QQ, United Kingdom. 8Department of Genomics of Common Disease, School of Public Health, Imperial College
London, Hammersmith Hospital, W12 0NN London, United Kingdom.
*These authors contributed equally to this work.
‡Co-senior authors
†Corresponding author. Email: [email protected] (R.J.); [email protected]
(M.B.); [email protected] (P.F.)
Abstract
Melatonin is produced during the night and regulates sleep and circadian rhythms. Loss-of-
function variants in MTNR1B, which encodes the melatonin receptor MT2, a G protein–
coupled receptor (GPCR), are associated with an increased risk of type 2 diabetes (T2D). To
identify specific T2D-associated signaling pathway(s), we profiled the signaling output of
40 MT2 variants by monitoring spontaneous (ligand-independent) and melatonin-induced
activation of multiple signaling effectors. Genetic association analysis showed that defects

106
in the melatonin-induced activation of Gαi1 and Gαz proteins and in spontaneous β-arrestin2
recruitment to MT2 were the most statistically significantly associated with an increased T2D
risk. Computational variant impact prediction by in silico evolutionary lineage analysis
strongly correlated with the measured phenotypic effect of each variant, providing a
predictive tool for future studies on GPCR variants. Together, this large-scale functional
study provides an operational framework for the postgenomic analysis of the multiple GPCR
variants present in the human population. The association of T2D risk with signaling
pathway–specific defects opens avenues for pathway-specific personalized therapeutic
intervention and reveals the potential relevance of MT2 function during the day, when
melatonin is undetectable, but spontaneous activity of the receptor occurs.
Introduction
Type 2 diabetes mellitus (T2D) is characterized by high blood glucose concentrations in the
context of insulin resistance and impaired insulin secretion from pancreatic beta cells (1).
The prevalence of T2D has increased over the last 20 years and closely parallels the
mounting epidemic of obesity. G protein–coupled receptors (GPCRs) are promising drug
targets for metabolic diseases, including T2D (2, 3). Agonists of GPCRs, such as the
glucagon-like peptide 1 receptor (GLP1R), are clinically used to improve glucose tolerance
in T2D patients (4). Furthermore, drugs targeting other GPCRs, such as the gastric inhibitory
polypeptide receptor (GIPR), the free fatty acid receptor 1 (FFAR1, also known as GPR40),
and the glucose-dependent insulinotropic receptor (GPR119), are currently in clinical trials
and at different stages of development for diabetes therapy (3).

107
In addition to several environmental risk factors, T2D has a strong genetic basis. Genome-
wide association studies (GWAS) and their meta-analyses have identified more than 100 loci
containing single nucleotide polymorphisms (SNPs) that are statistically significantly
associated with T2D risk and altered glycemic values or insulin secretion (5). The common
SNP rs10830963 is located in the unique intron of MTNR1B, which encodes MT2, the
melatonin (MLT) receptor, is statistically significantly associated with increased fasting
plasma glucose concentrations, reduced early insulin response to glucose, and increased risk
of both T2D and gestational diabetes mellitus (6-8). The homozygous T2D-associated SNP
(corresponding to a GG genotype; the wild-type sequence is CC) is associated with a two-
fold increase in cis MTNR1B mRNA abundance in human pancreatic islets compared with
the amount in the islets of CC genotype carriers (7, 9-11), suggesting that increased MLT
signaling might be associated with an increased T2D risk. However, when we performed a
large-scale exon resequencing of MTNR1B, we found that only rare, nonsynonymous
variants with a loss-of-function phenotype strongly associated with increased T2D risk (odds
ratio of 5, when analyzed in aggregation) (12). Considering these apparently contradictory
findings, the role of MT2 signaling on T2D risk in humans remains unanswered.
MT2 belongs to the MLT receptor family of GPCRs, which is composed of MT1, MT2, and
the orphan GPR50 based on their sequence homologies. However, only MT1 and MT2 and
not GPR50 bind to MLT and do so with high affinity (13-15). MLT is mainly secreted from
the pineal gland in a circadian manner with high plasma concentrations during the night (16).
MLT receptors are involved in the regulation of sleep, circadian and seasonal rhythms,
immune functions, retinal physiology, and glucose homeostasis (17). How MLT modulates
glucose homeostasis in humans is not well understood. In rodent -cell lines, MLT decreases
insulin secretion (18) (19), whereas studies of isolated human islets showed that MLT

108
stimulates insulin secretion (20, 21). It is well-known that MLT exerts opposing effects on
specific functions in a species-dependent manner (22). Epidemiological studies
demonstrated that people working on different shifts, compared to day workers, present with
a marked dysfunction in nocturnal MLT secretion and a higher risk of cardiovascular
disorders, metabolic diseases (including T2D), and cancer. A 12-year prospective study
showed that decreased nocturnal MLT secretion in nurses working on rotating night shifts is
associated with a higher risk of developing T2D (23).
Several sites of MLT action are possible, because MT1 and MT2 are present in many central
and peripheral tissues, including insulin target tissues, such as liver, muscle, and adipose
tissue (19, 24). The amounts of mRNA transcripts for MTNR1A (encoding MT1) and
MTNR1B are very low or undetectable in human islets and only detectable in a small subset
of -cells (25-27), raising questions about the relevance of human islets as an MLT target
tissue (28). In the hypothalamic suprachiasmatic nuclei, MT1 and MT2 regulate the circadian
rhythms of the master clock in mammals, and disruption of central and peripheral circadian
rhythms leads to metabolic disorders, including T2D (29-31). The T2D-associated SNP
rs10830963, which is in an intron unique to MTNR1B, affects the dynamics of MLT
secretion (32). Therefore, it is possible that the global dysregulation of MT2 signaling
contributes to T2D pathophysiology through the alteration of circadian rhythms.
Given that GPCRs can engage multiple distinct signaling pathways and that biased ligands
alter the balance of activated signaling pathways (33),(34), the objective of the current study
was to assess the effect of all MTNR1B variants identified by Bonnefond et al. (12) on
multiple pathways engaged upon MT2 activation. We generated a “signaling signature” for
each variant receptor to investigate whether the association between MT2 loss-of-function

109
and T2D was linked to specific signaling defects. MT2 has been described to activate three
signaling pathways. Through Gi/o proteins, MT2 inhibits the production of cyclic adenosine
monophosphate (cAMP) and stimulates extracellular signal–regulated kinase 1 and 2
(ERK1/2). In addition to engaging Gi/o proteins, MT2 also promotes the recruitment of β-
arrestin (35). Here, we assessed the effects of spontaneous (ligand-independent) and MLT-
induced activity of each MT2 variant for these three pathways.
The “evolutionary action” deduced from in silico trace evolution analysis (36) predicts the
functional effect of a mutation based on the sensitivity of the site that is mutated and on the
magnitude of the mutational substitution. We applied this evolutionary action analysis to
correlate the experimental data with mutations in the MT2 sequence. We then reassessed the
genetic association data to investigate the effects of specific signaling defects on T2D risk.
With this systematic multiparameter approach, we determined specific signaling defects
related to MT2 variation that are associated with T2D risk. This approach not only holds
promise for identifying strategies to develop specific treatments or preventative measures
for T2D, but also is a method that will facilitate the targeting of specific disease-related
pathway defects when implemented into drug discovery workflows.
Results
Identifying pathways engaged by MT2
To identify the pathways engaged by MT2, we used a combination of bioluminescence
resonance energy transfer (BRET)-based and protein complementation–based sensors to
assess G protein activation and -arrestin recruitment by wild-type (WT) MT2. We compared
the ligand-dependent activation of 10 individual Gα proteins by specific receptors known to
couple to each G protein with the activation induced by MLT-activated MT2 using a BRET

110
assay that detects separation of the G subunits from Gγ subunits (fig. S1A) and evaluated
the activation of 15 individual G proteins by MLT-activated MT2 using a BRET assay that
detects the association of a Gγ subunit with GPCR-regulated kinase 2 (GRK2) (fig. S1B).
Of the G protein subtypes assessed, only members of the Gi/o family showed statistically
significant activation, with Gi1 and Gz having the most robust activation amplitude (fig.
S1, A and B). Thus, we performed a concentration-response analysis for the MLT-induced
activation of Gi1 and Gz. We also assessed the ability of MT2 to spontaneously activate
these two Gα proteins in the absence of added MLT by comparing the differences in BRET
signals in the absence of MLT in cells expressing or not expressing MT2 (fig. S1, C and, D).
MT2 showed spontaneous activity towards both Gi1 and Gz and MLT promoted a
concentration-dependent increase in their activity with similar EC50 values for both G
proteins. The opposite directions of the presented concentration-response curves reflect the
different natures of the biosensors used to test their activity, which results in a decrease in
BRET for the sensor monitoring the separation of the Gα subunit from Gγ subunit (used for
Gi1) and the sensor detecting the interaction of the dissociated G with GRK2 (used for
Gz). MT2 also displayed spontaneous activity toward the recruitment of -arrestin2 in the
absence of MLT, an activity that was concentration-dependently increased by the addition
of MLT (fig. S1E).
To confirm signaling downstream of G proteins and β-arrestin2, we performed cAMP assays
and ERK1/2 activation assays, respectively. Gi1 and Gz both inhibit the activity of
adenylyl cyclases to inhibit cAMP production; therefore, we assessed the inhibition of
forskolin-stimulated cAMP production by MLT-activated MT2. MLT triggered a dose-
dependent reduction in cAMP concentration with maximal inhibition of approximately 30%,

111
consistent with the coupling of MT2 to G proteins that inhibit adenylyl cyclase activity (fig.
S1F). β-arrestins promote receptor internalization and desensitization of G protein–
dependent signaling at receptors located at the plasma membrane (37). In addition, β-
arrestins function as independent signaling transmitters (38) or mediate sustained endosomal
signaling (39-42). Both G protein–mediated and β-arrestin–mediated signaling can activate
ERK1/2. To determine whether MT2 can stimulate ERK activation, we performed an ERK
activation assay (43) and found that MLT stimulated a dose-dependent increase in ERK
activation in MT2-expressing cells (fig. S1G).
Evaluation of spontaneous Gi1 and Gz signaling and β-arrestin2 recruitment by MT2
variants
Subsequently, we monitored the effects of the 40 nonsynonymous MT2 variants (including
38 rare and the two common p.G24E and p.K243R variants), which are distributed
throughout the receptor (see fig. S2 for variant positions in the receptor) on the direct
engagement of Gi1 and Gz proteins, downstream cAMP production, the recruitment of β-
arrestin2, and ERK1/2 activation. To control for the potential influence of different cell-
surface abundances on signaling activity, we assessed cell surface receptor abundance by
ELISA for all tested forms of the variants and WT receptors (fig. S3). Four mutants are
classified as loss-of-MLT binding (p.A42P, p.L60R, p.P95L, and p.Y308S) on the basis of
results obtained in a radioligand binding assay (12). We measured the spontaneous (agonist-
independent) activation of Gi1 and Gz by the MT2 variants. For WT MT2, the spontaneous
activity represented 51.3 and 22.5% of the maximal MLT-stimulated activity for Gi1 and
Gz, respectively (fig. S1, C and D). Seventeen MT2 variants displayed reduced spontaneous
activation of Gαi1, and 14 displayed reduced spontaneous activation of Gαz (Fig. 1, A and B,
tables S1 and S2). Most MT2 variants (p.A42P, p.L60R, p.P95L, p.M120V, p.S123R,

112
p.R138C, p.R138H, p.R138L, p.T201M, p.I223T, p.F250V, p.Y308S, and p.R316H) were
defective for the spontaneous activation of both Gαi1 and Gαz. Only the p.Y141F variant
showed subtype-selective reduction for spontaneous activation of Gαi1. Some variants
exhibited increased spontaneous activation of Gαi1 (p.P36S, p.E237K, and p.S238G) or Gαz
(p.A8S, p.A13V, p.Y141F, p.L166I, p.S238G, p.K234R, p.R330W, and p.A342V).
We also determined the spontaneous recruitment of β-arrestin 2 to the MT2 variants. Similar
to G protein activation, we observed high spontaneous β-arrestin2 recruitment for WT MT2,
representing 70% of the maximal response (fig. S1E). Spontaneous β-arrestin2 recruitment
was statistically significantly reduced for 15 variants (Fig. 1C; table S3). The four mutants
that exhibit loss-of-MLT binding (p.A42P, p.L60R, p.P95L, and p.Y308S) did not display
any spontaneous β-arrestin2 recruitment, confirming that the spontaneous β-arrestin2
recruitment monitored for the WT MT2 was receptor-dependent and does not represent an
intrinsic feature of the assay. None of the variants showed increased spontaneous β-arrestin2
recruitment (Fig. 1C), suggesting that the constraints that restrict constitutive engagement of
G proteins are different from those controlling spontaneous -arrestin recruitment.
Evaluation of agonist-induced Gi1 and Gz signaling by MT2 variants
The effect of MLT on Gαi1 or Gαz activation was also differentially altered by the variants.
For each variant, full concentration-response curves were performed and both the half-
maximal effective concentration (potency; EC50) and the maximal agonist-mediated
response (efficacy; Emax) were determined (Fig. 2 and fig. S4, tables S1 and S2). From this
analysis, we grouped the variants into 8 categories (Fig. 2 and fig. S4): those that were
previously classified as loss-of-MLT-binding variants (Fig. 2A and fig. S4A), those that
exhibited impaired signaling through all pathways (Fig. 2B and fig. S4B), those that

113
exhibited impaired signaling in two or more pathways (Fig. 2C and fig. S4C), those with
specific defects in MLT-stimulated, G protein–specific signaling (Fig. 2D and fig. S4D),
those with a specific defect in β-arrestin recruitment (Fig. 2E and fig. S4E), those with a
specific defect in ERK activation (Fig. 2F), those that exhibited a gain of function (Fig. 2G),
and those that were similar to WT MT2 (fig. S4F).
Similar to their reduction in spontaneous activity, most of the variants (p.A42P, p.L60R,
p.A74T, p.P95L, p.S123R, p.V124I, p.R138C/H/L, p.Y141F, p.T201M, p.R222H, p.I223T,
p.F250V, p.Y308S, p.R316H, p.R330W, and p.A342V) were also deficient in coupling to
both G proteins, whereas five variants (p.G109A, p.M120I, p.M120V, p.R154H, and
p.D246N) showed subtype-specific defects in MLT-induced Gi1 and Gz activation (fig. 2
and fig. S4). Two variants (p.A359E and p.P36S) showed increased agonist-promoted Gαi1
activation (table S1), indicating that both loss and gain of MLT responsiveness can be found
among natural variants. We examined the influence of the variants on signaling downstream
of Gi by monitoring inhibition of forskolin-induced cAMP accumulation. The MLT-
induced responses show that, in addition to the four loss-of-MLT binding mutants (p.A42P,
p.L60R, p.P95L, and p.Y308S), markedly impaired cAMP responses were also observed for
p.S123R, p.R138C/H/L, p.F250V, and p.R316H (Fig. 2 and fig. S4, table S4). These data
indicate that an impaired ability to reduce cAMP production is consistent with the defective
ability of these variants to activate Gi1 and Gz. In some cases (p.A74T, p.V124I, p.Y141F,
p.T201M, p.A342V, p.M120I, p.R154H, p.D246N), defects in Gi activity were observed
with no effect on the measured cAMP. This is most likely due to the fact that whereas the
assays detecting G protein activation are stochiometric, the production of cAMP is an
amplified signal, making it more difficult to detect the effects of the mutations leading to the
less severe impairment in Gi activity.

114
Evaluation of β-arrestin2 recruitment by MT2 variants
Twenty-four variants were defective for their ability to recruit -arrestin2 in response to
MLT (table S3). In addition to the four loss-of-MLT-binding mutants, 15 MT2 mutants that
displayed impaired Gi signaling (p.A74T, p.G109A, p.M120V, p.S123R, p.V124I,
p.R138C/H/L, p.T201M, p.R222H, p.I223T, p.D246N, p.F250V, p.R316H, and p.A342V)
and an additional five mutants with normal Gi and cAMP signaling (p.L166I, p.R231H,
p.E237K, p.S238G, and p.K243R) showed reduced -arrestin2 recruitment (Fig. 2 and fig.
S4, table S3).
Evaluation of ERK signaling by MT2 variants
ERK phosphorylation upon MLT stimulation was used as a proxy for activation. For WT
MT2, ERK activation was fully blocked by the Gi/o inhibitor pertussis toxin (PTX) and was
unaffected by RNAi-mediated silencing of β-arrestin1 and β-arrestin 2 (fig. S5), indicating
that ERK activation occurred downstream of G protein activation. All MT2 variants that were
impaired for both the Gi/cAMP and β-arrestin2 pathways also exhibited reduced
phosphorylation of ERK in response to MLT (Fig. 2; fig. S4, and table S5). Other variants
showed partially impaired ERK activation (p.A74T, p.V124I and p.T201M) together with
partial impairment of both G protein–mediated signaling and β-arrestin2 recruitment or with
a specific Gαi1 signaling defect (p.R154H) or with a specific Gαz signaling defect (p.M120I).
Furthermore, the ERK signaling–defective variant p.M146V was the only variant with
normal Gi/cAMP signaling and β-arrestin2 recruitment, suggesting the potential
involvement of additional pathway(s) in mediating MT2-dependent ERK activation. The
p.A359E variant differed from all of the others: it exhibited a substantially increased ERK

115
response (246% Emax of the WT) (table S5), a property that extended to a lesser extent to
Gαi1 activation and β-arrestin2 recruitment (Fig. 2).
Evaluation of the relationship among signaling alterations exhibited by the MT2
variants
To determine whether there was a link between the effect of the mutation on spontaneous or
agonist-stimulated receptor activities, correlations between the effects on the two parameters
were performed for the different pathways (Fig. 3A and fig. S6, A and B). In addition, to
assess the possible functional links between two pathways, correlation between the effect on
each pathway was performed in a pairwise manner (Fig 3, B and C). We also performed
pairwise comparisons of spontaneous activity (fig. S6, C to E). Spontaneous Gαi1 and Gαz
activation only modestly correlated with the corresponding MLT-induced activation of Gαi1
(Fig. 3A, left) and Gαz (Fig. 3A, middle). A typical example is the p.M120V variant, which
exhibited markedly reduced spontaneous Gi1 activity and had WT-like agonist-stimulated
activity (Fig. 3A, left). Similar to the low correlation between spontaneous and agonist-
stimulated G protein activation, the correlation between spontaneous and MLT-induced β-
arrestin2 recruitment was also low (Fig. 3A, right). This lack of correlation between
spontaneous and agonist-induced activity indicated that the modes of spontaneous and MLT-
induced receptor activity were distinct with potentially different allosteric constraints. In
contrast, there was a strong correlation between the spontaneous activation of Gi1 and Gz
(fig. S5C) and between the MLT-induced activation of Gi1 and Gz (Fig. 3C, Gαi1 vs. Gαz).
These correlations suggest that similar receptor-mediated activation modes control these two
Gi family members.

116
To test for a link between G protein- and β-arrestin2–dependent events, we correlated MLT-
induced Gαi1 and Gαz activation and cAMP inhibition with MLT-induced β-arrestin2
recruitment (Fig. 3B). We also tested the correlation between MLT-induced G protein
activation and spontaneous β-arrestin2 recruitment (fig. S5, A and B) and between
spontaneous G protein activation and spontaneous β-arrestin2 recruitment (fig. S5, C to E).
All showed moderate, yet statistically significant correlations, which contrasted with the
tightly correlated G protein-dependent events (Fig. 3C), indicating that G protein activation
and -arrestin recruitment rely on at least partially independent processes. Together, these
data reveal a general trend of reduced spontaneous and MLT-induced activity for MT2
mutants at the level of β-arrestin2 recruitment and G protein activation and highlight the
independent nature of these two processes.
Generation of signaling signatures of MT2 variants
To represent the signaling characteristics of the different variants, the overall signaling
efficiencies of the WT and mutant receptors were assessed for each outcome using the
operational model of Black and Leff (44) as modified by Kenakin et al. (45). The
transduction coefficient log(τ/KA) was used as an indication of the signaling efficiency of
each variant and the comparison between WT receptor and each of the variants was then
obtained by subtracting the transduction coefficient log(τ/KA) of the mutants from that of the
WT and expressed as Δlog(τ/KA) (tables S1 to S5). We plotted radial graphs of the calculated
Δlog(τ/KA) together with the spontaneous and MLT-induced signaling efficacy to represent
a “signaling signature” for each MT2 variant. This representation revealed several groups of
variants with distinctive signaling signatures (Fig. 4). For example, twelve variants have
strong defects in the five signaling cascades considered (p.A42P, p.L60R, p.P95L, p.S123R,
P.R138C/H/L, p.R222H, p.I223T, p.F250V, p.Y308S, and p.R316H), six variants showed

117
specific defects in β-arrestin2 recruitment (p.L166I, p.R231H, p.E237K, p.S238G, p.K243R,
and p.D246N), and three variants displayed G protein–specific defects (p.R154H, p.Y141F,
and p.R330W). Three variants (p.M120I, p.P36S, and p.A359E) resulted in increased
signaling activity compared to that of WT MT2 in response to MLT.
Evolutionary action analysis of MT2 variants
The large amount of functional data collected here provides a tool to validate in silico models
predicting variant receptor functionality. One of these models, Evolutionary Action (EA)
(36), predicts the effect of a variant on protein function using the relative importance of each
residue based on evolutionary divergence, Evolutionary Trace (ET) (46), combined with the
likelihood to observe a given amino acid substitution for another across evolution measured
as the substitution log-odds (36). Based on these phylogenetic patterns of variation, an EA
score from 0 (benign) to 100 (highly detrimental or impactful) was assigned for each MT2
variant (Fig. 5A). To assess whether these empirical EA scores could be predictive of the
functional impact observed in the signaling assays, we assigned a “phenotype score” to each
variant that was calculated by averaging the 13 values corresponding to the normalized
functional parameters used for the signaling signatures. The predictive EA scores correlated
with the experimentally determined phenotype scores (Fig. 5B), indicating that the degree
of measured functional divergence of the variants from the WT correlated with the degree
of predicted evolutionary divergence. Overall, the good correlation of phenotypic scores
with EA scores confirmed the robustness of Evolutionary Action in predicting the effect of
variants on receptor fitness.

118
Association between functional MT2 defects and T2D risk
Based on the different signaling signatures observed for the MT2 variants, they clustered into
nine groups. For each of these nine groups, the association between T2D risk and the
aggregation of the variants was assessed by the kernel-based adaptive cluster method (47)
as previously described (12) (Table 1). By applying Bonferroni correction, we considered P
< 0.0056 to be statistically significant and we considered P values between 0.05 and 0.0056
to be a trend of association. We found that rare variants with defects in MLT-induced
activation of Gαi1 or Gαz or in spontaneous β-arrestin2 recruitment were the most strongly
and statistically significantly associated with increased T2D risk. For example, rare variants
with defects in MLT-induced activation of Gαi1 had an odds ratio of 3.25 with a 95%
confidence interval of 1.73-6.10 and a P value of 2.4×10⁻⁴ (Table 1). In contrast, all of the
other groups characterized by different signaling defects showed only a trend of association
with T2D. The absence of an association of defective MLT-induced β-arrestin2 recruitment
with T2D is consistent with the observation that the frequent p.K243R variant (rs61747139),
which exhibits defective MLT-induced β-arrestin2 recruitment, is not associated with T2D
(12, 48). Furthermore, the “neutral” rare variants were not found to be associated with T2D
risk (Table 1). This is consistent with lack of risk association between T2D and the common
p.G24E variant (rs8192552) (12, 48), which is also “neutral.”
Discussion
Our extensive functional genomics study on 40 rare or very rare MT2 variants identified an
overall loss-of-function phenotype for many parameters and pathways measured. The
observed disconnection of spontaneous vs. MLT-induced activity as well as G protein– vs.
β-arrestin–dependent signaling of these variants enabled us to dissect the respective
contributions of each of these parameters and to reveal the strongest associations to increased

119
T2D risk with defective MLT-induced Gαi1 and Gαz activation and defective spontaneous β-
arrestin2 recruitment.
Connecting rare GPCR variants with common diseases: a general framework
The present study provides a framework to correlate alterations in specific signaling
parameters with the risk to develop a common disease. Our study is distinct because the
functional basis or relevance of most genetic risk factors remains either unknown or is
restricted to a simple loss- and gain-of-function phenotype classification. It is now well-
established that the intracellular signaling of GPCRs is highly interconnected, involving
multiple signaling pathways. Defining the full functional profile or “signaling signature” of
a GPCR and its variants is important to understand the functional defect linked to disease-
associated receptor variants. Whereas the number of such GPCR variants has been largely
underestimated because of their low frequency, systematic whole-genome sequencing
projects revealed a large inter-individual diversity when considering large populations, a
relevant scenario in the case of common diseases like T2D.
For genes coding for non-odorant GPCRs in humans, an average of 32 non-synonymous
variants have been estimated to exist for each GPCR in a sample of 10,000 individuals (49,
50). This estimation provides a first measure of the number of rare GPCR variants in the
human population and gives an idea of the future challenges in terms of their functional
characterization to understand their effect on diseases. In terms of the number of variants,
the 40 variants identified in the MTNR1B gene in a cohort of ~10,000 individuals (12) seem
to fit with this assumption. As demonstrated by our study, such a number of variants can be
sufficient to identify receptor defects at the level of individual signaling pathways.
Application of the operational model of Kenakin and Christopoulos (34, 45), originally

120
designed to compare the relative signaling efficiency of different ligands, was very
instructive in defining an integrative measure for signaling defects that went beyond the
determination of the isolated signaling parameters. This is exemplified by the p.R154H
variant for which defects in Gi1 activation only became visible at the level of the
Δlog(τ/KA) transduction ratio because it integrates both potencies and maximal efficacies.
Indeed, a decrease in the maximal agonist-mediated efficacy and a rightward logEC50 shift
were observed for this variant but were not statistically significant. However, when both
maximal efficacy and potency were integrated, the global response depicted by Δlog(τ/KA)
value was statistically significantly reduced compared to that of the WT receptor. A good
correlation was seen between the EA score of MT2 variants and the corresponding
experimentally determined phenotypic scores, which indicates the usefulness of the EA
score to predict the functional effect of a specific GPCR variant. The EA score might
therefore be applied to obtain a first classification of GPCR variants before entering into
large-scale functional studies. Together, our data provide an operational template for the
evaluation of the functional effect of GPCR variants on common traits and diseases.
Specific pathway parameters of MT2 variants associate with T2D risk
Given that GPCRs, such as MT2, can signal through various cascades and that different
variants have the potential to modulate one or more signaling parameters, a complete
functional characterization is required to understand the full effect of receptor variants on
disease risk. Here, we determined both spontaneous and MLT-induced MT2 activity for five
signaling events (Gαi1 and Gαz activation, inhibition of cAMP production, β-arrestin2
recruitment, and ERK1/2 activation). Ten of the 38 rare receptor variants had a phenotype
that was indistinguishable from that of the WT receptor and were therefore classified as
“neutral” variants. The 28 other variants showed functional defects compared to the WT

121
receptor. Only the variant p.A359E showed a robust gain-of-function phenotype with 246,
145, and 130% increases in the Emax values of ERK activation, Gαi1 activation, and β-
arrestin2 recruitment, respectively. It would be interesting in a follow-up study to determine
the effect of this increased MT2 function on an individual’s metabolism. Together, our data
show that loss-of-function MT2 variants at different functional levels is associated with
increased T2D risk. Detailed genetic association analysis detected three parameters that
stand out in terms of the statistical significance of association with T2D risk: MLT-induced
activation of Gαi1 (19 variants) and Gαz (22 variants) and spontaneous β-arrestin2
recruitment (15 variants). The independence of signaling events associated with G protein
activation and β-arrestin2 recruitment was further highlighted by the poor correlation
between them for the 40 MT2 variants. The importance of Gαi1 activation underlines the
general importance of this well-characterized pathway for MT2. The activation of Gαz by
MT2 has not been reported previously but the importance of impaired Gαz coupling for the
association with T2D risk is of interest because the tissue distribution and GPCR coupling
profile of Gαz is more restricted than that of Gαi1. Indeed, Gαz is mainly expressed in
different brain regions and in retinal ganglion cells (51, 52), all regions for which MLT
receptor expression has been reported (53, 54). In addition, the intrinsic GTPase activity of
Gαz is very slow, with a hydrolysis rate that is 200-fold slower than that determined for any
other Gα protein (55). These results introduce Gαz as a previously uncharacterized player in
MT2 signaling with a potential effect on T2D risk.
Although the recruitment of β-arrestin2 to MT2 in transfected cells has been reported (56,
57), the physiological importance of this phenomenon and its robustness in a cellular context
expressing endogenous MT2 receptors remain unclear. MT2 has indeed a poor capacity for
MLT-induced β-arrestin recruitment, an observation that was confirmed here. Part of this

122
difficulty to reveal ligand-induced β-arrestin2 recruitment might be explained by the high
degree of spontaneous β-arrestin2 recruitment observed here. This spontaneous activity was
completely lost for several variants, including the four loss-of-MLT binding mutants, which
suggests that the measured spontaneous activity is receptor-dependent. β-arrestins are
important regulators of GPCR function and scaffolding platforms for many signaling
complexes (38) but the role of β-arrestin recruitment in MT2 function in peripheral and
central tissues is currently unknown. Our results indicating an association between the
spontaneous recruitment of β-arrestin2 to the receptor and T2D risk point to a possible
important role of β-arrestin2 recruitment to MT2.
Another unexpected and potentially relevant outcome of our study is the association of
spontaneous MT2 activity, namely β-arrestin 2 recruitment, with T2D risk. The notion that
spontaneous and ligand-induced receptor activation of the 40 variants should be considered
as independent signaling properties is supported by the poor correlation of these two
parameters for three signaling pathways (Gαi1 activation, Gαz activation, and β-arrestin2
recruitment), which enabled us to determine the effects of both parameters independently on
disease risk. Spontaneous MLT receptor activity was previously described for G proteins in
transfected cells and tissues (58-60). Our study shows that MT2 also spontaneously recruits
β-arrestin. The importance of constitutive GPCR activity in disease has been discussed in
the mesolimbic dopamine system for cannabinoid 1, 5-HT2C, and -opioid receptors (61).
Spontaneous activity as a risk factor for T2D is particularly interesting in the case of MT2,
given that its cognate ligand, MLT, is only produced during the night and absent during the
daytime because of a direct inhibitory effect of light on MLT synthesis (62). This opens the
interesting possibility that MT2 function might not only be physiologically relevant during

123
the night but also during the day, at a time when the regulation of plasma insulin
concentrations is most important in humans.
Whereas the link between the MTNR1B gene and T2D risk has been firmly established in
humans (8), the molecular mechanism and relevant melatonin target tissues in humans
remain largely unknown. Studies on rodent pancreatic -cells indicate that these cells are
relevant MLT targets in which MT1 or MT2 activation inhibits insulin secretion through the
Gi/cAMP pathway (63). However, studies conducted with human pancreatic -cells did not
have clear conclusions and several studies using single-cell transcriptome profiling and RNA
sequencing detected MTNR1B transcripts only in a minor fraction (5%) of human islet cells
and at extremely low concentrations (27) (64), questioning the physiological relevance and
effect of MTNR1B expression in the human pancreas. Functional studies on the common
SNP rs10830963, located in the intron of MTNR1B, showed a two-fold increase in MTNR1B
mRNA abundance in human pancreatic islets of GG T2D risk allele carriers (9). However,
the functional importance of this observation remains unclear because increased amounts of
mRNA transcripts do not necessarily result in increased numbers of receptors. Furthermore,
even if an increase in receptor number occurs, this does not necessarily result in an increased
signaling capacity because of the presence of spare receptors or chronic receptor
desensitization.
Taken together with the currently available data, the initially proposed inhibitory action of
MT2 in human -cells warrants revision and may be too simplistic. Other potential
physiological outputs and MLT target tissues should be considered. Among those are the
well-documented effect of MLT on the circadian rhythm of the hypothalamic master clock
and the effects on insulin target tissues, such as the adipose tissue (17). Without having

124
clarified this important point, validation of our results obtained in the HEK 293 model
system into a physiologically relevant context remains challenging. Our results provide hints
about the most relevant signaling pathways potentially involved, which are the activation of
Gαi1 and Gαz and the recruitment of β-arrestin2. These results will direct future research for
the relevant physiological outputs of MLT action. The finding that spontaneous receptor
activity also contributes to T2D will be important in guiding future studies in humans by
also considering the effects of MT2 during the daytime, when MLT is not produced.
In terms of therapeutic perspectives, both medical intervention and life style
recommendations can be envisioned. The predominant defects observed in MT2 variants are
decreased Emax values, suggesting that improving the residual responsiveness in these
patients is a possible therapeutic strategy. Because most of the loss-of-function mutants were
defective for G protein activation and β-arrestin2 recruitment, an optimal treatment should
aim to improve both components. In terms of life-style recommendations, future studies will
have to establish whether carriers of MT2 variants suffer from MLT-specific dysfunctions,
such as sleep problems or circadian misalignment of sleep-wake cycles with feeding
rhythms. If this is the case, carriers of MT2 variants could benefit from specific life-style
recommendations to decrease their T2D risk. Because carriers of MT2 variants are rare or
very rare, such interventions should be seen in the context of personalized medicine. Based
on the signaling signatures established in our study, patient groups might be identified that
would benefit from a similar treatment. Similar examples of other GPCRs are melanocortin
MC4 receptor mutants, which are associated with severe early-onset obesity for which
defective cell-surface expression can be rescued with pharmacological chaperones (65), and
gain-of-function mutants of the chemokine receptor CXCR4 identified in patients with the

125
WHIM syndrome for which the CXCR4 antagonist AMD3100 is currently in clinical trials
(66).
Our study further highlights an often-neglected issue, which is the time of blood sampling
or functional examination of patients to obtain meaningful results when trying to understand
the biology of the MLT system. Indeed, apart from the circadian secretion profile of MLT,
the constitutive MT2 activity and its potential importance during the day time, when MLT
concentrations are low, should also be taken into account in this respect. Finally, the set of
40 natural MT2 variants will constitute a rich source for future structure-function studies of
biased receptor signaling.
Conclusion
We provide here a comprehensive framework for the functional characterization of GPCR
variants that can serve as a template for future studies on further GPCRs. Our results on rare
MT2 variants demonstrate the association of the loss-of-function phenotype with T2D risk,
which served as a basis for the dissection of the specific signaling events most statistically
significantly associated with the disease. The two main signaling modules of GPCRs,
mediated by G proteins and β-arrestins, both seem to contribute to disease risk. Our finding
of the association of T2D risk with spontaneous MT2 activity should provide insights with
respect to circadian timing, an important aspect of MLT research. The information on
disease-associated signaling pathways will be valuable for future studies in defining the still
unknown functionally relevant outputs linking MT2 to T2D risk. This information will guide
future drug-screening programs intended to improve MT2 function.

126
Materials and methods
Plasmids and reagents
The 6mycMT2/pcDNA5/FRT plasmids encoding WT MTNR1B and the 40 MTNR1B
variants were previously described (12). The 3mycMT2/ARMS2/PL plasmids encoding WT
MTNR1B and its variants were generated by subcloning the coding regions of MTNR1B from
the 6mycMT2/pcDNA5/FRT plasmids into the pCMV-ProLink expression vector, pCMV-
ARMS2-PK2 (DiscoverX). The resulting plasmid encoded in the C terrminus the ProLink
(PL), a small enzyme donor fragment of β-galactosidase (β-gal) complementary peptide,
fused to the target receptor. All constructs were verified by Sanger sequencing (Institut
Cochin Sequencing Facility). MLT was obtained from Tocris Biosciences.
Cell culture and transfection
Human embryonic kidney 293T (HEK 293T) cells were cultured in DMEM (Dulbecco's
Modified Eagle's medium) supplemented with 10% fetal bovine serum (FBS) and
penicillin/streptomycin. HEK 293 cells stably expressing a β-arrestin2–β-gal-Enzyme
Acceptor (EA) fusion protein (DiscoverX) were maintained in the same culture conditions,
but with the addition of hygromycin B to maintain expression of the transgene. All cells were
transfected with PEI (Polysciences, Inc.) or Xtremegene 9 (Roche Diagnostics) according to
the manufacturer’s instructions.
Analysis of cell surface receptor expression
ELISAs were performed as previously described (67) using the mouse anti-myc antibody
and a horseradish peroxidase (HRP)-conjugated mouse immunoglobulin G (IgG) whole
sheep secondary antibody (Sigma).
BRET assay
Gαi1 activation was assessed by measuring BRET between RlucII-Gαi1 and GFP10-Gγ2
upon treatment of HEK 293 cells cotransfected to express Gβ1, receptor, and BRET sensors

127
with MLT (68). This BRET pair was also used for the screening of Gα proteins activated by
MT2, except for RlucII-Gαs, RlucII-Gαz, RlucII-Gαq, and RlucII-Gα12/13. For these
RlucII-tagged sensors, GFP10-Gγ1 was used given that optimal responsive window is
generally obtained using these BRET sensor pairs for these Gα proteins (fig. S1A). For this
Gα protein screening, vasopressin receptor type 2 was used as a positive control for Gαs
activation, whereas muscarinic type 2, angiotensin type 1, and TPα receptors were used as
positive controls for Gαi/o, Gαq, and Gα12/13, respectively. For Gαz activation, the MLT-
induced increase in BRET between RlucII-Gγ5 and GRK2-GFP10 was monitored in the
presence of Gαz, Gβ1, and the receptor. The same BRET pair was also used for the screening
of Gα proteins activated by MT2 (fig. S1B). Transfected cells were plated in poly-D-lysine-
pretreated, 96-well white microplates (100 l/well; Greiner). Forty-eight hours after
transfection, the cells were washed with DPBS (Dulbecco's Phosphate-Buffered Saline) and
then Tyrode's buffer was added. After the addition of agonist, the cells were incubated for
10 min at 37°C and coelenterazine 400a (2.5 M; NanoLight Technology) was added 5 min
before BRET reading in a Synergy Neo microplate reader (BioTek) (acceptor filter: 515 ±
30 nm; donor filter: 410 ± 80 nm). Net BRET represents the BRET signal subtracted by the
BRET monitored in the absence of a GFP10-tagged sensor. ΔBRET refers to the difference
in net BRET recorded from cells treated with agonist and cells treated with vehicle. For the
agonist dose-response curves, the percentage of the response of the WT receptor was
calculated from the ΔBRET value obtained from a given variant divided by the ΔBRET
obtained from the WT receptor in the same experiment. Spontaneous Gαi1 or Gαz activation
was calculated from the variant ΔBRET value divided by the ΔBRET obtained from the WT
receptor in the same experiment, where ΔBRET here represents the difference in basal net
BRET (vehicle only) in cells expressing biosensors and the receptor and the basal net BRET
monitored in cells expressing biosensors only (mock).

128
Homogeneous time-resolved fluorescence (HTRF)-based cAMP assay
The intracellular concentrations of cAMP were determined in cells transiently expressing
MT2 or one of the 40 MT2 variants in the presence of 2 μM FSK and after 30 min of
stimulation with MLT at room temperature by HTRF using the “cAMP femto2” kit (Cisbio)
according to the manufacturer's instructions.
Analysis of β-arrestin2 recruitment
The PathHunter assay (DiscoverX) was used to measure interactions between MT2 and β-
arrestin2 as previously described (43). HEK 293 cells stably expressing a fusion protein of
β-arrestin2 with a larger fragment of β-gal, called enzyme acceptor (EA) were transiently
transfected with the 3mycMT2/PL plasmids. Two days after transfection, the medium was
replaced with AssayComplete cell plating 4 reagent (DiscoverX) containing MLT and the
cells were incubated for 2 hours at 37°C. Activation of the MT2/PL stimulates the binding
of β-arrestin2-EA fusion protein to the PL-tagged MT2 and forces complementation of the
two β-gal enzyme fragments, resulting in the formation of an active β-gal enzyme. This
interaction leads to an increase in enzyme activity that can be measured with
chemiluminescent PathHunter Detection Reagents (DiscoverX;
https://www.discoverx.com/arrestin) and represents β-arrestin2 recruitment to the receptor.
Luminescence signal was determined after 60 min of incubation at room temperature.
Measurement of pERK1/2 abundance
Intracellular pERK1/2 was measured using the Surefire pERK kit (Thr202/Tyr204; Perkin
Elmer) in HEK 293T cells transiently expressing the MTNR1B or the MTNR1B variants, as
previously described (69). Given that the peak of pERK phosphorylation was previously
observed for MT2 at 5 min after MLT stimulation (12), this time point was chosen to test the
ability of MT2 variants to activate ERK in MLT dose-response curves.

129
Evolutionary action analysis
The predicted effect of each variant within the MT2 receptor was calculated as previously
described (36) using the amino acid sequence deduced from the MTNR1B gene for the query.
Statistical analysis
LogEC50, logIC50, and agonist-induced Emax values were determined by nonlinear regression
with a variable Hill slope using GraphPad Prism software (version 6.0). For each assay, the
agonist-induced Emax value for every MT2 variant was normalized as a percentage of the
maximal MLT-stimulated response of the WT receptor (set at 100) monitored in parallel
with the receptor variant. The dose-response curves were fitted to an operational model of
agonism designed by Kenakin and Christopoulos (34),(45) to obtain log(τ/KA) values for the
WT receptor and its variants. Normally, an agonist is set as a reference agonist, against which
within-pathway comparisons for the same receptor to other agonists can be made and
expressed as Δlog(τ/KA). In this study, within-pathway comparisons were made between
MT2 variants and the WT receptor. For each variant, the basal activation of Gαi1, activation
of Gαz, and recruitment of β-arrestin2 activation was expressed as a percentage of that of the
WT receptor. Normalized difference was calculated on values corresponding to the
constitutive activation, agonist-induced Emax and Δlog(τ/KA) to fit a -1 to +1 scale using the
following formula: (variant – WT)/ (variant + WT). In the case of Δlog(τ/KA), before
normalization, the anti-logs were first calculated and then were fitted to the aforementioned
formula. Positive and negative values represent mutations with better or worst responses,
respectively, than that of the WT receptor. Subsequently, logIC50, logEC50, agonist-induced
Emax, and Δlog(τ/KA) values were expressed as means ± SEM of the indicated number of
experiments (n). Statistical analysis for logIC50, logEC50, and agonist-induced Emax was
performed by comparing independent fits with a global fit that shared the selected parameter,
130
whereas a one-sample t test was used to examine the mean differences between WT MT2
and its variants for the values corresponding to the basal activation and Δlog(τ/KA) ratios.
T2D case-control association study
As previously described (12), rare MTNR1B variants (with a frequency <1%) were analyzed
in aggregation according to their functional effect. In a T2D case-control study including
2,186 individuals with T2D and 4,804 controls with normal fasting glucose concentrations,
we assessed the effect of these aggregated variants on T2D risk through the kernel-based
adaptive cluster method (47) embedded in a logistic regression model adjusted for age,
gender, and body mass index. Following the Bonferroni correction, a P value < 0.0056 (=
0.05÷9; where 9 was the number of independent tests performed in the present study) was
considered to be statistically significant, whereas a P value between 0.05 and 0.0056 was
considered nominal. These statistical analyses were performed through R. All samples were
collected with appropriate informed consent with their use in the present study. All cohort
studies followed ethical principles defined in the Helsinki declaration, and they were
approved by local ethical committees from Lille (France), Paris (France), Poitiers (France)
and Cambridge (UK).
REFERENCES AND NOTES
1. A. American Diabetes, Standards of medical care in diabetes--2014. Diabetes Care
37 Suppl 1, S14-80 (2014).
2. G. Vassart, S. Costagliola, G protein-coupled receptors: mutations and endocrine
diseases. Nat Rev Endocrinol 7, 362-372 (2011).
3. Y. Oh da, J. M. Olefsky, G protein-coupled receptors as targets for anti-diabetic
therapeutics. Nat Rev Drug Discov 15, 161-172 (2016).
4. B. Ahren, Islet G protein-coupled receptors as potential targets for treatment of type
2 diabetes. Nat Rev Drug Discov 8, 369-385 (2009).
5. A. Bonnefond, P. Froguel, Rare and common genetic events in type 2 diabetes: what
should biologists know? Cell Metab 21, 357-368 (2015).
6. N. Bouatia-Naji, A. Bonnefond, P. Froguel, [Inputs from the genetics of fasting
glucose: lessons for diabetes]. Med Sci (Paris) 25, 897-902 (2009).
7. V. Lyssenko, C. L. Nagorny, M. R. Erdos, N. Wierup, A. Jonsson, P. Spegel, M.
Bugliani, R. Saxena, M. Fex, N. Pulizzi, B. Isomaa, T. Tuomi, P. Nilsson, J.

131
Kuusisto, J. Tuomilehto, M. Boehnke, D. Altshuler, F. Sundler, J. G. Eriksson, A. U.
Jackson, M. Laakso, P. Marchetti, R. M. Watanabe, H. Mulder, L. Groop, Common
variant in MTNR1B associated with increased risk of type 2 diabetes and impaired
early insulin secretion. Nat Genet 41, 82-88 (2009).
8. A. Bonnefond, L. Valeriya, in From Association to Function. (Springer International
Publishing, 2016).
9. T. Tuomi, C. L. Nagorny, P. Singh, H. Bennet, Q. Yu, I. Alenkvist, B. Isomaa, B.
Ostman, J. Soderstrom, A. K. Pesonen, S. Martikainen, K. Raikkonen, T. Forsen, L.
Hakaste, P. Almgren, P. Storm, O. Asplund, L. Shcherbina, M. Fex, J. Fadista, A.
Tengholm, N. Wierup, L. Groop, H. Mulder, Increased Melatonin Signaling Is a Risk
Factor for Type 2 Diabetes. Cell Metab 23, 1067-1077 (2016).
10. J. Fadista, P. Vikman, E. O. Laakso, I. G. Mollet, J. L. Esguerra, J. Taneera, P. Storm,
P. Osmark, C. Ladenvall, R. B. Prasad, K. B. Hansson, F. Finotello, K. Uvebrant, J.
K. Ofori, B. Di Camillo, U. Krus, C. M. Cilio, O. Hansson, L. Eliasson, A. H.
Rosengren, E. Renstrom, C. B. Wollheim, L. Groop, Global genomic and
transcriptomic analysis of human pancreatic islets reveals novel genes influencing
glucose metabolism. Proc Natl Acad Sci U S A 111, 13924-13929 (2014).
11. M. van de Bunt, J. E. Manning Fox, X. Dai, A. Barrett, C. Grey, L. Li, A. J. Bennett,
P. R. Johnson, R. V. Rajotte, K. J. Gaulton, E. T. Dermitzakis, P. E. MacDonald, M.
I. McCarthy, A. L. Gloyn, Transcript Expression Data from Human Islets Links
Regulatory Signals from Genome-Wide Association Studies for Type 2 Diabetes and
Glycemic Traits to Their Downstream Effectors. PLoS Genet 11, e1005694 (2015).
12. A. Bonnefond, N. Clément, K. Fawcett, L. Yengo, E. Vaillant, J. L. Guillaume, A.
Dechaume, F. Payne, R. Roussel, S. Czernichow, S. Hercberg, S. Hadjadj, B. Balkau,
M. Marre, O. Lantieri, C. Langenberg, N. Bouatia-Naji, G. Charpentier, M.
Vaxillaire, G. Rocheleau, N. J. Wareham, R. Sladek, M. I. McCarthy, C. Dina, I.
Barroso, R. Jockers, P. Froguel, M.-A. o. G. , I.-R. T. Consortium, Rare MTNR1B
variants impairing melatonin receptor 1B function contribute to type 2 diabetes. Nat
Genet 44, 297-301 (2012).
13. N. Clement, N. Renault, J. L. Guillaume, E. Cecon, A. S. Journe, X. Laurent, K.
Tadagaki, F. Coge, A. Gohier, P. Delagrange, P. Chavatte, R. Jockers, Importance of
the second extracellular loop for melatonin MT1 receptor function and absence of
melatonin binding in GPR50. Br J Pharmacol 175, 3281–3297 (2017).
14. R. Jockers, P. Maurice, J. A. Boutin, P. Delagrange, Melatonin receptors,
heterodimerization, signal transduction and binding sites: what's new? Br J
Pharmacol 154, 1182-1195 (2008).
15. R. Jockers, P. Delagrange, M. L. Dubocovich, R. P. Markus, N. Renault, G. Tosini,
E. Cecon, D. P. Zlotos, Update on Melatonin Receptors. IUPHAR Review. Br J
Pharmacol 173, 2702-2725 (2016).
16. M. L. Dubocovich, P. Delagrange, D. N. Krause, D. Sugden, D. P. Cardinali, J.
Olcese, International Union of Basic and Clinical Pharmacology. LXXV.
Nomenclature, classification, and pharmacology of G protein-coupled melatonin
receptors. Pharmacol Rev 62, 343-380 (2010).
17. G. Tosini, S. Owino, J. L. Guillaume, R. Jockers, Understanding melatonin receptor
pharmacology: Latest insights from mouse models, and their relevance to human
disease. Bioessays 36, 778-787 (2014).
18. E. Peschke, I. Bahr, E. Muhlbauer, Melatonin and pancreatic islets: interrelationships
between melatonin, insulin and glucagon. Int J Mol Sci 14, 6981-7015 (2013).

132
19. A. Karamitri, N. Renault, N. Clement, J. L. Guillaume, R. Jockers, Minireview:
Toward the establishment of a link between melatonin and glucose homeostasis:
association of melatonin MT2 receptor variants with type 2 diabetes. Mol Endocrinol
27, 1217-1233 (2013).
20. R. D. Ramracheya, D. S. Muller, P. E. Squires, H. Brereton, D. Sugden, G. C. Huang,
S. A. Amiel, P. M. Jones, S. J. Persaud, Function and expression of melatonin
receptors on human pancreatic islets. J Pineal Res 44, 273-279 (2008).
21. S. Costes, M. Boss, A. P. Thomas, A. V. Matveyenko, Activation of Melatonin
Signaling Promotes beta-Cell Survival and Function. Mol Endocrinol 29, 682-692
(2015).
22. N. Y. Feng, A. H. Bass, "Singing" Fish Rely on Circadian Rhythm and Melatonin
for the Timing of Nocturnal Courtship Vocalization. Curr Biol 26, 2681-2689
(2016).
23. C. J. McMullan, E. S. Schernhammer, E. B. Rimm, F. B. Hu, J. P. Forman, Melatonin
secretion and the incidence of type 2 diabetes. Jama 309, 1388-1396 (2013).
24. E. Peschke, I. Bahr, E. Muhlbauer, Experimental and clinical aspects of melatonin
and clock genes in diabetes. J Pineal Res 59, 1-23 (2015).
25. D. M. Blodgett, A. Nowosielska, S. Afik, S. Pechhold, A. J. Cura, N. J. Kennedy, S.
Kim, A. Kucukural, R. J. Davis, S. C. Kent, D. L. Greiner, M. G. Garber, D. M.
Harlan, P. diIorio, Novel Observations From Next-Generation RNA Sequencing of
Highly Purified Human Adult and Fetal Islet Cell Subsets. Diabetes 64, 3172-3181
(2015).
26. K. J. Gaulton, T. Ferreira, Y. Lee, A. Raimondo, R. Magi, M. E. Reschen, A.
Mahajan, A. Locke, N. W. Rayner, N. Robertson, R. A. Scott, I. Prokopenko, L. J.
Scott, T. Green, T. Sparso, D. Thuillier, L. Yengo, H. Grallert, S. Wahl, M. Franberg,
R. J. Strawbridge, H. Kestler, H. Chheda, L. Eisele, S. Gustafsson, V.
Steinthorsdottir, G. Thorleifsson, L. Qi, L. C. Karssen, E. M. van Leeuwen, S. M.
Willems, M. Li, H. Chen, C. Fuchsberger, P. Kwan, C. Ma, M. Linderman, Y. Lu, S.
K. Thomsen, J. K. Rundle, N. L. Beer, M. van de Bunt, A. Chalisey, H. M. Kang, B.
F. Voight, G. R. Abecasis, P. Almgren, D. Baldassarre, B. Balkau, R. Benediktsson,
M. Bluher, H. Boeing, L. L. Bonnycastle, E. P. Bottinger, N. P. Burtt, J. Carey, G.
Charpentier, P. S. Chines, M. C. Cornelis, D. J. Couper, A. T. Crenshaw, R. M. van
Dam, A. S. Doney, M. Dorkhan, S. Edkins, J. G. Eriksson, T. Esko, E. Eury, J.
Fadista, J. Flannick, P. Fontanillas, C. Fox, P. W. Franks, K. Gertow, C. Gieger, B.
Gigante, O. Gottesman, G. B. Grant, N. Grarup, C. J. Groves, M. Hassinen, C. T.
Have, C. Herder, O. L. Holmen, A. B. Hreidarsson, S. E. Humphries, D. J. Hunter,
A. U. Jackson, A. Jonsson, M. E. Jorgensen, T. Jorgensen, W. H. Kao, N. D.
Kerrison, L. Kinnunen, N. Klopp, A. Kong, P. Kovacs, P. Kraft, J. Kravic, C.
Langford, K. Leander, L. Liang, P. Lichtner, C. M. Lindgren, E. Lindholm, A.
Linneberg, C. T. Liu, S. Lobbens, J. Luan, V. Lyssenko, S. Mannisto, O. McLeod, J.
Meyer, E. Mihailov, G. Mirza, T. W. Muhleisen, M. Muller-Nurasyid, C. Navarro,
M. M. Nothen, N. N. Oskolkov, K. R. Owen, D. Palli, S. Pechlivanis, L. Peltonen, J.
R. Perry, C. G. Platou, M. Roden, D. Ruderfer, D. Rybin, Y. T. van der Schouw, B.
Sennblad, G. Sigurethsson, A. Stancakova, G. Steinbach, P. Storm, K. Strauch, H.
M. Stringham, Q. Sun, B. Thorand, E. Tikkanen, A. Tonjes, J. Trakalo, E. Tremoli,
T. Tuomi, R. Wennauer, S. Wiltshire, A. R. Wood, E. Zeggini, I. Dunham, E. Birney,
L. Pasquali, J. Ferrer, R. J. Loos, J. Dupuis, J. C. Florez, E. Boerwinkle, J. S. Pankow,
C. van Duijn, E. Sijbrands, J. B. Meigs, F. B. Hu, U. Thorsteinsdottir, K. Stefansson,
T. A. Lakka, R. Rauramaa, M. Stumvoll, N. L. Pedersen, L. Lind, S. M. Keinanen-
133
Kiukaanniemi, E. Korpi-Hyovalti, T. E. Saaristo, J. Saltevo, J. Kuusisto, M. Laakso,
A. Metspalu, R. Erbel, K. H. Jocke, S. Moebus, S. Ripatti, V. Salomaa, E. Ingelsson,
B. O. Boehm, R. N. Bergman, F. S. Collins, K. L. Mohlke, H. Koistinen, J.
Tuomilehto, K. Hveem, I. Njolstad, P. Deloukas, P. J. Donnelly, T. M. Frayling, A.
T. Hattersley, U. de Faire, A. Hamsten, T. Illig, A. Peters, S. Cauchi, R. Sladek, P.
Froguel, T. Hansen, O. Pedersen, A. D. Morris, C. N. Palmer, S. Kathiresan, O.
Melander, P. M. Nilsson, L. C. Groop, I. Barroso, C. Langenberg, N. J. Wareham, C.
A. O'Callaghan, A. L. Gloyn, D. Altshuler, M. Boehnke, T. M. Teslovich, M. I.
McCarthy, A. P. Morris, D. I. G. Replication, C. Meta-analysis, Genetic fine
mapping and genomic annotation defines causal mechanisms at type 2 diabetes
susceptibility loci. Nat Genet 47, 1415-1425 (2015).
27. A. Segerstolpe, A. Palasantza, P. Eliasson, E. M. Andersson, A. C. Andreasson, X.
Sun, S. Picelli, A. Sabirsh, M. Clausen, M. K. Bjursell, D. M. Smith, M. Kasper, C.
Ammala, R. Sandberg, Single-Cell Transcriptome Profiling of Human Pancreatic
Islets in Health and Type 2 Diabetes. Cell Metab 24, 593-607 (2016).
28. A. Bonnefond, A. Karamitri, R. Jockers, P. Froguel, The Difficult Journey from
Genome-wide Association Studies to Pathophysiology: The Melatonin Receptor 1B
(MT2) Paradigm. Cell Metab 24, 345-347 (2016).
29. B. Marcheva, K. M. Ramsey, E. D. Buhr, Y. Kobayashi, H. Su, C. H. Ko, G. Ivanova,
C. Omura, S. Mo, M. H. Vitaterna, J. P. Lopez, L. H. Philipson, C. A. Bradfield, S.
D. Crosby, L. JeBailey, X. Wang, J. S. Takahashi, J. Bass, Disruption of the clock
components CLOCK and BMAL1 leads to hypoinsulinaemia and diabetes. Nature
466, 627-631 (2010).
30. J. Bass, J. S. Takahashi, Circadian integration of metabolism and energetics. Science
330, 1349-1354 (2010).
31. A. Knutsson, A. Kempe, Shift work and diabetes--a systematic review. Chronobiol
Int 31, 1146-1151 (2014).
32. J. M. Lane, A. M. Chang, A. C. Bjonnes, D. Aeschbach, C. Anderson, B. E. Cade, S.
W. Cain, C. A. Czeisler, S. A. Gharib, J. J. Gooley, D. J. Gottlieb, S. F. Grant, E. B.
Klerman, D. S. Lauderdale, S. W. Lockley, M. Munch, S. Patel, N. M. Punjabi, S.
M. Rajaratnam, M. Rueger, M. A. St Hilaire, N. Santhi, K. Scheuermaier, E. Van
Reen, P. C. Zee, S. A. Shea, J. F. Duffy, O. M. Buxton, S. Redline, F. A. Scheer, R.
Saxena, Impact of Common Diabetes Risk Variant in MTNR1B on Sleep, Circadian,
and Melatonin Physiology. Diabetes 65, 1741-1751 (2016).
33. S. Galandrin, G. Oligny-Longpre, M. Bouvier, The evasive nature of drug efficacy:
implications for drug discovery. Trends Pharmacol Sci 28, 423-430 (2007).
34. T. Kenakin, A. Christopoulos, Signalling bias in new drug discovery: detection,
quantification and therapeutic impact. Nat Rev Drug Discov 12, 205-216 (2013).
35. E. Cecon, A. Oishi, R. Jockers, Melatonin receptors: molecular pharmacology and
signalling in the context of system bias. Br J Pharmacol 175, 3263–3280 (2017).
36. P. Katsonis, O. Lichtarge, A formal perturbation equation between genotype and
phenotype determines the Evolutionary Action of protein-coding variations on
fitness. Genome Res 24, 2050-2058 (2014).
37. R. R. Gainetdinov, R. T. Premont, L. M. Bohn, R. J. Lefkowitz, M. G. Caron,
Desensitization of G protein-coupled receptors and neuronal functions. Annu Rev
Neurosci 27, 107-144 (2004).
38. S. Rajagopal, K. Rajagopal, R. J. Lefkowitz, Teaching old receptors new tricks:
biasing seven-transmembrane receptors. Nat Rev Drug Discov 9, 373-386 (2010).

134
39. D. Calebiro, V. O. Nikolaev, L. Persani, M. J. Lohse, Signaling by internalized G-
protein-coupled receptors. Trends Pharmacol Sci 31, 221-228 (2010).
40. J. P. Vilardaga, F. G. Jean-Alphonse, T. J. Gardella, Endosomal generation of cAMP
in GPCR signaling. Nat Chem Biol 10, 700-706 (2014).
41. N. G. Tsvetanova, R. Irannejad, M. von Zastrow, G protein-coupled receptor (GPCR)
signaling via heterotrimeric G proteins from endosomes. J Biol Chem 290, 6689-
6696 (2015).
42. A. R. Thomsen, B. Plouffe, T. J. Cahill, 3rd, A. K. Shukla, J. T. Tarrasch, A. M.
Dosey, A. W. Kahsai, R. T. Strachan, B. Pani, J. P. Mahoney, L. Huang, B. Breton,
F. M. Heydenreich, R. K. Sunahara, G. Skiniotis, M. Bouvier, R. J. Lefkowitz,
GPCR-G Protein-beta-Arrestin Super-Complex Mediates Sustained G Protein
Signaling. Cell 166, 907-919 (2016).
43. D. L. Bassoni, W. J. Raab, P. L. Achacoso, C. Y. Loh, T. S. Wehrman, Measurements
of beta-arrestin recruitment to activated seven transmembrane receptors using
enzyme complementation. Methods Mol Biol 897, 181-203 (2012).
44. J. W. Black, P. Leff, Operational models of pharmacological agonism. Proc R Soc
Lond B Biol Sci 220, 141-162 (1983).
45. T. Kenakin, C. Watson, V. Muniz-Medina, A. Christopoulos, S. Novick, A simple
method for quantifying functional selectivity and agonist bias. ACS Chem Neurosci
3, 193-203 (2012).
46. O. Lichtarge, H. R. Bourne, F. E. Cohen, An evolutionary trace method defines
binding surfaces common to protein families. J Mol Biol 257, 342-358 (1996).
47. D. J. Liu, S. M. Leal, A novel adaptive method for the analysis of next-generation
sequencing data to detect complex trait associations with rare variants due to gene
main effects and interactions. PLoS Genet 6, e1001156 (2010).
48. G. D. C. T2D-GENES Consortium, DIAGRAM Consortium. (2016/07/25).
49. M. R. Nelson, D. Wegmann, M. G. Ehm, D. Kessner, P. St Jean, C. Verzilli, J. Shen,
Z. Tang, S. A. Bacanu, D. Fraser, L. Warren, J. Aponte, M. Zawistowski, X. Liu, H.
Zhang, Y. Zhang, J. Li, Y. Li, L. Li, P. Woollard, S. Topp, M. D. Hall, K. Nangle, J.
Wang, G. Abecasis, L. R. Cardon, S. Zollner, J. C. Whittaker, S. L. Chissoe, J.
Novembre, V. Mooser, An abundance of rare functional variants in 202 drug target
genes sequenced in 14,002 people. Science 337, 100-104 (2012).
50. A. Karamitri, R. Jockers, in Methods in Pharmacology and Toxicology series, G
Protein-Coupled Receptor Genetics: Research and Methods in the Post-Genomic
Era, C. W. Stefens, Ed. (Springer Science, New York, 2014), pp. 313-332.
51. D. R. Hinton, J. C. Blanks, H. K. Fong, P. J. Casey, E. Hildebrandt, M. I. Simons,
Novel localization of a G protein, Gz-alpha, in neurons of brain and retina. J Neurosci
10, 2763-2770 (1990).
52. M. E. Kimple, J. W. Joseph, C. L. Bailey, P. T. Fueger, I. A. Hendry, C. B. Newgard,
P. J. Casey, Galphaz negatively regulates insulin secretion and glucose clearance. J
Biol Chem 283, 4560-4567 (2008).
53. K. Baba, A. Benleulmi-Chaachoua, A. S. Journe, M. Kamal, J. L. Guillaume, S.
Dussaud, F. Gbahou, K. Yettou, C. Liu, S. Contreras-Alcantara, R. Jockers, G.
Tosini, Heteromeric MT1/MT2 melatonin receptors modulate photoreceptor
function. Sci Signal 6, ra89 (2013).
54. R. M. Slominski, R. J. Reiter, N. Schlabritz-Loutsevitch, R. S. Ostrom, A. T.
Slominski, Melatonin membrane receptors in peripheral tissues: distribution and
functions. Mol Cell Endocrinol 351, 152-166 (2012).
135
55. P. J. Casey, H. K. Fong, M. I. Simon, A. G. Gilman, Gz, a guanine nucleotide-binding
protein with unique biochemical properties. J Biol Chem 265, 2383-2390 (1990).
56. T. Sakurai, T. Koike, M. Nakayama, Pharmacological characterization of a highly
selective and potent partial agonist of the MT(2) melatonin receptor. Pharmacology
93, 244-252 (2014).
57. M. Kamal, F. Gbahou, J. L. Guillaume, A. M. Daulat, A. Benleulmi-Chaachoua, M.
Luka, P. Chen, D. Kalbasi Anaraki, M. Baroncini, C. Mannoury la Cour, M. J.
Millan, V. Prevot, P. Delagrange, R. Jockers, Convergence of melatonin and
serotonin (5-HT) signaling at MT2/5-HT2C receptor heteromers. J Biol Chem 290,
11537-11546 (2015).
58. S. Devavry, C. Legros, C. Brasseur, P. Delagrange, G. Spadoni, W. Cohen, B.
Malpaux, J. A. Boutin, O. Nosjean, Description of the constitutive activity of cloned
human melatonin receptors hMT(1) and hMT(2) and discovery of inverse agonists.
J Pineal Res 53, 29-37 (2012).
59. M. A. Ayoub, C. Couturier, E. Lucas-Meunier, S. Angers, P. Fossier, M. Bouvier, R.
Jockers, Monitoring of ligand-independent dimerization and ligand-induced
conformational changes of melatonin receptors in living cells by bioluminescence
resonance energy transfer. J Biol Chem 277, 21522-21528 (2002).
60. C. Ersahin, M. I. Masana, M. L. Dubocovich, Constitutively active melatonin MT(1)
receptors in male rat caudal arteries. Eur J Pharmacol 439, 171-172 (2002).
61. F. J. Meye, G. M. Ramakers, R. A. Adan, The vital role of constitutive GPCR activity
in the mesolimbic dopamine system. Transl Psychiatry 4, e361 (2014).
62. J. Arendt, Melatonin, circadian rhythms, and sleep. N Engl J Med 343, 1114-1116
(2000).
63. E. Peschke, I. Stumpf, I. Bazwinsky, L. Litvak, H. Dralle, E. Muhlbauer, Melatonin
and type 2 diabetes - a possible link? J Pineal Res 42, 350-358 (2007).
64. S. K. Thomsen, A. Ceroni, M. van de Bunt, C. Burrows, A. Barrett, R. Scharfmann,
D. Ebner, M. I. McCarthy, A. L. Gloyn, Systematic Functional Characterization of
Candidate Causal Genes for Type 2 Diabetes Risk Variants. Diabetes 65, 3805-3811
(2016).
65. P. Rene, C. Le Gouill, I. D. Pogozheva, G. Lee, H. I. Mosberg, I. S. Farooqi, K. J.
Valenzano, M. Bouvier, Pharmacological chaperones restore function to MC4R
mutants responsible for severe early-onset obesity. J Pharmacol Exp Ther 335, 520-
532 (2010).
66. D. H. McDermott, J. Lopez, F. Deng, Q. Liu, T. Ojode, H. Chen, J. Ulrick, N.
Kwatemaa, C. Kelly, S. Anaya-O'Brien, M. Garofalo, M. Marquesen, D. Hilligoss,
R. DeCastro, H. L. Malech, P. M. Murphy, AMD3100 is a potent antagonist at
CXCR4(R334X) , a hyperfunctional mutant chemokine receptor and cause of WHIM
syndrome. J Cell Mol Med 15, 2071-2081 (2011).
67. F. F. Hamdan, M. D. Rochdi, B. Breton, D. Fessart, D. E. Michaud, P. G. Charest, S.
A. Laporte, M. Bouvier, Unraveling G protein-coupled receptor endocytosis
pathways using real-time monitoring of agonist-promoted interaction between beta-
arrestins and AP-2. J Biol Chem 282, 29089-29100 (2007).
68. S. Armando, J. Quoyer, V. Lukashova, A. Maiga, Y. Percherancier, N. Heveker, J.
P. Pin, L. Prezeau, M. Bouvier, The chemokine CXC4 and CC2 receptors form
homo- and heterooligomers that can engage their signaling G-protein effectors and
betaarrestin. FASEB J 28, 4509-4523 (2014).

136
69. E. T. van der Westhuizen, B. Breton, A. Christopoulos, M. Bouvier, Quantification
of ligand bias for clinically relevant beta2-adrenergic receptor ligands: implications
for drug taxonomy. Mol Pharmacol 85, 492-509 (2014).
70. M. Steinfath, B. Geertz, W. Schmitz, H. Scholz, A. Haverich, I. Breil, P. Hanrath, C.
Reupcke, M. Sigmund, H. B. Lo, Distinct down-regulation of cardiac á 1 - and á 2 -
adrenoceptors in different human heart diseases. Naunyn-Schmiedeberg's Archives
of Pharmacology 343, 217-220 (1991).
71. J. C. Venter, M. D. Adams, E. W. Myers, P. W. Li, R. J. Mural, G. G. Sutton, H. O.
Smith, M. Yandell, C. A. Evans, R. A. Holt, J. D. Gocayne, P. Amanatides, R. M.
Ballew, D. H. Huson, J. R. Wortman, Q. Zhang, C. D. Kodira, X. H. Zheng, L. Chen,
M. Skupski, G. Subramanian, P. D. Thomas, J. Zhang, G. L. Gabor Miklos, C.
Nelson, S. Broder, A. G. Clark, J. Nadeau, V. A. McKusick, N. Zinder, A. J. Levine,
R. J. Roberts, M. Simon, C. Slayman, M. Hunkapiller, R. Bolanos, A. Delcher, I.
Dew, D. Fasulo, M. Flanigan, L. Florea, A. Halpern, S. Hannenhalli, S. Kravitz, S.
Levy, C. Mobarry, K. Reinert, K. Remington, J. Abu-Threideh, E. Beasley, K.
Biddick, V. Bonazzi, R. Brandon, M. Cargill, I. Chandramouliswaran, R. Charlab,
K. Chaturvedi, Z. Deng, F. V. Di, P. Dunn, K. Eilbeck, C. Evangelista, A. E.
Gabrielian, W. Gan, W. Ge, F. Gong, Z. Gu, P. Guan, T. J. Heiman, M. E. Higgins,
R. R. Ji, Z. Ke, K. A. Ketchum, Z. Lai, Y. Lei, Z. Li, J. Li, Y. Liang, X. Lin, F. Lu,
G. V. Merkulov, N. Milshina, H. M. Moore, A. K. Naik, V. A. Narayan, B. Neelam,
D. Nusskern, D. B. Rusch, S. Salzberg, W. Shao, B. Shue, J. Sun, Z. Wang, A. Wang,
X. Wang, J. Wang, M. Wei, R. Wides, C. Xiao, C. Yan, A. Yao, J. Ye, M. Zhan, W.
Zhang, H. Zhang, Q. Zhao, L. Zheng, F. Zhong, W. Zhong, S. Zhu, S. Zhao, D.
Gilbert, S. Baumhueter, G. Spier, C. Carter, A. Cravchik, T. Woodage, F. Ali, H. An,
A. Awe, D. Baldwin, H. Baden, M. Barnstead, I. Barrow, K. Beeson, D. Busam, A.
Carver, A. Center, M. L. Cheng, L. Curry, S. Danaher, L. Davenport, R. Desilets, S.
Dietz, K. Dodson, L. Doup, S. Ferriera, N. Garg, A. Gluecksmann, B. Hart, J.
Haynes, C. Haynes, C. Heiner, S. Hladun, D. Hostin, J. Houck, T. Howland, C.
Ibegwam, J. Johnson, F. Kalush, L. Kline, S. Koduru, A. Love, F. Mann, D. May, S.
McCawley, T. McIntosh, I. McMullen, M. Moy, L. Moy, B. Murphy, K. Nelson, C.
Pfannkoch, E. Pratts, V. Puri, H. Qureshi, M. Reardon, R. Rodriguez, Y. H. Rogers,
D. Romblad, B. Ruhfel, R. Scott, C. Sitter, M. Smallwood, E. Stewart, R. Strong, E.
Suh, R. Thomas, N. N. Tint, S. Tse, C. Vech, G. Wang, J. Wetter, S. Williams, M.
Williams, S. Windsor, E. Winn-Deen, K. Wolfe, J. Zaveri, K. Zaveri, J. F. Abril, R.
Guigo, M. J. Campbell, K. V. Sjolander, B. Karlak, A. Kejariwal, H. Mi, B. Lazareva,
T. Hatton, A. Narechania, K. Diemer, A. Muruganujan, N. Guo, S. Sato, V. Bafna,
S. Istrail, R. Lippert, R. Schwartz, B. Walenz, S. Yooseph, D. Allen, A. Basu, J.
Baxendale, L. Blick, M. Caminha, J. Carnes-Stine, P. Caulk, Y. H. Chiang, M.
Coyne, C. Dahlke, A. Mays, M. Dombroski, M. Donnelly, D. Ely, S. Esparham, C.
Fosler, H. Gire, S. Glanowski, K. Glasser, A. Glodek, M. Gorokhov, K. Graham, B.
Gropman, M. Harris, J. Heil, S. Henderson, J. Hoover, D. Jennings, C. Jordan, J.
Jordan, J. Kasha, L. Kagan, C. Kraft, A. Levitsky, M. Lewis, X. Liu, J. Lopez, D.
Ma, W. Majoros, J. McDaniel, S. Murphy, M. Newman, T. Nguyen, N. Nguyen, M.
Nodell, The sequence of the human genome. Science 291, 1304-1351 (2001).

137
Acknowledgments
We thank A. Green and the Discoverx team for their valuable advice in assay design and
continuous support. We thank A. Oishi, E. Cecon (Institut Cochin, France), and N. Clement
(Clement, Institut Curie, France) for their help during the reviewing process. We are grateful
to the D.E.S.I.R. (B. Balkau, M. Marre, O. Lantieri, and R. Roussel) and Corbeil (G.
Charpentier) study groups for the availability of genetic data. Funding: This work was
supported by the Agence Nationale de la Recherche (ANR-2011-BSV1-012-01 “MLT2D”
and ANR-2011-META “MELA-BETES”, ANR-12-RPIB-0016 “MED-HET-REC-2”), the
Fondation de la Recherche Médicale (Equipe FRM DEQ20130326503), Institut National de
la Santé et de la Recherche Médicale (INSERM), Centre National de la Recherche
Scientifique (CNRS) and the “Who am I?” laboratory of excellence No.ANR-11-LABX-
0071 funded by the French Government through its “Investments for the Future” program
operated by The French National Research Agency (70) under grant No.ANR-11-IDEX-
0005-01 (to R.J.); by Canadian Institutes of Health Research (CIHR) operating (MOP10501)
and Foundation grants (FDN148431) to M. Bouvier and a Post-Doctoral Fellowship from
CIHR and a Post-Doctoral Fellowship Award from Diabetes Canada (71) to B.P. M. Bouvier
holds a Canada Research Chair in Signal Transduction and Molecular Pharmacology. A.B.
is supported by INSERM.
Author contributions
A.K., B.P., A.B., P.F., M. Bouvier, and R.J. participated in the project design; A.K., B.P.,
M.C., J.L.G., and A.H. performed the biochemical investigation; A.B., M. Boissel, and M.C.
performed the genetic investigation; J.G., and O.L. performed the Evolutionary Action
analysis; C.L., N.J.W., C.L.G., V.L., and P.F. provided resources; A.K., B.P., A.B., M.
Bouvier, and R.J. wrote the original draft of the manuscript; A.K., B.P., A.B., J.G., P.F., M.

138
Bouvier, and R.J. participated in the writing, reviewing, and editing of the manuscript; A.K.,
B.P. A.B., P.F., M. Bouvier, and R.J. participated in funding acquisition; A.K., A.B., O.L.,
M. Bouvier, and R.J. supervised the experiments.
Competing interests
The authors declare that they have no competing interests.
Data and materials availability
All BRET-based biosensors used in the study are available for non-commercial use through
a regular academic Material Transfer Agreement. All data needed to evaluate the conclusions
of this study are available in the paper or the supplementary materials.

139
Figures
Fig. 1. Functional profiling of MT2 variants for spontaneous receptor activity.
(A) Spontaneous Gαi1 activity of WT MT2 and the indicated MT2 variants as measured by
BRET. (B) Spontaneous Gαz activity of WT MT2 and the indicated MT2 variants as
measured by BRET. (C) Spontaneous recruitment of β-arrestin2 (β-arr2) to WT MT2 and the
indicated MT2 variants as measured by the pathHunter β-arrestin2 assay. Data are shown as
a percentage of the activity of WT MT2 (indicated by the dotted line) and are means ± SEM
of at least three experiments. One-sample t-test was performed to assess statistically
significant differences between the WT receptor and the MT2 variants. *P < 0.05; **P <
0.01; ***P < 0.0001. See also tables S1 to S5 for complete data sets for the spontaneous
activity of MT2 variants.
S C I E N C E S I G N A L I N G | R E S E A R C H A R T I C L E
Karamitri et al., Sci. Signal. 11, eaan6622 (2018) 28 August 2018 1 of 14
A

140
Fig. 2. MLT concentration-response curves for the MT2-mediated signaling of
variants representing each signaling profile.
(A to G) Analysis of the signaling profiles of MT2 variants. The MT2 variant tested is listed
on the left. Each of the five categories of signaling profile is listed above the row of graphs
for each variant receptor. The effect of each variant on signaling is listed for each panel.
Solid lines with filled circles correspond to the variant MT2 and dotted lines with open circles
correspond to the WT MT2, which was monitored in parallel with the variant receptors in
each experiment. Data were plotted using non-linear regression with a variable Hill slope.
Data are means ± SEM of at least three experiments. See also fig. S4 and tables S1 to S5 for
complete data sets for the agonist-mediated signaling activity of MT2 variants.
S C I E N C E S I G N A L I N G | R E S E A R C H A R T I C L E
Karamitri et al., Sci. Signal. 11, eaan6622 (2018) 28 August 2018 1 of 14
A
B
C
D
E
F
G

141
Fig. 3. Relationships between spontaneous and MLT-induced MT2 variant
activation, between G protein– and β-arrestin2–dependent events, and between
different G protein signaling events.
(A) Correlation plots between the spontaneous and MLT-induced effects (Emax) of each
variant MT2 for Gαi1 activation (left), Gαz activation (middle), and β-arrestin2 recruitment
(right). (B) Correlation plots between the Emax values of MLT-induced Gαi1 activation, Gαz
activation, and cAMP inhibition with β-arrestin2 recruitment for each variant MT2. (C)
Correlation plots between the Emax values of MLT-induced Gαi1activation and Gαz activation
(left), Gαi1 activation and cAMP inhibition (middle), and Gαz activation and cAMP
inhibition of each variant MT2. Spontaneous activities and Emax values represent means ±
SEM of at least three experiments and were normalized to those of the WT MT2. Data were
fitted by linear regression analysis and R2 values were obtained for the overall correlation.
All R values are statistically significant with P values less than 0.0001. See also fig. S6 for
correlations between spontaneous and agonist-promoted activity for G proteins and -
arrestin signaling parameters.
S C I E N C E S I G N A L I N G | R E S E A R C H A R T I C L E
Karamitri et al., Sci. Signal. 11, eaan6622 (2018) 28 August 2018 1 of 14
Spontaneous activity versus MLT-induced effect
A
G protein versus β-arrestin
B
G protein versus cAMP
C
Fig. 3. Relationships between spontaneous and MLT-induced MT2 variant activation, between G protein– and -arrestin2–dependent events, and between
different G protein signaling events. (A) Correlation plots between the spontaneous and MLT-induced effects (Emax) of each variant MT2 for Gi1 activation (left), Gz
activation (middle), and -arrestin2 recruitment (right). (B) Correlation plots between the Emax values of MLT-induced Gi1 activation, Gz activation, and cAMP inhibition
with -arrestin2 recruitment for each variant MT2. (C) Correlation plots between the Emax values of MLT-induced Gi1activation and Gz activation (left), Gi1 activation and
cAMP inhibition (middle), and Gz activation and cAMP inhibition of each variant MT2. Spontaneous activities and Emax values represent means ± SEM of at least three
experiments and were normalized to those of the WT MT2. Data were fitted by linear regression analysis, and R2 values were obtained for the overall correlation. All
R values are statistically significant with P values <0.0001. See also fig. S6 for correlations between spontaneous and agonist-promoted activity for G proteins and -arrestin
signaling parameters.
Dow
nlo
aded fro
m h
ttp://s
tke.s
cie
ncem
ag.o
rg/ o
n A
ugust 2
8, 2
018

142
Fig. 4. Graphical representation of the signaling signatures of MT2 variants.
Radial graphs representing spontaneous and MLT-induced activation of Gαi1 and Gαz,
inhibition of cAMP production, recruitment of β-arrestin2, and activation of ERK by WT
MT2 and the 40 indicated MT2 variants. The activity of WT MT2 was set as zero. Values of
variants with enhanced properties ranged from 0 to +1 and those with impaired properties
ranged from 0 to -1. The scale of all radial graphs ranged from -1 to +1. S, spontaneous; Em,
agonist-mediated efficacy; Δ, Δlog(τ/KA). See also tables S1 to S5 for complete data sets for
spontaneous and agonist-mediated signaling activity of the MT2 variants.
S C I E N C E S I G N A L I N G | R E S E A R C H A R T I C L E
Karamitri et al., Sci. Signal. 11, eaan6622 (2018) 28 August 2018 1 of 14
Fig. 4. Graphical representation of the signaling signatures of MT2 variants. Radial graphs representing spontaneous and MLT-induced activation of Gi1 and Gz,
inhibition of cAMP production, recruitment of -arrestin2, and activation of ERK by WT MT2 and the 40 indicated MT2 variants. The activity of WT MT2 was set as zero.
Values of variants with enhanced properties ranged from 0 to +1, and those with impaired properties ranged from 0 to −1. The scale of all radial graphs ranged from −1
to +1. S, spontaneous; Em, agonist-mediated efficacy; , log(/KA). See also tables S1 to S5 for complete data sets for spontaneous and agonist-mediated signaling activ-
ity of the MT2 variants.
Dow
nlo
aded fro
m h
ttp://s
tke.s
cie
ncem
ag.o
rg/ o
n A
ugust 2
8, 2
018

143
Fig. 5. Evolutionary Action analysis of MT2 variants and correlation with signaling
impairment.
(A) An Evolutionary Action (EA) score was calculated for each indicated MT2 variant. EA
ranges from 0 to 100 with a score of 0 predicted as benign and a score of 100 predicted as
highly impactful or detrimental to protein function. Scores are colored based on EA [EA =
0 (pink) to EA = 100 (blue)]. (B) Functional defects of every MT2 variant were defined by
phenotype score and correlated with the EA score. Data were fitted by linear regression
analysis and R2 values obtained for the overall correlation. Correlation value was statistically
significant, P < 0.0001. The A42P MT2 variant was excluded from the R2 calculation because
of the known detrimental effect of proline residues on general protein structure. See also
tables S1 to S5 for complete data sets for spontaneous and agonist-mediated signaling
activity of the MT2 variants.
S C I E N C E S I G N A L I N G | R E S E A R C H A R T I C L E
Karamitri et al., Sci. Signal. 11, eaan6622 (2018) 28 August 2018 1 of 14
A
B
Fig. 5. Evolutionary action analysis of MT2 variants and correlation with sig-
naling impairment. (A
quired to understand the full effect of receptor variants on disease
risk. Here, we determined both spontaneous and MLTinduced MT2
activity for five signaling events (Gi1 and Gz activation, inhibition
of cAMP production, arrestin2 recruitment, and ERK1/2 activation).
Ten of 38 rare receptor variants had a phenotype that was indistin
guishable from that of the WT receptor and were therefore classified
as neutral variants. The 28 other variants showed functional defects
compared to the WT receptor. Only the variant p.A359E showed a
robust gainoffunction phenotype with 246, 145, and 130% increases
in the Emax values of ERK activation, Gi1 activation, and arrestin2
recruitment, respectively. It would be interesting in a followup study
to determine the effect of this increased MT2 function on an individ
ual’s metabolism. Together, our data show that lossoffunction MT2
variants at different functional levels are associated with increased
T2D risk. Detailed genetic association analysis detected three param
eters that stand out in terms of the statistical significance of associa
tion with T2D risk: MLTinduced activation of Gi1 (19 variants) and
Gz (22 variants) and spontaneous arrestin2 recruitment (15 vari
ants). The independence of signaling events associated with G protein
activation and arrestin2 recruitment was further highlighted by the
poor correlation between them for the 40 MT2 variants. The impor
tance of Gi1 activation underlines the general importance of this
wellcharacterized pathway for MT2. The activation of Gz by MT2
has not been reported previously, but the importance of impaired Gz
coupling for the association with T2D risk is of interest because the
tissue distribution and GPCR coupling profile of Gz are more re
stricted than those of Gi1. Gz is mainly expressed in different brain
regions and in retinal ganglion cells (51, 52), all regions for which
) An evolutionary action score was calculated for each indi- cated MT2 variant. EA ranges from 0 to 100, with a score of 0 predicted as benign
and a score of 100 predicted as highly impactful or detrimental to protein function.
Scores are colored on the basis of EA [EA = 0 (pink) to EA = 100 (blue)]. (B) Function-
al defects of every MT2 variant were defined by phenotype score and correlated
with the EA score. Data were fitted by linear regression analysis, and R2 values were
obtained for the overall correlation. Correlation value was statistically significant,
P < 0.0001. The A42P MT2 variant was excluded from the R2 calculation because of
the known detrimental effect of proline residues on general protein structure. See
also tables S1 to S5 for complete data sets for spontaneous and agonist-mediated
signaling activity of the MT2 variants.
log(/KA) transduction ratio because it integrates both potencies
and maximal efficacies. A decrease in the maximal agonistmediated
efficacy and a rightward logEC50 shift were observed for this variant
but were not statistically significant. However, when both maximal
efficacy and potency were integrated, the global response depicted
by log(/KA) value was statistically significantly reduced compared
to that of the WT receptor. A good correlation was seen between the
EA score of MT2 variants and the corresponding experimentally de
termined phenotypic scores, which indicates the usefulness of the EA
score to predict the functional effect of a specific GPCR variant. The
EA score might therefore be applied to obtain a first classification of
GPCR variants before entering into largescale functional studies. To
gether, our data provide an operational template for the evaluation of
the functional effect of GPCR variants on common traits and diseases.
Specific pathway parameters of MT variants associated
MLT receptor expression has been reported (53, 54). In addition, the in trinsic GTPase (guanosine triphosphatase) activity of Gz is very slow, with a hydrolysis rate that is 200fold slower than that determined forany
other G proteins (55). These results introduce Gz as a previously un characterized player in MT2 signaling with a potential effect on T2D risk.
Although the recruitment of arrestin2 to MT2 in transfected
cells has been reported (56, 57), the physiological importance of this
phenomenon and its robustness in a cellular context expressing en dogenous MT2 receptors remain unclear. MT2 has indeed a poor
capacity for MLTinduced arrestin recruitment, an observation that
was confirmed here. Part of this difficulty to reveal ligandinduced
arrestin2 recruitment might be explained by the high degree of
spontaneous arrestin2 recruitment observed here. This spontaneous activity was completely lost for several variants, including the four lossofMLT binding mutants, which suggests that the measured spon
taneous activity is receptordependent. Arrestins are important reg ulators of GPCR function and scaffolding platforms for many signaling
complexes (38), but the role of arrestin recruitment in MT2 func tion in peripheral and central tissues is currently unknown. Our re
sults indicating an association between the spontaneous recruitment of
arrestin2 to the receptor and T2D risk point to a possible import ant
role of arrestin2 recruitment to MT2. Another unexpected and potentially relevant outcome of our study
is the association of spontaneous MT2 activity, namely, arrestin2 re
cruitment, with T2D risk. The notion that spontaneous and ligand
induced receptor activation of the 40 variants should be considered as
2
with T2D risk
Given that GPCRs, such as MT2, can signal through various cascades
and that different variants have the potential to modulate one or more
signaling parameters, a complete functional characterization is re
Dow
nlo
aded fro
m h
ttp://s
tke.s
cie
ncem
ag.o
rg/ o
n A
ugust 2
8, 2
018

144
Table 1. Association of specific functional defects of rare MT2 variants with T2D risk.
Only rare MT2 variants (with a frequency < 1%) were included. By applying Bonferroni
correction, a statistically significant P value was < 0.0056. A P value between 0.05 and
0.0056 was considered a trend of association (a nominal association). Nine independent
association tests were performed, based on a T2D case-control study including 2,186
individuals with T2D and 4,804 controls.
Consequences on MT2 Function
Rare MT2 Variants Frequency (cases)
Frequency (controls)
Odds Ratio [95% CI]
P value
Defects in Gαi1 activation
Spontaneous A25T, A42P, L60R, P95L, M120I/V, S123R, V124I, R138C/H/L, Y141F, T201M, I223T, F250V, Y308S, R316H
1.1% 0.7% 2.32 [1.17;4.60]
0.016
MLT-induced
A42P, L60R, A74T, P95L, S123R, V124I, R138C/H/L, Y141F, R154H, T201M, R222H, I223T, F250V, Y308S, R316H, R330W, A342V
1.4% 0.7% 3.25 [1.73;6.10]
2.4×10⁻⁴
Defects in Gαz activation
Spontaneous A42P, L60R, P95L, M120V, S123R, R138C/H/L, T201M, R222H, I223T, F250V, Y308S, R316H
0.9% 0.5% 2.95 [1.35;6.46]
0.0067
MLT-induced
A42P, L60R, A74T, P95L, G109A, M120I/V, S123R, V124I, R138C/H/L, Y141F, T201M, R222H, I223T, D246N, F250V, Y308S, R316H, R330W, A342V
1.4% 0.8% 2.93 [1.57;5.45]
7.3×10⁻⁴
Defects in cAMP inhibition
MLT-induced A42P, L60R, P95L, G109A, M120V, S123R, R138C/H/L, R222H, I223T, F250V, Y308S, R316H, R330W
0.9% 0.6% 2.83 [1.31;6.12]
0.0083
Defects in β-arrestin2 recruitment
Spontaneous A42P, L60R, P95L, G109A, S123R, V124I, R138C/L, Y141F, R154H, R222H, I223T, F250V, Y308S, A342V
1.3% 0.7% 3.06 [1.59;5.90]
8.3×10⁻⁴
MLT-induced
A42P, L60R, A74T, P95L, G109A, M120V, S123R, V124I, R138C/H/L, L166I, T201M, R222H, I223T, R231H, E237K, S238G, D246N, F250V, Y308S, R316H, A342V
2.7% 2.3% 2.13 [1.23;3.70]
0.0071
Defects in ERK activation
MLT-induced
A42P, L60R, A74T, P95L, M120I, S123R, V124I, R138C/H/L, M146V, R154H, T201M, R222H, I223T, F250V, Y308S, R316H
1.2% 0.8% 2.49 [1.29;4.80]
0.0066
Neutral variants A8S, A13V, G21S, W22L, A25T, P36S, A52T, A234T, I353T, A359E
0.2% 0.2% 2.50 [0.59;10.59]
0.21

145
Supplementary material
Fig. S1. Screening for G proteins and detection of pathways activated by WT-MT2.
(A) Screening of G proteins activated by MT2 by monitoring the melatonin-induced BRET
decrease between RlucII- Gα and GFP10-Gγ1 or GFP10-Gγ2 (GABY BRET biosensor).
Vasopressin receptor type 2 was used as a positive control for Gαs activation, and muscarinic
type 2, angiotensin type 1, and TPα receptors were used as positive controls for Gαi/o, Gαq,
and Gα12/13, respectively. (B) Screening of G proteins activated by MT2 by monitoring the
melatonin-induced BRET increase between RlucII-Gγ5 and GFP10-GRK2 in the absence or

146
presence of overexpressed Gα protein (GRK-based BRET biosensor). (C) Monitoring MT2-
mediated Gαi1 spontaneous activity with the RlucII-Gαi1/GFP10-Gγ2 BRET biosensor. (D)
Monitoring MT2-mediated Gαz spontaneous activity with the RlucII-Gγ5/GFP10-GRK2
BRET biosensor. The use of the RlucII-Gγ5/GFP10-GRK2 BRET biosensor resulted in a
better dynamic window for detecting agonist-promoted activity compared to the RlucII-
Gαz/GFP10-Gγ1 BRET biosensor. (E) Monitoring MT2-mediated β-arrestin2 spontaneous
recruitment both in the absence and presence of MLT in HEK 293 cells stably expressing β-
arrestin2-β-gal-EA and the empty plasmid pCMV-PL or MT2-PL with the PathHunter assay.
(F) Monitoring MT2-mediated cAMP inhibition in the presence or absence of MT2. (G)
Monitoring MT2-mediated ERK activation in the presence or absence of MT2. Data in all
panels are means ± SEM of at least three independent experiments.
Fig. S2. Predicted topology and distribution of the 40 MT2 variants.
The different variants are indicated in red. Assignment of residues was obtained by the
GPCRdb database (www.gpcrdb.org). e1 to e3, extracellular loops 1 to 3; i1 to i3,
intracellular loops 1 to 3.

147
Fig. S3. Detection of MT2 variants at the cell surface.
All MT2 variants were expressed at the cell surface as determined by cell surface ELISA.
The data were analyzed by one-sample t test compared to the WT-MT2 and are presented as
the means ± SEM of five to ten independent experiments. No statistically significant
differences were observed.

148

149

150

151
Fig. S4. MLT dose-response curves for Gαi1 and Gαz activation, β-arrestin2
recruitment, cAMP inhibition, and ERK activation by MT2 variants.
(A) MLT dose-response curves for the loss-of-MLT binding MT2 variants. (B) MLT dose-

152
response curves for the MT2 variants with marked defects in all measured pathways. (C)
MLT dose-response curves for the MT2 variants with defects in more than one signaling
pathway. (D) MLT dose-response curves for the MT2 variants with specific defects in G
protein activation. (E) MLT dose-response curves for the MT2 variants with specific defects
in β- arrestin2 recruitment. (F) MLT dose-response curves for the MT2 variants without
defects in any of the measured signaling pathways. Solid lines with filled circles correspond to the variant MT2 and dotted lines with open circles correspond to the WT-MT2 monitored
in parallel with the variant receptors in each experiment. Data were plotted using nonlinear
regression with a variable Hill slope. Data are means ± SEM of at least three experiments.
Fig. S5. G protein–dependent but β-arrestin–independent MLT-mediated ERK
phosphorylation by MT2.
(A) Effect of pertussis toxin (PTX) on ERK1/2 phosphorylation kinetics induced by MLT.
HEK 293T cells expressing MT2 were pretreated with or without PTX overnight before
being treated with 100 nM MLT for the indicated times. A representative Western blot is
shown. The immunoreactive bands for time 0 (basal) and 5 min after MLT addition (MLT)
from three independent experiments were quantified, and the data are expressed as the mean
± SEM of the fold-increase in the abundance of phosphorylated ERK1/2 compared to basal
amounts. (B) Effect of siRNA-mediated silencing of β- arrestin1/2 or control siRNA on the
kinetics of ERK1/2 phosphorylation induced by MLT. HEK 293T cells expressing MT2 were
transfected with control (si-C) or β-arrestin1/2–specific (si-β) siRNA 72 hours before being
treated with 100 nM MLT for the indicated times. A representative Western blot is shown.
The immunoreactive bands from three independent experiments for time 0 (basal) and 5 min
after MLT addition (MLT) were quantified by densitometry, and the data are expressed as
the mean ± SEM of the fold-increase in the abundance of phosphorylated ERK1/2 compared
to basal amounts. Right: Western blot shows knockdown of β-arrestin1/2. AKT was used as
a loading control. A one- sample t test was performed to assess statistically significant
differences between basal and MLT- induced ERK phosphorylation. *P < 0.05, **P < 0.01.

153
Fig. S6. Correlations between the effects of the mutations on spontaneous and
agonist-promoted activity for G proteins and β-arrestin signaling parameters
performed pairwise.
(A) Correlation between spontaneous β-arrestin2 recruitment and MLT-induced Gαi1
activation (Emax) of each MT2 variant. (B) Correlation between spontaneous β-arrestin2
recruitment and MLT-induced Gαz activation (Emax) of each MT2 variant. (C) Correlation
between spontaneous Gαi1 and Gαz activity of each MT2 variant. (D) Correlation between
spontaneous Gαi1 activity and β-arrestin2 recruitment of each MT2 variant. (E) Correlation
between spontaneous Gαz activity and β-arrestin2 recruitment of each MT2 variant.
Spontaneous activities and Emax values represent means ± SEM of at least three experiments
normalized to WT-MT2. Data were fitted in GraphPad Prism by linear regression analysis
and R2 values were obtained for the overall correlation.

154
Table S1. Summary of the functional profiling of Gαi1 activation by WT-MT2 and
MT2 variants.
Data are means ± SEM of four to ten independent experiments with repeats in quadruplicate.
ND denotes that the experimental parameter could not be determined due to lack of a
concentration- response curve. The data were analyzed by comparing independent fits with
a global fit that shares the selected parameter (##) and by one-sample t test (#) compared to
the WT. *P < 0.05, **P < 0.01, ***P < 0.0001.
Variant Spontaneous activity#
Agonist mediated## Potency (LogEC50)## (Emax)
Log(τ/KA) Δlog(τ/KA)#
(% WT) (% WT) WT Variant WT Variant
A8S 108 ± 4 91 ± 6 -9.40 ± 0.12 -9.55 ± 0.14 9.40 ± 0.12 9.42 ± 0.13 0.03 ± 0.18
A13V 93 ± 2 95 ± 7 -9.37 ± 0.08 -9.44 ± 0.16 9.38 ± 0.13 9.42 ± 0.13 0.04 ± 0.18
G21S 106 ± 5 94 ± 5 -9.39 ± 0.09 -9.53 ± 0.11 9.39 ± 0.10 9.49 ± 0.10 0.09 ± 0.14
W22L 123 ± 17 103 ± 8 -9.59 ± 0.08 -9.53 ± 0.16 9.56 ± 0.11 9.55 ± 0.12 -0.01 ± 0.16
G24E 120 ± 6* 100 ± 8 -9.39 ± 0.09 -9.40 ± 0.17 9.39 ± 0.13 9.39 ± 0.12 0.00 ± 0.18
A25T 89 ± 3* 96 ± 7 -9.39 ± 0.09 -9.44 ± 0.16 9.39 ± 0.12 9.40 ± 0.13 0.00 ± 0.18
P36S 124 ± 6** 127 ± 6*** -9.46 ± 0.06 -9.55 ± 0.12 9.27 ± 0.11 9.56 ± 0.09 0.29 ± 0.09*
A42P 33 ± 10*** 0*** -9.83 ± 0.08 ND 9.83 ± 0.08 ND ND
A52T 114 ± 13 105 ± 8 -9.88 ± 0.07 -9.85 ± 0.20 9.86 ± 0.15 9.85 ± 0.14 -0.01 ± 0.21
L60R 37 ± 16* 0*** -9.80 ± 0.10 ND 9.80 ± 0.10 ND ND
A74T 86 ± 6 74 ± 6* -9.59 ± 0.11 -9.26 ± 0.18 9.60 ± 0.12 8.94 ± 0.18 -0.66 ± 0.22*
P95L 39 ± 5*** 0*** -9.28 ± 0.14 ND 9.28 ± 0.14 ND ND
G109A 106 ± 15 103 ± 6 -9.73 ± 0.11 -9.66 ± 0.12 9.71 ± 0.11 9.66 ± 0.11 -0.06 ± 0.15
M120I 82 ± 6* 155 ± 12* -9.32 ± 0.15 -9.20 ± 0.18 8.97 ± 0.21 9.19 ± 0.15 0.22 ± 0.26
M120V 44 ± 9** 121 ± 7* -9.35 ± 0.11 -9.16 ± 0.12 9.24 ± 0.13 9.17 ± 0.11 -0.07 ± 0.17
S123R 23 ± 2*** 0*** -9.77 ± 0.15 ND 9.77 ± 0.15 ND ND
V124I 74 ± 3** 83 ± 4** -9.67 ± 0.09 -9.35 ± 0.11* 9.67 ± 0.09 9.19 ± 0.11 -0.48 ± 0.14*
R138C 46 ± 11** 0*** -9.57 ± 0.17 ND 9.57 ± 0.17 ND ND
R138H 58 ± 6*** 0*** -9.63 ± 0.18 ND 9.63 ± 0.18 ND ND
R138L 34 ± 10** 0*** -9.18 ± 0.29 ND 9.18 ± 0.29 ND ND
Y141F 67 ± 7** 76 ± 6** -9.73 ± 0.08 -9.25 ± 0.14** 9.74 ± 0.10 9.08 ± 0.16 -0.66 ± 0.19*
M146V 132 ± 16 98 ± 7 -9.47 ± 0.09 -9.68 ± 0.14 9.50 ± 0.12 9.63 ± 0.11 0.13 ± 0.16
R154H 121 ± 18 92 ± 4 -9.82 ± 0.11 -9.58 ± 0.11 9.83 ± 0.10 9.44 ± 0.11 -0.38 ± 0.15*
L166I 124 ± 16 122 ± 6* -9.55 ± 0.09 -9.45 ± 0.09 9.45 ± 0.10 9.45 ± 0.08 0.00 ± 0.13
T201M 46 ± 5*** 160 ± 14* -9.51 ± 0.14 -8.64 ± 0.18* 9.21 ± 0.19 8.60 ± 0.16 -0.61 ± 0.25*
R222H 65 ± 15 66 ± 8** -9.67 ± 0.11 -9.31 ± 0.25 9.68 ± 0.16 8.89 ± 0.26 -0.79 ± 0.30*
I223T 59 ± 11* 39 ± 7* -9.72 ± 0.10 -9.55 ± 0.39 9.71 ± 0.13 8.77 ± 0.36 -0.95 ± 0.38*
R231H 112 ± 17 116 ± 10 -9.66 ± 0.11 -9.51 ± 0.18 9.57 ± 0.16 9.49 ± 0.15 -0.08 ± 0.22
A234T 107 ± 11 96 ± 10 -9.87 ± 0.13 -9.85 ± 0.25 9.84 ± 0.17 9.79 ± 0.18 -0.05 ± 0.25
E237K 181 ± 21** 95 ± 6 -9.66 ± 0.10 -9.76 ± 0.15 9.65 ± 0.12 9.69 ± 0.12 0.04 ± 0.17
S238G 148 ± 9* 113 ± 8 -9.56 ± 0.12 -9.41 ± 0.14 9.49 ± 0.13 9.39 ± 0.12 -0.10 ± 0.18
K243R 128 ± 19 89 ± 8 -9.32 ± 0.17 -9.49 ± 0.19 9.36 ± 0.18 9.37 ± 0.19 0.01 ± 0.26
D246N 97 ± 11 92 ± 6 -9.37 ± 0.14 -9.40 ± 0.13 9.36 ± 0.13 9.33 ± 0.13 -0.03 ± 0.18
F250V 36 ± 19* 32 ± 6** -9.66 ± 0.10 -9.43 ± 0.34 9.65 ± 0.12 8.65 ± 0.37 -1.01 ± 0.38*
Y308S 41 ± 13* 0*** -9.36 ± 0.23 ND 9.36 ± 0.23 ND ND
R316H 16 ± 11** 28 ± 4* -9.52 ± 0.10 -9.09 ± 0.25 9.52 ± 0.09 8.43 ± 0.34 -1.09 ± 0.35*
R330W 154 ± 22 96 ± 5 -9.72 ± 0.13 -9.25 ± 0.10* 9.74 ± 0.11 9.22 ± 0.11 -0.52 ± 0.15*
A342V 142 ± 17 112 ± 4 -9.73 ± 0.11 -9.37 ± 0.08* 9.68 ± 0.09 9.33 ± 0.09 -0.34 ± 0.13*
I353T 88 ± 12 101 ± 13 -9.46 ± 0.11 -9.42 ± 0.30 9.44 ± 0.20 9.35 ± 0.20 -0.09 ± 0.29
A359E 115 ± 6 143 ± 6*** -9.53 ± 0.07 -9.84 ± 0.10* 9.38 ± 0.12 9.87 ± 0.09 0.49 ± 0.15*

155
Table S2. Summary of the functional profiling of Gαz activation by WT-MT2 and
MT2 variants.
Data are means ± SEM of four to six independent experiments with repeats in triplicate. ND
denotes that the experimental parameter could not be determined due to lack of a
concentration-response curve. The data were analyzed by comparing independent fits with a
global fit that shares the selected parameter (##) and by one-sample t test (#) compared to the
WT. *P < 0.05, **P < 0.01, ***P < 0.0001.
Variant Spontaneous activity#
Agonist mediated## Potency (LogEC50)## (Emax)
Log(τ/KA) Δlog(τ/KA)#
(% WT) (% WT) WT Variant WT Variant
A8S 134 ± 7* 100 ± 3 -9.33 ± 0.05 -9.42 ± 0.06 9.33 ± 0.06 9.43 ± 0.05 0.10 ± 0.08
A13V 138 ± 10* 104 ± 4 -9.33 ± 0.05 -9.39 ± 0.07 9.36 ± 0.08 9.40 ± 0.05 0.04 ± 0.09
G21S 120 ± 12 97 ± 2 -9.41 ± 0.04 -9.44 ± 0.03 9.41 ± 0.05 9.44 ± 0.04 0.03 ± 0.06
W22L 84 ± 9 94 ± 4 -9.41 ± 0.04 -9.41 ± 0.07 9.40 ± 0.05 9.44 ± 0.06 0.05 ± 0.08
G24E 150 ± 23 107 ± 4* -9.43 ± 0.04 -9.49 ± 0.06 9.44 ± 0.07 9.51 ± 0.05 0.07 ± 0.08
A25T 131 ± 18 108 ± 5* -9.41 ± 0.04 -9.46 ± 0.08 9.38 ± 0.07 9.48 ± 0.06 0.09 ± 0.09
P36S 122 ± 13 106 ± 4* -9.41 ± 0.04 -9.49 ± 0.06 9.41 ± 0.06 9.50 ± 0.05 0.09 ± 0.08
A42P 2 ± 1*** 0*** -9.46 ± 0.04 ND 9.46 ± 0.04 ND ND
A52T 138 ± 22 98 ± 3 -9.43 ± 0.04 -9.45 ± 0.05 9.41 ± 0.04 9.50 ± 0.06 0.09 ± 0.12
L60R 5 ± 3*** 0*** -9.46 ± 0.04 ND 9.46 ± 0.04 ND ND
A74T 79 ± 12 76 ± 3*** -9.41 ± 0.04 -9.30 ± 0.06 9.41 ± 0.04 9.35 ± 0.08 -0.06 ± 0.09
P95L 1 ± 1*** 0*** -9.46 ± 0.04 ND 9.46 ± 0.04 ND ND
G109A 77 ± 8 81 ± 3*** -9.46 ± 0.04 -9.54 ± 0.07 9.46 ± 0.04 9.58 ± 0.07 0.12 ± 0.08
M120I 70 ± 12 122 ± 6*** -9.46 ± 0.04 -9.08 ± 0.08*** 9.45 ± 0.09 9.11 ± 0.06 -0.34 ± 0.11*
M120V 39 ± 9** 88 ± 4 -9.47 ± 0.03 -9.14 ± 0.08*** 9.46 ± 0.05 9.18 ± 0.07 -0.29 ± 0.09*
S123R 15 ± 5*** 0*** -9.46 ± 0.04 ND 9.46 ± 0.04 ND ND
V124I 68 ± 19 80 ± 3*** -9.46 ± 0.03 -9.41 ± 0.07 9.46 ± 0.04 9.47 ± 0.07 0.01 ± 0.08
R138C 6 ± 3*** 0*** -9.46 ± 0.04 ND 9.46 ± 0.04 ND ND
R138H 7 ± 6*** 0*** -9.46 ± 0.04 ND 9.46 ± 0.04 ND ND
R138L 13 ± 7*** 0*** -9.46 ± 0.04 ND 9.46 ± 0.04 ND ND
Y141F 150 ± 19* 86 ± 3* -9.41 ± 0.04 -9.55 ± 0.06* 9.40 ± 0.04 9.59 ± 0.06 0.19 ± 0.07*
M146V 151 ± 23 98 ± 4 -9.41 ± 0.04 -9.45 ± 0.07 9.39 ± 0.05 9.48 ± 0.07 0.10 ± 0.09
R154H 151 ± 26 103 ± 4 -9.59 ± 0.04 -9.48 ± 0.07 9.58 ± 0.06 9.48 ± 0.06 -0.10 ± 0.08
L166I 169 ± 22* 107 ± 5 -9.59 ± 0.04 -9.55 ± 0.09 9.58 ± 0.08 9.54 ± 0.07 -0.04 ± 0.11
T201M 35 ± 19* 139 ± 4*** -9.59 ± 0.04 -9.04 ± 0.06*** 9.44 ± 0.07 9.05 ± 0.05 -0.39 ± 0.09*
R222H 26 ± 9** 53 ± 0*** -9.61 ± 0.04 -9.16 ± 0.06*** 9.61 ± 0.35 9.00 ± 0.09 -0.61 ± 0.10**
I223T 42 ± 7*** 49 ± 2*** -9.59 ± 0.04 -9.30 ± 0.07** 9.59 ± 0.04 9.02 ± 0.10 -0.57 ± 0.10**
R231H 119 ± 24 114 ± 4** -9.59 ± 0.04 -9.55 ± 0.07 9.57 ± 0.07 9.55 ± 0.05 -0.02 ± 0.09
A234T 89 ± 13 95 ± 3 -9.59 ± 0.04 -9.59 ± 0.05 9.60 ± 0.04 9.57 ± 0.05 -0.02 ± 0.07
E237K 135 ± 29 94 ± 4 -9.60 ± 0.05 -9.57 ± 0.07 9.62 ± 0.06 9.55 ± 0.06 -0.06 ± 0.09
S238G 185 ± 24* 107 ± 4 -9.59 ± 0.04 -9.59 ± 0.07 9.58 ± 0.06 9.59 ± 0.05 0.01 ± 0.08
K243R 178 ± 27* 108 ± 3* -9.59 ± 0.04 -9.58 ± 0.05 9.57 ± 0.05 9.58 ± 0.04 0.01 ± 0.07
D246N 131 ± 16 78 ± 2*** -9.61 ± 0.04 -9.66 ± 0.05 9.61 ± 0.04 9.62 ± 0.06 0.01 ± 0.07
F250V 27 ± 12** 21 ± 2*** -9.59 ± 0.04 -9.14 ± 0.13** 9.59 ± 0.04 8.42 ± 0.20 -1.18 ± 0.20**
Y308S 20 ± 7*** 0*** -9.49 ± 0.06 ND 9.49 ± 0.06 ND ND
R316H 44 ± 7** 26 ± 3*** -9.59 ± 0.04 -9.14 ± 0.21* 9.59 ± 0.04 8.59 ± 0.20 -1.00 ± 0.20**
R330W 166 ± 5*** 77 ± 5*** -9.59 ± 0.04 -9.57 ± 0.11 9.60 ± 0.07 9.47 ± 0.11 -0.13 ± 0.13
A342V 200 ± 24* 80 ± 3*** -9.54 ± 0.03 -9.36 ± 0.07* 9.54 ± 0.04 9.29 ± 0.06 -0.25 ± 0.08*
I353T 106 ± 10 101 ± 2 -9.53 ± 0.02 -9.55 ± 0.04 9.51 ± 0.03 9.57 ± 0.03 0.06 ± 0.05
A359E 193 ± 37 105 ± 3 -9.59 ± 0.04 -9.58 ± 0.06 9.57 ± 0.05 9.58 ± 0.05 0.01 ± 0.07

156
Table S3. Summary of the functional profiling of β-arrestin2 recruitment to WT-
MT2 and MT2 variants.
Data are means ± SEM of three or four independent experiments with repeats in triplicate.
ND denotes that the experimental parameter could not be determined due to lack of a
concentration- response curve. The data were analyzed by comparing independent fits with
a global fit that shares the selected parameter (##) and by one-sample t test (#) compared to
the WT. *P < 0.05, **P < 0.01, ***P < 0.0001.
Variant Spontaneous Agonist mediated## Potency (LogEC50)## activity# (Emax)
Log(τ/KA) Δlog(τ/KA)#
(% WT) (% WT) WT Variant WT Variant
A8S 80 ± 3 107 ± 13 -9.54 ± 0.13 -9.46 ± 0.28 9.55 ± 0.23 9.46 ± 0.22 -0.09 ± 0.32
A13V 106 ± 12 109 ± 17 -9.42 ± 0.32 -9.39 ± 0.36 9.53 ± 0.37 9.46 ± 0.27 -0.07 ± 0.46
G21S 77 ± 9 110 ± 7 -9.51 ± 0.13 -9.66 ± 0.18 9.61 ± 0.19 9.67 ± 0.15 0.06 ± 0.24
W22L 74 ± 13 92 ± 9 -9.38 ± 0.14 -9.35 ± 0.24 9.36 ± 0.16 9.45 ± 0.23 0.09 ± 0.28
G24E 97 ± 12 95 ± 5 -9.30 ± 0.09 -9.40 ± 0.13 9.31 ± 0.10 9.49 ± 0.13 0.18 ± 0.17
A25T 107 ± 6 108 ± 4 -9.20 ± 0.39 -9.30 ± 0.14 9.38 ± 0.16 9.28 ± 0.15 -0.10 ± 0.22
P36S 112 ± 6 108 ± 12 -9.43 ± 0.18 -9.54 ± 0.24 9.41 ± 0.21 9.54 ± 0.19 0.14 ± 0.28
A42P 10 ± 1*** 0*** -9.10 ± 0.14 ND 9.10 ± 0.09 ND ND
A52T 91 ± 7 106 ± 5 -9.39 ± 0.09 -9.36 ± 0.10 9.43 ± 0.10 9.36 ± 0.08 -0.07 ± 0.13
L60R 15 ± 1*** 0*** -9.10 ± 0.14 ND 9.10 ± 0.09 ND ND
A74T 100 ± 4 54 ± 11** -9.37 ± 0.20 -9.41 ± 0.42 9.37 ± 0.23 9.36 ± 0.48 -0.01 ± 0.54
P95L 16 ± 1*** 0*** -9.10 ± 0.14 ND 9.15 ± 0.10 ND ND
G109A 71 ± 1*** 60 ± 5*** -9.31 ± 0.12 -9.20 ± 0.17 9.29 ± 0.12 9.35 ± 0.21 0.06 ± 0.24
M120I 101 ± 11 107 ± 8 -9.38 ± 0.17 -9.42 ± 0.15 9.34 ± 0.15 9.43 ± 0.15 0.09 ± 0.21
M120V 66 ± 12 86 ± 7* -9.48 ± 0.12 -9.51 ± 0.19 9.48 ± 0.14 9.39 ± 0.15 -0.09 ± 0.20
S123R 45 ± 3** 19 ± 2* -9.53 ± 0.16 -9.58 ± 0.22 9.51 ± 0.11 8.98 ± 0.53 -0.54 ± 0.54
V124I 65 ± 2** 40 ± 4*** -9.45 ± 0.13 -9.50 ± 0.25 9.44 ± 0.10 9.04 ± 0.30 -0.40 ± 0.32
R138C 33 ± 2*** 41 ± 7** -9.43 ± 0.11 -9.17 ± 0.34 9.44 ± 0.11 8.90 ± 0.31 -0.54 ± 0.33
R138H 92 ± 5 0*** -9.30 ± 0.14 ND 9.32 ± 0.17 ND ND
R138L 32 ± 2*** 0*** -9.22 ± 0.12 ND 9.22 ± 0.08 ND ND
Y141F 22 ± 2*** 135 ± 21 -9.40 ± 0.32 -9.29 ± 0.34 9.30 ± 0.41 9.29 ± 0.29 -0.01 ± 0.50
M146V 97 ± 10 112 ± 6 -9.22 ± 0.19 -9.21 ± 0.09 9.22 ± 0.15 9.21 ± 0.12 -0.01 ± 0.19
R154H 74 ± 1*** 83 ± 9 -9.18 ± 0.14 -9.21 ± 0.21 9.17 ± 0.14 9.22 ± 0.20 0.05 ± 0.24
L166I 96 ± 12 81 ± 7* -9.37 ± 0.14 -9.28 ± 0.23 9.35 ± 0.14 9.44 ± 0.21 0.10 ± 0.25
T201M 67 ± 13 70 ± 5* -9.53 ± 0.20 -9.24 ± 0.16 9.53 ± 0.15 9.07 ± 0.25 -0.46 ± 0.29
R222H 44 ± 14* 15 ± 2** -9.39 ± 0.14 -9.18 ± 0.27 9.39 ± 0.10 8.46 ± 0.64 -0.93 ± 0.65
I223T 31 ± 5** 20 ± 4* -9.46 ± 0.12 -9.52 ± 0.39 9.47 ± 0.09 9.17 ± 0.48 -0.29 ± 0.49
R231H 106 ± 8 55 ± 7*** -9.51 ± 0.14 -9.45 ± 0.25 9.51 ± 0.14 9.37 ± 0.27 -0.14 ± 0.31
A234T 89 ± 9 122 ± 13* -9.47 ± 0.19 -9.44 ± 0.22 9.40 ± 0.23 9.45 ± 0.18 0.05 ± 0.30
E237K 94 ± 11 53 ± 7*** -9.50 ± 0.12 -9.46 ± 0.30 9.51 ± 0.14 9.14 ± 0.28 -0.37 ± 0.32
S238G 105 ± 10 52 ± 8*** -9.59 ± 0.18 -9.57 ± 0.32 9.59 ± 0.18 9.29 ± 0.37 -0.31 ± 0.41
K243R 105 ± 7 62 ± 7** -9.39 ± 0.17 -9.21 ± 0.24 9.39 ± 0.15 9.22 ± 0.28 -0.17 ± 0.32
D246N 99 ± 6 0*** -9.36 ± 0.09 ND 9.35 ± 0.10 ND ND
F250V 39 ± 4** 0*** -9.57 ± 0.23 ND 9.56 ± 0.18 ND ND
Y308S 14 ± 2*** 0*** -9.10 ± 0.14 ND 9.10 ± 0.10 ND ND
R316H 56 ± 20 0*** -9.43 ± 0.24 ND 9.43 ± 0.24 ND ND
R330W 94 ± 11 116 ± 18 -9.43 ± 0.25 -9.31 ± 0.35 9.32 ± 0.30 9.31 ± 0.27 -0.01 ± 0.40
A342V 81 ± 2** 70 ± 13** -9.30 ± 0.09 -9.53 ± 0.39 9.31 ± 0.19 9.41 ± 0.33 0.10 ± 0.38
I353T 99 ± 5 116 ± 10 -9.22 ± 0.10 -9.36 ± 0.19 9.16 ± 0.15 9.36 ± 0.14 0.21 ± 0.20
A359E 87 ± 13 129 ± 15* -9.37 ± 0.25 -9.51 ± 0.26 9.15 ± 0.26 9.52 ± 0.23 0.37 ± 0.35

157
Table S4. Summary of the functional profiling of cAMP inhibition by WT-MT2 and
MT2 variants.
Data are means ± SEM of three to five independent experiments with repeats in triplicate.
ND denotes that the experimental parameter could not be determined due to lack of a
concentration- response curve. The data were analyzed by comparing independent fits with
a global fit that shares the selected parameter (##) and by one-sample t test (#) compared to
the WT. *P < 0.05, ***P < 0.0001.
Variant Agonist mediated## Potency (LogEC50)## (Emax)
Log(τ/KA) Δlog(τ/KA)#
(% WT) WT Variant WT Variant
A8S 103 ± 20 -9.29 ± 0.20 -9.46 ± 0.45 9.31 ± 0.28 9.30 ± 0.27 -0.01 ± 0.39
A13V 112 ± 27 -9.52 ± 0.16 -9.48 ± 0.51 9.41 ± 0.40 9.51 ± 0.32 0.10 ± 0.52
G21S 106 ± 20 -9.41 ± 0.17 -9.39 ± 0.41 9.39 ± 0.28 9.41 ± 0.27 0.02 ± 0.39
W22L 108 ± 22 -9.45 ± 0.42 -9.04 ± 0.45 9.15 ± 0.40 9.25 ± 0.37 0.10 ± 0.55
G24E 114 ± 10 -9.03 ± 0.21 -9.09 ± 0.19 8.96 ± 0.19 9.06 ± 0.17 0.10 ± 0.25
A25T 94 ± 17 -9.09 ± 0.17 -9.05 ± 0.43 9.06 ± 0.24 9.01 ± 0.27 -0.04 ± 0.36
P36S 104 ± 16 -9.44 ± 0.32 -9.77 ± 0.33 9.46 ± 0.28 9.70 ± 0.28 0.24 ± 0.39
A42P 0*** -9.53 ± 0.16 ND 9.50 ± 0.23 ND ND
A52T 90 ± 10 -9.34 ± 0.13 -9.38 ± 0.29 9.34 ± 0.16 9.35 ± 0.20 0.01 ± 0.25
L60R 0*** -9.77 ± 0.15 ND 9.79 ± 0.34 ND ND
A74T 97 ± 8 -9.59 ± 0.15 -9.64 ± 0.21 9.62 ± 0.14 9.55 ± 0.20 -0.07 ± 0.25
P95L 0*** -9.57 ± 0.27 ND 9.31 ± 0.35 ND ND
G109A 70 ± 10* -9.41 ± 0.15 -9.43 ± 0.31 9.40 ± 0.16 9.42 ± 0.29 0.02 ± 0.33
M120I 98 ± 11 -9.11 ± 0.15 -9.00 ± 0.15 9.15 ± 0.16 8.96 ± 0.15 -0.20 ± 0.27
M120V 74 ± 9* -9.41 ± 0.18 -9.30 ± 0.26 9.40 ± 0.16 9.12 ± 0.25 -0.28 ± 0.30
S123R 0*** -9.24 ± 0.12 ND 9.16 ± 0.17 ND ND
V124I 90 ± 9 -9.31 ± 0.24 -8.91 ± 0.16 9.36 ± 0.20 8.79 ± 0.21 -0.57 ± 0.29
R138C 0*** -9.16 ± 0.25 ND 9.12 ± 0.25 ND ND
R138H 0*** -9.39 ± 0.26 ND 9.27 ± 0.31 ND ND
R138L 0*** -9.39 ± 0.26 ND 9.19 ± 0.28 ND ND
Y141F 94 ± 11 -9.26 ± 0.18 -9.45 ± 0.26 9.26 ± 0.19 9.35 ± 0.19 0.08 ± 0.27
M146V 111 ± 14 -9.60 ± 0.19 -9.52 ± 0.26 9.60 ± 0.20 9.48 ± 0.21 -0.11 ± 0.29
R154H 87 ± 11 -9.69 ± 0.27 -9.73 ± 0.26 9.73 ± 0.23 9.46 ± 0.23 -0.27 ± 0.33
L166I 108 ± 18 -9.16 ± 0.29 -9.12 ± 0.35 9.02 ± 0.29 9.12 ± 0.29 0.10 ± 0.41
T201M 93 ± 8 -9.26 ± 0.33 -9.36 ± 0.17 9.29 ± 0.22 9.27 ± 0.22 -0.02 ± 0.32
R222H 64 ± 8* -9.68 ± 0.21 -9.18 ± 0.23 9.69 ± 0.19 9.07 ± 0.27 -0.62 ± 0.33
I223T 86 ± 17 -9.47 ± 0.22 -8.46 ± 0.40* 9.38 ± 0.23 8.42 ± 0.26 -0.96 ± 0.35*
R231H 103 ± 10 -9.42 ± 0.35 -9.35 ± 0.21 9.40 ± 0.23 9.35 ± 0.24 -0.05 ± 0.34
A234T 92 ± 15 -9.12 ± 0.55 -9.18 ± 0.39 9.13 ± 0.42 9.10 ± 0.41 -0.03 ± 0.59
E237K 141 ± 29 -9.62 ± 0.26 -9.42 ± 0.42 9.17 ± 0.30 9.35 ± 0.31 0.18 ± 0.43
S238G 122 ± 15 -9.32 ± 0.10 -9.29 ± 0.26 9.23 ± 0.19 9.27 ± 0.17 0.04 ± 0.26
K243R 103 ± 7 -9.27 ± 0.11 -9.42 ± 0.14 9.21 ± 0.11 9.46 ± 0.12 0.25 ± 0.16
D246N 103 ± 13 -9.72 ± 0.17 -9.53 ± 0.28 9.64 ± 0.20 9.57 ± 0.22 -0.07 ± 0.30
F250V 0*** -9.57 ± 0.21 ND 9.56 ± 0.35 ND ND
Y308S 0*** -10.31 ± 0.25 ND 10.10 ± 0.38 ND ND
R316H 46 ± 16* -9.92 ± 0.22 -8.89 ± 0.57* 10.07 ± 0.31 7.95 ± 0.70 -2.12 ± 0.76*
R330W 108 ± 12 -9.63 ± 0.27 -9.03 ± 0.27 9.61 ± 0.25 8.96 ± 0.26 -0.65 ± 0.25*
A342V 105 ± 17 -9.43 ± 0.29 -9.11 ± 0.32 9.14 ± 0.29 9.12 ± 0.29 -0.02 ± 0.41
I353T 89 ± 14 -9.45 ± 0.16 -9.42 ± 0.35 9.43 ± 0.23 9.40 ± 0.24 -0.03 ± 0.33
A359E 91 ± 14 -9.42 ± 0.27 -9.54 ± 0.34 9.28 ± 0.27 9.58 ± 0.28 0.30 ± 0.39

158
Variant Agonist mediated## Potency (LogEC50)## (Emax)
Log(τ/KA) Δlog(τ/KA)#
(% WT) WT Variant WT Variant
A8S 118 ± 18 -8.74 ± 0.23 -8.78 ± 0.31 8.83 ± 0.39 8.78 ± 0.24 -0.05 ± 0.46
A13V 117 ± 18 -8.64 ± 0.26 -8.57 ± 0.38 8.66 ± 0.34 8.58 ± 0.31 -0.09 ± 0.46
G21S 164 ± 27 -8.14 ± 0.21 -8.02 ± 0.37 7.73 ± 0.38 8.02 ± 0.26 0.29 ± 0.46
W22L 149 ± 23 -8.20 ± 0.19 -7.99 ± 0.34 8.00 ± 0.30 7.95 ± 0.24 -0.05 ± 0.38
G24E 124 ± 22 -8.27 ± 0.19 -8.30 ± 0.35 8.18 ± 0.35 8.32 ± 0.25 0.13 ± 0.43
A25T 98 ± 17 -8.60 ± 0.22 -8.52 ± 0.41 8.52 ± 0.30 8.60 ± 0.30 0.13 ± 0.43
P36S 98 ± 13 -8.42 ± 0.22 -8.42 ± 0.28 8.41 ± 0.23 8.42 ± 0.23 0.01 ± 0.32
A42P 0*** -8.37 ± 0.30 ND 8.38 ± 0.26 ND ND
A52T 110 ± 19 -8.76 ± 0.22 -8.59 ± 0.36 8.59 ± 0.27 8.60 ± 0.27 0.02 ± 0.38
L60R 0*** -8.76 ± 0.22 ND 8.75 ± 0.18 ND ND
A74T 79 ± 8** -8.75 ± 0.12 -8.63 ± 0.20 8.75 ± 0.13 8.50 ± 0.19 -0.25 ± 0.23
P95L 0*** -8.75 ± 0.12 ND 8.79 ± 0.13 ND ND
G109A 81 ± 10 -8.75 ± 0.13 -8.87 ± 0.26 8.74 ± 0.14 8.79 ± 0.20 0.05 ± 0.25
M120I 80 ± 10* -8.75 ± 0.12 -8.77 ± 0.23 8.76 ± 0.15 8.72 ± 0.21 -0.04 ± 0.26
M120V 110 ± 12 -8.85 ± 0.15 -8.72 ± 0.23 8.74 ± 0.23 8.78 ± 0.18 0.03 ± 0.29
S123R 0*** -8.69 ± 0.22 ND 8.65 ± 0.18 ND ND
V124I 48 ± 4*** -8.46 ± 0.16 -8.34 ± 0.19 8.45 ± 0.12 7.98 ± 0.29 -0.48 ± 0.32
R138C 0*** -8.46 ± 0.16 ND 8.46 ± 0.26 ND ND
R138H 0*** -8.24 ± 0.10 ND 8.28 ± 0.12 ND ND
R138L 0*** -8.24 ± 0.10 ND 8.24 ± 0.13 ND ND
Y141F 83 ± 13 -8.45 ± 0.11 -8.53 ± 0.34 8.46 ± 0.22 8.59 ± 0.28 0.13 ± 0.36
M146V 55 ± 3*** -8.24 ± 0.09 -8.46 ± 0.14 8.24 ± 0.08 8.29 ± 0.18 0.05 ± 0.19
R154H 72 ± 9* -8.69 ± 0.16 -8.67 ± 0.29 8.65 ± 0.17 8.66 ± 0.28 0.00 ± 0.33
L166I 106 ± 13 -8.37 ± 0.19 -8.30 ± 0.26 8.28 ± 0.22 8.31 ± 0.20 0.03 ± 0.29
T201M 50 ± 9* -8.67 ± 0.23 -8.19 ± 0.42* 8.67 ± 0.19 7.79 ± 0.45 -0.87 ± 0.49
R222H 0*** -8.67 ± 0.23 ND 8.68 ± 0.20 ND ND
I223T 0*** -8.93 ± 0.22 ND 8.93 ± 0.20 ND ND
R231H 95 ± 19 -8.80 ± 0.19 -8.66 ± 0.39 8.72 ± 0.36 8.77 ± 0.25 0.05 ± 0.44
A234T 80 ± 8 -8.83 ± 0.26 -8.80 ± 0.20 8.87 ± 0.22 8.74 ± 0.23 -0.13 ± 0.32
E237K 103 ± 13 -8.67 ± 0.44 -8.51 ± 0.29 8.69 ± 0.36 8.51 ± 0.39 -0.18 ± 0.53
S238G 98 ± 19 -8.75 ± 0.21 -8.60 ± 0.44 8.73 ± 0.27 8.62 ± 0.29 -0.11 ± 0.40
K243R 100 ± 16 -8.75 ± 0.21 -8.78 ± 0.35 8.88 ± 0.28 8.90 ± 0.20 0.01 ± 0.35
D246N 107 ± 16 -8.85 ± 0.13 -8.87 ± 0.30 8.88 ± 0.28 8.90 ± 0.20 0.01 ± 0.35
F250V 0*** -8.86 ± 0.12 ND 8.87 ± 0.22 ND ND
Y308S 0*** -8.90 ± 0.10 ND 8.90 ± 0.23 ND ND
R316H 54 ± 9* -8.95 ± 0.12 -8.42 ± 0.38 8.95 ± 0.12 8.44 ± 0.53 -0.51 ± 0.54
R330W 97 ± 18 -8.94 ± 0.10 -9.03 ± 0.32 8.95 ± 0.16 9.05 ± 0.27 0.09 ± 0.32
A342V 91 ± 14 -8.77 ± 0.15 -8.42 ± 0.33 8.72 ± 0.18 8.43 ± 0.22 -0.29 ± 0.29
I353T 103 ± 29 -8.94 ± 0.16 -9.06 ± 0.43 8.97 ± 0.39 9.06 ± 0.27 0.09 ± 0.47
A359E 246 ± 21** -8.86 ± 0.20 -8.84 ± 0.17 8.60 ± 0.41 8.85 ± 0.12 0.24 ± 0.42
Table S5. Summary of the functional profiling of ERK activation by WT-MT2 and
MT2 variants.
Data are means ± SEM of three or four independent experiments with repeats in triplicate.
ND denotes that the experimental parameter could not be determined due to lack of a
concentration-response curve. The data were analyzed by comparing independent fits with a
global fit that shares the selected parameter (##) and by one-sample t test (#) compared to the
WT. *P < 0.05, **P < 0.01, ***P < 0.0001.

159
Résumé du chapitre 3 – Article 2
Dans ce manuscrit, dans lequel j’ai participé à la caractérisation de mutants en réalisant des
ELISA et en mesurant l’activation de ERK et l’inhibition de la production d’AMPc, nous
avons :
-Identifié que MT2 pouvait activer les protéines Gαi1, Gαi2, Gαi3, GαoA, GαoB, Gαz et
était capable de recruter la βarrestine-2
-Caractérisé les 40 variants naturels de MT2 précédemment identifiés par notre groupe. Nous
avons ainsi mesuré leur capacité à activer spontanément ou suite à leur liaison à la MLT, les
protéines Gαi1, Gαz, à recruter la βarrestine-2, à phosphoryler ERK et à inhiber la production
d’AMPc.
-Généré des profils de signalisation pour chaque variant et les avons classés en 9 groupes
selon leurs similitudes.
-Relié les défauts d’activation des protéines Gαi1, Gαz induites par la MLT et de recrutement
constitutif de la βarrestine-2 à un risque accru de développer le DT2.
-Montré que les analyses informatiques de prédiction de l’impact de mutations (EA score)
sont des outils robustes et pouvant être très utiles.
Après avoir caractérisé le récepteur MT2 et identifié les mécanismes par lesquels il était
impliqué dans le développement du DT2, nous nous sommes intéressés au récepteur MT1 et
ses mécanismes d’action.

160
Chapitre 4
Article 3

161
Identification of key regions mediating human melatonin type 1
receptor functional selectivity revealed by natural variants
Alan Hégron, Bianca Plouffe, Eunna Huh, Xavier Deupi, Wenwen Gao,
Amélie Bonnefond, Christian Le Gouill, Philippe Froguel, Olivier Lichtarge,
Ralf Jockers, Michel Bouvier
En rédaction

162
Identification of key regions mediating human melatonin type 1
receptor functional selectivity revealed by natural variants
Alan Hégron1,2,3,4,5,6, Bianca Plouffe5,6, Eunna Huh7, Xavier Deupi8, Wenwen Gao1,2,3,
Amélie Bonnefond9, Christian Le Gouill5, Philippe Froguel9, Olivier Lichtarge7, Ralf
Jockers1,2,3*, Michel Bouvier5,6*
1 Inserm, U1016, Institut Cochin, Paris, France
2 CNRS UMR 8104, Paris, France
3 University of Paris Descartes, Sorbonne Paris Cité, Paris, France
4 University of Paris Saclay, Paris, France
5 Institute for Research in Immunology and Cancer, University of Montreal, Montreal, QC,
Canada
6 Department of biochemistry and Molecular Medicine, Unversity of Montreal, QC, Canada
7 Computational and Integrative Biomedical Research Center, Baylor College of Medicine,
Houston, TX 77030, United States of America
8 Laboratory of Biomolecular Research, Paul Scherrer Institute (PSI), 5232 Villigen PSI,
Switzerland
9 CNRS UMR8199, Lille, France
*Corresponding authors: Michel Bouvier, University of Montreal, Canada, and Ralf
Jockers, University of Paris Descartes, France.

163
Statement of author contributions:
AH conceived and designed experiments. AH and WG made constructions of variant
plasmids. AH characterized receptors with the exception of binding done by WG. EH and
OL did the computational analysis. XD did the 3D modeling and contributed to the
discussion. AB and PF sequenced MT1 genes and found genetic variations. AH, BP and MB
analyzed data. AH, RJ and MB wrote the manuscript.
164
Abstract
Melatonin (5-methoxy-N-acetyltryptamine) is a hormone mainly produced by the pineal
gland in a circadian rhythm with low levels during the day and high levels at night. MT1 is
one of the 2 receptors mediating the action of melatonin and belongs to the G protein-coupled
receptors (GPCRs) family. Despite an increasing number of activated GPCR crystal
structures available, the molecular mechanism of action of a large number of receptors,
including MT1, remain poorly understood. We took advantage of the existence of numerous
rare variants found in the population to probe the role of specific residues and receptor
domains in the activation of the different pathways engaged by the receptor. To do this, 32
variants were identified and their signaling profiles were characterized using BRET-based
sensors probing 12 different signaling pathways in living cells. We then combined our
experimental results with computational tools to group variants in 5 different clusters
depending on the signaling profiles obtained. We used a three-dimensional structural model
of MT1 to visualize the position of each variant in the receptor and to identify regions
important for βarrestin-2 recruitment as well as Gα12 and Gα15 activation. This study
reinforces the idea that natural variants are powerful tools in order to understand the
mechanism of action of a receptor and that distinct receptor domains differentially controls
the activation of the various effectors engaged by the receptor.

165
Introduction
High-throughput sequencing is rapidly improving our understanding of disease causes and
susceptibilities in humans (359-361) as well as adaptation and evolution of organisms (362-
364). Studies revealed that each human contains 10000 to 11000 nonsynonymous genetic
variations (365) but only few of them are expected to cause diseases, the rest being
considered neutral. Variant information in databases is often limited to basic annotations like
neutral or deleterious. Deleteriousness can be approximated with measures of conservation
and molecular functionality, but available data on both information are rarely combined. In
the same way, even a strong association between a mutation and a phenotype provides no
information on the protein function and/or structure changes.
Studies regularly discover new genetic variations with a great variety of effects since just a
single nucleotide polymorphism (SNP) can change the folding or interactions between
protein (366, 367). Many proteins have several functions interacting with different other
proteins, but most protein-interacting maps ignore the structural details of each protein and
the mechanisms of their interactions. It’s the case for several G protein-coupled receptors
(GPCRs) which have a broad set of functions and are involved in the development of a
multitude of diseases. But the molecular determinants controlling their different actions are
not well understood. SNPs represent a rich pool of variants with potential functional
consequences that could be used to probe such molecular determinants.
One concept well recognized is the capacity of GPCRs to preferentially activate some
signaling pathways, depending on the ligand (368-370) and potentially leading to distinct
physiological actions. This concept is called functional selectivity or biased signaling.
Mutations at specific position in the receptor structure can have the same effect and modify
the signaling profile of a receptor (371, 372).
Here, we identified 32 melatonin type 1 receptor (MT1) variants in 9393 people which
revealed 32 non-synonymous genetic variations on MT1 coding regions providing a source
of genetic variants to study the structure function relationship of the receptor.
The MT1 receptor is one of the two melatonin receptors involved in the physiological action
of this neurohormone. Melatonin (MLT) is mainly released by the pineal gland in circadian
and seasonal manners (373). Melatonin was also reported in other tissues such as the retina
(374), the Harderian gland (375), the striatum (376), the gastrointestinal tracts (377), testis
(378), lymphocytes (133) or the pancreas (104, 106). This hormone binds to two GPCRs,

166
MT1 and MT2, which activate many signaling pathways regulating different physiological
functions including sleep-wake cycle, circadian entrainment, seasonal reproduction and
glycemic homeostasis (379-384).
Here, we used the MT1 SNPs to investigate their potential impact on the signaling profile of
the MT1 receptor in order to gain insight on the molecular determinants of its functional
selectivity.
167
Materials and methods
Cell culture and transfection
HEK293 cells were grown in complete medium (Dulbecco’s modified Eagle’s medium
supplemented with 10% fetal bovine serum, 4.5g/L glucose, 100 U/mL penicillin, 0.1mg/mL
streptomycin and 1mM glutamine) (Invitrogen, CA). Transient transfections were performed
using JetPEI (Polyplus Transfection, France), according to manufacturer’s instructions.
Analysis of cell surface receptor expression
ELISAs were performed as previously described (385) using the mouse anti-flag antibody
and a horseradish peroxidase–conjugated mouse immunoglobulin G (IgG) whole-sheep
secondary antibody (Sigma).
BRET measurement
Gαi1/i2/i3/oA/oB activations was assessed by measuring BRET between RlucII-
Gαi1/i2/i3/oA/oB and GFP10-Gγ2 upon treatment of HEK 293 cells cotransfected to express
Gαi1/i2/i3/oA/oB, receptor, and BRET sensors with MLT (386). For RlucII-Gαs, RlucII-
Gαz, RlucII-Gαq, and RlucII-Gα12/13, we used RlucII-tagged sensors, GFP10-Gγ1 was
used given that optimal responsive window is generally obtained using these BRET sensor
pairs for these Gα proteins. For this Gα protein screening we used these BRET pairs in the
presence of Gβ1 protein. Gα15 activation by receptors was assessed using a unimolecular
biosensor.Since MT1 stimulation by melatonin does not activate PKC in our HEK293T cells
in the absence of Gα15 but does so in its presence, we used the PKC activation as a surrogate
assay to measure Gα15 activation by MT1. PKC activation was assessed by measuring BRET
with this unimolecular biosensor. The BRET2-based PKC sensor consists of a GFP10, 2
phospho-sensing domains (FHA1 & FHA2), a long and flexible linker, 2 specific phospho‐
substrate sequences, a RLucII and the diacyl glycerol (DAG)‐binding “C1b” domain of
PKCδ added to increase signal specificity. Once phosphorylated, the phospho-substrates
interact with their respective phospho-sensing domain, which stabilizes a conformation
characterized by a higher BRET signal (387). βarrestin-2 recruitment was assessed by
measuring BRET between RlucII-βarrestin-2 rGFP-CAAX (prenylation CAAX box of
KRas) demonstrating the recruitment of the βarrestin-2 to the plasma membrane. Transfected
cells were plated in poly-d-lysine–pretreated 96-well white microplates (100 µl per well;
Greiner). Forty-eight hours after transfection, cells were washed with Dulbecco’s phosphate-

168
buffered saline, and then Tyrode’s buffer was added. After the addition of MLT, the cells
were incubated for 10 min at 37°C, and coelenterazine 400a (2.5 µM; NanoLight
Technology) was added 5 min before BRET reading in a Synergy Neo Microplate reader
(BioTek) (acceptor filter: 515 ± 30 nm; donor filter: 410 ± 80 nm). Net BRET represents the
BRET signal subtracted by the BRET monitored in the absence of a GFP10-tagged sensor.
αBRET refers to the difference in net BRET recorded from cells treated with agonist and
cells treated with vehicle. For the agonist dose-response curves, the percentage of the
response of the WT receptor was calculated from the αBRET value obtained from a given
variant divided by the αBRET obtained from the WT receptor in the same experiment.
Evolutionary action analysis
The predicted effect of each variant within the MT1 receptor was calculated, as previously
described, (388) using the amino acid sequence deduced from the MTNR1A gene for the
query.
Statistical analysis
LogEC50 and agonist-induced Emax values were determined by nonlinear regression with
a variable Hill slope using GraphPad Prism software (version 6.0). For each assay, the
agonist-induced Emax value for every MT1 variant was normalized as a percentage of the
maximal MLT-stimulated response of the WT receptor (set at 100) monitored in parallel
with the receptor variant. The dose-response curves were fitted to an operational model of
agonism designed by Kenakin and Christopoulos (389, 390) to obtain log(τ/KA) values for
the WT receptor and its variants. Normally, an agonist is set as a reference agonist, against
which within-pathway comparisons for the same receptor to other agonists can be made and
expressed as Δlog(τ/KA). Here, within- pathway comparisons were made between MT1
variants and the WT receptor. Normalized difference was calculated on values
corresponding to agonist-induced Emax, and Δlog(τ/KA) to fit a −1 to +1 scale using the
following formula: (variant – WT) / (variant + WT). In the case of Δlog(τ/KA), before
normalization, the anti-logs were first calculated and then were fitted to the aforementioned
formula. Positive and negative values represent variations with better or worst responses,
respectively, than those of the WT receptor. Subsequently, logEC50, agonist-induced Emax,
and Δlog(τ/KA) values were expressed as means ± SEM of the indicated number of
experiments (n). Statistical analysis for logEC50 and agonist-induced Emax was performed
by comparing independent fits with a global fit that shared the selected parameter.

169
Computational analysis
To quantify similarities between signaling perturbations resulting from each variation, we
adapted and implemented the Non-Negative Matrix Factorization (NMF) and K-means
clustering process originally described in (391). We performed this analysis on an input
matrix of 32 variations and 24 signaling parameters spanning 8 signaling pathways (Gαi1 /
Gαi2 / Gαi3 / GαoA / GαoB / Gα12 / Gα15 / βarrestin-2) in response to melatonin. The mean
and STD for each phenotypic measure were used to propagate experimental error through
the clustering process. Explicitly, 500 input matrices were generated by independently
sampling from the experimental error (Mean + STD) for each phenotypic data point. Each
of these sampled input matrices were then processed separately using the NMF/K-means
method. The values for each phenotype were scaled to avoid bias introduced by differences
in phenotype scale using:
Standardized Value = (Xij-minimumj)/(maximumj-minimumj)
for every variation i and every parameter j, where maximumj and minimumj values were
specific to each parameter column (e.g. EC50, E max, τ/Ka). In this way, every parameter
was normalized between 0-1. The dimensionality of these 500 input matrices were then
independently reduced using NMF to identify the key signaling patterns. K-means clustering
was used, as described, to cluster the [mutation x Feature] (32 x K) basis vector. As
previously described, clustering results for each sampled matrix were averaged across K=2
to K=10, where K is the number of features for NMF and the number of clusters for K-means
(KNMF=KK-means). Final cluster assignment, quantifying variation similarity, was the average
over all 500 sampled matrices. Clustering frequency was converted into distance matrix
using Pearson's correlation and visualized as a heatmap and dendrogram.
Radioligand Binding Experiments
Radioligand saturation binding experiments were performed in transient transfected
HEK293T cell lines. Saturation binding assays were carried out on crude membrane
preparations with increasing concentrations of 2-[125I]MLT(PerkinElmer Life Sciences) to
determine dissociation constants (Kd) and total melatonin receptor expression (Bmax) of
WT and variant MT1 receptors using PRISM software (GraphPad). Non-specific binding
was determined using 10 µM melatonin(Sigma).

170
Three-dimensional modeling
Three-dimensional models of the melatonin receptor type 1 (MT1) in inactive and active
conformations were built by homology modeling using as respective templates the crystal
structure of the human OX2 orexin receptor (OX2R) (PDBid: 4S0V) (392) and the crystal
structure of the human mu-opioid receptor in complex with a Gαi protein (PDBid: 6DDE)
(393). In addition, the second intracellular loop (residues 132-146) in the structure of the
human dopamine D3 receptor (PDBid: 3PBL) (394) was used as a structural template to
model this region in the inactive MT1. Also, helix 8 (residues 291-308) in the structure of
the human adenosine A(2A) receptor (PDBid: 2YDO) (395) was used as a structural
template to model this region in the active MT1. Structure-based alignments between the
MT1 template and the targets were obtained from the GPCRdb (396). These initial
alignments were manually refined using Chimera (397) to adjust some of the gaps in the
loop regions. Using these alignments and the structural templates, 3D models of MT1 in
inactive and active conformations were built using Modeller v9.14 (398). The putative
cysteine bridge between Cys1003.25 in TM3 and Cys177ECL2.50 in the second extracellular
loop was explicitly defined during model building. All models were subjected to 300
iterations of variable target function method optimization and thorough molecular dynamics
and simulated annealing optimization, and scored using the discrete optimized protein
energy potential. The 20 best-scoring models were analyzed visually, and a suitable model
(in term of low score and structure of the loops) was selected for analysis.

171
Results
WT- MT1 signaling profile
To establish an exhaustive profiling of the signaling repertoire of the MT1 receptor, we used
bioluminescence resonance energy transfer (BRET)-based biosensors to assess G protein
activation measuring Gα protein dissociation from Gβγ complex (399) and βarrestin-2
recruitment to the activated receptor measuring its proximity with the plasma membrane
(400). Melatonin stimulation in cells expressing the wild-type (WT) human MT1 lead to the
activation of Gαi1, Gαi2, Gαi3, GαoA, GαoB, Gα12 and Gα15 (Figure 1). This is consistent
with previous finding suggesting a Gαi coupling for this receptor. Previous studies, largely
based on the detection of MT1 promoted calcium mobilization or phospholipase C activity,
also suggested a coupling to Gαq (146, 401). Nevertheless, except for Gα15, no direct
activation of Gαq family member could be detected in the present study. Gα15 which is an
atypical Gαq family member as it has been shown to display promiscuous coupling to a large
diversity of receptor (402, 403). Because no BRET sensor directly assessing its activation is
available, activation was assessed by probing the downstream activation of PKC monitored
by BRET (387) upon Gα15 overexpression.
Figure 1. WT-MT1 activates Gαi/o, Gα12, Gα15 and recruits βarrestin-2.
MT1 response for Gαi1, Gαi2, Gαi3, GαoA, GαoB, Gα12, Gαq, Gα11, Gα15 and Gαs activation and
βarrestin-2 recruitment at saturated MLT concentration (100nM). Statistical analysis was
performed using One-way Anova followed by a Dunnett’s post-hoc test.
NS: Non significant, *p<0.05, **p<0.01, ***p<0.001 relative to control
Ag
on
ist
pro
mo
ted
BR
ET
at
sa
tura
tin
g M
LT
co
nc
en
tra
tio
n
Gi1
Gi2
Gi3
Go
A
Go
BG
12
Gq
G11
G15
Gs
ar r
est i
n-2
0 .0 0
0 .0 5
0 .1 0
0 .1 5
0 .2 0
***
****** ***
***
***
***
***
NS NS NS

172
Variant cell surface expression
In order to assess the putative effects of MT1 variations, we used ELISA to assess the cell
surface expression of the WT and every MT1 variant in parallel of functional characterization
experiments. In Figure 2 we show no significant differences in cell surface expression
detected among the variants.
Figure 2. MT1 receptors cell surface expression.
Cell surface expression of MT1 variants measured by enzyme-linked immunosorbent assay
(ELISA) in HEK293 cells in parallel of BRET experiments. Data represents means ± SEM
of at least three experiments.
Signaling profiles of MT1 variants
Concentration-response curves of the MLT-stimulated activation of Gαi1, Gαi2, Gαi3,
GαoA, GαoB, Gα12, Gα15 and βarrestin-2 were generated for the 32 MT1 variants (Suppl.
Figure 1 and Suppl. Table 1). Representative examples of the signaling profiles for the WT
and 3 variants are presented in Figure 3 and clearly indicate the differential impact of variants
on the signaling activity toward the different pathways.
To provide a visual representation of the relative activity of each of the variants for the
different signaling pathways, we use a radial graph representation describing the maximal
response (Emax) and the potency (EC50) for each pathway (Suppl. Figure 2). Using a matrix
factorisation clustering method, the different signaling profiles could be grouped in 5 distinct
Ce
ll s
urfa
ce
ex
pre
ss
ion
(% o
f W
T M
T1
)
WT
-MT
1
G18R
V52A
R54W
P80L
S87L
I88V
N91Y
G96D
I112N
R125C
H131R
L138P
A157V
G166E
A180T
I212T
V221M
K228R
A266T
A266V
S267G
R307S
I309T
C314R
V321M
D326N
V331F
K334N
T340I
N342S
V345I
0
5 0
1 0 0
1 5 0

173
clusters. Figure 4 presents the superposition of the individual signaling profiles of each
member of a given cluster providing a global view of the cluster signaling characteristics.
Cluster 1 comprises 19 variants (G18RNterm, N91Y2.68, G96D3.21, A157V4.55, A180TECL2,
I212T5.63, V221M5.72, K228R6.25, A266TECL3, A266VECL3, S267GECL3, R307S8.55,
D326NCterm, V321MCterm, V331FCterm, K334NCterm, T340ICterm, N342SCterm and V345ICterm)
without any impairment and a signaling profile similar to that of the WT receptor in response
to MLT stimulation. Cluster 2 comprises 2 variants (I88V2.65 and G166E4.64) without any
impairment on Gαi1, Gαi2, Gαi3, GαoA, GαoB activation, but with a slight decrease of
βarrestin-2 recruitment as well as a reduction in the activation of either Gα12 or Gα15.
Cluster 3, for its part, comprises 6 variants (V52A1.57, R54W1.59, S87L2.64, H131R3.56,
I309T8.57 and C314RCterm) with slight and variable impairments for Gαi1, Gαi2, Gαi3, GαoA,
GαoB, but with a total loss of βarrestin-2 recruitment and a reduction or loss of Gα12 and/or
Gα15 activation. Cluster 4 comprises 3 variants (I112N3.37, L138PICL2, I257F6.54) with a
global loss of potency for all the pathways but in most cases with little impact on their
efficacy. Cluster 5 comprises two mutants (P80L2.57 and R125C3.50) with a total loss of
function in response to MLT stimulation.
Figure 3. Melatonin concentration-response curves for G protein activations
and βarrestin-2 recruitment of the WT and representative receptor variants with
distinct signaling profiles.
MLT concentration curves for (A) WT-MT1, (B) V52A, (C) R125C and (D) L138P
receptors.

174
Data were plotted using non-linear regression curves with a fixed Hill slope. Data points
represent means ± SEM of at least three experiments. Βarr2: βarrestin-2, WT: wild-type. See
also Suppl. Figure 1.

175
Figure 4. Radial graph representation of the different variant profiles compiled in
5 clusters.
Compilation of the different MT1 variant radial graph profiles in five clusters. On each radial
maximal agonist-induced efficacy (Max) and potency (EC50) obtained by BRET are
indicated. The cluster 1 corresponds to the 19 variants with a similar profile to the WT-MT1
receptor. The cluster 2 groups 2 variants with a slight decrease of βarrestin-2 recruitment
and Gα12 or Gα15 activation. The cluster 3 groups 6 variants with a total loss of βarrestin-
2 recruitment and generally an impairment of Gα12 and/or Gα15 activation. The cluster 4
groups 3 variants with a defect for every efficacy (Max) but with similar potencies (EC50) to
the WT-MT1. The cluster 5 groups 2 variants with a total loss of function. See also Suppl.
Figure 2.
Mutant binding to MLT
To exclude the possibility that differences in the signaling activities observed could result
from reduced binding affinity to MLT, we measured it for each variant belonging to one of
the cluster with altered signaling. Binding affinities as measured by radioligand binding
using 2(125I)-iodomelatonin (125I-MLT) as the tracer was not statistically different among the
variants except for P80L2.57 which showed a complete loss of binding capacity (Figure 5).
Figure 5. MT1 variant receptors bind to melatonin as well as the WT-MT1, except
P80L.
Melatonin dissociation constant measured by 2-(125I)Iodomelatonin binding experiment on
MT1 variants with at least one signaling defect. Data represent means ± SEM of at least three
experiments.

176
Evolutionary action analysis of MT1 variants
To assess whether the extent of the functional impacts of the naturally occurring variants
could be estimated by the evolutionarily predicted impact of the individual substitution we
assessed the Evolutionary Action (EA) of the 32 variants. EA is a bioinformatic algorithm
predicting the impact of mutational variants (388). The EA score varies from 0 for variations
with the most benign predicted impact to 100 for those with the most predicted adverse
effects. Figure 6 illustrates a statistically significant correlation (R2=0.6553, P≤0,0001)
between the EA scores and the signaling phenotypic impact for each of the variants
indicating that the severity of the functional outcome of SNPs can be reasonably well
predicted using trace evolution-based methods such as EA.
Figure 6. Evolutionary Action of MT1 variants and correlation with signaling
impairment.
(A) An Evolutionary Action (EA) score was calculated for each variant. EA ranges from 0
to 100 with a score of 0 predicted to be benign and a score of 100 predicted to be highly
impactful or detrimental to protein function. Scores are colored based on EA (EA=0 (Dark
blue) to EA=100 (Red)). (B) Functional defects of every MT1 variant were correlated with
the EA score. The 5 clusters were represented with the cluster 1 in black, the cluster 2 in
blue, the cluster 3 in green, the cluster 4 in yellow and the cluster 5 in red. Data were fitted
in GraphPad Prism by linear regression analysis, P and R2 values obtained for the overall
correlation.
Structural determinants of the functional impact of MT1 variations
To investigate the possible structural determinants of the functional impact of the variants,
we analyzed the position of the individual mutated residues and the topology of Clusters 1-
5 on three-dimensional models of inactive and active MT1 built by homology modelling (see
Methods). We expect that these analyses will allow us to gain new insights into the structural
determinants of signal transduction, particularly in how these mechanisms may be disrupted
leading to malfunction.

177
Variations in Cluster 1 (with no impact on the receptor signaling profile) are spread
throughout the structure (Figure 7A and Suppl. Figure 3), appearing mostly in the surface of
the extra- and intracellular domains and far from the receptor core. This is also the case for
variations in Cluster 2 – I88V2.65 and G166E4.64 – (Figure 7B), located in the extracellular
part of TM2 and TM4 respectively. While these variations result in modest impacts on
βarrestin-2 recruitment and Gα12 or Gα15 activation, they are not near the ligand-binding
pocket (404) or to any of the known activation microswitches of GPCRs, precluding us to
make any inference on the structure/function impact of these variations. It could therefore
be proposed that these residues may contribute to an allosteric network between the binding
pocket and the microswitches involved in the engagement of arrestin-2 and either Gα12 or
Gα15. The fact that these variations do not affect the efficacy or potency of MT1 to activate
the Gαi family members rule out the possibility that the defect could result from a general
major misfolding of the receptor. Yet we cannot exclude the possibility that a modest non-
specific structural impairment may have a more important impact on the pathways that are
less efficiently coupled to the receptor. Indeed, the lower potency of MT1 to activate
arrestin-2, Gα12 and Gα15 vs the Gαi family members suggests that theses pathways are
less efficiently coupled to the receptor.
The 6 variations in Cluster 3 are associated to a major reduction of βarrestin-2 recruitment.
Interestingly, 4 of these variations are located in the interface between the cytoplasmic side
of TM1 (V52A1.57 and R54W1.59) and H8 (I309T8.57 and C314RCterm) (Figure 7C). The short
amphipathic H8 lies adjacent to the inner leaflet of the plasma membrane, anchored through
a palmitoylated cysteine (C314 in MT1). In other GPCRs, H8 has been shown to play a
crucial role in the interaction of the receptor with βarrestin-2 necessary for internalization
(405), and its palmytoylation has been shown to enhance the recruitment of arrestin-2
(406). In our structural models, H8 and intracellular loop 1 in the receptor can interact with
the finger loop of arrestin-2. Thus, we hypothesize that the variations V52A1.57, R54W1.59,
I309T8.57 and C314RCterm affect arrestin-2 recruitment by altering the local environment of
H8 in MT1. Both C314RCterm and I309T8.57 affect directly H8 by removing a palmytoylation
site or by weakening hydrophobic interactions with nearby phospholipids. On the other hand,
V52A1.57 and R54W1.59 – located at the interface between TM1 and ICL1 – would affect H8
indirectly. These results are consistent with findings on other GPCRs; for instance,
hydrophobic amino acids in H8 of the mouse odorant receptor mOR-S6 have been suggested

178
to form an hydrophobic core with TM1 responsible for the good positioning of H8, and
variations of these residues increase the flexibility of H8 and destabilize its structure (407).
Another variation in Cluster 3 (H131R3.56) is located at the interface between the cytoplasmic
end of TM3 and intracellular loop 2, at a location where it could interact directly with
βarrestin-2 (Figure 7C). This variation also places a positively charged residue next to the
highly conserved Y1263.51, which might alter its function by stablishing a spurious cation-pi
interaction. Interestingly, this region has been proposed to be a secondary site for βarrestin
interactions in other GPCRs (408, 409). The last variation (S87L2.64) of Cluster 3 is located
away from known potential functional sites (Figure 7C), so we could not rationalize its effect
from a structural point of view.
The three variations of Cluster 4 (L138PICL2, I257F6.54 and I112N3.37) (Figure 7D) have a
more severe effect in the signaling profile of MT1. On the one hand, as in Cluster 3, they
completely terminate arrestin-2 recruitment (Suppl. Figure 1); but, moreover, they result in
loss in potency (EC50) –but not in efficacy (Emax) – in all signaling pathways compared to
WT-MT1. The idea that this loss of potency could be due to a loss of binding affinity for
MLT could be ruled out since we observe no difference of binding affinity for these three
variants compared with WT-MT1. We suggest that these variations lead to a destabilized
active state, and, thus, to a less efficient activation.
The variant L138PICL2 is in the cytoplasmic ICL2, which is known to form a short alpha
helix in several GPCRs (e.g. rhodopsin, β1AR, β2AR with PDBid 4ZWJ, 2VT4 and 3P0G
respectively) and can interact with β-arrestins (Figure 7E) and G proteins (410) (Figure 7F).
The variation of a leucine for a proline is expected to break the α helix or at least prevent its
good position leading to a less efficient interaction with βarrestin-2 and G proteins and the
observed decrease in potency.
The I257F6.54 variation is located at the extracellular side of TM6 (Figure 7D), a site already
shown to be important for the active melatonin-bound form of MT1, favoring the
conformational changes necessary for signal transmission (411). Clement et al. proposed
that, similarly to rhodopsin (412), ECL2 of MT1 stabilizes TM5, TM6 and TM7 upon
activation, particularly through the interaction between ECL2 and I2576.54. Consequently,
we suggest that the variation I257F6.54 alters the interactions with ECL2 decreasing the
stability of the MT1 active form. Another hypothesis is that I2576.54 is located one turn above
the highly conserved proline-kink at P2536.50, which is key in shaping TM6, a key element
in the activation mechanism of GPCRs. The extracellular sides of TM6 and TM7 – near

179
position 2576.54 – form important interactions to maintain the fold of the receptor (413).
Thus, the I257F6.54 variation might destabilize the TM6/7 interface and impair the efficient
relocation of TM6 upon receptor activation.
Similarly, I112N3.37 is located in the middle of TM3 (Figure 7G), right next the key residues
I1153.40 and P1995.50 that form part of a key switch (the ‘’triad’’ or PIF motif) in GPCR
activation (414). The I112N3.37 variation would alter the packing and physico-chemical
properties of this region, leading to a less efficient activation of the PIF motif and an
impaired transduction of the conformational changes through TM6 and TM5 that lead to the
formation of the active state. As in L138PICL2, these variants (I257F6.54 and I112N3.37) can
still activate G proteins (Emax is not affected), but these events are less efficient due to an
impaired TM5 and TM6 leading to the observed decrease in potency.
Cluster 5 comprises two variants with almost complete loss of function. These phenotypes
are easier to explain since the P80L2.57 variation (located in the ligand-binding site) (Figure
7H) leads to a loss of MLT binding and the R125C3.50 variant mutates a key residue in the
D/NRY motif, known to be essential for GPCR function and directly involved in the binding
of arrestins and G proteins. R125C3.50 variant show a total loss of signaling capacity, except
for GαoB which remains well activated by this variant form of the receptor. Nevertheless,
we can not make any inference on the mechanism which allows this variant to activate only
GαoB.

180
Figure 7. Three-dimensional representation of residues of interest within MT1 and
βarrestin-2.
Three-dimensional representation of MT1 active form (wheat color), MT1 inactive form
(Grey), βarrestin-2 (Dark green), Gα protein (Orange) and Gβ protein (Light green).
Residues from clusters are shown in spheres. (A) Residues N91, G96, A157, A180, I212,
V221, K228, A266, S267, R307 from cluster 1. (B) Residues I88 and G166 from cluster 2.
(C) Residues V52, R54, S87, H131, I309 and C314 from cluster 3. (D) Residues I112, L138
and I257 from cluster 4. (E) Residue L138 in the MT1 active form bound to Gα protein. (F)
Residue L138 in the MT1 active form bound to βarrestin-2. (G) Residue I112 in inactive
(left) and active (right) conformation of MT1 with the 3 residues forming the ‘’triad’’ (PIF)
motif. (H) Residues P80 and R125 from cluster 5.

181
Discussion
In this study we report an exhaustive characterization of the MLT-activated MT1 receptor
signaling profile. Upon MLT stimulation, this receptor activates a broad set of pathways,
activating Gαi1, Gαi2, Gαi3, GαoA, GαoB, Gα12, Gα15 proteins and recruiting βarrestin-2
in transfected HEK293 cells. Several studies already showed interactions between MT1 and
several G proteins (146), activation of PTX sensitive Gαi/o proteins by MT1, leading to an
inhibition of cAMP production by the adenylate cyclase (146) and increase of intracellular
Ca2+ concentration, most likely due to the activation of the PTX insensitive Gαq/11/15
protein family (146) have been previously reported. Our results not only confirm these data,
but also provide direct evidence for the engagement of the entire family of Gαi proteins and
revealed that only Gα15 among the Gαq family could be efficiently activated and that neither
Gαq or Gα11 could be activated. It is noteworthy that Gα15 is an atypical member of the
Gαq family since it has been found to be activatable by a large proportion of GPCRs (402,
403). The lack of coupling to Gαq and Gα11 is not due to a lack of sensitivity of the
biosensors or the HEK293 cells used since coupling to the more conventional Gαq family
members (Gαq and Gα11) could be seen in HEK293 cells for other GPCRs (415, 416). The
study also reveals for the first time a coupling to Gα12.
The specific signaling profiles obtained for 32 naturally occurring MT1 variants revealed
different signaling signatures allowing us to classify the variants in 5 different clusters: no
effect (cluster 1), modest impacts on βarrestin-2 recruitment and Gα12 or Gα15 activation
(cluster 2), major reduction of βarrestin-2 recruitment and Gα12 and/or Gα15 activation
(cluster 3), severe impairing of signaling (cluster 4), and total impairing of signaling (cluster
5). Interestingly, EA scores matched with our experimental results reciprocally validating
the experimental signaling profiles observed and the predictive power of evolutionary-based
approaches.
The study of the location of these different clusters in three-dimensional structural models
of inactive and active MT1 allowed us to propose specific mechanisms for the effect of the
variations on receptor activation and signaling. The effects in Cluster 3 can be explained in
most of the cases by direct alterations of the receptor-βarrestin-2 interactions (through H8
and ICL2). On the other hand, each variation in Cluster 4 is located near key regions in
GPCR activation (The helical ICL2, the extracellular TM6/7 interface, and the PIF motif);
these variations may thus alter the signaling profile by altering the environment of these

182
activation switches. Finally, variations in Cluster 5 alter either the ligand- or the G
protein/βarrestin-binding sites.
The different clusters revealed crucial regions of the MT1 receptor involved in G protein
activation and βarrestin-2 recruitment highlighting specific residues that had greater impact
on arrestin-2 supporting the notion that distinct allosteric networks and interactions
domains maybe involved in the selective engagement of distinct signaling pathways, a
concept known as functional selectivity.
As we have shown in this study, computational analysis is a valuable tool to identify
important regions or residues within a receptor and to predict effect of mutations.
Nevertheless, natural variants can bring unexpected and precious information to decrypt the
mechanism of action of a receptor. In our case, we found natural MT1 variants in apparently
healthy people with signaling defects. Keeping in mind that MLT is known to act mainly
through its 2 receptors MT1 and MT2 and to be involved in many diseases, we can therefore
wonder how the whole organism can adapt to this decrease of MT1 activity. It would be easy
to think about a compensation from MT2 activity, but it was recently shown that MT2 can
only activate Gαi and Gαz proteins and to recruit βarrestin-2 (372). This compensation
would therefore lead to a partial signaling in response to MLT production.

183
Supplementary material

184
Supplementary figure 1. Melatonin concentration-response curves for G protein
activations and β-arrestin 2 recruitment of the WT and the different variant profiles
grouped in 5 clusters.
(A) Functional profile of the WT-MT1 receptor and the first cluster corresponding to the 19
variants with a similar profile to the WT-MT1 receptor. (B) The cluster 2 groups 2 variants
with a slight decrease of βarrestin-2 recruitment and Gα12 or Gα15 activation. The cluster 3
groups 6 variants with a total loss of βarrestin-2 recruitment and generally an impairment of
Gα12 and/or Gα15 activation. The cluster 4 groups 3 variants with a defect for every efficacy
(Max) but with similar potencies (EC50) to the WT-MT1. The cluster 5 groups 2 variants
with a total loss of function. Cell surface expression of each variant was adjusted to WT-
MT1 and monitored by ELISA. Experiments were repeated at least 3 times.
Data were plotted using non-linear regression with a fixed Hill slope. Data points represent
means ± SEM of at least three experiments. WT; wild-type.

185

186
Supplementary figure 2. Radial graph representation of the different variant
profiles grouped in 5 clusters.
On each radial graph for each MT1 variant, maximal agonist-induced efficacy (Max) and
potency (EC50) obtained by BRET are indicated. The five clusters were made regarding the
profile of each variant. Cell surface expression of each variant was adjusted to WT-MT1 and
monitored by ELISA. Experiments were repeated at least 3 times.

187
Supplementary Figure 3. Snake plot representation of WT-MT1 with the position
of the different variants.
MT1 representation with the different variants of Cluster 1 (Dark grey), Cluster 2 (Blue),
Cluster 3 (Green), Cluster 4 (Orange) and Cluster 5 (Red).

188

189
Supplementary table 1. Data from the functional characterization of variants.
Summary of the functional profiling of (A) Gαi1, Gαi2, Gαi3, (B) GαoA, GαoB, (C) Gα12
and Gα15 activation and βarrestin-2 recruitment by WT-MT1 and MT1 variants. Data
represents the mean ± SEM of 3-13 independent experiments with repeats in quadruplicate.
ND denotes that the experimental parameter could not be determined due to lack of a
concentration-response curve. The data were analyzed by comparing independent curves.

190
Résumé du chapitre 4 – Article 3
Dans ce manuscrit, nous avons :
-Identifié que MT1 pouvait activer les protéines Gαi1, Gαi2, Gαi3, GαoA, GαoB, Gα12,
Gα15 et était capable de recruter la βarrestine-2.
-Identifié 32 variations génétiques naturelles de MT1 en séquençant son gène chez 9393
personnes.
-Caractérisé les 32 variants naturels de MT1 précédemment identifiés. Nous avons ainsi
mesuré leur capacité à activer les protéines G précédemment nommées ainsi qu’à recruter la
βarrestine-2 suite à leur liaison à la MLT.
-Généré des profils de signalisation pour chaque variant et les avons classés en 4 groupes
selon leurs similitudes.
-Montré que les analyses informatiques de prédiction de l’impact de mutations (EA score)
sont des outils robustes et pouvant être très utiles.
-Généré de nouveaux modèles 3D de MT1 sous ses formes inactive et active.
-Identifié des régions du récepteur MT1 importantes spécifiquement dans l’activation des
protéines Gα12 et Gα15 et dans le recrutement de la βarrestine-2.
Ce troisième manuscrit apporte ainsi des informations précises quant au profil de
signalisation du récepteur MT1 et ses mécanismes d’action suite à son activation par la MLT.
L’ensemble de ces 3 manuscrits apporte de nombreuses informations sur les rôles et la
compréhension des récepteurs à la mélatonine et permet ainsi d’offrir de nouvelles
perspectives pour la recherche sur le système mélatoninergique. Ces points seront
notamment discutés plus en détails dans la section suivante (chapitre 5).

191
Chapitre 5
Discussion et conclusion générales

192
Lorsque j’ai débuté ma thèse, la MLT était connue pour réguler de nombreuses fonctions
physiologiques dans le corps humain. Je me suis alors impliqué dans la compréhension de
ses mécanismes de régulation du système dopaminergique et de l’homéostasie glycémique
en lien avec le DT2, deux fonctions qui étaient alors connues mais qui restaient floues.
I. Discussion sur le premier projet de la thèse
Dans le premier article de cette thèse, nous nous sommes intéressés à la régulation du
système dopaminergique par le système mélatoninergique. Comme indiqué dans
l’introduction de cette thèse, DAT est le principal régulateur de la dopamine extracellulaire
et la compréhension de sa régulation représente donc un intérêt majeur pour la recherche de
nouveaux traitements pour les maladies neurodégénératives comme la MP, pour le TDAH
et pour l’addiction aux drogues ciblant le système dopaminergique comme la cocaïne ou
l’amphétamine.
A. Discussion sur les interactions entre DAT et les MTRs
Nous avons révélé des interactions entre les MTRs et DAT, responsables d’une baisse
d’expression de DAT à la surface cellulaire par sa rétention au niveau du réticulum
endoplasmique (figure 1). Pour ce faire, nous avons utilisés des cellules HEK293 et HeLa
mais également des synaptosomes de striatum de souris afin de valider ces interactions dans
un modèle plus physiologique. Nous avons ainsi réalisé des co-immunoprécipitations, de
l’immunofluorescence ou encore du BRET. Néanmoins, ces techniques ne nous permettent
pas de dire si ces interactions sont directes ou indirectes au sein d’un complexe protéique. Il
serait donc intéressant de purifier les MTRs et DAT, par chromatographie d’affinité par
exemple, puis revérifier par co-immunoprécipitation si nous pouvons toujours observer ces
interactions dans une solution ne contenant aucune autre protéine. Nous avons également
tenté de découvrir des sites d’interactions entre ces protéines. La partie N-terminale de DAT
était connue pour interagir avec différentes protéines comme la syntaxine 1A (417) ou la
synaptogrine-3 (418). C’est pourquoi nous avons décidé de créer un transporteur DAT
dépourvu de sa partie N-terminale afin de vérifier si cette partie est également responsable
des interactions avec les MTRs. Néanmoins, nous n’avons vu aucune différence entre le
DAT entier et le DAT dépourvu de sa partie N-terminale. La partie C-terminale de DAT
contient une séquence de liaison aux protéines PDZ (PSD-95/Discs-large/ZO-1) (-LKV)
(419) qui est connue pour être importante pour des interactions avec des protéines

193
d’échafaudage comme PICK-1 (Protéine Interagissant avec la kinase C 1) (309, 420) et
régulant ainsi le trafic des protéines vers la surface cellulaire. Dans de futures études, il
serait donc intéressant de muter cette séquence -LKV afin d’observer si elle est
responsable des interactions avec MT1 et MT2. Nous pourrions envisager par la suite
d’essayer de découvrir si des interactions directes entre cette séquence PDZ et les MTRs
sont responsables de la rétention de DAT, par exemple en empêchant les interactions avec
PICK-1, nécessaires pour son expression à la surface cellulaire (309, 420). D’autres acides
aminés de la partie C terminale de DAT sont également importants pour son trafic vers la
membrane cellulaire ou au contraire responsables de sa rétention lorsque mutés (421) et
devraient également être étudiés pour voir s’ils sont responsables des interactions avec
les MTRs.
Figure 1. Modèle de régulation du système dopaminergique par les récepteurs
de la mélatonine.
En condition basale et après sa synthèse, (1) DAT migre à travers le RE et le Golgi (2) pour
aller s’exprimer à la surface du neurone présynaptique. (3) DAT peut ainsi recapter la
dopamine extracellulaire vers le neurone présynaptique (4) afin de diminuer la quantité de
dopamine dans l’espace intersynaptique et donc (5) d’éviter une suractivation des récepteurs
dopaminergiques. En revanche, lorsque la cellule produit également les MTRs, (6) ces
derniers interagissent avec DAT et entrainent sa rétention dans le RE (7) diminuant ainsi son
expression à la surface cellulaire. (8) La diminution du nombre de DAT à la surface
neuronale entraine ainsi une accumulation de la dopamine dans l’espace intersynaptique (9)
menant à une suractivation des récepteurs de la dopamine.

194
B. Discussion sur les effets in vivo des interactions entre DAT
et les MTRs
Après avoir rapporté que les MTRs retenaient DAT au niveau du réticulum endoplasmique
et diminuaient donc la recapture de la dopamine dans les neurones, nous avons étudié les
effets de cette baisse d’activité de DAT in vivo sur le comportement de souris. Nous avons
pour cela provoqué l’hypermotilité de souris sauvages ou déficientes en MT1 ou MT2 en leur
injectant de l’amphétamine. Nous avons ainsi démontré que les mécanismes observés in vitro
étaient retrouvés in vivo avec une hypermotilité réduite chez les souris déficientes en MT1
ou MT2 comparativement aux souris sauvages, un effet dû à une plus forte quantité de DAT
à la surface des neurones permettant d’éliminer plus rapidement la dopamine extracellulaire.
Dans la continuité de cette constatation, il serait intéressant d’étudier les différences
d’addiction à la cocaïne ou à l’amphétamine chez des souris sauvages ou déficientes en MT1
ou MT2. Nous pouvons alors penser que si le système de recapture de la dopamine
extracellulaire est plus efficace chez les souris déficientes en MTRs, alors celles-ci sont
moins susceptibles de devenir dépendantes de ces drogues. Ces informations pourraient être
utiles dans le cadre de traitements contre l’addiction.
C. Intérêt de cette découverte pour le traitement de la MP
De manière intéressante, deux des causes majeures de la MP sont une insuffisance en
dopamine au niveau du cerveau et la mort des neurones dopaminergiques due à un stress
oxydatif accru (422). Or, il a été montré qu’avec l’âge, la quantité de MTRs diminuait dans
le cerveau (218, 423), laissant alors penser que l’expression de DAT à la surface cellulaire
serait facilitée. Ceci aurait alors pour conséquence de diminuer la quantité de dopamine
extracellulaire et d’augmenter la quantité de dopamine dans les neurones présynaptiques.
Une trop forte quantité de dopamine intracellulaire entrainerait alors une augmentation de
radicaux libres et de peroxyde d’hydrogène due à son oxydation et à sa dégradation
enzymatique (268, 318, 424) aboutissant à la mort des neurones. Notre découverte de
régulation d’expression de DAT par les MTRs permet ainsi d’ouvrir de nouvelles voies à la
recherche de traitements contre la MP.

195
D. Discussion sur la régulation des interactions entre DAT et
les MTRs dans le corps
Suite aux résultats de cet article, nous pouvons nous demander comment la régulation du
nombre de DAT à la surface cellulaire est effectuée. En effet, les MTRs les retiennent dans
le réticulum endoplasmique mais nous ne savons pas comment ces interactions sont régulées.
Comme expliqué dans l’introduction de cette thèse, la quantité de MTRs à la surface
cellulaire diminue lorsqu’ils sont stimulés par la MLT. Nous pouvons donc prédire qu’à la
fin de la nuit biologique, la quantité de MTRs étant moindre, la quantité de DAT augmente
à la surface cellulaire, augmentant par conséquent la recapture de la dopamine. Cette
hypothèse est concordante avec l’étude de Ferris (425) qui montre un maximum de recapture
de la dopamine vers 6h contrairement à 18h où elle est au minimum et correspondant aux
heures auxquelles les quantités de MTRs exprimés à la surface cellulaire sont faibles et
élevées respectivement (426). Afin de confirmer que les interactions entre MTRs et DAT
varient pendant la journée, il serait intéressant de réaliser les expériences de recapture de la
dopamine dans les synaptosomes de souris prélevés à différents temps de la journée et de la
nuit. En effet, nos prélèvements et préparations de synaptosomes ont toujours été effectués
le matin vers 8h. Nous pouvons alors prédire que des prélèvements à 18h par exemple,
montreraient une augmentation des interactions entre DAT et les MTRs et donc une
diminution de l’activité de DAT dans les souris sauvages comparativement aux
synaptosomes préparés à 8h.
E. Utilisation de nouveaux anticorps anti-MTRs de souris
Lors de notre étude sur les interactions entre DAT et les MTRs de souris, nous avons
participé à la caractérisation de nouveaux anticorps. Ces derniers sont spécifiques et les
interactions avec les MTRs sont faibles mais suffisantes pour immunoprécipiter les MTRs
et observer la co-immunoprécipitation de DAT. Nous avons tout de même essayé
d’optimiser les étapes d’extraction et de purification des protéines DAT et MTRs en utilisant
différents détergents plus ou moins forts et différents temps d’incubation mais les résultats
montrés dans cette thèse sont les plus pertinents observés. La découverte de nouveaux
anticorps ayant encore plus d’affinité que ceux utilisés dans notre article reste donc difficile
mais cruciale pour les futures études sur les MTRs.

196
II. Discussion sur le second projet de la thèse
Non seulement la MLT est connue pour avoir des impacts sur les maladies et les troubles
neurologiques comme indiqué dans l’article 1, mais elle est également impliquée dans les
maladies métaboliques comme le DT2. Antérieurement à ma thèse, une étude de séquençage
du gène codant pour MT2 chez des personnes normoglycémiques et des patients DT2 avait
révélé 40 variants rares génétiques de ce récepteur (213). Dans le second projet de cette
thèse, notre but était alors de caractériser de manière précise l’ensemble de ces variants MT2
afin de relier un ou plusieurs défauts de signalisation à un risque accru de développer le DT2.
A. Caractérisation du récepteur sauvage MT2
Nous avons tout d’abord caractérisé le récepteur sauvage MT2 en utilisant la technique de
BRET afin de mesurer l’activation des protéines G, la technique PathHunter de Discover X
pour le recrutement de la βarrestine-2, la technique Surefire de PerkinElmer pour la
phosphorylation de ERK et la technique d’HTRF (homogeneous time-resolved
fluorescence) en utilisant le kit “cAMP femto2” de Cisbio pour mesurer la production
d’AMPc. Ces caractérisations nous ont permis d’obtenir le profil de signalisation de MT2 à
en absence et en présence de MLT. Nous pouvons ainsi observer que MT2 active les
protéines Gαi/o et Gαz et recrute également la βarrestine-2.
B. Caractérisation des variants naturels MT2 et lien avec le
DT2
Dans cette étude nous avons ensuite caractérisé les 40 mutants découverts précédemment en
testant 5 voies de signalisation activées par le récepteur sauvage, les voies Gαi1, Gαz,
βarrestin-2, AMPc et ERK. Nous avons ainsi pu relier la perte d’activation des protéines
Gαi1 et Gαz engendrée par la MLT ainsi que la perte de recrutement spontané de la
βarrestine-2 à un risque accru de développer le DT2. Ces informations offrent de nouvelles
perspectives dans le développement de traitements personnalisés contre cette maladie. Notre
étude se limite néanmoins aux cellules HEK293 qui sont couramment utilisées lors d’études
sur les RCPGs mais qui restent éloignées de notre système d’étude sur le DT2. C’est
pourquoi, il serait intéressant de mesurer l’inhibition de la sécrétion d’insuline dans des
cellules β-pancréatiques INS1 dans lesquelles les récepteurs endogènes MT2 auraient
préalablement été remplacés par les mutants MT2 associés au développement du DT2,

197
notamment grâce à la technique CRISPR (Courtes répétitions palindromiques groupées et
régulièrement espacées). L’inhibition de la sécrétion d’insuline dans ces cellules serait alors
comparée à celle obtenue dans les mêmes cellules mais transfectées avec le récepteur
sauvage ou les variants sans incidence sur les risques de développement de DT2.
Comme indiqué dans l’introduction de cette thèse, il est aujourd’hui connu que certains
ligands peuvent entrainer une signalisation biaisée du récepteur. Dans notre cas, il serait
intéressant de développer des composés pouvant agir comme modulateurs allostériques
positifs capables de restaurer la signalisation défective des variants identifiés comme étant
associés à des risques accrus de développer le DT2 mais aussi leur capacité à restaurer
l’inhibition de la sécrétion d’insuline.
III. Discussion sur le troisième projet de la thèse
En ce qui concerne le dernier projet de cette thèse, sur l’étude de la structure et des
mécanismes d’action de MT1, nous avions, à l’origine, planifié un projet semblable à celui
sur MT2 avec l’identification de variants naturels puis leur caractérisation afin de relier un
ou plusieurs défauts de signalisation à un risque accru de développer le DT2. Seulement,
nous n’avons pas trouvé de lien avec la maladie. C’est pourquoi nous avons décidé d’utiliser
les données récoltées afin de mieux comprendre les mécanismes de fonctionnement de ce
récepteur.
A. Caractérisation du récepteur sauvage MT1
Nous avons dans un premier temps caractérisé le récepteur MT1 sauvage en utilisant la
technique de BRET afin de mesurer l’activation des protéines G et le recrutement de la
βarrestine-2. Cette caractérisation nous a permis d’obtenir le profil de signalisation de ce
récepteur capable d’activer les protéines Gαi/o, Gα12, Gα15 et de recruter la βarrestine-2.
Des études sur MT1 avaient déjà montré que ce récepteur était capable d’activer les protéines
Gαi, notamment grâce à leur capacité à inhiber la production d’AMPc dans la cellule. Ici,
nous avons montré que MT1 est capable d’activer l’ensemble des protéines Gαi/o sensibles
à la toxine Pertussis. MT1 était également connu pour activer la phospholipase C par le biais
des protéines Gαq/11. Dans cette étude, nous avons pu démontrer que MT1 était capable
d’activer la phospholipase C seulement via la protéine Gα15 et non Gαq ou Gα11 dans nos
cellules HEK293. Pour la première fois, nous avons également montré une activation de la

198
protéine Gα12 par le récepteur MT1. La protéine Gα12 est importante puisqu’elle permet
l’activation de la protéine RhoGEF impliquée dans la prolifération et la mobilité cellulaire
(427).
B. Caractérisation des variants naturels MT1
Nous avons ensuite séquencé le gène codant pour MT1 chez 9393 personnes et révélé 32
variants génétiques naturels de ce récepteur. Leur caractérisation en utilisant les mêmes
expériences que pour le récepteur sauvage nous a alors permis de dévoiler des profils de
signalisation identiques au sein des variants. En utilisant une méthode de factorisation
matricielle, nous avons alors regroupé les variants en 5 groupes distincts dépendamment de
leurs profils de signalisation. Le groupe 1 rassemble 19 variants avec un profil de
signalisation similaire à celui du récepteur sauvage, mais les 4 autres contiennent des
variants avec différents défauts de signalisation. En visualisant l’emplacement de ces
variants sur notre nouveau modèle 3D de MT1, nous avons alors pu identifier des régions du
récepteur impliquées spécifiquement dans l’activation de certaines protéines. Par exemple,
nous avons pu observer que l’ICL2, la partie proche de la surface intracellulaire du TM1 et
l’H8 étaient très importants pour le recrutement de la βarrestine-2, mais aussi pour
l’activation des protéines Gα12 et Gα15. Ces 2 protéines semblent en effet avoir un profil
d’activation différent des autres protéines G, mais proche de celui de la βarrestine-2. C’est
la première fois qu’un lien entre ces protéines est reporté. Nous avons ainsi pu observer que
la puissance qu’a MT1 à activer ou recruter les différentes protéines testées dans ce projet
varie, avec une puissance (EC50) plus faible pour la βarrestine-2, la Gα12 et la Gα15
comparativement aux protéines Gαi/o. Cette observation peut notamment expliquer l’effet
plus délétère de certaines variations sur l’activation des protéines moins bien couplées
comparativement aux protéines Gαi/o.
Nous avons également observé que le milieu du TM3 (I112N) et la partie extracellulaire du
TM6 (I257F) étaient importants pour la stabilisation de la forme active de MT1. La première
de ces régions comporte le motif conservé chez les RCPGs ‘’PIF’’ connu pour être clé dans
le changement conformationnel des récepteurs vers leur forme active. La seconde région se
situe au niveau du TM6, un autre élément clé dans le changement conformationnel des
RCPGs vers leur forme active. La variation I257F6.54 se situant à proximité du résidu
conservé P2536.50, son effet drastique sur la signalisation de MT1 était prédictible.

199
Par la suite, il serait intéressant de simuler par dynamique moléculaire les effets de ces
variations sur la stabilité de la forme active du récepteur afin de tester nos hypothèses.
C. Discussion sur les limites de l’analyse de corrélation entre
effets phénotypiques et prédictions informatiques
Lors de l’analyse de la corrélation entre le score d’effet phénotypique (Average phenotypic
effect) et le score d’action d’évolution (EA score), nous avons pu observer une phase de
latence correspondant à un score phénotypique inférieur aux prédictions du EA score pour
certains variants du groupe 1 ayant un EA score entre 40 et 60 environ (Figure 2). Cette
phase de latence peut être expliquée par le fait que notre essai n’était peut-être pas assez
sensible pour mesurer de faibles variations fonctionnelles.
Figure 2. Score d’effet phénotypique en fonction du score d’action d’évolution.
Représentation graphique de la corrélation entre score d’effet phénotypique et le score
d’action d’évolution des 5 groupes de variants naturels de MT1. En violet, les membres du
groupe 1 ayant un faible score d’effet phénotypique comparativement au score d’action
d’évolution.
IV. Discussion sur les liens entre les projets 2 et 3
A. Discussion sur la comparaison des profils de signalisation
des récepteurs MT1 et MT2
Le point commun entre les projets 2 et 3 est la caractérisation des récepteurs MT1 et MT2
sauvages en utilisant les différentes techniques citées précédemment, nous permettant

200
d’obtenir le profil de signalisation de ces 2 récepteurs. Il reste néanmoins difficile de
comparer leurs profils puisque certaines techniques diffèrent entre les 2 récepteurs. De plus,
la mesure de la phosphorylation de ERK et de la production d’AMPc n’a été réalisée que
dans le cadre de l’étude sur le récepteur MT2. Ces différences peuvent être expliquées par le
fait que l’étude sur MT2 est antérieure à l’étude sur MT1 et certains biosenseurs utilisés dans
la caractérisation de ce dernier n’existaient alors pas. Ces 2 récepteurs étant impliqués dans
des maladies et troubles parfois différents, il serait donc intéressant de refaire la
caractérisation de ces 2 récepteurs de manière similaire afin de pouvoir les comparer,
comprendre les rôles différents qu’ils jouent dans le développement des maladies et réfléchir
aux stratégies qui pourraient être adoptées pour parer les défauts de signalisation associés.
B. Discussion sur la comparaison des mécanismes d’activation
des récepteurs MT1 et MT2
Nous avons démontré dans le troisième projet de cette thèse qu’il était possible de révéler
des mécanismes d’activation grâce à la caractérisation fonctionnelle de variants naturels.
Ayant déjà obtenu la caractérisation fonctionnelle de variants MT2, il serait maintenant
intéressant de réaliser un nouveau modèle 3D par homologie du récepteur MT2 et d’essayer
de comprendre ses modes de fonctionnement de la même manière que le travail réalisé sur
MT1. Ce travail pourrait ainsi permettre de comparer les mécanismes de ces 2 récepteurs qui
sont proches, mais qui ont des profils de signalisation différents, dans le but final de pouvoir
développer de nouvelles molécules capables d’activer, ou d’inhiber certaines voies
spécifiques et sur un seul de ces 2 récepteurs. En attendant, nous pouvons nous baser sur les
précédents modèles 3D de MT2.
Au cours de ma thèse, nous avons identifié des régions spécifiques des récepteurs MT1 et
MT2 importantes pour l’activation de la βarrestine-2 (figure 3). Lorsque nous comparons
leurs positions au sein de ces deux récepteurs, nous pouvons voir que certaines de ces régions
sont similaires et d’autres différentes. En effet, la région regroupant l’H8 et la partie proche
de la surface intracellulaire du TM1 ainsi que la partie proche de la surface extracellulaire
du TM1 et TM2 semblent importantes à la fois pour MT1 et MT2 afin de recruter
efficacement la βarrestine-2 (Figure 3A et B). En revanche, la région de MT1 regroupant
l’ICL2 et la partie proche de la surface intracellulaire du TM4 (Figure 3B) semble importante
pour MT1 mais pas pour MT2, tout comme la partie proche de la partie médiane du TM3 et

201
la partie extracellulaire du TM6 (Figure 3C). La partie proche de la surface intracellulaire
du TM6 (Figure 3-C), quant à elle, ne semble importante que pour MT2. Toutes ces
informations semblent nous indiquer des mécanismes d’action semblables entre MT1 et
MT2, mais avec des spécificités propres à chacun de ces deux récepteurs. Il reste néanmoins
difficile de tirer des conclusions quant aux différences entre MT1 et MT2 puisque les
variations génétiques ne sont pas les mêmes entre ces deux récepteurs. C’est pourquoi, même
si des régions semblent plus importantes pour un récepteur que pour l’autre d’après notre
caractérisation, ces différences pourraient seulement provenir de la position des variations
génétiques ou de la nature même du changement d’acide aminé. Après avoir montré durant
ma thèse que les analyses computationnelles étaient très efficaces afin de prédire l’effet de
mutations, nous pourrions réutiliser cette technique afin de prédire les variations de MT1 sur
MT2 et vice-versa. Nous pourrions ainsi identifier de manière plus précise les différences de
mécanismes entre ces deux récepteurs. Néanmoins, la meilleure manière afin de pouvoir
comparer les mécanismes de signalisation de ces 2 récepteurs serait de muter les mêmes
résidus et de refaire une caractérisation fonctionnelle des mutants.
Figure 3. Variants MT1 et MT2 ayant un défaut de recrutement de la βarrestine-2.
Représentation sphérique des variants MT1 (Vert) et MT2 (Bleu) ayant des défauts majeurs
de recrutement de la βarrestine-2 révélés lors des caractérisations fonctionnelles. Les figures
A, B et C représentent 3 différents points de vue des récepteurs.

202
V. Conclusion générale
En conclusion, cette thèse a permis de révéler une des premières interactions entre les MTRs
et un transporteur, dans notre cas DAT, régulant ainsi son trafic vers la membrane cellulaire
et donc la recapture de la dopamine de l’espace intersynaptique vers le neurone
présynaptique. Nous avons également caractérisé fonctionnellement de manière précise les
récepteurs MT1 et MT2 médiant la réponse de la MLT dans les cellules et avons identifié 3
voies de signalisation de MT2 impliquées dans le développement du DT2. Nous avons
également créé de nouveaux modèles 3D de MT1 inactif et actif et avons pu identifier des
régions précises de MT1 importantes dans la signalisation spécifique des protéines Gα12,
Gα15 et βarrestine-2. En outre, durant ma thèse, nous avons permis une avancée conséquente
dans la compréhension des mécanismes régulant le système mélatoninergique ouvrant sur
de nouvelles perspectives de recherche pour les scientifiques s’intéressant à la MLT.

VI. Bibliographie
1. Aaron B. Lerner JDC, Yoshiyata Takahashi, Teh H. Lee, and Wataru Mori. Isolation
of melatonin, the pineal gland factor that lightens melanocytes. J Am Chem Soc. 1958;80,
10, 2587-2587.
2. Lerner AB, Case, J.D. et Heinzelman, R.V. Structure of melatonin. J Am Chem Soc.
1959;81, 6084-5.
3. Dubocovich ML. Luzindole (N-0774): a novel melatonin receptor antagonist. J
Pharmacol Exp Ther. 1988;246(3):902-10.
4. Reiter RJ. Pineal melatonin: cell biology of its synthesis and of its physiological
interactions. Endocr Rev. 1991;12(2):151-80.
5. Melatonin. Monograph. Altern Med Rev. 2005;10(4):326-36.
6. Barrenetxe J, Delagrange P, Martinez JA. Physiological and metabolic functions of
melatonin. J Physiol Biochem. 2004;60(1):61-72.
7. Reppert SM, Weaver DR, Ebisawa T. Cloning and characterization of a mammalian
melatonin receptor that mediates reproductive and circadian responses. Neuron.
1994;13(5):1177-85.
8. Reppert SM, Godson C, Mahle CD, Weaver DR, Slaugenhaupt SA, Gusella JF.
Molecular characterization of a second melatonin receptor expressed in human retina and
brain: the Mel1b melatonin receptor. Proc Natl Acad Sci U S A. 1995;92(19):8734-8.
9. Hardeland R, Cardinali DP, Srinivasan V, Spence DW, Brown GM, Pandi-Perumal
SR. Melatonin--a pleiotropic, orchestrating regulator molecule. Prog Neurobiol.
2011;93(3):350-84.
10. Huether G. The contribution of extrapineal sites of melatonin synthesis to circulating
melatonin levels in higher vertebrates. Experientia. 1993;49(8):665-70.
11. Poeggeler RHaB. Actions of melatonin, its structural and functional analogs in the
central nervous system and the significance of metabolism. Central Nervous System Agents
in Medicinal Chemistry. 2007;vol. 7, no. 4, pp. 289– 303.
12. Karasek M. Melatonin, human aging, and age-related diseases. Exp Gerontol.
2004;39(11-12):1723-9.
13. Facciola G, Hidestrand M, von Bahr C, Tybring G. Cytochrome P450 isoforms
involved in melatonin metabolism in human liver microsomes. Eur J Clin Pharmacol.
2001;56(12):881-8.
14. Slominski A, Tobin DJ, Zmijewski MA, Wortsman J, Paus R. Melatonin in the skin:
synthesis, metabolism and functions. Trends Endocrinol Metab. 2008;19(1):17-24.
15. Semak I, Naumova M, Korik E, Terekhovich V, Wortsman J, Slominski A. A novel
metabolic pathway of melatonin: oxidation by cytochrome C. Biochemistry.
2005;44(26):9300-7.
16. Hirata F, Hayaishi O, Tokuyama T, Seno S. In vitro and in vivo formation of two
new metabolites of melatonin. J Biol Chem. 1974;249(4):1311-3.
17. Fischer TW, Sweatman TW, Semak I, Sayre RM, Wortsman J, Slominski A.
Constitutive and UV-induced metabolism of melatonin in keratinocytes and cell-free
systems. FASEB J. 2006;20(9):1564-6.
18. Boutin JA, Audinot V, Ferry G, Delagrange P. Molecular tools to study melatonin
pathways and actions. Trends Pharmacol Sci. 2005;26(8):412-9.

19. Arendt J. Melatonin and the pineal gland: influence on mammalian seasonal and
circadian physiology. Rev Reprod. 1998;3(1):13-22.
20. Cardinali DP. Melatonin.l A mammalian pineal hormone. Endocr Rev.
1981;2(3):327-46.
21. Dorsam RT, Gutkind JS. G-protein-coupled receptors and cancer. Nat Rev Cancer.
2007;7(2):79-94.
22. Attwood TK, Findlay JB. Fingerprinting G-protein-coupled receptors. Protein Eng.
1994;7(2):195-203.
23. Kolakowski LF, Jr. GCRDb: a G-protein-coupled receptor database. Receptors
Channels. 1994;2(1):1-7.
24. Fredriksson R, Lagerstrom MC, Lundin LG, Schioth HB. The G-protein-coupled
receptors in the human genome form five main families. Phylogenetic analysis, paralogon
groups, and fingerprints. Mol Pharmacol. 2003;63(6):1256-72.
25. Oldham WM, Hamm HE. Heterotrimeric G protein activation by G-protein-coupled
receptors. Nat Rev Mol Cell Biol. 2008;9(1):60-71.
26. Lambert NA. Dissociation of heterotrimeric g proteins in cells. Sci Signal.
2008;1(25):re5.
27. Zhang P, Mende U. Regulators of G-protein signaling in the heart and their potential
as therapeutic targets. Circ Res. 2011;109(3):320-33.
28. Sutherland EW, Rall TW. Fractionation and characterization of a cyclic adenine
ribonucleotide formed by tissue particles. J Biol Chem. 1958;232(2):1077-91.
29. Rhee SG. Regulation of phosphoinositide-specific phospholipase C. Annu Rev
Biochem. 2001;70:281-312.
30. Kadamur G, Ross EM. Mammalian phospholipase C. Annu Rev Physiol.
2013;75:127-54.
31. Rajagopal S, Shenoy SK. GPCR desensitization: Acute and prolonged phases. Cell
Signal. 2018;41:9-16.
32. Tsao P, Cao T, von Zastrow M. Role of endocytosis in mediating downregulation of
G-protein-coupled receptors. Trends Pharmacol Sci. 2001;22(2):91-6.
33. Bouvier M, Collins S, O'Dowd BF, Campbell PT, de Blasi A, Kobilka BK, et al. Two
distinct pathways for cAMP-mediated down-regulation of the beta 2-adrenergic receptor.
Phosphorylation of the receptor and regulation of its mRNA level. J Biol Chem.
1989;264(28):16786-92.
34. Thomsen ARB, Jensen DD, Hicks GA, Bunnett NW. Therapeutic Targeting of
Endosomal G-Protein-Coupled Receptors. Trends Pharmacol Sci. 2018.
35. Shenoy SK, Drake MT, Nelson CD, Houtz DA, Xiao K, Madabushi S, et al. beta-
arrestin-dependent, G protein-independent ERK1/2 activation by the beta2 adrenergic
receptor. J Biol Chem. 2006;281(2):1261-73.
36. Ribas C, Penela P, Murga C, Salcedo A, Garcia-Hoz C, Jurado-Pueyo M, et al. The
G protein-coupled receptor kinase (GRK) interactome: role of GRKs in GPCR regulation
and signaling. Biochim Biophys Acta. 2007;1768(4):913-22.
37. Ferguson SS, Downey WE, 3rd, Colapietro AM, Barak LS, Menard L, Caron MG.
Role of beta-arrestin in mediating agonist-promoted G protein-coupled receptor
internalization. Science. 1996;271(5247):363-6.
38. Goodman OB, Jr., Krupnick JG, Santini F, Gurevich VV, Penn RB, Gagnon AW, et
al. Beta-arrestin acts as a clathrin adaptor in endocytosis of the beta2-adrenergic receptor.
Nature. 1996;383(6599):447-50.

39. Laporte SA, Oakley RH, Zhang J, Holt JA, Ferguson SS, Caron MG, et al. The beta2-
adrenergic receptor/betaarrestin complex recruits the clathrin adaptor AP-2 during
endocytosis. Proc Natl Acad Sci U S A. 1999;96(7):3712-7.
40. Lohse MJ, Benovic JL, Codina J, Caron MG, Lefkowitz RJ. beta-Arrestin: a protein
that regulates beta-adrenergic receptor function. Science. 1990;248(4962):1547-50.
41. Wilden U, Hall SW, Kuhn H. Phosphodiesterase activation by photoexcited
rhodopsin is quenched when rhodopsin is phosphorylated and binds the intrinsic 48-kDa
protein of rod outer segments. Proc Natl Acad Sci U S A. 1986;83(5):1174-8.
42. Cao TT, Mays RW, von Zastrow M. Regulated endocytosis of G-protein-coupled
receptors by a biochemically and functionally distinct subpopulation of clathrin-coated pits.
J Biol Chem. 1998;273(38):24592-602.
43. von Zastrow M, Kobilka BK. Ligand-regulated internalization and recycling of
human beta 2-adrenergic receptors between the plasma membrane and endosomes
containing transferrin receptors. J Biol Chem. 1992;267(5):3530-8.
44. Oakley RH, Laporte SA, Holt JA, Caron MG, Barak LS. Differential affinities of
visual arrestin, beta arrestin1, and beta arrestin2 for G protein-coupled receptors delineate
two major classes of receptors. J Biol Chem. 2000;275(22):17201-10.
45. Walther C, Ferguson SS. Arrestins: role in the desensitization, sequestration, and
vesicular trafficking of G protein-coupled receptors. Prog Mol Biol Transl Sci. 2013;118:93-
113.
46. Diviani D, Lattion AL, Abuin L, Staub O, Cotecchia S. The adaptor complex 2
directly interacts with the alpha 1b-adrenergic receptor and plays a role in receptor
endocytosis. J Biol Chem. 2003;278(21):19331-40.
47. Fan GH, Yang W, Wang XJ, Qian Q, Richmond A. Identification of a motif in the
carboxyl terminus of CXCR2 that is involved in adaptin 2 binding and receptor
internalization. Biochemistry. 2001;40(3):791-800.
48. Fraile-Ramos A, Kohout TA, Waldhoer M, Marsh M. Endocytosis of the viral
chemokine receptor US28 does not require beta-arrestins but is dependent on the clathrin-
mediated pathway. Traffic. 2003;4(4):243-53.
49. Paing MM, Temple BR, Trejo J. A tyrosine-based sorting signal regulates
intracellular trafficking of protease-activated receptor-1: multiple regulatory mechanisms for
agonist-induced G protein-coupled receptor internalization. J Biol Chem.
2004;279(21):21938-47.
50. Doherty GJ, McMahon HT. Mechanisms of endocytosis. Annu Rev Biochem.
2009;78:857-902.
51. Feron O, Smith TW, Michel T, Kelly RA. Dynamic targeting of the agonist-
stimulated m2 muscarinic acetylcholine receptor to caveolae in cardiac myocytes. J Biol
Chem. 1997;272(28):17744-8.
52. Haasemann M, Cartaud J, Muller-Esterl W, Dunia I. Agonist-induced redistribution
of bradykinin B2 receptor in caveolae. J Cell Sci. 1998;111 ( Pt 7):917-28.
53. Kifor O, Diaz R, Butters R, Kifor I, Brown EM. The calcium-sensing receptor is
localized in caveolin-rich plasma membrane domains of bovine parathyroid cells. J Biol
Chem. 1998;273(34):21708-13.
54. Ishizaka N, Griendling KK, Lassegue B, Alexander RW. Angiotensin II type 1
receptor: relationship with caveolae and caveolin after initial agonist stimulation.
Hypertension. 1998;32(3):459-66.
55. Boucrot E, Ferreira AP, Almeida-Souza L, Debard S, Vallis Y, Howard G, et al.
Endophilin marks and controls a clathrin-independent endocytic pathway. Nature.
2015;517(7535):460-5.

56. Renard HF, Simunovic M, Lemiere J, Boucrot E, Garcia-Castillo MD, Arumugam S,
et al. Endophilin-A2 functions in membrane scission in clathrin-independent endocytosis.
Nature. 2015;517(7535):493-6.
57. Kenakin T. Signaling bias in drug discovery. Expert Opin Drug Discov.
2017;12(4):321-33.
58. Violin JD, DeWire SM, Yamashita D, Rominger DH, Nguyen L, Schiller K, et al.
Selectively engaging beta-arrestins at the angiotensin II type 1 receptor reduces blood
pressure and increases cardiac performance. J Pharmacol Exp Ther. 2010;335(3):572-9.
59. DeWire SM, Yamashita DS, Rominger DH, Liu G, Cowan CL, Graczyk TM, et al.
A G protein-biased ligand at the mu-opioid receptor is potently analgesic with reduced
gastrointestinal and respiratory dysfunction compared with morphine. J Pharmacol Exp
Ther. 2013;344(3):708-17.
60. Luttrell LM, Maudsley S, Bohn LM. Fulfilling the Promise of "Biased" G Protein-
Coupled Receptor Agonism. Mol Pharmacol. 2015;88(3):579-88.
61. Jockers R, Maurice P, Boutin JA, Delagrange P. Melatonin receptors,
heterodimerization, signal transduction and binding sites: what's new? Br J Pharmacol.
2008;154(6):1182-95.
62. von Gall C, Garabette ML, Kell CA, Frenzel S, Dehghani F, Schumm-Draeger PM,
et al. Rhythmic gene expression in pituitary depends on heterologous sensitization by the
neurohormone melatonin. Nat Neurosci. 2002;5(3):234-8.
63. von Gall C, Weaver DR, Moek J, Jilg A, Stehle JH, Korf HW. Melatonin plays a
crucial role in the regulation of rhythmic clock gene expression in the mouse pars tuberalis.
Ann N Y Acad Sci. 2005;1040:508-11.
64. Cardinali DP, Vacas MI, Boyer EE. Specific binding of melatonin in bovine brain.
Endocrinology. 1979;105(2):437-41.
65. Dubocovich ML. Melatonin is a potent modulator of dopamine release in the retina.
Nature. 1984;306, 782-4.
66. Vakkuri O, Lamsa, E., Rahkamaa, E., Ruotsalainen, H. et Leppaluoto, J. Iodinated
melatonin: preparation and characterization of the molecular structure by mass and proton
NMR spectroscopy. Anal Biochem. 1984;142, 284-9.
67. Laudon MeZ, N. Characterization of central melatonin receptors using 125Imelatonin.
FEBS Lett. 1986;197, 9-12.
68. Dubocovich ML. Pharmacology and function of melatonin receptors. FASEB J.
1988;2(12):2765-73.
69. Ebisawa T, Karne S, Lerner MR, Reppert SM. Expression cloning of a high-affinity
melatonin receptor from Xenopus dermal melanophores. Proc Natl Acad Sci U S A.
1994;91(13):6133-7.
70. Dubocovich ML, Delagrange P, Krause DN, Sugden D, Cardinali DP, Olcese J.
International Union of Basic and Clinical Pharmacology. LXXV. Nomenclature,
classification, and pharmacology of G protein-coupled melatonin receptors. Pharmacol Rev.
2010;62(3):343-80.
71. Heydenreich FM, Vuckovic Z, Matkovic M, Veprintsev DB. Stabilization of G
protein-coupled receptors by point mutations. Front Pharmacol. 2015;6:82.
72. Vassilatis DK, Hohmann JG, Zeng H, Li F, Ranchalis JE, Mortrud MT, et al. The G
protein-coupled receptor repertoires of human and mouse. Proc Natl Acad Sci U S A.
2003;100(8):4903-8.
73. Michino M, Abola E, participants GD, Brooks CL, 3rd, Dixon JS, Moult J, et al.
Community-wide assessment of GPCR structure modelling and ligand docking: GPCR Dock
2008. Nat Rev Drug Discov. 2009;8(6):455-63.

74. Kufareva I, Rueda M, Katritch V, Stevens RC, Abagyan R, participants GD. Status
of GPCR modeling and docking as reflected by community-wide GPCR Dock 2010
assessment. Structure. 2011;19(8):1108-26.
75. Beuming T, Sherman W. Current assessment of docking into GPCR crystal structures
and homology models: successes, challenges, and guidelines. J Chem Inf Model.
2012;52(12):3263-77.
76. Johnston JM, Filizola M. Showcasing modern molecular dynamics simulations of
membrane proteins through G protein-coupled receptors. Curr Opin Struct Biol.
2011;21(4):552-8.
77. Gillette MU, Mitchell JW. Signaling in the suprachiasmatic nucleus: selectively
responsive and integrative. Cell Tissue Res. 2002;309(1):99-107.
78. Moore RY. Organization of the mammalian circadian system. Ciba Found Symp.
1995;183:88-99; discussion 100-6.
79. Fujieda H, Scher J, Hamadanizadeh SA, Wankiewicz E, Pang SF, Brown GM.
Dopaminergic and GABAergic amacrine cells are direct targets of melatonin:
immunocytochemical study of mt1 melatonin receptor in guinea pig retina. Vis Neurosci.
2000;17(1):63-70.
80. Scher J, Wankiewicz E, Brown GM, Fujieda H. MT(1) melatonin receptor in the
human retina: expression and localization. Invest Ophthalmol Vis Sci. 2002;43(3):889-97.
81. Reiter RJ, Tan DX, Galano A. Melatonin: exceeding expectations. Physiology
(Bethesda). 2014;29(5):325-33.
82. Peters JL, Cassone VM. Melatonin regulates circadian electroretinogram rhythms in
a dose- and time-dependent fashion. J Pineal Res. 2005;38(3):209-15.
83. Rufiange M, Dumont M, Lachapelle P. Correlating retinal function with melatonin
secretion in subjects with an early or late circadian phase. Invest Ophthalmol Vis Sci.
2002;43(7):2491-9.
84. Tosini G, Pozdeyev N, Sakamoto K, Iuvone PM. The circadian clock system in the
mammalian retina. Bioessays. 2008;30(7):624-33.
85. Dubocovich ML, Masana MI, Iacob S, Sauri DM. Melatonin receptor antagonists
that differentiate between the human Mel1a and Mel1b recombinant subtypes are used to
assess the pharmacological profile of the rabbit retina ML1 presynaptic heteroreceptor.
Naunyn Schmiedebergs Arch Pharmacol. 1997;355(3):365-75.
86. Sengupta A, Baba K, Mazzoni F, Pozdeyev NV, Strettoi E, Iuvone PM, et al.
Localization of melatonin receptor 1 in mouse retina and its role in the circadian regulation
of the electroretinogram and dopamine levels. PLoS One. 2011;6(9):e24483.
87. Baba K, Benleulmi-Chaachoua A, Journe AS, Kamal M, Guillaume JL, Dussaud S,
et al. Heteromeric MT1/MT2 melatonin receptors modulate photoreceptor function. Sci
Signal. 2013;6(296):ra89.
88. Baba K, Pozdeyev N, Mazzoni F, Contreras-Alcantara S, Liu C, Kasamatsu M, et al.
Melatonin modulates visual function and cell viability in the mouse retina via the MT1
melatonin receptor. Proc Natl Acad Sci U S A. 2009;106(35):15043-8.
89. Menendez-Pelaez A, Poeggeler B, Reiter RJ, Barlow-Walden L, Pablos MI, Tan DX.
Nuclear localization of melatonin in different mammalian tissues: immunocytochemical and
radioimmunoassay evidence. J Cell Biochem. 1993;53(4):373-82.
90. Liu C, Weaver DR, Jin X, Shearman LP, Pieschl RL, Gribkoff VK, et al. Molecular
dissection of two distinct actions of melatonin on the suprachiasmatic circadian clock.
Neuron. 1997;19(1):91-102.
91. Jin X, von Gall C, Pieschl RL, Gribkoff VK, Stehle JH, Reppert SM, et al. Targeted
disruption of the mouse Mel(1b) melatonin receptor. Mol Cell Biol. 2003;23(3):1054-60.

92. Lacoste B, Angeloni D, Dominguez-Lopez S, Calderoni S, Mauro A, Fraschini F, et
al. Anatomical and cellular localization of melatonin MT1 and MT2 receptors in the adult
rat brain. J Pineal Res. 2015;58(4):397-417.
93. Uz T, Akhisaroglu M, Ahmed R, Manev H. The pineal gland is critical for circadian
Period1 expression in the striatum and for circadian cocaine sensitization in mice.
Neuropsychopharmacology. 2003;28(12):2117-23.
94. Wang X, Sirianni A, Pei Z, Cormier K, Smith K, Jiang J, et al. The melatonin MT1
receptor axis modulates mutant Huntingtin-mediated toxicity. J Neurosci.
2011;31(41):14496-507.
95. Zisapel N. Melatonin-dopamine interactions: from basic neurochemistry to a clinical
setting. Cell Mol Neurobiol. 2001;21(6):605-16.
96. Adi N, Mash DC, Ali Y, Singer C, Shehadeh L, Papapetropoulos S. Melatonin MT1
and MT2 receptor expression in Parkinson's disease. Med Sci Monit. 2010;16(2):BR61-7.
97. Ng KY, Leong MK, Liang H, Paxinos G. Melatonin receptors: distribution in
mammalian brain and their respective putative functions. Brain Struct Funct.
2017;222(7):2921-39.
98. Weaver DR, Stehle JH, Stopa EG, Reppert SM. Melatonin receptors in human
hypothalamus and pituitary: implications for circadian and reproductive responses to
melatonin. J Clin Endocrinol Metab. 1993;76(2):295-301.
99. Dubocovich ML, Benloucif S, Masana MI. Melatonin receptors in the mammalian
suprachiasmatic nucleus. Behav Brain Res. 1996;73(1-2):141-7.
100. Pandi-Perumal SR, Srinivasan, V., Maestroni, G.J., Cardinali, D.P., Poeggeler, B. et,
Hardeland R. Melatonin: Nature's most versatile biological signal? FEBS J. 2006;273, 2813-
38.
101. Tan DX, Manchester LC, Sainz RM, Mayo JC, Leon J, Reiter RJ. Physiological
ischemia/reperfusion phenomena and their relation to endogenous melatonin production: a
hypothesis. Endocrine. 2005;27(2):149-58.
102. Dominguez-Alonso A, Valdes-Tovar M, Solis-Chagoyan H, Benitez-King G.
Melatonin stimulates dendrite formation and complexity in the hilar zone of the rat
hippocampus: participation of the Ca++/Calmodulin complex. Int J Mol Sci.
2015;16(1):1907-27.
103. Ramirez-Rodriguez G, Ortiz-Lopez L, Dominguez-Alonso A, Benitez-King GA,
Kempermann G. Chronic treatment with melatonin stimulates dendrite maturation and
complexity in adult hippocampal neurogenesis of mice. J Pineal Res. 2011;50(1):29-37.
104. Peschke E, Fauteck JD, Musshoff U, Schmidt F, Beckmann A, Peschke D. Evidence
for a melatonin receptor within pancreatic islets of neonate rats: functional,
autoradiographic, and molecular investigations. J Pineal Res. 2000;28(3):156-64.
105. Peschke E, Muhlbauer E, Musshoff U, Csernus VJ, Chankiewitz E, Peschke D.
Receptor (MT(1)) mediated influence of melatonin on cAMP concentration and insulin
secretion of rat insulinoma cells INS-1. J Pineal Res. 2002;33(2):63-71.
106. Kemp DM, Ubeda M, Habener JF. Identification and functional characterization of
melatonin Mel 1a receptors in pancreatic beta cells: potential role in incretin-mediated cell
function by sensitization of cAMP signaling. Mol Cell Endocrinol. 2002;191(2):157-66.
107. Muhlbauer E, Peschke E. Evidence for the expression of both the MT1- and in
addition, the MT2-melatonin receptor, in the rat pancreas, islet and beta-cell. J Pineal Res.
2007;42(1):105-6.
108. Peschke E, Stumpf I, Bazwinsky I, Litvak L, Dralle H, Muhlbauer E. Melatonin and
type 2 diabetes - a possible link? J Pineal Res. 2007;42(4):350-8.

109. Lyssenko V, Nagorny CL, Erdos MR, Wierup N, Jonsson A, Spegel P, et al. Common
variant in MTNR1B associated with increased risk of type 2 diabetes and impaired early
insulin secretion. Nat Genet. 2009;41(1):82-8.
110. Prokopenko I, Langenberg C, Florez JC, Saxena R, Soranzo N, Thorleifsson G, et al.
Variants in MTNR1B influence fasting glucose levels. Nat Genet. 2009;41(1):77-81.
111. Nagorny CL, Sathanoori R, Voss U, Mulder H, Wierup N. Distribution of melatonin
receptors in murine pancreatic islets. J Pineal Res. 2011;50(4):412-7.
112. Bouatia-Naji N, Bonnefond A, Cavalcanti-Proenca C, Sparso T, Holmkvist J,
Marchand M, et al. A variant near MTNR1B is associated with increased fasting plasma
glucose levels and type 2 diabetes risk. Nat Genet. 2009;41(1):89-94.
113. Staiger H, Machicao F, Schafer SA, Kirchhoff K, Kantartzis K, Guthoff M, et al.
Polymorphisms within the novel type 2 diabetes risk locus MTNR1B determine beta-cell
function. PLoS One. 2008;3(12):e3962.
114. Li C, Shi Y, You L, Wang L, Chen ZJ. Melatonin receptor 1A gene polymorphism
associated with polycystic ovary syndrome. Gynecol Obstet Invest. 2011;72(2):130-4.
115. Bahr I, Muhlbauer E, Albrecht E, Peschke E. Evidence of the receptor-mediated
influence of melatonin on pancreatic glucagon secretion via the Galphaq protein-coupled
and PI3K signaling pathways. J Pineal Res. 2012;53(4):390-8.
116. Ramracheya RD, Muller DS, Squires PE, Brereton H, Sugden D, Huang GC, et al.
Function and expression of melatonin receptors on human pancreatic islets. J Pineal Res.
2008;44(3):273-9.
117. Kosa E, Maurel D, Siaud P. Effects of pinealectomy on glucagon responsiveness to
hypoglycaemia induced by insulin injections in fed rats. Exp Physiol. 2001;86(5):617-20.
118. Bahr I, Muhlbauer E, Schucht H, Peschke E. Melatonin stimulates glucagon secretion
in vitro and in vivo. J Pineal Res. 2011;50(3):336-44.
119. Gottlieb DJ, Punjabi NM, Newman AB, Resnick HE, Redline S, Baldwin CM, et al.
Association of sleep time with diabetes mellitus and impaired glucose tolerance. Arch Intern
Med. 2005;165(8):863-7.
120. Donga E, van Dijk M, van Dijk JG, Biermasz NR, Lammers GJ, van Kralingen KW,
et al. A single night of partial sleep deprivation induces insulin resistance in multiple
metabolic pathways in healthy subjects. J Clin Endocrinol Metab. 2010;95(6):2963-8.
121. Peschke E, Frese T, Chankiewitz E, Peschke D, Preiss U, Schneyer U, et al. Diabetic
Goto Kakizaki rats as well as type 2 diabetic patients show a decreased diurnal serum
melatonin level and an increased pancreatic melatonin-receptor status. J Pineal Res.
2006;40(2):135-43.
122. O'Brien IA, Lewin IG, O'Hare JP, Arendt J, Corrall RJ. Abnormal circadian rhythm
of melatonin in diabetic autonomic neuropathy. Clin Endocrinol (Oxf). 1986;24(4):359-64.
123. Peschke E, Peschke D. Evidence for a circadian rhythm of insulin release from
perifused rat pancreatic islets. Diabetologia. 1998;41(9):1085-92.
124. Delattre E, Cipolla-Neto J, Boschero AC. Diurnal variations in insulin secretion and
K+ permeability in isolated rat islets. Clin Exp Pharmacol Physiol. 1999;26(7):505-10.
125. Allaman-Pillet N, Roduit R, Oberson A, Abdelli S, Ruiz J, Beckmann JS, et al.
Circadian regulation of islet genes involved in insulin production and secretion. Mol Cell
Endocrinol. 2004;226(1-2):59-66.
126. Picinato MC, Hirata AE, Cipolla-Neto J, Curi R, Carvalho CR, Anhe GF, et al.
Activation of insulin and IGF-1 signaling pathways by melatonin through MT1 receptor in
isolated rat pancreatic islets. J Pineal Res. 2008;44(1):88-94.

127. Bizot-Espiard JG, Double A, Guardiola-Lemaitre B, Delagrange P, Ktorza A,
Penicaud L. Diurnal rhythms in plasma glucose, insulin, growth hormone and melatonin
levels in fasted and hyperglycaemic rats. Diabetes Metab. 1998;24(3):235-40.
128. la Fleur SE, Kalsbeek A, Wortel J, van der Vliet J, Buijs RM. Role for the pineal and
melatonin in glucose homeostasis: pinealectomy increases night-time glucose
concentrations. J Neuroendocrinol. 2001;13(12):1025-32.
129. Contreras-Alcantara S, Baba K, Tosini G. Removal of melatonin receptor type 1
induces insulin resistance in the mouse. Obesity (Silver Spring). 2010;18(9):1861-3.
130. Stumpf I, Muhlbauer E, Peschke E. Involvement of the cGMP pathway in mediating
the insulin-inhibitory effect of melatonin in pancreatic beta-cells. J Pineal Res.
2008;45(3):318-27.
131. Csaba G, Nagy SU. The regulatory role of the pineal gland on the thyroid gland,
adrenal medulla and islets of Langerhans. Acta Biol Med Ger. 1973;31(4):617-9.
132. Nelson RJ, Drazen DL. Melatonin mediates seasonal changes in immune function.
Ann N Y Acad Sci. 2000;917:404-15.
133. Carrillo-Vico A, Calvo JR, Abreu P, Lardone PJ, Garcia-Maurino S, Reiter RJ, et al.
Evidence of melatonin synthesis by human lymphocytes and its physiological significance:
possible role as intracrine, autocrine, and/or paracrine substance. FASEB J. 2004;18(3):537-
9.
134. Guerrero JM, Reiter RJ. Melatonin-immune system relationships. Curr Top Med
Chem. 2002;2(2):167-79.
135. Skwarlo-Sonta K, Majewski P, Markowska M, Oblap R, Olszanska B. Bidirectional
communication between the pineal gland and the immune system. Can J Physiol Pharmacol.
2003;81(4):342-9.
136. Drazen DL, Bilu D, Bilbo SD, Nelson RJ. Melatonin enhancement of splenocyte
proliferation is attenuated by luzindole, a melatonin receptor antagonist. Am J Physiol Regul
Integr Comp Physiol. 2001;280(5):R1476-82.
137. Lotufo CM, Lopes C, Dubocovich ML, Farsky SH, Markus RP. Melatonin and N-
acetylserotonin inhibit leukocyte rolling and adhesion to rat microcirculation. Eur J
Pharmacol. 2001;430(2-3):351-7.
138. Carrillo-Vico A, Lardone PJ, Alvarez-Sanchez N, Rodriguez-Rodriguez A, Guerrero
JM. Melatonin: buffering the immune system. Int J Mol Sci. 2013;14(4):8638-83.
139. Pontes GN, Cardoso EC, Carneiro-Sampaio MM, Markus RP. Pineal melatonin and
the innate immune response: the TNF-alpha increase after cesarean section suppresses
nocturnal melatonin production. J Pineal Res. 2007;43(4):365-71.
140. Gerdin MJ, Masana MI, Rivera-Bermudez MA, Hudson RL, Earnest DJ, Gillette
MU, et al. Melatonin desensitizes endogenous MT2 melatonin receptors in the rat
suprachiasmatic nucleus: relevance for defining the periods of sensitivity of the mammalian
circadian clock to melatonin. FASEB J. 2004;18(14):1646-56.
141. Morgan PJ, Barrett P, Howell HE, Helliwell R. Melatonin receptors: localization,
molecular pharmacology and physiological significance. Neurochem Int. 1994;24(2):101-
46.
142. MacKenzie RS, Melan MA, Passey DK, Witt-Enderby PA. Dual coupling of MT(1)
and MT(2) melatonin receptors to cyclic AMP and phosphoinositide signal transduction
cascades and their regulation following melatonin exposure. Biochem Pharmacol.
2002;63(4):587-95.
143. Witt-Enderby PA, Masana MI, Dubocovich ML. Physiological exposure to
melatonin supersensitizes the cyclic adenosine 3',5'-monophosphate-dependent signal
transduction cascade in Chinese hamster ovary cells expressing the human mt1 melatonin
receptor. Endocrinology. 1998;139(7):3064-71.
144. Jones MP, Melan MA, Witt-Enderby PA. Melatonin decreases cell proliferation and
transformation in a melatonin receptor-dependent manner. Cancer Lett. 2000;151(2):133-
43.
145. Roka F, Brydon L, Waldhoer M, Strosberg AD, Freissmuth M, Jockers R, et al. Tight
association of the human Mel(1a)-melatonin receptor and G(i): precoupling and constitutive
activity. Mol Pharmacol. 1999;56(5):1014-24.
146. Brydon L, Roka F, Petit L, de Coppet P, Tissot M, Barrett P, et al. Dual signaling of
human Mel1a melatonin receptors via G(i2), G(i3), and G(q/11) proteins. Mol Endocrinol.
1999;13(12):2025-38.
147. Petit L, Lacroix I, de Coppet P, Strosberg AD, Jockers R. Differential signaling of
human Mel1a and Mel1b melatonin receptors through the cyclic guanosine 3'-5'-
monophosphate pathway. Biochem Pharmacol. 1999;58(4):633-9.
148. Godson C, Reppert SM. The Mel1a melatonin receptor is coupled to parallel signal
transduction pathways. Endocrinology. 1997;138(1):397-404.
149. Nelson CS, Ikeda M, Gompf HS, Robinson ML, Fuchs NK, Yoshioka T, et al.
Regulation of melatonin 1a receptor signaling and trafficking by asparagine-124. Mol
Endocrinol. 2001;15(8):1306-17.
150. Slanar O, Pelisek V, Vanecek J. Melatonin inhibits pituitary adenylyl cyclase-
activating polypeptide-induced increase of cyclic AMP accumulation and [Ca2+]i in
cultured cells of neonatal rat pituitary. Neurochem Int. 2000;36(3):213-9.
151. Hunt AE, Al-Ghoul WM, Gillette MU, Dubocovich ML. Activation of MT(2)
melatonin receptors in rat suprachiasmatic nucleus phase advances the circadian clock. Am
J Physiol Cell Physiol. 2001;280(1):C110-8.
152. Peschke E, Schucht H, Muhlbauer E. Long-term enteral administration of melatonin
reduces plasma insulin and increases expression of pineal insulin receptors in both Wistar
and type 2-diabetic Goto-Kakizaki rats. J Pineal Res. 2010;49(4):373-81.
153. Stumpf I, Bazwinsky I, Peschke E. Modulation of the cGMP signaling pathway by
melatonin in pancreatic beta-cells. J Pineal Res. 2009;46(2):140-7.
154. Bach AG, Wolgast S, Muhlbauer E, Peschke E. Melatonin stimulates inositol-1,4,5-
trisphosphate and Ca2+ release from INS1 insulinoma cells. J Pineal Res. 2005;39(3):316-
23.
155. Peschke E, Bach AG, Muhlbauer E. Parallel signaling pathways of melatonin in the
pancreatic beta-cell. J Pineal Res. 2006;40(2):184-91.
156. Dijk DJ, Czeisler CA. Paradoxical timing of the circadian rhythm of sleep propensity
serves to consolidate sleep and wakefulness in humans. Neurosci Lett. 1994;166(1):63-8.
157. Cajochen C, Khalsa SB, Wyatt JK, Czeisler CA, Dijk DJ. EEG and ocular correlates
of circadian melatonin phase and human performance decrements during sleep loss. Am J
Physiol. 1999;277(3 Pt 2):R640-9.
158. Krauchi K, Cajochen C, Werth E, Wirz-Justice A. Functional link between distal
vasodilation and sleep-onset latency? Am J Physiol Regul Integr Comp Physiol.
2000;278(3):R741-8.
159. Nakagawa H, Sack RL, Lewy AJ. Sleep propensity free-runs with the temperature,
melatonin and cortisol rhythms in a totally blind person. Sleep. 1992;15(4):330-6.
160. Lockley SW, Skene DJ, Tabandeh H, Bird AC, Defrance R, Arendt J. Relationship
between napping and melatonin in the blind. J Biol Rhythms. 1997;12(1):16-25.

161. McArthur AJ, Lewy AJ, Sack RL. Non-24-hour sleep-wake syndrome in a sighted
man: circadian rhythm studies and efficacy of melatonin treatment. Sleep. 1996;19(7):544-
53.
162. Uchiyama M, Okawa M, Shibui K, Kim K, Tagaya H, Kudo Y, et al. Altered phase
relation between sleep timing and core body temperature rhythm in delayed sleep phase
syndrome and non-24-hour sleep-wake syndrome in humans. Neurosci Lett.
2000;294(2):101-4.
163. Davis FC. Melatonin: role in development. J Biol Rhythms. 1997;12(6):498-508.
164. Cajochen C, Krauchi K, Wirz-Justice A. The acute soporific action of daytime
melatonin administration: effects on the EEG during wakefulness and subjective alertness. J
Biol Rhythms. 1997;12(6):636-43.
165. Deacon S, Arendt J. Melatonin-induced temperature suppression and its acute phase-
shifting effects correlate in a dose-dependent manner in humans. Brain Res. 1995;688(1-
2):77-85.
166. Krauchi K, Cajochen C, Wirz-Justice A. A relationship between heat loss and
sleepiness: effects of postural change and melatonin administration. J Appl Physiol (1985).
1997;83(1):134-9.
167. Krauchi K, Cajochen C, Danilenko KV, Wirz-Justice A. The hypothermic effect of
late evening melatonin does not block the phase delay induced by concurrent bright light in
human subjects. Neurosci Lett. 1997;232(1):57-61.
168. Cajochen C, Krauchi K, Danilenko KV, Wirz-Justice A. Evening administration of
melatonin and bright light: interactions on the EEG during sleep and wakefulness. J Sleep
Res. 1998;7(3):145-57.
169. Redman JR. Circadian entrainment and phase shifting in mammals with melatonin.
J Biol Rhythms. 1997;12(6):581-7.
170. Lockley SW, Skene DJ, James K, Thapan K, Wright J, Arendt J. Melatonin
administration can entrain the free-running circadian system of blind subjects. J Endocrinol.
2000;164(1):R1-6.
171. Sack RL, Brandes RW, Kendall AR, Lewy AJ. Entrainment of free-running circadian
rhythms by melatonin in blind people. N Engl J Med. 2000;343(15):1070-7.
172. Radziuk J, McDonald TJ, Rubenstein D, Dupre J. Initial splanchnic extraction of
ingested glucose in normal man. Metabolism. 1978;27(6):657-69.
173. Rizza RA, Mandarino LJ, Gerich JE. Dose-response characteristics for effects of
insulin on production and utilization of glucose in man. Am J Physiol. 1981;240(6):E630-9.
174. Willemsen G, Ward KJ, Bell CG, Christensen K, Bowden J, Dalgard C, et al. The
Concordance and Heritability of Type 2 Diabetes in 34,166 Twin Pairs From International
Twin Registers: The Discordant Twin (DISCOTWIN) Consortium. Twin Res Hum Genet.
2015;18(6):762-71.
175. Fuchsberger C, Flannick J, Teslovich TM, Mahajan A, Agarwala V, Gaulton KJ, et
al. The genetic architecture of type 2 diabetes. Nature. 2016;536(7614):41-7.
176. Borai A, Livingstone C, Ferns GA. The biochemical assessment of insulin resistance.
Ann Clin Biochem. 2007;44(Pt 4):324-42.
177. Parhon CI. Congrès d`Endocrinologie de Bucarest. 1939;vol. I, 187.
178. Parhon CIP, I.; Felix, E.; Boeru, V. Influenta epifisectomiei si a administrarii de
extract epifisar asupra unor data metabolice privind mineralele (Ca, K, P, Si, Mg), lipidele,
protidele si glucidele, la sobolanul alb adult. Stud Cercet Endocr. 1952;3, 321–329.
179. Milcou IN, L.; Marcean, R. De l'existence d'une hormone hypoglycémiante
épiphysaire synergique de l'insuline. Ann Endocrinol. 1957;18, 612–620.

180. Milcu SM. Role de l’épiphyse dans le metabolisme glucidique . . J Annu Diabetol
Dieu. 1968;9, 163–180.
181. Milcu SMM, I. Über ein hypoglykämisch wirkendes Hormon in der Zirbeldrüse.
Medizinische. 1958;17, 711–715.
182. Milcu IN, L.; Marcean, R.; Sitaru, S. L'action de l'extrait pinéal et de la pinéalectomie
sur le glycogène hépatique et musculaire après infusion prolongée de glucose. Stud Cercet
Endocr 1963;14, 651–655.
183. Milcou SMM, I.; Nanu, L. . Le role de la glande pinéale dans le métabolisme des
glucides. Ann Endocrinol. 1963;24, 233–254.
184. Lerner ABC, J.D.; Takahashi, Y.; Lee, T.H.; Mori, W. Isolation of melatonin, the
pineal gland factor that lightens melanocytes. J Am Chem Soc 1958;80, 2587.
185. Milcu I, Nanu L, Marcean R, Sitaru S. [Research on the Diabetogenic Effects of
Epiphysectomy in the Lamb]. Stud Cercet Endocrinol. 1964;15:507-13.
186. Milcu SMN-I, L.; Milcu, I. The Effect of Pinealectomy on Plasma Insulin in Rats.
GEW Wolstenholme, J Knight (Eds), The Pineal Gland, Churchill Livingstone, London.
1971;pp. 345–357.
187. Diaz B, Blazquez E. Effect of pinealectomy on plasma glucose, insulin and glucagon
levels in the rat. Horm Metab Res. 1986;18(4):225-9.
188. Mellado MCR, M.V.; Diaz, B.; de Diego, J.G.; Alvarez, E.; Blázquez, E. . Role of
the Pineal Gland in the Normal Maintenance of Circulating Levels and of Liver Receptor
Concentrations of Insulin and Glucagon in the Rat. In Proceedings of the Workshop on the
Pineal Gland, Salamanca, Spain. 26–28 May 1986;pp. 52–56.
189. Rodriguez V, Mellado C, Alvarez E, De Diego JG, Blazquez E. Effect of
pinealectomy on liver insulin and glucagon receptor concentrations in the rat. J Pineal Res.
1989;6(1):77-88.
190. Munoz Barragán LLG, J.A.; Toranzo, D.; Blázquez, J.L.; Pizarro, M.D.L.; Pastor,
F.E.; Mosqueira, M.I. The Pineal Gland: A Neuroendocrine “Crossroad”. In Proceedings of
the Workshop on the Pineal Gland, Salamanca, Spain. 26–28 May 1986;pp. 57–61.
191. Munoz Barragán LT, D.; Blázquez, E.; Ghiglione, M.; Pastor, F.E. Role of the pineal
gland on insulin and glucagon release of control and diabetic rats. Diabetes. 1983;32, 141A.
192. Munoz Barragán LT, D.; Blázquez, E.; Pastor, F.E.; Mosqueira, M.I.; López, J.A.;
Blázquez, J.J. A radio-immunoanalytical and immunocytochemical study on A and B insular
cells in response to pinealectomy or pineal denervation. Diabetologia. 1984;27, 313A.
193. de Lima LM, dos Reis LC, de Lima MA. Influence of the pineal gland on the
physiology, morphometry and morphology of pancreatic islets in rats. Braz J Biol.
2001;61(2):333-40.
194. Quay WB, Gorray KC. Pineal effects on metabolism and glucose homeostasis:
evidence for lines of humoral mediation of pineal influences on tumor growth. J Neural
Transm. 1980;47(2):107-20.
195. Conti A, Maestroni GJ. Melatonin rhythms in mice: role in autoimmune and
lymphoproliferative diseases. Ann N Y Acad Sci. 1998;840:395-410.
196. Conti A, Maestroni GJ. Role of the pineal gland and melatonin in the development
of autoimmune diabetes in non-obese diabetic mice. J Pineal Res. 1996;20(3):164-72.
197. Benson B, Miller CW, Sorrentino S, Jr. Effects of blinding on blood glucose and
serum insulin-like activity in rats. Tex Rep Biol Med. 1971;29(4):513-25.
198. Burns JK. Serum sodium and potassium and blood glucose levels in cynamolgus
monkeys after administration of melatonin. J Physiol. 1973;232(2):84P-5P.
199. Csaba G, Barath P. Are Langerhan's islets influenced by the pineal body?
Experientia. 1971;27(8):962.

200. Dhar M, Dayal SS, Ramesh Babu CS, Arora SR. Effect of melatonin on glucose
tolerance and blood glucose circadian rhythm in rabbits. Indian J Physiol Pharmacol.
1983;27(2):109-17.
201. Cagnacci A, Arangino S, Renzi A, Paoletti AM, Melis GB, Cagnacci P, et al.
Influence of melatonin administration on glucose tolerance and insulin sensitivity of
postmenopausal women. Clin Endocrinol (Oxf). 2001;54(3):339-46.
202. Champney TH, Steger RW, Christie DS, Reiter RJ. Alterations in components of the
pineal melatonin synthetic pathway by acute insulin stress in the rat and Syrian hamster.
Brain Res. 1985;338(1):25-32.
203. Champney TH, Brainard GC, Richardson BA, Reiter RJ. Experimentally-induced
diabetes reduces nocturnal pineal melatonin content in the Syrian hamster. Comp Biochem
Physiol A Comp Physiol. 1983;76(1):199-201.
204. Boden G, Ruiz J, Urbain JL, Chen X. Evidence for a circadian rhythm of insulin
secretion. Am J Physiol. 1996;271(2 Pt 1):E246-52.
205. Champney TH, Holtorf AP, Craft CM, Reiter RJ. Hormonal modulation of pineal
melatonin synthesis in rats and Syrian hamsters: effects of streptozotocin-induced diabetes
and insulin injections. Comp Biochem Physiol A Comp Physiol. 1986;83(2):391-5.
206. John TM, Viswanathan M, George JC, Scanes CG. Influence of chronic melatonin
implantation on circulating levels of catecholamines, growth hormone, thyroid hormones,
glucose, and free fatty acids in the pigeon. Gen Comp Endocrinol. 1990;79(2):226-32.
207. Lynch HJ, Hsuan M, Wurtman RJ. Sympathetic neural control of indoleamine
metabolism in the rat pineal gland. Adv Exp Med Biol. 1975;54:93-114.
208. Tannenbaum MG, Reiter RJ, Vaughan MK, Troiani ME, Gonzalez-Brito A.
Adrenalectomy prevents changes in rat pineal melatonin content and N-acetyltransferase
activity induced by acute insulin stress. J Pineal Res. 1987;4(4):395-402.
209. Mahata SK, Mandal A, Ghosh A. Influence of age and splanchnic nerve on the action
of melatonin in the adrenomedullary catecholamine content and blood glucose level in the
avian group. J Comp Physiol B. 1988;158(5):601-7.
210. Mahata SK. Effect of insulin on serotonin, 5-hydroxyindole-acetic acid,
norepinephrine, epinephrine and corticosterone contents in chick. Neurosci Lett.
1991;121(1-2):115-8.
211. Maitra SK, Dey M, Dutta S, Bhattacharya S, Dey R, Sengupta A. Influences of
graded dose of melatonin on the levels of blood glucose and adrenal catecholamines in male
roseringed parakeets (Psittacula krameri ) under different photoperiods. Arch Physiol
Biochem. 2000;108(5):444-50.
212. Maitra SK, Dey M, Dey R, Bhattacharya S, Sengupta A. Influence of photoperiods
on glycemic and adrenal catecholaminergic responses to melatonin administrations in adult
male roseringed parakeets, Psittacula krameri Neumann. Indian J Exp Biol.
2000;38(11):1111-6.
213. Bonnefond A, Clement N, Fawcett K, Yengo L, Vaillant E, Guillaume JL, et al. Rare
MTNR1B variants impairing melatonin receptor 1B function contribute to type 2 diabetes.
Nat Genet. 2012;44(3):297-301.
214. Karlsson B, Knutsson A, Lindahl B. Is there an association between shift work and
having a metabolic syndrome? Results from a population based study of 27,485 people.
Occup Environ Med. 2001;58(11):747-52.
215. Ha E, Yim SV, Chung JH, Yoon KS, Kang I, Cho YH, et al. Melatonin stimulates
glucose transport via insulin receptor substrate-1/phosphatidylinositol 3-kinase pathway in
C2C12 murine skeletal muscle cells. J Pineal Res. 2006;41(1):67-72.

216. Scheer FA, Hilton MF, Mantzoros CS, Shea SA. Adverse metabolic and
cardiovascular consequences of circadian misalignment. Proc Natl Acad Sci U S A.
2009;106(11):4453-8.
217. Knutson KL, Ryden AM, Mander BA, Van Cauter E. Role of sleep duration and
quality in the risk and severity of type 2 diabetes mellitus. Arch Intern Med.
2006;166(16):1768-74.
218. Wu YH, Zhou JN, Van Heerikhuize J, Jockers R, Swaab DF. Decreased MT1
melatonin receptor expression in the suprachiasmatic nucleus in aging and Alzheimer's
disease. Neurobiol Aging. 2007;28(8):1239-47.
219. Wu YH, Ursinus J, Zhou JN, Scheer FA, Ai-Min B, Jockers R, et al. Alterations of
melatonin receptors MT1 and MT2 in the hypothalamic suprachiasmatic nucleus during
depression. J Affect Disord. 2013;148(2-3):357-67.
220. Savaskan E, Olivieri G, Meier F, Brydon L, Jockers R, Ravid R, et al. Increased
melatonin 1a-receptor immunoreactivity in the hippocampus of Alzheimer's disease patients.
J Pineal Res. 2002;32(1):59-62.
221. Zhou JN, Liu RY, Kamphorst W, Hofman MA, Swaab DF. Early neuropathological
Alzheimer's changes in aged individuals are accompanied by decreased cerebrospinal fluid
melatonin levels. J Pineal Res. 2003;35(2):125-30.
222. Comai S, Ochoa-Sanchez R, Dominguez-Lopez S, Bambico FR, Gobbi G.
Melancholic-Like behaviors and circadian neurobiological abnormalities in melatonin MT1
receptor knockout mice. Int J Neuropsychopharmacol. 2015;18(3).
223. Weil ZM, Hotchkiss AK, Gatien ML, Pieke-Dahl S, Nelson RJ. Melatonin receptor
(MT1) knockout mice display depression-like behaviors and deficits in sensorimotor gating.
Brain Res Bull. 2006;68(6):425-9.
224. Escribano BM, Colin-Gonzalez AL, Santamaria A, Tunez I. The role of melatonin in
multiple sclerosis, Huntington's disease and cerebral ischemia. CNS Neurol Disord Drug
Targets. 2014;13(6):1096-119.
225. Pinato L, da Silveira Cruz-Machado S, Franco DG, Campos LM, Cecon E, Fernandes
PA, et al. Selective protection of the cerebellum against intracerebroventricular LPS is
mediated by local melatonin synthesis. Brain Struct Funct. 2015;220(2):827-40.
226. Tchekalarova J, Nenchovska Z, Atanasova D, Atanasova M, Kortenska L, Stefanova
M, et al. Consequences of long-term treatment with agomelatine on depressive-like behavior
and neurobiological abnormalities in pinealectomized rats. Behav Brain Res. 2016;302:11-
28.
227. O'Neal-Moffitt G, Pilli J, Kumar SS, Olcese J. Genetic deletion of MT(1)/MT(2)
melatonin receptors enhances murine cognitive and motor performance. Neuroscience.
2014;277:506-21.
228. Wang LM, Suthana NA, Chaudhury D, Weaver DR, Colwell CS. Melatonin inhibits
hippocampal long-term potentiation. Eur J Neurosci. 2005;22(9):2231-7.
229. Larson J, Jessen RE, Uz T, Arslan AD, Kurtuncu M, Imbesi M, et al. Impaired
hippocampal long-term potentiation in melatonin MT2 receptor-deficient mice. Neurosci
Lett. 2006;393(1):23-6.
230. Comai S, Gobbi G. Unveiling the role of melatonin MT2 receptors in sleep, anxiety
and other neuropsychiatric diseases: a novel target in psychopharmacology. J Psychiatry
Neurosci. 2014;39(1):6-21.
231. Medeiros CA, Carvalhedo de Bruin PF, Lopes LA, Magalhaes MC, de Lourdes
Seabra M, de Bruin VM. Effect of exogenous melatonin on sleep and motor dysfunction in
Parkinson's disease. A randomized, double blind, placebo-controlled study. J Neurol.
2007;254(4):459-64.

232. Naskar A, Prabhakar V, Singh R, Dutta D, Mohanakumar KP. Melatonin enhances
L-DOPA therapeutic effects, helps to reduce its dose, and protects dopaminergic neurons in
1-methyl-4-phenyl-1,2,3,6-tetrahydropyridine-induced Parkinsonism in mice. J Pineal Res.
2015;58(3):262-74.
233. Joshi N, Biswas J, Nath C, Singh S. Promising Role of Melatonin as Neuroprotectant
in Neurodegenerative Pathology. Mol Neurobiol. 2015;52(1):330-40.
234. Wade AG, Farmer M, Harari G, Fund N, Laudon M, Nir T, et al. Add-on prolonged-
release melatonin for cognitive function and sleep in mild to moderate Alzheimer's disease:
a 6-month, randomized, placebo-controlled, multicenter trial. Clin Interv Aging.
2014;9:947-61.
235. Jin KL, Shiotani Y, Kawai Y, Kiyama H. Immunohistochemical demonstration of
tyrosine hydroxylase (TH)-positive but dopamine beta-hydroxylase (DBH)-negative
neuron-like cells in the pineal gland of golden hamsters. Neurosci Lett. 1988;93(1):28-31.
236. Fujiwara M, Inagaki C, Miwa S, Takaori S, Saeki Y, Nozaki M. Diurnal variation of
dopamine content in the rat pineal gland. Life Sci. 1980;26(1):71-8.
237. Govitrapong P, Hama Y, Pfeiffer R, Ebadi M. Status of dopamine in bovine pineal
glands and the stimulation of N-acetyltransferase activity by D2-dopaminergic receptor
agonists in the rat pineal glands in culture. J Pineal Res. 1989;6(1):17-31.
238. Miguez JM, Recio J, Vivien-Roels B, Pevet P. Daily variation in the content of
indoleamines, catecholamines and related compounds in the pineal gland of Syrian hamsters
kept under long and short photoperiods. J Pineal Res. 1995;19(3):139-48.
239. Miguez JM, Recio J, Vivien-Roels B, Pevet P. Diurnal changes in the content of
indoleamines, catecholamines, and methoxyindoles in the pineal gland of the Djungarian
hamster (Phodopus sungorus): effect of photoperiod. J Pineal Res. 1996;21(1):7-14.
240. Simonneaux V, Murrin LC, Ebadi M. Characterization of D1 dopamine receptors in
the bovine pineal gland with [3H]SCH 23390. J Pharmacol Exp Ther. 1990;253(1):214-20.
241. Govitrapong P, Murrin LC, Ebadi M. Characterization of dopaminergic receptor sites
in bovine pineal gland. J Pineal Res. 1984;1(3):215-26.
242. Axelrod J, Shein HM, Wurtman RJ. Stimulation of C14-melatonin synthesis from
C14-tryptophan by noradrenaline in rat pineal in organ culture. Proc Natl Acad Sci U S A.
1969;62(2):544-9.
243. Zisapel N, Egozi Y, Laudon M. Inhibition of dopamine release by melatonin:
regional distribution in the rat brain. Brain Res. 1982;246(1):161-3.
244. Richardson SB, Hollander CS, Prasad JA, Hirooka Y. Somatostatin release from rat
hypothalamus in vitro: effects of melatonin and serotonin. Endocrinology. 1981;109(2):602-
6.
245. Glass JD, Lynch GR. Melatonin: identification of sites of antigonadal action in
mouse brain. Science. 1981;214(4522):821-3.
246. Goldman B, Hall V, Hollister C, Roychoudhury P, Tamarkin L, Westrom W. Effects
of melatonin on the reproductive system in intact and pinealectomized male hamster
maintained under various photoperiods. Endocrinology. 1979;104(1):82-8.
247. Fertl E, Auff E, Doppelbauer A, Waldhauser F. Circadian secretion pattern of
melatonin in de novo parkinsonian patients: evidence for phase-shifting properties of l-dopa.
J Neural Transm Park Dis Dement Sect. 1993;5(3):227-34.
248. Ishibashi K, Oda K, Ishiwata K, Ishii K. Comparison of dopamine transporter decline
in a patient with Parkinson's disease and normal aging effect. J Neurol Sci. 2014;339(1-
2):207-9.

249. Uguz AC, Demirci K, Espino J. The Importance of Melatonin and Mitochondria
Interaction in Mood Disorders and Schizophrenia: A Current Assessment. Curr Med Chem.
2016;23(20):2146-58.
250. Fusar-Poli P, Meyer-Lindenberg A. Striatal presynaptic dopamine in schizophrenia,
Part I: meta-analysis of dopamine active transporter (DAT) density. Schizophr Bull.
2013;39(1):22-32.
251. Fusar-Poli P, Meyer-Lindenberg A. Striatal presynaptic dopamine in schizophrenia,
part II: meta-analysis of [(18)F/(11)C]-DOPA PET studies. Schizophr Bull. 2013;39(1):33-
42.
252. Bendz LM, Scates AC. Melatonin treatment for insomnia in pediatric patients with
attention-deficit/hyperactivity disorder. Ann Pharmacother. 2010;44(1):185-91.
253. Dougherty DD, Bonab AA, Spencer TJ, Rauch SL, Madras BK, Fischman AJ.
Dopamine transporter density in patients with attention deficit hyperactivity disorder.
Lancet. 1999;354(9196):2132-3.
254. D'Haenen H A, Bossuyt A. Dopamine D2 receptors in depression measured with
single photon emission computed tomography. Biol Psychiatry. 1994;35(2):128-32.
255. Laatikainen LM, Sharp T, Harrison PJ, Tunbridge EM. Sexually dimorphic effects
of catechol-O-methyltransferase (COMT) inhibition on dopamine metabolism in multiple
brain regions. PLoS One. 2013;8(4):e61839.
256. Rashid AJ, O'Dowd BF, Verma V, George SR. Neuronal Gq/11-coupled dopamine
receptors: an uncharted role for dopamine. Trends Pharmacol Sci. 2007;28(11):551-5.
257. Perreault ML, O'Dowd BF, George SR. Dopamine receptor homooligomers and
heterooligomers in schizophrenia. CNS Neurosci Ther. 2011;17(1):52-7.
258. Kebabian JW. Multiple classes of dopamine receptors in mammalian central nervous
system: the involvement of dopamine-sensitive adenylyl cyclase. Life Sci. 1978;23(5):479-
83.
259. Spano PF, Govoni S, Trabucchi M. Studies on the pharmacological properties of
dopamine receptors in various areas of the central nervous system. Adv Biochem
Psychopharmacol. 1978;19:155-65.
260. Massey SC, Redburn DA. Transmitter circuits in the vertebrate retina. Prog
Neurobiol. 1987;28(1):55-96.
261. Djamgoz MB, Wagner HJ. Localization and function of dopamine in the adult
vertebrate retina. Neurochem Int. 1992;20(2):139-91.
262. Witkovsky P. Dopamine and retinal function. Doc Ophthalmol. 2004;108(1):17-40.
263. Nguyen-Legros J, Chanut E, Versaux-Botteri C, Simon A, Trouvin JH. Dopamine
inhibits melatonin synthesis in photoreceptor cells through a D2-like receptor subtype in the
rat retina: biochemical and histochemical evidence. J Neurochem. 1996;67(6):2514-20.
264. Harnois C, Di Paolo T. Decreased dopamine in the retinas of patients with
Parkinson's disease. Invest Ophthalmol Vis Sci. 1990;31(11):2473-5.
265. Ikemoto S. Dopamine reward circuitry: two projection systems from the ventral
midbrain to the nucleus accumbens-olfactory tubercle complex. Brain Res Rev.
2007;56(1):27-78.
266. Di Chiara G. Nucleus accumbens shell and core dopamine: differential role in
behavior and addiction. Behav Brain Res. 2002;137(1-2):75-114.
267. Uhart M, Wand GS. Stress, alcohol and drug interaction: an update of human
research. Addict Biol. 2009;14(1):43-64.
268. Eisenhofer G, Kopin IJ, Goldstein DS. Catecholamine metabolism: a contemporary
view with implications for physiology and medicine. Pharmacol Rev. 2004;56(3):331-49.

269. Missale C, Nash SR, Robinson SW, Jaber M, Caron MG. Dopamine receptors: from
structure to function. Physiol Rev. 1998;78(1):189-225.
270. Rosati G, Maioli M, Aiello I, Farris A, Agnetti V. Effects of long-term L-dopa
therapy on carbohydrate metabolism in patients with Parkinson's disease. Eur Neurol.
1976;14(3):229-39.
271. Ericson LE, Hakanson R, Lundquist I. Accumulation of dopamine in mouse
pancreatic B-cells following injection of L-DOPA. Localization to secretory granules and
inhibition of insulin secretion. Diabetologia. 1977;13(2):117-24.
272. Zern RT, Bird JL, Feldman JM. Effect of increased pancreatic islet norepinephrine,
dopamine and serotonin concentration on insulin secretion in the golden hamster.
Diabetologia. 1980;18(4):341-6.
273. Arneric SP, Long JP, Williams M, Goodale DB, Mott J, Lakoski JM, et al. RDS-127
(2-di-n-propylamino-4,7-dimethoxyindane): central effects of a new dopamine receptor
agonist. J Pharmacol Exp Ther. 1983;224(1):161-70.
274. Ahren B, Lundquist I. Effects of L-dopa-induced dopamine accumulation on 45Ca2+
efflux and insulin secretion in isolated rat islets. Pharmacology. 1985;30(2):71-82.
275. Shankar E, Santhosh KT, Paulose CS. Dopaminergic regulation of glucose-induced
insulin secretion through dopamine D2 receptors in the pancreatic islets in vitro. IUBMB
Life. 2006;58(3):157-63.
276. Borelli MI, Gagliardino JJ. Possible modulatory effect of endogenous islet
catecholamines on insulin secretion. BMC Endocr Disord. 2001;1(1):1.
277. Borelli MI, Rubio M, Garcia ME, Flores LE, Gagliardino JJ. Tyrosine hydroxylase
activity in the endocrine pancreas: changes induced by short-term dietary manipulation.
BMC Endocr Disord. 2003;3(1):2.
278. Raffo A, Hancock K, Polito T, Xie Y, Andan G, Witkowski P, et al. Role of vesicular
monoamine transporter type 2 in rodent insulin secretion and glucose metabolism revealed
by its specific antagonist tetrabenazine. J Endocrinol. 2008;198(1):41-9.
279. Sakano D, Shiraki N, Kikawa K, Yamazoe T, Kataoka M, Umeda K, et al. VMAT2
identified as a regulator of late-stage beta-cell differentiation. Nat Chem Biol.
2014;10(2):141-8.
280. Rubi B, Ljubicic S, Pournourmohammadi S, Carobbio S, Armanet M, Bartley C, et
al. Dopamine D2-like receptors are expressed in pancreatic beta cells and mediate inhibition
of insulin secretion. J Biol Chem. 2005;280(44):36824-32.
281. Ustione A, Piston DW. Dopamine synthesis and D3 receptor activation in pancreatic
beta-cells regulates insulin secretion and intracellular [Ca(2+)] oscillations. Mol Endocrinol.
2012;26(11):1928-40.
282. Garcia-Tornadu I, Ornstein AM, Chamson-Reig A, Wheeler MB, Hill DJ, Arany E,
et al. Disruption of the dopamine d2 receptor impairs insulin secretion and causes glucose
intolerance. Endocrinology. 2010;151(4):1441-50.
283. Garcia-Tornadu I, Perez-Millan MI, Recouvreux V, Ramirez MC, Luque G, Risso
GS, et al. New insights into the endocrine and metabolic roles of dopamine D2 receptors
gained from the Drd2 mouse. Neuroendocrinology. 2010;92(4):207-14.
284. Chen Y, Hong F, Chen H, Fan RF, Zhang XL, Zhang Y, et al. Distinctive expression
and cellular distribution of dopamine receptors in the pancreatic islets of rats. Cell Tissue
Res. 2014;357(3):597-606.
285. Buttarelli FR, Fanciulli A, Pellicano C, Pontieri FE. The dopaminergic system in
peripheral blood lymphocytes: from physiology to pharmacology and potential applications
to neuropsychiatric disorders. Curr Neuropharmacol. 2011;9(2):278-88.

286. Sarkar C, Basu B, Chakroborty D, Dasgupta PS, Basu S. The immunoregulatory role
of dopamine: an update. Brain Behav Immun. 2010;24(4):525-8.
287. Aperia AC. Intrarenal dopamine: a key signal in the interactive regulation of sodium
metabolism. Annu Rev Physiol. 2000;62:621-47.
288. Zeng C, Sanada H, Watanabe H, Eisner GM, Felder RA, Jose PA. Functional
genomics of the dopaminergic system in hypertension. Physiol Genomics. 2004;19(3):233-
46.
289. Amara SG, Sonders MS. Neurotransmitter transporters as molecular targets for
addictive drugs. Drug Alcohol Depend. 1998;51(1-2):87-96.
290. Torres GE, Gainetdinov RR, Caron MG. Plasma membrane monoamine transporters:
structure, regulation and function. Nat Rev Neurosci. 2003;4(1):13-25.
291. Manepalli S, Surratt CK, Madura JD, Nolan TL. Monoamine transporter structure,
function, dynamics, and drug discovery: a computational perspective. AAPS J.
2012;14(4):820-31.
292. Pramod AB, Foster J, Carvelli L, Henry LK. SLC6 transporters: structure, function,
regulation, disease association and therapeutics. Mol Aspects Med. 2013;34(2-3):197-219.
293. German CL, Baladi MG, McFadden LM, Hanson GR, Fleckenstein AE. Regulation
of the Dopamine and Vesicular Monoamine Transporters: Pharmacological Targets and
Implications for Disease. Pharmacol Rev. 2015;67(4):1005-24.
294. Schmitt KC, Reith ME. Regulation of the dopamine transporter: aspects relevant to
psychostimulant drugs of abuse. Ann N Y Acad Sci. 2010;1187:316-40.
295. Ramamoorthy S, Shippenberg TS, Jayanthi LD. Regulation of monoamine
transporters: Role of transporter phosphorylation. Pharmacol Ther. 2011;129(2):220-38.
296. Guptaroy B, Fraser R, Desai A, Zhang M, Gnegy ME. Site-directed mutations near
transmembrane domain 1 alter conformation and function of norepinephrine and dopamine
transporters. Mol Pharmacol. 2011;79(3):520-32.
297. Guptaroy B, Zhang M, Bowton E, Binda F, Shi L, Weinstein H, et al. A
juxtamembrane mutation in the N terminus of the dopamine transporter induces preference
for an inward-facing conformation. Mol Pharmacol. 2009;75(3):514-24.
298. Sucic S, Dallinger S, Zdrazil B, Weissensteiner R, Jorgensen TN, Holy M, et al. The
N terminus of monoamine transporters is a lever required for the action of amphetamines. J
Biol Chem. 2010;285(14):10924-38.
299. Foster JD, Pananusorn B, Vaughan RA. Dopamine transporters are phosphorylated
on N-terminal serines in rat striatum. J Biol Chem. 2002;277(28):25178-86.
300. Cervinski MA, Foster JD, Vaughan RA. Psychoactive substrates stimulate dopamine
transporter phosphorylation and down-regulation by cocaine-sensitive and protein kinase C-
dependent mechanisms. J Biol Chem. 2005;280(49):40442-9.
301. Foster JD, Vaughan RA. Palmitoylation controls dopamine transporter kinetics,
degradation, and protein kinase C-dependent regulation. J Biol Chem. 2011;286(7):5175-86.
302. Fog JU, Khoshbouei H, Holy M, Owens WA, Vaegter CB, Sen N, et al. Calmodulin
kinase II interacts with the dopamine transporter C terminus to regulate amphetamine-
induced reverse transport. Neuron. 2006;51(4):417-29.
303. Lee FJ, Liu F, Pristupa ZB, Niznik HB. Direct binding and functional coupling of
alpha-synuclein to the dopamine transporters accelerate dopamine-induced apoptosis.
FASEB J. 2001;15(6):916-26.
304. Moszczynska A, Saleh J, Zhang H, Vukusic B, Lee FJ, Liu F. Parkin disrupts the
alpha-synuclein/dopamine transporter interaction: consequences toward dopamine-induced
toxicity. J Mol Neurosci. 2007;32(3):217-27.

305. Horn AS. Dopamine uptake: a review of progress in the last decade. Prog Neurobiol.
1990;34(5):387-400.
306. Giros B, Caron MG. Molecular characterization of the dopamine transporter. Trends
Pharmacol Sci. 1993;14(2):43-9.
307. Lis H, Sharon N. Protein glycosylation. Structural and functional aspects. Eur J
Biochem. 1993;218(1):1-27.
308. Kukuruzinska MA, Lennon K. Protein N-glycosylation: molecular genetics and
functional significance. Crit Rev Oral Biol Med. 1998;9(4):415-48.
309. Torres GE, Carneiro A, Seamans K, Fiorentini C, Sweeney A, Yao WD, et al.
Oligomerization and trafficking of the human dopamine transporter. Mutational analysis
identifies critical domains important for the functional expression of the transporter. J Biol
Chem. 2003;278(4):2731-9.
310. Li LB, Chen N, Ramamoorthy S, Chi L, Cui XN, Wang LC, et al. The role of N-
glycosylation in function and surface trafficking of the human dopamine transporter. J Biol
Chem. 2004;279(20):21012-20.
311. Tejeda HA, Shippenberg TS, Henriksson R. The dynorphin/kappa-opioid receptor
system and its role in psychiatric disorders. Cell Mol Life Sci. 2012;69(6):857-96.
312. Lee FJ, Pei L, Moszczynska A, Vukusic B, Fletcher PJ, Liu F. Dopamine transporter
cell surface localization facilitated by a direct interaction with the dopamine D2 receptor.
EMBO J. 2007;26(8):2127-36.
313. Garcia-Olivares J, Torres-Salazar D, Owens WA, Baust T, Siderovski DP, Amara
SG, et al. Inhibition of dopamine transporter activity by G protein betagamma subunits.
PLoS One. 2013;8(3):e59788.
314. Caudle WM, Richardson JR, Wang MZ, Taylor TN, Guillot TS, McCormack AL, et
al. Reduced vesicular storage of dopamine causes progressive nigrostriatal
neurodegeneration. J Neurosci. 2007;27(30):8138-48.
315. Chen MK, Kuwabara H, Zhou Y, Adams RJ, Brasic JR, McGlothan JL, et al.
VMAT2 and dopamine neuron loss in a primate model of Parkinson's disease. J Neurochem.
2008;105(1):78-90.
316. Masoud ST, Vecchio LM, Bergeron Y, Hossain MM, Nguyen LT, Bermejo MK, et
al. Increased expression of the dopamine transporter leads to loss of dopamine neurons,
oxidative stress and l-DOPA reversible motor deficits. Neurobiol Dis. 2015;74:66-75.
317. Mosharov EV, Larsen KE, Kanter E, Phillips KA, Wilson K, Schmitz Y, et al.
Interplay between cytosolic dopamine, calcium, and alpha-synuclein causes selective death
of substantia nigra neurons. Neuron. 2009;62(2):218-29.
318. Goldstein DS, Sullivan P, Holmes C, Miller GW, Alter S, Strong R, et al.
Determinants of buildup of the toxic dopamine metabolite DOPAL in Parkinson's disease. J
Neurochem. 2013;126(5):591-603.
319. Rees JN, Florang VR, Eckert LL, Doorn JA. Protein reactivity of 3,4-
dihydroxyphenylacetaldehyde, a toxic dopamine metabolite, is dependent on both the
aldehyde and the catechol. Chem Res Toxicol. 2009;22(7):1256-63.
320. Kristal BS, Conway AD, Brown AM, Jain JC, Ulluci PA, Li SW, et al. Selective
dopaminergic vulnerability: 3,4-dihydroxyphenylacetaldehyde targets mitochondria. Free
Radic Biol Med. 2001;30(8):924-31.
321. Mattammal MB, Haring JH, Chung HD, Raghu G, Strong R. An endogenous
dopaminergic neurotoxin: implication for Parkinson's disease. Neurodegeneration.
1995;4(3):271-81.
322. Wey MC, Fernandez E, Martinez PA, Sullivan P, Goldstein DS, Strong R.
Neurodegeneration and motor dysfunction in mice lacking cytosolic and mitochondrial

aldehyde dehydrogenases: implications for Parkinson's disease. PLoS One.
2012;7(2):e31522.
323. Goldstein DS, Sullivan P, Holmes C, Kopin IJ, Basile MJ, Mash DC. Catechols in
post-mortem brain of patients with Parkinson disease. Eur J Neurol. 2011;18(5):703-10.
324. Graham DG. Oxidative pathways for catecholamines in the genesis of neuromelanin
and cytotoxic quinones. Mol Pharmacol. 1978;14(4):633-43.
325. Jenner P. Oxidative stress in Parkinson's disease. Ann Neurol. 2003;53 Suppl 3:S26-
36; discussion S-8.
326. Jankovic J. Parkinson's disease: clinical features and diagnosis. J Neurol Neurosurg
Psychiatry. 2008;79(4):368-76.
327. Dauer W, Przedborski S. Parkinson's disease: mechanisms and models. Neuron.
2003;39(6):889-909.
328. Gowrishankar R, Hahn MK, Blakely RD. Good riddance to dopamine: roles for the
dopamine transporter in synaptic function and dopamine-associated brain disorders.
Neurochem Int. 2014;73:42-8.
329. Cook EH, Jr., Stein MA, Krasowski MD, Cox NJ, Olkon DM, Kieffer JE, et al.
Association of attention-deficit disorder and the dopamine transporter gene. Am J Hum
Genet. 1995;56(4):993-8.
330. Gill M, Daly G, Heron S, Hawi Z, Fitzgerald M. Confirmation of association between
attention deficit hyperactivity disorder and a dopamine transporter polymorphism. Mol
Psychiatry. 1997;2(4):311-3.
331. Yang B, Chan RC, Jing J, Li T, Sham P, Chen RY. A meta-analysis of association
studies between the 10-repeat allele of a VNTR polymorphism in the 3'-UTR of dopamine
transporter gene and attention deficit hyperactivity disorder. Am J Med Genet B
Neuropsychiatr Genet. 2007;144B(4):541-50.
332. Michelhaugh SK, Fiskerstrand C, Lovejoy E, Bannon MJ, Quinn JP. The dopamine
transporter gene (SLC6A3) variable number of tandem repeats domain enhances
transcription in dopamine neurons. J Neurochem. 2001;79(5):1033-8.
333. Mill J, Asherson P, Browes C, D'Souza U, Craig I. Expression of the dopamine
transporter gene is regulated by the 3' UTR VNTR: Evidence from brain and lymphocytes
using quantitative RT-PCR. Am J Med Genet. 2002;114(8):975-9.
334. Mazei-Robison MS, Bowton E, Holy M, Schmudermaier M, Freissmuth M, Sitte
HH, et al. Anomalous dopamine release associated with a human dopamine transporter
coding variant. J Neurosci. 2008;28(28):7040-6.
335. Mergy MA, Gowrishankar R, Gresch PJ, Gantz SC, Williams J, Davis GL, et al. The
rare DAT coding variant Val559 perturbs DA neuron function, changes behavior, and alters
in vivo responses to psychostimulants. Proc Natl Acad Sci U S A. 2014;111(44):E4779-88.
336. Sakrikar D, Mazei-Robison MS, Mergy MA, Richtand NW, Han Q, Hamilton PJ, et
al. Attention deficit/hyperactivity disorder-derived coding variation in the dopamine
transporter disrupts microdomain targeting and trafficking regulation. J Neurosci.
2012;32(16):5385-97.
337. Sagvolden T, Johansen EB, Aase H, Russell VA. A dynamic developmental theory
of attention-deficit/hyperactivity disorder (ADHD) predominantly hyperactive/impulsive
and combined subtypes. Behav Brain Sci. 2005;28(3):397-419; discussion -68.
338. Volkow ND, Wang GJ, Newcorn JH, Kollins SH, Wigal TL, Telang F, et al.
Motivation deficit in ADHD is associated with dysfunction of the dopamine reward pathway.
Mol Psychiatry. 2011;16(11):1147-54.
339. Eshel N, Tian J, Bukwich M, Uchida N. Dopamine neurons share common response
function for reward prediction error. Nat Neurosci. 2016;19(3):479-86.

340. Wise RA. Dopamine and reward: the anhedonia hypothesis 30 years on. Neurotox
Res. 2008;14(2-3):169-83.
341. Pandit R, Omrani A, Luijendijk MC, de Vrind VA, Van Rozen AJ, Ophuis RJ, et al.
Melanocortin 3 Receptor Signaling in Midbrain Dopamine Neurons Increases the
Motivation for Food Reward. Neuropsychopharmacology. 2016;41(9):2241-51.
342. Chang CH, Grace AA. Amygdala-ventral pallidum pathway decreases dopamine
activity after chronic mild stress in rats. Biol Psychiatry. 2014;76(3):223-30.
343. Koob GF, Stinus L, Le Moal M, Bloom FE. Opponent process theory of motivation:
neurobiological evidence from studies of opiate dependence. Neurosci Biobehav Rev.
1989;13(2-3):135-40.
344. Koob GF, Le Moal M. Review. Neurobiological mechanisms for opponent
motivational processes in addiction. Philos Trans R Soc Lond B Biol Sci.
2008;363(1507):3113-23.
345. Belujon P, Jakobowski NL, Dollish HK, Grace AA. Withdrawal from Acute
Amphetamine Induces an Amygdala-Driven Attenuation of Dopamine Neuron Activity:
Reversal by Ketamine. Neuropsychopharmacology. 2016;41(2):619-27.
346. Tye KM, Mirzabekov JJ, Warden MR, Ferenczi EA, Tsai HC, Finkelstein J, et al.
Dopamine neurons modulate neural encoding and expression of depression-related
behaviour. Nature. 2013;493(7433):537-41.
347. Friedman AK, Walsh JJ, Juarez B, Ku SM, Chaudhury D, Wang J, et al. Enhancing
depression mechanisms in midbrain dopamine neurons achieves homeostatic resilience.
Science. 2014;344(6181):313-9.
348. Miller GW, Gainetdinov RR, Levey AI, Caron MG. Dopamine transporters and
neuronal injury. Trends Pharmacol Sci. 1999;20(10):424-9.
349. Ritz MC, Lamb RJ, Goldberg SR, Kuhar MJ. Cocaine receptors on dopamine
transporters are related to self-administration of cocaine. Science. 1987;237(4819):1219-23.
350. Beuming T, Kniazeff J, Bergmann ML, Shi L, Gracia L, Raniszewska K, et al. The
binding sites for cocaine and dopamine in the dopamine transporter overlap. Nat Neurosci.
2008;11(7):780-9.
351. Sulzer D, Sonders MS, Poulsen NW, Galli A. Mechanisms of neurotransmitter
release by amphetamines: a review. Prog Neurobiol. 2005;75(6):406-33.
352. Sulzer D, Chen TK, Lau YY, Kristensen H, Rayport S, Ewing A. Amphetamine
redistributes dopamine from synaptic vesicles to the cytosol and promotes reverse transport.
J Neurosci. 1995;15(5 Pt 2):4102-8.
353. Donovan DM, Miner LL, Perry MP, Revay RS, Sharpe LG, Przedborski S, et al.
Cocaine reward and MPTP toxicity: alteration by regional variant dopamine transporter
overexpression. Brain Res Mol Brain Res. 1999;73(1-2):37-49.
354. Howell LL, Kimmel HL. Monoamine transporters and psychostimulant addiction.
Biochem Pharmacol. 2008;75(1):196-217.
355. Gether U, Andersen PH, Larsson OM, Schousboe A. Neurotransmitter transporters:
molecular function of important drug targets. Trends Pharmacol Sci. 2006;27(7):375-83.
356. Learned-Coughlin SM, Bergstrom M, Savitcheva I, Ascher J, Schmith VD,
Langstrom B. In vivo activity of bupropion at the human dopamine transporter as measured
by positron emission tomography. Biol Psychiatry. 2003;54(8):800-5.
357. Volkow ND, Fowler JS, Logan J, Alexoff D, Zhu W, Telang F, et al. Effects of
modafinil on dopamine and dopamine transporters in the male human brain: clinical
implications. JAMA. 2009;301(11):1148-54.

358. Korpi ER, den Hollander B, Farooq U, Vashchinkina E, Rajkumar R, Nutt DJ, et al.
Mechanisms of Action and Persistent Neuroplasticity by Drugs of Abuse. Pharmacol Rev.
2015;67(4):872-1004.
359. Ward LD, Kellis M. Interpreting noncoding genetic variation in complex traits and
human disease. Nat Biotechnol. 2012;30(11):1095-106.
360. MacArthur DG, Balasubramanian S, Frankish A, Huang N, Morris J, Walter K, et al.
A systematic survey of loss-of-function variants in human protein-coding genes. Science.
2012;335(6070):823-8.
361. Nelson MR, Wegmann D, Ehm MG, Kessner D, St Jean P, Verzilli C, et al. An
abundance of rare functional variants in 202 drug target genes sequenced in 14,002 people.
Science. 2012;337(6090):100-4.
362. Cooper GM, Shendure J. Needles in stacks of needles: finding disease-causal variants
in a wealth of genomic data. Nat Rev Genet. 2011;12(9):628-40.
363. Visscher PM, Brown MA, McCarthy MI, Yang J. Five years of GWAS discovery.
Am J Hum Genet. 2012;90(1):7-24.
364. Rohland N, Reich D. Cost-effective, high-throughput DNA sequencing libraries for
multiplexed target capture. Genome Res. 2012;22(5):939-46.
365. Genomes Project C, Abecasis GR, Altshuler D, Auton A, Brooks LD, Durbin RM,
et al. A map of human genome variation from population-scale sequencing. Nature.
2010;467(7319):1061-73.
366. DePristo MA, Weinreich DM, Hartl DL. Missense meanderings in sequence space:
a biophysical view of protein evolution. Nat Rev Genet. 2005;6(9):678-87.
367. Sanders CR, Myers JK. Disease-related misassembly of membrane proteins. Annu
Rev Biophys Biomol Struct. 2004;33:25-51.
368. Azzi M, Charest PG, Angers S, Rousseau G, Kohout T, Bouvier M, et al. Beta-
arrestin-mediated activation of MAPK by inverse agonists reveals distinct active
conformations for G protein-coupled receptors. Proc Natl Acad Sci U S A.
2003;100(20):11406-11.
369. Gesty-Palmer D, Chen M, Reiter E, Ahn S, Nelson CD, Wang S, et al. Distinct beta-
arrestin- and G protein-dependent pathways for parathyroid hormone receptor-stimulated
ERK1/2 activation. J Biol Chem. 2006;281(16):10856-64.
370. Rajagopal S, Ahn S, Rominger DH, Gowen-MacDonald W, Lam CM, Dewire SM,
et al. Quantifying ligand bias at seven-transmembrane receptors. Mol Pharmacol.
2011;80(3):367-77.
371. Lei S, Clydesdale L, Dai A, Cai X, Feng Y, Yang D, et al. Two distinct domains of
the glucagon-like peptide-1 receptor control peptide-mediated biased agonism. J Biol Chem.
2018;293(24):9370-87.
372. Karamitri A, Plouffe B, Bonnefond A, Chen M, Gallion J, Guillaume JL, et al. Type
2 diabetes-associated variants of the MT2 melatonin receptor affect distinct modes of
signaling. Sci Signal. 2018;11(545).
373. Reiter RJ. The melatonin rhythm: both a clock and a calendar. Experientia.
1993;49(8):654-64.
374. Zawilska J, Nowak JZ. Regulation of melatonin biosynthesis in vertebrate retina:
involvement of dopamine in the suppressive effects of light. Folia Histochem Cytobiol.
1991;29(1):3-13.
375. Djeridane Y, Touitou Y. Melatonin synthesis in the rat harderian gland: age- and
time-related effects. Exp Eye Res. 2001;72(4):487-92.

376. Benleulmi-Chaachoua A, Hegron A, Le Boulch M, Karamitri A, Wierzbicka M,
Wong V, et al. Melatonin receptors limit dopamine reuptake by regulating dopamine
transporter cell-surface exposure. Cell Mol Life Sci. 2018.
377. Bubenik GA, Brown GM, Grota LJ. Immunohistological localization of melatonin in
the rat digestive system. Experientia. 1977;33(5):662-3.
378. Tijmes M, Pedraza R, Valladares L. Melatonin in the rat testis: evidence for local
synthesis. Steroids. 1996;61(2):65-8.
379. Reiter RJ. The pineal and its hormones in the control of reproduction in mammals.
Endocr Rev. 1980;1(2):109-31.
380. Redman J, Armstrong S, Ng KT. Free-running activity rhythms in the rat:
entrainment by melatonin. Science. 1983;219(4588):1089-91.
381. Bartness TJ, Powers JB, Hastings MH, Bittman EL, Goldman BD. The timed
infusion paradigm for melatonin delivery: what has it taught us about the melatonin signal,
its reception, and the photoperiodic control of seasonal responses? J Pineal Res.
1993;15(4):161-90.
382. Slotten HA, Pitrosky B, Pevet P. Influence of the mode of daily melatonin
administration on entrainment of rat circadian rhythms. J Biol Rhythms. 1999;14(5):347-53.
383. Wyatt JK, Dijk DJ, Ritz-de Cecco A, Ronda JM, Czeisler CA. Sleep-facilitating
effect of exogenous melatonin in healthy young men and women is circadian-phase
dependent. Sleep. 2006;29(5):609-18.
384. Muhlbauer E, Gross E, Labucay K, Wolgast S, Peschke E. Loss of melatonin
signalling and its impact on circadian rhythms in mouse organs regulating blood glucose.
Eur J Pharmacol. 2009;606(1-3):61-71.
385. Hamdan FF, Rochdi MD, Breton B, Fessart D, Michaud DE, Charest PG, et al.
Unraveling G protein-coupled receptor endocytosis pathways using real-time monitoring of
agonist-promoted interaction between beta-arrestins and AP-2. J Biol Chem.
2007;282(40):29089-100.
386. Armando S, Quoyer J, Lukashova V, Maiga A, Percherancier Y, Heveker N, et al.
The chemokine CXC4 and CC2 receptors form homo- and heterooligomers that can engage
their signaling G-protein effectors and betaarrestin. FASEB J. 2014;28(10):4509-23.
387. Yoon Namkung CL, Sahil Kumar, Yubo Cao, Larissa B. Teixeira, Viktoria
Lukashova, Sarah C. Simões4 Jean-Michel Longpré, Dominic Devost, Terry E. Hébert,
Graciela Piñeyro, Richard Leduc, Claudio M. Costa-Neto, Michel Bouvier* and Stéphane
A. Laporte*. Functional selectivity profiling of the Angiotensin II type 1 receptor using
pathway-wide BRET signaling sensors. Science Signaling. in press.
388. Katsonis P, Lichtarge O. A formal perturbation equation between genotype and
phenotype determines the Evolutionary Action of protein-coding variations on fitness.
Genome Res. 2014;24(12):2050-8.
389. Kenakin T, Christopoulos A. Signalling bias in new drug discovery: detection,
quantification and therapeutic impact. Nat Rev Drug Discov. 2013;12(3):205-16.
390. Kenakin T, Watson C, Muniz-Medina V, Christopoulos A, Novick S. A simple
method for quantifying functional selectivity and agonist bias. ACS Chem Neurosci.
2012;3(3):193-203.
391. Schonegge AM, Gallion J, Picard LP, Wilkins AD, Le Gouill C, Audet M, et al.
Evolutionary action and structural basis of the allosteric switch controlling beta2AR
functional selectivity. Nat Commun. 2017;8(1):2169.
392. Yin J, Mobarec JC, Kolb P, Rosenbaum DM. Crystal structure of the human OX2
orexin receptor bound to the insomnia drug suvorexant. Nature. 2015;519(7542):247-50.

393. Koehl A, Hu H, Maeda S, Zhang Y, Qu Q, Paggi JM, et al. Structure of the micro-
opioid receptor-Gi protein complex. Nature. 2018;558(7711):547-52.
394. Chien EY, Liu W, Zhao Q, Katritch V, Han GW, Hanson MA, et al. Structure of the
human dopamine D3 receptor in complex with a D2/D3 selective antagonist. Science.
2010;330(6007):1091-5.
395. Lebon G, Warne T, Edwards PC, Bennett K, Langmead CJ, Leslie AG, et al. Agonist-
bound adenosine A2A receptor structures reveal common features of GPCR activation.
Nature. 2011;474(7352):521-5.
396. Isberg V, de Graaf C, Bortolato A, Cherezov V, Katritch V, Marshall FH, et al.
Generic GPCR residue numbers - aligning topology maps while minding the gaps. Trends
Pharmacol Sci. 2015;36(1):22-31.
397. Pettersen EF, Goddard TD, Huang CC, Couch GS, Greenblatt DM, Meng EC, et al.
UCSF Chimera--a visualization system for exploratory research and analysis. J Comput
Chem. 2004;25(13):1605-12.
398. Webb B, Sali A. Comparative Protein Structure Modeling Using MODELLER. Curr
Protoc Protein Sci. 2016;86:2 9 1-2 9 37.
399. Gales C, Van Durm JJ, Schaak S, Pontier S, Percherancier Y, Audet M, et al. Probing
the activation-promoted structural rearrangements in preassembled receptor-G protein
complexes. Nat Struct Mol Biol. 2006;13(9):778-86.
400. Namkung Y, Le Gouill C, Lukashova V, Kobayashi H, Hogue M, Khoury E, et al.
Monitoring G protein-coupled receptor and beta-arrestin trafficking in live cells using
enhanced bystander BRET. Nat Commun. 2016;7:12178.
401. Ahmed R, Mahavadi S, Al-Shboul O, Bhattacharya S, Grider JR, Murthy KS.
Characterization of signaling pathways coupled to melatonin receptors in gastrointestinal
smooth muscle. Regul Pept. 2013;184:96-103.
402. Giannone F, Malpeli G, Lisi V, Grasso S, Shukla P, Ramarli D, et al. The puzzling
uniqueness of the heterotrimeric G15 protein and its potential beyond hematopoiesis. J Mol
Endocrinol. 2010;44(5):259-69.
403. Milligan G, Marshall F, Rees S. G16 as a universal G protein adapter: implications
for agonist screening strategies. Trends Pharmacol Sci. 1996;17(7):235-7.
404. Pala D, Lodola A, Bedini A, Spadoni G, Rivara S. Homology models of melatonin
receptors: challenges and recent advances. Int J Mol Sci. 2013;14(4):8093-121.
405. Feierler J, Wirth M, Welte B, Schussler S, Jochum M, Faussner A. Helix 8 plays a
crucial role in bradykinin B(2) receptor trafficking and signaling. J Biol Chem.
2011;286(50):43282-93.
406. Charest PG, Bouvier M. Palmitoylation of the V2 vasopressin receptor carboxyl tail
enhances beta-arrestin recruitment leading to efficient receptor endocytosis and ERK1/2
activation. J Biol Chem. 2003;278(42):41541-51.
407. Sato T, Kawasaki T, Mine S, Matsumura H. Functional Role of the C-Terminal
Amphipathic Helix 8 of Olfactory Receptors and Other G Protein-Coupled Receptors. Int J
Mol Sci. 2016;17(11).
408. Marion S, Oakley RH, Kim KM, Caron MG, Barak LS. A beta-arrestin binding
determinant common to the second intracellular loops of rhodopsin family G protein-coupled
receptors. J Biol Chem. 2006;281(5):2932-8.
409. Raman D, Osawa S, Gurevich VV, Weiss ER. The interaction with the cytoplasmic
loops of rhodopsin plays a crucial role in arrestin activation and binding. J Neurochem.
2003;84(5):1040-50.

410. Dror RO, Arlow DH, Borhani DW, Jensen MO, Piana S, Shaw DE. Identification of
two distinct inactive conformations of the beta2-adrenergic receptor reconciles structural and
biochemical observations. Proc Natl Acad Sci U S A. 2009;106(12):4689-94.
411. Clement N, Renault N, Guillaume JL, Cecon E, Journe AS, Laurent X, et al.
Importance of the second extracellular loop for melatonin MT1 receptor function and
absence of melatonin binding in GPR50. Br J Pharmacol. 2017.
412. Ahuja S, Hornak V, Yan EC, Syrett N, Goncalves JA, Hirshfeld A, et al. Helix
movement is coupled to displacement of the second extracellular loop in rhodopsin
activation. Nat Struct Mol Biol. 2009;16(2):168-75.
413. Venkatakrishnan AJ, Deupi X, Lebon G, Tate CG, Schertler GF, Babu MM.
Molecular signatures of G-protein-coupled receptors. Nature. 2013;494(7436):185-94.
414. Rasmussen SG, Choi HJ, Fung JJ, Pardon E, Casarosa P, Chae PS, et al. Structure of
a nanobody-stabilized active state of the beta(2) adrenoceptor. Nature. 2011;469(7329):175-
80.
415. Zimmerman B, Beautrait A, Aguila B, Charles R, Escher E, Claing A, et al.
Differential beta-arrestin-dependent conformational signaling and cellular responses
revealed by angiotensin analogs. Sci Signal. 2012;5(221):ra33.
416. Mende F, Hundahl C, Plouffe B, Skov LJ, Sivertsen B, Madsen AN, et al. Translating
biased signaling in the ghrelin receptor system into differential in vivo functions. Proc Natl
Acad Sci U S A. 2018.
417. Binda F, Dipace C, Bowton E, Robertson SD, Lute BJ, Fog JU, et al. Syntaxin 1A
interaction with the dopamine transporter promotes amphetamine-induced dopamine efflux.
Mol Pharmacol. 2008;74(4):1101-8.
418. Egana LA, Cuevas RA, Baust TB, Parra LA, Leak RK, Hochendoner S, et al.
Physical and functional interaction between the dopamine transporter and the synaptic
vesicle protein synaptogyrin-3. J Neurosci. 2009;29(14):4592-604.
419. Rickhag M, Hansen FH, Sorensen G, Strandfelt KN, Andresen B, Gotfryd K, et al.
A C-terminal PDZ domain-binding sequence is required for striatal distribution of the
dopamine transporter. Nat Commun. 2013;4:1580.
420. Torres GE, Yao WD, Mohn AR, Quan H, Kim KM, Levey AI, et al. Functional
interaction between monoamine plasma membrane transporters and the synaptic PDZ
domain-containing protein PICK1. Neuron. 2001;30(1):121-34.
421. Miranda M, Sorkina T, Grammatopoulos TN, Zawada WM, Sorkin A. Multiple
molecular determinants in the carboxyl terminus regulate dopamine transporter export from
endoplasmic reticulum. J Biol Chem. 2004;279(29):30760-70.
422. Segura-Aguilar J, Paris I, Munoz P, Ferrari E, Zecca L, Zucca FA. Protective and
toxic roles of dopamine in Parkinson's disease. J Neurochem. 2014;129(6):898-915.
423. Ahmad R, Gupta S, Haldar C. Age dependent expression of melatonin membrane
receptor (MT1, MT2) and its role in regulation of nitrosative stress in tropical rodent
Funambulus pennanti. Free Radic Res. 2012;46(2):194-203.
424. Jenner P, Olanow CW. Oxidative stress and the pathogenesis of Parkinson's disease.
Neurology. 1996;47(6 Suppl 3):S161-70.
425. Ferris MJ, Espana RA, Locke JL, Konstantopoulos JK, Rose JH, Chen R, et al.
Dopamine transporters govern diurnal variation in extracellular dopamine tone. Proc Natl
Acad Sci U S A. 2014;111(26):E2751-9.
426. Gupta S, Haldar C. Nycthemeral variation in melatonin receptor expression in the
lymphoid organs of a tropical seasonal breeder Funambulus pennanti. J Comp Physiol A
Neuroethol Sens Neural Behav Physiol. 2014;200(12):1045-55.

427. Miller NL, Kleinschmidt EG, Schlaepfer DD. RhoGEFs in cell motility: novel links
between Rgnef and focal adhesion kinase. Curr Mol Med. 2014;14(2):221-34.

Université Paris-Saclay Espace Technologique / Immeuble Discovery Route de l’Orme aux Merisiers RD 128 / 91190 Saint-Aubin, France
Titre : Involvement of melatonin receptors in neurological disorders and type 2 diabetes and
identification of key regions mediating MT1 functional selectivity.
Keywords : Melatonin, G protein-coupled receptors, dopamine, transporter, neurobiology, type 2
diabetes, genetic variant, structure, signaling
Summary : Melatonin is a neurohormone mainly released from the pineal gland in a circadian
manner acting through two G protein-coupled receptors (GPCRs) called MT1 and MT2. Melatonin
regulates many important physiological functions. Regulation of dopamine (DA) and glucose levels
are two of them but how they do this is not clear.
Extracellular DA levels are mainly regulated by its transporter (DAT) which mediates DA re-
uptake into presynaptic nerve termini to prevent DA receptor hyperactivation in the presynaptic
cleft. Consequently, we verified the role of DAT in the regulation of the DA system by melatonin.
We showed that MT1 and MT2, by interacting with the immature non-glycosylated form of DAT
retain DAT in the endoplasmic reticulum thus regulating DAT cell surface expression and DA
reuptake. Consistently, mice with targeted deletion of MT1 and MT2 show markedly enhanced DA
uptake in striatal synaptosomes and decreased amphetamine-induced locomotor activity.
Collectively, we revealed here a molecular link between the melatonin and DA systems, which is
based on the formation of a molecular complex between melatonin receptors and DAT.
To better understand the role of melatonin on the regulation of glucose levels, we studied the
involvement of genetic variants of MT2 in the development of type 2 diabetes (T2D). Previous
studies showed that natural loss-of-function variants of MT2 associate with T2D risk. To determine
more precisely the defective properties linked to T2D risk we monitored spontaneous and
melatonin-induced activation of different signaling pathways by 40 MT2 variants. We show that
defects in melatonin-induced Gαi and Gαz activation and spontaneous βarrestin-2 recruitment are
most significantly associated to T2D risk. Experimental results correlated well with those predicted
by evolutionary lineage analysis. This work will help to propose personalized treatments for MT2
variant carriers to recover their defective responses.
Sequencing of MT1 gene of 9393 individuals resulted in the identification of 32 natural MT1
variants. MT1 wild-type and variants were functionally characterized in bioluminescence resonance
energy transfer (BRET) assays. We showed that MT1 activates Gαi/o, Gα12 and Gα15 proteins and
recruits βarrestin-2. Analyzes of results by non-linear matrix factorization revealed the existence
of 5 clusters characterized by different signaling profiles. Computational homology modeling of
the 3D model of MT1 helped to determine the impact of each variant on receptor activation and
interaction with G proteins and βarrestin-2. Collectively, our data illustrate that natural variants are
powerful tools to understand the molecular basis of GPCR function.
Overall, this work contributes to our understanding of the function of melatonin receptors and
highlights their importance in the regulation of the DA system and glucose homeostasis. Our results
will open new, personalized therapeutic options for patient suffering from a defective DA system
or T2D.
Université Paris-Saclay Espace Technologique / Immeuble Discovery Route de l’Orme aux Merisiers RD 128 / 91190 Saint-Aubin, France
Titre : Implication des récepteurs de la mélatonine dans les troubles neurologiques et le diabète
de type 2 et identification de régions clés du récepteur MT1 responsables de sa sélectivité
fonctionnelle.
Mots-clés : Mélatonine, récepteurs couplés aux protéines G, dopamine, transporteur,
neurobiologie, diabète de type 2, variant génétique, structure, signalisation
Résumé : La mélatonine est une neurohormone produite principalement par la glande pinéale de
manière circadienne et agissant par l’activation de deux récepteurs couplés aux protéines G
(RCPGs) appelés MT1 et MT2. La mélatonine régule de nombreuses fonctions physiologiques
importantes. La régulation des niveaux de dopamine (DA) et de glucose en font partie mais nous
ne savons pas clairement comment la mélatonine les régule.
Les niveaux de DA extracellulaire sont principalement régulés par son transporteur (DAT)
responsable de sa recapture dans les neurones présynaptiques afin de prévenir d’une
hyperactivation des récepteurs dopaminergiques. Par conséquent, nous avons vérifié le rôle de DAT
dans la régulation du système dopaminergique par le système mélatoninergique. Nous avons
montré qu’en interagissant avec la forme immature non-glycosylée de DAT, MT1 et MT2 le
retiennent dans le réticulum endoplasmique régulant ainsi son expression à la surface cellulaire et
donc la recapture de la DA. De la même manière, les souris déficientes en MT1 ou MT2 ont montré
une augmentation de la recapture de la DA dans les synaptosomes de striatum et une baisse de
l’hypermotilité induite par l’amphétamine. Dans ce projet nous avons ainsi révélé un nouveau lien
entre les systèmes mélatoninergiques et dopaminergiques basé sur la formation de complexes
moléculaires entre les récepteurs de la mélatonine et DAT.
Afin de mieux comprendre le rôle de la mélatonine dans la régulation des niveaux de glucose, nous
avons ensuite étudié l’implication de variants génétiques de MT2 dans le développement du diabète
de type 2 (DT2). Des études antérieures avaient montré que des variants naturels défectueux
fonctionnellement étaient associés à un risque de développer le DT2. Afin de déterminer plus
précisément les propriétés défectueuses en lien avec le DT2, nous avons mesuré l’activation
spontanée et celle induite par la mélatonine de 40 variants MT2. Nous avons ainsi montré que des
défauts d’activation des protéines Gαi et Gαz induite par la mélatonine et de recrutement spontané
de la βarrestine-2 sont significativement reliés à un risque de développer le DT2. Les résultats
expérimentaux corrélaient avec les prédictions de l’analyse sur le score d’évolution. Ce travail
permettra de nouvelles avancées dans la recherche de traitements personnalisés pour les personnes
portants les mutations sur MT2 afin qu’il retrouve une réponse non défectueuse.
Le séquençage du gène codant pour MT1 chez 9393 personnes a permis l’identification de 32
variants naturels MT1. Le récepteur MT1 sauvage et les variants ont ainsi été caractérisés grâce aux
techniques de transfert d’énergie par résonnance de bioluminescence (BRET). Nous avons montré
que MT1 active les protéines Gαi/o, Gα12 et Gα15 et recrute la βarrestine-2. L’analyse des résultats
par factorisation matricielle non linéaire a révélé l’existence de 5 clusters caractérisés par différents
profils de signalisation. La modélisation 3D par homologie de MT1 a permis de déterminer l’impact
de chaque variant sur l’activation du récepteur et ses interactions avec les protéines G et la
βarrestine-2. Ce projet a ainsi permis de démontrer que des variants naturels sont très intéressant
afin de comprendre les mécanismes d’action des RCPGs.
En résumé, ce travail contribue à la compréhension des fonctions des récepteurs à la mélatonine et
souligne leur importance dans la régulation du système dopaminergique et de l’homéostasie
glucidique. Nos résultats offrent de nouvelles perspectives dans la recherche de nouveaux
traitements personnalisés pour les patients souffrant d’un dérèglement du système dopaminergique
ou de DT2.