Air Pollution in Eastern Europe
46
AIR POLLUTION IN EASTERN EUROPE (EE) Eugene Genikhovich, Alla Polischuk Voeikov Main Geophysical Observatory, St. Petersburg, Russia
Transcript of Air Pollution in Eastern Europe
AIR POLLUTION IN EASTERN EUROPE (EE)
Eugene Genikhovich, Alla Polischuk
Voeikov Main Geophysical Observatory, St. Petersburg, Russia
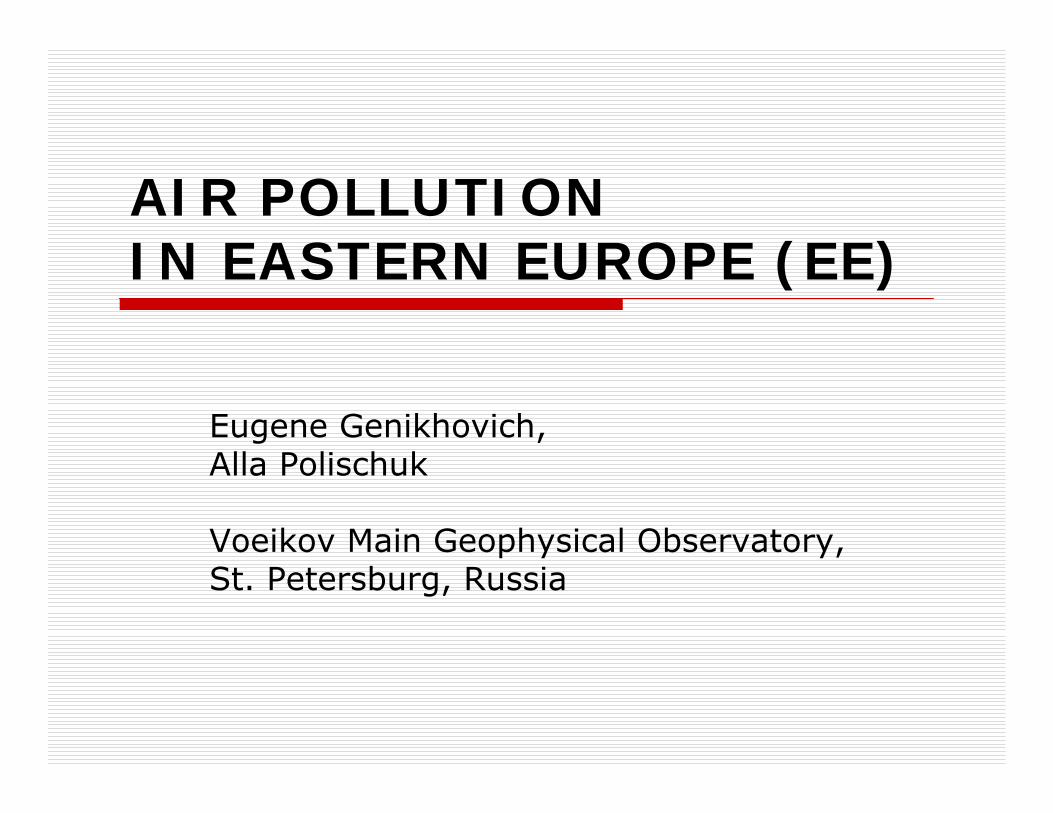
Introduction/1
Projected climate changes could significantly influence the air pollution in Northern Eurasia resulting in changes in the impact on the environment and human health; To detect these changes, one should know characteristics of the present air pollution, which could be estimated using monitoring data and/or modeling results.
Introduction/2EE including Russia is a substantial part of the NEESPI European region; It is highly "inhomogeneous" in respect to the air pollution problems as well as the abatement strategies; There is no unified strategies, policies and approaches to mitigation of air pollution problems across whole EE (in particular, they are different in EU and NIS countries); Among EE countries, the level of general coordination of corresponding environmental authorities is comparatively low.
Introduction/3
Information about the existing situation with the air pollution in EE is rather incomplete and patchy--that's why some of the EE countries, which are noticeable emitters, are actually missed from my review;I will speak here about the status of both, instrumental and computational (based on modeling results), types of monitoring of the air pollution in EE.
Eastern Europe: major impact of the Chernobyl accident (UNEP)
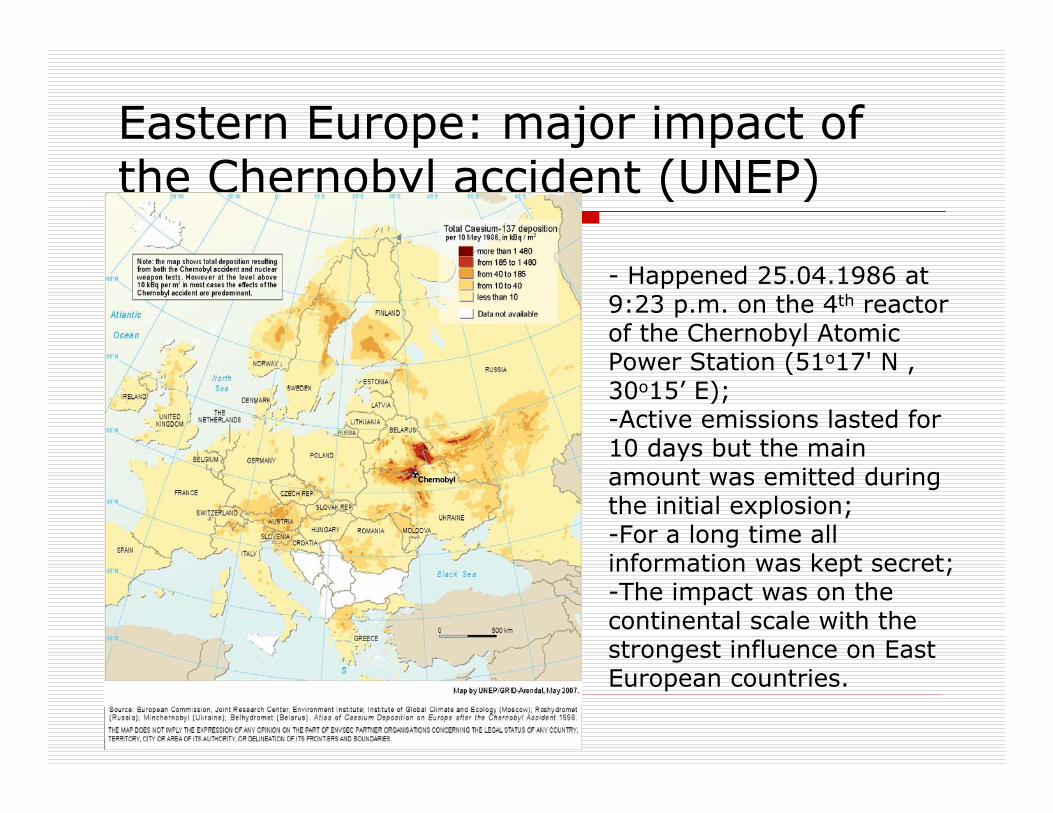
- Happened 25.04.1986 at9:23 p.m. on the 4th reactor of the Chernobyl Atomic Power Station (51o17' N , 30o15’ E);-Active emissions lasted for 10 days but the main amount was emitted during the initial explosion; -For a long time all information was kept secret; -The impact was on the continental scale with the strongest influence on East European countries.
Environment and security priority areas in Eastern Europe (UNEP)
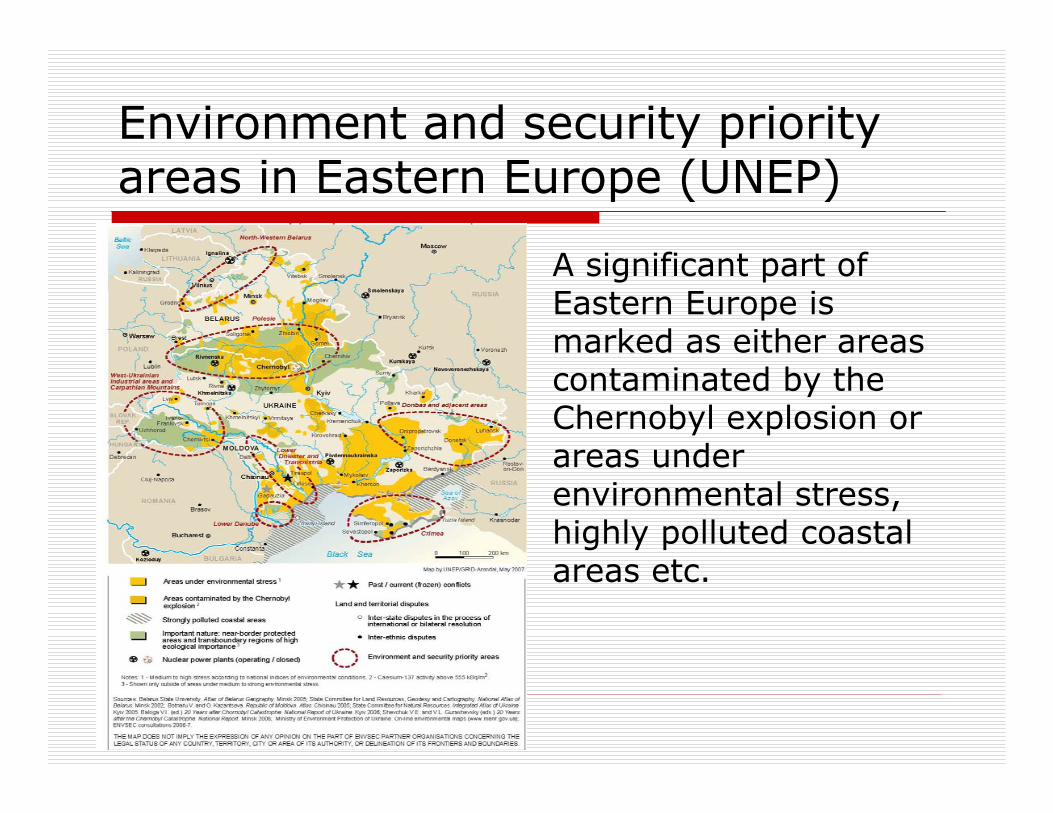
A significant part of Eastern Europe is marked as either areas contaminated by the Chernobyl explosion or areas under environmental stress, highly polluted coastal areas etc.
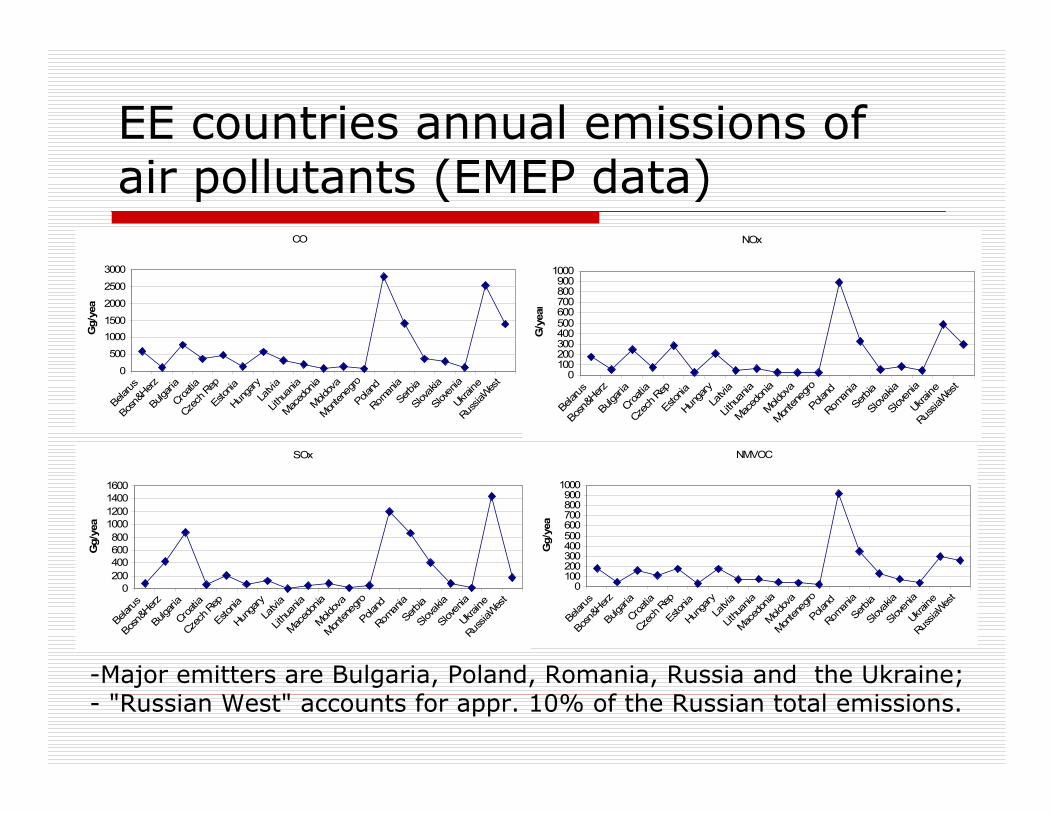
EE countries annual emissions of air pollutants (EMEP data)
CO
0
500
10001500
2000
2500
3000
Belarus
Bosn&
HerzBulg
aria
Croatia
Czech
Rep
Estonia
Hunga
ryLa
tvia
Lithu
ania
Maced
onia
Moldov
aMon
teneg
roPola
ndRom
ania
Serbia
Slovak
iaSlov
enia
Ukraine
Russia
West
Gg/
yea
NOx
0100200300400500600700800900
1000
Belar
usBos
n&Herz
Bulgari
aCroa
tiaCz
ech R
epEsto
niaHun
gary
Latvi
a Lit
huan
iaMac
edon
iaMold
ova
Monten
egro
Polan
dRom
ania
Serbia
Slova
kiaSlov
enia
Ukraine
Russia
West
G/y
ear
SOx
0200400600800
1000120014001600
Belarus
Bosn&
HerzBulg
aria
Croatia
Czech
Rep
Estonia
Hunga
ryLa
tvia
Lithu
ania
Maced
onia
Moldov
aMon
teneg
roPola
ndRom
ania
Serbia
Slovak
iaSlov
enia
Ukraine
Russia
West
Gg/
year
NMVOC
0100200300400500600700800900
1000Bela
rusBos
n&Herz
Bulgari
aCroa
tiaCze
ch R
epEsto
niaHun
gary
Latvi
a Lit
huan
iaMac
edon
iaMold
ova
Monten
egro
Poland
Roman
iaSerb
iaSlov
akia
Sloven
iaUkra
ineRus
siaWes
t
Gg/
year
-Major emitters are Bulgaria, Poland, Romania, Russia and the Ukraine; - "Russian West" accounts for appr. 10% of the Russian total emissions.
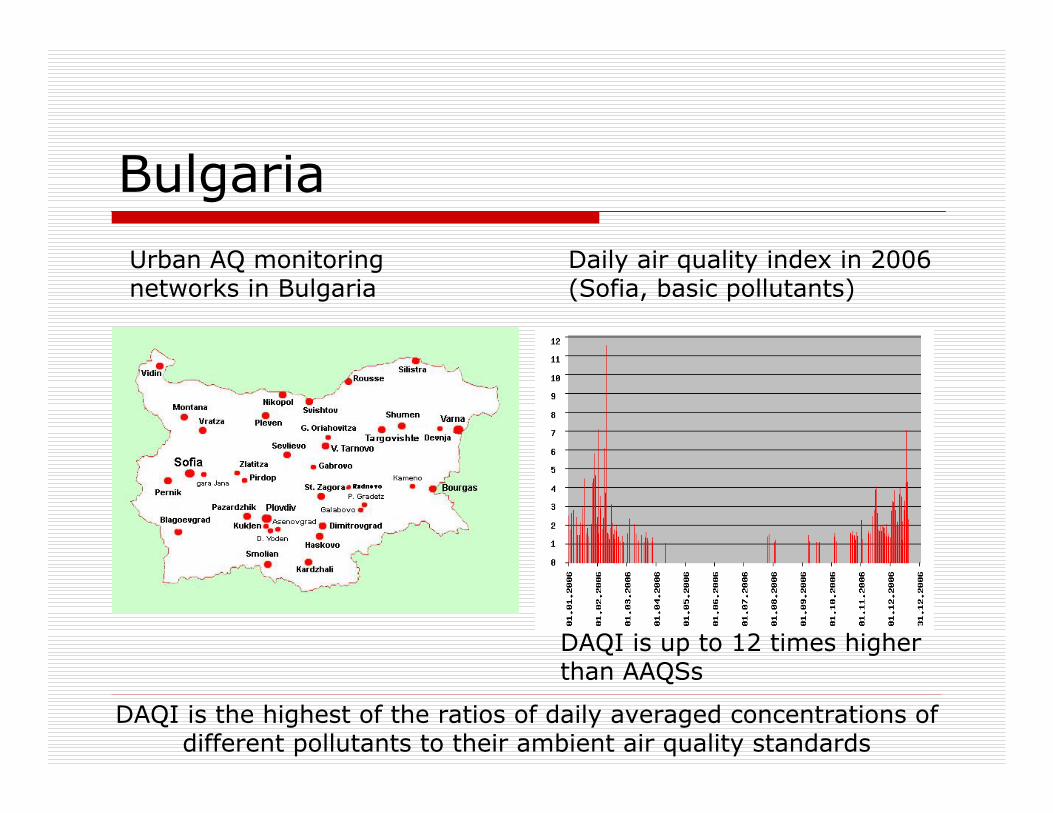
BulgariaDaily air quality index in 2006 (Sofia, basic pollutants)
DAQI is up to 12 times higher than AAQSs
Urban AQ monitoring networks in Bulgaria
DAQI is the highest of the ratios of daily averaged concentrations of different pollutants to their ambient air quality standards
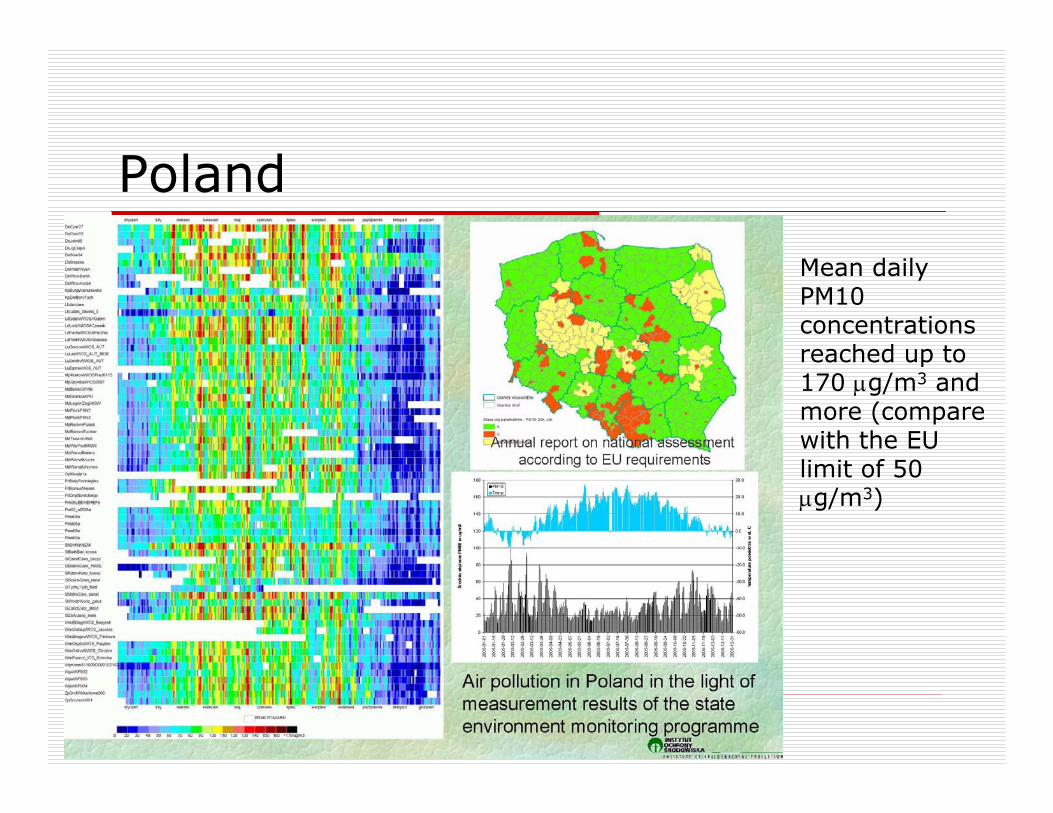
Poland
Mean daily PM10 concentrations reached up to 170 μg/m3 and more (compare with the EU limit of 50 μg/m3)
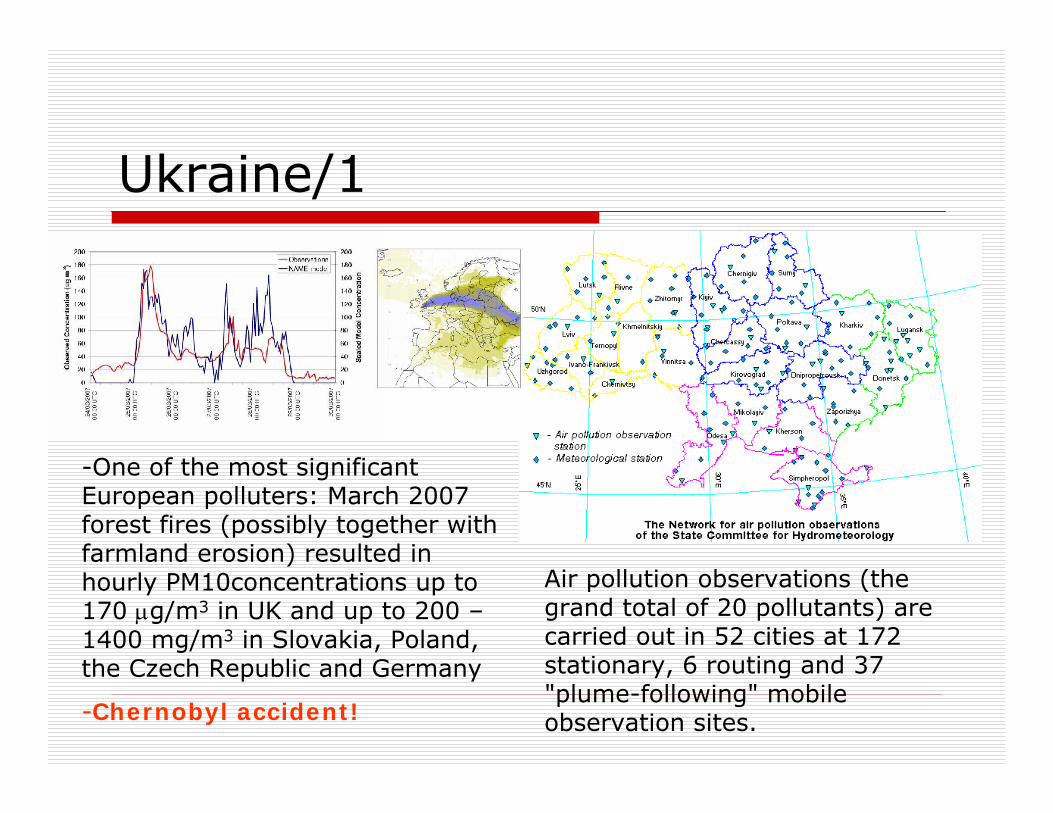
Ukraine/1
Air pollution observations (the grand total of 20 pollutants) arecarried out in 52 cities at 172 stationary, 6 routing and 37 "plume-following" mobile observation sites.
-One of the most significant European polluters: March 2007 forest fires (possibly together with farmland erosion) resulted in hourly PM10concentrations up to 170 μg/m3 in UK and up to 200 –1400 mg/m3 in Slovakia, Poland,the Czech Republic and Germany
-Chernobyl accident!
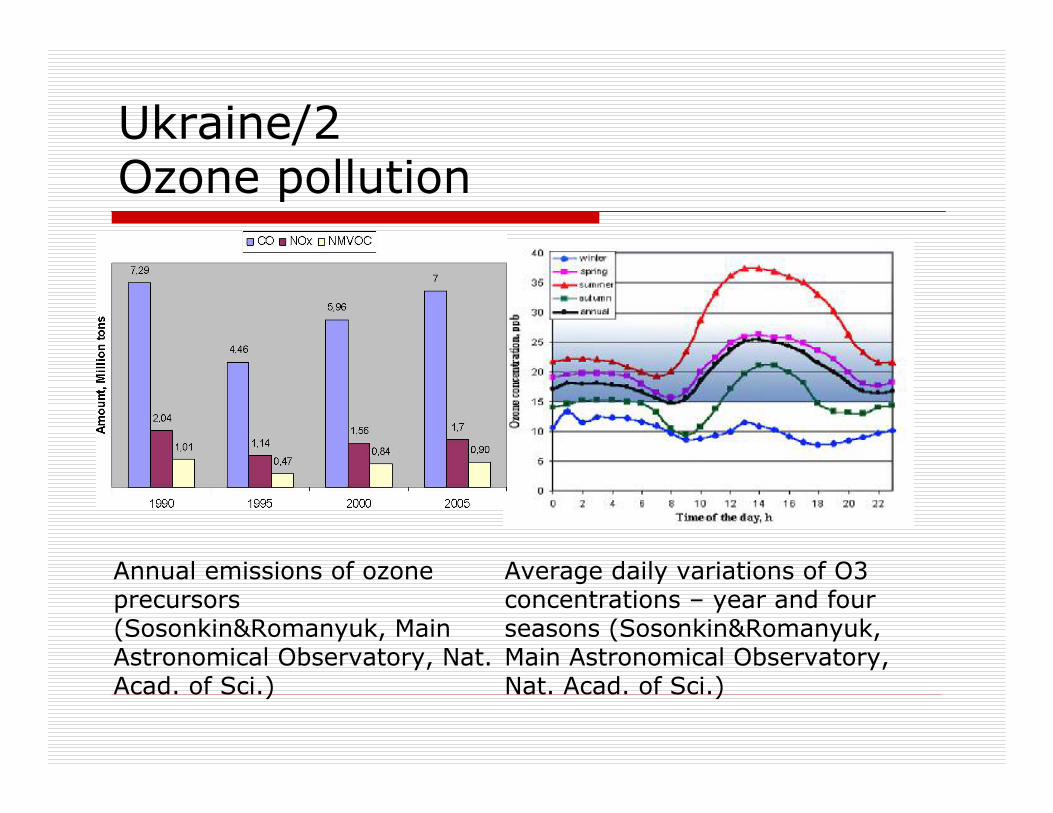
Ukraine/2Ozone pollution
Annual emissions of ozone precursors (Sosonkin&Romanyuk, Main Astronomical Observatory, Nat. Acad. of Sci.)
Average daily variations of O3 concentrations – year and four seasons (Sosonkin&Romanyuk, Main Astronomical Observatory, Nat. Acad. of Sci.)
Ukraine/3Cost estimates in 2006
The relative mortality risk attributed to air pollution isabout 55-59 cases per 100 000 population (appr. 6% of the total mortality);Corresponding economic damage accounts for appr. 4% of GDP; "…Costs of air pollution in Ukraine are sizable and inthe nearest future may offset the economic growth. Recovery of the Ukrainian economy based onrestoration of polluting industries may lead tostagnation since mortality and morbidity risks not onlyputs burden on the economy, but also reduce laborforce". /E. Strukova, A. Golub, A. Markandya – World Bank/.
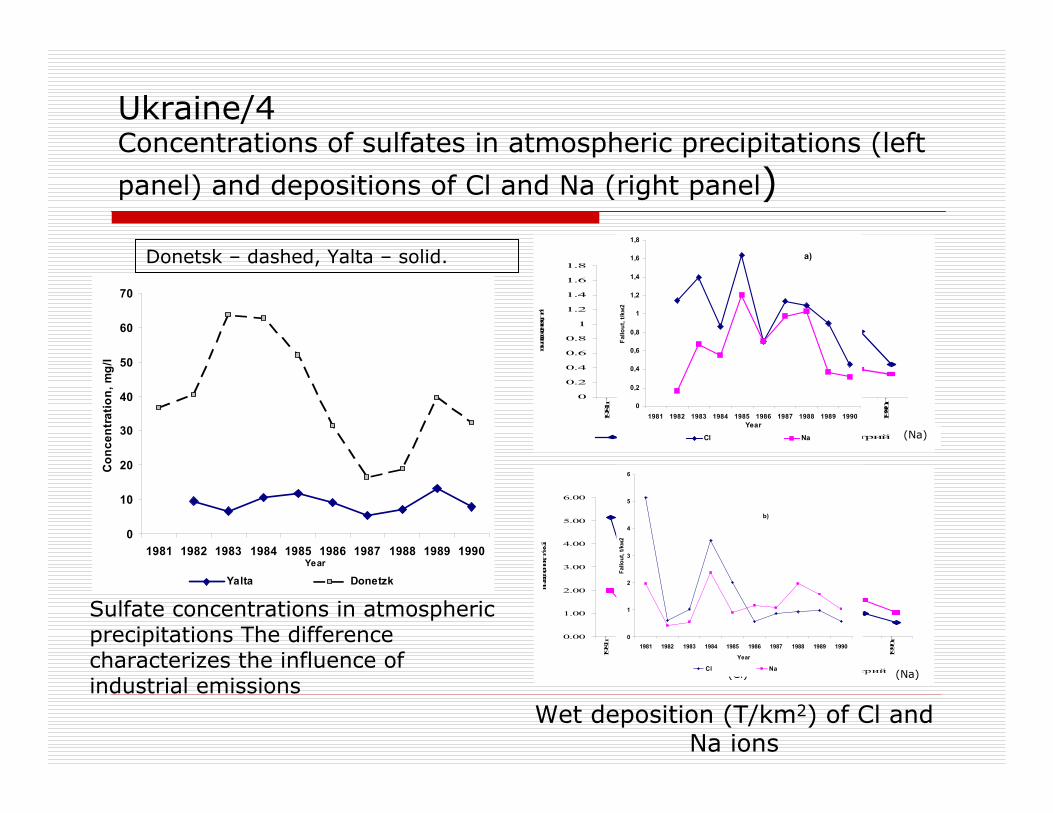
Ukraine/4 Concentrations of sulfates in atmospheric precipitations (left
panel) and depositions of Cl and Na (right panel)
Donetsk – dashed, Yalta – solid.
Sulfate concentrations in atmospheric precipitations The difference characterizes the influence of industrial emissions
0
0.2
0.4
0.6
0.8
1
1.2
1.4
1.6
1.8
1981 г
1982 г
1983 г
1984 г
1985 г
1986 г
1987 г
1988 г
1989 г
1990 г
выпадения, т/к
хлорид натрий
а)
0.00
1.00
2.00
3.00
4.00
5.00
6.00
1981
г
1982
г
1983
г
1984
г
1985
г
1986
г
1987
г
1988
г
1989
г
1990
г
выпадения, т/км2
хлорид натрий
б)
(Cl)
(Cl)
(Na)
(Na)
Yalta
Odessa
Wet deposition (T/km2) of Cl and Na ions
0
0,2
0,4
0,6
0,8
1
1,2
1,4
1,6
1,8
1981 1982 1983 1984 1985 1986 1987 1988 1989 1990Year
Fallo
ut, t
/kм
2
Cl Na
a)
0
1
2
3
4
5
6
1981 1982 1983 1984 1985 1986 1987 1988 1989 1990
Year
Fallo
ut, t
/kм
2
Cl Na
b)
0
10
20
30
40
50
60
70
1981 1982 1983 1984 1985 1986 1987 1988 1989 1990Year
Con
cent
ratio
n, m
g/l
Yalta Donetzk
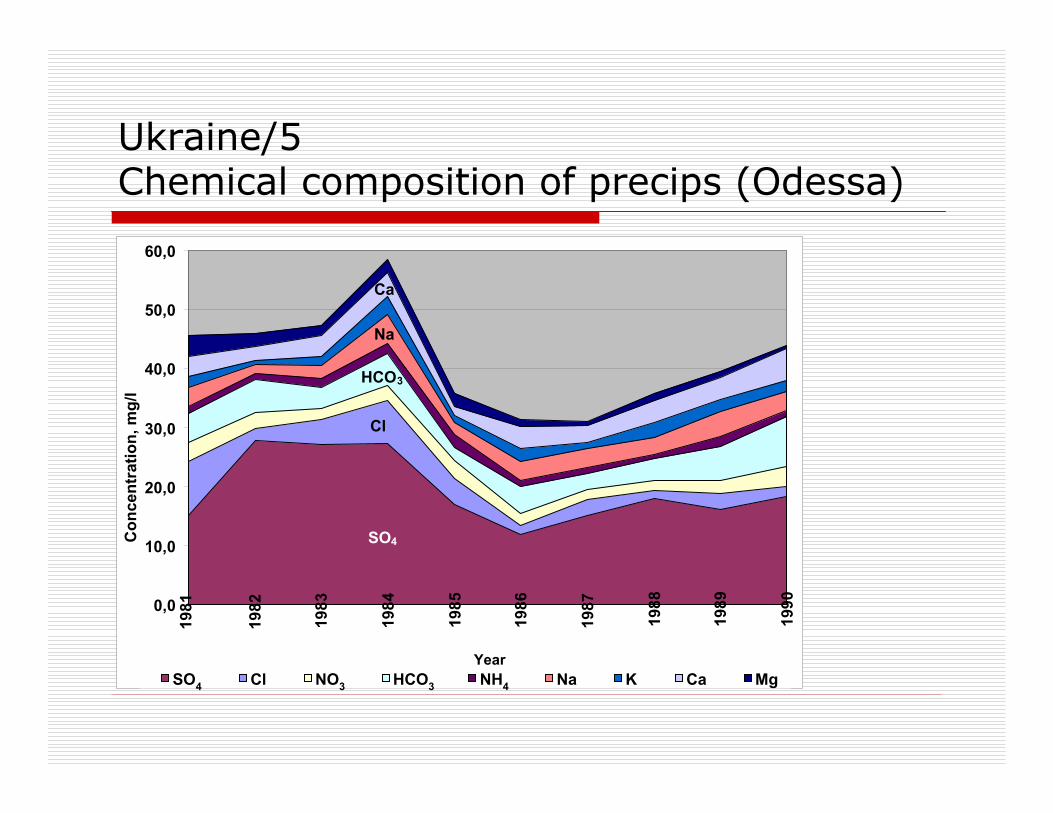
Ukraine/5 Chemical composition of precips (Odessa)
0,0
10,0
20,0
30,0
40,0
50,0
60,0
1981
1982
1983
1984
1985
1986
1987
1988
1989
1990
Year
Con
cent
ratio
n, m
g/l
SO4 Cl NO3 HCO3 NH4 Na K Ca Mg
SO4
Cl
HCO3
Na
Ca
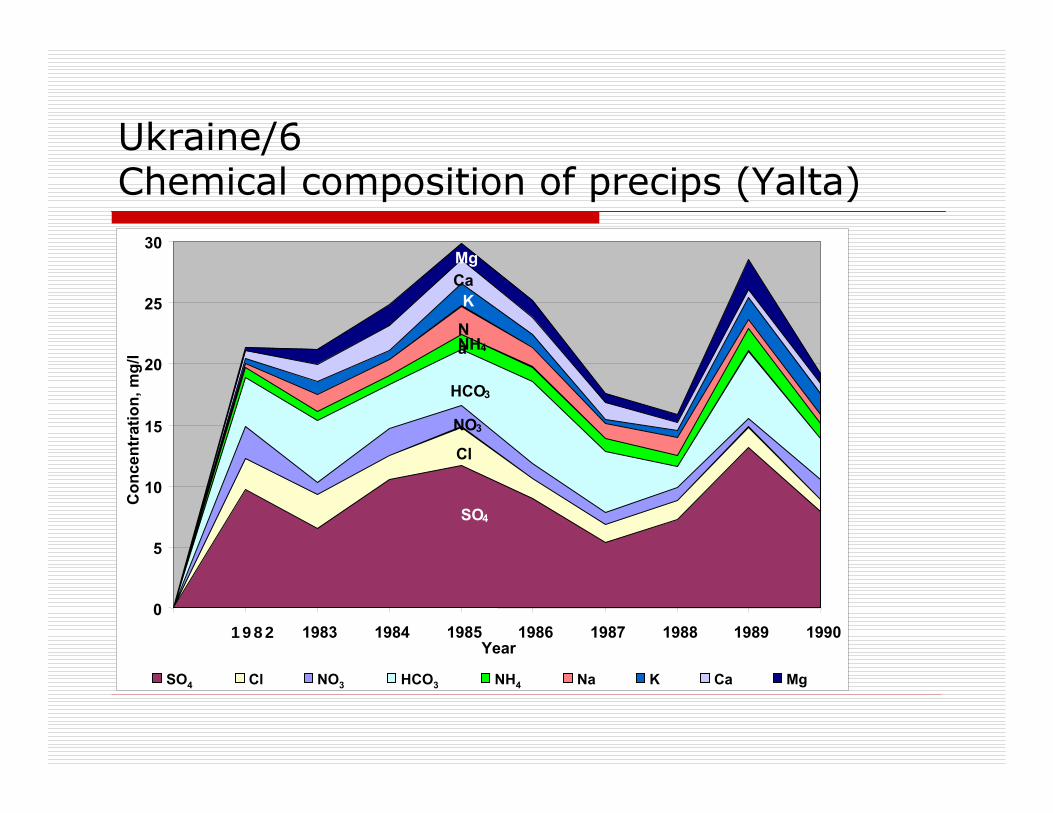
Ukraine/6 Chemical composition of precips (Yalta)
0
5
10
15
20
25
30
1982 1983 1984 1985 1986 1987 1988 1989 1990Year
Con
cent
ratio
n, m
g/l
SO4 Cl NO3 HCO3 NH4 Na K Ca Mg
SO4
Cl
NO3
HCO3
NH4Na
KCaMg
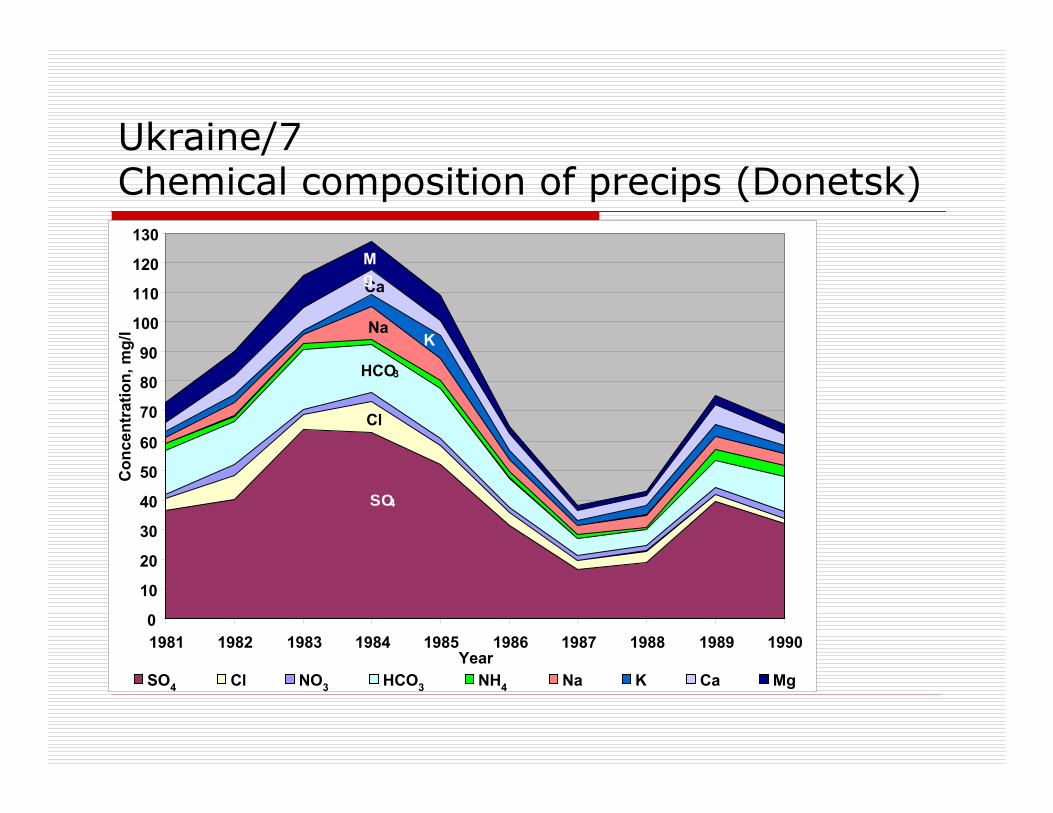
Ukraine/7 Chemical composition of precips (Donetsk)
0
10
20
30
40
50
60
70
80
90
100
110
120
130
1981 1982 1983 1984 1985 1986 1987 1988 1989 1990Year
Con
cent
ratio
n, m
g/l
SO4 Cl NO3 HCO3 NH4 Na K Ca Mg
SO4
Cl
HCO3
Na
Ca
Mg
K
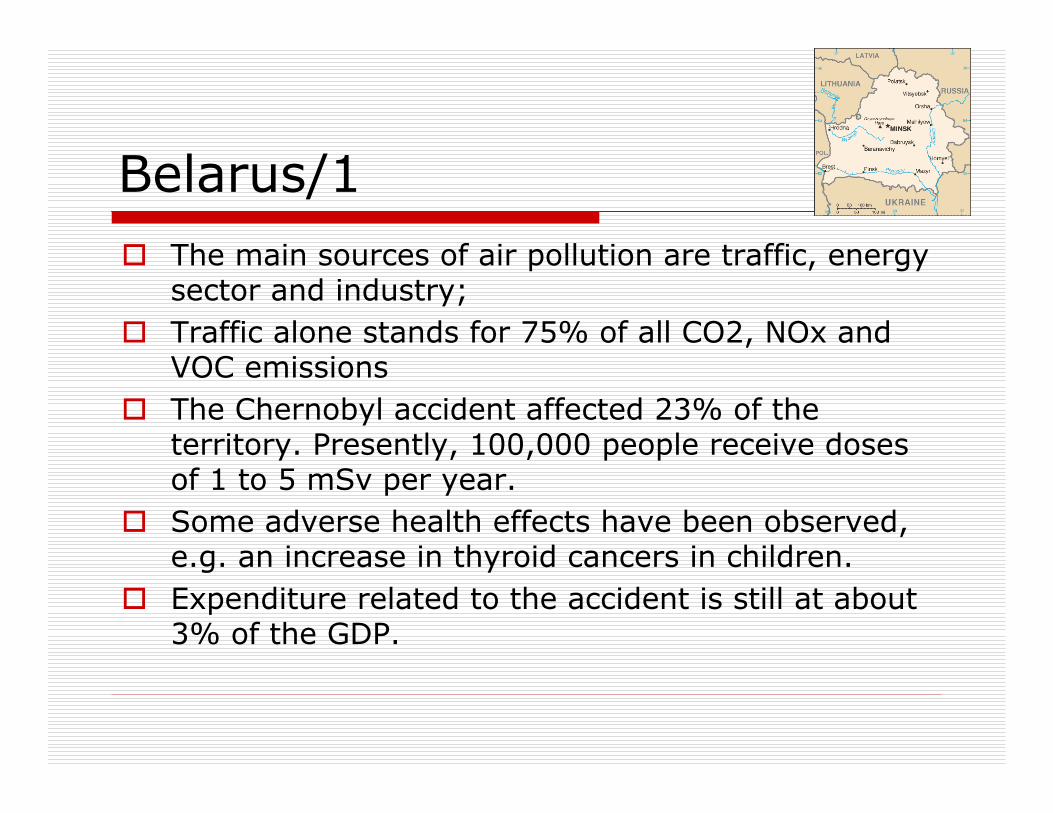
Belarus/1The main sources of air pollution are traffic, energysector and industry;Traffic alone stands for 75% of all CO2, NOx andVOC emissionsThe Chernobyl accident affected 23% of theterritory. Presently, 100,000 people receive dosesof 1 to 5 mSv per year. Some adverse health effects have been observed, e.g. an increase in thyroid cancers in children. Expenditure related to the accident is still at about3% of the GDP.
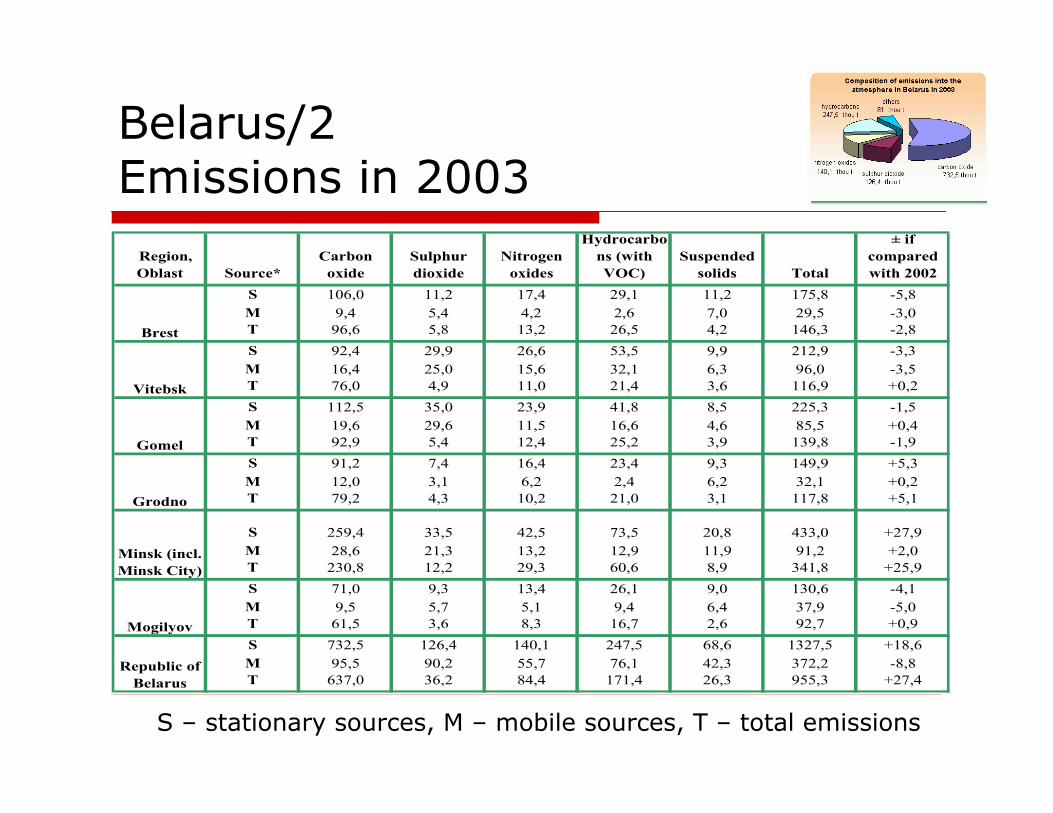
Belarus/2Emissions in 2003 Region,
Oblast Source*Carbon
oxideSulphur dioxide
Nitrogen oxides
Hydrocarbons (with VOC)
Suspended solids Total
± if compared with 2002
S 106,0 11,2 17,4 29,1 11,2 175,8 -5,8M 9,4 5,4 4,2 2,6 7,0 29,5 -3,0T 96,6 5,8 13,2 26,5 4,2 146,3 -2,8S 92,4 29,9 26,6 53,5 9,9 212,9 -3,3M 16,4 25,0 15,6 32,1 6,3 96,0 -3,5T 76,0 4,9 11,0 21,4 3,6 116,9 +0,2S 112,5 35,0 23,9 41,8 8,5 225,3 -1,5M 19,6 29,6 11,5 16,6 4,6 85,5 +0,4T 92,9 5,4 12,4 25,2 3,9 139,8 -1,9S 91,2 7,4 16,4 23,4 9,3 149,9 +5,3M 12,0 3,1 6,2 2,4 6,2 32,1 +0,2T 79,2 4,3 10,2 21,0 3,1 117,8 +5,1
S 259,4 33,5 42,5 73,5 20,8 433,0 +27,9M 28,6 21,3 13,2 12,9 11,9 91,2 +2,0T 230,8 12,2 29,3 60,6 8,9 341,8 +25,9S 71,0 9,3 13,4 26,1 9,0 130,6 -4,1M 9,5 5,7 5,1 9,4 6,4 37,9 -5,0T 61,5 3,6 8,3 16,7 2,6 92,7 +0,9S 732,5 126,4 140,1 247,5 68,6 1327,5 +18,6M 95,5 90,2 55,7 76,1 42,3 372,2 -8,8T 637,0 36,2 84,4 171,4 26,3 955,3 +27,4
Minsk (incl. Minsk City)
Mogilyov
Republic of Belarus
Brest
Vitebsk
Gomel
Grodno
S – stationary sources, M – mobile sources, T – total emissions
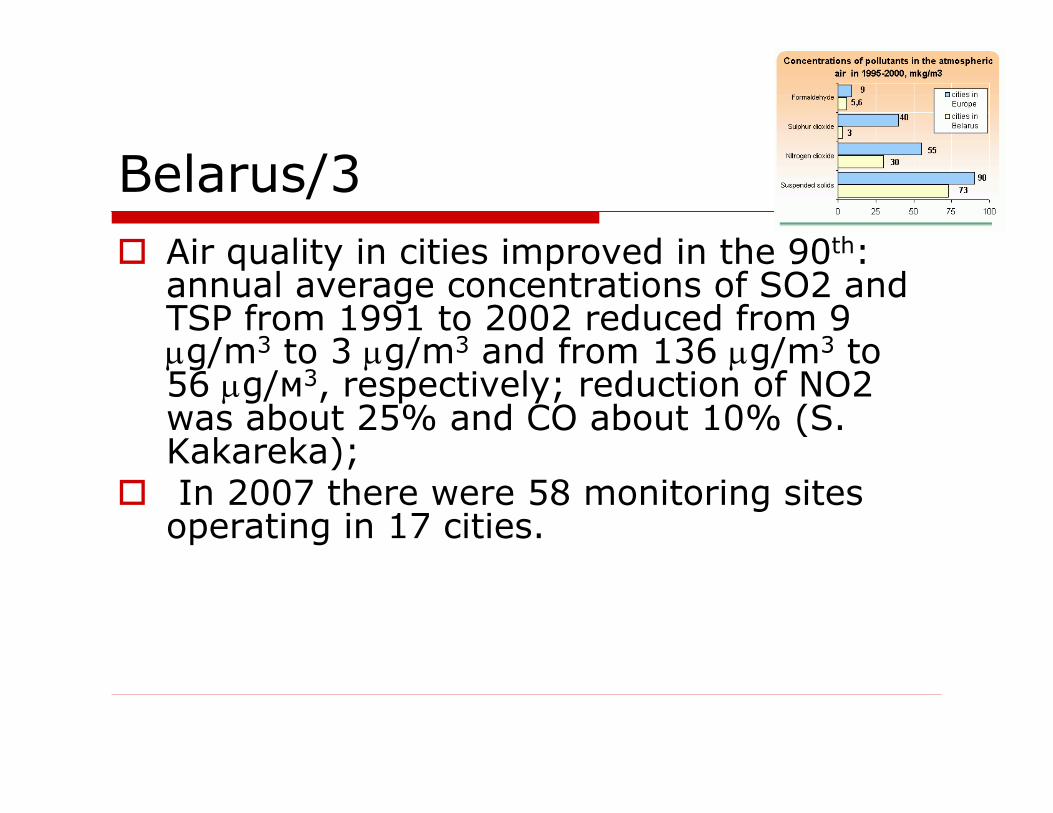
Belarus/3Air quality in cities improved in the 90th: annual average concentrations of SO2 and TSP from 1991 to 2002 reduced from 9 μg/m3 to 3 μg/m3 and from 136 μg/m3 to56 μg/м3, respectively; reduction of NO2 was about 25% and CO about 10% (S. Kakareka); In 2007 there were 58 monitoring sites operating in 17 cities.
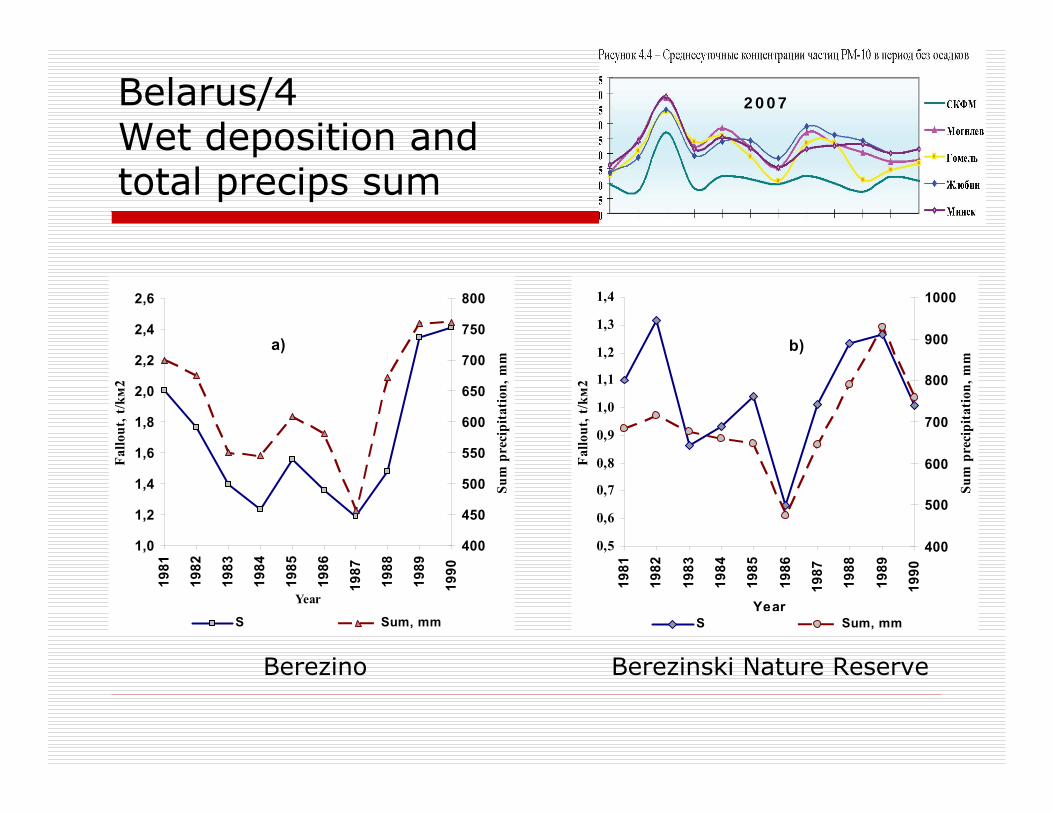
Belarus/4Wet deposition and total precips sum
1,0
1,2
1,4
1,6
1,8
2,0
2,2
2,4
2,6
1981
1982
1983
1984
1985
1986
1987
1988
1989
1990
Year
Fallo
ut, t
/kм
2
400
450
500
550
600
650
700
750
800
Sum
pre
cipi
tatio
n, m
m
S Sum, mm
а)
0,5
0,6
0,7
0,8
0,9
1,0
1,1
1,2
1,3
1,4
1981
1982
1983
1984
1985
1986
1987
1988
1989
1990
YearFa
llout
, t/kм
2
400
500
600
700
800
900
1000
Sum
pre
cipi
tatio
n, m
m
S Sum, mm
b)
Berezino Berezinski Nature Reserve
2007
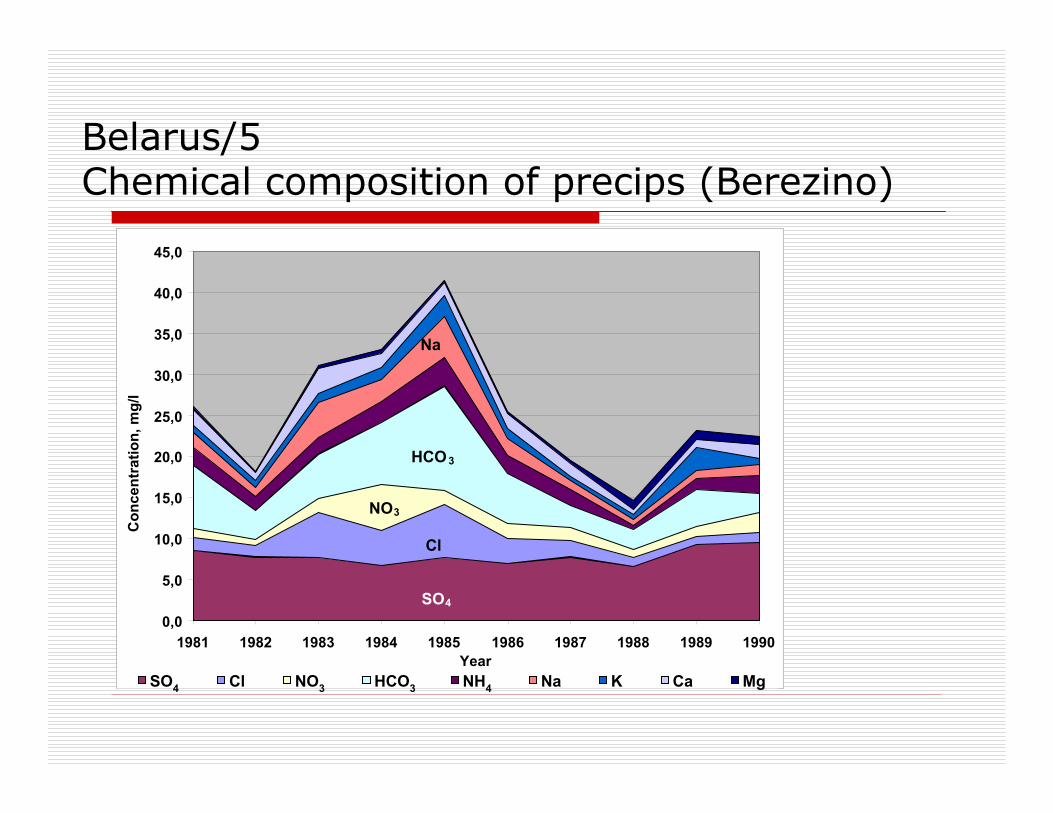
Belarus/5Chemical composition of precips (Berezino)
0,0
5,0
10,0
15,0
20,0
25,0
30,0
35,0
40,0
45,0
1981 1982 1983 1984 1985 1986 1987 1988 1989 1990Year
Con
cent
ratio
n, m
g/l
SO4 Cl NO3 HCO3 NH4 Na K Ca Mg
SO4
Cl
NO3
HCO3
Na
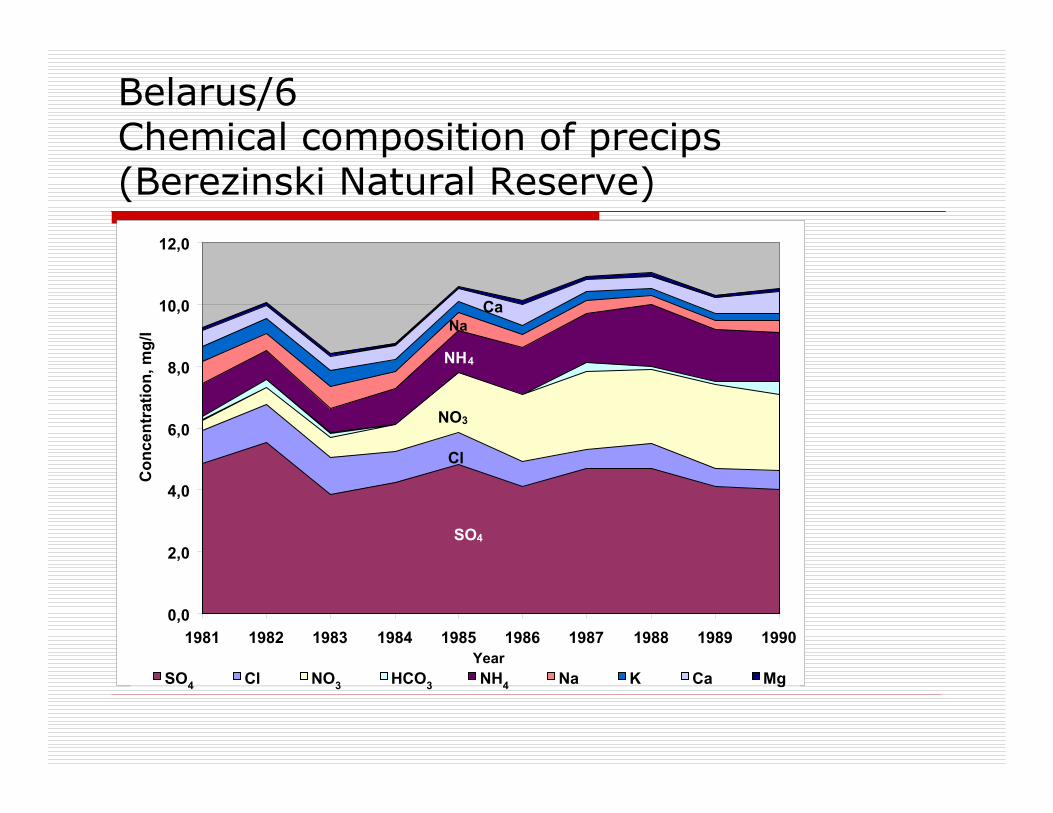
Belarus/6Chemical composition of precips(Berezinski Natural Reserve)
0,0
2,0
4,0
6,0
8,0
10,0
12,0
1981 1982 1983 1984 1985 1986 1987 1988 1989 1990Year
Con
cent
ratio
n, m
g/l
SO4 Cl NO3 HCO3 NH4 Na K Ca Mg
SO4
Cl
NO3
NH4
NaCa
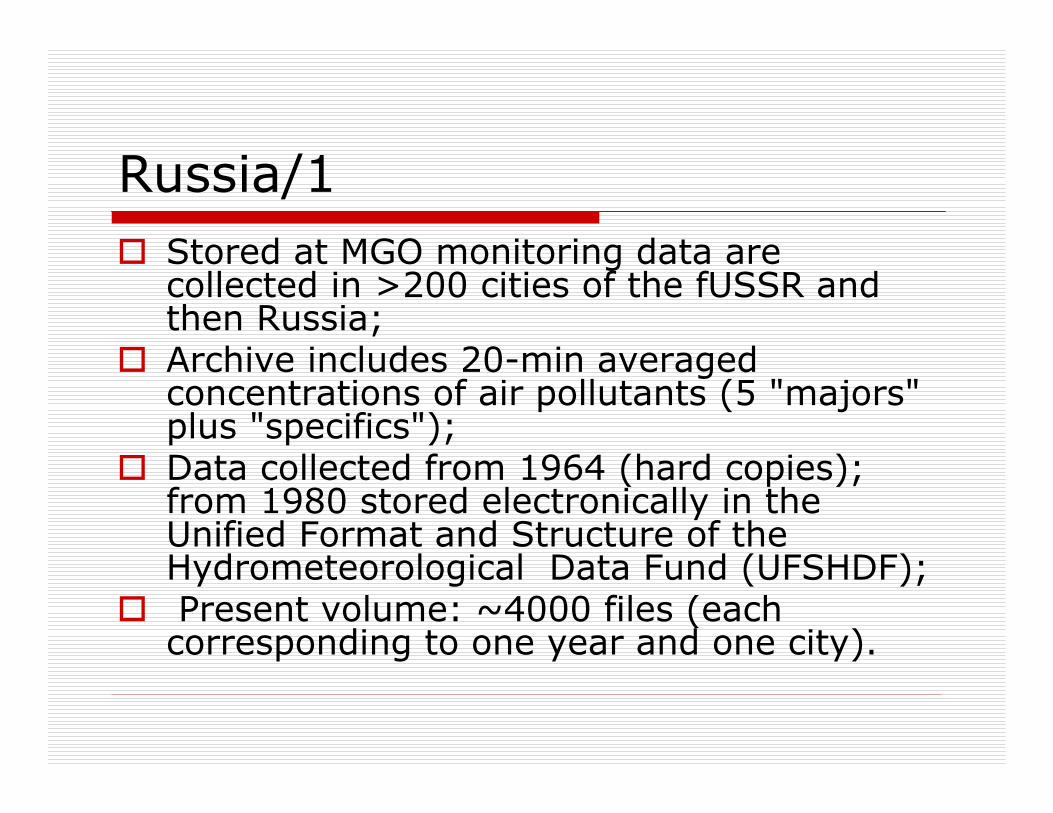
Russia/1Stored at MGO monitoring data are collected in >200 cities of the fUSSR and then Russia;Archive includes 20-min averaged concentrations of air pollutants (5 "majors" plus "specifics"); Data collected from 1964 (hard copies); from 1980 stored electronically in the Unified Format and Structure of the Hydrometeorological Data Fund (UFSHDF); Present volume: ~4000 files (each corresponding to one year and one city).
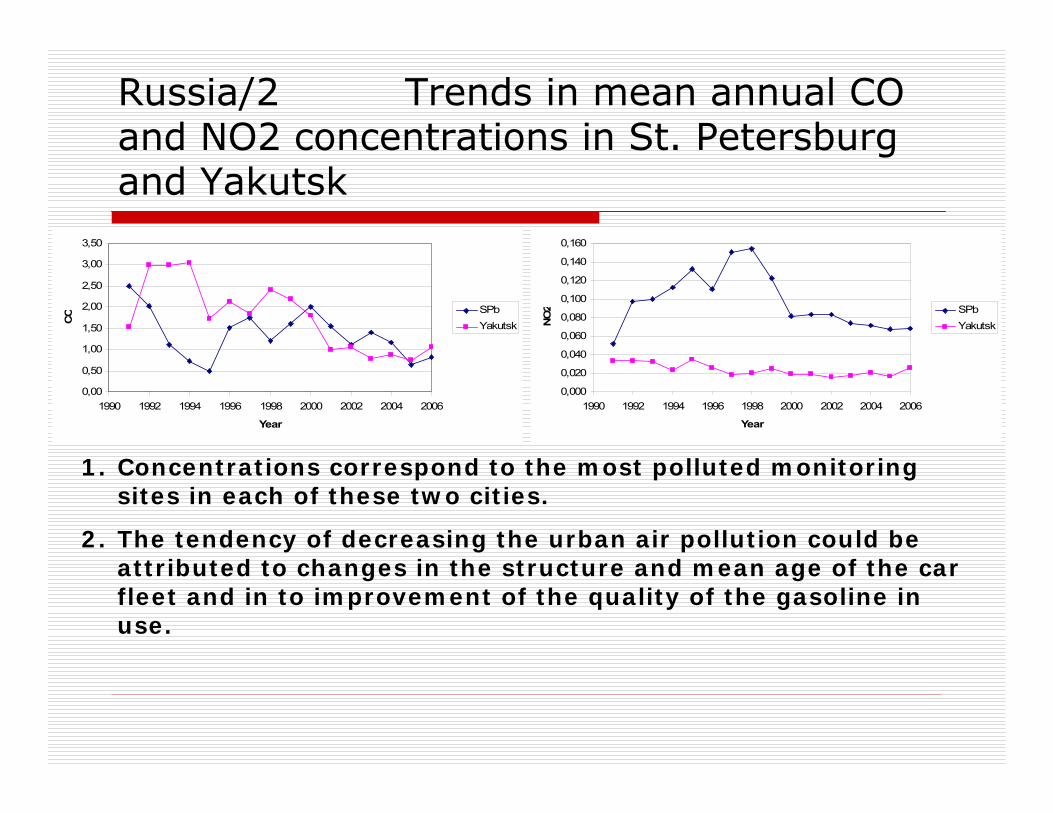
Russia/2 Trends in mean annual CO and NO2 concentrations in St. Petersburg and Yakutsk
0,00
0,50
1,00
1,50
2,00
2,50
3,00
3,50
1990 1992 1994 1996 1998 2000 2002 2004 2006
Year
CO
SPbYakutsk
0,000
0,020
0,040
0,060
0,080
0,100
0,120
0,140
0,160
1990 1992 1994 1996 1998 2000 2002 2004 2006
Year
NO2 SPb
Yakutsk
1. Concentrations correspond to the most polluted monitoring sites in each of these two cities.
2. The tendency of decreasing the urban air pollution could be attributed to changes in the structure and mean age of the car fleet and in to improvement of the quality of the gasoline in use.
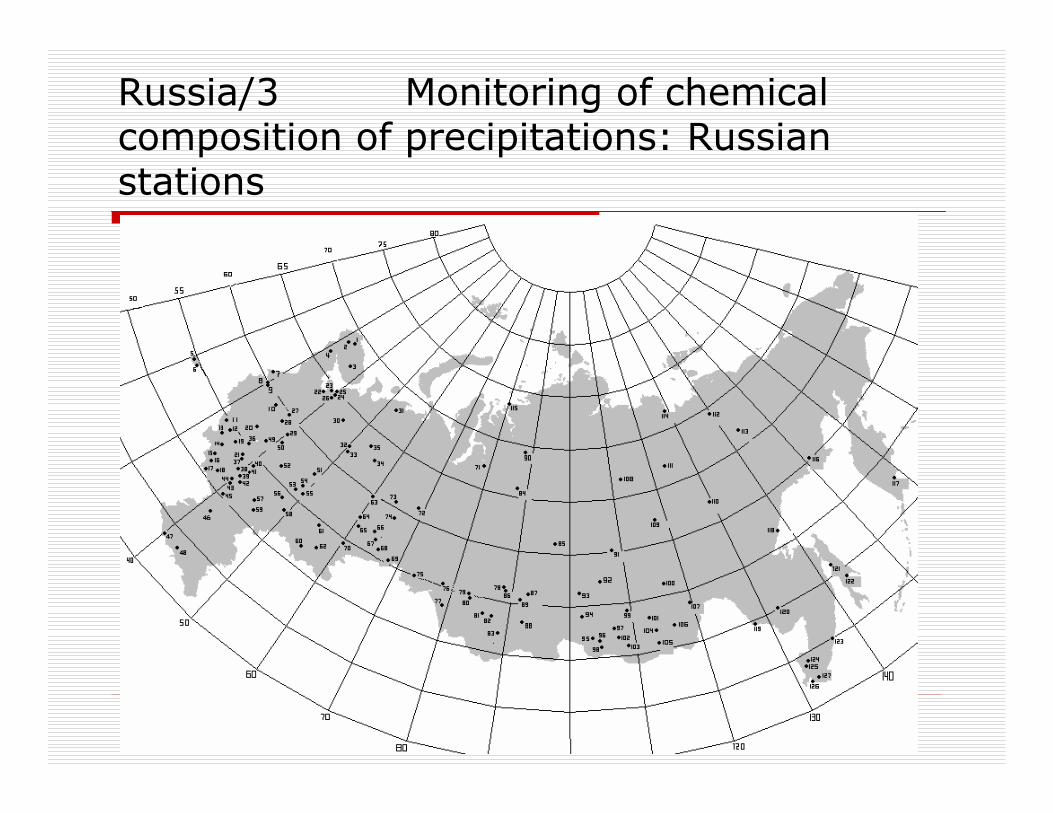
Russia/3 Monitoring of chemical composition of precipitations: Russian stations
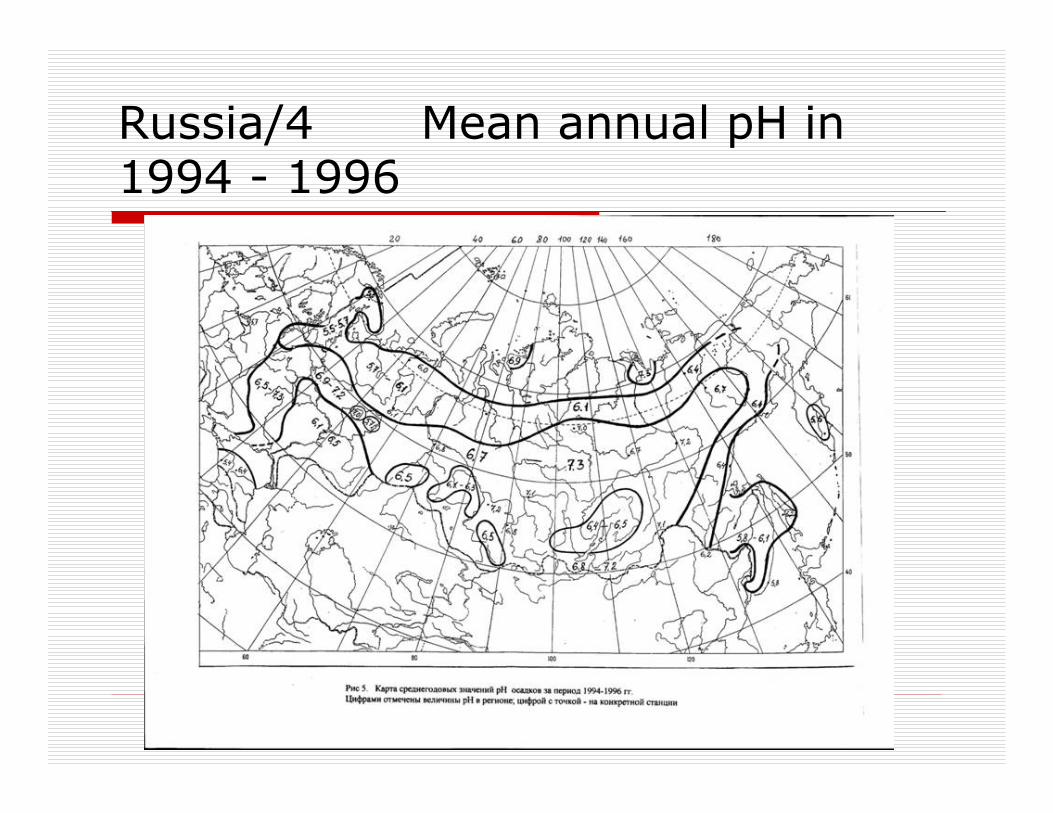
Russia/4 Mean annual pH in 1994 - 1996
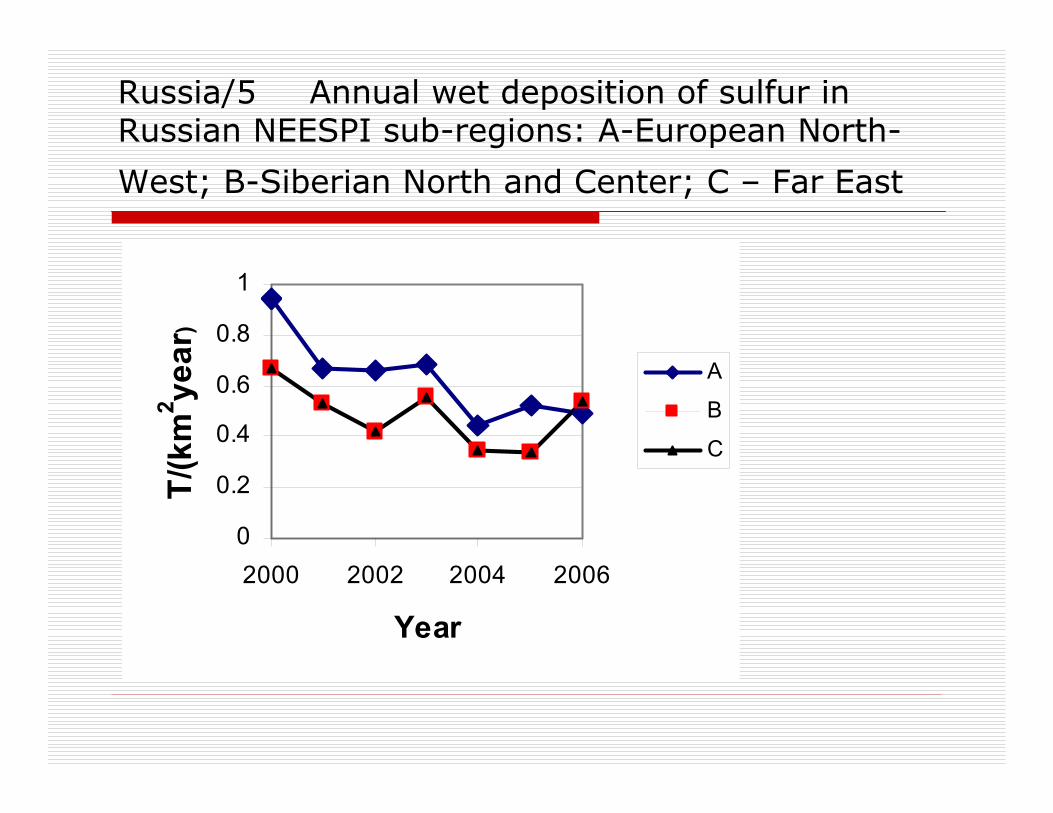
Russia/5 Annual wet deposition of sulfur in Russian NEESPI sub-regions: A-European North-
West; B-Siberian North and Center; C – Far East
0
0.2
0.4
0.6
0.8
1
2000 2002 2004 2006
Year
T/(k
m2 ye
ar)
A
B
C
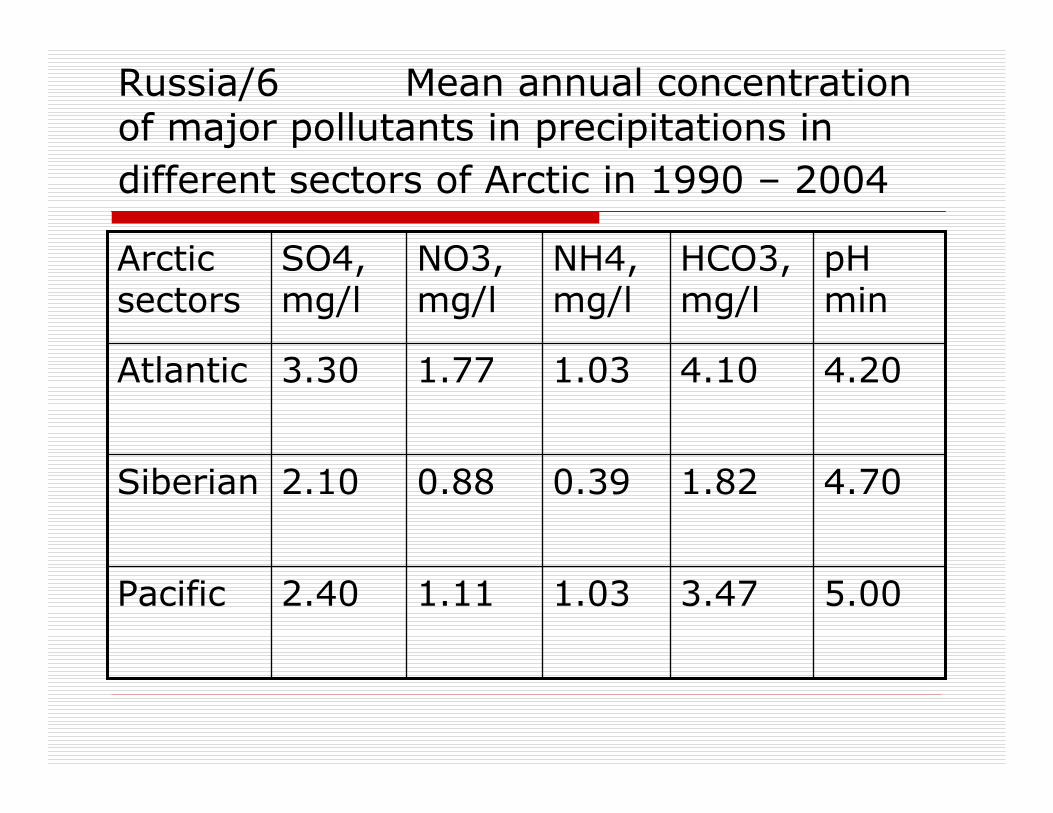
Russia/6 Mean annual concentration of major pollutants in precipitations in different sectors of Arctic in 1990 – 2004
5.003.471.031.112.40Pacific
4.701.820.390.882.10Siberian
4.204.101.031.773.30Atlantic
pH min
HCO3, mg/l
NH4, mg/l
NO3, mg/l
SO4, mg/l
Arctic sectors
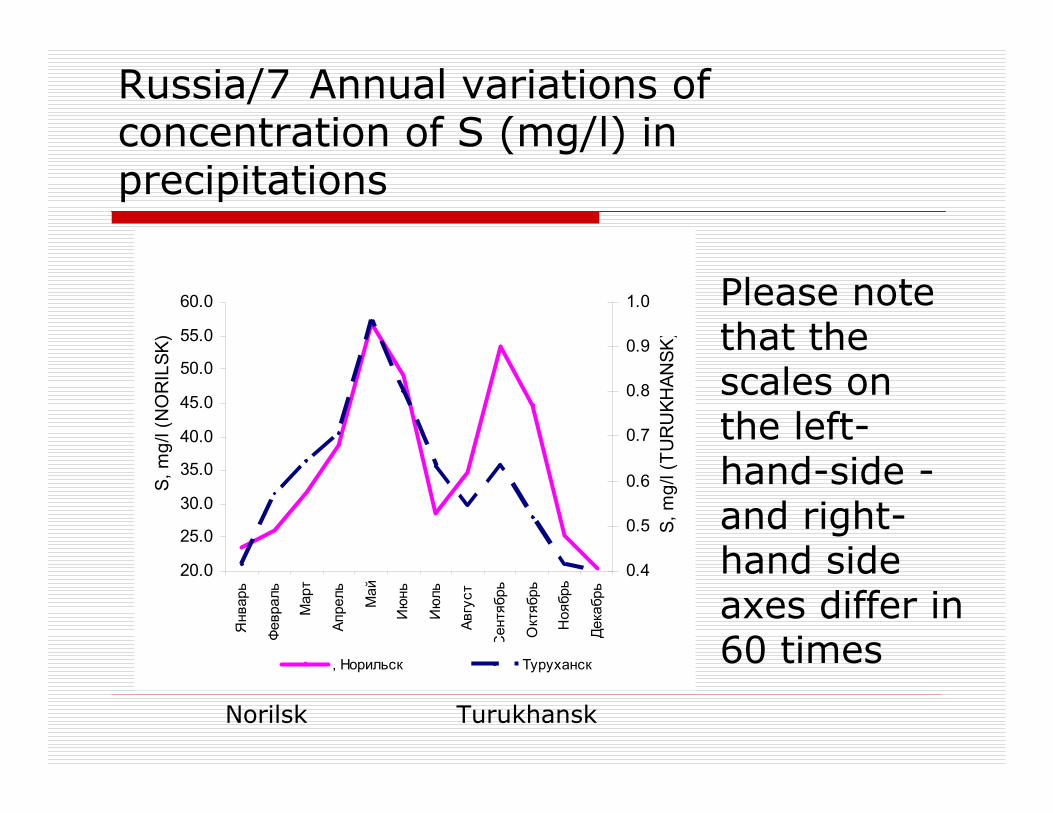
Russia/7 Annual variations of concentration of S (mg/l) in precipitations
20.0
25.0
30.0
35.0
40.0
45.0
50.0
55.0
60.0
Январь
Февраль
Март
Апрель Май
Июнь
Июль
Август
Сентябрь
Октябрь
Ноябрь
Декабрь
S, m
g/l (
NO
RIL
SK)
0.4
0.5
0.6
0.7
0.8
0.9
1.0
S, m
g/l (
TUR
UKH
ANSK
), Норильск Туруханск
Please note that the scales on the left-hand-side -and right-hand side axes differ in 60 times
Norilsk Turukhansk
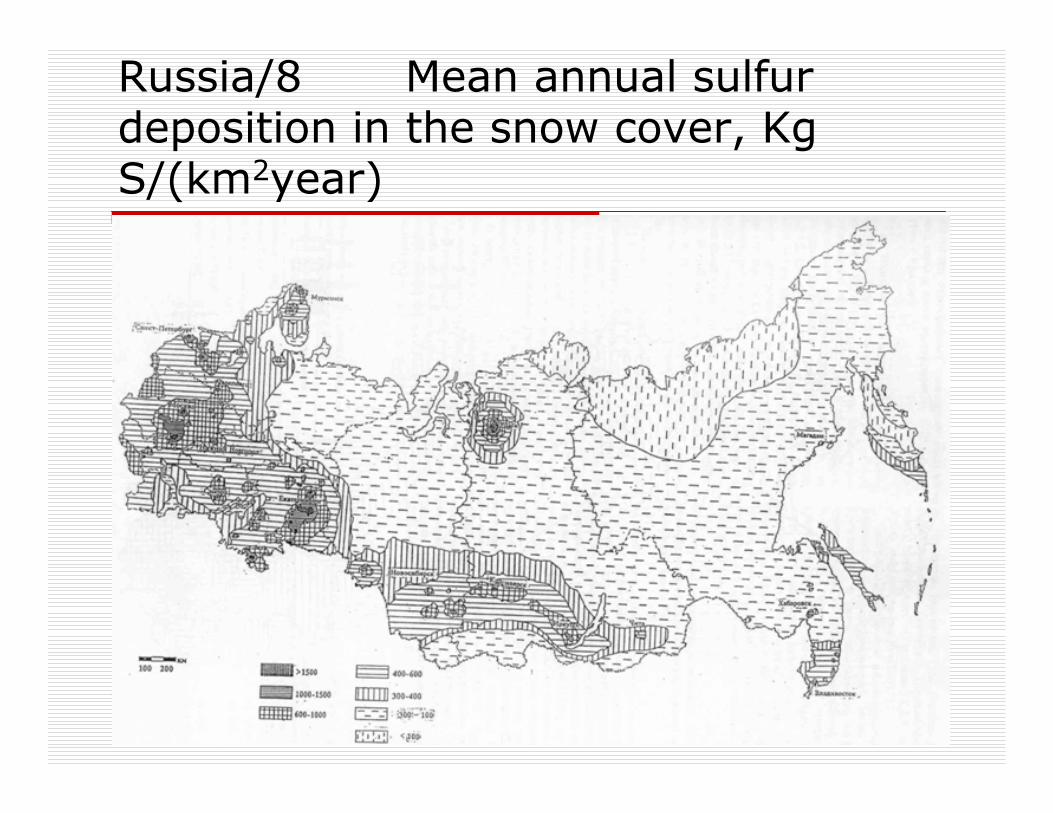
Russia/8 Mean annual sulfur deposition in the snow cover, Kg S/(km2year)
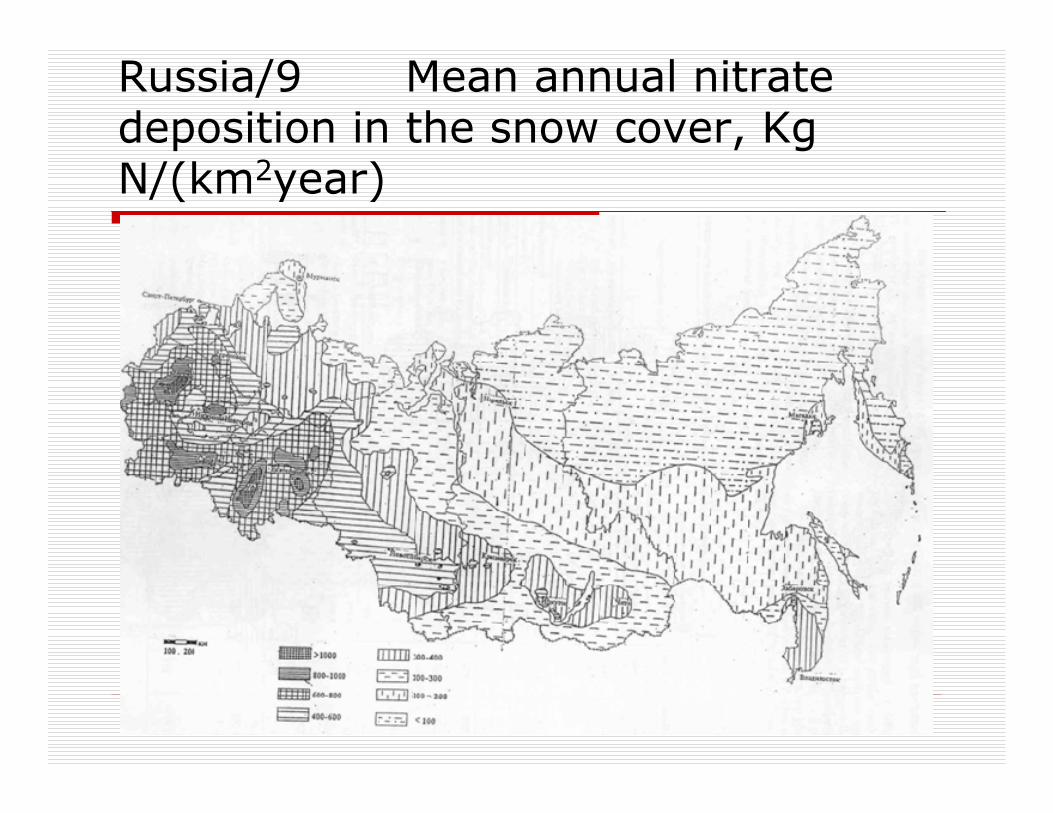
Russia/9 Mean annual nitrate deposition in the snow cover, Kg N/(km2year)
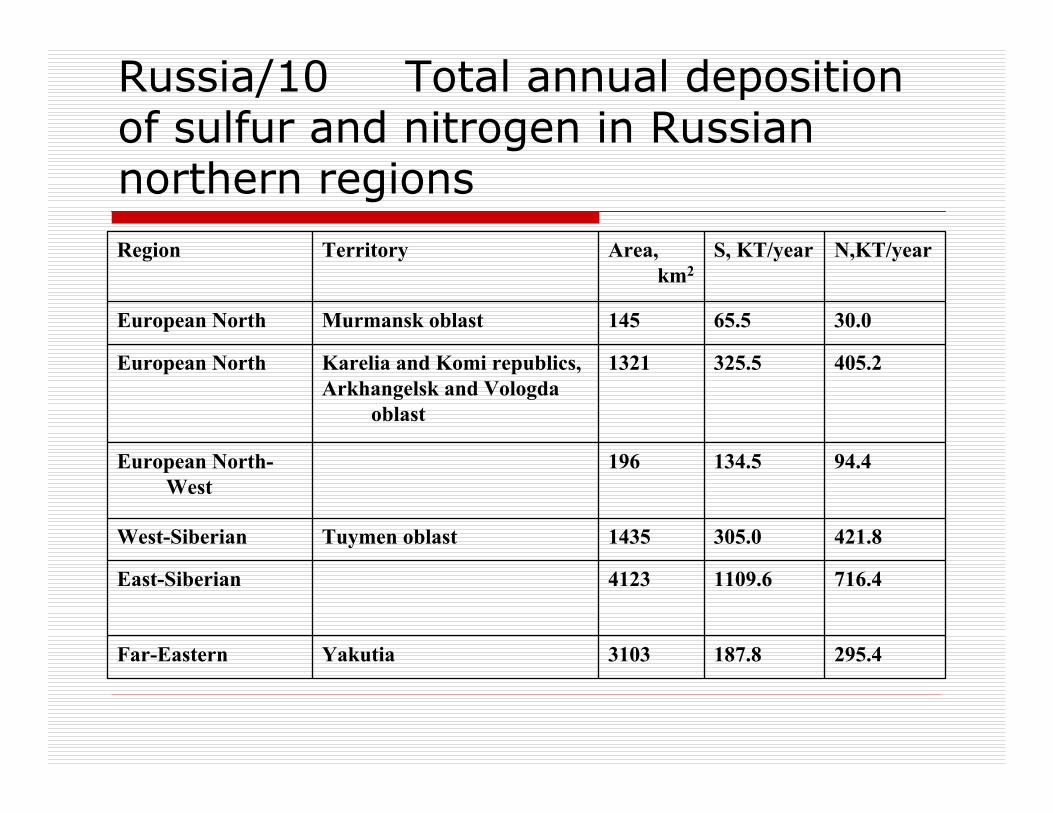
Russia/10 Total annual deposition of sulfur and nitrogen in Russian northern regions
295.4187.83103YakutiaFar-Eastern
716.41109.64123East-Siberian
421.8305.01435Tuymen oblastWest-Siberian
94.4134.5196European North-West
405.2325.51321Karelia and Komi republics, Arkhangelsk and Vologda
oblast
European North
30.065.5145Murmansk oblastEuropean North
N,KT/yearS, KT/yearArea, km2
TerritoryRegion
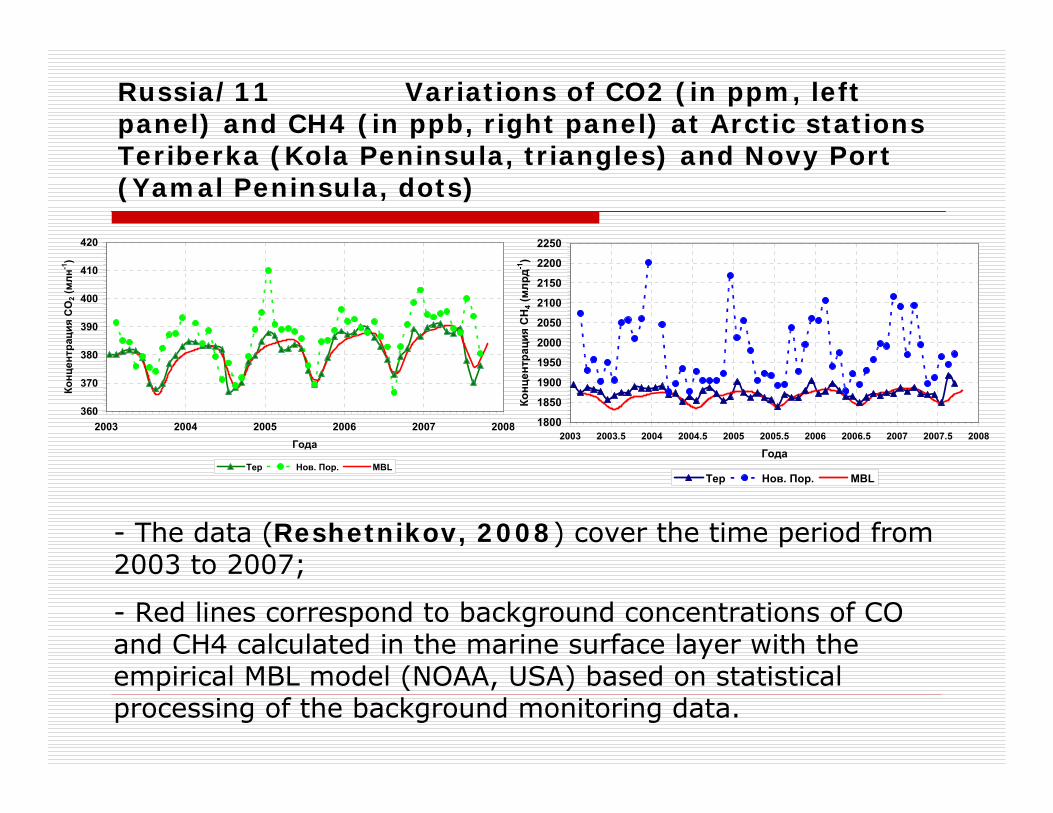
Russia/11 Variations of CO2 (in ppm, left panel) and CH4 (in ppb, right panel) at Arctic stations Teriberka (Kola Peninsula, triangles) and Novy Port (Yamal Peninsula, dots)
360
370
380
390
400
410
420
2003 2004 2005 2006 2007 2008Года
Конц
ентрац
ия C
O2 (млн
-1)
Тер Нов. Пор. MBL
1800
1850
1900
1950
2000
2050
2100
2150
2200
2250
2003 2003.5 2004 2004.5 2005 2005.5 2006 2006.5 2007 2007.5 2008
Года
Конц
ентрац
ия C
H4 (млр
д-1)
Тер Нов. Пор. MBL
- The data (Reshetnikov, 2008) cover the time period from 2003 to 2007;
- Red lines correspond to background concentrations of CO and CH4 calculated in the marine surface layer with the empirical MBL model (NOAA, USA) based on statistical processing of the background monitoring data.
Computational and hybrid monitoring in EE countries /1
Supplementing instrumental monitoring with dispersion modeling ("computational monitoring") is a standard practice nowadays; If supplemented with assimilation of monitoring data, it could be referred to as "hybrid monitoring"; In Russia the ambient air quality standards ("MPCs") are established for about 2000 pollutants but instrumental monitoring covers only about 100 pollutants – the rest could be controlled only using computational monitoring; A similar situation is in practically all NIS countries; Computational monitoring is used (obligatory for non-polluted areas) in all EU countries either.
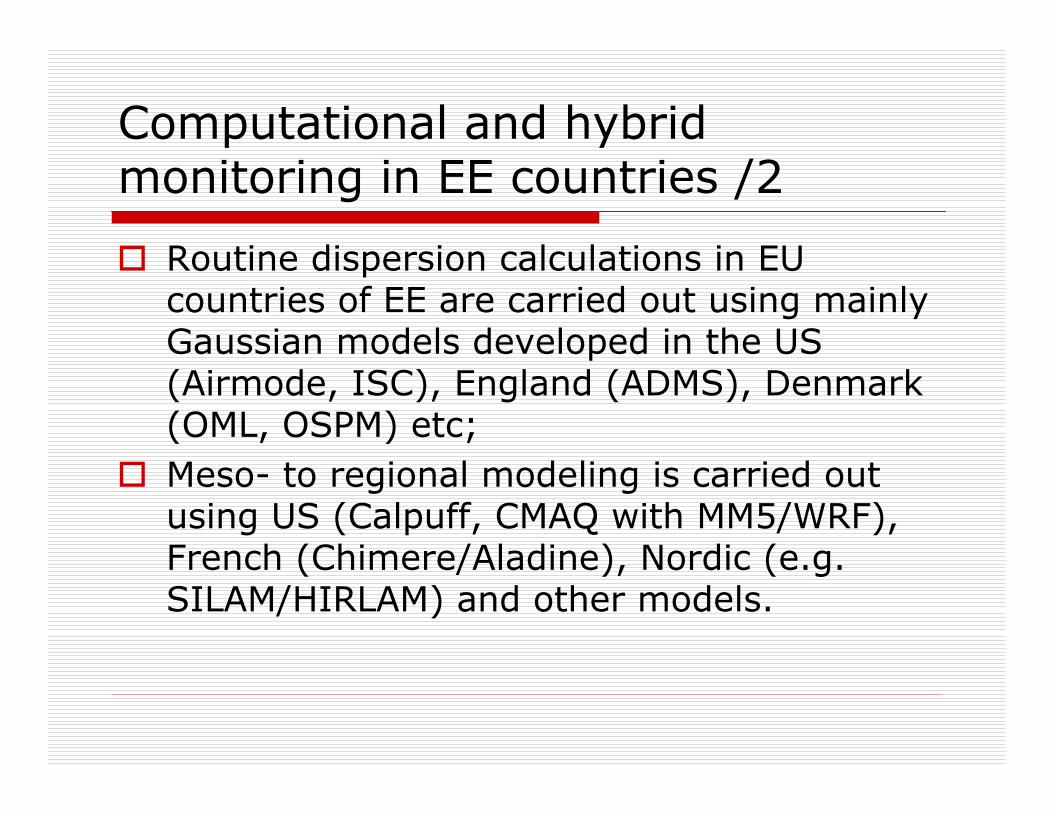
Computational and hybrid monitoring in EE countries /2
Routine dispersion calculations in EU countries of EE are carried out using mainly Gaussian models developed in the US (Airmode, ISC), England (ADMS), Denmark (OML, OSPM) etc; Meso- to regional modeling is carried out using US (Calpuff, CMAQ with MM5/WRF), French (Chimere/Aladine), Nordic (e.g. SILAM/HIRLAM) and other models.
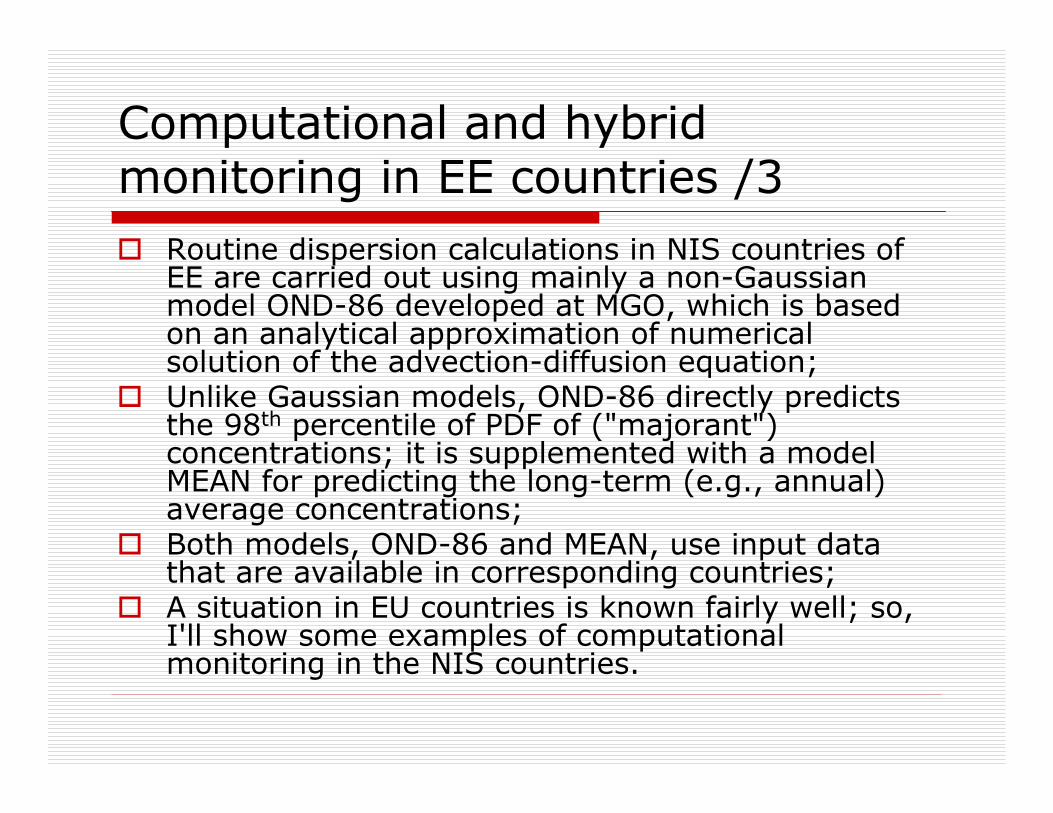
Computational and hybrid monitoring in EE countries /3
Routine dispersion calculations in NIS countries of EE are carried out using mainly a non-Gaussian model OND-86 developed at MGO, which is based on an analytical approximation of numerical solution of the advection-diffusion equation;Unlike Gaussian models, OND-86 directly predicts the 98th percentile of PDF of ("majorant") concentrations; it is supplemented with a model MEAN for predicting the long-term (e.g., annual) average concentrations; Both models, OND-86 and MEAN, use input data that are available in corresponding countries; A situation in EU countries is known fairly well; so, I'll show some examples of computational monitoring in the NIS countries.
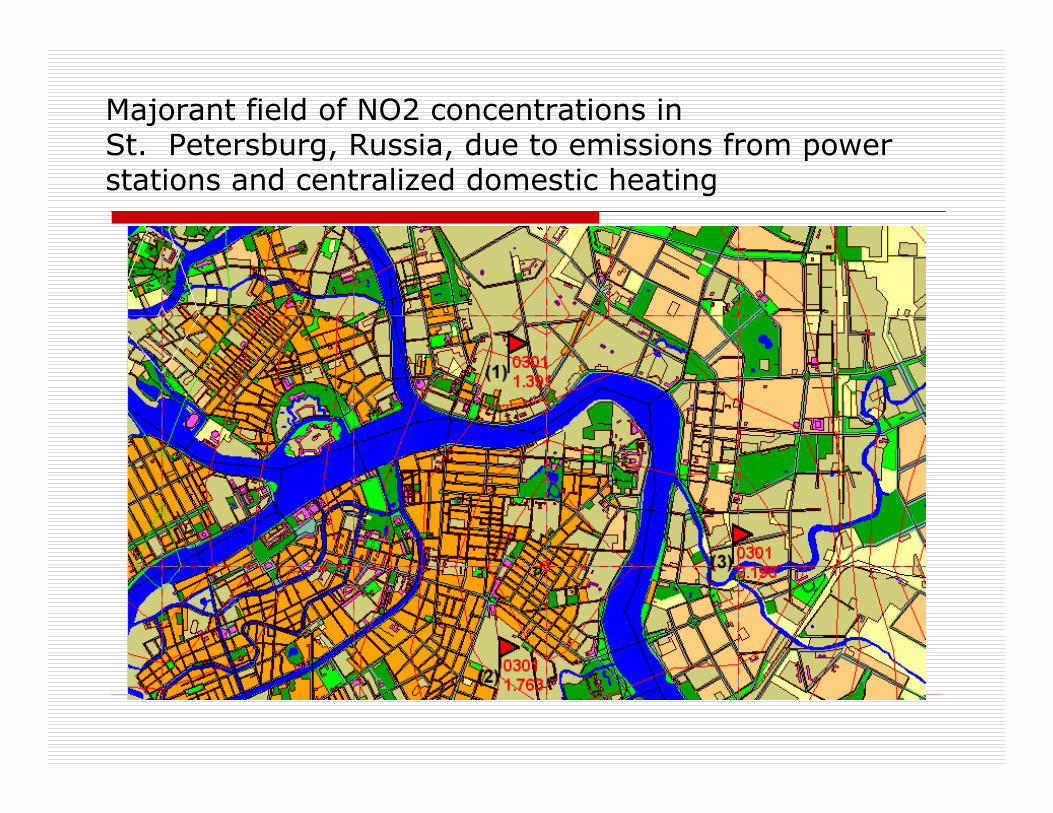
Majorant field of NO2 concentrations in St. Petersburg, Russia, due to emissions from power stations and centralized domestic heating
Mean annual concentrations
0
0.2
0.4
0.6
0.8
1
1.2
1 2 3 4 5
СО
, мг/м Расчет
Измерение
Majorant concentrations
00.5
11.5
22.5
33.5
4
1 2 3 4 5
СО
, мг/ь Расчет
Измерение
persio
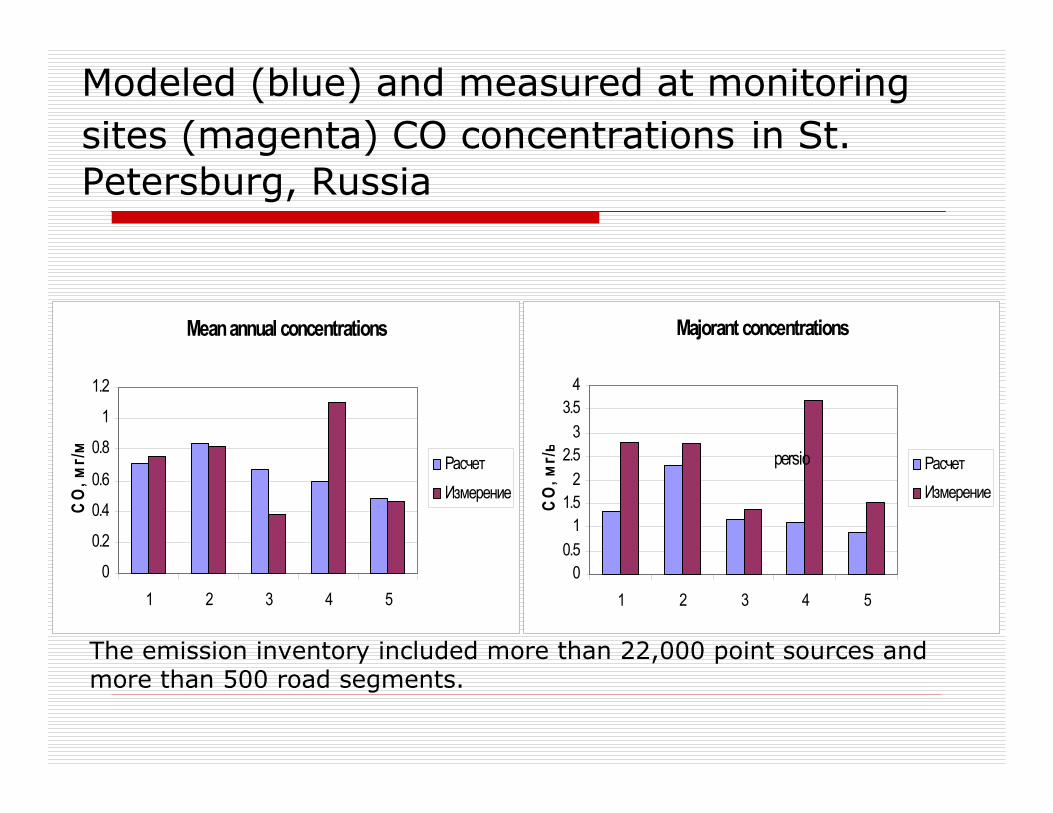
Modeled (blue) and measured at monitoring sites (magenta) CO concentrations in St. Petersburg, Russia
The emission inventory included more than 22,000 point sources and more than 500 road segments.
Mean annual concentrations
0
0.05
0.1
0.15
0.2
0.25
1 2 3 4 5
NO
x, м
г/м Расчет
Измерение
Majorant concentrations
00.5
11.5
22.5
33.5
4
1 2 3 4 5
NO
x, м
г/м Расчет
Измерение
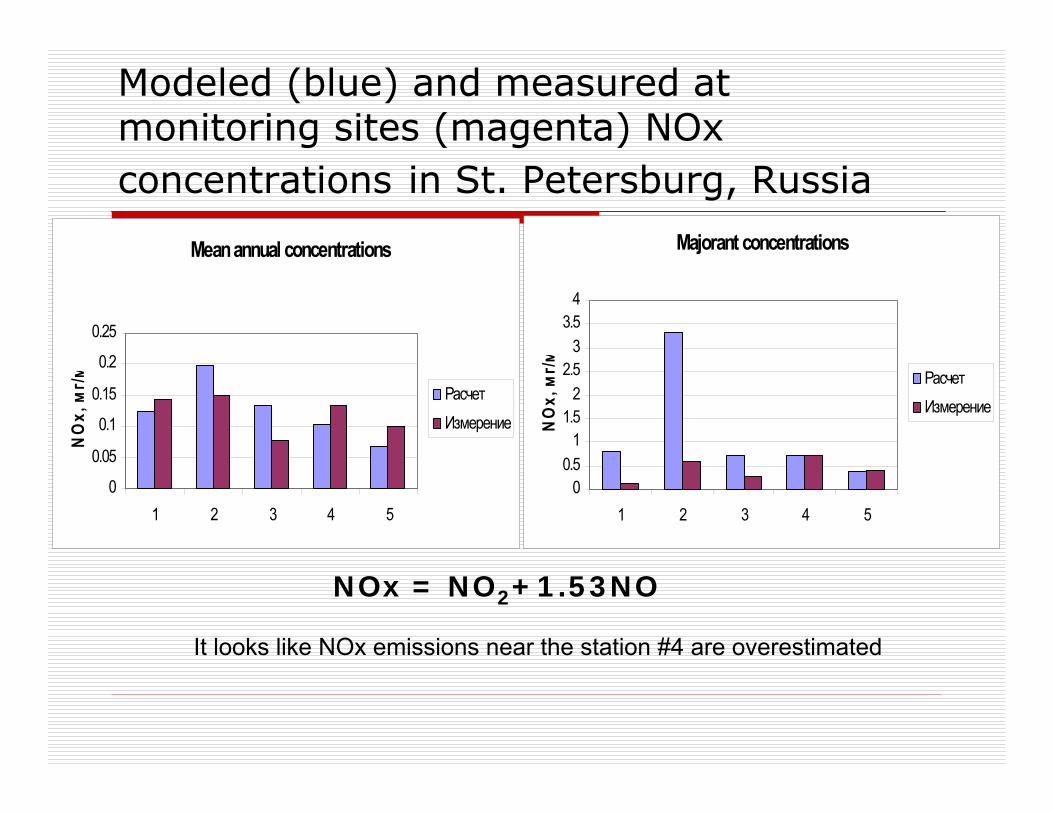
It looks like NOx emissions near the station #4 are overestimated
NOx = NO2+1.53NO
Modeled (blue) and measured at monitoring sites (magenta) NOxconcentrations in St. Petersburg, Russia
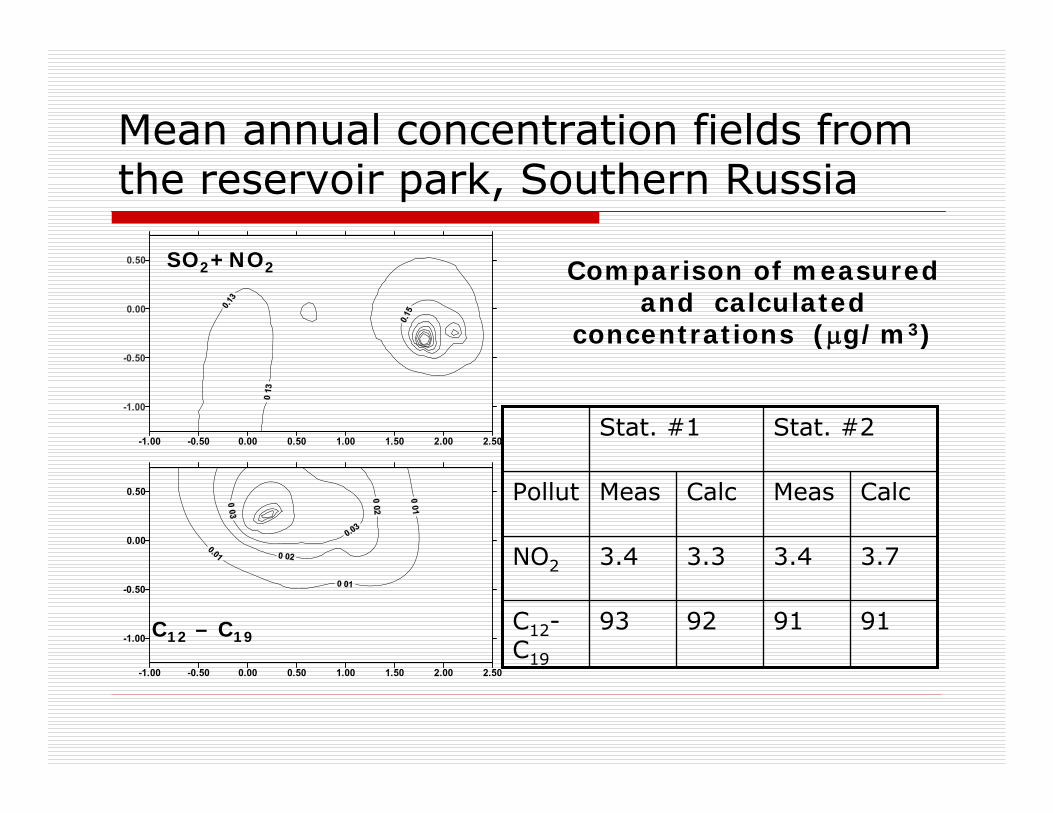
Mean annual concentration fields from the reservoir park, Southern Russia
-1.00 -0.50 0.00 0.50 1.00 1.50 2.00 2.50
-1.00
-0.50
0.00
0.50
-1.00 -0.50 0.00 0.50 1.00 1.50 2.00 2.50
-1.00
-0.50
0.00
0.50
SO2+NO2
C12 – C1991919293C12-
C19
3.73.43.33.4NO2
CalcMeasCalcMeasPollut
Stat. #2Stat. #1
Comparison of measured and calculated
concentrations (μg/m3)
Nationwide activities in computational monitoring in Russia
All emission standards for stationary sources are determined as a result of solution of the inverse dispersion problem;Permissions for constructing the new or reconstructing the existing emission sources could be obtained only after approval of pollution projections from corresponding dispersion calculations; Hygienists carry out health risk calculations for practically all Russian cities.
First two points are inherited from the USSR and applicable to all NIS countries!
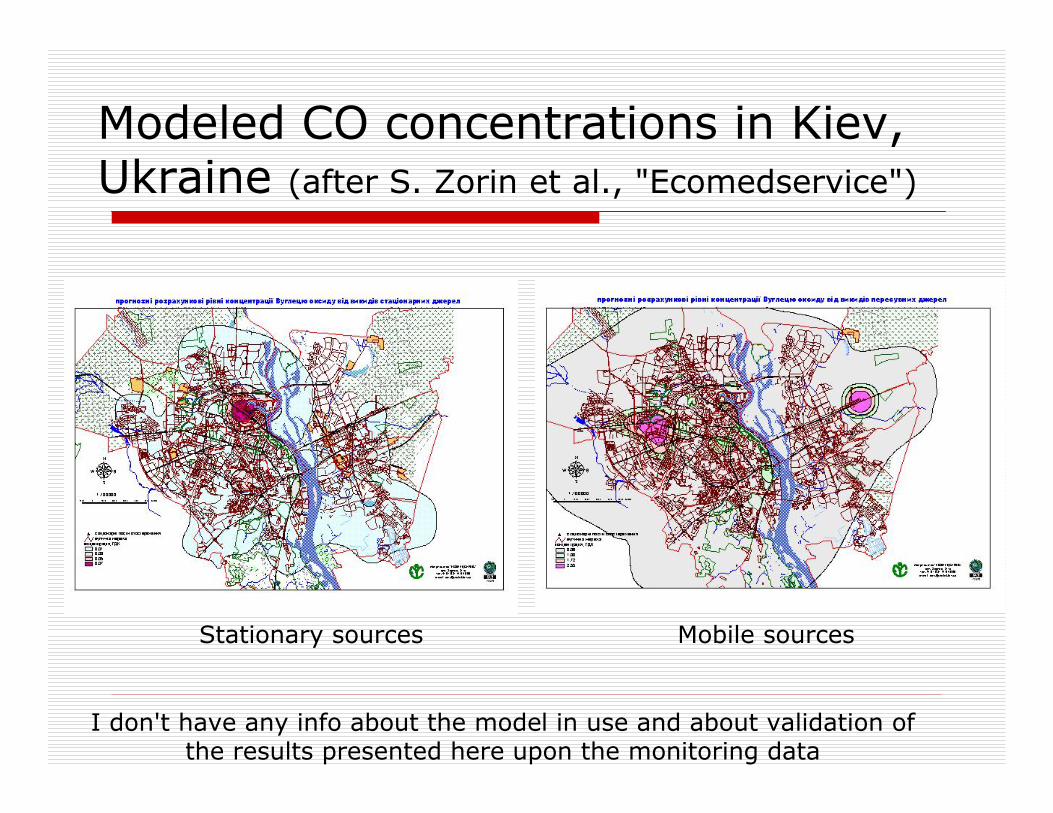
Modeled CO concentrations in Kiev, Ukraine (after S. Zorin et al., "Ecomedservice")
Stationary sources Mobile sources
I don't have any info about the model in use and about validation of the results presented here upon the monitoring data
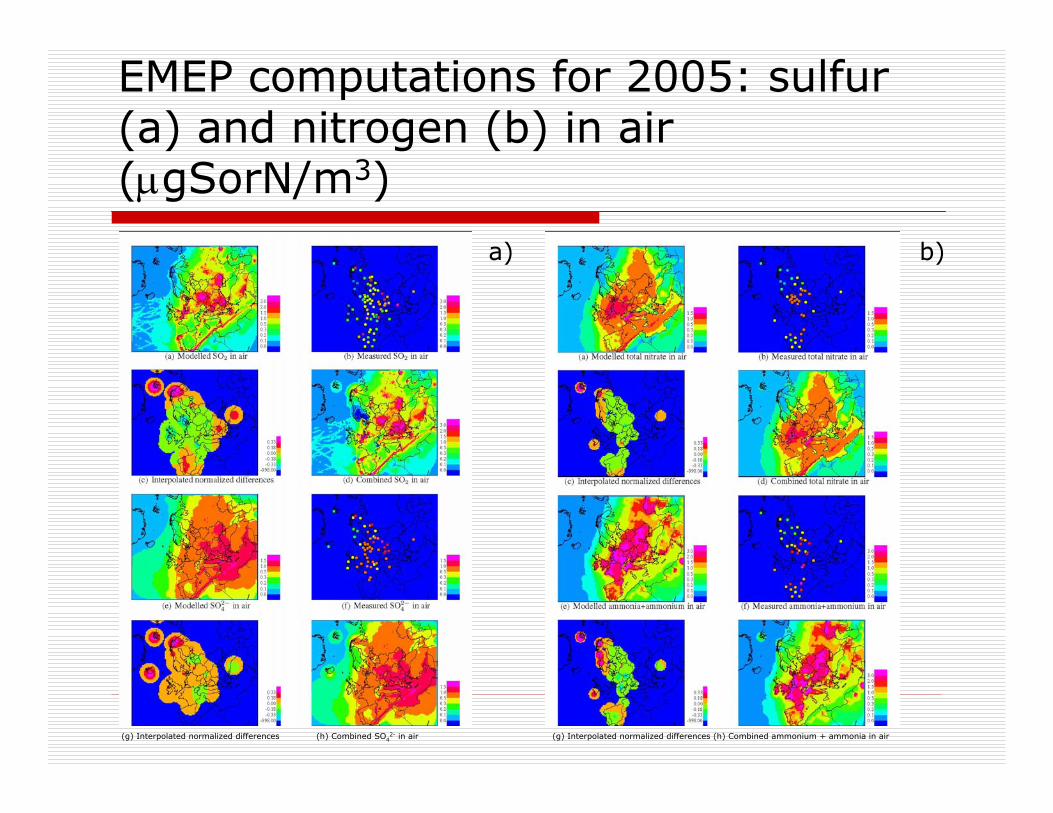
EMEP computations for 2005: sulfur (a) and nitrogen (b) in air (μgSorN/m3)
a) b)
(g) Interpolated normalized differences (h) Combined SO42- in air (g) Interpolated normalized differences (h) Combined ammonium + ammonia in air
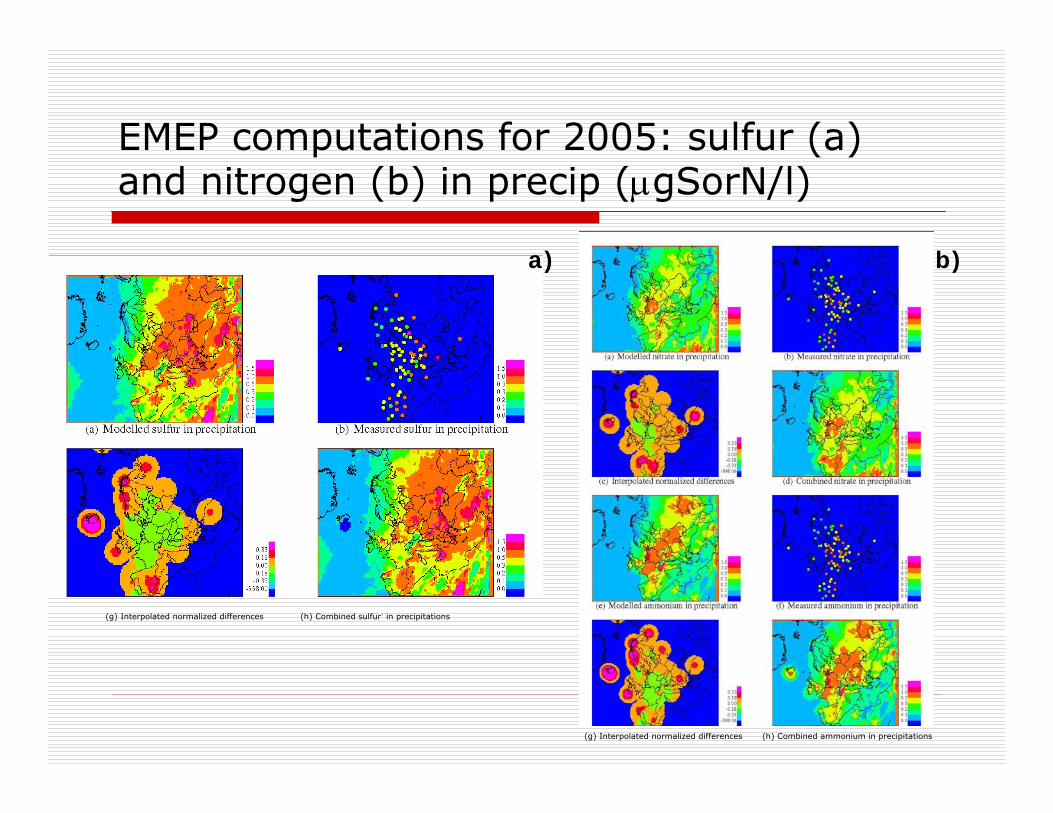
EMEP computations for 2005: sulfur (a) and nitrogen (b) in precip (μgSorN/l)
a) b)
(g) Interpolated normalized differences (h) Combined sulfur- in precipitations
(g) Interpolated normalized differences (h) Combined ammonium in precipitations
ConclusionThe EE countries are characterized with a significant level of atmospheric pollution; The Chernobyl impact is very prominent in these countries and will be registered in the visible future either; The trend in the air pollution is mainly negative, partially due to economic collapse of the fUSSR and corresponding reduction in industrial emission; The most polluted areas of EE countries are localized around major urban and industrial agglomerations; Systematic and coordinated efforts should be made to develop and implement a joint action plan for air pollution monitoring, short- and long-term forecasting, and mitigation in both, NIS and EU, EE countries

THANK YOU
VERY MUCH
FOR YOUR ATTENTION!