How much human capital does Eastern Europe have? Measurement
27
1 How much human capital does Eastern Europe have? Measurement methods and results Bas van Leeuwen International Institute of Social History Werkhovenseweg 7, 3984 LG Odijk, the Netherlands [email protected] and Péter Földvári University of Debrecen Kassai str. 26, Debrecen H-4028 Hungary e-mail: [email protected] version 1, 20 August 2007
Transcript of How much human capital does Eastern Europe have? Measurement

1
How much human capital does Eastern Europe have? Measurement
methods and results
Bas van Leeuwen
International Institute of Social History
Werkhovenseweg 7, 3984 LG Odijk, the Netherlands
and
Péter Földvári
University of Debrecen
Kassai str. 26, Debrecen H-4028 Hungary
e-mail: [email protected]
version 1, 20 August 2007
2
Abstract
There is a general consensus that human capital is a major determinant of economic
development. However, the range of available human capital variables is very wide both in
technical and theoretical sense, causing different human capital measures to be sometimes
just loosely correlated. This is partly because they capture different aspects of human capital
ranging from the resources devoted to human capital creation (without keeping account of
market forces) to attaching a monetary value based on the market value of labour. Hence,
different measures can lead to very different results and conclusions. This difference is
especially prevalent in Eastern Europe which experienced a massive expansion of formal
education in the 20th century which was not always paired by demand from the market or the
efficiency of institutions. Consequently, while looking at the attainment figures only, one
finds that Eastern Europe has about 70-80% of the USA’s human capital in per capita terms
in the 1990s. By using methods that measures the market value of human capital, however,
this estimate reduces to 10-20%.
Keywords: Human capital, labour market, Eastern Europe
3
How much human capital does Eastern Europe have? Measurement
methods and results
Introduction
There is a general consensus that human capital is a major determinant of economic
development. The majority of empirical and theoretical literature suggests a relationship
among human capital endowment, social indicators, institutions and economic growth,
making the estimation of human capital stock an important research topic in contemporary
economics.
The range of available human capital variables is very wide both in technical and
theoretical sense, causing different human capital measures to be sometimes just loosely
correlated. Such variation in human capital related variables and proxies makes cross-country
comparisons difficult, even though this is unavoidable if one seeks to explain income
differences by variation in human capital endowment. For a large part these differences can
be explained by the lack of clear distinction among proxies (variables thought to be related to
human capital) and direct estimates of the human capital stock. Today’s most popular human
capital proxies, especially those related to educational attainment, reflect the amount or share
of resources devoted to formal education in relative terms (relative to the total population) or
expressed in terms of non-monetary measurement unit (years of schooling or number of
students), but fail to capture what value is assigned to human capital by the market.
Obviously, the value of a factor of production includes not only its quantity but its price as
well, and therefore these proxies ignore an important component of human capital. Since the
market value of human capital depends not only on educational attainment but also on

4
institutions, technology and the quantity of other factors of production, neglecting these
factors causes misperceptions regarding the level of human capital stock in different
economies: different measures can lead to very different results and conclusions.
In this paper we present and compare the estimates of the human capital stock in
Eastern Europe created by different techniques. We choose this region not only because until
recently it has not been given the proper attention in the literature, but because we expect that
here the differences among the estimated human capital stocks by various methods will be
especially large. The reason is that, even though Eastern Europe experienced a massive
expansion of formal education in the 20th
century, this process was not driven by market
mechanisms, but rather by bureaucratic means. This, paired with central planning after 1945,
supposedly led to a less efficient formation of human capital, i.e. lower returns to human
capital and structural mismatch between supply and demand.
The paper follows the following structure: in section 2 we review the historical
measures of human capital, i.e. proxies that are available for longer periods, often covering
more than one century. This is followed by the variables related to educational attainment in
section 3, while section 4 focuses on cost and income based methods, which allow one to
express the estimated human capital stock in terms of currency units. In section 5 we compare
the results from these different methods to find out how much human capital Eastern Europe
has relative to Western Europe and the United States. Section 6 has the conclusions.
Historical measures and age-heaping
By historical measures, we mean those variables that are thought to be correlated with
human capital endowment and are available over very long periods (often several hundred
years). The greatest challenge of researching human capital in the very long-run is the poor
5
availability of data: often one simply needs to use what is available and therefore one should
not expect or demand too much accuracy from the results. Here we mention three measures
that have been used to approximate the amount of human capital in different societies and
make cross-country comparisons possible even in the early modern period: the number of
people who could sign a document (Johansson, 1981; Schofield, 1981; Houston, 1983; Reis,
2005), the number of published books (Baten and Van Zanden, 2007; Buringh and Van
Zanden, (work in progress)), and the historical measurement of age heaping (Zelnik, 1961;
Budd and Guinnane, 1991; A’Hearn, Baten and Crayen, 2006, Baten and Crayen, 2007).
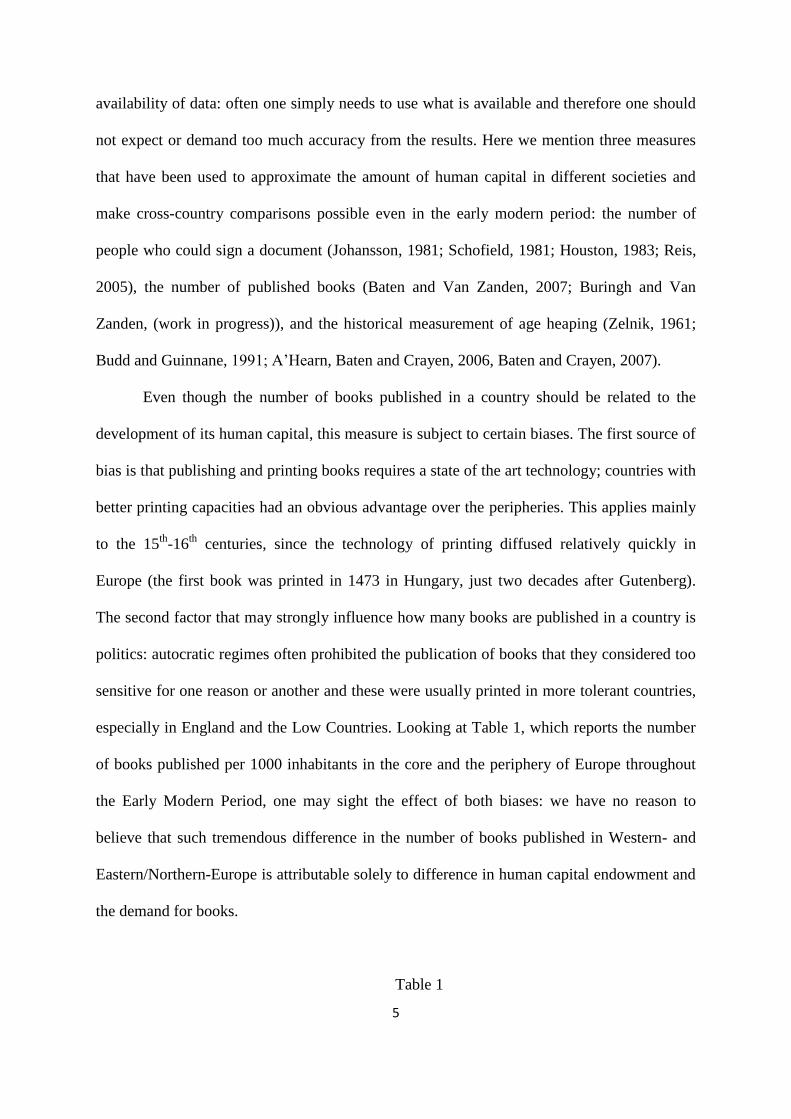
Even though the number of books published in a country should be related to the
development of its human capital, this measure is subject to certain biases. The first source of
bias is that publishing and printing books requires a state of the art technology; countries with
better printing capacities had an obvious advantage over the peripheries. This applies mainly
to the 15th
-16th
centuries, since the technology of printing diffused relatively quickly in
Europe (the first book was printed in 1473 in Hungary, just two decades after Gutenberg).
The second factor that may strongly influence how many books are published in a country is
politics: autocratic regimes often prohibited the publication of books that they considered too
sensitive for one reason or another and these were usually printed in more tolerant countries,
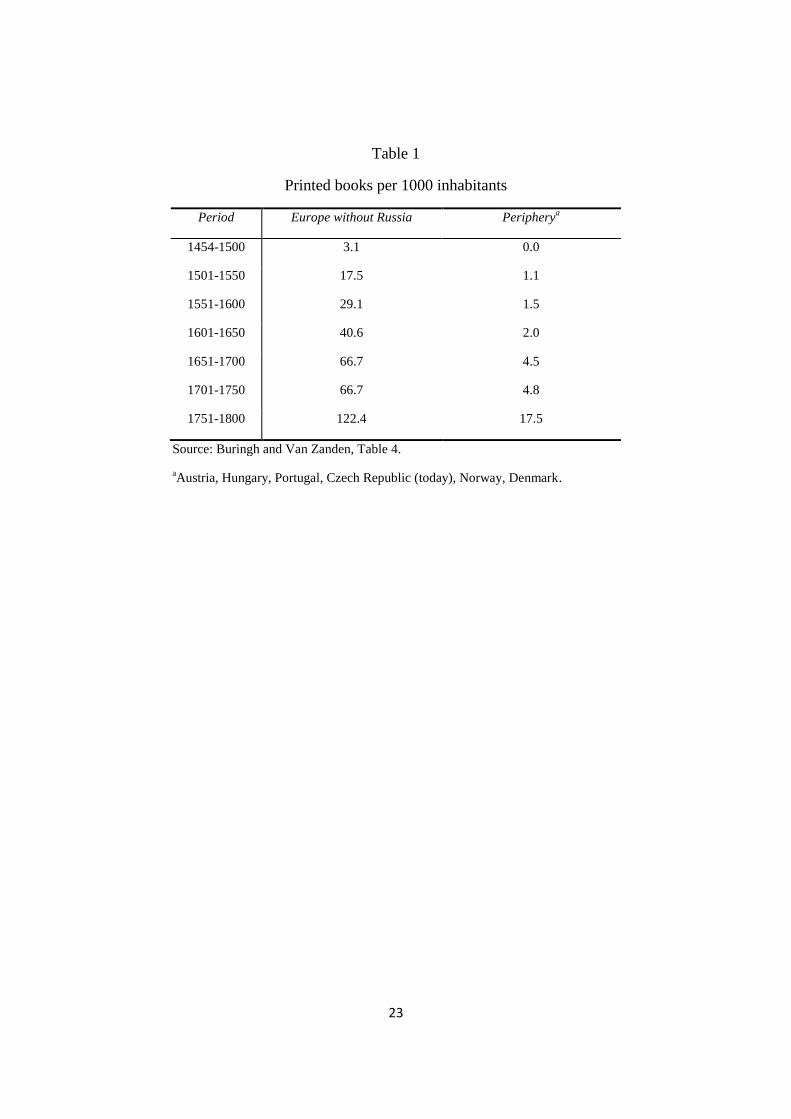
especially in England and the Low Countries. Looking at Table 1, which reports the number
of books published per 1000 inhabitants in the core and the periphery of Europe throughout
the Early Modern Period, one may sight the effect of both biases: we have no reason to
believe that such tremendous difference in the number of books published in Western- and
Eastern/Northern-Europe is attributable solely to difference in human capital endowment and
the demand for books.
Table 1
6
Next, we turn to the historical measurement of age heaping. Age heaping is the
tendency of the respondents in surveys to round their ages to the closest number ending on 5
or 0.1 One can use the survey data to calculate the Whipple-index, which can be used as a
measure of literacy/human capital. The index is calculated by taking the sum of all persons
that report their age ending on 5 or 0, and dividing this by one-fifth of the number of
respondents. In other words, the Whipple-index is the percentage of those respondents who
falsely reports their age, under the assumption that ages ending on 5 and 0 have the same
distribution in all age cohorts. In case of no age heaping one should find a Whipple index
close to 100, and any higher value indicates a growing number of false reports. Age heaping
measurement has not been developed as a historical measure, but rather as a proxy of literacy
applied to developing countries and consequently has been adopted by the UN. It is reported
for the first time in the UN’s Demographic Yearbook Special Census Topics for the years
1985-2003.
The Whipple-index has gained popularity among economic historians too: most of the
historical age heaping studies focus on the eighteenth and nineteenth century when the
quickly developing bureaucracy had already produced military records and tax registers.
Baten and Crayen (2007) report estimates of the Whipple-index for several regions for the
period 1820-1940. Their results suggest the presence of a slow convergence in terms of
numeracy/literacy and probably human capital endowment between Eastern Europe and the
industrialized countries. In 1820 the Whipple index in Eastern Europe is roughly 200, while
1 This tendency is subject of cultural differences, however, which is a major fallacy of age heaping when applied
to measure differences in literacy and human capital endowment. While in Europe and Africa, one may find a
tendency to round the respondents’ age to a number ending on 5 or 0, in China the age-heaping follows a 12
year cycle, in conformity with the traditional Chinese calendar (Jowett and Li, 1992).

7
in Western Europe just 120. By the turn of the 19th
and 20th
century in both region the index
reaches its minimum at circa 100 marking the point when the Whipple index will not supply
us with any useful information about human capital these regions any more. Nevertheless, the
difference in human capital endowment between Western and Eastern Europe suggested by
the age heaping data seems to be much more believable than what we found with the book
production data.
Literacy and educational variables
One very popular approach to approximate human capital stock is to equate human
capital with the attained formal education. Since statistics on formal education are relatively
easy to access, it is not surprising that the majority of empirical studies use either literacy or
formal schooling data to proxy for human capital Famous examples are Barro (1991) and
Mankiw, Romer and Weil (1992) using secondary enrolment data, and Azariadis and Drazen
(1990) and Romer (1990) who rely on adult literacy rates.
These measures, however, have their own shortcomings. Literacy, although it may
capture human capital accumulation in a certain phase of development, cannot measure the
growth of human capital in secondary and higher education (Wössmann, 2003) and is in this
respect similar to age heaping. The same applies to (secondary) enrolment ratios. In addition,
high secondary enrolments may also be accompanied by relatively low primary enrolments,
depending on the educational structure. Also, one should bear in mind that enrolment rates
can at best approximate the yearly addition to the stock of human capital, and therefore can
proxy the growth but not the stock of human capital.
The ‘average years of education’ or ‘average years of schooling’ has been proposed as
a relatively easy way to construct a variable that captures the population’s average
8
educational attainment. This measure has been used in countless empirical studies such as
Benhabib and Spiegel (1994), Islam (1995), Barro (1997, 2001), Temple (1999), Krueger and
Lindahl (2001), and Barro and Sala-i-Martin (2004). The average years of education can be
estimated in three different ways (Wössmann, 2003). The first one (Lau et al., 1991; and
Nehru et al., 1995) is based on a Perpetual Inventory Method (PIM): with sufficiently long
series of enrolment data one can calculate the total years spent with formal education. This
crude estimate is corrected for mortality, repeaters, and drop-outs, and finally divided by the
number of working age population yielding the average years of education. This method is
sensitive to the availability of data for the correction factors, though, which are in most cases
available for a few years only and are usually interpolated by a regression. This raises doubts
about the accuracy of these estimates. The second method is the projection applied by
Kyriacou (1991): he calculates the ‘average years of schooling’ from mid-1970s censuses for
a few benchmark years and then uses lagged enrolment ratios to interpolate average years of
schooling in the labor force for the missing years. Obviously, this method is based on quite
bold assumptions regarding the relationship between enrolment and educational attainment.
The third method relies on attainment figures taken directly from censuses (Psacharopoulos
and Arriagada 1986). A drawback is that the number of censuses is limited, being generally
available only once in every 10 years. Barro and Lee (1993; 2001) suggested solving this
problem by interpolating the census data to obtain estimates of ‘average years of education’
for every fifth year. Their method is however subject to a possible bias as pointed out by
Portela et al (2004). They argue that since Barro and Lee implicitly assume that the mortality
rate is independent of the education level, their estimates exhibit a serious downward bias
which accumulates over time until the next census data is available. Also, Barro and Lee’s
work is often criticized for the quality of data sources, which led to revisions and upgrades by
9
De la Fuente and Doménech (2000) for the OECD and Cohen and Soto (2007) for a larger set
of countries.
As a general critique on the use of literacy and schooling related variables as human
capital measures, we can conclude that these cannot capture the qualitative aspects of human
capital (Judson, 2002). It is reasonable to assume that an extra year of education in 1900
added less to the stock of human capital than it did in 2000. This difference will not be
reflected by either average years of education or enrolment data. Similarly, the available data
on the returns to different levels of education suggest higher education contributing more to
the stock of human capital than primary education. This also is not captured by the average
years of education, because it either does not reflects structural changes at all, or it does just
in a very indirect way. Since the structure and technology of education changed a lot in the
last century, one may assume that the accumulation of human capital accelerated more than it
is suggested by these traditional proxies.
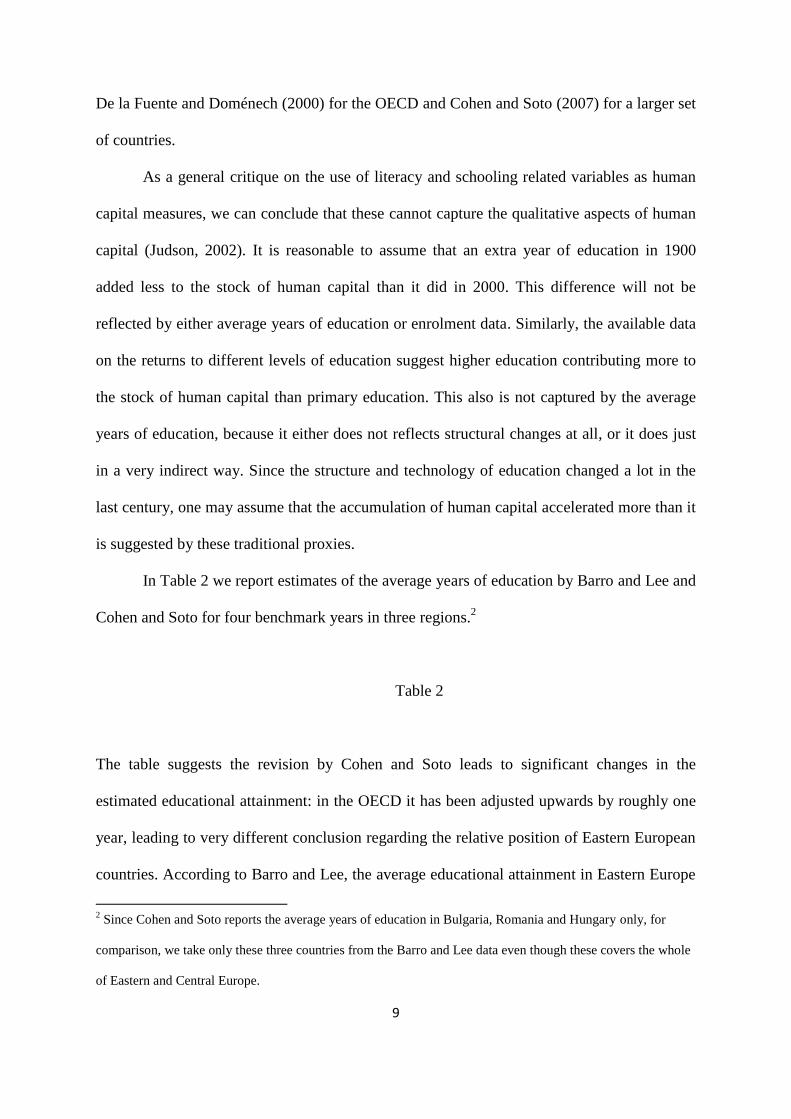
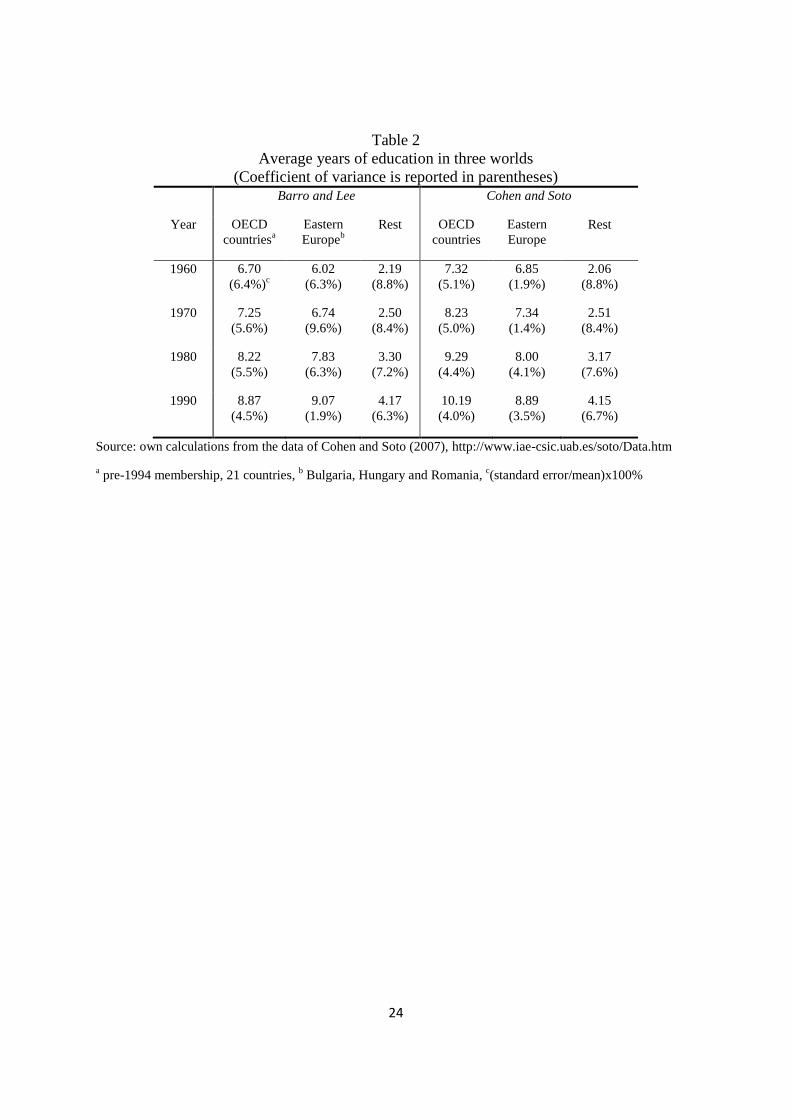
In Table 2 we report estimates of the average years of education by Barro and Lee and
Cohen and Soto for four benchmark years in three regions.2
Table 2
The table suggests the revision by Cohen and Soto leads to significant changes in the
estimated educational attainment: in the OECD it has been adjusted upwards by roughly one
year, leading to very different conclusion regarding the relative position of Eastern European
countries. According to Barro and Lee, the average educational attainment in Eastern Europe
2 Since Cohen and Soto reports the average years of education in Bulgaria, Romania and Hungary only, for
comparison, we take only these three countries from the Barro and Lee data even though these covers the whole
of Eastern and Central Europe.
10
was about 90% of the OECD in 1960, which grew to 102% by 1990. In other words: Eastern
Europe not only managed to converge to the OECD but even surpassed it in terms of
educational attainment. In de Cohen and Soto data, on the other hand, we find that Eastern
Europe has 94% of the OECD average in 1960 that reduces to 87% in 1990, which indicates a
divergence. This casts some doubts on the usefulness of the average years of education for a
cross-country comparison: two similar methods, with only some difference in the data
sources, lead to contradictory conclusions regarding the position of Eastern Europe in terms
of human capital endowment.
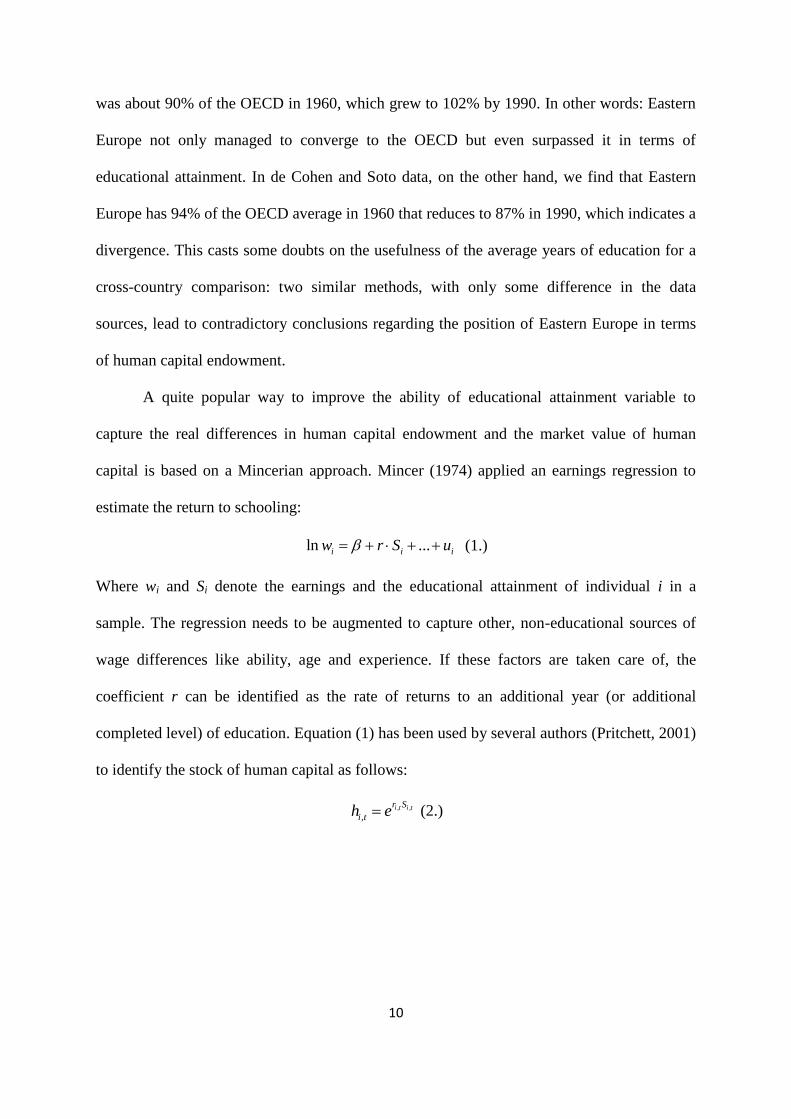
A quite popular way to improve the ability of educational attainment variable to
capture the real differences in human capital endowment and the market value of human
capital is based on a Mincerian approach. Mincer (1974) applied an earnings regression to
estimate the return to schooling:
ln ...i i iw r S u (1.)
Where wi and Si denote the earnings and the educational attainment of individual i in a
sample. The regression needs to be augmented to capture other, non-educational sources of
wage differences like ability, age and experience. If these factors are taken care of, the
coefficient r can be identified as the rate of returns to an additional year (or additional
completed level) of education. Equation (1) has been used by several authors (Pritchett, 2001)
to identify the stock of human capital as follows:
, ,
,i t i tr S
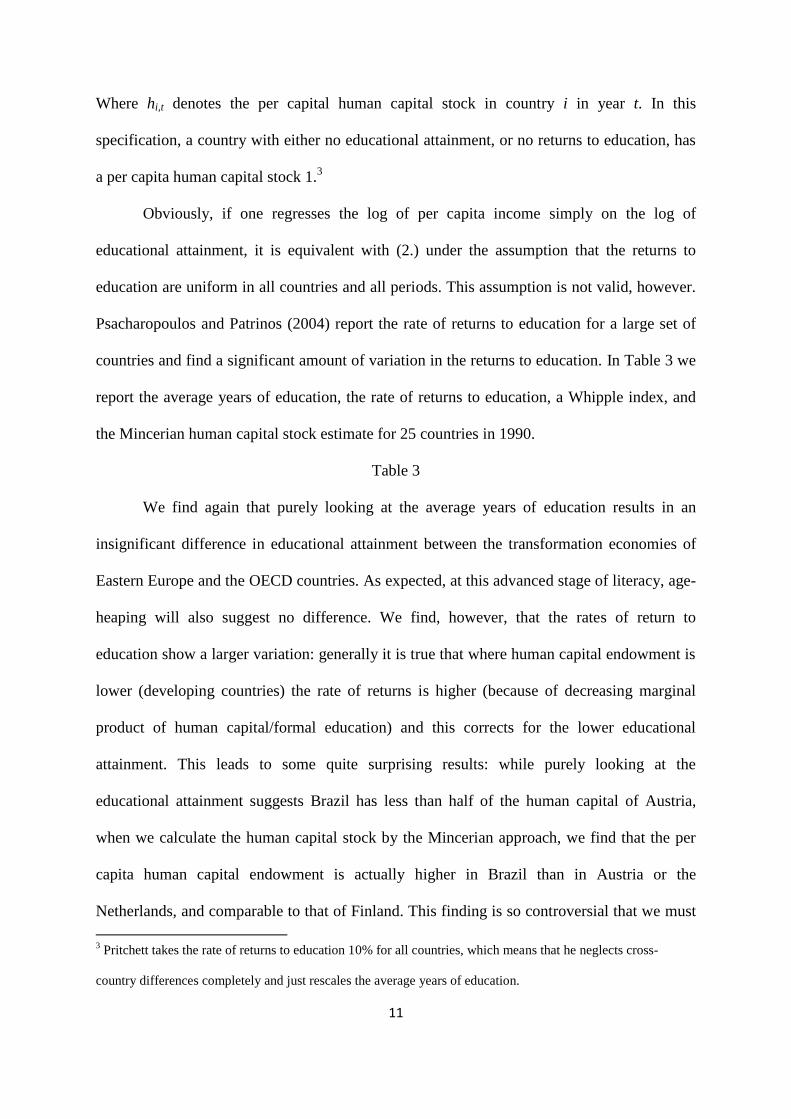
i th e (2.)
11
Where hi,t denotes the per capital human capital stock in country i in year t. In this
specification, a country with either no educational attainment, or no returns to education, has
a per capita human capital stock 1.3
Obviously, if one regresses the log of per capita income simply on the log of
educational attainment, it is equivalent with (2.) under the assumption that the returns to
education are uniform in all countries and all periods. This assumption is not valid, however.
Psacharopoulos and Patrinos (2004) report the rate of returns to education for a large set of
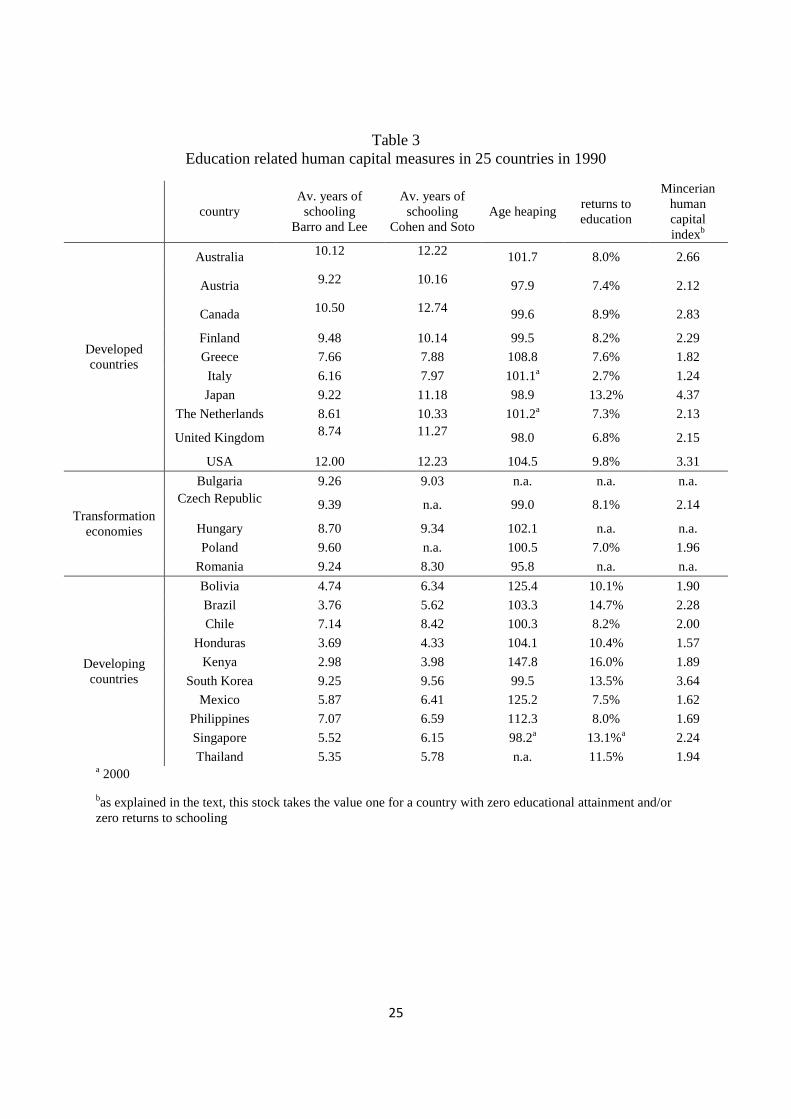
countries and find a significant amount of variation in the returns to education. In Table 3 we
report the average years of education, the rate of returns to education, a Whipple index, and
the Mincerian human capital stock estimate for 25 countries in 1990.
Table 3
We find again that purely looking at the average years of education results in an
insignificant difference in educational attainment between the transformation economies of
Eastern Europe and the OECD countries. As expected, at this advanced stage of literacy, age-
heaping will also suggest no difference. We find, however, that the rates of return to
education show a larger variation: generally it is true that where human capital endowment is
lower (developing countries) the rate of returns is higher (because of decreasing marginal
product of human capital/formal education) and this corrects for the lower educational
attainment. This leads to some quite surprising results: while purely looking at the
educational attainment suggests Brazil has less than half of the human capital of Austria,
when we calculate the human capital stock by the Mincerian approach, we find that the per
capita human capital endowment is actually higher in Brazil than in Austria or the
Netherlands, and comparable to that of Finland. This finding is so controversial that we must
3 Pritchett takes the rate of returns to education 10% for all countries, which means that he neglects cross-
country differences completely and just rescales the average years of education.
12
dismiss it, and conclude that neither educational attainment nor its augmented Mincerian
version can be trusted as a proxy or measure of the value of human capital. Educational
attainment may adequately proxy the time that is spent with education on average, but
neglects the effect of all other factors, while the Mincerian approach is obviously incorrectly
specified, since the decreasing marginal product of human capital causes the rate of returns to
education being higher in less developed country, finally leading to erroneous results and
conclusions. For a serious comparison, we need to choose alternative and, unfortunately,
more data demanding methods.
Pro-and retrospective methods
Aware of the limitations of ‘average years of education’ and other proxies, alternative
methods have gained popularity to measure human capital stock. These variables are either
calculated by summing the costs of human capital (retrospective method), or by summing the
gains from it (prospective method).
The prospective method
The prospective method is also referred to as income-based approach, since it
estimates the value of human capital from the future (expected) earnings. This method
originates with Petty (1690) who calculated the human capital of England as the difference
between his estimates of the national income and property income, capitalized in perpetuity at
a 5% interest rate. The modern versions of income based estimations define the (expected)
value of human capital as the total income that could be generated in the labor market over a
lifetime (Le, Gibson, and Oxley, 2003: p. 273). In other words, human capital is treated as an
investment. A typical example of income-based approach has been applied by Dagum and
Slottje (2001) to arrive at an estimate of the average human capital stock of the USA in 1982.

13
They define human capital as the discounted sum of future earnings, corrected for the
probability of survival. Algebraically:
70
0
( ) ( ) ( , )(1 )x
t
t
h x y x t p x x t i
(3.)
Where h(x) is the human capital of a household aged x (they equal the household head’s
human capital stock with that of the household), p(x,x+t) denotes the survival probability of a
household aged x in the following t years, and finally i is the discount rate normally taken as
6% per annum. In their original article, the authors apply this method as a first step to
determine the average human capital stock from a household survey and this was followed by
a latent variable estimation (Partial Least Squares or Structural Equation Modeling) to
estimate the distribution of human capital within the population. Since this last step requires
good quality data that is rarely available, it is only the first step that has been used by other
authors, such as Wei (2001) for Australia, Oxley and Zhu (2002) for New Zeeland, and
Földvári and Van Leeuwen (2005) for a set of Eastern European countries. Földvári and Van
Leeuwen find that in the mid-1990s Eastern Europe had circa 20-30% of the per capita
human capital stock of the USA in 1982.
The idea that wages reflect differences in efficiency and ultimately human capital
endowment has been used by other authors as well to develop their methods. Jeong (2002),
following Mulligan and Sala-i-Martin (1997), estimated a human capital index for 39
countries. He assumes that all countries have the same Cobb-Douglas type production
function, and therefore the difference in the observed real wages must be attributed only to
differences in human capital endowment and aggregate output. This leads to the following
equation:
ji i
j j i
wH Y
H Y w (4.)
14
Where Hi and Hj denote the human capital stock in countries i and j respectively, w denotes
real wages, and Y is aggregate income. He uses wage data from the ILO October Inquiry to
arrive at estimates of the human capital stock in 39 countries in 1995 relative to the USA.4
His results suggest that the human capital stock in Africa was roughly 52.3% (average of 11
countries), in Asia 66.2% (average of 10 countries), and in Europe 90.2% (average of 9
countries) of the human capital stock in the USA.
The retrospective method
Since earning data are rarely available for a larger period, the retrospective method is
still very popular. This method measures human capital as the sum of all costs incurred
during the formation of human capital. Engel (1883) was the first to apply this method when
he estimated human capital from the costs of rearing a child. His approach was adopted any
extended by Schultz (1961) and Machlup (1962). A more popular application (see for
example Pyo and Jin, 2000) of the cost-based approach has been developed by Kendrick
(1976) who estimated the human capital stock for the United States in the period 1929-1969
by summing the tangible costs (rearing a child until age 14) and the intangible costs (health,
safety, education, and the opportunity costs of students attending school).
Even though this method has its drawbacks (requires a lot of assumptions regarding
the importance of cost factors, or the depreciation of human capital) it partly solves the
problems associated with ‘average years of education’ as it at least partly incorporates the
qualitative aspects of human capital. Also, as suggested by Judson (2002), this approach is
4 The only Eastern European country for which he reports a human capital estimate is Romania. In an earlier
draft of his paper he included Poland and Hungary as well, but these were omitted from the final version so we
do not report these.
15
similar to the measurement of physical capital stock. She suggests a method to calculate the
per capita stock of human capital at its replacement costs:
it ijt ijtj
h d a (5.)
, where ijtd is the public expenditure on education per education level j in country i in year t,
ijta denotes the share of the labor force in year t with a certain level of education, and hit
denotes the average per worker human capital stock. Because of the lack of data, Judson does
not add private expenditure on education and foregone wages to her human capital stock,
even though on theoretical basis these should be included as well. Another problem is that
Judson’s method uses the expenditure per level of education for a single year and weighs this
with the shares of primary, secondary, and higher educated in the working population. Hence,
even after multiplying with the total working population she arrives at the replacement value
of a single year of education instead of the total accumulated stock of human capital. As
such, the human capital stock by the original method of Judson is very likely to underestimate
the value of the stock of human capital. This, however, can simply be corrected by
multiplying her per capita human capital stock by ‘average years of education’.
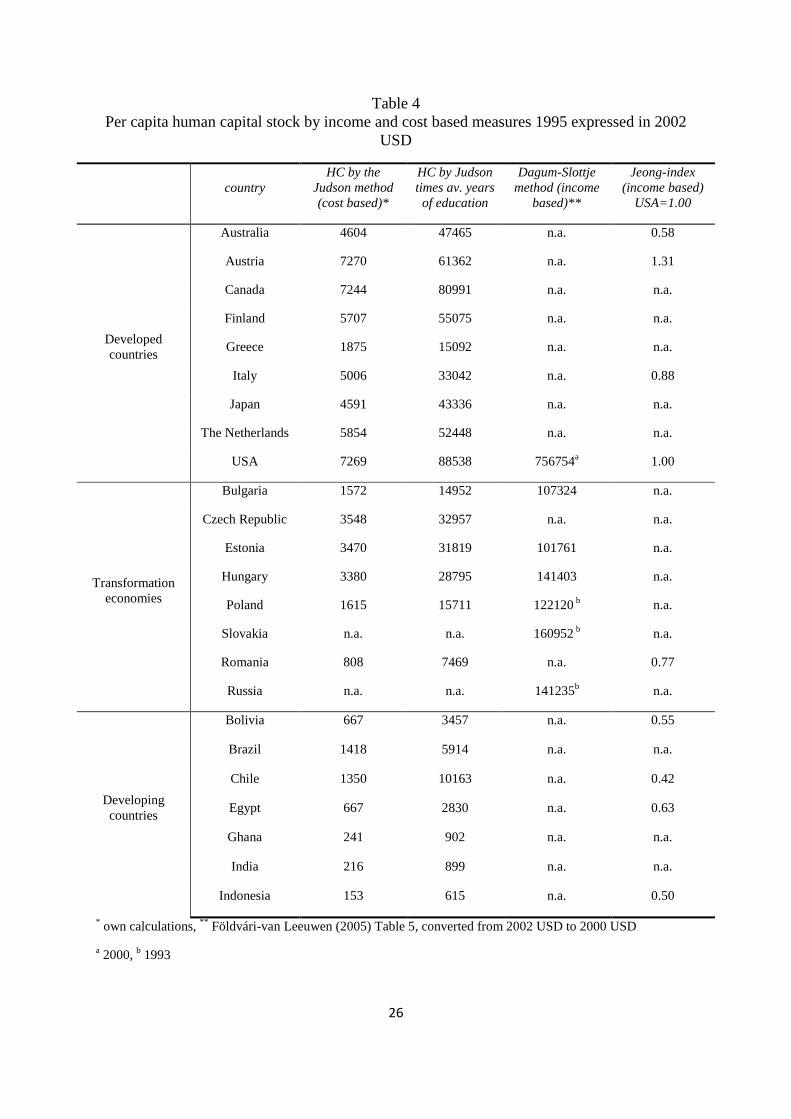
In Table 4, we report the estimated per capital human capital stock for a set of
countries by the Judson (2002) method, the method of Dagum and Slottje (from Földvári and
van Leeuwen, 2005), and finally by Jeong (2002).
Table 4
Since Judson’s dataset is not available, we arrived at the reported estimates by reproducing
her method. While both the Judson and the Dagum and Slottje method suggest quite large
differences between de human capital endowment in OECD countries and Easter Europe, the

16
possible conclusion from the Jeong method is more similar to that of the average years of
education.
How much human capital does Eastern Europe have?
After reviewing some of the best-known human capital measurement methods and the
results for Eastern Europe, we can answer the main question of this article: how much human
capital Eastern Europe has, or had in the 1990s.5 Table 5 has the summary results, where we
compare the human capital endowment in some Eastern European countries as suggested by
the reviewed estimation methods.
Table 5
The educational attainment data suggests the time devoted to formal education in Eastern
Europe be quite similar in all countries and equals roughly 70-80% of the USA. As we
argued earlier in this text, the amount of resources devoted to education does not equal
human capital. If we include the rate of returns to education (the Mincerian method), that
should reflect the cross-country differences in the efficiency and value of human capital
(even though incorrectly as we claimed in the section on educational variables), the estimated
human capital stock reduces to about 50-60% of the USA.
The direct estimates of human capital by cost or income based methods lead to even
larger differences: now we find that the per capita stock of human capital in Eastern Europe is
17-35% of the USA calculated at replacement costs (similarly to how physical capital stock is
estimated). If we estimate human capital stock from the expected future earnings (as if it was
5 Since most work in this field has estimates for the 1990s, unfortunately we cannot be more up to date.
17
an investment), the difference is even greater: Eastern Europe has about one-fifth to one-sixth
of the human capital of the USA.
Which result should be trusted? All the reported measures tell us something important
about human capital endowment in Eastern Europe, but each requires a different
interpretation. The educational attainment can be seen as a proxy of the share of educated
people in the society, which does not equal human capital, however. These estimates suggest
rather an upper bound, a possible maximum value of human capital stock: if the institutions
and the economy were as efficient in Eastern Europe as in the USA, the human capital
endowment could reach 70-80% of the USA. Inefficiencies and structural differences,
however, strongly affect how human capital is valued by the market. If we measure this by
either replacement costs (Judson method) or by the expected lifetime earnings (Dagum and
Slottje method) where these inefficiencies are already implicitly taken account of, the
estimated human capital stock becomes much lower.
Conclusion
In this paper we reviewed some well-known human capital measurement methods,
and compared the estimated human capital stock for Eastern Europe. We find that different
measures lead to very different estimates. Even though educational attainment (average years
of education) is still the most popular proxy used in the literature, we argue that it cannot be
trusted because it neglects how human capital is valued by the market. Since this value
depends directly on how efficiently human capital is allocated and employed in the economy
and therefore depends ultimately on the efficiency of institutions, we should find that
measures that take these differences into account should lead to very different estimates.
Using both cost-and income-based methods to estimate the human capital stock in Eastern
Europe, this is exactly what we find. While looking at the attainment figures only, one would
18
expect that Eastern Europe has about 70-80% of the USA’s human capital in per capita terms,
when we measure the value of human capital this estimate reduces to 10-20% in the 1990s.
References
Azariadis, C., Drazen, A., 1990. Threshold Externalities in Economic development.
Quarterly Journal of Economics 105 (2), 501-526.
A’Hearn, B., Baten, J., Crayen, D., 2006. Quantifying quantitative literacy: age heaping and
the history of human capital. Universitat Pompeu Fabra Economics Working Paper
No. 996.
Barro, R.J., 1997. Determinants of Economic Growth: A Cross-Country Empirical Study.
MIT Press, Cambridge, MA
Barro, R., Sala-i-Martin, X., 2004. Economic Growth. The MIT Press, Cambridge [etc.].
Barro, R.J., 1991. Economic Growth in a Cross Section of Countries. The Quarterly Journal
of Economics 106 (2), 407-443.
Barro, R. J., 1991. Human Capital and Growth. American Economic Review, Papers and
Proceedings 91 (2), 12-17.
Barro, R.J., Lee, J.-W., 1993. Institutional comparisons of educational attainment. Journal of
Monetary Economics 32 (3), 363-394.
Barro, R.J., Lee, J.-W., 2001. International Data on Educational Attainment: Updates and
Implications. Oxford Economic Papers 53 (3), 541-563.
Baten, J., Zanden, J. L. van, 2007. Book Production and the Onset of Modern Economic
Growth, Department of Economics and Business, Universitat Pompeu Fabra,
Economics Working Papers series, no. 1030.
19
(http://www.econ.upf.edu/docs/papers/downloads/1030.pdf)
Benhabib, J., Spiegel, M. M., 1994. The Role of Human Capital in Economic Development:
Evidence from Aggregate Cross-Country and Regional U.S. Data. Journal of
Monetary Economics 34 (2), 143-173.
Budd, J.W., Guinnane, T., 1991. Intentional Age-Misreporting, Age-Heaping, and the 1908
Old Age Pensions Act in Ireland. Population Studies 45 (3), 497-518.
Buringh, E., Zanden, J.L. van, (work in progress). Charting the "rise of the West".
Manuscript and printed books in Europe, a long-term perspective from the sixth
through eighteenth century. (http://www.iisg.nl/staff/jvz.php)
Cohen, D., Soto, M., 2007. Growth and Human Capital: Good Data, Good Results. Journal of
Economic Growth 12 (1), 51-76.
Crayen , D., 2005. The Relationship of Literacy, Numeracy, and Age Heaping: Patterns in
Recent LDC data. Working Paper, Tuebingen.
Crayen, D., Baten, J., 2007. Global trends in numeracy: A first glance at the age heaping
evidence from 1820-1940. Paper presented at The Seventh Conference of the
European Historical Economics Society, 29 June -1 July, 2007, Lund, Sweden.
Dagum, C., Slottje, D.J., 2000. A new method to estimate the level and distribution of
household human capital with application. Structural Change and Economic
Dynamics 11 (1-2), 67-94.
Engel, E., 1883. Der Wert des Menschen, Verlag von Leonhard Simion, Berlin.
Földvári, P., Leeuwen, B. van, 2005. An Estimation of the Human Capital Stock in Eastern
and Central Europe. Eastern European Economics 43 (6), 53-65.
Fuente, A. de la, Doménech, R., 2000. Human Capital in Growth Regressions: How Much
Difference Does Data Quality Make? OECD Economics Department Working Papers,
20
No. 262, 2-68.
Houston, R., 1983. Literacy and society in the West, 1500-1850. Social History 8 (3), 269-
293.
Islam, N., 1995. Growth Empirics: A Panel Data Approach. Quarterly Journal of Economics
110 (4), 1127-1170.
Jeong, B., 2002. Measurement of human capital input across countries: a method based on the
laborer's income. Journal of Development Economics 67 (2), 333-349.
Johansson, E., 1981. The history of Literacy in Sweden. In: Graff, H.J. (Ed.), Literacy and
Social Development in the West: A Reader. Cambridge University Press: Cambridge,
pp. 151-182.
Jowett, A. J., Li, Y., 1992. Age-heaping: contrasting patterns from China. GeoJournal 28 (4),
427-442.
Judson, R., 2002. Measuring Human Capital Like Physical Capital: What Does it Tell Us?
Bulletin of Economic Research 54 (3), 209-231.
Kendrick, J.W., 1976. The Formation and Stocks of Total Capital, Columbia university Press,
New York.
Krueger, A. B., Lindahl, M., 2001. Education for Growth: Why and For Whom? Journal of
Economic Literature 39 (4), 1101-1136.
Kyriacou, G.A., 1991. Level and Growth Effects of Human capital: A Cross-Country Study
of the Convergence Hypothesis. Economic Research Reports 19-26, C.V. Starr Center
for Applied Economics, New York University.
Lau, L.J., Jamison, D.T., Louat, F.F., 1991. Education and Productivity in Developing
21
Countries: An Aggregate Production Function Approach. World Bank PRE Working
Paper Series 612, Washington D.C.
Le, T., Gibson, J., Oxley, L., 2003. Cost- and Income-based measures of Human Capital.
Journal of Economic Surveys 17 (3), 271-307.
Machlup, F., 1962. The Production and Distribution of Knowledge in the United States.
Princeton University Press, Princeton, N.J.
Mankiw, N. G., Romer, D., Weil, D.N., 1992. A Contribution to the Empirics of Economic
growth. The Quarterly Journal of Economics 107 (2), 407-437.
Mincer, J., 1974. Schooling, experience and earnings. Columbia University Press, New York.
Mulligan, C.B., Sala-i-Martin, X., 1997. A Labor income-based measure of the value of
human capital: an application to the states of the United States. Japan and the World
Economy 9 (2), 159-191.
Nehru, V., Swanson, E., Dubey, A., 1995. A new database on human capital stock in
developing and industrial countries: Sources, methodology, and results. Journal of
Development Economics 46, 379-401.
Oxley, L., Zhu, W., 2002. How Much Human Capital Does New Zealand Have? Paper
presented at ESAM, Brisbane.
Petty, W., 1690. Political Arithmetic (1690). reprinted in Hull, C.H., 1899. The Economic
Writings of Sir William Petty. Cambridge University Press, Cambridge.
Portela, M., Alessie, R., Teulings, C., 2004. Measurement Error in Education and Growth
Regressions. Tinbergen Institute Discussion Paper, TI 2004-040/3.
Psacharopoulos, G., Arriagada, A.M., 1986. The Educational Composition of the Labour
Force: An International Comparison. International Labour Review 125 (5), 561-574.
Pritchett, L., 2001. Where has all the education gone? The World Bank Economic Review 15
(3), 367-391.
22
Psacharopoulos, G., 1994. Returns to investment in education: A global update. World
Development 22 (9), 1325-1343.
Psacharopoulos, G., Patrinos, H., 2004. Returns to Investment in Education: a Further
Update. Education Economics 12 (2), 111-134.
Pyo, H. K., Jin, S., 2000. A Comparative Profile of Human Capital: US, Japan and Korea. In
Hwang, I., Odaka, K., (Eds), The Long-Term Economic Statistics of Korea 1910-
1990. Institute of Economic Research. Hitotshubashi University, pp. 289-311.
Reis, J., 2005. Economic growth, human capital formation and consumption in Western
Europe before 1800, In: Allen, R.C., Bengtsson, T., Dribe, M., (Eds.), Living
Standards in the Past. Oxford University Press, Oxford, pp. 195-225.
Romer, P., 1990. Endogenous Technological Change. Journal of Political Economy 98 (5),
1002-1037.
Schofield, R. S., 1981. Dimensions of illiteracy in England 1750-1850. In: Graff, H.J., (Ed.),
Literacy and Social Development in the West: A Reader. Cambridge University Press,
Cambridge, pp. 201-213.
Schultz, Th., 1961. Investment in Human Capital. American Economic Review 51 (1), 1-17.
Temple, J., 1999. A Positive Effect of Human Capital on Growth. Economic Letters 65 (1),
131-134.
Wei, H., 2001. Measuring the Stock of Human Capital for Australia: A lifetime Labour
Income Approach. Paper presented at the 30th
Annual Conference of Economists,
Perth.
Wöβmann, L., 2003. Specifying Human Capital. Journal of Economic Surveys 17 (3), 239-
270.
Zelnik, M., 1961. Age Heaping in the United States Census: 1880-1950. The Milbank
Memorial Fund Quarterly 39 (3), 540-573.
23
Table 1
Printed books per 1000 inhabitants
Period Europe without Russia Peripherya
1454-1500 3.1 0.0
1501-1550 17.5 1.1
1551-1600 29.1 1.5
1601-1650 40.6 2.0
1651-1700 66.7 4.5
1701-1750 66.7 4.8
1751-1800 122.4 17.5
Source: Buringh and Van Zanden, Table 4.
aAustria, Hungary, Portugal, Czech Republic (today), Norway, Denmark.
24
Table 2
Average years of education in three worlds
(Coefficient of variance is reported in parentheses) Barro and Lee Cohen and Soto
Year OECD
countriesa
Eastern
Europeb
Rest OECD
countries
Eastern
Europe
Rest
1960 6.70
(6.4%)c
6.02
(6.3%)
2.19
(8.8%)
7.32
(5.1%)
6.85
(1.9%)
2.06
(8.8%)
1970 7.25
(5.6%)
6.74
(9.6%)
2.50
(8.4%)
8.23
(5.0%)
7.34
(1.4%)
2.51
(8.4%)
1980 8.22
(5.5%)
7.83
(6.3%)
3.30
(7.2%)
9.29
(4.4%)
8.00
(4.1%)
3.17
(7.6%)
1990 8.87
(4.5%)
9.07
(1.9%)
4.17
(6.3%)
10.19
(4.0%)
8.89
(3.5%)
4.15
(6.7%)
Source: own calculations from the data of Cohen and Soto (2007), http://www.iae-csic.uab.es/soto/Data.htm
a pre-1994 membership, 21 countries,
b Bulgaria, Hungary and Romania,
c(standard error/mean)x100%
25
Table 3
Education related human capital measures in 25 countries in 1990
country
Av. years of
schooling
Barro and Lee
Av. years of
schooling
Cohen and Soto
Age heaping returns to
education
Mincerian
human
capital
indexb
Developed
countries
Australia 10.12 12.22
101.7 8.0% 2.66
Austria 9.22 10.16
97.9 7.4% 2.12
Canada 10.50 12.74
99.6 8.9% 2.83
Finland 9.48 10.14 99.5 8.2% 2.29
Greece 7.66 7.88 108.8 7.6% 1.82
Italy 6.16 7.97 101.1a 2.7% 1.24
Japan 9.22 11.18 98.9 13.2% 4.37
The Netherlands 8.61 10.33 101.2a
7.3% 2.13
United Kingdom 8.74 11.27
98.0 6.8% 2.15
USA 12.00 12.23 104.5 9.8% 3.31
Transformation
economies
Bulgaria 9.26 9.03 n.a. n.a. n.a.
Czech Republic 9.39 n.a. 99.0 8.1% 2.14
Hungary 8.70 9.34 102.1 n.a. n.a.
Poland 9.60 n.a. 100.5 7.0% 1.96
Romania 9.24 8.30 95.8 n.a.
n.a.
Developing
countries
Bolivia 4.74 6.34 125.4 10.1% 1.90
Brazil 3.76 5.62 103.3 14.7% 2.28
Chile 7.14 8.42 100.3 8.2% 2.00
Honduras 3.69 4.33 104.1 10.4% 1.57
Kenya 2.98 3.98 147.8 16.0% 1.89
South Korea 9.25 9.56 99.5 13.5% 3.64
Mexico 5.87 6.41 125.2 7.5% 1.62
Philippines 7.07 6.59 112.3 8.0% 1.69
Singapore 5.52 6.15 98.2a
13.1%a
2.24
Thailand 5.35 5.78 n.a. 11.5% 1.94 a 2000
bas explained in the text, this stock takes the value one for a country with zero educational attainment and/or
zero returns to schooling
26
Table 4
Per capita human capital stock by income and cost based measures 1995 expressed in 2002
USD
country
HC by the
Judson method
(cost based)*
HC by Judson
times av. years
of education
Dagum-Slottje
method (income
based)**
Jeong-index
(income based)
USA=1.00
Developed
countries
Australia 4604 47465 n.a. 0.58
Austria 7270 61362 n.a. 1.31
Canada 7244 80991 n.a. n.a.
Finland 5707 55075 n.a. n.a.
Greece 1875 15092 n.a. n.a.
Italy 5006 33042 n.a. 0.88
Japan 4591 43336 n.a. n.a.
The Netherlands 5854 52448 n.a. n.a.
USA 7269 88538 756754a 1.00
Transformation
economies
Bulgaria 1572 14952 107324 n.a.
Czech Republic 3548 32957 n.a. n.a.
Estonia 3470 31819 101761 n.a.
Hungary 3380 28795 141403 n.a.
Poland 1615 15711 122120 b n.a.
Slovakia n.a. n.a. 160952 b n.a.
Romania 808 7469 n.a. 0.77
Russia n.a. n.a. 141235b n.a.
Developing
countries
Bolivia 667 3457 n.a. 0.55
Brazil 1418 5914 n.a. n.a.
Chile 1350 10163 n.a. 0.42
Egypt 667 2830 n.a. 0.63
Ghana 241 902 n.a. n.a.
India 216 899 n.a. n.a.
Indonesia 153 615 n.a. 0.50
* own calculations,
** Földvári-van Leeuwen (2005) Table 5, converted from 2002 USD to 2000 USD
a 2000,
b 1993

27
Table 5
Summary table, various human capital proxies and estimates for Eastern Europe as
percentage of the USA
av years of
education in
1990
Mincerian
hc in 1990
cost based
method by
Judson in
1995
(original)
cost based
method by
Judson in
1995
(multiplied
by av. years
of education)
income
based on
Dagum
and Slottje,
percentage
of the USA
in 2000
income
based
1995
Jeong
Bulgaria 77.1%a n.a. 21.6% 16.5% 14.2% n.a.
Czech Republic 78.3%a 64.6% 48.8% 37.2% n.a. n.a.
Estonia 76.4%b n.a. 22.2% 35.9% 13.4% n.a.
Hungary 72.5%a n.a. 46.5% 32.5% 18.7% n.a.
Poland 80.0%a 59.2% 22.2% 17.8% 16.1%
c n.a.
Slovakia 75.6%b n.a. n.a. n.a. 21.3%
c n.a.
Romania 77.0%a n.a. 11.1% 8.4% n.a. 77%
Russia 87.7%b n.a. n.a. n.a. 18.7%
c n.a.
a Cohen and Sotos,
b Barro and Lee (2001),
c1993