AHP Modelling of User Preference towards Sustainable Transport in Egypt
18
1 AHP Modelling of User Preferences Towards Sustainable Transport in Egypt Moataz M. Mahmoud a* , Mahmood M. Abdel kader b a Assistant Professor, Department of Architectural Engineering, Assiut University, Egypt, [email protected] b Assistant Lecturer, Department of Architectural Engineering, Assiut University, Egypt, [email protected] * Corresponding Author Author’s Copy Mahmoud M., Adel Kader, M., 2015, AHP Modelling of User Preferences Towards Sustainable Transport in Egypt, Assiut University Bulletin for Environmental Researches 18(1), 1-19
Transcript of AHP Modelling of User Preference towards Sustainable Transport in Egypt
1
AHP Modelling of User Preferences Towards Sustainable Transport in Egypt
Moataz M. Mahmouda*, Mahmood M. Abdel kader b
a Assistant Professor, Department of Architectural Engineering, Assiut University, Egypt, [email protected] b Assistant Lecturer, Department of Architectural Engineering, Assiut University, Egypt, [email protected]
* Corresponding Author
Author’s Copy
Mahmoud M., Adel Kader, M., 2015, AHP Modelling of User Preferences Towards Sustainable Transport in Egypt, Assiut University Bulletin for Environmental Researches 18(1), 1-19

2
Abstract There is a great reliance on sustainable transport assessment tools/models in order to monitor the implementation of sustainability in the transport arena. These assessment models are varying in nature, type, and context. The selection of an appropriate assessment model within different contexts is a challengeable task not only due to the vast number of available models, but also because of the numerous attributes of sustainable transport and the different relative importance that each attribute possesses from a user perspective. These attributes have different influences on the way sustainable transport could be monitored and achieved. Accordingly, this study aims to measure user preferences towards sustainable transport indicators in Assiut City, Egypt as an attempt to promote sustainable transport solution within the Egyptian context. The study utilizes the Analytical Hierarchy Process (AHP) model, and draws upon the data of 144 participants. The results of the study indicate that users allocated higher importance to attributes related to public transit and active travel modes. These results give clear indication directed at both policy makers and local authorities in the planning process of new communities in Egypt. In addition, it prioritise the required interventions that are required if we are to promote sustainable solutions in the transport and the urban contexts.
Keywords: Analytic hierarchy process, Sustainable Transport, User preference.
1. Introduction The term sustainability as a principle in urban transport policy is frequently advocated but rarely defined [1]. The term gained great value due to the role it plays in adding multidimensional tasks through the transport agenda [2]. Several policy packages have been implemented including; integrated transport in UK, smarter choice in EU, smart transport in US, and green mobility in Curitiba [1]. Although some of these attempts have gained huge success over the last decade, most notably walking and cycling schemes in Scandinavian countries, the meaning of sustainability in the context of mobility and transport is still broad and varying within context [3, 4].
The implementation of sustainable transport schemes is often associated with sets of indicators that are used to capture the multidimensionality of the concept. These indicators are mainly presented in the form of assessment models/tools. However, it is evident in the literature that most of these assessment models advocate a generalised profile that is claimed to be readily applicable to any context. Although this claim has been supported with empirical evidence, yet several remarks are emerged from the application of such models in different context. It is argued that these models represent the perspectives of policy makers/local authorities without the consideration of end user demands. In other words, what people demands is of equal importance to the objectives of policy makers, and the demands of people do
3
vary within different context. Accordingly, this study argues that using a pre-defined sustainable transport assessment could lead to bias results. It also argues that the assumption that sustainable transport models could be generalised across different contexts is not theoretically, and indeed logically, sound.
After the introduction, the remainder of this study is organised as follows. Section two provides taxonomy of sustainable transport objectives and introduces different sets of sustainable transport indicators in different contexts. Section three provides insights into the study methodology and the AHP applications. Section four details the results and identify profiles the characteristics of user preferences towards sustainable transport indicators. Lastly, section five concludes the study and discusses the potential practical relevance of the derived results in the Egyptian context.
2. Sustainability in the transport context
2.1. Definitions of sustainable transport Historically the term sustainable transport was derived from the origin of sustainable development as the expression of sustainability in the context of transport. Although there are previous attempts aimed to define sustainable transport, yet there is no single universally accepted definition of the term [2]. Out of these attempts Black [5]; Richardson [6] defined the term through adopting the Brundtland’s Commission definition of sustainable development as; “the ability to meet today`s transportation needs without compromising the ability of future generation to meet their transportation needs“. While, other scholars have defined the term in the context of the triple bottom life concept of economic growth, social justice, and positive environmental impacts [7-9].
Reacting to that, efforts have been made to break down the complexity of the triple bottom life concept. Gudmundsson and Hojer [10], and Black [11] explained the economic theme of sustainable transport, while Lautso and Toivanen [12], Gilbert and Tanguay [13], and Marsden and Bonsall [14] focused on the environmental impacts of sustainable transport applications. May et al, [4], OECD [8], and Castillo and Pitfield [2] investigated the social attributes of the concept. Furthermore, individuals and institutions have developed and constructed several assessment tools, check lists, and rating systems in order to evaluate different sustainable transport schemes within different contexts. Most notably is the efforts of; LEED, BREEM, OECD, and NRTEE [9].
2.2. Sustainable transport objectives
4
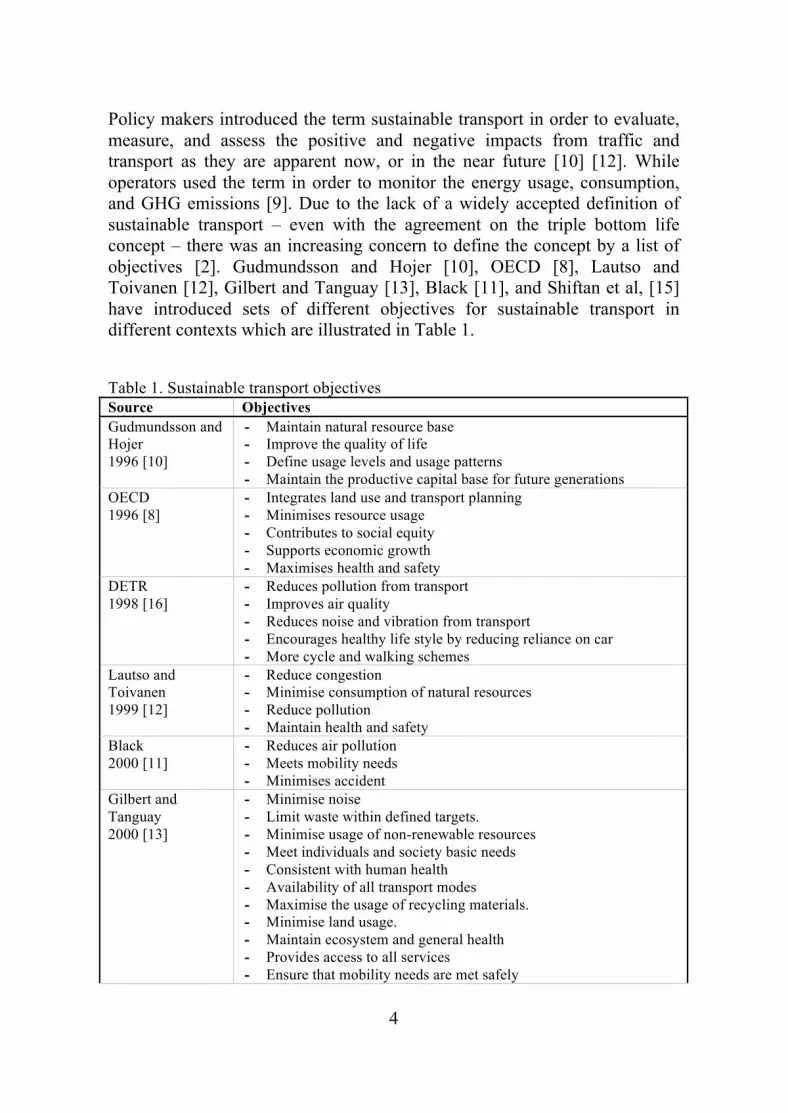
Policy makers introduced the term sustainable transport in order to evaluate, measure, and assess the positive and negative impacts from traffic and transport as they are apparent now, or in the near future [10] [12]. While operators used the term in order to monitor the energy usage, consumption, and GHG emissions [9]. Due to the lack of a widely accepted definition of sustainable transport – even with the agreement on the triple bottom life concept – there was an increasing concern to define the concept by a list of objectives [2]. Gudmundsson and Hojer [10], OECD [8], Lautso and Toivanen [12], Gilbert and Tanguay [13], Black [11], and Shiftan et al, [15] have introduced sets of different objectives for sustainable transport in different contexts which are illustrated in Table 1.
Table 1. Sustainable transport objectives Source Objectives Gudmundsson and Hojer 1996 [10]
- Maintain natural resource base - Improve the quality of life - Define usage levels and usage patterns - Maintain the productive capital base for future generations
OECD 1996 [8]
- Integrates land use and transport planning - Minimises resource usage - Contributes to social equity - Supports economic growth - Maximises health and safety
DETR 1998 [16]
- Reduces pollution from transport - Improves air quality - Reduces noise and vibration from transport - Encourages healthy life style by reducing reliance on car - More cycle and walking schemes
Lautso and Toivanen 1999 [12]
- Reduce congestion - Minimise consumption of natural resources - Reduce pollution - Maintain health and safety
Black 2000 [11]
- Reduces air pollution - Meets mobility needs - Minimises accident
Gilbert and Tanguay 2000 [13]
- Minimise noise - Limit waste within defined targets. - Minimise usage of non-renewable resources - Meet individuals and society basic needs - Consistent with human health - Availability of all transport modes - Maximise the usage of recycling materials. - Minimise land usage. - Maintain ecosystem and general health - Provides access to all services - Ensure that mobility needs are met safely

5
Source Objectives - Support economy
May et al, 2001 [4]
- Liveable streets and neighbourhoods - Protection of the environment - Equity and social inclusion - Health and safety - Support of vibrant and efficient economy
Shiftan et al, 2003 [15]
- Reduces energy consumption - Minimise air pollution. - Improves accessibility to employment, social activities - Maximises the availability of public transport to population - Protects wildlife and natural habitats - Decreases road transport accidents
Marsden and Bonsall, 2006 [14]
- Improve air quality by meeting UK national air quality strategy objectives for carbon monoxide, lead, nitrogen dioxide, particles, sulphur, benzene and 1-3 butadiene
- Reduce noise and vibration - Triple the number of cycling trips compared with a 2000 base
Castillo and Pitfield, 2010 [2]
- Liveable streets and neighbourhoods - Protection of the environment from transport pollution - Maximises Health and safety - Social equity and social activities inclusion - Support economic growth
However, May et al, [4] introduced a set of sustainable transport objectives based on expert panel review of all previous attempts in the PROSPECT project. Based on this project, five main objectives of sustainable transport system have been identified including: liveable streets and neighbourhoods, protection of the environment, equity and social inclusion, health and safety, and support of vibrant and efficient economy. The main aim of May’s study was to capture the multidimensionality of the sustainable transport system under one roof.
2.3. Sustainable transport indicators During the last two decades, and due to the role of transportation in our modern car oriented society, the development of sustainable transport indicators had the lion`s share from academic attentions. Indicators have been used in different contexts as a powerful tool to break down any complex subject into manageable items. The rational of using indicators is apparent in the context of; quality control, problem solving, and Multi-Criteria Decision Making [17]. The main idea is to break down the problem and/or objective into its simplest form [18]. Within the transport context, using indicators have long been recognised in the literature as it offers advantages in the process of evaluating segments of the service [3, 17]. Therefore, different studies have pointed out specific characteristics in the process of selecting indicators. OECD [8], identified three main characteristics including;

6
relevance, analytical soundness, and measurability. While, May et al, [1] identified the SMART selection criteria whereby the selected indicator must be; specific, measurable, attributable, realistic, and time bounded. Others have argued that, there are no universal characteristics for indicator selection as these characteristics vary within objective, context, method, and type of research [2, 3, 17, 18]. Although these indicators maximize the ability to capture the multidimensionality of the system and break it down into manageable items, it is still challengeable to operationalise sustainable transport indicators for two fundamental reasons; firstly, there are numerous existing indicators of sustainable transport that contain several subsets. Secondly, using indicator provides partial illustration of the system and the integration between all these indicators must be achieved in order to understand the overall picture[2]. Castillo and Pitfield, [2] analysed the existing sustainable transport indicators within thirteen different sources, they derived a short list of 20 indicators, illustrated in Table 2, based on the perspectives of both academics and operators.
However, it is of significant importance to understand how consumers perceive and evaluate these indicators. Attitude and preferences towards sustainable transport is an important determinant for evaluating the system [5]. User preference represents an essential aspect for the success of sustainable transport implementations. It is important for those who are affected by the concept (end-users), as equally for those who can affect sustainable decisions [2]. It is essential for policy makers to identify the most important attributes/indicators of sustainable transport that are perceived by users in order to insure that policy implementations are satisfying user demands and expectations. This will allow the development of tailored solutions that meets the varied requirements of different contexts.

7
Table 2. Short list of sustainable transport indicators [2] Indicators 1 - Motorised traffic volume 2 - Number of cycling trips 3 - Vulnerable road user accidents 4 - Local air pollutants 5 - Modal share of public transport 6 - Social/External cost of transport 7 - Quality of public transport 8 - Availability of key services locally 9 - Total number of killed or seriously injured (in road accidents) 10 - CO2 emissions from transport 11 - Public awareness of transport sustainability issues 12 - Percentage of freight transported by road 13 - Availability of cycling and walking lanes 14 - Access to public transport 15 - Percentage of population affected by high traffic noise levels 16 - Energy consumption by the road transport sector 17 - Number of crimes committed on or while waiting for public transport 18 - Total number of road motor vehicles 19 - Transport related wastes 20 - Public participation in transport planning
3. METHODOLOGY
3.1. Analytical Hierarchy Process (AHP) In order to measure the preferences of users, the study employs a quantitative model to derive a numeric weight of importance for each indicator. Although there are numerous methods to achieve this goal including; direct weight election (Likert data), derived weight (regression models), and integrated Multi-criteria decision-making models, the study utilises the AHP to derived the preferences of users.
Since its inception over 30 years ago, the AHP method has been used as a powerful tool to solve a wide range of multi-criteria decision problems. The AHP method has been applied into many disciplines such as; industry, military, business, social sciences, transport, and policy [14]. The applications of the AHP methods varied from overcoming unstructured problems to complex multi-disciplines problems [18, 19]. The application of AHP in general is carried out in two main stages; hierarchy structure and weighting election “Eigenvalue Method” EM. The AHP hierarchy chart is divided into; a goal in the first level of the hierarchy, objectives in the second level, evaluation criteria and sub-criteria levels, and finally alternatives in the final level of the hierarchical chart. The hierarchy indicates the relation between variables and elements in the same horizontal level, and the vertical
8
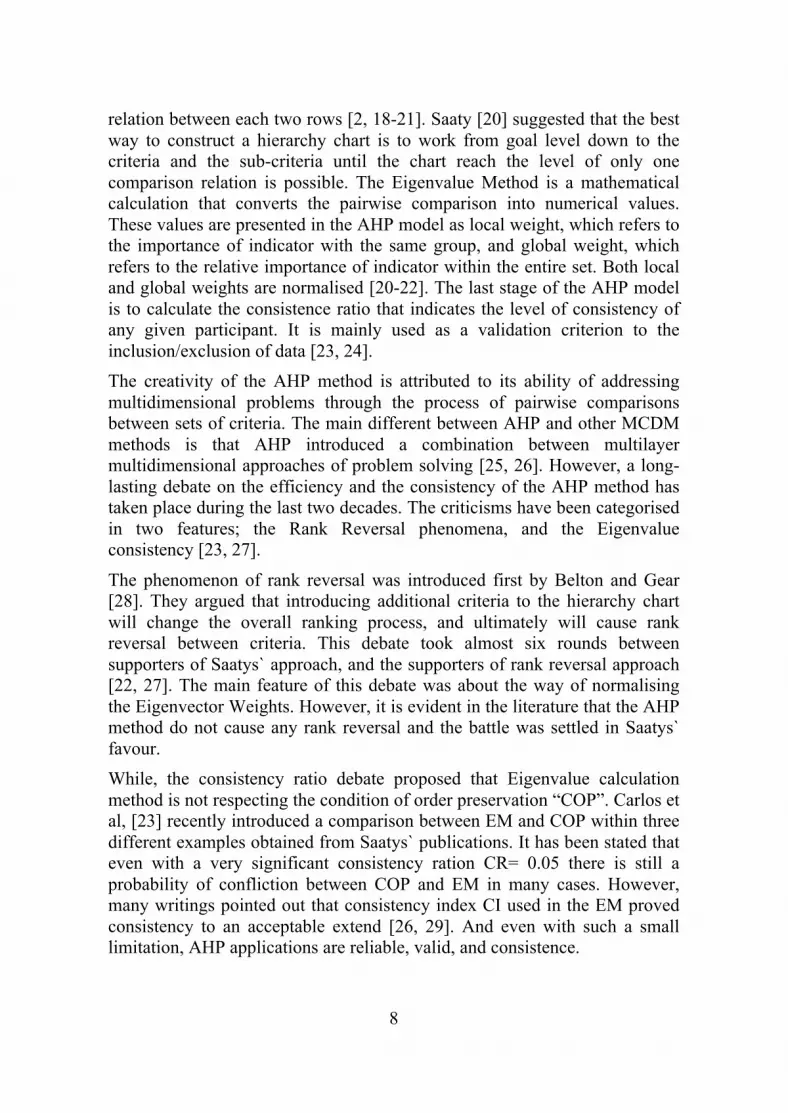
relation between each two rows [2, 18-21]. Saaty [20] suggested that the best way to construct a hierarchy chart is to work from goal level down to the criteria and the sub-criteria until the chart reach the level of only one comparison relation is possible. The Eigenvalue Method is a mathematical calculation that converts the pairwise comparison into numerical values. These values are presented in the AHP model as local weight, which refers to the importance of indicator with the same group, and global weight, which refers to the relative importance of indicator within the entire set. Both local and global weights are normalised [20-22]. The last stage of the AHP model is to calculate the consistence ratio that indicates the level of consistency of any given participant. It is mainly used as a validation criterion to the inclusion/exclusion of data [23, 24]. The creativity of the AHP method is attributed to its ability of addressing multidimensional problems through the process of pairwise comparisons between sets of criteria. The main different between AHP and other MCDM methods is that AHP introduced a combination between multilayer multidimensional approaches of problem solving [25, 26]. However, a long-lasting debate on the efficiency and the consistency of the AHP method has taken place during the last two decades. The criticisms have been categorised in two features; the Rank Reversal phenomena, and the Eigenvalue consistency [23, 27].
The phenomenon of rank reversal was introduced first by Belton and Gear [28]. They argued that introducing additional criteria to the hierarchy chart will change the overall ranking process, and ultimately will cause rank reversal between criteria. This debate took almost six rounds between supporters of Saatys` approach, and the supporters of rank reversal approach [22, 27]. The main feature of this debate was about the way of normalising the Eigenvector Weights. However, it is evident in the literature that the AHP method do not cause any rank reversal and the battle was settled in Saatys` favour. While, the consistency ratio debate proposed that Eigenvalue calculation method is not respecting the condition of order preservation “COP”. Carlos et al, [23] recently introduced a comparison between EM and COP within three different examples obtained from Saatys` publications. It has been stated that even with a very significant consistency ration CR= 0.05 there is still a probability of confliction between COP and EM in many cases. However, many writings pointed out that consistency index CI used in the EM proved consistency to an acceptable extend [26, 29]. And even with such a small limitation, AHP applications are reliable, valid, and consistence.

9
3.2. AHP chart The AHP chart is structured from three levels; the first level represents the aim of the study to evaluate user preferences towards sustainable transport indicators. The second level contains a set of five objectives/attributes of sustainable transportation based on the PROSPECTS project by May et al, [4]. These objectives include; liveable streets and neighbourhoods, protection of the environment, equity and social inclusion, health and safety, and efficient economics. While, the third level of the AHP chart contains a list of 20 different indicators [2] allocated to sustainable transport objectives. The AHP chart is illustrated in Figure 2.
Figure 1. AHP chart
3.3. Data collection process The study draws upon a primary data source. The data collection process is carried out through a questionnaire survey distributed in Assiut City in 2013. Assiut city is located in the middle of Egypt from both North-South and East-West axes. The city morphology is based on semi-linear shape due to the geographical barriers from East and West. The city has 11 districts with a growing links to many small villages. Assiut city features two main planning patterns including; compact urban form in the old city centre, and modern-permanent district developed on the Victorian era. The transport profile of the city shows high car dependency, and it could be considered as a car-oriented
User Preferences
Liveable neighbourhoods
Motorised traffic volume
Quality of
public transport
Total number of road motor
vehicles
Public participation on transport
planning
Protection of the environment
Local air pollution
CO2 emission from transport
Transport
related waste
Public
awareness on environmental
issues
Equity and social inclusion
Social cost of transport
Access to
public transport
Availability of cycling and
walking lanes
Number of cycling trips
Health and safety
Vulnerable road user accidents
Total number of road
accidents
Crimes on public
transport
Percent of pollution of high noise
levels
Efficient economy
Availability of key service
locally
Modal share of public transport
Percentage of freight
transported
Energy consumption

10
with a market share up to 52.4% for private car, 16.4% taxi, 18.8% minibuses, and 12.4% others [30]. The survey is distributed using “intercept approach” at several locations in the city. Participants are intercepted and asked to participate in the survey. A brief introduction was given on the study objectives, methods, and expected outcomes form the survey. No incentives were offered to participants, and the participation in the survey was completely voluntarily. Random sampling strategy was employed to insure that all socio-demographical characteristics are captured in the study.
The survey is organised in three sections. Firstly, a set of 9 socio-economic questions is addressed. Secondly, participants are asked to make pairwise comparisons between sustainable transport objectives based on AHP Standard scale detailed in Table 3. While in the third part, participants are asked to compare between five sets of sustainable transport indicators. Each set contains a group of four indicators as illustrated in the AHP chart. Example of the distributed questionnaire is illustrated in Figure 2. Please review the following example before you answer this section
Example
Liveable neighbourhood is ………..………………. than/as health and safety
ᴏ ᴏ ü ᴏ ᴏ ᴏ ᴏ ᴏ ᴏ
Strongly More
Important More
Important Equally important Less
Important Strongly
less Important
In this example, Liveable neighbourhood is more important than health and safety.
Please note that the blank spaces refer to intermediate values
Liveable neighbourhood is ………..……………than Protection of the environment ᴏ ᴏ ᴏ ᴏ ᴏ ᴏ ᴏ ᴏ ᴏ
Extremely more
Important Strongly
Important Equally important
Strongly less
Important
Extremely less
Important
Quality of public transport is ……… than Public participation on transport planning ᴏ ᴏ ᴏ ᴏ ᴏ ᴏ ᴏ ᴏ ᴏ
Extremely more
Important Strongly
Important Equally important
Strongly less
Important
Extremely less
Important
Figure 2. Partial illustration of the survey
11
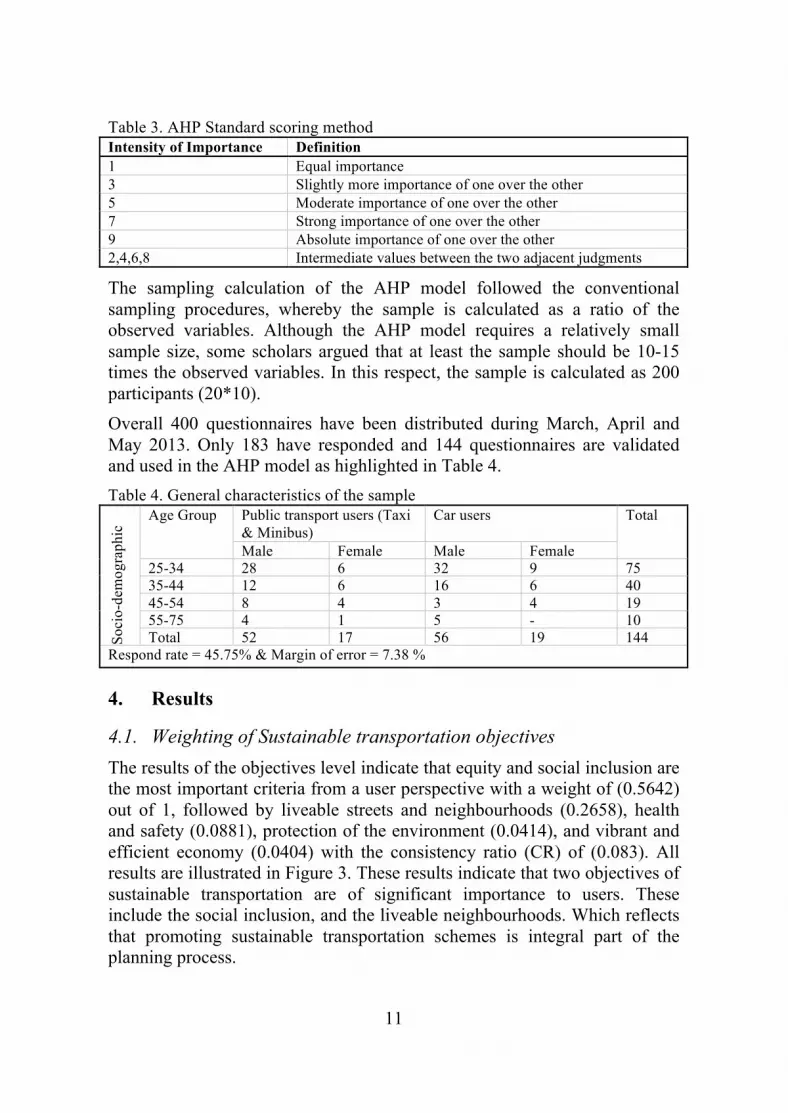
Table 3. AHP Standard scoring method Intensity of Importance Definition 1 Equal importance 3 Slightly more importance of one over the other 5 Moderate importance of one over the other 7 Strong importance of one over the other 9 Absolute importance of one over the other 2,4,6,8 Intermediate values between the two adjacent judgments
The sampling calculation of the AHP model followed the conventional sampling procedures, whereby the sample is calculated as a ratio of the observed variables. Although the AHP model requires a relatively small sample size, some scholars argued that at least the sample should be 10-15 times the observed variables. In this respect, the sample is calculated as 200 participants (20*10). Overall 400 questionnaires have been distributed during March, April and May 2013. Only 183 have responded and 144 questionnaires are validated and used in the AHP model as highlighted in Table 4. Table 4. General characteristics of the sample
Soci
o-de
mog
raph
ic Age Group Public transport users (Taxi
& Minibus) Car users Total
Male Female Male Female 25-34 28 6 32 9 75 35-44 12 6 16 6 40 45-54 8 4 3 4 19 55-75 4 1 5 - 10 Total 52 17 56 19 144
Respond rate = 45.75% & Margin of error = 7.38 %
4. Results
4.1. Weighting of Sustainable transportation objectives The results of the objectives level indicate that equity and social inclusion are the most important criteria from a user perspective with a weight of (0.5642) out of 1, followed by liveable streets and neighbourhoods (0.2658), health and safety (0.0881), protection of the environment (0.0414), and vibrant and efficient economy (0.0404) with the consistency ratio (CR) of (0.083). All results are illustrated in Figure 3. These results indicate that two objectives of sustainable transportation are of significant importance to users. These include the social inclusion, and the liveable neighbourhoods. Which reflects that promoting sustainable transportation schemes is integral part of the planning process.

12
Figure 3. User preference towards ST objectives
4.2. Weighting of Sustainable transport indicators The results of the indicators modelling give clear indications on the important indicators of sustainable transport from a user perspective. These results could be interpreted at both local (with the same attribute), and global (with all indicators) levels. At the local level, several indicators are regarded with high importance as detailed in Figures 4, 5, 6, 7, and 8.
Figure 4. Liveable streets and neighbourhoods (CR= 0.059)
Figure 5. Protection of the environment (CR= 0.058)
0.2658
0.0414
0.5642
0.0881
0.0404
Liveable streets and neighbourhoods
Protection of the environment
Equity and social inclusion
Health and safety
Efficient economic
0.0518
0.5642
0.1821
0.128
Motorised traffic volume
Quality of public transport
Public participation on transport planning
Total number of road motor vehicles
0.2188
0.0938
0.0938
0.5938
Local air pollution
CO2 emission from transport
Transport related waste
Public awareness on environmental issues

13
Figure 6. Equity and social inclusion (CR= 0.035)
Figure 7. Health and safety (CR= 0.016)
Figure 8. Efficient economic (CR= 0.048)
However, the global weights provide clear indications on the importance of each indicator relative to the entire set (20 indicators). In this respect, three indicators are emerged as, by far, the most important indicators for sustainable transport form a user perspective as detailed in Figure 9. These include, access to public transit (0.33), the availability of walking and cycling lanes (0.17), and the quality of public transit (0.15). Together they represent 65% of user preferences.
0.0575
0.5802
0.2966
0.0658
Social cost of transport
Access to public transport
Availability of cycling and walking paths
Number of cycling trips
0.6874
0.1705
0.0682
0.0739
Availability of key service locally
Modal share of public transport
Percentage of freight transported by road
Energy consumption by road transport modes
0.2516
0.5549
0.0967
0.0967
Vulnerable road user accidents
Total number of road accidents
Number of crimes committed on or while waiting for public
Percent of pollution of high noise levels

14
These results reflect the willingness of user to adopt more active transportation modes (walking and cycling), and to reduce car use (promote public transit). In other words, commuters demand to have access to high quality transit facilities associated with active transport links if we are to promote sustainable transport solutions in the Egyptian context.
In contrast, the results indicate that several indicators are regarded with relatively lower importance from a user perspective. These include transport percentage of freight transported by road (0.0028), energy consumption by transit (0.003), and Co2 emission by transit (0.0039). Although these indicators are of significant importance to promote sustainable transport from the perspective of policy makers, users have regarded it with less importance. This highlights the huge variation on the preferences held by both end users and policy makers, and emphasis that both should be considered in the process of implementing sustainable transport schemes. Simply, they represent different ends in the same loop.

15
Figure 9. Absolute weighting of sustainable transport indicators
6. Discussion and Conclusion This study offers empirical evidence on the preferences of users towards sustainable transport indicators. The study argues that a pre-defined sustainable transport implementation scheme is unlikely to produce similar results as user preference varies across different contexts. Three key remarks are emerged from the imperial analysis detailed as follows.
0.003
0.0028
0.0371
0.0069
0.0085
0.1673
0.0246
0.0039
0.0085
0.0278
0.034
0.0484
0.0489
0.3273
0.0324
0.0039
0.0222
0.0138
0.0091
0.15
Energy consumption by road transport modes
Percentage of freight transported by road
Number of cycling trips
Modal share of public transport
Percent of pollution of high noise levels
Availability of cycling and walking paths
Public awareness on environmental issues
Transport related waste
Number of crimes committed on or while waiting for PT
Availability of key service locally
Total number of road motor vehicles
Public participation on transport planning
Total number of road accidents
Access to public transport
Social cost of transport
CO2 emission from transport
Vulnerable road user accidents
Motorised traffic volume
Local air pollution
Quality of public transport

16
Firstly, the concept of sustainable transport is implemented to achieve three main objectives including environmental protection, social justice, and economic development, yet each context requires a tailored implementation scheme that maximise the utilisation of user preferences. Secondly, the results of the AHP models give clear indications on the potential behavioural shift of commuters in Assiut city. It is clear that people are willing to adopt a sustainable travel behaviour if we are to provide high quality transit service, and safe walking and cycling infrastructure. Thirdly, the study offers key practical solutions to promote sustainable transport solution in Egypt, which are readily to be implemented especially in new communities. It is apparent that Egypt faces a massive shortage of energy that is mainly oil-dependent, and therefore reducing car use would be of fundamental importance to balance the supply/demand chain. In this respect, the study advocates, with support of the empirical results, that the planning regulations of new settlements (such as New Assiut) should emphasise on the provision of public transit service as well as safe routes for pedestrians and cyclists. This will reduce care dependency, save energy, and ultimately promote sustainable transport solutions. Lastly, there are some limitations of this study that should be highlighted. The response rate of the survey is very low and this could be attributed to either the difficulty of answering AHP survey, or the lack of interest from the general public on the issue of sustainable transportation. In addition, the study could not use any supplementary and/or secondary data set to support the primary data, as they simply do not exist. Therefore, future research studies should be oriented towards the creation of threshold and benchmarks of user preferences towards sustainable transportation, which will allow for more comprehensive analysis that addresses both temporal and geographical elements.
7. Acknowledgment The authors would like to thank Editor-in-chief and the two anonymous reviewers for their insightful comments and feedback.
8. References [1] May AD, Kelly C, Shepherd S. The principles of integration in urban transport strategies. Transport Policy. 2006;13:319-27.
[2] Castillo H, Pitfield DE. ELASTIC - A methodological framework for identifying and selecting sustainable transport indicators. Transportation Research Part D: Transport and Environment. 2010;15:179-88.
17
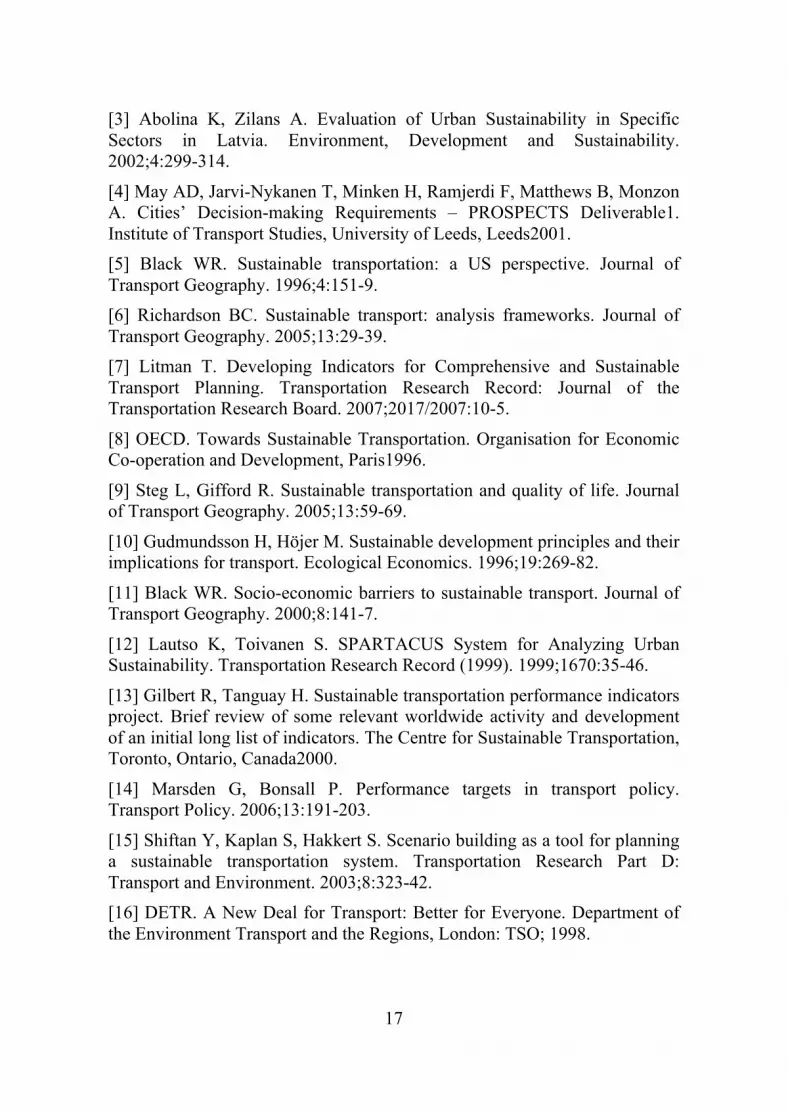
[3] Abolina K, Zilans A. Evaluation of Urban Sustainability in Specific Sectors in Latvia. Environment, Development and Sustainability. 2002;4:299-314.
[4] May AD, Jarvi-Nykanen T, Minken H, Ramjerdi F, Matthews B, Monzon A. Cities’ Decision-making Requirements – PROSPECTS Deliverable1. Institute of Transport Studies, University of Leeds, Leeds2001. [5] Black WR. Sustainable transportation: a US perspective. Journal of Transport Geography. 1996;4:151-9. [6] Richardson BC. Sustainable transport: analysis frameworks. Journal of Transport Geography. 2005;13:29-39. [7] Litman T. Developing Indicators for Comprehensive and Sustainable Transport Planning. Transportation Research Record: Journal of the Transportation Research Board. 2007;2017/2007:10-5.
[8] OECD. Towards Sustainable Transportation. Organisation for Economic Co-operation and Development, Paris1996.
[9] Steg L, Gifford R. Sustainable transportation and quality of life. Journal of Transport Geography. 2005;13:59-69.
[10] Gudmundsson H, Höjer M. Sustainable development principles and their implications for transport. Ecological Economics. 1996;19:269-82.
[11] Black WR. Socio-economic barriers to sustainable transport. Journal of Transport Geography. 2000;8:141-7.
[12] Lautso K, Toivanen S. SPARTACUS System for Analyzing Urban Sustainability. Transportation Research Record (1999). 1999;1670:35-46.
[13] Gilbert R, Tanguay H. Sustainable transportation performance indicators project. Brief review of some relevant worldwide activity and development of an initial long list of indicators. The Centre for Sustainable Transportation, Toronto, Ontario, Canada2000.
[14] Marsden G, Bonsall P. Performance targets in transport policy. Transport Policy. 2006;13:191-203.
[15] Shiftan Y, Kaplan S, Hakkert S. Scenario building as a tool for planning a sustainable transportation system. Transportation Research Part D: Transport and Environment. 2003;8:323-42. [16] DETR. A New Deal for Transport: Better for Everyone. Department of the Environment Transport and the Regions, London: TSO; 1998.

18
[17] Nicolas JP, Pochet P, Poimboeuf H. Towards sustainable mobility indicators: application to the Lyons conurbation. Transport Policy. 2003;10:197-208.
[18] Al Khalil MI. Selecting the appropriate project delivery method using AHP. International Journal of Project Management. 2002;20:469-74.
[19] Bhushan N, Rai K. Strategic decision making: applying the analytic hierarchy process: Springer; 2004.
[20] Saaty TL. The analytic hierarchy process: planning, priority setting, resource allocation: McGraw-Hill International Book Co.; 1980.
[21] Saaty TL. Multicriteria Decision Making: The Analytic Hierarchy Process: R W S Publications; 1996.
[22] Saaty TL, Sagir M. An essay on rank preservation and reversal. Mathematical and Computer Modelling. 2009;49:1230-43.
[23] Carlos BC, Vansnick JC. A critical analysis of the eigenvalue method used to derive priorities in AHP. European Journal of Operational Research. 2008;187:1422-8. [24] Bodin L, Gass SI. On teaching the analytic hierarchy process. Computers & Operations Research. 2003;30:1487-97. [25] Kim W, Kim BS, Youn MK. Usefulness of analytic hierarchy process (AHP) to determinants win-win growth factor for retailing industry in Korea. African Journal of Business Management. 2012;6:4824-34.
[26] Yuen KKF. Analytic hierarchy prioritization process in the AHP application development: A prioritization operator selection approach. Applied Soft Computing. 2010;10:975-89. [27] Wang Y-M, Elhag TMS. An approach to avoiding rank reversal in AHP. Decision Support Systems. 2006;42:1474-80. [28] Belton V, Gear T. On a short-coming of Saaty's method of analytic hierarchies. Omega. 1983;11:228-30. [29] Lippert RA. Fixing multiple eigenvalues by a minimal perturbation. Linear Algebra and its Applications. 2010;432:1785-817. [30] Mahmoud M, Hine J. Using AHP to measure the perception gap between current and potential users of bus services. Transportation Planning and Technology. 2013;36:4-23.