AgroLife Scientific Journal - USAMV
140
AgroLife Scientific Journal Volume 4, No. 2, 2015
-
Upload
khangminh22 -
Category
Documents
-
view
0 -
download
0
Transcript of AgroLife Scientific Journal - USAMV

AgroLifeScientific Journal
Volume 4, No. 2, 2015

.

University of Agronomic Sciencesand Veterinary Medicine of Bucharest
BucharesTDecember, 2015
AgroLifeScientific Journal
Volume 4, No. 2

EDITORIAL BOARD
General Editor: Prof. PhD Sorin Mihai CÎMPEANU Executive Editor: Prof. PhD Gina FÎNTÎNERU
Deputy Executive Editor: Prof. PhD Doru Ioan MARIN
Members: Adrian AS�NIC�, Silviu BECIU, Leonard ILIE, Viorel ION, Sorin IONI�ESCU, �tefana JURCOANE, Monica Paula MARIN,
Elena NISTOR, Aneta POP, R�zvan TEODORESCU, Ana VÎRSTA
���������Secretariate: ���������� ���
PUBLISHERS:
University of Agronomic Sciences and Veterinary Medicine of Bucharest Address: 59 M�r��ti Blvd., District 1, Postal Code 011464, Bucharest, Romania E-mail: [email protected]; Webpage: http://agrolifejournal.usamv.ro
CERES Publishing House Address:1 Pia�a Presei Libere, District l, Zip code 013701, Bucharest, Romania
Phone: + 40 21 317 90 23, E-mail: [email protected], Webpage: www.editura-ceres.ro
Copyright 2015 To be cited: AgroLife Sci. J. - Vol. 4, No. �, 2015
The mission of the AgroLife Scientific Journal is to publish original research relevant to all those involved in different fields of agronomy and life sciences. The publishers are not responsible for the opinions published in the Volume.
They represent the authors� point of view.
ISSN 2285-5718; ISSN - L 2285-5718

SCIENTIFIC COMMITTEE
� Bekir Erol AK - University of Harran, Sanliurfa, Turkey � Ioan Niculae ALECU - University of Agronomic Sciences and Veterinary Medicine of Bucharest, Romania � Adrian AS�NIC� - University of Agronomic Sciences and Veterinary Medicine of Bucharest, Romania � Sarah BAILLIE - Bristol Veterinary School, University of Bristol, United Kingdom � Narcisa Elena B�BEANU- University of Agronomic Sciences and Veterinary Medicine of Bucharest, Romania � Silviu BECIU - University of Agronomic Sciences and Veterinary Medicine of Bucharest, Romania � Diego BEGALLI - University of Verona, Italy � Stefano CASADEI - University of Perugia, Italy � Fulvio CELICO - University of Molise, Italy � Serghei CHILIMAR - Academy of Agricultural Sciences, Republic of Moldova � Gheorghe CIMPOIE� - Agrarian State University, Moldova � Sorin Mihai CÎMPEANU - University of Agronomic Sciences and Veterinary Medicine of Bucharest, Romania � Drago CVIJANOVIC - Institute of Agricultural Economics, Belgrade, Serbia � Eric DUCLOS-GENDREU - Spot Image, GEO-Information Services, France � André FALISSE -University of Liège, Gembloux Agro-Bio Tech, Gembloux, Belgium � Gina FÎNTÎNERU - University of Agronomic Sciences and Veterinary Medicine of Bucharest, Romania � Armagan HAYIRLI - Ataturk University, Erzurum, Turkey � Jean-Luc HORNICK - Faculté de Médecine Vétérinaire, Université de Liège, Belgium � Dorel HOZA - University of Agronomic Sciences and Veterinary Medicine of Bucharest, Romania � Mostafa A.R. IBRAHIM - University of Kafrelsheikh, Egypt � Viorel ION - University of Agronomic Sciences and Veterinary Medicine of Bucharest, Romania � Sorin IONI�ESCU - University of Agronomic Sciences and Veterinary Medicine of Bucharest, Romania � Mariana IONI�� - University of Agronomic Sciences and Veterinary Medicine of Bucharest, Romania � Karsten KLOPP - ObstbauversuchsanstaltJork, Germany � Horst Erich KÖNIG - Institute of Anatomy, Histology and Embriology, University of Veterinary Medicine
Vienna, Austria � Huub LELIEVELD - GHI Association Netherlands and EFFoST Executive Committee, Netherlands � Doru Ioan MARIN - University of Agronomic Sciences and Veterinary Medicine of Bucharest, Romania � Monica Paula MARIN - University of Agronomic Sciences and Veterinary Medicine of Bucharest, Romania � Mircea MIHALACHE - University of Agronomic Sciences and Veterinary Medicine of Bucharest, Romania � John D. OLDHAM - Scottish Agricultural College, Edinburgh Scotland, UK � Françoise PICARD-BONNAUD - University of Angers, France � Aneta POP - University of Agronomic Sciences and Veterinary Medicine of Bucharest, Romania � Mona POPA - University of Agronomic Sciences and Veterinary Medicine of Bucharest, Romania � Agatha POPESCU - University of Agronomic Sciences and Veterinary Medicine of Bucharest, Romania � Sri Bandiati Komar PRAJOGA - Padjadjaran University Bandung, Indonesia � Narayanan RANGESAN - University of Nevada, Reno, USA � Svend RASMUSSEN - University of Copenhagen, Denmark � Peter RASPOR - Faculty of Biotechnology, University of Ljubljana, Slovenia � Marco Dalla ROSA - Faculty of Food Technology, Università di Bologna, Polo di Cesena, Italy � Sam SAGUY - The Hebrew University of Jerusalem, Israel � Philippe SIMONEAU � Universitéd�Angers, France � Vasilica STAN - University of Agronomic Sciences and Veterinary Medicine of Bucharest, Romania � Alvaro STANDARDI - University of Perugia, Italy � Florin ST�NIC� - University of Agronomic Sciences and Veterinary Medicine of Bucharest, Romania � R�zvan TEODORESCU - University of Agronomic Sciences and Veterinary Medicine of Bucharest, Romania � André THEWIS - University of Liège, Gembloux Agro-Bio Tech, Gembloux, Belgium � André TOUSSAINT - University of Liège, Gembloux Agro-Bio Tech, Gembloux, Belgium � Ana VÎRSTA - University of Agronomic Sciences and Veterinary Medicine of Bucharest, Romania � David C. WEINDORF - Louisiana State University AgCenter, USA
5

6

CONTENTS
The planting period and the size of cloves influences on garlic production - Elena Maria DRAGHICI, Viorica LAGUNOVSCHI-LUCHIAN .....................................................................
9
Comparative research on several wheat (Triticum aestivum L.) varieties grown under the conditions of Dâlga, C�l�ra�i - Bogdan-Alexandru GU��, Doru Ioan MARIN, Pierre-Louis CARRIER ������������������������������������ 17 An innovative tool for in-row cultivation - Cristian IACOMI, Octavian POPESCU ������� 23 Grain yield and yield components at maize under different preceding crops and soil tillage conditions - Viorel ION, Adrian Gheorghe B��A, Marin DUMBRAV�, Lenu�a Iuliana EPURE, Niculae DINC�, Maria TOADER ����..�������������������� 27 Study regarding the vegetables sales in various distribution channels from Bucharest - Alina Maria IONESCU, Gheorghe Valentin ROMAN .......................................................................... 33 Influence of crop systems in reducing of drought effect for maize plants - Nicolae IONESCU �� 37 Influence of soil tillage upon production and energy efficiency in wheat and maize crops - Doru Ioan MARIN, Teodor RUSU, Mircea MIHALACHE, Leonard ILIE, Elena NISTOR, Ciprian BOLOHAN ..................................................................................................................................... 43 Research on the influence of the oregano oil use over the productive performances and quality of duck meat - Monica MARIN, Dumitru DR�GOTOIU, Carmen Georgeta NICOLAE, Georgeta DINI�� .................................................................................................................................... 48 Sustainable alternative for food packaging: chitosan biopolymer - a review - Amalia Carmen MITELU�, Elisabeta Elena T�NASE, Vlad Ioan POPA, Mona Elena POPA ��������... 52 The climatic and the relief characteristics specific to the Maronic soil subtype from Dobrogea - Irina MOISE, Daniela R�DUCU, Simona-Mariana PRICOP ���������������. 62 Results of research in noise pollution in urban areas - Anca-Maria MOSCOVICI, Oana GRECEA ... 68 The influence of treatment with growth stimulator (Gobbi Gib 2LG) on the quantity and quality of seedless grape �Beauty Seedless� - Gheorghe NICOLAESCU, Antonina DERENDOVSKAIA, Silvia SECRIERU, Dumitru MIHOV, Valeria PROCOPENCO, Mariana GODOROJA, �ornelia LUNGU .................................................................................................................................... 72 Development of a new technology for protective biofortification with selenium of Brassica crops - Anca-Olguta OANCEA, Alexandra GASPAR, Ana-Maria SECIU, Laura �TEFAN, Oana CR�CIUNESCU, Florentina GEORGESCU, Radu LACATU�U �������������� 80 Contribution to the foundation of knowledges concerning the biology, ecology and culture technology for chickpea (Cicer arietinum) in classic and ecological system under conditions of Dobrogea Plateau - Liliana PANAITESCU, Simona-Mariana PRICOP, Irina MOISE, Rzvan PANAITESCU, Simona NI��, Marsida Xenia BEJKO ������������������. 86
7
In vitro evaluation of Eupatorium cannabium antimicrobial activity - Tomina PURCARU, Ana ALECU, Camelia DIGUTA, Florentina MATEI �....................................................................... 92 Assessment of biogas production of certain varieties of Pennisetum purpureum, Zea mays and Sorghum saccharatum - Carlos SABORÍO VÍQUEZ ������������������.. 98 Biofortification and shoot: root ratio in wheat seedlings under the influence of certain mineral ELEMENTS - Florin SALA, Hamzeh RAWASHDEH, Marius BOLDEA ...................................... 106 The influence of water transfer favorability over the soil excess moisture - Tudor SLGEAN, Andra PORU�IU, Mariana CLIN, Raluca MANEA, Ana VÎRSTA , Paul SESTRA� ���� . 114 An exploratory research regarding romanian organic farming sector - Valentin-Cosmin SARACIN, Adrian VASILE ����������������������������.. 119 Enzymatic and genetic variability in Bacillus spp. strains with plant beneficial qualities - Oana-Alina SICUIA, Iulian GROSU, Florica CONSTANTINESCU, C�t�lina VOAIDE�, C�lina Petru�a CORNEA ������������������������������.. 124 Comparative study of length-weight relationship, size structure and fulton�s condition factor for Prussian carp from different romanian aquatic ecosystems - Mala-Maria STAVRESCU-BEDIVAN, Gina VASILE SCE�EANU, Roxana Maria MADJAR, Petre Bogdan MATEI, George Florea TOB ����������������������������������� 132
8
THE PLANTING PERIOD AND THE SIZE OF CLOVES INFLUENCES
ON GARLIC PRODUCTION
Elena Maria DRAGHICI, Viorica LAGUNOVSCHI-LUCHIAN
University of Agronomic Sciences and Veterinary Medicine of Bucharest, M�r� ti Blvd. 59, District 1, 011464 Bucharest, Romania, Email: [email protected], [email protected]
Corresponding author email: [email protected]
Abstract Climate change raises a number of issues of farmers. Even if growing spring garlic in Romania usually occurs in March, recent changes of temperature and moisture abundance on soil that occurred during February-March period compelled farmers to seek new periods and methods of garlic cultivation. For example, in the spring of 2012 garlic could not be grown before early April. The assessed results obtained by the cultivation of garlic on April 2nd, 7th and 12th showed us that the best results and yields were obtained on the crop originated from April 2nd, with a 7.75 t/ha garlic production as compared to 6.25 t/ha (garlic cultivated on April 7th) and 4.75 t/ha (garlic cultivated on April 12th). In addition the production quality was superior for the crops originating from April 2nd. The results obtained show clearly that it is necessary a permanent assessment of planting date according to climate change in order to have a satisfactory productivity in the new environment and better manage existing genetic resources.
Key words: Climate change, spring garlic, production.
INTRODUCTION Garlic (Allium sativum L.) is one vegetable species known since ancient times. References to this plant are found in the Bible, in the Koran, in studies and archaeological evidence reflecting its importance both as food as well as medicinal plants (Parejo et al., 2002; Tapsell et al., 2006; Petcov-Uzun et al., 2011). Garlic belongs to one of the most important groups of plants, in terms of economic importance, namely family Alliaceae (Brewster, 1994). Currently is cultivated mainly between 300 and 450 parallels in both northern and southern hemispheres. Garlic (Allium sativum L.) is a species easy to cultivate, it does not require special facilities and productions can be over 24 tons per hectare. At the level of the year 2011, according to data provided by the FAO, the total garlic planted areas (worldwide) amounted to 14119023 ha, with an overall output above 237211446 tons. The undisputed leader is China with more than 78% worldwide prduction, followed by India and Korea. The
European Union is the fourth world producer with a cultivated area of about of 37.819 ha with an outcome around of 283.154 tons. Spain (15,660 ha - 8.93 t/ha), France (2,700 ha - 7.18 t/ha) and Italy (3,150 ha - 9.69 t/ha) are also among the countries with the largest areas of cultivation of garlic in the EU in the year 2011. In Romania garlic is cultivated on large areas in Oltenia, Muntenia, Banat and Central Moldova. Thus cultivated area in 2011 was 12.2 thousand hectares with a total production of 66,606 tons. Garlic is grown for bulbs, cloves, false stem and green leaves, which are eaten fresh or used as flavors for dishes, sausages, canned meats and vegetables. Garlic is also used in the pharmaceutical industry. Bulbs of garlic as well as young green parts of the plant have a similar use of onions, but in lesser quantities. Because it contains essential oil, garlic is considered less of a food itself, and more of a spice of nutritional importance (Luchian, 2007). The bulb contains 25-30% dry with high content of sugar (20-26%) protein (6-7%), Vitamin C (10-20 mg), vitamin B1, B2, E and minerals (calcium, phosphorus, potassium -
9
AgroLife Scientific Journal - Volume 4, Number 2, 2015
ISSN 2285-5718; ISSN CD-ROM 2285-5726; ISSN ONLINE 2286-0126; ISSN-L 2285-5718

around 540 mg to 100 g of fresh substance). Also contains phytoncides with bactericidal activity with tonic and antiseptic properties and a wide range of antioxidants (Petcov-Uzun et al., 2011). The main bioactive substance from the bulbs of garlic is allicin, which has a role in reducing blood lipid content. (Leighton et al., 1992) noted that flavonols in this species, represented mainly by quercetin, inhibits tumor growth. Garlic is rich in antioxidants, which helps to destroy free radicals - particles that can damage cell membranes, interact with genetic material and contribute to the aging process and the development of a number of diseases including heart disease and cancer. Actually, the chemical composition of garlic (Allium sativum L.) is determined by its genotype and culture conditions. Plants respond to abiotic stressors by producing amino acid proline. Here we can specify Cenad garlic (grown on Timis County, Romania), which proved to be a good accumulator of proline in normal hydration and in drought conditions. Instead quantitative determination of chlorophyll pigments from fresh leaves of garlic Cenad population has been a below average content of 7.95 mg /L for chlorophyll a and 4.76 mg /L for chlorophyll type b (Petkov-Uzun et al., 2009). Cloves begin to vegetate at 40C. Typically minimum temperature of vegetation is 40C, the optimum of 18-200C and 25-300C maximum. The rooted bulbs withstand in the winter up to -250C. From bulbs stored at 20-240C, planted late spring, bulbs are no longer obtained. It is a long day plant, very pretentious to light and if it is grown in shaded places bulbs are not formed. It is sensitive to excess but also the inadequacy of water in the soil. Until the bulb formation it must ensure 70-75% of the field capacity, which is to be reduced afterwards to 60-65%. Specific consumption for garlic is 5-6 kg N, 1-1.5 kg P2O5, 4-5.5 kg K2O, 2-3 kg CaO and 0.5 kg MgO per ton of bulbs (Draghici, 2004). As we know in most cases garlic is multiplied, vegetative, by cloves, because many of its varieties have lost, in time, the ability to produce fertile flowers: the root system is poorly developed; fasciculate roots are developing to a depth of 15-29 cm. In soil the grow bulb (or head of garlic) of the species cultivated in Romania is composed of 10 to 20
cloves. Usually those facing towards the inside of the blub are smaller. Cloves are nothing more than auxiliary buds, usually going by three, formed from fleshy sheets, hypertrophied at armpit of leaf sheaths. Outside, each clove is protected by thin, translucent, white or pink coats. Each clove houses bud. The basal part of cloves differentiates a random number of roots which starts to develop when, after detachment, are placed in germination conditions. Cloves are fixed with the basal part on the stalk itself in the form of flattened disk. They are all together protected by 3-4 white-silver, white-yellow or pink parchment sheets. Leaves in number of 8-15, are linear, lanceolate and in the median part through superposition form false stalk. After leaf formation the central bud of bulb may abort flowers or may form a floral-filled cylindrical stalk with a height of 0.80 to 1 m with sterile flowers. Floriferous stems formation is favored when the bulbs are exposed to low temperatures or when low temperatures are associated with long days at the beginning of the formation of bulbs (Draghici, 2009). Changing climatic conditions and temperature fluctuations are the main causes of production losses in most species cultivated thus they are a limiting factor for the production of garlic. This requires constantly looking for solutions to increase plant productivity in their new environment and a better management of the existing genetic resources. In fact, in-depth knowledge about the varieties of garlic, its production and changes over time are quite limited, even if garlic is cultivated and consumed for thousands of years (Simon & Jenderek, 2003). Garlic has moderate temperature requirements. Thus the optimum temperature is 18-29 0C and long days, with a minimum of 2-3 0C and maximum of 25-30 0C (Ciofu et al., 2004). However in the current climate change situation requires the use of garlic varieties and the best crop conditions to maximize the production. For example in Italy garlic phenotypes with very good resistances to temperature variations, very productive and higher quality characteristics were selected (Di Stefano, 2012). Garlic has high demands regarding lighting conditions. Grown in shady places it favors not
10

the formation of bulbs. Due to its superficial root system it requires more water. Thus the soil moisture should be 70-75% of field capacity until bulb formation and 60-65% in its maturity period for the varieties currently cultivated. However the excess moisture leads the bulbs to rot. In this period of climate change purpose of this study was to underline some aspects of garlic cropping technology, to establish and to recommend the best time to plant spring garlic in a traditional garlic culture of Romania. In this situation we followed the objectives: The influence of the planting season on growth and development of garlic plants; The influence of the planting season on the size of garlic bulbs; The influence of the planting season and of the cloves size on the number of cloves the garlic bulbs are made of; The influence of the planting season and of the cloves size on the production of garlic and Commercial quality of garlic bulbs. Also we try, taking into consideration the climate conditions, to recommend the best planting material to achieve maximum efficiency.
MATERIALS AND METHODS The experiences have been placed in their own micro-farm from the city of Magurele, Pruni village, Ilfov County, on an area of 2500 m2. To improve the soil structure, on its surface this was embedded with perlite with granulation of 4 mm. The perlite was provided by S.C. PROCEMA S.R.L., Romania. This treatment was necessary because the soil structure in this region is too little aerated. Preparation of the land was done in the autumn prior to the experiment: phosphorus fertilization (300-350 kg/ha superphosphate) and potassium (100-150 kg/ha potassium sulphate), deep plowing at 28-30 cm and soil shredding. The biological material consisted of a variety of local spring garlic (Allium sativum L.). The culture methodology Culture of garlic (Allium sativum L.) was set up in some sunny days, in the first half of April 2012. Cloves were introduced at about 3 cm deep in the ground, at a distance of 25 cm between rows and at 15 cm on the row. Planting was carried out at three different dates,
on 2012 and 2013, April 2nd, April 7th and April 12th. The cloves been used were of different sizes, exterior (large), medium and central (small). The experimental variants are set out in Table 1. Maintenance works applied to culture were: manually hoeing by 2-3 times, additional fertilization to start of bulbs formation with Compex III (NPK 15.15.15.), dripping irrigation, especially in the phase of formation of the bulb, and combating disease and of garlic bite (Suillia lurid) with Sinoratox 35 EC 0.15%.
Table 1. Experimental variants
Var. Planting date Positioning
cloves used at planting
Dimension
V1 2.04.2012 2.04.2013
exterior large-sized V2 middle medium-sized V3 central/core small-sized V4 7.04.2012
7.04.2013 exterior large-sized
V5 middle medium-sized V6 central/core small-sized V7 12.04.2012
12.04.2013 exterior large-sized
V8 middle medium-sized V9 central/core small-sized
The amount of propagating material used for the planting was based on the size of the clove and plant density (Table 2).
Table 2. Quantity of planting material used according to the size cloves
Cloves size Quantity
The distance between
rows
The distance between plants
Density
g/m2 cm cm cloves/m2 Large - exterior cloves
75 25 4
1250.00 Medium sized -middle
50 25 3
1333.33 Small - central cloves
35 25 2.5
1600.00
The harvest methodology The harvest of garlic bulbs (Allium sativum L.) was carried out when the first signs of maturation were noticed - total yellowing and the beginning of leaves drying namely first harvests were conducted in 6th of June and the last on 23rd of June. It was not allowed final drying of the leaves before harvesting because the bulbs that exceed the harvest period are stripped out of husks and
11

come off in cloves which leads to great losses both at harvest as well as during storage. Harvesting was carried out on dry weather. The bulbs were removed from the earth by shaken (avoiding mechanical injuries) and were seated to dry on the surface for two days in the sun and after drying the leaves were cut leaving about 1.5 - 2 cm above the bulb shoulders and the root was shortened to 1 cm. The harvested garlic was stored at a temperature of 1-3 °C and an air humidity of 75%. The garlic quality evaluation After being harvested, the plants were measured for length, diameter and the height of garlic bulbs. The cloves were also counted for each garlic bulb in order to quantify the differences. The results of the measurements were analyzed by analysis of variance (analysis significance of difference-Duncan test).
RESULTS AND DISCUSSIONS Plant emergence was different depending on the cloves size and planting date. Thus the large cloves planted on April 2nd arose after 15 days from planting. Also, medium and small cloves sprouted after 16 days. At the later planting cloves were emerged after a lower number of days but with differences in the sizes of cloves (Figure 1).
1516 16
13
15
12 1213 13
0
2
4
6
8
10
12
14
16
18
V1 V2 V3 V4 V5 V6 V7 V8 V9
hy brid v ariant
days
Figure 1. Number of days from sowing to sprouting
The number of leaves per plant was different depending on planting date. At planting operations on April 2nd, plants from large and medium cloves presented a higher number of leaves than the rest of the variants. The lowest number of leaves was recorded at variants planted on April 7th (Figure 2).
10
7
9
78
109
8
11
0.00
2.00
4.00
6.00
8.00
10.00
12.00
V1 V2 V3 V4 V5 V6 V7 V8 V9
hybrid variant
Aver
age n
umbe
r of le
aves
Figure 2. Average number of leaves per variant at
planting
Plant heights were consistent with the size of the cloves used. The garlic heights, by the period of planting (Figure 3).
0
10
20
30
40
50
60
70
1 2 3 4 5 6 7 8 9
hy brid v ariant
cm
Figure 3. Garlic plants heights
The diameter of the garlic strains were greater at variants from larger cloves and much lower for those derived from lower cloves but the size also varied according to the date of planting (Figure 4).
0.0
0.2
0.4
0.6
0.8
1.0
1.2
1 2 3 4 5 6 7 8 9
hy brid v ariant
cm
Figure 4. Evolution of garlic plants diameter
The bulbs weight obtained from cultivated plants was different according to the size of cloves used and the planting date. For instance, from the large cloves planted on April 2nd, the larger bulbs of 34.7 g were obtained. Also,
12

from the medium and small cloves the average weight of bulbs of garlic was much lower (17.67 g respectively 15 g) (Figure 5).
0.00
5.00
10.00
15.00
20.00
25.00
30.00
35.00
40.00
average large medium small
cloves category at planting
clove
s weig
ht, g
02.04.2012 07.04.2012 12.04.2012
Figure 5. Weight of garlic bulbs depending on planting date and size of cloves
It is noted from the statistically data of significant negative differences, respectively significant distinct at variants 2 and 3 (Table 3).
Table 3. Synthesis of the garlic bulbs weight
depending on clove size - the date of planting: 02/April
Variant Weight of
garlic bulbs, g
Difference
Significance g %
Average 22.44 0 100 Control
V1 34.67 12.22 154.46 ***
V2 17.67 -4.78 78.71 O
V3 15 -7.44 66.83 OO DL5% = 3.020 DL5% in % = 13.4554 DL1% = 5.000 DL1% in % = 22.2772
DL0.1% = 9.370 DL0.1% in %= 41.7475
The size of the bulbs harvested from the variant planted on April 7th was lower compared to those planted on April 2nd. Their size ranged between 25.33 g and 13.67 g. Statistical interpretation of data obtained shows that there were differences in the size of the bulbs, planted on April 7th. These differences are significant distinct negative for V6 and significant positive for V4 (Table 4). At the planting of April 12th, the out of time plantation, differences between the size of harvested bulbs can be noticed, these being comprised between 18.67 g at V7 when large cloves were planted and 11.67 g at V9 when small cloves were planted.
Table 4. Synthesis of the garlic bulbs weight depending on clove size - the date of planting: 07/April
Statistically analyzing the data obtained regarding the mass of harvesting garlic bulbs according to the size of planted cloves we can appreciate that from the large cloves it obtained higher average bulbs masses. This is statistic supported by the fact that the V1 has achieved a highly statistically significant (Table 5).
Table 5. Synthesis of the garlic bulbs weight depending
on clove size - the date of planting: 12/April
Variant
Weight of garlic bulbs,
g
Difference
Signif.
g % Average 15.33 0 100 Control V7 18.67 3.33 121.74 * V8 15.67 0.33 102.17 N V9 11.67 -3.67 76.09 OO DL5% = 2.070 DL5% in % = 13.5000 DL1% = 3.420 DL1% in % = 22.3043 DL0.1% = 6.410 DL0.1% in %= 41.8043
The planting on April 2nd yielded the largest garlic bulbs, averaging to 34.67 g. At the V7 variant, when planting was done later (on April 12th), bulbs of average weight of 18.67 g were achieved. Statistically speaking against the average experience, a significantly negative grow was noticed, with a difference against the control batch of only 71.19% (Table 6).
Table 6. Synthesis of garlic bulbs weight depending on
planting date at the variants where large cloves were used
Variant Weight of garlic
bulbs, g
Difference Signif.
g % Average 26.22 0 100 Control
V1 34.67 8.44 132.2 ** V4 25.33 -0.89 96.61 N V7 18.67 -7.56 71.19 O
DL5% = 4.780 DL5% in % = 18.2288 DL1% = 7.910 DL1% in % = 30.1653 DL01% = 14.820 DL01% in %= 56.5169
Variant Weight of
garlic bulbs, g
Difference
Signif.
g % Average 18.89 0 100 Control V4 25.33 6.44 134.12 * V5 17.67 -1.22 93.53 N
V6 13.67 -5.22 72.35 O DL5% = 4.410 DL5% in % = 23.3471 DL1% = 7.300 DL1% in % = 38.6471 DL0.1% = 13.660 DL0.1% in %= 72.3176
13

Where they have used the medium bulbs at planting we found that the lowest weight of a bulb was obtained for the late plantings. However, statistically no real differences were found (Table 7).
Table 7. Synthesis of garlic bulbs weight depending on planting date at the variants where medium cloves were
used
Variant
Weight of garlic bulbs,
g
Difference
Signif. g % Average 17.00 0 100 Control
V2 17.67 0.67 3.92 N
V5 17.67 0.67 103.92 N V8 15.67 -1.33 92.16 N
DL5% = 5.240 DL5% in % = 30.8235 DL1% = 8.670 DL1% in % = 51.0000 DL01% = 16.230 DL01% in %= 95.4706
The number of cloves formed in garlic bulbs was higher in earlier variants planted (on April 2nd) compared with the number of cloves formed on garlic planted on April 7th or 12th (Figure 6).
8
5
11
9
7
9
65
12
0.00
2.00
4.00
6.00
8.00
10.00
12.00
14.00
V1 V2 V3 V4 V5 V6 V7 V8 V9
hybrid variant
Aver
age n
umbe
r of c
loves
Figure 6. Number of cloves formed in garlic bulb
depending on the time of planting and on the planting material size
Production levels per hectare were calculated by evaluating the size of garlic bulb and garlic quantities obtained for each variant. The data obtained is presented in Table 8. Table 8. The crop production of garlic achieved at one ha
according to the size and planting date of the bulbs
Variant Planting date
Density Production
estimated at 1 ha
Plants/ha kg/ha V1
02.April 1250000 7750
V2 1333333 5334 V3 1600000 4800 V4
07.April 1250000 6250
V5 1333333 4534 V6 1600000 4480 V7
14.April 1250000 4750
V8 1333333 4267 V9 1600000 4160
Figure 7 shows an inverse correlation between the achieved production and both cloves size at planting and planting date.
y = -323.85x + 6766.5R2 = 0.5787
0
1000
2000
3000
4000
5000
6000
7000
8000
9000
0 1 2 3 4 5 6 7 8 9 10Variant
Prod
uctio
n es
timat
ed, k
g/ha
Figure 7. The correlation between planting date, planting
bulbs size and achieved production From the point of view of garlic diameter, the largest garlic bulbs were identified from all the variants planted on April 02nd, while the smallest garlic bulbs were found at the variants planted on April 12th. The data was assessed in compliance with the national quality standards. These data is presented in Table 9.
Table 9. Compliance with standard quality
Variant Planting date
Bulbs diameter,
cm Quality class
V1
02.April
4.7 Superior
V2 3.3 First quality
V3 2.7 Second quality
V4
07. April
4.0 Superior
V5 3.7 First quality
V6 2.8 Second quality
V7
12. April
3.1 First quality
V8 2.9 Second quality
V9 2.0 Third quality � below
standard quality
Changing of climatic conditions and temperature fluctuations are the main causes of production losses in most cultivated species. For example, in China, the 2011 production of garlic was lower by 30% compared to previous years (www.prettygarlic.com), with an important negative impact on garlic exports. The global warming also affects Romania. The forecast of climate change in Romania show an annual increase of about 1.8 0C and a decrease in rainfall, for example the south of the country shows decreased values by 1.38 and 2.30% (Sandoiu, 2011). The survey results on garlic production in the last years indicate that
14
climate change affects the whole value chain of garlic. In conditions of climate change, spring garlic cultivation has raised a number of challenges. Even if the usual cultivation period of spring garlic in Southern Romania starts from the second decade of March, the lower temperatures followed by heavy rainfalls and flooding delayed the planting of garlic till early April. Such temperature conditions were consistent with planting from April 2nd, 2012-2013. Thus in these conditions our experiments were conducted by planting of garlic in three stages: first, on April 2nd, second, on April 7th and third on April 12th. In the first stage of planting the soil temperature was 5.3 0C, during the second stage was 6.2 0C and 7.6 0C in the third stage. Planting was carried out starting from April 2nd when the minimum temperature of 4 0C for rooting was achieved. As seen from the results, the best results were obtained from the first planting on 2nd of April for all categories of clove sizes. This can be explained by the increasing in temperature that reached at mid-April to 180C. This temperature is not suitable for vegetative growth of garlic. These high temperatures during vegetative growth were clearly unfavorable for garlic planted on the second and third stages, namely on April 7th and 12th. It is therefore clear the need to identify challenges and opportunities of garlic value chain and also to suggest adaptive mechanisms for climate changes. CONCLUSIONS The number of leaves formed on the plant varied accordingly to the planting date. At planting operations on April 2nd plants originated from large and medium cloves presented a higher number of leaves than the rest of the variants. The lowest number of leaves was recorded at variants planted on April 7th. Plant heights were influenced by planting period. The greatest heights were obtained from earlier variants planted. The highest yields were obtained from all variants originated from large cloves (V1 -
43,750.0 kg/ha, V4 - 31,250 kg/ha, V7 - 23,750.0 kg/ha). The lower yields were obtained from all variants originated from smaller cloves (24,000.0 kg/ha, 22,400.0 kg/ha, 20,800.0 kg/ha). The garlic bulbs diameter was greater at the earliest planted variants (April 2nd) and the lowest for the variants planted on April 12th. The climatic conditions are a limiting factor for garlic production. In order to have a satisfactory productivity in the new environment a permanent optimization of planting date (according to climate changes) and a better existing genetic resources management are required. ACKNOWLEDGEMENTS This work was supported by a grant of the Romanian National Authority for Scientific Research, CNDI - UEFISCDI, financed from project number PN-II-PT-PCCA-2011-3.2-1351 - Contract No. 68/2012 and SC PROCEMA PERLIT SRL, Romania, furnished the perlite. REFERENCES Brewster J.L., 1994. Onions and Other Vegetable Allium
CAB International Wallingford, United Kingdom, p. 236.
Ciofu R., Nistor S., Popescu V., Chilom P., Apahidean S., Horgos A., Berar V., Lemeni K., Atanasiu N., 2004. Tratat de legumicultur�. Ed. Ceres, Bucuresti.
Di Stefano C., 2012. Profitable garlic campaign 2012 and future expectations for Sicil Garlic. http://www.freshplaza.it/article/43713/Sicil-Garlic-bilancio-positivo-per-la-campagna-aglio-2012-e-prospettive-future.
Dr�ghici E., 2004. Legumicultur�. Ed. Elisavaros, Bucure�ti.
Dr�ghici E., 2008. Producerea semin�elor �i materialului s�ditor legumicol. Ed. Atlas Press, Bucuresti, pages.http://www.prettygarlic.com.
Leighton T., Ginther C., Fluss L., Harter W.K., Cansado J., Notario V., 1992. Molecular characterization of quercetin and quercetin glycosides in Allium vegetables-their effects on malignant-cell transformation. Am. Chem. Soc. Symp. Series, 507, p. 220-238.
Luchian V., 2007. Legumicultura general �i special�. Ed. Elisavaros, Bucuresti.
Parejo I., Viladomat F., Bastida J., Rosas - Romeo A., Flerlange N., Burillo J., Codina C., 2002. Comparison between the radical scavening activity and antioxidant activity of six distilled and
15

nondistilled mediterranean herbs and aromatic plants. J. Agric. Food Chem. 50, p. 6882-6890.
Petcov-Uzun A.A., Boleman A., Butnaru G., S�rac I., 2009. Determination of the chlorophyll content extracted from leaves of garlic (Allium sativum L.). Young people and Multidisciplinary Research. Proceedings of the XIth International Symposium. Ministry of Education. Research and Inovation, p. 105-108.
Petcov-Uzun A.A., Boto� A., Corneanu M., Butnaru G., L�zureanu A., 2011. Studies on the environmental hazards in drinking water evaluation from Caras - Severin district by Allium sativum L. Anales of the
University of Craiova, Vol. XXXVIII/A, Ed. Universitaria, p. 448-453.
Sandoiu I., 2011. Biofizica si Agrometeorologie. Ed. Ceres, Bucuresti, p. 194-197.
Simon P.W. & Jenderek M.M., 2003. Flowering. seed production and the genesis of garlic breeding. Plant Breeding Reviewes 23, p. 211-244.
Tapsell L.C., Hemphill I., Cobiac L., Patch C.S., Sullivan D.R., Fenech M., Roodenrys S., Keogh J.B., Clifton P.M., Williams P.G., Fazio V.A., Inge K.E., 2006. Health benefits of herbs and species: the past, the present, the future. Medical Journal Austr. 185, S21-S24.
16
�COMPARATIVE RESEARCH ON SEVERAL WHEAT (Triticum aestivum L.)
GENOTYPES GROWN UNDER THE CONDITIONS OF DÂLGA- C�L�RA�I
Bogdan-Alexandru GU��1,2, Doru Ioan MARIN2, Pierre-Louis CARRIER3
1Saaten Union Romania SRL,1-5 General Praporgescu Street, 4th floor, Ap. 8, District 2, 020965, Bucharest, Romania, Phone: +4021 318.67.14, Fax: +4021318.67.13,
Email: [email protected] 2University of Agronomic Sciences and Veterinary Medicine of Bucharest, 59 M�r��ti Blvd, District 1, 011464, Bucharest, Romania, Phone: +4021.318.25.64, Fax: + 4021.318.25.67,
Email: [email protected] 3Saaten-Union France, 163 ter Avenue de Flandre, 60190, Estrées-Saint-Denis, France,
Phone: +33 698 757 042, Fax: +33 344 914 848, Email: [email protected]
Corresponding author email: [email protected] Abstract Research was carried out between 2012 and 2014, under the soil-climate conditions of the Dâlga area, C�l�ra�i County, and included a comparative study of several winter wheat genotypes of foreign and local origin, as follows: four winter wheat varieties (Dropia, Glossa, Katarina, Mulan) and eight winter wheat hybrids (Hystar, Hyfi, Hywin, Hylux, Hyspeed, Hyland, Hybery, Hybiza). The experiment was established according to the randomized blocks method including three repetitive stages. The main goal of our research was the identification of the most competitive winter wheat varieties for the soil-climate conditions specific to the Romanian Plain. During our research, we performed phonological observations and determinations concerning plant density in autumn (plants/m2), plant density in spring (stems/m2), head density at harvesting time (ear/m2), grains weight per ear at harvest maturity (g), grain moisture (%) at harvesting time, the grain yield related to the area unit (kg/ha); we also carried out determinations concerning the main physical quality indices of grains: thousand grain weight and hectolitre weight. Sowing density was 500 germinable kernels/m2 for the winter wheat varieties and 200 germinable kernels/m2 for the winter wheat hybrids. The analysis of the average data for the two experimental years showed that the number of harvestable ears ranged between 545 ears/m² (Glossa) and 696 ears/m² (Katarina) in the winter wheat varieties, while the wheat hybrids varied between 559 ears/m² (Hybery) and 656 ears/m² (Hyspeed). Regarding their tillering capacity, the hybrids under study proved to be highly superior to the varieties. The analysis of the grain yields for the 12 winter wheat genotypes indicated that the recorded benefit values varied between 5623 kg/ha (Dropia) and 7291 kg/ha (Hystar), and that the tested hybrids were superior in productivity terms, as they recorded increased yields comprised between 316.2 Kg/ha and 1163.2 kg/ha, compared with the average of the average of the varieties, i.e. the control. The results obtained showed that the wheat hybrids had a high tillering capacity of forming fertile tillers, as six of the analysed hybrids recorded higher yields than the varieties. Key words: Triticum aestivum L., wheat, varieties, hybrids, yield, quality indices.
INTRODUCTION The increasingly frquent evolution of climate change latelt has demanded the updating of the technological links by using new winter wheat varieties as genotypes characterized by high tolerance to drought and heat stress. In Romania, research concerning the development of new winter wheat varieties with high yield potential and high baking value has made significant progress, resulting in
more early varieties with good tolerance to extreme conditions (S�ulescu, 2007, 2010; Ittu, 2012). The issues generated by the diversification of the winter wheat assortment and their vulnerability to evironmental conditions, were partly solved out by the research performed both in Romania (Must��ea et al., 2008; Lupu et al., 2010; Meluc� et al., 2011; Neac�u, 2012) and other countries (Egesel, 2012), so that the
17
AgroLife Scientific Journal - Volume 4, Number 2, 2015
ISSN 2285-5718; ISSN CD-ROM 2285-5726; ISSN ONLINE 2286-0126; ISSN-L 2285-5718

research concerning yield stability and quality balance are current topics. Research on hybrid wheat breeding began in the US around 1930. The first CHA (Chemical Hybidization Agent) was created in 1973, but it is only� in 1982 that HybriTech started a hybrid wheat breeding programme in the US, with the CHA system named Genesis. In 1992 the Orsan Lafarge company created the company Hybrinova based on their own CHA system named Croisor. In 1993 HybriTeck and Hybrinova obtained authorizations for the distribution of the first wheat hybrids in France. The data represents the beginning of the wheat hybrid business in Europe (***Saaten-Union, 2015). The Hystar variety was the first commercial wheat hybrid launched in Romania (2010). Recent studies have shown that introducing new wheat hybrids is a possibility to obtain high yields per ha, as the best hybrids wheat record yields of over 1.0 t/ha, compared with the winter wheat line varieties (Gowda et al., 2012; Longin et al., 2012). Our paper presents the experimental results obtained between 2012 and 2014 for an assortment of Romanian and foreign winter wheat varieties and hybrids grown under the soil-climate conditions specific to the Dâlga area, C�l�ra�i County. MATERIALS AND METHODS In order to identify the winter wheat quality and yield potential, during 2012-2014, we
organized a field - located monofactorial experiment according to the randomized complete block design in three replications; the experiment studied 12 wheat genotypes (four varieties: Dropia, Glossa, Katarina, Mulan, and eight hybrids: Hystar, Hyfi, Hywin, Hylux, Hyspeed, Hyland, Hybery, Hybiza). The observations and determinations throughout the vegetation period were performed in dynamics and were aimed at measuring: plant density after germination (end of October), at the beginning of winter (December), plant density in spring (April) and before the harvesting time (July), by using the metrical frame method. After harvesting the trial crop, we determined the grain yield for each genotype and collected grain samples for laboratory determinations for the main physical indices related to crop quality, i.e. thousand grain weight (TGW) and hectolitre weight (HL). The interpretation of the experimental results was based on variance analysis, with the as control element the averages of the analysed varieties and hybrids considered the control. The climatic conditions during our research were characterized as follows: in the autumn of 2012 (October-November) precipitations recorded 41 mm, adding 124.5 mm during winter (December-February), 117 mm in the spring of 2013 (March-April) and 99.52 mm in May and June, totalling 382.02 mm during the whole vegetation period (Table 1).
Table 1. Climatic conditions throughout experiments (2012 - 2014) - temperature (oC) and rainfall (mm)
Research year/ Month
2012 - 2013 (0C)
2013 - 2014 (0C)
Multiannual average
(0C)
2012 - 2013 (mm)
2013 - 2014 (mm)
Multiannual average (mm)
October 15.8 13.26 12.99 32 45 44.25 November 9.8 10.61 7.45 9 29 39.88 December 0.17 1.28 1.38 70.5 27 40.79 January 1.4 4.6 0.04 15.5 26 40.73 February 4.9 4.62 2.08 38.5 55 26.64 March 7.02 9.72 7.29 22.5 59 32.54 April 13.6 13.2 12.06 94.5 107 34.78 May 20.2 17.65 18.15 28.02 106.2 58.32 June 21.85 20.7 21.38 71.5 34 69.76 July 24 24.6 24.04 34.5 30.5 59.09 August 24.8 26.3 23.17 124.5 74 42.64 September 19.6 21.35 17.47 15.5 26 66.72 Average/Total 13.59 13.99 12.29 556.52 618.7 556.14
18
The 2013-2014 agricultural year was characterized by a higher pluviometric regime: 488.2 mm from sowing until harvesting and 306.2 during the spring-summer vegetation period, with a pluviometric contribution of 140.2 mm during the water shortage period for winter wheat (May-June). The daily average temperature throughout the wheat vegetation period (October-December) was 13.590C for the 2012-2013 agricultural year and 13.990C for the 2013-2014 agricultural year. Under those circumstances, the winter wheat hybrids under study achieved yields performances that made them competitive with the best varieties cultivated nowadays in the Romanian Plain, owing to the effective use of the water from rainfalls under conditions of absent irrigation.
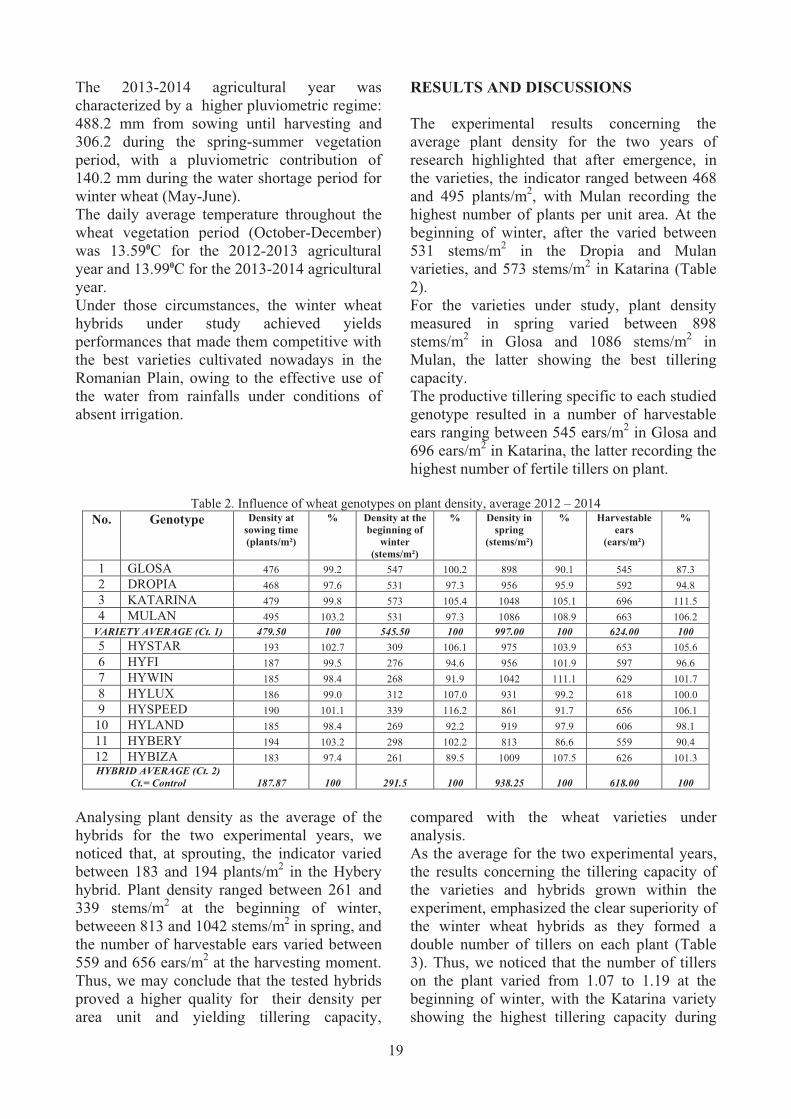
RESULTS AND DISCUSSIONS The experimental results concerning the average plant density for the two years of research highlighted that after emergence, in the varieties, the indicator ranged between 468 and 495 plants/m2, with Mulan recording the highest number of plants per unit area. At the beginning of winter, after the varied between 531 stems/m2 in the Dropia and Mulan varieties, and 573 stems/m2 in Katarina (Table 2). For the varieties under study, plant density measured in spring varied between 898 stems/m2 in Glosa and 1086 stems/m2 in Mulan, the latter showing the best tillering capacity. The productive tillering specific to each studied genotype resulted in a number of harvestable ears ranging between 545 ears/m2 in Glosa and 696 ears/m2 in Katarina, the latter recording the highest number of fertile tillers on plant.
Table 2. Influence of wheat genotypes on plant density, average 2012 � 2014 No. Genotype Density at
sowing time (plants/m²)
% Density at the beginning of
winter (stems/m²)
% Density in spring
(stems/m²)
%
Harvestable ears
(ears/m²)
%
1 GLOSA 476 99.2 547 100.2 898 90.1 545 87.3 2 DROPIA 468 97.6 531 97.3 956 95.9 592 94.8 3 KATARINA 479 99.8 573 105.4 1048 105.1 696 111.5 4 MULAN 495 103.2 531 97.3 1086 108.9 663 106.2
VARIETY AVERAGE (Ct. 1) 479.50 100 545.50 100 997.00 100 624.00 100 5 HYSTAR 193 102.7 309 106.1 975 103.9 653 105.6 6 HYFI 187 99.5 276 94.6 956 101.9 597 96.6 7 HYWIN 185 98.4 268 91.9 1042 111.1 629 101.7 8 HYLUX 186 99.0 312 107.0 931 99.2 618 100.0 9 HYSPEED 190 101.1 339 116.2 861 91.7 656 106.1
10 HYLAND 185 98.4 269 92.2 919 97.9 606 98.1 11 HYBERY 194 103.2 298 102.2 813 86.6 559 90.4 12 HYBIZA 183 97.4 261 89.5 1009 107.5 626 101.3 HYBRID AVERAGE (Ct. 2)
Ct.= Control 187.87 100 291.5 100 938.25 100 618.00 100
Analysing plant density as the average of the hybrids for the two experimental years, we noticed that, at sprouting, the indicator varied between 183 and 194 plants/m2 in the Hybery hybrid. Plant density ranged between 261 and 339 stems/m2 at the beginning of winter, betweeen 813 and 1042 stems/m2 in spring, and the number of harvestable ears varied between 559 and 656 ears/m2 at the harvesting moment. Thus, we may conclude that the tested hybrids proved a higher quality for their density per area unit and yielding tillering capacity,
compared with the wheat varieties under analysis. As the average for the two experimental years, the results concerning the tillering capacity of the varieties and hybrids grown within the experiment, emphasized the clear superiority of the winter wheat hybrids as they formed a double number of tillers on each plant (Table 3). Thus, we noticed that the number of tillers on the plant varied from 1.07 to 1.19 at the beginning of winter, with the Katarina variety showing the highest tillering capacity during
19
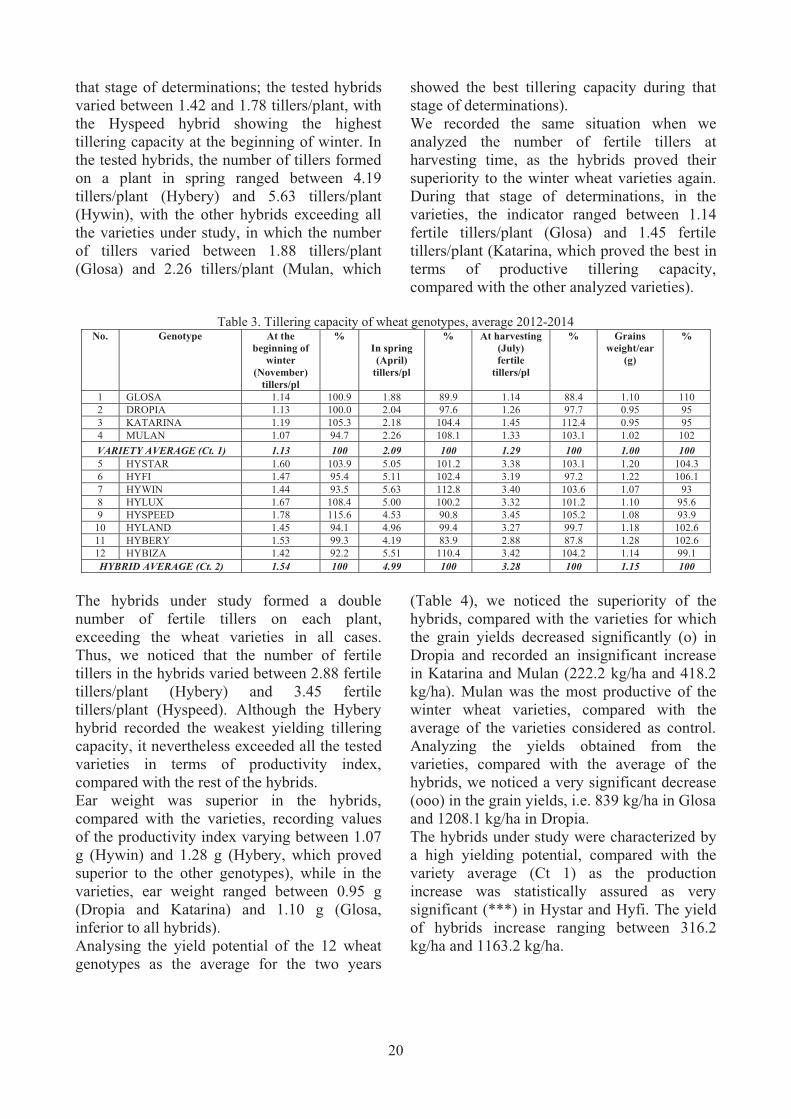
that stage of determinations; the tested hybrids varied between 1.42 and 1.78 tillers/plant, with the Hyspeed hybrid showing the highest tillering capacity at the beginning of winter. In the tested hybrids, the number of tillers formed on a plant in spring ranged between 4.19 tillers/plant (Hybery) and 5.63 tillers/plant (Hywin), with the other hybrids exceeding all the varieties under study, in which the number of tillers varied between 1.88 tillers/plant (Glosa) and 2.26 tillers/plant (Mulan, which
showed the best tillering capacity during that stage of determinations). We recorded the same situation when we analyzed the number of fertile tillers at harvesting time, as the hybrids proved their superiority to the winter wheat varieties again. During that stage of determinations, in the varieties, the indicator ranged between 1.14 fertile tillers/plant (Glosa) and 1.45 fertile tillers/plant (Katarina, which proved the best in terms of productive tillering capacity, compared with the other analyzed varieties).
Table 3. Tillering capacity of wheat genotypes, average 2012-2014
No. Genotype At the beginning of
winter (November)
tillers/pl
% In spring (April)
tillers/pl
% At harvesting (July) fertile
tillers/pl
% Grains weight/ear
(g)
%
1 GLOSA 1.14 100.9 1.88 89.9 1.14 88.4 1.10 110 2 DROPIA 1.13 100.0 2.04 97.6 1.26 97.7 0.95 95 3 KATARINA 1.19 105.3 2.18 104.4 1.45 112.4 0.95 95 4 MULAN 1.07 94.7 2.26 108.1 1.33 103.1 1.02 102 VARIETY AVERAGE (Ct. 1) 1.13 100 2.09 100 1.29 100 1.00 100 5 HYSTAR 1.60 103.9 5.05 101.2 3.38 103.1 1.20 104.3 6 HYFI 1.47 95.4 5.11 102.4 3.19 97.2 1.22 106.1 7 HYWIN 1.44 93.5 5.63 112.8 3.40 103.6 1.07 93 8 HYLUX 1.67 108.4 5.00 100.2 3.32 101.2 1.10 95.6 9 HYSPEED 1.78 115.6 4.53 90.8 3.45 105.2 1.08 93.9 10 HYLAND 1.45 94.1 4.96 99.4 3.27 99.7 1.18 102.6 11 HYBERY 1.53 99.3 4.19 83.9 2.88 87.8 1.28 102.6 12 HYBIZA 1.42 92.2 5.51 110.4 3.42 104.2 1.14 99.1 HYBRID AVERAGE (Ct. 2) 1.54 100 4.99 100 3.28 100 1.15 100
The hybrids under study formed a double number of fertile tillers on each plant, exceeding the wheat varieties in all cases. Thus, we noticed that the number of fertile tillers in the hybrids varied between 2.88 fertile tillers/plant (Hybery) and 3.45 fertile tillers/plant (Hyspeed). Although the Hybery hybrid recorded the weakest yielding tillering capacity, it nevertheless exceeded all the tested varieties in terms of productivity index, compared with the rest of the hybrids. Ear weight was superior in the hybrids, compared with the varieties, recording values of the productivity index varying between 1.07 g (Hywin) and 1.28 g (Hybery, which proved superior to the other genotypes), while in the varieties, ear weight ranged between 0.95 g (Dropia and Katarina) and 1.10 g (Glosa, inferior to all hybrids). Analysing the yield potential of the 12 wheat genotypes as the average for the two years
(Table 4), we noticed the superiority of the hybrids, compared with the varieties for which the grain yields decreased significantly (o) in Dropia and recorded an insignificant increase in Katarina and Mulan (222.2 kg/ha and 418.2 kg/ha). Mulan was the most productive of the winter wheat varieties, compared with the average of the varieties considered as control. Analyzing the yields obtained from the varieties, compared with the average of the hybrids, we noticed a very significant decrease (ooo) in the grain yields, i.e. 839 kg/ha in Glosa and 1208.1 kg/ha in Dropia. The hybrids under study were characterized by a high yielding potential, compared with the variety average (Ct 1) as the production increase was statistically assured as very significant (***) in Hystar and Hyfi. The yield of hybrids increase ranging between 316.2 kg/ha and 1163.2 kg/ha.
20
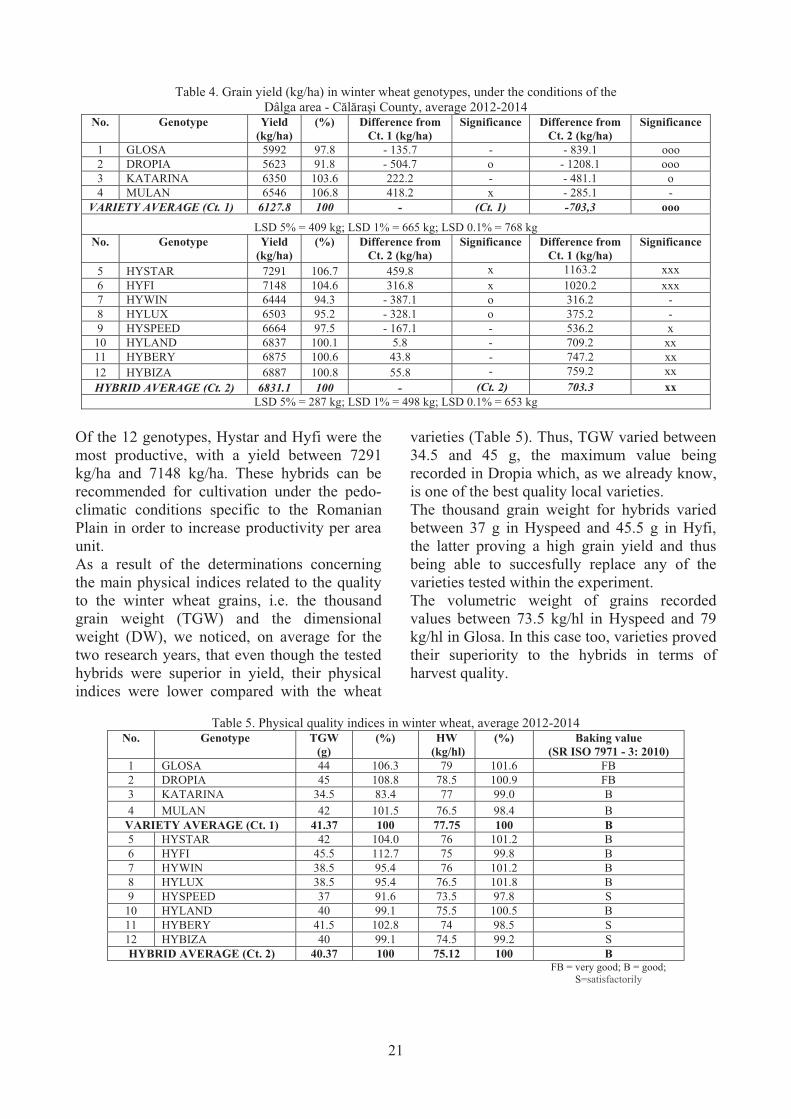
Table 4. Grain yield (kg/ha) in winter wheat genotypes, under the conditions of the Dâlga area - C�l�ra�i County, average 2012-2014
No. Genotype Yield (kg/ha)
(%) Difference from Ct. 1 (kg/ha)
Significance Difference from Ct. 2 (kg/ha)
Significance
1 GLOSA 5992 97.8 - 135.7 - - 839.1 ooo 2 DROPIA 5623 91.8 - 504.7 o - 1208.1 ooo 3 KATARINA 6350 103.6 222.2 - - 481.1 o 4 MULAN 6546 106.8 418.2 x - 285.1 -
VARIETY AVERAGE (Ct. 1) 6127.8 100 - (Ct. 1) -703,3 ooo
LSD 5% = 409 kg; LSD 1% = 665 kg; LSD 0.1% = 768 kg No. Genotype Yield
(kg/ha) (%) Difference from
Ct. 2 (kg/ha) Significance Difference from
Ct. 1 (kg/ha) Significance
5 HYSTAR 7291 106.7 459.8 x 1163.2 xxx 6 HYFI 7148 104.6 316.8 x 1020.2 xxx 7 HYWIN 6444 94.3 - 387.1 o 316.2 - 8 HYLUX 6503 95.2 - 328.1 o 375.2 - 9 HYSPEED 6664 97.5 - 167.1 - 536.2 x
10 HYLAND 6837 100.1 5.8 - 709.2 xx 11 HYBERY 6875 100.6 43.8 - 747.2 xx 12 HYBIZA 6887 100.8 55.8 - 759.2 xx HYBRID AVERAGE (Ct. 2) 6831.1 100 - (Ct. 2) 703.3 xx
LSD 5% = 287 kg; LSD 1% = 498 kg; LSD 0.1% = 653 kg
Of the 12 genotypes, Hystar and Hyfi were the most productive, with a yield between 7291 kg/ha and 7148 kg/ha. These hybrids can be recommended for cultivation under the pedo-climatic conditions specific to the Romanian Plain in order to increase productivity per area unit. As a result of the determinations concerning the main physical indices related to the quality to the winter wheat grains, i.e. the thousand grain weight (TGW) and the dimensional weight (DW), we noticed, on average for the two research years, that even though the tested hybrids were superior in yield, their physical indices were lower compared with the wheat
varieties (Table 5). Thus, TGW varied between 34.5 and 45 g, the maximum value being recorded in Dropia which, as we already know, is one of the best quality local varieties. The thousand grain weight for hybrids varied between 37 g in Hyspeed and 45.5 g in Hyfi, the latter proving a high grain yield and thus being able to succesfully replace any of the varieties tested within the experiment. The volumetric weight of grains recorded values between 73.5 kg/hl in Hyspeed and 79 kg/hl in Glosa. In this case too, varieties proved their superiority to the hybrids in terms of harvest quality.
Table 5. Physical quality indices in winter wheat, average 2012-2014
No. Genotype TGW (g)
(%) HW (kg/hl)
(%) Baking value (SR ISO 7971 - 3: 2010)
1 GLOSA 44 106.3 79 101.6 FB 2 DROPIA 45 108.8 78.5 100.9 FB 3 KATARINA 34.5 83.4 77 99.0 B 4 MULAN 42 101.5 76.5 98.4 B
VARIETY AVERAGE (Ct. 1) 41.37 100 77.75 100 B 5 HYSTAR 42 104.0 76 101.2 B 6 HYFI 45.5 112.7 75 99.8 B 7 HYWIN 38.5 95.4 76 101.2 B 8 HYLUX 38.5 95.4 76.5 101.8 B 9 HYSPEED 37 91.6 73.5 97.8 S
10 HYLAND 40 99.1 75.5 100.5 B 11 HYBERY 41.5 102.8 74 98.5 S 12 HYBIZA 40 99.1 74.5 99.2 S HYBRID AVERAGE (Ct. 2) 40.37 100 75.12 100 B
FB = very good; B = good;
S=satisfactorily
21

Analyzing the baking value of the 12 studied genotypes, we may say that they exceeded the minimal value of hectolitre wheight foreseen for milling-baking, i.e. 70 kg/hl, as they are adequate for this purpose. CONCLUSIONS The experimental results obtained during the experimental period 2012-2014 showed the following: On average for the two experimental years, the density of the winter wheat varieties varied between 468 and 495 plants/m2 after emergence, between 531 stems/m2 and 573 stems/m2 at the beginning of winter, 898 stems/m2 and 1086 stems/m2 in spring, resulting in about 545 and 696 harvestable ears/m2; in the tested hybrids, plant density after emergence time ranged between 261 and 339 stems/m2, in spring density recorded indices varying between 813 and 1042 stems/m2, and at harvesting time the ears number varied between 559 and 656 harvestable ears/m2; In varieties, the number of tillers formed on a plant varied between 1.07 and 1.19 tillers/plant at the beginning of winter, between 1.88 tillers/plant (Glosa) and 2.26 tillers/plant (Mulan) in spring; the number of fertile tillers number ranged between 1.14 (Glosa) and 1.45 (Katarina, which proved the best in terms of yielding tillering capacity); The tested hybrids formed a number of tillers varying between 1.42 and 1.78 tillers/plant at the beginning of winter, the number of tillers ranged between 4.19 tillers/plant (Hybery) and 5.63 tillers/plant (Hywin) in spring, while the number of fertile tillers at harvesting time varied between 2.88 (Hybery) and 3.45 (Hyspeed); Concerning the yield potential of the 12 studied winter wheat genotypes, the hybrids recorded higher values, compared with the average of the varieties (6127.8 kg/ha); Hyspeed, Hyfi, Hyland, Hybery, Hybiza and Hystar hybrids recorded a significant grain yield, compared with the varieties that ranged between 536.2 and 1163.2 kg/ha; The quality physical indices (thousand grain weight and hectolitre weight) were normal both for the varieties, i.e. 41.37 g - TGW and 77.75
kg/hl - HW, and the hybrids 40.37 g - TKW and 75.12 kg/hl - HW; All winter wheat genotypes tested within the experiment exceeded the minimal value of the hectolitre weight foreseen for milling-baking purposes. REFERENCES Egesel Cem Ömer, Kahrıman Fatih, Tümer Ali �hsan.
Çolak Ça�la, 2012. Yield and quality characteristics of some foreign bread wheat (Triticum aestivum L.) varieties in Turkey. Romanian Agricultural Research. No. 29, p. 31-38.
Gowda Manje, Longin C., Friedrich H., Volker Lein, and Jochen C. Reif, 2012. Relevance of specific versus general combining ability effects in wheat. Crop Sci. 52: p. 2494-2500.
Ittu Gh., 2012. Soiuri de grâu create la INCDA Fundulea, recomandate pentru 2011-2012. Profitul agricol, Nr. 44.
Longin C.F.H., Mühleisen J., Maurer H.P., Zhang H., Gowda M., Jochen Christoph, 2012. Hybrid breeding in autogamous cereals. Theoretical and Applied Genetics, October 2012, Vol. 125, Issue 6, p. 1087-1096.
Lupu Cornelia, 2010. Influen�a lucrrii de baz a solului asupra produc�iei de grâu i a unor însuiri ale solului în condi�iile de la SCDA Secuieni. An. I.N.C.D.A. Fundulea, Vol. LXXVIII, Nr. 2, p. 79-87.
Meluc Cristina, Sorina Cernat, Tudorina Nistor, 2011. Comportarea unor soiuri de grâu de toamn în condi�ii de stres hidric i termic în Câmpia Burnasului. An. I.N.C.D.A. Fundulea, Vol. LXXIX, Nr. 2, p. 201-210.
Must�ea P., Sulescu N., Ittu Gh., Gabriela Punescu, Leliana Voinea, Ioana Stere, Sorina Mîrlogeanu, Constantinescu E., Nstase D., 2008. Comportarea unor soiuri de grâu de toamn în condi�ii contrastante de mediu. An. I.N.C.D.A. Fundulea, Vol. LXXVI, 2008, p. 7-14.
Neacu Amalia. 2012. Cultivar and environment effects on dough strength in a set of winter wheat varieties grown in diverse environments and management practices. Romanian Aagricultural Rresearch, No. 29, p. 23-29.
Sulescu N. Nicolae, Gheorghe Ittu, Mariana Ittu, Pompiliu Must�ea, 2007. Cinci decenii de ameliorare a grâului la Fundulea. Analele INCDA. Fundulea, Vol. LXXV, Volum jubiliar, p. 55-72.
Sulescu N. Nicolae, Gheorghe Ittu, Aurel Giura, Matilda Ciuc, Pompiliu Must�ea, Mariana Ittu, Gabriela �erban, Florentina Amalia, 2010. Diversificarea bazei genetice ca fundament al progresului în ameliorarea grâului. An. I.N.C.D.A. Fundulea, Vol. LXXVIII, Nr. L, p. 7-20.
***Saaten-Union, 2015. The hybrid wheat website [online] http://www.hybridwheat.net. (30 April 2015).
22

AN INNOVATIVE TOOL FOR IN-ROW CULTIVATION
Cristian IACOMI, Octavian POPESCU
University of Agronomic Sciences and Veterinary Medicine of Bucharest, 59 Mărăşti Blvd.,
District 1, 011464, Bucharest, Romania
Corresponding author email: [email protected] Abstract In-row cultivation is the last piece in effective non-chemical weed control on a farm. In many ways, cultivation is the ‘crown jewel’; it is there where the skill, ability, observation and timing of a good operator makes or breaks the effort (much more so than the choice of any particular piece of equipment). Successful weed control is the sum of all operations and cultural management. The purpose of the cultural methods (crop rotation, soil fertility management, sanitation, good seed, cover crops, etc.) and early season weed control (so-called blind cultivation) is to achieve the greatest possible crop-weed size differential, especially when there are many hectares to be cultivated. The last stage, in-row cultivation, is the final performance in the whole package of weed control strategies. This paper presents an innovative new tool of an in-row cultivator, a new combination between classic knives (could be shovels, S-tine teeth, C-shank teeth or Trip-shank teeth also) and a special unit of two vertical mini-discs gangs to improve soil cultivation and weed chopping. Research was carried out in the Department of Mechanisation of the Faculty of Agriculture of the University of Agronomic Sciences and Veterinary Medicine of Bucharest. Key words: in-row cultivator, knives, mini-disc gang. INTRODUCTION From the very start, it is important to consider in-row cultivation as a ‘cleanup’ procedure, not as the primary weed control. Well-timed early weed control is absolutely essential to reduce the size of the weed population before it becomes a threat to the crop. Even with a good job of blind cultivation, there are usually some escapes (weed seeds that get away and resprout), and, especially when wet weather prevents proper timing, there may be lots of escapes. Subsequent in-row cultivation is then necessary to provide clean, productive fields. When it is necessary to in-row cultivate crops that are very small, it is impossible to do a good job on more than a few hectares per day. Weeders allow delaying the first cultivation until the crop is large enough to cultivate deeply and rapidly. Many organic farmers don’t have weeders, don’t have the right weeders, or don’t know how to operate them to get optimum weed control. Cultivation also provides many other beneficial effects far beyond the weeds. Indeed, cultivation is very important for aerating the soil, stimulating crop root growth, conserving soil moisture, and providing insulation from the hot sun with a loose, dry soil mulch.
Few conventional farmers who cultivate their crops spend much time adjusting their cultivators. Herbicides take care of most of the weeds, and skilled cultivator operators are hard to find. Many conventional farmers feel that if they can keep the machine between the rows and avoid taking out too much crop, then they can ‘cultivate’. This careless approach will not work on most quality farms. The real art and skill of cultivating is whether you can also get the weeds within the row without excessively damaging the crop plants. When the crop rows are clearly visible it is time to begin in-row cultivation. On most grain farms, usually two cultivation passes are required. The first pass is the most critical to determine the season’s weed control, but the second pass is often necessary to eliminate the weeds that were stimulated to grow by the first cultivation, to ‘hill up’ the crop, and to further aerate the soil. The stage of weeds and weather usually dictate how we time our cultivations. The period of greatest vulnerability for most weeds comes at a different time after planting than that of the crop plants. Because crop seeds are generally large and are planted deeper than most weed seeds, their window of maximum vulnerability mismatches that of the weeds. We have to take
23
AgroLife Scientific Journal - Volume 4, Number 2, 2015
ISSN 2285-5718; ISSN CD-ROM 2285-5726; ISSN ONLINE 2286-0126; ISSN-L 2285-5718
this difference into account when developing weed control strategy. The vulnerability of plants to mechanical disturbance goes through a predictable cycle, starting with a seed that has not yet started to germinate. At that stage, seeds are virtually indestructible by anything other than biological activity. Until a seed gets water and begins to grow, weeders and cultivators have little effect. A seedling is most vulnerable from the time it germinates until after the plant has fully emerged from the soil. The exact timing of these stages varies between species; generally, once plants are past the unifoliate stage, most seedlings are much more difficult to damage. Timing is indeed everything. Unfortunately, knowing the correct timing and being able to move forward are not always the same thing because of challenging weather conditions. Often, by combining the effects of two blind cultivation passes with one to two in-row cultivation passes, we get much more flexibility with sub-optimal conditions (and usually this results in good weed control). It is the timing and skill with which the operations are performed that is most critical, not the number of passes made. If everything else is done right, one to two passes with a row cultivator should be sufficient for good weed control in row crops. Badly timed weedings can actually make the weeds worse. Making a large number of poorly timed or poorly executed passes will result in failure, no matter how many trips are made over the field. It is important to remember that whenever soil is disturbed, a new flush of weeds will be stimulated to germinate. Fortunately, these later weeds are much easier to control, but they still must be considered in the timing of cultivations and weeding operations. Most cultivators built in recent years were not well-designed to control weeds in the row. While it is sometimes possible to do a reasonably good job with a modern rear-mounted cultivator, when the conditions are difficult or weeds are heavy, the shovels next to the row can not be adjusted precisely nor can it be operated close enough to the row to take out the in-row weeds.
Front-mounted or belly-mounted cultivators, or pusher cultivators on bi-directional tractors, are far easier to keep on the row and work close enough to the crop plants (they do enter into the so-called protection zone of the row, as closed as it is possible to the plants). The operator needs to be able to easily see all of the cultivator shovels. Carefully watching the soil flowing around the front cultivator shovels and crop plants helps the operator to keep the shovels adjusted precisely where they need to be. It is important to continually adjust speed and down-pressure on the go to respond to variations in soil conditions across the field and to always keep the action of the cultivator as aggressive as possible without excessive crop damage. This is not possible when the operator can’t look at the cultivator while steering the tractor. One of the big problem in Romania is still the old fashion in row cultivator, rear mounted on a tractor, with no way to see behind, this leading to excessive crop damage. There are as many ‘right’ ways to set a cultivator as there are farmers who can get their fields clean of weeds. Every farmer who is good at cultivating develops their own unique combination of equipment, settings and special ‘tricks’ that are especially well-suited to the soils, crops, and conditions found on farm. Two farmers will not do the job exactly alike, yet each one can be a master in his own right. Any new tool which is easing operator work to get a better weed control, which is useful to the soil and which is killing weeds would be of much help in keeping the land clear and in obtaining a good quality crop.
MATERIALS AND METHODS
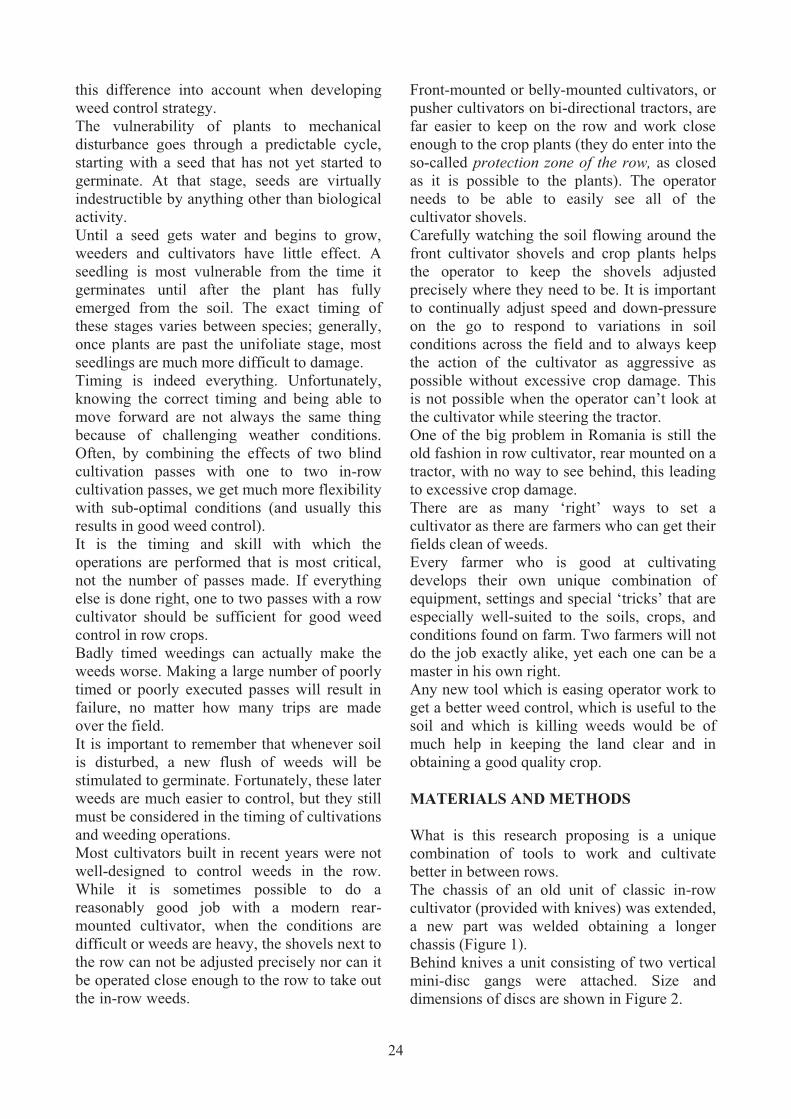
What is this research proposing is a unique combination of tools to work and cultivate better in between rows. The chassis of an old unit of classic in-row cultivator (provided with knives) was extended, a new part was welded obtaining a longer chassis (Figure 1). Behind knives a unit consisting of two vertical mini-disc gangs were attached. Size and dimensions of discs are shown in Figure 2.
24
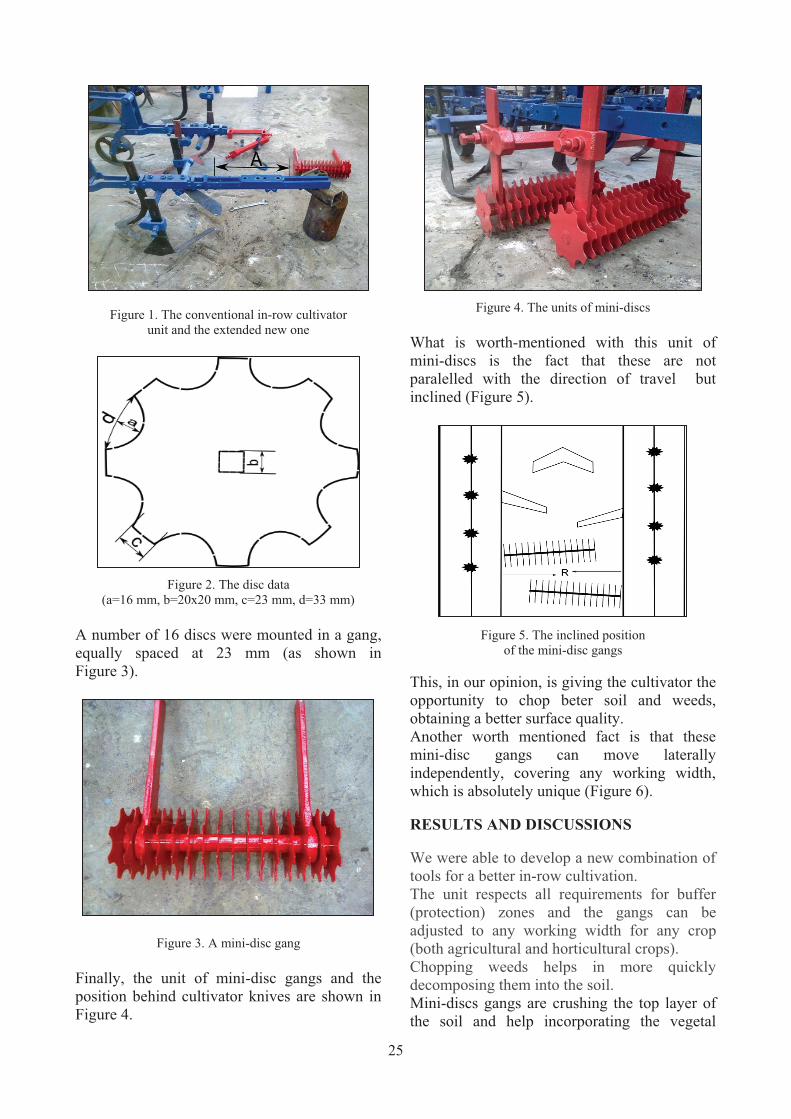
Figure 1. The conventional in-row cultivator unit and the extended new one
Figure 2. The disc data
(a=16 mm, b=20x20 mm, c=23 mm, d=33 mm) A number of 16 discs were mounted in a gang, equally spaced at 23 mm (as shown in Figure 3).
Figure 3. A mini-disc gang Finally, the unit of mini-disc gangs and the position behind cultivator knives are shown in Figure 4.
Figure 4. The units of mini-discs
What is worth-mentioned with this unit of mini-discs is the fact that these are not paralelled with the direction of travel but inclined (Figure 5).
Figure 5. The inclined position
of the mini-disc gangs
This, in our opinion, is giving the cultivator the opportunity to chop beter soil and weeds, obtaining a better surface quality. Another worth mentioned fact is that these mini-disc gangs can move laterally independently, covering any working width, which is absolutely unique (Figure 6). RESULTS AND DISCUSSIONS We were able to develop a new combination of tools for a better in-row cultivation. The unit respects all requirements for buffer (protection) zones and the gangs can be adjusted to any working width for any crop (both agricultural and horticultural crops).Chopping weeds helps in more quickly decomposing them into the soil.Mini-discs gangs are crushing the top layer of the soil and help incorporating the vegetal
25

residues. Also, behind the gangs we obtain a better, levelled soil surface and a minimum disturbance of plants.
Figure 6. The gangs position are set-off independently
CONCLUSIONS The main goal of modernizing an in-row cultivator was achieved by building a new solid structure with active working bodies acting different from the classics. The new bodies which have been developed (mini-disc gangs) are able to work in the vertical plane (like vertical tillage discs) and together with the knives (working in the horizontal plane) are capable to increase the
degree of killed weeds and thus having a better control over them. Shredding and loosening the soil is much better due to new bodies because the distance between discs is just 23 mm, small enough to crush any piece of soil or soil crust, this providing a better cover and protection against water loss. Since the start of the project we attempted to build a new, perfectly functioning structure, and this was achieved by developing a prototype. It is perfectly justified that this prototype requires small adjustments in solving problems that can occur during field operations. Further researches are carrying on optimize the use of this unit and the results will be presented in future papers. REFERENCES Kepner R., Bainer R., Barger E., 1978. Principles of
Farm Machinery. ASAE Book. Lerat P., 1999. Les machines agricoles. Ed. TEC &
DOC, Paris. Popescu S., Şandru A. ş.a., 1983. Exploatarea utilajelor
agricole. Ed. Didactică și Pedagogică, Bucureşti. Scripnic V., Babiciu P., 1979. Maşini agricole. Ed.
Ceres, Bucureşti. Srivastava A., Goering C., Rohrbach R., 1993.
Engineering Principles of Agricultural Machines. ASAE Book.
Şandru A. şi colab., 1971. Exploatarea agregatelor agricole. Ed. Ceres, Bucureşti.
Toma D., Sin Gh., 1987. Calitatea lucrărilor agricole executate mecanizat. Ed. Ceres, Bucureşti.
26

GRAIN YIELD AND YIELD COMPONENTS AT MAIZE UNDER
DIFFERENT PRECEDING CROPS AND SOIL TILLAGE CONDITIONS
Viorel ION, Adrian Gheorghe B�A, Marin DUMBRAV�, Lenua Iuliana EPURE, Niculae DINC�, Maria TOADER
University of Agronomic Sciences and Veterinary Medicine of Bucharest, 59 M�r��ti Blvd.,
District 1, 011464, Bucharest, Romania, Email: [email protected]
Corresponding author email: [email protected] Abstract The preceding crop and the soil tillage are among the important crop technology measures with a significant influence upon the yield, respectively upon the yield components which represent those elements participating to the yield formation. The aim of this paper is to present the grain yield and yield components at maize under different technological conditions in the specific growing conditions from South Romania. In this respect, field experiments were performed in the year 2014 in South Romania (44o29’ N latitude and 26o15’ E longitude), under rainfed conditions. Six maize hybrids were studied under two preceding crops, respectively sunflower and maize, and under two soil tillage, respectively ploughing and harrowing. There were determined the grain yield at 14% moisture content (kg.ha-1) and the following ear yield components: ear length (cm), ear diameter (mm), number of kernels per ear, ear weight (g), kernel weight on ear (g), and weight of thousand seeds (g). The highest values of the grain yield and yield components were registered under maize as preceding crop and ploughing as soil tillage. Among the two preceding crops, maize determined higher values for the grain yield and yield components. Among the two soil tillage conditions, ploughing determined higher values for the grain yield and yield components, except for the weight of thousand seeds. Key words: maize, yield, yield components, preceding crop, soil tillage. INTRODUCTION Maize (Zea mays L.) has a high grain yield potential, which is determined by the genetics of the cultivated hybrid and is influenced by the environmental factors that are affecting the plant growth (Ion et al., 2014). The yielding capacity of plants is determined by the yield components, which are the components that are participating to the yield formation (Ion et al., 2013). The preceding crop and the soil tillage are among the important crop technology measures with a significant influence upon the yield, respectively upon the yield components. Šeremeši� et al. (2013) found that the effect of crop rotation on maize yield was inversely proportional to the ratio of the maize in the crop rotation. Ciontu et al. (2012) found that the three and four years of crop rotation play an important role in achieving safe and stable yields. The benefits of crop rotation for land and water resource protection and productivity have been identified, but many of the rotation factors,
processes and mechanisms responsible for increased yield and other benefits need to be better understood (Berzsenyi et al., 2000). Tillage is one of important activities in the crop production system that optimizes the conditions of soil bed environment for seed germination, seedling establishment and crop growth (Wlaiwan and Jayasuriya, 2013). Different tillage practices may affect the growth and yield of maize due to different soil conditions created (Aikins et al., 2012). Soil tillage is one of the greatest energy and labour consumer in a crop technology. In this respect, Košuti� et al. (2005) found the following: no-till system enabled saving of almost 85% energy, while conservation tillage system enabled saving of 37-39% energy per hectare and per yield unit in comparison to conventional tillage system; labour requirement comparison shows that no-till soil tillage system saved 76-80%, while conservation tillage system saved 43-46% of labour; soil tillage systems differ with respect to achieved yields, but differences aren’t statistically
27
AgroLife Scientific Journal - Volume 4, Number 2, 2015
ISSN 2285-5718; ISSN CD-ROM 2285-5726; ISSN ONLINE 2286-0126; ISSN-L 2285-5718

significant; however, the greatest maize yield achieved conventional soil tillage system. Many farmers are converting to reduce tillage systems to diminish soil erosion and field-work time requirements, and to remain eligible for government programs (Lund et al., 1993). Although different soil tillage managements have been widely investigated on different soil types in the USA and Canada, there are relatively few studies that have been conducted on the soils of South-East Europe (Videnovi� et al., 2011). The aim of this paper is to present the grain yield and yield components at maize under different technological conditions (two preceding crops, respectively maize and sunflower, and two soil tillage, respectively ploughing and harrowing) in the specific growing conditions from South Romania. MATERIALS AND METHODS Researches were performed in field experiments located in South Romania, respectively at Moara Domneasca Experimental Farm (44o29’ N latitude and 26o15’ E longitude) belonging to the University of Agronomic Sciences and Veterinary Medicine of Bucharest. The field experiments were performed under rainfed conditions in the year 2014. In the studied area, the specific soil is reddish preluvosoil, with humus content of 2.2-2.8%, clay loam texture, and pH of 6.2-6.6. For the period April-August 2014, the average temperature was 18.8oC, while the multiannual average temperature for this period is 18.5oC. For the same period (April-August), in the year 2014 the sum of rainfall was 408.0 mm, while the multiannual average rainfall is 313.2 mm. Six maize hybrids were studied, respectively: ES Method (FAO precocity group 380), ES Antalia (FAO precocity group 450), Korimbos (FAO precocity group 530), Janett (FAO precocity group 540), Mikado (FAO precocity group 550), ES Feria (FAO precocity group 550). Every hybrid was studied under two preceding crops, respectively sunflower and maize, and under two soil tillage, respectively ploughing and harrowing. Each experimental variant consisted in six lines with a length of 10 m.
For the variants with ploughing as soil tillage, one harrowing work was performed on 26th of September 2013, and the ploughing was performed at a depth of 18 cm two days later, on 28th of September 2013. For the variants with harrowing as soil tillage, two harrowing works were performed on 26th of September 2013, at a depth of 12 cm. In spring, the soil preparation was performed by one harrowing passage on 1st of April 2014 and by one cultivator passage on 30th of April 2014. The fertilization was performed with 106 kg.ha-1 of nitrogen and 60 kg.ha-1 of phosphorus. The weed control was performed by herbicides, which were completed by one manual hoeing. The sowing was performed on 30th of April 2014, at 50 cm between rows and a plant density of 80,000 plants.ha-1. The determinations of grain yield and yield components were performed at the ears from one square meter for each experimental variant. The grain yield was reported at moisture content of 14%, and the following determinations of the ear yield components were performed: ear length (cm), ear diameter (mm), number of kernels per ear, ear weight (g), kernel weight on ear (g), and weight of thousand seeds (g). The data are presented and analyzed within the paper as average values for the six studied maize hybrids. RESULTS AND DISCUSSIONS Grain yield at 14% moisture content. In average for all the experimental variants, the grain yield was of 8,466 kg.ha-1 (Figure 1). Compared to soil tillage, the preceding crop determined larger variations of the grain yield, higher values being registered under maize as preceding crop compared to sunflower. Thus, the grain yield was in average of 9,023 kg.ha-1 under maize as preceding crop, while under sunflower it was of 7,909 kg.ha-1. Among the two soil tillage conditions, the ploughing determined higher values for the grain yield (8,592 kg.ha-1) compared to harrowing (8,340 kg.ha-1). The smallest value of the grain yield was registered under sunflower as preceding crop and harrowing as soil tillage (7,796 kg.ha-1), while the highest value was registered under
28

maize as preceding crop and ploughing as soil tillage (9,163 kg.ha-1). Compared to harrowing, the ploughing determined a comparable increased of the grain yield according to the preceding crop, respectively from 7,796 to 8,021 kg.ha-1 when the preceding crop was sunflower, and from 8,884 to 9,163 kg.ha-1 when the preceding crop was maize. This situation conducted to a comparable increased of the grain yield determined by the preceding crop under the same soil tillage. Thus, the grain yield under harrowing conditions increased from 7,796 kg.ha-1 when sunflower was the preceding crop to 8,884 kg.ha-1 when maize was the preceding crop. Under ploughing conditions, the grain yield increased from 8,021 kg.ha-1 when sunflower was the preceding crop to 9,163 kg.ha-1 when maize was the preceding crop.
Figure 1. Grain yield at 14% moisture content at
different preceding crops and soil tillage conditions Ear length. In average for all the experimental variants, the ear length was of 15.1 cm (Figure 2). Compared to preceding crop, the soil tillage determined larger variations of the ear length. Higher values were registered under ploughing conditions compared to harrowing conditions. Thus, the ear length was in average of 15.5 cm under ploughing conditions, while under harrowing conditions it was of 14.6 cm. Among the two preceding crops, the maize determined higher values of the ear length (15.2 cm) compared to sunflower (14.9 cm). The smallest value of the ear length was registered under sunflower as preceding crop and harrowing as soil tillage (14.4 cm), while the highest value was registered under maize as
preceding crop and ploughing as soil tillage (15.6 cm). Compared to harrowing, the ploughing increased more the ear length when the preceding crop was sunflower (from 14.4 to 15.4 cm) compared to maize as preceding crop (from 14.8 to 15.6 cm). Under harrowing conditions, the maize as preceding crop increased the ear length compared to sunflower, respectively from 14.4 to 14.8 cm. Under ploughing conditions, the maize as preceding crop also increased the ear length compared to sunflower, but the difference is less important, respectively from 15.4 to 15.6 cm.
Figure 2. Ear length at different preceding crops and soil
tillage conditions Ear diameter. In average for all the experimental variants, the ear diameter was of 42.71 mm (Figure 3). Opposite the situation registered for the ear length, compared to preceding crop, the soil tillage determined smaller variations of the ear diameter. Higher values of the ear diameter were registered under maize as preceding crop compared to sunflower. Thus, the ear diameter was in average of 42.93 mm under maize as preceding crop, while under sunflower it was of 42.49 mm. Among the two soil tillage conditions, the ploughing determined higher values for the ear diameter (42.79 mm) compared to harrowing (42.63 mm). The smallest value of the ear diameter was registered under sunflower as preceding crop and harrowing as soil tillage (42.33 mm), while the highest value was registered under maize as preceding crop, with values practically equal
7796
8021
8884
9163
7909
9023
8340
85928466
7.000
7.500
8.000
8.500
9.000
9.500
Harrowing Ploughing Harrowing Ploughing Sunflower Maize Harrowing Ploughing Average
Sunflower Maize Preceding�crop Soil�tillage Experiment
kg/ha
Preceding��crop�and�soil�tillageAverage�values
14.4
15.4
14.8
15.6
14.9
15.2
14.6
15.5
15.1
13,8
14,0
14,2
14,4
14,6
14,8
15,0
15,2
15,4
15,6
15,8
Harrowing Ploughing Harrowing Ploughing Sunflower Maize Harrowing Ploughing Average
Sunflower Maize Preceding�crop Soil�tillage Experiment
cm
Preceding��crop�and�soil�tillageAverage�values
15.8
15.6
15.4
15.2
15.0
14.8
14.6
14.4
14.2
14.0
13.8
29
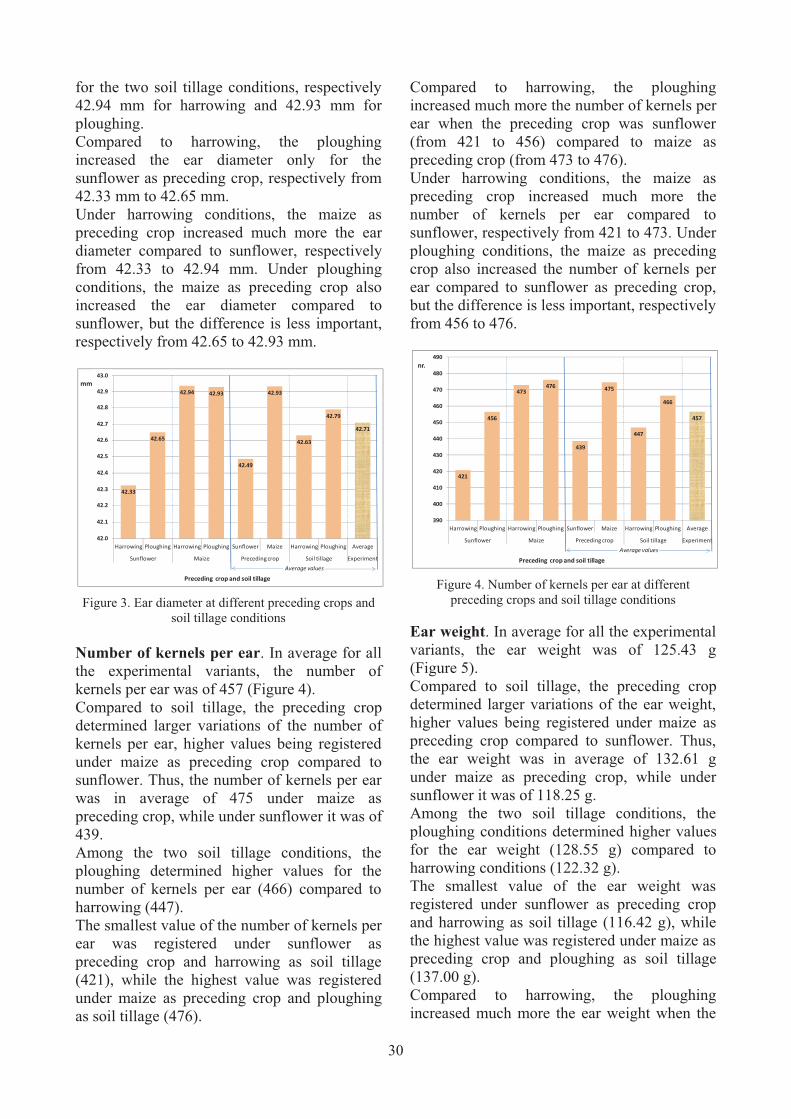
for the two soil tillage conditions, respectively 42.94 mm for harrowing and 42.93 mm for ploughing. Compared to harrowing, the ploughing increased the ear diameter only for the sunflower as preceding crop, respectively from 42.33 mm to 42.65 mm. Under harrowing conditions, the maize as preceding crop increased much more the ear diameter compared to sunflower, respectively from 42.33 to 42.94 mm. Under ploughing conditions, the maize as preceding crop also increased the ear diameter compared to sunflower, but the difference is less important, respectively from 42.65 to 42.93 mm.
Figure 3. Ear diameter at different preceding crops and
soil tillage conditions Number of kernels per ear. In average for all the experimental variants, the number of kernels per ear was of 457 (Figure 4). Compared to soil tillage, the preceding crop determined larger variations of the number of kernels per ear, higher values being registered under maize as preceding crop compared to sunflower. Thus, the number of kernels per ear was in average of 475 under maize as preceding crop, while under sunflower it was of 439. Among the two soil tillage conditions, the ploughing determined higher values for the number of kernels per ear (466) compared to harrowing (447). The smallest value of the number of kernels per ear was registered under sunflower as preceding crop and harrowing as soil tillage (421), while the highest value was registered under maize as preceding crop and ploughing as soil tillage (476).
Compared to harrowing, the ploughing increased much more the number of kernels per ear when the preceding crop was sunflower (from 421 to 456) compared to maize as preceding crop (from 473 to 476). Under harrowing conditions, the maize as preceding crop increased much more the number of kernels per ear compared to sunflower, respectively from 421 to 473. Under ploughing conditions, the maize as preceding crop also increased the number of kernels per ear compared to sunflower as preceding crop, but the difference is less important, respectively from 456 to 476.
Figure 4. Number of kernels per ear at different
preceding crops and soil tillage conditions Ear weight. In average for all the experimental variants, the ear weight was of 125.43 g (Figure 5). Compared to soil tillage, the preceding crop determined larger variations of the ear weight, higher values being registered under maize as preceding crop compared to sunflower. Thus, the ear weight was in average of 132.61 g under maize as preceding crop, while under sunflower it was of 118.25 g. Among the two soil tillage conditions, the ploughing conditions determined higher values for the ear weight (128.55 g) compared to harrowing conditions (122.32 g). The smallest value of the ear weight was registered under sunflower as preceding crop and harrowing as soil tillage (116.42 g), while the highest value was registered under maize as preceding crop and ploughing as soil tillage (137.00 g). Compared to harrowing, the ploughing increased much more the ear weight when the
42.33
42.65
42.94 42.93
42.49
42.93
42.63
42.79
42.71
42,0
42,1
42,2
42,3
42,4
42,5
42,6
42,7
42,8
42,9
43,0
Harrowing Ploughing Harrowing Ploughing Sunflower Maize Harrowing Ploughing Average
Sunflower Maize Preceding�crop Soil�tillage Experiment
mm
Preceding��crop�and�soil�tillageAverage�values
43.0
42.9
42.8
42.7
42.6
42.5
42.4
42.3
42.2
42.1
42.0
421
456
473476
439
475
447
466
457
390
400
410
420
430
440
450
460
470
480
490
Harrowing Ploughing Harrowing Ploughing Sunflower Maize Harrowing Ploughing Average
Sunflower Maize Preceding�crop Soil�tillage Experiment
nr.
Preceding��crop�and�soil�tillageAverage�values
30

preceding crop was maize (from 128.23 to 137.00 g) compared to sunflower (from 116.42 to 120.09 g). Under ploughing conditions, the maize as preceding crop increased much more the ear weight compared to sunflower as preceding crop, respectively from 120.09 to 137.00 g. Under harrowing conditions, the maize as preceding crop also increased the ear weight compared to sunflower, but the difference is less important, respectively from 116.42 to 128.23 g.
Figure 5. Ear weight at different preceding crops and soil
tillage conditions Kernel weight on ear. In average for all the experimental variants, the kernel weight on ear was of 107.89 g (Figure 6). Compared to soil tillage, the preceding crop determined larger variations of the kernel weight on ear, higher values being registered under maize as preceding crop compared to sunflower. Thus, the kernel weight on ear was in average of 114.16 g under maize as preceding crop, while under sunflower it was of 101.63 g. Among the two soil tillage conditions, the ploughing determined higher values for the kernel weight on ear (109.18 g) compared to harrowing (106.60 g). The smallest value of the kernel weight on ear was registered under sunflower as preceding crop and harrowing as soil tillage (100.56 g), while the highest value was registered under maize as preceding crop and ploughing as soil tillage (115.66 g). Compared to harrowing, the ploughing determined a comparable increase of the kernel weight on ear according to the preceding crop,
respectively from 100.56 to 102.70 g when the preceding crop was sunflower, and from 112.65 to 115.66 g when the preceding crop was maize. This situation conducted to a comparable increase of the kernel weight on ear determined by the preceding crop under the same soil tillage. Thus, the kernel weight on ear under ploughing conditions increased from 102.70 g when sunflower was the preceding crop to 115.66 g when maize was the preceding crop. Under harrowing conditions, the kernel weight on ear increased from 100.56 g when sunflower was the preceding crop to 112.65 g when maize was the preceding crop.
Figure 6. Kernel weight on ear at different preceding
crops and soil tillage conditions Weight of thousand seeds. In average for all the experimental variants, the weight of thousand seeds was of 238.59 g (Figure 7). Among the two soil tillage conditions, the harrowing conditions determined higher values for the weight of thousand seeds (240.03 g) compared to ploughing conditions (237.16 g). Among the two preceding crops, maize determined higher values for the weight of thousand seeds (240.60 g) compared to sunflower (236.59 g). The smallest value of the weight of thousand seeds was registered under sunflower as preceding crop and ploughing as soil tillage (231.16 g), while the highest value was registered under maize as preceding crop and ploughing as soil tillage (243.16 g). The soil tillage influenced differently the weight of thousand seeds according to preceding crop. Thus, compared to harrowing, the ploughing decreased the weight of thousand seeds when the preceding crop was sunflower
116.42
120.09
128.23
137.00
118.25
132.61
122.32
128.55
125.43
105
110
115
120
125
130
135
140
Harrowing Ploughing Harrowing Ploughing Sunflower Maize Harrowing Ploughing Average
Sunflower Maize Preceding�crop Soil�tillage Experiment
g
Preceding��crop�and�soil�tillageAverage�values
100.56
102.70
112.65
115.66
101.63
114.16
106.60
109.18107.89
90
95
100
105
110
115
120
Harrowing Ploughing Harrowing Ploughing Sunflower Maize Harrowing Ploughing Average
Sunflower Maize Preceding�crop Soil�tillage Experiment
g
Preceding��crop�and�soil�tillageAverage�values
31
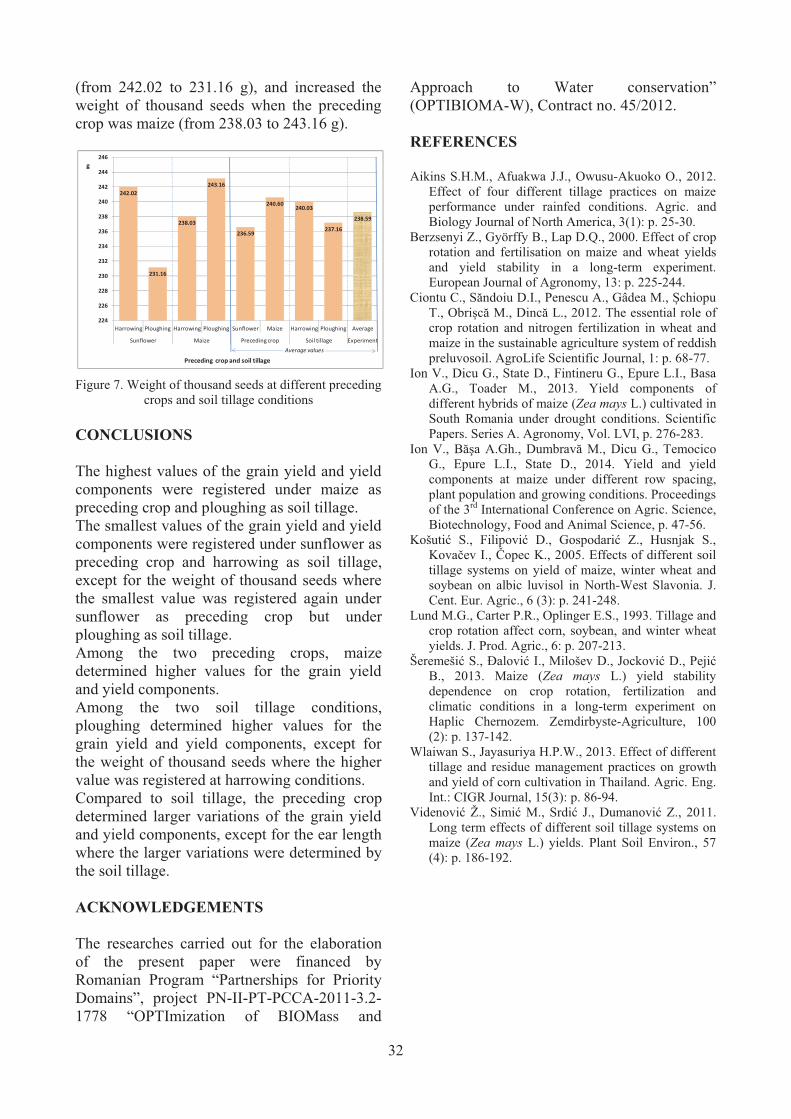
(from 242.02 to 231.16 g), and increased the weight of thousand seeds when the preceding crop was maize (from 238.03 to 243.16 g).
Figure 7. Weight of thousand seeds at different preceding
crops and soil tillage conditions CONCLUSIONS The highest values of the grain yield and yield components were registered under maize as preceding crop and ploughing as soil tillage. The smallest values of the grain yield and yield components were registered under sunflower as preceding crop and harrowing as soil tillage, except for the weight of thousand seeds where the smallest value was registered again under sunflower as preceding crop but under ploughing as soil tillage. Among the two preceding crops, maize determined higher values for the grain yield and yield components. Among the two soil tillage conditions, ploughing determined higher values for the grain yield and yield components, except for the weight of thousand seeds where the higher value was registered at harrowing conditions. Compared to soil tillage, the preceding crop determined larger variations of the grain yield and yield components, except for the ear length where the larger variations were determined by the soil tillage. ACKNOWLEDGEMENTS The researches carried out for the elaboration of the present paper were financed by Romanian Program “Partnerships for Priority Domains”, project PN-II-PT-PCCA-2011-3.2-1778 “OPTImization of BIOMass and
Approach to Water conservation” (OPTIBIOMA-W), Contract no. 45/2012. REFERENCES Aikins S.H.M., Afuakwa J.J., Owusu-Akuoko O., 2012.
Effect of four different tillage practices on maize performance under rainfed conditions. Agric. and Biology Journal of North America, 3(1): p. 25-30.
Berzsenyi Z., Györffy B., Lap D.Q., 2000. Effect of crop rotation and fertilisation on maize and wheat yields and yield stability in a long-term experiment. European Journal of Agronomy, 13: p. 225-244.
Ciontu C., S�ndoiu D.I., Penescu A., Gâdea M., �chiopu T., Obri�c� M., Dinc� L., 2012. The essential role of crop rotation and nitrogen fertilization in wheat and maize in the sustainable agriculture system of reddish preluvosoil. AgroLife Scientific Journal, 1: p. 68-77.
Ion V., Dicu G., State D., Fintineru G., Epure L.I., Basa A.G., Toader M., 2013. Yield components of different hybrids of maize (Zea mays L.) cultivated in South Romania under drought conditions. Scientific Papers. Series A. Agronomy, Vol. LVI, p. 276-283.
Ion V., B��a A.Gh., Dumbrav� M., Dicu G., Temocico G., Epure L.I., State D., 2014. Yield and yield components at maize under different row spacing, plant population and growing conditions. Proceedings of the 3rd International Conference on Agric. Science, Biotechnology, Food and Animal Science, p. 47-56.
Košuti� S., Filipovi� D., Gospodari� Z., Husnjak S., Kova�ev I., �opec K., 2005. Effects of different soil tillage systems on yield of maize, winter wheat and soybean on albic luvisol in North-West Slavonia. J. Cent. Eur. Agric., 6 (3): p. 241-248.
Lund M.G., Carter P.R., Oplinger E.S., 1993. Tillage and crop rotation affect corn, soybean, and winter wheat yields. J. Prod. Agric., 6: p. 207-213.
Šeremeši� S., �alovi� I., Milošev D., Jockovi� D., Peji� B., 2013. Maize (Zea mays L.) yield stability dependence on crop rotation, fertilization and climatic conditions in a long-term experiment on Haplic Chernozem. Zemdirbyste-Agriculture, 100 (2): p. 137-142.
Wlaiwan S., Jayasuriya H.P.W., 2013. Effect of different tillage and residue management practices on growth and yield of corn cultivation in Thailand. Agric. Eng. Int.: CIGR Journal, 15(3): p. 86-94.
Videnovi� Ž., Simi� M., Srdi� J., Dumanovi� Z., 2011. Long term effects of different soil tillage systems on maize (Zea mays L.) yields. Plant Soil Environ., 57 (4): p. 186-192.
242.02
231.16
238.03
243.16
236.59
240.60240.03
237.16
238.59
224
226
228
230
232
234
236
238
240
242
244
246
Harrowing Ploughing Harrowing Ploughing Sunflower Maize Harrowing Ploughing Average
Sunflower Maize Preceding�crop Soil�tillage Experiment
g
Preceding��crop�and�soil�tillageAverage�values
32
STUDY REGARDING THE VEGETABLES SALES IN VARIOUS
DISTRIBUTION CHANNELS FROM BUCHAREST
Alina Maria IONESCU, Gheorghe Valentin ROMAN
University of Agronomic Sciences and Veterinary Medicine of Bucharest, 59 M�r��ti Blvd.,
District 1, 011464, Bucharest, Romania, Phone: +4021.318.25.64, Fax: + 4021.318.25.67, Email: [email protected], [email protected]
Corresponding author email: [email protected]
Abstract The vegetables play a vital role in human diet as fresh foods sources of calories, vitamins, dietary fiber and special nutrients. Thus, the vegetables selling should be done with maximum health in order to keep them in the best possible conditions, without lead to spoiling. The purpose of this paper is to make a detailed analysis of how vegetables are marketed and capitalised in various hypermarkets, supermarkets and food markets in Bucharest. Focus was also placed on how their quality is influenced by the way they are displayed and marketed. The vegetables selected for the sample survey were potato, onion, tomato, bean, cucumber, pepper, garlic and carrot. The selection of these commodities was based on their importance in terms of their volume of sale in the Bucharest markets. Key words: vegetables, standards, price, quality. INTRODUCTION Vegetables occupy an important place in our food and can not be replaced-as-food value by any other aliment. The vegetables include main nutrients, such as: fats, carbohydrates, proteins, minerals and vitamins, absolutely necessary the functioning of the human body (Draghici, 2002). So selling vegetables should be done with maximum health to keep them in the best possible conditions and without lead to spoiling. Quality standards for fruits and vegetables on the Romanian market leave much room for improvement. Even though there is a general effort to bring Romania to EU standards, progress is slow, but steady. The overall tendency is to improve quality and meet sector-relevant standards, a tendency to which both authorities and economic agents adhere (Ministry of Economic Affairs, 2009). Consumers are becoming better informed with regard to quality standards and their own rights, and are putting pressure on traders to improve the quality of their products. Frequent inspections, awareness campaigns, legal developments and the market entry of
professional, high quality players are leading the market in the right direction (Ministry of Economic Affairs, 2009). According with Romanian legislation in force from 2002 any trader no matter if wholesaler or retailer must make the following information available at visible place (http://old.madr.ro): - general: name of the producer and packing company, variety, quality and quantity, - specific: for fruits and vegetables that were treated will mention “product treated by ionization” or “product treated with ionic radiations”. Marketing and sales to the public are the most important functions at the retail level. The structure of the retail trade for fruit and vegetables offers the consumer the possibility to make a choice from various points of sale, the most important being (Dumitrescu, 2009): - specialized fruit and vegetables shops; - hyper / supermarkets; - open-air markets; - producers / farmers. As Romanian consumers generally give importance to the origin of the products they purchase, as well as the price or quality of goods there is a split in retailing between specialised retailers and non-specialised
33
AgroLife Scientific Journal - Volume 4, Number 2, 2015
ISSN 2285-5718; ISSN CD-ROM 2285-5726; ISSN ONLINE 2286-0126; ISSN-L 2285-5718

retailers (such as supermarkets) which have a considerable bargaining strength when negotiating prices with suppliers and wholesalers (Ministry of Economic Affairs, 2009). In Romania fruit and vegetable production is very much focussed on small scale, family units and a high proportion of fruit and vegetable production is retained on farms for home consumption or sold directly to consumers, through street (peasant) markets (Department for Agriculture, Nature and Food Quality of the Embassy of the Kingdom of the Netherlands, 2010). In 2011 Romania imported vegetables with a total value of 152 million EUR (of which almost 29.4 million EUR of tomatoes and 26,1 million EUR of potatoes) while vegetable exports stood at 53 million EUR. Most of the imports originated from Turkey (27.6%), followed by the Netherlands (11.4%), Italy (10%), Poland (7.2%) and Belgium (6.7%) (www.faostat.org). MATERIALS AND METHODS In the quality standards of fresh fruits and vegetables, the quality concept is determined by the commercial aspect of the fresh produce offered for sale, by their visual (freshness, size, shape and color) and conditioning (sorting, packaging, labeling and presentation) characteristics. Fresh vegetables for consumption should be marketed in packages on which the origin of the product, the name of the packer, the variety, the quantity and the quality group are legibly marked in a visible position. The purpose of this paper is to make a detailed analysis of how vegetables are marketed and capitalized in various hypermarkets, supermarkets and food markets in Bucharest. Focus is also placed on how their quality is influenced by the way they are displayed and marketed. The study was based on the following steps: - analyze the distribution systems and circuits for vegetables; - study and analyze the fresh vegetables sold in agrifood markets in Bucharest; - study and analyze the fresh vegetables sold in various supermarkets in Bucharest;
- study and analyze the fresh vegetables sold in hypermarkets in Bucharest. The following vegetables were selected for the sample survey: potato, onion, tomato, bean, cucumber, pepper, garlic and carrot. The selection of these commodities was based on their importance in terms of their volume of sale in the Bucharest whole sale markets. RESULTS AND DISCUSSIONS The quality concept for fruit and vegetables is a complex notion, which can be analyzed under the following aspects: agronomic, commercial, organoleptic, nutritional and health. In this context, the study revealed that in hypermarkets three types of onions were sold: yellow, red and water onion - all of them produced in Romania. The produce was sold in bulk, on self-service basis and prices ranged between RON 2.09 and 4.29, depending on the variety. Regarding the use-by period, this was not displayed. The same produce, with yellow and red varieties, but packed in 2 kg bags, was found in supermarkets, but the country of origin was Germany and the price was lower compared to the Romanian onions (RON 2.99/2 kg). The produce was displayed in more attractive way, the sachets being placed in carton and separately labeled. The same kind of onion was found in agrifood markets, the price ranging between RON 1.85 and 2.00 per kg. But in this case the country of origin, the quality, the size and the use-by period were not specified. Concerning the marketing of potatoes within various distribution networks, it resulted that most potato tubers were imported and in only one hypermarket there were found potatoes produced in Romania. Also, in most cases, the information on the quality and size of potatoes was missing. Only in case of potatoes packed in 2.5 kg mesh bags and produced in Romania all mandatory labeling elements were mentioned (Table 1). Also, it can be noted that the street sale of potatoes is made sometimes around markets, directly from cars, without the hygiene conditions being met. This produce is most
34

often weighted in an incorrect manner. There is no guarantee in terms of freshness and quality.
Table 1. Aspects regarding potato sales in various distribution channels
Distribution channel Country of
origin Price
(RON)/kg
Variety
Quality
Packing mode
Size
Hypermaket
The Netherlands 2.39 - - bulk -
Romania 1.79 - - 5 kg bag -
Turkey 2.1 - - -
Romania 2.8 - 1 2.5 kg bag
50
France 2.29 - 1 bulk -
Supermarket France 2.79 - 1 bulk - Turkey 2.49 - 1 bulk -
Agrifood market
- 1.70 white potato - bulk -
- 1.60 red potato - bulk -
Regarding the marketing of tomatoes in various types of stores, it can be said that this was in most cases produced in Turkey and belonged to first category of quality (Table 2). The price ranged from RON 5.78 to 14.95, depending on the variety (Figure 1).
Table 2. Aspects regarding tomato sales in various distribution channels
Distribution channel
Country of
origin
Price (RON)/kg
Variety
Quality
Packing mode
Size
Hypermaket
Turkey 5.78 - - bulk -
Turkey 14.95 Cherry tomatoes 1 bulk -
Turkey 8.00 Cherry tomatoes 1
Plastic small dish
500 g
-
Spain 15.45 Cherry tomatoes 1 Plastic
cup -
Italy 6.70 - - bulk -
Supermarket Spain 6.69 - - casserole - Turkey 2.49 - 1 casserole 27/32
Agrifood market
- 7.99 - - bulk - - 6.99 - - bulk -
Figure 1. Tomatoes sold in the food market and
supermarket In agrifood markets, the same deficiencies were registered as in case of potatoes and onions, i.e. the information on the country of origin,
quality class and size was missing. The price ranged between RON 4.9 and 5.9/kg. Regarding the marketing of carrots, it was observed that they were produced in Romania, were sold in 1 kg bags or in bulk and the price ranged between RON 1.7 and 3.6/kg. Both in major commercial networks and marketplaces, deficiencies were registered in terms of quality category, i.e. this information was missing in all stores. In agrifood markets, carrots display situation is much different compared to supermarkets, i.e. in many of these markets there are no labels mentioning the country of origin or the quality class, and the packaging was often improper and improvised. Regarding the peppers sold across various sale networks, 4 types of peppers were distinguished, namely: - elongated sweet peppers (sharp); - square sweet peppers (splay); - square taper sweet peppers (peg); - flat sweet peppers (bell pepper). In hypermarkets and supermarkets, large quantities of California Giant pepper variety, with different colors (red, orange, yellow), were met. This variety has a longer storage period and is resistant to repeated handling and disease attack. The pepper fruits were packed in carton boxes. Kapia red pepper is sold both in bulk or in packages. This variety was met in all three shopping centers. Bianca sweet pepper was met in all three shopping centers, in bulk. In hypermarkets and supermarkets, the pepper fruits can be met in bulk or in crates and in casserole. The peppers were also displayed in transparent plastic bags. The display method directly influences the quality of the product and its storage period. Unlike bulk produce, the produce packed in casseroles with a protective film has a longer marketing period, because it prevents the water evaporation. The commercial spaces such hypermarkets provided the consumers with the necessary information on the quality categories of the produce. For bulk produce, the quality category is displayed on the stands containing that sort of pepper fruits, while for the packed produce, the quality category is showed on the packaging label (Figure 2).
35

Figure 2. Pepper sold in supermarkets
Peppers sold in hypermarkets and supermarkets are produced in countries like Turkey and Spain and belong to the 1st quality class. The prices ranged between RON 9.99 and 12.99. In shopping centers such as mini markets or agrifood markets, the information on the quality category of the produce is not provided to consumers. Only the name, the price and sometimes the country of origin of the produce are specified. Regarding the quality, it can be noticed that in some stores, there were peppers stored in bulk that showed signs of attack by gray mold (Botrytis cinerea) or rotting of the tips, which can lead to infection of the entire mass of fruits. The cucumbers were both marketed in bulk, on kilogram basis and packed in vacuum plastic bags. They were produced in countries like Turkey (cornichon) and Romania (Fabio) and belonged to the first class of quality. The prices ranged between RON 9.99 and 12.99 at cornichon and RON 2.99/piece at Fabio. In large retail chains, bean was sold both in bulk and in 1 kg bags. The countries of origin are various: Romania, China, Ethiopia, Poland and Hungary. The prices ranged between RON 9.99 and 13/kg. Regarding the bean sold in agrifood markets, it was produced in Romania and was sold in bulk, the sale price being higher than the price from hypermarkets (RON 14.99 - 15.00/kg). The study showed that the garlic was marketed in various forms, namely: • dry bulbs, in bulk; • dry bulbs packed in individual packages of 450 g, which are large meshes; • green garlic, in bundles of 3, 5, 8 or even 10 pieces; • green garlic, in bulk. In large supermarkets, the garlic came from countries like Spain and China. The prices ranged between RON 11.99 and 12.99/kg and
the garlic belonged to the first class of quality. It should be noticed that in case of garlic marketed in bulk, there were bulbs showing signs of attack by gray rot. In agrifood markets, garlic was sold either in bulk or as bundles of 10-20 dry bulbs tied up with a rope. The country of origin was Romania, the price ranged between RON 13.50 and 14/kg, but the information on the quality was missing. CONCLUSIONS The study led to the following conclusions: 1. All three categories of stores are included in important retail chains for fresh fruits and vegetables. The weight of these chains changes depending on the season. 2. The study revealed that agrifood markets are an important retail chain for the local produce. But within those, a set of deficiencies regarding the information about the country of origin, the class of quality and the size of marketed vegetables, as well as the prices sometimes higher than in the large retail chains were identified. 3. Regarding the large retail chains, most of the fresh sold vegetables are imported. The reason is related to the requirements on the produce imposed by these chains: aspect, calibration and packaging, prompt delivery, which typically takes place every other day, permanent availability of the produce from the offer and complete range of products. Often these requirements can not be met by local producers. REFERENCES Draghici Elena, 2002. Vegetable. Granada Publishing
House, Bucharest, Chap. 1, p. 5-15. Dumitrescu, 2009. Romania - Fruits and vegetables
export potential assessment. Annual publications of the University of Oradea, Vol. I, Section: International Business and European integration, p. 288-292.
***Department for Agriculture, Nature and Food Quality of the Embassy of the Kingdom of the Netherlands, 2010. The Romanian food sector and the use of EU funds for investments, www.hollandtrade.ro.
***The Ministry of Economic Affairs (EVD), 2009. Market survey Romania - Fruits and Vegetables. www.greenporthollandinternational.nl.
***www.faostat.org. ***http://old.madr.ro.
36

�INFLUENCE OF CROP SYSTEMS IN REDUCING OF DROUGHT
EFFECT FOR MAIZE PLANTS
Nicolae IONESCU
Agricultural Research and Development Station Pite�ti, Pite�ti-Slatina Road, Km. 5, 117030, Pite�ti, România, Phone: 0372753083, Fax: 0248206334, Email: [email protected],
Corresponding author email: [email protected]
Abstract Currently, new maize hybrids have had improved genetic traits. These characters are high production capacity and resistance to drought (Ali & Naidu, 1982). As the phenomena of increasing present drought affects maize plants (Dwyer & Steward, 1985; Lorens et al., 1987), so that grain yields that obtained are smaller (Undersander, 1987). Us, ordinary maize suffer from drought during maximum water consumption: July and August. Reducing the effects of drought can be done by different planting systems. The period under review was a dry year, a favorable year and a normal one. Of the three experimental factors (sowing date, density, new hybrids), the greatest influence was a time of sowing. The optimum time of sowing maize is held here from 10 April to 10 May. Early sowing favored obtain maximum yields of between 6.3 t.ha-1 in dry, 8.0 t.ha-1 in favorable and 5.9 t.ha-1 in a medium year. Late sowing maize produced more less with 4.0 t.ha-1 dry year, 3.6 t.ha-1 in favorable and 2.3 t.ha-1 in normal conditions. Density had positive influence in favorable year, with 50 thousand plants.ha-1 and 30-50 thousand plants.ha-
1 in the other two years. Cultivated hybrids with high production potential, demonstrated adaptability in these culture conditions. The new creations Iezer (F.125) Mosti�tea, F.425 and F.475M along side Olt is recommended in the southern white luvisol. Key words: density, drought, grain yield, maize, sowing time. �INTRODUCTION During the growing season maize has different requirements for water (Hall et al., 1984). Total rains that fall in growth here amounts to 300- 400 mm water. So if maize has blossomed to provide water, in July and August consumption is much higher. In these months the evapotranspiration potential (ETP) exceeds 70 mm and 50 mm rain fell. Under these conditions occurs drought. Drought is considered to be complex in maize (McPherson & Boyer, 1974; Pinter et al., 1979). Drought resistance, that definition is the ability of a plant/crop (maize us) to best use a limited resource of water (Morizet et al., 1990). New hybrids expressing different levels for drought resistance (Fabian & Gomoiu, 1982; Thakur & Rai, 1982; Martiniello & Lorenzoni, 1985). And hybrids of this material, specifically responded summer drought that occurs every year. In a very dry year, however, the negative effects in the formation of maize production were greatly amplified.
To reduce the effects of drought, can promote some culture systems. Practical goal is the best possible expression of genes optimized to avoid periods of drought. Some of these systems can promote early sowing. Thus, every year it aims to set the spring maize crop as early as possible. Sowing in an early period of time, is conditioned by several factors: achieving thermal factor, soil moisture, crop species staggering. For maize, sowing the good times may suffer some deviation, with great influence in the formation of grain production. Another necessary element is ensuring obtaining a successful chain is the density. While it was found that this crop density at emergence had a relatively low maximum yield formation. The explanation lies in the existence of production capacity offset the maize plant. Relatively low production from a maize plant may influence a higher yield per unit area, with a higher density. At the same time, by sowing maize hybrids us seeking and avoidance of summer droughts, both the sowing time and the density. Plants emerged as early showed a rapid increase until early summer. They proved to be
37
AgroLife Scientific Journal - Volume 4, Number 2, 2015
ISSN 2285-5718; ISSN CD-ROM 2285-5726; ISSN ONLINE 2286-0126; ISSN-L 2285-5718

more resistant to drought in July and August. If for some reason maize sowing is done late, in May, there are a number of negative phenomena: physiology unbalanced (Fabian & Gomoiu, 1982; Thakur & Rai, 1982), uneven growth (Ali & Naidu, 1982), effect of drought (Morizet et al., 1990). The consequence is to reduce grain production. In order to observe the influence of the planting periods and densities of creating new hybrids, the experiments were conducted herein. MATERIALS AND METHODS Between 2012-2014 three-factorial experiments were established, such as the subdivided parcel, with factors:
Factor A planting dates: first at the beginning of the sowing area, the second midterm, and the third at the end of sowing;
Factor B seeding density: the graduation 30, 50 and 70 thousand plants.ha-1;
Factor C hybrid: the first two were cultivated: Iezer (F.125), F.425 and Olt, and in the last year: Iezer (F.125), Mosti�tea and F.475M.
Photo 1. Iezer (F. 125) hybrid
Variants area of 20 m2 was in triplicate. Culture technology was recommended by the resort. Luvicsoil culture was in arable horizon following indices: pH=5.23, PAL=17.7 mg.kg-1 d.w., Al3+=37.2 mg.kg-1 d.w. and Ct=1.54%. During the growing season temperatures were recorded (minimum, average and maximum) and precipitation. For every moment of sowing were calculated amounts of active degrees (�tn>100C) and hydro-climatic indices (IHC=�����
������ ETP -
evapo-transpiration poten�ial).
For the Albota maize is close to optimum climatic conditions and namely from sowing until the end of June (Figure 1). In July and August, however, rainfall not cover consumption needs, so the phenomenon of drought. Compared to multi values in some years the phenomenon of drought can be attenuated or accentuated depending on the crop each year. Between investigated period 2012 was very dry, 2013 favorable and 2014 medium year. In these circumstances new hybrids of maize were differing in grain yields formation, with accents between times of sowing and densities.
Figure 1. The ETP and precipitations evolution
from maize vegetation, multiannual data RESULTS AND DISCUSSIONS Maize production depending on sowing dates, density, and hybrid expressed specificity in each crop year. It is caused by increasing variability of climatic conditions, from normal to close the obvious influence of drought. Thus, three different crop years were: 2012 arid, 2013 favorable and 2014 medium. To observe the influence of the three factors of the maize crop in these various conditions, the results will be presented for each crop year. Maize under year 2012. For this period the maize was sown between April 5 and May 15. In the experiment, three sowing times were: April 12, May 3 and May 15. Climatic elements have evolved specific (Table 1). Thermal factor of plant vegetation has been fairly consistent: 1636 �tn>100C first sown, between 14900 and 14020 to other sowing dates. Temperature excesses occurred in July, 8 days exceeded the maximum 350C and extreme media was 33.20C. Was very good rainfall in May and June, followed by lack of water in July (7 mm over the entire month). The climatic conditions this year have made it clear
0
50
100
150
200
1 2 3 4 5 6
ETP
& p
reci
pita
tions
, m
m
1-Apr, 2-Maiy 3-Jun, 4-Jul, 5-Aug, 6-Sep.
Maize
38

influence of drought. Hydro-climatic Index (IHC) was between 69 and 65%, depending on the time of sowing. Maize yields obtained fell from one time of sowing to another very evident (Table 2). Iezer hybrid (F.125) maximum yield was obtained at the first sowing time and density of 50,000 plants.ha-1, with 4.657 t.ha-1. In the second time production level dropped to an average of 2.314 t.ha-1, while the third grains production was in medium 0.893 t.ha-1. In this hybrid can say that in a typical year of drought, only by sowing at the earliest time could avoid large losses of production. Table 1. Climatic evolution from maize vegetation, 2012,
dry year
Sow times
Monthly values �tn> 100
IHC* %
Month Tn0C P,
mm Min Med Max
I
12. 04
Apr. May Jun. Jul.
Aug.
11 13 17 20 17
19 17 22 26 24
22 22 28 33 32
15 109 110
7 53
1636
69 %
II 3. 05
May Jun. Jul.
Aug.
12 17 20 17
17 22 26 24
21 28 33 32
107 110
7 53
1490
65 %
III 15. 05
May Jun. Jul.
Aug.
13 17 20 17
16 22 26 24
20 28 33 32
20 110
7 53
1402
65 %
*IHC = ����
������; ETP- evapo-transpiration potential
F.425 hybrid produced most first time and density of 50,000 plants.ha-1, with 4.823 t.ha-1 grain yield. Lowest production was obtained at 70,000 plants.ha-1 in the third sowing time (15 May), with 0.623 t.ha-1 grain. Olt hybrid pro-duced under the same conditions comparable between 6.270 and 1.080 t.ha-1 respectively grain.
Table 2. Maize grain yields obtained by 2012, dry year conditions
Sowing times
Grain yields, t.ha-1 Media Dens.
30 50 70
Hybrid F. 125, Iezer I* II III
4.623 2.550 1.000
4.657 2.433 1.007
3.767 1.960 0.673
4.349 2.314 0.893
Average 2.724 2.699 2.133 2.519 F. 425
I II III
4.713 2.487 0.850
4.823 2.673 1.100
4.217 2.093 0.623
4.584 2.418 0.858
Average 2.683 2.865 2.311 2.620 Olt
I II III
6.270 3.247 1.397
5.643 2.674 1.144
4.597 2.223 1.080
5.503 2.715 1.207
Average 3.638 3.154 2.633 3.142
LSD 5% LSD 1%
LSD 0.1%
Time, A Density, B Hybrid, C A.B.C
0.924 1.533 2.867
0.488 0.684 0.967
0.226 0.303 0.398
5.226 7.861 12.748
*I-12.04, II-3.05, III-15.05.2012 Maize under 2013. The range created for sowing maize this year was between 10 April and 10 May. Data from the experiment were: 18.04, 24.04 and 08.05.2013. In terms of climate plants have received moderate temperatures close to requirements and with peak rainfall of 119 mm in June. �tn>100C were between 15300C and 14730 the first two dates of sowing and 13550C last sowing (Table 3). Hydro-climatic indices ranged between 52-53%, although rain between 8 and 20 mm fell relatively uniform decadal intervals. Table 3. Climatic evolution from maize vegetation, 2013,
favorable year
Sow times
Monthly values �tn> 100
IHC* %
Month Tn0C P, mm Min Med Ma.
I
18. 04
Apr. May Jun. Jul.
Aug.
10 13 16 16 18
21 19 20 21 25
24 25 25 27 32
0 52
119 35 28
1530
52 %
II
24. 04
May Jun. Jul.
Aug.
12 16 16 18
19 20 21 25
29 25 27 32
52 119 35 32
1473
53 %
III 8. 05
May Jun. Jul.
Aug. Sep.
12 16 16 18 11
18 20 21 25 19
24 25 27 32 22
36 119 35 32 0
1355
53 %
*IHC = ����
������; ETP- evapo-transpiration potential
Maize under 2014. This year maize sowing took place in two intervals: one early April 1-5, and second late from 20 to 31 May. Climatic conditions have induced this phenomenon, especially by the rains that have fallen in large amounts from April to July, continuously - Table 5. In the experiment first succeeded sown on April 4th and the following two points on 23 May and 29 May. At first sowing rains fallen negatively influenced plant east, after about 30 days. Under these conditions the density of emerged plants was lower by about 5-8%. Overall, plants sown of three times, with
39

background excessively wet climate, and vegetation were extended until October (first decade). Temperature have evolved close to normal, without excesses. �tn>100C was different: the first sowing 15790, 14020 the second and 13390 for the third time. Hydro-climatic index was 116% for the first time and was between 95 and 100% in the over two times. �
Table 4. Maize grain yields obtained from 2013, favorable year conditions
Sowing times
Grain yields, t.ha-1 Media Dens. 30 50 70
Hybrid F. 125, Iezer I* II III
7.367 7.100 4.768
7.400 7.600 4.400
6.500 7.533 4.367
7.089 7. 411 4.512
Average 6.412 6.467 6.133 6.337 F. 425
I II III
6.833 6.933 6.068
7.300 7.833 5.000
6.833 7.133 4.767
6.989 7.300 5.278
Average 6.611 6.711 6.244 6.522 Olt
I II III
7.333 6.867 4.700
8.000 7.700 4.833
7.067 6.833 4.367
7.467 7.133 4.633
Average 6.300 6.844 6.089 6.411
LSD 5% LSD 1%
LSD 0.1%
Time, A Density, B Hybrid, C A.B.C 0.283 0.470 0.877
0.303 0.425 0.600
0.117 0.157 0.206
0.563 0.814 1.217
*I-18.04; II-24.04; III-08.05.2013
Table 5. Climatic evolution from maize vegetation, 2014, normal year
Sow times
Montly values �tn> 100
IHC* %
Month Tn0C P, mm
Min Med Max
I 4. 04
April May Jun. Jul.
Aug. Sep.
11 12 15 18 17 12
14 17 19 23 23 17
18 22 24 28 30 23
180 158 115 138 43 88
1579
116 %
II
23. 05
May Jun. Jul.
Aug. Sep.
15 15 18 17 12
18 19 23 23 17
26 24 28 30 23
0 115 138 43 88
1402
95 %
III 29. 05
Jun. Jul.
Aug. Sep. Oct.
15 18 17 12 11
20 23 23 17 13
24 28 30 23 18
107 138 43 88 66
1339
100 %
*IHC = ����
������; ETP- evapo-transpiration potential
Maize production formed under these conditions was very good and namely the first two planting dates. Their level often exceeded 5.000 t.ha-1 (Table 6). The highest yields in all three hybrids were obtained at densities of 30-50 thousand plants.ha-1. The lowest yields were formed on the age of the third and the density of 70,000 plants.ha-1. Statistical analysis of grain production. Three years of maize crop showed a high variability. Hybrids sown at different times and in several densities expressed the normal and low limits. Variance analysis of experiments in the three years highlights the influences of factors studied (Table 7).�
Table 6. Maize grain yields obtained from 2014, normal year condition
Sowing times
Grain yields, t.ha-1 Media Dens.
30 50 70
Hybrid F. 125, Iezer I* II III
5.825 5.400 4.200
5.925 5.900 4.250
5.100 4.975 3.625
5.617 5.425 4.025
Average 5.142 5.358 4.567 5.022 Mosti�tea
I II III
5.350 5.750 4.100
5.600 5.650 3.900
4.550 4.925 3.800
5.167 5.442 3.933
Average 5.067 5.050 4.425 4.847 F. 475 M
I II III
5.275 5.650 4.125
5.575 5.450 4.150
5.175 5.600 3.950
5.342 5.567 4.075
Average 5.017 5.058 4.908 4.994
LSD 5% LSD 1%
LSD 0.1%
Time, A Density, B Hybrid, C A.B.C 0.188 0.285 0.459
0.149 0.204 0.278
0.127 0.169 0.220
0.410 0.565 0.782
*I-4.04; II-23.05; III-29.05.2014
Statistical calculation demonstrates that planting dates A-factor had the highest influence in all three years (very significant). In terms of density (B factor) in the first year were observed very obvious influences, and in the last two years have highlighted significant influence. Hybrid (factor C) had evident influence in the first year and significant others two years. Of interactions, time of sowing (AxC), density (BxC) and hybrid (AxBxC) for 2013 year and sowing time (AxC) and density (BxC) with hybrid last year, had obvious influence.
40

CONCLUSIONS In the white luvisol maize benefit of 420 mm rainfall for vegetation. Compared to these, ETP has a value of 550 mm, thus registering a deficit of 130 mm.
Period with largest deficit is in July and August. In contrast, relative soil water reserve (whose regime is specific), and 10-20 mm rain falling during this period, could help mitigate the effect of drought.
Tabl� 7. The analysis of Anova test, yield grains of maize
Variability cause
Sq. sum LD Variance, S2 F test 2012 2013 2014 2012 2013 2014 2012 2013 2014
Rep. 1.62 0.35 0.181 2 A Factor 199.50 105.92 48.265 2 99.75 52.96 24.13 66.6*** 378*** 223*** Error A 5.99 0.56 0.648 4 1.498 0.140 0.108
Big parcels 207.11 106.83 49.094 8 B Factor 7.59 3.65 5.694 2 3.795 1.820 2.847 5.50* 7.00* 29.1***
AxB 1.46 3.78 0.614 4 0.365 0.945 0.154 0.537 3.63 0.72 Error B 8.16 3.15 1.761 12 0.680 0.260 0.098
Middle parcels 17.21 10.58 8.069 18 C Factor 8.17 0.47 0.637 2 4.085 0.237 0.319 24.2*** 5.27* 5.06*
AxC 1.67 4.07 0.864 4 0.418 1.018 0.216 2.47 22.6** 3.43* BxC 0.97 4.87 1.678 4 0.243 1.218 0.420 1.43 27.1** 6.67*
AxBxC 3.45 2.67 1.059 8 0.432 0.334 0.132 2.55 7.42* 2.10 Error C 6.09 1.62 3.397 36 0.169 0.045 0.063
Small parcels/plots 19.48 16.38 7.635 54 Total experiment 243.80 133.79 64.798 80
Climate of the three experimental years expressed a very dry first year (2012), a favorable year (2013) and third year medium favorable (2014). Among the factors studied, sowing time had the greatest influence in the formation of maize new hybrids production. For the area, the time in which the terms are planting this plant ranges from 15-20 April and 15 May. Depending on the structure of plants from a farm, can sow maize between 15 and 25 April. New experimented hybrids produced maximum for early sowing, between 4.657 t.ha-1 in dry year, 8.000 t.ha-1 in favorable year and 5.925 t.ha-1 in the medium year. Grain bigger losses occurred in the first year when hybrids were planted on May 3rd date. Summer drought of the three sowing period (15.05.2012) contributed to very low yields, between 0.623 and 1.397 t.ha-1. Densities studied, with relatively wide limits, had obvious influence on maize production in the first two years and very evident in the last year. In the favorable (2013) Iezer (F.125), F.425 and Olt produced more on 50,000 plants.ha-1. In medium year (2014) Iezer hybrid formed the largest grain production to 50,000 plants.ha-1 and Mosti�tea and F.475M to 30,000 plants.ha-1.
We cultivate hybrids were first noted very significant and meaningful in the first and significant third year. With high yield potential, all hybrids have fairly experienced the full spectrum of climate which benefited the studied period. The highest production was obtained with the hybrid Olt: 8.000 t.ha-1 grains sown in April 18, 2013 year and 50,000 plants.ha-1. Under the same conditions Iezer produced maximum 7.600 t.ha-1 grains, and F.425 hybrid 7.833 t.ha-1 grains. Among the factors, both planting dates and density, with new hybrids showed significance. This acquires practical importance that farmers will resemble a new hybrid early period as possible and appropriate density.
ACKNOWLEDGEMENTS The study was financial supported by 1.2.1 project of ADER 2020 with Ministry of Agriculture and Rural Development. REFERENCES Ali S.M. & Naidu A.P., 1982. Screening for drought
tolerance in maize. Indian Journal of Genetics and Plant Breeding, 42(3): p. 381-388.
Dwyer L.M. & Steward D.W., 1985. Water stress conditioning of corn (Zea mays) in the field and greenhouse. Canadian Journal of Botany, 63(4): p. 704-710.
41

Fabian G. & Gomoiu E., 1982. Modifications des valeurs osmotiques dans les conditions de l�absence de l�eau
dans le sol chez le maïs (Zea mays L.). Revista de Biologie, 27(2): p. 111-116.
Hall A.J., Chimenti C., Trapanin. & Vilella F., 1984. Yield in water-stressed maize genotypes: association with traits measured in seedlings and in flowering plants. Field Crops Researches, 9: p. 41-57.
Lorens G.F., Bennett J.M. & Loggale L.B., 1987. Differences in drought resistance between two corn hybrids. II. Component analysis and growth rates. Agronomy Journal, 79(5): p. 808-813.
Martiniello P. & Lorenzoni C., 1985. Response in maize genotypes to drought tolerance tests. Maydica, 30(4): p. 361-370.
McPherson H.G. & Boyer J.S., 1974. Adaptation of maize to drought. Proceedings Agronomy Society of New Zealand, 4: p. 86-89.
Morizet J., Triboi A.M., Pollacsek M., 1990. Résistance à la sécheresse chez le maïs: quelques mécanismes impliqués. Physiologie et production du maïs. Pau, INRA, France: p. 167-174.
Pinter L., Kalman L. & Palfi G., 1979. Determination of drought resistance in maize (Zea mays L.) by proline test. Maydica, 24(3): p. 155-159.
Thakur P.S. & Rai V.K., 1982. Dynamics of aminoacids of two differentially drought resistant Zea mays cultivars in response to osmotic stress. Environment and Experimental Botany, 21(2): p. 221-226.
Undersander D.J., 1987. Yield and yield component response of maize to water stress in hybrids with different sources of stress tolerance. Maydica, 32(1): p. 49-60.
�
42

INFLUENCE OF SOIL TILLAGE UPON PRODUCTION AND ENERGY EFFICIENCY IN WHEAT AND MAIZE CROPS
Doru Ioan MARIN1, Teodor RUSU2 , Mircea MIHALACHE1,
Leonard ILIE1, Elena NISTOR1 , Ciprian BOLOHAN1
1University of Agronomic Sciences and Veterinary Medicine of Bucharest, 59 M�r��ti Blvd., District 1, 011464, Bucharest, Romania, Email: [email protected],
[email protected], [email protected], [email protected], [email protected] 2University of Agricultural Science and Veterinary Medicine Cluj-Napoca
3-5 Calea Manastur, 400372, Cluj-Napoca, Romania, Email: [email protected]
Corresponding author email: [email protected]
Abstract The experiment was placed on the chromic luvisol of the Moara Domneasc� Teaching Farm belonging to the University of Agronomic Sciences and Veterinary Medicine of Bucharest. The soil tillage experimental variants were: a1 - ploughed at 20 cm in depth (control - conventional system); a2 - chisel ploughed at 20 cm in depth; a3 - chisel plough at 40 cm in depth; a4 - disking at 10 cm in depth (minimum tillage system). The biological material was Dropia in winter wheat (Triticum aestivum L), sown at a density of 450 bg/m2 and the PO216 hybrid in maize (Zea mays L.) sown at a density of 6 bg/m2. Basic tillage was performed during the last decade of September. In the Ilfov area, the weather conditions for the 2014-2015 agicultural year were less favourable to agricultural crops, particulalry rainfalls. In winter wheat rainfalls recorded 410.7 mm between October 2014 and June 2015; however, during the vegetation time in maize (April-August) they were much under the multi-annual average, i.e. only 153 mm (48.5%), compared with 315.7 mm. Temperatures were higher than normal in the area, i.e. 1.3oC in winter wheat and 2oC in maize during the vegetation time. Grain production was highest in the 40 chisel variant (6,378 kg.ha-1) and in ploughed maize (4,521 kg.ha-1). The calculation of energy efficiency was based on the energy indicators: energy consumed (Ec), energie produced (Ep), net energy (En), energy report (ER). Energy indicators Ep and ER recorded higher values in minimum tillage, compared with the conventional system in winter crop and lower in maize crop. Key words: Triticum aestivum L., Zea mays L., soil tillage system, yield, energy efficiency�
INTRODUCTION Optimising soil loosening and the number of mechanical works can increase energy and economic efficiency in agricultural production, not only directly through lower fuel consumption (10-40 %), working time (over 50 %) and the necessary equipment, and thus lower production costs, but also indirectly through the favorable effects on soil conservation and the reduced greenhouse gas. Soil tillage has a significant share in the direct energy consumption per area unit (St�nil� et al., 2011), i.e. about 52% in wheat and 60% in maize.
According to Moraru Paula et al. (2011), in the wheat crop grown on the Transylvanian Plateau fuel consumption decreases to 35% by replacing conventional soil tillage with minimum tillage (paraplough, chisel or disk) while the resulting crop production is close to the ploughed variant (98%). The results obtained by Raus et al. (2007) on energy consumption and energy efficiency in wheat crop showed that soil mobilization decreased together with the energy consumption per crop, from 5844 kwh.ha-1 in plough 30 cm, to 5515 kwh.ha-1 for disking, while the energy yield of the main production (grains) varied between 2.9 (plough 30) and 2.2 (disk) in N90P60.
43
AgroLife Scientific Journal - Volume 4, Number 2, 2015
ISSN 2285-5718; ISSN CD-ROM 2285-5726; ISSN ONLINE 2286-0126; ISSN-L 2285-5718
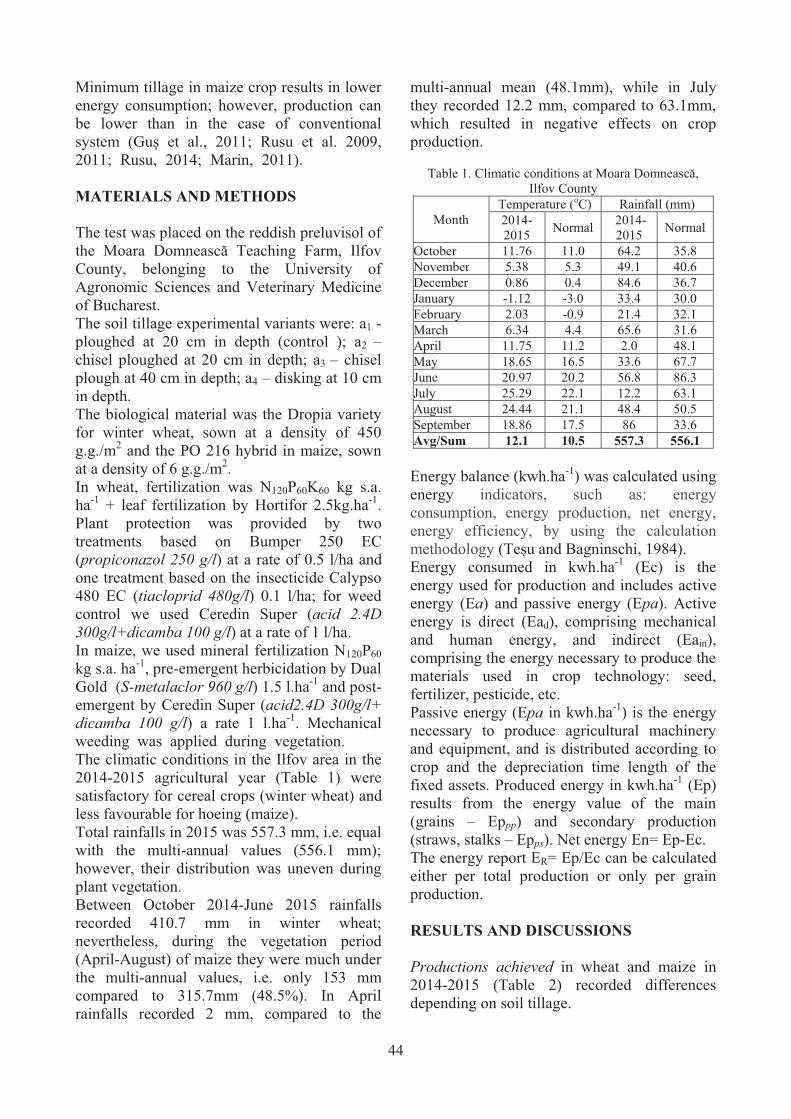
Minimum tillage in maize crop results in lower energy consumption; however, production can be lower than in the case of conventional system (Gu et al., 2011; Rusu et al. 2009, 2011; Rusu, 2014; Marin, 2011). MATERIALS AND METHODS The test was placed on the reddish preluvisol of the Moara Domneasc� Teaching Farm, Ilfov County, belonging to the University of Agronomic Sciences and Veterinary Medicine of Bucharest. The soil tillage experimental variants were: a1 - ploughed at 20 cm in depth (control ); a2 � chisel ploughed at 20 cm in depth; a3 � chisel plough at 40 cm in depth; a4 � disking at 10 cm in depth. The biological material was the Dropia variety for winter wheat, sown at a density of 450 g.g./m2 and the PO 216 hybrid in maize, sown at a density of 6 g.g./m2. In wheat, fertilization was N120P60K60 kg s.a. ha-1 + leaf fertilization by Hortifor 2.5kg.ha-1. Plant protection was provided by two treatments based on Bumper 250 EC (propiconazol 250 g/l) at a rate of 0.5 l/ha and one treatment based on the insecticide Calypso 480 EC (tiacloprid 480g/l) 0.1 l/ha; for weed control we used Ceredin Super (acid 2.4D 300g/l+dicamba 100 g/l) at a rate of 1 l/ha. In maize, we used mineral fertilization N120P60 kg s.a. ha-1, pre-emergent herbicidation by Dual Gold (S-metalaclor 960 g/l) 1.5 l.ha-1 and post-emergent by Ceredin Super (acid2.4D 300g/l+ dicamba 100 g/l) a rate 1 l.ha-1. Mechanical weeding was applied during vegetation. The climatic conditions in the Ilfov area in the 2014-2015 agricultural year (Table 1) were satisfactory for cereal crops (winter wheat) and less favourable for hoeing (maize). Total rainfalls in 2015 was 557.3 mm, i.e. equal with the multi-annual values (556.1 mm); however, their distribution was uneven during plant vegetation. Between October 2014-June 2015 rainfalls recorded 410.7 mm in winter wheat; nevertheless, during the vegetation period (April-August) of maize they were much under the multi-annual values, i.e. only 153 mm compared to 315.7mm (48.5%). In April rainfalls recorded 2 mm, compared to the
multi-annual mean (48.1mm), while in July they recorded 12.2 mm, compared to 63.1mm, which resulted in negative effects on crop production.
Table 1. Climatic conditions at Moara Domneasc�, Ilfov County
Month Temperature (oC) Rainfall (mm) 2014-2015 Normal 2014-
2015 Normal
October 11.76 11.0 64.2 35.8 November 5.38 5.3 49.1 40.6 December 0.86 0.4 84.6 36.7 January -1.12 -3.0 33.4 30.0 February 2.03 -0.9 21.4 32.1 March 6.34 4.4 65.6 31.6 April 11.75 11.2 2.0 48.1 May 18.65 16.5 33.6 67.7 June 20.97 20.2 56.8 86.3 July 25.29 22.1 12.2 63.1 August 24.44 21.1 48.4 50.5 September 18.86 17.5 86 33.6 Avg/Sum 12.1 10.5 557.3 556.1 Energy balance (kwh.ha-1) was calculated using energy indicators, such as: energy consumption, energy production, net energy, energy efficiency, by using the calculation methodology (Te u and Bagninschi, 1984). Energy consumed in kwh.ha-1 (Ec) is the energy used for production and includes active energy (Ea) and passive energy (Epa). Active energy is direct (Ead), comprising mechanical and human energy, and indirect (Eain), comprising the energy necessary to produce the materials used in crop technology: seed, fertilizer, pesticide, etc. Passive energy (Epa in kwh.ha-1) is the energy necessary to produce agricultural machinery and equipment, and is distributed according to crop and the depreciation time length of the fixed assets. Produced energy in kwh.ha-1 (Ep) results from the energy value of the main (grains � Eppp) and secondary production (straws, stalks � Epps). Net energy En= Ep-Ec. The energy report ER= Ep/Ec can be calculated either per total production or only per grain production. RESULTS AND DISCUSSIONS Productions achieved in wheat and maize in 2014-2015 (Table 2) recorded differences depending on soil tillage.
44

In wheat, grain yield varied between 6378 kg.ha-1, in chisel 40 and 6145 kg ha-1 in chisel 20, with differences of +1/-2% compared to the control. Secondary production was 1-2% higher in minimum tillage. In maize, grain yield was low due to the water deficit recorded in the second part of the vegetation period, particularly in July: 4521 kg.ha-1 in the control (plough 20) to 4028 kg.ha-1 in disking (-11%). Stalk yield was 6137 kg.ha-1 in the control and 5795 kg.ha-1, in the chisel 20 cm variant. Values of energy indicators (Table 3). In wheat crop, energy consumed Ec was 6672 kwh.ha-1, in plough 20 (control) and decreased to 6378
kwh.ha-1in disking (96%). The energy produced for the basic crop varied between 27407 kwh.ha-1 in chisel 20cm and 28446 kwh.ha-1. The energy based on straw yield varied between 28612 kwh.ha-1 in plough 20cm and 29264 kwh.ha-1 in chisel 40. The highest total energy yield (EpPP + EpPS) was recorded in the chisel 40 cm variant (57710 kwh.ha-1), i.e. 2% higher than the control. In maize crop (Table 4), energy consumed (Ec) was 5325 kwh.ha-1 in plough 20cm and decreased by 2-6% in minimum tillage. Total energy produced was up to 8% lower in minimum tillage (disk).
Table 2. Influence of soil tillage upon wheat and maize production, 2015
Crop Production
kg.ha-1 Soil tillage
Plough 20cm
% Chisel 20cm
% Chisel 40cm
% Disk %
Wheat Grains 6292 100 6145 98 6378 101 6305 100 Straws 6748 100 6825 101 6902 102 6867 102
Maize Grains 4521 100 4153 92 4310 95 4028 89 Stalks 6137 100 5795 94 5914 96 5819 95
Table 3. Energy consumption and energy produced depending on soil tillage in wheat crop
Soil tillage
Wheat Energy
consumed Ec
(kwh.ha-1)
% Energy produced
Eppp (kwh.ha-1)
% Energy produced
Epps (kwh.ha-1)
% Energy produced Ep = Eppp+ Epps
(kwh.ha-1)
%
Plough 20cm 6672 100 28062 100 28612 100 56674 100 Chisel 20cm 6484 97 27407 98 28938 101 56345 99 Chisel 40cm 6556 98 28446 101 29264 102 57710 102 Disk 6378 96 28120 100 29116 102 57236 101
Table 4. Energy consumption and energy produced depending on soil tillage in maize crop
Soil tillage
Maize
Energy consumed
Ec (kwh.ha-1)
% Energy produced
Eppp (kwh.ha-1)
% Energy produced
Epps (kwh.ha-1)
% Energy produced Ep = Eppp+ Epps
(kwh.ha-1)
%
Plough 20cm 5325 100 20616 100 26082 100 46698 100 Chisel 20cm 5137 96 18938 92 24629 94 43567 93 Chisel 40cm 5219 98 19654 95 25135 96 44789 96 Disk 5031 94 18368 89 24731 95 43099 92
The analysis of the net energy amount (En) shows that it was 2% higher in wheat crop (Table 5) in the conservation work variants and up to 6% lower (disk) than the conventional variant. Energy ratio was 8.49 in ploughing
and increased to 8.97 in disking in wheat; calculated only for the grain yield, it varied between 4.20 in ploughing and 4.40 in disking. In maize (Table 6), energy ratio varied between 8.77 (plough) and 8.48 (chisel 20); only for the
45

grain yield, it varied between 3.87 (control) and 3.65 (disk).
Minimum tillage resulted in higher energy indicators in wheat and slightly lower in maize, compared with the conventional variant.
Table 5. Net energy and energy ratio in wheat crop
Soil tillage
Wheat Net energy
En (kwh.ha-1) % Energy ratio
ER % Energy ratio
ERpp %
Plough 20cm 50002 100 8.49 100 4.20 100 Chisel 20cm 49861 100 8.69 102 4.22 100 Chisel 40cm 51154 102 8.80 104 4.33 103 Disk 50858 102 8.97 106 4.40 105
Table 6. Net energy and energy ratio in maize crop
Soil tillage Maize
Net energy En (kwh.ha-1)
% Energy ratio ER
% Energy ratio ERpp
%
Plough 20cm 41373 100 8.77 100 3.87 100 Chisel 20cm 38430 93 8.48 97 3.69 95 Chisel 40cm 39570 96 8.58 98 3.77 97 Disk 38068 92 8.57 98 3.65 94
In wheat, energy consumption for one kg grains (Table 7) was 1.01 kwh.kg-1 for disking and 1.06 kwh.kg-1 in the plough and chisel 20 variants; in maize, it increased from 1.18 kwh.kg-1 (plough) to 1.25 kwh.kg-1 (disk).
Table 7. Energy consumption (kwh.kg-1) to kg grains
in different tillage systems, 2015 Crop Soil tillage
Plough 20cm
% Chisel 20cm
% Chisel 40cm
% Disk %
Wheat 1.06 100 1.06 100 1.03 97 1.01 95
Maize 1.18 100 1.24 105 1.21 103 1.25 106
CONCLUSIONS Minimum tillage in winter crop results in equal or slightly higher yields than those resulted from conventional soil tillage; in maize, yield was 5-11% lower, as it was a less favourable year for this crop. The energy consumed for the crop decreased in minimum tillage, resulting from lower fuel consumption/ha. For minimum tillage, energy indicators Ep and ER recorded higher values in weat andlower in maize.
Chiselling 40 cm resulted in best results concerning the crops, as well as the energy indicators for both wheat and maize. ACKNOWLEDGMENTS This paper was written under the frame of the Partnership in priority domains - PN II, developed with the support of MEN-UEFISCDI, Project No. PN-II-PT-PCCA-2013-4-0015 contract 175/2014: Expert System for Risk Monitoring in Agriculture and Adaptation of Conservative Agricultural Technologies to Climate Change. REFERENCES Gu P., Teodor R., 2011. Unconventional soil tillage
systems, agrotechnical and economical alternative for durable agriculture. In Soil Minimum Tillage Systems. 6-th International Symposium, Ed. Risoprint, ISSN 2247-7525, Cluj-Napoca, p.11-23.
Marin D.I., M. Mihalache, C. Ciontu, C. Bolohan, L. Ilie, 2011. Influence of soil tillage of pea, wheat and maize crop in the Moara Domneasca-Ilfov area. In Soil Minimum Tillage Systems, 6-th International Symposium, Ed. Risoprint, ISSN 2247-7525, Cluj-Napoca, p.111-118.
Moraru Moraru Paula Ioana, Petru Gu , Teodor Rusu, Ileana Bogdan, Adrian Ioan Pop And Mara Lucia �opterean, 2011. Influence of soil tillage system and
46

cop rotation on soil and wheat production. In Soil Minimum Tillage Systems, 6-th International Symposium, Ed. Risoprint, ISSN 2247-7525, Cluj-Napoca, p.80-95.�
R�us L, Topa D., Cara M., 2007. Eficien�a energetic la cultura grâului de toamn� în diferite variante tehnologice. Lucr�ri tiin�ifice, vol. 50, Seria Agronomie, USAMV Ia i, p.400-404.
Rusu Teodor, 2014. Energy efficiency of conservative tiilage system in the hilly areas of Romania. Middle-East Journal of Scientific Research 22 (11) p. 1700-1706.�
Rusu Teodor, Paula Ioana Moraru, Ioan Rotar, 2011. Effect of soil tillage system on soil properties and yield in some arable crops. Journal of Food, Agriculture & Environment, Vol.9 (3&4), p. 426-429.
Rusu Teodor, Petru Gus, Ileana Bogdan, Paula Ioana Moraru, Adrian Ioan Pop, Doina Clapa, Doru Ioan Marin, Ioan Oroian, Lavinia Ioana Pop, 2009. Implications of minimum tillage systems on sustainability of agricultural production and soil conservation. Journal of Food, Agriculture & Environment Vol.7(2), p. 335 - 338
St�nil� Sorin, Droca Ioan, Ranta Ovidiu, Molnar Adrian, Nagy Mihaela, 2011. Considera�ii privind consumul de energie în produc�ia agricol� �i la lucr�rile solului. In Soil Minimum Tillage Systems, 6-th International Symposium, Ed. Risoprint, ISSN 2247-7525, p.340-346.
Te u I., Baghinschi V., 1984. Energia �i agricultura. Ed. Ceres, Bucure ti.
47
RESEARCH ON THE INFLUENCE OF THE OREGANO OIL USE OVER THE PRODUCTIVE PERFORMANCES AND QUALITY OF DUCK MEAT
Monica MARIN, Dumitru DRĂGOTOIU, Carmen Georgeta NICOLAE, Georgeta DINIŢĂ
University of Agronomic Sciences and Veterinary Medicine of Bucharest, 59 Mărăşti Blvd, District 1, 011464, Bucharest, Romania, Phone: +4021.318.25.64, Fax: + 4021.318.25.67,
Email: [email protected], [email protected], [email protected], [email protected]
Corresponding author email: [email protected]
Abstract The aim of the study is to highlight the effect of oregano oil used in vegetable fat mixture recipes from compound feed over the growth performance and slaughter of the ducklings. The experiments were conducted on 150 ducklings hybrids, intensively grown in two phases (phase I 0-21 days and phase II 22-56 days), the difference between compound feed recipes consisting of different proportion of oregano oil added to the sunflower oil, used as a source of fat, respectively at the control batch has been given only sunflower oil, for the experimental batch 1 was added 0.5% oregano oil, and for the experimental batch 2, was used 1% oregano oil. It was noted that through the use of the oregano oil in the feed of ducklings, there have improved their growth performance represented by the body weight, the average daily gain, the average daily and specific intake of compound feed. Slaughter randament, the chemical composition of meat and the blood content in total cholesterol were not influenced by the type of fat introduced into the compound feed. Instead, there has been noticed a positive influence in the use of oregano oil over the glucose level, superoxide dismutase and glutathione peroxidase from blood, as well as a decrease of losses through mortality. Key words: oregano oil, ducks, productive performances, meat quality. INTRODUCTION An important contribution to providing the market with meat is brought by ducks, this thing being possible primarily due to the tendency of poultry products diversify, and secondly due to the improvement of ducklings technology intensive growth, which resulted in comparable performances to those of broilers (Van et al., 2000). Feeding the meat ducklings at optimal nutritional requirements for obtaining a high quality meat is essential. Current research on ducklings nutrition are in a continuous progress, oriented to elucidate the action mode of nutrition - genetics and nutrition - technology main interrelations in order to determine the optimal levels of nutrients to satisfy the nutritional requirements of birds (Pop et al., 2006). From the wide range of substances or compounds that can be used in duck feeding, with a potential positive effect on the health state, on the productive performances and on the economic results for the research
conducted, it was selected the oregano oil that contains two compounds with antibacterial, antiviral, antifungal, respectively carvacrol and thymol were chosen (Baser, 2008). The aim of the research undertaken is to analyze the effect of the oregano oil administered in different doses in recipes of compound feed over the growth performance and of those at slaughter for the ducklings. MATERIALS AND METHODS The biological material was represented by 150 ducklings, meat Pekin breed hybrid, distributed in three uniform experimental batches in terms of body weight and sex ratio. The used growth technology was in intensive system, on land, on permanent litter. The density was of 15-20 birds/m2 in the first 2 weeks, after which the density decreases, reaching 4 birds/m2 at the age of 2 months, at which the slaughter is performed. Bedding straw were used and the microclimate conditions, i.e. temperature, humidity, air speed, have been fulfilled according to the
48
AgroLife Scientific Journal - Volume 4, Number 2, 2015
ISSN 2285-5718; ISSN CD-ROM 2285-5726; ISSN ONLINE 2286-0126; ISSN-L 2285-5718
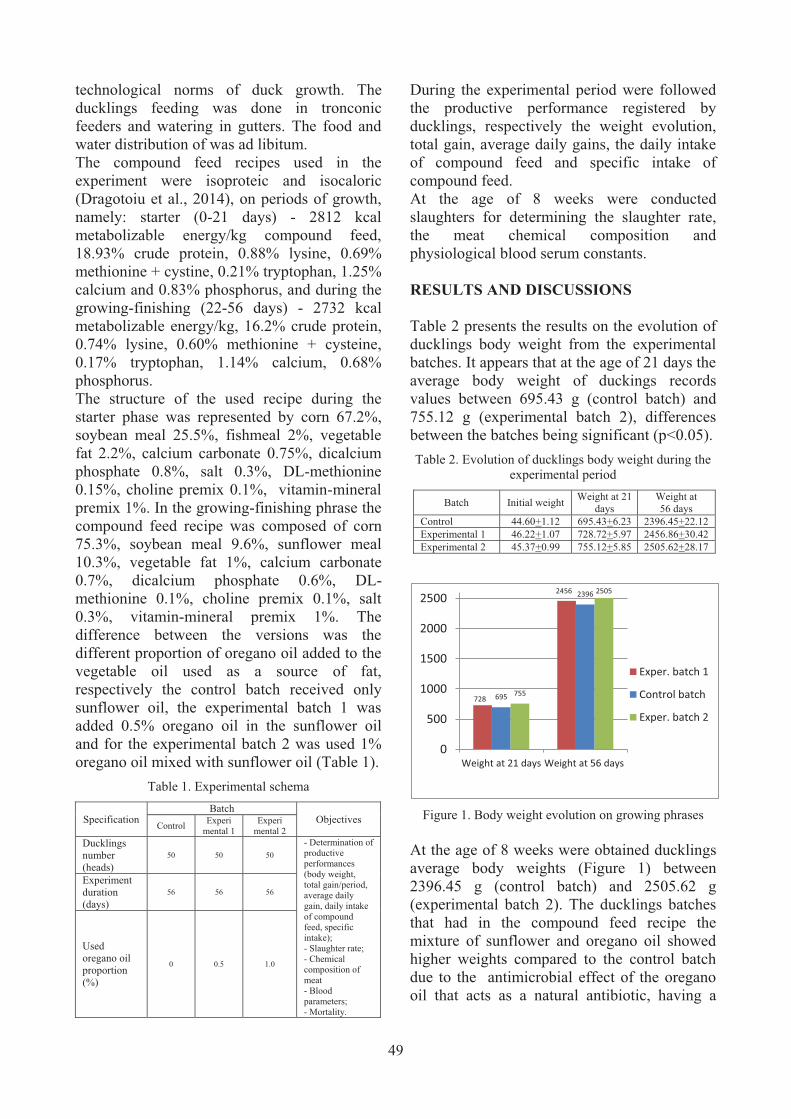
technological norms of duck growth. The ducklings feeding was done in tronconic feeders and watering in gutters. The food and water distribution of was ad libitum. The compound feed recipes used in the experiment were isoproteic and isocaloric (Dragotoiu et al., 2014), on periods of growth, namely: starter (0-21 days) - 2812 kcal metabolizable energy/kg compound feed, 18.93% crude protein, 0.88% lysine, 0.69% methionine + cystine, 0.21% tryptophan, 1.25% calcium and 0.83% phosphorus, and during the growing-finishing (22-56 days) - 2732 kcal metabolizable energy/kg, 16.2% crude protein, 0.74% lysine, 0.60% methionine + cysteine, 0.17% tryptophan, 1.14% calcium, 0.68% phosphorus. The structure of the used recipe during the starter phase was represented by corn 67.2%, soybean meal 25.5%, fishmeal 2%, vegetable fat 2.2%, calcium carbonate 0.75%, dicalcium phosphate 0.8%, salt 0.3%, DL-methionine 0.15%, choline premix 0.1%, vitamin-mineral premix 1%. In the growing-finishing phrase the compound feed recipe was composed of corn 75.3%, soybean meal 9.6%, sunflower meal 10.3%, vegetable fat 1%, calcium carbonate 0.7%, dicalcium phosphate 0.6%, DL-methionine 0.1%, choline premix 0.1%, salt 0.3%, vitamin-mineral premix 1%. The difference between the versions was the different proportion of oregano oil added to the vegetable oil used as a source of fat, respectively the control batch received only sunflower oil, the experimental batch 1 was added 0.5% oregano oil in the sunflower oil and for the experimental batch 2 was used 1% oregano oil mixed with sunflower oil (Table 1).
Table 1. Experimental schema
Specification Batch
Objectives Control Experi mental 1
Experi mental 2
Ducklings number (heads)
50 50 50 - Determination of productive performances (body weight, total gain/period, average daily gain, daily intake of compound feed, specific intake); - Slaughter rate; - Chemical composition of meat - Blood parameters; - Mortality.
Experiment duration (days)
56 56 56
Used oregano oil proportion (%)
0 0.5 1.0
During the experimental period were followed the productive performance registered by ducklings, respectively the weight evolution, total gain, average daily gains, the daily intake of compound feed and specific intake of compound feed. At the age of 8 weeks were conducted slaughters for determining the slaughter rate, the meat chemical composition and physiological blood serum constants. RESULTS AND DISCUSSIONS Table 2 presents the results on the evolution of ducklings body weight from the experimental batches. It appears that at the age of 21 days the average body weight of duckings records values between 695.43 g (control batch) and 755.12 g (experimental batch 2), differences between the batches being significant (p<0.05). Table 2. Evolution of ducklings body weight during the
experimental period
Batch Initial weight Weight at 21 days
Weight at 56 days
Control 44.60+1.12 695.43+6.23 2396.45+22.12 Experimental 1 46.22+1.07 728.72+5.97 2456.86+30.42 Experimental 2 45.37+0.99 755.12+5.85 2505.62+28.17
Figure 1. Body weight evolution on growing phrases
At the age of 8 weeks were obtained ducklings average body weights (Figure 1) between 2396.45 g (control batch) and 2505.62 g (experimental batch 2). The ducklings batches that had in the compound feed recipe the mixture of sunflower and oregano oil showed higher weights compared to the control batch due to the antimicrobial effect of the oregano oil that acts as a natural antibiotic, having a
728
2456
695
2396
755
2505
0
500
1000
1500
2000
2500
Weight at 21 days Weight at 56 days
Exper. batch 1
Control batch
Exper. batch 2
49
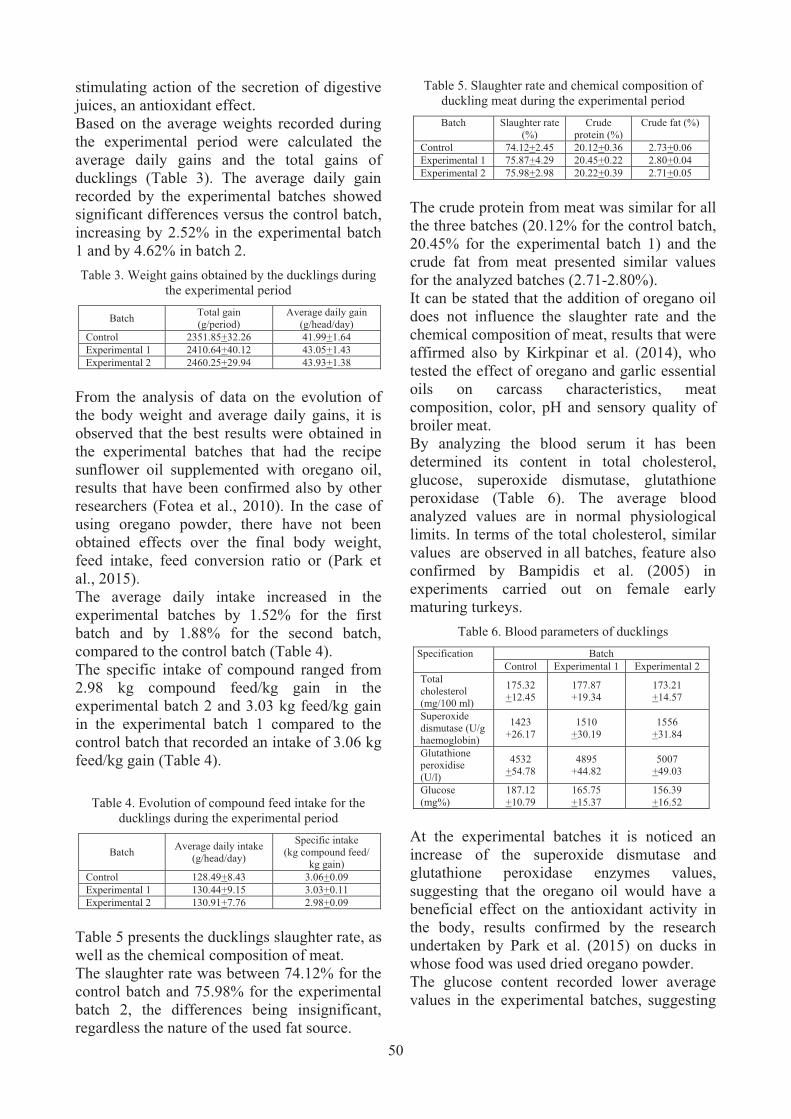
stimulating action of the secretion of digestive juices, an antioxidant effect. Based on the average weights recorded during the experimental period were calculated the average daily gains and the total gains of ducklings (Table 3). The average daily gain recorded by the experimental batches showed significant differences versus the control batch, increasing by 2.52% in the experimental batch 1 and by 4.62% in batch 2. Table 3. Weight gains obtained by the ducklings during
the experimental period
Batch Total gain (g/period)
Average daily gain (g/head/day)
Control 2351.85+32.26 41.99+1.64 Experimental 1 2410.64+40.12 43.05+1.43 Experimental 2 2460.25+29.94 43.93+1.38
From the analysis of data on the evolution of the body weight and average daily gains, it is observed that the best results were obtained in the experimental batches that had the recipe sunflower oil supplemented with oregano oil, results that have been confirmed also by other researchers (Fotea et al., 2010). In the case of using oregano powder, there have not been obtained effects over the final body weight, feed intake, feed conversion ratio or (Park et al., 2015). The average daily intake increased in the experimental batches by 1.52% for the first batch and by 1.88% for the second batch, compared to the control batch (Table 4). The specific intake of compound ranged from 2.98 kg compound feed/kg gain in the experimental batch 2 and 3.03 kg feed/kg gain in the experimental batch 1 compared to the control batch that recorded an intake of 3.06 kg feed/kg gain (Table 4).
Table 4. Evolution of compound feed intake for the ducklings during the experimental period
Batch Average daily intake (g/head/day)
Specific intake (kg compound feed/
kg gain) Control 128.49+8.43 3.06+0.09 Experimental 1 130.44+9.15 3.03+0.11 Experimental 2 130.91+7.76 2.98+0.09
Table 5 presents the ducklings slaughter rate, as well as the chemical composition of meat. The slaughter rate was between 74.12% for the control batch and 75.98% for the experimental batch 2, the differences being insignificant, regardless the nature of the used fat source.
Table 5. Slaughter rate and chemical composition of duckling meat during the experimental period Batch Slaughter rate
(%) Crude
protein (%) Crude fat (%)
Control 74.12+2.45 20.12+0.36 2.73+0.06 Experimental 1 75.87+4.29 20.45+0.22 2.80+0.04 Experimental 2 75.98+2.98 20.22+0.39 2.71+0.05
The crude protein from meat was similar for all the three batches (20.12% for the control batch, 20.45% for the experimental batch 1) and the crude fat from meat presented similar values for the analyzed batches (2.71-2.80%). It can be stated that the addition of oregano oil does not influence the slaughter rate and the chemical composition of meat, results that were affirmed also by Kirkpinar et al. (2014), who tested the effect of oregano and garlic essential oils on carcass characteristics, meat composition, color, pH and sensory quality of broiler meat. By analyzing the blood serum it has been determined its content in total cholesterol, glucose, superoxide dismutase, glutathione peroxidase (Table 6). The average blood analyzed values are in normal physiological limits. In terms of the total cholesterol, similar values are observed in all batches, feature also confirmed by Bampidis et al. (2005) in experiments carried out on female early maturing turkeys.
Table 6. Blood parameters of ducklings Specification Batch
Control Experimental 1 Experimental 2 Total cholesterol (mg/100 ml)
175.32 +12.45
177.87 +19.34
173.21 +14.57
Superoxide dismutase (U/g haemoglobin)
1423 +26.17
1510 +30.19
1556 +31.84
Glutathione peroxidise (U/l)
4532 +54.78
4895 +44.82
5007 +49.03
Glucose (mg%)
187.12 +10.79
165.75 +15.37
156.39 +16.52
At the experimental batches it is noticed an increase of the superoxide dismutase and glutathione peroxidase enzymes values, suggesting that the oregano oil would have a beneficial effect on the antioxidant activity in the body, results confirmed by the research undertaken by Park et al. (2015) on ducks in whose food was used dried oregano powder. The glucose content recorded lower average values in the experimental batches, suggesting
50

a better metabolism of the energy source from feed. During the experiment, the mortality of ducklings from the three experimental batches (Figure 2) was recorded daily, calculating the cumulative mortality rate, which ranged from 2.5% in the control batch and 1.34% in the experimental batch 2. The mortality decrease is due to the antimicrobial effect of the oregano oil, which acts as a natural antibiotic, preventing diseases and increasing animal productions (Hume, 2011).
Figure 2. Registered mortality evolution at the
experimental batches CONCLUSIONS At the age of 21 days the average weight of the ducklings batches fed with compound feed recipes, in which was added a mixture of sunflower and oregano oil, was higher compared to the one for the ducklings which consumed as vegetable fat sunflower oil. At the age of 8 weeks the ducklings body weight was with 2.5 up to 4.5% higher in the batches that used oregano oil compared to those that only used sunflower oil. The ducklings weight gain was influenced by the addition of oregano oil, the smallest gains being recorded for the batch in whose recipe was added only the sunflower oil. The specific intake of compound food of ducklings ranged from 3.03 kg/kg gain (batch E1) and 2.98 kg/kg gain (batch E2), pointing out a trend of improvement tendency in the batch for which the used proportion of oregano oil was higher (1%).
The slaughter rate and the chemical composition of the meat derived from ducklings were not influenced by the type of fat introduced into compound feed. The experimental batches which consumed oregano oil recorded the lowest values of blood glucose, as well as the highest values of superoxide dismutase and glutathione peroxidase. At the experimental batches was noted a reduction in the actual output through mortality, especially in the experimental batch 2, where the total period percentage was 1.34%. REFERENCES Bampidis V.A., Christodoulou V., Florou-Paneri P.,
Christaki E., Chatzopoulou P.S., Tsiligianni T., Spais A.B., 2005. Effect of dietary dried oregano leaves on growth performance, carcase characteristics and serum cholesterol of female early maturing turkeys. British Poultry Science, 46(5): p. 595-601.
Baser K.H., 2008. Biological and pharmacological activities of carvacrol and carvacrol bearing essential oils. Curr. Pharm. Des., 14(29): p. 3106-3119.
Dragotoiu D., Pogurschi Elena, Marin Monica, 2014. Nutriția și alimentația animalelor. Granada Publishing House, Bucharest, p. 89.
Fotea Lenuta, Costachescu Elena, Hoha G., Leonte Doina, 2010. The effect of oregano essential oil (Origanum vulgare L.) on broiler performance. Lucrari Stiintifice, Seria Zootehnie, 53, p. 253-256.
Hume M.E., 2011. Historic perspective: Prebiotics, probiotics, and other alternatives to antibiotics. Poultry Science, 90, p. 2663-2669.
Kirkpinar F., Unlu H.B., Serdaroglu M., Turp G.Y., 2014. Effects of dietary oregano and garlic essential oils on carcass characteristics, meat composition, colour, pH and sensory quality of broiler meat. British Poultry Science, 55(2): p. 157-166.
Park J.H., Kang S.N., Shin D., Shim K.S., 2015. Antioxidant enzymes activity and meat quality of meat type ducks fed with dried oregano (Origanum vulgare L.) powder. Asian-Australas J. Anim. Sci., 28(1): p. 79-85.
Pop I.M., Halga P., Avarvarei T., 2006. Nutriția și alimentația animalelor. Moldova Publishing House, p. 797-800.
Van I., Damian A., Marin Gh., Cofas V., 2000. Creșterea palmipedelor pentru carne, ficat gras și pene. Coral Sanivet Publishing House, p. 118-121, 142-154.
00,5
11,5
2
2,5
Mortality (%)
2,5
1,76 1,34 Control batch
Exper. batch 1
Exper. batch 2
51
SUSTAINABLE ALTERNATIVE FOR FOOD PACKAGING:
CHITOSAN BIOPOLYMER - A REVIEW Amalia Carmen MITELUȚ, Elisabeta Elena TĂNASE, Vlad Ioan POPA, Mona Elena POPA
University of Agronomic Sciences and Veterinary Medicine of Bucharest, 59 Mărăşti Blvd.,
District 1, 011464, Bucharest, Romania, Phone: +4021.318.25.64, Fax: +4021.318.25.67
Corresponding author email: [email protected] Abstract Food packaging technology is continuously evolving in response to growing challenges from a modern society. Active packaging is an innovative approach to enhance the shelf life of food stuffs while improving their quality, safety and integrity. Chitosan is the deacetylated derivative of chitin, which is the second most abundant polysaccharide found in nature after cellulose. Chitosan is nontoxic, biocompatible, and biodegradable and thus is considered as an environmentally friendly packaging material. Moreover, chitosan is a good inhibitor against the growth of a wide variety of yeasts, fungi and bacteria, and also displays gas and aroma barrier properties in dry conditions. Along with these characteristics, its ease for film formation, make chitosan an interesting choice for active antimicrobial food packaging applications. This study aims to present a literature review regarding chitin and chitosan biopolymers, their properties and the ability to be used in applications in food packaging industry. Key words: active packaging, chitosan, biodegradability, biocompatibility, antimicrobial applications. INTRODUCTION Major current and future challenges to fast-moving consumer goods packaging include legislation, global markets, longer shelf life, convenience, safer and healthier food, environmental concerns, authenticity, and food waste (Realini & Marcos, 2014). Environmental concerns enhance and stimulate the use of renewable resources for producing economically convenient applications to maintain or even improve life quality (Pereda et al., 2012). Biopolymers have been widely investigated over the last two decades because they can be a viable solution to the waste disposal of foods’ plastic packaging materials (Nitschke et al., 2011; Cooper, 2013). Furthermore, biopolymer films are excellent matrix for incorporating a wide variety of functional additives, such as antioxidants, antifungal agents, antimicrobials (Zemljic et al., 2013), colours, and nutrients, and through these, active materials can also improve food quality and extend shelf life by minimizing microbial growth in the product (Abdollahi et al., 2012). Such matrix biopolymers include starches, cellulose derivatives, chitosan/chitin, gums, proteins (animal or plant-based) and lipids. These
materials offer the possibility of obtaining thin films and coatings to cover fresh or processed foods to extend their shelf life (Elsabee & Abdou, 2013). Nowadays, consumer’s awareness regarding unhealthy side effects of chemicals (i.e. parabens, benzoic acids, nitrites, etc.) in food products is increasing. Food spoilage due to microbial action is also a problem (López-Carballo et al., 2012; Huang et al., 2012), resulting in the loss of more than 25% of food before consumption. A multitude of yeasts, moulds and bacteria can cause the deterioration of a specific food product, the responsible microorganism action being dependent on pH, water activity, oxygen and carbon dioxide partial pressures and temperature (López-Carballo et al., 2012). The incorporation of antioxidant and antimicrobial agents into edible films is one of the landmark advances in food technology today. For environmental reasons it is increasingly desirable for at least the packaging to be biodegradable and where possible to be obtained from low-cost, sustainable resources (Arancibia et al., 2014b). Food packaging has many purposes. It is designed not only to contain and protect food, but also to keep food safe and secure, to retain food quality and freshness, and to increase its
52
AgroLife Scientific Journal - Volume 4, Number 2, 2015
ISSN 2285-5718; ISSN CD-ROM 2285-5726; ISSN ONLINE 2286-0126; ISSN-L 2285-5718

shelf-life. In addition, packaging should be affordable to consumers worldwide and, more importantly; it must be naturally biodegradable upon disposal (Imam&Glenn, 2012). Packaging films incorporated with antimicrobial substances, are of great potential for food preservation due to their antiseptic properties and conveniences for food (Huang et al., 2012). This kind of materials are considered as one of the most promising active packaging systems, as they are highly effective in killing or inhibiting spoilage and pathogenic microorganisms that contaminate food, and can limit the possible undesirable flavours that are caused by the direct addition of active compounds into foods. Active packaging involves the interaction between the package, product and environment in order to prolong product shelf life or enhance its safety, while maintaining its nutritional quality. One class of active packages are antimicrobial packages used to reduce the growth rate and limit the maximum population of microorganisms. Antimicrobial packaging materials have to be in direct contact with the food surface if they are non-volatile and can be either immobilised on the materials surface or able to migrate into the food. Therefore, antimicrobial packaging is effective on food products were the microbial contamination occurs at the surface (Realini & Marcos, 2014). CHITIN AND CHITOSAN POLYSACCHARIDES Chitin was the first polysaccharide identified by man from mushrooms preceding cellulose by 30 years. After that this polymer was identified in the shells of insects and the exoskeletons of molluscs combined with minerals and proteins to harden these structures by cross-linking with polyphenols (Mati-Baouche et al., 2014). The main sources of chitin (in % of dry matter) are crustaceans such as shrimp and crab (58-85%), insects (20-60%), molluscs (3-26%); cephalopods including squids, octopuses and annelids (20-28%), protozoans which contain a little chitin, coelenterates (3-30%), seaweed which can contain low quantities of chitin and fungi whose chitin contents are from trace to
45% (Fernandez-Saiz, 2011; Reddy et al., 2013; Mati-Baouche et al., 2014). Chitosan is a deacetylated derivative of chitin (Arvanitoyannis, 2013), which is the second most abundant polysaccharide found in the nature after cellulose (Abdollahi et al., 2012; Kerry, 2012; Cruz-Romero et al., 2013; Leceta et al., 2013c; Nimesh, 2013; Nowzari et al., 2013; Ojijo & Ray, 2013) and commonly found in the shells and exoskeletons of crustaceans. Chitosan can also be obtained from the cell wall of some fungi (Fernandez-Saiz, 2011; Muzzarelli et al., 2012; Nitschke et al., 2011; Petrou et al., 2012; Wang et al., 2012; Leceta et al., 2013c; Sun et al., 2014), thus there is an alternative method of production that does not depend on environmentally harmful chemicals or the variable abundance of crustaceans. Chitosan is mostly applied as a food additive or preservative, and as a component of packaging material, not only to retard microbial growth in food, but also to improve the quality and shelf-life of food (Vasilatos & Savvaidis, 2013). The solubility of chitosan depends on the degree of deacetylation, the distribution of acetyl groups along the main chain, the molecular weight and the nature of the acid used for protonation, but unlike chitin, it is soluble in dilute acid solutions below pH 6.0 due to the presence of amino groups. Apart from solubility, chitosan molecular weight can also affect the quality of the final film such as elasticity or brittleness (López-Carballo et al., 2012; Leceta et al., 2013). Chitin and chitosan offer a wide range of applications, including clarification and purification of water and beverages, applications in pharmaceuticals and cosmetics, as well as agricultural, food and biotechnological uses. Recent efforts for the use of chitin and chitosan have intensified since efficient utilization of marine biomass resources has become an environmental priority (Fernandez-Saiz, 2011). Chitosan has been widely used in several industries and offers real potential for applications in food industry due to its natural origin and exceptional properties such as biodegradability, biocompatibility, biofunctionality, non-toxicity and chelation with metals (Abdollahi et al., 2012; Elsabee et al., 2012; Kanatt et al., 2012; Liu et al., 2012;
53

Cruz-Romero et al., 2013; Yu et al., 2013; Doulabi et al., 2013; Tanase & Spiridon, 2014) and antioxidant characteristics (Vargas et al., 2012; Peng et al., 2013; Schreiber et al., 2013; Cooksey, 2014). Chitosan is biodegradable and non-toxic and has some interesting biological activities, including excellent strength and elongation properties (Kaisangsri et al., 2012). Chitosan films have a selective permeability to gases (CO2 and O2) and good mechanical properties. However, due to its hydrophilic nature, it has poor barrier to moisture, which limits its uses (Lim et al., 2012; Pereda et al., 2012; Elsabee & Abdou, 2013). Chitosan has been approved as food ingredient from FDA (Food and Drug Administration). In food products, chitosan offers a wide range of applications, e.g. preservation of food from microbial deterioration, formation of edible-biodegradable films, coagulation of proteins and lipids from waste water, enhancing of gelation in surimi and fishery products and clarification/deacidification of fruit juice (Zemljic et al., 2013). ANTIMICROBIAL ACTIVITY OF CHITOSAN The antimicrobial activity of chitosan depends not only on the external conditions (target microorganism, nature of the medium, pH temperature, etc.), but also on different intrinsic factors such as its molecular weight, and degree of polymerization and deacetylation (López-Carballo et al., 2012; Vargas et al., 2012). The antimicrobial action of chitosan is derived from the positive charge (Li et al., 2011) that amino groups present at acidic pH. Chitosan having cationic groups along the backbone has been shown to have antimicrobial properties against bacteria, yeasts, moulds and fungi (Lim et al., 2012; Siripatrawan & Noipha, 2012; Vasile et al., 2013; Yu et al., 2013; Van den Broek et al., 2014). Chitosan has inherent antimicrobial activity owing to the fact that long positively charged chitosan molecules interact with negatively charged bacteria membrane causing disruption on the cell walls (Xiao et al., 2011; Leceta et al., 2013c). The antimicrobial action of chitosan is hypothesized to be mediated by the electrostatic forces between the protonated
amino group (NH2) in chitosan and the negative residues at cell surfaces. The number of protonated amino groups (NH2) present in chitosan increases with increased degrees of deacetylation (DD) which influences the antimicrobial activity (Elsabee & Abdou, 2013). Torlak and Sert (2013) studied the antibacterial effectiveness of chitosan-coated polypropylene films alone and incorporating ethanolic extract of propolis (EEP) against six foodborne pathogens (Bacillus cereus, Cronobacter sakazakii, Escherichia coli O157:H7, Listeria monocytogenes, Salmonella typhimurium and Staphylococcus aureus). The results obtained showed that antimicrobial activity was enhanced with addition of ethanolic extract of propolis (EEP) to film formulation. Also, the antibacterial efficacy of chitosan coated film was increased remarkably with the addition of propolis against both Gram-positive and Gram-negative bacteria tested, probably due to the synergistic effect between propolis and chitosan (Torlak and Sert, 2013). Cruz-Romero et al. (2013) investigated the antimicrobial activity of low- and medium-molecular weight chitosan. The obtained results showed that both low molecular weight (LMW) and medium molecular weight (MMW) chitosan exhibited high antimicrobial activity against all bacterial cultures tested (Cruz-Romero et al., 2013). POLYMER BLENDING Polymer blending is one of the most effective methods to have new material with desired properties. Films formed by blending of polymers usually results in modified physical and mechanical properties compared to films made of individual components. Blending of synthetic polymers with chitosan, such as PVA (Bano et al., 2014), PET (Torres-Huerta et al., 2014) and starch (Liu et al., 2009; Kowalczyk et al., 2015), have been reported to improve mechanical properties of chitosan films. Blending of chitosan with other natural polymers gives films and coatings with good properties, chitosan addition in edible films leads to good film forming and mechanical properties, no toxicity, biodegradability, relative more hydrophobic nature that could
54

provide higher moisture barrier and water resistance. Many researchers studied different properties of chitosan and chitosan blends (preparation, physical, mechanical, rheological, water vapour permeability and antimicrobial properties) their results show that chitosan and chitosan blends are extremely promising materials for bio-based active films preparation and that chitosan based edible films and coatings can be useful for preserving and
extending the shelf life of foods (Elsabee & Abdou, 2013). Chitosan nanoparticles have been successfully used as fillers to improve mechanical and barrier properties as well as the thermo-stability of films, decrease solubility and produce more compact and dense materials (Antoniou et al., 2014). In Table 1 some chitosan based materials and their reported characteristics are presented, stated in many studies.
Table 1. Chitosan based materials and their reported characteristics
Composition of chitosan based materials
Reported effects References
Chitosan /PEO increasing chitosan content in the blend solutions led to a significant reduction in nanofiber diameters - fact that is related to viscosity reduction and increased conductivity
Pakravan et al., 2011
PET/PP/chitosan higher antimicrobial activity against E. coli and B. subtilis when chitosan was added
Lei et al., 2014
Chitosan/PVA/pectin the formed films demonstrated antimicrobial activity against E. coli, S. aureus, B. subtilis, Pseudomonas and C. albicans
Tripathi et al., 2010
PLA/chitosan/keratin improved Young's modulus; decreased tensile strength; significant increase in hardness compared to PLA
Tanase & Spiridon, 2014
PLA/starch/chitosan improved hydrophilicity of the blends; the release procedure for chitosan could be divided into two stages: an initial fast stage and a following slow stage. The two stages exhibited the effectiveness and long residual action of antimicrobial property of the blends, and showed that the blend material was very suitable for foods with high water activity.
Bie et al., 2013
PEG /chitosan higher antibacterial activity compared to native chitosan film Davidovich-Pinhas et al., 2014
Gelatine/chitosan films higher mechanical properties and thermal stabilities and lower water vapour permeability with the addition of chitosan
Liu et al., 2012
Cassava starch/chitosan/glycerol the addition of chitosan increased mechanical resistance and decreased WVP of starch films
Pelissari et al., 2012
Chitosan/starch (modified with monomer 2-hydroxyethyl methacrylate)
modified films possess improved water stability, thermal stability than chitosan–starch film
Tuhin et al., 2012
TPS/chitosan/chitin WVP was reduced with chitosan/chitin incorporation; TPS films with chitosan reduced S. aureus and E. coli growth in the contact zone
Lopez et al., 2014
Wheat gluten/chitosan films presented lower moisture uptake and lower diffusivity than chitosan; once with the addition of chitosan higher toughness/extensibility and better microbial resistance was exhibited compared to wheat gluten
Chen et al., 2014
Chitosan-based /glycerol functional properties of chitosan-based films were improved with the addition of glycerol; being adequate for packaging purposes
Leceta et al., 2013a
Chitosan/PVA with aqueous mint extract (ME)/pomegranate peel extract (PE)
antibacterial activity against Gram-positive bacteria (S. aureus and B. cereus) and ineffective against Gram-negative bacteria (E. coli and P. fluorescens)
Kanatt et al., 2012
PVA/ chitosan/nano-ZnO increased antimicrobial activity when nano-ZnO was added Wang et al., 2012 Chitosan-N-arginine (CS-N-Arg) antibacterial activity against S. aureus and E. coli at the
concentrations higher than 150 ppm; at the concentrations lower than 50 ppm, it might be digested by microbes and absorbed as nutrients to promote the growth of microorganisms
Xiao et al., 2011
Chitosan/cellulose/caffeic acid superior antioxidant and antibacterial activity compared to the caffeic acid-free films
Yu et al., 2013
Chitosan–nanocellulose excellent inhibitory effects against Gram-positive and Gram-negative bacteria
Dehnad et al., 2014
Tara gum/chitosan better antimicrobial activity Antoniou et al., 2014
PET/chitosan successfuly inhibited E. coli, L. monocytogenes, and C. albicans Zemljic et al., 2013
55

Chitosan/eugenol improved thermal stability of eugenol; showed antioxidant activity and decreased water vapor permeability
Woranuch et al., 2013a; Woranuch & Yoksan, 2013b
Chitosan/clay-rosemary exhibit antimicrobial properties and more phenol content Abdollahi et al., 2012
Chitosan/ ferulic acid improved thermal stability of ferulic acid; greater antioxidant activities compared to naked ferulic acid; improved water solubility
Woranuch et al., 2014; Woranuch & Yoksan, 2013c
Chitosan/ grape pomace extracts (aqueous extract)
antioxidant properties without modification of their water solubility and mechanical properties
Ferreira et al., 2014
Chitosan/ ferulic acid (FA) and ethyl ferulate (EF)
improved antioxidant properties Aljawish et al., 2014
Chitosan/caffeic acid modulated antioxidant and antimicrobial properties Bozic et al., 2012 Chitosan/gallic acid improved antimicrobial properties; increased TS; improved barrier
properties Sun et al., 2014
Chitosan/glycerol/olive oil physical, mechanical and barrier proper-ties were strongly related with the chitosan concentration
Pereda et al., 2014
Chitosan/ carvacrol, grape seed extract
improved antimicrobial and antioxidant activity against P. aeruginosa, S. aureus, L. innocua, E. faecalis, S. cerevisiae
Rubilar et al., 2013
Chitosan /carvacrol improved antimicrobial activity Kurek et al., 2013 Gliadin-chitosonium acetate excellent antimicrobial properties Fernandez-Saiz et
al., 2008 Gelatin-chitosan/oregano essential oil (OEO)
improved antimicrobial activity Wu et al., 2014
Chitosan-based carbon dioxide (CO2) indicator
great potential to be used as sensors for monitoring the fermentation process and spoilage of foods
Jung et al., 2012
CHITOSAN BASED EDIBLE COATINGS Edible coating is a thin layer of material formed as a coating on a food product, while an edible film is a preformed thin layer, made of edible material, which once formed can be placed on or between food components (Nowzari et al., 2013). Films prepared with these polymers are usually based on polysaccharides (e.g. chitosan), proteins (e.g. zein) and lipids (e.g. waxes), which are generally biodegradable, nontoxic, and some of them are effective barriers to oxygen and carbon dioxide, so they can be used as protective coating to maintain food quality and, at the same time, reduce the environmental impact of packaging wastes (Leceta et al., 2013a; Fabra et al., 2014). The main drawbacks of these types of materials are their inherently
high rigidity and the difficulty of processing them in conventional equipment. A further disadvantage of proteins and polysaccharides is their very strong water sensitivity caused by their hydrophilic character (Fabra et al., 2014). Interest in edible coatings and films on highly perishable unmodified and/or fresh foods has intensified in recent years. The use of edible films and coatings has several aims, most importantly: the restriction of moisture loss, control of gas permeability, control of microbial activity (e.g., chitosan, which acts against microbes), preservation of the structural integrity of the product and the gradual release of enrobed flavours or antioxidants into the food (Fabra et al., 2014). Table 2 presents a series of researches performed using chitosan based coatings and solutions in food products applications.
Table 2. Chitosan based films and solutions and their reported effects on food products
Composition of chitosan based materials
Food product Reported effects References
Chitosan/ PVA minimally processed tomato
a viable alternative in shelf-life extension of minimally processed tomato
Tripathi et al., 2009
chitosan/antibrowning agents
fresh-cut lotus root lower respiration created by chitosan coating Xing et al., 2010
Carvacrol/ chitosan
green bean strong antimicrobial activity against E. coli O157:H7 and S. Typhimurium
Severino et al., 2015
Chitosan/GA peanut powder reduce lipid oxidation Schreiber et al., 2013
Chitosan/whey protein Ricotta cheese reduced growth of microbial contaminants and extended the shelf-life of the product; delayed
Di Pierro et al., 2011
56

development of undesirable acidity; better maintained the texture and did not seem to modify sensory characteristics
gelatin-chitosan/oregano essential oil (OEO)
grass carp muscle Both TPC and TVB-N were much lower than control samples; incorporating OEO can extend the shelf-life of fish muscle
Wu et al., 2014
chitosan films (CS) fresh fillets of hake (Merluccius merluccius) and sole (Solea solea)
decreased final bacterial population; the CS-AP(in air) extended the shelf-life of hake and sole fillets by 7 to 9 days
Fernández-Saiz et al., 2013
Chitosan–gelatin rainbow trout (Oncorhynchus mykiss) fillets
chitosan–gelatin coating and film retained their good quality characteristics and extend the shelf life of fish samples during refrigerated storage; showed antioxidant effect
Nowzari et al., 2013
Chitosan film fresh swordfish steaks
the combined use of chitosan and VP could inhibit bacterial growth; retard evolution of amines TMA-N and TVB-N; maintain or improve the sensory quality of fresh swordfish stored under refrigeration (4 °C)
Tsiligianni et al., 2012
Chitosan films fish soup proved to have biocidal effect without affecting the sensorial properties of the commercial product
Loâpez-Rubio et al., 2011
Chitosan/cyclodextrin incorporating carvacrol
packaging of fresh chicken
antimicrobial effect depending on the size of the film and storage time; increased concentration of carvacrol affected sensorial attributes of chicken meat
Higueras et al., 2014
Chitosan solution aerobically packaged chicken meat
shelf life extension of 6 to 7 days; shelf life extension using the combination chitosan dip plus MAP was 9 days
Latou et al., 2014
Chitosan, oregano and their combination
modified atmosphere packaged chicken breast meat
this combination could inhibit growth of microbial spoilage flora; retard lipid oxidation; maintain lightness; improve the sensory quality of fresh chicken meat
Petrou et al., 2012
Chitosan solution/ pure thymol oil
Ready-to-cook chicken and pepper kabobs
extended shelf life to 14 days; significantly reduced microbial counts throughout the storage period
Cooksey, 2014
Chitosan/rosemary EO turkey meat under VP conditions could inhibit growth of microbial spoilage flora; improve the sensory quality of fresh turkey meat stored under refrigeration (2 °C)
Vasilatos & Savvaidis, 2013
(LY-CS-OREC/ALG) 10.5 film-coated CA
fresh pork meat best antibacterial activity; could extend the shelf life of fresh pork for about 3 days;
Huang et al., 2012
Chitosan/green tea (CGT-film)
pork sausages maintain qualities and extend shelf life of the refrigerated pork sausages
Siripatrawan & Noipha, 2012
Chitosan film ground beef reduced lipid oxidation; improved surface red color of beef patties
Cooksey, 2014; Suman et al., 2010
Chitosan has proven its antimicrobial activity when used as a coating on several food products, cheese, fish patties, strawberries or bologna. In other cases, the role of chitosan is that of a matrix for the delivery of other antimicrobial compounds such as acids, salts, cinnamaldehyde, lysozyme, nisin or plant extracts (López-Carballo et al., 2012). Also, chitosan coatings have been successfully probed at an experimental level on food such as eggs, fruits, vegetables, dairy products and meats. However, for certain food products, the limited antimicrobial activity of pure chitosan films does not reach the antiseptic level desired by packers (Sun et al., 2014).
CONCLUSIONS The potential of chitosan, as shown by research and development efforts, is supported and enhanced by both the increasing consumer demand for natural and safer additives with functional properties, and increasing environmental concerns. It is likely that some of the future applications of chitosan in the food area will come from the medical and pharmaceutical sectors, where it has been extensively used because of its antioxidant and antimicrobial properties. Potentially, chitosan could be incorporated into recycled materials such as multilayer plastic packaging materials in which each layer of polymer would have a specific function: i.e., chitosan could act as
57

antimicrobial/antioxidant agent and another material could act as a water vapour barrier. Moreover, since chitosan properties are much affected by the pH and the ionic strength of the surrounding medium, chitosan-based systems could also be used for the controlled release of active ingredients (Vargas et al., 2012). The information presented in this review demonstrated the favourable effects of chitosan alone or in combination with different polymers, essential oils and other agents. Many researchers demonstrated that chitosan treatment can offer protection against contamination and microbial spoilage (Van den Broek et al., 2014). Chitosan coatings were also proved to be beneficial in maintaining a higher product quality during the storage period, and an increased shelf-life of food products was observed. ACKNOWLEDGEMENTS The research leading to these results has received funding from Romanian - EEA Research Programme operated by MEN under the EEA Financial Mechanism 2009-2014 and project contract no. 1SEE/2014. REFERENCES Abdollahi M., Rezaei M. & Farzi G., 2012. A novel
active bionanocomposite film incorporating rosemary essential oil and nanoclay into chitosan. Journal of Food Engineering, 111, p. 343-350.
Aljawish A., Chevalot I., Jasniewski J., Revol-Junelles A.M., Scher J. & Muniglia L., 2014. Laccase-catalysed functionalisation of chitosan by ferulic acid and ethyl ferulate: Evaluation of physicochemical and biofunctional properties. Food Chemistry, 161, p. 279-287.
Antoniou J., Liu F., Majeed H. & Zhong F., 2014. Characterization of tara gum edible films incorporated with bulk chitosan and chitosan nanoparticles: A comparative study. Food Hydrocolloids, 44, p. 309-319.
Arancibia M.Y., Aleman A., Lopez-Caballero M.E., & Gomez-Guillen M.C., 2014b. Development of active films of chitosan isolated by mild extraction with added protein concentrate from shrimp waste. Food Hydrocolloids, 43, p. 91-99.
Arvanitoyannis I.S., 2013. Waste Management for Polymers in Food Packaging Industries. Plastic Films in Food Packaging, 14, p. 249-310.
Banoa I., Ghauria M.A., Yasinb T., Huang Q., D’Souza Palaparthi A., 2014. Characterization and potential
applications of gamma irradiated chitosan and its blends with poly (vinyl alcohol). International Journal of Biological Macromolecules, 65, p. 81-88.
Bie P., Liu P., Yu L., Li X., Chen L. & Xie F., 2013. The properties of antimicrobial films derived from poly(lactic acid)/starch/chitosan blended matrix. Carbohydrate Polymers, 98, p. 959-966.
Bozic M., Gorgieva S. & Kokol V., 2012. Laccase-mediated functionalization of chitosan by caffeic and gallic acids for modulating antioxidant and antimicrobial properties. Carbohydrate Polymers, 87, p. 2388-2398.
Chen F., Monnier X., Gällstedt M., Gedde U.W. & Hedenqvist M.S., 2014. Wheat gluten/chitosan blends: A new biobased material. European Polymer Journal, 60, p. 186-197.
Cooksey K., 2014. Modified Atmosphere Packaging of Meat, Poultry and Fish. Innovations in Food Packaging, 19, p. 475-493.
Cooper T.A., 2013. Developments in bioplastic materials for packaging food, beverages and other fast- moving consumer goods. Trends in Packaging of Food, Beverages and Other Fast-Moving Consumer Goods (FMCG), 5, p. 108-152.
Cruz-Romero M.C., Murphy T., Morris M., Cummins E. & Kerry J.P., 2013. Antimicrobial activity of chitosan, organic acids and nano-sized solubilisates for potential use in smart antimicrobially-active packaging for potential food applications. Food Control, 34, p. 393-397.
Davidovich-Pinhas M., Danin-Poleg Y., Kashi Y. & Bianco-Peled H., 2014. Modified chitosan: A step toward improving the properties of antibacterial food packages. Food Packaging and Shelflife, 1, p. 160-169.
Dehnad D., Mirzaei H., Emam-Djomeh Z., Jafari S.M. & Dadashi S., 2014. Thermal and antimicrobial properties of chitosan-nanocellulose films for extending shelf life of ground meat. Carbohydrate Polymers, 109, p. 148-154.
Di Pierro P., Sorrentino A., Mariniello L., Giosafatto C. V.L. & Porta R., 2011. Chitosan/whey protein film as active coating to extend Ricotta cheese shelf-life. LWT - Food Science and Technology, 44(10), p. 2324-2327.
Doulabi A.H., Mirzadeh H., Imani M. & Samadi N., 2013. Chitosan/polyethylene glycol fumarate blend film: Physical and antibacterial properties. Carbohydrate Polymers, 92, p. 48-56.
Elsabee M.Z., Naguib H.F., Morsi R.E., 2012. Chitosan based nanofibers, review. Materials Science and Engineering C, 32, p. 1711-1726.
Elsabee M.Z. & Abdou E.S., 2013. Chitosan based edible films and coatings: A review. Materials Science and Engineering C, 33, p. 1819-1841.
Fabra M.J., Lopez-Rubio A. & Lagaron J.M., 2014. Biopolymers for food packaging applications. Smart Polymers and their Applications, 15, p. 476-509.
Fernandez-Saiz P., Lagaron J.M., Hernandez-Muñoz P. & Ocio M.J., 2008. Characterization of antimicrobial properties on the growth of S. aureus of novel renewable blends of gliadins and chitosan of interest
58

in food packaging and coating applications. Inter. Journal of Food Microbiology, 124, p. 13-20.
Fernandez-Saiz P., 2011. Chitosan polysaccharide in food packaging applications. Multifunctional and Nanoreinforced Polymers for Food Packaging, 20, Woodhead Publishing Limited, p. 571-593.
Fernández-Saiz P., Sánchez G., Soler C., Lagaron J.M. & Ocio M.J., 2013. Chitosan films for the microbiological preservation of refrigerated sole and hake fillets. Food Control, 34, p. 61-68.
Ferreira A.S., Nunes C., Castro A., Ferreira P. & Coimbra M.A., 2014. Influence of grape pomace extract incorporation on chitosan films properties. Carbohydrate Polymers, 113, p. 490-499.
Higueras L., López-Carballo G., Hernández-Muñoz P., Catalá R. & Gavara R., 2014. Antimicrobial packaging of chicken fillets based on the release of carvacrol from chitosan/cyclodextrin films. International Journal of Food Microbiology, 188, p. 53-59.
Huang W., Xu H., Xue Y., Huang R., Deng H. & Pan S., 2012. Layer-by-layer immobilization of lysozyme-chitosan–organic rectorite composites on electrospun nanofibrous mats for pork preservation. Food Research International, 48, p. 784-791.
Imam S.H., Glenn G.M. & Chiellini E., 2012. Utilization of biobased polymers in food packaging: assessment of materials, production and commercialization. Emerging Food Packaging Techn., 21, p. 435-468.
Jung J., Puligundla P., Ko S., 2012. Proof-of-concept study of chitosan-based carbon dioxide indicator for food packaging applications. Food Chemistry, 135, p. 2170-2174.
Kaisangsri N., Kerdchoechuen O. & Laohakunjit N., 2012. Biodegradable foam tray from cassava starch blended with natural fiber and chitosan. Industrial Crops and Products, 37, p. 542-546.
Kanatt S.R., Rao M.S., Chawla S.P. & Sharma A., 2012. Active chitosanepolyvinyl alcohol films with natural extracts. Food Hydrocolloids, 29, p. 290-297.
Kerry J.P., 2012. Application of smart packaging systems. Application of smart packaging systems for conventionally packaged muscle-based food products. Advances in Meat, Poultry and Seafood Packaging, 20, p. 522-564.
Kowalczyka D., Kordowska-Wiater M., Nowakc J., Baraniak B., 2015. Characterization of films based on chitosan lactate and its blends withoxidized starch and gelatin. International Journal of Biological Macromolecules, 77, p. 350-359.
Kurek M., Moundanga S., Favier C., Galic K. & Debeaufort F., 2013. Antimicrobial efficiency of carvacrol vapour related to mass partition coefficient when incorporated in chitosan based films aimed for active packaging. Food Control, 32, p. 168-175.
Latou E., Mexis S.F., Badeka A.V., Kontakos S. & Kontominas M.G., 2014. Combined effect of chitosan and modified atmosphere packaging for shelf life extension of chicken breast fillets. LWT - Food Science and Technology, 55(1), p. 263-268.
Leceta I., Guerrero P. & de la Caba K., 2013a. Functional properties of chitosan-based films. Carbohydrate Polymers, 93, p. 339-346.
Leceta I., Guerrero P., Ibarburu I., Dueñas M.T. & de la Caba K., 2013c. Characterization and antimicrobial analysis of chitosan-based films. Journal of Food Engineering, 116, p. 889-899.
Lei J., Yang L., Zhan Y., Wang Y., Ye T., Li Y., Deng H. & Li B., 2014. Plasma treated polyethylene terephthalate/polypropylene filmsassembled with chitosan and various preservatives for antimicrobialfood packaging. Colloids and Surfaces B: Biointerfaces, 114, p. 60-66.
Li X., Li X., Ke B., Shi X. & Du Y., 2011. Cooperative performance of chitin whisker and rectorite fillers on chitosan films. Carbohydrate Polymers, 85, p. 747-752.
Li H., Gao X., Wang Y., Zhang X. & Tong Z., 2013. Comparison of chitosan/starch composite film properties before and after cross-linking. International Journal of Biological Macromolecules, 52, p. 275-279.
Lim H.N., Huang N.M. & Loo C.H., 2012. Facile preparation of graphene-based chitosan films: Enhanced thermal, mechanical and antibacterial properties. Journal of Non-Crystalline Solids, 358, p. 525-530.
Liu F., Qin B., He L., Song R., 2009. Novel starch/chitosan blending membrane: Antibacterial, permeable and mechanical properties. Carbohydrate Polymers, 78, p. 146-150.
Liu Z., Ge X., Lu Y., Dong S., Zhao Y. & Zeng M., 2012. Effects of chitosan molecular weight and degree of deacetylation on the properties of gelatine-based films. Food Hydrocolloids, 26, p. 311-317.
Lopez-Rubio A., 2011. Bioactive food packaging strategies. Multifunctional and Nano reinforced Polymers for Food Packaging, 16, Wood head Publishing Limited, p. 460-482.
Lopez O., Garcia M.A., Villar M.A., Gentili A., Rodriguez M.S. & Albertengo L., 2014. Thermo-compression of biodegradable thermoplastic corn starch films containing chitin and chitosan. LWT - Food Science and Technology, 57(1), p. 106-115.
Lopez-Carballo G., Gomez-Estaca J., Catala R., Hernandez-Munoz P. & Gavara R., 2012. Active antimicrobial food and beverage packaging. Emerging Food Packaging Technologies, 3, p. 27-54.
Mati-Baouche N., Elchinger P.H., de Baynast H., Pierre G., Delattre C. & Michaud P., 2014. Chitosan as an adhesive. European Polymer Journal, 60, p. 198-213.
Muzzarelli R.A.A., Boudrant J., Meyer D., Manno N., DeMarchis M. & Paoletti M.G., 2012. Current views on fungal chitin/chitosan, human chitinases, food preservation, glucans, pectins and inulin: A tribute to Henri Braconnot, precursor of the carbohydrate polymers science, on the chitin bicentennial. Carbohydrate Polymers, 87, p. 995-1012.
Nimesh S., 2013. Chitosan nanoparticles. Gene therapy, 9, p. 163-196.
Nitschke J., Altenbach H.J., Malolepszy T. & Mölleken H., 2011. A new method for the quantification of
59

chitin and chitosan in edible mushrooms. Carbohydrate Research, 346, p. 1307-1310.
Nowzari F., Shábanpour B. & Ojagh S.M., 2013. Comparison of chitosan-gelatin composite and bilayer coating and film effect on the quality of refrigerated rainbow trout. Food Chemistry, 141, p. 1667-1672.
Ojijo V. & Ray S.S., 2013. Processing strategies in bionanocomposites. Progress in Polymer Science, 38, p. 1543-1589.
Pakravan M., Heuzey M.C. & Ajji A., 2011. A fundamental study of chitosan/PEO electrospinning. Polymer, 52, p. 4813-4824.
Pelissari F.M., Yamashita F., Garcia M.A., Martino M. N., Zaritzky N.E. & Grossmann M.V.E., 2012. Constrained mixture design applied to the development of cassava starch-chitosan blown films, Journal of Food Engineering, 108, p. 262-267.
Peng Y., Wu Y. & Li Y., 2013. Development of tea extracts and chitosan composite films for active packaging materials. International Journal of Biological Macromolecules, 59, p. 282-289.
Pereda M., Amica G. & Marcovich N.E., 2012. Development and characterization of edible chitosan/olive oil emulsion films. Carbohydrate Polymers, 87, p. 1318-1325.
Pereda M., Dufresne A., Aranguren M.I. & Marcovich N.E., 2014. Polyelectrolyte films based on chitosan/olive oil and reinforced withcellulose nanocrystals. Carbohydrate Polymers, 101, p. 1018-1026.
Petrou S., Tsiraki M., Giatrakou V. & Savvaidis I.N., 2012. Chitosan dipping or oregano oil treatments, singly or combined on modified atmosphere packaged chicken breast meat. International Journal of Food Microbiology, 156, p. 264-271.
Realini C.E. & Marcos B., 2014. Active and intelligent packaging systems for a modern society. Meat Science, 98, p. 404-419.
Reddy M.M., Vivekanandhan S., Misra M., Bhatia S. K. & Mohanty A.K., 2013. Biobased plastics and bionanocomposites: Current status and future opportunities. Progress in Polymer Science, 38, p. 1653-1689.
Rubilar J.F., Cruz R.M.S., Khmelinskii I. & Vieira M.C., 2013. Effect of antioxidant and optimal antimicrobial mixtures of carvacrol, grape seed extract and chitosan on different spoilage microorganisms and their application as coatings on different food matrices. International Journal of Food Studies, 2, p. 22-38.
Schreiber S.B., Bozell J.J., Hayes D.G. & Zivanovic S., 2013. Introduction of primary antioxidant activity to chitosan for application as a multifunctional food packaging material. Food Hydroc., 33, p. 207-214.
Severino R., Ferrari G., Vu K.D., Donsì F., Salmieri S. & Lacroix M., 2015. Antimicrobial effects of modified chitosan based coating containing nanoemulsion of essential oils, modified atmosphere packaging and gamma irradiation against Escherichia coli O157:H7 and Salmonella typhimurium on green beans. Food Control, 50, p. 215-222.
Siripatrawan U. & Noipha S., 2012. Active film from chitosan incorporating green tea extract for shelf life extension of pork sausages. Food Hydrocolloids, 27, p. 102-108.
Suman S.P., Mancini R.A., Joseph P., Ramanathan R., Konda M.K.R., Dady G. & Yin S., 2010. Packaging-specific influence of chitosan on color stability and lipid oxidation in refrigerated ground beef. Meat Science, 86, p. 994-998.
Sun X., Wang Z., Kadouh H. & Zhou K., 2014. The antimicrobial, mechanical, physical and structural properties of chitosan-gallic acid films. LWT - Food Science and Technology, 57(1), p. 83-89.
Tanase C.E. & Spiridon I., 2014. PLA/chitosan/keratin composites for biomedical applications. Materials Science and Engineering C, 40, p. 242-247.
Torlak E. & Sert D., 2013. Antibacterial effectiveness of chitosan-propolis coated polypropylene films against foodborne pathogens. International Journal of Biological Macromolecules, 60, p. 52-55.
Torres-Huerta A.M., Palma-Ramírez D., Domínguez-Crespo M.A., Del Angel-López D., de la Fuente D., 2014. Comparative assessment of miscibility and degradability on PET/PLA and PET/chitosan blends. European Polymer Journal, 61, p. 285-299.
Tripathi S., Mehrotra G.K. & Dutta P.K., 2009. Physicochemical and bioactivity of cross-linked chitosan-PVA film for food packaging applications. Int. J. of Biological Macromolecules, 45, p. 372-376.
Tripathi S., Mehrotra G.K. & Dutta P.K., 2010. Preparation and physicochemical evaluation of chitosan/poly(vinyl alcohol)/pectin ternary film for food-packaging applications. Carbohydrate Polymers, 79, p. 711-716.
Tsiligianni M., Papavergou E., Soultos N., Magra T. & Savvaidis I.N., 2012. Effect of chitosan treatments on quality parameters of fresh refrigerated swordfish (Xiphias gladius) steaks stored in air and under vacuum conditions. International Journal of Food Microbiology, 159, p. 101-106.
Tuhin M.O., Rahman N., Haque M.E., Khan R.A., Dafader N.C., Islam R., Nurnabi M. & Tonny W., 2012. Modification of mechanical and thermal property of chitosan-starch blend films. Radiation Physics and Chemistry, 81, p. 1659-1668.
Van den Broek L.A.M., Knoop R.J.I., Kappen F.H.J. & Boeriu C.G., 2014. Chitosan films and blends for packaging material. Carbohydrate Polymers, 116, p. 237-242.
Vargas M., Sanchez-Gonzalez L., Chafer M., Chiralt A. & Gonzalez-Martinez C., 2012. Edible chitosan coatings for fresh and minimally processed foods. Emerging Food Packaging Technologies, 5, Woodhead Publishing Limited, p. 66-95.
Vasilatos G.C. & Savvaidis I.N., 2013. Chitosan or rosemary oil treatments, singly or combined to increase turkey meat shelf-life. International Journal of Food Microbiology, 166, p. 54-58.
Vasile C., Darie R.N., Cheaburu-Yilmaz, C.N., Pricope, G.M., Bracic M., Pamfil D., Hitruc G.E. & Duraccio D., 2013. Low density polyethylene - Chitosan composites. Composites: Part B, 55, p. 314-323.
60

Wang Y., Zhang Q., Zhang C. & Li P., 2012. Characterisation and cooperative antimicrobial properties of chitosan/nano-ZnO composite nanofibrous membranes. Food Chemistry, 132, p. 419-427.
Woranuch S. & Yoksan R., 2013a. Eugenol-loaded chitosan nanoparticles: I. Thermal stability improvement of eugenol through encapsulation. Carbohydrate Polymers, 96, p. 578-585.
Woranuch S. & Yoksan R., 2013b. Eugenol-loaded chitosan nanoparticles: II. Application in bio-based plastics for active packaging. Carbohydrate Polymers, 96, p. 586-592.
Woranuch S., Yoksan R. & Akashi M., 2014. Ferulic acid-coupled chitosan: Thermal stability and utilization as anantioxidant for biodegradable active packaging film. Carbohydrate Polymers, 115, p. 744-751.
Wu J., Ge S., Liu H., Wang S., Chen S., Wang J., Li J., & Zhang Q., 2014. Properties and antimicrobial activity of silver carp (Hypophthalmichthys molitrix) skin gelatin-chitosan films incorporated with oregano essential oil for fish preservation. Food Packaging and Shelflife, 2, p. 7-16.
Xiao B., Wan Y., Zhao M., Liu Y. & Zhang S., 2011. Preparation and characterization of antimicrobial chitosan-N-arginine with different degrees of substitution. Carbohydrate Polymers, 83, p. 144-150.
Xing Y., Li X., Xu Q., Jiang Y., Yun J., & Li W., 2010. Effects of chitosan-based coating and modified atmosphere packaging (MAP) on browning and shelf life of fresh-cut lotus root (Nelumbo nucifera Gaerth). Innovative Food Science and Emerging Technologies, 11, p. 684-689.
Yu L., Gong J., Zeng C. & Zhang L., 2013. Preparation of zeolite-A/chitosan hybrid composites and their bioactivities and antimicrobial activities. Materials Science and Engineering C, 33, p. 3652-3660.
Yu S.H., Hsieh H.Y., Pang J.C., Tang D.W., Shih C.M., Tsai M.L., Tsai Y.C. & Mi F.L., 2013. Active films from water-soluble chitosan/cellulose composites incorporating releasable caffeic acid for inhibition of lipid oxidation in fish oil emulsions. Food Hydrocolloids, 32, p. 9-19.
Zemljic L.F., Tkavc T., Vesel A. & Sauperl O., 2013. Chitosan coatings onto polyethylene terephthalate for the development of potential active packaging material. Applied Surface Science, 265, p. 697-703.
61

THE CLIMATIC AND THE RELIEF CHARACTERISTICS SPECIFIC
TO THE MARONIC SOIL SUBTYPE FROM DOBROGEA
Irina MOISE1, Daniela RĂDUCU2, Simona-Mariana PRICOP1
1University „Ovidius” from Constanţa, No. 124 Mamaia Boulevard, Constanţa, 900527, Romania, Email: [email protected], [email protected]
2National Research and Development Institute for Soil Science, Agro-Chemistry and Environmental Protection (ICPA Bucharest), 61 Marasti, District 1, 73331, Bucharest, Romania,
Email: [email protected]
Corresponding author email: [email protected]
Abstract The maronic subtype was introduced in Romanian Soil Taxonomy System (RSTS) in 2003. Previously named „brown soils of xerophile woods”, it was described by N. Florea and Ana Conea in 1962. The soils with maronic subtype are formed under specific conditions, with the climatic and relief specificity which favored the manifestation of two main pedogenetic processes: a process characteristic for the soils formed under xerophile woods; and a process characteristic to the soils formed in the steppe zone (under grasses). In what concern the influence of the relief on the soil formation, it was observed that soils with maronic subtype are spread mainly on the north-facing or west-facing slopes and usually occupies the lower part of the slopes. In these relief and climatic conditions and under the forest vegetation, an Amf (A mollic forestalic) horizon was formed. Although formed under forest vegetation, the soils with maronic subtype showed a horizon succession similar to that of the steppe soils. Key words: forestalic horizon, maronic soil subtype, silvosteppe. INTRODUCTION Formerly named (Florea N., Conea Ana, 1962; Florea N. et al., 1968) ,,soils of xerophile forests and siblyaks”, the soils with maronic subtype are defined by the presence of a special diagnostic horizon, Am forestalic (Amf); feature applies to the Kastanozems and to the Chernozems. According to SRTS-2003 (Florea N., Munteanu I., 2003), Amf horizon is defined as ,,a variety of mollic horizon which meets the conditions for mollic horizon and further presents the following characters induced by their formation under the xerophile forests:
- medium and coarse blocky structure in the middle and/or lower part of the horizon, often associated with uncoated grains, and
- a minimum in the variation of the pH values, base saturation (BS) and the degree of base saturation (V%)”. The SRTS-2012 change the subtype designation from maronic to „forestic”, but the defined characteristics remained unchanged (Florea N., Munteanu I., 2012).
The soils with maronic subtype have been identified only in Dobrogea, making the transition between the steppe soils (formed under grasses) and the forest steppe soils. Their pedogenesis is specific to the steppe soils, aspect highlighted by the absence of a B horizon in their morphological profile, the transitions between Am and Cca horizons being made through AC horizon. Nevertheless, the A horizon is divided as the upper horizons of the forest soils. Although it was thought that their formation is dependent on a particular type of vegetation and consequently their previous name was given according to this vegetation (thermophile forest or dense scrubland - siblyak), these soils have not been identified in all regions of our country covered by this type of vegetation. As for example, the xerophile forests and siblyaks are found in Banat (Locvei Mountains), Valea Mare Natural Reserve - Iron Gates Natural Park, Semenic Natural Park - Cheile Carasului, areas with a Mediterranean climate influence. In these areas there were not formed soils with maronic subtype.
62
AgroLife Scientific Journal - Volume 4, Number 2, 2015
ISSN 2285-5718; ISSN CD-ROM 2285-5726; ISSN ONLINE 2286-0126; ISSN-L 2285-5718

This could be due to the fact that soils are formed on different types of parent material/rocks: limestone in Banat Mountains (inducing the formation of shallow soils) and loess and loess-like deposits in Dobrogea (favoring deeper soil formation). The aim of this paper is to emphasize the influence of the local climatic and the relief conditions on the pedogenesis of the soils with maronic subtype from Dobrogea, as well as the closer interdependence between these soils and the relief - climate - parent material - vegetation. MATERIALS AND METHODS To achieve the paper objectives, in the first step of the research, there were identified on soil maps (scale 1:25,000) the zones where there are soils with maronic subtype. The area chosen for the study is located in the northern part of Dobrogea, eastern part of the Babadag Tableland. The main characteristics of the climate, the mean annual rainfall and the mean annual temperatures, were analyzed, for the studied perimeter. The values of these indicators, provided from the closer Meteorological Stations (Babadag and Jurilovca), have been corrected in relation to the slope and the slope-facing according to the indicators 3 and 4 of the RISSA Methodology (1987 - Vol. III - Ecopedological Indicators). In the field, the relief conditions of the studied perimeter occupied by the soils with maronic subtypes has been analyzed, regarding the altitude, the slope, the slope-facing and the position on the slope. The profile description together with the collection of soil samples were also achieved in the field. For the laboratory physical and chemical analysis, large representative samples were taken from each pedogenetic horizon of each soil profile. To identify the relation between the environmental factors and the pedogenesis of the soils with maronic subtype, the pedologic structure of an N-S oriented soil catena from Babadag Tableland was also studied.
RESULTS AND DISCUSSIONS Analyzing the soil map of Dobrogea, it can be observed that soils with maronic subtype are spread mainly in the Northern part of Dobrogea, in the Babadag Tableland, where they occupy more compact and larger areas, while in the SW Constanta (in the neighborhood of Aliman, Oltina, Baneasa and Dobromir localities) these soils occupy small areas. In this view, for the research it was selected the North-Eastern part of the Babadag Tableland, where the climate is characterized by an average annual temperatures of 10.7-11.2oC, an average annual precipitations of 345- mm, and an evapotranspiration potential (ETP - after Thornthwaite) of 688 mm. The humidity deficit recorded in the studied area is between 273 mm and 343 mm. The torrential rains have a particular strong character. The average depth of the soil freezing is 12 cm, and up to 43 cm during the frostiest winters. The amplitude of the annual monthly average of temperatures is 23.8oC. A special influence on the dynamic of the meteorological elements is due to the other environmental factors such as: topography (characterized by the slope and orientation), type of vegetation and land coverage.
Figure 1. Perimeter with Maronic Chernozems
In order to characterize the landscape, the topographic map (1: 25000) was analyzed. In the studied area (Moise Irina, 2003), the highest altitudes are in the hills, near the Babadag town, ranging of 230 - 240 m and the lower altitudes, for the afforested areas, are achieved in Visterna Hill, 221 m and in Golovarf Hill, 164 m (Figure 1 and 2). Some hills from the studied perimeter have
63

bare and/or rocky surface and shallow soils, as in the Visina Hill (99.0 m high), Dolosman Hill (56.5 m) and Iancina Hill (62.5 m).
Figure 2. Visterna Hill covered by forest vegetation and
surrounding by agricultural flat lands
The soils with maronic subtype are located in the lower part of the north-facing or north-west-facing slope, with altitudes ranging from 50 - 80 m, gently - moderately sloping and with very low density fragmentation. The values of the relief energy intensity are ranging between 10 to 20 m. The parent material is loess and has high CaCO3 content.
Table 1. Annual average temperature corrected
according to the slope and the slope-facing Nr. Slope
% Slope facing
Registered temperatures
oC
Corrected temperatures
oC 1.
10-15
N 10.7 10.7 E 10.7 10.7 S 10.7 11.5 W 10.7 10.7
2.
15-20
N 10.7 9.5 E 10.7 10.7 S 10.7 11.5 W 10.7 11.5
3.
10-15
N 11.2 11.2 E 11.2 11.2 S 11.2 12.5 W 11.2 11.2
4.
15-20
N 11.2 10.5 E 11.2 11.2 S 11.2 12.5 W 11.2 12.5
Analyzing the data from Tables 1 and 2, it could be observed that the temperatures are corrected for the lands with the slope higher than 10%. In what concerning the slope-facing, the temperature for the lands located on the south-facing slopes will fall, after correction,
within a higher range of values (from 10.5oC to 11.5oC, and from 11.5oC to 12.5oC respectively), while for the north-facing slopes no differences were observed.
Table 2. Annual average precipitations corrected
according to the slope and permeability
Nr.
Slope %
Permeability
Registered precipitations
mm
Corrected precipitations
mm 1.
2.1 - 5
Extremely low- very
low
425 350
Low-medium
425 425
High - very high
425 425
2.
5.1 - 10
Extremely low- very
low
425 350
Low - medium
425 350
High - very high
425 425
3.
10 - 15
Extremely low- very
low
425 350
Low - medium
425 350
High - very high
425 350
4.
15 - 20
Extremely low- very
low
425 350
Low - medium
425 350
High - very high
425 350
For a strongly sloping (of 15%), the lands located on the south-facing slopes have the same correction (as the previous one), while for that ones located on the north-facing slopes, the temperature will fall, after correction, in a lower range (from 10.5oC to 9.5oC and from 11.5oC to 10.5oC respectively). These data showed that after corrections, appear a significant difference in temperature (of 2oC) of the slopes with various facing (south-facing and north-facing slopes respectively). Regarding the precipitations, there were registered differences after the corrections, only for the lands located on the slopes greater than 5%. For the soils with medium permeability, the lands with the slopes ranging from 5.1-20.0%, the corrections framed the lands in a lower range of values (425-350 mm respectively) from the precipitations point of view. The flat or gently sloping lands benefit of the entire quantity of precipitations.
64

Natural vegetation is represented by the xerophile forests composed mainly of the following species: Quercus pubescens, Quercus pedunculiflora, Carpinus druinensis, Fraxinus ornus and Mediterranean shrubs of Cornus mass, Crataegus monogyna, Cotinus coggigria, Siringa vulgaris and the Cerasus mahaleb as well as the wild apple and hair. These species formed vegetal formations called șibleacuri which consists of dense shrubs, difficult to cross. Being located at the contact with the cultivated lands, the forests has numerous clearings where the grass vegetation covering the soil at a rate of 80 - 90%. The vegetation of these clearing is composed of Poa bulbosa, Poa angustifolia, Festuca valesiaca, F. mezoxerofile pseudovina and other species. Due to the specificity of the environmental conditions (Mihalache M., 2014; Ciolacu T., 2015), the pedogenetic process is oriented on the one hand towards the intense and deep accumulation of the organic matter , in the soil profile (as a result of abundant grass vegetation, Cernisols are formed), on the other hand, towards a slightly debazification of the colloidal complex of the upper part or the soil profile, induced by the forest vegetation and favored by the water percolation (Rusu T., 2013). In these environmental conditions, the soil pedogenesis is oriented through intense bioaccumulation and, as a result, a large amounts of humus in the upper A horizon and in the intermediate part of the soil profile has been acquired (Figure 3). As a consequence of this specific pedogenesis of the soils with moronic subtype, the morphological profile is: Ol-Amf1-Amf2-A/C-Cca. These conditions lead to the formation of the Amf (A mollic forestalic) horizon, specific to the maronic subtype, which has two subhorizons with different degrees of debazification. In all the studied soil profiles it was identify the A mollic forestalic horizon (Amf), clearly individualized in the soil surface, with two sub-horizons: Amf1 and Amf2 respectively. In its upper part, a well structured, porous and humus-rich sub-horizon was formed. This subhorizon can have at about 10 cm thick.
From the morphologically point of view, the Amf1 subhorizon showed the following properties: loamy texture; very dark grayish brown (10YR 3/2) to wet and dark grayish brown to grayish brown (10YR 4.5/2) when dry; medium crumb structure in the lower part of the horizon and medium subangular blocky structure, well developed.
Figure 3. A Maronic Chernozem profile
Amf2 subhorizon has a loamy texture; a color of very dark grayish brown (10YR 3/2) to wet and dark grayish brown (10YR 4/2) when dry; medium to coarse subangular blocky structure, well developed. The morphological characteristics, as well as the physical and chemical properties of analyzed profiles, submit the requirements of the definition of the moronic subtype and allowed its classification as Chernozem type and moronic subtype (according the SRTS-2003). The main chemical properties of soil horizons are shown in Figures 4 and 5 and in the Table 3. These data showed (Figure 4) the high values (12.0-15.0%) of humus, in the Amf1 subhorizon, values specific for the forest soils. In the Amf2 subhorizon, the humus strongly decrease (3.8-4.2%) to the values specific for the cultivated steppe soils. In the transition horizon, A/C, the humus values are even lower (1.8-2.0%).
65

The depth of humus accumulation in the studied soil profiles is high, reaching up to 70 - 80 cm, as the steppe soils.
Figure 4. The humus content (%) of a Maronic
Chernozem from North Dobrogea
Table 3. Analytical data of a Maronic Chernozem from North Dobrogea
Horizon
Depth (cm)
pH
BS
V %
H %
Amf1 0-12 6.27 32.09 86.5 11.46
Amf2 12-40 6.34 23.31 88.5 4.14
A/C 40-77 6.69 21.36 94.4 1.86
Cca 77-110 7.95 - 100 -
Degree of base saturation (V%) shows quite high values, ranging between 80-85%, with a little variation between the two Amf1 and Amf2 subhorizons. Analyzing the pH values (Table 3), it could ascertain that in Amf horizon the pH is 6.27, the soil being slightly acid. These pH values correlated with the degree of base saturation values are indicating that in these soils, the debazification process is in an incipient stage. The leaching of the slightly soluble bases take place, which determine the pH decrease below 6.5, but the heavy soluble bases are still present in large quantities, enough to maintain the degree of the base saturation, to high values. This process can be determined, on the one hand, by the moisture addition due to the terrain configuration (flat land) and to the good cover with vegetation, and on the other hand, to the vegetal remains originate in the grass and forest vegetation.
The importance of the environmental factors (mainly the relief together with the local climatic conditions) for the pedogenesis of these soils, N-S oriented soil catena, from the studied perimeter, was analyzed.
Figure 5. Chemical properties of
a Maronic Chernozem from North Dobrogea Thus, starting from the immediately vicinity of the Lake Babadag and advancing towards the afforested hills, the Typical Carbonated Chernozems appears on the cultivated lands, Maronic Chernozems under the forest vegetation on the flat or gently sloping lands, Eutricambosols on the gently sloping north-facing lands, as well as Rendzinas and Argic Greic Chernozems on the top of the afforested hills. On the south-facing slopes, with much gently sloping, descending to the Lake Golovita, there were formed Rendzinas which continued with the Typical Carbonated Chernozems, Kastanozems and Mollic Solonchaks.
CONCLUSIONS Given the specific environmental conditions of the studied perimeter, which lead the pedogenesis throughout the formation of the maronic subtype, the following conclusions could be drawing:
- the formation of the soils with maronic subtype occurs mainly on the lands with gentle sloping, north-facing, under forest
66

vegetation, located to the north Dobrogea; - due to the environmental conditions
specificity, the pedogenetic process is oriented on the one hand towards the intense and deep accumulation of the organic matter in the soil profile and, on the other hand, towards a slightly debazification of the colloidal complex of the upper part or the soil profile;
- the intense and deep accumulation of the organic matter is a result of the abundant grass vegetation;
- the slightly debazification is induced by the forest vegetation and it is favored by the flat relief which do not permit the flow down of the precipitation but the water percolation;
- the physical, chemical and morphological characteristics of the analyzed soil profiles justify their classification as maronic subtypes;
- by the analysis of both relief and climate, it could be observed the good correlation between them and the wide spread of the soils with maronic subtype;
- because the soil with maronic subtype was not formed in the others regions of the country, under the same type of vegetation, it pointed out the specificity of the north Dobrogea conditions and the closer interdependence between the relief - climate - parent material - vegetation that lead the pedogenesis towards the formation of moronic subtype.
REFERENCES Ciolacu Tatiana, 2015. Anthropic transformation of
chernozems from Balti steppe of the republic of Moldova. Scientific Papers, Series A, Agronomy, Vol. LVIII, p. 36-40.
Florea N., Conea Ana, 1962. Solul castaniu (maroniu) de păduri xeroterme şi şibleacuri, un nou sol pentru RPR. Dări de Seamă ale Comitetului Geologic, Vol. XLXIII.
Florea N., Munteanu I., Rapaport Camelia, Chitu C., Opriş M., 1968. Geografia solurilor României. Ed. Ştiinţifică, Bucureşti.
Florea N., Munteanu I., 2003. Sistemul Român de Taxonomie a Solurilor. Ed. Estfalia, Bucureşti, p. 181.
Florea N., Munteanu I., 2012. Sistemul Român de Taxonomie a Solurilor. Ed. Sitech, Craiova, p. 206.
Mihalache M., Ilie L., Daniela Mihalache, Ana Maria Ghinea, 2014. Evaluation of chernozems from Balta Alba area, Buzau County. Scientific Papers, Series A, Agronomy, Vol. LVII, p. 54-57.
Moise Irina, 2003. Cercetări privind clasificarea ecologică a solurilor, cu privire specială asupra părţii de sud-est a Podişului Babadag. Teză de doctorat.
Munteanu I., 1982. Solurile de pădure din Dobrogea de Nord, cu privire specială asupra solurilor cenuşii. Teză de doctorat.
Rusu T., Paula Moraru, Ileana Bogdan, Pop A., Camelia Coste, Marin D.I., Mihalache M., 2013. Impacts of climate change on agricultural technology management in the Transylvanian plain, Romania. Scientific Papers, Series A, Agronomy, Vol. LVI, p. 113-118.
67

RESULTS OF RESEARCH IN NOISE POLLUTION IN URBAN AREAS
Anca-Maria MOSCOVICI, Oana GRECEA
Politehnica University of Timisoara, 2A - Traian Lalescu Str., Timișoara, Romania,
Email: [email protected], [email protected]
Corresponding author email: [email protected] Abstract The increase in road traffic in the recent years brings into question the complex issue of noise pollution. In numerous surveys carried out on population samples from urban areas, noise pollution or "noise" as it is generically called appears in the forefront of inconveniences and discomfort list. With the use of new techniques developed by acoustics experts, it is possible to study sound propagation and its impact on population in specific urban areas. The purpose of this paper is to compare noise levels in different areas of Timisoara, in order to determine the sensitive buildings in the city. Their identification is essential because on these building facades the noise level resulting from exposure to road noise exceeds or threatens to exceed at least one of the limit values. Key words: noise maps, urban areas, urbanisation, GIS. INTRODUCTION
A noise map with using GIS has become very important tool for environment of urban areas and road traffic has become an important factor in the development of society, particularly in terms of comfort of living and economic progress. With the increasing number of vehicles in former communist bloc countries, including Romania, traffic is the most common source of noise in urban areas (Figure 1). In various studies and surveys on the quality of urban life, noise is placed in the forefront of inconveniences and discomfort list.
Figure 1. Situation of Romanian National Car Parks
The most effective administrative method for the reduction of noise is the settlement and the optimization of the traffic.
One of the phenomena of urban traffic is of particular importance when determining noise is congestion (Figure 2) (Moscovici, 2015). This is the result of a large number of vehicles participating in traffic at peak hours on the same road section. Therefore we considered to be worthwhile tracking noise on a street in the central area of Timisoara in the 1200 - 1300 time intervals.
Figure 2. Congestion in Timişoara
The reasons for the emergence of congestion and noise are therefore the most diverse, from deficient design and systematization of cities and to managing inadequately to the present realities and challenges. Therefore, for an optimal approach, it is essential to integrate real-time traffic information in geographical information
68
AgroLife Scientific Journal - Volume 4, Number 2, 2015
ISSN 2285-5718; ISSN CD-ROM 2285-5726; ISSN ONLINE 2286-0126; ISSN-L 2285-5718

systems (GIS) for immediate decision-making (Runyoro, 2013). A first step in this direction can be the assessment of the traffic data provided by the organizations responsible for road traffic management and by road users. In areas where the traffic composition is maintained at the same parameters, decrease in noise can be achieved by reducing the vehicle speed. The immediate effect, in economic terms, would be experienced by reducing the billion euro losses per year due to traffic congestion (Lam, 2009). GIS is foreseen as a promising solution for the reduction of noise, road traffic congestion and, as a consequence, of toxic emissions (Figure 3).
Figure 3. Traffic Safety from GIS
Managed effectively, this solution would allow road users which are traffic participants to receive real time information about traffic and road conditions. NOISE AND BUILDINGS In the architecture field have the designers and engineers responsible for façade and enclosure systems which embraced smart materials for environmental protection. Buildings noise protection is expected to have a lesser impact on the environment by using mineral wool insulation, which is the most common method, by proper installation of
double-glazed windows or by using expanded polystyrene insulation. These factors can contribute significantly to reducing noise originating from the outside (Figure 4).
Figure 4. Insulated residential building
The following are some of the negative consequences caused by increased noise on the human factor: a). First noticeable effect is hearing impairment, as repeatedly subjecting the eardrum to noise can temporarily or even permanently damage it; b). Noise affects sleep and the worst aspect of this is the high noise pollution near hospitals, where patients need a restful sleep; c). Health is endangered, noise mainly affecting the heart, brain and liver; d). Noise creates discomfort that causes migraines, dilated pupils, elevated blood pressure; e). Noise affects people in terms of social and emotional comfort, as conversations are disrupted due to noise, leading to people raising their voices, which also results in forcing the vocal cords (Aziz, 2012). MATERIALS AND METHODS The traffic type of the street is accelerated pulse, as it is a one-way street with traffic lights and it connects two major streets. Measurements were made at 20 December 1989 Street, located at 230 m from the main artery Vasile Parvan Boulevard and at 110 m to Constantin Diaconovici Boulevard. By providing traffic lights on the artery, the noise pollution is the result of noise emitted by
69

motor vehicle at acceleration, deceleration and while waiting during red color. The interest for this street is increased because here is located the town hall of Timisoara, public institution with working hours from 8 to 19 hours on some days. Since the historical value of this building does not allow the sound insulation of the facade and being classified as a sensitive building, it is recommended in this area to reduce noise pollution at source and not at the receiver (Moscovici, 2015). RESULTS AND DISCUSSIONS In addition to the measurements carried out on the artery, we decided to perform a series of measurements on the Mihai Viteazu Bridge, which is a road traffic concentrator, redirecting traffic to 20 December 1989 Street as can be seen on Figure � (Moscovici, 2015).
Figure �. Section of the noise map and the location
of measured point
In the diagrams showing variation of noise over time in Figure � and Figure � below, we can see that the noise reaches the threshold of 75 dB in some cases. Using specific formulas, we determined the equivalent noise level measured with frequency A weighting - Leq dB (A) to be 68.96 for the artery and 68.93 for the bridge.
Figure �. Variation of noise over time on 20 December
1989 artery
Figure �. Variation of noise over time on Mihai Viteazu
Bridge The noise action plan based on noise maps and measurements is similar in nature to a policy statement where objectives have been described on a general level (Table 1).
Table 1. The measured parameters of noise pollutionNo. LAImin
[dB] LCFmin
[dB] LCSmin
[dB] LCImin
[dB] LCpeak
[dB] LAIeq [dB]
LCIeq [dB]
LAeq [dB]
LCeq [dB]
1 57.94 66.76 69.,48 70.89 99.12 71.53 81.06 68.93 78.302 51.59 62.08 64.49 65.41 106.66 70.77 80.30 68.96 76.443 47.02 60.21 62.91 63.79 82.73 54.26 69.56 52.38 66.76
The equipment used for measurements included a Bruel & Kjaer sonometer, which is a high-precision, Class 1 sound integrator, with
a monitoring software that we used to obtain the diagram of the statistical distribution of the
70

noise for point 2 (Figure �), which is essential in the analysis of noise (Herişanu, 2006).
Figure �. Diagram of the statistical distribution of the
noise for point 2
Noise maps are important at decisional level for establishing the adopted solutions and the activity of monitoring and managing strategic noise maps by means of GIS (Grecea, 2014). CONCLUSIONS Acoustic measurements for different areas of the city are essential for finding the most affected buildings. The activities undertaken in these buildings may increase the need for better soundproofing. The most effective solutions according to the building positioning, architectural importance and the number of people affected can only be found through acoustic studies and through involvement of responsible authorities in order to support noise reduction. Also another important tool is noise maps, which are important at decisional level for establishing the adopted solutions.
ACKNOWLEDGEMENT� This work was partially supported by the strategic grant POSDRU/159/1.5/S/137070 (2014) of the Ministry of National Education, Romania, co-financed by the European Social Fund - Investing in People, within the Sectorial Operational Programme Human Resources Development 2007-2013. REFERENCES Aziz S.Q., Lulusi F.A., Ramli N., Aziz H.A., Mojiri A.
& Umar M., 2012. Assessment of Traffic Noise Pollution in Bukit Mertajam, Malaysia and Erbil City, Iraq.
Herişanu N., Bacria V., Toader M. & Radovan S.P., 2006. Investigation and reduction of ambient noise in an urban area. Passages, 65, 60.
Lam K.C., Chan P.K., Chan T.C., Au W.H. & Hui W.C., 2009. Annoyance response to mixed transportation noise in Hong Kong. Applied Acoustics, 70(1), p. 1-10.
Runyoro A.A.K. & Ko J., 2013. Real-Time Road Traffic Management Using Floating Car Data. International Journal of Fuzzy Logic and Intelligent Systems, 13(4), p. 269-276.
Grecea C., Moscovici A.M., 2014. Phonic pollution and strategic acoustic mapping with geographic information systems. Environmental Engineering & Management Journal (EEMJ), 13(9).
Moscovici A.M., Rusu G., 2015. Comparative study of the noise pollution level in major areas from Timisoara city. Buletin Mecanică.
Moscovici A.M., 2015. Contribution to monitoring noise pollution of construction and preliminary data management in a Geographic Information System. ISSN: 1842-581X ISBN: 978-606-554-985-2.
71
THE INFLUENCE OF TREATMENT WITH GROWTH STIMULATOR (GOBBI GIB 2LG) ON THE QUANTITY AND QUALITY OF SEEDLESS
GRAPE ‘BEAUTY SEEDLESS’
Gheorghe NICOLAESCU1, Antonina DERENDOVSKAIA1, Silvia SECRIERU1, Dumitru MIHOV2, Valeria PROCOPENCO1, Mariana GODOROJA1, Сornelia LUNGU3
1State Agrarian University of Moldova, 44 Mircesti str., MD-2049, Chişinău, Moldova,
Phone: +373 79463186, +373 22 312301, E-mail: [email protected], [email protected], [email protected], [email protected],
[email protected] 2Tera Vitis Ltd., Burlacu vil., Cahul dis., Moldova,
Phone: +373 79861487, +373 299-79225, E-mail: [email protected] 3Dionysos Mereni Joint-stock Company, 44 Mircesti str., MD-2049, Chişinău, Moldova,
Phone: +373 69500548, E-mail: [email protected]
Corresponding author email: [email protected] Abstract Viticulture for the agriculture of Moldova is an important and effective branch. Increasing productivity of table grape varieties is imposed by society. The purpose of the research from this article is to study the influence of Gobbi Gib 2LG on the quantity and quality of seedless grapes of ‘Beauty seedless’ variety. The research was conducted in the vineyards of the company ”Terra Vitis” LTd from Southern wine region in Moldova. Research results have shown that the dose of 2.4 l / ha is most useful for conditions south of Moldova, for ‘Beauty seedless’ variety. Key words: ‘Beauty seedless’ grapes, growth stimulators. INTRODUCTION It is to be noted that table grapes production is commercialized as on the internal market as well as on the external one. At the same time you can find also imported commercialized grapes from other regions and countries on the same internal market. The development of this branch has a particular importance for the Republic of Moldova because it is closely connected to the difficulties that appeared within wine products commercialization and workplace ensuring for the population. Nowadays, beginning with the 2006th year we can observe a very big attention for the development of table grapes production. The calculations show us that the Republic of Moldova is able to produce 135000-136000 tons of grape per year meant for fresh consumption, including 115000-116000 tons meant for commercialization, out of which approximately 30000 tons are meant for commercialization after the storage. The
amount of the grape on the market may reach up to 80000-85000 tons and the export at its turn may reach 20000-30000 tons. In order to assure the production of such a volume of grapes there is a need of 20-22 thousand ha of vineyards with table grapes varieties whereof 15-16 thousand ha of vineyards in the fruiting period, which gives an average, harvest up to 8-9 t/ha. First of all it is necessary to create new vineyards with typical table grapes, having a high productivity and being widely demanded by the consumers; secondary to create new households and specialized enterprises with a corresponding advanced technological infrastructure. There are a lot of growth-regulation substances, that we use in the table grapes culture - for seedless varieties, with female flowers and for seed table grapes varieties inclined to forming small undeveloped berries: gibberellins (GA3), gibersib (mixtures GA11 + GA7 + GA11), α-ANA (α-naphtyl acetic acid), mixtures GA3 + α-ANA etc. (Manankov M.K., 1981 (Мананков М.К., 1981); Čajlahân M.H. and
72
AgroLife Scientific Journal - Volume 4, Number 2, 2015
ISSN 2285-5718; ISSN CD-ROM 2285-5726; ISSN ONLINE 2286-0126; ISSN-L 2285-5718
others, 1980 (Чайлахян М.Х. и др., 1980); Kazahmedov P.È. and others, 2004 (Казахмедов Р.Э. и др., 2004). Through the research of Smirnov K.V. and others, 1965, 1984, 1998 (Смирнов К.В. и др., 1965, 1984, 1998), Batukaev A.A., 1966, 1987 (Бутукаев А.А.,1996, 1987), Agafonov A.H. and others, 2007 (Агафонов А.Х. и др. 2007), Krasohina S.I., 2008 (Красохина С.И., 2008), Derendovskaâ A.I. and others, 2009 (Дерендовская А.И. и др., 2009) it was proved that the application of gibberellins to table grapes varieties lead to increased size and weight of grapes and berries; improve the appearance of grapes; grapes and berries structure modification; improving the processes of accumulation of sugars, formation in some varieties of seedless berries. MATERIALS AND METHODS The purpose of the research was to study the influence of the Gobbi Gib 2LG, produced by „L Gobbi” Ltd., Italy on the table grapes varieties productivity. To achieve the final purpose it was necessary to track down the following objectives: - the action of Gobbi Gib 2LG on the table grapes variety Beauty Seedless, on its berry morphological parameters and mechanical properties; - the action of Gobbi Gib 2LG on the productivity and quality of the grapes; - finding out the optimal concentration of the Gobbi Gib 2LG which has a more efficient action within the table grapes seedless varieties; The research in the field of studying the action of Gobbi Gib 2LG (active substance GA3, the commercial name for L.Gobbi S.R.L. ITALY, this regulator accepted in Moldova) as growth regulator needed to increase the productivity and quality of the grapes was effectuated by “Terra-Vitis” Ltd. located in the Cahul district. As the object of study it was taken the Beauty Seedless a seedless table grapes variety grafted on the Berlandieri x Riparia SO4 rootstock. Density of plants - 2222 plants/ha (3 x 1.5 m). Training system - horizontal cordon. The soil - ordinary black soil (chernozem). The GG2LG was used by means of treating the vines within different stages of its
development: the technology used in Italy (3.6; 4.6 1/ha) - on 8 cm shoots length; one week before the blossom; while blossoming 30% of the bloom; while blossoming 50% of the bloom; while blossoming 80% of the bloom; the treatment of Ø 3-4 mm grains; 8-10 days after the last treating; the technology suggested for Moldova (Mihov D., 2010, Дерендовская, А. и др., 2010) was the treatment of Ø 3-6 mm grains (2.0 and 2.4 l/ha). In this experiment we use 3 variations and 3 repetitions. RESULTS AND DISCUSSIONS
The reaction of the Beauty Seedless table grapes variety to the Gobbi Gib 2LG treatment While the control variant the average bunch weight is 251.7 g, the weight of the grains in the bunch - 248.0 and the weight of the cluster 3.7 g. The bunch characteristic value (grains weight/cluster weight) - 67.0. There were ascertained the bunch dimensions: 19.5 - length; top part width - 14.5; middle part width - 8.7; and the bottom width - 3.8 cm (Table 1, Figure 2). The number of berries per the bunch - 239.0 berries, including 24.7 berries of undeveloped berries, which is approximately 10.0%. The berries have a medium size, oval-shaped, black as colour. The weight of 100 berries is 113.8 g. The berries characteristic value (pulp weight/ weight of berry skin) - 409; the crushing strength is not too high and consists the force of 1432 g/cm2. As it is already known all the seedless varieties and some of the early-ripening varieties contain seed rudiments while different stages of their development. When growing in normal conditions the development of the germ stops itself and the seeds do not form. Before the bloom definitely took place it was fixed the blossoms’ pound flesh on the vine at an average of 15-18 inflorescences for each vine (the vine age 3-4 years). The harvest in the control variant reached 3.9 kg/vine. The sugar content 173 g/dm3 (this units of measure accepted in Moldova, similar g/1000 cm3, g/l), titratable acidity - 11.7 g/dm3. The usage of Gobbi Gib 2LG by the Italian technology While this type of treating, the vines has been sprayed with Gobbi Gib 2LG before the bloom
73

took actual place (2) (04.05.2013), (15.05.2013); while blossoming (3) (20.05.2013), (25.05.2013), (30.05.2013); in the post fecundation period (2) (12.06.2013), (23.06.2013). Within such type of treatment, multiple - 7 treatments with GG2LG the efficiency came through the bunch characteristic value increasing up to 1.6-1.7 times depending on the used dosage. It was noted the berries weight increases up to 1.6-1.7 times and vine weight increases up to 1.5-2.0 times when compared to the control. The berries characteristic value is the same as of the control or may be a bit lower. When using Gobbi Gib 2LG while growing weight of the bunch and berries leads as to the
vine weight increasing as to its dimension increasing (specially on the top and in the middle) which dominates the bunch compactness degree and allows an open distribution of the grains within the bunch, especially when it’s about the variant (GG2LG-4.6 l/ha) (Table 1, Figures 1, 2). The quantity of berries is equal to the control. At the same time the grain characteristic value increases and so the weight of a 100 grains increases up to 1.5 (GG2LG-3.6 l/ha) - 1.7 (GG2LG-4.6 l/ha). Within these terms the harvest data increases up to 2.3-2.6 kg/vine. The sugar content is at the same level as that of the control, or may even be a little higher but it is to be mentioned that decreases the level of the titratable acidity (Table 1, Figures 1, 2).
Figure 1. The Gobbi Gib 2LG influence on the external appearance of the bunch and berries. The Beauty seedless variety, (Italian technology). The variant of experience: 1-Control - Н2О; 2-GG2LG -3.6 l/ha; 3-GG2LG-4.6 l/ha
Figure 2. The Gobbi Gib 2LG influence on the external appearance of the bunch and berries.
The Beauty seedless variety, “Terra vitis” Ltd., 2013, (Italian technology). The variant of experience: 1-Control -Н2О; 2-GG2LG-3.6 l/ha; 3-GG2LG-4.6 l/ha
74
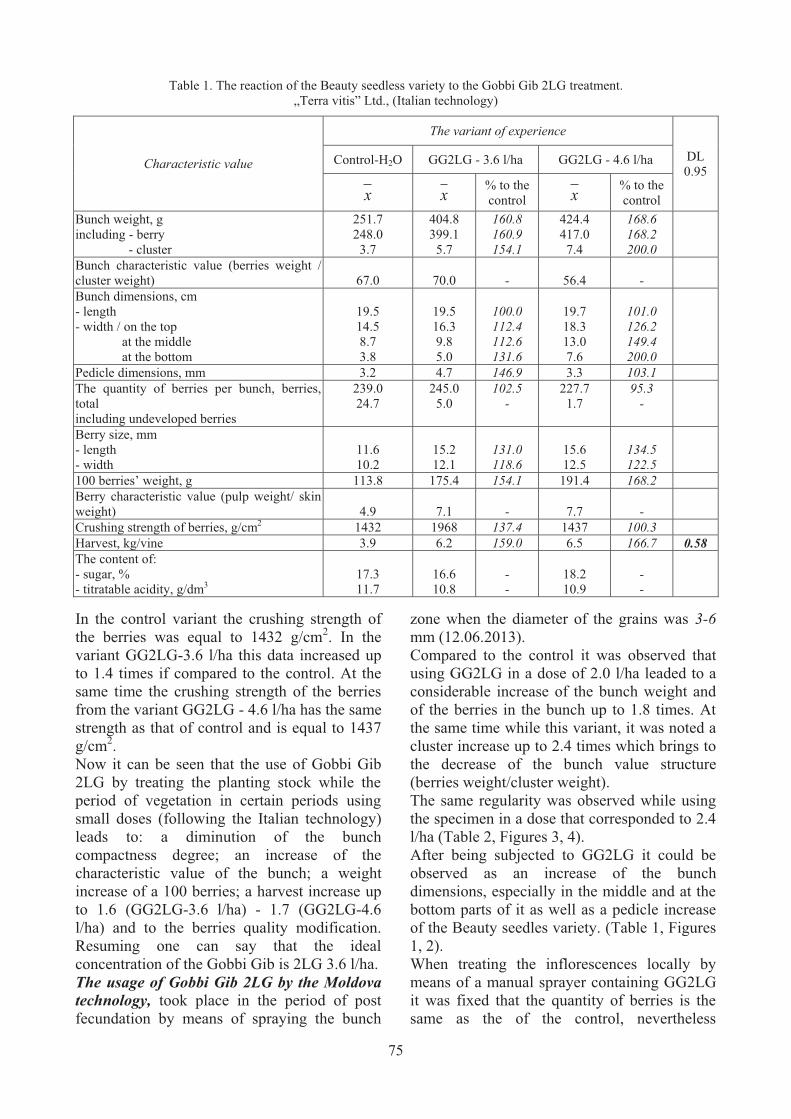
Table 1. The reaction of the Beauty seedless variety to the Gobbi Gib 2LG treatment. „Terra vitis” Ltd., (Italian technology)
Characteristic value
The variant of experience
DL 0.95
Control-Н2О GG2LG - 3.6 l/ha GG2LG - 4.6 l/ha
x x % to the control x
% to the control
Bunch weight, g including - berry - cluster
251.7 248.0 3.7
404.8 399.1
5.7
160.8 160.9 154.1
424.4 417.0 7.4
168.6 168.2 200.0
Bunch characteristic value (berries weight / cluster weight)
67.0
70.0
-
56.4
-
Bunch dimensions, cm - length - width / on the top at the middle at the bottom
19.5 14.5 8.7 3.8
19.5 16.3 9.8 5.0
100.0 112.4 112.6 131.6
19.7 18.3 13.0 7.6
101.0 126.2 149.4 200.0
Pedicle dimensions, mm 3.2 4.7 146.9 3.3 103.1 The quantity of berries per bunch, berries, total including undeveloped berries
239.0 24.7
245.0 5.0
102.5 -
227.7 1.7
95.3 -
Berry size, mm - length - width
11.6 10.2
15.2 12.1
131.0 118.6
15.6 12.5
134.5 122.5
100 berries’ weight, g 113.8 175.4 154.1 191.4 168.2 Berry characteristic value (pulp weight/ skin weight)
4.9
7.1
-
7.7
-
Crushing strength of berries, g/cm2 1432 1968 137.4 1437 100.3 Harvest, kg/vine 3.9 6.2 159.0 6.5 166.7 0.58 The content of: - sugar, % - titratable acidity, g/dm3
17.3 11.7
16.6 10.8
- -
18.2 10.9
- -
In the control variant the crushing strength of the berries was equal to 1432 g/cm2. In the variant GG2LG-3.6 l/ha this data increased up to 1.4 times if compared to the control. At the same time the crushing strength of the berries from the variant GG2LG - 4.6 l/ha has the same strength as that of control and is equal to 1437 g/cm2. Now it can be seen that the use of Gobbi Gib 2LG by treating the planting stock while the period of vegetation in certain periods using small doses (following the Italian technology) leads to: a diminution of the bunch compactness degree; an increase of the characteristic value of the bunch; a weight increase of a 100 berries; a harvest increase up to 1.6 (GG2LG-3.6 l/ha) - 1.7 (GG2LG-4.6 l/ha) and to the berries quality modification. Resuming one can say that the ideal concentration of the Gobbi Gib is 2LG 3.6 l/ha. The usage of Gobbi Gib 2LG by the Moldova technology, took place in the period of post fecundation by means of spraying the bunch
zone when the diameter of the grains was 3-6 mm (12.06.2013). Compared to the control it was observed that using GG2LG in a dose of 2.0 l/ha leaded to a considerable increase of the bunch weight and of the berries in the bunch up to 1.8 times. At the same time while this variant, it was noted a cluster increase up to 2.4 times which brings to the decrease of the bunch value structure (berries weight/cluster weight). The same regularity was observed while using the specimen in a dose that corresponded to 2.4 l/ha (Table 2, Figures 3, 4). After being subjected to GG2LG it could be observed as an increase of the bunch dimensions, especially in the middle and at the bottom parts of it as well as a pedicle increase of the Beauty seedles variety. (Table 1, Figures 1, 2). When treating the inflorescences locally by means of a manual sprayer containing GG2LG it was fixed that the quantity of berries is the same as the of the control, nevertheless
75

increased the size of the grains (length, width) and the grains became oval-shaped. The weight of a 100 grains became twice bigger. It could be noted an increase of the characteristical value of the berries (pulp
weight/skin weight) up to 1.8 times. The crushing strength increased up to 1.2 times (GG2LG -2.0 l/ha) -1.5 (GG2LG-2.4 l/h).
Table 2. The reaction of the Beauty seedless variety to the Gobbi Gib 2LG treatment while the post fecundation period. „Terra vitis” Ltd., 2013, (Moldova technology)
Characteristic value
The variant of experience
DL 0.95
Contol - Н2О GG2LG - 2.0 l/ha GG2LG - 2.4 l/ha
x x % to the control x
% to the control
Bunch weight, g including - berry - cluster
251.7 248.0 3.7
454.8 446.0 8.8
180.7 179.8 237.8
508.3 499.9
8.4
202.0 201.6 227.0
Bunch characteristic value (berries weight/ cluster weight)
67.0
50.7
-
59.5
-
Bunch dimensions, cm - length - width / on the top at the middle at the bottom
19.5 14.5 8.7 3.8
21.7 16.0 11.8 5.2
111.3 110.3 135.6 136.8
21.8 16.3 11.3 5.5
111.8 112.4 129.9 144.7
Pedicle dimensions, mm 3.2 4.0 125.0 3.5 109.4 The quantity of berries per bunch, berries, total including undeveloped berries
239.0 24.7
238.0 -
99.6 -
242.0 1.7
101.3 -
Berry size, mm - length - width
11.6 10.2
16.4 12.6
141.4 123.5
16.8 14.5
144.8 142.2
100 berries’ weight, g 113.8 196.3 172.5 217.6 191.2 Berry characteristic value (pulp weight/ skin weight)
4.9
9.3
-
8.9
-
Crushing strength of berries, g/cm2 1432 1766 123.3 2073 144.8 Harvest, kg/vine 3.9 7.0 179.5 7.8 200.0 0.58 The content of: - sugar, % - titratable acidity, g/dm3
17.3 11.7
16.1 11.5
- -
16.1 11.8
- -
The harvest of the Witness variant consisted - 3.9, kg/vine, at the same time the use of GG2LG brought to a double increase of the harvest. Within the variant GG2LG - 2.0 l/ha - it consisted - 7.0 kg/vine, the variant GG2LG - 2.4 l/ha - 7.8 kg/vine.
Inside the grains there was a inconsiderable fell down of the composition of the dry matter (sugar), and the titratable acidity rate was not higher than that of the control.
Figure 3. The Gobbi Gib 2LG influence on the external appearance of the bunch and berries. The Beauty seedless
variety, “Terra vitis” Ltd., 2013, (Moldova technology). The variant of experience: 1-Control - Н2О; 4-GG2LG - 2.0 l/ha; 5- GG2LG - 2.4 l/ha
76

Accordingly, Gobbi Gib 2LG was used within the vineyard on the zone of bunch placement for the sort Beauty seedless at a certain period of development with a dose of 2.0 and 2.4 l/ha and this leaded to a double bunch weight and characteristic value increase. At the same time the number of berries in a bunch stayed the
same as that of the control, nevertheless the increase of the parameters brought to a weight growth of a 100 berries up to 1.7-1.9 times. The increase of berries parameters causes the bunch compatibility which can lead at its turn to the grain deterioration while packing and transporting.
Figure 4. The Gobbi Gib 2LG influence on the external appearance of the bunch and berries. The Beauty seedless
variety, “Terra vitis” Ltd., 2013, (Moldova technology). The variant of experience: 1-Control-Н2О; 4-GG2LG-2.0 l/ha; 5-GG2LG-2.4 l/ha
Figure 5. The Gobbi Gib 2LG influence on the external appearance of the bunch and berries.The Beauty seedless
variety, “Terra vitis” Ltd., 2013. The variant of experience: 1-Control-Н2О; 2-GG2LG -3.6 l/ha; 3-GG2LG-4.6 l/ha, (Italian technology); 4-GG2LG-2.0 l/ha; 5-GG2LG-2.4 l/ha (Moldova technology)
Thus, it can be said that the use of Gobbi Gib 2LG, leads as to an increase of cluster productivity up to 1.6-1.7 (Italian technology) and to 1.8-2.0 times (Moldova technology) indifferent the ways of applications and concentration as well as to the quality production modification. Data analysis gives us a reason to recommend the use of the Gobbi Gib 2LG within seedless varietiy as an obligatory process within their harvest in the Republic of Moldova.
CONCLUSIONS In the issue of the received data, after using Gobbi Gib 2LG within the vitis it may be said that its action depends on the biological particularities of the sorts notwithstanding the method of using it. Within the seedless variety Beauty seedless the efficiency of the treatment showed through: 1. The bunch parameters increasing up to 1.6-2.0 times; weight berries increasing up to 1.6-
77

1.7 times, cluster weight increasing up to 1.5-2.4 times, a bunch structure value decrease (berries weight/cluster weight); 2. The quantity of berries is the same as that of the control, but at the same time the control parameters increase, the weight of a 100 berries increases up to 1.5-1.7 times, also increases the grain crushing strength; 3. The harvest increases up to 2.3-3.9 kg/vine (which is 1.6-2.0 times higher than that of the control) grain quality modifies also; Taking into consideration the obtained results on Gobbi Gib 2LG one may can confirm that the treatment may be included into the table grape sorts levelling technological system as growth regulator aiming to increase the productivity and the quality of the production based on the 2 schedules: Within the apyrene sort (without seeds) Beauty seedless: I schedule (Italy method), through vine spraying using the specimen within different periods of developement: � before the bloom; � while blossoming; � in the post fecundation period. II schedule (Moldova method), through spraying the zone of the bunch placement using the specimen only within one single period: � post fecundation period. REFERENCES Nicolaescu Gh., Cazac F., 2012. Producerea strugurilor
de masă soiuri cu bobul roze şi negru (ghid practic) / Gheorghe, Nicolaescu, Fiodor, Cazac. Chişinău. Elan Poligraf, p. 248
Nicolaescu Gh., Cazac T., Vacarciuc L., Cebotari V., Cumpanici A., Nicolaescu Ana, Hioară Veronica, 2010. Filiera vitivinicola della Repubblica Moldova - situazione attuale e prospettive di sviluppo. Istituto Nazionale per il Commercio Estero - Ufficio di Bucarest, Univ. Agraria di Stato di Moldova; Chişinău. Print-Caro SRL, p. 142
Nicolaescu Gh., 2013. Particularităţile culturii soiurilor de struguri pentru masa in Italia, Spania şi Ucraina. Raport la Forumul Naţional al Producătorilor şi Exportatorilor strugurilor de masă din 08.09.2013
Агафонов А.Х., Казахмедов Р.Э., 2007. Обработка регуляторами роста перспективных семенных сортов для получения бессемянных ягод винограда. Виноделие и виноградарство. №3, с.38-39. ------- Agafonov AK, Kazahmedov RE, 2007. Treatment of growth regulators promising seed varieties for seedless grapes. Wine-making and viticulture. №3, s. 38-39 (in Russian).
Батукаев А.А., 1987. Реакция семенных сортов винограда различных эколого-географических групп на применение гиббереллина: Автореферат диссертации канд. с.-х. наук. Ереван, 22 с. ------ Batukaev AA, 1987. Reaction seed grapes of different eco-geographical groups on the use of gibberellin: the Dissertation Cand. agricultural Sciences. Yerevan, 22 (in Russian).
Батукаев А.А., 1966. Реакция семенных сортов винограда различных эколого-географических групп на применение гиббереллина. Москва, МСХА. 139 с. ----- Batukaev AA, 1966. Reaction seed grapes of different eco-geographical groups on the use of gibberellin. Moscow ICCA. 139s (in Russian).
Дерендовская А.И., Николаеску Г.И. и др., 2009. Влияние гиббереллина на продуктивность и качество ягод бессемянных и семенных сортов винограда. Регуляция роста, развития и продуктивности растений. Минск. с. 43. ---- Derendovskaya AI, GI Nicolaescu et al. 2009. Effect of gibberellin on the productivity and quality of fruit seedless and seed varieties. Regulation of growth, development and productivity of plants. Minsk. from. 43 (in Russian).
Казахмедов Р.Э., Агафонов А.Х., 2004. Получение бессемянных ягод у семенных сортов винограда. В: Виноделие и виноградарство. №5, С.34-37. ---- Kazahmedov RE, Agafonov AK, 2004. Production of seedless berries from seed varieties. In: Wine-making and viticulture. №5, S.34-37 (in Russian).
Красохина С.И., 1998. Эффективность применения регуляторов роста для обработки новых столовых сортов винограда с функционально женским типом цветка. В: Виноделие и виноградарство. 2008, №2, с.42-43. ----- Krasohina SI, 1998. The effectiveness of the use of growth regulators for the treatment of new table grape varieties with functionally female type of flower. In: Wine-making and viticulture. 2008, №2, s.42-43. (in Russian).
Мананков М.К. Физиология действия гиббереллина на рост и генеративное развитие винограда: Автореферат диссерт. докт. биол. наук. Киев. ---- MK Manankov Physiology action gibberellin on growth and generative development of grapes: the Abstract's dissertation. Doctor. biol. Sciences. Kiev (in Russian).
Смирнов К., Малтабар Л. И др., 1998. Виноградарство. Москва: Колос. 468 с. ---- Smirnov K. Maltabar L. et al., 1998. Viticulture. Moscow: Kolos. 468 p. (in Russian).
Смирнов К.В., Перепелицына Е.П., 1965. О влиянии гиббереллина на бессемянные сорта винограда и продукты их переработки. В:Физиология растений. т. 12, №2, стр. 306-312. ----- Smirnov KV Perepelitsyna EP, 1965. The effect of gibberellin on seedless grapes and their products. In: Plant Physiology. v. 12, №2, p. 306-312 (in Russian).
Смирнов К.В., Раджабов А.К., Морозова С.Н., 1984. Применение регуляторов роста в виногра-дарстве Узбекской ССР. В: Пути интенсификации виноградарства. Москва, стр. 57-59. ----- Smirnov KV, Radjabov AK, Morozov SN, 1984. The use of
78

growth regulators in vinogra-States of the Uzbek SSR. Q: Path intensification of viticulture. Moscow, p. 57-59 (in Russian).
Чайлахян М.Х., Саркисова А.М., 1980. Регуляторы роста у виноградной лозы и плодовых культур.
Ереван: Изд-во АН Арм.ССР. 188 с. ---- Chailakhyan MH, Sarkisov AM, 1980. The growth regulators have the vine and fruit crops. Yerevan: Publishing House of the Academy of Sciences of the Armenian SSR. 188 p. (in Russian).
79

DEVELOPMENT OF A NEW TECHNOLOGY FOR PROTECTIVE BIOFORTIFICATION WITH SELENIUM OF BRASSICA CROPS
Anca-Olgu�a OANCEA1, Alexandra GASPAR1, Ana-Maria SECIU1, Laura ȘTEFAN1,
Oana CRĂCIUNESCU1, Florentina GEORGESCU2, Radu L�C�TUȘU3
1National Institute of Research-Development for Biological Sciences, 296, Splaiul Independentei, 060031 Bucharest, Romania, Tel./fax: +40-21-2200882, E-mail: [email protected], [email protected], [email protected],
[email protected], [email protected] 2S.C. Teso Spec S.R.L., 53, Muncii Street, 915200 Fundulea, Romania, [email protected]
3NCDPAPM-ICPA, 61, Marasti Blvd., 011464, Bucharest, Romania, [email protected]
Corresponding author email: [email protected]
Abstract Selenium (Se) has been proved to be an essential micronutrient for animals and microorganisms. Se is considered a beneficial element for plants, determining plant growth increase and enhanced response to biotic and abiotic stress. Se biofortification of food chain is considered essential for global health, but when applied on Brassicaceae family plants is interfering with sulfur (S) metabolism, reducing the accumulation of valuable S-phytonutrients. Moreover, Se-based biostimulants were acting first as potent pro-oxidants, bleaching the treated plants. Based on accumulated knowledge regarding cross-talking between Se and S assimilation pathways, we propose the development of a new biotechnological approach for protective biofortification of Brassica crops. The aim of this study was to develop new formulations of biostimulants, based on mixtures of betaine, selenium salt and spraying adjuvant, applied on cruciferous plants, in order to obtain safe functional food with enhanced chemopreventive compounds. We treated cabbage seedlings with different variants of biostimulants, we performed plant morphometric analysis and we determined the selenium content by atomic absorption spectroscopy, the glucosinolate and sulfur aminoacid content by HPLC and we evaluated plant antitumoral activity in Caco-2 human carcinoma cell line. The results of the qualitative and quantitative chemical determinations of spectroscopy and chromatography allowed us to select the mixture of 10 μM Na2O4Se, 10 mM betaine and 1% adjuvant, as optimal biostimulant formula that induced an equilibrated content of chemopreventive compounds in cabbage seedlings. Biological in vitro tests demonstrated that the obtained biofortified cabbage seedlings had enhanced antitumoral activity in Caco-2 human carcinoma cell line, compared to water-treated seedlings. In conclusion, we recommend a protective biofortification biotechnology based on selenium salts, betaine and spraying adjuvant to be tested in the field, on cruciferous crops of both cabbage and cauliflower. Key words: antitumoral activity, biofortification, cruciferous plants, phytonutrient, selenium salt. INTRODUCTION Biofortification of the food chain through treatments applied to plants (agronomic biofortification) brings the advantage of adding controlled levels of selenium (Se) compounds with high bioavailability (Pilon-Smits et al., 2009; Khan & Hell, 2014). In addition, agronomic biofortification with Se allows the capitalization of its protective and stimulating action in plants (Feng et al., 2013). Studies in the past 15 years have shown that Se, although it is not widely recognized as an essential microelement for plant, stimulates plant growth (Hartikainen and Xue, 1999) and plays a significant role in plant protection against
insects and phytopathogenic agents attack (Hanson et al., 2003), oxidative stress (Xue et al., 2001) and hydrostress (Wang, 2011). The plant treatment with Se has also the effect of improving the plants resistance to drought, when the hydrostress is combined with the oxidative one (Yao et al., 2009). A protective technology for biofortification with Se of cruciferous crops, in order to obtain functional food containing safe and constant level of chemopreventive Se compounds has, therefore, a double practical relevance, for public health, on the one hand (supplementation of the food chain with safe Se levels) and for agronomy, on the other hand (to increase the efficiency of
80
AgroLife Scientific Journal - Volume 4, Number 2, 2015
ISSN 2285-5718; ISSN CD-ROM 2285-5726; ISSN ONLINE 2286-0126; ISSN-L 2285-5718
crops throught their protection against biotic and abiotic stress and limitation of drought effects). Cruciferous vegetables are major crops on which treatments of Se biofortification have been applied (White and Broadley, 2009). This work aims to develop and apply some products as new inputs in Se protective biofortification technology for cruciferous plants, technology that will rebalance sulfur metabolism, while maintaining an optimal level for the formation of chemopreventive Se compounds. The main ways of intervention are applying betaine, an osmoprotectant, acting as donor of methyl groups (for recovery of methionine from homocysteine) and spraying adjuvants that favor plant penetration of Se salts and of betaine, ionic charged compounds, with very low penetration through hydrophobic plant cuticle. In this work, we aimed to establish the effect of new products on the levels of chemopreventive compounds in Se treated cruciferous plants (cabbage). MATERIALS AND METHODS Plant growth. Cabbage plants (Brassica oleracea L. var. capitata alba) were grown from seeds germinated in soil (mixture of peat moss, fertilizer and coarse sand). Plant seedlings were maintained in a room with controlled growth parameters. The plants were normally watered and grown for 10 weeks. Se biostimulant treatment. Plants (10 plants/treatment) were treated with different mixtures of sodium selenate (Na2O4Se), betaine and spraying adjuvant, as follows: � 10 μM Na2O4Se (V1), � 10 μM Na2O4Se, 10 mM betaine and 1%
adjuvant (V2), � 10 mM betaine and 1% adjuvant (V3) and � distilled water (M). The treatment was applied twice, at a distance of two weeks, by foliar spraying (2 mL/plant), using a split-split plot design. Plant analysis. Plant dry weight (d.w.) was determined at a moisture balance (Radwag, Poland). Se content was determined in dried plants after calcination at 450 °C. The analysis was performed by vapor-generation atomic absorption spectroscopy of the hydrogen selenide formed after boron hydride reducing procedure.
Plant extracts. Freshly harvested cabbage (1 g) was homogenized in 4 ml acidified water, pH 6, at 45 °C, for 2.5 h. Sulforaphane was extracted by addition of 20 ml dichloromethane and incubation at room temperature, for 1 h and then, was purified using solid-phase extraction (Campas Baypoli et al., 2010). The extract was evaporated to dryness, in vacuo, using a rotary evaporator (Heidolph VV Micro, Germany) and the residue was dissolved in 1 ml acetonitrile. For S-adenosyl-homocysteine (SAH) extraction, fresh plant samples (5 g) were subjected to two-step procedure, first with 5 ml methanol, precooled at -20 oC, then with 5 ml isopropanol, precooled at -20oC (Nichiforova et al., 2005). The obtained supernatants were further combined and filtered through 0.22 μm membrane filter. HPLC analysis of glucosinolate and S-adenosyl-homocysteine (SAH) was carried out on a HPLC Agilent 1200 system with diode array detector. Prior to injection into HPLC apparatus, the samples were filtered through 0.45 μm PTFE membrane filter. Their separation was performed in Zorbax XDB C18 column (150 x 4.6 mm i.d.), at flow rates of 0.6 mL/min and 0.2 mL/min, respectively and elution under isocratic conditions, using water/acetonitrile gradient mobile phase (Struys et al., 2000). Their detection was carried out at 202 nm and 258 nm, respectively and their peak retention times were compared with those obtained for sulforaphane and S-adenosyl-homocysteine (SAH) external standards (Sigma Aldrich). Calibration curves were built in the range of 5-100 μg/mL sulphoraphane and 2.5-50 μg/mL SAH and were used to quantify their concentration in cabbage plant extracts. In vitro antitumoral activity. Caco-2 human colon adenocarcinoma cell line was obtained from ECACC. Cells were grown in MEM medium supplemented with 2 mM glutamine, 1% non essential amino acids, 10% foetal bovine serum (FBS) and 1% antibiotics mixture (penicillin, streptomycin, neomycin) and incubated at 37 °C in a humidified atmosphere of 5% CO2. For cytotoxicity tests, cells were seeded at a concentration of 5x10⁴ cells/ml in a 96-well plate. After 24 h of cultivation in standard conditions, the medium was replaced with fresh medium containing V1-V3 treated plant extracts and control plant extract (M), in
81

0.05 - 2 mg/ml range of concentrations and the plates were cultivated in incubator, for 24 h and 72 h. Sample cytotoxicity was evaluated by MTT assay (Craciunescu et al., 2007) and cell morphology was observed at an inversed-phase light microscope (Nikon). The antitumoral activity, expressed as half-maximal inhibitory concentration (IC50), was calculated from dose-response curves as the concentration of sample that yielded 50% cell cytotoxicity. Statistics. Three replicates were used for all treatments in cell culture. The results were presented as mean ± standard deviation (SD). Significant statistic differences were considered for p<0.05 after performing Student’s t-test on paired samples. RESULTS AND DISCUSSIONS Cabbage seedlings growth, treatment and morphometric measurements Seeding was carried out, first, in alveoli, after 2 weeks, plants were picked out in pots and, after 4 weeks, in boxes (Figure 1). Seedlings were grown in a room with controlled temperature, humidity and light intensity, with a 12 h day length. At 1 week after the second treatment, consisting of sodium selenate (V1), mixture of sodium selenate, betaine and spraying adjuvant (V2), or mixture of betaine and spraying adjuvant (V3), plants were harvested and morphometrically analyzed, in comparison with control plants (M), sprayed only with water. Morphometric measurements, consisting of leaf number, height and weight of each seedling are presented in Table 1. The values represent the mean value of 10 plants measurements.
Table 1. Morphometric measurements of cabbage seedlings after two treatments with biostimulants
Applied treatment Leaf number
Height (cm)
Weight (g)
10 μM Na2O4Se (V1) 5 21.1 1.21 10 μM Na2O4Se, 10 mM betaine and 1% adjuvant (V2)
6 22.7 1.72
10 mM betaine and 1% adjuvant (V3)
5 20.5 1.65
Distilled water (M) 4 18.7 1.01
Figure 1. Images of cabbage seedlings at 2 weeks (A), 4
weeks (B) and 7 weeks (C) of cultivation
The results indicated that the used treatments have favoured a normal growth of the seedlings. Sulforaphane and SAH identification by HPLC HPLC analysis was performed in order to detect sulforaphane (Figure 2), as degradation product of glucosinolates, and to identify the S-aminoacid SAH (Figure 4) in cabbage seedling extracts by comparison of their retention time with those of standard solutions (Figure 3, Figure 5).
A
B
C
82
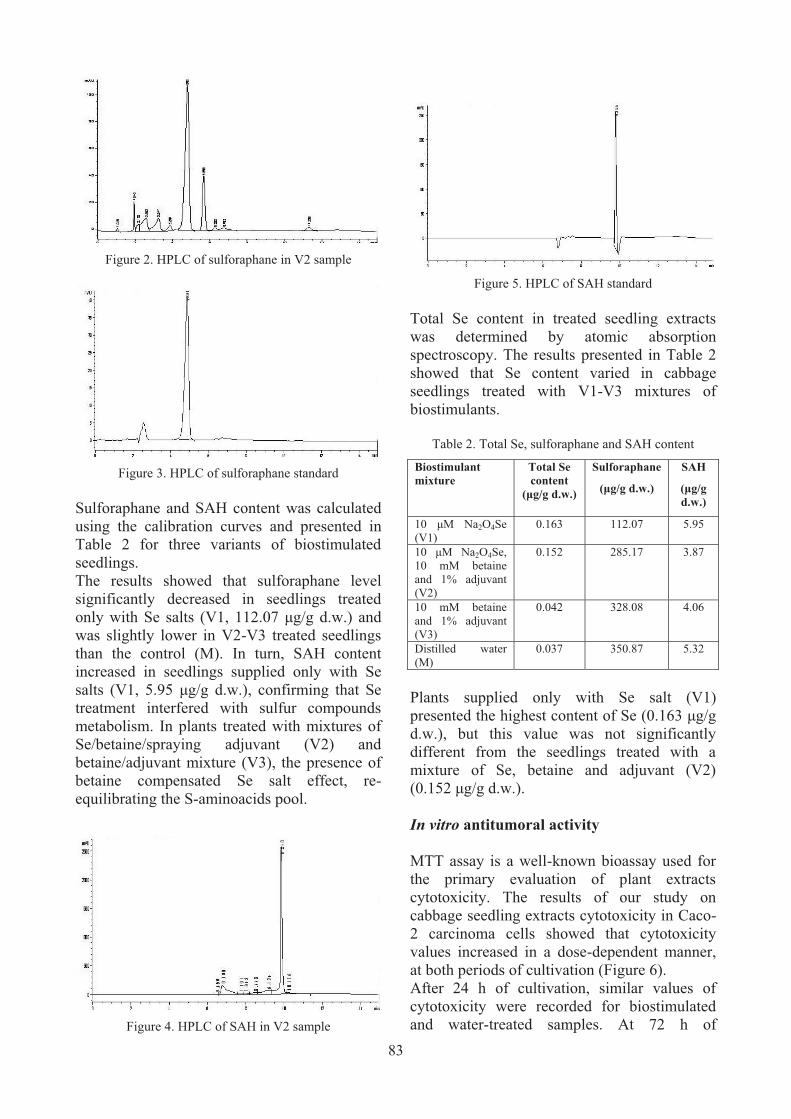
Figure 2. HPLC of sulforaphane in V2 sample
Figure 3. HPLC of sulforaphane standard
Sulforaphane and SAH content was calculated using the calibration curves and presented in Table 2 for three variants of biostimulated seedlings. The results showed that sulforaphane level significantly decreased in seedlings treated only with Se salts (V1, 112.07 μg/g d.w.) and was slightly lower in V2-V3 treated seedlings than the control (M). In turn, SAH content increased in seedlings supplied only with Se salts (V1, 5.95 μg/g d.w.), confirming that Se treatment interfered with sulfur compounds metabolism. In plants treated with mixtures of Se/betaine/spraying adjuvant (V2) and betaine/adjuvant mixture (V3), the presence of betaine compensated Se salt effect, re-equilibrating the S-aminoacids pool.
Figure 4. HPLC of SAH in V2 sample
Figure 5. HPLC of SAH standard
Total Se content in treated seedling extracts was determined by atomic absorption spectroscopy. The results presented in Table 2 showed that Se content varied in cabbage seedlings treated with V1-V3 mixtures of biostimulants.
Table 2. Total Se, sulforaphane and SAH content
Biostimulant mixture
Total Se content
(μg/g d.w.)
Sulforaphane
(μg/g d.w.)
SAH
(μg/g d.w.)
10 μM Na2O4Se (V1)
0.163 112.07 5.95
10 μM Na2O4Se, 10 mM betaine and 1% adjuvant (V2)
0.152 285.17 3.87
10 mM betaine and 1% adjuvant (V3)
0.042 328.08 4.06
Distilled water (M)
0.037 350.87 5.32
Plants supplied only with Se salt (V1) presented the highest content of Se (0.163 μg/g d.w.), but this value was not significantly different from the seedlings treated with a mixture of Se, betaine and adjuvant (V2) (0.152 μg/g d.w.). In vitro antitumoral activity MTT assay is a well-known bioassay used for the primary evaluation of plant extracts cytotoxicity. The results of our study on cabbage seedling extracts cytotoxicity in Caco-2 carcinoma cells showed that cytotoxicity values increased in a dose-dependent manner, at both periods of cultivation (Figure 6). After 24 h of cultivation, similar values of cytotoxicity were recorded for biostimulated and water-treated samples. At 72 h of
83

cultivation, significantly (*p<0.05) higher antiproliferative activity was observed for samples of cabbage plants treated with a mixture of Se, betaine and adjuvant (IC50, 0.630 mg/mL), compared to water-treated plants (IC50, 0.730 mg/mL). Seedlings treated with betaine and adjuvant presented comparable antitumoral activity (IC50, 0.715 mg/mL) with that of water-treated plants.
24h
0
20
40
60
80
100
120
control 0.05 0.1 0.5 1 2
cabbage plant extract concentration (mg/mL)
Cyto
toxi
city
(% o
f con
trol
)
Se+betaine+adjuvantbetaine+adjuvantwater
72h
0
20
40
60
80
100
120
control 0.05 0.1 0.5 1 2cabbage plant extract concentration (mg/mL)
Cyt
otox
icity
(% o
f con
trol
)
Se+betaine+adjuvantbetaine+adjuvantwater
Figure 6. In vitro cytotoxicity of cabbage biostimulated plant extracts, cultivated for 24 h and 72 h with Caco-2
carcinoma cells *p<0.05 Microscopy analysis showed that treated plant extracts induced a damaging effect on carcinoma cell morphology and decreased their cell density, in a dose-dependent manner (Figure 7).
Figure 7. Carcinoma cell morphology after cultivation in
the presence of V2 plant extracts for 72 h
After 72 h of cultivation, cells appeared degenerated and cell lysis took place, at high concentrations of extract. The micrographs indicated high antiproliferative activity of extracts of cabbage biofortified with a mixture of selenium salt, betaine and spraying adjuvant (V2). Previous studies have demonstrated that glucosinolates inhibited (deoxy)cytidine methylation by DNA methyl transferase in normal cells, mainly by their hydrolysis compounds (Stefanska et al., 2012; Shankar et al., 2013). Other studies have showed that methyl selenium amino acids were involved in repairing modified DNA in normal cells, through mechanisms that are yet unknown (Bera et al., 2013) and induced apoptosis in transformed cells (Steinbrenner et al., 2013). CONCLUSIONS The results of qualitative and quantitative chemical determinations allowed us to select the optimal formula, 10 μM Na2O4Se, 10 mM betaine and 1% adjuvant (V2), which will be used as biostimulant in the field culture of both cruciferous crops, cabbage and cauliflower. The obtained biofortified plants represent functional food with enhanced antitumoral activity, as demonstrated in vitro on Caco-2 human carcinoma cell line. This study, performed in human cell cultures, demonstrated the relationship between different chemopreventive compounds (glucosinolates, methylated selenium amino acids) formed in cruciferous biofortified with Se using the proposed technology. By applying new inputs in the proposed technology to be achieved, Se biofortified food with a safe and stable content of chemoprotective compounds will be obtained and the effect of various abiotic stress (lack of water, irradiation) and biotic stress (pests and diseases) on biostimulated crops will be limited. ACKNOWLEDGEMENTS This work was supported by UEFISCDI, Romania, National Project PN-II-PT-PCCA-2013, No. 186/2014.
* *
*
untreated control 0.05 mg/ml V2
0.5 mg/ml V2 2 mg/ml V2
84

REFERENCES Bera S., De Rosa V., Rachidi W., Diamond A.M., 2013.
Does a role for selenium in DNA damage repair explain apparent controversies in its use in chemoprevention? Mutagenesis, 28, p. 127-134.
Campas-Baypoli O.N., Sanchez-Machado D.I., Bueno-Solano C., Ramirez-Wong B., Lopez-Cervantes J., 2010. HPLC method validation for measurement of sulforaphane level in broccoli by-products. Biomedical Chromatography, 24, p. 387-392.
Craciunescu O., Stefan L.M., Balan M., Moldovan L., 2007. Evaluation of the radioprotective activity of new green tea-collagen materials. Journal of Optoelectronics and Advanced Materials, 9, p. 2602-2607.
Feng R., Wei C., Tu S., 2013. The roles of selenium in protecting plants against abiotic stresses. Environmental and Experimental Botany, 87, p. 58-68.
Hanson B., Garifullina G.F., Lindblom S.D., Wangeline A., Ackley A., Kramer K., Pilon-Smits E.A., 2003. Selenium accumulation protects Brassica juncea from invertebrate herbivory and fungal infection. The New Phytologist, 159, p. 461-469.
Hartikainen H., Xue T., 1999. The promotive effect of selenium on plant growth as triggered by ultraviolet irradiation. Journal of Environmental Quality, 28, p. 1372-1375.
Khan M.S., Hell R., 2014. Applied cell biology of sulphur and selenium in plants. In: Nick P. and Opatrny Z. (Eds.), Applied Plant Cell Biology: Cellular Tools and Approaches for Plant Biotechnology, Berlin, Springer-Verlag, p. 247-272.
Nichiforova V.J., Kopka J., Tolstikov V., Fiehn O., Hopkins L., Hawkesford M.J., Hesse H., Hoefgen R., 2005. Systems rebalancing of metabolism in response to sulfur deprivation, as revealed by
metabolome analysis of Arabidopsis plants. Plant Physiology, 138, p. 304-318.
Pilon-Smits E.H., Quinn C.F., Tapken W., Malagoli M., Schiavon M., 2009. Physiological functions of beneficial elements. Current Opinion in Plant Biology, 12, p. 267-274.
Shankar S., Kumar D., Srivastava R.K., 2013. Epigenetic modifications by dietary phytochemicals: implications for personalized nutrition. Pharmacotherapy, 138, p. 1-17.
Stefanska B., Karlic H., Varga F., Fabianowska-Majewska K., Haslberger A.G., 2012. Epigenetic mechanisms in anti-cancer actions of bioactive food components - the implications in cancer prevention. British Journal of Pharmacology, 167, p. 279-297.
Steinbrenner H., Speckmann B., Sies H., 2013. Toward understanding success and failures in the use of selenium for cancer prevention. Antioxidants & Redox Signaling, 19, p. 181-191.
Struys E.A., Jansen E.E.W., de Meer K., Jakobs C., 2000. Determination of S-adenosylmethionine and S-adenosylhomocysteine in plasma and cerebrospinal fluid by stable-isotope dilution tandem mass spectrometry. Clinical Chemistry 46, p. 1650-1656.
Wang C.Q., 2011. Water-stress mitigation by selenium in Trifolium repens. Journal of Plant Nutrition and Soil Science, 174, p. 276-282.
White P.J., Broadley M.R., 2009. Biofortification of crops with seven mineral elements often lacking in human diets - iron, zinc, copper, calcium, magnesium, selenium and iodine. The New Phytologist, 182, p. 49-84.
Xue T., Hartikainen H., Piironen V., 2001. Antioxidative and growth-promoting effect of selenium on senescing lettuce. Plant & Soil, 237, p. 55-61.
Yao X., Chu J., Wang G., 2009. Effects of selenium on wheat seedlings under drought stress. Biological Trace Element Research, 130, p. 283-290.
85

CONTRIBUTION TO THE FOUNDATION OF KNOWLEDGES CONCERNING THE BIOLOGY, ECOLOGY AND CULTURE
TECHNOLOGY FOR CHICKPEA (Cicer arietinum) IN CLASSIC AND ECOLOGICAL SYSTEM UNDER CONDITIONS
OF DOBROGEA PLATEAU
Liliana PANAITESCU1, Simona-Mariana PRICOP1, Irina MOISE1, R�zvan PANAITESCU2, Simona NI��3, Marsida Xenia BEJKO1
1University Ovidius Constan�a, No.124, Mamaia Boulevard, Constan�a, 900527, Romania
2Academy of Economic Studies, No. 6, Pia�a Roman�, Bucharest, 010374, Romania 3Banat�s University of Agricultural Sciences and Veterinary Medicine, no. 119, Calea Aradului,
300645 Timi�oara, Romania
Corresponding author email: [email protected]
Abstract Chickpea, known under the name of �peas of rams�, is an annual leguminous plant, originating from Asia Minor. Chickpea seeds have a great nutritional value, are used in human consumption as boiled, roasted or cofee surrogate, being rich in proteins, mineral salts (phosphorus, potassium, magnesium, calcium, iron) and vitamin B complex. Having an increased protein concentration (24%), plus a substantial percentage of carbohydrates and lipids, chickpea has a remarkable food value, largely replacing the meat protein. Chickpea is a characteristic ingredient in Middle East kitchen, Africa and India, known under the name of �desi� and �kabuli�. In Romania, there are cultivated local populations of chickpea: Galben de Moldova (Moldova Yellow), Naut galben de Lovrin (Lovrin Yellow chickpea). Chickpeas have quite high requirements to the temperature, the amount being of 2,000ºC and tolerate the easiest, among of all leguminous bean plants, the drought conditions, therefore it can be cultivated in Dobrogea, provided the early spring seeding. Key words: chickpea, culture, drought, resistance to water and thermal stress. INTRODUCTION Chickpea grains contain, on average: proteins 20-25%, fats 4-6%, nitrogen free extracts 53-63%, cellulose 4-8%, ash 3-5%. In recent years, in the world there were cultivated in 2008-11.02 million ha, in 2009-11.08 million ha, with an average yield of 7.71 quintals/ha in 2008 to 8.81 quintals/ha in 2009. In Romania, there were cultivated 10.000 ha in South-East of the country, but in recent years the surfaces were drastically reduced: in 2008, there were cutivated with chickpeas 487 ha, and in 2009 only 78 ha. The average yields were 1,201.2 kg/ha in 2008 and 961.5 kg/ha in 2009. MATERIALS AND METHODS Chickpea belongs to genus Cicer, species Arietinum. It has more subspecies, the most imortant being Eurasiaticum.
Cultivated species is Cicer arietinum L., divided into four subspecies: orientale, asiaticum, mediterraneum, eurasiaticum. In Romania, there are cultivated local populations of chickpea: Galben de Moldova (Moldova Yellow), Naut galben de Lovrin (Lovrin Yellow chickpea). In the Catalogue of Official Plant Varieties that were cultivated in Romania, 2014 edition, there were published 2 varieties, respectively Burnas and Rodin, registered in 2004 and maintained by Agricultural Research and Development Station from Teleorman. Variety Cicero 1, created by Agricultural Research and Development Institute of Fundulea (NARDI), was cutivated until the last years. RESULTS AND DISCUSSIONS Total area harvested with chickpea, on average in the last 5 years (2009-2013), is
86
AgroLife Scientific Journal - Volume 4, Number 2, 2015
ISSN 2285-5718; ISSN CD-ROM 2285-5726; ISSN ONLINE 2286-0126; ISSN-L 2285-5718

12,531,411 ha. In this period, in the European Union there were harvested, on average, 43,797.8 ha, while in Romania the yearly average was 125.6 ha.
Figure 1. Shares of Total Area Harvested with chickpea during 2009-2013
Figure 2. Chickpea plants before flowering - images
from didactic and research field Chickpea seeds germinate hypogeically. The root has a high power of absorbtion and solubilization, the stalk has 30-60 cm height, is edged, piliferousand erect. Leaves are compound odd pinnately with 7-17 pairs of leaflets, with dentate margins, leaflets are covered with hairs which secrete oxalic and malic acids. Flowers are solitary, in different colors, the flowering is echeloned along over 2-3 weeks, and they bloom from the bottom to the top, with self pollination, the pods are short, ovate, pale yellow, covered with hairs.
A pod contain 1-3 seeds, one thousand seeds weight is 230-270 grams, the vegetation period is 91-110 days. Towards temperatures, chickpea has quite high requirements. The amount of temperature degrees necessary for the entire vegetation period is about 2,000ºC.
Figure 3. Compound leaves imparipenat
Among of all leguminous bean plants, chickpea supports the easiest the drought conditions. The minimum germination temperature is 3-4 °C. At 6-8 °C it emerges in at least 10 days. As seedlings, it resists until -6 °C and during the vegetation period chickpea requires temperatures up to 20-21°C.
Figure 4. Chickpea plants during kernel filling period -
images from didactic and research field The most appropiate soil for chickpea must have medium texture and rich in calcium. It
87
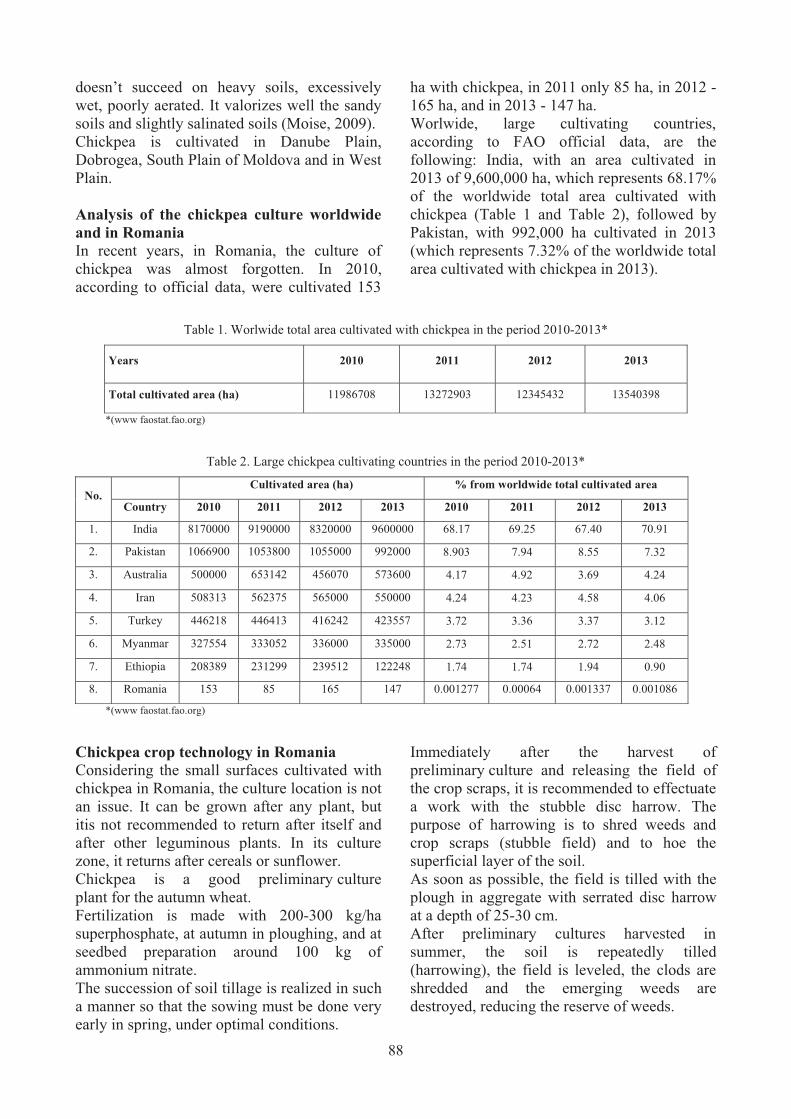
doesn�t succeed on heavy soils, excessively wet, poorly aerated. It valorizes well the sandy soils and slightly salinated soils (Moise, 2009). Chickpea is cultivated in Danube Plain, Dobrogea, South Plain of Moldova and in West Plain. Analysis of the chickpea culture worldwide and in Romania In recent years, in Romania, the culture of chickpea was almost forgotten. In 2010, according to official data, were cultivated 153
ha with chickpea, in 2011 only 85 ha, in 2012 - 165 ha, and in 2013 - 147 ha. Worlwide, large cultivating countries, according to FAO official data, are the following: India, with an area cultivated in 2013 of 9,600,000 ha, which represents 68.17% of the worldwide total area cultivated with chickpea (Table 1 and Table 2), followed by Pakistan, with 992,000 ha cultivated in 2013 (which represents 7.32% of the worldwide total area cultivated with chickpea in 2013).
Table 1. Worlwide total area cultivated with chickpea in the period 2010-2013*
Years 2010 2011 2012 2013
Total cultivated area (ha) 11986708 13272903 12345432 13540398
*(www faostat.fao.org)
Table 2. Large chickpea cultivating countries in the period 2010-2013*
No. Cultivated area (ha) % from worldwide total cultivated area
Country 2010 2011 2012 2013 2010 2011 2012 2013
1. India 8170000 9190000 8320000 9600000 68.17 69.25 67.40 70.91
2. Pakistan 1066900 1053800 1055000 992000 8.903 7.94 8.55 7.32
3. Australia 500000 653142 456070 573600 4.17 4.92 3.69 4.24
4. Iran 508313 562375 565000 550000 4.24 4.23 4.58 4.06
5. Turkey 446218 446413 416242 423557 3.72 3.36 3.37 3.12
6. Myanmar 327554 333052 336000 335000 2.73 2.51 2.72 2.48
7. Ethiopia 208389 231299 239512 122248 1.74 1.74 1.94 0.90
8. Romania 153 85 165 147 0.001277 0.00064 0.001337 0.001086
*(www faostat.fao.org)
Chickpea crop technology in Romania Considering the small surfaces cultivated with chickpea in Romania, the culture location is not an issue. It can be grown after any plant, but itis not recommended to return after itself and after other leguminous plants. In its culture zone, it returns after cereals or sunflower. Chickpea is a good preliminary culture plant for the autumn wheat. Fertilization is made with 200-300 kg/ha superphosphate, at autumn in ploughing, and at seedbed preparation around 100 kg of ammonium nitrate. The succession of soil tillage is realized in such a manner so that the sowing must be done very early in spring, under optimal conditions.
Immediately after the harvest of preliminary culture and releasing the field of the crop scraps, it is recommended to effectuate a work with the stubble disc harrow. The purpose of harrowing is to shred weeds and crop scraps (stubble field) and to hoe the superficial layer of the soil. As soon as possible, the field is tilled with the plough in aggregate with serrated disc harrow at a depth of 25-30 cm. After preliminary cultures harvested in summer, the soil is repeatedly tilled (harrowing), the field is leveled, the clods are shredded and the emerging weeds are destroyed, reducing the reserve of weeds.
88
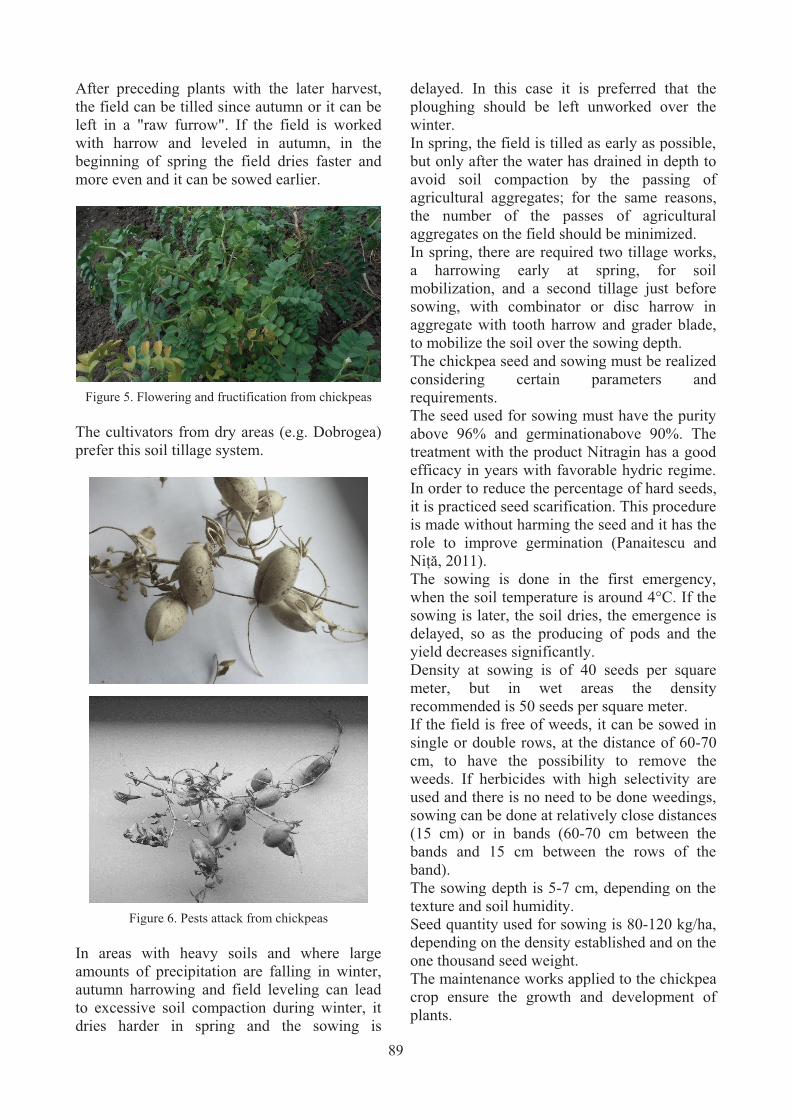
After preceding plants with the later harvest, the field can be tilled since autumn or it can be left in a "raw furrow". If the field is worked with harrow and leveled in autumn, in the beginning of spring the field dries faster and more even and it can be sowed earlier.
Figure 5. Flowering and fructification from chickpeas
The cultivators from dry areas (e.g. Dobrogea) prefer this soil tillage system.
Figure 6. Pests attack from chickpeas
In areas with heavy soils and where large amounts of precipitation are falling in winter, autumn harrowing and field leveling can lead to excessive soil compaction during winter, it dries harder in spring and the sowing is
delayed. In this case it is preferred that the ploughing should be left unworked over the winter. In spring, the field is tilled as early as possible, but only after the water has drained in depth to avoid soil compaction by the passing of agricultural aggregates; for the same reasons, the number of the passes of agricultural aggregates on the field should be minimized. In spring, there are required two tillage works, a harrowing early at spring, for soil mobilization, and a second tillage just before sowing, with combinator or disc harrow in aggregate with tooth harrow and grader blade, to mobilize the soil over the sowing depth. The chickpea seed and sowing must be realized considering certain parameters and requirements. The seed used for sowing must have the purity above 96% and germinationabove 90%. The treatment with the product Nitragin has a good efficacy in years with favorable hydric regime. In order to reduce the percentage of hard seeds, it is practiced seed scarification. This procedure is made without harming the seed and it has the role to improve germination (Panaitescu and Ni��, 2011). The sowing is done in the first emergency, when the soil temperature is around 4°C. If the sowing is later, the soil dries, the emergence is delayed, so as the producing of pods and the yield decreases significantly. Density at sowing is of 40 seeds per square meter, but in wet areas the density recommended is 50 seeds per square meter. If the field is free of weeds, it can be sowed in single or double rows, at the distance of 60-70 cm, to have the possibility to remove the weeds. If herbicides with high selectivity are used and there is no need to be done weedings, sowing can be done at relatively close distances (15 cm) or in bands (60-70 cm between the bands and 15 cm between the rows of the band). The sowing depth is 5-7 cm, depending on the texture and soil humidity. Seed quantity used for sowing is 80-120 kg/ha, depending on the density established and on the one thousand seed weight. The maintenance works applied to the chickpea crop ensure the growth and development of plants.
89

After sowing, before the plants emergence, a roller-harrow work is done in order to destroy the weeds and soil crust. When the plants have 4-6 cm in height, it is done a work with the rotary hoes, in the period when plants lose their turgescence.
Figure 7. Specific weeds in the chickpea culture - images
from didactic and research field
When the chickpea is sown in rare rows, 2-3 weedings are effectuated. Weed control also can be done using herbicides.
Figure 8. The emergence of drought in chickpea culture
Harvest is done when the pods are yellow and the leaves have fallen, in two phases or directly with the harvest combine. If the harvest is delayed, results hard to boil seeds (Panaitescu and Ni��, 2011). In our country, the yields obtained are 10-15 quintals/ha. Chickpea yield capacity is of 25 quintals/ha.
Figure 9. Chickpea pods - images from didactic and
research field
Figure 10. Weight of a chickpea plant at full maturity
Figure 11. Chickpea capsule damaged by pests
Figure 12. Chickpeas seeds healthy and damaged by
pests 90

CONCLUSIONS Chickpea has quite high requirements to the temperature, the amount of temperature degrees necessary for all vegetation period being approximately of 2,000ºC. Under climatic conditions from Dobrogea, this requirement can be accomplished. The minimum germination temperature is 3-4°C. At 6-8°C it emerges in at least 10 days. As seedling it resists until -6°C and during the vegetation period chickpea requires temperatures up to 20-21°C. Chickpea can valorize, by satisfying yields, the soils with medium texture, rich in calcium, but also sandy soils and slightly salinated soils existing in Dobrogea area. Considering the fact that, among all leguminous bean plants, chickpea can tolerate drought the easiest, knowing the arid, dry character of Dobrogea area, we can draw the conclusion that chickpea might succeed into culture on the soils and climatic conditions of Dobrogea. The location of this culture is not an issue. It can becultivated after any plant, but it is not recommended to return after itself and after other leguminous plants. In Dobrogea, among the cultures existing at the moment in the crop structure, it can return after cereals or sunflower. Chickpea is a good preliminary culture plant for autumn wheat (Panaitescu, 2008). Chickpea has a more evenripening than the other leguminous bean plants (favored by area temperature), erectstalk and indehicentpods, therefore issuited better to mechanical harvesting.
REFERENCES Ion V., Georgeta Dicu, Ba A.Gh., State D., 2013. Yield
components at some hybrids of sunflower (Helianthus annuus L.) under drought conditions from south Romania. Scientific Papers, Series "AgroLife Journal", Vol. 2, No. 2, p. 9-14.
Mihalache M., Ilie L., Marin D.I., 2015. Romanian Soil Resources - �Healthy Soils for a Healthy Life�, Scientific Papers, Series "AgroLife Journal", Vol. 4, No. 1, p. 101-110.
Moise Irina, 2009. Pedologie, Taxonomia solurilor României. Ed. Universitar, Bucureti.
Oprea Cristina Andreea, Marin D.I., Bolohan C., 2015. Influence of some technological factors on grain sorghum (Sorghum bicolor L.) moench var. eusorghum) yield grown under the conditions of southeastern Romania. Scientific Papers, Series "AgroLife Journal", Vol. 4, No. 1, p. 123-130.
Panaitescu Liliana, Ni� Simona, 2011. Fitotehnie. Cereale i leguminoase pentru boabe. Ed. Eurobit, Timioara.
Panaitescu Liliana, 2008. Evolution of the vegetal production profile in Constan�a. Lucrri �tiin�ifice USAMV Bucure ti, Seria A, Vol. LI.
Panaitescu Liliana, 2008. Biologia i tehnologia de cultivare a grâului de toamn în condi�iile din Podi ul Dobrogei. Ed. Universitar, Bucure ti.
***Catalogul oficial al soiurilor (hibrizilor) de plante de cultur din România. Bucure ti, 2014.
***www.faostat.fao.org.
91

IN VITRO EVALUATION OF Eupatorium cannabium
ANTIMICROBIAL ACTIVITY
Tomina PURCARU1, Ana ALECU1, Camelia DIGUTA1,2, Florentina MATEI1,2
1University of Agronomic Sciences and Veterinary Medicine of Bucharest, 59, Marasti Blvd.,
011464, Bucharest 1, Romania 2CBM BIOTEHGEN, 59 Marasti Blvd., 011464, Bucharest 1, Romania
Corresponding author email: [email protected]
Abstract This study aimed to prove the antimicrobial potential of different dried leaves Eupatorium cannabium extracts made of a Romanian cultivar, respectively chlorofomic extract, water extract and hydro-alcoholic extract. In the tests have taken into accoun Gram-positive test bacteria (Bacillus cereus, Staphylococcus aureus and Enterococcus faecalis), Gram-negative test bacteria (Escherichia coli) and fungus (Candida albicans and Aspergillus niger). In vitro, the antimicrobial activity was assessed by the "drop agar diffusion" method. In the case of the chloroformic extract and hydro-alcoholic extracts of the Eupatorium cannabium local variety the inhibitory activity have been noticed only in the case of Escherichia coli and Bacillus cereus, as well as on the dimorphic yeast Candida albicans. No clear inhibition have been noticed in the case of Staphylococcus aureus, Enterococcus faecalis and Aspergillus niger. Key words: in vitro, Eupatorium cannabium, antibacterial, antifungal. INTRODUCTION Phytotherapy, as form of traditional and conventional human and veterinary medicine, is one of the oldest and the most widely spread systems of therapy. The skill of treatment using medicinal plants was developed by all nations directly linked to the available plants. Phytotherapy is very intensively used in prophylactic purposes and with the aim of treatment of milder forms of diseases, chronic diseases and recurrent infections as well as in organic livestock production (Bojor, 2003; Davidovic, 2012). Aromatic and medicinal plants are known to produce certain bioactive molecules which can inhibit the growth of different microoganisms (Cowan, 1999). Many extracts from medicine plant have been known to possess antimicrobial effects and used for the purpose of food preservation and medicinal purposes. Considered as time tested and comparatively safe both for human used and for environment the herbal extracts have received much attention as a source of new antibacterial drugs (Arvind, 2011).
The literature reported Eupatorium sp. as a source of materials as flavonoids (e.g., quercetin, hypersoide, jaceosidin, kaempferol), ternary compounds (e.g., taraxasterol palmitate, b-taraxasterol), sesquiterpenes (e.g., eeupalinolide A and eupalinolide B) and volatile oil.
Figure 1. Aerial part of Eupatorium canabium These active ingredients produce varied pharmacological effects such as disinfection, antiinflammation, anti-neoplasm, immunoregulation, liver and damage protection, blood glucose decrease (Kazuo,
92
AgroLife Scientific Journal - Volume 4, Number 2, 2015
ISSN 2285-5718; ISSN CD-ROM 2285-5726; ISSN ONLINE 2286-0126; ISSN-L 2285-5718

Yoshihisa, & Mitsumasa, 1979; Xu et al., 1998; Yan et al., 2003). Moreover, extracts of Eupatorium lindleyanum are proposed to be used as food additive (Li et al., 2008), while essential oil of Eupatorium canabium can be employed during food storage against Aspegillus development and aflatoxin formation (Kumar et al., 2007). Eupatorium canabium, commonly known as Hemp-agrimony, is a robust perennial plant of Asteraceae family (Figure 1). Is native in many areas of Europe and is traditionally know for its use in tumor inhibition, hypertensions and diabetes; its toxicity comes from the presence of tumorigenic pyrrolizidine alkaloids. Sometimes the leaves are used as a substitute for tea. The presence of antimicrobial and other biological activities have been already demonstrated in different extracts of Eupatorium spp. Gupta et al. (2002) have noticed that petroleum ether extract of Eupatorium ayapana showed higher antibacterial and antifungal activity than the methanolic extract. In 2008, Ji et al. have reported the antimicrobial activity of water decoct of Eupatorium lindleyanum DC on tested Gram-positive bacteria (S. aureus, Bacillus subtilis, Bacillus cereus and Enterococcus faeciumand) and Gram-negative species (Escherichia coli, Salmonella typhimurium, Proteus vulgaris and Pseudomonas fluorescens). Meanwhile, Arvid and Amit (2011) have proved the antibacterial (Bacillus subtilis, Bacillus cereus, Staphylococcus aureus, Escherichia coli, Klebsiella aerogenes and Pseudomonas aeruginosa) and antifungal (Aspergilus niger, Aspergilus candidus and Candida albicans) effect of petroleum ether extract from Eupatorium adenophorum Spreng. Also, animal-studies and in vitro experiments with plant extracts of Eupatorium perfoliatum both indicate antiinflammatory effects beside antiplasmodial effect against Plasmodium falciparum (Hensel et al., 2011). Also, anitbacterial activity have been proven on resinous exudate from twigs and leaves of Eupatorium salvia (Urzua et al., 1998). Up to know few studies have been reported on the antimicobial activities of Eupatorium cannabium.
In this study we have focused on extracts of local Romanian variety of Eupatorium cannabium which have been tested for the anitmicrobial activity on Gram-positive and Gram-negative bacteria, as well as on yeast and moulds. MATERIALS AND METHODS Collection of plant material Plants of a local Romanian variety of Eupatorium cannabium have been harvested from the experimental field of Dacia Plant S.A., Bod, Brasov County (Centre-Romania) during the month of the plants have been cultivated under certified ecological conditions. Herbarium specimen was preserved at the manufacturer. Preparation of plant extracts The dried leaves of Eupatorium cannabium have been grounded into powder. Three type of extracts have been prepared by our partners (ICCF Bucharest) as follows: E1 was chloroformic extract E 62.5 mg/mL PPG 50%; E2 was water extract E 250 mg/mL PPG 20%; E3 was hydro-alcoholic extract E 250 mg/mL PPG 20%. Test microorganisms In the test have been taken into account different type of microorganisms (Table 1), respectively three Gram-positive test bacteria (Bacillus cereus, Staphylococcus aureus and Enterococcus faecalis), one Gram-negative test bacteria (Escherichia coli) and two fungus (Candida albicans and Aspergillus niger). The bacterial strains were maintained and tested on nutrient agar (0.5% peptone; 0.3% yeast extract; 1.5% agar; 0.5% NaCl) at 37oC, using 24 hours old inoculums. Yeasts and fungal strains were maintained and tested on Yeast Extract Glucose Agar (1% yeast extract; 2% peptone; 2% glucose; 2% agar) at 30oC, using 24 hours old inoculums for yeasts or mycelium block (5 mm) for filamentous fungi.
93

Table 1. Microorganisms tested for their susceptibility to Eupatorium canabium alcoholic extracts No. Strain Characteristics Origin 1. Bacillus cereus CP1 Gram-positive, beta hemolytic
bacterium Collection of Faculty of
Biotechnology, Bucharest, Romania 2. Staphylococcus aureus CP 4 Gram-positive, catalase-positive Collection of Faculty of
Biotechnology, Bucharest, Romania 3. Enterococcus faecalis CP 3 Gram-positive, sensible to β-lactam-
based antibiotics Collection of Faculty of
Biotechnology, Bucharest, Romania 4. Escherichia coli CP2 Gram-negative, toxinogenic serotype Collection of Faculty of
Biotechnology, Bucharest, Romania 5. Candida albicans ATCC10231 Serotype A, sensible to nystatin Collection of Microbial Genetics
and Biotechnology, Faculty of Biology, Bucharest, Romania
6. Aspergillus niger F2T Responsible for pulmonary infections in dogs
Collection CBM Biotehgen Bucharest, Romania
Antimicrobial Analysis In vitro, the antimicrobial activity was assessed by the "drop agar diffusion" method (Figure 2). The microorganisms were spread using 100 μl of suspension containing 108 CFU/ml on nutrient agar or on Yeast Extract Glucose Agar respectively. Concerning A. niger F2T, the mycelium block (5 mm) was placed in the centre of the medium in Petri dishes.
Figure 2. Aspects from the "drop agar diffusion" screening method
After 1 hour of incubation at 35oC for bacteria and 28oC for fungi, spots of 10 μL and 20 μL of each sterile extract have been added in the agar plates pre- inoculated with the tested microorganisms. Non diluted ampicillin (for bacteria) and fluconazole (for fungi) have been used as positive control and the Eupatorium extracts solvent have been used in the master plates.
The diameter of growth inhibition zones (halos) was measured in millimetres on two axes and the mean value reported. The results are the mean of two separate experiments with three repetitions for each sample. RESULTS AND DISCUSSIONS In this study three different extracts of Eupatorium cannabium (chloroformic, water extract and hydro-alcoholic extract) have been tested for their antimicrobial activity on different type of microorganisms, respectively three Gram-positive test bacteria (Bacillus cereus, Staphylococcus aureus and Enterococcus faecalis), one Gram-negative test bacteria (Escherichia coli) and two fungus (Candida albicans and Aspergillus niger). Antimicrobial activity of Eupatorium cannabium extracts on pathogenic bacteria The Eupatorium cannabium extracts have been tested on Gram-positive test bacteria (Bacillus cereus, Staphylococcus aureus and Enterococcus faecalis) and one Gram-negative test bacteria (Escherichia coli). The results are summarized in Table 2. In the case of the Gram-negative bacteria (Escherichia coli CP2) all the extracts has shown inhibitory activity in both applied concentrations (Figure 3).
94
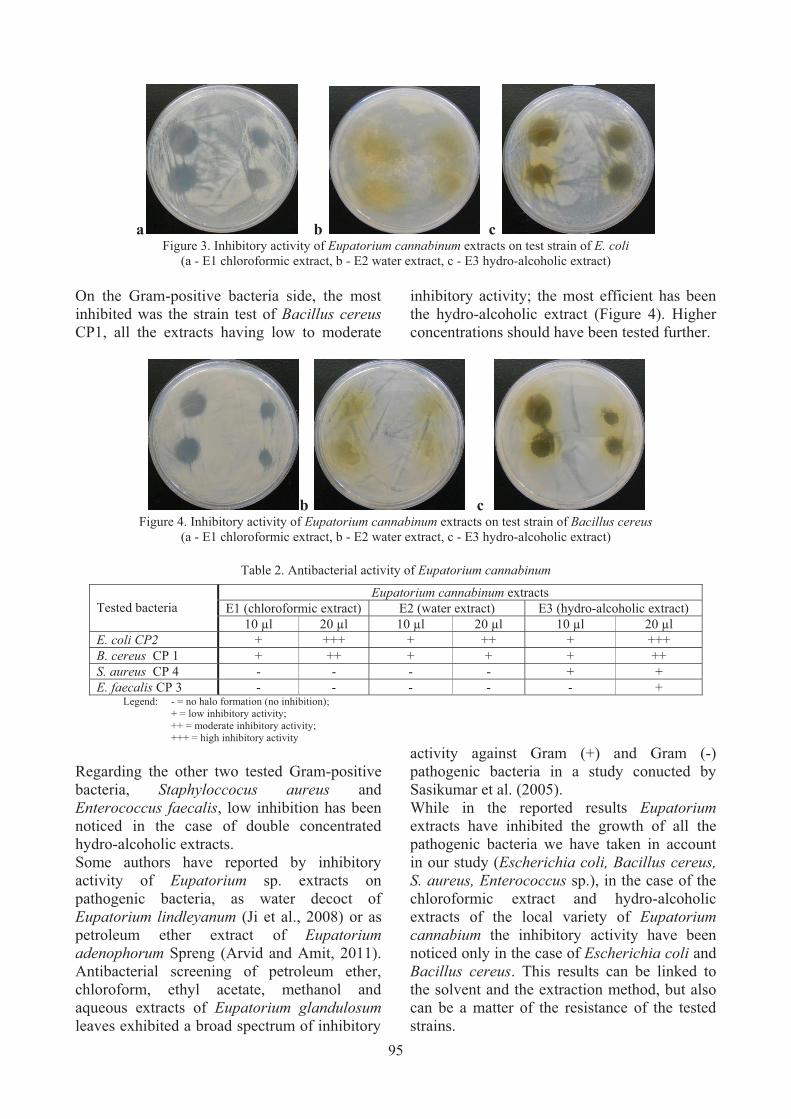
a b c Figure 3. Inhibitory activity of Eupatorium cannabinum extracts on test strain of E. coli
(a - E1 chloroformic extract, b - E2 water extract, c - E3 hydro-alcoholic extract) On the Gram-positive bacteria side, the most inhibited was the strain test of Bacillus cereus CP1, all the extracts having low to moderate
inhibitory activity; the most efficient has been the hydro-alcoholic extract (Figure 4). Higher concentrations should have been tested further.
b c Figure 4. Inhibitory activity of Eupatorium cannabinum extracts on test strain of Bacillus cereus
(a - E1 chloroformic extract, b - E2 water extract, c - E3 hydro-alcoholic extract)
Table 2. Antibacterial activity of Eupatorium cannabinum
Legend: - = no halo formation (no inhibition); + = low inhibitory activity; ++ = moderate inhibitory activity; +++ = high inhibitory activity Regarding the other two tested Gram-positive bacteria, Staphyloccocus aureus and Enterococcus faecalis, low inhibition has been noticed in the case of double concentrated hydro-alcoholic extracts. Some authors have reported by inhibitory activity of Eupatorium sp. extracts on pathogenic bacteria, as water decoct of Eupatorium lindleyanum (Ji et al., 2008) or as petroleum ether extract of Eupatorium adenophorum Spreng (Arvid and Amit, 2011). Antibacterial screening of petroleum ether, chloroform, ethyl acetate, methanol and aqueous extracts of Eupatorium glandulosum leaves exhibited a broad spectrum of inhibitory
activity against Gram (+) and Gram (-) pathogenic bacteria in a study conucted by Sasikumar et al. (2005). While in the reported results Eupatorium extracts have inhibited the growth of all the pathogenic bacteria we have taken in account in our study (Escherichia coli, Bacillus cereus, S. aureus, Enterococcus sp.), in the case of the chloroformic extract and hydro-alcoholic extracts of the local variety of Eupatorium cannabium the inhibitory activity have been noticed only in the case of Escherichia coli and Bacillus cereus. This results can be linked to the solvent and the extraction method, but also can be a matter of the resistance of the tested strains.
Tested bacteria
Eupatorium cannabinum extracts E1 (chloroformic extract) E2 (water extract) E3 (hydro-alcoholic extract)
10 μl 20 μl 10 μl 20 μl 10 μl 20 μl E. coli CP2 + +++ + ++ + +++ B. cereus CP 1 + ++ + + + ++ S. aureus CP 4 - - - - + + E. faecalis CP 3 - - - - - +
95
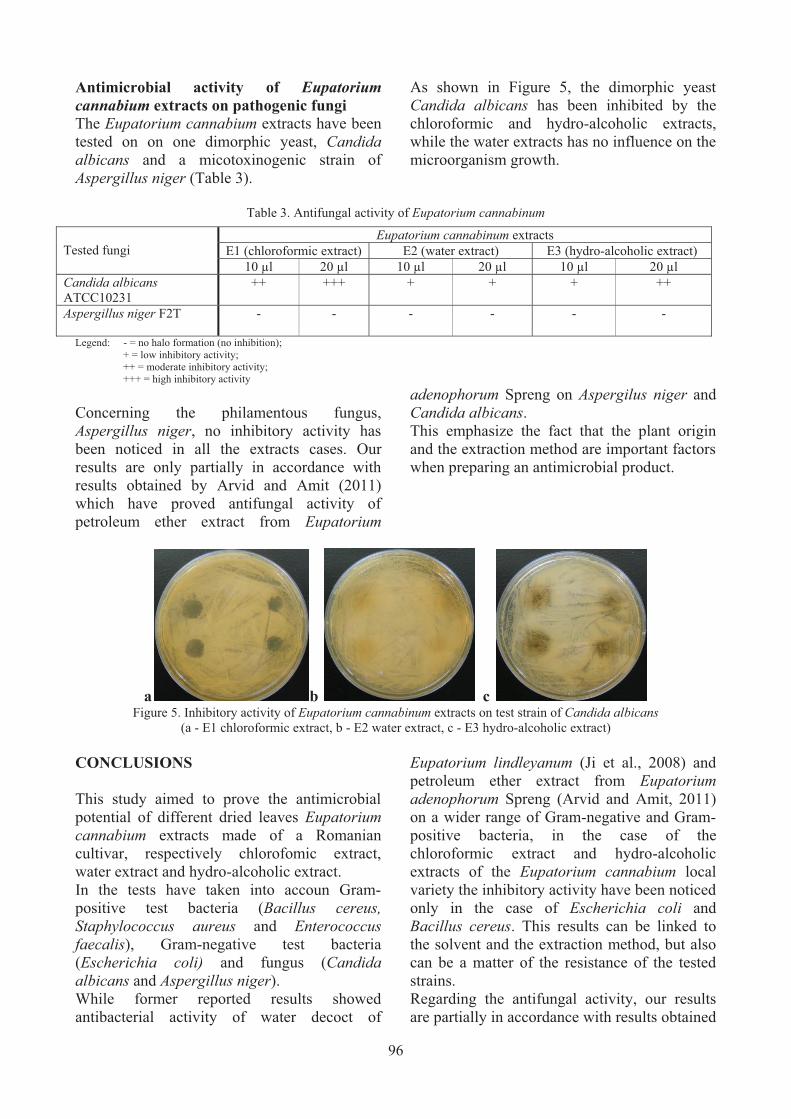
Antimicrobial activity of Eupatorium cannabium extracts on pathogenic fungi The Eupatorium cannabium extracts have been tested on on one dimorphic yeast, Candida albicans and a micotoxinogenic strain of Aspergillus niger (Table 3).
As shown in Figure 5, the dimorphic yeast Candida albicans has been inhibited by the chloroformic and hydro-alcoholic extracts, while the water extracts has no influence on the microorganism growth.
Table 3. Antifungal activity of Eupatorium cannabinum
Legend: - = no halo formation (no inhibition); + = low inhibitory activity; ++ = moderate inhibitory activity; +++ = high inhibitory activity Concerning the philamentous fungus, Aspergillus niger, no inhibitory activity has been noticed in all the extracts cases. Our results are only partially in accordance with results obtained by Arvid and Amit (2011) which have proved antifungal activity of petroleum ether extract from Eupatorium
adenophorum Spreng on Aspergilus niger and Candida albicans. This emphasize the fact that the plant origin and the extraction method are important factors when preparing an antimicrobial product.
a b c Figure 5. Inhibitory activity of Eupatorium cannabinum extracts on test strain of Candida albicans
(a - E1 chloroformic extract, b - E2 water extract, c - E3 hydro-alcoholic extract) CONCLUSIONS This study aimed to prove the antimicrobial potential of different dried leaves Eupatorium cannabium extracts made of a Romanian cultivar, respectively chlorofomic extract, water extract and hydro-alcoholic extract. In the tests have taken into accoun Gram-positive test bacteria (Bacillus cereus, Staphylococcus aureus and Enterococcus faecalis), Gram-negative test bacteria (Escherichia coli) and fungus (Candida albicans and Aspergillus niger). While former reported results showed antibacterial activity of water decoct of
Eupatorium lindleyanum (Ji et al., 2008) and petroleum ether extract from Eupatorium adenophorum Spreng (Arvid and Amit, 2011) on a wider range of Gram-negative and Gram-positive bacteria, in the case of the chloroformic extract and hydro-alcoholic extracts of the Eupatorium cannabium local variety the inhibitory activity have been noticed only in the case of Escherichia coli and Bacillus cereus. This results can be linked to the solvent and the extraction method, but also can be a matter of the resistance of the tested strains. Regarding the antifungal activity, our results are partially in accordance with results obtained
Tested fungi
Eupatorium cannabinum extracts E1 (chloroformic extract) E2 (water extract) E3 (hydro-alcoholic extract)
10 μl 20 μl 10 μl 20 μl 10 μl 20 μl Candida albicans ATCC10231
++ +++ + + + ++
Aspergillus niger F2T
- - - - - -
96

by Arvid and Amit (2011) which have proved antifungal activity of petroleum ether extract from Eupatorium adenophorum Spreng on both Aspergilus niger and Candida albicans, while in the case of the tested chloroformic extract and hydro-alcoholic extracts of the Eupatorium cannabium the inhibitory activity has been noticed only in the case of Candida albicans. This emphasize the fact that the plant origin and the extraction method are important factors when preparing an antimicrobial product. Further investigation have to be performed in different extraction conditions and solvent and the test of MCI should be applied in order to be able to recommend the leaves of Eupatorium cannabium extracts in the animal or human phytotherapy. ACKNOWLEDGEMENTS This work was supported by the Executive Agency for Higher Education, Research, Development and Innovation Funding in the frame of Partnerships in S&T priority domains Program, Project no. 134/2012, acronym PHYTOIMMUVET. REFERENCES Arvind N., Amit S., 2011. Antimicrobial Potential of
Eupatorium adenophorum Spreng. Pharmacognosy Journal, 2 (18), p. 61-64.
Bojor O., Popescu O., 2003. Fitoterapie tradiţională şi modern. Ed. Fiat Lux, Bucureşti.
Cowan M.M., 1999. Plant products as antimicrobial agents. Clinical Microb. Reviews, 12, p. 564-582.
Davidović V., Joksimović Todorović M., Stojanović B., Relić R., 2012. Plant usage in protecting the farm animal health. Biotechnology in Animal Husbandry 28 (1), p. 87-98. Institute for Animal Husbandry, Belgrade-Zemun.
Gupta M., Mazumder U.K., Chaudhuri I., Chaudhuri R.K., Bose P., Bhattacharya S., Manikandan L., Patra S., 2002. Antimicrobial activity of Eupatorium ayapana. Fitoterapia. Apr; 73(2): p. 168-170.
Hensel A., Maas M., Sendker J., Lechtenberg M., Petereit F., Deters A., Schimdt T., Stark T., 2011. Eupatorium perfoliatum L.: Phytochemistry, traditional use and current applications. Journal of Ethnopharmacology 138, p. 641-651.
Kazuo I., Yoshihisa S. & Mitsumasa H., 1979. Four new germacranolides from Eupatorium lindleyanum DC. Chemical Letter, 12, p. 1469-1472.
Kumar R., Dubey N., Tiwari O.P., Tripathi Y.B., Sinha K.K., 2007. Evaluation of some essential oils as botanical fungitoxicants for the protection of stored food commodities from fungal infestation. J. Sci. Food Agric. 87: p. 1737-1742.
Li-Lian Ji, Yu-Ming Luo, Gui-Long Yan, 2008. Studies on the antimicrobial activities of extracts from Eupatorium lindleyanum DC against food spoilage and food-borne pathogens. Food Control, Vol. 19, Issue 10, p. 995-1001.
Sasikumar J.M., Doss A.P., Doss A., 2005. Antibacterial activity of Eupatorium glandulosum leaves. Fitoterapia, Mar; 76(2): p. 240-3.
Urzua A., Caroli M., Vasquez L., Mendoza L., Wilkens M., Tojo E., 1998. Antimicrobial study of the resinous exudate and of diterpenoids isolated from Eupatorium salvia (Asteraceae). Journal of Ethnopharmacology, Vol. 62, Issue 3, p. 251-254.
Xu Y.L., Shan X.Z., & Wang Z.Y., 1998. Chemical constituents from Eupatorium adenophorum. Acta Bot Yunnan, 10, p. 238-240.
Yan L.Y., Qin S. H., Duan J.A., & Tian L.J., 2003. Studies on the chemical constituents of Eupatorium lindleyanum. Journal of China Pharmaceutical University, 34, p. 220-221.
97

ASSESSMENT OF BIOGAS PRODUCTION OF CERTAIN VARIETIES OF Pennisetum purpureum, Zea mays and Sorghum saccharatum
Carlos SABORÍO VÍQUEZ
University of Costa Rica, Postal Code 2060, San José, Costa Rica
Corresponding author email: [email protected]
Abstract The climate crisis that is affecting the planet Earth is pushing us to look forward for the optimization of the productive systems, with the final purpose of closing up energetic cycles, and in this way, attempt to take the most amount of energy that is produced. This is how clean energy or alternative energy sources are making their way into the productive systems, as it is the case of biogas, who takes advantage of the agricultural and/or urban waste in order to produce methane. In this experiment, we compared three crops: two varieties of King Grass (Pennisetum purpureum) two varieties of maize (Zea mays), and one variety of sorghum (Sorghum saccharatum), with the purpose to determine the corresponding variables of: plant height, stem thickness, and number of leaves. At the end of the test the respective laboratory analysis for fresh weight, dry weight, volatile mass, and biogas production were made. King Grass (P. purpureum) was the one who showed better results in terms of biomass production, being the “Altura” variety the one that gave better yields, which indicates better yields in terms of biogas production. The main objective of the present work was to compare the total biomass production as a source of biogas, by measuring: plant height, stem thickness, number of leaves and biogas production. Key words: biogas, alternative energy, Zea mays, Pennisetum purpureum, Sorghum saccharatum. INTRODUCTION Because of the un-sustainability of the actually used energy sources, such as fossils-based fuels, carbon sources burning, and others; it is indispensable the put on practice of alternative ways of production. Nowadays, new and quite promising ways of production of energy; one of this new technologies uses the organic matter, resultants of human and agricultural waste, from which biogas is obtained by using bio-digesters. This is then used for electric energy (Chamy and Vivanco, 2007; Escobar and Ronquillo, 2012; Fan et al., 1998). One issue with this way of energy production is the use of human consumption crops, such as corn, because it states a competition between energy production and the food security of the people. As a solution to this problem, we can use alternative biomass sources, such as the grass known as King Grass (Pennisetum purpureum) (Zwart et al., 2006; Reicha et al., 2013). P. purpureum has demonstrated to be a promising crop to be investigated, because of
its capacity of growing vigorously, such as the generation of biogas from it (Kukkonen, 2012). Estación Experimental Agrícola Fabio Baudrit Moreno (EEAFBM) data: EEAFBM it’s located at 840 MASL, has an area of 53.6 hectares; the annual precipitation average is 1940 mm, distributed from May to November, while the annual ambient temperature average is of 22°C (Jørgensen, 2009). The soil is compound by clay-sandy loam and sandy-clay loam. Sun brightness remains in a maximum of between 10 and 11 light hours per day, between January-April, and in a minimum of 4.9 hours per day from June to July. This region has a humid-tropic climate, with precipitation that varies from 3000 to 4000 mm per year (Table 1, Figure 1, 2 and 3). Investigation’s main objective: To compare total biomass yields as a source of obtaining biogas, by measuring: plant height, stem thickness and leaves number on two varieties of P. purpureum, Zea mays and one variety de Sorghum saccharatum.
98
AgroLife Scientific Journal - Volume 4, Number 2, 2015
ISSN 2285-5718; ISSN CD-ROM 2285-5726; ISSN ONLINE 2286-0126; ISSN-L 2285-5718

Table 1. Maximum and minimum temperature,
precipitation and light hours per month in Costa Rica
Figure 1. Maximum and minimum temperatures per
month in Costa Rica
Figure 2. Annual precipitation per month in Costa Rica
Figure 3. Annual light hours received percentage in
Costa Rica, per month
Specific objectives: � To measure periodically plant height of the
mentioned varieties. � To measure periodically stem thickness of
the mentioned varieties. � To count periodically the leaves number of
the mentioned varieties. � To obtain total biomass yield and biogas
produced from the mentioned varieties. MATERIALS AND METHODS Procedure This investigation was conducted from 2014 to 2015, at EEAFBM, in La Garita de Alajuela, Costa Rica. The experience was a factorial kind of, using subdivided plots in ten repetitions, where plant height, stem thickness, and number of leaves were measured. There upon, laboratory analysis were done, to determine fresh mass, dry mass, volatile mass content, and biogas produced (Table 2), with the purpose of assessing how many electric energy could be produced. This was done in a comparative way for the “Altura” and “Bajura” P. purpureum varieties, the “Diamante” and EJN2 Zea mays varieties, and “0936” Sorghum saccharatum variety. One plot was sown within an area of 324 m2 with “Bajura” P. purpureum variety. Vegetative seeds, from stems of approximately two-years-plants, were used (Figure 4). This seeds were cut at ~25 cm, and were sown in small knolls, with 110 cm distance between them, and ~70 cm between plants (Figure 5). The same procedure was done when sowing P. purpureum “Altura” variety, within a 195 m2 plot (Riek et al., 2012).
Figure 4. Pennisetum purpureum vegetative seeds
99

Figure 5. Pennisetum purpureum sown in small knolls
with vegetative seeds of ~25 cm lenght, at 100 cm distance between knolls, and ~70 cm between plants
At the plot sown with corn, “Diamante” and “EJN2” seeds were used to be sown in small knolls, spaced by ~20 cm between plants, and by 90 cm between knolls (Figure 6). Diamante’s sown area was of 463.45 m2, and 160 m2 for EJN2.
Figure 6. Zea mays sowing, at 90 cm distance between
small knolls, and ~20 cm between plants Sorghum saccharatum was sown in an area of 412.46 m2 and 0936-variety seeds were used. It was sown in a continuous line between knolls at ~90 cm (Figure 7).
Figure 7. Continuous line sown of Sorghum at 90 cm
between knolls Plant height, stem thickness and leaves number data were taken each week, until 5 months for P. purpurem and S. saccharatum; while for
both Z. mays varieties this data was taken for 3 months. The laboratory analyses were taken at the established time (fresh mass, dry mass, volatile mass and biogas production).
Table 2. Analyzed variables scheme during and after crop growth for two varieties of Pennisetum purpureum,
Zea mays, and one variety of Sorghum saccharatum
Experimental design A randomized block design was used, with five plots, one for each variety sown; comparatively measuring total biomass capacity between varieties. Statistic analysis Collected data was analyzed by Tukey multiple-comparison method, for which was used InfoStat-free version program. A significance level of 0.05 (5%) was used in this trial. RESULTS AND DISCUSSIONS Plant height In the following analysis it has been considered as the reference height of corn, when it has reached physiological maturity, which is when the corn grain is soft, and in the case of these varieties analyzed, this period is achieved in the third month after planting, reaching a height of 164.5 cm in the case of the variety Diamante and 155.62 cm in the case of the variety EJN2. In terms of height, P. purpureum “Altura” variety showed the highest level five months after having been sown, with 263.98 cm (p < 0.05). On the other hand, S. saccharatum 0936 variety had the lowest height, five months after having been sown, with 154.04 cm (Table 3 and Figure 9).
100
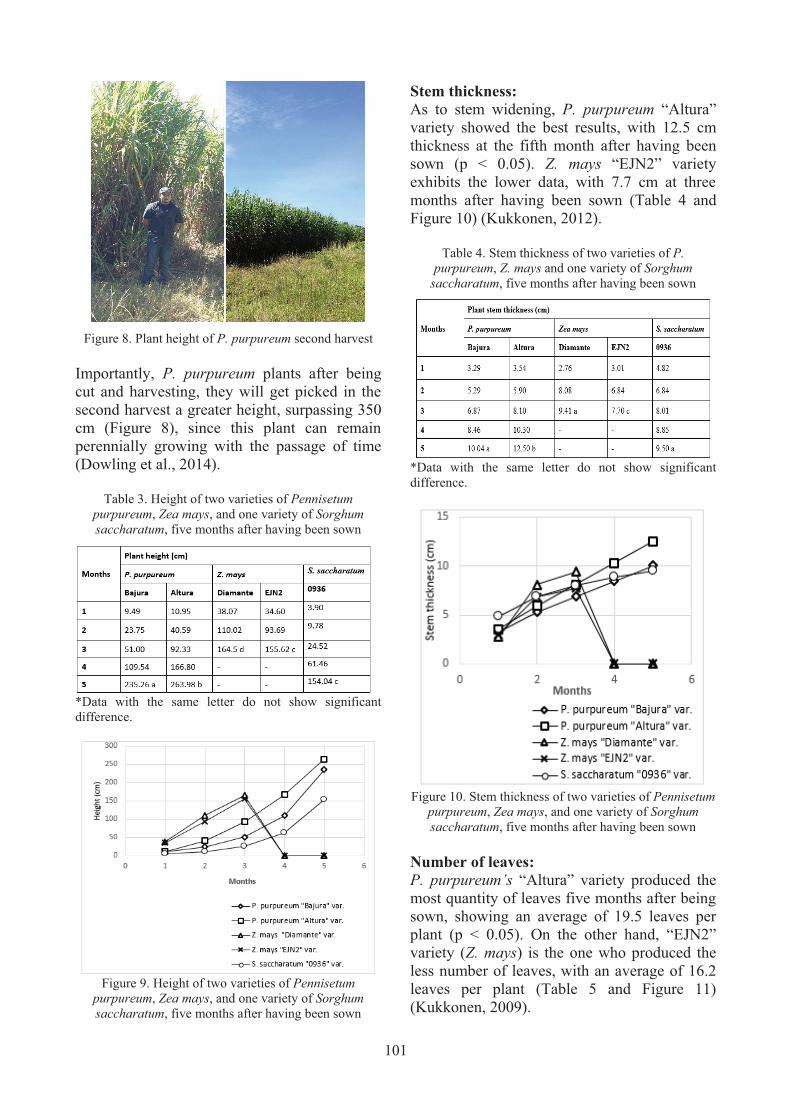
Figure 8. Plant height of P. purpureum second harvest
Importantly, P. purpureum plants after being cut and harvesting, they will get picked in the second harvest a greater height, surpassing 350 cm (Figure 8), since this plant can remain perennially growing with the passage of time (Dowling et al., 2014).
Table 3. Height of two varieties of Pennisetum purpureum, Zea mays, and one variety of Sorghum saccharatum, five months after having been sown
*Data with the same letter do not show significant difference.
Figure 9. Height of two varieties of Pennisetum
purpureum, Zea mays, and one variety of Sorghum saccharatum, five months after having been sown
Stem thickness: As to stem widening, P. purpureum “Altura” variety showed the best results, with 12.5 cm thickness at the fifth month after having been sown (p < 0.05). Z. mays “EJN2” variety exhibits the lower data, with 7.7 cm at three months after having been sown (Table 4 and Figure 10) (Kukkonen, 2012).
Table 4. Stem thickness of two varieties of P. purpureum, Z. mays and one variety of Sorghum
saccharatum, five months after having been sown
*Data with the same letter do not show significant difference.
Figure 10. Stem thickness of two varieties of Pennisetum
purpureum, Zea mays, and one variety of Sorghum saccharatum, five months after having been sown
Number of leaves: P. purpureum’s “Altura” variety produced the most quantity of leaves five months after being sown, showing an average of 19.5 leaves per plant (p < 0.05). On the other hand, “EJN2” variety (Z. mays) is the one who produced the less number of leaves, with an average of 16.2 leaves per plant (Table 5 and Figure 11) (Kukkonen, 2009).
101

Table 5. Number of leaves of two varieties of
Pennisetum purpureum, Zea mays, and one variety of Sorghum saccharatum, five months after having been
sown
*Data with the same letter do not show significant difference.
Figure 11. Number of leaves of two varieties of
Pennisetum purpureum, Zea mays, and one variety of Sorghum saccharatum, five months after having been
sown
Figure 12. Pennisetum purpureum “Altura” variety one month after being sown (1), and five months after being
sown (2)
Figure 13. Zea mays plant one month after being sown
(1), and five months after being sown (2)
Figure 14. Sorghum saccharatum, plants one month after
being sown (1), and five months after being sown (2)
Biomass analysis: With respect to the biomass, it was analyzed separately Zea mays and Pennisetum purpureum. Measurements of stem, root and leaves were made to determinate the fresh weight, dry weight and the percentage of biogas produced. Both as a plant seed like at a density of 40,000 plants/ha (Tables 6, 7, 8 and 9). The plant organ that brought major percentage of biogas were leaves, in both Zea mays and Pennisetum purpureum, which proves to be the most suitable part of the plant to produce biogas, roots and stems both as Zea mays and Pennisetum purpureum presented similar percentages in terms of production of biogas. In Figure 15 it can be seen graphically as the leaves are the most productive source of biogas for Zea mays and Pennisetum purpureum.
102

Table 6. Fresh mass, dry mass, volatile mass, and biogas produced by roots, stems and leaves of a Zea mays plant
Table 7. Fresh mass, dry mass, volatile mass, and biogas produced by roots, stems and leaves of a Pennisetum
purpureum plant
Table 8. Fresh mass, dry mass, volatile mass and biogas produced by roots, stems, and leaves in one hectare of
Zea mays at a 40000 plants/ha seed density
Table 9. Fresh mass, dry mass, volatile mass, and biogas produced by roots, stems, and leaves in one hectare of
Pennisetum purpureum at a 40,000 plants/ha seed density
Figure 15. Dry mass and biogas produced by roots,
stems, and leaves of a Pennisetum purpureum and a Zea mays plant
Table 10. Comparative analysis example between different sources of biogas for electric production
In the Table 10, a comparative analysis of various sources of biogas for electricity production is shown (Ribeiro and Lora, 2009). According to this picture, cow manure is who produces more biogas; however, the chicken manure brings more to the production of electricity. On the other hand, in terms of plant material, the two varieties of Pennisetum purpureum were those contributed as much methane as biogas and electricity, up from Zea mays and Sorghum saccharatum. This can be seen graphically in Figures 16, 17, 18, 19, 20 and 21. This shows that Pennisetum purpureum is the best plant source for biogas and electric power production, over other species such as maize and sorghum as well as being more effective, more easily exploitable and cultivable, since it has the ability to keep producing for several harvests per year.
103

Figure 16. Comparative analysis example of dry mass
production between various biomass sources for electric production
Figure 17. Comparative analysis example of volatile
mass production between various biomass sources for electric production
Figure 18. Comparative analysis example of biogas
production in terms of L/Kg between various biomass sources for electric production
Figure 19. Comparative analysis example of methane content between various biomass sources for electric
production
Figure 20. Comparative analysis example of biogas
production in m3/MT between various biomass sources for electric production
Figure 21. Comparative analysis example of electric
energy production between various biomass sources for biogas production
104

CONCLUSIONS The total biomass yield is a source that can be used to obtain biogas. In this case the biomass is given by the plant’s height, stem thickness and number of leaves. In terms of these variables, the “Altura” variety of the Pennisetum purpureum crop proves to have the highest biomass in comparison with the other varieties (Safarik, 2003; Kukkonen, 2012). These variables also show that the “Altura” variety is also more vigorous in relation with King Grass “Bajura” variety, the corn varieties (“Diamante” and “EJN2”), and the sorghum variety (0936). In order of biogas production, P. purpureum was compared with Z. mays. The results are shown in tables 8 and 9 as well as in figure 15. It can be seen that among the other crops that were evaluated, P. purpureum has the highest percentage of biogas produced. It can be concluded that the Pennisetum purpureum “Altura” variety has a high biomass that can be used to achieve a high performance in the production of electric energy from biogas. This crop shows optimum results in comparison with the King Grass “Bajura” variety, “Diamante” and “EJN2” corn varieties and 0936 sorghum variety. In addition to the superiority in performance with the analyzed varieties of Pennisetum purpureum, on varieties of Zea mays and Sorghum saccharatum, Pennisetum purpureum has the advantage of not being a crop that compete with crops for food safety performance, as is the case of maize, which is widely used for both human consumption and animal feed, as is also the case of sorghum (Kukkonen, 2012). Finally, it is important to stress the potential energy shown by this plant which is undoubtedly of great help to produce biogas as a source for electricity production.
REFERENCES Chamy R., Vivanco E., 2007. Potencial de biogás.
Proyecto Energías Renovables. Santiago de Chile. Dowling C., Burson B., Jessup R., 2014. Marker assisted
verification of Kinggrass (Pennisetum purpureum Schumach. X Pennisetum glaucum [L.] R. Br.). Plant Omics Journal. 7(2): p. 72-79.
Escobar J., Ronquillo O., 2012. Respuesta a la fertilización orgánica con el uso de Biol y potásica inorgánica en King grass (Pennisetum purpureum) para estimación energética de potencial productivo de biogás. Zamorano. Departamento de ciencia y producción agropecuaria, Honduras.
Fan S., Gloor M., Mahlman J., Pacala S., Sarmiento J., Takahasshi T., Tans P., 1998. A large terrestrial carbon sink in North America implied by atmospheric and oceanic carbon dioxide data and models. Science 282: p. 442-446.
Jørgensen P., 2009. Biogas - green energy. Faculty of Agricultural Sciences, Aarhus University.
Kukkonen C., 2009. Giant King Grass An Energy Crop for Cellulosic Biofuels & Electric Power Plants. VIASPACE Inc. Irvine, California, USA.
Kukkonen C., 2012. Biomass & Pellets. Giant KingGrass for Bioenergy & Pellets. Bangkok, Thailand.
Reicha P., Luoc Y., Bradfordd J., Perry C., and Oleksyna J., 2013. Temperature drives global patterns in forest biomass distribution in leaves, stems, and roots. PNAS. Vol. 111, No. 38.
Ribeiro K., Lora E., 2009. Estimate of the electric energy generating potential for different sources of biogas in Brazil. Federal University of Itajubá. Brazil Biomass and Bioenergy, 09/2009; 33(9): p. 1101-1107.
Riek I., Rücker A., Schall T., Uhlig M., 2012. Renewable Energy Generation from Biomass – Biogas in India. Center for Applied International Finance and Development.
Safarik M., 2003. Biomass & Environment. Czech Environmental Institute.
Zwart R., Boerrigter P., Deurwaarder E., van der Meijden C., and van Paasen S., 2006. Production of Synthetic Natural Gas (SNG) from Biomass. Development and operation of an integrated bio-SNG system, Netherlands.
105

BIOFORTIFICATION AND SHOOT: ROOT RATIO IN WHEAT SEEDLINGS UNDER THE INFLUENCE OF CERTAIN MINERAL
ELEMENTS
Florin SALA1, Hamzeh RAWASHDEH1,2, Marius BOLDEA1
1Banat University of Agricultural Sciences and Veterinary Medicine, “Regele Mihai I al României”, Timisoara, Soil Science and Plant Nutrition Department, Calea Aradului 119, 300645, Timișoara,
Romania, Phone +40256 277280, Fax: +40256 200296, Email: [email protected], [email protected]
2Water Management and Environment Research Department, National Center for Agricultural Research and Extension, P.O. Box 639, Baqa 19381, Jordan; [email protected]
Corresponding author email: [email protected]
Abstract Researching the way to strike a balance for the shoot : root ratio is beneficial for the normal growth and development of wheat plants even from the early stages of vegetation. The aim of this research was to study the influence of some mineral elements, with a structural and nutritional value, on shoot and root biomass and on the shoot : root ratio in wheat seedlings. The fertilizer used for providing the mineral elements was Lithovit; this is a product based on calcium carbonate and magnesium, with a balanced content of nutrients (Ca, Mg, Fe, Si, K, Na, P and Mn). The biological material was represented by Alex wheat cultivar, species Triticum aestivum L. ssp vulgare. The mineral elements were applied on the shoots when the wheat seedlings were in development stage 12-13 BBCH, through three concentrations of Lithovit (0.35%, 0.7% and 1%). One variant was treated with water, thus it became the control variant, for reference. The treatments applied had a different influence on the quantity of fresh and dry biomass at root level and at shoot level; the results presented statistical significance (p < 0.01; Fcrit <<F, for Alfa = 0.001, ANOVA test). The values of the shoot : root ratio for fresh weight (S/RFw) ranged from 1.006 to 1.015 in the treated variants, while for the control variant the result was 0.970. As for the dry weight (S/RDw), the results yielded by the treated variants were between 1.010 and 1.033, and the result for the control was 0.977. Key words: balanced growth, dry weight, fresh weight, shoot : root ratio, mineral elements, wheat. INTRODUCTION The critical nutrition stages in straw cereals are associated with the first stages of vegetation (10 - 20 BBCH code stage), the deficit of nutrients in these stages being reflected afterwards in the vegetation state of crops and in the quality and quantity of yields (Mengel and Kirkby 2001). The root and shoot systems of wheat have been studied in different stages of vegetation, in order to assess the nutrition and vegetation state of plants, plant state in relation with soil works, plants – nutrient relation (Erenoglu et al., 2010), plant tolerance to temperature and water stress (Essemine et al., 2010; Wasson et al., 2012), plant tolerance to salinity (Bahrani and Joo 2012; Tammam et al., 2008). In the study of the foliar and root systems, or of plants in their entirety, different parameters and
indices have been used, of different types: morpho-physiological (Bi et al., 2011; Rapaport et al., 2014), biochemical (Moayedi et al., 2011), enzymatic (Amirjani and Mahdiyeh 2013), genetic (El Sidding et al., 2013; Rashidi 2011) for the characterization of the momentary state of wheat plants under the influence of specific factors or of the relations of plants with different bioactive components in the environment. Nutrients in the soil or in applied fertilizers play a major role in plant development; their influence on the root and foliar systems in wheat is impacted by a series of factors (De Giorgio and Fornaro 2012; Ehdaie et al., 2010; Pedersen et al., 2010; Raza et al., 2013). Nutrients have different, specific contributions to balanced formation and growth of the root and foliar systems. A well-developed root system, starting with the early stages of
106
AgroLife Scientific Journal - Volume 4, Number 2, 2015
ISSN 2285-5718; ISSN CD-ROM 2285-5726; ISSN ONLINE 2286-0126; ISSN-L 2285-5718
vegetation, will explore a larger volume of soil to provide water and nutrients to plants. The balanced formation and development of the plant highly depends on the main macronutrients (N, P, K) as well as on elements with a structural role, Ca and Si (Ali et al., 2009; White and Broadley 2003), which contribute to the formation of the resistance structure at cell and tissue level. Micronutrients are associated with different enzymatic systems, and they also take specific action towards the development of the root system or the foliar system (Anongo et al., 2014). The present study focused on the influence of certain mineral elements with a structural and nutritive role on wheat plants. The aim of this study was to harness the accumulation of dry and fresh matter and their balance ratio in the root system and in the foliar system on wheat seedlings. MATERIALS AND METHODS The research was carried out at the Faculty of Agriculture within Banat University of Agricultural Sciences and Veterinary Medicine from Timisoara, Romania, in the years 2013-2014. The study included an investigation of the influence of certain mineral elements with nutritive and structural roles on the content and ratio of fresh matter and dry matter at shoot and root level in wheat seedlings, for harnessing their growth and development. The experiments were organized in laboratory conditions, in germinators with controlled con-ditions. Each variant was isolated, in order to make the best out of the applied treatments, with no external influences. The biological ma-terial was represented by Alex wheat cultivar, species Triticum aestivum L. ssp. vulgare, with specially selected seeds for ensuring uniformity to the seed material. Twenty seeds were used in each treatment, the average weight of seeds per variant being 1.094 ± 0.007 g. A natural product based on calcium and man-ganese carbonate was used to provide the mine-ral elements; this belongs to group Lithovit, and has the following composition: 75% CaCO3, 4% MgCO3, 0.5% Fe, 5% Si, 0.1% K2O, 0.015% Na, 0.015% P2O5, 0.01% Mn. There was a control variant (V1) and other three variants with different Lithovit concentrations
(0.35% - V2, 0.7% - V3 and 1% - V4). The treatments, in the form of a solution, were applied by spraying on the shoots of wheat seedlings when these were in growth stage 12-13 BBCH. Immediately after treatment, the variants were isolated and were placed individually under a hand glass, in order to avoid potential outside influences and to observe the contribution of each treatment to the realization of the parameters under study. In order to consider the effects of elements with nutritional and structural roles on the biofortification of wheat seedlings, some parameters were determined on the dry and fresh weight at root level (RFw - root fresh weight, RDw - root dry weight) and at shoot level (SFw - shoot fresh weight, SDw - shoot dry weight). In addition, the balance ratio was determined between foliar and root mass in what dry and fresh weight were concerned (S/RFw - shoot : root fresh weight, S/RDw - shoot : root dry weight). The determinations were made with Axis scales, with an accuracy of ±0.001 g. The experimental data on the root and foliar systems in each variant were processed through analysis of variance (ANOVA) using the mathematical module in EXCEL 2007. Correlation coefficients, regressions and Principal Component Analysis (PCA) were determined using the software PAST (Hammer et al., 2001). The symbols *, ** and *** used in the paper represent statistical significance at 99.9% (LSD0.01%), 99% (LSD0.1%) and 95% (LSD0.5%) probability level. RESULTS AND DISCUSSIONS Various concentrations of minerals applied on wheat seedlings in 12-13 BBCH code stage growth had different influences on dry and fresh matter accumulation rate in the root system and in the foliar system of wheat seedlings. At root level, the quantity of fresh weight accumulated by seedlings ranged from 1.918±0.087* g in variant V4 (Lithovit 1%) and 1.955±0.021* g in variant V2 (Lithovit 0.35%), while in the control variant the measurements showed 1.760±0.027 g. The dry weight in the root system was 0.199±0.004 g in variant V4 and 0.227±0.002*** g in variant V2, while the
107

control variant gave the results 0.196±0.002 g, Table 1. At the level of the foliar system of wheat seedlings, fresh weight varied between 1.699±0.059 g in the control variant and 2.028±0.036** g in variant V2 (Lithovit 0.35%), while, for the same variants, dry weight presented values between 0.191±0.003 g and 0.235±0.006*** g, Table 1. According to ANOVA statistical analysis, the
experimental results presented high statistical significance, p< 0.01, Fcalculated > Ftheoretical for Alfa = 0.001 (Table 2). Both in the root and shoot systems, small concentrations of minerals among those tested via Lithovit determined better growth rhythm and better accumulation of fresh and dry matter, although in all treated variants the values recorded were higher than those in the control variant.
Table 1. Variation in the fresh and dry matter contents under the influence of Lithovit
Variant Lithovit
Concentration Root Shoot
RFw RDw SFw SDw (%) Average values (g) and SE
V1 (Mt) 0 1.760±0.027 0.196±0.002 1.699±0.059 0.191±0.003 V2 0.35 1.955±0.021* 0.227±0.002*** 2.028±0.036** 0.235±0.006*** V3 0.7 1.933±0.043* 0.220±0.001*** 1.945±0.029** 0.223±0.002** V4 1 1.918±0.087 0.199±0.004 1.917±0.031* 0.201±0.005
Limits of significance for the differences (LSD)
LSD5% = 0.162 LSD1% = 0.245 LSD0.01% = 0.394
LSD1% = 0.005 LSD1% = 0.007 LSD0.1% = 0.011
LSD5% = 0.158 LSD1% = 0.240 LSD0.1% = 0.385
LSD5% = 0.017 LSD1% = 0.026 LSD0.01% = 0.041
RFw – root fresh matter; RDw – root dry matter; SFw – shoot fresh matter; SDw – shoot dry matter; SE – standard error
Table 2. Evaluation of variation source, ANOVA test
Source of Variation SS Df MS F P-value F crit Between Groups 33.96301 5 6.792603 998.9 9.17E-61 4.692334 Within Groups 0.448352 66 0.006793 Total 34.41137 71 Alfa = 0.001 An interdependence relation was identified between the fresh and dry matter in the shoots of wheat seedlings, with a high degree of significance and statistical certainty (p<0.01; R2 = 0.900), it is described by equation (1) with graphical representation in Figure 1.
8472.08243.0257.0 2 ��� xxSDw (1) where: SDw - Shoots dry weight on wheat seedlings; x - Shoot fresh weight on wheat seedlings - SFw In addition, an interdependence relation was identified between the dry weight content in the shoots and the dry weight content in the roots of wheat seedlings (p<0.01; R2=0.874), equation (2).
651.195.1439.38 2 ��� xxSDw (2) where:
SDw - Shoot dry weight on wheat seedlings; x - Shoot dry weight on wheat seedlings - RDm Dry weight distribution between shoot and root systems in wheat seedlings depends on a series of external factors which influence the growth medium of the two biological systems, as well as the plant as a whole. Chapin et al. (1988) considered that the root : shoot ratio is often increased by soil factors which influence specific root activities, such as low water potentials and low availability of nutrients. Changes in the root : shoot ratio are determined also by environmental factors, which increase specific shoot activity (i.e. enzymatic activity, photosynthetic rate) such as high light intensity (Mahall et al., 1981) or CO2 concentration (Larigauderie et al., 1991).
108
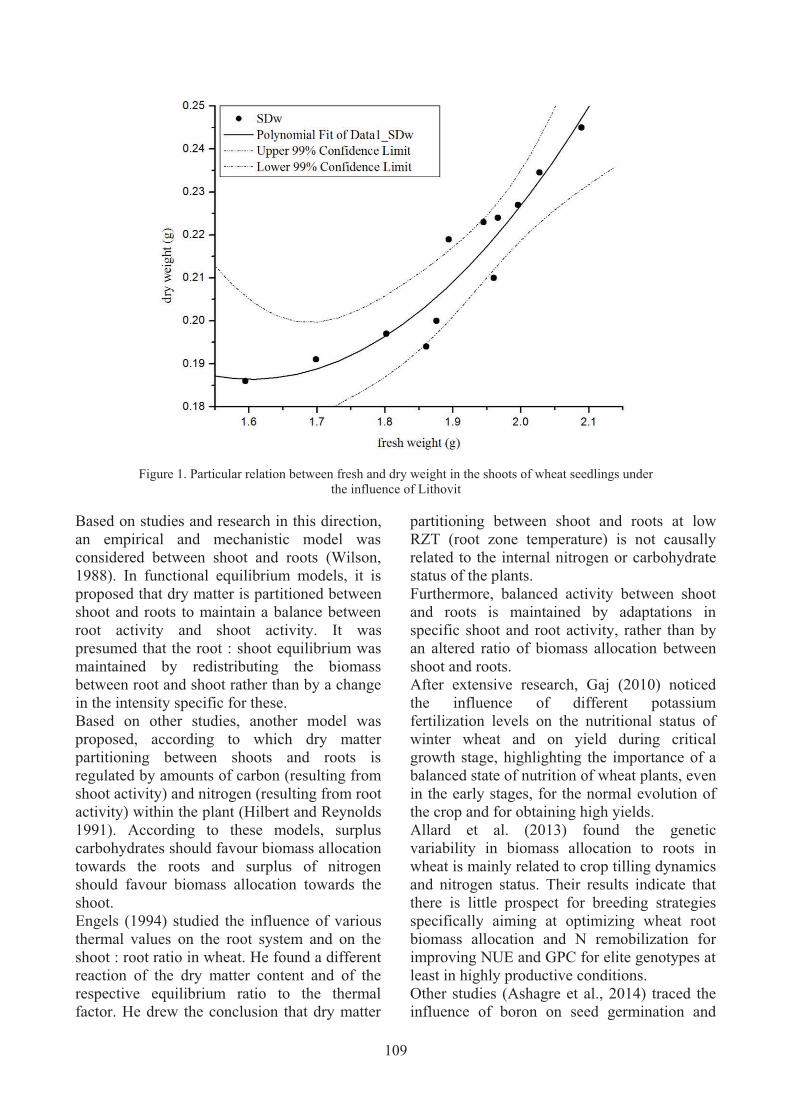
Figure 1. Particular relation between fresh and dry weight in the shoots of wheat seedlings under
the influence of Lithovit
Based on studies and research in this direction, an empirical and mechanistic model was considered between shoot and roots (Wilson, 1988). In functional equilibrium models, it is proposed that dry matter is partitioned between shoot and roots to maintain a balance between root activity and shoot activity. It was presumed that the root : shoot equilibrium was maintained by redistributing the biomass between root and shoot rather than by a change in the intensity specific for these. Based on other studies, another model was proposed, according to which dry matter partitioning between shoots and roots is regulated by amounts of carbon (resulting from shoot activity) and nitrogen (resulting from root activity) within the plant (Hilbert and Reynolds 1991). According to these models, surplus carbohydrates should favour biomass allocation towards the roots and surplus of nitrogen should favour biomass allocation towards the shoot. Engels (1994) studied the influence of various thermal values on the root system and on the shoot : root ratio in wheat. He found a different reaction of the dry matter content and of the respective equilibrium ratio to the thermal factor. He drew the conclusion that dry matter
partitioning between shoot and roots at low RZT (root zone temperature) is not causally related to the internal nitrogen or carbohydrate status of the plants. Furthermore, balanced activity between shoot and roots is maintained by adaptations in specific shoot and root activity, rather than by an altered ratio of biomass allocation between shoot and roots. After extensive research, Gaj (2010) noticed the influence of different potassium fertilization levels on the nutritional status of winter wheat and on yield during critical growth stage, highlighting the importance of a balanced state of nutrition of wheat plants, even in the early stages, for the normal evolution of the crop and for obtaining high yields. Allard et al. (2013) found the genetic variability in biomass allocation to roots in wheat is mainly related to crop tilling dynamics and nitrogen status. Their results indicate that there is little prospect for breeding strategies specifically aiming at optimizing wheat root biomass allocation and N remobilization for improving NUE and GPC for elite genotypes at least in highly productive conditions. Other studies (Ashagre et al., 2014) traced the influence of boron on seed germination and
109

seedling growth in wheat (Triticum aestivum L.), observing the differentiated effect of boron in relation to the concentration on the parameters under analysis: germination percentage and rate, shoot and root lengths, shoot and root fresh and dry weights, root number, root - shoot ratio and seedling vigour index. The favourable influence of boron and iron administered on the shoots in early growth parameters of wheat was shown also by Rawashdeh and Sala (2013), Rawashdeh et al., (2014). Based on the correlations identified in this research between the root system and the shoot system in wheat seedlings, comparative analysis of experimental data highlighted a change in shoot : root ratio for fresh weight (S/RFw) and dry weight (S/RDw) under the influence of the treatment with Lithovit. In the control variant, the shoot : root ratio was 0.961±0.020 g for fresh weight (S/RFw) and 0.979±0.006 g for dry weight (S/RDw). In the variants treated with Lithovit a balancing was observed in the shoot : root ratio, with values that ranged from 0.998±0.07 - 1.037±0.019 g for fresh weight (S/RFw) and 1.010±0.04 - 1.033±0.018 g for dry weight (S/RDw), Table 3.
Table 3. Shoot : root ratio in wheat seedlings
Variant Lithovit
concentration (%)
S/RFw S/RDw
V1 (Mt) 0 0.961±0.020 0.979±0.006 V2 0.35 1.037±0.019 1.033±0.018 V3 0.7 1.008±0.037 1.014±0.013 V4 1 0.998±0.07 1.010±0.04 S/RFw - shoot : root fresh weight; S/RDw - shoot : root dry weight The research found improper shoot : root ratio (S/R) with low Lithovit concentrations. Between the values of the balance ratios shoot : root mass for fresh weight (S/RFw) and dry weight (S/RDw), positive correlation was identified, with a high degree of statistical significance and certainty (p<0.01; R2 = 0.915), described by equation (3) with graphical representation in Figure 3.
8268.01972.0377.0/ 2 ��� xxRS Dw (3) where: S/RDw - shoots : roots dry weight; x - shoots : roots fresh weight - S/RFm
Figure 2. Distribution of the particular values on the shoot : root ratio for fresh weight (S/RFw) and dry weight (S/RDw)
on wheat seedlings
Principal Component Analysis (PCA) of the experimental data facilitated the orientation and
grouping of the variants in relation to the parameters analysed and the contribution to generating the variance.
110
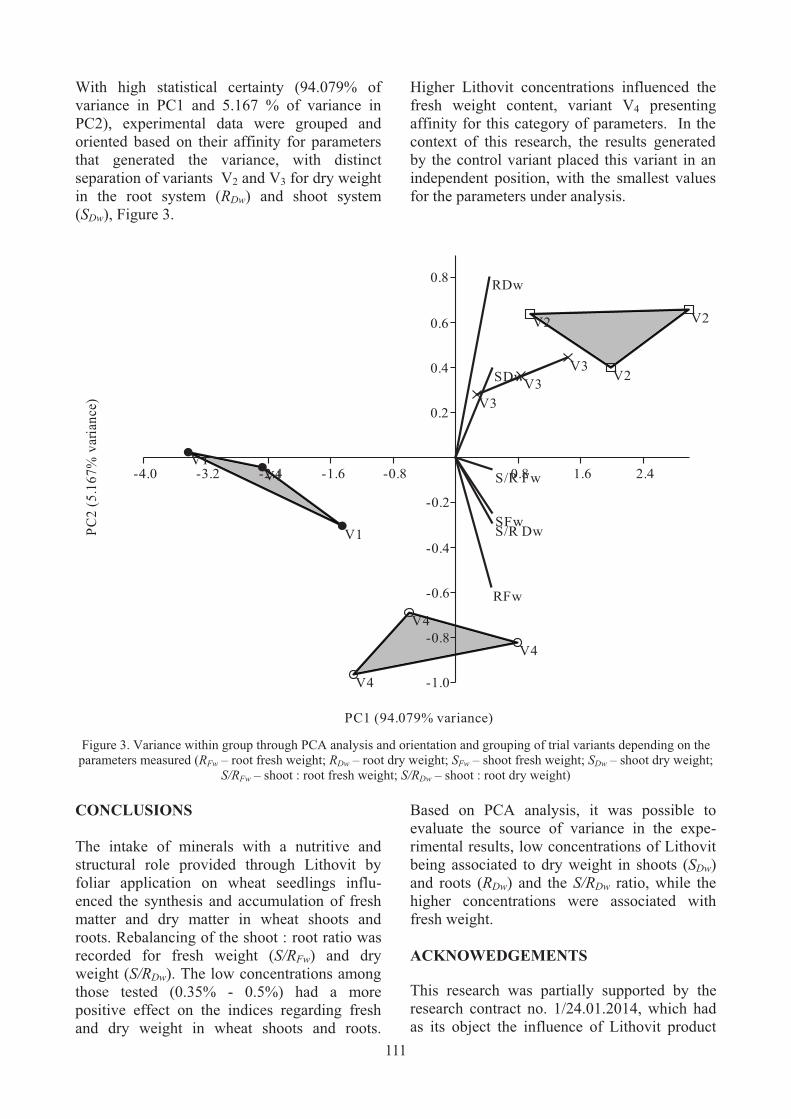
With high statistical certainty (94.079% of variance in PC1 and 5.167 % of variance in PC2), experimental data were grouped and oriented based on their affinity for parameters that generated the variance, with distinct separation of variants V2 and V3 for dry weight in the root system (RDw) and shoot system (SDw), Figure 3.
Higher Lithovit concentrations influenced the fresh weight content, variant V4 presenting affinity for this category of parameters. In the context of this research, the results generated by the control variant placed this variant in an independent position, with the smallest values for the parameters under analysis.
RFw
RDw
SFw
SDw
S/R Fw
S/R Dw
V1
V1
V1
V2 V2
V2V3
V3V3
V4
V4
V4
-4.0 -3.2 -2.4 -1.6 -0.8 0.8 1.6 2.4
PC1 (94.079% variance)
-1.0
-0.8
-0.6
-0.4
-0.2
0.2
0.4
0.6
0.8
PC2
(5.1
67%
var
ianc
e)
Figure 3. Variance within group through PCA analysis and orientation and grouping of trial variants depending on the parameters measured (RFw – root fresh weight; RDw – root dry weight; SFw – shoot fresh weight; SDw – shoot dry weight;
S/RFw – shoot : root fresh weight; S/RDw – shoot : root dry weight)
CONCLUSIONS The intake of minerals with a nutritive and structural role provided through Lithovit by foliar application on wheat seedlings influ-enced the synthesis and accumulation of fresh matter and dry matter in wheat shoots and roots. Rebalancing of the shoot : root ratio was recorded for fresh weight (S/RFw) and dry weight (S/RDw). The low concentrations among those tested (0.35% - 0.5%) had a more positive effect on the indices regarding fresh and dry weight in wheat shoots and roots.
Based on PCA analysis, it was possible to evaluate the source of variance in the expe-rimental results, low concentrations of Lithovit being associated to dry weight in shoots (SDw) and roots (RDw) and the S/RDw ratio, while the higher concentrations were associated with fresh weight. ACKNOWEDGEMENTS This research was partially supported by the research contract no. 1/24.01.2014, which had as its object the influence of Lithovit product
111
type on crops. The authors would like to thank the management of the Didactic and Experi-mental Station of BUASVM Timișoara for facilitating the setting up of the experiment. The biological material (wheat seed, Alex cultivar) was provided by the Agricultural Research and Development Station, Lovrin, Romania. REFERENCES Allard V., Martre P., Le Gouis J., 2013. Genetic
variability in biomass allocation to roots in wheat is mainly related to crop tillering dynamics and nitrogen status. European Journal of Agronomy, 46: p. 68-76.
Ali A., Basra S.M.A., Ahmad R., Wahid A., 2009. Optimizing silicon application to improve salinity tolerance in wheat. Soil & Environment, 28(2): p. 136-144.
Amirjani M.R., Mahdiyeh M., 2013. Antioxidative and biochemical responses of wheat to drought stres. ARPN Journal of Agricultural and Biological Science, 8(4): p. 291-301.
Anongo M.C., Bako S.P., Iortsuun D.N., Japhet W.S., Uyovbisere E.O., 2014. Levels of Trace Elements in plant parts of two cultivars of wheat at some selected growth stages. Sci-Afric Journal of Scientific Issues, Research and Essays, 2(3): p. 111-116.
Ashagre H., Hamza I.A., Fita U., Nedesa W., 2014. Influence of boron on seed germination and seedling growth of wheat (Triticum aestivum L.). African Journal of Plant Science, 8(2): p. 133-139.
Bahrani A., Joo M.H., 2012. Response of some wheat (Triticum aestivum L.) genotypes to salinity at germination and early seedling growth stages. World Applied Sciences Journal, 16(4): p. 599-609.
Bi K., Huang F., Wang C., 2011. Quick acquisition of wheat ear morphology parameter based on imaging processing. In: International Workshop, CSEEE 2011, Kunming, China, July 29-31, 2011. Proceedings: Communications in Computer and Information Science, 158: p. 300-307.
Chapin F.S., Walter C.H.S., Clarkson D.T., 1988. Growth response of barley and tomato on nitrogen stress and its control by abscisic acid, water relation and photosynthesis. Planta, 173(3): p. 352-366.
De Georgio D., Fornaro F., 2012. Nitrogen fertilization and root growth dynamics in durum wheat. Italian Journal of Agronomy, 7(3): p. 207-213.
Ehdaie B., Merhaut D.J., Ahmadian S., Hoops A.C., Khuong T., Layne A.P., Waines J.G., 2010. Root system size influences water-nutrient uptake and nitrate leaching potential in wheat. Journal of Agronomy and Crop Science, 196(6): p. 455-466.
El Siddig M. A., Baenziger S., Dweikat I., El Hussein A.A., 2013. Preliminary screening for water stress tolerance and genetic diversity in wheat (Triticum aestivum L.) cultivars from Sudan. Journal of Genetic Engineering and Biotechnology, 11(2): p. 87-94.
Engels C., 1994. Effect of root and shoot meristem temperature on shoot to root dry matter partitioning
and the internal concentrations of nitrogen and carbohydrates in mayze and wheat. Annals of Botany, 73: p. 211-219.
Erenoglu E.B., Kutman U.B., Ceylan Y., Yildiz B., Cakmak I., 2010. Improved nitrogen nutrition enhances root uptake, root-to-shoot translocation and remobilization of zinc (65Zn) in wheat. New Phytologist, 189(2): p. 438-448.
Essemine J., Ammar S., Bouzid S., 2010. Effect of temperature on root and shoot development in wheat seedling during early growth stage. Asian Journal of Plant Sciences, 9(6): p. 375-379.
Gaj R., 2010. Influence of different potassium fertilization level on nutritional status of winter wheat and on yield during critical growth stage. Journal of Elementology, 15(4): p. 629-637.
Hammer Ø., Harper D.A.T., Ryan P.D., 2001. PAST: Paleontological statistics software package for education and data analysis. Palaeontologia Electronica, 4(1): p. 1-9.
Hilbert D.W., Reynolds J.F., 1991. A model allocating growth among leaf proteins shoot structure and root biomass to produce balanced activity. Annals of Botany, 68(5): p. 417-425.
Larigauderie A., Ellis B.A., Mills J.N., Kimmerow J., 1991. The effect of root and shoot temperatures on growth of Ceanothus gregii seedlings. Annals of Botany, 67(2): p. 97-101.
Mahall B.E., Parker V.T., Fonteyn P.J., 1981. Growth and photosynthetic irradiance responses of Avena fatua L. and Bromus diandrus Roth. and their ecological significance in California savannas. Photosynthetica, 15(1): p. 5-15.
Mengel K., Kirkby E.A., 2001. Principles of plant nutrition, (5th ed.) Dordrecht; Kluwer Academic Publisher, 849 p.
Moayedi A.A., Nasrulhaq-Boyce A., Tavakoli H., 2011. Application of physiological and biochemical indices for screening and assessment of drought tolerance in durum wheat genotypes. Australian Journal of Crop Science, 5(8): p. 1014-1018.
Pedersen A., Zhang K., Thorup-Kristensen K., Jensen L.S., 2010. Modelling diverse root density dynamics and deep nitrogen uptake - A simple approach. Planta and Soil, 326(1-2): p. 493-510.
Rapaport T., Hochberg U., Rachmilevitch S., Karnieli A., 2014. The effect of differential growth rates across plants on spectral predictions of physiological parameters. PLoS ONE, 9(2): p. 1-11.
Rashidi V., 2011. Genetic parameters of some morphological and physiological traits in durum wheat genotypes (Triticum durum L.). African Journal of Agricultural Research, 6(10): p. 2285-2288.
Raza M.A.S., Saleem M.F., Shah G.M., Jamil M., Khan I.H., 2013. Potassium applied under drought improves physiological and nutrient uptake performances of wheat (Triticum Aestivun L.). Journal of Soil Science and Plant Nutrition, 13(1): p. 175-185.
Rawashdeh H.M., Sala F., 2013. The effect of foliar application of iron and boron on early growth parameters of wheat (Triticum aestivum L.). Research
112
Journal of Agricultural Sciences, 45(1): p. 21-26. Rawashdeh H.M., Sala F., Boldea M., 2014.
Mathematical and statistical analysis of the effect of boron on yield parameters of wheat, ICNAAM 2014, AIP 4 p. (in print).
Tammam A.A., Alhamd M.F.A., Hemeda M.M., 2008. Study of salt tolerance in wheat (Triticum aestium L.) cultivar Banysoif 1. Australian Journal of Crop Science, 1(3): p. 115-125.
Wasson A.P., Richards R.A., Chatrath R., Misra S.C.,
Sai Prasad S.V., Rebetzke G.J., Kirkegaard J.A., Christopher J., Watt M., 2012. Traits and selection strategies to improve root systems and water uptake in water-limited wheat crops. Journal of Experimental Botany, 63(9): p. 3485-3498.
White P.J., Broadley M.R., 2003. Calcium in plants. Annals of Botany, 92(4): p. 487-511.
Wilson J.B., 1988. A review of evidence on the control of shoot : root ratio, in relation to models. Annals of Botany, 61(4): p. 433-449.
113

THE INFLUENCE OF WATER TRANSFER FAVORABILITY
OVER THE SOIL EXCESS MOISTURE
Tudor SĂLĂGEAN1, Andra PORUŢIU1, Mariana CĂLIN2, Raluca MANEA2, Ana VÎRSTA2, Paul SESTRAŞ2
1University of Agricultural Sciences and Veterinary Medicine Cluj-Napoca, Calea Mănăştur 3-5,
400372, Cluj-Napoca, Romania, Phone: +40264.596.384, Fax: +40264.593.792, Email: [email protected]; [email protected]
2University of Agronomic Sciences and Veterinary Medicine of Bucharest, 59 Mărăşti Blvd., District 1, 011464, Bucharest, Romania, Phone: +4021.318.25.64, Fax: + 4021.318.25.67, Email:
[email protected]; [email protected]; [email protected]; [email protected]
Corresponding author email: [email protected] Abstract The paper aims to present the influence of the water transfer favorability over the soil excess moisture. The area taken into study is the Someş Mic meadow between Cluj-Napoca and Dej, which represents an area with many degraded land especially degraded land due to excess moisture. In order to highlight the water transfer favorabilty in the studied area (Someş Mic meadow between Cluj-Napoca and Dej) was used the GIS tehnique in order to create a thematic map which represents in a more suggestive way the water transfer process in the area. Key words: degraded land, excess moisture, water transfer. INTRODUCTION Defining soils with excess moisture is done considering the causes of excessive moisture, the frequency, extent, intensity, form and source of it (Dîrja and Budiu, 2006; Petersen et al., 2011) and also considering the consequences and unfavorable influences on plant growth, being necessary to take into account - as a whole - the climate (Li, 2007; Rohli and Vega, 2011; Karamouz et al., 2012), geomorphological, lithological, hydrographic, hydrogeological and soil conditions in which they are formed and evolve (all natural conditions and human factor), which determine moreover, the choosing of solutions for the development and improvement of these soils. The factors that generate excess moisture (Calinovici, 2004) are: � Natural factors: the climatic factor,
hydrological and hydrographic factor, hydrogeological factor, geomorphological factor and pedological factor;
� Anthropic factor. Taking into account the climatic characteristics of the country, the latest soil and climate
complex zoning made by Florea et al. (1988) led to the division of our country's territory into four climatic humidity zones: - hot - dry; - moderately warm - semi-humid; - cool - wet and - cold - very wet.
Cluj County is part of the moderately warm soil and climate - semi-humid with average annual temperatures of between 8.0-10.5 oC, temperature sum above 0 oC values between 3400-4100 oC or temperature sum above 10 oC between 3200-3500 °C. Average annual rainfall is between 500-700 mm and the amount of rainfall during the growing season (April to October) is between 400-475 mm, evapotranspiration from the period mentioned exhibits values between 220- 391 mm. The study of climatic elements (Figure 1) (precipitation, temperature, evapotranspiration, wind, air humidity etc.) show their effects in the onset or increased excess water from the ground or above the ground.
114
AgroLife Scientific Journal - Volume 4, Number 2, 2015
ISSN 2285-5718; ISSN CD-ROM 2285-5726; ISSN ONLINE 2286-0126; ISSN-L 2285-5718

Figure 1. Cartogram of Areas flooded by Rainfall and of Average Multiannual Temperatures
Source: Ministry of Environment and Water, 2006
MATERIALS AND METHODS Topographic documentation required to develop irrigation facilities and/or drainage comprises two phases of design, the following categories of maps and plans (Leu et al., 2003): for the phase of preliminary studies for the proposed irrigation systems are required topographic maps, scale of 1: 5000, 1: 2000, 1: 1000 with level curves and equidistances of 0.25 m respectively for drainage systems at scale of 1:25,000 with level curves and topographic plans at the scale of 1:10000 with the equidistances of level curves of 0.5 m and a density of planimetric and levelmetric network supporting at least one point per hectare and for thephase of preparation for projects execution, it is filled the terrain documentation based on
planimetric and levelmetric topographic surveying, that are performed for the irrigation system at the scale of 1:500, 1:200, respectively draining system at large and very large scales: 1:2000, 1:1000, 1:500 with equidistance of level curves of 0.25-0.5 m, for preparing the route for the collection, interception and escape channels. To achieve the primary database, the first step along the way was a data entry on a computer from cartographic products, in a digital form by scanning themat a specific scale, and then importing the data into ArcMap. There were digitized polygon type vector elements on geological and pedological map (Figure 2) which were used in geological mapping, soil mapping and land use mapping for the study area.
Figure 2. Elements digitized from the pedological and geological map
115

RESULTS AND DISCUSSIONS The Somesul Mic River corridor, oriented from south-west to north-east, through the meadow and terraces related to it, delineates from a physical-geographical point of view the Transylvanian Plain from the Somes Platform. The Transylvanian Plain, which includes the south and east of the territory studied, is characterized by a region of gentle hills separated by valleys relatively broad and swampy, landslides and frequent erosion processes on the slopes line with soils such as levigated chernozem, practically devoid of forests and with settlements as scattered households. The altitude of the almost equal hills is between 400-500 m. Peaks of hills are generally sandy ridges, underneath marl and clay infiltrating. At their contact weak springs appear. The
Transylvanian Plain is separated by the Somes meadow by the higher hills that reach up to 600 m altitude (Figure 3). The area studied presents geographic vulnerability because it overlapses the north of the territory and differs from the Transylvanian Plain by higher energy relief, consisting of small plates located at 500-600 meters altitude, (Figure 3) deep valleys, intense slope processes in the lower third of the slopes, relatively small deciduous forests, road traffic, especially in the valleys. The predominant rocks are sandstones, clays and marl. Cluj Hills exhibit also conglomerate and limestone. The predominance of softer rocks, facilitates erosion phenomena and lithological sequence of layers above and inclination favors landslides due to these clay loam deposits, drainage is unsatisfactory.
Figure 3. Elevation model of Somesul Mic river between Dej and Cluj-Napoca
Elevation model, created based on the interpolation of the elevations from an area, underpins the obtaining of a high number of thematic maps, being the reference raster to the
geographical arrangement on vertical. On the map (Figure 3) it can be observed the gradual descent altitude to the confluence area of the
116

Someş Mic river and the arrangement of the peaks which delimits the river valley. Depending on the texture of the surface and the manner in which the water enters and accumulates in the profile, by calculating the texture in the profile can lead to the transfer of water favorability map. In the studied area is noticed the predominance of accumulation structures which are specific for the valleys of
sedimentary areas, with predominantly a sand-rocky structure. On the map of favorability transfer of water (Figure 4) it can be observed the areas that retain more water in their profile, with high values and stable areas, the areas with less water retention are represented with light colors.
Figure 4. Favorability of the water transfer in soil, for Someșul Mic river between Cluj-Napoca and Dej
The land affected by excess moisture is 15.4% of degraded land in Cluj county, respectively 1.60% of the total land area of Cluj County. The total area of degraded land in Cluj county is 10.45% of the county's land of 667,440 ha (after the values obtained from statistical database with reference to the land fund, INSSE, 2011). CONCLUSIONS In order to formulate proposals and recommendations on the hydro-ameliorative works specific for the conditions of the studied
area (Somes Mic meadow between Cluj-Napoca and Dej) were taken into account the realization of field studies and creating a GIS from which it can be obtained data about the weather or the development of the area. By creating the GIS it is permitted to consider, permanently, the changes of natural factors, succeeding concomitant an adaptation of the irrigation and drainage works to the new conditions, whether it is changing the land use or climate change which are characterized by extreme phenomena which occur more often (very long periods of drought or rainfalls of high intensities).
117

REFERENCES Calinovici I., 2004. Ameliorarea și protecția solului. Ed.
Mirton, Timișoara. Dîrja M. and Budiu V., 2006. Îmbunătățiri funciare -
combaterea excesului de umiditate pe terenurile agricole. Ed. Academic Pres, Cluj-Napoca.
Karamouz M., Sara Nazif and Falahi M., 2012. Hydrology and Hydroclimatology: Principles and
Applications. Ed. Taylor & Francis Group, CRC Press, USA.
Li H., 2007. Understanding Soil Moisture Dynamics Using Observations and Climate Models. Ed. ProQuest LLC, USA.
Petersen J.F., Dorothy Sack and Gabler R.E., 2011. Physical Geography. Ed. Cengage Learning, UK.
Rohli R. and Vega A., 2011. Climatology. Ed. Jones & Bartlett Learning, USA.
118
AN EXPLORATORY RESEARCH REGARDING ROMANIAN ORGANIC FARMING SECTOR
Valentin-Cosmin SARACIN, Adrian VASILE
University of Agronomic Sciences and Veterinary Medicine of Bucharest, 59 M�r��ti Blvd., District 1, 011464, Bucharest, Romania, Phone: +4021.318.25.64, Fax: + 4021.318.25.67,
Email: [email protected], [email protected]
Corresponding author email: [email protected] Abstract The paper is aimed to identify how large is the sector of organic farming in Romania and why this sector should be developed. Because of the changes in the social structure, the economic crisis and the ageing of population, Romania must identify other segments and industries for an economic prosperity. This study focuses on a market niche represented by organic farming. In order to present how large is the sector of organic farming in Romania, statistical data regarding agricultural areas and livestock under organic farming were gathered and analyzed. Results shows that organic farming has a low impact in Romanian agriculture, and in agro-food system, but because of accelerated growth of indicators, Romania has a big potential and interest in developing the organic sector. As a conclusion, it is a very interesting and attractive subject, because people are more and more focused on consuming natural products for a healthy life. Key words: agriculture, organic farming, evolution, sustainable development, Romania. INTRODUCTION According to the Codex Committee on Food, organic farming is a production system management that promotes and also enhances the agro-system health, biodiversity, biological cycles and soil biological activity. On the other hand, this is a form of agriculture that is based on techniques like green manure, crop rotation, biological pest control and compost. Organic food also includes fertilizers and pesticides which include insecticides, herbicides, but all of these are natural, like bone meal for animals or pyrethrin for flowers. In this process, the use of other methods, which includes the synthetic petrochemical fertilizers and pesticides, is excluded. Organic farming is one of the most important sectors of agriculture and of Romanian economy, because it can bring significant contribution to a sustainable development, increasing the economic activities, thanks to the significant added value of the organic products. The premium price of organic products is paid by people from countries where there is a sizeable middleclass in the population, and where consumers are more educated and informed of food issues, and they incline to buy
organic products, whether for food safety, concern over the environment or health reasons (Voilcilas Dan Marius, 2009). The concept of sustainability, which is incorporated into the definition of organic farming, has a wider sense, not only to underline the conversion of non-renewable resources (soil, minerals and energy), but also in the social sustainability (Radev et al., 2012). Organic farming also increases the interest in rural areas; the methods and materials that organic farmers use in order to keep and build soil structure and fertility are:
- crop rotation, the right soil cultivation at the right time,
- composted and recycled crop wastes and animal manures,
- mulching on the soil surface and green manures and legumes.
In order to control pests, diseases and weeds, the methods and materials are: a good cultivation practice, encouraging useful predators that eat pests, careful planning and crop choice, increasing genetic diversity, crop rotation, using natural pesticides, and the use of resistant crops. A good practice of organic farming also involves a careful use of water resources and a good animal husbandry.
119
AgroLife Scientific Journal - Volume 4, Number 2, 2015
ISSN 2285-5718; ISSN CD-ROM 2285-5726; ISSN ONLINE 2286-0126; ISSN-L 2285-5718

Moreover, the main objective of ecological food system is to produce cleaner food according to environmental conservation and development, using safe methods in correlation with nature and its systems (Manole, 2006). Organic farming has a small share in the Romanian agriculture, in terms of agricultural area and livestock production, however Romania has a high potential for developing the organic farming sector (Ion Andreea-Raluca, 2012). This paper aims at answering the question how large is the organic farming sector in Romanian agriculture. In pursuing this, statistical data regarding agricultural areas and livestock under organic farming were gathered and analyzed. MATERIALS AND METHODS In order to analyze the organic farming sector in Romania, the following indicators were used: area under organic farming (hectares), area under organic farming, by category of use (percentage), area under organic farming, by main plantations and crops (hectares), evolution of livestock under organic farming (heads). For analyzing how large the organic farming sector is, we used data collected from the Ministry of Agriculture and Rural Development (MARD) and the European Commission (Eurostat), and the period analyzed was 2002-2012.
The data collected has been statistically processed and interpreted, building the trend line and setting up the forecast for the next years. According to Eurostat in 2011, the EU27 had a total area of 9.6 million hectares cultivated in accordance with the organic farming rules, up to 5.7 million in 2002. It increased by 1.6%, during the last decade. Although the whole organic area represents only 5.5% of the total utilized agriculture area in EU, we can say that is a significant increase. The European Commission provided Eurostat data which shows that in 2012 the area under organic farming is 5.7% of utilized agriculture area in EU27, which increased by 0.2% than 5.5% in 2011. In Romania, agriculture is now one of the major branches of the Romanian economy. The contribution of agriculture, forestry, fisheries in gross domestic product, stands around 6% of GDP and the EU Member States stands at about 1.7%, according to INS Bucharest. In Romania, in 2013, according to Ministry of Agriculture and Rural Development (MARD), the total area cultivated in accordance with the organic farming rules, was of 301,148 hectares. In 2003 the surface was 56.800 hectares, which means that it increased 5 times between 2003-2013 (Table 1).
Table 1. Evolution of land under organic farming, in Romania, 2003-2013 (hectares)
Figure 1. View from a land under organic farming
2003 2004 2005 2006 2007 2008 2009 2010 2011 2012 2013
56,800 73,300 92,770 107,582 131,401 140,132 168,288 182,706 229,946 288,261 301,148
120

Figure 2. Evolution of area under organic farming in Romania, 2003-2013 (hectares) In Figure 2, we can see that during 2003-2013, the evolution of area under organic farming in Romania has increased, mainly because the farmers were attracted to invest in organic farming, due to the satisfactions they can later obtain.
In 2012 Romanian agriculture area was 14,615.1 thousand hectares, of which 64.26% arable land, 22.38% pasture, 10.57% meadows, 1.44% vineyards and nurseries, and 1.35% orchards and nurseries, according to INS Bucharest (Figure 3).
64.26%
22.38%
10.57%
1.44% 1.35%
Romanian�agriculture�area�2012
Arable�land Pasture Meadows Vineyards�and�nurseries Orchards�and�nurseries
Figure 3. The Romanian agriculture area under organic farming, by category of use, 2012
In Table 2 surfaces of cereals under organic farming increased almost seven times during 2006-2013. Wheat is grown on more than half of the area occupied by cereals. Areas planted
with roots, permanent orchards and vineyards become larger almost every year. Surfaces planted with dried pulses, fresh vegetables and permanent pastures, vary from year to year.
Table 2. Evolution of land under organic farming, in Romania, 2003-2013 (hectares) Plantation/Crop 2006 2007 2008 2009 2010 2011 2012 2013 Cereals 16,310 32,222 56,337 63,446 72,298 79,167 105,149 109,105
- Wheat 11,965 18,418 36,137 38979 39,159 40,529 56151 - Dried pulses 7,777 1,394 870 6,088 5,560 3,147 2,764 2,397 Roots 29 45 407 435 504 1,075 1,125 741 Fresh vegetables 727 310 259 344 734 914 896 1,068 Permanent pastures 51,200 57,611 46,007 39,233 31,579 78,198 105,836 103,702 Permanent orchards and vineyards 294 862 1,551 1,870 3,093 4,167 7,781 9,400
56800 73300 92770 107582131401 140132
168288 182706229946
288261301148
050000
100000150000200000250000300000350000
2003 2004 2005 2006 2007 2008 2009 2010 2011 2012 2013
Evolution�of�area�under�organic�farming�in�Romania,�2003�2013�(hectares)
Evolution�of�area�under�organic�farming�in�Romania,�2003�2013�(hectares)
121

Figure 4. Evolution of area under organic agriculture, in Romania, by main plantations and crops, 2006-2013
In Figure 4 we can see the evolution of the area under organic agriculture, in Romania, by main plantations and crops. The highest increase was registered by cereals, especially wheat. In 2006, the wheat crop was 11,965 hectares and in 2012 it was 56,151 hectares. It means that wheat crop increased almost five times during 2006-2013. In Table 3 we can see the evolution of livestock under organic farming in 2006-2012. As we
can see in this table, the livestock under organic system is depends on the species. The number of sheep decreased with 60% during 2006-2012, but also had one of the largest oscillations from this sector. The number of cattle, swine and goats, vary from year to year. The number of bees and poultry are the ones which increased significant during the analyzed period.
Table 3. Evolution of livestock under organic farming, in Romania, 2006-2012 (heads) Species 2006 2007 2008 2009 2010 2011 2012 Sheep 86,180 59,680 121,175 51,470 18,883 27,389 51,722 Bees 30,796 37,260 52,599 59,414 64,836 77,994 85,225 Cattle 11,365 6,985 7,567 8,145 5,358 6,894 7,044 Poultry 4,300 4,320 6,080 9,400 21,580 46,506 60,121 Swine 1,652 1,174 416 603 320 414 344 Goats 117 215 4,296 4,738 1,093 801 1,212
RESULTS AND DISCUSSIONS Currently, Romanian agriculture is one of the most important sectors of the Romanian economy. The contribution of agriculture, forestry, gross domestic product in Fisheries, stands around 6% of GDP. Sector represented
agriculture occupies a small share of Romanian agriculture. The data supplied from European Commission and MAPDR reveals the increasing importance of the organic sector and the positive evolution of areas under organic farming like cereals (especially wheat).
Areas planted with roots, permanent orchards and vineyards become larger almost every year. The number of bees and poultry are the ones which increased significant during the analyzed period. All of this are proves that the organic this shows potential and initiative of development in Romania. Both land areas
under organic farming and the number of animals under organic farming increased in the investigated period (with minor exceptions). The trend is increasing and the perception of this sector as an alternative activity and income source is positive. Every farmer knows that his organic products will bring an added value.
122
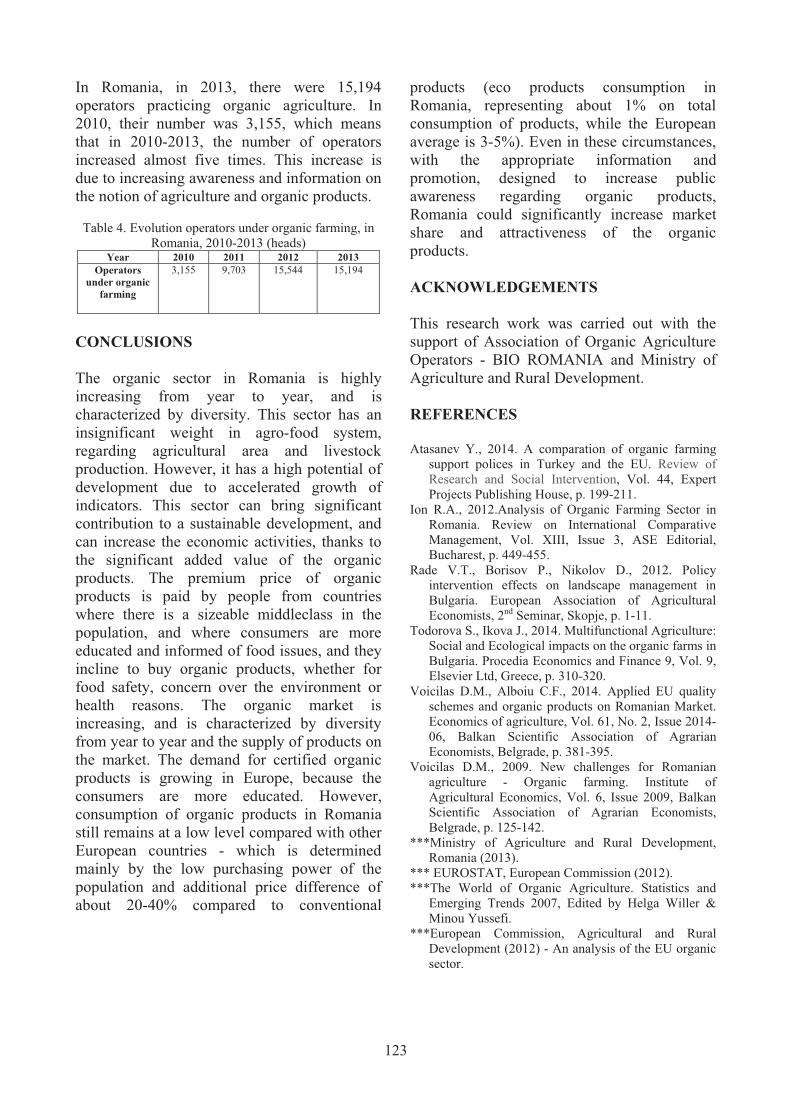
In Romania, in 2013, there were 15,194 operators practicing organic agriculture. In 2010, their number was 3,155, which means that in 2010-2013, the number of operators increased almost five times. This increase is due to increasing awareness and information on the notion of agriculture and organic products.
Table 4. Evolution operators under organic farming, in Romania, 2010-2013 (heads)
Year 2010 2011 2012 2013 Operators
under organic farming
3,155 9,703 15,544 15,194
CONCLUSIONS The organic sector in Romania is highly increasing from year to year, and is characterized by diversity. This sector has an insignificant weight in agro-food system, regarding agricultural area and livestock production. However, it has a high potential of development due to accelerated growth of indicators. This sector can bring significant contribution to a sustainable development, and can increase the economic activities, thanks to the significant added value of the organic products. The premium price of organic products is paid by people from countries where there is a sizeable middleclass in the population, and where consumers are more educated and informed of food issues, and they incline to buy organic products, whether for food safety, concern over the environment or health reasons. The organic market is increasing, and is characterized by diversity from year to year and the supply of products on the market. The demand for certified organic products is growing in Europe, because the consumers are more educated. However, consumption of organic products in Romania still remains at a low level compared with other European countries - which is determined mainly by the low purchasing power of the population and additional price difference of about 20-40% compared to conventional
products (eco products consumption in Romania, representing about 1% on total consumption of products, while the European average is 3-5%). Even in these circumstances, with the appropriate information and promotion, designed to increase public awareness regarding organic products, Romania could significantly increase market share and attractiveness of the organic products. ACKNOWLEDGEMENTS This research work was carried out with the support of Association of Organic Agriculture Operators - BIO ROMANIA and Ministry of Agriculture and Rural Development. REFERENCES Atasanev Y., 2014. A comparation of organic farming
support polices in Turkey and the EU. Review of Research and Social Intervention, Vol. 44, Expert Projects Publishing House, p. 199-211.
Ion R.A., 2012.Analysis of Organic Farming Sector in Romania. Review on International Comparative Management, Vol. XIII, Issue 3, ASE Editorial, Bucharest, p. 449-455.
Rade V.T., Borisov P., Nikolov D., 2012. Policy intervention effects on landscape management in Bulgaria. European Association of Agricultural Economists, 2nd Seminar, Skopje, p. 1-11.
Todorova S., Ikova J., 2014. Multifunctional Agriculture: Social and Ecological impacts on the organic farms in Bulgaria. Procedia Economics and Finance 9, Vol. 9, Elsevier Ltd, Greece, p. 310-320.
Voicilas D.M., Alboiu C.F., 2014. Applied EU quality schemes and organic products on Romanian Market. Economics of agriculture, Vol. 61, No. 2, Issue 2014-06, Balkan Scientific Association of Agrarian Economists, Belgrade, p. 381-395.
Voicilas D.M., 2009. New challenges for Romanian agriculture - Organic farming. Institute of Agricultural Economics, Vol. 6, Issue 2009, Balkan Scientific Association of Agrarian Economists, Belgrade, p. 125-142.
***Ministry of Agriculture and Rural Development, Romania (2013).
*** EUROSTAT, European Commission (2012). ***The World of Organic Agriculture. Statistics and
Emerging Trends 2007, Edited by Helga Willer & Minou Yussefi.
***European Commission, Agricultural and Rural Development (2012) - An analysis of the EU organic sector.
123

ENZYMATIC AND GENETIC VARIABILITY IN Bacillus spp. STRAINS WITH PLANT BENEFICIAL QUALITIES
Oana-Alina SICUIA1,2, Iulian GROSU1, Florica CONSTANTINESCU2,
Cătălina VOAIDEŞ1, Călina Petruţa CORNEA1
1University of Agronomic Sciences and Veterinary Medicine of Bucharest, 59 Marasti Blvd., District 1, 011464, Bucharest, Romania
2Research and Development Institute for Plant Protection, 8 Ion Ionescu de la Brad Blvd., Bucharest, Romania
Corresponding author email: [email protected]
Abstract Plant health is one of the issues that have to be maintained and closely monitored during cultivation and harvest. In this regard, prevention is the key factor in organic production. Biological control of plant pathogens and plant growth stimulation can be done through beneficial microorganisms. Different bacterial bio-preparates are available on the market, many of them based on selected strains of Bacillus species. In our previous studies, we isolated autochthones strains of Bacillus spp. with beneficial traits for plant protection and growth promotion. Considering the interest for biological production, and public concern for healthy products without significantly reduced yield, different biological control strains of Bacillus spp. that could be used as bio-inoculants for plant protection were analyzed. Thirteen biocontrol strains of Bacillus spp. were analyzed in comparison with three referent strains of B.subtilis and B.licheniformis. Qualitative and semi-quantitative analysis of these biocontrol Bacillus spp. strains was studied in order to characterize their enzymatic activity with implications either in cell wall degradation of plant pathogenic microorganisms, or in metabolism of various substrates. Genetic variability was studied by rep-PCR analysis compared with reference strains of B.subtilis and B.licheniformis. Microbiological studies performed in order to characterize the selected beneficial bacteria for their ability to produce lytic enzyme involved in plant pathogenic inhibition and plant growth stimulation revealed chitinase, cellulose, protease, lipase, amylase, decarboxylase, ACC-deaminase and phosphatase activity. The molecular techniques revealed significant genetic differences among the bacterial strains analyzed. The study allowed the detection of several enzymatic mechanisms involved in plant growth and protection, and revealed the potential of autochthon microbiota to be used for biotechnological purposes. Key words: Bacillus, lytic enzymes, genetic diversity. INTRODUCTION Public concern for healthy and high quality foodstuffs oriented the agricultural farmers to increase consideration for organic production. In Romania, the subsidies for organic farming conversion have made more attractive this agricultural sector, although the organic yields are highly export-oriented (http://www.ifoam-eu.org/en/romania). Pest and disease management is one of the most significant challenges in obtaining the estimated yield, also with grate implication in the quality of the product. In this regard, prevention is the key factor in organic production. Biological control of plant pathogens and plant growth stimulation could be completed with beneficial microorganism application (Borriss, 2011).
Different bacterial bio-products are available on the market, many of them based on selected strains of Bacillus species (Constantinescu and Sicuia, 2013). However, it is assumed that native strains are more suitable as bio-inoculants (Ceccon et al., 2012), due to a better environmental integration of the inoculated microorganism. Such treatments will act as enhancers in restoring the natural balance of the micro-biota inside the cropland. Plant growth-promoting bacteria with biological control competences, refer to as biocontrol-PGPB, can release different enzymes involved in plant pathogens inhibition, ISR elicitation and plant growth promotion (Compant et al., 2005). In our previous studies, we isolated autochthones strains of Bacillus spp. with beneficial traits for plant protection and growth promotion that could
124
AgroLife Scientific Journal - Volume 4, Number 2, 2015
ISSN 2285-5718; ISSN CD-ROM 2285-5726; ISSN ONLINE 2286-0126; ISSN-L 2285-5718
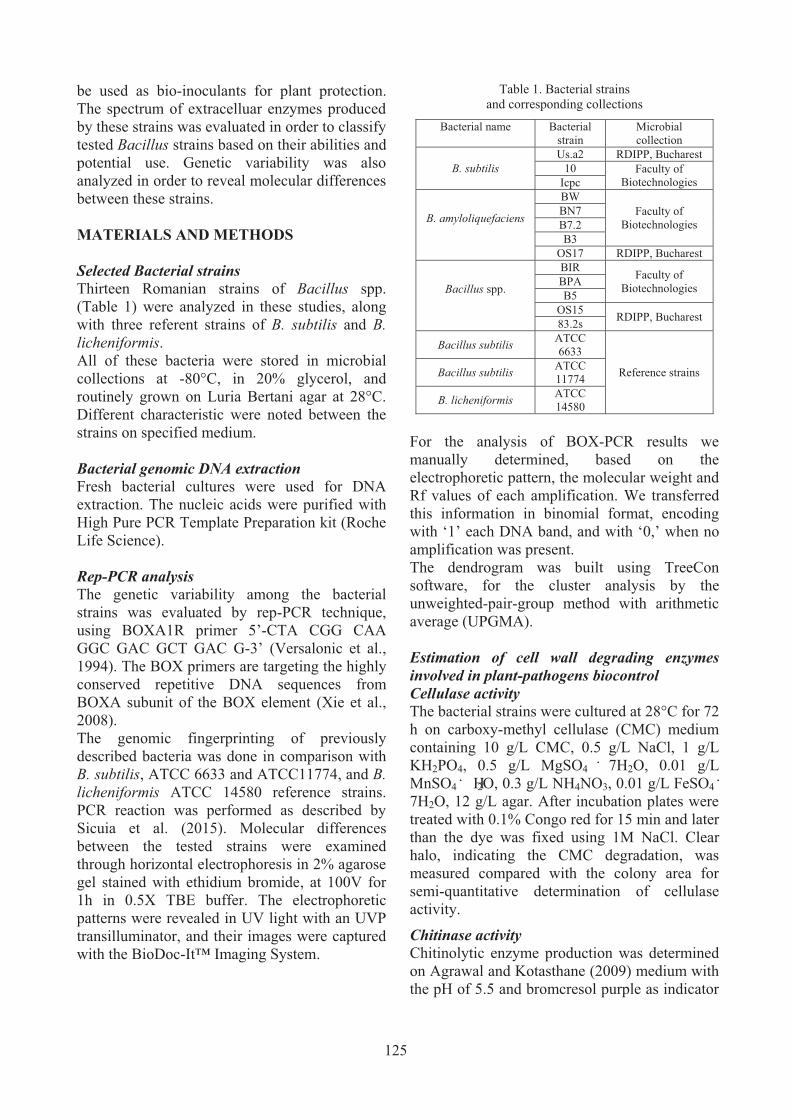
be used as bio-inoculants for plant protection. The spectrum of extracelluar enzymes produced by these strains was evaluated in order to classify tested Bacillus strains based on their abilities and potential use. Genetic variability was also analyzed in order to reveal molecular differences between these strains.
MATERIALS AND METHODS Selected Bacterial strains Thirteen Romanian strains of Bacillus spp. (Table 1) were analyzed in these studies, along with three referent strains of B. subtilis and B. licheniformis. All of these bacteria were stored in microbial collections at -80°C, in 20% glycerol, and routinely grown on Luria Bertani agar at 28°C. Different characteristic were noted between the strains on specified medium. Bacterial genomic DNA extraction Fresh bacterial cultures were used for DNA extraction. The nucleic acids were purified with High Pure PCR Template Preparation kit (Roche Life Science). Rep-PCR analysis The genetic variability among the bacterial strains was evaluated by rep-PCR technique, using BOXA1R primer 5’-CTA CGG CAA GGC GAC GCT GAC G-3’ (Versalonic et al., 1994). The BOX primers are targeting the highly conserved repetitive DNA sequences from BOXA subunit of the BOX element (Xie et al., 2008). The genomic fingerprinting of previously described bacteria was done in comparison with B. subtilis, ATCC 6633 and ATCC11774, and B. licheniformis ATCC 14580 reference strains. PCR reaction was performed as described by Sicuia et al. (2015). Molecular differences between the tested strains were examined through horizontal electrophoresis in 2% agarose gel stained with ethidium bromide, at 100V for 1h in 0.5X TBE buffer. The electrophoretic patterns were revealed in UV light with an UVP transilluminator, and their images were captured with the BioDoc-It™ Imaging System.
Table 1. Bacterial strains and corresponding collections
Bacterial name Bacterial strain
Microbial collection
B. subtilis Us.a2 RDIPP, Bucharest
10 Faculty of Biotechnologies Icpc
B. amyloliquefaciens
BW Faculty of
Biotechnologies BN7 B7.2 B3
OS17 RDIPP, Bucharest
Bacillus spp.
BIR Faculty of Biotechnologies BPA
B5 OS15 RDIPP, Bucharest 83.2s
Bacillus subtilis ATCC 6633
Reference strains Bacillus subtilis ATCC 11774
B. licheniformis ATCC 14580
For the analysis of BOX-PCR results we manually determined, based on the electrophoretic pattern, the molecular weight and Rf values of each amplification. We transferred this information in binomial format, encoding with ‘1’ each DNA band, and with ‘0,’ when no amplification was present. The dendrogram was built using TreeCon software, for the cluster analysis by the unweighted-pair-group method with arithmetic average (UPGMA). Estimation of cell wall degrading enzymes involved in plant-pathogens biocontrol Cellulase activity The bacterial strains were cultured at 28°C for 72 h on carboxy-methyl cellulase (CMC) medium containing 10 g/L CMC, 0.5 g/L NaCl, 1 g/L KH2PO4, 0.5 g/L MgSO4
. 7H2O, 0.01 g/L MnSO4
. H2O, 0.3 g/L NH4NO3, 0.01 g/L FeSO4 .
7H2O, 12 g/L agar. After incubation plates were treated with 0.1% Congo red for 15 min and later than the dye was fixed using 1M NaCl. Clear halo, indicating the CMC degradation, was measured compared with the colony area for semi-quantitative determination of cellulase activity.
Chitinase activity Chitinolytic enzyme production was determined on Agrawal and Kotasthane (2009) medium with the pH of 5.5 and bromcresol purple as indicator
125

dye. An identical test was performed on the same culture medium with the pH of 6.0 using phenol red as indicator dye. The colloidal chitin was prepared from crab shell using Roberts and Selitrennikoff (1988) method modified by Agrawal and Kotasthane (2009). However, the obtained colloidal chitin was brought to pH 5.0 using 1N NaOH solution in the distillated washing water. Chitinase activity was revealed by the change of color in the growth media, from yellow (at acid pH) to purple (at neutral pH) due to chitin degradation in the presence of bromcresol purple, or from yellow (at pH 6) to red (at pH 8), when phenol red dye was used.
Protease activity Bacteria were grown for three days on gelatin agar medium containing 5 g/L peptone, 3 g/L beef extract, 4 g/L gelatin, and 18 g/L agar. After incubation, plates were flooded with 15% HgCl2 in 20% HCl solution as protein precipitating agent. Mercuric chloride solution reacted with gelatin and produced a white precipitate, revealing clearing zones of protein degradation. Enzyme activity was quantified by measuring the clearing zones indicated the extracellular protease activity. Semi-quantitative estimation was possible using the following formula: EA = D-d; were D is the diameter of the clearing zone; and d is the microbial colony diameter (Hasan et al., 2013).
Lipase activity Two lipolytic screening assays were performed, revealing Tween 80 and olive oil degradation. Modified Schoofs et al. (1997) medium was prepared with 10g peptone, 5 g NaCl, 0.5 g CaCl2
.H2O, 18 g agar and 10 ml Tween 80 in 1L of distilled water. Tween 80 hydrolysis is associated with the production of lipolytic enzymes and the appearance of a white precipitate (calcium soap) underneath and around the bacterial growth. Oil degrading bacteria were selected by growing on YOC medium supplemented with 0.0001% (w/v) rhodamine B (Boonmahome and Mongkol-thanaruk, 2013). Pink-orange colony, observed under 350 nm UV light, reveals lipase production.
Enzymes involved in plant growth promotion Phosphorus solubilization Bacterial strains were inoculated on Pikovskaya agar medium modified by Sundara Rao and Sinha (1963). Clear zone around the bacterial colony indicate phosphorus solubilization.
ACC-deaminase activity Bacterial strains were tested for 1- aminocyclo-propane -1- carboxylic acid (ACC) deaminase by growing on DF salt minimal medium (Dworkin and Foster, 1958) supplemented with 3 mM ACC as sole nitrogen source. Plates containing DF medium supplemented with 2 g/L ammonium sulphate were inoculated as positive control, and DF medium with no nitrogen source were used as negative control. Arginin decarboxylase activity Linear polyamines can be produced by two alternatives pathways. Arginine decarboxylase activity triggers one of these pathways using arginine as enzymatic substrate. For the evaluation of this enzyme biosynthesis, bacterial strains were grown on the following medium, containing 2 g/L arginine, 5 g/L bacto-peptone, 5 g/L beef extract, 0.5 g/L glucose, 5 mg/L pyridoxine, 20 mg/L phenol red and 18 g/L agar, at pH 6.0. Positive reaction was seen due to the pH indicator dye that changed the color of the medium from yellow to red. Amylase activity. Starch depolymerization was screened on nutrient agar medium supplemented with 0.4% soluble starch. Amylase activity was revealed using Lugol solution, which results in a colorimetric reaction. Clear zone around the bacterial colony indicate starch hydrolysis, and the blue color is due to starch interaction with iodine.
RESULTS AND DISCUSSIONS
Genetic variability within Bacillus strains The BOX-PCR profile obtained with BOX1A primer for the 15 Bacillus strains analyzed (including de three reference strains) revealed 17 polymorphic bands within a total of 111 amplified DNA fragments (Figure 1).
126
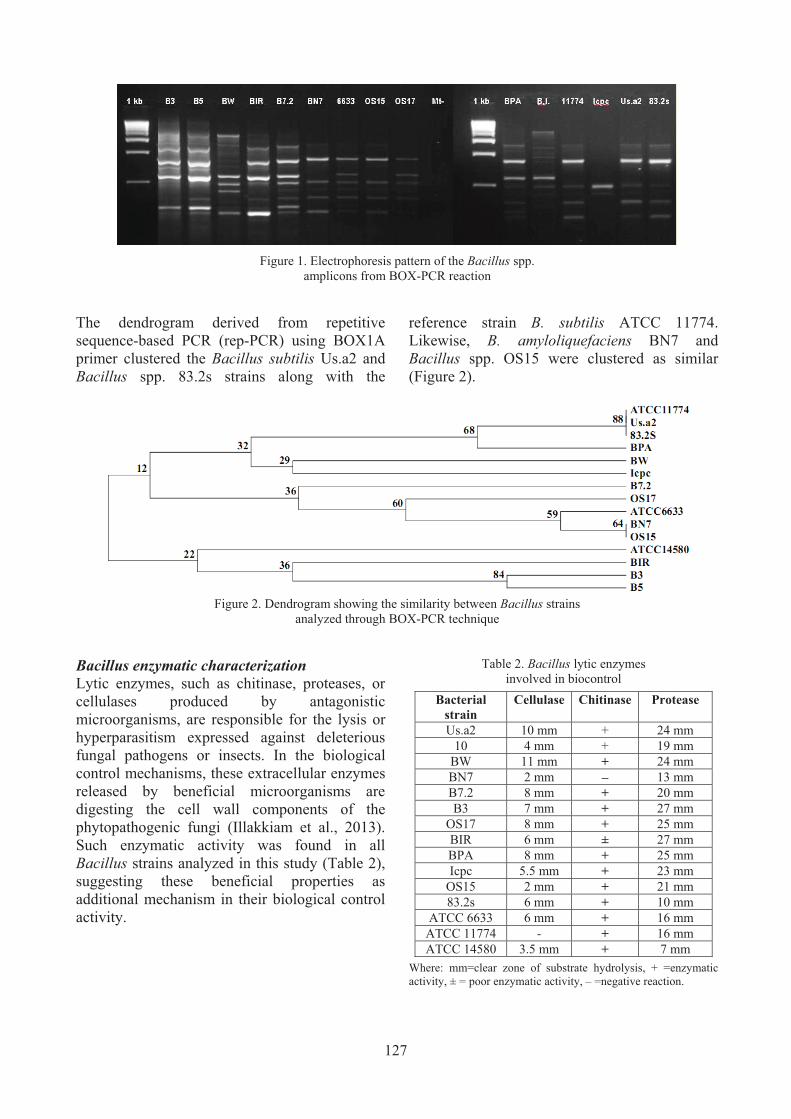
Figure 1. Electrophoresis pattern of the Bacillus spp.
amplicons from BOX-PCR reaction
The dendrogram derived from repetitive sequence-based PCR (rep-PCR) using BOX1A primer clustered the Bacillus subtilis Us.a2 and Bacillus spp. 83.2s strains along with the
reference strain B. subtilis ATCC 11774. Likewise, B. amyloliquefaciens BN7 and Bacillus spp. OS15 were clustered as similar (Figure 2).
Figure 2. Dendrogram showing the similarity between Bacillus strains
analyzed through BOX-PCR technique
Bacillus enzymatic characterization Lytic enzymes, such as chitinase, proteases, or cellulases produced by antagonistic microorganisms, are responsible for the lysis or hyperparasitism expressed against deleterious fungal pathogens or insects. In the biological control mechanisms, these extracellular enzymes released by beneficial microorganisms are digesting the cell wall components of the phytopathogenic fungi (Illakkiam et al., 2013). Such enzymatic activity was found in all Bacillus strains analyzed in this study (Table 2), suggesting these beneficial properties as additional mechanism in their biological control activity.
Table 2. Bacillus lytic enzymes involved in biocontrol
Bacterial strain
Cellulase Chitinase Protease
Us.a2 10 mm + 24 mm 10 4 mm + 19 mm
BW 11 mm + 24 mm BN7 2 mm – 13 mm B7.2 8 mm + 20 mm B3 7 mm + 27 mm
OS17 8 mm + 25 mm BIR 6 mm ± 27 mm BPA 8 mm + 25 mm Icpc 5.5 mm + 23 mm
OS15 2 mm + 21 mm 83.2s 6 mm + 10 mm
ATCC 6633 6 mm + 16 mm ATCC 11774 - + 16 mm ATCC 14580 3.5 mm + 7 mm
Where: mm=clear zone of substrate hydrolysis, + =enzymatic activity, ± = poor enzymatic activity, – =negative reaction.
127
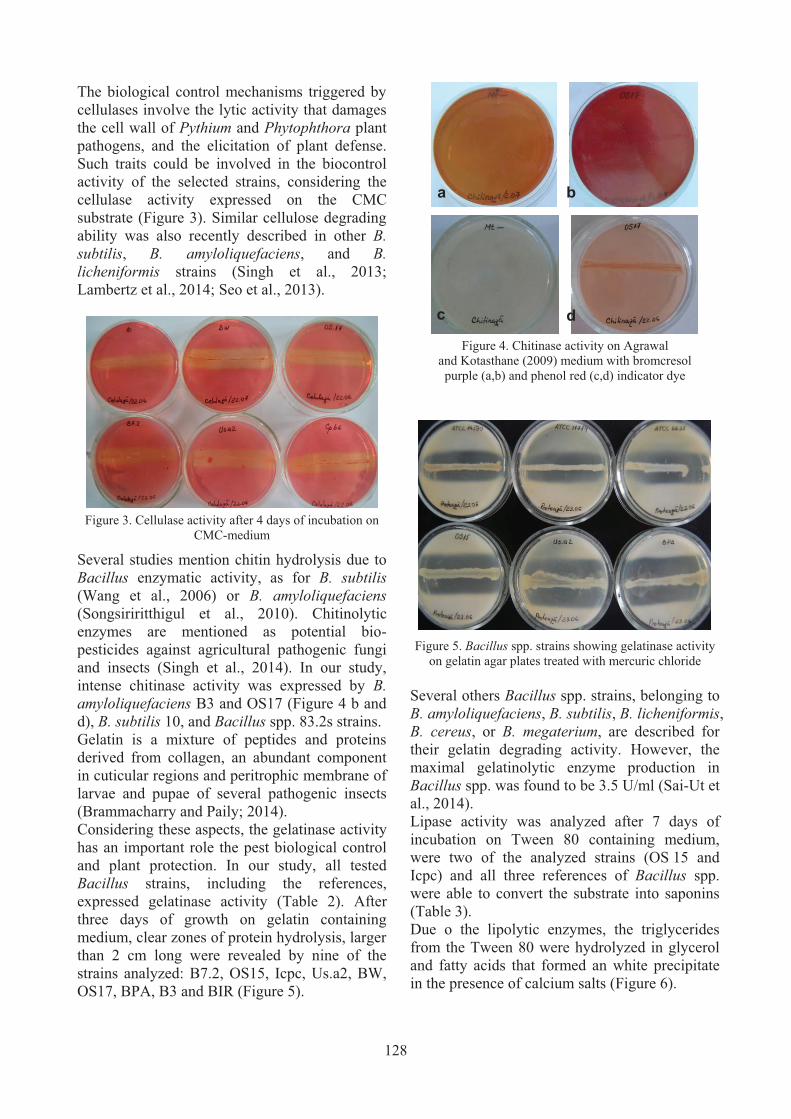
The biological control mechanisms triggered by cellulases involve the lytic activity that damages the cell wall of Pythium and Phytophthora plant pathogens, and the elicitation of plant defense. Such traits could be involved in the biocontrol activity of the selected strains, considering the cellulase activity expressed on the CMC substrate (Figure 3). Similar cellulose degrading ability was also recently described in other B. subtilis, B. amyloliquefaciens, and B. licheniformis strains (Singh et al., 2013; Lambertz et al., 2014; Seo et al., 2013).
Figure 3. Cellulase activity after 4 days of incubation on
CMC-medium
Several studies mention chitin hydrolysis due to Bacillus enzymatic activity, as for B. subtilis (Wang et al., 2006) or B. amyloliquefaciens (Songsiriritthigul et al., 2010). Chitinolytic enzymes are mentioned as potential bio-pesticides against agricultural pathogenic fungi and insects (Singh et al., 2014). In our study, intense chitinase activity was expressed by B. amyloliquefaciens B3 and OS17 (Figure 4 b and d), B. subtilis 10, and Bacillus spp. 83.2s strains. Gelatin is a mixture of peptides and proteins derived from collagen, an abundant component in cuticular regions and peritrophic membrane of larvae and pupae of several pathogenic insects (Brammacharry and Paily; 2014). Considering these aspects, the gelatinase activity has an important role the pest biological control and plant protection. In our study, all tested Bacillus strains, including the references, expressed gelatinase activity (Table 2). After three days of growth on gelatin containing medium, clear zones of protein hydrolysis, larger than 2 cm long were revealed by nine of the strains analyzed: B7.2, OS15, Icpc, Us.a2, BW, OS17, BPA, B3 and BIR (Figure 5).
Figure 4. Chitinase activity on Agrawal
and Kotasthane (2009) medium with bromcresol purple (a,b) and phenol red (c,d) indicator dye
Figure 5. Bacillus spp. strains showing gelatinase activity
on gelatin agar plates treated with mercuric chloride
Several others Bacillus spp. strains, belonging to B. amyloliquefaciens, B. subtilis, B. licheniformis, B. cereus, or B. megaterium, are described for their gelatin degrading activity. However, the maximal gelatinolytic enzyme production in Bacillus spp. was found to be 3.5 U/ml (Sai-Ut et al., 2014). Lipase activity was analyzed after 7 days of incubation on Tween 80 containing medium, were two of the analyzed strains (OS.15 and Icpc) and all three references of Bacillus spp. were able to convert the substrate into saponins (Table 3). Due o the lipolytic enzymes, the triglycerides from the Tween 80 were hydrolyzed in glycerol and fatty acids that formed an white precipitate in the presence of calcium salts (Figure 6).
a b
c d
128

Table 3. Lipase production revealed in tested Bacillus strains
Bacterial strain Lipase activity Tween 80 Olive oil
Us.a2 – + 10 N.A. +
BW – + BN7 N.A. + B7.2 N.A. + B3 N.A. +
OS17 – + BIR – + BPA – + Icpc + +
OS15 + + 83.2s – +
ATCC 6633 + + ATCC 11774 + + ATCC 14580 + +
Where: N.A. - not available, + positive reaction, – negative reaction
Figure 6. Lipolytic activity of Bacillus spp. OS15 and
B.licheniformis ATCC 14580 showing Twen 80 hydrolysis
On YOC medium with rhodamine B, lipase production was revealed at all tested strains after 5 day of incubation. Bacterial colonies depicted a fluorescent orange-pink growth in 350 nm UV light (Figure 7), due to lipase activity. The significance of microbial lipase activity is due to their implication in pest biological control, were lipolytic enzymes are contributing to the degradation of lipids contained by the insect epicuticle (Sandhu et al., 2012).
Figure 7. Lipase activity of bacterial colonies
having fluorescent orange-pink color on YOC rhodamine B medium
For plant growth promotion, some other enzymes are involved, increasing the opportunity of nutrients uptake. Phosphorus is one of the essential nutrients needed by the plants; however, it has very low solubility. Regarding the analyzed Bacillus spp., B3, BIR, 10, Icpc, BN7, OS17, 83.2s and BPA strains have shown phosphatase activity on modified Pikovskaya agar medium (Figure 8). Microbial phosphate solubilization ability being considered as the most important traits associated with plant P nutrition (Hemalatha et al., 2013).
Figure 8. Phosphate solublilizing bacteria on Pikovskaya
agar medium after 4 days of growth at 28°C Grown on minimal medium with ACC as sole nitrogen source, all the analyzed bacterial strains shown reduced bacterial growth compared with the same medium supplemented with ammonium sulphate; these being correlated with a low ACC-deaminase activity. The ACC deaminase is interfering in ethylene biosynthesis in plants, by converting its precursor, the ACC, into ammonia and α-ketobutyrate, and thereby lowering the levels of ethylene in plantlets or stressed plants (Glick, 2005). It is also suggested that, in plants, ethylene bio-synthesis is competed by polyamines (PAs) syn-thesis and application (de Dios et al., 2006). One of the PAs synthesis pathways is derived from ar-ginine, as enzymatic substrate. Analyzing our bacterial strains, we found arginine-decarboxylase activity in all tested strains, except for the ATCC 14580 reference (Figure 9), and a reduced enzy-matic activity in OS17 and ATCC 6633 strains.
Figure 9. Arginine-decarboxylase activity
revealed by the change of color in the media, from yellow to pink and pulple
129
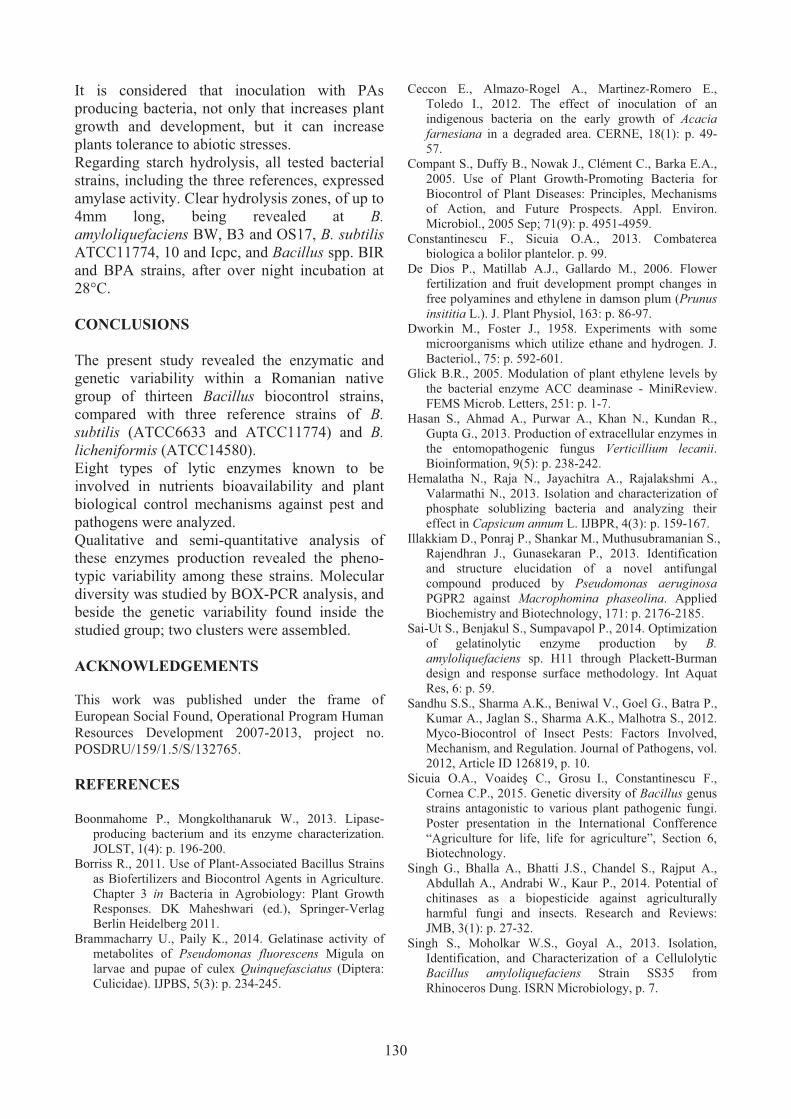
It is considered that inoculation with PAs producing bacteria, not only that increases plant growth and development, but it can increase plants tolerance to abiotic stresses. Regarding starch hydrolysis, all tested bacterial strains, including the three references, expressed amylase activity. Clear hydrolysis zones, of up to 4mm long, being revealed at B. amyloliquefaciens BW, B3 and OS17, B. subtilis ATCC11774, 10 and Icpc, and Bacillus spp. BIR and BPA strains, after over night incubation at 28°C.
CONCLUSIONS The present study revealed the enzymatic and genetic variability within a Romanian native group of thirteen Bacillus biocontrol strains, compared with three reference strains of B. subtilis (ATCC6633 and ATCC11774) and B. licheniformis (ATCC14580). Eight types of lytic enzymes known to be involved in nutrients bioavailability and plant biological control mechanisms against pest and pathogens were analyzed. Qualitative and semi-quantitative analysis of these enzymes production revealed the pheno-typic variability among these strains. Molecular diversity was studied by BOX-PCR analysis, and beside the genetic variability found inside the studied group; two clusters were assembled. ACKNOWLEDGEMENTS This work was published under the frame of European Social Found, Operational Program Human Resources Development 2007-2013, project no. POSDRU/159/1.5/S/132765. REFERENCES Boonmahome P., Mongkolthanaruk W., 2013. Lipase-
producing bacterium and its enzyme characterization. JOLST, 1(4): p. 196-200.
Borriss R., 2011. Use of Plant-Associated Bacillus Strains as Biofertilizers and Biocontrol Agents in Agriculture. Chapter 3 in Bacteria in Agrobiology: Plant Growth Responses. DK Maheshwari (ed.), Springer-Verlag Berlin Heidelberg 2011.
Brammacharry U., Paily K., 2014. Gelatinase activity of metabolites of Pseudomonas fluorescens Migula on larvae and pupae of culex Quinquefasciatus (Diptera: Culicidae). IJPBS, 5(3): p. 234-245.
Ceccon E., Almazo-Rogel A., Martinez-Romero E., Toledo I., 2012. The effect of inoculation of an indigenous bacteria on the early growth of Acacia farnesiana in a degraded area. CERNE, 18(1): p. 49-57.
Compant S., Duffy B., Nowak J., Clément C., Barka E.A., 2005. Use of Plant Growth-Promoting Bacteria for Biocontrol of Plant Diseases: Principles, Mechanisms of Action, and Future Prospects. Appl. Environ. Microbiol., 2005 Sep; 71(9): p. 4951-4959.
Constantinescu F., Sicuia O.A., 2013. Combaterea biologica a bolilor plantelor. p. 99.
De Dios P., Matillab A.J., Gallardo M., 2006. Flower fertilization and fruit development prompt changes in free polyamines and ethylene in damson plum (Prunus insititia L.). J. Plant Physiol, 163: p. 86-97.
Dworkin M., Foster J., 1958. Experiments with some microorganisms which utilize ethane and hydrogen. J. Bacteriol., 75: p. 592-601.
Glick B.R., 2005. Modulation of plant ethylene levels by the bacterial enzyme ACC deaminase - MiniReview. FEMS Microb. Letters, 251: p. 1-7.
Hasan S., Ahmad A., Purwar A., Khan N., Kundan R., Gupta G., 2013. Production of extracellular enzymes in the entomopathogenic fungus Verticillium lecanii. Bioinformation, 9(5): p. 238-242.
Hemalatha N., Raja N., Jayachitra A., Rajalakshmi A., Valarmathi N., 2013. Isolation and characterization of phosphate solublizing bacteria and analyzing their effect in Capsicum annum L. IJBPR, 4(3): p. 159-167.
Illakkiam D., Ponraj P., Shankar M., Muthusubramanian S., Rajendhran J., Gunasekaran P., 2013. Identification and structure elucidation of a novel antifungal compound produced by Pseudomonas aeruginosa PGPR2 against Macrophomina phaseolina. Applied Biochemistry and Biotechnology, 171: p. 2176-2185.
Sai-Ut S., Benjakul S., Sumpavapol P., 2014. Optimization of gelatinolytic enzyme production by B. amyloliquefaciens sp. H11 through Plackett-Burman design and response surface methodology. Int Aquat Res, 6: p. 59.
Sandhu S.S., Sharma A.K., Beniwal V., Goel G., Batra P., Kumar A., Jaglan S., Sharma A.K., Malhotra S., 2012. Myco-Biocontrol of Insect Pests: Factors Involved, Mechanism, and Regulation. Journal of Pathogens, vol. 2012, Article ID 126819, p. 10.
Sicuia O.A., Voaideş C., Grosu I., Constantinescu F., Cornea C.P., 2015. Genetic diversity of Bacillus genus strains antagonistic to various plant pathogenic fungi. Poster presentation in the International Confference “Agriculture for life, life for agriculture”, Section 6, Biotechnology.
Singh G., Bhalla A., Bhatti J.S., Chandel S., Rajput A., Abdullah A., Andrabi W., Kaur P., 2014. Potential of chitinases as a biopesticide against agriculturally harmful fungi and insects. Research and Reviews: JMB, 3(1): p. 27-32.
Singh S., Moholkar W.S., Goyal A., 2013. Isolation, Identification, and Characterization of a Cellulolytic Bacillus amyloliquefaciens Strain SS35 from Rhinoceros Dung. ISRN Microbiology, p. 7.
130

Songsiriritthigul C., Lapboonrueng S., Pechsrichuang P., Pesatcha P., Yamabhai M., 2010. Expression and characterization of Bacillus licheniformis chitinase (ChiA), suitable for bioconversion of chitin waste. Bioresource Technol, 101: p. 4096-4103.
Sundara Rao W.V.B., Sinha M.K., 1963. Phosphate dissolving microorganisms in the soil and rhizosphere. Indian J. of Agric. Sc. 33: p. 272-278
Versalonic J., Schneider M., de Bruijin F.J., Lupski J.R., 1994. Genomic fingerprinting of bacteria using
repetitive sequence-based polymerase chain reaction. Meth Mol Cel Biol, 5: p. 25-40.
Wang S.L., Lin T.Y., Yen Y.H., Liao H.F., Chen Y.J., 2006. Bioconversion of shellfish chitin wastes for the production of Bacillus subtilis W-118 chitinase. Carbohydr. Res., 341: p. 2507-2515.
Xie M., Yin H-q, Liu Y., Liu J., Liu X-d., 2008. Repetitive sequence based polymerase chain reaction to differentiate close bacteria strains in acidic sites. Trans Nonferrous Met Soc China, 18: p. 1392-1397.
131
COMPARATIVE STUDY OF LENGTH-WEIGHT RELATIONSHIP, SIZE STRUCTURE AND FULTON’S CONDITION FACTOR FOR PRUSSIAN
CARP FROM DIFFERENT ROMANIAN AQUATIC ECOSYSTEMS
Mala-Maria STAVRESCU-BEDIVAN1, Gina VASILE SCĂEŢEANU1, Roxana Maria MADJAR1, Petre Bogdan MATEI2, George Florea TOBĂ3
1University of Agronomic Sciences and Veterinary Medicine of Bucharest,
Faculty of Agriculture, 59 Mărăşti Blvd., 011464, Bucharest, Romania 2“Grigore Antipa” National Museum of Natural History, Şos. Kiseleff, No. 1,
011341, Bucharest, Romania 3Romanian Academy, INCE, Center for Studies and Researchers Agroforestry Biodiversity
“Acad. David Davidescu”, 13, Calea 13 Septembrie, 050711, Bucharest, Romania
Corresponding author email: [email protected] Abstract Length-weight relationship, Fulton’s K condition factor and the size structure were assessed for unsexed Prussian carp, Carassius gibelio (Bloch, 1782) caught from three different Romanian aquatic ecosystems: Cişmigiu Lake (Bucharest, October 2014), Brăneşti 3 Lake (Ilfov County, May 2015) and Sâi River (Teleorman County, April 2015). Positive allometric growth was estimated for specimens sampled from Cişmigiu Lake and Sâi River, while Prussian carp from Brăneşti 3 Lake exhibited a negative allometric growth pattern. Some physico-chemical parameters (pH, total dissolved solids, nitrite, nitrate, ammonium, phosphate, electrical conductivity, total hardness) were also recorded, in order to estimate the impact of water quality on C. gibelio population from Cişmigiu and Brăneşti 3 lakes. Both lentic ecosystems were found to be within the suitable range for well being of fish. To our knowledge, this paper provides first published information on length-weight relationship of a fish species inhabiting the freshwater ecosystems Sâi River and Brăneşti 3 Lake. Key words: Prussian carp, length-weight relationship, length distribution, condition factor, physico-chemical parameters, water quality. INTRODUCTION Carassius gibelio (Bloch, 1782), known as Prussian carp or gibel carp is an important freshwater species for recreational fishing in Europe (Marinović et al., 2015). A dominant species in stagnant and slow-running water, this fish could change the flow of nutrients in the entire ecosystem (Tsoumani et al., 2006; Lorenzoni et al., 2010; Kirankaya and Ekmekçi, 2013). There are only few studies regarding the biology of Prussian carp from Romanian waters, in terms of growth related to environmental factors (Cernisencu et al., 2007; Gheorghe et al., 2012). Sachidanandamurthy and Yajurvedi (2008) draw attention to the importance of studies regarding variation in fish growth parameters along with physico-chemical water quality parameters, to find out
whether variation in growth and well being of fish are influenced by fluctuations in water quality. Investigating length-weight relationship (LWR) offers information about the structure and function of fish population (Lemma et al., 2015). On the other hand, condition factor represents an indicator reflecting the interactions between biotic and abiotic factors to the physiological condition of fish, being assumed that heavier fish shows a healthier physiological state (Lemma et al., 2015). In addition, analyzing the size structure of a fish population could reveal many ecological and life-history traits, such the ecosystem health or stock conditions, even a basic description and length distribution having a great value for reference as well for comparison for future reports (Ranjan et al., 2005). Some
132
AgroLife Scientific Journal - Volume 4, Number 2, 2015
ISSN 2285-5718; ISSN CD-ROM 2285-5726; ISSN ONLINE 2286-0126; ISSN-L 2285-5718

authors consider that length of the fish is more relevant than its age, since several ecological and physiological factors are more size-depended than age-dependent (Kalaycı et al., 2007). The parameters for LWR and the type of growth were estimated before (Stavrescu-Bedivan et al., 2015) for the first time in C. gibelio specimens from an artificial lake from Bucharest. In the present paper, our purpose was to fulfill the following objectives: (1) to relate the biometric data obtained before for Prussian carp in Cişmigiu Lake with analysis of the water quality and (2) to compare length-weight relationship, Fulton’s condition factor and growth pattern within the same species, sampled from different aquatic ecosystems, presenting different physico-chemical water parameters. MATERIALS AND METHODS Fish collection and measurements A total of 262 Prussian carp individuals were collected from three different aquatic ecosystems, as follows: Cişmigiu Lake, an artificial lake from Bucharest (October 2014, n=94, by fish net) (Stavrescu-Bedivan et al., 2015), Brăneşti Lake 3, on the River Pasărea, tributary of the Dâmboviţa, Ilfov County (44° 26' 59.2'' N, 26° 20' 05.7'' E, May 2015, n=62, by recreational fishing) (Figure 1) and Sâi River, a tributary of the Danube, Teleorman County (43° 42' 52.8264'' N, 24° 51' 2.2896'' E, April 2015, n=106, by gill nets). After sampling, fish specimens were preserved frozen and analyzed in UASVM of Bucharest laboratory (Figure 2). Each individual of Carassius gibelio was measured for total length (TL ± 1 mm) and weighted (TW ± 1 g). The length-weight relationship (LWR) was expressed as: TW=aTLb, where coefficient a (intercept) describes the rate of change of weight with length and coefficient b (slope) provides information about isometric or allometric growth pattern (Froese, 2006). The relationships between the length and the weight of fish in each study area were assessed through linear regression (Log TW=Log a + b Log TL).
Positive allometric pattern of growth occurs when b>3, while negative allometric or hypoallometric growth is indicated by low values of b (< 3) (Froese et al., 2011; Karachle and Stergiou, 2012). The slope and intercept were estimated by the least-square method, using PAST (Paleontological Statististics Software) version 3.04. Fulton’s condition factor (K), showing the degree of well-being of the fish in their habitat (Nehemia et al., 2012) was calculated using the equation: K = (TW/TL3)*100. Size intervals for total length distribution of C. gibelio caught in study area were established and adapted in accordance with Innal (2012). Some physico-chemical water quality parameters were assessed in samples from Cişmigiu and Brăneşti Lakes.
Figure 1. Fishing on Brăneşti 3 Lake Figure 2. Prussian carp specimens from Sâi River, prior
to biometric analysis Water sampling Water samples were collected from Cişmigiu Lake (three sampling points) and Brăneşti Lake (three sampling points) at the same moment with fish collection. Water samples were taken at about 45 cm below surface layer in plastic bottles. The samples were subsequently stored
133

at 4°C for as short a time as possible before analysis to minimize physical and chemical changes. Chemical analyses were conducted within 48 hours of collection. The samples were allowed to stay until they reached room temperature before analysis. Chemical analyses The chemical analyses analysis of water samples were was performed by using methods similar to those recommended for drinking water (Mănescu et al., 1994). The assessment of all species was performed in triplicates and the presented results are the average of three similar values of each sample determinations. The concentrations of phosphate, nitrate, ammonium and nitrite species were determined by spectrophotometric means. Phosphate was quantified as molybdenum blue, for nitrate was used phenoldisulphonic method, for ammonium determination was used Nessler reagent and nitrite was achieved using Griess reaction. The pH was determined potentiometrically, after the water samples reached room temperature. Total hardness was assessed by complexometric method using as titrant a solution of Na2EDTA 0,05N meanwhile chemical oxygen demand (COD) was determined by manganometry. Electrical conductivity is a good indicator of total salinity of water and sometimes it is used to evaluate in a rough manner the total dissolved solids (TDS); it has been observed that usually TDS (mg/L) represents about half of the conductivity (�s/cm) (Stone et al., 2013). TDS was achieved using gravimetric method. Apparatus Prior to the analysis, all instruments were calibrated according to manufacturer's recommendations. Spectrophotometric measurements were carried out using Metertek SP830 Plus apparatus meanwhile pH was measured by using Inolab WTW pH-meter with combined glass electrode. The conductivity of water samples was determined using Hach SensIon7 apparatus. RESULTS AND DISCUSSIONS In a previous study (Stavrescu-Bedivan et al., 2015), were recorded biometric data for
Carassius gibelio sampled from Cişmigiu Lake: TL (min. 3.7 - max. 10.8 cm, with a mean of 5.28 cm) and TW (min.1.00 - max 23.00 g, with average of 3.39 g). The linear regression of the log-transformed values was calculated as: Log (TW)=3.63L Log (TL) - 2.26 (r2=0.913, 95% CL of the parameters a and b); the corresponding nonlinear equation was calculated as: TW=0.0055 x TL3.6303. Growth type for Prussian carp juveniles from this artificial lake was determined as positive allometric (b>3); K has a value of 1.62 (min. 0.85- max.2.55). The results recorded for sampling station Brăneşti Lake 3 are: TL (min. 16.5 - max. 27 cm, with a mean of 20.35 cm), TW (min. 8.8 - max 41.00 g, with average of 16.14 g), Log (TW)=2.66L Log (TL) - 1.28 (r2=0.879, 95% CL), TW=0.0523 x TL2.6569, K=1.87 (min. 1.51-max. 2.38). In this natural lake, Carassius gibelio indicated negative allometric growth (b < 3). In Sâi River, data recorded for Prussian carp specimens were: TL (min. 5.9 - max. 31.5 cm, with average of 11.46 cm), TW (min. 20 - max. 648 g, with average of 49.67 g), Log (TW)=3.24 L Log (TL) - 2.06 (r2=0.99, 95% CL), TW=0.0087 x TL3.249, K=1.58 (min.0.93-max. 2.34). The results showed positive allometric type of growth for Prussian carp from Sâi River. Length distribution of Carassius gibelio specimens caught in all sampling points is given in Figure 3.
Figure 3. Length distribution of Prussian carp in each study site
In Cişmigiu Lake, all fish caught (100%) were shorter than 11 cm. In Brăneşti 3 Lake, 87.09% of Prussian carp were 18.5-24 cm. Among specimens caught in Sâi River, 72.64% were shorter than 14.5 cm. Only 4.84% (Brăneşti 3 Lake) and 5.65% (Sâi River) of sampled C. gibelio were longer than 24 cm. The equations of the length-weight relationship in the study area are given in Figures 4-6.
0
20
40
60
80
100
0-11 11.5-14 14.5-16 16.5-18 18.5-20 20.5-22 22.5-24 24.5-26 26.5-28 28.5-32
TL (cm)
N (%
)
Cişmigiu Lake Sâi River Branesti 3 Lake
134

Figure 4. LWR of the Prussian carp in Cişmigiu Lake (Stavrescu-Bedivan et al., 2015)
Figure 5. LWR of the Prussian carp in Brăneşti 3 Lake
Figure 6. LWR of the Prussian carp in Sâi River The parameters of the LWR might be affected by various factors including season, sex, differences in the length range of the caught specimens, population density, sexual maturity age, habitat, food quality or quantity, fish health or environmental conditions (Innal, 2012; Lemma et al., 2015; Marinović et al., 2015; Moradinasab et al., 2012). Thus, the value of parameter b is directly affected by the habitat in which the fish lives (Erdogan et al., 2014) and may vary with the trophic state of the water (Tsoumani et al., 2006). In Brăneşti 3 Lake and Sâi River, the exponent b was within the expected range of 2.5-3.5. The
slope value recorded for the Prussian carp exceeded even the maximum value reported by FishBase (www.fishbase.org) only in Cişmigiu Lake (b = 3.6303) (Figure 4), but this is because most of the sampled specimens had a very small length range. Similar results were obtained by Treer et al. (2010), for Carassius gibelio from a Croatian Lake. In a previous survey (Stavrescu-Bedivan et al., 2015), we assumed that this high value of slope in LWR for C. gibelio from Cişmigiu Lake might suggest the presence of an oligotrophic water. This supposition is now confirmed by performed chemical water analyses and reported herein. This was confirmed by water quality parameters calculated in the present study. The negative allometric growth (b=2.6569) for fish from Brăneşti 3 Lake could be attributed to trophic state of the water, assuming the results of the chemical analysis. In addition, it was reported that Brăneşti 3 Lake is an unhygienic fishing pond, as on its banks and in the water there is quite a lot of rubbish (www.baltidepescuit.ro/balta-branesti-3.html). Our results are in agreement with the findings of Tsoumani et al. (2006), who showed significant negative correlation between the trophic state of the water and b values. However, Prussian carp is a resistant species to anthropogenic pollution, as Zhelev et al. (2015) reported. The lower value of b in the case of C. gibelio from Brăneşti 3 Lake can also be influenced by the number of caught fish specimens, since the small sample size can also influence the LWR parameters (Leonardos et al., 2008). Length-weight relationship indicated that Prussian carp populations caught in all studied ecosystems show allometric growth. Similar findings were reported for Carassius gibelio from Danube (Gheorghe et al., 2012) and Taşaul Lake (Cernisencu et al., 2007). Differences in condition factor for the same species in various habitats may be attributed to water quality parameters, as earlier studies mentioned (Khallaf et al., 2003; Sachidanandamurthy and Yajurvedi, 2008; Nehemia et al., 2012). The Fulton’s condition of C. gibelio sampled in study area has values between 1.58 and 1.87. Hence, fish specimens from Brăneşti 3 Lake suggest a better well-
y = 0.0523x2.6569
r2 = 0.879n=62
0
50
100
150
200
250
300
350
400
450
0 5 10 15 20 25 30
TL (cm)
TW (g
)
y = 0.0055x3.6303
r2 = 0.9133n = 94
0
5
10
15
20
25
30
35
0 2 4 6 8 10 12
TL (cm)
TW
(g)
y = 0.0087x3.249
r2 = 0.9904n=106
0
100
200
300
400
500
600
700
0 5 10 15 20 25 30 35TL (cm)
TW
(g)
135

being that that in other water bodies, although this lake seems to have a poor water quality comparing to Cişmigiu Lake (Tables 1 and 2). Also, from the total of three sampled aquatic ecosystems, Brăneşti 3 Lake seems to hold the best Prussian carp population, in terms of distribution of length frequencies. As Ranjan et al. (2005) suggested, the absence of very large specimens from a water resource might indicate that fish is target of anglers and fishermen. Although length-frequency distribution of C. gibelio has already been subject of several papers (Innal, 2012; Kirankaya and Ekmekçi, 2013; Marinović et al., 2015; Zhelev et al., 2015), there is still scarce literature available on this topic for Prussian carp from Romanian ichtyofauna. Physico-chemical parameters for water samples collected from Cişmigiu Lake and Brăneşti Lake are presented in Tables 1 and 2, respectively. Also, for comparison in Table 3 are presented the parameters and quality classes according to Order 161/2006. The conductivity and pH values of water samples collected from Cişmigiu Lake present very significant correlation with total hardness, the calculated correlation parameters being r=0.950*** and r=0.992***, respectively. (Figure 7). The coefficients resulted after conductivity-total hardness and pH-total hardness correlations (r=0.774*** and r=0.770***, respectively) indicate a very significant correlation between subjected parameters (Figure 8).
Table 1. Physico-chemical parameters for water collected
from Cişmigiu Lake Parameters Results
SP1 SP2 SP3 Av. Quality class
pH 6.85 6.53 7.00 6.79 - Conductivity (�S/cm)
829 784 841 818 -
Total hardness (mg CaCO3/L)
22.38 18.79 23.57 21.58 -
COD (mg O2/L) 7.91 8.71 7.83 8.15 II N-NH4
+ (mgN/L) 1.69 1.63 1.44 1.58 IV N-NO2
- (mg N/L) 0.015 0.017 0.014 0.015 IIN-NO3
- (mg N/L) 0.415 0.375 0.475 0.421 I P-PO4
3- (mg P/L) <DL <DL <DL - -Total dissolved solids (TDS) (mg/L)
389 410 413 404 I
SP- sampling point; Av. - average; DL - detection limit
Table 2. Physico-chemical parameters for water collected from Brăneşti 3 Lake
Parameters Results
SP1 SP2 SP3 Av. Quality class
pH 7.68 7.58 7.84 7.70 - Conductivity (�S/cm) 1132 1105 1156
1131
-
Total hardness (mg CaCO3/L) 26.27 24.93 27.84
26.34 -
COD (mg O2/L) 9.53 9.3 8.98 9.27 II N-NH4
+ (mgN/L) 4.28 4.41 4.5 4.39 V N-NO2
- (mg N/L) 0.068 0.076 0.078 0.074 IV N-NO3
- (mg N/L) 1.83 2.13 1.89 1.95 II P-PO4
3- (mg P/L) <DL <DL <DL - - Total dissolved solids (TDS) (mg/L) 558 542 531
543.66 II
SP- sampling point; Av. - average; DL - detection limit
Table 3. Quality classes for surface waters according to
Order 161/2006 Parameters
Classes
I II III IV V
pH 6.5-8.5
COD (mg O2/L) 5 10 20 50 >50
N-NH4+ (mgN/L) 0.4 0.8 1.2 3.2 >3.2
N-NO2- (mg N/L) 0.01 0.03 0.06 0.3 >0.3
N-NO3- (mg N/L) 1 3 5.6 11.2 >11.2
P-PO43- (mg P/L) 0.1 0.2 0.4 0.9 >0.9
Total dissolved solids
(TDS) (mg/L)
500 750 1000 1300 >1300
Figure 7. Correlations between conductivity and pH values with total hardness of water samples from
Cişmigiu Lake Desirable pH range for optimal growth of most fish species is 6.5-9.0, levels below 6.5 leading to a decrease of reproduction (Stone et al., 2013).
136

Figure 8. Correlations between conductivity and pH values with total hardness of water samples from
Brăneşti 3 Lake Dastagir et al. (2014) reported that a value pH lower than 8.4 indicate that the respiratory processes in a water resource are greater than the photosynthetic processes, while alkaline pH higher than 8.8 could produce death of the fish. In the present study, pH ranged from 6.79 in Cişmigiu Lake to 7.70 in Brăneşti 3 Lake. Electrical conductivity it is recommended to be encountered in the range 60-2000 �s/cm (Stone et al., 2013), this requirement being fulfilled for all analyzed water samples. Total hardness (as CaCO3) of water for fish culture it is desirable to be found in the range 50-150 mg/L but values greater than 20 mg/L are considered to be acceptable (Stone et al., 2013). With values of 21.58 and 26.34 respectively, total hardness of the water was in desirable range in both analyzed lakes. Ammonium level found in Cişmigiu Lake is 2.8 times lower than the level found in Brăneşti Lake. High values of ammonium are usually encountered in the spring and fall (Stone et al., 2013), related to the algal blooms. The increase in ammonia concentration in lake water may cause toxicity to aquatic organisms (Yang et al., 2011). Yet, toxicity of ammonia to fish varies with fish species, salmonids for example being more sensitive to this compound than other fish species (Stone et al., 2013), age or other quality parameters (Latha and Lipton, 2007). Goldfish, Carassius auratus, seems to have a greater resistance to ammonia (Schenone et al., 1982). Jeppensen et al. (2000) showed that body weight of cyprinids decrease with the increase
in phosphorus content of water samples. In present study, both analyzed lakes contain phosphate in levels lower than spectrophotometry may detect, which might suggest that water is suitable for optimal growth of the fish.The total dissolved solids (TDS) fluctuated between 389 (Cişmigiu Lake) and 558 mg/L (Brăneşti 3 Lake). It has been documented that TDS vary in different waters depending upon the season, location or other factors (Dastagir et al., 2014) and high amounts of dissolved solids may indicate poor water quality. In environmental chemistry, chemical oxygen demand (COD) is used to measure the amount of organic species in the water and to evaluate the quality of waters. COD is a measure of capacity of water to consume oxygen during decomposition of organics and oxidation of ammonia and nitrate (https://en.wikipedia.org/). From this point of view, the waters from Cişmigiu Lake and Brăneşti 3 Lake are similar and the chemical analyses allowed us to attribute them class II of quality.
CONCLUSIONS The length-weight equations determined from regression of Log weight on Log length of Prussian carp indicated a positive allometric type of growth for specimens sampled in Cişmigiu Lake and Sâi River (which means that fish increase in body thickness) and a hypoallometric growth pattern for specimens in Brăneşti 3 Lake (which suggest that fish becomes more slender as it increase in weight). Our results could be useful references for future comparative studies like Carassius gibelio biometric data registered by FishBase in various sites from Romania and worldwide. Assuming the values of all the analyzed physico-chemical parameters, both studied lakes were found to be within the suitable range for well being of fish. Yet, the natural fishing pond Brăneşti 3 Lake from Ilfov County seems to have a poor water quality condition comparing to the artificial Cişmigiu Lake from Bucharest. However, C. gibelio from Brăneşti 3 Lake holds the best population in terms of length distribution, having also the best degree of health population from all studied areas in terms of fish condition.
137

ACKNOWLEDGEMENTS This work was scientifically supported by the European Social Fund through Sectorial Operational Programme Human Resources Development 2007-2013, project number POSDRU/89/1.5/S/63258 Postdoctoral school for zootechnical biodiversity and food biotechnology based on the eco-economy and the bio-economy required by eco-sano-genesys. The authors are also grateful to Mrs. Cristina Costache, responsible for fish and water sampling from Brăneşti 3 Lake and to Mr. Alin Toma, for providing the biological samples from Sâi River. REFERENCES Cernisencu I., Alexandrov L., Orac O., Bloesch J.,
Tofan L., Arhire D., Paris P., 2007. Tasaul Lake fisheries characteristics and research. Cercetări Marine, 37: p. 126-142.
Dastagir G., Narejo N.T., Jalbani S., 2014. Physico-chemical prameters and their variations in relation to fish production in Zhob River Balochistan. Pak. J. Anal. Environ. Chem. 15, 2: p. 77-81.
Erdogan Z., Hatice T. K., Serkan G., Gulcin U., 2014. Age, growth and reproductive properties of an invasive species Carassius gibelio (Bloch, 1782) (Cyprinidae) in the Ikizcetepeler Dam lake (Balikesir), Turkey. Periodicum Biologorum, 116 (3): p. 285-291.
Froese R., 2006. Cube law, condition factor and weight-length relationships: history, meta-analysis and recommendations. Journal of Applied Ichthyology, 22 (4): p. 241-253.
Gheorghe D.C., Nica A., Cristea V., Răzlog G.P., 2012. Growth and mortality estamation parameters for the Prusian carp (Carassius gibelio, Bloch, 1782) population from Danube River (km 170-196). UASVM Iasi, Lucrări Științifice Journal, Seria Zootehnie 57 (17): p. 164-169.
Kalaycı F., Samsun N., Bilgin S., Samsun O., 2007. Length-weight relationship of 10 fish species caught by bottom trawl and midwater trawl from the Middle Black Sea, Turkey. Turkish Journal of Fisheries and Aquatic Sciences 7: p. 33-36.
Karachle P.K., Stergiou K.I., 2012. Morphometrics and allometry in fish. In: Wahl C.M., 2012. Morphometrics. New York: Cornell University, 65-68. (Agricultural and biological science). DOI: 10.5772/34529.
Khallaf E., Galal M., Athuman M., 2003. The biology of Oreochromis niloticus in a polluted canal. Ecotoxicology, 12: p. 405-416.
Kirankaya Ş.G., Ekmekçi F.G., 2013. Life-History Traits of the Invasive Population of Prussian Carp, Carassius gibelio (Actinopterigi: Cypriniformes: Cyprinidae), from Gelingüllü Reservoir, Yozgat,
Turkey. Acta Ichthyologica Et Piscatoria, Vol. 43,1: p. 31-40.
Innal D., 2012. Age and growth properties of Carassius gibelio (Cyprinidae) living in Aksu River Estuary (Antalya-Turkey). Review of Hydrobiology. 5,2: p. 97-109.
Jeppesen E., Jensen J.P., Søndergaard M., Lauridsen T., Landkildehus F., 2000. Trophic structure, species richness and biodiversity in Danish lakes: changes along a phosphorus gradient. Freshwater Biology 45: p. 201-218.
Latha Y.P., Lipton A.P., 2007. Water quality management in gold fish (Carassius auratus) rearing tanks using different filter materials. Indian Hydrobiology, 10 (2): p. 301-302.
Lemma A., Getahun A., Lemma B., 2015. Assessment of length-weight relationship, sex ratio and condition factor of common carp (Cyprinus carpio Linnaeus, 1758) in Lake Ziway, Ethiopia. Glob. J. Fish. Aquac. 3 (1): p. 192-197.
Leonardos I.D., Tsikliras A.C., Eleftheriou V., Cladas Y., Kagalou I., Chortatou R. Papigioti O., 2008. Life history characteristics of an invasive cyprinid fish (Carassius gibelio) in Chimaditis Lake (northern Greece). J. Appl. Ichthyol. 24, p. 213-217.
Lorenzoni M. Ghetti L., Pedicillo G., Carosi A., 2010. Analysis of the biological features of the gold fish Carassius auratus auratus in Lake Trasimeno (Umbria, Italy) with a view to drawing up plans for population control. Folia Zool. 59 (2): p. 142-156.
Marinović Z., Lujić J., Bolić-Trivunović, Marković G., 2015. Comparative study of growth in Carassius gibelio (Bloch, 1782) and Rutilus rutilus (L., 1758) from two Serbian reservoirs: Multi-model analysis and inferences. Fisheries Research, http://dx.doi.org/10.1016/j.fishres.2015.04.003.
Mănescu S., Cucu M., Diaconescu M.L., 1994. Chimia sanitară a mediului. Ed. Medicală, Bucureşti.
Moradinasab Gh., Daliri M., Ghorbani R., Paighambari S.Y., Davoodi R., 2012. Length-weight and length-length relationships, Relative condition factor and Fulton’s condition factor of Five Cyprinid species in Anzali wetland, southwest of the Caspian Sea. Caspian J. Env. Sci. 10 (1): p. 25-31.
Nehemia A., Maganira J.D., Rumisha C., 2012. Length-Weight relationship and condition factor of tilapia species grown in marine and fresh water ponds. Agric. Biol. J. N. Am., 3(3): p. 117-124.
Ranjan J.B., Herwig W., Subodh S., Michael S., 2005. Study of the length frequency distribution of sucker head, Garra gotyla gotyla (Gray, 1830) in different rivers and seasons in Nepal and its applications. Kathmandu University Journal of Science, Engineering and Technology I, p. 1: 1-14.
Sachidanandamurthy K.L., Yajurvedi H.N., 2008. A study on growth co-efficient and relative condition factor of the major carp (Catla catla) in two lakes differing in water quality. Applied ecology and environmental research 6(3): p. 33-47.
Schenone G., Arillo A., Margiocco C., Melodia F., Mensi P., 1982. Ecotoxicol Environ Saf. 6(5): p. 479-88. Biochemical bases for environmental adaptation
138
in goldfish (Carassius auratus L.): resistance to ammonia.
Stone N., Shelton J., Haggard B., Thomforde H., 2013. Interpretation of water analysis reports for fish culture. Southern Regional Aquaculture Center, SRAC Publication, no. 4606; https://srac.tamu.edu/.
Treer T., Matulic D., Bogdanovic G., Anicic I., Safner, R., Piria M., Sprem N., Tomljanovic T., 2010. The condition of allochtonous fishes in the Mediterranean Vransko Lake. J. Appl. Ichthyol. (2010), 1-3, https://bib.irb.hr/datoteka/512660.VranskoonlineLibraryTPS.pdf.
Tsoumani M., Liasko R., Moutsaki P., Kagalou I., Leonardos I., 2006. Length-weight relationships of an invasive cyprinid fish (Carassius gibelio) from 12 Greek lakes in relation to their trophic states. J. Appl. Ichthyol., 22 (4): p. 281-284.
Yang W., Xiang F., Liang L., Yang Z., 2011. Toxicity of ammonia and its effects on oxidative stress mechanisms of juvenile Crucian carp (Carassius auratus). Journal of Freshwater Ecology 25 (2): p. 297-302.
Zhelev Z., Boyadzhiev P., Angelov M., 2015. Analysis of size-age, sexual structure and condition of populations of Carassius gibelio (Pisces: Cyprinidae) from two water basins in Galabovo region (southern Bulgaria). Trakia Journal of Sciences, 2: p. 185-195.
***http://www.fishbase.org. ***http://www.baltidepescuit.ro/balta-branesti-3.html. ***Ordin nr. 161 din 16 februarie 2006 pentru aprobarea
Normativului privind clasificarea calităţii apelor de suprafaţă în vederea stabilirii stării ecologice a corpurilor de apă.
***https://en.wikipedia.org/wiki/Chemical_oxygen_demand.
139

140