American Journal of Scientific Research
147
American Journal of Scientific Research ISSN: 2301-2005 Issue 89 July, 2013 Editorial Advisory Board Maika Mitchell, Columbia University Medical Center Prabhat K. Mahanti, University of New Brunswick Parag Garhyan, Auburn University Morteza Shahbazi, Edinburgh University Jianfang Chai, University of Akron Raj Rajagopalan, National University of Singapore Sang-Eon Park, Inha University Said Elnashaie, Auburn University Subrata Chowdhury, University of Rhode Island Ghasem-Ali Omrani, Tehran University of Medical Sciences Ajay K. Ray, National University of Singapore Mutwakil Nafi, China University of Geosciences Felix Ayadi, Texas Southern University Bansi Sawhney, University of Baltimore David Wang, Hsuan Chuang University Cornelis A. Los, Kazakh-British Technical University Teresa Smith, University of South Carolina Ranjit Biswas, Philadelphia University Chiaku Chukwuogor-Ndu, Eastern Connecticut State University M. Femi Ayadi, University of Houston-Clear Lake Emmanuel Anoruo, Coppin State University H. Young Baek, Nova Southeastern University Mohand-Said Oukil, King Fahd University of Petroleum & Minerals David Wang, Chung Yuan Christian University Cornelis A. Los, Kazakh-British Technical University Abdul Jalil, Wuhan University Wen-jen Hsieh, National Cheng Kung University M. Carmen Guisan, University of Santiago de Compostela H. Young Baek, Nova Southeastern University Ebere Oriaku, Elizabeth City State University Neven Borak, Securities Market Agency Maria Elena Garcia-Ruiz, University of Cantabria Ghadir Mahdavi, Kyoto University Emanuele Bajo, University of Bologna Wassim Shahin, Lebanese American University Neil Reid, University of Toledo Christopher Balding, University of California, Irvine Jean-Luc Grosso, University of South Carolina Richard Omotoye, Virginia State University Eskandan A. Tooma, the American University in Cairo Rafa E. Al Qutaish, Al-Ain University of Science and Technology, UAE Leo V. Ryan, DePaul University Elmer-Rico E. Mojica, State University of New York at Buffalo Syrous Kooros, Nicholls State University G. M. Nasira, Sasurie College of Engineering
-
Upload
ciitvehari -
Category
Documents
-
view
1 -
download
0
Transcript of American Journal of Scientific Research

American Journal of Scientific Research
ISSN: 2301-2005 Issue 89
July, 2013
Editorial Advisory Board
Maika Mitchell, Columbia University Medical Center
Prabhat K. Mahanti, University of New Brunswick
Parag Garhyan, Auburn University
Morteza Shahbazi, Edinburgh University
Jianfang Chai, University of Akron
Raj Rajagopalan, National University of Singapore
Sang-Eon Park, Inha University
Said Elnashaie, Auburn University
Subrata Chowdhury, University of Rhode Island
Ghasem-Ali Omrani, Tehran University of Medical Sciences
Ajay K. Ray, National University of Singapore
Mutwakil Nafi, China University of Geosciences
Felix Ayadi, Texas Southern University
Bansi Sawhney, University of Baltimore
David Wang, Hsuan Chuang University
Cornelis A. Los, Kazakh-British Technical University
Teresa Smith, University of South Carolina
Ranjit Biswas, Philadelphia University
Chiaku Chukwuogor-Ndu, Eastern Connecticut State University
M. Femi Ayadi, University of Houston-Clear Lake
Emmanuel Anoruo, Coppin State University
H. Young Baek, Nova Southeastern University
Mohand-Said Oukil, King Fahd University of Petroleum & Minerals
David Wang, Chung Yuan Christian University
Cornelis A. Los, Kazakh-British Technical University
Abdul Jalil, Wuhan University
Wen-jen Hsieh, National Cheng Kung University
M. Carmen Guisan, University of Santiago de Compostela
H. Young Baek, Nova Southeastern University
Ebere Oriaku, Elizabeth City State University
Neven Borak, Securities Market Agency
Maria Elena Garcia-Ruiz, University of Cantabria
Ghadir Mahdavi, Kyoto University
Emanuele Bajo, University of Bologna
Wassim Shahin, Lebanese American University
Neil Reid, University of Toledo
Christopher Balding, University of California, Irvine
Jean-Luc Grosso, University of South Carolina
Richard Omotoye, Virginia State University
Eskandan A. Tooma, the American University in Cairo
Rafa E. Al Qutaish, Al-Ain University of Science and Technology, UAE
Leo V. Ryan, DePaul University
Elmer-Rico E. Mojica, State University of New York at Buffalo
Syrous Kooros, Nicholls State University
G. M. Nasira, Sasurie College of Engineering

American Journal of Scientific Research http://www.eurojournals.com/ajsr.htm
Aims and Scope
American Journal of Scientific Research is a peer-reviewed scientific research journal that addresses
both applied and theoretical issues. The scope of the journal encompasses research articles, original
research reports, reviews, short communications and scientific commentaries in the fields of applied
and theoretical sciences, biology, chemistry, physics, zoology, medical studies, environmental
sciences, mathematics, statistics, geology, engineering, computer science, social sciences, natural
sciences, technological sciences, linguistics, medicine, industrial, and all other applied and theoretical
sciences. The journal publishes both applied and conceptual research. American Journal of Scientific
Research covers all applications of polymers, from composite and structural materials, to those used in
packaging, biomedical implants, plastic electronics, energy, and many more.
American Journal of Scientific Research bridges the crucial gap between basic research and patenting
of an invention, targeting a broad audience of academic and industrial researchers, as well as the
increasingly important world of scientists and engineers at start-up companies. The journal publishes
experimental and theoretical results of research on, amongst other topics, semiconductors, magnetic
materials, and applied biophysics. American Journal of Scientific Research publishes papers based on
original research that are judged to make a novel and important contribution to understanding the
molecular and cellular basis of biological processes. T
American Journal of Scientific Research serves for the advancement and dissemination of knowledge
in all fields of applied physics. The journal publishes articles dealing with the applications of physical
principles as well as articles concerning the understanding of physics that have particular applications
in mind. The journal not only covers all aspects of modern technology such as semiconductor devices
including VLSI technology, photonic devices, superconductors, and magnetic recording but also covers
other diverse areas such as plasma physics, particle accelerators, nanoscience and technology, and
applied bioscience. Articles in interdisciplinary areas with potential technological implications are
strongly encouraged.
American Journal of Scientific Research particularly aims at publishing the finest peer-reviewed
research in all fields of science and technology on the basis of its originality, importance,
interdisciplinary interest, timeliness, accessibility, elegance and surprising conclusions. American
Journal of Scientific Research The journal realizes the meaning of fast publication to researchers,
particularly to those working in competitive and dynamic fields. Hence, it offers an exceptionally fast
publication schedule including prompt peer-review by the experts in the field and immediate
publication upon acceptance. The editorial board aims at reviewing the submitted articles as fast as
possible and promptly include them in the forthcoming issues should they pass the evaluation process.
The journal is published in both print and online formats.
Abstracting/Indexing
American Journal of Scientific Research is indexed in ProQuest ABI/INFORM Genamics, Elsevier
Bibliographic Databases, EMBASE, Ulrich, DOAJ, EMNursing, Compendex, GEOBASE and Mosby.
American Journal of Scientific Research is monitored by Science Citation Index (SCI)

American Journal of Scientific Research Issue 89 July, 2013
Contents
The Importance and Necessity of Concurrent Jourisdiction for Granting
Interim Measure Case: Islamic Republic of Iran 5-15
Reza Haghparast
Making and Optimizing Copper Oxide Nano-Particles from Second-Hand Sources 16-23 Farideh Yousefi and Malihe Jalili
Sassanid Religion and the Decline 24-28
Zia Khazaei and Mahnaz Ghaljeh
Production, Manufacturing System Operations, and Logistics Modeling the
Metrics of Lean, Agile, and Leagility: An AHP-Based Approach 29-40 Mahboobe Sadat Haj Mirfattah Tabrizi and Javad khamisabadi
Analyzing the Place of Myth in the Religion 41-46
Zahra Rezaei
Experimental Investigation of the Geotextile Effect on the Strength of Kaolinite Clay 47-59
Amir Kalhor and Kiarash Mirabi
Developing the Capability of Local Management Based on Iranian-Islamic
Criteria (Case Study: The Local Management of Sari) 60-80
Hamid Reza Saremi and Mohammad Rashidi Alashti
Pedestrian Network Development Planning in Kish Island Case
Study: Mirmohanna Walkway 81-90 Hassan Ali Laghai and Mona Loghman
Strategy for Sustainable Urban Development Guidelines for Tehran 91-96 Hassan Ali Laghai, Mona Loghman and Nabiollah Kolbadi
A Survey on Over Confidence under Increasing Inflation in Tehran Stock
Exchange and Tehran Real Estate Market 97-108 Majid Shakeri, Reyhaneh Sadat Tabatabei Yeganeh and Reza Teharni
Management of Ovarian Dermoid Cysts at Jordan University Hospital:
A Teaching Hospital Experience 109-115 Kamil Mosa Fram, MD, Shawqi S.Saleh, Frcog, Fawwaz A. Kazaleh, MD
Firas Obiedat, MD, Osama Samarah, MD and Nadir M. Al-Bsoul, MD
Joint Detection and Discrimination of CDMA2000, WiMAX and Frequency
Hopping Signals 116-124 Ammar Abdul-Hamed Khader, Ahmed M. Husein Shabani and Mirza Tariq Beg

The Impacts of SMS on Formal Writing: A Case Study Among the University
Students of Comsats Vehari Campus 125-138
NaziaSuleman, Iram RubabSial, SaydAbrarHussain Shah and Hafiz SajjadHussain
Role of Countryside Women in Decision Making in different Family Matters 139-143 Mazhar Abbas, Asma Kashif Shahzad, Rafia Waqar,
Wasim Abbas and Syed Abrar Hussain Shah
The Study of Relationship between Free Float Stock Less than 25% and the Stock
Returns of Listed Companies in Tehran Stock Exchange 144-147 Mehdi Najafi and Farshid Asgari

American Journal of Scientific Research
ISSN 2301-2005 Issue 89 July, 2013, pp.5-15
http://www.americanjournalofscientificresearch.com
The Importance and Necessity of Concurrent Jourisdiction for
Granting Interim Measure Case: Islamic Republic of Iran
Reza Haghparast
Masters of Private Law, University of Tehran International Campus Kish Island
Department of Law, Kish International Campus, University of Tehran, Kish Island, Iran
E-mail: [email protected]
Tel: +989124520029
Abstract
One of the most important issues of iran civil procedure code which has always
been dealt as a lacunas is the possibility of granting the interim measure by the arbitral
tribunal. Currently, it is not possible to seek for interim measure through the court and
arbitral tribunal. The reason of the impossibility is that article 311 of the civil procedure
code holds that the capability of handling the request of interim measure lies in the
jurisdiction of the court in which the dispute has been raised, and the reason of
impossibility of seeking it through the arbitral tribunal is due to the absence of giving such
power by the parties in the arbitration agreement. However, the point is that the granting
interim measure is one of the legal requirements that may occur in any dispute. The courts
and the arbitral tribunal must have the concurrent jurisdiction in granting such actions as
well.
Keywords: Arbitral tribunal, interim measure, concurrent jurisdiction, parties agreement,
enforcement of interim measure.
1. Introduction It is a common practice that parties to an arbitration procedure petition the arbitral tribunal for granting
interim measure where the urgency of the case necessitates. Therefore, interim measures are deemed as
a definite necessity and a tool to support or protect what might be endangered throughout the procedure
(Morek, 2007). One of the lacunas in the iran code of civil procedure is failure to determine provisions
concerning possibility to order interim measure by arbitral tribunal. Currently, such failure prevents the
arbitrators to grant interim measures. Even it is out of the court jurisdiction. The reason is that subject
to article 311 of the code of civil procedure, as general proposition, the only authority in capacity to
grant such award is the court where the procedure is commenced. This implies that neither the court
nor the arbitral tribunal may accept the petition of interim measure. However, taking into account
exception to the general proposition, the court may grant interim measure when the subject of the
request is included.
The point is that we can employ the term “lacunas” when there is no mutual agreement between
the parties regarding the grant of jurisdiction for issuing interim measure to the arbitrator. Otherwise,
what is agreed upon as arbitral procedure determines authenticity of the writ. This lies with the fact that
cause of writ is the mutual agreement of the parties, and the jurisdiction of arbitrator is rooted in the so-
called agreement. The lacuna in the law eventuates in inefficiency and ambiguity of arbitration and
makes the parties to bring their case directly to the court. Codification of comprehensive regulation
concerning grant of interim measure entails with using a set of principle bases such as principles of

The Importance and Necessity of Concurrent Jourisdiction for Granting Interim
Measure Case: Islamic Republic of Iran 6
court/arbitral tribunal concurrent jurisdiction, outcomes, and raised limitation as well. Thus, the present
work tries to answer; “under what condition and in observance of what principles and regulation the
arbitral tribunal may grant interim measure?”, “ are the parties allowed to refer to court or arbitral
tribunal to petition for interim measure?”, “is it a breach of arbitral agreement to refer to the court
seeking grant of interim measure?”, and “do the arbitrators have the power to enforce the order
following grant of interim measure by the arbitrator?”
2. Concurrent Jurisdiction of the Court and Arbitral Tribunal to Grant Interim
Measure and the Ambiguity By principle, the courts and arbitrators have jurisdiction to grant interim measures. That is, the parties
are free to petition either the court or the arbitral tribunal for granting interim measure. This is
permitted where there is no otherwise agreement, or the agreement (if any) shall constitute the
authenticity of the arbitration (Mcilwrath and Savage, 2010). the various sorces of arbitration law-
statutes, institutional rules, international conventions, and arbitral awards- recognize this principle and
there is an ascending trend for acknowledgment of concurrent jurisdiction (Fouchard, Gaillard and
Goldman, 1999). As mentioned earlier, the code of civil procedure is remained silent in this regard and,
consequently, it is not possible to petition neither court nor arbitral tribunal for interim measures.
Currently, what hinders grant of interim measure is that when the parties bring their case to arbitral
tribunal (i.e. the case is in jurisdiction of arbitral tribunal), the arbitrator does not have the power to
grant the write due to silence of legislator in this regard. On the other hand, for the case brought to the
court of law, article 311 of code of civil procedure (as a general proposition) stipulates that granting
interim measure is under jurisdiction of the court where the case is filed and/or has the jurisdiction to
deal with the case (Shams, 2009). By definition, jurisdiction is a legal right, which enables the judge to
affect their authority (Jafari Langroud, 1999). Grant of interim measure is not an exception of the
principle – part of public policy. That is, only competent authority, as stipulated by law, may deal with
such cases – intrinsic and acquired competencies (Nahreini, 1999).
Based on this introduction, where each party petitions the court for grant of interim measure,
the court shall reject the request as it does not have the jurisdiction (subject to article 311 of the code of
civil law) and the same is true for the arbitral tribunal. The court where the case is originally opened is
the sole court with the intrinsic jurisdiction to hear such petitions. However, this is not free of
exception, which is where the case is out of jurisdiction of the first court (article 312 of the same law).
Therefore, when the case is open in arbitral tribunal, the court may grant interim measure writ upon
petition of the parties only under the exceptional condition mentioned above. Otherwise, the court may
not grant the writ. Both old and new codes of civil procedures have remained silent on jurisdiction of
the arbitrator. Definitely, this is a sheer lacuna of the code of civil procedure pertinent to arbitration.
However, the principle of concurrent jurisdiction is acknowledge in other arbitration codes of Iranian
law such as Iran International Commercial Arbitration Code (article 9) and two main institution
arbitrations, Arbitration Rules of Center of Iran Chamber (ACIC) (section 35(C)) and Tehran Regional
Arbitration Center rules (TRAC)(23(3)). Subject to these, the parties may petition their request whether
in the court or arbitral tribunal.
Different judicial systems adopt different approaches regarding jurisdiction of courts and
arbitral tribunal. Some, such as Germany, recognizes concurrent jurisdiction of the court and arbitral
tribunal, and some deprive arbitration of the jurisdiction to grant interim measure and power the court
as the sole jurisdiction in this regard (China, Italy, and Argentina). In other case, the court loses the
jurisdiction when the arbitrator is adopted (France); while some have ambiguity in this regard (USA)
(Drahoza, 2003). Nowadays, majority of systems have recongnized concurrent jurisdiction and the
parties may petitionthe court or arbitral tribunal for grant of interim measure. This is the outcome of
decades of development. There was a time that the court was the sole body competent to grant interim
measure. (Winkler, Haver and Mailander, 2007; Moses, 2012)

7 Reza Haghparast
2.1. Consequences of Concurrent Jurisdiction and Silence in this Regard
Naturally, the principle of concurrent jurisdiction of the arbitral tribunal and the court results in
specific consequences. What follows deals with the consequences.
2.1.1. Jurisdiction of Courts
The primary outcome of concurrent of jurisdiction of the court and arbitral tribunal is that the each
party may petition the court for grant of interim measure while the case is under procedure in arbitral
tribunal. National courts may grant interim measure whether before or after commencement of
procedure in arbitral tribunal. However, some argue that when a case is open in arbitral tribunal, the
court may only play a secondary or supporting role where the tribunal fails to deal with the petition for
interim measure for whatever reason (Mistelis, 2010). Each party might refer to the court when the
tribunal is not started yet while there is an urgent issue to deal with and the tribunal is not available
immediately (Kroll and Mistelis, Lew, 2003). Deeper look into statute and norms makes it clear that
the legislator intention is that parties of arbitration shall be deprived from the advantages they might be
granted by the court, as the court accepts the petition when it helps facilitating the procedure.
(Fourchard, Gaillard and Golman, op.cit)
Failing to acknowledge jurisdiction of the court to grant interim measure may raise variety of
problems and procedures. To make such problems clearer, consider ISCID (International Center for
Settlement of Investment Disputes, 2006) tribunal codes for instance. The codes of the center remains
silent regarding jurisdiction of the court to grant interim measure and the arbitral tribunal is the only
power to grant the order. It is noticeable, however, this case is a bit different from other arbitral codes
and norms (Bismuth, 2009). Article 47 of the code stipulates “except as the parties otherwise agree, the
tribunal may, if it considers that the circumstances so require, recommend any provisional measures
which should be taken to preserve the respective rights of either party”. (Kryvoi, 2010) It is an old
debate in the convention that “whether the parities may petitions the court for grant of interim measure
where there is an arbitral agreement beforehand? ” or “ is the intention of the article is to imply an
exclusive right for the arbitrator to grant interim measure? At any rate, the center insists that
independency of the arbitrator is not in contrary with power of the court to grant interim measure. The
court of appeal of Ren based its ruling on this argument in Guinea vs. Atlantic Triton (Fouchard,
Gaillard, Goldman, op. cit). There is a great deal of ambiguity concerning this article. For instance, the
fact that it is not clearly stated that the court might grant interim measure in the arbitral agreement
might be interpreted as waiver of the parties of their right to refer to the court (Ibide, p. 643). Clearly,
failing to determine jurisdiction of the court causes may disputes and debates. National laws approach
in this regard is as follows:
2.1.1.1. German Code of Civil Procedure
The essence of articles 1033 and 1041 of the code is that concurrent jurisdiction of arbitral tribunal and
the court is accepted (Kroll, Mistelis and Lew, op. cit). Article 1033 stipulates concerning jurisdiction
of the court that “arbitral agreement may not cause hindrance to the court to grant interim measure
neither before nor during arbitration procedure (Uberstzungen, 2012). Therefore, jurisdiction of the
court is natural not acquired; that is, the jurisdiction of [court] to grant interim measure is identical to
the power granted to arbitral tribunal (Van Den Berg, 2005). In compliance with German code of civil
procedure, therefore, the parties may choose the court or arbitral tribunal to petitions for grant of
interim measure. Thus, German courts have jurisdiction to grant interim measure whether before or
during arbitration procedure.
2.1.1.2. English Arbitration Act 1996
Section 44 of the English Arbitration act (comprised of 7 paragraphs) is a complicated mechanism to
express jurisdiction of national courts concerning interim measures ( Harris and Planterose, 2007).
First of all, the arbitral tribunal has the jurisdiction to grant interim measure and the court may
intervene where the arbitrators do not have the jurisdiction or fail to deal with the case effectively.

The Importance and Necessity of Concurrent Jourisdiction for Granting Interim
Measure Case: Islamic Republic of Iran 8
Taking into account that this article is centerpiece of regulation that grant supplementary role to the
courts, it can be concluded that national courts of the UK may grant interim measure in specific
condition (Schaefer, 1998). However, it is not expected that the parties refer the case to the court
without sound reason unless the arbitrators recommend the same or the parties agree of doing so.
(Moses, op. cit)
2.1.1.3. France
The former French code of civil procedure was silent concerning jurisdiction to grant interim
measures, though substitute of power by the parties was confirmed. Moreover, the court had concurrent
jurisdiction with arbitral tribunal and could hear the urgent cases before arbitral tribunal (Van Den
Berg, Ibid). With introduction of new arbitral regulation in 2011, the matter of granting interim
measure was explicitly dealt with in an article where concurrent jurisdiction is recognized. Article
1449: " The existence of an arbitration agreement, insofar as the arbitral tribunal has not yet been
constituted, shall not preclude a party from applying to a court for measures relating to the taking of
evidence or provisional or conservatory
Measures". (Code of France Civil Procedure, 2001, Article 1449)
However, along with acknowledging concurrent jurisdiction there are some limitations. The
jurisdiction is recognized in case the arbitral tribunal is not held, and the parties may not refer to the
court when the case is open in the tribunal.
2.1.1.4. USA
The situation in the U.S.A, on the other hand, remains unclear.The Federal Arbitration act Does not
certain any provision on national court jurisdiction for interim measure. Jurisprudence seems to be
inconsistent. However, U.S.A courts, in practice, only shows interest to grant interim measure in the
framework of international arbitration, which is supplementary in nature. It is noticeable that the courts
may not grant the order unless the petitions for grant of interim measure in the arbitral tribunal is
impossible. (Ferrari and Kroll, 2011) Take Simula Inc vs.Autolive Inc where the court finally held the
petitions to grant interim measure unacceptable based on the fact that Sweden arbitral tribunal had the
power to grant the same. (Moses, op. cit)
2.2. No Waiver of the Arbitration Agreement
The paramount result of concurrent jurisdiction of the court and arbitral tribunal is that the request of
one party in the court shall not be deemed as waiver of attribution agreement. Moreover, where such
agreement exists, the national courts have the unquestionable jurisdiction to deal with petitions for
granting of interim measure (Winkler, Haver and Mailander, 2007). The power to grant such interim
measure is aimed to support domestic courts and to preserve interests of the parties. This lies with the
fact that local court are more accessible and their order has more enforcement power. Furthermore, a
fare procedure holds that the parties have the right refer to the court to deal with urgent issues,
preserver their interests, and enforcement of arbitration order. Therefore, this is not in controversy with
jurisdiction of arbitral proceeding and not waiver of arbitration agreement. (Gouchard, Gaillard,
Goldman, op. cit)
In spite of code of civil procedure, Iranian law international commercial arbitration holds in
article 9:“Either party may, before or during arbitration, request the issuance of an attachment order or
an interim measure of protection from the President of the Court, specified in Article (6)”. What is
inferred from the article is that referring the court does not means as breach of arbitration agreement.
Moreover, we read in article 35(c) of Arbitration Rules of Center of Iran Chamber (ACIC): “The
application to the courts in exceptional cases for the purpose of obtaining an interim measure order
before or during the arbitration process, shall not be deemed to be a breach or a waiver of the
Arbitration Agreement and does not preclude the arbitration from proceeding”. (Arbitration Rules of

9 Reza Haghparast
Center of Iran Chamber, 2011). Moreover, paragraph 3 of article 23(3) of Tehran Regional Arbitration
Center rules (TRAC) states: “A request for interim measures addressed by any party to a judicial
authority shall not be deemed incompatible with the agreement to arbitrate, or as a waiver of that
agreement”. (Tehran Regional Arbitration Center rules, 2007)
2.2.1. National law approach
2.2.1.1. German Code of Civil Procedure:
Articles 1033 and 1041 of the code recognize concurrent jurisdiction of the court and arbitral tribunal
for granting interim measure. We may conclude that the parties may petitions the court for granting
interim measure when their case is open in an arbitral tribunal and there is an arbitration agreement. In
compliance with the regulations, the lack of jurisdiction to hear and deal with petitions for grant of
interim measures is rejected. (Van Den Berg, op. cit,)
2.2.1.2. English Arbitration Act 1996
Article 44 of the code, which is the centerpiece of the regulation, authorizes the arbitral tribunal rather
than the court. In particular, there is no clear stipulation concerning no waiver of arbitration agreement,
though the content of the code also implies so. Therefore, referring to the court of law, subject to
arbitration code of England is not deemed as waiver of arbitration agreement. (Schaefer, op.cit; Harris
and Planterose, op. cit)
2.2.1.3. Code of International Arbitration
In this regard, paragraph 9- section 26 of UNCITRAL Arbitration Rules (2010), paragraph 2 of section
28 of international chamber of commerce (ICC 2012), paragraph 3-section 21 of American arbitration
associations (AAA( (Werbicki 2010), paragraph 2-section 31 of Stockholm Chamber of Commerce
(2004), and section (VI) of European convent of international commercial (1961), European
Arbitration (1961) are noticeable. In all these cases, we see that petitioning court for grant of interim is
not breach of arbitration agreement.
2.3. Jurisdiction of the Arbitrators
The third result of concurrent jurisdiction is that the arbitrator may have the jurisdiction to grant
interim measure upon request of the parties. As mentioned earlier, code of civil procedure is silent on
this regard and there is no clear recongnition of jurisdiction of arbitrator to grant interim measure. The
question is that “given the condition of code civil procedure, does the arbitrator have the jurisdiction to
grant interim measure when the arbitration agreement or the code is silent?” The answer is that the
arbitrator does not have the authority when such authority is not granted by the parties. The reason is
that the arbitration is mutually accepted and the cause of authority of the court is nothing but the
parties’ agreement.
That is, in absence of such agreement, the arbitrators do not have intrinsic authority to grant
interim measure. Thus, lack of clear statement of the legislator makes the agreement between the
parties as the only source of authority to grant interim measure. In case of no such agreement,
therefore, the arbitrator may not grant interim measure.
On the other hand, Iran code of international commercial arbitration and two major institutional
arbitrations in Iran recognize concurrent jurisdiction to grant interim measure. section 17 of the former
states “Unless otherwise agreed by the parties, the arbitrator may, at the request of a party, order
interim measure of protection in respect of the subject matter of the claim if an immediate decision is
needed, the arbitrator may require the requesting party to provide appropriate security.” Moreover,
paragraph “a” section 35 of Arbitration Rules of Center of Iran Chamber (Arbitration Rules of Center
of Iran Chamber, op.cit) adopts the same language and grants the jurisdiction to order interim measure
to the arbitral tribunal upon plea of each party and urgency of the case. We read in the note of this
section “The submission by the parties to the Arbitration Centre entails their acceptance of the power
of Arbitrator to order interim measure and to require the deposit of suitable security and the parties are

The Importance and Necessity of Concurrent Jourisdiction for Granting Interim
Measure Case: Islamic Republic of Iran 10
obliged to observe the content of the interim order”.Therefore, where the parties to the arbitration
agreement fail to state power of the arbitrator to grant interim measure, the arbitrator still has the
authority grant to such order if required. Tehran Regional Arbitration Center rules, section 23(1) states
“At the request of either party, the Arbitral Tribunal may order any interim measures it deems
necessary or appropriate in respect of the subject-matter of the dispute, including measures for the
conservation of the goods forming the subject-matter in dispute, such as ordering their deposit with a
third person or the sale of perishable goods”. (Tehran Regional Arbitration Center rules, op.cit).
Clearly, power of the arbitrator to grant interim measure is recognized in the section. This section relies
on section 17 of UNICITRAL 1985 and argues that the aim is to preserve the goods under dispute.
Moreover, paragraph 2 of the same section concerning predicted order states “Such interim measures
may be established in the form of an Interim Award...”
The modern approach of national laws is to grant authority to grant provisional measure order,
while the authority was limited to national courts in the past. However, some countries such as Italy are
still following the previous path and arbitrators under such jurisdiction do not have authority to grant
provisional measure. section 818 of Italian code of civil procedure states that "the arbitrators may not
grant attachments or other interim measures of protection, except if otherwise provided by the law".
However, the Italian courts’ authority is of supplementary nature and the final award of the court shall
be confirmed by the arbitral tribunal (Mcilwrath, Savage, op. cit). In the following section, some of the
arbitration rules where authority of arbitral tribunal to grant provisional measure is recognized are
presented.
2.3.1. France
As emphasized in former French code of civil procedure (1981), authority of arbitrators to grant
provisional measure is not specified, while the parties may grant such authority to the arbitrator (Van
Den Berg, op.cit). However, the new law is clear regarding such authority so that such authorities are
considerably increased. Consequently, arbitral tribunal may grant provisional measure if required and
revise previous order in this regard. section 1468 of the new code states:"The arbitral tribunal may
order upon the parties any conservatory or provisional measures that it deems appropriate…The
arbitral tribunal has the power to amend or add to any provisional or conservatory measure that it has
granted".(Code of France Civil Procedure, 2011)
2.3.2. German Code of Civil Procedure
According to paragraph 1 of section 1041 of German code of civil procedure:" Unless the parties to the
dispute have agreed otherwise, the arbitral tribunal may direct, upon a party having filed a
corresponding petition, provisional measures or measures serving to provide security as it deems fit
with a view to the subject matter of the litigation…". (Ubersetzungen and Von Schoning, 2012)
Accordingly, where there is a necessity to grant provisional measure, the arbitral tribunal may grant
conservative or provisional measure and secure proper sanction for the parties as required. (Van Den
Berg, op.cit)
2.3.3. English Arbitration act 1996
Section 39 of the English arbitration act 1996 empowers the arbitrator in different ways including the
power to order provisional measures provided that the parties are not otherwise agreed. As mentioned,
the parties may refer to the court for grant of provision measure when the granting the same is beyond
authority of the arbitrator. (Moses, op. cit; Konrad Schwarz, 2009)
Moreover, section 1696 of Belgian judicial code, section 183 of Umbricht (2007), and section
26 of rules of international arbitration of the same country are some other cases that imply similar
meaning.

11 Reza Haghparast
3. Limitations of Concurrent Authority of the Court and Arbitral Tribunal and no
Clarification There are a set of limitations for specific cases on the principle of concurrent competence of the court
and arbitral tribunal. One to name is caused by mutual agreements between the parties likewise
limitations concerning exclusive authority of the courts to enforce interim measure. We deal with such
limitations in what follows.
3.1. Agreement between the Parties
By definition, the principle of concurrent authority is not related to public order, as the cause and
nature of arbitration lies with mutual agreement (Fouchard Gaillard Goldman, op.cit). Thus, the parties
need to achieve an agreement before waiving the authority of the court or arbitrators to grant interim
measure order. In fact, the parties have the power to determine scope of their agreements. It is very rare
in practice that parties wish to waive part of their power so that as common practice, arbitrators or the
courts have the power to grant interim measure order. Iranian law international commercial arbitration
section 17 and Arbitration Rules of Center of Iran Chamber section 35 grant the parties power to waive
their right upon mutual agreement. In general, majority of codes of arbitrations – given that authority
of arbitration is rooted in mutual agreement of the parties- never ban the parties to waive their right.
This is in line with section 39 &44 of the UK arbitration code and section 1041 of German code of
civil procedure.
3.2. Exclusive Jurisdiction of the Courts to Enforce Interim Measure
Jurisdiction of courts to enforce the order of interim measure is due of lack of executive authority of
arbitrators. They are banned to hear any claim to enforce such holding. Therefore, a special limitation
pertaining concurrent jurisdiction of the court and arbitral tribunal is the exclusive jurisdiction of the
former to enforce interim measure. Such jurisdiction is acknowledged in majority of arbitration codes.
3.2.1. Executive Validity of Arbitrator Award
It is worthy to debate whether the award of arbitration has executive power or the power comes from
order of the court. To put it another word, who has the authority to grant enforcement order? From the
laws viewpoint, to enforce the award means to forward the award to the court to be archived and a
confirmed copy to be notified to the parties. (Jafari Langeroud, 1999)
Concerning enforcement of the award, we read in section 488 of Iran code of civil procedure
“when the losing party fails to enforce the award within 20 days after notification, the court prescribed
the arbitration or a competent court to hear the case shall issue enforcement verdict. Execution of
award is subject to applicable regulations”. The common practice for enforcement of arbitrator’ award
is to hand out the writ to the losing party and the subject to the law this party shall enforce the award
within 20 days to 2 months. Otherwise, execution guarantee shall be used against the losing party.
Therefore, the arbitrator award is of optional nature at first.
It is noticeable that power of court award and arbitration award is not the same. The former
receives its authority from the law, while the later receives its authority from mutual agreement
between the parties (Hossein Abadi, 2012). Therefore, the winning parity, if wishes to enforce the
award, shall bring the award to the court with jurisdiction over the case (Shams, op.cit). Given the
content of section 488 of Iran code of civil procedure “…enforcement of award in compliance with
laws…”, enforcement of the award is subject to due formalities to iran code of execution civil award
(Ghorbanian, 2011). Therefore, the compulsory enforcement of award is subject to written petition of
the winning party or the authorized representative (section 2 of iran code of execution civil award), and
when the plea for enforcement of award is received by the judge, they shall issue enforcement order
depending on the case. (Mohajeri, 2009)
Another differentiating feature between arbitration award and court award is that where the
court award is of declaration nature with no necessity for any measure by the losing party- enforcement
The Importance and Necessity of Concurrent Jourisdiction for Granting Interim
Measure Case: Islamic Republic of Iran 12
of the writ is liability of the Government institutions addressed by the write for execution and with no
need to enforcement order. Therefore, the winning party only needs to submit the writ and proof that
the writ is final the executive arms. On the other hand, provision of the award to the execution body
without order of the court is ineffective. Subject to section 493 of Iran code of civil procedure
arbitrator award is effective even with objection to the award. The aim of legislator is to empower
arbitration and motivate individuals to refer to arbitral tribunal rather than the court of law. Since the
award is issued upon mutual agreement of the parties, mere objection of one party is ineffective on the
enforcement of the award (Mohajeri, 2008). However, where the objection is based on reasonable
ground, the court may halt enforcement of the award for further revision of the ward and grant of final
writ (section 493 of Iran code of civil procedure); moreover, the court may getting proper security until
completion of procedure. Thus, arbitration award is granted with no enforcement power and the court
order is required for enforcement.
3.2.2. Enforcement of Interim Measure
As mentioned, the award of arbitration has no enforcement guarantee, though upon refusal of the
losing party, the winning party may plea for enforcement in a court of law. If so, the court shall further
examine the case and held that enforcement order as required (section 488 of Iran code of civil
procedure). Therefore, even when the award is based on predicted deed, enforcement of the award is
guaranteed by the court order. (Shams, op.cit)
The same issue concerning award of arbitration is ahead of enforcement of interim measure.
That is where the award is not enforced by free will; order of a court is required. However, the case
slightly differs and interim measure award is not supported by enough enforcement guarantees. This
makes the parties to refer to the court in first place to secure interim measure order. The problematic
ambiguity is that the parties may have breached the arbitration agreement by referring the court for
grant of interim measure (Eftekhari Jahroumi, 1999). The problem of enforcement of interim measure
is resolved by acknowledgment of concurrent jurisdiction of arbitral tribunal and court of law. The
court will be able to enforce award of arbitration with more ease and, consequently, their role may not
be neglected, as the award has no enforcement guarantee.
Iranian law international commercial arbitration is silent concerning the enforcement, while the
arbitrator is authorized to grant interim measure. However, apparently there are two reasons to accept
the jurisdiction. 1- section 17 of the said law clearly grants the power to the arbitrator to issue interim
measure. 2- we read in paragraph 1 section 35 of the same law “Excluding the cases mentioned in
Articles (33) and (34), the arbitration award issued in accordance with the regulations of this Law shall
be final and binding after notification. In case written application from the court mentioned in Article
(6), the arrangements for enforcement of court verdicts shall be executed”.Upon a written request to the
court specified in section 6, the procedure for the enforcement of court judgments shall be
implemented. Therefore, award of arbitration shall be enforced by petitioning the court for enforcement
as the award (measure or order) and none of the sections mentioned in section 33 and 34 of the said
law cause no hindrance in enforcement of interim measures.
Further survey of other national laws makes it clear that arbitral tribunal may grant provisional
measure upon plea of the parties, while enforcement guarantee is provided by the courts. Subject to old
German code of civil procedure, plea for enforcement is acceptable only for final awards, while the
new law – paragraph 2, section 1041) gives the parties right to seek interim measure in national courts
(Van Den Berg, 2003; Ubersetzungen and Von Schoning, 2012). Courts in Germany have special
authorities that give them power examine authenticity of arbitration agreement and reject interim
measure if any. section 1041 grants the court power to reexamine enforcement of provisional measures.
Moreover, in compliance with paragraph 3 of the same section, the court may reject or modify
provisional measure upon plea of one party. (Van Den Berg, op. cit)
The UK code of arbitration deals with enforcement of provisional measure award in section 41
and 42. There are two methods to enforce provisional measure under this law. The losing party may
13 Reza Haghparast
enforce the award by their free will or the winning party may petition the court for enforcement of the
award (Van Den Berg, 2003). The latter case is when the losing party refuses to enforce the award. If
so, the petitioner may refer to the court for grant of enforcement order.
4. Conclusion The code of civil arbitration lacks effective provisions for enforcement of interim measure awarded by
arbitral tribunal and remains silent in this regard. This failure of explicitness eventuates in lack of
jurisdiction of arbitral tribunal when the authority is not grant to the arbitrator in the arbitration
agreement. Therefore, where there is no specific grant of authority by the parties in their agreement of
arbitration, the arbitrator(s) is in effect unable to grant interim measure. This means that the arbitration
has no intrinsic authority to grant interim measure. Moreover, section 311 of code of civil procedure,
as a general proposition, does not permit referral to the court as the section gives jurisdiction to grant
interim measure order to the court where the case is opened in first place. However, as mentioned,
there is an exception to this proposition and that is when the subject of dispute is in the court (section
312 of code of civil procedure). This is the only case that the court may grant interim measure.
We concluded then except for some exceptional cases, neither the arbitral tribunal nor the court
is authorized to grant interim measure order. As a lacuna, whether in former or in new version of code
of procedure, this issue has triggered debates. We tried to develop a general framework to enable the
arbitral tribunal to grant interim measure by introducing the principle of concurrent jurisdiction,
results, and limitations. The principle means that where the mutual agreement of arbitration provides,
the parties may petition for interim measure both in arbitral tribunal and court of law. Both authorities
may hear such petition and referring to the court is no breach of arbitration agreement between the
parties. Moreover, the parties may not object jurisdiction of the court where provisional measure is
granted.
Different law systems follow different approaches in this regard. Some like Germany give the
main role to the courts so that the same authority for granting interim measure is given to the courts as
well. Some others like France deprive the court of its jurisdiction when arbitrators are determined;
therefore, concurrent jurisdiction is rejected. Another group of law systems takes unspecific ground
and it is not clear under what condition the courts may grant interim measure.
The principle of concurrent jurisdiction of courts and arbitral tribunal is not free of any
limitation. One limitation is that the parties may deprive the court and arbitrators from the authority to
grant interim measure. As the cause of arbitrator jurisdiction is the mutual agreement of the parties, the
same agreement may deprive the court from the authority in this regard. Moreover, the parties may
make an agreement in contrary, as the principle is not pertinent to public order. Another limitation is
the exclusive jurisdiction of the court to enforce interim measure. Incapacity of arbitrators for
enforcement of award makes the parties to refer to the court for enforcement of the award. Therefore,
where the losing party refuses to enforce the award by free will, the winning party must refer to the
court to grant of enforcement verdict. It is noticeable that such referral to the court is not in contrary
with arbitration agreement.
Reference [1] Mohajeri, A., 2009, Comprehensive Introduction to code of execution civil award, (4th ed.).
Tehran: Fekrsazan Publication, vol. 1.
[2] hams, A., (2008), Procedure Civil: Advanced course, (1th ed.). Tehran: Derak Publication, vol.
3.van Den Berg, A. J., (2003), International Commercial Arbitration: Important Contemporary
Question, Netherlands: Kluwer Law International.
[3] Van Den Berg, A. J., (2011), New Horizons in International Commercial Arbitration and
Byond, Netherlands: Kluwer Law International.

The Importance and Necessity of Concurrent Jourisdiction for Granting Interim
Measure Case: Islamic Republic of Iran 14
[4] Amir Abadi, A. H., (2011). Termination of Arbitrator Award, Collection of Articles Dedicated
in The Memmory of Centennial of Arzbitration in Iran. In: Collection of Articles Dedicated in
The Memmory of Centennial of Arzbitration in Iran, Tehran: Shahr Danesh, 1st ed.
[5] Arbitration Institute of the Stockholm Chamber of Commerce, (2010). [Online] Available:
http://www.sccinstitute.com/filearchive/3/35894/K4_Skiljedomsregler%20eng%20ARB%20T
RYCK_1_100927.pdf (july 14, 2012)
[6] Harris B., Planterose R., & Tecks J., (2007), Arbitration Act 1996: A Commentary, (4 st ed.).
Blackwell Publishing,
[7] Belgian Judicial Code Relating To Arbitration.[Online] Available:
http://www.cepina.be/images/upload/00001238_SCHEDULE%20III.pdf)
[8] Drahozal, Christopher, R., (2003), Party Autonomy and Interim Measures In International
Commercial Arbitration, In. van den Berg, A.J., International Council for Cmmercial
Arbitration: Important Contemporary Question, Netherland: Kluwer Law International.
[9] Gaillard E., Knobil Nanou, L., & Pellarini D., (2011), Code of Civil Procedure, Ministry of
Justice and Civil Liberties. [Online] Available:
http://www.iaiparis.com/pdf/FRENCH_LAW_ON_ARBITRATION.pdf
[10] European Convention on International Commercial Arbitration 1961, European Commission
for Europe, vol 484, No 7041. [Online] Available:
http://www.jus.uio.no/lm/europe.international.commercial.arbitration.convention.geneva.1961/
doc.html#1.
[11] Ferrari F., Kroll S., (2011), Conflict of Laws in International Arbitration, Munich: European
Law Publishers GmbH.
[12] Nahreini, F., (1999), Interim Measure in Iran Laws and an Introduction to Comparative Laws.
(1st ed) Tehran: Ganj Danesh.
[13] Franz, T., Schwarz, Christian W., & Konrad, (2009), The Vienna Rules: A Commentary on
International Arbitration in Austria, Netherlands: Kluwer Law International BV.
[14] Eftekhar Jahroumi, G. (1999). arbitration tribunal evolution is Iran Statute: outcomes in Int’l
field, Law Research Magazine, 27-28, 13-44.
[15] Ghorbanian, H., (2011), Necessity to review arbitration code in Iran law, In. Collection of
Articles Dedicated in The Memmory of Centennial of Arzbitration in Iran, Tehran: Shahr
Danesh, 1st ed.
[16] International Chamber of Commerce (ICC) and ADR Rules, (2012), [Online] Available:
http://www.iccwbo.org/Products-and-Services/Arbitration-and-ADR/Arbitration/Rules-of-
arbitration/Download-ICC-Rules-of-Arbitration/ICC-Rules-of-Arbitration-in-several-
languages.(July 14, 2012).
[17] Schaefer, J. K., (1998), New Solution for Interim Measures of Protection in International
Commercial Arbitration : English, German and Hong Kong Law Compared. Electronic Journal
of Camparative Law, [Online] Available: http://www.ejcl.org/22/abs22-2.html (May 28, 2012).
[18] Mistelis L. A., (2010), Concise International Arbitration, KLuwer Law International.
[19] Mcilwrath M., Savage j., (2010), International Arbitration and Meditation, Netherlands:
Kluwer Law International BV.
[20] Moses, M.L., (2012), The Principle and Practice of International Commercial Arbitration, (2nd
ed). Margaret L.Moses.
[21] Jafari Langeroudi, M.J., (1999), Advanced Terminology of Law. (10th
ed.). Tehran: Ganj
Danesh Publication, vol.3.
[22] Jafari Langeroudi, M. J., (1999), Terminology of Law. (10th
ed.). Tehran: Ganj Danesh
Publication.
[23] Fouchard, Ph., Gaillard, E. and Goldman, B., (1999), International Commercial Arbitration,
Kluwer Law International.

15 Reza Haghparast
[24] Bismuth, R., (2009), Anatomy of The Law and Practice of Interim Protective Measures in
International Investment Arbitration, Journal of International Arbitration. 26.
[25] Morek, R., (2007), Interim Measures in Arbitration Law and Practice in Central and Eastern
Europe: The Need for Further Harmonization, In. Interim Measures in International Cmmercial
Arbitration Association for International Arbitration.
[26] Werbicki, R. J., (2010), Arbitral Interim Measures: Fact or Fiction?, In. AAA Handbook on
International Arbitration & ADR, JurisNet, LLC.
[27] Umbricht, R. P., LL.M, (2007), Switzerland's Federal Code on Private International Law
(CPIL), Zurich (Switzerland): Umbricht Attorneys.
[28] Winkler, R. M., Haver and Mailander, (2007), Interim Measures in International Arbitration, In.
A.Alibekova, R.Carrow, International Arbitration and Meditation From the Professionals
Perspective, Association for International Commercial Arbitration (ed).
[29] Ubersetzungen, Samson, (2012), Germany Code of Civil Procedur. Juris GmbH, [Online]
Available: http://www.gesetze-im-internet.de/englisch_bgb (October 26, 2012) .
[30] Tehran Regional Arbitration Center Rules, (2007), Journal of Peresidential Center for
International Legal Affairs, 36, 329-356.
[31] NCITRAL Arbitration Rules, (2010), English, Publishing and Library Section United Nations
Office at Vienna.
[32] UNCITRAL Model Law on International Commercial Arbitration, United Nations Document
A/40/17, 1985. [Online] Available:
http://www.uncitral.org/uncitral/en/uncitral_texts/arbitration/1985Model_arbitration.html
(April 17, 2012).
[33] www.sccinstitute.com (May 15, 2012).
[34] www.uncitral.org (May 28, 2012).
[35] Kryvoi, Y., (2010), International Center for Settlement of Investment Disputes (ICSID),
Netherlands: Kluwer Law International BV.

American Journal of Scientific Research
ISSN 2301-2005 Issue 89 July, 2013, pp.16-23
http://www.americanjournalofscientificresearch.com
Making and Optimizing Copper Oxide Nano-Particles from
Second-Hand Sources
Farideh Yousefi
Corresponding Author, Sama Technical and Vocatinal Training College
Islamic Azad University, Kermanshah Branch, Kermanshah, Iran
E-mail: farideh.yousefi @ yahoo.com
Tel: +98-912-8556322
Malihe Jalili
Islamic Azad University, Saveh Branch
Chemistry Department, Saveh, Iran
Abstract
Hydro-methodological method was used to recycle copper from nickel metal battery
and other wastes. The primary components of battery sample is shown in X ray florescence
including 6.44 copper oxide, 47.52 nickel oxide, 5.46 magnesium oxide and 0.03 potassium
oxide. In the first stage the battery interior sample is solved with adding hydrochloric about
three hours in 87 degree centigrade. The second stage is to separate copper by adding iron
powder. Due to copper inadequacy we used copper pipe in this research. In the third stage
the copper pipe was solved using hydrochloric acid during two hours in 121 degree
centigrade. NaCl 0.5 solution was made by gained copper chloride and sodium carbonate.
To synthesize copper nano-particles the solid material were placed in 751 degree furnace
for two hours. The results XRF, SEM and XDR verified the nano-particle synthesis.
Keywords: Copper oxide nano-particles, Hydro-methodological, Second-hand battery
1. Introduction When you need a convenient and portable energy source, you can trust batteries. Batteries in different
sizes and shapes provide your needed energy. Batteries are applied to activate circuit so that all the
circuits working with battery cannot work without it. Batteries usually work in the place that we don’t
see them. They control electricity fluctuations and are used as providers of backup energy in critical
times in hospitals and military operations. Annually 15000000000 primary batteries are wasted away
all over the world transferred to land fields. Releasing of battery metal in land fields isn’t solely
problematic but the main issue is battery potential to contaminate underground waters. Burning
batteries are accompanied with two problems including metal releasing to outdoors and metal density
in trash ash which should be buried. Rechargeable batteries can be used again helping the decline of
the effects of buried batteries on environment. Also recycled materials of second-hand batteries can be
used in making new ones. The plan of valuable metal recycling is economical in developed countries
but in Iran it is a new plan.
Regarding the fact that most of batteries are imported to Iran, we can prevent valuable resource
wasting and start a productive and economic industry through recycling technology(A. Darya
beigiZand, M. A. Abduli, 2008). Nickel-metal hydride batteries are a bridge between nickel-cadmium

Making and Optimizing Copper Oxide Nano-Particles from Second-Hand Sources 17
batteries and new lithium ionic batteries which can maintain energy for longer times. Nickel-metal
hydride batteries have longer life and suffer from memory effect. In these batteries this effect is less
than other batteries. This type provides a current more than nickel cadmium batteries. For example, a
kind of nickel cadmium AA battery produces a current of 1200 mAh but AA kind of this battery
produces a current of 4800 mAh.
Never make a short circuit of nickel-metal hydride batteries and nickel-cadmium ones because
they may damage. When making a short circuit, a great current is extracted from battery which can
destroy the battery or warm the battery.
Making particles of nano-dimension are significantly important. Nano-particles have crucial
importance because of having particular features. In fact their extraordinary minutiae and superiority of
level to volume in theses mixtures have caused them electrical, optical, magnetic and chemical features
(Afshari.E. (2006).
2. Statement of the Problem The consumption of battery in household and industrial use has been increasing. These batteries have
valuable metals like nickel, cadmium and copper. After the end of their lives they are released useless
in nature . When batteries are buried or burned inappropriately may release some compounds. So their
recycling is very important. Recycling technology of these valuable metals and its expansion to other
wastes containing used catalysts can make a productive and economic industry in Iran.
3. Research Purpose The consumption of battery in household and industrial use has been increasing. These batteries have
valuable metals like nickel, cadmium and copper. After the end of their lives they are released useless
in nature. When batteries are buried or burned inappropriately may release some compounds. So their
recycling is very important. Recycling technology of these valuable metals and its expansion to other
wastes containing used catalysts can make a productive and economic industry in Iran.
4. Research Method study phase and stating the results of library research activities and information sources
performing laboratory procedures and stating optimized conditions
analyzing and evaluating laboratory findings regarding economic aspects
registering final results
5. History of Battery At the end of eighteenth century an Italian scientist called Luigi Galovani understood that when he
touched frogs’ legs with two different metals, the leg muscles are spurred and rounded. A short while
after another Italian scientist Alexandro Volta informed about Galovani’s discovery. He did lots of
electroscopic experiments to study the accuracy of his clams and recognized that the source of
electricity was not frog’s leg but the hands when touched with two metals. Volta did many experiments
with different metals and understood that two metal can cause potential difference. In one of his
experiments he put silver and zink on sides of his tongue and connected them with a wire. Electricity
flowed and sting his tongue. He concluded some chemicals cause two metals make potential
differences. He made the first battery in 1800. First he wet a paper in salt water and put it between zink
and silver. Then he made lots of these pieces and put them behind each other and made a powerful
battery. Potential difference of battery depends on the used metals. Usually potential difference of
batteries is from 0.5 to 2 volts. The size of metal plates don’t have effects in voltage. Battery facets

18 Farideh Yousefi and Malihe Jalili
only show the amount of used chemicals and determines the total amount of transferable load. So a
bigger battery has longer life not more voltage(American Chemical Society, 2011).
6. Battery Structure The functioning of all batteries are nearly the same. So reaching an exact understanding of one of their
functioning, we can know how all of them work. We explain how a zink-carbon battery. This is one of
the easiest batteries we can make sometimes called standard carbon battery. Suppose we have a
container of acis sulfuric. If we put the zink poles in the container, the acid solves the zink. Hydrogen
bubbles are seen on poles and the solution becomes warm due to chemical reaction. So it happens that:
Acid molecules are divided in three ions including two +H and one SO4-2
The atoms of zink electrons are changed to Zn+2 ions
Zn+2 ions are combined with SO4-2 changed to ZnSO4 which is solved in acid
Hydrogen ions attract electrons which have been lost by Zink atoms and are changed to H2
molecule. These are bubbles which are seen on the poles. If we put carbon pole in the solution and
connect it to the first pole by a wire, the condition change to the followings:
Electrons go to carbon pole through wire and attracted by hydrogen ions. This time the
bubbles of hydrogen gas are formed on carbon pole
In this situation a less amount of heat is released because a part of chemical energy made
by reaction is used for by electron current. In the first condition, chemical energy is only
changed to thermal energy but in the second condition a part is changed to electricity
energy and another part is changed to thermal energy(Linden and T.B. Reddy(2002)
7. Hydro-methodological Method This is a proper and stable procedure for separating and recycling metal ions from used samples. This
method possesses some advantages:
An hindrance to produce poisonous steams
Suitability in small industrial activities
Metal recycling with highest purity degree
Low level of needed energy(John C. BoxAlan P. Prosser, 1986)
8. Flowchart of Copper Recycling Procedure from Nickel-Hydride Second-Hand
Batteries
Figure 1: Flowchart of copper recycling procedure from nickel-hydride second-hand batteries

Making and Optimizing Copper Oxide Nano-Particles from Second-Hand Sources 19
9. Battery Opening The following is the parts of opened nickel-hydride battery used in this project:
In the time physical opening of nickel-hydride cylindrical batteries some sparks are seen
because of deleting separators and short circuit current.
10. Separators Separators are put between positive and negative plates to prevent ions current between plates and
short circuit and increase the resistance of inside of the cell.
Metal lattice
Positive and negative caused electrode
A lid to prevent explosion and tolerate high pressure
11. Preparing the Primary Sample The used sources to recycle the copper are nickel-hydride second-hand batteries and other rich copper
sources. Theses batteries have increasing uses because they are used in computers, cameras, dolls and
etc. copper is a valuable metal with lots of applications, so we decided to extract this metal. Battery is
opened by physical method.
12. Preparing the Primary Sample This section includes used chemicals, machine equipment and scientific parts of the project.
The used chemicals include hydrochloride acid, iron powder, sodium carbonate and deionized
water. Also we used X-ray diffraction (Philips, made in Holland), X-ray florescent (Philips, made in
Holland), deflation electronic microscope (Hitachi, made in Japan) and electric furnace (Batek, made
in England) to synthesize nano-particles. In this research copper oxide nano-particles were recycled optimized from secon-hand sources
by hydro-methodological method. Optimization stages include: first a used battery was solved by HCI
for three hours in 87 degree of centigrade temperature. In the second stage the replacement of copper
with iron was done by adding iron scobs and then adding sodium carbonate. In the third stage
carbonate sediment was heated in 751 degree centigrade temperature for 2 hours to exit water and other
matters and make copper oxide nano-particles. Nana-particles were washed many times with ethanol to
reach a pH equal to 7 (Bakhtiari, F., Darezereshki., 2011 , yong-feng, sh., wen- ying, X., wen- yong,
N., 2008).
13. Results The synthesis of copper oxide nano-particles were studied by XRD spectrum and SEM pictures.
Figure 2 is shows XRD diagram of copper sediment from 90-0◦. Maximum peak is observed in
45=θ2. Copper XRD has full conformity with card number 959-040-00. The peaks (20.98,36.65,44.72,
= θ2) in these areas showed that the provided sample was pure and unalloyed with any other material.

20 Farideh Yousefi and Malihe Jalili
Figure 2: Copper sediment after addition of iron scobs
Source: The Researcher
Figure 3 is shows X(XRD) diagram of copper sediment from 90-0◦. Copper X(XRD) has full
conformity with card number 01-078-1588. The peaks (37,40,42,44,53,56,64,44.72,= θ2) in these areas
showed that the provided sample was pure and unalloyed with any other material.
Figure 3: Copper oxide nano-particles
Source: The Researcher
The electronic deflation microscopic photos show copper oxide nano-particles in 570 degree
centigrade temperature. Its size is 79 nm and its shape is elliptical.

Making and Optimizing Copper Oxide Nano-Particles from Second-Hand Sources 21
Figure 4: Copper nano-particles in 570 temperature
Source: The Researcher
The following shows nano-particles in 660 degree centigrade temperature. Its size is 80 nm and
its shape is cylindrical.
Figure 5: Copper nano-particles in 660 degree centigrade
Source: The Researcher
The following picture shows nano-particles in 650 degree centigrade temperature. Its size is 85
nm and its shape is cylindrical.
Figure 6: Copper nano-particles in 650 degree centigrade
Source: The Researcher

22 Farideh Yousefi and Malihe Jalili
The following picture shows the nan-particles in 700 degree centigrade temperature. Its size is
97 nm and its shape is round.
Figure 7: Copper nano-particles in 700 degree centigrade
Source: The Researcher
The following picture shows nano-particles in 750 degree centigrade. Its size is 100 nm and its
shape is round.
Figure 8: Copper nano-particles in 750 degree centigrade
Source: The Researcher
14. Conclusion In this process the effective factors in recycling copper from second-hand nickel-hydride battery and
copper pipe was considered and optimized. Optimized condition of copper recycling included a 5-hour
leaching, 90-95 degree centigrade temperature, 6 molar density of used acid coloridric and acid
sulfuric, 5 grams water and 1 gram second-hand sample. Also copper pipe, the produced copper
sulphate, and used sodium carbonate. X ray was made from terminal sediment of diffraction spectrum.
Copper recycling has significant importance due to the following reasons:

Making and Optimizing Copper Oxide Nano-Particles from Second-Hand Sources 23
Environment: destruction of used batteries in environment releases heavy metals.
Recycling decreases these pollutions and assists human and environment health.
Costs: recycling copper from used batteries and other wastes has less expenditures
comparing with extracting from minds.
Reduction of raw materials
Reduction of energy consumption
Reduction of air pollution caused by burn of the materials
Reduction of water pollution caused by concealing the trash in soil.
References [1] A. Darya beigiZand, M. A. Abduli, (2008), Current situation of used household batteries in iran
and appropriate management policies, waste management 28, NO. 5. 2085-2090.
[2] Afshari.E. (2006). Considering the performance of Ni-MH batteries. 6th national conference of
chemical engineering and 5th national student conference of Isfahan oil engineering. P.34-41.
[3] American Chemical Society, (2011) "History of the Battery".National historic chemical
landmarks. 2005. (June 23).
[4] Bakhtiari, F., Darezereshki., (2011), one-step synthesis of tenorite (Cuo ) nano-particles from
Cu4(SO4) (OH)6 by direct thermal- decomposition, Januraly,P. 171-174.
[5] John C. BoxAlan P. Prosser,( 1986), A general model for the reaction of several minerals and
several reagents in heap and dump leaching, Hydrometallurgy, Volume 16, AApril, P. 77- 92.
[6] Linden and T.B. Reddy (2002), Handbook of Batteries, 3rd Ed. (New York: McGraw-Hill).
[7] yong-feng, sh., wen- ying, X., wen- yong, N., (2008), Recovery of co(II) and Ni(II) from
hydrochloric acid solution of alloy scrap .

American Journal of Scientific Research
ISSN 2301-2005 Issue 89 July, 2013, pp.24-28
http://www.americanjournalofscientificresearch.com
Sassanid Religion and the Decline
Zia Khazaei
Department of Political Science, Zahedan Branch
Islamic Azad University, Zahedan, Iran
Mahnaz Ghaljeh
Msc, Faculti of Nursing
Zahedan of Medical Science University, Zahedan, Iran
Abstract
Zoroastrianism was initially an universally obeyed and secular religion which
emphasized on the man`s will along with afterlife, but gradually it was influenced by
ascetic religious and philosophical circumstances and tended toward fatalism, anchorite and
surrendering fate as well as paved the way for the religious declining of the Sassanid which
was considered as a pillar for Sassanid dynasty establishment like feudalism.
Keywords: Declining, Zoroastrianism, Sassanid dynasty
1. Introduction Religion plays very important role in constructing the civilization of tribes and nations in a historic era.
Religion in the old time was more critical than secular and laic systems of today, so that in the
countries with feudalism structures, formal religion was considered as an important factor in durability
and consolidation of a society, in contrast the opposite political movements were demonstrated in the
form of faith and religion which was propounded in the concept of Bad religious and good religious.
As Marxists and Western liberal scholars have interpreted, there is no disagreement on it, the
Sassanid dynasty was known as a feudal system by the strong religious institutions and spiritual
hierarchy which demonstrated a feudal community, its founder, the First Artaxerxes had strived
initially to make the religion as its ideology and through it create an ideological unity among the tribe
and nation resident in Iran. From the beginning, Zoroastrianism with its special features was
considered as a model for a dynamic and creative civilization and people with determination and
perseverance, because the faith had given a lot of importance to men and their will and made them free
from fatalism and determinism rule on their fate.
In Tetser letter, it is well noted and written that: “In the Zoroastrian religion, it is commanded
to avoid seclusion, worshiping the God in solitude of mortification and hermitage. He in his letter,
referred to Avesta that says: “The man with wife is preferred to the one who lives single, the man with
a shelter is preferred to the one with no house, the one with one son is better than the one without son,
and the rich man is better than the poor.” Mary Boyce, researcher in Zoroastrianism refers to the choice
right in the religion and writes:"
The choice is so important in the Zoroastrian religion principles that it can be certainly said it is
a religion of choice. Angra Mainyu selected the evil and devil by its own will and intention.” Some
researchers suggest that the duality and dualism in Zoroastrianism is a sensual, mental, and moral
issue, which is deposited in the human nature. However belief in duality and dualism in creating the
existence would be taken meaningless and unreasonable because the duality is a moral issue which is

Sassanid Religion and the Decline 25
in the human nature and it is based on the Zoroastrian thought. So belief to the both good and evil
mainyu namely Spenta mainyu which is the source of goodness, purity, truthfulness in thought, word
and deed and the other Angra mainyuis as a source of all devils and evils in thoughts, words and deeds
are not something out of human nature and so are not appeared in the lifeless nature and inanimate
world but they are in human nature from the beginning of the creation abstractly such as dream world
which are move less and inactive, based on the Gathaa teaching, by entering to the world they may
become active in the nature of human as result of his choice that is done by freedom and liberty, so the
evil and goodness may be significant. Being aware of the choice right and power gradually increase the
sense of responsibility in people, while since he is the decision maker on choosing the goodness over
the evil, a moralist person will be emerged.
Zoroastrianism principal have been mentioned in Zoroaster’s Gathats and bring up belief to be
pure monotheism and moralist and responsible person. The following principles belonging to Zoroaster
Gathas are recognized by Dr. Bahar: «1 - there are two forces of rightness and badness in the world, 2 -
Ahura Mazda is the great god, He is the creator Sepanta mainly which has a twin called Ahrimen. 3 -
In addition, Ahura Mazda has six other figures and rules the world by assistance of these seven
appearances. 4 - All creatures in the world whether human or devil is liberal to choose good or evil.
“Thus Zoroaster in Gatha does not believe to a god other than the One God. He is opposite to sacrifice
rituals and intoxicating drinking, human should know his creator by his wisdom and choose the sepanta
mainyu to be saved. The Zoroastrianism with these principles and properties emphasized on human
freedom and free will also knew him accountable against his selection, gradually were exposed by
competitor flows and religions so that most of the principals were deviated and a passive immoral and
somehow polytheist human was replaced by the first Zoroastrian one. One of the Zoroastrian declining
aspects relates to the Zurvanism which is a historical form of Mazdaism and originated from
Magianism in Achaemenian era and has been seen in Sassanid period of time. When Ahura mazda had
being lost his status gradually as God and considered as equal as one of the two mainyu name Sepanta
mainyu opposed to Angra Mianyu that is why the Zurvanism was formed.
Sepanta mainyu was in an infinite light and by contrast, the other namely Angra mainyu was in
an infinite darkness. Since these two mainyu limited each other, hereby they would be bounded and
thus they should be originated from an infinite nature that was Zurvan or unlimited time or space. Arsi
Zener writes about it “Ohrmazd (Ahura Mazda) is introduced as the father of Sepenta mainyu so he is
probably the father of Angra mainyu in Gathas. But in the later (New) Zoroastrianism, the Ohrmazd
and Sepenta mainyu are equal. Thus, it was necessary to find a father for Ohrmazd because it had
become as one of the twins. One of them was in an infinite light and the other was in infinite darkness.
Therefore each of them bounded the other, and none had surpassed on time and space. Thus, the
Zurvanists knew unbounded time and space as father of the two bounded mainyus. “Believing to the
Zurvan had moral and behavioral negative results among the followers.
Considering that in this view, the Sepenta mainyu had been raised from the neutral time and space,
a kind of the materialism and fatalism dominated on Zurvanism beliefs. Everything has been taken as
Zoroastrian characteristics such as free will, reward and punishment, heaven and hell, Ohrmazd and
Ahriman were laid aside. Zener believes that “Zurvanism materialism denied three principals of
Zoroastrianism. 1- Existing of goodness God and evil mainyu, 2- Human freedom and will in selecting
between goodness and badness, 3- reward and punishment for human beings for their good and bad deeds.
Questioning the human will freedom that was the most important element in Zoroastrian religion led to
fatalism and determinism which effects can be seen in Sassanid era. Christian Sen writes about it: “At this
time the belief of Zurvanism which was spread during the Sassanid era led people to determinism and it
was as fatal poison that paralyzes the spirit of the old Zoroastrianism.
Zurvan was the old God and father of Devil and Ohrmazd, He was not only known as finite
time but his other name was destiny.” He refers to a story in Mainog-i - Khirad which is influenced by
Zurvanism. "Although a man possesses the strong intellect and powerful knowledge, He will not be
able to overcome the destiny." Historical studies show that there was a Zurvanism tendency at the
beginning of the Sassanid dynasty and most of political and religious figures tended to it. Manes who

26 Zia Khazaei and Mahnaz Ghaljeh
was favored by Shapur, the first, tended to Zurvanism that`s why he has not known Ahura Mazda but
Zurvan as superior God. Even Kritir, the great hierarch, who finally could bring forth and
institutionalize Zoroastrianism as a formal religion, had Zurvanism tendency and then became opposite
to Zurvanism so knew Manes dangerous for Zoroastrian.
Zurvanism is likely to have been prevalent more in Bahram v and Yazdegerd II era. Kertir
action for formalizing the Zoroastrian religion played an effective role to encountering materialism and
fatalism of Zoroastrianism-Zurvanism which was prevalent in that period of time but it seemed that the
theosophical religious and thought flows as well as fatalism were so strong in Iran that almost all of the
religious movements had such tendencies and influenced by foreign neighbors like India, Greece led
Zoroastrian to passiveness and fatalism. Manichaeism with its pessimistic nature and desire to
asceticism and mortification had been successful during the third century AD since the critical situation
of the period of time prepared the conditions for such trends. Dr. Bahar writes on the Manichaeism
tendencies "The fundamental difference of Manichaeism and Zoroastrianism is its view to the world,
because in Zoroastrianism, the hurmazd world is good and fragrant and save the people, meanwhile on
Manichaeism, the world originated from devil and it is evil, so the reproduction and agriculture just
help the spirit captivity sustainability. So Manichaeism is with pessimistic nature.”
Mazdak also was the supporter of ascetical and virtuous actions even vegetarianism by his
mysterious interpretation of Avesta. Not only in Iran the religious and reformative flows tended toward
asceticism and world-denying, as Max Veber says, flying from this world, but also neighbors send out
mysticism waves to the country. As if the mysticism discourse and avoiding the material world was
dominant in those days against which the Zoroastrianism resisted. Duchenne Gymen writes about it:
"Mazdakism who had struggled against all forms of mortification strictly, inevitably influenced by an
ideal that is preached by Christian, philosopher, Agnostics, Manichaeism, Mazdakism and Hindus."
Zener certainly knows materialism influenced by India and Greece. Although India society is
called Iran sister and they influence each other in some affairs such as class structures, in the country
orientation toward asceticism and world-denying so that as Zener says, the asceticism virtues were
respected and endeared in it, self-denying is the gravity center of their religious beliefs and thought.
Christianity so affected the people of the land during the Sassanid era that someone believe that
if Islam had not come into Iran, it finally dominate on Zoroastrian, it was an ascetical religion and
ceremony in which initially the imitation of the world was considered blameworthy and the world was
without nobility beside afterlife. The Holy Christ spent his life ascetically which led her to be
inattentive toward spouse and offspring and world. So some mystical flows in Islamic world made the
Holy Christ as a model of ascetic and mystic. Renaissance in Christian world was considered as a
reaction to Christian ascetic thought which had negated the world, thus its follower had to strive
additionally which was shown in the flow of secularism.
While the religion like Zoroastrian had no need to the flow since it was initially a secular
religion that gave genuineness to the world. Zener writes about it: “Zoroastrian is materialism in entire
of its religious steps in which the material world is considered as a tangible state of spiritual world so
that the one would be sent from the other one, relied on it and all of them have sustainable worth.
Importantly, according to some of the other researchers on Zoroastrian School, the world is considered
superior to the afterlife in the religion. Mary Boyce writes in this regard: "It is surprising that Zoroaster
prefers the mundane position to divine world. Because in his view the world is a creation of the divine
to which the grace of tangibility and perceptivity is being added. However turning from heaven
position to mundane is not meant as falling and descending but it is as perfection and ascending”.
In Zoroaster viewpoint to exist world structure, the human working and strive are emphasized
and prevent them to be passive and inattentive to material issues. Mary Boyce writes in this regard:
"The purpose of Mazda in holding mundane is practical stability against maliciousness that the belief is
called the universe agreed duality."
In following, she writes about the virtues of working as "according to Zoroaster only the
unremitting and good-mannered labor and strive can remedy the human being. No pleading or
resorting neither for forgiveness and compassion nor for interest and desire are not accepted from the

Sassanid Religion and the Decline 27
God. " The magi in Median era who had been become the clergies of Zoroastrian religion influenced
the religion by their tendencies and beliefs, and led the religion that initially emphasized on faith and
ethic toward canonical dos and don’ts so that at the end of Sassanid era, it became to a lawful inflexible
and dead religious which enact a religious law for every small aspects of human life that Zoroastrian
follower had no power to escape the situation. Christian Sen writes that: “Zoroastrian in the next
evolution was affected by Median Magi thought and so lost its freshness and was formed into
inflexible and boring jurisprudence principal. In Sassanid dynasty as a feudal system in which the
feudal aristocrats and nobles have privileged situation, Zoroastrian was turned into an ideology for the
system and reproduce its benefits. Emphasizing on feudal benefits was so that the magi actually
blocked the way for society class evolutions by enacting religious rules. In feudal system gradually the
way will be paved for developing and evolution the capitalists since the security resulted from
equilibrium between aristocrats and nobles with government will pave the way for capitalism. By
growing and expanding urban areas and developing the capitalism private sector who handled the
industry and commerce in the period of time in Sassanid dynasty, it was needed that an evolution be
occurred in production relations to support their benefits in the field of law, jurisprudence and norms.
But Zoroastrian clergies (Mobad) not only did not pay attention to the leading class requirement but
also prevent any evolution in the society by enacting rules opposing to capitalists` benefits. Pirnia
refers to the issue and writes: “Some beliefs that were entered into Zoroastrianism by magi made some
class of people unsatisfied specifically the city-dwellers and professionals for example they forbid
reddening iron in fire and making the copper red in it because of fire holiness.
Also the seafaring was not accepted for water holiness. Magi solidity was cause for
advancement of other religions in Iran.” Max Weber knew the Zoroastrian religion with anti urban
tendencies since just agriculture was acceptable by the God and all of them were a reflection of noble
feudal thoughts who was the carrier of the religion. It was not reasonless that when Arab attacked Iran,
capitalist was the first class that welcome them, since in Iran there was a meaning vacuum that no
reformative movement did not succeed to fill it. Max Weber says: “There are two directions in any
society, one of them is rational direction or technology and professional field or material evolution and
the second is irrational direction that is tradition, religious and philosophy field. Human as a wise being
should define himself and his environmental world that is charged by irrational direction. If the
definition consist with rational direction of society, human feel identity, otherwise a meaning vacuum
will be appeared in society that allow the revolutions and social uprising.
In the condition in which an interpreter(s) want to fill the vacuum by new commentary on
tradition or religion or presenting a philosophical thought, if he successes to find some followers, he
will win likely.
The society of Sassanid era can be investigated by the Max Weber theory- there was a meaning
vacuum in the dynasty thus reformative movements like Manichaeism and Mazdakism tried to fill the
vacuum by new commentaries of religious that did not success, the subsequent kings regardless to the
society demand just sought to consolidate the power bases that`s why some of the classes of people were
indifferent against the Arab attack and some others support them because they know Arab equalitarianism
interpretation as an answer to this class meaning vacuum. In Manichaeism attempted to pay attention to
leading capitalist class need as well as Mazdak movement answered to the low class of society by new
commentary of tradition and religious but their defeat make people disappointed about internal
reformations. Anyhow defeat of reformative internal movements, defeat of Sassanid kings against the
foreigners, internal war between the mass and nobles and power struggle among the seniors and the leading
active religious and as Max says the world accepted religion so that there is no impact of the positive
aspects of the religion at the end of Sassanid. Christian Sen writes about it: "the Zoroastrian religion that
was considered as formal religion in the country of Sassanid era had been based on the principles that
became completely empty and inane at the end of this era. So the decline was decisive and inevitable.”
Christian Sen refers to ascetical flows such as Christians, Agnostic, Manichaeism, Mazdakism and
influence of Indian thought on Zoroastrian religion and knows it as major factor in declining the religion.
He follows: “Influenced by the new thought, the initial optimism which was the base and fundamental of

28 Zia Khazaei and Mahnaz Ghaljeh
Zoroastrian and encourage people to work and strive was faded and broken, also the tendency toward
asceticism and abandonment that were privileged in Iranian sects against Zoroastrian gradually entered into
it and destruct the base of the religion. Dr. Daryaie also confirms Mystical and ascetic movements in late of
Sassanid dynasty and writes, "it is probable that at the end of the Sassanid period, there have been not only
the monasticism but also ascetic inward developments. These trends may lead to the formation of groups is
Zendican. Zendican were probably Sufis believed ascetic live or mystic desires influenced by Christianity
or Buddhism. They probably laid the foundation of Sufism in Islam. "
Along with Zoroastrian declining which show itself in determinism and fatalism, prevalence of
fetishism, fortunetelling and paying attention to astronomy at the end of Sassanid period aggravated the
situation and was the origin for unwise behavior of Sassanid kings. Duchenne Gymen knows and
writes Khosro-parviz as same as this and writes:” Khosro II is the last important Sassanid kings. He
had believed all sorts of superstitious and fortuneteller or magician surrounded him, even he knows
astronomy, too. “Althaim also writes about "During the Kingdom of Khosro Parviz the symbolic
concept of the sun and the universe was common again ... Tendency toward symbols testify the
hypothesis of prevalence of astronomical and planetary belief.
The influence of astronomer was never disappeared in Chaldean lands; it was comprehensive
and dominant during the last king of Sassanid and this influence was so that Khosro Parvis was forced
to kill his most loyal servant.” Also, Zarrinkob confirmed this irrational and unwise act and writes:”
His (Khosro Parviz) belief to superstitions of astronomers, diviners and fortunetellers made him
hesitate in taking decisive decisions, also his belief to vow, omen or vision made his decisions without
rational necessities and resulted from his interest in seraglio and exaggeration in companionship with
women”. Of course, Zarrinkoun interrelates Khoasro Parvis superstitious belief to harem and long
companionship with women that explain part of the fact that meanwhile society tendency toward
Zurvanism and determinism, lead reasonably people to astronomy because human is deprived of will
and is dominated by destiny, he can ask the astronomer to show him to show destiny to him. Of course
Zoroastrian Clergymen started some reformations to prevent the overall decline of the Zoroastrian
religion of Zoroaster, but this seemed to be that too late. After Iran defeat Muslim Arabs and after their
power was lost, the think for reform the childish aspects of Zurvanism fables and cancelling
worshiping the Sun as well as reviving the monotheism tradition of Zoroastrian religion
References [1] Boyce, Mary (1982), The History of Zoroastrianism, 2, Leiden: Brill, ISBN 90-04-06506-7,
(repr. 1997).
[2] Boyce, Mary (1984), Textual sources for the study of Zoroastrianism, Manchester: Manchester
UP, ISBN 0-226-06930-3
[3] Daryaee, Touraj (2009): Sasanian Persia. The Rise and Fall of an Empire. London: I. B. Tauris.
[4] Haldon, John (1997), Byzantium in the Seventh Century: the Transformation of a Culture,
Cambridge, ISBN 0-521-31917-X.
[5] Malandra, William W. (1983), an Introduction to Ancient Iranian Religion. Readings from the
Avesta and Achaemenid Inscriptions, Minneapolis: U. Minnesota Press, ISBN 0-8166-1114-9.
[6] Simpson, John A.; Weiner, Edmund S., eds. (1989), "Zoroastrianism", Oxford English
Dictionary (2nd ed.), London: Oxford UP, ISBN 0-19-861186-2.
[7] Wiesehöfer, Josef (1996), Ancient Persia, New York: I.B. Taurus.

American Journal of Scientific Research
ISSN 2301-2005 Issue 89 July, 2013, pp.29-40
http://www.americanjournalofscientificresearch.com
Production, Manufacturing System Operations, and Logistics
Modeling the Metrics of Lean, Agile, and Leagility:
An AHP-Based Approach
Mahboobe Sadat Haj Mirfattah Tabrizi
Corresponding Author, Master Student in Industrial Management Department
Central Tehran Branch University, Tehran, Iran
E-mail: [email protected], [email protected]
Tel: +98-9398388914
Javad Khamisabadi
Member of Young Researchers and Elite Club
Islamic Azad University, Tehran, Iran
Abstract
The aim of this study was to develop a methodology for estimating whether an
existing system can perform as a lean, agile, or leagile manufacturing system. We
compared and identified the similarities and differences between leanness and agility,
before developing leagility, by identifying the manufacturing features that were particularly
affected by interdependent variables by preparing based on the conditions and
characteristics that improved solutions to manufacturing practical operations in three case
studies. The present article describes the three case studies and examines the three
functions of lean, agile and leagile mechanisms by considering certain features. This study
measured the available factors and characteristics to build a model based on the Analytical
Hierarchy Process (AHP), which was sent to firms and factories to acquire their responses.
We determined whether the functions were applicable to the manufacturing systems in the
three case studies.
The characteristics of the three case studies did not respond to the same functions,
which suggests that more details or factors should be developed that might affect their
operations to improve manufacturing systems to meet the requirements of customers. The
leanness, agility, and leagility features were examined in the three case studies. Using these
operations to acquire precise results; may require more tests in more highly developed
conditions in certain locations.
Keywords: Agility, Analytical Hierarchy Process (AHP), Leagility, Leanness, Supply chain.
1. Introduction This study examines the difference between three systems based on the result sheets from selected
companies, which were used to produce complete description of their criteria and functions used for
testing and comparison on.
Lean production is highly suited to functional products and it is moving into the service
industries (Robertson and Jones, 1999). [17]. Lean production has its roots in Toyota production

Production, Manufacturing System Operations, and Logistics Modeling the Metrics of
Lean, Agile, and Leagility: An AHP-Based Approach 30
systems (Ohno, 1988)[15], but it has been suggested that leanness was first utilized during Spitfire
production in the UK during World War II (Aikten et al., 2002) [1].
The appropriate internal supply chain system is designed for a manufacturing system where
leanness is achieved by eliminating redundant periods while agility requires greater reductions of the value-
added time via production factors. Thus,lean and agile manufacturing features have been integrated into the
leagile systematic supply chain (Stevens, 1989)[20]. In the present study, the system lead time, cost,
quality, productivity, and service level were examined during the operations in three case studies.
The stable features considered by the manufacturing system are the lead time, service, costs,
and quality level. The feature (lead time), that needs to be minimized in lean manufacturing is excess
time wasting. Lean and agile systems have been studied by many researchers in various situations. The
first of these manufacturing systems was the lean system of manufacturing, while the agile
manufacturing principles emerged as a new system in companies. Lean was a reaction to old
production systems, which were full of wastes and unsatisfactory quality, while the latter is a response
to changing customer demands. Some researchers have suggested that agility is the next step after
leanness. Thus, if lean principles are implemented in a system, agility is the best next step (Hormozi,
2001; Mason-Jones et al., 2000a), although lean and agile features have contrasting goals. However,
they can be hybridized into total supply chain systems (Mason-Jones et al., 2000a) [13]. This idea
resulted in the combined term, ”leagility”, which fuses these two manufacturing systems(Lean &
Agile) in a total supply chain to ensure the enterprise’s performance.
The measurement of factors and their characteristics of these factors can be used to build a
model with the Analytical Hierarchy Process (AHP). We identified the characteristics that were
considered important by decision makers in different types of manufacturing systems in three
companies, i.e., case studies of Iran Mechanical Industries (IMI), Advanced Electronics Company
(AEC), and Iran Lightening Company (ILC). The selection of the best alternatives that met all of the
decision makers’ criteria attected how the firms performed.
The focus of this study was the applicability of the lean, agile, and leagile appropriate to the
manufacturing systems used by these firms. First we deal with the concepts and definitions of lean, agile, and
leagile features. Next, we provide some descriptions of the characteristics operations found in each firm.
Based on the factors and practical operations each company, we identified the best approach for
their manufacturing systems. The strategies and policies utilized by the three companies were also
different. We compared the results and performed statistical analyses of the best methods for the
manufacturing systems in each company. This study considered only three companies, but a more
accurate assessment of the appropriate manufacturing systems and methods used by more factory and
company would be required to deliver a more precise and scientific analysis of the effects of these
systems. Depending on the adaptations of each company and the functions used, the manufacturing
system was examined the determine the most appropriate approach and policy.
2. Attributes of Leanness, Agility, and Leagility Manufacturing Frameworks In recent years, many researchers have treated supply chain designs based on the relative merits of “lean”
and “agile” philosophies. The focus of lean thinking is the reduction or elimination of wastes, which later
led to the “lean management” or “lean manufacturing” concept (Womack and Jones, 1996)[22].
Agility requires the use of market knowledge to exploit profitable opportunities in a volatile
market place. Leanness means the development of a value stream to eliminate waste, including time,
and to ensure a uniform schedule. When industries shifted their conventional supply chain model to an
agile supply chain model, lean manufacturing was a prerequisite for agility (Richard, 1996) [16]. The
market sensitivity of the agile supply chain was reported by Christopher et al. (2000).
Further suggested that a much higher level of agility is required when the market place is
volatile and the customer demand for variety is high. These studies observed that the agile supply chain
is capable of handling an increased product variety, specialized fragmented customers, and markets.

31 Mahboobe Sadat Haj Mirfattah Tabrizi and Javad Khamisabadi
Furthermore Naylor proposed the concept of leagility by integrating lean and agile principles
factors (Hoekstra et al., 1992) [7].The aim of the leagile supply chain is to postpone the products at the
customer end, to handle the demand uncertainties. Various advantages have been pointed out by Hoek
(1998) [8] and many authors in recent years with respect to the postponement strategy, such as greater
flexibility during production (Kidd, 1995) [11].
The agile and lean approaches are complementary and, in many cases, there is a requirement for
a “hybrid” lean/agile strategy (Christopher and Towil, 2000) [2]. In some cases, lean and agile can be
brought together as a hybrid “leagile” solution (Naylor et al., 1999)[16]. There are three types of
product: standard, innovative, and hybrid. Thus, there is a need for a comprehensive framework to
categorize the supply chain types. According to the product characteristics and the stage of the product,
this may require different characteristics and capabilities, particularly in the category of innovative
production as the supply chain evolves from an agile focus (in the stages of introduction and growth) to
a lean focus (in the stages of maturity).
A number of key characteristics of the two paradigms were also identified by Naylor et al.
(1999)[16] based on a comprehensive review of the available literature1. These characteristics are
described in Table 1.
Table 1: The comparison in characteristics of the three manufacturing systems
Characteristics Lean Agile Leagile
Lead time ** *** **
Costs *** ** ***
Productivity *** ** **
Service * *** ***
Quality *** *** **
1. Rating the Importance of Different Characteristics of Leanness, Agility and Leagility
Table 1 shows the importance of the metrics for each paradigm: three stars indicate a key metric or
essential metric, two stars indicate secondary metrics that are also desirable, while one star is an
arbitrary metric. These characteristics can be used to differentiate the paradigms. The paradigms pay
particular attention to the need to develop an integrated, seamless supply chain, where producers act as
a virtual enterprise. The main difference between leanness and agility in terms of the value to
customers is service, which is the most important factor for agility where cost and the sales fee is
considerable to achieve leanness (Towil, 1996) [21]. Thus, there is only one necessary condition for
enabling agile manufacturing systems.
They also require a minimum total lead time, which is defined as the time taken from a
customer raising a request for a product or service until it is delivered. The total lead time has to be
minimized to enable agility because the demand is highly volatile and fast moving. If a supply chain
has a long lead time, it will not be able to respond quickly enough to exploit the marketplace demand.
Furthermore, the appropriate engineering of the cycle time reduction always leads to significant bottom
line improvements in the manufacturing costs and productivity (Towil, 1996) [21].
Table 2 shows details of the main characteristics when comparing the paradigms and
investigating their similarities and differences.
Table 2: Comparison of Lean and Agile Manufacturing System
Agile Manufacturing Lean Manufacturing
High Profit margin Low profit margin
High product variety Low product variety
1 Steven (1989), Womack et al. (1990), Grunwald and Fortuin (1992) [5], Stalk and Weber (1993) [19], Goldman et
al.,Nagel, R.N. and Preiss, K. (1994) [4], Hayes and Pisano (1994) [6], Harrison (1995), Kidd (1995),Womack and
Jones (1996), Anon (1997), Evans et al. (1997) [3], Mason-Jones and Towill (1997), Towill (1997).

Production, Manufacturing System Operations, and Logistics Modeling the Metrics of
Lean, Agile, and Leagility: An AHP-Based Approach 32
Table 2: Comparison of Lean and Agile Manufacturing System - continued
Marketability dominant cost Physical dominant cost
Market driven Customer driven
Emphasis on thriving in a market environment Emphasis on efficient use of resources
Unpredictable market demand Predictable market demand
Orders based on changing the market Orders based on customers
Greater flexibility for customized products Flexible production for product variety
Checking samples on the line by workers Checking samples on the line by workers
Obligatory enrichment Highly desirable enrichment
Focused on enterprise-wide operations Focused on factory operations
The tactics adopted may also be affected by whether the product is “standard” in scale (lean
approach) or “special” in scale (agile approach). If the lead-time is long and demand is predictable,
there is an opportunity for the pursuit of “lean” strategies.
Finally, if the demand is unpredictable but the lead-time is short, agile solutions will be
required based on a rapid response. “Standard” products, on the other hand, will tend to be more stable
and predictable.
It is possible to simplify the taxonomy in two dimensions: predictability and replenishment
lead-time. In the volatile unpredictable conditions or stable conditions used by for manufacturing
systems in companies, the stock out and obsolescence costs are wasteful.
After comparing lean and agile, we consider that the mixed attribute performance of leagile
manufacturing system has special characteristics. Table 3 shows a comparison of the attributes of lean
and agile supply. The purchasing policy moves from placing orders upstream for products moving in a
streamline flow to assigning lean and agile supply during manufacturing.
Table 3 shows the main points when attributing systems.
Table 3: Comparison of metrics used for leanness, agility, and leagility in manufacturing systems
Distinctive attributes Lean supply chain Agile supply chain Leagile supply chain
Market demand Predictable Volatile Volatile and unpredictable
Product variety Low High Medium
Product life style Long Short Short
Customer drivers Cost Lead-time and availability Service level
Profit margin Low High Moderate
Dominant costs Physical costs Marketability Both
Stock out penalties Long term contractual Immediate and volatile No place for stock out
Purchasing policy Buy goods Assign capacity Vender managed inventory
Information enrichment Highly desirable Obligatory Essential
Forecast mechanism Algorithmic Consultative Both/either
Typical products Commodities Fashion goods Product as per customer
demand
Lead time compression Essential Essential Desirable
Eliminate waste Essential Desirable Arbitrary
Rapid reconfiguration Desirable Essential Essential
Robustness Arbitrary Essential Desirable
Quality Market qualifier Market qualifier Market qualifier
Cost Market qualifier Market qualifier Market qualifier
Lead-time Market qualifier Market qualifier Market qualifier
Service level Market qualifier Market qualifier Market qualifier
Sources: Naylor et al. (1999) [16], Mason-Jones et al. (2000a) [14], Olhager (2003) [17], Bruce et al. (2004) [2].
We present a comprehensive framework for modeling the performance of lean, agile, and
leagile supply chains by analyzing the variables that affect market sensitivity, elimination of waste,

33 Mahboobe Sadat Haj Mirfattah Tabrizi and Javad Khamisabadi
information technology, and flexibility to assess the performance improvement in three cases of supply
chains with fast moving consumer goods business.
We used the Analytical Hierarchy Process (AHP) approach. By using AHP in a supply chain
(SC) context, we can evaluate the effects of various performance dimensions on the specified
objectives of SC, such as a timely response to meet the customer demand (lead-time). We also
explicitly consider the effects of the performance determinants on each other. The dimensions and
determinants of the supply chain performance have systematic characteristics, so they may be
integrated into one model. These systematic relationships can portray the true linkages and
interdependencies more accurately for these determinants (Saaty, 1996) [17].
Supply chain performance. Hult et al. (2004) [9] and Ketchen and Hult (2011) [10] described
supply chains as characterized by reciprocal interdependence, meaning that each SC factor depended on
adjoining participated components to perform its tasks. The supply chain is described as a chain linking
each shared level from up-streamed and down-streamed via manufacturing operations and services. Thus,
requests for the essential amount of material, cost, and information can be managed effectively to meet
the market requirement. Most companies and factories realize that in order to evolve an efficient and
effective supply chain, SCM needs to be assessed to determine its performance. Lee and Billington
(1995) believed that a supply chain is the network of facilities that processes raw materials, which
transforms and delivers the products to customers through a distribution system. The management of this
network requires the mastery of optimization logistics because a specific quantity of goods needs to be
supplied at a particular time and price. The successes and failures of supply chains are ultimately
determined in the marketplace by the end users.
SCM can be defined as the design and management of seamless, increased value process across
organizational boundaries to face the volatile and real needs of the end user (Fawcett et al., 2007).
However, its role in the system is manipulating and handling the tasks, operations, and costs.
The purpose of SCM is to maximize value in the supply chain. SCM competes for value by,
collaborating with users and applicants to create an atmosphere based on value to improve efficiency
by decreasing the costs, or increasing the benefits by promoting market effectiveness.
The goal of the SC is not limited to desirable products or services because it is also directed at
increasing value and absorbing more users into systems or activities.
Next, we describe the method used to determine the best manufacturing system for each sector.
3. AHP Model Initially, we explaine the effective items on the model used by this method, so we describe its
classifications and main levels. AHP is a fundamental approach for decision making, which is a major
multi-criteria decision model for systems that use processes. AHP was introduced by Saaty in the
1970’s (Saaty, 1977) [18]. AHP is utilized to identify problems and to solve them. Thus, the problem is
modeled as a hierarchical structure based on the viewpoints of decision makers’ from the objectives
through intermediate criteria at various levels. Firstly, we find the objectives, then the criteria or
characteristics followed by effective alternatives to solve the problem, as shown in the Figure 1.
Figure 1: A Three-level AHP model
Level 1 Goal
Level 2 A
A
D
A
C
A
B
A
Level 3 3
A
2
A
1
A

Production, Manufacturing System Operations, and Logistics Modeling the Metrics of
Lean, Agile, and Leagility: An AHP-Based Approach 34
By these three hierarchical stages, there are link between the goals, the major criteria, and the
alternatives solutions. After finding these three hierarchical levels of the process, the decision maker
evaluates every criterion compared with the alternatives. Finally, the decision makers must identify the
main priorities, which are arranged to classify or rank the alternatives to make a decision, where the
decision makers have to limit their choices by considering the priority goal. The inconsistency ratio is
calculated during the hierarchical process. The overall criteria are analyzed using three functions: the
first function structures the complexities at the top level of the hierarchical process in Figure 1; the
second function measures the ratios in a reciprocal or pair-wise comparison matrix; and the third
function synthesizes the scales and calculates the result. This level of structure or principle refers to the
lowest level elements, i.e., the alternatives based on all of the scales ranked by the decision makers.
Each priority is weighted based on the higher stage priorities in steps. The aim is to synthesize the
estimates of the majority for each alterative. The priority ranking of the decision alternatives can be
acquired from the synthesized priorities. This produces different values. However, Liu (1999)
considered that the level of hierarchy should be divided into a four level-hierarchy which comprises the
goal level, criterion level, sub-criterion level, and scheme or alternatives level (Liu et al, 1999) [12].
In this paper we briefly discuss the use of this multi-criterion decision making method to find
the best strategy for manufacturing systems based on characteristics of the three case studies. We begin
by defining the pair-wise priorities.
4. AHP Models of the Three Case Studies In this study, there are three decision makers in the three case studies. The decision makers’ use their
knowledge and experience to calculate the scales for each characteristic, before then prioritizing them
using 5 5 matrices. The scales used for the main characteristics depend on elements such as
flexibility, elimination of waste, information technology, market sensitivity. We can determine the
effects of different elements, such as flexibility, which is affected by the source flexibility, delivery
flexibility, and manufacturing flexibility, as well as other elements elimination of waste which is
affected by knowledge disconnects, inventory transportation waiting, and over-production. The
effective items related to information technology include electronic data interchange, types of
information, data accuracy, knowledge bases, and market sensitive elements related to the delivery
speed, new product introduction, and customers' responsiveness. However, the current results and
scales were based on these main characteristics.
The main aim is to identify the most suitable manufacturing system or the best strategy for each
company based on various levels and characteristics. Figure 2 shows the model used in this study.
Figure 2: The three-level hierarchical model used in this study.
The main aim is to identify the most suitable manufacturing system or the best strategy for each company
based on various levels and characteristics. Figure 2 shows the model used in this study.
The
The
The most appropriate manufacturing System
Cost Quality
Quality
Quality
Service
Level Lead Time Productivity
Elimination
of Waste Flexibility
Market
Sensitivity
Info.
Technology
Leanness Leagility Agility

35 Mahboobe Sadat Haj Mirfattah Tabrizi and Javad Khamisabadi
The aims of this research were to obtain the sequences, subsequences, or alternatives estimated
from the overall characteristics of the three case studies. We considered the scales at four levels to
determine the appropriate manufacturing system in each case. The experts (decision makers) were
informed by alternative supply chain then the experts give the relative weights between alternative
sequences during the process to identify the relative weights for the functional operations in
companies.
5. Mutual Interdependence of Criteria in Manufacturing Systems The overall goal of this study was to find the manufacturing system for a supply chain, which would
make it more professional when responding to market requests. The lead time, cost, quality, service
level and productivity were the major determinants in the proposed model. The effects are shown in a
pair-wise comparison matrix (1-9) in Table 4, which aims to find the most suitable manufacturing
system for each firm. We begin with the three manufacturing systems. We compared the
manufacturing systems used by each of the three enterprises from the upper levels down to the sub-
factors to determine the functions and operations.
The scales were based on expert' opinions of the supply chain performance. Next, we illustrate
the performance using scales and functions for a supply chain case with interdependencies.
6. Obtaining the Weights based on Expert' Opinions The weights were obtained based on the supply chain system in each of the three case studies,
according to decision makers and experts who had experience in the area of supply chain management.
They generated the ranks by asking questions relate to the supply chain, e.g., they asked the question:
what is the importance of market demand based on cost when cost is compared to quality? , which they
ranked as 2 in the ranking of 1-9, as shown in the second line of Table 4. Saaty (1980) suggested a
scale of 1-9 for comparing two components. In this ranking one implies equal effects whereas nine
implies the stronger effect of row elements compared with column elements. If experts felt that the
column element had a higher effects than the row element, the reciprocals of numbers from 1-9 were
used.
Table 4 shows the ranks and criteria for a case study when analyzing its manufacturing system,
as well as other manufacturing mechanisms. The second level in Table 4 shows there is a comparison
of the main characteristics of the supply chain of the selected case studies.
Table 4: Pair-wise comparison matrix showing the importance of interdependence among indices
Criteria Lead time Cost Quality Productivity Service Level e. Vector
Lead time 1 1/3 1/5 3 1/4 0.0866
Cost 3 1 1/4 1/6 3 0.1022
Quality 5 4 1 1/7 6 0.252
Productivity 1/3 6 7 1 1/5 0.246
Service Level 4 1/3 1/6 5 1 0.184
Sum 13.33 11.66 8.616 9.306 10.45
max = 0.1 CI= - 1.225 CR= -1.09 < 0.1
The ratios were determined by calculating the weights and the pair-wise consistency by
comparing the scales of the main indices with each other. The second calculation compared the pair-
wise scales for the sub-factors in the remaining hierarchical levels, as shows in next table 4.1, which
were based on the opinions of the decision makers' (ranking).
Production, Manufacturing System Operations, and Logistics Modeling the Metrics of
Lean, Agile, and Leagility: An AHP-Based Approach 36
Table 4.1: Characteristics of factors used to rate the lead time
Elimination of
waste Flexibility
Information
technology
Market
sensitivity e. Vector
Elimination of waste 1 1/3 1/6 1/4 0.005
Flexibility 3 1 2 1/5 0.25
Information technology 6 1/2 1 6 0.61
Market sensitivity 4 5 1/6 1 0.305
Table 4.2: Characteristics of factors used to rate Cost
Elimination of
waste Flexibility
Information
technology
Market
sensitivity e. vector
Elimination of waste 1 1/5 1/7 3 0.18
Flexibility 5 1 1/4 1/2 0.16
Information technology 7 4 1 1/3 0.32
Market sensitivity 1/3 2 3 1 0.27
Table 4.3: Characteristics of factors used to rate quality
Elimination of
waste Flexibility
Information
technology
Market
sensitivity e. Vector
Elimination of waste 1 7 1/7 1/3 0.05
Flexibility 1/7 1 3 1/5 0.2
Information technology 7 1/3 1 2 0.3
Market sensitivity 3 5 1/2 1 0.31
Table 4.4: Characteristics of factors used to rate productivity
Elimination of
waste Flexibility
Information
technology
Market
sensitivity e. Vector
Elimination of waste 1 1/6 3 1/5 0.14
Flexibility 6 1 1/4 1/3 0.2
Information technology 1/3 4 1 1/4 0.19
Market sensitivity 5 3 4 1 0.45
Table 4.5: Characteristics factors used to rate of the service Level
Elimination of
waste Flexibility
Information
technology
Market
sensitivity e. Vector
Elimination of waste 1 1/2 1/6 1/9 0.05
Flexibility 2 1 8 1/4 0.26
Information technology 6 1/8 1 1/3 0.15
Market sensitivity 9 4 3 1 0.4
There were three main sub-factors in the third level; so the identification of the most suitable
manufacturing system was based on all three weighted attributes or components scales for each
company based on the rankings of the decision makers or experts'.
Table 5.1: Expert' rating scales for manufacturing supply chain system with respect to the elimination of waste
Leagility Agility Leanness e. Vector
Leagility 1 5 3 0.59
Agility 1/5 1 4 0.263
Leanness 1/3 1/4 1 0.121

37 Mahboobe Sadat Haj Mirfattah Tabrizi and Javad Khamisabadi
Table 5.2: Expert's rating scales with respect to the flexibility of the system
Leagility Agility Leanness e. Vector
Leagility 1 6 5 0.65
Agility 1/6 1 3 0.183
Leanness 1/5 1/3 1 0.15
Table 5.3: Expert's rating scales with respect to the information technology in the system
Leagility Agility Leanness e. Vector
Leagility 1 4 1/3 0.26
Agility 1/4 1 1/6 0.08
Leanness 3 6 1 0.613
Table 5.4: Expert's rating scales with respect to the market sensitivity in the system
Leagility Agility Leanness e. Vector
Leagility 1 7 1/2 0.39
Agility 1/7 1 1/4 0.08
Leanness 2 4 1 0.47
The three rows and four columns of the scaled weights (three alternatives and four sub-criteria)
are shown in Tables 5.1 to 5.4, which were generated by multiplying the matrix of four by five (four
sub-criteria for five indices or main factors), and these in turn, were calculated from the third and
fourth levels of the model to yield in a matrix of three rows and five columns, as follows;
0.05 0.18 0.05 0.14 0.050.59 0.65 0.26 0.39 0.44 0.395 0.373 0.42 0.36
0.25 0.16 0.2 0.2 0.260.263 0.183 0.08 0.08 0.11 0.1 0.08 0.166 0.09
0.61 0.32 0.3 0.19 0.150.121 0.15 0.613 0.47 0
0.305 0.27 0.31 0.45 0.4 3 5.546 0.354 0.629 0.63 0.3
According to the weighted scales of the attributes, the matrix comprised sub-factor scales of
three by five (alternatives and sub-criteria with five indices) where the upper level indices were used to
estimate the weights for these two levels based on the ranking scales to the factors given by decision
makers or experts.
0.4404
0.079
0.3145
0.18
0.24
0.25
0.1
0.08
0.30.630.6290.3540.546
0.090.1060.080.10.11
0.360.420.340.3950.44
Leanness Manufacturing System
The measures generated by the three stages of values were considered by experts or decision
makers to be the main elements of each manufacturing system with respect to the lean, Agile or
Leagile Supply Chain. This allowed us to find the most suitable manufacturing system based on the
company performance so we could recommend suggested systematic improvements to the operation in
each factory. (0.4404) was determined by multiplying the upper and lower levels and, finally, the last
numerical rates, which related to the leanness factors for the company. This indicated the
manufacturing system that should be focused on as the most important items, which could improve the
efficiency of the manufacturing system and the structure of the company.
We applied this method to the other two enterprises as well. The final calculations for the
second enterprise are as follows;

Production, Manufacturing System Operations, and Logistics Modeling the Metrics of
Lean, Agile, and Leagility: An AHP-Based Approach 38
530.1010.09210300.1150.094
0.3020.430.380.440.41
0.3260.3430.3730.3490.365
0.180.060.10.1720.09
0.120.1390.180.0580.19
0.20.20.110.310.16
0.30.530.530.440.5
0.3130.0920.0690.093
0.110.210.610.53
0.530.680.260.33
.
After multiplying the matrix of sub-factors by the weighted index matrix, the results for the
manufacturing system are as follows.
0.09
0.327
0.293
0.34
0.14
0.23
0.162
0.038
0.1010.0920.1030.1150.094
0.3020.430.380.440.41
0.3260.3430.3730.3490.365
Agile Manufacturing System
After comparing the three manufacturing system, the best choice was the highest amount. The
second scale indicates the agility of the system during manufacturing. For the third company, this was
calculated in the same way as the first and second, as follows.
530.10550.10740.1060.1640.093
0.280.3250.2720.380.309
0.5630.5180.5310.6320.247
0.0870.260.0560.110.0425
0.090.1560.1240.29750.129
0.3050.5050.2450.22750.505
0.50.0540.520.59250.27
0.09230.2630.07850.1003
0.2160.560.34280.226
0.68230.1580.5750.643
This was then multiplied by the weighted index matrix, as follows.
0.116
0.298
0.477
0.2
0.03
0.08
0.42
0.177
0.10550.10740.1060.1640.093
0.280.3250.2720.380.309
0.5630.5180.5310.6320.247
Leagility Manufacturing System
These results evaluated each enterprise's manufacturing system based on the analysis of various
factors that affected the manufacturing systems in a hierarchical manner. The derived scales of the
main elements in the adjacent cluster were based on the priority ranking for the manufacturing system
used by each company. The Expert Choice Software generated the AHP results shown in Figure 3
where the leagile manufacturing system(0.477) for IMI had the best performance of the supply chain
manufacturing systems tested (Agile and Lean Supply Chain).
Figure 3: The results obtained using the Expert Choice Software.
7. Conclusion and Discussion In this paper, we compared major indices such as the lead time, cost, quality, productivity and service
level to analyze manufacturing system performance. These were the main criteria tested but other
factors could test to determine their effects on performance in a systematic manner. We assessed the
effects of these measures based on the opinions of decision makers and experts.

39 Mahboobe Sadat Haj Mirfattah Tabrizi and Javad Khamisabadi
Our analysis allowed us to find the most suitable manufacturing system and to identify the
needs of companies to promote their growth and survival in a supply chain system. These values were
based on the opinions of decision maker so these factors were particularly relevant to the companies.
The most important goal was identifying the use of the functions and operations in the
hierarchy of the model and determining how the main criteria were affected by alternatives. The rank
of each criterion was evaluated and aggregated based on its importance to supply chain management
depending on the expert opinions.
Thus, changes in the hierarchy or opinions would lead to changes in the outcomes. We used
AHP to find the most suitable manufacturing system for each chosen company (according to expert
opinions of the available factors and equipment, during the overall comparison). However, the results
also indicated conflicts between the three manufacturing systems used by the companies. The general
outcome was that the first system lost its agility by reducing some effective factors, although the lean
supply chain was improved. In the second and the third companies, the service level was an important
criterion that affected agility and leagility in the manufacturing systems. The lead time was reduced,
which decreased the cost and improved the quality of products. However, reducing the lead time also
eliminated more waste in the manufacturing supply chain.
Our model allowed us to identify the most suitable attributes for a manufacturing system to
improve the supply chain management performance, while it is also identified the main elements and
factors that could further affect the supply chain management. After considering the importance of
each of the main criteria for the manufacturing system in supply chain, we found that the most
important factors for lean manufacturing systems were cost, quality, and productivity Lead time was an
important criterion in agile manufacturing systems and the service level was an important criterion in
leagile manufacturing systems. To analyze the combined effects of the three supply chain performance
determinants on the selection of the three alternatives we performed clustered by calculating the
weightings of the supply chain system because the number of tables included four more matrices with
additional pair-wise comparison, i.e., one for each upper level determinant. The alternatives and
determinants were also evaluated to determine their importance for improving the supply chain
performance. The overall goal was to reduce the lead time and its score in lean was lower than that in
the agile manufacturing system in the supply chain. Our analysis identified changes that would affect
the supply chain manufacturing system with respect to the lean, agile, and leagile supply chain
elements. Reducing the lead time meant that the lean supply chain had a lower score than the agile
supply chain. The strategy used to decrease the cost and improve the quality meant that the lean supply
chain was better than the other supply chain manufacturing systems. A leagile supply chain was more
desirable for improving the service level and it had a higher rating than the agile supply chain.
References [1] Aitken, J., Christopher, M. and Towill, D. (2002), "Understanding, implementing and
exploiting agility and leanness", International Journal of Logistics, Vol.5 No.1, pp. 59-74
[2] Bruce, M. Daly, L., and Towers, N. (2004). "Lean and agile: A solution for supply chain
management in the textile and clothing industry?" International Journal of Operations and
production management 24(2), pp.151-170.
[3] Christopher, M., and TOWIL, D. R., (2000), “Supply Chain Migration from lean and
functional to agile and customised”, Int. J.Supply Chain Manage., Vol.5, pp.206-213.
[4] Evans, G., Naim, M., and Towill, D. (1997). “Process costing - the route to construction
reengineering.”Proceedings of the Mouchel Centenary Conference Innovation in Civil
Engineering and Construction Engineering, Cambridge, 153-162.
[5] Goldman, S.L., Nagel, R.N., and Preiss, K. (1994). "Agile competitors and virtual
organizations: strategies for enriching." Van Nostrand Reinhold, UK.
[6] Grunwald, H.J. and Fortuin, L. (1992). “Many steps towards zero inventory.” European
Journal of Operational Research, 59, pp.359-369.

Production, Manufacturing System Operations, and Logistics Modeling the Metrics of
Lean, Agile, and Leagility: An AHP-Based Approach 40
[7] Hayes, R. H. and Pisano, G. P. (1994). “Beyond world class: the new manufacturing
strategy.” Harvard Business Review, Jan.-Feb., pp.77-86.
[8] Hoekstra, S., and Romme, J., (1992)., “Integral Logistics Structures: Developing Customer
Oriented Goods Flow.” McGraw-Hill, London.
[9] Hoek, R. V., (1998), “Reconfiguration the supply chain to implement postponed
manufacturing.” Integration Journal of Logistics Management, Vol. 9, No.1, pp. 95-110.
[10] Hormozi, A. M. (2001). "Agile manufacturing: The next logical step." Benchmarking an
International Journal, Vol. 8, N. 2, P. 132-143.
[11] Hult G.T.M., and Ketchen, Jr. and D.J. and Slater S.F. (2004). Information processing,
knowledge development, and strategic supply chain performance, Acad. Manage, J., 47(2):
241-253.
[12] Ketchen Jr. D.J., Hult G.T.M., (2011). "Building Theory about Supply Chain Management:
Some Tools From the Organizational Sciences." J. Supply Chain Manage. 47(2): 12-18.
[13] Kidd, P.T. (1995). “Agile manufacturing: a strategy for the 21st Century.” IEE Agile
Manufacturing Colloquium, pp.11-16.
[14] Liu, D., Duan, G. and Wang, J.S. (1999). "Analytic Hierarchy Process Based Decision
Modeling in CAPP Development Tools", International Advanced Manufacturing Technology
15:pp. 26-31.
[15] Mason-Jones, R, Naylor, B. and Towil, D.R., (2000a). "Engineering the leagile supply chain
management." International Journal of Agile management systems 2/1, pp.54-61.
[16] Naylor et al., (1999), "Lean, agile or leagile?" Matching your supply chain to the marketplace,
International Journal of Production Research, Vol.38, No.17, pp.4061-4070.
[17] Ohno, Taiichi, (1988). "Toyota Production System: Beyond Large-Scale Production" (English
translation ed.). Portland, Oregon: Productivity Press. pp. 75-76.
[18] Olhager, J., 2003. Strategic Positioning of the order penetration point. International Journal of
Production Economics 85, pp.319-329.
[19] Richard, C. W., (1996). “Agile manufacturing: beyond lean?” Production and Inventory
Management Journal, 2nd Quarter, pp. 60-64.
[20] Robertson, M. and Jones, C. (1999), "Application of lean production and agile manufacturing
concepts in the telecommunications environment", International Journal of Agile Management
Systems, Vol.1 No.1, pp.14-17.
[21] Saaty, T.L. (1977). A Scaling Method for Priorities in Hierarchical Structures. Journal of
Mathematical Psychology. 15: pp.234-81.
[22] Saaty, T.L., (1980), “The Analytic Hierarchy Process:, New York, N.Y., McGraw Hill,
reprinted by RWS Publication, Pittsburgh”.
[23] Saaty, T.L., (1996). Decision Making with Dependence and Feedback: “The Analytic Network
Process. RWS Publication, Pittsburgh”, PA.
[24] Stalk, G. and Webber, A.M. (1993). “Japan’s dark side of time.” Harvard Business Review,
July-August, pp. 93-102.
[25] Stevens, J., (1989). “Integrating the Supply chain.” International Journal of Physical
Distribution and Materials Management, 19 (8), pp. 3-8.
[26] Towil, D.R. (1996), ”The compression and Supply chain management-a guided tour.” Journal
of Supply Chain Management, Vol.1 No.1, pp.15-27.
[27] Womack, J.P., Jones, D.T., and Roos, D. (1996). The machine that changed the world.
Rawson Associates, New York.

American Journal of Scientific Research
ISSN 2301-2005 Issue 89 July, 2013, pp.41-46
http://www.americanjournalofscientificresearch.com
Analyzing the Place of Myth in the Religion
Zahra Rezaei
Ahvaz of Farhangian University, Ahvaz.Iran
Abstract
This study is aimed at examining and determining the myth in religion according to
the researchers’ opinions in the field of religion thoughts taking an epistemic approach and
explaining three basic questions, i.e. the function, origin, and subject of the myth. This is a
document-based study, which uses descriptive-analytic method as well. To collect the data,
note-taking from the library and written materials was used. The results showed that
religion and myth have been two basic human being’s doctrinal issues and have been
considered by different scholars, who discover and interpret the message of the religious
sciences in the light of mental and verbal evidences. Based on the semantics of these texts,
different readings were achieved. To accept the myth, one should believe in God. If the
historian of religion “Mircea Eliade” knows the myth not only the explanation of repetition
or the return of a phenomenon, but also the explanation of it. He also believes that religion
and myth come together; therefore, limiting the myth to a superficial explanation or a
symbolic description of the natural phenomena causes that other available functions in the
myth not to be considered appropriately.
Keywords: Myth, religion, Noah’s flood
1. Introduction Thinking in the language of religious texts and the ways to understand the prepositions are the chronic
considerations of religious history and mythology. In the recent two centuries, some of the researchers
have tried a lot to interpret the religious thoughts and the language of it (secret, allegory, parable, and
myth) so that they expand understanding and cognition in the domain of religious thoughts. However,
through different attitudes of the religious thought, this issue was more significant. The difficulty of the
religious texts, different religious beliefs, generalization of the scientific and epistemic methods, and
the advent of new philosophies, have created new challenges against the issue of religion language and
understanding the myth. Although the issue of mythos has been one of the human being’s basic
questions, no single definition has been presented for it, yet and its historical course has been with
religious concepts and divine thoughts and clarified his curious mind to interpret the religious symbols,
abstract legends with the help of mental, verbal, and linguistic evidences. The mythology theoreticians’
opinions have changed continuously in the intellectual history of it and they have explained it based on
their interpretations. May be this unpredictable specification of myth has won the attentions of
historians and religion historians to it.
In order to explain the stable solutions in understanding these texts and achieving the
approaches to religious knowledge, the scholars of sciences established academic disciplines at
universities to analyze the scientific theories of myths based on social sciences structures and sociology
that are regarded as the cornerstone of the religious sciences. Of course this function does not mean to
overlook the presented challenges in the way of religious cognition in the present age. Instead our idea
is that relying on the archeological mystical documents such as Noah’s Flood and using the

Analyzing the Place of Myth in the Religion 42
experiences and new proper tools, we analyze this issue. The necessity of this research is explaining
these theories, describing and analyzing of which can discover the reason and form of the differences
between the theories. Although some of the modern theories believe that myth is extracted from old
sciences such as philosophy and literature, new theoreticians believe that it is extracted from the social
sciences. The historian of religion “Mircea Eliade” believes that myth is depended on religion, because
the domain of myth is associated with the religious beliefs and rituals. Although myth includes all the
scientific fields of study, there is no single opinion about the issue of myth independently, and it has
given a double importance to the issue, because there is not any study, which analyzes just the myth;
however, the myth is the integration of questions that exist in all different fields of study.
This question is about the origin, function, and the subject of myth and such concepts are
followed by the most number of challenges and the reason for which the concept of myth is associated
with secret, imagination, allegory, and parable. Is the origin of religion is imagination? Or it has had a
mystical and symbolic concept, which has come out of the symbolic imaginations in the form of
human being’s worship-like behaviors and has appeared in the places of worship in association with
rituals. Therefore, scientific analysis is very significant in the society to know exactly the origins of
this issue. This study is done to answer the basic question, relying the available theories in religious
studies, sociology of religion, philosophy, theology, how we can know and analyze the place of myth
in religion. Thus, paying attention to this issue and presenting scientific and functional solutions can be
determinant in planning and religious and cultural policymaking of today’s society.
2. The Relationship between Myth and Religion Although it is very necessary to consider in the language of religion, one should achieve the
infrastructures of such texts in order to interpret the religious texts. In the recent centuries, the basic
questions such as the myths functionality resulted in creating different opinions on the origin of myth
in the language of religion. The theories and opinions presented about the myths are as old as the
myths, and turn to the pre-history times. However, in the nineteenth and twentieth centuries, this issue
won the attention of science-oriented researchers and they had special attention to their special
functions and approaches. Specifically, they explained such origins of myths as philosophy, religion
and rituals. Through analyzing and explaining the myth from the perspective of religious studies, the
myth is included below the religion. Searching the reasons for which the secret allegories and the
language of myth were created showed that the soul governing the language is the addressee’s
stimulation and the functional side of the language, which has chosen this model to express itself.
Religion owns a content that is transferred through the tool of language. It has always been discussed
in the history of religion that whether the language of religious texts is superficial or it talks
mysteriously, with allegories, symbols, and parables (Louth, Andrew. 2007).
The existence of supernatural meanings in religious texts and searching their meanings all have
been the focus of particular attention in religious societies. The “secret language” is indirect and mixed
with ambiguities. Thus it is covered and symbolic, and this word has only stated in Holy Quran under
the name of “But a Symbol”, which is covered. The language of allegory is also coded, indirect, and it
usually states the issue in the form of a long or short anecdote. However, the language of “myth” has
been legendary and imaginary, such as the myths attributed to religions and gods that have been made
by the human being’s imaginations similar to legendary tales of the ancient Iran, which have been cited
by Shahnameh (the Book of Kings) in the form of tales such as Zahhak, the Dragon King, or Garshasp
from the Kianian Dynasty (Goodwin, J., 1981).
“Dehkhoda” defines myth as an anecdote with the help of which the people in the past
explained their beliefs about the creation of the universe and some of the natural phenomena, or the
same distracted words defined the legends or the first myths. Myth has been used as the news, tale, or
explanation in the ancient Greece. Then it was used as the “Historia” meaning something that cannot
be existed, and is the poetic imagination. One of the most functions of the myth is to discover the
sample-like paradigms of all the rituals and meaningful behaviors of people started from feeding to art

43 Zahra Rezaei
and wisdom, which have formed as the legends and folk tales as well. Myths are in close relationship
with religious narratives and they have been repeated in some religions. Philosophers were the first
people who explained the myths. As an example, Euhémére believed that the natural phenomena of
myths were the hyperbolic stories of the real people and looked for a historical origin for myths. Some
of the Christian priests believe that myths are previous reports of facts in the Bible or a distortion of it,
for example, “Deucalion” is Noah’s other name. As Alan Segal writes about the Noah’s Flood: if we
are looking for a document or evidence for the real flood and at the same time reject the wonderful
imagination of a ark as the resort of all the live creatures, we have domesticized the myth of Noah. If
we interpret the storm as a symbolic expression of insecurity in human’s life, we have demythologized.
The myths of each nation have their own interpretation. Until the nineteenth century in the west the
content of myths especially (Greek, Roman, and Greece) myths were focused mostly and when
Sanskrit was discovered, the nations’ myths and their different shapes were considered. This step was
taken by James Frazer, the Scottish anthropologist (1854-1941). He gathered a collection of similar
myths and rituals from around the world ignoring the cultural differences among them in a book called
“The Golden Bough” (Wright L.M. 2002). Alan Segal believes that myth is like a story and writes: if
we are asked to name some of the myths we mostly remember Greek and Roman gods’ stories at first.
In spite of this, the myth can be interpreted as a belief. Only two myths are regarded as myths in the
Holy Bible: the story of creation, Heaven, and Noah’s Flood. The other stories of the Holy Bible
should be regarded as legends and folk tales. However, he believes that the myth is absolutely a
significant story and can take place in addition to past, in present and future. (Kirk, G. S. 1973)
In addition, defining myth is very difficult. In answering to the myth, Ruthven says: I feel I am
Augustine’s when he was asked about time since I know it very well, of course if I am not asked about
it, if I am asked; I’m not able to answer and explain it (Goodwin, J.1981).
This hardship to define the myth caused many researchers and scholars to be interested in it.
During the history since from the time of Socrates, a wide range of different theories have been
presented for the myth, each of which is a place for the high number of myth theories. More exactly,
theories related to the myth have a range wider than the myth itself and myth is a subset of the range.
As “Mircea Eliade” presents the theory of social science about the myth of religious studies, or the
anthropological theories about the myth are just the theories of culture that are used about the myth.
(Stace, W. T. 1960)
There is not any independent theory about the mere subject of myth, because no field of study
can be found which is only related to the myth. However, three basic questions (origin, function, and
subject) about the myth unify all different fields of study. By origin, we mean the form and reason for
which myth has been created and by function we mean the way in which myth has been went on, and
by subject, we mean the signified of myth. Some of these theories are superficial readings of such
myths as gods, and some others have readings from the symbolic myth. This symbolic signified can be
everything (morality, beauty, and art…). The most number of theories in the nineteenth century to the
twentieth century are focused on symbolic signified and religious propositions.
“Rudolf Bultmann and Hans Jonas” are the major fans of symbolic readings of the religious
traditional myths. From Bultmann’s point of view, a major part of the New Testament has been written
in mystical language, and it is not an anecdote of the real phenomenon. Many descriptions in Gospel
are not the description of universe, but it is the description of human being’s situation and the condition
of his existence, and only some prepositions, which talk about the existential relationship between
human being and God, are known valid and verified about the description of God (Redford, Donald,
1987) .
He has known myth a truthful issue, since the main aim of myth is not presenting an objective
image of the universe as it is, but it is expressing the human being’s understanding of himself in a
world where he lives. The myth should not be interpreted in the cosmological form, but it should be
interpreted in an anthropological form or an existential form. If the Holy Bible is domesticized, the
conflict between the holy context and new science can be resolved, and Christianity can be specialized

Analyzing the Place of Myth in the Religion 44
to an age, presupposing that “the Holy Bible and Christian message are not allowed to say anything
which is different from the modern worldviews (Louth, Andrew. 2007).
He believes that human being’s interest in context and familiarity with it are effective in
understanding it. Salvation mentions the human being’s situation of mind, who believes in God. There
is no real Hell; the kingdom of Heaven does not own a Heaven-like place. God’s kingdom of Heaven
does not realize in the form of cosmic chaos, but it is an internal issue and it is realized when the
human being believes in God. One must believe in God to accept the myth. From the perspective of
scholars of Quranic studies such as Allameh Tabatabaei and regarding the doubt stages of the universe
which includes the nature and super nature on one hand, and the range of human being’s understanding
including experience, sense, wisdom revealed by the prophets on the other, when in Quran there are
some words about allegory, there is no chance for the approach to imaginary stories, because an
allegory or parable is a tale that reflects the speaker’s meaning to the listener by the use of figurative
metaphor style, and news of such the events as Noah’s Flood is not imaginary and unreal, but it is
telling the truth and warns the historians and historical scholars from beating around myths and
legends. The language of Quran in historical reports such as Noah’s story is for people to accept
advices not just telling the historical news and events, although Quran is not regarded as a historical
book to explain completely the events. However, language has defined these events during the story
without describing the details that is in opposite with the norm of mystical storytelling. Specifically, in
Noah’s story this issue has been mentioned in forty-three Surahs such as Al-'A`raf, Al-An'am, Hud in
different sides and according to different necessities. However, interpreters and historians have
sometimes suffered from legendary storytelling. Regarding the comprehensive nature of Noah’s story
which is theorized by the followers of different religions and geologists and archaeologists, James
Frazer attributes this issue to even the myths of North and South American nations. (Kroll, Jerome,
Bernard Bachrach.2005)
In spite of the comprehensive nature of this story, Noah’s story faces with many differences
among different nations. We are not aimed at analyzing the languages of such stories and myths,
because they are extracted from historical contexts, or they have been discussed in the Holy Books
(Torah, Gospel, and Quran) and have won the most amounts of analytical language and myth-telling
that is considered as the basis of questioning for this study so that the places of language of religion
and myth are analyzed. Moreover, the language of all the holy texts as Bultmann existentialism’s look
at the holy texts must be based on thought on understanding the language of these Holy Books.
3. Noah’s Flood Story in the Old Tablets (The Sumerian Story of Flood) During 1889 to 1900 while an American board in Iraq was excavating, they faced with a muddy tablet
on which the Sumerian story of the Flood in “Neibuhr” was written. Arnopoil was the first one who
published it and other people did it in the next years. (13) The way in which the story is written shows
that it refers back to the kingdom age of Babylon, Hammurabi (1686-1728 B.C). Discovering the
anecdotes of Sumerian story resulted in the advent of the theory estimates its age to more than the time
of occupying Euphrates by Semites and it seems that Semites have taken this story after immigrating to
Euphrates from Sumerians who have lived there after them. (Campbell, Joseph. 1991)
The Sumerian story of the Flood includes some significant events: the first issue that can be
understood by reading it is related to the human being’s, plants, animals’ creation, and the celestial
origin of the Heaven. In addition to it, it has talked about the available 5 cities before starting the
Flood. An angle-like human has come down from Heaven and established five cities. Then when gods
insist, there is a mention to creating storms, floods, and destroying mankind. Following this cruel
decision, people suffer from misery. Then there is a mention to the hero of the story named “Ziusudra”
who is described as an abstemious man, and the king who is afraid of God and is at God’s disposal.
While he was standing next to a wall hears God’s message that gods are decided to send a flood “to
destroy the mankind.” It can be stated that rest of the words are revelatory instructions to “Ziusudra”
about building the ark and boarding on it. Then we are faced with God’s warn to the human being

45 Zahra Rezaei
about the Flood that for seven days and nights rail fell, the waters rose and increase greatly on the earth
and the Heaven came on the Flood and Ziusudra saw his god’s light, came out of the ark and
worshipped his god in the land of “Dilmun” where the sun was shining, the holy land where is the
place of Heaven. Ziusudra is the one who saved the mankind’s health. (Wright L.M. 2002)
Scientists have different opinions about the Sumerian land “Dilmun”. Some believe that it is
situated in the Western South of Persian lands and some believe that it is the region of Indus Valley,
and some other have attributed it to the current Bahrain Island.
It is obvious to ask if there is any ancient sign that can prove the Sumerian story of Flood in
Iraq. “Sir Leonard Woolley” in 1929 faced with a hill of mud in Urbeh and concluded that the
synchronization of it reaches to the civilization time of “Obaid.” Therefore, there is a reason on the
material existence of Sumerian Flood and achieved this popular view which is synchronized with the
Flood in the Holy Books. However, Dr. Nazvari states that we cannot talk definitely about it because
we have faced winds and storms for many times in the old Iraq and there are some evidences that show
that the age of such winds refer back to the final part of “Jamdet Basr’s life.” Therefore, it is very hard
to analyze these floods definitely (Leonard, Scott. 2007).
Then, this document mentions the eight kings who governed in five cities before the Flood and
these kings governed for 200 to 241 years. (Frazer, J. G. 1930) However, in spite of the mystical data
these documents show us, it is very hard for us to know the end of the mystical time from the
beginning of the historical time. However, these documents can lead us to correct historical
understandings, undoubtedly. What is important at first in this study is the fact that such document
talks clearly about the Flood and separates the two kingdoms before and after it and the second
kingdom starts after the Flood, by resending rain from sky to “Kish” and “Ur.” It can be argued that the
Sumerian Kings’ tablets know the incidence of the Flood between the pre-historical time and the
historical time.
Anyway, the tablets achieved from the Sumerian kings and materials written in cuneiform,
show the historical stories whose age refers back to the historical time in ancient Iraq and even before
it. At the end, according to “Woolley” it is concluded that although in terms of time the Flood is the
same Flood about which the Sumerian Kings’ tablets talk, the same Flood about which Torah talks in
the Genesis, it should not be imagined that this story is completely correct and it should be noted that
the issue is the real historical substitution and interpreters’ discussions and explanations are to clarify
it. The only thing that can be proved is that whether there has been a city before the Flood and it can be
asked again whether the Sumerian Flood has been a comprehensive Flood, or it has been limited to the
South of Iraq. The Babylon story of Flood has been discussed in Gospel, Torah, and Quran each of
which can be the starter of a new research for those who are interested in.
4. Summary and Concluding Remarks Limiting the myth to a superficial explanation or a symbolic description of these natural phenomena
will result in overlooking other functions in the myth properly. The clearest evidence to verify the
existence of other functions and basics of myths is the fact that myth exists around us and this world is
full of events and characters that are similar to the events and characters available in traditional myths.
These are the ones who are not only focused on eradicating poverty, racism, and other social
corruptions, but also they are willing to put an end to the pollution and damages of the Earth like Noah
and help the others to survive through the language of religion and wisdom, because in order to accept
the myth, one should believe in God. The historian of religion “Mircea Eliade” believes that the myth
is not only the explanation of repetition or returning of a phenomenon, but also it is the explanation of
its origin and he believes that the myth and religion come together.

Analyzing the Place of Myth in the Religion 46
References [1] Bierlein, J.F. Parallel Myths. New York: Ballantine, 1994.
[2] Campbell, Joseph. 1991. The Masks of God: Occidental Mythology. NY: Penguin.
[3] Frazer, J. G. 1930.The Golden Bough: A Study in Magic and Religion. NY: Macmillan.
[4] Goodwin, J.1981. "Mystery Religions of the Ancient World". Thames & Hudson.
[5] Kirk, G. S. 1973. Myth, It’s Meaning and Function in Ancient and Other Cultures. Berkeley:
Cambridge UP.
[6] Kroll, Jerome, Bernard Bachrach.2005. The Mystic Mind: The Psychology of Medieval Mystics
and Ascetics. New York and London: Rutledge.
[7] Leonard, Scott. 2007."The History of Mythology: Part I". Scott A. Leonard's Home Page.
[8] Louth, Andrew. 2007. The Origins of the Christian Mystical Tradition. Oxford: Oxford
University Press.
[9] Redford, Donald, 1987."Similarity between Egyptian and Biblical Texts—Indirect Influence?"
Biblical Archaeology Review. . (13[3]:18-32, May/June)
[10] Stace, W. T. 1960.Mysticism and Philosophy.
[11] Wright L.M. 2002. Christianity, Astrology and Myth. USA: Oak Hill Free Press.

American Journal of Scientific Research
ISSN 2301-2005 Issue 89 July, 2013, pp.47-59
http://www.americanjournalofscientificresearch.com
Experimental Investigation of the Geotextile Effect on the
Strength of Kaolinite Clay
Amir Kalhor
Islamic Azad University, Shal Branch, Department of Civil Engineering
Kiarash Mirabi
Islamic Azad University, Tehran Branch, Department of Civil Engineering
E-mail: [email protected]
Abstract
This paper studies the mechanical properties of the Kaolinite Clay reinforced with
two types of Geotextile using uniaxial and CBR tests. Soil reinforcing in these tests is
carried out using Geotextile layers (1 to 4 layers). The layers are laid horizontally among
the compressed soil layers. The samples in uniaxial tests are wet with five different
percentages of humidity and in the CBR test they are moisturized with 23% of humidity.
The results analysis show that increasing the maximum strength of the samples is a
function of the type and number of Geotextile layers in the soil and on the whole,
increasing the number of Geotextile layers will result in increasing the samples’ ductility
and decreasing their secant module.
Keywords: Kaolinite Clay, Geotextile, uniaxial test, CBR test, reinforced soil
1. Introduction Using the soil for different structures has been customary in all eras and the soil has always been
considered and used as the cheapest construction materials. Weak mechanical properties of the soil
against tension constitute its important weak point. Because the soil structures’ dimensions are by far
larger than the similar concrete or steel structures, modifying the mechanical properties of the soil has
always been a subject of attention and attempts have been made to increase the soil strength against
different forces using other materials.
The reinforced soil is a material consisting of soil and some elements resistant to tension. The
reinforcements can include all the materials resistant to tensile forces (steel, glass, plastic, etc.) The
participation of the elements produces especial materials with properties totally different than those of
the actual elements, enabling it to be used for constructing feasible structures. The reinforcements are
normally laid horizontally and act as the transferring factor for the tension between themselves and the
ground mass. Although using the tensile strength elements for increasing the soil loading capacity has
been customary from the ancient times, new methods of soil reinforcing however have developed to
the point that they could be used in large scale engineering structures with economic feasibility.
Currently various methods of producing reinforced soil using different forms of tensile resistant
materials have been developed. Widespread theoretical and empirical studies and researches have been
undertaken since the introduction of these methods and accurate technical specifications and applied
standards have been presented for some of these methods.
Experimental Investigation of the Geotextile Effect on the Strength of Kaolinite Clay 48
Geosynthetics are flat products that are made of polymer products and are incorporated as
inseparable part of the civil engineering projects together with soil, stone, ground or other materials
relevant to the geotechnical engineering.
Using geosynthetics in soil modifies and strengthens some of the soil specifications like the
shear strength, drain ability, filtration, etc. In fact, using these products, the ground physical and
mechanical specifications can be changed considering the project conditions so that the project
requirements are better fulfilled.
Geosynthetics are divided into 5 general categories of geotextiles, geogrades, geonets,
geomembranes and geocomposites, and considering different applications, they can perform at least
one of the functions of separation, reinforcing, filtration, drainage, and protection of gases and liquids.
Geotextiles are the biggest group of geosynthetics. These products are porous and permeable textiles
that are made of polymeric fibers. Geotextiles ‒ once called as Filter fabrics‒ were first introduced for
erosion control applications and as a replacement for cohesionless soil filters. They are often made of
polypropyleneand polyester, although it is likely that some other polymers like the polyethylene and
polyamide are used in producing geotextiles. Geotextiles are divided into three general categories of
woven, non-woven and kneated categories. Currently the main cause for more spread use of geotextiles
than other geosyntheticsis their lower price, drain ability properties, and possibility of using lower
quality embankments. Application of these materials in constructing retaining walls is highly
important; these walls are constructed in several layers and the geotextile is used simultaneously as
both the reinforcement and wall shell.
The reinforced cohesive soils’ behavior is different from that of the non-cohesive soils. In
comparison with the experimental studies undertaken for studying the sandy soils, the fine-grained
soils have assigned smaller share of the studies to themselves.
Bowman through triaxial and unconfined compression tests on a reinforced clayey soil using
three types of geotextiles, studied the geotextile effect on the stress-strain behavior [1]. Results of these
studies showed that the shear strength of the clayey samples by laying horizontal layers of geotextile in
the samples is increased. This increase is considerable when the geotextile layers are laid in distances
less than the sample diameter. Meanwhile it was observed that for a non-woven geotextile with greater
surface roughness, the increase in the soil shear strength also will be greater.
AL.Ahmadi&Aiban et al. studied the regional soil [2]. This soil had low loading capacity and in
saturation state, this capacity was even considerably lower. So they improved it using two methods:
using geotextile layers and adding 5 to 10 percent of cement to it. Studies showed that although using
cement produced better results, but using geotextile was more economical and the soil samples
improved by geotextile showed considerable increase in loading capacity. This increase was more
visible in saturated soil.
The above studies also showed that:
A Increasing the base layer thickness will decrease the geotextile effect in decreasing of
continual deformations.
B The geotextile effect vs. deviation pressures is ignorable.
C Increasing in the loading capacity of the soil samples, having been improved using
400g/m2 of geotextile is similar to the increase obtained from adding 6.5% of Portland
cement to that soil.
Krishnaswamy and unnikrishnau studied the improvement of the soil strength by laying the
sand layers in the reinforced clay [3]. The cyclic and static behavior of the reinforced clay was studied
in triaxial compression test and the sand layer thickness, the humidity and the reinforcement type were
investigated. In this research, three different types of reinforcements including woven, non-woven, and
micrograde geotextiles were used and the cohesive and coarse grained soils were designated as CL and
SP respectively based on the unified classification.
In the present study, a great number of triaxial tests were performed to study the reinforced
clays’ behavior and the following results were obtained:

49 Amir Kalhor and Kiarash Mirabi
A The sandwich method increases the clay soil loading capacity through increasing the
contact surface between the boundaries.
B The grid type reinforcements have greater effect on increasing the strength and stiffness
of the clay soil compared with the sheet type due to the coherence of the sand in hallo
spaces of the grids.
C The advantage of the sandwich layers for low pore pressure state is higher than the high
pore pressure state. Because in high pore pressures, the effect of the reinforcing is
diminished due to less soil and reinforced material displacements.
D Using the thick sand layers will not result in increasing the efficiency and capacity of the
system.
Bergado, Long & Murthy carried out a series of experiments on an earthfill dam constructed on
a soft soil in two states of non-reinforced and reinforced with geotextileand concluded that using high
resistance geotextiles the following results can be obtained:
A Decreasing the plastic deformations in the foundation soil.
B Increasing the overturning height of the earthfill dam, so that by laying a geotextile layer,
the overturning height is increased about 1.5m above the non-reinforced state.
C The two-step breakage mechanism is provided for the earthfill dam; so that the first
breakage of the foundation soil occurs to thedeformation identical to the non-reinforced
state (before overturning) and the second step of the foundation and the earthfill dam
breakage or overturning occurs in failure time or pullout of the geotextile grids.
Previous studies on determining the loading capacity of the clay soil based foundation
reinforced with geotextile layers are rare. Sakti& Das conducted a number of tests to determine the
loading capacity of saturated clay based strip foundations, reinforced with nonwoven geotextile [4].
The following results were gained from the mentioned experiments:
A The reinforcing useful effects appear most of all when the geotextile layers are laid in
depths equal in size to the foundation width.
B To achieve the highest efficiency, the first geotextile layer must be laid in a depth equal to
0.35 of the foundation width.
Guido, Bresiadecki & Sullivan conducted a number of experiments on laboratory models to
determine the loading capacity of (50% relative density) loose sand based rectangular foundations,
reinforced with non-woven geotextile layers [4]. The results show that in general, when the geotextile
layer are put in a depth equal to the foundation width, they entail a positive effect on increasing the
loading capacity of the foundation, but only when a considerable settlement occurs. This is because the
geotextile layer must have some deformations before they can go under tension.
2. Materials The soil used in the tests was Kaolinite Clay which was supplied in 40Kg bags. To determine the
physical and mechanical properties of the soils, particle-size tests (hydrometery), particle density and
Atterberg limits tests were performed and the results of which have been represented in Table 1:
Table 1: The soil mechanical properties
(USCS) Classification Plasticity index (%) Liquid limit Plasticity limit (%) Gs
CH 37 59 22 2.66
Two types of geotextiles were used in this study. By changing the number of geotextile layers
in soil samples and through uniaxial and CBR tests, their effect in the strength and ductility of the soil
were examined. The properties of dome of the geotextiles used in the tests have been shown in Table 2.

Experimental Investigation of the Geotextile Effect on the Strength of Kaolinite Clay 50
Table 2: The geotextile properties used in uniaxial and CBR tests
Geotextile type
Length increase
percentage in
transverse
direction
Length increase
percentage in
longitudinal
direction
Average tensile
strength in
transverse
direction kN/m
Average tensile
strength in
longitudinal
direction kN/m
Weight of one
square meter
(kg)
PEC55 85 10 12 58 0.358
PEC75 85 10 12 79 0.377
Advantages:
- Resistant against chemical factors, resistant against sunlight, no side effects to the people who work with.
2.2. Method
At first the geotextile layers are cut to the sizes required for uniaxial and CBR tests. After adding water
to the soil and complete mixing, the resulting soil is poured into the uniaxial and CBR tests molds in
layered form and after densification of all the soil layers identically according to the relevant standard,
and scoring the layer surfaces (for better setting with subsequent layers), a geotextile layer is put on top
layer. The number of geotextile layers in these series of experiments are 1 to 4 layers and the uniaxial
tests has been performed with 5 different humidity percentages and the CBR test was done using the
optimum moisture content of the soil.
The prepared samples were tested under the uniaxial and CBR tests and the results were
recorded and analyzed.
3. Results 3.1. Uniaxial and CBR Tests’ Results
This experiment was performed on a series of samples with different percentages of humidity (20, 23,
25, 27.5, 30). The geotextile layers in two different types (55, 77) were cut with a diameter slightly less
than the mold diameter; the geotextile layers so prepared were laid in equal distances (1/2, 1/3, ¼ and
1/5 from the bottom of the mold) within the sample soil. The test was performed on the non-reinforced
(control) samples and reinforced with geotextile samples. Before executing the tests on the reinforced
clays, the strength of non-reinforced Kaolinite Clay was obtained in different humidity percentages
using the uniaxial test and the stress-strain graph was plotted as the control sample. In the next stage,
the mentioned test was performed on the Kaolinite clay reinforced with different number of geotextile
layers (1 to 4 layers).
Considering the results of stress-strain graph of the claysnon-reinforced and reinforced with
geotextile, it can be seen that the non-reinforced samples undergo more tensions with less
displacements, and this is while although all the reinforced samples attain strength with more gentle
slopes, ultimately the maximum strength of the samples having gentle behavior will be more than the
non-reinforced samples orthose reinforced with fewer number of geotextile layers. Also the strength of
the samples varies with respect to the type and number of geotextile layers; so that adding a geotextile
layer of type no. 1 to the sample increases the soil strength for about 7-25 percent. Such increase for
most of the samples is between 7-12% and as can be seen, using the type 2 geotextile increases about
17-25 percent in the samples’ strength in comparison with samples reinforced with type 1geotextile
and among them, the samples with less humidity show higher strength increase. Of course, laying 1 to
4 geotextile layers of higher strength in the samples causes up to 100 percent increase in the samples’
strength compared with the control sample. Meanwhile, by the increase in the number of geotextile
layers, the soil ductility is increased up to 5 times and their secant module is decreased up to 4 times. It
must be mentioned that one reason for ductility of the samples is the increase in humidity of the soil
and changes in the soil humidity is considerably effective in the soil ductility. Also the samples with

51 Amir Kalhor and Kiarash Mirabi
23% of humidity (optimum moisture content) have the highest level of strength and after that, the
samples with 20, 25, 27.5 and 30 percent of humidity rank highest respectively in terms of strength.
In Figs. (1-3) the effect of different number of type 1 geotextile layers in Kaolinite soil samples
with 20, 23, and 25% of humidity has been represented. As can be seen, the control samples have the
lowest strength and the samples with 4 layers of geotextile have the highest strength and an upward
trend is seen in the strength and ductility of the soil samples from the control samples to the samples
reinforced with 4 geotextile layers. It’s worth mentioning that the control samples’ strength and the
strength of samples reinforced with 1-2 geotextile layers will have a declining trend after reaching the
maximum strength, and they will not enjoy from prolong ductility; but the samples with 3-4 geotextile
layers will not show decline in their strength after reaching their maximum value.
Figure 1: Uniaxial test results using various number of geotextile layers of type 1 with 20% humidity
Figure 2: Uniaxial test results using various number of geotextile layers of type 1 with 23% humidity

Experimental Investigation of the Geotextile Effect on the Strength of Kaolinite Clay 52
Figure 3: Uniaxial test results using various number of geotextile layers of type 1 with 25% humidity
Figs. (4, 5) show the uniaxial test results conducted on the samples with different number of
type 1geotextile layers in 27.5 and 30% humidity. As can be seen from the results shown above, the
sample’s strength in these two humidity percentages declines relative to the previous humidities, but
with a constant trend; that is, the sample reinforced with 4 layers of geotextile shows the highest
strength and the control sample shows the lowest strength. This is while in 27.5% humidity all the
samples except for the control sample, along with preserving ductility properties, show constant trend
after reaching the maximum strength, without reversal to declining trend. With 30% humidity however,
all the samples and even the control sample are highly ductile and preserve a constant trend after
reaching the maximum strength without declining. This indicates that through increasing the humidity
and using more number of geotextile layers, the soil ductility could be increased, with the difference
that increasing the humidity causes decrease in the soil strength but using more number of geotextile
layers and even using a geotextile with higher strength increases the soil strength.
Figure 4: Uniaxial test results using various number of geotextile layers of type 1 with 27.5% humidity

53 Amir Kalhor and Kiarash Mirabi
Figure 5: Uniaxial test results using various number of geotextile layers of type 1 with 30% humidity
Figs. (6, 7) compare the effect of laying different numbers of types 1 and 2 geotextile layers in
Kaolinite soil. According to this comparison, the maximum strengths related to the samples with 23%
of humidity which show the highest strength in any condition and after that, the samples with 20, 25,
27.5 and 30% of humidity represent the highest strength respectively; this is while in 25% of humidity,
the strengths of the samples having different number of geotextile layers are closer to each other
compared with other humidities.
Figure 6: Comparison of the effect of laying different number of type 1 geotextile layers in different humidities

Experimental Investigation of the Geotextile Effect on the Strength of Kaolinite Clay 54
Figure 7: Comparison of the effect of laying different number of type 2 geotextile layers in different humidities
Figs. (8) evaluate the effect of different number of type 1 geotextile layers on the axial strain of
the samples in different humidities. As can be seen, by the increase in the number of geotextile layers
and the humidity percentage, the samples’ ductility is also increased.
Figure 8: Comparison of the effect of different number of geotextile layers on the axial strain of the samples
in different humidities
Figs. (9, 10) compare the effect of humidity on the secant module of the samples reinforced
with different numbers of type 1 geotextile layers. As can be seen, the secant module of all the samples
except for a few cases (control sample with 25% humidity, samples reinforced with: 1 type 1geotextile
layer with 23% humidity, 3 type 1geotextile layers with 27.5% humidity, 1 and 2 of type 2 geotextile
layers with 25% humidity, and 3 type 2 geotextile layers with 27.5% humidity) declines with the
increase in the humidity percentage compared with the previous sample and this declining trend is true
for the cases with increased number of geotextile layers in all the samples except for the control sample
with 1 type 2 geotextile layer; so that the secant module of the samples reinforced with different
numbers of geotextile layers and 30% of humidity are almost identical.

55 Amir Kalhor and Kiarash Mirabi
Figure 9: Comparison of the effect of humidity on the samples’ secant module in terms of laying different
number of type 1 geotextilelayers
Figure 10: Comparison of the effect of humidity on the samples’ secant module considering different number
of type 2 geotextile layer
Figs. (11, 12) indicate the effect of the number of type 1 and 2 geotextile layers on the
maximum strength of the samples in different humidities.
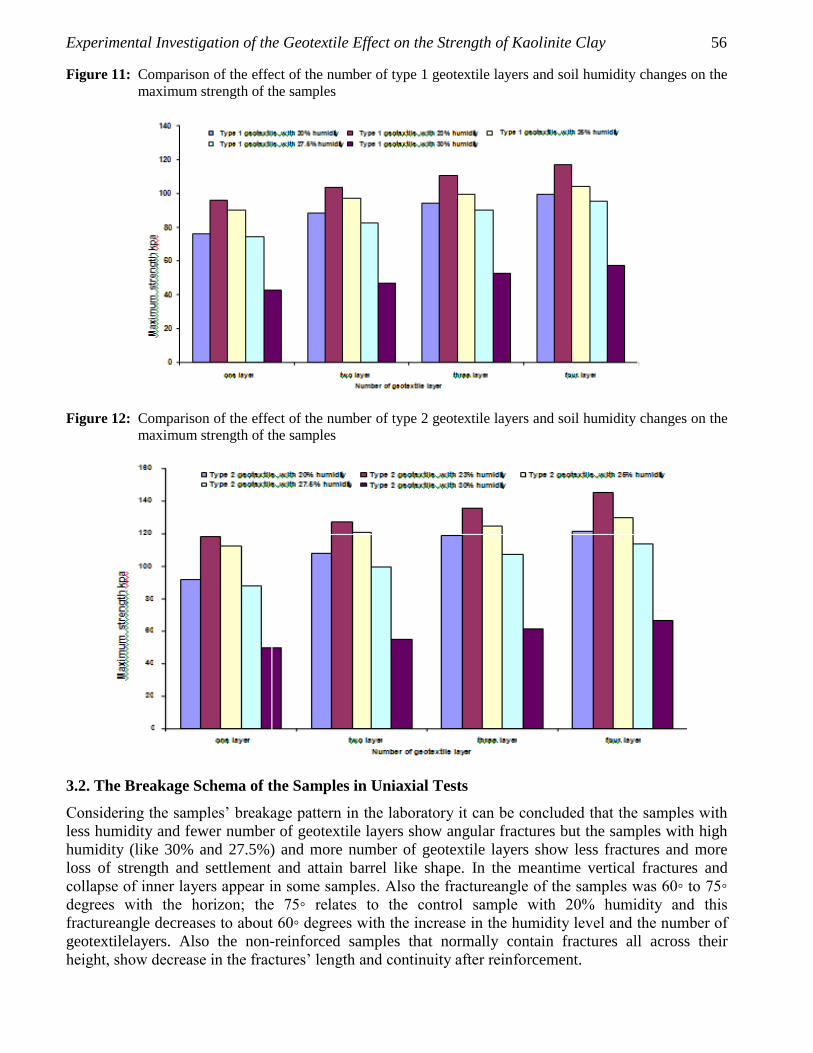
Experimental Investigation of the Geotextile Effect on the Strength of Kaolinite Clay 56
Figure 11: Comparison of the effect of the number of type 1 geotextile layers and soil humidity changes on the
maximum strength of the samples
Figure 12: Comparison of the effect of the number of type 2 geotextile layers and soil humidity changes on the
maximum strength of the samples
3.2. The Breakage Schema of the Samples in Uniaxial Tests
Considering the samples’ breakage pattern in the laboratory it can be concluded that the samples with
less humidity and fewer number of geotextile layers show angular fractures but the samples with high
humidity (like 30% and 27.5%) and more number of geotextile layers show less fractures and more
loss of strength and settlement and attain barrel like shape. In the meantime vertical fractures and
collapse of inner layers appear in some samples. Also the fractureangle of the samples was 60◦ to 75◦
degrees with the horizon; the 75◦ relates to the control sample with 20% humidity and this
fractureangle decreases to about 60◦ degrees with the increase in the humidity level and the number of
geotextilelayers. Also the non-reinforced samples that normally contain fractures all across their
height, show decrease in the fractures’ length and continuity after reinforcement.

57 Amir Kalhor and Kiarash Mirabi
3.3. CBR Test Results
This experiment was conducted in optimized humidity (23%) and using type 1 and 2 geotextiles laid as
1 layer in the middle of the mold height, 2 layers in 1/3 equal distances across the mold height, 3 layers
in ¼ equal distances across the mold height and 4 layers in 1/5 equal distances across the mold height
while the layers’ diameter was a bit smaller than the CBR mold. Results of the experiment shows that
laying 1 layer of geotextile increases the soil strength to about 11% compared with the control sample
and laying 2 layers of geotextile also adds to the strength with the same ration compared with the
sample having 1 layer of geotextile; but laying 3and 4 layers of geotextile adds less to the soil strength
(about 4 and 6% in comparison with the previous two samples). As a matter of fact, increase in the
number of the type 1 geotextile layers heightens the strength of sample reinforced with 4 layers of
geotextile to about 30% compared with the control sample. This is while it would be possible to
increase the samples’ strength to about 9-10 percent using the type 2 geotextile compared with the
samples reinforced with the type 1 geotextile.
Figure 13: Results of the CBR tests conducted on the samples reinforced with the type 1geotextile
Fig. 13 evaluates the results of using type 1 geotextile effects on the samples in CBR test.
Considering the loading employed in the CBR teats and the samples’ loading capacity, results show
that laying geotextile layers in the samples increases their loading capacity, although the geotextile
layers’ effective ratio in these series of tests is to a degree intangible compared with the uniaxial test.
Also by using more number of layers, less increase of strength is observed; that is using 1 layer of
geotextile produces more visible effect and ultimately, laying 4 layers of geotextile shows no
considerable difference in the soil loading capacity in comparison with using 3 layers of geotextile.

Experimental Investigation of the Geotextile Effect on the Strength of Kaolinite Clay 58
Figure 14: Results of the CBR tests conducted on the samples reinforced with the type 2geotextile
Figure 15: Comparison of the effect of different number of types 1 and 2 geotextile layers on the samples’
maximum strain in CBR test
Fig. 14 evaluates the results of using type 2 geotextile effects on the samples in CBR test. It can
be seen that laying different numbers of geotextile layers with higher strength would be more effective
in the soil strength and thereby the soil loading capacity.
Fig. 15 makes a comparison between the effects of the number of geotextile layers in CBR test.
Increasing the number of geotextile layers in this series of tests also increased the samples’ strength,
but the mentioned effect declined with increasing the number of layers.Hence, perhaps it can be said
that the best result is obtained by laying two layers of geotextile in samples. This effect also observed
with much less ratio in higher number of layers; but in large scale executive projects, using less
number of geotextile layers is more economical in terms of time, workforce and budget.

59 Amir Kalhor and Kiarash Mirabi
4. Conclusion Using geotextile increases the reinforced clay soil strength. Adding each geotextile layer causes
an increase of about 7-25% in the uniaxial strength of the soil. Meanwhile laying 1 to 4 of type
2 geotextile layers in the soil increases the samples’ strengths up to about 100% compared with
the control sample.
Using geotextiles in uniaxial tests increases the soil ductility up to 5 fold.
The strength and ductility increase ratio depend on the number of used geotextile layers in the
reinforced soil and more number of layers entails greater effects.
The strength and ductility increase ratio depends to the geotextile type as well; using geotextiles
of higher strength, obtaining a desirable strength with fewer numbers of layers would be
possible.
By the increase in the geotextile layer section, obtaining higher strengths would be possible.
Using geotextiles in uniaxial tests decreases the soil secant module to ¼.
On the whole, changes in the soil humidity percentage will change the soil’s strength and
ductility, and the best result is gained with the soil optimized humidity; so that increasing the
humidity will cause decrease in the strength and increase in the ductility.
Using geotextiles in CBR tests will cause an increase of 10 to 40% in the strength and loading
capacity.
References [1] Koerner, R.M.,Bowman, H.L., 1991, “Geosynthetics in Geotechnical Engineering”, New York.
[2] Aiban, S.A., AL-Ahmadi, H.M., Asi, I.M., Siddique Z.U., and AL-Amoudi, O.S.B. 2006,
“Effect of geotextile and cement on the performance of sabkha subgrade”, Building and
Environment, NO.41, 807-820.
[3] Unnikrishnan, N., Rajagopal, K., Krishnaswamy, N.R., 2001, “Behaviour of reinforced clay
under monotonic and cyclic loading”, Geotextiles and Geomembranes,NO. 20, 117-133.
[4] R. Noorzad , S. Mirmoradi“ Laboratory evaluation of the behavior of ageotextile reinforced
clay” Geotextiles and Geomembranes, Volume 28, Issue 4, August 2010, Pages 386-392
[5] Bergado, T., long, V., Murthy, B.R., 2002, “A case study of geotextile-reinforced embankment
on soft ground”, Geotexlites and Geombranes,NO. 20, 343-365.
[6] Anubhav,,P.K. Basudhar“ Modeling of soil–woven geotextile interface behavior from direct
shear test results”Geotextiles and Geomembranes, Volume 28, Issue 4, August 2010, Pages
403-408
[7] Jigisha M. Vashi, Atul K. Desai, Chandresh H. Solanki “ Evaluation of PET and PP Geotextile
Reinforced Embankment on Soft Soil” Procedia Engineering, Volume 51, 2013, Pages 19-24
[8] S.C. Tuna, S. Altun” Mechanical behaviour of sand-geotextile interface” Scientia Iranica,
Volume 19, Issue 4, August 2012, Pages 1044-1051

American Journal of Scientific Research
ISSN 2301-2005 Issue 89 July, 2013, pp.60-80
http://www.americanjournalofscientificresearch.com
Developing the Capability of Local Management Based on
Iranian-Islamic Criteria (Case Study: The Local
Management of Sari)
Hamid Reza Saremi
Department of Urban Planning, Science and Research Branch
Islamic Azad University, Boroujerd, Iran
Mohammad Rashidi Alashti
Department of Land- use Planning, Science and Research Branch
Islamic Azad University, Boroujerd, Iran
Abstract
The local management based on “conducting” people’s partnership and creating
many chances to achieve the fair interests in local domains, have strengthen the social and
political pillars of the country according to the political maturity and democracy stability
and the “political system” and is regarded as a teaching course to be politician and
manager, in addition to be an appropriate bed for accepting the culture by citizens. The
system of local management in Iran, due to focusing on the political-directorial structure, is
in comparison with the individual systems and the national-regional systems have a linear-
vertical direction that has led it to a passive management. Utilizing the Iranian-Islamic
basics and universal theories related to the urban and local management gives us a set of
standards and criteria to stabilize the local management with a specific approach, that is an
Iranian-Islamic approach in this research and it has a significant influence on improving the
role, position, and function of local management in the city. Therefore, at first, the Iranian-
Islamic dimensions of local management that does not have any comprehensive definition
as well as its international accepted dimensions are derived and based on the standards and
appropriate criteria of local managements are edited. These criteria have been measured
and evaluated at the status quo and they have been analyzed through the use of statistical
methods. This research that is done with a functional aim and is written and edited through
the cross-sectional survey has found out that actions such as submitting some parts of the
state tenures to the local management, creating a united urban management with the
centrality of municipality, editing and operating the strategic document of giving services
based on the Iranian-Islamic pattern, editing the structure of local management based on the
population, economic, and geographical specifications can have an effective role in
developing the capability of local management.
Keywords: Local management, Iranian-Islamic city, Sari, Iranian-Islamic pattern
1. Introduction The modern urbanism has introduced the city as an organism and a spatial- physical structure, whose
life is guided and monitored in the common scientific methods. The developmental process of human

Developing the Capability of Local Management Based on Iranian-Islamic
Criteria (Case Study: The Local Management of Sari) 61
societies and the philosophical- intellectual developments have shown that the traditional system of
urban management cannot meet the requirements of the modern cities. This issue as well as the lack of
partnership and the weak performance of social and civil institutions state the necessity of a modern
approach to the urban management.
The emergence of expanded social movements caused in the proliferation of new forms of
social organization and the requirement to increase the political partnership in the authorized regimes
at the end of 1970 and the beginning of 1980 and a kind of transition took place from official structures
as the axis of decision making to the role of civil society in performing the democratic rights and
performing the task. Therefore, the approach to the urban management and the approach to the
management-oriented urban management were developed to the approach to local management in the
beginning of 1980s and the beginning of 1990s.
Iran and its urban management also were affected by the above-mentioned changes. The local
management in Iran includes the institution of the Islamic Council of the City and municipality that are
defined as a part of the urban management system in the status quo.
The local management in Iran has won the attention of many policy-makers about one century
ago and laws were provided for it; however, due to different reasons including increasing the urbanism,
the main changes of the urban functions, increasing the dynamism and complexity of urban
phenomena, changes in the lifestyle and type of consumption in cities and increasing the environmental
risks and social harms in cities, the tasks assigned to the local management cannot meet all the
requirements.
Furthermore. The indefinite situation of the place and identity of urban identification in the
master system of civil management, lack of ability to assign the sense of system to the available urban
management due to the defects of functional and geographical coverage, lack of elements and the
citizens’ selected institutions, severe dependency on the central government and the conflicts of
institutions and elements together can be regarded as the reason of lack of urban management function
in managing the stable development of cities in Iran; although, 18 years after conducting this study and
implementing the reforms in the field of local management, it is inevitable to consider this issue.
Approving the law of Baladieh in 1907 and its next reform and approving the law of State and
Province Councils and then the law of organizations, states, and provinces and the authorities’
instruction in 1929 and the laws related to the options of the city council and approving the law of
organizations, duties and selection of the civil Islamic council and selecting mayors in 1996 have been
in meeting the needs of urbanization and the necessity of its management; however, it should be noted
that these laws did not enjoy a necessary universality to solve the problems of the society and the urban
management. One of the most important functional, behavioral, and structural damages dominating the
local managements of Iran is lack of a master pattern to self-control the local managements and lack of
responsibility by the elements of management and lack of harmony between the options with the
natural assignments of local managements, lack of separation between the assignments of the local
management such as mayors, and the institutions of the local management decision-making including
the city council and lack of an organized existence and a directorial element in these local
environments.
One of the most important reasons for the above-mentioned damages is lack of a special local
management pattern in Iran based on the Iranian and Islamic factors and specifications in accordance
with the Islamic Iranian society. If the organization of the local management set in Iran, especially the
municipalities, is observed, it can be seen that this organization has used a kind of organization that is
the organization based on the task; while, in addition to the quality difference of one city population
compared to another city, types of problems and difficulties of one city are changed compared to
another and this issue does not have any harmony with the structures of local management institutions
that are responsible to meet these needs.

62 Hamid Reza Saremi and Mohammad Rashidi Alashti
According to some authors and comparative studies theoreticians’ opinions in the field of local
managements in the book entitled governing the local governments and Barak Pour and Iraj Asadi in
the book entitled urban management and authority, recognizing the western patterns and experiences of
other countries can be useful for solving the urban problems and new local managements in developing
countries. Some other authors including Mohammad Bagher Ghalibaf in the book entitled the local
government with the strategy of spatial distribution of political power in Iran, believes that the
available patterns of the usual local managements in other countries, are considered merely based on
cultural, economic, and political peculiarities of the manufacturing country for that pattern and the
editors of these patterns have never sought to edit a universal pattern for their own local management
structures; therefore, they have never sought to solve the problems of such societies. Therefore, this
group of societies, i.e. developing societies should use a pattern based on the specifications of their
own population, political, economic situation and even in our country, such pattern should be based on
the religious specifications to solve the problems of the urban management.
Looking at the article 136, the law of economic, social, and cultural development third plan,
and article 137; the law of economic, social, and cultural development fourth plan show that the
government is able to submit the civil submissions in the affairs of the urban development to the local
management. What we see in practice is something different and it is while the article 173 of the
economic, social, and cultural development fifth plan has mentioned to providing the master plan of
urban management and the management concentration through submitting the governmental
assignments and commissions to municipalities and developing the place of municipalities. Regarding
the motto of independency in Islamic Republic of Iran and the unique nature of the management
system of Iran among other countries, finding a successful pattern of the local managements which
reminds religious democracy to solve the problems of society is very necessary. The present study is
aimed at finding such pattern. In this research, in the range of internal and external relations of the
local management of urbanism, some suggestions have been presented to form a master and functional
pattern of the domesticated local management (Iranian- Islamic) in addition to recognize the
dimensions and effective Iranian- Islamic variables.
2. Review of the Related Literature In the available archive, Fazilat Tooranian (editing and developing the management system of urban
macro region (the institutional aspect), the case study of Shiraz macro region, Elm and Saanat University
of Iran, 2002) has studied and examined the management system in the macro region of Shiraz, and
considering the institutional, and structural aspects and the tools of urban master management, she has
tried to create the institutional capacity to create a more functional management. The results of her
research that is associated with presenting modern institutional framework to integrate the management
of macro region of Shiraz, show that the institutional traditional structure in the urban macro region
including various institutions in the affairs of management and programming, is disable in adjusting the
metropolitan regions and if continues, these regions will be faced with spatial chaotic.
Furthermore, Leila Sayyar Alnagq (presenting an optimized management pattern for Tabriz
municipality, Geography Faculty of Yazd University, 2001) studied the urban management system in
some countries and then summarizing the Islamic management specifications, and the urban management
system in Iran, she focused on the sample of the study. This study that is aimed at studying and
recognizing the organizational structure of Tabriz municipality and the strengths and weaknesses as well
as presenting suitable solutions to reform the available management patterns in this organization, found
out that more than half of the tasks assigned to municipalities are done by other organizations according
to the law of municipality, approved in 1955 and in this regard she presented some suggestions to
improve and develop the management level of municipalities and destroy the available barriers.
The urban management in Iran is turned to a passive and incomprehensive management due to lack
of suitable consistency in systematic relations with the internal and subordinate levels. Therefore, regarding

Developing the Capability of Local Management Based on Iranian-Islamic
Criteria (Case Study: The Local Management of Sari) 63
the environmental dimensions, the urban management in Iran is active in improper environments due to
lack of enjoying proper political, social, financial beds and enough partnership of social contributors. At the
end, in this study some solutions are suggested based on determining a suitable view of the Tehran
management according to theoretical frameworks and analyzing the available situation.
Another study on the field of urban management; “designing the urban management system
suitable for the cities of Iran, case study: Mashhad” is that of Gholamreza Kazemian Shiravan which
was presented as the M.A thesis in 1994 in Shahid Beheshti University. In this study, the existence of
political-social systems, the dominant political role in cities of Iran and lack of separation between
political and civil affairs, are the factors that resulted in lack of forming the independent urban
management institutions. He believed that the urban management system is insufficient and named the
lack of main necessity to suggest the new elements and the necessity of concentration on editing the
tasks and new relations for the available institutions and elements as the main results of his study.
Furthermore, the gradual localizing of the urban planning procedure and improving the municipality as
the executive element can be named as the main suggestions presented in his thesis.
Among the non-Persian sources, the following books and articles can be mentioned:
In the book “Public Participation and Local Government” Bucces Imraan at al analyze the
available situation of local management under the study and study the available laws and state the issue
from the perspective of public participation in local management and present the consequences and
effects. Furthermore, they present some suggestions in terms of improving the system of local
management focusing the local partnership.
Conducting the survey and expanded analysis and examinations, the Improvement and
development agency managers in the book titled as “Key Principles Equality framework for local
government” concluded that the available urban management system follows the traditional standards
and laws and new standards need to be introduced in this regard. In order to achieve this goal, they
present some solutions and strategies.
In the book titled as “private – public partnership, the guide of local governments” The ministry
of municipality affairs of British Colombia states the public-private partnership as the guidance of local
management. They present that in 1998, by approving the province management law, regarding the
limitations that are created in terms of presenting the services and performing the substructure affairs,
the reform of municipality law was done as well. Furthermore, in this book the dimensions of public-
private partnership and the legal framework were studied and how to operate it was stated.
Pamela Gibson et al in an article titled as “Improving performance and Accountability in local
Government with Citizen Participation” believe that finding the successful ways to interact the local
management with people to form the future societies, is one of the significant challenges in the new
millennium. What has been stated as the role of democratic citizens, is the general partnership in the
completing process of modern civil culture; in other words, any change in the pattern of political
system and the functional separation of power, roles, and responsibilities, the citizen is merged in each
part of the government and the relationship with citizens is increased by the public opinion polls,
public sessions, and organizing the group activities.
3. Theoretical Basics Regarding the short-term literature of local management in modern method, the mere viewpoints about
the local management is limited. However, the reality is that before stating the local management,
cities were managed and the theories and viewpoints of many theoreticians have been effective in
forming the modern form of urban management. In this regard, in the European and Americak
countries, the content of local management is very separable and expanded. Therefore, according to the
functional condition and the systematic approach to it enjoy different categorizations, and this trend is
going to be developed and updated through developing the urban title. The deficiency of the theories of

64 Hamid Reza Saremi and Mohammad Rashidi Alashti
Chicago school in the first decades after the Second World War and the urban development and the
related affairs caused every subject in the city to be studied by the urban sociology and planning. The
interference of the irrelevant experts has increased the complexity of this subject. Lack of suitable
theories results in a serious challenge in this issue. Therefore, it is tried to present the theories related to
the local management:
3.1. The Theories Focusing the Urban Management
3.1.1. Max Weber and the Theory of Bureaucracy
Presenting the general theory of bureaucracy, Weber names domination and authority in the
organizational discussion and believes that a good organization is an organization that considers the
interactive relationship between organizations and individuals.
Figure 1: The Basics of Management from the Perspective of Weber
The Basics of Management from the Perspectives of Weber
Functional
Division of
Labour
Centralization
of authority
Applying
Regulations
instead of
Relations
Formulate rules and
regulations for all affairs
Recording
Prosperities, Actions
and Operations
3.1.2. Brian Mac Lalin and the Theory of Urban Authority and Management
He has considered the city as an open system where the systematic procedure dominating the city
affects the planning and the decision-making system. Furthermore, he believes that authorship is a
procedure, which is containing the integrated and interwoven system that includes both the
“government’ and “society.”
3.1.3. Rex and Moor Theory
These theoreticians have studied the distribution of power and its relation with the political criteria in
analyzing the rare sources in the city and the struggle which exits among the social groups to achieve it
(Rex and Moor, 1967).
3.1.4. Richard Tardaniko Theory
In his idea, the analysis of city is analyzable as a universal and regional action system and in the
viewpoint of structuralism; city is a part of higher system and is a complete behavior that is
continuously affecting and being affected
Figure 2: Theory of Richard Tardaniko
Theory of Richard Tardaniko
Urban Structural
Theory
Theory of Urban
Praxi
Theory of
Dependency to
Urbanization
The Theory of
Universal System of
Urbanization

Developing the Capability of Local Management Based on Iranian-Islamic
Criteria (Case Study: The Local Management of Sari) 65
3.1.5. Theory of Pahl
In his viewpoint, this theoretician names those who control and manage the city in the process of urban
management by assisting the concepts of power and management with the titles of social goal-keeper,
planners, social brokers, and etc. he knows a social system as an environment that reflects the power of
city managers (Pahl, 1975: 10).
3.1.6. The Theories of Partnership and Democracy in Urban Management
Democracy is often defined and analyzed based on the style of definition and interpretation of the
citizens’ partnership. The classic pattern of democracy can be categorized into the theory of elitist, the
partnership theories, and the pluralist theories that are a mixture of elitist and partnership theories.
According to the elitist theories, only a few numbers of citizens have the ability to use the power of
decision-making in the municipalities. Polling and election are the explainers of democracy and the
candidates in each municipality are the representatives of general interests of all the citizens and when
they apply the power of decision-making, they are able to make suitable decisions. The active
partnership of citizens in the government is not necessary. Citizens’ reaction to the election can be
regarded as a tool in evaluating the success of decision-makers. The elitist theories state that power is
divided unequally among citizens and elite is not only used and the various elitist groups fight to get
power. Furthermore, democracy can be placed under the subordination of various elitist groups and in
each case, one group of elitist use the power in one field and the other elite group use the power in
another field. The pluralist theories in democracy know the society as networks of various elitist
groups and direct partnership of citizens that are affected the elitist groups. These theories emphasize
that the partnership results in development and the growth of character and the sense of responsibility
among citizens (Hersey Paul& Blanchard Ken, 1988).
3.1.7. The Theory of Salah-e-Din Yaldyerim
He has stated his opinion about the role of municipality and local governments in four approaches that
is stated in the following table:
Table 1: Theory of Salahedin Yaldyerim
Approach The Issues Discussed
Pluralist The functional dependency of the government and local governments from any interest of social groups
Tool-Oriented The local governments, the realization tool of the interests of special classes or groups
Elitist Management The local government is assigned to defend the local and national interest.
Structuralism The main and vital focus on the orientation in the policies of government to provide the group points.
3.1.8. The Participatory Theory of Arnstein
He applied the citizen participation with the interpretation of citizen’s power and used the ladder of
partnership to explain it:
Citizen Control 8
Citizens’ Power Delegated power 7
Partnership 6
Plaction 5
Minor Participation Consultation 4
Informing 3
Denial of Participation Therapy 2
Manipulation 1
In the lowest step there is no power for Arnstein. In other words, lack of partnership in the
period, shows itself, which are named therapy and manipulation by him. As he believes the

66 Hamid Reza Saremi and Mohammad Rashidi Alashti
manipulation means that some of the government organizations supply the artificial forms of
partnership whose main aim is teaching citizens to accept affairs that are determined beforehand. Then
is the therapy step, which is a kind of unfaithful partnership. The step of informing and consulting is
the stage of informing citizens of the available facts in the programs of government and rights and their
responsibilities and the available solution (Rosenbloom David, 1989).
3.1.9. The Participation Theory of Scott Davidson
He designed his partnership circulation for the discussion of citizenship partnership. This circulation
shows different stages of partnership without any preferences for a single stage. In this model, he
considers a four-stage level including: 1. Informing, 2. Consultation, 3. Partnership, 4. Empowerment
3.1.10. The Partnership Theory of David Driksell
He believes that the partnership is based on the following three beliefs:
A Development should be in favor of local residents.
B People who live in the programming scope, have the most exact information about that
scope.
C People who accept the most effects from the decisions have greater share for partnership
in decision-making.
According to Driksell there are different forms of partnership that are categorized in two
general groups of “partnership” and “lack of partnership.” (Driksell, 2002: 32)
3.1.11. Theory of Mediation
This theory suggests the method of mediation to maximize the partnership. In this theory, the concepts
of general partnership and general consultation have been focused. Finally, a movement from the
general partnership in planning that is guided by the council and is mainly based on informing about
the programs of councils, to the partnership programming that is based on the basic principles of
mediation is considered as a necessity (Rakodi C, 2001).
3.1.12. The Theory of Public and Elites Participation of Lewin Folket
He believes that in the modern urban democracy, two elements are affective simultaneously. Only
elites and not citizens decide. If there is no partnership in the macro level of the society, the decisions
will be meaningless and the elite group will not be accepted by the public. Therefore, the decision-
making necessitates the existence of elites and the citizens’ partnership. One of the selected democracy
critics’ reasons can be due to this fact that this system rejects the possibility of active participation of
the citizens. Simply, it can be stated that partnership is only limited to the citizens’ activities in relation
to polling in the day of election (Rakodi C, 2001).
3.1.13. Theories Related to Government and Governance
Jonston (2005) defined the governance as “the act or procedure of governing” that the governing is
similar to the government. The government means leading, guiding, managing, and controlling.
Specifically, the government means governing through implementing the power and authority and
managing the civil affairs. Therefore, “the government is an official organization and an authorized
decision-making position, including the executive branches and civil legislation as well as those who
control it. Governing implicitly means the common action and the existence of common aims,
evaluative frameworks, and common rules, continuous balance and determination to achieve the
collective interest that is not achievable through individual actions (Rakodi, 2001: 524).

Developing the Capability of Local Management Based on Iranian-Islamic
Criteria (Case Study: The Local Management of Sari) 67
Table 2: Analzying the Theories of Participatory Urbanism
Theory/ Type of
Partnership Artificial Participation Limited Participation Real Participation
1. The Participation ladder
of Arnstein
Manipulation informing participation
therapy consultation Delegated power
placation Citizens’ control
2. The Participation
Circulation of Davidson
informing participation
consultation empowerment
3. Driksell
Decorative participation consultation People’s responsibility
manipulation Social movement Participation in decision-making
Dramatic egalitarianism
4. Mediation - Public partnership
Participatory planning (through the
way of commitment, negotiation,
pre-mediation, and mediation)
Jonstone believes that two widespread applications can be considered for governance. The first
application is related to the nature of “organizations.” In this application, the governance is defined as
the interference of a widespread range of institutions and actors in producing the policies. The next
application is related to the nature of “relations among organizations.” In this application, the
governance includes a special form of discipline. Contrary to control from up to down that exists in the
discipline based on hierarchy, the governance requires discipline through networks and partnerships.
Therefore, governance means “self-organizing the inter-organization relations.”
Rhodes believes that the governance is the “Self organized inter-organizational networks” and a
good starting point for discussion about the governance. According to this definition, the policymaking
process is regarded as a bargaining game among different types of actors. Therefore, the governance is
the subject about the public actions that are higher than the government and the public observation and
guiding the network to find specific results.
3.1.14. New Regionalism
This viewpoint believes that in the new universal economic conditions, it is necessary to integrate the
institutions to attract the interests and repel the harms of globalization. The fans of reformism have
rejected the support of traditional styles of reforming the government structure especially the classic
metropolitan and have accepted the deficiency of such structures at the status quo. In the pattern of
governing the metropolitan pattern – based on the available conditions- the duties are based on two
axes. On one hand, considering the economic development and the role of a metropolitan region in the
universal economic whose aims are the comparative benefits and effort to achieve the meritorious rank
in the region and on the other hand tasks that are related to the internal region and include partnership
in thinking and finding solutions in the environmental issues, the regional substructures, holding the
distributive justice and social economic affairs with the partnership of all the actors.
Figure 3: The View Point of New-regionalism

68 Hamid Reza Saremi and Mohammad Rashidi Alashti
3.2. The Relations of Central Government and Local Management
In developing countries the problem is that how the structure of the local government and its relations
are getting adjusted by the central government and how the responsibility of partnership in the national
development is assigned to the local government. In most of the developing countries with the
democratic tendency, the local governments enjoy the complete independency and go toward a new
concept of partnership; however, determining the trends in developing countries is hard since they own
various tendencies. The relations between the central government and local governments are adjusted
based on a set of different values (diagram 3-4) and the specifications of the approaches related to these
values are stated in table 3.
Figure 4: The Relations between the Central Government and the Local Government based on a Set of Values
Focusing on the
partnership
procedures
The Relations between the Central Government and the Local Government based on a Set of Values
Democratic Values Management Values (administrative) Combined Values
Creating a balance between the
local- oriented and service-
oriented governments
Service-oriented
Government
The approach of local-
oriented Government
Table 3: The Specifications and the Assumptions of the Government-oriented, Service-oriented, and
Combined Governments
Government-oriented Service-Oriented Combined
1. the self-managed units that own
the legal status
1. The local management in the
form of: District council, the
central agency or central
government
1. Through reinforcing the local
institutions, the central government
and in order to give effective services,
enjoying the structure, resources, and
responsibilities is active to achieve the
local needs and to fulfill the
democratic assignment.
2. using the financial source of
the central government
2. grants by controlling the
performance
2. supplying the grants through the central
government
3. they are not regarded as the
factor of central government
3. they are necessarily the agencies
of the central government
3. the central and local government as
partners to achieve the public welfare
4. they have freedom in
management
4. assessing the quality of local
units through effective and
functional standards
4. The central government of technical
consultation provides the grants and
the local government is the informing
channel and feedback resource.
5. controlling the local
government by the central
government in sensitive and
key points
5. comprehensive control of the
central government without
paying attention to improving
the response and the democratic
values
5. the partnership of central and local
government

Developing the Capability of Local Management Based on Iranian-Islamic
Criteria (Case Study: The Local Management of Sari) 69
Table 3: The Specifications and the Assumptions of the Government-oriented, Service-oriented, and
Combined Governments - continued
6. lack of attention to sufficient
facilities for effective services
6. local self-managing in giving
services
6. increasing the capacity of local units to
present the effective services with
protecting the interests of central
government
7. emphasizing the democratic
values
7. comprehensive and united
strategies and methods
7. emphasizing the partnership and
achieving the public welfare
8. emphasizing the local
independency
8. emphasizing the control of the
central government
4. Research Method Most of the methodology in the behavioral sciences is descriptive. In descriptive research projects what
exists or the available situation of phenomena is studied. According to Best, a descriptive research
studies the conditions or the available relations, opinions, viewpoints, approaches, and people’s beliefs
about one phenomenon, procedures, and the trends. The aim of a descriptive study is determining the
nature of conditions, activities, and dominant approaches. In a descriptive research, the researcher
describes the activities, objects, and people. The field research is a kind of descriptive research that is
used in the behavioral sciences. The field study includes: observing the phenomena to give meaning to
different aspects of collected information.
4.1. Participants
The population is just the individuals, groups, and organizations that the researcher is going to study
(Ahmadi, 2012: 147). In this research, the considerable society is 120 people of the managers, and
male and female experts of municipality and Islamic Council of Sari.
4.2. Sample and Sampling
4.2.1. Sample
Sample is a small sample of the society that is selected to be observed and analyzed. In other words, a
part of the participants that is selected based on a definite criterion and is considered as the
representative of the society, is called a sample. The sample is named as a subset of a society. In this
research and regarding the number of population, the sample size is 80 people who are selected through
the Table of Krejcie & Morgan.
4.2.2. Sampling
The sampling method in this research is the random method based on the experts and managers.
Table 4: The Sample under the Study Separated by the Post.
Post Manager Employees Total No.
Frequency of each class 30 72 102
The ratio of each class to the whole society 29% 71% 100%
The proportion of sample to the society 22 58 80
In the random sampling-class, the society is categorized in the equal groups and in every group
the individuals have the similar specifications. When the society was divided into the equal or subset
groups, the proportion of each society is calculated to the society and then the ratio calculated in each
group is multiplied in the sample size. Therefore, the number of people in each group gets clear in

70 Hamid Reza Saremi and Mohammad Rashidi Alashti
comparison to the whole group. Thus, the researcher is sure that the subsets are as much as those exits
as the representatives (Clarke John, J, 1955).
4.3. Data Collection
Two methods were used to collect the data:
a) Library method: in this research in order to collect data and in order to edit the literature of the
research as well as the theoretical basics and the scholars’ opinions, this method was used.
b) Questionnaire: in this research, in order to collect the data, a researcher-created questionnaire
that included 30 questions in 5-scal Likret type was used.
4.4. Validity and Reliability
In order to calculate the validity of the test, the advisor and reader’s opinions were used. Then the
necessary formations were applied and then in order to calculate the reliability, 20 questionnaires were
distributed among the experts and managers and then the reliability was calculated through alpha
Cranach’s as 0.81.
4.5. Analyzing the Data
The data collected through two descriptive and inferential methods was analyzed through SPSS. In this
research, the descriptive data was used to show the frequency of data and the related diagrams and the
Inferential data was used for the meaningfulness of the relations between the variables.
4.5.1. Descriptive Statistics
The set of methods that is used for organizing, summarizing, and describing the observations is called
the descriptive statistics. In this research, it includes a set of concepts and methods used to organize,
summarize, provide tables, draw diagrams, and describe the data collected.
4.5.2. Inferential Statistics
The set of methods through which we deduct the data of sampling, specifications of a major group or a
society is called the inferential statistics. The inferential data enables us to evaluate the specifications
of a bigger group through studying the specifications of a small group (Hasan Zadeh, 2010: 10). In
order to analyze the hypotheses in this research, single-variant t-test as well as the Friedman test was
used to prioritize the answers.
4.6. The Scope of the Research
4.6.1. The Subject Scope
The theoretical literature of this research is in the field of the urban and local management issues as
well as the Islam opinions about the management in city and in each subject, the related criteria are
derived and introduced.
4.6.2. The Place Scope
The present study was performed in the local management of urbanism (municipality and the Islamic
council of the city).
4.6.3. The Time Scope
This research was performed in the period of May 2012 to February 2012.

Developing the Capability of Local Management Based on Iranian-Islamic
Criteria (Case Study: The Local Management of Sari) 71
5. Analyzing the Data of the Research The data and information collected in this research was in fact a raw source that should be examined
and analyzed by suitable tools so that it was able to convey the functional load. Therefore, the most
appropriate instrument to analyze the data collected was the statistical tests. The analysis procedure of
data was changing them into the hypotheses and answering the questions so that the researchers were
able to follow the main and secondary aims of the study and it was completed in three stages:
First stage: analyzing the demographic of samples
Second stage: analyzing the hypotheses
Third stage: describing the demographic of samples
In order to describe the points of samples and the tests about the assumptions, the data were
studied by determining the percentage, frequencies, means, and the weights of respondents to the
variables of gender, educational license, and job experience.
5.1. Analyzing the Demography of Samples
5.1.1. Gender
Table 5: The Respondents Distribution based on Gender
Gender Frequency Percentage
Male 73 91%
Female 7 9%
Total No. 80 100%
According to table 4-2, 91% of respondents are male and 9% are women.
5.1.2. Age
Table 6: The Respondents Distribution based on Age
Age Frequency Percentage
20-30 11 14%
31-40 31 39%
41-50 24 30%
More than 51 14 17%
Total No. 80 100%
According to the above table, 39% of the respondents were between 31-40 years old (the most
frequent) and 14% of them were 20 -30 years old (the least frequent).
5.1.3. Educational Level
Table 7: The Respondents Distribution based on Educational Level
Education Frequency Percentage
Higher diploma 16 20%
Bachelor’s degree 43 54%
Master degree 21 26%
Total No. 80 100%
According to the above table 54% of the respondents held a B.A (the most frequent) and 20%
of them held a higher diploma (the least frequent).

72 Hamid Reza Saremi and Mohammad Rashidi Alashti
5.1.4. Job Experience
Table 8: The Respondents Distribution based on the Job Experience
Time period Frequency Percentage
Under 5 yrs 6 7%
6 – 10 yrs 21 26%
11 – 15 yrs 34 43%
Over 16 yrs 19 24%
Total No. 80 100%
According to table 5-4, 43% of the respondents had a job experience between 11 to 15 years
and 26% of them had a job experience of 6 to 10 years.
5.1.5. Testing the Hypotheses
Hypothesis 1
“The criterion of local management based on Islamic -Iranian criteria is one of the most important
criteria in developing the ability of the system of local management of Sari”
A. Description
Table 9: Describing the Variable
Number Mean SD
80 84/3 69/0
As it is observed in table 5-5, the calculated mean is 3.48 that is more than the theoretical mean
of 3, which shows the positive approach of respondents to the first hypothesis in terms of description.
In furtherance, in order to generalize the opinions of respondents to the whole society, a t-test is used.
B. Deduction
According to a ‘t-test’ the related coefficients are reflexed in table 5-6.
Table 10: T-Test
T-value df α p-value
63/10 79 May-00 00/0
Reject the H0 0.05= α >0.00= p-value
H0: µ ≤3 H1: µ > 3
Regarding the fact that in table 5-6 the amount of p-value is less than α = 0.05 and regarding
the fact that the mean is more than the theoretical amount of 3, with the confidence level of 95%, it can
be stated that the criterion of local management based on Iranian-Islamic criteria is one of the most
important criterion in developing the ability of local management system of Sari.
Hypothesis: the criteria of local management based on the Iranian-Islamic criteria are the most
important criteria in developing the ability of local management system of Sari.
A. Description
Table 11: T-test related to the first hypothesis
Criteria Number Mean SD t-value error p-value
Dominating the Law 80 45/3 66/0 42/6 May-00 Jan-00
Justice 80 88/3 58/0 67/14 May-00 00/0

Developing the Capability of Local Management Based on Iranian-Islamic
Criteria (Case Study: The Local Management of Sari) 73
Table 11: T-test related to the first hypothesis - continued
Idealism 80 81/3 72/0 10-Dec May-00 00/0
Responding System 80 77/3 64/0 11 May-00 00/0
Consulting Service 80 76/3 61/0 66/12 May-00 00/0
Informing Service 80 91/3 67/0 13 May-00 00/0
Public Partnership 80 97/3 70/0 51/14 May-00 Jan-00
H0: µ ≤3 H1: µ > 3
Source: the statistical data of the research
As it is observed in table 5-7, the mean observed from all the criteria of hypothesis 1 is more
than the theoretical mean amount of 3, showing the positive approach of the respondents in terms of
description compared to the criteria of hypothesis 1. Furthermore, regarding the fact that p-value is less
than α = 0.05, with a confidence level of 95% it can be stated that: the criteria of management are
based on Iranian-Islamic Criteria as the most important criterion in developing the ability of the local
management system of Sari.
Prioritizing the Criteria of Local Management based on Iranian-Islamic Criteria
A. Description
Table 12: The Categorization of Hypotheses in the First Hypothesis
Factors Rating Average
Public Partnership 3-Feb
System of Informing 55/2
Justice 53/2
Idealism 90/1
Table 13: Freidman Test in the First Hypothesis
Chi-square df α p-value
40/103 6 May-00 00/0
Hypothesis Rejection H0 0.05= α >0.00= p-value
Considering the fact that in table 5-9 the amount of p-value is less than α= 0.05, it can be
concluded that there is a significant difference between the criteria of local management based on
Iranian-Islamic criteria. Therefore, considering the table 4-9, it can be concluded that the most mean is
related to the criterion of public partnership and the criteria of informing system and justice are placed
in the next rankings.
Hypothesis 2
“the current criteria of local management in the field of local management of
Sari are in harmony with the Iranian-Islamic criteria of local management”
Table 14: The Description of Variable
Number Mean SD
80 24/3 61/0
Source: the statistical data of the research
As it is observed in table 5-10, the calculated mean equals with 3.24 that is more than the
theoretical mean of 3, indicating the positive approach of respondents from the perspective of
description to the second hypothesis. In furtherance, in order to generalize the respondents’ opinions to
the whole participants, a ‘t-test’ is used.

74 Hamid Reza Saremi and Mohammad Rashidi Alashti
B. Deduction
According to the ‘t-test’ the related coefficients are reflexed
Table 15: T-test
t-value df α p-value
4 79 May-00 Jan-00
Rejecting the hypothesis H0 0.05= α >0.01= p-value
H0: µ ≤3 H1: µ > 3
Considering the fact that in table 5-11 the p-value is less than α= 0.05, and considering the fact
that the value of mean calculated is more than the theoretical mean of 3 with a 95% of confidence, it
can be concluded that the criteria of local management are in harmony with the Iranian-Islamic
management criteria in the field of the local management of Sari. Although regarding the calculated
mean value is close to the theoretical mean, it shows that the adjustment of local management criteria
in the field of local management of Sari is relatively average with the Iranian-Islamic criteria of
management.
Hypothesis: the current criteria of local management in the field of local management of Sari
are in harmony with the Iranian-Islamic criteria of local management.
A. Description
Table 16: T-test in the second hypothesis
Criteria Number Mean SD t-value error p-value
Justice 80 33/3 64/0 71/4 May-00 00/0
Public partnership 80 36/3 69/0 14/5 May-00 00/0
Informing system 80 25/3 61/0 16/4 May-00 00/0
Consulting service 80 45/3 65/0 42/6 May-00 00/0
Dominance of law 80 86/2 71/0 2- May-00 21/0
Response system 80 92/2 66/0 14/1 May-00 13/0
Idealism 80 41/3 64/0 85/5 May-00 Jan-00
H0: µ ≤3 H1: µ > 3
As it is observed in table 5-12, the calculated mean of all the criteria of hypothesis 2except the
criteria of “dominance of law” and “response system” is more than the theoretical mean 3; indicating
the positive approach of respondents in descriptive terms compared to the criteria of second hypothesis
relatively. Furthermore, considering the fact that in except two cases in the table p-value is less than
the α= 0.05, with a confidence of 95%, it can be concluded that the “current criteria of local
management in the field of urban management of Sari are in harmony with the Iranian-Islamic criteria
of local management and there was not any harmony only in two cases of “dominance of law” and
“response system” with the Iranian-Islamic criteria.
Prioritizing the Matching of Current Criteria of Local Management in the Field of Local
Management of Urbanism with the Iranian-Islamic Criteria
A. Description
Table 17: The Ranking of Variables in the Second Hypothesis
Factors Ranking Average
Justice 61/2
Idealism 37/2
Public Partnership 97/1
Informing System 52/1

Developing the Capability of Local Management Based on Iranian-Islamic
Criteria (Case Study: The Local Management of Sari) 75
Table 18: Freidman test
Chi-Square df α p-value
31/64 6 May-00 00/0
Rejection of Hypothesis H0 0.05= α >0.00= p-value
Regarding the fact that in table 5-14, p-value is less than α= 0.05, it is concluded that there is a
significant difference between the mean matching of current criteria of the local management in the
field of local management of Sari with the Iranian-Islamic criteria. Therefore, considering table 5-13, it
can be concluded that the most amount of mean is related to the criterion of justice and the criterion of
idealism stands in the next place.
6. Conclusion and Suggestions for Further Studies This research was aimed at developing the system of local management in the levels of urban
management and the following questions were posed:
Q1: what are the most important criteria and Iranian-Islamic standard in developing the
capability of urban management?
The study shows that the criteria of justice, public partnership, consulting system, dominance of
law, response system, idealism, informing system can be considered as the most important criteria and
Iranian-Islamic standards in developing the capability of local management.
According to this and considering the results achieved from the data, in responding the first
question of the research that is in contrary with the first hypothesis, one can state that this hypothesis
has been approved by the mean of 3.84. It means that the criterion of local management, based on
Iranian-Islamic criteria is the most important criterion in developing the capability of local
management system, especially the local management of Sari.
Q2: to what extent the available local management is according to the criterion of Iranian-
Islamic standard?
Using the answer of the first question that is the criteria of Iranian-Islamic standard of the local
management and applying the statistical analysis, it is concluded that the local management at the
status quo is matched relatively with the criteria of Iranian-Islamic standard. Therefore, the results
achieved from the statistical data in the response to the second hypothesis of the research which is
related to the second question, are approved the hypothesis relatively.
Therefore, in order to achieve the aims of the research, relying on the Iranian-Islamic criterion
that is derived by the national opinions and religious goals of Iran, and can have the greatest impact in
practice, the functional program is going to be presented in furtherance.
6.1. Editing the Macro and Micro Aims Suggested for Developing the Local Management System
In theoretical studies and in order to achieve the urban development, three universal aims have been for
all the systems of local management:
Developing the condition of work and life of all people in the city
Encouraging the stable economic and social development
Protecting the physical environment of the city
The special aims of local management in Iran can be edited as a combination of evaluative aims
with goals based on solving the problems of the available system relying on the Iranian-Islamic criteria
as follows:
A Supporting the procedure of Urban Development and Stabilizing the Basics of Stable
Development: this issue is aimed at absorbing the citizens’ partnership in managing the affairs
and the urban development as a final goal, which includes the following micro aims:

76 Hamid Reza Saremi and Mohammad Rashidi Alashti
A-1) Strength of motivations and necessary mechanisms for active and real partnership
of citizens in managing the affairs
A-2) The strength of motivations and necessary mechanisms for maximum functional
utilization from the sources of urban development
A-3) the creation and strength of micro levels of city council
A-4) helping the procedure of development and reform of the administrative structure of
the country
A-5) increasing the factor of programming and managing the cities of Iran
B Determining and Examining the Identity and the Position of Local Management System in
the Macro Civil System
B-1) Creating harmony between the local management system and giving structure to
the administrative system and programming
B-2) submitting the controls and responsibilities to the local management system
C Considering the Local Management System as a Master Management System to Manage
the Urban Region
C-1) Integrating the local management system and all the related elements
C-2) the exact design of the inter-organizational and intra-organizational relations of
local management system and state organizations for the maximum utilization of
their facilities
Editing the Strategies and Suggested Policies of Developing the Local Management System
In order to solve the problems of local management system in Iran, the following policies and
strategies are suggested by relying on the Iranian-Islamic standard and achieving the determined goals:
6.2. Attracting the Active Partnership of Citizens in Local Management and Changing the
Cultural Approach and People’s Understanding of Local Management
1. Matching the policies and strategies of local management with the real needs of people
2. Improving the quality of local management services
3. administrative-executive decentralization of state system and paying specific attention to the
participatory mechanisms and the practical effects.
4. Increasing the control of local management system
5. Applying the programming and strategic management methods based on mechanisms and
participatory actions.
6.3. Considering City as a Source of Development
1. Determining expanded and comprehensive responsibilities for the local management system
in city development
2. Maximum utilization of limited available sources for the development of the city
3. Recycling energy and materials
6.4. Retaking Power from the Central Government and Submitting it to Local Management
System
1. Increasing the participation of the officials of organizations and the elements of central
government and submitting control to the institution of local management
2. Increasing the role and interference of the local management in all the fields of urban
management
3. Separating the political and civil affairs from other affairs as much as we can
4. Organizing and stabilizing the participatory mechanisms

Developing the Capability of Local Management Based on Iranian-Islamic
Criteria (Case Study: The Local Management of Sari) 77
5. Editing and approving the rules and regulations in order to do the administrative-executive
decentralization
6. The strength of horizontal relations of local management with the social groups,
nongovernmental organizations (NGOs), professional institutions, and private sector.
7. Using the income sources and local tax
8. Using the bonds at the national level
6.5. Dividing the Proper Work between the Central Government and its Elements with the Local
Management System
1. Separating the political and civil affairs from the urban affairs maximally
2. Submitting all the local affairs to the local management system
3. Determining the expanded responsibilities for the local management system in developing the
city
6.6. Improving the External Relations of Local Management System
1. administrative-executive decentralization from the management system and editing and
approving the necessary laws and regulations for them
2. Increasing the controls of local management system
3. Separating the urban affairs from the political affairs as much as possible
4. Reinforcement of horizontal relations of local management with social groups,
nongovernmental organizations (NGOs), professional institutions, and private sector.
5. Determining the expanded responsibilities for the local management system in developing
the city
6. Expanding the inclusion of local management system and its horizontal relations on all the
state organizations and effective elements in the management of city
7. Reinforcing the inter-organizational partnerships
6.7. The Reform of the Inter-Organizational Structure of Local Management
1. Increasing the controls of local management system
2. Utilizing the programming and planning methods and strategic management based on
mechanisms and participatory actions
3. Determining expanded responsibilities for the local management system in the development
of city
4. Reinforcing the horizontal relations of local management with social groups,
nongovernmental organizations (NGOs), professional institutions, and private sector
5. Expanding the inclusion of local management system and its horizontal relations on all the
state organizations and effective elements in the management of city
6. The flexibility of organizational structures based on social, cultural, and mobile management
conditions
7. Determining the role and special position for the mayor (as the manager of the city) in
policymaking, decision-making, and guiding the affairs of the city
8. Designing the local management system in three levels city, district, and neighborhood
including all the tasks and main functions
9. The inclusion of local management on the urban programming

78 Hamid Reza Saremi and Mohammad Rashidi Alashti
6.8. The Functional and Geographical Integration of Local Management System and Serving
State Organizations
1. Determining the comprehensive responsibilities for the local management system in
developing the city
2. Increasing the inclusion of local management system and its horizontal relations on all the
state organizations and effective elements in the city management
3. Reinforcing the horizontal relations of local management with social groups,
nongovernmental organizations (NGOs), professional institutions, and private sector
4. Determining the master geographical borders on developed kernels and non-developed
regions
6.9. Reforming the Financial Management of Local Management System
1. Matching the policies and methods of local management with the real needs of people
2. Utilizing the methods of programming and strategic management based on mechanisms and
participatory actions
3. Maximum utilization of the available limited sources for developing the city
4. Receiving the cost of services presented from consumers
5. Recycling materials and energy
6. Using the income sources and local taxes and multiplying the system of financial sources
7. Using the bond at the national level
8. Attracting the participation of private sector
9. Editing and approving the necessary financial laws and regulations
6.10. Organizing and Improving the Quality of Physical Environment of the City
1. Using the planning methods and strategic management based on participatory mechanisms
and actions
2. Receiving the cost of services and wealth resulted from the accumulation and urban focus
on the users and land owners
3. Reinforcing the horizontal relations of local management with social groups,
nongovernmental organizations (NGOs), professional institutions, and private sector
4. Increasing the inclusion of local management system and its horizontal relations on all the
public organizations and effective elements in the city management
5. Determining the master geographical borders including the developed kernels and
undeveloped regions
6. Editing and operating the necessary physical standards for developing the physic of the city
6.11. Editing the Macro and Micro Aims Suggested for Developing the Local Management
System of SARI
The aims of the local management system of Sari are resulted from the collection of issues and
theoretical basics of this city. Comparing with the public macro aims determined for the local
management system of the all cities of Iran, a macro aim is recognizable for Sari in addition to all the
aims, which is the powerful and authorized local management
In addition to all the public issues, in the field of micro aims, the following specific aims have
been recognized for the local management of Sari:
1. Maximum utilization of the administrative centralization of Sari to advance the aims of
local management
2. Increasing the range of services in the covered area

Developing the Capability of Local Management Based on Iranian-Islamic
Criteria (Case Study: The Local Management of Sari) 79
3. Maximum utilization of the facilities and potentials of the state organizations in city
management
4. Reinforcing the relations with a standard as a responsible of state organizations in the
province
5. Developing the municipality position and assigning the controls and responsibilities to
manage the city purposefully
12.6. Editing the Strategies and Suggested Policies for Developing the Local Management of Sari
Among the determined policies and strategies for the local management of Sari, the following two
strategies are considered specifically for Sari:
1. Paying attention to the administrative centrality of the city as an important factor in
assisting the development of the Sari municipality capability
2. Designing the management structure of Sari comprehensively
Other strategies and policies are much similar to the cases suggested for the local management
in Iran.
References [1] Akbar Alikhan Mohd and Muttalil M.A, 1982, theory of Local Government, Sterling publishier
private Limited.
[2] Alderfer Harold, 1956,American Local government and administration, the Memillan company.
[3] Arnstein sherry, 1995,A ladder of citizen panicpation,second edition,edited by Richard T.Gates
and Fredric stout,Rutledge press.
[4] Bucces Imraan & Hemson Dvid & Hicks Jnine & Piper Laurence, 2007, Public Participation
and Local Governance,The center for Public Participation(CPP).
[5] Byrne tony, 1983, Local government in Britania.
[6] City of Toronto, 1997, new city: new opportunities.Toronto,December.
[7] Clarke John, J, 1955, Local government of the unitd kingdom, pitman& Sons.
[8] D.Gibson Pamela & P.Lacy Donald & J.Dougherty Michael,Improving performance and
Accountability in local Government with Citizen Participation,The Innovavation Journal.
[9] Daft Richard, 2001, Organization Theory anad Design,Cincinnati:South-Western college
Publishing.
[10] Driskell david,2002،creating better city with children and youth(A manual of participation)،
Enesco publishing and Earth scan publication ITD.
[11] Frisken.F,1998,the greater Toronto area in transition: the search for new planning and servicing
in a period of economic chang and government.york University,Canada.
[12] Hersey Paul& Blanchard Ken,1988,Management of organizational Behavior: Utilizing Human
Resources, Prentice-Hall International, Editions
[13] Key Principles Equality framework for local government, 2009,Improvement and development
agency.
[14] Lawton Alan & Rose Aidan, 1994,Organization and management the public
sector,London:Financial Times.
[15] Leach Steve & Stoker Gerry, 1997,Understanding the local Government
Review:A,Retrospective Analysis,Public Administration,Vol 75,No.1.
[16] Local Government Discretion and Accountability:Application of a Local Governance
Framework,2009,The world bank,Social Development Department.
[17] Pahl R,1975,Whose City?,second edition,London penguin.
[18] Rakodi C,2001,Forget Planning,Put politics first?,priorities for urban management in
developing countries,journal of J A G,vol 3.

80 Hamid Reza Saremi and Mohammad Rashidi Alashti
[19] Rex. J, Moor Race, 1967, Community &Conflict, Oxford: Oxford University press.
[20] Rosenbloom David, 1989, Public Administration: Understanding Management Politics and law
in the Public Sector, Random House.
[21] Saffell David C, 1993, State and Local Government, McGraw-hill,Inc.
[22] Stoker.S, 1997, the new management of nritish local government, mcmillan press LTD.
[23] Stoner James & Freeman Edward &Gillbert Daniel, 1993, Management, New Iersey: Prentice-
hall International Editions.
[24] UNDP/UNCHS/World Bank, 1996, The Urban Management Program In Asia and the Pacific.
[25] United Nation, 1966, Local Government Personnel System, United Nation Publication.
[26] Wilson james Q, 1989, American government, D.C company.

American Journal of Scientific Research
ISSN 2301-2005 Issue 89 July, 2013, pp.81-90
http://www.americanjournalofscientificresearch.com
Pedestrian Network Development Planning in Kish Island
Case Study: Mirmohanna Walkway
Hassan Ali Laghai
Associate Professor, Urbanism Department
University of Tehran, Iran
Mona Loghman
Department of Urbanism, Rudehen Branch
Islamic Azad University, Rudehen, Iran
Abstract
Day by day residents of urban areas find themselves more dependent on
automobiles and this study attempts to explore its environmental consequences and
negative effects on normal life of people in cities. Urban development plans and especially
passages and arteries widening plans not only have failed to change this negative process,
but also encouraged people to use more automobiles in urban areas (heavy traffic jams in
mega cities). Nowadays having appropriate spaces for walking in cities, rather than driving,
is one of the most important objectives of human-oriented cities as well as sustainable
urban development in urbanism. Regarding the needs of a walker in Kish Island, this
research, investigates the features and theoretical indices in search for dealing approaches
in present city contexts with a humanistic approach. By extracting statistical and collected
data using various questionnaires as well as comparative and inductive studies with modern
programs of urbanism, the researchers attempted on locating of motion axes and find
presenting how to organize walkers’ movement in Island. SWOT mechanism for searching
suitable approaches was used as the useful instrument of the study. Finally by presenting
necessary strategies, the strategic planning of solutions was achieved.
Keywords: Walkway, Sustainable Tourism and Ecotourism, Sustainable Urban
Development, Pedestrian Network, Strategic Planning,
1. Introduction Regarding the importance of Sustainable development indices in small islands and development and
growth of tourism and ecotourism, it turns to be a must for urban planners to create urban walkways
and expand them. Creation of city spaces based on new set of activities, emphasizing on development
of tourism activities and making more attractions for persistence accompanied by the purpose of a
balanced development of the city leads to benefits of these services for residents and public
satisfaction.
Sustainable tourism applies logical methods to use the natural and human resources in a
standard way and prevents any incorrect use of these resources. Sustainable tourism development
emphasizes on aspects of environment and cultural heritage and resources.
The first international conference on sustainable tourism was held in Madrid in 1995. Criteria
of remaining sustainable were the main discussion of this conference. They negotiated ecological

Pedestrian Network Development Planning in Kish Island Case Study: Mirmohanna Walkway 82
issues in long term, observing economical problems, required obligations towards social and moral
aspects of sustainable tourism and preserving its originality, paying attention to cultural aspects and
values and traditional elements of ethnic communities. 2002 was called the year of ecotourism by
United Nations. The significant event of 2002 was the international meeting on ecotourism in Quebec,
Canada in May 2002. Due to its novel and innovative role, ecotourism must continue so as turn to be a
model for whole tourism industry. Ecotourism is a kind of tourism that requires a kind of responsive
trip to natural areas aiming at protecting the environment and leads to making of sustainable income
for local residents of that area (Saghaei. M, 2003). Walk way or pedestrian street is a single and
separated street in which automobiles have been eliminated. In other words, in this route, non-
motorized commute is prioritized. Of course, it should be mentioned that special vehicles (Fire
engines, ambulances and police car) can use this route in emergency. Cargo and some other service
providing vehicles are also allowed to use the route for traffic but in some pre-scheduled time table. In
walkways people have more freedom to stop, change direction and have direct contact with others. As
Cannon says “Pedestrians’’ freedom of motion in cities and urban spaces is a good mark of civilization
in that city.” (Us Epa Smart Growth Implementation Assistance, 2009).
Industrial Revolution and invention of car has a great contribution on changing relocating
model because before that time, city spaces were man-oriented and have been shaped based on the
capacity of pedestrians transportation. Discussion the role of private automobiles in cities, Jane Jacobs
refers to the position of elements such as highways, interchange vast parking lots. Jacobs believes that
these changes are sentences to failure, scattering and unsafe atmosphere. Jacobs warns about people’s
reluctance to attend urban areas and their tendency to use private automobiles (Pakzad, 2007 P. 144-
145. as cited in Kashani Jou, 2010 P.24.). It may seem hard to imagine cities without cars and
automobiles but the pint is that walkers and pedestrians’ convenience and comfort should be prioritized
in the process of planning, designing and management. After the industrial revolution and invention of
automobile, spreading the motto “Time is Gold” took the public spaces of cities from humans. World
War II, and dominance of United States to European countries accelerated the control shift from
humans to automobiles. By this motto, there was no room for pedestrians in city spaces. Everything
was ready for the advent of what we know as modern urbanism now. Athena Protocol (1933) realized
the separation of different kinds of commuting, distinguishing the neighbors as residential, work area,
transportation, and entertainment. The first phase of urbanism in Iran was the army urbanism in Reza
Khan era. By the approval of “Passages Development Law” in 1933 and the policy of “street making”
with checked design, the physical structure and traditional system of motion in cities transformed and
went under the control of automobiles (Kashani Jou, 2010. P. 36). Generally speaking, making
walkways meet three objectives: 1) Functional objectives which satisfy social needs of citizens.
Functional objectives also consider urban beautification and tourism attraction. 2) Environmental
objectives which are taking the opposition to the increasing number of automobiles, engines and
numerous forms of air pollution. These objectives try to decrease the environmental pollutions and to
create pleasant areas by natural or artificial elements in order to protect pedestrians. Advocates of this
group show great interest to make sustainable green areas that are adaptable with environment. 3)
Experimental and aesthetics objectives which include people’s psychological needs in relation with
nature and environment. These are objectives such as attention to visual perception that helps people
communicate with environment in experimental ways. Understanding environment and urban view is
also important (Jadali, 2003).
2. Reseach Methodology The present research is comparative-analogical (to elicit criteria). It is based on the process of urban
planning and includes comparative study, analysis and field studies. In analytical method, not only the
problem is described, but also causes and effects are analyzed. Whole is divided into pieces and each

83 Hassan Ali Laghai and Mona Loghman
piece is studied in details. In the next step the relationships between the pieces (elements) and effective
factors are studied.
To collect data two methods have been used: Library research and field study. Library research
includes theoretical sections of the projects. Field study was used to collect physical data of the present
condition. Major part of the task was done by field observations and distribution of questionnaire
among tourists and residents of that area. Later on, this data set went under final analysis. The
questionnaires were distributed in two different parts. In part one they were distributed among tourists
and residents in order to recognize the walking axes. In part two after preparing the SWOT tables they
were distributed among residents and experts in order to weighing and evaluation of indices. The
number of questionnaires was calculated by X=N(N-1)/2 (Asgharpour, 2010).
3. Introducing the Site Kish Island is located in Hormozgan province in south of Iran. It is geographically located in north of
Strait of Hormuz. Coasts of this provinces stretch Oman Sea in East and Persian Gulf in West. Area of
Kish Island is 90.457 square kilometers. According to latest political bordering of Iran’s map,
Hormozgan province consists of 9 cities. Lengeh is one of the cities of this province and includes five
sections: central, Bastak, Shibkouh, Gavbandi, and Kish). Kish has two rural districts that are Lavan
and Kish. Lavan includes Lavan island (Mehrban, 2009). The site of present research project in located
in northwest of Kish Island in Mirmohanna neighborhood which is a coastal line along side with the
seaside for about 1 kilometer.
Picture 1: Site of research project
To select the site, two kinds of questionnaires for Kish citizens and residents were prepared.
Then the axes which were suitable for walking and passengers and Kish citizens preferred those routes
for walking were recognized. The possibility of networking those axes was investigated. Then
Mirmohanna axis was studies as one of the favored axes by passengers and residents and by studying
the weak points, advantages, opportunities and threats, suggestions for planning and organizing that
axis were made. Descriptive statistics of 30 random participants who completed the questionnaires
showed that 45% of them go walking every day. 37 % go walking once a week, 3% once a month and
25% go walking occasionally. This statistics show that about 50 % of the residents go walking every
day and it confirms the necessity of developing plans for walking convenience in Kish.

Pedestrian Network Development Planning in Kish Island Case Study: Mirmohanna Walkway 84
Figure 1: Level of walking in Kish Island
68% of participants said that they walk just for fun and leisure activity. 20% walk to commute
from work to home and vice versa. 10% walk to go to shopping centers. This reveals that 70% of the
residents walk not only as a means of commuting to work, home and shopping centers but also as a
leisure activity and exercise.
Figure 2: Reasons of walking in Kish Island
Figure 2. Reasons of walking in Kish Island
0
10
20
30
40
50
60
70
walking go forshopping
reasen of walking
68% said that they do not go walking because of hot weather. 22% avoided walking because of
lacking suitable routes and for 8% of them lack of convenient access to routes was the main challenge.
Therefore the challenge ahead is to encourage the residents to go walking in hot days and seasons of
the year.
Figure 3: Obstacles of going walking in Kish Island.

85 Hassan Ali Laghai and Mona Loghman
15% of the participants have favored the routes of downtown for walking. 72 % preferred sea
side and 12% enjoyed inside routes. This can easily show that people are more interested in walking in
sea sides. Figure 4: Tendencies to walk in different routes of Kish Island
0
10
20
30
40
50
60
70
80
routs ofdowntown
seaside insiderouts
tendencies to walk indifferent routs
Among seaside routes, 45% liked to walk in Recreational Pier, 20% chose Marjan beach and
24% favored Mirmohanna beach and 8% chose other routes in other seaside.
Figure 5: Tendencies to walk in sea sides of Kish Island
Participants had mentioned Mirmohanna route, Damoon Saheli, Behind Morvarid Mall,
Maryam Street as options for walking inside the residential areas. For walking they had marked
Maryam Street, Mirmohanna Pier, Recreational Pier, Marjan Beach and downtown routes of the city.
Statistics show that the following 6 routes which were shown in the map are the most favorite ones for
residents and passengers for walking. First route is Mirmohanna beach, second route is Sanaei
walkway in city center, third center, Recreational Pier, fourth route is Marjan Beach, Fifth route is
Morvarid Mall and sixth route is the street located behind Morvarid Mall. Residents showed more
interest in to the routes inside the residential areas. In the following map suggested routes of walking
have been suggested. Since walking system and bicycling work together, it is possible to network the
current routes by joining to bicycling system.

Pedestrian Network Development Planning in Kish Island Case Study: Mirmohanna Walkway 86
Picture 6: Suggested routes for walking
Source: Researcher
4. Site Planning Process To achieve appropriate planning strategies, the site was investigated from different viewpoints.
Therefore SWOT method (Strategic planning) was used. Important methods of collecting the strategies
can be included in a three-step framework: Data input is the first step. The second step is to adaptation
of all possible strategies and therefore a kind of balance and parallel is set between the internal and
external factors. Techniques applied here include threats matrix, opportunities, weak and strong points,
situation evaluation matrix and strategic action. The third step which is called decision-making step
uses only the unique method of quantitative strategic planning matrix. In this way it can be evaluated in
an objective way without any personal interference. In order to find the internal and external factors, at
the beginning of the project all defined data in the comprehensive plan and field study are listed. They
either create opportunities or threaten the system. After data inserted, the internal factors are being
evaluated. (Table of weak and strong points, threats and opportunities) (A’raabi, 2010). In SWOT
analysis, internal and external factors are investigated to recognize the opportunities, threats, weak and
strong points of the organization in future. The results can contribute to preparation of suitable
strategies for a better confrontation. To conduct this analysis, SWOT matrix is used. This matrix is one
of the important instrumentation to compare the data of internal and external factors and regarding the
matrix of main strategies, different possible presented matrixes, we can include the matrixes in groups
of WT, ST, WO, SO.
In Mirmohanna route planning, the process of strategic planning was followed. The WOT of
intended site was prepared in nine parts: space organization, transportation, environmental, view and
landscape, climate, economic, social, cultural and functional system.
Table 1: Mirmohanna Site SWOT
Different systems of
Study Strong points Weak points Opportunities Threats
Application
S1. Vacant land
S2. Pier as a public
city area
S3. Close to
University of Tehran
W1. Lack of service
provider walls
alongside the route
W2. Shortage of
urban furniture
O1. Chance to attract
more tourists
O2. Relations with
residential context of
old Saffain
T1. Competitors in
the region
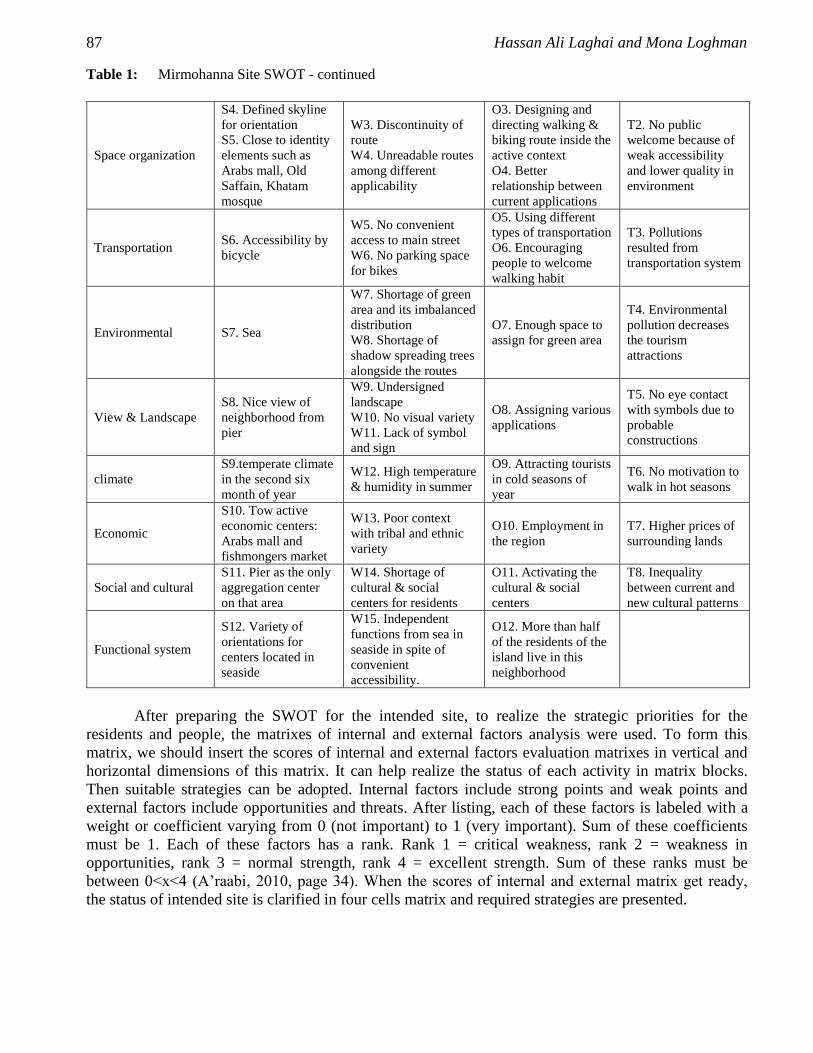
87 Hassan Ali Laghai and Mona Loghman
Table 1: Mirmohanna Site SWOT - continued
Space organization
S4. Defined skyline
for orientation
S5. Close to identity
elements such as
Arabs mall, Old
Saffain, Khatam
mosque
W3. Discontinuity of
route
W4. Unreadable routes
among different
applicability
O3. Designing and
directing walking &
biking route inside the
active context
O4. Better
relationship between
current applications
T2. No public
welcome because of
weak accessibility
and lower quality in
environment
Transportation S6. Accessibility by
bicycle
W5. No convenient
access to main street
W6. No parking space
for bikes
O5. Using different
types of transportation
O6. Encouraging
people to welcome
walking habit
T3. Pollutions
resulted from
transportation system
Environmental S7. Sea
W7. Shortage of green
area and its imbalanced
distribution
W8. Shortage of
shadow spreading trees
alongside the routes
O7. Enough space to
assign for green area
T4. Environmental
pollution decreases
the tourism
attractions
View & Landscape
S8. Nice view of
neighborhood from
pier
W9. Undersigned
landscape
W10. No visual variety
W11. Lack of symbol
and sign
O8. Assigning various
applications
T5. No eye contact
with symbols due to
probable
constructions
climate
S9.temperate climate
in the second six
month of year
W12. High temperature
& humidity in summer
O9. Attracting tourists
in cold seasons of
year
T6. No motivation to
walk in hot seasons
Economic
S10. Tow active
economic centers:
Arabs mall and
fishmongers market
W13. Poor context
with tribal and ethnic
variety
O10. Employment in
the region
T7. Higher prices of
surrounding lands
Social and cultural
S11. Pier as the only
aggregation center
on that area
W14. Shortage of
cultural & social
centers for residents
O11. Activating the
cultural & social
centers
T8. Inequality
between current and
new cultural patterns
Functional system
S12. Variety of
orientations for
centers located in
seaside
W15. Independent
functions from sea in
seaside in spite of
convenient
accessibility.
O12. More than half
of the residents of the
island live in this
neighborhood
After preparing the SWOT for the intended site, to realize the strategic priorities for the
residents and people, the matrixes of internal and external factors analysis were used. To form this
matrix, we should insert the scores of internal and external factors evaluation matrixes in vertical and
horizontal dimensions of this matrix. It can help realize the status of each activity in matrix blocks.
Then suitable strategies can be adopted. Internal factors include strong points and weak points and
external factors include opportunities and threats. After listing, each of these factors is labeled with a
weight or coefficient varying from 0 (not important) to 1 (very important). Sum of these coefficients
must be 1. Each of these factors has a rank. Rank 1 = critical weakness, rank 2 = weakness in
opportunities, rank 3 = normal strength, rank 4 = excellent strength. Sum of these ranks must be
between 0>x>4 (A’raabi, 2010, page 34). When the scores of internal and external matrix get ready,
the status of intended site is clarified in four cells matrix and required strategies are presented.

Pedestrian Network Development Planning in Kish Island Case Study: Mirmohanna Walkway 88
Figure 7: Four cells matrix
Figure 6.Four cells matrix
2 1
12/3 IFE=
2/5
SO
07/3 EFE=
conservative
WO
Defensive
WT
2 2/5
Competitive
2
1
Confluence point of internal and external factors and
the base of walkway design based on its location in
invasion space
Regarding the priority of invasive strategies in this study, as shown in this figure the researcher
tries to investigate the effect of other internal and external factors of the intended environment on
strategies of selected environment in the strategic quantitative planning table. To do so, all of the
internal and external factors as well as their coefficients (the coefficients that have been mentioned in
the tables of internal and external factors). Then to find the better strategy, each one is assigned with a
suggested score of attraction. This score shows the level of attraction for each strategy in the strategies
set. The score of attraction indicates the power and ability of that strategy in terms of logical
confrontation with internal and external factors. The score of attraction is in this way: 1 = not
attractive, 2 = somehow attractive, 3 = normally attractive, 4 = very attractive. Then this score is
calculated for the factors which are the result of coefficient of each factor multiplied by the score of
attraction. The sum total of attraction scores for each column shows that which one of these strategies
are more attractive and are prioritized to administer. The sum total of each one of the factors must be
something between 0 to 8.
5. Conclusion According to the conclusion and prioritization of the strategies, invasive strategies are list in order:
Table 2: Prioritization of strategies
Prioritization Strategies Policies
S3O1
First stretegy
Activating and improving the walking & biking route
form university to pier
Organizing the side walksand building
bike track from university to pier
S6O1
Second strategy
Activating bike tracks for connecting different
applicability
Building bike track in specified routes
S1O7
Third strategy
Assigning grean area applicability Building seaside park
S5O1
Fourth strategy
Empowering the permeability, accessibility,
exhilaration of current centers and organizations to
attract tourists
Using lighting elements in parks,
furniture, and creating visual symbols
and signs
S1O1
Fifth strategy
Assigning applicability for tourism and sightseeing Alfresco coffee shops and restaurants,
kiosks

89 Hassan Ali Laghai and Mona Loghman
Table 2: Prioritization of strategies - continued
S2O3
Sixth strategy
Connecting pier’s walking route with road network
of new Saffain and reforming the network
Organizing the walkways of pier and
connecting it to Saffain
S2O1
Seventh strategy
Using pier’s potentiality to start various activities
for tourism attraction by suggesting suitable urban
furniture
Using furniture matched with
environment in form and material,
establishing spaces for music
performance and ritual ceremonies
S12O11
Eighth strategy
Using the potentialities of Arabs malls and
fishmongers market to attract tourists by
establishing business-entertainment areas near these
centers
Establishing kiosks to sell food and
handicrafts with an emphasis on local
products
S2O7
Ninth strategy Designing urban furniture and green area in the pier
Combing local shadow spreading trees
with matched furniture in the
environment
S5O3
Tenth strategy
Involving the walking and biking networks with
current identity-oriented business centers
Establishing bike track between present
applicability
S1O8
Eleventh strategy Assigning cultural applicability
Positioning the cultural centers to run
exhibitions, etc.
S1O8
Twelfth strategy
Taking some actions to attract tourists in 6 cold
months of the year regarding the nice climate Establishing café and seaside restaurants
S7O3
Thirteenth strategy Empowering the connection between sea and beach
Designing walking routes with a view
toward sea
S1O6
Fourteenth strategy
Assigning applicability regarding the walker’s need
(aesthetic-service)
Positioning service providing applicability
such as kiosks and sale booth
S10O1
Fifteenth strategy
Using identity oriented centers in designing and
respecting psychological area
S1O2
Sixteenth strategy
Assigning applicability according to resident’s
needs
Positioning and establishing what the
residents needs
S1O3
Seventeenth strategy Improving bike tracks
Assigning temporary residence (station)
and parking for bike riders
S7O7
Eighteenth strategy
Reforming the beach edge regarding greenways and
all recreational green areas
Respecting privacy and using suitable
pavement and shadow spreading trees
S7O6
Nineteenth strategy
Reforming the edges and activating all projections
and indentationsof beach in order to make the
sidewalks more attractive
Designing areas to access a direct view
to sea and designing alcoves
S7O1
Twentieth strategy
Dependant recreational applicability regarding the
limitation
Establishing sports and recreational
clubs, etc.
S2O9
21st strategy
Using traditional potentiality of fishing and
revitalizing it in Mirmohanna pier
Using traditional boats and local
boatmen as well as establishing areas for
fishing
S7O8
22nd
strategy
Establishing different business centers in seaside
edge (zoning the activities)
Creational, tourism, cultural and
business applicability, etc.
S5O11
23rd
, strategy
Empowering relationship and association among
activity areas
Evoking the activities and involving the
nearby areas with them
S3O2
24th
strategy
Revitalizing old Saffain in order to attract present
social potentialities
Local community is benefited by
creating job opportunities in that site
S4O4
25th
, strategy
Creating a balance between development and
environment in sustainable development plan
Compiling the requirements of density
and construction in the area regarding the
present situation
6. Suggested Plan for Mirmohanna Route The general form or concept at site was considered based on the analysis of view and landscape and
performance. It continues in a linear way alongside with the coastal line. It is the place for locating
applicability, motion routes, water element, fountains, stop and concentration spots and walkway
routes. The applicability of site was clarified based on the conducted studies and the general form is as
follows:
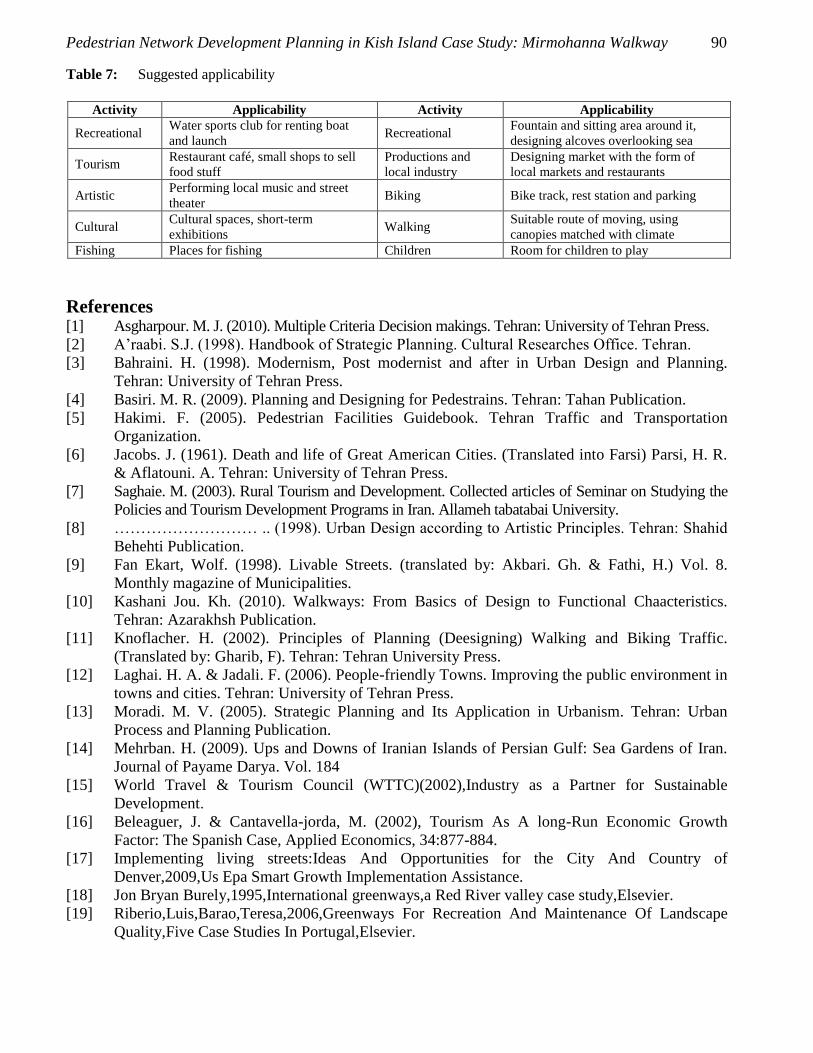
Pedestrian Network Development Planning in Kish Island Case Study: Mirmohanna Walkway 90
Table 7: Suggested applicability
Activity Applicability Activity Applicability
Recreational Water sports club for renting boat
and launch Recreational
Fountain and sitting area around it,
designing alcoves overlooking sea
Tourism Restaurant café, small shops to sell
food stuff
Productions and
local industry
Designing market with the form of
local markets and restaurants
Artistic Performing local music and street
theater Biking Bike track, rest station and parking
Cultural Cultural spaces, short-term
exhibitions Walking
Suitable route of moving, using
canopies matched with climate
Fishing Places for fishing Children Room for children to play
References
[1] Asgharpour. M. J. (2010). Multiple Criteria Decision makings. Tehran: University of Tehran Press.
[2] A’raabi. S.J. (1998). Handbook of Strategic Planning. Cultural Researches Office. Tehran.
[3] Bahraini. H. (1998). Modernism, Post modernist and after in Urban Design and Planning.
Tehran: University of Tehran Press.
[4] Basiri. M. R. (2009). Planning and Designing for Pedestrains. Tehran: Tahan Publication.
[5] Hakimi. F. (2005). Pedestrian Facilities Guidebook. Tehran Traffic and Transportation
Organization.
[6] Jacobs. J. (1961). Death and life of Great American Cities. (Translated into Farsi) Parsi, H. R.
& Aflatouni. A. Tehran: University of Tehran Press.
[7] Saghaie. M. (2003). Rural Tourism and Development. Collected articles of Seminar on Studying the
Policies and Tourism Development Programs in Iran. Allameh tabatabai University.
[8] ……………………… .. (1998). Urban Design according to Artistic Principles. Tehran: Shahid
Behehti Publication.
[9] Fan Ekart, Wolf. (1998). Livable Streets. (translated by: Akbari. Gh. & Fathi, H.) Vol. 8.
Monthly magazine of Municipalities.
[10] Kashani Jou. Kh. (2010). Walkways: From Basics of Design to Functional Chaacteristics.
Tehran: Azarakhsh Publication.
[11] Knoflacher. H. (2002). Principles of Planning (Deesigning) Walking and Biking Traffic.
(Translated by: Gharib, F). Tehran: Tehran University Press.
[12] Laghai. H. A. & Jadali. F. (2006). People-friendly Towns. Improving the public environment in
towns and cities. Tehran: University of Tehran Press.
[13] Moradi. M. V. (2005). Strategic Planning and Its Application in Urbanism. Tehran: Urban
Process and Planning Publication.
[14] Mehrban. H. (2009). Ups and Downs of Iranian Islands of Persian Gulf: Sea Gardens of Iran.
Journal of Payame Darya. Vol. 184
[15] World Travel & Tourism Council (WTTC)(2002),Industry as a Partner for Sustainable
Development.
[16] Beleaguer, J. & Cantavella-jorda, M. (2002), Tourism As A long-Run Economic Growth
Factor: The Spanish Case, Applied Economics, 34:877-884.
[17] Implementing living streets:Ideas And Opportunities for the City And Country of
Denver,2009,Us Epa Smart Growth Implementation Assistance.
[18] Jon Bryan Burely,1995,International greenways,a Red River valley case study,Elsevier.
[19] Riberio,Luis,Barao,Teresa,2006,Greenways For Recreation And Maintenance Of Landscape
Quality,Five Case Studies In Portugal,Elsevier.

American Journal of Scientific Research
ISSN 2301-2005 Issue 89 July, 2013, pp.91-96
http://www.americanjournalofscientificresearch.com
Strategy for Sustainable Urban Development Guidelines for
Tehran
Hassan Ali Laghai
Associate Professor, Urbanism Department
University of Tehran, Iran
Mona Loghman
Department of Urbanism, Rudehen Branch
Islamic Azad University, Rudehen, Iran
Nabiollah Kolbadi
Department of Urbanism, Rudehen Branch
Islamic Azad University, Rudehen, Iran
Abstract
Why sustainable development? Are Iran’s cities sustainable now? Have we been
able to stay loyal to our international obligations of Instruction 21 of Rio De Janeiro (1992)
and Istanbul (1996) as well as other international obligations to achieve sustainable housing
and city (Micro and Macro Architecture)? Considering the growth in Iran’s population
which is a consequence of appropriate and sustainable planning, future seems worrisome.
The population perspective of 120,000,000 requires having 800 or 1000 sustainable cities.
This attitude was presented in Bam Urban Sustainable Development Charter in association
with different experts in recent years. But actions different than what we have expected,
were taken. Unfortunately a set of repeated routine works are being done to remove
problems. This article analyzes the international findings and conventions that have been
confirmed by Iran Management System. It is also an attempt to discuss the horizons,
methods, indices, and practical mechanism of achieving urban sustainability in order to
present a practical approach in this area by using analytical-comparative method of
applicable suggestions. Suggestions are made on how to make a new start in preparing
urban sustainable development programs and how to administer them. This issue is the
result of forty years of Teaching and research which is presented in an article.
Key Terms: Sustainable urban development, applied plans, administrative mechanism,
public participation
1. Introduction To where urban sustainable development be end? Recognition of unsustainable factors becomes so
necessary ,according to instruction 21,Zhohansburg 2002,Habitat Istanbul 96 ,World Health
Organization plan ,under the name of healthy city, bringing up and considering Istanbul +5,annually
ratification CSD, that Ratified 17 years ago and based upon unsuccessful of comprehensive plans and
unsustainable urban development.
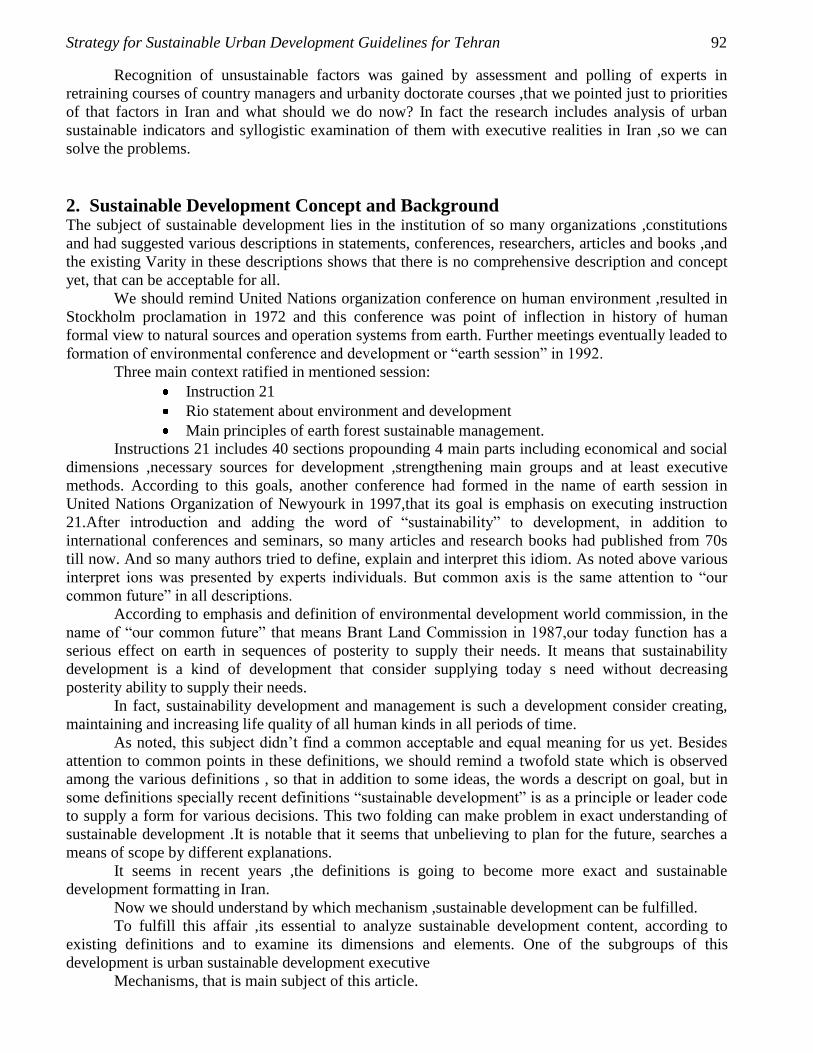
Strategy for Sustainable Urban Development Guidelines for Tehran 92
Recognition of unsustainable factors was gained by assessment and polling of experts in
retraining courses of country managers and urbanity doctorate courses ,that we pointed just to priorities
of that factors in Iran and what should we do now? In fact the research includes analysis of urban
sustainable indicators and syllogistic examination of them with executive realities in Iran ,so we can
solve the problems.
2. Sustainable Development Concept and Background The subject of sustainable development lies in the institution of so many organizations ,constitutions
and had suggested various descriptions in statements, conferences, researchers, articles and books ,and
the existing Varity in these descriptions shows that there is no comprehensive description and concept
yet, that can be acceptable for all.
We should remind United Nations organization conference on human environment ,resulted in
Stockholm proclamation in 1972 and this conference was point of inflection in history of human
formal view to natural sources and operation systems from earth. Further meetings eventually leaded to
formation of environmental conference and development or “earth session” in 1992.
Three main context ratified in mentioned session:
Instruction 21
Rio statement about environment and development
Main principles of earth forest sustainable management.
Instructions 21 includes 40 sections propounding 4 main parts including economical and social
dimensions ,necessary sources for development ,strengthening main groups and at least executive
methods. According to this goals, another conference had formed in the name of earth session in
United Nations Organization of Newyourk in 1997,that its goal is emphasis on executing instruction
21.After introduction and adding the word of “sustainability” to development, in addition to
international conferences and seminars, so many articles and research books had published from 70s
till now. And so many authors tried to define, explain and interpret this idiom. As noted above various
interpret ions was presented by experts individuals. But common axis is the same attention to “our
common future” in all descriptions.
According to emphasis and definition of environmental development world commission, in the
name of “our common future” that means Brant Land Commission in 1987,our today function has a
serious effect on earth in sequences of posterity to supply their needs. It means that sustainability
development is a kind of development that consider supplying today s need without decreasing
posterity ability to supply their needs.
In fact, sustainability development and management is such a development consider creating,
maintaining and increasing life quality of all human kinds in all periods of time.
As noted, this subject didn’t find a common acceptable and equal meaning for us yet. Besides
attention to common points in these definitions, we should remind a twofold state which is observed
among the various definitions , so that in addition to some ideas, the words a descript on goal, but in
some definitions specially recent definitions “sustainable development” is as a principle or leader code
to supply a form for various decisions. This two folding can make problem in exact understanding of
sustainable development .It is notable that it seems that unbelieving to plan for the future, searches a
means of scope by different explanations.
It seems in recent years ,the definitions is going to become more exact and sustainable
development formatting in Iran.
Now we should understand by which mechanism ,sustainable development can be fulfilled.
To fulfill this affair ,its essential to analyze sustainable development content, according to
existing definitions and to examine its dimensions and elements. One of the subgroups of this
development is urban sustainable development executive
Mechanisms, that is main subject of this article.

93 Hassan Ali Laghai, Mona Loghman and Nabiollah Kolbadi
3. Sustainibility Development Principles and Elements Its clear that mentioned principles should be risen from existing facts in economical, social, cultural
,formal, legal, political and executive patterns in every country.
Proclaimed formal principles in instruction 21 and healthy city program can be a suitable base
for understanding sustainability development concept.
The main goal of human residence is improving social, economical and environmental quality
of human residence and work and life environment for all people specially urban and rural poor people.
This important must be based upon common technical actions and cooperation of public and private
sector and social groups and participates these groups and other particular groups such as women,
native people and adults, in decision making process. These approaches should form central part of
settlement national strategies.
This programs dimensions including:
A Supplying suitable residence for all
B Improving human kind settlement management
C Coordinated environmental infrastructural actions :water ,healthy water ,stringing and
solid hysteresis bureau
D Advancing plan and management of earth application
E Development of transport and energy systems in human residence
F Planning and management development of human residences in disastrous areas.
G Industrial activities development for making clurable residences
H Human source development and increasing settlement capacity
The important point in instruction 21 is bringing up program dimensions and principles of
actions that is essential to achieve every mentioned goal. There is often used the word “must” in
describing these actions and their executive instructions, as government commitment in solving
problems of human residence.
They emphasis on the cases below in the field of development and urban sustainability
achievement:
A The cities should institute public and private sector, social group specially native men
and women ,based on continuous conversations among active elements in urban
sustainable development.
B City environment should improve supplying urban infrastructural actions, by
strengthening social organizations and people environmental knowledge through local
societies partnership in recognizing people need to public services.
C They should strengthen local executive administrations capacity and use urban planning
pattern, through society approach to plan according to particular need for every city.
D Participating in international sustainability city networks to exchange experiences and
mobilize international, financial and technical supports.
Where as instruction ,obliged representative board of participation governments to take part in
participable ,affairs, optimum performance participatory planning, Participatory management,
strengthening interested groups, assessment and controlling the process through networking and
applying modern technologies.
The human residence program of United Nations asked countries for represent ting assessment
of executed program after 5 years. Now we point to key elements in this regard.
4. Unsustainable Factores in Urban Program in Iran(Tehran) Before representing strategies for sustainable urban development it is better to say the important
unsustainable factors in urban development in Tehran.
Absence of single and centralized urban management
Shortage of comprehensive strategy for development

Strategy for Sustainable Urban Development Guidelines for Tehran 94
Momentarily decision making system
Non assessment of success in development programs
Giving no worth to world experiences
Excessive technicolize
Disbelieving to ratified programs
Discordance among programs and country development fourth program
Non measurement of success levels in reforming programs
Eroded office systems
Absence of planning center and permanent control
Poor belief to planning
Excessive centralization
Inability in applying citizens power
Inattention to cultural identities maintenance effect
All mentioned factors have fundamental role in creating unsustainablity in the cities.
5. Strategy for Urban Sustainable Development The strategies for Urban Sustainable Development represent in 5 parts:
1. Environmental goals
2. Urban development planning goals
3. Urban activity and land use goals
4. Strategical Goals in Social Problem solving
5. Physical and space development goals
5.1. Environmental Goals
Use the existing law for preparing the national land use plan based on carrying capacity of
the environment .
Define achievable horizon of National Sustainable Development.
Applicate the results and outputs into the national level programs (SNDS) .
Use the Environmental Impact Assessment in national, regional and local planning.
Good governance and management through the existent law for air pollution control and
finding the necessary cooperation, and public participation (NGOs).
Organize Youth participation for neighborhood recreational programs.
5.2. Urban Development Planning Goals
Preparation of a new law for urban planning , urban design and their implementation
process and providing monitoring system .
Define a new complementary role for Ministry of Housing and Urban planning in
cooperation with Department of Environment.
Planning to achieve the necessary speed for research and use the global experiences to
satisfy crescent social needs.
Prevent the gaps and pitfalls with systematic continues monitoring and planning.
Decentralization of the new settlement with
Regional strategic planning development and site selection in coordination with EIA.
Focus on small town and cities in relation with development axes.

95 Hassan Ali Laghai, Mona Loghman and Nabiollah Kolbadi
5.3. Urban Activity and Land Use Goals
Prepare new vision and policy focusing on urban and rural sustainable development in
consideration the changing world and entity of new population and their needs ,using existent
law for preparation new settlement texture.
Prevent the new centralization with urban regeneration in old cities with public participation in
process of planning, design, and implementation monitoring.
Create a new and sustainable vision for surveying and reviewing urban planning process and its
out com in various levels as regional ,municipal, and rural planning.
Up-to-date the methods of preparation of plans in sense of continues planning.
(Thinking room of decision makers )
Use the national traditional knowledge and combine it with up to date environmental, social ,
technical and economical sciences.
Create new policies for urban good governance with public participation and stockholders and
their organizations to prepare new policies for implementation and instruments.
5.4. Strategical Goals in Social Problem Solving
Prepare and organize public participation policy at neighborhood level, with responsibilities to
approve local land use and plan.
Provide land destination for the new social activities and centers (neighborhood city center and
NGOs center).
Create social communication center in the metropolitan area and give the necessary importance
and authority by the law.
5.5. Physical and Space Development Goals
Use analytical highrarchy process (AHP) for defining priority of development zones and its
potentialities to define objectives and projects.
Provide the management organization and interrelation between parts for good governance and
management.
Continuous land survey (remote sensing) and serious control for prevention undesirable
settlement growth.
Prepare the local development plan and use local authority and initiatives for partnership in
context of national policies.
Provide the coordinate urban managing system and prevent uncoordinated implementation.
References [1] Iniasim, zax, 1375, translated by victoria jamali,”looking at the difinitions of sustainable
developments from different perspectives”, jurnal of iranian society of environmentalists, vul. 3
&4.
[2] Kaabi nazadian, abdolrazzagh, 1378,”new energy technologies”.
[3] Pietro, las, translated by jahani&ghodrat nama, 1994,”water resource management and
sustainable development”, jurnal of development,vul2.
[4] Lester r.brown&hall kane،translated by taravati & bahar,”here are afew people?” Jihad
university publication of mashhad.
[5] Redclift, michael, translated by niroo hosain,” sustainable development,”1373, departmant of
argiculturepublication, tehran.
[6] Laghai, hassanali, “sustainable urban development”, 1378, jurnal of fine arts, tehran
university,vol6.

Strategy for Sustainable Urban Development Guidelines for Tehran 96
[7] Laghai, hassanali,”the role of public organization in the third development plan”1379,
proceedings of third conference of iranian society of environmentalists.
[8] Laghai, hassanali, ”a review on human settlement from rio until johansburg “,1380-81,jurnal of
the national committe on human settlements.
[9] Word conservation union, 1991,u.n.environment program and word wide fund for nature
[10] Coupland.a(ed), 1997, reclaiming the city ,e & epson
[11] Mcpherson ,e.g. .1994 ,chicagos urban fores ecosystems

American Journal of Scientific Research
ISSN 2301-2005 Issue 89 July, 2013, pp.97-108
http://www.americanjournalofscientificresearch.com
A Survey on Over Confidence under Increasing Inflation in
Tehran Stock Exchange and Tehran Real Estate Market
Majid Shakeri
Corresponding Author, Management Faculty
Tehran University, Jalal e ale Ahmad St., Tehran, Iran
E-mail: [email protected]
Reyhaneh Sadat Tabatabei Yeganeh
Architecture Faculty, Iran University of Science and Technology
Narmak, Tehran, Iran
E-mail: [email protected]
Reza Teharni
Management Faculty, Tehran University
Jalal e ale Ahmad St., Tehran, Iran
E-mail: [email protected]
Abstract
Iranian macroeconomic status has vastly changed during 2012 because of sanctions
and mismanaged fiscal policies and Investors’ expectations and overconfidence level
totally revolved. Glaser’s measure scores overconfidence in three aspects: miscalibration,
better than average effect, and illusion of control. This study tests if there is any significant
difference in distinct aspect of overconfidence scores, calculated in 2011 and 2012. On the
other hand we measure the overconfidence scores in real estate market and make a
comparison between real estate market extracted overconfidence data and that of stock
market. This study shows decreasing trend in general knowledge score in stock market. We
use T test to analyze questionnaires collected in stock market and real estate market. The
“better than average” score in stock market are low but more than scores calculated in2011.
Results supports that mean illusion of control score in 2012 stock market is lower than the
year 2011. T test outputs verify more general knowledge score in stock market than real
estate market, originated from more passive behavior in real estate investors. There is a
paradoxical situation in better than average score comparison in real estate and stock
market dependent on the way of measurement. Less liquidity risk in stock market may
explain more IOC score in stock market than real estate market.
Keywords: Miscalibration, better than average effect, illusion of control, overconfidence
1. Introduction According to Nofsinger (2005), behavioral finance demonstrates how actual behavior of individuals in
financial settings differs from rational behavior. Typical behavioral biases related to decision making
include anchoring, herding, framing, hindsight, loss aversion, regret, overreaction, overconfidence and
mental accounting. This study focuses on overconfidence because of the potential adverse effects on

A Survey on Over Confidence under Increasing Inflation in Tehran Stock Exchange and
Tehran Real Estate Market 98
decisions made by financial advisors with an overconfidence bias. Evidence of overconfidence biases
have been found for investment bankers (Oskamp 1965) and for security analysts and economic
forecasters (Ahlers & Lakonishok 1983; Froot & Frankel 1989; De Bondt & Thaler 1990). Little study
of this particular behavioural bias has been done among financial planners. (Tehrani, Shakeri,
Movafaghi and Mohamadkhani (2012))
Psychology studies suggest that people overestimate the precision of their knowledge in some
circumstances, especially for challenging judgment tasks (Alpert and Raiffa (1982)or chtenstein,
Fischhoff, and Phillips (1982)). Camerer (1995) argues that even experts can display overconfidence.
A similar phenomena is illusion of knowledge the fact that persons who do not agree become more
polarized when given arguments that serve both sides (Lord, Ross and Lepper (1979)).
Overconfidence as a psychological judgment trait can take on different forms in various
contexts. Nofsinger (2005) includes the systematic overestimation of knowledge, the underestimation
of risk and even an overstatement of the ability to control events as overconfidence biases. In a
business environment, overconfidence can have detrimental effects as illustrated by the following
example from Russo and Schoemaker (1992): In the early 1970s, Royal Dutch/Shell grew concerned
that its young geologists too confidently predicted the presence of oil or gas, costing the company
millions of dry-well dollars. For instance, they would estimate a 40% chance of finding oil, but when
ten such wells were actually drilled, only one or two would produce. (Tehrani, Shakeri, Movafaghi and
Mohamadkhani (2012))
Real estate agents adjust their valuation of the asset as new information arrives. With short-
selling constraints, this introduces a speculative motive to own the asset for the option to sell the asset
toanother agent who might in the future value the asset at a price higher than the original purchase
price. The size of the bubble increases with the level of overconfidence, the volatility of information,
and the underlying uncertainties about the asset. (Bucchianeri(2010))
In this study, we compare overconfidence scores in 2011 and 2012 to measure the effect of
economic crisis on investors’ overconfidence. On the other hand, we make a comparison between real
estate and stock market investors’ overconfidence. These two markets are different in liquidity. The
Lower liquidity of real estate market make slows its reaction to changing inflation rate slower than
stock market. This structural difference might lead to different investor expectation and overconfidence
level in two markets.
2. Previous Research Measurement of Overconfidence in Different Asset Markets
Researchers have shown that the majority of individuals tend to overestimate their ability to do well in
tasks requiring skill, the so-called better-than-average effect. In a seminal illustration of
overconfidence, Svenson (1981) reported on the perception of individuals regarding their driving
competence. If a symmetrically distributed skill level of the general population is assumed, 50% of
individuals should possess above average and 50% below average driving abilities. However, Svenson
found that that approximately 80% of drivers perceived themselves as more skillful and less risky than
the average driver, suggesting overconfidence in their own abilities. Sutton (1987) suggests this as a
reason why many individuals do not purchase auto, health or life insurance. This overconfidence also
extends to other social areas such as an individual’s self-evaluation of his or her ability to get along
with other people.
In a related field, a study by Glaser, Langer and Weber (2005) investigated overconfidence
among financial market professionals such as traders and investment bankers. The authors requested
90% confident ranges for five German indices over three time intervals. The prediction intervals were
found to be narrower for financial market professionals than a student control group, indicating
overconfidence in professionals related to task familiarity.

99 Majid Shakeri, Reyhaneh Sadat Tabatabei Yeganeh and Reza Teharni
Overconfidence in the financial planning industry suggested by this and earlier research may be
problematic for a number of reasons: (i) Overconfidence appears to occur more frequently amongst
males than females, a worrying fact considering the small number of females represented in the
financial planning industry; (ii) A significant negative correlation between years’ experience and
susceptibility to overconfidence implies that financial planners do not learn from judgmental errors and
confirms previous research that experienced and successful market forecasters become even more
overconfident over time; (iii) The Russel Investment Group survey of 2005 identified extreme
optimism among financial advisors; and, (iv) Extreme overconfidence has been shown to affect tasks
of great difficulty such as prediction of stock price changes. (Tehrani, Shakeri, Movafaghi and
Mohamadkhani (2012))
Wang, Zhou, Chan and Chau(2000) developed a model, using the unique pre-sale system
prevailing in Asian real estate markets as the framework. In other words, they treat the pre-sale activity
as a way for a developer to confirm her/his private belief. If the presale level conforms to a developer's
original belief, then the developer will become over-confident about her/his ability to estimate future
demand level. Otherwise, the developer will behave rationally. With the pre-sale system and over-
confidence on the developer's part, they show that the real estate market will become more over-
supplied and have a more prominent real estate cycle.
The results model confirm the stylized facts that cities in Asian countries tend to have higher
vacancy rates and longer real estate cycles than cities in North America and other parts of the world
because of overconfidence effect in developer decision making. (Wang, Zhou, Chan and Chau(2000))
3. Measurement of Overconfidence: Calibration Studies Most traditional confidence studies have focused on individuals’ perception of their knowledge and
skill compared to others. However, in line with Brenner et al (1996) definition of overconfidence as
‘the difference between mean confidence and overall accuracy’, calibration studies have concluded that
individuals are inclined to overestimate their own knowledge as manifested in their judgment skills and
prediction accuracy (Teigen & Jørgensen 2005). Teigen and Jørgensen and Klayman, Soll, Gonzalez-
Vallejo and Barlas (1999) indicate that the most common testing procedure is to ask respondents to
provide a numerical range (interval) estimate of an unknown quantity with the condition that their
estimate corresponds to a given high level of confidence. The purpose of the procedure is to deduce an
individual’s level of trust in their own knowledge by the narrowness of their interval provided.
Probability scales are frequently used in most areas of estimation and prediction. For example,
financial managers use range estimates in capital budgeting proposals as part of a sensitivity analysis.
Project managers typically estimate ‘most optimistic’ and ‘most pessimistic’ completion times (Teigen
& Jørgensen 2005). Range estimates are also very popular in financial markets where economists
regularly estimate possible outcome ranges with an associated probability. However, if the estimate is
biased by overconfidence, a narrower range will be given. Adapting the example of Brenner et al.
(1996), the client of a financial planner will be disillusioned to find out that their particular advisor’s
99% confidence prediction is actually only accurate 75% of the time. This point further emphasized by
Snelbecker, Roszkowski and Cutler (1990) who suggest that inconsistencies between financial planners
may be harmful to the majority of clients since they usually have access to only one advisor and there
are bound to be an abundance of unintentional, but nevertheless incorrect recommendations offered.
The first influential research of this type was conducted by Alpert and Raiffa (1982) who
illustrated that individuals tend to estimate very narrow intervals in their estimation of future quantities
such as index levels. For example, they found that the forecasted 99% intervals of individuals included
the true quantity only approximately 60% of the time. If individuals were well-calibrated, the number
of future values that fall outside the estimated 99% confidence interval should be about one out of 100.
The high reported values indicate that individuals perceive that they can estimate future values with
much greater accuracy than is actually the case. (Tehrani, Shakeri, Movafaghi and Mohamadkhani
(2012))

A Survey on Over Confidence under Increasing Inflation in Tehran Stock Exchange and
Tehran Real Estate Market 100
4. Overconfidence under Increasing Inflation Crisis We had a survey on investor’s overconfidence in Tehran exchange market in 2011 based on Glaser’s
overconfidence test. The study concluded to overconfidence scores calculation in miscalibration, better
than average effect and illusion of control areas. The miscalibration means score was 0.409877 and its
Standard Deviation was 0.3096792. The better than average effect (BTA) mean score was 0.204259
with 0.4263032 Standard Deviation. The illusions of control (IOC) mean score and standard deviation
was 0.533951 and 0.1254092. (Tehrani, Shakeri, Movafaghi and Mohamadkhani 2012)
Drastic changes in Iranian political and economic situation resulted to market economic crisis.
A complex of sanctions and mismanaged expansionary fiscal policy ended to high inflation rate and
national currency devaluation. Market indexes have been adjusted to new circumstance regarding their
own specifications. Stock index has been approximately doubled just in two months, Real estate prices
rose more than 50 percent and Investors’ expectations reshaped completely. In this situation, over
viewing the previous study is necessary.
Numerous studies analyze the determinants of investor expectations but little is known about
how market participants react in a crisis situation with a high degree of uncertainty in connection with
a large drop in share prices. (Glaser and weber 2003)
Several arguments are usually put forth in the literature stressing the usefulness of survey or
investor expectations data. Black (1993) and Shefrin and Statman (2003) argue that some competing
theories involving expected returns cannot be tested using realized returns only as these are only noisy
measures of expected returns. Other studies explicitly use expectations of financial markets participants
to test asset pricing models (see,for example, Brav et al. (2003)). Shiller et al. (1996) also emphasize
that it is impossible to find out what investors think in a crisis situation unless one asks them.
MacDonald (2000) especially stresses the usefulness of disaggregate survey data to test heterogeneous
behavior or beliefs of investors.
Choe et al (1999) find evidence of positive feedback trading by foreign investors before the
period of Korea’s economic crisis. However, during the crisis period, positive feedback trading by
foreign investors mostly disappears.
In this study, we focus on overconfidence level changes before and after 2012 increasing
inflation crisis in Iran. Rising uncertainty may lead to lower overconfidence scores in all three aspects:
miscalibration, the better than average effect and the illusion of control. One the other hand, the slower
changing prices in real estate market may result to higher investors’ overconfidence level than stock
market investors’.
5. Hypotheses There are 6 main hypotheses we have studied in this survey:
1. The average miscalibration score in stock market in 2012 is lower than the previous year.
Glaser test measures miscalibration in two forms, general knowledge questions and market
forecast. So, we can divide hypothesis 1 to two sub hypothesis:
1.1. The average general knowledge score in stock market in 2012 is lower than the
previous year.
1.2. The average market forecast score in stock market in 2012 is lower than the previous
year.
2. The average “better than average effect” score in stock market in 2012 is lower than the
previous year.
Glaser test measures better than average effect by two question forms which namedBTA1 and
BTA 2 in this study. Again we can divide the hypothesis 2:
2.1. The BTA1 score in stock market in 2012 is lower than the previous year.
2.2. The BTA2 score in stock market in 2012 is lower than the previous year.

101 Majid Shakeri, Reyhaneh Sadat Tabatabei Yeganeh and Reza Teharni
3. The average illusion of control score in stock market in 2012 is lower than the previous year
4. The average miscalibration score in stock market in 2012 is lower than the average
miscalibration score in real estate market.
As mentioned previously, micalibration could define in two ways and there is two subsets for
this hypothesis:
4.1. The average general knowledge score in stock market in 2012 is lower than the real
estate market in this year.
4.2. The average market forecast score in stock market in 2012 is lower than the real estate
market in this year
5. The average “better than average “effect score in stock market in 2012 is lower than The
average” better than average effect” score in real estate market.
This hypothesis has two subsets:
5.1. The BTA1 score in stock market in 2012 is lower than the real estate market's
5.2. The BTA2 score in stock market in 2012 is lower than that of real estate markets.
6. The average illusion of control score in stock market in 2012 is lower than the average
illusion of control score in real estate market.
6. Research Method 300 questionnaires were distributed among stock traders in Tehran Stock Exchange Market (TSEM)in
a week. 105 stock traders answered it which 93 of them were completely answered. So we have
response rate of 31% which is represents higher rate of response rate than our previous study. We
received the questionnaire data at the end of May, 2011, from the stock traders. On the other hand, 300
similar questionnaires were distributed among real estate investors, who had at list bought one property
for investment purpose.85 investor answered it which 68 of them were completed correctly. Our
response rate was 0.22% which is lower than stock market response rate. The mean age of Tehran
stock investor respondents is 35.1 but its median age is 42.9 years. About 95 % of investors are male.
On the other hand, the mean age of real estate investors is 40.5 and the median age is 49. All of real
estate investors are male.
7. Measures of Overconfidence We consider the following forms of overconfidence: miscalibration, the better than average Effect and
illusion of control. In this subsection, we will present the questions designed to measure
overconfidence as well as the overconfidence measures Obtained from the answers to these questions.
In designing the questionnaire we tried To be as close as possible to the concepts and experimental
tasks in the psychological Literature reviewed previously. Of course, we were aware of the fact that
this may lead to a lower response rate.
7.1. Miscalibration
7.1.1. General Knowledge Questions
The investors were asked to state upper and lower bounds of 90 % confidence intervals to five
questions concerning general knowledge:
1) Number of oil barrel, Iran produces in a day.
2) The highest price of gold in the summer of 1389(Persian year).
3) Number of automobile Iranian companies produced during the last year.
4) Amount of petroleum consumption in Iran a day
5) The percentage of Iranian governmental budget dependency on oil selling.
This way of measuring the degree of miscalibration is widely used. 101 of 300 stock Investors
answered at least one question. 84 real estate investors answered one or more question.
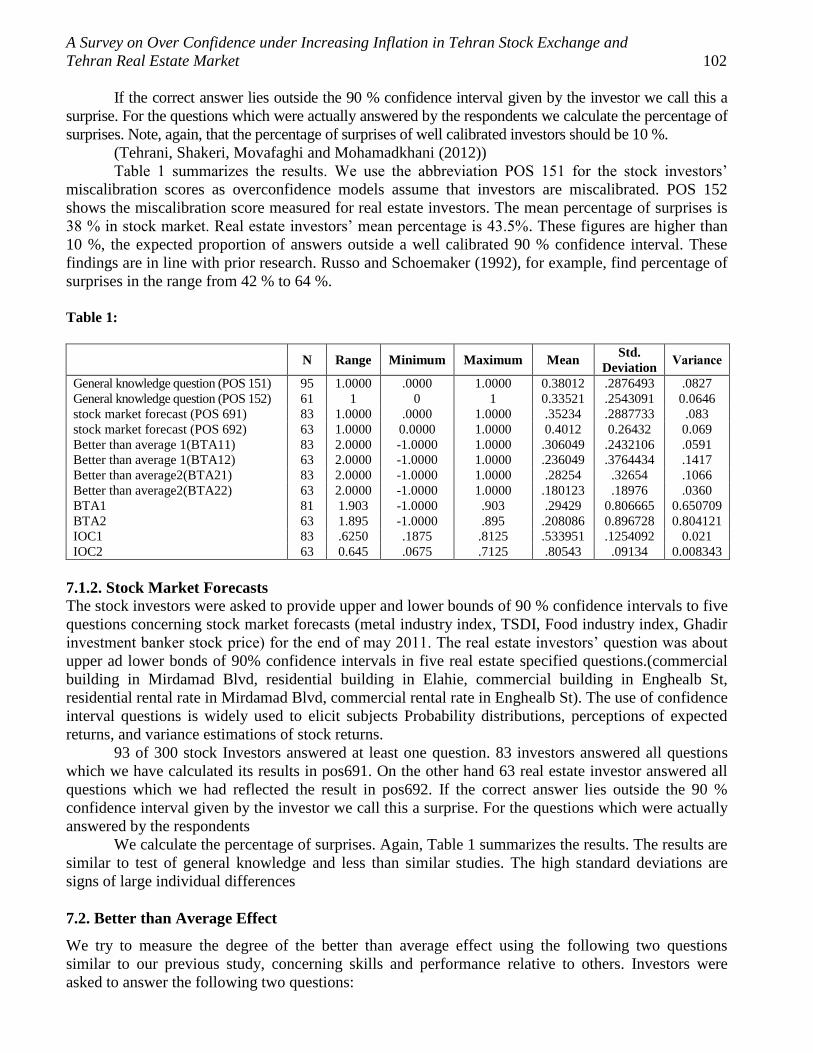
A Survey on Over Confidence under Increasing Inflation in Tehran Stock Exchange and
Tehran Real Estate Market 102
If the correct answer lies outside the 90 % confidence interval given by the investor we call this a
surprise. For the questions which were actually answered by the respondents we calculate the percentage of
surprises. Note, again, that the percentage of surprises of well calibrated investors should be 10 %.
(Tehrani, Shakeri, Movafaghi and Mohamadkhani (2012))
Table 1 summarizes the results. We use the abbreviation POS 151 for the stock investors’
miscalibration scores as overconfidence models assume that investors are miscalibrated. POS 152
shows the miscalibration score measured for real estate investors. The mean percentage of surprises is
38 % in stock market. Real estate investors’ mean percentage is 43.5%. These figures are higher than
10 %, the expected proportion of answers outside a well calibrated 90 % confidence interval. These
findings are in line with prior research. Russo and Schoemaker (1992), for example, find percentage of
surprises in the range from 42 % to 64 %.
Table 1:
N Range Minimum Maximum Mean Std.
Deviation Variance
General knowledge question (POS 151) 95 1.0000 .0000 1.0000 0.38012 .2876493 .0827
General knowledge question (POS 152) 61 1 0 1 0.33521 .2543091 0.0646
stock market forecast (POS 691) 83 1.0000 .0000 1.0000 .35234 .2887733 .083
stock market forecast (POS 692) 63 1.0000 0.0000 1.0000 0.4012 0.26432 0.069
Better than average 1(BTA11) 83 2.0000 -1.0000 1.0000 .306049 .2432106 .0591
Better than average 1(BTA12) 63 2.0000 -1.0000 1.0000 .236049 .3764434 .1417
Better than average2(BTA21) 83 2.0000 -1.0000 1.0000 .28254 .32654 .1066
Better than average2(BTA22) 63 2.0000 -1.0000 1.0000 .180123 .18976 .0360
BTA1 81 1.903 -1.0000 .903 .29429 0.806665 0.650709
BTA2 63 1.895 -1.0000 .895 .208086 0.896728 0.804121
IOC1 83 .6250 .1875 .8125 .533951 .1254092 0.021
IOC2 63 0.645 .0675 .7125 .80543 .09134 0.008343
7.1.2. Stock Market Forecasts
The stock investors were asked to provide upper and lower bounds of 90 % confidence intervals to five
questions concerning stock market forecasts (metal industry index, TSDI, Food industry index, Ghadir
investment banker stock price) for the end of may 2011. The real estate investors’ question was about
upper ad lower bonds of 90% confidence intervals in five real estate specified questions.(commercial
building in Mirdamad Blvd, residential building in Elahie, commercial building in Enghealb St,
residential rental rate in Mirdamad Blvd, commercial rental rate in Enghealb St). The use of confidence
interval questions is widely used to elicit subjects Probability distributions, perceptions of expected
returns, and variance estimations of stock returns.
93 of 300 stock Investors answered at least one question. 83 investors answered all questions
which we have calculated its results in pos691. On the other hand 63 real estate investor answered all
questions which we had reflected the result in pos692. If the correct answer lies outside the 90 %
confidence interval given by the investor we call this a surprise. For the questions which were actually
answered by the respondents
We calculate the percentage of surprises. Again, Table 1 summarizes the results. The results are
similar to test of general knowledge and less than similar studies. The high standard deviations are
signs of large individual differences
7.2. Better than Average Effect
We try to measure the degree of the better than average effect using the following two questions
similar to our previous study, concerning skills and performance relative to others. Investors were
asked to answer the following two questions:

103 Majid Shakeri, Reyhaneh Sadat Tabatabei Yeganeh and Reza Teharni
1) What percentage of customers of your discount brokerage house have better skills (e.g. in the
way you interpret information; general knowledge) than you at identifying stocks with above
average performance in the future? (Please give a number between 0 % and 100 %)
2) What percentage of customers of your discount brokerage house had higher returns than
you in the four-year period from January 2010 to December 2011? (Please give a number
between 0 % and 100 %)
The responses to these questions has named BTA11 and BTA12.
We reshape these questions in a compatible way with real estate market information.
1) What percentage of investors of your sector have better skills (e.g. in the way you
interpret information; general knowledge) than you at identifying properties with above
average performance in the future? (Please give a number between 0 % and 100 %)
2) What percentage of investors of your sector had higher returns than you in the four-year
period from January 2010 to December 2011? (Please give a number between 0 % and
100 %)
We measure two above questions by BTA12 and BTA22.
Table 1 summarizes the results of the answers to these two questions. Similar to 2011 survey,
using Glaser test shows that in Tehran Exchange traders BTA is much less than other studies. But the
results show high increasing trend in BTA1 in stock market investors. The BTA11 in this study is more
than 30 % which increased 8 % in comparison with previous study. In a similar way, the BTA 12 is
28% which was 18% in 2011 survey. Conversely, monitoring real estate data shows the mean of
BTA12 as lower as 23% and the mean of BTA 22 is as lower as 18%.
we calculate better than average scores of investor i (BTA11i andBTA12i or BTA21i and
BTA22i) as (50-answeri)/50, as well as the arithmetic average of these two scores (BTAi).
These ratios yield 0 if the respondent thinks she or he is average, 1 if she or he thinks is better
than everybody else, and -1 if she or he thinks to be worse than everybody else. (Tehrani, Shakeri,
Movafaghi and Mohamadkhani (2012))
This result indicates no better than average effect but increasing trend in stock investors’ BTA
could be understood. It seems to be more “better than average effect” in stock investors than real estate
investors. This phenomenon will be analyzed in conclusion section more detailed. The high standard
deviations are signs of large individual differences.
7.3. Illusion of Control
We consider the following aspects that are mainly summarized as illusion of control as control over (an
almost) random task (such as investing in the stock market), unrealistically high personal success
probability, and unrealistic optimism about the future. Nevertheless, we use the term illusion of control
for all these conceptualizations in the following.
We calculate three illusions of control scores. The first illusion of control score is based on the
level of agreement with the following four statements. Investors were asked to state scores from 1 (I
totally agree) to 5 (I completely disagree). For each question we calculate an illusion of control score
of investor i as described below the respective statement.
1) I never buy stocks that will underperform in the future.
I1i =( 5-Answeri)/4
If the investor thinks she or he will never buy stocks that will underperform in the future, the
score I1 is 100 %. If the investor completely disagrees, the score is 0 %.
2) I am not able to identify stocks with above average performance in the future.
I2i = (Answeri-1)/4
If the investor thinks she or he is not able to identify stocks with above average performance in
the future, the score I2 is 0 %.
3) Buying stocks is like buying lottery tickets. Above-average performance seems to me to
be more a matter of chance.

A Survey on Over Confidence under Increasing Inflation in Tehran Stock Exchange and
Tehran Real Estate Market 104
I3i =( Answeri-1)/4
If the investor thinks buying stocks is like buying lottery tickets, the score I3 is 0 %.
4) My forecasts of future stock prices are always true.
I4i = (5-Answeri)/4
If the respondent thinks her or his forecasts are always true, the score I4 is 100 %.
IOC is the arithmetic average of these four scores. (Tehrani, Shakeri, Movafaghi and
Mohamadkhani (2012))
8. Overconfidence Measures Comparison The three initial Hypothesis focus on a comparison between over confidence measures difference
between 2011 and 2012 survey. Sample sizes in both studies are more than 30, so we can assume
normal distribution for population mean. Although, the original population in both studies is Tehran
stock exchange market investors; the key factors with determinant effect on the population’s
expectation had been changed, so the population mean and variance can be changed from 2011 to
2012.
When we make a comparison between over confidence measures in real estate and stock
market, According to the sample size, it can be assumed that the mean variable in both samples has
normal distribution. On the other hand, because of different origins, the variances of two populations
(real estate investors and stock investors) are not necessary equal.
Before mean tests, we should test if the variances of the compared population are equal using
Levin test. The result of the test determines how to test the study hypothesis.
2
2
2
11
2
2
2
10
:H
:H
The test statistic has Fisher distribution and described with relation 1:
2
2
2
2
2
1
2
1
δ
s
δ
s
F Relation 1
If we assume that the variances are equal we can reform the relation 2:
2
2
2
1 s
sF Relation 2
The degree of freedom is described by relation 3:
1i i ndf Relation 3
Hypothesis 1 says that:”The average miscalibration score in stock market in 2012 is lower than
the previous year.” So we should compare the variance of miscalibration score in stock market in 2011
and 2012 to determine which statistical test should be used for testing the hypothesis 1. The degree of
freedom for miscalibration score variance in 2011. Comparison should be made for general knowledge
question (pos15) and stock market forecast.In case of general knowledge question the df2011 is 80, the
df2012 is 94 and α is 0.05. F0.025, 80, 94 is 1.52313054 and F0.975, 80, 94 is 0.65174608. Fhypothsis1 is 1.160822.
So h0 is not rejected.
Total results of fisher test have been shown in table2. According to table 2, we should assume
variance equality for hypothseis1-1, 3, 4-1,4-2,6 and inequality for 1-2,2-1,2-2,5-1,5-2.

105 Majid Shakeri, Reyhaneh Sadat Tabatabei Yeganeh and Reza Teharni
Table 2:
Hypothesis Df1 Df2
lower Critical
value
Upper
Critical value Test statistic result
Hypothesis 1-1,pos15(general
knowledge questions) 80 94 0.65174608 1.52313054 1.160822
2 2
1 2.
Hypothesis 1-2,pos69( stock
market forecast) 80 82 0.64451130 1.54969978 1.819277
2 2
1 2.
Hypothesis 2-1, BTA1 80 82 0.64451130 1.54969978 3.874788 2 2
1 2
Hypothesis 2-2, BTA2 80 82 0.64451130 1.54969978 0.24 2 2
1 2
Hypothesis 3-IOC 80 82 0.64451130 1.54969978 0.761905 2 2
1 2
Hypothesis 4-1, pos15(general
knowledge questions) 94 60 0.63773299 1.60580697 1.280186
2 2
1 2
Hypothesis 4-2, pos69( stock
market forecast) 82 62 0.62966759 1.61300067 1.202899
2 2
1 2
Hypothesis 5-1,BTA1 82 62 0.62966759 1.61300067 0.417078 2 2
1 2
Hypothesis 5-2,BTA2 82 62 0.62966759 1.61300067 2.961111 2 2
1 2
Hypothesis 6-IOC 82 62 0.62966759 1.61300067 0.809218 2 2
1 2
According to the equality or inequality variances in each hypothesis, there are two separated
way to test. In case of equality in population variances, T test used to determine if there is any
significant difference between mean scores as described below:
21
2121
11
nns
μμxxt
p
Relation 4
2
11
21
2
22
2
11
nn
snsnS p Relation 5
Degree of freedom= 221 nn Relation 6
The results are presented in table 3. According to table 3, it can be inferred that, hypothesis 1-1,
3, 4-1, 6 are significant. In the other word, the mean of general knowledge score in 2012 is lower than
2011. Also, the mean illusion of control score has decreased In comparison with last year. Mean
General knowledge in stock market investor is more than general knowledge in real estate investors in
2012. In case of mean market forecast score, hypothesis 4-2 is rejected and there is no significant
evidence to show any difference in mean market forecast between stock and real estate investors. As
hypothesis 6 is significant, study shows that mean illusion of control in stock market investors in more
than that of real estate investors.
Table 3:
hypothesis s1 s2 n1 n2 sp x1 x2 t df critical t
statistic result
1-1 0.096 0.0827 81 95 0.089062 0.40987 0.28764 9.07455 174 1.9736914 1
3 0.16 0.021 81 83 0.113425 0.53395 0.12540 23.0615 162 1.974715749 1
4-1 0.0827 0.0646 95 61 0.076161 0.28764 0.25430 2.66807 154 1.975488024 1
4-2 0.083 0.069 83 63 0.077284 0.28877 0.26432 1.89357 144 1.976575034 0
6 0.021 0.008343 83 63 0.016766 0.12540 0.09134 12.1609 144 1.976575034 1
In case of inequality in population variances, adjusted T test used to determine significance of
difference between mean scores as described below:

A Survey on Over Confidence under Increasing Inflation in Tehran Stock Exchange and
Tehran Real Estate Market 106
2
2
2
1
2
1
2121
n
s
n
s
μμxxt ' Relation 7
1
)(
1
)(
)(
2
2
2
2
2
1
2
1
2
1
2
2
2
1
2
1
'
n
n
s
n
n
s
n
s
n
s
d.f Relation 8
The results are presented in table 4. According to table 4, it can be inferred that, hypothesis 1-2
and 5-2 are significant but hypothesis 2-1, 2-2 and 5-1 are rejected. The results show that, mean market
forecast score, has been decreased since last year. Although hypothesis 2-1 says that the mean BTA1
score in 2012 is lower than that of 2011, table 4 shows that there is no significant evidence for any
difference in mean BTA1 score in these years. The behavior of BTA 2 is similar to BTA1 in 2011 and
2012. Hypothesis 5-1 has been rejected and the mean BTA1 in stock market investors is not more than
that of real estate investors. T test shows that the mean BTA2 score in stock market is much more than
this measure score in real estate.
Table 4:
Hypothesis s1 s2 n1 n2 x1 x2 x1-x2 t critical t
statistic Result
1-2 0.151 0.083 81 83 0.419753 0.288773 0.13098 6.860549505 1.959970921 1
2-1 0.229 0.0591 81 83 0.226049 0.243211 -0.01716 -0.65356694 1.959982029 0
2-2 0.24 0.1066 81 83 0.182469 0.32654 -0.14407 -4.94735582 1.95998225 0
5-1 0.0591 0.1417 83 63 0.243211 0.376443 -0.13323 -7.0142485 1.959974843 0
5-2 0.1066 0.036 83 63 0.32654 0.18976 0.13678 10.89952139 1.959967474 1
9. The Results of Hypotheses Testing Conclusion
This study shows decreasing trend in general knowledge score in stock market. It can be
inferred that fast changes in key market factors, has lowered the level of overconfidence in
general knowledge questions among stock market investors. This Proposition affected market
forecast score in a same way.
The BTA1 and BTA2 in stock market are low, similar to our previous study. Surprisingly, it
can be inferred that the mean BTA1 and BTA2 score increase in this year. The effect of new
dominant factors- foreign currency exchange rate, inflation rate and political news- in macro
economics and systematic risks has lowered the importance of market and industry level of
analyzing. This analyzing pattern reinforces Framing bias in investors’ decision making which
can explain the increasing BTA score.
Our study supports that mean illusion of control score in 2012 stock market is lower than the
year 2011.rapid changes in Macroeconomic main factors mostly explain the reason.
The results verify more general knowledge score in stock market than real estate market,
originated from more passive behavior in real estate investors. Traditional views about
continuous price increase in jumping inflation status concluded to more market forecast score
in real estate market than stock market.
There is a paradoxical situation in better than average score comparison in real estate and stock
market dependent on the way of measurement. Although there is no support for more BTA1 in

107 Majid Shakeri, Reyhaneh Sadat Tabatabei Yeganeh and Reza Teharni
stock market than real estate market investors, significant evidences show more BTA2 score in
stock market than real estate market. It may originate from different time horizon of BTA1 and
BTA2. Stock market better performance in last year may result in more optimistic
Retrospective views in stock market than real estate market. On the other hand, hopeful views
about real estate price adjustment may conclude to more mean BTA1 scores in this market.
Less liquidity risk in stock market may explain more IOC score in stock market than real estate
market. Liquidity capability reinforces active behaviors in stock market and increase IOC score
in stock market investors.
References [1] Alba, Joseph W., and J. Wesley Hutchinson, 2000, Knowledge calibration: What consumers
Know and what they think they know, Journal of Consumer Research 27, 123-156.
[2] Alpert, M. & Raiffa, H. 1982, ‘A progress report on the training of probability assessors’, in
Judgment under Uncertainty: Heuristics and Biases, eds. D.
[3] Baker, H.K. & Nofsinger, J.R. 2002, ‘Psychological biases of investors’, Financial Services
Review, vol. 11, pp. 97–116.
[4] Black, F. (1993) Beta and return, Journal of Portfolio Management 20, 8–18.
[5] Blanton, Hart, and W. Pelham ,Brett, and DeHart Tracy, and Carvallo ,Mauricio ,2001, Journal
of Experimental Social Psychology 37, 373–385
[6] Barber, Brad M., and Terrance Odean, 2000, Trading is hazardous to your wealth: The common
stock investment performance of individual investors, Journal of Finance 55, 773-806.
[7] Brav, A., Lehavy, R., and Michaely, R. (2003) Using expectations to test asset pricing models,
Working paper.
[8] Brenner, Lyle, Derek Koehler, Varda Liberman, and Amos Tversky (1996), Overconfidence in
probability and frequency judgements, Organizational Behavioral and Human Decision
Processes 65 (3), 212-219.
[9] Camerer, C.F. & Lovallo, D. 1999, ‘Overconfidence and excess entry: An experimental
approach’, American Economic Review, vol. 89, no. 1, pp. 306–18.
[10] Choe, H., Kho, B.-C., and Stulz, R. (1999) Do foreign investors destabilize stock markets? The
Korean experience in (1997), Journal of Financial Economics 54, 227–264.
[11] DeBondt, Werner F.M., and Richard H. Thaler, 1995, Financial decision making in markets and
firms: A behavioral perspective, in R. A. Jarrow, V. Maksimovic, and W. T.Ziemba, ed.:
Handbooks in Operations Research and Management Science, Volume 9, Finance, pp. 385-
410 (Elsevier)
[12] Diether, Karl B., Christopher J. Malloy, and Anna Scherbina, 2002, Diferences of opinion and
the cross section of stock returns, Journal of Finance 57, 2113-2141.
[13] Froot, Kenneth and Jeffrey Frankel. 1989."Forward Discount Bias: Is It an Exchange Risk
Premium?" Quarterly Journal of Economics. 104(1) (February): 139-161.
[14] Glaser, Markus, 2003, Online broker investors: Demographic information, investment Strategy,
portfolio positions, and trading activity, SFB 504 discussion paper 03-18, University of
Mannheim.
[15] Glaser, Markus Noth, and MartinWeber, 2004, Behavioral finance, in Derek Koehler, and Nigel
Harvey, ed.: Blackwell Handbook of Judgment and Decision Making (Blackwell) forthcoming.
[16] Glaser, Markus, and Martin Weber, 2003, September 11 and stock return expectations of
Individual investors, SFB 504 discussion paper 03-17, University of Mannheim.
[17] Kahneman, Daniel, and Amos Tversky, 1979, Prospect theory: An analysis of decision under
risk, Econometrica 47, 263-292.
[18] Kim, Kenneth A., and John R. Nofsinger, 2003, The behavior and performance of individual
investors in Japan, Working paper.

A Survey on Over Confidence under Increasing Inflation in Tehran Stock Exchange and
Tehran Real Estate Market 108
[19] Klayman, Joshua, Jack B. Soll, Claudia Gonz_ales-Vallejo, and Sema Barlas, 1999,
Overconfidence: It depends on how, what, and whom you ask, Organizational Behavior and
Human Decision Processes 79, 216-247
[20] Kyle, Albert S., 1985, Continuous auctions and insider trading, Econometrica 53, 1315-1336.
[21] Lichtenstein, S., Fischhoff, B. & Phillips, L.D. (1982). Calibration of subjective probabilities:
The state of the art up to 1980. In D. Kahneman, P. Slovic, & A. Tversky (Eds.). Judgment
under uncertainty: Heuristics and biases (pp. 306-334). New York: Cambridge University
Press.
[22] lord, Charles G.; Ross, Lee; Lepper, Mark R. (1979), "Biased assimilation and attitude
polarization: The effects of prior theories on subsequently considered evidence", Journal of
Personality and Social Psychology (American Psychological Association) 37 (11): 2098–2109
[23] MacDonald, R. (2000) Expectations formation and risk in three financial markets: Surveying
what the surveys say, Journal of Economic Surveys 14, 69–100.
[24] Menkhoff Lukas, Schmidt Ulrich, Brozynski Torsten, 2005, The Impact of Experience on Risk
Taking,Overconfidence, and Herding of Fund Managers: Complementary Survey Evidence,
University of Hannover,Discussion Paper No. 292.
[25] Odean, Terrance, 1998a, Are investors reluctant to realize their losses?, Journal of Finance 53,
1775-1798.
[26] Oskamp, S.: 1965, ‘Overconfidence in Case-Study Judgments’. Journal of Consulting and
Clinical Psychology 29, 261–265
[27] Russo, J. Edward, and Paul J. H. Schoemaker, 1992, Managing overcon_dence, Sloan
Management Review 33, 7-17.
[28] Shefrin, Hersh and Meir Statman (2003). “Style ofinvestment expectation,” The Handbook of
Equity and Style Management, Coggin & Fabozzi eds. New York: Wiley
[29] Snelbecker, G.E., Roszkowski, M.J. & Cutler, N.E. 1990, ‘Investors’ risk tolerance and return
aspirations, and financial advisors’ interpretations: A conceptual model and exploratory data’,
The Journal of Behavioural Economics, vol. 19, no. 4, pp. 377–93.
[30] Svenson, Ola, 1981, Are we all less risky and more skillful than our fellow drivers?,
ActaPsychologica 47, 143-148
[31] Tehrani, Reza, Shakeri, Majid, Movafaghi, Masoud, Mohammad khani, Hadi, 2012,
overconfidence and portfolio risk taking, American journal of scientific researches,78, 84-92
[32] Teigen, K.H. & Jørgensen, M. 2005, ‘When 90% confidence intervals are 50% certain: On the
credibility of credible intervals’, Applied Cognitive Psychology, vol. 19, pp. 455–75.
[33] Wang, Ko, Zhou, Yuqing, Chan ,Su Han, Chau, K. W., 2000, ‘Over-Confidence and Cycles in
Real Estate Markets: Cases in Hong Kong and Asia’, INTERNATIONAL REAL ESTATE
REVIEW, Vol. 3 No. 1: pp. 93 - 108

American Journal of Scientific Research
ISSN 2301-2005 Issue 89 July, 2013, pp.109-115
http://www.americanjournalofscientificresearch.com
Management of Ovarian Dermoid Cysts at Jordan University
Hospital: A Teaching Hospital Experience
Kamil Mosa Fram, MD
Corresponding Author, Department of Obstetrics and Gynecology
Faculty of Medicine, the University of Jordan, Amman-Jordan
E-mail: [email protected]
Tel: +962 7 9564 2000; Fax: +962 6 553 5469
Shawqi S.Saleh, Frcog
Department of Obstetrics and Gynecology
Faculty of Medicine, the University of Jordan, Amman-Jordan
Fawwaz A. Kazaleh, MD
Department of Obstetrics and Gynecology
Faculty of Medicine, the University of Jordan, Amman-Jordan
Firas Obiedat, MD
Department of Surgery, Faculty of Medicine
The University of Jordan, Amman-Jordan
Osama Samarah, MD
Department of Radiology, Faculty of Medicine
The University of Jordan, Amman-Jordan
Nadir M. Al-Bsoul, MD
Department of Surgery, Faculty of Medicine
The University of Jordan, Amman-Jordan
Summary
Purpose: This research concentrates on evaluating the best and the safest method of
treating patients diagnosed to have ovarian dermoid cysts. Setting: This analysis took place
at the University of Jordan hospital. Material and methods: The retrospective records
were reviewed for over 2 years (from January 2011 to January 2013). The sample of study
included a total number of 23 patients with benign ovarian dermoid. Ten patients (43.48%)
presented with abdominal pain, 8 patients (34.78%) were accidently found to have this kind
of ovarian cysts, 3 patients (13.04%) presented with dysparunia, and 2 patients (08.70%)
presented with abnormal vaginal bleeding. Eleven patients (47.83%) were found to have
right sided ovarian dermoid, while 7 patients (30.43%) were found to have bilateral, and 5
patients (21.74%) were found to have left sided one.
Conclusion: Laparotomy and ovarian cystectomy were performed for 20 patients
(86.95%) without rupturing or leakage of the content, which seems to be superior to other
methods of management.

Management of Ovarian Dermoid Cysts at Jordan University Hospital:
A Teaching Hospital Experience 110
Keywords: Ovarian dermoid, laparotomy, abdominal pain.
Introduction Of the most common germinative benign ovarian tumors is dermoid cysts, which occur in the
reproductive years of women [1], particularly so in the younger age group (mean patient age, 30 years)
[2] by comparison to epithelial ovarian neoplasms (mean patient age, 55years) [3]. The growth rate of
dermoids is a slow one with an average rate of 1.8 mm each year. Such slow growth rate led some
scholars to adopt nonsurgical management of smaller (<6-cm) tumors [4]. Dermoid cysts are, in about
10% of the cases, binary location wise, in the sense that they could occur in either or both ovaries [5,6].
Generally speaking, dermoid cysts of the ovary develop from a primary germ cell in the ovary
that is totipotential in nature; in the sense that, it has the ability to develop into any type of mature
tissue [7]. For this reason a combination of tissue types is found in these unusual tumors, including
teeth, bone, cartilage, nerves, oily material, fat, and hair [8]. The size of dermoid cysts ranges from tiny
to very large tumors that fill the entire abdomen [9]. Millions of women in their childbearing ages from
puberty to menopause are affected. Only in rare cases that dermoid cysts do pose either a diagnostic or
therapeutic issue; nevertheless, the complications that arise resultantly take various forms, all of which
are illustrated in a patient appearing quite ill, thus posing a diagnostic dilemma.
In some women this kind of cyst may develop early on in her life, even at the time of her birth.
The cyst may go unnoticed until it gets very large in size or ruptures. Many dermoid cysts of the ovary
do not cause symptoms; however, if a dermoid cyst grows, it may result in complications. Some
women with a dermoid cyst may have abdominal pain, abnormal vaginal bleeding, difficulty urinating,
or a dull ache in the lower back and thighs. In some cases, a dermoid cyst may grow large enough to
put pressure on or twist the ovary (ovarian torsion, which compromises the ovary’s blood supply and
constitutes an emergency) [10]. This may result in abnormal pain and bleeding. An enlarged dermoid
cyst can also cause pain in the pelvic region, and pressure on the bladder resulting in difficulty in and
during urinating. A small percentage of dermoid cysts can progress to cancer 1-3% [11, 12]. The exact
dermoid ovarian cyst causes are unknown but their development is understood. These cysts develop
from a special kind of cell called a "germ cell" in the tissue of the ovary. Germ cells are normal body
cells that can grow into a variety of types of body tissues including, as previously stated, fat, hair, skin,
teeth, eyes, and glands [13]. This study aims at outlaying the experience of its authors in diagnosing
and managing dermoid cysts as a type of ovarian tumors, with particular attention on cases involving
young age group suffering this type of tumors.
Patients and Methods For the period falling between the first of January 2011 and the first of January 2013, a total number of
23 patients diagnosed to have dermoid cysts and were considered to be candidates for surgery were
surveyed for the purpose of this study. All patients underwent preoperative evaluation including full
clinical history and examination, routine laboratory tests, chest X-ray and, in some cases,
electrocardiogram. CT scan, MRI, and plain abdomen imaging were requested in certain cases
according to the presentation and the probabilities as to the nature of the adnexal mass. The tumor
markers CA125, CA19.9 and AFP (alpha fetoprotein) were ordered to the majority of patients. All
patients were counseled about the surgery and various different possibilities were put forth, which
possibilities ranged from simple cystectomy to the possibility of radical surgery based on the nature of
the cyst, the operative findings, and the result of frozen section pathology.
All patients' questions and those of their families were thoroughly addressed, and the queries
that related to the future of reproductive and feminine life in particular were elaborately clarified. All
the twenty-three patients included in the study were diagnosed of having either unilateral or bilateral
dermoid cysts. Conclusive confirmation for the cysts was confirmed by the pathological examination
111 Kamil Mosa Fram, MD, Shawqi S.Saleh, Frcog, Fawwaz A. Kazaleh, MD, Firas Obiedat, MD
Osama Samarah, MD and Nadir M. Al-Bsoul, MD
for the specimens removed in all cases. The laparotomy was carried out via an abdominal wall incision
in layers and taking peritoneal washing for cytology. When a twisting of the cyst was noticed, a re-
twisting was immediately performed by covering the ovary with warm saline until it gained the normal
pink color. If and when the decision for cystectomy is taken (which was carried out in most of the
cases), a scalpel blade number 12 is used to make a fine gentle scar on the wall of the cyst, followed by
grasping the edges of the cyst by fine mosquitoes and slow blunt traction with fingers apart to undress
the cyst capsule and deliver the dermoid cyst whilst still intact out of its bed.
Eventually, the cysts were enucleated easily and haemostasis was performed for any bleeding
spots encountered during dissection. Due to thick nature of dermoid cyst capsule, blunt dissection and
pealing was quite easy and risk of cyst puncture seldom occurred if tissue planes were preserved
properly. The cysts were immediately sent for frozen section report in search for possibility of
malignancy, together with the resection of the necrotic tissues that were carried out in cases where
necrosis was found. Upon return of answers and revelation that the cyst was of benign nature, closure
the abdominal wall with the fashion steps were carried out.
Results The case records of all patients who were diagnosed to have benign cystic teratomas and underwent
surgical management were retrospectively reviewed. A total number of 23 patients were candidates for
review during the period extending from the first of January 2010 to the first of January 2013. Mean
age at the time of surgery was 32.7 years (range 16-53); mean gravidity among the married patients
was 1.79 (range 0-8), while the mean parity was 1.43 children (range 0-4), 11 patients were married
while 9 patients were single at the time of presentation, with a mean weight 66.6 kg (range 46-90) as
illustrated in table I. Among these patients, the chief complaint was pelvic pain in 10 (43.47%)
patients, dysparunia in 3 (13.04%) cases, abnormal irregular menstrual cycles in 2 (8.69%) patients,
and 8 (34.78%) cases were asymptomatic and discovered incidentally mainly during routine ultrasound
examination (Table 2). The cyst twisted 4 times in 2 cases, 3 times in 1 case, and once in 1 case.
Sixteen (69.57%) cases found to have unilateral cysts, 11 (47.82%) of them on the right side and the
largest cyst size was 15 × 10 cm and diagnosed accidently, while 5 (21.73%) of them on the left side,
the largest cyst size was 30 × 20 cm and diagnosed also accidently, where the rest 7 (30.43%) cases
had bilateral cysts. Different procedures were performed to manage the cysts according to patient age,
fertility and clinical presentation. Twenty cysts (86.96%) were removed by ovarian cystectomy and
enucleation, 1 case (4.34%) was subjected to bilateral salpingo-oopherectomy, 1 case (4.34%) was
subjected to left salpingo-oopherectomy, and 1 case (4.34%) was subjected to right salpingo-
oopherectomy, the latter two cases found to have necrotic ovaries due to torsion. Concomitant surgical
procedure consisted of myomectomy in 2 cases (8.7%), total abdominal hysterectomies in 2 cases
(8.7%), pelvic lymphadenectomy in 2 cases (8.7%), lysis of adhesions in 1 case (4.34%) case as seen in
Table 3. No leakage of the contents of the cysts was reported with preservation of the healthy ovarian
tissues in the managed cases as all cysts removed remained intact. Mean cyst diameter on the right side
was 7.7 cm (range 3- 15) and 9.3 cm (range 3-30) on the left side, Mean blood loss, and operative time
were 93.5 mL (range 50-300), and 63.3 minute (range 45-90) respectively.
Table 1: Reproductive Criteria
Variable Mean Range
Age (years) 32.7 16-53
Gravidity (G) 1.8 0-8
Parity (P) 1.4 0-5
Weight (Kg) 66.6 46-90

Management of Ovarian Dermoid Cysts at Jordan University Hospital:
A Teaching Hospital Experience 112
Table 2: Chief Complaint
Variable Number Percentage (%)
Abdominal pain 10 43.48
Accidental 8 34.78
Dysparunia 3 13.04
Abnormal bleeding 2 08.70
Table 3: Dermoid Presentation
Variable Number Percentage (%)
Bilateral 7 30.43
Right side 11 47.83
Left side 5 21.74
Total 23 100
Table 4: Surgical Procedure Variables
Variable Number Percentage (%)
Ovarian Cystectomy (case) 20 86.95
B.S.O* 01 04.35
Lt. S.O* 01 04.35
Rt. S.O* 01 04.35
B.S.O; bilateral salpingo-oophrectomy, Lt. S.O; left salpingo-oophrectomy, Rt. S. O; right salpingo-oophrectomy
Table 5: Surgical Procedure Variables
Variable Mean Range
Mean blood loss (ml) 93.5 50-300
Operative time (minute) 63.3 45-90
Average hospital stay (days) 3.48 2-7
Follow up (months) 12.13 2-24
Table 6: Concomitant Surgical Procedure
Variable Number Percentage (%)
Myomectomy 2 8.70
T.A.H* 2 8.70
P.L.A* 2 8.70
Adhesiolysis 1 4.35
Omentectomy 1 4.35
T.A.H; total abdominal hysterectomy, P.L.A; pelvic lymph adenectomy
In fact, the mean time for straight forward ovarian cystectomy without additional operative
intervention lasts approximately 54 minutes (range 45-90). Part of time consumption during surgery
was dedicated for the irrigation step to ensure complete pelvic clean out. Once the cyst was removed, it
was sent immediately for frozen section analysis to ensure the benign nature of the cyst. Pathological
confirmation of the definite mature cystic teratoma without atypia was quite clear in all cases. There
were no intraoperative complications. Overall hospital stays were 3.48 days (range 2-7). No
postoperative complication reported during the follow up period which ranged from 2-24 months
(mean 12.13). Two patients became pregnant after surgery.

113 Kamil Mosa Fram, MD, Shawqi S.Saleh, Frcog, Fawwaz A. Kazaleh, MD, Firas Obiedat, MD
Osama Samarah, MD and Nadir M. Al-Bsoul, MD
Discussion The approach adopted by the authors in managing ovarian dermoids took into consideration avoiding
any leakage of the content of the dermoid into the abdominal cavity. The effort was crowned with an
outstanding outcome as results shown not a single incident of rupture of ovarian cyst. We believe that
surgical excision is the treatment of choice. Surgery should be performed even more carefully than
usual because the content of the cyst may spread to the surrounding tissues or anatomic structures,
particularly if the cyst was infected with bacteria or was a malignant one. The spreading of these
contents can either cause foreign body reactions and severe complications or lead to the spreading of
an avoidable peritoneal malignancy.
Up to the point that cyst complications raise a red flag leading to a check up, the existence of ovarian
cysts is considered a natural phenomena. In general terms, there exist two groups of ovarian cysts, those being
the Functional group and the Complex group. As the name dictates, functional cysts carry out certain task as
part of the ovarian functions, which tasks are illustrated by way of an example in helping the release of ovum
at the right time for fertilization. On the other hand, the complex ones do nothing of the sort.
Dermoids belong to the second category of cysts, i.e. the complex ones. Although they contain
mature skin that is complete with sweat glands, hair follicles as well as pockets of stale blood, fat, bone,
cartilages, nails, teeth, and even traces of thyroid tissues, dermoids are cystic teratoma that serve no
functional purpose, quite the contrary, they could lead to complications and damage to the organs. [14].
Dermoids are generally very benign thus not calling for an alarm. Such though is somewhat
problematic given that, although it is not cancerous, some complications are possible if not detected and
treated in due time. Symptoms arising as a result of a dermoid ovarian cysts, are very similar to those
arising from the symptoms of an ovarian cyst, both sharing the differential diagnosis. As a cyst expands in
size it may apply pressure on the ovary or other organs causing symptoms to become more severe. In some
cases a dermoid ovarian cyst will cause the ovary to twist or distort and cut off its blood supply.
Intensity of symptoms is not experienced equally by all women. Only a respected percentage of
women will have no symptoms of dermoid ovarian cyst, while most will experience a range from mild
to severe. In the current study, abdominal pain was reported by 10 (43.47% of) patients, either as a
constant ache or sharp shooting pain, while 3(13.04 % of) patients experienced the pain during sexual
activity, and others reported abnormality in the menstrual cycle which in turn related to the dermoid.
Dermoid cysts may very well show no symptoms, and as such is discovered in the course of a routine
pelvic examination as an incidental finding or in the form of adnexal enlargement or swelling of the
ovary [15]. Due regard ought to be given to the fact that the prevalence of malignant transformation in
dermoid cysts has been reported as 1- 3 % [16].
As abnormal cysts become larger, they display a tendency to twisting, which results in severe pain in
the lower abdomen. In radical cases, the blood supply to the ovary is cut off, with more serious consequences
to the extent of killing the ovary. The preceding is in addition to the underlying risk of rupture and spillage of
the contents of the cyst in and within the abdominal cavity. No cases of rupture or spillage of the contents are
reported in this study, although, there were 5 cases of torsion ranging from 2 to 5 turns in which cases the
exposure to the risk of rupture and spillage is higher. The approach is to adopt holistic remedies in which the
body is treated as a whole with the focus being on detecting the root causes and eradicating them. Once causes
are dispensed with, the cyst goes away, never to return again. It is for this very reason that holistic remedies
have had a higher success rate in the treatment of all kinds of ovarian cysts.
Skilful laparotomy remains the most appropriate method by which the cyst is removed whilst
still intact, hence avoiding the possibility of rupture and spillage of the contents into the abdominal
cavity. As laparotomy coupled with skilful management of the cyst was adopted, no leakage was
reported in any of the managed cases subject of this study, though it is known that the rate of spillage
during laparotomy is about 4-12% [17, 18]. However, the spread of the content of the cyst especially in
malignant cases remain a cause for concern given its potential damage. The reported spillage rate via
laparoscopic approach is 15-100% [19, 20, 21], which practically means causing, duplicating, and flaring
Management of Ovarian Dermoid Cysts at Jordan University Hospital:
A Teaching Hospital Experience 114
complications in the future particularly, the adhesions and chronic pelvic pain together with fluctuation of
fertility. Chemical peritonitis following rupture of a dermoid cyst during laparoscopy was reported
nonetheless in addition to reports of intraperitoneal dissemination in a patient who underwent
laparoscopic cystectomy for a dermoid that had undergone malignant transformation [22, 23].
In a review by Cristoforoni P et al, he documented spillage of contents in 310 cases out of 470
(66%cases) managed laparoscopically [24]. This report supports the authors' vision concerning the ideal
approach to handle these cases which approach is also supported by Berek J et al 2010 [25]. The attention
should be addressed from a futuristic perspective vis-a-vis the patient and should not be limited to the
narrower perspective of possible malignancy. The big achievement in the clinical applications of
laparoscopic surgery in recent years cannot and must not be overlooked. However, this should be a topic of
individualization, and there should be certain guidelines governing its application. It must be stressed that
attempt are in place to have a criteria for selected cases of dermoids to be managed laparoscopically. This is
however, not without its limitations in light of the fact that the status of the setup and equipment in the
hospital is not contemporary, thus limiting the ability to undertake this type of surgery. Nonetheless,
distinguished skills were gained through and during training abroad. In this study, the common tumor
markers ordered were of negative value insofar as the possibility of malignancy and no spillage of the
content or rupture of the cysts have been documented. The frozen section and the final histopathology
report confirmed the benign nature of the cysts in the entire 23 cases subject of this study. Worthy of noting
that a main success factor of this study lied in the collaboration, coordination and mutual exchange of data
by, between and amongst the authors of this study.
Conclusion It is believed that the management of cases of young patients presented with ovarian dermoid cysts is best
served by skilful laparotomy, ultimately preserving and maintaining their fertility and ovarian functionality.
Although it constitutes a significant health risk for women, ovarian masses are not typically at the forefront
of one's mind. This state of mind is translated into a delay in diagnosis and subsequently enhances the
possibility of exposure to the risk of complications occurring. One of the ways by which the risk can be
mitigated is through detection by physical examination coupled with imaging evaluation given the fact that
the condition causes enlargement of the ovary, hence the importance of regular checkups. It is further
suggested that screening programs are introduced and implemented amongst the focused group of females.
Said suggestion should be given premium priority in national health policy strategies in the future.
However, prospective controlled clinical trials with a large number of patients are necessary to compare
conventional methods with laparoscopy in cases with dermoids and to assess more rare events like
undetected malignancy, chemical peritonitis or excess adhesion formation.
Declaration of Interests The authors report no declarations of interest.
References [1] Zulfo G, Nurija, Edin. Laparoscopic treatment of ovarian dermoid cysts is a safe procedure.
Bosn J Basic Med Sci 2011; 11 (4): 245-247
[2] Kathleen EO, Amber RC. The approach to ovarian dermoids in adolescents and young women.
J Pediatr Adolesc Gynecol 2011; 24(3):176-180
[3] Koonings PP, Campbell K, Mishell DR, Jr, Grimes DA. Relative frequency of primary ovarian
neoplasms: a 10-year review. Obstet Gynecol 1989; 74:921-926
[4] Caspi B, Appelman Z, Rabinerson D, Zalel Y, Tulandi T, Shoham Z. The growth pattern of ovarian
dermoid cysts: a prospective study in premenopausal and postmenopausal women. Fertil Steril 1997;
68:501-505.

115 Kamil Mosa Fram, MD, Shawqi S.Saleh, Frcog, Fawwaz A. Kazaleh, MD, Firas Obiedat, MD
Osama Samarah, MD and Nadir M. Al-Bsoul, MD
[5] Hasanzadeh M, Tabare S, MIrzaean S. Ovarian dermoid cyst. Professional Med J Sep 2010;
17(3):512-515.
[6] Ferrari MM, Mezzopane R, Bulfoni A, Grijuela B, Carminati R, Ferrazzi E, Pardi G.Surgical
treatment of ovarian dermoid cysts: a comparison between laparoscopic and vaginal removal.
Eur J Obstet Gynecol Reprod Biol. 2003; 109(1):88-91
[7] Yuen PM, Yu KM, Yip SK, Lau MS, Rogers MS, Chang A. A randomized prospective study of
laparoscopy and laparotomy in the management of benign ovarian masses. Am J Obstet
Gynecol 1997; 177(1):109-114.
[8] Outwater EK, Siegelman ES, Hunt JL. Ovarian teratomas: tumor types and imaging
characteristics. Radiographics 2001; 21:475-490
[9] Ayhan A, Bukulmez O, Genc C, Karamursel BS. Mature cystic teratomas for the ovary: case
series from one institute over 34 years. Eur J Obstet Gynecol Biol 2000; 88:153-157
[10] Wang C, Thia E, Lim T. An adnexal mass with raised serum beta-HCG: an unusual
presentation of ovarian dermoid cyst. Eur J Obstet Gynecol Reprod Biol. 2012; 160(2)238-239.
[11] Curling OM, Potsides PN, Hudson CN. Malignant change in benign cystic teratoma of the
ovary. Br J Obstet Gynecol. 1979; 86:399–402.
[12] Richardson G, Robertson DI, O'Connor ME, Nation JG, Stuart GCE. Malignant transformation
occurring in mature cystic teratomas of the ovary. Can J Surg. 1990; 33:499–503.
[13] Hoo WL, Yazbek J, Holland T, Mavrelos EC, Jurkovic D. Expectant management of
ultrasonically diagnosed ovarian dermoid cysts: is it possible to predict outcome? Ultrasound in
Obstet Gynecol 2010; 36(2):235-240
[14] Davis GL. Malignant melanoma arising in mature ovarian cystic teratoma (dermoid cyst).
Report of two cases and literature analysis. Int J Gynecol Pathol. 1996; 15(4):356-62.
[15] Bottomley C, Bourne T. Diagnosis and management of ovarian cyst accidents. Best Pract Res
Clin Obstet Gynaecol. 2009; 23(5):711-24.
[16] Stany MP, Hamilton CA. Benign disorders of the ovary. Obstet Gynecol Clin North Am. 2008;
35(2):271-84
[17] Jaworski RC, Boadle R, Greg J, Cocks P. Peritoneal melanosis associated with a ruptured
ovarian dermoid cyst: report of a case with electron-probe energy dispersive X-ray analysis. Int.
J Gynecol Pathol 2001 Oct; 20 (4): 386-9.
[18] Godara R, Karwasra R.K, Garg P, Sharma N. A Diagnostic Symptom Of Ovarian Dermoid
Cyst. The Internet Journal of Gynecology and Obstetrics. 2006; Volume 6, Number 1.
[19] Huss M, Lafay-Pillet MC, Lecuru F, Ruscillo MM, Chevalier JM, Vilde F, Taurelle R.
Granulomatous peritonitis after laparoscopic surgery of an ovarian dermoid cyst. Diagnosis,
management, prevention, a case report. J Gynecol Obstet Biol Reprod (Paris). 1996; 25:365-372.
[20] Rosen D, Lam A, Carlton M, Cario G. The safety of laparoscopic treatment for ovarian
dermoid tumors. Aust NZ Obstet Gynecol. 1998; 38(1):77–79.
[21] Teng FY, Muzsnai D, Perez R, Mazdisnian F, Ross A, Sayre J. A comparative study of laparoscopy
and colpotomy for the removal of ovarian dermoid cysts. Obstet Gynecol. 1996; 87(6):1009–1013.
[22] Clement D, Barranger E, Benchimol Y, Uzan S: Chemical peritonitis: a rare complication of an
iatrogenic ovarian dermoid cyst rupture. Surg Endosc 2003; 17(4):658
[23] Wang PH, Yen MS, Juang CM, Chen YJ, Chao HT, Yuan CC: Intraperitoneal cancer spread
after laparoscopic cystectomy for mature teratoma with malignant transformation. Eur J
Gynaecol Oncol 2002; 23(2):131-2.
[24] Cristoforoni P, Palmeri A, Walker D, Gerbaldo D, Lay R, Montz FJ. Ovarian Cystic teratoma:
to scope or not to scope? J Gynecol Tech. 1995; 1(3):153-156
[25] Berek J, Hacker F. Berek & Hacker Gynecologic Oncology. Fifth Edition 2010; 455-459.

American Journal of Scientific Research
ISSN 2301-2005 Issue 89 July, 2013, pp.116-124
http://www.americanjournalofscientificresearch.com
Joint Detection and Discrimination of CDMA2000, WiMAX and
Frequency Hopping Signals
Ammar Abdul-Hamed Khader
Dept. of Computer Engineering, Mosul University, Iraq
Ph.D. Candidate, Jamia Millia Islamia, New Delhi, India
E-mail: [email protected]
Ahmed M. Husein Shabani
Dept. of Electronics & Communication Engineering
Jamia Millia Islamia, New Delhi, India
E-mail: [email protected]
Mirza Tariq Beg
Head of Dept. of Electronics & Communication Engineering
Jamia Millia Islamia, New Delhi, India
E-mail: [email protected]
Abstract
With the advent of next generation mobile data networks, ubiquitous, high-speed,
mobile Internet access has become a reality. However, the concurrent development of
multiple mobile data technologies has led to the existence of overlapping, mutually
incompatible mobile data networks. This paper extending the work of Bouncing Detector
that used in detecting Frequency Hopping signals, to detect and discriminate other
important signals like CDMA2000 and WiMAX. The results show that this detector can
discriminate among these different signals easily and the performance guaranteed.
Keywords: Bouncing Detector (BD), Hopping Rate Detector (HRD), Frequency Hopping
(FH), CDMA2000, IEEE802.16-2004 OFDM (WiMAX).
1. Introduction Cellular mobile services were initially offered using analogue radio technologies and these were
considered as the first generation systems (1G). The definition of 2G was straight forward because
analogue radio networks were replaced with digital ones (2G networks) in the 1990’s. However the
definition of 3G is not so simple because these various 2G digital networks have been extensively
deployed throughout the world and have evolved significantly throughout their long service life to
offer greatly improved performance and capabilities, particularly for data services [1].
Despite the challenges faced when transmitting data through varying wireless channels,
broadband metropolitan area wireless systems are becoming a reality, partly thanks to the increasingly
sophisticated designs that are being employed. Such designs have been made possible by theoretical
advances and also by improvements in technology that have led to faster and cheaper implementations
compared to older systems. Currently, the focus is on developing 4G systems in the framework of
IMT-Advanced, an ITU platform on which the next generation of wireless systems will be built [2].

Joint Detection and Discrimination of CDMA2000, WiMAX and Frequency Hopping Signals 117
The world's first CDMA2000 networks were launched in Korea in October 2000, providing 144
Kbit/s data rates to subscribing customers and delivering nearly twice the voice capacity that operators
experienced with their CDMA One (IS-95) systems. The success of the CDMA2000 1X system in
Korea has encouraged many operators in the Americas and Asia to follow through with their plans to
launch CDMA2000 [3]. CDMA2000 also known as IMT Multi-Carriers (IMT-MC), is a family of 3G
mobile technology standards, which use CDMA channel access, to send voice, data, and signalling data
between mobile phones and cell sites. The name CDMA2000 actually denotes a family of standards
that represent the successive, evolutionary stages of the underlying technology. These are, in order of
evolution: (CDMA2000 1xRTT), (CDMA2000 1xEV-DO_Release 0, Revision A, Revision B),
(CDMA2000 1xEV-DO_Revision C or Ultra Mobile Broadband (UMB)) and (CDMA2000 1xEVDV).
All are approved radio interfaces for the ITU's IMT-2000. CDMA2000 has a relatively long technical
history and is backward-compatible with its previous 2G iteration IS-95 (CDMA One). In the United
States, CDMA2000 is a registered trademark of the Telecommunications Industry Association (TIA-
USA) [4].
WiMAX (Worldwide Interoperability for Microwave Access) Forum is a worldwide
organization created to promote and certify compatibility and interoperability of broadband wireless
products based on the IEEE 802.16 standard. The final standard for mobile WiMAX - IEEE802.16e-
2005 - was approved in late 2005. The WiMAX Forum undertakes testing and certification against the
IEEE standards to ensure vendor interoperability Overview of Mobile WiMAX [5].
WiMAX is a wireless broadband solution that offers a rich set of features with a lot of
flexibility in terms of deployment options and potential service offerings [6, 7]. IEEE802.16d,
IEEE802.16e and IEEE802.16m are standards for Wireless Metropolitan Area Network (WMAN).
WiMAX forum have released several technical specification profiles [8, 9].
Spread spectrum (SS) is a means of transmission in which the signal occupies a bandwidth in
excess of the minimum necessary to send the information. In the SS system, the transmitted signal is
spread over a frequency band that is much larger, in fact, than the maximum bandwidth required to
transmit the information bearing (baseband) signal. An SS system takes a baseband signal with a
bandwidth of only a few kilohertz (kHz), and spreads it over a band that may be many megahertz
(MHz) wide. Frequency hopping (FH) can introduce frequency diversity and interference diversity. It
can be an effective technique for combating Rayleigh fading, reducing interleaving depth, associated
delay, and enabling efficient frequency reuse in a multiple access communication system [10, 11].
The rest of the paper is organized as follows; Section II gives a summary on Mobile Generation
Updating. Section III, IV and V present a brief on CDMA2000, IEEE 802.16 and Frequency Hopping
Signal respectively. This is followed by a Simulation Model in Section VI. The Results are discusses in
Section VII. Discrimination drawbacks are illustrated in section VIII. And Section IX wraps up
everything to draw a conclusion
2. Mobile Generation Updating In the mid 1980’s the ITU started work to define the next “generation” of mobile radio standards to
move these networks from National and Regional standards onto a global basis. This necessitated
finding a new globally available frequency band as well as attempting to maximize convergence within
the many existing 2G wireless technologies. At the 1992 ITU World Radio Conference 230 MHz of
new radio spectrum was identified for ‘Future Public Land Mobile Telecommunication Systems”
(FPLMTS), later to be known as International Mobile Telecommunications-2000 (IMT-2000). Because
of the extensive deployment and investment in 2G radio technologies during the 1990’s IMT-2000
became a “family of standards” offering evolution/revolution options from the major existing 2G
network standards. In general an “evolution” option enabled backwards compatible evolution of a 2G
standard to its 3G equivalent within an operators existing spectrum allocation. Whereas a “revolution”
option typically required an operator to obtain additional spectrum, build an overlay network, and

118 Ammar Abdul-Hamed Khader, Ahmed M. Husein Shabani and Mirza Tariq Beg
utilize dual mode/band mobile equipment. These 3G ITU standards were finalized in time for 3G
services to be initially launched in 2000. Not surprisingly an evolution option was the first IMT-2000
technology to be deployed [1, 2].
3. Brief on CDMA2000 CDMA 2000 is a terrestrial radio interface for the third generation of wireless communications
developed within the framework of the International Mobile Telecommunications (IMT)-2000
standard, as defined by the International Telecommunication Union (ITU). The specifications of the
cdma2000 system are being developed by the Third Generation Partnership Project 2 (3GPP2). The
cdma2000 air interface is a direct spread technology. This means that it spreads encoded user data at a
relatively low rate over a much wider bandwidth (1.23 MHz for the 1x case), using a sequence of
pseudorandom units called chips at a much higher rate (1.2288 Mcps). By assigning a unique code to
each user, the receiver, which has knowledge of the code of the intended user, can successfully
separate the desired signal from the received waveform [12].
CDMA 2000 represents a family of technologies that includes CDMA2000 1X and
CDMA2000 1xEV. CDMA2000 1X can double the voice capacity of CDMA One networks and
delivers peak packet data speeds of 307 Kbps in mobile environments. 1xEV-DO Rev 0 had initial
success in Korea and Japan beginning in 2003 with additional major deployments following in 2004
and 2005. The initial launch for EV-DO Rev A with CDMA2000 UL enhancements took place in
Korea and Japan in 2005 [5].
A further enhancement to the CDMA2000 standard is 1xEV-DO-Rev B (also known as DO
Multi-Carrier). This enhancement will increase the DL peak over the air data rate for a 1.25 MHz
carrier to 4.9 Mbps and, by aggregating 3 carriers (known as 3xEV-DO) in a nominal 5 MHz channel
bandwidth, will provide a peak DL rate of 14.7 Mbps and a peak UL data rate of 5.4 Mbps.
Commercial deployments for 1xEVDO-Rev B are not anticipated until 2008 [5].
Table 1: Theoretical Throughputs of CDMA System
CDMA
Technology Theoretical Throughput
Forward link (Kbps) Return link (Kbps)
1 x 1.25MHz 614 614
1 x EV-DO Rev 0 (1.25MHz) 2458 153
2005
1 x EV-DO Rev A (1.25MHz)
2006-2007 3072 1800
1 x EV-DO Rev B (1.25MHz)
2007-2008 14745 5400
4. Brief on WiMAX WiMAX is one of the most promising technologies for broadband wireless access solution, as well as a
4G candidate. In parallel the WiMAX forum releases several technical specification profiles. Evolution
and deployment of WiMAX technology rely on cooperative and complementary efforts in the WiMAX
forum and IEEE 802.16 standard [5, 6, 9]. The important features of WiMAX are scalable OFDMA,
multiple input multiple output (MIMO) antenna, beam forming and adaptive modulation and coding
(AMC), support time division duplexing (TDD) and frequency division duplexing (FDD), space time
coding, strong security and multiple QoS classes [12]. IEE802.16 OFDMA divides the available
resources (frequency & time) into several orthogonal sub carriers in frequency domain and into several
adjacent symbols in time domain. This gives more flexibility in assigning those recourses, serving
many users supporting several service classes with QoS. This leads to a significant increase in resource

Joint Detection and Discrimination of CDMA2000, WiMAX and Frequency Hopping Signals 119
allocation challenges. In centralized system such as WiMAX system the Base Station (BS) performs
scheduling using Quality of services (QoS) scheduling algorithms and data packing using data packing
algorithms. The standards specify only uplink (UL) Packing algorithm and leaves QoS scheduling
algorithms and downlink (DL) Packing algorithms as open issues which open the door for researcher
and manufacturer to propose new algorithms or adopt some existing algorithms to improve WiMAX
system performance and capacity. In designing efficient downlink packing algorithm many factors and
tradeoffs issues like mapping overhead, wastage slots, power consummation... etc have to be
considered [13, 14, 15].
5. Brief on Frequency Hopping Signal FHSS technique has been used widely not only in public safety communications but also in
commercial communications such as GSM, home RF and Bluetooth, with interference avoidance and
multiple access capability. However, the traditional FHSS systems are regulated by fixed frequency
hop set. If some carrier frequencies are occupied by other wireless equipments, the FH system also
communicates in the occupied carrier frequencies which degrade the quality of communication [10].
A field of study known as Low Probability of Intercept (LPI) Communications is devoted to
designing waveforms that make interception and jamming more difficult. One of the most popular and
effective techniques is Frequency Hopping (FH) which is a type of spread spectrum (SS). In SS
systems, an advantage in signal-to-noise ratio (SNR) is achieved by the modulation and demodulation
process. The spreading signal is selected to have properties to facilitate demodulation of the
transmitted signal by the intended receiver and to make demodulation by an unintended receiver as
difficult as possible. These same properties also make it possible for the intended receiver to
differentiate between the communication signal and jamming [11]. As normal FH system, a hop-
sequence generator has to be determined, so that the FH system will avoid the congested channel and
transmit the data in clear channel. The hop-sequence generator is determined based on the link quality
testing results as well as the analysis of wireless communication theory. FH is categorized into slow
hopping and fast hopping. By slow hopping, more than one data symbol is transmitted in same
channel. Fast hopping change frequency several times during one symbol. For wideband
communication, a random FH schemes together with forward error correction, FEC method, the short
noise burst will not affect wideband transmission; it is protected from jamming transmission and has
low probability of interception [16].
6. Simulation Model As shown in figure (1) we built three different transmitter systems (IEEE 802.16-2004 OFDM
(WiMAX), frequency hopping FH and CDMA2000) using Matlab Simulink. Then separate Bouncing
Detectors (BDs) or Hopping Rate Detectors are used after all these signals crossing noisy channel
(Rayleigh and Gaussian Noise). BD is essentially designed for detection FH signals [16]. But here in
this article we extend the work of BD to detect and discriminate other important signals like
CDMA2000 and WiMAX. A block diagram of BD is shown in figure (2). Where the received signal
plus noise are passed through two adjoin bandpass filters (BPF). Those filters are split the bandwidth
of the noisy input into two continuous segments each of (bandwidth /2). In case of receiving a
frequency hopping noisy signal, the output of one of these two BPFs will be the sum of the signal plus
noise and the other BPF will contain only noise.
The particular BPF who contains the signal plus noise is bouncing at the hop rate between BPF
1 and BPF 2 in accordance whether the corresponding hop is in the upper or lower half of the input
spread spectrum band. The output of two BPFs are squared and differenced producing a signal whose
(signal dot signal) term ideally has a rectangular envelope with potential transition that occur at a
multiples of hop time (Th). Passing this signal through a lowpass filter (LPF) will extract the envelop.

120 Ammar Abdul-Hamed Khader, Ahmed M. Husein Shabani and Mirza Tariq Beg
Next a delay by half a hop time and multiply operation produces an approximately stationary
waveform that can be seen on oscilloscope. The exact value of hop rate can show in spectrum analyzer.
But the case is different in another input signals like CDMA2000 and WiMAX, where the data and its
carrier frequency are fixed in band. So, BD gives different shape than FH signal.
Figure 1: IEEE 802.16-2004 OFDM (WiMAX), Frequency Hopping FH and CDMA2000 Simulink
Transmitter’s Block
Figure 2: Bouncing Detector (BD) Matlab Simulink Block
7. The Results As mentioned above we can know the hop rate of FH signal by connecting a spectrum analyzer to the
output of BD2. Figures (3) and (4) show that we can get a maximum power value (Y axis) at one point
on the frequency (X axis), that corresponding or equal to the exact hop rate of the transmitted signal.
Where the FH transmitted signal’s hop rate is (500 hps) hop/sec. and (1000 hps) respectively.
Figure (5) shows the three transmitted signals in time domain before entering the detection
blocks (BDs), the first one is WiMAX signal the second one is FH signal and the third one is
CDMA2000. Where the (X) axis is the time and (Y) axis is the amplitude.

Joint Detection and Discrimination of CDMA2000, WiMAX and Frequency Hopping Signals 121
Figure 3: The Detected Spectrum of FH Signal Transmitted at 500 hps
Figure 4: The Detected Spectrum of FH Signal Transmitted At 1000 hps
Figure 5: WiMAX, FH and CDMA2000 in Time Domain Before Entering Their Detectors
The detection and discrimination among these three signals can be achieved easily by noticing
the output of the BDs in time domain. Where each detected signal has its own shape and differs from
the other (does not look like). Figure (6) and (7) show the output of BDs at different parameter values
like cyclic prefix in WiMAX, hopping rate in FH and data rate in CDMA2000 respectively but in ideal
case i.e. without noise. We can notice that the envelope shape for each recovered signal is remaining
same with slightly small difference when the parameter values are changed.
Figure (8), (9) and (10) illustrate the shape of the three signals but with different cases of noise
power (0, 5 and 10 dB) and different parameter values (Number of OFDM symbols per burst, cyclic
prefix (WiMAX), hop rate (FH) and data rate (CDMA2000)). Also here we can discriminate among
these signals easily. The effect of increasing noise power is appeared only on the tail of the WiMAX
signal. While its appeared on the top of FH signal. CDMA2000 is look like unstable signal on all cases
and that become very clear in higher values of noise power.

122 Ammar Abdul-Hamed Khader, Ahmed M. Husein Shabani and Mirza Tariq Beg
Figure 6: Signals Without Noise, Cyclic Prefix 1/ 8 (WiMAX), Hop Rate 1000 hps (FH) and Data Rate 4.8
Kbps (CDMA2000).
Figure 7: Signals Without Noise, Cyclic Prefix 1/ 32 (WiMAX), Hop Rate 500 hps (FH) and Data Rate 9.6
Kbps (CDMA2000).
Figure 8: Signals With 0 dB Noise, Number of OFDM Symbols Per Burst1, Cyclic Prefix 1/8 (WiMAX), Hop
Rate 1000 hps (FH) and Data Rate 4.8 Kbps (CDMA2000).

Joint Detection and Discrimination of CDMA2000, WiMAX and Frequency Hopping Signals 123
Figure 9: Signals With 5 dB Noise, Number of OFDM Symbols Per Burst 10, Cyclic Prefix 1/32 (WiMAX),
Hop Rate 1000 hps (FH) and Data Rate 9.6 Kbps (CDMA2000)
Figure 10: Signals With 10 dB Noise, Number of OFDM Symbols Per Burst 1 , Cyclic Prefix 1/8 (WiMAX),
Hop Rate 1000 Hps (FH) and Data Rate 4.8 Kbps (CDMA2000)
8. Summary and Concluding Remarks This paper considers the problem of detecting and discriminating the presence of CDMA2000 and
IEEE 802.16 2004 OFDM. We extended the work of Bouncing Detector or Frequency Hopping
Detector that used for detecting Frequency Hopping signals, to detect and discriminate these important
signals. The results show that this detector can discriminate among these different signals easily and
the performance guaranteed. There is a little drawback when the noise power is very high.
References [1] Jeff Kennington • Eli Olinick • Dinesh Rajan, Wireless Network Design, Optimization Models
and Solution Procedures, Springer Science + Business Media, LLC 2011.
[2] Ioannis Papapanagiotou, Dimitris Toumpakaris, Jungwon Lee, Michael Devetsikiotis, A Survey
on Next Generation Mobile WiMAX Networks: Objectives, Features and Technical
Challenges, IEEE Communications Surveys & Tutorials, Vol. 11, No. 4, Fourth Quarter 2009.
[3] Johan Langer and Gwenn Larsson ‘CDMA2000—A world view” Ericsson Review No. 3, Issue
no. 03/2001.
[4] CDMA2000 trademark application, uspto.gov, November 17, 2009.

124 Ammar Abdul-Hamed Khader, Ahmed M. Husein Shabani and Mirza Tariq Beg
[5] Comparing Mobile WiMAX, 3G and Beyond A technical comparison of mobile WiMAX and
third generation mobile technologies, [Online]. Avalable: http://www. crystalcomltd.
com/featured_whitepapers/010231032509Comparing_WiMAX_vs_3G_White_Page.
[6] J. G. Andrews, A. Ghosh, and R. Muhamed, Fundamentals of WiMAX Understanding
Broadband Wireless Networking, Prentice Hall, 2007.
[7] IEEE Std. 802.16-2004, “IEEE Standard for Local and Metropolitan Area Networks – Part 16:
Air Interface for Fixed Broadband Wireless Access Systems,” IEEE Computer Society and the
IEEE Microwave Theory and Techniques Society Oct. 2004.
[8] IEEE Std. 802.16e-2005 “IEEE Standard for Local and Metropolitan Area Networks – Part 16:
Air Interface for Fixed and Mobile Broadband Wireless Access Systems.” IEEE Computer
Society and the IEEE Microwave Theory and Techniques Society, 28 Feb. 2006.
[9] IEEE Std 802.16m™-2011 “IEEE Standard for Local and metropolitan area networks—Part
16: Air Interface for Broadband Wireless Access Systems” IEEE Computer Society and the
IEEE Microwave Theory and Techniques Society, 6 May 2011.
[10] Jim K Omura, Robert A Scholtz, Spread Spectrum Communications, Handbook McGraw-Hill
telecom: Engineering 2002.
[11] Ammar Abdul-Hamed Khader “Enhanced Performance of FH Detection System Using
Adaptive Threshold Level” AL Rafdain Engineering Journal, Volume: 18, Issue: 5, 2010.
[12] Michael Lin, Heesook Choi, Thomas La Porta “CDMA2000-WiMAX Interworking” [Online].
Avalable:http://nsrc.cse.psu.edu/slides/id08/ NSRC_ ID08_ poster_michaellin_sprinta.
[13] Kamran Etemad, Ming-YeeLai, WiMAX Technology and Network Evolution, Wiley-IEEE
Press , September 2010.
[14] Chakchai So-In, Raj Jain, and Abdel-Karim Tamimi, "Scheduling in IEEE 802.16e Mobile
WiMAX Networks: Key Issues and a Survey," IEEE Journal (JSAC), Vol. 27, No. 2, Feb 2009,
pp. 156-171.
[15] Ahmed M Husein Shabani, M.T.Beg and Ammar Abdul-Hamed Khader “Survey of Down Link
Data Allocation Algorithms in IEEE 802.16 WiMAX” International Journal of Distributed and
Parallel Systems (IJDPS) Vol.3, No.4, July 2012.
[16] Siddeeq Y. Ameen, Ammar Abdul-Hamed. Khader and M. N. Abdullah “Comparison and
Investigation of Hopping Rate Estimation Processes” 3rd International Conference on
Information and Communication Technologies: From Theory to Applications, ICTTA 2008.

American Journal of Scientific Research
ISSN 2301-2005 Issue 89 July, 2013, pp.125-138
http://www.americanjournalofscientificresearch.com
The Impacts of SMS on Formal Writing: A Case Study
Among the University Students of Comsats Vehari Campus
NaziaSuleman
Department of Humanities
COMSATS Institute of Information Technology Vehari Campus
E-mail: [email protected]
Tel: +923336268792
Iram RubabSial
PhD ScholerIslamia University Bahawalpur Department of English
E-mail: [email protected]
Tel: +923346087585
SaydAbrarHussain Shah
Department of Humanities
COMSATS Institute of Information Technology Vehari Campus
E-mail: [email protected]
Tel: +92333700275
Hafiz SajjadHussain
Department of Humanities
COMSATS Institute of Information Technology VehariCampus
E-mail: [email protected]
Tel: +923007855522
Abstract
SMS appears to have influenced the Standard English. SMS language had greatly
influenced the Standard English language used by the students because of its brevity and
conciseness. SMS language is in vogue because of its distinguishing features of easy and
quick way of communication. A questionnaire comprised of open and close ended
questions was administered to check the influence of the SMS language in students of
COMSATS Vehari. Findings strongly suggest that abbreviated language is very obvious in
writing English.
Introduction As more and more students are immersing themselves in mobile phone usage the text users are being
multiplied every day. Despite of its numerous benefits, language researchers/linguists have found that
the prolonged use of SMS has detrimental effects on the learners’ language proficiency (Dansieh,
2011; Mphahlele and Mashamaite, 2005; Ochonogor, Alakpodia and Achugbue, 2012; Winzker,
Southwood and Huddlestone, 2009).
An alarming impact of the text messaging had been observed at the English written expression
of the students (Daniesh, 2011). Teachers as well as parents are highly concerned about it and finding
the ways to deal with it and devising the ways to resist this practice in formal writing. Different schools

The Impacts of SMS on Formal Writing: A Case Study Among the
University Students of Comsats Vehari Campus 126
of thoughts have been brought in wake by this phenomenon (Daniesh, 2011). The first school of
thought is of the view that distinguishing features of brevity, precision, accuracy are flourishing the use
of texting and is over passing the basic rules of English grammar like spelling, punctuation,
capitalization and syntax (O’Conor, 2005). Second school of thought is being spearheaded by a renown
linguist David Crystal who is of the view that texting is not posing any threat to the language rather it’s
a source of practicing the language for a number of times and is enhancing the literary skills of the
users as well as paving the way for more and frequent use of a language, its acting like a catalyst for
the new learners of English language (Crystal, 2008). Third school of thought is of the view that SMS
is not posing negative or positive impact but rather its neutral and is not violating or by passing any
rule of grammar (Russell, 2010).
These views will be discussed in the literature review section and would be analyzed and
evaluated critically.
Objectives of the Study This study, firstly, aims at finding how SMS language affects the formal writing? Secondly, it will also
find out what are commonly repeated words in SMS which directly or indirectly affect the formal
writing?
To trace how sms is affecting the formal writing of students in COMSATS Vehari
Considering what are the commonly repeated words in SMS which directly or indirectly
influence formal writing
To identify the areas which need special care while writing
Literature Review In a short span of time (December, 1992 to 2012) text message language has aroused a great deal of
interest amongst the scholars, teachers and parents to look for its possible impact upon the young
generation. According to Goldstuck (2006) mobile phones were introduced to the youth market in the
late 1990’s. Thurlow (2011) studied the cell phone users, SMS character and its length and the factors
behind text language which are making users to go for rebus writing, for short spellings and for other
grammatical lapses. While Crystal (2008) is of the view that texting is a way to increase the literary
skills of a particular language and also a way of practice which would ultimately increase the
proficiency of a language.Txtng the Gr8 Db8 by David Crystal is so far the most comprehensive work
on SMS text language. Newspaper and on the internet are arguing about the impact of the language
upon the communication skills of the students. While one school of thought is calling the service a
curse as it is affecting the written skills and is posing threats to the real grammar with its excess usage.
Another school of thought led by Davis Crystal is of the view that texting is not of threat to the
language rather it’s a means to flourish it. Texting is not harmful to the student literacy rather it
enhances it (Crystal, 2008).
SMS Text Messaging Text messaging is in vogue since 1992 and its users are multiplying with the every passing day.
According to Buczynski (2008), “text messaging or more specifically, SMS (Short Message Service)
texting enables text messages up to 160 characters long to be sent and received by mobile phones” (p.
263). A reason of abbreviation is the number of characters which is limited. SMS has become an
indispensible part of our daily lives due to its widespread availability.
“Text has gripped the imagination of the U.K. in a very short space of time, and already has its
own language, its own etiquette and its own humour” (Peter Baker, The Dating Channel).

127 NaziaSuleman, Iram RubabSial, SaydAbrarHussain Shah and Hafiz SajjadHussain
As SMS is cheaper so its users are not only students but also professionals and businesspersons.
In 2007,Finnish author HannuLuntiala published the first ever book written solely in text message
language, about a business executive travelling throughout Europe and India.(Crystal, 2008). Its use is
multifaceted as its being employed by the electronic media for multiple kinds of polls and votes and for
ordering products.
SMS makes the communication possible within the twinkling of an eye and the feedback is also
on time. Even during the survey it was noticed that students are relying more on SMS for sharinglatest
information as compared to E-mails.
According to latest statistics issued by Pakistan Telecommunication Authority, cellular industry of
Pakistan ended May 2012 with almost 120 million subscribers or 119,860,799 subscribers to be exact.
Research Methods and Data Collection Thurlow’s (2003) division of text message as typographic or orthographic forms following divisions
have been addressed:
Shortening (deletion of letters)
Contractions
Number Homophones B4
Letter Homophones U
Non conventional Spellings for example: Good(gud)
Questionnaire particularly addresses a common area being employed by the students during the
writing that is abbreviation and spellings.A questionnaire composed of 20 questions was administered
comprising of both open and close ended questions in COMSATS Vehari from the undergraduate
students ranging from 18-21 years. The formal work of the students was also analyzed by giving them
a task of free writing. Students did commit the same spellings and abbreviations mistakes which were
observed in the questionnaire.
This study involved total 40 respondents, all were full-time university students. They all belong
from Bachelor programs of CIIT (COMSATS Institute of Information Technology Vehari Campus),
including 08 students from BSTN (CS), 04 male and 04 female, 07 Students from BSCS (CS) 03male
and 04 Female, 11 from BS (COM) all are male students and 14 from BSBA (MS), 10 female and 04
male. The ages of respondents ranged from 16 to 24 years.
This study provides different information about the use of SMS Language and the numbers of
errors which have harmful impacts upon their formal writings. The findings of the study show different
results, which is a new thing for the researchers and it shows that SMS Language has a stronger impact
upon the writings of Bachelor students. In this questionnaire there were total 20 questions, 07 were open
ended questions and 13 were close ended questions. All the results show through the use Pie Charts.
5.1 Q: Do you use SMS?

The Impacts of SMS on Formal Writing: A Case Study Among the
University Students of Comsats Vehari Campus 128
This Pie Chart shows that all the Students having cell phones and they are regular user of SMS
language. The 100% phone usage rate among student respondents probably demonstrates a high
frequency of Phone usage among CIIT students. It also suggests that all the student respondents are
strongly favor the SMS because the conciseness of its messages, it over come shyness and using it is an
appropriate social behavior.
5.2 Q: When you use SMS?
This pie chart shows different kind of information about the results, moods of the students and
their way of thinking is another important part if their study. This question responds differently from
the 1st one, because 67% student respondents suggest “every time”, 13% respondents suggest “Due to
less balance” and remaining 20% students respond that it depends on the “Mood of Chat”. These three
categories show that students are enough interest to use SMS language.
5.3 Q: Do you shorten up the words, or Chunk the words?

129 NaziaSuleman, Iram RubabSial, SaydAbrarHussain Shah and Hafiz SajjadHussain
As all the student respondents were belong from Bachelor programs, they have enough
knowledge about these words, (Abbreviate, chunk and shorten up) and they respond according to their
own contexts. But according to the results 67% having the answer “No”, 20% “shorten up the words”
and 13 % “chunk the words”. It shows that some student respondents know the meanings of these
words properly.
5.4 Q: Do you use Abbreviations in SMS?
All the students respond 100% “yes”. It shows that all the respondents are fully aware the use
of abbreviations in the SMS language and even they know how to abbreviate the words? They also
used abbreviations in the SMS Language frequently. Some student respondents respond differently
from each other because SMS Language varies from person to person and from region to region.
5.5 Q: Do you frequently use abbreviations for friends or family friends or others?
Same alike all others questions, there is also a new result for this question and students respond
according to their own SMS usage. They mostly use SMS for their friend and some are also support the

The Impacts of SMS on Formal Writing: A Case Study Among the
University Students of Comsats Vehari Campus 130
SMS for the use towards family friends and some also favors the others. About 67% of the respondents
use SMS for their “Friends”, 20% for their “Family” and about 13% use SMS for “Others”.
5.6 Q: Do you think shortening up in SMS is corrupting English Language?
This is another difficult question for the student respondents of bachelor programs that how
they realize that SMS language corrupt the English language. But they respond very well like the other
researchers, the results indicate that most respondents are well aware that the use shortening the words
is corrupting the English language and that is why about 80% having the answer “Yes” and 20 %
having the answer “No”. It shows that some student respondents having the sense of accurate English
language.
5.7 Q: What abbreviation you use for the word fine?
This Pie Chart shows straight kind of results about the shortening up the word “fine” for the use
of SMS language in communication. The 80% of the students which were in the favor of shorten the

131 NaziaSuleman, Iram RubabSial, SaydAbrarHussain Shah and Hafiz SajjadHussain
word “Fine” and they suggested “f9” and 20% suggested Fine should be written in the straightway like
“Fine”.
5.8 Q: In SMS language “bzi” is used for busy?
This is another complex question for the student, but they respond according to their own
understanding and their level of education. About 36 students respond in the favour of “bzi” which is
the 90% of the total 40 respondents and 4 respondents suggested shorten up the word “busy” which is
the 10% of the total respondents.
5.9 Q: In SMS language “AOA” is used for Assalam u Alaikum?
All the students respond 100% “yes”. It shows that all the respondents are fully aware the use
of “AOA” as an abbreviations in the SMS language and even they know how to abbreviate the words?
They also used this “AOA” abbreviation in the SMS Language frequently might be it is a standard
shorten up of Assalam u Alaikum.

The Impacts of SMS on Formal Writing: A Case Study Among the
University Students of Comsats Vehari Campus 132
5.10 Q: In SMS language “CUM” is used for come?
This is another interesting question for the student, but they respond according to their own
understanding and in the well manner. About 37 students respond in the favors of “CUM” which is the
92% of the total 40 respondents and 1 respondent suggested shorten up the word “come” in the form of
“CM” which is approximately 3% of the total respondents and 2 students were in the favors of no
response. 5.11 Q: In SMS language “Gr8” is used for great?
All the students respond 100% “yes”. It shows that all the respondents are fully aware the use
of “Gr8” as an abbreviations in the SMS language. They also used this “Gr8” abbreviation in the SMS
Language frequently might be they are habitual the use of this abbreviation of “great”.

133 NaziaSuleman, Iram RubabSial, SaydAbrarHussain Shah and Hafiz SajjadHussain
5.12 Q: In SMS language “4” is used for (for)?
This pie chart shows different kind of information about the results, moods of the students and
their way of thinking is another important part of their study. This question responds differently from
the other questions, because 70% student respondents favor the abbreviation of “4” instead of “for” and
30% were in the favors of “NO” and no support for the “suggestion” category. These three categories
show that students are enough interest to use SMS language.
5.13 Q: In SMS language “TC” is used for take care?
This pie chart also shows approximately same kind of results above one but the average is
different from the previous one, because SMS language vary from person to Person. This question
responds differently from the other questions, because 70% student respondents favour the
abbreviation of “TC” instead of take care, and 35% were in the favour of “NO” and no support for the
“suggestion” category.

The Impacts of SMS on Formal Writing: A Case Study Among the
University Students of Comsats Vehari Campus 134
5.14 Q: In SMS language “M2” is used for me too?
These are also same kind of results above one but the percentage, because SMS language varies
from person to Person. This question responds differently from the other questions, because 67%
student respondents favour the abbreviation of “M2” instead of me too, and 35% were in the favour of
“NO” and there is no for the “suggestion” category.
5.15 Q: In SMS language “Y” is used for why?
This is another interesting results for this question about 75 % students respond in the favour of
“Y” and about 20% students respond in the support of “NO” and about 5% participants responds in the
favour of “Suggestion”. It shows that all the respondents have different mind sets for the use of
abbreviations in the SMS communications.

135 NaziaSuleman, Iram RubabSial, SaydAbrarHussain Shah and Hafiz SajjadHussain
5.16 Q: In SMS language “CLG” is used for college?
As all the responds are mostly in the favour of questionnaire, but in this question all the
situation is changed and respondents respond about 68% against the question and 32 % in the favour of
abbreviation “CLG” and there is no respond in the category of “Suggestion”.
5.17 Q: In SMS language “U” is used for you?
All the students respond 100% “yes”. It shows that all the respondents are fully aware the use
of “U” as an abbreviations in the SMS language. They also used this “U” abbreviation in the SMS
Language frequently might be they are habitual the use of this abbreviation of “you”.

The Impacts of SMS on Formal Writing: A Case Study Among the
University Students of Comsats Vehari Campus 136
5.18 Q: In SMS language “B4” is used for before?
This is another surprise result which is in the favour of questionnaire, but in this question all the
situation is changed and respondents respond about 47% against the question and 45 % in the favour of
abbreviation “B4” and 8% respond in the category of “Suggestion”.
. 5.19 Q: In SMS language “v” is used for we?
As the students are regular user of the SMS language on the daily basisand they respond in the
different manner. For this question about 70 % students respond in the favour of “Y” and about 25%
students respond in the support of “NO” and about 5% participants responds in the favour of
“Suggestion”. It shows that all the respondents have different mind sets for the use of abbreviations in
the SMS communications.

137 NaziaSuleman, Iram RubabSial, SaydAbrarHussain Shah and Hafiz SajjadHussain
5.20 Q: In SMS language “Ni8” is used for night?
This is another interesting question for the student, but they respond according to their own
understanding and in the well manner. About 32 students respond in the favour of “Ni8” which is the
80% of the total 40 respondents, 12% students are against this question and 8% suggested new
abbreviations.
Conclusion For abbreviation and SMS usage all the students agreed and got 100% results. Use of abbreviation is
not standard it keeps on changing from person to person or circle to circle.
The negative impact of abbreviated language in the academic work makes a negative
impression on the receiver and the faculty which is also negating the David Crystal’s and Russell’s
view that SMS texting abbreviation has nil effect on writing. Abbreviation has also been compared to
codes, unfortunately coded language expressions (text message) are not necessarily comprehensible to
an outsider (Thurlow, 2003).
According to Gold stuck language has altered with the passage of time.
References [1] Text Full Word [Online] Available: http://www.txt2nite.com/message/sms-research-
history(15/02/2013)
[2] Crystal,D(2008).Txtng the Gr8 Deb8. Oxford: Oxford University Press
[3] Dansieh,S. SMS Texting and its Potential Impact on Student’s Written Communication Skills.
[4] International Journal of Linguistics. Department of General and Liberal Studies ,Wa
Polytechnic
[5] Luntiala,H.(2007). Viimeisetviestit (Last Message).Helsinki:Tammi
[6] Pakistan Telecommunication AuthoirtyAtta,A Pakistan Ends May 2012 with 119.9 Million
Cellular Subscribers (13 july, 2012) [Online] Available:
[7] http://propakistani.pk/2012/07/13/pakistan-ends-may-2012-with-119-9-million-cellular-
subscribers/retrived (15/02/ 2013)
[8] Bosman, D.B; Van der Merwe, I.W. and Hiemstra, L.W. 2003. Pharos Bilingual Dictionary.
Cape Town: PharosDictionaries.

The Impacts of SMS on Formal Writing: A Case Study Among the
University Students of Comsats Vehari Campus 138
[9] Cummins, J. 1984. Wanted: A theoretical framework for relating language proficiency to
academic achievement amongbilingual students.
[10] In C. Rivera (Ed.), Language proficiency and academic achievement. Avon, England:
MultilingualMatters Ltd.
[11] D’ Adamo, P.J. and Whitney, C. 2001. Eat Right 4 Your Type. Parktown: Random House
South Africa (Pty) Ltd.
[12] Erasmus-Kritzinger, L.E.; Bowler, A. and Goliath, D. 2000. Effective Communication.
Pretoria: Afritech publishers.
[13] Hartmann, R.K.K. 1989. Sociology of the Dictionary User: Hypotheses and Empirical Studies.
In Hausmann, F.J. et.al.(eds.). 1989-1991. Dictionaries: 102-111. Berlin: Walter de Gruyter.
[14] Macmillan English Dictionary for Advanced Learners. 2002. Oxford: Macmillan Education.
[15] Oller, J.W. and Damico, J.S. 1991. Theoretical considerations in the assessment of LEP
students. In E. Hamayan& J.S.
[16] Damico (Eds.), Limiting bias in the assessment of bilingual students. Austin: Pro-ed
publications.
[17] Sinclair, J. 1995. Collins Coubuild English Dictionary. London: HarperCollins Publishers.
[18] Theo, E.G. and Cutter, M.A. 1971. Why can’t the English: An analogy of admirable and
execrable English. Basterville:
[19] Valdés, G. and Figueroa, R. 1994. Bilingualism and testing A special case of bias. Norwood,
NJ: Ablex PublishingCorporation.
[20] Vecchio, A. D. and Guerrero, M. 1995. Handbook of Language Proficiency Tests. New
Mexico: New Mexico HighlandsUniversity.
[21] Vodacom SMS Dictionary. Vodacom.
[22] Webster’s Third International Dictionary. 1986. Chicago: Meriam-Webster Inc.
American Journal of Scientific Research
ISSN 2301-2005 Issue 89 July, 2013, pp.139-143
http://www.americanjournalofscientificresearch.com
Role of Countryside Women in Decision Making in Different
Family Matters
Mazhar Abbas
Department of Management Sciences
COMSATS Institute of Information Technology, Vehari Pakistan
E-mail: [email protected]
Asma Kashif Shahzad
Department of Management Sciences
COMSATS Institute of Information Technology, Vehari Pakistan
E-mail: [email protected]
Rafia Waqar
Department of Management Sciences
COMSATS Institute of Information Technology, Vehari Pakistan
E-mail: [email protected]
Wasim Abbas
Department of Management Sciences
COMSATS Institute of Information Technology, Vehari Pakistan
E-mail: [email protected]
Syed Abrar Hussain Shah
Department of Management Sciences
COMSATS Institute of Information Technology, Vehari Pakistan
E-mail: [email protected]
Abstract
The research was conducted to examine the role of countryside women in decision
making in different family matters. Six villages of mouza kotla rahim ali shah tehsil jatoi
(Dist. Muzaffar Garh), chosen at random, constituted the world of this study. Two married
female from each of the twenty four households arbitrarily chosen from each of the six
villages was face-to-face interviewed, via pretested interviewing calendar. Additionally
some individual information about the respondents, 15 family affairs subjectively listed in
the questionnaire to collect the data concerning the degree of participation of women in
decision making process. The participation of rural women in decision making was resolute
on the basis of extent of discussion of husbands with their spouses in respect of different
family affairs. The discussion among (under “frequently” discussion category) the
respondents and their spouses to take decision in many family matters was more or less
43% under the category of “a little bit” discussion among the respondents and their
spouses, the array varied from about 25 to 38%, the average being 22.66%. A huge
majority (75%) of respondents up till now believed in leading position of husband in

Role of Countryside Women in Decision Making in Different Family Matters 140
making significant decisions in family matter. Some respondents decided that they were
happy with their position as housewives.
Keywords: Arbitrarily, Participants, Countryside, Family Matters
1. Introduction In our human society women play an integral role. The development of any civilization and homeland
depends significantly upon women involvement in all fields of life. The involvement of countryside
women in the community and monetary wisdom has been much larger but extraordinarily sufficient,
they have not been particular acknowledgment. The responsibility of women in civilization
perspective, of Pakistan has constantly been misconceived. In rural areas most women classified as
housewives and fewer than 4% are revealed as working women. In Pakistani cultural women faced lot
of constrains most of which are lacking religious and moral sanctions. The literary prescriptions
attached with extensive working hours, place countryside women in a very fragile situation (Khizra,
1981). As a matter of fact, a distinctive Pakistani women lives in very undersized cottage in a remote
areas. She is born in poverty, lives in poverty and eventually dies in poverty (Haq, 1988).
Rural areas because of isolated region are no doubt more uncovered to the command of
illiteracy and unawareness, characterized via little as 7% female literacy rate (Tikka, 1994). It is feared
that gender inequity may be extra in trend in these remote areas. Conclusion taken as a cattle farm
house is several, varying from that of cost-effective to collective environment. The current study was
thus designed to examine the job of rural women in decision making in various family affairs.
2. Methodology The same kind of study was done in Faisalabad district (Romeena Nasreen, 1994). And we have
adopted their methodology because of same geography, climate, living standard and population for
extension of the research.
Our study was conducted in six villages of Mouza Kotla Rahim Ali Shah Tehsil Jatoi (Dist.
Muzaffar Garh). These villages were situated 6-10 km from Tehsil Jatoi and 2-4 km on either side of
Jatoi-Shah Jmal road. The residents of these villages ranged from 5000-7000. Irrigation services,
geography, soil type annual rainfall rate and ecological condition were uniform. Didactic services
though varied a bit. About 200 villages Mouza Kotla Rahim Ali Shah six were arbitrarily chosen.
Thirty five household were arbitrarily chosen for person interview from every village. After that from
every household two married female was interviewed via pretested interview calendar. All the
participants were interviewed individually and the total respondents were 125. Many of them were
uneducated. One dependent variable (i.e., level of respondent’s participation in decision making in
family matters) was used, though there were many independent variables such as education, income,
caste, family status, family structure and age.
Everything were examined into frequency distribution wherefrom the percentage were worked
away. Chi-square test was used to determine the significance of association among independent and
dependent variables.
3. Aim of the Study To examine the level to which women are concerned in decision making in family matters and to
discover if a few common variables for instance caste and education are correlated with female
involvement in family matters.
To examine the bond, if any among the preferred socio-economic distinctiveness of the
participants and their culture intensity and social order.

141 Mazhar Abbas, Asma Kashif Shahzad, Rafia Waqar
Wasim Abbas and Syed Abrar Hussain Shah
4. Result and Discussion The degree of participation of countryside women in decision making in various family affairs has
been shown in Table 1. This was analyzed on the basis of level of discussion of husbands with their life
partner in value of different family matters as subjectively listed in table 1.
The overall outcome signifying the level of discussion among the respondents and their
husbands in different family matters have been tabulated under three categories (frequently, a little bit
and never) according to the frequency distribution of the view of the participants. These values
suggested the series of “frequently” discussion among the respondents and their life partner in decision
making in many family matters different from practically 35.66 to 52.04%. Of 15 family matters
planned in table 1. Simply in case of three family matters the percentage for “frequently” discussion
attained the intensity of 46% or a little above. In two family matters the percentage was (i.e. and
control of day to day expenditure and saving) that the participants were consulted to the degree of a bit
above 41% and 45% correspondingly. On average the discussion (in “frequently” class) among the
participants and their life partner to take decisions in many family affairs was about 43% which even
though is much fewer than yet 45% up till now it’s not disappointing. Parveen (1980) and Shoukat
(1985) supported these results. The previous reported that 52% participants were concerned on the
whole decision making procedure on the subject of family matters, whereas the afterward supposed
that women played a dynamic job as decision makers, certainly men were governing in the majority
affairs. In the group of “a little bit” meeting among the participants and their life partners, the series
diverse from about 25 to 38%. Of 15 family matters randomly scheduled to determine the participation
of countryside women in decision making in family matters, only in case of five matters, discussion
under the group was less than 35.66%, while it was only in one case (care of milch animals) that the
discussion level dropped to the minimum of 25.08%. As a whole the discussion with countryside
women to take decisions in family matters under “a little bit” group was 35%.
The array of values representing “Never” discussion among the participants and their life
partner regarding family matters varied from about 13 to 39% (Table 1). “Never” discussion group
nevertheless accounted for above 20% in 8 out of 15 family matters referred to in this study (Table 1).
Taking as a whole average in this group (Never) was 22.66%. The previous found that countryside
women were permissible small height of activity in social and cost-effective domains in significant
decision making practice. Afterward acknowledged that in countryside areas men, the governing
power, kept women obedient. On the opposite, Charyulu and Reddy (1987) reported that countryside
women had a well-built reliant state of mind and they generally looked towards men for essential
decisions. Ali and Khan (1990) examined that women might recognize problems and help in their
resolution but lack of decision making influence in them might be kept in view.
A big majority (75%) of the participants thought in governing role of husbands in making
significant decisions concerning family matters, while less than one-fourth of the participants (31%)
were of the analyze that the men should have a restricted role (somewhat) in family matters. Nearly 8%
participants tended to forbid several jobs to the men in family matters (Table 1)
Table 1: Believing in men dominancy in making essential decisions
Response Frequency Percentage
somewhat 29 31
to a large extent 80 75
Not at all 9 8
The majority analysis articulated above evidently indicates that the spouses in common, up till
now suppose in compliant the supremacy of husbands in family matters or in other words they do not
have the daring, self-reliance to do the majority of it by yourself.
Investigation of the data showed that the independent variable such as education, caste, income,
age and family type of the participants had no important involvement with the decision making

Role of Countryside Women in Decision Making in Different Family Matters 142
procedure in family matters. Apart from an insignificant number, a large majority of the participants
decided they were satisfied with their position as housewives. Of 125 participants only ten were found
to be operational women. Of these five were instructor in nearby schools, one was lady health worker
and other four were self employed. Every one of them indicated that efficiently they were self-
governing and were happy with their profession.
Table 2: Degree of participation of countryside women in decision making in diverse family matters
Sr.No significant Matters Frequently
-----%-------
A little bit
------%------
Never
-----%-----
1 Education of Children “Male and Female” 42.00 35.25 22.75
2 Career of Children 39.13 38.13 22.74
3 Control of day to day spending 41.74 35.39 22.87
4 Overall management of budget 46.70 35.00 18.30
5 Saving 45.22 36.39 18.39
6 Routine menu 52.04 34.79 13.17
7 Medical expenditure 44.34 38.13 17.53
8 Engagement and marriage of children 46.21 37.26 16.53
9 Dealing with friends and kingship relationing 45.21 36.26 18.53
10 Repair/redecoration of house 36.78 35.39 27.83
11 Construction/ purchase of house 36.53 33.78 29.69
12 Purchase/trade of property 41.87 29.43 28.70
13 Keeping of milch animals 35.66 25.08 39.26
14 Sale of milk 35.77 34.66 29.57
15 gift for daughters 48.69 37.13 14.18
Different Family Matters
5. Conclusions A big majority 75% of the participants up till now believed in governing role of husbands in making
vital decisions regarding family matters. Majority of participants was also happy with their positions as
housewives.
The level of participation of countryside women in decision making was about 43% whereas
when consulted “a little bit” the participation of participants was found to be about 35%. On the other
hand overall average for the class that concerned no consultation with the participants was nearly
22.66%.
It was analyzed that independent variable such as education, caste, income, family structure and
age of the participants tend to have no considerable involvement with the decision making
development in family matters.
References [1] Tikka, MJ. 1994. Address of the provincial (Punjab) Minister, delivered at a seminar held at
Lahore in the month of December.
[2] Charyulu, U.V.N and A.N. Reddy. 1987. Rural Women: Decision making, public participation
and other basic needs: A study of two South Indian villages. Ind. J. Social work, 47(4): 407-415
(Rural Develop. Abst., 11: 707; 1988).
[3] Haq, MA. 1988. Local Participation in development planning: A strategy for improving
situation of Pakistani rural women. PARC, Islamabad.
[4] Jaffri, M.S. 1995. Empowerment of women or disem powerment of men; that is the question.
Daily newspaper, the news, March 7.
[5] Khizira, S. 1981. Constraints on women participation in developmental process: A focus on the
traditional image of women. M.Sc. Rural Sociology Thesis, Univ. Agri., Faisalabad.

143 Mazhar Abbas, Asma Kashif Shahzad, Rafia Waqar
Wasim Abbas and Syed Abrar Hussain Shah
[6] Parveen, S. 1980. A study of the status of rural women in their families. M.Sc. Rural Sociology
Thesis, Unv. Of Agri., Faisalabad.
[7] Shaukat, S. 1985. The role of women in rural development in three selected villages of
Peshawar. M.Sc. Thesis, NWFP Agri. Univ., Peshawar.
[8] Shafiq, M. 1994. A study of attitude of rural males towards female education and employment.
M.Sc. Rural Sociology Thesis, Univ, of Agri. Faisalabad
[9] Ali, A.G. and K. Khan. 1990. Women in development. The workshop on WID held at Karachi
in April.
[10] Nasreen, R. Qazi, A.R. Ijaz, K. and Ashfaq, M. 1994. Role of rural women in decision making
in various family affairs. Pakistan Journal of Agri. Sciences, Vol. 31, No.4.

American Journal of Scientific Research
ISSN 2301-2005 Issue 89 July, 2013, pp.144-147
http://www.americanjournalofscientificresearch.com
The Study of Relationship between Free Float Stock Less than
25% and the Stock Returns of Listed Companies in
Tehran Stock Exchange
Mehdi Najafi
Department of Management
Kish International Campus, University of Tehran, Iran
Farshid Asgari
Corresponding Author, Department of Management
Kish International Campus, University of Tehran, Iran
E-mail: [email protected]
Abstract
Investors always look for a good return on their investments. Therefore they attempt
to find some information to be effective on their investment returns. The main objective of
this research is to find the relationship between free float stock less than 25% and the stock
returns of listed companies in Tehran Stock Exchange. In line with this goal, 30 eligible
companies were selected from 6 periods of 50 best companies from 2011 until the end of
summer 2012. In this study the independent variable is the free float stock and the
dependent variable is the total return on stocks. To test this hypothesis, the Pearson
correlation coefficient was used. The obtained results indicate that there is no significant
relationship between free float stock and stock returns in Tehran Stock Exchange.
Keywords: Free float stock, Tehran Stock Exchange, Pearson correlation coefficient,
stock returns
Introduction Achieving economic growth and the desire to make investments requires the basic guidelines in order
to achieve a good return on new investments. The main motivation for the creation of a stock exchange
as a fundamental unit of capital markets is to facilitate re-trading securities. Besides this issue one of
the most important roles of stock is to attract and guide the scattered Savings and liquidity in society
towards the more efficient activities and optimal allocation of scarce resources(Najafi and Asgari
2013). Thus the scattered funds of the private sector must be collected and allocated to improve the
economy and provide the interests for investors. Therefore, the role of the private sector must be
highlighted in the capital market and this requires that the government reduces its ownership role in the
stock of exchange companies (Arabzadeh and Meghaminejad 2012). Government intervention in the
market and the low level of free float stock in the market lead to lower turnover and high stagnant
liquidity in the market. However, William O'Neill provides a different view. He concluded from his
studies on the equity capital markets around the world that Most of the successful stocks had free float
of less than 25%. O'Neill believes that the stock which is used by many people changes a little and has
the risk of loss due to the non-professional and emotional decisions of shareholders. But the stock with

The Study of Relationship between Free Float Stock Less than 25% and the Stock
Returns of Listed Companies in Tehran Stock Exchange 145
less free float amount is easy to swing. According to William O'Neill, the conclusion can be reached
that being large is not always good and this is the law of supply and demand that determines the price
of things in everyday life(O'Neil and Ryan 2002).
According to the statistics of the free float stock in Tehran Stock Exchange, The question arises
that is there a significant relationship between the free float stock below 25% and its return on equity?
Accordingly, due to the relationship between free float stock less than 25% and the stock
returns of in Tehran Stock Exchange, the hypothesis is stated as follows: There is a significant
relationship between stock returns and the free float stock below 25%
Methodology The research is primarily a descriptive – analytical which studies the subject’s background and then
introduces the free float stock. The Population consists of all companies listed in Tehran Stock
Exchange and the sample is consisted of a group of companies that are highly active and are in the list
of 50 top companies of Tehran Stock Exchange. Two-year period beginning in 2011 to the end of 2011
was considered and the listed companies in Tehran Stock Exchange were evaluated and analyzed for
this period.
Review of Literature Much research has been done on various factors affecting stock returns. However, there is little
research on the relationship between the amount of free float stock and stock returns of companies in
Iran. Much research has been done on the effect of free float stock on the market liquidity and
indicators.
Chan made a study entitled “Free float and market liquidity" in Hong Kong. They studied the
Relationship between market liquidity and free float stock after the intervention of government in the
stock market of Hong Kong. They concluded that the government intervention in the stock market
reduces the free float stock and the micro stock trading volume and increases the stagnant Liquidity in
the market (Chan, Chan et al. 2004).
Wang and Xu, made a study entitled "What determines Chinese stock returns" in the Chinese
stock market and tried to find some factors affecting the stock returns rate. They could provide a three-
factor model which includes the market and size and free float (Wang and Xu 2003).
AbdehTabrizi in an article entitled "Free float stock and determining the size of the base"
studied the Iranian market indices and stated that the free float stock should be considered in the
calculation of the index. However, due to the difficulty of computing to adjust the index, the base size
is used as a minimum number of dealing that shape the change in share price(AbdehTabrizi 2003).
Ali MollaHosseini and Kamran Ghorban Nejad in an article entitled "The relationship between
stock returns and free float stock of the companies in Tehran Stock Exchange" examined the
relationship between stock returns and free float stock. They eventually came to the conclusion that
there is a significant relationship between the level of free float stock and stock returns. However, this
relationship was different at the levels of free float stock, and there was no such a relationship between
various industries (Mollahosseini and GhorbanNezhad 2008).
Kashanipoor and Rezaee in an article entitled “Study of effects of changes in free float stock on
the stock returns of listed companies in Tehran Stock Exchange " investigated the relationship between
the two variables. The result shows that the Changes in free float stock have some information content
and have a significant effect on the stock returns of companies and reduces the Stock returns
(Kashanipoor and Rezaee 2011).

146 Mehdi Najafi and Farshid Asgari
Free Float Stock The total number of stock in the capital structure of the company shows the potential number of stock
for the purchase. Also supplying the float stock is a concept that means the number of stock that is
available to companies’ managers after deducting the stock. The high percentage of stock that is
available to the managers usually has a better future.
One of the positive signs for companies, especially small and medium ones is that they
purchase their stock within a specified period of time in the free market. This reduces the number of
stock in the capital structure and means that the company is waiting for increased revenue and profits
in the future. As a result, the total revenue of company is divided among fewer stocks and the profit of
each stock increases. As previously mentioned, the percentage of increased profit per stock is
considered as one of the main driving forces of increased stock prices.
The low ratio of corporate debt to capital is usually a good thing. After selecting the company's
stock which has a small share, the percentage of long-term debt to the total capital ratio will be
examined. When this ratio is lower the company is usually better and safer (O'Neil and Ryan 2002,
Tharp, Chabot et al. 2007).
Research Population There are 728 companies listed in Tehran Stock Exchange. About 434 companies have been stopped
and 5 other companies have not a certain condition. In other words, the stock of about 439 companies
in Tehran Stock Exchange is not exchanged due to different reasons (Arabzadeh and Meghaminejad
2012, Najafi and Asgari 2013). Therefore our sample will be 289 companies and the benchmark
turnover (the number of shares traded per day) related to the company's stock could be the best option
for the selected sample. Since the volume would be different on different days and arithmetic average
of the volume over a period of three months will be considered as a benchmark.
Tehran Stock Exchange introduces 50 active companies in Tehran Stock Exchange every three
months according to the mentioned criterion which is known as the index of 50 well-known
companies. In this study, the numbers of participating different companies on the list of top 50
companies were identified in this interval in order to select the sample size from March 2011 until
summer 2012. Then the companies that have continually participated in three periods were selected to
examine the reseacrh hypothesis. In total, 30 companies were selected randomly.
Method of Data Analysis To analyze the collected data, both descriptive and inferential statistical methods were used.
Descriptive statistics was used with the aim of collecting, arranging, presenting information clearly and
computing the society’s information and determining the relationships between the collected data. To
collect the necessary data, the information on the site of Stock Exchange and its associated sites and
the Trader 5 software were used. This study used PSS software and Pearson correlation analysis to
investigate the research hypothesis.
Conclusion As previously mentioned, The main objective of this research is to find the relationship between free
float stock less than 25% and the stock returns of listed companies in Tehran Stock Exchange, So that
the Investors and companies make more informed decisions in the Liberalization of their stock.
According to the theory of William O'Neill, those companies that have free float stock less than
25% have adequate power for development in the future. Table (1) shows the information of free float
stock of the companies and their revenues.

The Study of Relationship between Free Float Stock Less than 25% and the Stock
Returns of Listed Companies in Tehran Stock Exchange 147
According to the output of SPSS software, there is a direct and weak correlation between the
amount of free float stock below 25% and the total return per stock. (r = 0.011). However, because the
significance test is greater than 0.05 (i.e., 0.964), the correlation does not exist between the two
variables.
Table 1: The amount of free float stock in Tehran Stock Exchange
company Free float
percentage
Return
(%) company
Free float
percentage Return (%)
North Drilling 9 24.25 Takin Ku Corrosion Control 33 (27.37)
National Iranian Copper Industries 21 38.01 Iran communication 4 13.45
Iran Transfo 14 17.73 Tejarat Bank 12 8.47
Mellat Bank 24 25.21 Behshahr Industrial Group,
Iran
12 57.04
Jaber Hayan Pharmacy 23 (5.4) Pars Khodro 13 (2.6)
Sahand Rubber Industries 20 (10.28) East Electric Vehicle 16.5 (22.34)
Behshahr Industrial Development 25 34.77 Iran Zinc Mines 61 69.5
Pars Toosheh Investment 39 34.76 Khark Petrochemical 16.3 80.8
Sina Bank 5 26.53 Gas Pipe 44 (35.4)
Azarab Industry 49 (5.65) Saipa Leasing Rayan 27 37.9
Eghtesad Novin Bank 9 61.12 Mobarakeh Steel 18 29.9
Information Services 7 44.73 Saipa 18 (3.1)
KarAfarin Bank 39 (3.4) Porcelain factories in Iran 37 107.65
West Cement 18 158.14 Damavand future investment 5.66 5.7
Shahid Bahonar Copper 15 (0.77) Ardakan Industrial Ceramics 26 152.7
It is noteworthy that The major shareholders of listed companies in Tehran Stock Exchange are
dependent companies, thus the Indirect involvement of the government in Tehran Stock Exchange
Could cause the results of this study to be different from the theory of William O'Neill.
References [1] AbdehTabrizi, H. (2003). free float stock and determining the size of the base, Library
Exchange Organization of Iran.
[2] Arabzadeh, M. and M. Meghaminejad (2012). "The capital structure and Liquidity on the
Tehran Stock Exchange." American Journal of Scientific research 47: 69-78.
[3] Chan, K., et al. (2004). "Free float and market liquidity: A study of Hong Kong government
intervention." Journal of Financial Research 27(2): 179-197.
[4] Kashanipoor, M. and A. Rezaee (2011). "The Investigation of Free Float Change Effects on
Stock Return in Tehran Stock Exchange (TSE)." Journal of Research in Financial Accounting
3(3): 95-112.
[5] Mollahosseini, A. and K. GhorbanNezhad (2008). "INVESTIGATION OF RELEVANCE OF
FREE FLOAT OF THE COMPANIES IN TEHRAN STOCK EXCHANGE WITH THEIR
RATE OF RETURN." THE IRANIAN ACCOUNTING AND AUDITING REVIEW 51: 69-
86.
[6] Najafi, M. and F. Asgari (2013). "Using CANSLIM Analysis for Evaluating Stocks of the
Companies Admitted in Tehran Stock Exchange." Journal of American Science 9(4s).
[7] O'Neil, W. J. and C. Ryan (2002). How to make money in stocks: a winning system in good
times or bad, McGraw-Hill.
[8] Tharp, V. K., et al. (2007). Trade your way to financial freedom, McGraw-Hill.
[9] Wang, F. and Y. Xu (2003). "What determines Chinese stock returns?" Available at SSRN
581801.