Aging-Related Gene Expression in Hippocampus Proper Compared with Dentate Gyrus Is Selectively...
32
Aging-Related Gene Expression in Hippocampus Proper compared to Dentate Gyrus is Selectively Associated with Metabolic Syndrome Variables in Rhesus Monkeys E. M. Blalock *,1,† , R. Grondin *,2 , K. C. Chen 1 , O. Thibault 1 , V. Thibault 1 , J. D. Pandya 2,3 , A. Dowling 1 , Z. Zhang 2 , P. Sullivan 2,3 , N. M. Porter 1 , and P. W. Landfield 1 1 Department of Molecular and Biomedical Pharmacology 2 Department of Anatomy and Neurobiology 3 Spinal Cord and Brain Injury Research Center Abstract Age-dependent metabolic syndrome (MetS) is a well-established risk factor for cardiovascular disease, but it also confers major risk for impaired cognition in normal aging or Alzheimer's disease (AD). However, little is known about the specific pathways mediating MetS-brain interactions. Here, we performed the first studies quantitatively linking MetS variables to aging changes in brain genome-wide expression and mitochondrial function. In six young adult and six aging female rhesus monkeys, we analyzed gene expression in two major hippocampal subdivisions critical for memory/cognitive function (hippocampus proper, or cornu ammonis (CA), and dentate gyrus (DG)). Genes that changed with aging (aging-related genes, ARGs) were identified in each region. Serum variables reflecting insulin resistance and dyslipidemia were used to construct a quantitative MetS index (MSI). This MSI increased with age and correlated negatively with hippocampal mitochondrial function (state III oxidation). Over 2000 ARGs were identified in CA and/or DG, in approximately equal numbers, but substantially more ARGs in CA than in DG were correlated selectively with the MSI. Pathways represented by MSI-correlated ARGs were determined from the Gene Ontology database and literature. In particular, upregulated CA-ARGs representing glucocorticoid receptor (GR), chromatin assembly/histone acetyltransferase, and inflammatory/immune pathways were closely associated with the MSI. These results suggest a novel model in which MetS is associated with upregulation of hippocampal GR-dependent transcription and epigenetic co-activators, contributing to decreased mitochondrial function and brain energetic dysregulation. In turn, these MSI-associated neuroenergetic changes may promote inflammation, neuronal vulnerability and risk of cognitive impairment/AD. Keywords insulin; histone modification; memory; Alzheimer's disease; mitochondria; inflammation; glucocorticoid † To whom correspondence should be addressed: Phone: (859) 323-8033, Fax: (859) 323-1981. * These authors contributed equally to the present work Supplemental material: S1- alphabetical table of aging-related genes; S2- genes differentially expressed across region; S3- aging related genes in rhesus and rat; S4- Metabolic syndrome-correlated aging-related genes; Microarray data uploaded to Gene Expression Omnibus (www.ncbi.nlm.nih.gov/geo/) under accession number GSE11697 NIH Public Access Author Manuscript J Neurosci. Author manuscript; available in PMC 2011 August 12. Published in final edited form as: J Neurosci. 2010 April 28; 30(17): 6058–6071. doi:10.1523/JNEUROSCI.3956-09.2010. NIH-PA Author Manuscript NIH-PA Author Manuscript NIH-PA Author Manuscript
-
Upload
independent -
Category
Documents
-
view
4 -
download
0
Transcript of Aging-Related Gene Expression in Hippocampus Proper Compared with Dentate Gyrus Is Selectively...
Aging-Related Gene Expression in Hippocampus Propercompared to Dentate Gyrus is Selectively Associated withMetabolic Syndrome Variables in Rhesus Monkeys
E. M. Blalock*,1,†, R. Grondin*,2, K. C. Chen1, O. Thibault1, V. Thibault1, J. D. Pandya2,3, A.Dowling1, Z. Zhang2, P. Sullivan2,3, N. M. Porter1, and P. W. Landfield1
1Department of Molecular and Biomedical Pharmacology2Department of Anatomy and Neurobiology3Spinal Cord and Brain Injury Research Center
AbstractAge-dependent metabolic syndrome (MetS) is a well-established risk factor for cardiovasculardisease, but it also confers major risk for impaired cognition in normal aging or Alzheimer'sdisease (AD). However, little is known about the specific pathways mediating MetS-braininteractions. Here, we performed the first studies quantitatively linking MetS variables to agingchanges in brain genome-wide expression and mitochondrial function. In six young adult and sixaging female rhesus monkeys, we analyzed gene expression in two major hippocampalsubdivisions critical for memory/cognitive function (hippocampus proper, or cornu ammonis(CA), and dentate gyrus (DG)). Genes that changed with aging (aging-related genes, ARGs) wereidentified in each region. Serum variables reflecting insulin resistance and dyslipidemia were usedto construct a quantitative MetS index (MSI). This MSI increased with age and correlatednegatively with hippocampal mitochondrial function (state III oxidation). Over 2000 ARGs wereidentified in CA and/or DG, in approximately equal numbers, but substantially more ARGs in CAthan in DG were correlated selectively with the MSI. Pathways represented by MSI-correlatedARGs were determined from the Gene Ontology database and literature. In particular, upregulatedCA-ARGs representing glucocorticoid receptor (GR), chromatin assembly/histoneacetyltransferase, and inflammatory/immune pathways were closely associated with the MSI.These results suggest a novel model in which MetS is associated with upregulation ofhippocampal GR-dependent transcription and epigenetic co-activators, contributing to decreasedmitochondrial function and brain energetic dysregulation. In turn, these MSI-associatedneuroenergetic changes may promote inflammation, neuronal vulnerability and risk of cognitiveimpairment/AD.
Keywordsinsulin; histone modification; memory; Alzheimer's disease; mitochondria; inflammation;glucocorticoid
† To whom correspondence should be addressed: Phone: (859) 323-8033, Fax: (859) 323-1981.*These authors contributed equally to the present workSupplemental material: S1- alphabetical table of aging-related genes; S2- genes differentially expressed across region; S3- agingrelated genes in rhesus and rat; S4- Metabolic syndrome-correlated aging-related genes; Microarray data uploaded to Gene ExpressionOmnibus (www.ncbi.nlm.nih.gov/geo/) under accession number GSE11697
NIH Public AccessAuthor ManuscriptJ Neurosci. Author manuscript; available in PMC 2011 August 12.
Published in final edited form as:J Neurosci. 2010 April 28; 30(17): 6058–6071. doi:10.1523/JNEUROSCI.3956-09.2010.
NIH
-PA Author Manuscript
NIH
-PA Author Manuscript
NIH
-PA Author Manuscript
Metabolic syndrome (MetS), also termed insulin resistance syndrome, comprises aconstellation of age-dependent symptoms (insulin resistance and compensatoryhyperinsulinemia, atherogenic dyslipidemia, hypertension, and central obesity) thatcontributes to cardiovascular disease and is reaching epidemic proportions (Reaven, 2005).In addition, MetS is increasingly recognized to be a major risk factor for aging-relatedcognitive dysfunction or Alzheimer's disease (AD) (Yaffe et al., 2004; Fishel et al., 2005;Rivera et al., 2005; Gustafson, 2006; Craft, 2007; Whitmer et al., 2007). In the periphery,mitochondrial dysfunction accompanies MetS (Bugger and Abel, 2008), but it is unclearwhether MetS is also associated with energetic dysregulation in the brain. Several MetS-related variables have been linked to altered brain functions. Hyperinsulinemia, for example,can induce brain inflammatory responses, as well as stimulate some apparently beneficialeffects, such as beta amyloid clearance or improved cognitive performance (Fishel et al.,2005; Craft, 2006, 2007). Moreover, diabetes and insulin resistance are associated withneuronal Ca2+ dysregulation (Biessels et al., 2002; Verkhratsky and Fernyhough, 2008) orimpaired brain synaptic plasticity (Zhao and Alkon, 2001; Stranahan et al., 2008a). Further,glucocorticoids, which likely contribute to peripheral insulin resistance (Seckl and Walker,2004; Pedersen et al., 2006), also play a role in brain aging and cognitive impairment(Landfield et al., 1981; Issa et al., 1990; Lupien et al., 1998; McEwen et al., 1999; Sapolsky,1999; Seckl and Walker, 2004; Landfield et al., 2007; Piroli et al., 2007; Stranahan et al.,2008b; Bizon et al., 2009).
Nevertheless, the complex interactions of peripheral MetS with brain aging and memory arestill poorly understood. One approach to analyzing complex systems is microarrayexpression profiling, a powerful technology that allows simultaneous assessment ofthousands of genes and identification of multiple processes/pathways (Dennis et al., 2003;Mirnics and Pevsner, 2004; Blalock et al., 2005). In neuroscience, genome-wide profilinghas been used effectively to elucidate brain processes affected in normal aging (Lee et al.,2000; Blalock et al., 2003; Lu et al., 2004; Verbitsky et al., 2004; Burger et al., 2007; Roweet al., 2007; Xu et al., 2007; Berchtold et al., 2008; Duce et al., 2008; Kadish et al., 2009)and AD (Dickey et al., 2003; Blalock et al., 2004; Ginsberg et al., 2006).
Here, we performed the first study of aging-dependent associations between brainexpression profiles, brain mitochondrial function and peripheral MetS variables. Rhesusmonkeys were used for this study as aging rhesus monkeys develop multiple MetS-likesymptoms and frequently, MetS or type 2 diabetes (Tigno et al., 2004), as well as age-related cognitive decline similar to that in humans (Rapp and Amaral, 1991; Cai andArnsten, 1997; Moss et al., 1997; Lacreuse et al., 2005). Gene expression was analyzed inthe hippocampus proper (cornu ammonis, CA) and the dentate gyrus (DG), two regionscritical for spatial memory and plasticity functions in multiple species (Moser and Moser,1998; Hampson et al., 1999; Burke and Barnes, 2006; Lynch et al., 2006; Disterhoft and Oh,2007), including rhesus monkey (Porrino et al., 2005; Deadwyler et al., 2007; Skaggs et al.,2007; Hampson et al., 2009). The results reveal intriguing new candidates for roles in MetS-associated brain dysfunction, and perhaps in selective CA vulnerability.
Materials and MethodsSubjects
Six young (7.0 ± 0.3 years old) and six aged (23.5 ± 0.7 years old) female rhesus monkeys(Macaca mulatta) were used in this study. The monkeys were obtained from a breedingcolony (Covance, Alice, TX) at least 8 months prior to tissue collection and housed inindividual primate cages at the University of Kentucky primate facility, which is fullyaccredited by the Association for Assessment and Accreditation of Laboratory Animal Care(AAALAC). Animals were selected for this study on the basis of age, and peripheral MetS
Blalock et al. Page 2
J Neurosci. Author manuscript; available in PMC 2011 August 12.
NIH
-PA Author Manuscript
NIH
-PA Author Manuscript
NIH
-PA Author Manuscript
variables were not assessed at the start or used to determine subject inclusion. Animals wereprovided toys and other devices for enrichment and had individual access to an exercisemodule adjacent to their housing module, several hours a week. All procedures wereapproved by the University of Kentucky's Animal Care and Use Committee, andveterinarians trained in nonhuman primate care supervised animal health. Animals weremaintained on a 12h/12h light/dark cycle in temperature-controlled rooms. They were fedcertified nonhuman primate chow given in the morning and supplemented in the afternoonwith fresh fruit or vegetables. Water was available ad libitum. Based on prior workconsidering age-at-puberty, brain volume, and longevity (Tigges et al., 1988; Gore andTerasawa, 1991; Andersen et al., 1999), it is estimated that one year of rhesus life is roughlyequivalent to three years of human life. Therefore, the young animals here corresponded to∼21 year-old humans, while the aged cohort corresponded to ∼70 year-old humans.
Behavioral trainingBeginning six weeks prior to tissue collection, the 12 animals were trained and evaluated onbehavioral tasks, first for two weeks on a hand retrieval/ motor coordination task (Zhang etal., 2000), and subsequently, on an aging-sensitive cognitive memory task, the variabledelay response (VDR- Cai and Arnsten, 1997). This latter phase was staggered and timedsuch that the fourth and last test session was carried out just prior to euthanizing the animal.A significant age-related decline in motor performance was found on the initial task, butthose data are beyond the scope of the present paper and will be presented in a subsequentpublication on motor functions in these animals. In addition, a significant age-related declinein performance was also seen on the VDR task. However, this decline did not show theestablished age-dependent specificity for longer delay intervals (Rapp and Amaral, 1991;Cai and Arnsten, 1997; Lacreuse et al., 2005; Hampson et al., 2009), and instead was foundacross all delays tested (data not shown). Further, VDR data did not significantly correlatewith mitochondrial function (p > .6) or the MSI (p > .5), and the microarray-behavioralcorrelations showed high false discovery rates (> 1.5 in both CA and DG regions).Consequently, aging effects on cognition might have been partially obscured by one or morefactors, potentially including motor deficits (Cai and Arnsten, 1997), practice effects(‘overtraining’ Lacreuse et al., 2005; Walton et al., 2008) or low cognitive load (Deadwyleret al., 2007; Hampson et al., 2009), and are not presented here (data available on request).
Tissue harvestingAll animals appeared healthy and alert prior to euthanasia. Animals were sedated (50-100mg ketamine HCl, i.m.) and venous blood was collected for further analysis as describedbelow. Animals were then fatally overdosed (250-300 mg sodium pentobarbital i.v). Therewas no difference in time to death, nor was there an apparent agonal state in any subject.There also was no significant age difference in lethal dosage: Young 54.8 ± 5.3 mg/kg;Aged 46.1 ± 6.3 mg/kg; p = 0.33; Student's t-test). Following pentobarbital injection, brainswere quickly removed (5-10 minutes), placed ventral side up in an adult rhesus brain mold(Ted Pella, Inc., Redding, CA), and sectioned into 4mm-thick coronal tissue slabs. Thebrains were sectioned both rostrally and caudally starting at the level of the optic chiasm inall animals. The left side of each slab was notched to maintain orientation, and the slabswere removed from the mold in the rostral to caudal direction. Slabs were then placed inPetri dishes containing ice-cold mitochondrial isolation buffer composed of 215mMmannitol, 75mM sucrose, 0.1% BSA, 20mM HEPES, 1mM EGTA, pH 7.2. The righthippocampus was dissected for mitochondrial assays and the left for gene expressionmicroarray analysis as described below.
These anesthetic procedures raise a caveat regarding the data on aging-related mitochondrialfunction reported below, which is that the results could in part reflect an interaction of age
Blalock et al. Page 3
J Neurosci. Author manuscript; available in PMC 2011 August 12.
NIH
-PA Author Manuscript
NIH
-PA Author Manuscript
NIH
-PA Author Manuscript
with the anesthetic. It has been shown that inhalational anesthetic agents can directly impairmitochondrial activity (Yang et al., 2008; Wei and Xie, 2009). However, that effect has notbeen associated with intravenous pentobarbital (Short and Young, 2003) and further studieswill be needed to clarify this issue.
Peripheral metabolic markersTwo aliquots of venous blood were collected (5 ccs each, BD vacutainer #367820, BD,Franklin Lakes, NJ) from each animal after ketamine-induced anesthesia and prior to fataldosing with pentobarbital. Collected blood was chilled on ice for 30 min and centrifuged (10min at 1000 × g at 4 °C) to isolate serum. Serum from each subject was divided forsubsequent analysis (Antech Diagnostics, Memphis, TN) as follows: 1ml for SuperChem(catalogue # SA010, standard electrolyte, protein, glucose, insulin and cholesterol assay;stored at -20 °C); 0.2 ml for Lipoprotein Electrophoresis (catalogue # 85552; stored at 4 °C);and 0.3 ml for Insulin/ Glucose (catalogue # T470; stored at -20 °C). Serum pH was notmeasured here, but is another variable potentially linked to MetS (Maalouf et al., 2007).
Composition of the peripheral metabolic syndrome index (MSI)The MSI used here comprised three equally-weighted components that are symptomatic ofMetS (Reaven, 2005). For each animal, insulin/glucose ratios were calculated from themeasures of insulin divided by glucose. Because a higher ratio indicates increased insulinresistance, these ratios were ranked across animals from lowest to highest, and this rankingcontributed 1/3 of the total peripheral metabolic syndrome index. The second componentwas based on the ratio of triglyceride concentration from the SuperChem analysis to theHigh Density Lipoprotein concentration (type 1 and 2 summed) from the lipoproteinelectrophoresis determinations. Increased triglyceride/ HDL ratios are characteristicsymptoms of metabolic syndrome, and these ratios were ranked and used as the secondcomponent of the MSI. The final component was chylomicron concentration from thelipoprotein electrophoresis panel. Elevated chylomicrons are highly atherogenic and alsoindicative of metabolic syndrome (Reaven, 2005), and were ranked and incorporated as thethird and final component. The MSI was calculated as the overall sum of ranks of the threecomponents. However, it should be emphasized that a high score on the MSI does not aloneconstitute a diagnosis of MetS, as the latter generally also requires evidence of impairedfasting glucose and insulin resistance, as well as elevated blood pressure and obesity(reviewed in Ding et al., 2007). Thus, although monkeys in the present study varied fromhigh to low on an index of key MetS-related variables, and those with the highest valueslikely had MetS, their MetS status was not diagnosed formally.
Mitochondrial functional assayIsolation—Mitochondria enriched preparations from right hippocampus were madeaccording to standard procedures (Jin et al., 2004; Sullivan et al., 2004; Sullivan et al.,2007). Briefly, hippocampal tissue was homogenized in 2 ml ice-cold isolation buffer(215mM mannitol, 75mM sucrose, 0.1% BSA, 20mM HEPES, 1mM EGTA, and pHadjusted to 7.2 with KOH), and centrifuged twice at 1,300 × g for 3 min at 4°C in anEppendorf microcentrifuge. Each supernatant fraction was then topped off with isolationbuffer and centrifuged at 13,000 × g for 10 min. The resultant pellet was then re-suspendedin 500 μL of isolation buffer and burst in a nitrogen cell disruption bomb (model 4639; ParrInstrument Co., Moline, IL), at 4°C for 10 min at 1200 psi. The obtained crudemitochondrial fraction was then placed on a top of discontinuous Ficoll gradient (layered 2ml of 7.5% ficoll solution on top of 2 ml of 10% ficoll solution), and centrifuged at 100,000× g for 30 min using an ultracentrifuge (Beckman Coulter) as described earlier (Lai andClark, 1979; Sullivan et al., 2004). The mitochondrial pellet was suspended in isolation
Blalock et al. Page 4
J Neurosci. Author manuscript; available in PMC 2011 August 12.
NIH
-PA Author Manuscript
NIH
-PA Author Manuscript
NIH
-PA Author Manuscript
buffer (without EGTA), centrifuged for 10 min at 10,000 × g, and stored on ice until furtheruse for mitochondrial respiration assessment. The protein concentration was determinedusing the BCA protein assay kit by measuring absorbance at 560 nm with a Biotek SynergyHT plate reader (Winooski).
Respiration Measurement—Mitochondrial respiration was assessed using a miniatureClark-type oxygen electrode (Hansatech Instruments, Norfolk, UK) in a sealed,thermostatically controlled (at 37°C), and continuously stirred chamber as describedpreviously (Sullivan et al., 2003). Approximately 75-100 μg of mitochondrial protein wereadded into the chamber containing 250 μl of KCl-based respiration buffer (125mM KCl, 2mM MgCl2,2.5 mM KH2PO4, 0.1% BSA, 20mM HEPES, pH 7.2) as described previously.State II respiration was initiated by the addition of oxidative substrates pyruvate (5 mM) andmalate (2.5 mM). State III respiration was initiated by the addition of 150 μM ADP followedby the addition of oligomycin (1 μM) to induce state IV respiration. The mitochondrialuncoupler carbonyl cyanide 4-(trifluoromethoxy) phenylhydrazone (FCCP; 1 μM) wasadded to the chamber to allow for quantification of complex I driven, maximum electrontransport (State V). The complex I inhibitor rotenone (0.8 μM) was then added to thechamber, followed by the addition of succinate (10 mM) to allow for quantification ofcomplex II driven maximum electron transport. The respiratory control ratio (RCR) wascalculated by dividing state III respiration (presence of ADP) by state IV respiration(presence of 1 μM oligomycin and absence of ADP). The RCR is a very sensitive measureof “coupling” between electron transport (oxygen consumption during state III; in thepresence of ADP) to proton leakage (indicated by State IV) across the inner mitochondrialmembrane. Amount protein extracted, State IIII mitochondrial respiration and RCR arereported in this work, and other data are available upon request.
MicroarraysThe left hippocampal region was dissected from each subject and placed in cooled (0° C),95% O2/ 5% CO2 (‘carbogen’) gas-charged artificial cerebrospinal fluid (aCSF- in mM: 114NaCl, 2 KCl, 8 MgCl2, 30 NaHCO3, 10 glucose, 2 CaCl2) and transferred to a sub-dissection station. Here, the hippocampal region was placed in a chilled glass petri dish,immersed in chilled (0 °C) aCSF, and Cornu Ammonis (CA) and dentate gyrus (DG) regionswere sub-dissected with a scalpel, stored separately in 1.5 ml Eppendorf tubes, flash frozenon dry ice, and transferred to a -80 °C freezer until further use. For each animal (N = 12),one hippocampal CA region and one hippocampal DG region were collected. Each tissuesample underwent RNA extraction, purification, and cDNA labeling separately, as describedpreviously (Blalock et al., 2003; Blalock et al., 2004; Rowe et al., 2007; Kadish et al., 2009),according to standard Affymetrix procedures. Labeled cDNA for each region from eachsubject was individually hybridized to recently-developed rhesus Affymetrix microarraychips (Duan et al., 2007). Thus, for 12 animals in this study, there were 24 microarrays.Based on quality control assessments including standard Affymetrix measures and residualsign analysis (Affy PLM- Bolstad et al., 2005), one aged animal DG microarray (animal ID#669) was removed from the study for poor hybridization characteristics (Scaling factor4.06, % Present 47.57). Among the remaining 23 arrays, there were no significantdifferences in quality control parameters across age: Scaling factor (Y: 2.20 ± 0.10, A: 2.23+/- 0.11); %Present (Y: 54.14 ± 0.47, A: 53.98 ± 0.42).
Pre-statistical filteringThe MAS5 probe level algorithm was applied using Gene Expression Console (v 1.1,Affymetrix), to generate signal intensity values and presence/absence calls for each probeset on each chip. Signal intensities > 2 SD from the mean for each group were treated asmissing values and only probe sets/ genes with ‘A’ grade annotation and > 3 presence calls
Blalock et al. Page 5
J Neurosci. Author manuscript; available in PMC 2011 August 12.
NIH
-PA Author Manuscript
NIH
-PA Author Manuscript
NIH
-PA Author Manuscript
(gene expressed in > 3 subjects) were retained for further analysis (Fig. 2). Values weretransferred to Excel (2003, Microsoft), Bioconductor (Gentleman et al., 2004), andMultiExperiment Viewer (MEV, Saeed et al., 2003) for subsequent analysis. The Affymetrixrhesus GeneChip contains 52,865 probe sets. These were annotated using Affymetrixinformation, with 13,287 probe sets rated ‘A’ grade annotation (confirmed gene). Of these,7,623 were rated present (> 3 presence calls) in our study and tested statistically. Thecomplete data set including signal intensity, presence/absence calls, and cel files, is availablefor download from the Gene Expression Omnibus (accession #GSE11697).
StatisticsAging effects in CA and DG were assessed separately with non-paired heteroschedastic two-tailed t-tests between young and aged subjects. Age-group means, SEMs, direction ofchange, and p-values are reported alphabetically for each gene found to differ significantly(α = 0.05) with age (Supplemental Table 1). Because CA and DG brain regions wereisolated from the same subjects, a paired, two-tailed t-test was used to detect regionaldifferences in expression (omitting CA tissue microarray for aged animal ID# 669 becauseits paired partner DG microarray was removed due to poor quality- see above)(Supplemental Table 2). Results for each t-test analysis are interpreted in the context ofmultiple testing error by reporting the median False Discovery Rate (FDR) (Benjamini et al.,2001) for the overall test. Multiple testing error was assessed at the t-test level and otherstatistical procedures were performed post hoc. Similarity between aging transcriptionalprofiles in this non-human primate study and previous rodent aging studies (Blalock et al.,2003; Rowe et al., 2007; Kadish et al., 2009) was assessed using a binomial analysisprocedure (Blalock et al., 2005; Norris et al., 2005) given by:
where n = number of genes tested (all genes rated present in the four studies); x = number ofgenes found to be significantly changed with age in both rodent and non-human primatestudies (Supplemental Table 3), and p is the probability of any gene being assigned to theoverlap by chance, was employed. Using this procedure, a p-value was calculated reflectingthe probability that the number of genes found in the overlap could have arisen by chance. Inaddition, the MSI was tested for a significant correlation (α = 0.05, Pearson's test) with allgenes identified as age-related in the statistical aging comparisons (Supplemental Table 4).
Functional process/pathway analysisGene lists were analyzed for significant overrepresentation of functional processes/pathways, as described previously (Blalock et al., 2004; Rowe et al., 2007; Kadish et al.,2009). Functional categorization was assessed using the DAVID overrepresentationclustering analysis tool (Dennis et al., 2003; Huang da et al., 2009) on the Gene Ontology(GO) databases of Biological Process, Cellular Component, and Molecular Function(Ashburner et al., 2000). To reduce redundancy, only a single significant (α = 0.05) process/component/function populated by between 3 and 50 genes is reported for each cluster ofsimilar overrepresented processes.
Blalock et al. Page 6
J Neurosci. Author manuscript; available in PMC 2011 August 12.
NIH
-PA Author Manuscript
NIH
-PA Author Manuscript
NIH
-PA Author Manuscript
ResultsPeripheral metabolic measures (Table 1)
Blood chemistry panels in young and aged monkeys were used to assess metabolic status(Methods). Each blood panel variable was assessed individually for aging effects and extentof correlation with brain global gene expression. Of the serum measures, insulin andtriglycerides (TGs) showed significant aging effects in the rhesus monkeys, whereas HDLand chylomicrons showed near-significant effects, and glucose (p = 0.83) did not differ withage (Table 1). Somewhat surprisingly, triglyceride rather than insulin concentrationexhibited the most robust serum effect of age (p = 0.00019) and was correlated with themost ARGs of any MSI component variable (data not shown). Insulin's actions in the livercan stimulate synthesis of TGs (Adeli et al., 2001), which have a longer half-life thaninsulin. Therefore, TG measures may provide a more accurate index of integratedcumulative insulin action over extended periods than single-point measures of insulin.
Metabolic syndrome index (MSI: Figure 1a)Because it is not known which MetS components are most closely associated with alteredneural gene expression levels and other brain processes in humans, in the present study weused a metabolic syndrome index (MSI) comprising ranked and equally weightedcontributions of three measures: triglyceride/ HDL ratio, insulin/ glucose ratio andchylomicron concentration (Fig. 1a). Elevation of these measures reflects insulin resistanceor atherogenic dyslipidemia associated with MetS, and related markers are widely used toevaluate onset of metabolic syndrome/diabetes (Reaven, 2005). Moreover, rhesus monkeysshow an age-related elevation of similar metabolic markers (Tigno et al., 2004). There was asignificant increase with age in insulin/ glucose ratio, triglyceride/ HDL ratio, and a trendfor chylomicron density to increase with age, resulting in a highly significant aging-relatedincrease in the consolidated MSI (Fig. 1a, far right; p = 0.002). The consolidated MSI valueswere used for subsequent correlation analyses with microarray and mitochondrial functionalvariables. As noted, the variables comprising the MSI were selected to measure varyingdegrees of MetS development (and subsequent diabetes) in rhesus monkeys, rather than todiagnose full-blown MetS.
Hippocampal mitochondrial function (Fig. 1b)The right hippocampus was used to assess mitochondrial function (state III oxidation,protein and RCR), according to previous protocols (see Methods, Sullivan et al., 2007).State III oxidation levels assess the oxidative capacity of mitochondrial extract by measuringproduction of ATP per unit extracted protein, while RCR is a sensitive measure of thecoupling between electron transport and proton leakage. There was a significant, 37% age-related decrease in state III oxidation, and no significant difference in RCR or protein yield.This suggests that the number (or activity) of functional mitochondria is decreased with age,but that those remaining aged mitochondria maintain normal proton-electron couplingbehavior.
Relationship between metabolic syndrome and hippocampal mitochondrial function (Fig.1c)
In the present work, hippocampal mitochondrial activity (Fig. 1b) and peripheral bloodcomponents reflecting MetS (Fig. 1a) both showed significant alteration with age. Todetermine whether an elevated MSI specifically predicted brain bioenergetic function, acorrelation analysis was performed between the two variables. This demonstrated a highlysignificant negative correlation between magnitude of the MSI and mitochondrial oxidativefunction (Fig. 1c), suggesting close association of peripheral and brain functional variables.
Blalock et al. Page 7
J Neurosci. Author manuscript; available in PMC 2011 August 12.
NIH
-PA Author Manuscript
NIH
-PA Author Manuscript
NIH
-PA Author Manuscript
Transcriptional profiling (Fig. 2)The left CA and DG regions from each subject were sub-dissected apart (Methods), andeach region was processed separately on an individual microarray (two microarrays persubject, 12 subjects = 24 arrays). The newly developed Affymetrix rhesus gene expressionmicroarray was used to quantitatively interrogate thousands of genes in parallel. In order toreduce multiple statistical testing of the more than fifty thousand probe sets on the rhesusarray, and to focus on probes/genes with biological information, and exclude redundantprobes, we filtered data prior to statistical analysis (Fig. 2A- left). Similar to previous studies(Blalock et al., 2003;Blalock et al., 2004;Norris et al., 2005;Rowe et al., 2007;Kadish et al.,2009), only unique, ‘A’-grade annotated probe sets rated present were retained for statisticalanalysis (see Methods). To evaluate intra-subject variability, interquartile ranges and SEMsfor each microarray were calculated. Overall, there was no significant difference ininterquartile signal intensity range (1262.4 in Young vs 1262.1 in Aged) or SEM (30.24 inYoung vs 30.19 in Aged) with age.
Three separate t-tests were performed on the overall data set. Young and Aged subjects werecollapsed for a paired t-test across CA and DG regions, whereas two non-paired t-tests wereused to test for aging effects separately within the CA and DG regions. The false discoveryrate (FDR), used to correct for the error of multiple testing and/or gauge the relative strengthof findings (Benjamini et al., 2001; Reiner et al., 2003), was estimated for each of thesetests, using a single type I error cutoff (α = 0.05). All tests appeared to provide goodstatistical confidence (FDRs = 0.02, 0.29 and 0.27, respectively) for a microarray analysis,in which added confidence derives from co-regulation of related genes (Mirnics andPevsner, 2004; Blalock et al., 2005). In the present work, it is clear that the regional test (CAvs. DG) found many more genes than either the CA or DG aging tests (Fig. 2A- right).However, it should be noted that the three tests were not equivalently powered. The regionaltest employed the generally more powerful paired statistical design and used 22 arrays, asopposed to the 11 used in the DG analysis and 12 in the CA analysis (Methods).Nonetheless, test structure alone appears unlikely to explain the large differences in numbersof genes discovered.
Aging-related genes (ARGs) in CA and DG (Fig. 2; Supplemental Table 1)Although several studies in rodents have examined aging-related gene expression changes inwhole hippocampus (Verbitsky et al., 2004), dorsal hippocampus (Rowe et al., 2007), theCA1 region (Blalock et al., 2003; Burger et al., 2007; Kadish et al., 2009) and the DG region(Burger et al., 2008), none has quantitatively contrasted CA and DG in the same animals.Here, genes whose expression differed significantly (α = 0.05) with age in either the CA orDG regions were defined as aging-related genes (ARGs). These were categorized into thefollowing three subsets: significantly different with age in 1) both regions (‘both’), 2)selectively in the CA region (‘CA’), and 3) selectively in DG (‘DG’). Each sub-set ofidentified genes was separated into up- and down-regulated categories. From a total of 7,623filtered gene candidates, the CA region showed 1027 (13.5%) significant ARGs, while theDG region showed 996 (13.1%). To determine whether the two regions showed alterationsin a common subset of genes, we performed an ‘overlap’ analysis between the ARG lists forthe regions. In this analysis, if the genes altered with age in CA changed independently ofthose in DG, then the probability of common (‘overlapping’) genes is given by the productof their independent probabilities (13.1% × 13.5% = 1.8%). Thus, by chance, 1.8% percentof the total candidate list (7,623 × 1.8% = 135 genes) would be expected in the overlap. Infact, 372 genes were found to change with aging in both regions, nearly 3-fold more thanexpected by chance (p = 3.6-8; binomial test), indicating a strong common regulation ofmany genes in CA and DG. Bolstering this conclusion was the observation that all but twoof the 372 overlapping genes (Rpl7 and Srcap) agreed in direction of change between the
Blalock et al. Page 8
J Neurosci. Author manuscript; available in PMC 2011 August 12.
NIH
-PA Author Manuscript
NIH
-PA Author Manuscript
NIH
-PA Author Manuscript
two regions. Further, an overlap analysis of this type requires low p-values in each list,resulting in substantial false negatives and likely underestimates actual overlap. All aging-related genes, regardless of region, are listed alphabetically by gene symbol and proteinname in Supplemental Table 1, with mean expression values for age and region and otherstatistical data.
Functional pathways/processes represented by ARGs (Fig. 2)Functional grouping analysis (DAVID- Methods) was used to identify significantlyoverrepresented (α = 0.05) functional processes within CA and DG regional subsets ofARGs. Identified processes are shown in Fig. 2 and, for the both-regions-subset of ARGs,included increased hydrolase activity and anion transport and decreased protein modificationand folding processes. Processes selectively overrepresented by ARGs identified in CAincluded a large immune response category. This confirms that, in the nonhuman primate,inflammatory/immune changes occur in the hippocampus with aging that are similar to thoseseen in white matter of monkeys (Duce et al., 2008), and the neocortex/hippocampus ofaging humans (Lu et al., 2004;McGeer and McGeer, 2004;Parachikova et al., 2007) andaging rodents (Lee et al., 2000;Wyss-Coray and Mucke, 2002;Blalock et al., 2003;Mrak andGriffin, 2005;Burger et al., 2007;Gemma and Bickford, 2007;Rowe et al., 2007;Kadish etal., 2009). Other CA upregulated processes included the integrin pathway and cell surfacereceptor signaling, altered chromatin architecture (suggestive of long-term epigeneticmodulation) and transcriptional regulation. Downregulated functional processes in CAincluded transporter, nuclease, and enzyme regulator activity, as well as an age-relateddecrease in components of the cytoskeletal system. In the DG region of the rhesushippocampus, upregulated genes were significantly associated with pathways for lipolysis,proteolysis, redox reactions, and protein transport, while downregulated genes wereassociated with calcium homeostasis, extracellular matrix, ubiquitination and braindevelopment.
Regional differences in expression (Fig. 2; Supplemental Table 2)Several studies have found that transcriptional profiles are highly discriminant amongdifferent brain regions (Lein et al., 2004; Xu et al., 2007; Zahn et al., 2007), and our resultshere support these observations for the CA and DG regions of the hippocampus (Lein et al.,2004; Greene et al., 2009). In fact, nearly half of all genes tested were found to bedifferentially expressed between the two regions at α = 0.05. To further elucidate regionaldifferences in expression patterns, we also performed pathway analysis, identifyingprocesses overrepresented by genes expressed more in CA or in DG (Fig. 2, lower).Notably, the CA region showed greater expression than DG for genes associated withinflammatory responses and mitochondrial activity, mRNA translational capacity, lipidmetabolism, and lysosomal degradation pathways, whereas the DG region exhibited greaterexpression of genes associated with synaptic activity, neuronal development, and apoptosis.These results suggest that the DG region may contain a more homogeneous population ofcells that is predominately neuronal, while the CA region is more heterogeneous, containinga greater proportion of astrocytes, oligodendrocytes and microglia. However, it is alsohighly likely that the regional signatures reflect processes associated with some of theunique properties of resident neuronal types, for example, the DG granule neurons’ capacityfor adult neurogenesis and their unusually large mossy fiber terminals. The full list ofregionally differentially expressed genes is given in Supplemental Table 2.
Agreement with prior rat aging studies (Fig. 3; Supplemental Table 3)To test the possibility that transcriptional profiles associated with hippocampal aging in along-lived nonhuman primate share some common patterns with those in a rat model ofaging, we performed an overlap analysis of genes that changed with aging in both species
Blalock et al. Page 9
J Neurosci. Author manuscript; available in PMC 2011 August 12.
NIH
-PA Author Manuscript
NIH
-PA Author Manuscript
NIH
-PA Author Manuscript
(Fig. 3), comparing the present rhesus data with prior rat data that had been obtained in ourlab employing similar methods. Our three prior rat hippocampal aging studies (Blalock etal., 2003;Rowe et al., 2007; and Kadish et al, 2009) were combined for this comparison.Despite considerable differences in annotation, a list of 1541 unique, present, annotatedprobe sets common to the Affymetrix Rat RG-U34A, Rat RAE 230A, and rhesusmicroarrays was identified. Of these, 555 of the 1541 genes were found to have changedsignificantly in at least one of the rat studies, establishing a probability of 555/1541 (36%)for ARGs among genes expressed in the F344 rat hippocampus. In addition, 404 of the 1541common genes were found to change with aging in at least one region in the present rhesusstudy, yielding an ARG probability of 404/1541 (26%). The probability that genes would befound to be similarly regulated in both species by chance is the product of their independentprobabilities (36% for rat aging and 26% for rhesus aging, divided by two to account fordirectional agreement; 36%*26%*0.5 = 0.047). Thus, by chance, we would expect 72 genes(0.047*1541) to agree in direction between the two studies. However, the observed 101commonly regulated genes (Fig. 3) are significantly greater than expected by chance (p =3.8-4; binomial test), indicating that aging induces at least some common hippocampaltranscriptional signatures across mammalian species.
Nevertheless, the overlap number (101 genes), although greater than chance, representedonly a small proportion of the age-related genes and was weaker in comparison to theregional overlap analysis described above. As noted, the ‘overlap’ number is likely asubstantial underestimate. That is, the analysis sets a high criterion of confidence that genesmust fulfill to be identified as overlapping (α = 0.05 in both species) and is therefore subjectto high false negative rates (Blalock et al., 2005). Consequently, we tested whether relaxingthe p-value criterion improved the overlap. However, although the number of overlappinggenes inevitably increases with relaxed p-values, the ratio of number of genes found in theoverlap vs the number of genes expected in the overlap by chance showed a strongdeflection toward chance values at p-value cutoffs above 0.05. Therefore, reliability worsensrapidly at p-values above 0.05 (Fig. 3, upper), reducing confidence in the overlap list.
Apart from statistical considerations, a number of other factors could account for therelatively low overlap between ARGs in monkeys and rats, including the possibility that indifferent species aging changes in different molecular isoforms or slightly differentpathways might have similar consequences. Another possibility is that different proportionsof cellular components (e.g., neurons-to-glia) might obscure some cell-type-specificchanges. Alternatively, aging changes in rat brain may not be a good model for changes inprimate brain. However, the first possibility above gains support from the observation thatthere is substantial functional similarity between the hippocampal pathways that are up- anddown-regulated in the rhesus (Fig. 2, middle) and those up- and down-regulated in the rat(e.g., Table 3 in Kadish et al, 2009). The analogous pathways in the different species arefrequently populated by ARGs that are isoforms (e.g., Pdk3 in monkey, Pdk2 in rat) or thatmodulate related functions. On the other hand, not all aging-related pathways in the rat showsimilar changes in the rhesus. For example, astrocyte reactivity and cholesterol transportgenes, identified in rat hippocampus as ARGs (Blalock et al, 2003;Rowe et al, 2007), werenot widely detected in the present study. Nevertheless, further studies will be required todetermine the extent of similarity in aging-related expression profiles across species.
Because the list of 101 overlapping genes is somewhat small for pathway analysis, examplesof up- and down-regulated overlapping genes that are representative of larger pathways arepresented in Fig. 3. The complete list of 101 common overlapping aging-related genes, aswell as lists of genes changing exclusively in rat or rhesus aging, with expression data andstatistical values is provided in Supplemental Table 3.
Blalock et al. Page 10
J Neurosci. Author manuscript; available in PMC 2011 August 12.
NIH
-PA Author Manuscript
NIH
-PA Author Manuscript
NIH
-PA Author Manuscript
Metabolic syndrome index (MSI) correlations with hippocampal ARG expression (Figure 4;Supplemental Table 4)
To identify age-related changes in gene expression associated with the peripheral metabolicindex, we performed Pearson's correlation tests between the MSI and each ARG. MSI-correlated ARGs were then grouped according to whether they changed with age within CAonly, within DG only, or within both regions, and were subdivided based on direction ofcorrelation (positive or negative). The number of genes selectively regulated with age ineach region category, followed by the percent of the those genes also correlated with MSI inparentheses, was as follows: upregulated in both CA and DG regions, 90 (44.5%);downregulated in both CA and DG regions, 66 (39.2%); upregulated in CA region only, 255(63.6%); downregulated in CA region 199 (66.8%); upregulated in DG region only, 149(47.5%); downregulated in DG, 138 (39.4%). Among genes not identified as ARGs (5,748),only 164 (3% of the total list) were significantly correlated with MSI, well below the 5% (p= 0.05) expected from the error of multiple testing. Therefore, MSI-correlated non-ARGsappear to be present largely because of error from multiple testing, and are not shown here.Complete lists of MSI-correlated ARGs organized by region are given in SupplementalTable 4.
Aging vs. MSI association with ARGsBecause the metabolic syndrome index (MSI) changed significantly with age, the twovariables are not independent and aging-related genes (ARGs) might be associated primarilywith age, MSI, or some combination of the two. To clarify which genes were more closelylinked to MSI we have separately listed the MSI-correlated and the MSI-non-correlatedARGs (Supplemental Table S4). MSI-non-correlated ARGs are more likely to representaging changes independent of MSI associations, whereas MSI-correlated ARGs are morelikely to be linked to MetS variables. In addition, to further assess the degree to which agingaffected ARGs independently of the MSI, we compared the young animal with the highestMSI score (Y4, MSI = 16) to the aged animal with lowest MSI score (A10, MSI = 19). Thistwo-animal comparison minimized MSI but not age differences. Consequently, if age playeda major role apart from MSI in determining age changes, the direction of change from Y4(young) to A10 (aged) should strongly agree with the group-level ARG direction of change(directional agreement). Conversely, if ARGs were more widely related to MSI, then thedirectional agreement should be weak. For the 1027 significant ARGs in the CA region (inwhich the most MSI correlations were found), the two-animal contrast strongly agreed withgroup level data (86.5%; p = 1.24-133, binomial test). As a control comparison, directionalagreement between the two-animal contrast and the 1027 least significant genes was atchance levels (52.2%; p > .05, binomial test). This comparison indicates that many ARGsare associated with aging independently of associations with MSI, although some ARGshave a more specific relationship to MetS variables.
Functional pathways/processes overrepresented by MSI-correlated ARGsAll categories of MSI-correlated ARGs were then subjected to functional processoverrepresentation analysis, as was done for total ARGs. Figure 4 graphically displays thecorrelations of the MSI with the functional processes that met DAVID statistical criteria foroverrepresentation (α = 0.05, Methods), and lists the ARGs populating each identifiedprocess. To illustrate the patterns of correlation with functional processes, values of all MSI-correlated ARGs populating each identified functional process were standardized andaveraged, and the correlations of averaged ARGs with the MSI are plotted in Fig. 4.
MSI-correlated functional processes-CA region—The CA region containednumerically and proportionally more MSI-correlated ARGs than either the DG region or the
Blalock et al. Page 11
J Neurosci. Author manuscript; available in PMC 2011 August 12.
NIH
-PA Author Manuscript
NIH
-PA Author Manuscript
NIH
-PA Author Manuscript
‘Both’ category (see above). Moreover, DAVID analysis identified many more pathways/processes in CA than DG that were MSI- correlated, the preponderance of which wereupregulated (Fig. 4). Of these, the immune response was identified prominently, consistentwith its association with hyperinsulinemia (Craft, 2006). Also, a chromatin architecturecategory was prominently identified that contained multiple genes associated withepigenetic modification and histone acetyltransferase activity (Brd8, Ep400, Gtf2i, Hmgn2,Nap1l1, Nr3c1, Phf21a), some responsive to blood hormones/constituents (Brd8, Gtf2i,Nr3c1). This chromatin pathway category included Phf21a, a repressor of neuron-specificgene transcription that is upregulated in proliferating non-neuronal cells. Overall, thepopulating ARGs suggest that the source of these increases in epigenetic modification ARGsmay be at least partly non-neuronal in origin. Further, the spliceosome pathway (involved inremoving introns from nascent mRNA) and transcriptional factor ARGs were alsooverrepresented (Fig. 4), both suggesting that increased biosynthesis/mRNA processing inhippocampus may be associated with MetS. The overrepresentations of microtubuleorganization and lipid synthesis pathways may reflect changes in cytoskeletal structure andplasma membrane organization/ metabolism linked to the transcriptional alterations,whereas the downregulation of some nucleolar ARGs associated with transfer RNA andribosomal RNA production (Exosc5, Q8nd90, Rpp30, Rpp40, Utp11) could representadaptation of translational processes.
MSI-correlated Glucocorticoid Receptor (GR)/ Insulin signaling pathways-CAregion (Fig. 5)—The observation that Nr3c1, the gene encoding the GR, was upregulatedwith aging in CA (an ARG) and correlated with the MSI in CA, prompted inspection of thegene lists for similarly-regulated GR and insulin pathway ARGs. These two pathways exertopposing effects on many aspects of metabolism, and their efficacy ratio has been proposedto be important in brain aging (Landfield et al., 2007). Because the Gene Ontology and otherfunctional grouping databases are works in progress, their gene-to-function associations areoften incomplete in DAVID. Therefore, through literature search we manually curated aseparate cohort of MSI-correlated ARGs identified in CA that play important roles in theGR/insulin pathways. Along with Nr3c1 (alias GR) two downstream effectors known to bedriven by glucocorticoid (GC) signaling; Sgk (serum GC-regulated kinase) and Prkaa1/Ampk1 (5′-AMP-activated protein kinase catalytic subunit alpha-1), were also increasedwith age in CA and positively correlated with MSI. Further, Grlf1 (GR DNA binding factor1), a negative modulator of GR activity, was downregulated with age, suggesting the loss ofa GR suppressing mechanism. Concomitant downregulation of the insulin pathway issuggested by the increased expression of the insulin pathway negative regulator, Igfbp5(insulin-like growth factor binding protein 5), as well as the decreased expression of Akt3(alias protein kinase B), which is a major downstream effector of the insulin pathway. Forprocess correlation, these six CA ARGs were standardized and directions of changecoordinated (values inverted for the two downregulated ARGs, Grif1 and Akt3) such thatthey could be combined into a pathway that, when upregulated, reflected increased GC/insulin efficacy. Figure 5 graphically illustrates the substantial extent to which this GC/insulin ratio pathway correlated with MSI.
MSI-correlated functional processes-DG region—Upregulated MSI-correlatedpathways involved in protein transport (including Chm, Ipo9, Optn, Sec23b, Sec61g, Snx9,and Vti1b) could reflect increased endoplasmic reticulum stress related to misfolded proteinstransported through the endosomal pathway for degradation (Yoshida, 2007), or increasedglial activation, among other possibilities. Further, downregulated GPCR signaling isconsistent with patterns found previously in multiple studies of hippocampal aging in rats(e.g., Blalock et al., 2003; Kadish et al., 2009) but is also shown here to be pronounced inDG and to correlate with MetS.
Blalock et al. Page 12
J Neurosci. Author manuscript; available in PMC 2011 August 12.
NIH
-PA Author Manuscript
NIH
-PA Author Manuscript
NIH
-PA Author Manuscript
MSI-correlated mitochondrial-related ARGs—Consistent with MSI-correlatedmitochondrial dysfunction (Figs. 1b, 1c), multiple ARGs encoding mitochondrial proteinswere correlated in CA with the MSI (Table 2). As was done for the GR pathway describedabove, this functional category was compiled manually. Genes were tagged as‘mitochondrial’ via three approaches: 1) association with ‘mitochondria’ in the CellComponent section of the Gene Ontology; 2) classification in the recently publishedmammalian mitochondrial index of genes, ‘MitoCarta’ (Pagliarini et al., 2008); and 3)identification in PubMed searches. As compared to the DG, the CA region in generalshowed many more genes associated with mitochondrial function (Fig. 2) and correlatedwith MSI (Table 2). A number of downregulated mitochondrial genes, including Cmkt1b,Idh3b, Ndufa1, and Ogdh suggest decreased tricarboxylic acid cycle activity and oxidationof carbohydrates. Further, Pink1, which has been shown to protect mitochondria againstoxidative stress (Pridgeon et al., 2007) was correlated with MSI and downregulated with agein both CA and DG (Table 2, Supplemental Table 1). Consistent with this were selective DGincreases (Supplemental Table 1) in the expression of mitochondrial-related genesassociated with control of the fusion/fission ratio (Mfn2, Timm17a, Sels, Rab32, Acp6)(Hiroyama and Takenawa, 1999).
DiscussionThis is the first study to identify quantitative associations between genome-wide brainexpression profiles and peripheral MetS symptom variables. Given the wide-angle resolvingpower of microarray analysis, the data provide a uniquely comprehensive perspective onhippocampal pathways that may well be linked functionally to the progression of MetScomponents. Further, the present work may complement other recent studies relatingperipheral measures (diabetes and obesity) with central measures (brain imaging) (Raji etal., 2009). The results also reveal associations between brain gene expression and metabolicstatus that may reflect differential aging and vulnerability in specific regions of thehippocampal formation.
Hippocampal mitochondrial function and MetS variables with agingMany studies have found neuronal mitochondrial dysfunction with aging orneurodegenerative conditions, often linked to oxidative stress/inflammatory responses(Gibson et al., 2000; Smith et al., 2000; Blalock et al., 2003; Sullivan et al., 2003; Brown etal., 2004; Toescu and Verkhratsky, 2004; Gemma and Bickford, 2007; Brinton, 2008;Simpkins et al., 2008), and a few have found neuronal mitochondrial alterations related todiabetes (Verkhratsky and Fernyhough, 2008). In addition, the present study showed thatdecreased mitochondrial function in hippocampus was correlated quantitatively with anindex of MetS variables (Fig. 1c), indicating that peripheral MetS-related variables areassociated with brain energy dyshomeostasis (with the caveat that anesthetic agents usedhere might interact with age or metabolic status to influence mitochondrial measures-seeMethods). Furthermore, changes in numerous aging-related genes in CA or DG encodingmitochondrial proteins were correlated with MSI (Table 2). These mitochondrial ARGsincluded Pink1, which plays an important role in protecting cells against oxidative stress andapoptosis (Pridgeon et al., 2007). Clearly, however, additional research will be needed toclarify interactions of peripheral MetS variables with mitochondrial function inhippocampus.
Comparisons across brain regions and speciesIndependently of aging (i.e., combining age groups), nearly 40% of annotated genes showedsignificantly different expression in CA vs. DG, and the pathways represented by regionalexpression profiles also differed (Fig. 2, lower). Similar CA vs. DG microarray comparisons
Blalock et al. Page 13
J Neurosci. Author manuscript; available in PMC 2011 August 12.
NIH
-PA Author Manuscript
NIH
-PA Author Manuscript
NIH
-PA Author Manuscript
have been performed in rodents (Lein et al., 2004;Xu et al., 2007;Greene et al., 2009).However, it is unclear whether these regional differences reflect cell packing density,different proportions of glial vs. neuronal components, or unique properties of predominantcell types (e.g., capacity for neurogenesis and large mossy fiber terminals of granule cells),among other possibilities. Additional analyses will be needed to separate these contributions,as well as to determine the influence of several other relevant factors, including localizationalong the dorsal-ventral axis (Moser and Moser, 1998;Leonardo et al., 2006) andhemispheric lateralization (Shen et al., 2005).
The present study is also the first to analyze aging-related changes in global gene expressionin the hippocampal formation of a nonhuman primate, complementing a recent genome-wide study assessing aging changes in white matter of rhesus monkeys (Duce et al., 2008).There were pronounced differences in aging changes between the CA and the DG regions ofrhesus monkeys (Fig. 2, middle). A similar number of aging-related genes (ARGs) wereidentified in both regions, but the functional pathways represented by ARGs in each regiondiffered considerably (Results; Fig. 2-middle). Notably, we also found that substantiallymore ARGs in CA than in DG were correlated with MSI (Fig. 4). The CA pyramidalneurons and the DG granule neurons show somewhat distinct patterns ofelectrophysiological and cellular/molecular changes with aging (deToledo-Morrell et al.,1988; Burke and Barnes, 2006; Disterhoft and Oh, 2007; Foster, 2007; Thibault et al., 2007).Moreover, the CA is substantially more vulnerable to age-dependent neurodegeneration inAlzheimer's disease or ischemic insult (e.g., Arriagada et al., 1992; Braak et al., 1998;Mattson et al., 1999; McEwen, 2000), whereas the DG more prominently manifests someimaging/vascular changes with age (Small et al., 2004). Based on findings here, it appearspossible that some of the selective age-dependent vulnerability of CA neurons may arisefrom metabolic alterations associated with MetS-related variables (Figs. 4, 5), as discussedbelow.
To determine whether hippocampal aging changes in rhesus are similar to those in rodents,we compared present results with our prior work in rats. Although aging changes in genome-wide expression have been characterized in several studies of rodent brain (Prolla, 2002;Burger et al., 2007; Zahn et al., 2007; Burger et al., 2008; Haberman et al., 2009),methodological, design or platform differences make it difficult to compare those resultsagainst the present study. However, we compared the rhesus data against three rathippocampal microarray studies from our group employing similar approaches (Blalock etal., 2003; Rowe et al., 2007; Kadish et al., 2009). An overlap analysis showed more of thesame specific genes changed with aging in both rat and nonhuman primate hippocampusthan expected by chance (Results and Fig. 3), but the degree of overlap, while significant,was relatively small. Apart from statistical factors resulting in false negatives, several otherreasons might account for this low overlap of specific ARGs, including that differentmolecular isoforms participating in similar pathways may be affected by aging in differentspecies (e.g., Pdk3 in rhesus, Pdk2 in rats; Kadish et al, 2009). This appears consistent withthe observation that many analogous pathways appear to be altered with aging in rhesusmonkeys (Fig. 2) and rats (Table 3, Kadish et al, 2009). Another possibility is that differentproportions of neuronal and glial components between species might result in dilution andnon-detection of some cell-type-specific signals. This might account for the weak astrocytereactivity signals in rhesus hippocampus (Fig. 2) compared to the rat studies. Alternatively,the rat may not be a good model for some important aspects of primate brain aging. Furtherstudies will clearly be needed to resolve these complex questions.
MSI-associated pathways in CA: Immune/inflammationUpregulation of inflammatory/immune responses has been seen in multiple studies of brainaging/AD (see Refs. above), but its link to metabolic status is poorly understood. However,
Blalock et al. Page 14
J Neurosci. Author manuscript; available in PMC 2011 August 12.
NIH
-PA Author Manuscript
NIH
-PA Author Manuscript
NIH
-PA Author Manuscript
elevated insulin can induce immune molecules in brain (Fishel et al., 2005; Craft, 2006,2007), and the data here show that the hippocampal immune response is correlated withMetS variables, including hyperinsulinemia, in aging monkeys. Notably, the MSI-correlatedimmune response in monkey CA was characterized by a predominance of class II antigenpresenting molecules (Fig. 4, top), generally associated with microglial activation in thebrain (Sloane et al., 1999; Benveniste et al., 2001; Nakanishi, 2003). A similar upregulationof antigen-presenting molecules is seen in rat hippocampus during a midlife periodassociated with cognitive impairment (Kadish et al., 2009). Thus, upregulation of antigenpresenting molecules may play an important part in normal brain aging.
MSI-associated pathways in CA: GR signaling and chromatin modificationGC actions on the brain have long been suspected of a role in brain aging, cognitivedysfunction and AD. However, except under conditions of chronic stress (Eldridge et al.,1989), aging-related upregulation of brain GR has not been observed previously. Moststudies of GR in brain aging have been conducted in rodents (De Kloet et al., 1998;McEwen et al., 1999; Sapolsky, 1999), but the present data suggest that, in some primates,MetS variables during aging may be associated with elevated hippocampal GR. Results hereshow that the GR gene (Nr3c1) and several of its target genes (Prkaa1, Sgk) wereupregulated in CA with aging and were associated with MSI, whereas the GR repressor,Grlf1, and a major insulin pathway effector, Akt3, were downregulated with aging (Fig. 5).Interestingly, the GR target Prkaa1/Ampk encodes the adenosine monophosphate-activatedkinase (AMPK) that acts as a fuel sensor. When ATP is low, AMPK activity and expressionare upregulated, decreasing glucose oxidation and increasing lipolysis and fatty acidoxidation (Lage et al., 2008), thus contributing to mitochondrial dysfunction (Leverve et al.,2003; Rossmeisl et al., 2004; Kiens, 2006; Reznick and Shulman, 2006). Given that themetabolic actions of GCs and insulin are frequently antagonistic, these findings raise thestriking possibility that upregulated GR signaling (perhaps coupled with decreased insulinsignaling) plays an important role in MetS-associated changes in brain metabolic function.
Our data also show that MSI was closely correlated with several eukaryotic homologs (e.g.,Brd8, Ep400) of key molecules of the yeast NuA4 histone acetyltransferase (HAT) complex,which functions as an epigenetic co-activator for nuclear receptors (Doyon et al., 2004). TheMSI also was associated with other genes encoding chromatin-modifying enzymes thatfavor transcription (Hmgn2, Nap1l1, Smarcc1) and with a glial-specific repressor ofneuronal genes (Phf21) (Fig. 4). The GR is among the nuclear receptors that recruit NuA4 asa co-activator (Wallberg et al., 1999), and stress exposure can induce long-lasting epigeneticregulation of brain GR (Meaney et al., 2007). Therefore, the upregulation of HAT complexmolecules seen here might provide epigenetic support of GR-mediated transcription.
Together, the data suggest a new model of MetS component interactions with brain agingprocesses, in which MetS-related variables induce upregulated GR transcription/signaling inhippocampus, triggering metabolic alterations that lead to mitochondrial dysfunction,inflammatory responses, enhanced vulnerability and impaired cognition, as outlined in Fig.6. Although other models may of course fit the data, the present results provide acomprehensive framework that should facilitate generating and testing complex models onthe mechanisms and treatment of unhealthy cognitive aging.
Supplementary MaterialRefer to Web version on PubMed Central for supplementary material.
Blalock et al. Page 15
J Neurosci. Author manuscript; available in PMC 2011 August 12.
NIH
-PA Author Manuscript
NIH
-PA Author Manuscript
NIH
-PA Author Manuscript
AcknowledgmentsThis work was supported by NIH grants AG010836, AG013494, AG020251, NS048191, and AG029268. We thankDr. Don Gash for generous support and discussion, and Jelena Popovic for bioinformatics assistance and datahandling.
ReferencesAdeli K, Taghibiglou C, Van Iderstine SC, Lewis GF. Mechanisms of hepatic very low-density
lipoprotein overproduction in insulin resistance. Trends Cardiovasc Med. 2001; 11:170–176.[PubMed: 11597827]
Andersen AH, Zhang Z, Zhang M, Gash DM, Avison MJ. Age-associated changes in rhesus CNScomposition identified by MRI. Brain Res. 1999; 829:90–98. [PubMed: 10350533]
Arriagada PV, Growdon JH, Hedley-Whyte ET, Hyman BT. Neurofibrillary tangles but not senileplaques parallel duration and severity of Alzheimer's disease. Neurology. 1992; 42:631–639.[PubMed: 1549228]
Ashburner M, Ball CA, Blake JA, Botstein D, Butler H, Cherry JM, Davis AP, Dolinski K, Dwight SS,Eppig JT, Harris MA, Hill DP, Issel-Tarver L, Kasarskis A, Lewis S, Matese JC, Richardson JE,Ringwald M, Rubin GM, Sherlock G. Gene ontology: tool for the unification of biology. The GeneOntology Consortium. Nat Genet. 2000; 25:25–29. [PubMed: 10802651]
Benjamini Y, Drai D, Elmer G, Kafkafi N, Golani I. Controlling the false discovery rate in behaviorgenetics research. Behav Brain Res. 2001; 125:279–284. [PubMed: 11682119]
Benveniste EN, Nguyen VT, O'Keefe GM. Immunological aspects of microglia: relevance toAlzheimer's disease. Neurochem Int. 2001; 39:381–391. [PubMed: 11578773]
Berchtold NC, Cribbs DH, Coleman PD, Rogers J, Head E, Kim R, Beach T, Miller C, Troncoso J,Trojanowski JQ, Zielke HR, Cotman CW. Gene expression changes in the course of normal brainaging are sexually dimorphic. Proc Natl Acad Sci U S A. 2008; 105:15605–15610. [PubMed:18832152]
Biessels GJ, ter Laak MP, Hamers FP, Gispen WH. Neuronal Ca2+ disregulation in diabetes mellitus.Eur J Pharmacol. 2002; 447:201–209. [PubMed: 12151012]
Bizon JL, LaSarge CL, Montgomery KS, McDermott AN, Setlow B, Griffith WH. Spatial referenceand working memory across the lifespan of male Fischer 344 rats. Neurobiol Aging. 2009; 30:646–655. [PubMed: 17889407]
Blalock EM, Geddes JW, Chen KC, Porter NM, Markesbery WR, Landfield PW. IncipientAlzheimer's disease: microarray correlation analyses reveal major transcriptional and tumorsuppressor responses. Proc Natl Acad Sci U S A. 2004; 101:2173–2178. [PubMed: 14769913]
Blalock EM, Chen KC, Sharrow K, Herman JP, Porter NM, Foster TC, Landfield PW. Genemicroarrays in hippocampal aging: statistical profiling identifies novel processes correlated withcognitive impairment. J Neurosci. 2003; 23:3807–3819. [PubMed: 12736351]
Blalock EM, Chen KC, Stromberg AJ, Norris CM, Kadish I, Kraner SD, Porter NM, Landfield PW.Harnessing the power of gene microarrays for the study of brain aging and Alzheimer's disease:statistical reliability and functional correlation. Ageing Res Rev. 2005; 4:481–512. [PubMed:16257272]
Bolstad, BM.; Collin, F.; Brettschneider, J.; Simpson, K.; Cope, L.; Irizarry, R.; Speed, TP. QualityAssessment of Affymetrix GeneChip Data. In: Gentleman, R.; Carey, V.; Huber, W.; Irizarry, R.;Dudoit, S., editors. Bioinformatics and Computational Biology Solutions Using R andBioconductor. Springer; 2005.
Braak H, Braak E, Bohl J, Bratzke H. Evolution of Alzheimer's disease related cortical lesions. JNeural Transm Suppl. 1998; 54:97–106. [PubMed: 9850918]
Brinton RD. The healthy cell bias of estrogen action: mitochondrial bioenergetics and neurologicalimplications. Trends Neurosci. 2008; 31:529–537. [PubMed: 18774188]
Brown MR, Geddes JW, Sullivan PG. Brain region-specific, age-related, alterations in mitochondrialresponses to elevated calcium. J Bioenerg Biomembr. 2004; 36:401–406. [PubMed: 15377879]
Blalock et al. Page 16
J Neurosci. Author manuscript; available in PMC 2011 August 12.
NIH
-PA Author Manuscript
NIH
-PA Author Manuscript
NIH
-PA Author Manuscript
Burger C, Lopez MC, Baker HV, Mandel RJ, Muzyczka N. Genome-wide analysis of aging andlearning-related genes in the hippocampal dentate gyrus. Neurobiol Learn Mem. 2008; 89:379–396. [PubMed: 18234529]
Burger C, Lopez MC, Feller JA, Baker HV, Muzyczka N, Mandel RJ. Changes in transcription withinthe CA1 field of the hippocampus are associated with age-related spatial learning impairments.Neurobiol Learn Mem. 2007; 87:21–41. [PubMed: 16829144]
Burke SN, Barnes CA. Neural plasticity in the ageing brain. Nat Rev Neurosci. 2006; 7:30–40.[PubMed: 16371948]
Cai JX, Arnsten AF. Dose-dependent effects of the dopamine D1 receptor agonists A77636 orSKF81297 on spatial working memory in aged monkeys. J Pharmacol Exp Ther. 1997; 283:183–189. [PubMed: 9336323]
Craft S. Insulin resistance syndrome and Alzheimer disease: pathophysiologic mechanisms andtherapeutic implications. Alzheimer Dis Assoc Disord. 2006; 20:298–301. [PubMed: 17132977]
Craft S. Insulin resistance and Alzheimer's disease pathogenesis: potential mechanisms andimplications for treatment. Curr Alzheimer Res. 2007; 4:147–152. [PubMed: 17430239]
De Kloet ER, Vreugdenhil E, Oitzl MS, Joels M. Brain corticosteroid receptor balance in health anddisease. Endocr Rev. 1998; 19:269–301. [PubMed: 9626555]
Deadwyler SA, Porrino L, Siegel JM, Hampson RE. Systemic and nasal delivery of orexin-A(Hypocretin-1) reduces the effects of sleep deprivation on cognitive performance in nonhumanprimates. J Neurosci. 2007; 27:14239–14247. [PubMed: 18160631]
Dennis G Jr, Sherman BT, Hosack DA, Yang J, Gao W, Lane HC, Lempicki RA. DAVID: Databasefor Annotation, Visualization, and Integrated Discovery. Genome Biol. 2003; 4:3.
deToledo-Morrell L, Geinisman Y, Morrell F. Age-dependent alterations in hippocampal synapticplasticity: relation to memory disorders. Neurobiol Aging. 1988; 9:581–590. [PubMed: 3062469]
Dickey CA, Loring JF, Montgomery J, Gordon MN, Eastman PS, Morgan D. Selectively reducedexpression of synaptic plasticity-related genes in amyloid precursor protein + presenilin-1transgenic mice. J Neurosci. 2003; 23:5219–5226. [PubMed: 12832546]
Ding SY, Tigno XT, Hansen BC. Nuclear magnetic resonance-determined lipoprotein abnormalities innonhuman primates with the metabolic syndrome and type 2 diabetes mellitus. Metabolism. 2007;56:838–846. [PubMed: 17512318]
Disterhoft JF, Oh MM. Alterations in intrinsic neuronal excitability during normal aging. Aging Cell.2007; 6:327–336. [PubMed: 17517042]
Doyon Y, Selleck W, Lane WS, Tan S, Cote J. Structural and functional conservation of the NuA4histone acetyltransferase complex from yeast to humans. Mol Cell Biol. 2004; 24:1884–1896.[PubMed: 14966270]
Duan F, Spindel ER, Li YH, Norgren RB Jr. Intercenter reliability and validity of the rhesus macaqueGeneChip. BMC Genomics. 2007; 8:61. [PubMed: 17328815]
Duce JA, Podvin S, Hollander W, Kipling D, Rosene DL, Abraham CR. Gene profile analysisimplicates Klotho as an important contributor to aging changes in brain white matter of the rhesusmonkey. Glia. 2008; 56:106–117. [PubMed: 17963266]
Eldridge JC, Brodish A, Kute TE, Landfield PW. Apparent age-related resistance of type IIhippocampal corticosteroid receptors to down-regulation during chronic escape training. JNeurosci. 1989; 9:3237–3242. [PubMed: 2795161]
Fishel MA, Watson GS, Montine TJ, Wang Q, Green PS, Kulstad JJ, Cook DG, Peskind ER, BakerLD, Goldgaber D, Nie W, Asthana S, Plymate SR, Schwartz MW, Craft S. Hyperinsulinemiaprovokes synchronous increases in central inflammation and beta-amyloid in normal adults. ArchNeurol. 2005; 62:1539–1544. [PubMed: 16216936]
Foster TC. Calcium homeostasis and modulation of synaptic plasticity in the aged brain. Aging Cell.2007; 6:319–325. [PubMed: 17517041]
Gemma C, Bickford PC. Interleukin-1beta and caspase-1: players in the regulation of age-relatedcognitive dysfunction. Rev Neurosci. 2007; 18:137–148. [PubMed: 17593876]
Gentleman RC, Carey VJ, Bates DM, Bolstad B, Dettling M, Dudoit S, Ellis B, Gautier L, Ge Y,Gentry J, Hornik K, Hothorn T, Huber W, Iacus S, Irizarry R, Leisch F, Li C, Maechler M, RossiniAJ, Sawitzki G, Smith C, Smyth G, Tierney L, Yang JY, Zhang J. Bioconductor: open software
Blalock et al. Page 17
J Neurosci. Author manuscript; available in PMC 2011 August 12.
NIH
-PA Author Manuscript
NIH
-PA Author Manuscript
NIH
-PA Author Manuscript
development for computational biology and bioinformatics. Genome Biol. 2004; 5:R80. [PubMed:15461798]
Gibson GE, Haroutunian V, Zhang H, Park LC, Shi Q, Lesser M, Mohs RC, Sheu RK, Blass JP.Mitochondrial damage in Alzheimer's disease varies with apolipoprotein E genotype. Ann Neurol.2000; 48:297–303. [PubMed: 10976635]
Ginsberg SD, Che S, Counts SE, Mufson EJ. Single cell gene expression profiling in Alzheimer'sdisease. NeuroRx. 2006; 3:302–318. [PubMed: 16815214]
Gore AC, Terasawa E. A role for norepinephrine in the control of puberty in the female rhesusmonkey, Macaca mulatta. Endocrinology. 1991; 129:3009–3017. [PubMed: 1659522]
Greene JG, Borges K, Dingledine R. Quantitative transcriptional neuroanatomy of the rathippocampus: evidence for wide-ranging, pathway-specific heterogeneity among three principalcell layers. Hippocampus. 2009; 19:253–264. [PubMed: 18830999]
Gustafson D. Adiposity indices and dementia. Lancet Neurol. 2006; 5:713–720. [PubMed: 16857578]Haberman RP, Colantuoni C, Stocker AM, Schmidt AC, Pedersen JT, Gallagher M. Prominent
hippocampal CA3 gene expression profile in neurocognitive aging. Neurobiol Aging. 2009 Epubahead of print.
Hampson RE, Simeral JD, Deadwyler SA. Distribution of spatial and nonspatial information in dorsalhippocampus. Nature. 1999; 402:610–614. [PubMed: 10604466]
Hampson RE, Espana RA, Rogers GA, Porrino LJ, Deadwyler SA. Mechanisms underlying cognitiveenhancement and reversal of cognitive deficits in nonhuman primates by the ampakine CX717.Psychopharmacology (Berl). 2009; 202:355–369. [PubMed: 18985324]
Hiroyama M, Takenawa T. Isolation of a cDNA encoding human lysophosphatidic acid phosphatasethat is involved in the regulation of mitochondrial lipid biosynthesis. J Biol Chem. 1999;274:29172–29180. [PubMed: 10506173]
Huang da W, Sherman BT, Lempicki RA. Systematic and integrative analysis of large gene lists usingDAVID bioinformatics resources. Nat Protoc. 2009; 4:44–57. [PubMed: 19131956]
Issa AM, Rowe W, Gauthier S, Meaney MJ. Hypothalamic-pituitary-adrenal activity in aged,cognitively impaired and cognitively unimpaired rats. J Neurosci. 1990; 10:3247–3254. [PubMed:2170594]
Jin Y, McEwen ML, Nottingham SA, Maragos WF, Dragicevic NB, Sullivan PG, Springer JE. Themitochondrial uncoupling agent 2,4-dinitrophenol improves mitochondrial function, attenuatesoxidative damage, and increases white matter sparing in the contused spinal cord. J Neurotrauma.2004; 21:1396–1404. [PubMed: 15672630]
Kadish I, Thibault O, Blalock EM, Chen KC, Gant JC, Porter NM, Landfield PW. Hippocampal andcognitive aging across the lifespan: a bioenergetic shift precedes and increased cholesteroltrafficking parallels memory impairment. J Neurosci. 2009; 29:1805–1816. [PubMed: 19211887]
Kiens B. Skeletal muscle lipid metabolism in exercise and insulin resistance. Physiol Rev. 2006;86:205–243. [PubMed: 16371598]
Lacreuse A, Kim CB, Rosene DL, Killiany RJ, Moss MB, Moore TL, Chennareddi L, Herndon JG.Sex, age, and training modulate spatial memory in the rhesus monkey (Macaca mulatta). BehavNeurosci. 2005; 119:118–126. [PubMed: 15727518]
Lage R, Dieguez C, Vidal-Puig A, Lopez M. AMPK: a metabolic gauge regulating whole-body energyhomeostasis. Trends Mol Med. 2008; 14:539–549. [PubMed: 18977694]
Lai JC, Clark JB. Preparation of synaptic and nonsynaptic mitochondria from mammalian brain.Methods Enzymol. 1979; 55:51–60. [PubMed: 459854]
Landfield PW, Baskin RK, Pitler TA. Brain aging correlates: retardation by hormonal-pharmacologicaltreatments. Science. 1981; 214:581–584. [PubMed: 6270791]
Landfield PW, Blalock EM, Chen KC, Porter NM. A new glucocorticoid hypothesis of brain aging:implications for Alzheimer's disease. Curr Alzheimer Res. 2007; 4:205–212. [PubMed: 17430248]
Lee CK, Weindruch R, Prolla TA. Gene-expression profile of the ageing brain in mice. Nat Genet.2000; 25:294–297. [PubMed: 10888876]
Lein ES, Zhao X, Gage FH. Defining a molecular atlas of the hippocampus using DNA microarraysand high-throughput in situ hybridization. J Neurosci. 2004; 24:3879–3889. [PubMed: 15084669]
Blalock et al. Page 18
J Neurosci. Author manuscript; available in PMC 2011 August 12.
NIH
-PA Author Manuscript
NIH
-PA Author Manuscript
NIH
-PA Author Manuscript
Leonardo ED, Richardson-Jones JW, Sibille E, Kottman A, Hen R. Molecular heterogeneity along thedorsal-ventral axis of the murine hippocampal CA1 field: a microarray analysis of geneexpression. Neuroscience. 2006; 137:177–186. [PubMed: 16309847]
Leverve XM, Guigas B, Detaille D, Batandier C, Koceir EA, Chauvin C, Fontaine E, WiernspergerNF. Mitochondrial metabolism and type-2 diabetes: a specific target of metformin. DiabetesMetab. 2003; 29:6S88–94. [PubMed: 14502105]
Lu T, Pan Y, Kao SY, Li C, Kohane I, Chan J, Yankner BA. Gene regulation and DNA damage in theageing human brain. Nature. 2004; 429:883–891. [PubMed: 15190254]
Lupien SJ, de Leon M, de Santi S, Convit A, Tarshish C, Nair NP, Thakur M, McEwen BS, HaugerRL, Meaney MJ. Cortisol levels during human aging predict hippocampal atrophy and memorydeficits. Nat Neurosci. 1998; 1:69–73. [PubMed: 10195112]
Lynch G, Rex CS, Gall CM. Synaptic plasticity in early aging. Ageing Res Rev. 2006; 5:255–280.[PubMed: 16935034]
Maalouf NM, Cameron MA, Moe OW, Adams-Huet B, Sakhaee K. Low urine pH: a novel feature ofthe metabolic syndrome. Clin J Am Soc Nephrol. 2007; 2:883–888. [PubMed: 17702734]
Mattson MP, Pedersen WA, Duan W, Culmsee C, Camandola S. Cellular and molecular mechanismsunderlying perturbed energy metabolism and neuronal degeneration in Alzheimer's andParkinson's diseases. Ann N Y Acad Sci. 1999; 893:154–175. [PubMed: 10672236]
McEwen BS. Allostasis, allostatic load, and the aging nervous system: role of excitatory amino acidsand excitotoxicity. Neurochem Res. 2000; 25:1219–1231. [PubMed: 11059796]
McEwen BS, de Leon MJ, Lupien SJ, Meaney MJ. Corticosteroids, the Aging Brain and Cognition.Trends Endocrinol Metab. 1999; 10:92–96. [PubMed: 10322401]
McGeer PL, McGeer EG. Inflammation and the degenerative diseases of aging. Ann N Y Acad Sci.2004; 1035:104–116. [PubMed: 15681803]
Meaney MJ, Szyf M, Seckl JR. Epigenetic mechanisms of perinatal programming of hypothalamic-pituitary-adrenal function and health. Trends Mol Med. 2007; 13:269–277. [PubMed: 17544850]
Mirnics K, Pevsner J. Progress in the use of microarray technology to study the neurobiology ofdisease. Nat Neurosci. 2004; 7:434–439. [PubMed: 15114354]
Moser MB, Moser EI. Functional differentiation in the hippocampus. Hippocampus. 1998; 8:608–619.[PubMed: 9882018]
Moss MB, Killiany RJ, Lai ZC, Rosene DL, Herndon JG. Recognition memory span in rhesusmonkeys of advanced age. Neurobiol Aging. 1997; 18:13–19. [PubMed: 8983028]
Mrak RE, Griffin WS. Potential inflammatory biomarkers in Alzheimer's disease. J Alzheimers Dis.2005; 8:369–375. [PubMed: 16556968]
Nakanishi H. Microglial functions and proteases. Mol Neurobiol. 2003; 27:163–176. [PubMed:12777686]
Norris CM, Kadish I, Blalock EM, Chen KC, Thibault V, Porter NM, Landfield PW, Kraner SD.Calcineurin triggers reactive/inflammatory processes in astrocytes and is upregulated in aging andAlzheimer's models. J Neurosci. 2005; 25:4649–4658. [PubMed: 15872113]
Pagliarini DJ, Calvo SE, Chang B, Sheth SA, Vafai SB, Ong SE, Walford GA, Sugiana C, Boneh A,Chen WK, Hill DE, Vidal M, Evans JG, Thorburn DR, Carr SA, Mootha VK. A mitochondrialprotein compendium elucidates complex I disease biology. Cell. 2008; 134:112–123. [PubMed:18614015]
Parachikova A, Agadjanyan MG, Cribbs DH, Blurton-Jones M, Perreau V, Rogers J, Beach TG,Cotman CW. Inflammatory changes parallel the early stages of Alzheimer disease. NeurobiolAging. 2007; 28:1821–1833. [PubMed: 17052803]
Pedersen WA, McMillan PJ, Kulstad JJ, Leverenz JB, Craft S, Haynatzki GR. Rosiglitazone attenuateslearning and memory deficits in Tg2576 Alzheimer mice. Exp Neurol. 2006; 199:265–273.[PubMed: 16515786]
Piroli GG, Grillo CA, Reznikov LR, Adams S, McEwen BS, Charron MJ, Reagan LP. Corticosteroneimpairs insulin-stimulated translocation of GLUT4 in the rat hippocampus. Neuroendocrinology.2007; 85:71–80. [PubMed: 17426391]
Blalock et al. Page 19
J Neurosci. Author manuscript; available in PMC 2011 August 12.
NIH
-PA Author Manuscript
NIH
-PA Author Manuscript
NIH
-PA Author Manuscript
Porrino LJ, Daunais JB, Rogers GA, Hampson RE, Deadwyler SA. Facilitation of task performanceand removal of the effects of sleep deprivation by an ampakine (CX717) in nonhuman primates.PLoS Biol. 2005; 3:e299. [PubMed: 16104830]
Pridgeon JW, Olzmann JA, Chin LS, Li L. PINK1 protects against oxidative stress by phosphorylatingmitochondrial chaperone TRAP1. PLoS Biol. 2007; 5:e172. [PubMed: 17579517]
Prolla TA. DNA microarray analysis of the aging brain. Chem Senses. 2002; 27:299–306. [PubMed:11923192]
Raji CA, Ho AJ, Parikshak NN, Becker JT, Lopez OL, Kuller LH, Hua X, Leow AD, Toga AW,Thompson PM. Brain structure and obesity. Hum Brain Mapp. 2009
Rapp PR, Amaral DG. Recognition memory deficits in a subpopulation of aged monkeys resemble theeffects of medial temporal lobe damage. Neurobiol Aging. 1991; 12:481–486. [PubMed: 1770984]
Reaven GM. The insulin resistance syndrome: definition and dietary approaches to treatment. AnnuRev Nutr. 2005; 25:391–406. [PubMed: 16011472]
Reiner A, Yekutieli D, Benjamini Y. Identifying differentially expressed genes using false discoveryrate controlling procedures. Bioinformatics. 2003; 19:368–375. [PubMed: 12584122]
Reznick RM, Shulman GI. The role of AMP-activated protein kinase in mitochondrial biogenesis. JPhysiol. 2006; 574:33–39. [PubMed: 16709637]
Rivera EJ, Goldin A, Fulmer N, Tavares R, Wands JR, de la Monte SM. Insulin and insulin-likegrowth factor expression and function deteriorate with progression of Alzheimer's disease: link tobrain reductions in acetylcholine. J Alzheimers Dis. 2005; 8:247–268. [PubMed: 16340083]
Rossmeisl M, Flachs P, Brauner P, Sponarova J, Matejkova O, Prazak T, Ruzickova J, Bardova K,Kuda O, Kopecky J. Role of energy charge and AMP-activated protein kinase in adipocytes in thecontrol of body fat stores. Int J Obes Relat Metab Disord. 2004; 28 4:S38–44. [PubMed:15592485]
Rowe WB, Blalock EM, Chen KC, Kadish I, Wang D, Barrett JE, Thibault O, Porter NM, Rose GM,Landfield PW. Hippocampal expression analyses reveal selective association of immediate-early,neuroenergetic, and myelinogenic pathways with cognitive impairment in aged rats. J Neurosci.2007; 27:3098–3110. [PubMed: 17376971]
Saeed AI, Sharov V, White J, Li J, Liang W, Bhagabati N, Braisted J, Klapa M, Currier T, ThiagarajanM, Sturn A, Snuffin M, Rezantsev A, Popov D, Ryltsov A, Kostukovich E, Borisovsky I, Liu Z,Vinsavich A, Trush V, Quackenbush J. TM4: a free, open-source system for microarray datamanagement and analysis. Biotechniques. 2003; 34:374–378. [PubMed: 12613259]
Sapolsky RM. Glucocorticoids, stress, and their adverse neurological effects: relevance to aging. ExpGerontol. 1999; 34:721–732. [PubMed: 10579633]
Seckl JR, Walker BR. 11beta-hydroxysteroid dehydrogenase type 1 as a modulator of glucocorticoidaction: from metabolism to memory. Trends Endocrinol Metab. 2004; 15:418–424. [PubMed:15519888]
Shen YQ, Hebert G, Lin LY, Luo YL, Moze E, Li KS, Neveu PJ. Interleukine-1beta and interleukine-6levels in striatum and other brain structures after MPTP treatment: influence of behaviorallateralization. J Neuroimmunol. 2005; 158:14–25. [PubMed: 15589033]
Short TG, Young Y. Toxicity of intravenous anaesthetics. Best Pract Res Clin Anaesthesiol. 2003;17:77–89. [PubMed: 12751550]
Simpkins JW, Yang SH, Sarkar SN, Pearce V. Estrogen actions on mitochondria--physiological andpathological implications. Mol Cell Endocrinol. 2008; 290:51–59. [PubMed: 18571833]
Skaggs WE, McNaughton BL, Permenter M, Archibeque M, Vogt J, Amaral DG, Barnes CA. EEGsharp waves and sparse ensemble unit activity in the macaque hippocampus. J Neurophysiol.2007; 98:898–910. [PubMed: 17522177]
Sloane JA, Hollander W, Moss MB, Rosene DL, Abraham CR. Increased microglial activation andprotein nitration in white matter of the aging monkey. Neurobiol Aging. 1999; 20:395–405.[PubMed: 10604432]
Small SA, Chawla MK, Buonocore M, Rapp PR, Barnes CA. Imaging correlates of brain function inmonkeys and rats isolates a hippocampal subregion differentially vulnerable to aging. Proc NatlAcad Sci U S A. 2004; 101:7181–7186. [PubMed: 15118105]
Blalock et al. Page 20
J Neurosci. Author manuscript; available in PMC 2011 August 12.
NIH
-PA Author Manuscript
NIH
-PA Author Manuscript
NIH
-PA Author Manuscript
Smith MA, Nunomura A, Zhu X, Takeda A, Perry G. Metabolic, metallic, and mitotic sources ofoxidative stress in Alzheimer disease. Antioxid Redox Signal. 2000; 2:413–420. [PubMed:11229355]
Stranahan AM, Norman ED, Lee K, Cutler RG, Telljohann RS, Egan JM, Mattson MP. Diet-inducedinsulin resistance impairs hippocampal synaptic plasticity and cognition in middle-aged rats.Hippocampus. 2008a; 18:1085–1088. [PubMed: 18651634]
Stranahan AM, Lee K, Pistell PJ, Nelson CM, Readal N, Miller MG, Spangler EL, Ingram DK,Mattson MP. Accelerated cognitive aging in diabetic rats is prevented by lowering corticosteronelevels. Neurobiol Learn Mem. 2008b; 90:479–483. [PubMed: 18579418]
Sullivan PG, Dube C, Dorenbos K, Steward O, Baram TZ. Mitochondrial uncoupling protein-2protects the immature brain from excitotoxic neuronal death. Ann Neurol. 2003; 53:711–717.[PubMed: 12783416]
Sullivan PG, Krishnamurthy S, Patel SP, Pandya JD, Rabchevsky AG. Temporal characterization ofmitochondrial bioenergetics after spinal cord injury. J Neurotrauma. 2007; 24:991–999.[PubMed: 17600515]
Sullivan PG, Rabchevsky AG, Keller JN, Lovell M, Sodhi A, Hart RP, Scheff SW. Intrinsicdifferences in brain and spinal cord mitochondria: Implication for therapeutic interventions. JComp Neurol. 2004; 474:524–534. [PubMed: 15174070]
Thibault O, Gant JC, Landfield PW. Expansion of the calcium hypothesis of brain aging andAlzheimer's disease: minding the store. Aging Cell. 2007; 6:307–317. [PubMed: 17465978]
Tigges J, Gordon TP, McClure HM, Hall EC, Peters A. Survival rate and life span of rhesus monkeysat the Yerkes regional primate research center. American Journal of Primatology. 1988; 15:263–273.
Tigno XT, Gerzanich G, Hansen BC. Age-related changes in metabolic parameters of nonhumanprimates. J Gerontol A Biol Sci Med Sci. 2004; 59:1081–1088. [PubMed: 15602053]
Toescu EC, Verkhratsky A. Ca2+ and mitochondria as substrates for deficits in synaptic plasticity innormal brain ageing. J Cell Mol Med. 2004; 8:181–190. [PubMed: 15256066]
Verbitsky M, Yonan AL, Malleret G, Kandel ER, Gilliam TC, Pavlidis P. Altered hippocampaltranscript profile accompanies an age-related spatial memory deficit in mice. Learn Mem. 2004;11:253–260. [PubMed: 15169854]
Verkhratsky A, Fernyhough P. Mitochondrial malfunction and Ca2+ dyshomeostasis drive neuronalpathology in diabetes. Cell Calcium. 2008; 44:112–122. [PubMed: 18191198]
Wallberg AE, Neely KE, Gustafsson JA, Workman JL, Wright AP, Grant PA. Histoneacetyltransferase complexes can mediate transcriptional activation by the major glucocorticoidreceptor activation domain. Mol Cell Biol. 1999; 19:5952–5959. [PubMed: 10454542]
Walton A, Scheib JL, McLean S, Zhang Z, Grondin R. Motor memory preservation in aged monkeysmirrors that of aged humans on a similar task. Neurobiol Aging. 2008; 29:1556–1562. [PubMed:17428582]
Wei H, Xie Z. Anesthesia, calcium homeostasis and Alzheimer's disease. Curr Alzheimer Res. 2009;6:30–35. [PubMed: 19199872]
Whitmer RA, Gunderson EP, Quesenberry CP Jr, Zhou J, Yaffe K. Body mass index in midlife andrisk of Alzheimer disease and vascular dementia. Curr Alzheimer Res. 2007; 4:103–109.[PubMed: 17430231]
Wyss-Coray T, Mucke L. Inflammation in neurodegenerative disease--a double-edged sword. Neuron.2002; 35:419–432. [PubMed: 12165466]
Xu X, Zhan M, Duan W, Prabhu V, Brenneman R, Wood W, Firman J, Li H, Zhang P, Ibe C,Zonderman AB, Longo DL, Poosala S, Becker KG, Mattson MP. Gene expression atlas of themouse central nervous system: impact and interactions of age, energy intake and gender. GenomeBiol. 2007; 8:R234. [PubMed: 17988385]
Yaffe K, Blackwell T, Kanaya AM, Davidowitz N, Barrett-Connor E, Krueger K. Diabetes, impairedfasting glucose, and development of cognitive impairment in older women. Neurology. 2004;63:658–663. [PubMed: 15326238]
Blalock et al. Page 21
J Neurosci. Author manuscript; available in PMC 2011 August 12.
NIH
-PA Author Manuscript
NIH
-PA Author Manuscript
NIH
-PA Author Manuscript
Yang H, Liang G, Hawkins BJ, Madesh M, Pierwola A, Wei H. Inhalational anesthetics induce celldamage by disruption of intracellular calcium homeostasis with different potencies.Anesthesiology. 2008; 109:243–250. [PubMed: 18648233]
Yoshida H. ER stress and diseases. Febs J. 2007; 274:630–658. [PubMed: 17288551]Zahn JM, Poosala S, Owen AB, Ingram DK, Lustig A, Carter A, Weeraratna AT, Taub DD, Gorospe
M, Mazan-Mamczarz K, Lakatta EG, Boheler KR, Xu X, Mattson MP, Falco G, Ko MS,Schlessinger D, Firman J, Kummerfeld SK, Wood WH 3rd, Zonderman AB, Kim SK, BeckerKG. AGEMAP: a gene expression database for aging in mice. PLoS Genet. 2007; 3:e201.[PubMed: 18081424]
Zhang Z, Andersen A, Smith C, Grondin R, Gerhardt G, Gash D. Motor slowing and parkinsoniansigns in aging rhesus monkeys mirror human aging. J Gerontol A Biol Sci Med Sci. 2000;55:B473–480. [PubMed: 11034220]
Zhao WQ, Alkon DL. Role of insulin and insulin receptor in learning and memory. Mol CellEndocrinol. 2001; 177:125–134. [PubMed: 11377828]
Blalock et al. Page 22
J Neurosci. Author manuscript; available in PMC 2011 August 12.
NIH
-PA Author Manuscript
NIH
-PA Author Manuscript
NIH
-PA Author Manuscript
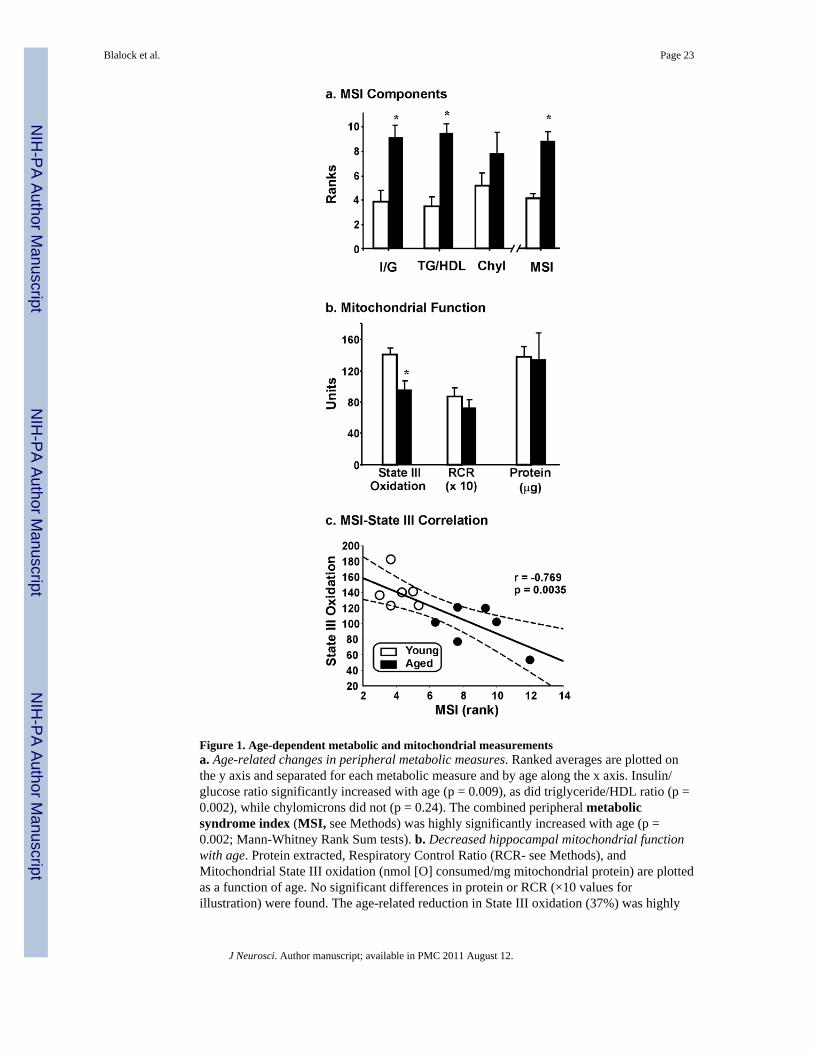
Figure 1. Age-dependent metabolic and mitochondrial measurementsa. Age-related changes in peripheral metabolic measures. Ranked averages are plotted onthe y axis and separated for each metabolic measure and by age along the x axis. Insulin/glucose ratio significantly increased with age (p = 0.009), as did triglyceride/HDL ratio (p =0.002), while chylomicrons did not (p = 0.24). The combined peripheral metabolicsyndrome index (MSI, see Methods) was highly significantly increased with age (p =0.002; Mann-Whitney Rank Sum tests). b. Decreased hippocampal mitochondrial functionwith age. Protein extracted, Respiratory Control Ratio (RCR- see Methods), andMitochondrial State III oxidation (nmol [O] consumed/mg mitochondrial protein) are plottedas a function of age. No significant differences in protein or RCR (×10 values forillustration) were found. The age-related reduction in State III oxidation (37%) was highly
Blalock et al. Page 23
J Neurosci. Author manuscript; available in PMC 2011 August 12.
NIH
-PA Author Manuscript
NIH
-PA Author Manuscript
NIH
-PA Author Manuscript
significant (* p = 0.009; Student's t-test). c. Correlation between MSI and hippocampalmitochondrial State III oxidation. MSI (x axis) is plotted against State III oxidation (y axis)for each subject. Pearson's test revealed a strong, significant negative correlation betweenthe blood measures and the central measures of mitochondrial activity (p = 0.0035; dottedgray lines- 95% confidence intervals).
Blalock et al. Page 24
J Neurosci. Author manuscript; available in PMC 2011 August 12.
NIH
-PA Author Manuscript
NIH
-PA Author Manuscript
NIH
-PA Author Manuscript
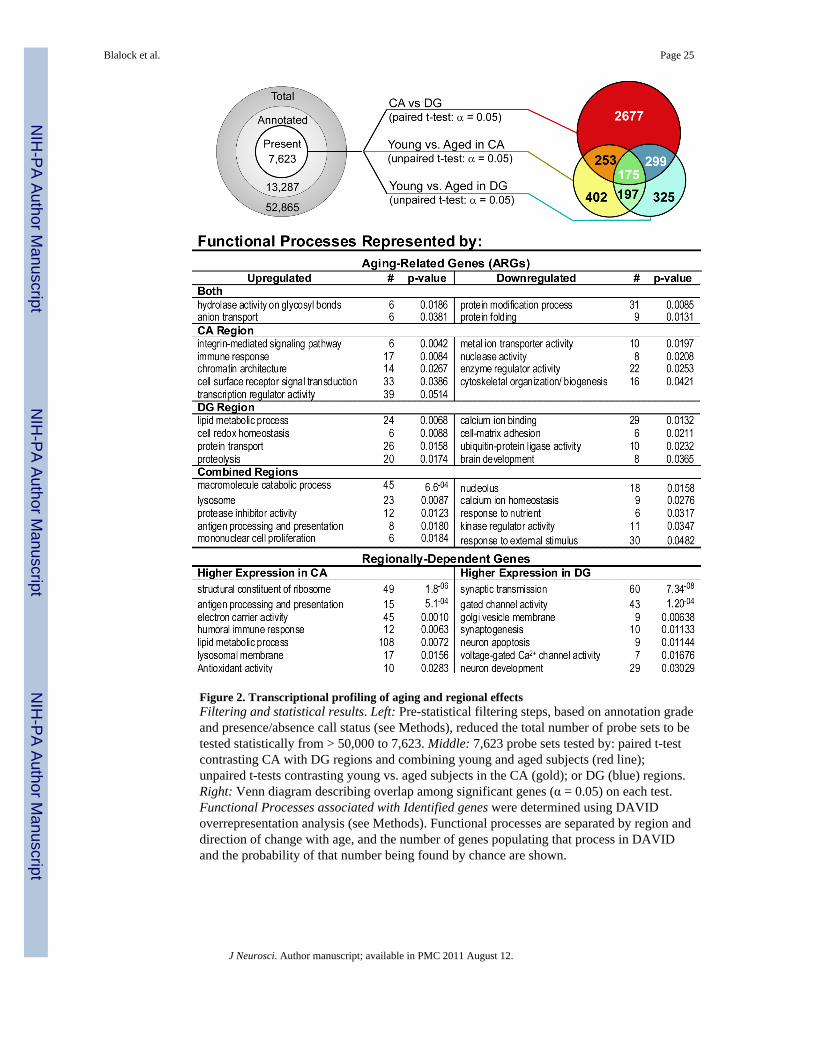
Figure 2. Transcriptional profiling of aging and regional effectsFiltering and statistical results. Left: Pre-statistical filtering steps, based on annotation gradeand presence/absence call status (see Methods), reduced the total number of probe sets to betested statistically from > 50,000 to 7,623. Middle: 7,623 probe sets tested by: paired t-testcontrasting CA with DG regions and combining young and aged subjects (red line);unpaired t-tests contrasting young vs. aged subjects in the CA (gold); or DG (blue) regions.Right: Venn diagram describing overlap among significant genes (α = 0.05) on each test.Functional Processes associated with Identified genes were determined using DAVIDoverrepresentation analysis (see Methods). Functional processes are separated by region anddirection of change with age, and the number of genes populating that process in DAVIDand the probability of that number being found by chance are shown.
Blalock et al. Page 25
J Neurosci. Author manuscript; available in PMC 2011 August 12.
NIH
-PA Author Manuscript
NIH
-PA Author Manuscript
NIH
-PA Author Manuscript
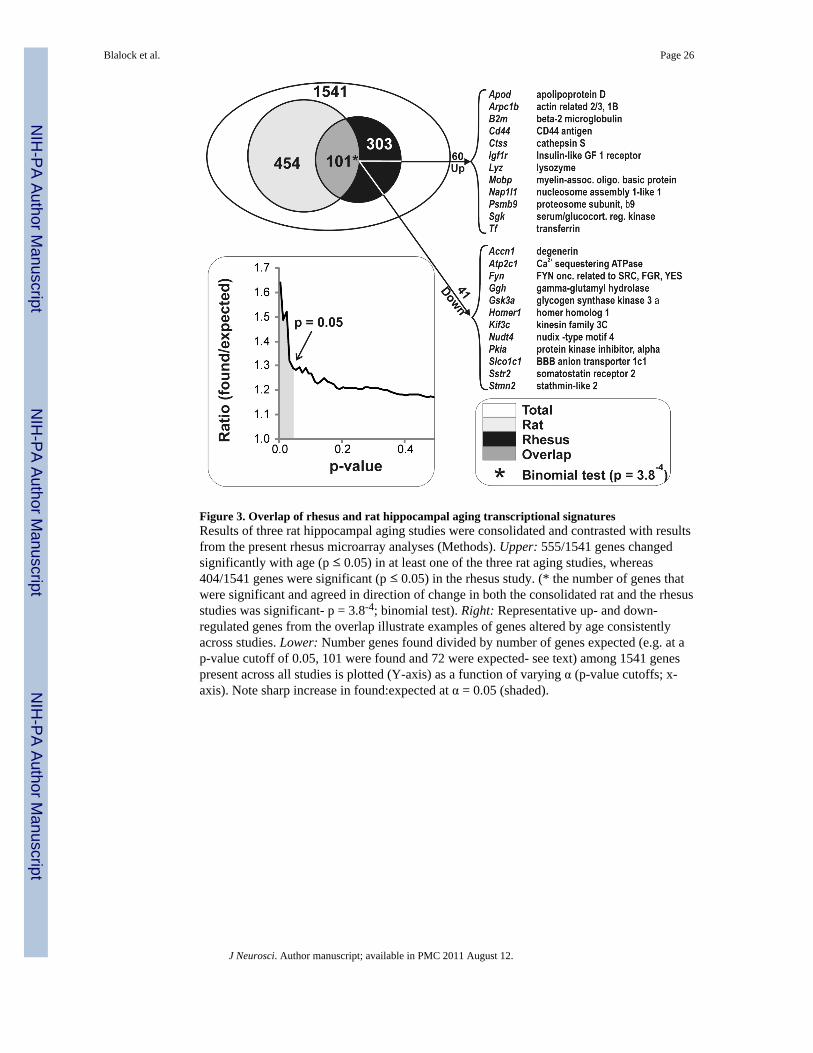
Figure 3. Overlap of rhesus and rat hippocampal aging transcriptional signaturesResults of three rat hippocampal aging studies were consolidated and contrasted with resultsfrom the present rhesus microarray analyses (Methods). Upper: 555/1541 genes changedsignificantly with age (p ≤ 0.05) in at least one of the three rat aging studies, whereas404/1541 genes were significant (p ≤ 0.05) in the rhesus study. (* the number of genes thatwere significant and agreed in direction of change in both the consolidated rat and the rhesusstudies was significant- p = 3.8-4; binomial test). Right: Representative up- and down-regulated genes from the overlap illustrate examples of genes altered by age consistentlyacross studies. Lower: Number genes found divided by number of genes expected (e.g. at ap-value cutoff of 0.05, 101 were found and 72 were expected- see text) among 1541 genespresent across all studies is plotted (Y-axis) as a function of varying α (p-value cutoffs; x-axis). Note sharp increase in found:expected at α = 0.05 (shaded).
Blalock et al. Page 26
J Neurosci. Author manuscript; available in PMC 2011 August 12.
NIH
-PA Author Manuscript
NIH
-PA Author Manuscript
NIH
-PA Author Manuscript
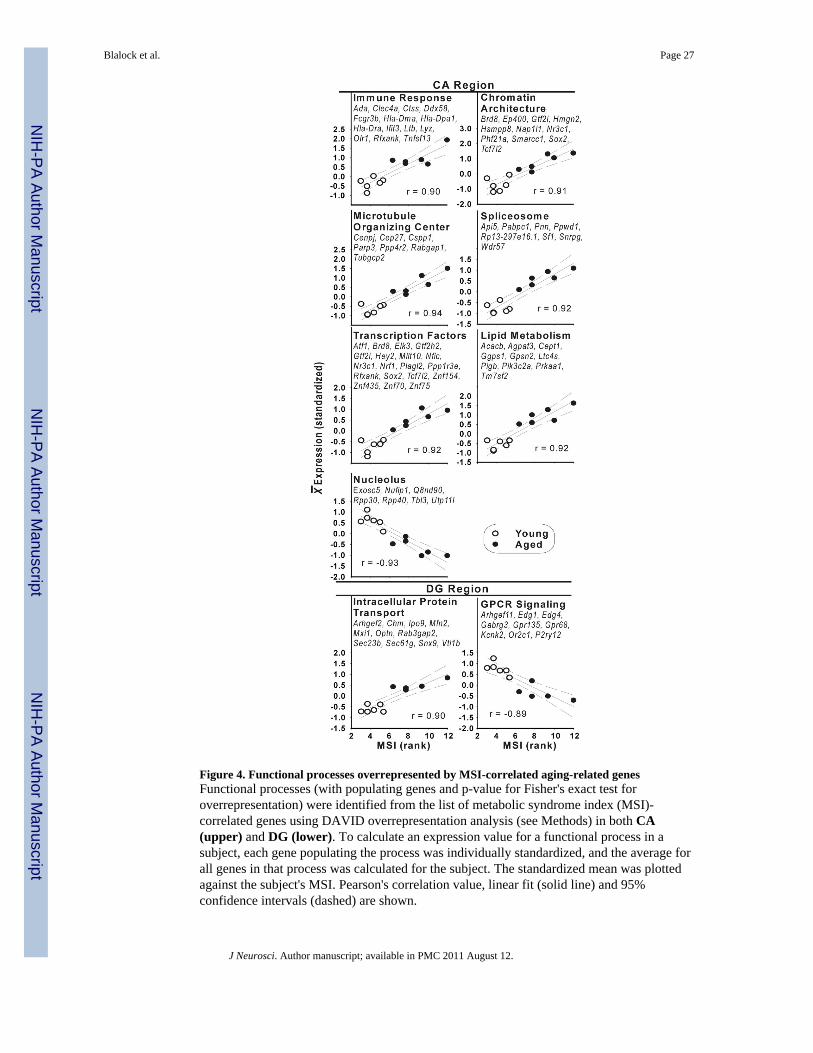
Figure 4. Functional processes overrepresented by MSI-correlated aging-related genesFunctional processes (with populating genes and p-value for Fisher's exact test foroverrepresentation) were identified from the list of metabolic syndrome index (MSI)-correlated genes using DAVID overrepresentation analysis (see Methods) in both CA(upper) and DG (lower). To calculate an expression value for a functional process in asubject, each gene populating the process was individually standardized, and the average forall genes in that process was calculated for the subject. The standardized mean was plottedagainst the subject's MSI. Pearson's correlation value, linear fit (solid line) and 95%confidence intervals (dashed) are shown.
Blalock et al. Page 27
J Neurosci. Author manuscript; available in PMC 2011 August 12.
NIH
-PA Author Manuscript
NIH
-PA Author Manuscript
NIH
-PA Author Manuscript
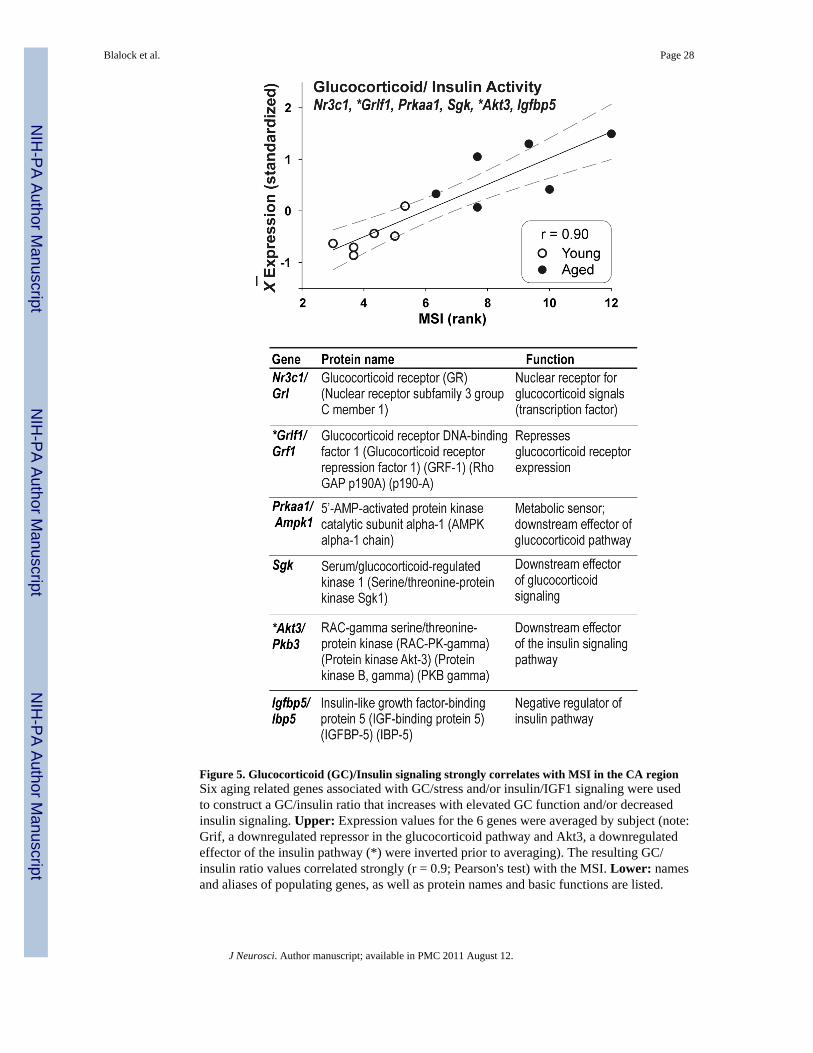
Figure 5. Glucocorticoid (GC)/Insulin signaling strongly correlates with MSI in the CA regionSix aging related genes associated with GC/stress and/or insulin/IGF1 signaling were usedto construct a GC/insulin ratio that increases with elevated GC function and/or decreasedinsulin signaling. Upper: Expression values for the 6 genes were averaged by subject (note:Grif, a downregulated repressor in the glucocorticoid pathway and Akt3, a downregulatedeffector of the insulin pathway (*) were inverted prior to averaging). The resulting GC/insulin ratio values correlated strongly (r = 0.9; Pearson's test) with the MSI. Lower: namesand aliases of populating genes, as well as protein names and basic functions are listed.
Blalock et al. Page 28
J Neurosci. Author manuscript; available in PMC 2011 August 12.
NIH
-PA Author Manuscript
NIH
-PA Author Manuscript
NIH
-PA Author Manuscript
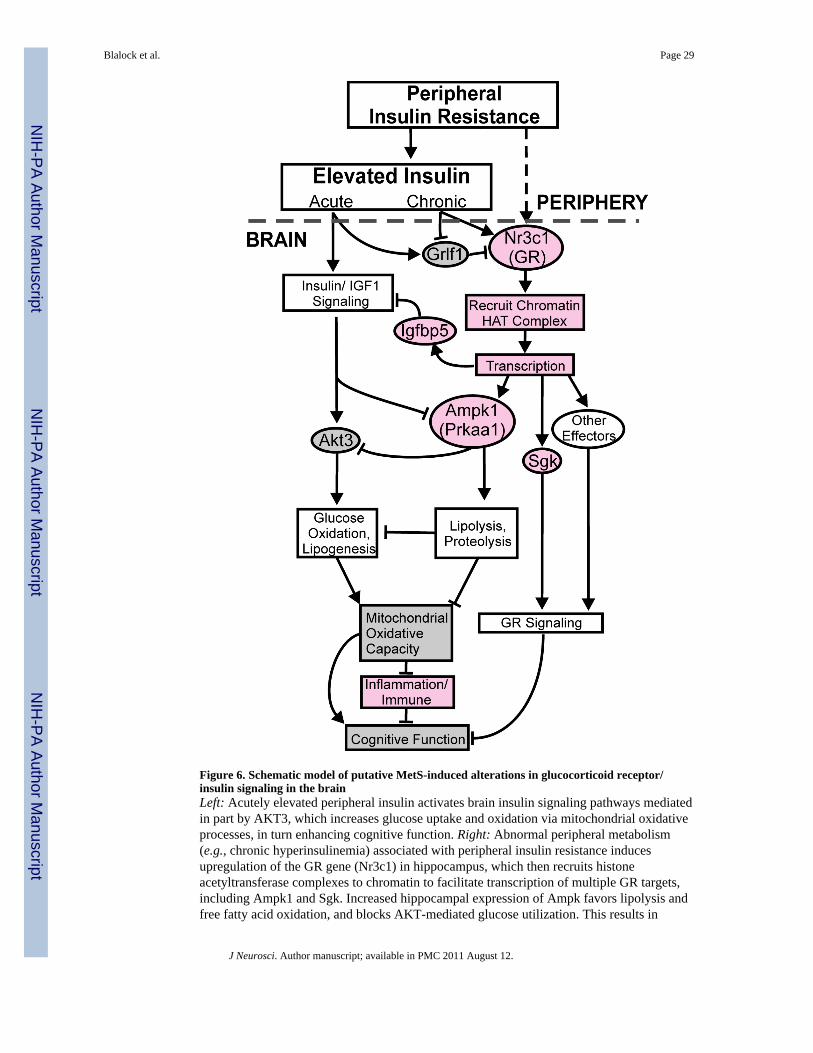
Figure 6. Schematic model of putative MetS-induced alterations in glucocorticoid receptor/insulin signaling in the brainLeft: Acutely elevated peripheral insulin activates brain insulin signaling pathways mediatedin part by AKT3, which increases glucose uptake and oxidation via mitochondrial oxidativeprocesses, in turn enhancing cognitive function. Right: Abnormal peripheral metabolism(e.g., chronic hyperinsulinemia) associated with peripheral insulin resistance inducesupregulation of the GR gene (Nr3c1) in hippocampus, which then recruits histoneacetyltransferase complexes to chromatin to facilitate transcription of multiple GR targets,including Ampk1 and Sgk. Increased hippocampal expression of Ampk favors lipolysis andfree fatty acid oxidation, and blocks AKT-mediated glucose utilization. This results in
Blalock et al. Page 29
J Neurosci. Author manuscript; available in PMC 2011 August 12.
NIH
-PA Author Manuscript
NIH
-PA Author Manuscript
NIH
-PA Author Manuscript
decreased mitochondrial function, thereby activating inflammatory-immune pathways.Inflammation and reduced mitochondrial function combine with other GR-activatedpathways to impair cognition and elevate risk of AD. Genes and processes found correlatedwith MSI in the present study are coded in light red if upregulated or gray if downregulated.Decreased cognitive function is inferred from the literature.
Blalock et al. Page 30
J Neurosci. Author manuscript; available in PMC 2011 August 12.
NIH
-PA Author Manuscript
NIH
-PA Author Manuscript
NIH
-PA Author Manuscript
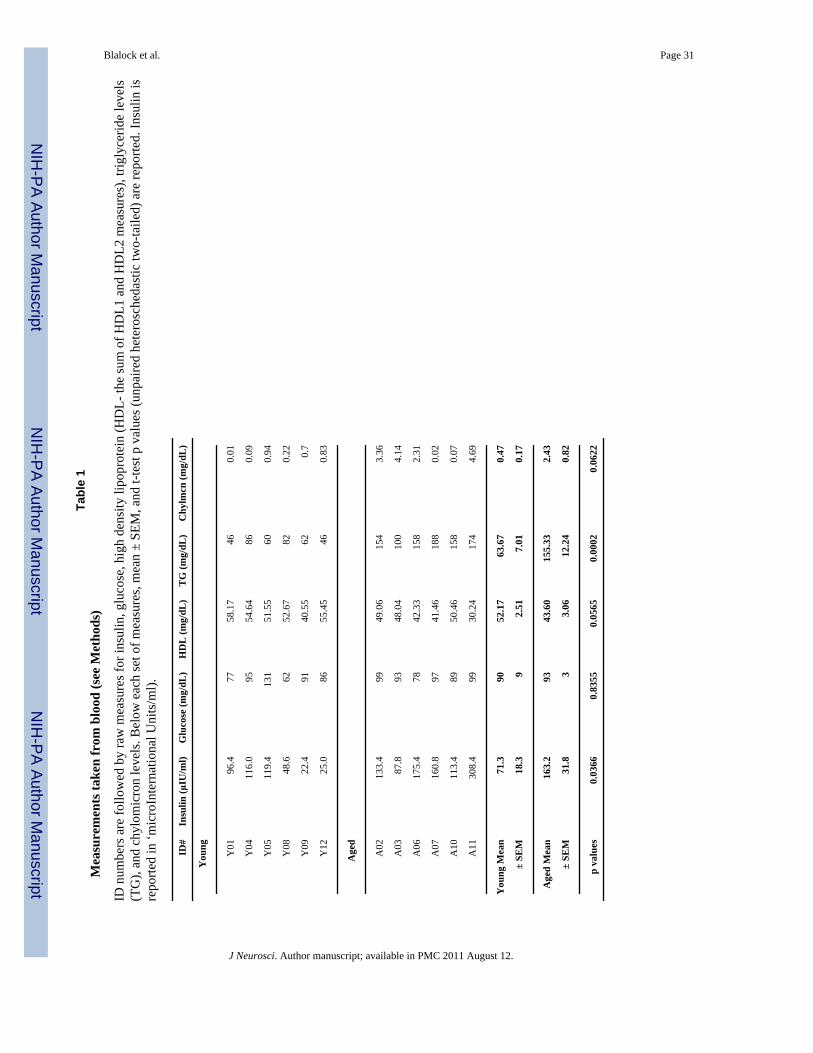
NIH
-PA Author Manuscript
NIH
-PA Author Manuscript
NIH
-PA Author Manuscript
Blalock et al. Page 31
Tabl
e 1
Mea
sure
men
ts ta
ken
from
blo
od (s
ee M
etho
ds)
ID n
umbe
rs a
re fo
llow
ed b
y ra
w m
easu
res f
or in
sulin
, glu
cose
, hig
h de
nsity
lipo
prot
ein
(HD
L- th
e su
m o
f HD
L1 a
nd H
DL2
mea
sure
s), t
rigly
cerid
e le
vels
(TG
), an
d ch
ylom
icro
n le
vels
. Bel
ow e
ach
set o
f mea
sure
s, m
ean
± SE
M, a
nd t-
test
p v
alue
s (un
paire
d he
tero
sche
dast
ic tw
o-ta
iled)
are
repo
rted.
Insu
lin is
repo
rted
in ‘m
icro
Inte
rnat
iona
l Uni
ts/m
l).
ID#
Insu
lin (μ
IU/m
l)G
luco
se (m
g/dL
)H
DL
(mg/
dL)
TG
(mg/
dL)
Chy
lmcn
(mg/
dL)
You
ng
Y01
96.4
7758
.17
460.
01
Y04
116.
095
54.6
486
0.09
Y05
119.
413
151
.55
600.
94
Y08
48.6
6252
.67
820.
22
Y09
22.4
9140
.55
620.
7
Y12
25.0
8655
.45
460.
83
Age
d
A02
133.
499
49.0
615
43.
36
A03
87.8
9348
.04
100
4.14
A06
175.
478
42.3
315
82.
31
A07
160.
897
41.4
618
80.
02
A10
113.
489
50.4
615
80.
07
A11
308.
499
30.2
417
44.
69
You
ng M
ean
71.3
9052
.17
63.6
70.
47
± SE
M18
.39
2.51
7.01
0.17
Age
d M
ean
163.
293
43.6
015
5.33
2.43
± SE
M31
.83
3.06
12.2
40.
82
p va
lues
0.03
660.
8355
0.05
650.
0002
0.06
22
J Neurosci. Author manuscript; available in PMC 2011 August 12.
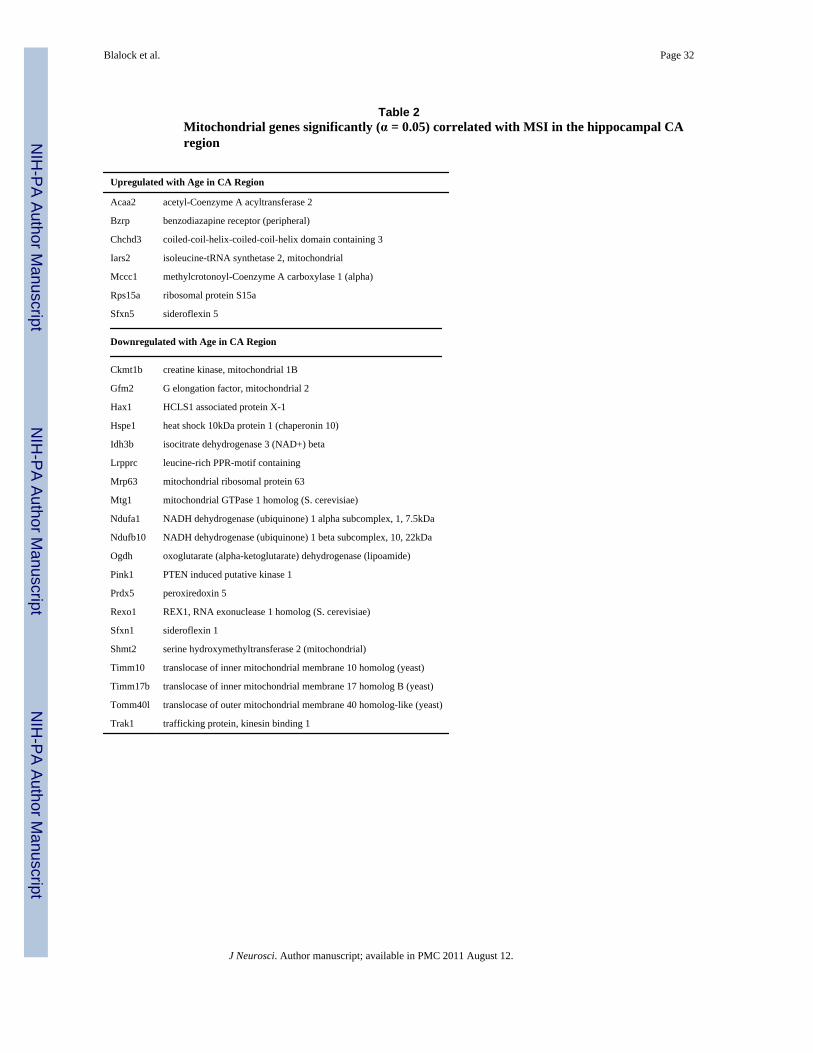
NIH
-PA Author Manuscript
NIH
-PA Author Manuscript
NIH
-PA Author Manuscript
Blalock et al. Page 32
Table 2Mitochondrial genes significantly (α = 0.05) correlated with MSI in the hippocampal CAregion
Upregulated with Age in CA Region
Acaa2 acetyl-Coenzyme A acyltransferase 2
Bzrp benzodiazapine receptor (peripheral)
Chchd3 coiled-coil-helix-coiled-coil-helix domain containing 3
Iars2 isoleucine-tRNA synthetase 2, mitochondrial
Mccc1 methylcrotonoyl-Coenzyme A carboxylase 1 (alpha)
Rps15a ribosomal protein S15a
Sfxn5 sideroflexin 5
Downregulated with Age in CA Region
Ckmt1b creatine kinase, mitochondrial 1B
Gfm2 G elongation factor, mitochondrial 2
Hax1 HCLS1 associated protein X-1
Hspe1 heat shock 10kDa protein 1 (chaperonin 10)
Idh3b isocitrate dehydrogenase 3 (NAD+) beta
Lrpprc leucine-rich PPR-motif containing
Mrp63 mitochondrial ribosomal protein 63
Mtg1 mitochondrial GTPase 1 homolog (S. cerevisiae)
Ndufa1 NADH dehydrogenase (ubiquinone) 1 alpha subcomplex, 1, 7.5kDa
Ndufb10 NADH dehydrogenase (ubiquinone) 1 beta subcomplex, 10, 22kDa
Ogdh oxoglutarate (alpha-ketoglutarate) dehydrogenase (lipoamide)
Pink1 PTEN induced putative kinase 1
Prdx5 peroxiredoxin 5
Rexo1 REX1, RNA exonuclease 1 homolog (S. cerevisiae)
Sfxn1 sideroflexin 1
Shmt2 serine hydroxymethyltransferase 2 (mitochondrial)
Timm10 translocase of inner mitochondrial membrane 10 homolog (yeast)
Timm17b translocase of inner mitochondrial membrane 17 homolog B (yeast)
Tomm40l translocase of outer mitochondrial membrane 40 homolog-like (yeast)
Trak1 trafficking protein, kinesin binding 1
J Neurosci. Author manuscript; available in PMC 2011 August 12.