Agilent E5052A Signal Source Analyzer 10 MHz to 7, 26.5, or ...
16
Agilent E5052A Signal Source Analyzer 10 MHz to 7, 26.5, or 110 GHz Data Sheet
-
Upload
khangminh22 -
Category
Documents
-
view
3 -
download
0
Transcript of Agilent E5052A Signal Source Analyzer 10 MHz to 7, 26.5, or ...

AgilentE5052A Signal Source Analyzer10 MHz to 7, 26.5, or 110 GHz
Data Sheet

2
Phase Noise Measurement
Table 1-1. Phase noise measurementDescription Specifications Frequency range 10 MHz to 7 GHzFrequency bands 10 M to 41 MHz
39 M to 101 MHz99 M to 1.5 GHz300 M to 7 GHz
Offset frequency rangeCarrier > 400 MHz 1 Hz to 40 MHz (standard)
10 Hz to 40 MHz (Option E5052A-011)39 MHz ≤ Carrier ≤ 99 MHz 1 Hz to 20 MHz (standard)
10 Hz to 20 MHz (Option E5052A-011)10 MHz ≤ Carrier ≤ 39 MHz 1 Hz to 5 MHz (standard)
10 Hz to 5 MHz (Option E5052A-011) Enhanced phase noise sensitivity1 Cross-correlation method (standard)
Number of correlation: 1 to 10,000Frequency tracking range 0.4% of carrier frequency IF gain 0, 10, 20, 30, 40, 50 dB (standard)
0, 10, 20 dB (E5053A-011)Input level
10 to 30 MHz –15 to +20 dBm 30 MHz to 7 GHz –20 to +20 dBm
Built-in LO phase noise optimization < 150 kHz (optimized for close-in phase noise)> 150 kHz (optimized for far-out phase noise)See Figure 1-2
Accuracy1 to 100 Hz offset < ± 4 dB (typical)100 to 1 kHz offset < ± 4 dB (typical)1 k to 1 MHz offset < ± 2 dB (typical)1 M to 40 MHz offset < ± 3 dB (typical)
SSB phase noise sensitivity See Table 1-2 through Table 1-4, Figure 1-1 through Figure 1-3 Spurious level 65 dBc (typical), > 1 kHz offsetMeasurement time See Table 1-5
1. Not available for E5052A-011.
Definitions
All specifications apply over a 18 °C to 28 °C range(unless otherwise stated) and 30 minutes after theinstrument has been turned on.
Supplemental information is intended to provideinformation that is helpful for using the instrumentbut that is not guaranteed by the product warranty.This information is denoted as either typical ornominal.
Specification (spec.): Warranted performance.Specifications include guardbands to account for
the expected statistical performance distribution, measurement uncertainties, and changes in perfor-mance due to environmental conditions.
Typical (typ.): Expected performance of an averageunit that does not include guardbands. It is notguaranteed by the product warranty.
Nominal (nom.): A general, descriptive term thatdoes not imply a level of performance. It is notguaranteed by the product warranty.

3
Table 1-4. SSB phase noise sensitivity improvement by correlationNumber of correlation 10 100 1000 10000 Improvement factor 5 dB 10 dB 15 dB 20 dB
1 10 100 1 k 10 k 100 k 1 M 10 M 40 M
Spec. -148.5 -156.5 -166.5 -168.5 —
—
—
—
—
—
Typ. -114.0-74.0
-54.0
-34.0
-24.5
-17.1
-144.5 -152.5 -160.5 -170.5 -172.5
Spec. -148.5 -156.5 -163.5 -168.5 -170.0
Typ. -94.0 -135.5 -152.5 -160.5 -167.5 -172.5 -174.0
Spec. -128.5 -137.5 -144.5 -160.5 -170.0 -170.5
Typ. -77.0 -115.5 -132.5 -141.5 -148.5 -164.5 -174.0 -174.5
Spec. -119.0 -128.0 -133.7 -149.7 -163.2 -166.7
Typ. -64.5 -106.0 -123.0 -132.0 -137.7 -153.7 -167.2 -170.7
Spec. -111.6 -120.6 -127.0 -143.0 -156.5 -160.0
Typ. -57.1 -98.6 -115.6 -124.6 -131.0 -147.0 -160.5 -164.0
100 MHz
1 GHz
3 GHz
7 GHz
Input frequency
Offset from carrier (Hz)
10 MHz
Table 1-2. SSB phase noise sensitivity (standard, < 150 kHz optim., correlation = 1, + 5 dBm input, start frequency = 1 Hz, measurement time = 17.7 sec)
10 100 1 k 10 k 100 k 1 M 10 M 40 M
Spec. -145.5 -153.5 -160.0 -160.0
Typ. -106.0 -138.5 -149.5 -157.5 -167.5 -169.5
Spec. -145.5 -153.5 -160.0 -160.0
Typ. -94.0 -132.5 -149.5 -157.5 -164.5 -169.5
Spec. -125.5 -134.5 -141.5 -157.5
Typ. -74.0 -112.5 -129.5 -138.5 -145.5 -161.5
Spec. -116.0 -125.0 -130.7 -146.7
Typ. -64.5 -103.0 -120.0 -129.0 -134.7 -150.7 -164.2 -167.7
Spec. -108.6 -117.6 -124.0 -140.0 -153.5 -157.0
Typ. -57.1 -95.6 -112.6 -121.6 -128.0 -144.0 -157.5 -161.0
100 MHz
1 GHz
3 GHz
7 GHz
Input frequency
Offset from carrier (Hz)
10 MHz
-160.0
-160.0
-160.0
-170.0
-170.0
-160.0
-160.0
-170.0
—
—
—
—
—
—
Table 1-3. SSB phase noise sensitivity (Option E5052A-011, < 150 kHz optim., + 5 dBm input, start frequency = 10 Hz, measurement time = 4.4 sec)

4
Figure1-4. SSB phase noise sensitivity of different LO optimization(typical)( standard, correlation = 1, carrier frequency = 1 GHz, startoffset frequency = 1 Hz, +5 dBm input, measurement time = 17.7 sec)
Figure1-2. SSB phase noise sensitivity (E5052A-011, typical)(standard, < 150 kHz optim., +5 dBm input, start offset frequency = 10 Hz, measurement time = 4.4 sec)
Figure1-3. SSB phase noise sensitivity improved with the cross-correlation function (typical) (standard, improvement with the correlation, carrier frequency = 1 GHz, < 150 kHz optim., +5 dBm input)
Figure1-1. SSB phase noise sensitivity (typical) (standard, < 150 kHz optim., correlation = 1, +5 dBm input, start offset frequency = 1 Hz, measurement time = 17.7 sec)

5
Table 1-5. Typical measurement time (sec) for phase noise measurement 1
Table 1-6. Measurement capabilitiesPhase noiseMeasurement parameters SSB phase noise, spurious, integrated
phase noise, rms noise, rms jitter, residual FM
Number of trace 1 data trace and 1 memory traceData formats dBc/Hz (SSB phase noise), dBc
(spurious), rms degree, rms radian (rms noise), sec (rms jitter), Hz rms (residual FM)
Measurement trigger Set to continuous, hold, or single, sweep with internal, external, manual, or bus trigger
Frequency, RF Power, DC Current Measurements
Table 1-7. Frequency measurementDescription Specifications Frequency range 10 M to 1.5 GHz
300 M to 7 GHzResolution 10 Hz, 1 kHz, 64 kHz Internal time base stability ± 5 ppm Accuracy ± (resolution + time base accuracy)
Table 1-8. RF power measurementDescription Specifications Frequency range band 10 M to 1.5 GHz
300 M to 7 GHzInput level10 MHz to 30 MHz -15 dBm to +20 dBm30 MHz to 7 GHz -20 dBm to +20 dBm Resolution 0.01 dB Accuracy (peak voltage response)30 MHz to 3 GHz, > -10 dBm ± 0.5 dBOther than the above ± 1 dB
Table 1-9. DC current measurementDescription Specifications Current range 0 to 80 mA Resolution 10 µA Accuracy ± (0.2% of reading + 160 µA)
Table 1-10. Frequency, RF power, DC current measurements (standard)Frequency, power, and DC current (for standard)
Measurement Analyzer mode:parameters Frequency versus DC control voltage, dF / dV
control (tuning sensitivity)Frequency versus DC power voltage (frequency pushing), dF / dV powerRF power versus DC control voltageRF power versus DC power voltageDC current (at DC power port only) versus DC control voltageDC current (at DC power port only) versus DC power voltageTester mode:Frequency, power, and DC current (at DC power port)
Number of points 2 to 1001 Data formats Frequency: Hz, dHz, %, ppm, Hz/V
RF Power: dBm DC Current: A
Measurementtrigger Set to continuous, hold, or single, sweep with
internal, external, manual, or bus trigger
Table 1-11. Frequency, power, and DC current (Option E5052A-011)Frequency, power, and DC current (Option E5052A-011)Measurement Frequency, power and DC current (at DC power parameters port) (numerical display only)Data format Frequency: Hz, dHz, %, ppm, Hz/V
RF Power: dBm DC Current: A
Measurement Set to continuous, hold, or single with internal, trigger external, manual, or bus trigger
1 10 100 1k
100 k 10.9 2.7 0.34 0.04
1 M 10.7 2.7 0.34 0.04
10 M 11.1 2.8 0.35 0.04
40 M 17.7 4.4 0.56 0.07
Stop frequency (Hz)Start frequency (Hz)
1. Measurement time (sec) = 0.2 + the above value x number of correlation when applyingcross-correlation function (standard ONLY). For E5052-011, number of correlation = 1.

Transient Measurement Table 1-12. Transient measurementDescription SpecificationsMeasurement function Frequency, power, phaseTarget frequency range 10 MHz to 7 GHzInput power level -20 to +20 dBmFrequency bandwidth
Wide band See Table 1-13Narrow band 3.125 kHz, 25 kHz, 200 kHz, 1.6 MHz,
or 25.6 MHzSpan (measurement time) 10 µsec to 100 msec, 1, 2, 5 step Time resolution 10 nsec to 100 µsecFrequency transient measurement
Accuracy ± (frequency resolution1 + time base accuracy)
Power transient measurementRange -20 to +20 dBmAccuracy ± 2 dB (typical)Resolution 0.1 dB (typical)
Phase transient measurement 2, 3
Accuracy 0.1 deg/GHz (0.1 deg min.) (typical)Trace noise 0.02 deg/GHz (0.02 deg min.) (typical)Stability 10 deg/sec (typical)
Pre-trigger delay -80% of span (measurement time)to +1 sec maximum
Frequencymax. (MHz)
Frequencymin. (MHz)
1800 2000 2200 24001000 1200 1400 1600400 500 600 80050 100 200 300
5400 6000 6600 72003000 3600 4200 48001200 1500 1800 2400150 300 600 900
Table 1-13. Wide band frequency selection table
Table 1-14-1. Wide band transient (Time span, time resolution and number of points)
Measurement 10 µ 20 µ 50 µ 100 µ 200 µ 500 µ 1 m 2 m 5 m 10 m 20 m 50 m 100 m 200 m 500 m 1 2 5 time (sec)
Time resolution 0.01 0.02 0.05 0.1 0.2 0.5 1 2 6.25 12.5 25 62.5 125 250 625 1250 2500 6250 (µsec)
Number 1001 1001 1001 1001 1001 1001 1001 1001 801 801 801 801 801 801 801 801 801 801of point
Table 1-14-2. Frequency resolution (Hzrms) of wide band transient Transient Time span (sec)frequencyband (MHz) 10 µ to 100 µ 200 µ 500 µ 1 m to 100 m 200 m to 550 to 150 28 k 10 k 3 k 1 k 313 100 to 300 56 k 20 k 7 k 2 k 313 200 to 600 113 k 40 k 14 k 5 k 313 300 to 900 169 k 60 k 21 k 7 k 313 400 to 1200 226 k 80 k 28 k 10 k 313 500 to 1500 282 k 100 k 35 k 12 k 313 600 to 1800 339 k 120 k 42 k 15 k 313 800 to 2400 452 k 160 k 56 k 20 k 313 1000 to 3000 565 k 200 k 70 k 25 k 313 1200 to 3600 678 k 240 k 84 k 30 k 313 1400 to 4200 791 k 280 k 98 k 35 k 313 1600 to 4800 905 k 320 k 113 k 40 k 313 1800 to 5400 1 M 360 k 127 k 45 k 313 2000 to 6000 1 M 400 k 141 k 50 k 313 2200 to 6600 1 M 440 k 155 k 55 k 313 2400 to 7200 1 M 480 k 169 k 60 k 313
1. See Tables 1-14 through 1-16 for details.2. The time base of DUT is required to lock with the time base of the analyzer.3. When a DUT’s frequency is settled to a selected target frequency.
6

Table 1-15. Narrow band transient (frequency bandwidth = 3.125 kHz)
Measurement time (sec) 100 m 200 m 500 m 1 2 5 10
Frequency resolution (Hz rms) 0.0095 0.0095 0.0034 0.0012 0.0004 0.0004 0.0004
Time resolution (µsec) 81.92 163.84 409.6 819.2 1638.4 4096 10240
Number of point 1222 1222 1222 1222 1222 1222 978
Table 1-16. Narrow band transient (frequency bandwidth = 25 kHz)
Measurement time (sec) 10 m 20 m 50 m 100 m 200 m 500 m 1 2 5 10
Frequency resolution (Hz rms) 0.22 0.22 0.076 0.027 0.0095 0.0095 0.0095 0.0095 0.0095 0.0095
Time resolution (µsec) 10.24 20.48 51.2 102.4 204.8 512 1280 2560 6400 12800
Number of point 978 978 978 978 978 978 783 783 783 783
Table1-17. Narrow band transient (frequency bandwidth = 200 kHz)
Measurement time (sec) 1 m 2 m 5 m 10 m 20 m 50 m 100 m 200 m 500 m 1 2 5 10
Frequency resolution (Hz rms) 4.9 4.9 1.7 0.6 0.2 0.2 0.2 0.2 0.2 0.2 0.2 0.2 0.2
Time resolution (µsec) 1.28 2.56 6.4 12.8 25.6 64 160 320 800 1600 3200 8000 16000
Number of point 783 783 783 783 783 783 626 626 626 626 626 626 626
Table1-18. Narrow band transient (frequency bandwidth = 1.6 MHz)
Measurement time (sec) 100 µ 200 µ 500 µ 1 m 2 m 5 m 10 m 20 m 50 m 100 m 200 m 500 m 1 2 5 10
Frequency resolution (Hz rms) 110 110 110 39 21 14 5 5 5 5 5 5 5 5 5 5
Time resolution (µsec) 0.16 0.32 0.8 0.8 1.6 4 8 20 80 160 320 800 1600 3200 8000 1600
Number of point 626 626 626 1251 1251 1251 1251 1001 626 626 626 626 626 626 626 626
Table1-19. Narrow band transient (frequency bandwidth = 25.6 MHz)
Measurement time (sec) 10 µ 20 µ 50 µ 100 µ 200 µ 500 µ 1 m 2 m 5 m 10 m 20 m 50 m 100 m 200 m 500 m 1 2 5
Frequency resolution (Hz rms) 7 k 7 k 7 k 7 k 3 k 884 313 313 313 313 313 313 313 313 313 313 312.5 312.5
Time resolution (µsec) 0.01 0.02 0.05 0.1 0.2 0.5 1 2 6.25 12.5 25 62.5 125 250 625 1250 2500 6250
Number of point 1001 1001 1001 1001 1001 1001 1001 1001 801 801 801 801 801 801 801 801 801 801
Table 20. Spectrum monitor measurement capabilities
Spectrum monitor
Number of trace 1 data trace and 1 memory trace per measurement trace
Data formats dBm, dBV, watt, volt, dBm / Hz, dBV / Hz, watt / Hz, volt / √Hz
Measurement trigger Set to continuous, hold, or single, sweep with internal, external, manual, or bus trigger
7

8
Port Output (DC Power/Control)
Table 1-21. DC power voltage outputDescription Specifications Voltage range 0 to 16 V Resolution 1 mV Setting accuracy ± (0.2% + 2 mV) Maximum output current 80 mA Noise < 10 nV / Hz at 10 kHz Output resistance < 0.3 ohm (typical) Settling time @error: 0.1% < 20 msec (typical)
Table 1-22. DC control voltage outputDescription SpecificationsVoltage range -15 to 35 V Resolution 0.1 mV Setting accuracy
-15 to 0 V ± ((Setting + 15 V) x 0.1% + 5 mV) (typical)
0 to 35 V ± (Setting x 0.1% + 2 mV) (typical) Maximum output current 20 mA (typical) Noise0 to 20 V 1 nV / Hz at 10 kHz-15 to 0 V, 20 to 35 V 1.5 nV / Hz at 10 kHz Output resistance (DC) < 50 ohm Output resistance (AC) 50 ohm (nominal) Settling time @error: 0.1% < 20 msec (typical)
Test Port Input
Table 1-23. RF inDescription Specifications Input level
10 M to 30 MHz -15 to +20 dBm30 M to 7 GHz -20 to +20 dBm
Input attenuator 0 to 35 dB in 5 dB steps Damage level +23 dBm (nominal)VSWR
10 M to 30 MHz < 1.630 M to 2 GHz < 1.22 G to 3 GHz < 1.33 G to 4 GHz < 1.3 (typical)4 G to 7 GHz < 1.5 (typical)
General Information
Table 1-24. Front panel informationDescription Supplemental information RF inType Type-N, female, 50 ohm (nominal) DC power / controlType BNC, female, 50 ohm (nominal) DisplaySize 10.4 in TFT color LCD Resolution VGA (640 • 480)1
Table 1-25. Rear panel informationDescription Supplemental information External trigger connectorType BNC, female Input level Low threshold voltage: 0.5 V
High threshold voltage: 2.1 VInput level range: 0 to + 5 V
Pulse width ≥ 2 µsec, typicalPolarity Positive/negative selectableExternal trigger 0 to 1 usectiming adjustmentExternal reference signal input connectorType BNC, female Input frequency 10 MHz ± 10 Hz, typical Input level -6 dBm to + 16 dBm, typical Internal reference signal output connectorType BNC, female Input frequency 10 MHz ± 50 Hz, typical Signal type Sine wave, typical Output level 2.5 dBm ± 3 dB, typical Output impedance 50 ohm nominal VGA video output 15-pin mini D-Sub; female;
drives VGA compatible monitorsGPIB 24-pin D-Sub (type D-24), female;
compatible with IEEE-488Parallel port 36-pin D-Sub (type 1284-C), female;
provides connection to printersUSB port
Universal serial bus jack Type A configuration, female;provides connection to printer, USB/GPIBinterfaceType B configuration 2 (USBTMC), female;provides connections to an external PC
Contact 1 Vcc: 4.75 to 5.25 VDC, 500 mA, maximumContact 2 DataContact 3 +DataContact 4 Ground LAN 10 / 100 base T ethernet, 8-pin configuration;
auto selects between the two data rates24 Bit I/O port 36-pin D-sub, female; provides connection to
handler systemLine power 3
Frequency 47 Hz to 63 Hz Voltage 90 to 132 VAC, or 198 to 264 VAC
(automatically switched)VA maximum 500 VA max
1. Valid pixels are 99.99% and more. Below 0.01% (approx. 30 points) of fixed points of black, blue, green or red are not regarded as failure.
2. USB Test and Measurement Class (TMC) interface that communicates over USB using USBTMC messages based on the IEEE 488.1 and IEEE 488.2 standards.Type B configuration will be included with E5052A shipments beginning August 2005.
3. A third-wire ground is required.
√
√√

9
Table 1-26. EMC and safetyDescription Supplemental information EMC
• European council directive 89 / 336 / EEC, 92 / 31 / EEC, 93 / 68 / EECIEC 61326 - 1: 1997 +A1: 1998 +A2:2000/EN 61326 - 1: 1997 +A1: 1998+A2: 2001
• CISPR 11: 1997 +A1: 1999 / EN 55011:1998 +A1: 1999
• Group 1, Class A• IEC 61000 - 4-2:1995 +A1: 1998 / EN
61000 - 4-2: 1995 +A1: 1998• 4 kV CD / 8 kV AD• IEC 61000 - 4-3: 1995 +A1: 1998 / EN
61000 - 4-3: 1996 +A1: 1998• 3 V / m, 80 - 1000 MHz, 80% AM• IEC 61000 - 4-4: 1995 / EN 61000 - 4-4:
1995• 1 kV power / 0.5 kV signal• IEC 61000 - 4-5: 1995 / EN 61000 - 4-5:
1995• 0.5 kV normal / 1 kV common• IEC 61000 - 4-6: 1996 / EN 61000 - 4-6:
1996• 3 V, 0.15-80 MHz, 80% AM• IEC 61000 - 4-11: 1994 / EN 61000 - 4-11:
1994• 100% 1 cycle European council directive
ICES/NMB-001 This ISM device complies with Canadian ICES-001:1998AS/NZS 2064.1/2 Group 1, Class A
SafetyEuropean council directive 73/23/EEC, 93/68/EECIEC 61010-1:2001/EN 61010-1:2001Measurement category I, pollution degree 2, indoor useIEC60825-1:1994 Class 1 LED
CAN/CSA C22.2 No. 1010.1-92
Table 1-27. Analyzer environment and dimensionsDescription Supplemental information Operating environmentTemperature +10 °C to +40 °CHumidity 20% to 80% at wet bulb temperature
< +29 °C (non-condensing)Altitude 0 to 2,000 m (0 to 6,561 feet) Vibration 0.5 G maximum, 5 Hz to 500 Hz Non-operating storage environmentTemperature -10 °C to +60 °CHumidity 20% to 90% at wet bulb temperature
< +40 °C (non-condensing)Altitude 0 to 4,572 m (0 to 15,000 feet) Vibration 0.5 G maximum, 5 Hz to 500 Hz Dimensions See Figures 1-5 through 1-7 Weight (net) 21 kg
ISM 1-A
ISM 1-A

Figure 1-5. Dimensions (front view, in millimeters, nominal)
Figure 1-6. Dimensions (rear view, in millimeters, nominal)
Figure 1-7. Dimensions (side view, in millimeters, nominal)
Table 1-28. Measurement capabilitiesNumber of Up to 4 measurement windows measurement windows: and 1 user defined windowData markers: 6 independent markers per trace. Reference
marker available for delta marker operation.Marker functionsMarker search: Max value, min value, peak, peak left, peak
right, target, target left, target right, multi-peak, multi-target, bandwidth parameters with user-defined bandwidth values
Marker-to functions: Set, start, stop, center to active marker stimulus value; set reference to active marker response value
Search range: User definable Tracking: Performs marker search continuously or on
demandUser defined window
Number of trace: 8 data traces and 8 memory traces
Table 1-29. DC power/control voltage settingMeasured number User definable from 2 to 1001of points per sweep(standard only): Sweep type (parameter) Control voltage sweep, power voltage(standard only): sweepControl voltage: Set control voltage from –15 V to +35 VPower voltage: Set power voltage from 0 V to +16 V
Table 1-30. Trace functionsDisplay data: Display current measurement data, memory
data, or current measurement and memory data simultaneously
Trace math: Addition, subtraction, multiplication or division of trace or memory data
Title: Add custom title to each measurement window. Titles are printed on hard copies of displayed measurements
Autoscale: Automatically selects scale resolution and reference value to vertically center the trace
Statistics: Calculates and displays mean, standard deviation and peak-to-peak deviation of the data trace
10

11
Table 1-31. StorageInternal hard disk drive: Store and recall instrument states and trace data on 10 GB, minimum, internal hard drive. Trace data can be saved
in CSV (comma separated value) format. All files are MS-DOS®-compatible. Instrument states include all control settings and memory trace data.
File sharing: Internal hard disk drive (F:) can be accessed from an external Windows® PC through LAN or USB (USBTMC)Disk drive: Instrument states and trace data can be stored on an internal 3.5 inch 1.4 MB floppy disk in MS-DOS-compatible
formatScreen hard copy: Printouts of instrument data are directly produced on a printer. The analyzer provides USB and parallel interfaces
Table 1-32. System capabilitiesFamiliar graphical The analyzer employs a graphical user interface based on Windows® operating system. There are three ways to user interface: operate the instrument manually: you can use a hard key interface, a touch screen interface, or a mouse interface.Limit line
Limit test Define the test limit that appears on the display for pass/fain testing. Defined limits may be any combination of horizontal/sloping lines and discrete data points.
Table1-33. Function differences between standard and E5052A-011Descriptions Standard E5052A-011Phase noise measurementOffset frequency 1 Hz to 40 MHz 10 Hz to 40 MHzIF gain 0, 10, 20, 30, 40, 50 dB 0, 10, 20 dBEnhanced phase noise sensitivity Yes (1 to 10,000 correlations) NoPhase noise sensitivity See table 1-2 See table 1-3Frequency, RF power, DC current measurementMeasurement parameters Analyzer mode: Tester mode:
Frequency versus DC control voltage dF/dV control Frequency, power, and DC current (tuning sensitivity) (at DC power port)Frequency versus DC power voltage (frequency pushing),dF/dV power RF power versus DC control voltage or DC power voltage DC current (at DC power port only) versusDC control voltage or DC power voltageTester mode:Frequency, power, and DC current (at DC power port)
Table 1-34. AutomationMethods
Internal analyzer execution: Applications can be developed in a built-in VBA® (Visual Basic for Applications) language. Applications canbe executed from within the analyzer via COM (component object model) or using SCPI.
Controlling via GPIB The GPIB interface operates to IEEE 488.2 and SCPI protocols. The analyzer can be controlled by a GPIBor USB (USBTMC): external controller. The analyzer can control external devices using a USB/GPIB interface.Controlling via USB The USB interface operates with USBTMC and SCPI protocols. The analyzer can be controlled with an(USBTMC): external PC using the USB interface with a USB cable.
LANStandard conformity: 10 base-T or 100 base-TX (automatically switched), Ethertwist, RJ45 connectorProtocol: TCP/IPFunction: Telnet, SICL-LAN
Table 1-35. E5001A SSA-J precision clock jitter analysis softwareDescription SpecificationMeasurement parameters Random jitter (RJ), Periodic jitter (PJ) frequency, PJ rms, Jitter trend (TJ vs. time), TJ p-p, PJ p-p, PJ d-dJitter spectrum bandwidth 1 Hz to 40 MHz (standard)
10 Hz to 40 MHz (Option E5052A-011)

System Performance with the E5053A Downconverter
The system performance is the combination of the E5052A SSAand E5053A downconverter. All data is typical performance.
Table 2-1. System performance characteristicsDescription Performance characteristicsTest portFrequency range 10 MHz to 3 GHz (E5052A SSA RF IN port)
3 to 26.5 GHz (E5053A downconverter input port)Input level -15 dBm to +20 dBm (10 M to 3 GHz, E5052A RF IN)
-30 dBm to + 10 dBm (3 to 10 G frequency band)-20 dBm to + 5 dBm (10 to 26.5 GHz frequency band)
Carrier search range 1 -10 dBm to +10 dBm (3 to 10 GHz frequency band)-10 dBm to +5 dBm (9 to 26.5 GHz frequency band)
Phase noise measurementFrequency band 10 MHz to 3 GHz (E5052A SSA RF IN port)
3 to 10 GHz or 9 to 26.5 GHz (E5053A downconverter RF IN port)SSB phase noise sensitivity See Figure 2 and Table 2Frequency tracking range 1.8 MHz (< 4.9 GHz, 3 to 10 GHz band)
2.8 MHz (>= 4.9 GHz, 3 to 10 GHz band)1.3 MHz (< 10 GHz, 9 to 26.5 GHz band)2.6 MHz (>= 10 GHz, 9 to 26.5 GHz band)
Transient measurementWide band measurement range 50 MHz to 3 GHz (E5052A SSA RF IN port)
500 MHz (E5053A downconverter RF IN port)Narrow band measurement range 200 kHz, 1.6 MHz, or 25.6 MHzRF power measurement accuracy 2 +/- 2 dB (10 MHz to 3 GHz)
+/- 3 dB (3 to 10 GHz)+/- 4 dB (9 to 26.5 GHz)
Frequency, RF power, DC current measurementFrequency measurement resolution 10 Hz, 1 kHz, or 64 kHzRF power measurement accuracy 2 +/- 2 dB (10 MHz to 3 GHz)
+/- 3 dB (3 to 10 GHz)+/- 4 dB (9 to 26.5 GHz)
Spectrum monitorFrequency span 15 MHz maxRBW 1.53 Hz to 400 kHz, 1-3-5 stepAbsolute level accuracy +/- 4 dB
1. Carrier search function is applicable for the phase noise, frequency/power/DC current, and spectrum monitor functions when using the E5053A downconverter RF IN port.
2. Power accuracy can be improved by applying the “user-power cal” function equipped with the SSA Rev2.0
Fundamentalor
3rd harmonicmixing
10 MHzto
3 GHz
PLL
PLL
ADC
ADC FFT
FFT
Correlation
DUT
3 TO 26.5 GHZ
IF gainblock
E5053A Microwave Downconverter E5052A Signal Source Analyzer
Figure 2-1. E5053A with E5052A block diagram
12
13
System Performance with the E5053A Downconverter
Table 2-2. System phase noise sensitivity (typical)
Offset from carrier (Hz)Input frequency 1 10 100 1k 10 k 100 k 1 M 10 M 40 M3 GHz -39.0 -78.7 -99.5 -124.4 -135.3 -137.5 -153.5 -164.5 -167.6 10 GHz -34.6 -71.8 -91.1 -116.1 -124.1 -128.1 -147.1 -156.6 -160.0 18 GHz -31.6 -66.5 -85.3 -110.3 -121.2 -125.3 -141.3 -150.7 -154.2 26.5 GHz -29.0 -63.2 -81.8 -106.8 -117.8 -121.8 -137.8 -147.3 -150.8
Figure 2-2. System phase noise sensitivity with the E5053A downconverter(standard, 0 dBm input, correlation = 1, start offset frequency = 1 Hz, measurement time = 17.7 sec)
E5052A with E5053A phase noise performance (standard, correlation = 1, measuring ultra-low noise N5507A uW LO)
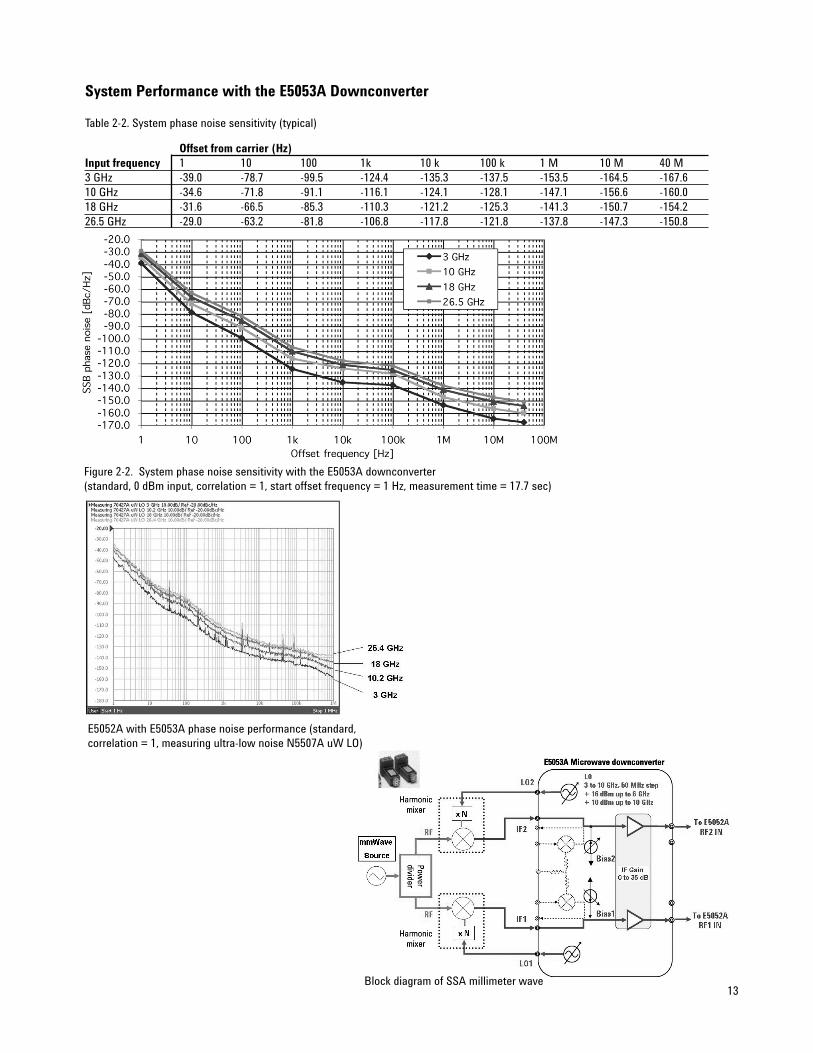
Block diagram of SSA millimeter wave

E5053A Microwave DownconverterSpecification Summary
Downconverter Test Port
Table 2-3. Input/output Description SpecificationTest port inputFrequency range 3 to 26.5 GHzMaximum Input level +10 dBm (3 to 10 GHz band)
+5 dBm (9 to 26.5 GHz band)Damage level +23 dBm (nominal)LO outputOutput frequency 3 to 10 GHzLO resolution 50 MHzOutput power 10 to 16 dBm (3 to 6 GHz)
10 to 15 dBm (6 to 10 GHz)LO spurious -55 dBc (Foffset > 300 Hz, typical)IF InputFrequency range 250 to 1250 MHzMaximum input level 0 dBm (typical)IF gain 0 to 35 dB (5 dB step)Noise floor -163 dBm/HzMixer bias current -10 to 10 mA
General Information
Table 2-4. Real Panel InformationDescription Supplemental InformationExternal reference signal input connectorType BNC, femaleInput frequency 10 MHz +/- 10 Hz (typical)Input level -5 dBm +/- 5 dB (typical)
Internal reference signal output connectorType BNC, femaleInput frequency 10 MHz +/- 50 Hz (typical)Input level 2.5 dBm +/- 3 dB (typical)USB port Universal serial bus jack,
type B configuration, female;provides connection to theE5052A SSA
Line power 1
Frequency 47 to 63 HzVoltage 90 to 132 VAC, or 198 to 264 VAC
(automatically switched)VA maximum 120 VA max
Table 5. Analyzer environment and dimensionsDescription Supplemental InformationOperating environmentTemperature +10 degC to +40 degCHumidity 20 to 80% at wet bulb temperature
< +28 degC (non-condensing)Non-operating storage environmentTemperature -10 degC to +60 degCHumidity 20 to 90% at wet bulb temperature
< +40 degC (non-condensing)Dimensions See figures Weight 11 kg
1. A third-wire ground is required.
E5053A Microwave Downconverter Specification Summary
Table 2-5. E5053A downconverter LO phase noise
Offset from carrier (Hz)Input frequency 1 10 100 1 k 10 k 100 k 1 M 10 M 40 M3 GHz Spec. -110.5 -116.5 -113.5 -127.5 -140.0 -140.0
Typ. -49.5 -79.5 -94.5 -114.5 -120.5 -117.5 -131.5 -144.0 -144.0 6 GHz Spec. -104.4 -110.4 -109.4 -123.4 -140.0 -140.0
Typ. -43.4 -73.4 -88.4 -108.4 -114.4 -113.4 -127.4 -144.0 -144.0 10 GHz Spec. -100.0 -103.0 -102.0 -119.0 -140.0 -140.0
Typ. -39.0 -69.0 -84.0 -104.0 -107.0 -106.0 -123.0 -144.0 -144.0
Figure 2-3. E5052A downconverter LO phase noise (typical)
14

15
Figure 2-4. Dimensions (front view, in millimeters, nominal
Figure 2-5. Dimensions (rear view, in millimeters, nominal)
Figure 2-6. Dimensions (side view, in millimeters, nominal)

Web Resources
Visit our Signal Source Analyzer Web site for additional product information and literature: www.agilent.com/find/ssa
Phase noise measurements:www.agilent.com/find/phasenoise
RF and microwave accessories:www.agilent.com/find/accessories
Windows‚ and Visual Basic‚ are U.S. registered trademarks of Microsoft Corporation.
www.agilent.com/find/emailupdatesGet the latest information on the products and applications you select.
Agilent Email Updates
www.agilent.com/find/agilentdirectQuickly choose and use your test equipment solutions with confidence.
Agilent Direct
AgilentOpen
www.agilent.com/find/openAgilent Open simplifies the process of connecting and programmingtest systems to help engineers design, validate and manufacture electronicproducts. Agilent offers open connectivity for a broad range of system-ready instruments, open industry software, PC-standard I/O and globalsupport, which are combined to more easily integrate test systemdevelopment.
www.agilent.com
For more information on Agilent Technologies’ products, applications or services, please contact your local Agilent office.The complete list is available at:
www.agilent.com/find/contactus
Phone or Fax
United States: Korea:(tel) 800 829 4444 (tel) (080) 769 0800(fax) 800 829 4433 (fax) (080) 769 0900
Canada: Latin America:(tel) 877 894 4414 (tel) (305) 269 7500(fax) 800 746 4866 Taiwan:China: (tel) 0800 047 866(tel) 800 810 0189 (fax) 0800 286 331(fax) 800 820 2816 Other Asia PacificEurope: Countries:(tel) 31 20 547 2111 (tel) (65) 6375 8100
Japan: (fax) (65) 6755 0042(tel) (81) 426 56 7832 Email: [email protected](fax) (81) 426 56 7840 Revised: 09/14/06
Product specifications and descriptions in this document subjectto change without notice.
© Agilent Technologies, Inc. 2004, 2005, 2006Printed in USA, September 25, 20065989-0903EN
Remove all doubt
Our repair and calibration services will get your equipment back to you, performing like new, when promised. You will getfull value out of your Agilent equipment throughout its lifetime.Your equipment will be serviced by Agilent-trained techniciansusing the latest factory calibration procedures, automatedrepair diagnostics and genuine parts. You will always have theutmost confidence in your measurements.
Agilent offers a wide range of additional expert test and measurement services for your equipment, including initialstart-up assistance, onsite education and training, as well asdesign, system integration, and project management.
For more information on repair and calibration services, go to
www.agilent.com/find/removealldoubt