Agenda Public Safety Committee Meeting - City of Pasadena
294
AGENDA PUBLIC SAFETY COMMITTEE MEETING NOTICE APRIL 17, 2019 PUBLIC MEETING 6:00 P.M. MEMBERS John J. Kennedy, Vice Mayor, District 3 Terry Tornek, Mayor Tyron Hampton, District 1 Steve Madison, District 6 STAFF Steve Mermell, City Manager Javan Rad, Chief Assistant City Attorney Valerie Flores, Recording Secretary MISSION STATEMENT The City of Pasadena is dedicated to delivering exemplary municipal services, responsive to our entire community and consistent with our history, culture and unique character. In compliance with the Americans with Disabilities Act of 1990, Assistive Listening Devices are available from the City Clerk’s Office with a 24-hour advance notice. Please call (626) 744-4124 to request use of a listening device. Language translation services are available for this meeting by calling (626) 744-4124 at least 24 hours in advance. Habrá servicio de interpretación disponible para éstas juntas llamando al (626) 744-4124 por lo menos con 24 horas de anticipación. Items on the agenda may not be called in order listed. Agendas and supporting documents are available on the Internet at http://www.cityofpasadena.net/commissions/city-council-public-safety-committee/ Materials related to an item on this Agenda submitted to the Public Safety Committee after distribution of the agenda packet are available for public inspection in the City Clerk’s Office at 100 N. Garfield Avenue, Room S-228, Pasadena, during normal business hours. COPIES OF THIS AGENDA ARE AVAILABLE FROM THE NEIGHBORHOOD INFORMATION SERVICE AT THE CENTRAL AND ALL BRANCH LIBRARIES.
-
Upload
khangminh22 -
Category
Documents
-
view
3 -
download
0
Transcript of Agenda Public Safety Committee Meeting - City of Pasadena

AGENDA
PUBLIC SAFETY COMMITTEE MEETING NOTICE
APRIL 17, 2019 PUBLIC MEETING 6:00 P.M.
MEMBERS John J. Kennedy, Vice Mayor, District 3
Terry Tornek, Mayor Tyron Hampton, District 1 Steve Madison, District 6
STAFF
Steve Mermell, City Manager Javan Rad, Chief Assistant City Attorney
Valerie Flores, Recording Secretary
MISSION STATEMENT The City of Pasadena is dedicated to delivering exemplary municipal services,
responsive to our entire community and consistent with our history, culture and unique character.
In compliance with the Americans with Disabilities Act of 1990, Assistive Listening Devices are available from the City Clerk’s Office with a 24-hour advance notice.
Please call (626) 744-4124 to request use of a listening device.
Language translation services are available for this meeting by calling (626) 744-4124 at least 24 hours in advance.
Habrá servicio de interpretación disponible para éstas juntas llamando al (626) 744-4124 por lo menos con 24 horas de anticipación.
Items on the agenda may not be called in order listed.
Agendas and supporting documents are available on the Internet at http://www.cityofpasadena.net/commissions/city-council-public-safety-committee/
Materials related to an item on this Agenda submitted to the Public Safety Committee after
distribution of the agenda packet are available for public inspection in the City Clerk’s Office at 100 N. Garfield Avenue, Room S-228, Pasadena, during normal business hours.
COPIES OF THIS AGENDA ARE AVAILABLE FROM THE
NEIGHBORHOOD INFORMATION SERVICE AT THE CENTRAL AND
ALL BRANCH LIBRARIES.


APPROVAL OF MINUTES
February 4, 2019 – Regular Meeting*
February 20, 2019 – Regular Meeting*
March 4, 2019 – Regular Meeting*
March 20, 2019 – Cancellation of Regular Meeting*
April 1, 2019 – Cancellation of Regular Meeting*

01 02/04/2019
CITY OF PASADENA PUBLIC SAFETY COMMITTEE MINUTES
PASADENA CITY HALL 100 NORTH GARFIELD AVENUE
CITY HALL COUNCIL CHAMBER – S249 FEBRUARY 4, 2019
REGULAR MEETING
OPENING The Chair called the regular meeting of the Public Safety Committee to order at 4:23 p.m.
ROLL CALL: Staff:
Vice Mayor John J. Kennedy (Chair) Mayor Terry Tornek Councilmember Tyron Hampton Councilmember Steve Madison (Arrived at 4:29 p.m.) Steve Mermell, City Manager Javan Rad, Chief Assistant City Attorney Bertral Washington, Fire Chief Bryan Frieders, Fire Bureau Chief David Reyes, Director of Planning Sarkis Nazerian, Building Official Valerie Flores, Recording Secretary
PUBLIC COMMENT Councilmember Madison arrived at 4:29 p.m.
Kristina Russell and Yvonne Trice, residence not stated, expressed their thanks and appreciation to Councilmember Hampton and the City Manager for the City’s willingness to post a reward to help solve the murder of their relative Monte Russell, as well as other unsolved murder cases. The City Manager noted that the City is moving forward with offering a $5,000 reward for information that leads to the arrest and conviction of any unsolved murder cases in the City, and stated that a formal press release will take place within the coming weeks. Councilmember Hampton thanked the family of Monte Russell for speaking on behalf of all families of unsolved murder cases. Kris Ockershauser, American Civil Liberties Union (ACLU), Coalition for Increased Oversight of Pasadena Police (CICOPP), reiterated requests from CICOPP and ACLU to review Pasadena Police Department’s Use of Force Policy. She read information from the Racial and Identity Profiling Advisory Board (RIPA) 2019 Annual Report related to use of force, and commented on a recent incident that involved the Pasadena Police and Brandon Green, stating the need for an independent review of that incident. Vincent De Stefano, (CICOPP), submitted an article titled, “State Report Calls For Over 40 Changes On Sacramento PD In Wake Of Stephon Clark Shooting”, and urged the City to move forward with revising and clearly defining the Department’s use of force policies. The Chair stated that the Police Chief is currently reviewing the Department’s policy and will present information to the Committee in the near future.

02 02/04/2019
In response to Councilmember Hampton, City Manager Mermell noted that the Department is in the midst of a Change in Command review and that the City has contracted the National Police Foundation to assist the Department in reviewing internal policies including use of force. City Manager Mermell also noted that Chief Perez is reviewing a report released by State Attorney General Becerra on the policies and practices of the Sacramento Police Department. Christina Mesesan, residence not stated, spoke on outstanding priorities associated with Police Chief’s “Change of Command” Review and submitted written material titled, “Pasadena Police Department Inspector General Proposal.” David Llanes, PPOA, spoke on the release of the Officer Involved Shooting (OIS) report related to the incident involving a Pasadena Police Officer and Brandon Green. Mr. Llanes also spoke on the need for City leadership to recognize the Department’s efforts to improve transparency and incorporate changes within the Police Department.
APPROVAL OF MINUTES It was moved by Councilmember Hampton, seconded by Mayor Tornek, to approve the minutes of October 1, 2018 (regular meeting), October 17, 2018 (regular meeting), November 5, 2018 (regular meeting), November 21, 2018 (cancelled meeting) and December 3, 2018 (regular meeting) as submitted. (Motion unanimously carried) (Absent: None)
NEW BUSINESS AUTHORIZATION TO ENTER INTO A JOINT POWERS AGREEMENT FOR THE LOS ANGELES AREA REGIONAL TRAINING GROUP OF FIRE PROTECTION AGENCIES
Steve Mermell, City Manager, introduced the agenda item, and Bertral Washington, Fire Chief, and Bryan Frieders, Fire Bureau Chief, provided a PowerPoint presentation summarizing the agenda report, and responded to questions. Following discussion, the Chair asked the City Attorney to provide information on the City’s liability insurance in relation to the JPA agreement when presenting to the full City Council for consideration. The Mayor expressed his support for staff’s recommendation, commented on the importance of public safety sector integration across cities, expressed his concerns regarding possible future budget implications associated with the JPA, but noted that Member Cities can withdraw from the Authority without penalty. Following brief discussion, it was moved by Mayor Tornek, seconded by Councilmember Hampton, to approve staff’s recommendation, and forward the item to the full City Council for consideration. (Motion unanimously carried) (Absent: None)
INFORMATION ITEMS EMERGENCY OPERATIONS CENTER (EOC) OVERVIEW – FOLLOW-UP INFORMATION
Following a brief discussion, on order of the Chair, and by consensus

03 02/04/2019
of the Committee, the information was received and filed.
SEISMIC RETROFITTING OF SOFT-STORY BUILDINGS PROGRESS REPORT
Sarkis Nazerian, Building Official, introduced the agenda item, and Daniel Zepeda, representing Degenkolb Engineers, provided a PowerPoint presentation, and responded to questions. David Reyes, Director of Planning, responded to questions regarding the proposed regulations for buildings identified as Priority 1, and the recommended timelines for compliance. Mr. Reyes noted that staff would further review and provide information on the criteria that identifies affordable housing units, as well as the steps that City staff will undertake to ensure that seismic retrofit improvements will be completed within the required period following issuance of the Notice to Comply to the property owners. Councilmember Hampton asked staff to provide additional information on permit fees. The Mayor asked staff to include cost estimates for the seismic retrofit work required for soft-story buildings when presenting to the full City Council. On order of the Chair, and by consensus of the Committee, the information was received and filed.
GEOGRAPHIC INFORMATION SYSTEMS (GIS) FOR FIRE DEPARTMENT ACCREDITATION AND EMERGENCY RESPONSE
Due to time constraints, the above information item was held for discussion at a future Committee meeting.
ADJOURNMENT On the order of the Chair, the regular meeting of the Public Safety
Committee was adjourned at 5:46 p.m. ATTEST: ____________________ Valerie Flores Recording Secretary
_________________________________ Vice Mayor John J. Kennedy, Chair Public Safety Committee

01 2/20/2019
CITY OF PASADENA PUBLIC SAFETY COMMITTEE MINUTES
PASADENA CITY HALL 100 NORTH GARFIELD AVENUE
CITY HALL COUNCIL CHAMBER – S249 FEBRUARY 20, 2019 REGULAR MEETING
OPENING The Chair called the regular meeting of the Public Safety Committee to order at 6:04 p.m.
ROLL CALL: Staff:
Vice Mayor John J. Kennedy (Chair) Mayor Terry Tornek Councilmember Tyron Hampton Councilmember Steve Madison (Arrived at 6:32 p.m.) Steve Mermell, City Manager Javan Rad, Chief Assistant City Attorney John Perez, Police Chief Valerie Flores, Recording Secretary
PUBLIC COMMENT No one appeared for public comment
NEW BUSINESS INDEPENDENT REVIEW OF THE PASADENA POLICE
DEPARTMENT’S ADMINISTRATIVE REVIEW OF THE DEATH OF REGINALD THOMAS, JR.
Councilmember Madison arrived at 6:32 p.m. The Committee recessed at 6:55 p.m. and reconvened at 7:01 p.m.
The Chair and the City Manager provided introductory comments and responded to questions. Rick Braziel, Executive Fellow of the National Police Foundation, provided a PowerPoint presentation summarizing the following: Scope of Work, Methodology, Incident Review, Use of Force Summary, CEW Deployment, Mr. Thomas’ Injuries, Toxicology Results, Recommendations, and Outside Agency Critical Incident Review, and responded to questions. John Perez, Police Chief, provided a PowerPoint presentation summarizing the Department’s response to the National Police Foundations recommendations. Councilmember Hampton thanked Mr. Braziel and Chief Perez for thorough presentations, and expressed his appreciation to the City Manager for conducting this retrospective assessment and evaluation as a way to learn from the incident. In response to questions, Javan Rad, Chief Assistant City Attorney, provided information on recent amendments to state law that require greater public access to records of administrative reviews for certain critical incidents. Following discussion, the Chair asked staff to agendize for further discussion the Chief’s response to Recommendation No. 7 of the National Police Foundation, which read as follows:

02 2/20/2019
7. If the PPD [Pasadena Police Department] chooses to continue to retain LASD [Los Angeles County Sheriff’s Department] to assist in use of force reviews, a comprehensive Memorandum of Understanding with the LASD should be agreed upon that includes roles and responsibilities for each agency: Agreed: If the retention of LASD continues, the Department agrees with the implementation of a formal MOU. However, the PPD is preparing a return to using PPD investigators to review OIS [Officer Involved Shooting] and In-Custody deaths. The change in practice will allow PPD to provide the community with more timely updates, overviews, and investigative efforts. This approach would also allow for an earlier release of BWC video as well as other relevant video to the public.
Following discussion, City Manager Mermell stated that he would consult with the City Attorney’s Office to determine if such changes in protocol fall within the authority and purview of the City Manager. The Mayor stated his support for the Chair’s request, and noted that the decision to retain the Los Angeles County Sheriff’s Department (LASD) to assist the City and Pasadena Police Department with reviews of OIS and In-Custody deaths was a highly debated and publicized decision, and warrants a robust discussion, and asked that staff provide the pros and cons on the Department’s intention to return to using PPD investigators. The following individuals provided comments, and questions regarding the agenda item:
Kris Ockershauser, Coalition for Increased Oversight of Pasadena Police (CICOPP) James Farr, residents not stated Deirdra Duncan, residents not stated Ed Washatka, Pasadena resident Caree Harper, Marina Del Rey resident David Llanes, Pasadena Police Officers Association (PPOA) Florence Anneny, Pasadena CICOPP
In response to Ms. Ockershauser, the City Manager briefly addressed the Racial and Identity Profiling Act (RIPA), stated his intent to pursue early implementation of RIPA, but also indicated that additional study related to workload impacts is required prior to implementation. Mr. Mermell also noted he would report back to the Committee on this matter and provide additional details within the next 90 days. Following discussion, the City Manager provided details on the early discussions related to holding a Public Safety Committee meeting at the Police Range to review PPD training tactics, restraint techniques, and other use of force matters.

03 2/20/2019
In response to Councilmember Hampton, Chief Perez expressed his support in exploring available resources that would allow for the deployment of crisis counselors during critical incidents to assist affected families, and to act as a liaison between families and Pasadena Police Officers. The Chair expressed his appreciation and thanked the public speakers, Mr. Braziel, and Chief Perez for their participation in tonight’s meeting. He also extended an apology to the relatives of Mr. Thomas for not informing them directly about tonight’s presentation. Following discussion, on the order of the Chair and by consensus of the Committee, the information was received and filed.
ADJOURNMENT On the order of the Chair, the regular meeting of the Public Safety
Committee was adjourned at 8:22 p.m. ATTEST: ____________________ Valerie Flores Recording Secretary
_________________________________ Vice Mayor John J. Kennedy, Chair Public Safety Committee

01 3/04/2019
CITY OF PASADENA PUBLIC SAFETY COMMITTEE MINUTES
PASADENA CITY HALL 100 NORTH GARFIELD AVENUE
CITY HALL COUNCIL CHAMBER – S249 MARCH 4, 2019
REGULAR MEETING
OPENING The Chair called the regular meeting of the Public Safety Committee to order at 4:28 p.m.
ROLL CALL: Staff:
Vice Mayor John J. Kennedy (Chair) Mayor Terry Tornek Councilmember Tyron Hampton Councilmember Steve Madison (Arrived at 4:52 p.m.) Steve Mermell, City Manager Javan Rad, Chief Assistant City Attorney John Perez, Police Chief Bahman Janka, Transportation Administrator Bertral Washington, Fire Chief Bryan Frieders, Fire Bureau Chief Robert Sepulveda, Fire Captain Valerie Flores, Recording Secretary
PUBLIC COMMENT Genevieve Clavreul, Pasadena resident, expressed concerns regarding an unsafe elevator that operates at the Lake Avenue Gold Line Station, and also noted areas of disrepair on the roads and sidewalks near Walnut and Hudson Street. Chris Ziegler, Pasadena resident, expressed concerns with the Lida Street Neighborhood Traffic Calming Project, and asked that City staff utilize temporary devices to assess proposed traffic measures prior to the approval of permanent installments. Kris Ockershauser, Coalition for Increased Oversight of Pasadena Police (CICOPP), referenced an article in the Pasadena Star News regarding the Supreme Court’s ruling limiting civil asset forfeitures, and questioned whether PPD intends to continuing impounding assets given the ruling. The Chair requested that the City Manager ask the Chief of Police to include in his forthcoming “Chief’s Monthly Report” information on the Department’s asset forfeiture practices, taking into account Ms. Ockershauser comments.
APPROVAL OF MINUTES It was moved by Mayor Tornek, seconded by Councilmember Hampton to approve the minutes of December 19, 2018 (special meeting), January 7, 2019 (cancelled meeting) and January 16, 2019 (cancelled meeting) as submitted. (Motion unanimously carried) (Absent: Councilmember Madison)

02 3/04/2019
NEW BUSINESS ROSE BOWL LOOP ROADWAY IMPROVEMENTS & SAFETY ENHANCEMENTS
Councilmember Madison arrived at 4:52 p.m.
Steve Mermell, City Manager, introduced the agenda item, and Bahman Janka, Transportation Administrator, provided a PowerPoint presentation summarizing the agenda item, and responded to questions. Councilmember Hampton expressed concerns with traffic impacts on Rosemont Avenue, commended staff for implementing temporary delineators prior to installing the permanent improvements, and stated that field testing measures should be a common practice when roadway modifications are proposed. Councilmember Hampton expressed his concerns with the spacing between delineators, and asked staff to reevaluate the spacing of the staggered cones. In response, the City Manager confirmed that an assessment of the impacts to safety and traffic at Rosemont Avenue (which will occur over a period of time) is already contemplated in the project. Councilmember Madison questioned the effectiveness of staff’s recommendations, and asked staff to determine whether resources are available within the Central Arroyo Master Plan to fund alternative safety enhancement at the Rose Bowl that will benefit all users, including the cyclists.
William (Bill) Urban, Pasadena resident, spoke in favor of the staff recommendation, provided comments, and suggestions
The following individuals spoke in opposition of the staff recommendation and/or provided comments and/or suggestions:
Chris Ziegler, Rose Bowl Peloton Lon Bender, Pasadena resident Dennis McCullough, Pasadena Athletic Association (PAA) Cycling Club Wes Reutmann, Pasadena resident Ben Barthel, Pasadena resident Clare Ceplecha, Pasadena resident John Barker, Pasadena resident
In response to questions, the City Manager stated that staff will compile the Central Arroyo Master Plan’s expenditures and budgetary information. Councilmember Hampton briefly spoke on K-rail barriers, and suggested that staff consider utilizing these devices as part of the delineator spacing concept in the Rose Bowl Loop pedestrian walkway to guard against bicyclists veering into other users. The Mayor recognized the efforts of staff to address safety issues between cyclists and pedestrians using the Rose Bowl recreation area but expressed concerns with the dimensions of the delineator spacing, and asked staff to use the temporary installment period for field-testing in order to collect pertinent data on traffic impacts around the loop.

03 3/04/2019
Following a brief discussion, on order of the Chair, and by consensus of the Committee, the information was received and filed.
GEOGRAPHIC INFORMATION SYSTEMS (GIS) FOR FIRE DEPARTMENT ACCREDITATION AND EMERGENCY RESPONSE
Steve Mermell, City Manager, and Bertral Washington, Fire Chief, provided introductory comments, and responded to questions. Robert Sepulveda, Fire Captain and Bryan Frieders, Fire Bureau Chief, provided a PowerPoint presentation summarizing the agenda item, and responded to questions. Councilmember Hampton suggested that staff include information on the GIS tools as part of the Department’s educational outreach to promote new career path opportunities for local high school students. Following a brief discussion, on order of the Chair, and by consensus of the Committee, the information was received and filed.
POLICE CHIEF’S MONTHLY REPORT
On order of the Chair, and by consensus of the Committee, the information was received and filed.
ADJOURNMENT On the order of the Chair, the regular meeting of the Public Safety
Committee was adjourned at 5:46 p.m. ATTEST: ____________________ Valerie Flores Recording Secretary
_________________________________ Vice Mayor John J. Kennedy, Chair Public Safety Committee

03/20/2019
CITY OF PASADENA PUBLIC SAFETY COMMITTEE MINUTES
PASADENA CITY HALL 100 NORTH GARFIELD AVENUE
CITY HALL COUNCIL CHAMBER – S249 MARCH 20, 2019
REGULAR MEETING
The regular meeting of the Public Safety Committee, scheduled for Wednesday, March 20, 2019, at 6:00 p.m., was cancelled as ordered on March 19, 2019, and posted as required by law.
___________________________________
Vice Mayor John J. Kennedy, Chair
Public Safety Committee
ATTEST:
Valerie Flores Recording Secretary
04/01/2019
CITY OF PASADENA PUBLIC SAFETY COMMITTEE MINUTES
PASADENA CITY HALL 100 NORTH GARFIELD AVENUE
CITY HALL COUNCIL CHAMBER – S249 APRIL 1, 2019
REGULAR MEETING
The regular meeting of the Public Safety Committee, scheduled for Monday, April 1, 2019, at 4:15 p.m., was cancelled due to lack of quorum.
____________________________________
Vice Mayor John J. Kennedy, Chair
Public Safety Committee
ATTEST:
Valerie Flores Recording Secretary

NEW BUSINESS
A. Authorization to Enter into a Contract with Donald MacDonald
Architects for Environmental and Design Services of the
Colorado Street Bridge – Suicide Mitigation Enhancements
Project for an Amount Not to Exceed $700,000 and Amendment
to FY 2019 CIP Budget*
B. Adoption of the City of Pasadena Local Hazard Mitigation
Plan*
C. Proposed Amendments to Pasadena Municipal Code Regarding
Sidewalk Vendors*

ITEM 4.A
Authorization to Enter into a Contract with Donald MacDonald
Architects for Environmental and Design Services of the
Colorado Street Bridge – Suicide Mitigation Enhancements
Project for an Amount Not to Exceed $700,000 and Amendment
to FY 2019 CIP Budget


ITEM 4.B
Adoption of the City of Pasadena Local Hazard Mitigation Plan


CITY OF PASADENA
LOCAL HAZARD MITIGATION PLAN
Final
March 2019

2

City of Pasadena
2018 Multi-Hazard Mitigation Plan
3
TABLE OF CONTENTS
Section 1
Introduction .................................................................................................................................... 6
Section 2
Plan Purpose and Authority ........................................................................................................... 8
Section 3
Overview ...................................................................................................................................... 10
Steering Committee...................................................................................................................... 11
Role and Responsibilities ............................................................................................................. 11
Members....................................................................................................................................... 12
Overview of the Steering Committee Meetings ........................................................................... 14
Public Outreach ............................................................................................................................ 15
Informing the Community of the LHMP Update process ............................................................ 15
Ongoing Public Outreach ............................................................................................................. 15
Capabilities Assessment ............................................................................................................... 17
Section 4
Community Profile ....................................................................................................................... 17
Demographics .............................................................................................................................. 18
Population Trends ........................................................................................................................ 19
Economy ...................................................................................................................................... 19
Employment ................................................................................................................................. 21
Precipitation ................................................................................................................................. 22
Air Quality ................................................................................................................................... 22
Physical Features .......................................................................................................................... 22
Housing …………………………………………………………………………………………22
Schools and Hospitals .................................................................................................................. 23
City Parks ..................................................................................................................................... 23
Water…. …………………………………………………………………………………………23
Power…. ...................................................................................................................................... 24
Land Use and Development ......................................................................................................... 25
Key Assets and Infrastructure ...................................................................................................... 27

City of Pasadena
2018 Multi-Hazard Mitigation Plan
4
Administrative and Technical Capacity ....................................................................................... 28
City Government Structure .......................................................................................................... 28
City Organization Chart ............................................................................................................... 28
City Departments ......................................................................................................................... 29
City Operating Companies ........................................................................................................... 33
Affiliate Agencies ........................................................................................................................ 34
Disaster Emergency Services Council ......................................................................................... 35
Relevant Governance ................................................................................................................... 36
Plans…… ..................................................................................................................................... 36
Policies… ..................................................................................................................................... 36
Programs ...................................................................................................................................... 36
Regulations .................................................................................................................................. 37
Fiscal Resources ........................................................................................................................... 37
City Budget .................................................................................................................................. 37
Grants that Support Mitigation Efforts ........................................................................................ 38
Section 5
Hazard Identification.................................................................................................................... 41
Hazard Prioritization .................................................................................................................... 42
Methodology ................................................................................................................................ 42
Results………………. ................................................................................................................ 43
Hazard Profiles ............................................................................................................................. 43
Higher Priority Hazards ............................................................................................................... 44
Earthquake ................................................................................................................................... 44
Wildfire... ..................................................................................................................................... 60
Drought and Water Shortage ........................................................................................................ 66
Windstorm .................................................................................................................................... 69
Energy Shortage/Outage .............................................................................................................. 74
Agricultural Pests and Disease ..................................................................................................... 76
Infectious Disease ........................................................................................................................ 77
Terrorism ...................................................................................................................................... 79
Cyber-Attack ................................................................................................................................ 79

City of Pasadena
2018 Multi-Hazard Mitigation Plan
5
Civil Disturbance ......................................................................................................................... 80
Lower Priority Hazards ............................................................................................................... 81
Flood.…. ...................................................................................................................................... 81
Landslide and other Earth Movements ........................................................................................ 87
Extreme Heat ............................................................................................................................... 92
Hailstorm ...................................................................................................................................... 94
Air Pollution ................................................................................................................................. 95
Oil Spills ...................................................................................................................................... 96
Dam Failure ................................................................................................................................. 97
Hazardous Materials Release ....................................................................................................... 99
Radiological Incident ................................................................................................................. 100
Aircraft Crashes ......................................................................................................................... 101
Train Accidents .......................................................................................................................... 101
Natural Gas Pipeline/Storage Failure ......................................................................................... 102
Section 6
Scientific Loss Estimation Models ............................................................................................ 105
Analysis of Exposure of Key Assets to Hazards ........................................................................ 106
Qualitative Estimate of Impacts from Hazards .......................................................................... 106
Scientific Loss Estimation Analysis .......................................................................................... 106
Critical Facilities Analysis ......................................................................................................... 109
Qualitative Estimate of Impacts Analysis .................................................................................. 110
Terrorism .................................................................................................................................... 110
Cyber Threats ............................................................................................................................. 110
Drought/Water Shortage ............................................................................................................ 110
Civil Disturbance ....................................................................................................................... 111
Windstorm .................................................................................................................................. 111
Infectious Disease ...................................................................................................................... 110
Agricultural Pest and Disease .................................................................................................... 111
Energy Shortage/Outage ............................................................................................................ 111
Flood.…. .................................................................................................................................... 113

City of Pasadena
2018 Multi-Hazard Mitigation Plan
6
Section 7
Mitigation Strategies .................................................................................................................. 115
Mitigation Goals and Objectives ................................................................................................ 115
Previous Mitigation Action Progress ......................................................................................... 116
Mitigation Prioritization ............................................................................................................. 122
Proposed Mitigation Actions ..................................................................................................... 123
Implementation Plan .................................................................................................................. 126
Section 8
Plan Maintenance ....................................................................................................................... 134
Review, Evaluation, and Monitoring ......................................................................................... 134
Point of Contact ......................................................................................................................... 135
Appendices
Appendix A- Adoption Forms ................................................................................................... 136
Appendix B - Steering Committee Presentations ...................................................................... 137
Appendix C - Public Outreach Efforts ....................................................................................... 138
Appendix D - List of Key Assets ............................................................................................... 139

City of Pasadena
2018 Multi-Hazard Mitigation Plan
7
1 Introduction
Across the United States, natural and manmade disasters have led to increasing levels of death, injury,
property damage, and interruption of business and government services. The impact on families and
individuals can be immense and damages to businesses can have catastrophic regional economic
effects. The time, money and effort to respond to and recover from these disasters also divert public
resources and attention from other important programs and problems. The City of Pasadena recognizes
the consequences of disasters and the need to reduce the impacts of hazards. The City’s leadership
understands that with thorough analysis, mitigation can become a long-term, cost effective means for
reducing the impact of these hazards.
Mitigation is commonly defined as any sustained action(s) taken to reduce or, where possible;
eliminate risk. Hazard mitigation focuses attention and resources on actions that will reduce or
eliminate long-term risks to human life or property from hazards. Hazard mitigation can reduce the
enormous cost of disasters to property owners and all levels of government. In addition, it can reduce
injuries, protect critical community facilities, reduce exposure to liability, and minimize community
disruption.
Federal and State legislation has provided funding for disaster preparedness, response, and recovery.
However, history has demonstrated that it is less expensive to mitigate against disaster damage than to
repeatedly repair damage in the aftermath. That is why many recognize that the impact of expected,
yet often unpredictable natural and manmade events, can be reduced through mitigation planning. A
mitigation plan states the aspirations and specific courses of action jurisdictions intend to follow to
reduce vulnerability and exposure to future hazard events.
The City of Pasadena Local Hazard Mitigation Plan (LHMP) guides the City of Pasadena towards
greater disaster preparedness and resiliency in harmony with the character and needs of the city and its
communities. The emphasis of the LHMP is on the assessment of current capabilities and relevant risk,
and understanding current and past mitigation efforts, for the purposes of identifying mitigation
measures to address existing exposures/vulnerability, thus reducing injuries and ensuring critical
infrastructure are functioning after a disaster. Hazard mitigation strategies help to eliminate losses by
limiting new exposures in identified hazard areas, diverting the hazard by reducing the impact, and
developing an awareness of hazard area location to avoid future development.
Updating of this LHMP demonstrates the city’s commitment to mitigation, fulfills regulatory
requirements as established by the Federal Emergency Management Agency (FEMA), establishes
eligibility for technical assistance and Hazard Mitigation Assistance (HMA) grant programs (Hazard
Mitigation Grant Program- HMGP, Pre-Disaster Mitigation- PDM, and Flood Mitigation Assistance-
FMA) and, serves as a guide to local decisions makers to implement mitigation programs.
The process to update the LHMP included nearly a year of coordination and was prepared with input
from city staff, key committee stakeholders, citizen participation, city officials, and support from the
State of California Governor’s Office of Emergency Services (Cal OES) and the FEMA.

City of Pasadena
2018 Multi-Hazard Mitigation Plan
8
It is the City’s hope that this LHMP continues to be used as a tool for all stakeholders to increase public
awareness of local hazards and risks, while at the same time providing information about options
and resources available to reduce those risks. Informing and educating the public about potential
hazards will help the City, its residents, and visitors protect themselves against their effects.

City of Pasadena
2018 Multi-Hazard Mitigation Plan
9
2 Plan Purpose and Authority
The primary purpose of this LHMP is to identify potential community actions that can be implemented
over the short- and long-term that will result in a reduction in risk and potential future losses citywide.
This is accomplished by using a systematic process of learning about the hazards that can affect the
jurisdiction, setting clear goals and objectives, identifying and implementing appropriate actions, and
keeping the plan current.
The LHMP is an integral part of a multi-pronged approach to minimizing personal injury and property
damage from natural and manmade hazards. It is designed to complement other planning documents
and regulatory authorities governing pre-disaster land use planning and post-disaster response and
recovery. It is intended to set the tone for the implementation of hazard mitigation practices that will
build a disaster resistant and sustainable community.
The impetus and authority to create this plan is derived from the Robert T. Stafford Disaster Relief and
Emergency Assistance Act (Public Law 93-288), as amended by the Disaster Mitigation Act of 2000
(DMA 2000). In response to escalating disaster costs, the federal government adopted DMA 2000
which places emphasis on hazard mitigation planning. Under DMA 2000, state and local governments
are required to have a FEMA-approved LHMP to be eligible for HMA grants.
The DMA 2000 is legislation designed to improve the delivery of mitigation programs through sound
and viable planning. The legislation reinforces the importance of mitigation planning and emphasizes
planning for disasters before they occur. DMA 2000 is intended to facilitate cooperation between state
and local authorities, prompting them to work together.
Section 322 of DMA 2000 specifically addresses mitigation planning at the state and local levels. It
identifies requirements that allow HMGP funds to be used for planning activities and increases the
amount of HMGP funds available to states that have developed a comprehensive, enhanced State
Hazard Mitigation Plan (HMP). LHMPs must be consistent with the State HMP and must demonstrate
that their proposed projects are based on a sound planning process that accounts for the risk to and the
capabilities of the individual communities. Local governments have certain responsibilities for
implementing Section 322 including:
Preparing and submitting a LHMP
Reviewing and updating the LHMP every five years, and
Monitoring mitigation actions included in the LHMP
The requirements and procedures for mitigation plans are found in the Code of Federal Regulations
(CFR) at Title 44, Chapter 1, Part 201 and the associated Interim Final Rule changes.
The federal law and associated rule changes and regulations establish planning and funding criteria for
states and local communities. This criterion includes the following:
Enhance Public Awareness and Understanding- to help residents of the City better understand
the natural hazards that threaten safety and welfare; economic vitality; and the operational
capability of critical infrastructure;

City of Pasadena
2018 Multi-Hazard Mitigation Plan
10
Create a Decision Tool for Management- to provide information that managers and leaders of
local government, business and industry, community associations, and other key institutions
and organizations need to take action to address vulnerabilities to future disasters;
Promote Compliance with State and Federal Program Requirements- to ensure that the City
of Pasadena can take full advantage of state and federal grant programs, policies, and
regulations that encourage or mandate that local governments develop comprehensive hazard
mitigation plans;
Enhance Local Policies for Hazard Mitigation Capability- to provide the policy basis for
mitigation actions that should be promulgated by participating jurisdictions to create a more
disaster-resistant future; and
Provide Inter-Jurisdictional Coordination of Mitigation-Related Programming- to ensure that
proposals for mitigation initiatives are reviewed and coordinated among the participating
jurisdictions within the County.
Achieve Regulatory Compliance- to qualify for certain forms of federal aid for pre- and post-
disaster funding, local jurisdictions must comply with the federal DMA 2000 and its
implementing regulations (44 CFR Section 201.6). DMA 2000 intends for hazard mitigation
plans to remain relevant and current. Therefore, Local plans are updated every five years. This
means that the Local Hazard Mitigation Plan for the City of Pasadena uses a “five-year
planning horizon”. It is designed to carry the City through the next five years, after which its
assumptions, goals, and objectives will be revisited and the LHMP resubmitted for approval.
Section 7 details specific goals and objectives with regard to implementing mitigation activities
over the life of this LHMP. In Section 8, the City of Pasadena has outlined a more aggressive
approach to ensuring the LHMP is implemented, evaluated, monitored and updated.
Adoption of this LHMP by the governing body through a signed resolution following formal review
and approval by the California OES and FEMA constitutes plan completion. The formal Adoption
Resolution is in Appendix A.

City of Pasadena
2018 Multi-Hazard Mitigation Plan
11
3 Planning Process
3.1 OVERVIEW
The planning process implemented to update the City of Pasadena’s 2013 LHMP followed the concepts
and principles outlined in FEMA’s Mitigation Guidance, as well as, FEMA’s Comprehensive
Preparedness Guide (CPG) 101. The planning process for the updating of the LHMP incorporated the
following steps:
1. Plan Preparation
Form/Validate planning team members
Establishing common project goals
Setting expectations and timelines
2. Plan Development
Validate and revise the existing conditions/situation within planning area; the Capabilities
Assessment and Hazard Assessment Sections in the LHMP
Develop and review the risk to hazards (exposure and vulnerability) within the planning
area; the Vulnerability Assessment Section in the LHMP
Review and identify mitigation actions within the planning area; the Mitigation Strategy in
the LHMP
3. Finalize the Plan
Review and revise the plan
Approve the plan
Adopt and disseminate the plan
It should be noted that there is a fourth step (Plan Implementation and Maintenance); however, that
step occurs after adoption and is not part of this update process. To help better understand the planning
process, a planning flow chart was also developed (Figure 3-1). The flow chart assists in better
visualizing the steps and the approach.
Figure 3-1 Local Hazard Mitigation Plan Update Planning Process

City of Pasadena
2018 Multi-Hazard Mitigation Plan
12
In support of the implementation of the planning process, a planning team was established. For this
purpose, the planning team is referred to as the Steering Committee. Section 3.2 provides further details
on the Steering Committee. Additionally, throughout this process, and complaint with other standard
City of Pasadena practices, opportunities for public involvement were offered and encouraged. More
details about public engagement are provided under the Public Outreach section of the LHMP (Section
3.3).
3.2 STEERING COMMITTEE
To ensure the update to the LHMP was comprehensive, considerable consideration was given to the
selection of Steering Committee members. The intent was to identify members who could represent
key segments of the community. In support of this effort, a consultant was hired to facilitate discussions
and provide technical assistance to the Steering Committee. The consultant’s role was to:
document the planning process
facilitate vulnerability assessment discussions
guide the Steering Committee in the identification of mitigation actions
review and update material and sections
coordinate with FEMA and OES
3.2.1 Role and Responsibilities
The Steering Committee was guided through the LHMP planning process; and as decisions were made
and material developed, it was the Steering Committee’s responsibility to review and accept results.
The Steering Committee focused on the following underlining philosophies:
Focus on the mitigation strategy
The mitigation strategy is the plan’s primary purpose. All other sections contribute to and
inform the mitigation strategy and specific hazard mitigation actions.
Process is as important as the plan itself
In mitigation planning, as with most other planning efforts, the plan is only as good as the
process and people involved in its development. The plan should also serve as the written
record, or documentation, of the planning process.
This is the community’s plan
To have value; the plan must represent the current needs and values of the community and be
useful for local officials and stakeholders. Develop the mitigation plan in a way that best serves
your community’s purpose and people.
Intent is as important as Compliance
Plan reviews will focus on whether the mitigation plan meets the intent of the law and
regulation; and ultimately that the plan will make the community safer from hazards.

City of Pasadena
2018 Multi-Hazard Mitigation Plan
13
The role of the Steering Committee was to:
validate the planning approach
provide information, material and existing plans for incorporation into LHMP
be the primary liaison with other community members and stakeholders
promote public participation
collaborate with other Steering Committee members
identified the hazards
develop risk assessment
update and review material
address FEMA and the Cal OES comments
oversee the adoption of the LHMP
review mitigation actions.
3.2.2 Hazard Mitigation Steering Committee Members
The City of Pasadena Hazard Mitigation Steering Committee was led by the City of Pasadena Fire
Department Emergency Services Coordinator Lisa Derderian. This responsibility was later transferred to Chief
Deputy Jon Trautwein.
The City’s Disaster Coordinators Committee who already met on a monthly basis comprised most of the
membership. Representation came from key City Departments and Agencies. A list of Steering
Committee Members with position titles and organization is provided in Table 3-2.
The Steering Committee meetings were arranged and scheduled to follow the planning process steps
outlined in Section 3.1 (Overview). Each meeting was designed to walk the members through sections
of the LHMP. In addition to reviewing and validating material, the intent was to also educate members
on the planning process and purpose of each section.
By taking this step it helped ensure that each member would bring this knowledge back to their
organizations and other stakeholders
Table 3.3 provides a list and the main purpose of each of the meetings. Discussions and results from
each meeting were captured and incorporated into the LHMP where appropriate. The attendance logs
and presentations of each meeting and can be found in Appendix B
Table 3-2 Steering Committee Members
Name Position/Title Organization Department
Adrienne Kung Program
Coordinator II
City of Pasadena Health
Alex Souto Human Resources
Manager (C)
City of Pasadena Human Resources
Ana Espanola Associate Planner City of Pasadena Planning
Anita Cerna Senior Planner City of Pasadena Planning
Art Silva Power Production
Superintendent
City of Pasadena Water & Power

City of Pasadena
2018 Multi-Hazard Mitigation Plan
14
Bertral Washington Fire Chief City of Pasadena Fire
Bob Ridley Controller City of Pasadena Finance
Brad Boman Engineering
Manager
City of Pasadena Water & Power
Burhan Alshanti Principal Electrical
Engineer
City of Pasadena Water & Power
Carlos Baffigo Principal Librarian City of Pasadena Library
Carolyn Gordon Police Sergeant City of Pasadena Police
Dan Augustyn Management
Analyst V
City of Pasadena Information Technology
Denise Guerrero Operations
Assistant
City of Pasadena Library
Ed Calatayud Police Commander
(C)
City of Pasadena Police
Erika Estrada Purchasing
Administrator
City of Pasadena Finance-Purchasing
Hayden Melbourn Capital Project
Manager
City of Pasadena Public Works
Heather Peron Event Operations
Manager
City of Pasadena Pasadena Center
Henry Frometa Management
Analyst III
City of Pasadena Human Resources
Horace Wormerly NO LONGER
W/CITY
City of Pasadena Human Services and Recreation
Israel Del Toro Senior Project
Manager
City of Pasadena Planning
James Tong Engineer City of Pasadena Public Works
Jan Hamblen Principal Electrical
Engineer
City of Pasadena Transportation
Jason Niccoli Principal Electrical
Engineer
City of Pasadena Water & Power
Jenessa Wendland Operations Manager City of Pasadena Rose Bowl Operating Company
Jennifer Curtis Director of Human
Resources
City of Pasadena Human Resources
Joaquin Siques Engineer City of Pasadena Transportation
Jon Trautwein Deputy Fire Chief City of Pasadena Fire
Julie Gutierrez Assistant City
Manager
City of Pasadena City Manager
Kenny James Senior Community
Rel Rep
City of Pasadena Human Services and Recreation
Kris Markarian City Engineer City of Pasadena Public Works
Lisa Derderian Public Information
Officer
City of Pasadena Fire
Mandy Templeton 311 Call Center
Manager
City of Pasadena Public Works
Michael Johnson Director of Public
Health
City of Pasadena Health
Mona Tse Management
Analyst IV
City of Pasadena Public Works
Norman Lara Water System
Operator
City of Pasadena Water & Power
Phil Tong Management Analyst
IV
City of Pasadena Transportation

City of Pasadena
2018 Multi-Hazard Mitigation Plan
15
Richard Yee Principal Engineer City of Pasadena Public Works
Robert Monzon Management
Analyst V
City of Pasadena City Clerk
Roger Roldan Police Sergeant City of Pasadena Police
Ruben Martinez Staff Assistant III City of Pasadena City Clerk
Sarkis Nazgrian Building Official City of Pasadena Planning
Shari Thomas Asst Gen Mgr -
Water & Power
City of Pasadena Water & Power
Tim McDonald Deputy Director City of Pasadena Library
Tunji Adedeji Wholesale
Operations Manager
City of Pasadena Water & Power
Andy Petrow Facilitator Consultant Soteria EM Services
Laura Hernandez Lead Planner Consultant Soteria EM Services
3.2.3 Community Stakeholders
Efforts were made to extend invitations to surrounding cities, counties, and other key stakeholders. A
copy of the e-mail invitation is contained in Appendix C. While some accepted the invitation, others
declined because of workload. Additionally, of those who accepted, some were unable to always
participate in meetings. To combat this a separate meeting for key stakeholders was held with city
staff. During this meeting the city was able to provide an overview of actions to date and discuss
coordination for the identification of mitigation actions. Stakeholders were invited to attend a
combined meeting with the Pasadena Steering Committee. The role of the Community Stakeholders
was as follows:
validate hazards and prioritization
provide information and material and existing plans for incorporation into LHMP
collaborate with other Steering Committee members
review and update material
contribute to mitigation strategies
The following tables provide a list of the key stakeholders (Table 3.2.1).
Table 3.2.1 Key Stakeholder Members
Name Organization Title
Catherine Christensen CalTech Program Manager
Steve Higginbotham Disaster Advisory Council Volunteer
Mary Schander Disaster Advisory Council Volunteer
John Penido LA Co Disaster Management JPA Area C Coordinator
Jennifer Waldron Huntington Hospital Disaster Program Manager
Alex Boekelheide Pasadena City College Executive Director
Andrew Oliver Pasadena Humane Society Animal Control Officer
Sara Muriello Pasadena Humane Society Animal Control Officer
Nelson Cayabyab Pasadena Unified School District Chief Facilities Officer
Hilda Ramirez-Horvath Pasadena Unified School District Chief of Communications
Steve Miller Pasadena Unified School District Chief of Human Resources

City of Pasadena
2018 Multi-Hazard Mitigation Plan
16
Table 3.3 Steering Committee Meetings Summary
Date Purpose
Oct 2017
Introductions
Role of the Steering Committee
Overview of planning process and update requirements
Restructure/Reorganization of previous LHMP Discuss
Collect and Review Existing Plans for Incorporation to LHMP
Public Outreach efforts
Nov 2017
Review of the revised Table of Content Review Planning
Process Section
Discuss the Capability Assessment section Discuss community
hazards
Identify Public Outreach target dates
Jan 2018
Review of Capabilities Assessment Section Discuss Hazard
Assessments Section Review Critical Facilities
Prepare for Public Outreach meeting #1- project introduction
Feb 2018
Review of Hazard Assessment Section
Present Initial Vulnerability Assessment results Review Goals &
Objectives
Jun 2018
Review Vulnerability Results Validate Hazard
Ranking
Review Revised Goals & Objectives
Review previous mitigation strategies Discuss new mitigation
strategies
Jul 2018
Review/Adopt Mitigation Actions List
Review Draft Mitigation Action Ranking (STAPLEE) Establish Project
Priorities
Validate Implementation Plan
Prepare for Public Outreach Meeting #2 Discuss review and
approval process
Aug 2018
Overview of update with Stakeholders Discussion of previous mitigation actions
Discussion of new mitigation actions
Sep 2018 Review previous mitigation actions
Discuss new mitigation actions Discuss monitoring
process
.

City of Pasadena
2018 Multi-Hazard Mitigation Plan
17
3.3 PUBLIC OUTREACH
There were two (2) different Public Outreach campaigns used during the City of Pasadena LHMP
update process: the first informing the community of LHMP update and the second educating the
community of hazards. Community education of hazards is an ongoing campaign that was leveraged
during the LHMP update process. Below is a summary of the campaigns:
3.3.1 Informing the Community of the LHMP Update process
In late 2017, the City of Pasadena issued a press release announcing the commencement of the LHMP
planning process. This announcement invited the public to notify the city of their interest to participate
in the planning process and/or to submit initial thoughts and comments.
In support of this announcement, a Public Outreach meeting was held May 16, 2018 to introduce the
community to the LHMP planning process and to inform the community of the hazards the Steering
Committee recommended to be included in the LHMP. A second Public Outreach meeting was held
September 17, 2018, to inform the community of recommended mitigation actions, provide an
opportunity for their input on the mitigation actions, and to invite them to review and submit comments
on the draft LHMP update. Both Public Outreach meeting announcements were posted on the city
website.
Although well announced, attendance was low at the Public Outreach meetings. Because of this, no
public comments were received. The public announcements and presentations for both meetings can
be found in Appendix C
3.3.2 Ongoing Public Outreach
The City of Pasadena utilizes several platforms to educate the public about hazards in the community,
relevant programs to safeguard and protect themselves from the effects of the hazards, and actions they
can take to prepare themselves for events. Below is a list of the different platforms used and a summary
of the some of the programs:
Websites
Social Media (Facebook, Twitter)
Meetings/Workshops
Public Service Announcements- radio and television
Community Emergency Response Team Training (CERT)
Additional City of Pasadena programs can be found in the Capability Assessment Section 4 of the
LHMP.

City of Pasadena
2018 Multi-Hazard Mitigation Plan
18
4 Capabilities Assessment
4.1 OVERVIEW
The purpose of the Capability Assessment is to determine the ability of the City of Pasadena to
implement a comprehensive mitigation strategy. A Capability Assessment helps understand the
existing tools, the administrative structure, and fiscal resources available to implement and support
mitigation efforts.
The Capability Assessment serves as a critical first step of the planning process. The Capability
Assessment, coupled with a Risk Assessment, helps to recognize challenges in current capabilities and
identify meaningful, needed mitigation actions for incorporation into the Mitigation Strategy. In
support to achieving a better understanding of current capabilities, this section is structured to present
a Community Profile,
4.2 COMMUNITY PROFILE
The city of Pasadena is located in the San Gabriel Valley, at the base of the San Gabriel Mountains.
The area was part of Rancho el Rincon de San Pasqual, a northeast section of the San Gabriel Mission
(1771). The city was founded in 1874 by Thomas B. Elliott as Indiana Colony; the name Pasadena, a
Chippewa word meaning “crown of the valley,” was adopted in 1875.
The city’s growth as a winter resort and citrus center was stimulated by the Santa Fe Railway, and
subsequent freeway construction brought it within easy commuting distance to Los Angeles, which
lies 12 miles (19 km) southwest.
Pasadena is the home to many recognized businesses including: Pasadena City (community) College
(1924), Pacific Oaks College (1945), and Art Center College of Design (1930), California Institute of
Technology- CalTech (1891), the Pasadena Playhouse, the Norton Simon Museum of Art (formerly
Pasadena Art Institute and Pasadena Museum of Modern Art), and the Pacific Asia Museum contains
exhibits on the history and art of Asia and the Pacific; its grounds contain a Chinese courtyard garden
and koi ponds.
The city is perhaps most famous for its New Year’s Day Tournament of Roses, first held in 1890,
which features a televised parade attended by several hundred thousand people and the Rose Bowl
classic, a contest between two major college gridiron football teams.

City of Pasadena
2018 Multi-Hazard Mitigation Plan
19
Figure 4-1 City of Pasadena Regional Location
The City is served by the California 210 - Foothill Freeway, the California 110 - Pasadena Freeway
(Arroyo Seco Parkway), the California 134 - Ventura Freeway, and the California Interstate 710 - Long
Beach Freeway. The major arterial highways are Fair Oaks Avenue, Lake Avenue, and Los Robles
Avenue, which run north to south. Colorado Boulevard. Walnut Street, Del Mar Boulevard, and Green
Street run east to west. (See Figure 4.1)
Pasadena has a residential population of 141,510. Pasadena consists of 23 square miles and is
approximately 58% residential, 9% commercial, 2% industrial and 31% open space, parks, institutional
or vacant land. (Land Use Element of Revised General Plan, 2015)
4.2.1 Demographics
In 2008, the Southern California Association of Governments (SCAG) initiated the Local Profiles
Project as a part of a larger initiative to provide a variety of new services to its member cities and
counties. The Local Profiles reports provide a variety of demographic, economic, education, housing,
and transportation information about each member jurisdiction including the City of Pasadena. The
Local Profile Report was updated and expanded in 2017 to include demographical information on
population, housing, transportation, employment, retail sales, and education. The report provides a
portrait of the city and its changes from 2000- 2016, using average figures for Los Angeles County as
a comparative baseline. In addition, the most current data available for the region is also included in
the Statistical Summary (Table 4.1 Population Pasadena vs. LA County)

City of Pasadena
2018 Multi-Hazard Mitigation Plan
20
Figure 4.2- Pasadena Facts
This profile demonstrates current trends occurring in the City of Pasadena. In addition, to City prepared
documents and reports, the SCAG report provides the most recent foundational information for
developing the City’s Community profile as described in this section. (Report by the Southern
California Association of Governments, 2017)
4.2.2 Population Trends
Between 2000 and 2016, the total population of the City of Pasadena increased by 7,087 to 141,510 in
2016. During this 16-year period, the city’s population growth rate of 5.3% was lower than the Los
Angeles County rate of 7.6%. 1.4% of the total population of Los Angeles County is in the City of
Pasadena. Between 2000 and 2016:
The age group 55-64 experienced the largest increase in share, growing from 8 to 12.1%
The age group that experienced the greatest decline, by share, was age group 21-34, decreasing
from 24.2 to 21.3%
The age group 55-64 added the most population, with an increase of 6,473 people between
2000 and 2016
The share of Hispanic population in the city remained at 33.4%
The share of Non-Hispanic White population in the city decreased from 39.1 to 38.5%
The share of Non-Hispanic Asian population in the city increased from 9.9 to 15.7%
The share of Non-Hispanic Black population in the city decreased from 14.0 to 8.9%
The share of Non-Hispanic American Indian population in the city remained at about 0.2%
The share of All Other Non-Hispanic population group in the city remained at 3.4%
4.2.3 Economy
Pasadena’s economic strengths come from its leading scientific institutions, a large international
engineering base, a regional health care cluster, and a broad retail sector. Like many other cities across
the country, Pasadena has suffered from a struggling economy. Unemployment rates lag near 10% as

City of Pasadena
2018 Multi-Hazard Mitigation Plan
21
businesses delay hiring and decreased retail sales hurt business owners and reduce local public tax
revenues. Even with these serious concerns, Pasadena is fortunate to have a relatively diverse business
environment.
Although the effects of a slow economy continue, the community has seen growth in a few industries.
Both Huntington Hospital and Kaiser Permanente provide many employment opportunities in the
medical and professional sectors. Other large professional job gains have been in the engineering,
software and financial fields.
In addition, retail sales have regained some of the losses incurred in 2009 with regional tourism
helping to support a modest improvement (Pasadena Economic Development Strategic Plan, 2012)
Table 4.1 - Population: Pasadena vs. LA County
Category Pasadena Los Angeles
County
Pasadena Relative to
Los Angeles County* SCAG
Region
2016 Total Population 141,023 10,241,335 [1.4%] 18,954,083
2016 Population Density
(Persons per Square Mile)
6,140 2,508 3,632 489
2016 Median Age (Years) 39.0 36.4 2.6 36.0
2016 Hispanic 33.4% 48.7% -15.3% 46.8%
2016 Non-Hispanic White 38.5% 26.3% 12.2% 31.2%
2016 Non-Hispanic Asian 15.7% 14.1% 1.6% 12.7%
2016 Non-Hispanic Black 8.9% 8.0% 0.9% 6.3%
2016 Non-Hispanic American
Indian
0.2% 0.2% 0.0% 0.3%
2016 All Other Non-Hispanic 3.4% 2.7% 0.7% 2.7%
2016 Number of Households 55,608 3,308,022 [1.7%] 6,132,938
2016 Average Household Size 2.5 3.0 -0.5 3.1
2016 Median Household
Income
$70,463 $57,864 $12,599 $61,792
2016 Number of Housing Units
60,703 3,504,061 [1.7%] 6,629,879
2016 Homeownership Rate 44.5% 54.3% -9.8% 54.3%
2016 Median Existing Home
Sales Price
$705,000 $520,000 $185,000 $466,000
2015 - 2016 Median Home
Sales Price Change
8.5% 7.0% 1.5% 6.6%
2016 Drive Alone to Work 75.6% 76.5% -0.9% 78.8%
2016 Mean Travel Time to
Work (minutes)
30.0 33.0 -3.0 31.0

City of Pasadena
2018 Multi-Hazard Mitigation Plan
22
2015 Number of Jobs 115,444 4,424,056 [2.6%] 7,920,602
2014 - 2015 Total Jobs Change
677 25,840 [3%] 117,499
2015 Average Salary per Job $64,376 $56,700 $7,676 $53,962
2016 K-12 Public School Student Enrollment
16,240 1,471,103 1% 2,961,726
Sources: U.S. Census Bureau American Community Survey, 2015; Nielsen Co.; California Department of Finance E-5, May 2016;
Core Logic/Data Quick; California Department of Education; and SCAG * Numbers with [] represent Pasadena’s share of Los
Angeles County. The other numbers represent the difference between Pasadena and Los Angeles County.
Mapped jurisdictional boundaries are as of July 1, 2016 and are for visual purposes only. Report data,
however, are updated according to their respective sources. (Southern California Association of
Governments Community Profile, 2017)
4.2.4 Employment
Total jobs include wage and salary jobs and jobs held by business owners and self-employed persons.
The total job count does not include unpaid volunteers or family workers, and private household
workers.
In 2015, total jobs in Pasadena numbered 115,444, a decrease of 5.3% from 2007
Manufacturing jobs include those employed in various sectors including food; apparel; metal;
petroleum and coal; machinery; computer and electronic products; and transportation
equipment
Between 2007 and 2015, the number of manufacturing jobs increased by 51.1%
Construction jobs include those engaged in both residential and non-residential construction
Between 2007 and 2015, construction jobs in the city decreased by 16.4%
Retail trade jobs include those at various retailers including motor vehicle and parts dealers,
furniture, electronics and appliances, building materials, food and beverage, clothing, sporting
goods, books, and office supplies
Between 2007 and 2015, the number of retail trade jobs in the city increased by 1.6%
Jobs in the professional and management sector include those employed in professional and
technical services, management of companies, and administration and support
Between 2007 and 2015, the number of professional and management jobs in the city decreased
by 30%
In 2015, the Education sector was the largest job sector, accounting for 29.8% of total jobs in
Pasadena. Other large sectors included Professional (19.8%), Leisure (10.7%), and Retail
(9.1%)
Average salaries for jobs located in the city increased from $44,440 in 2003 to $64,376 in 2015,
a 44.9% change. Note: Dollars are not adjusted for annual inflation
In 2015, the employment sector providing the highest salary per job in the city was Finance-
Insurance-Real Estate ($111,896)
The Leisure-Hospitality sector provided the lowest annual salary per job ($24,370)

City of Pasadena
2018 Multi-Hazard Mitigation Plan
23
4.2.5 Precipitation
The average amount of precipitation for the year in Pasadena is 20.4" (518.2 mm). The month with the
most precipitation on average is February with 4.6" (116.8 mm) of precipitation. The month with the
least precipitation on average is July with an average of 0.0" (0 mm). There is an average of 43.0 days
of precipitation, with the most precipitation occurring in January with 7.0 days and the least
precipitation occurring in July with 0.0 days.
The average temperature for the year is 63.9°F (17.7°C)
The warmest month on average is August, with an average temperature of 74.7°F (23.7°C)
The coolest month on average is January, with an average temperature of 54.4°F (12.4°C)
The highest recorded temperature is 113.0°F (45°C)
The lowest recorded temperature is 17.0°F (-8.3°C)
4.2.6 Air Quality
The South Coast Air Quality Management District (SCAQMD) reports that in 2007, Pasadena had no
unhealthful ozone days, a decrease from 7 unhealthful ozone days in 2003 and 71 in 1992. An
unhealthful ozone day occurs when the air has more than 120 parts per billion of ozone in one hour
and there is enough ozone in the air for some people to experience headaches, nausea or shortness of
breath. The smoggiest month in Southern California is August.
4.2.7 Physical Features
The City of Pasadena (City) is in the northwest portion of the San Gabriel Valley which is situated in
the southern half of Los Angeles County. The City is at the foot of the San Gabriel Mountains,
approximately 8.5 miles north-northeast of downtown Los Angeles, and encompasses approximately
14,802 acres (23 square miles). The City is bordered by the City of La Cañada-Flintridge to the
northwest; the City of Glendale to the west; the Highland Park community of the City of Los Angeles
to the southwest; unincorporated Los Angeles County and the cities of South Pasadena and San Marino
to the south; unincorporated Los Angeles County and the cities of Arcadia and Sierra Madre to the
east; and Altadena (an unincorporated area of Los Angeles County) and the San Gabriel Mountains to
the north.
The Arroyo Seco spans eight (8) miles through the western portion of the City of Pasadena. Surrounded
by urban development, it supports thriving natural ecosystems that include several native plant
communities and provides shelter, food and nesting sites for hundreds of wildlife species.
4.2.8 Housing
Between 2000 and 2016, the total number of households in the City of Pasadena increased by 3,764
units, or 7.3%. During this 16-year period, the city’s household growth rate of 7.3% was higher than
the county growth rate of 5.6%. 1.7% of Los Angeles County’s total number of households are in the
City of Pasadena.
In 2016, the city’s average household size was 2.5, lower than the county average of 3.0
In 2016, 79.5% of all city households had 3 people or fewer
About 34% of the households were single-person households

City of Pasadena
2018 Multi-Hazard Mitigation Plan
24
Approximately 9% of all households in the city had 5 people or more
In 2016, about 37% of households earned less than$50,000 annually
Approximately 36% of households earned $100,000 or more
From 2000 to 2016, median household income increased by $24,426. Note: Dollars are not
adjusted for annual inflation
Figure 4.3 Renters and Homeowners Percentage of Renters and Homeowners
2000 2010 2016
Sources: 2000 and 2010 U.S. Decennial Census; Nielsen Co., 2016. Between 2000 and 2016, homeownership rates
decreased, and the share of renters increased.
4.2.9 Schools and Hospitals
The City of Pasadena has 24 elementary schools, 3 middle schools, 4 high schools, 38 private schools,
69 pre-schools or childcare centers and 16 colleges/universities. It has one major hospital: Huntington
Memorial, as well as a psychiatric facility: Las Encinas.
4.2.10 City Parks
Pasadena has twenty-three (23) parks totaling more than one thousand acres of parkland. While
operationally distinct, maintenance efforts in the Arroyo Seco as well as those in all other city parks
similarly strive to keep parks safe, functional, and attractive for residents and visitors.
4.2.11 Water
Most of the City’s water is imported from the Colorado River and Northern California, but a substantial
portion of Pasadena’s water is acquired from our local aquifer, the Raymond Basin. The Raymond
Basin, a 40-square mile natural aquifer underlying Pasadena and neighboring cities, provides over 40%
of Pasadena’s drinking water supply. The basin water originates as surface water from the San Gabriel
Mountains. As the water percolates deep into the ground over many months it is purified through
natural filtration processes. The City of Pasadena has sixteen (16) wells that tap into the basin at depths
of 300-400 feet, drawing out 13 million gallons of groundwater or more per day, on average. The
Raymond Basin cannot provide enough water to meet demand, even in wet years, as our population
and development has long outpaced local supply.
Own Rent
45.8% 54.2%
Own Rent
45.0% 55.0%
Own Rent
44.5% 55.5%

City of Pasadena
2018 Multi-Hazard Mitigation Plan
25
Figure 4.4 - Water Service Systems and Areas Served
The City of Pasadena’s water system begins with “production,” which in means pumping local
groundwater and the purchased imported water. There are active wells across the city that tap into the
Raymond Basin, a vast natural aquifer underlying Pasadena and neighboring cities. Pasadena pumps
the groundwater at these well sites, treats it to eliminate microbes or other contaminants, and then either
diverts it to a reservoir for short-term storage or pumps it directly into underground water mains for
distribution to our customers. Since Pasadena topography is on a gentle gradient, gravity forces do most
of the work to distribute water through the system. Pumps near reservoirs and booster stations also
build pressure in the system to aid in moving water through the system.
To meet the demand, the City of Pasadena has purchased imported water from the Metropolitan Water
District of Southern California (MWD) since 1941. MWD uses aqueducts to transport water from the
Colorado River and from the Sacramento-San Joaquin River Delta to 26-member agencies, including
PDWP, in dry Southern California. MWD’s two primary sources of water are the State Water Project
and the Colorado River. The State Water Project is owned by the State of California and operated by
the State Department of Water Resources. The State Water Project transports water available from the
San Francisco Bay/Sacramento-San Joaquin Delta to Southern California via the California Aqueduct.
Management of the availability of State Water Project supplies through water marketing and
groundwater banking plays an important role in meeting California’s water needs. To obtain its
Colorado River supply, MWD has a permanent service contract with the United States Secretary of the
Interior for delivery of water via the Colorado River Aqueduct. Under the priority system that governs
the distribution of Colorado River water made available to California, MWD holds the fourth priority
right.
4.2.12 Power
Most of the City’s power is purchased via contracts from varied sources, both conventional and
renewable, or through the wholesale energy market. City of Pasadena-owned generating facilities meet
about 10% of its power demand. Power comes from a variety of sources including hydropower, natural-
gas-fired generators, renewable energy such as solar and wind power, and power that is purchased on
the wholesale market. Pasadena’s goal is to achieve a balanced and sustainable mix of sources and
becoming 50% green by 2030.

City of Pasadena
2018 Multi-Hazard Mitigation Plan
26
\
4.2.13 Land Use and Development
Pasadena’s General Plan Land Use Element is grounded by Guiding Principles that cumulatively
represent the community’s vision for the future. The Guiding Principles were developed through an
extensive program of community outreach and input conducted over a six-year period. The Guiding
Principles are:
1) Growth will be targeted to serve community needs and enhance the quality of life. Higher
density development will be directed away from residential neighborhoods and into the Central
District, Transit Villages, and Neighborhood Villages. These areas will have a diverse housing
stock, job opportunities, exciting districts with commercial and recreational uses, and transit
opportunities. New development will build upon Pasadena’s tradition of strong sense of place,
great neighborhoods, gardens, plazas, parks, and trees.
2) Pasadena’s historic resources will be preserved. Citywide, new development will be in
harmony with and enhance Pasadena’s unique character and sense of place. New construction
that could affect the integrity of historic resources will be compatible with, and differentiated
from, the existing resource.
3) Pasadena will be an economically vital city by providing jobs, services, revenues, and
opportunities. A diverse economic base with jobs for Pasadena residents will be fostered;
existing businesses will be encouraged to stay or expand; affordable housing will be provided
for the labor pool; the continued fiscal health of the city will be ensured.
4) Pasadena will be a socially, economically, and environmentally sustainable community. Safe,
well-designed, accessible and human-scale residential and commercial areas will be provided
where people of all ages can live, work and play.
5) These areas will include neighborhood parks, urban open spaces and the equitable distribution
of public and private recreational facilities; new public spaces will be acquired. Human services
will be coordinated and made accessible to those who need them.
6) Pasadena will be a city where people can circulate without cars. Specific plans in targeted
development areas will emphasize a mix of uses, pedestrian activity, and transit; public and
private transit will be made more available; neighborhood villages and transit villages will
reduce the need for auto use.
7) Pasadena will be a cultural, scientific, corporate, entertainment and education center for the
region. Long-term growth opportunities will be provided for existing institutions; a healthy
economy will be fostered to attract new cultural, scientific, corporate, entertainment and
educational institutions.
8) Community Participation will be a permanent part of achieving a greater city. Citizens will be
provided with timely and understandable information on planning issues and projects; citizens
will directly participate in shaping plans and policies for Pasadena’s future.
9) Pasadena is committed to public education and a diverse educational system responsive to the
broad needs of the community.
Below is the City of Pasadena’s General Plan proposed Land Use map (Figure 4.5). The Land Use map
depicts land use designations and depicts the proposed distribution and intensity of uses within the city.
Greater detailed information can be found in the City of Pasadena General Plan. The General Plan

City of Pasadena
2018 Multi-Hazard Mitigation Plan
27
Land Use Element established development capacities to regulate building intensity and population
density consistently with the designations established by the Land Use Diagram.
Figure 4.5- City of Pasadena Land Use Map
The city is mostly developed, with very few large areas of undeveloped land. Because of that the city
has had limited growth in the past 5 years, and it is anticipated this trend will continue over the next 5
years. The majority of growth in the city is centered around increased density in areas. There has been
an increase in development around the Gold Line. Much of this development includes replacing single
family units or older multi-family units with slightly denser and newer multi-family units.
All development occurring since the adoption of the LHMP was constructed in accordance with all
local, state and federal land use, building codes, zoning, and environmental requirements. Because of
the limited growth and rigorous project review over the past 5 years, there have been no changes to the
community’s vulnerability.
All future development proposed within the city will continue to be reviewed to ensure compliance
with all relevant land use, zoning, building codes and environmental standards. Additionally, prior to
incorporation of information from the updated LHMP into relevant plans and codes, the city will
leverage the LHMP during the review of future proposed development projects. In doing so, new
projects, whether on vacant land or infill projects will limit and/or reduce expose of structures or
population to potential hazards.

City of Pasadena
2018 Multi-Hazard Mitigation Plan
28
4.2.14 Key Assets and Infrastructure
The City of Pasadena has many assets at their disposal. While many are critical and/or essential to day-
to-day operations, this section is dedicated to the assets determined by the city to be key in the response
and recovery from events/incidents. Table 4-6 provides a list of the number of each key response and
recovery asset by category and Figure 4-7 depicts the general location of each key response and
recovery asset in the city. This list represents the government owned and/or operated assets, as well as,
some privately owned and operated assets that are of primary concern for ensuring efficient and
effective response and recovery from disaster events. A complete list of the response and recovery key
assets is located in Appendix D.
It is important to note that as the city refines and adjusts its emergency management practices some
assets may be added and/or remove from the list. It is expected that when the City’s Emergency
Operations Plan (EOP) is updated, and strategies are identified and/or refined, that the city will become
more aware of the need for certain assets. As the city goes through the EOP and similar processes, the
Steering Committee will review and reevaluate the key assets list.
Table 4-6 Summary of Key Response and Recovery Assets by Category
Category # of Structures
Community Center 10
Equipment 5
Fire 11
Government 14
Library/Museum 13
Misc. 39
Police 2
Utility- Power 21
Utility- Water 43
Venue 5
TOTAL 163
Figure 4-7- Location of Key Response and Recovery Assets

City of Pasadena
2018 Multi-Hazard Mitigation Plan
29
4.3 ADMINISTRATIVE AND TECHNICAL CAPACITY
4.3.1 City Government Structure
The City has a Council-Manager form of government with seven (7) City Council districts each
electing a Councilmember to a four-year term. The Mayor is an at-large or Citywide elected position
serving a four-year term. The City Council is responsible for setting policies, passing ordinances,
adopting the budget, appointing committee members, and hiring the City Manager, City Attorney/City
Prosecutor, and the City Clerk.
The Mayor acts as the chief executive of the City in performing all acts required to be performed under
the laws of the State of California and our City Charter. The Mayor is the official head of the City for
all ceremonial purposes, by the Courts for serving civil process and by the Governor of the State for
military purposes. The Mayor has a voice and vote in all proceedings of the City Council and presides
over City Council meetings.
The City of Pasadena has sixteen (16) departments, three (3) operating companies, the Successor
Agency to the Pasadena Community Development Commission (PCOC), and a City Council Office.
The City has full range of administrative and technical capabilities for expanding and improving on
existing and proposed hazard mitigation measures. Departments have identified opportunities to add
or expand a capability through proposed mitigation actions.
4.3.1.1 City Organization Chart

City of Pasadena
2018 Multi-Hazard Mitigation Plan
30
4.3.1.2 City Departments
4.3.1.2.1 City Attorney / City Prosecutor
Civil Division
Represents the City Council and City officers in all matters of law pertaining to their office
Represents and appears for the City and its officers in all civil actions and proceedings
Attends meetings of the City Council, Community Development Commission, Fire and Police
Retirement Board, and meetings as required
Prepares all necessary legal documents
Performs legal research and prepares opinions
Assists with updating codes and ordinances including those related to hazard mitigation strategies.
Prosecution Division
Prosecutes misdemeanor offenses occurring in the City of Pasadena arising out of violations
of State or City law
Drafts and files criminal complaints in Superior court
Conducts office hearings, pretrial hearings, court and jury trials
Represents the People of the State in motions, writs and appeals
Liability and Claims
Makes Risk Management recommendations as relates to the protection of City and its assets
Recommends the purchase/renewal of Citywide insurance program to include the City’s
Operating Companies
Investigates and resolves all pre-litigation claims presented against the City
Track claims trend
4.3.1.2.2 City Clerk
The City Clerk is the local official for elections, local legislation, the Public Records Act, the Political
Reform Act, and the Brown Act (open meeting laws). Before and after the City Council acts, the City
Clerk ensures that actions are in compliance with all federal, state, and local statutes and regulations
and that all actions are properly executed, recorded, and archived.
The statutes of the State of California prescribe the basic functions and duties of the City Clerk, and
the Government Code and Election Code provide precise and specific responsibilities and procedures
to follow.
The Office of the City Clerk is a service department within the municipal government upon which the
City Council, all City departments, and the general public rely for information regarding the operations
and legislative history of the City. The City Clerk serves as the liaison between the public and City
Council and provides related municipal services.
As an Elections Official, the City Clerk administers Federal, State, and Local procedures through which
local government representatives are selected. The City Clerk assists candidates in meeting their legal
responsibilities before, during and after an election. From Election pre-planning to certification of
election results and filing of final campaign disclosure documents, the City Clerk manages the process
which forms the foundation of our democratic system of government.

City of Pasadena
2018 Multi-Hazard Mitigation Plan
31
As a Legislative Administrator, the City Clerk plays a critical role in the decision-making process of
the local legislature. As the key staff for City Council meetings, the City Clerk prepares the legislative
Agenda, verifies legal notices have been posted or published, and completes the necessary
arrangements to ensure an effective meeting. The City Clerk is entrusted with the responsibility of
recording the decisions which constitute the building blocks of our representative government.
As a Records Manager, the City Clerk oversees yet another legislative process; the preservation and
protection of the public record. By statute, the City Clerk is required to maintain and index the Minutes,
Ordinances, and Resolutions adopted by the legislative body. The City Clerk also ensures that other
municipal records are readily accessible to the public. The public record under the conservatorship of
the City Clerk provides fundamental integrity to the structure of our democracy.
4.3.1.2.3 City Manager
The Office of the City Manager provides oversight and direction to ensure that all departments are
responding to City Council goals, applying policy consistently, identifying key issues that need Council
direction, keeping abreast of the changing needs of the community, and planning the services, programs
and projects. The Assistant City Manager is a key member of the City’s Hazard Mitigation Committee
and provides leadership and direction to the hazard mitigation planning process.
4.3.1.2.4 Finance
The City’s Finance Department is responsible for preparing and overseeing the City’s Operating
Budget. The City’s budgets are prepared on a fiscal year basis for the period commencing July 1st. The
budget represents the City’s spending plan and serves as an expenditure guideline for all City
operations including general city services as well as city utility enterprise operations. The Finance
Department is represented on the Hazard Mitigation Planning Committee and integrally involved in
the implementation of the Hazard Mitigation Grant process. The Finance Department when feasible
will receive and allocate funds to hazard mitigation projects.
4.3.1.2.5 Fire
The City’s Fire Department manages the City’s Disaster Preparedness Program and serves as the lead
agency for administering the City’s Hazard Mitigation Plan and program. The Fire Department
provides training for City staff and community outreach to residents. The City’s Disaster Preparedness
Coordinator conducts monthly meetings of the City’s Disaster Coordinator’s Committee. The Disaster
Coordinator’s Committee also serves as the Hazard Mitigation Steering Committee and is responsible
for monitoring and coordinating the implementation of the City’s LHMP. The Fire Department works
closely with City management to expand and develop hazard mitigation strategies.
Housing & Career Services
The City of Pasadena Housing and Career Services Department is responsible for managing City
programs that provide affordable housing and community development opportunities for low and
moderate-income persons and employment resources. City Housing and Career Services manages the
Community Development Block Grant Program (CDBG) and provides a critical role in disaster
recovery.

City of Pasadena
2018 Multi-Hazard Mitigation Plan
32
4.3.1.2.6 Human Resources
The role and functions of Human Resources is to ensure the City meets regulatory requirements
affecting employers and includes responsibilities such as equal employment opportunity programs,
health and safety efforts, labor relations, benefits programs, specialized training and development, and
a range of organizational development, and career planning programs. Human resources plays a key
role in assisting with Citywide emergency preparedness training for employees.
4.3.1.2.7 Human Services & Recreation
The role of Human Services and Recreation Department is to provide physical, social, and economic
health of Pasadena neighborhoods by managing and delivering recreational and human service
programs to City residents.
Representatives from the Human Services and Recreation Department participate on the Hazard
Mitigation Planning Committee. Facilities managed by Human Services and Recreation Department
are identified as critical facilities and therefore potentially eligible for hazard mitigation funding
assistance.
4.3.1.2.8 Information Technology
The Department of Information Technology (DoIT) is responsible for providing the City’s information
technology services and support. DoIT provides 24/7 services citywide in areas utilizing networks,
desktops, application development, radios, telephones, and related program and project management.
DoIT is also responsible for managing the City’s Open Data Portal and a collection of GIS services
and maps.
The City also owns and operates approximately 50 miles of fiber network within Pasadena. The fiber
infrastructure supports City business and transportation operations and provides the foundation for a
variety of business-oriented services that the City offers currently and plans to expand in the future.
Currently the City does not provide service in residential areas. DoIT continues to assess threats and
vulnerabilities to the City’s fiber infrastructure and has recommended several hazard mitigation
strategies for protecting the City’s ability to support information and technology services.
4.3.1.2.9 Library
The Library has more than 100 full-time employees and an annual budget of about $14.5 million. The
department includes Central Library and nine branch libraries, serving 1.3 million people per year in
person, online or via social media. With more than 3,000 on-site programs, free Wi-Fi services and an
extensive collection of printed books, periodicals, media and cloud-based eBooks, the Pasadena Public
Library serves as a life-long learning center and cultural center for the greater Pasadena community.
The Pasadena Library maintains representation on the City’s Hazard Mitigation Steering Committee
and continues seek out opportunities for expanding and improving on policies and procedures related
to hazard mitigation strategies and emergency preparedness.
4.3.1.2.10 Planning & Community Development
The Planning & Community Development Department is responsible for providing economic vitality
and safe livable neighborhoods, which reflect, preserve, and enhance Pasadena’s unique cultural and
historic character. The department also promotes informed decision-making, which facilitates
sustainable development, affordable housing and reinvestment in the community.

City of Pasadena
2018 Multi-Hazard Mitigation Plan
33
The City’s Planning Department is represented on the Hazard Mitigation Steering Committee and is a
key player in ensuring that the LHMP is linked to the City’s General Plan. City Planning staff also
assist with planning updates and identifying opportunities for improving and expanding on existing
policies, codes and ordinances.
4.3.1.2.11 Police
The Pasadena Police Department serves as the lead public safety agency for the City of Pasadena.
There are more than 400 civilian and non-civilian members of the Department.
The Chief of Police has ultimate responsibility of the Pasadena Police Department for the protection of
life and property, preservation of law and order, investigation and suppression of all crimes, including
organized crime and vice, and the enforcement of State Laws and City Ordinances. There are four
divisions in the Police Department: Administration Services Division; Criminal Investigations
Division; Field Operations Division; and, the Strategic Services Division. Representatives from the
Police Department sit on the City’s Hazard Mitigation Planning Committee and participate in the
planning process.
4.3.1.2.12 Public Health
The Pasadena Public Health Department (PPHD) is responsible for a variety of health-related
programs.
The City’s Public Health agency is responsible for maintaining the Vital Records Office which
handles birth and death records for events occurring in Pasadena.
Environmental Health is an enforcement agency operating as part of the Pasadena Public
Health Department by performing routine inspections of permitted facilities and investigating
complaints. Technically trained staff are commonly known as “Health Inspectors” but their
official title is “Environmental Health Specialist”.
The Public Health Emergency Preparedness Program promotes disaster preparedness and
response by planning with the entire Pasadena community. By understanding the needs of
everyone in the City, the role of the Public Health Department is to reduce the health impacts
that may be created as a result of an emergency. The PPHD works with the Pasadena Fire and
Police Departments, Huntington Memorial Hospital, the Pasadena Unified School District, and
other agencies to increase safety for all residents by conducting drills, exercises, trainings, and
outreaches.
City of Pasadena provides free to low-cost healthcare services. Clinical services offered at the
Pasadena Public Health Department include child and travel immunizations, screening and
treatment of tuberculosis, and HIV testing.
The Living Well Pasadena Program has two components: 1) The Nutrition and Physical
Activity Program aims to reduce the prevalence of obesity and other chronic diseases by
providing nutrition education and obesity prevention services in Pasadena; and, 2) The
Tobacco Control Program’s mission is to protect and preserve the health and well-being of the
Pasadena Community from the harmful effects of tobacco and tobacco smoke, especially
among youth.
The Pasadena Public Health Department maintains a close relationship with its health
professional partners within the community by providing timely and accurate health
information and facilitating mandated disease reporting requirements.
Reporting is crucial for disease surveillance and detection of disease outbreaks. Under the
California Code of Regulations, Title 17 (Section 2500), public health professionals, medical

City of Pasadena
2018 Multi-Hazard Mitigation Plan
34
providers and others are mandated to report more than 80 diseases or conditions to the Pasadena
Public Health Department. In addition, persons in charge of any type of school are also required
to report these diseases (Section 2508), as are laboratories (Section 2505).
Physicians, surgeons, veterinarians, podiatrists, nurse practitioners, physician assistants,
nurses, nurse midwives, infection control practitioners, medical examiners, coroners, dentists,
and administrators of health facilities and clinics knowing of a case or suspected case of a
communicable disease are required to report to the local health department (CCR, Title 17,
Section 2500).
In addition, anyone in charge of a public or private school, kindergarten, boarding school, or
preschool is also required to report these diseases (Section 2508).
4.3.1.2.13 Public Works
The Pasadena Department of Public Works (PDPW) preserves, maintains, and enhances the City’s
infrastructure and natural resources and provides environmental stewardship for the benefit of
residents, businesses, and visitors. Public Works Divisions include Parks and Natural Resources; Street
Maintenance and Integrated Waste Management; Building Systems and Fleet Maintenance; Finance
and Management Services; and Engineering. Representative from the City’s Public Works Department
are active participants in the City’s Hazard Mitigation Planning process and the Hazard Mitigation
Grant Program. Staff from all divisions actively seek opportunities to expand and improve on policies,
procedures and methods for securing City facilities and infrastructure. In 2018, PDPW submitted three
hazard mitigation applications to retrofit some of the City’s fire stations and the City’s Public Work’s
Yard.
Transportation
The Department of Transportation provides for the movement of people and goods within Pasadena,
while concurrently ensuring a balance between land use and transportation to maintain a livable
community in which cars are not necessary to travel within the city.
4.3.1.2.14 Water & Power
Pasadena Department of Water and Power (PDWP) is responsible for providing water and power to all
City residents and businesses. The PDWP General Manager reports to the City Manager and is
governed by the City Council with oversight from the Municipal Services Committee of the City
Council. PDWP is under the management of the General Manager and organized into five separate
business units: Water Delivery, Power Supply, Power Delivery, Finance, Administration, and
Customer Service, and Customer Relations and Legislative.
Pasadena’s City Council determines how PDWP’s services are provided within the community,
including setting rates and approving services. Council members are residents of Pasadena who are
customers of the utility. In addition to local accountability, PDWP is subject to requirements
established by numerous state and federal regulatory bodies.
4.3.1.3 City Operating Companies
4.3.1.3.1 Rose Bowl Operating Company
The mission of the Rose Bowl Operating Company (RBOC) is to improve the quality of life in
Pasadena by providing top quality entertainment and by generating revenue through the operation of a
world-class stadium and a professional quality golf course complex.

City of Pasadena
2018 Multi-Hazard Mitigation Plan
35
The RBOC is a California non- profit, public benefit corporation, founded in 1995 by an act of the
Pasadena City Council. The RBOC has an independent board that governs its operations and adopts its
annual budget.
4.3.1.3.2 Pasadena Center Operating Company
The Pasadena Center Operating Company (PCOC) is a private, non-profit corporation (401 C 4)
formed in 1973 to manage the Pasadena Convention & Visitors Bureau, Pasadena Convention Center,
Pasadena Civic Auditorium and the Pasadena Ice Skating Center and such other City facilities as may
be assigned by the City Council.
The PCOC has responsibility to ensure that Pasadena’s facilities are effectively and efficiently
managed while improving the local economy, adding value for our customers, residents, workers and
businesses within the City of Pasadena. The Pasadena Convention & Visitors Bureau (CVB) is the
official destination marketing organization for the City of Pasadena. The CVB stimulates the local
economy though sales and marketing efforts by increasing visits from tourist, business travelers and
conventions who generate overnight lodging, restaurant and shopping revenues.
4.3.1.3.3 Pasadena Community Access Corporation
The Pasadena Community Access Corporation (PCAC) is a component unit, nonprofit public benefit
corporation recognized under Nonprofit Benefit Corporation Law for charitable purposes. The specific
purposes of this corporation are to promote, coordinate, facilitate, produce and assist public service
community programming on behalf of all residents of the City of Pasadena, California (‘Pasadena”)
for all public, community and government access channels of Pasadena’s cable telecommunications
system; to inform Pasadena residents of the potential services and benefits of the cable
telecommunications systems and to provide training opportunities for the public to have their voice
heard through the public access channels. It serves as a production company and provides equipment,
instruction, hands on training, resources and facilities to individuals and groups in order that they may
produce and cable cast TV programs and productions; to provide a structure in which the public can
learn and develop media skills.
KPAS - Government Channel- Government Channel
The Arroyo Channel
KLRN - PUSD Channel- K-12 Education Channel
PCC TV - Pasadena City College Channel- Pasadena City College Education Channel
4.3.1.4 Affiliate Agencies
4.3.1.4.1 Burbank Glendale Pasadena Airport Authority
The Burbank-Glendale-Pasadena Airport Authority is a separate government agency created under a
Joint Powers Agreement between the three (3) cities of Burbank, Glendale, and Pasadena in 1977 for
the sole purpose of owning and operating Hollywood Burbank Airport. The mission of the Airport
Authority is to provide state-of-the-art regional airport facilities and related services which are
efficient, safe, convenient, and user-friendly, while being a good neighbor. The Authority consists of
nine (9) Commissioners, three (3) from each city. The Commissioners from each city are appointed by
their city council.
In 2012, the Burbank-Glendale-Pasadena Authority commenced construction of the Regional
Intermodal Transportation Center (RITC), housing consolidated rental car facilities and connecting
passengers and visitors to local passenger transit services.

City of Pasadena
2018 Multi-Hazard Mitigation Plan
36
The RITC is to date the largest capital project undertaken. In December 2017, the airport officially
rebranded itself the Hollywood Burbank Airport, putting an end to the former title that paid tribute to
the comedian and showman Bob Hope. The airport adopted the Bob Hope name in 2003 after being
named the Burbank-Glendale-Pasadena Airport for 25 years.
4.3.1.4.2 Metro Gold Line
Metro (the Los Angeles County Metropolitan Transportation Authority) is unique among the nation’s
transportation agencies. We serve as transportation planner and coordinator, designer, builder and
operator for one of the country’s largest, most populous counties. More than 9.6 million people – nearly
one-third of California’s residents – live, work, and play within our 1,433-square-mile service area.
Six (6) Gold Line Stations are located in the City of Pasadena. The Gold Line travels north to the
Fillmore Station which sits in the heart of Pasadena's up and coming biotechnology corridor and is two
blocks from Huntington Memorial Hospital. The line continues to Del Mar Station and Memorial Park
Station. Both stations are two blocks from Old Town Pasadena’s shopping, theaters, restaurants and
the annual Tournament of Roses Parade route. Memorial Park Station is walking distance to the city's
landmark City Hall. The final three stations are located in the median of the I-210 Freeway. The line
annexes the San Gabriel by way of Azusa, traveling 11 miles to the line (or from) the San Gabriel
Valley.
4.3.1.4.3 Pasadena Unified School District
The schools of the Pasadena Unified School District (PUSD) enroll more than 16,700 students in
Transitional Kindergarten-12th grade in a 76-square mile area that includes Altadena, Pasadena, Sierra
Madre and unincorporated areas of Los Angeles County. PUSD was formed in 1874 and unified in
1961.The District currently operates twenty-eight (28) schools and programs:
Seventeen (17) elementary schools (grades K-5)
Four (4) middle schools (grades 6-8)
One (1) K-8 school
Two (2) 6-12th grade schools
Two (2) high schools (grades 9-12)
One (1) continuation high school
One (1) alternative education program
PUSD also operates four (4) Early Childhood Education Centers, one (1) Transitional Kindergarten
programs, one (1) Focus Point Academy, and one (1) Twilight Adult Education.
4.3.1.5 Disaster Emergency Services Council
The Disaster Emergency Services Council (DESC) was established by ordinance which provides input
on the preparation of plans forth protection of persons and property within the city in the event of an
emergency. Membership to the DESC is established in accordance with Section 2.370.030 of the
Pasadena Municipal Code. The purpose of the DESC is to:
Provide for the preparation and carrying out of plans for the protection of persons and property
within the city in the event of an emergency;
Direct an emergency services organization;
Coordinate the emergency functions of the city with all other public agencies, corporations,
organizations and affected private persons.

City of Pasadena
2018 Multi-Hazard Mitigation Plan
37
The DESC consists of the following members:
The mayor of the city, who shall be chair of the council
The director of disaster emergency services, who shall be the vice chair of the council
The assistant director of disaster emergency services
Such chiefs of emergency services as are provided for in a current emergency plan of this city,
adopted pursuant to this chapter
Such representatives of civic, business, labor, veterans, professional or other organizations
having an official emergency responsibility, as may be appointed by the director with the
advice and consent of the city council

City of Pasadena
2018 Multi-Hazard Mitigation Plan
38
4.4 FISCAL RESOURCES
4.4.1 City Budget
The annual budget for the City of Pasadena makes it possible to provide many services and facilities
that contribute to the high quality of life for City residents. The budget seeks to maintain essential
services that protect resident’s quality of life such as neighborhood police patrols, keep roads and parks
in good condition, support youth and senior programs and other ways that make the City a desirable
place to live. In the 2019 Adopted Budget the City shows appropriations made for City Departments,
Affiliated Agencies and the Capital Improvement Program (CIP).
Figure 4.4 - 2019 Total Budget Appropriations
Over the past five (5) years, the city has not received any Hazard Mitigation Assistance (HMA) funds
to implement projects from the LHMP; general funds have been used to implement needed projects
within the jurisdiction. Administration of the projects were carried out in accordance with current city
policies and requirements. A sample of some of the completed projects is included in Section 7 of the
LHMP. With a better understanding of their risk, possible actions, and potential HMA funding sources,
the city is hoping to obtain grants to help implement future projects.

City of Pasadena
2018 Multi-Hazard Mitigation Plan
39
4.4.2 Grants that Support Mitigation Efforts
In addition to FEMA’s Hazard Mitigation Assistance (HMA) grants, the City of Pasadena has access
to other grant and grant programs that can assist in developing and expanding hazard mitigation
strategies. These grants include:
Pasadena Capital Grants Program
Planning and Community Development Department
Assistance to Firefighters Grants (AFG)
The Alisa Ann Ruch Burn Foundation
The Community Development Block Grant (CDBG) Program Police Department
Police Foundation
Department of Justice (DOJ) Body-Worn Camera Policy and Implementation Program
U.S. Department of Justice Assistance Grant
Supplemental Nutrition Assistance Program (SNAP) Additional Funding
Non-Potable Water Project - Phase I
Supplemental Food Program for Women, Infants and Children (WIC)
Supplemental Nutrition Assistance Program (SNAP)
Shelter Plus Care
Home Opportunities for Persons with AIDS
Continuum of Care Program
Water Conservation Field Services (WCFS)
Bullet Proof Vest Grant
Edward Byrne Memorial Justice Assistance Grant - Body-Worn Camera Initiative
Asset Forfeiture
WIOA - Foster Youth
WIOA - Adult
WIOA - High Performing Board
WIOA - VEAP
WIOA - Touch Screen Technology
WIOA - Youth
WIOA - Dislocated Worker
WIOA - Rapid Response
WIOA - Rapid Response Layoff Aversion
WIOA - Rapid Response Special - Hire Path
Purchase of Replace Transit Vehicle and Large Capacity Fixed Route Transit Vehicles
Dial-A-Ride Expansion for Accessibility Enhancement - FTA5310
Dial-A-Ride Aging Vehicle Replacement - FTA5310
Increase Local Transit Capacity for Improved Jobs Access-FTA5316 JARC Operation
Public Health Emergency Preparedness (formerly Bio-Terrorism)
Substance Abuse and Mental Health (SAMHSA)
Centers for Disease Control and Prevention - TB Local Assistance
Child Lead Poison Prevention
Substance Abuse and Mental Health (SAMHSA) - GBHI

City of Pasadena
2018 Multi-Hazard Mitigation Plan
40
Immunization Subvention Funds
CDC REACH
Temporary Assistance for Needy Families (TANF)
Transitional Subsidized Employment (TSE)
Child Health and Disability Prevention Program - Gateway
Special Projects of National Significance (HRSA)
Special Projects of National Significance (HRSA)
MCH County and Comprehensive Prenatal Outreach
MCH Black Infant (federal share only)
Homeland Security Grant Program (SHGP)
Urban Areas Security Initiative (UASI)
CDBG Entitlement
Emergency Shelter Grant Program
HOME - Investment in Affordable Housing
Home Opportunities for Persons with AIDS
Section 108 Loan - Robinson Park
Section 8 Low Income Housing - Voucher Program
Laundry to Landscape Greywater Recycling Program Expansion
La Loma Bridge
Holly Street Bridge Seismic Retrofit
Detect Bicycle at Intersection by Traffic Signal
Left Turn Signal Phasing at Colorado/Orange Grove/Holly
Light Rail Train Tracking
Intelligent Transportation System - Phase 1
OTS Safer Streets Pasadena - School Area Safety
Safer Streets Pasadena - Bicycle Safety Outreach Project
Selective Traffic Enforcement Program (STEP)
Asset Forfeiture
HIV Prevention Activities Health Department Based
Alcohol & Drug Abuse/Mental Health Services Block Grant - AODPS
State Homeland Security Program (SHSP)

City of Pasadena
2018 Multi-Hazard Mitigation Plan
41
5 Hazard Assessment
5.1 OVERVIEW
The purpose of this section is to review, validate, and/or update the profiled hazards in 2013 City of
Pasadena LHMP. The intent is to confirm, and if necessary, expand the list of hazards facing the city
and determine if the information is current and accurate. The importance of this is to ensure that
decisions (mitigation actions) are based on a comprehensive understanding of all hazards and that the
most up-to-date information on hazards is being considered. Another purpose of this section is to
prioritize (or rank) the hazards. This ranking will provide an understanding of the significance of each
hazard in the community.
During this effort to assess the hazard information and ranked the hazards, the Steering Committee
considered the following questions:
Is this hazard still present and significant within the jurisdiction?
Has the potential for the hazard within the jurisdiction changed including the location,
severity, and/or frequency?
- Including climate change considerations
Are there other hazards affecting the jurisdiction?
As part of process, the Steering Committee leveraged other planning efforts and documents, including
the State of California Multi-Hazard Mitigation Plan, the City of Pasadena General Plan, the City of
Pasadena 2013 LHMP, and other agency documents containing updated information and best practices
for hazards (i.e., FEMA, USGS, NOAA, USC). Utilizing the information and material, the Steering
Committee assessed and profiled hazards in the geographic area. The following is a summary of the
work.
5.2 HAZARD IDENTIFICATION
Using the City of Pasadena 2013 LHMP as the basis, the Steering Committee leveraged information
from other documents (i.e., California State Multi-Hazard Mitigation Plan, City of Pasadena General
Plan, City of Pasadena Climate Action Plan) and utilized local experience and knowledge to identify
and document the hazards relevant to the city (Table 5.1).

City of Pasadena
2018 Multi-Hazard Mitigation Plan
42
Table 5.1 Relevant Hazards in the City of Pasadena
Hazards
1 Earthquake
2 Wildfire
3 Flood
4 Landslide and other Earth Movement
6 Extreme Heat
7 Hailstorm
8 Windstorm
9 Energy Shortage/Outage
10 Air Pollution
11 Oil Spill
12 Dam Failure
13 Agricultural Pests and Disease
14 Infectious Disease
15 Hazardous Material Release
16 Radiological Incident
17 Terrorism
18 Cyber Attack
19 Aircraft Crash
20 Train Accident; Explosion and/or Chemical Release
21 Natural Gas Pipeline/Storage Failure
22 Civil Disturbance
5.3 HAZARD PRIORITIZATION
The intent of prioritizing hazards is to help evaluate which hazard is the greatest concern in the
community. The City of Pasadena 2013 LHMP did not document its prioritization process so there was
little to review and validate. For the 2018 update of the LHMP, the Steering Committee decided to
adopt and document their approach. A summary of the process (methodology) and the results are
presented below:
5.3.1 Methodology
Evaluate hazards on two (2) factors:
Probability of the hazard affecting the community
Potential impacts of the hazard on the community
To assist with rankings, terms of “High”, “Medium”, and “Low” were utilized to define probability of
occurrence and potential impact. The following are definitions of each term:
Probability of Occurrence
High- Highly Likely/Likely (significant chance will happen every year)
Medium- Possible (75% chance will happen every 5 years)
Low- Unlikely (50% chance will happen every 10 years)
Potential Impact
High- Catastrophic/Critical: Major loss of function, downtime, and/or evacuations

City of Pasadena
2018 Multi-Hazard Mitigation Plan
43
Medium- Limited: Some loss of function, downtime, and/or evacuations
Low- Negligible: Minimal loss of function, downtime, and/or evacuations
5.3.2 Results
Utilizing the methodology, the Steering Committee evaluated the list of hazards. The results of the
assessment are presented in Table 5-2. Based on LHMP update requirements and previous discussions
with Cal OES and FEMA, it has been suggested that the list of hazards be divided into “higher priority”
and “lower priority” hazards. The shading of the boxes above indicates the priority level: the “higher
priority” hazards are indicated in the Red boxes and the “lower priority” hazards are reflective in the
Green and Gray boxes. It should be noted that while some mitigation actions will be identified for
“lower priority” hazards, the focus will be on the “higher priority” hazards.
Table 5-2 Hazard Screening and Ranking
High
Impact
Medium
Impact
Low
Impact
High
Probability
Medium
Probability
Low
Probability
Earthquake
Wildfire
Terrorism
Cyber Attack
Drought/Water Shortage
Civil Disturbance
Windstorm
Infectious Disease
Agricultural Pest and Disease
Energy Shortage/Outage Flood
Extreme Heat
Train Accident
Hazardous Material Release
Landslide and other Earth
Movement
Aircraft Crash Dam Failure
Radiological Incident
Air Pollution
Natural Gas Pipeline/
Storage Failure
Hailstorm
Oil Spill
5.4 HAZARD PROFILES
To ensure each hazard was given proper consideration, a standardized format was used. Each hazard
presented on the LHMP will contain: 1) a brief description of the hazard; 2) an overview of the location
and extent of the hazard within the city; 3) the history of the hazard within the city; 4) the probability
of occurrence within the city; and, 5) the climate change considerations for the hazard. The Steering
Committee considered this information when they ranked each hazard. The following information is
intended to be an overview of the relevant hazards; more information may be found in the State of
California Multi-Hazard Mitigation Plan, the City of Pasadena General Plan, and/or other documents.

City of Pasadena
2018 Multi-Hazard Mitigation Plan
44
5.4.1 Higher Priority Hazards
5.4.1.1 Earthquake
5.4.1.1.1 Description of Hazard
An earthquake is caused by a release of strain within or
along the edge of the Earth's tectonic plates, producing
ground motion, surface fault rupture, and secondary hazards
such as ground failure. The severity of the shaking increases
with the amount of energy released, decreases with distance
from the causative fault or epicenter, and is amplified by
soft soils. After just a few seconds, earthquakes can cause
massive damage and extensive casualties. A fault is a
fracture between blocks of the earth’s crust where either
side moves relative to the other along a parallel plane to the fracture.
There are three (3) different types of earthquake faults: 1) Normal, 2) Thrust; and, 3) Strike-slip.
Normal fault and Thrust faults are examples of dip-slip faults. Dip-slip faults are slanted fractures
where the blocks mostly shift vertically. If the earth above an inclined fault moves down, the fault is
called a normal fault, but when the rock above the fault moves up, the fault is called a reverse (or trust)
fault. Thrust faults have a reverse fault with a dip of 45° or less.
Normal Fault Thrust Fault
Strike-slip faults are vertical or almost vertical rifts where the earth’s plates move mostly horizontally.
From the observer’s perspective, if the opposite block looking across the fault moves to the right, the
slip style is called a right lateral fault; if the block moves left, the shift is called a left lateral fault.
Strike-slip Fault
The effect of an earthquake on various locations throughout the felt area is called the intensity. The
intensity scale consists of a series of certain key responses such as people awakening, movement of

City of Pasadena
2018 Multi-Hazard Mitigation Plan
45
furniture, damage to chimneys, and total destruction of property. The scale currently used in the United
States is the Modified Mercalli Intensity (MMI) Scale (Table 5.3). It was developed in 1931 by the
American seismologists Harry Wood and Frank Neumann. This scale is composed of increasing levels
of intensity designated by Roman numerals that range from imperceptible shaking (MMI I) to
catastrophic destruction (MMI X). It does not have a mathematical basis; instead, it is an empirical
scale based on observed effects.
Table 5.3 Modified Mercalli Intensity (MMI) Scale
Intensity Shaking Description
I Not Felt Not felt except by a very few under especially favorable conditions.
II Weak Felt only by a few persons at rest, especially on upper floors of buildings
III
Weak Felt quite noticeably by persons indoors, especially on upper floors of
buildings. Many people do not recognize it as an earthquake. Standing motor
cars may rock slightly. Vibrations similar to the passing of a truck. Duration
estimated
IV
Light
Felt indoors by many, outdoors by few during the day. At night, some awakened.
Dishes, windows, doors disturbed; walls make cracking
sound. Sensation like heavy truck striking building. Standing motor cars rocked
noticeably.
V Moderate Felt by nearly everyone; many awakened. Some dishes, windows
broken. Unstable objects overturned. Pendulum clocks may stop
VI Strong Felt by all, many frightened. Some heavy furniture moved; a few
instances of fallen plaster. Damage slight
VII Very
Strong
Damage negligible in buildings of good design and construction; slight to
moderate in well-built ordinary structures; considerable damage in
poorly built or badly designed structures; some chimneys broken
VIII
Severe Damage slight in specially designed structures; considerable damage in
ordinary substantial buildings with partial collapse. Damage great in poorly
built structures. Fall of chimneys, factory stacks, columns, monuments, walls.
Heavy furniture overturned
IX
Violent
Damage considerable in specially designed structures; well-designed frame
structures thrown out of plumb. Damage great in substantial
buildings, with partial collapse. Buildings shifted off foundations
X Extreme Some well-built wooden structures destroyed; most masonry and frame
structures destroyed with foundations. Rails bent
However, most people are familiar with the Richter scale, a method of rating earthquakes based on the
amplitude of seismic waves - an indirect measure of energy released (Error! Not a valid bookmark self-
reference.). The Richter scale is logarithmic. Each one-point increase corresponds to a 10-fold increase
in the amplitude of the seismic shock waves and a 32-fold increase in energy released. For example,
an earthquake registering magnitude 7.0 on the Richter scale releases over 1,000 times more energy
than an earthquake registering magnitude 5.0. It should be noted that while an earthquake may have
many intensity values across the impacted area, there is just one Richter magnitude associated with
each event.

City of Pasadena
2018 Multi-Hazard Mitigation Plan
46
Table 5.4 Richter Scale
Magnitude Earthquake Effects
0-1.9 Micro- Not felt by people
2.0-2.9 Minor- Felt by few people
3.0-3.9 Minor- Felt by some people, inside objective can be seen shaking
4.0-4.9 Light- Felt by most people, inside object shake and fall
5.0-5.9 Moderate- Felt by everyone, damage and possible collapse of unreinforced buildings
6.0-6.9 Strong- Felt by everyone, widespread shaking/damage, some buildings collapse
7.0-7.9 Major- Felt by everyone, widespread shaking/damage, many buildings collapse
8.0 or greater Great- Felt by everyone, widespread shaking/damage, most buildings collapse
Ground shaking, surface fault rupture, landslides, and liquefaction are the specific hazards associated
with earthquakes. The severity of these hazards depends on several factors, including soil and slope
conditions, proximity to the fault, earthquake magnitude, and the type of earthquake.
Ground Shaking- Ground shaking is the motion felt on the earth's surface caused by seismic
waves generated by the earthquake. It is the primary cause of earthquake damage. The
strength of ground shaking depends on the magnitude of the earthquake, the type of fault,
distance from the epicenter (where the earthquake originates), and local soil conditions.
Soils and soft sedimentary rocks near the earth's surface can amplify earthquake ground
shaking. Amplification increases the magnitude of the seismic waves generated by the
earthquake. The amount of amplification is influenced by the thickness of geologic
materials and their physical properties. Buildings and structures built on soft and
unconsolidated soils can face greater risk. Amplification can also occur in areas with deep
sediment filled basins and on ridge tops. Peak ground acceleration (PGA) is a measure of
the strength of ground shaking. Larger PGAs result in greater damage to structures. PGA
is used to depict the risk of damage from future earthquakes by showing earthquake ground
motions that have a specified probability (10%, 5%, or 2%) of being exceeded in 50 years
return period. These values are often used for reference in construction design, and in
assessing relative hazards when making economic and safety decisions.
Surface Fault Rupture- As previously mentioned, the sudden sliding of one part of the
earth’s crust past another releases the vast store of elastic energy in the rocks as an
earthquake. The resulting fracture is known as a fault, while the sliding movement of earth
on either side of a fault is called fault rupture. Fault rupture generally begins below the
ground surface at the earthquake hypocenter, typically between three and ten miles below
the ground surface in California. If an earthquake is large enough, the fault rupture will
reach the ground surface (referred to as “surface fault rupture”), wreaking havoc on
structures built across its path. Structures built across the fault are a risk of significant
damage from surface fault rupture. In California, the 1972 Alquist-Priola Earthquake Fault
Zoning Act prohibits the siting of most structures for human occupancy across traces of
active faults that constitute a potential hazard to structures from surface faulting.

City of Pasadena
2018 Multi-Hazard Mitigation Plan
47
Recent large earthquakes in Turkey and Taiwan have shown that few structures built
across the surface traces of faults can withstand the large displacements that may occur
during an earthquake.
Landslides- Earthquake-induced landslides are secondary earthquake hazards that occur
from ground shaking. They can destroy the roads, buildings, utilities, and other critical
facilities necessary to respond and recover from an earthquake. Many communities in
Southern California have a high likelihood of encountering such risks, especially in areas
with steep slopes.
Liquefaction- Liquefaction is the phenomenon that occurs when ground shaking causes
loose, saturated soils to lose strength and act like viscous fluid. Liquefaction causes two
types of ground failure: lateral spread and loss of bearing strength. Lateral spreads develop
on gentle slopes and entail the sidelong movement of large masses of soil as an underlying
layer liquefies. Loss of bearing strength occurs when the soil supporting structures liquefy,
causing the structures to settle, resulting in damage and, in some cases, collapse.
5.4.1.1.2 Location and Extent of Hazard in Pasadena
As noted by the California Geological Survey, California is divided into eleven (11) geomorphic
provinces. California's geomorphic provinces are naturally defined geologic regions that display a
distinct landscape or landform. Each region displays unique, defining features based on geology, faults,
topographic relief and climate. These geomorphic provinces are remarkably diverse. They provide
spectacular vistas and unique opportunities to learn about earth's geologic processes and history. These
geomorphic provinces each have the potential to create significant earthquakes and associated hazards.
The City of Pasadena is located in a high seismic activity zone in the Transverse Range geologic
province. The Transverse Ranges are an east-west trending series of steep mountain ranges and valleys.
The east-west structure of the Transverse Ranges is oblique to the normal northwest trend of coastal
California, hence the name "Transverse." The province extends offshore to include San Miguel, Santa
Rosa, and Santa Cruz islands. Its eastern extension, the San Bernardino Mountains, has been displaced
to the south along the San Andreas Fault. Intense north-south compression is squeezing the Transverse
Ranges. As a result, this is one of the most rapidly rising regions on earth. Great thicknesses of
Cenozoic petroleum-rich sedimentary rocks have folded and faulted, making this one of the important
oil producing areas in the United States. Figure 5.1 maps the more significant faults within the region.

City of Pasadena
2018 Multi-Hazard Mitigation Plan
48
Figure 5.1 Earthquake Faults in Southern California Region
Historical and geological records show that California has a long history of seismic events. In
California, movement between the North American and the Pacific tectonic plates manifest primarily
along a region known as the San Andreas Fault system. Experts believe the San Andreas Fault is
capable of producing an earthquake of magnitude 8.0+ over the next few years. The San Andreas Fault
is considered the “Master Fault” because it has frequent (geologically speaking), large earthquakes,
and it controls the seismic hazard in southern California. Faults in the San Andreas Fault zone that
passes through Los Angeles County are part of the very active southern segment. This segment includes
historically active, active, potentially active, and inactive faults.
The San Andreas Fault is ten (10) miles deep and runs 800-miles from the Salton Sea in Imperial
County in the south to Cape Mendocino in Humboldt County in the north. Geologic studies show that
over the past 1,400 to 1,500 years large earthquakes have occurred at about 130-year intervals on the
southern San Andreas Fault segment. The last large earthquake on the southern San Andreas Fault
segment occurred in 1857, that section of the fault is considered a likely location for an earthquake
within the next few decades. The closets points of the San Andreas Fault are situated approximately
20-50 miles to the north and east of the City of Pasadena. Below is an overview of the San Andreas
Fault Zone.

City of Pasadena
2018 Multi-Hazard Mitigation Plan
49
San Andreas Fault Zone- Large faults, such as the San Andreas Fault, are generally
divided into segments in order to evaluate their future earthquake potential. The
segments are generally defined at discontinuities along the fault that may affect the
rupture length. The southern segment of the San Andreas Fault zone is divided into three
(3) segments named, from north to south: 1) Mojave; 2) San Bernardino Mountains; and,
3) Coachella Valley segments.
Each segment is assumed to have a characteristic slip rate (rate of movement averaged
over time), recurrence interval (time between moderate to large earthquakes), and
displacement (amount of offset during an earthquake). While this methodology has some
value in predicting earthquakes, historical records and studies of prehistoric earthquakes
show that it is possible for more than one segment to rupture during a large quake or for
ruptures to overlap into adjacent segments.
Mojave Segment- This segment of the San Andreas Fault is 83 miles long, extending from
approximately Three Points southward to just northwest of Cajon Creek, at the southern
limit of the 1857 rupture. Scientists estimate a recurrence interval of 150 years for this
segment. The Mojave segment is estimated to be capable of producing a magnitude 7.1
earthquake.
San Bernardino Mountains Segment- This segment extends approximately 49 miles from
Cajon Creek to the San Gorgonio Pass. This segment is a structurally complex zone that
is poorly understood, and for which there are scant data on fault behavior. It has been
estimated there is a probable recurrence interval on this fault of approximately 146 years.
This fault segment is estimated capable of producing a magnitude 7.3 earthquake. If this
fault segment ruptures together with the Mojave and Coachella Valley segments, higher
ground motions would be expected.
Coachella Valley Segment- This segment is about 71 miles long and extends from San
Gorgonio Pass to the Salton Sea. This segment has not produced any large surface-
rupturing earthquakes in historic times (Sieh and Williams, 1990). Paleo seismic studies
suggest that the last surface-rupturing earthquake on this segment occurred around 1680.
The data also suggest that during the 1680 earthquake, and the one prior to that, in 1450,
both the Coachella Valley and San Bernardino Mountain segments ruptured
simultaneously. This segment is thought capable of producing a magnitude 7.4 earthquake.
While the San Andreas Fault system is capable of producing an earthquake with a magnitude of 8.0+
on the Richter scale; some of the “lesser” known faults have the potential to inflict greater damage on
the urban core of the Los Angeles Basin. Experts believe that a magnitude 6.0 earthquake on the
Newport-Inglewood area would result in far more death and destruction than a “great” quake on the
San Andreas, because the San Andreas is relatively remote from the urban centers of Southern
California.
The two largest faults in the Pasadena area are the Sierra Madre Fault, a reverse fault on the north
boundary of the City, and the Raymond Fault, a left lateral strike-slip fault that extends into the
southern and eastern areas of the City. A rupture of either fault would result in major damage to the
city. Other nearby faults include the Verdugo, Hollywood, Whittier, and Elysian Park fault zones. Any
of these faults have the potential to cause serious damage to Pasadena. Below is an overview of the
Sierra Madre Fault, Verdugo Fault, and the Raymond Fault.

City of Pasadena
2018 Multi-Hazard Mitigation Plan
50
Sierra Madre Fault- The Sierra Madre fault zone is a north-dipping reverse fault zone
approximately 47 miles long that extends along the southern flank of the San Gabriel
Mountains from San Fernando to San Antonio Canyon, where it continues southeastward
as the Cucamonga fault. The Sierra Madre fault has been divided into five segments, and
each segment has a different rate of activity. The northwestern-most segment of the Sierra
Madre fault (the San Fernando segment) ruptured in 1971, causing the magnitude 6.7 San
Fernando (or Sylmar) earthquake. As a result of this earthquake, the Sierra Madre fault
has been known to be active. In the 1980s, Crook and others (1987) studied the Transverse
Ranges using general geologic and geomorphic mapping, coupled with a few trenching
locations, and suggested that the segments of the Sierra Madre fault east of the San
Fernando segment have not generated major earthquakes in several thousands of years,
and possibly as long as 11,000 years. By California’s definitions of active faulting, most
of the Sierra Madre fault would therefore be classified as not active. The segment in Los
Angeles County is active and may generate an earthquake in the future.
Verdugo Fault- the Verdugo fault is a 13-mile long, southeast-striking fault that lies along
the southern flank of the Verdugo Mountains, near Burbank. Earthquake researchers have
interpreted this fault as both a reverse fault and a left-lateral strike-slip fault. Results of
these studies suggest that the Verdugo fault changes in character from a reverse fault
adjacent to the Pacoima Hills, to a normal fault at the southwest edge of the Verdugo
Mountains. Vertical separation on the fault is at least 1,000 meters. The fault’s recurrence
interval is unknown.
Raymond Fault- The Raymond fault is a left-lateral, strike-slip fault about 13 miles long
that extends across the San Gabriel Valley, including southern Pasadena. The fault is
arcuate in shape, trending east- west in its western section, and east-northeast in its eastern
section. The fault produces a very obvious south-facing scarp along much of its length,
which led many geologists to favor reverse-slip as the predominant sense of fault motion.
However, left-deflected channels, shutter-ridges, sag ponds, and pressure ridges indicate
that the Raymond fault is predominantly a left-lateral strike slip fault. Research indicates
that the Raymond fault may rupture alone or together with other nearby faults, such as the
Hollywood fault. The recurrence rate is uncertain. The Raymond fault appears to transfer
slip southward from the Sierra Madre fault zone to other fault systems. This sense of
motion is confirmed by the seismological record, especially the main shock and aftershock
sequence to the 1988 Pasadena earthquake of local magnitude 5.0 that probably occurred
on this fault (Jones et al., 1990; Hauksson and Jones, 1991).
As indicted previously, earthquakes create associated hazards (i.e., ground shaking, liquefaction). To
help understand the potential of some of these hazards, the United States Geologic Survey (USGS)
illustrated the range of potential ground shaking throughout the state of California (Figure 5.2).
Earthquake ground shaking estimates are calculated considering earthquake magnitudes and rates, the
decrease in earthquake shaking with distance, and amplification of shaking by soils. The result is
expressed as the level of ground shaking (as a percentage of gravity). The figure below shows the level
of ground motion with a one (1) chance in 475 of being exceeded each year, which is equal to having
a 10% probability of being exceeded in 50 years.

City of Pasadena
2018 Multi-Hazard Mitigation Plan
51
Figure 5.2 Peak Ground Acceleration with a 10% Probability of being exceeded in 50 Years
As noted above, some areas of sandy soil may be prone to liquefaction. On sloping ground, liquefaction
will usually result in slope failure. On level ground, liquefaction results in water rising to the ground
surface. The National Earthquake Hazards Reduction Program (NEHRP) rates soils from hard to soft,
and gives the soils ratings from Type A through Type E. The hardest soils are rated Type A, and the
softest soils are rated Type
E. Liquefaction risk is considered high if there are soft sandy soils (some Types D or Type E) and
shallow ground water present. The California Geologic Survey conducted a study to document the
potential earthquake-induced landslides and liquefaction potential for the San Gabriel Mountain
foothill areas. Figure 5.3 and Figure 5.4 illustrate the potential in the Pasadena area. The areas in green
are liquefaction potential and the areas in light blue are earthquake-induced landslide potential.

City of Pasadena
2018 Multi-Hazard Mitigation Plan
52
Figure 5.3 Earthquake-induced Landslide and Liquefaction Potential- Pasadena Quadrangle
Figure 5.4 Earthquake-induced Landslide and Liquefaction Potential-Mount Wilson Quadrangle

City of Pasadena
2018 Multi-Hazard Mitigation Plan
53
5.4.1.1.3 History of Hazard in Pasadena
The most recent significant earthquake event affecting the Los Angeles area was the Northridge
Earthquake. At 4:31 A.M. on Monday, January 17, 1994, a very damaging earthquake with a magnitude
of 6.7 struck the San Fernando Valley. In the following days and weeks, thousands of aftershocks
occurred, causing additional damage to affected structures.
Fifty-seven (57) people were killed and more than 1,500 people seriously injured. For days afterward,
thousands of homes and businesses were without electricity; tens of thousands had no gas; and nearly
50,000 had little or no water. Approximately 15,000 structures were moderately to severely damaged,
leaving thousands of people temporarily homeless. Some 66,500 buildings were inspected. Nearly
4,000 were severely damaged, and over 11,000 were moderately damaged. Several collapsed bridges
and overpasses created commuter havoc on the freeway system. Extensive damage was caused by
ground shaking, but earthquake-triggered liquefaction and dozens of fires also caused additional severe
damage. This extremely strong ground motion in large portions of Los Angeles County resulted in
record economic losses.
However, the earthquake occurred early in the morning on a holiday, and this circumstance
considerably reduced the potential effects. Many collapsed buildings were unoccupied, and most
businesses were not yet open. Even so, the direct and indirect economic losses ran into the tens of
billions of dollars.
Two very large earthquakes, the Fort Tejon in 1857 (magnitude 7.9) and the Owens Valley in 1872
(magnitude 7.6) are evidence of the tremendously damaging potential of earthquakes in Southern
California. The Fort Tejon earthquake surface rupture broke the portions of the central and southern
segments of the San Andreas Fault system (Cholame, Carrizo, and Mojave segments), resulting in
displacements of as much as 27 feet (9 meters) along the rupture zone. These fault segments are thought
to have an incident recurrence interval of between 104 and 296 years.
In more recent times, two (2) magnitude 7.3 earthquakes struck Southern California, in Kern County
(1952) and Landers (1992). However, the damage from these large earthquakes was limited because
they occurred in areas which were sparsely populated at the time they happened. The seismic risk is
much more severe today than in the past because the population at risk is in the millions, rather than a
few hundred or a few thousand persons. Other significant earthquake events in the region included:
Newport-Inglewood Earthquake- Magnitude 6.4, March of 1933. 120 deaths, over $50
million in damage.
San Fernando (Sylmar) Earthquake- Magnitude 6.5, February 1971. 65 deaths, over $500
million in damage
Whittier Narrows Earthquake- Magnitude 5.9, October 1987. 8 deaths, over $358 million in
damage
Sierra Madre Earthquake - Magnitude 5.8, June 1991. 2 deaths, over $40 million in damage
Figure 5.5 displays historical epicenters of earthquakes located in southern California since 1568 and
Table 5.5 presents a list of significant earthquakes, magnitude 6.0 or greater since 1700 in the State of
California.

City of Pasadena
2018 Multi-Hazard Mitigation Plan
54
Figure 5.5 Significant Earthquakes in Southern California since 1568
Table 5.5 List of Significant Earthquakes in California Since 1700
Date Magnitude Name, Location, or
Region Affected Loss of Life and Property
1700, Jan. 26 9.0 Offshore, somewhere
between Cape
Mendocino and
Canada
Limited data available, magnitude is
an estimate. Shook northern
California, Oregon, Washington, and
southern British Columbia; caused
tsunami damage to villages in Japan
and western US
1857, Jan 9 7.9 Great Fort Tejon
earthquake
1 dead; damage from Monterey to San
Bernardino County
1906, Apr 18 7.8 Great 1906 San
Francisco Earthquake
and Fire
3,000 dead; $524 million in property
damage (includes damage from fire)
1838, Jun 7.4 San Francisco to San
Juan Bautista
Limited data available, magnitude is
an estimate. Damage to San Francisco
and Santa Clara
1872, Mar 26 7.4 Owens Valley 27 dead; 56 injured; $250,000
in property damage
1980, Nov 8 7.4 West of Eureka 6 injured; $2 million in property
damage

City of Pasadena
2018 Multi-Hazard Mitigation Plan
55
1812, Dec 8 7.3 Wrightwood Limited data available, magnitude is
an estimate. 40 dead at San Juan
Capistrano
1892, Feb 24 7.3 Laguna Salida, Baja
California
Damage to San Diego
and Imperial Valley
1922, Jan 31 7.3 Offshore, about 70 mi
W of Eureka
1952, Jul 21 7.3 Kern County
earthquake
12 dead; $60 million in
property damage
1954, Dec 16 7.3 Fairview Peak, near
Fallon, NV
1992, Jun 28 7.3 Landers 1 dead; 402 injured; $91.1 million in
property damage
1923, Jan 22 7.2 Off Cape Mendocino Destructive in Humboldt
County; strongly felt in Reno
1932, Dec 21 7.2 Cedar Mountain, near
Gabbs, NV
1992, Apr 25 7.2 Petrolia 356 injured; $48.3 million in property
damage
1812, Dec 21 7.1 Los Angeles, Ventura,
Santa Barbara
Limited data available, magnitude is an
estimate. 1 dead
1927, Nov 4 7.1 40 km west of Lompoc Damage in Santa Barbara
and San Luis Obispo
counties
1954, Dec 16 7.1 Dixie Valley, near
Fallon, NV
1868, Oct 21 7.0 Hayward Fault 30 dead; $350,000 in property damage
1899, Apr 16 7.0 Offshore, about 80
miles west of Eureka
1934, Dec 31 7.0 In Mexico, about 100
miles SE of El Centro
1940, May 19 7.0 Imperial Valley 9 dead; $6 million in property damage
1991, Aug 17 7.0 Offshore, about 100
miles NW of Eureka
Preceded by two quakes (M 6.3 and
6.2) on Aug. 16 and 17
1994, Sep 1 7.0 Offshore, about 70
miles W of Cape
Mendocino
1873, Nov 23 6.9 Crescent City region Damage in California-Oregon border
area
1989, Oct 17 6.9 Loma Prieta 63 dead; 3,737 injured; $6 billion
in property damage
1872, Mar 26 6.8 Owens Valley Aftershock of previous entry
1872, Apr 11 6.8 Owens Valley Aftershock of March 26, 1872 quake
1890, Feb 9 6.8 San Jacinto fault? Little damage

City of Pasadena
2018 Multi-Hazard Mitigation Plan
56
1918, Apr 21 6.8 San Jacinto 1 dead; several injuries; $200,000 in
property damage
1925, Jun 29 6.8 Santa Barbara 13 dead; $8 million in property damage
1954, Jul 6 6.8 Rainbow Mountain,
near Fallon, NV
1999, Oct 16 7.1 Bullion Mountains
(Hector Mine)
Minimal injuries and damage due to
sparse population in affected area
1954, Aug 24 6.8 Rainbow Mountain,
near Fallon, NV
1976, Nov 26 6.8 Offshore, about 100 mi
WNW of Eureka
1898, Apr 15 6.7 Fort Bragg -
Mendocino
Limited data available, magnitude is
an estimate. Damage from Fort Bragg
to Mendocino; 3 houses collapsed;
landslides reported
1899, Dec 25 6.7 San Jacinto and Hemet 6 dead; $50,000 in property damage
1994, Jan 17 6.7 Northridge 57 dead; more than 9,000 injured;
about $40 billion in property damage
1892, Apr 19 6.6 Vacaville 1 dead; $225,000 in property damage
1915, Nov 21 6.6 In Mexico, about 60
miles S of El Centro
1941, Feb 9 6.6 Offshore, about 65
miles W of Eureka
1954, Dec 21 6.6 East of Arcata 1 dead; several injured; $2.1 million in
property damage
1968, Apr 8 6.6 Borrego Mountain
1971, Feb 9 6.6 San Fernando 65 dead; more than 2,000 injured; $505
million in losses
1987, Nov 24 6.6 Superstition Hills part of above damage
1992, Apr 26 6.6 Petrolia Aftershock of the Apr. 25 quake
1992, Apr 26 6.6 Petrolia Another aftershock of Apr. 25 quake
1852, Nov 29 6.5 Near Fort Yuma,
Arizona
Limited data available, magnitude is an
estimate.
1860, Mar 15 6.5 Carson City Limited data available, magnitude is an
estimate.
1865, Oct 8 6.5 Santa Cruz Mountains $0.5 million in property damage
1918, Jul 15 6.5 Offshore, about 40 W
of Eureka
1934, Jul 6 6.5 Offshore, about 100 mi
WNW of Eureka
1934, Dec 30 6.5 In Mexico, about 40
miles S of El Centro
1947, Apr 10 6.5 East of Yermo
1956, Feb 9 6.5 In Mexico, about 80
miles SW of El Centro
1979, Oct 15 6.5 Imperial Valley 9 injured; $30 million in property

City of Pasadena
2018 Multi-Hazard Mitigation Plan
57
damage
1992, June 28 6.5 Big Bear Included with Landers losses, above
2003, Dec 22 6.5 San Simeon
1836, Jun 10 6.4 Near San Juan Bautista Limited data available, magnitude is
estimate. Older reports reported quake
as possibly larger and centered near
Oakland
1898, Mar 31 6.4 Mare Island $350,000 in property damage
1991, Jul 12 6.6 Offshore west of
Crescent City
1899, Jul 22 6.4 Wrightwood Chimneys knocked down; landslides
reported
1911, Jul 1 6.4 Morgan Hill area
1933, Mar 11 6.4 Long Beach 115 dead; $40 million in property
damage
1942, Oct 21 6.4 About 25 miles W of
Westmoreland
1983, May 2 6.4 Coalinga
1986, Jul 21 6.4 Chalfant Valley
1800, Nov 22 6.3 San Diego/San Juan
Capistrano region
Limited data available, magnitude is an
estimate. Damaged adobe walls of
missions in San Diego and San Juan
Capistrano
1922, Mar 10 6.3 Parkfield
1995, Feb 19 6.3 Offshore, about 70
miles W of Cape
Mendocino
1980, May 25 6.2 Mammoth Lakes
1984, Apr 24 6.2 Morgan Hill $8 million in property damage
1908, Nov 4 6.0 SW of Death Valley
1948, Dec 4 6.0 East of Yermo
1980, May 25 6.0 Mammoth Lakes
1987, Oct 1 6.0 Whittier Narrows 8 dead; $358 million in property
damage to 10,500 homes and
businesses
Some of the more local earthquake events to impacts the Pasadena areas include the Pasadena
Earthquake (1988, magnitude 5.0) and the Sierra Madre Earthquake (1991, magnitude 5.8). The
Pasadena Earthquake did not create significant damage, but it was widely felt within the area. The
earthquake did provide a clear example of the left-lateral movement of the Raymond fault. The Sierra
Madre Earthquake occurred on the Clamshell-Sawpit Canyon fault, an offshoot of the Sierra Madre
fault zone. Because of its depth and moderate size, it caused no surface rupture, though it triggered
rockslides that blocked some mountain roads. Roughly $40 million in property damage occurred in the
San Gabriel Valley. Unreinforced masonry buildings were the hardest hit. Two deaths resulted from
this earthquake and, at least 100 others were injured.

City of Pasadena
2018 Multi-Hazard Mitigation Plan
58
5.4.1.1.4 Probability of Occurrence
The United States Geological Survey (USGS) and their partners, as part of the latest Uniform California
Earthquake Rupture Forecast Version 3 (UCERF3; 2015), have estimated the chances of having large
earthquakes throughout California over the next 30 years (Figure 5.6). Figure 5.7 provides a zoom in
of the Los Angeles area of the UCERF3 work.
Figure 5.6 Likelihood of Earthquakes of M6.7 or Larger in the Next 30 years- Statewide

City of Pasadena
2018 Multi-Hazard Mitigation Plan
59
Figure 5.7 Likelihood of M6.7 or greater earthquakes in the Next 30 years- Los Angeles Area
Statewide, the rate of earthquakes around Magnitude 6.7 (the size of the 1994 Northridge earthquake)
has been estimated to be 1 per 6.3 years (more than 99% likelihood in the next 30 years); in southern
California, the rate is 1 per 12 years (93% likelihood in the next 30 years). Southern California’s rates
are given in Table 5.6.
Table 5.6 Southern California Region Earthquake Likelihoods (UCERF3, 2015)
Magnitude (greater
than or equal to)
Average Repeat Time
(years)
30-year likelihood of one
or more events
5.0 0.24 100%
6.0 2.3 100%
6.7 12 93%
7.0 25 75%
7.5 87 36%
8.0 522 7%
5.4.1.1.5 Climate Change Considerations
To date, no credible evidence has been provided that links climate to earthquakes; however, climate
and weather does play a significant role in the response and recovery from earthquakes. Effects from
climate change could create cascading complications and impacts.

City of Pasadena
2018 Multi-Hazard Mitigation Plan
60
5.4.1.2 Wildfire
5.4.1.2.1 Description of Hazard
Wildfires can be classified as either a wildland fire or a wildland-urban interface (WUI) fire. Wildland
fires involve situations where a fire occurs in an area that is relatively undeveloped except for the
possible existence of basic infrastructure such as roads and power lines. A WUI fire includes situations
in which a wildland fire enters an area that is developed with structures and other human developments.
In WUI fires, the fire is fueled by both naturally occurring vegetation and the urban structural elements
themselves. According to the National Fire Plan issued by the U.S. Departments of Agriculture and
Interior, the wildland-urban interface is defined as “…the line, area, or zone where structures and other
human development meet or intermingle with undeveloped wildland or vegetative fuels.”
The WUI fire can be subdivided into three (3) categories (NWUIFPP, 1998): 1) classic wildland-urban
interface; 2) the mixed wildland-urban interface; and, 3) the occluded wildland-urban interface. The
classic wildland-urban interface exists where well-defined urban and suburban development presses
up against open expanses of wildland areas. The mixed wildland-urban interface is characterized by
isolated homes, subdivisions, and small communities situated predominantly in wildland settings. The
occluded wildland- urban interface exists where islands of wildland vegetation occur inside a largely
urbanized area. Generally, many of the areas at risk within the City of Pasadena fall into the classic
wildland-urban interface category.
Certain conditions must be present for a wildfire hazard to occur; a large source of fuel must be present,
the weather must be conducive (generally hot, dry, and windy), and fire suppression sources must not
be able to easily suppress and control the fire. The cause of a majority of wildfires is human-induced
or lightning; however, once burning, wildfire behavior is based on three (3) primary factors: 1) fuel;
2) topography; and, weather. Fuel will affect the potential size and behavior of a wildfire depending
on the amount present, its burning qualities (e.g. level of moisture), and its horizontal and vertical
continuity. Topography affects the movement of air, and thus the fire, over the ground surface. The
terrain can also change the speed at which the fire travels, and the ability of firefighters to reach and
extinguish the fire. Weather as manifested in temperature, humidity and wind (both short and long
term) affect the probability, severity, and duration of wildfires. Other factors that create concern are
drought conditions and development (the build environment). Drought conditions bring on contributing
concerns in that it can lead to relatively drier conditions and leave reservoirs and water tables lower;
thus, creating hotter fires and less water to fight the fires. The expansion of the built environment into
previously unoccupied areas introduces more people to the hazard and in some cases make response
actions more challenging.
5.4.1.2.2 Location and Extent of Hazard in Pasadena
The climate, topography, and vegetation in Pasadena is conducive to annual wildfire events. California
Department of Forestry and Fire Protection, Fire and Resource Assessment Program (CDF-FRAP) was
established and mandated to map areas of significant fire hazards based on fuels (vegetation), terrain,
weather, and other relevant factors. These zones, referred to as Fire Hazard Severity Zones, define the
application of various mitigation strategies to reduce risk associated with wildland fires. CDF-FRAP
developed data that displays the relative risk to areas of significant population density from wildfire.

City of Pasadena
2018 Multi-Hazard Mitigation Plan
61
This data is created by intersecting residential housing unit density with proximate fire threat, to give
a relative measure of potential loss of structures and threats to public safety from wildfire. The most
current mapping efforts by CDF-FRAP were conducted in 2007. The maps below show the “very high”
Fire Hazard Severity Zones (VHFHSZ) located in Los Angeles County for state and local responsibility
areas (Figure 5.8).
Extent is the strength or magnitude of the hazard. Wildfire measurement of extent is described in
Table 5-7. Fire Hazard Severity Zones for Pasadena can be found in Figure 5.9.
Table 5-7 Wildfire Measurement of Extent

City of Pasadena
2018 Multi-Hazard Mitigation Plan
62
Figure 5.8 Fire Hazard Severity Zones- Los Angeles County
The City of Pasadena is located along the foothills of the San Gabriel Mountains. These mountains are
known for steep topography and extensive vegetation. The extended droughts characteristic of
California’s Mediterranean climate often results in large areas of dry vegetation. Furthermore, the
native vegetation typically has a high oil content that makes it highly flammable.
The area is also intermittently impacted by Santa Ana winds, the hot, dry winds that blow across
southern California in the spring and late fall. Because of these characteristics, wildfire is a significant
threat to the city. As part of CDF’s efforts under the FRAP, it produced a series of local “very high” Fire
Hazard Severity Zone maps. Figure 5.9 below depicts the mapping within the city of Pasadena city
limits.

City of Pasadena
2018 Multi-Hazard Mitigation Plan
63
Figure 5.9 Fire Hazard Severity Zones- City of Pasadena
In addition to the VHFHSZ maps, Cal Fire has also developed a State Fire Threat map showing the
ratings of wildland fire threat based on the combination of potential fire behavior (fuel rank) and
expected fire frequency (how often an area burns) under severe conditions. These factors combine to
create four (4) threat classes ranging from moderate to extreme. Fire frequency is derived from 50
years of fire history data, and fire behavior is derived from fuels and terrain data.

City of Pasadena
2018 Multi-Hazard Mitigation Plan
64
5.4.1.2.3 History of Hazard in Pasadena
Large fires have been part of the Southern California landscape for millennia. Written documents
reveal that during the 19th century human settlement of Southern California altered the fire regime of
coastal California by increasing the fire frequency. During this period, large crown fires covering tens
of thousands of acres were not uncommon. One of the largest fires in Los Angeles County occurred in
1878 (60,000 acres), and the largest fire in Orange County’s history was over half a million acres
(1889).
According to the 2013 State of California Multi-Hazard Mitigation Plan, there have been 44 state-
and/or federally declared wildfire disasters in Los Angeles County between 1950 and December 2012.
Of the 20 most disastrous wildfires in the state (based on the number of structures destroyed), three
have occurred in Los Angeles County, including the Bel Air Fire in November 1961, Topanga Fire in
November 1993, and Sayre Fire in November 2008.
In recent Los Angeles County history, the worst fire was the Station Fire, which burned from August
to October of 2009. This was an arson fire that burned 160,500 acres, destroyed over 200 structures,
and killed two firefighters. The fire started in the La Canada Flintridge area, burned northwest, and
then turned east. It was the 10th largest fire in California history.
Over the last five (5) years, Pasadena has not experienced a major wildfire. In 2016 and 2018, there
were three vegetation fires along the freeways and urban interface that escalated into a brush fire
response. The size and scope of the fires involved less than one half acre of brush, and the fires were
extinguished with no loss of structures, and no injuries to civilian or firefighter personnel. A complete
list of the significant previous and recent wildfires in the Pasadena area is provided in Table 5.8 and a
map depicting the location of past wildfire events in California is provided in Figure 5.10.
Table 5.8 Significant Wildfires in the Pasadena Area
Date Name Acres Structures Lost/ Deaths
1878 Unnamed 60,000
1961 Bel Air Fire 6,090 484/0
1970 Clampitt Fire 100,000 80/4
1993 Topanga Fire 18,000 323/0
1993 Kinneloa Fire 5,500 121/0
2008 Sayre Fire 11,262 604/0
2009 Station Fire 160,500 200/2

City of Pasadena
2018 Multi-Hazard Mitigation Plan
65
Figure 5.10 Recent, Significant Wildfire Perimeters in California
5.4.1.2.4 Probability of Occurrence
The majority of work done to estimate the probability of wildfire occurrence has been around
identifying the potential areas for wildfire to occur. As previously mentioned, vegetation and
topography were the significant elements in wildfire threat. The area north and west of the city of
Pasadena is marked by steep terrain. These mountains and canyons are covered in susceptible
vegetation. A large amount of the native vegetation in the Pasadena area is commonly called chaparral,
it is a dense and scrubby bush that has evolved to persist in a fire-prone habitat. Chaparral plants will
eventually age and die; however, they will not be replaced by new growth until a fire rejuvenates the
area. Chamise, manzanita and ceanothus are all examples of chaparral which are quite common in the
Pasadena area.
This knowledge and understanding are a key driver in the methodology of the CDF-FRAP program.
According the CDF, the FRAP “very high” Fire Hazard Severity Zone maps are based on data and
models of, potential fuels over a 30- to 50-year time horizon and their associated expected fire behavior

City of Pasadena
2018 Multi-Hazard Mitigation Plan
66
and expected burn probabilities to quantify the likelihood and nature of vegetation fore exposure to
buildings. This indicates a very high likelihood of wildfire occurrence in the area. As such, Pasadena
is susceptible to annual wildfire risk.
5.4.1.2.5 Climate Change Considerations
Climate change plays a significant role in wildfire hazards. The changing conditions from wet to dry
can create more fuel; the increased possibility of high winds increase risk and present a challenge, and
drought conditions could hinder ability to contain fires. Large wildfires also have several indirect
effects beyond those of a smaller, local fire. These may include air quality and health issues, road
closures, business closures, and other forms of losses. Furthermore, large wildfires increase the threat
of other disasters such as landslide and flooding.
Climate change presents Pasadena with both complex challenges and tremendous opportunities. In the
fall of 2015, the City of Pasadena embarked on a process to develop a Climate Action Plan (CAP) to
reduce community-wide GHG emissions and combat climate change. The Pasadena CAP is the latest
initiative in the City’s on-going commitment to confronting the issue of climate change.
The California Climate Action Plan does not currently reflect climate action planning efforts by the
City of Pasadena. More information about the City’s CAP can be found at
https://ww5.cityofpasadena.net/planning/planning-division/community-planning/pasadena-climate-
action-plan/
Figure 5-I - California Climate Change Program - Pasadena

City of Pasadena
2018 Multi-Hazard Mitigation Plan
67
5.4.1.3 Drought and Water Shortage
5.4.1.3.1 Description of Hazard
Drought can best be thought of as a condition of water shortage for a particular user in a particular
location. Drought is a condition when a region receives below-average precipitation, which results in
prolonged shortages in its water supply, whether the region’s water supply is provided by atmospheric,
surface, or ground water means. Adding to this hazard is the lack (or limits) of infrastructure in support
of the water resource network (storage, transmission, distribution).
There is no universal definition of when a drought begins. A drought can last for months or years; or
may be declared after as few as 15 days. Drought and water shortages are a gradual phenomenon and
generally are not signified by one or two dry years. In California, this is largely due its extensive system
of water supply infrastructure (reservoirs, groundwater basins, and interregional conveyance facilities)
that generally mitigates the effects of short‐term dry periods for most water users. The map below
depicts the water supply infrastructure (Figure 5.11), as tracked by the California Department of Water
Resources in the state of California. According to the U.S. Drought Monitor Map for California (Figure
5-10a), the City of Pasadena is in Area 2; a severe drought area. This information is dated December
25, 2018.
Figure 5-10a U.S. Drought Map for California

City of Pasadena
2018 Multi-Hazard Mitigation Plan
68
Figure 5.11 Water Supply Infrastructure in California
The U.S. Drought Monitor, established in 1999, is a weekly map of drought conditions produced jointly
by the National Oceanic and Atmospheric Administration, the U.S. Department of Agriculture, and the
National Drought Mitigation Center at the University of Nebraska-Lincoln. The map is based on
measurements of climatic, hydrologic and soil conditions as well as reported impacts and observations
from more than 350 contributors around the country. Droughts are generally categorized into five (5)
categories: 1) Abnormally Dry, 2) Moderate Drought; 3) Severe Drought; 4) Extreme Drought; and,
5) Exceptional Drought. There are many considerations that are factored into the determining the
drought status; these include consideration of status on the Palmer Drought Severity Index; CPC Soil
Moisture Model; USGS Weekly Streamflow; Standardized Precipitation Index; and Objective Drought
Indicator Blends.

City of Pasadena
2018 Multi-Hazard Mitigation Plan
69
5.4.1.3.2 Location and Extent of Hazard in Pasadena
The entire city is subject to drought conditions and water shortages. This is largely due to the limited
number of local water resources and reliance on heavily fought over outside water resources. Pasadena
receives the majority of its water supply by importing water from the Colorado River and Northern
California (State Water Project); but also relies on water from a local aquifer, the Raymond Basin. The
Raymond Basin, a 40 square mile natural aquifer underlying Pasadena and neighboring cities, provides
over 40% of Pasadena’s drinking water supply. The basin water originates as surface water from the
San Gabriel Mountains. As the water percolates deep into the ground over many months it is purified
through natural filtration processes. The city has 16 wells that tap into the basin at depths of 300-400
feet, drawing out 13 million gallons of groundwater or more per day, on average. This water is treated
and then either diverted it to a reservoir for short-term storage or pumped directly into underground
water mains for distribution to customers. However, the Raymond Basin cannot provide enough water
to meet demand, even in wet years, as the population and development has long outpaced local supply.
Efforts are underway to extend local water resources through recycling and expanding the ability to
recharge the groundwater basins.
5.4.1.3.3 History of Hazard in Pasadena
The state of California and Pasadena have been in drought conditions since December 2011; with the
Governor declaring a drought State of Emergency in 2015. However, in April 2017, the state, with a
few exceptions declared the Drought State of Emergency over. Ending the State of Emergency
declaration does not mean the drought is over; just that the drought category dropped to a category not
deemed critical.
California has experienced statewide droughts in 1841, 1864, 1924, 1928-1935, 1947-1950, 1959-
1960, 1976-1977, 1987-1992, 2006-2010, and 2012-2017. Of these, the 2006-2010 drought was the
only other drought to receive a statewide declaration under California’s Emergency Services Act. The
last significant regional drought occurred in parts of Southern California in 1999-2002.
5.4.1.3.4 Probability of Occurrence
In any given year, the City of Pasadena can be subject to drought conditions and water shortages. This
is especially true since much of the water is provided by outside resources, resources that a shared with
others. It is also important to note the droughts do not happened over night, they are a slow buildup of
conditions. On average, seventy-five percent (75%) of the state’s annual precipitation occurs in the
“wet season”- November thru March. December, January, and February generally see the most
precipitation but there have been many early and late season storms that bring in a substantial amount
of precipitation. One of the best ways to predict drought conditions is to study the status of the El Niño
Southern Oscillation (ENSO) patterns. In California. ENSO is a periodic shifting of ocean atmosphere
conditions in the tropical Pacific that ranges from El Niño (warm phase) to neutral to La Niña (cold
phase). La Niña conditions tend to favor a drier outlook for Southern California; while the El Niño
conditions favor stronger, and wetter storms.
5.4.1.3.5 Climate Change Considerations
Climate change has the potential to make drought events more common in the West, including
California. Extreme heat creates conditions more conducive for evaporation of moisture from the

City of Pasadena
2018 Multi-Hazard Mitigation Plan
70
ground, thereby increasing the possibility of drought. A warming planet could lead to earlier melting
of winter snow packs, leaving lower stream flows and drier conditions in the late spring and summer.
Snow packs are important in terms of providing water storage and ensuring adequate supply in the
summer, when water is most needed. Changing precipitation distribution and intensity have the
potential to cause more of the precipitation that does fall to run-off rather than be stored. The result of
these processes is an increased potential for more frequent and more severe periods of drought.
5.4.1.4 Windstorm
5.4.1.4.1 Description of Hazard
Winds are often referred to according to their strength, and the direction from which they are blowing.
Wind is caused by the difference in pressure from one point on the earth's surface to another. Wind is
created by air moving from the area of “higher” pressure to the area of “lower” pressure; the difference
in pressure over a certain distance, determines the strength of the wind. Air does not move directly
from the point of highest pressure to the point of lowest pressure. The earth's rotation affects the air
flow by deflecting it to the right. This effect is called the Coriolis Effect. In the Northern Hemisphere,
this causes air to flow clockwise around high-pressure areas and counter-clockwise around low-
pressure areas. Winds are categorized by types and each type is associated with wind speeds: breeze
(<0-31 mph), gale (32-65 mph), storm (66-72 mph), and hurricane (73-139> mph). Within each
category are sub classifications with differential names depending on geographic location (i.e., tropical
depression, tropical storm/cyclone) and/or categories (i.e., category 3 hurricane). Damage from winds
account for half of all severe reports in the lower 48 states and is more common than damage from
tornadoes.
For the purposes of the LHMP, windstorms are defined as events with significant winds, with little-
to-no precipitation. These storms have wind speeds capable of reaching up to 100 mph, capable of
producing a path of damage extending for hundreds of miles. Terms and characteristics of damaging
windstorm events include:
Straight-line winds- Straight-line winds are common with the gust front of a thunderstorm
or originate with a downburst from a thunderstorm. The winds can gust to 130 mph and
winds of 58 mph or more and can last for more than twenty minutes. Straight-line wind
events are most common during the spring when instability is highest and weather fronts
routinely cross the country.
Derecho- Derechos, Spanish for “straight”, are a widespread, long-lived, straight-line
windstorm event that is associated with a land-based, fast-moving group of severe
thunderstorms. Derechos can cause hurricane-force winds, tornadoes, heavy rains, and
flash floods. A warm-weather phenomenon, derechos occur mostly in summer, especially
during June, July, and August.
Updrafts/Downdraft- Localized regions of warm or cool air will exhibit vertical movement
(updrafts/downdrafts). Updrafts are small‐scale current of rising air, often within a cloud.
A mass of warm air will typically be less dense than the surrounding region, and so will
rise until it reaches air that is either warmer or less dense than itself. The converse will
occur for a mass of cool air and is known as subsidence. This movement of large volumes

City of Pasadena
2018 Multi-Hazard Mitigation Plan
71
of air, especially when regions of hot, wet air rise, can create large clouds, and is the central
source of thunderstorms. Drafts can also be conceived by low or high-pressure regions. A
low-pressure region will attract air from the surrounding area, which will move towards
the center and then rise, creating an updraft. A high-pressure region will then attract air
from the surrounding area, which will move towards the center and sink, spawning a
downdraft.
Downburst-Strong, downdraft winds flowing out of a thunderstorm cell. A downburst is
a straight- direction surface wind in excess of 39 miles per hour caused by a small-scale,
strong downdraft from the base of convective thundershowers and thunderstorms.
Downbursts of all sizes descend from the upper regions of severe thunderstorms when the
air accelerates downward through either exceptionally strong evaporative cooling or by
very heavy rain, which drags dry air down with it. When the rapidly descending air strikes
the ground, it spreads outward in all directions, like a fast-running faucet stream hitting
the bottom of the sink.
There are two (2) sub-categories of downbursts: the larger macrobursts and small microbursts.
Macroburst- Macrobursts are downbursts with winds up to 117 miles per hour which
spread across a path greater than 2.5 miles wide at the surface and which last from 5
to 30 minutes.
Microburst- Microbursts are strong, damaging winds which strike the ground and
often give the impression a tornado has struck. They frequently occur during intense
thunderstorms. The origin of a microburst is downward moving air from a
thunderstorm’s core. But unlike a tornado, they affect only a rather small area, less
than 2.5 miles in diameter from the initial point of downdraft impact. An intense
microburst can result in damaging winds near 170 miles per hour and often lasts for
less than five minutes. There are two (2) types of microburst windstorms: dry and wet.

City of Pasadena
2018 Multi-Hazard Mitigation Plan
72
Gust Front- A gust front is the leading edge of rain-cooled air that clashes with warmer
thunderstorm inflow. Gust fronts are characterized by a wind shift, temperature drop, and
gusty winds out ahead of a thunderstorm. Sometimes the winds push up air above them,
forming a shelf cloud or detached roll cloud.
Tornado- A tornado is a rapidly rotating column of air that is in contact with both the
surface of the Earth and a cumulonimbus cloud or, in rare cases, the base of a cumulus
cloud. Tornadoes come in many shapes and sizes, and are often visible in the form of a
condensation funnel originating from the base of a cumulonimbus cloud, with a cloud of
rotating debris and dust beneath it. Most tornadoes have wind speeds less than 110 miles
per hour, are about 250 feet across, and travel a few miles before dissipating. The Fujita
scale rates tornadoes by damage. An F0 tornado, the weakest category, damages trees, but
not substantial structures. An F5 tornado, the strongest category, rips buildings off their
foundations and can deform large skyscrapers.
Haboob- Haboobs, Arabic for blasting/drifting, is a type of intense dust storm carried on
an atmospheric gravity current (i.e., thunderstorm), also known as a weather front. When
a thunderstorm collapses, and begins to release precipitation, wind directions reverse,
gusting outward from the storm and generally gusting the strongest in the direction of the
storm's travel. Haboobs occur regularly in arid regions throughout the world.
In Southern California, Santa Ana winds are considered a windstorm event. Santa Ana winds are
katabatic winds- Greek for “flowing downhill”. These winds occur below the passes and canyons of
the coastal ranges of Southern California and in the Los Angeles basin. Santa Ana winds often blow
with exceptional speed in the Santa Ana Canyon (the canyon from which it derives its name). Santa
Ana winds are strong, extremely dry (low humidity) down-slope winds that originate from cool, dry
high-pressure air masses in the Great Basin region (the high plateau east of the Sierra Mountains and
west of the Rocky Mountains, including most of Nevada and Utah) and affect Southern California.
These winds come up, over, and are pulled southward down the eastern side of the Sierra Nevadas and
into the Southern California region. The air warms as it descends toward the California coast at the rate
of 5 degrees Fahrenheit per 1000 feet due to compressional heating. Thus, compressional heating
provides the primary source of warming. The air is dry since it originated in the desert, and it dries out
even more as it is heated.

City of Pasadena
2018 Multi-Hazard Mitigation Plan
73
Forecasters at the National Weather Service offices in Oxnard and San Diego usually place speed
minimums on these winds and reserve the use of “Santa Ana” for winds greater than 25 knots. These
winds accelerate to speeds of 35 knots as they move through canyons and passes, with gusts to 50 or
even 60 knots. Santa Ana winds can happen anytime during the year but are most prevalent in the
autumn and winter months.
5.4.1.4.2 Location and Extent of Hazard in Pasadena
The entire City of Pasadena is susceptible to various types of windstorms.
5.4.1.4.3 History of Hazard in Pasadena
Los Angeles County has a history with windstorm events. These types of events include tornadoes,
funnel clouds, waterspouts, and strong winds. Below is a list of the significant wind events as reported
by Los Angeles County Department of Public Works:
November 25, 1918: A strong windstorm produced a wind gust of 96 miles per hour in
Mt. Wilson area.
September 24-25, 1939: A tropical storm lost hurricane status shortly before moving on
shore at San Pedro generating sustained winds at 50 miles per hour. 48 people died due to
sinking boats.
March 16, 1952: Tornado in Santa Monica. Three people died in storm.
November 19-29, 1956: A strong and prolonged Santa Ana wind event started on
November 19 and ended on November 29. On November 20, 100 mile per hour wind
gust was recorded at a forest lookout in Saugus. A fire north of Descanso started on
November 19 and burned 44,000 acres. Two wooden bridges and a power plant were
destroyed.
November 5-6, 1961: Strong Santa Ana winds fanned fires in Bel Air and Brentwood.
There was also a fire in Topanga Canyon where 103 firefighters were injured. The fire
brought $100 million economic losses including 484 buildings, mostly residential, and
6,090 acres destroyed.
November 7, 1966: Tornado hits the City of Hawthorne.
February 4-10, 1976: Strong storm winds hit 64 miles per hour in Palmdale.
February 10, 1978: Tornado hits El Segundo as trees were hurled onto parked cars.
Power poles knocked down.
October 9, 1982: Santa Ana wind gust at 64 miles per hour as a major wildfire roared
across the Santa Monica Mountains. November 23, 1986: Strong Santa Ana winds hits
Los Angeles area and mountain foothills. Wind gust up to 54 miles per hour were
recorded, but the estimated gusts reached as high as 70 miles per hour in some areas. An
unfinished house in Glendale was blown to bits. Numerous beach rescues were needed for
sailors and windsurfers. Two sailboat masts were snapped in a boat race off Channel
Islands.
November 9, 1982: Seven tornadoes touched down in the Los Angeles basin. Three
began as waterspouts at Pt. Mugu, Malibu and Long Beach. The Long Beach
waterspout moved 10 miles inland and became an F2 Tornado. Another tornado
reached F2 strength in Van Nuys. Property damage was sustained especially in Long
Beach.
March 1, 1983: Two tornadoes categorized as F2 and F0 touched down in the Los

City of Pasadena
2018 Multi-Hazard Mitigation Plan
74
Angeles basin. In all 30 people were injured and 100 homes were damaged. At 8 p.m., an
F2 tornado damaged seven businesses and 50 homes in South Central Los Angeles. The
tornado caused 30 injuries and stopped just about one mile before reaching the Los
Angeles civic center area. F0 tornado injured a motorist when his Cadillac vehicle was
lifted 15 feet off the ground and carried across a highway in San Marino.
August 20, 1987: The remnants of Tropical Storm Ignacio tracked northward moved
inland in central California with gale force winds over portions of the Southern California
coastal waters. This occurred during the strong El Nino of 1997-1998.
December 12-13, 1987: Strong Santa Ana winds with gusts registering at 60-80 miles
per hour caused a parked helicopter to be blown down a hillside in Altadena. Power
poles and freeway signs were downed and damaged.
December 15, 1987: Strong storm wind gust measuring up to 60 miles per hour were
clocked in the San Gabriel Mountains.
February 16-19, 1988: Strong Santa Ana winds with gusts up to 70 miles per hour in the
San Gabriel Mountains and foothill areas on February 17. Numerous trees and power
lines were downed as there were power outages in the foothill communities of the San
Gabriel Mountain areas. The power outages impacted 200,000 customers in Los Angeles
and Orange counties. Roof damage was widespread in communities around Glendale and
Pasadena. Airplanes were flipped at Burbank Airport.
While Pasadena has experience various windstorm events, the most prevalent wind events are the Santa
Ana winds. The City of Pasadena has had several strong Santa Ana wind events which resulted in local
damages and power outages. Two of the most notable were the windstorms in 2006, 2010, and 2011.
January 2006, a windstorm struck the City with winds up to 70 mph. Over 30 trees were toppled, and
power was disrupted to many residents. April 2010, a windstorm struck the Pasadena area. Trees and
power lines were knocked down. December 2011, the San Gabriel Valley was struck by a freak
windstorm which caused over $40 million in damage. The City of Pasadena had nearly $25 million in
damage. Portions of the City were without power for days, and debris clean up lasted for over a month.
Over 6,300 customers lost electricity and 1450 customers lost water. Over 1,000 trees were damaged
or fallen, impacting over 325 miles of roads and causing the evacuation of 37 residents. City Public
Works staff received over 1,300 reports of damage and the Fire Department logged over 94 calls.
5.4.1.4.4 Probability of Occurrence
The City of Pasadena is at risk of windstorms at any given time during the calendar year. However, as
previously mentioned they are more prevalent in the autumn and winter months.
5.4.1.4.5 Climate Change Considerations
Climate change, although still being studied, could have an effect on high- and low-pressure zones.
High- and low-pressure zones are created by many factors, but many are related to uneven heating of
the earth’s surface by the sun. Many of the factors that go into the heating of the earth’s surface, but
many may be impacted by Climate change (i.e., type of vegetation in areas impact ability to absorb
heat, amount of snow cover which reflects heat). In addition to altering and possibly increasing
frequency of winds, it can also increase the likelihood of thunderstorms in the area. This indicates that
the City of Pasadena could experience a greater number of windstorm events in the future.

City of Pasadena
2018 Multi-Hazard Mitigation Plan
75
5.4.1.5 Energy Shortage/Outage
5.4.1.5.1 Description of Hazard
Energy shortages/outages are considered a form of lifeline system failure. These disruptions (shortages
and outages) can be the consequence of another hazard (earthquakes, floods, and landslides), or can be
a primary hazard, absent of an outside trigger. A failure could involve one, or a combination of other
lifelines systems (potable water, power, natural gas, wastewater, communication, or transportation).
Additionally, energy shortages/outages can create cascading impacts on the other lifeline and
operational systems. Most power shortages/outages are the result of situations involving unintended
events, such as an overwhelming need for power due to weather conditions, equipment failure, or
accidents. These shortages/outages can last anywhere from a few minutes to several weeks. There are
three (3) different power shortage/outage phenomena, all categorized to the duration and effect of the
shortage/outage: 1) permanent; 2) brownout; and, 3) blackout. Below is summary of the power outage
categories:
Permanent is a massive loss of power typically caused by a fault on a power line. Power is
automatically restored once the fault is cleared.
Brownout is a drop (or sag) in voltage in an electrical power supply. Brownouts can cause
poor performance of equipment or operational systems.
Blackout a total loss of power in an area and is the most severe form of power outage that
can occur. Blackouts may last from a few minutes to a few weeks depending on the nature
and the configuration of the electrical network.
The significant electrical energy infrastructure, as tracked by the US Department of Energy for the
state California is depicted in Figure 5.12.

City of Pasadena
2018 Multi-Hazard Mitigation Plan
76
Figure 5.12 Significant Electrical Infrastructure in California
5.4.1.5.2 Location and Extent of Hazard in Pasadena
The entire city is subject to energy shortages. The City of Pasadena Water and Power (PWP) manages
the energy resources within the city. While city purchases most of its needed power through outside
sources, it owns and operates a generating facility that meets about 10% of the city’s energy needs.
This leaves the city vulnerability to outside influences and competing demands.
Today, there are several mechanisms in place to monitor, manage and adapt to changing conditions
and demands to help reduce and/or eliminate energy shortages. California and regional departments
(California Independent System Operator- Cal ISO, Federal Energy Regulatory Commission- FERC,
Western Electricity Coordinating Council- WECC, North American Electric Reliability Corporation-
NERC, California Public Utilities Commission- CPUC, California Energy Commission- CEC) are in

City of Pasadena
2018 Multi-Hazard Mitigation Plan
77
place and play a significant role in planning, coordinating, and managing the allocation of energy
within the state.
5.4.1.5.3 History of Hazard in Pasadena
Energy disruptions on a small scale have occurred on a regular basis in the city. Energy shortages are
usually on a larger scale and more regional in nature. Because the City of Pasadena relies heavily on
outside resources, impacts the region ripple to the city as well. Significant state and regional energy
shortages include:
December 1982 (near Tracy California) - Loss of a transmission tower, two (2) 500-
kV lines, and a pair of 230-kV lines. Five (5) million people impacted
October 1989 (Loma Prieta Earthquake)- Loss of substations; 1.4 million people impacted
August 1996 (region)- Cascading impacts from loss of power from 1996 North American
Blackouts
December 1998 (San Francisco)- Loss of substations; impacting 350,000 buildings and
940,000 people
2000 (statewide)- Power outages due to electricity crisis
2011 (Southwest Blackout)- Cascading impacts from the loss of power from the 23 distinct
events that occurred on 5 separate power grids; impacted 1.4 million people
July 2017 (Los Angeles)- Explosion at power plant; causes widespread outages in San
Fernando Valley
5.4.1.5.4 Probability of Occurrence
In any given year, Pasadena can be subject to energy shortages. However, as previously mentioned,
programs, processes, and procedures have been put into place to help reduce and/or eliminate
probability.
5.4.1.5.5 Climate Change Considerations
With increased changes in weather and climate, the demands on energy will shift too. This shift in
demand could have significant impacts on energy supply and demand.
5.4.1.6 Agricultural Pests and Disease
5.4.1.6.1 Description of Hazard
Agricultural pests and disease infestation occur when an undesirable organism inhabits an area in a
manner that causes serious harm to agriculture crops/plants, livestock or poultry, and wildland
vegetation or animals. Countless insects and diseases live on, in, and around plants and animals in all
environments. Most are harmless, while some can cause significant damage and loss. Under some
conditions, insects and diseases that have been relatively harmless can become hazardous. For
example, severe drought conditions can weaken trees and make them more susceptible to destruction
from insect attacks than they would be under normal conditions.
5.4.1.6.2 History of Hazard in Pasadena
The City of Pasadena has very little agriculture crops or commercial livestock or poultry. However,
the city has a demonstrated vulnerability to insect infestation. Infestations of Mediterranean Fruit Fly,

City of Pasadena
2018 Multi-Hazard Mitigation Plan
78
Oriental Fruit Fly, Gypsy Moth, Glassy-winged Sharpshooter, Asian Citrus Psyllid, and Light-Brown
Apple Moth have all occurred in the last 30 years; however, there are not detailed records to list each
event. Diseases such as Chrysanthemum White Rust and Pierce’s Disease of Grapes have caused
significant losses to local plants and impacts on wildland vegetation or animals.
5.4.1.6.3 Location and Extent of Hazard in Pasadena
Impacts to local plants happen throughout the entire city. Impacts on wildland vegetation or animals
generally happened in interface areas along edges of the community (i.e., San Gabriel Mountain
foothills, Arroyo Seco, Eaton Canyon).
5.4.1.6.4 Probability of Occurrence
Due to its interaction with the global economy, its mild Mediterranean climate, and its diversified
agricultural and native landscape, the City of Pasadena can experience impacts from agricultural pests
and diseases annually.
5.4.1.6.5 Climate Change Consideration
Continued climate change is likely to alter the abundance and types of many pests, lengthen pests’
breeding season, and increase pathogen growth rates. For example, the pink bollworm, a common pest
of cotton crops, is currently a problem only in southern desert valleys because it cannot survive winter
frosts elsewhere in the state. However, if winter temperatures rise 3 to 4.5°F, the pink bollworm’s range
would likely expand northward, which could lead to substantial economic and ecological consequences
for the state.
Temperature is not the only climatic influence on pests. For example, some insects are unable to cope
in extreme drought, while others cannot survive in extremely wet conditions. Furthermore, while
warming speeds up the lifecycles of many insects, suggesting that pest problems could increase, some
insects may grow more slowly as elevated carbon dioxide levels decrease the protein content of the
leaves on which they feed (California Climate Change Center 2006).
5.4.1.7 Infectious Disease
5.4.1.7.1 Description of Hazard
Infectious disease is caused by biological agents, including organisms such as bacteria, viruses or
toxins, with the potential for significant illness or death in the population. Outbreaks, Epidemics, and
Pandemics are terms used to describe the spread of an infectious disease. Outbreaks, epidemics, or
pandemics can occur when a new virus emerges to which the population has little immunity. The 20th
century saw three such pandemics, the most notable of which was the 1918 Spanish influenza pandemic
that was responsible for 20 million deaths throughout the world. Secondary impacts include significant
economic disruption to a community’s infrastructure due to loss of employee work time, essential
services and products, and costs of treating or preventing spread of the disease.
An outbreak of an infectious disease is when there are more cases than would be normally expected,
often suddenly, in a community or facility. An epidemic is when there are more cases than would be
normally expected of an infectious disease, often suddenly, in a population of a large geographic area.

City of Pasadena
2018 Multi-Hazard Mitigation Plan
79
A pandemic refers to an epidemic that has spread over several countries or continents, usually affecting
a large number of people. Infectious disease emergencies may be caused or spread by:
Naturally occurring spread person to person (e.g., measles, mumps,
meningococcal disease, tuberculosis)
Food-borne (e.g., salmonella, E. coli, botulinum toxin)
Vector-borne such as a mosquito that spread disease (e.g., West Nile virus, Dengue, Zika,
Malaria)
Intentionally caused spread of disease or toxins (e.g., bioterrorism)
Public health measures are used to control outbreaks, epidemics, or pandemics of infectious diseases,
and are especially important for diseases with high morbidity or mortality and limited medical
prophylaxis and/or rapid treatment. The impact of infectious disease emergencies on the local
community will depend on:
The type of biological agent and availability of treatment for victims
The availability of prophylaxis for responders and the public
The scale of exposure and ongoing exposure
The mode of transmission and whether transmission can be interrupted
Whether the event is affecting staffing for critical infrastructure within and outside of the
county such as transportation, law enforcement, health care, and the medical and food
supply chains
Measures to control disease include legal measure such as isolation and quarantine of persons, products
and/or closure of food establishments; and control of contaminated food or water through recall of
product or, for water, “Do Not Use”, “Do Not Drink” or “Boil Water” orders.
5.4.1.7.2 Location and Extent of Hazard in Pasadena
An infectious disease hazard can occur throughout the entire city any time during year.
5.4.1.7.3 History of Hazard in Pasadena
The Communicable Disease Control and Prevention Program at the Pasadena Public Health
Department monitors disease reporting mandated by law. For more information, view the 2017 Annual
Report of Communicable Diseases in Pasadena.
5.4.1.7.4 Probability of Occurrence
There is an annual risk of experiencing an infectious disease outbreak in Pasadena. There is a continued
threat from a novel influenza virus or other emerging epidemic or pandemic disease; however, the
potential threat of outbreaks and epidemics have been increased due expanding global trade and
accessible national and international travel. Infectious disease outbreaks and epidemics occur on an
ongoing basis.
5.4.1.7.5 Climate Change Consideration
While many vector-borne diseases, such as malaria, yellow fever, dengue, and murine typhus, are
rarely seen in the United States, the United States are susceptible to these vector-borne diseases. Many
vector-borne diseases are climate sensitive and ecological shifts associated with climate change are
expected to impact the distribution and incidences of these diseases. Changes in temperature and

City of Pasadena
2018 Multi-Hazard Mitigation Plan
80
precipitation directly affect vector born disease transmission through pathogen-host interaction, and
indirectly through ecosystem changes and species composition. As temperatures increases vectors can
spread into new areas that were previously too cold. For example, two mosquito vectors that carry
malaria are now found at the U.S.-Mexico border.
5.4.1.8 Terrorism
5.4.1.8.1 Description of Hazard
There is no single, universally accepted definition of terrorism, and it can be interpreted in many ways.
The term terrorism usually refers to intentional, criminal malicious acts. Terrorism is defined in the
Code of Federal Regulations (CFR) as “...the unlawful use of force and violence against persons or
property to intimidate or coerce a government, the civilian population, or any segment thereof, in
furtherance of political or social objectives.” (28 CFR, Section 0.85). For the purposes of this plan,
terrorism refers to the use of weapons of mass destruction, including biological, chemical, nuclear, and
radiological weapons; arson, incendiary, explosive, and armed attacks; and, industrial sabotage and
intentional hazardous materials releases. Many of these incidents can be well-planned, coordinated
attacks with multiple suspects, or the result of a lone individual on a rampage.
5.4.1.8.2 Location and Extent of Hazard in Pasadena
Terrorism can occur throughout the entire city but due to terrorisms’ intended purpose it would most
likely happened in more populous areas where more devastation, fear, and chaos will ensue.
5.4.1.8.3 History of Hazard in Pasadena
The city has little to any experienced of terrorist events.
5.4.1.8.4 Probability of Occurrence
A terrorist event could occur throughout the city on any given day. With its annual events (i.e., Rose
Bowl Parade, Rose Bowl Game), large concert venues (i.e., Arroyo Seco, Rose Bowl), acclaimed local
businesses (i.e., Norton Simon Museum, Huntington Library), and overall international name
recognition, Pasadena could be a prime target for terrorism. While some of these facilities are perceived
as a soft target, many have taken preventative measures to become more resilient again terrorism.
5.4.1.8.5 Climate Change Consideration
While there is little evidence to link climate change increasing occurrences of terrorism, depending on
the type of attack, it could intensify the incident (i.e., Improvised Explosive Device- IED during high
wind event), and hinder the response and recovery efforts (i.e., evacuation during flooding).
5.4.1.9 Cyber-Attack
5.4.1.9.1 Description of Hazard
A cyber security threat is a circumstance or event that has or indicates the potential to exploit
vulnerabilities and to adversely impact organizational operations, organizational assets (including
information and information systems), individuals, other organizations, or society. Critical
infrastructure, such as utilities and telecommunications, are also potential targets. Cyber security
threats are most easily described as either external threats (where attacks originate outside of

City of Pasadena
2018 Multi-Hazard Mitigation Plan
81
established networks) or internal/insider threats (where attacks originate from users who have existing
access to an internal network). Examples of cyber threats include: malware and hacking, phishing,
denial of service attacks, ransomware, and state-sponsored hacking. Any one of these threats, if
initiated, and successful, can produce a cyber-attack that has major implications throughout the
organization.
5.4.1.9.2 Location and Extent of Hazard in Pasadena
A cyber security incident can happen anywhere within the City but will generally be targeted towards
larger corporations or government organizations. In fact, according to the California Department of
Justice, California Data Breach Report from February 2016, the retail sector is most affected by cyber
threats, accounting for 25% of those for the four-year reporting period, while the government sector
accounted for 5%.
5.4.1.9.3 History of Hazard in Pasadena
While the City of Pasadena has not experienced a severe incident related to a cyber-attack, the
frequency of cyber-attacks on public and private sector organizations in general, continues to rise.
5.4.1.9.4 Probability of Occurrence
The probability of occurrence of cyber-attacks is daily and is rapidly increasing, especially with
increased reliance on the internet and cloud-based computing. Local governments are increasingly
being targeted by cyber criminals on the basis that they have fewer resources to defend themselves.
Unlike natural hazards, where there is historical data, and some predictive modeling can occur, cyber-
attacks are an emerging hazard, which are more challenging to anticipate.
5.4.1.9.5 Climate Change Consideration
While there is little evidence to link climate change to an increase in occurrences of cyber-attacks, the
target could be related to persons/groups with issues with individuals or companies they perceive to
have effect on the climate (i.e., greenhouse gas producers). And much like terrorism, depending on the
consequence of the cyber-attack, it could hinder the response and recovery efforts.
5.4.1.10 Civil Disturbance
5.4.1.10.1 Description of Hazards
Civil Disturbance is a term generally used to describe disorderly conduct or a breakdown of orderly
society by a large group of people. Civil Disturbance can range from a form protest against major
socio-political problems to riots.
5.4.1.10.2 Location and Extent of Hazard in Pasadena
Civil Disturbance can occur in any part of the city; however, it will generally be located within larger,
more urbanized areas.
5.4.1.10.3 History of Hazard in Pasadena
No significant historical events to report to date.
5.4.1.10.4 Probability of Occurrence

City of Pasadena
2018 Multi-Hazard Mitigation Plan
82
There are no studies that predict the probability of civil disturbance occurrences, but the City is
susceptible to experiencing civil disturbance annually.
5.4.1.10.5 Climate Change Consideration
While there is no direct linkage between climate change and occurrences of civil disturbances, there
could be indirect linkages. As climate change impacts are either felt or perceived to be felt it could
ignite passions within people to demonstrate against possible causes or enablers.
5.4.2 Lower Priority Hazards
5.4.2.1 Flood
5.4.2.1.1 Description of Hazard
A flood is a temporary condition (short-duration or long-duration) of partial or complete inundation on
land that is normally dry. This condition is generally caused by precipitation (i.e., rainfall). Several
factors determine the severity of floods, including rainfall intensity and duration, antecedent moisture
conditions, surface permeability, and geographic characteristics of the watershed such as shape and
slope. Other causes of flooding can include rapid ice or snow melting in the mountains, dam or levee
failure, and/or under- engineered infrastructure.
According to FEMA, there are several different types of floods and under some there are subtypes. The
flooding types and subtypes include:
Riverine Flooding
o Overbank (River/Stream) Flooding
o Flash Floods
o Dam and Levee Failure
o Alluvia Fans
o Ice Jam Flooding
o Moveable Bed Streams
Urban Drainage
Ground Failures
o Mudflood and Mudflows
o Subsidence
o Liquefaction
Fluctuating lake levels
Coastal flooding and erosion
o Storm Surge
In California, some of the more common types of flooding fall under Riverine Flooding (i.e., flash
flooding), Urban Flooding, and Coastal Flooding (i.e., storm surge). A flash flood is a flood occurring
in a watershed where the time of travel of the peak of flow from one end of the watershed to the other
is less than six hours. Coastal flooding occurs when storms produce large ocean waves that sweep
across coastlines making landfall.

City of Pasadena
2018 Multi-Hazard Mitigation Plan
83
This “storm surge” inundates coastal areas, destroys dunes, and causes flooding. If a storm surge occurs
at the same time as high tide, the water height will be even greater. Urban Flooding is caused by
communities converting permeable surfaces (i.e., soils, plants) to more impervious surfaces (i.e.,
concrete, asphalt), losing its ability to absorb rainfall. The water moves from the clouds, to the ground,
and into streams at a much faster rate in urban areas (impervious) than in fields or woodlands
(permeable).
Some of these events are also associated with Ground Failures (i.e., mudflow, mudflows). Rain moves
rapidly downstream, often with severe consequences for anything in its path. These typically occur in
mountain canyons and foothills; however, any hilly or mountainous area with intense rainfall and the
proper geologic conditions may experience one of these sudden and devastating events. This problem
can be exacerbated when hillsides are bare following brush fires. As the slide continues, it can increase
in speed and begin carrying items like boulders, trees, and cars. In extreme cases, flood-generated
mudflows (aka debris flows) will roar down a canyon at speeds near forty miles per hour (40 mph)
with a wall of mud, debris, and water tens of feet high. Furthermore, the oils in the plants native to
Southern California, when burned, react with the soils, making them water-repellant. As a result, less
rainwater than usual infiltrates the ground, and instead makes its way down-slope as runoff, carrying
ashes and other burned debris with it.
Floods can take several hours to days to develop; the following flood characterization designates the
amount of time for response:
Flood Watch – a flood is possible in the area
Flood Warning – flooding is already occurring or will occur soon in the area
Flash Flood Watch – a flash flood is possible in the area. Seek immediate shelter or higher
ground
Flash Flood Warning – flooding is already occurring or will occur soon in the area. Flash
floods can occur without warning, during heavy rain in mountainous regions ensure that
precautions and flash flood warnings are adhered to.
To assist better understand flooding, the following terms are being offered:
Floodplain- A floodplain is a land area adjacent to a river, stream, lake, estuary, or other
water body that is subject to flooding. This area, if left undisturbed, acts to store excess
floodwater. The floodplain is made up of two sections: the floodway and the flood fringe.
Floodway- Floodways are defined for regulatory purposes, and unlike floodplains,
do not reflect a recognizable geologic feature. The National Flood Insurance
Program (NIPA) defines floodways as the channel of a river or other watercourse
areas adjacent land areas that must be reserved in order to discharge the base flood
without cumulatively increasing the water surface elevation more than one foot.
The floodway carries the bulk of the floodwater downstream and is usually the
area where water velocities and forces are the greatest. NFIP regulations require
that the floodway be kept open and free from development or other structures that
would obstruct or divert flood flows onto other properties.
Flood Fringe- The flood fringe refers to the outer portions of the floodplain,
beginning at the edge of the floodway and continuing outward. Generally, the

City of Pasadena
2018 Multi-Hazard Mitigation Plan
84
flood fringe is defined as "the land area which is outside of the stream flood way
but is subject to periodic inundation by regular flooding.” This is the area where
development is most likely to occur, and where precautions to protect life and
property need to be taken.
100-Year Flood- The 100-year flooding event is the flood having a one percent (1%)
chance of being equaled or exceeded in magnitude in any given year. Contrary to popular
belief, it is not a flood occurring once every 100 years. The 100-year floodplain is the area
adjoining a river, stream, or watercourse covered by water in the event of a 100-year flood.
5.4.2.1.2 Location and Extent of Hazard in Pasadena
The geographical location, climate, and topography of Pasadena make the city prone to flooding. In
Pasadena, floods usually occur during the winter “wet” season, the time of year with the highest
precipitation totals or heavy rainfalls. During significant rainfall years, the season is characterized by
high intensity rainfalls and rapid runoffs or discharge. These storm events have: inundate streams;
flooded areas; create debris flows (i.e., sediment, rock, dead trees) that have plug culverts and damage
bridges/overpasses; and/or, eroded or scared the landscape.
While the City of Pasadena is 6 miles east of Los Angeles, it is not so far away as to not be affected by
the heavy rains that brought flooding to Los Angeles. In addition, the towering mountains that give the
Los Angeles region its spectacular views also bring a great deal of rain out of the storm clouds that
pass through. Because the mountains are so steep, the rainwater moves rapidly down the slopes and
across the coastal plains on its way to the ocean. The Santa Monica, Santa Susana, and Verdugo
Mountains which surround three (3) sides of the valley seldom reach heights above three thousand feet
(3,000 ft.). The western San Gabriel Mountains, in contrast, have elevations of more than seven
thousand feet (6,000 ft.). These higher ridges often trap eastern moving winter storms. Although
downtown Los Angeles averages just fifteen (15) inches of rain a year, some mountain peaks in the
San Gabriel Mountains receive more than forty (40) inches of precipitation annually.
Two (2) types of flooding primarily affect the City of Pasadena: Riverine Flooding and Urban
Flooding. While the entire city is subjective to Urban Flooding, the northern and western parts of the
city are the most prone to riverine flooding due to its proximity to the San Gabriel Mountains. Two (2)
main north-to-south flowing stream systems drain in the Pasadena area: Arroyo Seco and Eaton Wash.
The Arroyo Seco runs along the western edge of the City of Pasadena, while Eaton Wash drain the
eastern side of the city. A dam and reservoir system protect both of these streams, but they are still
prone to flooding during significant events. Discussion of the dams (and reservoirs) are presented under
the Dam Failure hazard.
As mentioned previously, Urban Flooding can happen throughout the city. Over fifty percent (50%) of
the area in Pasadena has a high concentration of impermeable surfaces that either collect water or
concentrate the flow of water in unnatural channels. During periods of heavy rainfall, controlled rainfall
runoff from the San Gabriel Mountains merges with city runoff from impervious surface (i.e., houses,
asphalt) in the city’s storm water infrastructure. Times the city’s storm water infrastructure can become
overwhelmed, while in other instances, the infrastructure is inadequate to handle the volume.
Additionally, storm drains often back up with debris causing additional localized flooding. This has
led to streets becoming swift moving rivers and/or turning intersections into ponds.

City of Pasadena
2018 Multi-Hazard Mitigation Plan
85
5.4.2.1.3 History of Hazard in Pasadena
Pasadena has had serious floods throughout its history. Several canyons near the Pasadena area,
including Eaton, Zachau, Rubio, and Shields canyons, have flooded in recent recorded history. The
historic and continued threat for flooding led the County of Los Angeles and the City of Pasadena to
begin developing a flood management strategy for the area in the early 1920s. While dams and other
flood infrastructure has helped address flooding, it has not eliminated flooding. The history of flooding
in Pasadena is closely linked to the flooding in Los Angeles County. Los Angeles County has
experienced 14 significant flooding events that have received a federal disaster declaration. Table 5.9 lists
these floods, as well as information concerning the nature of the flooding and the extent of the damages.
Table 5.9 Historical Records of Floods in Los Angeles County
Date Federal Disaster
Number Name
Jan 1969 DR-253 Severe Storms & Flooding
Feb 1978 DR-547 Coastal Storm, Mudslides & Flooding
Feb 1980 DR-615 Severe Storms, Mudslides & Flooding
Feb 1983 DR-677 Coastal Storms, Floods, Slides & Tornadoes
Feb 1988 DR-812 Severe Storms, High Tides & Flooding
Feb 1992 DR-935 Rain/Snow Storms, Flooding, Mudslides
Feb 1993 DR-979 Severe Winter Storm, Mud & Land Slides, & Flooding
Jan 1995 DR-1044 Severe Winter Storms, Flooding, Landslides, Mud Flows
Mar 1995 DR-1046 Severe Winter Storms, Flooding, Landslides, Mud Flows
Feb 1998 DR-1203 Severe Winter Storms and Flooding
Feb 2005 DR-1577 Severe Storms, Flooding, Mudslides, And Landslides
Apr 2005 DR-1585 Severe Storms, Flooding, Landslides, and Mudslides
Mar 2010 DR-1884 Severe Winter Storms, Flooding, and Debris and Mud Flows
Mar 2017 DR-4305 Severe Storms, Flooding, and Mudslides
5.4.2.1.4 Probability of Occurrence
FEMA National Flood Insurance Program (NFIP) produces Flood Insurance Rate Maps (FIRM). The
FIRM identifies potential flood risk in geographic areas. The FIRMs are the official map of a
community on which FEMA has delineated both the special flood hazard areas and the risk premium
zones applicable to the community. Historically, FIRMs were produced on paper; however, over recent
years FEMA has begun the process of creating digital versions- DFIRM. Because of the volume of
area, not all FIRMs have been digitized. Due to the limited detail and large scale of the base maps used
for most FIRMs, much interpolation between contour lines is done in mapping the floodplain
boundaries. This is why you may find discrepancies when actual ground elevations are surveyed: the
maps are just the best available graphic representations of the BFEs.
The flood hazard zones on the FIRMs include: Zone A, Zone AE, Zone AE Floodway, Zone AH, Zone
AO, and Zone Shaded X. Complete definitions of flood zone designations are provided in Table 5-10.

City of Pasadena
2018 Multi-Hazard Mitigation Plan
86
Table 5-10 FEMA Flood Zone Designations
Risk Level Flood Zone Description
High
A Areas with a 1% annual chance of flooding and a 26% chance
of flooding over the life of a 30‐year mortgage. Because
detailed analyses are not performed for such areas; no depths or base flood elevations are shown within these zones.
AE The base floodplain where base flood elevations are provided.
AH
Areas with a 1% annual chance of shallow flooding, usually in
the form of a pond, with an average depth ranging from 1 to 3
feet. These areas have a 26% chance of flooding over the life of
a 30‐year mortgage. Base flood elevations derived from
detailed analyses are shown at selected intervals within these
zones.
AO
River or stream flood hazard areas, and areas with a 1% or
greater chance of shallow flooding each year, usually in the
form of sheet flow, with an average depth ranging from 1 to 3
feet. These areas have a 26% chance of flooding over the life of
a 30‐year mortgage. Average flood depths derived
from detailed analyses are shown within these zones.
Moderate to
Low
X (Shaded) Area of moderate flood hazard, usually the area between the limits of the 100-year and 500-year floods.
X
(Unshaded)
Area of minimal flood hazard usually depicted on FIRMs as
above the 500-year flood level. Zone X is the area determined to
be outside the 500-year flood and protected by levee from 100- year flood.
Undetermined
D Areas with possible but undetermined flood hazards. No flood
hazard analysis has been conducted. Flood insurance rates are
commensurate with the uncertainty of the flood risk.
As part of FEMA’s practice, it processes a Letter of Map Revision (LOMR) when changes are needed
to the FIRMs. LOMRs are generally based on the implementation of physical measures that affect the
hydrologic or hydraulic characteristics of a flooding source and thus result in the modification of the
existing regulatory floodway, the effective Base Flood Elevations (BFEs), or the Special Flood Hazard
Area (SFHA). In short, the LOMR officially revises the FIRM.
Because the FIRMs are not updated on a regular basis, approximately once every 10 years, FEMA has
developed National Flood Hazard Layer (NFHL) maps. The NFHL maps are simplified digital maps
that enable FEMA to produce a map that incorporates the LOMR data with the FIRM data. In essence,
the NFHL maps are considered the most up-to-date data available on the probability of flooding in an
area. Because FIRMs for the City of Pasadena do not have any LOMRs, there is not a NFHL for the
area.
There are two (2) FEMA FIRMs for the city of Pasadena (Figure 5.13 and Figure 5.14). While difficult
to view, the FIRMs indicate that majority of the City of Pasadena is within Zone D (Other Areas which
flood hazards are undetermined, but possible) and Zone X (Other Areas determined to be outside the
0.2% annual chance floodplain); and a small portion of the city within the Arroyo Seco in the shaded

City of Pasadena
2018 Multi-Hazard Mitigation Plan
87
Zone X (Other Flood Areas of 0.2% annual chance flood; areas of 1% annual chance flood with average
depths of less than 1 foot/draining areas less than 1 square mile).
Figure 5.13 Flood Insurance Rate Map- Panel 1400F
Figure 5.14 Flood Insurance Rate Map- Panel 1375F

City of Pasadena
2018 Multi-Hazard Mitigation Plan
88
5.4.2.1.5 Climate Change Consideration
Climate change is acts as an amplifier of existing flood hazards. Extreme weather events have become
more frequent over the past 40 to 50 years and this trend is projected to continue. Rising sea levels and
shifting weather patterns (temperate, winds) are expected to have a significant impact on rainfall
frequency, intensity and distribution; which in turn will have a significant impact on the frequency of
flood occurrences.
Climate Change can also increase the frequency and/or intensity of mudflows. Changes in
precipitation, specifically the increased frequency of intense precipitation, can result in a water content
the ground cannot tolerate, and may cause mudflows. These mudflows may happen more frequently
due to the increased number of heavy rainfall events.
5.4.2.2 Landslide and other Earth Movements
5.4.2.2.1 Description of Hazard
A landslide is defined as the movement of a mass of rock, debris, or earth down an incline. The most
common cause of a landslide is an increase in the down slope gravitational stress that exceeds the
strength of the earth materials that compose the slope, also known as over-steepening. Over-steepening
can be caused by natural processes or by man-made activities. Undercutting of a valley wall by stream
erosion or of a sea cliff by wave erosion are ways in which over-steeping may occur naturally.
Landslides can be broken down into: large, deep, slow moving slides (i.e., rockslides, earth flow),
and/or small, shallow, fast-moving slides (rock falls, debris slides, debris flows).
Fast-moving (or rapidly moving) landslides present the greatest risk to human life, and people living
in or traveling through areas prone to rapidly moving landslides are at increased risk of serious injury.
Debris- flows can travel down a hillside with speeds up to 200 miles per hour (though more commonly,
30-50 miles per hour), depending on the slope angle and type of earth and debris in the flow.
Slow-moving landslides can occur on relatively gentle slopes and can cause significant property
damage but are less likely to result in serious human injuries. Slow-moving slides include rotational
slides, where sliding material moves along a curved surface, and translational slides, where movement
occurs along a flat surface. These slides are generally slow moving and can be deep. Slumps are small
rotational slides that are generally shallow.
The size of a landslide usually depends on the geology and the initial cause of the landslide. Landslides
vary greatly in their volume of rock and soil; the length, width, and depth of the area affected; frequency
of occurrence; and speed of movement. Some characteristics that determine the type of landslide are
slope of the hillside, moisture content, and the nature of the underlying materials. Landslides are given
different names, depending on the type of failure and their composition and characteristics.
NOTE: This hazard does not include earthquake-induced movements (i.e., landslides, liquefaction) or
flood- induced movements (i.e., mudflows). Those hazards can be found under the relevant hazard
section.
5.4.2.2.2 Location and Extent of Hazard in Pasadena
Landslides are a common hazard in California. Weathering and the decomposition of geologic
materials produce conditions conducive to landslides, and human activity further exacerbates many

City of Pasadena
2018 Multi-Hazard Mitigation Plan
89
landslide problems. Many landslides are difficult to mitigate, particularly in areas of large historic
movement with weak underlying geologic materials. As communities continue to modify the terrain
and influence natural processes, it is important to be aware of the physical properties of the underlying
soils as they, along with climate, create landslide hazards. Proper planning cannot eliminate the threat of
landslides to the safety of people, property, and infrastructure; however, without proper planning,
landslide hazards will be even more common and more destructive.
Locations at risk from landslides or debris flows include areas with one or more of the following
conditions:
On or close to steep hills;
Steep road-cuts or excavations;
Existing landslides or places of known historic landslides (such sites often have tilted
power lines, trees tilted in various directions, cracks in the ground, and irregular-
surfaced ground);
Steep areas where surface runoff is channeled, such as below culverts, V -shaped valleys,
canyon bottoms, and steep stream channels;
Fan-shaped areas of sediment and boulder accumulation at the outlets of canyons; and
Canyon areas below hillside and mountains that have recently (within 1-6 years) been
subjected to a wildland fire.
5.4.2.2.3 History of Hazard in Pasadena
The City’s mountain and foothill areas are vulnerable to slope instability. Steep-sided slopes along the
Arroyo Seco and other incised drainages may also be locally susceptible to slope instability. Further,
most of the residential construction in the foothills of Pasadena occurred prior to the development and
enforcement of stronger grading codes in the 1970s, as well as before the heightened awareness of
slope stability issues that has resulted from the periodic intense rainstorms of the last 30 years.
Consequently, there are older residences built in or near natural drainage courses and steep slopes that
may be at risk from slope failures. Older developments along the top of the Arroyo Seco bluffs may
also be locally susceptible.
The City of Pasadena has had a number of landslides in the past. The U.S. and State of California
Geological Survey organizations have identified landslide areas they have evaluated as dormant
(Figure 5.15). These are areas with a history of landslide activity but have been inactive in the recent
past. These dormant areas are in the hills directly west of the Rose Bowl and can be seen below as
yellow marks in a close-up snapshot of a 2007 California Geological Survey map.

City of Pasadena
2018 Multi-Hazard Mitigation Plan
90
Figure 5.15 Pasadena Landslide Areas
The City’s 2002 General Plan includes a figure showing areas where either previous occurrences of
landslide movement, or local topographic, geological, geotechnical, or groundwater conditions indicate
a potential for permanent ground displacements requiring mitigation (Figure 5.16). These areas are
shown in blue in the following figure:

City of Pasadena
2018 Multi-Hazard Mitigation Plan
91
Figure 5.16 Pasadena Areas Susceptible to Landslides
Some of the more recent events include the following:
1958- Pasadena Freeway landslide
2005- Landslide on Mount Wilson Toll Road in Eaton Canyon – destroyed 50 yards of road
2010- Landslide on Avenue 64
5.4.2.2.4 Probability of Occurrence
Landslides are common throughout the San Gabriel Mountains, particularly near the range front, where
rock weakened by fracturing, shearing, and crushing along the numerous fault zones is present.
Because of this, the city of Pasadena can experience landslides on a daily basis. This weakness in the
rock fabric, combined with the moderate to extremely steep slopes that have resulted from rapid uplift
of the mountains, are important elements that create the setting for the development of slope failures.
Similar conditions are present in the San Rafael Hills, where rocks are highly weathered and slope
gradients of 30 degrees or steeper are common.
The City’s hillsides are vulnerable to slope instability due primarily to the fractured, crushed, and
weathered condition of the bedrock, as well as the steep terrain. Over-steepened slopes along the large
drainage channels are also locally susceptible. The probability of large bedrock landslides occurring is
relatively low; therefore, the source of potential losses due to slope instability arises primarily from

City of Pasadena
2018 Multi-Hazard Mitigation Plan
92
the occurrence of smaller slope failures in the form of small slides, slumps, soil slips, debris flows, and
rock falls.
The Technical Background Report developed for the 2002 General Plan Safety Element included a
figure showing slope instability (Figure 5.17). This map identified provided information about
potential slope instability types for three areas: San Gabriel Mountains, San Rafael Hills (north of
Colorado Boulevard), and San Rafael Hills (south of Colorado Boulevard).
Figure 5.17 Slope Instability and Past Landslides in Pasadena

City of Pasadena
2018 Multi-Hazard Mitigation Plan
93
5.4.2.2.5 Climate Change Consideration
Based on the definition of the under this LHMP, climate change will not have little impact on
Landslides and other earth movements. However, the increase in heavy precipitation may cause
instability in areas where landslides are likely; therefore, resulting in more and larger widespread
landslides.
5.4.2.3 Extreme Heat
5.4.2.3.1 Description of Hazard
Extreme Heat is a function of heat and relative humidity. A Heat Index describes how hot the heat‐
humidity combination makes the air feel. As relative humidity increases, the air seems warmer than it
actually is because the body is less able to cool itself via evaporation of perspiration. As the Heat Index
rises, so do health risks such as heat exhaustion, sunstroke, and heatstroke. Some Heat Index Program
Alert procedures are implemented when the high temperature is expected to exceed 105° to 110°
(depending on local climate) for at least two consecutive days.
5.4.2.3.2 Location and Extent of Hazard in Pasadena
The entire city is subject to extreme heat conditions.
5.4.2.3.3 History of Hazard in Pasadena
The county of Los Angeles has experienced several extreme heat events. Below is a list of extreme
heat events tracked by the County of Los Angeles:
June 11, 1877: The Los Angeles temperature hit 112 degrees, at the time it was an all-
time record, but official recording keeping did not begin until 20 days later.
March 28-29, 1879: Temperatures reached 99 degrees in Los Angeles on March 29.
July 25, 1891: The Los Angeles temperature registered at 109 degrees.
April 23, 1900: Temperatures reached 100 degrees in Los Angeles, a record for the month
of April.
February 25, 1921: The Los Angeles temperature measured at 92 degrees, a record for
the month of February.
September 18-22, 1939: Temperatures reached 100 degrees for seven consecutive
days in Los Angeles, peaking at 107 degrees on September 20. Two days later, the
low temperature in Los Angeles was 84 degrees, the highest minimum on record.
August 31-September 7, 1955: Los Angeles hits 110 degrees on September 1, an all-time
record.
October 14, 1961: Hot Santa Ana winds drove temperatures to 110 degrees in Long
Beach, recorded as the hottest spot in the nation, Los Angeles registered at 100 degrees in
many coastal and inland locations.
October 20-29, 1965: Los Angeles experienced 10 consecutive days with afternoon
highs reaching over 100 degrees.
November 1, 1966: Temperatures reached 101 degrees at Los Angeles International
Airport and 100 degrees in Los Angeles, record highs for the month of November. Also,
Santa Ana winds fan fires that killed 16 firefighters.
September 25-30, 1970: Drought in Southern California came to a climax. Hot Santa Ana
winds sent temperatures soaring to 105 degrees in Los Angeles.

City of Pasadena
2018 Multi-Hazard Mitigation Plan
94
September 12, 1971: Temperatures reached 103 degrees in Los Angeles.
October 3-4, 1987: For two straight days Los Angeles temperatures registered 108 degrees.
February 10-11, 1988: Record heat from Santa Ana wind conditions caused temperatures
to reach 88 degrees in Los Angeles.
March 25-26, 1988: Santa Ana conditions brought temperatures in the 90 degrees range.
On March 25, temperatures reached 95 degrees in Los Angeles. Several brush fires
resulted due to the hot temperature conditions.
April 6-7, 1989: Temperatures reached 106 degrees in Los Angeles, setting record high for
the month of April.
March 5, 1990: Downtown Los Angeles temperatures registered at 101 degrees, eight
degrees higher than the previous record for the date.
August 17, 1992: Tropical air brought high temperatures and heat index values to Los
Angeles where the temperature reached 99 degrees with a heat index of 110 degrees.
February 20, 1995: 95-degree temperatures set a record for the month of February in Los
Angeles.
While Pasadena was impacted by the Los Angeles County events, exact past extreme heat events in
the city; have not been well documented.
5.4.2.3.4 Probability of Occurrence
In any given year, Pasadena can be subject to extreme heat conditions.
5.4.2.3.5 Climate Change Considerations
As temperatures rise due to climate change, Californians will face greater risk of death from
dehydration, heat stroke/exhaustion, heart attack, stroke, and respiratory distress caused by extreme
heat. By mid‐century, extreme heat events in urban centers could cause two to three times more heat‐
related deaths than occur today. By 2100, hotter temperatures are expected throughout the state, with
an increase of 3 to 5.5°F under the lower emissions scenario and 8 to 10.5°F under the higher emissions
scenario (Figure 5.18).

City of Pasadena
2018 Multi-Hazard Mitigation Plan
95
Figure 5.18 Comparison between Historic and Projected Temperature
5.4.2.4 Hailstorm
5.4.2.4.1 Description of Hazard
Hail is a type of precipitation in the form of pellets or balls of ice more than 0.19 inches in diameter.
Hail is possible within most thunderstorms as it is produced by cumulonimbus, and within 2 nautical
miles of the parent storm. Hail formation requires environments of strong, upward motion of air with
the parent thunderstorm (similar to tornadoes) and lowered heights of the freezing level. In the mid-
latitudes, hail forms near the interiors of continents, while in the tropics, it tends to be confined to high
elevations.
There are methods available to detect hail-producing thunderstorms using weather satellites and
weather radar imagery. Hailstones generally fall at higher speeds as they grow in size, though
complicating factors such as melting, friction with air, wind, and interaction with rain and other
hailstones can slow their descent through Earth's atmosphere. Severe weather warnings are issued for
hail when the stones reach a damaging size, as it can cause serious damage to human-made structures.
5.4.2.4.2 Location and Extent of Hazard in Pasadena
The entire city is subject to hailstorms.
5.4.2.4.3 History of Hazard in Pasadena
There is no current record of a hailstorm in the city.
5.4.2.4.4 Probability of Occurrence
In any given year, Pasadena can be subject to hailstorm condition.
5.4.2.4.5 Climate Change Considerations

City of Pasadena
2018 Multi-Hazard Mitigation Plan
96
Hailstorms have the possibility of becoming more frequent with the climate temperatures increasing,
and the atmosphere becomes more convective.
5.4.2.5 Air Pollution
5.4.2.5.1 Description of Hazard
Air pollution is much more hazardous to the health of large numbers of Californians than some other
significant hazards (i.e., earthquakes, floods, fires). Air pollution is a continuing problem, with the
largest concentration of pollution in the highest populated air basins: the San Francisco Bay Area, San
Joaquin Valley, Sacramento Valley, San Diego, and the South Coast. Pollutants include smog, soot,
and toxic air contaminants (TACs). Air pollution is generally measured by particles.
As stated by the US Environmental Protection Agency (EPA), particle pollution is a mixture of
microscopic solids and liquid droplets suspended in air. This pollution, known as particle matter, is
made up of a number of components, including acids (such as nitrates and sulfates), organic chemicals,
metals, soil or dust particles, and allergens (such as fragments of pollen and mold spores). The size of
the particles is directly linked to their potential for causing health problems. Small particles pose the
greatest risk because they can get deep into the lungs, and even the bloodstream. Larger particle are
less of a concern but can cause issues with eyes, nose, and throat.
The South Coast Air Quality Management District (SCAQMD) is the air pollution control agency for
all of Orange County and the urban portion of San Bernardino, Riverside, and Los Angeles (including
Pasadena). SCAQMD has adopted the US EPA’s Air Quality Index (AQI) which establishes six (6)
health categories:
Hazardous 301-500 parts per million
Very Unhealthy 201 to 300 parts per million
Unhealthy 151 to 200 parts per million
Unhealthy for Sensitive Groups 101 to 150 parts per million
Moderate 51 to 100 parts per million
Good 0 to 50 parts per million
Based on air monitoring systems, community considerations (i.e., traffic, fires), and expected weather
conditions (i.e., temperature, winds), SCAQMD will forecast the air health category.
5.4.2.5.2 Location and Extent of Hazard in Pasadena
Air pollution, while on the decline since 1970, is still an issue throughout the city. Air pollution in the
city intensified when there are onshore breezes or still air conditions. Under these conditions, air
pollution is trapped along foothills and mountains. In addition, in the summer months, the thinner
warmer air can strengthen air pollutants.
5.4.2.5.3 History of Hazard in Pasadena
In Pasadena, the number of days per year that pollution levels due to fine particles (PM2.5) exceed
government standards has remained relatively steady over the past several years (under 5 days). The
number of days per year that ozone levels exceed government standards varied over the past several
years but had a generally decreasing trend (Figure X).

City of Pasadena
2018 Multi-Hazard Mitigation Plan
97
Figure X Days/Year Ozone Quality and Particles Pollution Exceeded Government Standards
5.4.2.5.4 Probability of Occurrence
At any given time, the city can experience concentrations of air pollution; however, the smoggiest
month in Southern California is August.
5.4.2.5.5 Climate Change Considerations
Oddly, climate change does not have an impact on air pollution as much as air pollution has an impact
on climate change. In clear air, air pollution and particles interact with solar beams. Particles containing
little or no carbon reflect solar radiation, making the air and Earth surface below a bit cooler than they
would otherwise be. In contrast, particles containing substantial amounts of carbon warm their
surroundings by absorbing solar radiation before it reaches the ground. A secondary effect from
carbon-based pollutants is that it reflects the incoming sunlight; casting shade and the ground surface
below making it cooler.
5.4.2.6 Oil Spills
5.4.2.6.1 Description of Hazard
An oil spill is a release of liquid petroleum hydrocarbon into the environment due to human activity or
technological error that results in pollution of land, water, and air. Oil releases also occur naturally
through oil seeps either on land or under water. Marine oil spills, whether accidental or intentional, can
result from the release of crude oil from offshore oil platforms, drilling rigs, wells, pipelines, tank
trucks, and marine tank vessels (tankers). Refined petroleum products such as gasoline, diesel, and
heavier fuels such as bunker fuel used by cargo ships are also sources of potential oil spill releases.
Depending on the origin, size, and duration of the release, an oil spill can have serious impacts on air
and water quality, public health, plant and animal habitat, and biological resources. Clean up and
recovery is time and cost consuming, and dependent on weather conditions such as wind and rain.
Tidal and Current conditions may also make the spill more dynamic.

City of Pasadena
2018 Multi-Hazard Mitigation Plan
98
5.4.2.6.2 Location and Extent of Hazard in Pasadena
Most sources of liquid petroleum hydrocarbon storage and use in Pasadena can be found at motor
vehicle fueling stations and emergency generators. These sources, although may be large in quantity,
are properly stored, secondarily contained and monitored. Therefore, release of petroleum
hydrocarbons will gen pose an insignificant hazard to the community.
5.4.2.6.3 History of Hazard in Pasadena
There have been no significant historical events to report to date.
5.4.2.6.4 Probability of Occurrence
There is a small probability that a major release can occur anytime of the year.
5.4.2.6.5 Climate Change Considerations
With increased changes in climate, the demands for oil and oil byproducts will also increase. This shift
in demand could increase production, distribution, and transportation of oil products; thus, increasing
the potential oil spill occurrences.
5.4.2.7 Dam Failure
5.4.2.7.1 Description of Hazard
Dams fail due to old age, poor design, structural damage, improper siting, landslides flowing into a
reservoir, or terrorist actions. Structural damage is often a result of a flood, erosion, or earthquake. A
catastrophic dam failure could inundate the area downstream. The force of the water is large enough
to carry boulders, trees, automobiles, and even houses along a destructive path downstream. The
potential for casualties, environmental damage, and economic loss is great. Damage to electric
generating facilities and transmission lines could impact life support systems in communities outside
the immediate hazard area.
5.4.2.7.2 History of Hazard in Pasadena
The State of California and the federal government have a rigorous Dam Safety Program. This is a
proactive program that ensure proper planning in the event of failure but also sets standards for dam
design and maintenance. Because of this, many potential issues have been addressed and/or resolved.
However, prior to the construction of the dams, the area experienced several events.
5.4.2.7.3 Location and Extent of Hazard in Pasadena
There are fifteen (15) dams in Los Angeles County (Figure 5.19). These dams range in purpose from
water supply to flood control. Dam failure inundation zones, mapped by the State of California,
indicate areas that would be inundated should a dam fail catastrophically. Efforts were made to obtain
these maps but locating available and practical maps was difficult. In the case of the dams in question
it is further complicated by the fact that the reservoirs behind the dams can be dry; only filling up after
significant storms.

City of Pasadena
2018 Multi-Hazard Mitigation Plan
99
Figure 5.19 Dam Locations- Los Angeles County
Of the 15 dams, there are two (2) major flood infrastructure structures located in or upstream from the
Pasadena area to manage the Riverine Flooding potential: the Devil’s Gate Dam and Reservoir and the
Eaton Wash (Creek) Dam and Reservoir. These structures are owned by the Los Angeles County
Department of Public Works and are located along the Arroyo Seco and Eaton Wash (Creek) tributary
stream systems, respectively.
The Devil’s Gate Dam flood inundation path shows that the floodway of the Arroyo Seco
would contain most of the water. Since this area is largely undeveloped and used primarily
for recreation purposes, the risk posed by this hazard could be considered low.
The Eaton Wash Dam inundation path shows that, on its southern reaches, some developed
areas would be impacted. The risk posed by this hazard could be considered low.
5.4.2.7.4 Probability of Occurrence

City of Pasadena
2018 Multi-Hazard Mitigation Plan
100
Dam failure events are infrequent and usually coincide with the events that cause them, such as
earthquakes, landslides and excessive rainfall and snowmelt. There is a “residual risk” associated with
dams; residual risk is the risk that remains after safeguards have been implemented. For dams, the
residual risk is associated with events beyond those that the facility was designed to withstand.
However, the probability of occurrence of any type of dam failure event is considered to be low in
today’s regulatory and dam safety oversight environment.
5.4.2.7.5 Climate Change Considerations
Increased rainfall from changing climate conditions could present a risk to dams if volume of runoff is
greater than the dam’s capacity. This could cause the County to release stored water into the
downstream watercourses in order to ensure the integrity of the dam.
5.4.2.8 Hazardous Materials Release
5.4.2.8.1 Description of Hazard
Hazardous waste/materials are widely used at and/or created by facilities such as hospitals, wastewater
treatments plants, universities and industrial/manufacturing warehouses. Several household products
such as cleaning supplies and paint are also considered hazardous materials. Hazardous materials
include:
Explosives;
Flammable, non-flammable, and poisonous gases;
Flammable liquids;
Flammable, spontaneously combustible, and dangerous when wet solids;
Oxidizers and organic peroxides;
Poisons and infectious substances;
Radioactive materials; and
Corrosive materials.
Both mobile and external hazardous materials releases can spread and affect a wide area, through the
release of plumes of chemical, biological, or radiological elements or leaks or spills. Conversely,
internal releases are more likely to be confined to the structure the material is stored in.
Chemical may be corrosive or otherwise damaging over time. A hazardous materials release could also
result in fire or explosion. Contamination may be carried out of the immediate area of the incident by
people, vehicles, wind, and water. Weather conditions can increase the size and intensity of the
Hazardous Materials Release. Typography, such as hills and canyons, can increase the size of the
release or make it more difficult to contain.
5.4.2.8.2 Location and Extent of Hazard in Pasadena
The locations and identity of facilities that store hazardous materials are reported to local and federal
governments. Many facilities have their own hazardous materials guides and response plans, including
transportation companies who transport hazardous materials.
The release of hazardous materials into the environment can cause a multitude of problems. Although
these incidents can happen almost anywhere, certain areas of the city are at higher risk, such as near

City of Pasadena
2018 Multi-Hazard Mitigation Plan
101
roadways and railways, that are frequently used to transport hazardous materials and locations with
industrial facilities that use, store, and/or dispose of such materials.
5.4.2.8.3 History of Hazard in Pasadena
Most releases that have occurred in Pasadena, have been minor releases and easily mitigated in
compliance with industry standards in accordance with State and Federal regulations. There have been
no significant historical events to report to date.
5.4.2.8.4 Probability of Occurrence
The release of hazardous materials can occur throughout the entire city on any given day. Incidences
can occur during production, storage, transportation, use or disposal of hazardous materials.
Communities can be at risk if a chemical is used unsafely or released in harmful amounts into the
environment. Hazardous materials can cause death, serious injury, long lasting health effects, and
damage to buildings, the environment, homes, and other property.
5.4.2.8.5 Climate Change Consideration
As mentioned above, weather can play a significant factor in hazardous material releases. While there
is little evidence to link climate change increase occurrences of hazardous material releases, it could
impact the response and recovery efforts.
5.4.2.9 Radiological Incident
5.4.2.9.1 Description of Hazard
Radioactive materials are routinely transported in California. These materials include the medical and
industrial sources described below, as well as wastes that have radioactive components. Many of the
radioactive waste shipments come from research and cleanup efforts at national laboratories and
nuclear power plants. Radiological incidents that result in the release of radioactive materials may
result in long‐term health risks and contamination of the state resources, including air, water supply,
groundwater, and agricultural lands.
Four (4) Emergency Classification Levels (ECLs) have been established in federal regulations to
characterize the severity of the emergency and the response actions required. The ECLs must be used
as the foundation for emergency response planning, training and exercises.
5.4.2.9.2 Location and Extent of Hazard in Pasadena
There are a few medical, industrial and research/educational sources within the city that generate, store
or utilize radioactive material; and because of the transport of the material this hazard can occur
throughout most of the city.
5.4.2.9.3 History of Hazard in Pasadena
No significant radiological incidents have occurred to date in Pasadena.
5.4.2.9.4 Probability of Occurrence
A major radiological incident can occur anytime during the year.
5.4.2.9.5 Climate Change Consideration

City of Pasadena
2018 Multi-Hazard Mitigation Plan
102
While there is little evidence to link climate change increase occurrences of radiological incidents (i.e.,
material releases), it could impact the response and recovery efforts.
5.4.2.10 Aircraft Crashes
5.4.2.10.1 Description of Hazard
Airline crashes are defined as any accident of private, commercial, or military aircraft on land or over
sea. Airline crashes, like other transportation accidents, are less likely to lead to a state or federal
disaster declaration, than other hazards previously and afore mentioned.
5.4.2.10.2 Location and Extent of Hazard in Pasadena
Only small aircraft typically fly over the City of Pasadena including Pasadena Police Department’s
helicopters.
5.4.2.10.3 History of Hazard in Pasadena
No significant historical events to report to date. Although within the last 25 years, two small fixed
wing aircraft have crashed in Pasadena and the Pasadena Police helicopter has had emergency landings
in a handful of situations. No significant injury or damage was sustained as a result of these incidents.
5.4.2.10.4 Probability of Occurrence
Aircraft crashes have a low probability of occurrences but can occur anytime during the year.
5.4.2.10.5 Climate Change Consideration
There is no none linkage between climate change and airline crashes. Although bad weather does play
a factor in some airline crashes, current technology does a good job of forecasting potential conditions.
5.4.2.11 Train Accidents
5.4.2.11.1 Description of Hazard
Train accidents are defined as any accidents involving public or private trains carrying passengers or
cargo along the rail corridor. Train accidents, like other transportation accidents, are less likely to lead
to a state or federal disaster declaration, than other hazards previously and afore mentioned.
5.4.2.11.2 Location and Extent of Hazard in Pasadena
Trains running through Pasadena carry both commuters and commodities. Such commodities include
hazardous materials, fuel (including oil), agriculture, meats, and non-consumables. A hazardous
materials incident on the rails or roadway has the potential to shut down both rail and highway
transportation routes where the two are within close proximity to another. Train accidents are generally
localized, and the incidents result in limited impacts at the community level. However, if there are
volatile or flammable substances on the train and the train is in a highly populated or densely forested
area, death, injuries, and damage to homes, infrastructure, and the environment, including forest fires
can occur.

City of Pasadena
2018 Multi-Hazard Mitigation Plan
103
5.4.2.11.3 History of Hazard in Pasadena
The only significant train accidents in Pasadena in the last 10 years would be related to the light rail
Metro Gold Line commuter train. There have been several auto verses train accidents at the Del Mar
crossing and there have been a handful of big rig trucks that have come off the 210 Freeway and ended
up on the train tracks and in the Metro Gold Line right-of-way as a result of traffic collisions.
5.4.2.11.4 Probability of Occurrence
Train accidents can occur anytime during the year.
5.4.2.11.5 Climate Change Consideration
There is no none linkage between climate change and train accidents.
5.4.2.12 Natural Gas Pipeline/Storage Failure
5.4.2.12.1 Description of Hazard
The United States is heavily dependent on transmission pipelines to distribute energy and fuel sources.
Virtually all-natural gas, which accounts for about 28% of energy consumed annually, is transported
by transmission pipelines. Energy demand in the United States continues to increase. Although
California is a leader in exploring and implementing alternative energy sources such as wind and solar,
the expansion of traditional energy sources, such as natural gas, continues.
Most of the natural gas used in California comes from out‐of‐state natural gas basins. It is delivered
to California via the interstate natural gas pipeline system. In 2012, California customers received 42%
of their natural gas supply from basins in the Southwest, 22% from Canada, 23% from the Rocky
Mountains, and 12% from California.
Generally speaking, transmission lines are large‐diameter steel pipes carrying natural gas at high
pressure and compressed to provide higher carrying capacity. Transmission lines are both interstate
and intrastate, with the latter connecting to smaller distribution lines delivering gas directly to homes
and businesses.
5.4.2.12.2 Location and Extent of Hazard in Pasadena
Natural gas transported via the interstate pipelines, and some of the California‐produced natural gas,
is delivered into the Pacific Gas & Electric (PG&E) and Southern California Gas (SoCal Gas) intrastate
natural gas transmission pipeline systems (commonly referred to as California's "backbone" natural
gas pipeline system). Natural gas on the utilities' backbone pipeline systems is then delivered into the
local transmission and distribution pipeline systems, or to natural gas storage fields. SoCal Gas own
and operate several natural gas storage fields that are located in Northern and Southern California.
SoCal Gas operates a natural gas storage field, Aliso Canyon, located in the north end of the San
Fernando Valley area.
Data compiled by the Pipeline and Hazardous Materials Safety Administration (PHMSA) report a total
of 115,292 miles of gas pipelines in California, of which 12,414 miles are classified as gas transmission
lines, 403 miles are gas‐gathering lines, and the majority, 102,475 miles, are for gas distribution. Nearly
40% of gas transmission lines are located in Los Angeles, Kern, and San Bernardino counties. Figure

City of Pasadena
2018 Multi-Hazard Mitigation Plan
104
5.20 shows the location and ownership of the natural gas pipeline system. Many of the pipelines are
located in areas with high seismic activity, crossing the San Andreas and other active faults.
Figure 5.20 Natural Gas Pipeline and Service Providers in California
5.4.2.12.3 History of Hazard in Pasadena
No significant historical events to report to date.
5.4.2.12.4 Probability of Occurrence
Increased urbanization is resulting in more people living and working closer to existing gas
transmission pipelines that were placed prior to government agencies adopting and implementing land
use and other pipeline safety regulations. Compounding the potential risk is the age and gradual
deterioration of the gas transmission system due to natural causes. Significant failure, including pipe

City of Pasadena
2018 Multi-Hazard Mitigation Plan
105
breaks and explosions, can result in loss of life, injury, property damage, and environmental impacts.
Causes of and contributors to pipeline failures include construction errors, material defects, internal
and external corrosion, operational errors, control system malfunctions, outside force damage,
subsidence, and seismicity. Growth in population, urbanization, and land development near
transmission pipelines, together with addition of new facilities to meet new demands, may increase the
likelihood of pipeline damage due to human activity and the exposure of people and property to
pipeline failures. Because of this, natural gas pipeline/storage facility failure can occur anytime during
the year.
5.4.2.12.5 Climate Change Consideration
Climate change will not have a direct effect on natural gas pipelines; however, climate change could
increase the demand for natural gas. This increase in demand may require the development of new
pipelines; which could increase potential complications.

City of Pasadena
2018 Multi-Hazard Mitigation Plan
106
6 Vulnerability Assessment
6.1 OVERVIEW
The purpose of this section is to estimate the potential vulnerability (impacts) of the priority hazards
within the city on the population and built environment (residential, non-residential, critical facilities,
etc.). To accomplish this three (3) different approaches have been used: 1) application of scientific loss
estimation models; 2) analysis of exposure of key assets to hazards; and, 3) a qualitative estimate of
potential impacts from hazards. It is important to note that the first two approaches can only be applied
to hazards that have an exposure area (footprint). For those priority hazards where an exposure layer
does not exist or where the hazard exposure area is the entire planning area (i.e., City of Pasadena), a
brief analysis of the potential vulnerability is presented. The vulnerability assessment was only done
for the hazards within the city that have been categorized as “high priority” in Section 5 of this LHMP.
6.1.1 Scientific Loss Estimation Models
The approach used to complete this effort involves the utilization of the Federal Emergency
Management Agency’s (FEMA) Hazes model. Hazes is a nationally applicable standardized
methodology that estimates potential losses from earthquakes, hurricane winds and floods. Hazes uses
state-of-the-art Geographic Information Systems (GIS) software to map and present data results of
damage and economic loss estimates for buildings and infrastructure from earthquake, hurricane winds
and flood hazard. It also allows users to estimate the impacts of the hazards on populations. Estimating
losses is essential to decision-making at all levels of government, providing a basis for developing
mitigation plans/policies and emergency preparedness, response, and recovery plans/planning.
Hazes’ standard configuration allows for “out-of-the-box” regional or community-wide loss
assessment using default (“Level 1”) population and building inventory databases, aggregated to the
census tract level for earthquakes or census block level for flood and hurricane. Additionally, there is
a default essential facilities and lifeline systems database; however, these data sets are incomplete and
usually need augmentation and/or adjustments.
Hazes default building inventory data can be presented by general occupancy and by general building
type. The distribution of buildings across the various construction classes given in Table 6-0-7 is
estimated using Hazes default relationships (e.g., X% of offices may be built of concrete frame, Y%
of offices may be built of reinforced masonry, etc.). The actual distribution of building across these
construction types may be different.
The Hazes essential facilities default data is also used for the analysis. Potential impacts are estimated
using the construction type and design level assumed for the essential facilities considered in the Hazes
risk assessment. A more accurate risk assessment could be conducted if additional facility information
was collected, such as structural system, number of stories, year of construction/seismic code used for
design, building square footage, building replacement value, and content replacement value. It should
also be noted that the Hazes default database represents each school campus with a single building
record of an assumed construction type.

City of Pasadena
2018 Multi-Hazard Mitigation Plan
107
Most public schools are multi-building campuses, built over a period of years (i.e., buildings may be
designed to different seismic codes). To improve the risk assessment for public schools, information
on each individual building would need to be collected.
The lifeline inventory within HAZUS is divided between transportation and utility lifeline systems.
There are seven (7) transportation systems in Hazes that include 1) highways, 2) railways, 3) light rail,
4) buses, 5) ports, 6) ferries and 7) airports; while the six (6) utility systems include 1) potable water,
2) wastewater, 3) natural gas, 4) crude & refined oil, 5) electric power, and 6) communications.
6.1.2 Analysis of Exposure of Key Assets to Hazards
The approach used to complete this effort involves using GIS software to geolocation each key asset
to identify which fall within the hazard exposure area (footprint). The results provide an overview of
the total number of exposed key assets and if possible, the estimate cost of building replacement and
content. Section 4.2.14 provides a summary of the categories of key assets identified by the City of
Pasadena. While similar, this list is different than the Hazes list which was developed to estimate
damage (loss) from hazards. Information for government-owned or -operated facilities (building
replacement cost and building content costs) were reviewed and updated as needed; where available
the same information was reviewed and updated for the privately owned or operated facilities. As
mentioned previously, a complete list of the key assets can be found in Appendix D.
6.1.3 Qualitative Estimate of Impacts from Hazards
The approach used to complete this effort involves utilizing readily available data (i.e., historical and
recent events), After Action Reports, and census data to extrapolate and estimate potential
vulnerability. In some cases, the estimation built upon historic events but projected worst-case
potentials.
6.2 SCIENTIFIC LOSS ESTIMATION ANALYSIS
There have been several earthquake risk assessments completed using the Hazes model done for the
Pasadena area. These assessments were done as part of other projects but can be leveraged for this
plan. While there are several earthquakes scenarios that are in closer proximity to Pasadena (i.e., M6.5
along the Raymond fault, M6.7 along the Verdugo Fault, M7.1 along the Puente Hills fault, M6.8 along
the Whittier fault, and the M6.9 along the Newport-Inglewood fault), the Planning Committee focused
on the earthquake scenario developed by the United States Geological Survey (USGS), commonly
referred to as the Southern California ShakeOut scenario, to assess potential impacts in the region. The
“ShakeOut” scenario is the simulation of the magnitude 7.8 scenario on the San Andreas fault in
Southern California (Figure 6-5).

City of Pasadena
2018 Multi-Hazard Mitigation Plan
108
Figure 6-5 M7.8 Earthquake on the San Andreas Fault- Southern California
The M7.8 earthquake scenario ruptures 186 miles of the San Andreas fault from Bombay Beach at the
edge of the Salton Sea in the south to Lake Hughes northwest of Palmdale in the north. The final slip
(offset across the fault) ranges from 6-23 ft. This scenario also had the most readily available
information which presented estimates for the region and the city.
An overview of the Hazes results the City of Pasadena and Los Angeles County for the M7.8
earthquake scenario is provided in Table 6-0-6. Table 6-0-7 and Table 6-0-8 provides a breakdown
of estimated building damage by general building type and general occupancy (use) type.

City of Pasadena
2018 Multi-Hazard Mitigation Plan
109
Table 6-0-6 M7.8 Earthquake Scenario Impacts
Direct Economic Losses for Buildings ($1,000) Los Angeles Co.
Cap
ital
Sto
ck
Cost of Structural Damage $ 75,052 $ 2,644,589
Cost of Non-Structural Damage $ 219,081 $ 10,162,098
Cost of Contents Damage $ 88,724 $ 4,548,931
Inventory Loss $ 1,125 $ 127,886
Inco
me
Relocation Loss $ 1,132 $ 35,799
Capital-Related Loss $ 12,224 $ 305,052
Rental Income Loss $ 20,842 $ 683,136
Wage Losses $ 16,244 $ 466,476
Total Direct Economic Loss $ 434,424 $ 18,973,967
Casualties
Level 1 - minor injuries, basic first aid 290 12,254
Level 2 - hospital treat & release 2 98
Level 3 - injuries requiring hospitalization 0 15
Level 4 - fatalities 1 69
Total Casualties 293 12,436
Shelter
Displaced Households 623 27,941
People Requiring Short-term Shelter 200 12,069
Debris (in 1,000 tons)
Brick, Wood & Other (Light) Debris 25 1,101
Concrete & Steel (Heavy) Debris 65 2,368
Total Debris 90 3,469
Table 6-0-7 Estimated Damage by Building Type- M7.8 Earthquake Scenario
General Building Type Damage State
None Slight Moderate Extensive Complete Concrete
Pasadena 397 190 144 51 10
LA Co 29,806 6,862 4,483 1,145 364
Manufactured Housing
Pasadena 0 0 1 0 0
LA Co 329 202 497 575 512
Precast Concrete
Pasadena 93 20 6 1 0
LA Co 8,825 1,312 465 52 5
Reinforced Masonry
Pasadena 535 84 41 17 1
LA Co 35,979 3,565 1,709 402 88
Steel
Pasadena 163 93 73 15 2
LA Co 8,138 2,623 1,910 412 78
Unreinforced Masonry

City of Pasadena
2018 Multi-Hazard Mitigation Plan
110
Pasadena 224 69 24 4 1
LA Co 9,201 1,386 446 95 53
Wood Frame (other)
Pasadena 2,161 924 294 17 1
LA Co 131,036 21,046 6,885 1,922 553
Wood Frame (single family)
Pasadena 20,924 4,223 287 1 0
LA Co 1,452,616 188,618 31,841 2,077 178
Table 6-0-8 Estimated Building Damage by Occupational Use- M7.8 Earthquake Scenario
General Building Type Damage State
None Slight Moderate Extensive Complete Agriculture
Pasadena 8 3 2 0 0
LA Co 487 122 62 11 1
Commercial
Pasadena 1,582 528 274 59 10
LA Co 93,798 15,645 7,678 1,618 417
Education
Pasadena 148 26 10 2 0
LA Co 2,676 330 167 44 9
Government
Pasadena 3 1 0 0 0
LA Co 142 25 13 3 1
Industrial
Pasadena 189 58 56 28 3
LA Co 27,075 3,815 2,019 591 173
Other Residential
Pasadena 5,689 1,589 283 15 1
LA Co 348,679 40,394 8,123 2,344 1,042
Religion
Pasadena 202 52 18 2 0
LA Co 7,464 1.062 374 70 15
Single Family
Pasadena 16,676 3,348 228 1 0
LA Co 1,195,609 164,221 29,799 2,001 172
6.3 CRITICAL FACILITIES ANALYSIS
The only “priority” hazard, other than Earthquake to have a hazard footprint is Wildfire. However,
there are no models available that can estimate potential damage from wildfire scenarios. Because of
this, the Wildfire hazard is analyzed by estimating the potential exposure of key assets to California
Department of Forestry and Fire Protection, Fire Resource Assessment Program (CDF-FRAP) Fire
Hazard Severity Zones. Table 6-0-9 represents the number of key assets exposed to CDF-FRAP Fire
Hazard Severity Zones within the City of Pasadena.

City of Pasadena
2018 Multi-Hazard Mitigation Plan
111
Table 6-0-9 Key asset Wildfire Exposure
Category Number of Assets
Fire 2
Library/Museum 2
Misc. 3
Police 1
Utilities- Water 15
TOTAL 23
6.4 QUALITATIVE ESTIMATE OF IMPACTS ANALYSIS
This section assesses the risk for the other “priority” hazards that do not have a hazard footprint or
hazard area. In most cases, the hazard footprint is the entire city.
6.4.1 Terrorism
A significant terrorism event could have considerable impact on the population, built environment,
lifeline infrastructure, environment, and the economy. Because of its international recognition and
significant annual events, Pasadena could be targeted by terrorist groups. It is also possible that local
individuals/organizations (commonly referred to as homegrown) could be targeted individuals,
businesses, and events in Pasadena.
6.4.2 Cyber Threats
A significant cyber event could have considerable impact on the population, built environment, lifeline
infrastructure, environment, and the economy. Most jurisdictions have several levels of security in
place, dependent upon security levels of individuals and the geographical locations (onsite or remote).
Many also have redundant dispatch centers with separate systems that can function if the primary center
isn’t functioning.
A cyber-attack can infiltrate many institutions including banking, medical, education, government,
military, and communication and infrastructure systems. The majority of effective malicious cyber-
activity has become web-based. Recent trends indicate that hackers are targeting users to steal personal
information and targeting computers to cause system failures. The duration of a cyber-attack is
dependent on the complexity of the attack, how widespread it is, how quickly the attack is detected,
and the resources available to aid in restoring the system. A cyber-attack could be geared toward one
organization, one type of infrastructure and/or a specific geographical area. The affected area could
range from small to large scale. Cyber-attacks generated toward large corporations can negatively
affect the economy. A 2014 report from the MacAfee Corporation stated that the annual global loss to
the global economy is between $375B and $500B. Attacks geared toward critical infrastructure and
hospitals can result in the loss of life and the loss of basic needs, such as power and water, to the general
public. Cyber-attacks can lead to the loss of operational capacity.
6.4.3 Drought/Water Shortage
Past experience with droughts indicates that impacts are felt first by those most dependent on or
affected by annual rainfall – fire departments, ranchers engaged in dryland grazing, rural residents
relying on wells in low‐yield rock formations, or other small water systems lacking a reliable water
source.

City of Pasadena
2018 Multi-Hazard Mitigation Plan
112
However, drought and water shortage can happen citywide; and have significant impacts on the
populations and the economy. In some cases, droughts can also cause significant increases in food
prices to the consumer due to shortages.
Drought can have secondary impacts too. For example, drought is a major determinant of wildfire
hazard, in that it creates greater propensity for fire starts and larger, more prolonged conflagrations
fueled by excessively dry vegetation, along with reduced water supply for firefighting purposes.
Climate change has the potential to make drought events more common in California. Extreme heat
creates conditions more conducive for evaporation of moisture from the ground, increasing the
possibility of drought. A warming planet could lead to earlier melting of winter snow packs, leaving
lower stream flows and drier conditions in the late spring and summer. Snow packs in northern
California are important for water storage and ensuring adequate supply in the summer months when
water is most needed. Changing precipitation distribution and intensity have the potential to cause more
of the fallen precipitation run-off rather than be stored. The result is an increased potential for more
frequent and more severe periods of drought.
6.4.4 Civil Disturbance
A civil disturbance, depending on the cause and effect, could have a considerable impact on the
population, built environment, lifeline infrastructure, economy, and the environment. Downtown Los
Angeles is a frequent site of demonstrations due to its high profile and presence of government
buildings. It is conceivable that a demonstration could turn to violence and begin spreading into
neighboring communities. While the City of Pasadena does not have a history of riots, it also has a
high profile and has several events which attract large crowds. This coupled with increased causes
creating disharmony within society may provide opportunities for some individuals.
6.4.5 Windstorm
Windstorms have the capability of being of long or short duration. While longer duration events can
have significant impact on the population, built environment, lifeline infrastructure, or the economy,
shorter duration events can be just as damaging if the winds are powerful. As can be expected, these
events will only become more frequent and severe when factoring in climate change considerations.
This could include both the increase of frequency, as well as, the increase in intensity. A case could
also be made that the increase of windstorm events could trigger the increase of other hazards. For
example, prolonged periods of high winds, whether short or long, could create issues with trees and
power lines; combining to create prolonged power outages.
Other impacts from windstorms include:
Life and Property
Based on the history of the region, windstorm events can be expected, perhaps annually, across
widespread areas of the region. Obviously, the city and surrounding region can be adversely
impacted during a windstorm event. This can result in the involvement in the City of Pasadena’s
emergency response personnel during a wide-ranging windstorm or microburst tornadic activity.
Both residential and commercial structures with weak reinforcement are susceptible to damage.
Wind pressure can create a direct and frontal assault on a structure, pushing walls, doors, and
windows inward. Conversely, passing currents can create lift suction forces that pull building
components and surfaces outward.

City of Pasadena
2018 Multi-Hazard Mitigation Plan
113
With extreme wind forces, the roof or entire building can fail, causing considerable damage. Debris
carried along by extreme winds can directly contribute to loss of life and indirectly to the failure
of protective building envelopes, siding, or walls. When severe windstorms strike a community,
downed trees, power lines, and damaged property can be major hindrances to emergency response
and disaster recovery.
Utilities
Historically, falling trees and other flying debris have been the major cause of power outages in
the region. Windstorms such as strong microbursts and Santa Ana Wind conditions can cause flying
debris and downed utility lines. For example, tree limbs breaking in winds of only 45 mph can be
thrown over 75 feet. As such, overhead power lines can be damaged even in relatively minor
windstorm events. Falling trees can bring electric power lines down to the pavement, creating the
possibility of lethal electric shock. Rising population growth and new infrastructure in the region
creates a higher probability for damage to occur from windstorms as more life and property are
exposed to risk.
Infrastructure
Windstorms can result in direct damage and indirect consequences (interrupted services) to the
local economy. Direct impacts include damages to buildings, personnel, and other vital equipment;
while secondary (indirect) impacts include economic losses. Windstorms can collapse or damage
buildings, roads, bridges, traffic signals, streetlights, parks, and other facilities. Windstorms can
damage buildings/properties and infrastructure due to falling trees and flying debris. During wet
winters, saturated soils cause trees to become less stable and more vulnerable to uprooting from
high winds. Roads blocked by fallen trees during a windstorm may have severe consequences to
people who need access to emergency services. Emergency response operations can be complicated
when roads are blocked or when power supplies are interrupted.
Increased Fire Threat
Perhaps the greatest danger from windstorm activity in Southern California comes from the
combination of windstorms and wildfires. With the Santa Ana winds driving the flames, the speed
and reach of the flames are greater than in times of calm wind conditions.
Transportation
Windstorm activity can have an impact on local transportation infrastructure. During periods of
extremely strong winds, major roads and highways can be temporarily closed to personal,
commercial (high profile trucks), and recreational vehicle traffic. However, typically these
disruptions are not long lasting, nor do they carry a severe long-term economic impact on the
region.
6.4.6 Infectious Disease
The city, as well as the state and country, are vulnerable to infectious disease (epidemics or pandemics)
caused by either newly emerging or existing diseases spread person to person, through a vector such
as a mosquito, or both. The Centers for Disease Control and Prevention (CDC) and the Los Angeles
County Department of Public Health have considered the impact of disease outbreaks on urban areas
in the United States.

City of Pasadena
2018 Multi-Hazard Mitigation Plan
114
For example, the rapid transmission of influenza could result in the closure of local schools, surge in
hospital visits, and a reduced ability to provide basic City services including public safety.
A significant epidemic or pandemic disease event can have considerable impact on the population, the
economy, and essential public services. Pasadena is one of three cities in California that maintains a
city-based health department, and therefore has local capacity to develop and exercise response plans
related to infectious disease outbreaks. Plans are developed through the coordination efforts of partner
agencies to establish a solid foundation for improved coordination and intervention by all participants.
Implementation of plans would enable the city to fulfill their significant roles and responsibilities
through a coordinated strategy aimed at protecting the public’s health and minimizing the impact on
the economy and essential public services.
6.4.7 Agricultural Pest and Disease
A significant agricultural pest and/or disease event will have an impact on the environment and the
community, but since there is limited agriculture and/or crops, it will not impact the local economy.
While nurseries and home improvement store garden sections may be impacted the greatest effects will
be felt by property owners. Another impact will be to the overall community as tree lined streets may
be effect causing a permeant alteration to the community’s character and feel.
6.4.8 Energy Shortage/Outage
Energy shortage/outages (disruptions) are considered a form of lifeline system failure and could have
a significant impact on the population, built environment, infrastructure, and the economy. Disruptions
can be the consequence of another hazard, or can be the primary hazard, absent of an outside trigger.
Pasadena and Southern California as a whole, has experienced a population growth, this coupled with
changes to daily life styles and weather have contributed to a heavy demand for power over recent
years.
There are two (2) factors to consider: 1) increased demand within the city; and, 2) increased demand
elsewhere. Because Pasadena is connected to the Southern Californian Edison (Edison) power grid,
increases in other parts of the state could curtail the energy available to Pasadena. This vulnerability is
compounded by the reality that our communities have become more reliant on power for gadgets and
appliances to perform basic daily activities. This loss of power will not only be an inconvenience but
could become a life-threatening experience. Many citizens rely on power to operate medical machinery
to survive (i.e., oxygen tanks, dialysis machines).
Climate change considerations indicate that as the weather conditions change, there could be an
increase in energy needs. This could be from both potential increase in heat and cold. These predicted
increases will put ever-greater strain on Pasadena’s energy supply.
6.4.9 Flood
Although not a “priority” hazard, it is worth to note aspects of the Flood hazard. As previously
mentioned, flooding in the City of Pasadena is generally related to urban flooding; not riverine flooding.
In addition, although the city is not a participating member of the NFIP and has gone through several
flood events in which properties have experienced repetitive loss, there are no properties that fall under
the NFIP definition of Repetitive Loss Properties.

City of Pasadena
2018 Multi-Hazard Mitigation Plan
115
Repetitive loss properties are defined as property that is insured under the NFIP that has filed two or
more claims in excess of $1,000 each within any consecutive 10-year period since 1978.
The City of Pasadena has two repetitive loss properties, both residential properties. One property has
two (2) claims and is located on the southern boundary of Eaton Canyon Park; the other property has
three (3) claims and is located just west of the Rose Bowl.

City of Pasadena
2018 Multi-Hazard Mitigation Plan
116
7 Mitigation Strategies
7.1 OVERVIEW
The City of Pasadena’s Mitigation Strategy is derived from an in-depth review of the revised hazards,
vulnerabilities, and capabilities sections of this plan coupled with the Steering Committee’s vision for
creating a disaster resistant and sustainable community for the future. The Steering Committee’s vision
is expressed in terms of Goals and Objectives. A focused set of Goals and Objectives helped assist the
Steering Committee identify needed mitigation actions. The Goals and Objectives should consider both
mitigation challenges and opportunities.
To begin, the Steering Committee reviewed the Goals and Objectives and the mitigation actions
identified in the City of Pasadena 2013 Local Hazard Mitigation Plan (LHMP). The Goals and
Objectives were reviewed to ensure that they still reflect the intended vision. Then the previous
mitigation actions were reviewed to determine the current status of action (complete,
underway/planned, or not started). With a validation (or revision) of the Goals and Objectives and an
understanding of the status of the previous mitigation actions the Steering Committee could evaluate
whether any of the unfinished mitigation action were still needed. This process also helped identify
new mitigation actions that may be needed. Lastly, with a new list of recommended mitigation actions
an implementation plan for each of the mitigation actions was prepared, providing a roadmap forward.
7.2 MITIGATION GOALS AND OBJECTIVES
The Goals and Objectives in the existing LHMP were reviewed by the Steering Committee. Based on
current hazard profiles and knowledge of existing vulnerabilities and capabilities, appropriate revisions
were made to the Goals and Objectives. The City of Pasadena LHMP Steering Committee has reviewed
the goals and objectives for adoption as of August 2018. The revised set of Goals and Objectives are
outlined below:
GOAL 1 PROTECT LIFE AND PROPERTY
Objective 1.1 Implement activities that assist in protecting lives by making homes, businesses,
infrastructure, critical facilities, and other property more resistant to losses
from natural hazards.
Objective 1.2 Reduce losses and repetitive damages for chronic hazard events while promoting
insurance coverage for catastrophic hazards.
Objective 1.3 discouraging new development in high hazard areas and encouraging
preventative measures for existing development in areas vulnerable to natural
hazards.
GOAL 2 PUBLIC AWARENESS:
Objective 2.1 Develop and implement education and outreach programs to increase public
awareness of the risks associated with natural hazards.
Objective 2.2 Provide information on tools, partnership opportunities, and funding resources
to assist in implementing mitigation activities.

City of Pasadena
2018 Multi-Hazard Mitigation Plan
117
GOAL 3 NATURAL SYSTEMS:
Objective 3.1 Balance natural resource management and land use planning with natural hazard
mitigation to protect life, property, and the environment.
Objective 3.2 Preserve, rehabilitate, and enhance natural systems to serve natural hazard
mitigation functions.
GOAL 4 PARTNERSHIPS AND IMPLEMENTATION:
Objective 4.1 Strengthen communication and coordinate participation among and within public
agencies, citizens, non-profit organizations, businesses, and industry to gain a
vested interest in implementation.
Objective 4.2 Encourage leadership within public and private sector organizations to prioritize
and implement local and regional hazard mitigation activities.
GOAL 5 EMERGENCY SERVICES:
Objective 5.1 Establish policy to ensure mitigation actions for critical facilities, services, and
infrastructure.
Objective 5.2 Strengthen emergency operations by increasing collaboration and coordination
among public agencies, non-profit organizations, businesses, and industry.
Objective 5.3 Coordinate and integrate natural hazard mitigation activities, where appropriate,
with emergency operations plans and procedures.
7.3 PREVIOUS MITIGATION ACTION PROGRESS
As part of the LHMP update process, FEMA requires that the Mitigation Strategy section describe the
status of mitigation actions included in the previous plan. A meeting was held with the Steering
Committee to review the mitigation actions included in the 2013 City of Pasadena LHMP. For
convenience, a numbering system was incorporated which was not part of the 2013 LHMP. During the
Steering Committee meeting members identified whether the mitigation action was completed,
ongoing, underway/planned, or not completed. Results were used when discussing recommended
mitigation actions (Section 7.5). Table 7-10 indicates the status of each of the 2013 mitigation actions.
Table 7-10 Status of 2013 Mitigation Actions
Mitigation Action Mitigation Sub Action Status
Multi-hazard- Short-term #1
Integrate the goals and action
items from the City of Pasadena
Multi-Hazard Mitigation Plan into
existing regulatory documents and
programs, where appropriate
1 Use the Mitigation Plan to help the
City's General Plan institutionalize
guidelines for sustainable development
in all new construction and
development projects according to the
hazards that impact the City of Pasadena
Ongoing
2 Integrate the City's Mitigation Plan into
current capital improvement plans to
ensure that development plans include
specific strategies for mitigation requirements
Ongoing
Multi-hazard- Short-term #2 3 Develop public and private partnerships
for hazard mitigation activities Ongoing

City of Pasadena
2018 Multi-Hazard Mitigation Plan
118
Identify and pursue funding
opportunities to develop and
implement local and City mitigation activities
4 Track state and federal grant programs
which support location mitigation
programs
Ongoing
Multi-hazard- Short-term #3
Develop public and private
partnerships to foster hazard
mitigation program coordination
and collaboration in City of
Pasadena
5 Identify organizations within City of
Pasadena that have programs or
interests in hazards mitigation
Complete
6 Involve private businesses throughout
the City in hazard mitigation awareness
and planning
Ongoing
7 Encourage continuity planning for local
businesses as part of community wide hazard mitigation efforts
Ongoing
Multi-hazard- Long-term #1
Strengthen emergency services
preparedness and response by
linking emergency services with
hazard mitigation programs
8 Ensure on-going operational planning
for emergencies includes recognition
and inclusion of hazard mitigation
requirements
Ongoing
9 Coordinate with neighboring
jurisdictions regarding their specific
hazard mitigation challenges and plans
Ongoing
10 Coordinate the maintenance of
emergency transportation routes
through communication with the
County Department of Public Works,
neighboring jurisdictions, Metrolink
and the California Department of Transportation
Ongoing
Multi-hazard- Long-term #2
Establish a formal role for the
City of Pasadena Hazard
Mitigation Advisory Committee to
develop a sustainable process for
implementing, monitoring, and
evaluating citywide mitigation
activities
11 Establish clear roles for participants,
meeting regularly to pursue and
evaluate implementation of mitigation
strategies through the disaster
coordinators meeting
Ongoing
12 Oversee implementation of the Multi-
Hazard Mitigation Plan
Ongoing
13 Monitor hazard mitigation
implementations by jurisdictions
and participating organizations
through surveys and other reporting
methods
Complete
14 Develop updates for the Multi-Hazards
Mitigation Action Plan based on new
information
Complete
15 Conduct a full review of the Multi-
Hazards Mitigation Action Plan every 5
years by evaluating mitigation
successes, failures, and areas that were not addressed
Complete
16 Provide training for Committee
members to remain current on
developing issues in the natural hazard
loss reduction field
Complete
Multi-hazard- Long-term #3
Develop and implement outreach
programs designed to educate the
public about hazard mitigation
17 Make the City of Pasadena Multi-
Hazard Mitigation Plan available to the
public by publishing the Plan
electronically on the City websites
Ongoing

City of Pasadena
2018 Multi-Hazard Mitigation Plan
119
18 Provide information regarding
mitigation hazards and planning at
events promoted by the City
Ongoing
19 Include emergency preparedness
information related to hazard mitigation
in public safety information and
training programs (e.g. Citizen’s
Academy, Community Emergency
Response Team Program)
Ongoing
Multi-hazard- Long-term #4
Use technical knowledge of
natural ecosystems and events to
20 Review ordinances that protect natural
systems and resources to mitigate for
natural hazards for possible enhancements
Ongoing
link natural resource management
and land use organizations to
mitigation activities and technical
assistance
21 Pursue vegetation and restoration
practices that assist in enhancing and
restoring the natural and beneficial
functions of the watershed
Ongoing
Multi-hazard- Long-term #5
Develop a long-term approach to
monitoring hazard mitigation
planning by conducting meetings
of the Hazard Mitigation Advisory
Committee annually
22 Review mitigation efforts from the past
six months for effectiveness
Complete
23 Identify changes in regulations, regional
planning, or technology which may
impact ongoing mitigation plans or
programs
Complete
24 Prepare an annual report to the City
Manager regarding Multi-Hazard
mitigation efforts in the City of Pasadena
Complete
Earthquake- Short-term #1
Partner with the California
Institute of Technology and other
institutions (located in Pasadena)
to identify advances in earthquake
effects modeling
25 Use the latest advances in
understanding the effects of
earthquakes in urban areas to improve
local standards and requirements for
earthquake resistant private
construction
Ongoing
26 Use CalTech’s or other institutions
latest advances in understanding of the
impact of earthquake’s on municipal
infrastructure to harden critical systems
necessary for earthquake recovery
efforts
Ongoing
Earthquake- Short-term #2
Incorporate all earthquake
evacuation planning developed by
the Los Angeles County
Emergency Alliance, Sheriff’s
Department, and Mutual Aid Area
C into the City of Pasadena Emergency Operations Plan.
27 Conduct a review to determine if any
changes have been made to area-wide evacuation plans
Ongoing
28 Integrate any Los Angeles County
evacuation routes data into the City of
Pasadena Emergency Operations Plan
Ongoing
Earthquake- Long-term #1
Encourage purchase of
earthquake hazard insurance
29 Provide earthquake insurance
information to the City of Pasadena
residents
Complete
30 Coordinate with the State of California
program to produce and distribute
earthquake insurance information
Complete

City of Pasadena
2018 Multi-Hazard Mitigation Plan
120
Earthquake- Long-term #2
Conduct seismic evaluations of
critical facilities in the City of
Pasadena to identify
vulnerabilities of buildings and
infrastructure
31 Coordinate with California Institute of
Technology (Cal Tech) staff or other
institutions to identify structures based
on their use, construction type, and
potential risk to failure during earthquakes
Complete
32 Provide information to private building
owners on potential risks from
earthquake damage and options for
mitigating these affects
Complete
Earthquake- Long-term #3
Evaluate, repair or replace rubble
walls in the Arroyo Seco Park Area
33 Evaluate all rubble walls in the Arroyo
Seco Park Area
Complete
34 Repair or replace the walls to make
them resistant to earthquake and floods
Complete
Flood-Short-term #1
Analyze potential flood properties
or locations within the City of
Pasadena and identify
appropriate and feasible
mitigation options
35 Identify appropriate and feasible
mitigation activities for potential flood
properties.
Complete
36 Encourage and assist property owners
to engage in mitigation activities.
Complete
Flood-Short-term #2
Recommend revisions to
requirements for development
within potential flood areas.
Include private property owners
and developers in reviewing
development standards
37 Evaluate elevation requirements for
new residential and nonresidential
structures in the unincorporated
floodplain area
Ongoing
38 Provide opportunities for private
property owners and developers to offer
suggestions and feedback on standards
for development in potential flood areas.
Ongoing
Flood-Long-term #1
Encourage development of
strategies to preserve open space
for flood mitigation, fish habitat,
and water quality in the localized
floodplain
39 Conduct biannual reviews of existing
flood and water use management
projects.
Ongoing
40 Promote regional partnerships between
flood mitigation, fish habitat, and water
quality enhancement organizations and
programs.
Ongoing
41 Identify sites where environmental
restoration work can benefit flood
mitigation, fish habitat, and water
quality and supply.
Ongoing
Flood-Long-term #2
Identify surface water drainage
obstructions within the City of
Pasadena
42 Prepare an inventory of major urban
drainage problems and identify causes
and potential mitigation actions for
urban drainage problem areas.
Ongoing
43 Use this list to establish priorities for
maintenance and removal of mud and debris.
Ongoing
Flood-Long-term #3
Improve water management and
flood control efforts in the
Hahamongna Watershed and
Arroyo Seco park areas. Protect
and restore natural habitats where
practical
44 Replace aging storm drains. Ongoing
45 Monitor sediment buildup and remove
as necessary. Ongoing
46 Restore natural habitats near flood
basins Ongoing
47 Raise park roadways where necessary
to improve the flow of water
downstream.
Ongoing

City of Pasadena
2018 Multi-Hazard Mitigation Plan
121
Flood-Long-term #4
Upgrade the City storm drain
system. The City of Pasadena has
many miles of storm drains, some
of which are over 80 years old.
Normal use combined with
frequent seismic events can
gradually weaken the system and
result in failures during periods of heavy water flow
48 Continue annual Storm Drain
inspections. Ongoing
49 Restore/replace any damaged section of
the Storm Drain system Ongoing
Flood-Long-term #5
Repair and replace the raised
concrete gutters and curbs in the
City. The gutters and curbs are
critical for directing runoff during
flooding conditions. They protect
vehicles and pedestrians as well
as structures during flooding
events. Gutters and curbs are
often damaged or displaced by
tree root
50 Continue annual inspections Ongoing
51 Restore/replace any damaged portions
of the curb or gutter system Ongoing
Landslide- Short-term #1
Improve knowledge of landslide
hazard areas and understanding
of vulnerability and risk to life
and property in hazard-prone
areas. Increase coordination
between City Departments regarding landslide risk areas.
52 Conduct an annual review of potential
landslide areas in the City of Pasadena
Ongoing
53 Provide private property owners maps
of possible risk areas
Ongoing
Landslide- Short-term #2
Identify safe evacuation routes in
high-risk debris flow and landslide
areas
54 Identify potential debris removal
resources Ongoing
55 Increase participation in regional
committee planning for emergency
transportation routes
Ongoing
56 Identify and publicize information
regarding emergency transportation
routes
Complete
Landslide- Long-term #1
Review local ordinances
regarding building and
development in landslide prone
areas
57 Review local ordinances for building in
potential landslide areas based on
proposed development plans and
current environmental conditions
Ongoing
58 Create committee of local stakeholders
to study the issues and make
recommendations to staff
Ongoing
Windstorm-Short-term #1
Provide public warning during
periods when high winds are
forecast for the area
59 Provide warnings on the City website Ongoing
60 Provide public service announcements
to the media Ongoing
Windstorm-Long-term #1
Assist private property owners
regarding windstorm mitigation
activities
61 Provide information on the City website
about annual tree maintenance
programs to limit damage from falling
debris including tree trimming and debris removal
Ongoing

City of Pasadena
2018 Multi-Hazard Mitigation Plan
122
62 Provide information on the City website
regarding property protection strategies
to limit damage from windstorms
Complete
Windstorm-Long-term #2
Upgrade the current utility pole
system in the City. The City of
Pasadena is gradually moving
electrical utilities underground.
Pasadena has 14,000 wooden
utility poles, many of which are over 30 years old
63 Continue annual inspections Ongoing
64 Restore/replace any worn or damaged
power poles. Ongoing
Human Threat- Short-term #1
Develop contingency plans for
responding to a light rail accident
in the downtown area
65 Develop and coordinate planning with
Mutual Aid Area C for light rail
accident involving mass casualties
Ongoing
Human Threat- Short-term #2
Develop contingency plans for
responding to a terrorist incident in Pasadena
66 Develop and coordinate planning with
Mutual Aid Area C for terrorist events
involving mass casualties
Ongoing
Human Threat- Short-term #3
Develop contingency plans for
responding to a terrorist incident
in Pasadena
67 Develop and coordinate planning with
Mutual Aid Area C for civil unrest
events involving mass arrests
Ongoing
68 Provide mobile field force training for
Pasadena police officer Complete
Human Threat- Short-term #4
Develop contingency plans for
responding to a pandemic
outbreak involving Pasadena
69 Develop and coordinate planning with
LA County Department of Health for distribution of medicines
Ongoing
70 Prepare a plan for reducing City
services due to sickness Ongoing
71 Prepare an operational plan for
coordination of efforts with the local
school district
Ongoing
Human Threat- Long-term #1
Develop contingency plans for
responding to a mass casualty
event involving Pasadena
72 Develop and coordinate planning with
LA County Mutual Aid Area C Ongoing
73 Prepare a plan with local hospitals and
the Los Angeles Coroner’s office
Ongoing
74 Prepare an operational plan for
coordination of efforts with the local
school district
Ongoing
It is worth to mention that although not included as part of the 2013 City of Pasadena LHMP, the City
of Pasadena has completed several projects that have been beneficial to the City’s mitigation efforts.
Below is a sample of some of those mitigation actions:
Monk Hill Treatment Plant- the Monk Hill Treatment Plant located in Northwest Pasadena
near NASA’s Jet Propulsion Lab (JPL), is a state-of-the-art water treatment plant that is part
of an ongoing effort to remove perchlorate and volatile organic compounds (VOCs) from the
groundwater. The plant is funded by NASA and backed by the U.S. EPA, California
Department of Toxic Substances Control and the Los Angeles Regional Water Quality Board.
Glenarm Repowering Project- the Pasadena Department Water and Power completed the
Glenarm Repowering Project, an extensive power plant upgrade that includes the replacement
of a 51-year-old steam- g e n e r a t i n g unit, with a more efficient combined cycle turbine
unit

City of Pasadena
2018 Multi-Hazard Mitigation Plan
123
known as Gas Turbine 5 (GT-5). Now fully operational, GT-5 provides Pasadena with clean,
natural-gas fueled power that is the most efficient and environmentally “clean” unit in its class.
7.4 MITIGATION PRIORITIZATION
FEMA requests that all proposed mitigation actions be prioritized. The Steering Committee decided to
use an evaluation process to prioritize the proposed mitigation actions. The STAPLEE Criteria process
was used to evaluate the feasibility of each of the mitigation actions being considered for inclusion in
the 2018 LHMP. STAPLEE is an acronym with each letter standing for a subject area which should be
considering when implementing a project/action. STAPLEE stands for Social, Technical,
Administrative, Political, Legal, Economic, and Environmental. Each of these areas can pose a threat
(or challenge) for a project/action. The questions considered under the STAPLEE criteria, included the
following:
Social
Is the proposed action socially acceptable to the community?
Are there equity issues involved that would mean that one segment of the community is
treated unfairly?
Will the action cause social disruption?
Technical
Will the proposed action work?
Will it create more problems than it solves?
Does it solve a problem or only a symptom?
Is it the most useful action in light of other community goals?
Administrative
Can the community implement the action?
Is there someone to coordinate and lead the effort?
Is there sufficient funding, staff, and technical support available?
Are there ongoing administrative requirements that need to be met?
Political
Is the action politically acceptable?
Is there public support both to implement and to maintain the project?
Legal
Is the community authorized to implement the proposed action? Is there a clear legal basis
or precedent for this activity?
Are there legal side effects? Could the activity be construed as a taking?
Is the proposed action allowed by the general plan, or must the general plan be amended to
allow the proposed action?
Will the community be liable for action or lack of action?
Will the activity be challenged?
Economic
What are the costs and benefits of this action?
Do the benefits exceed the costs?

City of Pasadena
2018 Multi-Hazard Mitigation Plan
124
Are initial, maintenance, and administrative costs taken into account?
Has funding been secured for the proposed action? If not, what are the potential sources
(public, non-profit, and private)?
How will this action affect the fiscal capability of the community?
What burden will this action place on the tax base or local economy?
What are the budget and revenue effects of this activity?
Does the action contribute to other community goals, such as capital improvements or
economic development?
What benefits will the action provide?
Environmental
How will the action affect the environment?
Will the action need environmental regulatory approvals?
Will it meet local and state regulatory requirements?
Are endangered or threatened species likely to be affected?
A scale of 1 – 5 where 5 is favorable/beneficial or NO major issues/opposition; 3 is middle of the road,
and 1 is unfavorable/not beneficial or major issues/opposition was used to score each STAPLEE
criteria. Each STAPLEE criteria score was totaled to achieve one relative score for each mitigation
action.
This evaluation is intended to assist the city to focus their efforts on those actions with the greatest
potential for implementation. However, it is recognized that the criteria is not weighted; some criteria
may be considered more important than others in determining the final prioritization of individual
mitigation actions. For example, the urgency of implementing a mitigation action to address a high
priority hazard, or the current availability of funding to initiate a mitigation action affected the final
priority assigned to each mitigation action. The Steering Committee engaged in an interactive
consensus building exercise to assign a priority rating of High, Medium or Low to each of the
mitigation actions under consideration. The final list of mitigation actions, the STAPLEE score
assigned and the final priority ranking are presented in the next section. The highest possible score any
mitigation action could receive, based on the scoring criteria is 35. The scores assigned range from a
low of 20 to a high of 31.
7.5 PROPOSED MITIGATION ACTIONS
The table below (Table 7-11) represents the proposed mitigation actions and ranking (or scoring) as
identified by the Steering Committee. The list of proposed mitigation actions is a combined effort of
reviewing and evaluating previous mitigation actions (Section 7.3), understanding current hazards
(Section 5), assessing current vulnerabilities against current capabilities (Section 6 and Section 4), and
incorporating new, best practices.
As part of the assessment of current capabilities, emphasis was placed on evaluating current plans,
programs, policies, regulations, and codes to determine if there are any deficiencies or if new plans,
programs, policies, regulations, and codes were needed. The findings of this evaluation are captured in
the form of new mitigation actions. As mentioned earlier, the focus of the mitigation actions was
focused on the “high priority” hazards; however, some mitigation actions also address lower priority
hazards.

City of Pasadena
2018 Multi-Hazard Mitigation Plan
125
Previous mitigation actions that have been “completed” were deleted from the list. Mitigation actions
identified as “ongoing”, “underway/planned”, or “not completed” were reevaluated to determine if
they were still relevant and should be carried forward. Mitigation actions that were carried forward
were also reviewed for wording; and in several instances existing mitigation actions were changed to
reflect more appropriate needs.
Table 7-11 Proposed Mitigation Actions
Mitigation Action STAPLEE Score
Design water delivery systems to accommodate drought events and develop new or upgrade
existing water delivery systems to eliminate breaks and leaks. 33
Develop a program to retrofit at-risk structures in wildfire hazard areas with non-combustible
materials and technologies. 31
Develop a comprehensive plan to understand and assess local vulnerability to drought by
gathering and analyzing local water and climate data, identifying factors effecting severity of
the drought and determining how the community has been impacted in the past
31
Make the City of Pasadena Multi-Hazard Mitigation Plan available on the City website 30 Develop a comprehensive plan that recognizes wildfire hazards identifying areas of risk and
describing policies and recommendations for addressing the risk including land use and public
safety.
30
Establish and provide annual cyber-security risk briefings to City officials. Possibly leverage
the Department of Homeland Security’s State, Local, Tribal, and Territorial Cyber security
engagement programs.
28
Improve regulations for safer construction in wildfire very high hazard areas addressing access,
signage, fire hydrants, water availability, vegetation management and special building
construction standards.
28
Implement a fuels management program to reduce hazardous vegetation fuels on public lands,
near essential infrastructure and on private lands by working with landowners. 28
Retrofit existing residential buildings, public buildings and critical facilities with modifications
to reduce future wind damage including improving roof coverings, anchoring roof-mounted
utilities, and adding load-path connectors to strengthen structural frames.
28
Establish and conduct annual employee training on privacy and security policies and incident
response procedures. 28
Develop a policy to ensure the City's LHMP is reviewed during the development of capital
improvement plans 28
Upgrade Traffic Signal, Street Lighting Poles, and Systems citywide to meet or exceed
modern loading requirements 26
Seismic Retrofit of City-owned Essential Buildings, including Fire Stations and Evacuation
Centers. 26
Develop a policy to ensure the annual review of potential landslide areas in the City of
Pasadena 26
Develop a Public Outreach Plan geared towards providing hazard education, emergency
management, and mitigation action activities. 26
Review and revise the Emergency Operations Plan (EOP) to reflect response and recovery
Concept of Operations best practices 26
Purchase supplies, equipment, and other resources to enable critical facilities identified in the
EOP to be able to function as needed 26
Review area-wide evacuation plans/routes to identify changes and determine if changes need
to be incorporated in the City Emergency Operations Plan (EOP) and/or Evacuation Plan 25

City of Pasadena
2018 Multi-Hazard Mitigation Plan
126
Develop a Disaster Communications Plan 25 Develop an EOP scenario-based Annex light rail accident 25 Develop an EOP scenario-based Annex for active shooter events 25 Develop a planning team to work with local school districts and universities to prepare both
scenario-based and functional-based plans 25
Utilize drought tolerant landscape design for all new public buildings and develop a plan to
retrofit all existing public buildings with drought tolerant landscape. 25
Develop a plan to move all power lines in severe wind vulnerable areas underground. 25 Develop and adopt a soft-story retrofit ordinance; possibly administer an implementation
program for the ordinance. 24
Evaluate and take necessary actions to ensure robust cyber-security of utility infrastructure and
protection of critical information systems from cyber-attacks/incidents. 24
Partner with the (Cal OES) California Office of Emergency Services and the (Cal-CSIC)
California Cybersecurity Integration Center to assess the risks to Pasadena's critical
infrastructure and information technology networks. Enable cross-sector coordination and
sharing of recommended best practices and security measures. Support cybersecurity
assessments, audits, and accountability programs that help to protect the information
technology networks of California's agencies and departments.
24
Develop a policy and/or possibly a Memorandum of Understanding (MOU) with the County
Department of Public Works, neighboring jurisdictions, Metrolink, and the California 24
Department of Transportation to ensure coordination and maintenance of the emergency
transportation routes 24
Establish a Disaster Coordination group and establish a regular meeting schedule; include both
public and private members; and federal, state, county, and local partners. Part of the duties will include the review, evaluation, and monitoring of the LHMP
24
Provide information to the public regarding hazard mitigation and emergency planning at
events promoted by the City 24
Develop a policy that encourages incorporation or consideration of vegetation and restoration
practices that assist in enhancing and restoring the natural and beneficial functions of the
watershed when mitigation against hazards
24
Develop a policy to ensure the City’s Building Codes are reviewed annually to reflect changes
and best practices in hazard science (flood, earthquake). 24
Develop a Debris Removal Plan. 24 Develop a landslide area-building ordinance. Review local ordinances for building in potential
landslide areas based on proposed development plans and current environmental conditions 24
Develop an EOP functional-based Annex for evacuations 24 Identify City-service, mission critical tasks and develop Business Continuity Plans for each
service 24
Utility infrastructure improvements against earthquake and other hazards including seismic
upgrade of power and water facilities, Sunset reservoir improvements, and upgrades and
replacements of local generating units.
23
Ensure training protocols reflect current and industry best practices in the fields of cyber,
information, and critical infrastructure security. Where necessary or applicable, integrate
cyber-security training in staff’s professional annual training/development goals and/or
performance reviews.
23
Integrate the LHMP into the City’s General Plan 23 Integrate hazard mitigation material into public safety information and training programs (e.g.
Citizen’s Academy, Community Emergency Response Team Program) 23
Prepare an inventory of major urban drainage problems and identify causes and potential
mitigation actions for urban drainage problem areas. 23

City of Pasadena
2018 Multi-Hazard Mitigation Plan
127
Assess and evaluate critical facilities identified in the EOP 23 Evaluate and retrofit critical facilities identified in the EOP 23 Develop an EOP scenario-based Annex for terrorist events 23 Implement measures to bolster local water supply to meet demand, create a sustainable water
supply, while meeting environmental mandates. 23
Develop a drought communication plan and early warning system to facilitate timely
communication of relevant information to officials, decision makers, emergency managers, and
the public.
23
Develop and maintain a database to track community vulnerability to severe wind including
GIS mapping of vulnerable areas. 22
Seismic Retrofit of City-owned Bridges 22 Restoration of habitat, improvements to the watershed, and enhancement of spreading
activities of water runoff to enhance the flood protection systems and preserve the natural
systems
22
Evaluate and implement protective measures of critical utility buildings, plants and facilities
against natural hazards (fire, flood, windstorm) 22
Develop and implement a program to develop Business Continuity Plans of utility mission
critical tasks. Potentially purchase of equipment, mobile electrical sub-stations, and emergency
backup generators for utility facilities; emergency transmission and distribution system
replacements to ensure continuous functionality after disaster events
22
Support enhanced cyber-security training for IT staff to maintain expertise and foster
operational readiness 22
Develop a Floodplain Management/Flood Plan. 22 Develop an EOP functional-based Annex for mass casualties 22
Develop an EOP functional-based Annex for Mass Shelter 22 Develop an EOP scenario-based Annex for civil unrest events 22 Develop a Dam Mitigation Plan. 21 Develop a Vegetation Management Plan. 21 In accordance with the 2011 Water Integrated Resources Plan, develop alternative sources of
water to meet Pasadena’s annual water demands (non-potable water project) 21
Upgrade the Arroyo Seco stream water intake structure to improve our ability to capture more
stream water and to recharge the groundwater basin (Arroyo Seco Project) 21
Develop and coordinate planning with partners for dispensing of medications or vaccines 21 Coordinate infection control planning with partners 21 Vegetation management on City lands in the watershed for water supply enhancement and fire
reduction; Improvements to the Arroyo Seco Canyon; Azusa Hydro upgrades and replacements; and rainwater capture and recycling
20
Develop a program to encourage and support business continuity planning for local businesses 20 Evaluate and implement necessary retrofits and upgrades to the diversion facilities in Arroyo
Canyon 20
Upgrade and replace local generating units 20 Replace emergency transmission and distribution systems 20 Increase wildfire risk awareness by developing education and outreach programs that target
citizens, businesses, developers, landscapers, and insurers with strategies to protect homes and
infrastructure.
19
Evaluate and implement security and protective measures of critical utility buildings, plants
and facilities from man-made hazards (terrorist) 19

City of Pasadena
2018 Multi-Hazard Mitigation Plan
128
Identity the libraries role as a critical facility during response and recovery efforts. Assess the
current facilities and retrofit as needed (i.e., fire systems, seismic upgrades) to ensure the
integrity of library buildings for use as critical facilities during multi-hazard events. Purchase equipment, supplies, and other resources necessary to carry out the intended role.
19
Develop a Landslide Management Plan. 19 Raise park roadways where necessary to improve the flow of water downstream. 19 Purchase emergency generators at facilities 19 Azusa Hydro upgrades and replacements 17 Develop requirements for wind engineering measures and construction techniques in wind
vulnerable areas including structural bracing, straps and clips, anchor bolts, impact resistant
glass, reinforced garage doors, window shutters, waterproof adhesive sealing strips or
interlocking roof shingles.
15
7.6 IMPLEMENTATION PLAN
The following table (Table 7-12) reflects the implementation plan for each proposed mitigation
actions. The implementation plan is the key to a successful LHMP effort. The implementation plan
identifies responsible department, the estimated cost and/or potential funding source to support the
action, and the proposed timeframe for completion.
Table 7-12 Proposed Mitigation Actions- Implementation Plan
Mitigation Action
Sub Action(s)
Relevant
Hazard
Responsible
Departments
Cost/
Funding Source
Action
Timeframe
Develop and adopt a soft-story
retrofit ordinance; possibly
administer an implementation
program for the ordinance.
Earthquake Building & Safety $67.2 million HMA
5 to 7 years
Upgrade Traffic Signal, Street
Lighting Poles, and Systems
citywide to meet or exceed modern
loading requirements
Multi-
hazard
Public Works $5.5 million
HMA
General Fund
3 to 7 years
Seismic Retrofit of City-owned
Essential Buildings, including Fire
Stations and Evacuation Centers.
Earthquake Public Works $50 million
HMA
1 to 5 years
Seismic Retrofit of City-owned
Bridges
Earthquake Public Works $40 million
HMA
1 to 5 years
Utility infrastructure improvements
against earthquake and other
hazards including seismic upgrade
of power and water facilities, Sunset
reservoir improvements, and
upgrades and replacements of local generating units.
Earthquake Water and Power $60-$75 million
HMA
General Fund
4 to 5 years

City of Pasadena
2018 Multi-Hazard Mitigation Plan
129
Restoration of habitat,
improvements to the watershed, and
enhancement of spreading activities
of water runoff to enhance the flood
protection systems and preserve the natural systems
Flood Water and Power $12-$15 million
HMA
General Fund
3 to 5 years.
Vegetation management on City
lands in the watershed for water
supply enhancement and fire
reduction; Improvements to the
Arroyo Seco Canyon; Azusa Hydro
upgrades and replacements; and rainwater capture and recycling
Multi-
hazard
Water and Power $12-$15 million
HMA
General Fund
3 to 5 years.
Evaluate and implement protective
measures of critical utility
buildings, plants and facilities
against natural hazards (fire, flood,
windstorm)
Multi-
hazard
Water and Power $5-$7 million
HMA
2 to 3 years
Evaluate and take necessary actions
to ensure robust cyber-security of
utility infrastructure and protection
of critical information systems from
cyber-attacks/incidents.
Cyber-
Attack
Water and Power $5-$7 million
General Fund
HMA
2 to 3 years
Evaluate and implement security
and protective measures of critical
utility buildings, plants and facilities
from man-made hazards (terrorist)
Terrorism Water and Power $25-$30 million
General Fund
HMA
4 to 5 years.
Develop and implement a program
to develop Business Continuity
Plans of utility mission critical
tasks. Potentially purchase of
equipment, mobile electrical sub-
stations, and emergency backup
generators for utility facilities;
emergency transmission and
distribution system replacements to
ensure continuous functionality after disaster events
Multi-
hazard
Water and Power $5-$7 million
General Fund
HMA
2 to 3 years
Identity the libraries role as a
critical facility during response and
recovery efforts. Assess the current
facilities and retrofit as needed (i.e.,
fire systems, seismic upgrades) to
ensure the integrity of library
buildings for use as critical facilities
during multi-hazard events.
Purchase equipment, supplies, and
other resources necessary to carry
out the intended role.
Multi-
hazard
Library $2-$10 million
HMA
General Fund
2 to 7 years

City of Pasadena
2018 Multi-Hazard Mitigation Plan
130
Partner with the (Cal OES)
California Office of Emergency
Services and the (Cal-CSIC)
California Cybersecurity Integration
Center to assess the risks to
Pasadena's critical infrastructure
and information technology
networks. Enable cross-sector
coordination and sharing of
recommended best practices and
security measures. Support
cybersecurity assessments, audits,
and accountability programs that
help to protect the information
technology networks of California's
agencies and departments.
Cyber-
Attack
Dept. of Information
Technology (DoIT)
$300,000
General Fund
Computing and
Communications
Fund
2 to 3 years
Ensure training protocols reflect
current and industry best practices
in the fields of cyber, information,
and critical infrastructure security.
Where necessary or applicable,
integrate cyber-security training in
staff’s professional annual
training/development goals and/or
performance reviews.
Cyber-
Attack
Dept. of Information
Technology (DoIT)
$200,000
General Fund
1 year
Support enhanced cyber-security
training for IT staff to maintain
expertise and foster operational
readiness
Cyber-
Attack
Dept. of Information
Technology (DoIT)
$100,000
General Fund
Computing and
Communications
Fund
1 year
Establish and provide annual cyber-
security risk briefings to City
officials. Possibly leverage the
Department of Homeland Security’s
State, Local, Tribal, and Territorial
Cyber security engagement programs.
Cyber-
Attack
Dept. of Information
Technology (DoIT)
$75,000
General Fund
Computing and
Communications
Fund
1 year
Establish and conduct annual
employee training on privacy and
security policies and incident
response procedures.
Cyber-
Attack
Dept. of Information
Technology (DoIT)
$200,000
General Fund
1 year
Integrate the LHMP into the City’s
General Plan
Multi-
hazard
Planning $150,000
General Fund
1 -2 years

City of Pasadena
2018 Multi-Hazard Mitigation Plan
131
Develop a policy and/or possibly a
Memorandum of Understanding
(MOU) with the County
Department of Public Works,
neighboring jurisdictions,
Metrolink, and the California
Department of Transportation to
ensure coordination and
maintenance of the emergency transportation routes
Multi-
hazard
Fire $50,000
General Fund
1 year
Establish a Disaster Coordination
group and establish a regular
meeting schedule; include both
public and private members; and
federal, state, county, and local
partners. Part of the duties will
include the review, evaluation, and monitoring of the LHMP
Multi-
hazard
Fire $50,000
General Fund
1 year
Make the City of Pasadena Multi-
Hazard Mitigation Plan available on
the City website
Multi-
hazard
PIO $20,000
General Fund
1 year
Provide information to the public
regarding hazard mitigation and
emergency planning at events
promoted by the City
Multi-
hazard
PIO $100,000
General Fund
HMA
1 year
Integrate hazard mitigation material
into public safety information and
training programs (e.g. Citizen’s
Academy, Community Emergency
Response Team Program)
Multi-
hazard
Fire $100,000
General Fund
HMA
1 year
Develop a policy to ensure the
City's LHMP is reviewed during the
development of capital
improvement plans
Multi-
hazard
City Manager $20,000
General Fund
1 year
Develop a policy that encourages
incorporation or consideration of
vegetation and restoration practices
that assist in enhancing and
restoring the natural and beneficial
functions of the watershed when mitigation against hazards
Multi-
hazard
Planning $150,000
General Fund
1 to 2 years
Develop a policy to ensure the
City’s Building Codes are reviewed
annually to reflect changes and best
practices in hazard science (flood,
earthquake).
Multi-
hazard
Planning $150,000
General Fund
1 to 2 years
Review area-wide evacuation
plans/routes to identify changes and
determine if changes need to be
incorporated in the City Emergency
Operations Plan (EOP) and/or Evacuation Plan
Multi-
hazard
Fire $150,000
General Fund
1 year

City of Pasadena
2018 Multi-Hazard Mitigation Plan
132
Prepare an inventory of major urban
drainage problems and identify
causes and potential mitigation
actions for urban drainage problem areas.
Flood Public Works $300,000
HMA
General Fund
2 to 3 years
Develop a Debris Removal Plan. Multi-
hazard
Public Works $300,000
General Fund
HMA
2 to 3 years
Develop a Dam Mitigation Plan. Flood Public Works $300,000
General Fund
HMA
2 to 3 years
Develop a Vegetation Management
Plan.
Multi-
hazard
Public Works $300,000
General Fund
HMA
2 to 3 years
Develop a Floodplain
Management/Flood Plan.
Flood Public Works $300,000
General Fund
HMA
2 to 3 years
Develop a Landslide Management
Plan.
Landslide Public Works $300,000
General Fund
HMA
2 to 3 years
Raise park roadways where
necessary to improve the flow of
water downstream.
Flood Public Works $3 million
General Fund
HMA
4 to 5 years
Develop a policy to ensure the
annual review of potential landslide
areas in the City of Pasadena
Landslide Public Works $70,000
General Fund
1 year
Develop a landslide area building
ordinance. Review local ordinances
for building in potential landslide
Landslide Public Works $200,000
General Fund
2 to 3 years
areas based on proposed
development plans and current
environmental conditions

City of Pasadena
2018 Multi-Hazard Mitigation Plan
133
Develop a Public Outreach Plan
geared towards providing hazard
education, emergency management,
and mitigation action activities.
Multi-
hazard
PIO $200,000
General Fund
HMA
1 to 2 years
Develop a Disaster
Communications Plan
Multi-
hazard
DoIT $200,000
General Fund
HMA
1 to 2 years
Review and revise the Emergency
Operations Plan (EOP) to reflect
response and recovery Concept of
Operations best practices
Multi-
hazard
Fire $300,000
General Fund
HMA
1 to 2 years
Assess and evaluate critical
facilities identified in the EOP
Multi-
hazard
Planning $2-$3 million
General Fund
HMA
3 to 4 years
Evaluate and retrofit critical
facilities identified in the EOP
Multi-
hazard
Planning $12-$13 million
General Fund
HMA
5 to 10 years
Purchase supplies, equipment, and
other resources to enable critical
facilities identified in the EOP to be
able to function as needed
Multi-
hazard
Fire $1 million
General Fund
HMA
1 to 2 years
Develop an EOP functional-based
Annex for mass casualties
Multi-
hazard
Fire $200,000
General Fund
HMA
1 to 2 years
Develop an EOP functional-based
Annex for evacuations
Multi-
hazard
Fire $200,000
General Fund
HMA
1 to 2 years
Develop an EOP functional-based
Annex for Mass Shelter
Multi-
hazard
Public Health $200,000
General Fund
HMA
1 to 2 years

City of Pasadena
2018 Multi-Hazard Mitigation Plan
134
Develop an EOP scenario-based
Annex for terrorist events
Terrorist Police $200,000
General Fund
HMA
1 to 2 years
Develop an EOP scenario-based
Annex light rail accident
Train
Accident
Fire $200,000
General Fund
HMA
1 to 2 years
Develop an EOP scenario-based
Annex for civil unrest events
Civil
Unrest
Fire $200,000
General Fund
HMA
1 to 2 years
Develop an EOP scenario-based
Annex for active shooter events
Terrorist Police $200,000
General Fund
HMA
1 to 2 years
Develop a program to encourage
and support business continuity
planning for local businesses
Multi-
hazard
City Manager $300,000
General Fund
HMA
2 to 3 years
Identify City-service, mission
critical tasks and develop Business
Continuity Plans for each service
Multi-
hazard
City Manager $300,000
General Fund
HMA
2 to 3 years
Develop a planning team to work
with local school districts and
universities to prepare both
scenario-based and functional-based
plans
Multi-
hazard
Fire $300,000
General Fund
HMA
2 to 3 years
In accordance with the 2011 Water
Integrated Resources Plan, develop
alternative sources of water to meet
Pasadena’s annual water demands
(non-potable water project)
Multi-
hazard
Water and Power $1 million
General Fund
HMA
2 to 3 years
Upgrade the Arroyo Seco stream
water intake structure to improve
our ability to capture more stream water and to recharge the
Multi-
hazard
Water and Power $10 million
General Fund
2 to 3 years
groundwater basin (Arroyo Seco
Project)
HMA

City of Pasadena
2018 Multi-Hazard Mitigation Plan
135
Implement measures to bolster local
water supply to meet demand,
create a sustainable water supply,
while meeting environmental mandates.
Multi-
hazard
Water and Power $10 million
General Fund
HMA
2 to 3 years
Evaluate and implement necessary
retrofits and upgrades to the
diversion facilities in Arroyo
Canyon
Multi-
hazard
Water and Power $10 million
General Fund
HMA
2 to 3 years
Develop and coordinate planning
with partners for dispensing of
medications or vaccines
Infectious
Disease
Health $3 million
General Fund
HMA
2 years
Coordinate infection control
planning with partners
Infectious
Disease
Health $3 million
General Fund
HMA
2 years
Upgrade and replace local
generating units
Multi-
hazard
Water and Power $20-$25 million
General Fund
HMA
2-4 years
Purchase emergency generators at
facilities
Multi-
hazard
Water and Power $2 million
General Fund
HMA
1 year
Replace emergency transmission
and distribution systems
Multi-
hazard
Water and Power $3 million
General Fund
HMA
5 years
Azusa Hydro upgrades and
replacements
Multi-
hazard
Water and Power $10 million
General Fund
HMA
2-4 years
Develop a comprehensive plan that
recognizes wildfire hazards
identifying areas of risk and
describing policies and
recommendations for addressing the
risk including land use and public
safety.
Fire Fire Department $250,000
General Fund
HMA
1-2 years
Improve regulations for safer
construction in wildfire very high
hazard areas addressing access,
signage, fire hydrants, water
availability, vegetation management
and special building construction
standards.
Fire Fire Department
Building & Safety
$50,000
General Fund
HMA
I year

City of Pasadena
2018 Multi-Hazard Mitigation Plan
136
Develop a program to retrofit at-risk
structures in wildfire hazard areas with
non-combustible materials and
technologies.
Fire Fire Department
Building & Safety
$75,000
General Fund
HMA
1-2 years
Implement a fuels management
program to reduce hazardous
vegetation fuels on public lands, near
essential infrastructure and on private
lands by working with landowners.
Fire Fire Department $500,000
General Fund
HMA
3-5 years
Increase wildfire risk awareness by
developing education and outreach
programs that target citizens,
businesses, developers, landscapers,
and insurers with strategies to protect
homes and infrastructure
Fire Fire Department $75,000
General Fund
HMA
1-2 years
Develop a comprehensive plan to
understand and assess local
vulnerability to drought by gathering
and analyzing local water and climate
data, identifying factors effecting
severity of the drought and
determining how the community has
been impacted in the past.
Drought Pasadena Water &
Power
$200,000
General Fund
HMA
1-2 years
Develop a drought communication
plan and early warning system to
facilitate timely communication of
relevant information to officials,
decision makers, emergency
managers, and the public.
Drought Pasadena Water &
Power
$50,000
General Fund
HMA
1-2 years
Design water delivery systems to
accommodate drought events and
develop new or upgrade existing water
delivery systems to eliminate breaks
and leaks.
Drought Pasadena Water &
Power
$10 Million
General Fund
HMA
7-10 years
Utilize drought tolerant landscape
design for all new public buildings and
develop a plan to retrofit all existing
public buildings with drought tolerant
landscape.
Drought Pasadena Water &
Power
$100,000
General Fund
HMA
1-2 years

City of Pasadena
2018 Multi-Hazard Mitigation Plan
137
Develop requirements for wind
engineering measures and construction
techniques in wind vulnerable areas
including structural bracing, straps and
clips, anchor bolts, impact resistant
glass, reinforced garage doors,
window shutters, waterproof adhesive
sealing strips or interlocking roof
shingles.
Windstorm Pasadena Water &
Power, Public Works
$200,000
General Fund
HMA
1-3 years
Develop and maintain a database to
track community vulnerability to
severe wind including GIS mapping of
vulnerable areas.
Windstorm Department of
Information
Technology (DoIT)
$75,000
General Fund
HMA
1-2 years
Develop a plan to move all power
lines in severe wind vulnerable areas
underground.
Windstorm Pasadena Water &
Power, Public Works
$500,000
General Fund
HMA
3-5 years
Retrofit existing residential buildings,
public buildings and critical facilities
with modifications to reduce future
wind damage including improving
roof coverings, anchoring roof-
mounted utilities, and adding load-
path connectors to strengthen
structural frames.
Windstorm Pasadena Water &
Power, Public Works
$5 Million
General Fund
HMA
5-7 years
7.7 Relevant Governance
The City of Pasadena has many plans, programs and regulations that address disaster management.
Some of them (or elements of them) directly relate to hazards, such as the Safety Element of the
General Plan, while others focus on different aspects of disaster management such as emergency
response (Emergency Operations Plan- EOP). Still others do not focus directly on disaster issues but
have implications that are relevant to hazard mitigation, such as plans related to spending on public
facilities.
As part of the LHMP planning process, each of these plans, programs, and regulations were reviewed
to identify relevant information to be incorporated into the LHMP Update, to identify deficiencies with
plans, programs, and regulations, or to understand needed plans, programs, and regulations. The review
for deficiencies also included actions to leverage information and findings from the LHMP update into
the plans, programs, and regulations. These plans, policies and codes were used to help inform the risk
assessment and mitigation actions in the plan.
The City can expand and improve on their plans, programs, and regulations but may have little control
over other’s plans, programs, and regulations (i.e., NFIP). Whether they have the ability or not to
expand/improve, relevant plan, program, or regulation, each was assessed for deficiencies.

City of Pasadena
2018 Multi-Hazard Mitigation Plan
138
Recommended changes or needed plans, programs, and regulations are reflected in the mitigation
actions section (Section 7). Below is a list of the relevant plans, programs, and regulations:
7.8 Plans
These plans were used to inform sections of the City’s LHMP related to the City’s Community Profile,
Hazard Assessment, Hazard Profiles and Mitigation Strategies.
Arroyo Seco Flood Hazard Warning and Contingency Plan (Draft)
Water Integrated Resources Plan (2011)
Pasadena Adopted Budget (2018-19)
Pasadena Adopted Capital Improvement Plan (2018-19)
Pasadena Climate Action Plan (2017)
Pasadena Community Access Corporation (Section 26)
Pasadena Economic Development Task Force Report (2012)
Pasadena Economic Strategic Plan (2012)
Pasadena General Plan Land Use Element (2015)
Pasadena General Plan Safety Element (2002)
Public Safety Committee Meeting Report of Soft Story Structures (12/4/2017)
Southern California Association of Governments Profile of City of Pasadena (2017)
7.9 Policies
These policies were used to inform the section of the City’s LHMP related to City’s capabilities.
Citywide Media Policy on Emergency Media Relations
Disaster Service Worker
Injury and Illness Prevention Program
Worker’s Compensation
Disaster Emergency Services Council
7.10 Programs
These programs were used to inform sections of the City’s LHMP related to hazard mitigation
strategies.
Hazardous Materials Disclosure Program
Earthquake Hazard Reduction in Existing Unreinforced Masonry
Excavation and Grading in Hillside Areas
Fire and Life Safety Protection Systems
Urban Forestry Program
Undergrounding Utility Program
Electric System Conversion Program
NOTE: The City of Pasadena is not a participating member of the NFIP

City of Pasadena
2018 Multi-Hazard Mitigation Plan
139
7.11 Regulations
These programs were used to inform sections of the City’s LHMP related to the City’s hazard
mitigation strategies.
Regulatory Environment
California Alquist-Priolo Earthquake Fault Zoning Act (2017)
California Seismic Hazards Mapping Act (2007)
Real Estate Disclosure Requirements (2005)
California Environmental Quality Act (2016)
California Building Code (2016)
National Pollutant Discharge Elimination System (NPDES)
Emergency Planning and Community Right-To-Know Act (EPCRA)
Comprehensive Environmental Response, Compensation and Liability Act
Resources Conservation and Recovery Act
Pasadena Code of Ordinances
7.12 LHMP Integration
The Pasadena Local Hazard Mitigation Plan (LHMP) will be integrated into other city plans such as
the City’s Capital Improvement Plan (CIP), the General Plan (GP), the Climate Action Plan (CAP) and
the Emergency Operations Plan (EOP). In general, the City’s Hazard Mitigation Steering Committee
should work collaboratively and across disciplines to ensure that, when possible, the development of
City plans, policies and regulations integrate hazard mitigation strategies contained in the LHMP. This
can be accomplished through monthly meetings and close monitoring of the City’s adopted LHMP.
The LHMP will help the City achieve efficiencies, avoid duplication of effort, enhance problem
solving and realize cost savings by ensuring that mitigation-planning activities are developed
collaboratively with other City plans. The City’s CIP, CAP, GP and the LHMP are among some of the
plans that contain mitigation actions. Mitigations actions should be discussed and shared among
Hazard Mitigation Steering Committee members and community stakeholders. Developing successful
hazard mitigation strategies requires a comprehensive approach, inclusiveness among all players and
collaboration of all planning efforts.
There are many benefits to the integration of LHMP with City plans the. Some of these include:
LHMP Hazard Maps can be used in the City’s Emergency Operations Plan and assist
with EOP hazard analysis, evacuation planning and public education;
The LHMP Hazard Analysis can be integrated with the Safety Element of the City’s
General Plan.
The LHMP may be integrated into the CIP, CAP and GP to help identify other
mitigation planning efforts and future trends;
The LHMP may be integrated the CAP, CIP and the City’s Budget to help identify
alternate funding sources that are aligned with proposed hazard mitigation actions;

City of Pasadena
2018 Multi-Hazard Mitigation Plan
140
The LHMP can help the City achieve a favorable rating under the FEMA’s
Community Rating System (CRS) leading to lower flood insurance premiums for
residents.

City of Pasadena
2018 Multi-Hazard Mitigation Plan
141
8 Plan Maintenance
8.1 REVIEW, EVALUATION, AND MONITORING
As part of the 2013 LHMP Plan Maintenance, the City of Pasadena committed to leveraging, and where
possible, incorporating the LHMP information into other plans. Since adoption, the City of Pasadena
has leveraged LHMP information to review projects, support permits, substantiate comments on draft
plans, and prepare public education outreach information/material. Additionally, while some actions
have been taken to incorporate the LHMP into the City’s General Plan Safety Element, the information
in the 2011 LHMP was not fully incorporated.
The City of Pasadena is committed to review, monitor, and evaluate this plan on a regular basis. The
City of Pasadena Fire Department will lead the effort and will be responsible for ensuring that this plan
is being monitored over the next five (5) years. The City of Pasadena will leverage existing meetings
to review, evaluate, and to discuss progress on the mitigation actions set forth in this plan. While there
is not a confirmed meeting schedule, the City of Pasadena Fire Department will ensure that at a
minimum there is an annual meeting of the Steering Committee and other interested stakeholders to
discuss the LHMP. The first annual meeting will occur one (1) year from the date of FEMA approval.
Information obtained from these meetings will be captured by the City of Pasadena Fire Department
and made available for the next LHMP update.
In addition to the annual meeting and leveraging other meetings, the City of Pasadena will also ensure
that the LHMP is an agenda item during any preparation of any After Action Report for a disaster event
occurring within the city. This will provide the city with an opportunity to evaluate the value of any
implemented mitigation actions and validate the needs for others.
Similar to the efforts done after approval of the 2013 LHMP, upon adoption, the LHMP will be
leveraged and possibly incorporated into the other City of Pasadena plans (i.e., General Plan) and other
materials (i.e., building codes/ordinances), and relevant plans and ordinances maintained by the City
of Pasadena. This has ensured that past and will ensure that future planning efforts and capital projects
are influenced by the findings of this Plan. The LHMP will also be utilized and referenced for the City
of Pasadena Emergency Operations Plan update.
The City of Pasadena is also committed to evaluating and updating this plan at least once every five
(5) years, as required by the Disaster Mitigation Act of 2000. To ensure that this update occurs in a
timely fashion, after completion of the third year following plan adoption, the primary contact for the
City of Pasadena will engage the Steering Committee to undertake the following activities:
Thoroughly analyze and update the risk of natural and human-caused hazards in the Planning
Area
Provide a detailed review and revision of the mitigation strategy
Prepare a new mitigation action plan
Prepare an updated draft LHMP and submit it to Cal OES and FEMA for preliminary review
Submit the updated draft LHMP to the City Council for adoption
Submit the updated LHMP to FEMA for final approval

City of Pasadena
2018 Multi-Hazard Mitigation Plan
142
The City of Pasadena will ensure the public will continue to be involved whenever the plan is updated
and as appropriate during the monitoring and evaluation process. Prior to adoption of updates, the City
of Pasadena will provide multiple opportunities for the public to comment on the plan and revisions,
as was done during the preparation of this update. A public notice will be published announcing the
start of the update process, outlining the public comment period, and identifying meeting locations.
8.2 POINT OF CONTACT
Comments or suggestions regarding this plan may be submitted to:
Jon Trautwein, Deputy Fire Chief
City of Pasadena Fire Department
100 North Garfield, Pasadena, CA 91101
[email protected] (email)
(626) 744-4745 (telephone)

City of Pasadena
2018 Multi-Hazard Mitigation Plan
143
APPENDIX A
Adoption forms
Letter from California State Office of Emergency Services
Letter from Federal Emergency Management Agency
FEMA Review Tool
Pasadena City Council Letter of Adoption

GAVIN NEWSOM
GOVERNOR
MARK S. GHILARDUCCI
DIRECTOR
3650 SCHRIEVER AVENUE, MATHER, CA 95655
(916) 845-8506 TELEPHONE (916) 845-8511 FAX
www.CalOES.ca.gov
March 15, 2019
Ms. Juliette Hayes, Mitigation Division Director
Federal Emergency Management Agency, Region IX
1111 Broadway Street, Suite 1200
Oakland, California 94607
Subject: City of Pasadena Local Hazard Mitigation Plan
Dear Ms. Hayes:
The California Governor’s Office of Emergency Services (Cal OES) is forwarding the Local Hazard Mitigation Plan
for City of Pasadena for formal review. Enclosed are the plan and CD containing the electronic documents.
If you have any questions, please contact me at (916) 845-8187, or Victoria LaMar-Haas, Senior Emergency
Services Coordinator, Mitigation Planning Division, at (916) 845-8135.
Sincerely,
ADAM SUTKUS, Chief
Mitigation Planning Division
Enclosures
c: Jon Trautwein, Deputy Fire Chief, City of Pasadena Fire Department


FEMA Region IX Local Mitigation Plan Review Tool 1
REGION IX LOCAL HAZARD MITIGATION PLAN REVIEW TOOL The Local Hazard Mitigation Plan Review Tool demonstrates how the Local Hazard Mitigation Plan meets the regulation in 44 CFR §201.6 and offers State and FEMA Mitigation Planners an opportunity to provide feedback to the community.
• The Regulation Checklist provides a summary of FEMA’s evaluation of whether the plan has addressed all requirements.
• The Plan Assessment identifies the plan’s strengths as well as documents areas for future improvement. This section also includes a list of resources for implementation of the plan.
• The Multi-Jurisdiction Summary Sheet is a mandatory worksheet for multi-jurisdictional plans that is used to document which jurisdictions are eligible to adopt the plan.
• The Hazard Identification and Risk Assessment Matrix is a tool for plan reviewers to identify if all components of Element B are met.
Jurisdiction: City of Pasadena
Title of Plan: City of Pasadena Local Hazard Mitigation Plan
Date of Plan: September 2018 March 2019 (Resubmission)
Local Point of Contact: Jon Trautwein
Address: 100 North Garfield Avenue Pasadena, California 91101 Title:
Deputy Fire Chief
Agency: Pasadena Fire Department
Phone Number: 626-744-4745
E-Mail: [email protected]
State Reviewer: Wendy Boemecke [email protected] 916-926-9878 Victoria LaMar-Haas [email protected]
Title: Emergency Services Coordinator Senior Emergency Services Coordinator
Date: October 2018 January 2019
Date Received at State Agency
Date Sent to FEMA March 15, 2019
FEMA Reviewer: Jesse Carpentier
Title: Community Planner
Date: March 18, 2019
Date Received in FEMA Region IX March 15, 2019
Date Not Approved
Date Approvable Pending Adoption March 20, 2019
Date Approved

2 FEMA Region IX Local Mitigation Plan Review Tool
SECTION 1: REGULATION CHECKLIST
INSTRUCTIONS: The Regulation Checklist must be completed by FEMA. The purpose of the Checklist is to identify the location of relevant or applicable content in the plan by element/sub-element and to determine if each requirement has been ‘Met’ or ‘Not Met.’ The ‘Required Revisions’ summary at the bottom of each element must be completed by FEMA to provide a clear explanation of the revisions that are required for plan approval. Required revisions must be explained for each plan sub-element that is ‘Not Met.’ Sub-elements should be referenced in each summary by using the appropriate numbers (A1, B3, etc.), where applicable. Requirements for each Element and sub-element are described in detail in the Local Plan Review Guide in Section 4, Regulation Checklist.
1. REGULATION CHECKLIST
Regulation (44 CFR 201.6 Local Mitigation Plans)
Location in Plan (section and/or page number)
Met Not Met
ELEMENT A. PLANNING PROCESS
A1. Does the plan document the planning process, including how it was prepared and who was involved in the process for each jurisdiction? (Requirement §201.6(c)(1))
a. Does the plan provide documentation of how the plan was prepared? This documentation must include the schedule or timeframe and activities that made up the plan’s development as well as who was involved.
Section 3 Appendix B
X
b. Does the plan list the jurisdiction(s) participating in the plan that are seeking approval?
Section 1
X
c. Does the plan identify who represented each jurisdiction? (At a minimum, it must identify the jurisdiction represented and the person’s position or title and agency within the jurisdiction.)
Section 3.2.2
X

FEMA Region IX Local Mitigation Plan Review Tool 3
1. REGULATION CHECKLIST
Regulation (44 CFR 201.6 Local Mitigation Plans)
Location in Plan (section and/or page number)
Met Not Met
A2. Does the plan document an opportunity for neighboring communities, local and regional agencies involved in hazard mitigation activities, agencies that have the authority to regulate development as well as other interests to be involved in the planning process? (Requirement §201.6(b)(2))
a. Does the plan document an opportunity for neighboring communities, local, and regional agencies involved in hazard mitigation activities, agencies that have the authority to regulate development, as well as other interested parties to be involved in the planning process?
Section 3 Appendix C
X
b. Does the plan identify how the stakeholders were invited to participate in the process?
Appendix C X
A3. Does the plan document how the public was involved in the planning process during the drafting stage? (Requirement §201.6(b)(1))
a. Does the plan document how the public was given the opportunity to be involved in the planning process?
Section 3.3
X
b. Does the plan document how the public’s feedback was incorporated into the plan?
None received N/A
A4. Does the plan describe the review and incorporation of existing plans, studies, reports, and technical information? (Requirement §201.6(b)(3))
Section 7.7-7.11
X
A5. Is there discussion of how the community(ies) will continue public participation in the plan maintenance process? (Requirement §201.6(c)(4)(iii))
Section 3.3.2, 8.1 X
A6. Is there a description of the method and schedule for keeping the plan current (monitoring, evaluating and updating the mitigation plan within a 5-year cycle)? (Requirement §201.6(c)(4)(i))
a. Does the plan identify how, when, and by whom the plan will be monitored (how will implementation be tracked) over time?
Section 8
X
b. Does the plan identify how, when, and by whom the plan will be evaluated (assessing the effectiveness of the plan at achieving stated purpose and goals) over time?
Section 8
X
c. Does the plan identify how, when, and by whom the plan will be updated during the 5-year cycle?
Section 8
X
ELEMENT A: REQUIRED REVISIONS
ELEMENT B. HAZARD IDENTIFICATION AND RISK ASSESSMENT (Reviewer: See Section 4 for assistance with Element B)
B1. Does the plan include a description of the type, location, and extent of all natural hazards that can affect each
a. Does the plan include a general description of all natural hazards that can affect each jurisdiction?
Section 5
X

4 FEMA Region IX Local Mitigation Plan Review Tool
1. REGULATION CHECKLIST
Regulation (44 CFR 201.6 Local Mitigation Plans)
Location in Plan (section and/or page number)
Met Not Met
jurisdiction(s)? (Requirement §201.6(c)(2)(i))
b. Does the plan provide rationale for the omission of any natural hazards that are commonly recognized to affect the jurisdiction(s) in the planning area?
Section 5
X
c. Does the plan include a description of the type of all natural hazards that can affect each jurisdiction?
Section 5.4
X
d. Does the plan include a description of the location for all natural hazards that can affect each jurisdiction?
Section 5.4
X
e. Does the plan include a description of the extent for all natural hazards that can affect each jurisdiction?
Section 5.4
X
B2. Does the plan include information on previous occurrences of hazard events and on the probability of future hazard events for each jurisdiction? (Requirement §201.6(c)(2)(i))
a. Does the plan include information on previous occurrences of hazard events for each jurisdiction?
Section 5.4
X
b. Does the plan include information on the probability of future hazard events for each jurisdiction?
Section 5.4
X
B3. Is there a description of each identified hazard’s impact on the community as well as an overall summary of the community’s vulnerability for each jurisdiction? (Requirement §201.6(c)(2)(ii))
a. Is there a description of each hazard’s impacts on each jurisdiction (what happens to structures, infrastructure, people, environment, etc.)?
Section 6
X
b. Is there a description of each identified hazard’s overall vulnerability (structures, systems, populations, or other community assets defined by the community that are identified as being susceptible to damage and loss from hazard events) for each jurisdiction?
Section 6
X
B4. Does the plan address NFIP insured structures within the jurisdiction that have been repetitively damaged by floods? (Requirement §201.6(c)(2)(ii))
Section 6.4.9 X
ELEMENT B: REQUIRED REVISIONS

FEMA Region IX Local Mitigation Plan Review Tool 5
1. REGULATION CHECKLIST
Regulation (44 CFR 201.6 Local Mitigation Plans)
Location in Plan (section and/or page number)
Met Not Met
ELEMENT C. MITIGATION STRATEGY
C1. Does the plan document each jurisdiction’s existing authorities, policies, programs and resources and its ability to expand on and improve these existing policies and programs? (Requirement §201.6(c)(3))
a. Does the plan document each jurisdiction’s existing authorities, policies, programs and resources?
Section 4.3, 7.7-7.12
X
b. Does the plan document each jurisdiction’s ability to expand on and improve these existing policies and programs?
Section 4.3, 7.7-7.12
X
C2. Does the plan address each jurisdiction’s participation in the NFIP and continued compliance with NFIP requirements, as appropriate? (Requirement §201.6(c)(3)(ii))
Section 6.4.9
X
C3. Does the plan include goals to reduce/avoid long-term vulnerabilities to the identified hazards? (Requirement §201.6(c)(3)(i))
Section 7.2 X
C4. Does the plan identify and analyze a comprehensive range of specific mitigation actions and projects for each jurisdiction being considered to reduce the effects of hazards, with emphasis on new and existing buildings and infrastructure? (Requirement §201.6(c)(3)(ii))
a. Does the plan identify and analyze a comprehensive range of specific mitigation actions and projects to reduce the impacts from hazards?
Section 7.3, 7.6
X
b. Does the plan identify mitigation actions for every hazard posing a threat to each participating jurisdiction?
Section 7.3, 7.6
X
c. Do the identified mitigation actions and projects have an emphasis on new and existing buildings and infrastructure?
Section 7.6
X
C5. Does the plan contain an action plan that describes how the actions identified will be prioritized (including cost benefit review), implemented, and administered by each jurisdiction? (Requirement §201.6(c)(3)(iv)); (Requirement §201.6(c)(3)(iii))
a. Does the plan explain how the mitigation actions will be prioritized (including cost benefit review)?
Section 7.4
X
b. Does the plan identify the position, office, department, or agency responsible for implementing and administering the action, potential funding sources and expected timeframes for completion?
Section 7.6
X
C6. Does the plan describe a process by which local governments will integrate the requirements of the mitigation plan into other planning mechanisms, such as comprehensive or capital improvement
a. Does the plan identify the local planning mechanisms where hazard mitigation information and/or actions may be incorporated?
Section 3.1, 4.4.2, 7.1, 7.5, 7.12
X

6 FEMA Region IX Local Mitigation Plan Review Tool
1. REGULATION CHECKLIST
Regulation (44 CFR 201.6 Local Mitigation Plans)
Location in Plan (section and/or page number)
Met Not Met
plans, when appropriate? (Requirement §201.6(c)(4)(ii))
b. Does the plan describe each community’s process to integrate the data, information, and hazard mitigation goals and actions into other planning mechanisms?
Section 3.1, 4.3.2, 7.1, 7.5, 7.12
X
c. The updated plan must explain how the jurisdiction(s) incorporated the mitigation plan, when appropriate, into other planning mechanisms as a demonstration of progress in local hazard mitigation efforts.
Section 7.3, 8
X
ELEMENT C: REQUIRED REVISIONS
ELEMENT D. PLAN REVIEW, EVALUATION, AND IMPLEMENTATION (Applicable to plan updates only)
D1. Was the plan revised to reflect changes in development? (Requirement §201.6(d)(3))
Section 4.2.13 X
D2. Was the plan revised to reflect progress in local mitigation efforts? (Requirement §201.6(d)(3))
Section 7.3 X
D3. Was the plan revised to reflect changes in priorities? (Requirement §201.6(d)(3))
Section 7.2 X
ELEMENT D: REQUIRED REVISIONS
ELEMENT E. PLAN ADOPTION
E1. Does the plan include documentation that the plan has been formally adopted by the governing body of the jurisdiction requesting approval? (Requirement §201.6(c)(5))
Pending APA status
E2. For multi-jurisdictional plans, has each jurisdiction requesting approval of the plan documented formal plan adoption? (Requirement §201.6(c)(5))
NA
ELEMENT E: REQUIRED REVISIONS
ELEMENT F. ADDITIONAL STATE REQUIREMENTS (Optional for State Reviewers only; not to be completed by FEMA)
F1.
F2.
ELEMENT F: REQUIRED REVISIONS

FEMA Region IX Local Mitigation Plan Review Tool 7
SECTION 2: PLAN ASSESSMENT
Element A: Planning Process
Strengths:
1) Issuing a press release about the LHMP to the community and holding multiple public meetings.
2) The planning process is well-documented.
3) The steering committee represents a wide variety of interests and expertise.
Opportunities for Improvement: 1) Although it is entirely up to the City, we do not encourage including the addresses of every critical facility for the publicly accessible version of the LHMP.
2) Attendance might have been low at the meetings because there was not enough targeted outreach. We encourage reaching out to community organizations who represent vulnerable communities and related interests, so they can share information about upcoming meetings or opportunities for input with their constituents.
Element B: Hazard Identification and Risk Assessment
Strengths: 1) The hazard assessment is clear and consistently organized throughout.
2) The plan does a really good job of capturing the history of most of the identified hazards.
3) The climate change discussion in each hazard profile is excellent and will help the community understand how risk will evolve in the future.
Opportunities for Improvement: 1) While it is useful to understand exposure of assets, it is also important to assess and consider the characteristics of structures and people that make them vulnerable to the identified hazards.
2) Similarly, we encourage doing a social vulnerability assessment in future updates. What sectors of the population are more vulnerable to each hazard, and why? How can the mitigation strategy support the resilience of those specific communities?
3) Although it makes sense to do an initial hazard ranking so that resources can be attributed appropriately to the analysis and writing that goes into each section, I recommend doing a hazard priority ranking that considers the risk and vulnerability assessment as well. In other words, the community’s ranking of hazards might be more accurate if supported by the research and analysis done for the risk and vulnerability assessments.

8 FEMA Region IX Local Mitigation Plan Review Tool
4) I would like to see more detail on the impacts of drought on the City of Pasadena. Are there specific demographics or economic sectors affected by drought conditions?
Element C: Mitigation Strategy
Strengths: 1) It is great that the plan uses the STAPLEE evaluation criteria to prioritize mitigation actions.
2) It is good to see that effort was made into estimating costs of the actions.
3) The plan has a wide variety of mitigation measures that leverage existing capabilities.
4) Detailed capabilities assessment and discussion of plan integration. This is very important for a successful plan, as it helps the planning team identify the tools it can use, as well as the gaps that can be addressed by the mitigation strategy.
Element D: Plan Update, Evaluation, and Implementation (Plan Updates Only)
Strengths: 1) Detailed discussion of population and land use trends that may impact vulnerability.
2) Clear and useful table illustrating progress in mitigation actions from the previous plan.
Opportunities for Improvement: 1) Table 7-10 lists all but one action as “ongoing” – it would be helpful if this was defined better. Does ongoing mean partially complete, or does it indicate a continued process that does not have an end? If the latter, indicate whether the identified process has been established or not.
2) It would also be useful to see more evaluation of the existing actions. Has implementation been successful? Why or why not? Have any of these projects or processes been tested by a hazard event? Did they succeed in reducing impacts to the community?

FEMA Region IX Local Mitigation Plan Review Tool 9
B. Resources for Implementing and Updating Your Approved Plan ic This resource section is organized into three categories:
1) Guidance and Resources 2) Training Topics and Courses 3) Funding Sources
Guidance and Resources Local Mitigation Planning Handbook
https://www.fema.gov/media-library/assets/documents/31598
Beyond the Basics http://mitigationguide.org/
Mitigation Ideas https://www.fema.gov/media-library/assets/documents/30627
Plan Integration: Linking Local Planning Efforts https://www.fema.gov/media-library/assets/documents/108893
Integrating Disaster Data into Hazard Mitigation Planning https://www.fema.gov/media-library/assets/documents/103486
Integrating Historic Property and Cultural Resource Considerations into Hazard Mitigation Planning https://www.fema.gov/ar/media-library/assets/documents/4317
Community Rating System User Manual https://www.fema.gov/media-library/assets/documents/8768
U.S. Climate Resilient Toolkit https://toolkit.climate.gov/
2014 National Climate Assessment http://nca2014.globalchange.gov/
Managing the Risks of Extreme Events and Disasters to Advance Climate Change Adaptation http://ipcc-wg2.gov/SREX/images/uploads/SREX-All_FINAL.pdf
FY15 Hazard Mitigation Assistance Unified Guidance https://www.fema.gov/media-library/assets/documents/103279
Climate Resilient Mitigation Activities for Hazard Mitigation Assistance https://www.fema.gov/media-library/assets/documents/110202
Training
More information at https://training.fema.gov/emi.aspx or through your State Training Officer Mitigation Planning IS-318 Mitigation Planning for Local and Tribal Communities https://training.fema.gov/is/courseoverview.aspx?code=is-318
IS-393 Introduction to Hazard Mitigation https://training.fema.gov/is/courseoverview.aspx?code=is-393.a
G-318 Preparing and Reviewing Local Plans G-393 Mitigation for Emergency Managers Hazard Mitigation Assistance (HMA) Grant Programs

10 FEMA Region IX Local Mitigation Plan Review Tool
IS-212.b Introduction to Unified HMA http://www.training.fema.gov/is/courseoverview.aspx?code=IS-212.b
IS-277 Benefit Cost Analysis Entry Level http://www.training.fema.gov/is/courseoverview.aspx?code=IS-277
E-212 HMA: Developing Quality Application Elements E-213 HMA: Application Review and Evaluation E-214 HMA: Project Implementation and Programmatic Closeout E-276 Benefit-Cost Analysis Entry Level
GIS and Hazus-MH IS-922 Application of GIS for Emergency Management http://www.training.fema.gov/is/courseoverview.aspx?code=IS-922
E-190 ArcGIS for Emergency Managers E-296 Application of Hazus-MH for Risk Assessment E-313 Basic Hazus-MH Floodplain Management
E-273 Managing Floodplain Development through the NFIP E-278 National Flood Insurance Program/ Community Rating System
Potential Funding Sources Hazard Mitigation Grant Program POC: FEMA Region IX and State Hazard Mitigation Officer Website: https://www.fema.gov/hazard-mitigation-grant-program Pre-Disaster Mitigation Grant Program POC: FEMA Region IX and State Hazard Mitigation Officer Website: https://www.fema.gov/pre-disaster-mitigation-grant-program Flood Mitigation Assistance Grant Program POC: FEMA Region IX and State Hazard Mitigation Officer Website: https://www.fema.gov/flood-mitigation-assistance-grant-program Emergency Management Performance Grant Program POC: FEMA Region IX Website: https://www.fema.gov/emergency-management-performance-grant-program

FEMA Region IX Local Mitigation Plan Review Tool 11
SECTION 3: MULTI-JURISDICTIONAL SUMMARY SHEET
INSTRUCTIONS: For multi-jurisdictional plans, this summary sheet must be completed by listing each participating jurisdiction that is eligible to adopt the plan.
MULTI-JURISDICTION SUMMARY SHEET
# Jurisdiction Name Jurisdiction Type Eligible to Adopt the
Plan? Plan POC Email
1
2
3
4
5
6
7
8
9
10
11
12
13
14
15

FEMA Region IX Local Mitigation Plan Review Tool 12
SECTION 4: HAZARD IDENTIFICATION AND RISK ASSESSMENT MATRIX (OPTIONAL)
INSTRUCTIONS: This matrix can be used by the plan reviewer to help identify if all of the components of Element B have been met. List out natural hazard names that are identified in the plan in the column labeled “Hazards” and put a “Y” or “N” for each component of Element B.
HAZARD IDENTIFICATION AND RISK ASSESSMENT MATRIX
Hazard
Requirement Met? (Y/N)
Type Location Extent Previous
Occurrences Probability Impacts Vulnerability
Mitigation Action
Earthquake* Y Y Y Y Y Y Y Y
Wildfire* Y Y Y Y Y Y Y Y
Drought* Y Y Y Y Y N Y Y
Windstorm* Y Y Y Y Y Y Y Y
Flood Y Y Y Y Y Y N
Landslide and other Earth Movement
Y Y N Y Y Y Y
Extreme Heat Y Y Y Y Y Y N
Hailstorm Y Y Y Y Y Y N
*Top hazards; require mitigation measure

Placeholder: Insert Pasadena City Council Letter of Adoption

City of Pasadena
2018 Multi-Hazard Mitigation Plan
144
APPENDIX B
Steering Committee Presentations

Pasadena Steering Committee Roster and Attendance Log
NAME ORGANIZATION DEPARTMENT
Adrienne Kung City of Pasadena Health X X X X
Alex Souto City of Pasadena HR X X X
Ana Espanola City of Pasadena Planning X
Anita Cerna City of Pasadena Planning X X
Art Silva City of Pasadena Water & Power X
Bertral Washington City of Pasadena Fire X
Bob Ridley City of Pasadena Finance X X X X X
Brad Boman City of Pasadena Water & Power X X
Burhan Ashanti City of Pasadena Water & Power
Carlos Baffigo City of Pasadena Library X X
Carolyn Gordon City of Pasadena Police X X
Dan Augustyn City of Pasadena DOIT X X X X
Denise Guerrero City of Pasadena Library X X X X X
Ed Calatayud City of Pasadena Police X
Erika Estrada City of Pasadena Finance-Purchasing X X X
Hayden Melbourn City of Pasadena Public Works
Heather Peron City of Pasadena Pasadena Center X X X X
Henry Frometa City of Pasadena HR X X
Horace Wormerly City of Pasadena HSRD X X X
Israel Del Toro City of Pasadena Planning X
James Tong City of Pasadena Public Works, Engineering X X X
Jan Hamblen City of Pasadena DOT
Jason Niccoli City of Pasadena PWP X
Jenessa Wendland City of Pasadena RBOC X
Jennifer Curtis City of Pasadena Human Resources X X
Joaquin Siques City of Pasadena Transportation X X X
Jon Trautwein City of Pasadena Fire X X
Julie Gutierrez City of Pasadena City Manager X X X X
Kenny James City of Pasadena HSRD X X
Kris Markarian City of Pasadena PW X
Lisa Derderian City of Pasadena Fire X X X X
Mandy Templeton City of Pasadena PW X
Michael Johnson City of Pasadena Health X
Mona Tse City of Pasadena Public Works Engineering X
Norman Lara City of Pasadena Water & Power X X
Phil Tong City of Pasadena Transportation X
Richard Yee City of Pasadena Public Works, Engineering
Robert Monzon City of Pasadena City Clerk X X
Roger Roldan City of Pasadena Police X
Ruben Martinez City of Pasadena City Clerk X
Sarkis Nazgrian City of Pasadena Planning X
Shari Thomas City of Pasadena PWP X X
Tim McDonald City of Pasadena Library
Tunji Adedeji City of Pasadena PWP X X

3.4 Steering Committee Kickoff Meeting
October 2017


Propose d Update Methodology
1. Plan Preparation
* Es tablish project
goal
.... ·.
e pectations &
timelines
Za. Understand
Your Situation
+ Cbrnm unity
Profile
I + Haza rds Pr of ile
+ Capabilities
t Key Assets
2. Develop the Plan
2b. Amu the Risk
+ [x posurs
+ Vulnerabilities
♦ 2c. Assemble Actions
&Pro jects
+ Objective Settrng
(optional)
+ ldentifica1 tion
+ Considera tion
+ Prioritization
3. Finalize the Plan
* Review
t Approval
• Adopt &
Disseminate
4 Pli!n Implementation
& Maintenance
* Trainin
◆ Ei:ertise,
UPDATES
lllcorporateillto a11d Le11erage from £Jd$tingPlans


3.5 Steering Committee Meeting
Planning Meeting #2
Thursday, November 16, 2017


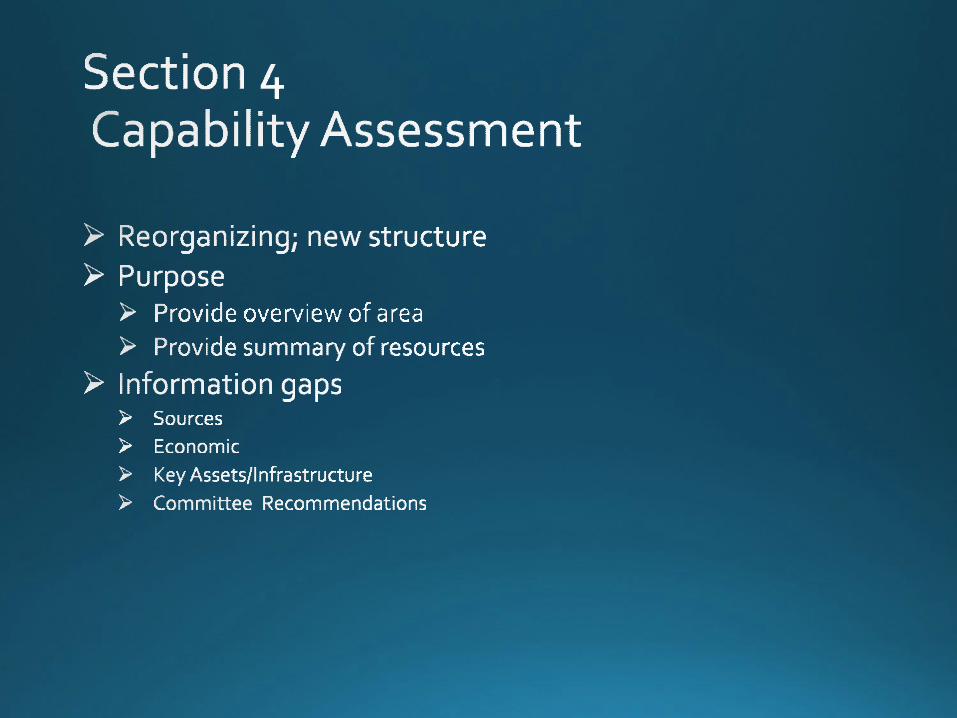


Hazard Mitigation Plan Update
Steering Committee Meeting
Planning Meeting #3
Thursday, January 18, 2018

Agenda - Meeting #3
Roll Call
Call for Questions or Additional Agenda Items
Recap of Meeting #2
Discussion Topics for Meeting #3
Next Steps
Questions

Recap of Meeting #2
Draft Section 1 and 2 (distributed via email)
Draft Section 3- Planning Process (distributed via email)
Section 4- Capability Assessment (Introduced)
State hazards (distributed via email)
Confirm target date for Public Outreach meeting #1 (Public Safety Meeting – L. Derderian)

Discussion Topics for Today
Overview of Capabilities Assessment – Remaining Gaps
Hazard Assessment and Prioritization
Public Outreach Objectives
Newspaper Public Safety Meeting Information Sheet for City Council Offices

Overview of Capabilities Assessment and Gaps
Objective: Document authorities, policies, programs, staff, funding and other resources to accomplish mitigation strategies that reduce long term vulnerability.
May include existing plans, reports, programs, resources, regulations, City procedures and practices
Primary Types of Capabilities (Current):
• Planning and Regulatory – Need Current • Administrative and Technical – General Description of City Functions • Financial – Budget, Capital Improvement Plan, Economic Strategic Plan • Education and Outreach – Programs
Must relate to the reduction of disaster losses and or used to reduce future losses.

Screening and Priority of Hazards
Identified approximately 23 of 31 California hazards
See Hand-Out of revised list of hazards
Determining probability and potential for impact

Public Outreach Objectives
Public Safety Meeting
Newspaper
Website
Introduce the HMP update process Get feedback on hazards in the community Encourage participation Must meet requirements of Element A

Next Steps
Provide comments and revisions to consultant
Draft Section 4 - Capabilities Assessment
Set date and venue for Public Outreach meeting #1
Next Meeting February 15, 2018

Questions
Lisa Derderian◦ (818) 744-7276 ◦ [email protected]
Andy Petrow◦ (818) 294-5472 ◦ [email protected]
Laura Hernandez◦ (805) 844-1720 ◦ [email protected]

1
Hazard Mitigation Plan Update
Agenda ‐ Meeting #4
Recap of Meeting #3

2
High
Impact
Medium
Impact
Low
Impact
High
Probability
Medium
Probability
Low
Probability
Earthquake
Wildfire
Terrorism
Cyber Threat
Drought/Water Shortage
Civil Disturbance
Windstorm
Infectious Disease
Agricultural Pest and
Disease
Energy Shortage/Outage Flood
Extreme Heat
Train Accident
Hazardous Material Release
Landslide and other Earth
Movement
Aircraft Crash Dam Failure
Radiological Incident
Air Pollution
Natural Gas
Pipeline/Storage Failure
Hailstorm
Oil Spill
Discussion Topics for Today
Hazard Assessment & Prioritization

3
Gaps and Needs
Next Steps
Lisa Derderian
Andy Petrow
Laura Hernandez
Questions

1
Sign- In
Call for Questions or Additional Agenda Items
LHMP Status
Discussion Topics for Meeting #5
Next Steps
Questions
Agenda - Meeting #5
Section 1 Introduction – Distributed via email
Section 2 Plan Purpose and Authority- Distributed via email
Section 3 Planning Process - Distributed via email
Section 4 Capability Assessment -Introduced
Section 5 Hazards Assessment - Distributed via email
Section 6 Vulnerability Assessment – Today’s Hand-Out
Section 7 Mitigation Strategy – Today’s Handout
Section 8 Plan Maintenance - Next Step

2
Comments on Section 6 - Vulnerability Assessment (emailed)
Section 7- Mitigation Strategy Discussion (See HandOut)
Gaps and Needs
Discussion Topics for Today
Critical Facilities List – Content Value
Fire HQ - Content Value
Critical Asset Wildfire Exposure
□ Next Meeting 0830 Hours July 19, 2018
Public Outreach meeting #1 – TBD
100 N. Garfield Avenue Pasadena City Hall
Council Chamber S249

3
Lisa Derderian (818) 744-7276
(818) 294-5472
(805) 844-1720
Questions

1
Hazard Mitigation Plan Update
Steering Committee Meeting
Planning Meeting #6 Thursday, July 19, 2018

2
Agenda - Meeting #6
Sign- In/Roll Call
Call for Additional Agenda Items or Questions
LHMP Update Status
Discussion Topics for Today
Next Steps
Questions

3
LHMP Update Status
Section 1 Introduction – Distributed
Section 2 Plan Purpose and Authority- Distributed
Section 3 Planning Process - Distributed
Section 4 Capability Assessment -Introduced
Section 5 Hazards Assessment - Distributed
Section 6 Vulnerability Assessment – Distributed
Section 7 Mitigation Strategy – Distributed
Section 8 Plan Maintenance - Next Step
First Public Outreach meeting was conducted last night

Discussion Topics for Today
1. Gaps and Needs
2. Projects

Section Review: Gaps and Needs 1. Section 4 – Capability Assessment ( Sent via e-mail)
a) Are we missing any Critical Facilities? See excel doc.
b) Roles in Mitigation. Do you agree?
c) Policies – Are the policies for each department listed accurately?
d) Grants – Are all grants identified and listed accurately?
2. Section 5 - Hazard Assessment ( Sent via-email) a) Do you agree with prioritization? Page 5-3
b) Do you agree with description of hazard? Pages 5-3
c) Are we missing any historic past events? See Pages 5-24, 28, 37, 43, 55, 56, 59, 60, 61
3. Section 6 – Vulnerability Assessment (sent via e-mail) a) Do you have Content Value and Replacement Costs of Critical Facilities? See
excel doc. b) Do you have damage estimates from past historic events? Page 6-2,6-6, 6-9
4. Section 7 – Status on Projects (sent via e-mail) a) Do you have an information on past projects?
b) What is current status?

Projects
6

Next Steps
Data and Comment Collection
◦ Need input from team ◦ Revise LHMP sections ◦ Projects
Next Meeting 0830 Hours August 19, 2018 ◦ May be virtual meeting

Questions
Lisa Derderian ◦ (818) 744-7276 ◦ [email protected]
Andy Petrow ◦ (818) 294-5472 ◦ [email protected]
Laura Hernandez ◦ (805) 844-1720 ◦ [email protected]

1
Hazard Mitigation Plan Update
Steering Committee Meeting
Planning Meeting #7 Thursday, August 23, 2018

2
Agenda
Sign- In/Roll Call
Call for Questions or Additional Agenda Items
Comments on Sections 1-6
Discuss Section 7- Mitigation Strategies
Next Steps
Questions

3
Comments on LHMP Sections
Section 1 Introduction
Section 2 Plan Purpose and Authority
Section 3 Planning Process
Section 4 Capability Assessment
Section 5 Hazards Assessment
Section 6 Vulnerability Assessment
Validate: Plans, Disaster History and Impact, Critical Facilities

Section 7- Mitigation Strategies
A. Review Previous Projects
B. Review Capabilities and Vulnerabilities
C. Identify New Projects
D. Prioritize New Projects
E. Project Implementation Plan

Section 7A- Previous Projects
List of Previous Projects Previously Disseminated- Section 7
Need to Know Projects that are:• complete
• underway/planned
• no longer needed
Any Project NOT in an Above Category Assumed Needed• “underway/planned” and “needed” projects will carry over
into the LHMP update

Section 7B- Capabilities and Vulnerabilities
Look at Capabilities/Vulnerabilities for each Priority Hazard
Earthquake
• 290 injuries; 2 with hospital stay, 1 death
• 623 displaced households; 200 requiring shelter
Wildfire
Terrorism
Cyber
Drought/Water Shortage Threat

Section 7B- Capabilities and Vulnerabilities
Civil Disturbance
Windstorm
Infectious Disease
Energy Shortage/Outage
Agricultural Pest/Disease

Section 7C- New Projects
Must look at previous projects Consideration should be given to:
• Vulnerability to/ impacts from “high priority” hazards
• Current capabilities (staffing, resources, plans, policies, programs)
Must have project for every priority hazard Can reference /leverage:
• Surrounding area LHMPs (LA City, San Marino, South Pasadena)
• Reference State HMP
• FEMA Mitigation Idea Guide
• CFR 44
New: Fire Station/PW Building Retrofit(s)

Section 7D- Prioritize New Projects
No set method• FEMA introduces STAPLEE in guidance material
Uses STAPLEE last time but did not prioritize Suggest applying 1-5 scoring
• 5 favorable/beneficial - 1 unfavorable/not beneficial • Higher score; easier to implement/fewer challenges • Use equal weighting; unless otherwise
STAPLEE questions in Section 7

Section 7E- Project Implementation
Plan
Identify the Goal, Objective, and Hazard project addresses
Identify Participating Jurisdiction
Identify Responsible Agencies/Departments
Estimate Cost
Potential Funding Source
Projected Timeframe for Completion Plan

Next Steps
Create List of New Projects
• Prioritize
• Implementation Plan
Create Administrative Draft of LHMP
Prepare for 2nd Public Outreach meeting

Questions
Chief Jon Trautwein• (626) 744-4745
Lisa Derderian• (626) 744-7276
Andy Petrow• (818) 294-5472
Laura Hernandez• (805) 844-1720

City of Pasadena
2018 Multi-Hazard Mitigation Plan
APPENDIX C
Public Outreach Efforts
5-

AGENDA
PUBLIC SAFETY COMMITTEE MAY 16, 2018
MEMBERS John J. Kennedy, Vice Mayor, District 3
Terry Tornek, Mayor Tyron Hampton, District 1 Steve Madison, District 6
STAFF
Steve Mermell, City Manager Valerie Flores, Recording Secretary
MISSION STATEMENT The City of Pasadena is dedicated to delivering exemplary municipal services,
responsive to our entire community and consistent with our history, culture and unique character.
In compliance with the Americans with Disabilities Act of 1990, Assistive Listening Devices are available from the City Clerk’s Office with a 24-hour advance notice.
Please call (626) 744-4124 to request use of a listening device.
Language translation services are available for this meeting by calling (626) 744-4124 at least 24 hours in advance.
Habrá servicio de interpretación disponible para éstas juntas llamando al (626) 744-4124 por lo menos con 24 horas de anticipación.
Public meeting begins at 6:00 p.m. Items on the agenda may not be called in order listed.
Agendas and supporting documents are available on the Internet at
http://ww5.cityofpasadena.net/commissions/city-council-public-safety-committee/
Materials related to an item on this Agenda submitted to the Public Safety Committee after distribution of the agenda packet are available for public inspection in the City Clerk’s Office at 100 N. Garfield
Avenue, Room S-228, Pasadena, during normal business hours.
COPIES OF THIS AGENDA ARE AVAILABLE FROM THE
NEIGHBORHOOD INFORMATION SERVICE AT
THE CENTRAL AND ALL BRANCH LIBRARIES.


9/13/2018
1
M P MP

9/13/2018
2

9/13/2018
3
f
11. Oil Spill
f
f

9/13/2018
4
A
f f
f f
f
f f
f
f
f

NEWS RELEASE FOR IMMEDIATE RELEASE: September 10, 2018 NEWS MEDIA CONTACT:
Lisa Derderian, Acting Pasadena Public Information Officer, City Manager’s Office
(626) 744-4755, [email protected]
CITY OF PASADENA ANNOUNCES COMMUNITY MEETING FOR PUBLIC
REVIEW OF UPDATED LOCAL HAZARD MITIGATION PLAN
(PASADENA, CA) - The City of Pasadena will be conducting a community meeting to seek comment
and public review of the draft update to the 2013 City of Pasadena Local Hazard Mitigation Plan
(LHMP). The meeting will take place at 7:00 pm on Monday, September 17, 2018 at Villa Parke
(Conference Room 131A), 363 E. Villa Street, Pasadena. The Plan will then be open for public review
and comment at https://ww5.cityofpasadena.net/fire/ beginning Tuesday, September 18 through close of
business Tuesday, September 25. A hardcopy of the draft updated LHMP will be available at Fire
Administration, 215 N. Marengo Ave., #195, Pasadena.
The California Office of Emergency Services (CalOES) and Federal Emergency Management Agency
(FEMA) requires that the LHMP be reviewed, updated and submitted for approval at least once every
five years. The City must have an approved LHMP to maintain eligibility for State and Federal Hazard
Mitigation grant programs. The LHMP’s list of hazards includes earthquakes, floods, fires and
windstorms. It also addresses man-made hazards such as hazardous material accidents, gas pipeline
ruptures, and homeland security threats. The purpose of the City’s LHMP is to identify goals, objectives,
and mitigation strategies for reducing the impact of the hazards. Mitigation strategies should address
findings in in the LHMP and can be based on working knowledge, best practices, and innovative ideas.
The draft updated LHMP is a demonstration of the City’s commitment to reducing the impact of
disasters. Your participation in the planning process will help ensure the successful implementation of
the City’s LHMP and enable the City to be better prepared for future disasters. Your time and cooperation
will be greatly appreciated.
For further information please Chief Jon Trautwein, Pasadena Fire Department at 626-744-4745

9/27/2018
1
Fire Department
Local Hazard Mitigation Plan (HMP) Public Outreach Meeting
Deputy Chief Jon Trautwein
Laura D. Hernandez
September 17, 2018
Legislative Requirement Fire Department
Purpose of Local Hazard Mitigation Plan Fire Department
Ensure local jurisdictions are made aware of the hazards and vulnerabilities within their jurisdiction and to develop strategies to reduce those vulnerabilities.
The LHMP is preventative and not an Emergency Response Plan.

9/27/2018
2
Fire Department
Update the Hazard Mitigation Plan (HMP)
Must be updated every 5 years to remain eligible to receive Hazard Mitigation Assistance grants
Last approved in 2013
Ensure regional coordination and encourage regional mitigation strategies
Provide technical assistance
Provide a catalyst for implementation
Methodology Fire Department
Steering
Public
External
Objective of HMPs Fire Department
Utilize a comprehensive approach Multi-hazards
Engage the public and others
Understand capabilities and vulnerabilities
Identify projects and actions
Integrated with other planning efforts
Meet eligibility requirements to receive HMA grants

9/27/2018
3
8. Plan Maintenance
Hazard Mitigation Plan Outline Fire Department
1. Introduction
2. Authority
3. Planning Process
4. Capabilities Assessment
5. Hazard Assessment
6. Vulnerability Assessment
7. Mitigation Strategy
Community Hazards Fire Department
Mitigation Actions Fire Department
Any long term action taken that reduces or eliminates
effect of the hazard or increases capabilities
Multi-hazard action items are those activities that
pertain to two or more of the six hazards.
Mitigation action items are in order of priority at the
time of submittal of this LHMP and are prioritized.
Required to have implementation plan (timeline, cost
estimate, responsible department)

9/27/2018
4
Sample List of Projects (Prioritized) Fire Department
Next Steps Fire Department
Receive comments back Work with Steering Committee Submit to OES to review Make requested changes Submit to FEMA for approval Submit to City Council for Approval City implementation!
How to Review and Comment Fire Department
The Plan will be open for public review and
comment at https://ww5.cityofpasadena.net/fire/
beginning Tuesday, September 18 through close
of business Tuesday, September 25.
A hardcopy of the draft updated LHMP will also
be available at Fire Administration,
215 N. Marengo Ave., #195, Pasadena.

9/27/2018
5
Questions Fire Department
Deputy Chief Jon Trautwein 626-744-4745
Andy Petrow (818) 294-5472
Laura Hernandez (805) 844-1720

City of Pasadena
2018 Multi-Hazard Mitigation Plan
Invite to Community Stakeholders

APPENDIX D
List of Key Assets
5-

ID Category Address Mapped Occupancy Description
1 COMMUNITY CENTER 1020 N FAIR OAKS AVE COMMUNITY CENTER JACKIE ROBINSON CENTER
2 COMMUNITY CENTER 1081 N FAIR OAKS AVE GYM, RESTROOMS JACKIE ROBINSON PARK (Values incl in Loc 53)
3 COMMUNITY CENTER 1415 N RAYMOND AVE YOUTH COUNCIL PASADENA AREA YOUTH COUNCIL aka NorthWest
School
4 COMMUNITY CENTER 1835 N FAIR OAKS AVE COMM HEALTH CTR - BUILDING 2 PASADENA COMMUNITY HEALTH CENTER
5 COMMUNITY CENTER 1845 N FAIR OAKS AVE COMM HEALTH CTR - BUILDING 1 PASADENA COMMUNITY HEALTH CENTER
6 COMMUNITY CENTER 1855 N FAIR OAKS AVE COMM HEALTH CTR - BUILDING 3 PASADENA COMMUNITY HEALTH CENTER
7 COMMUNITY CENTER 2575 PALOMA ST COMM CNTR GYM, PICNIC AREA VICTORY PARK
8 COMMUNITY CENTER 363 E VILLA ST RECREATION CENTER VILLA PARKE COMM CTR, POOL AND RESTROOMS
9 COMMUNITY CENTER 85 E HOLLY ST PASADENA SENIOR CENTER CENTRAL DISTRICT & SUB-DIVISION
10 COMMUNITY CENTER 85 E HOLLY ST SR CITIZEN COMM CENTER SR. CITIZEN CENTER
11 EQUIPMENT 100 N GARFIELD AVE EQUIPMENT - RC CONTRACTORS EQUIPMENT
12 EQUIPMENT 100 N GARFIELD AVE RC YARD MACHINERY AND EQUIPMENT
13 EQUIPMENT 1000 E WASHINGTON BLVD PARK - EQUIPMENT MACDONALD PARK
14 EQUIPMENT 2057 N LOS ROBLES AVE TELECOMMUNICATIONS EQUIPMENT PCAC OFFICE HENS TEETH - Telecom Property
15 EQUIPMENT 300 E GREEN ST BUSINESS INTERRUPTION COVERAGE CONFERENCE CENTER - BI COVERAGE
16 FIRE 1140 N FAIR OAKS AVE FIRE STATION FIRE STATION #36
17 FIRE 1150 LINDA VISTA AVE FIRE STATION FIRE STATION #38
18 FIRE 135 S FAIR OAKS AVE FIRE STATION FIRE STATION #31
19 FIRE 1360 E DEL MAR BLVD FIRE STATION FIRE STATION 34 - Constr Cost $2,660,312
20 FIRE 199 S LOS ROBLES AVE FIRE DEPT ADMN OFFICES FIRE HEADQUARTERS (STORY VALUES INCL IN L 15)
21 FIRE 2424 E VILLA ST FIRE STATION FIRE STATION #32
22 FIRE 3430 FOOTHILL BLVD FIRE STATION FIRE STATION #37
23 FIRE 50 AVENUE 64 FIRE STATION FIRE STATION #39
24 FIRE 515 N LAKE AVE FIRE STATION FIRE STATION #33
25 FIRE 515 N LAKE AVE TOWER AND CLASSROOM FIRE STATION #33 (VALUES INCLUDED IN LOC #8)
26 FIRE 845 E VILLA ST VEHICLE REPAIR FIRE STATION #33 (VALUES INCLUDED IN LOC #8)
27 GOVERNMENT 100 N GARFIELD AVE CITY HALL - HIGH END 1741 FLOOD.JPG - City Hall
28 GOVERNMENT 145 N RAYMOND AVE ARMORY ARMORY BUILDING
29 GOVERNMENT 150 S LOS ROBLES AVE LEASED BLDG - DEPT OF WATER & POWER GROSVENOR BUILDING
30 GOVERNMENT 187 N GARFIELD AVE OFFICE PERMIT CENTER - Hale Building
31 GOVERNMENT 207 N GARFIELD AVE JAIL POLICE STATION
32 GOVERNMENT 233 W MOUNTAIN ST SHOP BUILDING CITY YARDS - PUBLIC WORKS BLDG - Lockers,
parking

33 GOVERNMENT 233 W MOUNTAIN ST TEMPORARY MOBILE HOME CITY YARDS-SOLID WASTE - Recycling Ctr Ofc
34 GOVERNMENT 245 W MOUNTAIN ST OFFICE CITY YARD-WATER & POWER OFC AND EOC
35 GOVERNMENT 300 E GREEN ST AUDITORIUM CIVIC CENTER (AUDITORIUM)
36 GOVERNMENT 300 E GREEN ST CONFERENCE CENTER CONVENTION CENTER - EAST PAVILION
37 GOVERNMENT 300 E GREEN ST CONFERENCE CENTER - EXHIB HALL EXHIBITION BUILDING - West PAVILION
38 GOVERNMENT 323 W MOUNTAIN ST SHEDS, WAREHOUSE, OFFICE CITY YARDS BLDGS 4,5,6 Fleet Maint Truck Repair
39 GOVERNMENT 345 W MOUNTAIN ST SHOP BUILDING WAREHOUSE/OFFICE/SHOPS - Bldg Maint #1
40 GOVERNMENT 500 LAKE AVE JOB CENTER JOB CENTER
41 LIBRARY/MUSEUM 100 N GARFIELD AVE ART PIECES PLACED THROUGHOUT CITY FINE ART - ROTATING ART PROGRAM
42 LIBRARY/MUSEUM 1130 S MARENGO AVE LIBRARY BLDG AND BOOKS ONLY ALLENDALE LIBRARY (PP INCL. IN LOC. #17)
43 LIBRARY/MUSEUM 1240 NITHSDALE RD LIBRARY BLDG & BOOKS ONLY SAN RAFAEL BRANCH LIBRARY (PP INCL. IN LOC.
#17)
44 LIBRARY/MUSEUM 1281 BRYANT ST LIBRARY BLDG & BOOKS ONLY LINDA VISTA BRANCH LIBRARY (PP INCL. IN LOC.
#17)
45 LIBRARY/MUSEUM 1355 N RAYMOND AVE LIBRARY BLDG & BOOKS ONLY LA PINTORESCA LIBRARY (PP INCL. IN LOC. #17)
46 LIBRARY/MUSEUM 140 S ALTADENA AVE LIBRARY BLDG & BOOKS ONLY LAMANDA PARK LIBRARY (PP INCL. IN LOC. #17)
47 LIBRARY/MUSEUM 285 E WALNUT ST LIBRARY CENTRAL LIBRARY
48 LIBRARY/MUSEUM 285 E WALNUT ST LIBRARY BOOKS ( PP INCL IN #17) CENTRAL LIBRARY - BOOKS
49 LIBRARY/MUSEUM 285 E WALNUT ST FINE ART COLLECTION MAIN LIBRARY - FINE ART COLLECTION
50 LIBRARY/MUSEUM 3325 E ORANGE GROVE BLVD LIBRARY BLDG & BOOKS ONLY HASTINGS BRANCH LIBRARY (PP INCL. IN LOC. #17)
51 LIBRARY/MUSEUM 363 E VILLA ST LIBRARY BOOKS ONLY VILLA PARKE BRANCH LIBRARY (PP incl in Loc #17)
52 LIBRARY/MUSEUM 55 S HILL AVE LIBRARY BLDG & BOOKS ONLY HILL AVENUE LIBRARY (PP INCL. IN LOC. #17)
53 LIBRARY/MUSEUM 999 E WASHINGTON BLVD LIBRARY BLDG & BOOKS ONLY SANTA CATALINA BRANCH LIBY (PP INCL. IN LOC.
#17)
54 MISC 1 E GREEN ST PARKING GARAGE SCHOOL HOUSE PARKING
55 MISC 100 N GARFIELD AVE PLATE GLASS PLATE GLASS
56 MISC 100 N GARFIELD AVE PERSONAL PROPERTY FOR VRSS PARKS PERSONAL PROPERTY
57 MISC 1133 ROSEMONT AVE CLUBHOUSE, RESTAURANT, PRO SHOP BROOKSIDE GOLF COURSE
58 MISC 150 HOLLY ST UNICORN PARKING GARAGE HOLLY STREET PARKING
59 MISC 1501 E VILLA ST PUBLIC RESTROOMS JEFFERSON PARK
60 MISC 171 N RAYMOND AVE SUBTERRANEAN PARKING GARAGE MARRIOTT PKG GAR - BI ONLY - 146 spaces, air
leased to city
61 MISC 177 S ARROYO PL LOWER ARROYO CLUBHOUSE LA CASITA DEL ARROYO
62 MISC 178 W VILLA ST VACANT LAND
63 MISC 198 S RAYMOND AVE UNDERGROUND PARKING GARAGE DEL MAR TRAIN STATION PARKING GARAGE
64 MISC 2180 E FOOTHILL BLVD VACANT (SET FOR DEMOLITION) RESTAURANT

65 MISC 221 E WALNUT ST LEASED OFFICE - CONTENTS ONLY WALNUT PARK CENTER - Transp Dept and Pkg
Authority
66 MISC 232 S MICHIGAN AVE PUBLIC RESTROOMS GRANT PARK
67 MISC 275 S RAYMOND AVE PUBLIC RESTROOMS CENTRAL PARK
68 MISC 2783 EATON CANYON DR RIFLE RANGE/AUDITORIUM CIVIL DEFENSE/RIFLE RANGE
69 MISC 2791 EATON CANYON RD PISTOL RANGE INDOOR PISTOL RANGE
70 MISC 280 W CALIFORNIA BLVD PUBLIC RESTROOMS SINGER PARK
71 MISC 300 E GREEN ST PARKING GARAGE CIVIC CENTER PARKING GARAGE
72 MISC 300 E GREEN ST ICE RINK CIVIC CENTER - ICE RINK - In same bldg as CC
Auditorium
73 MISC 300 E GREEN ST ICE RINK - ON TOP OF PARKING GARAGE NEW ICE RINK - CONVENTION CENTER
74 MISC 303 CORDOVA ST PARKING GARAGE CENTRAL DISTRICT & SUB-DIVISION
75 MISC 3100 E DEL MAR AVE PARKS-SEE NOTES - EQUIPMENT EATON PARKS
76 MISC 311 W MOUNTAIN ST LEASED OFFICE TRAILER
77 MISC 311 W MOUNTAIN ST LEASED OFFICE TRAILER
78 MISC 350 N ARROYO BLVD NATATORIUM ROSE BOWL AQUATICS CENTER - Swimming pools
and Clubhs
79 MISC 360 N ARROYO BLVD BROOKSIDE PARK BUILDING & RESTROOMS BROOKSIDE PARK
80 MISC 360 N ARROYO BLVD JR MEM FIELD BLEACHERS BROOKSIDE PARK (values incl in Loc 45)
81 MISC 3680 CARTWRIGHT ST PUBLIC RESTROOM HAMILTON PARK
82 MISC 39 S DELACEY ST PARKING GARAGE DELACEY PARKING STRUCTURE
83 MISC 391 S ORANGE GROVE BLVD MANSION TOURNAMENT HOUSE (WRIGLEY MANSION)
84 MISC 4024 OAK GROVE DR PUBLIC RESTROOM HAHAMONGA WATERSHED
85 MISC 45 E WASHINGTON BLVD RESTROOMS & PLAY EQUIPMENT LA PINTORESCA PARK
86 MISC 4550 ORANGE GROVE BLVD PUBLIC RESTROOMS OAKGROVE PARK
87 MISC 488 ARBOR ST CARETAKER'S HOUSE WRIGLEY MANSION
88 MISC 700 E WASHINGTON BLVD PUBLIC RESTROOMS WASHINGTON PARK
89 MISC 700 SECO ST FLOAT BUILDING WAREHOUSE ROSEMONT PAVILION (Will be vacant February
thru October each year)
90 MISC 78 N MARENGO AVE HISTORIC PRESERVATION OF YWCA BUILDING ECONOMIC REDEVELOPMENT Including Office
91 MISC 835 S RAYMOND AVE FLOAT BUILDING WAREHOUSE ROSE PALACE (To be vacant as of 8/1/2017 until
leased to a new tenant)
92 MISC 85 E HOLLY ST BANDSTAND & RESTROOMS MEMORIAL PARK BANDSTAND (contents $ incl in
Loc 152)
93 POLICE 2175 YUCCA LN HELIPORT POLICE HELIPORT - Hanger, Portable Trailers
94 POLICE 220 S RAYMOND AVE POLICE SUB - STATION - LEASED SPACE DEL MAR HISTORIC TRAIN STATION - Leased space
in Depot
95 UTILITIES - POWER 1001 N ARROYO BLVD BROOKSIDE SUBSTATION BROOKSIDE SUBSTATION

96 UTILITIES - POWER 1004 N WILSON AVE WILSON SUBSTATION WILSON SUBSTATION
97 UTILITIES - POWER 1055 E COLORADO BLVD POWER POWER
98 UTILITIES - POWER 1154 S FAIR OAKS AVE STORAGE -WAREHOUSE BLDG POWER PLANT HISTORIC BLDG-PACIFIC ELECT
RAILWAY
99 UTILITIES - POWER 1180 S FAIR OAKS AVE ELECTRICAL SHOP POWER/GENERAL INDUSTRIAL DISTRICT
100 UTILITIES - POWER 120 SIERRA MADRE VILLA AVE EASTERN SUBSTATION EASTERN SUBSTATION
101 UTILITIES - POWER 1410 N FAIR OAKS AVE FAIR OAKS SUBSTATION FAIR OAKS SUBSTATION
102 UTILITIES - POWER 160 N ALTADENA DR SANTA ANITA SUBSTATION (HISTORIC
SUBSTATION) SANTA ANITA /LAMANDA PARK SUBSTATION
103 UTILITIES - POWER 176 E VILLA ST VILLA SUBSTATION VILLA SUBSTATION
104
UTILITIES - POWER
1850 RANCH RD
AZUSA HYDROELECTRIC POWER PLANT
Power House, Main Transformer, Switch Gear,
Pelton Wheel Hydro Generator, Penstock Bypass,
Forebay, Afterbay
105 UTILITIES - POWER 1850 RANCH RD RESIDENCE AZUSA HYDROELECTRIC
106 UTILITIES - POWER 1850 RANCH RD SHED AZUSA HYDROELECTRIC
107 UTILITIES - POWER 300 N HALSTEAD UTIL/ELECTRO OPTICAL UTILITIES MACHINERY AND EQUIPMENT
108 UTILITIES - POWER 3001 E FOOTHILL BLVD GOODRICH SUBSTATION GOODRICH SUBSTATION
109 UTILITIES - POWER 310 W MOUNTAIN ST OFFICE & WAREHOUSE CITY YARDS #7,10,13,15 Dept of Water & Power
110 UTILITIES - POWER 311 W MOUNTAIN ST TRANSFORMER TEST BLDG TRANSFORMER TEST BLDG. (values - see Loc 30)
111 UTILITIES - POWER 3665 E SIERRA MADRE BLVD HASTING SUBSTATION HASTINGS SUBSTATION
112 UTILITIES - POWER 45 E GLENARM ST GLENARM SUBSTATION (POWER
DISTRIBUTION BUSINESS UNIT) POWER DISTRIBUTION BUSINESS UNIT
113 UTILITIES - POWER 44 S MICHIGAN AVE CHESTER SUBSTATION CHESTER SUBSTATION
114 UTILITIES - POWER 85 E STATE ST HISTORIC POWER PLANT BLDG - MUSUEM GLENARM HISTORIC POWER PLANT STRUCTURE
115 UTILITIES - POWER 95 WAVERLY DR DEL MAR SUBSTATION DEL MAR SUBSTATION
116 UTILITIES - WATER 1 N SAN RAFAEL AVE SAN RAFAEL PUMP STATION SAN RAFAEL PUMP STATION
117 UTILITIES - WATER 125 TUSTIN RD RESERVOIR/PUMP STATION EAGLE ROCK RESERVOIR
118 UTILITIES - WATER 1265 FAIRLAWN WAY RESERVOIR ANNENDALE RESERVOIR
119 UTILITIES - WATER 1377 GLEN OAKS BLVD PUMP STATION ANNENDALE PUMP STATION
120 UTILITIES - WATER 1433 1/2 RUTHERFORD DR PUMP STATION MIRADOR PUMP STATION
121 UTILITIES - WATER 1480 HASTINGS RANCH RD THOMAS RESERVOIR/BOOSTER THOMAS RESEVOIR
122 UTILITIES - WATER 1599 KNOLLWOOD DR LIDA PUMP STATION LIDA PUMP STATION
123 UTILITIES - WATER 1619 GLEN OAKS BLVD RESERVOIR/PUMP STATION MIRADOR RESERVOIR
124 UTILITIES - WATER 180 N HALESTEAD CHAPMAN WELL CHAPMAN WELL
125 UTILITIES - WATER 1800 N ARROYO BLVD PUMP STATION SHELDON RESERVOIR #1
126 UTILITIES - WATER 1800 N ARROYO BLVD RESERVOIR SHELDON RESERVOIR #2
127 UTILITIES - WATER 184 N HALSTEAD 2 ATTACHED TRAILERS - TEMPORARY WATER SERVICES HALSTEAD TRAILER
128 UTILITIES - WATER 1879 E WALNUT ST WOODBURY WELL WOODBURY WELL
129 UTILITIES - WATER 201 W MOUNTAIN ST SUNSET WELL SUNSET WELL

130 UTILITIES - WATER 201 W MOUNTAIN ST 2 RESERVOIRS SUNSET RESERVOIR
131 UTILITIES - WATER 2040 DUNHAM ALLEY CRAIG WELL PUMP STATION CRAIG PUMP STATION
132 UTILITIES - WATER 2073 PINECREST DR RESERV/PUMP STATION ALLEN RESERVOIR
133 UTILITIES - WATER 21 KARL JOHNSON PARKWAY VENTURA WELL/PUMP STATION VENTURA WELL
134 UTILITIES - WATER 2437 ALTADENA DR RESERVOIR /PUMP STATION SANTA ANITA RESERVOIR
135 UTILITIES - WATER 2437 ALTADENA DR SANTA ANITA PUMP STATION SANTA ANITA PUMP STATION
136 UTILITIES - WATER 2696 WINDSOR AVE WINDSOR WELL / RESERVOIR WINDSOR RESERVOIR
137 UTILITIES - WATER 3030 E WALNUT ST JURDAN WELL JURDAN WELL
138 UTILITIES - WATER 311 W MOUNTAIN ST WATER METER SHOP WATER METER SHOP (values - see Loc 30)
139 UTILITIES - WATER 34 E ORANGE GROVE BLVD ONE OF TWO DWELLINGS COMMUNITY DEVELOPMENT
140 UTILITIES - WATER 34 E ORANGE GROVE BLVD 2ND OF TWO DWELLINGS COMMUNITY DEVELOPMENT
141 UTILITIES - WATER 3410 FAIR POINT ST PUMP STATION MURRAY RESERVOIR
142 UTILITIES - WATER 3416 FIGUEROA ST RESERVOIR LIDA RESERVOIR
143 UTILITIES - WATER 345 E VILLA ST WELL VILLA WELL
144 UTILITIES - WATER 345 W MOUNTAIN ST WELL COPELIN WELL
145 UTILITIES - WATER 3665 E SIERRA MADRE BLVD RESERVOIR/HAMILTON PARK JONES RESERVOIR - PUMP STATION ON TOP OF RES
146 UTILITIES - WATER 3671 RANCH TOP RD WATER TANKS DON BENITO TANKS #1 AND #2
147 UTILITIES - WATER 521 SECO ST LINDA VISTA PUMP STATION LINDA VISTA PUMP STATION
148 UTILITIES - WATER 525 S OAK KNOLL OAK KNOLL SUBSTATION OAK KNOLL SUBSTATION
149 UTILITIES - WATER 586 N GARFIELD AVE GARFIELD AVE WELL GARFIELD AVE WELL
150 UTILITIES - WATER 64 E CALAVERAS CALAVERAS RESERVOIR CALAVERAS RESERVOIR
151 UTILITIES - WATER 691 W WOODBURY RD PUMPING STATION ALTADENA PUMPING STATION
152 UTILITIES - WATER 75 KARL JOHNSON PARKWAY AWELL PUMP STATION ARROYO WELL
153 UTILITIES - WATER 7700 N FIGUEREA ST ROSS PUMP STATION ROSS PUMP STATION
154 UTILITIES - WATER 920 N WILSON AVE WILSON PUMP STATION WILSON PUMP STATION
155 UTILITIES - WATER 995 SUNSET AVE PUMP STATION GLORIETTA PUMP STATION
156 UTILITIES - WATER N OF JPL WATER TANKS GOULD RESERVOIR
157 UTILITIES - WATER 52 KARL JOHNSON PARKWAY WELL WELL S2
158 UTILITIES - WATER SIERRA MADRE & PALOMA USMC RESERVE CENTER USMC RESERVE CENTER
159 VENUE 1001 ROSE BOWL DR ROSE BOWL STADIUM STADIUM*
160 VENUE 1001 ROSE BOWL DR ROSE BOWL VIDEO BOARD N Video Bd, Loop, Swtichgear
161 VENUE 1001 ROSE BOWL DR ROSE BOWL DISPLAY BOARD S&E Scorebds + 10 LED Ad Bds, electrical
162 VENUE 1001 ROSE BOWL DR ROSE BOWL ROSE SIGN ROSE SIGN
163 VENUE 1001 ROSE BOWL DRIVE ROSE BOWL MISC SIGNS MISC SIGNS

ITEM 4.C
Proposed Amendments to Pasadena Municipal Code Regarding
Sidewalk Vendors


INFORMATION ITEMS
A. Pasadena Police Department’s Asset Forfeiture Fund*
B. Police Chief’s Monthly Report*

ITEM 5.A
Pasadena Police Department’s Asset Forfeiture Fund


ITEM 5.B
Police Chief’s Monthly Report


1
PASADENA POLICE Community Brief - March 2019
This information provides a greater awareness to the Pasadena
community. The critical events detailed below are merely a
snapshot of the one-thousand calls received to the Police
Communications Center every day. As your police department
moves forward under new leadership, the principles of the
“Pasadena Way” possess greater significance no matter what
assignment, function, or mission an employee serves in the
organization as we continue to police with compassion and best
intentions.
March 1, 2019, 11:57 p.m., officers responded to a shots fired call in the area of Hammond St. &
Morton Ave. Officers located several expended casings near the south parking lot of Kings
Villages. Officers then heard several gunshots north of their location. As officers investigated, a
black BMW driven by S-Jackson drove westbound Hammond St, to southbound Sunset Ave. S-
Jackson drove his vehicle recklessly and hit an unmanned patrol unit. Officers saw the suspect
vehicle, and a pursuit ensued. The suspect abandoned his vehicle at Maple St. & Fair Oaks Ave.,
and ran onto the westbound 210 freeway. Officers gave chase on foot and apprehended the suspect
on the 210 eastbound. The suspect was transported to LCMC for minor injuries and
exhaustion. Air-1 directed officers to Summit Ave/ Maple Street, regarding a hot spot from the
FLIR. The hot spot turned out to be the suspect’s handgun. Officers located more expended shell
casings on Pepper Street/ Sunset Ave. but as of this writing, no victim(s) have been identified.
March 3, 2019, 12:07 p.m., Officers responded to 400 N. Fair Oaks, in regards to a strong arm
robbery. The victim was collecting bottles at the gas station when he was approached by two male
subjects. Suspect #2 distracted the victim, while suspect #1 patted the victim down and took
money from his pants pocket. The suspects fled the location east on Maple St. Officers
located one male in the area who matched the suspect description. He was detained and identified
as the suspect who took the victim's money. Suspect #2 is still outstanding. The victim was not
injured.
March 3, 2019, 4:37 p.m., Officers responded to a residential burglary at the 1200 block of Glen
Oaks Blvd. The homeowner was out of town monitoring his camera system at the home. The
victim reported the suspects were ransacking the residence. Officers arrived but the suspects were
gone. As a perimeter was set up, another caller from Glen Oaks said 2 males came to her door to
ask if they could borrow a car jack for a flat tire. The police helicopter arrived and spotted a broken
down vehicle with 4 occupants. Responding officers detained the subjects. The victim of the
burglary was able to send still photos from his video surveillance equipment to dispatch and the
subjects were in fact the suspects from the burglary. They were arrested and were linked to 1 other
residential burglary and a hot prowl in the area.

2
March 5, 2016, 4:26p.m., Officers and Fire personnel responded to Target in the 3100 block of
east Colorado Blvd. in regard to a fire in the stairwell of the parking structure. PFD was able to
extinguish the fire and no injuries occurred. The responding officer was able to view video
surveillance capturing the incident. The video showed the suspect place something in a shopping
cart in the stairwell of the parking structure and a fire ensued. Still photos of the suspect were
shown to a H.O.P.E. officer who immediately recognized the suspect. A few hours later the
responding officer saw the suspect in the area of Sierra Madre Blvd. and Foothill. He was taken
into custody without incident.
March 6, 2019, 6:07p.m., Officers responded to a hit/run call on Hudson Ave. and Mountain
St. The suspect vehicle was located and officers attempted to pull it over. The suspect stopped
momentarily but quickly drove away southbound on Lake Ave to Oak Knoll Ave. and onto
Huntington Drive. A slow speed pursuit ensued but after about twelve minutes, it became unsafe
for officers and the public. The pursuit was then cancelled but the suspect was later identified.
March 7, 2016, 9:06p.m., Officers responded to the 2300 block of east Colorado Blvd, in regard
to suspects placing numerous over the counter pharmaceuticals into backpacks. As the suspects
were leaving the location, one of the suspects sprayed the loss prevention officer with pepper
spray. A description of the suspects and their vehicle were provided by the victim. Police
Helicopter PD-1 was on scene immediately and saw the suspect vehicle fleeing the area. PD-1
directed officers to the suspect vehicle and 3 occupants were detained. A field show up was
conducted, which positively identified the people detained. All three suspects were arrested
without incident. As this investigation was unfolding, officers were simultaneously investigating
a similar crime at CVS on south Arroyo Parkway where the victim had also been pepper sprayed.
A field show up with that victim also developed a positive identification. The estimated recovered
loss is approximately was valued in excess of $3000.
March 9, 2019, 8:44p.m., Officers responded to a call of a fight in the area of Mentor Ave. and
Bell St. The police helicopter arrived at the scene and the helicopter observer directed officers to
a vehicle seen leaving the area. Officers stopped the vehicle and spoke to the occupants who
admitted to being in a verbal argument with another individual, but officers were unable to locate
the other party. Forty-five minutes later, dispatch received a call from a resident in the 1100 Block
of Mentor Ave. who said a bloody male was on her front lawn. Officers responded and contacted
the victim who claimed he was hit by a car. The victim was bleeding and PFD was summoned to
the scene. Upon closer examination it was discovered the victim had a wound on his stomach that
appeared to be a slash from a knife. The victim was very uncooperative and would not tell the
officers what happened. He was transported to the hospital for medical treatment which was non-
life threatening. Officers were able to re-contact the original subjects they stopped and they
admitted to being in a physical fight with the victim. Both were arrested for the assault.
March 12, 2019, 7:26p.m., In December 2018, the victim's boyfriend was contacted regarding a
fraudulent account he allegedly had at a bank in China. The caller was able to convince the victim's
boyfriend to have the victim provide her information to verify his account activity. Eventually the
same caller got in touch with the victim and told her she was wanted in China for money laundering
with a fraudulent account and if she didn't pay $50,000 she would be arrested and extradited back
to China. The victim wired the 50k and then the caller kept asking for more money. The victim
ended up sending a total of $178, 000 through wire transfers. Eventually the victim figured out she
had been scammed and called the police.

3
March 14, 2019, 10:06p.m., A violent collision occurred between a small white passenger van
and a black sedan in the intersection of Fair Oaks Ave. & Claremont St. The collision caused the
sedan to careen into at least 2 parked vehicles, one of which was occupied. The driver of the van
was transported to a hospital in serious condition. The black vehicle caught fire and at least 3
teenagers from this car were taken to local area hospitals. One additional passenger from this
vehicle may have fled the scene but that has yet to be confirmed. The debris field from the collision
spread across a whole city block and structural damage occurred to an apartment on the west side
of the street from the wreckage. A bloody bottle of alcohol was found on scene as well as a
handgun. Motor Officers were called out to investigate.
March 14, 2019, 10:50p.m., PPD received a call of shots fired in the area of Garfield Ave. and
Washington Blvd. The responding officers were unable to locate any evidence of a shooting.
Later, someone posted a report of the shots fired on Nextdoor.com. A subject then replied to the
post and he admitted to shooting homemade ammunition and everything was alright. The posted
was coded to a screen name that identified the poster as living in Bungalow Heights which is
between Washington Blvd. and Eldora St. Numerous messages were then sent back and forth
between this subject and dozens of concerned citizens. The messages were then reported to the
PPD and copied into a report. The next day the subject confirming the shooting was identified and
claimed he was only trolling people on the internet. He was not found to be in possession of
contraband and was not arrested. This investigation was forwarded to the City Prosecutor’s Office
for review.
March 17, 2019, 7:18a.m., A subject walked into to the cosmetic area of a pharmacy in the 700
block of South Arroyo Parkway and is seen concealing cosmetic items in her jacket pocket. She
walked by registers and exited the store without paying. Employees followed the suspect and
asked for the items back. The suspect pulled out a Taser, pointed it at the victim and pulled the
trigger. The victim heard a sound and saw an electric arc. He immediately backed off as he
believed the Taser did not have a cartridge. The suspect was last seen walking away in the parking
lot toward the platform of the Gold line. The victim was not injured.
March 17, 2019, 7:48a.m., A woman was in bed in the 3000 block of Margareta Dr. when
she heard a noise. Her dog started barking and ran towards the kitchen. She went into the living
room and saw a male subject standing in her kitchen. She asked him what was he doing and he
said he was looking for "Maria". The victim told the suspect he does not belong in her house and
to leave before she calls the police. She stepped away and when she returned the suspect was
gone. The victim walked to the front of the residence and the saw the suspect standing in a
neighbor’s driveway. The suspect left the area on foot. The victim was not injured and there was
no loss.
March 20, 2019, 1:51a.m., PPD units responded to a report of a fire in the 500 block of South
Hill Ave. As units arrived they found one home fully engulfed in flames. The house, which is
under construction, was vacant at the time of the fire. There are no reported injuries, no one was
displaced and the cause of the fire is under investigation.
March 22, 2019, 11:26p.m., Officers observed a vehicle leaving a hotel in the 2000 block of
Colorado Boulevard at a high rate of speed and conducted a traffic stop. The vehicle was occupied
by 6 passengers. The Officer obtained consent to search the vehicle and recovered an unregistered
firearm concealed inside the vehicle. All 6 occupants were arrested and transported to the Pasadena
jail. 4 of the occupants were juveniles and released to their parents. The two adults were booked
in the Pasadena jail.

4
March 23, 2019, 6:39a.m., Officers responded to a residence in the 1700 block of Orangewood
St. regarding three suspects attempting to break into the home. The victim was inside when the
suspects approached the front door and kicked it several times. The suspects then broke a front
window and walked away toward the driveway. The suspects returned to the broken window and
one subject was seen armed with a firearm. The victim opened the front kitchen window and
shouted to the suspects the police were coming. The suspects ran away from the residence and
were last seen south on Allen toward California. The victim was not injured. There was no loss
or entry into the home.
March 23, 2019, 10:09a.m., Officers responded to an apartment complex on Oak Knoll Ave.
south of Colorado Blvd. regarding a male wo was urinating and littering on the property. They
contacted the suspect who was in the driver's seat of a vehicle with a female front passenger. The
driver initially refused to roll down the window of the vehicle, provide identification or exit the
vehicle. At one point he rolled down the driver's window a few inches and verbally provided his
name. During the contact it was determined that the driver had an outstanding felony assault
warrant for his arrest. When he was told this information he became extremely agitated and
secured himself in the vehicle. Communication was established with the occupants over the cell
phone however they refused orders to exit the vehicle. After two hours of containment and
communication with suspect, they exited the vehicle and were taken into custody.
March 27, 2019, 9:23p.m., A woman was getting ready to close her business in the 400 block of
south Marengo Ave., and walked to the back of the store to get her purse. She heard the front door
of the business open and thought her last client had come back in the shop. When the victim came
out to the front she saw a male standing in the doorway. The suspect then approached the victim,
grabbed her and threw her on the ground. The suspect hit the victim on the top of her head and
took her purse. The suspect ran out of the location with the victim’s purse. An area check was
conducted but the suspect was not found.
March 28, 2019, 3:11p.m., members of the Pasadena Police Department's Special Enforcement
Section served a narcotic search warrant in the 400 block of east Montana St. A subject had been
observed conducting hand to hand narcotic transactions. SES contacted the seller and a buyer as
they recovered rock cocaine and U.S. currency. Both suspects were arrested.
March 28, 2019, 6:32p.m., Officers responded to a report of a garage burglary in the 500 block
of North Oakland Avenue. The victim reported seeing the suspect enter the garage via
surveillance. Upon arrival, Officers searched the garage and located the suspect hiding inside. The
suspect was in possession of loss from the same location on a prior date and believed to be
responsible for another garage burglary at an adjacent property. In addition, the suspect was on
parole for burglary and had two no bail warrants.
March 28, 2019, 9:55p.m., Officers responded to the 700 block of east Villa St. in regard to a
woman heard screaming. The 82 year old victim was walking towards her residence when she
was pushed from behind and fell to the ground. The suspect kicked and punched the victim in the
head and thorax area; grabbed her purse and ran away. A witness heard a woman yell for help and
saw a person run across the street into a vehicle that fled the scene. Paramedics responded to the
location for the victim however she was not transported to a hospital.

5
March 29, 2019, 1:32p.m., Special Enforcement Section officers conducted a traffic stop on
Arroyo Blvd and the 210 Freeway for driving infractions. The officers obtained consent to search
the vehicle and a loaded .38 revolver was located in the passenger compartment. The suspect was
arrested without incident and booked at PPD jail. It was later learned the gun was stolen of the
City of Los Angeles. The suspect is a known felon, who is on active probation for distribution of
narcotics, with prior weapon charges, and also had an outstanding no-bail probation warrant for
his arrest.
March 29, 2019, 7:55p.m., Officers responded to the 400 block of east Orange Grove Blvd. in
regards to a shooting. One subject fired a handgun at a male that walked by him. The suspect fled
the area in a black compact car. Officers were unable to locate the suspects or the victim. The
victim's identity was obtained during the investigation. Evidence shows the victim was not
believed to be hit during the shooting.
March 30, 2019, 12:27p.m., Officers responded to an armed carjacking in the 1400 block of
Locust St. The victim was driving home when she saw two men standing on the north curb. As
she drove closer, both men walked into the middle of the street which forced her to stop the
vehicle. The suspects pointed at the front bumper of the victim's vehicle. The victim leaned out
of the vehicle not knowing if there was a problem. Suspect #1 went to the driver's side, pointed a
gun at the victim and pulled her out of the vehicle. Suspect #2 entered the passenger side of the
vehicle. Suspect #1 entered the driver's seat and both suspects fled east on Locust. The victim was
not injured. The investigation is ongoing.
March 31, 2019, 11:25p.m., A 68 year old woman was walking in the 1000 block of east Colorado
Blvd. The suspect, a 60 year old female, called out to the victim but the victim tried to walk
away. The suspect caught up to the victim, turned her around and struck her twice in the eye. The
victim's property was taken out of her purse by the suspect who fled the scene. The victim was
transported to a local hospital for medical treatment.
March 31, 2019, 3:24p.m., PPD responded to an assault with a firearm, which occurred at
Marengo Av/Orange Grove Bl. The 52 year old suspect was involved in a verbal dispute with the
32 year old victim. The suspect removed a pistol from his waistband and pointed it at the
victim during the dispute. No one was injured and the parties separated and left the scene before
police arrived. The investigation is on-going.
March 31, 2018, 10:37p.m., A 29 year old male and his friend exited a vehicle in the 400 block
of north Allen Ave. and immediately started fighting with 5 male subjects. The victim was stabbed
by a suspect numerous times in the torso. All of the suspects fled the area after the fight. The
victim was transported to a local hospital, where he was treated. His injuries are not life
threatening.

6
New California License Plate Laws
The California Department of Motor Vehicles (DMV) has now modernized issuing temporary
license plates to new vehicles. The new temporary plates display letters and numbers similar to
permanent license plates, and eliminates the traditional dealer based “paper plates”. This is being
done in an effort to close the gap in vehicle registration identification and verification between the
time of purchase and the issuance of permanent license plates. The temporary license plates allow
law enforcement to verify the ownership of new vehicles, and will also assist in the tracking of
new vehicles that may be stolen, utilized in crimes, or are being operated fraudulently. Individuals
who continue to display paper plates issued by car dealerships may be stopped to verify vehicle
registration status. Community members are encouraged to affix their permanent plates as quickly
as possible after issuance by the DMV. Please feel free to call Traffic Section Lieutenant Mark
Goodman at 626-744-7159 with any questions related to this topic.