
2019-05-15 FPRS Board Agenda and Packet - City of Pasadena
463
-
Upload
khangminh22 -
Category
Documents
-
view
1 -
download
0
Transcript of 2019-05-15 FPRS Board Agenda and Packet - City of Pasadena

bjazmines
Typewritten Text


mprice
Typewritten Text
DATE: 5/15/19 ITEM #: 3


PASADENA FIRE AND POLICE RETIREMENT SYSTEM
MONTHLY ALLOWANCE ROLL - TOTALS
MONTH 2017-2018 2018-2019 Notes
JULY 1,080,895.48 1,087,861.08 a., b.
AUGUST 1,072,450.04 1,087,861.08
SEPTEMBER 1,073,179.24 1,087,861.08
OCTOBER 1,067,418.15 1,082,715.19 c.
NOVEMBER 1,073,865.44 1,086,317.32 d. e.
DECEMBER 1,071,271.25 1,068,434.20 f. g. h.
JANUARY 1,069,560.74 1,069,961.18 g.
FEBRUARY 1,069,560.74 1,060,113.61 i. j. k.
MARCH 1,066,101.66 1,048,594.93 l. m. n. o.
APRIL 1,062,125.72 1,047,879.22 p.
MAY 1,058,324.10 0.00
JUNE 1,057,281.28 0.00
Refund Checks -4,015.13 0.00
Prior Year Accruals Paid -2,859.76 0.00
FY TOTALS 12,815,158.95 10,727,598.89
COL BENEFITS
INCLUDED ABOVE 6,772,116.67 5,777,150.79
COL - % Of Total 53% 54%
a. 2% COLA applied to all members and beneficiaries.
b. C. Freeman has an accrual (from FY 2017) of $2,654.95
d. H. Heidner, surviving spouse of J. Heidner, passed 10/19/2018. She was not a payee.
f. C. Long passed 12/2/2018. Final payment to estate on 12/31/18. Surviving spouse, Nancy Long.
g. R. Stone passed 12/3/2018. Final payment to estate on 1/31/19. No survivor.
h. R. Patterson passed 12/14/2018. Final payment will be paid to estate. Surviving spouse, Carol Patterson.
i. M. Parillo passed 2/14/2019. Final payment will be paid to estate. No survivor.
j. R. Vis passed 2/14/2019. Final payment will be paid to estate. Surviving spouse, Sharon Vis.
k. R. Shultz passed 2/18/2019. Final payment will be paid to estate. No survivor.
l. M. Nelson passed 2/17/2019. Final payment on 2/28/19. No survivor.
m. D. Smith passed 3/1/2019. Final payment will be paid to estate. No survivor.
n. C. Smith, QDRO of D. Smith, passed 3/1/2019. Final payment will be paid.
o. S. Tellez replacement check for un-deposited check, passed 1/4/2015. Payment made to estate.
p. D. McClanahan passed 3/16/2019. Final payment on 3/31/19. Surviving spouse, Evelyn McClanahan.
Y:\Office Docs\Budget\FY 2019 Budget\[FY19 GL Detail FYTD 2019-5-8.xlsx]Journal Detail Export (2)
c. A. Cauchon passed 9/21/2018, ACH reversal processed in Oct. 2018. Final payment to estate on
11/30/18. No survivor.
e. F. Galligan, surviving spouse of James Galligan, passed 9/21/2018. She was a payee and the System
was informed by U.S. Bank's monthly death audit on 11/26/18. The estate has a debt to the System.
mprice
Typewritten Text
DATE: 5/15/19 ITEM #: 4

1OPINION AND ANALYSIS OF KEY ECONOMIC AND INVESTMENT ISSUES
Bill Hackney, CFA
April 10, 2019
How is your mood lately? Despite rising incomes, low
unemployment, falling poverty rates, and one of the
greatest bull markets in history, there is increasing evidence
that many of us are . . . well, going bonkers.
Last summer, Barnes and Noble reported a 25% surge in
sales of books about anxiety. Nothing more relaxing than
reading a book about anxiety at the beach, I suppose.
According to the World Health Organization, about 300
million people worldwide suffer from anxiety disorder. Here
in the US, 40 million adults, about one in five of us, suffer
from this malady.
Despite being one of the wealthiest and safest countries on
earth, the US, with 4% of the world’s population, accounts
for 13% of global anxiety disorders. And the diagnosis
of and prescriptions for anxiety disorders are on a steep
rise. The American Psychiatric Association reports 39% of
Americans said they were more anxious last year than the
year before.
The WHO study found there wasn’t much difference
between rich and poor nations when it came to the
prevalence of depression, but there was a difference when
it came to anxiety. Rich nations tended to be more anxious
than poor ones, with the US leading the way. Researchers
have linked increased anxiety to the pursuit of money, looks
and social status (stereotypically American pursuits) as well
as to increased loneliness and use of social media.
Fortunately, there is a wide variety of prescription drugs to
treat anxiety. It is estimated that one in six Americans takes
some kind of psychiatric drug—mostly antidepressants. But
America’s psychological problems are more serious than
just anxiety. Deaths of despair—suicide, drug overdoses and
liver cirrhosis—are tragically on the increase in the US.
Nobel Prize winning Economist Angus Deaton and his wife
Princeton professor Anne Case made news a few years
ago when they reported mortality rates among white,
working-class Americans are going up in contrast to other
demographic groups. Said Deaton, “You can find episodes
like the flu epidemic or wartimes when mortality rates
go up, but sustained increases in mortality for any major
group in society are really quite rare. It’s an indication that
something is very wrong.”
High
Anxiety
bjazmines
Typewritten Text
Date: 5/15/19 Item#: 6a
bjazmines
Typewritten Text

2OPINION AND ANALYSIS OF KEY ECONOMIC AND INVESTMENT ISSUES
Building on the work of Case and Deaton, the University of
Chicago published last month, “Men without Work: Why are
They So Unhappy in the US Compared to Other Places?” The
key finding: “Prime-aged males out of the labor force in
the US are the least hopeful and most stressed and angry
compared to the same group in other regions, including the
Middle East.”
What’s driving all this anxiety, deaths of despair and
disaffected workforce dropouts? Probably the usual
suspects. Dislocations caused by globalization—pressure
on wages, jobs lost due to plant relocations. Concerns
about immigration. Declining trust in bedrock American
institutions—education, media, religion, government and
capitalism. Cultural factors like loneliness and addiction to
social media.
I am not a psychologist, but I do know that psychology
can have a major impact on the capital markets, causing
them to “overshoot” both on the upside and the
downside. What’s more, the fragile psyche of the American
electorate—and the electorates of many countries—does
impact politics and government policy. In the near-term,
our nation’s declining psychological health is unlikely to
have much effect on the markets: Our economy is strong,
monetary policy is accommodative and our collective
mental condition is a somewhat nebulous force that is slow
moving and difficult to measure. Longer term, say 2020 and
beyond, I believe America’s mental state could threaten the
markets and the economy.
First, let’s look at near-term economic and stock market
conditions. Here the news is decidedly more upbeat. In
March the bull market in stocks turned ten years old and
it is not yet showing many of the late-cycle behaviors
(troublesome inflation and weakening labor markets) which
typically signal the end is nigh.
Exhibit 1 shows my five stock market indicators at the end
of the first quarter of 2019 (S&P 500, 2834) compared with
the end of the third quarter of 2018 (S&P 500, 2914). Of
course, between these two periods, there was a massive
stock market correction followed by an impressive rebound.
Closing prices for the respective quarters, however, were
within 3% of each other.
Note what has changed over the past six months.
Valuations have improved. The market’s price/earnings ratio
dropped by about 3X, thanks to robust earnings growth
due in part to the 2017 tax act (put into effect in 2018). The
economy has gotten a little weaker. The trend in the US
leading economic index flatlined over the last five months
Exhibit 1: Our indicators suggest the US stock market still has modest upside potential.
Indicator Rationale September 30, 2018 March 31, 2019
Short- vs. long-term interest rates
When short-term interest rates rise to meet or exceed long-term rates, monetary policy is usually tight enough to eventually cause a recession.
Fed funds rate is below 10-year T- note, but gap is narrowing
Fed funds rate is below 10-year T-note, but gap is narrowing
Widening spread between high- and low-qualitybond yields
A widening spread between junk bond yields and Treasuries indicates deteriorating credit market conditions.
Credit Spreads are still narrow
Credit Spreads are still narrow
Rising wage inflationWhen wages rise at a 4% annual rate, it is difficult for the Fed to keep core inflation near its 2% goal. So the Fed usually tightens policy aggressively.
Wage growth is 2.9% and beginning to accelerate
Wage growth is 3.2%
S&P 500 P/E ratioover 20 times
Price/earnings ratios over 20 times trailing four quarter earnings makes stocks vulnerable to rising interest rates and inflation.
P/E is 20.7 times P/E is 17.5 times
Downturn in Leading Economic Index®
The Conference Board’s LEI has peaked and turned down in advance of each recession since 1960. Average lead time is 13 months.
Strong uptrend Flat trend last five months
Sources: Bureau of Labor Statistics, Bloomberg, The Conference Board, Atlanta Capital

3OPINION AND ANALYSIS OF KEY ECONOMIC AND INVESTMENT ISSUES
following a protracted period of strength. Not surprising
given the sharp slowdown in the global economy in recent
months.
None of my indicators are negative, but three are flashing
a cautious yellow. The yield curve is very flat and has
remained so for several months. See Exhibit 2. A brief
inversion occurred in March but did not persist. I would be
more concerned about this indicator if it were confirmed
by a sustained rise in credit spreads, which, so far, has not
occurred.
Wage inflation continues to creep higher but is below the
4.0% threshold which would set off a bigger inflation alarm.
Given the recent favorable economic news from the US and
China, the Leading Economic Index seems unlikely to turn
sharply lower anytime soon. If it did, a recession could be
eight to 21 months away based on the history of this index.
The remaining months of 2019 are likely to be a benign,
but unexciting environment for equity investors and a
tricky one for bond investors. Inflation pressures from
rising energy prices and tight labor markets should push
longer-dated fixed income yields higher and keep the yield
curve from inverting. Higher inflation will also keep price/
earnings ratios from expanding. Global economic growth
will remain sluggish as will corporate earnings. In an
environment of no P/E expansion and maybe 5% earnings
growth, I can see the potential for the S&P 500® to hit 2975
this year (17.5 times $170 in earnings).
While the Trump Administration may pull the proverbial
“rabbit out of the hat” with a China trade deal later this
year, American business could face new uncertainties of
higher taxes and tighter regulations if there is a significant
change of leadership in Washington following the 2020
elections.
Here are three key issues that give me high anxiety as we
approach 2020.
A major change in tax policy with unintended
consequences. Anti-capitalist sentiment in the US is high.
In an effort to “punish the rich,” the US could implement
tax policies that could wreck the stock market. Can the rich
afford to pay more in taxes? Of course, they can. It’s clear
to virtually everyone that a return of the Democrats to the
White House will result in higher taxes of some sort. But it
is important to consider what types of income or property
should be taxed. Higher taxes on dividends and capital
gains are often discussed because stocks are perceived to
be owned primarily by the rich. Tax stocks and you avoid
hitting the little guy, so the reasoning goes. However,
taxable individuals and corporations make up a massive
Exhibit 2: Mind the Gaps! The gaps between short and long-term interest rates and low and high quality bonds provide
Sources: Bloomberg, ICE® BofA ML® US High Yield Index, Atlanta Capital as of 3/31/19.
0%
5%
10%
15%
20%
25%
0%
5%
10%
15%
20%
25%
1998 2000 2002 2004 2006 2008 2010 2012 2014 2016 2018
90-Day Treasury Bill Yield 10-Yr Treasury Note Yield High Yield (Junk) Bond Yield Recessions
Today, credit spreads are narrow and the yield curve is flat, but not inverted
Junk bond yields rise relative to Treasury yields
Short-term interest rates rise above long-term rates.
important signals for equity investors.

4OPINION AND ANALYSIS OF KEY ECONOMIC AND INVESTMENT ISSUES
amount of ownership of US equities. A tax scheme aimed at
the equity market will depress stock prices and hurt non-tax
paying equity owners as well. What about underfunded
state and local pension funds? These funds and most other
pension funds have 60% to 70% of their assets in stocks
and equity-like investments (private equity, hedge funds,
etc.) A major tax increase targeting stocks could precipitate
a municipal financial crisis in my view.
Liquidity in the capital markets dries up. Liquidity
measures how quickly a security can be bought or sold,
at a price close to the last transaction. Since the Great
Recession, liquidity in the stock and bond markets
has been reduced as the Dodd-Frank Act raised capital
requirements for banks and broker/dealers, thus reducing
their incentive to hold securities on their balance sheets
and “make markets.” Liquidity is influenced by investor
psychology and market structure. Add an anxious investor
class to a broker/dealer network not willing to assume
much risk and you get a market panic like the fourth
quarter of 2018. Stock prices dropped 20%, the market for
junk bonds and initial public offerings virtually shut down
and credit spreads on investment grade debt widened
significantly. Anxious investors can spark increased price
volatility which can cause more panic and more volatility.
The fourth quarter market debacle was not an isolated
event. It was a warning shot!
Inflation creeps up, surprising everyone including the
Fed. One key reason for the remarkable longevity of the
current economic and market cycle is that the US economy
never got overheated, forcing the Fed to tighten monetary
policy aggressively. Whenever our economy got up a full
head of steam, something came along to slow it down
and tame inflationary pressures. Most recently it was the
weakness in the Chinese and European economies, with
a little help from the Fed. Still, through it all, the labor
market remained strong and wage inflation continued to
trend higher. Now, it’s practically conventional wisdom that
inflation is dead and the Fed is finished with its tightening
cycle. What a surprise to the markets if this wasn’t true.
With the last year of his first term fast approaching,
President Trump has every incentive to stimulate the
economy. Is a surprising burst of inflation around the
corner? I am anxious to find out. Any unexpected uptick in
inflation could lead to a liquidity driven panic in the bond
market . . . which would eventually impact the stock market
. . . and then the economy.
Good grief! Where’s my Xanax?
This material is presented for informational and illustrative purposes only and should not be construed as investment advice, a recommendation to purchase or sell specific securities, or to adopt any particular investment strategy. The opinions expressed herein are those of the author and do not necessarily reflect the views of other employees at Atlanta Capital Management. Any current investment views and opinions/analyses expressed constitute judgments as of the date of this material and are subject to change at any time without notice. Index and commodity changes are based on price-only percentage change. This material has been prepared on the basis of publicly available information, internally developed data, and other third party sources believed to be reliable. However, no assurances are provided regarding the reliability of such information and Atlanta Capital has not sought to independently verify information taken from public and third party sources. This material may contain statements that are not historical facts, referred to as forward-looking statements. Future results may differ significantly from those stated in forward-looking statements, depending on factors such as changes in securities or financial markets or general economic conditions. Investing entails risks and there can be no assurance that any forecasts or opinions expressed in this material will be realized. ICE® BofA ML® US High Yield Index is an unmanaged index of below investment grade U.S. corporate bonds. ICE® BofA ML® indexes not for redistribution or other uses; provided “as is,” without warranties and with no liability. BofAML® is a licensed registered trademark of Bank of America Corporation in the United States and other countries. It is not possible to directly invest in an index. Past performance does not predict future results.
Atlanta Capital Management Co., LLC | 1075 Peachtree Street NE, Suite 2100, Atlanta, Georgia 30309 | Tel: 404.876.9411 | atlcap.com

│ │ │ │
bjazmines
Typewritten Text
bjazmines
Typewritten Text
Date: 5/15/19 Item#: 6a

•
•
•
•
Assets under management
1

•
•
•
│
│
│
│ │
│
2

89 90 91 92 93 94 95 96 97 98 99 00 01 02 03 04 05 06 07 08 09 10 11 12 13 14 15 16 17 18
(3%)
0%
3%
6%
9%
12%
15%
Russell 2000® Index by Earnings Stability
Five-Year Rolling CAGR of As Reported Earnings
3

4

•
•
•
•
•
•
•
•
•
•
•
•
•
•
5

•
•
•
•
•
•
•
•
•
•
•
6

7

+
+
+
+
+
+
–
–
–
–
–
8

9

10

11

12

•
•
•
•
•
•
•
13

14

15

Appendix
Portfolio Administration ReviewInvestment Summary,
Holdings and Transactions
16

CITY OF PASADENA FIRE AND POLICE 03/31/19 RETIREMENT SYSTEM
INVESTMENT SUMMARY
TOTAL TOTAL PORT ANNUAL CURRENTCOST MARKET WGHT INCOME YIELD ($) ($) (%) ($) (%)
EQUITIES
CONSUMER DISCRETIONARY 459,315 636,313 14.5 4,405 0.7CONSUMER STAPLES 303,830 435,964 9.9 4,923 1.1ENERGY 59,791 39,431 0.9 0 0.0FINANCIALS 619,544 759,126 17.3 16,820 2.2HEALTH CARE 249,972 260,402 5.9 1,490 0.6INDUSTRIALS 801,381 968,499 22.1 6,297 0.7INFORMATION TECHNOLOGY 592,696 827,948 18.9 3,678 0.4MATERIALS 157,667 259,496 5.9 3,456 1.3REAL ESTATE 36,020 51,331 1.2 1,831 3.6 EQUITIES 3,280,215 4,238,512 96.6 42,900 1.0
INVESTABLE CASH
EQUITY CASH 147,982 147,982 3.4 3,478 2.4 TOTAL INVESTMENTS 3,428,197 4,386,493 100.0 46,378 1.1
ACCRUED DIVIDENDS 2,318
______________
TOTAL PORTFOLIO 4,388,811
______________
17

CITY OF PASADENA FIRE AND POLICE 03/31/19 RETIREMENT SYSTEM
ASSET STATEMENT
SECURITY COST/ MARKET/ TOTAL TOTAL PORT ANNUAL CURRENTDESCRIPTION SHARE SHARE COST MARKET WHTG INCOME YIELD
SHARES ($) ($) ($) ($) (%) ($) (%)
EQUITIES
CONSUMER DISCRETIONARY
CHOICE HOTELS INT'L INC 1,656 61.26 77.74 101,441 128,737 2.9 1,424 1.1 COLUMBIA SPORTSWEAR CO 735 38.87 104.18 28,566 76,572 1.7 706 0.9 DORMAN PRODUCTS INC 1,171 50.14 88.09 58,715 103,153 2.4 0 0.0 FRONTDOOR INC 1,870 30.36 34.42 56,765 64,365 1.5 0 0.0 MONRO INC 840 63.19 86.52 53,082 72,677 1.7 672 0.9 POOL CORP 337 78.24 164.97 26,367 55,595 1.3 607 1.1 SALLY BEAUTY HOLDINGS INC 2,510 19.92 18.41 49,991 46,209 1.1 0 0.0 WOLVERINE WORLD WIDE INC 2,491 33.88 35.73 84,387 89,003 2.0 996 1.1
459,315 636,313 14.5 4,405 0.7
CONSUMER STAPLES
CASEY'S GEN'L STORES INC 1,022 95.39 128.77 97,488 131,603 3.0 1,186 0.9 CENTRAL GARDEN & PET CO 1,439 33.68 25.56 48,461 36,781 0.8 0 0.0 INTER PARFUMS INC 1,324 28.87 75.87 38,221 100,452 2.3 1,456 1.4 J&J SNACK FOODS CORP 774 118.09 158.84 91,398 122,942 2.8 1,548 1.3 LANCASTER COLONY CORP 282 100.22 156.69 28,262 44,187 1.0 733 1.7
303,830 435,964 9.9 4,923 1.1
ENERGY
DRIL-QUIP INC 860 69.52 45.85 59,791 39,431 0.9 0 0.0
FINANCIALS
ARTISAN PARTNERS ASSET MGMT INC 1,386 45.38 25.17 62,896 34,886 0.8 3,105 8.9 CADENCE BANCORPORATION 3,103 15.85 18.55 49,169 57,561 1.3 2,172 3.8 IBERIABANK CORP 843 63.28 71.71 53,347 60,452 1.4 1,450 2.4 KINSALE CAPITAL GROUP INC 728 47.41 68.57 34,512 49,919 1.1 233 0.5 MORNINGSTAR INC 800 50.67 125.99 40,535 100,792 2.3 896 0.9 NAVIGATORS GROUP INC 1,160 46.53 69.87 53,979 81,049 1.8 325 0.4 PINNACLE FINANCIAL PARTNERS 1,110 43.56 54.70 48,355 60,717 1.4 710 1.2 PROSPERITY BANCSHARES INC 1,074 54.57 69.06 58,607 74,170 1.7 1,761 2.4 RLI CORP 765 49.72 71.75 38,034 54,889 1.3 673 1.2 SOUTH STATE CORP 1,199 86.97 68.34 104,277 81,940 1.9 1,822 2.2
18

CITY OF PASADENA FIRE AND POLICE 03/31/19 RETIREMENT SYSTEM
ASSET STATEMENT
SECURITY COST/ MARKET/ TOTAL TOTAL PORT ANNUAL CURRENTDESCRIPTION SHARE SHARE COST MARKET WHTG INCOME YIELD
SHARES ($) ($) ($) ($) (%) ($) (%)
EQUITIES - cont.
FINANCIALS - cont.
UMPQUA HOLDINGS CORP 2,452 13.00 16.50 31,879 40,458 0.9 2,060 5.1 WESTAMERICA BANCORPORATION 1,008 43.60 61.80 43,953 62,294 1.4 1,613 2.6
619,544 759,126 17.3 16,820 2.2
HEALTH CARE
COVETRUS INC 610 33.73 31.85 20,574 19,429 0.4 0 0.0 EMERGENT BIOSOLUTIONS INC 938 60.11 50.52 56,386 47,388 1.1 0 0.0 ICU MEDICAL INC 350 161.34 239.33 56,468 83,766 1.9 0 0.0 INTEGRA LIFESCIENCES HOLDINGS 1,409 43.58 55.72 61,408 78,509 1.8 0 0.0 PATTERSON COMPANIES INC 1,433 38.48 21.85 55,137 31,311 0.7 1,490 4.8
249,972 260,402 5.9 1,490 0.6
INDUSTRIALS
AAON INC 1,182 25.92 46.18 30,641 54,585 1.2 378 0.7 ALAMO GROUP INC 235 96.69 99.94 22,721 23,486 0.5 113 0.5 BEACON ROOFING SUPPLY INC 2,810 38.33 32.16 107,709 90,370 2.1 0 0.0 EXPONENT INC 1,868 22.50 57.72 42,030 107,821 2.5 1,196 1.1 FORWARD AIR CORP 1,167 52.98 64.73 61,833 75,540 1.7 840 1.1 GENERAC HOLDINGS INC 870 55.68 51.23 48,445 44,570 1.0 0 0.0 HURON CONSULTING GROUP INC 1,251 56.50 47.22 70,680 59,072 1.3 0 0.0 KIRBY CORP 1,260 57.19 75.11 72,054 94,639 2.2 0 0.0 LANDSTAR SYSTEM INC 707 62.66 109.39 44,299 77,339 1.8 467 0.6 MOOG INC CL A 1,293 76.66 86.95 99,121 112,426 2.6 1,293 1.2 RAVEN INDUSTRIES INC 1,015 20.35 38.37 20,652 38,946 0.9 528 1.4 SIMPSON MANUFACTURING CO INC 933 70.82 59.27 66,078 55,299 1.3 821 1.5 UNIFIRST CORP 507 126.66 153.50 64,215 77,825 1.8 228 0.3 US ECOLOGY INC 602 47.38 55.98 28,520 33,700 0.8 433 1.3 WELBILT INC 1,397 16.02 16.38 22,382 22,883 0.5 0 0.0
801,381 968,499 22.1 6,297 0.7
19
CITY OF PASADENA FIRE AND POLICE 03/31/19 RETIREMENT SYSTEM
ASSET STATEMENT
SECURITY COST/ MARKET/ TOTAL TOTAL PORT ANNUAL CURRENTDESCRIPTION SHARE SHARE COST MARKET WHTG INCOME YIELD
SHARES ($) ($) ($) ($) (%) ($) (%)
EQUITIES - cont.
INFORMATION TECHNOLOGY
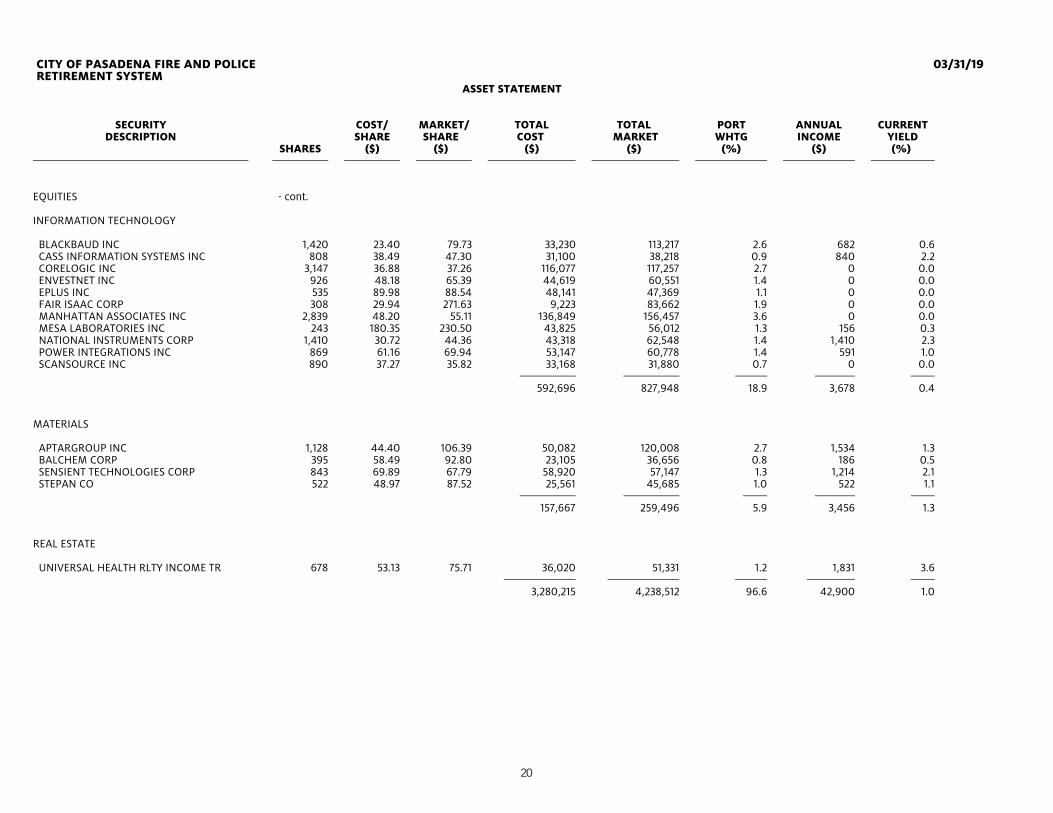
BLACKBAUD INC 1,420 23.40 79.73 33,230 113,217 2.6 682 0.6 CASS INFORMATION SYSTEMS INC 808 38.49 47.30 31,100 38,218 0.9 840 2.2 CORELOGIC INC 3,147 36.88 37.26 116,077 117,257 2.7 0 0.0 ENVESTNET INC 926 48.18 65.39 44,619 60,551 1.4 0 0.0 EPLUS INC 535 89.98 88.54 48,141 47,369 1.1 0 0.0 FAIR ISAAC CORP 308 29.94 271.63 9,223 83,662 1.9 0 0.0 MANHATTAN ASSOCIATES INC 2,839 48.20 55.11 136,849 156,457 3.6 0 0.0 MESA LABORATORIES INC 243 180.35 230.50 43,825 56,012 1.3 156 0.3 NATIONAL INSTRUMENTS CORP 1,410 30.72 44.36 43,318 62,548 1.4 1,410 2.3 POWER INTEGRATIONS INC 869 61.16 69.94 53,147 60,778 1.4 591 1.0 SCANSOURCE INC 890 37.27 35.82 33,168 31,880 0.7 0 0.0
592,696 827,948 18.9 3,678 0.4
MATERIALS
APTARGROUP INC 1,128 44.40 106.39 50,082 120,008 2.7 1,534 1.3 BALCHEM CORP 395 58.49 92.80 23,105 36,656 0.8 186 0.5 SENSIENT TECHNOLOGIES CORP 843 69.89 67.79 58,920 57,147 1.3 1,214 2.1 STEPAN CO 522 48.97 87.52 25,561 45,685 1.0 522 1.1
157,667 259,496 5.9 3,456 1.3
REAL ESTATE
UNIVERSAL HEALTH RLTY INCOME TR 678 53.13 75.71 36,020 51,331 1.2 1,831 3.6 3,280,215 4,238,512 96.6 42,900 1.0
20

CITY OF PASADENA FIRE AND POLICE 03/31/19 RETIREMENT SYSTEM
ASSET STATEMENT
SECURITY COST/ MARKET/ TOTAL TOTAL PORT ANNUAL CURRENTDESCRIPTION SHARE SHARE COST MARKET WHTG INCOME YIELD
SHARES ($) ($) ($) ($) (%) ($) (%)
INVESTABLE CASH
EQUITY CASH 148 0.00 1000.00 147,982 147,982 3.4 3,478 2.4 TOTAL INVESTMENTS 3,428,197 4,386,493 100.0 46,378 1.1
ACCRUED DIVIDENDS 2,318
____________________________
TOTAL PORTFOLIO 4,388,811
____________________________
21
CITY OF PASADENA FIRE AND POLICE RETIREMENT SYSTEM
TRANSACTION SCHEDULE - PURCHASES
FROM: 01/01/19 TO: 03/31/19
COST/ TOTAL PAR/ TRADE SHARE COST
SECURITY SHARES DATE ($) ($)
EQUITIES
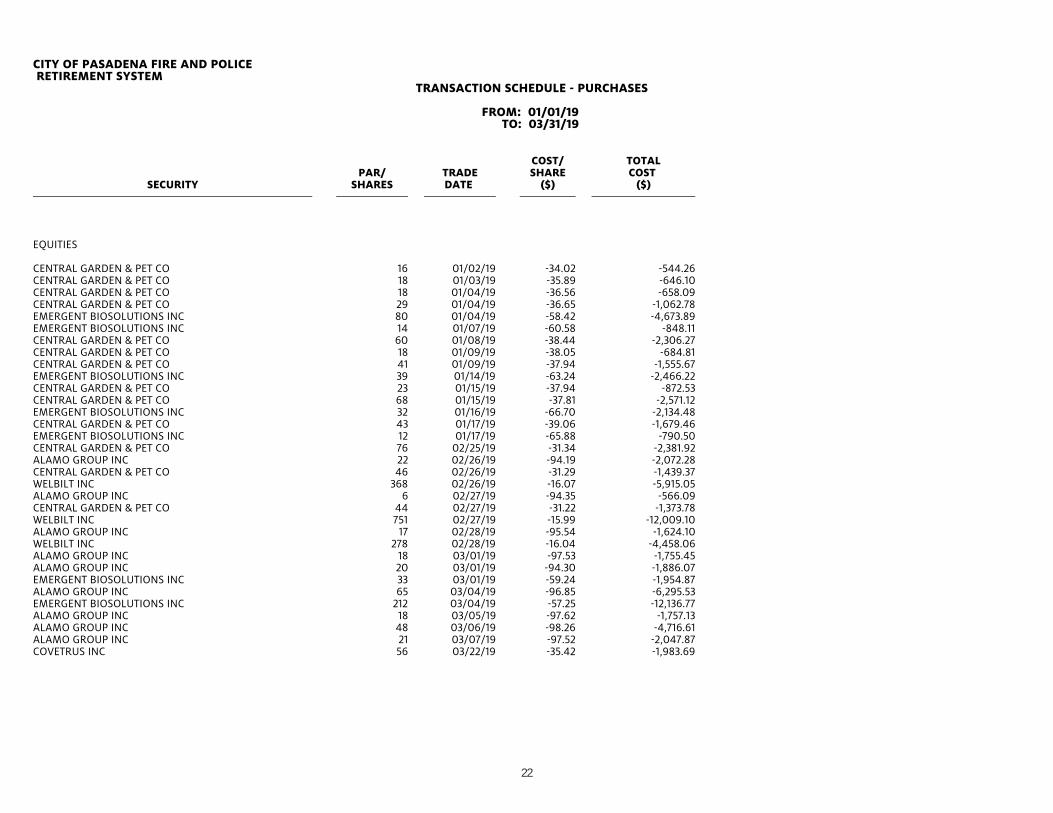
CENTRAL GARDEN & PET CO 16 01/02/19 -34.02 -544.26CENTRAL GARDEN & PET CO 18 01/03/19 -35.89 -646.10CENTRAL GARDEN & PET CO 18 01/04/19 -36.56 -658.09CENTRAL GARDEN & PET CO 29 01/04/19 -36.65 -1,062.78EMERGENT BIOSOLUTIONS INC 80 01/04/19 -58.42 -4,673.89EMERGENT BIOSOLUTIONS INC 14 01/07/19 -60.58 -848.11CENTRAL GARDEN & PET CO 60 01/08/19 -38.44 -2,306.27CENTRAL GARDEN & PET CO 18 01/09/19 -38.05 -684.81CENTRAL GARDEN & PET CO 41 01/09/19 -37.94 -1,555.67EMERGENT BIOSOLUTIONS INC 39 01/14/19 -63.24 -2,466.22CENTRAL GARDEN & PET CO 23 01/15/19 -37.94 -872.53CENTRAL GARDEN & PET CO 68 01/15/19 -37.81 -2,571.12EMERGENT BIOSOLUTIONS INC 32 01/16/19 -66.70 -2,134.48CENTRAL GARDEN & PET CO 43 01/17/19 -39.06 -1,679.46EMERGENT BIOSOLUTIONS INC 12 01/17/19 -65.88 -790.50CENTRAL GARDEN & PET CO 76 02/25/19 -31.34 -2,381.92ALAMO GROUP INC 22 02/26/19 -94.19 -2,072.28CENTRAL GARDEN & PET CO 46 02/26/19 -31.29 -1,439.37WELBILT INC 368 02/26/19 -16.07 -5,915.05ALAMO GROUP INC 6 02/27/19 -94.35 -566.09CENTRAL GARDEN & PET CO 44 02/27/19 -31.22 -1,373.78WELBILT INC 751 02/27/19 -15.99 -12,009.10ALAMO GROUP INC 17 02/28/19 -95.54 -1,624.10WELBILT INC 278 02/28/19 -16.04 -4,458.06ALAMO GROUP INC 18 03/01/19 -97.53 -1,755.45ALAMO GROUP INC 20 03/01/19 -94.30 -1,886.07EMERGENT BIOSOLUTIONS INC 33 03/01/19 -59.24 -1,954.87ALAMO GROUP INC 65 03/04/19 -96.85 -6,295.53EMERGENT BIOSOLUTIONS INC 212 03/04/19 -57.25 -12,136.77ALAMO GROUP INC 18 03/05/19 -97.62 -1,757.13ALAMO GROUP INC 48 03/06/19 -98.26 -4,716.61ALAMO GROUP INC 21 03/07/19 -97.52 -2,047.87COVETRUS INC 56 03/22/19 -35.42 -1,983.69
22

CITY OF PASADENA FIRE AND POLICE RETIREMENT SYSTEM
TRANSACTION SCHEDULE - PURCHASES
FROM: 01/01/19 TO: 03/31/19
COST/ TOTAL PAR/ TRADE SHARE COST
SECURITY SHARES DATE ($) ($)
EQUITIES - cont.
COVETRUS INC 74 03/22/19 -35.02 -2,591.12COVETRUS INC 480 03/25/19 -33.33 -15,999.07
-108,458.22
23
CITY OF PASADENA FIRE AND POLICE RETIREMENT SYSTEM
TRANSACTION SCHEDULE - SALES
FROM: 01/01/19 TO: 03/31/19
SECURITY COST/ TOTAL PRICE/ TOTAL GAIN DESCRIPTION PAR/ TRADE SHARE COST SHARE PROCEEDS LOSS
SHARES DATE ($) ($) ($) ($) ($)
EQUITIES
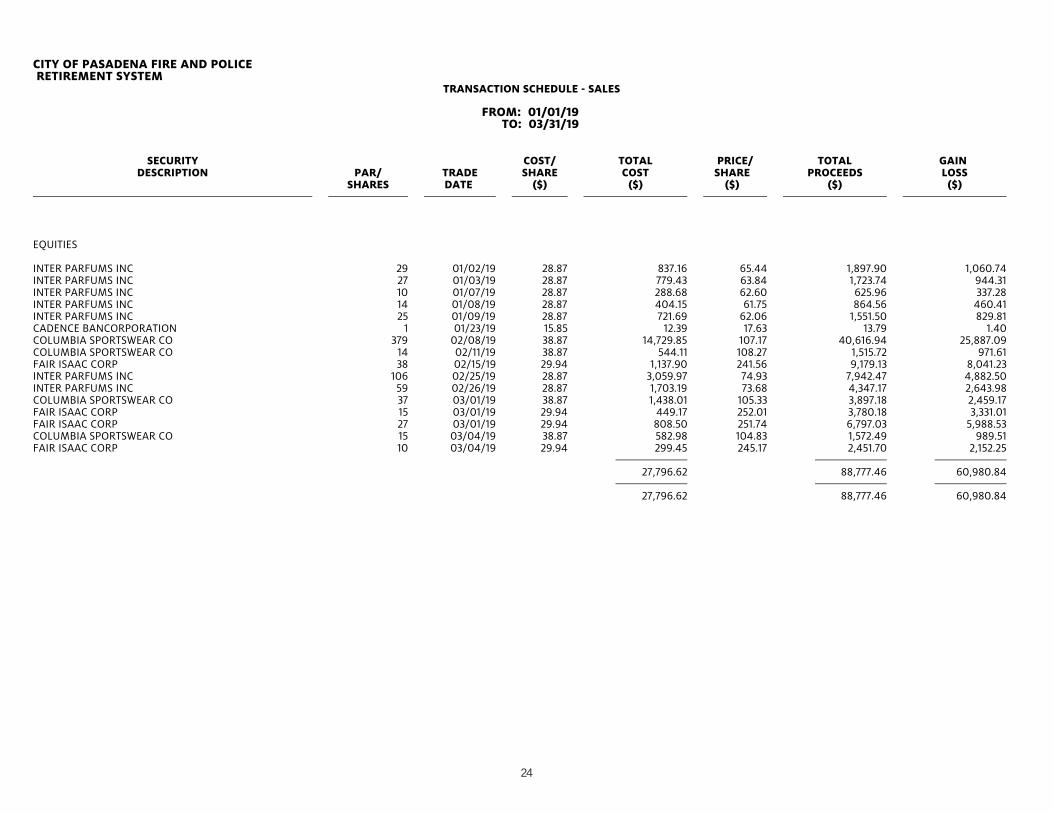
INTER PARFUMS INC 29 01/02/19 28.87 837.16 65.44 1,897.90 1,060.74INTER PARFUMS INC 27 01/03/19 28.87 779.43 63.84 1,723.74 944.31INTER PARFUMS INC 10 01/07/19 28.87 288.68 62.60 625.96 337.28INTER PARFUMS INC 14 01/08/19 28.87 404.15 61.75 864.56 460.41INTER PARFUMS INC 25 01/09/19 28.87 721.69 62.06 1,551.50 829.81CADENCE BANCORPORATION 1 01/23/19 15.85 12.39 17.63 13.79 1.40COLUMBIA SPORTSWEAR CO 379 02/08/19 38.87 14,729.85 107.17 40,616.94 25,887.09COLUMBIA SPORTSWEAR CO 14 02/11/19 38.87 544.11 108.27 1,515.72 971.61FAIR ISAAC CORP 38 02/15/19 29.94 1,137.90 241.56 9,179.13 8,041.23INTER PARFUMS INC 106 02/25/19 28.87 3,059.97 74.93 7,942.47 4,882.50INTER PARFUMS INC 59 02/26/19 28.87 1,703.19 73.68 4,347.17 2,643.98COLUMBIA SPORTSWEAR CO 37 03/01/19 38.87 1,438.01 105.33 3,897.18 2,459.17FAIR ISAAC CORP 15 03/01/19 29.94 449.17 252.01 3,780.18 3,331.01FAIR ISAAC CORP 27 03/01/19 29.94 808.50 251.74 6,797.03 5,988.53COLUMBIA SPORTSWEAR CO 15 03/04/19 38.87 582.98 104.83 1,572.49 989.51FAIR ISAAC CORP 10 03/04/19 29.94 299.45 245.17 2,451.70 2,152.25
27,796.62 88,777.46 60,980.84 27,796.62 88,777.46 60,980.84
24

Appendix
Proxy Report
25

City of Pasadena Fire and Police Retirement SystemReporting Period: 01/01/2019 to 03/31/2019
UniFirst Corp.Meeting Date: 01/08/2019 Record Date: 11/16/2018 Shares Voted: 456
Issue VoteProposal Number
Elect Director Phillip L. Cohen1.1 For
Elect Director Cynthia Croatti1.2 For
2 Ratify Ernst & Young LLP as Auditors For
Sally Beauty Holdings, Inc.Meeting Date: 01/31/2019 Record Date: 12/06/2018 Shares Voted: 2,510
Issue VoteProposal Number
1.1 Elect Director Christian A. Brickman For
Elect Director Marshall E. Eisenberg1.2 For
Elect Director Diana S. Ferguson1.3 For
Elect Director David W. Gibbs1.4 For
Elect Director Linda Heasley1.5 For
Elect Director Joseph C. Magnacca1.6 For
Elect Director Robert R. McMaster1.7 For
Elect Director John A. Miller1.8 For
Elect Director P. Kelly Mooney1.9 For
Elect Director Susan R. Mulder1.10 For
Elect Director Denise Paulonis1.11 For
Elect Director Edward W. Rabin1.12 For
Advisory Vote to Ratify Named Executive Officers' Compensation
2 For
Approve Omnibus Stock Plan3 For
4 Ratify KPMG LLP as Auditors For
J&J Snack Foods Corp.Meeting Date: 02/05/2019 Record Date: 12/11/2018 Shares Voted: 774
Issue VoteProposal Number
1 Elect Director Vincent Melchiorre For
2 Advisory Vote to Ratify Named Executive Officers' Compensation
For
Beacon Roofing Supply, Inc.Meeting Date: 02/12/2019 Record Date: 12/18/2018 Shares Voted: 2,810
Issue VoteProposal Number
1.1 Elect Director Robert R. Buck For
Elect Director Paul M. Isabella1.2 For
Elect Director Carl T. Berquist1.3 For
Elect Director Barbara G. Fast1.4 For
Elect Director Richard W. Frost1.5 For
Elect Director Alan Gershenhorn1.6 For
Elect Director Philip W. Knisely1.7 For
Elect Director Robert M. McLaughlin1.8 For
Elect Director Neil S. Novich1.9 For
Elect Director Stuart A. Randle1.10 For
Elect Director Nathan K. Sleeper1.11 For
Elect Director Douglas L. Young1.12 For
Ratify Ernst & Young LLP as Auditors2 For
3 Advisory Vote to Ratify Named Executive Officers' Compensation
For
Central Garden & Pet Co.Meeting Date: 02/12/2019 Record Date: 12/14/2018 Shares Voted: 465
Issue VoteProposal Number
1.1 Elect Director John B. Balousek For
Elect Director William E. Brown1.2 Withhold
Elect Director Thomas J. Colligan1.3 For
Elect Director Michael J. Edwards1.4 For
Elect Director John E. Hanson1.5 For
Elect Director Brooks M. Pennington, III1.6 Withhold
Elect Director John R. Ranelli1.7 Withhold
Elect Director George C. Roeth1.8 Withhold
Elect Director Mary Beth Springer1.9 For
2 Ratify Deloitte & Touche LLP as Auditors For
26

Moog, Inc.Meeting Date: 02/12/2019 Record Date: 12/18/2018 Shares Voted: 1,293
Issue VoteProposal Number
1 Elect Director Bradley R. Lawrence For
2 Ratify Ernst & Young LLP as Auditors For
Fair Isaac Corp.Meeting Date: 02/28/2019 Record Date: 01/02/2019 Shares Voted: 398
Issue VoteProposal Number
1a Elect Director A. George Battle For
Elect Director Braden R. Kelly1b For
Elect Director James D. Kirsner1c For
Elect Director William J. Lansing1d For
Elect Director Eva Manolis1e For
Elect Director Marc F. McMorris1f For
Elect Director Joanna Rees1g For
Elect Director David A. Rey1h For
Approve Qualified Employee Stock Purchase Plan2 For
Amend Omnibus Stock Plan3 For
Advisory Vote to Ratify Named Executive Officers' Compensation
4 For
Ratify Deloitte & Touche LLP as Auditors5 For
Other Business6 For
27

EuroPacific Growth Fund®As of March 31, 2019
Consider for a core international allocation.
Executive Summary
Implementation guidance:
The fund's investment objective is to provide long-term growth of capital.Fund Objective:
• EuroPacific Growth advanced in the first quarter, outpacing its primary benchmark, MSCI ACWI ex USA, which finished up 10.31%.
• Stock selection drove nearly all of the excess return for EuroPacific Growth relative to the benchmark, as both sector and regional selection detracted fromresults. That was primarily due to the fund's average cash weighting of about 7% amid a strong market rally.
• Japanese companies in the portfolio were the leading contributors overall, by country, with strength from both Softbank on news of a stock buyback andDaiichi Sankyo on an announced agreement with AstraZeneca to develop and sell one of their cancer drugs.
• Not all companies in Japan contributed as the biggest company detractor was Sony, which reported weak numbers due to declining sales of its PS4 gamingconsole. International Airlines Group, or IAG, which is the parent of British Airways as well as a number of other European airlines, also detracted from resultsas Brexit concerns weighed on investor sentiment.
• Emerging markets collectively helped the fund with strength from a number of technology and consumer-related companies. In particular, those from SouthKorea and India led the way.
• While the fund's technology holdings push its orientation toward the growth style, broad positioning in many other sectors exhibits a less growth-orientedfootprint than many peers -- having less exposure in industrials, consumer staples and health care as examples. The market has generally continued to favorgrowth stocks, and this orientation, while helpful to results relative to the index is unhelpful to peer group rankings in the short run.
Invests in attractively valued companies in developed and emerging markets that are positioned to benefit frominnovation, global economic growth, increasing consumer demand or a turnaround in business conditions.Distinguishing characteristics:
1
Investments are not FDIC-insured, nor are they deposits of or guaranteed by a bank or any other entity, so they may lose value.© 2019 Capital Group. All rights reserved
mprice
Typewritten Text
DATE: 5/15/19 ITEM #: 6b

EuroPacific Growth Fund®As of March 31, 2019
Figures shown are past results for Class F-1, F-2, F-3 and R-6 shares and are not predictive of results in future periods. Current and future results may be lower or higher than those shown. Share prices and returns will vary, so investors may lose money. Investing for short periods makes losses more likely. For current information and month-end results, visit americanfunds.com or americanfundsretirement.com.
Returns Total returns Average annual total returns Expense Ratio
For periods ended March 31, 2019 (%) 3 mo YTD 1 year 3 years 5 years 10 years Lifetime
EuroPacific Growth Fund F-1 13.11 13.11 -5.01 8.91 3.88 9.55 10.42 0.85
EuroPacific Growth Fund F-2 13.18 13.18 -4.75 9.22 4.16 9.84 10.70 0.58
EuroPacific Growth Fund F-3 13.21 13.21 -4.65 9.32 4.27 9.95 10.86 0.49
EuroPacific Growth Fund R-6 13.20 13.20 -4.66 9.33 4.27 9.95 10.81 0.49
Historical Benchmarks Index* 10.31 10.31 -4.22 8.09 2.57 8.85 8.18 ---MSCI All Country World ex USA Index** 10.31 10.31 -4.22 8.09 2.57 8.85 --- ---Lipper International Funds Average 10.84 10.84 -5.77 6.65 2.14 8.80 8.51 ---
Fund inception: April 16, 1984
Market indexes are unmanaged and, therefore, have no expenses. Investors cannot invest directly in an index. Lipper averages reflect the current composition of all eligible mutualfunds (all share classes) within a given category. There have been periods when the fund has lagged the indexes.
*Returns reflect results of the fund's current and former benchmark indexes: MSCI All Country World ex USA Index, April 2007-present; MSCI EAFE Index, fund inception-March 2007.Results reflect net dividends.**Results reflect gross dividends through December 31, 2000 and net dividends thereafter.We offer a range of share classes designed to meet the needs of retirement plan sponsors and participants. The different share classes incorporate varying levels of advisorcompensation and service provider payments. Because Class R-6 shares do not include any recordkeeping payments, expenses are lower and results are higher. Other share classesthat include recordkeeping costs have higher expenses and lower results than Class R-6.
Investment results assume all distributions are reinvested and reflect applicable fees and expenses. When applicable, investment results reflect fee waivers and/or expensereimbursements, without which results would have been lower. Please see americanfunds.com for more information. Certain share classes were offered after the inception dates ofsome funds. Results for these share classes prior to the dates of first sale are hypothetical based on Class A share results without a sales charge, adjusted for estimated annualexpenses. (Inception date: Class F-1, March 15, 2001; Class F-2, August 1, 2008; Class F-3, January 27, 2017; Class R-6, May 1, 2009.) Results for certain funds with an inception dateafter the share class inception also include hypothetical returns because those funds' shares sold after the date of first offering. Please see americanfunds.com for more information onspecific expense adjustments and the actual dates of first sale. Expense ratios are as of the fund's prospectus available at the time of publication.
2

EuroPacific Growth Fund®As of March 31, 2019
Quarterly Market review
• Non-U.S. stocks surged over the quarter, rebounding from the steep selloff at the end of 2018. Investor sentiment was boosted by optimism surrounding the tradeconflict between the U.S. and China, as well as an increasingly dovish tone from central banks. Currency movements had a mixed impact on returns: the euro andJapanese yen declined against the U.S. dollar while the British pound rallied amid rising speculation that the U.K. would not leave the European Union without adeal.
• European companies advanced strongly. Rising risk appetite helped stocks overcome signs of slowing economic growth in the eurozone and the uncertaintycaused by the U.K.'s imminent scheduled departure from the EU. The German economy recorded no growth in the final quarter of 2018, while Italy fell into arecession, having delivered two consecutive quarters of negative growth. After ending its bond-buying program in December, the European Central Bank decidedto reinstate its long-term loans to eurozone banks and pledged to hold interest rates until the end of 2020. In general, U.K. companies overcame Brexit-relateduncertainty and joined the global stock market rally.
• Japanese companies delivered solid gains but lagged the broader advance in global stocks amid weak economic data and concerns over trade uncertainty.February's flash estimate of the Nikkei-Markit manufacturing purchasing managers' index slid below the 50 level, indicating that manufacturing activity wascontracting for the first time since August 2016, owing in part to reduced demand from China. Other developed Asia-Pacific markets also rallied, led by double-digit gains in Hong Kong and Australia.
• Companies domiciled in developing economies delivered sizable gains over the quarter, lifted by hopes that the U.S. and China could resolve their tradedifferences. Chinese stocks rebounded after a sharp selloff in 2018, boosted by further stimulus measures from the Chinese authorities as well as a major indexprovider's decision to increase the weighting to Chinese companies in its benchmark index. Brazilian stocks also surged, buoyed by incoming President JairBolsonaro's pledge to liberalize trade and reduce taxes for business. In contrast, Indian stocks advanced but lagged other emerging markets due to rising politicaluncertainty ahead of elections.
3
EuroPacific Growth Fund®
As of March 31, 2019
1Q Quarterly analysis
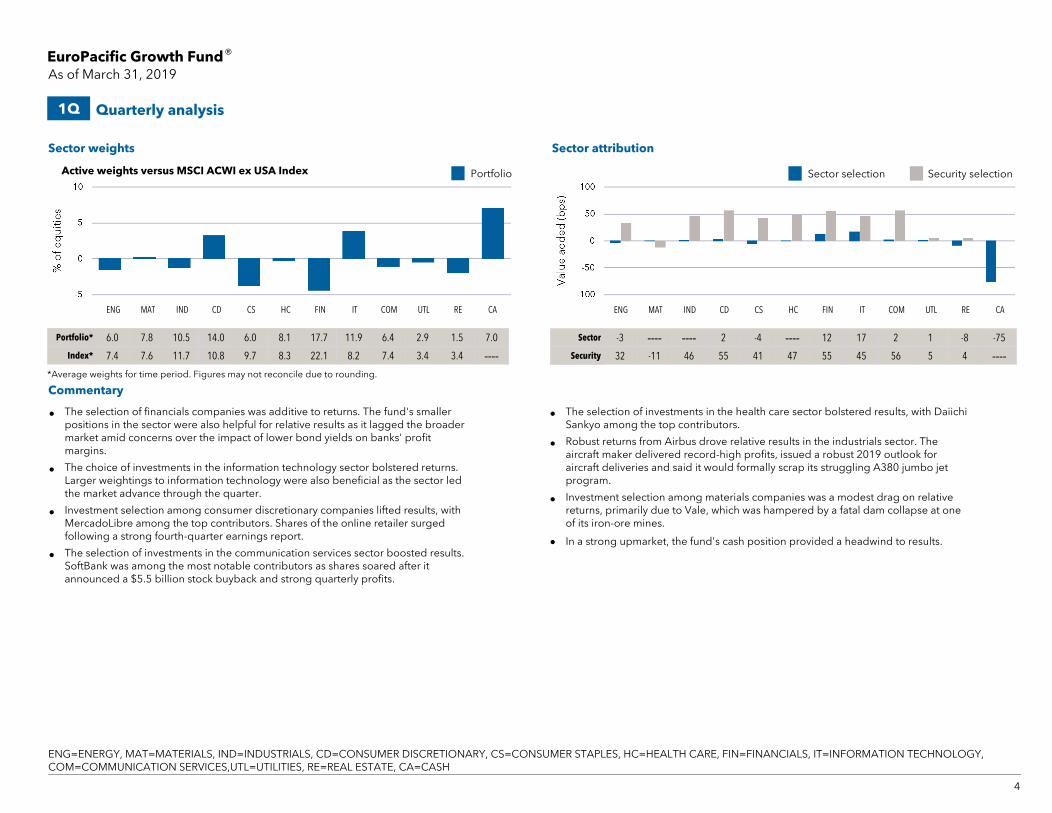
Portfolio* 6.0 7.8 10.5 14.0 6.0 8.1 17.7 11.9 6.4 2.9 1.5 7.0
Index* 7.4 7.6 11.7 10.8 9.7 8.3 22.1 8.2 7.4 3.4 3.4 ----*Average weights for time period. Figures may not reconcile due to rounding.
Sector weights Sector attribution
Commentary
Sector -3 ---- ---- 2 -4 ---- 12 17 2 1 -8 -75
Security 32 -11 46 55 41 47 55 45 56 5 4 ----
Active weights versus MSCI ACWI ex USA Index Portfolio
ENG MAT IND CD CS HC FIN IT COM UTL RE CA
• The selection of financials companies was additive to returns. The fund's smallerpositions in the sector were also helpful for relative results as it lagged the broadermarket amid concerns over the impact of lower bond yields on banks' profitmargins.
• The choice of investments in the information technology sector bolstered returns.Larger weightings to information technology were also beneficial as the sector ledthe market advance through the quarter.
• Investment selection among consumer discretionary companies lifted results, withMercadoLibre among the top contributors. Shares of the online retailer surgedfollowing a strong fourth-quarter earnings report.
• The selection of investments in the communication services sector boosted results.SoftBank was among the most notable contributors as shares soared after itannounced a $5.5 billion stock buyback and strong quarterly profits.
• The selection of investments in the health care sector bolstered results, with DaiichiSankyo among the top contributors.
• Robust returns from Airbus drove relative results in the industrials sector. Theaircraft maker delivered record-high profits, issued a robust 2019 outlook foraircraft deliveries and said it would formally scrap its struggling A380 jumbo jetprogram.
• Investment selection among materials companies was a modest drag on relativereturns, primarily due to Vale, which was hampered by a fatal dam collapse at oneof its iron-ore mines.
• In a strong upmarket, the fund's cash position provided a headwind to results.
Sector selection Security selection
ENG MAT IND CD CS HC FIN IT COM UTL RE CA
4
SM
ENG=ENERGY, MAT=MATERIALS, IND=INDUSTRIALS, CD=CONSUMER DISCRETIONARY, CS=CONSUMER STAPLES, HC=HEALTH CARE, FIN=FINANCIALS, IT=INFORMATION TECHNOLOGY,COM=COMMUNICATION SERVICES,UTL=UTILITIES, RE=REAL ESTATE, CA=CASH

EuroPacific Growth Fund®
As of March 31, 2019
1Q Quarterly analysis
*Average weights for time period. Figures may not reconcile due to rounding.
Regional weights Regional attribution
Commentary
Active weights versus MSCI ACWI ex USA Index
Canada Eurozone Japan EmergingMarkets
OtherEurope
Pacificex Japan
UK USA
Portfolio* 4.0 20.6 12.7 31.1 6.2 7.0 9.2 2.1
Index* 6.8 21.3 16.4 26.0 9.7 8.4 11.4 ----
Canada Eurozone Japan EmergingMarkets
OtherEurope
Pacificex Japan
UK USA
Region -14 4 12 -5 -2 -6 -4 1
Security -3 93 82 108 15 26 25 62
• Positive investment selection in South Korea and India buoyed returns amongcompanies domiciled in developing economies. India's Reliance Industries was anotable contributor.
• The selection of eurozone companies boosted results. France-based Airbus wasamong the top contributors as the aircraft maker delivered record-high profits,issued a robust 2019 outlook for aircraft deliveries and said it would formally scrapits struggling A380 jumbo jet program.
• SoftBank helped lift results among Japanese companies when it announced a $5.5billion stock buyback and strong quarterly profits. Holding Daiichi Sankyo was alsobeneficial as U.K.-listed AstraZeneca has struck a deal worth up to $6.9 billion todevelop and sell one of the Japanese pharmaceutical company's new cancer drugs.
• MercadoLibre was a notable contributor. Shares in the U.S.-listed company, whichoperates an online trading site for Latin American markets, surged following better-than-expected fourth-quarter results.
• Smaller investments in Canadian companies weighed on relative returns, withinvestment selection further hindering relative results.
• In a strong upmarket, the fund's cash position provided a headwind to results.
Portfolio Region selection Security selection
5
SM

EuroPacific Growth Fund®
As of March 31, 2019
Company Portfolio* % Index* % Relative Contribution
Airbus SE 2.42 0.35 0.50
MercadoLibre, Inc. 0.90 0.00 0.46
Reliance Industries Limited 2.31 0.25 0.25
Daiichi Sankyo Company, Limited 0.82 0.10 0.24
SoftBank Group Corp. 0.98 0.35 0.21
Company Portfolio* % Index* % Relative Contribution
Sony Corporation 1.09 0.30 -0.22
ISR: International Consolidated Airlines Group SA 0.68 0.02 -0.19
ISR: Vale S.A. 1.63 0.21 -0.16
EssilorLuxottica SA 0.55 0.18 -0.10
Yamato Holdings Co., Ltd. 0.46 0.04 -0.07
1Q Quarterly analysis
* Average position for quarter; portfolio holdings change. * Average position for quarter; portfolio holdings change.
Commentary Commentary
Airbus
Airbus manufactures aircrafts, helicopters and military equipment. Shares rallied afterthe company beat fourth-quarter earnings forecasts and raised its guidance for planedeliveries and operating profit for 2019. There was also a positive reaction to itsdecision to discontinue production of its loss-making A380 passenger plane.
MercadoLibre, Inc.
MercadoLibre operates online e-commerce and online auctions, includingmercadolibre.com, the leading e-commerce site for Latin America. Shares surged afterthe company reported strong fourth-quarter results, with both earnings and revenuessurpassing forecasts. MercadoLibre s total number of registered users jumped morethan 25% year-over-year, while new confirmed registered users increased more than75% on a year-over-year basis. Total payments transactions jumped by 72%.
Top five security contributors versus MSCI ACWI ex USA Index Bottom five security contributors versus MSCI ACWI ex USA Index
Sony Corporation
Sony is engaged in the development, design, manufacture and sale of various kinds ofelectronic equipment, instruments and devices for consumer, professional andindustrial markets, as well as game consoles and software. Shares slid after financialresults for the third-quarter fiscal disappointed forecasts as earnings from its gamingbusiness declined, with falling sales of PS4 consoles. Although Sony maintained itsoverall profit forecast for the fiscal year, it lowered guidance for the imaging sensorssegment owing to weakness in the smartphone market.
Vale
Vale engages in the exploration, production and sale of iron ore and nickel in Braziland other countries around the world. Shares slid after hundreds of people were killeddue to the collapse of its Brumadinho dam in Southeast Brazil. Vale subsequentlyannounced various writedowns in relation to the disaster, including $124 millionrelated to the Corrego de Feijao mine, which lies in the vicinity of the dam collapse.Emergency compensation agreements with local authorities were projected to reachup to $520 million. As an interim measure, Vale chief executive Fabio Schvartsman wassucceeded by Eduardo Bartolomeu, who was previously director of base metals.
The mnemonic 'ISR:' indicates that two or more issues of the same issuer have been rolled up and thus what is presented in the report is the Issuer Level data.
6
SM

EuroPacific Growth Fund®
As of December 31, 2018
YTD Year-to-date analysis
Portfolio* 5.5 8.8 9.6 12.5 7.2 7.2 17.2 17.6 3.7 2.6 0.9 7.3
Index* 7.2 8.0 11.8 11.0 9.5 8.1 22.6 10.9 4.7 3.0 3.2 ----*Average weights for time period. Figures may not reconcile due to rounding.
Sector weights Sector attribution
Commentary
Sector -13 ---- 2 -13 -14 -9 14 -14 1 -5 -7 107
Security 13 -42 27 -10 -75 -11 78 -24 -48 30 1 ----
Active weights versus MSCI ACWI ex USA Index Portfolio
• The selection of consumer staples companies dragged on returns, with BritishAmerican Tobacco among the largest detractors. Smaller investments in the sectorfurther hindered results: While consumer staples companies declined over the year,they held up better than the broader market.
• AAC Technologies weighed on results among information technology companies:The company was affected by concerns of slowing demand for smartphones,particularly Apple's iPhone. Nintendo, which moved into the new communicationservices sector in September, was another notable detractor. Larger holdings ininformation technology further hampered results as the sector was among those withthe weakest returns over the year.
• Investment selection among materials companies dampened returns.
• Indian banks HDFC Bank and Kotak Mahindra Bank boosted relative results amongfinancials companies, as did Hong Kong-listed insurer AIA Group. Smaller holdingsin the sector were also helpful for relative results as financials companies lagged thebroader market.
• Investment selection among industrials companies was additive to relative returns.
• The selection of utilities companies bolstered returns. Orsted was among the mostnotable contributors.
Sector selection Security selection
ENG MAT IND CD CS HC FIN IT COM UTL RE CA ENG MAT IND CD CS HC FIN IT COM UTL RE CA
7
SM
ENG=ENERGY, MAT=MATERIALS, IND=INDUSTRIALS, CD=CONSUMER DISCRETIONARY, CS=CONSUMER STAPLES, HC=HEALTH CARE, FIN=FINANCIALS, IT=INFORMATION TECHNOLOGY,COM=COMMUNICATION SERVICES, UTL=UTILITIES, RE=REAL ESTATE, CA=CASH

EuroPacific Growth Fund®
As of December 31, 2018
YTD Year-to-date analysis
*Average weights for time period. Figures may not reconcile due to rounding.
Regional weights Regional attribution
Commentary
Active weights versus MSCI ACWI ex USA Index
Canada Eurozone Japan EmergingMarkets
OtherEurope
Pacificex Japan
UK USA
Portfolio* 3.7 20.7 13.5 30.2 6.1 6.4 10.6 1.4
Index* 6.5 22.4 16.6 25.1 9.3 8.2 12.0 ----
Canada Eurozone Japan EmergingMarkets
OtherEurope
Pacificex Japan
UK USA
Region 12 8 ---- 19 -9 19 ---- 3
Security -33 42 -35 7 15 -22 -138 -3
• The selection of U.K.-listed companies hindered returns. British American Tobaccoand ASOS were among the largest detractors.
• Nintendo weighed on results among Japanese companies.
• Investment selection in Canada dragged on returns, due to select holdings inmaterials and energy companies.
• The selection of eurozone companies boosted relative returns. Investment selectionamong France-based companies lifted relative results, as did having smallerpositions in Germany.
• Holdings of Indian companies were additive to returns among companies domiciledin developing economies. HDFC Bank, Reliance Industries and Kotak Mahindra Bankwere among the top contributors.
Region selection Security selectionPortfolio
8
SM

EuroPacific Growth Fund®
As of December 31, 2018
Company Portfolio* % Index* % Relative Contribution
ISR: HDFC Bank Limited 2.41 0.00 0.45
Reliance Industries Limited 2.08 0.20 0.45
Orsted 0.93 0.06 0.29
Kotak Mahindra Bank Limited 1.08 0.00 0.27
AIA Group Limited 2.56 0.49 0.27
Company Portfolio* % Index* % Relative Contribution
British American Tobacco p.l.c. 1.69 0.56 -0.52
AAC Technologies Holdings Inc. 0.44 0.05 -0.31
Nintendo Co., Ltd. 2.05 0.20 -0.29
ISR: Ryanair Holdings Plc 1.15 0.01 -0.22
ASOS plc 0.36 0.00 -0.21
YTD Year-to-date analysis
* Average position for time period; portfolio holdings change. * Average position for time period; portfolio holdings change.
Commentary Commentary
Kotak Mahindra Bank
Kotak Mahindra Bank is a bank headquartered in Mumbai, India. Shares were driven bystrong growth in customer deposits and loans, as the bank continued to gain marketshare. The bank reported solid profit growth throughout the year. Kotak said it had metits target to double the number of customers to 16 million over the 18-month periodending September 30, 2018. It also reported a decline in its nonperforming loan ratio.
Reliance Industries
Reliance Industries is an India-based conglomerate, with businesses across the energy,petrochemicals and telecommunications sectors. Shares rallied on positive financialresults as earnings from its petrochemical business nearly doubled year-over-year inthe first quarter of its 2019 fiscal year, with the unit experiencing record operatingearnings and substantial improvement in polyester-chain margins. The stock wasadditionally boosted by positive sentiment surrounding its Jio telecom venture, whichcontinued to gain market share and supplanted Vodafone to stand as the secondlargest telecom company by revenue in the Indian market.
Top five security contributors versus MSCI ACWI ex USA Index Bottom five security contributors versus MSCI ACWI ex USA Index
AAC Technologies
AAC Technologies is a vertically integrated manufacturer of miniature technologycomponents and a key supplier to Apple. Shares slid after the company reporteddisappointing results on falling shipments of smartphones, which saw AAC's earningsdecline 21% year-over-year for the nine months ended September 2018. Along with aslowdown in overall demand, AAC was also impacted by higher interest rates and abroader selloff of Hong Kong stocks as the trade dispute between the U.S. and Chinaweighed on sentiment.
British American Tobacco
British American Tobacco (BAT) is one of the world's largest producers of cigarettesand other tobacco products. Shares weakened amid ongoing worries over fallingglobal cigarette demand given the impact of anti-smoking legislation and reports thatthe U.S. Food and Drug Administration (FDA) was moving to ban sales of mentholcigarettes, which account for just over half of BAT's U.S. sales volumes. The FDAbelieves menthol cigarettes are more difficult to quit than regular cigarettes and holdtoo much appeal for younger smokers as they come in various flavors. There were alsocontinuing doubts over the potential of alternative, next-generation products.
The mnemonic 'ISR:' indicates that two or more issues of the same issuer have been rolled up and thus what is presented in the report is the Issuer Level data.
9
SM

EuroPacific Growth Fund®
As of March 31, 2019
Portfolio Positioning Portfolio manager years of experience
Portfolio managers Years with Capital Group Years in profession
Mark E. Denning 36 36
Nicholas J. Grace 25 28
Carl M. Kawaja 27 31
Jonathan Knowles 26 26
Lawrence Kymisis 15 23
Sung Lee 24 24
Jesper Lyckeus 22 23
Andrew B. Suzman 25 25
Christopher Thomsen 21 21
The industrials sector, nearing a 15-year high, has a heavy emphasis in aerospace anddefense, as well as airlines. The fund holds fewer companies here than the index dueprimarily to a lack of exposure in trading, railroad and construction companies. Inaddition, the consumer staples sector is now at a more than a 10-year low on the heelsof weakness in tobacco and resulting trims as conviction waned.
The information technology and consumer discretionary sectors stand out among thefund's largest exposures relative to the index. Semiconductors and electronicequipment & components are a focus in technology, while internet & direct marketingretail and luxury goods are prominent in the consumer discretionary sector. The healthcare sector, recently coming off a multi-year low, continues to garner attention frominvestors for its promising drug pipelines and M&A activity, as well as appealingdefensive characteristics.
The communication services sector, recently changed from telecommunicationservices, now includes additional companies such as Tencent, Naspers, Baidu andNintendo. This shift brings the fund's weight in technology materially lower comparedto previous quarters with minimal impact to the consumer discretionary classification.
The fund's investments in European companies are now at a 15-year low due to weakshare prices and the decision to trim airline holdings as concerns regarding Brexitlingered.
Exposure to emerging markets companies increased to an all-time high of 32.4%, upfrom 31.3%, higher than the index weighting of 26.1%. Our emerging marketsinvestments are concentrated in just a handful of countries with the top 5 capturingnearly all of the fund's exposure: China, India, South Korea, Brazil and Taiwan. Thecompanies have shown strength with broad industry participation. Solid stock selectionresulted in the emerging markets being the fund's top regional contributor during thequarter. Over the longer term, security selection in emerging markets has been aleading regional contributor for the 1-, 3- and 5-year periods, due mostly toinvestments in Indian banks and Chinese internet companies.
10
Although the American Funds are compared to their benchmarks, portfolio managers manage the funds consistent with each fund’s investment objectives.

EuroPacific Growth Fund®
As of March 31, 2019
Attribution methodology disclosure
Equity attribution data was produced using FactSet, a third-party software system,based on daily portfolios. Securities in their initial period of acquisition may not beincluded in this analysis. The analysis includes equity investments only and excludesforward contracts and fixed-income investments, if applicable. It does not account forbuy and sell transactions that might have occurred intraday. As a result, averageportfolio weight percentages are approximate and the actual average portfolio weightpercentages might be higher or lower. Data elements such as pricing, income, marketcap, etc., were provided by FactSet. The index provided for attribution is based onFactSet’s methodology. The index is a broad-based market benchmark and may not beused by Capital Group as the sole comparative index for this fund. Capital believes thesoftware and information from FactSet to be reliable. However, Capital cannot beresponsible for inaccuracies, incomplete information or updating of information byFactSet. Past results are not predictive of results in future periods.
Index definitions
EuroPacific Growth Fund Historical Benchmarks Index returns reflect the results of theMSCI EAFE® Index through 3/31/2007 and the MSCI All Country World ex USA Index,the fund’s current primary benchmark, thereafter. MSCI EAFE® (Europe, Australasia, FarEast) Index is a free float-adjusted market capitalization weighted index that isdesigned to measure developed equity market results, excluding the United States andCanada. MSCI All Country World ex USA Index is a free float-adjusted marketcapitalization weighted index that is designed to measure equity market results in theglobal developed and emerging markets, excluding the United States. The indexconsists of more than 40 developed and emerging market country indexes. Resultsreflect dividends net of withholding taxes. These indexes are unmanaged and,therefore, have no expenses, and their results include reinvested dividends and/ordistributions.
MSCI All Country World ex USA Index is a free float-adjusted market capitalizationweighted index that is designed to measure equity market results in the globaldeveloped and emerging markets, excluding the United States. The index consists ofmore than 40 developed and emerging market country indexes. Results reflectdividends gross of withholding taxes through December 31, 2000, and dividends netof withholding taxes thereafter. This index is unmanaged, and its results includereinvested dividends and/or distributions but do not reflect the effect of sales charges,commissions, account fees, expenses or taxes. This index was not in existence as of thedate the fund began investment operations; therefore, lifetime results are not available.
Lipper International Funds Average is composed of funds that invest assets in securitieswith primary trading markets outside the United States. The results of the underlyingfunds in the average include the reinvestment of dividends and capital gaindistributions, as well as brokerage commissions paid by the funds for portfoliotransactions and other fund expenses, but do not reflect the effect of sales charges,account fees or taxes.
Investors should carefully consider investment objectives, risks, charges and expenses. This and other important information is contained in the fund prospectus and summary prospectus, which can be obtained from a financial professional and should be read carefully before investing. Investing outside the United States involves riskssuch as currency fluctuations, periods of illiquidity and price volatility, as more fully described in the prospectus. These risks may be heightened in connection withinvestments in developing countries.
Important Information
MSCI has not approved, reviewed or produced this report, makes no express orimplied warranties or representations and is not liable whatsoever for any data in thereport. You may not redistribute the MSCI data or use it as a basis for other indices orinvestment products.
Source: Thomson Reuters Lipper
This content, developed by Capital Group, home of American Funds, should not be used as a primary basis for investment decisions and is not intended to serve as impartialinvestment or fiduciary advice.All Capital Group trademarks referenced are registered trademarks owned by The Capital Group Companies, Inc. or an affiliated company. All other company and product namesmentioned are the trademarks or registered trademarks of their respective companies.Cash/cash and equivalents/cash and money market may include short-term securities, accrued income and other assets less liabilities as well as currencies. It may also includeinvestments in money market or similar funds, which may be managed by the investment adviser or its affiliates that are not offered to the public.Securities offered through American Funds Distributors, Inc.
11Lit. No. ITGEQSX-016-0419O CGD/10219-S67023 © 2019 Capital Group. All rights reserved.

Institutional and Intermediary Quarterly Update
Presentation
I. Update on Dodge & CoxII. Stock Fund OverviewIII. International Stock Fund OverviewIV. Global Stock Fund OverviewV. Balanced Fund OverviewVI. Income Fund OverviewVII. Global Bond Fund Overview
This presentation was prepared for a prospective shareholder of the Dodge & Cox Funds and must be accompanied or preceded by a current prospectus and/or summary prospectus for the relevant fund(s). Dodge & Cox does not guarantee the future performance of any account (including Dodge & Cox Funds) or any specific level of performance, the success of any investment decision or strategy that Dodge & Cox may use, or the success of Dodge & Cox's overall management of an account. Investment decisions made for a client's account by Dodge & Cox are subject to various market, currency, economic, political, and business risks (foreign investing, especially in developing countries, has special risks such as currency and market volatility and political and social instability), and those investment decisions will not always be profitable. While every effort is made to ensure accuracy, no representation is made that all information in this presentation is accurate or complete. Neither the information nor any opinion expressed in this presentation constitutes an offer to buy or sell the securities mentioned. This information is the confidential and proprietary product of Dodge & Cox. Any unauthorized use, reproduction, or disclosure is strictly prohibited.
First Quarter 2019
E-1110-070918-100511 | DODGE & COX Investment Managers | San Francisco
mprice
Typewritten Text
DATE: 5/15/19 ITEM #: 6c
Key Characteristics of Our Organization
Over 85 Years of Investment ExperienceDodge & Cox was founded in 1930. We have a stable and well-qualified team of investment professionals, most of whom have spent their entire careers at Dodge & Cox.
Independent OrganizationOwnership of Dodge & Cox is limited to active employees of the firm. Currently there are 76 shareholders and 280(a) total employees.
One BusinessDodge & Cox is solely in the business of investing our clients’ assets. We apply a consistent investment approach to managing equity, debt, and balanced portfolios.
Single Investment Office LocationWe maintain close communication among our investment professionals by managing investments from one office in San Francisco.
Independent Research StaffThorough fundamental analysis of each investment allows us to make independent, long-term decisions for our clients’ portfolios.
(a) Includes employees of wholly owned subsidiary Dodge & Cox Worldwide Investments Ltd. (UK).
E-325-040219-100611 |
March 31, 2019
DODGE & COX Investment Managers | San Francisco 1

Dodge & Cox’s Focused Investment Strategies ($ in Billions)
$307.6 in Total Assets: $174.4 in Equities / $133.2 in Fixed Income
March 31, 2019
Before investing in any Dodge & Cox Fund, you should carefully consider the Fund’s investment objectives, risks, and charges and expenses. To obtain a Fund’s prospectus and summary prospectus, which contain this and other important information, visit dodgeandcox.com or call 800-621-3979. Please read the prospectus and summary prospectus carefully before investing.
Dodge & Cox Funds: $202.5 Billion Separate Accounts: $98.5 Billion
Fixed Income $69.9
Equity$24.3
Balanced$4.3
Core SA $27.8
Liability Hedging$26.8
Other $4.2
Non-U.S. Funds (Irish UCITS): $6.6 Billion
E-353-041219-110718 |
Stock Fund$69.9
Income Fund$56.6
International Stock Fund$51.1
Balanced Fund$15.2
Global Stock Fund$9.5
Global Bond Fund$250 Million
Global Stock$4.2
US Stock$2.1
Global Bond$347 Million
Stable Value $11.1
DODGE & COX Investment Managers | San Francisco 2

Experienced, Integrated, and Stable Investment Team March 31, 2019
Years of experience at Dodge & Cox are updated annually in May
Fixed Income Team / Years at D&C / CoverageDana Emery 35 CEO, President, Co-Director of Fixed IncomeThomas Dugan 24 SVP, Co-Director of Fixed IncomeStephanie Notowich 23 Structured Products Sector CommitteeLarissa Roesch 21 Credit Sector CommitteeJames Dignan 19 MBS/ABS AnalysisE. Saul Peña 18 Portfolio Transitions, Credit TradingLucy Johns 16 Global Bonds, Credit Sector CommitteeJay Stock 16 Treasury/Derivatives Trading, SystemsAdam Rubinson 16 Credit ResearchDamon Blechen 16 Credit Trading/Analysis, Global Bonds Anthony Brekke 15 Credit ResearchNils Reuter 15 MBS/ABS Analysis/Trading Kristina Sormark 14 Credit Trading/AnalysisLinda Chong 13 MBS/ABS Analysis/Trading, Global BondsNicholas Lockwood 11 Munis, Treasury/Derivatives Trading Allen Feldman 11 MBS/ABS Analysis/Trading, SystemsMichael Kiedel 10 Credit ResearchMatthew Schefer 10 Credit Research, Global BondsMasato Nakagawa 6 MBS/ABS Analysis/Trading Mimi Yang 4 Macro, Currency, Global BondsJessica Corr 4 Credit Trading/AnalysisJose Ursua 3 Macro, Currency, Global BondsDavid Strasburg 3 Credit ResearchSamir Amso 3 Credit Trading/Analysis, Global BondsDustin Seely 2 MBS/ABS Analysis/Trading Thomas Powers 2 Macro, Currency, Global BondsShane Cox 2 Treasury/Derivatives Trading, Global Bonds
Global Research Team / Years at D&C / CoverageBryan Cameron 35 SVP, Director of ResearchCharles Pohl 34 Chairman and CIOWendell Birkhofer 31 SVP, TMT Sector CommitteeLynn Poole 31 Healthcare/Consumer Sector CommitteeDiana Strandberg 30 SVP, Director of International EquityKevin Johnson 29 Energy/Industrials Sector CommitteeSteven Cassriel 26 Energy/Industrials Sector CommitteeDavid Hoeft 25 SVP, Associate CIOSteven Voorhis 22 Pharmaceuticals, Assoc. Dir. of ResearchJohn Iannuccillo 21 Aerospace, Elec. Equip., Forest ProductsMario DiPrisco 20 Finance Sector CommitteeRoger Kuo 20 SVP, Internet, MediaKeiko Horkan 18 Banks, Specialty/Consumer FinanceKarol Marcin 18 InsuranceAmanda Nelson 18 Electric Utilities, PipelinesLily Beischer 17 Cosmetics, Apparel, Retail Richard Callister 16 Machinery, Medical DevicesEnglebert Bangayan 16 Commercial Services, Oil/Oil ServicesRaymond Mertens 15 Healthcare Services, Consumer Philippe Barret, Jr. 14 Banks, Asset Managers, BrokersKarim Fakhry 12 Biotech & Pharma, AppliancesKathleen McCarthy 11 Beverages, Building Products, TobaccoParitosh Somani 11 IT Hardware & Services, MiningEmily Han 11 Quantitative AnalysisTae Yamaura 10 Components, Semiconductors, JapanArun Palakurthy 10 Electronics, Semiconductors, Telecom Benjamin Garosi 9 Chemicals, Transportation, AutosSalil Phadnis 7 Energy/Oil, Homebuilders, REITs, HotelsSophie Chen 6 Telecom Equipment, ChinaRobert Turley 5 Asset Allocation, Portfolio StrategyRameez Dossa 5 Banks, IT SoftwareKevin Glowalla 5 TelecomNate Liao New ChinaRaja Patnaik New Portfolio Strategy
U.S. Equity Investment CommitteeBryan Cameron 35 Steven Voorhis 22Charles Pohl 34 Karol Marcin 18Wendell Birkhofer 31 Philippe Barret 14Diana Strandberg 30 Kathleen McCarthy 11
David Hoeft 25 Benjamin Garosi 9
Average Tenure: 23
International Equity Investment CommitteeBryan Cameron 35 Keiko Horkan 18Charles Pohl 34 Richard Callister 16Diana Strandberg 30 Englebert Bangayan 16Mario DiPrisco 20 Raymond Mertens 15Roger Kuo 20 Average Tenure: 23
Global Equity Investment CommitteeCharles Pohl 34 Roger Kuo 20Diana Strandberg 30 Karol Marcin 18David Hoeft 25 Lily Beischer 17Steven Voorhis 22 Average Tenure: 24
U.S. Fixed Income Investment CommitteeDana Emery 35 Adam Rubinson 16Thomas Dugan 24 Anthony Brekke 15Larissa Roesch 21 Nils Reuter 15James Dignan 19 Michael Kiedel 10
Lucy Johns 16 Average Tenure: 19
Global Fixed Income Investment CommitteeDana Emery 35 Lucy Johns 16Thomas Dugan 24 Adam Rubinson 16James Dignan 19 Matthew Schefer 10
Average Tenure: 20
E-1182-040919-112111 | DODGE & COX Investment Managers | San Francisco 3

Dodge & Cox Funds Performance Results March 31, 2019
Average Annual Total Returns for Periods Ended March 31, 2019
E-1775-040319-061814 |
(a) Unannualized rate of total return. (b) Since Global Stock Fund’s inception on May 1, 2008 through March 31, 2019: 5.23% vs. 5.28% MSCI World Index vs. 4.82% MSCI ACWI Index. (c) Since International Stock Fund’s inception on May 1, 2001 through March 31, 2019: 6.86% vs. 4.46% MSCI EAFE Index vs. 5.14% MSCI ACWI free ex USA. (d) A private fund managed by Dodge & Cox with proprietary assets was reorganized into the Dodge & Cox Global Bond Fund on April 30, 2014. Any Fund portfolio characteristics, performance, or attribution information for periods prior to May 1, 2014, are those of the private fund. (e) Since Global Bond Fund’s inception on December 5, 2012 through March 31, 2019: 2.79% compared to 0.66% for the Bloomberg Barclays Global Aggregate Bond Index. The Combined Index reflects an unmanaged portfolio (rebalanced monthly) of 60% of the S&P 500 Index, which is market capitalization-weighted index of 500 large-capitalization stocks commonly used to represent the U.S. equity market, and 40% of the Bloomberg Barclays U.S. Aggregate Bond Index (BBG Barclays U.S. Agg), which is a widely recognized, unmanaged index of U.S. dollar-denominated, investment-grade, taxable fixed income securities. Returns represent past performance and do not guarantee future results. Investment return and share price will fluctuate with market conditions, and investors may have a gain or loss when shares are sold. Fund performance changes over time and currently may be significantly lower than stated above. Performance is updated and published monthly. Before investing in any Dodge & Cox Fund, you should carefully consider the Fund’s investment objectives, risks, and charges and expenses. To obtain a Fund’s prospectus and summary prospectus, which contain this and other important information, or for current month-end performance figures, visit dodgeandcox.com or call 800-621-3979. Please read the prospectus and summary prospectus carefully before investing.
3 Months Ended(a) YTD(a) 1 Year 3 Years 5 Years 10 Years 20 Years
Stock Fund 10.28% 10.28% 4.30% 14.11% 8.65% 16.14% 9.16%
S&P 500 Index 13.65% 13.65% 9.50% 13.51% 10.91% 15.92% 6.04%
Russell 1000 Value Index 11.93% 11.93% 5.67% 10.45% 7.72% 14.52% 6.68%
Global Stock Fund 9.70% 9.70% -1.55% 11.39% 5.27% 14.33% N.A.(b)
MSCI World Index 12.48% 12.48% 4.01% 10.68% 6.78% 12.38% N.A.(b)
MSCI ACWI Index 12.18% 12.18% 2.60% 10.67% 6.45% 11.98% N.A.(b)
International Stock Fund 9.78% 9.78% -8.00% 7.87% 0.85% 10.25% N.A.(c)
MSCI EAFE Index 9.98% 9.98% -3.71% 7.27% 2.33% 8.96% N.A.(c)
MSCI ACWI ex USA Index 10.31% 10.31% -4.22% 8.09% 2.57% 8.85% N.A.(c)
Balanced Fund 7.80% 7.80% 4.40% 10.38% 6.85% 13.10% 8.11%
Combined Index 9.31% 9.31% 7.78% 8.95% 7.76% 11.15% 5.81%
Income Fund 3.70% 3.70% 4.32% 3.64% 3.15% 5.37% 5.29%
Bloomberg Barclays U.S. Aggregate Bond Index 2.94% 2.94% 4.48% 2.03% 2.74% 3.77% 4.73%
Global Bond Fund(d) 4.69% 4.69% 2.72% 5.49% 2.38% N.A.(e) N.A.
Bloomberg Barclays Global Aggregate Bond Index 2.20% 2.20% -0.38% 1.49% 1.04% N.A.(e) N.A.
DODGE & COX Investment Managers | San Francisco 4

E-10020-041818-031611 |
Dodge & CoxStock Fund Overview
DODGE & COX Investment Managers | San Francisco 5

Dodge & Cox Stock Fund
Fund Overview
Key Characteristics Shared by Dodge & Cox Funds
Low expenses Stable and experienced investment team Consistent investment approach Team decision-making process Historically low turnover resulting from long-term view
March 31, 2019
(a) Excludes negative earners. (b) Excludes Financials and Utilities. (c) Net Cash & Other includes cash, short-term investments, receivables, and payables. Source: Bloomberg LP. Before investing in any Dodge & Cox Fund, you should carefully consider the Fund’s investment objectives, risks, and charges and expenses. To obtain a Fund’s prospectus and summary prospectus, which contain this and other important information, visit www.dodgeandcox.com or call 800-621-3979. Please read the prospectus and summary prospectus carefully before investing. DC
Dodge & Cox Stock Fund (Established January 4, 1965)
Equity Securities96.7%
Net Cash & Other(c)
3.3%
E-833-041319-110211 |
Stock Fund Characteristics
Objective: long-term growth of principal and income Diversified portfolio of 69 securities Long-term investment horizon Well-established companies: Generally with market capitalizations greater than $3 billion Weighted average market capitalization of $148 billion
Below-average valuations Price-to-earnings ratio (forward) of 13.1x(a)
Price-to-sales ratio of 1.5x(b)
Gradual portfolio changes
Total net assets: $69.9 billion Net asset value per share: $183.47 Expense ratio: 0.52%
DODGE & COX Investment Managers | San Francisco 6

Performance Attribution Quarter Ended March 31, 2019
Source: FactSet. The above information is not a complete analysis of every material fact concerning any market, industry or investment. Data has been obtained from sources considered reliable, but Dodge & Cox makes no representations as to the completeness or accuracy of such information. Opinions expressed are subject to change without notice. The information provided is historical and does not predict future results or profitability. This is not a recommendation to buy, sell, or hold any security and is not indicative of Dodge & Cox’s current or future trading activity. The securities identified are subject to change without notice and may not represent an account’s entire holdings. Returns represent past performance and do not guarantee future results. Investment return and share price will fluctuate with market conditions, and investors may have a gain or loss when shares are sold. Fund performance changes over time and currently may be significantly lower than stated above. Performance is updated and published monthly. Before investing in any Dodge & Cox Fund, you should carefully consider the Fund’s investment objectives, risks, and charges and expenses. To obtain a Fund’s prospectus and summary prospectus, which contain this and other important information, or for current month-end performance figures, visit dodgeandcox.com or call 800-621-3979. Please read the prospectus and summary prospectus carefully before investing.
Dodge & Cox Stock Fund vs. S&P 500 (Three-Month Total Return)
Key Detractors from Relative Results
In the Health Care sector, the Fund’s overweight position (averaging 22% versus 15%) and weaker returns from holdings (up 4% compared to up 7% for the S&P 500 sector) detracted. CVS Health (down 17%), Cigna (down 15%), and Bristol-Myers Squibb (down 7%) performed poorly.
Strong performance from certain large technology and internet related stocks not held by the Fund (e.g., Amazon, Apple) hurt relative results.
Within the Information Technology sector, the Fund’s holdings (up 14%) were not as strong as the S&P 500 sector (up 20%). HP Inc. (down 4%) and Juniper Networks (down 1%) lagged.
Within the Consumer Discretionary sector, the Fund’s holdings (flat) were substantially weaker than the S&P 500 sector (up 16%) and Qurate Retail (down 18%) was the main detractor.
The Financials sector detracted during the period (up 8% for the Fund’s holdings and up 9% for S&P 500 sector) as the Fund’s large overweight position (averaging 26% versus 13%) negatively impacted relative results.
Stock Fund SEC Standardized Average Annual Total Returns as of March 31, 2019: 1 Year +4.30%; 5 Years +8.65%; 10 Years +16.14%.
Key Contributors to Relative Results
No single sector added meaningfully to relative performance. Several individual holdings contributed, including Micro Focus International (up 53%), Apache (up 33%), Baker Hughes, a GE Co. (up 30%), Johnson Controls International (up 25%), and Charter Communications (up 22%).
E-861-041019-101311 |
10.28%
13.65%
0.0%
5.0%
10.0%
15.0%
◼ Stock Fund ◼ S&P 500
DODGE & COX Investment Managers | San Francisco 7

Performance Attribution Quarter Ended March 31, 2019
Source: FactSet. The above information is not a complete analysis of every material fact concerning any market, industry or investment. Data has been obtained from sources considered reliable, but Dodge & Cox makes no representations as to the completeness or accuracy of such information. Opinions expressed are subject to change without notice. The information provided is historical and does not predict future results or profitability. This is not a recommendation to buy, sell, or hold any security and is not indicative of Dodge & Cox’s current or future trading activity. The securities identified are subject to change without notice and may not represent an account’s entire holdings. Returns represent past performance and do not guarantee future results. Investment return and share price will fluctuate with market conditions, and investors may have a gain or loss when shares are sold. Fund performance changes over time and currently may be significantly lower than stated above. Performance is updated and published monthly. Before investing in any Dodge & Cox Fund, you should carefully consider the Fund’s investment objectives, risks, and charges and expenses. To obtain a Fund’s prospectus and summary prospectus, which contain this and other important information, or for current month-end performance figures, visit dodgeandcox.com or call 800-621-3979. Please read the prospectus and summary prospectus carefully before investing.
Dodge & Cox Stock Fund vs. Russell 1000 Value (Three-Month Total Return)
Stock Fund SEC Standardized Average Annual Total Returns as of March 31, 2019: 1 Year +4.30%; 5 Years +8.65%; 10 Years +16.14%.
Key Contributors to Relative Results
Returns from holdings in the Communication Services sector (up 14% compared to up 9% for the Russell 1000 Value sector), combined with a higher average weighting (16% versus 7%), added to results. Media holdings DISH Network (up 27%), Charter Communications (up 22%), and Comcast (up 17%) were strong.
Additional contributors included Micro Focus International (up 53%), Apache (up 33%), Baker Hughes, a GE Co. (up 30%), and Johnson Controls International (up 25%).
Key Detractors from Relative Results
In the Health Care sector, the Fund’s overweight position (averaging 22% versus 15%) and weaker returns from holdings (up 4% compared to up 8% for the Russell 1000 Value sector) hampered relative results. CVS Health (down 17%), Cigna (down 15%), Bristol-Myers Squibb (down 7%), and Sanofi (up 2%) performed poorly.
The Fund’s Consumer Discretionary holdings (flat) trailed the Russell 1000 Value sector (up 13%). Qurate Retail (down 18%) was the main detractor.
HP Inc. (down 4%) and Charles Schwab (up 3%) also lagged.
E-862-041119-101311 |
10.28%11.93%
0.0%
4.0%
8.0%
12.0%
◼ Stock Fund ◼ Russell 1000 Value
DODGE & COX Investment Managers | San Francisco 8

Performance Attribution One Year Ended March 31, 2019
Source: FactSet. The above information is not a complete analysis of every material fact concerning any market, industry or investment. Data has been obtained from sources considered reliable, but Dodge & Cox makes no representations as to the completeness or accuracy of such information. Opinions expressed are subject to change without notice. The information provided is historical and does not predict future results or profitability. This is not a recommendation to buy, sell, or hold any security and is not indicative of Dodge & Cox’s current or future trading activity. The securities identified are subject to change without notice and may not represent an account’s entire holdings. Returns represent past performance and do not guarantee future results. Investment return and share price will fluctuate with market conditions, and investors may have a gain or loss when shares are sold. Fund performance changes over time and currently may be significantly lower than stated above. Performance is updated and published monthly. Before investing in any Dodge & Cox Fund, you should carefully consider the Fund’s investment objectives, risks, and charges and expenses. To obtain a Fund’s prospectus and summary prospectus, which contain this and other important information, or for current month-end performance figures, visit dodgeandcox.com or call 800-621-3979. Please read the prospectus and summary prospectus carefully before investing.
Dodge & Cox Stock Fund vs. S&P 500 (Twelve-Month Total Return)
Key Contributors to Relative Results
The account's average overweight position (23% versus 15%) and holdings in the Health Care sector (up 16% compared to up 15% for the S&P 500 sector) benefited results. Eli Lilly (up 72%), Express Scripts (up 34% to date of acquisition), and Novartis (up 21%) were particularly strong.
Returns from holdings in the Communication Services sector (up 15% compared to up 10% for the S&P 500 sector), combined with a higher average weighting (16% versus 10%) had a positive impact. Twenty-First Century Fox (up 36% to date of acquisition) and Comcast (up 20%) performed well.
Technology companies Micro Focus International (up 94%) and Dell Technologies (up 85%) were exceptional performers.
Stock Fund SEC Standardized Average Annual Total Returns as of March 31, 2019: 1 Year +4.30%; 5 Years +8.65%; 10 Years +16.14%
Key Detractors from Relative Results
The Financials sector (down 5% for the S&P 500) was the weakest segment of the Index; the Fund’s large overweight position (averaging 26% versus 14%) and returns from holdings in the sector (down 8%) hindered performance. Goldman Sachs (down 23%), Charles Schwab (down 17%), and Capital One Financial (down 13%) lagged.
Returns from holdings in the Energy sector (down 15% compared to up 2% for the S&P 500 sector), combined with a higher average weighting (9% versus 6%), had a negative impact. Schlumberger (down 30%) and Anadarko Petroleum (down 23%) were key detractors.
The Fund’s Consumer Discretionary holdings (down 12%) significantly trailed the S&P 500 sector (up 14%), especially Qurate Retail (down 37%) and Booking Holdings (down 16%). Not owning Amazon (up 23%) was also a negative factor.
In the Information Technology sector, a lower average weighting (14% versus 20%) also hampered results since this area of the Index was strong (up 18% for the S&P 500 sector).
FedEx (down 24%) and Bristol-Myers Squibb (down 22%) also detracted.
E-1085-041119-101311 |
4.30%
9.50%
0.0%
4.0%
8.0%
12.0%
◼ Stock Fund ◼ S&P 500
DODGE & COX Investment Managers | San Francisco 9

Performance Attribution One Year Ended March 31, 2019
Source: FactSet. The above information is not a complete analysis of every material fact concerning any market, industry or investment. Data has been obtained from sources considered reliable, but Dodge & Cox makes no representations as to the completeness or accuracy of such information. Opinions expressed are subject to change without notice. The information provided is historical and does not predict future results or profitability. This is not a recommendation to buy, sell, or hold any security and is not indicative of Dodge & Cox’s current or future trading activity. The securities identified are subject to change without notice and may not represent an account’s entire holdings. Returns represent past performance and do not guarantee future results. Investment return and share price will fluctuate with market conditions, and investors may have a gain or loss when shares are sold. Fund performance changes over time and currently may be significantly lower than stated above. Performance is updated and published monthly. Before investing in any Dodge & Cox Fund, you should carefully consider the Fund’s investment objectives, risks, and charges and expenses. To obtain a Fund’s prospectus and summary prospectus, which contain this and other important information, or for current month-end performance figures, visit dodgeandcox.com or call 800-621-3979. Please read the prospectus and summary prospectus carefully before investing.
Dodge & Cox Stock Fund vs. Russell 1000 Value (Twelve-Month Total Return)
Key Contributors to Relative Results
The Fund's overweight position (averaging 16% versus 7%) and stronger returns in the Communication Services sector (holdings up 15% compared to up 13% for the Russell 1000 Value sector) aided results. Standout performers included Twenty-First Century Fox (up 36% to date of acquisition) and Comcast (up 20%).
Returns from holdings in the Information Technology sector (up 17% compared to up 11% for the Russell 1000 Value sector), combined with a higher average weighting (14% versus 9%), benefited performance. Micro Focus International (up 94%), Dell Technologies (up 85%), and Microsoft (up 31%) were all exceptional.
The Fund’s overweight position (averaging 23% versus 15%) in the Health Care sector was a positive since the segment was strong (up 19% for the Russell 1000 Value sector). Eli Lilly (up 72%), Express Scripts (up 34% to date of acquisition), Roche (up 23%), and Novartis (up 21%) performed well.
Stock Fund SEC Standardized Average Annual Total Returns as of March 31, 2019: 1 Year +4.30%; 5 Years +8.65%; 10 Years +16.14%.
Key Detractors from Relative Results
The Fund’s Energy holdings (down 15%) significantly trailed the Russell 1000 Value sector (up 2%). Schlumberger (down 30%), Halliburton (down 24%), and Anadarko Petroleum (down 23%) were key detractors.
The Fund's lack of holdings in the Utilities (up 20%) and Real Estate (up 19%) sectors, the top-performing sectors of the Index during the period, impeded relative results.
The Fund’s overweight position (averaging 26% versus 24%) and weaker returns from holdings in the Financials sector (down 8% compared to down 6% for the Russell 1000 Value sector) reduced performance. Goldman Sachs (down 23%), Charles Schwab (down 17%), and Capital One Financial (down 13%) were especially weak.
Holdings Qurate Retail (down 37%) and Bristol-Myers Squibb (down 22%) also detracted.
E-1086-041119-101311 |
4.30%
5.67%
0.0%
2.0%
4.0%
6.0%
◼ Stock Fund ◼ Russell 1000 Value
DODGE & COX Investment Managers | San Francisco 10

0%
5%
10%
15%
20%
25%
30%
Financials Health Care CommunicationServices
InformationTechnology
Energy Industrials ConsumerDiscretionary
Materials ConsumerStaples
Utilities Real Estate Cash
Stock Fund
S&P 500
Russell 1000 Value
Portfolio Structure March 31, 2019
(a) Portfolio estimate excludes negative earners. S&P 500 estimate is bottom-up. (b) Portfolio calculation excludes Financials and Utilities. (c) Net Cash & Other includes short-term investments (e.g., money market funds and repurchase agreements) and other assets less liabilities (e.g., cash, receivables, payables, and unrealized appreciation/depreciation on certain derivatives). A portion of the short-term investments position is equitized using futures contracts.Source: Bloomberg LP, Bank of New York Mellon. The above information is not a complete analysis of every material fact concerning any market, industry or investment. Data has been obtained from sources considered reliable, but Dodge & Cox makes no representations as to the completeness or accuracy of such information. Opinions expressed are subject to change without notice. The information provided is historical and does not predict future results or profitability. This is not a recommendation to buy, sell, or hold any security and is not indicative of Dodge & Cox’s current or future trading activity. The securities identified are subject to change without notice and may not represent an account’s entire holdings. Before investing in any Dodge & Cox Fund, you should carefully consider the Fund’s investment objectives, risks, and charges and expenses. To obtain a Fund’s prospectus and summary prospectus, which contain this and other important information, visit www.dodgeandcox.com or call 800-621-3979. Please read the prospectus and summary prospectus carefully before investing.
Dodge & Cox Stock Fund
Portfolio Characteristics Ten Largest Holdings
Portfolio Composition by Sector
(c)
E-858-041219-110211 |
Stock Fund S&P 500 Russell ValueNumber of holdings 69 505 722Price-to-earnings (forward) (a) 13.1x 17.0x 14.5xPrice-to-cash flow (b) 9.1x 13.7x 11.2xPrice-to-sales (b) 1.5x 2.2x 1.7xPrice-to-book value 1.9x 3.4x 2.1xWeighted average market cap. $148B $232B $127BMedian market cap. $41B $22B $9B
Comcast 4.3%Wells Fargo 3.5%Charter Communications 3.5%Microsoft 3.2%Alphabet 3.1%FedEx 3.0%Capital One Financial 3.0%Charles Schwab 2.9%Bank of America 2.7%Novartis 2.6%Total Weight 32.0%
DODGE & COX Investment Managers | San Francisco 11

ELECTRONIC MEDIA 13.0% BANKS 9.7% HEALTH CARE SERVICES 4.3% BUILDING PRODUCTS 2.4% CONSUMER DURABLES 0.3%
Alphabet Inc. Class A 0.1% Bank of America Corp 2.8% Cigna Corp. 1.9% Johnson Controls International plc Harley-Davidson, Inc. 0.3%
Alphabet Inc. Class C 3.1% BB&T Corp. 0.8% CVS Health Corp. 0.9%
Charter Communications, Inc. JPMorgan Chase & Co. 2.4% UnitedHealth Group Inc. 1.4% ENERGY 9.8% CONSUMER PRODUCTS 0.8%Comcast Corp. 4.5% Wells Fargo & Co. 3.6%
DISH Network Corp. 0.8% MEDICAL DEVICES 1.1% Anadarko Petroleum Corp. 1.9% Molson Coors Brewing Co. 0.8%
Walt Disney Co. 0.0% FINANCIAL SERVICES 12.8% Apache Corp. 1.7%
Fox Corp. Class B 0.1% Danaher Corp. 0.6% Baker Hughes, a GE Co. 1.5% PUB/LEISURE 0.4%Fox Corp. Class A 0.5% American Express Co. 2.4% Medtronic plc 0.5% Concho Resources Inc. 0.5%
News Corp. 0.2% Bank of New York Mellon Corp. Halliburton Co. 0.8% Mattel, Inc. 0.4%
Capital One Financial Corp. 3.1% PHARMACEUTICALS 16.7% National Oilwell Varco, Inc. 0.4%
TECHNOLOGY 14.6% Goldman Sachs Group, Inc. 2.0% Occidental Petroleum Corp. 1.8% RETAIL & DISTRIBUTION 2.9%Charles Schwab Corp. 3.0% Alnylam Pharmaceuticals, Inc 0.4% Schlumberger NV 1.3%
Cisco Systems, Inc. 1.6% Astrazeneca PLC Spon. ADR 2.0% Weatherford International plc 0.0% Booking Holdings Inc. 1.5%
Dell Technologies Inc 0.8% INSURANCE 2.8% Bristol-Myers Squibb Co. 1.8% Gap, Inc. 0.5%
Hewlett Packard Enterprise Co. Gilead Sciences, Inc. 1.1% GENERAL INDUSTRIAL 2.0% Qurate Retail, Inc. 0.8%
HP Inc. 1.7% AEGON N.V. ADR 0.5% GlaxoSmithKline plc Spon. ADR Target Corp. 0.2%
Juniper Networks, Inc. 1.1% Brighthouse Financial, Inc. 0.4% Incyte Corp. 0.3% Ball Corp. 0.1%
Maxim Integrated Products, Inc. MetLife, Inc. 1.9% Eli Lilly and Co. 1.7% United Technologies Corp. 1.8%
Micro Focus International plc Novartis AG Spon. ADR 2.7%
Microchip Technology Inc. 1.4% Roche Holding Ltd Spon. ADR 2.1% INDUSTRIAL COMMODITIES 0.9%Microsoft Corp. 3.4% Sanofi Spon. ADR 2.6%
TE Connectivity Ltd. 1.5% Celanese Corp. 0.9%
TELECOM 1.7% TRANSPORTATION 3.7%
AT&T Inc. 0.6% FedEx Corp. 3.1%
Sprint Corp. 0.5% Union Pacific Corp. 0.6%
Zayo Group Holdings, Inc. 0.7%
Technology, Media, and Communication Services Finance and Real Estate Health Care
Industrials, Energy,Materials, and Utilities Consumer
Portfolio TotalS&P 500 IndexRussell 1000 Value
29.3%31.3%16.8%
25.3%15.8%26.9%
22.1%14.6%15.3%
18.9%20.9%27.9%
4.4%17.4%13.1%
Stock Fund Holdings March 31, 2019
Ten largest equity holdings are in bold. The above information is not a complete analysis of every material fact concerning any market, industry or investment. Data has been obtained from sources considered reliable, but Dodge & Cox makes no representations as to the completeness or accuracy of such information. Opinions expressed are subject to change without notice. The information provided is historical and does not predict future results or profitability. This is not a recommendation to buy, sell, or hold any security and is not indicative of Dodge & Cox’s current or future trading activity. The securities identified are subject to change without notice and may not represent an account’s entire holdings. Before investing in any Dodge & Cox Fund, you should carefully consider the Fund’s investment objectives, risks, and charges and expenses. To obtain a Fund’s prospectus and summary prospectus, which contain this and other important information, visit dodgeandcox.com or call 800-621-3979. Please read the prospectus and summary prospectus carefully before investing.
E-859-041219-110211 | DODGE & COX Investment Managers | San Francisco 12

Dodge & CoxGlobal Stock Fund Overview
E-354-022218-011509 | DODGE & COX Investment Managers | San Francisco 13

Dodge & Cox Global Stock Fund
Fund Overview
Key Characteristics Shared by Dodge & Cox Funds
Low expenses Stable and experienced investment team Consistent investment approach Team decision-making process Low turnover resulting from long-term view
March 31, 2019
Dodge & Cox Global Stock Fund (Established May 1, 2008)
Equity Securities98.5%
Net Cash & Other(d)
1.5%
E-934-041819-110211 |
Global Stock Fund Characteristics
Objective: long-term growth of principal and income Diversified portfolio by sector & region Long-term investment horizon Well-established companies: Weighted average market capitalization of $104 Billion Median market capitalization of $40 Billion
Below-average valuations: Price-to-earnings ratio (forward)(a) of 12.1x Price-to-sales ratio(b) of 1.3x
Gradual portfolio shifts
Total net assets: $9.5 billion Net asset value per share: $12.10 Expense ratio: 0.62%(c)
(a) Excludes extraordinary items and negative earnings. (b) Excludes financial services and utilities. (c) 0.63% expense ratio as per Fund Prospectus dated May 1, 2018. (d) Net Cash & Other includes cash, short-term investments, receivables, and payables. Before investing in any Dodge & Cox Fund, you should carefully consider the Fund’s investment objectives, risks, and charges and expenses. To obtain a Fund’s prospectus and summary prospectus, which contain this and other important information, visit www.dodgeandcox.com or call 800-621-3979. Please read the prospectus and summary prospectus carefully before investing.
DODGE & COX Investment Managers | San Francisco 14

Performance Attribution Quarter Ended March 31, 2019
(a) All returns are holding period returns. Source: Dodge & Cox, MSCI. The above information is not a complete analysis of every material fact concerning any market, industry or investment. Data has been obtained from sources considered reliable, but Dodge & Cox makes no representations as to the completeness or accuracy of such information. Opinions expressed are subject to change without notice. The information provided is historical and does not predict future results or profitability. This is not a recommendation to buy, sell, or hold any security and is not indicative of Dodge & Cox’s current or future trading activity. The securities identified are subject to change without notice and may not represent an account’s entire holdings. Returns represent past performance and do not guarantee future results. Investment return and share price will fluctuate with market conditions, and investors may have a gain or loss when shares are sold. Fund performance changes over time and currently may be significantly lower than stated above. Performance is updated and published monthly. Before investing in any Dodge & Cox Fund, you should carefully consider the Fund’s investment objectives, risks, and charges and expenses. To obtain a Fund’s prospectus and summary prospectus, which contain this and other important information, or for current month-end performance figures, visit dodgeandcox.com or call 800-621-3979. Please read the prospectus and summary prospectus carefully before investing.
Dodge & Cox Global Stock Fund vs. MSCI World(a) (Three-Month Total Return)
Key Contributors to Relative Results
Strong returns in the Energy sector (up 18% compared to up 14% for the MSCI World sector) had a positive impact. Apache (up 33%) was a big contributor.
Relative returns in the Communication Services sector (up 13% compared to up 12% for the MSCI World sector) also helped performance. Charter Communications (up 22%) and Comcast (up 17%) contributed to results.
Additional contributors included Micro Focus International (up 51%), JD.com (up 44%), Incyte (up 35%), Axis Bank (up 26%), and Johnson Controls International (up 25%).
Global Stock Fund SEC Standardized Average Annual Total Returns as of March 31, 2019: 1 Year -1.55%; 5 Years +5.27%; 10 Years +14.33%.
Key Detractors from Relative Results
The Fund’s average overweight position in the Financials sector (31% versus 16% for the MSCI World sector), combined with weak relative returns (up 7% compared to up 8%), hurt results. Societe Generale (down 9%) and UBS Group (down 2%) were detractors.
Relative returns in the Health Care sector (up 5% compared to up 8% for the MSCI World), combined with an average overweight position (17% versus 13%), had a negative impact. CVS Health (down 17%), Cigna (down 15%), Bristol-Myers Squibb (down 7%), Bayer (down 7%), and Sanofi (up 2%) detracted from performance.
Additional detractors included Qurate Retail (down 18%) and GrupoTelevisa (down 12%).
E-2162-041019-101311 |
9.70%12.48%
0.0%
5.0%
10.0%
15.0%
◼ Global Stock Fund ◼ MSCI World
DODGE & COX Investment Managers | San Francisco 15
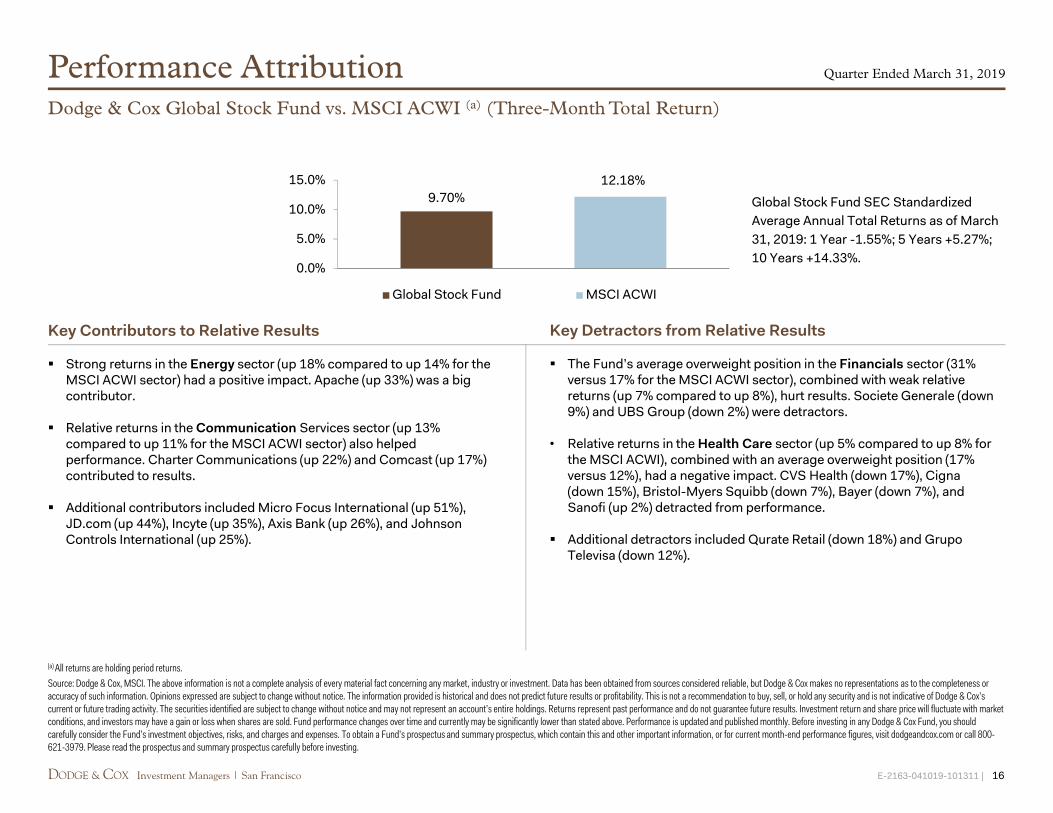
Performance Attribution Quarter Ended March 31, 2019
(a) All returns are holding period returns. Source: Dodge & Cox, MSCI. The above information is not a complete analysis of every material fact concerning any market, industry or investment. Data has been obtained from sources considered reliable, but Dodge & Cox makes no representations as to the completeness or accuracy of such information. Opinions expressed are subject to change without notice. The information provided is historical and does not predict future results or profitability. This is not a recommendation to buy, sell, or hold any security and is not indicative of Dodge & Cox’s current or future trading activity. The securities identified are subject to change without notice and may not represent an account’s entire holdings. Returns represent past performance and do not guarantee future results. Investment return and share price will fluctuate with market conditions, and investors may have a gain or loss when shares are sold. Fund performance changes over time and currently may be significantly lower than stated above. Performance is updated and published monthly. Before investing in any Dodge & Cox Fund, you should carefully consider the Fund’s investment objectives, risks, and charges and expenses. To obtain a Fund’s prospectus and summary prospectus, which contain this and other important information, or for current month-end performance figures, visit dodgeandcox.com or call 800-621-3979. Please read the prospectus and summary prospectus carefully before investing.
Dodge & Cox Global Stock Fund vs. MSCI ACWI (a) (Three-Month Total Return)
Key Contributors to Relative Results
Strong returns in the Energy sector (up 18% compared to up 14% for the MSCI ACWI sector) had a positive impact. Apache (up 33%) was a big contributor.
Relative returns in the Communication Services sector (up 13% compared to up 11% for the MSCI ACWI sector) also helped performance. Charter Communications (up 22%) and Comcast (up 17%) contributed to results.
Additional contributors included Micro Focus International (up 51%), JD.com (up 44%), Incyte (up 35%), Axis Bank (up 26%), and Johnson Controls International (up 25%).
Global Stock Fund SEC Standardized Average Annual Total Returns as of March 31, 2019: 1 Year -1.55%; 5 Years +5.27%; 10 Years +14.33%.
Key Detractors from Relative Results
The Fund’s average overweight position in the Financials sector (31% versus 17% for the MSCI ACWI sector), combined with weak relative returns (up 7% compared to up 8%), hurt results. Societe Generale (down 9%) and UBS Group (down 2%) were detractors.
• Relative returns in the Health Care sector (up 5% compared to up 8% for the MSCI ACWI), combined with an average overweight position (17% versus 12%), had a negative impact. CVS Health (down 17%), Cigna (down 15%), Bristol-Myers Squibb (down 7%), Bayer (down 7%), and Sanofi (up 2%) detracted from performance.
Additional detractors included Qurate Retail (down 18%) and GrupoTelevisa (down 12%).
E-2163-041019-101311 |
9.70%12.18%
0.0%
5.0%
10.0%
15.0%
◼ Global Stock Fund ◼ MSCI ACWI
DODGE & COX Investment Managers | San Francisco 16
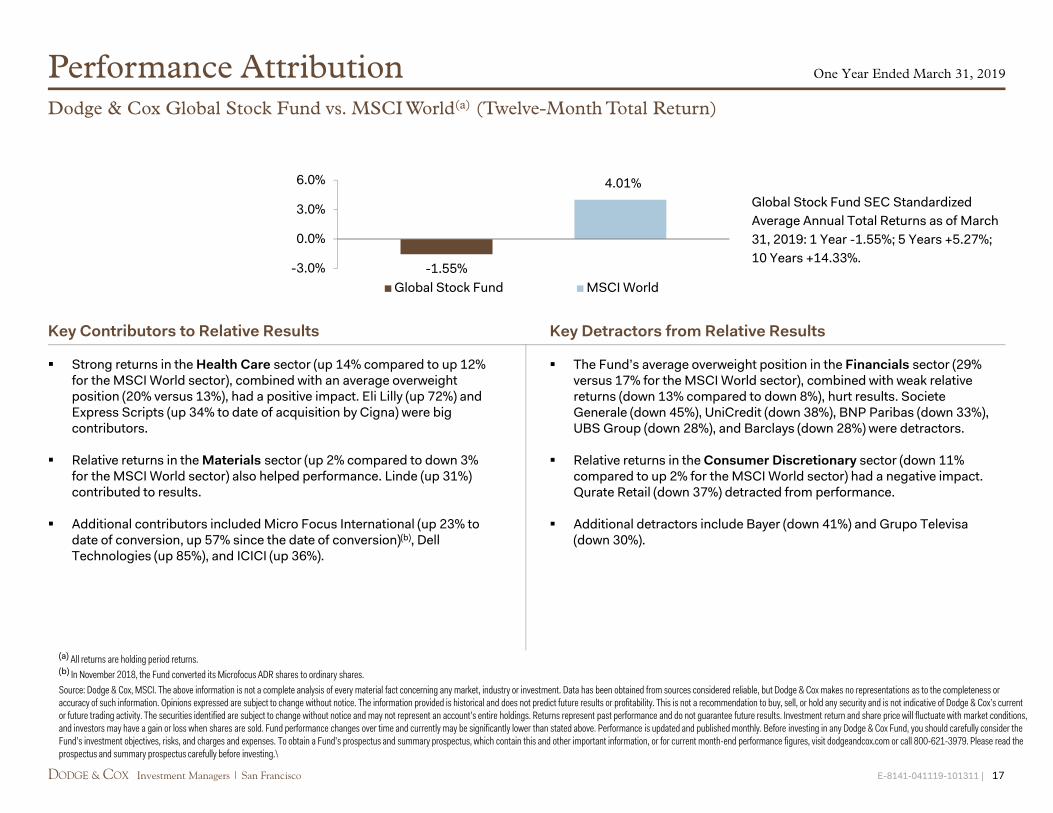
Performance Attribution
(a) All returns are holding period returns. (b) In November 2018, the Fund converted its Microfocus ADR shares to ordinary shares.Source: Dodge & Cox, MSCI. The above information is not a complete analysis of every material fact concerning any market, industry or investment. Data has been obtained from sources considered reliable, but Dodge & Cox makes no representations as to the completeness or accuracy of such information. Opinions expressed are subject to change without notice. The information provided is historical and does not predict future results or profitability. This is not a recommendation to buy, sell, or hold any security and is not indicative of Dodge & Cox’s current or future trading activity. The securities identified are subject to change without notice and may not represent an account’s entire holdings. Returns represent past performance and do not guarantee future results. Investment return and share price will fluctuate with market conditions, and investors may have a gain or loss when shares are sold. Fund performance changes over time and currently may be significantly lower than stated above. Performance is updated and published monthly. Before investing in any Dodge & Cox Fund, you should carefully consider the Fund’s investment objectives, risks, and charges and expenses. To obtain a Fund’s prospectus and summary prospectus, which contain this and other important information, or for current month-end performance figures, visit dodgeandcox.com or call 800-621-3979. Please read the prospectus and summary prospectus carefully before investing.\
Dodge & Cox Global Stock Fund vs. MSCI World(a) (Twelve-Month Total Return)
One Year Ended March 31, 2019
Key Contributors to Relative Results
Strong returns in the Health Care sector (up 14% compared to up 12% for the MSCI World sector), combined with an average overweight position (20% versus 13%), had a positive impact. Eli Lilly (up 72%) and Express Scripts (up 34% to date of acquisition by Cigna) were big contributors.
Relative returns in the Materials sector (up 2% compared to down 3% for the MSCI World sector) also helped performance. Linde (up 31%) contributed to results.
Additional contributors included Micro Focus International (up 23% to date of conversion, up 57% since the date of conversion)(b), Dell Technologies (up 85%), and ICICI (up 36%).
Global Stock Fund SEC Standardized Average Annual Total Returns as of March 31, 2019: 1 Year -1.55%; 5 Years +5.27%; 10 Years +14.33%.
Key Detractors from Relative Results
The Fund’s average overweight position in the Financials sector (29% versus 17% for the MSCI World sector), combined with weak relative returns (down 13% compared to down 8%), hurt results. SocieteGenerale (down 45%), UniCredit (down 38%), BNP Paribas (down 33%), UBS Group (down 28%), and Barclays (down 28%) were detractors.
Relative returns in the Consumer Discretionary sector (down 11% compared to up 2% for the MSCI World sector) had a negative impact. Qurate Retail (down 37%) detracted from performance.
Additional detractors include Bayer (down 41%) and Grupo Televisa(down 30%).
E-8141-041119-101311 |
-1.55%
4.01%
-3.0%
0.0%
3.0%
6.0%
◼ Global Stock Fund ◼ MSCI World
DODGE & COX Investment Managers | San Francisco 17

Performance Attribution One Year Ended March 31, 2019
(a) All returns are holding period returns.(b) In November 2018, the Fund converted its Microfocus ADR shares to ordinary sharesSource: Dodge & Cox, MSCI. The above information is not a complete analysis of every material fact concerning any market, industry or investment. Data has been obtained from sources considered reliable, but Dodge & Cox makes no representations as to the completeness or accuracy of such information. Opinions expressed are subject to change without notice. The information provided is historical and does not predict future results or profitability. This is not a recommendation to buy, sell, or hold any security and is not indicative of Dodge & Cox’s current or future trading activity. The securities identified are subject to change without notice and may not represent an account’s entire holdings. Returns represent past performance and do not guarantee future results. Investment return and share price will fluctuate with market conditions, and investors may have a gain or loss when shares are sold. Fund performance changes over time and currently may be significantly lower than stated above. Performance is updated and published monthly. Before investing in any Dodge & Cox Fund, you should carefully consider the Fund’s investment objectives, risks, and charges and expenses. To obtain a Fund’s prospectus and summary prospectus, which contain this and other important information, or for current month-end performance figures, visit dodgeandcox.com or call 800-621-3979. Please read the prospectus and summary prospectus carefully before investing.
Dodge & Cox Global Stock Fund vs. MSCI ACWI(a) (Twelve-Month Total Return)
Key Contributors to Relative Results
Strong returns in the Health Care sector (up 14% compared to up 11% for the MSCI ACWI sector), combined with an average overweight position (20% versus 12%), had a positive impact. Eli Lilly (up 72%) and Express Scripts (up 34% to date of acquisition by Cigna) were big contributors.
Relative returns in the Materials sector (up 2% compared to down 3% for the MSCI ACWI sector) also helped performance. Linde (up 31%) contributed to results.
Additional contributors included Micro Focus International (up 23% to date of conversion, up 57% since the date of conversion) (b), Dell Technologies (up 85%), and ICICI (up 36%).
Global Stock Fund SEC StandardizedAverage Annual Total Returns as of March 31, 2019: 1 Year -1.55%; 5 Years +5.27%; 10 Years +14.33%.
Key Detractors from Relative Results
The Fund’s average overweight position in the Financials sector (29% versus 17% for the MSCI ACWI sector), combined with weak relative returns (down 13% compared to down 8%), hurt results. SocieteGenerale (down 45%), UniCredit (down 38%), BNP Paribas (down 33%), UBS Group (down 28%), and Barclays (down 28%) were detractors.
Relative returns in the Consumer Discretionary sector (down 11% compared to flat for the MSCI ACWI) had a negative impact. QurateRetail (down 37%) detracted from performance.
Additional detractors include Bayer (down 41%) and Grupo Televisa(down 30%).
E-8151-041119-041416 |
-1.55%
2.60%
-2.0%
0.0%
2.0%
4.0%
◼ Global Stock Fund ◼ MSCI ACWI
DODGE & COX Investment Managers | San Francisco 18

0%
5%
10%
15%
20%
25%
30%
35%
Financials Health Care CommunicationServices
InformationTechnology
Energy Industrials ConsumerDiscretionary
Materials ConsumerStaples
Real Estate Utilities Net Cash &Other
Global Stock FundMSCI WorldMSCI ACWI
Portfolio Structure March 31, 2019
(a) Net Cash & Other includes cash, short-term investments, derivatives, receivables, and payables. (b) Price-to-earnings ratio of Dodge & Cox Global Stock Fund excludes extraordinary items and negative earnings. (c) Price-to-sales ratio excludes financial services, real estate and utilities. (d) The Fund may classify a company in a different category than the Index. The Fund usually classifies a company based on its country of incorporation, but may designate a different country in certain circumstances. Source: Dodge & Cox, MSCI, State Street. Before investing in any Dodge & Cox Fund, you should carefully consider the Fund’s investment objectives, risks, and charges and expenses. To obtain a Fund’s prospectus and summary prospectus, which contain this and other important information, visit www.dodgeandcox.com or call 800-621-3979. Please read the prospectus and summary prospectus carefully before investing.
Dodge & Cox Global Stock Fund
Portfolio Characteristics Portfolio Composition (MSCI World, MSCI ACWI) by Region(d)
Portfolio Composition by Sector
E-941-041119-110211 |
(a)
Global Stock Fund
MSCI World
MSCI ACWI
Number of holdings 85 1635 2771
Price-to-earnings (forward)(b) 12.1x 15.3x 14.8x
Price-to-earnings (trailing)(b) 13.9x 17.8x 17.1x
Price-to-sales (trailing)(c) 1.3x 1.6x 1.5x
Price-to-book value (trailing) 1.3x 2.4x 2.3x
Weighted average market capitalization $104B $148B $141B
Median market capitalization $40B $13B $9B
United States46% (62%, 55%)Developed Europe ex UK24% (16%, 14%)Emerging Markets14% (0%, 12%)United Kingdom10% (6%, 5%)Net Cash & Other2% (0%, 0%)Other Developed2% (8%, 7%)Japan3% (8%, 7%)
DODGE & COX Investment Managers | San Francisco 19

Global Stock Fund Holdings March 31, 2019
(a) The Fund may classify a company in a different category than the Index. The Fund usually classifies a company based on its country of incorporation, but may designate a different country in certain circumstances. (b) Net Cash & Other includes cash, short-term investments, receivables, and payables. Companies in bold are Global Stock Fund’s ten largest holdings. The above information is not a complete analysis of every material fact concerning any market, industry or investment. Data has been obtained from sources considered reliable, but Dodge & Cox makes no representations as to the completeness or accuracy of such information. Opinions expressed are subject to change without notice. The information provided is historical and does not predict future results or profitability. This is not a recommendation to buy, sell, or hold any security and is not indicative of Dodge & Cox’s current or future trading activity. The securities identified are subject to change without notice and may not represent an account’s entire holdings. Before investing in any Dodge & Cox Fund, you should carefully consider the Fund’s investment objectives, risks, and charges and expenses. To obtain a Fund’s prospectus and summary prospectus, which contain this and other important information, visit dodgeandcox.com or call 800-621-3979. Please read the prospectus and summary prospectus carefully before investing.
E-942-041519-110211 |
US UK Europe Japan Other Developed EM Asia EM EMEA EM Latin AmericaCommunication Services Al pha bet Liberty Global Altice Europe Television Broadcasts Baidu MultiChoice Group Grupo Televisa14.9% Chart er Com m uni c at i ons Millicom Intl Cellular
Com c a stDISH NetworkSprintZayo Group Holdings
Consumer Discretionary Booking Holdings BMW Honda Motor JD.com Naspers7.6% Mattel Naspers/Tencent Structured Note
Qurate Retail
Consumer Staples Magnit0.6%Energy Anadarko Petroleum Weatherford Int'l Suncor Energy Petrobras8.1% Apache
Baker HughesNational Oilwell VarcoOccidental PetroleumSchlumberger
Financials American Express Aviva Aegon Mitsubishi UFJ Financial Group Axis Bank Itau Unibanco29.4% Bank of America Barclays Banco Santander ICICI Bank
Bank of NY Mellon Standard Chartered BNP Paribas KasikornbankCapital One Credit Suisse GroupCharles Schwab Societe GeneraleGoldman Sachs UBS GroupWells Fargo U ni Credi t
Healthcare Alnylam Pharmaceuticals AstraZeneca Bayer16.8% Bristol-Myers Squibb Gl a xoSm i t hKl i ne Novart i s
Cigna Roc he Hol di ngCVS Health SanofiEli LillyIncyte Corp.UnitedHealth Group
Industrials Fe dE x J ohnson Cont rol s Mitsubishi Electric7.8% United Technologies Schneider ElectricInformation Technology Dell Technologies Micro Focus TE Connectivity Samsung Electronics9.2% Hewlett Packard Enterprise
HP Inc.Juniper NetworksMicrochip TechnologyMicrosoft
Materials Celanese LafargeHolcim Cemex3.6% LindeReal Estate Hang Lung Group0.5%Utilities0.0%
Equity Sum = 98.5% 46.4% 9.5% 23.8% 3.1% 1.9% 6.9% 2.8% 4.1%
Net Cash & Other (b) = 2.5%
Developed Markets(a) Emerging Markets
DODGE & COX Investment Managers | San Francisco 20

E-10020-041818-031611 |
Dodge & CoxInternational Stock Fund Overview
DODGE & COX Investment Managers | San Francisco 21

Dodge & Cox International Stock Fund
Fund Overview
Key Characteristics Shared by Dodge & Cox Funds
Low expenses Stable and experienced investment team Consistent investment approach Team decision-making process Historically low turnover resulting from long-term view
March 31, 2019
(a)Excludes extraordinary items and negative earnings. (b)Net Cash & Other includes cash, short-term investments, receivables, and payables. Before investing in any Dodge & Cox Fund, you should carefully consider the Fund’s investment objectives, risks, and charges and expenses. To obtain a Fund’s prospectus and summary prospectus, which contain this and other important information, visit dodgeandcox.com or call 800-621-3979. Please read the prospectus and summary prospectus carefully before investing.
International Stock Fund (Established May 1, 2001)
Equity Securities97.2%
Net Cash & Other(b)
2.8%
E-885-041519-110211 |
International Stock Fund Characteristics
Objective: long-term growth of principal and income Diversified portfolio by sector & region Long-term investment horizon Well-established companies: Weighted average market capitalization of $76 Billion Median market capitalization of $34 Billion
Below-average valuation: Price-to-earnings ratio (forward)(a) of 11.6x Price-to-book value of 1.2x
Gradual portfolio shifts
Total net assets: $51.1 billion Net asset value per share: $40.52 Expense ratio: 0.63% Fund inception date: May 1, 2001
DODGE & COX Investment Managers | San Francisco 22

Performance Attribution Quarter Ended March 31, 2019
(a) All returns are holding period returns. Source: Dodge & Cox, MSCI. The above information is not a complete analysis of every material fact concerning any market, industry or investment. Data has been obtained from sources considered reliable, but Dodge & Cox makes no representations as to the completeness or accuracy of such information. Opinions expressed are subject to change without notice. The information provided is historical and does not predict future results or profitability. This is not a recommendation to buy, sell, or hold any security and is not indicative of Dodge & Cox’s current or future trading activity. The securities identified are subject to change without notice and may not represent an account’s entire holdings. Returns represent past performance and do not guarantee future results. Investment return and share price will fluctuate with market conditions, and investors may have a gain or loss when shares are sold. Fund performance changes over time and currently may be significantly lower than stated above. Performance is updated and published monthly. Before investing in any Dodge & Cox Fund, you should carefully consider the Fund’s investment objectives, risks, and charges and expenses. To obtain a Fund’s prospectus and summary prospectus, which contain this and other important information, or for current month-end performance figures, visit dodgeandcox.com or call 800-621-3979. Please read the prospectus and summary prospectus carefully before investing.
Dodge & Cox International Stock Fund vs. MSCI EAFE(a) (Three-Month Total Return)
Key Contributors to Relative Results
In Japan, the worst-performing region of the market, the Fund’s stock selection contributed to results (up 12% compared to up 7% for the MSCI EAFE region). Mitsubishi Electric (up 18%) performed well.
Within emerging markets, the Fund’s Chinese Internet holdings bolstered results, especially JD.com (up 44%), Alibaba (up 33%), and Naspers (up 19%). Petrobras (up 23%) and Samsung Electronics (up 13%) also contributed.
The Fund’s stock selection in Industrials helped performance (up 17% compared to up 11% for the MSCI EAFE sector). Johnson Controls International (up 25%) outperformed.
Additional contributors were Micro Focus (up 51%), Lloyds (up 23%), Liberty Global (up 17%), and Schlumberger (up 22%).
International Stock Fund SEC Standardized Average Annual Returns as of March 31, 2019: 1 Year -8.00%; 5 Years +0.85%; 10 Years +10.25%.
Key Detractors from Relative Results
The Fund’s average overweight position (15% versus 8% for the MSCI EAFE) and underperformance within European Financials detracted from results. Societe Generale (down 9%) and UBS (down 2%) performed poorly.
Within the Health Care sector, selected holdings detracted from relative performance, notably Bayer (down 7%) and Sanofi (up 2%).
Additional detractors included Grupo Televisa (down 12%) and BMW (down 4%).
E-893-041219-101311 |
9.78% 9.98%
0.0%
4.0%
8.0%
12.0%
◼ International Stock Fund ◼ MSCI EAFE
DODGE & COX Investment Managers | San Francisco 23

Performance Attribution Quarter Ended March 31, 2019
(a) All returns are holding period returns. Source: Dodge & Cox, MSCI. The above information is not a complete analysis of every material fact concerning any market, industry or investment. Data has been obtained from sources considered reliable, but Dodge & Cox makes no representations as to the completeness or accuracy of such information. Opinions expressed are subject to change without notice. The information provided is historical and does not predict future results or profitability. This is not a recommendation to buy, sell, or hold any security and is not indicative of Dodge & Cox’s current or future trading activity. The securities identified are subject to change without notice and may not represent an account’s entire holdings. Returns represent past performance and do not guarantee future results. Investment return and share price will fluctuate with market conditions, and investors may have a gain or loss when shares are sold. Fund performance changes over time and currently may be significantly lower than stated above. Performance is updated and published monthly. Before investing in any Dodge & Cox Fund, you should carefully consider the Fund’s investment objectives, risks, and charges and expenses. To obtain a Fund’s prospectus and summary prospectus, which contain this and other important information, or for current month-end performance figures, visit dodgeandcox.com or call 800-621-3979. Please read the prospectus and summary prospectus carefully before investing.
Dodge & Cox International Stock Fund vs. MSCI ACWI ex USA(a) (Three-Month Total Return)
Key Contributors to Relative Results
In Japan, the worst-performing region of the market, the Fund’s stock selection contributed to results (up 12% compared 7% for the MSCI ACWI ex USA region). Mitsubishi Electric (up 18%) performed well.
Within emerging markets, the Fund’s Chinese Internet holdings bolstered results, especially JD.com (up 44%) and Naspers (up 19%). Axis Bank (up 26%), Petrobras (up 23%) and Samsung Electronics (up 13%) also contributed.
The Fund’s stock selection in Industrials helped performance (up 17% versus 10% for the MSCI ACWI ex USA). Johnson Controls International (up 25%) outperformed.
Additional contributors were Micro Focus (up 51%), Lloyds (up 23%), Liberty Global (up 17%), and Schlumberger (up 22%).
International Stock Fund SEC Standardized Average Annual Returns as of March 31, 2019: 1 Year -8.00%; 5 Years +0.85%; 10 Years +10.25%.
Key Detractors from Relative Results
The Fund’s average overweight position (15% versus 6% for the MSCI ACWI ex USA) and underperformance within European Financials detracted from results. Societe Generale (down 9%), UBS (down 2%), and Banco Santander (up 4%) had poor relative performance.
Within the Health Care sector, selected holdings detracted from relative performance, notably Bayer (down 7%) and Sanofi (up 2%).
Additional detractors included Grupo Televisa (down 12%) and BMW (down 4%).
E-894-040919-101311 |
*Total return since Altice Rights Issuance on May 22, 2018 for the Altice USA spinoff.
9.78% 10.31%
0.0%
4.0%
8.0%
12.0%
◼ International Stock Fund ◼ MSCI ACWI ex USA
DODGE & COX Investment Managers | San Francisco 24

Performance Attribution One Year Ended March 31, 2019
(a) All returns are holding period returns. Source: Dodge & Cox, MSCI. The above information is not a complete analysis of every material fact concerning any market, industry or investment. Data has been obtained from sources considered reliable, but Dodge & Cox makes no representations as to the completeness or accuracy of such information. Opinions expressed are subject to change without notice. The information provided is historical and does not predict future results or profitability. This is not a recommendation to buy, sell, or hold any security and is not indicative of Dodge & Cox’s current or future trading activity. The securities identified are subject to change without notice and may not represent an account’s entire holdings. Returns represent past performance and do not guarantee future results. Investment return and share price will fluctuate with market conditions, and investors may have a gain or loss when shares are sold. Fund performance changes over time and currently may be significantly lower than stated above. Performance is updated and published monthly. Before investing in any Dodge & Cox Fund, you should carefully consider the Fund’s investment objectives, risks, and charges and expenses. To obtain a Fund’s prospectus and summary prospectus, which contain this and other important information, or for current month-end performance figures, visit dodgeandcox.com or call 800-621-3979. Please read the prospectus and summary prospectus carefully before investing.
Dodge & Cox International Stock Fund vs. MSCI EAFE(a) (Twelve-Month Total Return)
Key Contributors to Relative Results
The Fund’s emerging markets Financials holdings had a positive impact. Axis Bank (up 43%) and ICICI Bank (up 36%), were key contributors.
In the Health Care sector, the Fund’s average overweight position (18% versus 11% for the MSCI EAFE) contributed to results, especially Roche (up 23%), Novartis (up 22%), Astra Zeneca (up 20%), Sanofi (up 14%), and GlaxoSmithKline (up 12%).
The Fund’s stock selection in the Materials sector helped performance, especially Linde (up 31%) and Nutrien (up 15%).
Strong performance in the Fund’s Information Technology holdings (up 3% versus down 2% for the MSCI EAFE) helped results. Micro Focus International (up 100%) and Ericsson (up 41% to date of sale) were contributors.
Petrobras (up 16%) was an additional contributor.
International Stock Fund SEC Standardized Average Annual Returns as of March 31, 2019: 1 Year -8.00%; 5 Years +0.85%; 10 Years +10.25%.
Key Detractors from Relative Results
In the Financials sector, the Fund’s average overweight position (30% versus 20% for the MSCI EAFE) significantly detracted from results. In particular, Financials in Europe and the UK detracted from performance, including Societe Generale (down 45%), UniCredit (down 38%), BNP Paribas (down 33%), Credit Suisse (down 29%), UBS Group (down 28%), and Barclays (down 28%).
The Fund’s underperformance in the Communication Services sector (down 21% versus down 7% for the MSCI EAFE) weakened results. MTN Group (down 36%) and Liberty Global (down 20%) were key detractors.
The Fund’s significant underweight position in traditional defensive sectors (including Consumer Staples, Real Estate, and Utilities) detracted from results. Not owning Nestle (up 23%) was a detractor.
Additional detractors included Bayer (down 41%) and Schlumberger (down 30%).
E-4876-041519-101311 |
-8.00%
-3.71%
-9.0%
-6.0%
-3.0%
0.0%
◼ International Stock Fund ◼ MSCI EAFE
DODGE & COX Investment Managers | San Francisco 25

Performance Attribution One Year Ended March 31, 2019
(a) All returns are holding period returns. Source: Dodge & Cox, MSCI. The above information is not a complete analysis of every material fact concerning any market, industry or investment. Data has been obtained from sources considered reliable, but Dodge & Cox makes no representations as to the completeness or accuracy of such information. Opinions expressed are subject to change without notice. The information provided is historical and does not predict future results or profitability. This is not a recommendation to buy, sell, or hold any security and is not indicative of Dodge & Cox’s current or future trading activity. The securities identified are subject to change without notice and may not represent an account’s entire holdings. Returns represent past performance and do not guarantee future results. Investment return and share price will fluctuate with market conditions, and investors may have a gain or loss when shares are sold. Fund performance changes over time and currently may be significantly lower than stated above. Performance is updated and published monthly. Before investing in any Dodge & Cox Fund, you should carefully consider the Fund’s investment objectives, risks, and charges and expenses. To obtain a Fund’s prospectus and summary prospectus, which contain this and other important information, or for current month-end performance figures, visit dodgeandcox.com or call 800-621-3979. Please read the prospectus and summary prospectus carefully before investing.
Dodge & Cox International Stock Fund vs. MSCI ACWI ex USA(a) (Twelve-Month Total Return)
International Stock Fund SEC Standardized Average Annual Returns as of March 31, 2019: 1 Year -8.00%; 5 Years +0.85%; 10 Years +10.25%.
Key Contributors to Relative Results
The Fund’s emerging markets Financials holdings had a positive impact. Axis Bank (up 43%) and ICICI Bank (up 36%), were key contributors.
In the Health Care sector, the Fund’s average overweight position (18% versus 8% for the MSCI ACWI ex USA) contributed to results, especially Roche (up 23%), Novartis (up 22%), Astra Zeneca (up 20%), Sanofi (up 14%), and GlaxoSmithKline (up 12%).
Strong performance in the Fund’s Information Technology holdings (up 3% versus down 5% for the MSCI ACWI ex USA) helped results. Micro Focus International (up 100%) and Ericsson (up 41% to date of sale) were contributors.
The Fund’s stock selection in the Materials sector helped performance, especially Linde (up 31%) and Nutrien (up 15%).
An additional contributor was Petrobras (up 16%).
Key Detractors from Relative Results
In the Financials sector, the Fund’s average overweight position (30% versus 22% for the MSCI ACWI ex USA) significantly detracted from results. In particular, Financials in Europe and the UK hurt performance, including Societe Generale (down 45%), UniCredit (down 38%), BNP Paribas (down 33%), Credit Suisse (down 29%), UBS Group (down 28%), and Barclays (down 28%).
The Fund’s underperformance in the Communication Services sector (down 21% versus down 9% for the MSCI ACWI ex USA) weakened results. MTN Group (down 36%), Grupo Televisa (down 30%), and Liberty Global (down 20%) were key detractors.
The Fund’s significant underweight position in traditional defensive sectors (including Consumer Staples, Real Estate, and Utilities) detracted from results.
Additional detractors included Bayer (down 41%) and Schlumberger (down 30%).
E-4877-041219-101311 |
-8.00%
-4.22%
-9.0%
-6.0%
-3.0%
0.0%
◼ International Stock Fund ◼ MSCI ACWI ex USA
DODGE & COX Investment Managers | San Francisco 26

Portfolio Structure March 31, 2019
(a) Net Cash & Other includes short-term investments (e.g., money market funds and repurchase agreements) and other assets less liabilities (e.g., cash, receivables, payables, and unrealized appreciation/depreciation on certain derivatives). (b) International Stock Fund price-to-earnings ratio excludes extraordinary items and negative earnings. MSCI figures include extraordinary items and negative earnings. (c) Price-to-sales ratio excludes financial services and utilities. (d) The Fund may classify a company in a different category than the Index. Source: Dodge & Cox, MSCI, State Street. Before investing in any Dodge & Cox Fund, you should carefully consider the Fund’s investment objectives, risks, and charges and expenses. To obtain a Fund’s prospectus and summary prospectus, which contain this and other important information, visit dodgeandcox.com or call 800-621-3979. Please read the prospectus and summary prospectus carefully before investing.
Dodge & Cox International Stock Fund
Portfolio Characteristics Portfolio Composition (MSCI EAFE, ACWI ex USA) by Region(d)
Developed Europe ex UK38% (46%, 31%)
Emerging Markets23% (0%, 26%)
United Kingdom16% (17%, 11%)
Japan10% (24%, 16%)
Other Developed11% (13%, 16%)
Net Cash and Other(a)
3% (0%, 0%)
E-891-041219-110211 |
Portfolio Composition by Sector
International MSCI MSCI ACWI Stock Fund EAFE ex USA
Number of Holdings 68 920 2,148
Price-to-Earnings (forward)(b) 11.6x 13.3x 12.9x
Price-to-Earnings (trailing)(b) 13.7x 14.7x 14.4x
Price-to-Book Value (trailing) 1.2x 1.6x 1.6x
Price-to-Sales (trailing)(c) 1.3x 1.1x 1.2x
Weighted Average Market Capitalization
$76B $59B $64B
Median Market Capitalization $34B $10B $7B
0%
5%
10%
15%
20%
25%
30%
Financials Health Care CommServices
InformationTechnology
Industrials Energy ConsumerDiscretionary
Materials Utilities ConsumerStaples
Real Estate Net Cash &Other (a)
International Stock Fund
MSCI EAFE
MSCI ACWI ex USA
DODGE & COX Investment Managers | San Francisco 27

UK Europe Japan Other Developed EM Asia EM EMEA EM Latin AmericaCommunication Services Liberty Global Altice Europe Television Broadcasts Baidu MTN Group America Movil7.2% Millicom Intl Cellular MultiChoice Group Grupo Televisa
Consumer Discretionary BMW Honda Booking Holdings Alibaba Naspers10.6% Yamaha Motor JD.com Naspers/Tencent Note
Consumer Staples Magnit0.7%Energy Equinor Schlumberger Petrobras8.2% Total Suncor Energy
Weatherford InternationalFinancials Aviva Aegon Mitsubishi UFJ Axis Bank Haci Omer Sabanci Itau Unibanco28.7% Barclays Banco Santander ICICI Bank
Lloyds Banking Group BNP Paribas KasikornbankStandard Chartered Credit Suisse Group
Societe GeneraleUBS GroupUnicredit
Health Care AstraZeneca Bayer16.2% GlaxoSmithKline Novartis
Roche HoldingSanofi
Industrials Smiths Group Schneider Electric Mitsubishi Electric Johnson Controls DP World8.5% NidecInformation Technology Micro Focus TE Connectivity Brother Industries Hewlett Packard Enterprise Samsung Electronics9.3% Fujitsu
KyoceraMurata
Materials Akzo Nobel Linde Cemex5.8% LafargeHolcim NutrienReal Estate Hang Lung Group0.7%Utilities Engie1.3%
Equity Sum = 97.2% 15.6% 37.8% 9.8% 11.5% 11.2% 5.4% 5.9%
Net Cash & Other(b) = 2.8%
Developed Markets(a) Emerging Markets
International Stock Fund Holdings March 31, 2019
(a) Companies in bold are International Stock Fund’s ten largest holdings. The Fund may classify a company in a different category than the Index. The Fund usually classifies a company based on its country of incorporation, but may designate a different country in certain circumstances. (b) Net Cash & Other includes short-term investments (e.g., money market funds and repurchase agreements) and other assets less liabilities (e.g., cash, receivables, payables, and unrealized appreciation/depreciation on certain derivatives).The above information is not a complete analysis of every material fact concerning any market, industry or investment. Data has been obtained from sources considered reliable, but Dodge & Cox makes no representations as to the completeness or accuracy of such information. Opinions expressed are subject to change without notice. The information provided is historical and does not predict future results or profitability. This is not a recommendation to buy, sell, or hold any security and is not indicative of Dodge & Cox’s current or future trading activity. The securities identified are subject to change without notice and may not represent an account’s entire holdings. Before investing in any Dodge & Cox Fund, you should carefully consider the Fund’s investment objectives, risks, and charges and expenses. To obtain a Fund’s prospectus and summary prospectus, which contain this and other important information, visit dodgeandcox.com or call 800-621-3979. Please read the prospectus and summary prospectus carefully before investing.
E-892-101018-110211 | DODGE & COX Investment Managers | San Francisco 28

E-10020-041818-031611 |
Dodge & CoxBalanced Fund Overview
DODGE & COX Investment Managers | San Francisco 29

Dodge & Cox Balanced Fund
Fund Overview
Key Characteristics Shared by Dodge & Cox Funds
Low expenses Stable and experienced investment team Consistent investment approach Team decision-making process Low turnover resulting from long-term view
March 31, 2019
(a) Excludes negative earners. (b)Excludes Financials and Utilities. (c) Net Cash & Other includes cash, short-term investments, receivables, and payables. The Fund’s holds a 0.6% position in put options on the S&P 500 index to hedge against a general downturn in the equity markets. Source: Bloomberg LP. Before investing in any Dodge & Cox Fund, you should carefully consider the Fund’s investment objectives, risks, and charges and expenses. To obtain a Fund’s prospectus and summary prospectus, which contain this and other important information, visit dodgeandcox.com or call 800-621-3979. Please read the prospectus and summary prospectus carefully before investing.
E-836-041319-111518 |
Equity Securities60.4%
Debt Securities29.9%
Preferred Stocks4.8%
Net Cash & Other(c)
4.9%
Dodge & Cox Balanced Fund (Established June 26, 1931)
Objective: regular income, conservation of principal, and an opportunity for long-term growth of principal and income
Total net assets: $15.2 billion Net asset value per share: $97.64 Expense ratio: 0.53%
Equity Portfolio Characteristics
Diversified portfolio of 74 equity securities (69 Common Stocks, 5 Preferred Stocks)
Long-term investment horizon Well-established companies: Generally with market capitalizations greater than $3 billion Weighted average market capitalization of $146 billion
Below-average valuations Price-to-earnings ratio (forward) of 13.0x (a)
Price-to-sales ratio of 1.5x (b)
Gradual portfolio changes
Fixed Income Portfolio Characteristics
Diversified portfolio Long-term investment horizon Moderate relative interest rate exposure Effective duration of 4.3 years
Seek above-average yield to maturity Gradual portfolio changes
DODGE & COX Investment Managers | San Francisco 30

Performance Attribution Quarter Ended March 31, 2019
(a) All returns are holding period returns. The Combined Index reflects an unmanaged portfolio (rebalanced monthly) of 60% of the S&P 500 Index, which is market capitalization-weighted index of 500 large-capitalization stocks commonly used to represent the U.S. equity market, and 40% of the Bloomberg Barclays U.S. Aggregate Bond Index, which is a widely recognized, unmanaged index of U.S. dollar-denominated, investment-grade, taxable fixed income securities. (b)Bloomberg Barclays U.S. Aggregate Bond Index (BBG Barclays U.S. Agg). Source: FactSet. The above information is not a complete analysis of every material fact concerning any market, industry or investment. Data has been obtained from sources considered reliable, but Dodge & Cox makes no representations as to the completeness or accuracy of such information. Opinions expressed are subject to change without notice. The information provided is historical and does not predict future results or profitability. This is not a recommendation to buy, sell, or hold any security and is not indicative of Dodge & Cox’s current or future trading activity. The securities identified are subject to change without notice and may not represent an account’s entire holdings. Returns represent past performance and do not guarantee future results. Investment return and share price will fluctuate with market conditions, and investors may have a gain or loss when shares are sold. Fund performance changes over time and currently may be significantly lower than stated above. Performance is updated and published monthly. Before investing in any Dodge & Cox Fund, you should carefully consider the Fund’s investment objectives, risks, and charges and expenses. To obtain a Fund’s prospectus and summary prospectus, which contain this and other important information, or for current month-end performance figures, visit dodgeandcox.com or call 800-621-3979. Please read the prospectus and summary prospectus carefully before investing.
Dodge & Cox Balanced Fund vs. Combined Index(a) (Three-Month Total Return)
Balanced Fund SEC Standardized Average Annual Total Returns as of March 31, 2019: 1 Year +4.40%; 5 Years +6.85%; 10 Years +13.10%
Asset Allocation The positive relative impact of the Fund’s lower allocation to fixed income and strong security selection within the fixed income portfolio was offset by the
equity portfolio’s underperformance.
E-13704-041119-120315 |
7.80%9.31%
0.0%
4.0%
8.0%
12.0%
◼ Balanced Fund ◼ Combined Index
Fixed Income Portion Outperformed BBG Barclays U.S. AggKey Contributors to Relative Results Security selection within credit was positive as several issuers
performed well, including Cemex, Citigroup capital securities, Enel, Pemex, and Royal Bank of Scotland.
The portfolio’s overweight to corporate bonds and underweight to U.S. Treasuries added to relative returns given the significant outperformance of credit.
Key Detractors from Relative Results The portfolio’s shorter relative duration (72% of the Bloomberg
Barclays U.S. Agg’s duration) hampered relative returns.
Equity Portion Underperformed S&P 500 Key Detractors from Relative Results In the Health Care sector, the portfolio’s overweight position (averaging
22% versus 15%) and weaker returns from holdings (up 4% compared to up 7% for the S&P 500 sector) detracted. CVS Health (down 17%), Cigna (down 15%), and Bristol-Myers Squibb (down 7%) performed poorly.
Strong performance from certain large technology and internet-related stocks not held by the portfolio (e.g., Amazon, Apple) hurt relative results.
The Financials sector detracted during the period (up 8% for the portfolio’s holdings and up 9% for S&P 500 sector) as the portfolio’s large overweight position (averaging 26% versus 13%) negatively impacted relative results.
Key Contributors to Relative Results Several individual holdings contributed, including Micro Focus
International (up 53%), Apache (up 33%), Baker Hughes, a GE company (up 30%), Johnson Controls International (up 25%), and Charter Communications (up 22%).
DODGE & COX Investment Managers | San Francisco 31

Performance Attribution One Year Ended March 31, 2019
(a) All returns are holding period returns. The Combined Index reflects an unmanaged portfolio (rebalanced monthly) of 60% of the S&P 500 Index, which is a market capitalization-weighted index of 500 large-capitalization stocks commonly used to represent the U.S. equity market,and 40% of the Bloomberg Barclays U.S. Aggregate Bond Index, which is a widely recognized, unmanaged index of U.S. dollar-denominated investment-grade fixed income securities. (b) Bloomberg Barclays U.S. Aggregate Bond Index (BBG Barclays U.S. Agg).Source: FactSet. The above information is not a complete analysis of every material fact concerning any market, industry or investment. Data has been obtained from sources considered reliable, but Dodge & Cox makes no representations as to the completeness or accuracy ofsuch information. Opinions expressed are subject to change without notice. The information provided is historical and does not predict future results or profitability. This is not a recommendation to buy, sell, or hold any security and is not indicative of Dodge & Cox’s current or futuretrading activity. The securities identified are subject to change without notice and may not represent an account’s entire holdings. Returns represent past performance and do not guarantee future results. Investment return and share price will fluctuate with market conditions, andinvestors may have a gain or loss when shares are sold. Fund performance changes over time and currently may be significantly lower than stated above. Performance is updated and published monthly. Before investing in any Dodge & Cox Fund, you should carefully consider theFund’s investment objectives, risks, and charges and expenses. To obtain a Fund’s prospectus and summary prospectus, which contain this and other important information, or for current month-end performance figures, visit dodgeandcox.com or call 800-621-3979. Please readthe prospectus and summary prospectus carefully before investing.
Dodge & Cox Balanced Fund vs. Combined Index(a) (Twelve-Month Total Return)
Balanced Fund SEC Standardized Average Annual Total Returns as of March 31, 2019: 1 Year +4.40%; 5 Years +6.85%; 10 Years +13.10%
Asset AllocationAsset allocation did not meaningfully impact relative results, which were driven mainly by weaker performance from the Fund’s equity holdings.
E-13703-041119-120315 |
4.40%
7.78%
0.0%
3.0%
6.0%
9.0%
◼ Balanced Fund ◼ Combined Index
Equity Portion Underperformed S&P 500 Key Detractors from Relative Results The Financials sector (down 5% for the S&P 500) was the weakest
segment of the Index; the Fund’s large overweight position (averaging 27% versus 14%) and returns from holdings in the sector (down 8%) hindered performance. Goldman Sachs (down 23%), Charles Schwab (down 17%), and Capital One Financial (down 13%) lagged.
Returns from holdings in the Energy sector (down 15% compared to up 2% for the S&P 500 sector), combined with a higher average weighting (9% versus 6%), had a negative impact. Schlumberger (down 30%) and Anadarko Petroleum (down 23%) were key detractors.
The Fund’s Consumer Discretionary holdings (down 12%) significantly trailed the S&P 500 sector (up 14%), especially Qurate Retail (down 37%) and Booking Holdings (down 16%). Not owning Amazon (up 23%) was also a negative factor.
Key Contributors to Relative Results The account's average overweight position (23% versus 15%) and holdings
in the Health Care sector (up 17% compared to up 15% for the S&P 500 sector) benefited results. Eli Lilly (up 72%), Express Scripts (up 34% to date of acquisition), and Novartis (up 21%) were particularly strong.
Fixed Income Portion Underperformed BBG Barclays U.S. AggKey Detractors From Relative Results The portfolio’s shorter relative duration detracted from relative returns. The portfolio’s Agency MBS holdings underperformed the MBS in the
Bloomberg Barclays U.S. Agg after adjusting for duration differences. Certain credit issuers underperformed, including Pemex, Telecom Italia,
and TransCanada.
Key Contributors to Relative Results Security selection within credit was positive as several issuers
outperformed, including Bank of America capital securities, Citigroup capital securities, Rio Oil Finance Trust, and Verizon.
The portfolio’s overweight to corporate bonds and underweight to U.S. Treasuries added to relative returns.
The portfolio’s nominal yield advantage added to relative returns.
DODGE & COX Investment Managers | San Francisco 32

12/87: 54.1%
12/10: 75.0%
50%
55%
60%
65%
70%
75%
1974 1979 1984 1989 1994 1999 2004 2009 2014 2019
Common Equity Allocation Preferred Equity Allocation
Asset AllocationDodge & Cox Balanced Fund
March 31, 2019
(a)Net Cash & Other includes short-term investments (e.g., money market funds and repurchase agreements) and other assets less liabilities (e.g., cash, receivables, payables, and unrealized appreciation/depreciation on certain derivatives).The above information is not a complete analysis of every material fact concerning any market, industry, or investment. Data has been obtained from sources considered reliable, but Dodge & Cox makes no representations as to the completeness or accuracy of such information. Opinions expressed are subject to change without notice. Before investing in any Dodge & Cox Fund, you should carefully consider the Fund’s investment objectives, risks, and charges and expenses. To obtain a Fund’s prospectus and summary prospectus, which contain this and other important information, visit dodgeandcox.com or call 800-621-3979. Please read the prospectus and summary prospectus carefully before investing.
Current Asset Allocation
Equities vs. Bloomberg Barclays U.S. Aggregate Bond Index Yield Observations
Quarterly Allocation to Equities
Changes in the equity allocation are made based on our three- to five-year relative outlook for the Fund's equity and fixed income holdings.
The Fund’s common equity weighting has remained in the 60%-70% range over the last few years.
The Fund’s Prospectus allows the equity allocation to vary from a minimum 25% to a maximum 75% of its total assets at time of purchase.
The Fund has an allocation to preferred equities (4.4% as of March 31, 2019). The asset class is attractive on a risk-adjusted basis relative to common equities and fixed income.
Common Equity61.0%
Fixed Income30.9%
Preferred Equity 4.4%
Net Cash & Other3.7%
Combined Average64.7%
(a)
E-1174-041219-101518 |
1%
2%
3%
4%
5%
6%
7%
50%
55%
60%
65%
70%
75%
'00 '01 '02 '03 '04 '05 '06 '07 '08 '09 '10 '11 '12 '13 '14 '15 '16 '17 '18 '19
Preferred Equity Allocation (LHS)Common Equity Allocation (LHS)Bloomberg Barclays U.S. Agg Yield to Worst (RHS)
DODGE & COX Investment Managers | San Francisco 33

Portfolio Structure March 31, 2019
(a)Portfolio estimate excludes negative earners. S&P 500 estimate is bottom-up. (b) Portfolio calculation excludes Financials and Utilities. (c) Excludes preferred equity allocation (4.4% of the Fund).Source: Bloomberg LP, Bank of New York Mellon. The above information is not a complete analysis of every material fact concerning any market, industry or investment. Data has been obtained from sources considered reliable, but Dodge & Cox makes no representations as to the completeness or accuracy of such information. Opinions expressed are subject to change without notice. The information provided is historical and does not predict future results or profitability. This is not a recommendation to buy, sell, or hold any security and is not indicative of Dodge & Cox’s current or future trading activity. The securities identified are subject to change without notice and may not represent an account’s entire holdings. Before investing in any Dodge & Cox Fund, you should carefully consider the Fund’s investment objectives, risks, and charges and expenses. To obtain a Fund’s prospectus and summary prospectus, which contain this and other important information, visit dodgeandcox.com or call 800-621-3979. Please read the prospectus and summary prospectus carefully before investing.
Dodge & Cox Balanced Fund – Common Equity Portion(c)
Portfolio Characteristics Ten Largest Equity Holdings
Portfolio Composition by Sector
E-853-041219-110211 |
0%
5%
10%
15%
20%
25%
30%
Financials Health Care InformationTechnology
CommunicationServices
Energy Industrials ConsumerDiscretionary
Materials ConsumerStaples
Utilities Real Estate
Balanced Fund
S&P 500
Russell Value
Balanced Fund(c) S&P 500 Russell ValueNumber of holdings 69 505 722Price-to-earnings (forward) (a) 13.0x 17.0x 14.5xPrice-to-cash flow (b) 9.1x 13.7x 11.2xPrice-to-sales (b) 1.5x 2.2x 1.7xPrice-to-book value 1.9x 3.4x 2.1xWeighted average market cap. $146B $232B $127BMedian market cap. $41B $22B $9B
Comcast 4.4%Wells Fargo 3.8%Charter Communications 3.7%Microsoft 3.3%Alphabet 3.2%FedEx 3.2%Charles Schwab 3.1%Capital One Financial 3.1%Bank of America 2.9%Novartis 2.8%Total Weight 33.3%
DODGE & COX Investment Managers | San Francisco 34
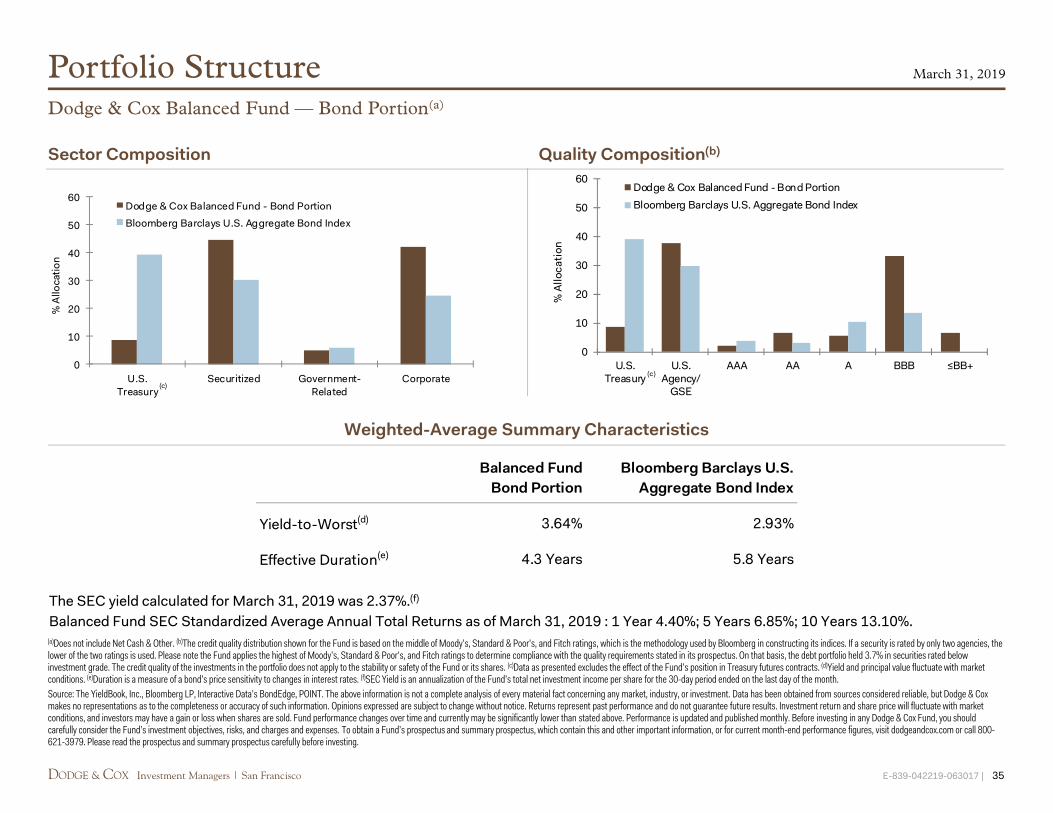
Portfolio Structure
Sector Composition Quality Composition(b)
Weighted-Average Summary Characteristics
March 31, 2019
The SEC yield calculated for March 31, 2019 was 2.37%.(f)
Balanced Fund SEC Standardized Average Annual Total Returns as of March 31, 2019 : 1 Year 4.40%; 5 Years 6.85%; 10 Years 13.10%.(a)Does not include Net Cash & Other. (b)The credit quality distribution shown for the Fund is based on the middle of Moody’s, Standard & Poor’s, and Fitch ratings, which is the methodology used by Bloomberg in constructing its indices. If a security is rated by only two agencies, the lower of the two ratings is used. Please note the Fund applies the highest of Moody’s, Standard & Poor’s, and Fitch ratings to determine compliance with the quality requirements stated in its prospectus. On that basis, the debt portfolio held 3.7% in securities rated below investment grade. The credit quality of the investments in the portfolio does not apply to the stability or safety of the Fund or its shares. (c)Data as presented excludes the effect of the Fund’s position in Treasury futures contracts. (d)Yield and principal value fluctuate with market conditions. (e)Duration is a measure of a bond’s price sensitivity to changes in interest rates. (f)SEC Yield is an annualization of the Fund’s total net investment income per share for the 30-day period ended on the last day of the month.Source: The YieldBook, Inc., Bloomberg LP, Interactive Data’s BondEdge, POINT. The above information is not a complete analysis of every material fact concerning any market, industry, or investment. Data has been obtained from sources considered reliable, but Dodge & Cox makes no representations as to the completeness or accuracy of such information. Opinions expressed are subject to change without notice. Returns represent past performance and do not guarantee future results. Investment return and share price will fluctuate with market conditions, and investors may have a gain or loss when shares are sold. Fund performance changes over time and currently may be significantly lower than stated above. Performance is updated and published monthly. Before investing in any Dodge & Cox Fund, you should carefully consider the Fund’s investment objectives, risks, and charges and expenses. To obtain a Fund’s prospectus and summary prospectus, which contain this and other important information, or for current month-end performance figures, visit dodgeandcox.com or call 800-621-3979. Please read the prospectus and summary prospectus carefully before investing.
Dodge & Cox Balanced Fund — Bond Portion(a)
E-839-042219-063017 |
0
10
20
30
40
50
60
U.S.Treasury
Securitized Government-Related
Corporate
% A
lloca
tion
Dodge & Cox Balanced Fund - Bond PortionBloomberg Barclays U.S. Aggregate Bond Index
(c)
Balanced Fund Bloomberg Barclays U.S.Bond Portion Aggregate Bond Index
Yield-to-Worst(d) 3.64% 2.93%
Effective Duration(e) 4.3 Years 5.8 Years
0
10
20
30
40
50
60
U.S.Treasury
U.S.Agency/
GSE
AAA AA A BBB ≤BB+
% A
lloca
tion
Dodge & Cox Balanced Fund - Bond PortionBloomberg Barclays U.S. Aggregate Bond Index
(c)
DODGE & COX Investment Managers | San Francisco 35

E-10020-041818-031611 |
Dodge & CoxIncome Fund Overview
DODGE & COX Investment Managers | San Francisco 36

Dodge & Cox Income Fund
Fund Overview
Key Characteristics Shared by Dodge & Cox Funds
Low expenses Stable and experienced investment team Consistent investment approach Team decision-making process Low turnover resulting from long-term view
Income Fund Characteristics
Diversified portfolio Long-term investment horizon Moderate relative interest rate exposure Effective duration of 4.4 years
Seek above-average yield to maturity Gradual portfolio shifts
March 31, 2019
Dodge & Cox Income Fund (Established January 3, 1989)
Debt Securities98.9%
Net Cash & Other(b)
1.1%
E-805-011519-041510 |
Total net assets: $56.6 Billion Net asset value per share: $13.64 Expense ratio: 0.42%(a)
(a) 43% 2017 expense ratio as per Fund Prospectus dated May 1, 2018. (b) Net Cash & Other includes cash, short-term investments, receivables, and payables. Before investing in any Dodge & Cox Fund, you should carefully consider the Fund’s investment objectives, risks, and charges and expenses. To obtain a Fund’s prospectus and summary prospectus, which contain this and other important information, visit dodgeandcox.com or call 800-621-3979. Please read the prospectus and summary prospectus carefully before investing.
DODGE & COX Investment Managers | San Francisco 37

3.70%2.94%
0%
1%
2%
3%
4%
Income Fund Bloomberg Barclays U.S. Agg
Performance Attribution Quarter Ended March 31, 2019
The above information is not a complete analysis of every material fact concerning any market, industry or investment. Data has been obtained from sources considered reliable, but Dodge & Cox makes no representations as to the completeness or accuracy of such information. Opinions expressed are subject to change without notice. The information provided is historical and does not predict future results or profitability. This is not a recommendation to buy, sell, or hold any security and is not indicative of Dodge & Cox’s current or future trading activity. The securities identified are subject to change without notice and may not represent an account’s entire holdings. Returns represent past performance and do not guarantee future results. Investment return and share price will fluctuate with market conditions, and investors may have a gain or loss when shares are sold. Fund performance changes over time and currently may be significantly lower than stated above. Performance is updated and published monthly. Before investing in any Dodge & Cox Fund, you should carefully consider the Fund’s investment objectives, risks, and charges and expenses. To obtain a Fund’s prospectus and summary prospectus, which contain this and other important information, or for current month-end performance figures, visit dodgeandcox.com or call 800-621-3979. Please read the prospectus and summary prospectus carefully before investing.
Dodge & Cox Income Fund vs. Bloomberg Barclays U.S. Aggregate Index (Three-Month Total Return)
Relative Contributors Security selection within credit was positive as several issuers
performed well, including Cemex, Citigroup capital securities, Enel, Pemex, and Royal Bank of Scotland.
The Fund’s overweight to corporate bonds and underweight to U.S. Treasuries added to relative returns given the significant outperformance of credit.
Income Fund SEC Standardized Average Annual Total Returns as of March 31, 2019: 1 Year 4.32%; 5 Years 3.15%; 10 Years 5.37%.
Relative Detractors The Fund’s shorter relative duration hampered relative returns.
E-809-041119-041514 | DODGE & COX Investment Managers | San Francisco 38

4.32% 4.48%
0%
1%
2%
3%
4%
5%
Income Fund Bloomberg Barclays U.S. Agg
Performance Attribution One Year Ended March 31, 2019
The above information is not a complete analysis of every material fact concerning any market, industry or investment. Data has been obtained from sources considered reliable, but Dodge & Cox makes no representations as to the completeness or accuracy of such information. Opinions expressed are subject to change without notice. The information provided is historical and does not predict future results or profitability. This is not a recommendation to buy, sell, or hold any security and is not indicative of Dodge & Cox’s current or future trading activity. The securities identified are subject to change without notice and may not represent an account’s entire holdings. Returns represent past performance and do not guarantee future results. Investment return and share price will fluctuate with market conditions, and investors may have a gain or loss when shares are sold. Fund performance changes over time and currently may be significantly lower than stated above. Performance is updated and published monthly. Before investing in any Dodge & Cox Fund, you should carefully consider the Fund’s investment objectives, risks, and charges and expenses. To obtain a Fund’s prospectus and summary prospectus, which contain this and other important information, or for current month-end performance figures, visit dodgeandcox.com or call 800-621-3979. Please read the prospectus and summary prospectus carefully before investing.
Dodge & Cox Income Fund vs. Bloomberg Barclays U.S. Aggregate Index (Twelve-Month Total Return)
Relative Contributors Security selection within credit was positive as several issuers
outperformed, including Bank of America capital securities, Citigroup capital securities, Rio Oil Finance Trust, and Verizon.
The Fund’s overweight to corporate bonds and underweight to U.S. Treasuries added to relative returns.
The Fund’s nominal yield advantage added to relative returns.
Income Fund SEC Standardized Average Annual Total Returns as of March 31, 2019: 1 Year 4.32%; 5 Years 3.15%; 10 Years 5.37%.
Relative Detractors The Fund’s shorter relative duration detracted from relative
returns.
The Fund’s Agency MBS holdings underperformed the MBS in the Bloomberg Barclays U.S. Agg after adjusting for duration differences.
Certain credit issuers underperformed, including Pemex, Telecom Italia, and TransCanada.
E-810-041119-041514 | DODGE & COX Investment Managers | San Francisco 39

Dodge & Cox Income Fund
Bloomberg Barclays U.S. Aggregate Bond Index
Yield-to-Worst(d) 3.65% 2.93%
Effective Duration(e) 4.4 Years 5.8 Years
0
10
20
30
40
50
60
U.S.Treasury
Securitized Government-Related
Corporate Net Cash &Other
% A
lloca
tion
Dodge & Cox Income Fund
Bloomberg Barclays U.S. Aggregate Bond Index
(b)(c)
Portfolio Structure
Sector Composition Quality Composition(a)
Weighted-Average Summary Characteristics
Dodge & Cox Income Fund
March 31, 2019
The SEC yield calculated for March 31, 2019 was 3.45%(f)
Income Fund SEC Standardized Average Annual Total Returns as of March 31, 2019: 1 Year 4.32%; 5 Years 3.15%; 10 Years 5.37%.(a)The credit quality distributions shown for the Fund is based on the middle of Moody's, Standard & Poor’s, and Fitch ratings, which is the methodology used by Bloomberg in constructing its indices. If a security is rated by only two agencies, the lower of the two ratings is used. Please note the Fund applies the highest of Moody's, Standard & Poor's, and Fitch ratings to determine compliance with the quality requirements stated in its prospectus. On that basis, the Fund held 3.7% of securities rated below investment grade. The credit quality of the investments in the portfolio does not apply to the stability or safety of the Fund or its shares. (b)Data as presented excludes the effect of the Fund’s position in Treasury futures contracts. (c)Net Cash & Other includes short-term investments (e.g., money market funds and repurchase agreements) and other assets less liabilities (e.g., cash, receivables, payables, and unrealized appreciation/depreciation on certain derivatives). (d)Yield and principal value fluctuate with market conditions. (e)Duration is a measure of a bond’s price sensitivity to changes in interest rates. (f)SEC Yield is an annualization of the Fund’s total net investment income per share for the 30-day period ended on the last day of the month.Source: The YieldBook, Inc., Bloomberg LP, Interactive Data’s BondEdge, POINT. The above information is not a complete analysis of every material fact concerning any market, industry, or investment. Data has been obtained from sources considered reliable, but Dodge & Cox makes no representations as to the completeness or accuracy of such information. Opinions expressed are subject to change without notice. Returns represent past performance and do not guarantee future results. Investment return and share price will fluctuate with market conditions, and investors may have a gain or loss when shares are sold. Fund performance changes over time and currently may be significantly lower than stated above. Performance is updated and published monthly. Before investing in any Dodge & Cox Fund, you should carefully consider the Fund’s investment objectives, risks, and charges and expenses. To obtain a Fund’s prospectus and summary prospectus, which contain this and other important information, or for current month-end performance figures, visit dodgeandcox.com or call 800-621-3979. Please read the prospectus and summary prospectus carefully before investing.
E-811-042219-123112 |
0
10
20
30
40
50
60
U.S.Treasury
U.S. Agency/GSE
AAA AA A BBB ≤BB+ Net Cash &Other
% A
lloca
tion
Dodge & Cox Income Fund
Bloomberg Barclays U.S. Aggregate Bond Index
(c)(b)
DODGE & COX Investment Managers | San Francisco 40

Anheuser-Busch InBev SA/NV CSX Corp. Nordstrom, Inc. Seasoned Pass-Throughs 26.9% AT&T, Inc. CVS Health Corp. RELX PLC Collateralized Mortgage Obligations 5.6% Bank of America Corp. Dell Technologies, Inc. Royal Bank of Scotland Group PLC "Hybrid" ARMs 4.4% Barclays PLC Dillard's, Inc. Telecom Italia SPA Bayer AG Dominion Energy, Inc. The Walt Disney Co. Bayerische Motoren Werke AG DowDuPont, Inc. TransCanada Corp. BHP Billiton, Ltd. Elanco Animal Health, Inc. Ultrapar Participacoes SA Agency Multifamily 0.3% BNP Paribas SA Enel SPA UniCredit SPA Boston Properties, Inc. Equity Residential Union Pacific Corp. Burlington Northern Santa Fe LLC(b) Ford Motor Credit Co. LLC(b) United Technologies Corp. Capital One Financial Corp. Fox Corp. Unum Group Student Loans 5.4% Cemex SAB de CV HSBC Holdings PLC Verizon Communications, Inc. Charter Communications, Inc. Imperial Brands PLC Vodafone Group PLC Rio Oil Finance Trust 1.4% Cigna Corp. JPMorgan Chase & Co. Wells Fargo & Co. Citigroup, Inc. Kinder Morgan, Inc. Xerox Corp. Comcast Corp. Lloyds Banking Group PLC Zoetis, Inc. Cox Enterprises, Inc. Macy's, Inc. CRH PLC Naspers, Ltd.
L.A. Unified School District GO 3.2% Various U.S. Treasury Notes(c) 6.2% New Jersey Turnpike Authority RB State of California GO Small Business Admin. - 504 Program 0.1% State of Illinois GO New Valley Generation Petroleo Brasileiro SA 2.5% Petroleos Mexicanos
Long-Term U.S. Treasury Bond Futures (Short) 0.9% Contribution to Duration(e) -0.16 years
Provide attractive risk/reward and diversification versus corporates U.S. Treasury and Agency 6.3%
Net Cash & Other 1.1%(d)
Derivatives 0.9% (Notional Value)Manage portfolio duration and yield curve exposure
Commercial Mortgage-Backed Securities 0.3%
Asset-Backed Securities 6.8%
U.S. Government and Cash 7.4%Balance yield curve exposure, provide liquidity
Non-Corporate Credit 5.7%
Credit 48.7% Securitized 43.9%Build portfolio yield and enhance relative total return potential Seek attractive total return in the intermediate part of the curve
Corporate Credit(a) 43.0% Mortgage-Backed Securities 36.8%
Portfolio Composition by Theme March 31, 2019
Dodge & Cox Income Fund
(a)Except as noted, investments grouped by parent company. Actual securities may be issued by the listed parent company or one of its subsidiaries. (b)Subsidiary. (c)Data as presented excludes the Fund’s position in Treasury futures contracts. (d)Net Cash & Other includes short-term investments (e.g., money market funds and repurchase agreements) and other assets less liabilities (e.g., cash, receivables, payables, and unrealized appreciation/depreciation on certain derivatives). (e)Contribution to Duration = Portfolio weightings (%) x Duration (Years). The above information is not a complete analysis of every material fact concerning any market, industry or investment. Data has been obtained from sources considered reliable, but Dodge & Cox makes no representations as to the completeness or accuracy of such information. Opinions expressed are subject to change without notice. The information provided is historical and does not predict future results or profitability. This is not a recommendation to buy, sell, or hold any security and is not indicative of Dodge & Cox’s current or future trading activity. The securities identified are subject to change without notice and may not represent an account’s entire holdings. Before investing in any Dodge & Cox Fund, you should carefully consider the Fund’s investment objectives, risks, and charges and expenses. To obtain a Fund’s prospectus and summary prospectus, which contain this and other important information, visit dodgeandcox.com or call 800-621-3979. Please read the prospectus and summary prospectus carefully before investing.
E-815-041119-120811 | DODGE & COX Investment Managers | San Francisco 41

Dodge & CoxGlobal Bond Fund Overview
E-354-022218-011509 | DODGE & COX Investment Managers | San Francisco 42

Dodge & Cox Global Bond Fund
Fund Overview
Key Characteristics Shared by Dodge & Cox Funds
Low expenses Stable and experienced investment team Consistent investment approach Team decision-making process Historically low turnover resulting from long-term view
Fund Characteristics
Objective: High rate of total return, consistent with long-term preservation of capital
Portfolio diversified by sectors, countries, and currencies Long-term investment horizon
Seek above-average yield to maturity Gradual portfolio shifts
March 31, 2019
(a) Dodge & Cox has contractually agreed to reimburse the Fund for all ordinary expenses to the extent necessary to maintain Total Annual Fund Operating Expenses at 0.45% through April 30, 2019. The term of the agreement renews annually thereafter unless terminated with 30 days’ written notice by either party prior to the end of the term. (b) Net Cash & Other includes cash, short-term investments, derivatives, receivables, and payables. The above information is not a complete analysis of every material fact concerning any market, industry, or investment. Data has been obtained from sources considered reliable, but Dodge & Cox makes no representations as to the completeness or accuracy of such information. Opinions expressed are subject to change without notice. Before investing in any Dodge & Cox Fund, you should carefully consider the Fund’s investment objectives, risks, and charges and expenses. To obtain a Fund’s prospectus and summary prospectus, which contain this and other important information, visit dodgeandcox.com or call 800-621-3979. Please read the prospectus and summary prospectus carefully before investing.
Dodge & Cox Global Bond Fund (Established May 1, 2014)
Debt Securities97.1%
Net Cash & Other(b)
2.9%
Total Net Assets: $249.5 Million Gross Expense Ratio : 0.92% Net Expense Ratio: 0.45% (a)
E-13816-021219-041318 | DODGE & COX Investment Managers | San Francisco 43

Performance AttributionDodge & Cox Global Bond Fund vs. Bloomberg Barclays Global Aggregate Bond Index (Three-Month Total Return)
E-13813-041019-042814 |
(a)Asset Allocation includes market and sector allocation. (b)Other represents the residual return not explained by market factors in the attribution model (primarily intra-day price movements and transaction costs). (c)Effective May 1, 2017, Dodge & Cox . Dodge & Cox has contractually agreed to reimburse the Fund for all ordinary expenses to the extent necessary to maintain Total Annual Fund Operating Expenses at 0.45% through April 30, 2018. The term of the agreement renews annually thereafter unless terminated with 30 days’ written notice by either party prior to the end of the term. For periods prior to May 1, 2017, the Fund’s Net Expense Ratio was 0.60%. The Fund’s gross expense ratio (1/1/17 to 12/31/2018) was 0.92%. (d)Expense reimbursements have been in effect since the Fund’s inception. Without the expense reimbursements, returns for the Fund would have been lower. Source: POINT. A private fund managed by Dodge & Cox with proprietary assets was reorganized into the Dodge & Cox Global Bond Fund, which commenced operations on May 1, 2014. Any Fund portfolio characteristics, performance, or attribution information for periods prior to May 1, 2014, are those of the private fund. The above information is not a complete analysis of every material fact concerning any market, industry or investment. Data has been obtained from sources considered reliable, but Dodge & Cox makes no representations as to the completeness or accuracy of such information. Opinions expressed are subject to change without notice. The information provided is historical and does not predict future results or profitability. This is not a recommendation to buy, sell, or hold any security and is not indicative of Dodge & Cox’s current or future trading activity. The securities identified are subject to change without notice and may not represent an account’s entire holdings. Returns represent past performance and do not guarantee future results. Investment return and share price will fluctuate with market conditions, and investors may have a gain or loss when shares are sold. Fund performance changes over time and currently may be significantly lower than stated above. Performance is updated and published monthly. Before investing in any Dodge & Cox Fund, you should carefully consider the Fund’s investment objectives, risks, and charges and expenses. To obtain a Fund’s prospectus and summary prospectus, which contain this and other important information, or for current month-end performance figures, visit dodgeandcox.com or call 800-621-3979. Please read the prospectus and summary prospectus carefully before investing.
Quarter Ending March 31, 2019
Global Bond Fund SEC Standardized Average Annual Total Returns as of March 31, 2019: 1 Year 2.72%; 3 Years 5.49%; 5 Years 2.38%; Since Inception (December 5, 2012) 2.79%.
4.69%
2.20%
0.0%
2.0%
4.0%
6.0%
Global Bond Fund Bloomberg Barclays Global Agg
SourceRelativeContribution (pp) Notable Contributors and Detractors
Currency +1.11+ No exposure to the euro and yen
+ Overweight exposure to the Mexican peso, Indonesian rupiah and Indian rupee
Duration/-0.55
- Underweight exposure to rates in the Eurozone, U.K. and Japan
Yield Curve + Exposure to rates in the U.S. and select EMs (Mexico and Indonesia)
Asset Allocation(a) and+2.08
+ Overweight allocation to corporate bonds
Security Selection + Security selection (AT&T, Southern Company, Kinder Morgan and Enel)
Expenses and Other(b) -0.15 - Net fund operating expenses (0.45% annual expense ratio(c))
Total Relative Return(d) +2.49
DODGE & COX Investment Managers | San Francisco 44

Performance AttributionDodge & Cox Global Bond Fund vs. Bloomberg Barclays Global Aggregate Bond Index (Twelve-Month Total Return)
E-13812-041019-042814 |
One Year Ending March 31, 2019
(a)Asset Allocation includes market and sector allocation. (b)Other represents the residual return not explained by market factors in the attribution model (primarily intra-day price movements and transaction costs). (c)Effective May 1, 2017, Dodge & Cox . Dodge & Cox has contractually agreed to reimburse the Fund for all ordinary expenses to the extent necessary to maintain Total Annual Fund Operating Expenses at 0.45% through April 30, 2019. The term of the agreement renews annually thereafter unless terminated with 30 days’ written notice by either party prior to the end of the term. For periods prior to May 1, 2017, the Fund’s Net Expense Ratio was 0.60%. The Fund’s gross expense ratio (1/1/18 to 12/31/2018) was 0.92%. (d)Expense reimbursements have been in effect since the Fund’s inception. Without the expense reimbursements, returns for the Fund would have been lower. Source: POINT. A private fund managed by Dodge & Cox with proprietary assets was reorganized into the Dodge & Cox Global Bond Fund, which commenced operations on May 1, 2014. Any Fund portfolio characteristics, performance, or attribution information for periods prior to May 1, 2014, are those of the private fund. The above information is not a complete analysis of every material fact concerning any market, industry or investment. Data has been obtained from sources considered reliable, but Dodge & Cox makes no representations as to the completeness or accuracy of such information. Opinions expressed are subject to change without notice. The information provided is historical and does not predict future results or profitability. This is not a recommendation to buy, sell, or hold any security and is not indicative of Dodge & Cox’s current or future trading activity. The securities identified are subject to change without notice and may not represent an account’s entire holdings. Returns represent past performance and do not guarantee future results. Investment return and share price will fluctuate with market conditions, and investors may have a gain or loss when shares are sold. Fund performance changes over time and currently may be significantly lower than stated above. Performance is updated and published monthly. Before investing in any Dodge & Cox Fund, you should carefully consider the Fund’s investment objectives, risks, and charges and expenses. To obtain a Fund’s prospectus and summary prospectus, which contain this and other important information, or for current month-end performance figures, visit dodgeandcox.com or call 800-621-3979. Please read the prospectus and summary prospectus carefully before investing.
SourceRelativeContribution (pp) Notable Contributors and Detractors
Currency +4.55+ No exposure to the euro, yen and pound
+ Overweight exposure to the Mexican peso and Indonesian rupiah
Duration/-1.58
- Underweight exposure to rates in the Eurozone, U.K. and Japan
Yield Curve + Exposure to rates in the U.S. and select EMs (India and Colombia)
Asset Allocation(a)
+0.96+ Security selection (Citigroup capital securities, AT&T, HCA and Naspers)
Security Selection - Certain credits underperformed (Province of Buenos Aires and Telecom Italia)
Expenses and Other(b) -0.82 - Net fund operating expenses (0.45% annual expense ratio(c))
Total Relative Return(d) +3.10
2.72%
-0.38%-1.0%
0.0%
1.0%
2.0%
3.0%
Global Bond Fund Bloomberg Barclays Global Agg
Global Bond Fund SEC Standardized Average Annual Total Returns as of March 31, 2019: 1 Year 2.72%; 3 Years 5.49%; 5 Years 2.38%; Since Inception (December 5, 2012) 2.79%.
DODGE & COX Investment Managers | San Francisco 45

Portfolio Structure
Sector Composition(a) Quality Composition(a)(b)
(a)Region, sector, and quality weights exclude the effect of the Fund’s derivative contracts. (b)The credit quality distributions shown for the Fund and the Index are based on the middle of Moody's, Standard & Poor’s, and Fitch ratings, which is the methodology used by Bloomberg in constructing its indices. If a security is rated by only two agencies, the lower of the two ratings is used. Please note the Fund applies the highest of Moody's, Standard & Poor's, and Fitch ratings to comply with the quality requirements stated in its prospectus. The credit quality of the investments in the portfolio does not apply to the stability or safety of the Fund or its shares. (c)Net Cash & Other includes short-term investments (e.g., money market funds and repurchase agreements) and other assets less liabilities (e.g., cash, receivables, payables, and unrealized appreciation/depreciation on certain derivatives). (d)Yield and principal value fluctuate with market conditions. (e)Duration is a measure of a bond’s price sensitivity to changes in interest rates. (f)SEC Yield is an annualization of the Fund’s total net investment income per share for the 30-day period ended on the last day of the month. (g)Effective May 1, 2017, Dodge & Cox has contractually agreed to reimburse the Fund for all ordinary expenses to the extent necessary to maintain Total Annual Fund Operating Expenses at 0.45% through April 30, 2019. The term of the agreement renews annually thereafter unless terminated with 30 days’ written notice by either party prior to the end of the term. For periods prior to May 1, 2017, the Fund’s Net Expense Ratio was 0.60%.Source: The YieldBook, Inc., Bloomberg LP, Interactive Data’s BondEdge, POINT. This exhibit must be accompanied or preceded by a current prospectus or summary prospectus for the relevant fund(s). A private fund managed by Dodge & Cox with proprietary assets was reorganized into the Dodge & Cox Global Bond Fund, which commenced operations on May 1, 2014. Any Fund portfolio characteristics, performance, or attribution information for periods prior to May 1, 2014, are those of the private fund. Returns represent past performance and do not guarantee future results. Investment return and share price will fluctuate with market conditions, and investors may have a gain or loss when shares are sold. Fund performance changes over time and currently may be significantly lower than stated above. Performance is updated and published monthly. Before investing in any Dodge & Cox Fund, you should carefully consider the Fund’s investment objectives, risks, and charges and expenses. To obtain a Fund’s prospectus and summary prospectus, which contain this and other important information, or for current month-end performance figures, visit dodgeandcox.com or call 800-621-3979. Please read the prospectus and summary prospectus carefully before investing.
Weighted-Average Summary Characteristics
Dodge & Cox Global Bond Fund
E-13832-041219-042814 |
The SEC yield(f) calculated for March 31, 2019 was 4.51% using net expenses(g) and 4.04% using gross expenses.
March 31, 2019
0
10
20
30
40
50
60
Government Government-Related
Securitized Corporate Net Cash &Other
% A
lloca
tion
Dodge & Cox Global Bond FundBloomberg Barclays Global Aggregate Bond Index
(c)
0
10
20
30
40
50
60
AAA AA A BBB ≤BB+ Net Cash &Other
% A
lloca
tion
Dodge & Cox Global Bond FundBloomberg Barclays Global Aggregate Bond Index
(c)
Dodge & CoxGlobal Bond Fund
Bloomberg Barclays GlobalAggregate Bond Index
Yield-to-Worst(d) 4.79% 1.77%
Effective Duration(e) 3.7 Years 7.0 Years
Global Bond Fund SEC Standardized Average Annual Total Returns as of March 31, 2019: 1 Year 2.72%; 3 Years 5.49%; 5 Years 2.38%; Since Inception (December 5, 2012) 2.79%.
DODGE & COX Investment Managers | San Francisco 46

Global Bond Holdings by Geography and Sector(a)(b)
(a)Region, sector, and quality weights exclude the effect of the Fund’s derivative contracts. (b)The Fund may classify an issuer in a different category than the Bloomberg Barclays Global Aggregate Bond Index. The Fund generally classifies based on country of domicile but may designate a different country in certain circumstances. (c)Except as noted, investments grouped by parent company. Actual securities may be issued by the listed parent company or one of its subsidiaries. (d)Subsidiary. (e)Net Cash & Other includes short-term investments (e.g., money market funds and repurchase agreements) and other assets less liabilities (e.g., cash, receivables, payables, and unrealized appreciation/depreciation on certain derivatives).The above information is not a complete analysis of every material fact concerning any market, industry or investment. Data has been obtained from sources considered reliable, but Dodge & Cox makes no representations as to the completeness or accuracy of such information. Opinions expressed are subject to change without notice. The information provided is historical and does not predict future results or profitability. This is not a recommendation to buy, sell, or hold any security and is not indicative of Dodge & Cox’s current or future trading activity. The securities identified are subject to change without notice and may not represent an account’s entire holdings. Before investing in any Dodge & Cox Fund, you should carefully consider the Fund’s investment objectives, risks, and charges and expenses. To obtain a Fund’s prospectus and summary prospectus, which contain this and other important information, visit dodgeandcox.com or call 800-621-3979. Please read the prospectus and summary prospectus carefully before investing.
Dodge & Cox Global Bond Fund
Bolded lines indicate non-USD holdings
E-13803-042219-070815 |
March 31, 2019
Government U.S. Government Argentina Government Mexico Government (MXN)22.4% Brazil Government (BRL) Poland Government (PLN)
Colombia Government (COP) Thailand Government (THB)India Government (INR) Turkey Government (TRY)Indonesia Government (IDR)
U.S. Government 4.6% EM Government 17.7%
Government-Related Chicago Transit Authority RB Indonesia Government International (EUR)5.2% State of Illinois GO Peru Government International (EUR)
Petroleo Brasileiro SA (GBP, USD)Petroleos Mexicanos (EUR, USD)Province of Buenos Aires Argentina (ARS, EUR)
U.S./Canada Government-Related 0.9% EM Government-Related 4.3%
Securitized U.S. Agency MBS SMB Private Education Loan Trust (Private Loans) Rio Oil Finance Trust 1.4%20.3% Navient Student Loan Trust (Private Loans) SLM Student Loan Trust
Navient Student Loan Trust (FFELP) U.S. Agency Military Housing
U.S./Canada Securitized 19.0% EM Securitized 1.4%
Corporate(c) AT&T, Inc. (EUR) Ford Motor Credit Co. LLC(d) Anheuser-Busch InBev SA/NV Cemex SAB de CV49.3% Bank of America Corp. HCA Holdings, Inc. Barclays PLC Grupo Televisa SAB
Becton, Dickinson and Co. JPMorgan Chase & Co. Bayer AG (EUR) MTN Group, Ltd.Capital One Financial Corp. Kinder Morgan, Inc. BHP Billiton, Ltd. Naspers, Ltd.Charter Communications, Inc. Macy’s, Inc. BNP Paribas SA Ultrapar Participacoes SACigna Corp. Molex Electronic Technologies LLC(d) Chubb, Ltd. (EUR)Citigroup, Inc. QVC, Inc.(d) Enel SPA (EUR)Concho Resources, Inc. The Southern Co. HSBC Holdings PLC (GBP, USD)Cox Enterprises, Inc. The Walt Disney Company Imperial Brands Finance PLC (EUR)CVS Health Corp. TransCanada Corp. LafargeHolcim, Ltd.Dell Technologies Inc. Verizon Communications, Inc. Lloyds Banking Group PLCDominion Energy, Inc. Wells Fargo & Co. Millicom International Cellular SADowDuPont, Inc. Xerox Corp. RELX PLCElanco Animal Health, Inc. Royal Bank of Scotland PLC
Telecom Italia SPA (GBP, USD)Unicredit SPAVodafone Group PLC
U.S./Canada Corporate 25.0% Developed ex-U.S./Canada Corporate 19.2% EM Corporate 5.1%
Net Cash & Other(e): 2.9% 2.9%
Derivatives: Long-Term U.S. Treasury Bond Futures (Sho -4.4% U.S. Interest Rate Swaps (Pay Fixed) -0.6% Euro-Bobl Futures (Short) -1.6% Brazilian Real Forward (Short) -0.2%Notional Value Ultra Long-Term U.S. Treasury Bond (Short) -2.2% U.S. Dollar Forward (Long) 12.1% Euro-Buxl Futures (Short) -1.3% Thai Baht Forward (Short) -0.5%
Euro-Bund Futures (Short) -5.6%Long Gilt Futures (Short) -2.0%Euro Forward (Short) -9.4%
U.S./Canada and Cash 52.3% Developed ex-U.S./Canada 19.2% Emerging Markets 28.4%
DODGE & COX Investment Managers | San Francisco 47

Source Citations
MSCIMSCI EAFE Index: The MSCI EAFE (Europe, Australasia, Far East) Index is a broad-based, unmanaged equity market index aggregated from 21 developed market country indices, excluding the United States and Canada.MSCI World Index: The MSCI World Index is a broad-based, unmanaged equity market index aggregated from 24 developed market country indices, including the United States.MSCI ACWI Index: The MSCI ACWI (All Country World Index) Index is a broad-based, unmanaged equity market index aggregated from 47 developed and emerging market country indices.MSCI ACWI ex USA Index: The MSCI ACWI (All Country World Index) ex USA Index is a broad-based, unmanaged equity market index aggregated from 46 developed and emerging market country indices, excluding the United States.The MSCI information in this presentation may only be used for your internal use, may not be reproduced or redisseminated in any form and may not be used as a basis for or a component of any financial instruments or products or indices. None of the MSCI information is intended to constitute investment advice or a recommendation to make (or refrain from making) any kind of investment decision and may not be relied on as such. Historical data and analysis should not be taken as an indication or guarantee of any future performance analysis, forecast or prediction. The MSCI information is provided on an “as is” basis and the user of this information assumes the entire risk of any use made of this information. MSCI, each of its affiliates and each other person involved in or related to compiling, computing or creating any MSCI information (collectively, the “MSCI Parties”) expressly disclaims all warranties (including, without limitation, any warranties of originality, accuracy, completeness, timeliness, non-infringement, merchantability and fitness for a particular purpose) with respect to this information. Without limiting any of the foregoing, in no event shall any MSCI Party have any liability for any direct, indirect, special, incidental, punitive, consequential (including, without limitation, lost profits) or any other damages. (www.msci.com)MSCI,® EAFE,® and ACWI® are trademarks of MSCI, Inc.
BloombergBloomberg Barclays U.S. Aggregate Index: The Bloomberg Barclays U.S. Aggregate Bond Index is a widely recognized, unmanaged index of U.S. dollar-denominated, investment-grade, taxable fixed income securities.Bloomberg Barclays Global Aggregate Index: The Bloomberg Barclays Global Aggregate Bond Index is a widely recognized, unmanaged index of multi-currency, investment-grade fixed income securities. POINT is a portfolio analytics platform.Bloomberg® and POINT® are registered trademarks of Bloomberg Finance L.P. and its affiliates. Barclays® is a registered trademark of Barclays Bank PLC.
GICSThe Global Industry Classification Standard (“GICS”) classifies securities into asset classes by assigning each company—based on its principal business activity—to a sub-industry, industry, industry group, and sector. GICS was developed by and is the exclusive property and a service mark of MSCI Inc. (“MSCI’’) and Standard & Poor’s, a division of The McGraw-Hill Companies, Inc. (“S&P”) and is licensed for use by Dodge & Cox. Neither MSCI, S&P nor any other party involved in making or compiling the GICS or any GICS classifications makes any express or implied warranties or representations with respect to such standard or classification (or the results to be obtained by the use thereof), and all such parties hereby expressly disclaim all warranties of originality, accuracy, completeness, merchantability and fitness for a particular purpose with respect to any of such standard or classification. Without limiting any of the foregoing, in no event shall MSCI, S&P, any of their affiliates or any third party involved in making or compiling the GICS or any GICS classifications have any liability for any direct, indirect, special, punitive, consequential or any other damages (including lost profits) even if notified of the possibility of such damages.
RussellRussell 1000 Value Index: The Russell 1000 Value Index is a broad-based, unmanaged equity market index composed of those Russell 1000 companies with lower price-to-book ratios and lower forecasted growth values.Russell 1000® is a trademark of Frank Russell Company.
Standard & Poor’sS&P 500 Index: The S&P 500 Index is a market capitalization-weighted index of 500 large-capitalization stocks commonly used to represent the U.S. equity market. S&P 500® is a trademark of S&P Global Inc.
E-12823-032519-091118 | DODGE & COX Investment Managers | San Francisco 48

Fund HighlightsPerformance For the first quarter 2019, Invesco Core Real Estate – U.S.A. (“ICRE” or “the Fund”) generated a total
gross return of 1.11%, comprised of 0.92% income and 0.19% appreciation. Due to the decline in interest rates during the quarter, debt mark-to-market had a negative 14 bps
impact to the 1Q19 return. The Fund produced gross unlevered property appreciation of 19 bps on the total portfolio for the
quarter, driven primarily by the office and industrial sectors. Eight assets within the retail andapartment sectors experienced appreciation headwinds, largely driven by softening market rents inthe retail sector and increased expenses in the apartment sector.
ICRE continues to experience income and dividend growth, with a quarter-over-quarter increase inNOI of $3M, or 1 bp on the quarterly income return, and a $5M increase in the dividend, or 2 bps onthe quarterly dividend yield.
Operations Total Portfolio percentage leased increased 40 bps from the prior quarter to 92.0% primarily as a
result of continued leasing within assets recently migrated to Core. Leasing momentum is expected tocontinue with active negotiations on a few large retail suites and continued lease-up in the recentlycompleted apartment assets and self-storage portfolio.
The Core Portfolio is budgeted to deliver NOI growth of over 8% in 2019.Transactions During the quarter, the Fund closed on six acquisitions (total gross purchase price $380.8M: three
assets in the Boston MSA – multi-family, office and self-storage; two land sites for future self-storagedevelopment in SF Bay Area and Los Angeles; land for future office development in Charlotte).Further, the Fund purchased the minority interest partner equity on 131-137 Spring retail in NYC fortotal equity proceeds of $15M.
In addition, the Fund exercised the accordion option on its unsecured line of credit, increasing thetotal revolver capacity to $550M and added an additional $50M in term loan proceeds.
Looking Forward ICRE continues to provide a durable – and growing – income stream from assets that demonstrate
resiliency throughout cycles. The Fund is projected to generate a 30%+ increase in NOI over the next three years primarily through
contractual rent increases in the Core portfolio and the phase-in of income from the Manage-to-CorePortfolio.
31.9%
15.3%31.0%
19.7%2.1%
Investment Performance
Gross ReturnsCurrent Quarter 1 Year 3 Year 5 Year 7 Year 10 Year SI 4Q’04
Income 0.92 3.78 3.76 3.98 4.23 4.69 5.07
Appreciation 0.19 4.02 4.96 6.48 6.43 3.14 3.12
Total 1.11 7.91 8.86 10.65 10.86 7.95 8.32
Key Statistics 1
Gross Asset Value $14.03B
Net Asset Value $10.27B
Investments 107
LTV (incl./excl. short-term borrowings) 2 25.0%/23.6%
Manage-to-Core Portfolio 3 8.5%
Total/Core Leased 92.0%/93.5%
Investors 4 132
Contributions 5 $288.0M
Withdrawals $11.6M
Dividend Declared $90.0M
Trailing 4Q Gross Dist Yield/CQAnnualized Gross Dist Yield
3.4%/3.5%
Cash % of NAV 1.2%
1 See Notes to Performance2 Short-term line of credit balance was $190M3 Represents the Manage-to-Core Portfolio on a fully
funded basis plus appreciation to date – At current carry values, the Manage-to-Core portfolio is 6.4%
4 Invested as of 3/31/195 Includes reinvested dividends
1 Based on Proforma Gross Market Values, which includes the Manage-to-Core Portfolio on a fully funded basis plus appreciation to date2 Certain MSAs within close proximity to each other are grouped into Areas
Invesco Core Real Estate – U.S.A. Flash Report
First Quarter 2019
Diversification by Property Type 1
19%
14%
10% 9%8% 8% 6% 6%
3% 2%
0.0
0.5
1.0
1.5
2.0
2.5
3.0
SF B
ay A
rea
Los
Ang
eles
Are
a
New
Yor
k
Bos
ton
Dal
las
Den
ver
Hou
ston
Was
hing
ton
DC
Ora
nge
Cou
nty
Seat
tle
Top Ten MSAs ($ billions) 1, 2
Legend: Apartments Industrial Office Retail Other
22 Boston Wharf Boston, MA
confidential
confidential
mprice
Typewritten Text
DATE: 5/15/19 ITEM #: 6d

Investment Policy & Performance
William C. Grubbs Jr.Managing Director,Lead Portfolio ManagerInvesco Real Estate101 California Street, Suite 1800San Francisco, CA [email protected]
Michelle L. FossManaging Director,Portfolio ManagerInvesco Real Estate101 California Street, Suite 1800San Francisco, CA [email protected]
Chad ProvostDirector,Associate Portfolio ManagerInvesco Real Estate101 California Street, Suite 1800San Francisco, CA [email protected]
David Chen Associate Director,Portfolio ManagementInvesco Real Estate101 California Street, Suite 1800San Francisco, CA [email protected]
Fund Operations Investor Relations
Beth WorthySenior Director,Fund OperationsInvesco Real Estate2001 Ross Avenue, Suite 3400Dallas, TX [email protected]
Thomas ThreadgillSenior Associate,Fund Operations Invesco Real Estate2001 Ross Avenue, Suite 3400Dallas, TX [email protected]
Trent HeinerAssociate,Fund OperationsInvesco Real Estate2001 Ross Avenue, Suite 3400Dallas, TX [email protected]
Melissa NeckarAssociate Director,Investor Relations SpecialistInvesco Real Estate2001 Ross Avenue, Suite 3400Dallas, TX [email protected]
Notes to Performance
Invesco Core Real Estate – U.S.A.First Quarter 2019
1. The Invesco Core Real Estate U.S.A., L.P. is a core style, open-end real estate fund with a September 30, 2004 inception date. The Fund can alsoinvest up to 15% of gross assets in value added strategies.
2. Information is presented on a preliminary basis and is subject to change.3. Performance is calculated in U.S. dollars. Performance returns are leveraged and calculated on an investment level following the Modified Dietz
methodology.4. Returns include Fund Level operating expenses. The impact of cash balances and any interest earnings are also reflected in the Fund’s returns.5. Returns are shown gross of fees. An investor’s return would be reduced by the amount of the fees which could differ based on the size of their
investment. The highest fee would be 1.1% of NAV assuming a minimum investment of $10 million.6. Operating results of the Fund are presented on a fair value basis of accounting in conformity with U.S. GAAP and are audited annually.7. Real estate investments and debt obligations are valued on a quarterly basis by independent third party valuers.8. In an effort to most accurately reflect the Fund’s geographic and property type exposure and provide information on leverage and other investment
parameters, all Joint Venture investments are reported at the Fund’s ownership percentage.9. Investors in the Fund have the option of reinvesting all or a portion of the quarterly cash distributions made by the Fund.10. UBIT/Transactions: To date, no investments have been made outside of ICRE REIT Holdings. If ICRE REIT Holdings is determined to be a "pension-
held REIT", the Manager does not anticipate that tax-exempt Members will be subject to unrelated business income tax except to the extent theyown more than 10% of the Fund's Units or they have borrowed to make their investment in the Fund. As of the date of this report ICRE REITHoldings is not a “pension-held REIT”.
11. As with all investments there are associated inherent risks. Please obtain and review all financial materials carefully before investing.12. Certain information contained in this report constitutes forward-looking statements, which can be identified by the use of forward-looking
terminology such as “may,” “seek,” “should,” “expect,” “anticipate,” “project,” “estimate,” “intend,” “continue,” or “believe” or the negativesthereof or other variations thereon or comparable terminology. While we believe that such statements and information are based upon reasonableestimates and assumptions, due to various risks and uncertainties, actual events or results or the actual performance may differ materially fromthose reflected or contemplated in such forward-looking statements.
All material presented is compiled from sources believed to be reliable and current but accuracy cannot be guaranteed. This is not to be construed as anoffer to buy or sell any financial instrument. It is not our intention to state, indicate or imply in any manner that current or past results are indicative offuture profitability or expectations. As with all investments there are associated inherent risks. Please obtain and review all financial material carefullybefore investing. This report may contain confidential and proprietary information for the Fund and Invesco Ltd. Circulation, disclosure or dissemination ofall or any part of this material to any unauthorized persons is prohibited. This report is intended for Fund investors only.
The Harlo Boston, MA
confidential
confidential
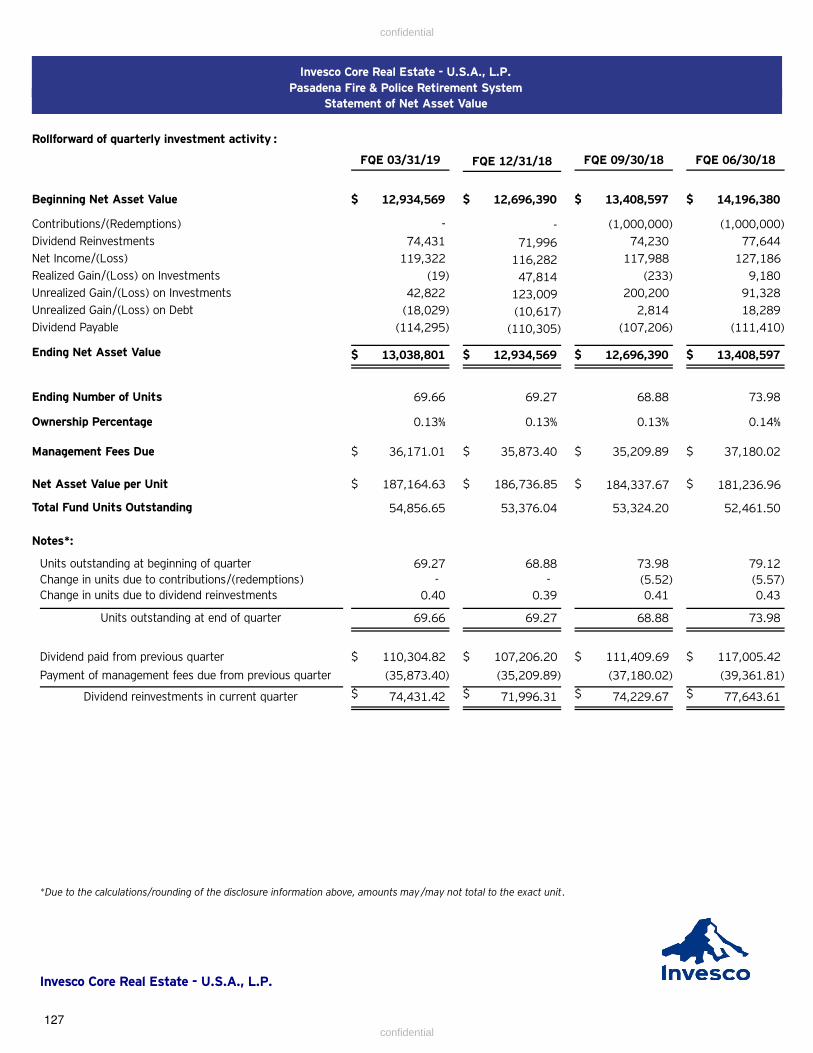
Invesco Core Real Estate - U.S.A., L.P.
Pasadena Fire & Police Retirement System
Statement of Net Asset Value
Rollforward of quarterly investment activity :
FQE 03/31/19 FQE 06/30/18FQE 09/30/18FQE 12/31/18
Beginning Net Asset Value 12,934,569 12,696,390 13,408,597 14,196,380$ $ $ $
Contributions/(Redemptions) - - (1,000,000) (1,000,000)
Dividend Reinvestments 74,230 77,64471,99674,431
Net Income/(Loss) 119,322 116,282 117,988 127,186
Realized Gain/(Loss) on Investments 47,814 (233) 9,180(19)
Unrealized Gain/(Loss) on Investments 42,822 123,009 200,200 91,328
Unrealized Gain/(Loss) on Debt (18,029) (10,617) 2,814 18,289
Dividend Payable (110,305) (107,206) (111,410)(114,295)
Ending Net Asset Value 13,038,801 12,934,569 12,696,390 13,408,597$ $ $ $
Ending Number of Units 69.66 69.27 68.88 73.98
Ownership Percentage 0.13% 0.13% 0.13% 0.14%
Management Fees Due 36,171.01 35,873.40 35,209.89 37,180.02$ $ $ $
Net Asset Value per Unit 187,164.63 186,736.85 184,337.67 181,236.96$ $ $ $
Total Fund Units Outstanding 52,461.5053,324.2053,376.0454,856.65
Notes*:
Units outstanding at beginning of quarter 69.27 68.88 73.98 79.12
Change in units due to contributions/(redemptions) - - (5.52) (5.57)
Change in units due to dividend reinvestments 0.40 0.39 0.41 0.43
Units outstanding at end of quarter 69.66 69.27 68.88 73.98
Dividend paid from previous quarter 110,304.82$ $ $ $107,206.20 111,409.69 117,005.42
Payment of management fees due from previous quarter (35,873.40) (35,209.89) (37,180.02) (39,361.81)
74,431.42 74,229.67 77,643.6171,996.31$ $ $ $Dividend reinvestments in current quarter
Pasadena Fire & Police Ret
*Due to the calculations/rounding of the disclosure information above, amounts may /may not total to the exact unit.
Invesco Core Real Estate - U.S.A., L.P.
127
confidential
confidential

Invesco Core Real Estate–U.S.A., L.P.Quarterly Report
March 31, 2019
INVESCO REAL ESTATENorth America: Dallas ▪ San Francisco ▪ Newport Beach ▪ New York ▪ AtlantaEurope: London ▪ Paris ▪ Munich ▪ Prague ▪ Madrid ▪ Luxembourg ▪ Warsaw ▪ MilanAsia: Hong Kong ▪ Hyderabad ▪ Shanghai ▪ Tokyo ▪ Seoul ▪ Singapore ▪ Sydney ▪ Beijing
confidential
confidential

Investment Policy & Performance
William C. Grubbs Jr.Managing Director,Lead Portfolio ManagerInvesco Real Estate101 California Street, Suite 1800San Francisco, CA [email protected]
Michelle L. FossManaging Director,Portfolio ManagerInvesco Real Estate101 California Street, Suite 1800San Francisco, CA [email protected]
Chad ProvostDirector,Associate Portfolio ManagerInvesco Real Estate101 California Street, Suite 1800San Francisco, CA [email protected]
David ChenAssociate Director,Portfolio ManagementInvesco Real Estate101 California Street, Suite 1800San Francisco, CA [email protected]
Fund Operations Investor Relations
Beth WorthySenior Director,Fund OperationsInvesco Real Estate2001 Ross Avenue, Suite 3400Dallas, TX [email protected]
Thomas ThreadgillSenior Associate,Fund Operations Invesco Real Estate2001 Ross Avenue, Suite 3400Dallas, TX [email protected]
Trent HeinerAssociate,Fund OperationsInvesco Real Estate2001 Ross Avenue,Suite 3400Dallas, TX [email protected]
Melissa NeckarAssociate Director,Investor Relations SpecialistInvesco Real Estate2001 Ross Avenue, Suite 3400Dallas, TX [email protected]
Product ManagementFinancialReporting
Max SwangoManaging Director,Client Portfolio ManagerInvesco Real Estate2001 Ross Avenue, Suite 3400Dallas, TX [email protected]
Laler DeCostaManaging Director,Client Portfolio ManagerInvesco Real Estate1360 Peachtree Street NEAtlanta, GA [email protected]
Brooks MonroeSenior Director,Client Portfolio ManagerInvesco Real Estate2001 Ross Avenue, Suite 3400Dallas, TX [email protected]
De’Juan CollinsDirector,Client Portfolio ManagerInvesco Real Estate2001 Ross Avenue, Suite 3400Dallas, TX [email protected]
Alison DepperschmidtSenior Director,Senior ControllerInvesco Real Estate2001 Ross Avenue, Suite 3400Dallas, TX [email protected]
Contact Information
Invesco Core Real Estate–U.S.A., L.P.
Cover Photos
Top: RunwayPlaya Vista, CA (Left)
101 SecondSan Francisco, CA (Right)
Middle: 1800 LarimerDenver, CO (Left)
North Water Apartments Chicago, IL (Middle)
Shops at CrystalsLas Vegas, NV (Right)
Bottom: IE LogisticsSan Bernardino, CA (Left)
Broadstone Little ItalySan Diego, CA (Right)
confidential
confidential

QuarterlyFlash Report
Table of Contents
1 Portfolio Facts
2 Fund Overview
7 Investment Portfolio
8 Fund Diversification
11 Fund Performance
12 Portfolio Fundamentals
13 Sustainability Program
14 Investment Activity
18 Fund Capitalization
20 Joint Venture Investments
21 Manage-to-Core
22 Valuation Summary
23 Sector Profile
24 Fund Governance Log
25 Market Commentary
30 Additional Information – Performance / Top Ten Assets (Net)
31 Additional Information – T1 Leverage
32 Additional Information – Performance Notes
33 Financial Statements
37 Notes to Consolidated Financials
Invesco Core Real Estate–U.S.A., L.P.
confidential
confidential
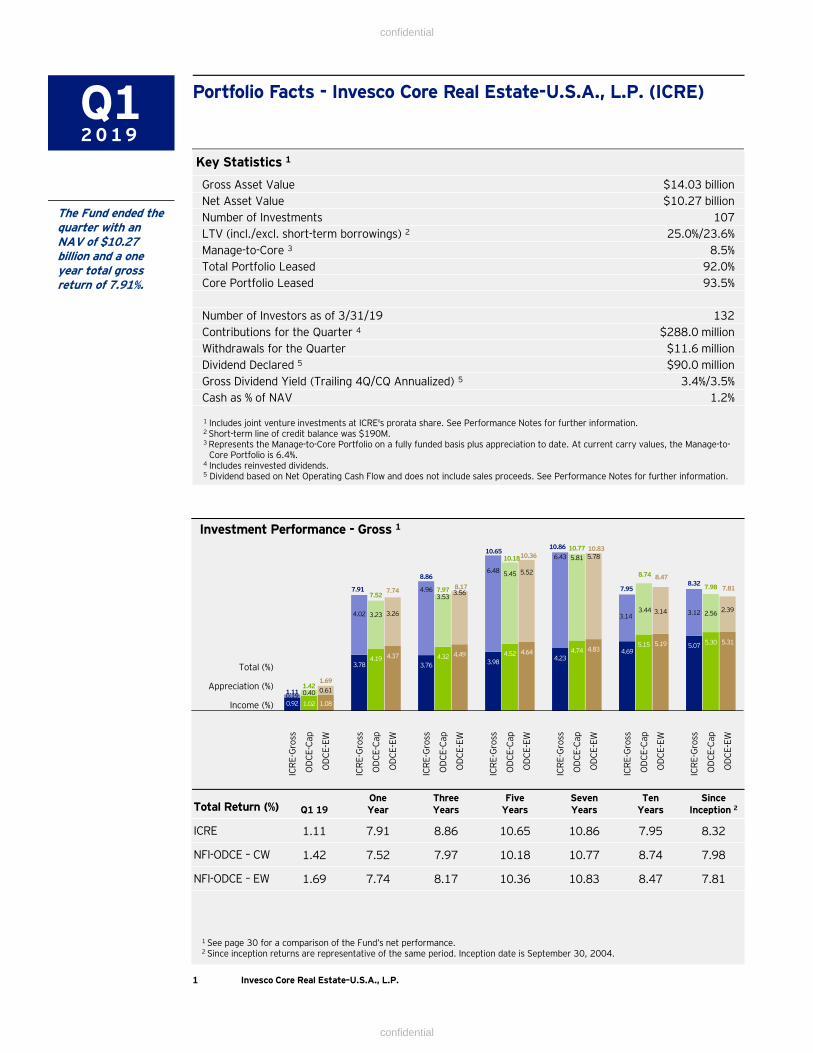
Portfolio Facts - Invesco Core Real Estate-U.S.A., L.P. (ICRE)
Key Statistics 1
Gross Asset Value $14.03 billionNet Asset Value $10.27 billionNumber of Investments 107LTV (incl./excl. short-term borrowings) 2 25.0%/23.6%Manage-to-Core 3 8.5%Total Portfolio Leased 92.0%Core Portfolio Leased 93.5%
Number of Investors as of 3/31/19 132Contributions for the Quarter 4 $288.0 millionWithdrawals for the Quarter $11.6 millionDividend Declared 5 $90.0 millionGross Dividend Yield (Trailing 4Q/CQ Annualized) 5 3.4%/3.5%Cash as % of NAV 1.2%
1 Invesco Core Real Estate–U.S.A., L.P.
Q12 0 1 9
The Fund ended the quarter with an NAV of $10.27 billion and a one year total gross return of 7.91%.
Total (%)
Appreciation (%)
Income (%)
Investment Performance - Gross 1
1 Includes joint venture investments at ICRE's prorata share. See Performance Notes for further information.2 Short-term line of credit balance was $190M.3 Represents the Manage-to-Core Portfolio on a fully funded basis plus appreciation to date. At current carry values, the Manage-to-
Core Portfolio is 6.4%.4 Includes reinvested dividends.5 Dividend based on Net Operating Cash Flow and does not include sales proceeds. See Performance Notes for further information.
1 See page 30 for a comparison of the Fund’s net performance.2 Since inception returns are representative of the same period. Inception date is September 30, 2004.
Total Return (%) Q1 19One Year
Three Years
Five Years
Seven Years
Ten Years
Since Inception 2
ICRE 1.11 7.91 8.86 10.65 10.86 7.95 8.32
NFI-ODCE – CW 1.42 7.52 7.97 10.18 10.77 8.74 7.98
NFI-ODCE – EW 1.69 7.74 8.17 10.36 10.83 8.47 7.81
0.92 1.02 1.08
3.784.19 4.37
3.764.32 4.49
3.984.52 4.64
4.234.74 4.83 4.69
5.15 5.19 5.07 5.30 5.31
0.19 0.40 0.61
4.02 3.23 3.26
4.963.53
3.56
6.48 5.45 5.52
6.43 5.81 5.78
3.143.44 3.14 3.12 2.56 2.39
1.111.42
1.69
7.917.52
7.74
8.86
7.97 8.17
10.6510.1810.36
10.86 10.77 10.83
7.95
8.74 8.478.32 7.98 7.81
ICR
E-G
ross
OD
CE-C
ap
OD
CE-E
W
ICR
E-G
ross
OD
CE-C
ap
OD
CE-E
W
ICR
E-G
ross
OD
CE-C
ap
OD
CE-E
W
ICR
E-G
ross
OD
CE-C
ap
OD
CE-E
W
ICR
E-G
ross
OD
CE-C
ap
OD
CE-E
W
ICR
E-G
ross
OD
CE-C
ap
OD
CE-E
W
ICR
E-G
ross
OD
CE-C
ap
OD
CE-E
W
confidential
confidential

Fund Overview
Executive Summary
The last days of 2018 brought a wild ride in the equities markets, however, the first quarter of 2019proved to be yet another period of economic resilience. The U.S. economy continues to enjoy a sweet spotof healthy growth, expanding fast enough so that the warning signs of a recession are largely absent, yetnot enough to stoke fears of inflation or imminent Fed action. First quarter GDP growth was a robust 3.2%after having moderated slightly in the fourth quarter of 2018, keeping the economy on very solid footing.Job growth continued – a healthy 196,000 new jobs in March alone – and unemployment remains at just3.8%, barely above last Fall’s 49-year low. If anything, concerns in the jobs arena tilt more toward laborconstraints given low unemployment and record high job openings, but to-date, the economy hasmaintained its momentum as we near a point that will mark the longest economic expansion in U.S.history. Given the length of this expansion in relationship to history, it is argued by many that the odds ofeconomic growth continuing unabated much longer are low, although a downturn is not immediatelyimminent.
Not surprisingly with the above economic backdrop, U.S. Real Estate remained fundamentally sound duringthe beginning of 2019. Supply and demand are in relative equilibrium throughout the U.S. with rents formost product/market combinations – apart from retail – continuing to rise although at a generally slowerpace, with some exceptions to the upside in Boston and San Francisco, for example. Where new supplydoes exist, it has been in response to tenant demand and thus rising rents, and will likely be dampenedgoing forward by the continued rise in construction costs.
From a capital markets perspective, transaction volume remains strong and the debt markets continue toprovide plentiful liquidity, although equity capital continues to trend more selectively and unequally acrossasset profiles and markets. The sharp decline in Treasury rates – with the ten-year at 2.50% as of thiswriting – has brought relative pricing back in line with historical norms, albeit on the low end of the caprate spread to Treasuries, and likely means less pressure on pricing.
With the above economic and real estate context, the Core Fund team remains highly focused on activelymanaging the assets and the Fund – controlling what we can control and being cycle-aware – and on buyingand selling the right assets at the margin. We believe our intentional portfolio construction and strategywill provide the following to our investors:
A durable income stream generated from a highly diversified portfolio – with the largest investmentless than 5% of GAV and the largest tenant less than 2% of revenue - complemented by an activelymanaged lease expiration schedule with less than 7% rollover in each of the next seven years.Further supporting the Fund’s income durability, the Fund has no “high-risk” credit tenants withinthe Portfolio as analyzed by MSCI.
Growing income, as evidenced by the $3m organic increase in NOI and $5m increase in dividendquarter-over-quarter. Furthermore, we expect an additional 30% increase in NOI over the next threeyears, an increase that is highly contractual in nature.
A prudent and deliberate strategy within each sector to ensure long-term Core resiliency.
Exposure to markets and locations that our centers of value creation and innovation offering highquality jobs and job growth throughout the U.S., with an emphasis on the growing markets of theWestern and Southern U.S.
Differentiated assets where tenants want to be and that offer liquidity throughout cycles.
All underpinned by a strong, simple and flexible balance sheet with a modest leverage level,significant remaining loan term of almost eight years and a pool of unencumbered assets totaling66% of the Portfolio.
2 Invesco Core Real Estate–U.S.A., L.P.
Q12 0 1 9
The last days of 2018 brought a wild ride in the equities markets, however, the first quarter of 2019 proved to be yet another period of economic resilience.
The Core Fund team remains highly focused on actively managing the assets and the Fund – controlling what we can control and being cycle-aware – and on buying and selling the right assets at the margin.
confidential
confidential

Fund Overview
3 Invesco Core Real Estate–U.S.A., L.P.
Q12 0 1 9
Given the above property and Portfolio attributes, we believe we are well-positioned to continue to achievethe Fund’s performance objectives going forward.
ICRE Performance
During the first quarter of 2019, the NFI-ODCE Cap Weight returned 1.42% while the NFI-ODCE EqualWeight returned 1.69%, tied with the largest divergence between the two since the financial crisis. For thetrailing one-year period, the Cap Weight and Equal Weight returned 7.52% and 7.74%, respectively, in-linewith historical norms but continuing to gradually moderate. It is worth noting however that the variationamongst sectors is considerable, with Industrial far outperforming any other sector and Retail weighing onperformance of the Index.
In comparison, ICRE and the U.S. stock and bond indices provided the following returns:
ICRE generated a 1.11% total return during the first quarter, comprised of 0.92% income and 0.19%appreciation. Overall performance for the quarter was healthy although more moderate - similar to thetrend seen in the ODCE return for the quarter – and ICRE continues to outperform across almost all trailingperiods.
What went well?
The majority of the Fund’s assets this quarter held steady or experienced an increase in value during thequarter and top contributors in appreciation for the quarter were broad-based, spread across office,industrial and multifamily assets. Key drivers include Boston Office and Life Sciences, West LA office, theFund’s two southeast Florida apartment development properties as well as the now 100% leased MeridianDistribution Center (Industrial) in the Inland Empire.
What was a challenge?
Challenges during the quarter were mostly isolated and specific to a handful of assets. Debt mark-to-market tempered performance during the quarter with a -14 bps impact to the Fund return. Eight assetswithin the apartment and retail sectors experienced appreciation headwinds due in large part to lowermarket rents on specific retail assets and increased expenses in certain apartment submarkets buffeted bynew supply. Also, the Fund did not experience meaningful appreciation from the Manage-to-Core portfoliothis quarter with no major valuation milestones achieved; this lull contrasts with previous quarters – theManage-to-Core assets have delivered $123m in net appreciation over the last four quarters - andtempered returns in this segment of the portfolio, but we expect renewed lift in the coming quarters.
Portfolio Position
We believe the ICRE portfolio is very well positioned to continue to provide our investors withoutperformance across market cycles. The foundation of our portfolio strategy is continued successfulexecution within the $14 billion existing asset portfolio in the Fund – that is the team’s priority, withincremental acquisitions and dispositions that support our key Core Fund themes.
Overall performance for the quarter was healthy although more moderate - similar to the trend seen in the ODCE return for the quarter – and ICRE continues to outperform across almost all trailing periods.
We believe the ICRE portfolio is very well positioned to continue to provide our investors with outperformance across market cycles.
1Q19 Total Return (%) One Year Total Return (%)ICRE 1.11 7.91ODCE (Equal Weight) 1.69 7.74ODCE (Cap Weight) 1.42 7.52SP 500 13.65 9.48Barclays Capital Bond Index 2.94 4.48
confidential
confidential

Fund Overview
4 Invesco Core Real Estate–U.S.A., L.P.
YE2 0 1 8
From a top-down, Fund-level perspective:
Sector allocation – As noted above, ICRE maintains a definitive strategy for each property type sector:
Office – A pinpoint approach: differentiated, highly functional assets where tenants want to be located,in walkable, amenity-rich urban locations, such as Fort Point in Boston’s Seaport, The Quad (LifeScience) in Cambridge or the soon-to-be-developed Tryon Office project in Charlotte’s South End (seepage 17).
Industrial – A very targeted strategy in limited markets: assets that comprise multi-building Industrialparks providing best-in-class functionality near ports and growing population centers; Oakesdale inSeattle and Gateway 80 in the Bay Area are good examples. In addition, the Fund has a materialIndustrial position in Manage-to-Core assets that exactly fit this bill: specifically, the Pacific CommonsSouth project (SF Bay Area) currently under construction and Avion Burbank adjacent to the BurbankAirport, soon to commence.
Apartments – An intentionally diverse portfolio of urban and suburban assets in live-work-playlocations near transit nodes. These assets provide a diversifier and support the durability of the Fund’sincome with growth potential. The Bay Area offers two examples of the diversity with some sharedattributes – the newly-built, recently stabilized 33 Tehama high-rise in downtown San Francisco; andStoneridge Apartments in Pleasanton, built in 1989 but adjacent to mass transit and walkable toamenities and jobs.
Retail – A barbell approach comprised of places people need to go and places people want to go:exceptionally located centers in high-barrier, dense locations and anchored by the market-dominantgrocer (the Fund’s Bay Area Safeway centers); or places that provide shoppers with a uniqueexperience, such as Legacy West in Plano, TX part of a larger, dynamic mixed-use environment. Some,like Runway Playa Vista, offer elements of both. And importantly, what we don’t own is as important aswhat we do – the Fund owns virtually no “middle-market” commodity assets where the internet is moreeffective at serving consumers, nor do we have meaningful exposure to the capital-intensive andrapidly evolving mall sector.
Self-storage – A focus on newer product in dense locations with low self-storage space per capita anda strategy to prudently round out the existing portfolio.
Market selection – Dynamic submarkets within innovation markets that are centers of value creationthroughout the U.S. (with an emphasis on the West and South). The Fund is currently most selective onOffice markets with exposure to just 13, and Industrial, with eight.
While sector and market selection are important elements of portfolio construction, bottom-up assetselection and execution are critical to generating continued outperformance in a maturing cycle:
Asset selection – In the current environment of secular disruptions in the way people shop, goods aredistributed, tenants use space, etc., it is essential to differentiate between the winners and losers – byasset and micro location – and requires assets with the right functionality and location to benefit fromthese trends rather than succumb to them. We are focused on ensuring we own the right assets for thefuture: differentiated real estate where tenants want to be – today and tomorrow.
Property execution – The ICRE team’s primary focus is on execution within the existing portfolio togenerate continued outperformance. A few recent highlights of leasing and operational successes include:
Renewed a key tenant totaling 780,000 sf at the Empire Gateway industrial asset for a five-year termat a rent 15% greater than that previously in-place.
ICRE maintains a definitive strategy for each property type sector.
While sector and market selection are important elements of portfolio construction, bottom-up asset selection and execution are critical to generating continued outperformance in a maturing cycle.
Q12 0 1 9
confidential
confidential

Leased Meridian Distribution Center (Industrial; 504,000 sf) in the Inland Empire to a single tenantsix months earlier than projected in the underwriting.
Executed a lease at Fort Point in Boston (Seaport Mixed-Use – Office/Retail) for 12,500 sf with aspecialty grocer; in negotiations with an office tenant for an additional 16,000 sf that would takeFort Point to approximately 99% leased.
In addition, the Fund’s Manage-to-Core Portfolio (8.5% of GAV) execution remains strong as we continue tomake material progress bringing these assets to fruition after having migrated three – 33 Tehama (SanFrancisco apartments), Legacy West (Plano, TX mixed-use) and the Royce (Orange County apartments) –into the Core Portfolio during 2018. Highlights include substantial completion and the commencement ofleasing at 5250 Park, a high-rise multifamily asset in a very desirable Doral (SE Florida) location; Blu27(fka Biscayne 27) in the Wynwood submarket of Miami, is soon to follow with leasing commencing in thesecond quarter. Progress also continues on Pacific Commons South, a ten-building, 1.7 million sf industrialproject in the supply-constrained Bay Area I-880 Industrial corridor with healthy tenant interest to-date.Construction is also well under way at Canvass at Press Blocks (140,000 sf) office development in theheart of Portland adjacent to transit and Mark 302 (120,000 sf office/retail), the redevelopment of thehistoric Sears building in Santa Monica. We expect over $120m in additional value creation from theManage-to-Core portfolio (180+ bps) in the coming quarters. As these investments progress through theirlife cycle, it is our intent to continue to prudently replenish the Manage-to-Core portfolio with additionalinvestments, however we are focused on shorter execution time frames in this maturing cycle.
The deliberate portfolio position as outlined above is the foundation for the Fund’s ability to provide adurable and growing income stream:
Durable Income – The 93.5% leased Core portfolio has a weighted average remaining lease term of6.4 years; in excess of ten years for the top ten tenants. Further bolstering the income durabilityare in-place rents averaging 16% below market in the commercial portfolio providing a largercushion than the peer group. The Fund’s differentiated assets and the highly diversified portfolioand a lack of middle market retail and suburban office also speak to the durability of the incomestream.
Income Growth – We expect to deliver a 30% increase in NOI for the Fund over the next three years,an increase which is “built-in,” with 98% contractual in year one and still a strong 80% contractual inyear three. The first quarter NOI increase of $3 million over the prior quarter demonstrates theFund’s growing income and contributed a basis point to the Fund’s income return.
Fund Overview
5 Invesco Core Real Estate–U.S.A., L.P.
YE2 0 1 8
The Fund’s Manage-to-Core Portfolio execution remains strong as we continue to make material progress bringing these assets to fruition after having migrated three into the Core Portfolio during 2018.
The first quarter NOI increase of $3 million over the prior quarter demonstrates the Fund’s growing income and contributed a basis point to the Fund’s income return.
Q12 0 1 9
confidential
confidential

Fund Overview
6 Invesco Core Real Estate–U.S.A., L.P.
Q12 0 1 9
Transactions
The Fund completed six acquisitions during the first quarter totaling $381 million:
Two assets in Boston – a 100% leased office property in the Seaport that is highlycomplementary to the existing Fort Point portfolio; and a newly completed, recently stabilizedmultifamily asset in the dynamic Fenway neighborhood proximate to the Longwood MedicalArea.
Three assets in the self-storage sector – a stabilized asset in the Norwood submarket ofBoston, and two land sites for self-storage development in the SF Bay Area and Los Angeles.
A future two-building office development in the South End submarket of Charlotte that willcommence construction upon sufficient preleasing.
Operations
Portfolio fundamentals remained solid during the quarter ending at 93.5% leased in the Core portfoliodespite inclusion of recently migrated-to-core assets. Leasing momentum is expected to continue withadditional leasing in recently completed multifamily assets and the self-storage portfolio. The Fund ison track through the first quarter to deliver its 2019 budgeted NOI growth of 8.4%.
Balance Sheet
We continue our comprehensive approach to balance sheet management to ensure the Fundmaintains a simple and flexible balance sheet to provide the foundation for the Fund to successfullynavigate market cycles. Toward that end, the Fund exercised the accordion feature on its line of creditduring the quarter, increasing the total revolver capacity to $550 million; the Fund ended the quarterwith an all-in LTV of 25% and an unencumbered asset pool of 66%. Beyond leverage level, we activelymanage the term and structure of the Fund’s debt, with a current weighted average remaining termof almost 8 years on our fixed rate debt which we believe is significantly longer than that of the peerset. The Fund is currently in the process of refinancing its two 2019 loan maturities – one into a long-term fixed rate loan and the other on a shorter-term floating rate loan to provide the flexibility to payoff without penalty.
Sustainability Highlights
The Fund continues to maintain its commitment to Sustainability and ESG efforts as we gear up tocomplete this year’s GRESB survey. We remain proud of our efforts in this key area and of our five-star ranking and placement in the top five over 140 funds globally.
We thank you for your continued investment in Invesco Core Real Estate - U.S.A. and remain focusedon delivering on our performance objectives for our investors.
The Fund completed six acquisitions during the first quarter totaling $381 million.
We continue our comprehensive approach to balance sheet management to ensure the Fund maintains a simple and flexible balance sheet to provide the foundation for the Fund to successfully navigate market cycles.
William C. Grubbs Jr.Managing DirectorLead Portfolio ManagerInvesco Core Real Estate – [email protected]
Michelle FossManaging DirectorPortfolio ManagerInvesco Core Real Estate – [email protected]
confidential
confidential

7 Invesco Core Real Estate–U.S.A., L.P.
Investment Portfolio
The schedule below reflects the Fund’s investment in real estate including the Fund’s prorata share ofjoint venture investments and excludes Fund level assets and debt. Please note that the loweroccupancy in Retail is driven by expected vacancy in the office portion of 130 Prince (with strongleasing activity), which is classified as Retail due to its majority retail component.
Property Type# of
InvestmentsSq. Ft./ Units
Current Quarter
% Leased
Prior Quarter
% Leased
MarketValue
($ MM)Net Market
Value ($ MM)
Apartment 29 8,451 95.1 94.2 4,304.3 3,453.0
Industrial 15 12,210,468 99.1 99.1 1,710.7 1,670.1
Office 21 6,110,032 93.5 93.5 4,231.3 3,928.0
Retail 25 2,960,870 87.4 88.0 2,683.3 2,118.9
Other 2 1,348 90.5 93.0 36.3 36.3
Core Portfolio Total 92 28,838,354 93.5 93.3 12,965.9 11,206.3
Manage-to-Core Portfolio Total 15 931,180 31.0 24.9 887.4 778.2
Portfolio Total 107 29,769,534 92.0 91.6 13,853.3 11,984.5
Q12 0 1 9
Industrial portfolio: Ports,
population,strong functionality
Empire Gateway
Clayton Lane
Self storage portfolio: Newer product,
dense trade areas,undersupplied locations
US Storage Newly-built product with modern, best-in-class
functionality
West Coast emphasis near ports and populationcenters
Focus on multi-building assets and parks in keysubmarkets
Industrial Portfolio:
Ports, population,strong functionality
Retail Portfolio:
Unique goods, services,& experiences
Clayton Lane
Self Storage Portfolio:
Newer product, dense trade areas,undersupplied locations
Office Portfolio:
Centers ofglobal comparative advantage
101 Second
Apartment Portfolio:
Dynamic, walkable,& transit-oriented
Cadence
Submarkets where inventory per capita is belowUS and metro averages
Current markets include SF Bay Area, LA,Portland, Austin & Raleigh
Variety of execution: development, lease-up andstabilized assets
Centers anchored by market-dominant grocers in
high-barrier locations
“Experiential” retail not easily replicated online
Do NOT own the “broad middle” in the RetailSector
85% urban, amenity-rich, live-work-play locations
Differentiated, highly functional assets “wheretenants want to be”
6.9 year WALE
Newer vintage urban & suburban assets indynamic markets
Transit-oriented, live-work-play locations
Primarily mid/high rise with an average age ofseven years(1)
Empire Gateway
US Storage
(1) Includes properties under development as of March 31, 2019.
confidential
confidential

15%
32%
20%
31%
2%0%
10%
20%
30%
40%
50%
Industrial Apartment Retail Office Other
ICRE Projected Portfolio Tactical Target ODCE Weights
Diversification by Property TypeBased on Proforma Gross Market Value
8 Invesco Core Real Estate–U.S.A., L.P.
Fund Diversification
The Fund’s current target weightings by property type are reviewed twice per year as part of theInvesco House View process, which assesses a combination of top-down capital markets pricing andbottom-up fundamentals.
Current tactical targets call for a mild overweight to Industrial, Apartment and Other, a mildunderweight to Office and a strong underweight to Retail relative to the ODCE index.Current tactical
targets call for a mild overweight to Industrial, Apartment and Other, a mild underweight to Office and a strong underweight to Retail relative to the ODCE index.
Top Ten MSAs – Durable, Growing and LiquidBased on Proforma Gross Market Value
1 Proforma Gross Market Value includes the Manage-to-Core Portfolio on a fully funded basis plus appreciation to date.2 Target diversification may change based on changing market conditions.3 ODCE weights presented on a gross, value weight basis.
1
The Fund’s diversified exposure to top performing markets should help deliver strong rent growth going forward.
■ Strategic Range2
1 SF Bay Area includes San Francisco, SF East Bay and San Jose; 2 Los Angeles Area includes Los Angeles and the Inland Empire region; 3 Denver Area includes Denver and Boulder.
Q12 0 1 9
3
confidential
confidential

9 Invesco Core Real Estate–U.S.A., L.P.
Fund Diversification
Diversification by RegionBased on Proforma Gross Market Value
Midwest3%West
53%
South19%
East25%
Apt (%)
Ind (%)
Off (%)
Ret (%)
Oth(%)
Total(%)
ODCE 1
(%)
West 16 12 16 8 1 53 40
Midwest 2 0 0 1 0 3 9
South 4 3 7 5 0 19 19
East 9 1 8 6 1 25 32
The Fund does not intentionally over or under weight regions based on ODCE weightings, but will targetits investments within those regions to markets that provide the most attractive opportunities forupwardly stable net operating income profiles as well as those that provide favorable investor liquidity.Therefore, the Fund may have material differences in regional allocations when compared to the index.
Property Diversification by Size 1
Based on Proforma Gross Market Value
$300M+
$200-$299.9M
$100-199.9M
$50-99.9M
$0-49.9M
1 Includes multi-property portfolios. Mixed-use investments are grouped and counted as one.
15% (29 investments)
29% (10 investments)
4% (19 investments)
35% (36 investments)
17% (10 investments)
Focused on markets and regions (the West) with favorable demographic and economic trends.
Average Size of Investments $137.1
Q12 0 1 9
1 ODCE weights presented on a gross, value weight basis.
confidential
confidential
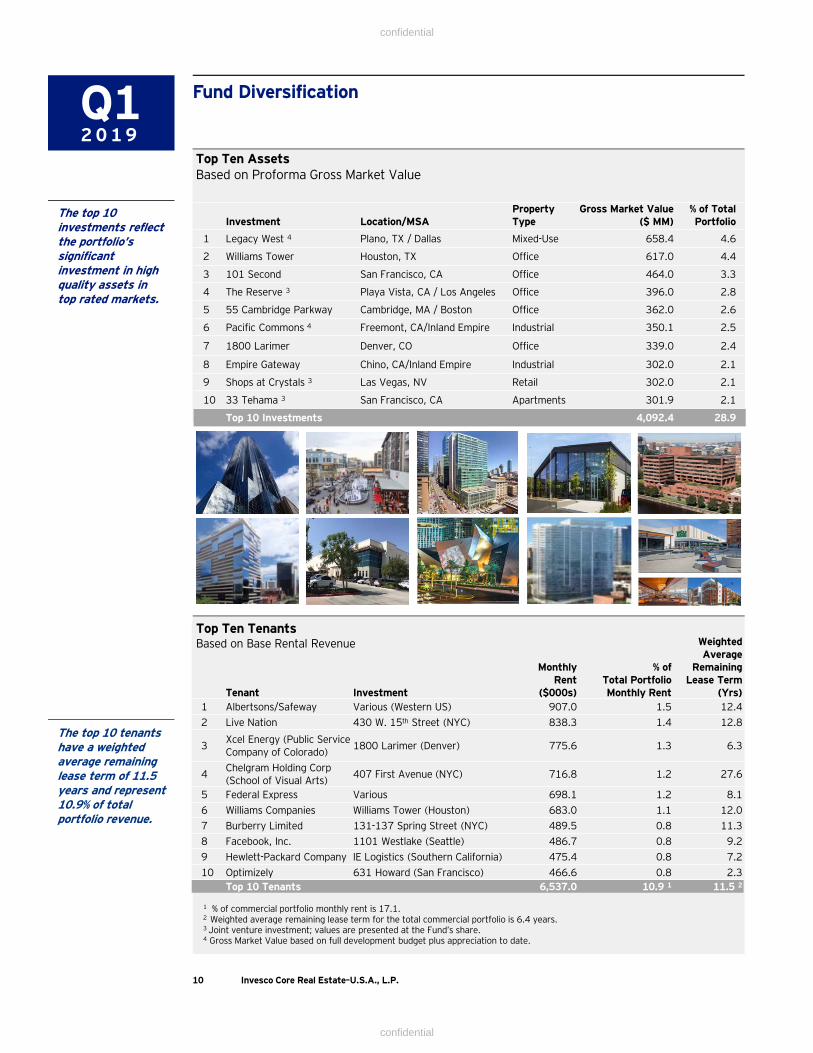
Investment Location/MSAPropertyType
Gross Market Value($ MM)
% of TotalPortfolio
1 Legacy West 4 Plano, TX / Dallas Mixed-Use 658.4 4.6
2 Williams Tower Houston, TX Office 617.0 4.4
3 101 Second San Francisco, CA Office 464.0 3.3
4 The Reserve 3 Playa Vista, CA / Los Angeles Office 396.0 2.8
5 55 Cambridge Parkway Cambridge, MA / Boston Office 362.0 2.6
6 Pacific Commons 4 Freemont, CA/Inland Empire Industrial 350.1 2.5
7 1800 Larimer Denver, CO Office 339.0 2.4
8 Empire Gateway Chino, CA/Inland Empire Industrial 302.0 2.1
9 Shops at Crystals 3 Las Vegas, NV Retail 302.0 2.1
10 33 Tehama 3 San Francisco, CA Apartments 301.9 2.1
Top 10 Investments 4,092.4 28.9
Top Ten AssetsBased on Proforma Gross Market Value
10 Invesco Core Real Estate–U.S.A., L.P.
Tenant Investment
Monthly Rent
($000s)
% of Total Portfolio Monthly Rent
Weighted Average
Remaining Lease Term
(Yrs)1 Albertsons/Safeway Various (Western US) 907.0 1.5 12.42 Live Nation 430 W. 15th Street (NYC) 838.3 1.4 12.8
3Xcel Energy (Public Service Company of Colorado)
1800 Larimer (Denver) 775.6 1.3 6.3
4Chelgram Holding Corp (School of Visual Arts)
407 First Avenue (NYC) 716.8 1.2 27.6
5 Federal Express Various 698.1 1.2 8.16 Williams Companies Williams Tower (Houston) 683.0 1.1 12.07 Burberry Limited 131-137 Spring Street (NYC) 489.5 0.8 11.38 Facebook, Inc. 1101 Westlake (Seattle) 486.7 0.8 9.29 Hewlett-Packard Company IE Logistics (Southern California) 475.4 0.8 7.210 Optimizely 631 Howard (San Francisco) 466.6 0.8 2.3
Top 10 Tenants 6,537.0 10.9 1 11.5 2
1 % of commercial portfolio monthly rent is 17.1.2 Weighted average remaining lease term for the total commercial portfolio is 6.4 years.3 Joint venture investment; values are presented at the Fund’s share.4 Gross Market Value based on full development budget plus appreciation to date.
Top Ten TenantsBased on Base Rental Revenue
Fund Diversification
The top 10 investments reflect the portfolio’s significant investment in high quality assets in top rated markets.
The top 10 tenants have a weighted average remaining lease term of 11.5 years and represent 10.9% of total portfolio revenue.
Q12 0 1 9
confidential
confidential

4.133.35 3.82 4.06 3.69 4.07 4.48
3.57
8.93
2.882.75
3.645.17 4.61
-1.13
1.97
Industrial Apartment Retail Office Fund Avg West South Midwest East
Fund Average Appreciation Income
As of March 31, 2019, one year total gross unleveraged property level performance was led by theIndustrial sector, followed by Office, Apartment and Retail. On a regional basis, the West led performancefollowed by the South, East and the Midwest on a trailing twelve month basis.
Fund Performance
11 Invesco Core Real Estate–U.S.A., L.P.
Unleveraged property level performance totaled 7.28% on a one year basis, led by Industrial, followed by Office, Apartment and Retail.
Three Year Gross Return
Returns shown reflect the performance of the properties, on an unleveraged basis.
3.69 3.45 4.03 4.22 3.64 4.19 4.25 3.80
9.19
0.97
-0.11
4.614.41 3.72
-3.44
1.82
Industrial Apartment Retail Office Fund Avg West South Midwest East
Fund Average Appreciation Income
13.13
7.288.17 8.02
5.680.70
8.97
4.45 3.91
13.33
6.30 6.64
9.00 8.82
3.31
5.60
7.81 7.78
One Year Gross Return
Q12 0 1 9
confidential
confidential

Same Store Summary Operating Statistics
As of March 31, 2019, the “same store pool” represented 91.4% of the total portfolio (based on gross market values).
The Core Same Store Portfolio percentage leased increased 90 bps over the prior year to 93.1%.
Same Store Core Portfolio NOI grew a robust 11.8% over the same period last year, which is roughly inline with budget.
Same store apartment NOI increased 13.2% on a year-over-year basis, driven largely by the stabilization of 33 Tehama (San Francisco,CA), The Royce (Orange County, CA), The Grand at Legacy West (Plano, TX) and Flats 8300 (Washington DC); excluding these assets,same store NOI growth was 2.2%. Other key contributors include a successful common area renovation at Instrata Pentagon City(Washington, DC) that drove NOI growth of over 11% and a unit renovation program at Retreat at Park Meadows (Denver, CO) wherewe are seeing 9%+ NOI growth. This NOI growth was partially offset by temporary softness in some markets due to new supply andincreases in real estate taxes, payroll and marketing costs. The Core portfolio ended the quarter at 95.1% leased.
Same store industrial NOI increased 6.7% on a year-over-year basis, driven largely by additional leasing at the Miami and Steeplechaseportfolios, and by higher rents captured on tenant renewals in line with continued strong demand in the sector. Other contributorsincluded increased tenant reimbursements, operating expense efficiencies, and free rent burn off. NOI growth was consistent acrossmost markets within the portfolio, with 11 of 13 investments increasing NOI compared to the prior year. The Core portfolio ended thequarter at 99.1% leased.
The same store office portfolio continues to deliver robust NOI growth with a 12.8% increase on a year-over-year basis. Free rent burnoff at 1101 Westlake (Seattle, WA) and Legacy West Office (Plano, TX) were large contributors combined with strong rent growth andleasing in the Boston/Cambridge assets (55 Cambridge Parkway and Fort Point) and select West Los Angeles (The Reserve) and SF BayArea (101 2nd Avenue) assets. Leasing within the Core portfolio remains strong at 92.9% leased, though down 90bps from Q1.2018.
The core retail portfolio delivered 12.0% year-over-year, same-store NOI growth, driven primarily by the successful lease up of LegacyWest (Dallas MSA). However, NOI growth was roughly flat when excluding Legacy West. Looking forward, core retail NOI is projectedto decline ~2% versus the trailing 12 months primarily due to a known move-out at 130 Prince (SoHo street retail & office) and free rentbeing incurred at Cityline at Tenley (DC MSA). Excluding these two assets, core retail NOI growth is expected to be 2-3%, and thisgrowth is predominantly contractual.
12 Invesco Core Real Estate–U.S.A., L.P.
Portfolio Fundamentals
The same store apartment portfolio delivered the strongest year-over-year NOI growth for the Fund at 13.2%.
The Core Portfolio is budgeted to deliver NOI growth of 8.4% during 2019.
126
58
134
98
142
62
152
110
020406080
100120140160
Apt Ind Off Ret
Same Store – Core TTM NOI ($ MM) – as of Mar 31 2018 2019
9799
94 9496
95
99
94
87
91
94
80
84
88
92
96
100
Apt Ind Off Ret Other Total
Total Portfolio - CorePercentage Leased (%) 1Q 2018 1Q 2019
39
18
42
25
39
18
43
25
0
20
40
60
Apt Ind Off Ret
Total Portfolio - Core *NOI ($ MM)
YTD Budget YTD Actual
88
99
94 93 9295
99
93
88
93
75
80
85
90
95
100
Apt Ind Off Ret Total
Same Store - CorePercentage Leased (%)
1Q 2018 1Q 2019
Growth (%): 13.2 6.7 12.8 12.0
* Represents the pool of Core properties held as of December 31, 2018.
Overview Overall portfolio fundamentals remained strong with the Total Core Portfolio ending the year at 93.5% leased. The Total Core Portfolio saw flat to slightly negative changes in occupancy across the sectors on a year-over-year basis, but
most notably the Retail sector declined by 620 bps. This was primarily the result of expected tenant vacancies at ChandlerPavilion (Phoenix, AZ) and 130 Prince (New York, NY; vacancy in the office portion of the property), which have ameaningful amount of leasing activity.
The pool of Core properties held as of December 31, 2018 is budgeted to deliver NOI growth of 8.4% in 2019, which is ontrack through the end of the first quarter.
Q12 0 1 9
N/A
confidential
confidential

13 Invesco Core Real Estate–U.S.A., L.P.
Sustainability Program
Program Elements
Complete Global Real Estate Sustainability Benchmark (GRESB) annually. Conduct ESG assessments during due diligence. Benchmark and monitor all landlord-controlled energy, water and waste consumption/cost in ENERGY STAR
Portfolio Manager, and in doing so seeking to continually and steadily improve performance across our managedportfolio. Targets are established at the property level and reviewed no less than annually. Our long-termreduction target is 10% or approx. 1% per year in energy, emissions, water and waste.
Take a managed approach to the procurement of energy in deregulated energy markets. Providing tools and resources such as Energy & Sustainability Guidelines & Requirements to engage property
managers on sustainability issues. Track the implementation of energy, GHG emissions, water and waste reduction measures as well as sustainable
practices including health & well-being, indoor environmental quality, resilience and tenant & communityengagement strategies in the annual ESG Survey and ABP/Budget process for all property types.
Pursuing ENERGY STAR certification for eligible buildings annually. Evaluate feasibility of pursuing green building certifications such as LEED as well as health and wellness
certifications such as WELL and Fitwel. Provide Green Living Guide for residents and Sustainable Office Handbook and Sustainable Office Checklist for
commercial tenants. Conduct tenant/resident satisfaction surveys annually. Disclosing our ESG strategy and performance to investors through reporting frameworks such as the Global Real
Estate Sustainability Benchmark (GRESB), Global Reporting Initiative (GRI), the European Association forInvestors in Non-Listed Real Estate Vehicles (INREV), Carbon Disclosure Project (CDP), United Nations Principlesfor Responsible Investment (UNPRI), etc.
Note: This report is aligned with INREV Sustainability Reporting Recommendations and the sustainability data has been reviewedby LORD Green Real Estate Strategies, Inc.
2018 GRESB ResultsICRE has consistently ranked in the top 5 globally of more than 140 diversified funds through GRESB for the past 5years – current ranking is No. 3 of 42 North America Diversified. The Fund’s score has remained strong despite theunderweight to Office relative to peers. ICRE leads its peer set in implementation and measurement of ESG(Environmental, Social and Governance).
ENERGY STAR Certifications (Office Properties Only)
Q12 0 1 9
Green Building Certifications
Total Square Footage Certified: 16.2 million sq ft
Property Type % Certified
Office 85.0%
Multifamily 83.4%
Retail 53.0%Industrial 22.1%
confidential
confidential

Sq. Ft./Units 1
Gross Sales Price ($ MM) 1
Carry ValuePre Marketing
($ MM) 1%
Change
SinceInception Gross IRR
(%)ICRE
Share %InvestmentYear
AcquiredQuarter
SoldProperty
Type MSA
None
2019 Disposition Totals
InvestmentQuarterAcquired
Property Type MSA
Sq. Ft./ Units 1
GrossPurchase
Price ($ MM) 1,2Debt
($ MM) 1,2
Fund Equity
($ MM) 2ICRE
Share % 3
The Harlo 1Q19 Apartment Boston 212 150.0 0.0 150.0 100.0
22 Boston Wharf 1Q19 Office Boston 123,875 178.1 0.0 178.1 100.0
Norwood Self Storage 1Q19 Self Storage Boston 1,005 18.2 0.0 18.2 100.0
Newark Self Storage 4 1Q19 Self Storage SF East Bay 1,607 6.0 0.0 5.9 97.5
US Storage – 4800 Valley 5
1Q19 Self Storage LA Area 1,192 5.4 0.0 5.1 95.0
Tryon South End 6 1Q19 Office Charlotte 326,859 27.0 0.0 23.6 87.3
2019 Acquisition Totals
384.7 0.0 380.9
1 Values presented at 100%.2 At acquisition.3 Current contractual ownership %.4 Future development; Total Capitalization of the project is $28.5 million.5 Future development; Total Capitalization of the project is $21.7 million.6 Future development; Total Capitalization of the project is $170.7 million.
14 Invesco Core Real Estate–U.S.A., L.P.
Investment Activity
2019 Acquisitions
2019 Dispositions
Q12 0 1 9
The Harlo 22 Boston Wharf Norwood Self Storage
Newark Self Storage Rendering
US Storage – 4800 ValleyRendering
Tryon South End Rendering
confidential
confidential

Investment Activity
15 Invesco Core Real Estate–U.S.A., L.P.
First Quarter 2019 Acquisitions
22 Boston Wharf RoadOffice/Parking ▪ Boston, Massachusetts
Acquisition of a 123,875 SF office and 555 space garage (4.5x per 1,000 SF) in the Boston Seaportsubmarket. The property was built in 2001 and renovated in 2018.
The office space is 100% leased with 11+ years of WALT.
Significant demand for office space in the Seaport has resulted in less than 5% vacancy and averagerent growth of 6% per year since 2012.
The Property is located directly across the street from Amazon’s new Boston office, which is expectedto bring at least 2,000 employees when fully completed by 2022.
The continued development of surface parking lots in the Seaport is resulting in increased demand withdiminishing relative supply.
Purchase Price: $178.1M
Allocated Office Price Per SF: $963
Allocated Parking Price Per Stall: $105,912
Year 1 Income Return: 4.82%
10 Year Average Income Return: 5.62%
10 Year Average Cash Return 5.50%
Year 10 Unleveraged IRR: 7.39%
Source: Invesco Real Estate as of March 2019. For illustrative purposes only. It does not constitute recommendation or advice. Returns stated are underwriting forecasts.
Key Statistics
rendering
Rendering
Q12 0 1 9
confidential
confidential

Investment Activity
16 Invesco Core Real Estate–U.S.A., L.P.
First Quarter 2019 Acquisitions
The Harlo FenwayApartment ▪ Boston, Massachusetts
Acquisition a new Class A, 212-unit multifamily high-rise in the Fenway submarket of Boston.
The location is proximate to numerous STEM employment centers including the Longwood MedicalArea, Back Bay and Cambridge.
Nearby amenities include walkable retail and dining options, cultural and entertainment venues andoutdoor recreation areas.
The Property’s renewal ratio has averaged 65% with more than 4% average rent growth on recent leaserenewals.
Significant Job Growth with Limited Apartment Supply Pipeline: only 357 units are scheduled to deliverover the next three years while one million square feet of office/lab/retail development will occur in thesubmarket.
Source: Invesco Real Estate as of February 2019. For illustrative purposes only. It does not constitute recommendation or advice. Returns stated are underwriting forecasts.
Key Statistics
rendering
Rendering
Q12 0 1 9
Purchase Price: $150.0M
Price per Unit: $707,665
Year 1 Income Return: 4.06%
10 Year Average Income Return: 4.63%
10 Year Average Cash Return: 4.45%
Year 10 Unleveraged IRR: 6.10%
confidential
confidential

Investment Activity
17 Invesco Core Real Estate–U.S.A., L.P.
First Quarter 2019 Acquisitions
Tryon South EndOffice ▪ Charlotte, North Carolina (Charlotte MSA)
To-be-built, 633,283 SF, trophy office project in one of the most desirable live-work-play areas in theSoutheastern United States.
Project to be built in two phases: Phase 1 will commence with significant pre-leasing and Phase 2 willcommence after additional pre-leasing hurdles.
South End is Charlotte’s fastest-growing retail scene and is the primary destination for its young andeducated workforce.
Build to an all-in basis that is well below recent and pending trades.
Joint-venture with Spectrum Companies, who has 35 years of experience developing best-in-classproduct in the market.
Source: Invesco Real Estate as of January 2019. For illustrative purposes only. It does not constitute recommendation or advice.Returns stated are underwriting forecasts.
Key Statistics
Q12 0 1 9
Total Development Cost: $270.1M (Phase 1 + 2)
$170.7M (Phase 1 only)
Rentable SF: 633,283
Cost Per RSF: $427
Untrended Return on Cost: 6.93%
Trended Return on Cost: 7.50%
Year 5 Structured IRR: 14.83%
Rendering
confidential
confidential

Net Asset Value ($ MM) Investors
Current
March 31, 2019 NAV 10,267.2 132
April 2019 Capital Call 136.9 3
April 2019 Redemptions (54.0) 0
10,350.1 135
Investor Commitments
Signed - 0
In Documentation 307.3 1
307.3 1
Total Investors 10,657.4 136
Fund Capitalization
18 Invesco Core Real Estate–U.S.A., L.P.
The Fund called $245.5 million of capital from one new and six existing investors during the quarter. Inaddition, the Fund paid redemptions in the amount of $11.6 million.
Subsequent to quarter end, the Fund called $136.9 million of capital and paid $54.0 million inredemptions.
The Fund ended the quarter with 136 investors either invested or committed as summarized in the tablebelow.
As of the issuance of this report (post March 31, 2019), the Fund has approximately $337.3 million ofcommitments in various stages of negotiation and documentation.
Equity Investor Composition 1
1 Based on NAV as of March 31, 2019.2 Includes Sovereign Wealth Funds, High Net Worth and Other investor types.
The Fund called $245.5 million of capital during the quarter.
Other 2 – $813M;8%; 15 clients
Corporate Pension – $1,995M;19%; 30 clients
By Type
Asia Pacific – $1,424M;
14%; 15 clients
By Domicile
Investor Activity as of 3/31/19
Q12 0 1 9
Taft Hartley – $828M;8%; 21 clients
InsuranceCo. – $453M;4%; 5 clients
Foundation/Endowment – $223M;
2%; 13 clients
Fund of Funds – $663M;
7%; 7 clients
Public Pension – $5,293M; 52%; 41 clients
Europe – $923M;9%; 7 clients
US – $7,398M;72%; 104 clients
Other North America – $521M;5%; 6 clients
confidential
confidential

Maturity Schedule 1, 4
19 Invesco Core Real Estate–U.S.A., L.P.
Fund Capitalization
The Fund has a weighted average remaining maturity on fixed rate debt of 7.9 years, meaningfully longer than ODCE.
Fixed 73%
Floating 17% 4
Secured 56%
Unsecured 44% 4
LTV (incl./excl. short-term borrowings) 2, 3 25.0%/23.6% Total Outstanding Principal 4 $3,329.5M
DSCR 3.6x Contract Rate 4 4.0%
Debt Yield 14.0% Market Rate 4 4.1%Unencumbered to Total Asset Ratio 66.0% Weighted Average Remaining
Term Fixed Only 57.9 years
Fund Level Debt Summary 1
1 Includes joint venture investments debt at ICRE’s prorata share.2 Calculated with debt at fair value. 3 Short-term line of credit balance was $190M. 4 Excludes the Fund’s $400M short-term line of credit, which had $190M balance outstanding as of March 31, 2019.5 Weighted average remaining term including floating rate debt is 6.4 years.
Floating w/ Cap 10%
Q12 0 1 9
$0
$100
$200
$300
$400
$500
$600
$700
$800
2019 2020 2021 2022 2023 2024 2025 2026 2027 2028 Thereafter
$ in
mill
ions
JV secured ICRE secured ICRE unsecured
confidential
confidential

Investment Type LocationSq. Ft. /Units
CurrentCarry Value
($ MM)
Loan to Value/
Cost (%)
ICRE Share
(%) 4
The Reserve 1 Office Playa Vista, CA 374,433 411.0 0 96.4
Pacific Commons South 2,3 Industrial Fremont, CA 1,651,552 376.0 49 93.1
33 Tehama Apartment San Francisco, CA 403 339.0 42 89.1
Fort Point Portfolio 1 Office Boston, MA 398,226 281.0 0 98.9
The Royce Apartment Irvine, CA 520 228.0 47 92.2
Clayton Lane Retail Denver, CO 182,621 198.9 24 95.6
Hercules East and South Campus 1 Office Playa Vista, CA 193,742 197.0 0 96.7
The Quad 2, 3 Life Science Cambridge, MA 199.487 153.2 46 64.9
The Blu27 (fka Biscayne 27) 2, 3 Apartment Miami, FL 330 116.4 50 90.0
Legacy West Block H 2, 3 Mixed-Use Plano, TX 656,521/161 116.2 0 77.8
Avion Burbank Industrial Burbank, CA N/A 112.5 0 91.7
139 Spring Street 1 Retail New York, NY 8,120 112.0 0 99.2
Baranof Self-Storage Portfolio Self-Storage Various 4,888 110.7 0 92.6
Miami Industrial Portfolio Industrial Various, FL 666,164 97.4 31 88.8
Ten Fawcett Office Cambridge, MA 131,565 62.2 48 97.0
US Storage Portfolio 2, 3 Self-Storage Compton, CA 1,390 31.0 44 95.0
Tryon South End Office Charlotte, NC N/A 28.2 0 86.8
4th & Colorado Retail Santa Monica, CA 4,710 16.6 0 80.0
Newark Self-Storage Self-Storage Newark, CA N/A 6.3 0 97.5
Investment Type LocationSq. Ft. /Units
TotalAssets ($ MM)
Loan to Value/
Cost (%)
ICRE Share
(%) 4
Shops at Crystals Retail Las Vegas, NV 290,092 1,208.0 45 25.0
Runway at Playa Vista Mixed-Use Playa Vista, CA 250,035/420 558.0 42 53.0
The Mark 302 Office Santa Monica, CA 118,585 113.2 0 49.9
5250 Park 2, 3 Apartment Miami, FL 231 93.9 44 50.4
Canvas at Press Blocks 2, 3 Office Portland, OR 140,146 77.5 0 95.6
Consolidated Joint Venture Investments
Joint Venture Investments
ICRE’s policy regarding the reporting of joint venture interests is pursuant to the requirements under U.S.generally accepted accounting principles (GAAP). In general, joint ventures where ICRE has a controllingfinancial interest are consolidated on the Fund’s financial statements for reporting purposes unless thejoint venture partner has significant rights. Joint ventures where the Fund holds less than a majoritycontrolling financial interest are reported under the equity method (unconsolidated), with only the Fund’sequity interest being reported on ICRE’s balance sheet. However, the reported diversification and leveragemeasures include the Fund’s prorata share of all joint venture real estate and debt.
Unconsolidated Joint Venture Investments
1 While classified as consolidated joint venture investments on the balance sheet, the partners for these assets have a de minimisminority interest position and ICRE has control. Therefore the assets are not included in the calculation of ICRE’s overall joint venture exposure.
2 Figures are based on the most recent development budget and are subject to change.3 Values reflected on a fully funded basis.4 Effective share.
Wholly Owned 83.8%
Joint Ventures 16.2%
Note: The tables above reflect the total assets and total debt at 100%; not ICRE’s share. LTV reflects debt at fair value.
The Fund acquired the minority interest partner equity on 131-137 Spring St. and this asset is now wholly-owned.
20 Invesco Core Real Estate–U.S.A., L.P.
Q12 0 1 9
confidential
confidential

Property NamePropertyType Location Strategy
Current Carry Value
($ MM)
Remaining Cost
($ MM)
Total Capitalization
($ MM)
Pacific Commons South 1, 2 Industrial Fremont, CA Development 229.9 146.1 376.0
The Blu27 (fka Biscayne 27) 1, 2 Apartment Miami, FL Development 109.4 7.0 116.4
Legacy West Block H 2 Mixed-Use Plano, TX Development 15.4 100.8 116.2
Avion Burbank 2 Industrial Burbank, CA Development 112.5 N/A 112.5
5250 Park 1, 2 Apartment Miami, FL Development 83.7 10.2 93.9
Canvas at Press Blocks 1, 2 Office Portland, OR Development 15.0 62.5 77.5
Clayton Lane 2 Apartment Denver, CO Development 41.0 N/A 41.0
US Storage 1, 2 Self-Storage Compton, CA Development 23.3 7.7 31.0
2270 Broadway Apartment Oakland, CA Development 28.2 N/A 28.2
Tryon South End Office Charlotte, NC Development 28.2 N/A 28.2
Newark Self-Storage Self-Storage Newark, CA Development 6.3 N/A 6.3
Subtotal 692.9 334.3 1,027.2
The Quad 2 Life Science Cambridge, MA Re-Development 127.7 25.5 153.2
The Mark 302 2 Office Santa Monica, CA Re-Development 113.2 N/A 113.2
4th & Colorado 2 Retail Santa Monica, CA Re-Development 16.6 N/A 16.6
Subtotal 257.5 25.5 283.0
Baranof Self-Storage Portfolio 2 Self-Storage Various Lease-Up 110.7 N/A 110.7
Austin Self Storage Portfolio Self-Storage Austin, TX Lease-Up 28.0 N/A 28.0
Subtotal 138.7 N/A 138.7
Total 1,089.1 359.8 1448.9
Manage-to-Core
ICRE continues the prudent and successful use of the Fund’s value add capacity as this phase of the realestate cycle continues to offer opportunities to increment return through manage-to-core executionstrategies that produce long-term core assets at their conclusion. To date, the Fund has focused onmanage-to-core strategies primarily in the apartment and industrial sectors to increment return and accesslong term strategic “uber core” assets.
Manage-to-Core Investments
21 Invesco Core Real Estate–U.S.A., L.P.
Core 91.5%
Manage-to-Core 8.5% 3
1 Figures are based on the most recent development budget and are subject to change.2 Joint venture investment, however values are presented at 100%.3 Manage-to-Core percentage is calculated using the total capitalization of the assets at ICRE’s effective share.
Meridian Distribution Center II, an industrial property in the Inland Empire area, is now 100% leased and was reclassified to Core during the quarter.
Q12 0 1 9
Status Highlights 5250 Park (Doral, FL Apartments) began leasing during the quarter.
The Blu27 (fka Biscayne 27) apartment development should begin preleasing by Q3
Pacific Commons South construction is well underway with strong tenant interest.
Construction continues Canvass at Press Block Portland office development in Portland.
The last phase of Legacy West (Block H) began construction during the quarter complementing the already‐stabilized main project.
Tryon South End office in Charlotte will commence development upon significant preleasing.
confidential
confidential

Valuation Summary
22 Invesco Core Real Estate–U.S.A., L.P.
Property Type
Implied Year 1
Cap Rate(%)
Stabilized Cap Rate
(%)
10 YearDiscount
Rate(%)
5 Year NOI Return
(%)
10 Year Exit Cap Rate
(%)
5 Year Rent Growth
(%)
Apartment 3.92 4.18 6.04 4.31 4.68 3.24
Industrial 4.14 4.51 5.81 4.53 4.88 3.36
Office 4.13 4.86 6.31 4.81 5.48 3.19
Retail 3.99 4.83 6.05 4.71 5.11 3.20
Other 5.07 5.07 6.75 5.46 6.50 3.47.
Core Portfolio Total 4.04 4.58 6.10 4.59 5.06 3.23
Manage-to-Core Portfolio Total 3 5.65 7.16 4.45 5.72 2.36
Portfolio Total 4.65 6.17 4.58 5.10 3.17
1 Includes the valuation of joint venture investments at the Fund’s prorata share of the gross property level vs. entity level valuation.2 Previous value represents prior appraised value plus subsequent capital to date.3 Metrics for the Manage-to-Core Portfolio exclude assets that are currently in development and being held at cost and land that is
being held for future development.
First Quarter Summary of Key Valuation Metrics 1
First Quarter Summary of Valuations 1
Gain/Loss Summary
Overall appreciation moderated this quarter but Office and Industrial continued to be key drivers.
Property Type
Gross Pre-Appraisal Property Value 2
($ MM)
Gross AppraisedProperty
Value($ MM)
Gain/Loss Previous
Value($ MM)
% Gain/Loss(%)
Apartment 4,178.8 4,163.5 -15.3 -0.37
Industrial 1,696.1 1,711.9 15.8 0.93
Office 4,043.7 4,065.3 21.6 0.53
Retail 2,698.1 2,686.9 -11.2 -0.41
Other 17.8 17.8 0.0 0.00
Core Portfolio Total 12,634.5 12,645.4 10.9 0.09
Manage-to-Core Portfolio Total 879.0 893.8 14.8 1.69
Portfolio Total 13,513.5 13,539.2 25.7 0.19
Stabilized cap rate of 4.58% for the Core Portfolio is both near term and largely “baked”.
Q12 0 1 9
confidential
confidential

Existing & Target Markets
Existing Sub-Portfolio (# assets) Target Sub-Portfolio (# assets)
Strategy/Objective Aggregate a national portfolio via core, infill metro and regional sub-portfolios
Target submarkets where inventory per capita is below the US and metro averages
Focus on newer product in dense trade areas
Acquire stabilized assets in a disciplined manner where operations can be enhanced by institutional management
Develop-to-core with two existing partners with a focus on the West Coast and Northeast
Fund Exposure to Self Storage (03/31/2019)
Stabilized In Lease Up Development Total
Number of Properties 2 9 3 14
Number of Units 1,348 6,331 4,020 1 11,868 1
Average Occupancy – Leased 90.5% 43.5% 0.0% 53.7% 2
Market Value ($ MM) 3 $36.2MM $130.5MM $28.MM 4 $195.1MM
% of Fund Gross Asset Value 3 0.3% 0.9% 0.2% 1.4%
Sector Profile – Self StorageInfill sub-portfolios in key markets
1 Proforma units; subject to change; 2 Excludes Development; 3 At Fund Share; 4 Carried at Cost
Representative Photographs
Walden Park (Austin, TX)
Office
SF Bay Area (2)
Seattle (0)
Boston (1)
Portland (3)
New York (0)
Austin (4)
Los Angeles (2)
South Florida (0)
Washington, DC (0)
San Diego / O.C. (0)
Raleigh (2)
4800 Valley Boulevard (Los Angeles, CA)
Rendering
Q12 0 1 9
23 Invesco Core Real Estate–U.S.A., L.P.
confidential
confidential

Fund Governance Log
24 Invesco Core Real Estate–U.S.A., L.P.
Date: Description/Action
September 20, 2004 Placeholder LLC Agreement
September 30, 2004 Fund Inception – Amended and Restated LLC Agreement
December 1, 2004 Amendment(s)1. Modification of lock-out date for founding investors2. Clarification that borrowing restrictions are based on FMV rather than NAV3. Reasonable efforts to minimize UBIT
January 20, 2005 –April 5, 2006
Second Amended & Restated LLC Agreement
August 2005 Amendment 1 (approved): Modification of borrowing restriction to allow short-term borrowings on LOC that result in final LTV to exceed 30% to the extent that there are outstanding subscriptions
April 5, 2006 Amendment 2 (approved)-primary modifications:1. Raise negligence standard for manager to “Prudent Person” from simple negligence2. Provide for ERISA Fiduciary in the event Fund loses VCOC status and becomes “Plan Assets”
under ERISA
April 6, 2006 – March 5, 2008
Third Amended & Restated LLC Agreement
May 2007 Advisory Committee approval of Brill Building acquisition and co-investment
February 15, 2008 Amendment (approved) – primary modifications:1. Increase property type limit from 40% to 45% (consistent with IRE strategic ranges)2. Clarification that 15% value added measurement is based on gross asset value of both investment
and Fund3. Increase Fund’s leverage limit from 30% to 35%
March 5, 2008 Amendment 2 (approved) – primary modifications1. Decrease the single property, single metropolitan area diversification limitation2. Remove the extended period of time the Manager had to meet investment restrictions, a benefit
provided to the Manager in Amendment No. 13. Clarify the language regarding new fund counsel
March 6, 2008 –June 30, 2010
Fourth Amended & Restated LLC Agreement
October 14, 2009 Amendment (approved) – primary modifications:1. Temporary increase of Fund’s leverage limit from 35% to 45% between September 2009 and
September 20112. Proceeds of any borrowings over 35% used solely for recasting or repaying down existing debt,
funding of capital expenditures or other such expenses in the normal course of business
October 22, 2010 Amendment to Fourth Amended & Restated LLC Agreement (approved) – primary modifications:1. Return Fund’s leverage limit to 35% via elimination of temporary increase from 35% to 45% as
provided for in the Fourth Amended and Restated LLC Agreement approved in April 20082. Revision of partial redemption payment allocation methodology to be based on an investor’s NAV
vs. requested redemption amount
July 1, 2011 Fund conversion from a Limited Liability Company (LLC) to a Limited Partnership (LP)- Primary objective of the conversion was to provide Non-U.S. Investors with a more tax efficient
vehicle while maintaining benefits for existing investors
November 3, 2011 Amendment to Limited Partnership Agreement:- Revision to correct a clerical error omitting the revision of partial redemption payment allocation
methodology, as approved in the Amendment to Fourth Amended & Restated LLC Agreement
November 3, 2011 Amended & Restated Limited Partnership Agreement (effective July 1, 2011)
November 3, 2015 Advisory Committee approval of Runway acquisition and co-investment
March 9, 2016 Advisory Committee approval of Shops at Crystals acquisition and co-investment
August 11, 2016 First Amendment to the Amended and Restated Limited Partnership Agreement:1. Updates/clarifications to the definition of Management Fee and provisions on Operating Expenses,
Limitation of Liability, delivery of reports and Fund Counsel 2. Tax updates related to Bipartisan Budget Act of 20153. Addition to require the approval of two-thirds of the members of the Advisory Committee for co-
investments and joint ventures with Invesco affiliates or directed accounts4. Addition to allow for certain employees of Invesco Real Estate to invest in the Fund at a reduced
or no fees basis
Q12 0 1 9
confidential
confidential
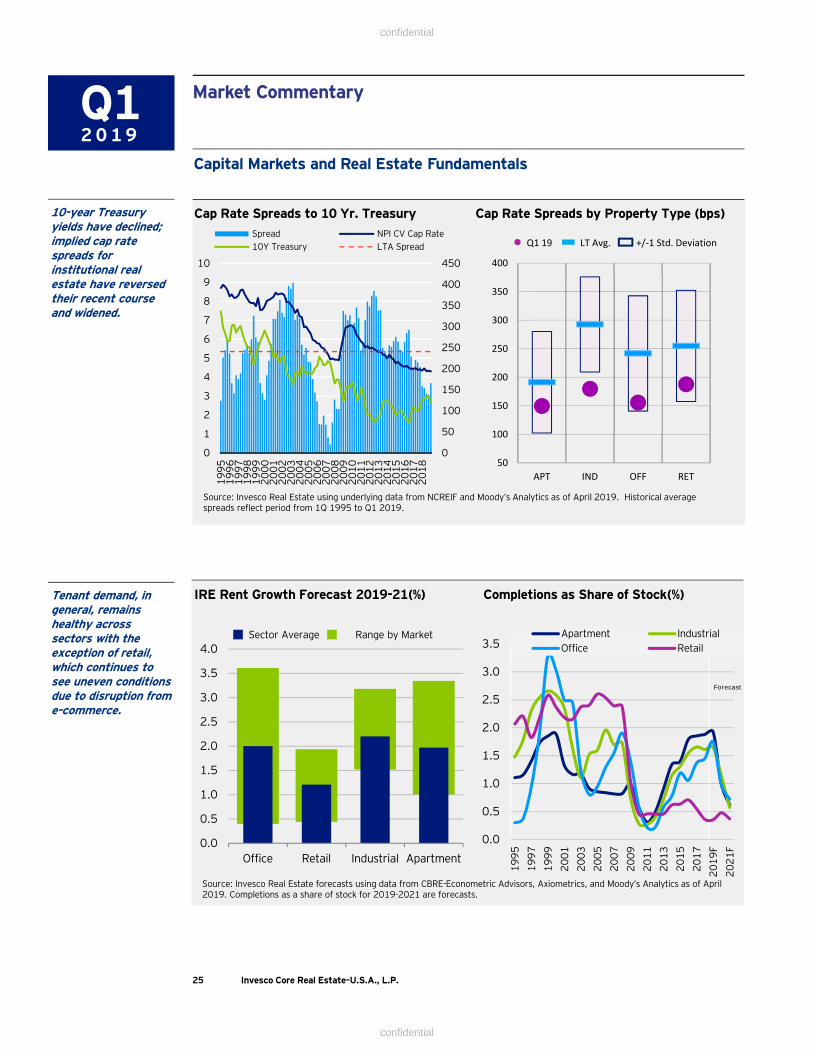
Capital Markets and Real Estate Fundamentals
Market Commentary
Source: Invesco Real Estate using underlying data from NCREIF and Moody’s Analytics as of April 2019. Historical average spreads reflect period from 1Q 1995 to Q1 2019.
IRE Rent Growth Forecast 2019-21(%)
Source: Invesco Real Estate forecasts using data from CBRE-Econometric Advisors, Axiometrics, and Moody’s Analytics as of April 2019. Completions as a share of stock for 2019-2021 are forecasts.
Completions as Share of Stock(%)
10-year Treasury yields have declined; implied cap rate spreads for institutional real estate have reversed their recent course and widened.
Tenant demand, in general, remains healthy across sectors with the exception of retail, which continues to see uneven conditions due to disruption from e-commerce.
0
50
100
150
200
250
300
350
400
450
0
1
2
3
4
5
6
7
8
9
10
1995
1996
1997
1998
1999
2000
2001
2002
2003
2004
2005
2006
2007
2008
2009
2010
2011
2012
2013
2014
2015
2016
2017
2018
Spread NPI CV Cap Rate10Y Treasury LTA Spread
Cap Rate Spreads to 10 Yr. Treasury Cap Rate Spreads by Property Type (bps)
0.0
0.5
1.0
1.5
2.0
2.5
3.0
3.5
4.0
Office Retail Industrial Apartment
Sector Average Range by Market
0.0
0.5
1.0
1.5
2.0
2.5
3.0
3.5
1995
1997
1999
2001
2003
2005
2007
2009
2011
2013
2015
2017
2019
F
2021
F
Apartment IndustrialOffice Retail
Forecast
50
100
150
200
250
300
350
400
APT IND OFF RET
Q1 19 LT Avg. +/‐1 Std. Deviation
Q12 0 1 9
25 Invesco Core Real Estate–U.S.A., L.P.
confidential
confidential
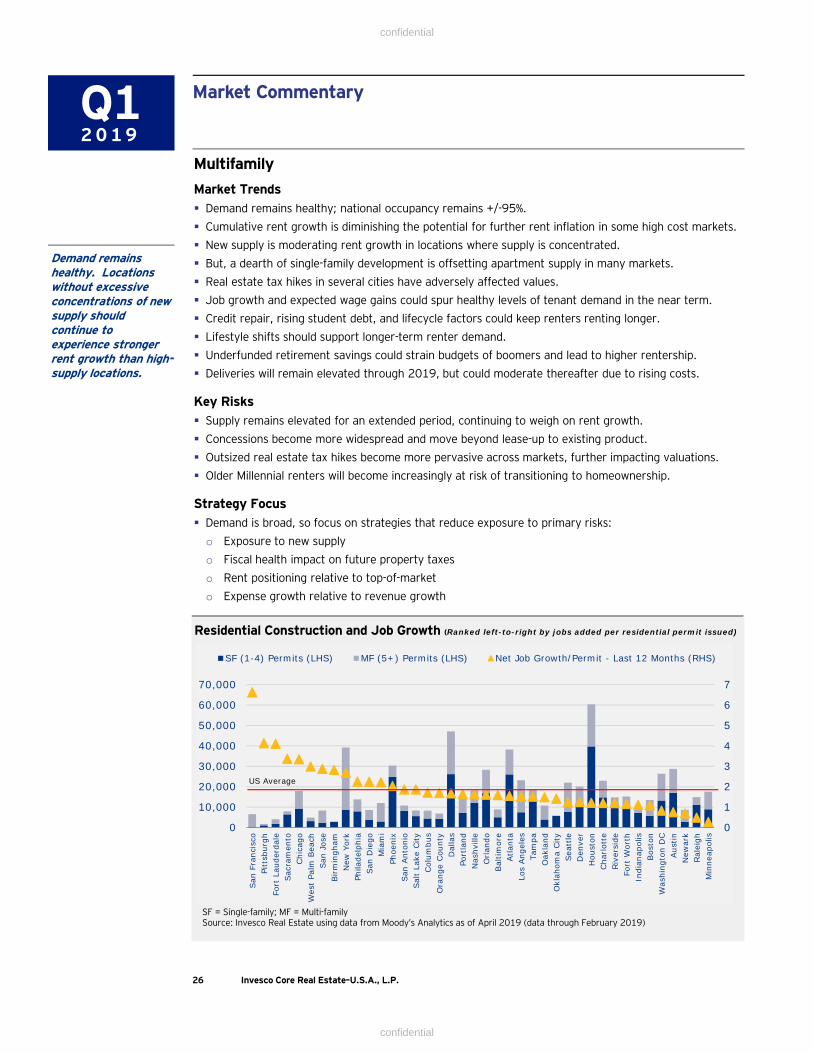
Multifamily
Market Trends Demand remains healthy; national occupancy remains +/-95%.
Cumulative rent growth is diminishing the potential for further rent inflation in some high cost markets.
New supply is moderating rent growth in locations where supply is concentrated.
But, a dearth of single-family development is offsetting apartment supply in many markets.
Real estate tax hikes in several cities have adversely affected values.
Job growth and expected wage gains could spur healthy levels of tenant demand in the near term.
Credit repair, rising student debt, and lifecycle factors could keep renters renting longer.
Lifestyle shifts should support longer-term renter demand.
Underfunded retirement savings could strain budgets of boomers and lead to higher rentership.
Deliveries will remain elevated through 2019, but could moderate thereafter due to rising costs.
Key Risks Supply remains elevated for an extended period, continuing to weigh on rent growth.
Concessions become more widespread and move beyond lease-up to existing product.
Outsized real estate tax hikes become more pervasive across markets, further impacting valuations.
Older Millennial renters will become increasingly at risk of transitioning to homeownership.
Strategy Focus Demand is broad, so focus on strategies that reduce exposure to primary risks:
o Exposure to new supply
o Fiscal health impact on future property taxes
o Rent positioning relative to top-of-market
o Expense growth relative to revenue growth
Market Commentary
Demand remains healthy. Locations without excessive concentrations of new supply should continue to experience stronger rent growth than high-supply locations.
Residential Construction and Job Growth (Ranked left-to-right by jobs added per residential permit issued)
SF = Single-family; MF = Multi-familySource: Invesco Real Estate using data from Moody’s Analytics as of April 2019 (data through February 2019)
0
1
2
3
4
5
6
7
0
10,000
20,000
30,000
40,000
50,000
60,000
70,000
San
Fra
ncis
coPi
ttsb
urgh
Fort
Lau
derd
ale
Sac
ram
ento
Chi
cago
Wes
t Pa
lm B
each
San
Jos
eBirm
ingh
amN
ew Y
ork
Phila
delp
hia
San
Die
goM
iam
iPh
oeni
xSan
Ant
onio
Sal
t La
ke C
ityCol
umbu
sO
rang
e Cou
nty
Dal
las
Port
land
Nas
hvill
eO
rlan
doBal
timor
eAtla
nta
Los
Ang
eles
Tam
paO
akla
ndO
klah
oma
City
Sea
ttle
Den
ver
Hou
ston
Cha
rlot
teRiv
ersi
deFo
rt W
orth
Indi
anap
olis
Bos
ton
Was
hing
ton
DC
Aus
tinN
ewar
kRal
eigh
Min
neap
olis
SF (1-4) Permits (LHS) MF (5+) Permits (LHS) Net Job Growth/Permit - Last 12 Months (RHS)
US Average
Q12 0 1 9
26 Invesco Core Real Estate–U.S.A., L.P.
confidential
confidential

Office
Market Trends Office employment continues to grow at a steady pace.
Office demand rebounded in 2018; occupancy has improved moderately.
Innovation markets exhibit strongest fundamentals; large blocks of space becoming increasingly scarce.
New supply remains disciplined, but is capturing an outsized share of demand.
Tenants attracted to new product in live-work-play locations for efficiency and talent attraction.
NOI growth in near term should be driven by marking expiring leases to current market rents.
Key Risks Innovation upside risk: Dearth of availabilities could lead to renewed rent spikes in some locations.
Innovation downside risk: Dearth of skilled labor will curb the need for additional leasing; locations withhigh exposure to venture start-ups could experience more volatility as the cycle matures.
Demand could moderate due to ongoing space densification and impact from disruptive technologies.
Coworking tenants’ business model could make them more sensitive to an economic downturn.
Supply increases at faster pace than anticipated in certain key office markets.
Strategy Focus Focus on locations and asset attributes driven by innovation industries:
o Location relative to innovation clusters
o Building functionality
o Commodity versus differentiated space
o Flexibility of tenant finishes
o Capacity to accommodate tenant expansion
o Price versus replacement cost
Market Commentary
Innovation hub locations and higher quality assets have pricing power that far outpaces all other office segments and locations.
Office Rent Mark-to-Market: 2019 Renewals (% chg.)
Sources: Invesco Real Estate using underlying data from CBRE-EA as of April 2019
-20
0
20
40
60
80
100
120
140
-20
0
20
40
60
80
100
120
140
SAF
AU
S
OA
K
SAJ
DEN
POT
SEA
BOS
OR
G
DA
L
MIA
LOS
US
ATL
SAN
NEY PH
I
PHO
CH
I
HO
U
MIN
WA
S5Y Leases 10Y Leases
Q12 0 1 9
27 Invesco Core Real Estate–U.S.A., L.P.
confidential
confidential

Industrial
Market Trends Occupancy is now well above the prior cyclical peak for most markets.
New supply is concentrated most in large bulk segment; limited new supply in infill locations.
Supply growth has largely caught up with demand, but remains in line with historical average growth.
Rent growth has moderated from robust levels, yet still exceeds long-term averages.
Continued job growth and broadening wage gains should support consumer spending, lifting demand.
Demand for highly functional bulk space continues to be driven by rapid online sales growth.
Demand for last-mile space has increased in line with consumers’ expectations for speedy delivery.
Location decisions are being driven not only by access to end users, but also access to labor.
Key Risks Supply expands at a faster pace than expected.
Further intensification of restrictive trade policies could impact demand close to ports.
Increased leasing by 3PL’s could evolve into volatile occupancy conditions if the economy falters.
Impact of technology (driverless trucks, drone delivery) adds uncertainty to mid/long-term outlook.
Strategy Focus Lean into robust e-commerce growth; manage property risks specific to infill and bulk:
o For infill: Access to labor and consumers; low versus high stock per capita
o For bulk: Access to labor, supply exposure, building functionality and modern systems, site efficiency, employee parking, trailer parking, price versus replacement cost
Market Commentary
E-commerce wave continues to spur demand for distribution space and last-mile logistics. New supply is building in the bulk segment but remains limited for infill.
Source: Invesco Real Estate using underlying data from CBRE-Econometric Advisors and Moody’s Analytics as of March 2014.
Sources: Invesco Real Estate using underlying data from CBRE-EA and CoStar as of April 2019. Coastal Markets: Seattle, San Jose, Oakland, Los Angeles, Orange County, Riverside, New York, Ft. Lauderdale, Miami, Houston. Inland Hubs: Atlanta, Chicago, Dallas, Fort Worth. Data for industrial occupancy by building age and size is an aggregation of IRE qualified market set.
82
84
86
88
90
92
94
96
1997
1998
1999
2000
2001
2002
2003
2004
2005
2006
2007
2008
2009
2010
2011
2012
2013
2014
2015
2016
2017
2018
2019
Coastal MarketsInland HubsAll Others
85
90
95
100
100-249KSF
250-499KSF
500-749KSF
750K+ SF
Built 1970-99 Built 2000-17
Industrial Occupancy (%) Industrial Occupancy by Building Age & Size (%)
Q12 0 1 9
28 Invesco Core Real Estate–U.S.A., L.P.
confidential
confidential

Retail
Market Trends National occupancy continues to be impacted by ongoing store closures; varies by center type.
Fragmented performance across property segments and store categories; winners vs losers
Retailers more focused on individual store productivity and role in multi-channel marketplace.
E-commerce formats have started selectively to open bricks-and-mortar stores.
Traditional bricks-and-mortar retailers are increasing their online platform budgets.
Construction across formats remains limited; not expected to materially increase in near term.
Key Risks Internet retail and shifting age demographics could constrain longer-term storefront spending trends.
Tenant right-sizing continues as retailers balance physical space needs with e-commerce growth.
Store closures remain elevated; this trend intensifies.
Online grocery gains faster acceptance, driven by Millennial generation, leading to grocery consolidation.
Strategy Focus Look for strength across trade area support, retailer credit, and physical space attributes:
o High versus low store sales productivity
o Prefer mixed-use settings to increase traffic
o Exposure to vulnerable anchors and co-tenancy
o Site efficiency
o Ability to demise large spaces
Market Commentary
(1) Adjusted Retail Sales excludes motor vehicles and parts deals, food service, gasoline stations, and fuel dealers(2) Assume average retailer sales productivity of $350 PSF for bricks & mortar retail spaceSources: Invesco Real Estate using underlying data from CBRE-EA and Moody’s Analytics as of April 2019
E-Commerce as Share of Retail Sales Power Center Recovery Outpaces Broader Retail
0
2
4
6
8
10
12
14
16
18
20
2000
2001
2002
2003
2004
2005
2006
2007
2008
2009
2010
2011
2012
2013
2014
2015
2016
2017
2018
E-C
omm
erce
Sal
es a
s Sh
are
of A
djus
ted
Ret
ail
Sale
s 1(
%)
Every 1% shift to online sales equates to sales that would support about 75 million SF of ”bricks and mortar” retail sales. 2
86
88
90
92
94
96
98
100
2005
2006
2007
2008
2009
2010
2011
2012
2013
2014
2015
2016
2017
2018
2019
Occ
upan
cy R
ate
(%)
Lifestyle & MallsPowerNeigh'd & Community
Slow to moderate consumer spending growth is expected in storefront retail, which could lead to additional store closures and continued soft rental conditions.
Q12 0 1 9
29 Invesco Core Real Estate–U.S.A., L.P.
confidential
confidential

Additional Information – Performance / Top Ten Assets (Net)
30 Invesco Core Real Estate–U.S.A., L.P.
0.73 0.80 0.85
2.993.27 3.49 2.95
3.39 3.623.16
3.58 3.76 3.413.78 3.94
3.864.18 4.29 4.27 4.33 4.39
0.19 0.400.62
4.02 3.21 3.24
4.963.52 3.56
6.485.45 5.51
6.43 5.81 5.77
3.14 3.43 3.13 3.12 2.582.40
0.92 1.20 1.47
7.106.55 6.79
8.02
7.01 7.26
9.809.18 9.42
9.999.75 9.87
7.10
7.73 7.52 7.507.03 6.85
ICR
E
OD
CE-
CW
OD
CE
- EW
ICR
E
OD
CE-
CW
OD
CE
- EW
ICR
E
OD
CE-
CW
OD
CE
- EW
ICR
E
OD
CE-
CW
OD
CE
- EW
ICR
E
OD
CE-
CW
OD
CE
- EW
ICR
E
OD
CE-
CW
OD
CE
- EW
ICR
E
OD
CE-
CW
OD
CE
- EW
Total (%)
Appreciation (%)
Income (%)
Investment Performance – Net
Total Return (%) 1Q 19One Year
Three Years
Five Years
Seven Years
Ten Years
Since Inception 1
ICRE 0.92 7.10 8.02 9.80 9.99 7.10 7.50
NFI-ODCE – CW 1.20 6.55 7.01 9.18 9.75 7.73 7.03
NFI-ODCE – EW 1.47 6.79 7.26 9.42 9.87 7.52 6.85
Top Ten Assets (Net Market Value)Based on Proforma Gross Market Value
Investment Location/MSAProperty Type
Net Market Value
($ MM)% of Total Portfolio
1 101 Second San Francisco, CA Office 464.0 3.9
2 Williams Tower Houston, TX Office 433.6 3.6
3 The Reserve 1 Playa Vista, CA / Los Angeles Office 396.0 3.3
4 55 Cambridge Parkway Cambridge, MA /Boston Office 362.0 3.0
5 Legacy West 2 Plano, TX/Dallas Mixed Use 355.7 3.0
6 1800 Larimer Denver, CO Office 339.0 2.8
7 Empire Gateway Chino, CA/Inland Empire Industrial 302.0 2.5
8 Fort Point Portfolio 1 Boston, MA Office 278.0 2.3
9 North Water Apartments Chicago, IL Apartment 256.0 2.1
10 Flats 8300 Washington DC Apartment 245.0 2.0
Top 10 Investments 3,431.4 28.51 Joint venture investment; values are presented at the Fund’s share.2 Net Market Value based on full development budget, plus appreciation to date, less full loan commitment.
1 Since inception returns are representative of the same period. Inception date is September 30, 2004.
Q12 0 1 9
confidential
confidential

Fund T1 Total Leverage, at costWholly-owned property level debt 1,179,257,130$ Fund's economic share of operating model debt 700,232,452 Revolving line of credit 190,000,000 Unsecured debt 1,450,000,000
3,519,489,582$
Total Gross AssetsTotal balance sheet assets 13,949,222,457$ Less: Joint venture partner economic share of total assets (205,390,911) Add: Fund's economic share of total joint venture liabilities (unconsolidated) 286,962,320
14,030,793,866$
Fund T1 Leverage Percentage:
Fund T1 Total Leverage, at cost 3,519,489,582 Total Gross Assets 14,030,793,866
25.084%= =
31 Invesco Core Real Estate–U.S.A., L.P.
In accordance with the NCREIF PREA Reporting Standards Tier 1 (T1) disclosure requirements, thefollowing is the Fund’s current quarter T1 Leverage, T1 Gross Assets and T1 Leverage Ratio:
Additional Information – T1 Leverage
T1 Leverage
Q12 0 1 9
confidential
confidential

32 Invesco Core Real Estate–U.S.A., L.P.
Additional Information – Performance Notes
1. The Invesco Core Real Estate U.S.A., L.P. is a core style, open-end real estate fund with a September30, 2004 inception date. The Fund can also invest up to 15% of gross assets in value addedstrategies.
2. Performance is calculated in US dollars. Performance returns are leveraged and calculated on aninvestment level following the Modified Dietz methodology.
3. Returns include Fund Level operating expenses. The impact of cash balances and any interestearnings are also reflected in the Fund’s returns.
4. Returns are shown gross of fees. An investor’s return would be reduced by the amount of the feeswhich could differ based on the size of their investment. The highest fee would be 1.1% of NAVassuming a minimum investment of $10 million.
5. Operating results of the Fund are presented on a fair value basis of accounting in conformity with U.S.GAAP and are audited annually.
6. Real estate investments and debt obligations are valued on a quarterly basis by independent thirdparty valuers.
7. In an effort to most accurately reflect the Fund’s geographic and property type exposure and provideinformation on leverage and other investment parameters, all Joint Venture investments are reportedat the Fund’s ownership percentage.
8. The total expenses included in this quarterly report contain certain payments made by InvescoAdvisers, Inc. to third-party vendors that directly relate to the on-going management/operations ofthe properties. These expenses may include costs for third-party software, tenant relations, propertymanagement assessment, regulatory compliance, travel and IT support. They are typically billed backto the properties by Invesco twice per year but at least on an annual basis. Invesco has an establishedprocess for how these expenses are tracked and allocated to properties under management for eachreal estate product.
9. Dividends are declared and distributed to investors on a quarterly basis and are based on NetOperating Cash Flow as defined in the limited partnership agreement. Net Capital Event Proceeds aretypically not distributed, but are reinvested back into the Fund.
10. Investors in the Fund have the option of reinvesting all or a portion of the quarterly dividenddistributed by the Fund.
11. UBIT/Transactions: To date, no investments have been made outside of ICRE REIT Holdings. If ICREREIT Holdings is determined to be a "pension-held REIT", the Manager does not anticipate that tax-exempt Members will be subject to unrelated business income tax except to the extent they own morethan 10% of the Fund's Units or they have borrowed to make their investment in the Fund. As of thedate of this report ICRE REIT Holdings is not a “pension-held REIT”.
12. As with all investments there are associated inherent risks. Please obtain and review all financialmaterials carefully before investing.
13. Certain information contained in this report constitutes forward-looking statements, which can beidentified by the use of forward-looking terminology such as “may,” “seek,” “should,” “expect,”“anticipate,” “project,” “estimate,” “intend,” “continue,” or “believe” or the negatives thereof orother variations thereon or comparable terminology. While we believe that such statements andinformation are based upon reasonable estimates and assumptions, due to various risks anduncertainties, actual events or results or the actual performance may differ materially from thosereflected or contemplated in such forward-looking statements.
Q12 0 1 9
confidential
confidential

Consolidated Statements of Assets, Liabilities and Partners’ CapitalAs of March 31, 2019
33 Invesco Core Real Estate–U.S.A., L.P.
Q12 0 1 9
As of As ofMarch 31, 2019 December 31, 2018
AssetsInvestments in real estate, at fair value 13,345,077,316$ 12,619,576,371$
(cost of $10,482,144,875 and $9,761,482,702, respectively)Investments in unconsolidated entities, at fair value 428,866,324 517,089,275
(cost of $366,939,877 and $477,430,462, respectively) Investments 13,773,943,640 13,136,665,646
Cash and cash equivalents 123,968,258 263,473,097 Earnest money deposits 1,635,000 3,135,000 Accounts receivable, net 33,194,744 32,311,323 Derivatives, at fair value 15,377 110,218 Other assets 16,465,438 19,784,175 Total assets 13,949,222,457 13,455,479,459
Liabilities Notes payable, at fair value 1,647,509,930 1,476,139,542
(cost of $1,657,117,654 and $1,490,099,903, respectively)Revolving line of credit, at fair value 190,000,000 75,000,000
(cost of $190,000,000 and $75,000,000, respectively)Unsecured debt, at fair value 1,442,980,280 1,383,860,861
(cost of $1,450,000,000 and $1,400,000,000, respectively)Accrued expenses and other liabilities 131,093,821 283,524,675 Dividends payable 90,000,000 85,000,000 Accrued property taxes 33,378,811 45,532,806 Total liabilities 3,534,962,842 3,349,057,884
Partners' capitalGeneral partner 16,715 16,676 Limited partners 10,267,207,243 9,967,256,619 Noncontrolling interests 147,035,657 139,148,280 Partners' capital 10,414,259,615 10,106,421,575
Total liabilities and partners' capital 13,949,222,457$ 13,455,479,459$
Outstanding units in Fund 54,857 53,376 Fund unit value 187,165$ 186,737$
See accompanying notes to the consolidated financial statements.
confidential
confidential

Consolidated Statements of Operations For the period ended March 31, 2019
34 Invesco Core Real Estate–U.S.A., L.P.
Q12 0 1 9
Investment incomeRevenue from investments in real estate 193,777,405$ 170,743,668$ Equity in income of unconsolidated entities 1,844,310 3,374,351 Interest income 759,097 72,197 Total investment income 196,380,812 174,190,216
ExpensesOperating expenses 37,833,243 34,685,144 Real estate taxes and insurance 32,746,603 28,997,349 Interest expense 30,598,354 25,525,813
General and administrative 950,692 1,096,627 Total expenses 102,128,892 90,304,933
Net investment income 94,251,920 83,885,283
Realized and unrealized gain (loss) on investmentsRealized (loss) on sale of investments in real estate (15,268) (960,727) Realized (loss) on sale of investments - (3,023) in unconsolidated entities Net realized (loss) on sale of investments (15,268) (963,750)
Unrealized gain on investments in 36,169,136 113,999,256 real estate and unconsolidated entities
Net realized and unrealized gain on investments 36,153,868 113,035,506
Net realized and unrealized (loss) gain on debt and derivatives (14,231,233) 35,071,501
Net income 116,174,555 231,992,290
Portion attributable to noncontrolling interests (2,708,111) (6,044,280)
Net income attributable to the Fund 113,466,444$ 225,948,010$
See accompanying notes to the consolidated financial statements.
For the 3 months ended
March 31, 2019
For the 3 months ended
March 31, 2018
confidential
confidential

Consolidated Statements of Changes in Partners’ CapitalFor the period ended March 31, 2019
35 Invesco Core Real Estate–U.S.A., L.P.
Q12 0 1 9
General Partner Limited PartnersNoncontrolling
Interests Total
Partners' capital at December 31, 2017 15,767$ 8,982,277,195$ 168,469,155$ 9,150,762,117$
Contributions - 629,807,936 19,150,377 648,958,313
Reinvestments - 149,017,034 - 149,017,034
Distributions (547) (323,999,453) (103,418,364) (427,418,364)
Redemptions - (331,618,985) - (331,618,985)
Net investment income 600 354,871,180 1,161,807 356,033,587
Net realized and unrealized gain 856 506,901,712 53,785,305 560,687,873
on investments, debt, and derivatives
Partners' capital at December 31, 2018 16,676 9,967,256,619 139,148,280 10,106,421,575
Contributions - 245,530,000 5,377,938 250,907,938
Reinvestments - 42,518,133 - 42,518,133
Distributions (146) (89,999,854) (198,672) (90,198,672)
Redemptions - (11,563,914) - (11,563,914)
Net investment income 153 93,957,966 293,801 94,251,920
Net realized and unrealized gain 32 19,508,293 2,414,310 21,922,635
on investments, debt, and derivatives
Partners' capital at March 31, 2019 16,715$ 10,267,207,243$ 147,035,657$ 10,414,259,615$
See accompanying notes to the consolidated financial statements.
confidential
confidential

Consolidated Statements of Cash FlowsFor the period ended March 31, 2019
36 Invesco Core Real Estate–U.S.A., L.P.
Q12 0 1 9
Cash flows from operating activities:
Net income 116,174,555$ 231,992,290$ Adjustments to reconcile net income to net cash flows provided by operating activities: Net realized loss (gain) on sale of investments 15,268 963,750 Unrealized (gain) on investments in (36,169,136) (113,999,256) real estate and unconsolidated entities Net realized and unrealized (gain) loss on notes payable 14,231,233 (35,071,501) Equity in income of unconsolidated entities (1,844,310) (3,374,351) Distributions of income from unconsolidated entities 2,314,600 8,454,326 Change in operating assets and liabilities: Accounts receivable, net (879,688) (50,630) Other assets 4,182,058 (4,508,754) Accrued expenses and other liabilities (150,405,590) 50,984,664 Accrued property taxes (12,153,995) (11,165,906) Net cash flows (used in) provided by operating activities (64,535,005)$ 124,224,632$
Cash flows from investing activities:
Purchases of investments in real estate (443,942,103)$ (237,770,144)$ Purchase of unconsolidated entity interest (13,287,577) - Investment in unconsolidated entities (5,784,403) (56,143,594) Proceeds from sale of investments in real estate (15,268) 15,323,051 Earnest money deposits 1,500,000 (1,980,000) Net cash flows used in investing activities (461,529,351)$ (280,570,687)$
Cash flows from financing activities:
Contributions from partners 245,530,000$ 218,050,000$ Reinvestments from partners 42,518,133 31,572,879 Distributions to partners (85,000,000) (70,000,000) Redemptions by partners (11,563,914) (38,380,000) Contributions from noncontrolling interests 5,377,938 6,784,006 Distributions to noncontrolling interests (198,672) (2,824,751) Repayment of revolving line of credit (75,000,000) - Cash borrowings from revolving line of credit 190,000,000 - Cash borrowings from unsecured debt 50,000,000 - Repayment of notes payable (41,709,556) (698,123) Cash borrowings from notes payable 67,727,307 52,747,733 Payment of debt issuance costs (1,121,719) - Net cash flows provided by financing activities 386,559,517$ 197,251,744$
Net change in cash and cash equivalents (139,504,839) 40,905,689
Cash and cash equivalents—Beginning of period 263,473,097 252,631,184
Cash and cash equivalents—End of period 123,968,258$ 293,536,873$
Supplemental cash flow information:
Cash paid for interest 33,029,306$ 27,250,777$
Increase in dividend payable 5,000,000$ 7,000,000$
Accrued capital expenditures 51,838,099$ 61,854,083$
Consolidation of purchased unconsolidated entity interest:
Real estate (at fair value) 263,000,000$ -$
Note Payable (at fair value) 141,000,000$ -$
See accompanying notes to the consolidated financial statements.
For the 3 months ended
March 31, 2019
For the 3 months ended
March 31, 2018
confidential
confidential

Notes to Consolidated Financial Statements
ORGANIZATIONInvesco Core Real Estate – U.S.A., L.P. (the Fund) is an open-end, perpetual life real estate investmentfund organized in the state of Delaware. The Fund was created by Invesco Real Estate (Invesco), the realestate management division of Invesco Advisers, Inc., and commenced operations on September 30,2004. On July 1, 2011, the Fund converted from a limited liability company to a limited partnership. Theobjective of the Fund is to provide investors with access to an institutional-quality portfolio of core realestate investments throughout the United States.
The Fund owns 99.9% of a Maryland real estate investment trust (REIT), ICRE REIT Holdings (the ICREREIT), which owns all of the Fund’s underlying real estate investments. ICRE REIT owns a 99.9% interest inInvesco ICRE Massachusetts REIT Holdings, LLC (the MA REIT), a Delaware real estate investment trust,created to own investments in the state of Massachusetts. The Fund’s investments consist of a diversifiedportfolio of institutional quality industrial, apartment, retail and office real estate assets, using a “core”investment strategy within the United States. The Fund may also invest up to 15% in a “value added”property strategy.
SUMMARY OF SIGNIFICANT ACCOUNTING POLICIESBasis of presentation: The consolidated financial statements are presented on the fair value basis ofaccounting in conformity with U.S. generally accepted accounting principles (GAAP) and include thefinancial position and results of operations of the Fund, the ICRE REIT, its subsidiaries and its majorityowned and controlled partnerships. All intercompany transactions are eliminated in consolidation.
Use of estimates: The preparation of the consolidated financial statements in conformity with GAAPrequires management to make estimates and assumptions that affect certain reported amounts anddisclosures in the consolidated financial statements and accompanying notes to the consolidated financialstatements. The real estate and capital markets are cyclical in nature. Property and investment values areaffected by, among other things, the availability of capital, occupancy rates, rental rates and interest andinflation rates. As a result, determining real estate investment and debt values involves many assumptions.Amounts ultimately realized from each investment may vary significantly from the fair values presented.
Consolidation: The Fund consolidates variable interest entities (VIEs) or entities evaluated under thevoting interest model (VOE) in which it has a controlling financial interest. A reporting entity will be a VIE ifit meets certain defined characteristics and will be required to consolidate a VIE if the reporting entity hasthe power to direct the activities that most significantly impact the VIE’s economic performance and hasthe right to receive benefits or has the obligation to absorb losses which could potentially be significant tothe VIE. Generally, a limited partnership or entity that operates as such will be a VOE if any one of thefollowing substantive rights exist: 1) the ability to remove the investment manager (i.e. kick-out rights),without cause, with a simple majority vote of unrelated Limited Partners. The definition of kick-out rightsinclude both removal rights and the ability to liquidate the entity; or 2) participating rights granted toLimited Partners (rights to block or participate in significant financial and operating decisions that aremade in the ordinary course of business).
Investments in which the Fund has a controlling interest have been consolidated. Unconsolidatedinvestments are accounted for under the equity method.
37 Invesco Core Real Estate–U.S.A., L.P.
Q12 0 1 9
confidential
confidential

Noncontrolling interests: The Fund has presented noncontrolling interests as a separate component ofpartners’ capital in the consolidated financial statements. Income allocated to noncontrolling interestsrepresents their share of the respective entities’ gains and losses.
Preferred unit holders: In 2014, 115 Class A unit holders of ICRE REIT were redeemed and replaced with125 preferred unit holders in exchange for Class B Units of ICRE REIT. In 2012, 125 preferred unit holderscontributed $125,000 in exchange for Class B units of the MA REIT. The investments entitle the preferredunit holders to cumulative preferential cash dividends of 12.5% annually and is reflected as noncontrollinginterests in the accompanying consolidated financial statements.
Fair Value Measurements: Fair value measurement guidelines establish a hierarchy for inputs used inmeasuring fair value that maximizes the use of observable inputs and minimizes the use of unobservableinputs by requiring that the most observable input be used when available. Observable inputs are used bymarket participants in pricing the asset or liability based on market data obtained from sourcesindependent of the Fund. Unobservable inputs reflect the Fund’s assumptions that market participantswould use in pricing the asset or liability based on the best information available in the circumstances.
In instances where the determination of the fair value measurement is based on inputs from more thanone level of the fair value hierarchy the entire fair value measurement is classified within the hierarchybased on the lowest level input that is significant to the fair value measurement in its entirety.
The hierarchy is measured in three levels based on the reliability of inputs:
Level 1 – Valuations based on quoted prices in active markets for identical assets as of the reportingdate.
Level 2 – Valuations based on pricing inputs that are other than quoted prices in active markets, whichare either directly or indirectly observable as of the reporting date.
Level 3 – Valuations are derived from other valuation methodologies, including pricing models,discounted cash flow models and similar techniques. Level 3 valuations incorporate certainassumptions and projections that are not observable in the market and require significant professionaljudgment in determining the fair value assigned to such assets or liabilities.
Investments in real estate: Real estate investments are carried at estimated fair value based on thefollowing procedures and parameters:
All real estate investments are externally valued on a quarterly basis. Newly acquired investments are carried at purchase price until their first valuation (the initial
valuation). All valuations are prepared in accordance with standard industry practice by an independent third-party
appraiser which is licensed and has an MAI designation (Member of the Appraisal Institute). Development investments are initially carried at cost if there have been no material changes to the
investment premise as it is assumed that the costs incurred to date are the best estimate of fairvalue. If it is determined that there has been a material change to the investment premise, a valuationwill be performed.
The values of real estate properties have been prepared giving consideration to the income, cost and salescomparison approaches of estimating property value. The income approach estimates an income streamfor a property (typically 10 years) and discounts this income plus a reversion (presumed sale) into apresent value at a risk adjusted rate. Yield rates and growth assumptions utilized in this approach arederived from market transactions as well as other financial and industry data. The cost approach estimatesthe replacement cost of the building less physical depreciation plus the land value. Generally, this approachprovides a check on the value derived using the income approach. The sales comparison approachcompares recent transactions to the appraised property. Adjustments are made for dissimilarities whichtypically provide a range of value.
Notes to Consolidated Financial Statements
38 Invesco Core Real Estate–U.S.A., L.P.
Q12 0 1 9
confidential
confidential
The income approach is often used by the appraiser to estimate the fair value of each investment. Theincome approach requires an estimate of cash flows for each investment over the anticipated holdingperiod. The appraiser‘s estimates will include (1) the amount of expected future cash flows, (2) the timingof receipt of those cash flows, and (3) the discount and/or capitalization rate for each investment. Cashflows are derived from property rental revenue (base rents plus reimbursements) less operating expenses,real estate taxes, capital and other costs, plus projected sales proceeds in the year of exit. Propertyrental revenue is based on leases currently in place and an estimate of future leasing activity, which arebased on current market rents for similar space plus a projected growth factor. Similarly, estimatedoperating expenses, real estate taxes and other costs are based on amounts incurred in the current periodplus a projected growth factor for future periods. Capital includes all expenditures that add value to theproperty beyond one year. Anticipated sales proceeds at the end of an investment’s expected holdingperiod are determined based on the net cash flow of the investment in the year of exit, divided by aterminal capitalization rate. The terminal capitalization rate and the discount rate are significant inputs tothese valuations. These rates are based on the location, type and nature of each property, and currentand anticipated market conditions. In isolation, significant increases or decreases in discount orcapitalization rates would result in a significantly lower or higher fair value measurement, respectively.
Since the resulting valuations are based on estimates, the values reflected in the consolidated financialstatements may materially differ from the values that would be determined by negotiations held betweenparties in a sales transaction.
Expenditures for lease renewals and betterments are capitalized, and expenditures for repairs andmaintenance are expensed when incurred. Leasing commissions are capitalized as additions to real estateinvestments when incurred. Depreciation and amortization of real estate are not recognized as anydecline in fair value due to use or obsolescence is considered in the determination of fair value. All theFund’s investments in real estate are valued on the basis of Level 3 inputs.
Investments in unconsolidated entities are generally carried at fair value based on level 3 inputs and arepresented in the consolidated financial statements using the equity method of accounting as control of theinvestment is not held by the Fund. Under the equity method, the investment is initially recorded at theoriginal investment amount, plus additional amounts invested, reduced by distributions and adjusted forthe Fund’s share of undistributed earnings or losses (including unrealized appreciation and depreciation)from the underlying entity.
Debt: All debt is carried at estimated fair value due to the open-end structure of the Fund, consistent withindustry standards. The Fund has made the election to record its debt at fair value because it believes itprovides a better representation of partners’ capital. All valuations are prepared by an independent third-party provider and the Fund reports unrealized gains and losses due to changes in fair value in earnings ateach reporting date.
The fair values of the notes payable and unsecured debt are determined by discounting the differencebetween the contractual loan payments and estimated market loan payments at an equity discount rate,which reflects how a typical market participant would value the cash flows. The significant unobservableinputs used in the fair value measurement of the Fund’s notes payable and unsecured debt include amarket rate to derive the estimated market loan payments and the unlevered fair value and discount ratefor the property to derive the equity discount rate. The Fund’s notes payable and unsecured debt aregenerally classified within Level 3 of the valuation hierarchy. In isolation, significant increases ordecreases in any of those inputs could potentially result in a significantly lower or higher fair value,respectively.
Notes to Consolidated Financial Statements
39 Invesco Core Real Estate–U.S.A., L.P.
Q12 0 1 9
confidential
confidential

Derivatives: The fair values of derivatives are the estimated amounts the Fund would receive or pay tosettle the contracts in a current exchange transaction at the reporting date. The fair value of the Fund’sderivatives are determined by reference to observable market prices, utilizing quoted prices obtained fromfinancial institutions. The Fund’s derivatives are generally classified within level 2 of the valuationhierarchy as the pricing methodology relies on actively quoted prices and does not entail materialsubjectivity or significant judgment and unobservable inputs. The ultimate realizable value will fluctuatedepending on market movements principally in interest rates and may differ significantly from the valuesreflected in the consolidated financial statements.
Concentration of Risk: Concentrations of market, interest rate, and credit risk may exist with respect tothe Fund's investment and its other assets and liabilities. Market risk is a potential loss the Fund may incuras a result of changes in the fair value of its investments. Interest rate risk includes the risk associated withchanges in prevailing interest rates. Credit risk is the risk of default on the Fund’s real estate investmentthat results from an underlying tenant’s inability or unwillingness to make contractually required payments.
In the normal course of its activities, the Fund may employ derivative financial instruments, includinginterest rate contracts. Such derivatives are predominantly used for managing risk associated with theFund’s investments. Credit risk for derivatives includes the possibility that a loss may occur from thefailure of counterparties or issuers to make payments according to the terms of the contract. The Fund'sexposure to credit risk at any point in time is generally limited to amounts recorded as assets on theconsolidated statement of net assets.
Fair Value of Other Assets and Liabilities: Assets and liabilities other than investments in real estate,investments in unconsolidated entities, debt and derivatives are valued at cost (which approximates fairvalue) since these are the amounts at which they are expected to be realized or liquidated.
Cash and cash equivalents: The Fund considers all highly liquid investments with original maturities of 90days or less to be cash and cash equivalents. At times, cash and cash equivalent balances at banks andfinancial institutions may exceed insurable amounts. Management believes it mitigates this risk bymonitoring the financial stability of institutions holding material cash balances.
Accounts Receivable, net: Accounts receivable, net includes amounts due from tenants for rental andoperating expense payments in accordance with the tenants’ lease agreements. An allowance for doubtfulaccounts is maintained for estimated losses resulting from the inability of certain tenants to meetcontractual obligations under their lease agreements. Accounts are written off when, in the opinion ofmanagement, the balance is deemed uncollectible.
Revenue recognition: Rental revenue is recorded on an accrual basis in accordance with the annualcontractual terms of the lease, without consideration of rent escalations and rental concessions, such asfree rent periods. Operating expense reimbursements represent recoveries of operating expenses whichare billed to tenants in certain properties pursuant to the terms of the leases. Operating expensereimbursements are recognized as earned in the same period the expenses are incurred assumingcollectability is reasonably assured.
The Fund records realized gains on sale of investments in real estate and unconsolidated entities on thefull accrual method once (a) a sale is consummated, (b) the buyer’s initial investment and continuinginvestments are adequate to demonstrate a commitment to pay for the property, (c) any receivable is notsubject to future subordination, and (d) the seller has transferred the usual risks and rewards or ownershipin a transaction that is in substance a sale and does not have a substantial continuing involvement with theproperty.
Notes to Consolidated Financial Statements
40 Invesco Core Real Estate–U.S.A., L.P.
Q12 0 1 9
confidential
confidential

Income taxes: The ICRE REIT and MA REIT (the REITs) are taxed as real estate investment trusts asdefined in the Internal Revenue Code and therefore, will generally not be subject to federal income tax aslong as they distribute at least 100% of their taxable income each year. Management believes it hasdistributed at least 100% of the taxable income and accordingly, no provision for income taxes is madewith respect to the income of the REITs. Even if the REITs qualify for taxation as real estate investmenttrusts, they may be subject to certain state and local taxes on their income and property and to federalincome and excise taxes on their undistributed income. In addition, management believes the REITs meetcertain other requirements to maintain their status as real estate investment trusts. If such requirementswere not met, the REITs’ income could be taxable at standard federal rates.
Since the Fund is structured as a partnership, no provision for income taxes is reflected in theaccompanying consolidated financial statements. The Fund’s investors are responsible for reporting theirallocable share of the Fund’s income or loss on their individual tax returns.
In accordance with authoritative guidance on how to account for uncertainty in income taxes, the Fund hasdetermined that no material unrecognized tax benefits or liabilities exist as of period-end. If applicable, theFund will recognize interest and penalties related to underpayment of income taxes as income taxexpense.
Certain transactions of the Fund may be subject to accounting methods for income tax purposes whichdiffer from the accounting methods used in preparing these consolidated financial statements inaccordance with GAAP. Accordingly, the net income or loss of the Fund and the resulting balances in thepartners’ capital accounts reported for income tax purposes may differ from the balances reported forthose same items in the accompanying consolidated financial statements.
Notes to Consolidated Financial Statements
41 Invesco Core Real Estate–U.S.A., L.P.
Q12 0 1 9
confidential
confidential

For professional use only.
Client-specific update –
not for public distribution.
Winner of a 2017 Greenwich
Quality Leader Award for Overall
U.S. Institutional Investment
Management Service Quality
Pasadena Fire & Police Retirement SystemMay 2019
mprice
Typewritten Text
DATE: 5/15/19 ITEM #: 6e

2
Past performance is not a guarantee or a reliable indicator of future results. Shares distributed by PIMCO Investments LLC.
PIMCO is a registered trademark of Allianz Asset Management of America L.P. and Pacific Investment Management Company LLC, in the United
States and throughout the world.
The Morningstar Fixed-Income Fund Manager of the Year award [PIMCO Short-Duration (2015) awarded to Jerome Schneider and Team; PIMCO
Income (2013) awarded to Dan Ivascyn and Alfred Murata; PIMCO Investment Grade Corporate (2012) awarded to Mark Kiesel] is based on the
strength of the manager, performance, strategy and firm’s stewardship. Morningstar Awards 2016©. Morningstar, Inc. All Rights Reserved.
Greenwich Associates accolade is based on interviews conducted by Greenwich Associates, between July and October 2017, with 1,059 senior
professionals at 884 of the largest tax-exempt funds in the United States, including corporate and union funds, public funds, endowments and
foundations, insurance general accounts, and healthcare organizations with either pension or investment pool assets greater than $150 million.
Study participants were asked to provide quantitative and qualitative evaluations of their asset management and investment consulting providers,
including qualitative assessments of those firms soliciting their business and detailed information on important market trends. The Greenwich
Quality LeaderSM is determined entirely by the results of the interviews described above and do not represent opinions or endorsements by
Greenwich Associates or its staff. Such designations are a product of numerical scores in Greenwich Associates’ proprietary studies that are
generated from the study interviews and are based on a statistical significance confidence level of at least 80%. © 2018 Greenwich Associates, LLC.
For professional use only. Client-specific update – not for public distribution.

0
Casey J. Finneran , CFA, CAIA, CIMAMr. Finneran is an account consultant in the New York office, focusing on institutional client servicing. Previously, he was a member of PIMCO’s global wealth management team, servicing clients in the North Central U.S. Prior to joining PIMCO in 2010, he held a sales role at AIG SunAmerica and worked in the personal wealth management division of Morgan Stanley. He has 13 years of investment and financial services experience and holds an undergraduate degree from the University of Scranton. He is currently pursuing an MBA at the SC Johnson College of Business at Cornell University.

3

4 AAF_review_01
All Asset’s goals
Deliver attractive real returns
- Secondary Benchmark: CPI +5%
Diversify away from equity risk
- Historical equity beta: 0.3-0.4
Provide inflation protection
- ~80% correlation to changes in inflation expectations
Target moderate volatility
- Historical average volatility: 9% (comparable to 60/40)
Investor challenges
Conventional stock/bond allocations are not priced
to provide adequate forward-looking returns
High equity allocations drive the need for risk
diversification
A need to grow purchasing power requires focusing
on returns net of inflation (real returns)
Conventional stock/bond approaches may face
serious headwinds by renewed inflation
All Asset: A distinctive approach to meeting investor needs
Emphasize “third pillar” assets (out-of-mainstream, inflation-sensitive markets)
– To provide attractive return potential with diversification and inflation protection attributes
Allocate using a value-oriented, contrarian process
– A disciplined approach to sell rich assets, realize gains then rotate into cheaper markets
Combine the complementary expertise from two leading firms into one strategy
– Research Affiliates (asset allocation sub-advisor)
– PIMCO (active manager of underlying funds)

5
Diversifying and
inflation-related
assets, 20%
U.S.
equities,
50%
U.S. bonds,
30%
EM
equity
Inflation
-related
Liquid Alt.
Strategies
Global
& EM
bonds
Global
credit
AAF_review_03
Third pillar-centric portfolio* Traditional balanced portfolio
All Asset seeks to provide:
Attractive long-term real returns Diversification away from U.S. equity risk
Inflation protection Moderate average volatility
* Percentages based on historical average allocations for the PIMCO All Asset and All Asset All Authority Funds. Allocations at any point in time are subject to change.
Refer to appendix for additional investment strategy and risk information.
FIRST PILLAR
All Asset Average: 9%
SECOND PILLAR
All Asset Average: 14%
THIRD PILLAR
All Asset Average: 76%

6
0
10
20
30
40
50
60
70
80
90
100
'03 '04 '05 '06 '07 '08 '09 '10 '11 '12 '13 '14 '15 '16 '17 '18
Perc
ent
(%)
AAF_structure_01
As of 31 March 2019
* TIPS: Treasury Inflation Protected Securities; REITs: Real Estate Investment Trusts
Refer to Appendix for additional investment strategy, portfolio structure and risk information.
Emerging markets equities
Commodities and REITs
Inflation-linked bonds
Emerging markets bonds
Global bonds
Credit
Alternative strategies
U.S. Long maturity bonds
U.S. Core bonds
Short-term bonds
Developed ex-U.S. equities U.S. equities
Uses all asset classes, while emphasizing third pillar assets as the core
Tactical rotation across and within each of the three pillars
Contrarian style – selling what has already gone up and buying what has already gone down
Average: 76%
Current: 80%
Third Pillar
Average: 14%
Current: 14%
Second Pillar
Average: 9%
Current: 6%
First Pillar

7
S&P 500
U.S. core fixed
income
60% S&P 500/
40% U.S. core
bonds
Third pillar
6.0%
8.0%
10.0%
12.0%
4.0% 8.0% 12.0% 16.0%
Annualiz
ed
retu
rns
Volatility
Third pillar helps provide attractive risk adjusted returns
S&P 500
U.S. core fixed
income
60% S&P 500/
40% U.S. core
bonds
Third pillar
6.0%
8.0%
10.0%
12.0%
0% 50% 100%
Annualiz
ed
retu
rns
Correlation to S&P 500
Third pillar delivers attractive diversification benefits
As of 31 March 2019
SOURCE: Research Affiliates, Ibbotson, Encorr, Bloomberg
Chart intentionally not shown to scale to emphasize volatility and correlation
* U.S. core bonds are represented by Barclays U.S. Gov't/Credit TR USD from Jan ‘73 to Dec ‘75 and the Barclays U.S. Aggregate Bonds TR USD thereafter.
** Third pillar consists of an equally-weighted blend of: U.S. high yield represented by Barclays U.S. Corporate High Yield Index (1973 to 1992) and BofA-ML U.S. High Yield (1993 to present);
diversified commodities represented by S&P GSCI TR (1973 to 1990) and Bloomberg Commodity Index (1991 to present); REITs represented by FTSE REIT All REITS (1973 to 1986) and DJ-UBS
Select REIT (1987 to present); EM equities represented by MSCI EM Index (1988 to present); EM local bonds/currencies represented by JPMorgan ELMI+ TR (1994 to 2002) and JPMorgan
Government Bond Index-Emerging Markets Global Diversified Index (Unhedged) (2003 to present); and U.S. TIPS represented by Barclays U.S. Treasury U.S. TIPS (March 1997 to June 1998)
and Barclays U.S. Treasury Inflation Notes: 10+ Year Index (July 1998 to present)
Past performance is not a guarantee of future results.
Refer to Appendix for additional index, investment strategy and risk information
1cs_AAF_review_29
(1973-2019) (1973-2019)

8
The Third Pillar asset mix has outperformed U.S. 60/40 cumulatively and in the majority of calendar years
Following strong 60/40 outperformance, third pillar assets historically tend to outperform over multiple subsequent years
As of 31 March 2019
The 60/40 mix is comprised of 60% S&P 500 and 40% Barclays U.S. Aggregate Index
* Third pillar composite is an equally-weighted blend of U.S. high yield (Barclays U.S. Corporate High Yield Index), Long U.S. TIPS (Barclays U.S. Treasury Inflation Notes: 10+ Year Index), EM
local bonds (JPMorgan Government Bond Index-Emerging Markets Global Diversified Index (Unhedged)), EM equities (MSCI EM Index), REITs (Dow Jones U.S. Select REIT Total Return Index),
and diversified commodities (DJ-UBS Commodity TR Index)
Past performance is not a guarantee of future results.
Refer to Appendix for additional index, investment strategy and risk information
1cs_AAF_review_24
+
+
+
+
-40%
-30%
-20%
-10%
0%
10%
20%
30%
40%
'73 '74 '75 '76 '77 '78 '79 '80 '81 '82 '83 '84 '85 '86 '87 '88 '89 '90 '91 '92 '93 '94 '95 '96 '97 '98 '99 '00 '01 '02 '03 '04 '05 '06 '07 '08 '09 '10 '11 '12 '13 '14 '15 '16 '17 '18 '19
Th
ird
pilla
r re
turn
–60/4
0 r
etu
rn
Calendar year relative performance: 60/40 vs. third pillar
60/40 full period performance:
9.4% per annum
Third pillar* full period performance:
9.9% per annum
Third pillar* outperforms:
28 of 47 years (60%)
60/40 outperforms:
19 of 47 years (40%)
?


10
Q1 market recap: Strong third pillar rebound YTD after nearly all major asset classes saw negative returns in 2018
– Optimism over trade talks, the Fed’s dovish pivot on rate hikes, and Chinese stimulus helped bolster investor sentiment.
– Within the Third Pillar, REITs and EM equities had the largest Q1 gains (+15.72% and +9.93%, respectively).
– REITs benefited from the Fed’s decision to halt its hiking cycle and robust fundamentals across commercial real estate markets.
– EM equities were led by Chinese stocks, which rose due to the improving outlook on trade talks, domestic stimulus measures,
as well as the increase in weighting of China A shares in global indices.
The All Asset Fund posted positive returns in Q1 ‘19
– Q1 ‘19 returns: All Asset, +5.39%; Third Pilar composite*, 8.10%
– 2018 returns: All Asset, -4.98%; Third Pillar composite*, -7.35%
Looking forward, Third Pillar markets remain poised for multi-year outperformance versus U.S. stocks and bonds; All Asset
seeks to amplify this effect
– Research Affiliates’ return forecasts show Third Pillar’s outperformance potential vs. U.S. 60/40** is well above the historical avg.
– The elevated yield levels (YTM + Div. yields) of the fund reinforces this outperformance potential (AAF: 5.4%)
– In addition, All Asset seeks further outperformance potential though 1) tactical allocation shifts, that seek to balance long-term
value with near-term momentum; and 2) net alpha potential from underlying PIMCO funds
1cs_AAF_AAAAF_review_02
*Represented by an equally weighted average of 6 indexes: BarCap US TIPS 10+, DJ UBS Commodities, DJ US REITs, MSCI EM, JPM EM Local Global Diversified, ML High Yield BB-B Constrained
**Represented by 60% S&P500 and 40% Barclays U.S. Aggregate Indices
As of 31 March 2019

11
As of 31 March 2019
SOURCE: Barclays, BofA, JPMorgan, Bloomberg
First pillar represented by an equal blend of: U.S. equities represented by S&P 500 Total Return Index; Small cap equities represented by Russell 2000 index; Developed ex. U.S. equities
represented by MSCI Daily TR Gross EAFE USD Index; Second pillar represented by an equal blend of: U.S. core fixed income represented by Barclays U.S. Aggregate Total Return Index; Long
U.S. Treasuries represented by Barclays U.S. Aggregate Long Treasury Index; U.S. investment grade credit represented by Barclays U.S. Aggregate Credit Total Return Index; Third pillar
represented by an equal blend of: U.S. high yield represented by Barclays U.S. Corporate High Yield Index; Long U.S. TIPS represented by Barclays U.S. Treasury Inflation Notes: 10+ Year Index;
EM local bonds represented by JPMorgan Government Bond Index-Emerging Markets Global Diversified Index (Unhedged); EM equities represented by MSCI EM Index; REITS represented by
Dow Jones Select U.S. REITs Index.; Diversified commodities represented by DJ-UBS Commodity TR Index.
S&P 500 Second Pillar Third Pillar
$100
$150
$200
$250
$300
$350
$400
$450
$500
Mar '09 Feb '10 Jan '11 Dec '11 Nov '12 Oct '13 Sep '14 Aug '15 Jul '16 Jun '17 May '18
Gro
wth
of
$1
00
Last 5 Years: 1.8%
Post-Taper Tantrum
Annualized Returns 30 Apr ‘13 – 31 Mar ’19
S&P 500: 12.5%
Barclays U.S. Agg: 2.1%
Third Pillar: 1.1%
Pre-Taper Tantrum
Annualized Returns 31 Mar ‘09 – 30 Apr ’13
S&P 500: 21.1%
Barclays U.S. Agg: 6.2%
Third Pillar: 17.3%

12
13.6% 14.6%
10.0%
2.9%
4.7% 4.9%7.3%
2.9%
9.9%
6.4%
15.7%
6.3%
-4.4%
-11.0%
-13.8%
0.0%
-1.8% -2.1% -2.0%
-6.2%
-14.6%
-5.8% -4.2%
-11.2%
21.8%
14.6%
25.0%
3.5%
8.5%6.2% 7.0%
15.2%
37.3%
7.5%
3.8%
1.7%
-20%
-15%
-10%
-5%
0%
5%
10%
15%
20%
25%
30%
35%
40%
U.S.
equities
Small cap
equities
Developed
ex. U.S.
equities
U.S. core
fixed
income
Long U.S.
Treasuries
U.S.
investment
grade credit
U.S. high
yield
EM local
bonds
EM
equities
Long U.S.
TIPS
REITs Diversified
commodities
Asset class returns
AAF_review_31
As of 31 March 2019
SOURCE: Barclays, BofA, JPMorgan, Bloomberg
U.S. equities represented by S&P 500 Total Return Index; Small cap equities represented by Russell 2000 index; Developed ex. U.S. equities represented by MSCI Daily TR Gross EAFE USD Index;
U.S. core fixed income represented by Barclays U.S. Aggregate Total Return Index; Long U.S. Treasuries represented by Barclays U.S. Aggregate Long Treasury Index; U.S. investment grade credit
represented by Barclays U.S. Aggregate Credit Total Return Index; U.S. high yield represented by Barclays U.S. Corporate High Yield Index; Long U.S. TIPS represented by Barclays U.S. Treasury
Inflation Notes: 10+ Year Index; EM local bonds represented by JPMorgan Government Bond Index-Emerging Markets Global Diversified Index (Unhedged); EM equities represented by MSCI EM
Index; REITS represented by Dow Jones Select U.S. REITs Index.; Diversified commodities represented by DJ-UBS Commodity TR Index.
Second pillar First pillar Third pillar
Q1 ‘19 average: +12.7%
2018 average: -9.7%
2017 average: +20.5%
Trailing 5 year average: +6.8%
Q1 ‘19 average: +4.2%
2018 average: -1.3%
2017 average: +6.1%
Trailing 5 year average: +3.9%
Q1 ’19 average: +8.1%
2018 average: -7.4%
2017 average: +12.1%
Trailing 5 year average: +1.8%
2018 Q1 ‘19 2017 Trailing 5 years

13 AA_perf_retu_736_MOD
Third Pillar Bear Market
Third Pillar Bull Market Third Pillar Bull Market
PIMCO All Asset Fund
Market value as of Mar '19 17,756,109,657$
Performance quoted represents past performance. Past performance is not a guarantee or a reliable indicator of future results. Current performance may be
lower or higher than performance shown. Investment return and principal value will fluctuate, so that fund shares may be worth more or less than their
original cost when redeemed. Performance data current to the most recent month-end is available at www.pimco.com or by calling 888.87.PIMCO. As of 31 March 2019
1 Note: Partial performance for 2002 is due to a 31 July '02 inception date of the All Asset Fund
* Due to lag in CPI release, YTD performance lagged by one month.
The CPI + 500 Basis Points benchmark is created by adding 5% to the annual percentage change in the Consumer Price Index (“CPI”). This index reflects non-seasonably adjusted returns. The
Consumer Price Index is an unmanaged index representing the rate of inflation of the U.S. consumer prices as determined by the U.S. Department of Labor Statistics. There can be no guarantee that
the CPI or other indexes will reflect the exact level of inflation at any given time.
Performance is shown for the institutional class.
Refer to Appendix for additional performance and fee, index, risk and secondary benchmark information.
S.I.
PIMCO All Asset Fund 31 Jul '02 10 yrs. 5 yrs. 3 yrs. 1 yr. 6 mos. 3 mos.
After fees (%) 6.74 7.36 3.07 7.14 -0.13 1.93 5.39
Barclays U.S. TIPS:1-10 Yr Index (%) 3.89 2.73 1.50 1.53 2.72 2.51 2.57
CPI + 5 (%)* 7.08 6.75 6.45 7.15 6.50 2.94 1.36
12.00
15.98
11.85
6.485.27
8.68
-15.48
22.99
13.68
2.44
15.44
0.77 0.80
-8.72
13.34 13.98
-4.98
5.39
-20
-15
-10
-5
0
5
10
15
20
25
Aug-
Dec
'02¹
'03 '04 '05 '06 '07 '08 '09 '10 '11 '12 '13 '14 '15 '16 '17 '18 YTD '19
Retu
rns
(%)
Performance Portfolio (after fees)
Third
Pillar
Bear
Market

14 AAF_review_37
3rd pillar drawdown (beyond 10%)*
As of 31 March 2019
* Third pillar drawdowns are the peak to trough drawdown periods greater than -10% of an equally weighted allocation to U.S. high yield (represented by Barclays U.S. Corporate High Yield
Index), Long U.S. TIPS (represented by Barclays U.S. Treasury Inflation Notes: 10+ Year Index), EM local bonds (represented by JPMorgan Government Bond Index-Emerging Markets Global
Diversified Index (Unhedged)), EM equities (represented by MSCI EM Index), REITS (represented by Dow Jones Select U.S. REITs Index.), and Diversified commodities (represented by DJ-UBS
Commodity TR Index)
The CPI + 500 Basis Points benchmark is created by adding 5% to the annual percentage change in the Consumer Price Index ("CPI"). This index reflects non-seasonably adjusted returns. The
Consumer Price Index is an unmanaged index representing the rate of inflation of the U.S. consumer prices as determined by the U.S. Department of Labor Statistics. There can be no
guarantee that the CPI or other indexes will reflect the exact level of inflation at any given time.
Refer to Appendix for additional performance and fee, index, risk and secondary benchmark information.
Third Pillar
Bear
Market*
$100
$120
$140
$160
$180
$200
$220
$240
$260
$280
$300
$320
Jul '02 Jun '03 May '04 Apr '05 Mar '06 Feb '07 Jan '08 Dec '08 Nov '09 Oct '10 Sep '11 Aug '12 Jul '13 Jun '14 May '15 Apr '16 Mar '17 Feb '18 Jan '19
Gro
wth
of
$100
All Asset Fund vs CPI+5%
PIMCO All Asset Fund
CPI+5%
CPI
Bloomberg Barclays U.S. TIPS: 1-10 Year Index
Third Pillar
Bear
Market*

15
Do
wn
Mark
et
(S&
P 5
00 <
0%
)
Up
Mark
et
(S&
P 5
00 >
= 0
%)
As of 31 March 2019
Based on returns from November 2003 – March 2019
All Asset funds have outperformed conventional portfolios in down equity markets – given their diversification away from equity risk
They have also meaningfully outperformed in choppy markets – using volatility as an opportunity to average into newly cheap assets
Low Volatility Market (Rolling 12 month average VIX <= 20%)
High Volatility Market (Rolling 12 month average VIX > 20%)
AAF_review_42
7.50%
10.20%
0%
2%
4%
6%
8%
10%
12%
All Asset Fund 60/40
Avera
ge R
ollin
g
12-M
on
th R
etu
rn
25.36%
17.51%
0%
5%
10%
15%
20%
25%
30%
All Asset Fund 60/40
Avera
ge R
ollin
g
12-M
on
th R
etu
rn
1.01%
-0.96%-1%
-1%
0%
0%
0%
1%
1%
All Asset Fund 60/40
Avera
ge R
ollin
g
12-M
on
th R
etu
rn
-11.63%
-17.38%-20%
-15%
-10%
-5%
0%
All Asset Fund 60/40
Avera
ge R
ollin
g
12-M
on
th R
etu
rn

16
-15.63%
-17.18%
-11.13%-10.18% -10.10%
-19.37%
0.05%
-2.86%-4.05% -3.44% -4.07%
-3.54%
4/26/2010 - 7/2/2010 7/8/2011 - 8/8/2011 8/18/2015 - 8/25/2015 12/16/2015 - 2/11/2016 1/29/2018 - 2/8/2018 9/20/2018 - 12/24/2018
S&P 500 Index PIMCO All Asset Fund Performance quoted represents past performance. Past performance is not a guarantee or a reliable indicator of future results. Current performance may be
lower or higher than performance shown. Investment return and principal value will fluctuate, so that fund shares may be worth more or less than their
original cost when redeemed. Performance data current to the most recent month-end is available at www.pimco.com or by calling 888.87.PIMCO. As of 31 December 2018
Source: Bloomberg
Performance is shown for the institutional share class, after fees.
Refer to Appendix for additional performance and fee, index, and risk information.
Flash Crash/
Jobs Report
European Debt
Crisis
Yuan
Devaluation
Oil Crash Global
Risk Off
2018 U.S.
Correction

17
0.53 0.53
0.38
0.0
0.1
0.2
0.3
0.4
0.5
0.6
0.7
Equity Beta
0.34
0.50
0.59
0.0
0.1
0.2
0.3
0.4
0.5
0.6
0.7
Sharpe Ratio
AAF_review_39
Performance quoted represents past performance. Past performance is not a guarantee or a reliable indicator of future results. Current performance may be
lower or higher than performance shown. Investment return and principal value will fluctuate, so that fund shares may be worth more or less than their
original cost when redeemed. Performance data current to the most recent month-end is available at www.pimco.com or by calling 888.87.PIMCO. 31 July 2002 to 31 March 2019. SOURCE: Bloomberg, PIMCO. All Asset Fund data shown is for Institutional class shares
3 Real Assets is represented by: 33% Barclays U.S. TIPS, 33% Bloomberg Commodity Total Return, 33% Dow Jones Select REIT
6 Asset Third Pillar is represented by an equal weighted composite of the following indices which are added to the overall mix in the first full month they became investable by virtue of a related
fund launch (date in bracket). Barclays U.S. Corporate High Yield Index (Aug 2002), Barclays U.S. Treasury Inflation Notes: 10+ Year Index (Aug 2002), JPMorgan Government Bond Index-
Emerging Markets Global Diversified Unhedged Index (Jan 2007), MSCI EM Index (Dec 2008), Dow Jones Select U.S. REITs Index (Nov 2003) and the DJ-UBS Commodity TR Index (Aug 2002).
Refer to Appendix for additional performance and fee, correlation, index, investment strategy, and risk information.
Higher risk-adjusted returns Lower volatility and drawdown
Lower equity beta Seek inflation protection
PIMCO All Asset Fund 6 Third Pillar Assets
(TIPS, Commodities, REITs, HY, EM Equities, EM Local Bonds) 3 Real Assets (TIPS, Commodities, REITs)
-43%-34%
-24%
-60%
-50%
-40%
-30%
-20%
-10%
0%
10%
20%
Drawdown (RHS)
11% 11%
9%
-2%
0%
2%
4%
6%
8%
10%
12%
14%
Total Volatility (LHS)
0.720.80 0.81
0.0
0.2
0.4
0.6
0.8
1.0
Correl to Δ 10 yr BEI
All Asset has provided more attractive risk-adjusted
returns, net of fees, than either passive approach
All Asset has also displayed lower total volatility and a
smaller peak-to-trough drawdown
All Asset has provided superior equity diversification
since inception
All Asset has provided greater correlation with changes in
inflation expectations

18
0%
10%
20%
30%
40%
50%
60%
70%
80%
90%
100%
US Large
Blend
US Small
Blend
Foreign
Large Blend
US Short-
Term Bond
US
Intermediate
Term Bond
US Corporate
Bond
US High
Yield Bond
Diversified
Commodities
US Real
Estate
US Inflation
Protected
Bond
EM Local
Currency
Bond
EM
Diversified
Equities
Percent of active managers beating median passive over 5 years
As of 31 March 2019. SOURCE PIMCO, Morningstar
* PIMCO Underlying Funds Alpha is calculated by multiplying the net of fee alpha of each underlying Fund (relative to its respective benchmark) by the beginning of the month allocation to that
underlying Fund. The total figure is the sum of monthly return contributions, scaled to account for compounding of monthly returns. Based on actual allocation of AAF to those funds since
inception, 31 July 2002.
Refer to Appendix for additional performance and fee, attribution analysis, investment strategy and risk information.
First Pillar average: 27% Second Pillar average: 39% Third Pillar average: 63%
Performance Attribution (net of fees) Since inception 5-year
Underlying PIMCO Funds Alpha, net*
(at actual weight within All Asset)
76 bps 35 bps
Results represent past performance. Past performance is not a guarantee or a reliable indicator of future results. Current performance may be lower or
higher than performance shown. Investment return and principal value will fluctuate, so that fund shares may be worth more or less than their original cost when
redeemed. Performance data current to the most recent month-end is available at www.pimco.com or by calling 888.87.PIMCO.

19
As of 31 March 2019
The attribution analysis contained herein is calculated by PIMCO and is intended to provide an estimate as to which elements of a strategy contributed (positively or negatively) to a portfolio's performance.
The attribution results contain certain assumptions that require elements of subjective judgment and analysis. Attribution analysis is not a precise measure and should generally be considered within a range
(e.g., +/- 5 bps). Further, attribution analysis should not be relied upon for investment decisions. Refer to Appendix for additional performance and fee, attribution analysis and risk information.
AAF_attrib_01
(Net)
57-63
23356 42
32
3928
-20
81
39160
-312
594
248 30
124
-50
72
117
42
39
-90
256
153
55
84
156
128
70
13668
-35
93
23
70-65
494
76
-800
-400
0
400
800
1200
1600
1Q '19 2018 2017 2016 Since
Inception
Co
ntr
ibu
tio
n (b
ps)
All Asset performance attribution (after fees) as of 3/31/19
US Equities Developed ex-US Equities
US Core Bonds US Long Maturity Bonds
Short-Term Bonds Emerging Markets Equities
Commodities and REITs Emerging Markets Bonds
Global Bonds Credit
Inflation-Linked Bonds Alternative Strategies
Underlying PIMCO Fund Alpha
Total: 674 bps
Total: 1398 bps
Total: 539 bps
Total: -498 bps
Total: 1334 bps
Performance quoted represents past performance. Past performance is not a guarantee or a
reliable indicator of future results. Current performance may be lower or higher than
performance shown. Investment return and principal value will fluctuate, so that fund shares
may be worth more or less than their original cost when redeemed. Performance data current
to the most recent month-end is available at www.pimco.com or by calling 888.87.PIMCO.
Q1 2019 Recap
Positive returns across nearly all markets supported Q1 performance;
contributions from EM equities and REITs exposures were most beneficial
2018 Recap
Volatility in EM assets in Q2 and Q4, driven by localized issues and trade tensions,
detracted from returns
Alpha from underlying PIMCO funds added to performance (+0.69%); strong
alpha from RAE EM equity strategies more than offset a mixed 2018 result from
PIMCO’s active fixed income strategies
― PIMCO alpha (-0.78%) + RAE alpha (+1.47%) = Total alpha (+0.69%)
2016 and 2017 Recap
Strong 2-year performance was driven by returns in EM equities and debt,
developed ex-US equities, with stabilizing EM fundamentals and rising inflation
expectations acting as joint tailwinds after 2013-15
Cumulative alpha from underlying PIMCO funds was +3.51%, driven primarily by
PIMCO’s fixed income funds; RAE’s equity alpha was also positive despite
continued value headwinds
― PIMCO alpha (+3.35%) + RAE alpha (+0.17%) = Total alpha (+3.51%)
Since Inception Recap
All Asset has sourced returns from its full opportunity set, with 3rd Pillar being the
largest contributors; underlying PIMCO fund alpha (net) also added to returns


21 AAF_outlook_04
* Yield Represented by yield to maturity for bonds and dividend yield for equities
As of 31 March 2019
Elevated current yields The All Asset Fund benefits from an elevated yield
(5.4%), which contributes to total return potential
Attractive conditions in EM EM assets continue to trade at below-average
valuations, particularly EM FX and EM equities
Chinese stimulus should help stabilize the EM
fundamental backdrop
Rising inflation/weakening USD Inflation may gradually trend upward with upside risks
from tight domestic labor markets, synchronized global
growth and stabilizing commodity prices
All Asset stands to benefit from the recent dovish shift
in the Fed’s outlook given its intentionally elevated
exposure to non-USD-denominated assets
Potential PIMCO fund alpha Underlying PIMCO funds enhance returns with PIMCO’s
fixed income management and RAE equity strategies
SUPPORTIVE RETURN FACTORS CONSIDERED RISKS
Global economic slowdown Forecasted probabilities of economic slowdown
have risen over the past year and now stand near
neutral. As a precautionary measure, All Asset has
lowered ex-ante equity beta
EM volatility Potential geopolitical tensions and trade disputes
can lead to unforeseen volatility in EM. In response,
All Asset allocations are counterbalanced with
defensive bond and alternative strategies to buffer
downside risk
Disinflationary shock Inflation expectations can surprise to the downside
from factors such as slowing global growth,
commodity price shocks, increased unemployment.
All Asset has limited exposure to traditional real
assets, instead favoring “stealth inflation fighters” at
more attractive valuations

22
U.S. Equities
Developed ex-U.S.
Equities
U.S. Small EquitiesLong U.S. Treasuries
U.S. Core Bonds
U.S. IG
CreditCashBank Loans
EM Non Local Debt
EM Currency
U.S. HY
U.S. TIPS
U.S. REITs
EM Local Bonds
EM
Equities
Commodities
60/40
Third Pillar
-2%
-1%
0%
1%
2%
3%
4%
5%
6%
7%
8%
0% 5% 10% 15% 20% 25%
Long
-Term
Real E
xpect
ed
Retu
rns
(5-7
years
)
Volatility
1cs_AAF_outlook_05
Third pillar remains attractively priced following significant trailing S&P 500 outperformance, forward-looking prospects are reversed
CPI+5% is achievable with PIMCO alpha, Research Affiliates Equity (RAE) alpha and tactical asset allocation
All Asset’s yield1 of 5.39% underscores cheapness of underlying assets and support the All Asset’s return potential
Long-term real return estimates for major asset classes
~3% forecasted
annual return
difference
(passive and equal-weighted)
Third pillar Second pillar First pillar
Performance quoted represents past performance. Past performance is not a guarantee or a reliable indicator of future results. Current performance may be lower or higher than performance
shown. Investment return and principal value will fluctuate, so that fund shares may be worth more or less than their original cost when redeemed. Performance data current to the most
recent month-end is available at www.pimco.com or by calling 888.87.PIMCO. Real Return Estimates as of 31 March 2019. 1 Yield Represented by yield to maturity for bonds and dividend yield for equities
SOURCE: Research Affiliates, LLC, based on data building blocks, mean reversion and business cycle models.
The asset classes shown above are represented by the following indexes: U.S. Equities represented by S&P 500; Developed ex U.S. Equities represented by MSCI EAFE; Long U.S. Treasuries
represented by Barclays U.S. Treasury Long; U.S. Core Fixed Income represented by Barclays U.S. Aggregate; U.S. Investment Grade Credit represented by Barclays U.S. Interim Credit; U.S. high yield represented
by Barclays U.S. Corporate High Yield; U.S. TIPS represented by Barclays U.S. Treasury U.S. TIPS, U.S. REITS represented by FTSE NAREIT; EM local bonds represented by JPM GBI-EM; EM equities represented by
MSCI EM; EM currencies represented by JPMorgan ELMI Composite (Unhedged); Commodities represented by Bloomberg Commodity Index; cash represented by the 30 Day T-Bill Index, EM currency
represented by JPMorgan ELMI+ Composite (Unhedged), EM Non-Local Debt represented by JPMorgan EMBI+ (Unhedged), and U.S. Small Equities represented by the Russell 2000. Third Pillar represented by
an equal weighting of indices for U.S. High Yield, EM Local Bonds, EM Equities, Long U.S. TIPS, REITs, Diversified Commodities; 60/40 represented by 60% S&P500 and 40% Barclays U,S. Aggregate indices.
Refer to Appendix for additional performance and fee, forecast, index, investment strategy, outlook, return estimate, and risk information.

23
1 2 1 0 0 0 0
4
116 8
11 96 6
5 2
54
6 45
4 6
57 8
53
4 2 3
59
8
56
1317 15
96
14
17
5
1
8
34 4
27
4
1
1
0 0 0
0 033 28
15
1817
12
9 8
16 20 21
1820
20 1815
12 86
6
511
9
8
912
14
2219 18
2024
0
10
20
30
40
50
60
70
80
90
100
Dec '11 Dec '13 Dec '15 Jun '16 Dec '16 Dec '17 Sep '18 Mar '19
Perc
en
t o
f n
et
ass
ets
(%
)
Current allocation mix
Emerging markets equities
Commodities and REITs
Inflation-linked bonds
Emerging markets bonds
Global bonds
Credit
Alternative strategies
U.S. Long maturity bonds
U.S. Core bonds
Short-term bonds
Developed ex-U.S. equities
U.S. equities
As of 31 March 2019
1 Yield comprised of yield to maturity for fixed income and dividend yield for equities
2 Trailing 3 years using weekly data
3 See page “All Asset has limited exposure to U.S. rates while pursuing a high level of income” for more information on duration positioning
Key statistics
Yield1: 5.4%
Trailing equity beta2: 0.31
Duration3: 3.7
Trimmed risk in 2018 (equity beta and
total portfolio volatility); made tactical
refinements in Q1 2019
Total equity allocation (30%) favors EM
(24%) and EMEA (6%) over U.S. (0%)
given meaningfully lower valuations and
higher multi-year return potential
Sell-off in Q4 provided the
opportunity to modestly add to EM
equity position
Trimmed developed ex-U.S. equities
after strong returns in 2017 to take
profits
Maintaining tactical emphasis on EM
currencies and local debt given high
yields and attractive FX valuations
Rotated into alternative strategies as a
market neutral “dry powder” in addition
to traditional bond positions, consistent
with modest overall risk reduction
Increased TIPS exposure as BEI levels fell
toward 1.7%
AAF_structure_03

24
0%
3%
6%
9%
12%
15%
0 5 10 15 20 25 30 35 40 45 50
% o
f o
bse
rvati
on
s
0%
4%
8%
12%
16%
20%
0 5 10 15 20 25 30 35 40 45 50% o
f o
bse
rvati
on
s
0%
3%
6%
9%
12%
15%
18%
0 5 10 15 20 25 30 35 40 45 50
% o
f o
bse
rvati
on
s
U.S. valuations: Cyclically-adjusted P/E
EAFE valuations: Cyclically-adjusted P/E
EM valuations: Cyclically-adjusted P/E
-5%
0%
5%
10%
15%
20%6x
12x
24x
48x
1990 1995 2000 2005 2010 2015
An
nu
alize
d 1
0 Y
ear
Su
bse
qu
en
t Retu
rn
CA
PE (lo
g s
cale
, in
vert
ed
)
CAPE, inverted (lhs) 10-Year Subsequent Return (rhs)
-5%
0%
5%
10%
15%
20%6x
12x
24x
48x
1926 1936 1946 1956 1966 1976 1986 1996 2006 2016
An
nu
alize
d 1
0 Y
ear
Su
bse
qu
en
t Retu
rn
CA
PE (lo
g s
cale
, in
vert
ed
)
CAPE, inverted (lhs) 10-Year Subsequent Return (rhs)
-5%
0%
5%
10%
15%
20%6x
12x
24x
48x
1982 1987 1992 1997 2002 2007 2012 2017
An
nu
alize
d 1
0 Y
ear
Su
bse
qu
en
t Retu
rn
CA
PE (lo
g s
cale
, in
vert
ed
)
CAPE, inverted (lhs) 10-Year Subsequent Return (rhs)
As of 31 March 2019
Source: Research Affiliates; U.S. represented by S&P 500; EAFE/International represented by MSCI EAFE Index; EM represented by MSCI EM Index
Refer to Appendix for additional investment strategy, index and risk information
Expected annualized return above U.S.: +5%
Expected annualized return above U.S.: +6%
Current = 30x
Percentile = 95th
Current = 17x
Percentile = 31st
Current = 13x
Percentile = 23rd
RICH CHEAP
RICH CHEAP
RICH CHEAP
AAF_Outlook_15

25
As of 31 March 2019
Source: Research Affiliates
Today's CAPE:S&P 500
Simple Average: 1926 - 2018
Simple Average: 1977 - 2018
Adjusted for Business Cycle
& Macro Vol
What’s “Fair” Value? What’s Today’s “Actual” Value?
21.2x
22.2x
CAPE excluding
highest & lowest earnings years
28.5x
CAPE excluding
lowest 12 months of earnings
27.6x
Valuation differential
still implies -2.9%
annual return headwind
over 10 years!
29.8x
(95th percentile)
18.1x
EAFE- Simple Average: 23.1, Business Cycle: 15.8, CAPE Ex 12 Months: 16.2
CAPE Ex High & Low: 16.5 CAPE: 16.7 (31st), Valuation Change: -0.5%
EM - Simple Average: 20.1, Business Cycle: 15.8, CAPE Ex 12 Months: 13.0
CAPE Ex High & Low: 13.4, CAPE: 13.4 (23rd), Valuation Change: 0.5%

26
-14.2%
1.0%
13x
20x
Current (3/31/2019) 80th percentile 20th percentile Average
386 bps
376 bps
0%
20%
40%
60%
80%
100%
Dec '03 Dec '06 Dec '09 Dec '12 Dec '15 Dec '18
Probability of EM Slowdown
Neutral Slowdown Probability
As of 31 March 2019.
* Shiller P/E measured from 31 Jan 1990. Spread to U.S. Treasuries measure from 31 Jan 2005; EM FX valuation from 31 August 1994
Refer to Appendix for additional investment strategy, index and risk information
AAF_review_36
Valuations are attractive:
After recent weakness, EM currencies approaching discounts to the
US dollar not seen since the 1997 “Asian Contagion” and the 1998
Russian debt default, trading at -15% discount
EM assets remain attractive even after recent outperformance
Fundamentals are supportive:
Probabilities of economic slowdown (acceleration) across EM
countries remain slightly below (above) neutral levels, indicating
continued cyclical strength
Also, risk of an EM funding crisis remains remote given generally
1) low external debt; 2) high currency reserves; and 3) reasonable
current account balances among index constituents
Technicals are mixed:
Q4 volatility in EM equities, local bonds, and currencies has caused
near-term price momentum to move from positive to neutral
Investor flows into EM equities and debt have been decidedly
positive providing another source of technical support.
Positive price momentum
Negative price momentum
EM Local Bonds
(Yield Spread)
EM Currencies
(Relative PPP)
EM Equities
(Shiller P/E)*
Decelerating economy
Accelerating economy
-40%
-20%
0%
20%
40%
-100%
-50%
0%
50%
100%
Dec '03 Dec '06 Dec '09 Dec '12 Dec '15 Dec '18
Tra
iling
12
-Mo
nth
Retu
rnTra
iling
12-M
onth
Retu
rnMSCI EM EM Local Bond (RHS) EM Currencies (RHS)
20th percentile 47th percentile 23rd percentile

27
Third pillar returns have exhibited high positive correlation with 12
month changes (not levels) in BEI
Even in periods of stable inflation (change in BEI = ~0) third pillar
markets have had strong performance (+7.9% on average)
-20%
-10%
0%
10%
20%
30%
40%
-2.0% -1.0% 0.0% 1.0% 2.0%
12
mo
nth
“th
ird
pilla
r" r
etu
rns
12 month changes in 10yr breakeven inflation
2013
2014
2012
2015
20162017
2018
2cs_intl_outlook_05
Third pillar returns are responsive to changing
inflation expectations
The ‘13-’15 collapse in inflation expectations, and the
recent rebound/stabilization, help explain returns
As of 31 March 2019.; SOURCE: PIMCO; Research Affiliates based on data from Bloomberg and St. Louis Fed
NOTE: Breakeven inflation is the difference between TIPS and Treasury yields
* Fed’s central inflation target is 2.0% as measured by the PCE, which equates to 2.4% on the CPI, based on the long-term difference between the two series.
Refer to Appendix for additional investment strategy, index and risk information
Correlation = 75%
y-Intercept = 7.9%
-2.0%
0.0%
2.0%
4.0%
6.0%
1998 2001 2004 2007 2010 2013 2016 2019
10
ye
ar
bre
ak
ev
en
infl
ati
on
/ C
PI
Breakeven inflation CPI
Fed Target PIMCO CPI Forecast
Inflation expectations continue to trend higher, after having fallen
during 2013-2015
Supportive factors include tight labor markets, stabilizing commodity
prices, rising oil prices, late cycle fiscal stimulus and synchronized
global growth
FOMC recently reaffirmed 2.4% CPI as symmetric objective, implying
a willingness to let inflation overshoot

28
As of 31 December 2018. SOURCE: Research Affiliates, CRSP, Compustat, Worldscope, Datastream. US universe comprised of US companies in the CRSP/Compustat database. International and emerging
markets universes are comprised of developed ex-US and emerging markets companies in the Worldscope/Datastream database. The terms “cheap” and “rich” as used herein generally refer to a security
or asset class that is deemed to be substantially under- or overpriced compared to both its historical average as well as to the investment manager’s future expectations. There is no guarantee of future
results or that a security’s valuation will ensure a profit or protect against a loss.
Refer to Appendix for additional index, investment strategy and risk information.
RAE_fundamental_review_18
2cs_rae_fundamental_review_07
0.10
0.15
0.20
0.25
0.30
0.35
0.40
0.45
0.50
1968 1976 1984 1992 2000 2008 2016
Rela
tive v
alu
ati
on
U.S.
(July 1968 - December 2018)
Rel. Value
Mean
10th %-ile
90th %-ile
0.10
0.15
0.20
0.25
0.30
0.35
0.40
0.45
0.50
1989 1993 1997 2001 2005 2009 2013 2017
Rela
tive v
alu
ati
on
International
(July 1989 - December 2018)
0.10
0.15
0.20
0.25
0.30
0.35
0.40
0.45
0.50
2002 2005 2008 2011 2014 2017
Rela
tive v
alu
ati
on
Emerging Markets
(July 2002 - December 2018)
Growth cheap
Growth cheap
Growth cheap
Value cheap
Value cheap
Value cheap

29
-50%
-30%
-10%
10%
30%
'97 '98 '99 '00 '01 '02 '03 '04 '05 '06 '07 '08 '09 '10 '11 '12 '13 '14 '15 '16 '17 '18 '19
EM FX Valuation Average
0.0%
1.0%
2.0%
3.0%
'98 '03 '08 '13 '18
10 Year BEI Fed Target
8%
13%
18%
23%
28%
33%
38%
'97 '98 '99 '00 '01 '02 '03 '04 '05 '06 '07 '08 '09 '10 '11 '12 '13 '14 '15 '16 '17
Relative Valuation Average
0.20
0.40
0.80
1.60
'97'98'99'00'01'02'03'04'05'06'07'08'09'10'11'12'13'14'15'16'17'18
-12%
-4%
4%
12%
20%
Su
bse
qu
en
t 10-Y
ear A
nn
ual
Retu
rn D
iffere
nce
, EM
vs U
S
(Inverte
d)
Rela
tive V
alu
ati
on
, EM
vs
US
CA
PE (
Log
Sca
le)
Return Difference (EM-US)
EM/US CAPE Ratio (LHS)
Average EM/US CAPE Ratio
1. U.S. Break-even Inflation U.S. breakevens rallied 1.5% over subsequent 1.5 years
2. EM Currencies EM currencies rallied 8.8% and 8.5% annualized over subsequent 5 and 10
year periods
3. EM to U.S. CAPE ratio EM outperformed by 10.7% and 10.4% annualized over subsequent 5 and 10
year periods
4. Global Value Premium
Value outperformed growth following multiple years of underperformance
AAF_Outlook_17
U.S
. 10Y B
reak-e
ven
in
flati
on
(%
)
EM
FX
Valu
ati
on
R
ela
tive V
alu
ati
on
(Rati
o o
f V
alu
e P
/B t
o G
row
th P
/B)
In the 5 years and 10 years subsequent to Dec 1998, Third Pillar outperformed 60/40 by an annualized 8.8% and 6.2%, respectively
As of 31 March 2019. Global value premium updated through 31 December 2018.
Refer to Appendix for additional investment strategy, index and risk information
Current Percentile= 1st
Current Percentile= 20thCurrent percentile= 35th
Third Pillar allocation= 80% EM allocation= 39%
EM equity allocation= 24% RAE allocation= 40%
Current Percentile = 25th

30
Looking Back
Over the last 5 years, Third Pillar asset classes have delivered an average annualized return of 1.83%, which explains the low
absolute returns for All Asset over that period.
– U.S. equities meaningfully outperformed all major asset classes globally over this period, however periods of sustained
out/underperformance are typically followed by reversals
2018 was a challenging environment for all risk assets, with both Third Pillar markets and U.S. equities posting negative returns.
Looking Ahead
Our return forecasting analysis suggest that Third Pillar markets are now poised for multi-year outperformance potential versus
U.S. 60/40.
All Asset aims to amplify that outperformance potential to meet its return and diversification goals
– A high current yield, more than twice that of 60/40
– An value emphasis on cheaper priced Third Pillar assets, with limited exposure to fully valued U.S. stocks
– Supportive macro-economic and fundamentals backdrop
– Additional return potential through underlying PIMCO funds
AAF_review_26


32 AA_structure_02
As of 31 March 2019
Dec '02 Dec '03 Dec '04 Dec '05 Dec '06 Dec '07 Dec '08 Dec '09 Dec '10 Dec '11 Dec '12 Dec '13 Dec '14 Dec '15 Dec '16 Dec '17 Mar '18 Jun '18 Sep '18 Dec '18 Jan '19 Feb '19 Mar '19
Third Pillar 84.9% 73.3% 65.4% 67.1% 81.2% 74.2% 77.9% 64.4% 86.8% 86.2% 80.3% 82.0% 74.2% 81.9% 74.3% 70.8% 73.6% 74.1% 72.6% 74.7% 78.5% 80.0% 80.0%
Emerging Markets Equities 0.0% 0.0% 0.0% 0.0% 0.0% 0.0% 0.1% 1.9% 5.9% 9.2% 9.9% 11.9% 11.8% 14.1% 18.8% 17.8% 18.2% 18.4% 20.1% 22.9% 24.2% 23.7% 23.6%
RAE Emerging Markets Fund - - - - - - - - - - 4.6% 5.3% 5.5% 5.3% 5.8% 6.7% 7.3% 7.3% 7.4%
RAE PLUS EMG Fund 0.1% 1.9% 5.9% 8.9% 9.7% 11.6% 4.1% 4.7% 3.4% 6.4% 7.9% 9.2% 10.1% 11.9% 12.6% 12.2% 12.0%
RAE Low Volatility PLUS EMG Fund 0.0% 7.7% 9.5% 10.8% 5.8% 3.9% 3.0% 3.3% 3.3% 3.3% 3.3% 3.2%
EqS Emerging Markets Fund 0.2% 0.2% 0.2% 0.0% - - - - - - - - - -
RAFI Dynamic Multi-Factor EM Equity ETF 0.3% 1.0% 0.9% 0.9% 0.9% 1.0% 1.0% 1.0%
Commodities and REITs 10.7% 8.5% 18.6% 7.2% 14.7% 4.3% 6.5% 4.9% 8.8% 12.2% 2.4% 7.6% 9.9% 5.5% 5.3% 10.7% 10.7% 10.4% 8.9% 8.5% 9.4% 9.0% 8.4%
CommoditiesPLUS™ Strategy Fund 3.1% 4.5% 2.4% 2.8% 3.1% 1.7% 3.5% 5.4% 5.3% 4.7% 3.7% 3.2% 3.6% 3.6% 3.4%
CommodityRealReturn Strategy Fund® 10.7% 3.5% 15.4% 3.7% 14.2% 3.5% 2.4% 4.5% 4.2% 4.5% 0.1% 1.4% 4.0% 1.6% 0.5% 1.1% 1.1% 1.1% 1.1% 1.2% 1.2% 1.2% 1.0%
RealEstateRealReturn Strategy Fund 5.0% 3.3% 3.5% 0.5% 0.7% 4.1% 0.3% 1.5% 3.3% - 3.4% 2.9% 2.2% 1.3% 4.2% 4.3% 4.6% 4.2% 4.0% 4.6% 4.1% 3.9%
Emerging Markets Bonds 18.5% 7.1% 12.5% 14.9% 17.0% 19.4% 25.5% 5.8% 5.1% 15.6% 18.6% 19.8% 18.8% 20.8% 19.9% 20.1% 20.6% 18.6% 18.1% 17.7% 16.5% 15.9% 15.4%
Emerging Markets Local Currency and Bond Fund 7.0% 10.3% 1.8% 1.5% 5.7% 7.4% 7.2% 9.1% 8.5% 7.0% 6.4% 6.7% 5.7% 5.6% 5.7% 5.3% 4.8% 4.4%
Emerging Markets Currency and Short-Term Investments Fund 5.4% 11.8% 8.1% 7.9% 2.5% 3.0% 7.1% 7.0% 7.4% 9.1% 11.9% 13.0% 13.7% 13.9% 12.9% 12.5% 12.0% 11.2% 11.1% 11.0%
Emerging Markets Bond Fund 18.5% 7.1% 12.5% 9.6% 5.2% 4.3% 7.3% 1.4% 0.6% 2.7% 3.4% 3.7% 0.5% 0.3% - - - - - - - - -
Emerging Markets Corporate Bond Fund - - - - - - - - - - 0.8% 1.4% 0.2% 0.1% - - - - - - - - -
Credit 0.4% 12.0% 16.6% 14.9% 30.7% 33.5% 19.0% 9.5% 27.1% 33.3% 33.8% 27.5% 14.2% 15.3% 17.4% 12.4% 11.8% 12.1% 9.2% 8.2% 8.4% 8.4% 8.5%
High Yield Fund 0.4% 5.0% 6.0% 6.9% 3.6% 4.1% 4.1% 0.7% 3.9% 6.5% 6.2% 4.8% 2.6% 2.5% 2.3% 0.6% 0.6% 0.6% 0.6% 1.0% 1.0% 1.0% 1.1%
High Yield Spectrum Fund 0.8% 1.6% 3.0% 4.3% 2.9% 3.8% 4.6% 1.6% 1.5% 1.6% 1.6% 1.6% 1.6% 1.6% 1.6%
Income Fund 0.9% 1.7% 1.8% 8.9% 9.1% 10.3% 10.7% 6.2% 6.3% 7.6% 6.3% 6.6% 7.0% 6.6% 5.5% 5.8% 5.8% 5.8%
Diversified Income Fund - - - 1.4% 4.5% 3.0% 3.5% 3.6% 4.4% 4.3% 3.6% 0.1% 0.2% 0.5% 0.0% 0.0% 0.0% 0.0% 0.0% 0.0% 0.0% 0.0%
Low Duration Income Fund 7.7% 7.6% 25.4% 20.9% 2.4% 0.9% 6.1% 7.4% 6.6% 2.0% 0.1% 0.3% - - - - - - - - -
Senior Floating Rate Fund 0.8% 2.6% 2.2% 2.3% 2.1% 2.3% 4.0% 3.2% 3.0% 0.4% 0.0% 0.0% 0.0% 0.0%
Convertible Fund - - 0.6% 0.4% 0.4% 3.1% 7.7% 2.7% 3.7% 3.4% 0.7% - - - - - - - - - - - -
European Convertible Fund - 7.0% 2.3% - - - - - - - - - - - - - - - - - - - -
Global Bonds 1.7% 0.0% 5.4% 2.1% 0.3% 2.7% 0.1% 2.0% 3.3% 4.2% 5.9% 1.1% 0.3% 1.2% 0.0% 0.0% 0.0% 0.0% 0.0% 0.0% 0.0% 0.0% 0.0%
International Bond Fund (Unhedged) 5.4% 2.1% 0.3% 1.6% 0.1% 0.1% 0.8% 1.5% 2.7% 0.1% 0.3% 0.3% - - - - - - - - -
Global Advantage Strategy Bond Fund 2.0% 2.6% 2.7% 3.2% 1.0% 0.0% 0.9% - - - - - - - - -
Global Bond Opportunities Fund (Unhedged) 1.7% - - - - 1.1% 0.1% - - - - - - - - - - - - - - - -
Inflation-Linked Bonds 53.6% 45.7% 12.3% 28.1% 18.5% 14.3% 25.6% 31.9% 9.9% 5.4% 0.1% 0.7% 2.7% 7.9% 3.9% 3.8% 3.0% 2.6% 1.9% 1.9% 4.5% 6.8% 7.3%
Real Return Fund 12.3% 25.0% 6.0% 12.9% 6.5% 5.1% 0.1% 5.9% 1.7% 0.0% 0.0% 0.3% 1.4% 0.8% 3.2% 3.3% 2.6% 2.2% 1.5% 1.5% 1.3% 1.2% 1.3%
Long-Term Real Return Fund 41.3% 20.7% 6.4% 15.2% 12.0% 9.3% 25.5% 26.0% 8.2% 5.3% 0.0% 0.3% 1.3% 7.0% 0.5% 0.4% 0.4% 0.4% 0.4% 0.4% 3.3% 5.6% 6.1%
Global Advantage® Inflation-Linked Bond ETF 0.1% 0.1% 0.1% 0.1% 0.1% - - - - - - - -
Alternative Strategies 0.0% 0.0% 0.0% 0.0% 0.0% 0.0% 1.2% 8.5% 26.8% 6.4% 9.6% 13.5% 16.3% 17.0% 9.0% 6.1% 9.4% 12.0% 14.4% 15.5% 15.4% 16.1% 16.7%
Dynamic Bond Fund - - 11.0% 2.6% 3.8% 3.8% 1.8% 2.1% - - - - 1.7% 1.6% 1.5% 1.5% 1.5%
Credit Opportunities Bond Fund 0.2% 0.5% 2.0% 0.8% 0.2% 0.0% 0.0% 0.0% 0.0% 0.0% 0.0% 0.0% 0.0% 0.0%
Mortgage Opportunities and Bond Fund - 0.5% 0.6% 0.7% 0.7% 0.7% 0.7% 0.7% 0.7% 0.7% 0.7% 0.7% 0.7%
TRENDS Managed Futures Strategy Fund - 0.2% 0.3% 0.3% 0.3% 0.3% 0.3% 1.0% 1.1% 1.0% 1.0% 1.0%
EqS Long/Short Fund 0.3% 0.4% 0.5% - - - - - - - - - -
RAE Worldwide Long/Short PLUS Fund 3.1% 8.0% 5.7% 3.0% 3.4% 5.2% 5.6% 6.3% 6.4% 6.5% 6.8%
RAE Fundamental Advantage PLUS Fund 1.2% 8.5% 15.7% 3.6% 4.1% 2.3% 4.8% 2.6% 1.1% 2.1% 5.0% 5.9% 5.4% 5.9% 5.8% 6.4% 6.7%
RAE Worldwide Fundamental Advantage PLUS Fund 0.8% 4.3% 4.6% 3.2% 1.2% - - - - - - - -

33 AA_structure_02
As of 31 March 2019
Dec '02 Dec '03 Dec '04 Dec '05 Dec '06 Dec '07 Dec '08 Dec '09 Dec '10 Dec '11 Dec '12 Dec '13 Dec '14 Dec '15 Dec '16 Dec '17 Mar '18 Jun '18 Sep '18 Dec '18 Jan '19 Feb '19 Mar '19
Second Pillar 10.7% 5.7% 13.6% 26.0% 7.5% 15.8% 11.3% 32.4% 10.5% 8.3% 10.8% 5.4% 13.8% 10.8% 14.7% 19.9% 19.0% 19.9% 21.3% 19.6% 15.7% 14.1% 13.9%
US Core Bonds 4.4% 3.6% 11.1% 11.7% 4.4% 6.2% 10.0% 14.4% 5.5% 5.0% 4.3% 0.8% 4.6% 3.7% 4.7% 7.2% 6.3% 6.5% 7.7% 4.2% 4.7% 4.7% 4.6%
Total Return Fund 3.2% - 3.4% 8.0% 2.4% 3.8% 0.1% 2.3% 0.2% 0.0% 1.5% 0.5% 2.2% 1.6% 1.9% 4.9% 4.2% 4.2% 5.7% 2.1% 2.7% 2.7% 2.5%
Investment Grade Credit Bond Fund - - - - - - 10.0% 12.1% 5.3% 5.0% 2.8% 0.3% 2.3% 2.0% 2.8% 2.3% 2.2% 2.2% 2.0% 2.1% 2.0% 2.0% 2.1%
Mortgage-Backed Securities Fund - - - 2.6% 1.3% 1.5% - - - - - - - - - - - - - - - - -
GNMA and Government Securities Fund 1.2% 3.6% 7.8% 1.1% 0.7% 0.9% - - - - - - - - - - - - - - - - -
US Long Maturity Bonds 4.1% 0.0% 1.6% 11.1% 1.5% 1.8% 0.9% 13.0% 4.3% 3.2% 6.5% 4.0% 7.7% 2.3% 5.3% 8.7% 8.0% 8.2% 7.7% 9.6% 5.7% 4.6% 5.1%
Extended Duration Fund - - - - - - - - - - 1.5% 3.1% 2.9% 3.5% 3.3% 4.6% 3.3% 2.4% 2.8%
Long-Term US Government Fund 4.1% - 1.6% 11.1% 1.5% 1.8% 0.1% 3.6% 0.1% 0.1% 1.0% 0.1% 3.9% 0.0% 2.4% 4.3% 3.8% 3.4% 3.1% 3.6% 1.1% 0.9% 1.0%
Long Term Credit Bond Fund 6.0% 4.2% 3.0% 3.7% 3.8% 1.9% 0.9% 0.2% - - - - - - - -
Long Duration Total Return Fund - - 0.8% 3.3% 0.0% 0.1% 1.8% 0.1% 1.9% 1.4% 1.2% 1.3% 1.2% 1.3% 1.3% 1.3% 1.3% 1.3% 1.3%
Short-Term Bonds 2.2% 2.1% 0.9% 3.1% 1.6% 7.9% 0.4% 5.0% 0.7% 0.1% 0.0% 0.6% 1.5% 4.8% 4.7% 4.0% 4.7% 5.2% 5.9% 5.9% 5.4% 4.8% 4.3%
Low Duration Fund 2.2% 2.1% 0.7% 3.1% 1.6% 7.0% 0.4% 2.3% 0.7% 0.0% 0.0% 0.6% 0.5% 1.5% 2.4% 3.3% 4.1% 4.9% 5.6% 5.3% 5.0% 4.5% 3.9%
Low Duration Exchange Traded Fund 0.2% 0.2% - - - - - - - - -
Short Term Fund - - 0.2% - 0.1% 0.9% 0.0% 2.7% 0.1% 0.0% 0.0% 0.0% 0.0% - - - - - - - - - -
Government Money Market Fund - - - - - 0.8% - 2.3% 0.6% 0.3% 0.3% 0.3% 0.6% 0.3% 0.3% 0.3%
Money Market Fund 3.1% - - - - - - - - -
Net Cash Equivalents - - - - - - - - - - 0.0% 0.1% 0.0% 0.0% 0.0% 0.0% 0.2% 0.0% 0.0% 0.0% 0.0% 0.0% 0.0%
- - - - - - -
First Pillar 4.4% 21.0% 21.1% 6.9% 11.2% 10.0% 10.7% 3.1% 2.7% 5.5% 8.8% 12.5% 12.0% 7.3% 11.1% 9.3% 7.4% 6.0% 6.1% 5.7% 5.8% 5.9% 6.1%
US Equities 4.4% 19.4% 16.6% 4.6% 6.9% 6.3% 8.2% 2.0% 1.0% 1.3% 0.9% 1.2% 4.0% 1.5% 0.2% 0.3% 0.3% 0.3% 0.3% 0.0% 0.0% 0.0% 0.0%
RAE PLUS Fund 3.6% 3.5% 2.8% 2.7% 0.7% 0.4% 0.2% 0.1% 0.1% 0.6% - - - - - - - - - -
RAE Low Volatility PLUS Fund 0.0% 2.7% 1.2% 0.2% 0.3% 0.3% 0.3% 0.3% - - - -
RAE PLUS Small Fund 0.6% 0.6% 0.8% 0.7% 0.3% - - - - - - - - -
StocksPLUS® Small Fund 0.0% 0.1% 4.1% 0.7% 0.1% 0.1% 0.1% 0.1% 0.0% - - - - - - - - - -
Fundamental IndexPLUS™ 0.4% 2.5% 2.8% 1.0% 0.1% 0.1% - - - - - - - - - - - - - -
StocksPLUS® Fund 0.4% 6.9% 8.0% 0.1% 0.2% 0.1% 0.1% 0.1% 0.1% 0.0% 0.0% 0.0% 0.0% - - - - - - - - - -
StocksPLUS® Absolute Return Fund 4.0% 12.5% 8.7% 0.5% 0.7% 0.5% 0.3% 0.3% 0.3% 0.3% 0.1% 0.1% 0.0% - - - - - - - - - -
Developed ex-US Equities 0.0% 1.6% 4.4% 2.3% 4.3% 3.7% 2.6% 1.2% 1.7% 4.2% 7.9% 11.4% 8.0% 5.8% 10.8% 9.0% 7.1% 5.7% 5.8% 5.7% 5.8% 5.9% 6.1%
RAE PLUS International Fund 0.8% 5.3% 6.9% 3.0% 1.5% 2.5% 3.4% 1.7% 0.5% 0.5% 0.9% 0.9% 1.0% 1.0%
RAE Low Volatility PLUS International Fund 0.0% 3.8% 4.2% 5.3% 1.8% 1.8% 1.8% 1.9% 1.7% 1.7% 1.8% 1.9%
StocksPLUS® International Fund (USD-Hedged) 1.6% 4.4% 2.3% 3.9% 3.2% 2.3% 0.8% 0.3% 0.5% 0.2% 0.2% 0.0% 0.1% 2.8% 3.0% 2.9% 3.1% 3.1% 3.0% 3.1% 3.2% 3.2%
StocksPLUS® International Fund (Unhedged) 0.4% 0.5% 0.3% 0.3% 0.3% 0.6% 0.6% 0.6% 0.0% - 0.2% 0.8% 0.8% 0.3% 0.3% - - - -
EqS Dividend Fund 0.1% 0.1% 0.1% 0.0% - - - - - - - - - -
EqS Pathfinder Fund 1.1% 2.3% 1.8% 3.5% 1.2% - - - - - - - - - -

34
Summary Statistics US 60/40* Global 60/40**Morningstar World
Allocation Category
Morningstar Tactical
Allocation Category ex
All Asset Funds
PIMCO All Asset Fund
Total Realized Volatility 8.0% 8.5% 9.6% 8.3% 8.6%
% of Volatility from Equities 89.0% 87.5% 77.4% 85.0% 24.3%
World Equity Beta 0.60 0.59 0.58 0.56 0.22
-2%
0%
2%
4%
6%
8%
10%
12%
US 60/40* Global 60/40** Morningstar World
Allocation Category
Morningstar Tactical
Allocation Category
ex All Asset Funds
PIMCO All Asset Fund PIMCO All Asset All
Realiz
ed
Vo
lati
lity (
%)
Residual
EM FX
DM FX
Momentum
Commodity
HY spread
IG spread
U.S. Duration
EM premium
JP premium
EUR premium
U.S. premium
World equity
SOURCE: PIMCO, Bloomberg, As of 31 December 2018.
Hypothetical example for illustrative purposes only.
• US 60/40 represented by 60% S&P 500/40% Barclays U.S. Aggregate Index (Unhedged)
** Global 60/40 represented by 60% MSCI World Index/40% Barclays Global Aggregate Index (USD Hedged)
All Asset is represented in the Morningstar Tactical Allocation Category. The Morningstar World Allocation Category is comprised of funds that seek to provide both capital appreciation and
income by investing in three major areas: stocks, bonds, and cash. Typically these portfolios have at least 10% of assets in bonds, less than 70% of assets in stocks, and at least 40% of assets in
non-U.S. stocks or bonds. All Asset is comparable to portfolios in this category. 1 Based on returns from 31 December 2003 to 28 February 2018, representing maximum history where all of the data is available. Realized volatility is calculated using a multi-factor regression
model – factors are defined in the appendix. Realized volatility may not be representative of forward-looking volatility.
Refer to Appendix for additional hypothetical example, index, investment strategy, portfolio analysis, and risk information.
All Asset vs. World Allocation and Tactical Allocation Categories*
Full Sample Realized Volatility Contribution by Risk Factor1

35
0th
20th
40th
60th
80th
100th
Return
/ Volatility
Return
/ Beta to S&P
Perc
en
tile
All Asset Fund vs. Morningstar Liquid
Alternatives Funds
0th
20th
40th
60th
80th
100th
Return
/ Volatility
Average Return
in Down
U.S. Equity Markets
Perc
en
tile
All Asset Fund vs. Morningstar Tactical
and World Allocation Funds
0th
20th
40th
60th
80th
100th
Return
/ Volatility
Correlation
to 12m Changes
in BEI
Perc
en
tile
All Asset Fund vs. Morningstar Real
Return Funds
vs. GTAA peers vs. Real Return peers
Analysis run from July 31, 2002 to December 31, 2018. All Asset was incepted July 31, 2002.
Source: Research Affiliates based on data from Morningstar using funds with at least as long a track record as the All Asset Fund.
All Asset
vs. Liquid Alternative Peers
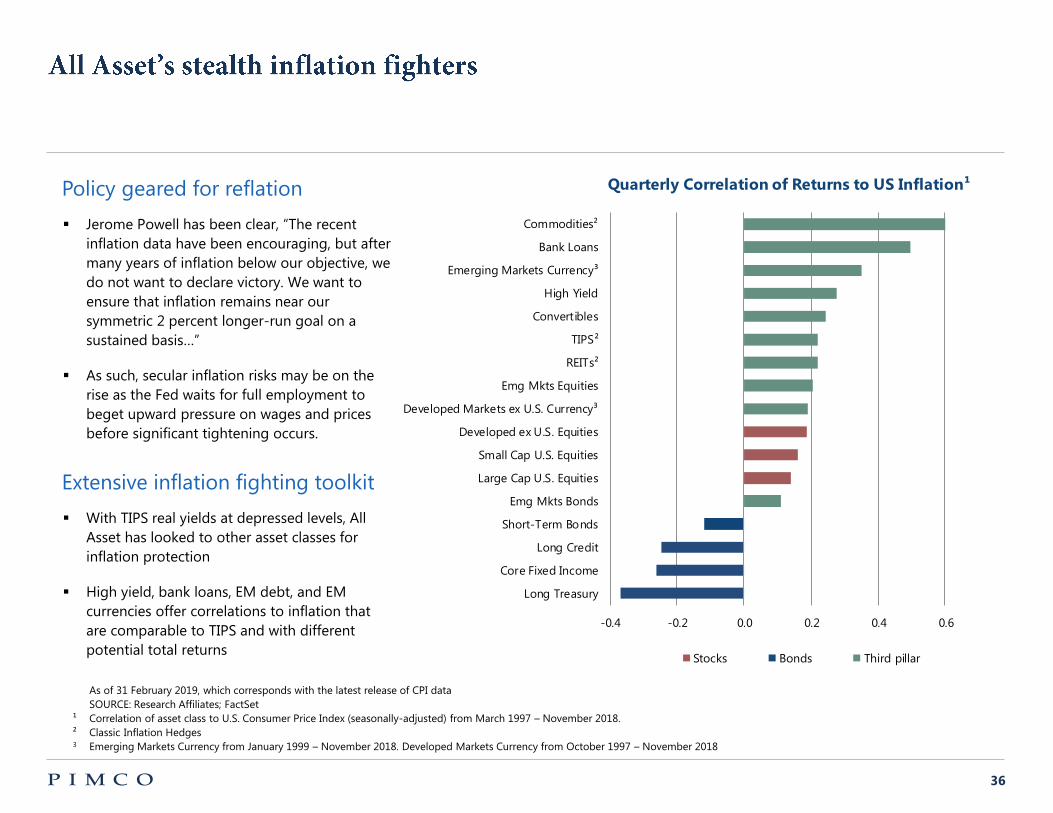
36
-0.4 -0.2 0.0 0.2 0.4 0.6
Commodities²
Bank Loans
Emerging Markets Currency³
High Yield
Convertibles
TIPS²
REITs²
Emg Mkts Equities
Developed Markets ex U.S. Currency³
Developed ex U.S. Equities
Small Cap U.S. Equities
Large Cap U.S. Equities
Emg Mkts Bonds
Short-Term Bonds
Long Credit
Core Fixed Income
Long Treasury
Quarterly Correlation of Returns to US Inflation¹Policy geared for reflation
Jerome Powell has been clear, “The recent
inflation data have been encouraging, but after
many years of inflation below our objective, we
do not want to declare victory. We want to
ensure that inflation remains near our
symmetric 2 percent longer-run goal on a
sustained basis…”
As such, secular inflation risks may be on the
rise as the Fed waits for full employment to
beget upward pressure on wages and prices
before significant tightening occurs.
Extensive inflation fighting toolkit
With TIPS real yields at depressed levels, All
Asset has looked to other asset classes for
inflation protection
High yield, bank loans, EM debt, and EM
currencies offer correlations to inflation that
are comparable to TIPS and with different
potential total returns
1cs_AAF_review_07
Stocks Bonds Third pillar
As of 31 February 2019, which corresponds with the latest release of CPI data
SOURCE: Research Affiliates; FactSet
¹ Correlation of asset class to U.S. Consumer Price Index (seasonally-adjusted) from March 1997 – November 2018.
² Classic Inflation Hedges
3 Emerging Markets Currency from January 1999 – November 2018. Developed Markets Currency from October 1997 – November 2018

37
All Asset provided much better portfolio diversification than 60/40, as measured by both equity beta and correlation
The historical diversification benefits were most pronounced when 60/40 posted negative returns
All Asset delivered outperformance in the vast majority of these periods – positive diversification when it is needed most
All Authority has historically provided more pronounced value-add when 60/40 is falling
As of 31 March 2019
1 The 60/40 mix is comprised of 60% S&P 500 and 40% Barclays U.S. Aggregate Index
Performance is shown for the institutional class; Volatility is the annualized standard deviation of monthly returns
Refer to Appendix for additional performance and fee, index, correlation and risk information.
AAF_AAAAF_review_38
Diversification
benefit most
pronounced
when 60/40 is
failing!
A4F Avg.
AAF Avg.
0.99
0.600.62
0.38
0.53
0.34
0%
10%
20%
30%
40%
50%
60%
70%
80%
90%
100%
Equity Correlation Equity Beta
Co
rrela
tio
n a
nd
Beta
Lower correlation and beta to equities than a balanced portfolio
60/40 mix (%)¹
PIMCO All Asset Fund
PIMCO All Asset All Authority Fund
-20%
-15%
-10%
-5%
0%
5%
10%
15%
20%
-40% -20% 0% 20% 40%
All A
sset
All A
uth
ori
ty e
xcess
retu
rns
over
60/4
0
US 60/40 Total Return
All Asset and All Asset All Authority vs. US
60/40, since inception (rolling 12m periods)
All Asset
All Asset All Authority

38
Valuations
EM Equity
Weights
EM Currency
Weights
External debt to
GDP
Foreign FX as %
of GDP
FX Reserves to
Ext. Debt
Gov't Spending
% vs. Per Capita
GDP
CAPE
Representative EM Countries
EM Average --- --- 40% 23% 69% 27% 16x
China 33% 10% 13% 28% 0% 23% 14x
South Korea 16% 10% 30% 26% 92% 20% 13x
Taiwan 12% 6% 34% --- 248% 21% 21x
India 9% 8% 20% 16% 78% 27% 23x
South Africa 7% 2% 51% 16% 31% 29% 19x
Brazil 6% 4% 31% 20% 66% 38% 12x
Russia 4% 6% 42% 29% 70% 33% 6x
Mexico 3% 9% 41% 17% 42% 25% 22x
Malaysia 3% 4% 70% 32% 46% 27% 17x
Thailand 3% 5% 31% 42% 134% 21% 19x
Indonesia 2% 3% 35% 12% 36% 18% 18x
Chile 1% 1% --- 16% --- 23% ---
Philippines 1% 2% --- 26% --- 20% ---
Turkey 1% 4% 48% 12% 26% 36% 8x
Poland 0% 5% 70% 24% 30% 44% 11x
Representative DM Countries
DM Average --- --- 156% 9% 8% 39% 23x
United States --- --- 98% 2% 0% 36% 32x
United Kingdom --- --- 313% 5% 2% 39% 15x
Germany --- --- 141% 5% 1% 45% 18x
Japan --- --- 74% 25% 29% 37% 26x
Constituent Weighting Economic Metrics
EM averages are better than DM averages on multiple fronts, while valuations are more attractive

39
SECOND PILLAR
Provide income
Reduce volatility
Disinflationary bias
FIRST PILLAR
Participate in economic growth
Seek returns
Disinflationary bias
THIRD PILLAR
Provide uncorrelated return
Seek diversification with income
Inflationary bias
All Asset
Average allocation
(since fund inception)
AAF_AAAAF_review_14
As of 31 December 2018
Max: 30%
Min: 3%
Max: 37%
Min: 0%
Max: 89%
Min: 50% 14%9% 76%

40
0.6%
1.8% 1.7% 1.8%
-2%
0%
2%
4%
6%
8%
U.S. 60/40 Global 60/40 Average Global Wealth Manager Average Public Pension
(liquid assets)
Estimated 5-7 year real returns 80th percentile 20th percentile Expected return
Hypothetical forecast for illustrative purposes only
As of 31 March 2019
SOURCE: Research Affiliates, Barron’s, OFI Global Wealth Management, Wilshire Consulting; Willis Towers Watson
U.S. 60/40 represented by 60% S&P 500 Index and 40% Bloomberg Barclays U.S. Aggregate Index; Global 60/40 represented by 36% S&P 500 Index, 24% MSCI EAFE Index, and 40%
Bloomberg Barclays Global Aggregate Index (USD Hedged); Average Global Wealth Manager represented by average wealth management portfolio from Barron’s PENTA Report; Average
Public Pension (liquid assets) based on industry reports from OFI Global Asset Managements, Wilshire Consulting, and Willis Towers Watson;
Return estimates listed above may vary from PIMCO Capital Market Assumptions.
Refer to Appendix for additional index, return estimate and risk information.
Most investors’ long-term return objectives are well higher than what developed market stocks and bonds are priced to deliver
Looking forward, broader opportunity sets, underlying fund alpha and tactical asset allocation will be increasingly important
20th percentile 80th percentile Expected return
AAF_outlook_23
TYPICAL LONG-TERM TARGET RETURN
Estimated volatility
9.0% 9.4% 9.6% 10.5%
Estimated percent of total risk from equities
100.2% 87.3% 91.6% 94.2%
Equity Beta
0.59 0.55 0.60 0.62

41
Excess return forecast
As of 31 March 2019
From March 1997 to March 2019
* Represents the current 10 year excess return forecast of Third Pillar vs. 60/40
When comparing current projected excess returns (green bar) to subsequent results, as the length of time increases:
– Range of outcomes narrows
– Outcomes converge towards the forecast
AAF_outlook_06
0.3%
4.3% 4.9%
2.6%
-10%
-5%
0%
5%
10%
15%
20%
Realized excess returns of Third Pillar vs. 60/40 from
a starting excess return forecast of 2% to 3%*
Bottom Quartile, Average 2nd Quartile, Average Median
3rd Quartile, Average Top Quartile, Average
Subsequent
1 Year
Subsequent
3 Year
Subsequent
5 Year
Subsequent
10 Year

42
Equity markets are inefficient as stock prices often deviate from
“fair value”
Over time, stock prices eventually revert towards estimates of
fair value
Investors can profit from this mean-reverting process by
systematically buying low and selling high
This process has recently led to elevated exposure to value
stocks
SOURCE: Research Affiliates
Refer to Appendix for additional investment strategy, and risk information.
PIMCO RAE Fundamental methodology Philosophy of fundamental weighting
Price
Price
Random error
1. Select and weight stocks by non-price measures of
company size (i.e. economic footprint)
2. Incorporate quantitative enhancements to a
Fundamental Index (RAFI) chassis to improve portfolio
returns
3. Rebalance the portfolio back to fundamental weights,
contra-trading against recent price movements
Sales
1
Cash flow
2
Dividends
3
Book Value
4
Quality
1
Momentum
2
Style
Diversification
3 Size
Diversification
4
AAF_RAE_Slides
Fair Value
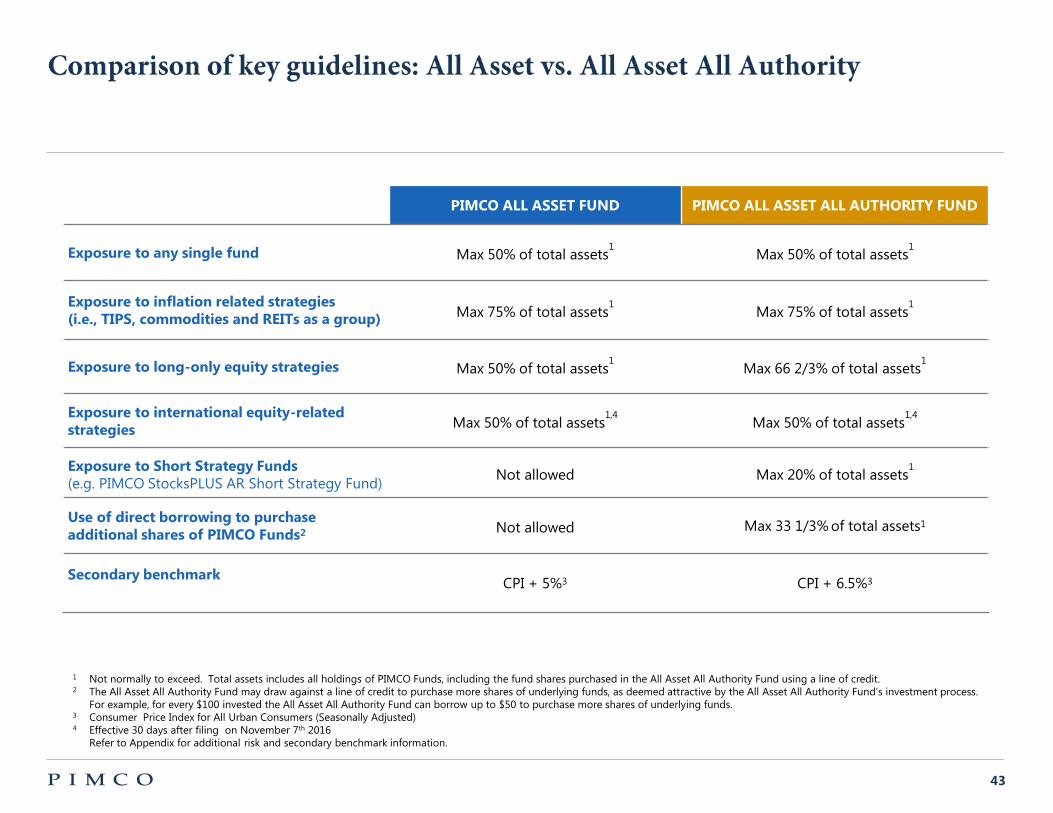
43
1 Not normally to exceed. Total assets includes all holdings of PIMCO Funds, including the fund shares purchased in the All Asset All Authority Fund using a line of credit.
2 The All Asset All Authority Fund may draw against a line of credit to purchase more shares of underlying funds, as deemed attractive by the All Asset All Authority Fund’s investment process.
For example, for every $100 invested the All Asset All Authority Fund can borrow up to $50 to purchase more shares of underlying funds.
3 Consumer Price Index for All Urban Consumers (Seasonally Adjusted)
4 Effective 30 days after filing on November 7th 2016
Refer to Appendix for additional risk and secondary benchmark information.
all_asset_review_12c
PIMCO ALL ASSET FUND PIMCO ALL ASSET ALL AUTHORITY FUND
Exposure to any single fund Max 50% of total assets1
Max 50% of total assets1
Exposure to inflation related strategies
(i.e., TIPS, commodities and REITs as a group) Max 75% of total assets1
Max 75% of total assets1
Exposure to long-only equity strategies Max 50% of total assets1
Max 66 2/3% of total assets1
Exposure to international equity-related
strategies Max 50% of total assets1,4
Max 50% of total assets1,4
Exposure to Short Strategy Funds
(e.g. PIMCO StocksPLUS AR Short Strategy Fund) Not allowed
Max 20% of total assets
1
Use of direct borrowing to purchase
additional shares of PIMCO Funds2 Not allowed
Max 33 1/3% of total assets1
Secondary benchmark
CPI + 5%3 CPI + 6.5%3

44
$4$15 $17 $27 $40 $48
$63
$103$118 $126
$143$176
$146
$14$16 $15
$19
$29$40
$62
$64$52 $31
$27
$29
$24
$5 $12 $18$31 $32
$46
$69
$88
$124
$167 $170$157
$170
$205
$170
$0
$20
$40
$60
$80
$100
$120
$140
$160
$180
$200
$220
$240
'04 '05 '06 '07 '08 '09 '10 '11 '12 '13 '14 '15 '16 '17 '18
Billio
ns
(US$)
Total RAFI and All Asset suite assets RAE + RAFI*
All Asset suite
AAF_update_01
As of March 2019. AUM is preliminary. * Excludes RAFI investments made by the AAF suite Based on estimates. Includes assets managed or sub-advised by Research Affiliates or licensees using RAFI, eRAFI® or GTAA strategies
Mission:
Concentrate on research and product development
Partner with world-class affiliates to bring product
to market
Investment Philosophy:
Asset prices exhibit long-horizon mean reversion and
shorter-horizon random variation
Behavioral tendencies (i.e., trend following, asymmetric
risk tolerance) and governance constraints perpetuate
these deviations
Systematically contra-trading price volatility to capture
long-horizon mean reversion offers significant
incremental return potential
Global leader in:
Global tactical asset allocation (GTAA)
Innovative indexation
Profile:
Founded in 2002 by Rob Arnott & Jason Hsu
Majority employee-owned
Currently 88 employees, 43 investment professionals
Diversifying sources of revenue:
All Asset (third pillar beta)
RAE/RAFI (equity beta)
5
9
1618
2123
27
34
40
44 43 4244
49
43
0
10
20
30
40
50
'05 '06 '07 '08 '09 '10 '11 '12 '13 '14 '15 '16 '17 '18 '19
Total investment professionals
Years ended 31 March**
Research & Investment Management Professionals
Masters
PhDs

45 As of

46 !mk_Solutions_All_Channels_body
KEY RISK FACTORS Long Exposure Short Exposure
World equity (beta)Return to MSCI All Country
World Local Index (ACWI)
U.S. premium (beta) Return to MSCI USA IndexReturn to MSCI All Country
World Local Index (ACWI)
EUR premium (beta)Return to MSCI Europe Local
Index
Return to MSCI All Country
World Local Index (ACWI)
JP premium (beta)Return to MSCI Japan Local
Index
Return to MSCI All Country
World Local Index (ACWI)
EM premium (beta)Return to MSCI EM Local
Index
Return to MSCI All Country
World Local Index (ACWI)
U.S. Duration (yrs)Change in 10Y U.S. Nominal
yield
IG spread (yrs)
Change in Barclays Global
Aggregate Corporate Avg.
OAS
HY spread (yrs)
Change in Barclays Global
Corporate High Yield Avg.
OAS
Commodity (beta)Return to Bloomberg
Commodity Index
Momentum (beta)Return to S&P Diversified
Trends Indicator
DM FX (beta)Inverse return of the DXY
Index
EM FX (beta)Return to JP Morgan ELMI+
IndexBeta to emerging market currencies
For a 1.0 EM FX beta, a 1% increase in EM FX will lead to a 1% increase in
portfolio return
Beta to commodity returnsFor a 1.0 Commodity Beta, a 1% increase in the Bloomberg Commodity
Index will lead to a 1% increase in portfolio return
Beta to a multi-asset trend following
(momentum) strategy
For a 1.0 Trend Following Beta, a 1% increase in the S&P Diversified
Trends Indicator Index will lead to a 1% increase in portfolio return
Beta to developed market currenciesFor a 1.0 DM FX beta, a 1% increase in DM FX will lead to a 1% increase in
portfolio return
Duration to U.S. nominal interest ratesFor each year of duration, a 1% instantaneous increase in nominal yields
will lead to a 1% instantaneous decline in portfolio return
Duration to investment grade credit spreadFor each year of IG credit spread duration, a 1% instantaneous increase in
IG credit spreads will lead to a 1% instantaneous deline in portfolio return
Duration to high yield credit spreads
For each year of HY credit spread duration, a 1% instantaneous increase
in HY credit spreads will lead to a 1% instantaneous decline in the
portfolio
Beta to European equity market returns net of
world equity market returns
For a 1.0 EU Equity Beta, a 1% increase in the MSCI Europe Local Index
over the MSCI ACWI Index will lead to a 1% increase in portfolio return
Beta to Japanese equity market returns net of
world equity market returns
For a 1.0 JP Equity Beta, a 1% increase in the MSCI Japan Local Index over
the MSCI ACWI Index will lead to a 1% increase in portfolio return
Beta to EM equity market returns net of world
equity market returns
For a 1.0 EM Equity Beta, a 1% increase in the MSCI EM Index over the
MSCI ACWI Index will lead to a 1% increase in portfolio return
Definition Description
Beta to world equity market returnsFor a 1.0 World Equity Beta, each 1% increase in the MSCI ACWI Index will
lead to a 1% increase in portfolio return
Beta to U.S. equity market returns net of world
equity market returns
For a 1.0 U.S. Equity Beta, a 1% increase in the MSCI USA Index over the
MSCI ACWI Index will lead to a 1% increase in portfolio return

47 !mk_AAF_Finals_Cavalieri_app
PERFORMANCE AND FEE: Past performance is not a guarantee or a reliable indicator of future results. The minimum initial investment for PIMCO institutional class shares is $1 million;
however, it may be modified for certain financial intermediaries who submit trades on behalf of eligible investors.
CHART: Performance results for certain charts and graphs may be limited by date ranges specified on those charts and graphs; different time periods may produce different results.
HYPOTHETICAL EXAMPLE: No representation is being made that any account, product, or strategy will or is likely to achieve profits, losses, or results similar to those shown. Hypothetical or
simulated performance results have several inherent limitations. Unlike an actual performance record, simulated results do not represent actual performance and are generally prepared with the
benefit of hindsight. There are frequently sharp differences between simulated performance results and the actual results subsequently achieved by any particular account, product, or strategy. In
addition, since trades have not actually been executed, simulated results cannot account for the impact of certain market risks such as lack of liquidity. There are numerous other factors related to
the markets in general or the implementation of any specific investment strategy, which cannot be fully accounted for in the preparation of simulated results and all of which can adversely affect
actual results.
INDEX: It is not possible to invest directly in an unmanaged index.
INVESTMENT STRATEGY: There is no guarantee that these investment strategies will work under all market conditions or are suitable for all investors and each investor should evaluate their ability
to invest long-term, especially during periods of downturn in the market. No representation is being made that any account, product, or strategy will or is likely to achieve profits, losses, or results
similar to those shown.
PORTFOLIO ANALYSIS: The portfolio analysis is based on a sample portfolio and index blends. No representation is being made that the structure of the average portfolio or any account will
remain the same or that similar returns will be achieved. Results shown may not be attained and should not be construed as the only possibilities that exist. Different weightings in the asset
allocation illustration will produce different results. Actual results will vary and are subject to change with market conditions. There is no guarantee that results will be achieved. No fees or expenses
were included in the estimated results and distribution. The scenarios assume a set of assumptions that may, individually or collectively, not develop over time. The analysis reflected in this
information is based upon data at time of analysis. Forecasts, estimates, and certain information contained herein are based upon proprietary research and should not be considered as investment
advice or a recommendation of any particular security, strategy or investment product.
PIMCO routinely reviews, modifies, and adds risk factors to its proprietary models. Due to the dynamic nature of factors affecting markets, there is no guarantee that simulations will capture all
relevant risk factors or that the implementation of any resulting solutions will protect against loss. All investments contain risk and may lose value. Simulated risk analysis contains inherent
limitations and is generally prepared with the benefit of hindsight. Realized losses may be larger than predicted by a given model due to additional factors that cannot be accurately forecasted or
incorporated into a model based on historical or assumed data.
RISK: Investing in securities carries risk, including the risk of loss of principal invested. Investing in the bond market is subject to certain risks including market, interest-rate, issuer, credit, and
inflation risk;. The value of most bonds and bond strategies are impacted by changes in interest rates. Bonds and bond strategies with longer durations tend to be more sensitive and volatile than
those with shorter durations, bond prices generally fall as interest rates rise, and current low interest rate environment increases this risk. Current reductions in bond counterparty capacity may
contribute to decreased market liquidity and increased price volatility. Bond investments may be worth more or less than the original cost redeemed. Investing in foreign denominated and/or
domiciled securities may involve heightened risk due to currency fluctuations, and economic and political risks, which may be enhanced in emerging markets. High-yield, lower-rated, securities
involve greater risk than higher-rated securities; portfolios that invest in them may be subject to greater levels of credit and liquidity risk than portfolios that do not. Equities may decline in value
due to both real and perceived general market, economic, and industry conditions. Derivatives may involve certain costs and risks such as liquidity, interest rate, market, credit, management and
the risk that a position could not be closed when most advantageous. Investing in derivatives could lose more than the amount invested. Diversification does not ensure against loss.
Please refer to the Funds' prospectus for a complete overview of the primary risks associated with a specific fund.
This material contains the current opinions of the manager and such opinions are subject to change without notice. This material has been distributed for informational purposes only and should
not be considered as investment advice or a recommendation of any particular security, strategy or investment product. No part of this material may be reproduced in any form, or referred to in
any other publication, without express written permission. PIMCO is a trademark of Allianz Asset Management of America L.P. in the United States and throughout the world. PIMCO Investments
LLC, distributor, 1633 Broadway, New York, NY 10019, is a company of PIMCO. ©2018, PIMCO
.

Executive SummaryBase Currency: US Dollar
Portfolio Characteristics
Total Rate of Return (%)
Sector Allocation Highlights
1.9
9
3.1
4
4.9
5
2.8
0
3.1
7
6.6
0
5.9
1
1.9
6
3.0
5
4.5
9
2.4
5
2.8
3
6.2
6
5.5
8
1.9
2
2.9
4
4.4
8
2.0
3 2.7
4
3.7
7
4.8
6
March Latest 3-Months 1 Year 3 Years 5 Years 10 Years Annualized S.I.
TCW (Gross) TCW (Net) Bloomberg Barclays Aggregate
Portfolio Index
Mortgage Backed 40.39% 29.93%
Agency MBS 28.33% 27.98%
Non-Agency MBS 7.08% 0.00%
CMBS 4.98% 1.95%
Credit 26.98% 29.13%
24.83% 24.17%Corporate Credit
Investment Grade 24.83% 24.17%
HY / Bank Loans 0.00% 0.00%
Non Corp Credit 1.83% 3.24%
Emerging Markets 0.33% 1.73%
Other 0.00% 0.00%
IndexPortfolio
Yield To Worst 3.16% 2.93%
Duration 5.93 yrs 5.82 yrs
Spread Duration 4.17 yrs 3.63 yrs
Quality AA AA+
21,304,211.09
Ending Market Value
26.73%Government 40.46%
26.98%Credit 29.13%
40.39%Mortgage Backed 29.93%
6.39%Asset Backed 0.48%
(0.49)%Cash and Equivalents 0.00%
0.00%Other 0.00%
Pasadena Fire and Police Retirement System
As of 03/31/2019
Core Fixed Income (Account #: SMS650)Benchmark: Bloomberg Barclays Aggregate
Inception Date: 07/24/2000- Trade date basis- Returns are annualized for periods greater than one year.
1
mprice
Typewritten Text
DATE: 5/15/19 ITEM #: 6f

Duration BreakdownQuality Breakdown
Maturity BreakdownBase Currency: US Dollar
Characteristics Summary
IndexPortfolio
Yield to Worst 3.16% 2.93%
Spread Duration 4.17 yrs 3.63 yrs
Effective Duration 5.93 yrs 5.82 yrs
Duration Difference 0.11 yrs
Average Maturity 7.69 yrs 8.01 yrs
Average Credit Quality AA AA+
Average Coupon 3.61% 3.22%
Current Yield 4.32% 3.15%
Average Convexity 0.08 yrs 0.12 yrs
Index
Market Value %
PortfolioMarket Value Portfolio Index
Duration %
489,5470 - 1 Yrs 2.30% 0.07% 0.17% 0.01%
2,862,2531 - 3 Yrs 13.44% 22.30% 7.13% 7.36%
4,352,7803 - 5 Yrs 20.43% 22.24% 13.31% 13.51%
10,444,7565 - 10 Yrs 49.03% 39.12% 38.91% 36.13%
937,55810 - 20 Yrs 4.40% 3.75% 6.35% 7.04%
2,217,31720+ Yrs 10.41% 12.52% 34.13% 35.96%
TOTAL 21,304,211 100%100% 100% 100%
Index
Market Value %
PortfolioMarket Value Portfolio Index
Duration %
30< 0 Yrs 0.00% 0.00% 0.00% 0.00%
2,998,5040 - 1 Yrs 14.07% 0.17% 0.60% 0.02%
2,424,4811 - 2 Yrs 11.38% 12.96% 6.65% 3.40%
1,262,2232 - 3 Yrs 5.92% 14.65% 2.50% 6.40%
6,989,7763 - 5 Yrs 32.81% 33.15% 25.66% 22.80%
2,812,8175 - 7 Yrs 13.20% 17.05% 12.56% 16.79%
1,914,8917 - 9 Yrs 8.99% 6.48% 11.96% 8.64%
2,901,4899+ Yrs 13.62% 15.53% 40.07% 41.94%
TOTAL 21,304,211 100%100% 100% 100%
Index
Market Value %
PortfolioMarket Value Portfolio Index
Duration %
13,949,385AAA 65.48% 72.67% 70.67% 65.76%
855,797AA 4.02% 3.43% 3.44% 3.66%
1,989,246A 9.34% 10.37% 6.98% 13.04%
4,005,276BBB 18.80% 13.53% 18.77% 17.54%
33,812BB 0.16% 0.00% 0.00% 0.00%
302,658B 1.42% 0.00% 0.08% 0.00%
168,037CCC & Below 0.79% 0.00% 0.05% 0.00%
0Not Rated 0.00% 0.00% 0.00% 0.00%
TOTAL 21,304,211 100%100% 100% 100%
Pasadena Fire and Police Retirement System
Core Fixed Income (Account #: SMS650)
As of 03/31/2019
Benchmark: Bloomberg Barclays Aggregate
All market values include accrued interestAll securities unrated by NRSROs will defer to the manager determined rating where applicable and permitted 2
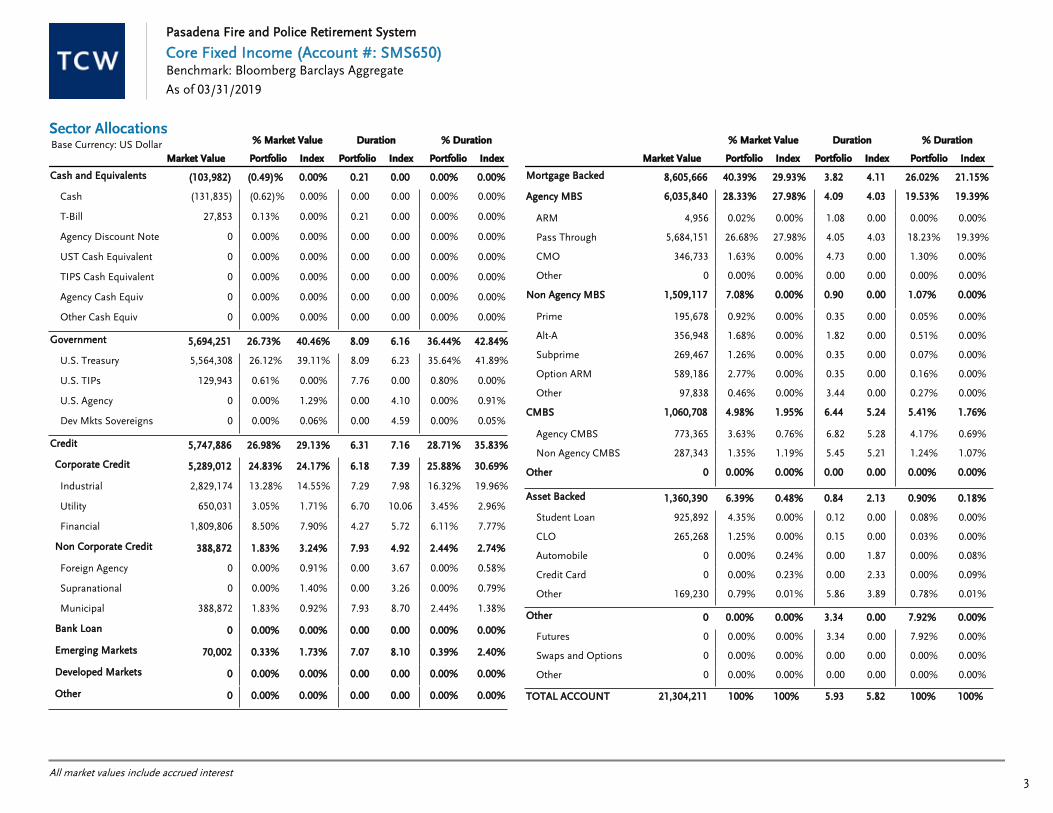
Base Currency: US Dollar
Sector Allocations
Market Value Portfolio Index
% Market Value
Portfolio Index Portfolio Index
Duration % Duration
Mortgage Backed 40.39%8,605,666 26.02% 21.15%29.93% 3.82 4.11
Agency MBS 6,035,840 28.33% 27.98% 4.09 19.39%4.03 19.53%
0.00ARM 0.02% 0.00%4,956 0.00%0.00% 1.08
4.03Pass Through 26.68% 18.23%5,684,151 19.39%27.98% 4.05
0.00CMO 1.63% 1.30%346,733 0.00%0.00% 4.73
0.00Other 0.00% 0.00%0 0.00%0.00% 0.00
Non Agency MBS 1,509,117 7.08% 0.00% 0.90 0.00%0.00 1.07%
0.00Prime 0.92% 0.05%195,678 0.00%0.00% 0.35
0.00Alt-A 1.68% 0.51%356,948 0.00%0.00% 1.82
0.00Subprime 1.26% 0.07%269,467 0.00%0.00% 0.35
0.00Option ARM 2.77% 0.16%589,186 0.00%0.00% 0.35
0.00Other 0.46% 0.27%97,838 0.00%0.00% 3.44
CMBS 1,060,708 4.98% 1.95% 6.44 1.76%5.24 5.41%
5.28Agency CMBS 3.63% 4.17%773,365 0.69%0.76% 6.82
5.21Non Agency CMBS 1.35% 1.24%287,343 1.07%1.19% 5.45
Other 0 0.00% 0.00% 0.00 0.00%0.00 0.00%
Asset Backed 6.39%1,360,390 0.90% 0.18%0.48% 0.84 2.13
0.00Student Loan 4.35% 0.08%925,892 0.00%0.00% 0.12
0.00CLO 1.25% 0.03%265,268 0.00%0.00% 0.15
1.87Automobile 0.00% 0.00%0 0.08%0.24% 0.00
2.33Credit Card 0.00% 0.00%0 0.09%0.23% 0.00
3.89Other 0.79% 0.78%169,230 0.01%0.01% 5.86
Other 0.00%0 7.92% 0.00%0.00% 3.34 0.00
0.00Futures 0.00% 7.92%0 0.00%0.00% 3.34
0.00Swaps and Options 0.00% 0.00%0 0.00%0.00% 0.00
0.00Other 0.00% 0.00%0 0.00%0.00% 0.00
TOTAL ACCOUNT 5.9321,304,211 5.82100% 100% 100% 100%
Market Value Portfolio Index
% Market Value
Portfolio Index Portfolio Index
Duration % Duration
Cash and Equivalents (0.49)%(103,982) 0.00% 0.00%0.00% 0.21 0.00
0.00Cash (0.62)% 0.00%(131,835) 0.00%0.00% 0.00
0.00T-Bill 0.13% 0.00%27,853 0.00%0.00% 0.21
0.00Agency Discount Note 0.00% 0.00%0 0.00%0.00% 0.00
0.00UST Cash Equivalent 0.00% 0.00%0 0.00%0.00% 0.00
0.00TIPS Cash Equivalent 0.00% 0.00%0 0.00%0.00% 0.00
0.00Agency Cash Equiv 0.00% 0.00%0 0.00%0.00% 0.00
0.00Other Cash Equiv 0.00% 0.00%0 0.00%0.00% 0.00
Government 26.73%5,694,251 36.44% 42.84%40.46% 8.09 6.16
6.23U.S. Treasury 26.12% 35.64%5,564,308 41.89%39.11% 8.09
0.00U.S. TIPs 0.61% 0.80%129,943 0.00%0.00% 7.76
4.10U.S. Agency 0.00% 0.00%0 0.91%1.29% 0.00
4.59Dev Mkts Sovereigns 0.00% 0.00%0 0.05%0.06% 0.00
Credit 26.98%5,747,886 28.71% 35.83%29.13% 6.31 7.16
24.83% 24.17%5,289,012Corporate Credit 30.69%25.88%6.18 7.39
7.98Industrial 13.28% 16.32%2,829,174 19.96%14.55% 7.29
10.06Utility 3.05% 3.45%650,031 2.96%1.71% 6.70
5.72Financial 8.50% 6.11%1,809,806 7.77%7.90% 4.27
1.83% 3.24%388,872Non Corporate Credit 2.74%2.44%7.93 4.92
3.67Foreign Agency 0.00% 0.00%0 0.58%0.91% 0.00
3.26Supranational 0.00% 0.00%0 0.79%1.40% 0.00
8.70Municipal 1.83% 2.44%388,872 1.38%0.92% 7.93
0.00% 0.00%0Bank Loan 0.00%0.00%0.00 0.00
0.33% 1.73%70,002Emerging Markets 2.40%0.39%7.07 8.10
0.00% 0.00%0Developed Markets 0.00%0.00%0.00 0.00
0.00% 0.00%0Other 0.00%0.00%0.00 0.00
Pasadena Fire and Police Retirement System
Core Fixed Income (Account #: SMS650)
As of 03/31/2019
Benchmark: Bloomberg Barclays Aggregate
All market values include accrued interest3

Cusip Security Name Coupon Maturity PriceParOriginal
CostCostPrice Principal Accrued
% ofPortfolio Dur S&PMoodys Fitch
CreditQuality
CASH AND EQUIVALENTS
CASH
USD US DOLLAR (131,835.06)1.000 (131,835.06) 0.00 (0.62)% 0.01 AAA
TOTAL CASH (131,835.06) (131,835.06) 0.00 (0.62)% 0.00
T-BILL
912796QM4 US TREASURY BILL6/20/2019
0.000 06/20/19 99.47628,000.00 27,841.3399.433 27,853.28 0.00 0.13% 0.21 AAA Aaa AA+ AAA
TOTAL T-BILL 27,841.33 27,853.28 0.00 0.13% 0.21
(103,993.73) (103,981.78) 0.00 (0.49)%TOTAL CASH AND EQUIVALENTS 0.21
GOVERNMENT
U.S. TREASURY
912810SF6 US TREASURY N/B 3.000 02/15/49 103.6191,275,000.00 1,275,632.40100.050 1,321,147.01 4,754.83 6.22% 20.19 AAA Aaa AA+ AAA
9128285X4 US TREASURY N/B 2.500 01/31/21 100.353585,000.00 585,227.32100.039 587,063.32 2,424.03 2.77% 1.78 AAA Aaa AA+ AAA
9128285Z9 US TREASURY N/B 2.500 01/31/24 101.168165,000.00 165,206.83100.125 166,926.74 683.70 0.79% 4.52 AAA Aaa AA+ AAA
9128286B1 US TREASURY N/B 2.625 02/15/29 101.866455,000.00 459,524.60100.994 463,489.55 1,484.72 2.18% 8.68 AAA Aaa AA+ AAA
9128286D7 US TREASURY N/B 2.500 02/28/21 100.398600,000.00 600,859.58100.143 602,390.63 1,304.35 2.83% 1.86 AAA Aaa AA+ AAA
9128286G0 US TREASURY N/B 2.375 02/29/24 100.666755,000.00 751,044.9299.476 760,028.42 1,559.24 3.57% 4.61 AAA Aaa AA+ AAA
912828W71 US TREASURY N/B 2.125 03/31/24 99.4551,660,000.00 1,654,846.1799.690 1,650,954.29 97.24 7.75% 4.72 AAA Aaa AA+ AAA
TOTAL U.S. TREASURY 5,492,341.82 5,551,999.96 12,308.12 26.12% 8.09
U.S. TIPS
912828WU0 TSY INFL IX N/B 0.125 07/15/24 98.76810,600.20 10,117.2895.219 10,469.58 2.78 0.05% 5.26 AAA Aaa AA+ AAA
912828XL9 TSY INFL IX N/B 0.375 07/15/25 99.94642,454.80 40,966.8296.086 42,432.05 33.43 0.20% 6.21 AAA Aaa AA+ AAA
912828Y38 TSY INFL IX N/B 0.750 07/15/28 102.23975,203.25 73,384.5097.228 76,886.78 118.42 0.36% 8.96 AAA Aaa AA+ AAA
TOTAL U.S. TIPS 124,468.60 129,788.41 154.63 0.61% 7.76
5,616,810.42 5,681,788.36 12,462.75 26.73%TOTAL GOVERNMENT 8.09
Pasadena Fire and Police Retirement System
Core Fixed Income (Account #: SMS650)
As of 03/31/2019
Base Currency: US Dollar
Account Holdings Detail
Benchmark: Bloomberg Barclays Aggregate
4

Pasadena Fire and Police Retirement System
Core Fixed Income (Account #: SMS650)
As of 03/31/2019
Base Currency: US Dollar
Account Holdings Detail (continued)
Benchmark: Bloomberg Barclays Aggregate
Cusip Security Name Coupon Maturity PriceParOriginal
CostCostPrice Principal Accrued
% ofPortfolio Dur S&PMoodys Fitch
CreditQuality
5,616,810.42 5,681,788.36 12,462.75 26.73%TOTAL GOVERNMENT 8.09
CREDIT
CORPORATE CREDIT
INDUSTRIAL
00287YAW9 ABBVIE INC. 4.450 05/14/46 92.50340,000.00 35,047.2087.618 37,001.06 677.39 0.18% 15.21 A- Baa2 A-
00507UAH4 ACTAVIS FUNDING SCS 4.850 06/15/44 99.36325,000.00 26,638.25106.553 24,840.86 357.01 0.12% 14.58 BBB- Baa3 BBB BBB-
02343UAB1 AMCOR FINANCE (USA)INC.
4.500 05/15/28 105.12235,000.00 34,933.1599.809 36,792.57 595.00 0.18% 7.36 BBB Baa2 BBB
03522AAF7 ANHEUSER-BUSCHCOMPANIES LLC /
4.900 02/01/46 100.51172,000.00 67,929.8494.347 72,367.81 588.00 0.34% 15.05 BBB+ Baa1 A- BBB
035240AQ3 ANHEUSER-BUSCH INBEVWORLDWIDE
4.750 01/23/29 106.63420,000.00 19,937.0099.685 21,326.85 179.44 0.10% 7.81 BBB+ Baa1 A- BBB
037833BX7 APPLE INC. 4.650 02/23/46 113.13525,000.00 24,855.7599.423 28,283.75 122.71 0.13% 16.19 AA+ Aa1 AA+
00206RCG5 AT&T INC 4.800 06/15/44 98.02020,000.00 19,071.2095.356 19,604.07 282.67 0.09% 14.51 BBB Baa2 BBB A-
00206RDR0 AT&T INC 5.250 03/01/37 105.52480,000.00 79,623.2099.529 84,419.34 350.00 0.40% 11.80 BBB Baa2 BBB A-
07274NAJ2 BAYER US FINANCE II LLC 4.250 12/15/25 101.16460,000.00 60,110.40100.184 60,698.09 750.83 0.29% 5.72 BBB+ Baa1 BBB A-
075887BV0 BECTON DICKINSON ANDCOMPANY
3.363 06/06/24 99.96630,000.00 28,848.9096.163 29,989.71 322.29 0.14% 4.63 BBB- Ba1 BBB BBB-
11134LAB5 BROADCOM CRP /CAYMN FI
2.375 01/15/20 99.49350,000.00 49,402.0098.804 49,746.70 250.69 0.23% 0.78 BBB- Baa3 BBB- BBB-
134429BD0 CAMPBELL SOUPCOMPANY
3.300 03/15/21 100.59835,000.00 34,975.1599.929 35,209.46 51.33 0.17% 1.89 BBB Baa2 BBB- BBB
124857AX1 CBS CORPORATION 3.700 06/01/28 97.64735,000.00 34,405.0098.300 34,176.36 431.67 0.16% 7.62 BBB Baa2 BBB BBB
14987BAE3 CC HOLDINGS GS V LLC /CROWN C
3.849 04/15/23 102.49535,000.00 36,678.60104.796 35,873.23 621.19 0.17% 3.68 BBB Baa2 BBB- BBB
151020AU8 CELGENE CORP 5.000 08/15/45 105.82875,000.00 74,948.2599.931 79,370.96 479.17 0.37% 15.10 BBB+ Baa2 BBB+
161175BJ2 CHARTERCOMMUNICATIONSOPERATI
3.750 02/15/28 96.48590,000.00 82,649.7091.833 86,836.23 431.25 0.41% 7.45 BBB- Ba1 BBB- BBB-
20030NBW0 COMCAST CORPORATION 2.350 01/15/27 93.52925,000.00 22,107.7588.431 23,382.23 124.03 0.11% 6.97 A- A3 A- A-
20030NCM1 COMCAST CORPORATION 4.700 10/15/48 108.57055,000.00 54,954.9099.918 59,713.49 1,263.78 0.29% 16.38 A- A3 A- A-
205887CE0 CONAGRA BRANDS INC 5.400 11/01/48 100.70710,000.00 9,058.0090.580 10,070.66 238.50 0.05% 14.68 BBB- Baa3 BBB- BBB-
210805CT2 CONTL AIRLINES 1999-2 7.256 03/15/20 101.41012,995.31 13,974.53107.535 13,178.54 41.91 0.06% 0.93 A+ Baa1 A+
5

Pasadena Fire and Police Retirement System
Core Fixed Income (Account #: SMS650)
As of 03/31/2019
Base Currency: US Dollar
Account Holdings Detail (continued)
Benchmark: Bloomberg Barclays Aggregate
Cusip Security Name Coupon Maturity PriceParOriginal
CostCostPrice Principal Accrued
% ofPortfolio Dur S&PMoodys Fitch
CreditQuality
CORPORATE CREDIT
INDUSTRIAL
210805CY1 CONTL AIRLINES 2000-1 8.048 11/01/20 103.23017,869.43 19,567.03109.500 18,446.62 599.22 0.09% 0.58 A Baa1 A
126650CN8 CVS HEALTH CORP 5.125 07/20/45 101.78435,000.00 37,481.15107.089 35,624.50 353.77 0.17% 14.61 BBB Baa2 BBB
126650CZ1 CVS HEALTH CORP 5.050 03/25/48 100.89225,000.00 24,857.5099.430 25,223.11 21.04 0.12% 15.47 BBB Baa2 BBB
29273RBF5 ENERGY TRANSFERPARTNERS
5.150 03/15/45 95.553125,000.00 124,715.0099.772 119,441.50 286.11 0.56% 14.22 BBB- Baa3 BBB- BBB-
345397YP2 FORD MOTOR CREDIT COLLC
3.818 08/03/22 95.76735,000.00 34,686.4099.104 33,518.54 207.84 0.16% 0.05 BBB Baa3 BBB BBB
345397ZG1 FORD MOTOR CREDIT COLLC
3.677 10/12/21 96.92930,000.00 29,741.1099.137 29,078.82 235.94 0.14% 0.05 BBB Baa3 BBB BBB
345397YS6 FORD MOTOR CREDITCOMPANY LLC
2.343 11/02/20 97.73570,000.00 67,673.9096.677 68,414.79 678.82 0.32% 1.54 BBB Baa3 BBB BBB
35802XAD5 FRESENIUS MED CARE II 5.625 07/31/19 100.65170,000.00 72,916.90104.167 70,455.82 667.19 0.33% 0.33 BBB- Baa3 BBB- BBB-
36962G4R2 GENERAL ELEC CAP CORP 4.375 09/16/20 101.97350,000.00 49,697.5099.395 50,986.38 91.15 0.24% 1.41 BBB+ Baa1 BBB+ BBB+
36962G5J9 GENERAL ELEC CAP CORP 4.650 10/17/21 103.68550,000.00 51,081.50102.163 51,842.50 1,059.17 0.25% 2.36 BBB+ Baa1 BBB+ BBB+
36962G4Y7 GENERAL ELECTRIC CO 4.625 01/07/21 102.62065,000.00 66,249.95101.923 66,702.91 701.46 0.32% 1.69 BBB+ Baa1 BBB+ BBB+
36962GT95 GENERAL ELECTRICCOMPANY
5.550 01/05/26 107.23035,000.00 33,836.9596.677 37,530.62 464.04 0.18% 5.65 BBB+ Baa1 BBB+ BBB+
370334CE2 GENERAL MILLS INC. 3.700 10/17/23 102.55514,000.00 13,969.6299.783 14,357.67 235.98 0.07% 4.07 BBB Baa2 BBB BBB
37045XBJ4 GENERAL MOTORS FINLCO
2.400 05/09/19 99.96085,000.00 84,830.8599.801 84,965.65 804.67 0.40% 0.10 BBB Baa3 BBB BBB
375558BA0 GILEAD SCIENCES INC 4.500 02/01/45 100.61650,000.00 50,226.00100.452 50,307.93 375.00 0.24% 15.40 A A3 A
361841AH2 GLP CAPITAL L.P. AND GLPFINAN
5.375 04/15/26 104.74040,000.00 40,448.00101.120 41,896.00 991.39 0.20% 5.79 BBB- Ba1 BBB- BBB-
361841AL3 GLP CAPITAL L.P. AND GLPFINAN
5.300 01/15/29 105.32725,000.00 24,996.2599.985 26,331.75 279.72 0.12% 7.60 BBB- Ba1 BBB- BBB-
404119BQ1 HCA INC 5.250 04/15/25 107.51720,000.00 20,650.00103.250 21,503.43 484.17 0.10% 5.12 BBB- Baa3 BBB- BB+
44962LAF4 IHS MARKIT LTD 4.750 08/01/28 104.75645,000.00 44,832.6099.628 47,140.20 356.25 0.22% 7.49 BBB- Ba1 BBB- BBB
459506AL5 INTERNATIONAL FLAVORS& FRAGRA
5.000 09/26/48 105.00230,000.00 29,872.9099.576 31,500.62 20.83 0.15% 15.95 BBB Baa3 BBB
49456BAP6 KINDER MORGAN INC. 4.300 03/01/28 103.46540,000.00 38,217.2095.543 41,385.88 143.33 0.19% 7.35 BBB Baa2 BBB BBB-
50077LAB2 KRAFT HEINZ FOODSCOMPANY
4.375 06/01/46 86.94640,000.00 39,873.6099.684 34,778.56 583.33 0.17% 15.00 BBB- Baa3 BBB BBB-
502413BG1 L3 TECHNOLOGIES INC 4.400 06/15/28 104.72335,000.00 34,965.7099.902 36,653.07 453.44 0.17% 7.46 BBB- Baa3 BBB- BBB-
6

Pasadena Fire and Police Retirement System
Core Fixed Income (Account #: SMS650)
As of 03/31/2019
Base Currency: US Dollar
Account Holdings Detail (continued)
Benchmark: Bloomberg Barclays Aggregate
Cusip Security Name Coupon Maturity PriceParOriginal
CostCostPrice Principal Accrued
% ofPortfolio Dur S&PMoodys Fitch
CreditQuality
CORPORATE CREDIT
INDUSTRIAL
666807BN1 NORTHROP GRUMMANCORPORATION
3.250 01/15/28 98.42735,000.00 34,981.4599.947 34,449.46 240.14 0.16% 7.53 BBB Baa2 BBB BBB
72650RBJ0 PLAINS ALL AMERICANPIPELINE L
4.650 10/15/25 104.57840,000.00 39,948.4099.871 41,831.18 857.67 0.20% 5.45 BBB- Ba1 BBB- BBB-
743756AB4 PROVIDENCE HEALTH &SERVICES O
2.746 10/01/26 95.06685,000.00 85,000.00100.000 80,805.98 1,167.05 0.38% 6.75 AA- Aa3 AA- AA-
761713BF2 REYNOLDS AMERICANINC.
4.000 06/12/22 102.26435,000.00 37,148.65106.139 35,792.54 423.89 0.17% 2.97 BBB Baa2 BBB+ BBB
761713BT2 REYNOLDS AMERICANINC.
6.875 05/01/20 104.07625,000.00 26,842.75107.371 26,019.11 716.15 0.13% 1.02 BBB Baa2 BBB+ BBB
785592AJ5 SABINE PASSLIQUEFACTION LLC
5.750 05/15/24 110.21015,000.00 15,654.15104.361 16,531.45 325.83 0.08% 4.24 BBB- Baa3 BBB- BBB-
82481LAA7 SHIRE ACQ INV IRELANDDA
1.900 09/23/19 99.58050,000.00 49,350.5098.701 49,789.84 21.11 0.23% 0.47 BBB+ Baa2 BBB+
85208NAE0 SPRINT SPECTRUM COLLC / SPRIN
5.152 03/20/28 102.00040,000.00 39,300.0098.250 40,800.00 62.97 0.19% 5.55 BBB Baa2 BBB
437076BW1 THE HOME DEPOT INC. 3.900 12/06/28 105.86810,000.00 9,931.3099.313 10,586.79 124.58 0.05% 7.96 A A2 A A
501044DM0 THE KROGER CO. 5.400 01/15/49 103.19810,000.00 9,845.2098.452 10,319.77 115.50 0.05% 15.07 BBB+ Baa1 BBB
96949LAA3 THE WILLIAMSCOMPANIES INC.
3.600 03/15/22 101.50827,000.00 25,194.5193.313 27,407.11 43.20 0.13% 2.69 BBB- Baa3 BBB BBB-
887317AZ8 TIME WARNER INC. 3.875 01/15/26 100.43470,000.00 67,762.8096.804 70,303.56 572.64 0.33% 5.83 BBB Baa2 BBB A-
902494BJ1 TYSON FOODS INC. 4.000 03/01/26 102.34410,000.00 9,964.7099.647 10,234.36 46.67 0.05% 5.97 BBB Baa2 BBB BBB
907818EY0 UNION PACIFICCORPORATION
3.950 09/10/28 105.27625,000.00 24,937.7599.751 26,318.94 57.60 0.12% 7.85 A- Baa1 A-
913017DA4 UNITED TECHNOLOGIESCORPORATIO
3.350 08/16/21 101.30010,000.00 9,987.8099.878 10,129.97 41.88 0.05% 2.27 BBB+ Baa1 BBB+
90345WAA2 US AIRWAYS 2012-1A PTT 5.900 10/01/24 108.153131,004.89 126,395.7796.482 141,685.59 3,864.64 0.68% 3.47 A A3 A+ A
92343VCV4 VERIZONCOMMUNICATIONS
4.272 01/15/36 101.499100,000.00 92,184.0092.184 101,499.34 901.87 0.48% 12.01 BBB+ Baa1 BBB+ A-
92857WBK5 VODAFONE GROUP PLC 4.375 05/30/28 101.73825,000.00 24,675.2598.701 25,434.42 367.62 0.12% 7.49 BBB+ Baa2 BBB+ BBB+
931427AC2 WALGREENS BOOTSALLIANCE
4.800 11/18/44 95.38335,000.00 30,906.7588.305 33,383.98 620.67 0.16% 14.42 BBB Baa2 BBB BBB
931427AQ1 WALGREENS BOOTSALLIANCE INC.
3.450 06/01/26 97.96170,000.00 69,823.6099.748 68,572.42 805.00 0.33% 6.20 BBB Baa2 BBB BBB
92940PAD6 WRKCO INC 4.900 03/15/29 108.49720,000.00 19,990.2099.951 21,699.40 43.56 0.10% 7.91 BBB Baa2 BBB
7

Pasadena Fire and Police Retirement System
Core Fixed Income (Account #: SMS650)
As of 03/31/2019
Base Currency: US Dollar
Account Holdings Detail (continued)
Benchmark: Bloomberg Barclays Aggregate
Cusip Security Name Coupon Maturity PriceParOriginal
CostCostPrice Principal Accrued
% ofPortfolio Dur S&PMoodys Fitch
CreditQuality
CORPORATE CREDIT
INDUSTRIAL
98956PAP7 ZIMMER BIOMETHOLDINGS
3.375 03/19/21 99.69935,000.00 35,000.00100.000 34,894.53 42.66 0.16% 0.05 BBB Baa3 BBB
TOTAL INDUSTRIAL 2,730,361.90 2,799,458.56 29,715.60 13.28% 7.29
UTILITY
030288AB0 AMERICANTRANSMISSION SY
5.000 09/01/44 110.83275,000.00 74,255.2599.007 83,123.93 312.50 0.39% 15.03 BBB+ A3 BBB BBB+
26442CAM6 DUKE ENERGY CAROLINAS 4.250 12/15/41 106.17150,000.00 49,936.5099.873 53,085.35 625.69 0.25% 14.83 AA Aa2 A
65339KAY6 NEXTERA ENERGYCAPITAL
3.218 05/04/21 99.99570,000.00 70,000.00100.000 69,996.74 350.35 0.33% 0.05 BBB+ Baa1 BBB+
65473QBH5 NISOURCE INC. 2.650 11/17/22 98.59725,000.00 24,968.5099.874 24,649.29 246.60 0.12% 3.38 BBB Baa2 BBB+ BBB
68233JAH7 ONCOR ELECTRICDELIVERY
5.250 09/30/40 120.19250,000.00 50,463.50100.927 60,096.02 7.29 0.28% 13.94 A A2 A+ A
8426EPAA6 SOUTHERN COMPANYGAS CAPITAL C
2.450 10/01/23 97.252130,000.00 129,898.6099.922 126,426.95 1,592.50 0.60% 4.19 BBB+ Baa1 A- BBB+
898813AL4 TUCSON ELECTRIC POWERCO
3.850 03/15/23 101.837225,000.00 224,268.7599.675 229,133.14 385.00 1.08% 3.66 A- A3 A-
TOTAL UTILITY 623,791.10 646,511.41 3,519.93 3.05% 6.70
FINANCIAL
00912XAJ3 AIR LEASE CORP 4.750 03/01/20 101.60235,000.00 36,405.60104.016 35,560.67 138.54 0.17% 0.90 BBB BBB BBB
00912XBE3 AIR LEASE CORPORATION 3.500 01/15/22 100.96245,000.00 44,680.5099.290 45,432.98 332.50 0.21% 2.64 BBB BBB BBB
024836AD0 AMERICAN CAMPUSCOMMUNITIES OP
3.625 11/15/27 97.96635,000.00 34,969.2099.912 34,288.19 479.31 0.16% 7.24 BBB Baa2 BBB
06051GFF1 BANK OF AMERICA CORP 4.000 04/01/24 104.36755,000.00 55,749.10101.362 57,401.79 1,100.00 0.27% 4.54 A A2 A- A+
06051GGT0 BANK OF AMERICACORPORATION
3.093 10/01/25 99.25350,000.00 50,000.00100.000 49,626.58 773.25 0.24% 5.05 A A2 A- A+
06051GHC6 BANK OF AMERICACORPORATION
3.004 12/20/23 99.649107,000.00 107,056.92100.053 106,624.13 901.78 0.50% 3.48 A A2 A- A+
06051GHD4 BANK OF AMERICACORPORATION
3.419 12/20/28 97.87347,000.00 46,739.9099.447 46,000.06 450.83 0.22% 7.46 A A2 A- A+
06051GHH5 BANK OF AMERICACORPORATION
3.499 05/17/22 101.262100,000.00 100,000.00100.000 101,261.80 1,302.41 0.48% 2.02 A A2 A- A+
10112RAY0 BOSTON PROPERTIESLIMITED PART
2.750 10/01/26 94.839100,000.00 91,666.0091.666 94,839.20 1,375.00 0.45% 6.68 BBB+ Baa1 A- BBB+
8

Pasadena Fire and Police Retirement System
Core Fixed Income (Account #: SMS650)
As of 03/31/2019
Base Currency: US Dollar
Account Holdings Detail (continued)
Benchmark: Bloomberg Barclays Aggregate
Cusip Security Name Coupon Maturity PriceParOriginal
CostCostPrice Principal Accrued
% ofPortfolio Dur S&PMoodys Fitch
CreditQuality
CORPORATE CREDIT
FINANCIAL
125509BV0 CIGNA CORPORATION 3.050 10/15/27 94.86035,000.00 34,932.8099.808 33,200.93 492.24 0.16% 7.32 BBB Baa2 A- BBB-
172967EV9 CITIGROUP INC 8.500 05/22/19 100.815200,000.00 218,080.00109.040 201,629.70 6,091.67 0.98% 0.14 A- A3 BBB+ A
30958PAA1 FARMERS EXCHANGE CAPII
6.151 11/01/53 104.67080,000.00 80,000.00100.000 83,735.76 2,050.33 0.40% 9.82 BBB+ Baa2 BBB+
36164QMS4 GE CAPITALINTERNATIONAL FUNDI
2.342 11/15/20 98.77960,000.00 58,022.4096.704 59,267.40 530.85 0.28% 1.58 BBB+ Baa1 BBB+ BBB+
36164QNA2 GE CAPITALINTERNATIONAL FUNDI
4.418 11/15/35 92.59760,000.00 53,816.4089.694 55,558.11 1,001.41 0.27% 11.45 BBB+ Baa1 BBB+ BBB+
38141GWV2 GOLDMAN SACHS GROUPINC.
3.814 04/23/29 99.15535,000.00 35,000.00100.000 34,704.40 585.87 0.17% 7.55 A- A3 BBB+ A
40573LAQ9 HALFMOON PARENT INC 4.125 11/15/25 103.59290,000.00 89,925.3099.917 93,232.67 2,000.63 0.45% 5.64 BBB Baa2 A- BBB-
40414LAK5 HCP INC 4.200 03/01/24 103.82565,000.00 67,671.50104.110 67,485.94 227.50 0.32% 4.29 BBB+ Baa1 BBB+ BBB
46625HRY8 JPMORGAN CHASE & CO. 3.782 02/01/28 102.12825,000.00 26,032.25104.129 25,531.89 157.58 0.12% 6.77 A A2 A- AA-
46647PAM8 JPMORGAN CHASE & CO. 3.509 01/23/29 99.40550,000.00 50,000.00100.000 49,702.45 331.41 0.23% 7.54 A A2 A- AA-
46647PAS5 JPMORGAN CHASE & CO. 3.514 06/18/22 101.42745,000.00 45,000.00100.000 45,642.01 452.43 0.22% 2.11 A A2 A- AA-
46647PAY2 JPMORGAN CHASE & CO. 4.023 12/05/24 103.82755,000.00 55,000.00100.000 57,104.76 712.97 0.27% 4.22 A A2 A- AA-
638671AJ6 NATIONWIDE MUTUALINSURA
4.901 12/15/24 99.500105,000.00 105,000.00100.000 104,475.00 243.00 0.49% 0.22 A- A-
754730AF6 RAYMOND JAMESFINANCIAL INC.
4.950 07/15/46 105.26715,000.00 14,531.1096.874 15,790.03 156.75 0.07% 15.41 BBB+ Baa1 BBB+
80281LAE5 SANTANDER UK GROUPHOLDINGS PL
2.875 08/05/21 99.16040,000.00 38,514.0096.285 39,664.18 178.89 0.19% 2.25 BBB+ Baa1 BBB A
06406RAC1 THE BANK OF NEW YORKMELLON CO
2.661 05/16/23 99.34750,000.00 50,182.00100.364 49,673.69 498.94 0.24% 2.96 A+ A1 A AA-
949746RW3 WELLS FARGO &COMPANY
3.000 04/22/26 97.33135,000.00 34,191.8597.691 34,065.92 463.75 0.16% 6.26 A A2 A- A+
94974BGP9 WELLS FARGO &COMPANY
3.550 09/29/25 102.02645,000.00 45,505.80101.124 45,911.53 8.88 0.22% 5.81 A A2 A- A+
95000U2B8 WELLS FARGO &COMPANY
2.625 07/22/22 99.32510,000.00 9,581.0095.810 9,932.53 50.31 0.05% 3.14 A A2 A- A+
42217KAU0 WELLTOWER INC 4.950 01/15/21 103.02955,000.00 56,233.30102.242 56,665.92 574.75 0.27% 1.47 BBB+ Baa1 BBB+ BBB+
42217KBF2 WELLTOWER INC 4.000 06/01/25 102.93150,000.00 52,652.50105.305 51,465.67 666.67 0.24% 5.31 BBB+ Baa1 BBB+ BBB+
TOTAL FINANCIAL 1,787,139.42 1,785,475.87 24,330.43 8.50% 4.27
9

Pasadena Fire and Police Retirement System
Core Fixed Income (Account #: SMS650)
As of 03/31/2019
Base Currency: US Dollar
Account Holdings Detail (continued)
Benchmark: Bloomberg Barclays Aggregate
Cusip Security Name Coupon Maturity PriceParOriginal
CostCostPrice Principal Accrued
% ofPortfolio Dur S&PMoodys Fitch
CreditQuality
TOTAL CORPORATE CREDIT 5,141,292.42 5,231,445.85 57,565.96 24.83% 6.18
NON CORPORATE CREDIT
MUNICIPAL
13063BFS6 CALIFORNIA ST 6.650 03/01/22 110.07750,000.00 63,108.00126.216 55,038.50 277.08 0.26% 2.24 AA- Aa3 AA- AA-
544525NZ7 LA DWP 6.008 07/01/39 125.570100,000.00 124,307.00124.307 125,570.00 1,502.00 0.60% 9.74 AA Aa2 AA+ AA
64971M4P4 NYC FIN AUTH 5.508 08/01/37 121.53550,000.00 63,200.50126.401 60,767.50 459.00 0.29% 10.96 AAA Aa1 AAA AAA
649902T29 NYS DORM AUTH-BABS 5.500 03/15/30 116.61450,000.00 59,215.00118.430 58,307.00 122.22 0.27% 6.65 AA+ Aa1 AA+ AA+
93974CRD4 WASHINGTON ST-F-BABS 5.040 08/01/31 114.93275,000.00 86,037.00114.716 86,199.00 630.00 0.41% 7.64 AA+ Aa1 AA+ AA+
TOTAL MUNICIPAL 395,867.50 385,882.00 2,990.31 1.83% 7.93
TOTAL NON CORPORATE CREDIT 395,867.50 385,882.00 2,990.31 1.83% 7.93
EMERGING MARKETS
067316AF6 BACARDI LIMITED 4.700 05/15/28 100.07720,000.00 19,149.6095.748 20,015.46 355.11 0.10% 7.25 BBB- Ba1 BBB- BBB-
71654QCG5 PETROLEOS MEXICANOS 6.500 03/13/27 100.70010,000.00 9,230.0092.300 10,070.00 32.50 0.05% 6.26 BBB- Baa3 BBB+ BBB-
71654QCK6 PETROLEOS MEXICANOS 5.350 02/12/28 93.05010,000.00 8,590.0085.900 9,305.00 72.82 0.04% 6.99 BBB- Baa3 BBB+ BBB-
71654QCP5 PETROLEOS MEXICANOS 6.500 01/23/29 99.27530,000.00 29,000.0096.667 29,782.50 368.33 0.14% 7.25 BBB- Baa3 BBB+ BBB-
TOTAL EMERGING MARKETS 65,969.60 69,172.96 828.76 0.33% 7.07
5,603,129.52 5,686,500.80 61,385.03 26.98%TOTAL CREDIT 6.31
MORTGAGE BACKED
AGENCY MBS
ARM
31407ULL9 FN 841031 4.710 11/01/35 104.157787.84 788.58100.094 820.59 3.09 0.00% 0.71 AAA Aaa AAA AAA
31411YL27 FN 918445 3.690 05/01/37 104.5333,941.65 3,966.13100.621 4,120.33 12.12 0.02% 1.15 AAA Aaa AAA AAA
TOTAL ARM 4,754.71 4,940.92 15.21 0.02% 1.08
10

Pasadena Fire and Police Retirement System
Core Fixed Income (Account #: SMS650)
As of 03/31/2019
Base Currency: US Dollar
Account Holdings Detail (continued)
Benchmark: Bloomberg Barclays Aggregate
Cusip Security Name Coupon Maturity PriceParOriginal
CostCostPrice Principal Accrued
% ofPortfolio Dur S&PMoodys Fitch
CreditQuality
AGENCY MBS
PASS THROUGH
3128KRVU5 FG A61527 5.000 07/01/36 108.73323,630.34 24,132.49102.125 25,694.06 98.46 0.12% 3.78 AAA Aaa AAA AAA
3128M8MJ0 FG G06361 4.000 03/01/41 104.67876,376.04 75,170.7398.422 79,949.07 254.59 0.38% 4.79 AAA Aaa AAA AAA
3128MJX47 FG G08698 3.500 03/01/46 101.79113,164.14 13,795.61104.797 13,399.93 38.40 0.06% 4.29 AAA Aaa AAA AAA
3128MJYH7 FG G08711 3.500 06/01/46 101.760144,233.05 151,664.44105.152 146,771.32 420.68 0.69% 4.53 AAA Aaa AAA AAA
3128MJYM6 FG G08715 3.000 08/01/46 99.652293,441.95 305,134.02103.985 292,419.19 733.60 1.38% 5.35 AAA Aaa AAA AAA
3128MJYT1 FG G08721 3.000 09/01/46 99.652129,549.78 134,377.53103.727 129,098.28 323.87 0.61% 5.40 AAA Aaa AAA AAA
3128MJYY0 FG G08726 3.000 10/01/46 99.634163,161.62 169,229.19103.719 162,564.40 407.90 0.77% 5.54 AAA Aaa AAA AAA
3128MJ3D0 FG G08795 3.000 01/01/48 99.57960,911.16 58,622.2396.242 60,654.76 152.28 0.29% 5.33 AAA Aaa AAA AAA
3128MJ3J7 FG G08800 3.500 02/01/48 101.48269,273.50 68,618.6599.055 70,299.79 202.05 0.33% 4.32 AAA Aaa AAA AAA
3128MJ4A5 FG G08816 3.500 06/01/48 101.439134,447.63 132,163.0798.301 136,382.51 392.14 0.64% 3.81 AAA Aaa AAA AAA
3128MJ4T4 FG G08833 5.000 07/01/48 106.17830,840.16 32,577.33105.633 32,745.57 128.50 0.15% 3.00 AAA Aaa AAA AAA
3128MJ5D8 FG G08843 4.500 10/01/48 104.42647,523.95 49,130.67103.381 49,627.12 178.21 0.23% 2.93 AAA Aaa AAA AAA
3128M1RU5 FG G12399 6.000 09/01/21 102.4028,195.81 8,431.44102.875 8,392.69 40.98 0.04% 0.86 AAA Aaa AAA AAA
3128MFRT7 FG G16598 2.500 12/01/31 99.60178,357.17 77,273.6398.617 78,044.57 76.18 0.37% 4.12 AAA Aaa AAA AAA
3128MFWR5 FG G16756 3.500 01/01/34 102.71883,619.65 85,135.26101.813 85,892.34 243.89 0.40% 3.30 AAA Aaa AAA AAA
3128MMYK3 FG G18713 3.500 11/01/33 102.40599,627.63 101,227.12101.606 102,023.67 290.58 0.48% 2.72 AAA Aaa AAA AAA
31335AJX7 FG G60278 4.000 10/01/45 104.79370,432.36 75,736.79107.531 73,808.37 234.77 0.35% 4.90 AAA Aaa AAA AAA
3132XCRY3 FG G67703 3.500 04/01/47 102.41693,731.02 97,245.93103.750 95,995.64 273.38 0.45% 5.36 AAA Aaa AAA AAA
3132XCR31 FG G67706 3.500 12/01/47 102.354139,079.44 141,038.23101.408 142,352.80 405.65 0.67% 5.06 AAA Aaa AAA AAA
3132XCR49 FG G67707 3.500 01/01/48 102.42881,074.68 81,125.35100.063 83,043.20 236.47 0.39% 5.48 AAA Aaa AAA AAA
3132XCR56 FG G67708 3.500 03/01/48 102.009230,506.85 231,354.15100.368 235,138.51 672.31 1.11% 4.72 AAA Aaa AAA AAA
3132XCR64 FG G67709 3.500 03/01/48 102.207116,424.73 116,997.76100.492 118,994.00 339.57 0.56% 5.22 AAA Aaa AAA AAA
3132XCR72 FG G67710 3.500 03/01/48 101.849246,211.58 246,733.48100.212 250,764.57 718.12 1.18% 4.66 AAA Aaa AAA AAA
3132XCSA4 FG G67713 4.000 06/01/48 104.38751,169.78 52,245.32102.102 53,414.35 170.57 0.25% 3.75 AAA Aaa AAA AAA
3132XCSF3 FG G67718 4.000 01/01/49 104.198133,749.72 136,995.93102.427 139,364.66 445.83 0.66% 2.73 AAA Aaa AAA AAA
3132GLQN7 FG Q05261 3.500 12/01/41 102.88570,859.67 72,780.63102.711 72,903.86 206.67 0.34% 5.01 AAA Aaa AAA AAA
3132JMFT1 FG Q20178 3.500 07/01/43 102.502122,726.38 123,167.42100.359 125,796.58 357.95 0.59% 5.55 AAA Aaa AAA AAA
11

Pasadena Fire and Police Retirement System
Core Fixed Income (Account #: SMS650)
As of 03/31/2019
Base Currency: US Dollar
Account Holdings Detail (continued)
Benchmark: Bloomberg Barclays Aggregate
Cusip Security Name Coupon Maturity PriceParOriginal
CostCostPrice Principal Accrued
% ofPortfolio Dur S&PMoodys Fitch
CreditQuality
AGENCY MBS
PASS THROUGH
H400419BA FGLMC 30 YR 4.0 TBA APR19
4.000 06/15/48 102.93825,000.00 25,564.45102.258 25,734.38 0.00 0.12% 2.61 AAA Aaa AAA AAA
H450419GS FGLMC 30 YR 4.5 TBA APR19
4.500 07/15/48 104.34525,000.00 25,934.57103.738 26,086.19 0.00 0.12% 2.90 AAA Aaa AAA AAA
31390TVV8 FN 655928 7.000 08/01/32 116.32128,877.37 30,790.50106.625 33,590.31 168.45 0.16% 3.32 AAA Aaa AAA AAA
31402RHX0 FN 735646 4.500 07/01/20 101.7493,292.28 3,275.3199.485 3,349.86 12.35 0.02% 0.40 AAA Aaa AAA AAA
31416WYK2 FN AB1613 4.000 10/01/40 104.62494,891.19 96,670.40101.875 99,278.47 316.30 0.47% 4.48 AAA Aaa AAA AAA
31418RHG9 FN AD3830 4.500 04/01/25 104.04344,571.07 46,409.63104.125 46,373.20 167.14 0.22% 1.89 AAA Aaa AAA AAA
3140Q8J97 FN CA1187 3.500 02/01/48 101.50323,669.15 23,777.32100.457 24,024.98 69.04 0.11% 4.36 AAA Aaa AAA AAA
3140Q83U7 FN CA1710 4.500 05/01/48 104.371138,139.71 143,643.72103.984 144,177.93 518.02 0.68% 3.20 AAA Aaa AAA AAA
3140Q83V5 FN CA1711 4.500 05/01/48 104.37169,963.52 72,248.27103.266 73,021.69 262.36 0.34% 3.25 AAA Aaa AAA AAA
3140Q9N25 FN CA2208 4.500 08/01/48 104.41371,093.00 73,745.11103.731 74,230.06 266.60 0.35% 3.22 AAA Aaa AAA AAA
31418AXN3 FN MA1584 3.500 09/01/33 102.75641,902.71 43,330.02103.406 43,057.43 122.22 0.20% 3.59 AAA Aaa AAA AAA
31418CKH6 FN MA2995 4.000 05/01/47 103.56459,028.11 62,097.11105.199 61,132.08 196.76 0.29% 3.09 AAA Aaa AAA AAA
31418CLK8 FN MA3029 3.000 06/01/32 100.92846,763.67 47,943.72102.523 47,197.76 116.91 0.22% 3.54 AAA Aaa AAA AAA
31418CNE0 FN MA3088 4.000 08/01/47 103.596168,707.31 178,058.71105.543 174,773.35 562.36 0.82% 3.24 AAA Aaa AAA AAA
31418CR89 FN MA3210 3.500 12/01/47 101.631205,206.55 204,076.3099.449 208,552.91 598.52 0.98% 4.29 AAA Aaa AAA AAA
F500519FB FNCL 30 YR 5.0 TBA MAY19
5.000 08/25/48 105.60975,000.00 79,207.03105.609 79,207.03 0.00 0.37% 3.15 AAA Aaa AAA AAA
36179R4E6 G2 MA3521 3.500 03/20/46 102.37839,477.03 41,820.98105.938 40,415.78 115.14 0.19% 4.14 AAA Aaa AAA AAA
36179SQW0 G2 MA4069 3.500 11/20/46 102.379175,638.84 182,609.51103.969 179,816.73 512.28 0.85% 4.10 AAA Aaa AAA AAA
36179SUU9 G2 MA4195 3.000 01/20/47 100.630236,081.99 238,708.14101.112 237,569.82 590.21 1.12% 5.13 AAA Aaa AAA AAA
36179S2P1 G2 MA4382 3.500 04/20/47 102.29071,803.86 74,827.48104.211 73,447.90 209.43 0.35% 3.93 AAA Aaa AAA AAA
36179TAK1 G2 MA4510 3.500 06/20/47 102.21620,949.28 21,805.26104.086 21,413.56 61.10 0.10% 3.92 AAA Aaa AAA AAA
36179TCX1 G2 MA4586 3.500 07/20/47 102.21621,578.07 21,206.3598.277 22,056.29 62.94 0.10% 3.90 AAA Aaa AAA AAA
36179TCZ6 G2 MA4588 4.500 07/20/47 104.491147,266.35 153,571.19104.281 153,880.03 552.25 0.72% 2.39 AAA Aaa AAA AAA
36179TC29 G2 MA4589 5.000 07/20/47 105.09739,254.73 42,174.30107.438 41,255.36 163.56 0.19% 3.15 AAA Aaa AAA AAA
36179TG41 G2 MA4719 3.500 09/20/47 102.21622,162.52 22,905.31103.352 22,653.69 64.64 0.11% 3.77 AAA Aaa AAA AAA
36179TLR4 G2 MA4836 3.000 11/20/47 100.43227,291.24 26,587.6497.422 27,409.15 68.23 0.13% 4.98 AAA Aaa AAA AAA
12
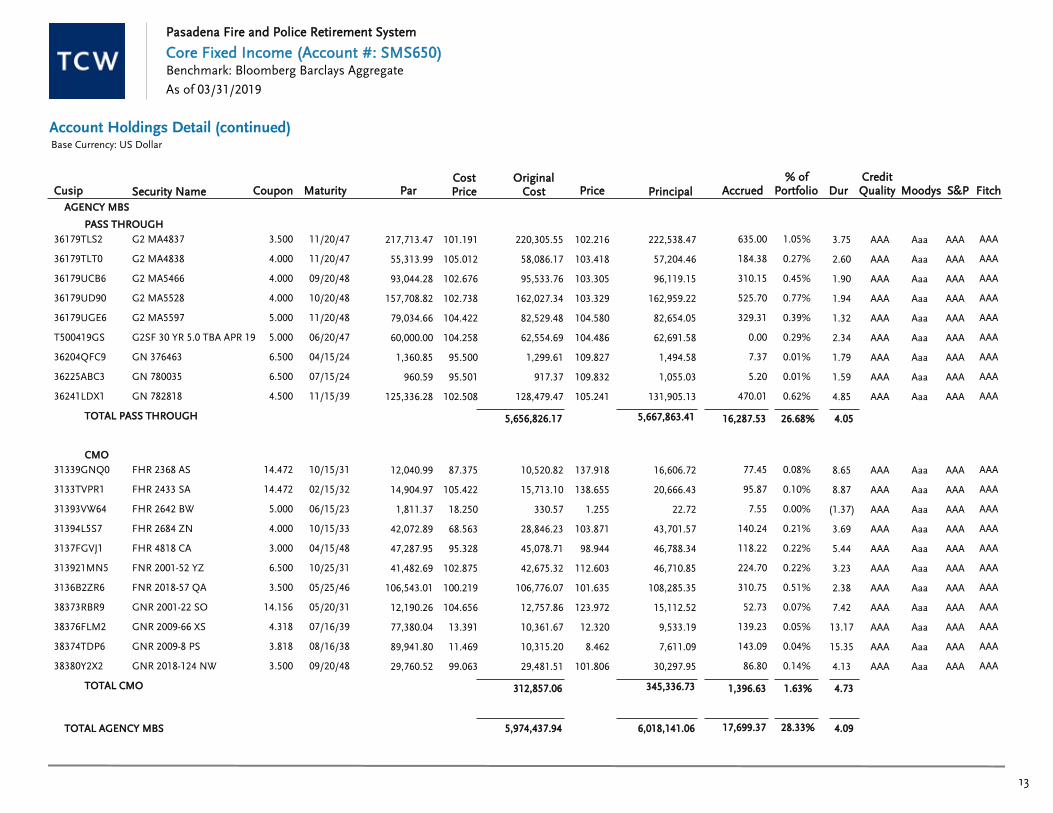
Pasadena Fire and Police Retirement System
Core Fixed Income (Account #: SMS650)
As of 03/31/2019
Base Currency: US Dollar
Account Holdings Detail (continued)
Benchmark: Bloomberg Barclays Aggregate
Cusip Security Name Coupon Maturity PriceParOriginal
CostCostPrice Principal Accrued
% ofPortfolio Dur S&PMoodys Fitch
CreditQuality
AGENCY MBS
PASS THROUGH
36179TLS2 G2 MA4837 3.500 11/20/47 102.216217,713.47 220,305.55101.191 222,538.47 635.00 1.05% 3.75 AAA Aaa AAA AAA
36179TLT0 G2 MA4838 4.000 11/20/47 103.41855,313.99 58,086.17105.012 57,204.46 184.38 0.27% 2.60 AAA Aaa AAA AAA
36179UCB6 G2 MA5466 4.000 09/20/48 103.30593,044.28 95,533.76102.676 96,119.15 310.15 0.45% 1.90 AAA Aaa AAA AAA
36179UD90 G2 MA5528 4.000 10/20/48 103.329157,708.82 162,027.34102.738 162,959.22 525.70 0.77% 1.94 AAA Aaa AAA AAA
36179UGE6 G2 MA5597 5.000 11/20/48 104.58079,034.66 82,529.48104.422 82,654.05 329.31 0.39% 1.32 AAA Aaa AAA AAA
T500419GS G2SF 30 YR 5.0 TBA APR 19 5.000 06/20/47 104.48660,000.00 62,554.69104.258 62,691.58 0.00 0.29% 2.34 AAA Aaa AAA AAA
36204QFC9 GN 376463 6.500 04/15/24 109.8271,360.85 1,299.6195.500 1,494.58 7.37 0.01% 1.79 AAA Aaa AAA AAA
36225ABC3 GN 780035 6.500 07/15/24 109.832960.59 917.3795.501 1,055.03 5.20 0.01% 1.59 AAA Aaa AAA AAA
36241LDX1 GN 782818 4.500 11/15/39 105.241125,336.28 128,479.47102.508 131,905.13 470.01 0.62% 4.85 AAA Aaa AAA AAA
TOTAL PASS THROUGH 5,656,826.17 5,667,863.41 16,287.53 26.68% 4.05
CMO
31339GNQ0 FHR 2368 AS 14.472 10/15/31 137.91812,040.99 10,520.8287.375 16,606.72 77.45 0.08% 8.65 AAA Aaa AAA AAA
3133TVPR1 FHR 2433 SA 14.472 02/15/32 138.65514,904.97 15,713.10105.422 20,666.43 95.87 0.10% 8.87 AAA Aaa AAA AAA
31393VW64 FHR 2642 BW 5.000 06/15/23 1.2551,811.37 330.5718.250 22.72 7.55 0.00% (1.37) AAA Aaa AAA AAA
31394L5S7 FHR 2684 ZN 4.000 10/15/33 103.87142,072.89 28,846.2368.563 43,701.57 140.24 0.21% 3.69 AAA Aaa AAA AAA
3137FGVJ1 FHR 4818 CA 3.000 04/15/48 98.94447,287.95 45,078.7195.328 46,788.34 118.22 0.22% 5.44 AAA Aaa AAA AAA
313921MN5 FNR 2001-52 YZ 6.500 10/25/31 112.60341,482.69 42,675.32102.875 46,710.85 224.70 0.22% 3.23 AAA Aaa AAA AAA
3136B2ZR6 FNR 2018-57 QA 3.500 05/25/46 101.635106,543.01 106,776.07100.219 108,285.35 310.75 0.51% 2.38 AAA Aaa AAA AAA
38373RBR9 GNR 2001-22 SO 14.156 05/20/31 123.97212,190.26 12,757.86104.656 15,112.52 52.73 0.07% 7.42 AAA Aaa AAA AAA
38376FLM2 GNR 2009-66 XS 4.318 07/16/39 12.32077,380.04 10,361.6713.391 9,533.19 139.23 0.05% 13.17 AAA Aaa AAA AAA
38374TDP6 GNR 2009-8 PS 3.818 08/16/38 8.46289,941.80 10,315.2011.469 7,611.09 143.09 0.04% 15.35 AAA Aaa AAA AAA
38380Y2X2 GNR 2018-124 NW 3.500 09/20/48 101.80629,760.52 29,481.5199.063 30,297.95 86.80 0.14% 4.13 AAA Aaa AAA AAA
TOTAL CMO 312,857.06 345,336.73 1,396.63 1.63% 4.73
TOTAL AGENCY MBS 5,974,437.94 6,018,141.06 17,699.37 28.33% 4.09
13

Pasadena Fire and Police Retirement System
Core Fixed Income (Account #: SMS650)
As of 03/31/2019
Base Currency: US Dollar
Account Holdings Detail (continued)
Benchmark: Bloomberg Barclays Aggregate
Cusip Security Name Coupon Maturity PriceParOriginal
CostCostPrice Principal Accrued
% ofPortfolio Dur S&PMoodys Fitch
CreditQuality
NON AGENCY MBS
PRIME
06051GAX7 BAFC 2004-A 1A3 4.746 09/20/34 102.5109,344.61 9,303.7299.563 9,579.13 36.96 0.05% 0.35 AA+ AA+ AA
07384M4F6 BSARM 2004-10 14A1 4.459 01/25/35 99.49084,646.69 80,042.3094.561 84,214.80 314.50 0.40% 0.35 A+ A+
576433WL6 MARM 2004-13 3A7A 4.467 11/21/34 103.24997,984.66 96,024.9798.000 101,168.09 364.75 0.48% 0.35 AA+ AA+
TOTAL PRIME 185,370.99 194,962.02 716.21 0.92% 0.35
ALT-A
173109AE9 CRMSI 2007-1 A5 5.349 03/25/37 104.827300,000.00 204,750.0068.250 314,482.29 1,337.20 1.48% 1.88 BBB Aa3 CCC BBB
576433MW3 MARM 2004-5 3A1 3.625 06/25/34 99.6131,697.65 1,718.60101.234 1,691.07 5.13 0.01% 0.35 AA+ AA+
55265WBD4 MSSTR 2004-1 4A1 4.625 10/25/32 101.8459,063.46 9,241.90101.969 9,230.72 34.93 0.04% 0.35 AA AA
760985W98 RAMP 2004-SL1 A8 6.500 11/25/31 105.36812,227.26 12,664.77103.578 12,883.60 66.23 0.06% 3.63 BBB B+ BBB
45660LAP4 RAST 2004-IP2 2A1 4.458 12/25/34 100.09117,137.42 17,371.99101.369 17,153.00 63.67 0.08% 0.35 A+ A+
TOTAL ALT-A 245,747.26 355,440.68 1,507.16 1.68% 1.82
SUBPRIME
17311CAU5 CMLTI 2007-WFH1 A4 2.686 01/25/37 100.42821,218.91 11,458.2154.000 21,309.75 11.08 0.10% 0.35 AAA Aaa AA
126698AC3 CWL 2007-13 2A1 3.386 10/25/47 98.999124,624.68 85,056.3568.250 123,377.25 82.04 0.58% 0.35 AA A2 AA
64352VLK5 NCHET 2005-3 M2 3.221 07/25/35 100.29717,167.74 16,507.8696.156 17,218.73 10.75 0.08% 0.35 AAA Baa3 AAA AAA
73316MAD9 POPLR 2006-C A4 2.736 07/25/36 99.545107,891.74 54,485.3350.500 107,400.32 57.39 0.50% 0.35 AAA Aaa AA+
TOTAL SUBPRIME 167,507.75 269,306.05 161.26 1.26% 0.35
OPTION ARM
45660LWD7 INDX 2005-AR18 2A1A 2.796 10/25/36 74.373225,775.01 107,807.5747.750 167,914.56 122.72 0.79% 0.35 CCC+ Caa1 CCC
45668RAC2 INDX 2007-FLX2 A1C 2.676 04/25/37 93.976321,880.76 148,467.5146.125 302,490.31 167.45 1.42% 0.35 B- B3 CCC
92922FR75 WAMU 2005-AR8 2A1A 3.066 07/25/45 99.590118,907.64 108,503.2291.250 118,419.88 70.88 0.56% 0.35 AA- A3 AA-
TOTAL OPTION ARM 364,778.30 588,824.75 361.06 2.77% 0.35
OTHER
59560UAD3 MDST 2004-1 B 8.900 08/15/37 114.35885,002.48 90,328.42106.266 97,207.15 630.44 0.46% 3.44 A+ A1 BBB
14

Pasadena Fire and Police Retirement System
Core Fixed Income (Account #: SMS650)
As of 03/31/2019
Base Currency: US Dollar
Account Holdings Detail (continued)
Benchmark: Bloomberg Barclays Aggregate
Cusip Security Name Coupon Maturity PriceParOriginal
CostCostPrice Principal Accrued
% ofPortfolio Dur S&PMoodys Fitch
CreditQuality
TOTAL OTHER 90,328.42 97,207.15 630.44 0.46% 3.44
TOTAL NON AGENCY MBS 1,053,732.72 1,505,740.65 3,376.12 7.08% 0.90
CMBS
AGENCY CMBS
3136AY7L1 FANNIE MAE 2018-M1 2.987 12/25/27 100.411100,000.00 100,000.00100.000 100,410.67 248.87 0.47% 7.06 AAA Aaa AAA AAA
31419AEG8 FN AE0134 4.400 02/01/20 101.13210,603.99 11,414.20107.641 10,724.00 40.18 0.05% 0.40 AAA Aaa AAA AAA
3138EHAF9 FN AL0905 3.948 09/01/21 102.907108,578.85 117,825.02108.516 111,735.41 369.13 0.53% 1.84 AAA Aaa AAA AAA
3138L7QP4 FN AM6761 3.570 10/01/29 105.30174,062.07 79,153.84106.875 77,987.97 227.68 0.37% 7.49 AAA Aaa AAA AAA
3138L9C26 FN AM8188 2.640 03/01/27 99.58973,882.65 74,217.43100.453 73,578.81 167.96 0.35% 6.11 AAA Aaa AAA AAA
3138LAFP9 FN AM9173 3.110 06/01/27 102.36975,058.38 77,732.33103.563 76,836.60 201.01 0.36% 6.26 AAA Aaa AAA AAA
3138LAS26 FN AM9536 3.340 08/01/30 103.27575,404.35 78,785.76104.484 77,873.45 216.87 0.37% 8.04 AAA Aaa AAA AAA
3138LDJF1 FN AN1161 3.050 04/01/28 101.03585,000.00 86,072.46101.262 85,879.54 223.24 0.40% 7.05 AAA Aaa AAA AAA
3140HRHU0 FN BL0242 3.820 11/01/30 106.13950,000.00 50,312.50100.625 53,069.30 164.47 0.25% 8.94 AAA Aaa AAA AAA
3137FHQ71 FREMF K-1507 3.990 08/25/33 109.06250,000.00 50,669.00101.338 54,530.89 166.25 0.26% 10.80 AAA Aaa AAA AAA
3137FJY78 FREMF K-1508 3.900 10/25/33 107.92645,000.00 44,135.3798.079 48,566.79 146.25 0.23% 10.87 AAA Aaa AAA AAA
TOTAL AGENCY CMBS 770,317.91 771,193.42 2,171.92 3.63% 6.82
NON AGENCY CMBS
05491YAA8 BAMLL COMMERCIALMORTGAGE SECU
4.091 08/10/38 107.15135,000.00 36,181.92103.377 37,502.89 119.31 0.18% 7.53 AAA AAA
05529SAC3 BBCMS TRUST 3.756 09/05/32 101.26740,000.00 42,137.50105.344 40,506.72 125.21 0.19% 1.14 AAA Aaa
129890AA7 CALI 2019-101C A 3.957 03/10/39 105.48325,000.00 25,749.93103.000 26,370.80 82.44 0.12% 7.80 AAA AAA
178772AA7 CITYLINE MORTGAGETRUST 2016-C
2.778 11/10/31 99.53225,000.00 24,068.3696.273 24,883.01 57.88 0.12% 3.60 AAA AAA
12592FAA3 COMMERCIAL MORTGAGETRUST
3.611 08/10/49 103.91640,000.00 41,657.81104.145 41,566.33 120.38 0.20% 4.54 AAA AAA
21870LAA4 CORE INDUSTRIAL TRUST2015-CAL
3.040 02/10/34 100.91323,716.78 23,664.9099.781 23,933.20 60.08 0.11% 2.25 AAA Aaa AAA
74932QAA8 RBS COMMERCIALFUNDING INC TRU
3.834 01/15/32 103.00345,000.00 47,696.48105.992 46,351.13 143.76 0.22% 3.89 AAA AAA AAA
15

Pasadena Fire and Police Retirement System
Core Fixed Income (Account #: SMS650)
As of 03/31/2019
Base Currency: US Dollar
Account Holdings Detail (continued)
Benchmark: Bloomberg Barclays Aggregate
Cusip Security Name Coupon Maturity PriceParOriginal
CostCostPrice Principal Accrued
% ofPortfolio Dur S&PMoodys Fitch
CreditQuality
CMBS
NON AGENCY CMBS
78413MAA6 SFAVE 2015-5AVE A1 3.872 01/05/43 100.83345,000.00 43,468.9596.598 45,374.72 145.20 0.21% 11.32 AAA AAA
TOTAL NON AGENCY CMBS 284,625.85 286,488.78 854.25 1.35% 5.45
TOTAL CMBS 1,054,943.76 1,057,682.21 3,026.17 4.98% 6.44
8,083,114.42 8,581,563.92 24,101.66 40.39%TOTAL MORTGAGE BACKED 3.82
ASSET BACKED
STUDENT LOAN
10620NCE6 BRHEA 2010-1 A2 3.851 02/25/35 101.418100,000.00 95,585.9495.586 101,417.92 374.40 0.48% 0.15 AAA AAA AAA
10620NCL0 BRHEA 2011-2 A3 3.771 10/27/36 100.10380,000.00 77,884.3897.356 80,082.19 553.03 0.38% 0.15 AAA AA+ AAA
17284LAA2 CITEL 2007-1 A 2.692 03/25/42 96.58746,202.24 41,928.5490.750 44,625.12 26.16 0.21% 0.15 AAA Aaa AA+
36156YAW1 GCOE 2006-2AR A1RN 3.140 08/27/46 95.41492,135.03 87,067.6094.500 87,909.45 56.25 0.41% 0.05 AAA Aaa AAA AAA
63938QAA5 NAVSL 2014-4 A 3.106 03/25/83 98.574115,659.03 115,659.03100.000 114,009.55 69.84 0.54% 0.05 AAA Aaa AA
64033MAB4 NSLT 2014-4A A2 3.436 11/25/48 99.475115,000.00 115,000.00100.000 114,396.27 76.82 0.54% 0.05 AAA Aa1 AAA
78442GHH2 SLMA 2003-7A A5A 3.811 12/15/33 100.16252,474.52 53,138.65101.266 52,559.24 94.43 0.25% 0.15 BBB- Baa3 AA+ BB
78443HAF0 SLMA 2006-8 A6 2.931 01/25/41 97.152125,000.00 109,687.5087.750 121,439.68 671.60 0.57% 0.15 AAA Aaa AA+ AAA
784442AD7 SLMA 2008-2 B 3.971 01/25/83 96.42735,000.00 30,311.9186.606 33,749.42 254.78 0.16% 0.15 A A1 A B
78444GAD6 SLMA 2008-3 B 3.971 04/26/83 95.87635,000.00 30,995.5188.559 33,556.73 254.78 0.16% 0.15 BB Aaa BB B
78445CAD4 SLMA 2008-6 A4 3.871 07/25/23 100.081108,534.92 109,771.58101.139 108,622.79 770.18 0.51% 0.15 BBB- Baa3 A B
78445JAA5 SLMA 2008-9 A 4.271 04/25/23 101.21029,728.98 30,360.72102.125 30,088.69 232.76 0.14% 0.15 BBB- Baa3 A B
TOTAL STUDENT LOAN 897,391.36 922,457.04 3,435.04 4.35% 0.12
CLO
04965CAJ7 ATRM 12A AR 3.591 04/22/27 99.49760,000.00 59,820.0099.700 59,698.14 412.97 0.28% 0.15 AAA AAA
06761CAA7 BABSN 2016-2A AR 3.841 07/20/28 100.00750,000.00 50,000.00100.000 50,003.40 368.10 0.24% 0.15 AAA Aaa AAA
26249BAQ4 DRSLF 2013-30A AR 3.504 11/15/28 99.26620,000.00 19,960.0099.800 19,853.26 87.59 0.09% 0.15 AAA Aaa AAA
16

Pasadena Fire and Police Retirement System
Core Fixed Income (Account #: SMS650)
As of 03/31/2019
Base Currency: US Dollar
Account Holdings Detail (continued)
Benchmark: Bloomberg Barclays Aggregate
Cusip Security Name Coupon Maturity PriceParOriginal
CostCostPrice Principal Accrued
% ofPortfolio Dur S&PMoodys Fitch
CreditQuality
CLO
38123HAN4 GOLD9 2014-9A AR2 3.862 10/29/29 99.83760,000.00 60,000.00100.000 59,902.34 399.04 0.28% 0.15 AAA AAA AAA
55951PBA4 MAGNE 2012-7A A1R2 3.587 01/15/28 98.39660,000.00 59,610.0099.350 59,037.51 454.39 0.28% 0.15 AAA AAA AAA
87230AAE6 TFLAT 2016-1A AR 3.733 07/17/28 100.06115,000.00 15,000.00100.000 15,009.21 41.99 0.07% 0.15 AAA Aaa AAA
TOTAL CLO 264,390.00 263,503.86 1,764.07 1.25% 0.15
OTHER
37952UAE3 GLOBAL SC FINANCE IISRL
3.090 07/17/29 98.86745,333.33 45,321.1599.973 44,819.76 54.48 0.21% 2.50 A- A-
46617LAA9 HENDR 2013-3A A 4.080 01/17/73 103.91652,696.06 52,653.4099.919 54,759.68 95.56 0.26% 6.77 AAA Aaa
46618AAA2 HENDR 2014-2A A 3.610 01/17/73 101.81768,153.02 68,108.8599.935 69,391.52 109.35 0.33% 7.30 AAA Aaa
TOTAL OTHER 166,083.40 168,970.95 259.38 0.79% 5.86
1,327,864.76 1,354,931.85 5,458.50 6.39%TOTAL ASSET BACKED 0.84
OTHER
FUTURES
TUM9 2 YEAR BOND FUTURESJUN19
6.000 06/28/19 106.54710.00 0.00 0.00 0.00% 1.93 AAA Aaa AA+ AAA
FVM9 FIVE YEAR NOTE FUTUREJUN 19
6.000 06/28/19 115.8286.00 0.00 0.00 0.00% 4.17 AAA Aaa AA+ AAA
WNM9 US ULTRA BOND CBTJUN19
6.000 06/19/19 168.0001.00 0.00 0.00 0.00% 17.84 AAA Aaa AA+ AAA
TOTAL FUTURES 0.00 0.00 0.00 0.00% 3.34
0.00 0.00 0.00 0.00%TOTAL OTHER 3.34
17

Pasadena Fire and Police Retirement System
Core Fixed Income (Account #: SMS650)
As of 03/31/2019
Base Currency: US Dollar
Account Holdings Detail (continued)
Benchmark: Bloomberg Barclays Aggregate
Cusip Security Name Coupon Maturity PriceParOriginal
CostCostPrice Principal Accrued
% ofPortfolio Dur S&PMoodys Fitch
CreditQuality
21,200,803.15
103,407.94
21,304,211.09
Principal Market Value
Accrued Income
Total Portfolio Market Value
Account Holdings Summary MarketValue
18

DescriptionTrade DateCurrent
FaceRealized
Gains/LossesCUSIP/SEDOL
NetAmount
OriginalFacePrice
Currency: US Dollar
Settle DateMaturity
Date
PURCHASES
02/14/2019 G2 MA4837 101.01236179TLS2 46,204.6945,741.91 0.0003/21/2019 11/20/2047 50,000.00
02/14/2019 G2 MA4837 101.01236179TLS2 -45,815.8645,356.97 0.0003/21/2019 11/20/2047 50,000.00
02/21/2019 G2 MA5528 102.73836179UD90 162,647.20158,312.17 0.0003/21/2019 10/20/2048 160,000.00
02/21/2019 G2 MA5528 102.73836179UD90 -162,027.34157,708.82 0.0003/21/2019 10/20/2048 160,000.00
03/01/2019 US TREASURY N/B 99.2039128286G0 -54,561.7255,000.00 0.0003/04/2019 02/29/2024 55,000.00
03/04/2019 US TREASURY N/B 99.2979128286G0 -114,191.41115,000.00 0.0003/05/2019 02/29/2024 115,000.00
03/04/2019 US TREASURY N/B 99.2199128286G0 -104,179.69105,000.00 0.0003/05/2019 02/29/2024 105,000.00
03/04/2019 US TREASURY N/B 99.1419128286G0 -89,226.5690,000.00 0.0003/05/2019 02/29/2024 90,000.00
03/05/2019 US TREASURY N/B 99.2819128286G0 -203,526.56205,000.00 0.0003/06/2019 02/29/2024 205,000.00
03/05/2019 US TREASURY N/B 99.1959128286G0 -54,557.4255,000.00 0.0003/06/2019 02/29/2024 55,000.00
03/06/2019 US TREASURY N/B 99.5009128286B1 -49,750.0050,000.00 0.0003/07/2019 02/15/2029 50,000.00
03/07/2019 CALI 2019-101C A 103.000129890AA7 -25,749.9325,000.00 0.0003/22/2019 03/10/2039 25,000.00
03/07/2019 FNCL 30 YR 5.0 TBA APR 19 104.797F500419FB -209,593.75200,000.00 0.0004/10/2019 08/25/2048 200,000.00
03/07/2019 GE CAPITAL INTERNATIONAL FUNDI 88.96236164QNA2 -8,896.2010,000.00 0.0003/11/2019 11/15/2035 10,000.00
03/07/2019 US TREASURY N/B 99.5709128286G0 -398,281.25400,000.00 0.0003/08/2019 02/29/2024 400,000.00
03/08/2019 FGLMC 30 YR 4.0 TBA APR 19 102.258H400419BA -25,564.4525,000.00 0.0004/10/2019 06/15/2048 25,000.00
03/08/2019 FGLMC 30 YR 4.5 TBA APR 19 103.738H450419GS -25,934.5725,000.00 0.0004/10/2019 07/15/2048 25,000.00
03/08/2019 FNCI 15 YR 2.5 TBA APR 19 98.408D250419FB -73,806.1575,000.00 0.0004/15/2019 05/25/2032 75,000.00
03/08/2019 GE CAPITAL INTERNATIONAL FUNDI 88.70236164QNA2 -8,870.2010,000.00 0.0003/12/2019 11/15/2035 10,000.00
03/08/2019 US TREASURY BILL 4/9/2019 99.813912796UW7 -52,900.9853,000.00 0.0003/12/2019 04/09/2019 53,000.00
03/12/2019 FG G16598 98.6173128MFRT7 -77,273.6378,357.17 0.0004/15/2019 12/01/2031 85,000.00
03/12/2019 GE CAPITAL INTERNATIONAL FUNDI 90.12536164QNA2 -36,050.0040,000.00 0.0003/14/2019 11/15/2035 40,000.00
03/12/2019 US TREASURY N/B 100.0709128286D7 -30,021.0930,000.00 0.0003/13/2019 02/28/2021 30,000.00
03/12/2019 US TREASURY N/B 100.0709128286D7 -135,094.92135,000.00 0.0003/13/2019 02/28/2021 135,000.00
03/12/2019 US TREASURY N/B 100.0709128286D7 -65,045.7065,000.00 0.0003/13/2019 02/28/2021 65,000.00
03/13/2019 INTERNATIONAL FLAVORS & FRAGRA 101.104459506AL5 -10,110.4010,000.00 0.0003/15/2019 09/26/2048 10,000.00
03/13/2019 US TREASURY BILL 5/7/2019 99.641912796VA4 -86,687.7887,000.00 0.0003/14/2019 05/07/2019 87,000.00
Pasadena Fire and Police Retirement System
Core Fixed Income (Account #: SMS650)
Account Transaction Activity
As of 03/31/2019
Benchmark: Bloomberg Barclays Aggregate
19

Pasadena Fire and Police Retirement System
Core Fixed Income (Account #: SMS650)
Account Transaction Activity (continued)
As of 03/31/2019
Benchmark: Bloomberg Barclays Aggregate
DescriptionTrade DateCurrent
FaceRealized
Gains/LossesCUSIP/SEDOL
NetAmount
OriginalFacePrice
Currency: US Dollar
Settle DateMaturity
Date
PURCHASES
03/13/2019 US TREASURY N/B 100.1259128286B1 -30,037.5030,000.00 0.0003/14/2019 02/15/2029 30,000.00
03/14/2019 INTERNATIONAL FLAVORS & FRAGRA 100.396459506AL5 -10,039.6010,000.00 0.0003/18/2019 09/26/2048 10,000.00
03/15/2019 G2SF 30 YR 5.0 TBA APR 19 104.258T500419GS -62,554.6960,000.00 0.0004/17/2019 06/20/2047 60,000.00
03/15/2019 US TREASURY N/B 100.0789128286B1 -115,089.84115,000.00 0.0003/18/2019 02/15/2029 115,000.00
03/18/2019 US TREASURY N/B 100.2039128286B1 -50,101.5650,000.00 0.0003/19/2019 02/15/2029 50,000.00
03/20/2019 US TREASURY N/B 100.8289128286B1 -15,124.2215,000.00 0.0003/21/2019 02/15/2029 15,000.00
03/21/2019 US TREASURY N/B 100.1859128286D7 -230,424.43230,000.00 0.0003/25/2019 02/28/2021 230,000.00
03/21/2019 US TREASURY N/B 100.582912810SF6 -95,553.2695,000.00 0.0003/25/2019 02/15/2049 95,000.00
03/21/2019 US TREASURY N/B 100.1959128286D7 -140,273.44140,000.00 0.0003/22/2019 02/28/2021 140,000.00
03/25/2019 US TREASURY N/B 99.560912828W71 -44,802.2245,000.00 0.0004/01/2019 03/31/2024 45,000.00
03/25/2019 US TREASURY N/B 99.671912828W71 -44,851.7345,000.00 0.0004/01/2019 03/31/2024 45,000.00
03/25/2019 US TREASURY N/B 100.6889128286G0 -25,171.8825,000.00 0.0003/27/2019 02/29/2024 25,000.00
03/25/2019 US TREASURY N/B 99.535912828W71 -109,488.47110,000.00 0.0004/01/2019 03/31/2024 110,000.00
03/25/2019 US TREASURY N/B 99.688912828W71 -159,501.24160,000.00 0.0004/01/2019 03/31/2024 160,000.00
03/26/2019 US TREASURY BILL 6/20/2019 99.433912796QM4 -27,841.3328,000.00 0.0003/27/2019 06/20/2019 28,000.00
03/26/2019 US TREASURY N/B 102.563912810SF6 -5,128.135,000.00 0.0003/27/2019 02/15/2049 5,000.00
03/26/2019 US TREASURY N/B 99.667912828W71 -49,833.5650,000.00 0.0004/01/2019 03/31/2024 50,000.00
03/26/2019 US TREASURY N/B 101.8139128286B1 -35,634.3835,000.00 0.0003/27/2019 02/15/2029 35,000.00
03/26/2019 US TREASURY N/B 99.530912828W71 -154,270.75155,000.00 0.0004/01/2019 03/31/2024 155,000.00
03/27/2019 US TREASURY N/B 99.778912828W71 -269,401.95270,000.00 0.0004/01/2019 03/31/2024 270,000.00
03/27/2019 US TREASURY N/B 99.742912828W71 -174,548.15175,000.00 0.0003/28/2019 03/31/2024 175,000.00
03/27/2019 US TREASURY N/B 99.727912828W71 -44,876.9845,000.00 0.0004/01/2019 03/31/2024 45,000.00
03/27/2019 US TREASURY N/B 99.772912828W71 -104,760.12105,000.00 0.0004/01/2019 03/31/2024 105,000.00
03/27/2019 US TREASURY N/B 99.722912828W71 -54,847.0255,000.00 0.0004/01/2019 03/31/2024 55,000.00
03/28/2019 US TREASURY N/B 99.666912828W71 -179,398.80180,000.00 0.0003/29/2019 03/31/2024 180,000.00
03/28/2019 US TREASURY N/B 99.750912828W71 -69,825.0070,000.00 0.0004/01/2019 03/31/2024 70,000.00
03/28/2019 US TREASURY N/B 99.730912828W71 -179,514.59180,000.00 0.0004/01/2019 03/31/2024 180,000.00
20

Pasadena Fire and Police Retirement System
Core Fixed Income (Account #: SMS650)
Account Transaction Activity (continued)
As of 03/31/2019
Benchmark: Bloomberg Barclays Aggregate
DescriptionTrade DateCurrent
FaceRealized
Gains/LossesCUSIP/SEDOL
NetAmount
OriginalFacePrice
Currency: US Dollar
Settle DateMaturity
Date
PURCHASES
03/28/2019 US TREASURY N/B 102.1179128286B1 -76,587.8975,000.00 0.0003/29/2019 02/15/2029 75,000.00
03/29/2019 FNCL 30 YR 5.0 TBA MAY 19 105.609F500519FB -79,207.0375,000.00 0.0005/13/2019 08/25/2048 75,000.00
03/29/2019 US TREASURY N/B 101.8599128286B1 -25,464.8425,000.00 0.0004/01/2019 02/15/2029 25,000.00
03/29/2019 US TREASURY N/B 101.7349128286B1 -66,127.3465,000.00 0.0004/01/2019 02/15/2029 65,000.00
03/29/2019 US TREASURY N/B 103.438912810SF6 -25,859.3825,000.00 0.0004/01/2019 02/15/2049 25,000.00
03/29/2019 US TREASURY N/B 99.504912828W71 -14,925.5915,000.00 0.0004/02/2019 03/31/2024 15,000.00
03/29/2019 US TREASURY N/B 103.484912810SF6 -31,045.3130,000.00 0.0004/01/2019 02/15/2049 30,000.00
03/29/2019 US TREASURY N/B 101.8289128286B1 -25,457.0325,000.00 0.0004/01/2019 02/15/2029 25,000.00
0.00-4,766,434.92TOTAL PURCHASES
SALES
03/01/2019 US TREASURY N/B 100.2969128285U0 55,163.0555,000.00 -34.8403/04/2019 12/31/2023 55,000.00
03/04/2019 US TREASURY N/B 99.8669128285Z9 114,845.45115,000.00 266.5103/05/2019 01/31/2024 115,000.00
03/04/2019 US TREASURY N/B 100.2289128285U0 90,204.9690,000.00 -118.8603/05/2019 12/31/2023 90,000.00
03/04/2019 US TREASURY N/B 99.7889128285Z9 104,777.79105,000.00 131.9403/05/2019 01/31/2024 105,000.00
03/05/2019 US TREASURY N/B 99.7619128285Z9 54,868.7255,000.00 65.9103/06/2019 01/31/2024 55,000.00
03/05/2019 US TREASURY N/B 100.3699128285U0 210,774.37210,000.00 -163.4703/06/2019 12/31/2023 210,000.00
03/06/2019 US TREASURY N/B 103.7349128285M8 51,867.1950,000.00 445.7103/07/2019 11/15/2028 50,000.00
03/07/2019 FNCL 30 YR 5.0 TBA MAR 19 104.838F500319FB 209,675.78200,000.00 -449.2203/13/2019 07/25/2048 200,000.00
03/07/2019 US TREASURY N/B 104.0239128285M8 26,005.8625,000.00 148.4403/08/2019 11/15/2028 25,000.00
03/07/2019 US TREASURY N/B 99.281912810SF6 4,964.065,000.00 19.7603/08/2019 02/15/2049 5,000.00
03/07/2019 US TREASURY N/B 100.6439128285U0 412,635.32410,000.00 716.5703/08/2019 12/31/2023 410,000.00
03/08/2019 FGLMC 30 YR 4.0 TBA MAR 19 102.316H400319GS 25,579.1025,000.00 41.9903/13/2019 05/15/2048 25,000.00
03/08/2019 FGLMC 30 YR 4.5 TBA MAR 19 103.793H450319FB 25,948.2425,000.00 26.3603/13/2019 06/15/2048 25,000.00
03/08/2019 FN MA3444 103.69531418CZJ6 95,871.3092,454.80 -288.9203/13/2019 08/01/2048 100,000.00
03/08/2019 US TREASURY N/B 99.406912810SF6 4,970.315,000.00 26.0103/11/2019 02/15/2049 5,000.00
03/12/2019 FNCI 15 YR 2.5 TBA APR 19 98.406D250419FB 73,804.6975,000.00 -1.4604/15/2019 05/25/2032 75,000.00
03/12/2019 US TREASURY N/B 100.0449128285X4 30,013.2430,000.00 62.4603/13/2019 01/31/2021 30,000.00
21

Pasadena Fire and Police Retirement System
Core Fixed Income (Account #: SMS650)
Account Transaction Activity (continued)
As of 03/31/2019
Benchmark: Bloomberg Barclays Aggregate
DescriptionTrade DateCurrent
FaceRealized
Gains/LossesCUSIP/SEDOL
NetAmount
OriginalFacePrice
Currency: US Dollar
Settle DateMaturity
Date
SALES
03/12/2019 US TREASURY N/B 100.0449128285X4 140,061.80140,000.00 287.9803/13/2019 01/31/2021 140,000.00
03/12/2019 US TREASURY N/B 100.0449128285X4 70,030.9070,000.00 106.1503/13/2019 01/31/2021 70,000.00
03/12/2019 US TREASURY N/B 100.258912810SF6 20,051.5620,000.00 274.3503/13/2019 02/15/2049 20,000.00
03/13/2019 US TREASURY N/B 104.3769128285M8 31,312.7330,000.00 248.4703/14/2019 11/15/2028 30,000.00
03/13/2019 US TREASURY N/B 99.883912810SF6 9,988.2810,000.00 99.6803/14/2019 02/15/2049 10,000.00
03/14/2019 US TREASURY N/B 99.156912810SF6 9,915.6310,000.00 27.0303/15/2019 02/15/2049 10,000.00
03/15/2019 G2SF 30 YR 5.0 TBA MAR 19 104.313T500319FB 62,587.5060,000.00 75.0003/21/2019 07/20/2047 60,000.00
03/15/2019 US TREASURY N/B 104.3379128285M8 119,987.20115,000.00 886.3803/18/2019 11/15/2028 115,000.00
03/18/2019 US TREASURY N/B 104.4469128285M8 52,223.0450,000.00 64.2003/19/2019 11/15/2028 50,000.00
03/20/2019 US TREASURY N/B 105.0729128285M8 15,760.7415,000.00 113.0903/21/2019 11/15/2028 15,000.00
03/21/2019 FNCL 30 YR 5.0 TBA APR 19 105.383F500419FB 131,728.52125,000.00 732.4304/10/2019 08/25/2048 125,000.00
03/21/2019 TSY INFL IX N/B 100.742912810SB5 77,091.2075,000.00 2,837.5403/25/2019 02/15/2048 75,000.00
03/21/2019 US TREASURY N/B 100.9499128286B1 30,284.7730,000.00 434.7703/22/2019 02/15/2029 30,000.00
03/22/2019 US TREASURY BILL 4/9/2019 99.900912796UW7 52,947.0153,000.00 46.0303/25/2019 04/09/2019 53,000.00
03/22/2019 US TREASURY BILL 5/7/2019 99.715912796VA4 86,751.6487,000.00 63.8603/25/2019 05/07/2019 87,000.00
03/25/2019 GENERAL MILLS INC. 102.501370334CE2 30,750.3030,000.00 815.4003/27/2019 10/17/2023 30,000.00
03/25/2019 US TREASURY N/B 100.7509128286G0 45,337.5045,000.00 478.1203/26/2019 02/29/2024 45,000.00
03/25/2019 US TREASURY N/B 100.8599128286G0 45,386.7245,000.00 527.3403/26/2019 02/29/2024 45,000.00
03/25/2019 US TREASURY N/B 101.3919128285Z9 167,294.53165,000.00 2,791.5103/26/2019 01/31/2024 165,000.00
03/25/2019 US TREASURY N/B 101.2349128285Z9 111,357.81110,000.00 1,751.8903/26/2019 01/31/2024 110,000.00
03/26/2019 US TREASURY N/B 106.0559128285M8 37,119.1935,000.00 695.9503/27/2019 11/15/2028 35,000.00
03/26/2019 US TREASURY N/B 101.2349128285Z9 161,975.00160,000.00 2,136.4203/27/2019 01/31/2024 160,000.00
03/26/2019 US TREASURY N/B 101.2739128285Z9 30,382.0330,000.00 472.3903/27/2019 01/31/2024 30,000.00
03/26/2019 US TREASURY N/B 100.8679128286G0 50,433.5950,000.00 589.8403/27/2019 02/29/2024 50,000.00
03/27/2019 US TREASURY N/B 101.4389128285Z9 55,790.6355,000.00 833.6103/28/2019 01/31/2024 55,000.00
03/27/2019 US TREASURY N/B 100.9539128286G0 176,667.97175,000.00 2,241.6103/28/2019 02/29/2024 175,000.00
03/27/2019 US TREASURY N/B 100.9839128286G0 272,654.56270,000.00 4,004.5603/28/2019 02/29/2024 270,000.00
22

Pasadena Fire and Police Retirement System
Core Fixed Income (Account #: SMS650)
Account Transaction Activity (continued)
As of 03/31/2019
Benchmark: Bloomberg Barclays Aggregate
DescriptionTrade DateCurrent
FaceRealized
Gains/LossesCUSIP/SEDOL
NetAmount
OriginalFacePrice
Currency: US Dollar
Settle DateMaturity
Date
SALES
03/27/2019 US TREASURY N/B 100.9389128286G0 45,421.8845,000.00 646.8803/28/2019 02/29/2024 45,000.00
03/27/2019 US TREASURY N/B 101.4849128285Z9 106,558.59105,000.00 1,696.8703/28/2019 01/31/2024 105,000.00
03/28/2019 FN AN0335 102.8133138LCLR4 80,840.3478,628.90 -4,349.1603/29/2019 01/01/2031 80,000.00
03/28/2019 US TREASURY N/B 100.8759128286G0 181,575.00180,000.00 2,869.5303/29/2019 02/29/2024 180,000.00
03/28/2019 US TREASURY N/B 101.4659128285Z9 71,025.3970,000.00 945.5103/29/2019 01/31/2024 70,000.00
03/28/2019 US TREASURY N/B 100.9389128286G0 181,687.50180,000.00 3,082.0303/29/2019 02/29/2024 180,000.00
03/29/2019 FNCL 30 YR 5.0 TBA APR 19 105.742F500419FB 79,306.6475,000.00 708.9804/10/2019 08/25/2048 75,000.00
03/29/2019 GENERAL MILLS INC. 102.544370334CE2 16,407.0416,000.00 441.7604/02/2019 10/17/2023 16,000.00
03/29/2019 US TREASURY N/B 105.9769128285M8 68,884.6765,000.00 1,509.4704/01/2019 11/15/2028 65,000.00
32,082.364,519,548.83TOTAL SALES
MATURED BOND PRINCIPAL
03/28/2019 US TREASURY BILL 3/28/2019912796PX1 28,000.0028,000.00 196.5703/28/2019 03/28/2019 28,000.00
196.5728,000.00TOTAL MATURED BOND PRINCIPAL
PAYDOWNS
03/15/2019 CONTL AIRLINES 1999-2210805CT2 48,748.68-48,748.68 -3,673.2903/15/2019 03/15/2020 512,000.00
03/15/2019 FG A615273128KRVU5 94.78-94.78 -2.0103/15/2019 07/01/2036 520,000.00
03/15/2019 FG G063613128M8MJ0 399.08-399.08 6.3003/15/2019 03/01/2041 210,000.00
03/15/2019 FG G086983128MJX47 110.79-110.79 -5.3103/15/2019 03/01/2046 20,000.00
03/15/2019 FG G087113128MJYH7 1,507.65-1,507.65 -77.6803/15/2019 06/01/2046 205,000.00
03/15/2019 FG G087153128MJYM6 1,946.28-1,946.28 -77.5403/15/2019 08/01/2046 365,000.00
03/15/2019 FG G087213128MJYT1 930.92-930.92 -34.6903/15/2019 09/01/2046 160,000.00
03/15/2019 FG G087263128MJYY0 1,124.46-1,124.46 -41.8203/15/2019 10/01/2046 200,000.00
03/15/2019 FG G087953128MJ3D0 280.59-280.59 10.5403/15/2019 01/01/2048 65,000.00
03/15/2019 FG G088003128MJ3J7 429.29-429.29 4.0603/15/2019 02/01/2048 75,000.00
03/15/2019 FG G088163128MJ4A5 687.46-687.46 11.6803/15/2019 06/01/2048 140,000.00
03/15/2019 FG G088333128MJ4T4 812.57-812.57 -45.7703/15/2019 07/01/2048 35,000.00
03/15/2019 FG G088433128MJ5D8 889.27-889.27 -30.0603/15/2019 10/01/2048 50,000.00
23

Pasadena Fire and Police Retirement System
Core Fixed Income (Account #: SMS650)
Account Transaction Activity (continued)
As of 03/31/2019
Benchmark: Bloomberg Barclays Aggregate
DescriptionTrade DateCurrent
FaceRealized
Gains/LossesCUSIP/SEDOL
NetAmount
OriginalFacePrice
Currency: US Dollar
Settle DateMaturity
Date
PAYDOWNS
03/15/2019 FG G123993128M1RU5 512.02-512.02 -14.7203/15/2019 09/01/2021 795,000.00
03/15/2019 FG G167563128MFWR5 679.11-679.11 -12.3103/15/2019 01/01/2034 85,000.00
03/15/2019 FG G187133128MMYK3 956.56-956.56 -15.3603/15/2019 11/01/2033 105,000.00
03/15/2019 FG G6027831335AJX7 730.57-730.57 -55.0203/15/2019 10/01/2045 110,000.00
03/15/2019 FG G677033132XCRY3 873.53-873.53 -32.7603/15/2019 04/01/2047 115,000.00
03/15/2019 FG G677063132XCR31 932.94-932.94 -13.1403/15/2019 12/01/2047 155,000.00
03/15/2019 FG G677073132XCR49 594.75-594.75 -0.3703/15/2019 01/01/2048 90,000.00
03/15/2019 FG G677083132XCR56 1,652.42-1,652.42 -6.0803/15/2019 03/01/2048 250,000.00
03/15/2019 FG G677093132XCR64 629.98-629.98 -3.1003/15/2019 03/01/2048 125,000.00
03/15/2019 FG G677103132XCR72 1,333.94-1,333.94 -2.8303/15/2019 03/01/2048 265,000.00
03/15/2019 FG G677133132XCSA4 375.96-375.96 -7.9003/15/2019 06/01/2048 55,000.00
03/15/2019 FG G677183132XCSF3 661.57-661.57 -16.0603/15/2019 01/01/2049 135,000.00
03/15/2019 FG Q052613132GLQN7 1,146.04-1,146.04 -31.0703/15/2019 12/01/2041 165,000.00
03/15/2019 FG Q201783132JMFT1 1,135.15-1,135.15 -4.0803/15/2019 07/01/2043 220,000.00
03/15/2019 FHR 2368 AS31339GNQ0 70.11-70.11 8.8503/15/2019 10/15/2031 500,000.00
03/15/2019 FHR 2433 SA3133TVPR1 219.61-219.61 -11.9103/15/2019 02/15/2032 275,000.00
03/15/2019 FHR 2684 ZN31394L5S7 201.32-201.32 63.2903/15/2019 10/15/2033 190,000.00
03/15/2019 FHR 4818 CA3137FGVJ1 380.63-380.63 17.7803/15/2019 04/15/2048 50,000.00
03/15/2019 GN 37646336204QFC9 22.21-22.21 1.0003/15/2019 04/15/2024 341,247.00
03/15/2019 GN 78003536225ABC3 22.12-22.12 1.0003/15/2019 07/15/2024 199,051.00
03/15/2019 GN 78281836241LDX1 2,325.11-2,325.11 -58.3103/15/2019 11/15/2039 430,000.00
03/15/2019 HENDR 2013-3A A46617LAA9 345.96-345.96 0.2803/15/2019 01/17/2073 75,000.00
03/15/2019 HENDR 2014-2A A46618AAA2 391.50-391.50 0.2503/15/2019 01/17/2073 90,000.00
03/15/2019 SLMA 2003-7A A5A78442GHH2 1,668.90-1,668.90 -21.1203/15/2019 12/15/2033 110,000.00
03/17/2019 GLOBAL SC FINANCE II SRL37952UAE3 708.33-708.33 0.1903/18/2019 07/17/2029 85,000.00
03/18/2019 MDST 2004-1 B59560UAD3 1,292.52-1,292.52 -80.9803/15/2019 08/15/2037 400,000.00
03/20/2019 BAFC 2004-A 1A306051GAX7 35.23-35.23 0.1503/20/2019 09/20/2034 660,000.00
24

Pasadena Fire and Police Retirement System
Core Fixed Income (Account #: SMS650)
Account Transaction Activity (continued)
As of 03/31/2019
Benchmark: Bloomberg Barclays Aggregate
DescriptionTrade DateCurrent
FaceRealized
Gains/LossesCUSIP/SEDOL
NetAmount
OriginalFacePrice
Currency: US Dollar
Settle DateMaturity
Date
PAYDOWNS
03/20/2019 G2 MA352136179R4E6 454.70-454.70 -27.0003/20/2019 03/20/2046 70,000.00
03/20/2019 G2 MA406936179SQW0 2,010.52-2,010.52 -79.7903/20/2019 11/20/2046 245,000.00
03/20/2019 G2 MA419536179SUU9 2,516.04-2,516.04 -27.9903/20/2019 01/20/2047 295,000.00
03/20/2019 G2 MA438236179S2P1 651.89-651.89 -27.4503/20/2019 04/20/2047 90,000.00
03/20/2019 G2 MA451036179TAK1 188.53-188.53 -7.7003/20/2019 06/20/2047 25,000.00
03/20/2019 G2 MA458636179TCX1 177.58-177.58 3.0603/20/2019 07/20/2047 25,000.00
03/20/2019 G2 MA458836179TCZ6 2,356.89-2,356.89 -100.9003/20/2019 07/20/2047 230,000.00
03/20/2019 G2 MA458936179TC29 712.15-712.15 -52.9703/20/2019 07/20/2047 65,000.00
03/20/2019 G2 MA471936179TG41 179.05-179.05 -6.0003/20/2019 09/20/2047 25,000.00
03/20/2019 G2 MA483636179TLR4 232.61-232.61 6.0003/20/2019 11/20/2047 30,000.00
03/20/2019 G2 MA483736179TLS2 1,462.77-1,462.77 -18.1103/20/2019 11/20/2047 190,000.00
03/20/2019 G2 MA483836179TLT0 696.49-696.49 -34.9103/20/2019 11/20/2047 65,000.00
03/20/2019 G2 MA546636179UCB6 462.72-462.72 -12.3803/20/2019 09/20/2048 95,000.00
03/20/2019 G2 MA559736179UGE6 395.73-395.73 -17.5003/20/2019 11/20/2048 80,000.00
03/20/2019 GNR 2001-22 SO38373RBR9 209.52-209.52 -9.7603/20/2019 05/20/2031 1,707,394.00
03/20/2019 GNR 2018-124 NW38380Y2X2 40.76-40.76 0.3803/20/2019 09/20/2048 30,000.00
03/21/2019 MARM 2004-13 3A7A576433WL6 2,367.67-2,367.67 47.3503/21/2019 11/21/2034 555,000.00
03/25/2019 BSARM 2004-10 14A107384M4F6 265.70-265.70 14.4503/25/2019 01/25/2035 1,530,000.00
03/25/2019 CITEL 2007-1 A17284LAA2 1,362.57-1,362.57 126.0403/25/2019 03/25/2042 150,000.00
03/25/2019 CMLTI 2007-WFH1 A417311CAU5 2,333.46-2,333.46 1,073.3903/25/2019 01/25/2037 100,000.00
03/25/2019 FN 65592831390TVV8 132.76-132.76 -8.8003/25/2019 08/01/2032 765,000.00
03/25/2019 FN 73564631402RHX0 513.39-513.39 2.6503/25/2019 07/01/2020 900,000.00
03/25/2019 FN 84103131407ULL9 2.49-2.49 0.0003/25/2019 11/01/2035 380,000.00
03/25/2019 FN 91844531411YL27 11.99-11.99 -0.0703/25/2019 05/01/2037 705,000.00
03/25/2019 FN AB161331416WYK2 510.59-510.59 -9.5703/25/2019 10/01/2040 305,000.00
03/25/2019 FN AD383031418RHG9 1,256.98-1,256.98 -51.8503/25/2019 04/01/2025 390,000.00
03/25/2019 FN AE013431419AEG8 2,742.33-2,742.33 -209.5303/25/2019 02/01/2020 121,000.00
25

Pasadena Fire and Police Retirement System
Core Fixed Income (Account #: SMS650)
Account Transaction Activity (continued)
As of 03/31/2019
Benchmark: Bloomberg Barclays Aggregate
DescriptionTrade DateCurrent
FaceRealized
Gains/LossesCUSIP/SEDOL
NetAmount
OriginalFacePrice
Currency: US Dollar
Settle DateMaturity
Date
PAYDOWNS
03/25/2019 FN AL09053138EHAF9 243.36-243.36 -20.7203/25/2019 09/01/2021 210,000.00
03/25/2019 FN AM67613138L7QP4 145.72-145.72 -10.0203/25/2019 10/01/2029 80,000.00
03/25/2019 FN AM81883138L9C26 155.41-155.41 -0.7003/25/2019 03/01/2027 80,000.00
03/25/2019 FN AM91733138LAFP9 142.04-142.04 -5.0603/25/2019 06/01/2027 80,000.00
03/25/2019 FN AM95363138LAS26 139.40-139.40 -6.2503/25/2019 08/01/2030 80,000.00
03/25/2019 FN AN03353138LCLR4 124.82-124.82 -10.4103/25/2019 01/01/2031 80,000.00
03/25/2019 FN CA11873140Q8J97 164.51-164.51 -0.7503/25/2019 02/01/2048 25,000.00
03/25/2019 FN CA17103140Q83U7 2,423.01-2,423.01 -96.5403/25/2019 05/01/2048 150,000.00
03/25/2019 FN CA17113140Q83V5 808.62-808.62 -26.4103/25/2019 05/01/2048 75,000.00
03/25/2019 FN CA22083140Q9N25 992.65-992.65 -37.0303/25/2019 08/01/2048 75,000.00
03/25/2019 FN MA158431418AXN3 507.22-507.22 -17.2803/25/2019 09/01/2033 100,000.00
03/25/2019 FN MA299531418CKH6 488.92-488.92 -25.4203/25/2019 05/01/2047 75,000.00
03/25/2019 FN MA302931418CLK8 575.18-575.18 -14.5103/25/2019 06/01/2032 60,000.00
03/25/2019 FN MA308831418CNE0 1,404.86-1,404.86 -77.8703/25/2019 08/01/2047 200,000.00
03/25/2019 FN MA321031418CR89 1,264.08-1,264.08 6.9603/25/2019 12/01/2047 225,000.00
03/25/2019 FN MA344431418CZJ6 1,744.05-1,744.05 -69.9003/25/2019 08/01/2048 100,000.00
03/25/2019 FNR 2001-52 YZ313921MN5 1,245.64-1,245.64 -35.8103/25/2019 10/25/2031 575,000.00
03/25/2019 FNR 2018-57 QA3136B2ZR6 1,182.56-1,182.56 -2.5903/25/2019 05/25/2046 115,000.00
03/25/2019 INDX 2005-AR18 2A1A45660LWD7 490.25-490.25 256.1603/25/2019 10/25/2036 1,300,000.00
03/25/2019 MARM 2004-5 3A1576433MW3 2.00-2.00 -0.0203/25/2019 06/25/2034 505,000.00
03/25/2019 MSSTR 2004-1 4A155265WBD4 49.52-49.52 -0.9703/25/2019 10/25/2032 550,000.00
03/25/2019 NAVSL 2014-4 A63938QAA5 1,142.93-1,142.93 0.0003/25/2019 03/25/2083 185,000.00
03/25/2019 NCHET 2005-3 M264352VLK5 3,040.86-3,040.86 116.8803/25/2019 07/25/2035 250,000.00
03/25/2019 POPLR 2006-C A473316MAD9 1,864.01-1,864.01 922.6803/25/2019 07/25/2036 243,000.00
03/25/2019 RAMP 2004-SL1 A8760985W98 102.59-102.59 -3.6703/25/2019 11/25/2031 675,000.00
03/25/2019 RAST 2004-IP2 2A145660LAP4 519.89-519.89 -7.1203/25/2019 12/25/2034 535,000.00
03/25/2019 WAMU 2005-AR8 2A1A92922FR75 1,060.12-1,060.12 92.7603/25/2019 07/25/2045 2,000,000.00
26

Pasadena Fire and Police Retirement System
Core Fixed Income (Account #: SMS650)
Account Transaction Activity (continued)
As of 03/31/2019
Benchmark: Bloomberg Barclays Aggregate
DescriptionTrade DateCurrent
FaceRealized
Gains/LossesCUSIP/SEDOL
NetAmount
OriginalFacePrice
Currency: US Dollar
Settle DateMaturity
Date
-2,752.49124,132.01TOTAL PAYDOWNS
IO FACTOR ADJUSTMENT
03/15/2019 FHR 2642 BW31393VW64 0.001,811.37 -35.5503/15/2019 06/15/2023 520,000.00
03/16/2019 GNR 2009-66 XS38376FLM2 0.0077,380.04 -234.4103/18/2019 07/16/2039 1,350,000.00
03/16/2019 GNR 2009-8 PS38374TDP6 0.0089,941.80 -120.1903/18/2019 08/16/2038 995,000.00
-390.150.00TOTAL IO FACTOR ADJUSTMENT
INTEREST - BUY & SELL
02/14/2019 G2 MA483736179TLS2 0.750.00 0.0003/21/2019 11/20/2047 100,000.00
02/21/2019 G2 MA552836179UD90 1.340.00 0.0003/21/2019 10/20/2048 320,000.00
03/01/2019 US TREASURY N/B9128286G0 -14.200.00 0.0003/04/2019 02/29/2024 55,000.00
03/01/2019 US TREASURY N/B9128285U0 251.260.00 0.0003/04/2019 12/31/2023 55,000.00
03/04/2019 US TREASURY N/B9128285Z9 262.090.00 0.0003/05/2019 01/31/2024 115,000.00
03/04/2019 US TREASURY N/B9128286G0 -33.880.00 0.0003/05/2019 02/29/2024 105,000.00
03/04/2019 US TREASURY N/B9128286G0 -37.110.00 0.0003/05/2019 02/29/2024 115,000.00
03/04/2019 US TREASURY N/B9128286G0 -29.040.00 0.0003/05/2019 02/29/2024 90,000.00
03/04/2019 US TREASURY N/B9128285U0 417.680.00 0.0003/05/2019 12/31/2023 90,000.00
03/04/2019 US TREASURY N/B9128285Z9 239.300.00 0.0003/05/2019 01/31/2024 105,000.00
03/05/2019 US TREASURY N/B9128285Z9 129.140.00 0.0003/06/2019 01/31/2024 55,000.00
03/05/2019 US TREASURY N/B9128286G0 -79.380.00 0.0003/06/2019 02/29/2024 205,000.00
03/05/2019 US TREASURY N/B9128286G0 -21.300.00 0.0003/06/2019 02/29/2024 55,000.00
03/05/2019 US TREASURY N/B9128285U0 989.810.00 0.0003/06/2019 12/31/2023 210,000.00
03/06/2019 US TREASURY N/B9128285M8 483.430.00 0.0003/07/2019 11/15/2028 50,000.00
03/06/2019 US TREASURY N/B9128286B1 -72.510.00 0.0003/07/2019 02/15/2029 50,000.00
03/07/2019 CALI 2019-101C A129890AA7 -57.710.00 0.0003/22/2019 03/10/2039 25,000.00
03/07/2019 GE CAPITAL INTERNATIONAL FUNDI36164QNA2 -142.360.00 0.0003/11/2019 11/15/2035 10,000.00
03/07/2019 US TREASURY N/B9128285U0 1,991.950.00 0.0003/08/2019 12/31/2023 410,000.00
03/07/2019 US TREASURY N/B912810SF6 8.700.00 0.0003/08/2019 02/15/2049 5,000.00
03/07/2019 US TREASURY N/B9128286G0 -206.520.00 0.0003/08/2019 02/29/2024 400,000.00
27

Pasadena Fire and Police Retirement System
Core Fixed Income (Account #: SMS650)
Account Transaction Activity (continued)
As of 03/31/2019
Benchmark: Bloomberg Barclays Aggregate
DescriptionTrade DateCurrent
FaceRealized
Gains/LossesCUSIP/SEDOL
NetAmount
OriginalFacePrice
Currency: US Dollar
Settle DateMaturity
Date
INTEREST - BUY & SELL
03/07/2019 US TREASURY N/B9128285M8 243.870.00 0.0003/08/2019 11/15/2028 25,000.00
03/08/2019 FN MA344431418CZJ6 138.680.00 0.0003/13/2019 08/01/2048 100,000.00
03/08/2019 GE CAPITAL INTERNATIONAL FUNDI36164QNA2 -143.590.00 0.0003/12/2019 11/15/2035 10,000.00
03/08/2019 US TREASURY N/B912810SF6 9.940.00 0.0003/11/2019 02/15/2049 5,000.00
03/12/2019 FG G165983128MFRT7 -76.180.00 0.0004/15/2019 12/01/2031 85,000.00
03/12/2019 GE CAPITAL INTERNATIONAL FUNDI36164QNA2 -584.160.00 0.0003/14/2019 11/15/2035 40,000.00
03/12/2019 US TREASURY N/B9128286D7 -176.630.00 0.0003/13/2019 02/28/2021 200,000.00
03/12/2019 US TREASURY N/B9128285X4 84.940.00 0.0003/13/2019 01/31/2021 30,000.00
03/12/2019 US TREASURY N/B912810SF6 43.090.00 0.0003/13/2019 02/15/2049 20,000.00
03/12/2019 US TREASURY N/B9128286D7 -26.490.00 0.0003/13/2019 02/28/2021 30,000.00
03/12/2019 US TREASURY N/B9128285X4 594.610.00 0.0003/13/2019 01/31/2021 210,000.00
03/13/2019 INTERNATIONAL FLAVORS & FRAGRA459506AL5 -234.720.00 0.0003/15/2019 09/26/2048 10,000.00
03/13/2019 US TREASURY N/B9128286B1 -58.740.00 0.0003/14/2019 02/15/2029 30,000.00
03/13/2019 US TREASURY N/B9128285M8 308.180.00 0.0003/14/2019 11/15/2028 30,000.00
03/13/2019 US TREASURY N/B912810SF6 22.380.00 0.0003/14/2019 02/15/2049 10,000.00
03/14/2019 INTERNATIONAL FLAVORS & FRAGRA459506AL5 -238.890.00 0.0003/18/2019 09/26/2048 10,000.00
03/14/2019 US TREASURY N/B912810SF6 23.200.00 0.0003/15/2019 02/15/2049 10,000.00
03/15/2019 US TREASURY N/B9128285M8 1,221.080.00 0.0003/18/2019 11/15/2028 115,000.00
03/15/2019 US TREASURY N/B9128286B1 -258.510.00 0.0003/18/2019 02/15/2029 115,000.00
03/18/2019 US TREASURY N/B9128286B1 -116.020.00 0.0003/19/2019 02/15/2029 50,000.00
03/18/2019 US TREASURY N/B9128285M8 535.220.00 0.0003/19/2019 11/15/2028 50,000.00
03/20/2019 US TREASURY N/B9128286B1 -36.980.00 0.0003/21/2019 02/15/2029 15,000.00
03/20/2019 US TREASURY N/B9128285M8 163.160.00 0.0003/21/2019 11/15/2028 15,000.00
03/21/2019 TSY INFL IX N/B912810SB5 80.330.00 0.0003/25/2019 02/15/2048 75,000.00
03/21/2019 US TREASURY N/B912810SF6 -299.170.00 0.0003/25/2019 02/15/2049 95,000.00
03/21/2019 US TREASURY N/B9128286D7 -390.620.00 0.0003/25/2019 02/28/2021 230,000.00
03/21/2019 US TREASURY N/B9128286B1 76.140.00 0.0003/22/2019 02/15/2029 30,000.00
28

Pasadena Fire and Police Retirement System
Core Fixed Income (Account #: SMS650)
Account Transaction Activity (continued)
As of 03/31/2019
Benchmark: Bloomberg Barclays Aggregate
DescriptionTrade DateCurrent
FaceRealized
Gains/LossesCUSIP/SEDOL
NetAmount
OriginalFacePrice
Currency: US Dollar
Settle DateMaturity
Date
INTEREST - BUY & SELL
03/21/2019 US TREASURY N/B9128286D7 -209.240.00 0.0003/22/2019 02/28/2021 140,000.00
03/25/2019 GENERAL MILLS INC.370334CE2 493.330.00 0.0003/27/2019 10/17/2023 30,000.00
03/25/2019 US TREASURY N/B912828W71 -5.220.00 0.0004/01/2019 03/31/2024 90,000.00
03/25/2019 US TREASURY N/B9128285Z9 1,025.550.00 0.0003/26/2019 01/31/2024 275,000.00
03/25/2019 US TREASURY N/B912828W71 -15.680.00 0.0004/01/2019 03/31/2024 270,000.00
03/25/2019 US TREASURY N/B9128286G0 -43.560.00 0.0003/27/2019 02/29/2024 25,000.00
03/25/2019 US TREASURY N/B9128286G0 151.020.00 0.0003/26/2019 02/29/2024 90,000.00
03/26/2019 US TREASURY N/B9128285Z9 113.950.00 0.0003/27/2019 01/31/2024 30,000.00
03/26/2019 US TREASURY N/B9128286G0 87.130.00 0.0003/27/2019 02/29/2024 50,000.00
03/26/2019 US TREASURY N/B9128286B1 -101.520.00 0.0003/27/2019 02/15/2029 35,000.00
03/26/2019 US TREASURY N/B912828W71 -9.000.00 0.0004/01/2019 03/31/2024 155,000.00
03/26/2019 US TREASURY N/B9128285Z9 607.730.00 0.0003/27/2019 01/31/2024 160,000.00
03/26/2019 US TREASURY N/B912810SF6 -16.570.00 0.0003/27/2019 02/15/2049 5,000.00
03/26/2019 US TREASURY N/B912828W71 -2.900.00 0.0004/01/2019 03/31/2024 50,000.00
03/26/2019 US TREASURY N/B9128285M8 398.830.00 0.0003/27/2019 11/15/2028 35,000.00
03/27/2019 US TREASURY N/B9128286G0 487.910.00 0.0003/28/2019 02/29/2024 270,000.00
03/27/2019 US TREASURY N/B912828W71 -1,828.730.00 0.0003/28/2019 03/31/2024 175,000.00
03/27/2019 US TREASURY N/B912828W71 -9.290.00 0.0004/01/2019 03/31/2024 160,000.00
03/27/2019 US TREASURY N/B9128285Z9 618.790.00 0.0003/28/2019 01/31/2024 160,000.00
03/27/2019 US TREASURY N/B912828W71 -15.680.00 0.0004/01/2019 03/31/2024 270,000.00
03/27/2019 US TREASURY N/B912828W71 -2.610.00 0.0004/01/2019 03/31/2024 45,000.00
03/27/2019 US TREASURY N/B9128286G0 316.240.00 0.0003/28/2019 02/29/2024 175,000.00
03/27/2019 US TREASURY N/B9128286G0 81.320.00 0.0003/28/2019 02/29/2024 45,000.00
03/28/2019 FN AN03353138LCLR4 207.320.00 0.0003/29/2019 01/01/2031 80,000.00
03/28/2019 US TREASURY N/B912828W71 -4.060.00 0.0004/01/2019 03/31/2024 70,000.00
03/28/2019 US TREASURY N/B9128286G0 336.890.00 0.0003/29/2019 02/29/2024 180,000.00
03/28/2019 US TREASURY N/B9128285Z9 275.550.00 0.0003/29/2019 01/31/2024 70,000.00
29

Pasadena Fire and Police Retirement System
Core Fixed Income (Account #: SMS650)
Account Transaction Activity (continued)
As of 03/31/2019
Benchmark: Bloomberg Barclays Aggregate
DescriptionTrade DateCurrent
FaceRealized
Gains/LossesCUSIP/SEDOL
NetAmount
OriginalFacePrice
Currency: US Dollar
Settle DateMaturity
Date
INTEREST - BUY & SELL
03/28/2019 US TREASURY N/B9128286B1 -228.420.00 0.0003/29/2019 02/15/2029 75,000.00
03/28/2019 US TREASURY N/B912828W71 -1,891.480.00 0.0003/29/2019 03/31/2024 180,000.00
03/28/2019 US TREASURY N/B912828W71 -10.450.00 0.0004/01/2019 03/31/2024 180,000.00
03/28/2019 US TREASURY N/B9128286G0 336.890.00 0.0003/29/2019 02/29/2024 180,000.00
03/29/2019 GENERAL MILLS INC.370334CE2 271.330.00 0.0004/02/2019 10/17/2023 16,000.00
03/29/2019 US TREASURY N/B912810SF6 -111.880.00 0.0004/01/2019 02/15/2049 30,000.00
03/29/2019 US TREASURY N/B9128286B1 -81.580.00 0.0004/01/2019 02/15/2029 25,000.00
03/29/2019 US TREASURY N/B9128285M8 768.730.00 0.0004/01/2019 11/15/2028 65,000.00
03/29/2019 US TREASURY N/B9128286B1 -212.100.00 0.0004/01/2019 02/15/2029 65,000.00
03/29/2019 US TREASURY N/B9128286B1 -81.580.00 0.0004/01/2019 02/15/2029 25,000.00
03/29/2019 US TREASURY N/B912828W71 -1.740.00 0.0004/02/2019 03/31/2024 15,000.00
03/29/2019 US TREASURY N/B912810SF6 -93.230.00 0.0004/01/2019 02/15/2049 25,000.00
0.006,587.55TOTAL INTEREST - BUY & SELL
INTEREST - MORTGAGE COUPON
03/05/2019 BBCMS TRUST05529SAC3 125.2140,000.00 0.0003/05/2019 09/05/2032 40,000.00
03/05/2019 SFAVE 2015-5AVE A178413MAA6 145.2045,000.00 0.0003/05/2019 01/05/2043 45,000.00
03/10/2019 BAMLL COMMERCIAL MORTGAGE SECU05491YAA8 119.3135,000.00 0.0003/11/2019 08/10/2038 35,000.00
03/10/2019 CITYLINE MORTGAGE TRUST 2016-C178772AA7 57.8825,000.00 0.0003/11/2019 11/10/2031 25,000.00
03/10/2019 COMMERCIAL MORTGAGE TRUST12592FAA3 120.3840,000.00 0.0003/11/2019 08/10/2049 40,000.00
03/10/2019 CORE INDUSTRIAL TRUST 2015-CAL21870LAA4 60.0823,716.78 0.0003/11/2019 02/10/2034 25,000.00
03/13/2019 RBS COMMERCIAL FUNDING INC TRU74932QAA8 143.7645,000.00 0.0003/13/2019 01/15/2032 45,000.00
03/15/2019 FG A615273128KRVU5 98.8523,725.12 0.0003/15/2019 07/01/2036 520,000.00
03/15/2019 FG G063613128M8MJ0 255.9276,775.12 0.0003/15/2019 03/01/2041 210,000.00
03/15/2019 FG G086983128MJX47 38.7213,274.93 0.0003/15/2019 03/01/2046 20,000.00
03/15/2019 FG G087113128MJYH7 425.08145,740.70 0.0003/15/2019 06/01/2046 205,000.00
03/15/2019 FG G087153128MJYM6 738.47295,388.23 0.0003/15/2019 08/01/2046 365,000.00
03/15/2019 FG G087213128MJYT1 326.20130,480.70 0.0003/15/2019 09/01/2046 160,000.00
30

Pasadena Fire and Police Retirement System
Core Fixed Income (Account #: SMS650)
Account Transaction Activity (continued)
As of 03/31/2019
Benchmark: Bloomberg Barclays Aggregate
DescriptionTrade DateCurrent
FaceRealized
Gains/LossesCUSIP/SEDOL
NetAmount
OriginalFacePrice
Currency: US Dollar
Settle DateMaturity
Date
INTEREST - MORTGAGE COUPON
03/15/2019 FG G087263128MJYY0 410.72164,286.08 0.0003/15/2019 10/01/2046 200,000.00
03/15/2019 FG G087953128MJ3D0 152.9861,191.75 0.0003/15/2019 01/01/2048 65,000.00
03/15/2019 FG G088003128MJ3J7 203.3069,702.79 0.0003/15/2019 02/01/2048 75,000.00
03/15/2019 FG G088163128MJ4A5 394.14135,135.08 0.0003/15/2019 06/01/2048 140,000.00
03/15/2019 FG G088333128MJ4T4 131.8931,652.73 0.0003/15/2019 07/01/2048 35,000.00
03/15/2019 FG G088433128MJ5D8 181.5548,413.22 0.0003/15/2019 10/01/2048 50,000.00
03/15/2019 FG G123993128M1RU5 43.548,707.83 0.0003/15/2019 09/01/2021 795,000.00
03/15/2019 FG G167563128MFWR5 245.8784,298.76 0.0003/15/2019 01/01/2034 85,000.00
03/15/2019 FG G187133128MMYK3 293.37100,584.19 0.0003/15/2019 11/01/2033 105,000.00
03/15/2019 FG G6027831335AJX7 237.2171,162.92 0.0003/15/2019 10/01/2045 110,000.00
03/15/2019 FG G677033132XCRY3 275.9394,604.55 0.0003/15/2019 04/01/2047 115,000.00
03/15/2019 FG G677063132XCR31 408.37140,012.38 0.0003/15/2019 12/01/2047 155,000.00
03/15/2019 FG G677073132XCR49 238.2081,669.44 0.0003/15/2019 01/01/2048 90,000.00
03/15/2019 FG G677083132XCR56 677.13232,159.27 0.0003/15/2019 03/01/2048 250,000.00
03/15/2019 FG G677093132XCR64 341.41117,054.70 0.0003/15/2019 03/01/2048 125,000.00
03/15/2019 FG G677103132XCR72 722.01247,545.52 0.0003/15/2019 03/01/2048 265,000.00
03/15/2019 FG G677133132XCSA4 171.8251,545.73 0.0003/15/2019 06/01/2048 55,000.00
03/15/2019 FG G677183132XCSF3 448.04134,411.28 0.0003/15/2019 01/01/2049 135,000.00
03/15/2019 FG Q052613132GLQN7 210.0272,005.70 0.0003/15/2019 12/01/2041 165,000.00
03/15/2019 FG Q201783132JMFT1 361.26123,861.53 0.0003/15/2019 07/01/2043 220,000.00
03/15/2019 FHR 2368 AS31339GNQ0 145.9312,111.10 0.0003/15/2019 10/15/2031 500,000.00
03/15/2019 FHR 2433 SA3133TVPR1 182.2415,124.58 0.0003/15/2019 02/15/2032 275,000.00
03/15/2019 FHR 2642 BW31393VW64 8.362,006.15 0.0003/15/2019 06/15/2023 520,000.00
03/15/2019 FHR 2684 ZN31394L5S7 140.9142,274.21 0.0003/15/2019 10/15/2033 190,000.00
03/15/2019 FHR 4818 CA3137FGVJ1 119.1747,668.58 0.0003/15/2019 04/15/2048 50,000.00
03/15/2019 GN 37646336204QFC9 7.491,383.06 0.0003/15/2019 04/15/2024 341,247.00
03/15/2019 GN 78003536225ABC3 5.32982.70 0.0003/15/2019 07/15/2024 199,051.00
31

Pasadena Fire and Police Retirement System
Core Fixed Income (Account #: SMS650)
Account Transaction Activity (continued)
As of 03/31/2019
Benchmark: Bloomberg Barclays Aggregate
DescriptionTrade DateCurrent
FaceRealized
Gains/LossesCUSIP/SEDOL
NetAmount
OriginalFacePrice
Currency: US Dollar
Settle DateMaturity
Date
INTEREST - MORTGAGE COUPON
03/15/2019 GN 78281836241LDX1 478.73127,661.39 0.0003/15/2019 11/15/2039 430,000.00
03/15/2019 HENDR 2013-3A A46617LAA9 180.3453,042.01 0.0003/15/2019 01/17/2073 75,000.00
03/15/2019 HENDR 2014-2A A46618AAA2 206.2068,544.52 0.0003/15/2019 01/17/2073 90,000.00
03/15/2019 MDST 2004-1 B59560UAD3 640.0286,295.01 0.0003/15/2019 08/15/2037 400,000.00
03/15/2019 SLMA 2003-7A A5A78442GHH2 527.8454,143.42 0.0003/15/2019 12/15/2033 110,000.00
03/16/2019 GNR 2009-66 XS38376FLM2 284.7879,130.63 0.0003/18/2019 07/16/2039 1,350,000.00
03/16/2019 GNR 2009-8 PS38374TDP6 289.5590,989.74 0.0003/18/2019 08/16/2038 995,000.00
03/17/2019 GLOBAL SC FINANCE II SRL37952UAE3 118.5646,041.67 0.0003/18/2019 07/17/2029 85,000.00
03/20/2019 BAFC 2004-A 1A306051GAX7 37.109,379.84 0.0003/20/2019 09/20/2034 660,000.00
03/20/2019 G2 MA352136179R4E6 116.4739,931.73 0.0003/20/2019 03/20/2046 70,000.00
03/20/2019 G2 MA406936179SQW0 518.14177,649.36 0.0003/20/2019 11/20/2046 245,000.00
03/20/2019 G2 MA419536179SUU9 596.49238,598.03 0.0003/20/2019 01/20/2047 295,000.00
03/20/2019 G2 MA438236179S2P1 211.3372,455.76 0.0003/20/2019 04/20/2047 90,000.00
03/20/2019 G2 MA451036179TAK1 61.6521,137.82 0.0003/20/2019 06/20/2047 25,000.00
03/20/2019 G2 MA458636179TCX1 63.4521,755.65 0.0003/20/2019 07/20/2047 25,000.00
03/20/2019 G2 MA458836179TCZ6 561.09149,623.25 0.0003/20/2019 07/20/2047 230,000.00
03/20/2019 G2 MA458936179TC29 166.5339,966.88 0.0003/20/2019 07/20/2047 65,000.00
03/20/2019 G2 MA471936179TG41 65.1622,341.57 0.0003/20/2019 09/20/2047 25,000.00
03/20/2019 G2 MA483636179TLR4 68.8127,523.85 0.0003/20/2019 11/20/2047 30,000.00
03/20/2019 G2 MA483736179TLS2 506.97173,819.27 0.0003/20/2019 11/20/2047 190,000.00
03/20/2019 G2 MA483836179TLT0 186.7056,010.48 0.0003/20/2019 11/20/2047 65,000.00
03/20/2019 G2 MA546636179UCB6 311.6993,507.00 0.0003/20/2019 09/20/2048 95,000.00
03/20/2019 G2 MA559736179UGE6 330.9679,430.38 0.0003/20/2019 11/20/2048 80,000.00
03/20/2019 GNR 2001-22 SO38373RBR9 146.3512,399.77 0.0003/20/2019 05/20/2031 1,707,394.00
03/20/2019 GNR 2018-124 NW38380Y2X2 86.9229,801.27 0.0003/20/2019 09/20/2048 30,000.00
03/21/2019 MARM 2004-13 3A7A576433WL6 373.57100,352.34 0.0003/21/2019 11/21/2034 555,000.00
03/25/2019 BSARM 2004-10 14A107384M4F6 315.4984,912.39 0.0003/25/2019 01/25/2035 1,530,000.00
32

Pasadena Fire and Police Retirement System
Core Fixed Income (Account #: SMS650)
Account Transaction Activity (continued)
As of 03/31/2019
Benchmark: Bloomberg Barclays Aggregate
DescriptionTrade DateCurrent
FaceRealized
Gains/LossesCUSIP/SEDOL
NetAmount
OriginalFacePrice
Currency: US Dollar
Settle DateMaturity
Date
INTEREST - MORTGAGE COUPON
03/25/2019 CITEL 2007-1 A17284LAA2 342.3847,564.81 0.0003/25/2019 03/25/2042 150,000.00
03/25/2019 CMLTI 2007-WFH1 A417311CAU5 49.2723,552.37 0.0003/25/2019 01/25/2037 100,000.00
03/25/2019 CRMSI 2007-1 A5173109AE9 1,337.20300,000.00 0.0003/25/2019 03/25/2037 300,000.00
03/25/2019 CWL 2007-13 2A1126698AC3 328.58124,624.68 0.0003/25/2019 10/25/2047 400,000.00
03/25/2019 FANNIE MAE 2018-M13136AY7L1 248.83100,000.00 0.0003/25/2019 12/25/2027 100,000.00
03/25/2019 FN 65592831390TVV8 169.2329,010.13 0.0003/25/2019 08/01/2032 765,000.00
03/25/2019 FN 73564631402RHX0 14.273,805.67 0.0003/25/2019 07/01/2020 900,000.00
03/25/2019 FN 84103131407ULL9 3.10790.33 0.0003/25/2019 11/01/2035 380,000.00
03/25/2019 FN 91844531411YL27 12.163,953.63 0.0003/25/2019 05/01/2037 705,000.00
03/25/2019 FN AB161331416WYK2 318.0195,401.78 0.0003/25/2019 10/01/2040 305,000.00
03/25/2019 FN AD383031418RHG9 171.8645,828.05 0.0003/25/2019 04/01/2025 390,000.00
03/25/2019 FN AE013431419AEG8 67.2610,603.99 0.0003/25/2019 02/01/2020 121,000.00
03/25/2019 FN AL09053138EHAF9 334.16108,822.21 0.0003/25/2019 09/01/2021 210,000.00
03/25/2019 FN AM67613138L7QP4 206.0574,207.80 0.0003/25/2019 10/01/2029 80,000.00
03/25/2019 FN AM81883138L9C26 152.0274,038.06 0.0003/25/2019 03/01/2027 80,000.00
03/25/2019 FN AM91733138LAFP9 181.9075,200.41 0.0003/25/2019 06/01/2027 80,000.00
03/25/2019 FN AM95363138LAS26 196.2575,543.75 0.0003/25/2019 08/01/2030 80,000.00
03/25/2019 FN AN03353138LCLR4 207.6578,753.72 0.0003/25/2019 01/01/2031 80,000.00
03/25/2019 FN AN11613138LDJF1 201.6485,000.00 0.0003/25/2019 04/01/2028 85,000.00
03/25/2019 FN BL02423140HRHU0 148.5650,000.00 0.0003/25/2019 11/01/2030 50,000.00
03/25/2019 FN CA11873140Q8J97 69.5123,833.65 0.0003/25/2019 02/01/2048 25,000.00
03/25/2019 FN CA17103140Q83U7 527.11140,562.73 0.0003/25/2019 05/01/2048 150,000.00
03/25/2019 FN CA17113140Q83V5 265.4070,772.14 0.0003/25/2019 05/01/2048 75,000.00
03/25/2019 FN CA22083140Q9N25 270.3272,085.65 0.0003/25/2019 08/01/2048 75,000.00
03/25/2019 FN MA158431418AXN3 123.7042,409.93 0.0003/25/2019 09/01/2033 100,000.00
03/25/2019 FN MA299531418CKH6 198.3959,517.03 0.0003/25/2019 05/01/2047 75,000.00
03/25/2019 FN MA302931418CLK8 118.3547,338.85 0.0003/25/2019 06/01/2032 60,000.00
33

Pasadena Fire and Police Retirement System
Core Fixed Income (Account #: SMS650)
Account Transaction Activity (continued)
As of 03/31/2019
Benchmark: Bloomberg Barclays Aggregate
DescriptionTrade DateCurrent
FaceRealized
Gains/LossesCUSIP/SEDOL
NetAmount
OriginalFacePrice
Currency: US Dollar
Settle DateMaturity
Date
INTEREST - MORTGAGE COUPON
03/25/2019 FN MA308831418CNE0 567.04170,112.17 0.0003/25/2019 08/01/2047 200,000.00
03/25/2019 FN MA321031418CR89 602.21206,470.62 0.0003/25/2019 12/01/2047 225,000.00
03/25/2019 FN MA344431418CZJ6 353.2594,198.85 0.0003/25/2019 08/01/2048 100,000.00
03/25/2019 FNR 2001-52 YZ313921MN5 231.4542,728.33 0.0003/25/2019 10/25/2031 575,000.00
03/25/2019 FNR 2018-57 QA3136B2ZR6 314.20107,725.58 0.0003/25/2019 05/25/2046 115,000.00
03/25/2019 FREMF K-15073137FHQ71 166.2550,000.00 0.0003/25/2019 08/25/2033 50,000.00
03/25/2019 FREMF K-15083137FJY78 146.2545,000.00 0.0003/25/2019 10/25/2033 45,000.00
03/25/2019 GCOE 2006-2AR A1RN36156YAW1 225.0192,135.03 0.0003/25/2019 08/27/2046 130,000.00
03/25/2019 INDX 2005-AR18 2A1A45660LWD7 547.29226,265.26 0.0003/25/2019 10/25/2036 1,300,000.00
03/25/2019 INDX 2007-FLX2 A1C45668RAC2 670.91321,880.76 0.0003/25/2019 04/25/2037 320,000.00
03/25/2019 MARM 2004-5 3A1576433MW3 5.131,699.65 0.0003/25/2019 06/25/2034 505,000.00
03/25/2019 MSSTR 2004-1 4A155265WBD4 35.129,112.98 0.0003/25/2019 10/25/2032 550,000.00
03/25/2019 NAVSL 2014-4 A63938QAA5 282.52116,801.96 0.0003/25/2019 03/25/2083 185,000.00
03/25/2019 NCHET 2005-3 M264352VLK5 50.6920,208.60 0.0003/25/2019 07/25/2035 250,000.00
03/25/2019 NSLT 2014-4A A264033MAB4 307.68115,000.00 0.0003/25/2019 11/25/2048 115,000.00
03/25/2019 POPLR 2006-C A473316MAD9 233.89109,755.75 0.0003/25/2019 07/25/2036 243,000.00
03/25/2019 RAMP 2004-SL1 A8760985W98 66.7912,329.85 0.0003/25/2019 11/25/2031 675,000.00
03/25/2019 RAST 2004-IP2 2A145660LAP4 65.6017,657.31 0.0003/25/2019 12/25/2034 535,000.00
03/25/2019 WAMU 2005-AR8 2A1A92922FR75 286.45119,967.76 0.0003/25/2019 07/25/2045 2,000,000.00
0.0028,285.02TOTAL INTEREST - MORTGAGE COUPON
INTEREST - NON MORTGAGE COUPON
03/01/2019 AIR LEASE CORP00912XAJ3 831.2535,000.00 0.0003/01/2019 03/01/2020 35,000.00
03/01/2019 AMERICAN TRANSMISSION SY030288AB0 1,875.0075,000.00 0.0003/01/2019 09/01/2044 75,000.00
03/01/2019 AT&T INC00206RDR0 2,100.0080,000.00 0.0003/01/2019 03/01/2037 80,000.00
03/01/2019 CALIFORNIA ST13063BFS6 1,662.5050,000.00 0.0003/01/2019 03/01/2022 50,000.00
03/01/2019 HCP INC40414LAK5 1,365.0065,000.00 0.0003/01/2019 03/01/2024 65,000.00
03/01/2019 KINDER MORGAN INC.49456BAP6 860.0040,000.00 0.0003/01/2019 03/01/2028 40,000.00
34

Pasadena Fire and Police Retirement System
Core Fixed Income (Account #: SMS650)
Account Transaction Activity (continued)
As of 03/31/2019
Benchmark: Bloomberg Barclays Aggregate
DescriptionTrade DateCurrent
FaceRealized
Gains/LossesCUSIP/SEDOL
NetAmount
OriginalFacePrice
Currency: US Dollar
Settle DateMaturity
Date
INTEREST - NON MORTGAGE COUPON
03/10/2019 UNION PACIFIC CORPORATION907818EY0 746.1125,000.00 0.0003/11/2019 09/10/2028 25,000.00
03/13/2019 PETROLEOS MEXICANOS71654QCG5 325.0010,000.00 0.0003/13/2019 03/13/2027 10,000.00
03/15/2019 CAMPBELL SOUP COMPANY134429BD0 577.5035,000.00 0.0003/15/2019 03/15/2021 35,000.00
03/15/2019 CONTL AIRLINES 1999-2210805CT2 2,240.0861,743.99 0.0003/15/2019 03/15/2020 512,000.00
03/15/2019 ENERGY TRANSFER PARTNERS29273RBF5 3,218.75125,000.00 0.0003/15/2019 03/15/2045 125,000.00
03/15/2019 NATIONWIDE MUTUAL INSURA638671AJ6 1,303.40105,000.00 0.0003/15/2019 12/15/2024 105,000.00
03/15/2019 NYS DORM AUTH-BABS649902T29 1,375.0050,000.00 0.0003/15/2019 03/15/2030 50,000.00
03/15/2019 THE WILLIAMS COMPANIES INC.96949LAA3 486.0027,000.00 0.0003/15/2019 03/15/2022 27,000.00
03/15/2019 TUCSON ELECTRIC POWER CO898813AL4 4,331.25225,000.00 0.0003/15/2019 03/15/2023 225,000.00
03/15/2019 WRKCO INC92940PAD6 277.6720,000.00 0.0003/15/2019 03/15/2029 20,000.00
03/16/2019 GENERAL ELEC CAP CORP36962G4R2 1,093.7550,000.00 0.0003/18/2019 09/16/2020 50,000.00
03/19/2019 ZIMMER BIOMET HOLDINGS98956PAP7 310.9435,000.00 0.0003/19/2019 03/19/2021 35,000.00
03/20/2019 SPRINT SPECTRUM CO LLC / SPRIN85208NAE0 515.2040,000.00 0.0003/20/2019 03/20/2028 40,000.00
03/23/2019 SHIRE ACQ INV IRELAND DA82481LAA7 475.0050,000.00 0.0003/25/2019 09/23/2019 50,000.00
03/25/2019 CVS HEALTH CORP126650CZ1 631.2525,000.00 0.0003/25/2019 03/25/2048 25,000.00
03/26/2019 INTERNATIONAL FLAVORS & FRAGRA459506AL5 750.0030,000.00 0.0003/26/2019 09/26/2048 30,000.00
03/29/2019 WELLS FARGO & COMPANY94974BGP9 798.7545,000.00 0.0003/29/2019 09/29/2025 45,000.00
03/30/2019 ONCOR ELECTRIC DELIVERY68233JAH7 1,312.5050,000.00 0.0003/30/2019 09/30/2040 50,000.00
03/31/2019 US TREASURY N/B912828W71 3,771.88355,000.00 0.0003/31/2019 03/31/2024 355,000.00
0.0033,233.78TOTAL INTEREST - NON MORTGAGE COUPON
INTEREST - STIF
03/04/2019 STIF INTERESTN/A 768.580.00 0.0003/04/2019 0.00
0.00768.58TOTAL INTEREST - STIF
FUTURES OPEN LONG (CONTRACTS)
03/29/2019 FIVE YEAR NOTE FUTURE JUN 19 115.855FVM9 0.001.00 0.0004/01/2019 06/28/2019 1.00
0.000.00TOTAL FUTURES OPEN LONG (CONTRACTS)
MARGIN FLOW
35

Pasadena Fire and Police Retirement System
Core Fixed Income (Account #: SMS650)
Account Transaction Activity (continued)
As of 03/31/2019
Benchmark: Bloomberg Barclays Aggregate
DescriptionTrade DateCurrent
FaceRealized
Gains/LossesCUSIP/SEDOL
NetAmount
OriginalFacePrice
Currency: US Dollar
Settle DateMaturity
Date
03/01/2019 2 YEAR BOND FUTURES JUN19TUM9 -2,187.500.00 0.0003/04/2019 06/28/2019 0.00
03/01/2019 FIVE YEAR NOTE FUTURE JUN 19FVM9 -1,210.950.00 0.0003/04/2019 06/28/2019 0.00
03/01/2019 US ULTRA BOND CBT JUN19WNM9 -1,093.750.00 0.0003/04/2019 06/19/2019 0.00
03/04/2019 2 YEAR BOND FUTURES JUN19TUM9 546.900.00 0.0003/05/2019 06/28/2019 0.00
03/04/2019 FIVE YEAR NOTE FUTURE JUN 19FVM9 625.000.00 0.0003/05/2019 06/28/2019 0.00
03/04/2019 US ULTRA BOND CBT JUN19WNM9 1,000.000.00 0.0003/05/2019 06/19/2019 0.00
03/05/2019 2 YEAR BOND FUTURES JUN19TUM9 -390.600.00 0.0003/06/2019 06/28/2019 0.00
03/05/2019 FIVE YEAR NOTE FUTURE JUN 19FVM9 -39.050.00 0.0003/06/2019 06/28/2019 0.00
03/05/2019 US ULTRA BOND CBT JUN19WNM9 125.000.00 0.0003/06/2019 06/19/2019 0.00
03/06/2019 2 YEAR BOND FUTURES JUN19TUM9 1,171.900.00 0.0003/07/2019 06/28/2019 0.00
03/06/2019 FIVE YEAR NOTE FUTURE JUN 19FVM9 781.250.00 0.0003/07/2019 06/28/2019 0.00
03/06/2019 US ULTRA BOND CBT JUN19WNM9 562.500.00 0.0003/07/2019 06/19/2019 0.00
03/07/2019 2 YEAR BOND FUTURES JUN19TUM9 2,109.400.00 0.0003/08/2019 06/28/2019 0.00
03/07/2019 FIVE YEAR NOTE FUTURE JUN 19FVM9 1,445.300.00 0.0003/08/2019 06/28/2019 0.00
03/07/2019 US ULTRA BOND CBT JUN19WNM9 1,343.750.00 0.0003/08/2019 06/19/2019 0.00
03/08/2019 2 YEAR BOND FUTURES JUN19TUM9 390.600.00 0.0003/11/2019 06/28/2019 0.00
03/08/2019 FIVE YEAR NOTE FUTURE JUN 19FVM9 273.450.00 0.0003/11/2019 06/28/2019 0.00
03/08/2019 US ULTRA BOND CBT JUN19WNM9 500.000.00 0.0003/11/2019 06/19/2019 0.00
03/11/2019 2 YEAR BOND FUTURES JUN19TUM9 -468.800.00 0.0003/12/2019 06/28/2019 0.00
03/11/2019 FIVE YEAR NOTE FUTURE JUN 19FVM9 -390.600.00 0.0003/12/2019 06/28/2019 0.00
03/11/2019 US ULTRA BOND CBT JUN19WNM9 -656.250.00 0.0003/12/2019 06/19/2019 0.00
03/12/2019 2 YEAR BOND FUTURES JUN19TUM9 1,250.000.00 0.0003/13/2019 06/28/2019 0.00
03/12/2019 FIVE YEAR NOTE FUTURE JUN 19FVM9 664.050.00 0.0003/13/2019 06/28/2019 0.00
03/12/2019 US ULTRA BOND CBT JUN19WNM9 1,250.000.00 0.0003/13/2019 06/19/2019 0.00
03/13/2019 2 YEAR BOND FUTURES JUN19TUM9 78.100.00 0.0003/14/2019 06/28/2019 0.00
03/13/2019 US ULTRA BOND CBT JUN19WNM9 -468.750.00 0.0003/14/2019 06/19/2019 0.00
03/14/2019 2 YEAR BOND FUTURES JUN19TUM9 -546.900.00 0.0003/15/2019 06/28/2019 0.00
03/14/2019 FIVE YEAR NOTE FUTURE JUN 19FVM9 -351.550.00 0.0003/15/2019 06/28/2019 0.00
36

Pasadena Fire and Police Retirement System
Core Fixed Income (Account #: SMS650)
Account Transaction Activity (continued)
As of 03/31/2019
Benchmark: Bloomberg Barclays Aggregate
DescriptionTrade DateCurrent
FaceRealized
Gains/LossesCUSIP/SEDOL
NetAmount
OriginalFacePrice
Currency: US Dollar
Settle DateMaturity
Date
03/14/2019 US ULTRA BOND CBT JUN19WNM9 -1,031.250.00 0.0003/15/2019 06/19/2019 0.00
03/15/2019 2 YEAR BOND FUTURES JUN19TUM9 859.400.00 0.0003/18/2019 06/28/2019 0.00
03/15/2019 FIVE YEAR NOTE FUTURE JUN 19FVM9 703.100.00 0.0003/18/2019 06/28/2019 0.00
03/15/2019 US ULTRA BOND CBT JUN19WNM9 875.000.00 0.0003/18/2019 06/19/2019 0.00
03/18/2019 2 YEAR BOND FUTURES JUN19TUM9 -625.000.00 0.0003/19/2019 06/28/2019 0.00
03/18/2019 FIVE YEAR NOTE FUTURE JUN 19FVM9 -351.550.00 0.0003/19/2019 06/28/2019 0.00
03/18/2019 US ULTRA BOND CBT JUN19WNM9 250.000.00 0.0003/19/2019 06/19/2019 0.00
03/19/2019 2 YEAR BOND FUTURES JUN19TUM9 -546.900.00 0.0003/20/2019 06/28/2019 0.00
03/19/2019 FIVE YEAR NOTE FUTURE JUN 19FVM9 -234.400.00 0.0003/20/2019 06/28/2019 0.00
03/19/2019 US ULTRA BOND CBT JUN19WNM9 -500.000.00 0.0003/20/2019 06/19/2019 0.00
03/20/2019 2 YEAR BOND FUTURES JUN19TUM9 2,968.700.00 0.0003/21/2019 06/28/2019 0.00
03/20/2019 FIVE YEAR NOTE FUTURE JUN 19FVM9 2,109.400.00 0.0003/21/2019 06/28/2019 0.00
03/20/2019 US ULTRA BOND CBT JUN19WNM9 1,562.500.00 0.0003/21/2019 06/19/2019 0.00
03/21/2019 2 YEAR BOND FUTURES JUN19TUM9 -468.700.00 0.0003/22/2019 06/28/2019 0.00
03/21/2019 FIVE YEAR NOTE FUTURE JUN 19FVM9 -195.300.00 0.0003/22/2019 06/28/2019 0.00
03/21/2019 US ULTRA BOND CBT JUN19WNM9 312.500.00 0.0003/22/2019 06/19/2019 0.00
03/22/2019 2 YEAR BOND FUTURES JUN19TUM9 3,593.700.00 0.0003/25/2019 06/28/2019 0.00
03/22/2019 FIVE YEAR NOTE FUTURE JUN 19FVM9 2,109.350.00 0.0003/25/2019 06/28/2019 0.00
03/22/2019 US ULTRA BOND CBT JUN19WNM9 2,375.000.00 0.0003/25/2019 06/19/2019 0.00
03/25/2019 2 YEAR BOND FUTURES JUN19TUM9 2,812.500.00 0.0003/26/2019 06/28/2019 0.00
03/25/2019 FIVE YEAR NOTE FUTURE JUN 19FVM9 1,367.200.00 0.0003/26/2019 06/28/2019 0.00
03/25/2019 US ULTRA BOND CBT JUN19WNM9 625.000.00 0.0003/26/2019 06/19/2019 0.00
03/26/2019 2 YEAR BOND FUTURES JUN19TUM9 -156.200.00 0.0003/27/2019 06/28/2019 0.00
03/26/2019 FIVE YEAR NOTE FUTURE JUN 19FVM9 195.300.00 0.0003/27/2019 06/28/2019 0.00
03/26/2019 US ULTRA BOND CBT JUN19WNM9 -31.250.00 0.0003/27/2019 06/19/2019 0.00
03/27/2019 2 YEAR BOND FUTURES JUN19TUM9 1,640.600.00 0.0003/28/2019 06/28/2019 0.00
03/27/2019 FIVE YEAR NOTE FUTURE JUN 19FVM9 703.150.00 0.0003/28/2019 06/28/2019 0.00
37

Pasadena Fire and Police Retirement System
Core Fixed Income (Account #: SMS650)
Account Transaction Activity (continued)
As of 03/31/2019
Benchmark: Bloomberg Barclays Aggregate
DescriptionTrade DateCurrent
FaceRealized
Gains/LossesCUSIP/SEDOL
NetAmount
OriginalFacePrice
Currency: US Dollar
Settle DateMaturity
Date
03/27/2019 US ULTRA BOND CBT JUN19WNM9 1,468.750.00 0.0003/28/2019 06/19/2019 0.00
03/28/2019 2 YEAR BOND FUTURES JUN19TUM9 -859.400.00 0.0003/29/2019 06/28/2019 0.00
03/28/2019 FIVE YEAR NOTE FUTURE JUN 19FVM9 -742.200.00 0.0003/29/2019 06/28/2019 0.00
03/28/2019 US ULTRA BOND CBT JUN19WNM9 312.500.00 0.0003/29/2019 06/19/2019 0.00
03/29/2019 2 YEAR BOND FUTURES JUN19TUM9 -2,187.500.00 0.0004/01/2019 06/28/2019 0.00
03/29/2019 FIVE YEAR NOTE FUTURE JUN 19FVM9 -1,159.380.00 0.0004/01/2019 06/28/2019 0.00
03/29/2019 US ULTRA BOND CBT JUN19WNM9 -375.000.00 0.0004/01/2019 06/19/2019 0.00
0.0023,692.12TOTAL MARGIN FLOW
FUTURES/OPTIONS COMMISSION
03/29/2019 FIVE YEAR NOTE FUTURE JUN 19 115.855FVM9 -2.020.00 0.0004/01/2019 06/28/2019 1.00
0.00-2.02TOTAL FUTURES/OPTIONS COMMISSION
29,136.29TOTALS -2,189.05
38

Metropolitan West Asset Management, LLC, TCW Asset Management Company LLC, and TCW Investment Management Company LLC are wholly owned subsidiaries of TheTCW Group Inc. (“TCW”).
This statement was prepared as a private communication to clients regarding an account with TCW, and is not intended for public circulation. Clients may authorize TCW inwriting to distribute this statement to their consultants or other agents. TCW manages a number of separate strategies, and the holdings in each separate strategy may differdepending on the portfolio manager’s views or analysis with respect to a particular company, security or the economy.
As part of the respective investment process, some TCW equity strategies have a defined range or maximum number of securities for the portfolio. The number of securitiesreflected in this statement may be over or under the range or maximum number due to open orders.
Nothing in this statement constitutes investment, legal, accounting, or tax advice, or a representation that any investment strategy is suitable or appropriate to therecipient’s individual circumstances. This statement is not to be relied upon for investment decisions by the client, or as a substitute for the exercise of independentjudgment by its recipient.
This statement is provided to its recipient as an indication of the holdings of the client’s account as of the date the statement was generated. This statement should not berelied upon to make investment decisions with respect to holdings of the portfolio. TCW may in fact be currently recommending the purchase of a security or the sale of asecurity regardless of any statement made in this document about that security and whether it is held in the client portfolio.
Important Information Regarding Risk FactorsInvestment strategies may not achieve the desired results due to implementation lag, other timing factors, portfolio management decision-making, economic or marketconditions or other unanticipated factors. The price and value of any of the securities or financial instruments mentioned in this statement are subject to variability and canfall as well as rise. Past performance is no guarantee of future results.
Important Information Regarding Client ResponsibilitiesClients are requested to carefully review all portfolio holdings and strategies and to promptly inform TCW of any potential or perceived policy or guideline inconsistencies. Inparticular, TCW understands that guideline enabling language is subject to a measure of interpretation and TCW strongly encourages clients to express any contrastinginterpretation as soon as practical. Due to changing industry standards and the wide variety of interpretations to which a client guideline may be subjected, there can be noassurance that TCW’s interpretation will conform to that of clients or their consultants. TCW Client Services can be reached by calling (213) 244-0810, or [email protected].
Clients are also requested to notify TCW of any updates to Client’s organization, such as (but not limited to) adding affiliates (including broker dealer affiliates), issuingadditional securities, name changes, mergers or other alterations to Client’s legal structure.
Important Information Regarding This Report
The manager has the discretion to assign a security to a country other than its Bloomberg Country of Risk in the event that (i) the relevant index has assigned the security tothat country and/or (ii) the largest share of its income and/or assets is generated or located in that country.
Benchmark: Bloomberg Barclays Aggregate
Pasadena Fire and Police Retirement System
Core Fixed Income (Account #: SMS650)
As of 03/31/2019
© 2016 The TCW Group Inc. 39

Nimbus 9
PORTFOLIO UPDATE
Institutional Large-Cap Growth FundAs of March 31, 2019
Not for use with Individual Investors. 1
MARKET COMMENTARYMajor U.S. stock indexes were mixed in March, as volatility picked up following two months of solidstock market gains. As measured by various Russell indexes, large-cap shares outperformed mid-and small-caps. Growth stocks outperformed value across all market capitalizations. Within the S&P500 Index, sector performance was mostly positive. A sharp drop in long-term interest ratesboosted real estate stocks by making their strong dividend yields more attractive in comparison.Technology stocks also performed well, bolstered by a solid rise in Apple shares as investorsappeared to welcome the tech giant's new video streaming platform.
Optimism regarding U.S.-China trade talks modestly supported stocks for much of the month, andsigns of more accommodative U.S. monetary policy provided tailwinds later in the period. TheFederal Reserve kept interest rates unchanged at its policy meeting on March 20, as expected.However, the summary of individual policymakers' economic and policy projections released afterthe meeting showed that most Fed policymakers expect no interest rate increases in 2019, whichhelped lift the S&P 500 to a five-month high. The general downbeat tone of global economic data,combined with a dovish Fed, sent longer-term bond yields tumbling, and the 10-year Treasury noteyield fell to levels not seen since late 2017. Concerns about an economic downturn following alate-month yield curve inversion drove stock market weakness at the end of the month.
The Federal Reserve's dovish turn and growing hopes for a trade deal have moderated two of theprimary sources of uncertainty that derailed U.S. stock markets late in 2018. The economic growthworries that emerged near the end of 2018 remain a more persistent source of concern, but wegenerally do not anticipate a recession in the U.S. this year. Earnings growth may be harder to comeby, however, as the impact of the December 2017 tax cuts on year-over-year comparisons rolls offand fiscal stimulus wanes. This could favor an active approach to investing, along with carefulfundamental research, to find companies able to leverage competitive advantages to prosper in amore challenging environment.
FUND INFORMATION
Symbol TRLGX 1
CUSIP 45775L408 2
Inception Date of Fund October 31, 2001 3
Benchmark Russell 1000 GrowthIndex 4
Expense Information (as of themost recent Prospectus) 0.56% 5
Fiscal Year End December 31 6
12B-1 Fee – 7
Portfolio Manager:Taymour Tamaddon
Managed Fund Since:2017
Joined Firm:2004
INVESTMENT OBJECTIVEThe fund seeks to provide long-term capital appreciationthrough investments in common stocks of growthcompanies.
PERFORMANCE(NAV, total return) Annualized
OneMonth
ThreeMonths
OneYear
ThreeYears
FiveYears
TenYears
FifteenYears
Institutional Large-Cap Growth Fund 1.09% 14.68% 13.98% 21.92% 15.19% 19.60% 11.14%
Russell 1000 Growth Index 2.85 16.10 12.75 16.53 13.50 17.52 9.71
Current performance may be lower or higher than the quoted past performance, which is not a reliable indicator of future performance. Share price,principal value, and return will vary, and you may have a gain or loss when you sell your shares. To obtain the most recent month-end performance,please call 1-800-638-7780 or visit troweprice.com. Consider the investment objectives, risks, and charges and expenses carefully before investing. Fora prospectus or, if available, a summary prospectus containing this and other information, call 1-800-638-7780 or visit troweprice.com. Read itcarefully. Total return figures include changes in principal value, reinvested dividends, and capital gain distributions.The Fund is subject to the volatility inherent in common stock investing, and its share price may fluctuate more than a Fund investing in income-oriented stocks.The fund(s) may have other share classes available that offer different investment minimums and fees. See the prospectus for details.
mprice
Typewritten Text
DATE: 5/15/19 ITEM #: 6g

Institutional Large-Cap Growth Fund As of March 31, 2019
Not for use with Individual Investors. 2
RISK RETURN CHARACTERISTICS(Five Years ended March 31, 2019)
Active Share*(as of
3/31/19)
AnnualizedStd.
Deviation Alpha Beta R-SquaredInformation
RatioSharpeRatio
TrackingError
Institutional Large-Cap Growth Fund 60.4% 13.39% 1.24% 1.03 0.88 0.36 1.07 4.65%
Russell 1000 Growth Index – 12.17 0.00 1.00 1.00 0.00 1.04 0.00
*Active Share is a snapshot in time as of the indicated date.Past performance is not a reliable indicator of future performance. Figures are calculated using monthly data and are net of fees.
Past performance is not a reliable indicator of future performance. Numbers may not total due to rounding; all other numbers are percentages. Analysisrepresents the total performance of the portfolio as calculated by the FactSet attribution model and is inclusive of other assets that that will not receive aclassification assignment in the detailed structure shown. Returns will not match official T. Rowe Price performance because FactSet uses different exchange ratesources and does not capture intra-day trading. Performance for each security is obtained in the local currency and, if necessary, is converted using an exchangerate determined by an independent third party. Figures are shown with gross dividends reinvested. Sources: Financial data and analytics provider FactSet. Copyright2019 FactSet. All Rights Reserved. MSCI/S&P GICS Sectors; Analysis by T. Rowe Price Associates, Inc. T. Rowe Price uses the current MSCI/S&P Global IndustryClassification Standard (GICS) for sector and industry reporting. T. Rowe Price will adhere to all updates to GICS for prospective reporting. Figures are shown grossof fees. Returns would be lower as a result of the deduction of such fees. Performance returns are in USD.
SECTOR ATTRIBUTION DATA VS. RUSSELL 1000 GROWTH INDEX(12 months ended March 31, 2019)
-3%
-2%
-1%
0%
1%
2%
3%
4%Total Value Added
Value Added from Group Weight
Value Added from Stock Selection
Over/Underweight
TotalInfoTech
HealthCare
Indust &BusSvcs Energy
Materi-als Utilities
Con-sumerStaples
CommSvcs
Real Es-tate
Finan-cials
Con-sumerDisc
Over/Underweight 0.00% -6.35% 6.09% -2.34% -0.74% -1.81% 1.10% -4.75% 4.63% -2.39% -0.72% 3.43%
Fund Performance 14.43 30.66 17.64 9.25 0.00 0.00 21.55 -5.87 6.52 1.90 -13.06 10.86
Index Performance 12.75 20.23 12.04 4.44 -14.86 3.99 1.70 10.56 6.28 22.81 2.85 15.64
Value Add - Group Weight 0.14 -0.50 -0.09 0.37 0.29 0.25 0.10 0.15 -0.23 -0.22 -0.04 0.23
Value Add - Stock Selection 1.54 2.11 1.03 0.43 0.00 0.00 0.02 -0.22 0.01 -0.02 -0.75 -1.07
Total Contribution 1.68 1.61 0.94 0.80 0.29 0.25 0.13 -0.08 -0.22 -0.24 -0.80 -0.84
-9%
-6%
-3%
0%
3%
6%
9%
12%

Institutional Large-Cap Growth Fund As of March 31, 2019
Not for use with Individual Investors. 3
TOP 10 ISSUERSComprising 46.8% of total net assets.
Industry
Alphabet Interactive Media & Services
Amazon.com Internet & Direct Marketing Retail
Boeing Aerospace & Defense
Facebook Interactive Media & Services
Intuitive Surgical Health Care Equip & Supplies
Microsoft Software
Stryker Health Care Equip & Supplies
Tencent Holdings Interactive Media & Services
UnitedHealth Group Health Care Providers & Services
Visa IT Services
The Top 10 Issuers shown are sorted in alphabetical order.
SECTOR DIVERSIFICATION
InfoTech
HealthCare
ConsDisc
CommSvcs
Indust &BusSvcs
Finan-cials Utilities
ConsStpls
Real Es-tate
Materi-als Energy
Institutional Large-Cap Growth Fund 27.2% 19.5% 19.3% 17.0% 9.6% 3.6% 1.1% 1.0% 0.0% 0.0% 0.0%
Russell 1000 Growth Index 33.0 13.2 15.0 12.1 11.8 4.3 0.0 5.8 2.4 1.8 0.7
Over/Underweight -5.8 6.4 4.4 4.9 -2.2 -0.7 1.1 -4.8 -2.4 -1.8 -0.7
PORTFOLIO CHARACTERISTICS
Institutional Large-Cap Growth Fund
Russell1000
GrowthIndex
Number of Holdings 65 534
Investment Weighted Median Market Cap (mm) $137,517 $118,220
Price to Earnings (12 Months Forward) (IBES)° † 24.3X 22.2X
Price to Book° 7.9X 9.1X
Projected Earnings Growth Rate (IBES)° † 15.8% 14.0%
Return on Equity (Last 12 Months excl. charges)° 28.0% 31.6%
Top 20 Holdings as Percent of Total 64.8% 45.1%
Total Assets (all share classes) 18,608,491,622 –
Percent of Portfolio in Cash 1.7% –
°Investment Weighted Median.
†Based on the fund’s underlying holdings and is not a projection of future portfolio performance.

Institutional Large-Cap Growth Fund As of March 31, 2019
Not for use with Individual Investors. 4
Definitions
Active Share is a holdings based measure of active management representing the percentage of a portfolio’s holdings that differ from those in its benchmark.Compared to tracking error, which measures the standard deviation of the difference in a manager’s returns versus the Benchmark returns, Active Share allowsinvestors to get a clearer understanding of what a manager is doing to drive performance, rather than drawing conclusions from observed returns. The greater thedifference between the asset composition of a product and its benchmark, the greater the active share is.
Additional Disclosures
Russell Investment Group is the source and owner of the trademarks, service marks and copyrights related to the Russell Indexes. Russell® is a trademark ofRussell Investment Group.The information shown does not reflect any ETFs that may be held in the portfolio.Source for Sector Diversification: T. Rowe Price uses the MSCI/S&P Global Industry Classification Standard (GICS) for sector and industry reporting. T. Rowe Pricewill adhere to all future updates to GICS for prospective reporting.Diversification exhibits may not add to 100% due to exclusion or inclusion of cash.Certain numbers in this report may not equal stated totals due to rounding. Unless otherwise stated, data is as of the report date.Unless indicated otherwise the source of all data is T. Rowe Price.This material should not be deemed a recommendation to buy or sell any of the securities mentioned.This material has been prepared for informational purposes only. The views and opinions stated in this commentary are those of the portfolio managers listed as ofthe date indicated. These views and opinions are subject to change based on market or other conditions and may differ from those of other T. Rowe Priceassociates. Actual market and investment results may differ materially from expectations.© 2019 T. Rowe Price. All rights reserved. T. ROWE PRICE, INVEST WITH CONFIDENCE, and the Bighorn Sheep design are, collectively and/or apart, trademarksor registered trademarks of T. Rowe Price Group, Inc.T. Rowe Price Investment Services, Inc., Distributor.2017-US-30718 201904-799304
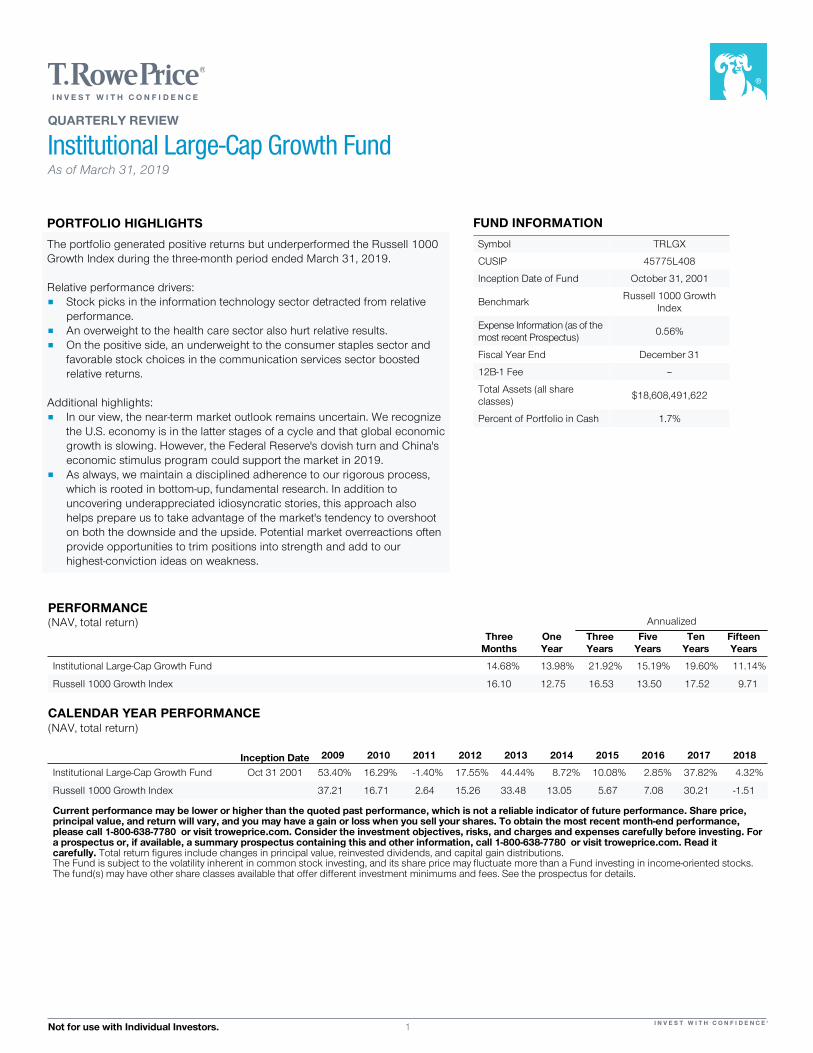
Nimbus 9
QUARTERLY REVIEW
Institutional Large-Cap Growth FundAs of March 31, 2019
Not for use with Individual Investors. 1
PERFORMANCE(NAV, total return) Annualized
ThreeMonths
OneYear
ThreeYears
FiveYears
TenYears
FifteenYears
Institutional Large-Cap Growth Fund 14.68% 13.98% 21.92% 15.19% 19.60% 11.14%
Russell 1000 Growth Index 16.10 12.75 16.53 13.50 17.52 9.71
PORTFOLIO HIGHLIGHTS
The portfolio generated positive returns but underperformed the Russell 1000Growth Index during the three-month period ended March 31, 2019.
Relative performance drivers:p Stock picks in the information technology sector detracted from relative
performance.p An overweight to the health care sector also hurt relative results.p On the positive side, an underweight to the consumer staples sector and
favorable stock choices in the communication services sector boostedrelative returns.
Additional highlights:p In our view, the near-term market outlook remains uncertain. We recognize
the U.S. economy is in the latter stages of a cycle and that global economicgrowth is slowing. However, the Federal Reserve's dovish turn and China'seconomic stimulus program could support the market in 2019.
p As always, we maintain a disciplined adherence to our rigorous process,which is rooted in bottom-up, fundamental research. In addition touncovering underappreciated idiosyncratic stories, this approach alsohelps prepare us to take advantage of the market's tendency to overshooton both the downside and the upside. Potential market overreactions oftenprovide opportunities to trim positions into strength and add to ourhighest-conviction ideas on weakness.
FUND INFORMATION
Symbol TRLGX 1
CUSIP 45775L408 2
Inception Date of Fund October 31, 2001 3
Benchmark Russell 1000 GrowthIndex 4
Expense Information (as of themost recent Prospectus) 0.56% 5
Fiscal Year End December 31 6
12B-1 Fee – 7
Total Assets (all shareclasses) $18,608,491,622 8
Percent of Portfolio in Cash 1.7% 9
CALENDAR YEAR PERFORMANCE(NAV, total return)
Inception Date 2009 2010 2011 2012 2013 2014 2015 2016 2017 2018
Institutional Large-Cap Growth Fund Oct 31 2001 53.40% 16.29% -1.40% 17.55% 44.44% 8.72% 10.08% 2.85% 37.82% 4.32%
Russell 1000 Growth Index 37.21 16.71 2.64 15.26 33.48 13.05 5.67 7.08 30.21 -1.51
Current performance may be lower or higher than the quoted past performance, which is not a reliable indicator of future performance. Share price,principal value, and return will vary, and you may have a gain or loss when you sell your shares. To obtain the most recent month-end performance,please call 1-800-638-7780 or visit troweprice.com. Consider the investment objectives, risks, and charges and expenses carefully before investing. Fora prospectus or, if available, a summary prospectus containing this and other information, call 1-800-638-7780 or visit troweprice.com. Read itcarefully. Total return figures include changes in principal value, reinvested dividends, and capital gain distributions.The Fund is subject to the volatility inherent in common stock investing, and its share price may fluctuate more than a Fund investing in income-oriented stocks.The fund(s) may have other share classes available that offer different investment minimums and fees. See the prospectus for details.

Institutional Large-Cap Growth Fund As of March 31, 2019
Not for use with Individual Investors. 2
PERFORMANCE REVIEWU.S. Stocks Bounce BackMajor U.S. stock indexes surged in the first quarter of 2019, as themarket rebounded from its late-December 2018 lows. Domesticequities were lifted by fourth-quarter corporate earnings reportsthat were generally better than expected, although earningsgrowth moderated from the robust pace earlier in 2018. Anothertailwind came from the Federal Reserve. In January, ChairmanJerome Powell promised to help counteract an economicdownturn or financial turmoil, and, in March, the central bankstopped raising short-term interest rates and offered a dovishpost-meeting statement. Hopes for a trade deal between the U.S.and China improved as the quarter progressed, providing anadditional boost to markets. While there were several positives for U.S. stocks during thequarter, continuing signs of a moderation in U.S. economic growthand a much sharper slowdown overseas raised some concerns.Chinese and European growth expectations ratcheted lowerthroughout the period, and Wall Street had one of its worst dayson March 22, following news of a sharp contraction in theexport-sensitive German manufacturing sector. U.S. manufacturingcontinued to expand, but at a significantly slower pace. The U.S.housing sector also weakened, particularly in terms of newconstruction. Labor market signals remained strong through mostof the quarter, but February job gains, reported on March 1, camein at their lowest level in 17 months. Consumer spending andbusiness investment generally disappointed as well, held down inpart by the partial federal government shutdown that lastedthrough most of January.
Stock Picks in Information Technology Hurt Relative ResultsAn underweight to the sector relative to the benchmark alsoweighed on returns as the sector broadly rebounded following itslate-2018 swoon, driven by solid corporate earnings reports andstrong demand for enterprise technology offerings. In addition,reports that the U.S. and China were making progress in resolvingtheir lengthy trade dispute supported certain sector names.p Despite disruption from both foreign exchange headwinds and
the pending merger with IBM, shares of Red Hat enjoyedmodest gains. Overall, the stock lagged its benchmark peersduring the first quarter as shares had already recordedsignificant gains following the deal announcement in October2018. Moving forward, IBM's vast amount of technology,services, and distribution capabilities should benefit Red Hatas they attempt to scale their hybrid cloud platform.
p Shares of Maxim Integrated Products traded higher but laggedsector peers as the analog semiconductor company facedheadwinds from soft demand in its industrial segment,including in China, and slower auto sales. We continue to likethe company because we believe it offers differentiatedproducts that are positioned to benefit from a growing marketfor power management solutions in electric vehicles,autonomous driving, and industrial automation.
An Overweight to Health Care Detracted From RelativeReturnsThe health care sector lagged the broader benchmark index.Concerns over political rhetoric surrounding prescription drugpricing and the potential for single-payer health care also servedas headwinds for the sector. A federal government proposal tochange drug rebate rules also weighed on companies along thedrug supply chain.
An Underweight to Consumer Staples Boosted RelativeResultsMany consumer staples businesses continue to struggle due toshifting consumer preferences, rising competition fromprivate-label names, and operational missteps. We remainunderweight to the sector, where attractive growth opportunitiesare difficult to find.
Stock Choices in Communication Services Added to RelativeResultsThe diverse industries composing the communication servicessector turned in relatively strong results within the benchmarkindex. The changing media, entertainment, and communicationslandscape is creating clear winners and losers. We remainfocused on emphasizing innovative businesses on the right side ofthis secular change while also avoiding the companies that arebeing disrupted. During the period, certain sector names benefitedfrom strong user engagement and/or subscriber growth.p Shares of Facebook traded higher on the back of broad-based
user growth and robust ad revenue growth, driven in part byadvertisers' accelerating adoption of the stories format. Withsignificant progress made on the security front, we think thecompany should be better positioned to go on the offensivewith key initiatives that include the integration of messagingacross its platforms and improving its growing stories format.We think Facebook's immense data collection capabilities,dominant share of consumer time spent on mobile devices,world-class advertising monetization ability, and visionarymanagement team could drive strong earnings growth overtime.
p Shares of Netflix climbed higher, driven by continued strengthin international subscription growth, pricing power, and robustviewership momentum behind its slate of originalprogramming. As viewership grows on an aggregate andper-subscriber basis, we anticipate that Netflix will continue toimprove the consumer viewing experience, thereby increasingthe company's negotiating leverage with content suppliersglobally and increasing its competitive positioning againstregional companies.
PORTFOLIO POSITIONING AND ACTIVITYAmid the market rally, we sold shares of several companies onstrength. However, we also identified certain idiosyncraticinvestment opportunities. We continue to favor many of ourhigh-conviction holdings in the information technology and healthcare sectors, where valuations still look relatively compelling giventhe trajectories of the underlying businesses.
Information TechnologyDisruptive business models and technologies within the sectorcontinue to present compelling investment opportunities. Seculardemand for public cloud computing services continues to be agrowth driver in the segment. We also continue to favorcompanies driven by the convergence of communications andcomputing, including internet software companies, and those thatwill benefit from broad global tailwinds in digital payments. p We bought shares of Splunk as we like that the company's
flexible technology allows it to address many IT use cases,including cybersecurity and applications management, thusproviding it with the potential for a long growth runway, in ourview. We also value Splunk's strong management team,consistent competitive leadership, and mix of recurringrevenues.

Institutional Large-Cap Growth Fund As of March 31, 2019
Not for use with Individual Investors. 3
p We trimmed our position in software company Microsoft onvaluation given its continued success in cloud computingthrough Office 365 applications, the Azure public cloudplatform, and a ramping demand environment for enterpriseIT. We believe the company has long-term growth potentialwith its established customer base, and robust software anddata center capabilities.
Consumer DiscretionaryWe have a sizable position in the consumer discretionary sectorand are constructive on stock-specific opportunities within thesector. We are focused on businesses benefiting from the secularshift of consumer spending to online retail, as well as companiespositioned to take advantage of the long-term growth in onlinetravel services.p We increased our position in Aptiv, an automotive supplier in
the electrical/electronic architecture and electronics and safetyindustries. We feel the company possesses superiortechnology and is benefiting from the adoption of autonomousdriving and electric vehicles.
p Booking Holdings, formerly known as Priceline, is a worldwideprovider of online travel services. We continued to trim ourexposure to the stock as we expect growth to moderate as thebusiness matures. We are modestly overweight in BookingHoldings as we still think the company's expansionsinternationally and into non-hotel properties present attractiveopportunities for growth.
Health CareWe remain focused on finding opportunities in the health caresector that can take advantage of lasting trends such as managedcare industry consolidation, innovations in medical equipment, androbotic technology. In therapeutics, our emphasis is on selectcompanies that have strong fundamentals and the potential tobring additional new drugs to market in areas with large, unmetclinical needs.p Cigna is one of the largest health insurers in the U.S. by
enrollment and maintains a leading position in bothcommercial insurance and Medicare. We increased ourposition as we believe there is potential for earnings growthbased on Cigna's attractive business model, high barriers toentry, and limited substitutes. We also think Cigna's mergerwith Express Scripts presents attractive synergies that couldhelp unlock shareholder value for the combined entity.
p Alexion Pharmaceuticals develops and commercializestherapies for severe and rare diseases. We trimmed ourposition on strength during the quarter as shares jumpedhigher in February after management released earnings resultsthat exceeded expectations. While we continue to like thecompany and have a favorable view of its management team,we have some concerns about competitive pressures facingSoliris, the company's drug for the treatment of two rare blooddiseases.
MANAGER'S OUTLOOKWe are mindful that the factors that spurred the downturn during thefourth quarter of 2018 could lead to further challenges throughout2019. The slowdown in the U.S. and global economies certainlyposes some market risk in the near term, and corporate earningsgrowth is showing signs of deceleration due to rising labor costs andthe fading benefits of the 2017 U.S. tax cuts. We think volatility willlikely persist until there is more clarity on the U.S.-China tradesituation. In our view, global trade policy uncertainty may further
undermine business capital spending and other growth-drivingefforts. Furthermore, as the presidential election campaigns gainmomentum and controversial policy issues are debated, politicalheadline risk may become more of a concern. Given these factors, we feel the near-term market outlook remainssomewhat uncertain. We recognize the U.S. economy is in the latterstages of a cycle and that global economic growth is slowing.However, we believe the Federal Reserve's dovish turn and China'seconomic stimulus program could support more cyclical areas of themarket. In this environment, we have taken a broadly balancedapproach in the portfolio as we feel there are still interestingopportunities in select high-quality growth companies with strongfundamentals that can comfortably grow into their valuation multiplesover the next couple of years. As always, we maintain a disciplined adherence to our rigorousprocess, which is rooted in bottom-up, fundamental research. Inaddition to uncovering underappreciated idiosyncratic stories, thisapproach also helps prepare us to take advantage of the market'stendency to overshoot on both the downside and the upside.Potential market overreactions often provide opportunities to trimpositions into strength and add to our highest-conviction ideas onweakness.

Institutional Large-Cap Growth Fund As of March 31, 2019
Not for use with Individual Investors. 4
QUARTERLY ATTRIBUTIONSECTOR ATTRIBUTION DATA VS. RUSSELL 1000 GROWTH INDEX(3 months ended March 31, 2019)
-2%
-1%
0%
1%Total Value Added
Value Added from Group Weight
Value Added from Stock Selection
Over/Underweight
Total
Con-sumerStaples
CommSvcs
Con-sumerDisc
Indust &BusSvcs
Materi-als Energy Utilities
Real Es-tate
Finan-cials
HealthCare
InfoTech
Over/Underweight 0.00% -4.75% 4.63% 3.43% -2.34% -1.81% -0.74% 1.10% -2.39% -0.72% 6.09% -6.35%
Fund Performance 14.79 34.11 18.09 16.12 18.09 0.00 0.00 16.46 0.00 3.45 7.15 19.70
Index Performance 16.10 10.92 16.69 15.38 16.32 14.91 14.43 0.00 18.86 13.25 7.43 21.36
Value Add - Group Weight -1.13 0.25 -0.02 -0.03 -0.01 0.03 0.02 0.01 -0.05 0.02 -0.55 -0.31
Value Add - Stock Selection -0.18 0.20 0.22 0.15 0.11 0.00 0.00 0.00 0.00 -0.38 -0.05 -0.43
Total Contribution -1.31 0.45 0.20 0.12 0.10 0.03 0.02 0.01 -0.05 -0.36 -0.60 -0.74
-14%
-7%
0%
7%
TOP 5 RELATIVE CONTRIBUTORS VS. RUSSELL 1000GROWTH INDEX(3 months ended March 31, 2019)
TOP 5 RELATIVE DETRACTORS VS. RUSSELL 1000GROWTH INDEX(3 months ended March 31, 2019)
Security % of Equities
NetContribution(Basis Points) Security % of Equities
NetContribution(Basis Points)
Boeing Company 5.2% 68 Apple Inc. 1.6% -104
Alibaba Group Holding Ltd. 1.9 55 Cigna Corporation 2.1 -41
Amazon.Com, Inc. 8.3 53 Mastercard Incorporated 0.0 -37
Vmware, Inc. 1.8 49 Nvidia Corporation 0.0 -23
Visa Inc. 4.8 49 Home Depot, Inc. 0.0 -21
Net contribution is calculated versus a specific benchmark. It is the difference between the security’s absolute contribution to the portfolio and the security’sabsolute contribution to the benchmark. This reflects the amount the security has impacted relative return.Past performance is not a reliable indicator of future performance. Numbers may not total due to rounding; all other numbers are percentages. Analysisrepresents the total performance of the portfolio as calculated by the FactSet attribution model and is inclusive of other assets that will not receive a classificationassignment in the detailed structure shown. Returns will not match official T. Rowe Price performance because FactSet uses different exchange rate sources anddoes not capture intra-day trading. Performance for each security is obtained in the local currency and, if necessary, is converted using an exchange ratedetermined by an independent third party. Figures are shown with gross dividends reinvested. Sources: Financial data and analytics provider FactSet. Copyright2019 FactSet. All Rights Reserved. MSCI/S&P GICS Sectors; Analysis by T. Rowe Price Associates, Inc. T. Rowe Price uses the current MSCI/S&P Global IndustryClassification Standard (GICS) for sector and industry reporting. T. Rowe Price will adhere to all updates to GICS for prospective reporting. Figures are showngross of fees. Returns would be lower as a result of the deduction of such fees. Performance returns are in USD.

Institutional Large-Cap Growth Fund As of March 31, 2019
Not for use with Individual Investors. 5
12-MONTH ATTRIBUTIONSECTOR ATTRIBUTION DATA VS. RUSSELL 1000 GROWTH INDEX(12 months ended March 31, 2019)
-3%
-2%
-1%
0%
1%
2%
3%
4%Total Value Added
Value Added from Group Weight
Value Added from Stock Selection
Over/Underweight
TotalInfoTech
HealthCare
Indust &BusSvcs Energy
Materi-als Utilities
Con-sumerStaples
CommSvcs
Real Es-tate
Finan-cials
Con-sumerDisc
Over/Underweight 0.00% -6.35% 6.09% -2.34% -0.74% -1.81% 1.10% -4.75% 4.63% -2.39% -0.72% 3.43%
Fund Performance 14.43 30.66 17.64 9.25 0.00 0.00 21.55 -5.87 6.52 1.90 -13.06 10.86
Index Performance 12.75 20.23 12.04 4.44 -14.86 3.99 1.70 10.56 6.28 22.81 2.85 15.64
Value Add - Group Weight 0.14 -0.50 -0.09 0.37 0.29 0.25 0.10 0.15 -0.23 -0.22 -0.04 0.23
Value Add - Stock Selection 1.54 2.11 1.03 0.43 0.00 0.00 0.02 -0.22 0.01 -0.02 -0.75 -1.07
Total Contribution 1.68 1.61 0.94 0.80 0.29 0.25 0.13 -0.08 -0.22 -0.24 -0.80 -0.84
-9%
-6%
-3%
0%
3%
6%
9%
12%
Past performance is not a reliable indicator of future performance. Numbers may not total due to rounding; all other numbers are percentages. Analysisrepresents the total performance of the portfolio as calculated by the FactSet attribution model and is inclusive of other assets that will not receive a classificationassignment in the detailed structure shown. Returns will not match official T. Rowe Price performance because FactSet uses different exchange rate sources anddoes not capture intra-day trading. Performance for each security is obtained in the local currency and, if necessary, is converted using an exchange ratedetermined by an independent third party. Figures are shown with gross dividends reinvested. Sources: Financial data and analytics provider FactSet. Copyright2019 FactSet. All Rights Reserved. MSCI/S&P GICS Sectors; Analysis by T. Rowe Price Associates, Inc. T. Rowe Price uses the current MSCI/S&P Global IndustryClassification Standard (GICS) for sector and industry reporting. T. Rowe Price will adhere to all updates to GICS for prospective reporting. Figures are showngross of fees. Returns would be lower as a result of the deduction of such fees. Performance returns are in USD.
TOP 5 RELATIVE CONTRIBUTORS VS. RUSSELL 1000GROWTH INDEX(12 months ended March 31, 2019)
TOP 5 RELATIVE DETRACTORS VS. RUSSELL 1000GROWTH INDEX(12 months ended March 31, 2019)
Security % of Equities
NetContribution(Basis Points) Security % of Equities
NetContribution(Basis Points)
Vmware, Inc. 1.8% 83 Apple Inc. 1.6% -75
Visa Inc. 4.8 80 Booking Holdings Inc. 1.1 -47
Amazon.Com, Inc. 8.3 73 Mastercard Incorporated 0.0 -46
Boeing Company 5.2 68 Charles Schwab Corporation 1.5 -28
Intuit Inc. 2.0 63 Tencent Holdings Ltd. 2.3 -25
Net contribution is calculated versus a specific benchmark. It is the difference between the security’s absolute contribution to the portfolio and the security’sabsolute contribution to the benchmark. This reflects the amount the security has impacted relative return.

Institutional Large-Cap Growth Fund As of March 31, 2019
Not for use with Individual Investors. 6
PORTFOLIO POSITIONING
SECTOR DIVERSIFICATION – CHANGES OVER TIME
-5%
0%
5%
10%
15%
20%
25%
30%
35%Fund - Prior Year (3/31/18)
Fund - Prior Quarter (12/31/18)
Fund - Current Quarter (3/31/19)
Russell 1000 Growth Index - Current Quarter (3/31/19) Info Tech Health
CareConsDisc
CommSvcs
Indust &Bus Svcs
Financials Utilities ConsStpls
Real Es-tate
Materials Energy
LARGEST PURCHASES LARGEST SALES
Issuer Sector
% of FundCurrentQuarter3/31/19
% of FundPrior
Quarter12/31/18 Issuer Sector
% of FundCurrentQuarter3/31/19
% of FundPrior
Quarter12/31/18
Boeing 5.3% 5.1% Amazon.com 8.4% 8.3%
Facebook 5.2 3.8 VMware 1.8 1.6
VMware 1.8 1.6 Booking Holdings 1.2 1.8
Splunk 1.0 0.8 Philip Morris International 1.0 0.9
IAC/InterActiveCorp 0.7 0.5 Hilton Worldwide Holdings 0.9 1.0
ASML Holding 0.7 0.4 ServiceNow 0.9 0.8
PACCAR (N) 0.5 0.0 Alexion Pharmaceuticals 0.5 0.6
Regeneron Pharmaceuticals (N) 0.5 0.0 Tesla (E) 0.0 1.2
Electronic Arts (N) 0.4 0.0 Kansas City Southern (E) 0.0 0.5
J.B. Hunt Transport Services (N) 0.4 0.0 Activision Blizzard (E) 0.0 0.4
(N) New Position(E) Eliminated

Institutional Large-Cap Growth Fund As of March 31, 2019
Not for use with Individual Investors. 7
HOLDINGSTOP 10 ISSUERS
Issuer Industry % of Fund% of Russell 1000
Growth Index
Amazon.com Internet & Direct Marketing Retail 8.4% 5.5%
Alphabet Interactive Media & Services 7.0 5.3
Microsoft Software 6.4 6.3
Boeing Aerospace & Defense 5.3 1.5
Facebook Interactive Media & Services 5.2 3.0
Visa IT Services 4.8 2.1
UnitedHealth Group Health Care Providers & Services 2.6 1.8
Tencent Holdings Interactive Media & Services 2.3 0.0
Intuitive Surgical Health Care Equip & Supplies 2.3 0.5
Stryker Health Care Equip & Supplies 2.3 0.5
TOP 5 OVER/UNDERWEIGHT POSITIONS VS. RUSSELL 1000 GROWTH INDEX
Issuer Industry % of Fund
% of Rus-sell 1000
Growth In-dex Over/Underweight
Boeing Aerospace & Defense 5.3% 1.5% 3.8%
Amazon.com Internet & Direct Marketing Retail 8.4 5.5 2.9
Visa IT Services 4.8 2.1 2.8
Tencent Holdings Interactive Media & Services 2.3 0.0 2.3
Facebook Interactive Media & Services 5.2 3.0 2.2
Apple Technology Hardware, Storage & Peripherals 1.6 6.8 -5.1
Home Depot Specialty Retail 0.0 1.6 -1.6
MasterCard IT Services 0.0 1.6 -1.6
PepsiCo Beverages 0.0 1.2 -1.2
Coca-Cola Beverages 0.0 1.0 -1.0
Portfolio Manager:Taymour Tamaddon
Managed Fund Since:2017
Joined Firm:2004
PORTFOLIO MANAGEMENT

Institutional Large-Cap Growth Fund As of March 31, 2019
Not for use with Individual Investors. 8
Additional Disclosures
Russell Investment Group is the source and owner of the trademarks, service marks and copyrights related to the Russell Indexes. Russell® is a trademark of Russell Investment Group.The manager’s views and portfolio holdings are historical and subject to change. This material should not be deemed a recommendation to buy or sell any of the securities mentioned. The specific securities identified and described do not represent all of the securities purchased, sold, or recommended for the Fund and no assumptions should be made that the securities identified and discussed were or will be profitable.The information shown does not reflect any ETFs that may be held in the portfolio.Source for Sector Diversification: T. Rowe Price uses the MSCI/S&P Global Industry Classification Standard (GICS) for sector and industry reporting. T. Rowe Price will adhere to all future updates to GICS for prospective reporting.Diversification exhibits may not add to 100% due to exclusion or inclusion of cash.Certain numbers in this report may not equal stated totals due to rounding. Unless otherwise stated, data is as of the report date.Unless indicated otherwise the source of all data is T. Rowe Price.This material has been prepared for informational purposes only. The views and opinions stated in this commentary are those of the portfolio managers listed as of the date indicated. These views and opinions are subject to change based on market or other conditions and may differ from those of other T. Rowe Price associates. Actual market and investment results may differ materially from expectations.© 2019 T. Rowe Price. All rights reserved. T. ROWE PRICE, INVEST WITH CONFIDENCE, and the Bighorn Sheep design are, collectively and/or apart, trademarks or registered trademarks of T. Rowe Price Group, Inc.T. Rowe Price Investment Services, Inc., Distributor.201904-815744

Fact sheet | March 31, 2019
Vanguard Inflation-Protected Securities FundBond fund | Institutional Shares
$14,041 Fund as of 12/31/18
$14,065 Benchmark as of 12/31/18
2009 2010 2011 2012 2013 2014 2015 2016 2017 2018
2009 2010 2011 2012 2013 2014 2015 2016 2017 2018
Fund 11.03 6.33 13.39 6.87 -8.83 4.07 -1.67 4.63 2.97 -1.40
Benchmark 11.41 6.31 13.56 6.98 -8.61 3.64 -1.44 4.68 3.01 -1.26
Benchmark
BloomBarc US Trsy Inflat Prtcd Idx
Investment objective
Vanguard Inflation-Protected Securities Fundseeks to provide investors inflation protectionand income consistent with investment ininflation-indexed securities.
Investment strategy
The fund invests at least 80% of its assets ininflation-indexed bonds issued by the U.S.government, its agencies and instrumentalities,and corporations. The fund may invest in bondsof any maturity; however, its dollar-weightedaverage maturity is expected to be in a range of7 to 20 years. At a minimum, all bondspurchased by the fund will be rated “investmentgrade” or, if unrated, will be considered by theadvisor to be investment grade.
For the most up-to-date fund data,please scan the QR code below.
BloomBarc US Trsy Inflat Prtcd Idx: Includes the inflation-indexed securities within the Bloomberg Barclays U.S.Treasury Bond Index, which represents U.S. Treasury obligations with maturities of more than 1 year.The fund held a subscription period from June 5, 2000 (the effective date of the fund) to June 29, 2000, during whichtime all assets were held directly or indirectly in money market instruments. Performance measurement began June29, 2000.
F1190 032019
Risk levelLow High
Total netassets
Expense ratio as of 04/26/18
Tickersymbol
Turnover rateas of 12/31/18
Inceptiondate
Fundnumber
1 2 3 4 5 $10,015 MM 0.07% VIPIX 27.3% 12/12/03 1190
Growth of a $10,000 investment : January 31, 2009—December 31, 2018
Annual returns
Periods ended March 31, 2019
Quarter Year to date One year Three years Five years Ten years
Fund 3.21% 3.21% 2.72% 1.59% 1.91% 3.34%
Benchmark 3.19% 3.19% 2.70% 1.70% 1.94% 3.41%
The performance data shown represent past performance, which is not a guarantee of futureresults. Investment returns and principal value will fluctuate, so investors’ shares, when sold,may be worth more or less than their original cost. Current performance may be lower or higherthan the performance data cited. For performance data current to the most recent month-end,visit our website at vanguard.com/performance.Figures for periods of less than one year are cumulative returns. All other figures represent averageannual returns. Performance figures include the reinvestment of all dividends and any capital gainsdistributions. All returns are net of expenses.
Total returns
Distribution by issuer–bonds
Treasury/Agency 100.0%Asset-Backed 0.0Commercial Mortgage-Backed 0.0Finance 0.0
Foreign 0.0Government Mortgage-Backed 0.0Industrial 0.0Utilities 0.0
mprice
Typewritten Text
DATE: 5/15/19 ITEM #: 6h

Fact sheet | March 31, 2019
Vanguard Inflation-Protected Securities Fund
Bond fund | Institutional Shares
Connect with Vanguard ® > vanguard.comPlain talk about riskAn investment in the fund could lose money over short or even long periods. You should expect the fund’s share price and total return to fluctuate within awide range, like the fluctuations of the overall bond market. The fund’s performance could be hurt by:Income fluctuations: The fund’s quarterly income distributions are likely to fluctuate considerably more than the income distributions of a typical bond fund.Income fluctuations associated with changes in interest rates are expected to be low; however, income fluctuations associated with changes in inflation areexpected to be high. Overall, investors can expect income fluctuations to be high for the fund.Interest rate risk: The chance that bond prices will decline because of rising interest rates. Although inflation-indexed bonds seek to provide inflationprotection, their prices may decline when interest rates rise and vice versa. Because the fund’s dollar-weighted average maturity is expected to be in the rangeof 7 to 20 years, interest rate risk is expected to be moderate to high for the fund.Manager risk: The chance that poor security selection will cause the fund to underperform relevant benchmarks or other funds with a similar investmentobjective.Derivatives risk: The chance that investments in derivatives may involve risks different from, and possibly greater than, those of investments in the underlyingsecurities, assets, or market indexes.
Note on frequent trading restrictionsFrequent trading policies may apply to those funds offered as investment options within your plan. Please log on to Vanguard.com for your employer plans orcontact Participant Services at 800-523-1188 for additional information.
While U.S. Treasury or government agency securities provide substantial protection against credit risk, they do not protect investors against price changes dueto changing interest rates. Unlike stocks and bonds, U.S. Treasury bills are guaranteed as to the timely payment of principal and interest.
BLOOMBERG® is a trademark and service mark of Bloomberg Finance L.P. BARCLAYS® is a trademark and service mark of Barclays Bank Plc, used under license. Bloomberg Finance L.P. and itsaffiliates, including Bloomberg Index Services Limited (”BISL”) (collectively, ”Bloomberg”), or Bloomberg’s licensors own all proprietary rights in the Bloomberg Barclays Indices. The products are notsponsored, endorsed, issued, sold or promoted by “Bloomberg or Barclays”. Bloomberg and Barclays make no representation or warranty, express or implied, to the owners or purchasers of theproducts or any member of the public regarding the advisability of investing in securities generally or in the products particularly or the ability of the Bloomberg Barclays Indices to track general bondmarket performance. Neither Bloomberg nor Barclays has passed on the legality or suitability of the products with respect to any person or entity. Bloomberg’s only relationship to Vanguard and theproducts are the licensing of the Bloomberg Barclays Indices which are determined, composed and calculated by BISL without regard to Vanguard or the products or any owners or purchasers of theproducts Bloomberg has no obligation to take the needs of the products or the owners of the products into consideration in determining, composing or calculating the Bloomberg Barclays Indices.Neither Bloomberg nor Barclays is responsible for and has not participated in the determination of the timing of, prices at, or quantities of the products to be issued. Neither Bloomberg nor Barclays hasany obligation or liability in connection with the administration, marketing or trading of the products.
For more information about Vanguard funds or to obtain a prospectus, see below for which situation is right for you.If you receive your retirement plan statement from Vanguard or log on to Vanguard’s website to view your plan, visit vanguard.com or call 800-523-1188.If you receive your retirement plan statement from a service provider other than Vanguard or log on to a record keeper’s website that is not Vanguard to viewyour plan, please call 855-402-2646. Visit vanguard.com to obtain a prospectus or, if available, a summary prospectus. Investment objectives, risks, charges, expenses, and otherimportant information about a fund are contained in the prospectus; read and consider it carefully before investing.
Financial advisor clients: For more information about Vanguard funds, contact your financial advisor to obtain a prospectus.
Investment Products: Not FDIC Insured • No Bank Guarantee • May Lose Value
© 2019 The Vanguard Group, Inc. All rights reserved. Vanguard Marketing Corporation, Distributor. F1190 032019

Fact sheet | March 31, 2019
Vanguard Institutional Index FundDomestic stock fund | Institutional Shares
$37,410 Fund as of 12/31/18
$37,461 Benchmark as of 12/31/18
2009 2010 2011 2012 2013 2014 2015 2016 2017 2018
2009 2010 2011 2012 2013 2014 2015 2016 2017 2018
Fund 26.63 15.05 2.09 15.98 32.35 13.65 1.37 11.93 21.79 -4.42
Benchmark 26.46 15.06 2.11 16.00 32.39 13.69 1.38 11.96 21.83 -4.38
Benchmark
S&P 500 Index
Investment objective
Vanguard Institutional Index Fund seeks to trackthe performance of a benchmark index thatmeasures the investment return oflarge-capitalization stocks.
Investment strategy
The fund employs an indexing investmentapproach designed to track the performance ofthe Standard & Poor’s 500 Index, which isdominated by the stocks of large U.S.companies. The fund attempts to replicate thetarget index by investing all, or substantially all,of its assets in the stocks that make up theindex.
For the most up-to-date fund data,please scan the QR code below.
S&P 500 Index: A widely used barometer of U.S. stock market performance; as a market-weighted index of leadingcompanies in leading industries, it is dominated by large-capitalization companies.
F0094 032019
Risk levelLow High
Total netassets
Expense ratio as of 04/26/18
Tickersymbol
Turnover rateas of 12/31/18
Inceptiondate
Fundnumber
1 2 3 4 5 $114,380 MM 0.035% VINIX 5.6% 07/31/90 0094
Growth of a $10,000 investment : January 31, 2009—December 31, 2018
Annual returns
Periods ended March 31, 2019
Quarter Year to date One year Three years Five years Ten years
Fund 13.65% 13.65% 9.47% 13.48% 10.88% 15.90%
Benchmark 13.65% 13.65% 9.50% 13.51% 10.91% 15.92%
The performance data shown represent past performance, which is not a guarantee of futureresults. Investment returns and principal value will fluctuate, so investors’ shares, when sold,may be worth more or less than their original cost. Current performance may be lower or higherthan the performance data cited. For performance data current to the most recent month-end,visit our website at vanguard.com/performance.Figures for periods of less than one year are cumulative returns. All other figures represent averageannual returns. Performance figures include the reinvestment of all dividends and any capital gainsdistributions. All returns are net of expenses.
Total returns
Top sector holdings–stocks
Information Tech 21.2%Health Care 14.6Financials 12.7Consumer Discretionary 10.2Communication Services 10.1
Industrials 9.5Consumer Staples 7.3Energy 5.4Utilities 3.3Real Estate 3.1
Sector categories are based on the Global Industry Classification Standard (“GICS”), exceptfor the “Other” category (if applicable), which includes securities that have not beenprovided a GICS classification as of the effective reporting period.
mprice
Typewritten Text
DATE: 5/15/19 ITEM #: 6i

Fact sheet | March 31, 2019
Vanguard Institutional Index Fund
Domestic stock fund | Institutional Shares
Connect with Vanguard ® > vanguard.comPlain talk about riskAn investment in the fund could lose money over short or even long periods. You should expect the fund’s share price and total return to fluctuate within awide range, like the fluctuations of the overall stock market. The fund’s performance could be hurt by: Stock market risk: The chance that stock prices overall will decline. Stock markets tend to move in cycles, with periods of rising stock prices and periods offalling stock prices. The fund’s target index may, at times, become focused in stocks of a particular sector, category, or group of companies. Because the fundseeks to track its target index, the fund may underperform the overall stock market.Investment style risk: The chance that returns from large-capitalization stocks will trail returns from the overall stock market. Large-cap stocks tend to gothrough cycles of doing better—or worse—than other segments of the stock market or the stock market in general. These periods have, in the past, lasted foras long as several years.
Note on frequent trading restrictionsFrequent trading policies may apply to those funds offered as investment options within your plan. Please log on to Vanguard.com for your employer plans orcontact Participant Services at 800-523-1188 for additional information.
The index is a product of S&P Dow Jones Indices LLC (“SPDJI”), and has been licensed for use by Vanguard. Standard & Poor’s® and S&P® are registered trademarks of Standard & Poor’s FinancialServices LLC (“S&P”); Dow Jones® is a registered trademark of Dow Jones Trademark Holdings LLC (“Dow Jones”); S&P® and S&P 500® are trademarks of S&P; and these trademarks have beenlicensed for use by SPDJI and sublicensed for certain purposes by Vanguard. Vanguard product(s) are not sponsored, endorsed, sold or promoted by SPDJI, Dow Jones, S&P, or their respectiveaffiliates and none of such parties make any representation regarding the advisability of investing in such product(s) nor do they have any liability for any errors, omissions, or interruptions of the index.
For more information about Vanguard funds or to obtain a prospectus, see below for which situation is right for you.If you receive your retirement plan statement from Vanguard or log on to Vanguard’s website to view your plan, visit vanguard.com or call 800-523-1188.If you receive your retirement plan statement from a service provider other than Vanguard or log on to a recordkeeper’s website that is not Vanguard to viewyour plan, please call 855-402-2646.Visit vanguard.com to obtain a prospectus or, if available, a summary prospectus. Investment objectives, risks, charges, expenses, and otherimportant information about a fund are contained in the prospectus; read and consider it carefully before investing.
Financial advisor clients: For more information about Vanguard funds, contact your financial advisor to obtain a prospectus.
Investment Products: Not FDIC Insured • No Bank Guarantee • May Lose Value
© 2019 The Vanguard Group, Inc. All rights reserved. Vanguard Marketing Corporation, Distributor. F0094 032019
Ten largest holdings*
1 Microsoft Corp.
2 Apple Inc.
3 Amazon.com Inc.
4 Alphabet Inc.
5 Facebook Inc.
6 Berkshire Hathaway Inc.
7 Johnson & Johnson
8 Exxon Mobil Corp.
9 JPMorgan Chase & Co.
10 Visa Inc.
Top 10 as % of total net assets 22.4%
* The holdings listed exclude any temporary cashinvestments and equity index products.

Fact sheet | March 31, 2019
Vanguard Short-Term Investment-Grade FundBond fund | Institutional Shares
$13,953 Fund as of 12/31/18
$14,150 Benchmark as of 12/31/18
2009 2010 2011 2012 2013 2014 2015 2016 2017 2018
2009 2010 2011 2012 2013 2014 2015 2016 2017 2018
Fund 14.21 5.37 2.06 4.66 1.10 1.90 1.16 2.85 2.16 1.00
Benchmark 13.52 5.44 3.04 5.51 1.24 1.95 1.06 2.58 2.32 1.11
Benchmark
BloomBarc US 1-5 Year Credit Index
Investment objective
Vanguard Short-Term Investment-Grade Fundseeks to provide current income whilemaintaining limited price volatility.
Investment strategy
The fund invests in a variety of high-quality and,to a lesser extent, medium-quality fixed incomesecurities, at least 80% of which will be short-and intermediate-term investment-gradesecurities. High-quality fixed income securitiesare those rated the equivalent of A3 or better byMoody’s Investors Service, Inc., or anotherindependent rating agency; medium-quality fixedincome securities are those rated the equivalentof Baa1, Baa2, or Baa3 by Moody’s or anotherindependent rating agency. (Investment-gradefixed income securities are those rated theequivalent of Baa3 and above by Moody’s.) Thefund is expected to maintain a dollar-weightedaverage maturity of 1 to 4 years.
For the most up-to-date fund data,please scan the QR code below.
BloomBarc US 1-5 Year Credit Index: Includes investment-grade (rated Baa3 or above by Moody’s) corporate andinternational dollar-denominated bonds with maturities of 1 to 5 years.
F0858 032019
Risk levelLow High
Total netassets
Expense ratio as of 05/24/18
Tickersymbol
Turnover rateas of 01/31/19
Inceptiondate
Fundnumber
1 2 3 4 5 $10,248 MM 0.07% VFSIX 70.8% 09/30/97 0858
Growth of a $10,000 investment : January 31, 2009—December 31, 2018
Annual returns
Periods ended March 31, 2019
Quarter Year to date One year Three years Five years Ten years
Fund 2.19% 2.19% 3.73% 2.14% 2.08% 3.59%
Benchmark 2.39% 2.39% 4.27% 2.22% 2.13% 3.85%
The performance data shown represent past performance, which is not a guarantee of futureresults. Investment returns and principal value will fluctuate, so investors’ shares, when sold,may be worth more or less than their original cost. Current performance may be lower or higherthan the performance data cited. For performance data current to the most recent month-end,visit our website at vanguard.com/performance.Figures for periods of less than one year are cumulative returns. All other figures represent averageannual returns. Performance figures include the reinvestment of all dividends and any capital gainsdistributions. All returns are net of expenses.
Total returns
Distribution by issuer–bonds
Finance 25.8%Industrial 25.8Asset-Backed 13.0Commercial Mortgage-Backed 11.3Treasury/Agency 10.0
Foreign 6.7Utilities 4.7Short-Term Reserves 1.9Government Mortgage-Backed 0.6Other 0.2
mprice
Typewritten Text
DATE: 5/15/19 ITEM #: 6j

Fact sheet | March 31, 2019
Vanguard Short-Term Investment-Grade Fund
Bond fund | Institutional Shares
Connect with Vanguard ® > vanguard.comPlain talk about riskThe fund is designed for investors with a low tolerance for risk; however, the fund’s performance could be hurt by: Income risk: The chance that the fund’s income will decline because of falling interest rates.Interest rate risk: The chance that bond prices will decline because of rising interest rates. Interest rate risk should be low for the fund because it investsprimarily in short-term bonds, whose prices are much less sensitive to interest rate changes than are the prices of longer term bonds.Credit risk: The chance that a bond issuer will fail to pay interest or principal in a timely manner or that negative perceptions of the issuer’s ability to make suchpayments will cause the price of that bond to decline. Credit risk should be relatively low for the fund because it invests primarily in bonds that are consideredto be of high quality.Call risk: The chance that during periods of falling interest rates, issuers of callable bonds may call (redeem) securities with higher coupon rates or interestrates before their maturity dates. The fund would then lose any price appreciation above the bond’s call price and would be forced to reinvest the unanticipatedproceeds at lower interest rates, resulting in a decline in the fund’s income.Extension risk: The chance that during periods of rising interest rates, certain debt obligations will be paid off substantially more slowly than originallyanticipated, and the value of those securities may fall. Extension risk is generally low for short-term bond funds.Liquidity risk: The chance that the fund may not be able to sell a security in a timely manner at a desired price. Liquidity risk is generally low for short-termbond funds.Manager risk: The chance that poor security selection will cause the fund to underperform relevant benchmarks or other funds with a similar investmentobjective.BLOOMBERG® is a trademark and service mark of Bloomberg Finance L.P. BARCLAYS® is a trademark and service mark of Barclays Bank Plc, used under license. Bloomberg Finance L.P. and itsaffiliates, including Bloomberg Index Services Limited (”BISL”) (collectively, ”Bloomberg”), or Bloomberg’s licensors own all proprietary rights in the Bloomberg Barclays Indices. The products are notsponsored, endorsed, issued, sold or promoted by “Bloomberg or Barclays”. Bloomberg and Barclays make no representation or warranty, express or implied, to the owners or purchasers of theproducts or any member of the public regarding the advisability of investing in securities generally or in the products particularly or the ability of the Bloomberg Barclays Indices to track general bondmarket performance. Neither Bloomberg nor Barclays has passed on the legality or suitability of the products with respect to any person or entity. Bloomberg’s only relationship to Vanguard and theproducts are the licensing of the Bloomberg Barclays Indices which are determined, composed and calculated by BISL without regard to Vanguard or the products or any owners or purchasers of theproducts Bloomberg has no obligation to take the needs of the products or the owners of the products into consideration in determining, composing or calculating the Bloomberg Barclays Indices.Neither Bloomberg nor Barclays is responsible for and has not participated in the determination of the timing of, prices at, or quantities of the products to be issued. Neither Bloomberg nor Barclays hasany obligation or liability in connection with the administration, marketing or trading of the products.
For more information about Vanguard funds or to obtain a prospectus, see below for which situation is right for you.If you receive your retirement plan statement from Vanguard or log on to Vanguard’s website to view your plan, visit vanguard.com or call 800-523-1188.If you receive your retirement plan statement from a service provider other than Vanguard or log on to a record keeper’s website that is not Vanguard to viewyour plan, please call 855-402-2646. Visit vanguard.com to obtain a prospectus or, if available, a summary prospectus. Investment objectives, risks, charges, expenses, and otherimportant information about a fund are contained in the prospectus; read and consider it carefully before investing.
Financial advisor clients: For more information about Vanguard funds, contact your financial advisor to obtain a prospectus.
Investment Products: Not FDIC Insured • No Bank Guarantee • May Lose Value
© 2019 The Vanguard Group, Inc. All rights reserved. Vanguard Marketing Corporation, Distributor. F0858 032019

For financial professional or qualified institutional investor use only. Not for inspection by, distribution or quotation to, the general public.
voyainvestments.com
Pasadena Fire and Police Ret. System
Quarter Ending March 31, 2019
Prepared for
Portfolio Review
mprice
Typewritten Text
DATE: 5/15/19 ITEM #: 6k

2
Voya Team Table of Contents
For financial professional or qualified institutional investor use only. Not for inspection by, distribution or quotation to, the general public.
Pasadena Fire and Police Ret. System
Dan Norman
Group Head and Managing Director, Senior Loans
Ryan Jusko
Vice President, Institutional Client Advisor
Rosa Martone
Institutional Client Service
Assistant Vice President, Client Service Manager
Phone: 860-275-4607
Email: [email protected]
Web Access:
https://www.investments.voya.com/ClientAccess
.................................................................................. 3 Market Review 4 .................................................................................. Investment Policy 5 .................................................................................. Performance Analysis 7 .................................................................................. Performance Summary 8 .................................................................................. Portfolio Characteristics
10 .................................................................................. Asset Allocation
.................................................................................. 11 Business Highlights 12 .................................................................................. Appendix

3
Market Review - Quarter Ending March 31, 2019
For financial professional or qualified institutional investor use only. Not for inspection by, distribution or quotation to, the general public.
Pasadena Fire and Police Ret. System
The first quarter of 2019 saw a strong equity rally. The continuation of the recovery in risk assets was most evident among U.S. small- and mid-
cap equities, then among U.S. large caps; followed by shallower gains in international developed and emerging markets. In the United States,
the S&P 500 and Russell 2000 indexes returned 13.65% and 14.58%, respectively. Within the S&P 500 index, the technology sector performed
the best, while the healthcare and financial sectors detracted value.
A couple of key factors have lifted investor sentiment; most notably, the U.S. Federal Reserve’s pivot in January to data dependency with its
interest-rate path has shifted market expectations from a hiking cycle on pause to signaling a neutral stance. Additionally, uncertainty
surrounding China‒U.S. trade tensions has diminished, at least over the near term.
At its March meeting, the European Central Bank (ECB) maintained its dovish tone, cutting its 2019 forecast for European GDP from 1.7% to
1.1%. The ECB also unveiled a new round of TLTRO funding (targeted longer-term refinancing operations), the third since 2016. Market
expectations of a rate hike have shifted to September 2020. The MSCI EAFE and Emerging Markets indexes gained 10.13% and 9.95%,
respectively.
In fixed income markets, credit remained the top performer, with high yield and leveraged loans outpacing U.S. Treasurys. Bond markets were
supported by a dovish Fed and easing concerns in credit markets. Spread sectors outperformed as recession worries eased, and corporate
credit snapped back after weakness in the fourth quarter. High yield corporates posted the best returns, supported by stronger financial markets
and demand for yield. The Bloomberg Barclays U.S. Aggregate and Global Aggregate indexes returned 2.94% and 2.20%, respectively. The
U.S. dollar was flat for the quarter against a basket of currencies. Oil prices gained over the quarter, whereas gold prices were flat.

4
Investment Policy
For financial professional or qualified institutional investor use only. Not for inspection by, distribution or quotation to, the general public.
Pasadena Fire and Police Ret. System Senior Loan
Mandate Senior Loan
S&P/LSTA Leveraged Loan Index
The investment management agreement between Voya Investment Management and Pasadena Fire and Police Ret.
System was effective June 27, 2014.
Inception
Actively managed, ultra-short duration floating-rate income strategy that invests primarily in privately syndicated, below
investment grade senior secured corporate loans
Strategy Summary
Supported by an over 50-person dedicated investment team, our investment process focuses on fundamental credit
analysis, relative value assessment and high levels of diversification. We conduct top-down analysis to target industries with strong operating momentum or improving credit conditions, while avoiding those sectors prone to the clustering of
defaults. The other major component of our process, specific borrower selection, is based on fundamental bottom-up credit analysis that includes independent credit research, in-depth collateral review and relative value analysis.
Process
Benchmark
$10,784,125.00 as of March 31, 2019 Account Balance

5
Performance Analysis - Quarter Ending March 31, 2019
For financial professional or qualified institutional investor use only. Not for inspection by, distribution or quotation to, the general public.
Pasadena Fire and Police Ret. System Senior Loan
Portfolio Review
For the quarter, the Trust returned 3.85%, underperforming the index. On a net basis, given the nature of the market’s price rally during the first
quarter, cash held within the Trust (well within the normal operating target levels) detracted from relative returns. On an industry selection basis,
the portfolio’s selection in business equipment and services and nonferrous metals/minerals sectors were the primary contributors to relative
performance. Apart from a small detractor due to selection in the oil and gas sector, relative detractors were distributed across several industries,
with no material impact from any one industry. From an individual issuer perspective, an overweight to Covia Holdings Corporation was the
largest relative contributor, as the company saw its secondary price improve in line with the overall market technical factors during the month.
What’s more, a move higher in oil prices supported the fracking industry’s fundamentals. Still, the total effect was more than offset by an
overweight to Maxar Technologies Ltd, which traded down following the announcement of fourth quarter results that showed weaker than
expected performance in its space systems segment. The Trust’s underweight to BB-rated loans was a detractor on a relative basis given the
cohort’s outperformance versus the broad Index.
The Trust did not experience any defaults during the quarter, versus four defaults for the index. Diversification measures remain robust, with 307
individual issuers and 34 different industry sectors represented.
Current Strategy and Outlook
On the heels of the significant technical correction that occurred in the last two months of last year, 2019 opened with plenty of discounted
valuations, prompting loan managers to move into bargain-hunting mode. Following the retreat, the average bid price of the S&P/LSTA
Leveraged Loan index (the “index”) gained 257 basis points (bp) over the quarter, resulting in a total return of 4.00% for the Index, the best
quarterly performance in nine years.
As the new-year rally underpinned the secondary market, arrangers were met with a healthier backdrop to clear out some backlogged supply in
January. Still, after the initial jump, the primary market experienced a supply lull that lasted through the entirety of the quarter. Total institutional

6
Performance Analysis - Quarter Ending March 31, 2019
For financial professional or qualified institutional investor use only. Not for inspection by, distribution or quotation to, the general public.
Pasadena Fire and Police Ret. System Senior Loan
loan volume aggregated to just $77.9 billion, which was slightly above fourth quarter’s figure, but marked the second lightest quarter since 1Q’16
($40.7 billion). To no one’s surprise, some of the factors behind the fourth quarter of 2018 turmoil can still be felt, especially when digging into
other side of the technical equation. Outflows from retail loan funds, while down significantly relative to December totals, continued to
reverberate throughout the market in the first quarter of 2019, resulting in an $11 billion withdrawal from the asset class. CLO issuance, a far
larger technical driver, picked up mid-quarter but is still down year-over-year by about 11%, at $28.4 billion. Nonetheless, the loan market ended
the quarter with a more balanced technical equation compared to the start of the year.
From a return by ratings perspective, the year-to-date leaderboard reflects a hierarchy favoring higher-rated credits. BBs have outpaced the
broad index at 4.33%, followed by single Bs at 3.91% and CCCs at 3.58%. The outperformance to start the year was largely expected given the
underperformance of BB-rated loans (-0.42%) versus lower rated credits in 2018: single B’s and CCC’s returned 0.86% and 2.35%, respectively.
Turning to default activity, the index default rate ended March at its lowest level in roughly seven years, at 0.93% by amount outstanding. The
main catalyst behind the steep decline was the drop-off of iHeart Media (one of the largest bankruptcies ever) from the rolling calculation.
Generally speaking, we have not materially changed our overall positioning and continue to focus on avoiding idiosyncratic credit and undue
sector risk, while maintaining an appropriate diversification profile.
While expectations for future hikes in 2019 have been all but eliminated in the minds of most investors and analysts, average coupons and yields
continue to garner the attention of investors willing to go beyond the simplistic view that the asset class provides value only in a rising-rate
environment. The weighted average coupon within the index ended the quarter at 5.98%, well above the long-term historical average for 4.73%
for the asset class. Furthermore, barring a rapid decline in economic growth, we believe reasonably sufficient credit fundamentals should help
keep default rates relatively low for the remainder of the year. Due to the combination of these two factors, along with more potential upside for
loan prices (index bid currently at 96.41), we view current market conditions attractive for loan investing.

7
Performance Summary
For financial professional or qualified institutional investor use only. Not for inspection by, distribution or quotation to, the general public.
Pasadena Fire and Police Ret. System Senior Loan
Quarter 1 Year 3 Year Since Inception*
Portfolio Gross (%) 3.85 3.06 5.06 3.87
Portfolio Net (%) 3.73 2.55 4.54 3.36
Benchmark (%) 4.00 2.97 5.67 3.51
Relative to Gross (%) -0.15 0.09 -0.61 0.36
Calendar Year Returns 2018 2017 2016 2015
Portfolio Gross (%) 0.81 3.67 8.52 1.39
Portfolio Net (%) 0.31 3.16 7.98 0.88
Benchmark (%) 0.44 4.12 10.16 -0.69
Quarter Ending March 31, 2019
*Performance inception date is 7/01/2014. Benchmark: S&P/LSTA Leveraged Loan Index
Performance returns for time periods greater than 1 year are annualized. Past performance does not guarantee future results.
Investors cannot invest directly in an index. See Explanatory Notes Section for footnotes and disclosures.

8
Portfolio Characteristics
Quarter Ending March 31, 2019
Characteristics Portfolio
Number of Industries 34
Average per Industry $59,590,210
Average per Industry as a % of AUM 2.94%
Number of Issuers 307
Average per Issuer $6,599,567
Average per Issuer as a % of AUM 0.33%
Weighted Average Spread 3.49%
Weighted Average Maturity Years 5.39
Weighted Average Market Price 97.54%
Leverage for Investment Purposes Percent 0.00%
Weighted Average Days To Reset 0
Weighted Average Coupon 6.05
Weighted Average Quality B+
Discount Yield To 3 yr Call 6.97
Total AUM ($ Millions) 2026.07
% of Loans Denominated in USD 100.00%
Weighted Average Rating Factor 2457.00
See Explanatory Notes Section for footnotes and disclosures.
For financial professional or qualified institutional investor use only. Not for inspection by, distribution or quotation to, the general public.
Pasadena Fire and Police Ret. System Senior Loan
Returns-Based Statistics (10 years) Portfolio Benchmark
Standard Deviation (%) 3.98 5.02
Tracking Error (%) 1.39 N/A
Information Ratio -0.40 N/A
Alpha (annualized %) 1.14 N/A
Beta 0.78 1.00
R-Squared 0.96 1.00
Sharpe Ratio 1.76 1.51
Portfolio holdings characteristics are subject to change and may not be representative of current holdings and characteristics.

9
Portfolio Characteristics
Quarter Ending March 31, 2019
For financial professional or qualified institutional investor use only. Not for inspection by, distribution or quotation to, the general public.
Pasadena Fire and Police Ret. System Senior Loan
See Explanatory Notes Section for footnotes and disclosures.
Loans by Country % of MV
United States 87.9%
United Kingdom 4.4%
Canada 3.7%
Netherlands 1.7%
IMN 0.6%
Belgium 0.4%
Germany 0.4%
New Zealand 0.3%
Czech Republic 0.2%
France 0.2%
Hong Kong 0.1%
Asset Breakdown (%) Portfolio
Senior Loans 98.3%
- First Lien 97.3%
- Second Lien 2.7%
- Secured 100.0%
- Unsecured 0.0%
Fixed Rate Notes/Bonds 0.0%
Structured Products 0.0%
Cash & Other Net Assets* 1.7%
*These weightings reflect "other net assets." "Other net assets" include cash, payable, receivables and all other assets and liabilities on the

10
Asset Allocation
Quarter Ending March 31, 2019
For financial professional or qualified institutional investor use only. Not for inspection by, distribution or quotation to, the general public.
Pasadena Fire and Police Ret. System Senior Loan
Top Issuers ($ millions) Market Value % of MV
Refinitiv (aka Thomson Reuters Financial & $29.6 1.49%
Asurion, LLC $25.5 1.28%
Level 3 Financing, Inc $20.3 1.02%
Caesars Resort Collection $19.7 0.99%
Gates Global LLC $19.4 0.97%
Envision Healthcare Corporation $19.3 0.97%
Bausch Health Companies, Inc. $19.2 0.97%
Scientific Games International, Inc. $18.1 0.91%
Albertsons LLC $16.6 0.84%
JBS USA, Inc. (FKA Swift) $16.4 0.83%
Industry Allocations* Market Value % of MV
Electronics/Electrical $291.6 14.65%
Business Equipment & Services $258.3 12.97%
Health Care $204.4 10.27%
Telecommunications $120.0 6.03%
Diversified Insurance $96.4 4.84%
Leisure Goods/Activities/Movies $91.8 4.61%
Lodging & Casinos $81.9 4.12%
Retailers (Except Food & Drug) $79.7 4.00%
Chemicals & Plastics $69.0 3.47%
Containers & Glass Products $65.0 3.27%
Building & Development $62.2 3.12%
Food Products $61.3 3.08%
Automotive $59.6 2.99%
Financial Intermediaries $58.0 2.91%
Food Service $53.9 2.71%
Other $337.8 16.96%
See Explanatory Notes Section for footnotes and disclosures.
Allocations may not add to 100% due to rounding.
*Industry allocation is tracked using S&P Industries.

11
For financial professional or qualified institutional investor use only. Not for inspection by, distribution or quotation to, the general public.
Pasadena Fire and Police Ret. System
Business Highlights - Quarter Ending March 31, 2019
Voya’s Toms Named A Top 10 Fund Manager To Watch
Financial Planning’s Money Management Executive unveiled its list of
the Top 10 Fund Managers To Watch for 2019, including Voya
Investment Management Chief Investment Officer Matt Toms.
https://corporate.voya.com/newsroom/news-releases/voya-investment- management-named-pensions-investments-magazines-2018-best
Investment Outlook: Current Viewpoints
Fixed Income Perspectives
Multi-Asset Perspectives
Senior Loan Talking Points
https://institutional.voya.com/insights/investment-outlook
Voya IM Blog provides regular access to our most compelling
insights across fixed income, senior loans, equity and multi-asset
strategies and solutions
https://investments.voya.com/Institutional/Research-Insights/Blog
Research Papers
https://institutional.voya.com/insights/research
If you would like to receive any of our thought leadership, please contact your
client service representative or visit our website: www.voyainvestments.com
Thought Leadership
Personnel Update Voya in the News
Additions
Anuranjan Sharma – Macro Strategist, Fixed Income Research
Kevin Shea – Equity Research Analyst
Scott Heath – Real Estate Investment Officer
Departures
Abhishek Sinha – Portfolio Manager, Investment Grade Fixed
Income
Staff Changes on Fixed Income Platform
Mustafa Chowdhury, head of rates for Voya Investment
Management’s fixed income platform and portfolio manager for
Voya’s global bond strategy, has announced his retirement effective
August 31, 2019. We thank Mustafa for his many years of service to
Voya, and wish him well in his retirement.
Mustafa’s team will be incorporated into the macro and quantitative
research team led by Brian Timberlake. In addition, we are pleased
to announce that Anuranjan Sharma has joined the Voya fixed
income team. He will contribute to the macro and FX processes as
part of Brian Timberlake’s team.
With Anuranjan joining the firm, we do not anticipate a direct
replacement for Mustafa at this time. As always, however, the Voya
fixed income team will evaluate its resources and expand the team
as necessary to support the growth of its client base.

12
Appendix
For financial professional or qualified institutional investor use only. Not for inspection by, distribution or quotation to, the general public.
Pasadena Fire and Police Ret. System
.............................................................................................. 13 Portfolio: Voya Senior Loan Trust
........................................................................................ Holdings 13
.............................................................................................. 32 Explanatory Notes

13
Holdings Report
Quarter Ending March 31, 2019
For financial professional or qualified institutional investor use only. Not for inspection by, distribution or quotation to, the general public.
Pasadena Fire and Police Ret. System Senior Loan
Issuer LoanX ID Tranche Market Value % Portfolio Maturity Spread %
S&P
Rating Price Industry (S&P)
Aerospace & Defense
Maxar Technologies Ltd. (f/k/a MacDonald, Dettwiler and Associates Ltd. LX166203 Term Loan B $13,752,586 0.69% 10/04/2024 2.75 B 78.29 Aerospace & Defense
Transdigm, Inc. LX171403 Term Loan G $5,024,759 0.25% 8/22/2024 2.50 B+ 97.60 Aerospace & Defense
KBR LX171821 Term Loan B $4,159,022 0.21% 4/25/2025 3.75 B+ 100.25 Aerospace & Defense
Transdigm, Inc. LX173457 Incremental Term Loan F $3,044,483 0.15% 6/09/2023 2.50 B+ 97.80 Aerospace & Defense
StandardAero LX178165 Term Loan B-1 $758,807 0.04% 1/24/2026 4.00 B 100.15 Aerospace & Defense
StandardAero LX178418 Term Loan B-2 $407,961 0.02% 1/24/2026 4.00 B 100.15 Aerospace & Defense
$27,147,619 1.36%
Automotive
Gates Global LLC LX169689 USD TL $19,390,491 0.97% 4/01/2024 2.75 B+ 99.10 Automotive
American Traffic Solutions LX171476 Upsized First Lien Term Loan $6,148,712 0.31% 2/28/2025 3.75 B+ 100.09 Automotive
Caliber Collision LX178151 First Lien Term Loan $5,001,697 0.25% 1/24/2026 3.50 B 100.23 Automotive
Truck Hero, Inc. LX163494 Upsized First Lien Term Loan $4,642,742 0.23% 4/21/2024 3.75 B 96.44 Automotive
JCI Power Solutions LX179100 USD Term Loan $4,365,790 0.22% 3/18/2026 3.50 B+ 99.00 Automotive
Lumileds LX171142 Upsized Term Loan $3,864,039 0.19% 6/30/2024 3.50 B 78.88 Automotive
EOC Group, Inc. LX171798 First Lien Term Loan $3,494,642 0.18% 3/20/2025 3.25 B 98.13 Automotive
Dynacast International LLC LX144577 2017 First Lien Term Loan $3,060,872 0.15% 1/28/2022 3.25 B 98.63 Automotive
Hertz Corporation (The) LX153003 Term Loan B $2,934,054 0.15% 6/30/2023 2.75 BB 98.31 Automotive
Superior Industries International, Inc. LX174310 Term Loan B $2,690,406 0.14% 5/22/2024 4.00 B 98.00 Automotive
Holley/Driven LX176336 First Lien Term Loan $2,224,699 0.11% 10/15/2025 5.00 B- 98.25 Automotive
Truck Hero, Inc. LX163496 Second Lien Term Loan $1,350,375 0.07% 4/21/2025 8.25 CCC+ 97.50 Automotive
EOC Group, Inc. LX171800 DD First Lien $454,164 0.02% 3/20/2025 3.25 B 98.13 Automotive
$59,622,681 2.99%

14
Holdings Report
Quarter Ending March 31, 2019
For financial professional or qualified institutional investor use only. Not for inspection by, distribution or quotation to, the general public.
Pasadena Fire and Police Ret. System Senior Loan
Issuer LoanX ID Tranche Market Value % Portfolio Maturity Spread %
S&P
Rating Price Industry (S&P)
Beverage & Tobacco
Refresco Group N.V. LX170104 TL B USD $4,026,587 0.20% 3/28/2025 3.25 B+ 99.25 Beverage & Tobacco
$4,026,587 0.20%
Building & Development
Ply Gem Industries, Inc. LX172378 Incremental Term Loan B $12,066,803 0.61% 4/12/2025 3.75 B+ 95.50 Building & Development
Quikrete Holdings LX155959 Term Loan B $9,978,396 0.50% 11/15/2023 2.75 BB- 97.50 Building & Development
HD Supply Waterworks, Ltd. LX167192 Term Loan B $9,251,016 0.46% 8/01/2024 3.00 B+ 99.37 Building & Development
Wilsonart LLC LX167947 Term Loan B $8,055,426 0.40% 12/19/2023 3.25 B+ 97.28 Building & Development
Gypsum Management & Supply, Inc. (a/k/a GMS) LX173655 First Lien Term Loan $7,313,147 0.37% 6/01/2025 2.75 BB- 97.31 Building & Development
Henry Company LLC LX154802 Term Loan B $4,714,404 0.24% 10/05/2023 4.00 B 99.81 Building & Development
WernerCo LX165605 Incremental Term Loan B $4,132,700 0.21% 7/24/2024 4.00 B 96.50 Building & Development
SMG LX170713 First Lien Term Loan $3,696,902 0.19% 1/23/2025 3.00 B+ 99.04 Building & Development
Interior Logic Group, Inc. LX173552 Term Loan B $2,956,411 0.15% 5/31/2025 4.00 B 98.44 Building & Development
$62,165,205 3.12%
Business Equipment & Services
Refinitiv (aka Thomson Reuters Financial & Risk) LX174544 1L USD $29,564,918 1.49% 9/17/2025 3.75 B 97.18 Business Equipment & Services
Misys (Finastra) LX163228 TL B USD $13,386,260 0.67% 6/13/2024 3.50 B- 96.55 Business Equipment & Services
Red Ventures LX176332 1st Lien with Add-On $12,969,357 0.65% 11/08/2024 3.00 B+ 99.42 Business Equipment & Services
AlixPartners, LLP LX161956 Upsized Term Loan B $12,231,164 0.61% 4/04/2024 2.75 B+ 99.56 Business Equipment & Services
Verscend Technologies, Inc. LX175332 Term Loan B $12,048,566 0.61% 8/09/2025 4.50 B+ 99.31 Business Equipment & Services
Paysafe LX169667 TL B USD add-on $10,554,015 0.53% 1/03/2025 3.50 B 98.39 Business Equipment & Services
KinderCare Education, LLC (fka Knowledge Universe Education, LLC) LX176016 Upsized 2025 First Lien Term Loan $10,151,173 0.51% 2/20/2025 3.75 B- 98.72 Business Equipment & Services
Staples, Inc. LX166934 TL-B $10,025,279 0.50% 9/12/2024 4.00 B+ 99.49 Business Equipment & Services
NVA Holdings, Inc. LX171118 Upsized Incremental Term Loan B-3 $9,804,148 0.49% 2/02/2025 2.75 B 96.96 Business Equipment & Services

15
Holdings Report
Quarter Ending March 31, 2019
For financial professional or qualified institutional investor use only. Not for inspection by, distribution or quotation to, the general public.
Pasadena Fire and Police Ret. System Senior Loan
Issuer LoanX ID Tranche Market Value % Portfolio Maturity Spread %
S&P
Rating Price Industry (S&P)
Business Equipment & Services
West Corp LX168759 Term Loan $8,814,897 0.44% 10/10/2024 4.00 B 94.00 Business Equipment & Services
Cision LX167639 US Term Loan $7,987,709 0.40% 6/16/2023 2.75 B 99.13 Business Equipment & Services
Endurance International LX174135 Term Loan B $7,776,337 0.39% 2/09/2023 3.75 B+ 99.71 Business Equipment & Services
Verifone, Inc. LX175222 1st Lien Term Loan $7,094,406 0.36% 8/15/2025 4.00 B 98.58 Business Equipment & Services
Legal Shield LX172721 1L Term Loan $7,081,003 0.36% 5/01/2025 3.00 B 98.81 Business Equipment & Services
Solera Management LX151194 USD Term Loan B $7,040,373 0.35% 3/03/2023 2.75 B 99.40 Business Equipment & Services
Clarivate (f/k/a Thomson Reuters Intellectual Property & Science) LX169575 1st Lien Term Loan $6,040,692 0.30% 10/03/2023 3.25 B+ 99.50 Business Equipment & Services
Convergint Technologies LX170999 New Upsized Term Loan $5,706,823 0.29% 2/03/2025 3.00 B 97.25 Business Equipment & Services
Prometric LX170802 First Lien Term Loan $5,682,297 0.29% 1/29/2025 3.00 B 98.88 Business Equipment & Services
iQor LX135318 1st Lien Term Loan $5,064,695 0.25% 4/01/2021 5.00 CCC 94.03 Business Equipment & Services
Ascend Learning LLC LX166009 Term Loan B $5,047,693 0.25% 7/12/2024 3.00 B 98.25 Business Equipment & Services
Garda World Security Corp. LX162709 US Term Facility $5,042,949 0.25% 5/24/2024 3.50 B 99.33 Business Equipment & Services
Learning Care Group LX171794 First Lien Term Loan $5,024,466 0.25% 3/13/2025 3.25 B- 98.17 Business Equipment & Services
Yak Mat LX173885 1st Lien TL $5,016,305 0.25% 7/02/2025 5.00 B 85.50 Business Equipment & Services
GreenSky LX172188 Term Loan B $4,601,967 0.23% 3/26/2025 3.25 B+ 99.63 Business Equipment & Services
West Corp LX172702 Term Loan B-1 $4,348,906 0.22% 10/10/2024 3.50 B 93.03 Business Equipment & Services
Guidehouse (f/k/a Eton, a/k/a PricewaterhouseCoopers Public Sector) LX171987 First Lien Term Loan $4,216,438 0.21% 5/01/2025 3.00 B 98.00 Business Equipment & Services
EVO Payments LX173992 Upsized 1L Term Loan $4,012,092 0.20% 12/22/2023 3.25 B 99.94 Business Equipment & Services
Spring Education LX174889 Incermental First Lien Term Loan $3,779,710 0.19% 7/30/2025 4.25 B- 99.31 Business Equipment & Services
Renaissance Learning Inc. LX173615 1st Lien Term Loan $3,501,329 0.18% 5/31/2025 3.25 B- 96.13 Business Equipment & Services
Big Ass Fans, LLC LX174412 First Lien Term Loan $3,074,229 0.15% 5/21/2024 3.75 B 100.06 Business Equipment & Services
EagleView Technology Corporation LX175037 1st Lien Term Loan $2,967,369 0.15% 7/31/2025 3.50 B+ 97.38 Business Equipment & Services
Procera Networks, Inc. LX176609 1st Lien $2,800,232 0.14% 10/25/2025 4.50 B- 98.50 Business Equipment & Services
SurveyMonkey.com, LLC LX176247 Term Loan $2,762,222 0.14% 10/15/2025 3.75 B+ 98.25 Business Equipment & Services

16
Holdings Report
Quarter Ending March 31, 2019
For financial professional or qualified institutional investor use only. Not for inspection by, distribution or quotation to, the general public.
Pasadena Fire and Police Ret. System Senior Loan
Issuer LoanX ID Tranche Market Value % Portfolio Maturity Spread %
S&P
Rating Price Industry (S&P)
Business Equipment & Services
Research Now LX169473 First Lien Term Loan $2,625,053 0.13% 12/20/2024 5.50 B 99.38 Business Equipment & Services
Learning Care Group LX171796 Second Lien Term Loan $2,084,525 0.10% 3/13/2026 7.50 CCC 99.50 Business Equipment & Services
iQor LX135320 2nd Lien Term Loan $2,064,035 0.10% 4/01/2022 8.75 CC 80.83 Business Equipment & Services
Advantage Sales & Marketing, Inc. LX138509 Second Lien Term Loan $1,889,247 0.09% 7/25/2022 6.50 CCC+ 73.67 Business Equipment & Services
Misys (Finastra) LX163231 TL 2nd lien USD $1,592,663 0.08% 6/13/2025 7.25 CCC 96.53 Business Equipment & Services
Renaissance Learning Inc. LX173617 2nd Lien Term Loan $872,550 0.04% 5/29/2026 7.00 CCC 92.33 Business Equipment & Services
Verifone, Inc. LX175224 2nd Lien Term Loan $818,300 0.04% 8/09/2026 8.00 B- 98.00 Business Equipment & Services
AlliedUniversal fka Universal Services of America LX176296 Incremental First Lien Term Loan $778,272 0.04% 7/28/2022 4.25 B- 97.90 Business Equipment & Services
Legal Shield LX172723 2L Term Loan $352,781 0.02% 5/01/2026 7.50 CCC+ 99.38 Business Equipment & Services
Neustar, Inc. LX171717 Term Loan B-4 $0 0.00% 8/08/2024 3.50 BB- 96.58 Business Equipment & Services
$258,297,443 12.97%
Cable & Satellite Television
RCN Grande Cable LX157714 TLB $12,132,801 0.61% 2/01/2024 3.00 B 97.86 Cable & Satellite Television
Virgin Media Investment Holdings Limited LX169525 TL K USD $6,579,141 0.33% 1/15/2026 2.50 BB- 99.01 Cable & Satellite Television
UPC Financing Partnership LX169045 USD TLB AR $6,549,409 0.33% 1/15/2026 2.50 BB 99.76 Cable & Satellite Television
Wideopenwest Finance, LLC LX165396 2016 TLB $4,660,500 0.23% 8/18/2023 3.25 B 96.34 Cable & Satellite Television
$29,921,852 1.50%
Chemicals & Plastics
Avantor Inc LX168603 USD Term B $14,392,728 0.72% 11/24/2024 3.75 B 100.35 Chemicals & Plastics
AkzoNobel Specialty Chemicals (Starfruit Finco B.V.) LX175815 TL B USD $13,099,892 0.66% 10/01/2025 3.25 B+ 98.72 Chemicals & Plastics
Tronox Finance LLC LX168581 B1 Term Loan $10,322,677 0.52% 9/23/2024 3.00 BB- 99.74 Chemicals & Plastics
Atotech LX159041 TL B USD $7,398,435 0.37% 1/31/2024 3.00 B 98.06 Chemicals & Plastics
Tronox Finance LLC LX168798 B2 Term Loan $4,666,115 0.23% 9/23/2024 3.00 BB- 99.74 Chemicals & Plastics

17
Holdings Report
Quarter Ending March 31, 2019
For financial professional or qualified institutional investor use only. Not for inspection by, distribution or quotation to, the general public.
Pasadena Fire and Police Ret. System Senior Loan
Issuer LoanX ID Tranche Market Value % Portfolio Maturity Spread %
S&P
Rating Price Industry (S&P)
Chemicals & Plastics
Cypress Performance Group (a/k/a Encapsys) LX169170 First Lien Term Loan $4,410,691 0.22% 11/07/2024 3.25 B 98.13 Chemicals & Plastics
Allnex S.a.r.l. (Monarch) LX152754 Term B-2 new $4,308,992 0.22% 9/13/2023 3.25 B 99.31 Chemicals & Plastics
AOC / Aliancys LX174417 Term Loan $3,989,651 0.20% 8/01/2025 4.25 B+ 99.50 Chemicals & Plastics
Allnex S.a.r.l. (Monarch) LX152923 Term B-3 new $3,246,353 0.16% 9/13/2023 3.25 B 99.31 Chemicals & Plastics
SI Group (aka Polar US Borrower LLC) LX175356 Term Loan $1,992,500 0.10% 10/15/2025 4.75 B 99.63 Chemicals & Plastics
Natgasoline, LLC LX176628 Term Loan $1,178,492 0.06% 11/14/2025 3.50 BB- 100.12 Chemicals & Plastics
$69,006,526 3.47%
Clothing/Textiles
Varsity Brands (fka Herff Jones, Inc.) LX169970 Senior Secured First Lien $10,174,298 0.51% 12/11/2024 3.50 B 98.50 Clothing/Textiles
$10,174,298 0.51%
Containers & Glass Products
Novolex (aka Flex Acquisition Company, Inc) LX157924 First Lien Term Loan $9,321,015 0.47% 12/29/2023 3.00 B 97.16 Containers & Glass Products
Bway Holding Company LX161694 Upsized Term Loan $7,213,278 0.36% 4/03/2024 3.25 B 97.80 Containers & Glass Products
Reynolds Group Holdings Inc LX159202 USD Term Loan $6,728,503 0.34% 2/04/2023 2.75 B+ 98.96 Containers & Glass Products
Novolex (aka Flex Acquisition Company, Inc) LX174279 Incremental TL $6,190,607 0.31% 6/29/2025 3.25 B 97.21 Containers & Glass Products
TricorBraun LX156672 Incremental 1L TL $6,131,292 0.31% 11/30/2023 3.75 B- 99.92 Containers & Glass Products
Trident TPI Holdings, Inc (a.k.a Tekni Plex) LX168808 Re-Upsized Term Loan $5,922,717 0.30% 10/17/2024 3.25 B- 96.75 Containers & Glass Products
Ring Container Technologies, LLC LX168799 Upsized First Lien Term Loan $4,849,511 0.24% 10/31/2024 2.75 B 98.29 Containers & Glass Products
Berlin Packaging, LLC LX173185 1L TL $3,987,145 0.20% 11/07/2025 3.00 B- 97.13 Containers & Glass Products
Pelican Products, Inc. LX172822 First Lien Term Loan $3,978,883 0.20% 5/01/2025 3.50 B 98.50 Containers & Glass Products
Consolidated Container Company LLC LX163510 Term Loan $3,447,225 0.17% 5/22/2024 2.75 BB- 98.69 Containers & Glass Products
Albea S.A LX172001 USD TLB $3,198,159 0.16% 4/22/2024 3.00 B 98.13 Containers & Glass Products
Ball Metalpack (aka Finco, LLC) LX174848 1L Term Loan $3,182,804 0.16% 7/31/2025 4.50 B 99.13 Containers & Glass Products

18
Holdings Report
Quarter Ending March 31, 2019
For financial professional or qualified institutional investor use only. Not for inspection by, distribution or quotation to, the general public.
Pasadena Fire and Police Ret. System Senior Loan
Issuer LoanX ID Tranche Market Value % Portfolio Maturity Spread %
S&P
Rating Price Industry (S&P)
Containers & Glass Products
ProAmpac PG Borrower LLC LX156416 Second Lien Term Loan $850,425 0.04% 11/18/2024 8.50 CCC+ 97.75 Containers & Glass Products
$65,001,562 3.27%
Cosmetics/Toiletries
PDC Brands LX165998 First Lien Term Loan $3,925,353 0.20% 6/30/2024 4.25 B 98.63 Cosmetics/Toiletries
$3,925,353 0.20%
Diversified Insurance
Acrisure, LLC LX169343 Existing Term Loan (11/2017) $15,108,225 0.76% 11/22/2023 4.25 B 99.41 Diversified Insurance
Alliant Holdings, I, LLC LX173270 Upsized Term Loan B $9,967,596 0.50% 5/09/2025 2.75 B 96.50 Diversified Insurance
Hub International Limited LX173150 New Term Loan $9,796,934 0.49% 4/25/2025 2.75 B 96.86 Diversified Insurance
National Financial Partners Corp. LX157681 Upsized Term Loan B $9,172,917 0.46% 1/08/2024 3.00 B 96.54 Diversified Insurance
USI, Inc. LX167989 Upsized Term Loan $8,861,033 0.45% 5/16/2024 3.00 B 96.88 Diversified Insurance
AssuredPartners, Inc. LX168847 Incremental 1st Lien TL (10/2018) $8,860,991 0.45% 10/22/2024 3.25 B 97.00 Diversified Insurance
CCC Information Services Group, Inc. LX161958 1st Lien Term Loan $8,793,616 0.44% 4/29/2024 3.00 B 98.48 Diversified Insurance
Applied Systems Inc. LX168507 Incremental 1st Lien Term Loan $8,143,724 0.41% 9/19/2024 3.00 B- 98.90 Diversified Insurance
OneDigital LX176137 First Lien Term Loan $5,197,313 0.26% 10/03/2025 4.00 B 99.38 Diversified Insurance
Sedgwick Holdings, Inc. LX176786 Term Loan B $4,858,954 0.24% 12/31/2025 3.25 B 98.11 Diversified Insurance
Alera LX174984 Incremental 1st Lien Term Loan $4,158,798 0.21% 8/01/2025 4.50 B 100.88 Diversified Insurance
Cetera Financial Group LX175452 1st Lien Term Loan $2,130,361 0.11% 10/01/2025 4.25 B- 98.88 Diversified Insurance
Applied Systems Inc. LX168509 Incremental 2nd Lien Term Loan $1,012,188 0.05% 9/19/2025 7.00 CCC 101.22 Diversified Insurance
CCC Information Services Group, Inc. LX161960 2nd Lien Term Loan $298,500 0.01% 4/28/2025 6.75 CCC 99.50 Diversified Insurance
$96,361,148 4.84%

19
Holdings Report
Quarter Ending March 31, 2019
For financial professional or qualified institutional investor use only. Not for inspection by, distribution or quotation to, the general public.
Pasadena Fire and Police Ret. System Senior Loan
Issuer LoanX ID Tranche Market Value % Portfolio Maturity Spread %
S&P
Rating Price Industry (S&P)
Drugs
Amneal Pharmaceuticals LLC LX172008 Term B $10,101,494 0.51% 5/05/2025 3.50 BB- 99.87 Drugs
Alvogen Pharma U.S. LX174280 Term Loan B $6,733,955 0.34% 4/02/2022 4.75 B 97.63 Drugs
Endo LLC LX163026 Term B $2,648,710 0.13% 4/29/2024 4.25 B+ 98.53 Drugs
$19,484,159 0.98%
Ecological Services & Equipment
GFL Environmental Inc. LX173477 First Lien Term Loan $8,383,360 0.42% 5/31/2025 3.00 B+ 97.13 Ecological Services & Equipment
Gopher Resource, LLC LX171303 Upsized FIrst Lien Term Loan $5,224,007 0.26% 3/06/2025 3.25 B 99.75 Ecological Services & Equipment
$13,607,367 0.68%
Electronics/Electrical
SolarWinds Holdings, Inc. LX171686 Term Loan $15,575,771 0.78% 2/05/2024 2.75 B 99.11 Electronics/Electrical
BMC Software, Inc. LX174341 USD Term Loan $13,979,000 0.70% 10/02/2025 4.25 B 98.14 Electronics/Electrical
Kronos Incorporated LX163804 First Lien Term Loan $13,909,462 0.70% 11/01/2023 3.00 B 99.04 Electronics/Electrical
McAfee, LLC LX176623 USD 1st Lien Term Loan $13,361,208 0.67% 9/30/2024 3.75 B 99.86 Electronics/Electrical
Internet Brands, Inc. LX168014 1st Lien incl Add-On $12,237,739 0.61% 9/13/2024 3.75 B 98.82 Electronics/Electrical
Rackspace Hosting LX169594 Upsized Term Loan B $11,689,304 0.59% 11/03/2023 3.00 BB- 93.88 Electronics/Electrical
JDA Software (f.k.a RedPrairie Corporation) LX155106 Term Loan B $10,087,996 0.51% 10/12/2023 2.75 B 98.88 Electronics/Electrical
Epicor Software Corporation LX144606 Incremental Term Loan $9,989,991 0.50% 6/01/2022 3.25 B- 98.98 Electronics/Electrical
Quest Software US Holdings Inc. LX173579 1st Lien Term Loan $9,051,957 0.45% 5/15/2025 4.25 B+ 98.91 Electronics/Electrical
Informatica Corporation LX170849 USD Term Loan B $8,730,787 0.44% 8/05/2022 3.25 B 99.89 Electronics/Electrical
Greeneden U.S. Holdings II, L.L.C. LX171645 USD Term Loan $8,346,908 0.42% 12/01/2023 3.25 B- 98.81 Electronics/Electrical
Vertafore, Inc. LX173729 1st Lien Term Loan $8,287,385 0.42% 7/02/2025 3.25 B- 98.43 Electronics/Electrical
Hyland Software, Inc. LX176492 1st Lien Term Loan $8,286,323 0.42% 7/01/2024 3.50 B- 100.02 Electronics/Electrical
Veritas Technologies Corporation LX165578 USD Term Loan B-1 $8,236,168 0.41% 1/27/2023 4.50 B 92.81 Electronics/Electrical

20
Holdings Report
Quarter Ending March 31, 2019
For financial professional or qualified institutional investor use only. Not for inspection by, distribution or quotation to, the general public.
Pasadena Fire and Police Ret. System Senior Loan
Issuer LoanX ID Tranche Market Value % Portfolio Maturity Spread %
S&P
Rating Price Industry (S&P)
Electronics/Electrical
Micro Focus LX163339 Seattle Term Loan $7,289,638 0.37% 6/21/2024 2.50 BB- 97.33 Electronics/Electrical
Riverbed Technology, Inc. LX152765 1st Lien Term Loan $7,058,685 0.35% 4/24/2022 3.25 B+ 91.05 Electronics/Electrical
Imperva, Inc. LX176959 1st Lien Term Loan $7,048,644 0.35% 1/12/2026 4.00 B- 99.42 Electronics/Electrical
Rocket Software, Inc. LX176847 1st Lien Term Loan $6,893,070 0.35% 11/30/2025 4.25 B 99.89 Electronics/Electrical
Barracuda Networks, Inc. LX170759 1st Lien Term Loan $6,847,773 0.34% 2/12/2025 3.25 B- 99.42 Electronics/Electrical
Skillsoft Corp. LX136501 First Lien Term Loan $6,225,781 0.31% 4/28/2021 4.75 CCC+ 84.25 Electronics/Electrical
Infor (US), Inc. LX159959 USD Term Loan B $5,979,372 0.30% 2/01/2022 2.75 B 99.66 Electronics/Electrical
PowerSchool LX174029 1st Lien Term Loan $5,773,514 0.29% 8/01/2025 3.25 B- 97.69 Electronics/Electrical
Compuware Corporation LX175334 Term Loan $5,146,757 0.26% 8/22/2025 3.50 B 100.19 Electronics/Electrical
Optiv Security, Inc. (f.k.a. Accuvant Inc.) LX158907 1st Lien Term Loan $5,061,998 0.25% 2/01/2024 3.25 B- 96.00 Electronics/Electrical
Bomgar Corporation LX172811 Term Loan $5,060,961 0.25% 4/17/2025 4.00 B- 98.96 Electronics/Electrical
Superion LX175394 Incremental 1st Lien Term Loan $4,966,337 0.25% 8/31/2025 3.75 B 98.69 Electronics/Electrical
Dynatrace LLC LX175134 1st Lien Term Loan $4,931,027 0.25% 8/15/2025 3.25 B 99.77 Electronics/Electrical
Navex Global LX175329 1st Lien Term Loan $4,500,945 0.23% 9/04/2025 3.25 B- 98.13 Electronics/Electrical
TTM Technologies LX168563 Upsized Term Loan B $4,418,829 0.22% 9/28/2024 2.50 BB+ 98.88 Electronics/Electrical
Cohu, Inc. LX175809 Term Loan B $4,087,410 0.21% 10/02/2025 3.00 BB- 97.00 Electronics/Electrical
ASG Technologies Group, Inc. LX171144 Term Loan $3,969,752 0.20% 7/31/2024 3.50 B 98.31 Electronics/Electrical
Avast Software B.V. LX173191 Term Loan USD $3,640,384 0.18% 9/29/2023 2.50 BB 99.99 Electronics/Electrical
Travelport, Inc. LX179026 First Lien $3,321,375 0.17% 3/22/2026 4.75 B+ 97.69 Electronics/Electrical
ECi Software Solutions LX168646 Incremental 1st Lien Term Loan $3,301,007 0.17% 9/24/2024 4.25 B 99.54 Electronics/Electrical
ABC Financial Inc. LX170018 1st Lien Term Loan $3,254,738 0.16% 1/02/2025 4.25 B 100.25 Electronics/Electrical
Quest Software US Holdings Inc. LX173580 2nd Lien Term Loan $3,212,550 0.16% 5/15/2026 8.25 B- 99.00 Electronics/Electrical
Kofax, Inc LX178173 Incremental Term Loan $2,926,765 0.15% 7/07/2023 4.25 B 99.13 Electronics/Electrical
Web.com Group, Inc. LX175671 1st Lien $2,858,558 0.14% 10/10/2025 3.75 B+ 98.77 Electronics/Electrical

21
Holdings Report
Quarter Ending March 31, 2019
For financial professional or qualified institutional investor use only. Not for inspection by, distribution or quotation to, the general public.
Pasadena Fire and Police Ret. System Senior Loan
Issuer LoanX ID Tranche Market Value % Portfolio Maturity Spread %
S&P
Rating Price Industry (S&P)
Electronics/Electrical
Dynatrace LLC LX175135 2nd Lien Term Loan $2,734,866 0.14% 8/15/2026 7.00 CCC+ 100.00 Electronics/Electrical
Internet Brands, Inc. LX168015 2nd Lien Term Loan $2,720,563 0.14% 9/15/2025 7.50 CCC+ 98.75 Electronics/Electrical
Xperi Corporation (f/k/a Tessera Technologies) LX170905 Term Loan B $2,535,176 0.13% 12/01/2023 2.50 BB- 98.13 Electronics/Electrical
Aptean Holdings, Inc. LX166079 1st Lien Term Loan $2,414,059 0.12% 12/20/2022 4.25 B- 100.06 Electronics/Electrical
Vertafore, Inc. LX173731 2nd Lien Term Loan $2,313,840 0.12% 7/02/2026 7.25 CCC 99.09 Electronics/Electrical
Barracuda Networks, Inc. LX170761 2nd Lien Term Loan $1,444,088 0.07% 2/12/2026 7.25 CCC+ 99.25 Electronics/Electrical
SonicWall US Holdings Inc. LX173538 2nd Lien Term Loan $1,408,444 0.07% 5/31/2026 7.50 CCC+ 95.81 Electronics/Electrical
Carbonite, Inc. LX179153 Term Loan $1,287,310 0.06% 3/29/2026 3.75 B 99.41 Electronics/Electrical
Rocket Software, Inc. LX176849 2nd Lien Term Loan $1,283,750 0.06% 11/30/2026 8.25 B- 98.75 Electronics/Electrical
Web.com Group, Inc. LX175673 2nd Lien $1,239,193 0.06% 10/09/2026 7.75 CCC+ 98.75 Electronics/Electrical
McAfee, LLC LX168583 2nd Lien Term Loan $1,209,708 0.06% 9/29/2025 8.50 B- 101.13 Electronics/Electrical
Micro Focus LX162911 MA Finance Co USD Term Loan $1,079,427 0.05% 6/21/2024 2.50 BB- 97.33 Electronics/Electrical
Navex Global LX175331 2nd Lien Term Loan $354,300 0.02% 9/04/2026 7.00 CCC 98.42 Electronics/Electrical
$291,570,592 14.65%
Equity REITs and REOCs
Brookfield Property Partners LX173184 Term A-1 $5,955,000 0.30% 8/27/2021 2.25 BB+ 99.25 Equity REITs and REOCs
Forest City Enterprises, L.P. LX176555 Term B $3,492,996 0.18% 12/08/2025 4.00 B+ 100.63 Equity REITs and REOCs
Brookfield Property Partners LX173186 Term Loan A-2 $2,895,000 0.15% 8/28/2023 2.25 BB+ 96.50 Equity REITs and REOCs
Brookfield Property Partners LX173182 Term Loan B $2,890,237 0.15% 8/27/2025 2.50 BB+ 96.58 Equity REITs and REOCs
Capital Automotive L.P. LX161337 2L Term Loan $2,845,236 0.14% 3/24/2025 6.00 CCC+ 99.75 Equity REITs and REOCs
$18,078,469 0.91%
Financial Intermediaries
Edelman Financial Services LX174293 1L Term Loan $15,319,298 0.77% 7/21/2025 3.25 B 99.56 Financial Intermediaries

22
Holdings Report
Quarter Ending March 31, 2019
For financial professional or qualified institutional investor use only. Not for inspection by, distribution or quotation to, the general public.
Pasadena Fire and Police Ret. System Senior Loan
Issuer LoanX ID Tranche Market Value % Portfolio Maturity Spread %
S&P
Rating Price Industry (S&P)
Financial Intermediaries
Blackhawk Network Holdings, Inc. LX171003 Term Loan 1L $9,907,810 0.50% 6/15/2025 3.00 B 98.40 Financial Intermediaries
Duff & Phelps LX169993 Upsized 1L term Loan $8,041,255 0.40% 2/13/2025 3.25 B 97.97 Financial Intermediaries
Advisor Group LX175247 1L Term Loan $6,333,004 0.32% 8/09/2025 3.75 B+ 100.31 Financial Intermediaries
Cushman & Wakefield LX175455 1L Term Loan $6,032,512 0.30% 8/16/2025 3.25 BB- 99.39 Financial Intermediaries
Priority Payments LX157031 1L Term Loan $3,197,525 0.16% 1/03/2023 5.00 B 100.13 Financial Intermediaries
TaxAct / HD Vest LX169647 Ter Loan B $3,184,505 0.16% 5/22/2024 3.00 BB 98.50 Financial Intermediaries
Focus Financial Partners LX174383 1L Term Loan $2,731,692 0.14% 7/03/2024 2.50 BB- 99.71 Financial Intermediaries
Vistra Group Ltd LX146617 USD TLB $2,275,356 0.11% 10/26/2022 3.00 B 98.75 Financial Intermediaries
Edelman Financial Services LX174295 2L Term Loan $954,750 0.05% 7/20/2026 6.75 CCC+ 100.50 Financial Intermediaries
$57,977,707 2.91%
Food Products
JBS USA, Inc. (FKA Swift) LX159478 1L Term Loan Add-On $16,445,822 0.83% 10/30/2022 2.50 BB+ 99.40 Food Products
Inspire Brands (FKA Arby's Restaurant Group) LX170447 1LTL $11,457,829 0.58% 2/05/2025 3.25 B 97.72 Food Products
Flora Food Group LX171721 USD TL B $8,139,608 0.41% 7/02/2025 3.00 B+ 97.46 Food Products
C.H. Guenther LX172016 Term Loan B $6,833,511 0.34% 3/31/2025 2.75 B 98.50 Food Products
NPC International LX161940 TL-B $6,439,900 0.32% 4/19/2024 3.50 B 90.67 Food Products
8th Avenue Food & Provisions, Inc. LX175827 First Lien Term Loan $4,868,003 0.24% 10/01/2025 3.75 B 100.31 Food Products
Atkins Nutritionals Holdings II, Inc. LX162989 1st Lien Term Loan $3,985,211 0.20% 7/08/2024 3.50 BB- 98.50 Food Products
Del Monte Foods Consumer Products, Inc. LX133785 1st Lien $2,032,763 0.10% 2/18/2021 3.25 CCC+ 79.25 Food Products
NPC International LX161941 Second Lien Term Loan $763,438 0.04% 4/18/2025 7.50 CCC 87.25 Food Products
8th Avenue Food & Provisions, Inc. LX175828 Second Lien Term $365,456 0.02% 10/01/2026 7.75 CCC+ 100.13 Food Products
$61,331,540 3.08%

23
Holdings Report
Quarter Ending March 31, 2019
For financial professional or qualified institutional investor use only. Not for inspection by, distribution or quotation to, the general public.
Pasadena Fire and Police Ret. System Senior Loan
Issuer LoanX ID Tranche Market Value % Portfolio Maturity Spread %
S&P
Rating Price Industry (S&P)
Food Service
Golden Nugget Inc. (fka Landry's) LX168592 TL-B $14,950,954 0.75% 10/04/2023 2.75 B+ 99.13 Food Service
Hearthside Food Solutions, LLC LX173322 First Lien Term Loan $7,073,796 0.36% 5/23/2025 3.68 B- 97.50 Food Service
Restaurant Brands International (F.K.A. Burger King Corporation) LX160554 TL B $6,951,686 0.35% 2/16/2024 2.25 BB- 98.44 Food Service
Tacala, LLC LX170720 TL-B $4,507,901 0.23% 1/31/2025 3.25 B- 98.87 Food Service
K-Mac Holdings Corp. LX171706 1L TL $3,950,342 0.20% 3/14/2025 3.25 B- 99.00 Food Service
Flynn Restaurant Group LX174093 TL-B $3,720,758 0.19% 6/15/2025 3.50 B 97.50 Food Service
Dhanani Group Inc. LX174227 Term Loan B $3,691,207 0.19% 7/20/2025 3.75 B 98.00 Food Service
Bojangles Restaurants, Inc. LX177412 1LTL $3,070,000 0.15% 1/28/2026 4.75 B 100.00 Food Service
Fogo de Chao Churrascaria LX176283 TL-B $2,786,868 0.14% 4/05/2025 4.25 B 99.75 Food Service
Del Frisco's Restaurant Group LX175163 TL-B $1,968,773 0.10% 6/27/2025 6.00 B- 97.00 Food Service
K-Mac Holdings Corp. LX171707 2L TL $656,280 0.03% 3/16/2026 6.75 CCC 99.44 Food Service
Tacala, LLC LX170721 2L TL $560,763 0.03% 1/30/2026 7.00 CCC 99.25 Food Service
$53,889,327 2.71%
Food/Drug Retailers
Albertsons LLC LX176679 TL-B7 $8,372,077 0.42% 11/17/2025 3.00 BB- 98.91 Food/Drug Retailers
Albertsons LLC LX164598 TL-B6 $8,254,451 0.41% 6/22/2023 3.00 BB- 99.27 Food/Drug Retailers
EG Group (Euro Garages) LX172070 USD Add on $7,114,018 0.36% 2/06/2025 4.00 B 97.83 Food/Drug Retailers
United Natural Foods, Inc. (FKA SUPERVALU) LX176260 Term Loan B $6,072,413 0.31% 10/15/2025 4.25 B+ 86.63 Food/Drug Retailers
Smart & Final Stores LX126664 Extended TL-B $2,110,511 0.11% 11/15/2022 3.50 B 95.83 Food/Drug Retailers
The Nature's Bounty (fka NBTY, Inc.) LX167866 First Lien Term Loan $1,835,457 0.09% 9/26/2024 3.50 B- 92.94 Food/Drug Retailers
Save-A-Lot LX157028 TL-B $1,741,104 0.09% 12/05/2023 6.00 CCC 57.00 Food/Drug Retailers
The Nature's Bounty (fka NBTY, Inc.) LX167868 Second Lien Term Loan $1,439,850 0.07% 9/26/2025 7.75 CCC 82.75 Food/Drug Retailers

24
Holdings Report
Quarter Ending March 31, 2019
For financial professional or qualified institutional investor use only. Not for inspection by, distribution or quotation to, the general public.
Pasadena Fire and Police Ret. System Senior Loan
Issuer LoanX ID Tranche Market Value % Portfolio Maturity Spread %
S&P
Rating Price Industry (S&P)
Food/Drug Retailers
EG Group (Euro Garages) LX171055 TL B1 USD $803,896 0.04% 2/07/2025 4.00 B 97.83 Food/Drug Retailers
$37,743,778 1.90%
Forest Products
Blount International, Inc. LX176001 Term Loan B $5,512,207 0.28% 4/12/2023 3.75 B 100.03 Forest Products
$5,512,207 0.28%
Health Care
Envision Healthcare Corporation LX175867 Term B $19,292,668 0.97% 10/15/2025 3.75 B+ 93.73 Health Care
Bausch Health Companies, Inc. LX173606 Term B $19,239,957 0.97% 6/01/2025 3.00 BB- 99.39 Health Care
athenahealth, Inc. LX178382 First Lien Term Loan $14,010,671 0.70% 2/04/2026 4.50 B 98.67 Health Care
CHG Medical Staffing, Inc. LX170133 Term B $12,509,889 0.63% 6/07/2023 3.00 B 99.46 Health Care
Surgery Center Holdings, Inc. LX165294 Upsized Term B $12,239,469 0.61% 8/31/2024 3.25 B- 98.47 Health Care
Ortho-Clinical Diagnostics, Inc. LX173721 Term B $11,981,568 0.60% 6/30/2025 3.25 B- 96.46 Health Care
Change Healthcare, Inc. LX159695 Term B $9,472,727 0.48% 3/01/2024 2.75 B+ 98.75 Health Care
Davis Vision + Superior Vision LX169184 Upsized First Lien Term Loan $7,943,049 0.40% 12/02/2024 3.00 B 96.94 Health Care
Multiplan, Inc LX152711 First lien term loan $7,450,112 0.37% 6/07/2023 2.75 B+ 96.91 Health Care
LifePoint Health, Inc. LX176702 Term B $7,324,493 0.37% 11/30/2025 4.50 B+ 99.19 Health Care
Vizient, Inc. LX163354 B4 $6,146,329 0.31% 2/13/2023 2.75 BB- 99.66 Health Care
Acadia LX172092 TLB-4 $5,941,081 0.30% 2/16/2023 2.50 B+ 99.27 Health Care
Aspen Dental Management, Inc. LX172654 First Lien Term Loan $5,919,316 0.30% 4/30/2025 3.00 B 98.56 Health Care
PetVet Care Centers LX170763 First Lien Term Loan $5,487,903 0.28% 2/14/2025 2.75 B 94.75 Health Care
GoodRx LX176164 First Lien Term Loan $5,207,542 0.26% 10/01/2025 3.00 B+ 99.06 Health Care
ExamWorks Group, Inc. LX159615 Upsized 1L Term Loan $5,126,125 0.26% 7/27/2023 3.25 B 99.50 Health Care
Kinetic Concepts, Inc. LX159619 USD Term B $5,039,918 0.25% 2/02/2024 3.25 B 99.46 Health Care

25
Holdings Report
Quarter Ending March 31, 2019
For financial professional or qualified institutional investor use only. Not for inspection by, distribution or quotation to, the general public.
Pasadena Fire and Police Ret. System Senior Loan
Issuer LoanX ID Tranche Market Value % Portfolio Maturity Spread %
S&P
Rating Price Industry (S&P)
Health Care
ATI Physical Therapy LX152458 Upsized First Lien Term Loan $4,436,188 0.22% 5/10/2023 3.50 B 97.25 Health Care
US Anesthesia Partners LX165390 Upsized First Lien Term Loan $3,834,393 0.19% 6/23/2024 3.00 B 98.98 Health Care
Concentra Inc LX171176 Term B $3,639,394 0.18% 6/01/2022 2.75 B+ 99.62 Health Care
U.S. Renal Care, Inc. LX148925 First Lien Term Loan $3,533,562 0.18% 12/30/2022 4.25 B 99.91 Health Care
Tecomet LX169359 Upsized 1L Term Loan $3,204,576 0.16% 5/01/2024 3.50 B 99.75 Health Care
Diplomat Pharmacy LX169734 Term B $3,014,538 0.15% 12/20/2024 4.50 B 95.50 Health Care
Dental Corporation of Canada Inc. LX173658 First Lien Term Loan $2,960,955 0.15% 6/06/2025 3.75 B- 97.75 Health Care
PAREXEL International Corporation LX167279 Term B $2,778,822 0.14% 9/27/2024 2.75 B 96.53 Health Care
LifeScan Global Corp LX173565 1L Term Loan $2,734,131 0.14% 10/01/2024 6.00 B+ 96.29 Health Care
Global Medical Response, Inc. (fka Air Medical Group Holdings, Inc.) LX168639 Term Loan B-2 $2,628,248 0.13% 3/14/2025 4.25 B 94.34 Health Care
Pharmaceutical Product Development, Inc. LX172432 Term B $2,359,832 0.12% 8/18/2022 2.50 B 99.08 Health Care
Press Ganey LX173130 Upsized First Lien Term Loan $2,272,303 0.11% 10/23/2023 2.75 B 98.19 Health Care
Air Methods LX162655 Term Loan B $1,846,322 0.09% 4/21/2024 3.50 B 75.55 Health Care
PetVet Care Centers LX170764 First Lien DDTL $1,623,027 0.08% 2/14/2025 2.75 B 94.75 Health Care
Universal Hospital Services, Inc. LX176339 Term B $1,433,170 0.07% 1/04/2026 3.00 B 99.87 Health Care
Davis Vision + Superior Vision LX169185 Second Lien Term Loan $889,163 0.04% 12/01/2025 6.75 CCC+ 98.25 Health Care
Dental Corporation of Canada Inc. LX173659 First Lien DDTL $742,940 0.04% 6/06/2025 3.75 B- 97.75 Health Care
PetVet Care Centers LX170766 Second Lien Term Loan $97,500 0.00% 2/13/2026 6.25 CCC+ 97.50 Health Care
Team Health, Inc. LX156377 Term B $4,545 0.00% 2/06/2024 2.75 B 89.17 Health Care
Sotera Health (f.k.a. Sterigenics International LLC) LX162147 Upsized Incremental TLB $0 0.00% 5/15/2022 3.00 B 98.19 Health Care
$204,366,427 10.27%
Home Furnishings
ADT fka Protection One, Inc. LX157682 New Upsized Term Loan B $10,206,639 0.51% 5/02/2022 2.75 BB- 99.14 Home Furnishings

26
Holdings Report
Quarter Ending March 31, 2019
For financial professional or qualified institutional investor use only. Not for inspection by, distribution or quotation to, the general public.
Pasadena Fire and Police Ret. System Senior Loan
Issuer LoanX ID Tranche Market Value % Portfolio Maturity Spread %
S&P
Rating Price Industry (S&P)
Home Furnishings
SharkNinja LX168781 Term loan B $1,898,446 0.10% 10/03/2024 4.00 B+ 98.88 Home Furnishings
$12,105,085 0.61%
Industrial Equipment
Filtration Group Corporation LX172395 First Lien Term Loan $10,056,989 0.51% 3/31/2025 3.00 B 99.40 Industrial Equipment
ExGen Renewables IV, LLC LX169539 TL-B $3,712,638 0.19% 11/28/2024 3.00 B 93.96 Industrial Equipment
Shape Technologies Group, Inc. LX172397 First Lien Term Loan $3,709,444 0.19% 4/15/2025 3.00 B 98.88 Industrial Equipment
MKS Instruments LX177878 Incremental Term Loan B $2,890,601 0.15% 2/01/2026 2.25 BB+ 100.02 Industrial Equipment
Kenan Advantage Group, Inc. LX146807 Upsized USD Term loan B $2,767,350 0.14% 7/31/2022 3.00 B+ 98.75 Industrial Equipment
Evoqua Water (fka WTG) LX170201 Upsized First Lien Term Loan $2,304,007 0.12% 12/20/2024 3.00 B 99.00 Industrial Equipment
CPM Holdings, Inc. LX176453 First Lien Term Loan $1,472,029 0.07% 11/15/2025 3.75 B 99.38 Industrial Equipment
Kenan Advantage Group, Inc. LX146975 Term Loan Canada Borrower $711,224 0.04% 7/31/2022 3.00 B+ 98.75 Industrial Equipment
Safe Fleet LX170944 Second Lien Term Loan $602,851 0.03% 2/02/2026 6.75 CCC 96.38 Industrial Equipment
$28,227,133 1.42%
Leisure Goods/Activities/Movies
Thor Industries, Inc. LX176521 USD Term loan B $11,112,624 0.56% 2/01/2026 3.75 BB 95.81 Leisure Goods/Activities/Movies
Equinox Holdings, Inc. LX169635 First Lien TL-B $9,764,077 0.49% 3/08/2024 3.00 B+ 99.38 Leisure Goods/Activities/Movies
Fitness International, LLC. LX172914 Term Loan B $7,487,987 0.38% 4/18/2025 3.25 BB- 99.25 Leisure Goods/Activities/Movies
ClubCorp Club Operations, Inc LX167985 Senior Secured Term Loan B $7,124,073 0.36% 9/18/2024 2.75 B 94.90 Leisure Goods/Activities/Movies
Life Time Fitness LX159083 Upsized Term Loan B $7,123,229 0.36% 6/10/2022 2.75 BB- 98.92 Leisure Goods/Activities/Movies
Cineworld LX171023 Term Loan B $6,927,840 0.35% 2/28/2025 2.50 BB- 97.83 Leisure Goods/Activities/Movies
AMF Bowling Centers, Inc. LX174061 1st Lien Term Loan $6,242,189 0.31% 7/03/2024 3.50 B 100.00 Leisure Goods/Activities/Movies
24 Hour Fitness Worldwide, Inc LX173632 Term Loan B $5,573,383 0.28% 5/30/2025 3.50 B+ 99.96 Leisure Goods/Activities/Movies
SRAM, LLC LX173003 First Lien Term Loan $4,803,421 0.24% 3/15/2024 2.75 B+ 99.62 Leisure Goods/Activities/Movies

27
Holdings Report
Quarter Ending March 31, 2019
For financial professional or qualified institutional investor use only. Not for inspection by, distribution or quotation to, the general public.
Pasadena Fire and Police Ret. System Senior Loan
Issuer LoanX ID Tranche Market Value % Portfolio Maturity Spread %
S&P
Rating Price Industry (S&P)
Leisure Goods/Activities/Movies
Winnebago LX170097 Term Loan B $4,018,000 0.20% 11/08/2023 3.50 BB 98.00 Leisure Goods/Activities/Movies
Alterra Mountain Company (fka Intrawest) LX166114 New Fungible TLB $3,975,767 0.20% 7/31/2024 3.00 B 99.65 Leisure Goods/Activities/Movies
Airxcel, Inc. LX172968 First Lien Term Loan $3,452,960 0.17% 4/27/2025 4.50 B 92.75 Leisure Goods/Activities/Movies
AMC Entertainment Inc. LX179152 Term Loan B due 2026 $3,361,515 0.17% 3/20/2026 3.00 BB- 99.45 Leisure Goods/Activities/Movies
NEP/NCP Holdco, Inc LX176183 New 1st Lien TL $2,709,974 0.14% 10/15/2025 3.25 B+ 99.33 Leisure Goods/Activities/Movies
Callaway Golf Company LX177366 Term B Facility $2,055,375 0.10% 12/31/2025 4.50 BB- 101.25 Leisure Goods/Activities/Movies
GVC Holdings PLC LX172211 USD TL B $1,704,800 0.09% 3/29/2024 2.50 BB 99.69 Leisure Goods/Activities/Movies
Equinox Holdings, Inc. LX160948 Second Lien TL-B $1,578,587 0.08% 9/06/2024 7.00 CCC+ 100.56 Leisure Goods/Activities/Movies
WeddingWire LX176821 1st Lien $1,542,260 0.08% 12/19/2025 4.50 B+ 99.75 Leisure Goods/Activities/Movies
Airxcel, Inc. LX172970 Second Lien Term Loan $698,650 0.04% 4/27/2026 8.75 CCC+ 89.00 Leisure Goods/Activities/Movies
WeddingWire LX176824 2nd Lien $563,588 0.03% 12/21/2026 8.25 CCC+ 99.75 Leisure Goods/Activities/Movies
$91,820,296 4.61%
Lodging & Casinos
Caesars Resort Collection LX168784 TLB $19,663,791 0.99% 12/23/2024 2.75 BB 99.02 Lodging & Casinos
Scientific Games International, Inc. LX171269 Term Loan B-5 $18,064,263 0.91% 8/14/2024 2.75 B+ 97.41 Lodging & Casinos
The Stars Group (fka Amaya) LX174018 USD TLB $15,035,932 0.76% 7/10/2025 3.50 B+ 99.96 Lodging & Casinos
Everi Holdings Inc (fka Global Cash Access) LX163694 Term Loan B $7,911,182 0.40% 5/09/2024 3.00 B+ 99.50 Lodging & Casinos
Station Casinos LLC LX152816 Add-on TLB $7,889,318 0.40% 6/08/2023 2.50 BB- 99.14 Lodging & Casinos
Golden Entertainment LX165659 1st Lien $5,312,108 0.27% 10/21/2024 3.00 B+ 99.25 Lodging & Casinos
Twin River Management Group, Inc. LX136336 Term Loan B $3,520,265 0.18% 7/10/2020 3.50 BB 100.00 Lodging & Casinos
Belmond Interfin LX165656 TL USD $2,749,330 0.14% 7/03/2024 2.75 BB 99.94 Lodging & Casinos
Golden Entertainment LX165662 2nd Lien $1,777,500 0.09% 10/20/2025 7.00 CCC+ 98.75 Lodging & Casinos

28
Holdings Report
Quarter Ending March 31, 2019
For financial professional or qualified institutional investor use only. Not for inspection by, distribution or quotation to, the general public.
Pasadena Fire and Police Ret. System Senior Loan
Issuer LoanX ID Tranche Market Value % Portfolio Maturity Spread %
S&P
Rating Price Industry (S&P)
Lodging & Casinos
Horseshoe Baltimore LX165522 TLB $0 0.00% 7/08/2024 4.00 B 99.59 Lodging & Casinos
$81,923,690 4.12%
Nonferrous Metals/Minerals
Covia Holdings Corporation (fka Unimin Corporation) LX172861 Term Loan $10,840,503 0.54% 6/01/2025 3.75 BB 85.83 Nonferrous Metals/Minerals
U.S. Silica Company LX172957 Term Loan $7,172,613 0.36% 5/01/2025 4.00 B+ 94.75 Nonferrous Metals/Minerals
$18,013,116 0.90%
Oil & Gas
McDermott International, Inc. LX170450 Term Loan $6,045,560 0.30% 5/10/2025 5.00 B+ 96.05 Oil & Gas
Encino Energy LX175821 2nd Lien TL $4,024,169 0.20% 10/29/2025 6.75 BB- 97.00 Oil & Gas
Glass Mountain Pipeline, LLC LX170112 Term Loan $2,989,912 0.15% 12/23/2024 4.50 B 97.63 Oil & Gas
Lucid Energy Group II Borrower, LLC LX171113 Term Loan $2,843,755 0.14% 2/17/2025 3.00 B 95.03 Oil & Gas
Crestwood Holdings LLC LX171649 Term Loan $2,034,671 0.10% 3/06/2023 7.50 B- 98.50 Oil & Gas
Navitas Midstream Midland Basin, LLC LX170023 Term Loan $1,919,947 0.10% 12/13/2024 4.50 B+ 96.25 Oil & Gas
Tallgrass Energy Partners LP LX178951 Term Loan $1,802,853 0.09% 3/01/2026 4.75 BB+ 100.44 Oil & Gas
Harvey Gulf International Marine, LLC LX172240 Exit Term Loan $1,695,918 0.09% 7/03/2023 6.00 B 99.38 Oil & Gas
FTS International, Inc. (fka FracTech) LX136541 Term Loan $1,428,305 0.07% 4/16/2021 4.75 B 100.06 Oil & Gas
MEG Energy Corp. LX159204 Term Loan $1,013,710 0.05% 12/31/2023 3.50 BB 99.63 Oil & Gas
$25,798,800 1.30%
Property & Casualty Insurance
BroadStreet Partners, Inc. LX173600 Upsized Term Loan B $7,309,475 0.37% 11/08/2023 3.25 B 99.38 Property & Casualty Insurance
$7,309,475 0.37%

29
Holdings Report
Quarter Ending March 31, 2019
For financial professional or qualified institutional investor use only. Not for inspection by, distribution or quotation to, the general public.
Pasadena Fire and Police Ret. System Senior Loan
Issuer LoanX ID Tranche Market Value % Portfolio Maturity Spread %
S&P
Rating Price Industry (S&P)
Publishing
Meredith Corporation LX176584 New Term Loan B $6,353,138 0.32% 1/31/2025 2.75 BB 99.88 Publishing
Merrill Communications, LLC LX144578 New First Lien Term Loan $1,368,464 0.07% 6/01/2022 5.25 BB- 100.44 Publishing
$7,721,602 0.39%
Radio & Television
CBS Radio, Inc. LX160915 Incremental Term Loan B-1 $9,179,029 0.46% 11/18/2024 2.75 BB- 97.50 Radio & Television
Univision Communications, Inc. LX161197 TL-C5 $8,806,980 0.44% 3/15/2024 2.75 B 94.46 Radio & Television
Learfield Communications, Inc LX156663 Upsized 1st Lien Term Loan $8,492,421 0.43% 12/01/2023 3.25 B+ 99.78 Radio & Television
Cumulus Media Inc. LX174067 Exit Term Loan $7,778,106 0.39% 5/13/2022 4.50 B 98.48 Radio & Television
$34,256,536 1.72%
Retailers (Except Food & Drug)
Tailored Brands (fka Men’s Wearhouse) LX172429 1LTL $11,839,918 0.59% 4/09/2025 3.25 BB- 96.31 Retailers (Except Food & Drug)
BJs Wholesale Club LX159354 TL-B $8,800,020 0.44% 2/03/2024 3.00 BB- 99.88 Retailers (Except Food & Drug)
Harbor Freight Tools USA, Inc. LX170998 TL-B $7,963,425 0.40% 8/18/2023 2.50 BB- 97.92 Retailers (Except Food & Drug)
Leslies Poolmart, Inc. LX154098 TL-B $7,764,594 0.39% 8/16/2023 3.50 B 96.88 Retailers (Except Food & Drug)
Jo-Ann Stores, Inc. LX155217 1LTL $7,487,597 0.38% 10/20/2023 5.00 B 99.44 Retailers (Except Food & Drug)
Bass Pro Group, LLC LX156196 1LTL $6,050,151 0.30% 9/25/2024 5.00 B+ 98.00 Retailers (Except Food & Drug)
PetSmart, Inc. LX155570 TL-B $4,826,746 0.24% 3/11/2022 3.00 CCC 89.94 Retailers (Except Food & Drug)
Ascena Retail Group, Inc. LX146680 TLB $4,654,183 0.23% 8/21/2022 4.50 B+ 87.63 Retailers (Except Food & Drug)
Party City Holdings Inc LX171402 TL-B $3,050,564 0.15% 8/19/2022 2.50 BB- 99.41 Retailers (Except Food & Drug)
Shutterfly Inc LX171584 Incremental TLB-2 $3,019,724 0.15% 8/17/2024 2.75 BB- 98.54 Retailers (Except Food & Drug)
National Vision, Inc. LX169606 TL-B $2,973,514 0.15% 11/20/2024 2.50 BB- 99.58 Retailers (Except Food & Drug)
General Nutrition Centers, Inc. LX171799 TL-B1 $2,432,636 0.12% 3/04/2021 8.75 B- 97.06 Retailers (Except Food & Drug)
Petco Animal Supplies, Inc. LX158994 TLB-1 $2,160,530 0.11% 1/26/2023 3.25 CCC+ 76.90 Retailers (Except Food & Drug)
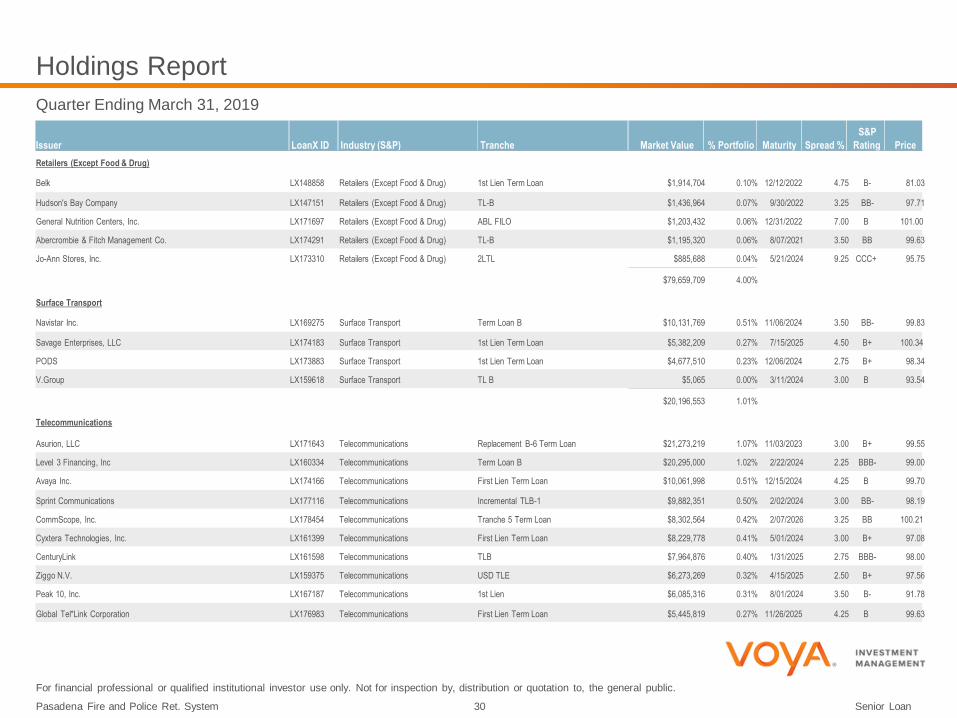
30
Holdings Report
Quarter Ending March 31, 2019
For financial professional or qualified institutional investor use only. Not for inspection by, distribution or quotation to, the general public.
Pasadena Fire and Police Ret. System Senior Loan
Issuer LoanX ID Tranche Market Value % Portfolio Maturity Spread %
S&P
Rating Price Industry (S&P)
Retailers (Except Food & Drug)
Belk LX148858 1st Lien Term Loan $1,914,704 0.10% 12/12/2022 4.75 B- 81.03 Retailers (Except Food & Drug)
Hudson's Bay Company LX147151 TL-B $1,436,964 0.07% 9/30/2022 3.25 BB- 97.71 Retailers (Except Food & Drug)
General Nutrition Centers, Inc. LX171697 ABL FILO $1,203,432 0.06% 12/31/2022 7.00 B 101.00 Retailers (Except Food & Drug)
Abercrombie & Fitch Management Co. LX174291 TL-B $1,195,320 0.06% 8/07/2021 3.50 BB 99.63 Retailers (Except Food & Drug)
Jo-Ann Stores, Inc. LX173310 2LTL $885,688 0.04% 5/21/2024 9.25 CCC+ 95.75 Retailers (Except Food & Drug)
$79,659,709 4.00%
Surface Transport
Navistar Inc. LX169275 Term Loan B $10,131,769 0.51% 11/06/2024 3.50 BB- 99.83 Surface Transport
Savage Enterprises, LLC LX174183 1st Lien Term Loan $5,382,209 0.27% 7/15/2025 4.50 B+ 100.34 Surface Transport
PODS LX173883 1st Lien Term Loan $4,677,510 0.23% 12/06/2024 2.75 B+ 98.34 Surface Transport
V.Group LX159618 TL B $5,065 0.00% 3/11/2024 3.00 B 93.54 Surface Transport
$20,196,553 1.01%
Telecommunications
Asurion, LLC LX171643 Replacement B-6 Term Loan $21,273,219 1.07% 11/03/2023 3.00 B+ 99.55 Telecommunications
Level 3 Financing, Inc LX160334 Term Loan B $20,295,000 1.02% 2/22/2024 2.25 BBB- 99.00 Telecommunications
Avaya Inc. LX174166 First Lien Term Loan $10,061,998 0.51% 12/15/2024 4.25 B 99.70 Telecommunications
Sprint Communications LX177116 Incremental TLB-1 $9,882,351 0.50% 2/02/2024 3.00 BB- 98.19 Telecommunications
CommScope, Inc. LX178454 Tranche 5 Term Loan $8,302,564 0.42% 2/07/2026 3.25 BB 100.21 Telecommunications
Cyxtera Technologies, Inc. LX161399 First Lien Term Loan $8,229,778 0.41% 5/01/2024 3.00 B+ 97.08 Telecommunications
CenturyLink LX161598 TLB $7,964,876 0.40% 1/31/2025 2.75 BBB- 98.00 Telecommunications
Ziggo N.V. LX159375 USD TLE $6,273,269 0.32% 4/15/2025 2.50 B+ 97.56 Telecommunications
Peak 10, Inc. LX167187 1st Lien $6,085,316 0.31% 8/01/2024 3.50 B- 91.78 Telecommunications
Global Tel*Link Corporation LX176983 First Lien Term Loan $5,445,819 0.27% 11/26/2025 4.25 B 99.63 Telecommunications

31
Holdings Report
Quarter Ending March 31, 2019
For financial professional or qualified institutional investor use only. Not for inspection by, distribution or quotation to, the general public.
Pasadena Fire and Police Ret. System Senior Loan
Issuer LoanX ID Tranche Market Value % Portfolio Maturity Spread %
S&P
Rating Price Industry (S&P)
Telecommunications
Asurion, LLC LX167792 Replacement B-4 Term Loan $4,203,135 0.21% 8/04/2022 3.00 B+ 99.63 Telecommunications
Switch, Ltd LX170230 TLB $3,953,692 0.20% 6/27/2024 2.25 BBB- 99.09 Telecommunications
Securus Technologies, Inc. LX164887 Fully Upsized First Lien Term Loan $3,522,658 0.18% 11/01/2024 4.50 B 99.53 Telecommunications
Peak 10, Inc. LX167188 2nd lien $2,413,125 0.12% 8/01/2025 7.25 CCC 87.75 Telecommunications
Global Tel*Link Corporation LX177113 Second Lien Term Loan $2,049,506 0.10% 11/26/2026 8.25 CCC+ 98.06 Telecommunications
$119,956,306 6.03%
Utilities
Edgewater Generation LX176845 Term Loan $5,104,805 0.26% 12/13/2025 3.75 BB 99.95 Utilities
Longview Power, LLC LX143826 Term Loan $4,371,497 0.22% 4/13/2021 6.00 CCC+ 87.50 Utilities
Nautilus Power, LLC LX163284 Term Loan $3,816,946 0.19% 5/16/2024 4.25 B+ 100.38 Utilities
MRP Generation Holdings, LLC (fka TPF Generation Holdings, LLC) LX154155 Term Loan $1,285,843 0.06% 10/18/2022 7.00 B+ 95.76 Utilities
$14,579,091 0.73%
$1,990,779,240 100.00% Total Loans
Total Market Value $1,990,779,240
Coupon reflects a calculation of the loan spread plus 3-month LIBOR, and does not necessarily reflect the actual changing underlying LIBOR contracts for the
loan.
The holdings displayed represent the holdings of the entire commingled fund and do not represent individual client ownership.

32
For financial professional or qualified institutional investor use only. Not for inspection by, distribution or quotation to, the general public.
Pasadena Fire and Police Ret. System
Explanatory Notes
The information contained in this document has been prepared solely for informational purposes and is not an offer or invitation to buy or sell any security or to
participate in any trading activity. This document is intended only for professional investors and describes a strategy only. Some material shown is compiled from third
party sources thought to be reliable, but accuracy and completeness cannot be guaranteed. Any opinions expressed herein reflect our judgment at this date and are
subject to change without notice. Neither Voya Investment Management nor any other company or unit belonging to Voya Financial, nor any of its officers, directors, or
employees accept any liability or responsibility in respect to the information or any recommendations expressed herein. No liability is accepted for any losses sustained
by readers as a result of using this publication or basing decisions on it. The value of your investments may rise or fall. Past performance is not indicative of future
results. Investments involve risk. The primary risks of investing in market based securities include, but are not limited to, credit risk (the risk that a borrower may default
in the payment of interest and/or principal on its loans), interest rate risk (the risk that the yield on an investment will rise and fall in response to changes in market
rates of interest), and market risk (the risk that the value of an investment will rise or fall in response to general economic conditions and events). Exposure to
financial, market, prepayment, credit and interest rate risks. The value of an investment is not guaranteed and will fluctuate. Higher yielding bonds are subject to
greater volatility and credit risk. A strategy may invest in securities guaranteed by the U.S. Government as to timely payments of interest and principal, butt the
strategy itself is not insured or guaranteed. Bonds have fixed principal and return if held to maturity, but may fluctuate in the interim. Generally, when interest rates
rise, bond prices fall. Bonds with longer maturities tend to be more sensitive to changes in interest rates. In addition to the general risks of investing in fixed income
securities, investing in foreign securities poses special risks, including currency fluctuation, economic and political risks not found in investments that are solely
domestic. Risks of foreign investing are generally intensified for investments in emerging markets
The account information presented in this report is based on the records and information provided by Voya Investment Management. The results may be preliminary
and unreconciled and are subject to change. Voya Investment Management does not guarantee the accuracy of the information contained in this portfolio accounting
report. The report is for informational purposes only and should not be relied upon or construed to be final. Clients are advised to refer to their custodial statements
and confirmations for trade and holdings information.
Footnotes
Market Value
The ending balance shown on the Investment Policy page may differ from the total market value on the Portfolio Holdings Report due to cash flow posted at close of
business on the last day of the quarter.
Portfolio Characteristics
The portfolio specific characteristics (such as Average Duration, Average Yield, etc.) are based on the total portfolio market value including cash and derivatives, as
provided by our valuation provider (BNY Mellon) and security characteristics provided by BlackRock Solutions which utilizes a different pricing hierarchy
(Barclays). BNY Mellon prices combined with Barclays analytics will result in different portfolio averages than are reported.Portfolio and Benchmark averages
(Duration, Yield to Maturity, Convexity and Average Life) are reported directly from BlackRock Solutions using Blackrock models and assumptions. As such, the
Benchmark Analytics provided above may be different from Barclays. Top ten credit exposures include cash.

33
For financial professional or qualified institutional investor use only. Not for inspection by, distribution or quotation to, the general public.
Pasadena Fire and Police Ret. System
Explanatory Notes
Ratings
The portfolio’s average quality rating is calculated as a market value-weighted average of the rating assigned to all positions, including derivative securities, but
excluding non-rated securities held within the portfolio measured and reported as of the date of this report. The "Effective Rating" is determined as follows: Voya IM
seeks individual security ratings from three credit rating agencies that are registered with the SEC as nationally recognized statistical rating organizations -- typically
Moody's, S&P and Fitch. If ratings are available from all three agencies, the security will be assigned the median rating. If ratings are available from only two of the
agencies, the lower of the ratings will be used.If a rating is available from only one agency, then that rating will be used.If ratings are not available from any of the
three agencies, then we may either assign the security an internal rating or mark it as "N/R" (not rated). AAA is the highest (best) Effective Rating, and D is the lowest
(worst) Effective Rating. When an Effective Rating is reported for a group of securities (such as for an asset class or the overall portfolio), it is calculated as a market
value-weighted average of the Effective Rating assigned to each component security (excluding securities without an Effective Rating). Please note that Voya does
not endorse or affirm the Effective Ratings or any agency ratings.
Furthermore, credit rating agencies disclaim all warranties and liability for their ratings, which (a) should be viewed as their opinions and not as statements of fact or
recommendations as to suitability or to purchase, hold, or sell a security and (b) are not guaranteed as being accurate, timely or available. For derivative securities,
swap contracts are rated on the basis of the underlying security, however, futures contracts are treated as a combination of Treasury securities and cash positions,
they have no net impact to the average quality rating in the portfolio. Measures pertaining to average credit quality may change over time and illustrations presented in
the client report are for informational purposes only. Individual client investment guidelines may have different rules and the foregoing presentation is not meant to
represent a compliance certification of the portfolio’s overall credit quality.
This report may contain information obtained from third parties, including ratings from credit ratings agencies.Reproduction and distribution of third party content in
any form is prohibited except with the prior written permission of the related third party. Third party content providers do not guarantee the accuracy, completeness,
timeliness or availability of any information, including ratings, and are not responsible for any errors or omissions (negligent or otherwise), regardless of the cause, or
for the result obtained from the use of such content. THIRD PARTY CONTENT PROVIDERS GIVE NO EXPRESS OR IMPLIED WARRANTIES, INCLUDING, BUT
NOT LIMITED TO, ANY WARRANTIES OF MERCHANTABILITY OR FITNESS FOR A PARTICULAR PURPOSE OR USE. THIRD PARTY CONTENT PROVIDERS
SHALL NOT BE LIABLE FOR ANY DIRECT, INDIRECT, INCIDENTAL, EXEMPLARY, COMPENSATORY, PUNITIVE, SPECIAL OR CONSEQUENTIAL DAMAGES,
COSTS, EXPENSES, LEGAL FREES, OR LOSSES (INCLUDING LOST INCOME OR PROFITS AND OPPORTUNITY COSTS OR LOSSES CAUSED BY
NEGLIGENCE) IN CONNECTION WITH ANY USE OF THEIR CONTENT, INCLUDING RATINGS. Credit agency ratings are statement of opinions and are not
statements of fact or recommendations to purchase, hold or sell securities. They do not address the suitability of securities or the suitability of securities for investment
purposes, and should not be relied on as investment advice.
Bond Sector Comparisons
Sector weights are based on total portfolio market value, which includes security market values (including accrued income), plus cash, cash equivalents and
derivatives (variation margin for Futures, and Market Value of Swaps).

34
For financial professional or qualified institutional investor use only. Not for inspection by, distribution or quotation to, the general public.
Pasadena Fire and Police Ret. System
Explanatory Notes
With the exception of the Treasury, ABS, and CMBS Sectors, the following sector groupings apply:
■ Treasury and Cash includes Cash/Cash equivalents which includes trade receivables/payables (which may be net positive or negative), TBA liabilities,
accrued income on securities that have been sold pending settlement (accrued income is otherwise reflected in the other sectors), and in Sector
Weights, also includes variation margin for futures (which may be positive or negative).
■ Government Related sector is comprised of Agency, Local Government, Sovereign and Supranational securities.
■ Corporate sector is comprised of Financial Institutions, Industrial and Utility securities.
■ Agency Mortgages sector contains Fannie Mae (FNMA), Freddie Mac (FHLMC), and Government National Mortgage Association (GNMA).
■ Securitized sector is comprised of ABS, CMBS, and Agency and Non-Agency Mortgage Backed Securities.
■ Other sector is comprised of Convertibles, Common and Preferred Stocks and Municipal Bonds.
■ "Derivatives“ (if applicable) includes forwards, options and swaps (see Appendix – Portfolio Holdings Derivatives for details) and futures.
Performance Disclosures
Performance is calculated on a time-weighted total return basis. Performance quoted is past performance, is no guarantee of future results and assumes that
dividends and distributions are reinvested. Current performance may be lower or higher. Investment value will fluctuate, and shares, when redeemed, may be worth
more or less than original cost.
Net returns are reflective of trading costs, management fees, and other administrative fees. Gross returns are net of trading costs, but do not reflect the deduction of
management, operating and admin fees. The returns for the Benchmark Indexes are time-weighted total return performance results.
Attribution results for sub-portfolio components, as provided by Blackrock Solutions Systems, are calculated on a daily basis. These daily results are then
geometrically compounded using a smoothing algorithm (Frongello Linking Algorithm) to produce results for “Month to Date” , “Quarter To Date” and “Year To Date”
time periods. However, the use of this smoothing process, as well as rounding effects, may create immaterial differences to total portfolio returns reported to the client
for “Month To Date” , “Quarter To Date” and “Year To Date” time periods. Additional details of these calculations are available upon request. Total attribution may not
add or match portfolio returns due to rounding. Total attribution may not add or match portfolio returns due to rounding.
Holdings
Cash and Cash Equivalents include trade receivables/payables (which may be net positive or negative), accrued income, cash collateral, variation margin (which may
be positive or negative), and TBA liabilities. The current market value of foreign currency as well as derivative holdings is (a) included in the net cash/cash equivalent
line at the end of the Portfolio Holdings Report and (b) reflected in the “other” sector in the Bond Sector Comparisons page.

35
For financial professional or qualified institutional investor use only. Not for inspection by, distribution or quotation to, the general public.
Pasadena Fire and Police Ret. System
Explanatory Notes
All derivative holdings (including notional amounts) are listed, as applicable. The market value of all derivatives other than futures (and only the variation margin for
futures) is (a) included in the net cash/cash equivalent line at the end of the Portfolio Holdings Report and (b) reflected in the “other” sector in the Bond Sector
Comparisons page.
The individual holdings and their respective valuations, (pricing and accruals) illustrated in this report are provided by IM’s operations servicer, Bank of New York
Mellon. Individual Security and Portfolio Level attributes illustrations are provided by BlackRock Solutions which utilizes a different pricing hierarchy (Barclays) in the
deriving of analytics such as; Duration, Yield to Maturity, Convexity, and Average Life. Please refer to the Explanatory Notes Section of your quarterly performance
report for the valuation hierarchy as provided by Bank of New York Mellon, as well as other important disclosures.
Notes
A To-Be-Announced (“TBA”) security represents a “forward purchase” of a potential mortgage pool of similar characteristics such as coupon, yield and par value to be
announced by a broker bundling “like” mortgages. The cash segregated as collateral for these forward purchases, in an amount equal to the purchase price to be paid,
may be invested in “liquid assets, such as cash, U.S. Government securities or other appropriate high grade debt obligations” in a “segregated account” as described
in Release 10666 of the SEC. Voya reports these within “Portfolio Holdings”. The valuation of this collateral is independent of the valuation of the TBA liability and may
rise or fall, based on interest rates and market conditions.
FAS 157 Tier levels
FASB 157 establishes a framework for measuring fair value in Generally Accepted Accounting Principles. Under FAS, “fair value” is the price that would be received
to sell an asset or paid to transfer a liability in an orderly transaction between market participants at the measurement date. FASB 157 identifies a fair value hierarchy
to rank the reliability of inputs used in a valuation approach. The first – and highest – level (Level 1) refers to quoted prices for identical assets or liabilities in an active
market. When those prices are not available, the second – or middle – level (Level 2) will base fair value estimates on observable inputs that a market participant
would use. If observable inputs are not available, the third – and lowest – level (Level 3) will require the use of unobservable inputs. Source: Valuation Research
Corporation
Voya Investment Management employs the following criteria for the tier selection under the FAS 157 Rule:
Level 2 is identified as any security for which we have received a price through one of our pricing vendors (currently IDC, Pricing Direct, and Markit Partners). We
identify as Level 3 any security (including mortgage-related securities) for which only a broker quote is available for valuation, as opposed to prices sourced from
pricing vendors. Under our current policy, Level 1 is reserved for U.S. Treasury securities.
Effective January 1, 2013 , all Subprime assets that are priced by an external vendors are now classified as Tier 2. Prior to this time, Voya Investment Management
was categorizing subprime external vendor priced securities as Tier 3 since December 2008.

Date: 5/15/2019 Item: 8
Pasadena Fire & Police Retirement System
AGENDA REPORT
TO: Chair Jones and Board Members of the Fire & Police Retirement System
FROM: Bernadette Jazmines, Secretary to the Board
DATE: May 15, 2019
ITEM: Board Election and Reorganization
RECOMMENDATION Upon review of the report and Board discussion, the Board will:
1. Elect from its membership the position of Chair and Vice-Chair to serve for fiscal year 2020, effective July 1, 2019, or
2. Other direction provided by the Board.
BACKGROUND At its meeting September 2017, the Board approved an Organization Policy consistent with Section 1502
of the City Charter and Section 2.250.090 of the Pasadena Municipal Code that established the policy and
term for the election of its Chair and Vice Chair. The Board shall elect from its membership a Chair and
Vice-Chair annually at the scheduled meeting of the Board in May. The duties of the Chair are to develop
the monthly Board agenda in concert with the Secretary of the Board and to preside over Board meetings.
The Chair is also authorized to execute and deliver, on behalf of the Board, any documents necessary or
appropriate to implement actions that have been ordered or approved by the Board. In the event of the
Chair’s absence or his or her inability to act, the Vice-Chair shall perform the duties of the Chair, and shall
be authorized to execute and deliver documents as set forth herein.
FISCAL IMPACT There is no fiscal impact anticipated from this action. ATTACHMENT
1. Organization Policy: Election and Duties of the Chair and Vice-Chair (approved 9-20-17)

POLICY OF THE
PASADENA FIRE AND POLICE RETIREMENT BOARD
ORGANIZATION POLICY:
ELECTION AND DUTIES OF THE CHAIR AND VICE CHAIR
Pursuant to the authority granted to the Pasadena Fire and Police Retirement Board (the “Board”) by Section
1502 of the Charter of the City of Pasadena and Section 2.250.090 of the Pasadena Municipal Code, the
Board hereby adopts the following policy concerning the election and duties of the Chair and Vice Chair
of the Board:
1. The Board shall elect from its membership a Chair and Vice Chair annually at the scheduled
meeting of the Board in May.
2. The term for both the Chair and Vice Chair shall be for one-year, and shall commence on July
1. In the event of the death, resignation, or removal of the Chair or Vice Chair during such
term, his or her replacement shall be selected by the remaining members of the Board at its
next regularly scheduled meeting.
3. The duties of the Chair are to develop the monthly Board agenda in concert with the Secretary
of the Board and to preside over Board meetings. The Chair is also authorized to execute and
deliver, on behalf of the Board, any documents necessary or appropriate to implement actions
that have been ordered or approved by the Board. In the event of the Chair’s absence or his
or her inability to act, the Vice Chair shall perform the duties of the Chair, and shall be
authorized to execute and deliver documents as set forth herein.
Approval Date: September 20, 2017
mprice
Typewritten Text
DATE: 5/15/19 ITEM #: 8 attachment

May 15, 2019 Page 1 of 2 Financial Auditing Services Engagement Letter, June 30, 2019
Pasadena Fire & Police Retirement System
AGENDA REPORT
TO: Chair Jones and Board Members of the Fire & Police Retirement System
FROM: Bernadette Jazmines, Secretary to the Board
DATE: May 15, 2019
ITEM: Engagement Letter with System Auditor Macias Gini & O’Connell LLP for the June 30, 2019 financial audit
RECOMMENDATION Upon review of the report and presentation, the Board may:
1. Approve the engagement letter with Macias Gini & O’Connell LLP for the June 30, 2019 financial services audit, or
2. Other direction provided by the Board.
BACKGROUND At the March 21, 2018 Board meeting, three-year contract, with an optional 2-year extension, with Macias Gini & O’Connell LLP (“MGO”) for auditing financial services and the June 30, 2018-2020 financial audits was approved by the Board. The objective of the audit is the expression of an opinion as to whether the financial statements are fairly presented, in all material respects, in conformity with U.S. Generally Accepted Accounting Principles. Further, the objective includes reporting on the fairness of the supplementary information when considered in relation to the financial statements as a whole. An audit includes examining, on a test basis, evidence supporting the amounts and disclosures in the financial statements; therefore, the audit will involve judgment about the number of transactions to be examined and the areas to be tested. The audit also includes evaluating the appropriateness of accounting policies used and the reasonableness of significant accounting estimates made by management, as well as evaluating the overall presentation of the financial statements. An audit is not designed to detect immaterial misstatements or violations of laws or governmental regulations that do not have a direct and material effect on the financial statements. However, MGO will inform management of any material errors, any fraudulent financial reporting, or misappropriation of assets that comes to their attention. In addition, MGO will also inform management of any violations of laws or governmental regulations that come to their attention during the audit. Audit work on the June 30, 2019 financial audit will consist of the following:
MGO will plan and perform the audit to obtain reasonable rather than absolute assurance regarding whether the financial statements are free of material misstatement, whether from (1) errors, (2) fraudulent financial reporting, (3) misappropriation of assets, or (4) violations of laws
mprice
Typewritten Text
DATE: 5/15/19 ITEM #: 9

May 15, 2019 Page 2 of 2 Financial Auditing Services Engagement Letter, June 30, 2019
or governmental regulations that are attributable to the System or to acts by management or employees acting on behalf of the System.
MGO will perform certain agreed-upon procedures regarding the records and internal control procedures related to the administration of the System.
MGO will perform required reporting for GASB statements, with related notes.
The audit will be conducted in accordance with auditing standards generally accepted in the United States of America and the standards for financial audits contained in Government Auditing Standards, issued by the Comptroller General of the United States, and will include tests of the accounting records of the System and other procedures the auditors consider necessary to enable MGO to express such opinions. Upon completion of the audit, results will be presented in a written report to the Board in October containing the System’s financial statements, findings, and recommendations for improvements in System operations, internal controls, and accounting procedures. The engagement letter and the Statement of Auditing Standards 114 Letter (SAS 114) has been reviewed by the System’s counsel Best, Best & Krieger. FISCAL IMPACT The total maximum contract amount for the June 30, 2019 financial audit is $47,500 (as approved by the Board on March 21, 2018) and is included in the FY 2020 Recommended Budget. ATTACHMENT
1. Engagement Letter for the June 30, 2019 financial audit with Macias Gini & O’Connell, LLP 2. MGO SAS 114 Letter

www.mgocpa.com Macias Gini & O’Connell LLP 700 South Flower St., Suite 800 Los Angeles, CA 90017
1
May 1, 2019
To the Retirement Board Pasadena Fire & Police Retirement System
We are pleased to confirm our understanding of the services we are to provide Pasadena Fire & Police Retirement System (System) for the year ended June 30, 2019.
We will audit the financial statements of the System as of and for the year ended June 30, 2019. Accounting standards generally accepted in the United States of America provide for certain required supplementary information (RSI), such as management’s discussion and analysis (MD&A), to supplement the System’s basic financial statements. Such information, although not a part of the basic financial statements, is required by the Governmental Accounting Standards Board who considers it to be an essential part of financial reporting for placing the basic financial statements in an appropriate operational, economic, or historical context. As part of our engagement, we will apply certain limited procedures to the System’s RSI in accordance with auditing standards generally accepted in the United States of America. These limited procedures will consist of inquiries of management regarding the methods of preparing the information and comparing the information for consistency with management’s responses to our inquiries, the basic financial statements, and other knowledge we obtained during our audit of the basic financial statements. We will not express an opinion or provide any assurance on the information because the limited procedures do not provide us with sufficient evidence to express an opinion or provide any assurance. The following RSI is required by generally accepted accounting principles and will be subjected to certain limited procedures, but will not be audited:
1) Management’s Discussion and Analysis2) Schedule of Changes in Employer’s Net Pension Liability3) Schedules of Employer’s Net Pension Liability and Related Ratios4) Schedules of Employer Contributions5) Schedule of Investment Returns6) Notes to Required Supplementary Information
We have also been engaged to report on supplementary information other than RSI that accompanies the System’s financial statements. We will subject the following supplementary information to the auditing procedures applied in our audit of the financial statements and certain additional procedures, including comparing and reconciling such information directly to the underlying accounting and other records used to prepare the financial statements or to the financial statements themselves, and other additional procedures in accordance with auditing standards generally accepted in the United States of America, and we will provide an opinion on it in relation to the financial statements as a whole, in a report combined with our auditor’s report on the financial statements.
1) Additions by Source and Deductions by Type
The following other information accompanying the financial statements will not be subjected to the auditing procedures applied in our audit of the financial statements, and our auditor’s report will not provide an opinion or any assurance on that other information:
1) Comparative Information from Prior Fiscal Years: Interest Rate Risk
mprice
Typewritten Text
DATE: 5/15/19 ITEM #: 9 attachment

2
Audit Objectives
The objective of our audit is the expression of an opinion as to whether the System’s financial statements are fairly presented, in all material respects, in conformity with U.S. generally accepted accounting principles and to report on the fairness of the supplementary information referred to in the second paragraph when considered in relation to the financial statements as a whole.
Our audit will be conducted in accordance with auditing standards generally accepted in the United States of America and the standards for financial audits contained in Government Auditing Standards, issued by the Comptroller General of the United States, and will include tests of accounting records of the System and other procedures we consider necessary to enable us to express such opinions. We will issue a written report upon completion of our audit of the System’s financial statements. Our report will be addressed to the Board of Retirement of the System. We cannot provide assurance that an unmodified opinion will be expressed. Circumstances may arise in which it is necessary for us to modify our opinion or add emphasis-of-matter or other-matter paragraphs. If our opinion are other than unmodified, we will discuss the reasons with you in advance. If, for any reason, we are unable to complete the audit or unable to form or have not formed an opinion, we may decline to express an opinion or issue reports, or may withdraw from this engagement.
We will also provide a report (that does not include an opinion) on internal control related to the financial statements and compliance with the provisions of laws, regulations, contracts, and grant agreements, noncompliance with which could have a material effect on the financial statements as required by Government Auditing Standards. The report on internal control and on compliance and other matters will include a paragraph that states (1) that the purpose of the report is solely to describe the scope of testing of internal control and compliance, and the results of that testing, and not to provide an opinion on the effectiveness of the entity’s internal control on compliance, and (2) that the report is an integral part of an audit performed in accordance with Government Auditing Standards in considering the entity’s internal control and compliance. The paragraph will also state that the report is not suitable for any other purpose. If during our audit we become aware that the System is subject to an audit requirement that is not encompassed in the terms of this engagement, we will communicate to management and those charged with governance that an audit in accordance with U.S. generally accepted auditing standards and the standards for financial audits contained in Government Auditing Standards may not satisfy the relevant legal, regulatory, or contractual requirements.
Audit Procedures—General
An audit includes examining, on a test basis, evidence supporting the amounts and disclosures in the financial statements; therefore, our audit will involve judgment about the number of transactions to be examined and the areas to be tested. An audit also includes evaluating the appropriateness of accounting policies used and the reasonableness of significant accounting estimates made by management, as well as evaluating the overall presentation of the financial statements. We will plan and perform the audit to obtain reasonable assurance about whether the financial statements are free of material misstatement, whether from (1) errors, (2) fraudulent financial reporting, (3) misappropriation of assets, or (4) violations of laws or governmental regulations that are attributable to the government or to acts by management or employees acting on behalf of the government. Because the determination of abuse is subjective, Government Auditing Standards do not expect auditors to provide reasonable assurance of detecting abuse.
Because of the inherent limitations of an audit, combined with the inherent limitations of internal control, and because we will not perform a detailed examination of all transactions, there is a risk that material misstatements or noncompliance may exist and not be detected by us, even though the audit is properly planned and performed in accordance with U.S. generally accepted auditing standards and Government Auditing Standards. In addition, an audit is not designed to detect immaterial misstatements or violations of

3
laws or governmental regulations that do not have a direct and material effect on the financial statements or major programs. However, we will inform the appropriate level of management of any material errors, any fraudulent financial reporting, or misappropriation of assets that come to our attention. We will also inform the appropriate level of management of any violations of laws or governmental regulations that come to our attention, unless clearly inconsequential, and of any material abuse that comes to our attention. Our responsibility as auditors is limited to the period covered by our audit and does not extend to any later periods for which we are not engaged as auditors.
Our procedures will include tests of documentary evidence supporting the transactions recorded in the accounts, and may include tests of the physical existence of inventories, and direct confirmation of receivables and certain other assets and liabilities by correspondence with selected individuals, funding sources, creditors, and financial institutions. We will request written representations from your attorneys as part of the engagement, and they may bill you for responding to this inquiry. At the conclusion of our audit, we will require certain written representations from you about your responsibilities for the financial statements; and other responsibilities required by generally accepted auditing standards.
Audit Procedures—Internal Control
Our audit will include obtaining an understanding of the System and its environment, including internal control, sufficient to assess the risks of material misstatement of the financial statements and to design the nature, timing, and extent of further audit procedures. Tests of controls may be performed to test the effectiveness of certain controls that we consider relevant to preventing and detecting errors and fraud that are material to the financial statements and to preventing and detecting misstatements resulting from illegal acts and other noncompliance matters that have a direct and material effect on the financial statements. Our tests, if performed, will be less in scope than would be necessary to render an opinion on internal control and, accordingly, no opinion will be expressed in our report on internal control issued pursuant to Government Auditing Standards.
An audit is not designed to provide assurance on internal control or to identify significant deficiencies or material weaknesses. However, during the audit, we will communicate to management and those charged with governance internal control related matters that are required to be communicated under AICPA professional standards and Government Auditing Standards.
Audit Procedures—Compliance
As part of obtaining reasonable assurance about whether the financial statements are free of material misstatement, we will perform tests of the System’s compliance with provisions of applicable laws, regulations, contracts, and agreements, including grant agreements. However, the objective of those procedures will not be to provide an opinion on overall compliance and we will not express such an opinion our report on compliance issued pursuant to Government Auditing Standards.
Management Responsibilities
Management is responsible for establishing and maintaining effective internal controls, including evaluation and monitoring ongoing activities; to help ensure that appropriate goals and objectives are met; following laws and regulations; and ensuring that management and financial information is reliable and properly reported. Management is also responsible for implementing systems designed to achieve compliance with applicable laws, regulations, contracts, and grant agreements. You are also responsible for the selection and application of accounting principles; for the preparation and fair presentation of the financial statements and all accompanying information in conformity with U.S. generally accepted accounting principles; and for compliance with applicable laws and regulations and the provisions of contracts and grant agreements.

4
Management is also responsible for making all financial records and related information available to us and for the accuracy and completeness of that information. You are also responsible for providing us with (1) access to all information of which you are aware that is relevant to the preparation and fair presentation of the financial statements, (2) access to personnel, accounts, books, records, supporting documentation, and other information as needed to perform an audit, (3) additional information that we may request for the purpose of the audit, and (4) unrestricted access to persons within the government from whom we determine it necessary to obtain audit evidence.
Management’s responsibilities include adjusting the financial statements to correct material misstatements and confirming to us in the management representation letter that the effects of any uncorrected misstatements aggregated by us during the current engagement and pertaining to the latest period presented are immaterial, both individually and in the aggregate, to the financial statements as a whole.
Management is responsible for the design and implementation of programs and controls to prevent and detect fraud, and for informing us about all known or suspected fraud affecting the government involving (1) management, (2) employees who have significant roles in internal control, and (3) others where thefraud could have a material effect on the financial statements. Management’s responsibilities includeinforming us of your knowledge of any allegations of fraud or suspected fraud affecting the governmentreceived in communications from employees, former employees, grantors, regulators, or others. In addition,management is responsible for identifying and ensuring that the government complies with applicable laws,regulations, contracts, agreements, and grants. Management is also responsible for taking timely andappropriate steps to remedy fraud and noncompliance with provisions of laws, regulations, contracts, andgrant agreements, or abuse that we report.
Management is also responsible for the preparation of the other supplementary information, which we have been engaged to report on, in conformity with U.S. generally accepted accounting principles. Management agrees to include our report on the supplementary information in any document that contains, and indicates that we have reported on, the supplementary information. Management also agrees to include the audited financial statements with any presentation of the supplementary information that includes our report thereon. Management’s responsibilities include acknowledging to us in the written representation letter that (1) management is responsible for presentation of the supplementary information in accordance with GAAP; (2) management believes the supplementary information, including its form and content, is fairly presentedin accordance with GAAP; (3) the methods of measurement or presentation have not changed from thoseused in the prior period (or, if they have changed, the reasons for such changes); and (4) management hasdisclosed to us any significant assumptions or interpretations underlying the measurement or presentation ofthe supplementary information.
Management is responsible for establishing and maintaining a process for tracking the status of audit findings and recommendations. Management is also responsible for identifying and providing report copies of previous financial audits, attestation engagements, performance audits, or other studies related to the objectives discussed in the Audit Objectives section of this letter. This responsibility includes relaying to us corrective actions taken to address significant findings and recommendations resulting from those audits, attestation engagements, performance audits, or studies. Management is also responsible for providing management’s views on our current findings, conclusions, and recommendations, as well as your planned corrective actions, for the report, and for the timing and format for providing that information.
You agree to assume all management responsibilities relating to the financial statements and related notes. You will be required to acknowledge in the management representation letter our assistance with preparation of the financial statements and related notes and that you have reviewed and approved the financial statements and related notes prior to their issuance and have accepted responsibility for them.
Engagement Administration, Fees, and Other

5
Third-party Service Providers
We may from time to time and depending on the circumstances, use third-party service providers in serving your account. We may share confidential information about you with these service providers, but remain committed to maintaining the confidentiality and security of your information. Accordingly, we maintain internal policies, procedures, and safeguards to protect the confidentiality of your personal information. In addition, we will secure confidentiality agreements with all service providers to maintain the confidentiality of your information and we will take reasonable precautions to determine that they have appropriate procedures in place to prevent the unauthorized release of your confidential information to others. In the event that we are unable to secure an appropriate confidentiality agreement, you will be asked to provide your consent prior to the sharing of your confidential information with the third-party service provider. Furthermore, we will remain responsible for the work provided by any such third-party service providers.
Assistance from the System
We understand that the System’s employees will prepare all cash, investments or other confirmations we request and will locate any documents selected by us for testing.
Report Copies
We will provide copies of our reports to the System; however, management is responsible for distribution of the reports and the financial statements. Unless restricted by law or regulation, or containing privileged and confidential information, copies of our reports are to be made available for public inspection.
Audit Documentation
The audit documentation for this engagement is the property of Macias Gini & O’Connell LLP (MGO) and constitutes confidential information. However, subject to applicable laws and regulations, audit documentation and appropriate individuals will be made available upon request and in a timely manner to the System’s cognizant agency or its designee, a federal agency providing direct or indirect funding, or the U.S. Government Accountability Office for purposes of a quality review of the audit, to resolve audit findings, or to carry out oversight responsibilities. We will notify management of any such request. If requested, access to such audit documentation will be provided under the supervision of MGO personnel. Furthermore, upon request, we may provide copies of selected audit documentation to the aforementioned parties. These parties may intend, or decide, to distribute the copies or information contained therein to others, including other governmental agencies.
The audit documentation for this engagement will be retained for a minimum of seven years after the report release date or for any additional period requested by the cognizant agency. If we are aware that a federal awarding agency, pass-through entity, or auditee is contesting an audit finding, we will contact the party(ies) contesting the audit finding for guidance prior to destroying the audit documentation
Engagement Partner
We expect to begin our audit on approximately May 15, 2019 and to issue our reports no later than November 15, 2019. James V. Godsey is the engagement partner and is responsible for supervising the engagement and signing the reports or authorizing another individual to sign them.
6
Fees
Our fee for these services will be at our standard hourly rates and will not exceed $47,500. Our standard hourly rates vary according to the degree of responsibility involved and the experience level of the personnel assigned to your audit. Our invoices for these fees will be rendered each month as work progresses. Each invoice is due and payable upon presentation and becomes past due after 30 days.
If we elect to terminate our services for nonpayment, our engagement will be deemed to have been completed upon written notification of termination, even if we have not completed our report(s). You will be obligated to compensate us for all time expended and to reimburse us for all out-of-pocket costs through the date of termination. The above fee is based on anticipated cooperation from your personnel and the assumption that unexpected circumstances will not be encountered during the audit. If significant additional time is necessary, we will discuss it with you and arrive at a new fee estimate before we incur the additional costs.
Subpoena and Other Release of Documents
As a result of our services to you, we may be required or requested to provide information or documents to you or a third-party pursuant to a subpoena, court order or other administrative or legal process in connection with governmental regulations or activities, or a legal, arbitration or administrative proceeding, in which we are not a party. You agree that our efforts in complying with such requests or demands will be deemed a part of this engagement and MGO shall be entitled to additional compensation for our time, which is based on the hourly rates as specified in the original cost proposal, and reimbursement for our out-of-pocket expenditures (including legal fees) in complying with such requests or demands.
Use of Electronic Communication and Cloud-based Computing
In connection with this engagement, we may communicate with management or others via e-mail transmission. As e-mail can be intercepted and read, disclosed, or otherwise used or communicated by an unintended third party, or may not be delivered to each of the parties to whom they are directed and only to such parties, we cannot guarantee or warrant that e-mail from us will be properly delivered and read only by the addressee. Therefore, we specifically disclaim and waive any liability or responsibility whatsoever for interception or unintentional disclosure or communication of e-mail transmissions, or for the unauthorized use or failed delivery of e-mail transmitted by us in connection with the performance of this engagement, except liability that results from gross negligence, willful misconduct, or fraud on the part of MGO and/or any of its employees, representatives, and/or agents. In that regard, management agrees that we shall have no liability for any loss of damage to any person or entity resulting from the use of e-mail transmissions, including any consequential, incidental, direct, indirect, or special damages, such as loss of revenues or anticipated profits, or disclosure or communication of confidential or proprietary information, except liability that results from gross negligence, willful misconduct, or fraud on the part of MGO and/or any of its employees, representatives, and/or agents.
With regards to the electronic dissemination of audited financial statements, including financial statements published electronically on the System’s website, management understands that electronic sites are a means to distribute information and, therefore, we are not required to read the information contained in these sites or to consider the consistency of other information in the electronic site with the original audited financial statement.
MGO uses cloud-based computing services, including the storage of data and files, at third party, offsite, secure facilities. In that regard, you agree that we shall have no liability for any loss or damage to any person or entity resulting from the use of email transmissions and cloud-based computing, including any direct or indirect damages that may result from any inadvertent or unanticipated disclosure of confidential
7
or proprietary information, or disclosure through third party criminal conduct (e.g., hackers or hacking activities), except liability that results from gross negligence, willful misconduct, or fraud on the part of MGO and/or any of its employees, representatives and/or agents.
Additional Limitations on Liability
We rely in good faith on all information, assumptions, procedures and decisions communicated to us by you, your employees or your representatives, and we will not be responsible for any loss or other obligation arising from our reliance. Furthermore, the procedures we will perform in our engagement will be heavily influenced by, and dependent upon the written and oral representations and information that we receive from you. You agree that you are responsible for the accuracy and completeness of the representations and information provided to us by your employees, representatives and management, and you acknowledge that we may rely on the System to ensure the accuracy and completeness of the representations and information we receive from its employees, representatives and management.
Independence
Professional and certain regulatory standards require us to be independent, in both fact and appearance, with respect to the System in the performance of our services. Any discussions that the System representatives have with professional personnel of MGO regarding employment could pose a threat to our independence. Therefore, you agree to inform us prior to any such discussions so that we can implement appropriate safeguards to maintain our independence.
Government Auditing Standards require that we provide the System with a copy of our most recent external peer review report and any letter of comment, and any subsequent peer review reports and letters of comment received during the period of the contract. Our 2018 peer review report accompanies this letter.
We appreciate the opportunity to be of service to the System and believe this letter accurately summarizes the significant terms of our engagement. If you have any questions, please let us know. If you agree with the terms of our engagement as described in this letter, please sign the enclosed copy and return it to us.
A facsimile or electronic signature shall be treated as an original signature, provided that the party providing the facsimile or electronic signature shall be responsible for obtaining an ink signature that will be provided to the other party(ies) immediately upon request.
Very truly yours,
James V. Godsey Partner Macias Gini & O’Connell LLP

8
RESPONSES:
This letter correctly sets forth the understanding of the engagement. I have read this agreement, including the attached Terms and Conditions, and understand its terms. I am authorized to sign this agreement on behalf of the System.
Management Signature:_______________________________________
Title: _____________________________________
Date: _____________________________________

9250 EAST COSTILLA AVENUE, SUITE 450
GREENWOOD VILLAGE, COLORADO 80112
303‐792‐3020 (O) | 303‐792‐5153 (F)WWW.WCRCPA.COM
Report on the Firm’s System of Quality Control
October 25, 2018
To the Partners of Macias Gini & O’Connell LLP and the National Peer Review Committee
We have reviewed the system of quality control for the accounting and auditing practice of Macias Gini & O’Connell LLP (the firm) applicable to engagements not subject to PCAOB permanent inspection in effect for the year ended March 31, 2018. Our peer review was conducted in accordance with the Standards for Performing and Reporting on Peer Reviews established by the Peer Review Board of the American Institute of Certified Public Accountants (Standards).
A summary of the nature, objectives, scope, limitations of, and the procedures performed in a System Review as described in the Standards may be found at www.aicpa.org/prsummary. The summary also includes an explanation of how engagements identified as not performed or reported in conformity with applicable professional standards, if any, are evaluated by a peer reviewer to determine a peer review rating.
Firm’s Responsibility
The firm is responsible for designing a system of quality control and complying with it to provide the firm with reasonable assurance of performing and reporting in conformity with applicable professional standards in all material respects. The firm is also responsible for evaluating actions to promptly remediate engagements deemed as not performed or reported in conformity with professional standards, when appropriate, and for remediating weaknesses in its system of quality control, if any.
Peer Reviewer’s Responsibility
Our responsibility is to express an opinion on the design of the system of quality control and the firm’s compliance therewith based on our review.
9

10
Required Selections and Considerations
Engagementsselected forreviewincludedanengagementsperformedunderGovernmentAuditingStandards,includingcomplianceauditsundertheSingleAuditAct;anauditofanemployeebenefitplanandanexaminationofaserviceorganization,SOC1engagement.
As a part of our peer review, we considered reviews by regulatory entities as communicated by the firm, if applicable, in determining the nature and extent of our procedures.
Opinion
In our opinion, the system of quality control for the accounting and auditing practice of Macias Gini & O’Connell LLP engagements not subject to PCAOB permanent inspection in effect for the year ended March 31, 2018, has been suitably designed and complied with to provide the firm with reasonable assurance of performing and reporting in conformity with applicable professional standards in all material respects. Firms can receive a rating of pass, pass with deficiency(ies) or fail. Macias Gini & O’Connell LLP has received a peer review rating of pass.
wWatsonCoonRyan,LLC

www.mgocpa.com Macias Gini & O’Connell LLP 700 South Flower St., Suite 800 Los Angeles, CA 90017
1
May 1, 2019
To the Board of Retirement Pasadena Fire & Police Retirement System Pasadena, California
We are engaged to audit the statement of fiduciary plan net position and the related statement of changes in fiduciary plan net position of the Pasadena Fire and Police Retirement System for the year ended June 30, 2019. Professional standards require that we provide you with the following information related to our audit. We would also appreciate the opportunity to meet with you to discuss this information further since a two-way dialogue can provide valuable information for the audit process.
Our Responsibility under U.S. Generally Accepted Auditing Standards
As stated in our engagement letter dated May 1, 2019, our responsibility, as described by professional standards, is to express an opinion about whether the financial statements prepared by management with your oversight are fairly presented, in all material respects, in conformity with U.S. generally accepted accounting principles. Our audit of the financial statements does not relieve you or management of your responsibilities.
Generally accepted accounting principles provide for certain required supplementary information (RSI) to supplement the basic financial statements. Our responsibility with respect to the Management’s Discussion and Analysis, Schedule of Changes in Employer’s Net Position Liability, Schedule of Employer’s Net Pension Liability and Related Ratios, Schedule of Employer Contributions, Schedule of Investment Returns and Notes to Required Supplementary Information, which supplement the basic financial statements, is to apply certain limited procedures in accordance with generally accepted auditing standards. However, the RSI will not be audited and, because the limited procedures do not provide us with sufficient evidence to express an opinion or provide any assurance, we will not express an opinion or provide any assurance on the RSI.
We have been engaged to report on Additions by Sources and Deductions by Type, which accompanies the financial statements but are not RSI. Our responsibility for this supplementary information, as described by professional standards, is to evaluate the presentation of the supplementary information in relation to the financial statements as a whole and to report on whether the supplementary information is fairly stated, in all material respects, in relation to the financial statements as a whole.
We have not been engaged to report on Comparative Information from Prior Fiscal Years: Interest Rate Risk, which accompany the financial statements but are not RSI. Our responsibility with respect to this other information in documents containing the audited financial statements and auditor’s report does not extend beyond the financial information identified in the report. We have no responsibility for determining whether this other information is properly stated. This other information will not be audited and we will not express an opinion or provide any assurance on it.
mprice
Typewritten Text
DATE: 5/15/19 ITEM #: 9 attachment

2
Planned Scope, Timing of the Audit, and Other An audit includes examining, on a test basis, evidence supporting the amounts and disclosures in the financial statements; therefore, our audit will involve judgment about the number of transactions to be examined and the areas to be tested. Our audit will include obtaining an understanding of the entity and its environment, including internal control, sufficient to assess the risks of material misstatement of the financial statements and to design the nature, timing, and extent of further audit procedures. Material misstatements may result from (1) errors, (2) fraudulent financial reporting, (3) misappropriation of assets, or (4) violations of laws or governmental regulations that are attributable to the entity or to acts by management or employees acting on behalf of the entity. We will generally communicate our significant findings at the conclusion of the audit. However, some matters could be communicated sooner, particularly if significant difficulties are encountered during the audit where assistance is needed to overcome the difficulties or if the difficulties may lead to a modified opinion. We will also communicate any internal control related matters that are required to be communicated under professional standards. We expect to begin our audit on approximately May 15, 2019 and issue our report on approximately November 15, 2019. James V. Godsey is the engagement partner and is responsible for supervising the engagement and signing the report or authorizing another individual to sign it. This information is intended solely for the use of the Board of Retirement and management of Pasadena Fire and Police Retirement System and is not intended to be, and should not be, used by anyone other than these specified parties. Very truly yours,
Macias Gini & O’Connell LLP Los Angeles, California

Date: 5/15/19 Item: 10
May 15, 2019 Page 1 of 1 Actuarial Assumptions, June 30, 2019 Valuation
Pasadena Fire & Police Retirement System
AGENDA REPORT
TO: Chair Jones and Board Members of the Fire & Police Retirement System
FROM: Bernadette Jazmines, Secretary to the Board
DATE: May 15, 2019
ITEM: Actuarial Assumptions for Use in Preparing the June 30, 2019 Actuarial Valuation
RECOMMENDATION Upon review of the report, the Board may:
1. Approve the assumptions for use in preparing the June 30, 2019 actuarial valuation, as recommended by System Actuary, Bartel Associates:
a. Funding Discount Rate 5.25% b. Expected Rate of Return 5.75% c. Inflation 2.75% d. Base Mortality CalPERS 1997-2015 Experience Study e. Mortality Improvement Scale MP-2017
2. Or, other direction provided by the Board.
BACKGROUND System Actuary Joe D’Onofrio of Bartel Associates (“Bartel”) has recommended that the discount rate, inflation rate, and mortality assumptions for the June 30, 2019 valuation be the same as those adopted for the June 30, 2018 actuarial valuation. It should also be noted that the discount rate, expected rate of return, inflation rate, and mortality assumptions were all changed last year for the June 30, 2018 actuarial valuation. FISCAL IMPACT Adequate funding is budgeted in Account 811400 for the recommended assumptions letter. The budget for the preparation of the June 30, 2019 actuarial valuation of $17,000 (as approved by the Board on February 15, 2017) is included in the FY 2020 Recommended Budget. ATTACHMENT
1. June 30, 2019 Actuarial Valuation Assumptions, Bartel Associates, LLC (dated May 2, 2019)
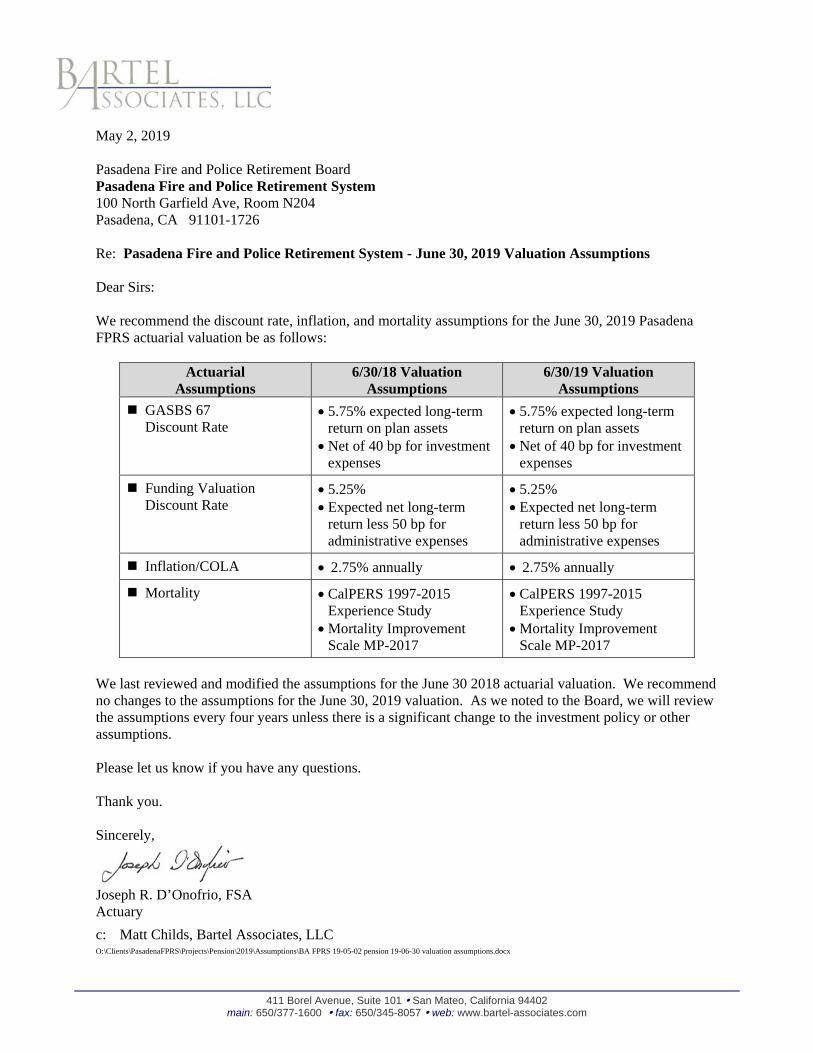
411 Borel Avenue, Suite 101 San Mateo, California 94402 main: 650/377-1600 fax: 650/345-8057 web: www.bartel-associates.com
May 2, 2019 Pasadena Fire and Police Retirement Board Pasadena Fire and Police Retirement System 100 North Garfield Ave, Room N204 Pasadena, CA 91101-1726 Re: Pasadena Fire and Police Retirement System - June 30, 2019 Valuation Assumptions Dear Sirs: We recommend the discount rate, inflation, and mortality assumptions for the June 30, 2019 Pasadena FPRS actuarial valuation be as follows:
Actuarial Assumptions
6/30/18 Valuation Assumptions
6/30/19 Valuation Assumptions
GASBS 67 Discount Rate
5.75% expected long-term return on plan assets
Net of 40 bp for investment expenses
5.75% expected long-term return on plan assets
Net of 40 bp for investment expenses
Funding Valuation Discount Rate
5.25% Expected net long-term
return less 50 bp for administrative expenses
5.25% Expected net long-term
return less 50 bp for administrative expenses
Inflation/COLA 2.75% annually 2.75% annually
Mortality CalPERS 1997-2015 Experience Study
Mortality Improvement Scale MP-2017
CalPERS 1997-2015 Experience Study
Mortality Improvement Scale MP-2017
We last reviewed and modified the assumptions for the June 30 2018 actuarial valuation. We recommend no changes to the assumptions for the June 30, 2019 valuation. As we noted to the Board, we will review the assumptions every four years unless there is a significant change to the investment policy or other assumptions. Please let us know if you have any questions. Thank you. Sincerely,
Joseph R. D’Onofrio, FSA Actuary
c: Matt Childs, Bartel Associates, LLC O:\Clients\PasadenaFPRS\Projects\Pension\2019\Assumptions\BA FPRS 19-05-02 pension 19-06-30 valuation assumptions.docx
mprice
Typewritten Text
DATE: 5/15/19 ITEM #: 10 attachment

May 15, 2019 Page 1 of 3 Fiduciary Liability and Cyber Liability Insurance
Pasadena Fire & Police Retirement System
AGENDA REPORT
TO: Chair Jones and Board Members of the Fire & Police Retirement System
FROM: Bernadette Jazmines, Secretary to the Board
DATE: May 15, 2019
ITEM: Policy Renewal for Fiduciary Liability Insurance and Renewal of Cyber Liability Insurance
RECOMMENDATION
Upon review and discussion, the Board may direct staff to:
1. Approve the policy renewal for fiduciary liability insurance with Markel America Insurance Company in the amount of $17,700 effective July 2, 2019, subject to Counsel review, and
2. Approve the policy renewal of cyber liability insurance with BCS Insurance Company in the amount of $3,994.00 effective July 2, 2019 (with an optional Cyber Deception Premium of $450.00 and optional Tria Premium of $44.00) , subject to Counsel review, or
3. Other direction provided by the Board.
BACKGROUND
Insurance is a means of protection from financial loss. It is a form of risk management primarily used to hedge against the risk of a contingent, uncertain loss. The System and its current fiduciaries are named as additional insured under the City of Pasadena’s General Liability Insurance (“GL”) and Government Crime Insurance (“Crime”) policies. If a situation arises regarding the System that falls within the available limits and endorsements of the City’s GL and Crime policies, the City’s policies will provide coverage for System claims and expenses up to the allowable limits. However, the City’s GL policy provides express exclusions for fiduciary liability, and at this time, the City does not purchase a Fiduciary policy. The System purchases fiduciary liability insurance on an annual basis. The purpose of this type insurance is to provide coverage for claims and expenses arising from allegations of actions taken or not-taken by fiduciaries involving fraud, self-dealing, neglect, or other criminal acts. Fiduciary standards are process rather than results focused. If fiduciaries make decisions in good faith within the scope of their authority, they are judged on whether the process was prudent, not whether the result achieved the objective. For FPRS, current and former board members (plan trustees), and current and former staff are considered fiduciaries. The coverage afforded under the System’s fiduciary policy is considered the primary coverage. In the past, the City had purchased fiduciary liability coverage so the System’s policy provided secondary coverage in the event the limits were met or if the City and System had divergent interests.
mprice
Typewritten Text
DATE: 5/15/19 ITEM #: 11

May 15, 2019 Page 2 of 3 Fiduciary Liability and Cyber Liability Insurance
Risk Assessment and Recommendation
Two years ago, the City’s Risk Manager was asked by staff to provide a deeper-dive review of the System’s scope of work. Such review (from a risk perspective) included the work processes to develop and implement Investment Policy Statement, the funding mechanism with the City, stability of the Board, historically clean audits (including new auditors two years ago), and the Plan’s status of closed/full-retired. The City’s Risk Manager believed the risk assessment conducted was likely more formulaic than substantive and had not fully considered the specific dynamics of the Plan. Further, given that no claims had ever been filed against the System, as well as the comparatively high cost for increased coverage, the Risk Manager believes that the current level of liability coverage is adequate. Lastly, given the minimal premium discount offered in exchange for a retainer (i.e., deductible), she recommended continuing the policy with no retainer.
Risk Manager Recommendation of $5,000,000 limit of liability coverage at $0 retainer o FPRS staff concurred last year with this recommendation and continues to concur with this
recommendation.
Note: The coverage offered this year is the same as last year’s but the premium is $413 less.
US Bank Coverage for Retiree Payroll
As noted above, retiree payroll processing was transitioned to custodian U.S. Bank beginning in January 2017. As such, Exhibit C to the Custody Agreement provides safeguards for the client (the System). Specifically in paragraph eight, “The Bank shall maintain physical, electronic, and procedural safeguards that are designed to (a) maintain the security and confidentiality of Personal Data; (b) protect Personal Data against anticipated threats or hazards to the security or integrity of Personal Data; and (c) prevent unauthorized access to or use of such Personal Data that could result in substantial harm or inconvenience to the applicable Customer.” Further, Amendment #1 to the Custody Agreement regarding Indemnification (Section 9.2) modified the agreement to provide that the System would not indemnify U.S. Bank “… to the extent that the Harm resulted directly from the Bank’s failure to maintain the physical, electronic, and procedural Safeguards described in Exhibit C.” U.S. Bank has provided staff with evidence of coverage for Cyber Liability ($10M), Error & Omissions ($25M), and Crime ($25M). Although U.S. Bank provides coverage to the System through the custodial agreement and maintains adequate insurance levels, the Risk Manager recommends that the Board purchase its own cyber liability policy. It should also be noted that the coverage quoted to the System for cyber liability is afforded at the same level as the City’s policy.
Risk Manager Recommendation of $1,000,000 limit of liability coverage at $2,500 retainer o FPRS staff concurred last year with this recommendation and continues to concur with this
recommendation.
Note: The coverage offered and the premium this year is the same as last year.
Also note: This year an additional coverage option was offered, Cyber Deception Premium with a $2 million limit, $2,500 retention and a cost of $450. The Cyber Deception coverage extension provides coverage for the intentional misleading of the System by means of a dishonest misrepresentation of a material fact contained or conveyed within an electronic or telephonic communication(s) and which is relied upon by the System believing it to be genuine.
Coverage, Retainers and Quotes

May 15, 2019 Page 3 of 3 Fiduciary Liability and Cyber Liability Insurance
There are no notable changes as respect to coverages and limits with either insurance. The terms have remained the same. Staff was informed by the System’s insurance broker, AJG, that Markel America Insurance Company (“Markel”) was pleased to offer a renewal of the current policy. Although other carriers were approached to provide fiduciary and/or cyber liability coverage (including Argo Pro, Beazley, Hiscox, and Travelers), they all expressed that they could not compete with the rates offered. Thus each of these other carriers declined to offer terms for fiduciary and/or cyber liability. The final fiduciary liability renewal quote (see Attachment 1, Governmental Fiduciary Liability Insurance Proposal) and cyber liability quote (see Attachment 2, Cyber Liability Insurance Proposal) were presented to staff in May. FPRS Portion of City’s Broker Fee Starting in FY2018, the City of Pasadena Finance Department started charging various departments their share of the broker fee charged by Arthur J. Gallagher & Co. According to Finance, all the policies purchased through Arthur J. Gallagher & Co. absorb a percentage of the broker fee based on the amount of the policy as calculated on the attached spreadsheet which for FPRS was $938 for FY2019. The charges for FY2018 were reversed by Finance since the FPRS Board was not notified of this change but advised that FPRS will need to begin the payments in FY2019. The Board was notified and approved this adjustment to the FY2019 Budget at the Board meeting on November 28, 2018. The estimated broker fee in the FY2020 Recommended Budget will be $1,000 for this purpose.
FISCAL IMPACT
The cost for the annual fiduciary liability insurance policy with Markel, effective 7/2/19 is $17,900.00 ($17,700 premium plus $200 wholesaler fee), a reduction from 7/2/18, when the cost was $18,313.00 ($18,113 premium plus $200 wholesaler fee), and will be included in the FY 2020 Recommended Budget. The cost for the cyber liability policy with BCS Insurance, effective 7/2/19, is $3,994, which is the same as last year and will be requested as part of the FY 2020 budget process. Based on staff’s recommendation, the total cost for insurance for fiscal year 2020 would be $22,894 which is includes the $1,000 FPRS portion of the City’s broker fee which is $801 less than the FY 2019 actual cost.
*NOTE: In addition to the premiums quoted, a mandatory fee of $200 for the wholesaler/producer, Risk Placement Services, Inc., will be included on the invoice from the City’s insurance broker Arthur J. Gallagher & Co.
ATTACHMENTS
1. Governmental Fiduciary Liability Insurance Proposal 2. Cyber Liability Insurance Proposal

Risk Placement Services525 West Van BurenSuite 1325Chicago, IL 60607Ph: 312-803-6324Fax312-803-6309
INSURANCE QUOTE
DATE ISSUED: May 9, 2019
RETAIL PRODUCER: AJG - San Francisco - Risk Mgmt1255 Battery Street, Suite 450, San Francisco, CA 94111
INSURED: Pasadena Fire and Police Retirement System 100 N. Garfield Ave, N204
Pasadena, CA 91101 INSURER: Markel American Insurance Company
Admitted AM Best Rating: A XV
COVERAGE: Fiduciary Liability
POLICY PERIOD: 7/2/2019 TO 7/2/2020
PREMIUM: $17,700.00
FEES:Broker Fee - RPS $200.00
TOTAL: $17,900.00
RETAIL PRODUCER COMMISSION: 10% Gross Commission: 15%
LIMITS: $5,000,000 Aggregate
DEDUCTIBLE: $0 Each Claim
TERMS / CONDITIONS / SUBJECTIVITIES:
Terms & Conditions are per attached carrier quote
PAYMENT TERMS: PREMIUM PAYMENT IS DUE WITHIN TWENTY (20) DAYS FROM EFFECTIVE DATE UNLESS OTHERWISE STIPULATED.
mprice
Typewritten Text
DATE: 5/15/19 ITEM #: 11 attachment

The coverage outlined above may not conform to the terms and conditions you requested. Please check carefully.
If this policy is issued on a Non-Admitted basis, all applicable taxes & fees must be added to the bound premium. Your office is
responsible for collecting Surplus Lines taxes & fees (if applicable) from the Insured in addition to completing any required Surplus Lines
forms. RPS will remit the applicable taxes and forms to the State. This Policy is subject to the Surplus Lines Laws in your State, therefore
you should make every effort to comply with any special provisions and regulations of your State.
Tim Foody, Account ExecutiveAUTHORIZED REPRESENTATIVE
INSURED: Pasadena Fire and Police Retirement SystemDATE ISSUED: May 9, 2019
Reference #:BK1129358C

DATE ISSUED:
QUOTATION NO:
ISSUED BY:
INSURANCE REPRESENTATIVE:
PRODUCER:
ADDRESS:
TRUST(S) OR PLAN(S):
ULLICO ORGANIZED LABOR PROTECTION GROUP, LLC
a voluntary membership organization operating pursuant to the Liability Risk Retention Act of 1986 and whoseprincipal office is: 1625 Eye Street NW, Washington, DC 20006
GOVERNMENTAL FIDUCIARY LIABILITY INSURANCE PREMIUM QUOTATION
UNDERWRITER:
RENEWAL:
Markel American Insurance Company Ullico Casualty Group, LLC8403 Colesville Road, 13th FloorSilver Spring, MD 20910
05/08/2019 Vicky Go
QT0000052891 Y
Risk Placement Services, Inc.
6625 W 78th Street, Suite 210Bloomington, MN 55439
Pasadena Fire and Police Retirement System
(a)
(b)
ADDRESS:
POLICY PERIOD:
PRIOR & PENDINGLITIGATION DATE:
LIMITS OF LIABILITY:
SELF-INSURED RETENTION:
COVERAGE:
Limit of Liability for all Loss (Aggregate)
Voluntary Compliance Program Expenditure Sub-Limit:Aggregate Limit of Liability for all Voluntary ComplianceProgram Expenditures (included within and not in additionto the maximum Aggregate Limit of Liability set forth inItem 04(a) of the Policy Certificate.
each Claim
Markel American Insurance CompanyGovernmental Fiduciary Liability Insurance Claims-Made Policy Form GOV-1000(11/2014), Claims Expenses Inclusive
100 N Garfield AveN204Pasadena, CA 91101
07/02/2019 to 07/02/2020
07/02/2007
$5,000,000
$250,000
$0
GOV-1000-Q (11/2014) Page 1 of 2

CONDITIONS/COVERAGE SUBJECT TO:
Basic PremiumTax/Other Total
(a)(b)(c)
PREMIUM:
COMMISSION:
$17,700.00$0.00
$17,700.00
15.00%
Nothing else required
THE FOLLOWING ENDORSEMENTS WILL ATTACH TO THE POLICY:
END NO./REF NO. ENDORSEMENT
1. MIL 1214 (09/17) Trade or Economic Sanctions2. TRIA (06/15) Cap on Losses From Certified Acts of Terrorism3. GOV-CA (06/15) California Amendatory Endorsement4. GOV-005b (06/15) Additional Insured Natural Person and/or Organization5. GOV-053 (06/15) Individual Insured Amended Retention for Non-Indemnifiable Loss6. GOV-054 (05/16) Modification Endorsement
This quotation is valid for a period of thirty (30) days from the Issue Date shown above unless amended or withdrawn byMarkel American Insurance Company (Insurer), with or without cause, prior to its acceptance and binding, and is subjectto the terms and conditions of the policy (ies) to be issued. If the information supplied by the Trust or Plan in theapplication changes between the date of the application for this insurance and the Effective Date of the insurance or the timewhen the policy is bound (whichever is later), the Trust or Plan must immediately notify Insurer in writing of such changesand the Insurer may withdraw or amend any outstanding quotations based upon such changes.
Ullico Organized Labor Protection Group, LLC is administered by Ullico Casualty Group, LLC, a/k/a Ullico InsuranceAgency, LLC in CA, and Ullico Casualty Agency in NY. CA License #OH86030 and FL (Craig Arneson) License # A008437.
GOV-1000-Q (11/2014) Page 2 of 2

Cyber Insurance Quotation
mprice
Typewritten Text
DATE: 5/15/19 ITEM #: 11 attachment

Frequently Asked Questions
Do you have any questions about your insurance? The frequently asked questions below are here to help you makean informed decision.
What is Cyber Liability Insurance?
“Cyber” Liability is insurance coverage specifically designed to protect a business or organization from a range ofthreats and incidents relating to a breach event including:
Liability claims involving the unauthorized release of information for which the organization has a legal obligationto keep privateLiability claims alleging invasion of privacy and/or copyright/trademark violations in a digital, online or socialmedia environmentLiability claims alleging failures of computer security that result in deletion/alteration of data, transmission ofmalicious code, denial of service, etc.Defense costs in State or Federal regulatory proceedings that involve violations of privacy law; andThe provision of expert resources and monetary reimbursement to the Insured for the out-of-pocket (1st Party)expenses associated with the appropriate handling of the types of incidents listed above
The term “Cyber” implies coverage only for incidents that involve electronic hacking or online activities, when infact this product is much broader, covering private data and communications in many different formats – paper,digital or otherwise.
What does Privacy Liability (including Employee Privacy) cover?
The Privacy Liability aspect of the insuring agreement in our policy goes beyond providing liability protection for theInsured against the unauthorized release of Personally Identifiable Information (PII), Protected Health Information(PHI), and corporate confidential information of third parties and employees, like most popular "Data Breach"policies. Rather, our policy provides true Privacy protection in that the definition of includesPrivacy Breachviolations of a person's right to privacy, etc. Because information lost in every data breach may not fit State orFederal-specific definitions of PII or PHI, our policy broadens coverage to help fill these potentially costly gaps. Thisis a key provision that truly sets the BCS policy apart from others.
What does Privacy Regulatory Claims Coverage cover?
The Privacy Regulatory Claims Coverage insuring agreement provides coverage for both legal defense and theresulting fines/penalties emanating from a made against the Insured, alleging a privacy breachRegulatory Claimor a violation of a Federal, State, local or foreign statute or regulation with respect to privacy regulations.
Does this policy cover regulatory investigations and/or fines related to GDPR privacy violations?
The BCS cyber policy has always provided broad coverage that would contemplate defenseRegulatory Claimand penalties associated with unintentional violations of domestic and foreign privacy statutes. In accordance withthe implementation of the EU’s General Data Protection Regulation, BCS added clarifying language to the policyform under the definitions of and to specifically reference coverage forPrivacy Regulations Private InformationGDPR by name (subject to policy terms and conditions). It is important to note that fines and penalties may not beinsurable by law in certain U.S. States and in certain foreign countries, including some member countries of theEuropean Union.
Quotation RPS-Q-50149291M/1 | Page 2 of 54

What does Security Breach Response Coverage cover?
This 1st Party coverage reimburses an Insured for costs incurred in the event of a security breach of personal,non-public information of their customers or employees. Examples include:
The hiring of a public relations consultant to help avert or mitigate damage to the Insured’s brandIT forensics, customer notification and 1st Party legal expenses to determine the Insured’s obligations underapplicable Privacy RegulationsCredit monitoring expenses for affected customers for up to 12 months, and longer if circumstances require.
Our policy can also extend coverage even in instances where there is no legal duty to notify if the Insured feels thatdoing so will mitigate potential brand damage (such voluntary notification requires prior written consent).
What does Security Liability cover?
The Security Liability insuring agreement provides coverage for the Insured for allegations of a Security Wrongful, including:Act
The inability of a third-party, who is authorized to do so, to gain access to the Insured’s computer systemsThe failure to prevent unauthorized access to or use of a computer system, and/or the failure to prevent falsecommunications such as phishing that results in corruption, deletion of or damage to electronic data, theft ofdata and denial of service attacks against websites or computer systems of a third partyProtects against liability associated with the Insured’s failure to prevent transmission of malicious code fromtheir to a third party’s Computer System Computer System
What does Multimedia Liability cover?
The Multimedia Liability insuring agreement provides broad coverage against allegations that include:
Defamation, libel, slander, emotional distress, invasion of the right to privacy, copyright and other forms ofintellectual property infringement (patent excluded) in the course of the Insured’s communication of Media
in electronic (website, social media, etc.) or non-electronic formsContent
Other Cyber insurance policies often limit this coverage to content posted to the Insured’s website. Our policyextends what types of media are covered as well as the locations where this information resides.
What does Cyber Extortion cover?
The Cyber Extortion insuring agreement provides:
Expense and payments (including ransom payments if necessary) to a third party to avert potential damagethreatened against the Insured such as the introduction of malicious code, system interruption, data corruptionor destruction or dissemination of personal or confidential corporate information.Ramsomware is among the most reported types of cybersecurity incidents. Verizon’s 2018 Data BreachInvestigations Report (DBIR) indicated that ransomware is the most common type of malware, found in 39percent of malware-related data breaches – double of the amount reported in last year’s DBIR. Investigationand other expenses associated with ransomware events are contemplated under the insuringCyber Extortionagreement. Additionally, Symantec’s 2018 Internet Security Threat Report indicated that 2017 brought a 46%increase in new ransomware variants. Having the proper team in place to help you navigate the intricacies of aransomware attack is critical and the BCS policy provides this through the coverage.Cyber Extortion
Quotation RPS-Q-50149291M/1 | Page 3 of 54

What does Business Income and Digital Asset Restoration cover?
The Business Income and Digital Asset Restoration insuring agreement provides for lost earnings and expensesincurred because of a , or, an authorized third-party's inability to access a Network Disruption Computer System. The policy will also cover for lost business as a result of a loss of reputation caused by any failure or disruption to
. to restore or recreate digital (not hardware) assets to their pre-loss stateComputer Systems Restoration Costsare provided for as well. What's more, the definition of is broadened to include not onlyComputer Systemsystems under the Insured's direct control, but also systems under the control of a with whomService Providerthe Insured contracts to hold or process their digital assets. Most competing Cyber insurance forms require that a
take place in order for Business Interruption coverage to respond. The BCS form is unique inSecurity Breachthat the definition of is extremely broad and includes any unplanned failure, interruption orNetwork Disruptiondegradation of the operation of your or the of a an IT service provider –Computer System Computer Systemwhether it was caused by a or otherwise. The BCS policy further differentiates itself by taking thisSecurity Breachexpansion of coverage a step further. In addition to IT service providers, coverage for isNetwork Disruptionprovided (on a sub-limited basis) to , that is, any provider, other than an IT Outsourced Providers Service
, that provides services (other than IT services) for you, pursuant to a written contract. This expandedProvidercoverage is offered without the need for additional underwriting.
What is “PCI-DSS Assessment” coverage?
The Payment Card Industry Data Security Standard (PCI-DSS) was established in 2006 through a collaboration ofthe major credit card brands as a means of bringing standardized security best practices for the secureprocessing of credit card transactions. Merchants and service providers must adhere to certain goals andrequirements in order to be "PCI Compliant," and certain specific agreements, may subject an Insured to an"assessment" for breach of such agreements. The AJG Cyber Policy responds to as well asPCI Assessmentsclaims expenses in the wake of a breach involving cardholder information. Additionally, this coverage provides forexpenses associated with a mandatory audit performed by a Qualified Security Assessor (QSA), certified by thePCI Security Standards Council, to show you are PCI DSS compliant, following a .Security Breach
What is Cyber Deception coverage?
The extension is purchased for an additional premium if the applicant is eligible. The extensionCyber Deceptionprovides coverage for the intentional misleading of the Applicant by means of a dishonest misrepresentation of amaterial fact contained or conveyed within an electronic or telephonic communication(s) and which is relied uponby the Applicant believing it to be genuine. This is commonly known as spear-phishing or social engineering", and,along with ransomware events, is among the most reported incidents to the BCS Cyber policy. Many Cyberpolicies offering this coverage require that the insured call back, or, attempt to verify the request’s authenticity via amethod other than the original means. In other words, if a request to transfer money to a different bank routingnumber is received via email, other Cyber policies may require that the person receiving the email attempt to verifythe request also via telephone before authorizing the transfer of money. While the application process asks aquestion regarding controls in place for this, the BCS policy differentiates itself further by not requiring this ofinsureds in the policy wording.
What is Telephone Hacking coverage?
coverage is included in the sub-section of the BCS policy. It provides aTelephone Hacking Electronic Fraudsub-limit of coverage for the intentional, unauthorized and fraudulent use of your Telecommunications Services(ie: telephone, fax, broadband or other data transmission services that you purchase from third parties) that resultsin unauthorized calls or unauthorized use of your bandwidth.
Quotation RPS-Q-50149291M/1 | Page 4 of 54

What is Funds Transfer Fraud coverage?
coverage is available in the sub-section of the BCS policy for insuredsFunds Transfer Fraud Electronic Fraudwho are NOT classified as Financial Institutions (Financial Institutions includes Community, State or Credit Unions,as well as National financial institutions, banks, etc.) For those organizations who are not in the financial institutionclassification, the coverage provides coverage for unauthorized electronic funds transfer, theft of your money orother financial assets from your bank by electronic means, theft of your money or other financial assets from yourcorporate credit cards by electronic means, or any fraudulent manipulation of electronic documentation whilestored on your . This should not be confused with coverage which requiresComputer System Cyber Deceptiona willful release of funds (not theft) based on a fraudulent instruction the insured believes to be true.
How is this policy better than other options in the marketplace?
As with any insurance policy, what sets our coverage apart lies in the definitions and exclusions in the policy. TheAJG Cyber Policy offers broader definitions of critical terms such as , , and Privacy Breach Computer System
. These definitions, along with the absence of some industry-standard exclusions and a drasticallyMedia Contentstreamlined application process, make this policy more comprehensive and easier to access than the typicalCyber policy available from traditional sources.
Isn’t this already covered under most business insurance plans?
The short answer is "No". While liability coverage for data breach and privacy claims has been found in limitedinstances through General Liability, Commercial Crime and some D&O policies, these forms were not intended torespond to the modern threats posed in today's 24/7 information environment. Where coverage has been affordedin the past, carriers (and the ISO) are taking great measures to include exclusionary language in form updates thatmake clear their intentions of not covering these threats. Additionally, even if coverage can be found in rareinstances through other policies, they lack the expert resources and critical 1st Party coverages that help mitigatethe financial, operational and reputational damages a data breach can inflict on an organization.
Are businesses required to carry this coverage?
While there is presently no law that requires a business or organization to carry Cyber Liability Insurance, there is anational trend in business contracts for proof of this coverage. In addition, the SEC and other regulatory bodies areencouraging disclosure of this coverage as a way of demonstrating sound information security risk management.Laws such as HIPAA-HITECH, GDPR and Gramm-Leach-Bliley and state-specific data breach laws are continuallydriving demand as requirements for notification in the wake of a data breach become more expensive, andexpectations around the level of response by an impacted organization are increased.
Quotation RPS-Q-50149291M/1 | Page 5 of 54

Do small businesses need this coverage?
A recent Ponemon Institute report uncovered that 50% of small and medium sized US businesses had suffered adata breach, with 55% suffering a cyber-attack, with the most prevalent attack being non-sophisticated phishingattempts. The US National Cyber Security Alliance has advised that 60% of small companies are out of businesswithin 6 months after being hacked. While breaches involving public corporations and government entities garnerthe vast majority of headlines, it is the small business that can be most at risk. With lower information securitybudgets, limited personnel and greater system vulnerabilities, small businesses are increasingly at risk for a databreach. In the past, many small business owners in the SME space were reluctant to purchase Cyber liabilityinsurance coverage because they did not see themselves as data rich targets. Today’s trends are showing thatmuch of the data breach and ransomware attacks in today’s business environment are indiscriminant of industryor size. Random attacks distributed to thousands of unknown recipients with the hopes of snaring just a limitednumber have caused business owners of all sizes and descriptions to re-think their approach to this huge risk andpurchase insurance to mitigate the effects.
If e-commerce functions such as payment processing or data storage are outsourced, is this coveragestill needed?
The responsibility to notify customers of a data breach or legal liabilities associated with protecting customer data,remain the responsibility of the Insured. Generally speaking, business relationships exist between Insureds andtheir customers, not their customers and the back-office vendors the Insured uses to assist them in theiroperations. Outsourcing business critical functions such as payment processing, data storage, website hosting,etc. can help insulate Insureds from risk, however, the contractual agreement wording between Insureds, theircustomers and the vendors with whom they do business will govern the extent to which liability is assigned inspecific incidents.
What is the cost of not buying the coverage and self-insuring a data breach?
The Ponemon Institute, a well-known research firm, publishes an annual “Cost of a Data Breach” report. Inpartnership with IBM, the 2017 report indicated that the average cost paid for each lost or stolen record is $141.These numbers are reflective of both the indirect expenses associated with a breach (time, effort and otherorganizational resources spent during the data breach resolution, customer churn, etc.), as well as direct expenses(customer notification, credit monitoring, forensics, hiring a law firm, etc.).
While there has been a decrease in the average cost paid for each lost or stolen record since 2016, (down from$158), the average size of a breach has increased to 1.8 times the size of breaches last year. So, despitedecreasing average costs per record, more records are being lost which means an increasing cost to businesses. More information can be found in the “2017 Cost of Data Breach Study: Global Overview” at . www.ponemon.org
In addition, the cost of breaches has evolved from just the cost of notification to now include ransom demands,business income loss, theft, and associated liability costs. These additional factors have also contributed to drivingup the potential financial impact of a breach incident.
Quotation RPS-Q-50149291M/1 | Page 6 of 54

Who is the insurance carrier?
The BCS Cyber and Privacy Liability Policy is underwritten by BCS Insurance Company and powered by and withthe backing of certain syndicates at Lloyd’s of London. BCS Insurance Company is a licensed, admitted insurancecompany in all states and the District of Columbia. The BCS Cyber policy is admitted in every state except VT.BCS Insurance Company provides value through a solid foundation of strong governance, national andinternational capabilities and product and industry expertise and israted A- (Excellent) by A.M. Best. BCSInsurance has been in business for over 60 years. It is a wholly owned subsidiary of BCS Financial Corporationwhich, in turn, is owned by all Blue Cross Blue Shield primary licensees.BCS Insurance Company’s relationshipwith certain syndicates at Lloyd’s of London brings additional strength, stability and industry-leading expertise tothe AJG cyber insurance program. BCS was recognized by S&P Global as the #6 underwriter of cybersecurityinsurance in 2017, according to direct written premium, and the #3 market for in-force policies.
What is the claims-handling process?
A 24-hour data breach hotline is available to report incidents or even suspected incidents. As soon as you suspecta data breach incident or receive notice of a claim, you should call the hotline listed in your policy. This hotline ismanned by Baker Hostetler, a world-wide leading privacy law firm with experience in handling thousands of databreach events. Immediately after calling the hotline, you are required to send notice to Clyde & Co., the designatedlegal firm that has been contracted to triage initial notices in this regard. This can be done by sending an email witha brief description of the incident, including your contact information, to the claims-reporting email address listed inyour policy. Your Gallagher broker will receive notification of the incident (or any third-party claim) as well. It iscritical that you immediately report any and all incidents that you believe could give rise to a claim of any kindunder this policy.
What if there are questions that are not answered here?
Please contact your preferred Cyber professional who will assist you with any questions you may have.
Quotation RPS-Q-50149291M/1 | Page 7 of 54

BCS Insurance Company2 Mid America Plaza, Suite 200
Oakbrook Terrace, IL 60181
(A stock insurance company, herein the "Company")
Policy No. RPS-Q-50149291M/1
Renewal of: RPS-P-50131153M
Cyber and Privacy Liability Insurance Policy
94.111 (06/18)
NOTICE: THE POLICY CONTAINS ONE OR MORE COVERAGES. CERTAIN COVERAGES ARE LIMITED TOLIABILITY FOR CLAIMS THAT ARE FIRST MADE AGAINST THE INSURED AND NOTIFIED TO US DURING THEPOLICY PERIOD AS REQUIRED. CLAIM EXPENSES SHALL REDUCE THE APPLICABLE LIMITS OF LIABILITY ANDARE SUBJECT TO THE APPLICABLE RETENTION (S). PLEASE READ THIS POLICY CAREFULLY.
POLICY DECLARATIONS
ITEM 1. NAMED INSURED Pasadena Fire & Police Retirement System
ADDRESS 100 N. Garfield Avenue, N204 , Pasadena, California, 91101
ITEM 2. POLICY PERIOD FROM: July 2, 2019
TO: July 2, 2020
(12:01 A.M. Standard time at the address shown in Item 1.)
ITEM 3. POLICY LIMITS OFLIABILITY ANDCOVERAGESPURCHASED
A. Aggregate Limit of Liability: $1,000,000
(Aggregate for Each and Every Claim including Claims Expenses)
B. Sublimit of Liability for Individual Coverage(s) Purchased: $1,000,000
"Nil" or "N/A" Sublimit of Liability for any coverage indicates that the coverage
was not purchased
COVERAGEPER CLAIM SUBLIMIT OF LIABILITYINCLUDES CLAIM EXPENSES
AGGREGATE SUBLIMITOF LIABILITY
A. Privacy Liability (including Employee
Privacy)$1,000,000 $1,000,000
B. Privacy Regulatory Claims Coverage $1,000,000 $1,000,000
C. Security Breach Response Coverage $1,000,000 $1,000,000
D. Security Liability $1,000,000 $1,000,000
E. Multimedia Liability $1,000,000 $1,000,000
F. Cyber Extortion $1,000,000 $1,000,000
G. Business Income and Digital Asset
Restoration$1,000,000 $1,000,000
H. PCI DSS Assessment $1,000,000 $1,000,000
Quotation RPS-Q-50149291M/1 | Page 8 of 54

BCS Insurance Company2 Mid America Plaza, Suite 200
Oakbrook Terrace, IL 60181
1.
2.
I. Electronic Fraud
1. Telephone Hacking $100,000 $100,000
2. Funds Transfer Fraud $100,000 $100,000
ITEM 4. RETENTION (including Claims Expenses ):
COVERAGE EACH CLAIM
A. Privacy Liability (including Employee Privacy) $2,500
B. Privacy Regulatory Claims Coverage $2,500
C. Security Breach Response Coverage $2,500
D. Security Liability $2,500
E. Multimedia Liability $2,500
F. Cyber Extortion $2,500
G. Business Income and Digital Asset Restoration $2,500 / 12 hrs waiting period
H. PCI DSS Assessment $2,500
I. Electronic Fraud
1. Telephone Hacking $2,500
2. Funds Transfer Fraud $2,500
ITEM 5. PREMIUM $3,994.00
CYBER DECEPTIONPREMIUM:
$450.00 (IF ELECTED)
TRIA PREMIUM: $44.00 (IF ELECTED IS 1% OF THE TOTAL PREMIUM)
TOTAL: $4,488.00
ITEM 6. TERRITORIAL LIMITS Worldwide
ITEM 7. RETROACTIVE DATE Full Prior Acts
ITEM 8. NOTICE OF CLAIM 2 Steps:
Call Baker Hostetler at the 24 Hour Security Breach Hotline:
1-866-288-1705
File your claim with:
Clyde & Co. US LLP
101 Second Street, 24th Floor
San Francisco CA 94105
USA
ITEM 9. NOTICE OF ELECTION RPS National Claims
190 New Camellia Blvd.
Quotation RPS-Q-50149291M/1 | Page 9 of 54

BCS Insurance Company2 Mid America Plaza, Suite 200
Oakbrook Terrace, IL 60181Covington, LA 70433
USA
ITEM 10. SERVICE OF SUIT Risk Situated in California:
Eileen Ridley
FLWA Service Corp.
c/o Foley & Lardner LLP
555 California Street, Suite 1700, San Francisco, CA 94104-1520
Risks Situated in All Other States:
Mendes & Mount
750 Seventh Avenue, New York, NY 10019
ITEM 11. CHOICE OF LAW California
ITEM 12. WAITING PERIOD: 12 hrs waiting period
FORMS AND ENDORSEMENTSEFFECTIVE AT INCEPTION
94.200 (06/17) CYBER AND PRIVACY LIABILITY POLICY FORM
94.510 (09/15) Cyber Deception Endorsement (If elected)
94.102 (01 15) Nuclear Incident Exclusion
94.103 (01 15) Radioactive Contamination Exclusion
94.805 (06/17) Breach Response Team Endorsement
94.801 (06/17) CALIFORNIA Amendatory
94.527 (06/18) Coverage Enhancements Endorsement
94.528 (06/18) FTF Coverage Endorsement
BCSI-X009 CA (01 15) CA Premium Return Notice
94.551 (01 15) Coverage for Certified Acts of Terrorism (Included only if
Terrorism coverage is elected at 1% additional premium)
94.552 CA (01 15) War and Terrorism Endorsement
Quotation RPS-Q-50149291M/1 | Page 10 of 54

BCS INSURANCE COMPANY 2 Mid America Plaza, Suite 200
Oakbrook Terrace, Illinois 60181 NOTICE: THIS POLICY IS LIMITED TO LIABILITY FOR CLAIMS THAT ARE FIRST MADE AGAINST YOU AND NOTIFIED TO US DURING THE POLICY PERIOD (OR EXTENDED REPORTING PERIOD, IF APPLICABLE) AS REQUIRED HEREIN, AND LOSS FROM EVENTS THAT FIRST OCCUR AFTER THE RETROACTIVE DATE AND BEFORE THE END OF THE POLICY PERIOD THAT YOU FIRST LEARN OF AND REPORT TO US DURING THE POLICY PERIOD AS REQUIRED HEREIN. CLAIM EXPENSES SHALL REDUCE THE APPLICABLE LIMITS OF LIABILITY AND ARE SUBJECT TO THE APPLICABLE RETENTION(S). TERMS THAT APPEAR IN “QUOTATIONS” HAVE SPECIAL MEANINGS. SEE THE DEFINITIONS FOR MORE INFORMATION. PLEASE READ THIS POLICY CAREFULLY.
CYBER AND PRIVACY LIABILITY POLICY FORM
94.200 (06/17)
In consideration of the payment of the premium and reliance upon the statements made by “You” in the “Application” and subject to the Limit of Liability, exclusions, conditions and other terms of this Policy, it is agreed as follows: I. COVERAGES
A. PRIVACY LIABILITY (INCLUDING EMPLOYEE PRIVACY)
“We” shall pay on “Your” behalf “Damages” and “Claim Expenses” that “You” become legally obligated to pay in excess of the applicable retention resulting from a “Claim” first made against “You” and reported to “Us” during the “Policy Period” or “Extended Reporting Period” arising out of a “Privacy Wrongful Act” occurring after the “Retroactive Date” and before the end of the “Policy Period”, harming any third (3rd) party or “Employee”.
B. PRIVACY REGULATORY CLAIMS COVERAGE
“We” shall pay on “Your” behalf “Regulatory Fines”, “Consumer Redress Funds” and “Claim Expenses” that “You” become legally obligated to pay in excess of the applicable retention resulting from a “Regulatory Claim” first made against “You” and reported to “Us” during the “Policy Period” or “Extended Reporting Period” arising out of a “Privacy Wrongful Act” occurring after the “Retroactive Date” and before the end of the “Policy Period”.
C. SECURITY BREACH RESPONSE COVERAGE “We” shall pay on “Your” behalf any “Breach Response Costs” in excess of the applicable retention that are incurred in the event of a “Security Breach” with respect to “Private Information”. “We” will not make any payment under this Coverage unless the “Security Breach” first occurs after the “Retroactive Date” and before the end of the “Policy Period” and “You” first learn of the “Security Breach” during the “Policy Period” and report the “Security Breach” to “Us” as soon as practicable within the “Policy Period”.
Quotation RPS-Q-50149291M/1 | Page 11 of 54

D. SECURITY LIABILITY “We” shall pay on “Your” behalf “Damages” and “Claim Expenses” that “You” become legally obligated to pay in excess of the applicable retention resulting from a “Claim” first made against “You” and reported to “Us” during the “Policy Period” or “Extended Reporting Period” arising out of a “Security Wrongful Act” occurring after the “Retroactive Date” and before the end of the “Policy Period”.
E. MULTIMEDIA LIABILITY
“We” shall pay on “Your” behalf “Damages” and “Claims Expenses” that “You” become legally obligated to pay in excess of the applicable retention resulting from a “Claim” first made against “You” and reported to “Us” during the “Policy Period” or “Extended Reporting Period” arising out of a “Multimedia Wrongful Act” occurring after the “Retroactive Date” and before the end of the “Policy Period”.
F. CYBER EXTORTION
“We” shall reimburse “You” for the “Cyber-Extortion Expenses and Cyber-Extortion Payments” that “You” actually pay in excess of the applicable retention directly resulting from a “Cyber-Extortion Threat” that “You” first receive and report to “Us” as soon as practicable during the “Policy Period”.
G. BUSINESS INCOME AND DIGITAL ASSET RESTORATION
1. “We” shall pay the “Business Income Loss” that “You” sustain during a “Period of Restoration”
resulting directly from a “Network Disruption” that commences during the “Policy Period”, but only if the duration of such “Period of Restoration” exceeds the “Waiting Period” set forth in the Declarations, and such “Network Disruption” results solely and directly from a “Security Compromise” that first occurs after the “Retroactive Date” and before the end of the “Policy Period” and “You” first learn of the “Security Compromise” during the “Policy Period” and report the “Security Compromise” to “Us” as soon as practicable within the “Policy Period”.
2. “We” shall reimburse “You” for the “Restoration Costs” that “ because of the alteration,
destruction, damage or loss of “Digital Assets” that commences during the “Policy Period” resulting solely and directly from a “Security Compromise”, but only if such “Security Compromise” first occurs on or after the “Retroactive Date” and before the end of the “Policy Period” and “You” first learn of the “Security Compromise” during the “Policy Period” and report the “Security Compromise” to “Us” as soon as practicable within the “Policy Period”.
3 “We” shall pay the “Reputation Business Income Loss” that “You” sustain following a “Security
Breach” or “Network Disruption”, but only if such “Security Breach” or “Network Disruption” first occurs on or after the “Retroactive Date” and before the end of the “Policy Period” and “You” first learn of the “Security Breach” or “Network Disruption” during the “Policy Period” and report the “Security Breach” or “Network Disruption” to “Us” as soon as practicable within the “Policy Period”.
H. PCI DSS ASSESSMENT
“We” shall pay on “Your” behalf “Damages” and “Claims Expenses” that “You” become legally obligated to pay in excess of the applicable retention resulting from a “PCI DSS Assessment” first made against “You” and reported to “Us” during the “Policy Period” or “Extended Reporting Period”
Quotation RPS-Q-50149291M/1 | Page 12 of 54

arising out of a “PCI DSS Wrongful Act” occurring after the “Retroactive Date” and before the end of the “Policy Period”.
II. DEFENSE, SETTLEMENT, AND INVESTIGATION OF CLAIMS
A. “We” shall have the right and duty to defend, subject to the “Policy Aggregate Limit” and applicable “Sublimits of Liability”, exclusions and other terms and conditions of this Policy, any “Claim” against “You” seeking “Damages” which are potentially payable under the terms of this Policy, even if any of the allegations of the “Claim” are groundless, false, or fraudulent. “You” and “We” shall mutually agree on counsel to defend “Claims”. “You” shall not formally appoint defense counsel without “Our” consent, which shall not be unreasonably withheld. However, in the absence of such agreement, “Our” choice of counsel decision shall control. “We” agree that “You” may settle any “Claim” where the “Damages” and “Claims Expenses” do not exceed fifty percent % (50%) of the applicable retention, provided that the entire “Claim” is resolved and “You” receive a full release from all claimants. “We” shall have the right to make any investigation We” deem necessary, including without limitation, any investigation with respect to the “Application” and statements made in the “Application” and with respect to potential coverage. The “Policy Aggregate Limit” and “Sublimits of Liability” available to pay “Damages”, “Claims Expenses” and “Loss” shall be reduced and may be completely exhausted by payment of “Damages”, “Claims Expenses” and “Loss” and shall be applied against the applicable retention “You” pay.
B. If “You” refuse to consent to a settlement or compromise “We” recommend, which settlement or compromise is acceptable to the claimant, and “You” elect to contest the “Claim”, then:
1. Subject to the applicable Limits of Liability, our liability for any “Damages” and “Claims
Expenses” shall not exceed: a. the amount for which the “Claim” could have been settled, plus the “Claims Expenses”
incurred up to the date of such refusal; and b. fifty percent (50%) of the “Damages” and “Claims Expenses” in excess of the amount in a.
above incurred for such “Claim”; provided that “You” bear the remaining fifty percent (50%)
of the “Damages” and “Claims Expenses” in excess of the amount in a. above as uninsured
and at “Your” own risk; and
2. “We” shall have the right to withdraw from the further defense of such “Claim” by tendering control of the defense to “You”.
This clause shall not apply to any settlement where the total of the proposed settlement and incurred “Claims Expenses” do not exceed all applicable retentions.
C. “We” shall not be obligated to pay any “Damages”, “Claims Expenses” or “Loss” or to undertake or
continue any defense of any “Claim”, after the “Policy Aggregate Limit” or applicable “Sublimit(s) of Liability” have been exhausted by payment of “Damages”, “Claims Expenses” and/or “Loss” or after deposit of the “Policy Aggregate Limit” or applicable “Sublimit(s) of Liability” in a court of competent jurisdiction, and that upon such payment or deposit, “We” shall have the right to withdraw from the further defense thereof by tendering control of said defense to “You”.
Quotation RPS-Q-50149291M/1 | Page 13 of 54

III. TERRITORY
This insurance applies to “Events” occurring, “Claims” made and “Wrongful Acts”, acts, errors or omissions committed or alleged to have been committed anywhere in the world.
IV. EXCLUSIONS
The coverage under this Policy shall not apply to any “Damages”, Claims Expenses”, “Loss” or other amounts, arising out of or resulting, directly or indirectly, from:
A. “Bodily Injury” or “Property Damage”; B. “Your” employment practices or any alleged or actual discrimination against any person or entity on
any basis, including without limitation, race, creed, color, religion, ethnic background, national origin, age, handicap, disability, sex, sexual orientation, or pregnancy; provided, however, this exclusion shall not apply to any “Claim” alleging a “Privacy Wrongful Act” or “Security Wrongful Act” in connection with an “Employee’s” or prospective employee’s employment;
C. The failure, malfunction or inadequacy of any satellite; any electrical or mechanical failure and/or
interruption, including but not limited to electrical disturbance, spike, brownout or blackout; or any outage to gas, water, telephone, cable, telecommunications or other infrastructure, unless such infrastructure is under “Your” operational control; provided, however this exclusion shall not apply to any “Privacy Wrongful Act” that is caused by such electrical or mechanical failure or that is caused by such failure of telephone lines, data transmission lines or other infrastructure comprising or supporting the “Internet”;
D. Fire, smoke, explosion, lightning, wind, water, flood, earthquake, volcanic eruption, tidal wave,
landslide, hail, an act of God or any other physical event, however caused; E. Breach of any express, implied, actual or constructive contract, agreement, warranty, guarantee or
promise, provided, however, this exclusion shall not apply to: 1. any liability or obligation “You” would have in the absence of such contract or agreement; 2. any breach of “Your” privacy statement; or 3. any indemnity by “You” in a written contract or agreement with “Your” client regarding any
“Privacy Wrongful Act” or “Security Wrongful Act” by “You” in failing to preserve the confidentiality or privacy of “Private Information”;
F. Any of the following:
1. Any presence of pollutants or contamination of any kind; 2. Any actual, alleged or threatened discharge, dispersal, release, or escape of pollutants or
contamination of any kind; 3. Any direction or request to test for, monitor, clean up, remove, contain, treat, detoxify, or
neutralize pollutants or in any way respond to or assess the effects of pollutants or contamination of any kind;
4. Manufacturing, mining, use, sale, installation, removal, distribution of or exposure to asbestos, materials, or products containing asbestos, asbestos fibers or dust;
5. Ionizing radiation or contamination by radioactivity from any nuclear fuel or any nuclear waste from the combustion of nuclear fuel;
6. Actual, potential or alleged presence of mold, mildew or fungi of any kind; 7. The radioactive, toxic, or explosive or other hazardous properties of any explosive nuclear
assembly or nuclear component thereof; or
Quotation RPS-Q-50149291M/1 | Page 14 of 54

8. The existence, emission or discharge of any electromagnetic field, electromagnetic radiation or electromagnetism that actually or allegedly affects the health, safety or condition of any person or the environment or that affects the value, marketability, condition or use of any property;
G. Any of the following:
1. the purchase, sale, offer of or solicitation of an offer to purchase or sell securities, or alleged or actual violation of any securities law, including but not limited to the provisions of the Securities Act of 1933 or the Securities Exchange Act of 1934, as amended, the Sarbanes-Oxley Act of 2002, or any regulation promulgated under the foregoing statutes, or any federal, state, local or foreign laws similar to the foregoing statutes (including “Blue Sky” laws), whether such law is statutory, regulatory or common law. However, this exclusion G.1. does not apply to any “Claim” alleging or arising out of a violation of Regulation S-P (17 C.F.R. §248) or any failure to disclose a “Security Breach” or violation of any “Privacy Regulation”;
2. alleged or actual violation of the Organized Crime Control Act of 1970 (commonly known as Racketeer Influenced And Corrupt Organizations Act or RICO), as amended, or any regulation promulgated thereunder, or any federal, state, local or foreign law similar to the foregoing statute, whether such law is statutory, regulatory or common law;
3. alleged or actual violation of the responsibilities, obligations or duties imposed upon fiduciaries by the Employee Retirement Income Security Act of 1974, as amended; or
4. alleged or actual anti-trust violations, restraint of trade or unfair competition, including without limitation, violations of the Sherman Act, the Clayton Act or the Robinson-Patman Act, or any other federal, state, local, or foreign laws regulating the same or similar conduct; provided, however, this exclusion G.4 shall not apply to a “Claim” for a “Multimedia Wrongful Act” or a “Regulatory Claim”;
H. Any “Act Of Terrorism”; strike or similar labor action, war, invasion, act of foreign enemy, hostilities or
warlike operations (whether declared or not), civil war, mutiny, civil commotion assuming the proportions of or amounting to a popular uprising, military rising, insurrection, rebellion, revolution, military or usurped power, or any action taken to hinder or defend against these actions; including all amounts, “Damages”, “Claims Expenses” or “Loss” of whatsoever nature directly or indirectly caused by, resulting from or in connection with any action taken in controlling, preventing, suppressing, or in any way relating to the above; provided, however, if “We” allege that by reason of this exclusion any “Damages”, “Claims Expenses” or “Loss” are not covered by this Policy, the burden of proving the contrary shall be upon “You”. However, this exclusion does not apply to acts perpetrated electronically;
I. Any of the following:
1. any circumstance or “Event” occurring, or “Wrongful Act”, act, error, or omission committed, prior to the inception date of this Policy or, if this is a renewal, prior to the first date of this type of insurance granted by “Us” or any other insurer, that a member of the “Control Group” knew, or could have reasonably foreseen that such circumstance, “Event”, “Wrongful Act”, act, error, or omission a “Claim” or lead to an “Event”;
2. any “Claim”, “Event” or circumstance of which notice was provided to “Us” or another insurer prior to the “Policy Period” that was, could reasonably be expected to be, or lead to, the type of “Claim” or “Event” potentially covered by this Policy; or
3. any circumstance occurring or “Event” commencing, or “Wrongful Act”, act, error, or omission committed prior to the “Retroactive Date”;
J. Any criminal conduct, dishonest act, intentional violation of the law, unfair or deceptive business
practice, fraudulent or malicious act, or error or omission committed by “You” with actual criminal, dishonest, fraudulent or malicious purpose or intent; provided, however, this exclusion shall not apply to: 1. “Claims Expenses” incurred in defending any such “Claim” until there is a final adjudication,
judgment, binding arbitration decision or conviction against “You” in such “Claim” or an
Quotation RPS-Q-50149291M/1 | Page 15 of 54

admission by “You” establishing such conduct, or a plea of nolo contendere or no contest by “You” regarding such conduct, in which event “You” shall reimburse “Us” for all “Claims Expenses” that “We” have paid and “We” shall have no further liability for “Claims Expenses” from such “Claim”; and
2. any of “You” who did not personally commit, personally participate in committing or personally acquiesce in such conduct, except that this exclusion shall apply with respect to “Your Organization” if an admission, final adjudication, or finding in a proceeding separate or collateral to the “Claim” establishes that a current member of the “Control Group” in fact engaged in such conduct;
K. Any “Claim” made by or on behalf of:
1. any person or entity within the definition of “You” against any other Insured person or entity within the definition of “You”; provided, however, this exclusion shall not apply to an otherwise potentially covered “Claim” under Coverage A made by a current or former “Employee” of “Your Organization”; or
2. any entity which: a. is operated, managed, or controlled by “You” or in which “You” have an ownership interest
in excess of fifteen percent (15%) or in which “You” are an officer or director; or b. operates, controls, or manages “Your Organization”, or has an ownership interest of more
than fifteen percent (15%) in “Your Organization”; L. “Your” activities as a trustee, partner, officer, director, or “Employee” of any employee trust,
charitable organization, corporation, company or business other than “Your Organization”; M. Any alleged or actual:
1. infringement or violation of patent rights; or 2. misappropriation, theft, copying, display or publication of any trade secret;
N. Any trading losses or trading liabilities; the monetary value of any electronic fund transfers or transactions by or on behalf of “You” which is lost, diminished, or damaged during transfer from, into or between accounts; or the face value of coupons, price discounts, prizes, awards, or any other valuable consideration given in excess of the total contracted or expected amount; provided, however, this exclusion will not apply to any “Breach Response Costs” incurred due to a “Security Breach”.
With respect to Insuring Coverage G only, this Policy does not apply to any “Damages”, “Claims
Expenses”, Loss” or other amounts arising out of, or resulting, directly or indirectly from: O. Any failure of:
1. telephone lines; 2. data transmission lines or wireless communications connection; or 3. other telecommunications equipment, facilities or electronic infrastructure, including equipment,
facilities or infrastructure that supports the operation of computer networks, including the “Internet”, which are used to transmit or receive voice or data communications and which are not under “Your” direct operational control or, if applicable, not under the direct operational control of “Your” “Service Provider”;
P. Any seizure, confiscation, nationalization, or destruction of, or damage to or loss of use of any
“Digital Asset” or “Your” “Computer Systems” by order of any governmental authority; Q. Ordinary wear and tear or gradual deterioration of “Digital Assets” or “Computer Systems” on which
“Digital Assets” are processed or stored, whether owned by “You” or others; or
Quotation RPS-Q-50149291M/1 | Page 16 of 54

R. The physical loss of, damage to or destruction of tangible property, including the loss of use thereof; however, “tangible property” does not include “Digital Assets”, but does include all computer hardware;
NOTE: Exclusions O through R apply to Coverage G only. V. DEFINITIONS
A. “Acquiring Bank” means a bank or financial institution that accepts credit and/or debit payments (including credit cards, debit cards, stored value cards and pre-paid cards) for products or services on behalf of a merchant, including processing and crediting those payments to a merchant.
B. “Act Of Terrorism” means:
1. any act certified an “Act Of Terrorism” pursuant to the federal Terrorism Risk Insurance Act of 2002 or otherwise declared an “Act Of Terrorism” by any government;
2. any act committed by any person or group of persons designated by any government as a terrorist or terrorist group or any act committed by any person or group of persons acting on behalf of or in connection with any organization designated by any government as a terrorist organization; or
3. the use of force or violence and/or the threat thereof by any person or group of persons, whether acting alone or on behalf of or in connection with any organization or government, committed for political, religious, ideological, or similar purposes, including the intention to influence any government and/or put the public, or any section of the public, in fear.
C. “Application” means all applications, including any attachments thereto, and all other information and
materials submitted by “You” or on “Your” behalf to “Us” in connection with the underwriting of this Policy.
D. “Bodily Injury” means injury to the body, sickness, or disease sustained by any person, and where
resulting from such injuries, mental anguish, mental injury, shock, humiliation, emotional distress, loss of consortium, or death.
E. “Breach Response Costs” means the following fees, costs, charges or expenses, if reasonable and
necessary, that our “Breach Response Team” incurs in responding to a “Security Breach” during the period of twelve (12) months after “You” first learn of such “Security Breach”:
1. forensic professional fees and expenses to determine the cause and extent of such “Security
Breach” and terminate the “Security Breach” (however, betterment of the “Computer System” is not covered or included within this definition), including restoration, recreation or recollection of “Digital Assets”;
2. “Breach Response Counsel” fees and expenses to: determine whether “You” are obligated under applicable “Privacy Regulations” to notify applicable regulatory agencies or individuals affected or reasonably believed to be affected by such “Security Breach”; effect compliance with any applicable “Privacy Regulations”; draft the text of privacy notifications to individuals affected or reasonably believed to be affected by such “Security Breach”; and, coordinate the investigation of such “Security Breach”;
3. costs to notify individuals affected or reasonably believed to be affected by such “Security Breach”, including printing costs, publishing costs, postage expenses, call center costs or costs of notification via phone or e-mail, including “voluntary notification” where “You” have no legal obligation to provide notification, but wish to do so to protect “Your” brand and reputation;
4. “Credit Monitoring Expenses”; and 5. public relations expenses.
Quotation RPS-Q-50149291M/1 | Page 17 of 54

“Breach Response Costs” do not include “Your” overhead expenses or any salaries, wages, fees, or benefits of “Your” “Employees”.
F. “Breach Response Counsel” means the vendors approved in the Breach Response Team
Endorsement and vendors as appointed by “Us”.
G. “Breach Response Team” means the vendors approved in the Breach Response Team Endorsement and vendors approved by “Us”.
H. “Business Income Loss” means:
1. “Earnings Loss”; and/or 2. “Expenses Loss”.
“Business Income Loss” does not include:
1) any contractual penalties; 2) any costs or expenses incurred to update, upgrade, replace, restore or otherwise improve any
“Computer System” to a level beyond that which existed prior to a “Network Disruption”; 3.) any costs or expenses incurred to identify, remove or remediate computer program errors or
vulnerabilities, or costs to update, upgrade, replace, restore, maintain or otherwise improve any “Computer System”;
4) any legal costs or expenses or other amounts arising out of liability to any third (3rd) party; 5) any amounts incurred as a result of unfavorable business conditions; or 6) any other consequential amounts, loss or damage.
I. “Claim” means:
1. A written demand received by “You” for money or services, including the service of a civil suit or institution of arbitration proceedings;
2. Initiation of a civil suit against “You” seeking injunctive relief; 3. Solely with respect to Coverage B., a “Regulatory Claim” made against “You”; or 4. Solely with respect to Coverage H., a “PCI DSS Assessment”.
Multiple “Claims” arising from the same or a series of related or repeated “Wrongful Acts”, acts, errors, or omissions or from any continuing “Wrongful Acts”, acts, errors or omissions shall be considered a single “Claim” for the purposes of this Policy, irrespective of the number of claimants or “You” involved therein. All such related “Claims” shall be deemed to have been first made at the time the earliest such “Claim” was made or deemed made under Section IX.A.
J. “Claims Expenses” means:
1. reasonable and necessary fees charged in the defense or settlement of a “Claim” by an attorney
whom “We” designate or whom “You” designate with “Our” prior written consent, such consent not to be unreasonably withheld; and
2. all other legal costs and expenses resulting from the investigation, adjustment, defense and appeal of a “Claim”, if incurred by “Us” or by “You” with “Our” prior written consent; however, “Claims Expenses” do not include “Your” overhead expenses or any salaries, wages, fees, or benefits of “Your” “Employees” for any time spent in cooperating in the defense or investigation of any “Claim” or circumstance that might lead to a “Claim”.
K. “Computer System” means electronic, wireless, web or similar systems (including all hardware and
software) used to process data or information in an analog, digital, electronic or wireless format, including computer programs, electronic data, operating systems, and components thereof, including but not limited to laptops, personal digital assistants, cellular phones, media storage and peripheral devices, media libraries, associated input and output devices, networking equipment, and
Quotation RPS-Q-50149291M/1 | Page 18 of 54

electronic backup equipment. With respect to Coverage G only, “Computer System” means a “Computer System” over which “You” have direct operational control or that is under the direct operation control of a “Service Provider” used to process, maintain or store “Your” “Digital Assets”.
L. “Consumer Redress Funds” means any sums of money “You” are legally required to deposit in a
fund for the payment of consumers due to a settlement of, or an adverse judgment in, a “Regulatory Claim”.
M. “Control Group” means the board members, executive officers, Chief Technology Officer, Chief
Information Officer, Risk Manager and General Counsel or their functional equivalents of “Your Organization”. This does not include any administrative staff who work in the offices of these named positions.
N. “Credit Monitoring Expenses” means the reasonable and necessary expense of providing free credit
report, identity theft protection services, credit monitoring services, credit freezes, healthcare fraud monitoring services, fraud alerts or call center services for customers affected or reasonably believed to be affected by a “Security Breach”. However, “We” shall not be obligated to pay for more than twelve (12) months from the date of enrollment in such services, unless there is a statute, rule, regulation, court ruling or requirement by a regulator requiring otherwise, or in the opinion of “Breach Response Counsel”, offering more than 12 months will justifiably reduce “Your” potential liability, “Damages” or “Loss”.
O. “Cyber-Extortion Threat” means a credible threat or connected series of threats made by someone
other than a member of the “Control Group”: 1. to introduce “Malicious Code” into “Your” “Computer System”; 2. to interrupt “Your” “Computer System” or interrupt access to “Your” “Computer System”, such
as through a “Denial of Service Attack”; 3. to corrupt, damage or destroy “Your” “Computer System”; or 4. to disseminate, divulge, or improperly utilize any “Private Information” on “Your” “Computer
Systems” taken as a result of a “Network Disruption”.
P. “Cyber-Extortion Payment” means any sum paid to or at the direction of any third (3rd) party that “You” reasonably believe to be responsible for a “Cyber-Extortion Threat”; provided that: 1. “You” obtain “Our” written consent prior to making such “Cyber-Extortion Payment”; 2. “You” make such “Cyber-Extortion Payment” to terminate the “Cyber-Extortion Threat”; and 3. the “Cyber-Extortion Payment” does not exceed the amounts “We” reasonably believe would
have been incurred had such “Cyber-Extortion Payment” not been made.
Q. “Cyber-Extortion Expenses” means the reasonable and necessary expenses “You” incur with “Our” approval in evaluating and responding to a “Cyber-Extortion Threat”. However, “Cyber-Extortion Expenses” do not include “Your” overhead expenses or any salaries, wages, fees, or benefits of “Your” “Employees”.
R. “Damages” means:
1. Solely with respect to Coverages A, D, E and H, a monetary judgment, award or settlement, including: a. Pre-judgment interest; b. Post-judgment interest that accrues after entry of the judgment or award and before “We”
have paid, offered to pay or deposited in court that part of the judgment or award within the applicable Limits of Liability; and
c. subject to this Policy’s terms, conditions, and exclusions, punitive or exemplary “Damages” (where insurable by the applicable law that most favors coverage for such “Damages”); and
2. Solely with respect to Coverage B, “Regulatory Fines” and “Consumer Redress Funds”.
Quotation RPS-Q-50149291M/1 | Page 19 of 54

“Damages” shall not include or mean: 1. “Your” future profits, restitution, or disgorgement of profits; or “Your” cost to comply with any
order granting injunctive or non-monetary relief, including specific performance, or any agreement to provide such relief;
2. “Your” return or offset of fees, charges, royalties, or commissions for goods or services already provided or contracted to be provided;
3. fines or penalties of any nature, except those that are part of “Regulatory Fines” and “Consumer Redress Funds” as identified above, or sought in a “PCI DSS Assessment”;
4. any amount “You” are not financially or legally obligated to pay; 5. the portion of multiplied “Damages” awarded in excess of actual or compensatory damages; 6. any donations or contributions to any charitable organization; 7. charge backs, interchange fees, discount fees or prospective services fees sought, awarded or
agreed to as part of a settlement in a “PCI DSS Assessment”; or 8. matters that may be deemed uninsurable under law. “We” shall apply the most favorable state
law to “You” in determining insurability.
S. “Denial of Service Attack” means unauthorized attacks or deliberate overloading of bandwidth connections and/or web servers by means of the sending of substantial quantities of repeat or irrelevant communication or data with the intent of blocking access to “Your” “Computer System” through the “Internet” by third (3rd) parties.
T. “Digital Assets” means any electronic data, including personally identifiable, non-public information,
or computer software over which “You” have direct control or for which such control has been contractually assigned by “Your Organization” to a “Service Provider”. “Digital Assets” do not include computer hardware of any kind.
U. “Earnings Loss” means the difference between the revenue that “Your Organization” would have
earned, based on reasonable projections and the variable costs that would have been incurred, but which “Your Organization” would have saved as a result of not earning that revenue.
V. “Employee” means any individual in “Your Organization’s” service, including any part-time, seasonal,
and temporary employee, who is compensated by salary, wages, fees or commissions, or unpaid intern or volunteer over whom “You” have the right to direct and control, but excluding any partner or director of “Your Organization”.
W. “Event” means a “Security Breach” to which Coverages C or G potentially apply, a “Cyber-Extortion
Threat”, or a “Security Compromise” or “Network Disruption” to which Coverage G potentially applies.
Multiple “Events” arising from the same or a series of related or repeated “Events”, acts, errors, or
omissions, or from any continuing “Events”, acts, errors, or omissions shall be considered a single “Event” for the purposes of this Policy. All such related “Events” shall be deemed to have first occurred at the time the earliest such “Event” first occurred or commenced.
X. “Expenses Loss” means the additional expenses “Your Organization” incurred to minimize the
suspension of business and to continue operations that are over and above the expenses that “Your Organization” reasonably and necessarily would have incurred to conduct “Your” business had no “Network Disruption” occurred. These additional expenses do not include any “Restoration Costs” or any actual, reasonable and necessary expenses “You” incur in response to a “Network Disruption” in order to prevent, minimize or mitigate any further damage to “Your” “Digital Assets”, minimize the duration of a “Network Disruption” or preserve critical evidence of any wrongdoing.
Y. “Extended Reporting Period” means the period of time after the end of the “Policy Period” for
reporting “Claims” as provided in Section VIII. of this Policy.
Quotation RPS-Q-50149291M/1 | Page 20 of 54

Z. “Intranet” means a private computer network inside a company or organization that uses the same
kinds of software found on the “Internet”, but only for internal use. AA. “Internet” means the worldwide public network of computer networks which enables the transmission of electronic data between different users, commonly referred to as the “Internet”, including a private communications network existing within a shared or public network platform.
BB. “Loss(es)” means:
1. “Business Income Loss”; 2. “Breach Response Costs”; 3. “Reputation Business Income Loss”; 4. “Restoration Costs”; and 5. “Cyber-Extortion Payments” and “Cyber-Extortion Expenses”.
CC. “Malicious Code” means any unauthorized and corrupting or harmful computer code, including but
not limited to computer viruses, spyware, Trojan horses, worms, logic bombs, and mutations of any of the proceeding.
DD. “Media Content” means data, digital code, images, graphics, sounds, text or any other similar
material regardless of the method or medium of communication of such content or the purpose of the communication.
EE. “Multimedia Wrongful Act” means any of the following acts committed in the ordinary course of
“Your Organization’s” business in gathering, communicating, reproducing, publishing, disseminating, displaying, releasing, transmitting or disclosing “Media Content” via any “Computer System” that “You” own or operate or is operated on “Your” behalf by a third (3rd) party, including any web-based social media authorized or operated by “Your Organization” or any “Internet” or “Intranet” website, or via any non-electronic media: 1. defamation, libel, slander, product disparagement, trade libel, infliction of emotional distress,
outrage, outrageous conduct, or other tort related to disparagement or harm to the reputation or character of any person or organization;
2. invasion of or interference with the right to privacy or publicity; 3. false arrest, detention or imprisonment or malicious prosecution; 4. infringement of any right to private occupancy, including trespass, wrongful entry, eviction or
eavesdropping; 5. infringement of copyright, domain name, trade dress, title or slogan, or the dilution or
infringement of trademark, service mark, service name or trade name; 6. plagiarism, piracy or misappropriation of ideas; or 7. other conduct causing liability regarding any” Media Content” for which “You” are responsible;
provided always that any “Multimedia Wrongful Act” was committed or alleged to have been committed by “You”, or any person for whom or entity for which “You” are legally responsible, including an independent contractor or outsourcing organization.
FF. “Network Disruption” means any of the following incidents:
a failure, interruption or degradation of the operation of “Your” “Computer System”; or the denial, restriction or hindrance of access to or use of “Your” “Computer System” or “Your” “Digital Assets” by any party who is otherwise authorized to have access.
More than one such incident that results from the same or related underlying facts, circumstances, situations, transactions or “Security Compromises” shall be considered a single “Network Disruption” which first occurs on the date of the earliest of such events.
Quotation RPS-Q-50149291M/1 | Page 21 of 54

GG.“PCI DSS Assessment(s)” means a written demand received by “You” from “Your” “Acquiring Bank” or a card association (MasterCard, VISA, Discover, American Express or JCB) for monetary fines, penalties, reimbursements, PFI fees/expenses, or fraud recoveries or assessments, but not including any charge backs, interchange fees, discount fees or prospective services fees.
HH. “PCI Data Security Standards” (known as PCI DSS) means the published data security standard in effect now or as hereafter amended that all merchants and processors must follow when storing, processing and transmitting cardholder data.
II. “PCI DSS Wrongful Act” means “Your” actual or alleged non-compliance with “PCI Data Security Standards”.
JJ. “Period of Restoration” means the time period from the commencement of a “Network Disruption” to the date that “Your” “Computer System” is, or with reasonable diligence could have been, restored to the condition and functionality that existed immediately prior to the “Network Disruption”.
KK. “Policy Period” means the period of time from the effective date to the expiration date specified in
the Policy, or any earlier cancellation date. LL. “Privacy Breach” means a common law breach of confidence, infringement, or violation of any rights
to privacy, including but not limited to breach of “Your” privacy statement, breach of a person’s right of publicity, wrongful collection, false light, intrusion upon a person’s seclusion, public disclosure of “Private Information”, or misappropriation of a person’s picture or name for commercial gain.
MM. “Privacy Regulations” means any federal, state, local or foreign statute or regulation requiring “You”
to limit or control the collection, use of, or access to, “Private Information” in “Your” possession or under “Your” control, or obligating “You” to inform customers of the “Unauthorized Access” or disclosure of such personally identifiable, non-public information, including the following statutes and regulations: 1. the Health Insurance Portability and Accountability Act of 1996 (Public Law 104-191), including
Title II requiring protection of confidentiality and security of electronic protected health information, and as amended by the Health Information Technology for Economic and Clinical Health Act (HITECH), any rules and regulations promulgated thereunder as they currently exist and as amended, and any related state medical privacy laws as they currently exist and as amended;
2. the Gramm-Leach-Bliley Act of 1999, also known as the Financial Services Modernization Act of 1999, including sections concerning security protection and standards for customer records maintained by financial services companies, and the rules and regulations promulgated thereunder as they currently exist and as amended;
3. Section 5(a) of the Federal Trade Commission Act, 15 U.S.C. 45(a), but solely with respect to alleged unfair or deceptive acts or practices in or affecting commerce;
4. federal, state or local privacy protection regulations or laws, such as the California Database Protection Act of 2003 (previously called SB 1386), as they currently exist now or may be amended, associated with the control and use of, or limiting “Unauthorized Access” to, personal information, including but not limited to requirements to post privacy policies, adopt specific privacy controls, or inform customers of breaches of security that has or may impact their personal information;
5. federal, state or local data breach regulations or laws, as they currently exist now or in the future, imposing liability for failure to take reasonable care to guard against “Unauthorized Access” to credit or debit account information that is in “Your” possession or under “Your” control;
6. Identity Theft Red Flags under the Fair and Accurate Credit Transactions Act of 2003; 7. federal and state consumer credit reporting laws, such as the Federal Fair Credit Reporting Act
(FCRA) and the California Consumer Credit Reporting Agencies Act (CCCRAA); 8. the Children’s Online Privacy Protection Act of 1998; and 9. privacy protection regulations or laws adopted by countries outside of the United States, such
as the EU Data Protection Directive and the Canadian Personal Information Protection and
Quotation RPS-Q-50149291M/1 | Page 22 of 54

Electronic Documents Act, as they currently exist now or may be amended, associated with the collection, control and use of, or limiting “Unauthorized Access” to, personal information.
NN. “Privacy Wrongful Act” means any “Privacy Breach” or breach of “Privacy Regulations” actually or
allegedly committed by “You” or by any person or entity for which “You” are legally responsible, including an independent contractor or outsourcing organization.
OO. “Private Information” means any:
1. proprietary or confidential information owned by a third party or “You”; 2. information that can be used to determine, distinguish or trace an individual’s identity, either
alone or when combined with other information that is linked or linkable to a specific individual.
PP. “Property Damage” means physical injury to or destruction of any tangible property, including the loss of use thereof. Electronic data is not considered tangible property.
QQ. “Regulatory Claim” means:
1. any request for information, civil investigative demand or formal investigation of “You” by an administrative or regulatory agency or similar governmental body concerning a “Privacy Breach” or possible breach of “Privacy Regulations”; or
2. any administrative or civil proceeding against “You” by an administrative or regulatory agency or similar governmental body for a breach of “Privacy Regulations”.
RR. “Regulatory Fines” means fines, penalties, or sanctions awarded for a violation of any “Privacy Regulation”.
SS. “Reputation Business Income Loss” means:
1. “Earnings Loss” and/or 2. “Expenses Loss”;
solely due to the loss of current or future customers during a 12 month period following a notification to “Us” in accordance with Section IX.A of a “Security Breach” or “Network Disruption” and where such customer loss arises directly from a “Security Breach” or “Network Disruption”. “Reputation Business Income Loss” does not include or mean:
1. any contractual penalties; 2. any costs or expenses incurred to update, upgrade, replace, restore or otherwise improve any
“Computer System” to a level beyond that which existed prior to a “Network Disruption”; 3. any costs or expenses incurred to identify, remove or remediate computer program errors or
vulnerabilities, or costs to update, upgrade, replace, restore, maintain or otherwise improve any “Computer System”;
4. any legal costs, expenses or other amounts arising out of liability to any third party; 5. any amounts incurred as a result of unfavorable business conditions; or 6. any other consequential amounts, loss or damage.
TT. “Restoration Costs” means the actual, reasonable and necessary costs “You” incur to replace, restore, or re-create “Your” “Digital Assets” to the level or condition at which they existed prior to sustaining any alteration, destruction, damage or loss thereof. If such “Digital Assets” cannot be replaced, restored or re-created, then “Restoration Costs” will be limited to the actual, reasonable and necessary costs “You” incur to reach this determination. “Restoration Costs” do not include:
Quotation RPS-Q-50149291M/1 | Page 23 of 54

1. any costs “You” incur to replace, restore or re-create any of “Your” “Digital Assets” that were not subject to regular network back-up procedures at the time of the alteration, destruction, damage or loss;
2. any costs or expenses incurred to update, upgrade, replace, restore or otherwise improve “Your” “Digital Assets” to a level beyond that which existed prior to sustaining any alteration destruction, damage or loss thereof;
3. any costs or expenses incurred to identify, remove or remediate computer program errors or vulnerabilities, or costs to update, upgrade, replace, restore, maintain or otherwise improve any “Computer System”; or
4. the economic or market value of any “Digital Assets”, including trade secrets. UU. “Retroactive Date” means the date specified in ITEM 7. of the Declarations.
VV. “Security Breach” means:
1. the loss or disclosure of “Private Information” in “Your” care, custody or control, including such information stored on paper or on a “Computer System” operated by “You” or on “Your” behalf; or
2. “Theft of Data”, “Unauthorized Access” to or “Unauthorized Use” of “Private Information” in “Your” care, custody or control, including such information stored on paper or on a “Computer System” operated by “You” or on “Your” behalf;
that results in or may result in the compromise of the privacy or confidentiality of “Private Information”. More than one “Security Breach” arising from the same or a series of continuous, repeated or related acts, errors, or omissions shall be considered a single “Security Breach”, which shall be deemed to have first occurred at the time of the first such “Security Breach”.
WW. “Security Compromise” means:
1. the “Unauthorized Access” or “Unauthorized Use” of “Your” “Computer System” or “Your” “Digital Assets”;
2. the unauthorized transmission of computer code into “Your” “Computer System” that causes loss or damage to “Your” “Digital Assets”; or
3. a “Denial of Service Attack” on “Your” “Computer System” that causes loss or damage to “Your” “Digital Assets”.
XX. “Security Wrongful Act” means any act, error, or omission committed by “You” or a person or entity
for which “You” are legally responsible, including an independent contractor or outsourcing organization, in the conduct of “ Computer Systems” security and the protection of the security and confidentiality of “Private Information”, that results in: 1. the inability of a third (3rd) party, who is authorized to do so, to gain access to “Your” “Computer
Systems”; 2. the failure to prevent or hinder “Unauthorized Access” to or “Unauthorized Use” of a “Computer
System” operated by “You” or on “Your” behalf, the failure to prevent physical theft of hardware or firmware “You” control, the failure to prevent people or processes security failures, or the failure to prevent false communications designed to trick the user into surrendering “Private Information” (such as phishing, pharming or vishing), any of which results in: a. The alteration, copying, corruption, destruction or deletion of, or damage to, electronic data
on a “Computer System” operated by “You” or on “Your” behalf; b. Unauthorized disclosure of “Private Information”; c. “Theft of Data” (including identity theft); or d. Denial of service attacks against “Internet” sites or “Computer Systems” of a third (3rd)
party; or
Quotation RPS-Q-50149291M/1 | Page 24 of 54

3. the failure to prevent transmission of “Malicious Code” from a “Computer System” operated by “You” or on “Your” behalf to a third (3rd) party’s “Computer System”.
YY. “Service Provider” means any third (3rd) party that is responsible for the processing, maintenance,
protection or storage of “Digital Assets” pursuant to a written contract directly with “Your Organization”. A “Service Provider” does not include any provider of telecommunications services, including “Internet” access, to “You”.
ZZ. “Subsidiary” means any corporation of which more than fifty percent (50%) of the outstanding
securities representing the present right to vote for the election of such corporation’s directors are owned by the “Named Insured” directly or indirectly, if such corporation was so owned on the inception date of this Policy; or 1. becomes so owned after the inception date of this Policy, provided the revenues of the newly
acquired corporation do not exceed fifteen percent (15%) of “Your Organization’s” annual revenues as set forth in its most recent audited financial statement; or
2. becomes so owned after the inception date of this Policy, provided that if the revenues of the newly acquired corporation exceed fifteen percent (15%) of “Your Organization’s” annual revenues as set forth in its most recent audited financial statement, the provisions of Section IX. I. must be fulfilled.
AAA. “Theft Of Data” means the unauthorized taking, misuse or disclosure of information on “Computer Systems”, including but not limited to charge, debit, or credit information, banking, financial and investment services account information, proprietary information, and “Private Information”. BBB. “Unauthorized Access” means the gaining of access to a “Computer System” by an unauthorized person or an authorized person in an unauthorized manner. CCC. “Unauthorized Use” means the use of a “Computer System” by an unauthorized person or an authorized person in an unauthorized manner. DDD. “Waiting Period” means the date specified in ITEM 12. of the Declarations. EEE. “We”, “Us” or “Our” means the underwriters providing this insurance. FFF. “Wrongful Act” means a “Privacy Wrongful Act”, “Security Wrongful Act”, “Multimedia Wrongful Act”, or “PCI DSS Wrongful Act”. GGG. “You” or “Your” or “Yours” means:
1. the entity named in ITEM 1. of the Declarations (“Named Insured”) and its “Subsidiaries” (together “Your Organization”);
2. any present or future director, officer, or trustee of “Your Organization”, but only with respect to the performance of his or her duties as such on behalf of “Your Organization”;
3. any present or future “Employee” of “Your Organization” but only with respect to work done while acting within the scope of his or her employment and related to the conduct of “Your Organization’s” business;
4. in the event that the “Named Insured” is a partnership, limited liability partnership, or limited liability company, then any general or managing partner, principal, or owner thereof, but only while acting within the scope of his or her duties as such;
5. any person who previously qualified as “You” under 2, 3, or 4 above prior to the termination of the required relationship with “Your Organization”, but only with respect to the performance of his or her duties as such on behalf of “Your Organization”;
6. the estate, heirs, executors, administrators, assigns and legal representatives of any of “You” in the event of “Your” death, incapacity, insolvency or bankruptcy, but only to the extent that “You” would otherwise be provided coverage under this insurance;
Quotation RPS-Q-50149291M/1 | Page 25 of 54

7. any agent or independent contractor, including any distributor, licensee or sub-licensee, but only while acting on “Your” behalf, at “Your” direction, and under “Your” control; and
8. any third (3rd) party entity (including a HIPAA Covered Entity) required by contract to be named as an insured under this Policy, but only in respect of sums which they become legally obligated to pay (including liability for claimants’ costs and expenses) as a result of a “Claim” arising solely out of an act, error or omission committed by “You”, provided that: a) “You” contracted in writing to indemnify the third (3rd) party for such a “Claim” prior to it first
being made against them; and b) had the “Claim” been made against “You”, then “You” would be entitled to indemnity under
this Policy. As a condition to “Our” indemnification of any third (3rd) party they shall prove to “Our” satisfaction that the “Claim” arose solely out of a “Wrongful Act”, act, error or omission committed by “You”; and where a third (3rd) party is indemnified as an additional insured as a result, it is understood and agreed that any “Claim” made by that third (3rd) party against “You” shall be treated by “Us” as if they were a third (3rd) party, not an additional insured.
VI. LIMITS OF LIABILITY
A. The amount stated in the Policy as stated in ITEM 3.A of the Declarations (herein the “Policy Aggregate Limit”) is the most “We” will pay in the aggregate under this Policy, under all Coverages combined, for: 1. all “Damages”; 2. all “Claims Expenses”; and 3. all “Loss”;
regardless of the number of “Claims”, “Events”, “Wrongful Acts”, acts, errors, or omissions, insured persons, insured entities or claimants involved, or Coverages triggered.
B. For any Coverage purchased as indicated in ITEM 3.B of the Declarations, any Per Single “Claim”,
Per Single “Event” or Aggregate Per Coverage “Sublimit(s) of Liability” shall be part of, and not in addition to, the “Policy Aggregate Limit”.
C. If any single “Claim”, single “Event”, or single “Event” combined with a single “Claim” directly arising
therefrom (“Combined Matter”) is covered under more than one Coverage, the highest applicable Per Single “Claim” or Per Single “Event” “Sublimit of Liability” shall be the most “We” shall pay as to such single “Claim”, single “Event” or “Combined Matter”, and such single “Claim”, single “Event” or “Combined Matter” shall be subject to the highest applicable retention.
D. Any Aggregate Per Coverage “Sublimit of Liability” as stated in ITEM 3.B of the Declarations shall be
the most “We” will pay in the aggregate for any given Coverage, for:
1. all “Damages”; 2. all “Claims Expenses”; and 3. all “Loss”; regardless of the number of “Claims”, “Events”, “Wrongful Acts”, acts, errors, or omissions, insured persons, insured entities or claimants to which such given Coverage applies.
Quotation RPS-Q-50149291M/1 | Page 26 of 54
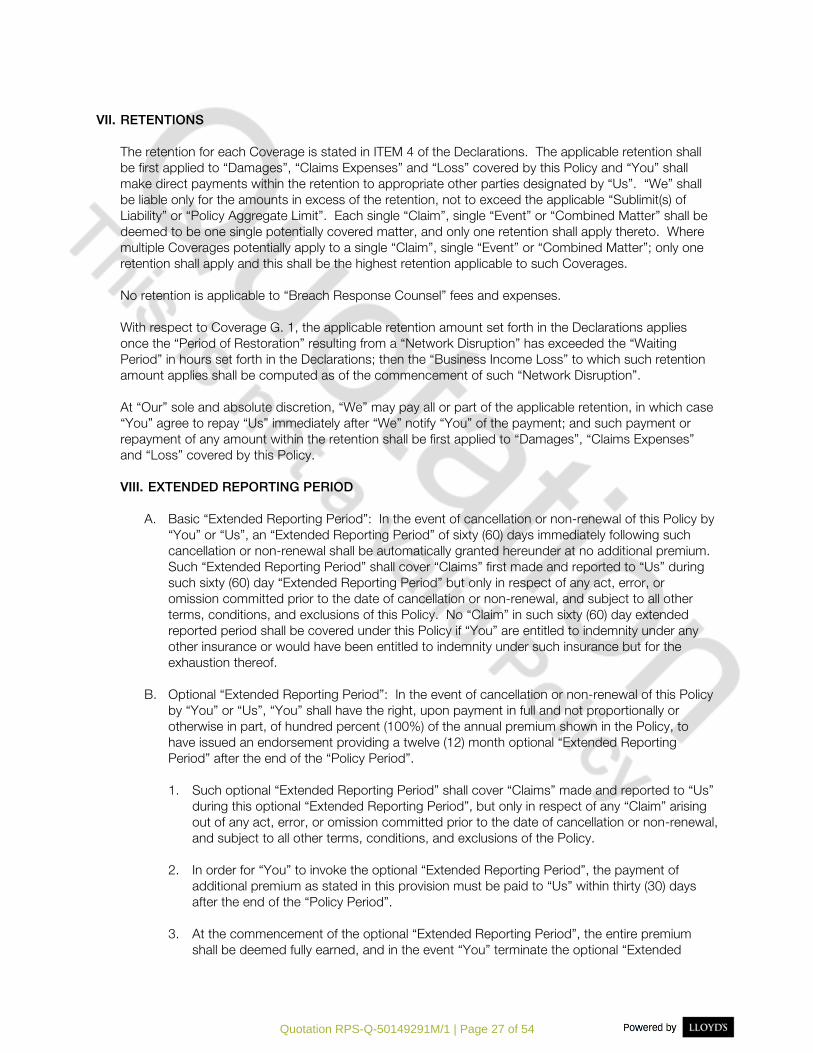
VII. RETENTIONS
The retention for each Coverage is stated in ITEM 4 of the Declarations. The applicable retention shall be first applied to “Damages”, “Claims Expenses” and “Loss” covered by this Policy and “You” shall make direct payments within the retention to appropriate other parties designated by “Us”. “We” shall be liable only for the amounts in excess of the retention, not to exceed the applicable “Sublimit(s) of Liability” or “Policy Aggregate Limit”. Each single “Claim”, single “Event” or “Combined Matter” shall be deemed to be one single potentially covered matter, and only one retention shall apply thereto. Where multiple Coverages potentially apply to a single “Claim”, single “Event” or “Combined Matter”; only one retention shall apply and this shall be the highest retention applicable to such Coverages. No retention is applicable to “Breach Response Counsel” fees and expenses. With respect to Coverage G. 1, the applicable retention amount set forth in the Declarations applies once the “Period of Restoration” resulting from a “Network Disruption” has exceeded the “Waiting Period” in hours set forth in the Declarations; then the “Business Income Loss” to which such retention amount applies shall be computed as of the commencement of such “Network Disruption”. At “Our” sole and absolute discretion, “We” may pay all or part of the applicable retention, in which case “You” agree to repay “Us” immediately after “We” notify “You” of the payment; and such payment or repayment of any amount within the retention shall be first applied to “Damages”, “Claims Expenses” and “Loss” covered by this Policy.
VIII. EXTENDED REPORTING PERIOD
A. Basic “Extended Reporting Period”: In the event of cancellation or non-renewal of this Policy by
“You” or “Us”, an “Extended Reporting Period” of sixty (60) days immediately following such cancellation or non-renewal shall be automatically granted hereunder at no additional premium. Such “Extended Reporting Period” shall cover “Claims” first made and reported to “Us” during such sixty (60) day “Extended Reporting Period” but only in respect of any act, error, or omission committed prior to the date of cancellation or non-renewal, and subject to all other terms, conditions, and exclusions of this Policy. No “Claim” in such sixty (60) day extended reported period shall be covered under this Policy if “You” are entitled to indemnity under any other insurance or would have been entitled to indemnity under such insurance but for the exhaustion thereof.
B. Optional “Extended Reporting Period”: In the event of cancellation or non-renewal of this Policy by “You” or “Us”, “You” shall have the right, upon payment in full and not proportionally or otherwise in part, of hundred percent (100%) of the annual premium shown in the Policy, to have issued an endorsement providing a twelve (12) month optional “Extended Reporting Period” after the end of the “Policy Period”. 1. Such optional “Extended Reporting Period” shall cover “Claims” made and reported to “Us”
during this optional “Extended Reporting Period”, but only in respect of any “Claim” arising out of any act, error, or omission committed prior to the date of cancellation or non-renewal, and subject to all other terms, conditions, and exclusions of the Policy.
2. In order for “You” to invoke the optional “Extended Reporting Period”, the payment of additional premium as stated in this provision must be paid to “Us” within thirty (30) days after the end of the “Policy Period”.
3. At the commencement of the optional “Extended Reporting Period”, the entire premium shall be deemed fully earned, and in the event “You” terminate the optional “Extended
Quotation RPS-Q-50149291M/1 | Page 27 of 54

Reporting Period” for whatever reason prior to its natural expiration, “We” will not be liable to return any premium paid for the optional “Extended Reporting Period”.
C. Terms and conditions of basic and optional “Extended Reporting Period”
1. At renewal of this Policy, “Our” quotation of different premium, retention or limit of indemnity or changes in policy language shall not constitute non-renewal by “Us” for the purposes of granting the optional “Extended Reporting Period”.
2. The right to the “Extended Reporting Period” shall not be available to “You” where “We” cancel or non-renew due to non-payment of premium.
3. The limit of liability for the “Extended Reporting Period” shall be part of, and not in addition to, the limit of liability for the “Policy Period”.
4. All notices and premium payments with respect to the “Extended Reporting Period” shall be directed to “Us” through the entity named in the Policy.
IX. TERMS AND CONDITIONS
A. NOTICE OF CLAIM OR CIRCUMSTANCE THAT MIGHT LEAD TO A CLAIM
1. If any “Claim” is made against “You” during the “Policy Period” (or an “Extended Reporting Period”, if applicable), or an “Event” first occurs during the “Policy Period”, then as soon as practicable after a member of the “Control Group” becomes aware of such “Claim” or “Event”, “You” must provide notice thereof to “Us” through the person identified in ITEM 8. in the Declarations, during the “Policy Period” (or an “Extended Reporting Period”, if applicable), including every demand, notice, summons or other process “You” or “Your” representative receive.
2. If during the “Policy Period” a member of the “Control Group” becomes aware of any situation,
circumstance, “Wrongful Act”, act, error or omission that might reasonably give rise to a “Claim”, and if “You” give written notice to “Us” through the person identified in ITEM 8. in the Declarations, as soon as practicable during the “Policy Period”, of:
a. The specific details of the situation, circumstance, “Wrongful Act”, act, error or omission that
might reasonably give rise to a “Claim”; b. The possible damage which may result or has resulted from the situation, circumstance,
“Wrongful Act”, act, error or omission; c. A description of how “You” first became aware of the situation, circumstance, “Wrongful
Act”, act, error or omission; and d. Any “Computer System” security and event logs which provide evidence of the situation,
circumstance, “Wrongful Act”, act, error or omission, then any subsequent “Claim” made against “You” arising out of such situation, circumstance, “Wrongful Act”, act, error or omission which is the subject of the written notice will be deemed to have been first made at the time written notice complying with the above requirements was first given to “Us”.
3. A “Claim” shall be considered to be reported to “Us” when notice is first given to “Us” through
the person identified in ITEM 8. in the Declarations or when notice of a situation, circumstance, “Wrongful Act", act, error or omission which might reasonably give rise to a “Claim” is first provided in compliance with Section IX.A.2 above. An “Event” shall be considered reported to “Us” when notice is first given to “Us” through the person identified in ITEM 8. in the Declarations.
4. Whenever coverage under this Policy would be lost due to non-compliance of Section IX.A.1.’s notice requirements because of the failure to give such notice, or concealment of such failure,
Quotation RPS-Q-50149291M/1 | Page 28 of 54

by one or more “You” responsible for causing the “Damage”, “Loss” or other amounts potentially insured hereunder, then “We” agree that such insurance as would otherwise be afforded under this Policy shall remain available with respect to those of “You” who did not personally commit, personally participate in committing or personally acquiesce in such failure to give notice, provided that those of “You” entitled to the benefit of this provision provide notice of a “Claim” or “Event” during the “Policy Period” (or “Extended Reporting Period”, if applicable), promptly after obtaining knowledge of such failure of any others of “You” to comply with Section IX.A.1.
However, such insurance as afforded by this provision shall not cover a “Claim” against “Your Organization”, or an “Event”, if a member of the “Control Group” failed to give notice as required by Section IX.A.1.if such “Claim” or “Event” arises from “Wrongful Acts”, acts, errors or omissions that were also known to another then current member of the “Control Group”.
B. ASSISTANCE AND COOPERATION
1. “You” shall cooperate with “Us” in all investigations. “You” shall execute or cause to be executed
all papers and render all assistance as requested by “Us”. Part of this assistance may require “You” to provide soft copies of “Your” system security and event logs.
2. Upon “Our” request, “You” shall assist in making settlements, in the conduct of suits and in
enforcing any right of contribution or indemnity against any person or organization who may be liable to “You” because of “Wrongful Acts”, acts, errors, or omissions with respect to which insurance is afforded under this Policy; and “You” shall attend hearings and trials and assist in securing and giving evidence and obtaining the attendance of witnesses.
3. “You” shall not admit liability, make any payment, assume any obligation, incur any expense,
enter into any settlement, stipulate to any judgment or award or dispose of any “Claim” without “Our” written consent, unless otherwise provided under Section II.
4. As soon as practicable after “You” give “Us” notice of any “Claim”, “Event”, or circumstance,
“You” must also give “Us” copies of reports, photographs, investigations, pleadings and all other papers in connection therewith, including allowing “Us” to question “You” under oath at such times as may be reasonably required regarding “Your Organization’s” books, records, and any other information relating to such matters.
5. In the event of a “Privacy Breach”, “Security Breach” or other “Event”, “You” must take all
reasonable steps to protect “Computer Systems” and “Private Information” from further access, disclosure, loss or damage.
C. DUTIES FOLLOWING NOTICE OF AN EVENT (applicable to Coverages C, F and G only)
“You” must see that the following are done if “You” send “Us” notice of an “Event” to which Coverages C, F or G potentially apply:
1. at “Our” request, notify the police, FBI, CERT or other applicable law enforcement authority, central reporting or investigative organization that “We” may designate, if it appears that a law may have been broken;
2. immediately take all reasonable steps and measures necessary to limit or mitigate the “Loss”;
3. send “Us” copies of every demand, notice, summons, or any other applicable information “You” receive;
4. if requested, permit “Us” to question “You” under oath at such times and places as may be reasonably required about matters relating to this insurance, including “Your” books and records;
Quotation RPS-Q-50149291M/1 | Page 29 of 54

5. send “Us” a sworn statement of “Loss” or other amounts incurred containing the information “We” request to resolve, settle or otherwise handle the “Event”. “We” will provide “You” with the necessary forms;
6. cooperate with “Us” and counsel “We” may appoint in the investigation of any “Event” covered by this Policy;
7. assist “Us” and counsel “We” may appoint in the investigation or settlement of “Loss”; 8. assist “Us” in protecting and enforcing any right of subrogation, contribution or indemnity
against any person, organization or other entity that may be liable to “You”, including attending depositions, hearings and trials; and
9. otherwise assist in securing and giving documentation and evidence, and obtaining the attendance of witnesses.
D. SUBROGATION
In the event of any payment under this Policy, “You” agree to give “Us” the right to any subrogation and recovery to the extent of “Our” payments. “You” agree to execute all papers required and will do everything that is reasonably necessary to secure these rights to enable “Us” to bring suit in “Your” name. “You” agree to fully cooperate in “Our” prosecution of that suit. “You” agree not to take any action that could impair “Our” right of subrogation without “Our” written consent, whether or not “You” have incurred any unreimbursed amounts. Any recoveries shall be applied first to subrogation expenses, second to “Damages”, “Claims Expenses” and “Loss” paid by “Us”, and third to the Retention. Any additional amounts recovered shall be paid to “You”.
E. INSPECTIONS AND SURVEYS “We” may choose to perform inspections or surveys of “Your” operations, conduct interviews and review documents as part of our underwriting, our decision whether to provide continued or modified coverage, or our processing of any “Claim” or “Event”. If “We” make recommendations as a result of these inspections, “You” should not assume that every possible recommendation has been made or that “Your” implementation of a recommendation will prevent a “Claim” or “Event”. “We” do not indicate by making an inspection or by providing “You” with a report that “You” are complying with or violating any laws, regulations, codes or standards.
F. OTHER INSURANCE
This insurance shall apply in excess of any other valid and collectible insurance available to “You”, including any retention or deductible portion thereof, unless such other insurance is written only as specific excess insurance over this Policy. However, this insurance shall apply as primary in respect of any professional liability, errors & omissions, medical malpractice or professional service liability policy purchased by “You”.
G. ACTION AGAINST US
No action shall lie against “Us” or “Our” representatives unless, as a condition precedent thereto: (1) there shall have been full compliance with all terms of this insurance; and (2) until the amount of “Your” obligation to pay shall have been finally determined by judgment or award against “You” after trial, regulatory proceeding, or arbitration or by written agreement between “You”, the claimant, and “Us”.
“Your” bankruptcy or insolvency shall not relieve “Us” of our obligations hereunder.
H. ENTIRE AGREEMENT
Quotation RPS-Q-50149291M/1 | Page 30 of 54

By acceptance of the Policy, “You” agree that this Policy embodies all agreements between “You” and “Us” relating to this insurance. Notice to any agent or knowledge possessed by any agent or by any other person shall not effect a waiver or a change in any part of this Policy or stop “Us” from asserting any right under the terms of this Policy; nor shall the terms of this Policy be waived or changed, except by endorsement issued to form a part of this Policy signed by “Us”. I. NEW SUBSIDIARIES/CHANGES IN NAMED INSURED OR YOUR ORGANIZATION
1. During the “Policy Period”, if “You” acquire another corporation whose annual revenues are
more than fifteen percent (15%) of “Your Organization’s” annual revenues as set forth in its most recent audited financial statements there shall be no coverage under this Policy for “Wrongful Acts”, acts, errors, or omissions committed or allegedly committed by the newly acquired “Subsidiary” or any persons who may become insureds therewith, unless “You” give “Us” written notice of the acquisition containing full details thereof, and “We” have agreed to add coverage for the newly acquired “Subsidiary” upon such terms, conditions, and limitations of coverage and such additional premium as “We”, in “Our” sole discretion, may require.
2. During the “Policy Period”, if the “Named Insured” consolidates or merges with or is
acquired by another entity, or sells substantially all of its assets to another entity, or a receiver, conservator, trustee, liquidator, or rehabilitator, or any similar official is appointed for or with respect to the “Named Insured”, then all coverage under this Policy shall continue for post-transaction “Claims” first made prior to the expiration of the “Policy Period” but only for “Wrongful Acts”, acts, errors or omissions that occurred prior to the date of such consolidation, merger or appointment. Coverage under this Policy shall not continue for “Events” that first commence post-transaction but prior to the expiration of the “Policy Period”, unless coverage for such “Events” is specifically agreed to by “Us” and provided by endorsement hereto.
3. Should an entity cease to be a “Subsidiary” after the inception date of this Policy, coverage
with respect to such entity and its insured persons shall continue as if it was still a “Subsidiary” until the expiration date of this Policy, but only with respect to a “Claim” that arises out of any “Wrongful Act”, act, error, or omission committed prior to the date that it ceased to be a “Subsidiary”.
4. All notices and premium payments made under this paragraph shall be directed to “Us”
through the “Named Insured”.
J. ASSIGNMENT
“Your” interest under this Policy may not be assigned to any other person or organization, whether by operation of law or otherwise, without “Our” written consent. If “You” shall die or be adjudged incompetent, such insurance shall cover “Your” legal representative as “You” would be covered under this Policy.
K. CANCELLATION AND NON-RENEWAL
This Policy may be cancelled or non-renewed by “You” at any time on request by sending a prior written notice to “Us” stating when thereafter the cancellation will be effective.
1. “We” may not cancel this Policy, except for nonpayment of Premium. If “We” cancel this
Policy for non-payment of Premium, “We” will provide “You” with at least twenty (20) days advance written notice.
Quotation RPS-Q-50149291M/1 | Page 31 of 54

2. If this Policy is cancelled by “You”, “We” shall refund the unearned Premium computed in accordance with the customary short rate table. If this Policy is cancelled by “Us”, the refund of paid Premium shall be computed pro-rata. Payment or tender of any unearned Premium by “Us” shall not be a condition precedent to the effectiveness of such termination, but such payment shall be made as soon as practicable. No Premium will be refunded where any “Claims” or circumstances have been notified under this Policy.
3. “We” may non-renew this Policy by providing “You” with at least sixty (60) days written notice
before the expiration date. If the notice is given less than sixty (60) days before expiration, Coverage will remain in effect until sixty (60) days after notice is mailed. The Premium due for any period of Coverage that extends beyond the expiration date will be determined pro-rata based upon this Policy’s total Premium for the expiring Policy Period.
4. Any offer to renew this Policy on terms involving a change in Retentions, Limit of Liability,
Premium or other terms or conditions will not constitute a refusal to renew this Policy.
L. WORDS AND TITLES OF PARAGRAPHS
The titles of paragraphs, section, provisions, or endorsements of or to this Policy are intended solely for convenience and reference, and are not deemed in any way to limit or expand the provisions to which they relate and are not part of the Policy. Whenever the singular form of a word is used herein, the same shall include the plural when required by context.
M. NAMED INSURED AUTHORIZATION
The “Named Insured” has the right and duty to act on “Your” behalf for:
1. the giving and receiving of notice of cancellation; 2. the payment of premiums, including additional premiums; 3. the receiving of any return premiums; 4. the acceptance of any endorsements added after the effective date of coverage; 5. the payment of any retentions; 6. the receiving of any amounts paid hereunder; and 7. otherwise corresponding with “Us”.
N. REPRESENTATIONS BY YOU By acceptance of this Policy, “You” agree that the statements contained in the “Application”, any application for coverage of which this Policy is a renewal, and any supplemental materials submitted therewith, are “Your” agreements and representations, that they shall be deemed material to the risk assumed by “Us”, and that this Policy is issued in reliance upon the truth thereof.
The misrepresentation or non-disclosure of any matter by “You” or “Your” agent in the “Application”, any application for coverage of which this Policy is a renewal, or any supplemental materials submitted therewith will render the Policy null and void and relieve “Us” from all liability under the Policy.
Quotation RPS-Q-50149291M/1 | Page 32 of 54

O. SERVICE OF SUIT CLAUSE (U.S.A.)
1. It is agreed that in the event of “Our” failure to pay any amount claimed to be due under this
Policy, at “Your” request “We” will submit to the jurisdiction of a court of competent jurisdiction within the United States. Nothing in this clause constitutes or should be understood to constitute a waiver of “Our” rights to commence an action in any court of competent jurisdiction in the United States, to remove an action to a United States District Court, or seek a transfer of a case to another court as permitted by the laws of the United States or any state in the United States. It is further agreed that service of process in such suit may be made upon “Our” representative, designated in the Policy, and that in any suit instituted against any one of “Us” upon this contract, “We” will abide by the final decision of such court or of any appellate court, in the event of an appeal.
2. “Our” representative designated in the Policy is authorized and directed to accept service of
process on “Our” behalf in any such suit and/or upon “Your” request to give a written undertaking to “You” that they will enter a general appearance upon “Our” behalf in the event such a suit shall be instituted.
3. Pursuant to any statute of any state, territory, or district of the United States which makes
provision therefore, “We” hereby designate the Superintendent, Commissioner, or Director of Insurance or other officer specified for that purpose in the statute, or his successor in office, as “Our” true and lawful attorney upon whom may be served any lawful process in any action, suit, or proceeding instituted by or on behalf of “You” or any beneficiary hereunder arising out of this Policy, and hereby designate “Our” representative listed in the Policy as the person to whom the said officer is authorized to mail such process or a true copy thereof.
P. CHOICE OF LAW
Any disputes involving this Policy shall be resolved applying the laws of the state identified in ITEM 11. of the Declarations.
Q. ARBITRATION
Any controversy arising out of or relating to this policy or the breach, termination or invalidity thereof shall be settled by binding arbitration in accordance with the commercial arbitration rules, but not the authority or jurisdiction, of the American Arbitration Association (herein “AAA”) then in effect. “We” and the Named Insured shall each appoint an arbitrator. Each arbitrator must be disinterested other than the Named Insured or any present or former officers or directors of the Insured. As soon as one party notifies the other of its demand for arbitration and names its arbitrator, the other party agrees to name its arbitrator within thirty (30) days of said notice. Within thirty (30) days of the naming of the second arbitrator, the two arbitrators will select a third arbitrator to be chairman of the panel, other than the Named Insured or any present or former officers or directors of the Insured. Should the two arbitrators not be able to agree on a choice of the third, then the Chief Judge of the chosen competent jurisdiction will make the appointment of such third arbitrator. None of the arbitrators may be current or former officers, directors, or employees of the Named Insured or “Us.” The three arbitrators will comprise the arbitration panel for the purposes of this Policy.
Each party to this policy will submit its case with supporting documents to the arbitration panel within thirty (30) days after appointment of the third arbitrator. However, the panel may agree to extend this period for a reasonable time. Unless extended by the consent of the parties, the
Quotation RPS-Q-50149291M/1 | Page 33 of 54

majority of the three arbitrators will issue a written decision resolving the controversy before them within thirty (30) days of the time the parties are required to submit their cases and related documentation. The arbitrators’ written decision will state the facts reviewed, conclusions reached and the reasons for these conclusions. That decision will be final and binding upon the parties in any court of competent jurisdiction.
Each party will pay the fees and expenses of its arbitrator, unless otherwise agreed by the
parties. The remaining costs of arbitration will be shared equally by the parties.
Arbitration will take place in a competent jurisdiction agreed to by the parties.
Any disputes involving this Policy shall be resolved applying the substantive law as designated in Item 11. of the Declarations.
In witness whereof, the company has caused this policy to be signed by its Secretary and its President at Oakbrook Terrace, Illinois.
Quotation RPS-Q-50149291M/1 | Page 34 of 54

BCS Insurance Company2 Mid America Plaza, Suite 200
Oakbrook Terrace, IL 60181
I.
II.
1.
a.
b.
2.
1.
2.
3.
4.
5.
6.
7.
8.
III.
CALIFORNIA AMENDATORY ENDORSEMENT
94.801 CA (06/17)
This Endorsement, effective at 12:01 a.m. CST, on 07/02/2019 forms part of:
Policy No.: RPS-Q-50149291M/1
Issued to: Pasadena Fire & Police Retirement System
This endorsement modifies insurance provided under the following:
CYBER AND PRIVACY LIABILITY POLICY
The following changes are made to the policy:
The following is added to Section :IV. EXCLUSIONS
Punitive or exemplary “Damages”.
Section , paragraph is replaced by the following:V. DEFINITIONS R. Damages
means:R. “Damages”
Solely with respect to Coverages A, D, E and H, a monetary judgment, award or settlement, including:
Pre-judgment interest; and
Post-judgment interest that accrues after entry of the judgment or award and before “We” have paid, offered to pay
or deposited in court that part of the judgment or award within the applicable Limits of Liability; and
Solely with respect to Coverage B, “Regulatory Fines” and “Consumer Redress Funds”.
shall not include or mean:“Damages”
“Your” future profits, restitution, or disgorgement of profits; or “Your” cost to comply with any order granting injunctive or
non-monetary relief, including specific performance, or any agreement to provide such relief;
“Your” return or offset of fees, charges, royalties, or commissions for goods or services already provided or contracted
to be provided;
fines or penalties of any nature, except those that are part of “Regulatory Fines” and “Consumer Redress Funds” as
identified above, or sought in a “PCI DSS Assessment”;
any amount “You” are not financially or legally obligated to pay;
the portion of multiplied “Damages” awarded in excess of actual or compensatory damages;
any donations or contributions to any charitable organization;
charge backs, interchange fees, discount fees or prospective services fees sought, awarded or agreed to as part of a
settlement in a “PCI DSS Assessment”; or
matters that may be deemed uninsurable under law. “We” shall apply the most favorable state law to “You” in
determining insurability.
Section , paragraph is replaced by theIX. TERMS AND CONDITIONS K. CANCELLATION AND NON-RENEWAL
following:
K. CANCELLATION AND NON-RENEWAL
This Policy may be cancelled or non-renewed by “You” at any time on request by sending a prior written notice to “Us”
stating when thereafter the cancellation will be effective.
Quotation RPS-Q-50149291M/1 | Page 35 of 54

BCS Insurance Company2 Mid America Plaza, Suite 200
Oakbrook Terrace, IL 60181
III.
1.
2.
3.
4.
a.
b.
c.
d.
5.
a.
b.
c.
d.
e.
f.
“We” may not cancel this Policy, except for nonpayment of Premium. If “We” cancel this Policy for non-payment of
Premium, “We” will provide “You” and the agent of record with at least twenty (20) days advance written notice at
the mailing address shown in the Policy.
If this Policy is cancelled by “You”, “We” shall refund the unearned Premium computed in accordance with the
customary short rate table. If this Policy is cancelled by “Us”, the refund of paid Premium shall be computed
pro-rata. Payment or tender of any unearned Premium by “Us” shall not be a condition precedent to the
effectiveness of such termination, but such payment shall be made as soon as practicable. If any “Claims” or
circumstances which may lead to a “Claims” have been notified under the Policy, the return Premium will be the
difference between the unearned Premium and the actual or estimated value of such “Claims” or circumstances.
“We” may non-renew this Policy by providing “You” and the agent of record with at least sixty (60) days, but less
than one hundred twenty (120) days, written notice before the expiration date. If the notice is given less than sixty
(60) days before expiration, Coverage will remain in effect until sixty (60) days after notice is mailed. The Premium
due for any period of Coverage that extends beyond the expiration date will be determined pro-rata based upon this
Policy’s total Premium for the expiring Policy Period.
“We” will send notice, in accordance with the provisions of item 3. above, if we offer renewal that includes:
A reduction in limits of liability;
The elimination of coverage;
An increase in Retention(s); or
An increase of more than twenty-five percent (25%) in the rate upon which the premium is based.
If “We” fail to give timely notice as required in 3. above, the Policy shall be continued, with no change in its terms or
conditions, for a period of sixty (60) days after “We” mail or deliver such notice.
“We” need not give notice of non-renewal if:
The Policy or the renewal of the Policy, without a change in its terms, conditions, or rates, has been transferred
between insurers who are members of the same insurance group;
The Policy has been extended for ninety (90) days or less, if the notice required in 3. above has been given prior
to the extension;
“You” have obtained replacement coverage or have agreed, in writing, within sixty (60) days of the termination of
the Policy, to obtain that coverage;
The Policy is for a period of no more than sixty (60) days and “You” are notified at the time of issuance that it may
not be renewed;
“You” request a change in the terms or conditions or risks covered by the Policy within sixty (60) days prior to the
end of the Policy Period; or
“We” have made a written offer to “You”, within the time period specified in 3. above, to renew the Policy under
changed terms or conditions or at a changed premium rate. As used herein, “terms or conditions” includes, but is
not limited to, a reduction in limits, elimination of coverage, or an increase in Retentions.
All other terms and conditions of this Policy shall remain unchanged.
This endorsement forms a part of the Policy to which attached, effective on the inception date of the Policy unless otherwise
stated herein.
Quotation RPS-Q-50149291M/1 | Page 36 of 54

BCS Insurance Company2 Mid America Plaza, Suite 200
Oakbrook Terrace, IL 60181
A.
1.
2.
3.
4.
CYBER DECEPTION ENDORSEMENT
CYBER AND PRIVACY LIABILITY POLICY
94.510 (09/15)
This Endorsement, effective at 12:01 a.m. CST, on July 2, 2019 forms part of:
Policy No.: RPS-Q-50149291M/1
Issued to: Pasadena Fire & Police Retirement System
Issued by: BCS Insurance Company
Item I: Retention: $25,000 for each "Cyber Deception Event"
A single retention shall apply to all "Cyber Deception Event" arising out of the same, related, or continuing acts,
facts, or circumstances
Item II: Sub-Limit: $100,000 in the aggregate for all "Cyber Deception Event"
Such sub-limit shall be part of and not in addition to the "Policy Aggregate Limit"
For the avoidance of doubt, in the event a “Claim” and “Cyber Deception Event” arises from the same or a series of related or
repeated acts, errors, or omissions or from any continuing acts, errors, or omissions then this shall be considered a single
“Claim” for the purposes of this policy and furthermore each corresponding “Retention” shall apply separately to the applicable
portion of such single “Claim”, and in no event shall the corresponding “Retentions” be combined to create a larger retention
amount than that exists for each corresponding “Retention”.
This endorsement modifies insurance provided under the following:
CYBER AND PRIVACY LIABILITY POLICY
In consideration of the premium required for the Cyber Deception Endorsement, and subject to all of the terms, conditions and
exclusions in the Policy referenced above, (except as amended by this Endorsement), the Company hereby agrees to extend
coverage to the Insured as follows:
I. CYBER DECEPTION
We shall reimburse “Your Organization” for the “Loss of Funds” or for the “Value of Goods” transferred which occur as a direct
result of a “Cyber Deception Event” (which follows the “Retroactive Date” on the declarations page) which is notified to “Us”
during the “Policy Period”.
DEFINITIONS:
“Account” means any bank account held in the name of “Your Organization”;
means any individual or entity to whom “You” are contracted to perform services or supply goods;“Client”
means the intentional misleading of “You” by means of a dishonest misrepresentation of a material“Cyber Deception”
fact contained or conveyed within an electronic or telephonic communication(s) and which relied upon by “You” believing
it to be genuine.
Quotation RPS-Q-50149291M/1 | Page 37 of 54

BCS Insurance Company2 Mid America Plaza, Suite 200
Oakbrook Terrace, IL 60181
A.
4.
a.
b.
5.
6.
a.
b.
c.
7.
a.
b.
B.
1.
2.
3.
4.
C.
1.
2.
means:“Cyber Deception Event”
The good faith transfer by “You” of “Your Organization’s” funds or the transfer of “Your Goods”, in lieu of payment, to
a third party as a direct result of a “Cyber Deception”, whereby “You” were directed to transfer “Goods” or pay funds
to a third party under false pretences; or
The theft of “Your Organization’s” funds as a result of an unauthorized intrusion into or “Security Compromise” of
“Your” “Computer System” directly enabled as a result of a “Cyber Deception”.
“Goods” means those products supplied by “You” to a “Client” under a contract.
means the loss of “Your Organization's” money from “Your” account. “Loss of Funds” shall not include:“Loss of Funds”
Any fees, fines or charges assessed against “You” or any expenses “You” incur as a result of any “Cyber Deception
Event”;
Any monies held by “You” on behalf of “Client”; or
The cost of “Your” time in identifying and rectifying the “Cyber Deception Event”.
means the cost price of those “Goods” excluding:“Value of Goods”
Any element of profit to “Your Organization”; or
Any tax which “You” may be able to recover as a result of “Goods” being misappropriated by way of the “Cyber
Deception Event”.
NOTICE OF CYBER DECEPTION EVENT
If any “Cyber Deception Event” occurs, then as soon as reasonably practicable after “Your” Chief Executive Office, Finance
Director, General Counsel, or Risk Manager or their functional equivalents becomes aware of such “Cyber Deception Event”,
“You” shall notify “Us” by forwarding notice to the persons named in Item 8. of the Declarations and giving as much details
as possible of the following:
Specific details of the acts, facts, or circumstances that gave rise to the “Cyber Deception Event”;
Possible amounts potentially covered under this policy that may result or have resulted from the acts, facts or
circumstances;
Details regarding how “You” first became aware of the acts, facts, or circumstances; and
The “Computer Network” security and event logs, which provide evidence of the alleged incident.
Any subsequent “Cyber Deception Event” arising out of such acts, facts, or circumstances which is the subject of the written
notice will be deemed to be a “Cyber Deception Event” at the time written notice complying with the above requirements
was first given to “Us”.
EXCLUSIONS
"We” shall not be liable for any “Cyber Deception Event” arising out of:
Any “Cyber Deception Event”, which was first committed or occurred prior to the “Retroactive Date”;
Any “Cyber Deception Event” notified to and accepted by a previous insurer under an insurance policy of which this policy
is a renewal or replacement;
Quotation RPS-Q-50149291M/1 | Page 38 of 54

BCS Insurance Company2 Mid America Plaza, Suite 200
Oakbrook Terrace, IL 60181
C.
3.
a.
b.
c.
d.
e.
4.
Any “Loss of Funds” or “Value of Goods” arising out of or caused by:
The wear and tear, drop in performance, progressive or gradual deterioration, or aging of electronic equipment and
other property or “Hardware” used by “You”;
Failure by “You” or those acting on “Your” behalf to maintain any computer, computer network or network, computer
software, or any other equipment;
Failure or gradual deterioration of overhead transmission, distribution lines or subterranean insulation or cabling;
“Your” knowing use of illegal or unlicensed programs that are in violation of provisions or laws referring to software
protection; or
The existence, emission, or discharge of any electromagnetic field, electromagnetic radiation, or electromagnetism
that actually or allegedly affects the health, safety, or condition of any person or the environment or that affects the
value, marketability, condition, or use of any property.
Gambling, pornography, prizes, awards, coupons, or the sale or provision of prohibited, restricted, or regulated items
including, but not limited to, alcoholic beverages, tobacco, or drugs.
Quotation RPS-Q-50149291M/1 | Page 39 of 54

BCS Insurance Company2 Mid America Plaza, Suite 200
Oakbrook Terrace, IL 60181
I.
II.
III.
IV.
NUCLEAR INCIDENT EXCLUSION CLAUSE-LIABILITY-DIRECT(BROAD) (U.S.A.)
94.102 (01/15)
This Endorsement, effective at 12:01 a.m. CST, on July 2, 2019 forms part of:
Policy No.: RPS-Q-50149291M/1
Issued to: Pasadena Fire & Police Retirement System
Issued by: BCS Insurance Company
For attachment to insurances of the following classifications in the U.S.A., its Territories and Possessions, Puerto Rico and the
Canal Zone:
Owners, Landlords and Tenants Liability, Contractual Liability, Elevator Liability, Owners or Contractors (including railroad)
Protective Liability, Manufacturers and Contractors Liability, Product Liability, Professional and Malpractice Liability,
Storekeepers Liability, Garage Liability, Automobile Liability (including Massachusetts Motor Vehicle or Garage Liability),
not being insurances of the classifications to which the Nuclear Incident Exclusion Clause-Liability-Direct (Limited) applies.
This Policy* does not apply:
Under any Liability Coverage, to injury, sickness, disease, death or destruction:
Under any Medical Payments Coverage, or under any Supplementary Payments Provision relating to immediate medical or
surgical relief, to expenses incurred with respect to bodily injury, sickness, disease or death resulting from the hazardous
properties of nuclear material and arising out of the operation of a nuclear facility by any person or organization.
Under any Liability Coverage, to injury, sickness, disease, death or destruction resulting from the hazardous properties of
nuclear material, if:
with respect to which an insured under the Policy is also an insured under a nuclear energy liability policy issued by
Nuclear Energy Liability Insurance Association, Mutual Atomic Energy Liability Underwriters or Nuclear Insurance
Association of Canada, or would be an insured under any such policy but for its termination upon exhaustion of its limit
of liability; or
(a)
resulting from the hazardous properties of nuclear material and with respect to which (1) any person or organization is
required to maintain financial protection pursuant to the Atomic Energy Act of 1954, or any law amendatory thereof, or
(2) the insured is, or had this Policy not been issued would be, entitled to indemnity from the United States of America,
or any agency thereof, under any agreement entered into by the United States of America, or any agency thereof, with
any person or organization.
(b)
the nuclear material (1) is at any nuclear facility owned by, or operated by or on behalf of, an insured or (2) has been
discharged or dispersed therefrom;
(a)
the nuclear material is contained in spent fuel or waste at any time possessed, handled, used, processed, stored,
transported or disposed of by or on behalf of an insured; or
(b)
the injury, sickness, disease, death or destruction arises out of the furnishing by an insured of services, materials, parts
or equipment in connection with the ning, construction, maintenance, operation or use of any nuclear facility, but if such
facility is located within the United States of America, its territories or possessions or Canada, this exclusion (c) applies
only to injury to or destruction of property at such nuclear facility.
(c)
Quotation RPS-Q-50149291M/1 | Page 40 of 54

BCS Insurance Company2 Mid America Plaza, Suite 200
Oakbrook Terrace, IL 60181
IV. As used in this endorsement:
"hazardous properties" include radioactive, toxic or explosive properties; "nuclear material" means source material, special
nuclear material or by-product material; "source material", "special nuclear material", and "by-product material" have the
meanings given them in the Atomic Energy Act 1954 or in any law amendatory thereof; "spent fuel" means any fuel element
or fuel component, solid or liquid, which has been used or exposed to radiation in a nuclear reactor; "waste" means any
waste material (1) containing by-product material and (2) resulting from the operation by any person or organization of any
nuclear facility included within the definition of nuclear facility under paragraph (a) or (b) thereof; "nuclear facility" means:
NOTE: As respects policies which afford liability coverages and other forms of coverage in addition, the words underlined should
be amended to designate the liability coverage to which this clause is to apply.
It is understood and agreed that, except as specifically provided in the foregoing to the contrary, this clause is subject to the
terms, exclusions, conditions and limitations of the Policy to which it is attached.
any nuclear reactor,(a)
any equipment or device designed or used for (1) separating the isotopes of uranium or plutonium, (2) processing or
utilizing spent fuel, or (3) handling, processing or packaging waste,
(b)
any equipment or device used for the processing, fabricating or alloying of special nuclear material if at any time the
total amount of such material in the custody of the insured at the premises where such equipment or device is located
consists of or contains more than 25 grams of plutonium or uranium 233 or any combination thereof, or more than 250
grams of uranium 235,
(c)
any structure, basin, excavation, premises or place prepared or used for the storage or disposal of waste, and includes
the site on which any of the foregoing is located, all operations conducted on such site and all premises used for such
operations; "nuclear reactor" means any apparatus designed or used to sustain nuclear fission in a self-supporting
chain reaction or to contain a critical mass of fissionable material. With respect to injury to or destruction of property,
the word "injury" or "destruction" includes all forms of radioactive contamination of property.
(d)
Quotation RPS-Q-50149291M/1 | Page 41 of 54

BCS Insurance Company2 Mid America Plaza, Suite 200
Oakbrook Terrace, IL 60181
RADIOACTIVE CONTAMINATION EXCLUSION CLAUSE-LIABILITYDIRECT (U.S.A.)
94.103 01/15
This Endorsement, effective at 12:01 a.m. CST, on July 2, 2019 forms part of:
Policy No.: RPS-Q-50149291M/1
Issued to: Pasadena Fire & Police Retirement System
Issued by: BCS Insurance Company
When attached to the Policy, (in addition to the appropriate Nuclear Incident Exclusion Clause-Liability-Direct) provides worldwide
coverage.
In relation to liability arising outside the U.S.A., its Territories or Possessions, Puerto Rico or the Canal Zone, this Policy does not
cover any liability of whatsoever nature directly or indirectly caused by or contributed to by or arising from ionising radiations or
contamination by radioactivity from any nuclear fuel or from any nuclear waste from the combustion of nuclear fuel.
All other terms and conditions of this Policy shall remain unchanged.
This endorsement forms a part of the Policy to which attached, effective on the inception date of the Policy unless otherwise
stated herein.
Quotation RPS-Q-50149291M/1 | Page 42 of 54

BCS Insurance Company2 Mid America Plaza, Suite 200
Oakbrook Terrace, IL 60181
BREACH RESPONSE TEAM ENDORSEMENT
94.805 (06/17)
The following vendors have been approved to support “You” in the event of a “Security Breach”. “You” do not require “our” prior
written consent to contact these vendors:
"Breach Response Counsel":
Baker & Hostetler LLP
24/7 Breach Response hotline - 1-866-288-1705
"Breach Response Team":
Kroll
Data Breach Hotline - 1-877-300-6816
Quotation RPS-Q-50149291M/1 | Page 43 of 54

BCS Insurance Company2 Mid America Plaza, Suite 200
Oakbrook Terrace, IL 60181
1.
2.
3.
1.
COVERAGE ENHANCEMENTS ENDORSEMENT
94.527 (06/18)
CYBER AND PRIVACY LIABILITY
THIS ENDORSEMENT CHANGES THE CYBER AND PRIVACY LIABILITY POLICY.
PLEASE READ IT CAREFULLY
This Endorsement, effective at 12:01 a.m. CST, on July 2, 2019 forms part of:
Policy No.: RPS-Q-50149291M/1
Issued to: Pasadena Fire & Police Retirement System
Issued by: BCS Insurance Company
This endorsement modifies the policy as follows:
I. Under Section is deleted in itsI. COVERAGES; G. BUSINESS INCOME AND DIGITAL ASSET RESTORATION
entirety and replaced with the following:
G. BUSINESS INCOME AND DIGITAL ASSET RESTORATION
“We” shall pay "Your Organization" for the “Business Income Loss” in excess of the applicable retention that
“You” sustain during a “Period of Restoration” resulting directly from a “Network Disruption” that commences
during the “Policy Period”, but only if the duration of such “Period of Restoration” exceeds the “Waiting Period”
set forth in the Declarations, and such “Network Disruption” first occurs after the “Retroactive Date” and before
the end of the “Policy Period” and “You” first learn of the “”Network Disruption” during the “Policy Period” and
report the “Network Disruption” to “Us” as soon as practicable within the “Policy Period”.
“We” shall reimburse “Your Organization” for the “Restoration Costs” in excess of the applicable retention that
“You" incur because of the alteration, destruction, damage or loss of “Digital Assets” that commences during
the “Policy Period” resulting solely and directly from a “Security Compromise”, but only if such “Security
Compromise” first occurs on or after the “Retroactive Date” and before the end of the “Policy Period” and “You”
first learn of the “Security Compromise” during the “Policy Period” and report the “Security Compromise” to
“Us” as soon as practicable within the “Policy Period”.
“We” shall pay "Your Organization" for the “Reputation Business Income Loss” in excess of the applicable
retention that “You” sustain following a “Security Breach” or “Network Disruption”, but only if such “Security
Breach” or “Network Disruption” first occurs on or after the “Retroactive Date” and before the end of the “Policy
Period” and “You” first learn of the “Security Breach” or “Network Disruption” during the “Policy Period” and
report the “Security Breach” or “Network Disruption” to “Us” as soon as practicable within the “Policy Period”.
II. Under Section the following is added:I. COVERAGES
I. ELECTRONIC FRAUD
Telephone Hacking
“We” shall reimburse “Your Organization” for “Telephone Hacking Loss” in excess of the applicable retention
arising from a “Telephone Hacking Event” first discovered by “You” during the “Policy Period” as a direct result
of “Your” “Telecommunications Services” being subject to a “Telephone Hacking Event” arising from
unauthorized calls or unauthorized use of “Your” bandwidth, but only if "You" first learn of the "Telephone
Quotation RPS-Q-50149291M/1 | Page 44 of 54

BCS Insurance Company2 Mid America Plaza, Suite 200
Oakbrook Terrace, IL 60181
1.
1.
2.
1.
2.
3.
4.
5.
6.
1.
2.
3.
4.
5.
6.
1.
2.
Hacking Event" during the "Policy Period" and report the "Telephone Hacking Event" to "Us" as soon as
practicable within the "Policy Period."
III. Under Section , paragraph is deleted in its entirety and replaced with the following:V. DEFINITIONS H.
H. “Business Income Loss” means:
“Earnings Loss”; and/or
“Expenses Loss.”
The most “We” will pay for “Business Income Loss” that “You” sustain resulting directly from a “Network Disruption”
involving an “Outsourced Provider” “Computer System” (as defined in part 2. of the Definition of "Network Disruption") is
$250,000. This Sub-Limit of Liability is part of, and not in addition to, the Sub- Limit of Liability stated in ITEM 3.G. of the
Declarations.
“Business Income Loss” does not include:
any contractual penalties;
any costs or expenses incurred to update, upgrade, replace, restore or otherwise improve any “Computer
System” to a level beyond that which existed prior to a “Network Disruption”;
any costs or expenses incurred to identify, remove or remediate computer program errors or vulnerabilities, or
costs to update, upgrade, replace, restore, maintain or otherwise improve any “Computer System”;
any legal costs or expenses or other amounts arising out of liability to any third (3rd) party;
any amounts incurred as a result of unfavorable business conditions; or
any other consequential amounts, loss or damage.
IV. Under Section , paragraph is deleted in its entirety and replaced with the following:V., DEFINITIONS W.
W. “Event” means a “Security Breach”, “Cyber- Extortion Threat”, “Security Compromise”, “Network Disruption, or
“Telephone Hacking Event”.
Multiple “Events” arising from the same or a series of related or repeated “Events”, acts, errors, or omissions, or
from any continuing “Events”, acts, errors, or omissions shall be considered a single “Event” for the purposes of this
Policy. All such related “Events” shall be deemed to have first occurred at the time the earliest such “Event” first
occurred or commenced.
V. Under Section , paragraph is deleted in its entirety and replaced with the following:V., DEFINITIONS BB.
BB. “Loss(es)” means:
“Business Income Loss”;
“Breach Response Costs”;
“Reputation Business Income Loss”;
“Restoration Costs”;
“Cyber-Extortion Payments” and “Cyber-Extortion Expenses;” and
“Telephone Hacking Loss.”
VI. Under Section , paragraph is deleted in its entirety and replaced with the following:V. DEFINITIONS FF.
FF. “Network Disruption” means any of the following incidents:
an unplanned failure, interruption or degradation of the operation of “Your” “Computer System” or an
“Outsourced Provider” “Computer System”; or the denial, restriction or hindrance of access to or use of “Your”
“Computer System”, an “Outsourced Provider” “Computer System” or “Your” “Digital Assets” by any party who
is otherwise authorized to have access; and
Quotation RPS-Q-50149291M/1 | Page 45 of 54

BCS Insurance Company2 Mid America Plaza, Suite 200
Oakbrook Terrace, IL 60181
2.
1.
2.
1.
2.
1.
2.
3.
with respect to Coverage G.1 only, "Network Disruption" also means an unplanned failure, interruption or
degradation of the operation of “an “Outsourced Provider” “Computer System”; or the denial, restriction or
hindrance of access to or use of an “Outsourced Provider” “Computer System” by any party who is otherwise
authorized to have access.
More than one such incident that results from the same or related underlying facts, circumstances, situations,
transactions or “Security Compromises” shall be considered a single “Network Disruption” which first occurs on the
date of the earliest of such events.
VII. Under Section , paragraph is deleted in its entirety and replaced with the following:V., DEFINITIONS GG.
GG. “PCI DSS Assessment(s)” means:
a written demand received by “You” from “Your” Acquiring Bank or a card association (MasterCard, VISA,
Discover, American Express or JCB) for monetary fines, penalties, reimbursements, PCI Forensic Investigator
(PFI) fees/expenses, and fraud recoveries or assessments, due to “Your” actual or alleged non-compliance with
PCI Data Security Standards further to the terms of a Merchant Services Agreement, but not including any
charge backs, interchange fees, discount fees or prospective service fees; and
reasonable and necessary fees for a mandatory audit by a Qualified Security Assessor (QSA) to show “You” are
PCI Data Security Standards compliant following a “Security Breach.”
Merchant Services Agreement means any written agreement between “You” and a card association (MasterCard,
VISA, Discover, American Express or JCB), which allows “You” to accept payment by credit, debit or prepaid card.
VIII. Under Section , paragraph is deleted in its entirety and replaced with the following:V. DEFINITIONS JJ.
JJ. "Period of Restoration" means the time period from the commencement of a "Network Disruption" to the earlier of
the following dates:
the date "Your" "Computer System", "Outsourced Provider" "Computer System" or "Your" "Digital Assets" are
restored to the condition and functionality that existed immediately prior to the "Network Disruption;" or
the date "Your" "Computer System", "Outsourced Provider" "Computer System" or "Your" "Digital Assets" with
reasonable diligence, could have been restored to the condition and functionality that existed immediately prior
to the "Network Disruption."
IX. Under Section , item 9. under paragraph is deleted and replaced with the following:V. DEFINITIONS MM.
9. privacy protection regulations or laws adopted by countries outside of the United States, such as the General Data
Protection Regulation (Regulation (EU) 2016/679 (GDPR) and the Canadian Personal Information Protection and
Electronic Documents Act (PIPEDA), as they currently exist now or may be amended, associated with the
collection, control and use of, or limiting “Unauthorized Access” to, personal information.
X. Under Section , paragraphs and are deleted in their entirety and replaced with the following:V. DEFINITIONS OO. QQ.
OO. “Private Information” means any:
proprietary or confidential information owned by a third party or “You”;
information that can be used to determine, distinguish or trace an individual’s identity, either alone or when
combined with other information that is linked or linkable to a specific individual; or,
information concerning an individual that would be considered personal data or sensitive personal data within
the meaning of the General Data Protection Regulation (Regulation (EU) 2016/679 (GDPR) and any amendments
thereto.
Quotation RPS-Q-50149291M/1 | Page 46 of 54

BCS Insurance Company2 Mid America Plaza, Suite 200
Oakbrook Terrace, IL 60181
1.
2.
1.
2.
3.
1.
QQ. “Regulatory Claim” means:
any request for information, civil investigative demand or formal investigation of “You” by an administrative or
regulatory agency or similar governmental body concerning a “Privacy Breach” or possible breach of “Privacy
Regulations”; or
any administrative or civil proceeding against “You” by an administrative or regulatory agency, supervisory
authority, authorized data protection authority or similar governmental body for a breach of “Privacy
Regulations”.
XI. Under Section the following are added:V. DEFINITIONS
“Outsourced Provider” means any provider, other than a “Service Provider”, that “You” do not own, operate, or control,
that performs services, other than IT services, for “You” pursuant to a written contract. An “Outsourced Provider” does
not include any provider of “Telecommunications Services” including “Internet” access to “You”.
“Telephone Hacking Loss” means “Your” monetary or other financial asset loss as a result of a “Telephone Hacking
Event” under Coverage I.1.
“Telephone Hacking Event” means a third party’s intentional, unauthorized and fraudulent use of “Your”
“Telecommunications Services” that results in unauthorized calls or unauthorized use of “Your” bandwidth.
“Telecommunications Services” means telephone, fax, broadband, or other data transmission services that “Your
Organization” purchases from third parties.
XII. Under Section , , paragraph , the following changes are made:IX. TERMS AND CONDITIONS C.
The title is revised to read:
.DUTIES FOLLOWING NOTICE OF AN EVENT (applicable to Coverages C, F, G and I only)
The first sentence is revised to read:
“You” must see that the following are done if “You” send “Us” notice of an “Event” to which Coverages C, F, G or I
potentially apply:
The following sub-paragraphs are added to the end of paragraph C.: Assist “Us” when a “Telephone Hacking Event”
occurs.
“Telephone Hacking Event” will be deemed to occur when “You” first discover that a “Telephone Hacking Event” has
occurred, or “You” have a reasonable basis to know that a “Telephone Hacking Event” has occurred, including the
receipt of any notice, invoice, or billing evidencing unauthorized use of “Telecommunications Services”. If any related
“Telephone Hacking Events” subsequently occur, and are reported to “Us,” all such related “Telephone Hacking Events”
will be considered a single “Telephone Hacking Event” and will be deemed to have occurred on the date the first of
those “Telephone Hacking Events” occurred.
As soon as a “Telephone Hacking Event” first occurs, “You” must notify us in accordance with Section , IX. TERMS AND
, paragraph CONDITIONS A. NOTICE OF CLAIM OR CIRCUMSTANCE THAT MIGHT LEAD TO A CLAIM.
XIII. Under Section , , paragraph , IX. TERMS AND CONDITIONS I. NEW SUBSIDIARIES/CHANGES IN NAMED INSURED
, sub-paragraph 1. is deleted in its entirety and replaced with the following:OR YOUR ORGANIZATION
During the “Policy Period”, if “You” acquire another corporation whose annual revenues are more than twenty-five
percent (25%) of “Your Organization’s” annual revenues as set forth in its most recent audited financial statements,
“You” shall give “Us” written notice of the acquisition containing full details thereof, no later than sixty (60) days after
the effective date of such acquisition or creation. Coverage under this Policy for “Wrongful Acts”, acts, errors, or
omissions committed or allegedly committed by the newly acquired “Subsidiary” or any persons who may become
Quotation RPS-Q-50149291M/1 | Page 47 of 54

BCS Insurance Company2 Mid America Plaza, Suite 200
Oakbrook Terrace, IL 60181
1.
insureds therewith shall be automatic for ninety (90) days after such acquisition or creation or, until the end of the
‘Policy Period,’ whichever is earlier; after the end of this ninety (90) day period, “We” may agree to add coverage for
the newly acquired “Subsidiary” upon such terms, conditions, and limitations of coverage and such additional
premium as “We”, in “Our” sole discretion, may require.
All other terms, conditions, limitations and exclusions of the Policy remain unchanged.
This endorsement forms a part of the Policy to which attached, effective on the inception date of the Policy unless otherwise
stated herein.
Quotation RPS-Q-50149291M/1 | Page 48 of 54

BCS Insurance Company2 Mid America Plaza, Suite 200
Oakbrook Terrace, IL 60181
a.
b.
c.
d.
FUNDS TRANSFER FRAUD ENDORSEMENT
94.528 (06/18)
CYBER AND PRIVACY LIABILITY
THIS ENDORSEMENT CHANGES THE CYBER AND PRIVACY LIABILITY POLICY.
PLEASE READ IT CAREFULLY
This Endorsement, effective at 12:01 a.m. CST, on July 2, 2019 forms part of:
Policy No.: RPS-Q-50149291M/1
Issued to: Pasadena Fire & Police Retirement System
Issued by: BCS Insurance Company
I. Under Section , item 2. is added to include the following:I. COVERAGES
I. ELECTRONIC FRAUD
2. Funds Transfer Fraud
“We” shall reimburse “Your Organization” for “Direct Financial Loss” in excess of the applicable retention as a direct
result of any third party committing a "Funds Transfer Fraud", but only if "You" first learn of the "Funds Transfer
Fraud" during the "Policy Period" (or an “Extended Reporting Period”, if applicable) and report the "Funds Transfer
Fraud" to "Us" as soon as practicable within the "Policy Period" (or an “Extended Reporting Period”, if applicable).
II. Under Section , paragraph is amended to include the following:V. DEFINITIONS W.
“Event” also means “Funds Transfer Fraud”.
III. Under Section , paragraph is amended to include the following:V. DEFINITIONS BB.
"Loss(es)" also means "Direct Financial Loss."
IV. Under Section the following are added:V. DEFINITIONS
“Direct Financial Loss” means “Your” monetary or other financial asset loss as a result of a “Funds Transfer Fraud” under
Coverage I.2. The most “We” will pay for any “Direct Financial Loss” arising from all “Funds Transfer Fraud” is $100,000.
"Funds Transfer Fraud" means any:
unauthorized electronic funds transfer;
theft of “Your” money or other financial assets from your bank by electronic means;
theft of money or other financial assets from “Your” corporate credit cards by electronic means; or
fraudulent manipulation of electronic documentation while stored on “Your” “Computer system”.
V. Under Section , , paragraph , the following changes are made: The followingIX. TERMS AND CONDITIONS C.
sub-paragraphs are added to the end of paragraph C.:
Assist “Us” when a “Funds Transfer Fraud” Occurs.
“Funds Transfer Fraud” will be deemed to occur when “You” first know that a “Funds Transfer Fraud” has occurred, or
“You” have a reasonable basis to know that a “Funds Transfer Fraud” has occurred, including any unauthorized
electronic funds transfer; theft of money or other financial assets from “Your” bank by electronic means; theft of money
Quotation RPS-Q-50149291M/1 | Page 49 of 54

BCS Insurance Company2 Mid America Plaza, Suite 200
Oakbrook Terrace, IL 60181
or other financial assets from “Your” corporate credit cards by electronic means; or any fraudulent manipulation of
electronic documentation while stored on “Your” “Computer System”. If related “Funds Transfer Fraud” events
subsequently occur, and are reported to “Us,” all such related “Funds Transfer Fraud” events will be considered a single
“Funds Transfer Fraud” event and will be deemed to have occurred on the date the first of those “Funds Transfer Fraud”
events occurred.
As soon as a “Funds Transfer Fraud” event first occurs, “You” must notify us in accordance with Section IX., TERMS
, paragraph AND CONDITIONS A. NOTICE OF CLAIM OR CIRCUMSTANCE THAT MIGHT LEAD TO A CLAIM.
All other terms, conditions, limitations and exclusions of the Policy remain unchanged.
This endorsement forms a part of the Policy to which attached, effective on the inception date of the Policy unless otherwise
stated herein.
Quotation RPS-Q-50149291M/1 | Page 50 of 54

BCS Insurance Company2 Mid America Plaza, Suite 200
Oakbrook Terrace, IL 60181
CALIFORNIA PREMIUM RETURN DISCLOSURE NOTICE
BCSI-X009 (01 15)
If "You" cancel this Policy, "We" will calculate your return Premium on the customary short-rate basis.
If "We" cancel this Policy, "We" will calculate your return Premium on a pro-rata basis.
If a "Claim" or circumstances which may lead to a "Claim" has been reported, "We" will only return that portion of the unearned
Premium in excess of the actual or estimated value of such "Claim" or circumstance.
Quotation RPS-Q-50149291M/1 | Page 51 of 54
BCS Insurance Company2 Mid America Plaza, Suite 200
Oakbrook Terrace, IL 60181
A.
B.
Coverage for Certified Acts of Terrorism
CYBER AND PRIVACY LIABILITY POLICY
94.551 (01/15)
This Endorsement, effective at 12:01 a.m. CST, on July 2, 2019 forms part of:
Policy No.: RPS-Q-50149291M/1
Issued to: Pasadena Fire & Police Retirement System
Issued by: BCS Insurance Company
In consideration of the additional premium payment of $44, the Exclusion under this Policy for acts of “Terrorism” that are
certified by the Secretary of the Treasury as “Certified Acts of Terrorism” pursuant to the federal Terrorism Risk Insurance Act is
hereby deleted, subject to the following provisions and restrictions:
With respect to any one or more “Certified Acts of Terrorism”, “We” will not pay any amounts for which “We” are not
responsible under the terms of the federal Terrorism Risk Insurance Act of 2002 (including subsequent action of Congress
pursuant to the Act) due to the application of any clause which results in a cap on “Our” liability for payments for “Certified
Acts of Terrorism” losses.
The terms and limitations of any “Terrorism” Exclusion, or the inapplicability or omission of a “Terrorism” Exclusion, do not
serve to create coverage for any loss which would otherwise be excluded under this Policy, such as losses excluded under a
Nuclear Incident Exclusion or Radioactive Contamination Exclusion.
All other terms and conditions of this Policy shall remain unchanged.
This endorsement forms a part of the Policy to which attached, effective on the inception date of the Policy unless otherwise
stated herein.
Quotation RPS-Q-50149291M/1 | Page 52 of 54

BCS Insurance Company2 Mid America Plaza, Suite 200
Oakbrook Terrace, IL 60181
I.
II.
III.
IV.
a.
b.
1.
2.
a.
War and Terrorism Endorsement - California
CYBER AND PRIVACY LIABILITY POLICY
94.552 CA (01/15)
This Endorsement, effective at 12:01 a.m. CST, on July 2, 2019 forms part of:
Policy No.: RPS-Q-50149291M/1
Issued to: Pasadena Fire & Police Retirement System
Issued by: BCS Insurance Company
The following changes are made to the Policy:
Section , paragraph is replaced by the following:IV. EXCLUSIONS H.
H. Any "strike or similar labor action, war, invasion, act of foreign enemy, hostilities or warlike operations (whether
declared or not), civil war, mutiny, civil commotion assuming the proportions of or amounting to a popular rising,
military rising, insurrection, rebellion, revolution, military or usurped power, or any action taken to hinder or defend
against these actions; including all amounts, "Damages", or "Claim Expenses" of whatsoever nature directly or
indirectly caused by, resulting from or in connection with any action taken in controlling, preventing, suppressing, or in
any way relating to the above; however, if "We" allege that by reason of this exclusion any "Damages" or "Claim
Expenses" are not covered by this Policy, the burden of proving the contrary shall be upon "You". However this
exclusion does not apply to acts perpetuated electronically.
The following is added to Section :IV. EXCLUSIONS
Any act of "Terrorism".
Section , paragraph is deleted.V. DEFINITIONS A. "Act of Terrorism"
The following are added to Section V. DEFINITIONS:
means an act that is certified by the Secretary of the Treasury to be an act of terrorism"Certified Act of Terrorism"
pursuant to the federal Terrorism Risk lnsurance Act. The criteria contained in the Terrorism Risk Insurance Act for a certified
act of terrorism include the following:
The act resulted in insured losses in excess of $5 million in the aggregate, attributable to all types of insurance subject to
the Terrorism Risk Insurance Act; and
The act is a violent act or an act that is dangerous to human life, property or infrastructure and is committed by an
individual or individuals as part of an effort to coerce the civilian population of the United States or to influence the policy
or affect the conduct of the United States Government by coercion.
"Terrorism" means:
Any "Certified Act of Terrorism"; and
Activities against persons, organizations or property of any nature:
That involve the following or preparation for the following:
Quotation RPS-Q-50149291M/1 | Page 53 of 54

BCS Insurance Company2 Mid America Plaza, Suite 200
Oakbrook Terrace, IL 60181
IV.
2.
a.
b.
1) Use or threat of force or violence; or
2) Commission or threat of a dangerous act; or
3) Commission or threat of an act that interferes with or disrupts an electronic, communication, information, or
mechanical system; and
When one or both of the following applies:
1) The effect is to intimidate or coerce a government or the civilian population or any segment thereof, or to disrupt
any segment of the economy; or
2) It appears that the intent is to intimidate or coerce a government, or to further political, ideological, religious,
social or economic objectives or to express (or express opposition to) a philosophy or ideology.
All other terms and conditions of this Policy shall remain unchanged.
This endorsement forms a part of the Policy to which attached, effective on the inception date of the Policy unless otherwise
stated herein.
Quotation RPS-Q-50149291M/1 | Page 54 of 54

May 15, 2019 FY 2019 Estimated Actual Expenditures and FY 2020 Recommended Budget Page 1 of 5
Pasadena Fire & Police Retirement System
AGENDA REPORT
TO: Chair Jones and Board Members of the Fire & Police Retirement System
FROM: Bernadette Jazmines, Secretary to the Board
DATE: May 15, 2019
ITEM: Fiscal Year 2020 Recommended Budget
RECOMMENDATION Upon review of the report and presentation, the Board may direct staff to:
1. Adopt the Fiscal Year 2020 Recommended Budget, and/or 2. Other direction provided by the Board.
FISCAL YEAR 2019 IN REVIEW The Pasadena Fire & Police Retirement System (“System”) is a closed defined-benefit pension fund that disburses approximately $12.8 million annually in benefits payments to retirees and beneficiaries. As of the April 30, 2019 payroll, the System included 144 Retirees, 61 beneficiaries, and 23 Domestic Relations Orders for a total of 228 payees (compared to 238 at this time last year). Accomplishments and major work efforts for the System over the past year include:
System Administration o Transitioned from the prior Acting Administrator, and made all the changes in computer
systems, permissions, signature authority, etc. that were necessary. Communicated with all service providers, to ensure a seamless transition, and that no information/processes were lost. Worked with the Finance department during the transition, to maintain controls.
o Worked collaboratively with the System’s auditor to prepare the June 30, 2018 audited financial statements (receiving a clean audit), and with the System’s actuary to prepare the June 30, 2018 actuarial valuation.
o Updated the payroll with the July 1, 2018 COLA, 2019 Medical Rates and 2019 Federal and State Withholding tables.
o As of May 15, 2019, will have completed four CalPERS disability hearing retirements (compared to two over the same time period in the previous year), and initiated/continued efforts on seven additional disability hearings that are currently working their way through the disability hearing process.
o Prepared the third annual five-year and ten-year expense forecast, including a work assessment. The analysis will be updated and evaluated on an annual basis to provide the Board with information to assist with long-term planning.
mprice
Typewritten Text
DATE: 5/15/19 ITEM #: 12

May 15, 2019 FY 2019 Estimated Actual Expenditures and FY 2020 Recommended Budget Page 2 of 5
Investments o Received a Total Fund return (net of fees) of 4.5% matching Policy Index return of 4.5% FYTD. o Directed Verus investments to analyze and present on Portfolio Duration and perform a
Liquidity Analysis. o Conducted five Rebalances and Withdrawals including May’s pending rebalance and
withdrawal. $6,095,000 redeemed from Fixed Income investments, $3,820,000 redeemed from Domestic Equity investments, $2,700,000 redeemed from Real Estate investment, and $405,000 redeemed from Alternative investments.
System/City Collaborative Efforts o Approval of the Amendment to the Amended and Restated Contribution Agreement No.
20,823 approved by the Board on 2/20/19 and by City Council on 3/11/19, in the fiscal year in which the System first receives proceeds from the sale of the Concord, the City's supplemental payment to the System required during that same fiscal year shall be reduced by the amount of the Concord proceeds received by the System, or not required in that fiscal year if the Concord proceeds received by the System exceed the supplemental payment. Such one-time setoff of the supplemental payment shall be required regardless of whether the supplemental payment was made before or after the System receives proceeds from the sale of the Concord during such fiscal year.
o Pasadena Police Department Museum Committee formation. FPRS staff have been invited by the PPD to be part of the PPD Museum Committee as PPD begins efforts to develop its museum.
FISCAL YEAR 2019 SYSTEM ASSETS AND REVENUES For the period ending April 30, 2019, System assets totaled approximately $112.9 million, including pooled cash with the City. According to Amended and Restated Contribution Agreement No. 20,823, a contribution from the City would not be required in FY 2019 if the minimum funding percentage of 79.0% was deemed met by the June 30, 2018 actuarial analysis. The June 30, 2018 Actuarial Value of Assets funded percentage was 79.9%, thus no supplemental payment was required of the City during Fiscal Year 2019. The System’s beneficial ownership in the Concord property has historically been carried at a zero value due to the HUD restrictions on the use of the property, as well as the perception that the property was unable to generate sufficient residual receipt income to cover the annual ground lease payment. As negotiations are currently being conducted on the Concord property, other details will not be released in this Agenda Report but will be discussed in the near future.

May 15, 2019 FY 2019 Estimated Actual Expenditures and FY 2020 Recommended Budget Page 3 of 5
FISCAL YEAR 2019 ESTIMATED ACTUAL EXPENSES
Total expenses for retiree payroll for the year are estimated to be $12,844,482, which is $155,518 or 1.2% less than the Fiscal Year 2019 (“FY 2019”) Adopted Budget of $13,000,000. Total estimated actual expenditures for the year in Administration are $389,458, which is $45,736 or 10.5% less than the FY 2019 Adopted Budget. Overall, year-end estimated actual expenditures are anticipated to be $13,233,940, which is $201,254 or 1.5% less than the FY 2019 Adopted Budget. The calculation of estimated actual expenses is generally based on actual expenses incurred through April, in addition to planned/expected expenses for May and June. Admin Personnel Administration staffing has been traditionally provided by two 0.75 positions: one 30-hour Management Analyst IV and one 30-hour Senior Office Assistant, and both receive City benefits. Currently administration is being staffed by one 30-hour Management Analyst IV and an up-to-30-hour Temporary Office Aide (no City benefits). The System is currently recruiting for a permanent Senior Office Assistant and this change is included in the FY2020 proposed budget. In the current fiscal year, year-end estimated expenditures for Admin Personnel are $142,028 which is $40,728 less than the FY 2019 Adopted Budget of $182,756. This figure is based on actual posted personnel expenses in the City’s financial system through April 30, 2019. Services & Supplies Estimated expenses for Services & Supplies are $237,176, which 1.7% or $4,215 lower than the FY 2019 Adopted Budget. Several areas in this category are under budget such as auditing services, conferences, equipment maintenance, custodial bank services, payroll services and actuarial services. Newsletters have been converted to self-addressed mailers which reduces costs of envelopes and associated labor. Staff make efforts to go paperless whenever feasible which lowers supply costs and copy machine charges.
Internal Service Charges & Equipment Estimated expenses for Internal Service Charges are $10,254, which is $793 less than the FY 2019 Adopted Budget. The majority of the expenses in this category are fixed (representing overhead) and determined by either square footage, or the number of telephones and computer connections. Other expenses are based on the System’s use of City services (such as postage, printing, and telephone use). Postage was under budget due to the use of postage paid envelopes which were charged to materials and supplies.
Category FY 2019 Budget Est. Actual Expenses Difference Percentage
Retiree Payroll 13,000,000 12,844,482 (155,518) -1.2%
Admin Personnel 182,756 142,028 (40,728) -22.3%
Services & Supplies 241,391 237,176 (4,215) -1.7%
Internal Service Charges 11,047 10,254 (793) -7.2%
Equipment 0 0 - 0.0%
Subtotal Admin 435,194 389,458 (45,736) -10.5%
TOTAL FPRS 13,435,194 13,233,940 (201,254) -1.5%

May 15, 2019 FY 2019 Estimated Actual Expenditures and FY 2020 Recommended Budget Page 4 of 5
FISCAL YEAR 2020 RECOMMENDED BUDGET
The total Fiscal Year 2020 (“FY 2020”) Recommended Budget is $13,544,042 which is $108,848 more than the FY 2019 Adopted Budget. Estimated pension payroll for FY 2020 is $13,108,855. This figure is based on realized deaths in the past fiscal year, and includes the 4% COLA increase (effective 7/1/19). The estimated amount for annual benefits payments is consistent with the long-term actuarial evaluation. The FY 2020 Recommended Budget for Administration is $435,187, which is $7 or 0.002% less than the FY 2019 Adopted Budget. Changes per budget category are detailed in the following sections. Admin Personnel The FY 2020 Recommended Budget for Admin Personnel is $185,337, which is 1.4% more or $2,581 more than the FY 2019 Adopted Budget. This figure represents the estimated total expenses that will be charged to the System’s fund for personnel, including abated costs for worker’s compensation and general liability insurance. The increase assumes an average annual increase of 4.50% (consistent with City 5-year forecast projection) beginning in FY 2020 to project increasing CalPERS medical and retirement costs, COLAs, and other payroll increases. Services & Supplies The FY 2020 Recommended Budget for Services & Supplies is $237,690, which is $3,701 less or 1.5% less than the FY 2019 Adopted Budget. In addition to minor account reallocations (to reflect actual spending), the decrease in this budget category is primarily due to the following adjustments:
Decrease of $413 for fiduciary and cyber liability insurance premiums in Account 815600 based on the policies presented but not yet approved by the Board on May 15, 2019.
Decrease of $500 for actuarial services since the actuary will not review assumptions this year as actuarial assumptions were last reviewed and modified for the FY2018 actuarial valuation.
Decrease of $600 for equipment maintenance which covers our copy machine as we have reduced printing costs by utilizing dual monitors in lieu of printing.
Decrease of $500 for outside printing and duplication as we have reallocated to internal service charges for in-house printing.
Internal Service Charges The FY 2020 Recommended Budget for Internal Service Charges is $12,160 which is $1,113 or 10.1% more than the FY 2019 Adopted Budget. The net increase in this category assumes an annual increase of 10% of FY 2019 actual costs for FY 2020 which is consistent with the City’s 5-year forecast projection. It also reflects the switch from outside printing to utilization of the City’s in-house print shop for printing newsletters and other materials.
Category FY 2019 Budget FY 2020 Rec'd Budget Difference Percentage
Retiree Payroll 13,000,000 13,108,855 108,855 0.8%
Admin Personnel 182,756 185,337 2,581 1.4%
Services & Supplies 241,391 237,690 (3,701) -1.5%
Internal Service Charges 11,047 12,160 1,113 10.1%
Equipment 0 0 - 0.0%
Subtotal Admin 435,194 435,187 (7) 0.00%
TOTAL FPRS 13,435,194 13,544,042 108,848 0.8%

May 15, 2019 FY 2019 Estimated Actual Expenditures and FY 2020 Recommended Budget Page 5 of 5
FISCAL YEAR 2020 SYSTEM REVENUES AND ASSETS For the period ending April 30, 2019, the System’s assets total approximately $112.9 million including
pooled cash with the City (compared to $121.2 million last year at this time). According to the Amended
and Restated Contribution Agreement No. 20,823, a contribution from the City is anticipated in the FY
2020 Recommended Budget as estimated by the June 30, 2018 Actuarial Valuation. For the fiscal year
ending June 30, 2019, the minimum funding percentage for the year’s valuation that is used to calculate
the City’s supplemental payment for FY 2020 is 79.5%. If the minimum funding percentage of 79.5% is
deemed met by the upcoming June 30, 2019 actuarial analysis, the City will not be required to provide a
supplemental payment to the System by January 1, 2020. However, if it is not met, the City will be
required to make a contribution of $3.1M.
According to the Amendment to the Amended and Restated Contribution Agreement No. 20,823
approved by the Board on 2/20/19 and by City Council on 3/11/19, any proceeds from the sale of the
Concord received in FY 2020 would be counted towards the City’s obligation of making a payment to
maintain the minimum funding level of 79.5% for that year (the “Supplemental Contribution”). If the
Concord proceeds are received after January 1, 2020, the date by which the Supplemental Contribution is
required, but before July 1, 2020, then the Concord proceeds remitted to the System would be reduced
by the amount of the Supplemental Contribution made by the City for FY 2020.
MAJOR PROJECTS/ISSUES FOR FISCAL YEAR 2020 Over the next fiscal year, staff anticipates working collaboratively with the City and the System’s professional consultants to complete a number of projects, including:
Continued implementation of the Records Retention/Destruction Policy, including destruction of all non-permanent files upon creation of electronic copies.
Continue storage and cataloguing of permanent files and records in the City’s digital record storage system, including subsequent destruction of the paper files.
Pursuit of efforts to obtain net proceeds from the prospective sale of the Concord property.
Publish a RFP for fiduciary and cyber liability insurance.
Finalize staffing of a permanent Senior Office Assistant in the FPRS office, including training for position once filled.
FISCAL IMPACT The FY 2020 Recommended Budget for benefits and administration is $13,543,992, which is $108,798 more than the FY 2019 Adopted Budget. ATTACHMENTS
1. Fiscal Year 2019 Estimated/Actual Expenditures, and Fiscal Year 2020 Recommended Budget

Acct # Descriptions FY 2019
Est. Actual
FY 2019
Adopted
Budget
Est. Variance
FY 2020
Recommended
Budget
FY 2019/
FY 2020 Diff Diff %
NON-BUDGETED Pooled Cash Revenues
751000 Concord Asset Income - - - - - -
668900 Miscellaneous Cash/Income 5,760 - 5,760 - - -
703200 City Cash Contributions - - - - - -
Total Pooled Cash Revenue 5,760 - 5,760 - - -
802200 Retiree Payroll 12,844,482 13,000,000 155,518 13,108,855 108,855 0.8%
Retiree COLA 3% 4%
800500/5800 Personnel Costs 142,028 182,756 40,728 185,337 2,581 1.4%
Services & Supplies:810100 Materials and Supplies 1,566 750 (816) 750 - 0.0%810900 Small Equipment Purchases - - - - - 0.0%
811000 Outside Printing & Duplication 791 1,100 309 600 (500) -45.5%
811300 Equipment Maintenance 1,291 2,100 809 1,500 (600) -28.6%810800 Computer Related Supplies - Software 446 - (446) 100 100 0.0%
813500 Reference Materials - Subscriptions - - - - - 0.0%813900 Water 496 396 (100) 396 - 0.0%812400 Dues and Memberships 750 750 - 750 - 0.0%
812700/2900 Conferences/Meetings - Board/Staff 817 2,000 1,183 1,900 (100) -5.0%815600 Insurance 23,695 23,695 0 22,894 (801) -3.4%811400 Contract Services - 811400 Misc Services - - - - - 0.0%811400 Actuarial Services 17,000 17,500 500 17,000 (500) -2.9%811400 Asset Managers - - - - - 0.0%811400 Auditing Services 46,109 47,500 1,391 47,500 - 0.0%811400 US Bank Pension Payroll Svs
(Formerly PensionGold Svs)
7,703 8,300 597 8,000 (300) -3.6%
811400 Outside Legal Counsel - - - - - 0.0%860700 Berwyn Group 300 300 - 300 - 0.0%
Subtotal Contract Services 71,112 73,600 2,488 72,800 (800) -1.1%814800 Investment Expenses - 0.0%814800 Custodial Bank Svs 21,213 22,000 787 21,000 (1,000) -4.5%814800 Investment Consultant Svs 115,000 115,000 0 115,000 - 0.0%814800 Subtotal Investment Expenses 136,213 137,000 787 136,000 (1,000) -0.7%
Subtotal Services & Supplies 237,176 241,391 4,215 237,690 (3,701) -1.5%
Internal Service Charges:860700 Printing 500 100 (400) 900 800 800.0%814400 Postage 245 850 605 650 (200) -23.5%862600 Mail Services - 100 100 150 50 50.0%861100 IS-Applic. Devel. & Support - 200 200 - (200) -100.0%861200 IS-PC Network Support - 250 250 - (250) -100.0%
Subtotal Int. Service Charges 745 1,500 755 1,700 200 6
City Service Charges:860100/2000/3400 Struct Maint/Prev Maint/Sec 5,469 5,269 (200) 6,016 747 14.2%
860400 Utilities/Insurance 1,946 2,160 214 2,141 (19) -0.9%860500 Housekeeping 1,709 1,683 (26) 1,880 197 11.7%862200 Telephones 100 150 50 110 (40) -26.7%863600 IS-DoIT Desktop Replcmnt Prog 285 285 - 314 29 10.0%864300 FY13 Cost Allocation Plan - - - - - NA
Subtotal City Serv Charges 9,509 9,547 38 10,460 913 9.6%
Subtotal FPRS Admin Expenses 389,459$ 435,194$ 45,735$ 435,187$ (7)$ 0.0%
Total FPRS Operating Expenses 13,233,940$ 13,435,194$ 201,254$ 13,544,042$ 108,848$ 0.8%
Attachment 1
Fire and Police Retirement System
Fiscal Year 2019 Estimated/Actual Expenditures and Fiscal Year 2020 Recommended Budget
(Based on Expenses July 1, 2018 through April 30, 2019)

PERIOD ENDING: MARCH 31, 2019
Investment Performance Review for
Pasadena Fire & Police Retirement System
mprice
Typewritten Text
DATE: 5/15/19 ITEM #: 13a

VERUSINVESTMENTS.COM
SEATTLE 206‐622‐3700LOS ANGELES 300‐297‐1777
SAN FRANCISCO 415‐362‐3484
Table of Contents
Investment Landscape TAB I
Investment Performance Review
TAB II

2ND QUARTER 2019Investment Landscape

FOUR RULES OF OUTSOURCING CAPITAL MARKET ASSUMPTIONS ACTIVE MANAGEMENT ENVIRONMENT
Recent Verus research
2nd Quarter 2019Investment Landscape 2
The choice to use the services of an Outsourced Chief Investment Officer (OCIO) provider is one of the most significant decisions that a board is likely to make. This piece is focused on the four most important rules that Verus believes investors should understand, and OCIO providers should deliver upon.
Verus held the first Capital Market Assumptions Webinar. On the call, we discussed:― How market shifts of 2018 have affected
our long‐term outlook― Why the current environment continues
to indicate modest long‐term performance across most asset classes
― The important differences between shorter‐term and longer‐term forecasting exercises
Our work on active management addresses some shortfalls of the traditional analysis, which uses the median product to describe the active management universe as a whole. These improvements and insights have allowed us to better understand product behavior and may allow for more informed selection in the future.
Visit: https://www.verusinvestments.com/insights/
Sound thinking Annual outlooks
Consulting | Outsourced CIO (OCIO) | Risk Advisory | Private Markets

VERUSINVESTMENTS.COM
SEATTLE 206‐622‐3700LOS ANGELES 310‐297‐1777
SAN FRANCISCO 415‐362‐3484
Table of Contents
3
Economic environment 6
Fixed income rates & credit 18
Equity 27
Other assets 39
Appendix 42

1st quarter summaryTHE ECONOMIC CLIMATE
— Real GDP growth continued at 3.0% YoY ‐ on pace with the third quarter (2.2% quarterly annualized rate). Forecasts for 2019 U.S. growth have weakened. The U.S. economy is expected to grow at a 2.4% pace in 2019, according to the Survey of Professional Forecasters, while the Federal Reserve expects 2.1% growth this year. p. 8
— In March, negotiations resumed between U.S. and Chinese trade delegations. The dialogue was viewed as constructive, and optimism picked up for a trade resolution being reached in the near‐to‐intermediate future. The two sides have yet to agree on a formal timeline. p. 16
PORTFOLIO IMPACTS
— The Federal Open Market Committee reiterated its “patient” approach to policy, leaving rates unchanged, helping to push asset prices upward. Chairman Powell announced that starting in May the balance sheet runoff would slow from $50 to $30 billion a month, and would end in September. p. 19
— Risk assets exhibited strong performance over the quarter. U.S. equities delivered the greatest gains (S&P 500 +13.6%, MSCI ACWI +12.2%), reversing U.S. underperformance in Q4 2018 (S&P 500 ‐13.5%, MSCI ACWI ‐12.8%). This was followed by riskier credit with high single‐digit returns, and safer credit and government bonds with low single‐digit returns. p. 46
2nd Quarter 2019Investment Landscape
THE INVESTMENT CLIMATE
— The first quarter was nearly a mirror image of 2018 Q4, as many assets retraced losses of the prior quarter. p. 38
— Declining long‐term Treasury yields following the Fed meeting in March briefly caused the yield curve to invert, meaning that short‐term yields (3‐month) were higher than long‐term yields (10‐year). Investors have expressed concerns that this may signal a near term recession. We believe these concerns are overblown. p. 21
— The House of Commons in the British Parliament briefly took control of their government’s legislative agenda, but failed to reach a majority vote on a path forward. On April 10th, British Prime Minister Theresa May and the European Council agreed to extend the Brexit deadline from April 12th to October 31st. p. 17
ASSET ALLOCATION ISSUES
— All major asset classes delivered positive performance in Q1, a refreshing change of pace from broad‐based losses experienced in 2018. p. 46
— Economic conditions around the world have exhibited a weakening trend, leading to the question of whether a turn in the economic cycle is near. The first quarter was more mixed with strength in places, easing some concern. We remain watchful of this weakening trend, but believe the economy and market may have more room to run. p. 17
4
A neutral risk stance may be appropriate in today’s environment

What drove the market in Q1?
2nd Quarter 2019Investment Landscape
10‐YEAR MINUS 3‐MONTH TREASURY YIELD SPREAD
S&P 500 INDEX 12‐MONTH FORWARD EPS ESTIMATE
5
Source: Bloomberg, as of 3/31/19
Source: Bloomberg, as of 4/2/19
Source: Bloomberg, as of 3/31/19
“Central banks take to stage as dovish outlooks spread”
MARKET EXPECTATIONS FOR 1‐YEAR CHANGE IN FED FUNDS RATE (BPS)
Oct Nov Dec Jan Feb Mar62 48 10 ‐10 ‐5 ‐31
Article Source: Bloomberg, February 16th, 2019
MARKET EXPECTATIONS FOR CHANGES IN SHORT‐TERM RATES
“Slowing earnings growth, gloomy forecasts add to stock market’s woes”S&P 500 INDEX 12‐MONTH FORWARD EPS ESTIMATE ($)
Oct Nov Dec Jan Feb Mar175 175 174 171 171 172
Article Source: Wall Street Journal, January 13th, 2019
“Part of the yield curve inverts as 3‐month yield tops 10‐year rate”
10‐YEAR MINUS 3‐MONTH TREASURY YIELD SPREAD (BPS)
Oct Nov Dec Jan Feb Mar82 65 33 25 28 2
Article Source: CNBC, March 22nd, 2019
“World markets hit 2019 high amid trade war optimism”
NUMBER OF GOOGLE NEWS ARTICLES WITH ‘TRADE OPTIMISM’ IN TITLE
Oct Nov Dec Jan Feb Mar5 24 31 92 116 96
Article Source: The Guardian, February 18th, 2019
‐0.31%
0.00%
‐0.04% ‐0.02%
‐0.43%
0.10%
‐0.06%
0.08%
‐0.6%
‐0.4%
‐0.2%
0.0%
0.2%
US Eurozone Japan UK
1‐Year Forward 2‐Year Forward
160
165
170
175
Apr‐18 Jul‐18 Oct‐18 Jan‐19
‐1%
0%
1%
2%
3%
Apr‐14 Apr‐15 Apr‐16 Apr‐17 Apr‐18

Economic environment
2nd Quarter 2019Investment Landscape 6

U.S. economics summary
— Real GDP growth continued at 3.0% YoY, on pace with the third quarter (2.2% on a quarterly annualized rate).
— Forecasts for 2019 U.S. growth have weakened. The U.S. economy is expected to grow at a 2.4% pace in 2019, according to the Survey of Professional Forecasters, while the Federal Reserve expects 2.1% growth this year.
— In March, negotiations resumed between U.S. and Chinese trade delegations. The dialogue was viewed as constructive, and optimism picked up for a formal trade resolution being reached in the near future.
— U.S. inflation remained near the 2.0% Fed target. After dipping to 1.5% YoY in February, headline inflation recovered to 1.9% in March, resulting in no change over the quarter.
— Average hourly earnings grew 3.2% YoY in March, missing expectations of 3.3%. A slight tick up in the average non‐farm private workweek from 34.4 to 34.5 hours likely contributed to the cooler wage data.
— The labor market remained strong in Q1. U‐3 unemployment fell to 3.8% from 3.9% in December, though the labor force participation rate weakened from 63.1% to 63.0% during the period.
— The Federal Open Market Committee reiterated its “patient” approach to policy, leaving rates unchanged. Expectations for 2019 GDP growth and rate hikes were cut, and markets rallied. Chairman Powell announced that starting in May the balance sheet runoff would slow from $50 billion per month to $30 billion, and would end in September.
2nd Quarter 2019Investment Landscape 7
Most Recent 12 Months Prior
GDP (YoY) 3.0%12/31/18
2.5%12/31/17
Inflation(CPI YoY, Core)
2.0%3/31/19
2.1%3/31/18
Expected Inflation (5yr‐5yr forward)
2.0%3/31/19
2.2%3/31/18
Fed Funds Target Range
2.25 – 2.50%3/31/19
1.50 – 1.75%3/31/18
10 Year Rate 2.4%3/31/19
2.7%3/31/18
U‐3 Unemployment 3.8%3/31/19
4.0%3/31/18
U‐6 Unemployment 7.3%3/31/19
7.9%3/31/18

GDP growth
Real GDP growth continued at 3.0% YoY, on pace with growth in the third quarter (2.2% on a quarterly annualized rate). Consumption was the greatest contributor to real GDP growth.
The U.S. economy faces multiple headwinds, including the broad impacts of slowing global growth, fading of 2018 fiscal stimulus, and a tight labor market which constrains further upside from employment gains. While the U.S. is in a strong position relative to other developed nations, the economy is expected to grow at a 2.4% pace in 2019 according to a
survey of professional forecasters. The Federal Reserve expects 2.1% growth this year.
The Trump administration appears to have succeeded in reaching its 3% U.S. growth target during 2018. The Tax Cuts & Jobs Act helped stimulate the economy in the form of reduced taxes for individuals, which increased after‐tax incomes and greatly reduced corporate tax burdens. These changes likely had positive impacts on worker wages and spurred recent capital investment.
2nd Quarter 2019Investment Landscape
Source: Bloomberg, as of 12/31/18 Source: BEA, annualized quarterly rate, as of 12/31/18
8
U.S. REAL GDP GROWTH (YOY) U.S. GDP GROWTH ATTRIBUTION
‐6%
‐3%
0%
3%
6%
9%
12%
Dec‐55 Dec‐65 Dec‐75 Dec‐85 Dec‐95 Dec‐05 Dec‐15
1.8%
1.2%
3.1% 3.2% 2.9%2.2%
4.2%3.4%
2.2%
‐3%
‐2%
‐1%
0%
1%
2%
3%
4%
5%
6%
Q4 16 Q1 17 Q2 17 Q3 17 Q4 17 Q1 18 Q2 18 Q3 18 Q4 18
Consumption Investment Government Exports Imports Inventories

A long but moderate expansion
2nd Quarter 2019Investment Landscape
The current economic cycle is just three quarters shy of matching the longest expansion on record
Source: FRED, Verus, as of 12/31/18 – each expansion is labeled with the starting year of expansion
9
1949
1949
1958
1961
1970
1975
1980
1982
2001
2007
0%
10%
20%
30%
40%
50%
60%
0 5 10 15 20 25 30 35 40 45
Cumulative Re
al GDP
Growth (%
)
Quarters
1990

U.S. inflation remained near the Federal Reserve’s 2.0% target. After dipping to 1.5% YoY in February, headline CPI recovered to 1.9% in March, unchanged over the quarter. Core CPI, which removes the impact of energy and food prices, continued to ease, falling to 2.0% YoY at quarter‐end. Moderate inflation around 2% has helped justify the Fed’s recent pause in monetary tightening and has allowed for a patient approach. A material shift in either direction might place Fed officials in a difficult position, and should be watched closely.
Inflation in services was the sole contributor to the year‐over‐year growth in CPI as goods prices were unchanged during the period. Within services, shelter prices (+3.4% YoY) continued to be the main driver of inflation.
Market participants’ expectations for future inflation recovered from depressed levels after falling sharply last quarter. The 10‐year TIPS breakeven inflation rate rose 22 bps to 1.93%. Meanwhile, consumers’ view of future inflation moderated from 2.7% to 2.5% as indicated by the University of Michigan survey.
‐4%
0%
4%
8%
12%
16%
Dec‐70 Nov‐77 Sep‐84 Jul‐91 May‐98 Mar‐05 Jan‐12 Nov‐18
US CPI Ex Food & Energy US CPI
U.S. CPI (YOY) BREAKEVEN INFLATION RATES INFLATION EXPECTATIONS
Inflation
2nd Quarter 2019Investment Landscape
Source: Bloomberg, as of 3/31/19 Source: FRED, as of 3/31/19 Source: Bloomberg, as of 3/31/19
10
0%
2%
4%
Mar‐18 Sep‐18 Mar‐19
0%
1%
2%
3%
4%
5%
6%
Jun‐01 Dec‐03 Jun‐06 Nov‐08 May‐11 Oct‐13 Apr‐16 Sep‐18
US Breakeven 10 Year UMich Expected Change in Price
2.0% 2.0%1.8%
2.1% 2.1%
1.9%
0.0%
0.6%
1.2%
1.8%
2.4%
12 Months Prior 6 Months Prior Mar‐19
5‐Year Breakeven 10‐Year Breakeven

Relationship – inflation & growth
2nd Quarter 2019Investment Landscape
History suggests inflation risks are still present at the later stage of the economic cycle
Inflation risk has been more acute during late cycle & recession
Source: FRED, Verus
11
‐4%
‐2%
0%
2%
4%
6%
8%
10%
12%
14%
16%
‐5% 0% 5% 10% 15%
U.S. Inflatio
n (YoY
)
U.S. Real GDP (YoY)
Inflation often rises through economic peaks & recessions
‐4%
‐2%
0%
2%
4%
6%
8%
10%
12%
14%
16%
Jan‐68 Jan‐78 Jan‐88 Jan‐98 Jan‐08 Jan‐18
U.S. CPI YoY U.S. Real GDP Growth YoY
Inflation often rises through economic peaks & recessions

UNEMPLOYMENT RATE LONG‐TERM EMPLOYMENT & WAGE GROWTH NFIB: JOBS HARD TO FILL (3‐MONTH AVG)
Labor market
Although there was some month‐to‐month volatility in job growth during the quarter, net additions to non‐farm payrolls averaged 180,000 per month. Meanwhile, the U‐3 unemployment rate fell slightly from 3.9% to 3.8%, just above the cycle low of 3.7%. The U‐6 unemployment rate, which includes underemployed and discouraged workers, fell to a cycle low of 7.3%. The spread between the U‐6 and U‐3 unemployment rates compressed from 3.7% to 3.5%, the smallest difference since 2006. The decline in underemployed and discouraged workers indicates a further tightening of the labor market.
Wages continued to grow at a modest pace, but not fast enough to warrant concern over corporate margin deterioration or a flow through to general price inflation. In March, average hourly earnings rose 3.2% from 12 months ago.
Given the relatively few number of unemployed persons and high percentage of companies reporting that jobs are hard to fill, we believe it may be difficult for job growth to continue at its recent strong rate.
2nd Quarter 2019Investment Landscape
Source: FRED, as of 3/31/19 Source: Bloomberg, as 3/31/19 Source: NFIB, as of 3/31/19, net % of small businesses reporting that open positions are hard to fill
12
3%
7%
Sep‐16 Sep‐18
0%
4%
8%
12%
16%
20%
Jun‐05 Jun‐07 Jun‐09 May‐11 May‐13 May‐15 Apr‐17
U3 U6
0%
2%
4%
6%
8%
10%
12%
Jan‐65 Jan‐75 Jan‐85 Jan‐95 Jan‐05 Jan‐15
U3 Unemployment U.S. Hourly Wage Growth (YoY)0
5
10
15
20
25
30
35
40
Jan‐86 Jan‐91 Jan‐96 Jan‐01 Jan‐06 Jan‐11 Jan‐16

REAL CONSUMER SPENDING & RETAIL SALES GROWTH (YOY) AUTO SALES CONSUMER CREDIT OUTSTANDING (YOY)
The consumer
February retail sales grew 2.2% year‐over‐year, rebounding from a sharp slowdown in the fourth quarter. Real consumer spending continued along at a modest 1.8% pace from the previous year.
Further labor market strength, wage gains, and low interest rates would likely provide support for spending. Consumer behavior remains conservative relative to past cycles, as indicated by broad spending and borrowing patterns. While consumer credit growth has been fairly muted, other specific spending areas such as auto sales were very strong in recent
years – perhaps as consumers played catch‐up from restrained purchases during the global financial crisis.
In 2018, there were rising concerns that higher interest rates would squeeze budgets and lead to a slowdown in spending and business activity. These fears have subsided as interest rates have fallen back to previous levels and the Federal Reserve is not expected to raise rates in the near future.
2nd Quarter 2019Investment Landscape
Source: Bloomberg, as of 1/31/19 Source: FRED, as of 3/31/19 Source: Federal Reserve, as of 2/28/19
13
Average
‐15%
‐10%
‐5%
0%
5%
10%
Apr‐03 Apr‐06 Apr‐09 Apr‐12 Apr‐15 Apr‐18
Consumer Spending Retail Sales8
10
12
14
16
18
20
22
24
Feb‐82 Feb‐92 Feb‐02 Feb‐12
Millions (a
nnua
l)
‐10%
‐5%
0%
5%
10%
15%
20%
Feb‐82 Jun‐90 Oct‐98 Feb‐07 Jun‐15
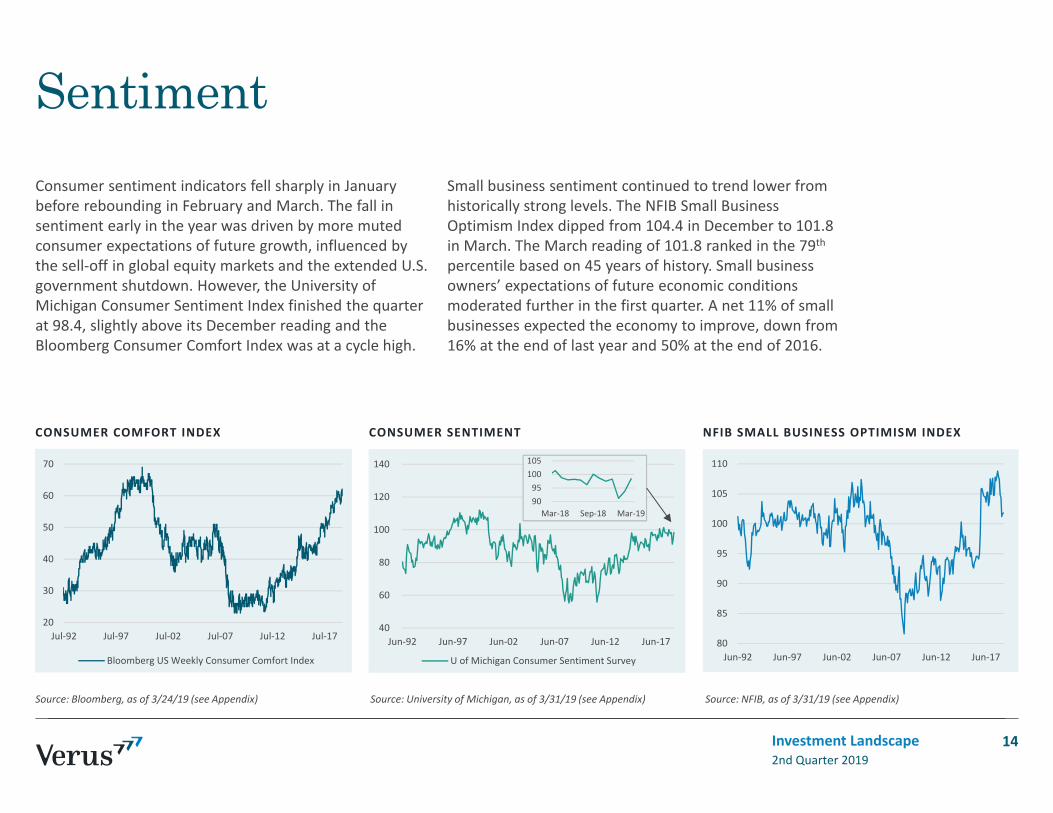
20
30
40
50
60
70
Jul‐92 Jul‐97 Jul‐02 Jul‐07 Jul‐12 Jul‐17
Bloomberg US Weekly Consumer Comfort Index
CONSUMER COMFORT INDEX CONSUMER SENTIMENT NFIB SMALL BUSINESS OPTIMISM INDEX
Sentiment
Consumer sentiment indicators fell sharply in January before rebounding in February and March. The fall in sentiment early in the year was driven by more muted consumer expectations of future growth, influenced by the sell‐off in global equity markets and the extended U.S. government shutdown. However, the University of Michigan Consumer Sentiment Index finished the quarter at 98.4, slightly above its December reading and the Bloomberg Consumer Comfort Index was at a cycle high.
Small business sentiment continued to trend lower from historically strong levels. The NFIB Small Business Optimism Index dipped from 104.4 in December to 101.8 in March. The March reading of 101.8 ranked in the 79thpercentile based on 45 years of history. Small business owners’ expectations of future economic conditions moderated further in the first quarter. A net 11% of small businesses expected the economy to improve, down from 16% at the end of last year and 50% at the end of 2016.
2nd Quarter 2019Investment Landscape
Source: Bloomberg, as of 3/24/19 (see Appendix) Source: University of Michigan, as of 3/31/19 (see Appendix) Source: NFIB, as of 3/31/19 (see Appendix)
14
40
60
80
100
120
140
Jun‐92 Jun‐97 Jun‐02 Jun‐07 Jun‐12 Jun‐17
U of Michigan Consumer Sentiment Survey
80
85
90
95
100
105
110
Jun‐92 Jun‐97 Jun‐02 Jun‐07 Jun‐12 Jun‐17
90 95
100105
Mar‐18 Sep‐18 Mar‐19

0
10
20
30
40
50
60
70
80
May‐05 May‐08 May‐11 May‐14 May‐17
NAHB HOUSING MARKET INDEX 30‐YEAR FIXED MORTGAGE RATE MEDIAN U.S. HOME SALES PRICE
Housing
The U.S. housing market remains strong, though higher prices have dampened affordability and led to less demand. Rising interest rates in the fourth quarter generated fear of a housing slowdown, as borrowing costs have a large impact on home purchase activity. However, a reversal of monetary policy from expected tightening to expected neutrality (or easing) has placed downward pressure on the 30‐year fixed mortgage rate. Given the importance of borrowing costs on housing demand, the move from 4.95% borrowing rates (peak reached in Q4) to 4.05% at the end of Q1 should ease concerns of a slowdown and bolster buying activity.
The National Association of Homebuilders (NAHB) Housing Market Index, based on a monthly survey of NAHB members designed to take the pulse of the single‐family housing market, improved from 56 to 62 – above the neutral level of 50.
Home prices have faltered a bit, with the median U.S. home sales price falling ‐6.1% year‐over‐year in Q4. As is often the case, home price trends can vary significantly from city to city, which makes annual summary statistics difficult to interpret on a local level.
2nd Quarter 2019Investment Landscape
Source: Bloomberg, NAHB, as of 3/31/19 (see appendix) Source: FRED, as of 3/31/19 Source: FRED, as of 12/31/18
15
Positive perceived housing market conditions
Negative perceived housing market conditions
3.0
3.5
4.0
4.5
5.0
5.5
6.0
6.5
7.0
7.5
May‐05 May‐08 May‐11 May‐14 May‐17
4.0
4.5
5.0
May‐18 Feb‐19
$200
$220
$240
$260
$280
$300
$320
$340
$360
Jan‐09 Jan‐11 Jan‐13 Jan‐15 Jan‐17
Thou
sand
s
U.S. Median Home Sales Price
Median U.S. home sales price down ‐6% YoY

International economics summary—Global growth expectations for the
next two years were revised materially lower in Q1. The OECD’s global GDP growth forecast for 2019 and 2020 fell from 3.5% to 3.3%, and from 3.5% to 3.4%, respectively.
— In March, negotiations resumed between high‐level U.S. and Chinese trade delegations. The dialogue was viewed as constructive, and optimism picked up for some sort of formal trade resolution being reached in the near‐to‐intermediate future, although the two sides have yet to agree on a formal timeline.
— The German Manufacturing PMI fell from 47.6 to 44.1 in March, falling further into the contractionary territory below 50. New orders and export sales data came in weaker than expected which contributed to a more pessimistic outlook for German manufacturing activity.
— The House of Commons in the British Parliament briefly took control of their government’s legislative agenda, but failed to reach a majority vote on a path forward. On April 10th, British Prime Minister Theresa May and the European Council agreed to extend the Brexit deadline from April 12th to October 31st.
— The spread between the JP Morgan Global Services and Manufacturing PMIs rose to 3.1 in March. Last March, the spread was at 0.0, indicating that over the past year the outlook for global manufacturing activity has weakened relative to the outlook for global services activity. Typically, services activity is more resilient to a worsening economic backdrop.
2nd Quarter 2019Investment Landscape 16
AreaGDP
(Real, YoY)Inflation (CPI, YoY) Unemployment
United States 3.0%12/31/18
1.5%2/28/19
3.8%3/31/19
Eurozone 1.1%12/31/18
1.4%3/31/19
7.8%2/28/19
Japan 0.3%12/31/18
0.2%2/28/19
2.3%2/28/19
BRICS Nations
5.8%12/31/18
2.4%3/31/19
5.3%12/31/18
Brazil 1.1%12/31/18
3.9%2/28/19
12.2%3/31/19
Russia 2.7%12/31/18
5.3%3/31/19
4.9%2/28/19
India 7.2%12/31/18
2.6%2/28/19
8.5%12/31/17
China 6.4%12/31/18
1.5%2/28/19
3.8%12/31/18
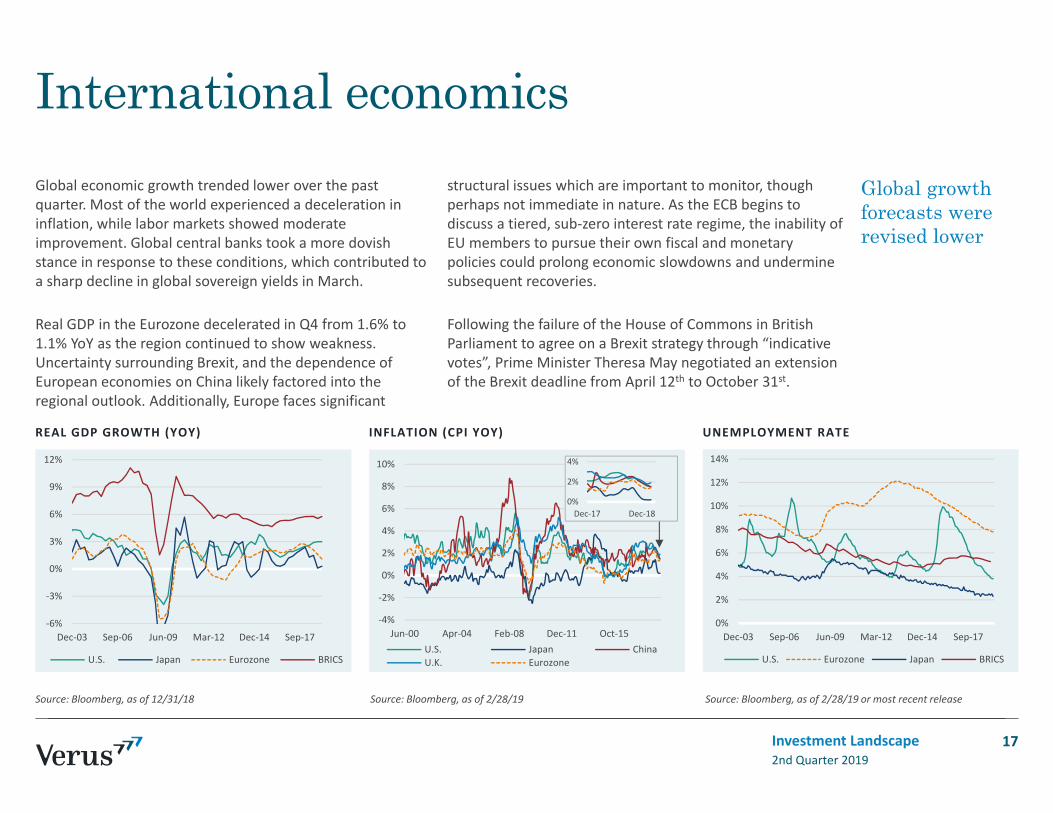
REAL GDP GROWTH (YOY) INFLATION (CPI YOY) UNEMPLOYMENT RATE
International economics
Global economic growth trended lower over the past quarter. Most of the world experienced a deceleration in inflation, while labor markets showed moderate improvement. Global central banks took a more dovish stance in response to these conditions, which contributed to a sharp decline in global sovereign yields in March.
Real GDP in the Eurozone decelerated in Q4 from 1.6% to 1.1% YoY as the region continued to show weakness. Uncertainty surrounding Brexit, and the dependence of European economies on China likely factored into the regional outlook. Additionally, Europe faces significant
structural issues which are important to monitor, though perhaps not immediate in nature. As the ECB begins to discuss a tiered, sub‐zero interest rate regime, the inability of EU members to pursue their own fiscal and monetary policies could prolong economic slowdowns and undermine subsequent recoveries.
Following the failure of the House of Commons in British Parliament to agree on a Brexit strategy through “indicative votes”, Prime Minister Theresa May negotiated an extension of the Brexit deadline from April 12th to October 31st.
2nd Quarter 2019Investment Landscape
Global growth forecasts were revised lower
Source: Bloomberg, as of 12/31/18 Source: Bloomberg, as of 2/28/19 Source: Bloomberg, as of 2/28/19 or most recent release
17
‐6%
‐3%
0%
3%
6%
9%
12%
Dec‐03 Sep‐06 Jun‐09 Mar‐12 Dec‐14 Sep‐17
U.S. Japan Eurozone BRICS
‐4%
‐2%
0%
2%
4%
6%
8%
10%
Jun‐00 Apr‐04 Feb‐08 Dec‐11 Oct‐15U.S. Japan ChinaU.K. Eurozone
0%
2%
4%
6%
8%
10%
12%
14%
Dec‐03 Sep‐06 Jun‐09 Mar‐12 Dec‐14 Sep‐17
U.S. Eurozone Japan BRICS
0%
2%
4%
Dec‐17 Dec‐18

Fixed income rates & credit
2nd Quarter 2019Investment Landscape 18

Interest rate environment— The Federal Reserve held the fed
funds rate unchanged over the quarter, and communicated a much more dovish stance on monetary policy amid slower growth expectations and stable inflation near 2%.
— Fed officials lowered their collective expectations for rate hikes in 2019 from two to zero, and announced that the balance sheet unwind would conclude in September, much earlier than previously anticipated.
— More dovish expectations for monetary policy and concerns over economic growth likely helped push long‐term Treasury yields lower. The 10‐year yield fell 28 bps to just above 2.4%.
— Falling long‐term yields and stable short‐term yields led to a brief inversion of the Treasury curve between the 10‐year and 3‐month yields.
—While widely considered a bearish signal for the economy and risk markets, the timing between curve inversion and bearish economic and market environments has varied widely. Additionally, Fed asset purchases of long‐term Treasuries has artificially lowered yields and muddied the information conveyed by the yield curve.
— The ECB also pivoted to a more dovish stance as officials announced that deposit rates will be on hold through at least the end of the year.
— The 10‐year German bund yield dipped back into negative territory for the first time since late 2016.
— Emerging market local bonds offer attractive yields relative to developed markets, even after adjusting for inflation. The JPM GBI‐EM Index yielded 7% at the end of March.
2nd Quarter 2019Investment Landscape
Source: Bloomberg, as of 3/31/19
19
Area Short Term (3M) 10‐Year
United States 2.39% 2.41%
Germany (0.53%) (0.07%)
France (0.54%) 0.32%
Spain (0.40%) 1.10%
Italy (0.20%) 2.49%
Greece 0.87% 3.73%
U.K. 0.80% 1.00%
Japan (0.17%) 0.08%
Australia 1.68% 1.77%
China 2.08% 3.07%
Brazil 6.31% 8.97%
Russia 7.35% 8.41%

Yield environment
2nd Quarter 2019Investment Landscape
Source: Bloomberg, as of 3/31/19
20
YIELD CURVE CHANGES OVER LAST FIVE YEARS IMPLIED CHANGES OVER NEXT YEAR
U.S. YIELD CURVE GLOBAL GOVERNMENT YIELD CURVES
‐1%
0%
1%
2%
3%
4%
5%
1M 2M 3M 6M 1Y 2Y 3Y 5Y 7Y 10Y 12Y 15Y 20Y 30Y
US Treasury Curve 3/31/19 US Treasury Curve 12/31/17 US Treasury Curve 12/31/16
US Treasury Curve 12/31/10 US Treasury Curve 12/31/05
‐1%
0%
1%
2%
3%
4%
5%
1M3M6M 1Y 2Y 3Y 4Y 5Y 7Y 9Y 10Y 12Y 15Y 20Y 30YUS Treasury Curve 3/31/19 Japan Curve 3/31/19 Canada Curve 3/31/19Germany Curve 3/31/19 United Kingdom Curve 3/31/19 France Curve 3/31/19Italy Curve 3/31/19 China Curve 3/31/19
‐0.3
‐0.1
0.1
0.3
0.5
0.7
0.9
1.1
1M 3M 6M 1Y 2Y 3Y 4Y 5Y 7Y 9Y 10Y 12Y 15Y 20Y 30Y
Yield Ch
ange (%
)
US Treasury UK Treasury Japan Treasury Germany TreasuryCanada Treasury France Treasury Italy Treasury
‐3%
‐2%
‐1%
0%
1%
2%
3%
1M3M6M 1Y 2Y 3Y 4Y 5Y 7Y 9Y 10Y 12Y 15Y 20Y 30Y
US Japan Canada Germany
United Kingdom France Italy China
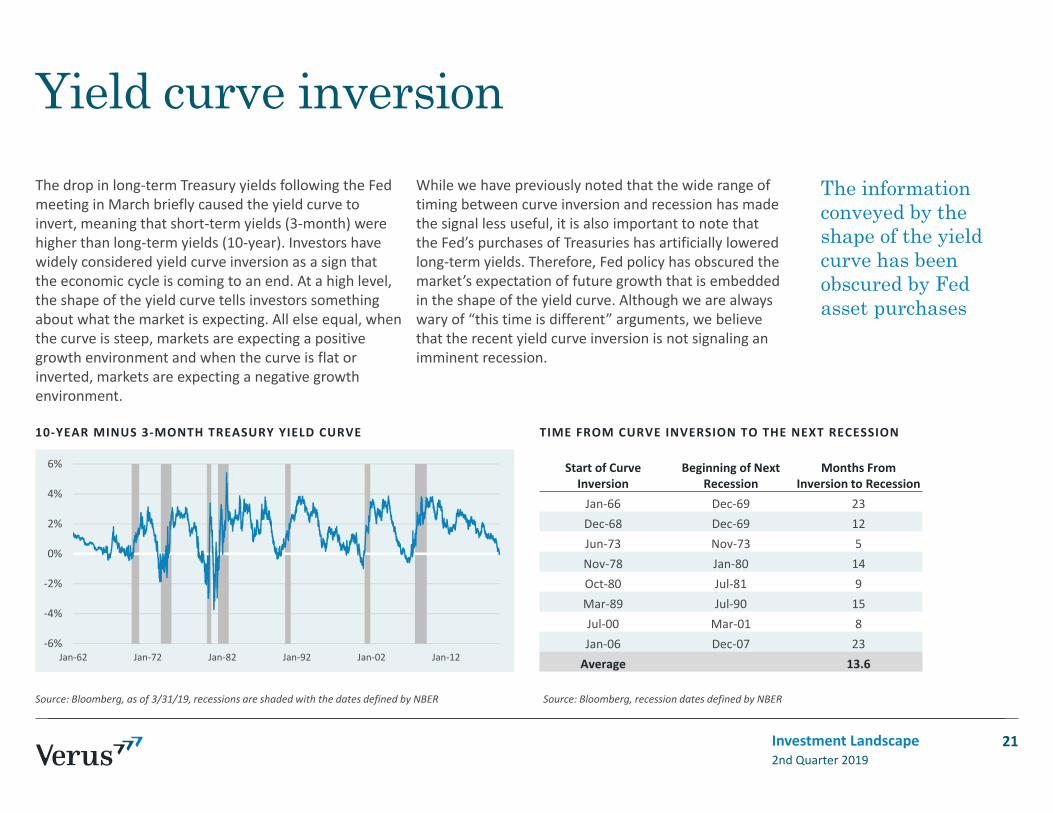
The drop in long‐term Treasury yields following the Fed meeting in March briefly caused the yield curve to invert, meaning that short‐term yields (3‐month) were higher than long‐term yields (10‐year). Investors have widely considered yield curve inversion as a sign that the economic cycle is coming to an end. At a high level, the shape of the yield curve tells investors something about what the market is expecting. All else equal, when the curve is steep, markets are expecting a positive growth environment and when the curve is flat or inverted, markets are expecting a negative growth environment.
While we have previously noted that the wide range of timing between curve inversion and recession has made the signal less useful, it is also important to note that the Fed’s purchases of Treasuries has artificially lowered long‐term yields. Therefore, Fed policy has obscured the market’s expectation of future growth that is embedded in the shape of the yield curve. Although we are always wary of “this time is different” arguments, we believe that the recent yield curve inversion is not signaling an imminent recession.
‐6%
‐4%
‐2%
0%
2%
4%
6%
Jan‐62 Jan‐72 Jan‐82 Jan‐92 Jan‐02 Jan‐12
10‐YEAR MINUS 3‐MONTH TREASURY YIELD CURVE TIME FROM CURVE INVERSION TO THE NEXT RECESSION
Yield curve inversion
Start of Curve Inversion
Beginning of Next Recession
Months From Inversion to Recession
Jan‐66 Dec‐69 23Dec‐68 Dec‐69 12Jun‐73 Nov‐73 5Nov‐78 Jan‐80 14Oct‐80 Jul‐81 9Mar‐89 Jul‐90 15Jul‐00 Mar‐01 8Jan‐06 Dec‐07 23Average 13.6
2nd Quarter 2019Investment Landscape
The information conveyed by the shape of the yield curve has been obscured by Fed asset purchases
Source: Bloomberg, as of 3/31/19, recessions are shaded with the dates defined by NBER Source: Bloomberg, recession dates defined by NBER
21

Eurozone monetary policy
2nd Quarter 2019Investment Landscape
Source: Bloomberg, as of 1/31/19
22
TLTRO I TLTRO II
— The European Central Bank (ECB) followed the Fed by pivoting to a more dovish monetary policy stance amid expectations of slower economic growth and muted inflation. ECB officials’ latest growth forecasts show they expect only 1.1% real GDP growth in 2019.
— To counteract a potential growth slowdown, the ECB announced a third round of targeted long‐term refinancing operations (TLTRO) and that it will keep deposit rates on hold through at least the end of the year. In the TLTRO program, the ECB gives out cheap short‐term financing to banks with incentives for them to lend this money out to corporations and households.
— A total of €739 billion were lent out in the first two rounds of TLTROs, which helped lead to a modest pick up in bank lending growth. While this round of TLTROs may lead to banks rolling over previous loans, it is not likely to result in a significant increase in lending as the Eurozone already has ample liquidity and credit demand remains weak.
— Despite these recent steps, the ECB has limited ability to effectively ease. This puts the region at risk of a self‐reinforcing downturn if conditions were to worsen, particularly since countries also have little room to provide fiscal stimulus.
‐4%
‐2%
0%
2%
4%
6%
8%
10%
12%
14%
Mar‐04 Sep‐05 Mar‐07 Sep‐08 Mar‐10 Sep‐11 Mar‐13 Sep‐14 Mar‐16 Sep‐17
Lend
ing grow
th (Y
oY)
TLTRO I
TLTRO II
EUROZONE BANK LENDING TO HOUSEHOLDS & CORPORATES

Market
Credit Spread (OAS)
3/31/19 3/31/18
Long U.S. Corp 1.7% 1.5%
U.S. Agg Corp 1.2% 1.1%
U.S. High Yield 3.9% 3.5%
U.S. Bank Loans* 4.4% 3.9%
SPREADS HIGH YIELD SECTOR SPREADS (BPS)
Credit environment
2nd Quarter 2019Investment Landscape
Credit spreads widened due to concerns over slowing global growth and broader risk-off behavior
Source: Barclays, Bloomberg, as of 3/31/19 Source: Bloomberg, as of 3/31/19 Source: Barclays, Credit Suisse, Bloomberg, as of 3/31/19*Discount margin (4‐year life)
23
High yield bond yields fell in March, impacted by the Fed’s pause in the hiking cycle. Anticipation of an easier policy, which could potentially lengthen the credit cycle, has strengthened sentiment for risk assets. BB‐rated bonds outperformed both CCC‐ and B‐rated bonds in March. High yield bonds returned 7.3% YTD which is the strongest start to a calendar year on record for the asset class since 2003.
Leveraged loan prices declined during March as the asset class deals with outflows and a pause in the Fed’s hiking cycle. The outflows have exceeded $30 billion over the past two quarters
which represents 20% of assets under management, according to J.P. Morgan. Leveraged loans have returned 3.8% YTD, underperforming both high yield and investment grade bonds.
Based on concerns over late‐cycle behavior in credit markets, we do not believe investors are being adequately compensated for credit risk. Late‐cycle volatility tends to coincide with a jump in credit spreads and steep credit losses. An underweight to U.S. investment grade, high yield credit, and bank loans may be warranted. Within credit, higher quality and more liquid assets appear most attractive.
0%
5%
10%
15%
20%
Dec‐99 Dec‐03 Dec‐07 Dec‐11 Dec‐15
Barclays Long US Corp. Barclays US Agg.Barclays US HY Bloomberg US HY EnergyIG Energy
200
500
800
1100
1400
Dec‐14 May‐16 Sep‐17 Feb‐19
Bloomberg US HY Energy USD HY ConsDisc. OASUSD HY Financials Snr OAS USD HY Comm. OASUSD HY Comm. OAS USD HY Materials OASUSD HY Technology OAS USD HY Industrial OASUSD HY HealthCare OAS USD HY ConsStaple OAS
0%
5%
May‐18 Nov‐18

Credit is sensitive to equity volatility
2nd Quarter 2019Investment Landscape
When volatility rises, higher risk credit typically experiences losses
Source: Cboe, FRED, as of 3/31/19
24
0
10
20
30
40
50
60
70
0
5
10
15
20
25
Jan‐97 Jan‐00 Jan‐03 Jan‐06 Jan‐09 Jan‐12 Jan‐15 Jan‐18
VIX (RHS) HY Spread (LHS)
HIGH YIELD BOND SPREADS & VOLATILITY

Default activity has been low and stable in the U.S. credit market, despite volatility in spreads. The par‐weighted default rate declined to 0.9% and remains below its long‐term average range of 3.0‐3.5%. For loans, the par‐weighted default rate at the end of March was 1.0%, its lowest level since April 2012 (0.8%), according to data from JPMorgan. Sectors that have been more prone to defaults include: consumer, retail, telecom, and automotive. The 2018 loan par‐weighted default rate was 1.6%.
Senior loan and high yield markets have essentially
recovered from a wave of defaults seen in 2015‐2016 that were generated from the energy and metals/mining sectors. High yield bond recovery rates have improved significantly since that time.
Gross high yield issue activity increased in March to the highest level seen since March of 2018. Loan market issuance is significantly behind last year’s pace, likely influenced by a lower demand for floating rate securities now that the Fed has paused monetary tightening.
HY DEFAULT RATE (ROLLING 1‐YEAR) U.S. HY SECTOR DEFAULTS (LAST 12 MONTHS) GLOBAL ISSUANCE ($ BILLIONS)
Default & issuance
2nd Quarter 2019Investment Landscape
Source: BofA Merrill Lynch, as of 3/31/19 Source: BofA Merrill Lynch, as of 3/31/19 – par weighted Source: Bloomberg, BofA Merrill Lynch, as of 3/31/19
25
0
100
200
300
400
500
600
2001
2002
2003
2004
2005
2006
2007
2008
2009
2010
2011
2012
2013
2014
2015
2016
2017
2018
2019
$ Billion
Global Bank Loan Issuance Global HY Issuance
0%
5%
10%
15%
Jan‐01 Jan‐04 Jan‐07 Jan‐10 Jan‐13 Jan‐16 Jan‐19
Developed Market High Yield US High YieldUS Ex Commodities 0% 1% 2% 3% 4% 5% 6%
Capital GoodsCommercial Services
FinancialsFood
GamingHealth Care
Hotels & LeisureMaterials
Real EstateTechnology
TransportationUtilitiesEnergyMedia
TelecommunicationsRetail
AutomotiveConsumer Products
0%
2%
4%
Jan‐18 Jan‐19

Private credit
Fundraising in the private credit market slowed through year‐end 2018. A total of 163 funds closed on $110 billion during the year, which was down from 189 funds and $129 billion in 2017. Direct lending, mezzanine, and distressed debt were the most active strategies, raising $45 billion, $31 billion, and $21 billion, respectively. Even with slower fundraising, dry powder in private credit is at record levels. Private debt dry powder at the end of 2018 was $280 billion, which beat the 2017 record of $246 billion.
Yields for loans made by direct lending funds finished March at 8.5%. While yields have been aided by slightly higher LIBOR rates, which grew from 2.3% to 2.6% year‐to‐date, spreads increased from 4.3% to 5.9% year‐to‐date.
Credit spreads expanded in the first quarter, along with the debt multiples for borrowers. Borrowers now average debt totaling 5.9x EBITDA at the end of March, a 0.4x increase from one year prior.
2nd Quarter 2019Investment Landscape
Fundraising slowed in private credit last year
Source: The Lead Left, Middle Market, EBITDA < $50MM; S&P LSTA US Leveraged Loan Index; ICE BofAML US High Yield Master II, as of 3/31/19
26
4%
5%
6%
7%
8%
9%
10%
Jan‐18 Apr‐18 Jul‐18 Oct‐18 Jan‐19
Direct Lending Bank Loans High Yield
4.0
4.5
5.0
5.5
6.0
6.5
Jan‐17 Apr‐17 Jul‐17 Oct‐17 Jan‐18 Apr‐18 Jul‐18 Oct‐18 Jan‐19
Debt / EBITDA Spread
YIELDS FOR DIRECT LENDING, BANK LOANS & HIGH YIELD DIRECT LENDING LEVERAGE MULTIPLES (DEBT / EBITDA) & SPREAD
Source: The Lead Left, Middle Market Credit Stats, as of 3/31/19

Equity
2nd Quarter 2019Investment Landscape 27

Equity environment
QTD TOTAL RETURN 1 YEAR TOTAL RETURN
(unhedged) (hedged) (unhedged) (hedged)
US Large Cap (Russell 1000)
13.8% 8.7%
US Small Cap (Russell 2000)
14.6% 2.1%
US Large Value(Russell 1000 Value)
11.7% 4.9%
US Large Growth(Russell 1000 Growth)
16.0% 12.3%
International Large(MSCI EAFE)
10.0% 11.3% (3.7%) 5.2%
Eurozone (Euro Stoxx 50)
10.6% 12.9% (6.3%) 5.8%
U.K. (FTSE 100)
9.5% 10.1% (0.2%) 9.6%
Japan (NIKKEI 225)
6.8% 7.6% (3.4%) 2.9%
Emerging Markets(MSCI Emerging Markets)
9.9% 9.8% (7.4%) (2.1%)
2nd Quarter 2019Investment Landscape
Source: Russell Investments, MSCI, STOXX, FTSE, Nikkei, as of 3/31/19
—U.S. equities experienced a 13.6% total return (S&P 500 Index) in Q1, nearly a mirror image of Q4 2018. The first quarter has indeed been one of the strongest quarters recently, but was simply a bounce back in lost performance from the prior quarter. At the end of March, the S&P 500 price index was just 3.2% below its high watermark that was reached in September.
— Currency movement had little impact on unhedged international equity over the quarter, though currencies on a 1‐year basis have had a substantially negative effect. An unhedged investment in international developed equities (MSCI EAFE) lost 8.9% of portfolio value due to currency movement.
— First quarter earnings growth for S&P 500 companies is expected to be negative for the first time since Q2 2016. If corporate earnings
expectations continue to be downgraded, this will likely hold back markets around the world. The greatest determinant of medium and long‐term equity performance is typically the underlying trend of corporate earnings.
— The risk‐on quarter drove small cap equities forward. The Russell 2000 Index posted a 14.6% return, compared to the 13.8% return of the Russell 1000 Index.
— Value equities underperformed growth equities over the quarter (Russell 1000 Value +11.7%, Russell 1000 Growth +16.0%). Performance over the quarter reversed value’s gains from Q4 2018.
— After spiking in the fourth quarter, U.S. equity volatility returned to muted levels.
28

80
85
90
95
100
105
Mar‐18 Jun‐18 Sep‐18 Dec‐18
Price EPS P/E Ratio
U.S. equities experienced a 13.6% total return (S&P 500 Index) in the first quarter, rebounding from the sharp sell‐off in the prior quarter. At the end of March, the S&P 500 price index was just 3.2% below its high watermark that was reached in September. The bounce back in equity prices was driven by better than expected/feared Q1 corporate earnings, improving sentiment toward a U.S.‐China trade deal, and the Fed’s pivot to a more patient approach to monetary policy. The fall and subsequent rise in equities was primarily reflected in valuation changes. After dropping to a low of 13.6 in December, the forward 12‐month P/E ratio on the S&P 500 finished the
quarter at 16.7, essentially unchanged over the past six months.
Now 10 years removed from the bottom of the financial crisis, it is worth noting that U.S. equities have experienced one of their best decades of performance ever. The S&P 500 had a compound price return of 14.2% per year, and over 75% of this was due to profit margin and valuation expansion. With both of these measures at above average levels, we do not think that it is reasonable to expect this level of performance to continue moving forward.
U.S. EQUITIES S&P 500 PRICE MOVEMENT ATTRIBUTION S&P 500 10‐YR PRICE RETURN ATTRIBUTION
Domestic equity
2nd Quarter 2019Investment Landscape
We maintain a neutral view on U.S. equities
Source: Russell Investments, as of 3/31/19 Source: Bloomberg, as of 3/31/19 Source: Verus, Bloomberg, as of 3/31/19
29
4000
5000
6000
7000
8000
9000
10000
Jul‐13 Jul‐14 Jul‐15 Jul‐16 Jul‐17 Jul‐18
Russell 3000
Indexed to 9/30/18 Cyclicals outperforming
4.3%
2.6%
6.5%
0.8%14.2%
0%
3%
6%
9%
12%
15%
S&P 500Valuation Expansion Sales GrowthProfit Margin Expansion Net Change in Share CountTotal Price Change
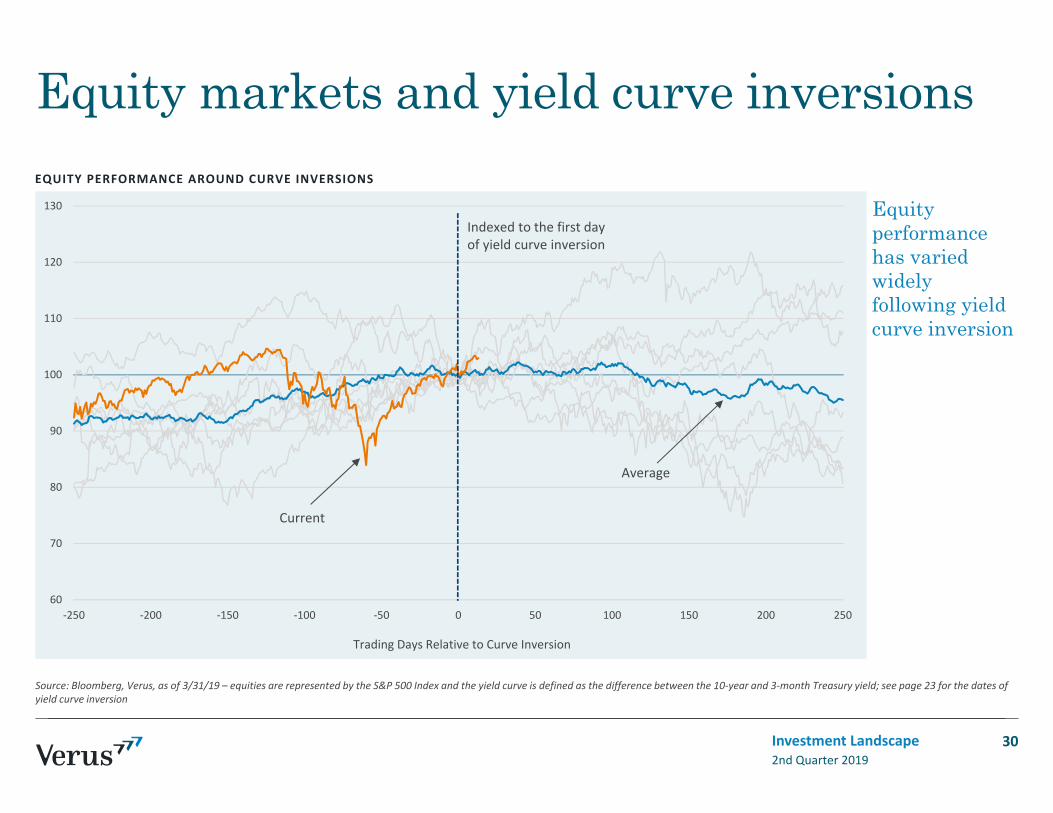
Equity markets and yield curve inversions
2nd Quarter 2019Investment Landscape
Source: Bloomberg, Verus, as of 3/31/19 – equities are represented by the S&P 500 Index and the yield curve is defined as the difference between the 10‐year and 3‐month Treasury yield; see page 23 for the dates of yield curve inversion
Equity performance has varied widely following yield curve inversion
30
60
70
80
90
100
110
120
130
‐250 ‐200 ‐150 ‐100 ‐50 0 50 100 150 200 250
Trading Days Relative to Curve Inversion
Indexed to the first day of yield curve inversion
Current
Average
EQUITY PERFORMANCE AROUND CURVE INVERSIONS

U.S. equity & the economic cycle
2nd Quarter 2019Investment Landscape
A material short-term relationship exists between equity performance and economic growth
An investor’s views on the economy cycle should therefore impact equity positioning
Source: Standard & Poor’s, data since 1948
31
R² = 0.23
‐60%
‐40%
‐20%
0%
20%
40%
60%
80%
‐6% ‐4% ‐2% 0% 2% 4% 6% 8% 10% 12% 14% 16%
S&P 50
0 after‐infla
tion pe
rforman
ce (Y
oY)
U.S. Real GDP (YoY)

‐20
‐15
‐10
‐5
0
5
10
15
20
Jan‐10 Jan‐12 Jan‐14 Jan‐16 Jan‐18
Return Differen
ce (%
)
R3000 Value minus R3000 Growth
SMALL CAP VS LARGE CAP (YOY) VALUE VS GROWTH (YOY) Q1 S&P 500 SECTOR RETURNS
Domestic equity size & style
Small cap equities (Russell 2000 +14.6%) slightly outperformed large cap equities (Russell 1000 +14.0%) during the quarter. Meanwhile, growth stocks outperformed value stocks by a wide margin (Russell 1000 Growth +16.1% vs. Russell 1000 Value +11.9%).
The impact of sector performance on the value premium was more nuanced in Q1, as Materials (+10.3%) and Financials (+8.6%) underperformed the overall index (S&P 500 +13.6%), but Energy (+16.4%) outperformed. Information Technology,
the top performing sector, continued to deliver outsized returns (+19.9%).
Both the small cap premium and value premium have struggled to deliver positive risk premiums over the past 10 years. It can be difficult to endure longer periods of factor underperformance, but similar to the equity premium in general, these periods do exist and investors should expect this on occasion.
2nd Quarter 2019Investment Landscape
Source: FTSE, as of 3/31/19 Source: FTSE, as of 3/31/19 Source: Morningstar, as of 3/31/19
32
‐20
‐15
‐10
‐5
0
5
10
15
20
Jan‐01 Jan‐04 Jan‐07 Jan‐10 Jan‐13 Jan‐16
Return Differen
ce (%
)
‐20%
‐10%
0%
10%
20%
Mar‐09 Mar‐11 Mar‐13 Mar‐15 Mar‐17 Mar‐19R3000 Value minus R3000 Growth
‐20%
‐10%
0%
10%
20%
Mar‐09 Mar‐11 Mar‐13 Mar‐15 Mar‐17 Mar‐19
Russell 2000 minus Russell 1000
‐20%‐10%0%
10%
Dec‐16 Jun‐18‐10%
0%
10%
Mar‐18 Dec‐18
6.6%
8.6%
10.3%
10.8%
12.0%
13.6%
14.0%
15.7%
16.4%17.2%
17.5%
19.9%
‐5% 0% 5% 10% 15% 20% 25%
Health Care Financials Materials Utilities Consumer Staples S&P 500 Telecom Consumer Discretionary Energy Industrials Real Estate Information Technology

Like U.S. equities, international developed equities erased most of the losses they suffered in the prior quarter. After posting a return of ‐12.5% in Q4, the MSCI EAFE Index returned +10.2% in Q1. Currency losses were a mild detractor from unhedged U.S. dollar performance. On a currency hedged basis, EAFE equities returned 11.3%. From a country perspective, Swiss, French and UK equities outperformed, while Japanese and German equities lagged the overall index. While most markets are back near record highs, German equities (MSCI Germany) finished the quarter 17% below the previous high watermark. Underperformance in German equities has likely been influenced by a greater
sensitivity to global growth and trade as well as concerns over a slowing domestic economy.
International developed equity markets are still cheap on both an absolute and relative basis at 13.3x forward earnings, but we believe there are good reasons for this pricing in certain markets. Within equity allocations, we are pessimistic on EAFE equities primarily due to a negative view on the Eurozone. We believe slowing economic growth, rising political risks, and the lacking ability of the ECB to meaningfully ease policy presents material headwinds to equity performance.
EFFECT OF CURRENCY (1‐YEAR ROLLING)INTERNATIONAL DEVELOPED EQUITIES Q1 COUNTRY PERFORMANCE
International developed equity
2nd Quarter 2019Investment Landscape
Source: MSCI, as of 3/31/19 Source: MSCI, as of 3/31/19 Source: MSCI, largest five country exposures shown above
33
13.4% 11.9% 11.8%
7.3%6.8%
‐4%
‐2%0%2%
4%6%8%
10%
12%14%16%
Switzerland France UK Japan Germany
Equity Currency Total Return USD
625
1250
2500
Jan‐90 Jan‐95 Jan‐00 Jan‐05 Jan‐10 Jan‐15
MSCI EAFE
‐20%‐15%‐10%‐5%0%5%
10%15%20%25%30%
Mar‐09 Mar‐11 Mar‐13 Feb‐15 Feb‐17 Feb‐19
MSCI EAFE MSCI ACWI ex USA MSCI EM

EQUITY PERFORMANCE (3‐YR ROLLING) FORWARD P/E PURCHASING MANGERS’ INDEX (PMI)
Emerging market equity
Emerging market equity performance was in‐line with international developed markets in the first quarter, while U.S. equities outperformed. Currencies in these markets continued to show stability (MSCI EM +9.9%, MSCI EM Hedged +9.8%). Business sentiment across emerging market economies indicates expanding conditions, and fears of a sharp China slowdown have subsided. Moderating conditions may bolster emerging market returns throughout the year.
Equity multiples rebounded in the first quarter and are near
the long‐term average. The divide between domestic and emerging equities remains wide.
Decelerating global growth and rising probability of recession do present unique risks to emerging markets, as these markets typically exhibit a higher beta during market downside and upside moves. However, emerging markets can also deliver robust performance in times of moderate growth and easy monetary policy when investors seek growth and higher yields.
2nd Quarter 2019Investment Landscape
Source: Standard & Poor’s, MSCI, as of 3/31/19 Source: MSCI, as of 3/31/19 Source: Markit, Institute for Supply Management (ISM)
34
EM expected to accelerate while DM expected to slow
IMF Forecasts
‐20%
‐10%
0%
10%
20%
30%
40%
Mar‐09 Mar‐11 Mar‐13 Mar‐15 Mar‐17 Mar‐19US Large International DevelopedEmerging Markets
Row Labels 18‐Dec 19‐Jan 19‐Feb 19‐Mar
Manufacturing
Global 51.4 50.8 50.6 50.6
Developed 52.3 51.8 50.4 50.0
US 54.3 56.6 54.2 55.3
EM 50.3 49.5 50.6 51.0
Services
Global 53.0 52.6 53.3 53.7
Developed 52.8 52.5 53.7 53.7
US 58.0 56.7 59.7 56.1
EM 53.6 52.9 52.1 53.6
6
8
10
12
14
16
18
20
Jun‐07 Jun‐09 Jun‐11 Jun‐13 Jun‐15 Jun‐17
U.S. EAFE EM

FORWARD P/E RATIOS P/E MULTIPLES RELATIVE TO U.S. EQUITIES
Equity valuations
The fall and subsequent rise in global equity prices was primarily driven by changes in valuations. The recovery in Q1 brought most broad equity market valuations back to September 2018 levels, but below recent cycle highs. In the U.S., equities commanded a forward P/E multiple of 16.7x after hitting a multi‐year low in December at 14.6x. International equity valuations also recovered, but are still cheap on a relative basis, particularly when compared to the U.S. At the end of March, the MSCI EAFE and EM Indexes had forward P/E multiples of 13.3x and 11.8x, respectively. U.S. equities currently trade at a 25% forward premium to EAFE
equities, which is the largest gap over the past 15 years. While we believe there are reasons that EAFE equity markets command cheap valuations, particularly in Europe, it is worth noting that barring a significant change in the earnings environment, these markets should have a strong valuation support.
Over the long‐term, valuations have had a material relationship with forward equity returns. Given this relationship, we are wary of extrapolating out the recent strong outperformance in U.S. equities.
2nd Quarter 2019Investment Landscape
Source: MSCI, as of 3/31/19 Source: Verus, MSCI, as of 3/31/19 Source: Bloomberg, MSCI as of 3/31/19 ‐ trailing P/E
35
VALUATION METRICS (3‐MONTH AVERAGE)
4
6
8
10
12
14
16
18
20
Jun‐06 Jun‐09 Jun‐12 Jun‐15 Jun‐18
U.S. EAFE EM
0.6
0.7
0.8
0.9
1.0
1.1
1.2
Jun‐03 Jun‐08 Jun‐13 Jun‐18EAFE EM
3.3
18.6 18.9
2.0
5.4
1.5
15.2 14.8
3.6
6.6
1.6
12.8
17.4
2.8
7.8
02468
101214161820
P/B P/E P/FCF DividendYield (%)
EarningsYield (%)
United States EAFE Emerging Markets

Equity volatility spiked in the fourth quarter of 2018 but returned to low levels in Q1. The VIX Index ended March at 13.7, which ranked in the 26th percentile dating back to 1990 (volatility was this low 26% of the time). Low volatility is somewhat normal during later stages of the market cycle as the economy expands and business conditions hold steady. However, some investors have questioned the lack of price movement, given seemingly heightened geopolitical and economic risks present around the world today.
One‐year volatility picked up after a tumultuous fourth quarter. U.S. markets have shown higher volatility than international markets for the first time since 2008, with a trailing 1 year volatility of 16%.
Equity performance around the world in Q1 was nearly a mirror image of 2018 Q4. The first quarter has indeed been one of the strongest quarters of recent decades, but this was mostly a bounceback in lost performance from the prior quarter.
U.S. IMPLIED VOLATILITY (VIX) REALIZED 1‐YEAR ROLLING VOLATILITY 2019 Q1 PERFORMANCE BOUNCE BACK
Equity volatility
2nd Quarter 2019Investment Landscape
Source: CBOE, as of 3/31/19 Source: Bloomberg, as of 3/31/19 Source: Bloomberg, as of 3/31/19
36
10203040
Sep‐18 Dec‐18
0
10
20
30
40
50
60
70
80
90
Jun‐90 May‐95 May‐00 Apr‐05 Mar‐10 Feb‐15
10
30
Jun‐18 Dec‐18
70%
75%
80%
85%
90%
95%
100%
Oct‐18 Nov‐18 Dec‐18 Jan‐19 Feb‐19 Mar‐19S&P 500 Russell 2000
Q4 Q1
0%
5%
10%
15%
20%
25%
30%
35%
40%
45%
Dec‐01 Dec‐04 Dec‐07 Dec‐10 Dec‐13 Dec‐16
U.S. EAFE EM

0x
2x
4x
6x
8x
10x
12x
14x
Debt/EBITDA Equity/EBITDA
0
10
20
30
40
50
60
$0
$20
$40
$60
$80
$100
$120
$140
Deal Value ($B) Capital Raised ($B)
TRANSACTION MULTIPLES VENTURE DEAL VOLUME & FUNDRAISING BUYOUTS DEAL VOLUME & CAPITAL RAISED
Private equity
Venture capital fundraising and deal volumes continued to set records. $55 billion of venture capital was raised in the U.S. in 2018, an increase of 63% over the previous year. Similarly, the amount of venture deals were up 58%. Venture deal volume in 2018 of $131 billion exceeded the record of $82 billion that was set in 2017.
Buyout activity continued to increase in 2018. Through the fourth quarter, buyouts were up 29% and 5% when measured by dollar value and number of transactions, respectively. The size of the average buyout, $155 million, increased from $133 million in 2017. Unlike deal flow, fund capital raising has slowed from the peaks of 2017. Only 186
buyout funds representing $166 billion closed in 2018, down from 235 funds representing a record $225 billion in 2017.
Buyout multiples decreased slightly from 2017. Average EV/EBITDA was 11.6x through December 31, 2018 (down from 11.9x in 2017) with debt multiples averaging 6.2x through the fourth quarter. Debt as a percentage of transaction value hovered around 54%.
Balancing high deal multiples and a growing number of deals against a slowdown in fundraising, we advocate selectivity in fund investments.
2nd Quarter 2019Investment Landscape
Deals increased in buyouts and venture; multiples are steady; buyout fundraising has slowed
Source: PitchBook, as of 12/31/18 Source: PitchBook , as of 12/31/18 Source: PitchBook , as of 12/31/18*2018 figures are estimates and are subject to change
37
0
50
100
150
200
250
$0
$100
$200
$300
$400
$500
$600
$700
$800
Buyout Deal Value ($B) Buyout Capital Raised ($B)

Long-term equity performance
2nd Quarter 2019Investment Landscape
Source: Morningstar, as of 3/31/19
38
500
1000
1500
2000
2500
3000
3500
4000
4500
5000
Mar‐09 Mar‐11 Mar‐13 Mar‐15 Mar‐17 Mar‐19
Growth of $
1,00
0
S&P 500 Russell 2000 MSCI EAFE MSCI EAFE Small Cap MSCI EM MSCI ACWI

Other assets
2nd Quarter 2019Investment Landscape 39

The U.S. dollar failed to gain traction in either direction during the first quarter, and remained near cycle highs. The Major Trade Weighted U.S. Dollar Index fell 0.3% over the period, but was 12.5% above its long‐term average dating back to 1974 at the end of March. Expectations for a more accommodative Fed and weaker relative U.S. economic growth (from strong levels in 2018) has led many investors to call for U.S. dollar depreciation, but this has not occurred thus far. This may in part be because other developed central banks have followed the Fed’s lead in moving away from monetary tightening.
Emerging market currencies were relatively stable versus the dollar for a second consecutive quarter. The JPMorgan Emerging Market Currency Index gained 0.4%. EM currencies have yet to stage a major comeback after falling more than 15% in the middle of last year.
Despite some high‐profile Brexit related volatility in the British pound, the global FX market has been relatively quiet. The trailing 1‐year volatility of the Bloomberg Dollar Spot Index was 5.2% at the end of the quarter, the lowest level since 2014.
U.S. DOLLAR TRADE WEIGHTED INDEX JPM EMERGING MARKET CURRENCY INDEX BLOOMBERG DOLLAR SPOT INDEX VOLATILITY
Currency
2nd Quarter 2019Investment Landscape
The U.S. dollar remained near a cycle high
Source: Federal Reserve, Verus, as of 3/31/19 Source: Bloomberg, JPMorgan, as of 3/31/19 Source: Bloomberg, as of 3/31/19, trailing 12‐month vol shown
40
Undervalued
Overvalued
0%
2%
4%
6%
8%
10%
12%
Mar‐06 Mar‐09 Mar‐12 Mar‐15 Mar‐1850
60
70
80
90
100
110
120
Jul‐10 Jul‐12 Jul‐14 Jul‐16 Jul‐18
‐6%
‐4%
‐2%
0%
2%
4%
6%
60
80
100
120
140
Sep‐74 Sep‐88 Sep‐02 Sep‐16US Major Currency Index (real) Average Currency Index ValueSubsequent 10 Year Return

Hedge funds
Hedge funds consistently advanced alongside the broad markets and enjoyed the best first calendar quarter result since 2006 (Hedge Fund Weighted Composite (FWC) +5.9% in 2019Q1; +0.9% trailing 12‐months). While gains were broad based across strategy types, funds with greater equity market sensitivity earned the highest results. Within the equity hedge strategy set, funds with higher beta exposure rallied strongly.
According to Hedge Fund Research, growth‐oriented managers (+9.3%) narrowly outperformed value‐oriented (9%) peers. Healthcare focused funds (+13.2%) also stood out as winners. Activists (+8.3%) largely rebounded from a dismal Q4 last year.
For managers trading fixed income securities, funds focused on convertible arbitrage (+5.5%) and credit arbitrage (+5.1%) fared well as those markets bounced back this quarter. Asset backed (+1.7%) and fixed income multi‐strategy managers (+2%) posted more muted gains.
Hedge funds responded to the Q4 sell‐off last year by cutting gross and net exposure levels to relatively low levels by year end. Gross leverage has since largely rebounded while net exposure, with the exception of Asia, remains below pre‐sell off levels.
2nd Quarter 2019Investment Landscape
Source: HFRI, as of 3/31/19 Source: Morgan Stanley, as of 3/31/19
41
HFRI HEDGE FUND STYLE PERFORMANCE HEDGE FUND LEVERAGE LEVELS BY REGION
Value bias outperforming
Growth bias outperforming5.9%
7.9%
4.3%
2.9%3.8%
0.9%
‐0.1%
1.9%
0.3%
2.9%
5.1%
6.8% 6.9%
0.1%
5.5%
‐1%0%1%2%3%4%5%6%7%8%9%
Fund WeightedComposite
Equity Hedge Event Driven Macro Relative Value
Q4 1‐Year 3‐Year
68%
99%
59%
14% 16%
57%
0%
20%
40%
60%
80%
100%
120%
US Europe Asia
Gross Net

Appendix
2nd Quarter 2019Investment Landscape 42

Periodic table of returns
Investment Landscape
Source Data: Morningstar, Inc., Hedge Fund Research, Inc. (HFR), National Council of Real Estate Investment Fiduciaries (NCREIF). Indices used: Russell 1000, Russell 1000 Value, Russell 1000 Growth, Russell 2000, Russell 2000 Value, Russell 2000 Growth, MSCI EAFE, MSCI EM, BBgBarc US Aggregate, T‐Bill 90 Day, Bloomberg Commodity, NCREIF Property, HFRI FOF, MSCI ACWI, BBgBarc Global Bond. NCREIF Property Index performance data as of 12/31/18.
43
Large Cap Equity Small Cap Growth Commodities
Large Cap Value International Equity Real Estate
Large Cap Growth Emerging Markets Equity Hedge Funds of Funds
Small Cap Equity US Bonds 60% MSCI ACWI/40% BBgBarc Global Bond
Small Cap Value Cash
BEST
WORS
T
2nd Quarter 2019
1998 1999 2000 2001 2002 2003 2004 2005 2006 2007 2008 2009 2010 2011 2012 2013 2014 2015 2016 2017 2018 YTD 5‐Year 10‐Year
Small Cap Growth 38.7 66.4 31.8 14.0 25.9 56.3 26.0 34.5 32.6 39.8 5.2 79.0 29.1 14.3 18.6 43.3 13.5 13.3 31.7 37.3 6.7 17.1 13.5 17.5
Large Cap Growth 27.0 43.1 22.8 8.4 10.3 48.5 22.2 21.4 26.9 16.2 1.4 37.2 26.9 7.8 18.1 38.8 13.2 5.7 21.3 30.2 1.9 16.1 10.6 16.5
Small Cap Equity 20.3 33.2 12.2 7.3 6.7 47.3 20.7 20.1 23.5 15.8 ‐6.5 34.5 24.5 2.6 17.9 34.5 13.0 0.9 17.3 25.0 0.0 14.6 8.7 16.0
Large Cap Equity 19.3 27.3 11.6 3.3 1.6 46.0 18.3 14.0 22.2 11.8 ‐21.4 32.5 19.2 1.5 17.5 33.5 11.8 0.6 12.1 22.2 ‐1.5 14.0 8.4 15.4
Large Cap Value 16.2 26.5 7.0 2.8 1.0 39.2 16.5 7.5 18.4 11.6 ‐25.9 28.4 16.8 0.4 16.4 33.1 6.0 0.0 11.8 21.7 ‐3.5 11.9 7.7 14.5
Small Cap Value 15.6 24.3 6.0 2.5 ‐5.9 30.0 14.5 7.1 16.6 10.9 ‐28.9 27.2 16.7 0.1 16.3 32.5 5.6 ‐0.4 11.3 17.1 ‐4.8 11.9 7.1 14.1
International Equity 8.7 21.3 4.1 ‐2.4 ‐6.0 29.9 14.3 6.3 15.5 10.3 ‐33.8 23.3 16.1 ‐2.1 15.3 23.3 4.9 ‐0.8 11.2 14.6 ‐6.0 10.0 5.6 9.0
Emerging Markets Equity 4.9 20.9 ‐3.0 ‐5.6 ‐11.4 29.7 12.9 5.3 15.1 7.0 ‐35.6 20.6 15.5 ‐2.9 14.6 12.1 4.2 ‐1.4 8.0 13.7 ‐8.3 9.9 4.4 8.9
60/40 Global Portfolio 1.2 13.2 ‐7.3 ‐9.1 ‐15.5 25.2 11.4 4.7 13.3 7.0 ‐36.8 19.7 13.1 ‐4.2 11.5 11.0 3.4 ‐2.5 7.1 7.8 ‐9.3 8.1 3.7 8.5
Commodities ‐2.5 11.4 ‐7.8 ‐9.2 ‐15.7 23.9 9.1 4.6 10.4 5.8 ‐37.6 18.9 10.2 ‐5.5 10.5 9.0 2.8 ‐3.8 5.7 7.7 ‐11.0 6.3 2.7 8.3
Hedge Funds of Funds ‐5.1 7.3 ‐14.0 ‐12.4 ‐20.5 11.6 6.9 4.6 9.1 4.4 ‐38.4 11.5 8.2 ‐5.7 4.8 0.1 0.0 ‐4.4 2.6 7.0 ‐11.2 5.0 2.3 3.8
US Bonds ‐6.5 4.8 ‐22.4 ‐19.5 ‐21.7 9.0 6.3 4.2 4.8 ‐0.2 ‐38.5 5.9 6.5 ‐11.7 4.2 ‐2.0 ‐1.8 ‐7.5 1.0 3.5 ‐12.9 2.9 2.3 3.6
Cash ‐25.3 ‐0.8 ‐22.4 ‐20.4 ‐27.9 4.1 4.3 3.2 4.3 ‐1.6 ‐43.1 0.2 5.7 ‐13.3 0.1 ‐2.3 ‐4.5 ‐14.9 0.5 1.7 ‐13.8 0.6 0.8 0.4
Real Estate ‐27.0 ‐1.5 ‐30.6 ‐21.2 ‐30.3 1.0 1.4 2.4 2.1 ‐9.8 ‐53.2 ‐16.9 0.1 ‐18.2 ‐1.1 ‐9.5 ‐17.0 ‐24.7 0.3 0.9 ‐14.6 0.0 ‐8.9 ‐2.6
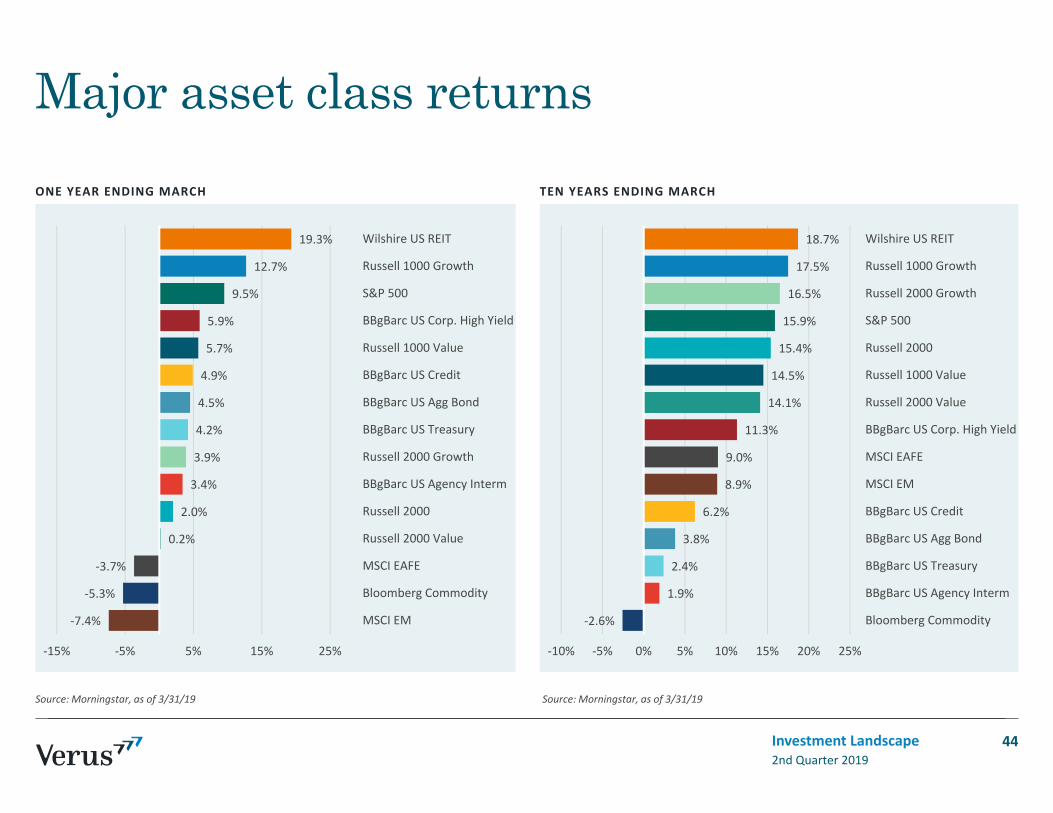
ONE YEAR ENDING MARCH
Major asset class returns
Investment Landscape
Source: Morningstar, as of 3/31/19 Source: Morningstar, as of 3/31/19
44
TEN YEARS ENDING MARCH
2nd Quarter 2019
‐7.4%
‐5.3%
‐3.7%
0.2%
2.0%
3.4%
3.9%
4.2%
4.5%
4.9%
5.7%
5.9%
9.5%
12.7%
19.3%
‐15% ‐5% 5% 15% 25%
MSCI EM
Bloomberg Commodity
MSCI EAFE
Russell 2000 Value
Russell 2000
BBgBarc US Agency Interm
Russell 2000 Growth
BBgBarc US Treasury
BBgBarc US Agg Bond
BBgBarc US Credit
Russell 1000 Value
BBgBarc US Corp. High Yield
S&P 500
Russell 1000 Growth
Wilshire US REIT
‐2.6%
1.9%
2.4%
3.8%
6.2%
8.9%
9.0%
11.3%
14.1%
14.5%
15.4%
15.9%
16.5%
17.5%
18.7%
‐10% ‐5% 0% 5% 10% 15% 20% 25%
Bloomberg Commodity
BBgBarc US Agency Interm
BBgBarc US Treasury
BBgBarc US Agg Bond
BBgBarc US Credit
MSCI EM
MSCI EAFE
BBgBarc US Corp. High Yield
Russell 2000 Value
Russell 1000 Value
Russell 2000
S&P 500
Russell 2000 Growth
Russell 1000 Growth
Wilshire US REIT

QTD
S&P 500 sector returns
Investment Landscape
Source: Morningstar, as of 3/31/19 Source: Morningstar, as of 3/31/19
45
ONE YEAR ENDING MARCH
2nd Quarter 2019
6.6%
8.6%
10.3%
10.8%
12.0%
13.6%
14.0%
15.7%
16.4%
17.2%
17.5%
19.9%
‐5% 0% 5% 10% 15% 20% 25%
Health Care
Financials
Materials
Utilities
Consumer Staples
S&P 500
Telecom
Consumer Discretionary
Energy
Industrials
Real Estate
Information Technology
‐4.7%
‐0.4%
1.3%
3.2%
7.8%
9.5%
10.5%
13.2%
14.9%
15.4%
19.3%
21.0%
‐10% ‐5% 0% 5% 10% 15% 20% 25%
Financials
Materials
Energy
Industrials
Telecom
S&P 500
Consumer Staples
Consumer Discretionary
Health Care
Information Technology
Utilities
Real Estate

Detailed index returns
Investment Landscape
Source: Morningstar, HFR, as of 3/31/19
462nd Quarter 2019
DOMESTIC EQUITY FIXED INCOMEMonth QTD YTD 1 Year 3 Year 5 Year 10 Year Month QTD YTD 1 Year 3 Year 5 Year 10 Year
Core Index Broad Index
S&P 500 1.9 13.6 13.6 9.5 13.5 10.9 15.9 BBgBarc US TIPS 1.8 3.2 3.2 2.7 1.7 1.9 3.4
S&P 500 Equal Weighted 0.9 14.9 14.9 7.2 12.0 9.5 17.8 BBgBarc US Treasury Bills 0.2 0.6 0.6 2.2 1.2 0.8 0.5
DJ Industrial Average 0.2 11.8 11.8 10.1 16.4 12.2 16.0 BBgBarc US Agg Bond 1.9 2.9 2.9 4.5 2.0 2.7 3.8
Russell Top 200 2.1 13.1 13.1 10.4 14.2 11.4 15.7 Duration
Russell 1000 1.7 14.0 14.0 9.3 13.5 10.6 16.0 BBgBarc US Treasury 1‐3 Yr 0.6 1.0 1.0 2.7 1.0 1.0 1.0
Russell 2000 (2.1) 14.6 14.6 2.0 12.9 7.1 15.4 BBgBarc US Treasury Long 5.3 4.7 4.7 6.2 1.5 5.4 5.1
Russell 3000 1.5 14.0 14.0 8.8 13.5 10.4 16.0 BBgBarc US Treasury 1.9 2.1 2.1 4.2 1.0 2.2 2.4
Russell Mid Cap 0.9 16.5 16.5 6.5 11.8 8.8 16.9 Issuer
Style Index BBgBarc US MBS 1.5 2.2 2.2 4.4 1.8 2.6 3.1
Russell 1000 Growth 2.8 16.1 16.1 12.7 16.5 13.5 17.5 BBgBarc US Corp. High Yield 0.9 7.3 7.3 5.9 8.6 4.7 11.3
Russell 1000 Value 0.6 11.9 11.9 5.7 10.5 7.7 14.5 BBgBarc US Agency Interm 0.9 1.4 1.4 3.4 1.2 1.6 1.9
Russell 2000 Growth (1.4) 17.1 17.1 3.9 14.9 8.4 16.5 BBgBarc US Credit 2.4 4.9 4.9 4.9 3.5 3.6 6.2
Russell 2000 Value (2.9) 11.9 11.9 0.2 10.9 5.6 14.1
INTERNATIONAL EQUITY OTHER Broad Index Index
MSCI ACWI 1.3 12.2 12.2 2.6 10.7 6.5 12.0 Bloomberg Commodity (0.2) 6.3 6.3 (5.3) 2.2 (8.9) (2.6)
MSCI ACWI ex US 0.6 10.3 10.3 (4.2) 8.1 2.6 8.8 Wilshire US REIT 3.2 16.0 16.0 19.3 5.5 9.0 18.7
MSCI EAFE 0.6 10.0 10.0 (3.7) 7.3 2.3 9.0 CS Leveraged Loans (0.1) 3.8 3.8 3.3 5.9 3.8 8.0
MSCI EM 0.8 9.9 9.9 (7.4) 10.7 3.7 8.9 Alerian MLP 3.8 17.4 17.4 16.8 5.9 (4.2) 11.1
MSCI EAFE Small Cap 0.2 10.7 10.7 (9.4) 7.5 4.5 12.8 Regional Index
Style Index JPM EMBI Global Div 1.4 7.0 7.0 4.2 5.8 5.4 8.5
MSCI EAFE Growth 1.8 12.0 12.0 (1.3) 7.6 3.9 9.7 JPM GBI‐EM Global Div (1.3) 2.9 2.9 (7.6) 3.3 (0.8) 4.4
MSCI EAFE Value (0.5) 7.9 7.9 (6.1) 6.9 0.7 8.1 Hedge Funds
Regional Index HFRI Composite 1.0 5.9 5.9 0.9 5.1 3.1 5.5
MSCI UK 1.1 11.9 11.9 (0.1) 6.3 0.7 9.3 HFRI FOF Composite 1.3 5.0 5.0 0.5 4.1 2.3 3.6
MSCI Japan 0.6 6.7 6.7 (7.8) 8.1 5.6 8.0 Currency (Spot)
MSCI Euro 0.0 9.8 9.8 (7.8) 6.5 0.6 7.5 Euro (1.4) (1.8) (1.8) (8.7) (0.5) (4.0) (1.7)
MSCI EM Asia 1.8 11.1 11.1 (6.8) 11.8 6.2 10.8 Pound (2.0) 2.3 2.3 (7.1) (3.2) (4.8) (0.9)
MSCI EM Latin American (2.5) 7.9 7.9 (6.7) 11.1 (0.3) 5.3 Yen 0.6 (0.9) (0.9) (3.9) 0.5 (1.4) (1.1)
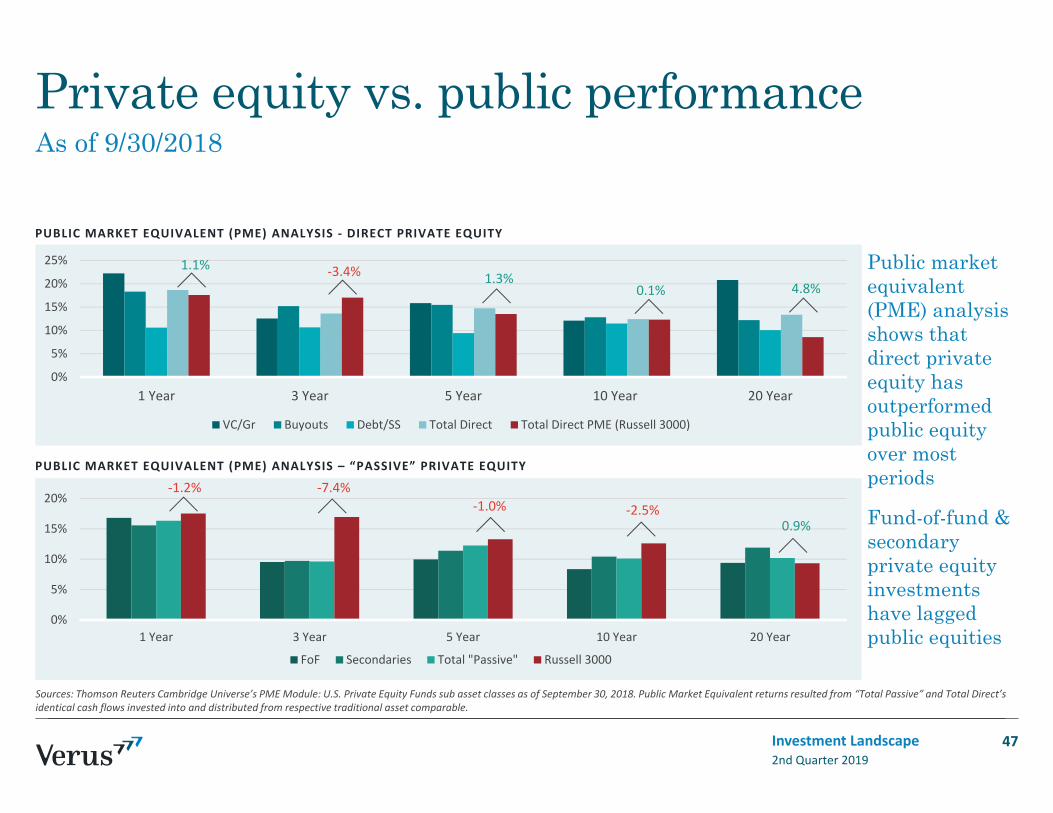
Private equity vs. public performance
47
0%
5%
10%
15%
1 Year 3 Year 5 Year 10 Year 20 YearU.S. Real Estate Wilshire US REIT
‐3.3%7.8%
1.7%
4.6%
‐1.3%Public market equivalent (PME) analysis shows that direct private equity has outperformed public equity over most periods
Fund-of-fund & secondary private equity investments have lagged public equities0%
5%
10%
15%
1 Year 3 Year 5 Year 10 Year 20 YearU.S. Real Estate NCREIF Property Index
4.3%1.9%
3.7%
0.5%‐0.6%
Sources: Thomson Reuters Cambridge Universe’s PME Module: U.S. Private Equity Funds sub asset classes as of September 30, 2018. Public Market Equivalent returns resulted from “Total Passive” and Total Direct’sidentical cash flows invested into and distributed from respective traditional asset comparable.
Investment Landscape2nd Quarter 2019
PUBLIC MARKET EQUIVALENT (PME) ANALYSIS ‐ DIRECT PRIVATE EQUITY
PUBLIC MARKET EQUIVALENT (PME) ANALYSIS – “PASSIVE” PRIVATE EQUITY
As of 9/30/2018
0%
5%
10%
15%
20%
25%
1 Year 3 Year 5 Year 10 Year 20 Year
VC/Gr Buyouts Debt/SS Total Direct Total Direct PME (Russell 3000)
0%
5%
10%
15%
20%
1 Year 3 Year 5 Year 10 Year 20 Year
FoF Secondaries Total "Passive" Russell 3000
0.9%
‐7.4%‐1.0% ‐2.5%
‐1.2%
1.1% ‐3.4% 1.3%0.1% 4.8%

0%
5%
10%
15%
20%
1 Year 3 Year 5 Year 10 Year
Global Natural Resources MSCI World Natural Resources
1.5%0.2%
‐6.3%
Private vs. liquid real assets performance
Sources: Thomson Reuters C|A PME: Global Natural Resources (vintage 1996 and later, inception of MSCI ACWI Energy benchmark) and Global Infrastructure (vintage 2002 and later, inception of S&P Infrastructure benchmark) universes as of September 30, 2018. Public Market Equivalent returns resulted from identical cash flows invested into and distributed from respective liquid real assets universes.
48
Public market equivalent (PME) analysis shows that private infrastructure has recently underperformed publicly listed infrastructure
Private infrastructure has materially outperformed publicly listed infrastructure0%
5%
10%
15%
1 Year 3 Year 5 Year 10 YearGlobal Infrastructure S&P Infrastructure
10.8% 6.2%
1.6%
3.1%
Investment Landscape2nd Quarter 2019
PUBLIC MARKET EQUIVALENT (PME) ANALYSIS ‐ GLOBAL NATURAL RESOURCES FUNDS
PUBLIC MARKET EQUIVALENT (PME) ANALYSIS ‐ GLOBAL INFRASTRUCTURE FUNDS
‐5%
0%
5%
10%
15%
1 Year 3 Year 5 Year 10 Year
Global Infrastructure S&P Infrastructure
11.9%4.6%
1.5%4.7%
As of 9/30/2018
‐2.4%

0%
5%
10%
15%
1 Year 3 Year 5 Year 10 Year 20 Year
U.S. Real Estate NCREIF Property Index
4.5%2.2%
3.8%
0.5%0.2%
0%
5%
10%
15%
1 Year 3 Year 5 Year 10 Year 20 Year
U.S. Real Estate Wilshire US REIT
‐2.1%7.9%
2.3%3.1%
‐1.6%
Private vs. liquid & core real estate performance
49
Public market equivalent (PME) analysis shows that U.S. private R.E. has underperformed liquid real estate over the long-term
U.S. private R.E. has outperformed the NCREIF Property Index over each time period
Sources: Thomson Reuters C|A PME: Global and U.S. Real Estate universes as of September 30, 2018. Public Market Equivalent returns resulted from identical cash flows invested into and distributed from respective liquid real estate universes.
Investment Landscape2nd Quarter 2019
PUBLIC MARKET EQUIVALENT (PME) ANALYSIS ‐ U.S PRIVATE REAL ESTATE VS. LIQUID UNIVERSE
PUBLIC MARKET EQUIVALENT (PME) ANALYSIS ‐ U.S. PRIVATE REAL ESTATE FUNDS VS. CORE FUNDS
As of 9/30/2018

Definitions
2nd Quarter 2019Investment Landscape 50
Bloomberg US Weekly Consumer Comfort Index ‐ tracks the public’s economic attitudes each week, providing a high‐frequency read on consumer sentiment. The index, based on cell and landline telephone interviews with a random, representative national sample of U.S. adults, tracks Americans' ratings of the national economy, their personal finances and the buying climate on a weekly basis, with views of the economy’s direction measured separately each month. (www.langerresearch.com)
University of Michigan Consumer Sentiment Index ‐ A survey of consumer attitudes concerning both the present situation as well as expectations regarding economic conditions conducted by the University of Michigan. For the preliminary release approximately three hundred consumers are surveyed while five hundred are interviewed for the final figure. The level of consumer sentiment is related to the strength of consumer spending. (www.Bloomberg.com)
NFIB Small Business Outlook ‐ Small Business Economic Trends (SBET) is a monthly assessment of the U.S. small‐business economy and its near‐term prospects. Its data are collected through mail surveys to random samples of the National Federal of Independent Business (NFIB) membership. The survey contains three broad question types: recent performance, near‐term forecasts, and demographics. The topics addressed include: outlook, sales, earnings, employment, employee compensation, investment, inventories, credit conditions, and single most important problem. (http://www.nfib‐sbet.org/about/)
NAHB Housing Market Index – the housing market index is a weighted average of separate diffusion induces for three key single‐family indices: market conditions for the sale of new homes at the present time, market conditions for the sale of new homes in the next six months, and the traffic of prospective buyers of new homes. The first two series are rated on a scale of Good, Fair, and Poor and the last is rated on a scale of High/Very High, Average, and Low/Very Low. A diffusion index is calculated for each series by applying the formula “(Good‐Poor + 100)/2” to the present and future sales series and “(High/Very High‐Low/Very Low + 100)/2” to the traffic series. Each resulting index is then seasonally adjusted and weighted to produce the HMI. Based on this calculation, the HMI can range between 0 and 100.
Notices & disclosuresPast performance is no guarantee of future results. This report or presentation is provided for informational purposes only and is directed to institutional clients and eligible institutional counterparties only and should not be relied upon by retail investors. Nothing herein constitutes investment, legal, accounting or tax advice, or a recommendation to buy, sell or hold a security or pursue a particular investment vehicle or any trading strategy. The opinions and information expressed are current as of the date provided or cited only and are subject to change without notice. This information is obtained from sources deemed reliable, but there is no representation or warranty as to its accuracy, completeness or reliability. Verus Advisory Inc. expressly disclaim any and all implied warranties or originality, accuracy, completeness, non‐infringement, merchantability and fitness for a particular purpose. This report or presentation cannot be used by the recipient for advertising or sales promotion purposes.
The material may include estimates, outlooks, projections and other “forward‐looking statements.” Such statements can be identified by the use of terminology such as “believes,” “expects,” “may,” “will,” “should,” “anticipates,” or the negative of any of the foregoing or comparable terminology, or by discussion of strategy, or assumptions such as economic conditions underlying other statements. No assurance can be given that future results described or implied by any forward looking information will be achieved. Actual events may differ significantly from those presented. Investing entails risks, including possible loss of principal. Risk controls and models do not promise any level of performance or guarantee against loss of principal.
“VERUS ADVISORY™ and any associated designs are the respective trademarks of Verus Advisory, Inc. Additional information is available upon request.

Pasadena Fire & Police Retirement SystemInvestment Performance ReviewPeriod Ending: March 31, 2019

Portfolio Reconciliation
Last ThreeMonths Fiscal Year-To-Date
_
Beginning Market Value $105,154,696 $117,514,017
Contributions $2,100,000 $7,780,924
Withdrawals -$4,240,892 -$18,729,690
Net Cash Flow -$2,140,892 -$10,948,767
Net Investment Change $6,597,102 $3,045,655
Ending Market Value $109,610,906 $109,610,906
Net Change $4,456,210 -$7,903,111_
Contributions and withdrawals may include intra-account transfers between managers/funds. Portfolio Reconciliation does not include Pooled Cash.
Total FundPortfolio Reconciliation Period Ending: March 31, 2019
Pasadena Fire & Police Retirement System 1
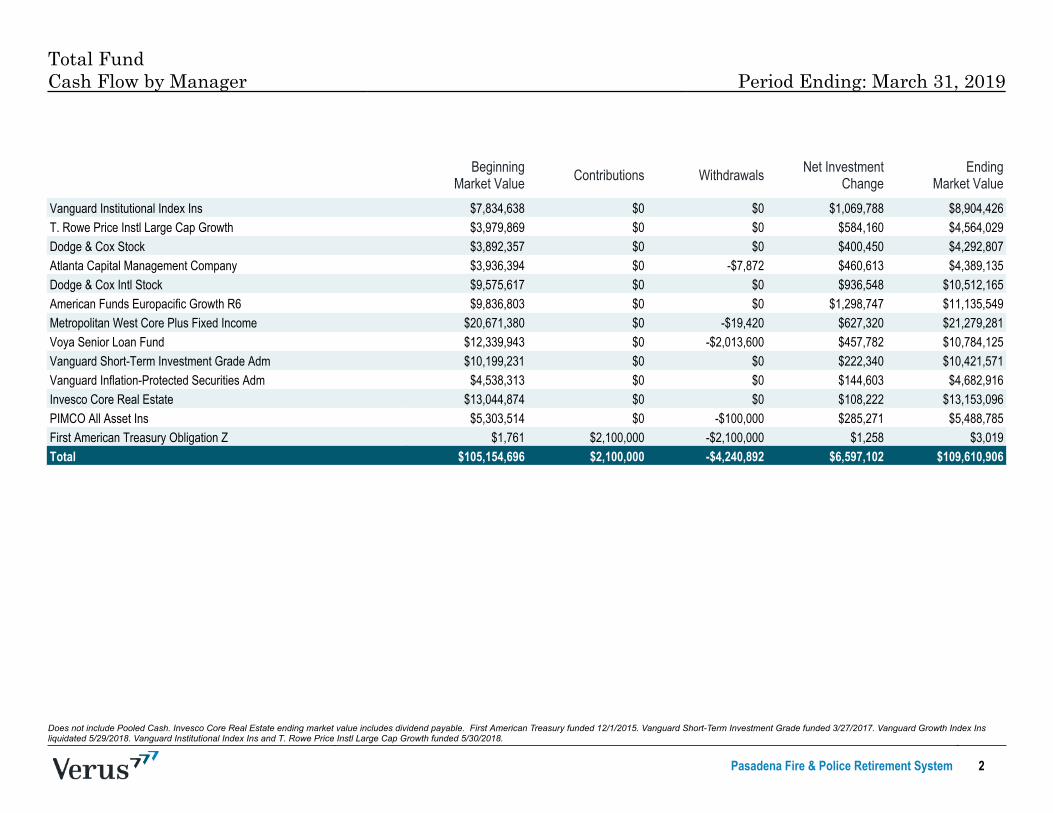
Does not include Pooled Cash. Invesco Core Real Estate ending market value includes dividend payable. First American Treasury funded 12/1/2015. Vanguard Short-Term Investment Grade funded 3/27/2017. Vanguard Growth Index Insliquidated 5/29/2018. Vanguard Institutional Index Ins and T. Rowe Price Instl Large Cap Growth funded 5/30/2018.
BeginningMarket Value Contributions Withdrawals Net Investment
ChangeEnding
Market Value_
Vanguard Institutional Index Ins $7,834,638 $0 $0 $1,069,788 $8,904,426T. Rowe Price Instl Large Cap Growth $3,979,869 $0 $0 $584,160 $4,564,029Dodge & Cox Stock $3,892,357 $0 $0 $400,450 $4,292,807Atlanta Capital Management Company $3,936,394 $0 -$7,872 $460,613 $4,389,135Dodge & Cox Intl Stock $9,575,617 $0 $0 $936,548 $10,512,165American Funds Europacific Growth R6 $9,836,803 $0 $0 $1,298,747 $11,135,549Metropolitan West Core Plus Fixed Income $20,671,380 $0 -$19,420 $627,320 $21,279,281Voya Senior Loan Fund $12,339,943 $0 -$2,013,600 $457,782 $10,784,125Vanguard Short-Term Investment Grade Adm $10,199,231 $0 $0 $222,340 $10,421,571Vanguard Inflation-Protected Securities Adm $4,538,313 $0 $0 $144,603 $4,682,916Invesco Core Real Estate $13,044,874 $0 $0 $108,222 $13,153,096PIMCO All Asset Ins $5,303,514 $0 -$100,000 $285,271 $5,488,785First American Treasury Obligation Z $1,761 $2,100,000 -$2,100,000 $1,258 $3,019Total $105,154,696 $2,100,000 -$4,240,892 $6,597,102 $109,610,906
XXXXX
Total FundCash Flow by Manager Period Ending: March 31, 2019
Pasadena Fire & Police Retirement System 2

Pasadena Fire & Police Retirement System 3
Total FundAsset Allocation vs. Policy Period Ending: March 31, 2019
CurrentBalance
CurrentAllocation Policy Difference Policy Range Within IPS
Range?_
Domestic Equity Large CapCore $8,904,426 8.1% 8.0% $135,554 3.0% - 20.0% Yes
Domestic Equity Large CapGrowth $4,564,029 4.2% 4.0% $179,593 0.0% - 10.0% Yes
Domestic Equity Large CapValue $4,292,807 3.9% 4.0% -$91,629 0.0% - 10.0% Yes
Domestic Equity Small CapCore $4,389,135 4.0% 4.0% $4,699 0.0% - 10.0% Yes
International Equity $21,647,714 19.7% 20.0% -$274,467 10.0% - 25.0% YesDomestic Fixed Income Core $21,279,281 19.4% 20.0% -$642,900 10.0% - 35.0% YesDomestic Fixed Income BankLoans $10,784,125 9.8% 10.0% -$176,966 0.0% - 15.0% Yes
Domestic Fixed Income ShortTerm $10,421,571 9.5% 10.0% -$539,519 0.0% - 15.0% Yes
Domestic Fixed Income RealReturn $4,682,916 4.3% 5.0% -$797,629 0.0% - 10.0% Yes
Real Estate $13,153,096 12.0% 10.0% $2,192,005 0.0% - 15.0% YesAlternative Investment $5,488,785 5.0% 5.0% $8,240 0.0% - 10.0% YesCash and Equivalents $3,019 0.0% 0.0% $3,019 0.0% - 10.0% YesTotal $109,610,906 100.0% 100.0%
XXXXX

Policy Index as of 6/01/2018: 8% S&P 500, 4% Russell 1000 Value, 4% Russell 1000 Growth, 4% Russell 2000, 20% MSCI EAFE, 20% BBgBarc US Aggregate, 5% BBgBarc US TIPS, 10% S&P/LSTA Leveraged Loan, 10% BBgBarc USCredit 1-5 Year, 10% NCREIF-ODCE, 5% CPI+5%. CPI LOCAL (LA) included Los Angeles-Riverside-Orange County until 12/31/2017. Effective 1/1/2018 due to geographical revisions, CPI LOCAL (LA) includes Los Angeles-LongBeach-Anaheim. FY: 6/30.
Market Value % ofPortfolio 3 Mo Fiscal
YTD YTD 1 Yr 3 Yrs 5 Yrs Fiscal2018
Fiscal2017
Fiscal2016
Fiscal2015
Fiscal2014
_
Total Fund 109,610,906 100.0 6.3 2.7 6.3 2.9 6.9 5.2 5.6 10.7 0.4 3.7 15.4Policy Index 6.4 2.9 6.4 3.9 6.4 5.2 5.8 8.9 1.8 3.0 14.8
Total Domestic Equity 22,150,398 20.2 12.8 4.7 12.8 9.1 14.8 10.8 15.3 22.5 -0.4 8.3 26.4S&P 500 13.6 5.9 13.6 9.5 13.5 10.9 14.4 17.9 4.0 7.4 24.6
Total International Equity 21,647,714 19.7 11.5 -2.4 11.5 -6.3 8.6 2.6 4.9 26.2 -14.2 -1.3 25.8MSCI EAFE 10.0 -2.5 10.0 -3.7 7.3 2.3 6.8 20.3 -10.2 -4.2 23.6MSCI ACWI ex USA 10.3 -1.6 10.3 -4.2 8.1 2.6 7.3 20.5 -10.2 -5.3 21.8
Total Domestic Fixed 47,167,893 43.0 3.0 3.4 3.0 3.7 2.5 2.8 1.2 0.9 4.4 1.8 4.7BBgBarc US Aggregate TR 2.9 4.6 2.9 4.5 2.0 2.7 -0.4 -0.3 6.0 1.9 4.4
Total Real Estate 13,153,096 12.0 0.8 5.1 0.8 6.7 7.6 9.4 7.0 7.3 9.8 15.2 9.6NCREIF-ODCE 1.4 5.4 1.4 7.5 8.0 10.2 8.4 7.9 11.8 14.4 12.7NCREIF Property Index 1.8 4.9 1.8 6.8 7.1 9.1 7.2 7.0 10.6 13.0 11.2
Total Alternatives 5,488,785 5.0 5.4 2.3 5.4 -0.1 7.1 3.1 4.2 10.8 0.1 -5.8 11.4CPI + 5% 2.4 4.6 2.4 6.9 7.3 6.5 8.0 6.7 6.0 5.1 7.2CPI (UNADJUSTED) 1.2 0.9 1.2 1.9 2.2 1.5 2.9 1.6 1.0 0.1 2.1CPI LOCAL (LA) 1.4 2.2 1.4 2.7 3.1 2.3 4.0 2.2 1.8 0.8 1.8
XXXXX
Pasadena Fire & Police Retirement System 4
Total FundExecutive Summary (Net of Fees) Period Ending: March 31, 2019

Total MarketValue
% ofPortfolio
DomesticEquity Large
Cap Core
DomesticEquity LargeCap Growth
DomesticEquity Large
Cap Value
DomesticEquity Small
Cap Core
InternationalEquity
DomesticFixed
IncomeCore
DomesticFixed
IncomeBank Loans
DomesticFixed
IncomeShort Term
DomesticFixed
Income RealReturn
Real Estate AlternativeInvestment
Cash andEquivalents
_
Total Domestic Equity Vanguard Institutional Index Ins $8,904,426 8.1% $8,904,426T. Rowe Price Instl Large Cap Growth $4,564,029 4.2% $4,564,029Dodge & Cox Stock $4,292,807 3.9% $4,292,807Atlanta Capital Management Company $4,389,135 4.0% $4,389,135
Total International Equity Dodge & Cox Intl Stock $10,512,165 9.6% $10,512,165American Funds Europacific Growth R6 $11,135,549 10.2% $11,135,549
Total Domestic Fixed Metropolitan West Core Plus Fixed Income $21,279,281 19.4% $21,279,281Voya Senior Loan Fund $10,784,125 9.8% $10,784,125Vanguard Short-Term Investment Grade Adm $10,421,571 9.5% $10,421,571Vanguard Inflation-Protected Securities Adm $4,682,916 4.3% $4,682,916
Total Real Estate Invesco Core Real Estate $13,153,096 12.0% $13,153,096
Total Alternatives PIMCO All Asset Ins $5,488,785 5.0% $5,488,785
Cash First American Treasury Obligation Z $3,019 0.0% $3,019
Total $109,610,906 100.0% $8,904,426 $4,564,029 $4,292,807 $4,389,135 $21,647,714 $21,279,281 $10,784,125 $10,421,571 $4,682,916 $13,153,096 $5,488,785 $3,019XXXXX
Invesco Core Real Estate market value includes dividend payable. Total Fund does not include Pooled Cash.
Pasadena Fire & Police Retirement System 5
Total FundAsset Allocation by Account Period Ending: March 31, 2019

TotalMarketValue
% ofPortfolio
DomesticEquity
Large CapCore
DomesticEquity
Large CapGrowth
DomesticEquity
Large CapValue
DomesticEquity
Small CapCore
International Equity
DomesticFixed
IncomeCore
DomesticFixed
IncomeBank Loans
DomesticFixed
IncomeShort Term
DomesticFixed
IncomeReal Return
Real Estate AlternativeInvestment
Cash andEquivalents
_
Total Fund Total Domestic Equity
Vanguard Institutional Index Ins $8,904,426 7.9% $8,904,426T. Rowe Price Instl Large Cap Growth $4,564,029 4.1% $4,564,029Dodge & Cox Stock $4,292,807 3.8% $4,292,807Atlanta Capital Management Company $4,389,135 3.9% $4,389,135
Total International Equity Dodge & Cox Intl Stock $10,512,165 9.4% $10,512,165American Funds Europacific Growth R6 $11,135,549 9.9% $11,135,549
Total Domestic Fixed Metropolitan West Core Plus Fixed Income $21,279,281 19.0% $21,279,281Voya Senior Loan Fund $10,784,125 9.6% $10,784,125Vanguard Short-Term Investment Grade Adm $10,421,571 9.3% $10,421,571Vanguard Inflation-Protected Securities Adm $4,682,916 4.2% $4,682,916
Total Real Estate Invesco Core Real Estate $13,153,096 11.7% $13,153,096
Total Alternatives PIMCO All Asset Ins $5,488,785 4.9% $5,488,785
Cash First American Treasury Obligation Z $3,019 0.0% $3,019
Pooled Cash $2,400,000 2.1% $2,400,000Total $112,010,906 100.0% $8,904,426 $4,564,029 $4,292,807 $4,389,135 $21,647,714 $21,279,281 $10,784,125 $10,421,571 $4,682,916 $13,153,096 $5,488,785 $2,403,019
Total Fund with Pooled CashAsset Allocation by Account with Pooled Cash Period Ending: March 31, 2019
Invesco Core Real Estate market value includes dividend payable. Pooled Cash balance is an estimate.
Pasadena Fire & Police Retirement System 6

Weighted returns shown in attribution analysis may differ from actual returns.
Attribution SummaryLast Three Months
Wtd. ActualReturn
Wtd. IndexReturn
ExcessReturn
SelectionEffect
AllocationEffect
InteractionEffects
TotalEffects
Total Domestic Equity 12.8% 14.0% -1.2% -0.2% -0.1% 0.0% -0.3%Total International Equity 11.5% 10.0% 1.5% 0.3% -0.1% 0.0% 0.2%Total Domestic Fixed 3.0% 3.1% 0.0% 0.0% 0.0% 0.0% 0.0%Total Real Estate 0.8% 1.4% -0.6% -0.1% -0.1% 0.0% -0.2%Total Alternatives 5.4% 2.4% 3.0% 0.2% 0.0% 0.0% 0.1%Total 6.3% 6.4% -0.1% 0.1% -0.2% 0.0% -0.1%
Performance AttributionQuarter YTD
Wtd. Actual Return 6.27% 6.27%Wtd. Index Return * 6.41% 6.41%Excess Return -0.14% -0.14%Selection Effect 0.14% 0.14%Allocation Effect -0.24% -0.24%Interaction Effect -0.03% -0.03%
*Calculated from benchmark returns and weightings of each component.
Total FundAttribution Analysis - Asset Class Level (Net of Fees) Period Ending: March 31, 2019
Pasadena Fire & Police Retirement System 7

Anlzd StandardDeviation Anlzd Alpha Beta R-Squared Up Mkt
Capture RatioDown Mkt
Capture RatioInformation
Ratio Tracking Error Sharpe Ratio_
Total Fund 4.48% 0.40% 1.01 0.96 103.58% 95.05% 0.54 0.90% 1.28
Total Domestic Equity 11.13% 1.01% 1.02 0.96 106.08% 98.32% 0.57 2.17% 1.22
Total International Equity 11.55% 0.95% 1.05 0.91 106.48% 97.41% 0.39 3.45% 0.65
Total Domestic Fixed 1.96% 1.32% 0.60 0.82 74.67% 42.89% 0.35 1.46% 0.70
Total Real Estate 3.32% -0.08% 0.97 0.89 95.15% -- -0.31 1.09% 1.95
Total FundRisk Analysis - 3 Years (Net of Fees) Period Ending: March 31, 2019
Pasadena Fire & Police Retirement System 8

Pasadena Fire & Police Retirement System 9
Total FundRolling Risk Statistics (Net of Fees) Period Ending: March 31, 2019

Pasadena Fire & Police Retirement System 10
Total FundRolling Performance Relative to Policy (Net of Fees) Period Ending: March 31, 2019

Page excludes managers with less than 5 years of history.
Anlzd StandardDeviation Anlzd Alpha Beta R-Squared Up Mkt
Capture RatioDown Mkt
Capture RatioInformation
Ratio Tracking Error Sharpe Ratio_
Vanguard Institutional Index Ins 11.06% -0.03% 1.00 1.00 99.82% 100.12% -2.70 0.01% 0.92
T. Rowe Price Instl Large Cap Growth 12.73% 2.71% 0.92 0.85 105.99% 84.01% 0.34 5.01% 1.13
Dodge & Cox Stock 11.88% 0.55% 1.05 0.86 113.93% 106.79% 0.21 4.44% 0.67
Atlanta Capital Management Company 11.39% 6.64% 0.68 0.87 92.77% 51.65% 0.67 6.51% 0.94
Dodge & Cox Intl Stock 13.57% -1.91% 1.08 0.90 94.01% 111.54% -0.39 4.39% 0.01
American Funds Europacific Growth R6 12.85% 1.61% 1.03 0.93 115.08% 95.62% 0.49 3.45% 0.28
Metropolitan West Core Plus Fixed Income 2.69% 0.45% 0.86 0.98 93.57% 78.65% 0.11 0.59% 0.78
Vanguard Short-Term Investment Grade Adm 1.47% 0.12% 0.91 0.99 92.42% 77.05% -0.34 0.23% 0.89
Vanguard Inflation-Protected Securities Adm 3.76% -0.09% 1.02 0.99 100.51% 103.53% -0.20 0.29% 0.31
Invesco Core Real Estate 1.96% -0.79% 1.00 0.58 91.20% -- -0.59 1.28% 4.44
PIMCO All Asset Ins 7.26% -15.47% 2.84 0.31 52.92% 2,129.79% -0.53 6.57% 0.32XXXXX
Total FundRisk Analysis by Manager - 5 Years (Net of Fees) Period Ending: March 31, 2019
Pasadena Fire & Police Retirement System 11

Dodge & Cox Stock Inception: 8/31/2000. Vanguard Growth Index Ins and Atlanta Capital Management Company Inception: 6/30/2009. Dodge & Cox separate account performance shown prior to 6/19/2009. Effective 3/1/2015 Atlanta SMIDCap strategy changed to Atlanta Small Cap Core strategy. Vanguard Growth Index Ins liquidated 5/29/2018. Vanguard Institutional Index Ins and T. Rowe Price Instl Large Cap Growth funded 5/30/2018.
Market Value % ofPortfolio 3 Mo Fiscal
YTD YTD 1 Yr 3 Yrs 5 Yrs Fiscal2018
Fiscal2017
Fiscal2016
Fiscal2015
Fiscal2014 Inception Inception
Date_
Total Domestic Equity 12.8 4.7 12.8 9.1 14.8 10.8 15.3 22.5 -0.4 8.3 26.4Vanguard Institutional Index Ins 8,904,426 40.2 13.7 5.8 13.7 9.5 13.5 10.9 14.3 17.9 4.0 7.4 24.6 5.8 May-18
S&P 500 13.6 5.9 13.6 9.5 13.5 10.9 14.4 17.9 4.0 7.4 24.6 5.8 May-18T. Rowe Price Instl Large Cap Growth 4,564,029 20.6 14.7 6.8 14.7 14.0 21.9 15.2 29.1 31.5 -3.1 11.9 31.9 7.6 May-18
Russell 1000 Growth 16.1 6.6 16.1 12.7 16.5 13.5 22.5 20.4 3.0 10.6 26.9 7.1 May-18Dodge & Cox Stock 4,292,807 19.4 10.3 1.5 10.3 4.3 14.1 8.7 11.9 28.6 -5.1 4.5 28.0 8.8 Aug-00
Russell 1000 Value 11.9 4.4 11.9 5.7 10.5 7.7 6.8 15.5 2.9 4.1 23.8 6.7 Aug-00Atlanta Capital Management Company 4,389,135 19.8 11.5 3.7 11.5 10.9 13.6 11.4 18.3 14.8 4.4 13.5 19.7 16.0 Jun-09
Russell 2000 14.6 -5.3 14.6 2.0 12.9 7.1 17.6 24.6 -6.7 6.5 23.6 13.6 Jun-09Russell 2500 15.8 -1.2 15.8 4.5 12.6 7.8 16.2 19.8 -3.7 5.9 25.6 14.5 Jun-09
XXXXX
Total Domestic EquityPerformance Summary (Net of Fees) Period Ending: March 31, 2019
Pasadena Fire & Police Retirement System 12

Dodge & Cox Intl Stock Inception: 9/30/2004. American Funds Europacific Growth R6 Inception: 2/24/2012. Dodge & Cox separate account performance shown prior to 6/19/2009.
Market Value % ofPortfolio 3 Mo Fiscal
YTD YTD 1 Yr 3 Yrs 5 Yrs Fiscal2018
Fiscal2017
Fiscal2016
Fiscal2015
Fiscal2014 Inception Inception
Date_
Total International Equity 11.5 -2.4 11.5 -6.3 8.6 2.6 4.9 26.2 -14.2 -1.3 25.8Dodge & Cox Intl Stock 10,512,165 48.6 9.8 -3.0 9.8 -8.0 7.9 0.8 0.5 30.4 -18.9 -3.6 29.3 6.2 Sep-04
MSCI ACWI ex USA 10.3 -1.6 10.3 -4.2 8.1 2.6 7.3 20.5 -10.2 -5.3 21.8 5.8 Sep-04American Funds Europacific Growth R6 11,135,549 51.4 13.2 -1.9 13.2 -4.7 9.3 4.3 9.3 22.2 -9.6 1.0 22.4 6.8 Feb-12
MSCI ACWI ex USA 10.3 -1.6 10.3 -4.2 8.1 2.6 7.3 20.5 -10.2 -5.3 21.8 4.6 Feb-12XXXXX
Total International EquityPerformance Summary (Net of Fees) Period Ending: March 31, 2019
Pasadena Fire & Police Retirement System 13

Metropolitan West Core Plus Fixed Income Inception: 7/31/2000. Vanguard Inflation-Protected Securities Ins Inception: 6/30/2011. Voya Senior Loan Fund Inception: 6/27/2014. Vanguard Inflation-Protected Securities underwent share classchange on 4/27/2016. Vanguard Short-Term Investment Grade funded 3/27/2017.
Market Value % ofPortfolio 3 Mo Fiscal
YTD YTD 1 Yr 3 Yrs 5 Yrs Fiscal2018
Fiscal2017
Fiscal2016
Fiscal2015
Fiscal2014 Inception Inception
Date_
Total Domestic Fixed 3.0 3.4 3.0 3.7 2.5 2.8 1.2 0.9 4.4 1.8 4.7Metropolitan West Core Plus Fixed Income 21,279,281 45.1 2.9 4.5 2.9 4.6 2.5 2.8 0.3 0.6 4.8 1.9 5.0 5.6 Jul-00
BBgBarc US Aggregate TR 2.9 4.6 2.9 4.5 2.0 2.7 -0.4 -0.3 6.0 1.9 4.4 4.8 Jul-00Voya Senior Loan Fund 10,784,125 22.9 3.7 2.0 3.7 2.5 4.5 -- 3.9 5.7 1.5 2.9 -- 3.4 Jun-14
S&P/LSTA Leveraged Loan Index 4.0 2.3 4.0 3.0 5.7 -- 4.4 7.4 0.9 1.8 -- 3.5 Jun-14Vanguard Short-Term Investment Grade Adm 10,421,571 22.1 2.2 3.5 2.2 3.7 2.1 2.1 0.2 1.3 3.3 1.1 3.3 2.2 Mar-17
BBgBarc US Credit 1-5 Yr TR 2.4 4.0 2.4 4.3 2.2 2.1 0.1 1.3 3.1 1.3 3.4 2.5 Mar-17Vanguard Inflation-Protected Securities Adm 4,682,916 9.9 3.2 1.9 3.2 2.7 1.6 1.9 1.9 -0.8 4.8 -1.9 4.5 2.1 Jun-11
BBgBarc US TIPS TR 3.2 1.9 3.2 2.7 1.7 1.9 2.1 -0.6 4.4 -1.7 4.4 2.1 Jun-11XXXXX
Total Domestic FixedPerformance Summary (Net of Fees) Period Ending: March 31, 2019
Pasadena Fire & Police Retirement System 14

Invesco Core Real Estate Inception: 10/1/2012. Invesco Core Real Estate market value includes dividend payable.
Market Value % ofPortfolio 3 Mo Fiscal
YTD YTD 1 Yr 3 Yrs 5 Yrs Fiscal2018
Fiscal2017
Fiscal2016
Fiscal2015
Fiscal2014 Inception Inception
Date_
Total Real Estate 0.8 5.1 0.8 6.7 7.6 9.4 7.0 7.3 9.8 15.2 9.6Invesco Core Real Estate 13,153,096 100.0 0.8 5.1 0.8 6.7 7.6 9.4 7.0 7.3 9.8 15.2 10.0 9.8 Oct-12
NCREIF-ODCE 1.4 5.4 1.4 7.5 8.0 10.2 8.4 7.9 11.8 14.4 12.7 10.7 Oct-12XXXXX
Total Real EstatePerformance Summary (Net of Fees) Period Ending: March 31, 2019
Pasadena Fire & Police Retirement System 15

PIMCO All Asset Ins Inception: 5/28/2013.
Market Value % ofPortfolio 3 Mo Fiscal
YTD YTD 1 Yr 3 Yrs 5 Yrs Fiscal2018
Fiscal2017
Fiscal2016
Fiscal2015
Fiscal2014 Inception Inception
Date_
Total Alternatives 5.4 2.3 5.4 -0.1 7.1 3.1 4.2 10.8 0.1 -5.8 11.4PIMCO All Asset Ins 5,488,785 100.0 5.4 2.3 5.4 -0.1 7.1 3.1 4.2 10.8 0.1 -5.8 11.4 2.8 May-13
CPI + 5% 2.4 4.6 2.4 6.9 7.3 6.5 8.0 6.7 6.0 5.1 7.2 6.6 May-13HFRI Fund of Funds Composite Index 4.6 -0.4 4.6 0.1 3.9 2.2 5.2 6.5 -5.4 4.0 7.6 2.7 May-13
XXXXX
Pasadena Fire & Police Retirement System 16
Total AlternativesPerformance Summary (Net of Fees) Period Ending: March 31, 2019
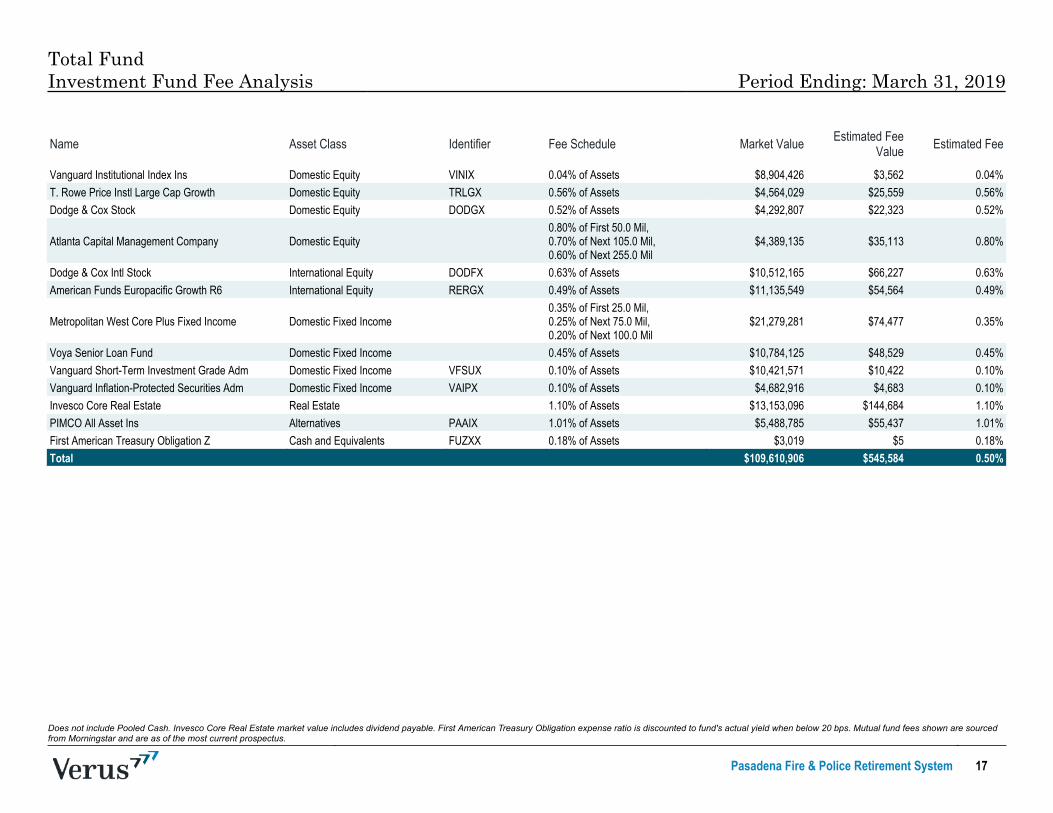
Name Asset Class Identifier Fee Schedule Market Value Estimated FeeValue Estimated Fee
Vanguard Institutional Index Ins Domestic Equity VINIX 0.04% of Assets $8,904,426 $3,562 0.04%T. Rowe Price Instl Large Cap Growth Domestic Equity TRLGX 0.56% of Assets $4,564,029 $25,559 0.56%Dodge & Cox Stock Domestic Equity DODGX 0.52% of Assets $4,292,807 $22,323 0.52%
Atlanta Capital Management Company Domestic Equity0.80% of First 50.0 Mil,0.70% of Next 105.0 Mil,0.60% of Next 255.0 Mil
$4,389,135 $35,113 0.80%
Dodge & Cox Intl Stock International Equity DODFX 0.63% of Assets $10,512,165 $66,227 0.63%American Funds Europacific Growth R6 International Equity RERGX 0.49% of Assets $11,135,549 $54,564 0.49%
Metropolitan West Core Plus Fixed Income Domestic Fixed Income0.35% of First 25.0 Mil,0.25% of Next 75.0 Mil,0.20% of Next 100.0 Mil
$21,279,281 $74,477 0.35%
Voya Senior Loan Fund Domestic Fixed Income 0.45% of Assets $10,784,125 $48,529 0.45%Vanguard Short-Term Investment Grade Adm Domestic Fixed Income VFSUX 0.10% of Assets $10,421,571 $10,422 0.10%Vanguard Inflation-Protected Securities Adm Domestic Fixed Income VAIPX 0.10% of Assets $4,682,916 $4,683 0.10%Invesco Core Real Estate Real Estate 1.10% of Assets $13,153,096 $144,684 1.10%PIMCO All Asset Ins Alternatives PAAIX 1.01% of Assets $5,488,785 $55,437 1.01%First American Treasury Obligation Z Cash and Equivalents FUZXX 0.18% of Assets $3,019 $5 0.18%Total $109,610,906 $545,584 0.50%
XXXXX
Does not include Pooled Cash. Invesco Core Real Estate market value includes dividend payable. First American Treasury Obligation expense ratio is discounted to fund's actual yield when below 20 bps. Mutual fund fees shown are sourcedfrom Morningstar and are as of the most current prospectus.
Total FundInvestment Fund Fee Analysis Period Ending: March 31, 2019
Pasadena Fire & Police Retirement System 17

Pasadena Fire & Police Retirement System 18
Total FundAsset Allocation History Period Ending: March 31, 2019

Effective 1/01/2017, only traditional asset class (public equity, public fixed income, REITs) investment management fees will be included in the gross of fee return calculation.
Pasadena Fire & Police Retirement System 19
Total FundPeer Universe Comparison: Cumulative Performance (Gross of Fees) Period Ending: March 31, 2019

Effective 1/01/2017, only traditional asset class (public equity, public fixed income, REITs) investment management fees will be included in the gross of fee return calculation.
Total FundPeer Universe Comparison: Consecutive Periods (Gross of Fees) Period Ending: March 31, 2019
Pasadena Fire & Police Retirement System 20

Pasadena Fire & Police Retirement System 21
Total FundPeer Universe Comparison: Asset Allocation Period Ending: March 31, 2019

Data Sources & Methodology Period Ending: March 31, 2019
Pasadena Fire & Police Retirement System 22

Allocation Effect: An attribution effect that describes the amount attributable to the managers' asset allocation decisions, relative to the benchmark.
Alpha: The excess return of a portfolio after adjusting for market risk. This excess return is attributable to the selection skill of the portfolio manager. Alpha is calculated as: Portfolio Return - [Risk-free Rate +
Portfolio Beta x (Market Return - Risk-free Rate)].
Benchmark R-squared: Measures how well the Benchmark return series fits the manager's return series. The higher the Benchmark R-squared, the more appropriate the benchmark is for the manager.
Beta: A measure of systematic, or market risk; the part of risk in a portfolio or security that is attributable to general market movements. Beta is calculated by dividing the covariance of a security by the
variance of the market.
Book-to-Market: The ratio of book value per share to market price per share. Growth managers typically have low book-to-market ratios while value managers typically have high book-to-market ratios.
Capture Ratio: A statistical measure of an investment manager's overall performance in up or down markets. The capture ratio is used to evaluate how well an investment manager performed relative to an
index during periods when that index has risen (up market) or fallen (down market). The capture ratio is calculated by dividing the manager's returns by the returns of the index during the up/down market,
and multiplying that factor by 100.
Correlation: A measure of the relative movement of returns of one security or asset class relative to another over time. A correlation of 1 means the returns of two securities move in lock step, a correlation of
-1 means the returns of two securities move in the exact opposite direction over time. Correlation is used as a measure to help maximize the benefits of diversification when constructing an investment
portfolio.
Excess Return: A measure of the difference in appreciation or depreciation in the price of an investment compared to its benchmark, over a given time period. This is usually expressed as a percentage and
may be annualized over a number of years or represent a single period.
Information Ratio: A measure of a manager's ability to earn excess return without incurring additional risk. Information ratio is calculated as: excess return divided by tracking error.
Interaction Effect: An attribution effect that describes the portion of active management that is contributable to the cross interaction between the allocation and selection effect. This can also be explained as
an effect that cannot be easily traced to a source.
Portfolio Turnover: The percentage of a portfolio that is sold and replaced (turned over) during a given time period. Low portfolio turnover is indicative of a buy and hold strategy while high portfolio turnover
implies a more active form of management.
Price-to-Earnings Ratio (P/E): Also called the earnings multiplier, it is calculated by dividing the price of a company's stock into earnings per share. Growth managers typically hold stocks with high
price-to-earnings ratios whereas value managers hold stocks with low price-to-earnings ratios.
R-Squared: Also called the coefficient of determination, it measures the amount of variation in one variable explained by variations in another, i.e., the goodness of fit to a benchmark. In the case of
investments, the term is used to explain the amount of variation in a security or portfolio explained by movements in the market or the portfolio's benchmark.
Selection Effect: An attribution effect that describes the amount attributable to the managers' stock selection decisions, relative to the benchmark.
Sharpe Ratio: A measure of portfolio efficiency. The Sharpe Ratio indicates excess portfolio return for each unit of risk associated with achieving the excess return. The higher the Sharpe Ratio, the more
efficient the portfolio. Sharpe ratio is calculated as: Portfolio Excess Return / Portfolio Standard Deviation.
Sortino Ratio: Measures the risk-adjusted return of an investment, portfolio, or strategy. It is a modification of the Sharpe Ratio, but penalizes only those returns falling below a specified benchmark. The
Sortino Ratio uses downside deviation in the denominator rather than standard deviation, like the Sharpe Ratio.
Standard Deviation: A measure of volatility, or risk, inherent in a security or portfolio. The standard deviation of a series is a measure of the extent to which observations in the series differ from the arithmetic
mean of the series. For example, if a security has an average annual rate of return of 10% and a standard deviation of 5%, then two-thirds of the time, one would expect to receive an annual rate of return
between 5% and 15%.
Style Analysis: A return based analysis designed to identify combinations of passive investments to closely replicate the performance of funds
Style Map: A specialized form or scatter plot chart typically used to show where a Manager lies in relation to a set of style indices on a two-dimensional plane. This is simply a way of viewing the asset loadings
in a different context. The coordinates are calculated by rescaling the asset loadings to range from -1 to 1 on each axis and are dependent on the Style Indices comprising the Map.
Glossary

This report contains confidential and proprietary information and is subject to the terms and conditions of the Consulting Agreement. It is being provided for use solely by the customer. The reportmay not be sold or otherwise provided, in whole or in part, to any other person or entity without written permission from Verus Advisory, Inc., (hereinafter Verus) or as required by law or any
regulatory authority. The information presented does not constitute a recommendation by Verus and cannot be used for advertising or sales promotion purposes. This does not constitute an offer
or a solicitation of an offer to buy or sell securities, commodities or any other financial instruments or products.
The information presented has been prepared using data from third party sources that Verus believes to be reliable. While Verus exercised reasonable professional care in preparing the report, itcannot guarantee the accuracy of the information provided by third party sources. Therefore, Verus makes no representations or warranties as to the accuracy of the information presented. Verus
takes no responsibility or liability (including damages) for any error, omission, or inaccuracy in the data supplied by any third party. Nothing contained herein is, or should be relied on as a promise,
representation, or guarantee as to future performance or a particular outcome. Even with portfolio diversification, asset allocation, and a long-term approach, investing involves risk of loss that the
investor should be prepared to bear.
The information presented may be deemed to contain forward-looking information. Examples of forward looking information include, but are not limited to, (a) projections of or statementsregarding return on investment, future earnings, interest income, other income, growth prospects, capital structure and other financial terms, (b) statements of plans or objectives of management,
(c) statements of future economic performance, and (d) statements of assumptions, such as economic conditions underlying other statements. Such forward-looking information can be identified
by the use of forward looking terminology such as believes, expects, may, will, should, anticipates, or the negative of any of the foregoing or other variations thereon comparable terminology, or by
discussion of strategy. No assurance can be given that the future results described by the forward-looking information will be achieved. Such statements are subject to risks, uncertainties, and
other factors which could cause the actual results to differ materially from future results expressed or implied by such forward looking information. The findings, rankings, and opinions expressed
herein are the intellectual property of Verus and are subject to change without notice. The information presented does not claim to be all-inclusive, nor does it contain all information that clients
may desire for their purposes. The information presented should be read in conjunction with any other material provided by Verus, investment managers, and custodians.
Verus will make every reasonable effort to obtain and include accurate market values. However, if managers or custodians are unable to provide the reporting period's market values prior to thereport issuance, Verus may use the last reported market value or make estimates based on the manager's stated or estimated returns and other information available at the time. These estimates
may differ materially from the actual value. Hedge fund market values presented in this report are provided by the fund manager or custodian. Market values presented for private equity
investments reflect the last reported NAV by the custodian or manager net of capital calls and distributions as of the end of the reporting period. These values are estimates and may differ
materially from the investments actual value. Private equity managers report performance using an internal rate of return (IRR), which differs from the time-weighted rate of return (TWRR)
calculation done by Verus. It is inappropriate to compare IRR and TWRR to each other. IRR figures reported in the illiquid alternative pages are provided by the respective managers, and Verus has
not made any attempts to verify these returns. Until a partnership is liquidated (typically over 10-12 years), the IRR is only an interim estimated return. The actual IRR performance of any LP is not
known until the final liquidation.
Verus receives universe data from InvestorForce, eVestment Alliance, and Morningstar. We believe this data to be robust and appropriate for peer comparison. Nevertheless, these universes maynot be comprehensive of all peer investors/managers but rather of the investors/managers that comprise that database. The resulting universe composition is not static and will change over time.
Returns are annualized when they cover more than one year. Investment managers may revise their data after report distribution. Verus will make the appropriate correction to the client account
but may or may not disclose the change to the client based on the materiality of the change.
Disclaimer

Current % Policy %_
Domestic Equity LargeCap Core $9,264,604 8.3% $8,924,484 8.0%
Domestic Equity LargeCap Growth $4,716,758 4.2% $4,462,242 4.0%
Domestic Equity LargeCap Value $4,494,965 4.0% $4,462,242 4.0%
Domestic Equity SmallCap Core $4,592,128 4.1% $4,462,242 4.0%
International Equity $22,420,679 20.1% $22,311,210 20.0%Domestic FixedIncome Core $21,266,543 19.1% $22,311,210 20.0%
Domestic FixedIncome Bank Loans $10,964,760 9.8% $11,155,605 10.0%
Domestic FixedIncome Short Term $10,458,126 9.4% $11,155,605 10.0%
Domestic FixedIncome Real Return $4,695,894 4.2% $5,577,803 5.0%
Real Estate $11,452,442 10.3% $11,155,605 10.0%Alternative Investment $5,522,253 5.0% $5,577,803 5.0%Cash and Equivalents $1,706,900 1.5% $0 0.0%Total $111,556,051 100.0% $111,556,051 100.0%
XXXXX
Market Value % ofPortfolio 1 Mo YTD Fiscal
YTD 1 Yr_
Total Fund 111,556,051 100.0 1.8 8.2 4.5 4.5Policy Index 1.6 8.1 4.5 5.1Total Domestic Equity 23,068,456 20.7 4.2 17.5 9.1 12.9
S&P 500 4.0 18.2 10.1 13.5Vanguard Institutional Index Ins 9,264,604 8.3 4.0 18.3 10.1 13.5
S&P 500 4.0 18.2 10.1 13.5T. Rowe Price Instl Large Cap Growth 4,716,758 4.2 3.3 18.5 10.3 15.4
Russell 1000 Growth 4.5 21.3 11.4 17.4Dodge & Cox Stock 4,494,965 4.0 4.7 15.5 6.3 8.4
Russell 1000 Value 3.5 15.9 8.2 9.1Atlanta Capital Management Company 4,592,128 4.1 4.8 16.8 8.6 14.9
Russell 2000 3.4 18.5 -2.1 4.6Russell 2500 3.5 19.9 2.3 7.9
Total International Equity 22,420,679 20.1 3.6 15.5 1.0 -3.8MSCI EAFE 2.8 13.1 0.2 -3.2MSCI ACWI ex USA 2.6 13.2 1.0 -3.2Dodge & Cox Intl Stock 10,950,604 9.8 4.2 14.4 1.0 -5.5
MSCI ACWI ex USA 2.6 13.2 1.0 -3.2American Funds Europacific Growth R6 11,470,075 10.3 3.0 16.6 1.1 -2.1
MSCI ACWI ex USA 2.6 13.2 1.0 -3.2Total Domestic Fixed 47,385,322 42.5 0.5 3.5 3.9 4.5
BBgBarc US Aggregate TR 0.0 3.0 4.7 5.3Metropolitan West Core Plus Fixed Income 21,266,543 19.1 0.0 2.9 4.5 5.2
BBgBarc US Aggregate TR 0.0 3.0 4.7 5.3Voya Senior Loan Fund 10,964,760 9.8 1.7 5.5 3.7 3.9
S&P/LSTA Leveraged Loan Index 1.7 5.7 3.9 4.2Vanguard Short-Term Investment Grade Adm 10,458,126 9.4 0.4 2.5 3.9 4.3
BBgBarc US Credit 1-5 Yr TR 0.3 2.7 4.3 4.7Vanguard Inflation-Protected Securities Adm 4,695,894 4.2 0.3 3.5 2.1 3.1
BBgBarc US TIPS TR 0.3 3.5 2.3 3.1
Pasadena Fire & Police Retirement SystemExecutive Summary - Preliminary (Net of Fees) Period Ending: April 30, 2019
Policy Index as of 6/1/2018: 8% S&P 500, 4% Russell 1000 Value, 4% Russell 1000 Growth, 4% Russell 2000, 20% MSCI EAFE, 20% BBgBarc US Aggregate, 5% BBgBarc US TIPS, 10% BBgBarc US 1-5 Yr Credit, 10% S&P/LSTALeveraged Loan, 10% NCREIF-ODCE, 5% CPI + 5%. FY: 6/30. Pooled Cash not included in Total Fund calculation. CPI LOCAL (LA) included Los Angeles-Riverside-Orange County until 12/31/2017. Effective 1/1/2018 due to geographicalrevisions, CPI LOCAL (LA) includes Los Angeles-Long Beach-Anaheim. Effective 3/1/2015 Atlanta SMID Cap strategy changed to Atlanta Small Cap Core strategy. Vanguard Growth Index Ins liquidated 5/29/2018. T. Rowe Price Instl LargeCap Growth Ins and Vanguard Institutional Index Ins funded 5/30/2018. All data is preliminary.
Pasadena Fire & Police Retirement System 1
mprice
Typewritten Text
DATE: 5/15/19 ITEM #: 13b

Policy Index as of 6/1/2018: 8% S&P 500, 4% Russell 1000 Value, 4% Russell 1000 Growth, 4% Russell 2000, 20% MSCI EAFE, 20% BBgBarc US Aggregate, 5% BBgBarc US TIPS, 10% BBgBarc US 1-5 Yr Credit, 10% S&P/LSTALeveraged Loan, 10% NCREIF-ODCE, 5% CPI + 5%. FY: 6/30. Pooled Cash not included in Total Fund calculation. CPI LOCAL (LA) included Los Angeles-Riverside-Orange County until 12/31/2017. Effective 1/1/2018 due to geographicalrevisions, CPI LOCAL (LA) includes Los Angeles-Long Beach-Anaheim. Effective 3/1/2015 Atlanta SMID Cap strategy changed to Atlanta Small Cap Core strategy. Vanguard Growth Index Ins liquidated 5/29/2018. T. Rowe Price Instl LargeCap Growth Ins and Vanguard Institutional Index Ins funded 5/30/2018. All data is preliminary.
Pasadena Fire & Police Retirement SystemExecutive Summary - Preliminary (Net of Fees) Period Ending: April 30, 2019
Pasadena Fire & Police Retirement System 2
Market Value % ofPortfolio 1 Mo YTD Fiscal
YTD 1 Yr_
Total Real Estate 11,452,442 10.3 N/A N/A N/A 6.7NCREIF-ODCE N/A N/A N/A 7.5NCREIF Property Index N/A N/A N/A 6.8Invesco Core Real Estate 11,452,442 10.3 N/A N/A N/A 6.7
NCREIF-ODCE N/A N/A N/A 7.5Total Alternatives 5,522,253 5.0 0.6 6.0 2.9 0.4
CPI + 5% N/A N/A N/A 6.1CPI (UNADJUSTED) N/A N/A N/A 1.5CPI LOCAL (LA) N/A N/A N/A 2.3PIMCO All Asset Ins 5,522,253 5.0 0.6 6.0 2.9 0.4
CPI + 5% N/A N/A N/A 6.1HFRI Fund of Funds Composite Index N/A N/A N/A -0.1
Cash 1,706,900 1.5 0.2 0.7 1.7 2.0FTSE T-Bill 3 Months TR 0.2 0.8 1.9 2.2First American Treasury Obligation Z 1,706,900 1.5 0.2 0.7 1.7 2.0
FTSE T-Bill 3 Months TR 0.2 0.8 1.9 2.2XXXXX

Pasadena Fire & Police Retirement SystemExecutive Summary with Pooled Cash - Preliminary Period Ending: April 30, 2019
Pasadena Fire & Police Retirement System 3
TotalMarketValue
% ofPortfolio
DomesticEquity
Large CapCore
DomesticEquity
Large CapGrowth
DomesticEquity
Large CapValue
DomesticEquity
Small CapCore
International Equity
DomesticFixed
IncomeCore
DomesticFixed
IncomeBank Loans
DomesticFixed
IncomeShort Term
DomesticFixed
IncomeReal Return
Real Estate AlternativeInvestment
Cash andEquivalents
_
Total Fund Total Domestic Equity
Vanguard Institutional Index Ins $9,264,604 8.2% $9,264,604T. Rowe Price Instl Large Cap Growth $4,716,758 4.2% $4,716,758Dodge & Cox Stock $4,494,965 4.0% $4,494,965Atlanta Capital Management Company $4,592,128 4.1% $4,592,128
Total International Equity Dodge & Cox Intl Stock $10,950,604 9.7% $10,950,604American Funds Europacific Growth R6 $11,470,075 10.2% $11,470,075
Total Domestic Fixed Metropolitan West Core Plus Fixed Income $21,266,543 18.8% $21,266,543Voya Senior Loan Fund $10,964,760 9.7% $10,964,760Vanguard Short-Term Investment Grade Adm $10,458,126 9.3% $10,458,126Vanguard Inflation-Protected Securities Adm $4,695,894 4.2% $4,695,894
Total Real Estate Invesco Core Real Estate $11,452,442 10.1% $11,452,442
Total Alternatives PIMCO All Asset Ins $5,522,253 4.9% $5,522,253
Cash First American Treasury Obligation Z $1,706,900 1.5% $1,706,900
Pooled Cash $1,299,346 1.2% $1,299,346Total $112,855,397 100.0% $9,264,604 $4,716,758 $4,494,965 $4,592,128 $22,420,679 $21,266,543 $10,964,760 $10,458,126 $4,695,894 $11,452,442 $5,522,253 $3,006,246

Asset Class Manager Name Ticker Symbol CUSIP Actual $ Actual % Targets %
Above / Under
Target % Target $
Re‐Balance
Estimate
Re‐Balance
Actual New $ New %
Variance to
Targets (%)
Domestic Equity
Large Cap Core Vanguard Institutional Index VINIX 922040100 9,265,299$ 8.3% 8.0% 0.3% 8,927,886$ (337,413)$ (150,000) 9,115,299$ 8.3% 0.3%
Large Cap Value Dodge & Cox Stock DODGX 256219106 4,501,750$ 4.0% 4.0% 0.0% 4,463,943$ (37,807)$ 4,501,750$ 4.1% 0.1%
Large Cap Growth T. Rowe Price Institutional Large Cap Growth TRLGX 45775L408 4,720,103$ 4.2% 4.0% 0.2% 4,463,943$ (256,159)$ (200,000) 4,520,103$ 4.1% 0.1%
Small Cap Core Atlanta Capital Management n/a n/a 4,653,291$ 4.2% 4.0% 0.2% 4,463,943$ (189,348)$ (150,000) 4,503,291$ 4.1% 0.1%
Total Domestic 23,140,443$ 20.7% 20.0% 0.7% 22,319,716$ (820,726)$ (500,000) 22,640,443$ 20.7% 0.7%
International Equity
International Value Dodge & Cox Int'l Stock DODFX 256206103 10,963,576$ 9.8% 10.0% ‐0.2% 11,159,858$ 196,282$ 10,963,576$ 10.0% 0.0%
International Growth American Funds EuroPacific Growth RERGX 298706821 11,572,838$ 10.4% 10.0% 0.4% 11,159,858$ (412,979)$ 11,572,838$ 10.6% 0.6%
Total International 22,536,413$ 20.2% 20.0% 0.2% 22,319,716$ (216,697)$ 0 22,536,413$ 20.6% 0.6%
Total Equity 45,676,856$ 40.9% 40.0% 0.9% 44,639,432$ (1,037,424) (500,000) 45,176,856$ 41.3% 1.3%
Fixed Income
Core Fixed MetWest Core Plus 1 n/a n/a 21,154,886$ 19.0% 20.0% ‐1.0% 22,319,716$ 1,164,830$ 21,154,886$ 19.3% ‐0.7%
Short‐Term Fixed Vanguard Short‐Term Investment‐Grade VFSUX 922031836 10,438,394$ 9.4% 10.0% ‐0.6% 11,159,858$ 721,464$ 10,438,394$ 9.5% ‐0.5%
Senior Bank Loans Voya Senior Bank Loan CIT n/a n/a 10,974,277$ 9.8% 10.0% ‐0.2% 11,159,858$ 185,581$ 10,974,277$ 10.0% 0.0%
Real Return Vanguard Inflation‐Protected Securities VAIPX 922031745 4,677,355$ 4.2% 5.0% ‐0.8% 5,579,929$ 902,574$ 4,677,355$ 4.3% ‐0.7%
Total Fixed 47,244,911$ 42.3% 45.0% ‐2.7% 50,219,362$ 2,974,450$ 0 47,244,911$ 43.2% ‐1.8%
Real Estate
Real Estate Invesco Core Real Estate 2 n/a n/a 11,452,442$ 10.3% 10.0% 0.3% 11,159,858$ (292,584)$ 11,452,442$ 10.5% 0.5%
Total Real Estate 11,452,442$ 10.3% 10.0% 0.3% 11,159,858$ (292,584)$ 0 11,452,442$ 10.5% 0.5%
Liquid Alternatives
Liquid Alternatives PIMCO All Asset PAAIX 722005626 5,517,472$ 4.9% 5.0% ‐0.1% 5,579,929$ 62,457$ 5,517,472$ 5.0% 0.0%
Total Alternatives 5,517,472$ 4.9% 5.0% ‐0.1% 5,579,929$ 62,457$ 0 5,517,472$ 5.0% 0.0%
Cash First American Treasury Obligations 3 FUZXX 195998BA6 1,706,900$ 1.5% 0.0% 1.5% ‐$ (1,706,900)$ (1,700,000) 6,900$ 0.0% 0.0%
Total Assets 111,598,581$ 100.0% 100% 0% 111,598,581$ 0$ (2,200,000)$ 109,398,581$ 100% 0.0%
Total assets including Pooled Cash ($1,299,346) 112,897,927$ 1 Including negative cash from mortgage TBD forward contracts2 As of 3/31/2019 less April 1 redemption
Pasadena Fire and Police Retirement Plan
May 3, 2019
mprice
Typewritten Text
DATE: 5/15/19 ITEM #: 13c

PASADENA FIRE & POLICE RETIREMENT SYSTEM
STATEMENT OF INVESTMENT POLICY
Adopted:
May 15, 2019
bjazmines
Typewritten Text
Date: 5/15/19 Item #: 13d
bjazmines
Typewritten Text
bjazmines
Typewritten Text
bjazmines
Typewritten Text
bjazmines
Typewritten Text
bjazmines
Typewritten Text
bjazmines
Typewritten Text

Page 2 of 7 Pasadena Fire & Police Retirement System Investment Policy Statement
I. Statement of Purpose
The purpose of this Investment Policy Statement is to set forth in writing: (1) an appropriate set of objectives and goals regarding the investment of the assets of the Pasadena Fire & Police Retirement System(the “System”); (2) the position of the System’s Retirement Board (the “Retirement Board” or “Board”) with respect to the System's risk/return posture, including allocation of assets, and establishment of investment guidelines; and (3) an overall system of investment policies and practices designed to permit the continued financial obligations of the System to be satisfied.
II. Statement of Responsibilities
The following parties associated with the System shall discharge their respective responsibilities in accordance with all applicable fiduciary standards, including: (1) in the sole interest of the System’s participants and beneficiaries; (2) with the care, skill, prudence and diligence under the circumstances then prevailing that a prudent person acting in like capacity and familiar with such matters would use in the conduct of an enterprise of a like character and of like aims; (3) by diversifying the investments so as to minimize the risk of large losses; (4) complying with all applicable rulings, regulations, and legislation; and (5) acknowledging and accepting this Statement of Investment Policy. A. Retirement Board: The members of the Retirement Board are fiduciaries with respect to
the System and have been delegated the authority to supervise the System’s investments. B. Investment Managers: The investment managers are delegated the responsibility of
investment management of the System’s assets in accordance with this Investment Policy Statement and any laws that supersede it. The investment managers must either be (1) registered under the Investment Company Act of 1940, (2) registered under the Investment Advisers Act of 1940 (the “Advisers Act”), (3) a bank, as defined in the Advisers Act, (4) an insurance company qualified under the laws of more than one state to perform the services of managing, acquiring or disposing of System assets, or, (5) such other person or organization authorized by applicable law or regulation to function as an investment manager.
C. Custodian: The custodian bank is charged with the responsibility of safekeeping the
securities; collection and disbursement of System assets, and periodic accounting statements. D. Investment Consultant: The investment consultant is charged with the responsibility of
advising the Retirement Board on investment policy, the selection of investment managers, providing performance analysis and monitoring services.
E. Legal Counsel: Legal counsel will advise and represent the Retirement Board in all matters
requiring legal insight and advice.
F. Actuary: The plan actuary is charged with the responsibility of preparing a comprehensive evaluation of the System’s funded status, required contribution levels, and attest to the appropriateness of the System’s assumptions and funding policy.
III. Statement of Investment Philosophy
A. The Retirement Board is committed to: (1) protecting the corpus of the System; (2) obtaining
adequate investment returns in order to protect and pay the benefits promised to the participants; (3) complying with applicable law.

Page 3 of 7 Pasadena Fire & Police Retirement System Investment Policy Statement
B. The System shall be managed in a prudent manner recognizing risk and return trade-offs. While concerned with avoiding undue risk, the Retirement Board is desirous of maximizing investment gains. Accordingly, consistent with safety of principal over the long term, investments shall be chosen to maximize the return on invested assets. Sufficient liquidity shall also be maintained to fund expenses and benefit payments.
IV. Investment Objectives
The Investment Objectives for the System will be for the asset value, exclusive of contributions or withdrawals, to grow over the long run and earn, through a combination of investment income and capital appreciation, a rate of return (time-weighted total return) in excess of the benchmarks established for the medium term (3 years) and long term (5 years). Given the System is currently a closed-plan, the Retirement Board has adopted a long-term investment horizon such that the chances and duration of investment losses are carefully weighed against the long-term potential for the appreciation of assets.
Medium Term Performance Objectives
A. The objective of the total fund is to earn a return that exceeds the return of the indexes weighted in accordance with the current target asset allocation.
B. Within each of the following segments, the objective of an index fund is to
match the respective index while the objective of an active manager is to exceed
the return of the respective index as well as the median return within a
representative performance universe.
Segment Index
Large Cap Core Equity S&P 500
Large Cap Growth Equity Russell 1000 Growth
Large Cap Value Equity Russell 1000 Value
Small Cap Core Equity Russell 2000
International Developed Equity MSCI ACWI ex US
Core Plus Fixed Income Bloomberg Barclays US Aggregate
Bond
Short-Term Fixed Income Bloomberg Barclays US 1-5 Year
Credit
Bank Loans S&P/LSTA Leveraged Loan
TIPS Bloomberg Barclays US TIPS
REITs FTSE NAREIT
Real Estate NCREIF-ODCE
Liquid Alternatives Consumer Price Index +5%

Page 4 of 7 Pasadena Fire & Police Retirement System Investment Policy Statement
Long Term Performance Objectives
A. The objective of the total fund is to earn a return that exceeds the return of the indexes
weighted in accordance with the current target asset allocation. B. The Total Fund is to meet or exceed the actuarial assumed rate of return
V. Asset Allocation
The following allocations of System assets shall serve as the general guidelines for System investments:
Asset Class Target Allocation Minimum Maximum
US Large Cap Core 8.0% 3.0% 20.0%
US Large Cap Value 4.0% 0.0% 10.0%
US Large Cap Growth 4.0% 0.0% 10.0%
US Small Cap Core 4.0% 0.0% 10.0%
Non-U.S.(Developed Market) 20.0% 10.0% 25.0%
US Core Fixed Income 25.0% 15.0% 40%
Short-Term Fixed Income 10.0% 0.0% 15.0%
Bank Loans 5.0% 0.0% 10.0%
TIPS 5.0% 0.0% 10.0%
US REITS 0.0% 0.0% 15.0%
Real Estate 10.0% 0.0% 15.0%
Liquid Alternatives 5.0% 0.0% 10.0%
Cash 0.0% 0.0% 10.0%
VI. Investment Guidelines
It is the intention of the Retirement Board to allow the investment managers full discretion within the scope of these mutually agreed upon investment guidelines, the applicable investment management agreement, and any laws that supersede either of these documents. The investment managers shall review the cash flow requirements with the Retirement Board at least annually and shall take such requirements into consideration in their investment decisions. Annual Review Meeting: Each investment manager will be expected to meet annually with the Retirement Board. The agenda for these meetings shall include, but not be limited to:
explain performance behavior against respective benchmarks as given in the performance standards section of the statement of investment policy
Page 5 of 7 Pasadena Fire & Police Retirement System Investment Policy Statement
the manager’s investment performance and risk levels in light of the stated policies and objectives;
the manager’s view on important developments within the economy and the securities markets and their potential effect on investment strategy, asset allocation, and portfolio performance;
the effects of changes within the manager’s organization on investment philosophy, strategy, and performance;
amendments to the policies and objectives presented in this Policy;
pertinent changes in the portfolio’s actuarial situation. The Retirement Board may call more frequent meetings at its discretion. Liquidity: The Retirement Board will monitor the System’s cash flow on a regular basis, and sufficient liquidity shall be maintained to fund benefit payment outflows. When withdrawals become necessary, the Board will notify the investment managers as far in advance as possible to allow them sufficient time to acquire necessary liquid reserves. Proxy Voting: The investment managers shall have the sole and exclusive right to vote any and all proxies solicited in connection with the securities held by the System. Investment managers must vote proxies in a manner that, in the judgment of the investment manager, serves the best interests of the System and its beneficiaries. Managers are not permitted to vote proxies blindly as recommended by management, and must exercise due diligence in ascertaining the facts and circumstances of the matter being voted on. Trading and Execution: The investment managers shall use their best efforts to obtain execution of orders through responsible brokerage firms at the most favorable prices and competitive commission rates.
VII. Investment Performance Review and Evaluation
A. It is the objective of the Retirement Board to review the investment results of the System quarterly. Performance comparisons will be made against a representative performance universe and the performance objectives set forth in this policy statement.
B. The Retirement Board, with the assistance of the investment consultant, shall periodically
review the qualitative developments of each investment manager. This evaluation should include: changes in ownership, personnel turnover, adherence to investment style and philosophy, and any other qualities that the Retirement Board deems appropriate. This review should also include an assessment as to whether each investment manager has operated within the scope of this Investment Policy Statement.
C. The Retirement Board is desirous of holding each investment manager accountable for the
performance of the assets over which such investment manager exercises discretion. If an investment manager fails to accomplish the investment objectives as set forth in this Investment Policy Statement over a market cycle (typically three to five years), the Retirement Board may place the investment manager on probation. The Retirement Board will continue to monitor the investment results until the Board determines that removal of probation or termination of the investment manager is warranted. The Retirement Board still reserves the right to terminate investment managers if they violate this investment policy statement, experience personnel or organizational changes, or if the Retirement Board determines that a change of investment managers is in the best interests of the participants.

Page 6 of 7 Pasadena Fire & Police Retirement System Investment Policy Statement
D. The investment managers must disclose all major changes in their organization or investment philosophy to the Retirement Board within 30 days. Further, all registered investment advisors must present updated ADV-2 forms on an annual basis to the Retirement Board.
VIII. Administrative Practices
A. Communication and Reporting of Investment Managers: The investment managers are responsible for
frequent and open communication in writing with the Retirement Board on all significant matters pertaining to investment policies and the management of the System's assets. Each investment manager must include a copy of its individual portfolio guidelines along with the quarterly report. Investment managers are required to advise the Retirement Board in writing of any violation or any need for changes to the portfolio guidelines.
B. Compensation of Investment Managers: Each investment manager retained by the System shall be
compensated quarterly by a formula contained in the investment management agreement. No investment manager retained by the System shall receive a payment of commission or other fees on a particular investment transaction. Further, each investment manager must disclose to the Retirement Board any indirect compensation received in addition to its fees as a result of servicing the System.
C. Acknowledgment of Fiduciary Responsibility: The investment managers are expected to acknowledge
in writing their recognition and acceptance of full responsibility as a fiduciary under appropriate federal and state legislation and be covered by appropriate and adequate insurance and bonding.
D. Rebalancing: The Retirement Board will periodically review the asset allocation set forth in this
Investment Policy Statement and determine the necessity of rebalancing the System’s assets. The Retirement Board will consider the benefits of maintaining an asset allocation that is consistent with the target asset allocation against the transaction costs associated with rebalancing. While it is considered beneficial to allow the portfolio to moderately change relative to the target allocation, rebalancing should occur prior to the maximum and minimum targets specified above.
E. Cash Liquidity Policy: The following procedures are hereby adopted and will remain in effect
until such time as monthly cash flows of the System support the ongoing benefit and expense payments required by the System.
The Cash Liquidity Policy for the System shall be integrated with the management of the System’s asset allocation rebalancing policy
Cash required for monthly benefit payments and operating expenses shall be distributed from a cash account. The balance in that account will be monitored on a frequent basis and replenished as necessary, but not less often than quarterly.
When it is determined that there is insufficient cash in the designated cash account to fund upcoming cash withdrawals, transfers will be made from one or more of the investment accounts into the cash account. The determination of which accounts will provide funds to the cash account will be made by the Board in consultation with the investment consultant, with the following objectives:
Rebalance toward the target asset allocation of each account
Minimize the transaction costs of providing cash.

Page 7 of 7 Pasadena Fire & Police Retirement System Investment Policy Statement
IX. Policy Changes
The investment consultant shall advise the Retirement Board of any restrictions within this Investment Policy Statement which may prevent the investment manager(s) from obtaining the objectives and goals set forth herein. Any violation of the investment guidelines or other sections of this Investment Policy Statement discovered by the investment consultant in the preparation of its regular performance review shall be reported immediately to the Retirement Board and discussed at their next regularly scheduled meeting.
X. Review and Revisions
The Investment Policy Statement shall be updated as required and reviewed on an annual basis. The Retirement Board reserves the right to amend the Investment Policy Statement at any time they deem such amendment to be necessary, or to comply with changes in federal law as these changes affect the investment of System assets.
IN WITNESS HEREOF, the Investment Policy Statement has been approved and executed by the Retirement Board on this _____ day of _______________, 2019.
__________________________________ _________________________________ Chairman Board Member

A B C D E F G H
Acct # Descriptions
Actual
For
Month
Budget
For
Month
Variance
For
Month
Actual
Year To
Date
Budget
Year To Date
Variance
Year To
Date
1 System Revenue:
2 751000 Concord Asset Income 0 0 0 0 0 0
3 668900 Miscellaneous Cash/Income 1,161 0 1,161 1,262 0 1,262
4 703200 City Cash Contributions 0 0 0 0 0 0
5 Total System Revenues 1,161 0 1,161 1,262 0 1,262
6
7 Expenses:
8 800500/5800 Personnel Costs 13,296 15,308 2,012 115,435 152,140 36,705
9 802200 Retiree Payroll 1,043,784 1,078,806 35,022 10,724,255 10,842,389 118,134
10 Subtotal Pers./Retiree Payroll 1,057,080 1,094,113 37,033 10,839,690 10,994,529 154,839
11
12 Services & Supplies:
13 810100 Materials and Supplies 0 63 63 1,566 625 (941)
14 810900 Small Equipment Purchases 0 0 0 0 0 0
15 811000 Outside Printing & Duplication 0 0 0 389 733 344
16 811300 Equip. Lease Payments 117 175 58 1,057 1,750 693
17 810800 Computer Related Supplies - Software 0 0 0 446 0 (446)
18 813500 Reference Materials - Subscriptions 0 0 0 0 0 0
19 813900 Water 37 33 (4) 422 330 (92)
20 812400 Dues and Memberships 0 0 0 750 750 0
21 812700/2900 Conferences/Meetings - Board/Staff 0 167 167 317 1,667 1,350
22 815600 Insurance 1,975 0 (1,975) 19,746 23,695 3,949
23 811400 Contract Services 0 0 0 0 0 0
24 811400 Misc Services 0 0 0 0 0 0
25 811400 Actuarial Services 2,500 0 (2,500) 16,000 17,500 1,500
26 811400 Asset Managers 0 0 0 0 0 0
27 811400 Auditing Services 0 0 0 46,109 47,500 1,391
28 811400 PensionGold Svs 641 692 51 6,421 6,917 495
29 811400 Custodial Bank Svs 0 0 0 0 0 0
30 811400 Investment Consultant Svs 0 0 0 0 0 0
31 811400 Outside Legal Counsel 0 0 0 0 0 0
32 860700 Berwyn Group 0 0 0 300 300 0
33 Contract Services 3,141 692 (2,449) 68,830 72,217 3,386
34 814800 Investment Expenses
35 814800 Misc/Other Fees 0 0 0 0 0 0
36 814800 Custodial Bank Svs 1,770 1,833 63 17,673 16,500 (1,173)
37 814800 Investment Consultant Svs 9,583 9,583 0 95,833 95,833 0
38 814800 Subtotal Investment Expenses 11,353 11,417 63 113,506 112,333 (1,173)
39 Subtotal Services & Supplies 16,622 12,546 (4,077) 207,029 215,933 8,905
40
41 Internal Service Charges:
42 860700 Printing 2 0 (2) 300 83 (217)
43 814400 Postage 15 71 56 215 708 493
44 862600 Mail Services 0 8 8 0 83 83
45 861100 IS-Applic. Devel. & Support 0 17 17 0 167 167
46 861200 IS-PC Network Support 0 21 21 0 208 208
47 Subtotal Int. Service Charges 17 117 99 515 1,250 735
48
Fire and Police Retirement Board
FY 2019
Comparison of Actual to Budget
For the Month and Year Ended April 30, 2019
Administration and Operating Expenses
Page 1 of 2
5/8/2019 5:05 PM
FPRS Adopted Budget FY 2019 draft
April
mprice
Typewritten Text
DATE: 5/15/19 ITEM #: 14a

A B C D E F G H
Acct # Descriptions
Actual
For
Month
Budget
For
Month
Variance
For
Month
Actual
Year To
Date
Budget
Year To Date
Variance
Year To
Date
Fire and Police Retirement Board
FY 2019
Comparison of Actual to Budget
For the Month and Year Ended April 30, 2019
Administration and Operating Expenses
49 Equipment:
50 850400 Equipment/Furniture 0 0 0 0 0 0
51 850600 Computer Equipment 0 0 0 0 0 0
52 Subtotal Equipment 0 0 0 0 0 0
53
54 City Service Charges:
55 860100/2000/3400 Struct Maint/Prev Maint/Sec 456 439 (17) 4,557 4,391 (166)
56 860400 Utilities and Insurance 162 180 18 1,622 1,800 178
57 860500 Housekeeping 142 140 (2) 1,425 1,403 (23)
58 862200 Telephones 8 13 5 84 125 41
59 863600 DoIT Desktop Replacement Prog 24 24 (0) 237 238 1
60 864300 FY 2014 Cost Allocation Prog 0 0 0 0 0 0
61 Subtotal City Serv Charges 792 796 4 7,925 7,956 31
62
63 Subtotal FPRS Admin Expenses 30,728 28,766 (1,962) 330,905 377,280 46,375
64
65 Total FPRS Operating Expenses 1,074,512 1,107,571 33,060 11,055,159 11,219,668 164,509
66
67 City Legal Expenses (I. Safie) 0 32,578
Balance of FPRS Funds Actual for Actual for
US Bank - Beg. Of Month 109,496,619 Investment Expenses Month YTD
Receipts 0 Atlanta Cap Qtly (USB) 8,778 35,275
Investment Income 0 MetWest Qtly (USB) 18,619 78,491
Disbursements 0 Invesco (USB) 0 108,263
Fees & Expenses 0 Voya (USB) 4,600 46,780
Net Chg in Unrealized Gain/Loss 0 Class Action Fees (USB) 0 0
Realized Gain/Loss 0 Misc/Other 0 0
US Bank - End Of Month* 111,556,051 US Bank 1,770 17,673
Equity in Pooled Cash (100100) 1,299,346 Verus Investments 9,583 95,833
Concord Investment 0 Total Investment Exp 34,573 382,316
Total FPRS Funds on Deposit 112,855,397
Page 2 of 2
5/8/2019 5:05 PM
FPRS Adopted Budget FY 2019 draft
April