
AGENDA NO. 9/15 Works and Community Committee - City of ...
271
ATTACHMENTS FOR: AGENDA NO. 9/15 Works and Community Committee Meeting Date: Tuesday 16 June 2015 Location: Committee Room 1, Level 5, Civic Centre, 1 Devlin Street, Ryde Time: 5.00pm ATTACHMENTS FOR WORKS AND COMMUNITY COMMITTEE Item Page 2 PARRAMATTA RYDE SUBCATCHMENTS, KITTYS CREEK AND BUFFALO CREEK CATCHMENT FLOOD STUDY AND FLOODPLAIN RISK MANAGEMENT STUDY AND PLAN Attachment 1 Buffalo and Kittys Creek Flood Study Report - November 2014 .................................................................. 1 Attachment 2 Buffalo and Kittys Creek Floodplain Risk Management Study and Plan Report - November 2014................................................................................ 177 Attachment 3 Buffalo and Kittys Creek Floodplain Risk Management Committee - Minutes - 4 March 2015 ........ 271 Attachment 4 Parramatta River Ryde subcatchment - Flood Study Report - August 2013...................................................... 276 Attachment 5 Parramatta Ryde subcatchment- Floodplain Risk Management Study and Plan Report - August 2015....... 348 Attachment 6 Parramatta River - Ryde Subcatchment Floodplain Risk Management Committee Meeting - 22 April 2015 - Minutes ................................................................ 444
-
Upload
khangminh22 -
Category
Documents
-
view
0 -
download
0
Transcript of AGENDA NO. 9/15 Works and Community Committee - City of ...
ATTACHMENTS FOR: AGENDA NO. 9/15
Works and Community Committee
Meeting Date: Tuesday 16 June 2015 Location: Committee Room 1, Level 5, Civic Centre, 1 Devlin Street, Ryde Time: 5.00pm
ATTACHMENTS FOR WORKS AND COMMUNITY COMMITTEE
Item Page 2 PARRAMATTA RYDE SUBCATCHMENTS, KITTYS CREEK AND
BUFFALO CREEK CATCHMENT FLOOD STUDY AND FLOODPLAIN RISK MANAGEMENT STUDY AND PLAN Attachment 1 Buffalo and Kittys Creek Flood Study Report -
November 2014 .................................................................. 1 Attachment 2 Buffalo and Kittys Creek Floodplain Risk
Management Study and Plan Report - November 2014 ................................................................................ 177
Attachment 3 Buffalo and Kittys Creek Floodplain Risk Management Committee - Minutes - 4 March 2015 ........ 271
Attachment 4 Parramatta River Ryde subcatchment - Flood Study Report - August 2013 ...................................................... 276
Attachment 5 Parramatta Ryde subcatchment- Floodplain Risk Management Study and Plan Report - August 2015 ....... 348
Attachment 6 Parramatta River - Ryde Subcatchment Floodplain Risk Management Committee Meeting - 22 April 2015 - Minutes ................................................................ 444
City of Ryde Council Buffalo and Kittys Creek Flood Study
Flood Study Report
November 2014
ITEM 2 (continued) ATTACHMENT 1
Page 1

ITEM 2 (continued) ATTACHMENT 1
Page 2

GHD | Report for City of Ryde Council - Buffalo and Kittys Creek Flood Study, 21/21394 | i
This report has been prepared by GHD for City of Ryde Council and may only be used and relied on by City of Ryde Council for the purpose agreed between GHD and City of Ryde Council as set out in section 1 of this report.
GHD otherwise disclaims responsibility to any person other than City of Ryde Council arising in connection with this report. GHD also excludes implied warranties and conditions, to the extent legally permissible.
The services undertaken by GHD in connection with preparing this report were limited to those specifically detailed in the report and are subject to the scope limitations set out in the report.
The opinions, conclusions and any recommendations in this report are based on conditions encountered and information reviewed at the date of preparation of the report. GHD has no responsibility or obligation to update this report to account for events or changes occurring subsequent to the date that the report was prepared.
The opinions, conclusions and any recommendations in this report are based on assumptions made by GHD described in this report. GHD disclaims liability arising from any of the assumptions being incorrect.
GHD has prepared this report on the basis of information provided by City of Ryde Council and others who provided information to GHD (including Government authorities)], which GHD has not independently verified or checked beyond the agreed scope of work. GHD does not accept liability in connection with such unverified information, including errors and omissions in the report which were caused by errors or omissions in that information.
GHD excludes and disclaims all liability for all claims, expenses, losses, damages and costs, including indirect, incidental or consequential loss, legal costs, special or exemplary damages and loss of profits, savings or economic benefit, City of Ryde Council may incur as a direct or indirect result of the database being transferred to council, for any reason being inaccurate, incomplete or incapable of being processed on City of Ryde Council’s equipment or systems or failing to achieve any particular purpose. To the extent permitted by law, GHD excludes any warranty, condition, undertaking or term, whether express or implied, statutory or otherwise, as to the condition, quality, performance, merchantability or fitness for purpose of the information database transferred to Council. This study was commissioned by the City of Ryde with financial assistance from the NSW Government through its Floodplain Management Program. This document does not necessarily represent the opinions of the NSW Government or the Office of Environment and Heritage.
ITEM 2 (continued) ATTACHMENT 1
Page 3
ii | GHD | Report for City of Ryde Council - Buffalo and Kittys Creek Flood Study, 21/21394
Table of contents 1. Introduction..................................................................................................................................... 1
1.1 NSW Flood Prone Land Policy ............................................................................................ 1 1.2 Key Issues ........................................................................................................................... 1 1.3 Study Objectives .................................................................................................................. 1
2. Background .................................................................................................................................... 3 2.1 Study Location ..................................................................................................................... 3 2.2 Catchment Description......................................................................................................... 3
3. Available Data ................................................................................................................................ 5 3.1 Previous Flood Studies ........................................................................................................ 5 3.2 Data Received from Council ................................................................................................ 5
3.3 Additional Data Received .................................................................................................... 6 3.4 Historical Rainfall and Flooding ........................................................................................... 6
4. Community Consultation ................................................................................................................ 8 4.1 Overview .............................................................................................................................. 8 4.2 Floodplain Risk Management Committee ............................................................................ 8 4.3 Consultation Activities .......................................................................................................... 8
5. Hydrological Model ....................................................................................................................... 10 5.1 Overview ............................................................................................................................ 10 5.2 Subcatchment Delineation ................................................................................................. 10 5.3 DRAINS Model Configuration ............................................................................................ 10 5.4 Model Validation and Calibration ....................................................................................... 11
6. Hydraulic Modelling ...................................................................................................................... 12 6.1 Overview ............................................................................................................................ 12 6.2 Model Configuration ........................................................................................................... 12 6.3 Model Validation and Calibration ....................................................................................... 14
7. Design Flood Conditions .............................................................................................................. 16 7.1 Overview ............................................................................................................................ 16 7.2 Design Rainfall ................................................................................................................... 16
8. Design Flood Behaviour ............................................................................................................... 18 8.1 Overview ............................................................................................................................ 18 8.2 Peak Flood Conditions ....................................................................................................... 18 8.3 Design Flood Hydrographs ................................................................................................ 21 8.4 Provisional Hazard Classifications ..................................................................................... 23 8.5 Sensitivity Analyses ........................................................................................................... 24 8.6 Low Flow Assessment ....................................................................................................... 26
9. Summary and Conclusions .......................................................................................................... 27
10. Glossary ....................................................................................................................................... 29
ITEM 2 (continued) ATTACHMENT 1
Page 4

GHD | Report for City of Ryde Council - Buffalo and Kittys Creek Flood Study, 21/21394 | iii
11. References ................................................................................................................................... 32
Table index Table 2-1 Catchment Information ............................................................................................................. 3
Table 2-2 Drainage Network Data ............................................................................................................ 4
Table 5-1 Impervious Percentages ........................................................................................................ 11
Table 5-2 Model Parameters .................................................................................................................. 11
Table 6-1 Manning’s ‘n’ Values .............................................................................................................. 13
Table 6-2 Reported Locations of Flooding ............................................................................................. 14
Table 6-3 Flow Level Comparison – TUFLOW and HEC-RAS .............................................................. 15
Table 7-1 Catchment IFD Parameters ................................................................................................... 16
Table 7-2 Average Design Rainfall Intensities (mm/hr).......................................................................... 16
Table 7-3 PMP Rainfall Information ....................................................................................................... 17
Table 8-1 Peak flows at selected locations – Kittys Creek catchment ................................................... 18
Table 8-2 Peak flows at selected locations – Buffalo Creek catchment ................................................ 18
Table 8-3 Peak flood levels at selected locations – Kittys Creek catchment ......................................... 19
Table 8-4 Peak flood levels at selected locations – Buffalo Creek catchment ...................................... 19
Table 8-5 Sensitivity Analysis – Adjusted Roughness Values ............................................................... 24
Table 8-6 Sea Level Rise for 2050 and 2100 ......................................................................................... 26
Figure index Figure 1-1 Floodplain Risk Management Process ................................................................................... 2
Figure 8-1 Buffalo Creek Peak Storm Duration Hydrograph .................................................................. 21
Figure 8-2 Kittys Creek Peak Storm Duration Hydrograph .................................................................... 22
Figure 8-3 Floodplain Hazard Classification .......................................................................................... 23
Appendices Appendix A – Catchment and Supporting Information
Appendix B – Community Consultation
Appendix C – Design Flood Maps
Appendix D – Hazard Categorisation Maps
Appendix E – Sensitivity Analysis and Climate Change Maps
Appendix F - Low Flow Assessment
ITEM 2 (continued) ATTACHMENT 1
Page 5

ITEM 2 (continued) ATTACHMENT 1
Page 6
GHD | Report for City of Ryde Council - Buffalo and Kittys Creek Flood Study, 21/21394 | 1
1. Introduction 1.1 NSW Flood Prone Land Policy
The primary objective of the New South Wales Government’s Flood Prone Land Policy (the Policy) is to reduce the impact of flooding and flood liability on individual owners and occupiers of flood prone property, and to reduce private and public losses resulting from floods, utilising ecologically positive methods wherever possible.
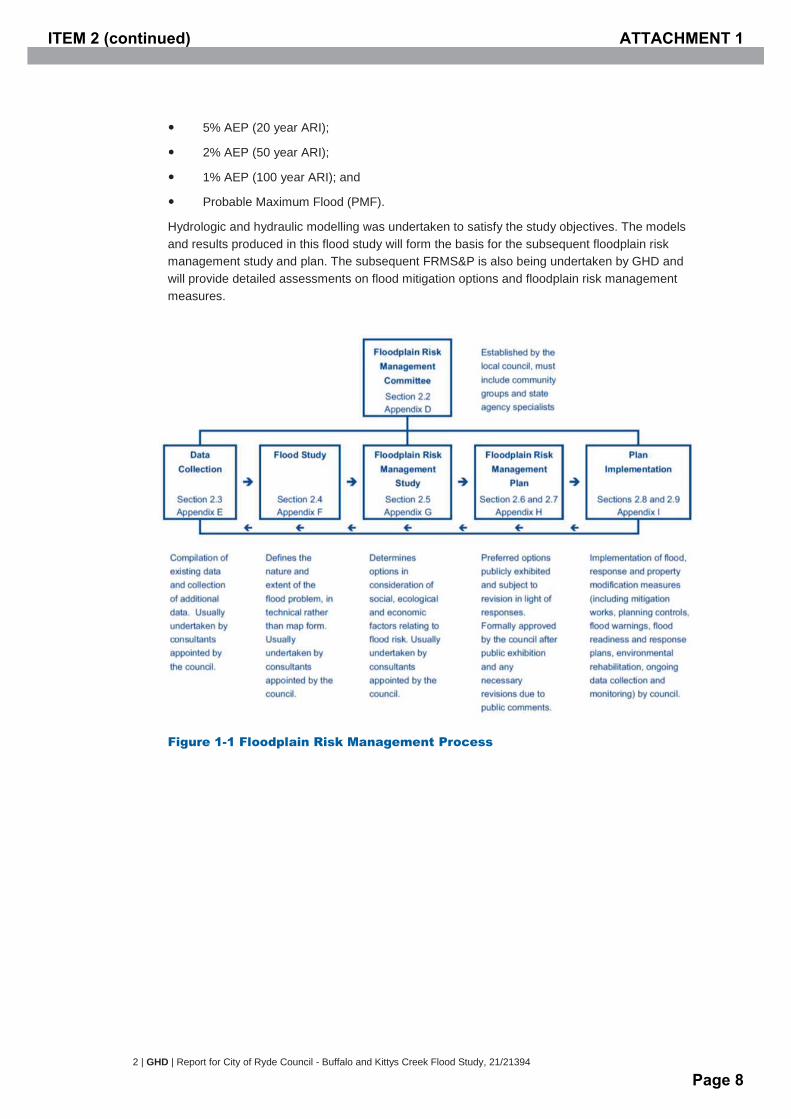
Through the Office of Environment and Heritage (OEH), the Department of Planning and Infrastructure (DP&I) and the State Emergency Service (SES), the NSW Government provides specialist technical assistance to local government on all flooding and land use planning matters. The Floodplain Development Manual (NSW Government, 2005) (the Manual) is provided to assist Councils to meet their obligations through the preparation of floodplain risk management plans.
Figure 1-1 from the Manual documents the process for plan preparation, implementation and review.
City of Ryde Council (Council) is responsible for local land use planning in the Buffalo and Kittys Creek Catchments and its floodplains. Under the NSW Flood Prone Land Policy, the Council’s Floodplain Risk Management Committee is proposing to undertake a comprehensive floodplain risk management plan for the study area. This flood investigation is conducted in accordance with the Manual.
GHD was commissioned by City of Ryde Council to undertake this flood investigation and to produce the Buffalo and Kittys Creek Flood Study, Floodplain Risk Management Study and Plan (FRMS&P).
1.2 Key Issues
The City of Ryde experienced several large storm events in the 1980s that caused widespread flooding. Since then, rainfall events in May 1998 and April 2003 caused significant problems but not to the extent experienced in the late 1980s; this was mainly due to stormwater improvements works completed in the area, acquisition of some of the worst affected properties and the adoption of more stringent development controls. The study area comprises the Buffalo Creek and Kittys Creek catchments, which drains to the Lane Cove River. The catchment areas of Buffalo Creek and Kittys Creek are 550 ha and 193 ha, respectively.
1.3 Study Objectives
Council has the responsibility to undertake a Flood Study (the study) and a Floodplain Risk Management Study and Plan (FRMS&P) in accordance with the manual in order to identify and assess flood management options for Buffalo and Kittys Creek, and prepare an effective Floodplain Risk Management Plan for the community.
This current report forms the Flood Study component only. The primary objective of this study is to define the flood behaviour under historical conditions and design flood behaviour under existing and future climate conditions in the study area. The study produced information on flood levels, depths, flows, hydraulic categories, and provisional hazard categories for a full range of design events.
The design events comprised the:
20% AEP (5 year ARI);
ITEM 2 (continued) ATTACHMENT 1
Page 7
2 | GHD | Report for City of Ryde Council - Buffalo and Kittys Creek Flood Study, 21/21394
5% AEP (20 year ARI);
2% AEP (50 year ARI);
1% AEP (100 year ARI); and
Probable Maximum Flood (PMF).
Hydrologic and hydraulic modelling was undertaken to satisfy the study objectives. The models and results produced in this flood study will form the basis for the subsequent floodplain risk management study and plan. The subsequent FRMS&P is also being undertaken by GHD and will provide detailed assessments on flood mitigation options and floodplain risk management measures.
Figure 1-1 Floodplain Risk Management Process
ITEM 2 (continued) ATTACHMENT 1
Page 8
GHD | Report for City of Ryde Council - Buffalo and Kittys Creek Flood Study, 21/21394 | 3
2. Background 2.1 Study Location
The Buffalo and Kittys Creek catchments (the study area) are located within the City of Ryde local government area, an inner-city western suburb of Sydney, NSW, as shown in the Locality Plan in Appendix A, Figure A1. The catchments are bounded by Victoria Road to the west and by Pittwater Road to the east and south-east. Both creeks rise in the north-west and flows in a south easterly direction, draining into Lane Cove River.
2.2 Catchment Description
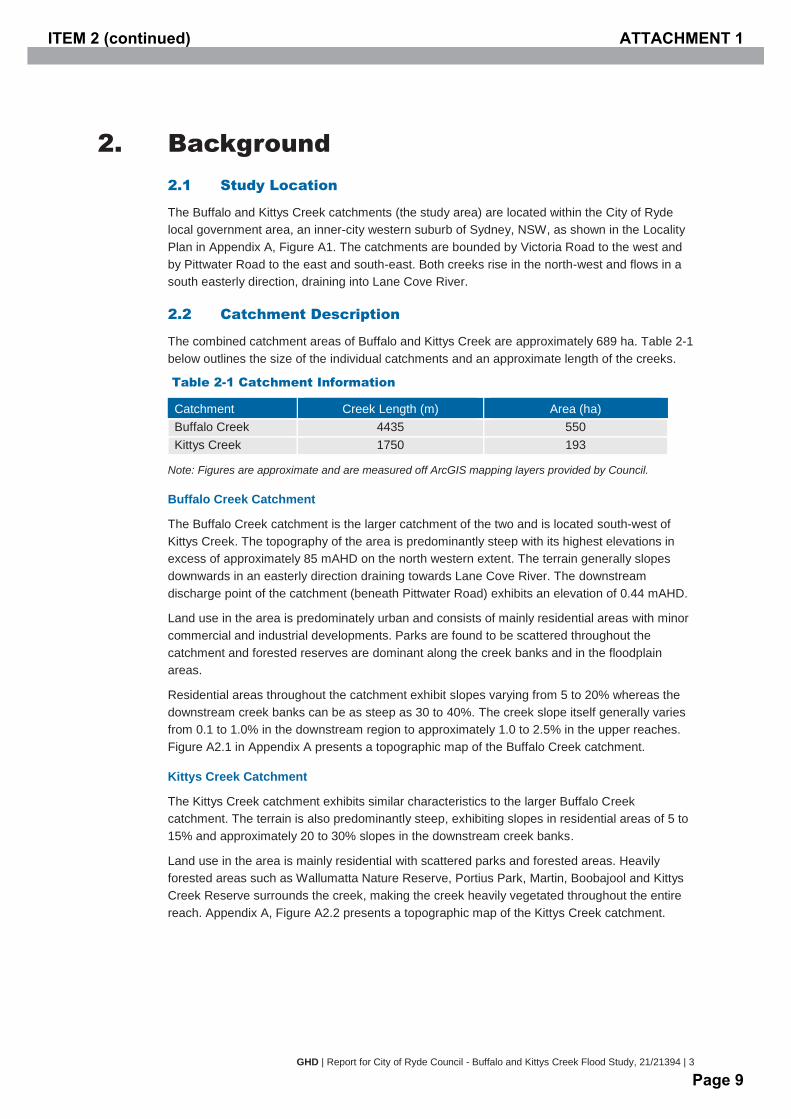
The combined catchment areas of Buffalo and Kittys Creek are approximately 689 ha. Table 2-1 below outlines the size of the individual catchments and an approximate length of the creeks.
Table 2-1 Catchment Information
Catchment Creek Length (m) Area (ha) Buffalo Creek 4435 550 Kittys Creek 1750 193
Note: Figures are approximate and are measured off ArcGIS mapping layers provided by Council.
Buffalo Creek Catchment
The Buffalo Creek catchment is the larger catchment of the two and is located south-west of Kittys Creek. The topography of the area is predominantly steep with its highest elevations in excess of approximately 85 mAHD on the north western extent. The terrain generally slopes downwards in an easterly direction draining towards Lane Cove River. The downstream discharge point of the catchment (beneath Pittwater Road) exhibits an elevation of 0.44 mAHD.
Land use in the area is predominately urban and consists of mainly residential areas with minor commercial and industrial developments. Parks are found to be scattered throughout the catchment and forested reserves are dominant along the creek banks and in the floodplain areas.
Residential areas throughout the catchment exhibit slopes varying from 5 to 20% whereas the downstream creek banks can be as steep as 30 to 40%. The creek slope itself generally varies from 0.1 to 1.0% in the downstream region to approximately 1.0 to 2.5% in the upper reaches. Figure A2.1 in Appendix A presents a topographic map of the Buffalo Creek catchment.
Kittys Creek Catchment
The Kittys Creek catchment exhibits similar characteristics to the larger Buffalo Creek catchment. The terrain is also predominantly steep, exhibiting slopes in residential areas of 5 to 15% and approximately 20 to 30% slopes in the downstream creek banks.
Land use in the area is mainly residential with scattered parks and forested areas. Heavily forested areas such as Wallumatta Nature Reserve, Portius Park, Martin, Boobajool and Kittys Creek Reserve surrounds the creek, making the creek heavily vegetated throughout the entire reach. Appendix A, Figure A2.2 presents a topographic map of the Kittys Creek catchment.
ITEM 2 (continued) ATTACHMENT 1
Page 9
4 | GHD | Report for City of Ryde Council - Buffalo and Kittys Creek Flood Study, 21/21394
Drainage Description
The existing trunk drainage system within the study area provides extensive drainage coverage within each catchment. Figure A3.1 and A3.2 in Appendix A, provides a layout plan for the drainage network within the Buffalo Creek catchment and Kittys Creek catchment, respectively.
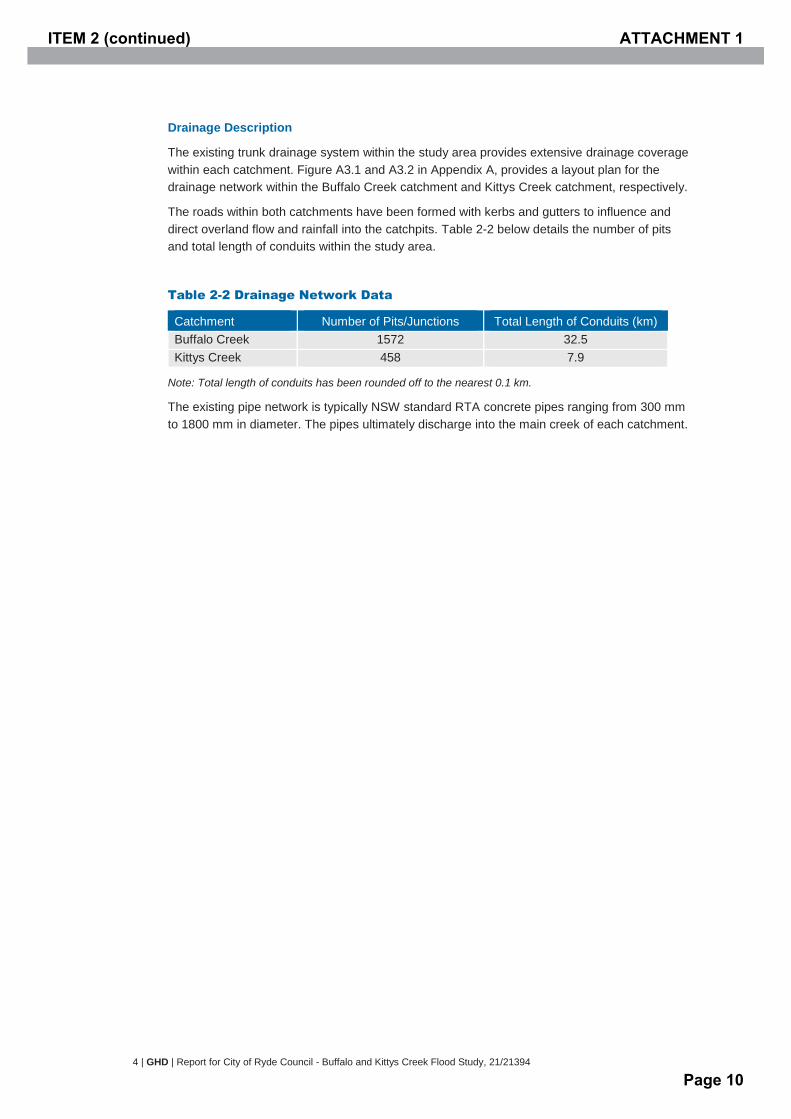
The roads within both catchments have been formed with kerbs and gutters to influence and direct overland flow and rainfall into the catchpits. Table 2-2 below details the number of pits and total length of conduits within the study area.
Table 2-2 Drainage Network Data
Catchment Number of Pits/Junctions Total Length of Conduits (km) Buffalo Creek 1572 32.5 Kittys Creek 458 7.9
Note: Total length of conduits has been rounded off to the nearest 0.1 km.
The existing pipe network is typically NSW standard RTA concrete pipes ranging from 300 mm to 1800 mm in diameter. The pipes ultimately discharge into the main creek of each catchment.
ITEM 2 (continued) ATTACHMENT 1
Page 10
GHD | Report for City of Ryde Council - Buffalo and Kittys Creek Flood Study, 21/21394 | 5
3. Available Data 3.1 Previous Flood Studies
No Flood Studies have previously been conducted for the Buffalo and Kittys Creek catchments. This current Flood Study prepared for City of Ryde will form the basis for all future floodplain management activities.
3.2 Data Received from Council
For the purposes of undertaking this Flood Study, the following information was received from Council on 17 April 2012 in the form of MapInfo GIS files.
Stormwater Asset Information
– Buffalo Creek Pipes Network (March 2012)
– Buffalo Creek Pits/Junctions Network (March 2012)
– Kittys Creek Pipes Network (February 2012)
– Kittys Creek Pits/Junctions Network (February 2012)
Topographic Information
– Airborne Laser Scanning Data Set (ALS 2010)
– Airborne Laser Scanning Data Set (ALS 2006)
Study Area Information
– Property Lot Cadastral
– Catchment Extents
– Overland Flow Paths
– Park Areas
– Street Names and Numbers
– Easements
– Aerial Photography (2006)
In addition, various AutoCAD files detailing stormwater assets were also provided for reference.
Stormwater Assets
Four MapInfo files containing stormwater asset data was provided by Council, these are listed above. The files contained key information on the pit and pipe networks such as pipe sizes, lengths, invert levels and pit types. Significant gaps of missing information (mainly pipe invert levels) were prevalent throughout the datasets. A survey by Garvin Morgan & Company, local registered surveyors, was conducted to obtain some of this missing information. Additional field work was conducted by GHD and the adoption of an ‘averaged’ pit depth method was applied in all other locations not surveyed.
Topographic Survey
Two sets of Airborne Laser Scanning (ALS) data in the form of ground spot heights were provided by Council, these were dated 2006 and 2010. A digital elevation model (DEM) used for modelling purposes was constructed using the more recent 2010 data set. Extents that were not covered by this version were complemented with the older 2006 data.
Due to the nature of ALS data, additional survey was required to pick up the bottom of creeks and channels. This additional survey was conducted by Garvin Morgan & Company.
ITEM 2 (continued) ATTACHMENT 1
Page 11

6 | GHD | Report for City of Ryde Council - Buffalo and Kittys Creek Flood Study, 21/21394
Aerial Photography
The aerial photography dataset comprises a series of 12 1125 m x 1125 m photo tiles that covers the entire area of the Buffalo and Kittys Creek catchments. This data was used to assist with the development of sub-areal boundaries and impervious fractions for the hydrologic model and to assist with the generation of roughness data for use in the hydraulic model.
3.3 Additional Data Received
Additional survey data was conducted by Garvin Morgan & Company, local registered surveyors, in agreement with Council. This included the surveying of:
Selected structures (including culverts and pit invert levels) – Data received on 28 August 2012; and
Creek cross sections including invert levels – Data received on 4 February 2013.
Additional data was also received from Council on Lane Cove River design water surface levels for various ARI events. This information is understood from Council to be extracted from the Macquarie Park Flood Study Report (Bewsher Consulting, 2010).
3.4 Historical Rainfall and Flooding
3.4.1 Historical Rainfall
Historical rainfall data was unavailable for the immediate study area of Buffalo and Kittys Creek catchments. Nearby locations including North Ryde Golf Club (BOM Station ID 66213), Concord Golf Club (BOM Station ID 66013) and Macquarie Park (BOM Station ID 66156) was obtained from the Bureau of Meteorology (BOM). Other sources were considered including the Department of Primary Industries and Sydney Water, but were found to be lacking in data periods required for modelling.
All rainfall data collected was checked for continuity and similarity with adjacent gauges. The data was then assessed for its suitability for model calibration. Suitability for model calibration is reliant on:
The data being from a location close to the catchment and therefore representative;
The data being of high quality (no missing rainfall values);
The data extending for the full duration of the storm;
The event being of sufficient severity as to generate flooding of some consequence; and
Corresponding historic flood level information being available in the study area (either from residents or data recorders such as Maximum Height Indicators (MHIs)).
Although three different gauging stations were found in the nearby vicinity, none of them qualified as suitable for use for model calibration as they did not satisfy the above criteria.
3.4.2 Historical Flooding
Historical flooding data was obtained from two different sources, these are listed below.
Council Flooding Database (1984 – 1999)
A flooding database was provided by Council covering the period from 1984 to 1999. These records provided information on lot location, flood depths and comments. The flood depths
ITEM 2 (continued) ATTACHMENT 1
Page 12

GHD | Report for City of Ryde Council - Buffalo and Kittys Creek Flood Study, 21/21394 | 7
listed in the database are rounded to the nearest 50 mm and appear to be visual estimates rather than surveyed levels.
Community Consultation (2012)
Community consultation was conducted as part of this current Flood Study. A survey questionnaire was sent out to all the residents within the study area. Response from this survey included visual flood depths from the May 1998 flood event. This is detailed in Section 4 Community Consultation.
3.4.3 Streamflow
Streamflow stations and monitoring gauges are not present within the study area. Streamflow data for Lane Cove River is also not available.
ITEM 2 (continued) ATTACHMENT 1
Page 13
8 | GHD | Report for City of Ryde Council - Buffalo and Kittys Creek Flood Study, 21/21394
4. Community Consultation 4.1 Overview
The primary aim of the community consultation program is to raise public awareness of the Buffalo and Kittys Creek Flood Study and FRMS&P and to involve their on-going participation and input throughout the project.
4.2 Floodplain Risk Management Committee
The purpose of the Floodplain Risk Management Committee is to:
Act as both a focus and forum for the discussion of technical, economic, environmental and cultural issues and for the distillation of possibly differing viewpoints on these uses into a management plan; and
Make sure that all stakeholders are equally represented.
The Floodplain Risk Management Committee performs an important advisory role. The principal objective of the committee is to assist the Council in the development and implementation of a management plan for the area(s) under its jurisdiction.
4.3 Consultation Activities
Newspaper Media Release and Newsletter
As part of the consultation activities for the project, a public notice was placed in the local newspaper to inform the general public of the Flood Study and to invite them for participation.
A newsletter was then prepared by GHD, providing key project information and a better understanding of the floodplain management process. The newsletter, along with a survey questionnaire was distributed by Council to residents living in the catchment areas.
Survey Questionnaire
GHD prepared a questionnaire to involve the community by seeking local knowledge and past flood experience in the Buffalo and Kitty Creek catchments. The main objectives of the survey were to:
Obtain local knowledge from the community on key issues relating to flooding;
Obtain information from property owners relating to previous flood experiences from 1984 to 2003; and
To understand the concerns of the community to be considered and integrated into the Study.
Paper surveys were sent by mail to 3,247 owners of properties in the related areas around Buffalo and Kittys Creek catchments. In addition, the survey was available online on Council’s website. Appendix B Figure B1 presents a copy of the mailed out survey. Data was collected from the 12 November until the 7 December 2012. A total of 622 surveys were completed (both online and through return mail), representing a 19% response rate. Key issues raised in the survey were:
8% of respondents reported previously being flood affected;
15% believed they could be affected by floods in the future;
Positioning of property, drain blockages were the main reasons for future flooding; and
ITEM 2 (continued) ATTACHMENT 1
Page 14

GHD | Report for City of Ryde Council - Buffalo and Kittys Creek Flood Study, 21/21394 | 9
81% were not aware of any risk management measure.
The next stage of consultation activities for the Flood Risk Management Study and Plan Stage will include engaging the community to determine:
The preferred floodplain risk management measures, controls on development, and how property owners want to be notified regarding potential flood effects on individual properties.
Figure B2 and B3 in Appendix B provides a full summary of the outcomes and results from the community survey.
ITEM 2 (continued) ATTACHMENT 1
Page 15
10 | GHD | Report for City of Ryde Council - Buffalo and Kittys Creek Flood Study, 21/21394
5. Hydrological Model 5.1 Overview
Hydrologic modelling conducted for this Flood Study was undertaken using the DRAINS software package. DRAINS is a comprehensive program used for designing and analysing various types of catchments and urban stormwater drainage systems.
Its capabilities include, but are not limited to the modelling of drainage systems of various scales using the ILSAX hydrology method, Rational Method and storage routing models. It simulates the conversion of rainfall patterns to stormwater runoff hydrographs and routes these through network pipes, channels and streams
DRAINS was used to model the drainage networks within the Buffalo and Kittys Creek catchments using the ILSAX hydrologic method to simulate the catchment rain-fall runoff processes. Hydrographs produced from catchment run-off were used in the hydraulic model TUFLOW.
The DRAINS version used for this study is Version 2013.05 – 16 March 2013.
5.2 Subcatchment Delineation
The Buffalo and Kittys Creek catchments drain an area of approximately 550 ha and 139 ha respectively. Subcatchments were delineated from these to provide inflows to the pits within both the study area’s drainage networks. Delineation was based on topographic information and aerial photography. The area of each sub-catchment was then divided and applied to the pits that fall within them. Figure A4.1 and A4.2 in Appendix A in provides details on the subcatchment delineations.
5.3 DRAINS Model Configuration
Model Extent
Two DRAINS models were developed for each catchment’s stormwater networks to simulate different rainfall events. This was to allow for ease of use by Council. A total of four models were produced consisting of the below:
Buffalo DRAINS model: Consisting of the 1%, 2%, 5% and 20% AEP rainfall events;
Buffalo DRAINS model PMF: Consisting of the PMF rainfall durations;
Kittys DRAINS model: Consisting of the 1%, 2%, 5% and 20% AEP rainfall events; and
Kittys DRAINS model PMF: Consisting of the PMF rainfall durations.
The model extent within each model consists of the full set of pit and pipe network data for each catchment provided by Council.
Configuration of the Existing Stormwater System
The stormwater pit and pipe networks were provided directly from Council’s stormwater asset database. Additional data sourcing, analysis and data extrapolation was required due to missing gaps in the data provided. The following lists the additional work conducted for the DRAINS model:
Field work undertaken by GHD;
Additional creek cross-section survey;
Additional water conveying structures survey; and
ITEM 2 (continued) ATTACHMENT 1
Page 16

GHD | Report for City of Ryde Council - Buffalo and Kittys Creek Flood Study, 21/21394 | 11
Adopting interpolated ‘averaged’ pit depths where depths were not provided in Council’s database.
Subcatchment Delineation and Overland Flow Paths
Subcatchment boundaries were derived using topographic data and aerial photography provided by Council as described in Section 5.2. Overland flow paths were determined using the same medium as well as from site inspections.
Blockage Factors
Blockage factors adopted for the hydrologic model include a 20% blockage for on-grade pits and a 50% blockage for sag pits. These values were in agreement with Council and were incorporated into the design runs for all AEP events.
Percentage Impervious and Pervious Areas
Impervious and pervious percentages were delineated and directly measured according to land use as depicted in the digital aerial images provided by Council. Table 5-1 provides information on the impervious percentages applied in agreement with Council.
Table 5-1 Impervious Percentages
Land Use Classification Impervious Percentage Roads 95% Industrial 80% Commercial 90% Residential 60% Parks and Vegetated Areas 5%
Other Model Parameters
Table 5-2 Model Parameters
Parameter Application in Model Soil Type ILSAX Type 3 Antecedent Moisture Content (AMC) 3 Initial Losses 1 mm for paved areas
5 mm for grassed areas Pit and Lintel Standard NSW RTA SA Inlet Blockage 20% for on-grade pits
50% for sag pits (Recommended by AR&R)
Pipe Roughness 0.013 Pit Losses Applied using Mills Equation Rainfall Temporal Patterns Derived from AR&R and BOM GSDM method
IFD curves derived from BOM
5.4 Model Validation and Calibration
As detailed in Section 3.4, historical rainfall data suitable for model validation and calibration was found to be insufficient. Flow gauge data was also unavailable for the creeks. As a result of this, a full calibration of the hydrological model was not possible.
Manual checks were performed in selected areas and the results were used to compare and assess that of the hydrologic model. This was in the form of peak flow calculations using the Rational Method for Urban Catchments as prescribed in AR&R.
ITEM 2 (continued) ATTACHMENT 1
Page 17
12 | GHD | Report for City of Ryde Council - Buffalo and Kittys Creek Flood Study, 21/21394
6. Hydraulic Modelling 6.1 Overview
Flood conveyance through the Buffalo and Kittys Creek catchments was modelled using the TUFLOW hydraulic model.
TUFLOW is a computer program for simulating depth-averaged, two and one-dimensional free-surface flows such as occurs from floods and tides. TUFLOW was originally developed for modelling twodimensional (2D) flows, and stands for Two-dimensional Unsteady FLOW. However, it incorporates the full functionality of the ESTRY 1D network or quasi-2D modelling system based on the full onedimensional (1D) free-surface St Venant flow equations.The 2D solution algorithm is based on Stelling 1984, and is documented in Syme 1991. It solves the full two-dimensional, depth averaged, momentum and continuity equations for free-surface flow. The scheme includes the viscosity or subgrid- scale turbulence term that other mainstream software omit. The initial development was carried out as a joint research and development project between WBM Oceanics Australia and The University of Queensland in 1990. The project successfully developed a 2D/1D dynamically linked modelling system (Syme 1991). Latter improvements from 1998 to today focus on hydraulic structures, flood modelling, advanced 2D/1D linking and using GIS for data management (Syme 2001a, Syme 2001b). TUFLOW has also been the subject of extensive testing and validation by WBM Pty Ltd and others (Barton 2001, Huxley, 2004).
6.2 Model Configuration
Model Extent
Two separate TUFLOW models were developed to model the Buffalo Creek and Kittys Creek catchments individually. The extent of each model covers the entire catchment boundary for each creek, as outlined in Red in Figure A1 of Appendix A. The downstream extent for each model was extended down to Lane Cove River to incorporate any flooding effects due to backwater from the river.
A linked 1D/2D model was developed to model both the one-dimensional stormwater drainage system and two-dimensional flow patterns. The modelling parameters and attributes are described below, these were applied consistently between both models.
6.2.1 Two Dimensional Inputs
Topographic Layers
ALS data provided by Council was imported into a digital terrain-modelling program (12D) and triangulated to represent the ground surface as a digital elevation model (DEM). A TUFLOW grid was generated using a cell size of 2 m by 2 m, with each point within the grid given an elevation based on its location in the DEM.
Additional topographic adjustments were performed to lower the creek beds of both Buffalo and Kittys creek. This was due to the nature of ALS data not being able to pick up bottom of creek invert levels. The creek beds were manually lowered according to the surveyed creek cross sections and through cross sections interpolation where survey was not conducted.
Additional terrain adjustments were made at Top Ryde Shopping Centre and at 461-495 Victoria Road to fill in the excavation zone that the ALS picked up during construction at those sites.
ITEM 2 (continued) ATTACHMENT 1
Page 18

GHD | Report for City of Ryde Council - Buffalo and Kittys Creek Flood Study, 21/21394 | 13
Terrain surface patches were placed at various locations across the catchments to smooth the elevation points that caused instabilities in TUFLOW.
Hydraulic Roughness
Based on aerial photography and site inspections, industry standard hydraulic roughness coefficients were applied in the 2D domain areas and input to the model. Table 6-1 below lists the Manning’s ‘n’ roughness coefficients adopted.
Table 6-1 Manning’s ‘n’ Values
Material Layer (Surface Type) Manning’s n value Urban, housing with backyard vegetation. 0.05 Commercial, buildings not detailed separately. 0.06 Short grass, no bush cover. 0.03 Medium to dense shrub cover, forested areas. 0.10 Sealed roads. 0.02 Industrial Areas, highly concreted. 0.02
A sensitivity analysis for the hydraulic roughness was tested and is described in Section 8.5.3 of this report.
Boundary Conditions
An initial and continuing water level condition was applied at the downstream model boundary to simulate flow conditions at Lane Cove River. A constant water level time series was applied at this location for the duration of the modelled events.
As there is no flow gauge data available for Lane Cove River, water levels were extracted based on design surface water levels of the river provided by Council. These figures are understood from Council to have been extracted from the Macquarie Park Flood Study Report (Bewsher, 2010). A sensitivity analysis was conducted for the water levels adopted and is discussed in Section 8.5.4.
6.2.2 One Dimensional Inputs
Stormwater System
The stormwater system was imported directly from Council’s MapInfo database and applied as one-dimensional (Estry) layers in TUFLOW. This included the entire pit inlet and pipe network drainage system. The properties applied for the 1D elements in the hydraulic model were industry standard and consistent with the hydrologic model.
Structures
All bridges and culverts within the floodplain were configured in TUFLOW using existing ALS data and additional survey data acquired by the registered surveyors, Garvin and Morgan. These structures were applied in TUFLOW as either 1D (Estry) components or incorporated into the 2D terrain.
Boundary Conditions
Catchment run-off hydrographs determined through the hydrologic model were applied to TUFLOW as flow vs. time inputs. These were applied to the corresponding drainage pits.
ITEM 2 (continued) ATTACHMENT 1
Page 19
14 | GHD | Report for City of Ryde Council - Buffalo and Kittys Creek Flood Study, 21/21394
6.3 Model Validation and Calibration
As no historically recorded flooding and flow gauge data for the study area is available, a full calibration of the hydraulic model was not possible. Limited validation and calibration of the model was undertaken using the following approach:
Review of community consultation flood survey results; and
Construction of a HEC-RAS model to validate TUFLOW creek flood level results.
6.3.1 Community Consultation Flood Survey Results
As described in Section 4, a survey was sent to residents within the study area to provide relative information on flooding, with particular interest to the February 1990 Flood Event.
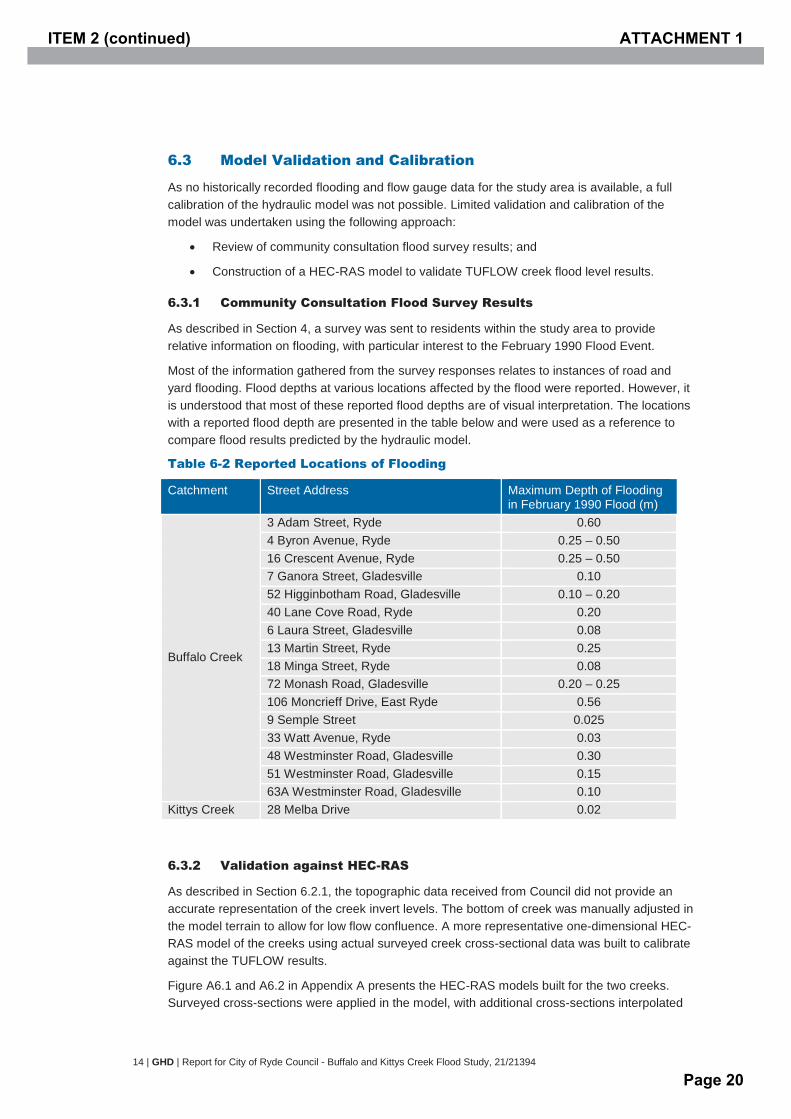
Most of the information gathered from the survey responses relates to instances of road and yard flooding. Flood depths at various locations affected by the flood were reported. However, it is understood that most of these reported flood depths are of visual interpretation. The locations with a reported flood depth are presented in the table below and were used as a reference to compare flood results predicted by the hydraulic model.
Table 6-2 Reported Locations of Flooding
Catchment Street Address Maximum Depth of Flooding in February 1990 Flood (m)
Buffalo Creek
3 Adam Street, Ryde 0.60 4 Byron Avenue, Ryde 0.25 – 0.50 16 Crescent Avenue, Ryde 0.25 – 0.50 7 Ganora Street, Gladesville 0.10 52 Higginbotham Road, Gladesville 0.10 – 0.20 40 Lane Cove Road, Ryde 0.20 6 Laura Street, Gladesville 0.08 13 Martin Street, Ryde 0.25 18 Minga Street, Ryde 0.08 72 Monash Road, Gladesville 0.20 – 0.25 106 Moncrieff Drive, East Ryde 0.56 9 Semple Street 0.025 33 Watt Avenue, Ryde 0.03 48 Westminster Road, Gladesville 0.30 51 Westminster Road, Gladesville 0.15 63A Westminster Road, Gladesville 0.10
Kittys Creek 28 Melba Drive 0.02
6.3.2 Validation against HEC-RAS
As described in Section 6.2.1, the topographic data received from Council did not provide an accurate representation of the creek invert levels. The bottom of creek was manually adjusted in the model terrain to allow for low flow confluence. A more representative one-dimensional HEC-RAS model of the creeks using actual surveyed creek cross-sectional data was built to calibrate against the TUFLOW results.
Figure A6.1 and A6.2 in Appendix A presents the HEC-RAS models built for the two creeks. Surveyed cross-sections were applied in the model, with additional cross-sections interpolated
ITEM 2 (continued) ATTACHMENT 1
Page 20
GHD | Report for City of Ryde Council - Buffalo and Kittys Creek Flood Study, 21/21394 | 15
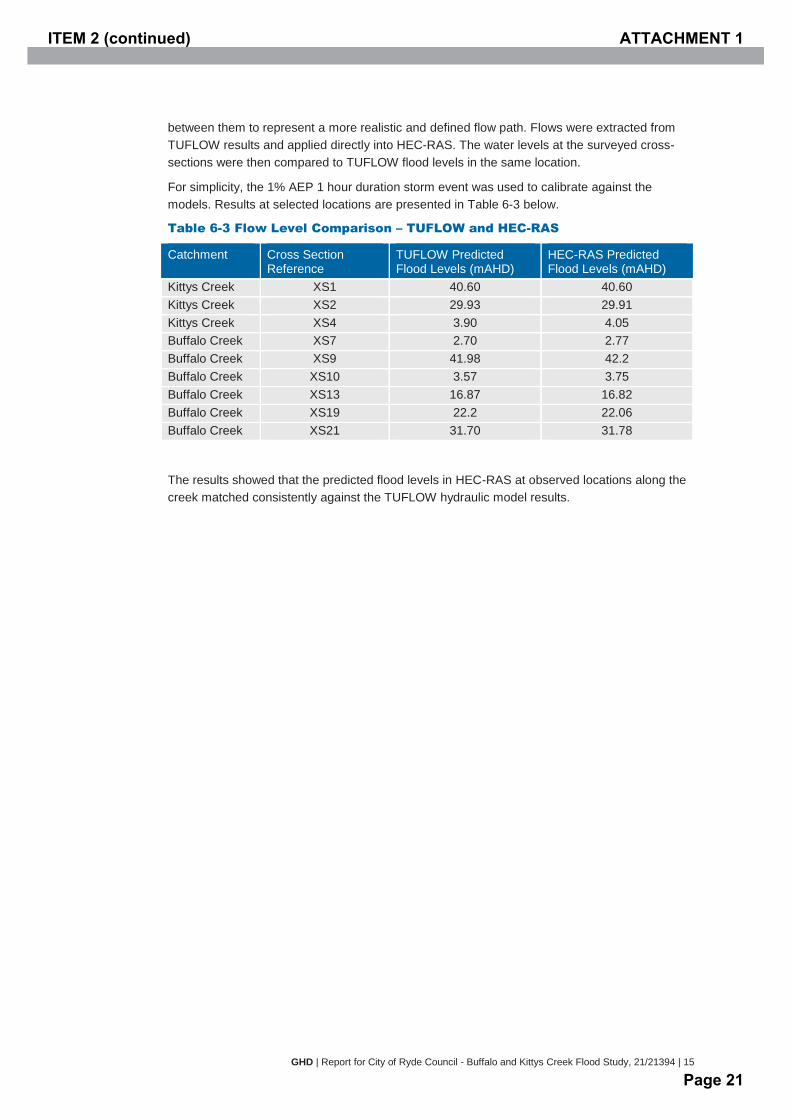
between them to represent a more realistic and defined flow path. Flows were extracted from TUFLOW results and applied directly into HEC-RAS. The water levels at the surveyed cross-sections were then compared to TUFLOW flood levels in the same location.
For simplicity, the 1% AEP 1 hour duration storm event was used to calibrate against the models. Results at selected locations are presented in Table 6-3 below.
Table 6-3 Flow Level Comparison – TUFLOW and HEC-RAS
Catchment Cross Section Reference
TUFLOW Predicted Flood Levels (mAHD)
HEC-RAS Predicted Flood Levels (mAHD)
Kittys Creek XS1 40.60 40.60 Kittys Creek XS2 29.93 29.91 Kittys Creek XS4 3.90 4.05 Buffalo Creek XS7 2.70 2.77 Buffalo Creek XS9 41.98 42.2 Buffalo Creek XS10 3.57 3.75 Buffalo Creek XS13 16.87 16.82 Buffalo Creek XS19 22.2 22.06 Buffalo Creek XS21 31.70 31.78
The results showed that the predicted flood levels in HEC-RAS at observed locations along the creek matched consistently against the TUFLOW hydraulic model results.
ITEM 2 (continued) ATTACHMENT 1
Page 21
16 | GHD | Report for City of Ryde Council - Buffalo and Kittys Creek Flood Study, 21/21394
7. Design Flood Conditions 7.1 Overview
A series of design floods were generated based on Australian Rainfall and Runoff (AR&R, 2001) guidelines to cover a range of flooding extents at Buffalo and Kittys Creek. The parameters and conditions used in generating the design floods are outlined in this section.
7.2 Design Rainfall
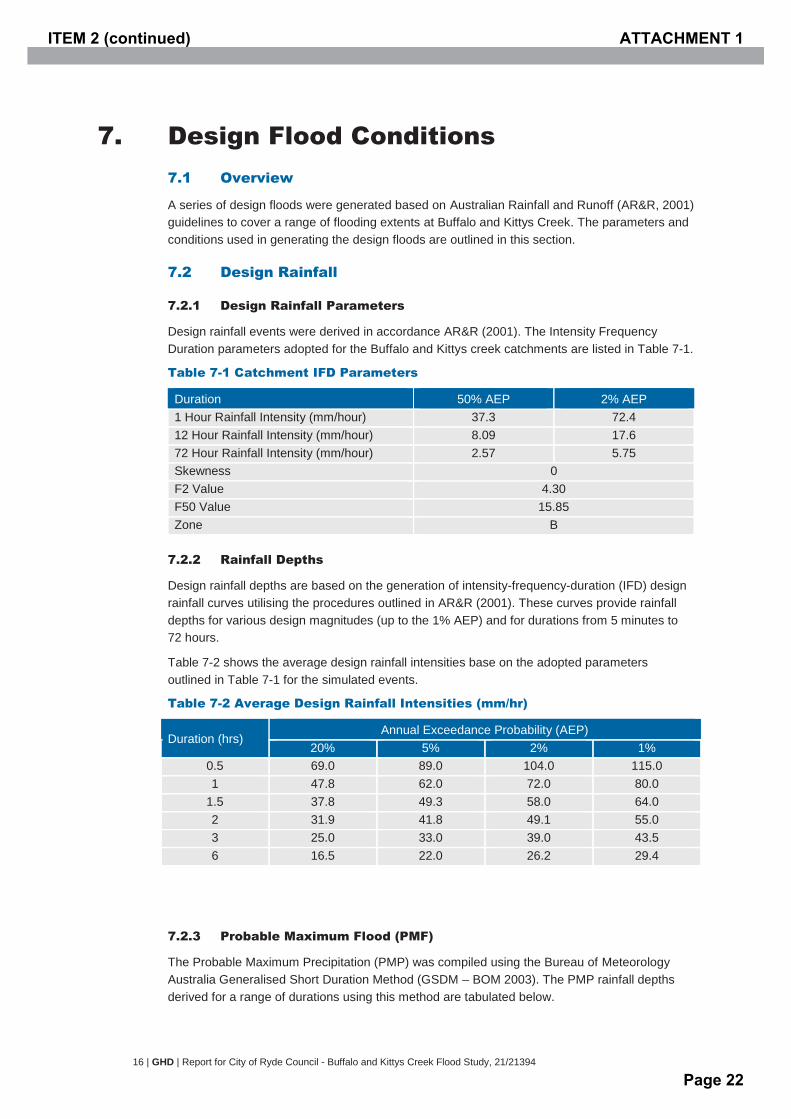
7.2.1 Design Rainfall Parameters
Design rainfall events were derived in accordance AR&R (2001). The Intensity Frequency Duration parameters adopted for the Buffalo and Kittys creek catchments are listed in Table 7-1.
Table 7-1 Catchment IFD Parameters
Duration 50% AEP 2% AEP 1 Hour Rainfall Intensity (mm/hour) 37.3 72.4 12 Hour Rainfall Intensity (mm/hour) 8.09 17.6 72 Hour Rainfall Intensity (mm/hour) 2.57 5.75 Skewness 0 F2 Value 4.30 F50 Value 15.85 Zone B
7.2.2 Rainfall Depths
Design rainfall depths are based on the generation of intensity-frequency-duration (IFD) design rainfall curves utilising the procedures outlined in AR&R (2001). These curves provide rainfall depths for various design magnitudes (up to the 1% AEP) and for durations from 5 minutes to 72 hours.
Table 7-2 shows the average design rainfall intensities base on the adopted parameters outlined in Table 7-1 for the simulated events.
Table 7-2 Average Design Rainfall Intensities (mm/hr)
Duration (hrs) Annual Exceedance Probability (AEP)
20% 5% 2% 1% 0.5 69.0 89.0 104.0 115.0 1 47.8 62.0 72.0 80.0
1.5 37.8 49.3 58.0 64.0 2 31.9 41.8 49.1 55.0 3 25.0 33.0 39.0 43.5 6 16.5 22.0 26.2 29.4
7.2.3 Probable Maximum Flood (PMF)
The Probable Maximum Precipitation (PMP) was compiled using the Bureau of Meteorology Australia Generalised Short Duration Method (GSDM – BOM 2003). The PMP rainfall depths derived for a range of durations using this method are tabulated below.
ITEM 2 (continued) ATTACHMENT 1
Page 22

GHD | Report for City of Ryde Council - Buffalo and Kittys Creek Flood Study, 21/21394 | 17
Durations of up to 6-hours have been considered for the PMP in accordance with the GSDM.
Table 7-3 PMP Rainfall Information
Duration (hrs) PMP Rainfall Depth (mm) PMP Rainfall Intensity (mm/hr) 0.5 220 440 1 330 330
1.5 420 280 2 500 250 3 600 200 6 800 133
The PMP rainfall depths were simulated in the hydrologic model to calculate the PMF hydrographs used for the hydraulic model.
7.2.4 Rainfall Losses
Initial rainfall losses were adopted in accordance with the Australian Rainfall and Runoff (AR&R 2001) and the DRAINS manual to simulate rainfall losses in the hydrologic model. These recommended values are listed below
1 mm for paved areas; and
5 mm for grassed areas.
7.2.5 Rational Method
The Rational Method for urban catchments was used to provide an additional estimate of the flood peak for the 1% AEP event, as identified in Section 5.4.
ITEM 2 (continued) ATTACHMENT 1
Page 23
18 | GHD | Report for City of Ryde Council - Buffalo and Kittys Creek Flood Study, 21/21394
8. Design Flood Behaviour 8.1 Overview
To determine the design flood behaviour, both the hydrologic and hydraulic models were simulated using the parameters as outlined in Sections 5 and 6 of this report. The simulations were undertaken as follows:
The hydrologic DRAINS models were simulated using design rainfall and rainfall loss parameters in accordance with AR&R;
A range of design events were simulated, including the 20%, 5%, 2% and 1% AEP and the PMF for durations from 0.5 hours to 3 hours to capture the peak flows;
Local catchment hydrographs produced from the hydrologic models were applied as rainfall for the hydraulic TUFLOW model and simulated for the same events; and
A series of results were generated and is described in this section of the report.
8.2 Peak Flood Conditions
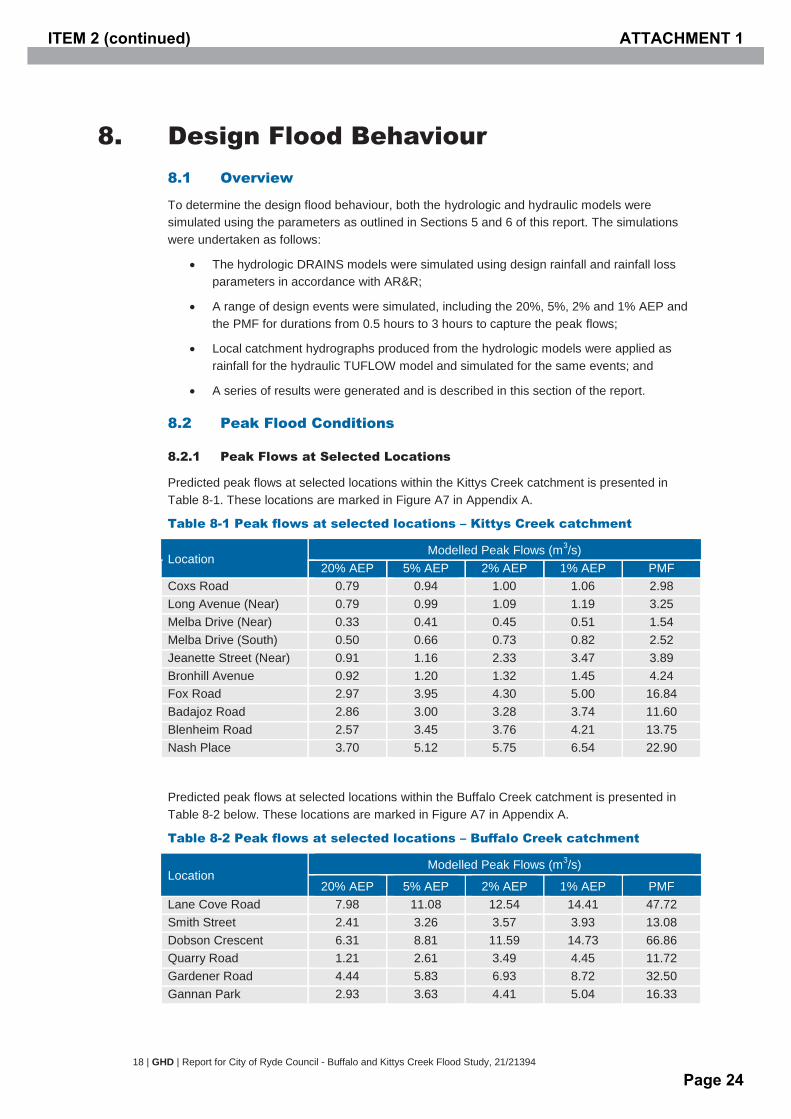
8.2.1 Peak Flows at Selected Locations
Predicted peak flows at selected locations within the Kittys Creek catchment is presented in Table 8-1. These locations are marked in Figure A7 in Appendix A.
Table 8-1 Peak flows at selected locations – Kittys Creek catchment
Location Modelled Peak Flows (m3/s)
20% AEP 5% AEP 2% AEP 1% AEP PMF Coxs Road 0.79 0.94 1.00 1.06 2.98 Long Avenue (Near) 0.79 0.99 1.09 1.19 3.25 Melba Drive (Near) 0.33 0.41 0.45 0.51 1.54 Melba Drive (South) 0.50 0.66 0.73 0.82 2.52 Jeanette Street (Near) 0.91 1.16 2.33 3.47 3.89 Bronhill Avenue 0.92 1.20 1.32 1.45 4.24 Fox Road 2.97 3.95 4.30 5.00 16.84 Badajoz Road 2.86 3.00 3.28 3.74 11.60 Blenheim Road 2.57 3.45 3.76 4.21 13.75 Nash Place 3.70 5.12 5.75 6.54 22.90
Predicted peak flows at selected locations within the Buffalo Creek catchment is presented in Table 8-2 below. These locations are marked in Figure A7 in Appendix A.
Table 8-2 Peak flows at selected locations – Buffalo Creek catchment
Location Modelled Peak Flows (m3/s)
20% AEP 5% AEP 2% AEP 1% AEP PMF Lane Cove Road 7.98 11.08 12.54 14.41 47.72 Smith Street 2.41 3.26 3.57 3.93 13.08 Dobson Crescent 6.31 8.81 11.59 14.73 66.86 Quarry Road 1.21 2.61 3.49 4.45 11.72 Gardener Road 4.44 5.83 6.93 8.72 32.50 Gannan Park 2.93 3.63 4.41 5.04 16.33
ITEM 2 (continued) ATTACHMENT 1
Page 24
GHD | Report for City of Ryde Council - Buffalo and Kittys Creek Flood Study, 21/21394 | 19
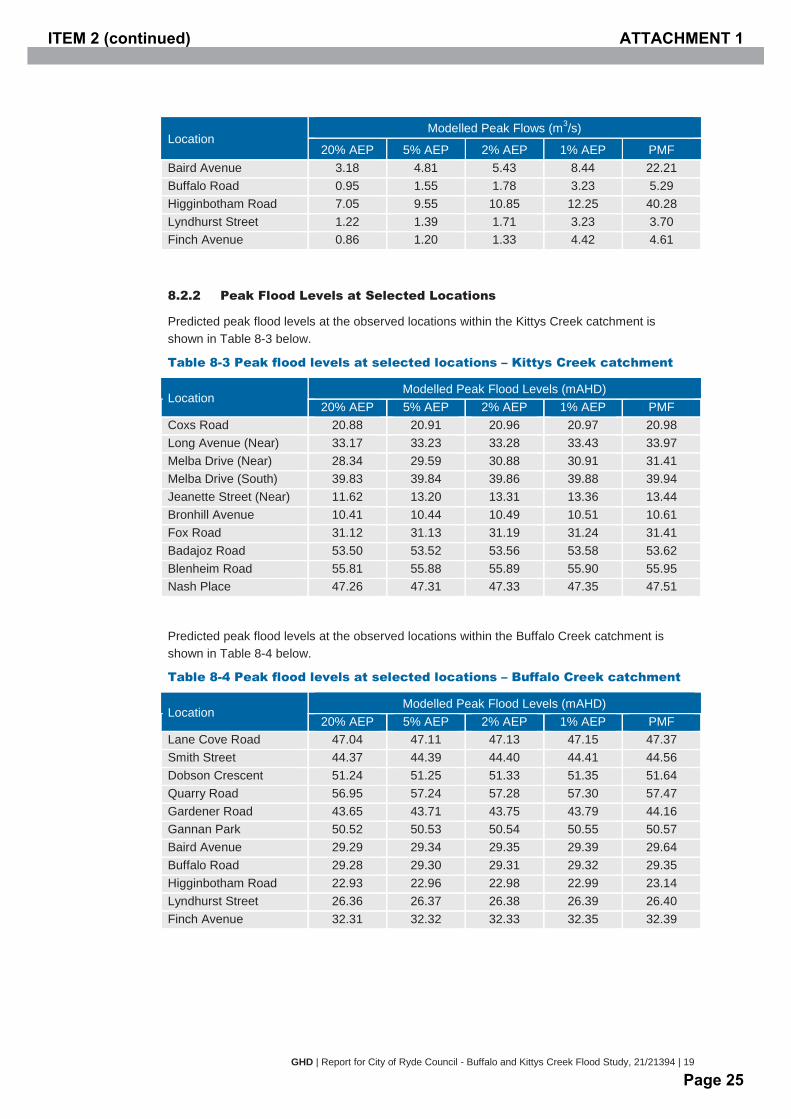
Location Modelled Peak Flows (m3/s)
20% AEP 5% AEP 2% AEP 1% AEP PMF Baird Avenue 3.18 4.81 5.43 8.44 22.21 Buffalo Road 0.95 1.55 1.78 3.23 5.29 Higginbotham Road 7.05 9.55 10.85 12.25 40.28 Lyndhurst Street 1.22 1.39 1.71 3.23 3.70 Finch Avenue 0.86 1.20 1.33 4.42 4.61
8.2.2 Peak Flood Levels at Selected Locations
Predicted peak flood levels at the observed locations within the Kittys Creek catchment is shown in Table 8-3 below.
Table 8-3 Peak flood levels at selected locations – Kittys Creek catchment
Location Modelled Peak Flood Levels (mAHD)
20% AEP 5% AEP 2% AEP 1% AEP PMF Coxs Road 20.88 20.91 20.96 20.97 20.98 Long Avenue (Near) 33.17 33.23 33.28 33.43 33.97 Melba Drive (Near) 28.34 29.59 30.88 30.91 31.41 Melba Drive (South) 39.83 39.84 39.86 39.88 39.94 Jeanette Street (Near) 11.62 13.20 13.31 13.36 13.44 Bronhill Avenue 10.41 10.44 10.49 10.51 10.61 Fox Road 31.12 31.13 31.19 31.24 31.41 Badajoz Road 53.50 53.52 53.56 53.58 53.62 Blenheim Road 55.81 55.88 55.89 55.90 55.95 Nash Place 47.26 47.31 47.33 47.35 47.51
Predicted peak flood levels at the observed locations within the Buffalo Creek catchment is shown in Table 8-4 below.
Table 8-4 Peak flood levels at selected locations – Buffalo Creek catchment
Location Modelled Peak Flood Levels (mAHD)
20% AEP 5% AEP 2% AEP 1% AEP PMF Lane Cove Road 47.04 47.11 47.13 47.15 47.37 Smith Street 44.37 44.39 44.40 44.41 44.56 Dobson Crescent 51.24 51.25 51.33 51.35 51.64 Quarry Road 56.95 57.24 57.28 57.30 57.47 Gardener Road 43.65 43.71 43.75 43.79 44.16 Gannan Park 50.52 50.53 50.54 50.55 50.57 Baird Avenue 29.29 29.34 29.35 29.39 29.64 Buffalo Road 29.28 29.30 29.31 29.32 29.35 Higginbotham Road 22.93 22.96 22.98 22.99 23.14 Lyndhurst Street 26.36 26.37 26.38 26.39 26.40 Finch Avenue 32.31 32.32 32.33 32.35 32.39
ITEM 2 (continued) ATTACHMENT 1
Page 25
20 | GHD | Report for City of Ryde Council - Buffalo and Kittys Creek Flood Study, 21/21394
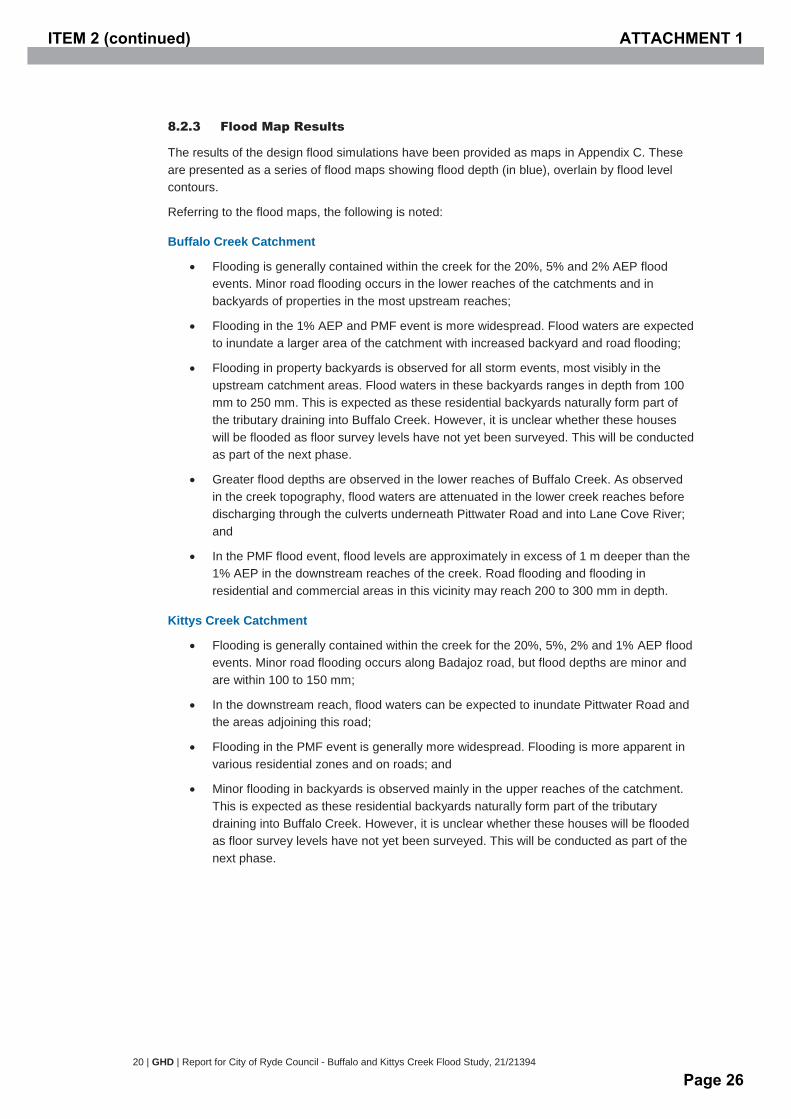
8.2.3 Flood Map Results
The results of the design flood simulations have been provided as maps in Appendix C. These are presented as a series of flood maps showing flood depth (in blue), overlain by flood level contours.
Referring to the flood maps, the following is noted:
Buffalo Creek Catchment
Flooding is generally contained within the creek for the 20%, 5% and 2% AEP flood events. Minor road flooding occurs in the lower reaches of the catchments and in backyards of properties in the most upstream reaches;
Flooding in the 1% AEP and PMF event is more widespread. Flood waters are expected to inundate a larger area of the catchment with increased backyard and road flooding;
Flooding in property backyards is observed for all storm events, most visibly in the upstream catchment areas. Flood waters in these backyards ranges in depth from 100 mm to 250 mm. This is expected as these residential backyards naturally form part of the tributary draining into Buffalo Creek. However, it is unclear whether these houses will be flooded as floor survey levels have not yet been surveyed. This will be conducted as part of the next phase.
Greater flood depths are observed in the lower reaches of Buffalo Creek. As observed in the creek topography, flood waters are attenuated in the lower creek reaches before discharging through the culverts underneath Pittwater Road and into Lane Cove River; and
In the PMF flood event, flood levels are approximately in excess of 1 m deeper than the 1% AEP in the downstream reaches of the creek. Road flooding and flooding in residential and commercial areas in this vicinity may reach 200 to 300 mm in depth.
Kittys Creek Catchment
Flooding is generally contained within the creek for the 20%, 5%, 2% and 1% AEP flood events. Minor road flooding occurs along Badajoz road, but flood depths are minor and are within 100 to 150 mm;
In the downstream reach, flood waters can be expected to inundate Pittwater Road and the areas adjoining this road;
Flooding in the PMF event is generally more widespread. Flooding is more apparent in various residential zones and on roads; and
Minor flooding in backyards is observed mainly in the upper reaches of the catchment. This is expected as these residential backyards naturally form part of the tributary draining into Buffalo Creek. However, it is unclear whether these houses will be flooded as floor survey levels have not yet been surveyed. This will be conducted as part of the next phase.
ITEM 2 (continued) ATTACHMENT 1
Page 26
GHD | Report for City of Ryde Council - Buffalo and Kittys Creek Flood Study, 21/21394 | 21
8.3 Design Flood Hydrographs
8.3.1 Critical Storm Duration
A range of storm durations were modelled for the Buffalo and Kittys Creek catchments in order to identify the critical storm duration for design event flooding. Design durations modelled for each AEP event included the 0.5 hour, 1 hour, 1.5 hour, 2 hour, 3 hour, 4.5 hour and 6 hour durations.
Outputs from the hydrologic model simulations indicate that the maximum peak inflows for the Buffalo Creek catchment are generally derived when using storm durations of 1 to 2 hours. Similarly, maximum peak inflows for the Kittys Creek catchment also occur during the same storm durations.
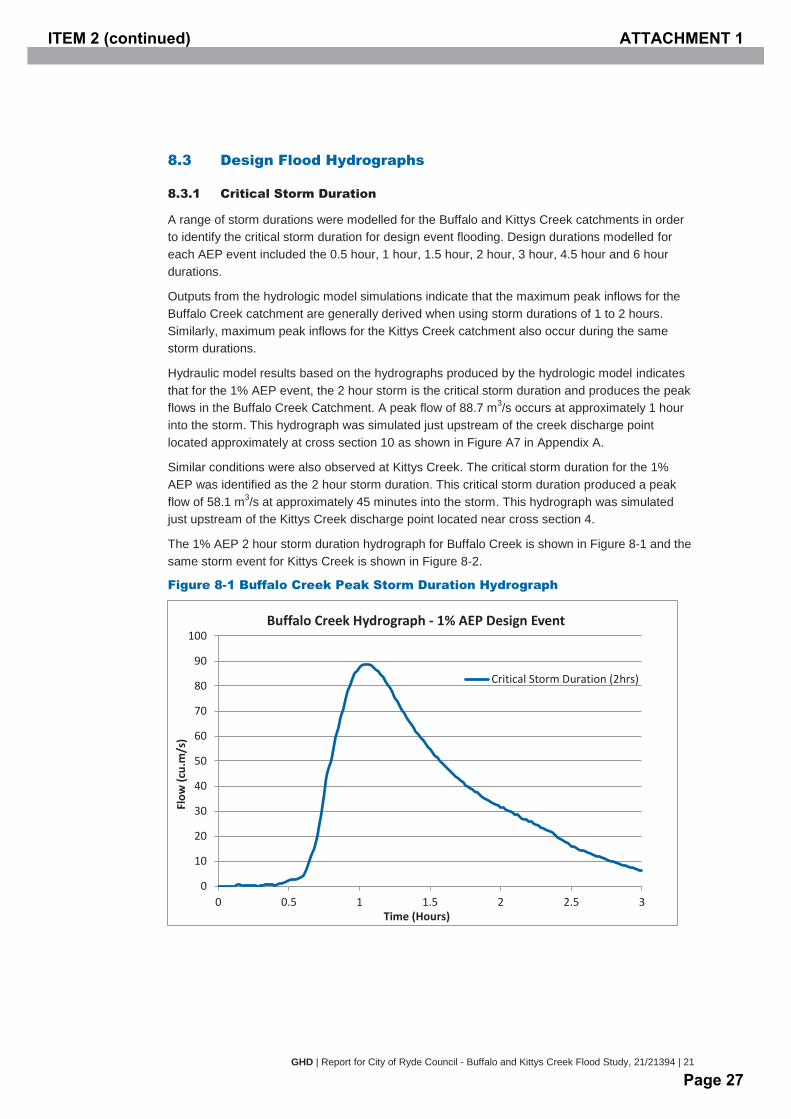
Hydraulic model results based on the hydrographs produced by the hydrologic model indicates that for the 1% AEP event, the 2 hour storm is the critical storm duration and produces the peak flows in the Buffalo Creek Catchment. A peak flow of 88.7 m3/s occurs at approximately 1 hour into the storm. This hydrograph was simulated just upstream of the creek discharge point located approximately at cross section 10 as shown in Figure A7 in Appendix A.
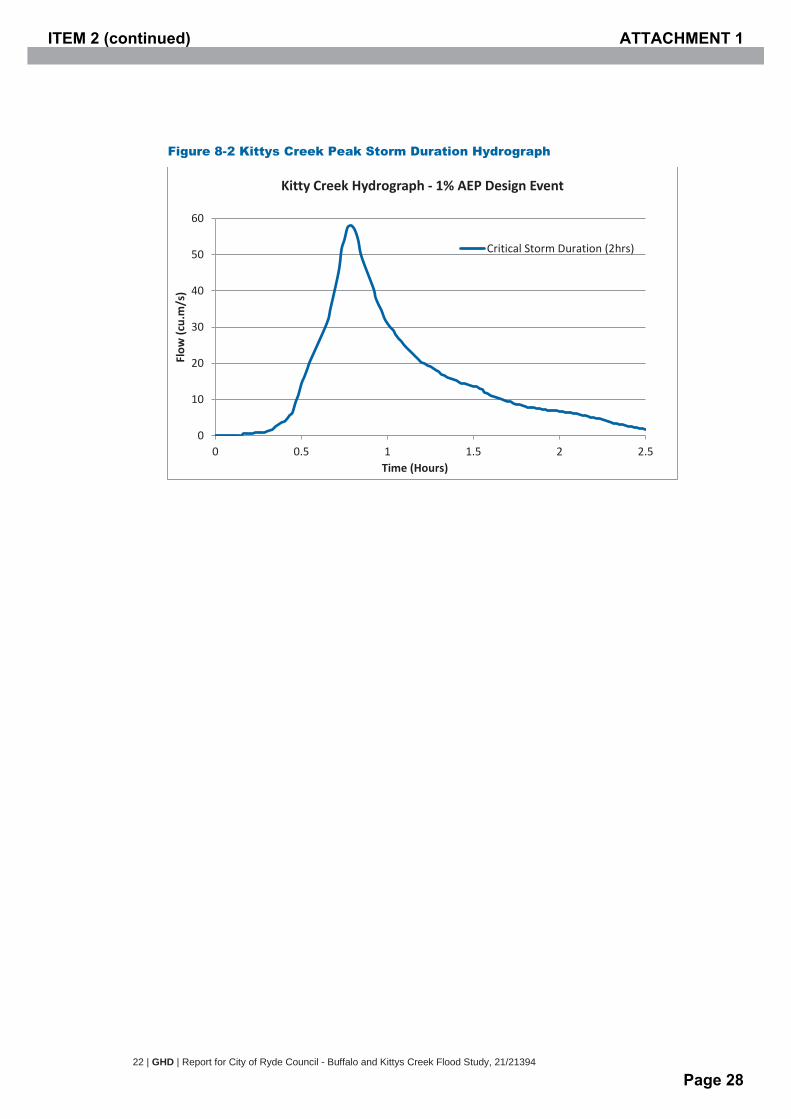
Similar conditions were also observed at Kittys Creek. The critical storm duration for the 1% AEP was identified as the 2 hour storm duration. This critical storm duration produced a peak flow of 58.1 m3/s at approximately 45 minutes into the storm. This hydrograph was simulated just upstream of the Kittys Creek discharge point located near cross section 4.
The 1% AEP 2 hour storm duration hydrograph for Buffalo Creek is shown in Figure 8-1 and the same storm event for Kittys Creek is shown in Figure 8-2.
Figure 8-1 Buffalo Creek Peak Storm Duration Hydrograph
0
10
20
30
40
50
60
70
80
90
100
0 0.5 1 1.5 2 2.5 3
Flow
(cu.
m/s
)
Time (Hours)
Buffalo Creek Hydrograph - 1% AEP Design Event
Critical Storm Duration (2hrs)
ITEM 2 (continued) ATTACHMENT 1
Page 27
22 | GHD | Report for City of Ryde Council - Buffalo and Kittys Creek Flood Study, 21/21394
Figure 8-2 Kittys Creek Peak Storm Duration Hydrograph
0
10
20
30
40
50
60
0 0.5 1 1.5 2 2.5
Flow
(cu.
m/s
)
Time (Hours)
Kitty Creek Hydrograph - 1% AEP Design Event
Critical Storm Duration (2hrs)
ITEM 2 (continued) ATTACHMENT 1
Page 28
GHD | Report for City of Ryde Council - Buffalo and Kittys Creek Flood Study, 21/21394 | 23
8.4 Provisional Hazard Classifications
8.4.1 Provisional Hazard Classification Maps
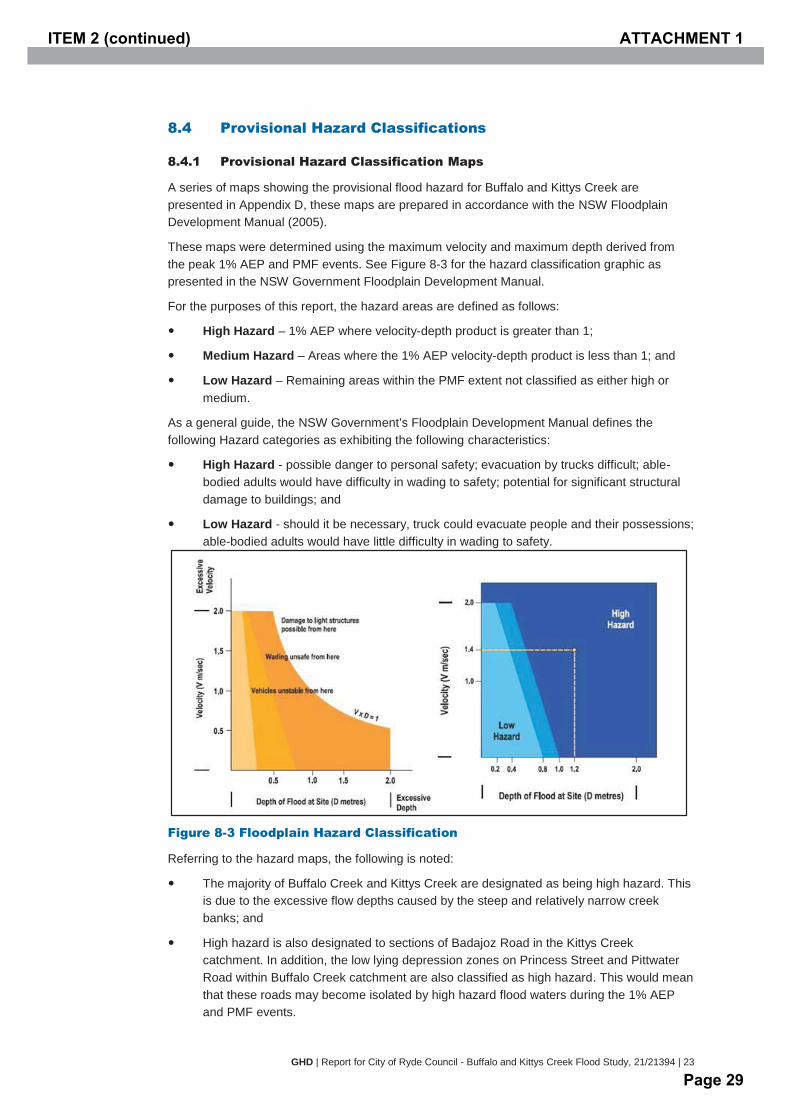
A series of maps showing the provisional flood hazard for Buffalo and Kittys Creek are presented in Appendix D, these maps are prepared in accordance with the NSW Floodplain Development Manual (2005).
These maps were determined using the maximum velocity and maximum depth derived from the peak 1% AEP and PMF events. See Figure 8-3 for the hazard classification graphic as presented in the NSW Government Floodplain Development Manual.
For the purposes of this report, the hazard areas are defined as follows:
High Hazard – 1% AEP where velocity-depth product is greater than 1;
Medium Hazard – Areas where the 1% AEP velocity-depth product is less than 1; and
Low Hazard – Remaining areas within the PMF extent not classified as either high or medium.
As a general guide, the NSW Government’s Floodplain Development Manual defines the following Hazard categories as exhibiting the following characteristics:
High Hazard - possible danger to personal safety; evacuation by trucks difficult; able-bodied adults would have difficulty in wading to safety; potential for significant structural damage to buildings; and
Low Hazard - should it be necessary, truck could evacuate people and their possessions; able-bodied adults would have little difficulty in wading to safety.
Figure 8-3 Floodplain Hazard Classification
Referring to the hazard maps, the following is noted:
The majority of Buffalo Creek and Kittys Creek are designated as being high hazard. This is due to the excessive flow depths caused by the steep and relatively narrow creek banks; and
High hazard is also designated to sections of Badajoz Road in the Kittys Creek catchment. In addition, the low lying depression zones on Princess Street and Pittwater Road within Buffalo Creek catchment are also classified as high hazard. This would mean that these roads may become isolated by high hazard flood waters during the 1% AEP and PMF events.
ITEM 2 (continued) ATTACHMENT 1
Page 29

24 | GHD | Report for City of Ryde Council - Buffalo and Kittys Creek Flood Study, 21/21394
8.5 Sensitivity Analyses
8.5.1 Overview
A number of sensitivity analyses were undertaken to determine the impacts of parameters and assumptions on flood behaviour. This was achieved by adjusting the key model parameters and re-simulating both the hydrologic and hydraulic models. As the 1% AEP is an important benchmark for flood planning in NSW, this event formed the basis for all the sensitivity assessments.
The results are presented in the form of changes in flood depths compared with the 1% AEP event in Appendix E. The items and assumptions assessed in the sensitivity analysis include:
Sensitivity of Manning’s ‘n’ roughness;
Sensitivity to downstream boundary conditions and initial water levels; and
Future Climate Change impacts on increased rainfall and sea level rise.
8.5.2 Sensitivity to Culvert Blockage
Sensitivity to culvert blockages in the hydraulic models was not assessed in this study. This is because there are only two main culverts in the Buffalo Creek Catchment (underneath Buffalo Road and Lane Cove River) and these are quite substantial in size, both being larger than 2 m in width. It is noted however, that potential blockage of the pit and pipe network has already been incorporated as outlined in Section 5 and Section 6.
8.5.3 Sensitivity to Manning’s ‘n’ Roughness
To assess the impacts of roughness assumptions, the hydraulic models were re-simulated using the amended roughness assumptions tabulated below. As the original values used for the design runs were industry standard, for conservative purposes the roughness values for the highly vegetated forested areas was increased to the upper limit of 0.15 from 0.10. In addition, as houses were not individually modelled, and to account for flooding caused by residential fences, a more conservative roughness value of 0.1 (from 0.05) was trialled for urban residential areas.
Table 8-5 Sensitivity Analysis – Adjusted Roughness Values
Material Layer (Surface Type) Original Manning’s ‘n’ values
Adjusted Manning’s ‘n’ values
Urban, housing with backyard vegetation.
0.05 0.10
Commercial, buildings not detailed separately.
0.05 0.06
Short grass, no bush cover. 0.03 0.03 Medium to dense shrub cover, forested areas.
0.10 0.15
Sealed roads. 0.02 0.02 Industrial Areas, highly concreted. 0.02 0.02
The change in peak flood levels as a result of more conservative Manning’s ‘n’ Roughness values are shown as afflux maps in Appendix E, Figures E1.1 and E1.2.
These generally represent between a 100 mm to 300 mm increase in flood levels along the creeks itself. Flood level changes along residential and road areas were found to be minimal, with changes of less than 100 mm.
ITEM 2 (continued) ATTACHMENT 1
Page 30
GHD | Report for City of Ryde Council - Buffalo and Kittys Creek Flood Study, 21/21394 | 25
8.5.4 Sensitivity to Downstream Boundary Conditions
The downstream boundary conditions for both Buffalo and Kittys Creek are governed by design surface water levels of Lane Cove River. Sensitivity testing for different water levels at the downstream boundary has been re-simulated in the hydraulic models. These include an increase of 0.4 m and 0.9 m to the existing 1% AEP design water levels. More detail is described in Section 8.5.5 of this report.
8.5.5 Sensitivity to Climate Change
Increase in Rainfall
Future climate impacts on rainfall have been assessed generally in accordance with the following guidelines:
Floodplain Risk Management Guideline, Practical Consideration of Climate Change (NSW DECC 2007); and the
Flood Risk Management Guide, Incorporating Sea Level Rise Benchmarks in Flood Risk Assessments (DECCW, 2010).
For this assessment the hydrological DRAINS model was updated to represent future climate change rainfall increases suggested in the guidelines. A conservative approach of simulating the maximum suggested 30% increase in rainfall was adopted. The hydrographs produced from the hydrologic model was re-simulated in the hydraulic model. The change in peak flows are presented as afflux maps in Appendix E, Figures E2.1 and E2.2.
Referring to the afflux maps, the following is noted:
Increase in flood levels generally occurred along the main creeks. Flood level increases in residential, commercial and road areas were minimal with the majority of the flooding increasing by less than 100 mm;
Increases of flood levels of between 100 mm to 300 mm along the upper reaches of Buffalo Creek were observed. This occurred along the tributary areas adjoining the creek itself;
Increases of flooding between 300 mm to in excess of 500 mm were observed along Buffalo Creek. However, flooding extents do not extend beyond the immediate creek floodplain, posing minimal affects to roads and residential areas; and
Increases of flooding between 100 mm to 500 mm were generally observed along Kittys Creek.
Impacts of Sea Level Rise
In accordance with the sea level rise planning benchmarks provided by the DECCW 2009 NSW Sea Level Rise Policy Statement, the impacts of sea level rise for the 1% AEP event was assessed for this Study.
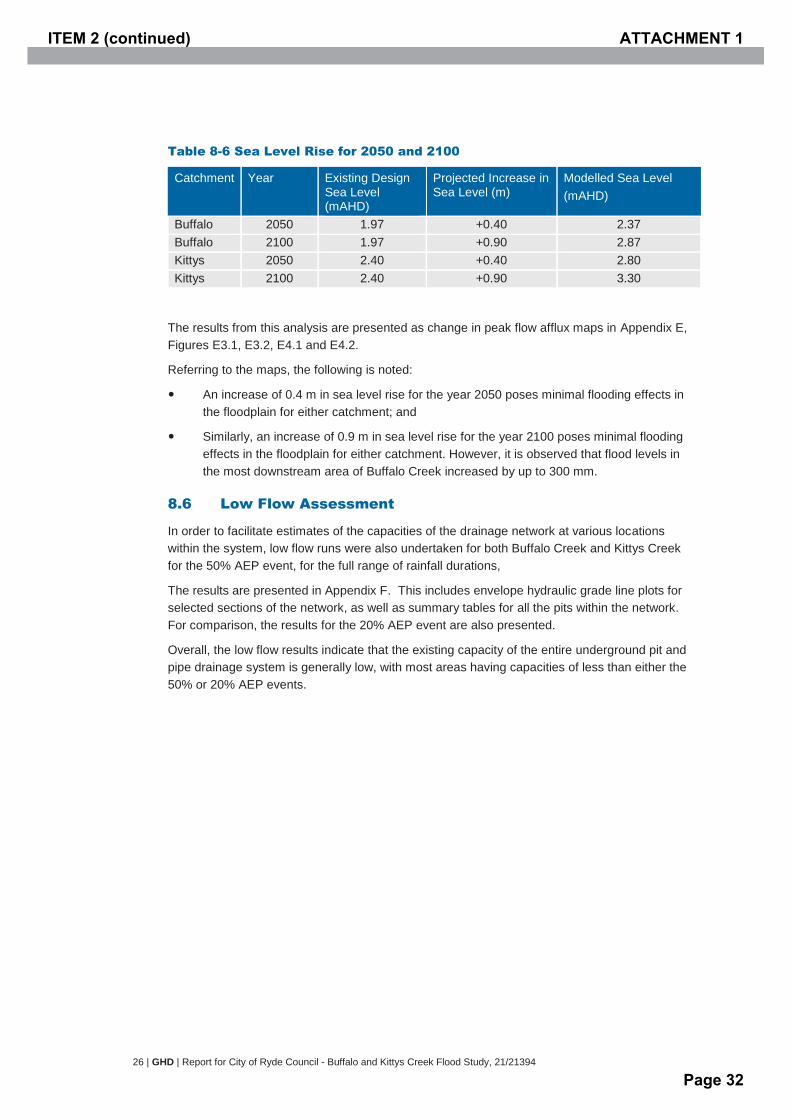
The benchmarks provided in this policy statement projected that the sea level will rise by 0.4 m by 2050 and 0.9 m by 2100. These levels were adopted in the hydraulic models and are presented in the table below.
ITEM 2 (continued) ATTACHMENT 1
Page 31
26 | GHD | Report for City of Ryde Council - Buffalo and Kittys Creek Flood Study, 21/21394
Table 8-6 Sea Level Rise for 2050 and 2100
Catchment Year Existing Design Sea Level (mAHD)
Projected Increase in Sea Level (m)
Modelled Sea Level (mAHD)
Buffalo 2050 1.97 +0.40 2.37 Buffalo 2100 1.97 +0.90 2.87 Kittys 2050 2.40 +0.40 2.80 Kittys 2100 2.40 +0.90 3.30
The results from this analysis are presented as change in peak flow afflux maps in Appendix E, Figures E3.1, E3.2, E4.1 and E4.2.
Referring to the maps, the following is noted:
An increase of 0.4 m in sea level rise for the year 2050 poses minimal flooding effects in the floodplain for either catchment; and
Similarly, an increase of 0.9 m in sea level rise for the year 2100 poses minimal flooding effects in the floodplain for either catchment. However, it is observed that flood levels in the most downstream area of Buffalo Creek increased by up to 300 mm.
8.6 Low Flow Assessment
In order to facilitate estimates of the capacities of the drainage network at various locations within the system, low flow runs were also undertaken for both Buffalo Creek and Kittys Creek for the 50% AEP event, for the full range of rainfall durations,
The results are presented in Appendix F. This includes envelope hydraulic grade line plots for selected sections of the network, as well as summary tables for all the pits within the network. For comparison, the results for the 20% AEP event are also presented.
Overall, the low flow results indicate that the existing capacity of the entire underground pit and pipe drainage system is generally low, with most areas having capacities of less than either the 50% or 20% AEP events.
ITEM 2 (continued) ATTACHMENT 1
Page 32

GHD | Report for City of Ryde Council - Buffalo and Kittys Creek Flood Study, 21/21394 | 27
9. Summary and Conclusions The objective of this Flood Study is to assist City of Ryde Council and its Floodplain Risk Management Committee in undertaking a detailed flooding assessment for the Buffalo and Kittys Creek catchments and its floodplains.
The outcomes from this flood study and the hydrologic and hydraulic models will form the basis for all future floodplain management activities. In particular, this flood investigation will be used directly to form the Buffalo and Kittys Creek floodplain management plan and study (FRMS&P).
The key tasks performed for this Flood Study include:
The collection and review of existing data and the acquisition of additional data crucial to the study, including data required for the production of the hydrologic and hydraulic models;
Involving the community by undertaking a community consultation and engagement program to identify local concerns, collect information on historical flood data and involving the community in the on-going floodplain management process;
Establishment of appropriate hydrologic and hydraulic models and applying suitable validation and calibration methods;
Determination of design flood conditions for the 1%, 5%, 20% and 50% AEP events and the Probable Maximum Flood (PMF) and assessing the output results;
Conducting model sensitivity checks for various scenarios; and
Assessing the impacts of climate change based on the latest guidelines.
The key study outputs include a full set of design flood maps incorporating peak flood depths and flood levels for the full range of design storm events. A set of provisional hazard categorisation flood maps were also produces based on the guidelines as outlined in the Floodplain Development Manual.
Below is a summary of the key findings of this Flood Study:
Flooding in the Buffalo Creek catchment is generally contained within the creek itself, for the 20%, 5% and 2% AEP flood events. Flooding in the 1% AEP and PMF event is more widespread. Flood waters are expected to inundate larger areas of the catchment including increased backyard and road flooding for these extreme storm events;
Greater flood depths are observed in the lower reaches of Buffalo Creek. As observed in the creek topography, flood waters are attenuated in the lower creek reaches before discharging through the culverts underneath Pittwater Road into Lane Cove River;
In the PMF flood event, flood levels in Buffalo Creek are in excess of 1 m deeper than the 1% AEP in the downstream reaches along the creek. Road flooding, and flooding in residential and commercial areas may reach 200 to 300 mm in depth;
Flooding in the Kittys Creek catchment is generally contained within the creek itself for the 20%, 5%, 2% and 1% AEP flood events. Minor road flooding occurs along Badajoz road;
In the downstream reach, flood waters can be expected to inundate Pittwater Road and the areas surrounding this road;
Flooding in the Kittys Creek catchment in the PMF event is generally more widespread. However, flood depths in the residential areas and on roads are generally minor;
ITEM 2 (continued) ATTACHMENT 1
Page 33

28 | GHD | Report for City of Ryde Council - Buffalo and Kittys Creek Flood Study, 21/21394
Minor flooding in backyards is observed mainly in the upper reaches of the catchment. This is expected as the residential backyards in these areas form part of the tributaries draining into Kittys Creek. Housing along this tributary is typically built on a higher elevation than the backyard; and
In addition, a full set of peak afflux maps were produced to assess the sensitivity of the results to various model parameters and climate change scenarios based on the 1% AEP 2 hour duration storm.
The key findings from this sensitivity analysis are listed below:
A change in hydraulic Manning’s ‘n’ roughness had minimal impacts to flooding in both catchments. Flood level changes along residential and road areas were found to be of less than 100 mm;
The models were found to have minimal sensitivity against different boundary conditions. A change in initial and continual water levels had minimal impacts on flooding along the catchments; and
The impacts of flooding caused by climate change are generally low for both the modelled sea level rise scenarios. Adversely, the impacts due to a 30% increase in rainfall are observed to be more significant in both catchments.
Additional low flow runs were undertaken to assess the capacities of the underground pits and pipes at various locations within the drainage system. The results indicated that the capacities are generally low, with much of the entire system having capacities of less than either the 50% or 20% AEP events.
ITEM 2 (continued) ATTACHMENT 1
Page 34
GHD | Report for City of Ryde Council - Buffalo and Kittys Creek Flood Study, 21/21394 | 29
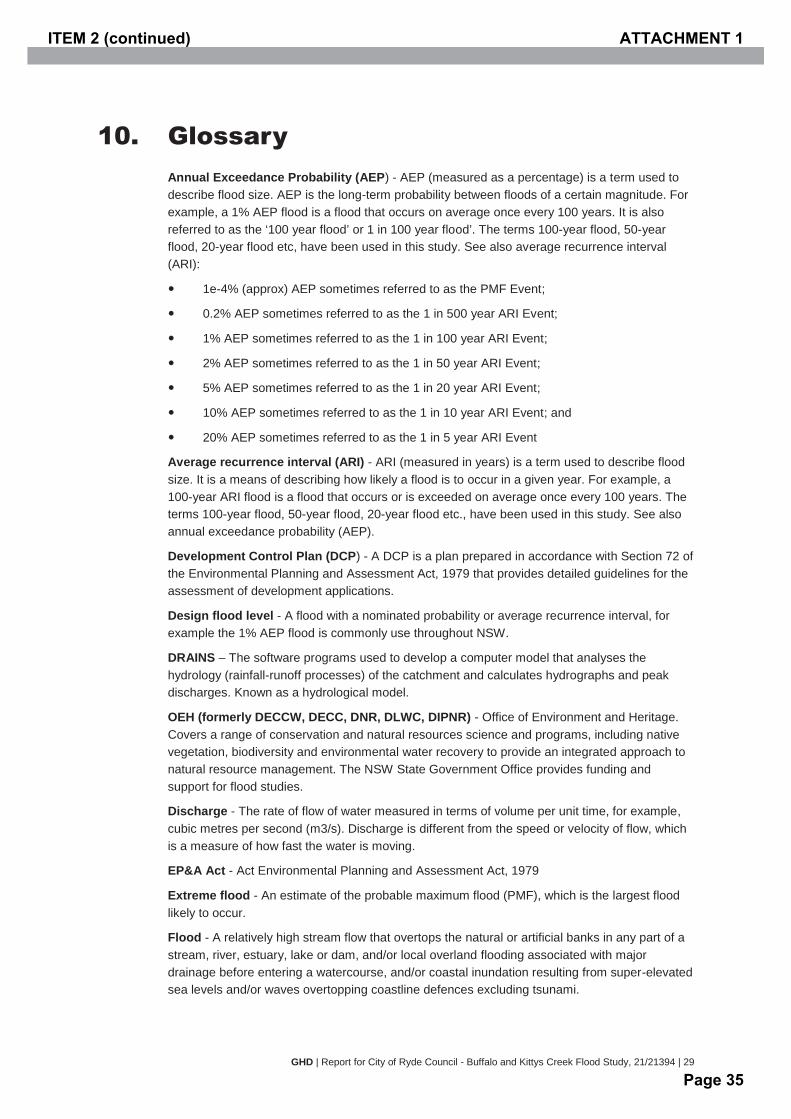
10. Glossary Annual Exceedance Probability (AEP) - AEP (measured as a percentage) is a term used to describe flood size. AEP is the long-term probability between floods of a certain magnitude. For example, a 1% AEP flood is a flood that occurs on average once every 100 years. It is also referred to as the ‘100 year flood’ or 1 in 100 year flood’. The terms 100-year flood, 50-year flood, 20-year flood etc, have been used in this study. See also average recurrence interval (ARI):
1e-4% (approx) AEP sometimes referred to as the PMF Event;
0.2% AEP sometimes referred to as the 1 in 500 year ARI Event;
1% AEP sometimes referred to as the 1 in 100 year ARI Event;
2% AEP sometimes referred to as the 1 in 50 year ARI Event;
5% AEP sometimes referred to as the 1 in 20 year ARI Event;
10% AEP sometimes referred to as the 1 in 10 year ARI Event; and
20% AEP sometimes referred to as the 1 in 5 year ARI Event
Average recurrence interval (ARI) - ARI (measured in years) is a term used to describe flood size. It is a means of describing how likely a flood is to occur in a given year. For example, a 100-year ARI flood is a flood that occurs or is exceeded on average once every 100 years. The terms 100-year flood, 50-year flood, 20-year flood etc., have been used in this study. See also annual exceedance probability (AEP).
Development Control Plan (DCP) - A DCP is a plan prepared in accordance with Section 72 of the Environmental Planning and Assessment Act, 1979 that provides detailed guidelines for the assessment of development applications.
Design flood level - A flood with a nominated probability or average recurrence interval, for example the 1% AEP flood is commonly use throughout NSW.
DRAINS – The software programs used to develop a computer model that analyses the hydrology (rainfall-runoff processes) of the catchment and calculates hydrographs and peak discharges. Known as a hydrological model.
OEH (formerly DECCW, DECC, DNR, DLWC, DIPNR) - Office of Environment and Heritage. Covers a range of conservation and natural resources science and programs, including native vegetation, biodiversity and environmental water recovery to provide an integrated approach to natural resource management. The NSW State Government Office provides funding and support for flood studies.
Discharge - The rate of flow of water measured in terms of volume per unit time, for example, cubic metres per second (m3/s). Discharge is different from the speed or velocity of flow, which is a measure of how fast the water is moving.
EP&A Act - Act Environmental Planning and Assessment Act, 1979
Extreme flood - An estimate of the probable maximum flood (PMF), which is the largest flood likely to occur.
Flood - A relatively high stream flow that overtops the natural or artificial banks in any part of a stream, river, estuary, lake or dam, and/or local overland flooding associated with major drainage before entering a watercourse, and/or coastal inundation resulting from super-elevated sea levels and/or waves overtopping coastline defences excluding tsunami.
ITEM 2 (continued) ATTACHMENT 1
Page 35
30 | GHD | Report for City of Ryde Council - Buffalo and Kittys Creek Flood Study, 21/21394
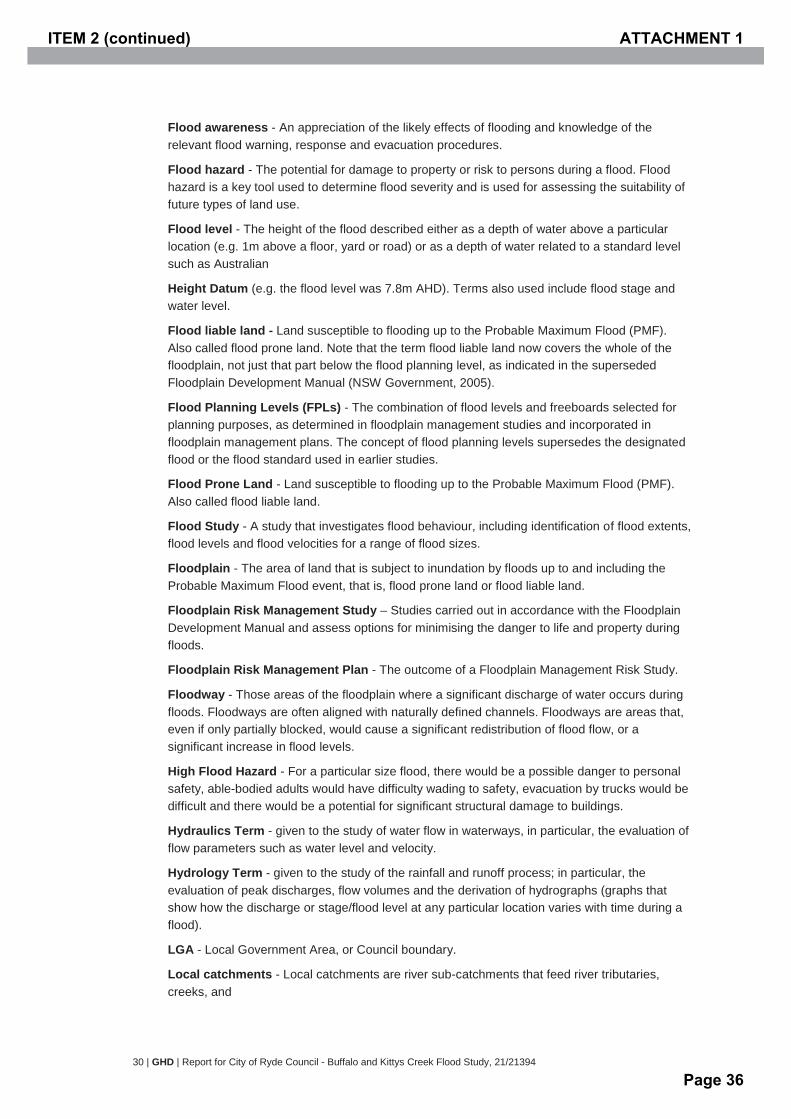
Flood awareness - An appreciation of the likely effects of flooding and knowledge of the relevant flood warning, response and evacuation procedures.
Flood hazard - The potential for damage to property or risk to persons during a flood. Flood hazard is a key tool used to determine flood severity and is used for assessing the suitability of future types of land use.
Flood level - The height of the flood described either as a depth of water above a particular location (e.g. 1m above a floor, yard or road) or as a depth of water related to a standard level such as Australian
Height Datum (e.g. the flood level was 7.8m AHD). Terms also used include flood stage and water level.
Flood liable land - Land susceptible to flooding up to the Probable Maximum Flood (PMF). Also called flood prone land. Note that the term flood liable land now covers the whole of the floodplain, not just that part below the flood planning level, as indicated in the superseded Floodplain Development Manual (NSW Government, 2005).
Flood Planning Levels (FPLs) - The combination of flood levels and freeboards selected for planning purposes, as determined in floodplain management studies and incorporated in floodplain management plans. The concept of flood planning levels supersedes the designated flood or the flood standard used in earlier studies.
Flood Prone Land - Land susceptible to flooding up to the Probable Maximum Flood (PMF). Also called flood liable land.
Flood Study - A study that investigates flood behaviour, including identification of flood extents, flood levels and flood velocities for a range of flood sizes.
Floodplain - The area of land that is subject to inundation by floods up to and including the Probable Maximum Flood event, that is, flood prone land or flood liable land.
Floodplain Risk Management Study – Studies carried out in accordance with the Floodplain Development Manual and assess options for minimising the danger to life and property during floods.
Floodplain Risk Management Plan - The outcome of a Floodplain Management Risk Study.
Floodway - Those areas of the floodplain where a significant discharge of water occurs during floods. Floodways are often aligned with naturally defined channels. Floodways are areas that, even if only partially blocked, would cause a significant redistribution of flood flow, or a significant increase in flood levels.
High Flood Hazard - For a particular size flood, there would be a possible danger to personal safety, able-bodied adults would have difficulty wading to safety, evacuation by trucks would be difficult and there would be a potential for significant structural damage to buildings.
Hydraulics Term - given to the study of water flow in waterways, in particular, the evaluation of flow parameters such as water level and velocity.
Hydrology Term - given to the study of the rainfall and runoff process; in particular, the evaluation of peak discharges, flow volumes and the derivation of hydrographs (graphs that show how the discharge or stage/flood level at any particular location varies with time during a flood).
LGA - Local Government Area, or Council boundary.
Local catchments - Local catchments are river sub-catchments that feed river tributaries, creeks, and
ITEM 2 (continued) ATTACHMENT 1
Page 36

GHD | Report for City of Ryde Council - Buffalo and Kittys Creek Flood Study, 21/21394 | 31
watercourses and channelised or piped drainage systems.
Local Environmental Plan (LEP) – A Local Environmental Plan is a plan prepared in accordance with the Environmental Planning and Assessment Act, 1979, that defines zones, permissible uses within those zones and specifies development standards and other special matters for consideration with regard to the use or development of land.
Local overland flooding - Local overland flooding is inundation by local runoff within the local
catchment.
Local runoff - local runoff from the local catchment is categorised as either major drainage or local drainage in the NSW Floodplain Development Manual, 2005.
Low flood hazard - For a particular size flood, able-bodied adults would generally have little difficulty wading and trucks could be used to evacuate people and their possessions should it be necessary.
Flows or discharges - It is the rate of flow of water measured in terms of volume per unit time.
Overland flow path - The path that floodwaters can follow if they leave the confines of the main flow channel. Overland flow paths can occur through private property or along roads. Floodwaters travelling along overland flow paths, often referred to as ‘overland flows’, may or may not re-enter the main channel from which they left — they may be diverted to another watercourse.
Peak discharge - The maximum flow or discharge during a flood.
Present value - In relation to flood damage, is the sum of all future flood damages that can be expected over a fixed period (usually 20 years) expressed as a cost in today’s value.
Probable Maximum Flood (PMF) - The largest flood likely to ever occur. The PMF defines the extent of flood prone land or flood liable land, that is, the floodplain.
Reliable access - During a flood, reliable access means the ability for people to safely evacuate an area subject to imminent flooding within effective warning time, having regard to the depth and velocity of floodwaters, the suitability of the evacuation route, and other relevant factors.
Risk - Chance of something happening that will have an impact. It is measured in terms of consequences and likelihood. In the context of this study, it is the likelihood of consequences arising from the interaction of floods, communities and the environment.
Runoff - the amount of rainfall that ends up as flow in a stream, also known as rainfall excess.
SES - State Emergency Service of New South Wales
ITEM 2 (continued) ATTACHMENT 1
Page 37
32 | GHD | Report for City of Ryde Council - Buffalo and Kittys Creek Flood Study, 21/21394
11. References AR&R 2001, Australian Rainfall and Runoff, 2001;
BMT WBM 2010, TUFLOW User Manual;
BOM 2003, Bureau of Meteorology Australia Generalised Tropical Storm Method – Revised Version, November 2003;
NSW DECC 2005, NSW Government, Floodplain Development Manual, Management of Flood Liable Land 2005;
NSW DECC 2007, Practical Consideration of Climate Change, NSW Department of Environment & Climate Change;
NSW DECCM 2010, Flood Risk Management Guide, Incorporating Sea Level Rise Benchmarks in Flood Risk Assessments
OEH 2007, Department of Environment and Climate Change, Flood Risk Management Guideline,
Watercom Pty Ltd. (2004) DRAINS User Manual
ITEM 2 (continued) ATTACHMENT 1
Page 38

GHD | Report for City of Ryde Council - Buffalo and Kittys Creek Flood Study, 21/21394 | 33
Appendices
ITEM 2 (continued) ATTACHMENT 1
Page 39

34 | GHD | Report for City of Ryde Council - Buffalo and Kittys Creek Flood Study, 21/21394
ITEM 2 (continued) ATTACHMENT 1
Page 40
GHD | Report for City of Ryde Council - Buffalo and Kittys Creek Flood Study, 21/21394 | 35
Appendix A – Catchment and Supporting Information
A1 Locality Plan
A2.1 Buffalo Creek Catchment Topography
A2.2 Kittys Creek Catchment Topography
A3.1 Buffalo Creek Catchment Drainage Network
A3.2 Kittys Creek Catchment Drainage Network
A4.1 Buffalo Creek Subcatchment Plan
A4.2 Kittys Creek Subcatchment Plan
A5 Surveyed Cross Section Locations
A6.1 Buffalo Creek HEC-RAS Model
A6.2 Buffalo Creek HEC-RAS Model
A7 Observed Flood Locations
ITEM 2 (continued) ATTACHMENT 1
Page 41
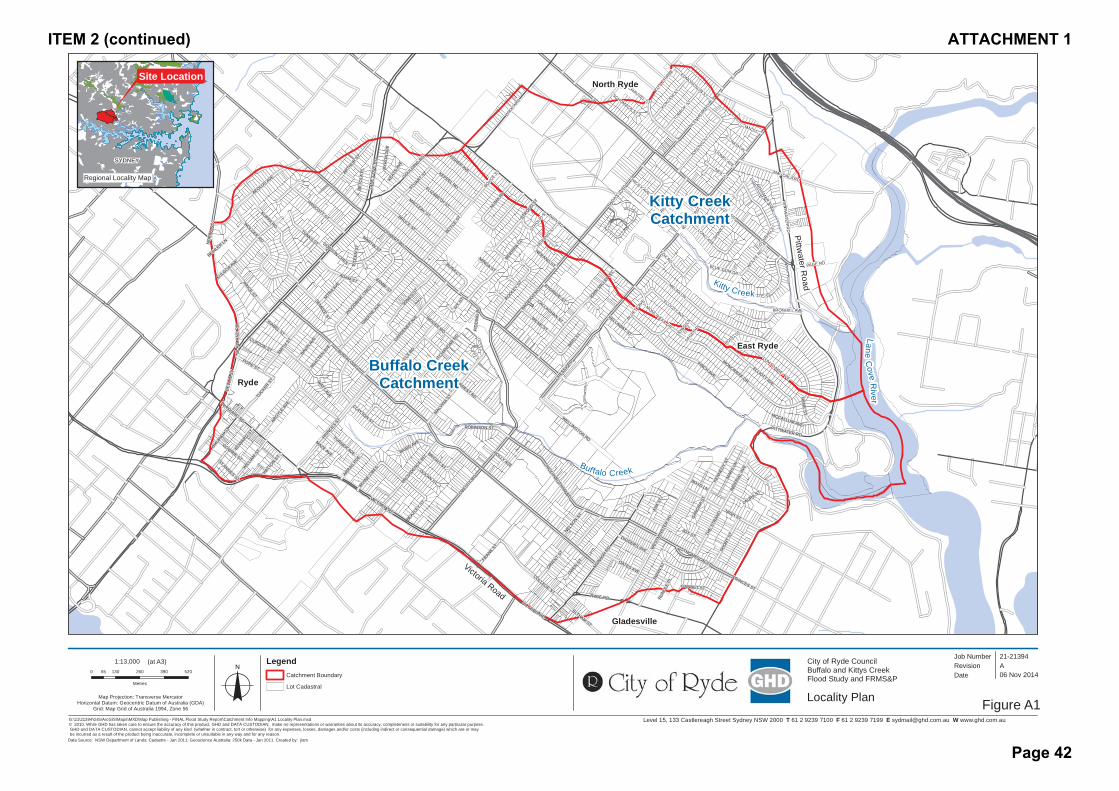
Level 15, 133 Castlereagh Street Sydney NSW 2000 T 61 2 9239 7100 F 61 2 9239 7199 E [email protected] W www.ghd.com.au
COXS RDTWIN RD
CRESSY
RD
MELBA DR
PITTWATE
R R
D
WIC
KS RD
MAGDALA RD
BADAJO
Z RD
ELLIOTT AVE
BLENHEIM
RD
JOPLIN
G ST
FOX RD
CUTLER P
DE
LONG AVE
PAGE RD
BRONHILL AVE
LUMSDAINE AVE
TOBRUK S
T
KOKODA ST
EDMONDSON ST
CONRAD S
T
NERANG ST
JEANETTE ST
HARFORD S
T
SHAW
ST
IAN ST
WOLF
E RD
CHAUVEL ST
BLUE GUM DR
NASH PL
NEIL STPACEY AVE
SCHUMACK ST
MONCRIEFF DR
LIONEL AVE
STROUD S
T
RUDD ST
CARRAMAR AVE
BOYCE S
T
DOWD L
NBLUETT
AVE
SAGER
PL
BUFFALO RD
QUARRY RD
LAN
E C
OV
E R
D
PITTWATER RD
HIGH ST
MONAS
H RD
CRESSY RD
PRIN
CES ST
MONCRIEFF DR
BOYCE S
T
GREENE AVE
AEOLUS AVE
KELLS R
D
KUPPA RD
WES
TMIN
STER
RD
THOMPSON ST
GARDENER AVE
FINCH AVE
HIGGINBOTHAM RD
AITCHANDAR R
D
JONES S
T
COLLEGE ST
BRUCE ST
SMIT
H ST
WOODBIN
E CRES
WOLGER RD
PRICE ST
GOULDIN
G RD
DEV
LIN
ST
ARGYLE
AVE
BADAJO
Z RD
SWAN
ST
KULGOA AVE
MAR
S LN
FORREST RD
ARTHUR S
T
ELLIOTT AVE
KEPPEL RD
POOLE
Y ST
WELLINGTON RD
THE
STRA
ND
HANCOTT ST
RYDE RD
FISHER AVE
MACLEAY ST
TUNKS ST
SHO
RT S
T
KENN
EDY
ST
BLA
XLA
ND
RD
PROVIDENCE R
D
OATES AVE
CHURCH ST
BIRD S
T
POPE ST
NUMA RD
MILNE ST
TUCKER
ST
ORIENT S
T
MINGA ST
ELTHAM ST
MALVIN
A ST
DOBSON CRES
WILL
IAM S
T
ELIZABETH ST
BUNA CT
BIDGEE RD
ROBINSON ST
GANNET ST
BAIRD AVE
IRVIN
E CRES
STUART ST
BEAZLEY S
T
BAVIN
AVE
RE
NE S
T
BRIGHT ST
OWEN S
T
GOWRIE ST
FRANK S
T
ISABEL ST
VICTORIA RD
MYRA AVE
CLAYTON ST
BYR
ON
AV
E
TURNER AVE
JOY ST
NELSON S
T
CURZON ST
DOLAN ST
IVY
ST CALLAGHAN ST
ARRAS
PDE
IMPE
RIAL
AVE
NERANG ST
KIM
ST
DIGGERS AVE
HATTO
N ST
LAURA ST
EDW
ARD ST
BOYD LN
PRAT
TEN AV
E
BYGRAVE ST JOHN M
ILLER S
T
BERRIP
A CL
MCCALLUM AVE
WATT AVE
BETO
LA P
L
KELLAWAY ST
ST ANNES ST
STROUD S
T
BAMBI ST
HOLLY AVE
MAZE AVE
GAN
ORA
ST
RUND
LE P
L
PID
DIN
G R
D
MARTIN ST
NO
RTH
RD
EILE
EN
ST
SEMPLE ST
BEIHLER LN
KEAT
S AV
E
ADAM ST
CRESSY
RD
BLAXLAND RD
PRINCES ST
VICTORIA RD
G:\21\21394\GIS\ArcGIS\Maps\MXD\Map Publishing - FINAL Flood Study Report\Catchment Info Mapping\A1 Locality Plan.mxd© 2010. While GHD has taken care to ensure the accuracy of this product, GHD and DATA CUSTODIAN, make no representations or warranties about its accuracy, completeness or suitability for any particular purpose. GHD and DATA CUSTODIAN, cannot accept liability of any kind (whether in contract, tort or otherwise) for any expenses, losses, damages and/or costs (including indirect or consequential damage) which are or may be incurred as a result of the product being inaccurate, incomplete or unsuitable in any way and for any reason.
0 130 260 390 52065
Metres
Map Projection: Transverse MercatorHorizontal Datum: Geocentric Datum of Australia (GDA)
Grid: Map Grid of Australia 1994, Zone 56
Figure A1
Job NumberRevision A
21-21394
06 Nov 2014o Date
Data Source: NSW Department of Lands: Cadastre - Jan 2011; Geoscience Australia: 250k Data - Jan 2011. Created by: jlam
1:13,000 (at A3)
SYDNEY
City of Ryde CouncilBuffalo and Kittys CreekFlood Study and FRMS&P
Locality Plan
Site Location
Regional Locality Map
Buffalo CreekCatchment
Kitty CreekCatchment
Buf falo Creek
Kitty Creek
LaneC
oveR
iver
North Ryde
Gladesville
Ryde
East Ryde
Victoria Road
Pittwater R
oad
LegendCatchment Boundary
Lot Cadastral
ITEM 2 (continued) ATTACHMENT 1
Page 42
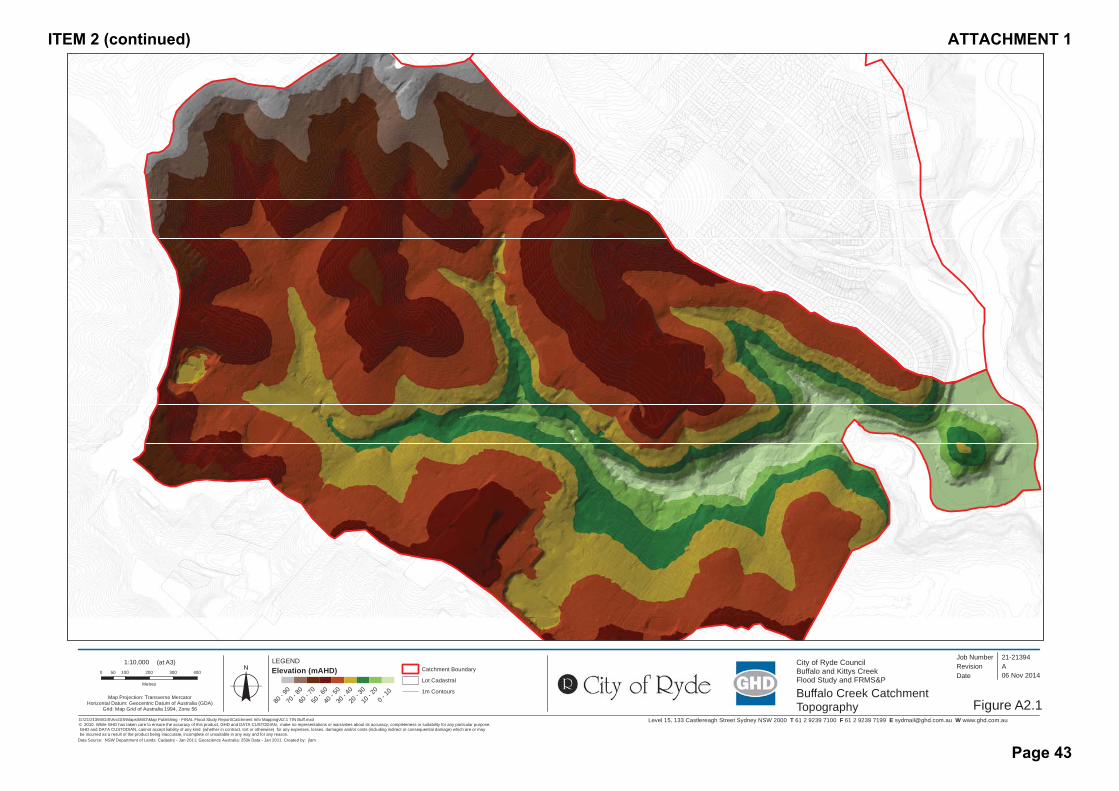
Level 15, 133 Castlereagh Street Sydney NSW 2000 T 61 2 9239 7100 F 61 2 9239 7199 E [email protected] W www.ghd.com.auG:\21\21394\GIS\ArcGIS\Maps\MXD\Map Publishing - FINAL Flood Study Report\Catchment Info Mapping\A2.1 TIN Buff.mxd© 2010. While GHD has taken care to ensure the accuracy of this product, GHD and DATA CUSTODIAN, make no representations or warranties about its accuracy, completeness or suitability for any particular purpose. GHD and DATA CUSTODIAN, cannot accept liability of any kind (whether in contract, tort or otherwise) for any expenses, losses, damages and/or costs (including indirect or consequential damage) which are or may be incurred as a result of the product being inaccurate, incomplete or unsuitable in any way and for any reason.
LEGEND0 100 200 300 40050
Metres
Map Projection: Transverse MercatorHorizontal Datum: Geocentric Datum of Australia (GDA)
Grid: Map Grid of Australia 1994, Zone 56
Figure A2.1
Job NumberRevision A
21-21394
06 Nov 2014o Date
Data Source: NSW Department of Lands: Cadastre - Jan 2011; Geoscience Australia: 250k Data - Jan 2011. Created by: jlam
1:10,000 (at A3) City of Ryde CouncilBuffalo and Kittys CreekFlood Study and FRMS&P
Buffalo Creek CatchmentTopography
Catchment Boundary
Lot Cadastral
1m Contours
Elevation (mAHD)
80 - 9
070
- 80
60 - 7
050
- 60
40 - 5
030
- 40
20 - 3
010
- 20
0 - 10
ITEM 2 (continued) ATTACHMENT 1
Page 43
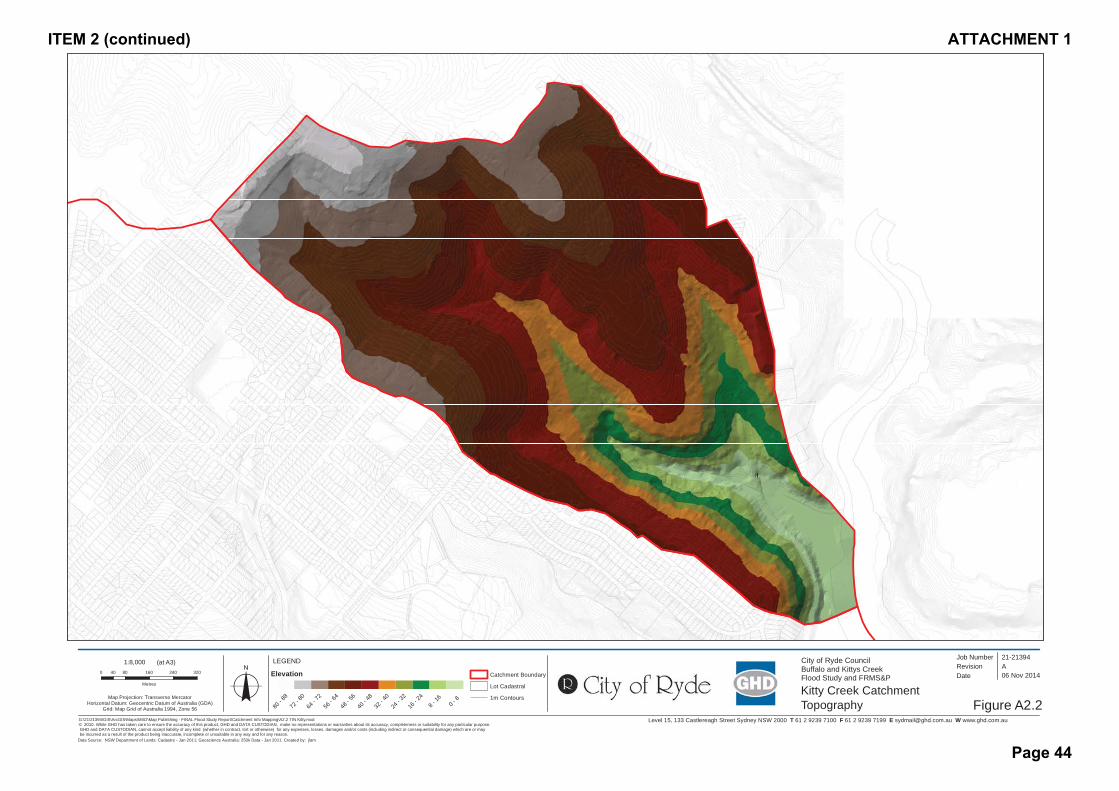
Level 15, 133 Castlereagh Street Sydney NSW 2000 T 61 2 9239 7100 F 61 2 9239 7199 E [email protected] W www.ghd.com.auG:\21\21394\GIS\ArcGIS\Maps\MXD\Map Publishing - FINAL Flood Study Report\Catchment Info Mapping\A2.2 TIN Kitty.mxd© 2010. While GHD has taken care to ensure the accuracy of this product, GHD and DATA CUSTODIAN, make no representations or warranties about its accuracy, completeness or suitability for any particular purpose. GHD and DATA CUSTODIAN, cannot accept liability of any kind (whether in contract, tort or otherwise) for any expenses, losses, damages and/or costs (including indirect or consequential damage) which are or may be incurred as a result of the product being inaccurate, incomplete or unsuitable in any way and for any reason.
LEGEND0 80 160 240 32040
Metres
Map Projection: Transverse MercatorHorizontal Datum: Geocentric Datum of Australia (GDA)
Grid: Map Grid of Australia 1994, Zone 56
Figure A2.2
Job NumberRevision A
21-21394
06 Nov 2014o Date
Data Source: NSW Department of Lands: Cadastre - Jan 2011; Geoscience Australia: 250k Data - Jan 2011. Created by: jlam
1:8,000 (at A3) City of Ryde CouncilBuffalo and Kittys CreekFlood Study and FRMS&P
Kitty Creek CatchmentTopography
Elevation
80 - 8
872
- 80
64 - 7
256
- 64
48 - 5
640
- 48
32 - 4
024
- 32
16 - 2
4
8 - 16 0 - 8
Catchment Boundary
Lot Cadastral
1m Contours
ITEM 2 (continued) ATTACHMENT 1
Page 44

180 Lonsdale Street Melbourne VIC 3000 Australia T 61 3 8687 8000 F 61 3 8687 8111 E [email protected] W www.ghd.comG:\21\21394\GIS\ArcGIS\Maps\MXD\Map Publishing - FINAL Flood Study Report\Catchment Info Mapping\A5 XS Locations.mxd
© 2011. Whilst every care has been taken to prepare this map, GHD (and DATA CUSTODIAN) make no representations or warranties about its accuracy, reliability, completeness or suitability for any particular purpose and cannot accept liability and responsibility of any kind (whether in contract, tort or otherwise) for any expenses, losses, damages and/or costs (including indirect or consequential damage) which are or may be incurred by any party as a result of the map being inaccurate, incomplete or unsuitable in any way and for any reason.
0 90 180 270 36045
Metres
Map Projection: Transverse MercatorHorizontal Datum: GDA 1994Grid: GDA 1994 MGA Zone 56 Figure A5
Job NumberRevision A
21-21394
06 Nov 2014o Date
Data source: Data Custodian, Data Set Name/Title, Version/Date. Created by:jlam
Paper Size A3
Surveyed Cross Section Locations
XS7
XS12
XS11
XS10
XS13
XS15
XS16
XS17
XS18
XS19XS20
XS21
XS9
XS8
XS1
XS2
XS3
XS4
XS5
XS6
XS14
City of Ryde CouncilBuffalo and Kittys CreekFlood Study and FRMS&P
LegendCatchment_region
Lot Cadastral
ITEM 2 (continued) ATTACHMENT 1
Page 45

Level 15, 133 Castlereagh Street Sydney NSW 2000 T 61 2 9239 7100 F 61 2 9239 7199 E [email protected] W www.ghd.com.auG:\21\21394\GIS\ArcGIS\Maps\MXD\Map Publishing - FINAL Flood Study Report\Catchment Info Mapping\Kitty_Catchment_Delineation.mxd© 2010. While GHD has taken care to ensure the accuracy of this product, GHD and DATA CUSTODIAN, make no representations or warranties about its accuracy, completeness or suitability for any particular purpose. GHD and DATA CUSTODIAN, cannot accept liability of any kind (whether in contract, tort or otherwise) for any expenses, losses, damages and/or costs (including indirect or consequential damage) which are or may be incurred as a result of the product being inaccurate, incomplete or unsuitable in any way and for any reason.
LEGEND
0 60 120 180 24030
Metres
Map Projection: Transverse MercatorHorizontal Datum: Geocentric Datum of Australia (GDA)
Grid: Map Grid of Australia 1994, Zone 56
Figure A4.2
Job NumberRevision A
21-21394
06 Nov 2014o Date
Data Source: NSW Department of Lands: Cadastre - Jan 2011; Geoscience Australia: 250k Data - Jan 2011. Created by: jlam
1:6,500 (at A3) City of Ryde CouncilBuffalo and Kittys CreekFlood Study and FRMS&P
Kitty Creek CatchmentSubcatchment Plan
Catchment Boundary
Kitty Stormwater Pits/Junctions
Kitty Creek Stormwater Pipes
Lot Cadastral
Subcatchments
ITEM 2 (continued) ATTACHMENT 1
Page 46
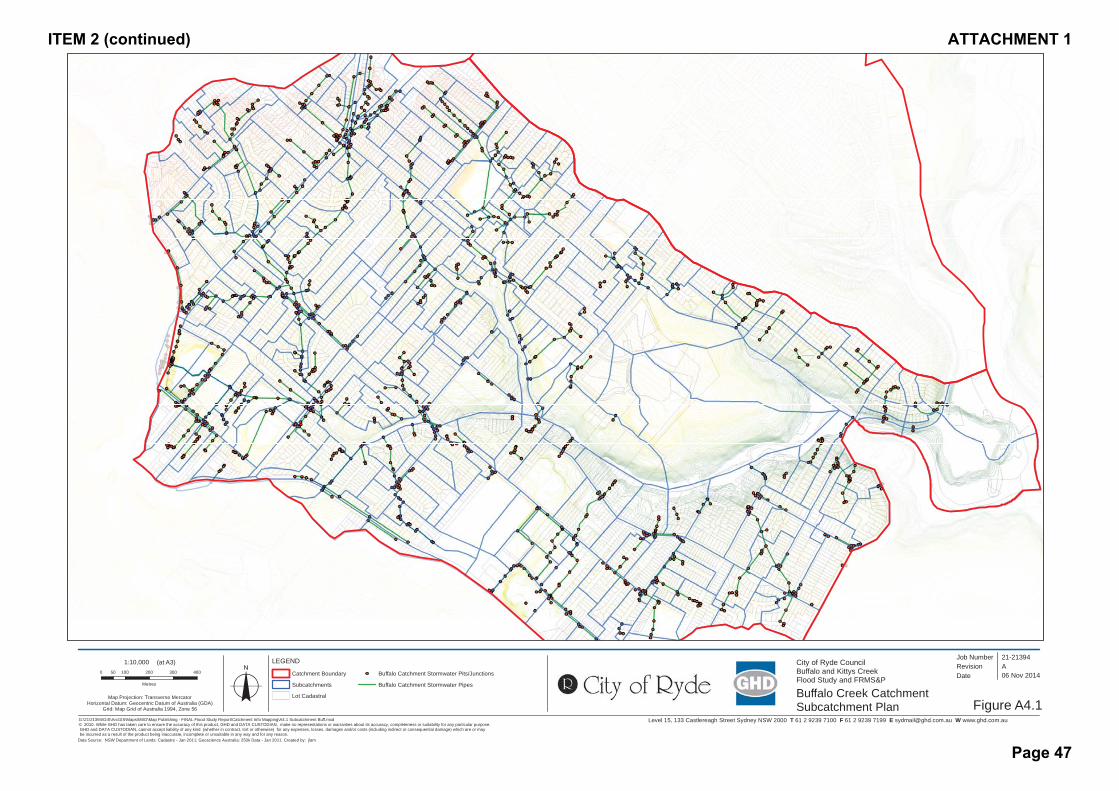
Level 15, 133 Castlereagh Street Sydney NSW 2000 T 61 2 9239 7100 F 61 2 9239 7199 E [email protected] W www.ghd.com.auG:\21\21394\GIS\ArcGIS\Maps\MXD\Map Publishing - FINAL Flood Study Report\Catchment Info Mapping\A4.1 Subcatchment Buff.mxd© 2010. While GHD has taken care to ensure the accuracy of this product, GHD and DATA CUSTODIAN, make no representations or warranties about its accuracy, completeness or suitability for any particular purpose. GHD and DATA CUSTODIAN, cannot accept liability of any kind (whether in contract, tort or otherwise) for any expenses, losses, damages and/or costs (including indirect or consequential damage) which are or may be incurred as a result of the product being inaccurate, incomplete or unsuitable in any way and for any reason.
LEGEND0 100 200 300 40050
Metres
Map Projection: Transverse MercatorHorizontal Datum: Geocentric Datum of Australia (GDA)
Grid: Map Grid of Australia 1994, Zone 56
Figure A4.1
Job NumberRevision A
21-21394
06 Nov 2014o Date
Data Source: NSW Department of Lands: Cadastre - Jan 2011; Geoscience Australia: 250k Data - Jan 2011. Created by: jlam
1:10,000 (at A3) City of Ryde CouncilBuffalo and Kittys CreekFlood Study and FRMS&P
Buffalo Creek CatchmentSubcatchment Plan
Catchment Boundary
Subcatchments
Lot Cadastral
Buffalo Catchment Stormwater Pits/Junctions
Buffalo Catchment Stormwater Pipes
ITEM 2 (continued) ATTACHMENT 1
Page 47

Level 15, 133 Castlereagh Street Sydney NSW 2000 T 61 2 9239 7100 F 61 2 9239 7199 E [email protected] W www.ghd.com.au
!(!(
!(!(
!(!(
!(!(
!(!(!(
!(!(
!(!(!(!(
!(!(
!(
!(
!(
!(
!(!(
!(
!(
!(
!(!(
!(
!(
!(
!(
!(
!(
!(
!(
!(
!(
!(!(
!(!(!(
!(
!(
!(
!(
!(
!(
!(
!(!(
!(
!(
!(
!(!(
!(!(!(
!(
!(
!(!(
!(!(
!(!(
!(
!(!(
!(
!(!(
!(!(
!(!(
!(
!(
!(
!(
!(
!(
!(
!(
!(!(
!(!(
!(
!(
!(!(
!(
!(
!(
!(
!(
!(
!(
!(
!(!(
!(
!(
!(
!(
!(
!(
!(
!(
!(
!(
!(
!(
!(
!(!(
!(
!(
!(
!(!(!(
!(
!(
!(!(!(
!(
!(
!(
!(
!(!(
!(
!(!(
!(!(!(
!(
!(
!(
!(
!(
!(!(!(
!(
!(!(!(
!(!(
!(!(
!(
!(
!(
!(
!(
!(
!(
!(
!(!(
!(!(
!(
!(
!(!(
!(
!(
!(
!(
!(
!(
!(
!(
!(
!(
!(
!(!(!(
!(!(
!(
!(
!(!(
!(
!(
!(
!(
!(!(
!(
!(!(
!(
!(
!(
!(!(
!(
!(!(
!(!(
!(!(!(
!(
!(
!(
!(
!(
!(
!(
!(
!(
!(
!(
!(
!(
!(!(!(
!(!(
!(!(
!(
!(
!(
!(
!(
!(
!(
!(
!(!(!(
!(
!( !(
!(
!(
!(!(
!(!(
!(!(
!(
!(
!(
!(!(
!(
!( !(
!(!(!(
!(
!(
!(!(
!(
!(
!(
!(
!(
!(
!(
!(
!(!(
!(
!(!(!(
!(
!(
!(!(!(!(!( !(
!(!(
!(
!(
!(!(
!(
!(
!(
!(
!(!(
!(
!(
!(
!(
!(
!(
!(
!(
!(!(
!(!(!(
!(
!(
!(
!(
!(
!(
!(
!(
!(
!(
!(!(
!(
!(
!(
!(
!(
!(
!(
!(
!(
!(
!(
!(!(
!(
!(!(
!(
!( !(
!(!(
!(
!(
!(!(
!(
!(!(
!(
!(
!(
!(!(
!(
!(!(
!(
!(
!(
!(!(
!(
!(
!(
!(
!(
!(
!(
!(
!(
!(
!(
!(
!(!(
!(
!(
!(
!(
!(
!(
!(!(
!(
!(!(
!(!(
!(
!(
!(
!(
!(!(
!(
!(
!(
!(
!(
!(
!(
!(
!(
!(!(
!(!(
!(
!(
!(
!(
!(
!(
!(
!(
!(!(
!(!(
!(!(
!(
!( !(
!(
!(
!(!(
!(!(
G:\21\21394\GIS\ArcGIS\Maps\MXD\Map Publishing - FINAL Flood Study Report\Catchment Info Mapping\A3.2 Pipe Network Kitty.mxd© 2010. While GHD has taken care to ensure the accuracy of this product, GHD and DATA CUSTODIAN, make no representations or warranties about its accuracy, completeness or suitability for any particular purpose. GHD and DATA CUSTODIAN, cannot accept liability of any kind (whether in contract, tort or otherwise) for any expenses, losses, damages and/or costs (including indirect or consequential damage) which are or may be incurred as a result of the product being inaccurate, incomplete or unsuitable in any way and for any reason.
LEGEND
0 60 120 180 24030
Metres
Map Projection: Transverse MercatorHorizontal Datum: Geocentric Datum of Australia (GDA)
Grid: Map Grid of Australia 1994, Zone 56
Figure A3.2
Job NumberRevision A
21-21394
06 Nov 2014o Date
Data Source: NSW Department of Lands: Cadastre - Jan 2011; Geoscience Australia: 250k Data - Jan 2011. Created by: jlam
1:6,500 (at A3) City of Ryde CouncilBuffalo and Kittys CreekFlood Study and FRMS&P
Kitty Creek CatchmentDrainage Network
!( Kitty Stormwater Pits/Junctions
Kitty Creek Stormwater Pipes
Catchment Boundary
Lot Cadastral
ITEM 2 (continued) ATTACHMENT 1
Page 48
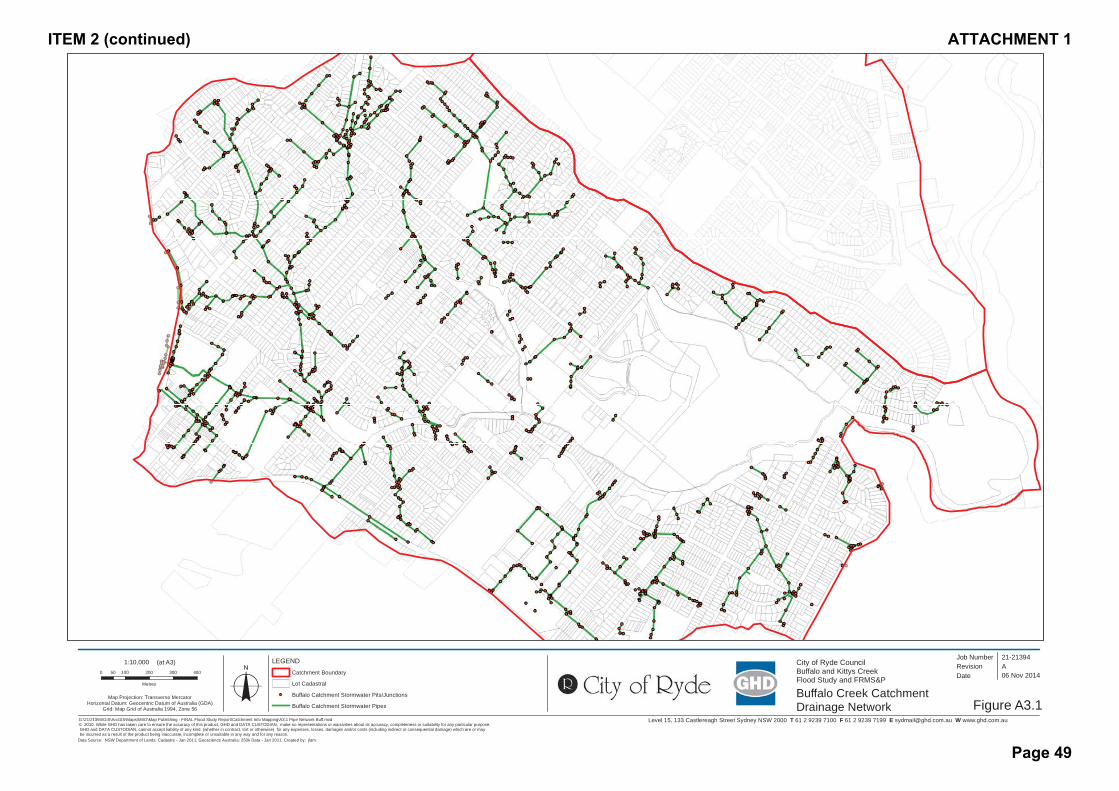
Level 15, 133 Castlereagh Street Sydney NSW 2000 T 61 2 9239 7100 F 61 2 9239 7199 E [email protected] W www.ghd.com.auG:\21\21394\GIS\ArcGIS\Maps\MXD\Map Publishing - FINAL Flood Study Report\Catchment Info Mapping\A3.1 Pipe Network Buff.mxd© 2010. While GHD has taken care to ensure the accuracy of this product, GHD and DATA CUSTODIAN, make no representations or warranties about its accuracy, completeness or suitability for any particular purpose. GHD and DATA CUSTODIAN, cannot accept liability of any kind (whether in contract, tort or otherwise) for any expenses, losses, damages and/or costs (including indirect or consequential damage) which are or may be incurred as a result of the product being inaccurate, incomplete or unsuitable in any way and for any reason.
LEGEND0 100 200 300 40050
Metres
Map Projection: Transverse MercatorHorizontal Datum: Geocentric Datum of Australia (GDA)
Grid: Map Grid of Australia 1994, Zone 56
Figure A3.1
Job NumberRevision A
21-21394
06 Nov 2014o Date
Data Source: NSW Department of Lands: Cadastre - Jan 2011; Geoscience Australia: 250k Data - Jan 2011. Created by: jlam
1:10,000 (at A3) City of Ryde CouncilBuffalo and Kittys CreekFlood Study and FRMS&P
Buffalo Creek CatchmentDrainage Network
Catchment Boundary
Lot Cadastral
Buffalo Catchment Stormwater Pits/Junctions
Buffalo Catchment Stormwater Pipes
ITEM 2 (continued) ATTACHMENT 1
Page 49
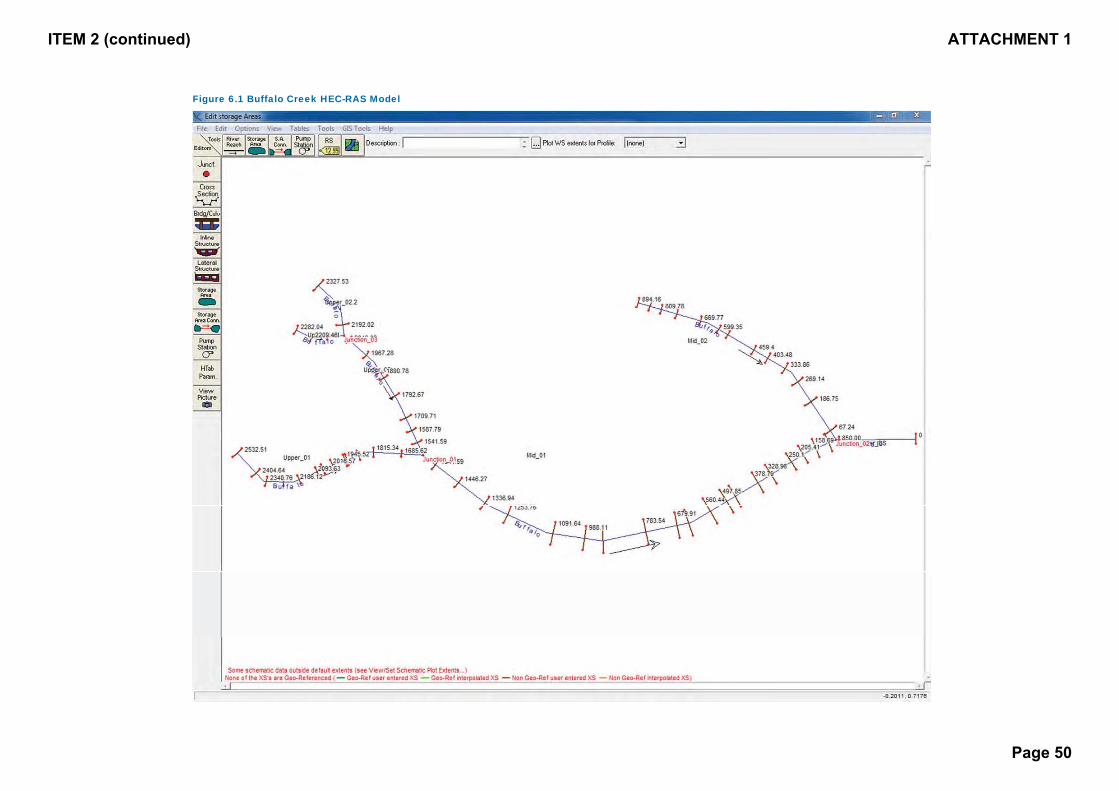
Figure 6.1 Buffalo Creek HEC-RAS Model
ITEM 2 (continued) ATTACHMENT 1
Page 50
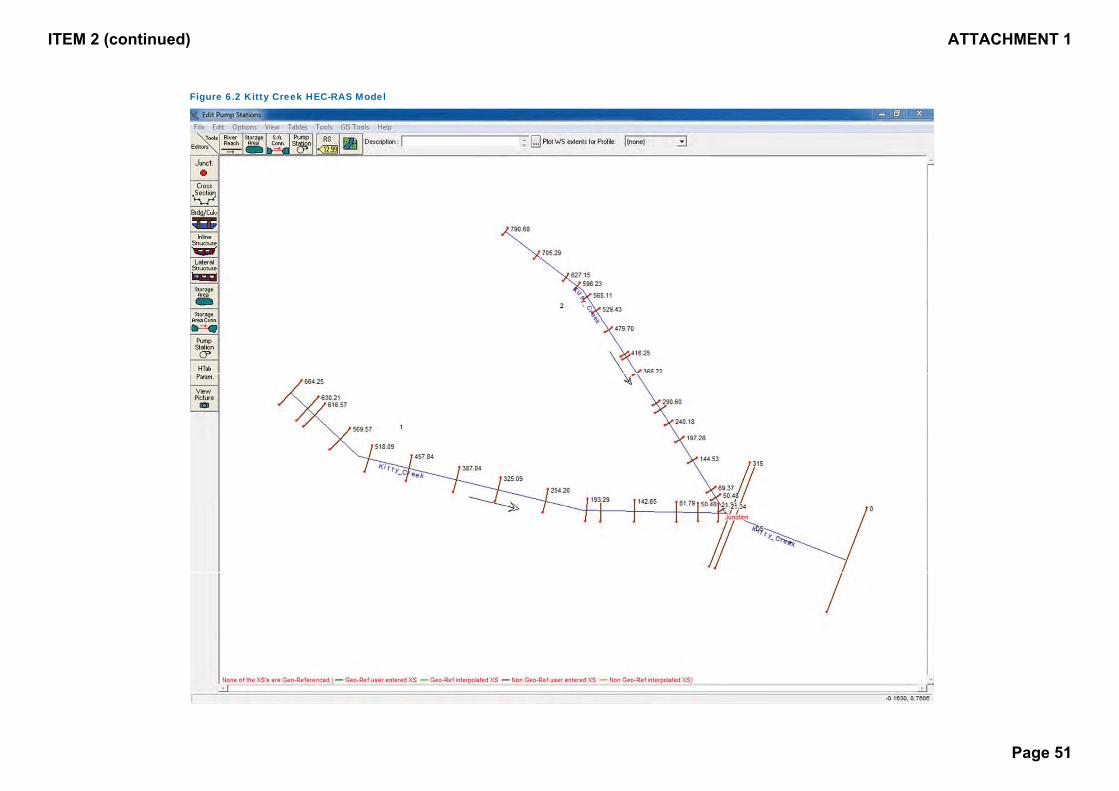
Figure 6.2 Kitty Creek HEC-RAS Model
ITEM 2 (continued) ATTACHMENT 1
Page 51
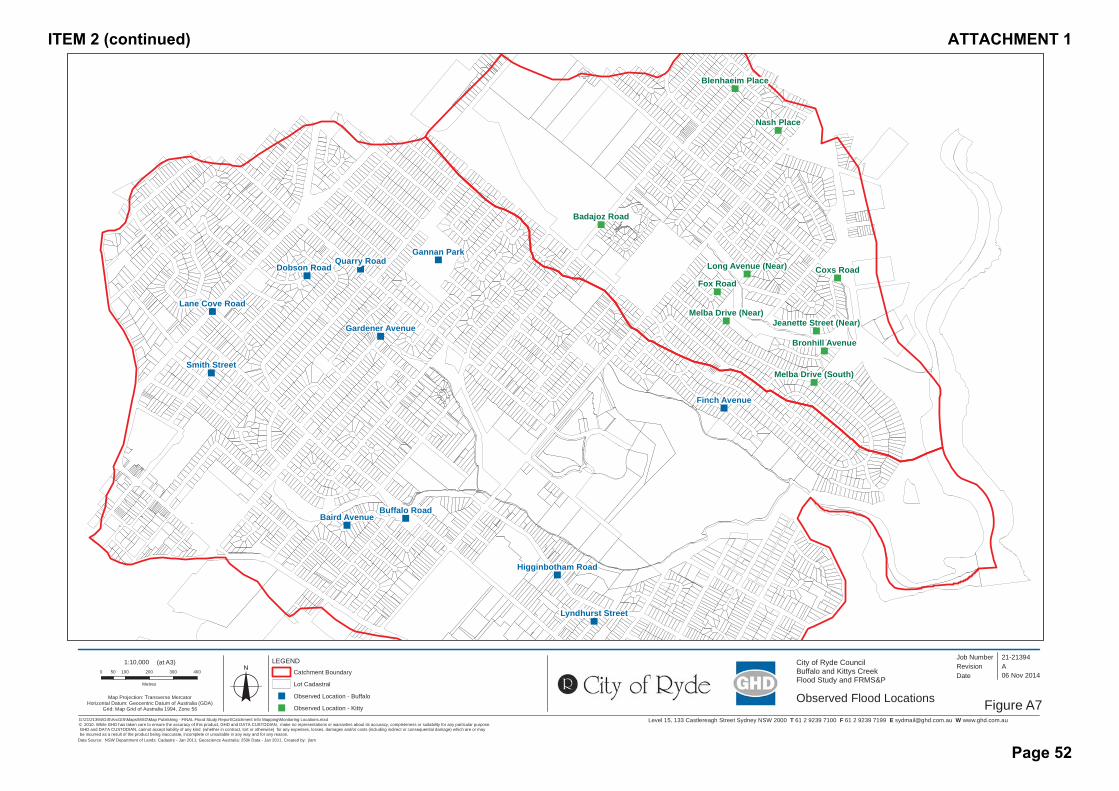
Level 15, 133 Castlereagh Street Sydney NSW 2000 T 61 2 9239 7100 F 61 2 9239 7199 E [email protected] W www.ghd.com.au
"
"
""
"
"
""
"
"
"
"
"
"
"
"
"
"
"
"
"
Gannan ParkQuarry Road
Dobson Road
Finch Avenue
Buffalo RoadBaird Avenue
Smith Street
Lane Cove Road
Gardener Avenue
Lyndhurst Street
Higginbotham Road
Fox RoadCoxs Road
Nash Place
Badajoz Road
Blenhaeim Place
Bronhill Avenue
Melba Drive (Near)
Long Avenue (Near)
Melba Drive (South)
Jeanette Street (Near)
G:\21\21394\GIS\ArcGIS\Maps\MXD\Map Publishing - FINAL Flood Study Report\Catchment Info Mapping\Monitoring Locations.mxd© 2010. While GHD has taken care to ensure the accuracy of this product, GHD and DATA CUSTODIAN, make no representations or warranties about its accuracy, completeness or suitability for any particular purpose. GHD and DATA CUSTODIAN, cannot accept liability of any kind (whether in contract, tort or otherwise) for any expenses, losses, damages and/or costs (including indirect or consequential damage) which are or may be incurred as a result of the product being inaccurate, incomplete or unsuitable in any way and for any reason.
LEGEND0 100 200 300 40050
Metres
Map Projection: Transverse MercatorHorizontal Datum: Geocentric Datum of Australia (GDA)
Grid: Map Grid of Australia 1994, Zone 56
Figure A7
Job NumberRevision A
21-21394
06 Nov 2014o Date
Data Source: NSW Department of Lands: Cadastre - Jan 2011; Geoscience Australia: 250k Data - Jan 2011. Created by: jlam
1:10,000 (at A3) City of Ryde CouncilBuffalo and Kittys CreekFlood Study and FRMS&P
Observed Flood Locations
Catchment Boundary
Lot Cadastral
" Observed Location - Buffalo
" Observed Location - Kitty
ITEM 2 (continued) ATTACHMENT 1
Page 52

36 | GHD | Report for City of Ryde Council - Buffalo and Kittys Creek Flood Study, 21/21394
ITEM 2 (continued) ATTACHMENT 1
Page 53

Appendix B – Community Consultation B1 Survey Questionnaire
B2 Community Consultation Survey Results Full Summary
B3 Community Consultation Survey Results Brief Summary
ITEM 2 (continued) ATTACHMENT 1
Page 54
B1 Survey Questionnaire
ITEM 2 (continued) ATTACHMENT 1
Page 55
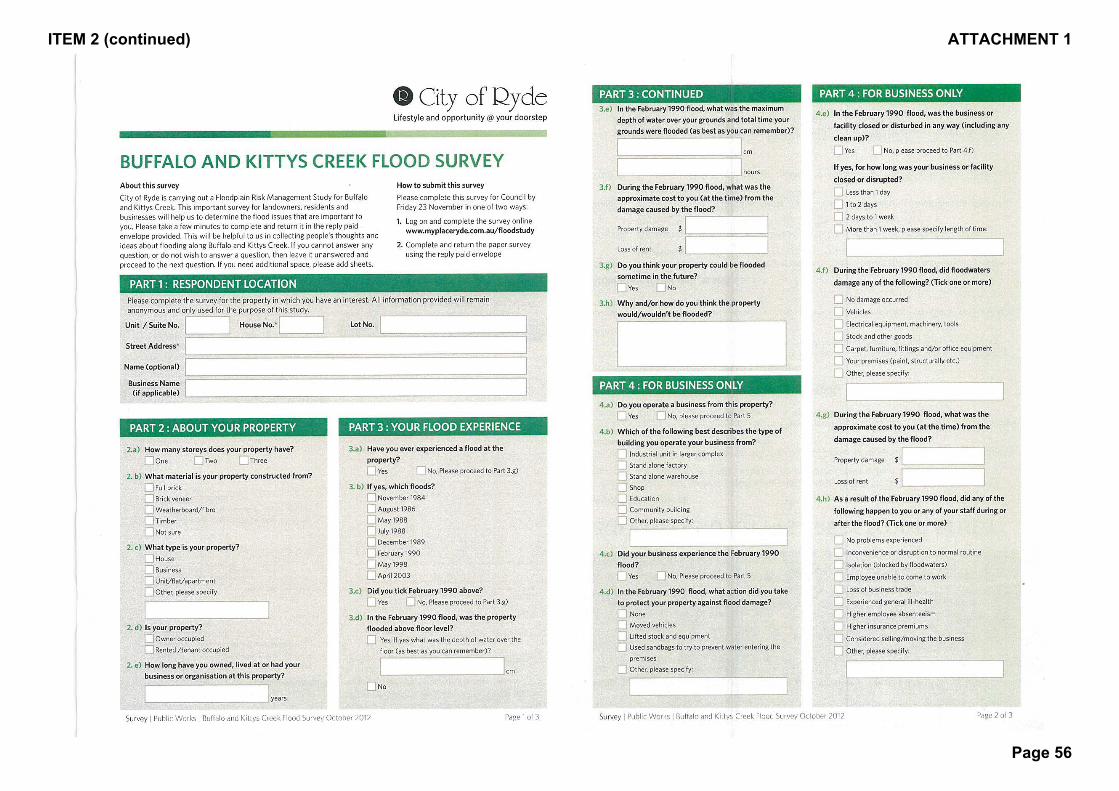
ITEM 2 (continued) ATTACHMENT 1
Page 56
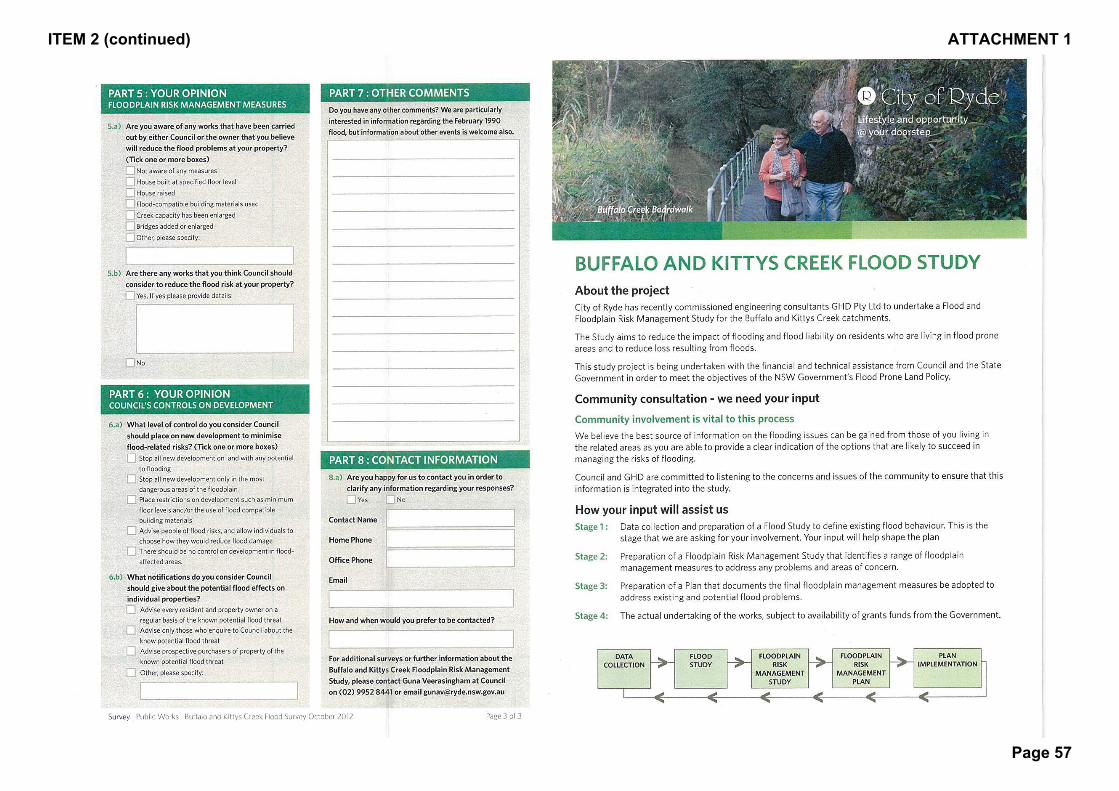
ITEM 2 (continued) ATTACHMENT 1
Page 57
B2 Community Consultation Survey Results Full Summary
ITEM 2 (continued) ATTACHMENT 1
Page 58

1
2012 Buffalo and Kittys Creek Flood
Study SurveyInfrastructure Integration
February 2013
ITEM 2 (continued) ATTACHMENT 1
Page 59
2
TABLE OF CONTENTS
Introduction ................................................................................................................................................................. 3
Background ........................................................................................................................................................ 3
Methodology ....................................................................................................................................................... 3
Sampling error .................................................................................................................................................... 3
Executive Summary ................................................................................................................................................... 4
Previous Flood Experience ................................................................................................................................ 4
Comparison of properties: .................................................................................................................................. 5
Flood effects on Businesses .............................................................................................................................. 7
Awareness of risk management measures ........................................................................................................ 7
Main issues identified ......................................................................................................................................... 8
Recommendations ............................................................................................................................................. 8
Appendix 1 – Flood Affected Properties ............................................................................................................ 9
Appendix 2 – Reasons against future flood potential ....................................................................................... 11
2.1 – Comments requiring review ....................................................................................................... 11
2.2 - Specific road upgrades mentioned ............................................................................................. 12
Appendix 3 – Suggestions of other works to consider to reduce flood risk - specific locations mentioned ..... 13
ITEM 2 (continued) ATTACHMENT 1
Page 60
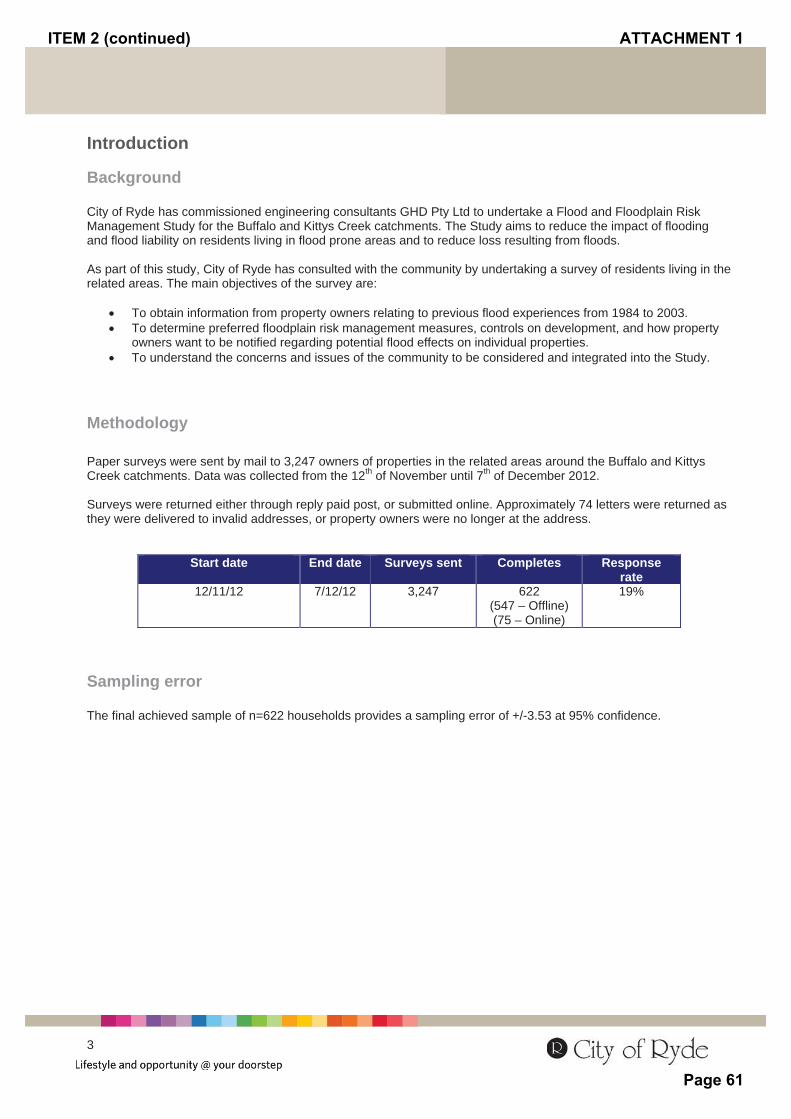
3
Introduction
Background
City of Ryde has commissioned engineering consultants GHD Pty Ltd to undertake a Flood and Floodplain Risk Management Study for the Buffalo and Kittys Creek catchments. The Study aims to reduce the impact of flooding and flood liability on residents living in flood prone areas and to reduce loss resulting from floods.
As part of this study, City of Ryde has consulted with the community by undertaking a survey of residents living in the related areas. The main objectives of the survey are:
To obtain information from property owners relating to previous flood experiences from 1984 to 2003. To determine preferred floodplain risk management measures, controls on development, and how property
owners want to be notified regarding potential flood effects on individual properties. To understand the concerns and issues of the community to be considered and integrated into the Study.
Methodology
Paper surveys were sent by mail to 3,247 owners of properties in the related areas around the Buffalo and Kittys Creek catchments. Data was collected from the 12th of November until 7th of December 2012.
Surveys were returned either through reply paid post, or submitted online. Approximately 74 letters were returned as they were delivered to invalid addresses, or property owners were no longer at the address.
Start date End date Surveys sent Completes Response rate
12/11/12 7/12/12 3,247 622 (547 – Offline) (75 – Online)
19%
Sampling error
The final achieved sample of n=622 households provides a sampling error of +/-3.53 at 95% confidence.
ITEM 2 (continued) ATTACHMENT 1
Page 61
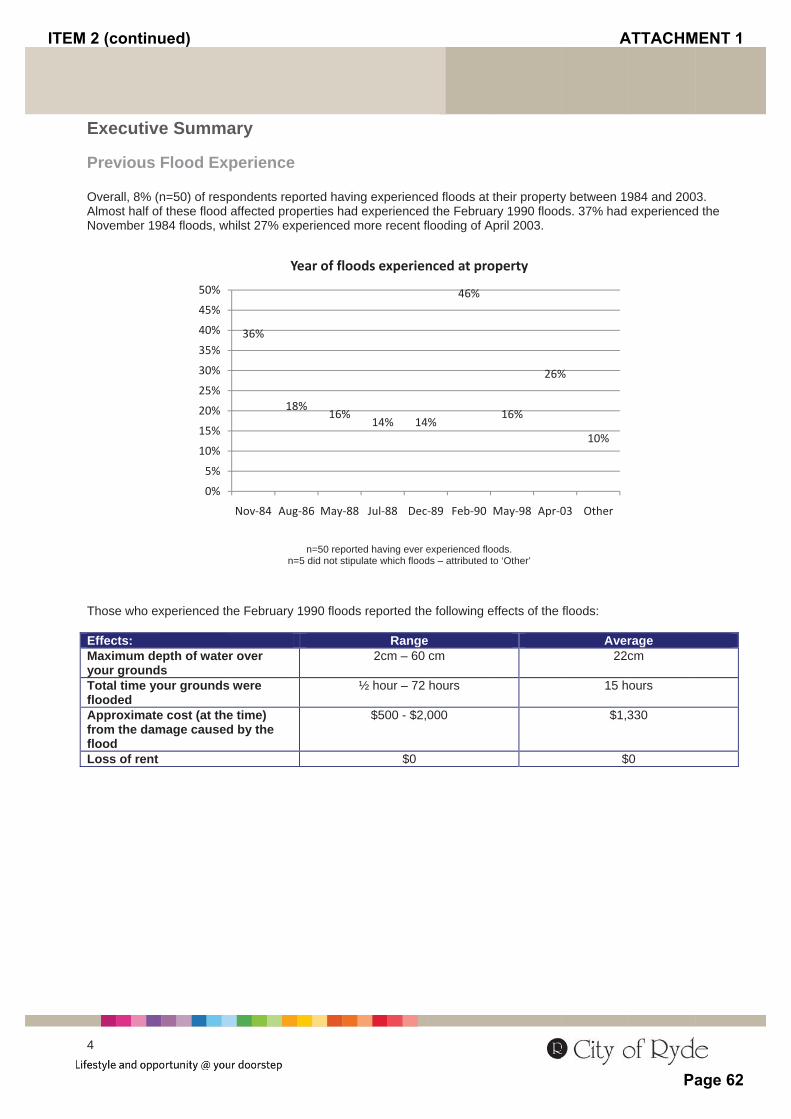
4
E
P
OAN
T
EMyTfAffL
4
Executiv
Previous
Overall, 8% (Almost half oNovember 19
Those who ex
Effects: Maximum deyour groundTotal time yolooded
Approximaterom the damlood
Loss of rent
e Summ
Flood Ex
n=50) of resf these flood
984 floods, w
xperienced t
epth of watedsour grounds
e cost (at thmage cause
0%
5%
10%
15%
20%
25%
30%
35%
40%
45%
50%
ary
xperience
pondents repd affected prowhilst 27% ex
n
the February
er over
s were
e time) d by the
36%
18
Nov 84 Aug
Y
e
ported havinoperties had xperienced m
n=50 reporte=5 did not stipu
y 1990 floods
½
8%16%
g 86 May 88
Year of floo
g experienceexperienced
more recent f
ed having ever eulate which flood
s reported the
Range2cm – 60
½ hour – 72
$500 - $2,
$0
14% 14
Jul 88 Dec
ods experien
ed floods at td the Februarflooding of Ap
experienced floods – attributed to
e following e
ecm
hours
000
4%
46%
89 Feb 90 M
nced at pro
their propertyry 1990 floodpril 2003.
ods.o ‘Other’
ffects of the
16%
26%
May 98 Apr 0
operty
y between 19ds. 37% had
floods:
Aver22c
15 h
$1,3
$
%
10%
03 Other
984 and 200experienced
ragecm
ours
330
$0
03. d the
ITEM 2 (continued) ATTACHMENT 1
Page 62

5
C
Ba
N
P
P
O
T
C
F
1O4
5
Comparis
Below is a coaffected.
A higaffecA higaffecAll floA hig
The raveraA higflood
No. of storie
Property Ma
Property typ
Owned or re
Tenure
Catchment
Future flo
5% of propeOf those who44% did not b
son of pro
omparison be
gher percentated)
gher percentated)
ood affected gher percentarange of yeaage tenure wgher percentas (9%) than
es
terial
pe
ented
oods:
erty owners bo have previobelieve flood
0%
50%
100%
operties:
etween prope
age of non flo
age of flood a
properties wage of flood ars the owner
was longer foage of propeKittys Creek
1 story 2 stories 3 stories Full brickBrick venWeatherbTimberNot sure House BusinessUnit/flat/aOtherOwner ocRented/teRange Average Kittys CreBuffalos C
believed theirously experies to be a futu
15%
%
%
%
Do you th
erties that ha
ood affected
affected prop
were residentaffected proprs owned ther flood affectrties in the B
k Catchment
kneer board/fibro
sapartment/
ccupied enant occupi
eek CatchmeCreek Catch
r property coenced floods,ure threat.
%
56%
Yes
hink your p
ave been floo
properties w
perties were
tial (98% houperties were e property wated propertie
Buffalos CreeArea propert
ied
ent Area hment Area
ould be floode, 56% though
85%
N
property couin the futu
od affected a
were 3 storie
full brick (47
uses + 2% seowner occup
as wider for nes. ek Catchmenties (See Ap
Flaffe
442
43260
9002
94
3-5834
49
ed some timht their prope
44%
No
uld be floodure?
and those tha
s (9% non flo
7% flood affe
emi detachedpied (96% vsnon flood affe
nt Area reporpendix 1 for
loodected
49%49%2%
47%35%22%6%0%
98%0%0%2%
96%4%8 years years4%9%
e in the futurerty could be
ded someti
All
Previou
at have not b
ood affected
ected vs. 36%
d)s. 90% non fected proper
rted being affProperty Lis
Non floodaffected
52%39%9%
36%42%22%7%1%
86%2%7%5%
90%10%
1-79 years23 years
96%91%
re. e flooded in t
me
usly flooded
been flood
vs. 2% flood
% non flood
flood affectedrties, howeve
fected by prest)
s
he future, wh
d
d)er the
evious
hilst
ITEM 2 (continued) ATTACHMENT 1
Page 63

6
Reasons for or against future flooding:
The most commonly cited reasons property owners thought their property could be flooded in the future were because of the position of their property being at the bottom of a hill, or the street sloping towards their property, followed by stormwater drain blockages, and also proximity to the creek.
Reasons for future flood potential Frequency PercentSlope of road towards house/situated at bottom of hill/low side of street or below street 22 26.5%Stormwater/drain blockages/inadequate runoff 17 20.5%Near a creek/waterfall 13 15.7%Bottom of property or garage gets flooded but not top 8 9.6%Depends on the catchment/near catchment overflow 5 6.0%Footpath/easements/street frequently floods 4 4.8%Run off from nearby industrial estate/units/roads 4 4.8%Backyard alterations changing course of floods/clearing of trees 3 3.6%Flash flooding potential 3 3.6%House in Kittys Creek catchment 3 3.6%Backyard flooding 2 2.4%House in Buffalo Creek catchment 2 2.4%Excessive development 1 1.2%Natural disasters 1 1.2%Neighbours emptying pool 1 1.2%Street gutters and stormwater drains not cleaned out regularly 1 1.2%Tree roots causing broken pipes in property 1 1.2%
Conversely, the most commonly stated reasons for those who did not think their properties were at risk were; the property being on the higher end of a slope, the property itself being elevated, or the property being located far from the creek. New or improved drainage installation was commonly cited as having removed flood risk that had existed previously. Furthermore, some property owners had never experienced any flooding at their properties so did not perceive this to be a threat.
Reasons against future flood potential Frequency Percent House is on higher end of slope/slope of block 137 39.8%Elevation of blocks/land raised/live in upper floors 71 20.6%House is high above or far from creek/flood area 52 15.1%Drainage system - new, improved, or adequate 46 13.4%Never had a flood problem before, even during heavy rain 28 8.1%Above sea level 7 2.0%Requires review (See Appendix 2.1) 5 1.5%Council fixed the problem after flooding 4 1.2%House near a waterfall cascade. 4 1.2%Council approved pit in backyard/underground stormwater tank 3 0.9%Council approved retaining walls 3 0.9%Depends on weather in the future 2 0.6%Specific road upgrades (See Appendix 2.2) 2 0.6%Don't know 2 0.6%
ITEM 2 (continued) ATTACHMENT 1
Page 64
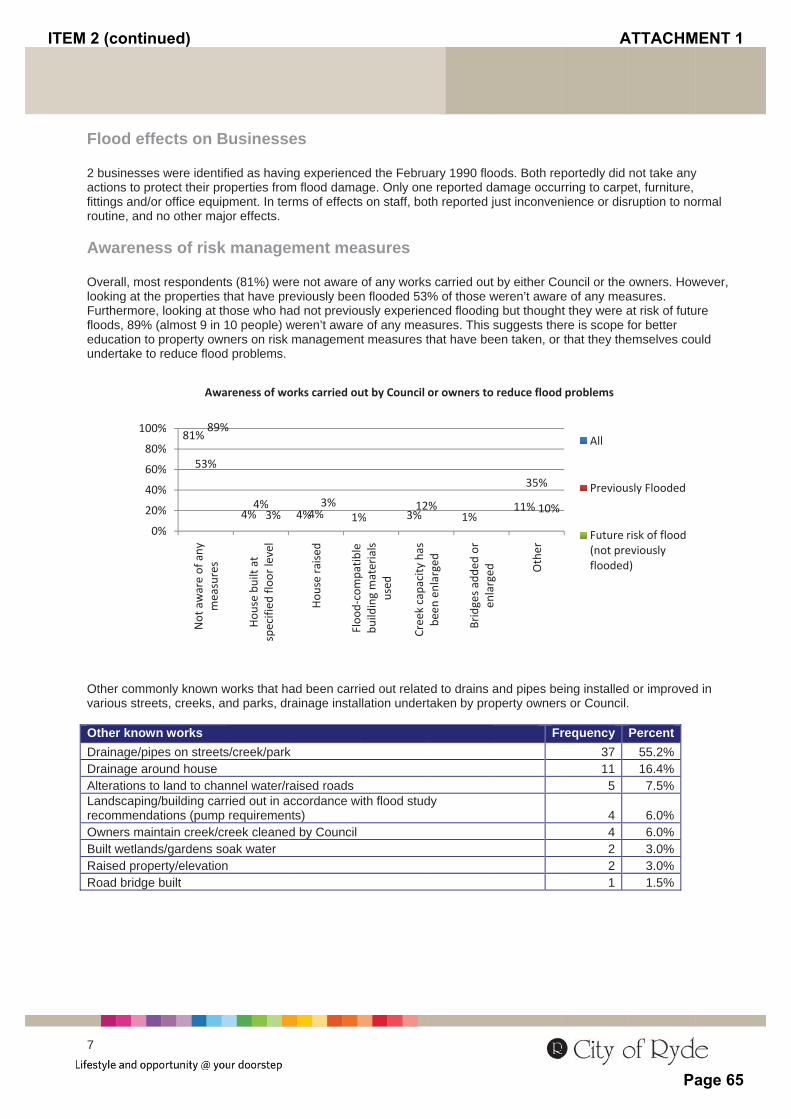
7
F
2afiro
A
OloFfleu
Ov
ODDALreOBRR
7
Flood effe
2 businessesactions to proittings and/oroutine, and n
Awarenes
Overall, mostooking at theFurthermore,loods, 89% (education to undertake to
Other commovarious street
Other knownDrainage/pipeDrainage aroAlterations toLandscaping/ecommenda
Owners mainBuilt wetlandsRaised propeRoad bridge
0%
20%
40%
60%
80%
100%
ects on B
s were identifotect their pror office equipno other majo
ss of risk
t respondente properties t looking at th(almost 9 in 1property ownreduce flood
only known wts, creeks, a
n works es on streetsund house
o land to chan/building carr
ations (pump ntain creek/crs/gardens soerty/elevationbuilt
81%
53%
89%
%
%
%
%
%
%
Not
awareof
any
measures
Awa
Businesse
fied as havinoperties frompment. In termor effects.
managem
ts (81%) werthat have prehose who ha10 people) wners on risk md problems.
works that hand parks, dra
s/creek/park
nnel water/raried out in acrequirement
reek cleanedoak water n
4%4%
%
3%
Hou
sebu
iltat
specified
floor
level
areness of wo
es
g experiencem flood damams of effects
ment mea
e not awareeviously beend not previou
weren’t awaremanagemen
ad been carriainage instal
aised roadsccordance wts) d by Council
4% 1%4%3%
Hou
seraised
Floo
dcompatib
le
rks carried ou
ed the Februage. Only ones on staff, bo
asures
of any worksn flooded 53usly experiene of any meat measures t
ied out relatellation undert
ith flood stud
% 3%12
Floo
dcompatib
lebu
ildingmaterials
used
Creekcapacityhas
ut by Council
uary 1990 flooe reported da
oth reported j
s carried out % of those wnced floodingasures. This sthat have be
ed to drains ataken by pro
dy
1%2%
been
enlarged
Bridgesadde
dor
enlarged
or owners to
ods. Both reamage occuust inconven
by either Coweren’t awareg but thoughsuggests theen taken, or
and pipes beoperty owners
Fr
11%
35%
10%
g
Other
reduce flood
portedly did rring to carpenience or dis
ouncil or the e of any meat they were a
ere is scope fthat they the
eing installeds or Council.
requency 37 11 5
44221
d problems
All
Previou
Future r(not preflooded
not take anyet, furniture, ruption to no
owners. Howasures. at risk of futufor better emselves co
d or improved.
Percent55.2%16.4%
7.5%
6.0%6.0%3.0%3.0%1.5%
sly Flooded
risk of floodeviouslyd)
y
ormal
wever,
ure
uld
d in
ITEM 2 (continued) ATTACHMENT 1
Page 65

8
24% thought there were other works Council should consider to reduce flood risks. The most commonly suggested additional works were improvements to drainage or installation of drain systems, clearing existing drains of leaves and other rubbish through regular street sweeping, and clearing the creek of weeds and other plants.
Suggestions Frequency Percent Better drains/check drainage system/sewers/higher capacity 42 30.4%Clearing drains, gutters and pipes of leaves/rubbish/weed/debris - regular street sweeping 36 26.1%Clear the creek/river banks of weeds/plants 23 16.7%Check redirection of water flow (footpaths) 6 4.3%Enforce new building/development specifications/overdevelopment concerns 5 3.6%Enforce open wire fences/restrict hard surface areas/nature strips/ for less run off 5 3.6%Reuse rainwater 4 2.9%Tree logs/branches keep falling into creek - tree maintenance 4 2.9%Check easements flood coping capacity 3 2.2%Council approved construction/previous decision has led to more flooding/requires review 3 2.2%Enforce house owners to drain properties into drains provided 3 2.2%Council should bear the cost 2 1.4%Creek - adequately sized 2 1.4%Survey to determine flood risk 2 1.4%Check possible flood threat 1 0.7%Creek bank erosion a problem - plants required 1 0.7%Retaining wall around creek 1 0.7%Risk assessment for every house in flood risk area 1 0.7%Roof water to streets, not absorption pits 1 0.7%Safer access way to creek - previously car went into creek 1 0.7%Use rubbish collecting grates in rivers 1 0.7%Specific locations mentioned (See Appendix 3) 19 13.8%Don't know/not actionable 3 2.2%
Main issues identified
A relatively small percentage of properties surveyed reported being affected by floods previously (8%); however 15% believed their properties could be affected by floods in the future.
The positioning of the property (in terms of where it was situated on a slope as well as proximity to a flood prone area), and possibility of drain blockages were the main reasons people thought they could be affected by floods.
A very high percentage of respondents (81%) were not aware of any risk management measures carried out to reduce flood problems. The most commonly known works were related to drainage and pipe works on streets, creeks, and parks, drainage improvements inside or around the property itself, and changes to creek capacity.
Recommendations
The flood affected properties identified through this survey are to be reviewed and incorporated into GHD’s mapping system.
Council will consider the suggestions for additional works to reduce flood risk to determine feasibility and key actions.
Council will also implement a communications strategy to ensure residents are made aware of the next stages of the flood plain risk management study.
ITEM 2 (continued) ATTACHMENT 1
Page 66

9
Appendix 1 – Flood Affected Properties
Buffalos Creek Catchment Area (42 properties)
House no. Street Address Maximum depth of water in February 1990 flood
Maximum hours flooded in February 1990 flood
3 Adam Street, Ryde, NSW 2112 60 cm
25 Baird Avenue, Ryde, NSW 2112 224 Buffalo Road, Ryde, NSW 2112
4 Byron Avenue, Ryde, NSW 2112 25 cm
4 Byron Avenue, Ryde, NSW 2112 50 cm
10 Crescent Avenue, Ryde, NSW 2112 16 Crescent Avenue, Ryde, NSW 2112 Knee A few hours
14 Finch Avenue, East Ryde, NSW 2113 6 Ganora Street, Gladesville, NSW 2111 7 Ganora Street, Gladesville, NSW 2111 10 cm 24 hours
51 Gardener Avenue, Ryde, NSW 2112 63 Greene Avenue, Ryde, NSW 2112 68 Greene Avenue, Ryde, NSW 2112 30 cm Few days
52 Higginbotham Road, Gladesville, NSW 2111 10-20 cm
62A Higginbotham Road, Gladesville, NSW 2111 17 Kulgoa Avenue, Ryde, NSW, 2112 40 Lane Cove Road, Ryde, NSW 2112 20 cm 24 hours
46 Lane Cove Road, Ryde, NSW 2112 6 Laura Street, Gladesville, NSW 2111 8 cm 1.5 hours
1 Laurel Place, Ryde, NSW 2112 11 Martin Street, Ryde, NSW 2112 13 Martin Street, Ryde, NSW 2112 25 cm 0.5 hours
15 Martin Street, Ryde, NSW 2112 18 Minga Street, Ryde, NSW 2112 2 cm
24 Minga Street, Ryde, NSW 2112 25 Minga Street, Ryde, NSW 2112 26 Minga Street, Ryde, NSW 2112 47 Monash Road, Gladesville, NSW 2111 72 Monash Road, Gladesville, NSW 2111 20-25 cm 2 hours
102 Moncrieff Drive, East Ryde, NSW 2113 56 cm 1 hour
14 Oates Avenue, Gladesville, NSW 2111 16 Oates Avenue, Gladesville, NSW 2111 42 Pooley Street, Ryde, NSW 2112
142 Quarry Road, Ryde, NSW 2112 3 Semple Street, Ryde, NSW 2112 9 Semple Street, Ryde, NSW 2112 2.5 cm
ITEM 2 (continued) ATTACHMENT 1
Page 67
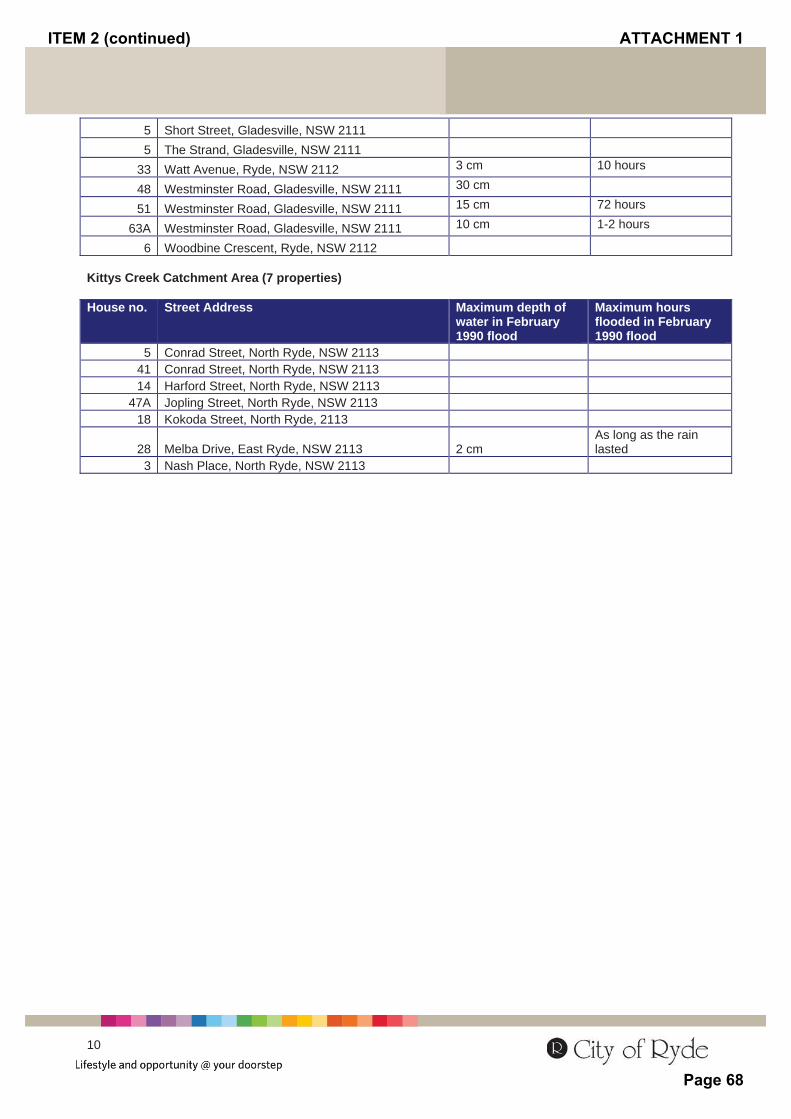
10
5 Short Street, Gladesville, NSW 2111 5 The Strand, Gladesville, NSW 2111
33 Watt Avenue, Ryde, NSW 2112 3 cm 10 hours
48 Westminster Road, Gladesville, NSW 2111 30 cm
51 Westminster Road, Gladesville, NSW 2111 15 cm 72 hours
63A Westminster Road, Gladesville, NSW 2111 10 cm 1-2 hours
6 Woodbine Crescent, Ryde, NSW 2112
Kittys Creek Catchment Area (7 properties)
House no. Street Address Maximum depth of water in February 1990 flood
Maximum hours flooded in February 1990 flood
5 Conrad Street, North Ryde, NSW 2113 41 Conrad Street, North Ryde, NSW 2113 14 Harford Street, North Ryde, NSW 2113
47A Jopling Street, North Ryde, NSW 2113 18 Kokoda Street, North Ryde, 2113
28 Melba Drive, East Ryde, NSW 2113 2 cm As long as the rain lasted
3 Nash Place, North Ryde, NSW 2113
ITEM 2 (continued) ATTACHMENT 1
Page 68
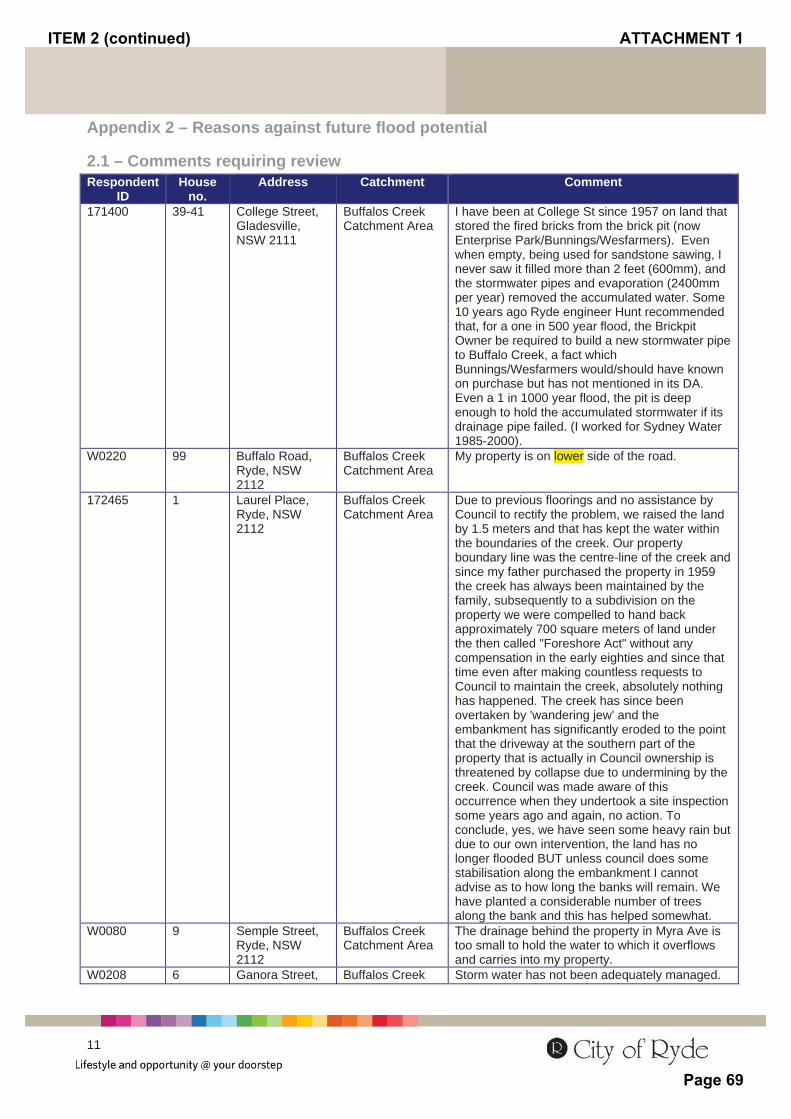
11
Appendix 2 – Reasons against future flood potential
2.1 – Comments requiring review Respondent
IDHouse
no.Address Catchment Comment
171400 39-41 College Street, Gladesville,NSW 2111
Buffalos Creek Catchment Area
I have been at College St since 1957 on land that stored the fired bricks from the brick pit (now Enterprise Park/Bunnings/Wesfarmers). Even when empty, being used for sandstone sawing, I never saw it filled more than 2 feet (600mm), and the stormwater pipes and evaporation (2400mm per year) removed the accumulated water. Some 10 years ago Ryde engineer Hunt recommended that, for a one in 500 year flood, the Brickpit Owner be required to build a new stormwater pipe to Buffalo Creek, a fact which Bunnings/Wesfarmers would/should have known on purchase but has not mentioned in its DA. Even a 1 in 1000 year flood, the pit is deep enough to hold the accumulated stormwater if its drainage pipe failed. (I worked for Sydney Water 1985-2000).
W0220 99 Buffalo Road, Ryde, NSW 2112
Buffalos Creek Catchment Area
My property is on lower side of the road.
172465 1 Laurel Place, Ryde, NSW 2112
Buffalos Creek Catchment Area
Due to previous floorings and no assistance by Council to rectify the problem, we raised the land by 1.5 meters and that has kept the water within the boundaries of the creek. Our property boundary line was the centre-line of the creek and since my father purchased the property in 1959 the creek has always been maintained by the family, subsequently to a subdivision on the property we were compelled to hand back approximately 700 square meters of land under the then called "Foreshore Act" without any compensation in the early eighties and since that time even after making countless requests to Council to maintain the creek, absolutely nothing has happened. The creek has since been overtaken by 'wandering jew' and the embankment has significantly eroded to the point that the driveway at the southern part of the property that is actually in Council ownership is threatened by collapse due to undermining by the creek. Council was made aware of this occurrence when they undertook a site inspection some years ago and again, no action. To conclude, yes, we have seen some heavy rain but due to our own intervention, the land has no longer flooded BUT unless council does some stabilisation along the embankment I cannot advise as to how long the banks will remain. We have planted a considerable number of trees along the bank and this has helped somewhat.
W0080 9 Semple Street, Ryde, NSW 2112
Buffalos Creek Catchment Area
The drainage behind the property in Myra Ave is too small to hold the water to which it overflows and carries into my property.
W0208 6 Ganora Street, Buffalos Creek Storm water has not been adequately managed.
ITEM 2 (continued) ATTACHMENT 1
Page 69
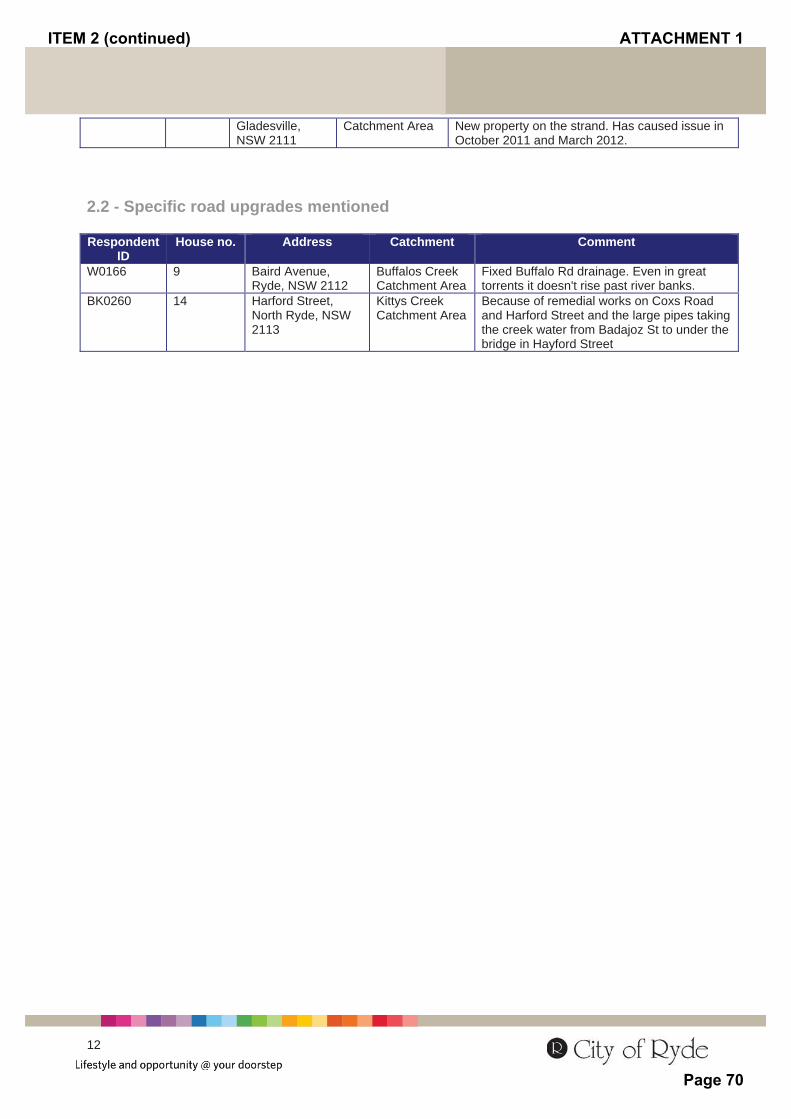
12
Gladesville,NSW 2111
Catchment Area New property on the strand. Has caused issue in October 2011 and March 2012.
2.2 - Specific road upgrades mentioned
Respondent ID
House no. Address Catchment Comment
W0166 9 Baird Avenue, Ryde, NSW 2112
Buffalos Creek Catchment Area
Fixed Buffalo Rd drainage. Even in great torrents it doesn't rise past river banks.
BK0260 14 Harford Street, North Ryde, NSW 2113
Kittys Creek Catchment Area
Because of remedial works on Coxs Road and Harford Street and the large pipes taking the creek water from Badajoz St to under the bridge in Hayford Street
ITEM 2 (continued) ATTACHMENT 1
Page 70
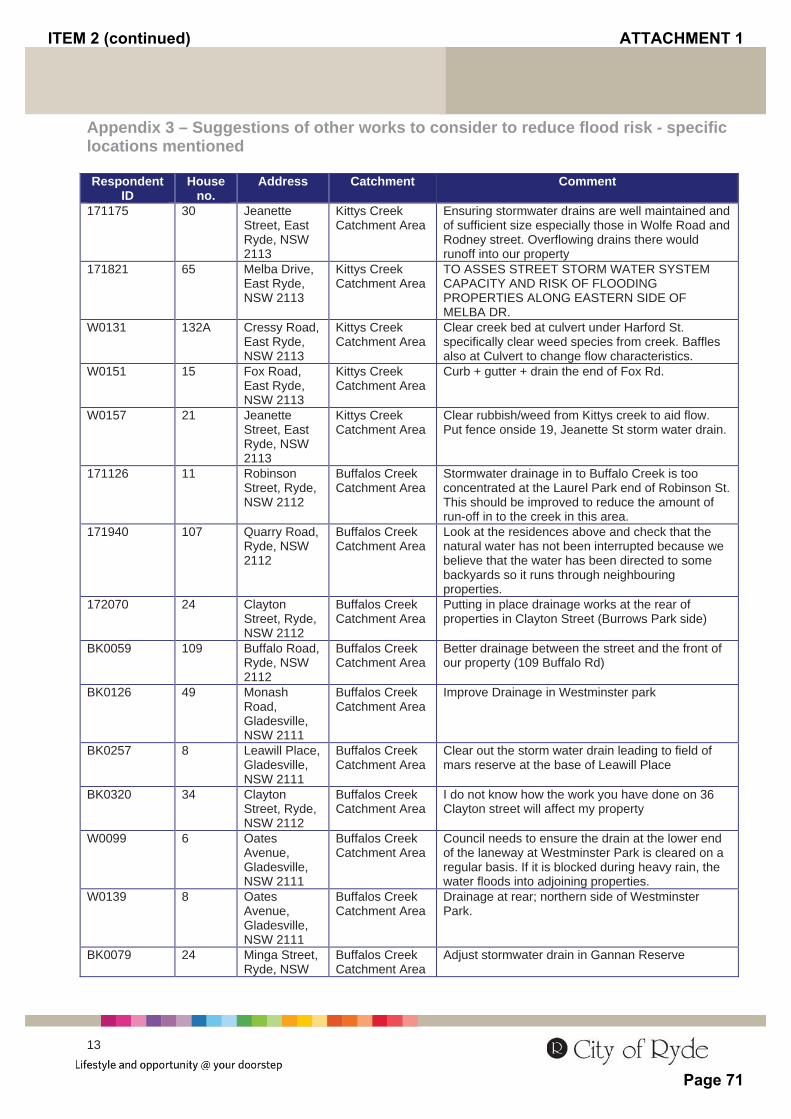
13
Appendix 3 – Suggestions of other works to consider to reduce flood risk - specific locations mentioned
Respondent ID
House no.
Address Catchment Comment
171175 30 Jeanette Street, East Ryde, NSW 2113
Kittys Creek Catchment Area
Ensuring stormwater drains are well maintained and of sufficient size especially those in Wolfe Road and Rodney street. Overflowing drains there would runoff into our property
171821 65 Melba Drive, East Ryde, NSW 2113
Kittys Creek Catchment Area
TO ASSES STREET STORM WATER SYSTEM CAPACITY AND RISK OF FLOODING PROPERTIES ALONG EASTERN SIDE OF MELBA DR.
W0131 132A Cressy Road, East Ryde, NSW 2113
Kittys Creek Catchment Area
Clear creek bed at culvert under Harford St. specifically clear weed species from creek. Baffles also at Culvert to change flow characteristics.
W0151 15 Fox Road, East Ryde, NSW 2113
Kittys Creek Catchment Area
Curb + gutter + drain the end of Fox Rd.
W0157 21 Jeanette Street, East Ryde, NSW 2113
Kittys Creek Catchment Area
Clear rubbish/weed from Kittys creek to aid flow. Put fence onside 19, Jeanette St storm water drain.
171126 11 Robinson Street, Ryde, NSW 2112
Buffalos Creek Catchment Area
Stormwater drainage in to Buffalo Creek is too concentrated at the Laurel Park end of Robinson St. This should be improved to reduce the amount of run-off in to the creek in this area.
171940 107 Quarry Road, Ryde, NSW 2112
Buffalos Creek Catchment Area
Look at the residences above and check that the natural water has not been interrupted because we believe that the water has been directed to some backyards so it runs through neighbouring properties.
172070 24 Clayton Street, Ryde, NSW 2112
Buffalos Creek Catchment Area
Putting in place drainage works at the rear of properties in Clayton Street (Burrows Park side)
BK0059 109 Buffalo Road, Ryde, NSW 2112
Buffalos Creek Catchment Area
Better drainage between the street and the front of our property (109 Buffalo Rd)
BK0126 49 Monash Road, Gladesville,NSW 2111
Buffalos Creek Catchment Area
Improve Drainage in Westminster park
BK0257 8 Leawill Place, Gladesville,NSW 2111
Buffalos Creek Catchment Area
Clear out the storm water drain leading to field of mars reserve at the base of Leawill Place
BK0320 34 Clayton Street, Ryde, NSW 2112
Buffalos Creek Catchment Area
I do not know how the work you have done on 36 Clayton street will affect my property
W0099 6 Oates Avenue,Gladesville,NSW 2111
Buffalos Creek Catchment Area
Council needs to ensure the drain at the lower end of the laneway at Westminster Park is cleared on a regular basis. If it is blocked during heavy rain, the water floods into adjoining properties.
W0139 8 Oates Avenue,Gladesville,NSW 2111
Buffalos Creek Catchment Area
Drainage at rear; northern side of Westminster Park.
BK0079 24 Minga Street, Ryde, NSW
Buffalos Creek Catchment Area
Adjust stormwater drain in Gannan Reserve
ITEM 2 (continued) ATTACHMENT 1
Page 71

14
2112 BK0114 72 Monash
Road, Gladesville,NSW 2111
Buffalos Creek Catchment Area
Improve stormwater drainage as has been done in other sections of Monash Road from buffalo to Higginbotham. Current drainage is on the wrong side of the road.
BK0139 142 Quarry Road, Ryde, NSW 2112
Buffalos Creek Catchment Area
Apply drains in Goulding Road
BK0183 42 Pooley Street, Ryde, NSW 2112
Buffalos Creek Catchment Area
Fix the drainage problem on Pooley street in Ryde
W0242 46 Lane Cove Road, Ryde, NSW 2112
Buffalos Creek Catchment Area
Checking and clearing of easement pipes. It was blocked by Council i.e. we still had part of an old unblocked pipe on our property causing soil erosion and a partial collapse of part of our lawn with a toddler at our house.
ITEM 2 (continued) ATTACHMENT 1
Page 72

B3 Community Consultation Survey Results Brief Summary
ITEM 2 (continued) ATTACHMENT 1
Page 73

2012 Buffalo and Kittys Creek Flood Study Survey Results
ITEM 2 (continued) ATTACHMENT 1
Page 74
Agenda
• Examine results from Flood Study Survey• Determine feasibility of suggested works
to consider• Determine next steps – i.e. mapping of
results, communications plan
ITEM 2 (continued) ATTACHMENT 1
Page 75

Background of research• As part of the Floodplain risk management study for the
Buffalo and Kittys Creek catchments, City of Ryde has consulted with the community by undertaking a survey of residents living in the related areas.
• The main objectives of the survey were:– Obtain information from property owners relating to
previous floods from 1984 – 2003– Determine preferred risk management measures and
controls, and notifications of potential flood effects– Understand issues and concerns to be considered
ITEM 2 (continued) ATTACHMENT 1
Page 76

Methodology• Surveys mailed to 3,247 property owners in Buffalo and
Kittys Creek Catchment areas• Data was collected over 4 weeks (12th of November until
7th of December 2012)
Start date
Enddate
Surveyssent
Completes Responserate
12/11/12 7/12/12 3,247 622(547 – Offline)(75 – Online)
19%
ITEM 2 (continued) ATTACHMENT 1
Page 77

• Surveys received from:– East Ryde– Gladesville– North Ryde– Ryde
ITEM 2 (continued) ATTACHMENT 1
Page 78
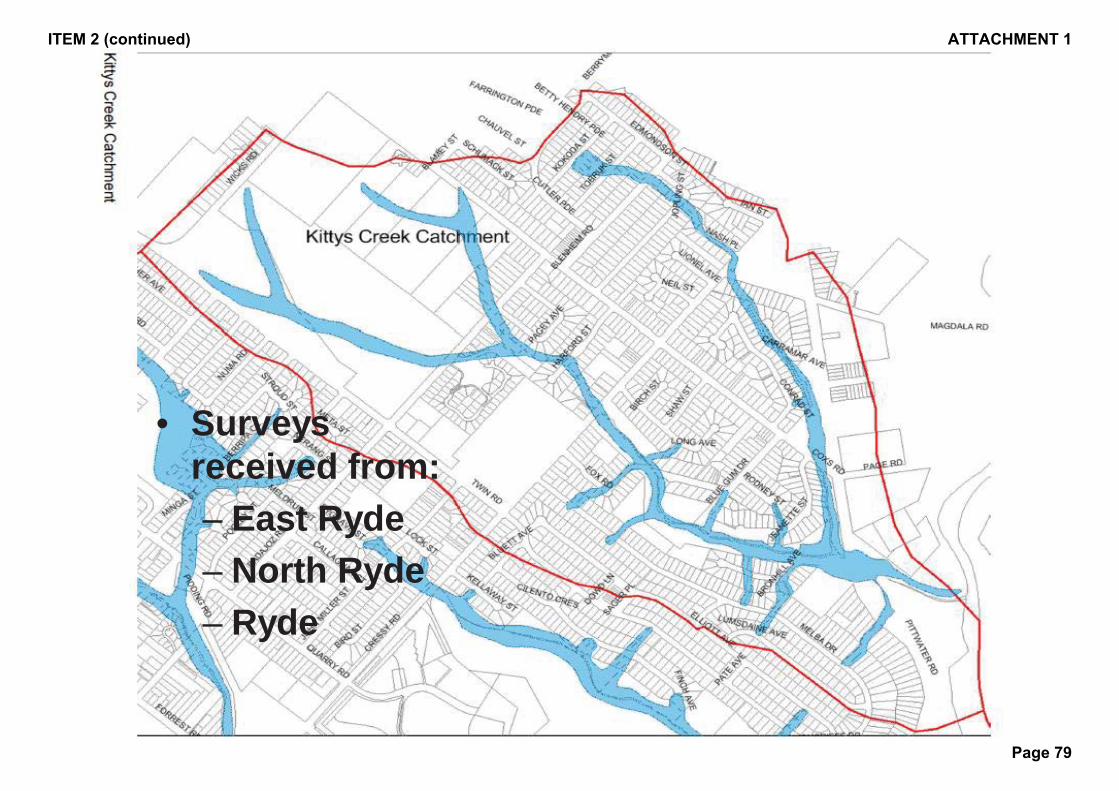
• Surveys received from:– East Ryde– North Ryde– Ryde
ITEM 2 (continued) ATTACHMENT 1
Page 79
Methodology• Sampling error:
– Final achieved sample of n=622 households provides a sampling error of +/-3.53 at 95% confidence.
• Other considerations:– Approximately 74 letters were returned as they were
delivered to invalid addresses, or property owners were no longer at the address.
– As the survey related to floods over a long time span of 20 years, some flood affected residents may have already moved houses.
ITEM 2 (continued) ATTACHMENT 1
Page 80
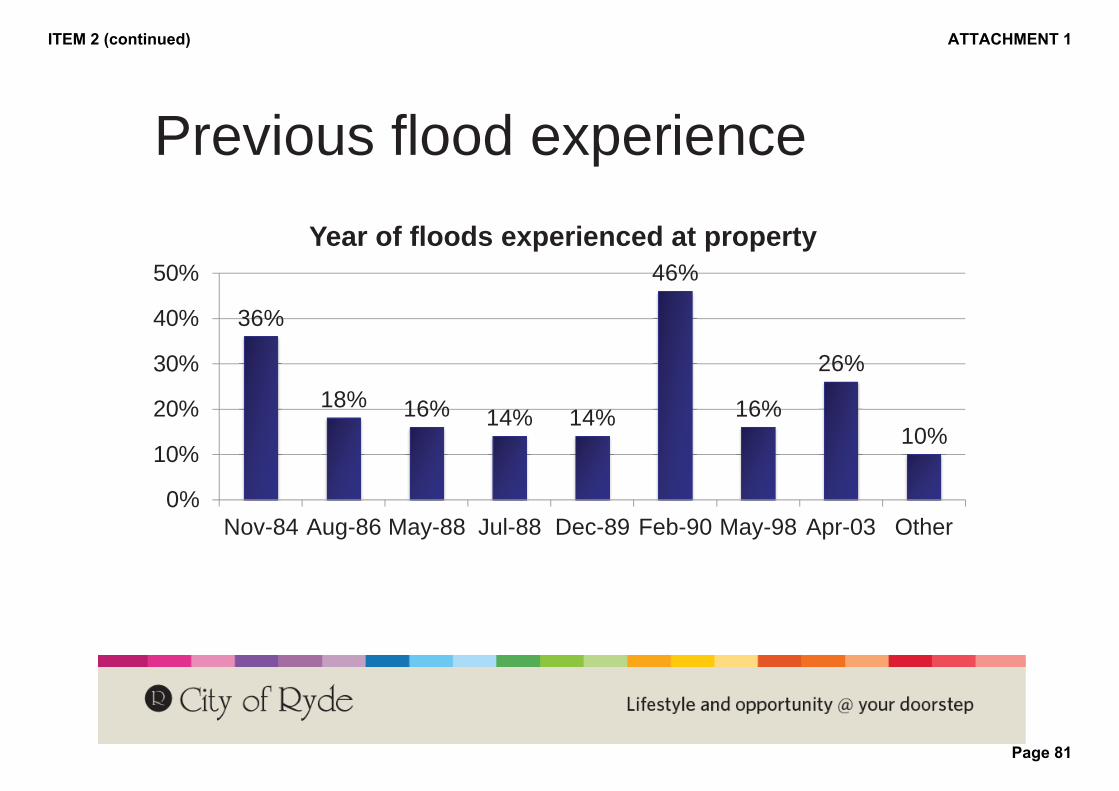
Previous flood experience
36%
18% 16% 14% 14%
46%
16%
26%
10%
0%
10%
20%
30%
40%
50%
Nov-84 Aug-86 May-88 Jul-88 Dec-89 Feb-90 May-98 Apr-03 Other
Year of floods experienced at property
ITEM 2 (continued) ATTACHMENT 1
Page 81
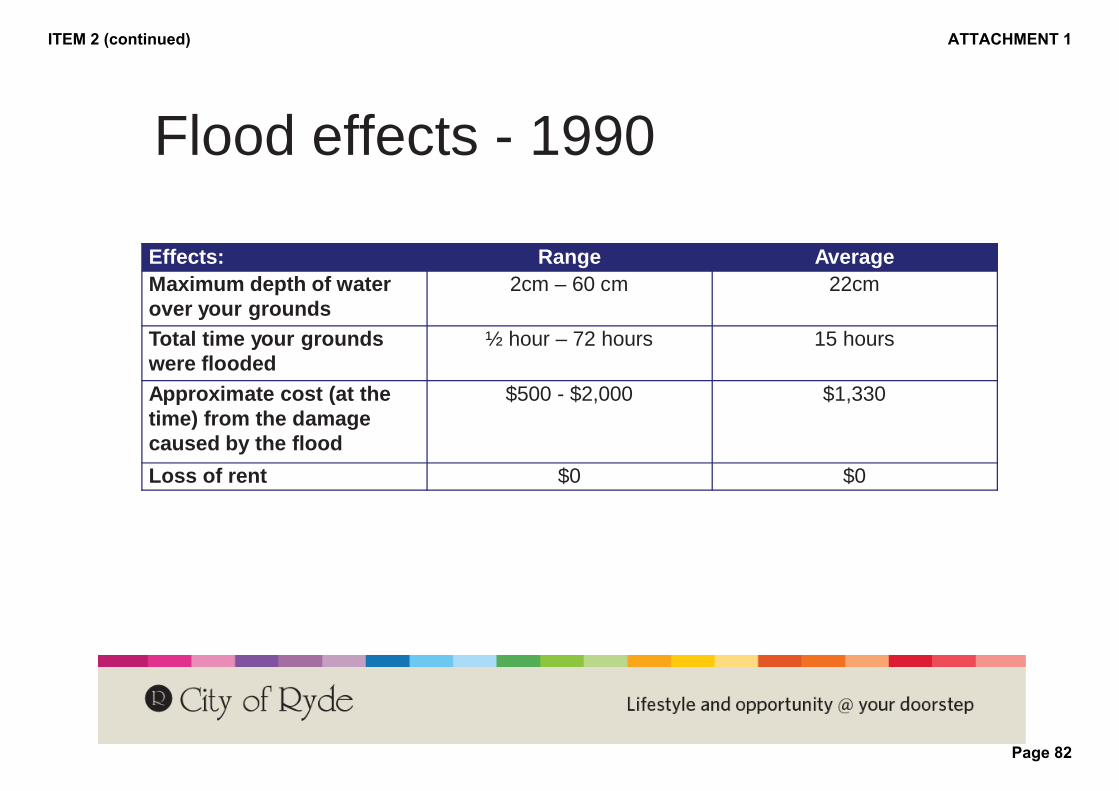
Flood effects - 1990
Effects: Range AverageMaximum depth of water over your grounds
2cm – 60 cm 22cm
Total time your grounds were flooded
½ hour – 72 hours 15 hours
Approximate cost (at the time) from the damage caused by the flood
$500 - $2,000 $1,330
Loss of rent $0 $0
ITEM 2 (continued) ATTACHMENT 1
Page 82

Comparison of flood vs. non flood affected properties
Floodaffected
Non flood affected
No. of stories 1 story 49% 52%2 stories 49% 39%3 stories 2% 9%
Property Material Full brick 47% 36%Brick veneer 35% 42%Weatherboard/fibro 22% 22%Timber 6% 7%Not sure 0% 1%
Property type House 98% 86%Business 0% 2%Unit/flat/apartment/ 0% 7%Other 2% 5%
Owned or rented Owner occupied 96% 90%Rented/tenant occupied 4% 10%
Tenure Range 3-58 years 1-79 yearsAverage 34 years 23 years
Catchment Kittys Creek Catchment Area 4% 96%Buffalos Creek Catchment Area 9% 91%
ITEM 2 (continued) ATTACHMENT 1
Page 83

Future floods
15%
85%
56%44%
0%
20%
40%
60%
80%
100%
Yes No
Do you think your property could be flooded sometime in the future?
All
Previouslyflooded
ITEM 2 (continued) ATTACHMENT 1
Page 84

Reasons for future floodingReasons for future flood potential Frequency PercentSlope of road towards house/situated at bottom of hill/low side of street or below street 22 26.5%Stormwater/drain blockages/inadequate runoff 17 20.5%Near a creek/waterfall 13 15.7%Bottom of property or garage gets flooded but not top 8 9.6%Depends on the catchment/near catchment overflow 5 6.0%Footpath/easements/street frequently floods 4 4.8%Run off from nearby industrial estate/units/roads 4 4.8%Backyard alterations changing course of floods/clearing of trees 3 3.6%Flash flooding potential 3 3.6%House in Kittys Creek catchment 3 3.6%Backyard flooding 2 2.4%House in Buffalo Creek catchment 2 2.4%Excessive development 1 1.2%Natural disasters 1 1.2%Neighbours emptying pool 1 1.2%Street gutters and stormwater drains not cleaned out regularly 1 1.2%Tree roots causing broken pipes in property 1 1.2%
ITEM 2 (continued) ATTACHMENT 1
Page 85

Reasons against future floodingReasons against future flood potential Frequency Percent
House is on higher end of slope/slope of block 137 39.8%Elevation of blocks/land raised/live in upper floors 71 20.6%House is high above or far from creek/flood area 52 15.1%Drainage system - new, improved, or adequate 46 13.4%Never had a flood problem before, even during heavy rain 28 8.1%Above sea level 7 2.0%Requires review 5 1.5%Council fixed the problem after flooding 4 1.2%House near a waterfall cascade. 4 1.2%Council approved pit in backyard/underground stormwater tank 3 0.9%Council approved retaining walls 3 0.9%Depends on weather in the future 2 0.6%Specific road upgrades 2 0.6%Don't know 2 0.6%
ITEM 2 (continued) ATTACHMENT 1
Page 86
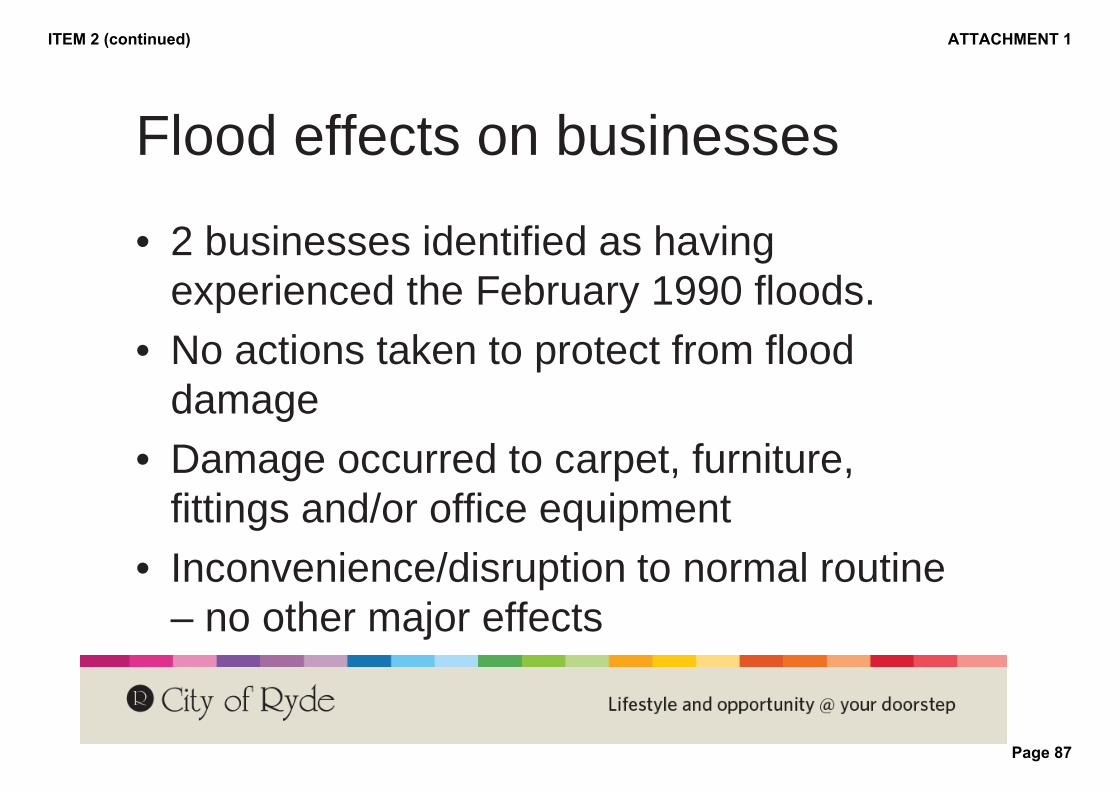
Flood effects on businesses
• 2 businesses identified as having experienced the February 1990 floods.
• No actions taken to protect from flood damage
• Damage occurred to carpet, furniture, fittings and/or office equipment
• Inconvenience/disruption to normal routine – no other major effects
ITEM 2 (continued) ATTACHMENT 1
Page 87
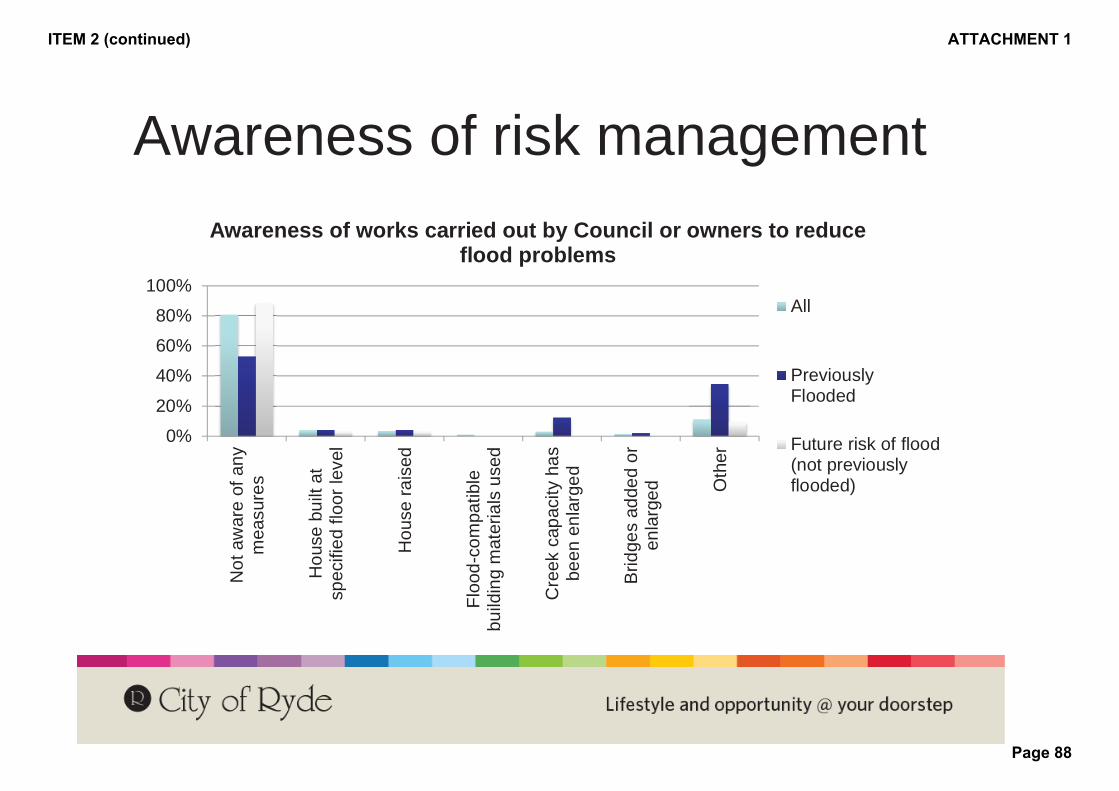
Awareness of risk management
0%
20%
40%
60%
80%
100%
Not
aw
are
of a
nym
easu
res
Hou
se b
uilt
atsp
ecifi
ed fl
oor l
evel
Hou
se ra
ised
Floo
d-co
mpa
tible
build
ing
mat
eria
ls u
sed
Cre
ek c
apac
ity h
asbe
en e
nlar
ged
Brid
ges
adde
d or
enla
rged O
ther
Awareness of works carried out by Council or owners to reduce flood problems
All
PreviouslyFlooded
Future risk of flood(not previouslyflooded)
ITEM 2 (continued) ATTACHMENT 1
Page 88
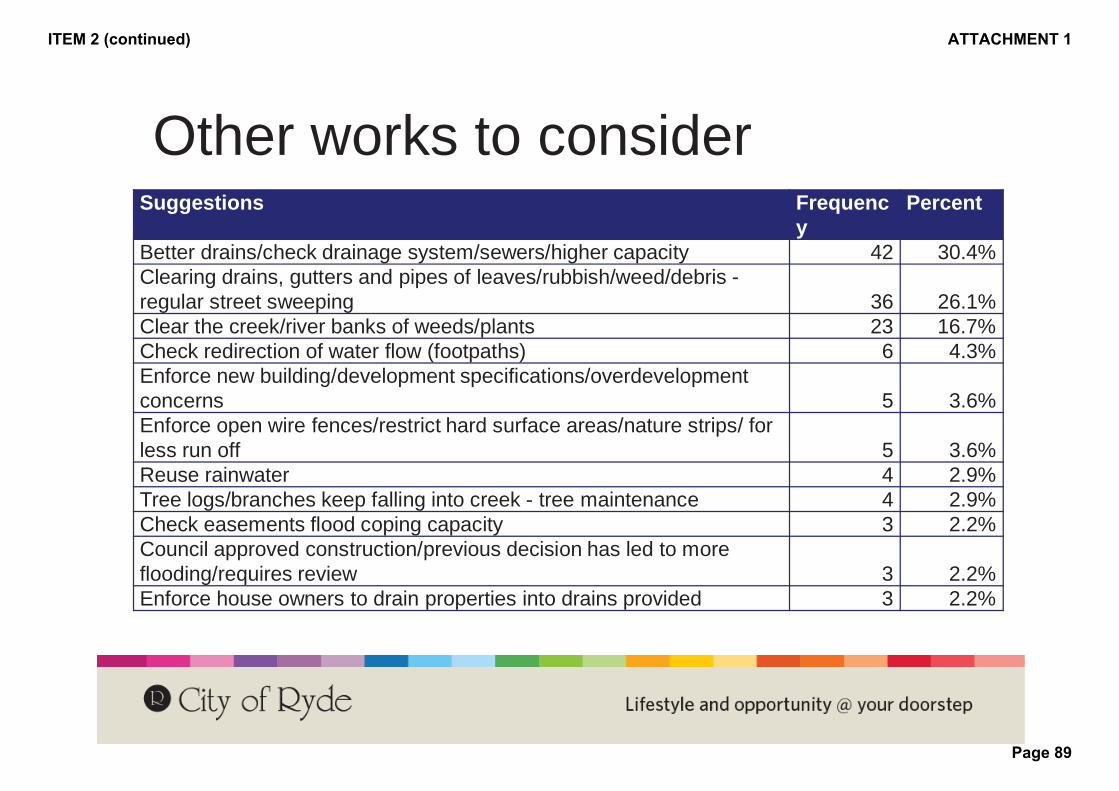
Other works to considerSuggestions Frequenc
yPercent
Better drains/check drainage system/sewers/higher capacity 42 30.4%Clearing drains, gutters and pipes of leaves/rubbish/weed/debris -regular street sweeping 36 26.1%Clear the creek/river banks of weeds/plants 23 16.7%Check redirection of water flow (footpaths) 6 4.3%Enforce new building/development specifications/overdevelopment concerns 5 3.6%Enforce open wire fences/restrict hard surface areas/nature strips/ for less run off 5 3.6%Reuse rainwater 4 2.9%Tree logs/branches keep falling into creek - tree maintenance 4 2.9%Check easements flood coping capacity 3 2.2%Council approved construction/previous decision has led to more flooding/requires review 3 2.2%Enforce house owners to drain properties into drains provided 3 2.2%
ITEM 2 (continued) ATTACHMENT 1
Page 89
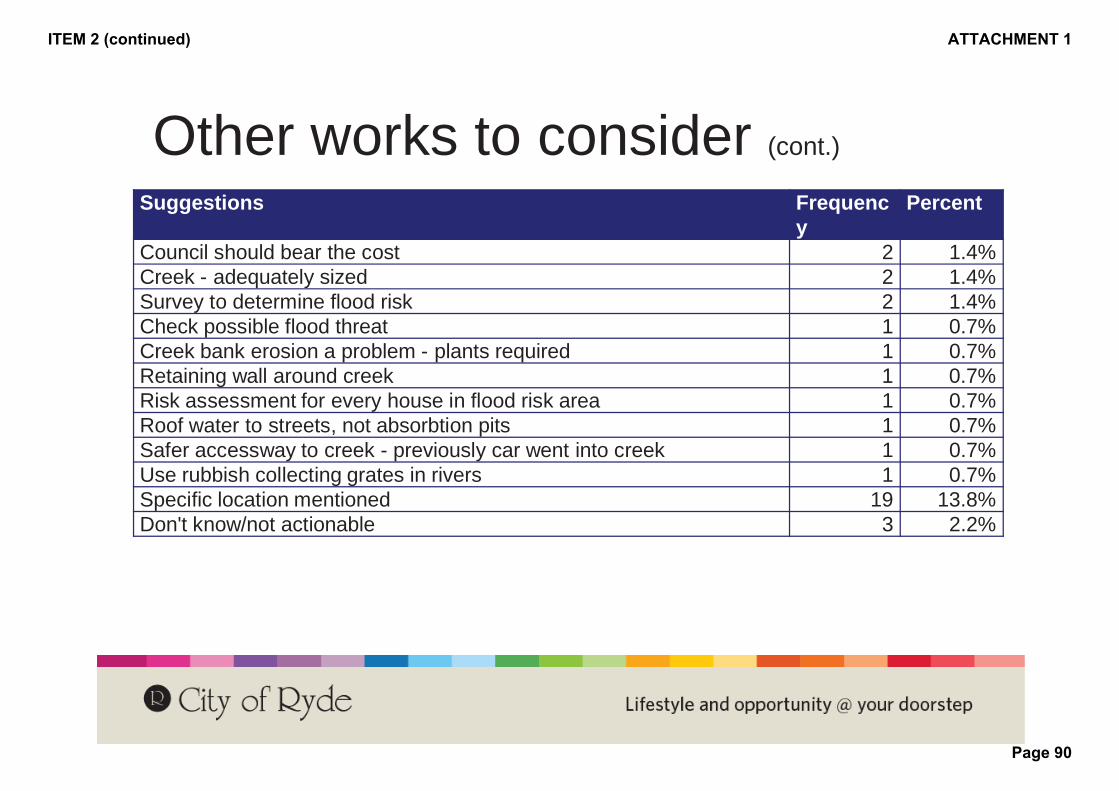
Other works to consider (cont.)
Suggestions Frequency
Percent
Council should bear the cost 2 1.4%Creek - adequately sized 2 1.4%Survey to determine flood risk 2 1.4%Check possible flood threat 1 0.7%Creek bank erosion a problem - plants required 1 0.7%Retaining wall around creek 1 0.7%Risk assessment for every house in flood risk area 1 0.7%Roof water to streets, not absorbtion pits 1 0.7%Safer accessway to creek - previously car went into creek 1 0.7%Use rubbish collecting grates in rivers 1 0.7%Specific location mentioned 19 13.8%Don't know/not actionable 3 2.2%
ITEM 2 (continued) ATTACHMENT 1
Page 90
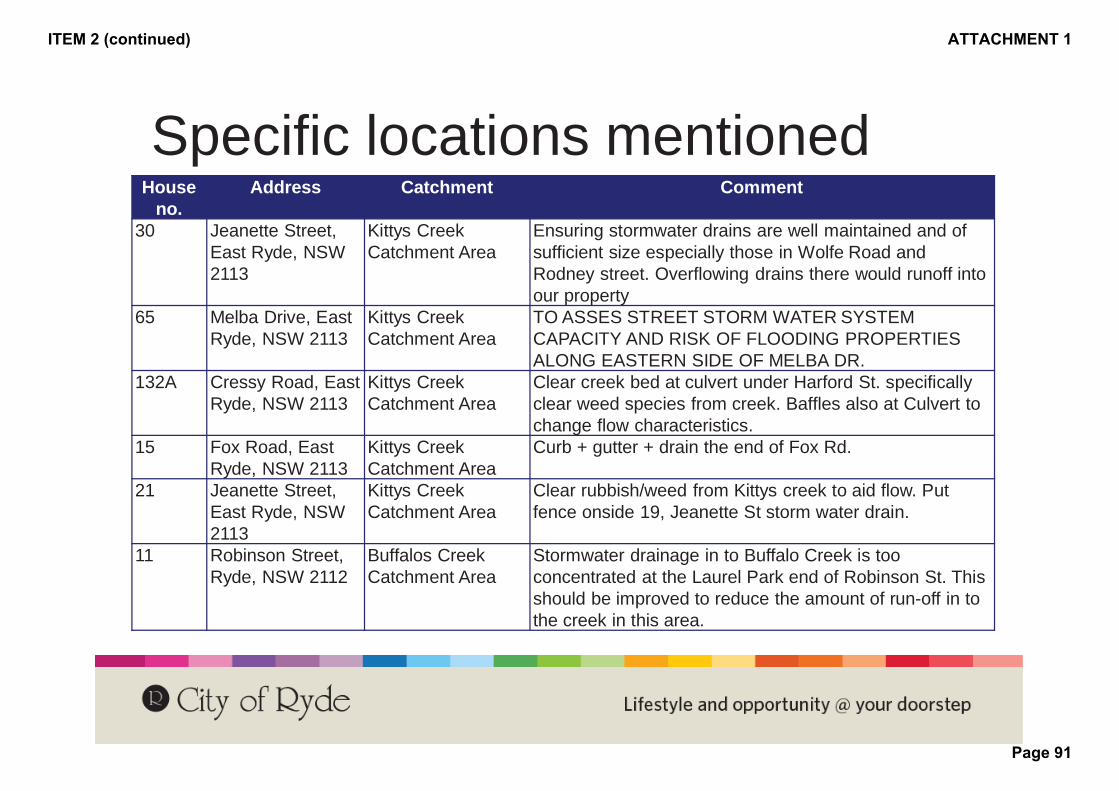
Specific locations mentionedHouse
no.Address Catchment Comment
30 Jeanette Street, East Ryde, NSW 2113
Kittys Creek Catchment Area
Ensuring stormwater drains are well maintained and of sufficient size especially those in Wolfe Road and Rodney street. Overflowing drains there would runoff into our property
65 Melba Drive, East Ryde, NSW 2113
Kittys Creek Catchment Area
TO ASSES STREET STORM WATER SYSTEM CAPACITY AND RISK OF FLOODING PROPERTIES ALONG EASTERN SIDE OF MELBA DR.
132A Cressy Road, East Ryde, NSW 2113
Kittys Creek Catchment Area
Clear creek bed at culvert under Harford St. specifically clear weed species from creek. Baffles also at Culvert to change flow characteristics.
15 Fox Road, East Ryde, NSW 2113
Kittys Creek Catchment Area
Curb + gutter + drain the end of Fox Rd.
21 Jeanette Street, East Ryde, NSW 2113
Kittys Creek Catchment Area
Clear rubbish/weed from Kittys creek to aid flow. Put fence onside 19, Jeanette St storm water drain.
11 Robinson Street, Ryde, NSW 2112
Buffalos Creek Catchment Area
Stormwater drainage in to Buffalo Creek is too concentrated at the Laurel Park end of Robinson St. This should be improved to reduce the amount of run-off in to the creek in this area.
ITEM 2 (continued) ATTACHMENT 1
Page 91
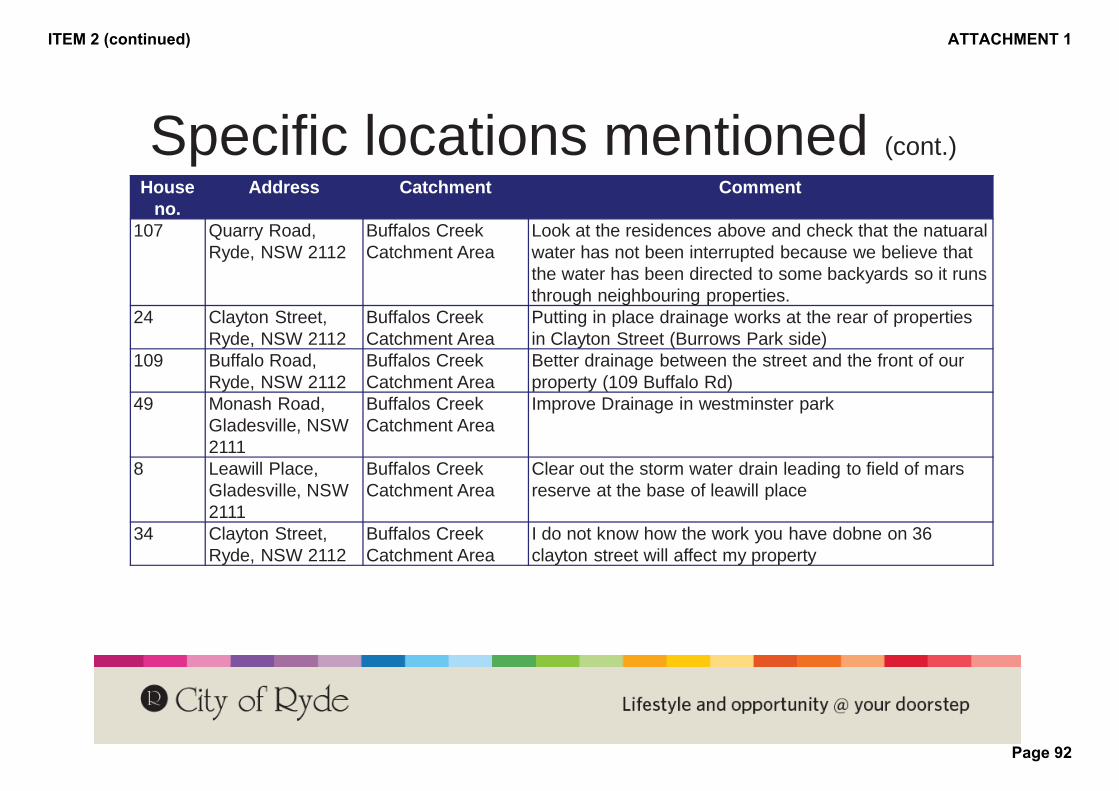
Specific locations mentioned (cont.)House
no.Address Catchment Comment
107 Quarry Road, Ryde, NSW 2112
Buffalos Creek Catchment Area
Look at the residences above and check that the natuaral water has not been interrupted because we believe that the water has been directed to some backyards so it runs through neighbouring properties.
24 Clayton Street, Ryde, NSW 2112
Buffalos Creek Catchment Area
Putting in place drainage works at the rear of properties in Clayton Street (Burrows Park side)
109 Buffalo Road, Ryde, NSW 2112
Buffalos Creek Catchment Area
Better drainage between the street and the front of our property (109 Buffalo Rd)
49 Monash Road, Gladesville, NSW 2111
Buffalos Creek Catchment Area
Improve Drainage in westminster park
8 Leawill Place, Gladesville, NSW 2111
Buffalos Creek Catchment Area
Clear out the storm water drain leading to field of mars reserve at the base of leawill place
34 Clayton Street, Ryde, NSW 2112
Buffalos Creek Catchment Area
I do not know how the work you have dobne on 36 clayton street will affect my property
ITEM 2 (continued) ATTACHMENT 1
Page 92
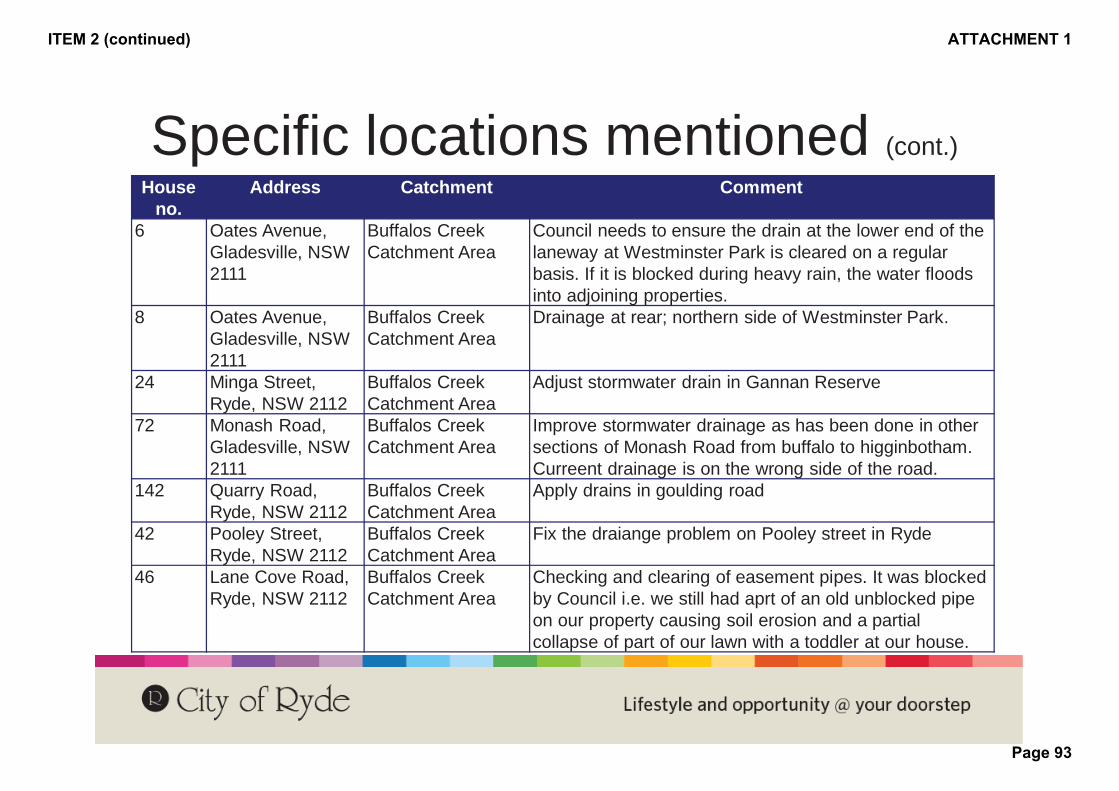
Specific locations mentioned (cont.)House
no.Address Catchment Comment
6 Oates Avenue, Gladesville, NSW 2111
Buffalos Creek Catchment Area
Council needs to ensure the drain at the lower end of the laneway at Westminster Park is cleared on a regular basis. If it is blocked during heavy rain, the water floods into adjoining properties.
8 Oates Avenue, Gladesville, NSW 2111
Buffalos Creek Catchment Area
Drainage at rear; northern side of Westminster Park.
24 Minga Street, Ryde, NSW 2112
Buffalos Creek Catchment Area
Adjust stormwater drain in Gannan Reserve
72 Monash Road, Gladesville, NSW 2111
Buffalos Creek Catchment Area
Improve stormwater drainage as has been done in other sections of Monash Road from buffalo to higginbotham. Curreent drainage is on the wrong side of the road.
142 Quarry Road, Ryde, NSW 2112
Buffalos Creek Catchment Area
Apply drains in goulding road
42 Pooley Street, Ryde, NSW 2112
Buffalos Creek Catchment Area
Fix the draiange problem on Pooley street in Ryde
46 Lane Cove Road, Ryde, NSW 2112
Buffalos Creek Catchment Area
Checking and clearing of easement pipes. It was blocked by Council i.e. we still had aprt of an old unblocked pipe on our property causing soil erosion and a partial collapse of part of our lawn with a toddler at our house.
ITEM 2 (continued) ATTACHMENT 1
Page 93
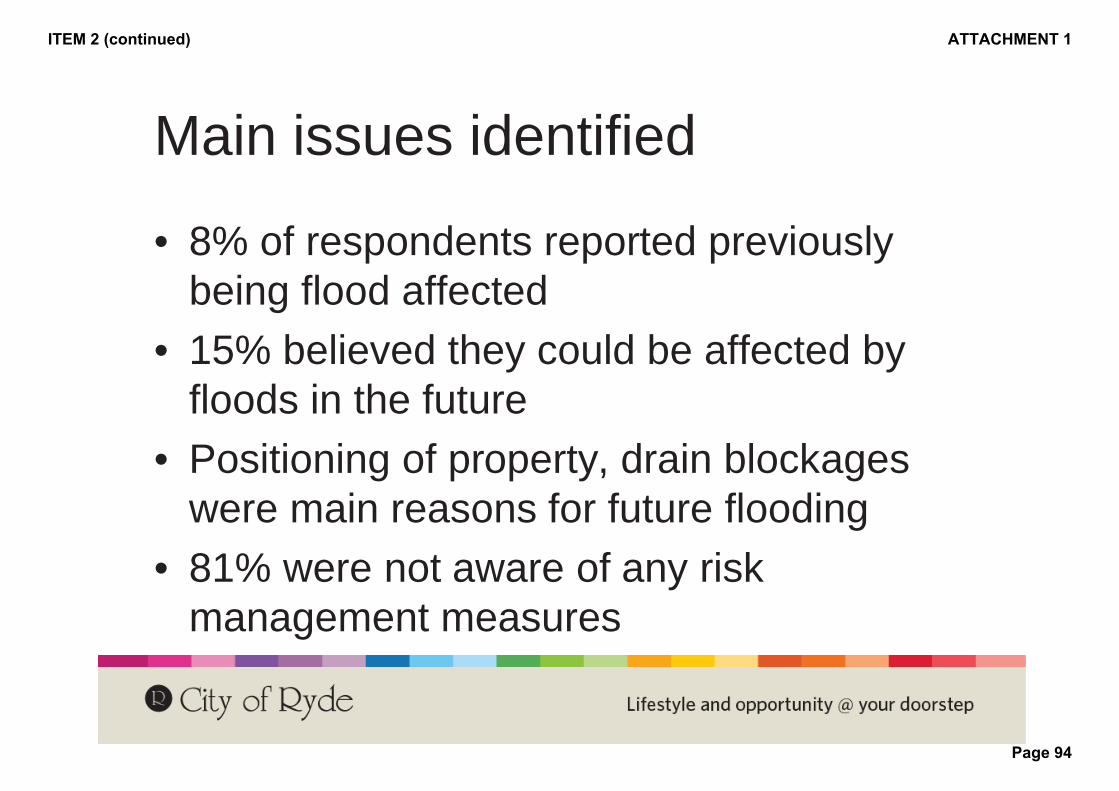
Main issues identified
• 8% of respondents reported previously being flood affected
• 15% believed they could be affected by floods in the future
• Positioning of property, drain blockages were main reasons for future flooding
• 81% were not aware of any risk management measures
ITEM 2 (continued) ATTACHMENT 1
Page 94
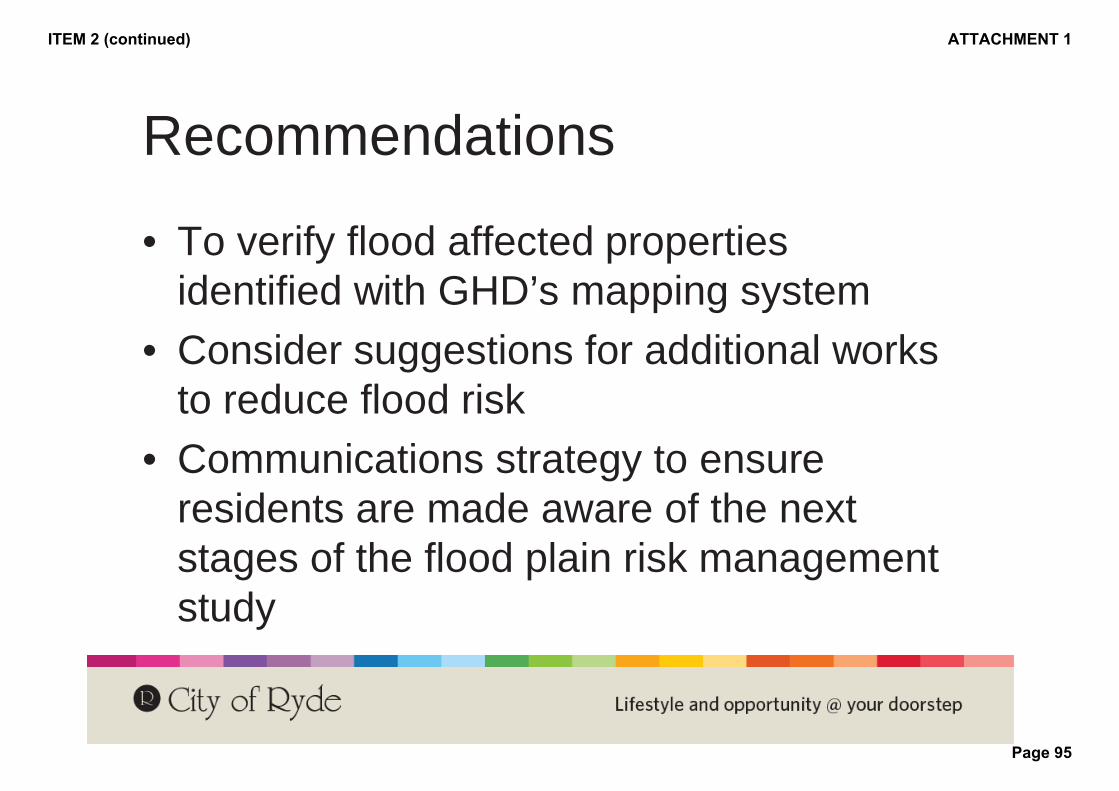
Recommendations
• To verify flood affected properties identified with GHD’s mapping system
• Consider suggestions for additional works to reduce flood risk
• Communications strategy to ensure residents are made aware of the next stages of the flood plain risk management study
ITEM 2 (continued) ATTACHMENT 1
Page 95
Appendix C – Design Flood Maps C1.1 Buffalo Creek Flood Extents – 20%AEP
C1.2 Buffalo Creek Flood Extents – 5%AEP
C1.3 Buffalo Creek Flood Extents – 2%AEP
C1.4 Buffalo Creek Flood Extents – 1%AEP
C1.5 Buffalo Creek Flood Extents – PMF
C2.1 Kittys Creek Flood Extents – 20%AEP
C2.2 Kittys Creek Flood Extents – 5%AEP
C2.3 Kittys Creek Flood Extents – 2%AEP
C2.4 Kittys Creek Flood Extents – 1%AEP
C2.5 Kittys Creek Flood Extents – PMF
ITEM 2 (continued) ATTACHMENT 1
Page 96

Level 15, 133 Castlereagh Street Sydney NSW 2000 T 61 2 9239 7100 F 61 2 9239 7199 E [email protected] W www.ghd.com.au
4
24
2
32
40
8
6
34
18
12
38
20
46
16
36
44
26
50
42
10
14
48
30
28
22
60
52
56
5854
72
38
34
26
4
6
46
10
30
16
14
24
2
44
22
22
36
10
24
38
2428
36
38
42
28
52
30
42
36
4
4
30
44
12
42
30
48
12
4
46
4
626
34
40
20
2
28
24
12
40
44
8
38
36
30
4
18
40
36
24
40
32
6
40
38
50
40
18
44
30
26
34
12
38
16
50
8
22
26
28
4
2
20
G:\21\21394\GIS\ArcGIS\Maps\MXD\Map Publishing - Draft Report\Flood Mapping\C1 Buff 5yr.mxd© 2010. While GHD has taken care to ensure the accuracy of this product, GHD and DATA CUSTODIAN, make no representations or warranties about its accuracy, completeness or suitability for any particular purpose. GHD and DATA CUSTODIAN, cannot accept liability of any kind (whether in contract, tort or otherwise) for any expenses, losses, damages and/or costs (including indirect or consequential damage) which are or may be incurred as a result of the product being inaccurate, incomplete or unsuitable in any way and for any reason.
LEGEND0 100 200 300 40050
Metres
Map Projection: Transverse MercatorHorizontal Datum: Geocentric Datum of Australia (GDA)
Grid: Map Grid of Australia 1994, Zone 56 Figure C1.1
Job NumberRevision A
21-21394
27 Apr 2013o Date
Data Source: NSW Department of Lands: Cadastre - Jan 2011; Geoscience Australia: 250k Data - Jan 2011. Created by: jlam
1:10,000 (at A3) City of Ryde CouncilBuffalo and Kittys CreekFlood Study and FRMS&P
Buffalo Creek CatchmentFlood Extents - 20% AEP
Catchment Boundary
Flood Level (mAHD)
Flood Depth (m)
0.00 -
0.05
0.05 -
0.10
0.10 -
0.20
0.20 -
0.30
0.30 -
0.40
0.40 -
0.50
0.50 -
1.00
1.00 -
2.00
2.00 -
3.00
Above
3.00
ITEM 2 (continued) ATTACHMENT 1
Page 97

Level 15, 133 Castlereagh Street Sydney NSW 2000 T 61 2 9239 7100 F 61 2 9239 7199 E [email protected] W www.ghd.com.au
24
34
18
40
6
8
32
38
2428
12
22
36
26
44
10
46
42
20
50
48
16
60
14
30
5256 62
64
6670
54 58
36
20
26
4
42
38
44
60
20
52
28
32
42
8
26
4
44
8
2
8
30
10
32
30
42
38
56
42
16
46
6
30
30
8
4
38
50
36
8
4
50
34
4
6
44
30
34
40
28
26
48
48
18
42
6
44 16
8
14
34
34
8
52
46
28
52
14
26
12
26
64
24
46
42
42
40
48
54
38
12
2
12
44
32
28
38
24
20
24
40
30
4
58
4
46
28
34
20
36
4
36
22
46
36
8
44
22
38
8
3240
4
22
30
12
24
44
48
16
28
38
44
52
50
26
4
38
52
42
46
42
22
14
40
G:\21\21394\GIS\ArcGIS\Maps\MXD\Map Publishing - Draft Report\Flood Mapping\C1 Buff 20yr.mxd© 2010. While GHD has taken care to ensure the accuracy of this product, GHD and DATA CUSTODIAN, make no representations or warranties about its accuracy, completeness or suitability for any particular purpose. GHD and DATA CUSTODIAN, cannot accept liability of any kind (whether in contract, tort or otherwise) for any expenses, losses, damages and/or costs (including indirect or consequential damage) which are or may be incurred as a result of the product being inaccurate, incomplete or unsuitable in any way and for any reason.
LEGEND0 100 200 300 40050
Metres
Map Projection: Transverse MercatorHorizontal Datum: Geocentric Datum of Australia (GDA)
Grid: Map Grid of Australia 1994, Zone 56 Figure C1.2
Job NumberRevision A
21-21394
27 Apr 2013o Date
Data Source: NSW Department of Lands: Cadastre - Jan 2011; Geoscience Australia: 250k Data - Jan 2011. Created by: jlam
1:10,000 (at A3) City of Ryde CouncilBuffalo and Kittys CreekFlood Study and FRMS&P
Buffalo Creek CatchmentFlood Extents - 5% AEP
Catchment Boundary
Flood Level (mAHD)
Flood Depth (m)
0.00 -
0.05
0.05 -
0.10
0.10 -
0.20
0.20 -
0.30
0.30 -
0.40
0.40 -
0.50
0.50 -
1.00
1.00 -
2.00
2.00 -
3.00
Above
3.00
ITEM 2 (continued) ATTACHMENT 1
Page 98
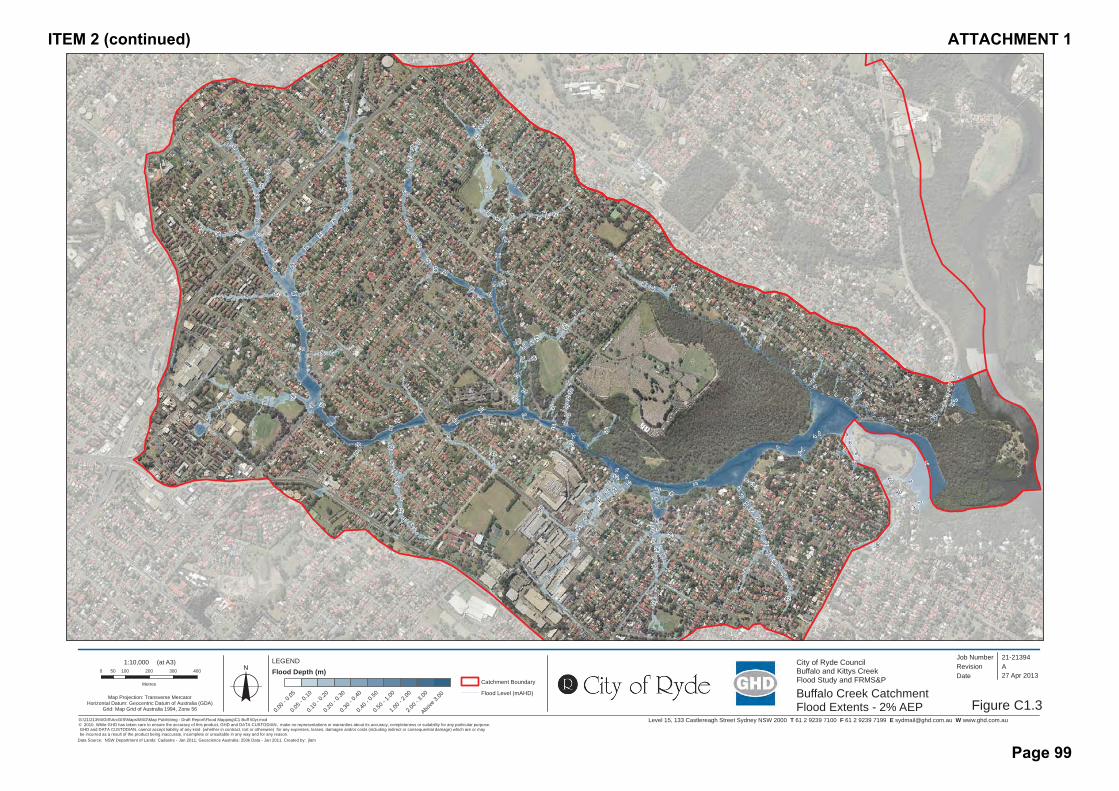
Level 15, 133 Castlereagh Street Sydney NSW 2000 T 61 2 9239 7100 F 61 2 9239 7199 E [email protected] W www.ghd.com.au
2
4
8
34
6
40
26
38
24
22
32
18
28
12
50
44
36
20
14
10
42
46
48
16
60
54
30
52
64
62
66
56
70
58
4
40
24
12
36
4
38
38
8
2
30
28
42
10
44
52
34
34
40
50
54
38
6
28
52
10 2
22
50
42
42
58
2
12
22
32
40
42
36
16
4
8
46
30
50
4
50
24
4
28
6
56
42
24
52
20
32
64
42
32
38
6
48
30
42
16
16
36
40
2642
30
28
46
56
52
30
8
8
50
4
42
8
42
44
28
20
4032
40
38
60
10
48
4
2
14
48
30
20
10
24
44
30
46
26
2
36
22
44
52
6
44
44
2
38
26
6
24
4
26
48
26
26
12
22
34
54
20
18
34
44
16
44
36
2
30
4
36
42
4
4
38
34
42
46
2
50
2
38
44
16
48
12
22
26
40
6
14
8
46
52
G:\21\21394\GIS\ArcGIS\Maps\MXD\Map Publishing - Draft Report\Flood Mapping\C1 Buff 50yr.mxd© 2010. While GHD has taken care to ensure the accuracy of this product, GHD and DATA CUSTODIAN, make no representations or warranties about its accuracy, completeness or suitability for any particular purpose. GHD and DATA CUSTODIAN, cannot accept liability of any kind (whether in contract, tort or otherwise) for any expenses, losses, damages and/or costs (including indirect or consequential damage) which are or may be incurred as a result of the product being inaccurate, incomplete or unsuitable in any way and for any reason.
LEGEND0 100 200 300 40050
Metres
Map Projection: Transverse MercatorHorizontal Datum: Geocentric Datum of Australia (GDA)
Grid: Map Grid of Australia 1994, Zone 56 Figure C1.3
Job NumberRevision A
21-21394
27 Apr 2013o Date
Data Source: NSW Department of Lands: Cadastre - Jan 2011; Geoscience Australia: 250k Data - Jan 2011. Created by: jlam
1:10,000 (at A3) City of Ryde CouncilBuffalo and Kittys CreekFlood Study and FRMS&P
Buffalo Creek CatchmentFlood Extents - 2% AEP
Catchment Boundary
Flood Level (mAHD)
Flood Depth (m)
0.00 -
0.05
0.05 -
0.10
0.10 -
0.20
0.20 -
0.30
0.30 -
0.40
0.40 -
0.50
0.50 -
1.00
1.00 -
2.00
2.00 -
3.00
Above
3.00
ITEM 2 (continued) ATTACHMENT 1
Page 99

Level 15, 133 Castlereagh Street Sydney NSW 2000 T 61 2 9239 7100 F 61 2 9239 7199 E [email protected] W www.ghd.com.au
2
4
8
34
6
40
26
38
24
22
20
18
14
50
28
12
36
32
44
46
10
42
58
48
16
60
54
30
52
66
62
64
56
70
28
8
14
26
38
36
42
14
42
52
26
8
840
28
26
14
46
34
42
50
20
54
56
34
42
58
46
4212
10
10
8
44
26
54
42
30
28
66
42
2
40
20
30
38 48
48
4
38
48
2
52
44
24
6
44
50
4
44
44
52
32
42
32
26
36
30
26
30
30
40
6
26
8
4
40
8
24
32
40
44
44
10
32
42
52
4
32
18
38
12
54
48
44
40
36
48
50
46
36
50
48
26
36
44
30
4
50 52
22
42
30
40
48
6
38
64
28
6
8
46
32
1234
26
24
46
4
40
52
18
4
26
20
4
24
38
50 46
16
36
42
28
22
60
10
44
20
38
16
42
30
4
42
36
20
48
36
56
36
44
22
58
16
26
38
50
52
G:\21\21394\GIS\ArcGIS\Maps\MXD\Map Publishing - Draft Report\Flood Mapping\C1 Buff 100yr.mxd© 2010. While GHD has taken care to ensure the accuracy of this product, GHD and DATA CUSTODIAN, make no representations or warranties about its accuracy, completeness or suitability for any particular purpose. GHD and DATA CUSTODIAN, cannot accept liability of any kind (whether in contract, tort or otherwise) for any expenses, losses, damages and/or costs (including indirect or consequential damage) which are or may be incurred as a result of the product being inaccurate, incomplete or unsuitable in any way and for any reason.
LEGEND0 100 200 300 40050
Metres
Map Projection: Transverse MercatorHorizontal Datum: Geocentric Datum of Australia (GDA)
Grid: Map Grid of Australia 1994, Zone 56 Figure C1.4
Job NumberRevision A
21-21394
27 Apr 2013o Date
Data Source: NSW Department of Lands: Cadastre - Jan 2011; Geoscience Australia: 250k Data - Jan 2011. Created by: jlam
1:10,000 (at A3) City of Ryde CouncilBuffalo and Kittys CreekFlood Study and FRMS&P
Buffalo Creek CatchmentFlood Extents - 1% AEP
Catchment Boundary
Flood Level (mAHD)
Flood Depth (m)
0.00 -
0.05
0.05 -
0.10
0.10 -
0.20
0.20 -
0.30
0.30 -
0.40
0.40 -
0.50
0.50 -
1.00
1.00 -
2.00
2.00 -
3.00
Above
3.00
ITEM 2 (continued) ATTACHMENT 1
Page 100

Level 15, 133 Castlereagh Street Sydney NSW 2000 T 61 2 9239 7100 F 61 2 9239 7199 E [email protected] W www.ghd.com.au
4
6
8
14
18
20
42
24
50
16
22
10
32
12
38
36
28
4634
30
44
40
48
62
26
60
52
5866
54
64 56
7468
70
80
72
76
78
26
38
42
12
64
30
16
4
46
12
40
34
30
32
22
40
48
40
26
52
46
46
50
30
50
12
40
38
42
62
34
54
66
40
24
70
18
20
50
32
2030
48
38
60
24
44
32
20
14
32
2640
58
42
10
36
54
58
44
38
52
46
26
12
40
52
52
40
26
48
20
20
24
50
68
52
38
40
70
44
10
32
5454
30
72
36
36
56
22
3440
40
24
52
48
62
30
44
54
22
24
12
70
50
8
16
74
10
38
30
30
50
56
28
56
30
34
26
62
16
28
12
36
32
38
62
40
30
52
40
32
12
22
38
46
30
48
44
30
50
42
44
46
44
20
52
22
24
22
36
44
40
34
30
56
30
22
70
44
28
42
50
42
38
46
5856
50
52
44
26
44
30
36
40
40
36
30
50
28
62
20
38
48
34
68
6
40
54
54
40
38
44
48
50
62
46
42
18
44
6
50
2638
48
26
48
68
34
40
44
28
40
46
44
56
32
50
64
56
830
62
6
42
60
42
46
44
42
54
58
54
36
20
42
36
44
28
26
30
42
6
36
48
44
8
36
32
42
20
34
34
8
20
36
38
52
54
42
18
28
46
40
50
50
20
6
66
246
14
40
34
48
34
48
36
24
16
56
48
58
584
62
36
22
18
22
38
62
44
68
60
3826
3426
58
34
34
32
56
52
40
46
6030
52
40
34
48
28
56
40
72
66
8
26
8
58
38
58
46
70
62
32
68
46
54
30
3436
52
50
28
64
10
48
36
38
40
42
38
44
44
54
34
60
12
38
38
28
42
48
46
38
48
48
42
22
38
34
38
56
64
16
44
42
60
36
16
28
64
38
44
66
3064
44
50
48
G:\21\21394\GIS\ArcGIS\Maps\MXD\Map Publishing - Draft Report\Flood Mapping\C1 Buff PMF.mxd© 2010. While GHD has taken care to ensure the accuracy of this product, GHD and DATA CUSTODIAN, make no representations or warranties about its accuracy, completeness or suitability for any particular purpose. GHD and DATA CUSTODIAN, cannot accept liability of any kind (whether in contract, tort or otherwise) for any expenses, losses, damages and/or costs (including indirect or consequential damage) which are or may be incurred as a result of the product being inaccurate, incomplete or unsuitable in any way and for any reason.
LEGEND0 100 200 300 40050
Metres
Map Projection: Transverse MercatorHorizontal Datum: Geocentric Datum of Australia (GDA)
Grid: Map Grid of Australia 1994, Zone 56 Figure C1.5
Job NumberRevision A
21-21394
27 Apr 2013o Date
Data Source: NSW Department of Lands: Cadastre - Jan 2011; Geoscience Australia: 250k Data - Jan 2011. Created by: jlam
1:10,000 (at A3) City of Ryde CouncilBuffalo and Kittys CreekFlood Study and FRMS&P
Buffalo Creek CatchmentFlood Extents - PMF Event
Catchment Boundary
Flood Level (mAHD)
Flood Depth (m)
0.00 -
0.05
0.05 -
0.10
0.10 -
0.20
0.20 -
0.40
0.40 -
0.60
0.06 -
1.00
1.00 -
2.00
2.00 -
3.00
3.00 -
5.00
Above
5.00
ITEM 2 (continued) ATTACHMENT 1
Page 101

Level 15, 133 Castlereagh Street Sydney NSW 2000 T 61 2 9239 7100 F 61 2 9239 7199 E [email protected] W www.ghd.com.au
2
24
22
6
4
840
10
36
44
42
28
20
52
18
14
56
38
12
30
16
26
32
46
48
54
3458
50
64
62
58
2
20
2
2
2
26
46
40
46
50
10
54
8
48
26
2036
8
40
58
8
2
28
2
38
2
2
22
44
8
56
62
54
10
30
16
12
6
44
28
2
42
32
2
56
22
50
58
2
2
52
2
42
30
14
32
38
54
52
46
2
44
2
482
2
34
16
30
34
48
26
24
G:\21\21394\GIS\ArcGIS\Maps\MXD\Map Publishing - Draft Report\Flood Mapping\C6 Kitty 5yr.mxd© 2010. While GHD has taken care to ensure the accuracy of this product, GHD and DATA CUSTODIAN, make no representations or warranties about its accuracy, completeness or suitability for any particular purpose. GHD and DATA CUSTODIAN, cannot accept liability of any kind (whether in contract, tort or otherwise) for any expenses, losses, damages and/or costs (including indirect or consequential damage) which are or may be incurred as a result of the product being inaccurate, incomplete or unsuitable in any way and for any reason.
LEGEND0 60 120 180 24030
Metres
Map Projection: Transverse MercatorHorizontal Datum: Geocentric Datum of Australia (GDA)
Grid: Map Grid of Australia 1994, Zone 56 Figure C2.1
Job NumberRevision A
21-21394
02 May 2013o Date
Data Source: NSW Department of Lands: Cadastre - Jan 2011; Geoscience Australia: 250k Data - Jan 2011. Created by: jlam
1:6,500 (at A3) City of Ryde CouncilBuffalo and Kittys Creek
Kitty Creek CatchmentFlood Extents - 20% AEP
Flood Study and FRMS&PFlood Depth (m)
0.00 -
0.05
0.05 -
0.50
0.50 -
0.75
0.75 -
1.00
1.00 -
1.25
1.25 -
1.50
1.50 -
1.75
1.75 -
2.00
2.00 -
2.25
2.25 -
2.50
2.50 -
2.75
2.75 -
3.00
3.00 -
3.25
3.25 -
3.50
3.50 -
3.75
Catchment Boundary
Flood Level (mAHD)
ITEM 2 (continued) ATTACHMENT 1
Page 102
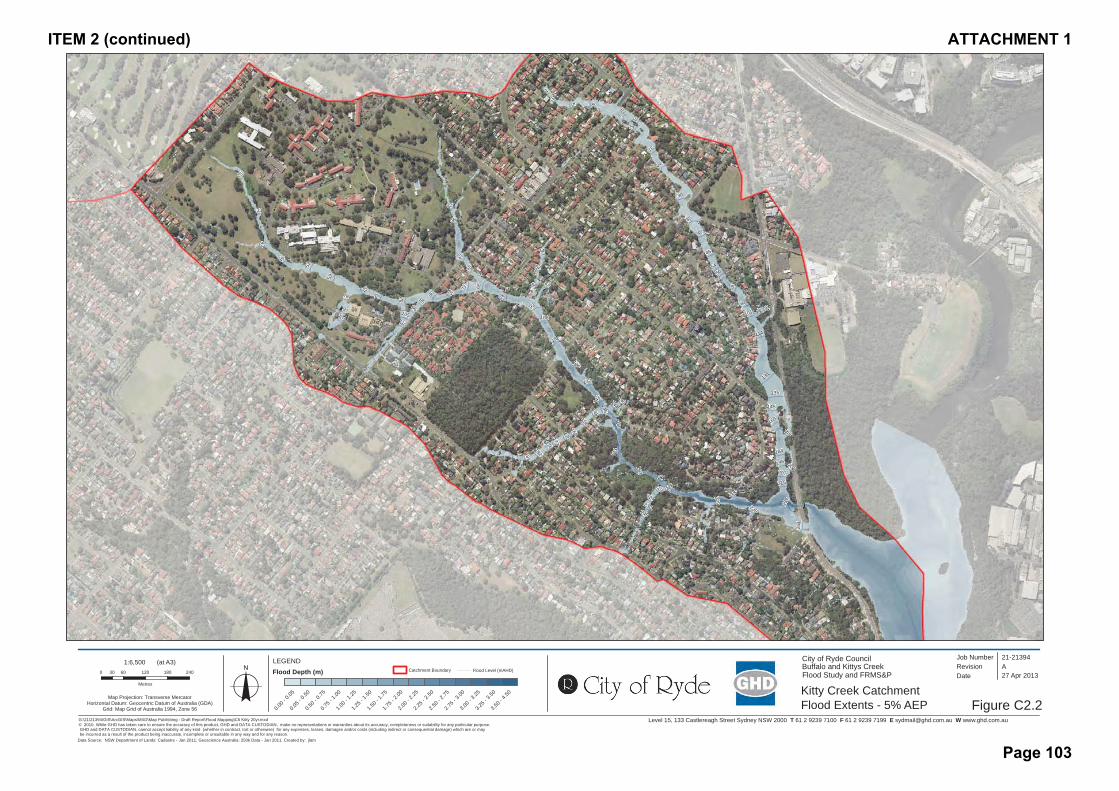
Level 15, 133 Castlereagh Street Sydney NSW 2000 T 61 2 9239 7100 F 61 2 9239 7199 E [email protected] W www.ghd.com.au
131
4
135
5
72 65
35
7
93
80
53 54
30
237
87
261
59
40
79
1
56
82
166
145
46
160
15
105
126
184
146
22
207
114
69
132
101
118
215
108
71
47
11
85
196
96
75
44
77
142
49
229
99
176
170
211
6
172
183
3
219
55
107
78
43
94
225
182
97
144
110
203
33
220
32
36
227
10
201
239
25
187
158169
168
245
62
233
148
52
64
140
G:\21\21394\GIS\ArcGIS\Maps\MXD\Map Publishing - Draft Report\Flood Mapping\C6 Kitty 20yr.mxd© 2010. While GHD has taken care to ensure the accuracy of this product, GHD and DATA CUSTODIAN, make no representations or warranties about its accuracy, completeness or suitability for any particular purpose. GHD and DATA CUSTODIAN, cannot accept liability of any kind (whether in contract, tort or otherwise) for any expenses, losses, damages and/or costs (including indirect or consequential damage) which are or may be incurred as a result of the product being inaccurate, incomplete or unsuitable in any way and for any reason.
LEGEND0 60 120 180 24030
Metres
Map Projection: Transverse MercatorHorizontal Datum: Geocentric Datum of Australia (GDA)
Grid: Map Grid of Australia 1994, Zone 56 Figure C2.2
Job NumberRevision A
21-21394
27 Apr 2013o Date
Data Source: NSW Department of Lands: Cadastre - Jan 2011; Geoscience Australia: 250k Data - Jan 2011. Created by: jlam
1:6,500 (at A3) City of Ryde CouncilBuffalo and Kittys Creek
Kitty Creek CatchmentFlood Extents - 5% AEP
Flood Study and FRMS&PFlood Depth (m)
0.00 -
0.05
0.05 -
0.50
0.50 -
0.75
0.75 -
1.00
1.00 -
1.25
1.25 -
1.50
1.50 -
1.75
1.75 -
2.00
2.00 -
2.25
2.25 -
2.50
2.50 -
2.75
2.75 -
3.00
3.00 -
3.25
3.25 -
3.50
3.50 -
4.50
Catchment Boundary Flood Level (mAHD)
ITEM 2 (continued) ATTACHMENT 1
Page 103

Level 15, 133 Castlereagh Street Sydney NSW 2000 T 61 2 9239 7100 F 61 2 9239 7199 E [email protected] W www.ghd.com.au
4
8
24
22
6
26
42 40
36
44
46
1014
32
20
56
18
52
38
12
30
28
54
34
50
48
16
58
62
60
64
66
6
10
60
56
34
44
8
26
38
16
50
30
24
52
36
28
6
16
56
32
22
46
52
10
58
54
58
48
48
24
46
6
48
18
62
56
2822
32
30
28
42
6
8
52
28
20
38
12
50
54
42
54
18
46
36
40
54
42
8
42
18
44
62
58
50
8
40
30
54
40
52
4
34
56
48
40
44
1250
26
4
50
48
4244
18
30
G:\21\21394\GIS\ArcGIS\Maps\MXD\Map Publishing - Draft Report\Flood Mapping\C6 Kitty 50yr.mxd© 2010. While GHD has taken care to ensure the accuracy of this product, GHD and DATA CUSTODIAN, make no representations or warranties about its accuracy, completeness or suitability for any particular purpose. GHD and DATA CUSTODIAN, cannot accept liability of any kind (whether in contract, tort or otherwise) for any expenses, losses, damages and/or costs (including indirect or consequential damage) which are or may be incurred as a result of the product being inaccurate, incomplete or unsuitable in any way and for any reason.
LEGEND0 60 120 180 24030
Metres
Map Projection: Transverse MercatorHorizontal Datum: Geocentric Datum of Australia (GDA)
Grid: Map Grid of Australia 1994, Zone 56 Figure C2.3
Job NumberRevision A
21-21394
27 Apr 2013o Date
Data Source: NSW Department of Lands: Cadastre - Jan 2011; Geoscience Australia: 250k Data - Jan 2011. Created by: jlam
1:6,500 (at A3) City of Ryde CouncilBuffalo and Kittys Creek
Kitty Creek CatchmentFlood Extents - 2% AEP
Flood Study and FRMS&PFlood Depth (m)
0.00 -
0.05
0.05 -
0.50
0.50 -
0.75
0.75 -
1.00
1.00 -
1.25
1.25 -
1.50
1.50 -
1.75
1.75 -
2.00
2.00 -
2.25
2.25 -
2.50
2.50 -
2.75
2.75 -
3.00
3.00 -
3.25
3.25 -
3.50
3.50 -
4.50
Catchment Boundary Flood Level (mAHD)
ITEM 2 (continued) ATTACHMENT 1
Page 104

Level 15, 133 Castlereagh Street Sydney NSW 2000 T 61 2 9239 7100 F 61 2 9239 7199 E [email protected] W www.ghd.com.au
4
8
22
24
6
26
42 40
44
36
14
46
10
32
20
38
18
5652
30
12
2850
34
48
54
58
16
62
60
64
66
68
22
6
62
62
28
56
42
10
58
3030
34
30
8
60
4
54
50
8
46
44
34
54
2046
26
52
58
56
24
42
18
4
58
40
56
48
60
46
28
42
16
20
32
16
18
24
44
36
18
28
48
20
34
50
6
60
6
52
6
4
28
50
48
44
28
26
34
56
32
52
58
48
38
44
1210
3816
22
40
40
26
54
54
52
32
42
50
18
36
50
G:\21\21394\GIS\ArcGIS\Maps\MXD\Map Publishing - Draft Report\Flood Mapping\C6 Kitty 100yr.mxd© 2010. While GHD has taken care to ensure the accuracy of this product, GHD and DATA CUSTODIAN, make no representations or warranties about its accuracy, completeness or suitability for any particular purpose. GHD and DATA CUSTODIAN, cannot accept liability of any kind (whether in contract, tort or otherwise) for any expenses, losses, damages and/or costs (including indirect or consequential damage) which are or may be incurred as a result of the product being inaccurate, incomplete or unsuitable in any way and for any reason.
LEGEND0 60 120 180 24030
Metres
Map Projection: Transverse MercatorHorizontal Datum: Geocentric Datum of Australia (GDA)
Grid: Map Grid of Australia 1994, Zone 56 Figure C2.4
Job NumberRevision A
21-21394
27 Apr 2013o Date
Data Source: NSW Department of Lands: Cadastre - Jan 2011; Geoscience Australia: 250k Data - Jan 2011. Created by: jlam
1:6,500 (at A3) City of Ryde CouncilBuffalo and Kitty's Creek
Kitty Creek CatchmentFlood Extents - 1% AEP
Flood Study and FRMSFlood Depth (m)
0.00 -
0.05
0.05 -
0.50
0.50 -
0.75
0.75 -
1.00
1.00 -
1.25
1.25 -
1.50
1.50 -
1.75
1.75 -
2.00
2.00 -
2.25
2.25 -
2.50
2.50 -
2.75
2.75 -
3.00
3.00 -
3.25
3.25-
3.50
3.50 -
3.75
Flood Level (mAHD)Catchment Boundary
ITEM 2 (continued) ATTACHMENT 1
Page 105
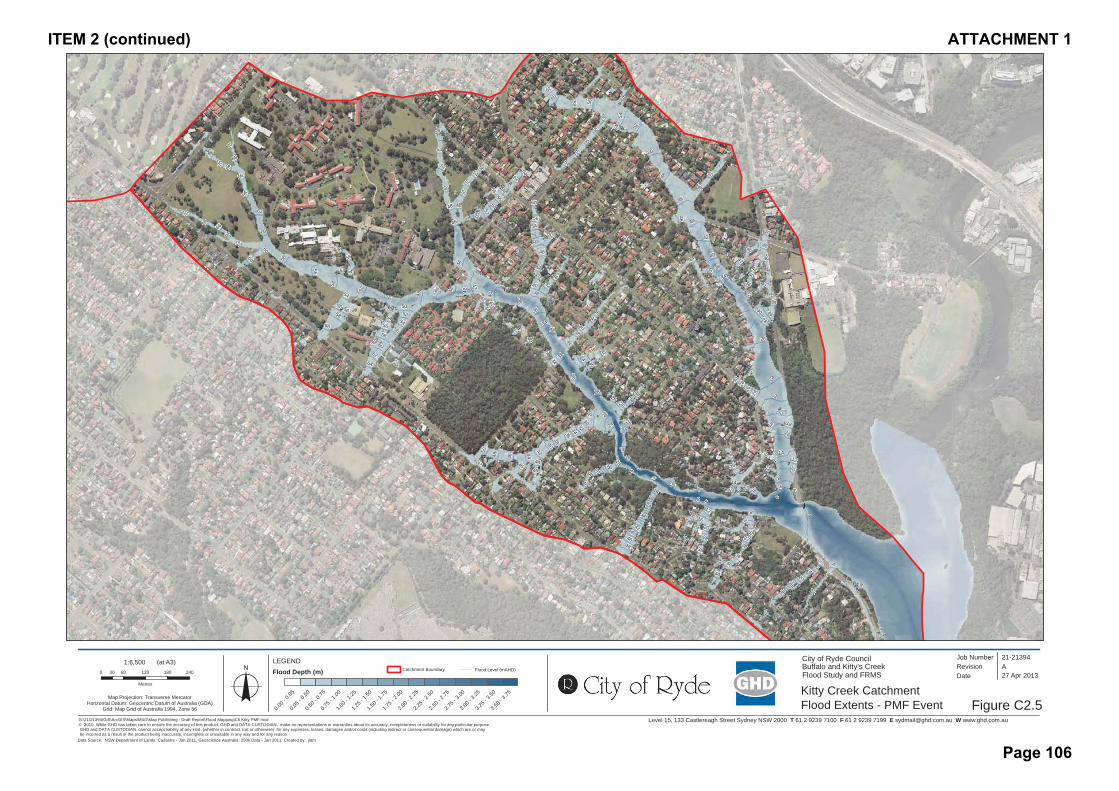
Level 15, 133 Castlereagh Street Sydney NSW 2000 T 61 2 9239 7100 F 61 2 9239 7199 E [email protected] W www.ghd.com.au
4
68
22
20
24
26
14
42
50 30
54
10
28
44
46
48
58
16
40
34
32
56 38
18
36
52
12
62
60
64
66
68
74
72
70
24
16
30
56
12
48
22 20
52
38
34
12
48
36
12
3634
14
38
14
28
10
52
34
34
4618
56
64
44
56
8
50
28
42
28
58
14
48
34
22
62
4658
54
56
40
36
50
4
52
48
54
8
60
44
56
50
68
8
46
46
54
56
38
54
2624
60
62
60
58
38
42
54
70
24
44
4
10
46
8
46
20
48 28
52
28
68
34
58
34
8
64
8
64
18
16
50
40
54
40
44
56
38
18
42
56
44
40
44
34
34
40
60
60
40
56
30
40
8
56
42
22
44
62
44
42
16
42
4
42
46
50
20
46
24
22
50
52
38
56
18
46
14
42
52
28
32
58
48
5828
60
42
54
3640
6
50
48
16
4
60
50
8
44
52
34
52
54
38
26
48
40
40
26
12
30
26
64
64
62
62
56
52
32
42
28
18
36
42
10
30
50
6
48
42
46
4
44
66
46
42
28
44
54
54
58
54
12
G:\21\21394\GIS\ArcGIS\Maps\MXD\Map Publishing - Draft Report\Flood Mapping\C6 Kitty PMF.mxd© 2010. While GHD has taken care to ensure the accuracy of this product, GHD and DATA CUSTODIAN, make no representations or warranties about its accuracy, completeness or suitability for any particular purpose. GHD and DATA CUSTODIAN, cannot accept liability of any kind (whether in contract, tort or otherwise) for any expenses, losses, damages and/or costs (including indirect or consequential damage) which are or may be incurred as a result of the product being inaccurate, incomplete or unsuitable in any way and for any reason.
LEGEND0 60 120 180 24030
Metres
Map Projection: Transverse MercatorHorizontal Datum: Geocentric Datum of Australia (GDA)
Grid: Map Grid of Australia 1994, Zone 56 Figure C2.5
Job NumberRevision A
21-21394
27 Apr 2013o Date
Data Source: NSW Department of Lands: Cadastre - Jan 2011; Geoscience Australia: 250k Data - Jan 2011. Created by: jlam
1:6,500 (at A3) City of Ryde CouncilBuffalo and Kitty's Creek
Kitty Creek CatchmentFlood Extents - PMF Event
Flood Study and FRMSFlood Depth (m)
0.00 -
0.05
0.05 -
0.50
0.50 -
0.75
0.75 -
1.00
1.00 -
1.25
1.25 -
1.50
1.50 -
1.75
1.75 -
2.00
2.00 -
2.25
2.25 -
2.50
2.50 -
2.75
2.75 -
3.00
3.00 -
3.25
3.25 -
3.50
3.50 -
3.75
Catchment Boundary Flood Level (mAHD)
ITEM 2 (continued) ATTACHMENT 1
Page 106
Appendix D – Hazard Categorisation Maps D1 Buffalo Creek Catchment Provisional Hazard Classification
D1 Kittys Creek Catchment Provisional Hazard Classification
ITEM 2 (continued) ATTACHMENT 1
Page 107
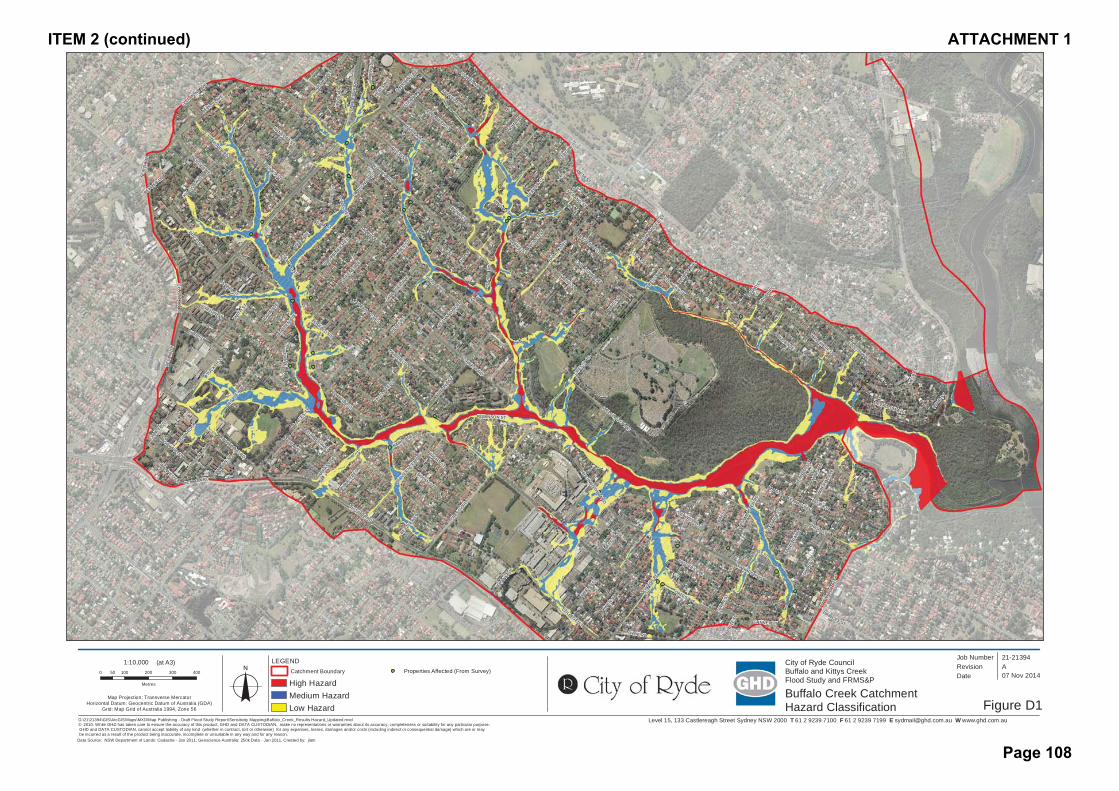
Level 15, 133 Castlereagh Street Sydney NSW 2000 T 61 2 9239 7100 F 61 2 9239 7199 E [email protected] W www.ghd.com.au
BUFFALO RD
QUARRY RD
LAN
E C
OVE
RD
VICTORIA RD
PITT
WAT
ER R
D
HIGH ST
MONASH R
D
CRESSY RD
PRIN
CES S
T
MONCRIEFF DR
BOYC
E ST
GREENE AVE
AEOLUS AVE
KELLS R
D
KUPPA RD
WES
TMIN
STER
RD
THOMPSON ST
GARDENER AVE
FINCH AVE
HIGGINBOTHAM
RD
AITCHANDAR R
D
JONES S
T
BRUCE ST
COLLEGE ST
SMIT
H ST
WOODBIN
E CRES
WOLGER RD
PRICE ST
GOULDIN
G RD
DE
VLIN
ST
ARGYLE
AVE
BADAJO
Z RD
SWAN
ST
KULGOA AV
E
MAR
S LN
FORREST RD
ELLIOTT AVE
KEPPEL RD
POOLE
Y ST
WELLINGTON RD
THE
STR
AND
HANCOTT ST
MACLEAY ST
RYDE RD
TUNKS ST
SHO
RT S
T
FISHER AVE
KENN
EDY
ST
BLAX
LAN
D R
D
PROVIDENCE R
D
OATES AVE
CHURCH ST
BIRD S
T
POPE ST
ARTHUR ST
NUMA RD
MILNE ST
TUCKER
ST
ORIENT
ST
MINGA ST
MALVIN
A ST
DOBSON CRES
WILL
IAM
ST
ELIZABETH ST
BUNA CT
BIDGEE RD
ROBINSON ST
GANNET ST
BAIRD AVE
IRVIN
E CRES
STUART ST
BEAZLEY S
T
BAVIN
AVE
RENE ST
BRIGHT ST
OWEN S
T
GOWRIE ST
FRANK S
T
ISABEL STMYRA AV
E
CLAYTON ST
BYR
ON
AV
E
TURNER AVE
JOY ST
NELSON S
T
CURZON ST
DOLAN ST
IVY
ST
CALLAGHAN ST
ARRAS
PDE
BLUETT
AVE
IMPE
RIA
L AV
E
NERANG ST
KIM
ST
RATCLIF
FE S
T
DIGGERS AVE
HATTO
N ST
LAURA ST
EDW
ARD ST
BOYD LN
PRAT
TEN AV
E
BYGRAVE ST
JOHN M
ILLE
R ST
BERRIP
A CL
MCCALLUM AVE
CAMERON CRES
WATT AVE
BETO
LA P
L
KELLAWAY ST
ST ANNES ST
STROUD ST
BAMBI ST
HOLLY AVE
MAZE AVE
GAN
ORA
ST
RUND
LE P
L
DOWD L
N
PID
DIN
G R
D
META ST
LOCK ST
SAGER PL
KENNEDY LN
NO
RTH
RD
MEL
BA D
R
EILE
EN
ST
BURKE ST
LEAWILL PL
SEMPLE ST
BEIHLER LN
KEATS AV
E
ADAM ST
CLERMONT AVE
CHATFIELD ST
TON
I CRES
VICTORIA RD
PRINCES ST
CRESSY
RD
CRESSY
RD
BLAXLAND RD
G:\21\21394\GIS\ArcGIS\Maps\MXD\Map Publishing - Draft Flood Study Report\Sensitivity Mapping\Buffalo_Creek_Results Hazard_Updated.mxd© 2010. While GHD has taken care to ensure the accuracy of this product, GHD and DATA CUSTODIAN, make no representations or warranties about its accuracy, completeness or suitability for any particular purpose. GHD and DATA CUSTODIAN, cannot accept liability of any kind (whether in contract, tort or otherwise) for any expenses, losses, damages and/or costs (including indirect or consequential damage) which are or may be incurred as a result of the product being inaccurate, incomplete or unsuitable in any way and for any reason.
LEGEND0 100 200 300 40050
Metres
Map Projection: Transverse MercatorHorizontal Datum: Geocentric Datum of Australia (GDA)
Grid: Map Grid of Australia 1994, Zone 56
Figure D1
Job NumberRevision A
21-21394
07 Nov 2014o Date
Data Source: NSW Department of Lands: Cadastre - Jan 2011; Geoscience Australia: 250k Data - Jan 2011. Created by: jlam
1:10,000 (at A3) City of Ryde CouncilBuffalo and Kittys CreekFlood Study and FRMS&P
Buffalo Creek CatchmentHazard Classification
Catchment Boundary
High HazardMedium HazardLow Hazard
Properties Affected (From Survey)
ITEM 2 (continued) ATTACHMENT 1
Page 108
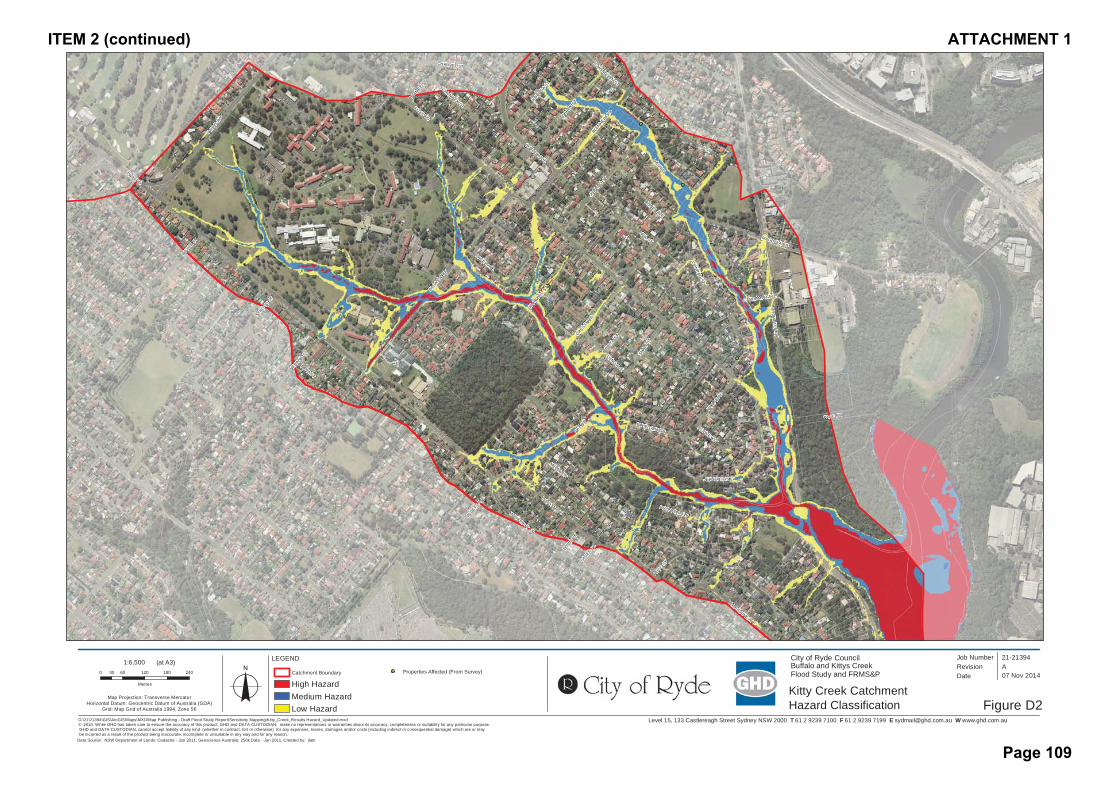
Level 15, 133 Castlereagh Street Sydney NSW 2000 T 61 2 9239 7100 F 61 2 9239 7199 E [email protected] W www.ghd.com.au
COXS RD
TWIN RD
CRESSY
RD
MELBA DR
PITTWATER
RD
MAGDALA RD
WIC
KS RD
BADAJO
Z RD
ELLIOTT AVE
BLENHEIM
RD
JOPLI
NG ST
FOX
RD
LONG AVE
PAGE RD
CUTLER PDE
BRONHILL AVE
TOBRUK S
T
CONR
AD ST
KOKODA ST
NERANG ST
JEANETTE ST
HARFORD S
T
SHAW
ST
IAN ST
LUMSDAINE AVE
WOLF
E RD
CHAUVEL ST
BLUE GUM DR
NASH PL
NEIL ST
PACEY AVE
SCHUMACK ST
MONCRIEFF DR
LIONEL AVE
STROUD S
T
RUDD ST
CARRAMAR AVE
EDMONDSON ST
BIRCH S
T
BOYC
E ST
RODNEY ST
DOWD L
N
BLUETT
AVE
META ST
SAGER P
L
BLAMEY S
T
G:\21\21394\GIS\ArcGIS\Maps\MXD\Map Publishing - Draft Flood Study Report\Sensitivity Mapping\Kitty_Creek_Results Hazard_Updated.mxd© 2010. While GHD has taken care to ensure the accuracy of this product, GHD and DATA CUSTODIAN, make no representations or warranties about its accuracy, completeness or suitability for any particular purpose. GHD and DATA CUSTODIAN, cannot accept liability of any kind (whether in contract, tort or otherwise) for any expenses, losses, damages and/or costs (including indirect or consequential damage) which are or may be incurred as a result of the product being inaccurate, incomplete or unsuitable in any way and for any reason.
LEGEND
0 60 120 180 24030
Metres
Map Projection: Transverse MercatorHorizontal Datum: Geocentric Datum of Australia (GDA)
Grid: Map Grid of Australia 1994, Zone 56
Figure D2
Job NumberRevision A
21-21394
07 Nov 2014o Date
Data Source: NSW Department of Lands: Cadastre - Jan 2011; Geoscience Australia: 250k Data - Jan 2011. Created by: jlam
1:6,500 (at A3) City of Ryde CouncilBuffalo and Kittys Creek
Kitty Creek CatchmentHazard Classification
Flood Study and FRMS&PHigh HazardMedium HazardLow Hazard
Catchment Boundary Properties Affected (From Survey)
ITEM 2 (continued) ATTACHMENT 1
Page 109
Appendix E – Sensitivity Analysis and Climate Change Maps
E1.1 Buffalo Creek Increased Hydraulic Roughness
E1.2 Kittys Creek Increased Hydraulic Roughness
E2.1 Buffalo Creek 30% Increased Rainfall
E2.2 Kittys Creek 30% Increased Rainfall
E3.1 Buffalo Creek Sea Level Rise – year 2050
E3.2 Kittys Creek Sea Level Rise – year 2050
E4.1 Buffalo Creek Sea Level Rise – year 2100
E4.2 Kittys Creek Sea Level Rise – year 2100
ITEM 2 (continued) ATTACHMENT 1
Page 110
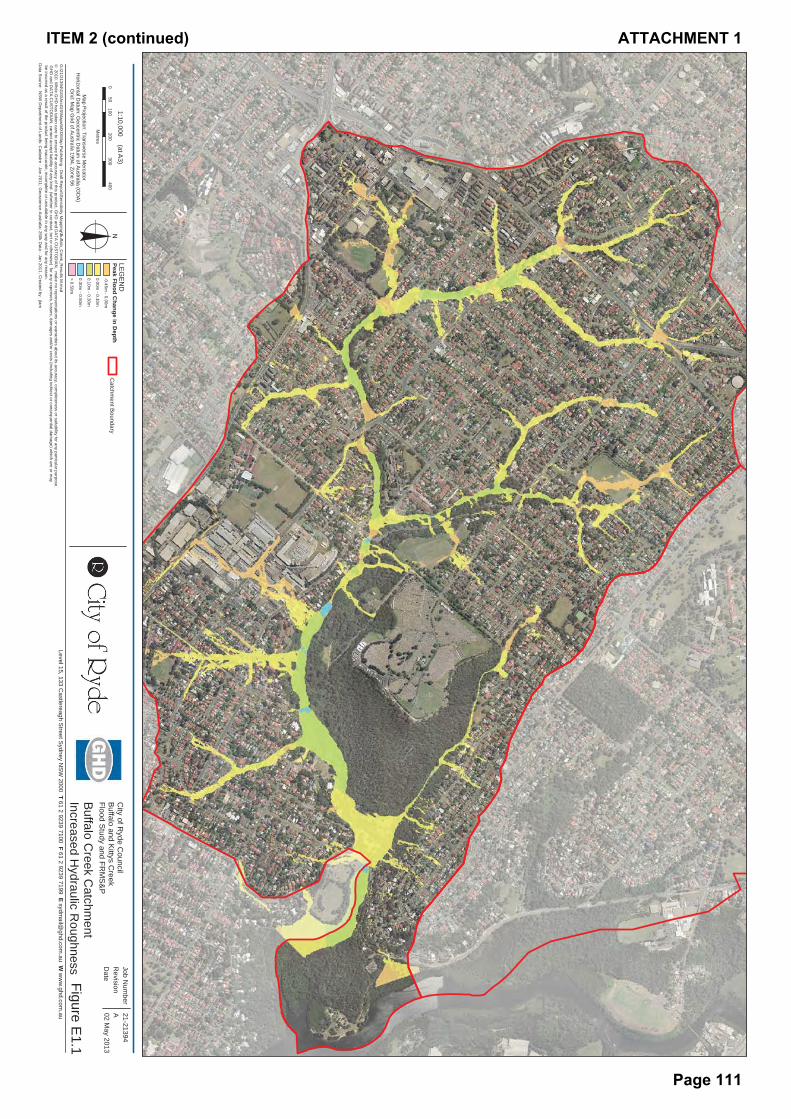
Level 15, 133 Castlereagh S
treet Sydney N
SW
2000 T 61 2 9239 7100 F 61 2 9239 7199 E sydmail@
ghd.com.au W
ww
w.ghd.com
.auG
:\21\21394\GIS\A
rcGIS\M
aps\MX
D\M
ap Publishing - Draft R
eport\Sensitivity M
apping\Buffalo_Creek_R
esults M.m
xd©
2010. While G
HD
has taken care to ensure the accuracy of this product, GH
D and D
ATA
CU
STO
DIA
N, m
ake no representations or warranties about its accuracy, com
pleteness or suitability for any particular purpose. G
HD
and DATA
CU
STO
DIA
N, cannot accept liability of any kind (w
hether in contract, tort or otherwise) for any expenses, losses, dam
ages and/or costs (including indirect or consequential damage) w
hich are or may
be incurred as a result of the product being inaccurate, incomplete or unsuitable in any w
ay and for any reason.
LEG
EN
D0
100200
300400
50
Metres
Map Projection: Transverse M
ercatorH
orizontal Datum
: Geocentric D
atum of A
ustralia (GD
A)
Grid: M
ap Grid of A
ustralia 1994, Zone 56Figure E
1.1
Job Num
berR
evisionA 21-21394
02 May 2013
oD
ate
Data S
ource: NS
W D
epartment of Lands: C
adastre - Jan 2011; Geoscience A
ustralia: 250k Data - Jan 2011. C
reated by: jlam
1:10,000(at A
3)C
ity of Ryde C
ouncilB
uffalo and Kittys C
reekFlood S
tudy and FRM
S&
P
Buffalo Creek C
atchment
Increased Hydraulic R
oughness
Catchm
ent Boundary
Peak Flood Change in D
epth-0.45m
- 0.00m
0.00m - 0.10m
0.10m - 0.30m
0.30m - 0.50m
> 0.50m
ITEM 2 (continued) ATTACHMENT 1
Page 111
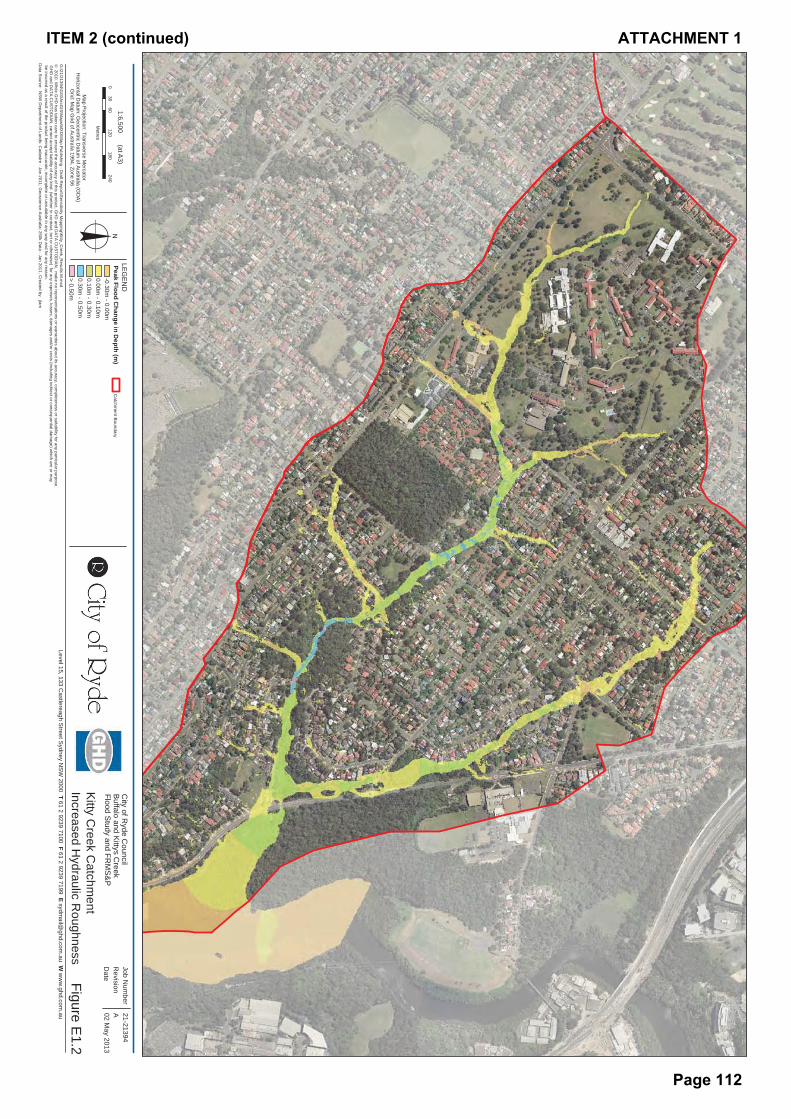
Level 15, 133 Castlereagh S
treet Sydney N
SW
2000 T 61 2 9239 7100 F 61 2 9239 7199 E sydmail@
ghd.com.au W
ww
w.ghd.com
.auG
:\21\21394\GIS\A
rcGIS\M
aps\MX
D\M
ap Publishing - Draft R
eport\Sensitivity M
apping\Kitty_Creek_R
esults M.m
xd©
2010. While G
HD
has taken care to ensure the accuracy of this product, GH
D and D
ATA
CU
STO
DIA
N, m
ake no representations or warranties about its accuracy, com
pleteness or suitability for any particular purpose. G
HD
and DATA
CU
STO
DIA
N, cannot accept liability of any kind (w
hether in contract, tort or otherwise) for any expenses, losses, dam
ages and/or costs (including indirect or consequential damage) w
hich are or may
be incurred as a result of the product being inaccurate, incomplete or unsuitable in any w
ay and for any reason.
LEG
EN
D
060
120180
24030
Metres
Map Projection: Transverse M
ercatorH
orizontal Datum
: Geocentric D
atum of A
ustralia (GD
A)
Grid: M
ap Grid of A
ustralia 1994, Zone 56Figure E
1.2
Job Num
berR
evisionA 21-21394
02 May 2013
oD
ate
Data S
ource: NS
W D
epartment of Lands: C
adastre - Jan 2011; Geoscience A
ustralia: 250k Data - Jan 2011. C
reated by: jlam
1:6,500(at A
3)C
ity of Ryde C
ouncilB
uffalo and Kittys C
reek
Kitty Creek C
atchment
Increased Hydraulic R
oughness
Flood Study and FR
MS
&P
Peak Flood Change in D
epth (m)
-0.30m - 0.00m
0.00m - 0.10m
0.10m - 0.30m
0.30m - 0.50m
> 0.50m
Catchm
ent Boundary
ITEM 2 (continued) ATTACHMENT 1
Page 112
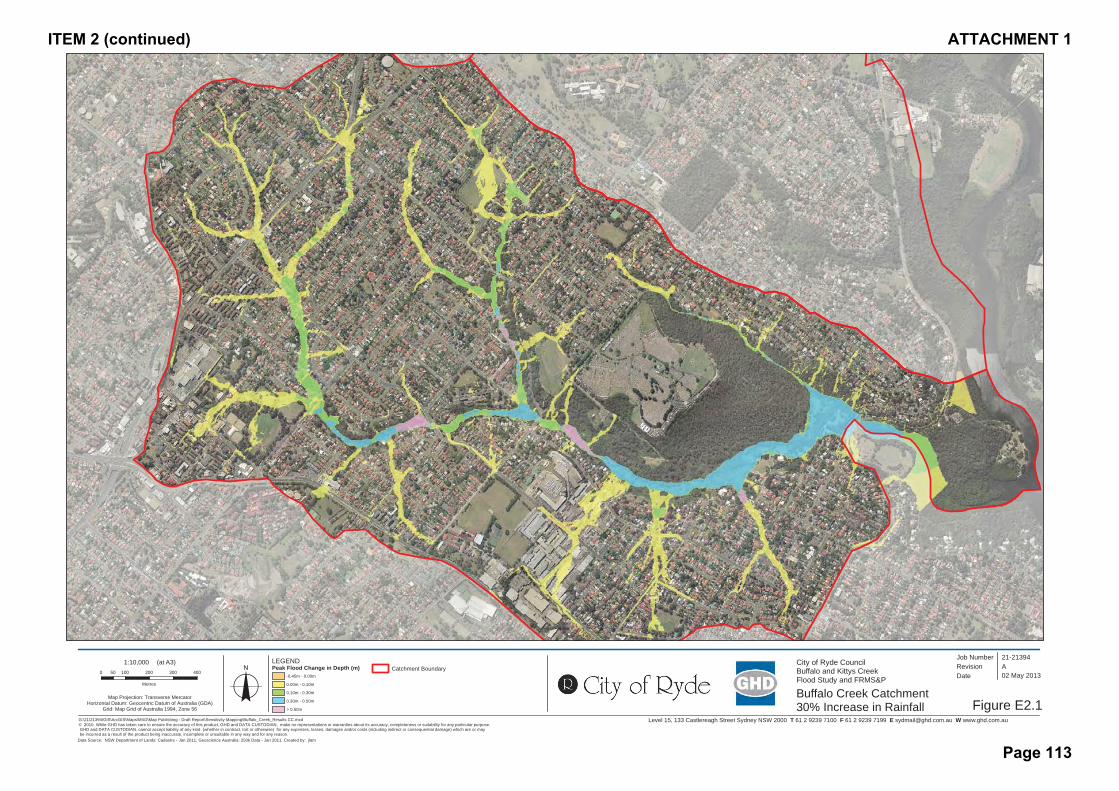
Level 15, 133 Castlereagh Street Sydney NSW 2000 T 61 2 9239 7100 F 61 2 9239 7199 E [email protected] W www.ghd.com.auG:\21\21394\GIS\ArcGIS\Maps\MXD\Map Publishing - Draft Report\Sensitivity Mapping\Buffalo_Creek_Results CC.mxd© 2010. While GHD has taken care to ensure the accuracy of this product, GHD and DATA CUSTODIAN, make no representations or warranties about its accuracy, completeness or suitability for any particular purpose. GHD and DATA CUSTODIAN, cannot accept liability of any kind (whether in contract, tort or otherwise) for any expenses, losses, damages and/or costs (including indirect or consequential damage) which are or may be incurred as a result of the product being inaccurate, incomplete or unsuitable in any way and for any reason.
LEGEND0 100 200 300 40050
Metres
Map Projection: Transverse MercatorHorizontal Datum: Geocentric Datum of Australia (GDA)
Grid: Map Grid of Australia 1994, Zone 56 Figure E2.1
Job NumberRevision A
21-21394
02 May 2013o Date
Data Source: NSW Department of Lands: Cadastre - Jan 2011; Geoscience Australia: 250k Data - Jan 2011. Created by: jlam
1:10,000 (at A3) City of Ryde CouncilBuffalo and Kittys CreekFlood Study and FRMS&P
Buffalo Creek Catchment30% Increase in Rainfall
Catchment BoundaryPeak Flood Change in Depth (m)-0.45m - 0.00m
0.00m - 0.10m
0.10m - 0.30m
0.30m - 0.50m
> 0.50m
ITEM 2 (continued) ATTACHMENT 1
Page 113

Level 15, 133 Castlereagh Street Sydney NSW 2000 T 61 2 9239 7100 F 61 2 9239 7199 E [email protected] W www.ghd.com.auG:\21\21394\GIS\ArcGIS\Maps\MXD\Map Publishing - Draft Report\Sensitivity Mapping\Kitty_Creek_Results CC.mxd© 2010. While GHD has taken care to ensure the accuracy of this product, GHD and DATA CUSTODIAN, make no representations or warranties about its accuracy, completeness or suitability for any particular purpose. GHD and DATA CUSTODIAN, cannot accept liability of any kind (whether in contract, tort or otherwise) for any expenses, losses, damages and/or costs (including indirect or consequential damage) which are or may be incurred as a result of the product being inaccurate, incomplete or unsuitable in any way and for any reason.
LEGEND
0 60 120 180 24030
Metres
Map Projection: Transverse MercatorHorizontal Datum: Geocentric Datum of Australia (GDA)
Grid: Map Grid of Australia 1994, Zone 56 Figure E2.2
Job NumberRevision A
21-21394
02 May 2013o Date
Data Source: NSW Department of Lands: Cadastre - Jan 2011; Geoscience Australia: 250k Data - Jan 2011. Created by: jlam
1:6,500 (at A3) City of Ryde CouncilBuffalo and Kitty's Creek
Kitty Creek Catchment30% Increase in Rainfall
Flood Study and FRMSPeak Flood Change in Depth (m)
-0.30m - 0.00m
0.00m - 0.10m
0.10m - 0.30m
0.30m - 0.50m
> 0.50m
Catchment Boundary
ITEM 2 (continued) ATTACHMENT 1
Page 114
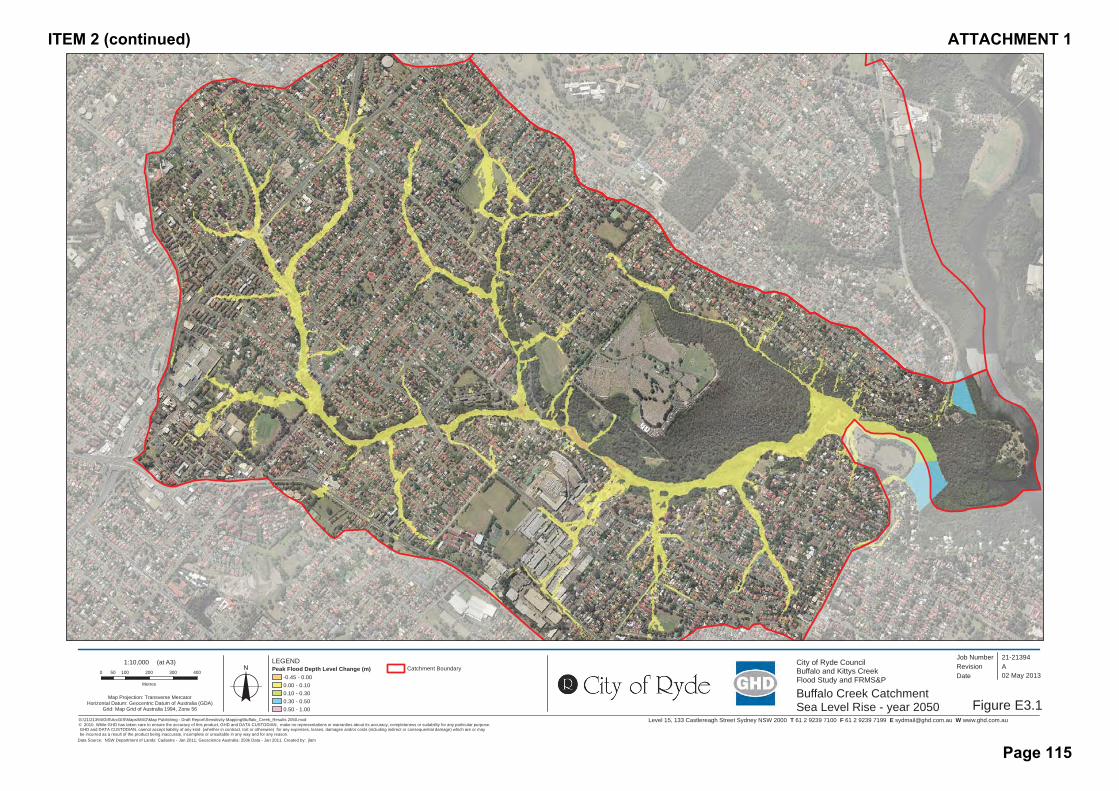
Level 15, 133 Castlereagh Street Sydney NSW 2000 T 61 2 9239 7100 F 61 2 9239 7199 E [email protected] W www.ghd.com.auG:\21\21394\GIS\ArcGIS\Maps\MXD\Map Publishing - Draft Report\Sensitivity Mapping\Buffalo_Creek_Results 2050.mxd© 2010. While GHD has taken care to ensure the accuracy of this product, GHD and DATA CUSTODIAN, make no representations or warranties about its accuracy, completeness or suitability for any particular purpose. GHD and DATA CUSTODIAN, cannot accept liability of any kind (whether in contract, tort or otherwise) for any expenses, losses, damages and/or costs (including indirect or consequential damage) which are or may be incurred as a result of the product being inaccurate, incomplete or unsuitable in any way and for any reason.
LEGEND0 100 200 300 40050
Metres
Map Projection: Transverse MercatorHorizontal Datum: Geocentric Datum of Australia (GDA)
Grid: Map Grid of Australia 1994, Zone 56 Figure E3.1
Job NumberRevision A
21-21394
02 May 2013o Date
Data Source: NSW Department of Lands: Cadastre - Jan 2011; Geoscience Australia: 250k Data - Jan 2011. Created by: jlam
1:10,000 (at A3) City of Ryde CouncilBuffalo and Kittys CreekFlood Study and FRMS&P
Buffalo Creek CatchmentSea Level Rise - year 2050
Catchment BoundaryPeak Flood Depth Level Change (m)-0.45 - 0.000.00 - 0.100.10 - 0.300.30 - 0.500.50 - 1.00
ITEM 2 (continued) ATTACHMENT 1
Page 115

Level 15, 133 Castlereagh Street Sydney NSW 2000 T 61 2 9239 7100 F 61 2 9239 7199 E [email protected] W www.ghd.com.auG:\21\21394\GIS\ArcGIS\Maps\MXD\Map Publishing - Draft Report\Sensitivity Mapping\Kitty_Creek_Results SLR2050.mxd© 2010. While GHD has taken care to ensure the accuracy of this product, GHD and DATA CUSTODIAN, make no representations or warranties about its accuracy, completeness or suitability for any particular purpose. GHD and DATA CUSTODIAN, cannot accept liability of any kind (whether in contract, tort or otherwise) for any expenses, losses, damages and/or costs (including indirect or consequential damage) which are or may be incurred as a result of the product being inaccurate, incomplete or unsuitable in any way and for any reason.
LEGEND
0 60 120 180 24030
Metres
Map Projection: Transverse MercatorHorizontal Datum: Geocentric Datum of Australia (GDA)
Grid: Map Grid of Australia 1994, Zone 56 Figure E3.2
Job NumberRevision A
21-21394
02 May 2013o Date
Data Source: NSW Department of Lands: Cadastre - Jan 2011; Geoscience Australia: 250k Data - Jan 2011. Created by: jlam
1:6,500 (at A3) City of Ryde CouncilBuffalo and Kitty's Creek
Kitty Creek CatchmentSea Level Rise - year 2050
Flood Study and FRMSPeak Flood Depth Level Change (m)
-0.30m - 0.00m
0.00m - 0.10m
0.10m - 0.30m
0.30m - 0.50m
> 0.50m
Catchment Boundary
ITEM 2 (continued) ATTACHMENT 1
Page 116

Level 15, 133 Castlereagh Street Sydney NSW 2000 T 61 2 9239 7100 F 61 2 9239 7199 E [email protected] W www.ghd.com.auG:\21\21394\GIS\ArcGIS\Maps\MXD\Map Publishing - Draft Report\Sensitivity Mapping\Buffalo_Creek_Results 2100.mxd© 2010. While GHD has taken care to ensure the accuracy of this product, GHD and DATA CUSTODIAN, make no representations or warranties about its accuracy, completeness or suitability for any particular purpose. GHD and DATA CUSTODIAN, cannot accept liability of any kind (whether in contract, tort or otherwise) for any expenses, losses, damages and/or costs (including indirect or consequential damage) which are or may be incurred as a result of the product being inaccurate, incomplete or unsuitable in any way and for any reason.
LEGEND0 100 200 300 40050
Metres
Map Projection: Transverse MercatorHorizontal Datum: Geocentric Datum of Australia (GDA)
Grid: Map Grid of Australia 1994, Zone 56 Figure E4.1
Job NumberRevision A
21-21394
02 May 2013o Date
Data Source: NSW Department of Lands: Cadastre - Jan 2011; Geoscience Australia: 250k Data - Jan 2011. Created by: jlam
1:10,000 (at A3) City of Ryde CouncilBuffalo and Kittys CreekFlood Study and FRMS&P
Buffalo Creek CatchmentSea Level Rise - year 2100
Catchment BoundaryPeak Flood Change in Depth (m)-0.45 - 0.00
0.00 - 0.10
0.10 - 0.30
0.30 - 0.50
> 0.50
ITEM 2 (continued) ATTACHMENT 1
Page 117

Level 15, 133 Castlereagh Street Sydney NSW 2000 T 61 2 9239 7100 F 61 2 9239 7199 E [email protected] W www.ghd.com.auG:\21\21394\GIS\ArcGIS\Maps\MXD\Map Publishing - Draft Report\Sensitivity Mapping\Kitty_Creek_Results SLR2100.mxd© 2010. While GHD has taken care to ensure the accuracy of this product, GHD and DATA CUSTODIAN, make no representations or warranties about its accuracy, completeness or suitability for any particular purpose. GHD and DATA CUSTODIAN, cannot accept liability of any kind (whether in contract, tort or otherwise) for any expenses, losses, damages and/or costs (including indirect or consequential damage) which are or may be incurred as a result of the product being inaccurate, incomplete or unsuitable in any way and for any reason.
LEGEND
0 60 120 180 24030
Metres
Map Projection: Transverse MercatorHorizontal Datum: Geocentric Datum of Australia (GDA)
Grid: Map Grid of Australia 1994, Zone 56 Figure E4.2
Job NumberRevision A
21-21394
02 May 2013o Date
Data Source: NSW Department of Lands: Cadastre - Jan 2011; Geoscience Australia: 250k Data - Jan 2011. Created by: jlam
1:6,500 (at A3) City of Ryde CouncilBuffalo and Kitty's Creek
Kitty Creek CatchmentSea Level Rise - year 2100
Flood Study and FRMSPeak Flood Change in Depth (m)
-0.30m - 0.00m
0.00m - 0.10m
0.10m - 0.30m
0.30m - 0.50m
> 0.50m
Catchment Boundary
ITEM 2 (continued) ATTACHMENT 1
Page 118
Appendix F – Low Flow Analysis
ITEM 2 (continued) ATTACHMENT 1
Page 119
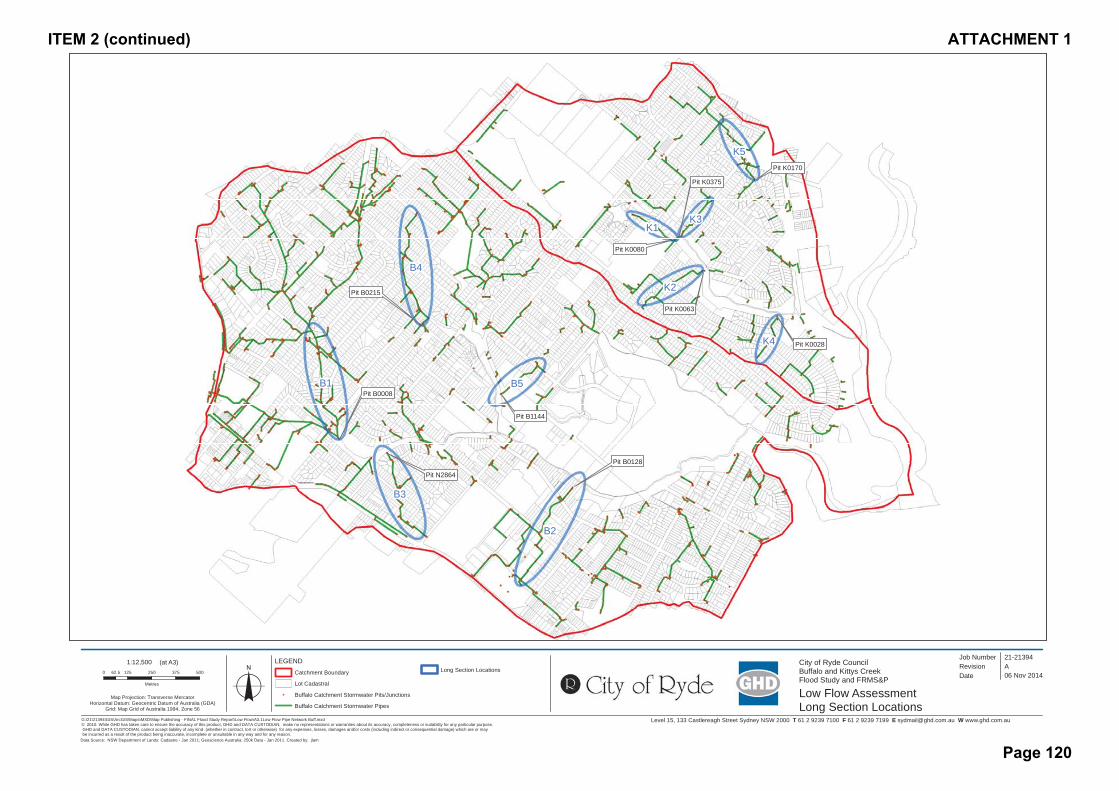
Level 15, 133 Castlereagh Street Sydney NSW 2000 T 61 2 9239 7100 F 61 2 9239 7199 E [email protected] W www.ghd.com.au
B2
B1
B4
B3
B5
K2
K5
K4
K1K3
G:\21\21394\GIS\ArcGIS\Maps\MXD\Map Publishing - FINAL Flood Study Report\Low Flow\A3.1Low Flow Pipe Network Buff.mxd© 2010. While GHD has taken care to ensure the accuracy of this product, GHD and DATA CUSTODIAN, make no representations or warranties about its accuracy, completeness or suitability for any particular purpose. GHD and DATA CUSTODIAN, cannot accept liability of any kind (whether in contract, tort or otherwise) for any expenses, losses, damages and/or costs (including indirect or consequential damage) which are or may be incurred as a result of the product being inaccurate, incomplete or unsuitable in any way and for any reason.
LEGEND0 125 250 375 50062.5
Metres
Map Projection: Transverse MercatorHorizontal Datum: Geocentric Datum of Australia (GDA)
Grid: Map Grid of Australia 1994, Zone 56
Job NumberRevision A
21-21394
06 Nov 2014o Date
Data Source: NSW Department of Lands: Cadastre - Jan 2011; Geoscience Australia: 250k Data - Jan 2011. Created by: jlam
1:12,500 (at A3) City of Ryde CouncilBuffalo and Kittys CreekFlood Study and FRMS&P
Low Flow AssessmentLong Section Locations
Catchment Boundary
Lot Cadastral
!( Buffalo Catchment Stormwater Pits/Junctions
Buffalo Catchment Stormwater Pipes
Pit K0080
Pit K0375
Pit K0063
Pit K0170
Pit K0028
Pit B0215
Pit B0008
Pit N2864
Pit B1144
Pit B0128
Long Section Locations
ITEM 2 (continued) ATTACHMENT 1
Page 120
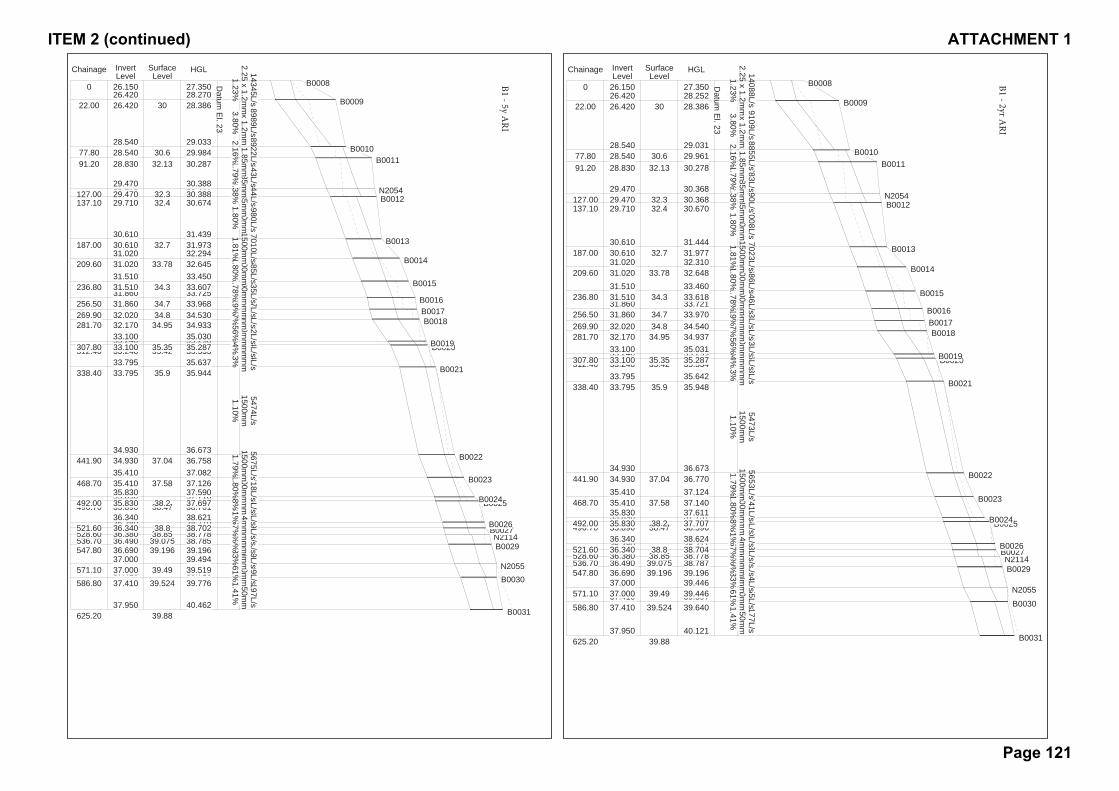
Datum
El. 23
Chainage InvertLevel
SurfaceLevel
HGL
625.20 B003139.8840.121
39.640
6177L/s1350m
m1.41%
37.950
37.410586.80 B003039.52439.59739.446
6555L/s1500m
m2.61%37.41037.000571.10 N205539.49
39.44639.196
6554L/s1500m
m1.33%37.000
36.690547.80 B002939.19638.83238.787
5193L/s1500m
m1.80%36.69036.490536.70 N211439.075
38.78738.778
5189L/s2.3 x 1.4m
m1.36%36.49036.380528.60 B002738.85
38.71138.704
5473L/s2.3 x 1.4m
m0.57%36.38036.340521.60 B002638.8
38.62438.596
5960L/s2.3 x 1.4m
m1.81%36.340
35.890496.70 B002538.4737.73137.707
5526L/s1500m
m1.28%35.890
35.830492.00 B002438.237.61137.140
5741L/s1500m
m1.80%35.830
35.410468.70 B002337.5837.12436.770
5653L/s1500m
m1.79%
35.41034.930441.90 B002237.04
36.673
35.948
5473L/s1500m
m1.10%
34.930
33.795338.40 B002135.935.64235.534
5303L/s1500m
m2.13%33.795
33.240312.40 B002035.4235.29935.287
5426L/s1500m
m3.04%33.240
33.100307.80 B001935.3535.03134.937
5453L/s1500m
m3.56%33.100
32.170281.70 B001834.9534.57134.540
5535L/s1500m
m1.27%32.17032.020269.90 B001734.8
34.04133.970
6053L/s1500m
m1.19%32.02031.860256.50 B001634.7
33.72133.618
6046L/s1500m
m1.78%31.860
31.510236.80 B001534.333.46032.648
6686L/s1500m
m1.80%
31.51031.020209.60 B001433.78
32.31031.977
7023L/s1500m
m1.81%31.020
30.610187.00 B001332.731.444
30.670 7008L/s1500m
m1.80%
30.610
29.710137.10 B001232.430.44030.368
7890L/s2.4 x 1.85m
m2.38%29.71029.470127.00 N205432.3
30.368
30.278
7783L/s2.4 x 1.85m
m1.79%
29.470
28.83091.20 B001132.1329.99829.961
8855L/s2.4 x 1.85m
m2.16%28.83028.54077.80 B001030.6
29.031
28.386 9109L/s2.4 x 1.2m
m3.80%
28.540
26.42022.00 B00093028.25227.350
14088L/s2.25 x 1.2m
m1.23%26.420
26.1500 B0008Datum
El. 23
Chainage InvertLevel
SurfaceLevel
HGL
625.20 B003139.8840.462
39.776
6197L/s1350m
m1.41%
37.950
37.410586.80 B003039.52439.71639.519
6599L/s1500m
m2.61%37.41037.000571.10 N205539.49
39.49439.196
6599L/s1500m
m1.33%37.000
36.690547.80 B002939.19638.83138.785
5208L/s1500m
m1.80%36.69036.490536.70 N211439.075
38.78538.778
5205L/s2.3 x 1.4m
m1.36%36.49036.380528.60 B002738.85
38.71038.702
5509L/s2.3 x 1.4m
m0.57%36.38036.340521.60 B002638.8
38.62138.701
6013L/s2.3 x 1.4m
m1.81%36.340
35.890496.70 B002538.4737.71837.697
6276L/s1500m
m1.28%35.890
35.830492.00 B002438.237.59037.126
5718L/s1500m
m1.80%35.830
35.410468.70 B002337.5837.08236.758
5675L/s1500m
m1.79%35.410
34.930441.90 B002237.0436.673
35.944
5474L/s1500m
m1.10%
34.930
33.795338.40 B002135.935.63735.533
5254L/s1500m
m2.13%33.795
33.240312.40 B002035.4235.29835.287
5414L/s1500m
m3.04%33.240
33.100307.80 B001935.3535.03034.933
5432L/s1500m
m3.56%33.100
32.170281.70 B001834.9534.56034.530
5520L/s1500m
m1.27%32.17032.020269.90 B001734.8
34.03233.968
6057L/s1500m
m1.19%32.02031.860256.50 B001634.7
33.72533.607
6035L/s1500m
m1.78%31.860
31.510236.80 B001534.333.45032.645
6685L/s1500m
m1.80%31.510
31.020209.60 B001433.7832.29431.973
7010L/s1500m
m1.81%31.020
30.610187.00 B001332.731.439
30.674 6980L/s1500m
m1.80%
30.610
29.710137.10 B001232.430.44130.388
8144L/s2.4 x 1.85m
m2.38%29.71029.470127.00 N205432.3
30.388
30.287
7843L/s2.4 x 1.85m
m1.79%
29.470
28.83091.20 B001132.1329.99929.984
8922L/s2.4 x 1.85m
m2.16%28.83028.54077.80 B001030.6
29.033
28.386 8989L/s2.4 x 1.2m
m3.80%
28.540
26.42022.00 B00093028.27027.350
14345L/s2.25 x 1.2m
m1.23%26.420
26.1500 B0008
ITEM 2 (continued) ATTACHMENT 1
Page 121
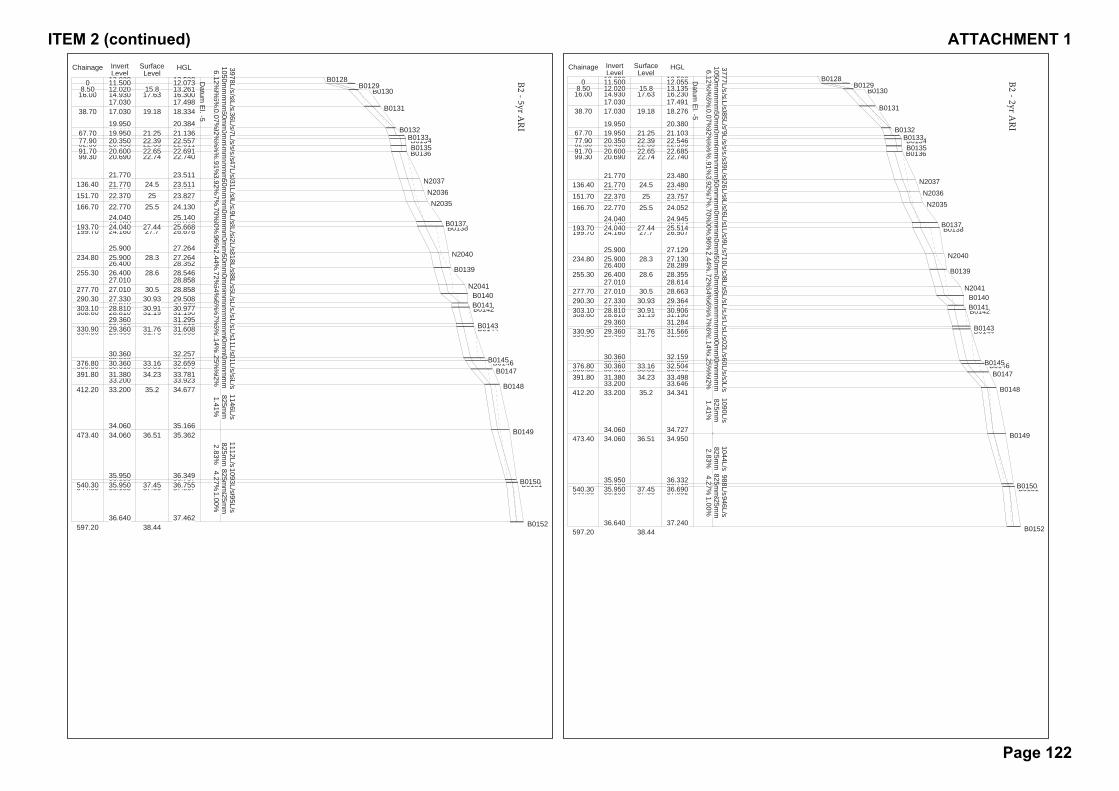
Datum
El. -5
Chainage InvertLevel
SurfaceLevel
HGL
597.20 B015238.4437.240
37.002 946L/s825m
m1.00%
36.640
36.108544.00 B015137.6636.71536.690
988L/s825m
m4.27%36.108
35.950540.30 B015037.4536.332
34.950
1044L/s825m
m2.83%
35.950
34.060473.40 B014936.5134.727
34.341 1090L/s825m
m1.41%
34.060
33.200412.20 B014835.233.64633.498
1160L/s825m
m8.92%33.200
31.380391.80 B014734.2333.12333.049
1334L/s825m
m7.00%31.38030.610380.80 B014633.81
32.53032.504
2660L/s900m
m6.25%30.610
30.360376.80 B014533.1632.159
31.905 1402L/s900m
m2.14%
30.360
29.460334.80 B014431.7631.57831.566
1223L/s900m
m2.56%29.460
29.360330.90 B014331.7631.28431.190
1277L/s900m
m2.47%29.360
28.810308.60 B014231.1930.91730.906
1415L/s900m
m0.00%28.810
28.810303.10 B014130.9129.46029.364
3503L/s1200m
m11.56%28.81027.330290.30 B014030.93
28.92828.663
3595L/s1050m
m2.54%27.33027.010277.70 N204130.5
28.61428.355
3608L/s1050m
m2.72%27.010
26.400255.30 B013928.628.28927.130
3710L/s1050m
m2.44%26.400
25.900234.80 N204028.327.129
26.507
3709L/s1050m
m4.96%
25.900
24.160199.70 B013827.726.02325.514
3781L/s1050m
m2.00%24.160
24.040193.70 B013727.4424.94524.052
3926L/s1050m
m4.70%
24.04022.770166.70 N203525.5
24.05223.757
3929L/s1050m
m2.67%22.77022.370151.70 N203625
23.75723.480
3926L/s1050m
m3.92%22.37021.770136.40 N203724.5
23.480
22.740
3939L/s1050m
m2.91%
21.770
20.69099.30 B013622.7422.68522.685
3216L/s1.5 x 1.4m
m1.18%20.69020.60091.70 B013522.65
22.60122.598
3337L/s1.5 x 1.4m
m1.60%20.60020.45082.30 B013422.63
22.55522.546
3422L/s1.46 x 1.4m
m2.27%20.450
20.35077.90 B013322.3921.18721.103
2879L/s1050m
m3.92%20.35019.95067.70 B013221.25
20.380
18.276
3085L/s1050m
m10.07%19.950
17.03038.70 B013119.1817.49116.230
3361L/s1050m
m9.25%17.030
14.93016.00 B013017.6315.39913.135
3608L/s1050m
m38.80%14.93012.0208.50 B012915.8
12.50812.055
3777L/s1050m
m6.12%12.02011.5000 B0128D
atum E
l. -5
Chainage InvertLevel
SurfaceLevel
HGL
597.20 B015238.4437.462
37.067 995L/s825m
m1.00%
36.640
36.108544.00 B015137.6636.75736.755
1093L/s825m
m4.27%36.108
35.950540.30 B015037.4536.349
35.362 1112L/s825m
m2.83%
35.950
34.060473.40 B014936.5135.166
34.677 1146L/s825m
m1.41%
34.060
33.200412.20 B014835.233.92333.781
1215L/s825m
m8.92%33.200
31.380391.80 B014734.2333.36033.270
1303L/s825m
m7.00%31.38030.610380.80 B014633.81
32.68132.659
1401L/s900m
m6.25%30.610
30.360376.80 B014533.1632.257
31.965
1511L/s900m
m2.14%
30.360
29.460334.80 B014431.7631.61931.608
1221L/s900m
m2.56%29.460
29.360330.90 B014331.7631.29531.190
1285L/s900m
m2.47%29.360
28.810308.60 B014231.1930.99830.977
1428L/s900m
m0.00%28.810
28.810303.10 B014130.9129.58329.508
3554L/s1200m
m11.56%28.81027.330290.30 B014030.93
29.00028.858
3665L/s1050m
m2.54%27.33027.010277.70 N204130.5
28.85828.546
3688L/s1050m
m2.72%27.010
26.400255.30 B013928.628.35227.264
3818L/s1050m
m2.44%26.400
25.900234.80 N204028.327.264
26.676
3762L/s1050m
m4.96%
25.900
24.160199.70 B013827.726.02825.668
3888L/s1050m
m2.00%24.160
24.040193.70 B013727.4425.14024.130
4019L/s1050m
m4.70%24.040
22.770166.70 N203525.524.13023.827
4019L/s1050m
m2.67%22.77022.370151.70 N203625
23.82723.511
4031L/s1050m
m3.92%22.37021.770136.40 N203724.523.511
22.740
4047L/s1050m
m2.91%
21.770
20.69099.30 B013622.7422.68622.691
3213L/s1.5 x 1.4m
m1.18%20.69020.60091.70 B013522.65
22.60922.611
3329L/s1.5 x 1.4m
m1.60%20.60020.45082.30 B013422.63
22.56922.557
3423L/s1.46 x 1.4m
m2.27%20.450
20.35077.90 B013322.3921.21021.136
2907L/s1050m
m3.92%20.35019.95067.70 B013221.25
20.384
18.334
3136L/s1050m
m10.07%19.950
17.03038.70 B013119.1817.49816.300
3458L/s1050m
m9.25%17.030
14.93016.00 B013017.6315.40913.261
3742L/s1050m
m38.80%14.93012.0208.50 B012915.8
12.50812.073
3978L/s1050m
m6.12%12.02011.5000 B0128
ITEM 2 (continued) ATTACHMENT 1
Page 122

Datum
El. 14
Chainage InvertLevel
SurfaceLevel
HGL
583.10 B075851.5851.53751.532
141L/s375m
m6.52%50.51050.060576.20 B075751.55
50.296
46.751
295L/s375m
m5.43%
50.060
45.740496.70 B075646.5846.13146.003
212L/s375m
m5.98%45.74045.130486.50 B075545.98
45.324
44.225 204L/s375m
m4.89%
45.130
42.990442.70 B030844.4643.322
42.613 564L/s525m
m5.06%
42.990
41.170406.70 B030742.4242.06241.950
417L/s525m
m4.30%41.17040.590393.20 B030641.95
41.047
40.510 510L/s525m
m4.59%
40.590
38.740352.90 B030540.5140.19440.081
524L/s600m
m0.59%38.740
38.600329.20 B030440.139.34239.173
607L/s600m
m4.35%38.60037.900313.10 B030339.1
38.92138.862
515L/s600m
m2.28%37.90037.670303.00 B030238.87
38.44938.280
584L/s600m
m3.16%37.670
37.080284.30 B030138.2838.084
38.003
462L/s600m
m0.82%
37.080
36.810251.20 B030038.0137.59037.456
520L/s600m
m4.26%36.81036.350240.40 B029937.45
37.34037.300
610L/s750m
m1.52%36.350
35.950214.10 B029837.337.04436.962
692L/s750m
m1.43%35.95035.750200.10 B029737.1
36.11235.801
983L/s750m
m3.68%
35.75034.750172.90 B029635.8
35.17534.825
964L/s675m
m3.54%34.750
33.900148.90 B029534.734.43334.394
754L/s675m
m15.52%
33.90033.450146.00 B029434.4
33.759
32.573
871L/s675m
m5.83%
33.450
31.700116.00 B029332.531.958
28.971 695L/s675m
m7.16%
31.700
27.61058.90 B029228.9628.38928.342
726L/s675m
m1.45%27.61027.51052.00 B029128.91
28.23428.206
880L/s750m
m8.08%27.510
27.30049.40 B029028.227.88427.847
990L/s750m
m3.97%27.30027.01042.10 B028927.86
27.330
25.010 987L/s750m
m5.51%
27.010
24.6900 N2864Datum
El. 14
Chainage InvertLevel
SurfaceLevel
HGL
583.10 B075851.5851.55451.537
140L/s375m
m6.52%50.51050.060576.20 B075751.55
50.296
46.752
295L/s375m
m5.43%
50.060
45.740496.70 B075646.5846.13146.003
212L/s375m
m5.98%45.74045.130486.50 B075545.98
45.323
44.380 204L/s375m
m4.89%
45.130
42.990442.70 B030844.4643.368
42.655
593L/s525m
m5.06%
42.990
41.170406.70 B030742.4242.07141.968
415L/s525m
m4.30%41.17040.590393.20 B030641.95
41.047
40.510 510L/s525m
m4.59%
40.590
38.740352.90 B030540.5140.19840.087
525L/s600m
m0.59%38.740
38.600329.20 B030440.139.34339.174
608L/s600m
m4.35%38.60037.900313.10 B030339.1
38.92338.864
514L/s600m
m2.28%37.90037.670303.00 B030238.87
38.45038.280
585L/s600m
m3.16%37.67037.080284.30 B030138.28
38.086
38.012
460L/s600m
m0.82%
37.080
36.810251.20 B030038.0137.57437.456
541L/s600m
m4.26%36.81036.350240.40 B029937.45
37.34237.302
630L/s750m
m1.52%36.350
35.950214.10 B029837.337.05636.985
701L/s750m
m1.43%35.95035.750200.10 B029737.1
36.11435.805
1006L/s750m
m3.68%35.750
34.750172.90 B029635.835.17834.824
964L/s675m
m3.54%34.750
33.900148.90 B029534.734.43334.396
754L/s675m
m15.52%
33.90033.450146.00 B029434.4
33.759
32.574
872L/s675m
m5.83%
33.450
31.700116.00 B029332.531.958
28.973 696L/s675m
m7.16%
31.700
27.61058.90 B029228.9628.39528.346
723L/s675m
m1.45%27.61027.51052.00 B029128.91
28.23528.214
883L/s750m
m8.08%27.51027.30049.40 B029028.2
27.89627.849
996L/s750m
m3.97%27.30027.01042.10 B028927.86
27.331
25.011 995L/s750m
m5.51%
27.010
24.6900 N2864
ITEM 2 (continued) ATTACHMENT 1
Page 123
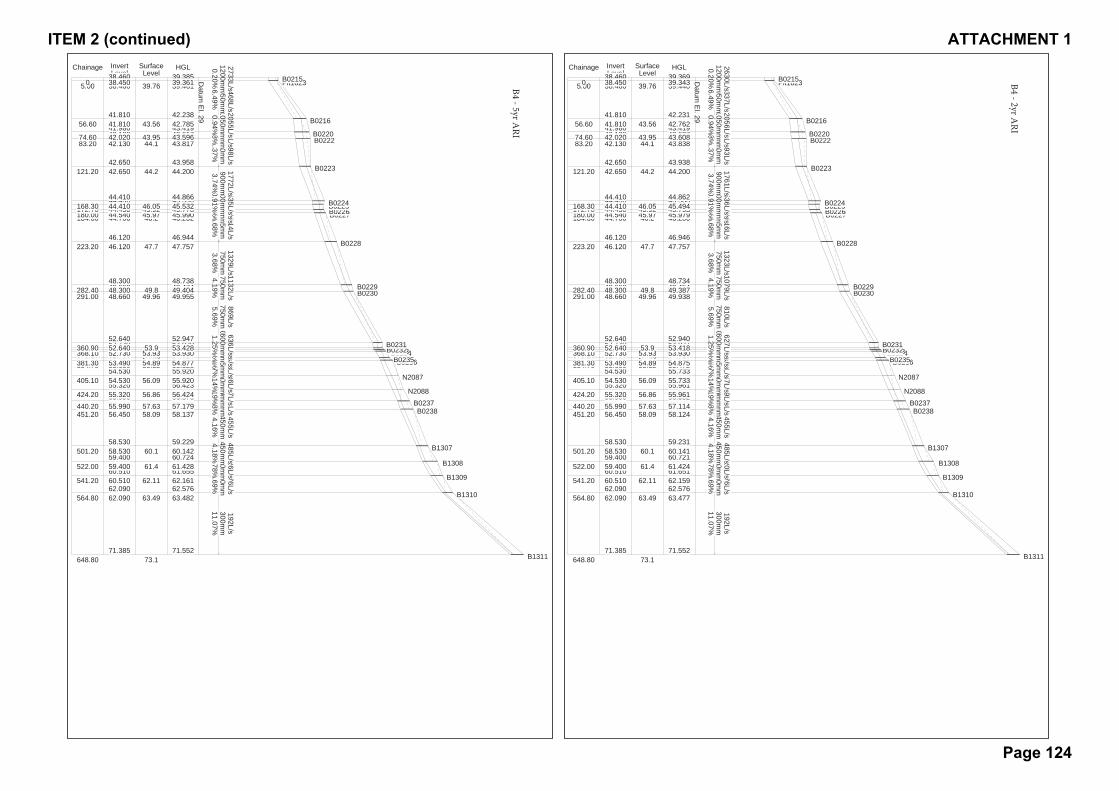
Datum
El. 29
Chainage InvertLevel
SurfaceLevel
HGL
648.80 B131173.171.552
63.477
192L/s300m
m11.07%
71.385
62.090564.80 B131063.4962.57662.159
376L/s450m
m6.69%62.090
60.510541.20 B130962.1161.65161.424
320L/s450m
m5.78%60.510
59.400522.00 B130861.460.72160.141
485L/s450m
m4.18%59.400
58.530501.20 B130760.159.231
58.124 455L/s450m
m4.16%
58.530
56.450451.20 B023858.0957.46357.114
559L/s450m
m4.18%56.45055.990440.20 B023757.63
56.35255.961749L/s600m
m4.19%55.99055.320424.20 N208856.86
55.96155.733
667L/s600m
m4.14%55.32054.530405.10 N208756.09
55.73355.472
670L/s600m
m4.17%54.530
53.680384.70 B023655.3254.90454.875
674L/s600m
m5.59%53.680
53.490381.30 B023554.8954.76454.714
1005L/s0.75 x 0.75m
m5.68%53.49052.990372.50 B023454.39
54.54254.530
813L/s750m
m10.00%
52.99052.760370.20 B023354.2
53.95053.930
521L/s600m
m1.43%52.760
52.730368.10 B023253.9353.92753.418
627L/s600m
m1.25%52.73052.640360.90 B023153.9
52.940
49.938
810L/s750m
m5.69%
52.640
48.660291.00 B023049.9649.45449.387
1079L/s750m
m4.19%48.66048.300282.40 B022949.8
48.734
47.757 1323L/s750m
m3.68%
48.300
46.120223.20 B022847.746.946
46.200
1216L/s675m
m3.68%
46.120
44.700184.60 B022746.245.99745.979
1332L/s900m
m3.48%44.700
44.540180.00 B022645.9745.78945.753
1463L/s900m
m1.23%44.54044.450172.70 B022545.92
45.58345.494
1536L/s900m
m0.91%44.450
44.410168.30 B022446.0544.862
44.200 1761L/s900m
m3.74%
44.410
42.650121.20 B022344.243.938
43.838
1593L/s900m
m1.37%
42.650
42.13083.20 B022244.143.63743.608
1655L/s1050m
m1.28%42.13042.02074.60 B022043.95
43.41942.762
2056L/s1050m
m0.94%41.98041.81056.60 B021643.56
42.231
39.440 2337L/s1050m
m6.49%
41.810
38.4605.00 Pit182339.7639.36939.343
2630L/s1200m
m0.20%38.460
38.4500 B0215Datum
El. 29
Chainage InvertLevel
SurfaceLevel
HGL
648.80 B131173.171.552
63.482
192L/s300m
m11.07%
71.385
62.090564.80 B131063.4962.57662.161
376L/s450m
m6.69%62.090
60.510541.20 B130962.1161.65561.428
326L/s450m
m5.78%60.510
59.400522.00 B130861.460.72460.142
485L/s450m
m4.18%59.400
58.530501.20 B130760.159.229
58.137 455L/s450m
m4.16%
58.530
56.450451.20 B023858.0957.49957.179
561L/s450m
m4.18%56.45055.990440.20 B023757.63
56.37356.424
777L/s600m
m4.19%55.99055.320424.20 N208856.86
56.42355.920
736L/s600m
m4.14%55.32054.530405.10 N208756.09
55.92055.523
739L/s600m
m4.17%54.530
53.680384.70 B023655.3254.91554.877
693L/s600m
m5.59%53.680
53.490381.30 B023554.8954.76454.720
1020L/s0.75 x 0.75m
m5.68%53.49052.990372.50 B023454.39
54.54754.534
816L/s750m
m10.00%
52.99052.760370.20 B023354.2
53.94853.930
523L/s600m
m1.43%52.760
52.730368.10 B023253.9353.92953.428
636L/s600m
m1.25%52.73052.640360.90 B023153.9
52.947
49.955
869L/s750m
m5.69%
52.640
48.660291.00 B023049.9649.47449.404
1132L/s750m
m4.19%48.66048.300282.40 B022949.8
48.738
47.757 1329L/s750m
m3.68%
48.300
46.120223.20 B022847.746.944
46.202
1214L/s675m
m3.68%
46.120
44.700184.60 B022746.246.00645.990
1349L/s900m
m3.48%44.700
44.540180.00 B022645.9745.81245.778
1476L/s900m
m1.23%44.54044.450172.70 B022545.92
45.59045.532
1535L/s900m
m0.91%44.450
44.410168.30 B022446.0544.866
44.200 1772L/s900m
m3.74%
44.410
42.650121.20 B022344.243.958
43.817
1598L/s900m
m1.37%
42.650
42.13083.20 B022244.143.61743.596
1693L/s1050m
m1.28%42.13042.02074.60 B022043.95
43.41942.785
2055L/s1050m
m0.94%41.98041.81056.60 B021643.56
42.238
39.461 2468L/s1050m
m6.49%
41.810
38.4605.00 Pit182339.7639.38539.361
2733L/s1200m
m0.20%38.460
38.4500 B0215
ITEM 2 (continued) ATTACHMENT 1
Page 124

Datum
El. 34
Chainage InvertLevel
SurfaceLevel
HGL
341.10 B116762.3461.61361.572
50L/s300m
m1.47%61.12060.890325.50 B116661.73
61.39561.230
146L/s375m
m3.30%60.890
60.120302.20 B116561.2360.86160.733
136L/s300m
m1.58%60.12059.970292.70 B116460.95
60.166
59.095229L/s375m
m5.91%
59.970
58.080260.70 B11635958.72358.579
216L/s375m
m3.55%58.08057.530245.20 B116258.63
57.84157.551
344L/s450m
m4.32%57.53056.710226.20 B116157.76
56.949
51.192
403L/s450m
m6.56%
56.710
50.200127.00 B116051.150.89150.820
316L/s450m
m7.93%50.200
49.740121.20 B115950.7950.48050.450
331L/s450m
m10.63%
49.74049.400118.00 B115850.45
50.02949.865
389L/s450m
m6.30%49.40048.430102.60 B115750.03
49.01848.740
440L/s450m
m5.93%48.43047.73090.80 B114948.76
48.27648.198
523L/s600m
m2.28%47.73047.45078.50 B114848.48
47.757
47.102
586L/s600m
m3.38%
47.450
46.22042.10 B114747.1346.45745.127
601L/s600m
m8.89%46.22044.70025.00 B114646.5
44.92142.851
601L/s600m
m10.50%44.700
42.6005.00 B11454442.85141.301
971L/s900m
m31.00%
42.60041.0500 B1144D
atum E
l. 34
Chainage InvertLevel
SurfaceLevel
HGL
341.10 B116762.3461.77361.711
61L/s300m
m1.47%61.12060.890325.50 B116661.73
61.46161.230
174L/s375m
m3.30%60.890
60.120302.20 B116561.2360.91760.819
136L/s300m
m1.58%60.12059.970292.70 B116460.95
60.176
59.151
248L/s375m
m5.91%
59.970
58.080260.70 B11635958.76258.615
217L/s375m
m3.55%58.08057.530245.20 B116258.63
57.91157.661
345L/s450m
m4.32%57.53056.710226.20 B116157.76
56.961
51.241
438L/s450m
m6.56%
56.710
50.200127.00 B116051.150.91150.834
330L/s450m
m7.93%50.200
49.740121.20 B115950.7950.48550.471
331L/s450m
m10.63%
49.74049.400118.00 B115850.45
50.12049.998
393L/s450m
m6.30%49.40048.430102.60 B115750.03
49.07348.764
460L/s450m
m5.93%48.43047.73090.80 B114948.76
48.39248.321
532L/s600m
m2.28%47.73047.45078.50 B114848.48
47.777
47.135
653L/s600m
m3.38%
47.450
46.22042.10 B114747.1346.46045.134
615L/s600m
m8.89%46.22044.70025.00 B114646.5
44.92042.856
615L/s600m
m10.50%44.700
42.6005.00 B11454442.85641.307
1014L/s900m
m31.00%
42.60041.0500 B1144
ITEM 2 (continued) ATTACHMENT 1
Page 125
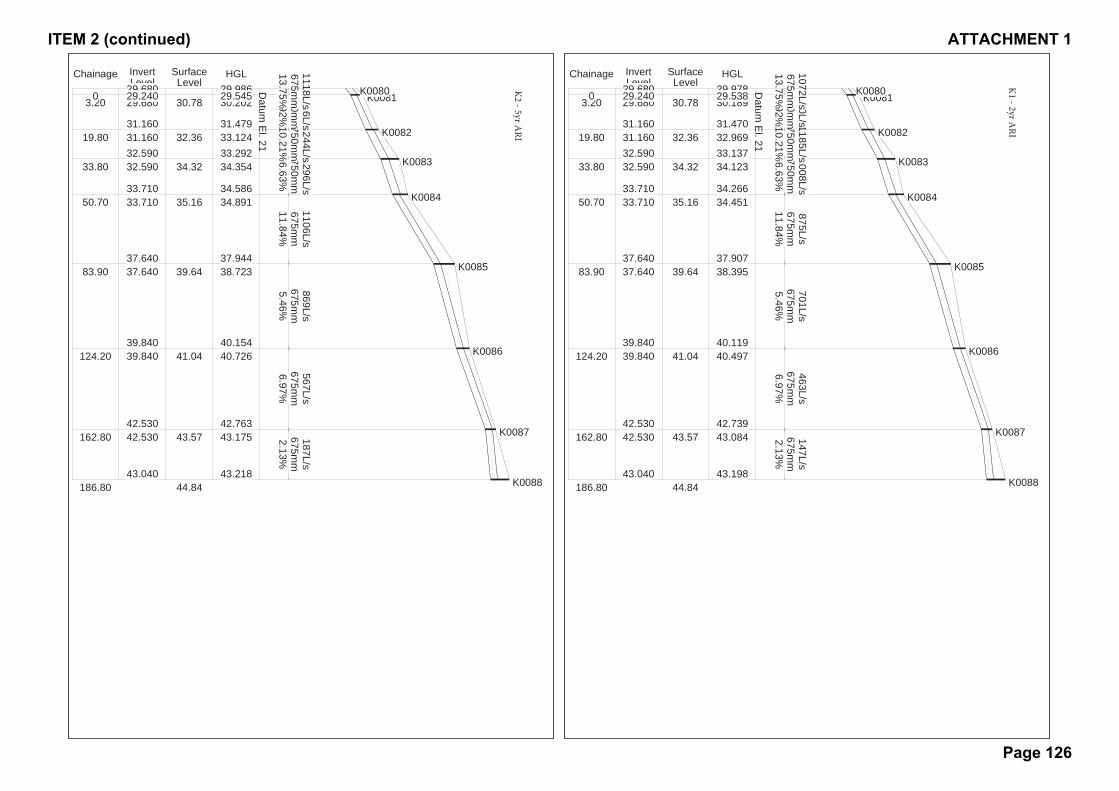
Datum
El. 21
Chainage InvertLevel
SurfaceLevel
HGL
186.80 K008844.8443.198
43.084 147L/s675m
m2.13%
43.040
42.530162.80 K008743.5742.739
40.497
463L/s675m
m6.97%
42.530
39.840124.20 K008641.0440.119
38.395
701L/s675m
m5.46%
39.840
37.64083.90 K008539.6437.907
34.451
875L/s675m
m11.84%
37.640
33.71050.70 K008435.1634.266
34.123
1008L/s750m
m6.63%
33.710
32.59033.80 K008334.3233.13732.969
1185L/s750m
m10.21%32.590
31.16019.80 K008232.3631.470
30.189
970L/s600m
m8.92%
31.160
29.6803.20 K008130.7829.97829.538
1072L/s675m
m13.75%
29.68029.2400 K0080D
atum E
l. 21
Chainage InvertLevel
SurfaceLevel
HGL
186.80 K008844.8443.218
43.175 187L/s675m
m2.13%
43.040
42.530162.80 K008743.5742.763
40.726
567L/s675m
m6.97%
42.530
39.840124.20 K008641.0440.154
38.723
869L/s675m
m5.46%
39.840
37.64083.90 K008539.6437.944
34.891 1106L/s675m
m11.84%
37.640
33.71050.70 K008435.1634.586
34.354
1296L/s750m
m6.63%
33.710
32.59033.80 K008334.3233.29233.124
1244L/s750m
m10.21%32.59031.16019.80 K008232.36
31.479
30.202
1016L/s600m
m8.92%
31.160
29.6803.20 K008130.7829.98629.545
1118L/s675m
m13.75%
29.68029.2400 K0080
ITEM 2 (continued) ATTACHMENT 1
Page 126
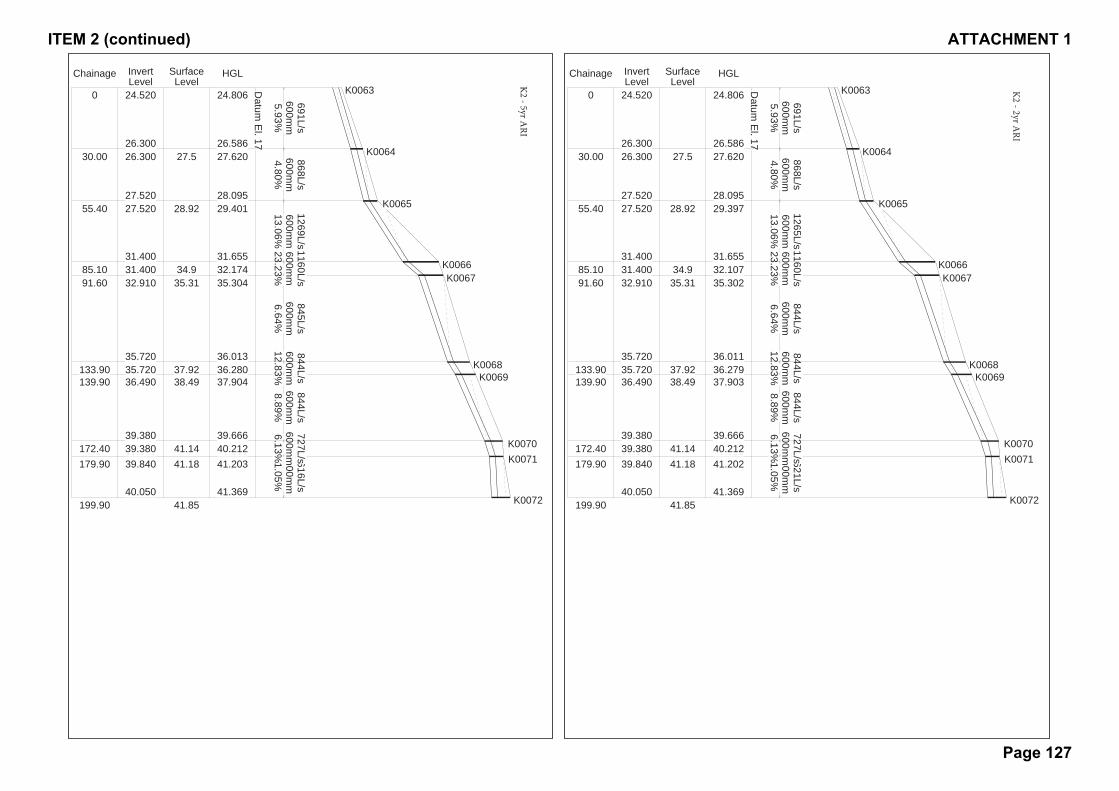
Datum
El. 17
Chainage InvertLevel
SurfaceLevel
HGL
199.90 K007241.8541.369
41.202 621L/s600m
m1.05%
40.050
39.840179.90 K007141.1840.30840.212
727L/s600m
m6.13%39.84039.380172.40 K007041.14
39.666
37.903
844L/s600m
m8.89%
39.380
36.490139.90 K006938.4936.76736.279
844L/s600m
m12.83%36.49035.720133.90 K006837.92
36.011
35.302
844L/s600m
m6.64%
35.720
32.91091.60 K006735.3133.24432.107
1160L/s600m
m23.23%32.91031.40085.10 K006634.9
31.655
29.397 1265L/s600m
m13.06%
31.400
27.52055.40 K006528.9228.095
27.620 868L/s600m
m4.80%
27.520
26.30030.00 K006427.526.586
24.806 691L/s600m
m5.93%
26.300
24.5200 K0063Datum
El. 17
Chainage InvertLevel
SurfaceLevel
HGL
199.90 K007241.8541.369
41.203 616L/s600m
m1.05%
40.050
39.840179.90 K007141.1840.30840.212
727L/s600m
m6.13%39.84039.380172.40 K007041.14
39.666
37.904
844L/s600m
m8.89%
39.380
36.490139.90 K006938.4936.76736.280
844L/s600m
m12.83%36.49035.720133.90 K006837.92
36.013
35.304
845L/s600m
m6.64%
35.720
32.91091.60 K006735.3133.24432.174
1160L/s600m
m23.23%32.91031.40085.10 K006634.9
31.655
29.401 1269L/s600m
m13.06%
31.400
27.52055.40 K006528.9228.095
27.620 868L/s600m
m4.80%
27.520
26.30030.00 K006427.526.586
24.806 691L/s600m
m5.93%
26.300
24.5200 K0063
ITEM 2 (continued) ATTACHMENT 1
Page 127
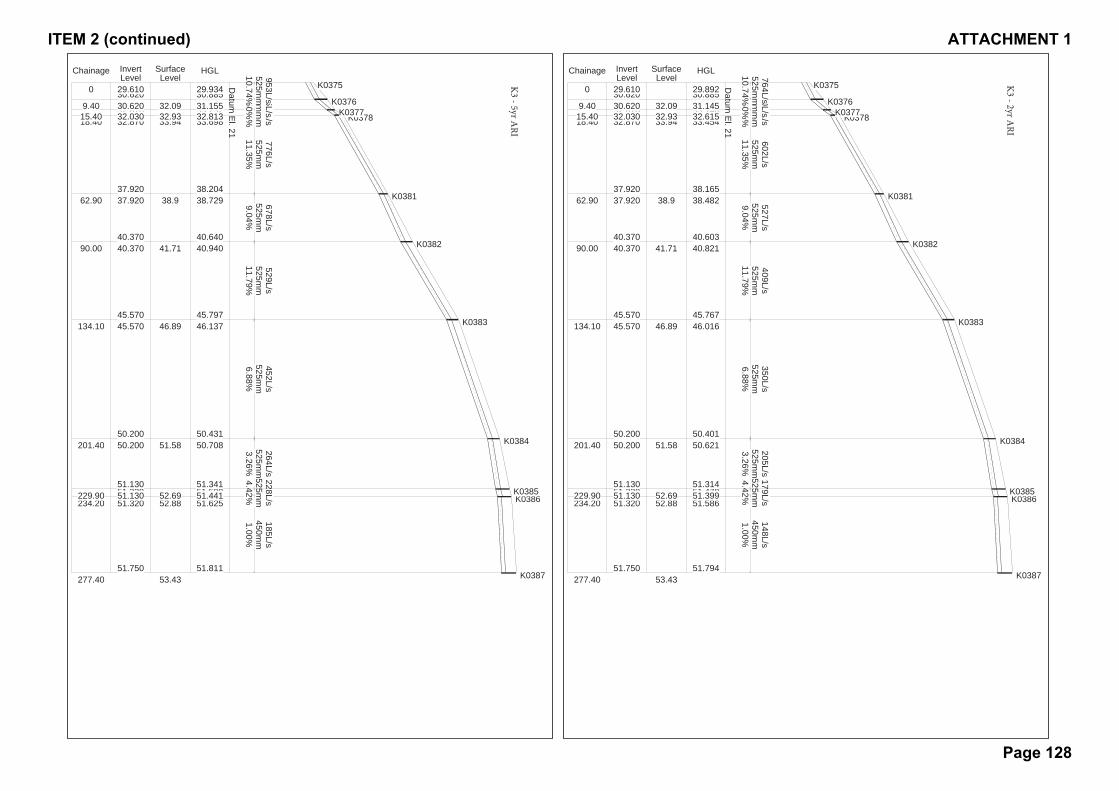
Datum
El. 21
Chainage InvertLevel
SurfaceLevel
HGL
277.40 K038753.4351.794
51.586
148L/s450m
m1.00%
51.750
51.320234.20 K038652.8851.47851.399
179L/s525m
m4.42%51.32051.130229.90 K038552.69
51.314
50.621 205L/s525m
m3.26%
51.130
50.200201.40 K038451.5850.401
46.016
350L/s525m
m6.88%
50.200
45.570134.10 K038346.8945.767
40.821
409L/s525m
m11.79%
45.570
40.37090.00 K038241.7140.603
38.482 527L/s525m
m9.04%
40.370
37.92062.90 K038138.938.165
33.454
602L/s525m
m11.35%
37.920
32.87018.40 K037833.9433.14832.615
750L/s525m
m28.00%
32.87032.03015.40 K037732.93
32.30831.145
750L/s525m
m23.50%32.03030.6209.40 K037632.09
30.88529.892
764L/s525m
m10.74%30.62029.6100 K0375D
atum E
l. 21
Chainage InvertLevel
SurfaceLevel
HGL
277.40 K038753.4351.811
51.625
185L/s450m
m1.00%
51.750
51.320234.20 K038652.8851.50051.441
228L/s525m
m4.42%51.32051.130229.90 K038552.69
51.341
50.708 264L/s525m
m3.26%
51.130
50.200201.40 K038451.5850.431
46.137
452L/s525m
m6.88%
50.200
45.570134.10 K038346.8945.797
40.940
529L/s525m
m11.79%
45.570
40.37090.00 K038241.7140.640
38.729 678L/s525m
m9.04%
40.370
37.92062.90 K038138.938.204
33.698
776L/s525m
m11.35%
37.920
32.87018.40 K037833.9433.23232.813
925L/s525m
m28.00%
32.87032.03015.40 K037732.93
32.34831.155
925L/s525m
m23.50%32.03030.6209.40 K037632.09
30.88529.934
953L/s525m
m10.74%30.62029.6100 K0375
ITEM 2 (continued) ATTACHMENT 1
Page 128
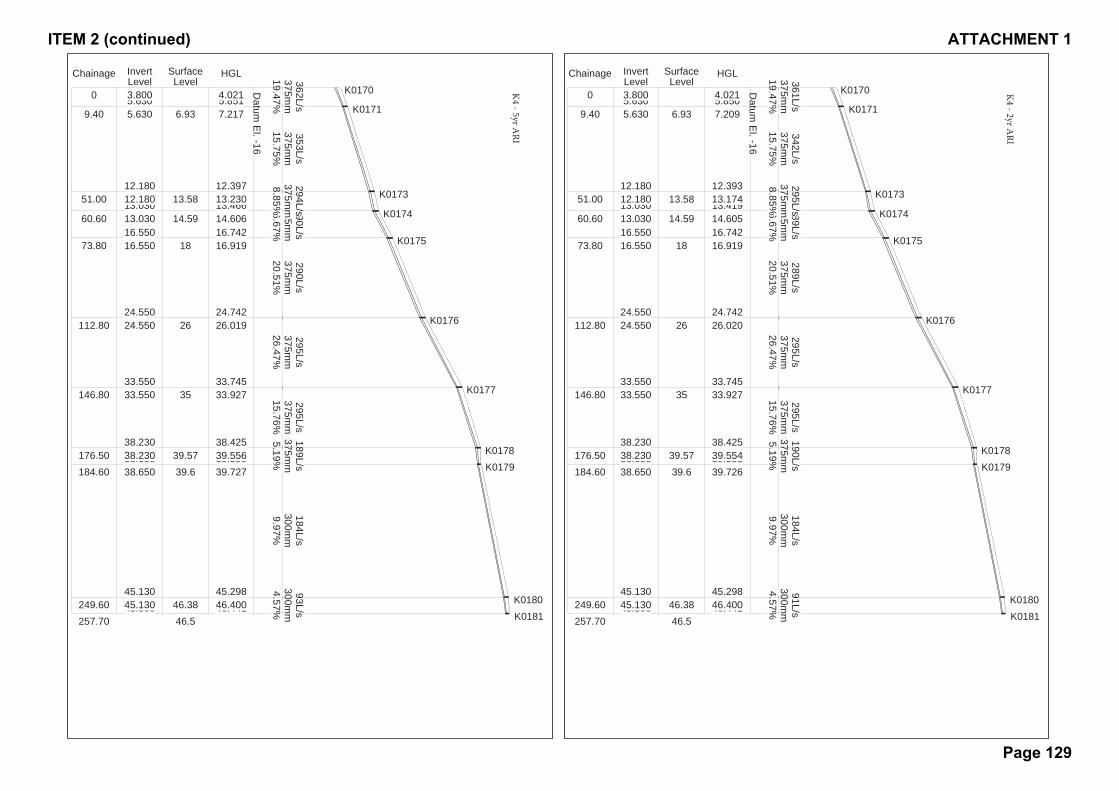
Datum
El. -16
Chainage InvertLevel
SurfaceLevel
HGL
257.70 K018146.546.44146.400
91L/s300m
m4.57%45.50045.130249.60 K018046.38
45.298
39.726
184L/s300m
m9.97%
45.130
38.650184.60 K017939.639.58839.554
190L/s375m
m5.19%38.65038.230176.50 K017839.57
38.425
33.927 295L/s375m
m15.76%
38.230
33.550146.80 K01773533.745
26.020295L/s375m
m26.47%
33.550
24.550112.80 K01762624.742
16.919
289L/s375m
m20.51%
24.550
16.55073.80 K01751816.74214.605
289L/s375m
m26.67%16.550
13.03060.60 K017414.5913.41913.174
295L/s375m
m8.85%13.03012.18051.00 K017313.58
12.393
7.209
342L/s375m
m15.75%
12.180
5.6309.40 K01716.935.8504.021
361L/s375m
m19.47%5.6303.8000 K0170D
atum E
l. -16
Chainage InvertLevel
SurfaceLevel
HGL
257.70 K018146.546.44146.400
93L/s300m
m4.57%45.50045.130249.60 K018046.38
45.298
39.727
184L/s300m
m9.97%
45.130
38.650184.60 K017939.639.59039.556
189L/s375m
m5.19%38.65038.230176.50 K017839.57
38.425
33.927 295L/s375m
m15.76%
38.230
33.550146.80 K01773533.745
26.019
295L/s375m
m26.47%
33.550
24.550112.80 K01762624.742
16.919
290L/s375m
m20.51%
24.550
16.55073.80 K01751816.74214.606
290L/s375m
m26.67%16.550
13.03060.60 K017414.5913.46613.230
294L/s375m
m8.85%13.03012.18051.00 K017313.58
12.397
7.217
353L/s375m
m15.75%
12.180
5.6309.40 K01716.935.8514.021
362L/s375m
m19.47%5.6303.8000 K0170
ITEM 2 (continued) ATTACHMENT 1
Page 129
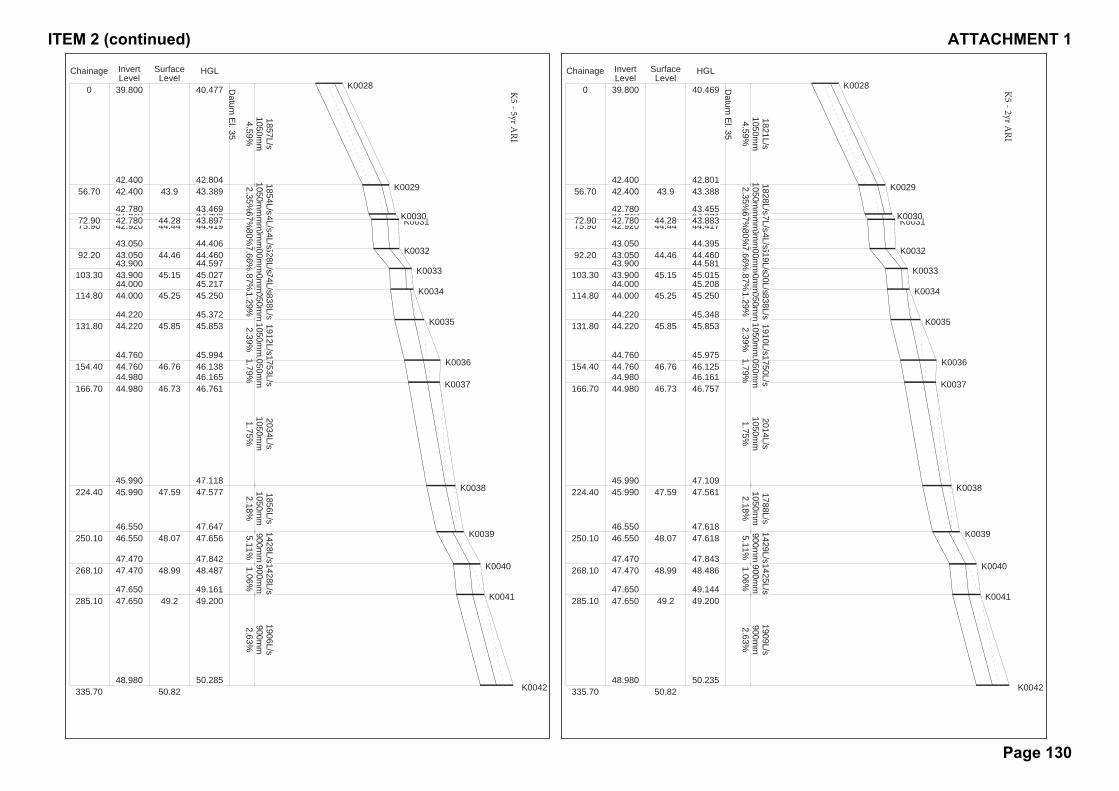
Datum
El. 35
Chainage InvertLevel
SurfaceLevel
HGL
335.70 K004250.8250.235
49.200
1909L/s900m
m2.63%
48.980
47.650285.10 K004149.249.144
48.486
1425L/s900m
m1.06%
47.650
47.470268.10 K004048.9947.843
47.618
1429L/s900m
m5.11%
47.470
46.550250.10 K003948.0747.618
47.561 1788L/s1050m
m2.18%
46.550
45.990224.40 K003847.5947.109
46.757
2014L/s1050m
m1.75%
45.990
44.980166.70 K003746.7346.16146.125
1750L/s1050m
m1.79%44.980
44.760154.40 K003646.7645.975
45.853 1910L/s1050m
m2.39%
44.760
44.220131.80 K003545.8545.348
45.250
1838L/s1050m
m1.29%
44.220
44.000114.80 K003445.2545.20845.015
1300L/s900m
m0.87%44.000
43.900103.30 K003345.1544.58144.460
1519L/s900m
m7.66%43.900
43.05092.20 K003244.4644.395
44.417
1034L/s900m
m0.80%
43.050
42.92075.90 K003144.4443.89243.883
1157L/s900m
m4.67%42.920
42.78072.90 K003044.2843.455
43.388
1828L/s1050m
m2.35%
42.780
42.40056.70 K002943.942.801
40.469
1821L/s1050m
m4.59%
42.400
39.8000 K0028Datum
El. 35
Chainage InvertLevel
SurfaceLevel
HGL
335.70 K004250.8250.285
49.200
1906L/s900m
m2.63%
48.980
47.650285.10 K004149.249.161
48.487
1428L/s900m
m1.06%
47.650
47.470268.10 K004048.9947.842
47.656
1428L/s900m
m5.11%
47.470
46.550250.10 K003948.0747.647
47.577 1856L/s1050m
m2.18%
46.550
45.990224.40 K003847.5947.118
46.761
2034L/s1050m
m1.75%
45.990
44.980166.70 K003746.7346.16546.138
1753L/s1050m
m1.79%44.980
44.760154.40 K003646.7645.994
45.853 1912L/s1050m
m2.39%
44.760
44.220131.80 K003545.8545.372
45.250
1838L/s1050m
m1.29%
44.220
44.000114.80 K003445.2545.21745.027
1274L/s900m
m0.87%44.000
43.900103.30 K003345.1544.59744.460
1528L/s900m
m7.66%43.900
43.05092.20 K003244.4644.406
44.419
1044L/s900m
m0.80%
43.050
42.92075.90 K003144.4443.90843.897
1174L/s900m
m4.67%42.920
42.78072.90 K003044.2843.469
43.389
1854L/s1050m
m2.35%
42.780
42.40056.70 K002943.942.804
40.477
1857L/s1050m
m4.59%
42.400
39.8000 K0028
ITEM 2 (continued) ATTACHMENT 1
Page 130
DRAINS OUTPUT – LOW FLOW ASSESSMENT BUFFALO CREEK CATCHMENT – 2yr ARI
ITEM 2 (continued) ATTACHMENT 1
Page 131
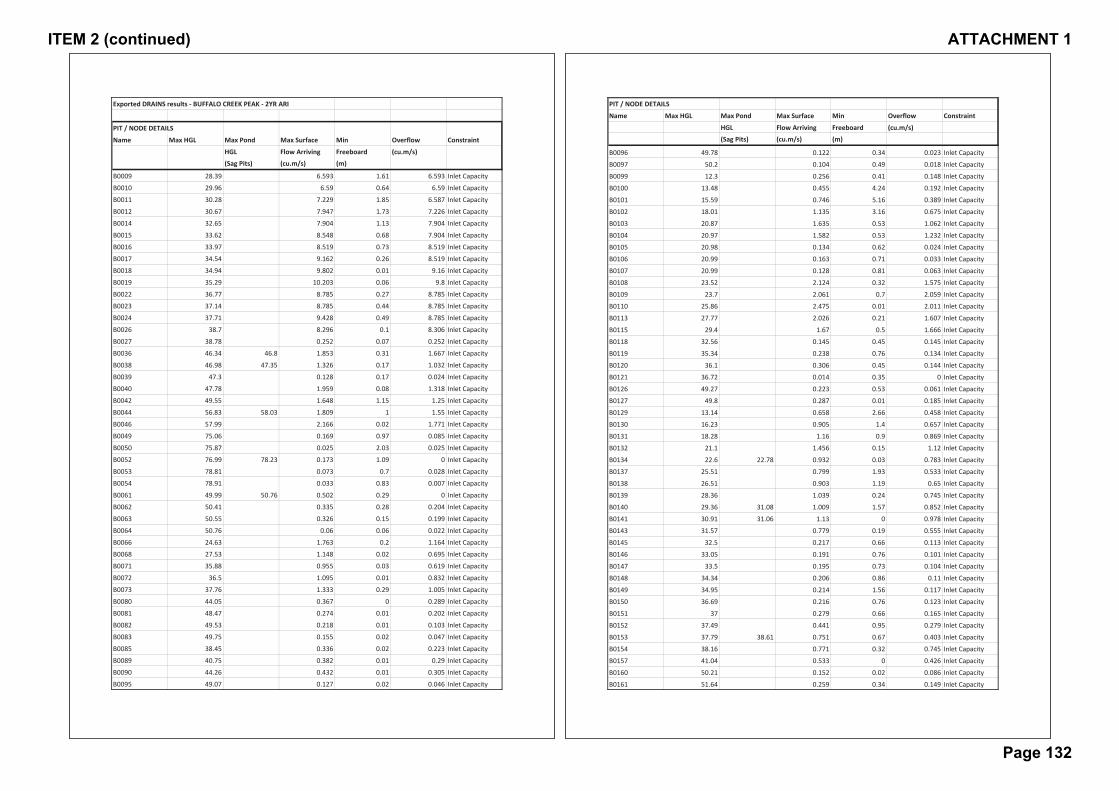
Exported DRAINS results BUFFALO CREEK PEAK 2YR ARI
PIT / NODE DETAILS
Name Max HGL Max Pond Max Surface Min Overflow Constraint
HGL Flow Arriving Freeboard (cu.m/s)(Sag Pits) (cu.m/s) (m)
B0009 28.39 6.593 1.61 6.593 Inlet Capacity
B0010 29.96 6.59 0.64 6.59 Inlet Capacity
B0011 30.28 7.229 1.85 6.587 Inlet Capacity
B0012 30.67 7.947 1.73 7.226 Inlet Capacity
B0014 32.65 7.904 1.13 7.904 Inlet Capacity
B0015 33.62 8.548 0.68 7.904 Inlet Capacity
B0016 33.97 8.519 0.73 8.519 Inlet Capacity
B0017 34.54 9.162 0.26 8.519 Inlet Capacity
B0018 34.94 9.802 0.01 9.16 Inlet Capacity
B0019 35.29 10.203 0.06 9.8 Inlet Capacity
B0022 36.77 8.785 0.27 8.785 Inlet Capacity
B0023 37.14 8.785 0.44 8.785 Inlet Capacity
B0024 37.71 9.428 0.49 8.785 Inlet Capacity
B0026 38.7 8.296 0.1 8.306 Inlet Capacity
B0027 38.78 0.252 0.07 0.252 Inlet Capacity
B0036 46.34 46.8 1.853 0.31 1.667 Inlet Capacity
B0038 46.98 47.35 1.326 0.17 1.032 Inlet Capacity
B0039 47.3 0.128 0.17 0.024 Inlet Capacity
B0040 47.78 1.959 0.08 1.318 Inlet Capacity
B0042 49.55 1.648 1.15 1.25 Inlet Capacity
B0044 56.83 58.03 1.809 1 1.55 Inlet Capacity
B0046 57.99 2.166 0.02 1.771 Inlet Capacity
B0049 75.06 0.169 0.97 0.085 Inlet Capacity
B0050 75.87 0.025 2.03 0.025 Inlet Capacity
B0052 76.99 78.23 0.173 1.09 0 Inlet Capacity
B0053 78.81 0.073 0.7 0.028 Inlet Capacity
B0054 78.91 0.033 0.83 0.007 Inlet Capacity
B0061 49.99 50.76 0.502 0.29 0 Inlet Capacity
B0062 50.41 0.335 0.28 0.204 Inlet Capacity
B0063 50.55 0.326 0.15 0.199 Inlet Capacity
B0064 50.76 0.06 0.06 0.022 Inlet Capacity
B0066 24.63 1.763 0.2 1.164 Inlet Capacity
B0068 27.53 1.148 0.02 0.695 Inlet Capacity
B0071 35.88 0.955 0.03 0.619 Inlet Capacity
B0072 36.5 1.095 0.01 0.832 Inlet Capacity
B0073 37.76 1.333 0.29 1.005 Inlet Capacity
B0080 44.05 0.367 0 0.289 Inlet Capacity
B0081 48.47 0.274 0.01 0.202 Inlet Capacity
B0082 49.53 0.218 0.01 0.103 Inlet Capacity
B0083 49.75 0.155 0.02 0.047 Inlet Capacity
B0085 38.45 0.336 0.02 0.223 Inlet Capacity
B0089 40.75 0.382 0.01 0.29 Inlet Capacity
B0090 44.26 0.432 0.01 0.305 Inlet Capacity
B0095 49.07 0.127 0.02 0.046 Inlet Capacity
PIT / NODE DETAILS
Name Max HGL Max Pond Max Surface Min Overflow Constraint
HGL Flow Arriving Freeboard (cu.m/s)(Sag Pits) (cu.m/s) (m)
B0096 49.78 0.122 0.34 0.023 Inlet Capacity
B0097 50.2 0.104 0.49 0.018 Inlet Capacity
B0099 12.3 0.256 0.41 0.148 Inlet Capacity
B0100 13.48 0.455 4.24 0.192 Inlet Capacity
B0101 15.59 0.746 5.16 0.389 Inlet Capacity
B0102 18.01 1.135 3.16 0.675 Inlet Capacity
B0103 20.87 1.635 0.53 1.062 Inlet Capacity
B0104 20.97 1.582 0.53 1.232 Inlet Capacity
B0105 20.98 0.134 0.62 0.024 Inlet Capacity
B0106 20.99 0.163 0.71 0.033 Inlet Capacity
B0107 20.99 0.128 0.81 0.063 Inlet Capacity
B0108 23.52 2.124 0.32 1.575 Inlet Capacity
B0109 23.7 2.061 0.7 2.059 Inlet Capacity
B0110 25.86 2.475 0.01 2.011 Inlet Capacity
B0113 27.77 2.026 0.21 1.607 Inlet Capacity
B0115 29.4 1.67 0.5 1.666 Inlet Capacity
B0118 32.56 0.145 0.45 0.145 Inlet Capacity
B0119 35.34 0.238 0.76 0.134 Inlet Capacity
B0120 36.1 0.306 0.45 0.144 Inlet Capacity
B0121 36.72 0.014 0.35 0 Inlet Capacity
B0126 49.27 0.223 0.53 0.061 Inlet Capacity
B0127 49.8 0.287 0.01 0.185 Inlet Capacity
B0129 13.14 0.658 2.66 0.458 Inlet Capacity
B0130 16.23 0.905 1.4 0.657 Inlet Capacity
B0131 18.28 1.16 0.9 0.869 Inlet Capacity
B0132 21.1 1.456 0.15 1.12 Inlet Capacity
B0134 22.6 22.78 0.932 0.03 0.783 Inlet Capacity
B0137 25.51 0.799 1.93 0.533 Inlet Capacity
B0138 26.51 0.903 1.19 0.65 Inlet Capacity
B0139 28.36 1.039 0.24 0.745 Inlet Capacity
B0140 29.36 31.08 1.009 1.57 0.852 Inlet Capacity
B0141 30.91 31.06 1.13 0 0.978 Inlet Capacity
B0143 31.57 0.779 0.19 0.555 Inlet Capacity
B0145 32.5 0.217 0.66 0.113 Inlet Capacity
B0146 33.05 0.191 0.76 0.101 Inlet Capacity
B0147 33.5 0.195 0.73 0.104 Inlet Capacity
B0148 34.34 0.206 0.86 0.11 Inlet Capacity
B0149 34.95 0.214 1.56 0.117 Inlet Capacity
B0150 36.69 0.216 0.76 0.123 Inlet Capacity
B0151 37 0.279 0.66 0.165 Inlet Capacity
B0152 37.49 0.441 0.95 0.279 Inlet Capacity
B0153 37.79 38.61 0.751 0.67 0.403 Inlet Capacity
B0154 38.16 0.771 0.32 0.745 Inlet Capacity
B0157 41.04 0.533 0 0.426 Inlet Capacity
B0160 50.21 0.152 0.02 0.086 Inlet Capacity
B0161 51.64 0.259 0.34 0.149 Inlet Capacity
ITEM 2 (continued) ATTACHMENT 1
Page 132
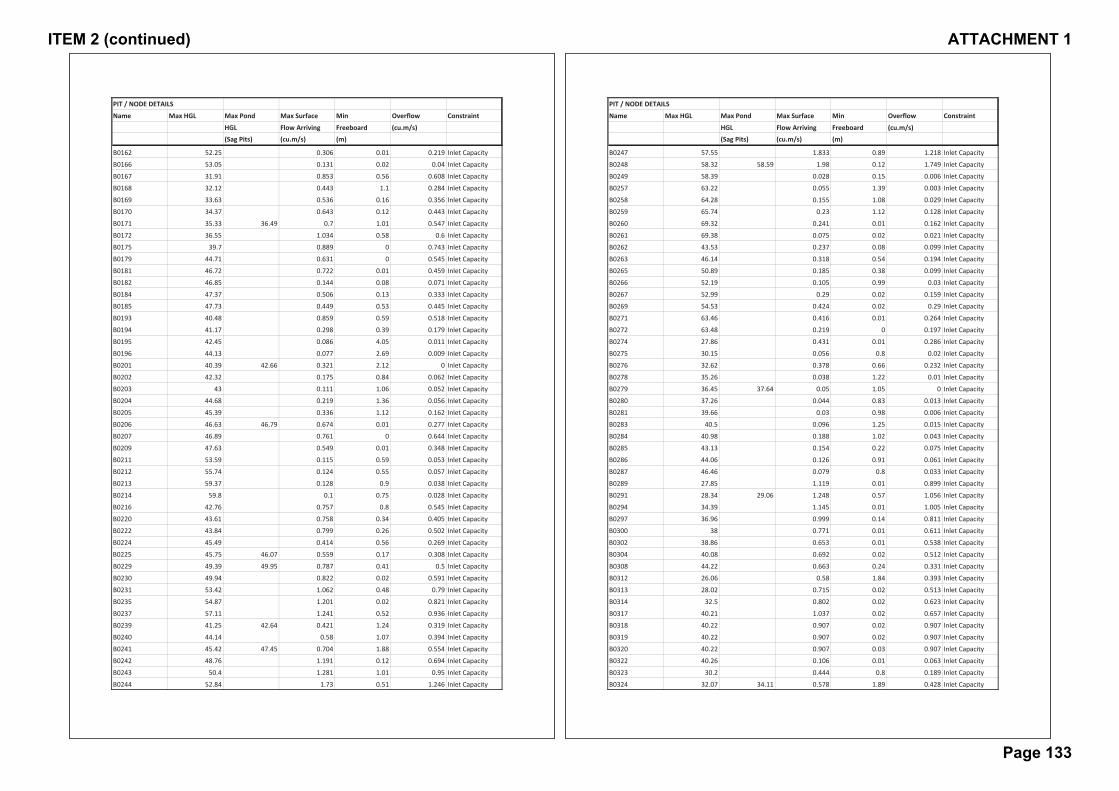
PIT / NODE DETAILS
Name Max HGL Max Pond Max Surface Min Overflow Constraint
HGL Flow Arriving Freeboard (cu.m/s)(Sag Pits) (cu.m/s) (m)
B0162 52.25 0.306 0.01 0.219 Inlet Capacity
B0166 53.05 0.131 0.02 0.04 Inlet Capacity
B0167 31.91 0.853 0.56 0.608 Inlet Capacity
B0168 32.12 0.443 1.1 0.284 Inlet Capacity
B0169 33.63 0.536 0.16 0.356 Inlet Capacity
B0170 34.37 0.643 0.12 0.443 Inlet Capacity
B0171 35.33 36.49 0.7 1.01 0.547 Inlet Capacity
B0172 36.55 1.034 0.58 0.6 Inlet Capacity
B0175 39.7 0.889 0 0.743 Inlet Capacity
B0179 44.71 0.631 0 0.545 Inlet Capacity
B0181 46.72 0.722 0.01 0.459 Inlet Capacity
B0182 46.85 0.144 0.08 0.071 Inlet Capacity
B0184 47.37 0.506 0.13 0.333 Inlet Capacity
B0185 47.73 0.449 0.53 0.445 Inlet Capacity
B0193 40.48 0.859 0.59 0.518 Inlet Capacity
B0194 41.17 0.298 0.39 0.179 Inlet Capacity
B0195 42.45 0.086 4.05 0.011 Inlet Capacity
B0196 44.13 0.077 2.69 0.009 Inlet Capacity
B0201 40.39 42.66 0.321 2.12 0 Inlet Capacity
B0202 42.32 0.175 0.84 0.062 Inlet Capacity
B0203 43 0.111 1.06 0.052 Inlet Capacity
B0204 44.68 0.219 1.36 0.056 Inlet Capacity
B0205 45.39 0.336 1.12 0.162 Inlet Capacity
B0206 46.63 46.79 0.674 0.01 0.277 Inlet Capacity
B0207 46.89 0.761 0 0.644 Inlet Capacity
B0209 47.63 0.549 0.01 0.348 Inlet Capacity
B0211 53.59 0.115 0.59 0.053 Inlet Capacity
B0212 55.74 0.124 0.55 0.057 Inlet Capacity
B0213 59.37 0.128 0.9 0.038 Inlet Capacity
B0214 59.8 0.1 0.75 0.028 Inlet Capacity
B0216 42.76 0.757 0.8 0.545 Inlet Capacity
B0220 43.61 0.758 0.34 0.405 Inlet Capacity
B0222 43.84 0.799 0.26 0.502 Inlet Capacity
B0224 45.49 0.414 0.56 0.269 Inlet Capacity
B0225 45.75 46.07 0.559 0.17 0.308 Inlet Capacity
B0229 49.39 49.95 0.787 0.41 0.5 Inlet Capacity
B0230 49.94 0.822 0.02 0.591 Inlet Capacity
B0231 53.42 1.062 0.48 0.79 Inlet Capacity
B0235 54.87 1.201 0.02 0.821 Inlet Capacity
B0237 57.11 1.241 0.52 0.936 Inlet Capacity
B0239 41.25 42.64 0.421 1.24 0.319 Inlet Capacity
B0240 44.14 0.58 1.07 0.394 Inlet Capacity
B0241 45.42 47.45 0.704 1.88 0.554 Inlet Capacity
B0242 48.76 1.191 0.12 0.694 Inlet Capacity
B0243 50.4 1.281 1.01 0.95 Inlet Capacity
B0244 52.84 1.73 0.51 1.246 Inlet Capacity
PIT / NODE DETAILS
Name Max HGL Max Pond Max Surface Min Overflow Constraint
HGL Flow Arriving Freeboard (cu.m/s)(Sag Pits) (cu.m/s) (m)
B0247 57.55 1.833 0.89 1.218 Inlet Capacity
B0248 58.32 58.59 1.98 0.12 1.749 Inlet Capacity
B0249 58.39 0.028 0.15 0.006 Inlet Capacity
B0257 63.22 0.055 1.39 0.003 Inlet Capacity
B0258 64.28 0.155 1.08 0.029 Inlet Capacity
B0259 65.74 0.23 1.12 0.128 Inlet Capacity
B0260 69.32 0.241 0.01 0.162 Inlet Capacity
B0261 69.38 0.075 0.02 0.021 Inlet Capacity
B0262 43.53 0.237 0.08 0.099 Inlet Capacity
B0263 46.14 0.318 0.54 0.194 Inlet Capacity
B0265 50.89 0.185 0.38 0.099 Inlet Capacity
B0266 52.19 0.105 0.99 0.03 Inlet Capacity
B0267 52.99 0.29 0.02 0.159 Inlet Capacity
B0269 54.53 0.424 0.02 0.29 Inlet Capacity
B0271 63.46 0.416 0.01 0.264 Inlet Capacity
B0272 63.48 0.219 0 0.197 Inlet Capacity
B0274 27.86 0.431 0.01 0.286 Inlet Capacity
B0275 30.15 0.056 0.8 0.02 Inlet Capacity
B0276 32.62 0.378 0.66 0.232 Inlet Capacity
B0278 35.26 0.038 1.22 0.01 Inlet Capacity
B0279 36.45 37.64 0.05 1.05 0 Inlet Capacity
B0280 37.26 0.044 0.83 0.013 Inlet Capacity
B0281 39.66 0.03 0.98 0.006 Inlet Capacity
B0283 40.5 0.096 1.25 0.015 Inlet Capacity
B0284 40.98 0.188 1.02 0.043 Inlet Capacity
B0285 43.13 0.154 0.22 0.075 Inlet Capacity
B0286 44.06 0.126 0.91 0.061 Inlet Capacity
B0287 46.46 0.079 0.8 0.033 Inlet Capacity
B0289 27.85 1.119 0.01 0.899 Inlet Capacity
B0291 28.34 29.06 1.248 0.57 1.056 Inlet Capacity
B0294 34.39 1.145 0.01 1.005 Inlet Capacity
B0297 36.96 0.999 0.14 0.811 Inlet Capacity
B0300 38 0.771 0.01 0.611 Inlet Capacity
B0302 38.86 0.653 0.01 0.538 Inlet Capacity
B0304 40.08 0.692 0.02 0.512 Inlet Capacity
B0308 44.22 0.663 0.24 0.331 Inlet Capacity
B0312 26.06 0.58 1.84 0.393 Inlet Capacity
B0313 28.02 0.715 0.02 0.513 Inlet Capacity
B0314 32.5 0.802 0.02 0.623 Inlet Capacity
B0317 40.21 1.037 0.02 0.657 Inlet Capacity
B0318 40.22 0.907 0.02 0.907 Inlet Capacity
B0319 40.22 0.907 0.02 0.907 Inlet Capacity
B0320 40.22 0.907 0.03 0.907 Inlet Capacity
B0322 40.26 0.106 0.01 0.063 Inlet Capacity
B0323 30.2 0.444 0.8 0.189 Inlet Capacity
B0324 32.07 34.11 0.578 1.89 0.428 Inlet Capacity
ITEM 2 (continued) ATTACHMENT 1
Page 133
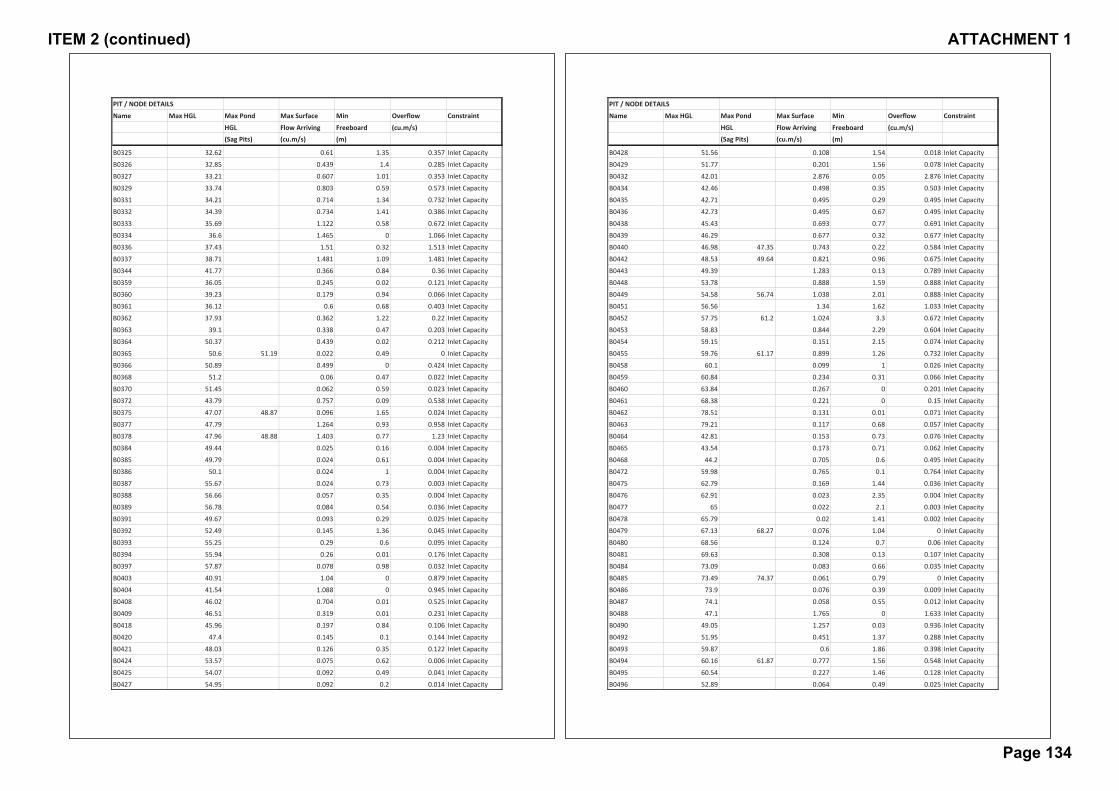
PIT / NODE DETAILS
Name Max HGL Max Pond Max Surface Min Overflow Constraint
HGL Flow Arriving Freeboard (cu.m/s)(Sag Pits) (cu.m/s) (m)
B0325 32.62 0.61 1.35 0.357 Inlet Capacity
B0326 32.85 0.439 1.4 0.285 Inlet Capacity
B0327 33.21 0.607 1.01 0.353 Inlet Capacity
B0329 33.74 0.803 0.59 0.573 Inlet Capacity
B0331 34.21 0.714 1.34 0.732 Inlet Capacity
B0332 34.39 0.734 1.41 0.386 Inlet Capacity
B0333 35.69 1.122 0.58 0.672 Inlet Capacity
B0334 36.6 1.465 0 1.066 Inlet Capacity
B0336 37.43 1.51 0.32 1.513 Inlet Capacity
B0337 38.71 1.481 1.09 1.481 Inlet Capacity
B0344 41.77 0.366 0.84 0.36 Inlet Capacity
B0359 36.05 0.245 0.02 0.121 Inlet Capacity
B0360 39.23 0.179 0.94 0.066 Inlet Capacity
B0361 36.12 0.6 0.68 0.403 Inlet Capacity
B0362 37.93 0.362 1.22 0.22 Inlet Capacity
B0363 39.1 0.338 0.47 0.203 Inlet Capacity
B0364 50.37 0.439 0.02 0.212 Inlet Capacity
B0365 50.6 51.19 0.022 0.49 0 Inlet Capacity
B0366 50.89 0.499 0 0.424 Inlet Capacity
B0368 51.2 0.06 0.47 0.022 Inlet Capacity
B0370 51.45 0.062 0.59 0.023 Inlet Capacity
B0372 43.79 0.757 0.09 0.538 Inlet Capacity
B0375 47.07 48.87 0.096 1.65 0.024 Inlet Capacity
B0377 47.79 1.264 0.93 0.958 Inlet Capacity
B0378 47.96 48.88 1.403 0.77 1.23 Inlet Capacity
B0384 49.44 0.025 0.16 0.004 Inlet Capacity
B0385 49.79 0.024 0.61 0.004 Inlet Capacity
B0386 50.1 0.024 1 0.004 Inlet Capacity
B0387 55.67 0.024 0.73 0.003 Inlet Capacity
B0388 56.66 0.057 0.35 0.004 Inlet Capacity
B0389 56.78 0.084 0.54 0.036 Inlet Capacity
B0391 49.67 0.093 0.29 0.025 Inlet Capacity
B0392 52.49 0.145 1.36 0.045 Inlet Capacity
B0393 55.25 0.29 0.6 0.095 Inlet Capacity
B0394 55.94 0.26 0.01 0.176 Inlet Capacity
B0397 57.87 0.078 0.98 0.032 Inlet Capacity
B0403 40.91 1.04 0 0.879 Inlet Capacity
B0404 41.54 1.088 0 0.945 Inlet Capacity
B0408 46.02 0.704 0.01 0.525 Inlet Capacity
B0409 46.51 0.319 0.01 0.231 Inlet Capacity
B0418 45.96 0.197 0.84 0.106 Inlet Capacity
B0420 47.4 0.145 0.1 0.144 Inlet Capacity
B0421 48.03 0.126 0.35 0.122 Inlet Capacity
B0424 53.57 0.075 0.62 0.006 Inlet Capacity
B0425 54.07 0.092 0.49 0.041 Inlet Capacity
B0427 54.95 0.092 0.2 0.014 Inlet Capacity
PIT / NODE DETAILS
Name Max HGL Max Pond Max Surface Min Overflow Constraint
HGL Flow Arriving Freeboard (cu.m/s)(Sag Pits) (cu.m/s) (m)
B0428 51.56 0.108 1.54 0.018 Inlet Capacity
B0429 51.77 0.201 1.56 0.078 Inlet Capacity
B0432 42.01 2.876 0.05 2.876 Inlet Capacity
B0434 42.46 0.498 0.35 0.503 Inlet Capacity
B0435 42.71 0.495 0.29 0.495 Inlet Capacity
B0436 42.73 0.495 0.67 0.495 Inlet Capacity
B0438 45.43 0.693 0.77 0.691 Inlet Capacity
B0439 46.29 0.677 0.32 0.677 Inlet Capacity
B0440 46.98 47.35 0.743 0.22 0.584 Inlet Capacity
B0442 48.53 49.64 0.821 0.96 0.675 Inlet Capacity
B0443 49.39 1.283 0.13 0.789 Inlet Capacity
B0448 53.78 0.888 1.59 0.888 Inlet Capacity
B0449 54.58 56.74 1.038 2.01 0.888 Inlet Capacity
B0451 56.56 1.34 1.62 1.033 Inlet Capacity
B0452 57.75 61.2 1.024 3.3 0.672 Inlet Capacity
B0453 58.83 0.844 2.29 0.604 Inlet Capacity
B0454 59.15 0.151 2.15 0.074 Inlet Capacity
B0455 59.76 61.17 0.899 1.26 0.732 Inlet Capacity
B0458 60.1 0.099 1 0.026 Inlet Capacity
B0459 60.84 0.234 0.31 0.066 Inlet Capacity
B0460 63.84 0.267 0 0.201 Inlet Capacity
B0461 68.38 0.221 0 0.15 Inlet Capacity
B0462 78.51 0.131 0.01 0.071 Inlet Capacity
B0463 79.21 0.117 0.68 0.057 Inlet Capacity
B0464 42.81 0.153 0.73 0.076 Inlet Capacity
B0465 43.54 0.173 0.71 0.062 Inlet Capacity
B0468 44.2 0.705 0.6 0.495 Inlet Capacity
B0472 59.98 0.765 0.1 0.764 Inlet Capacity
B0475 62.79 0.169 1.44 0.036 Inlet Capacity
B0476 62.91 0.023 2.35 0.004 Inlet Capacity
B0477 65 0.022 2.1 0.003 Inlet Capacity
B0478 65.79 0.02 1.41 0.002 Inlet Capacity
B0479 67.13 68.27 0.076 1.04 0 Inlet Capacity
B0480 68.56 0.124 0.7 0.06 Inlet Capacity
B0481 69.63 0.308 0.13 0.107 Inlet Capacity
B0484 73.09 0.083 0.66 0.035 Inlet Capacity
B0485 73.49 74.37 0.061 0.79 0 Inlet Capacity
B0486 73.9 0.076 0.39 0.009 Inlet Capacity
B0487 74.1 0.058 0.55 0.012 Inlet Capacity
B0488 47.1 1.765 0 1.633 Inlet Capacity
B0490 49.05 1.257 0.03 0.936 Inlet Capacity
B0492 51.95 0.451 1.37 0.288 Inlet Capacity
B0493 59.87 0.6 1.86 0.398 Inlet Capacity
B0494 60.16 61.87 0.777 1.56 0.548 Inlet Capacity
B0495 60.54 0.227 1.46 0.128 Inlet Capacity
B0496 52.89 0.064 0.49 0.025 Inlet Capacity
ITEM 2 (continued) ATTACHMENT 1
Page 134
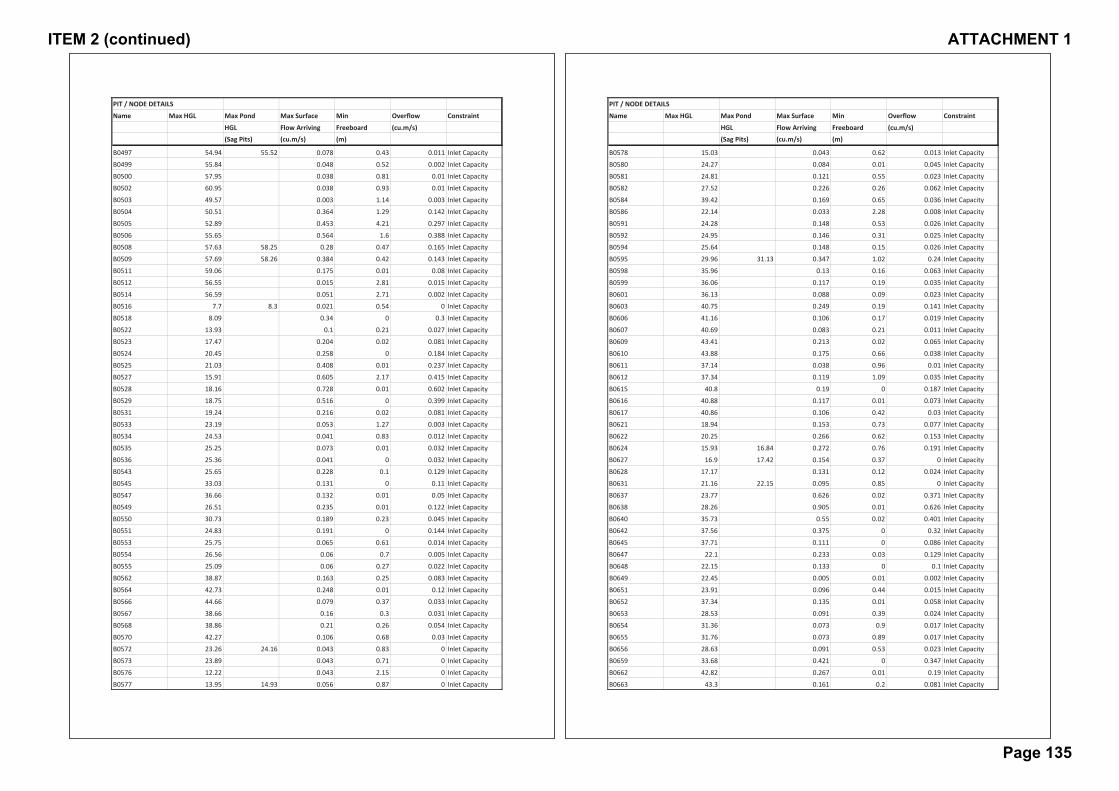
PIT / NODE DETAILS
Name Max HGL Max Pond Max Surface Min Overflow Constraint
HGL Flow Arriving Freeboard (cu.m/s)(Sag Pits) (cu.m/s) (m)
B0497 54.94 55.52 0.078 0.43 0.011 Inlet Capacity
B0499 55.84 0.048 0.52 0.002 Inlet Capacity
B0500 57.95 0.038 0.81 0.01 Inlet Capacity
B0502 60.95 0.038 0.93 0.01 Inlet Capacity
B0503 49.57 0.003 1.14 0.003 Inlet Capacity
B0504 50.51 0.364 1.29 0.142 Inlet Capacity
B0505 52.89 0.453 4.21 0.297 Inlet Capacity
B0506 55.65 0.564 1.6 0.388 Inlet Capacity
B0508 57.63 58.25 0.28 0.47 0.165 Inlet Capacity
B0509 57.69 58.26 0.384 0.42 0.143 Inlet Capacity
B0511 59.06 0.175 0.01 0.08 Inlet Capacity
B0512 56.55 0.015 2.81 0.015 Inlet Capacity
B0514 56.59 0.051 2.71 0.002 Inlet Capacity
B0516 7.7 8.3 0.021 0.54 0 Inlet Capacity
B0518 8.09 0.34 0 0.3 Inlet Capacity
B0522 13.93 0.1 0.21 0.027 Inlet Capacity
B0523 17.47 0.204 0.02 0.081 Inlet Capacity
B0524 20.45 0.258 0 0.184 Inlet Capacity
B0525 21.03 0.408 0.01 0.237 Inlet Capacity
B0527 15.91 0.605 2.17 0.415 Inlet Capacity
B0528 18.16 0.728 0.01 0.602 Inlet Capacity
B0529 18.75 0.516 0 0.399 Inlet Capacity
B0531 19.24 0.216 0.02 0.081 Inlet Capacity
B0533 23.19 0.053 1.27 0.003 Inlet Capacity
B0534 24.53 0.041 0.83 0.012 Inlet Capacity
B0535 25.25 0.073 0.01 0.032 Inlet Capacity
B0536 25.36 0.041 0 0.032 Inlet Capacity
B0543 25.65 0.228 0.1 0.129 Inlet Capacity
B0545 33.03 0.131 0 0.11 Inlet Capacity
B0547 36.66 0.132 0.01 0.05 Inlet Capacity
B0549 26.51 0.235 0.01 0.122 Inlet Capacity
B0550 30.73 0.189 0.23 0.045 Inlet Capacity
B0551 24.83 0.191 0 0.144 Inlet Capacity
B0553 25.75 0.065 0.61 0.014 Inlet Capacity
B0554 26.56 0.06 0.7 0.005 Inlet Capacity
B0555 25.09 0.06 0.27 0.022 Inlet Capacity
B0562 38.87 0.163 0.25 0.083 Inlet Capacity
B0564 42.73 0.248 0.01 0.12 Inlet Capacity
B0566 44.66 0.079 0.37 0.033 Inlet Capacity
B0567 38.66 0.16 0.3 0.031 Inlet Capacity
B0568 38.86 0.21 0.26 0.054 Inlet Capacity
B0570 42.27 0.106 0.68 0.03 Inlet Capacity
B0572 23.26 24.16 0.043 0.83 0 Inlet Capacity
B0573 23.89 0.043 0.71 0 Inlet Capacity
B0576 12.22 0.043 2.15 0 Inlet Capacity
B0577 13.95 14.93 0.056 0.87 0 Inlet Capacity
PIT / NODE DETAILS
Name Max HGL Max Pond Max Surface Min Overflow Constraint
HGL Flow Arriving Freeboard (cu.m/s)(Sag Pits) (cu.m/s) (m)
B0578 15.03 0.043 0.62 0.013 Inlet Capacity
B0580 24.27 0.084 0.01 0.045 Inlet Capacity
B0581 24.81 0.121 0.55 0.023 Inlet Capacity
B0582 27.52 0.226 0.26 0.062 Inlet Capacity
B0584 39.42 0.169 0.65 0.036 Inlet Capacity
B0586 22.14 0.033 2.28 0.008 Inlet Capacity
B0591 24.28 0.148 0.53 0.026 Inlet Capacity
B0592 24.95 0.146 0.31 0.025 Inlet Capacity
B0594 25.64 0.148 0.15 0.026 Inlet Capacity
B0595 29.96 31.13 0.347 1.02 0.24 Inlet Capacity
B0598 35.96 0.13 0.16 0.063 Inlet Capacity
B0599 36.06 0.117 0.19 0.035 Inlet Capacity
B0601 36.13 0.088 0.09 0.023 Inlet Capacity
B0603 40.75 0.249 0.19 0.141 Inlet Capacity
B0606 41.16 0.106 0.17 0.019 Inlet Capacity
B0607 40.69 0.083 0.21 0.011 Inlet Capacity
B0609 43.41 0.213 0.02 0.065 Inlet Capacity
B0610 43.88 0.175 0.66 0.038 Inlet Capacity
B0611 37.14 0.038 0.96 0.01 Inlet Capacity
B0612 37.34 0.119 1.09 0.035 Inlet Capacity
B0615 40.8 0.19 0 0.187 Inlet Capacity
B0616 40.88 0.117 0.01 0.073 Inlet Capacity
B0617 40.86 0.106 0.42 0.03 Inlet Capacity
B0621 18.94 0.153 0.73 0.077 Inlet Capacity
B0622 20.25 0.266 0.62 0.153 Inlet Capacity
B0624 15.93 16.84 0.272 0.76 0.191 Inlet Capacity
B0627 16.9 17.42 0.154 0.37 0 Inlet Capacity
B0628 17.17 0.131 0.12 0.024 Inlet Capacity
B0631 21.16 22.15 0.095 0.85 0 Inlet Capacity
B0637 23.77 0.626 0.02 0.371 Inlet Capacity
B0638 28.26 0.905 0.01 0.626 Inlet Capacity
B0640 35.73 0.55 0.02 0.401 Inlet Capacity
B0642 37.56 0.375 0 0.32 Inlet Capacity
B0645 37.71 0.111 0 0.086 Inlet Capacity
B0647 22.1 0.233 0.03 0.129 Inlet Capacity
B0648 22.15 0.133 0 0.1 Inlet Capacity
B0649 22.45 0.005 0.01 0.002 Inlet Capacity
B0651 23.91 0.096 0.44 0.015 Inlet Capacity
B0652 37.34 0.135 0.01 0.058 Inlet Capacity
B0653 28.53 0.091 0.39 0.024 Inlet Capacity
B0654 31.36 0.073 0.9 0.017 Inlet Capacity
B0655 31.76 0.073 0.89 0.017 Inlet Capacity
B0656 28.63 0.091 0.53 0.023 Inlet Capacity
B0659 33.68 0.421 0 0.347 Inlet Capacity
B0662 42.82 0.267 0.01 0.19 Inlet Capacity
B0663 43.3 0.161 0.2 0.081 Inlet Capacity
ITEM 2 (continued) ATTACHMENT 1
Page 135

PIT / NODE DETAILS
Name Max HGL Max Pond Max Surface Min Overflow Constraint
HGL Flow Arriving Freeboard (cu.m/s)(Sag Pits) (cu.m/s) (m)
B0665 44.98 0.108 0.11 0.019 Inlet Capacity
B0666 45.16 0.112 0.02 0.055 Inlet Capacity
B0667 45.2 0.122 0.05 0.059 Inlet Capacity
B0670 38.17 0.232 0.01 0.112 Inlet Capacity
B0672 28.53 0.073 0 0.028 Inlet Capacity
B0673 32.45 0.099 0.02 0.028 Inlet Capacity
B0677 39.94 0.412 0 0.293 Inlet Capacity
B0679 49.56 0.242 0.95 0.103 Inlet Capacity
B0680 50 0.026 0.92 0.005 Inlet Capacity
B0681 50.2 0.026 0.58 0.005 Inlet Capacity
B0682 39.88 0.13 0.09 0.129 Inlet Capacity
B0683 40.03 0.11 0.46 0.02 Inlet Capacity
B0687 18.5 0.214 0 0.167 Inlet Capacity
B0688 20.03 0.281 0.8 0.166 Inlet Capacity
B0689 21.04 0.376 0.99 0.235 Inlet Capacity
B0690 22.47 0.502 2.36 0.333 Inlet Capacity
B0692 25.82 0.526 0.24 0.527 Inlet Capacity
B0693 26.38 27.15 0.741 0.62 0.507 Inlet Capacity
B0694 27.31 0.458 2.1 0.454 Inlet Capacity
B0695 29.74 0.287 0.77 0.171 Inlet Capacity
B0697 20.65 0.254 0.08 0.076 Inlet Capacity
B0698 21.45 0.341 0.71 0.209 Inlet Capacity
B0699 21.59 0.293 0.86 0.292 Inlet Capacity
B0700 22.98 0.388 0.31 0.246 Inlet Capacity
B0702 23.88 0.154 0.02 0.094 Inlet Capacity
B0703 21.66 22.34 0.054 0.58 0 Inlet Capacity
B0704 23.05 0.046 0.33 0.008 Inlet Capacity
B0706 37.16 0.065 0.02 0.012 Inlet Capacity
B0707 37.58 0.066 1.32 0.014 Inlet Capacity
B0708 38.27 0.069 0.83 0.015 Inlet Capacity
B0709 39.67 0.057 0.74 0.012 Inlet Capacity
B0710 39.2 0.057 0.77 0.004 Inlet Capacity
B0712 33.5 0.085 0.01 0.045 Inlet Capacity
B0713 34.36 0.069 0.74 0.016 Inlet Capacity
B0717 38.62 1.398 0.01 1.073 Inlet Capacity
B0719 26.38 1.344 0.01 1.126 Inlet Capacity
B0725 37.87 0.213 0.02 0.096 Inlet Capacity
B0731 46.49 0.258 0.11 0.15 Inlet Capacity
B0732 45.95 0.609 0 0.516 Inlet Capacity
B0736 26.17 26.38 0.747 0.06 0.528 Inlet Capacity
B0737 26.51 0.763 0.02 0.596 Inlet Capacity
B0739 25.81 0.014 0.01 0.004 Inlet Capacity
B0741 27.2 0.125 0.86 0.024 Inlet Capacity
B0742 28.93 0.114 0.72 0.021 Inlet Capacity
B0744 28.98 29.63 0.133 0.5 0.057 Inlet Capacity
B0745 29.37 0.179 0.19 0.094 Inlet Capacity
PIT / NODE DETAILS
Name Max HGL Max Pond Max Surface Min Overflow Constraint
HGL Flow Arriving Freeboard (cu.m/s)(Sag Pits) (cu.m/s) (m)
B0757 51.53 0.551 0.02 0.28 Inlet Capacity
B0759 37.45 37.8 0.026 0.3 0 Inlet Capacity
B0760 37.56 38.11 0.017 0.51 0 Inlet Capacity
B0761 35.31 0.287 0.19 0.085 Inlet Capacity
B0762 35.61 0.257 0.01 0.132 Inlet Capacity
B0763 35.29 0.264 0 0.214 Inlet Capacity
B0764 37.53 0.345 0.01 0.21 Inlet Capacity
B0765 37.93 0.058 0.74 0.012 Inlet Capacity
B0766 38.16 0.045 0.93 0.001 Inlet Capacity
B0767 38.32 0.043 1.06 0.007 Inlet Capacity
B0768 38.66 0.038 0.87 0.005 Inlet Capacity
B0769 34.56 0.695 0.01 0.517 Inlet Capacity
B0774 35.19 0.136 0.31 0.042 Inlet Capacity
B0775 35.76 0.062 0.34 0.013 Inlet Capacity
B0776 36.02 0.143 0.01 0.087 Inlet Capacity
B0777 36.17 0.101 0.36 0.017 Inlet Capacity
B0779 39.29 0.109 0.04 0.02 Inlet Capacity
B0781 42.84 0.109 0.68 0.032 Inlet Capacity
B0783 39.35 0.261 0.01 0.165 Inlet Capacity
B0786 40.71 0.051 0.34 0.01 Inlet Capacity
B0787 41.41 0.12 0.67 0.035 Inlet Capacity
B0788 41.6 0.14 0.56 0.044 Inlet Capacity
B0790 38.97 0.18 0.4 0.095 Inlet Capacity
B0791 51.86 0.344 0.01 0.236 Inlet Capacity
B0794 60.58 0.219 0 0.143 Inlet Capacity
B0796 62.47 0.147 1.18 0.026 Inlet Capacity
B0797 40.47 0.074 0 0.057 Inlet Capacity
B0799 41.64 0.1 0.46 0.028 Inlet Capacity
B0800 42.23 0.195 0.55 0.075 Inlet Capacity
B0803 44.32 0.085 0.33 0.011 Inlet Capacity
B0804 45.09 0.069 0.56 0.027 Inlet Capacity
B0805 46.82 0.058 0.89 0.012 Inlet Capacity
B0811 52.61 0.289 0 0.247 Inlet Capacity
B0812 55.22 0.249 0.18 0.132 Inlet Capacity
B0813 55.44 0.158 0.02 0.091 Inlet Capacity
B0818 58.64 0.255 0.01 0.16 Inlet Capacity
B0821 59.72 0.081 0.39 0.034 Inlet Capacity
B0822 59.82 0.073 0.9 0.008 Inlet Capacity
B0823 59.8 0.081 0.21 0.02 Inlet Capacity
B0824 59.88 0.073 0.61 0.008 Inlet Capacity
B0827 45.84 0.121 0 0.093 Inlet Capacity
B0829 54.24 0.061 0.2 0.012 Inlet Capacity
B0830 54.84 0.1 0.3 0.027 Inlet Capacity
B0831 55.18 0.178 0.73 0.065 Inlet Capacity
B0832 44.91 0.215 0.01 0.151 Inlet Capacity
B0834 49.88 0.184 0 0.142 Inlet Capacity
ITEM 2 (continued) ATTACHMENT 1
Page 136

PIT / NODE DETAILS
Name Max HGL Max Pond Max Surface Min Overflow Constraint
HGL Flow Arriving Freeboard (cu.m/s)(Sag Pits) (cu.m/s) (m)
B0836 51.24 0.039 0.38 0.011 Inlet Capacity
B0837 52.88 0.023 1.34 0.018 Inlet Capacity
B0838 54.26 0.046 0.86 0.001 Inlet Capacity
B0839 54.46 0.027 0.98 0.002 Inlet Capacity
B0840 55.67 0.06 2.39 0.005 Inlet Capacity
B0842 50.81 0.026 0.14 0.005 Inlet Capacity
B0843 50.91 0.025 1.13 0.004 Inlet Capacity
B0844 50.93 0.022 1.57 0.003 Inlet Capacity
B0845 43.63 44.78 0.022 1.09 0 Inlet Capacity
B0846 55.75 0.088 0.64 0.038 Inlet Capacity
B0847 56.22 0.078 0.4 0.01 Inlet Capacity
B0848 49.94 0.113 0.09 0.02 Inlet Capacity
B0849 52.79 0.076 0.96 0.009 Inlet Capacity
B0850 50.09 0.086 1.23 0.036 Inlet Capacity
B0853 31.17 0.028 0.82 0.005 Inlet Capacity
B0856 33.04 0.051 0.93 0.002 Inlet Capacity
B0857 33.62 0.142 0.2 0.025 Inlet Capacity
B0858 32.81 33.85 0.027 0.99 0 Inlet Capacity
B0859 33.26 0.018 0.61 0 Inlet Capacity
B0860 34.47 0.082 0.08 0.02 Inlet Capacity
B0861 36.09 0.17 0.43 0.056 Inlet Capacity
B0862 37.66 0.091 0.01 0.047 Inlet Capacity
B0863 38.26 0.069 0.02 0.022 Inlet Capacity
B0864 38.55 0.096 0.37 0.027 Inlet Capacity
B0866 35.27 36.19 0.105 0.77 0 Inlet Capacity
B0867 38.24 0.148 2.16 0.148 Inlet Capacity
B0868 39.02 39.45 0.29 0.28 0.087 Inlet Capacity
B0869 36.38 0.209 0.31 0.052 Inlet Capacity
B0871 37.26 0.068 0.07 0.015 Inlet Capacity
B0872 37.53 0.132 0.15 0.025 Inlet Capacity
B0873 38.25 0.112 0.55 0.021 Inlet Capacity
B0875 37.34 0.112 0 0.091 Inlet Capacity
B0876 37.71 0.036 0.61 0.009 Inlet Capacity
B0877 37.81 38.54 0.036 0.61 0 Inlet Capacity
B0879 38.67 0.054 0.16 0.01 Inlet Capacity
B0881 38.89 0.333 0.01 0.252 Inlet Capacity
B0883 39.95 0.244 0.01 0.128 Inlet Capacity
B0884 40.37 0.15 0.2 0.048 Inlet Capacity
B0885 40.61 0.175 0.06 0.062 Inlet Capacity
B0886 40.63 0.087 0.05 0.087 Inlet Capacity
B0887 40.67 0.087 0.02 0.018 Inlet Capacity
B0888 40.05 0.08 0.08 0.01 Inlet Capacity
B0893 43.97 0.082 0.56 0.011 Inlet Capacity
B0895 41.44 0.212 0.28 0.056 Inlet Capacity
B0896 44.3 0.118 0.48 0.023 Inlet Capacity
B0897 44.07 0.118 0.75 0.035 Inlet Capacity
PIT / NODE DETAILS
Name Max HGL Max Pond Max Surface Min Overflow Constraint
HGL Flow Arriving Freeboard (cu.m/s)(Sag Pits) (cu.m/s) (m)
B0898 46.46 0.118 0.02 0.024 Inlet Capacity
B0903 37.77 0.101 1 0.017 Inlet Capacity
B0904 38.29 0.018 0.69 0 Inlet Capacity
B0905 43.09 0.112 0.88 0.031 Inlet Capacity
B0906 43.98 0.085 1.04 0.036 Inlet Capacity
B0907 44.15 0.069 1.06 0.016 Inlet Capacity
B0908 44.97 0.069 1.1 0.007 Inlet Capacity
B0910 45.37 0.305 0.27 0.142 Inlet Capacity
B0911 50.24 0.344 0.01 0.272 Inlet Capacity
B0913 51.57 0.241 0 0.203 Inlet Capacity
B0914 51.93 0.241 0.02 0.104 Inlet Capacity
B0916 44.65 0.089 1.03 0.039 Inlet Capacity
B0920 44.25 0.174 0.02 0.049 Inlet Capacity
B0921 46.52 0.121 0.06 0.121 Inlet Capacity
B0922 46.85 0.155 0 0.121 Inlet Capacity
B0923 47.1 0.131 0.2 0.025 Inlet Capacity
B0924 48.09 0.264 0.72 0.26 Inlet Capacity
B0925 51.19 0.207 0.17 0.054 Inlet Capacity
B0926 51.6 0.033 0.02 0.004 Inlet Capacity
B0927 44.82 0.583 0.22 0.329 Inlet Capacity
B0929 45.96 0.353 0.02 0.249 Inlet Capacity
B0930 46.9 0.353 0.01 0.231 Inlet Capacity
B0933 53.48 0.062 0 0.049 Inlet Capacity
B0934 53.49 0.062 0.01 0.035 Inlet Capacity
B0936 50.09 0.168 0.01 0.112 Inlet Capacity
B0937 50.11 0.096 0.01 0.072 Inlet Capacity
B0939 49.55 0.096 0.03 0.043 Inlet Capacity
B0940 49.56 0.096 0.01 0.07 Inlet Capacity
B0941 49.01 0.096 0.52 0.043 Inlet Capacity
B0942 56.83 0.062 0.95 0.004 Inlet Capacity
B0943 56.92 0.047 0.87 0.015 Inlet Capacity
B0944 57.04 0.047 0.76 0.015 Inlet Capacity
B0945 56.95 0.062 0.56 0.022 Inlet Capacity
B0948 54.09 0.14 0.02 0.043 Inlet Capacity
B0949 57.07 0.117 0.52 0.022 Inlet Capacity
B0950 59.45 0.117 0.71 0.022 Inlet Capacity
B0951 61.51 61.92 0.093 0.3 0 Inlet Capacity
B0952 62.03 0.332 0.01 0.227 Inlet Capacity
B0953 64.62 0.389 0.01 0.266 Inlet Capacity
B0958 79.2 0.146 0.56 0.047 Inlet Capacity
B0964 70.74 0.567 0.02 0.414 Inlet Capacity
B0966 70.91 0.113 0.17 0.021 Inlet Capacity
B0967 55.84 56.34 0.077 0.4 0 Inlet Capacity
B0968 56.41 0.13 0.02 0.037 Inlet Capacity
B0969 55.87 0.064 0.77 0.014 Inlet Capacity
B0970 55.24 56.27 0.064 0.91 0 Inlet Capacity
ITEM 2 (continued) ATTACHMENT 1
Page 137
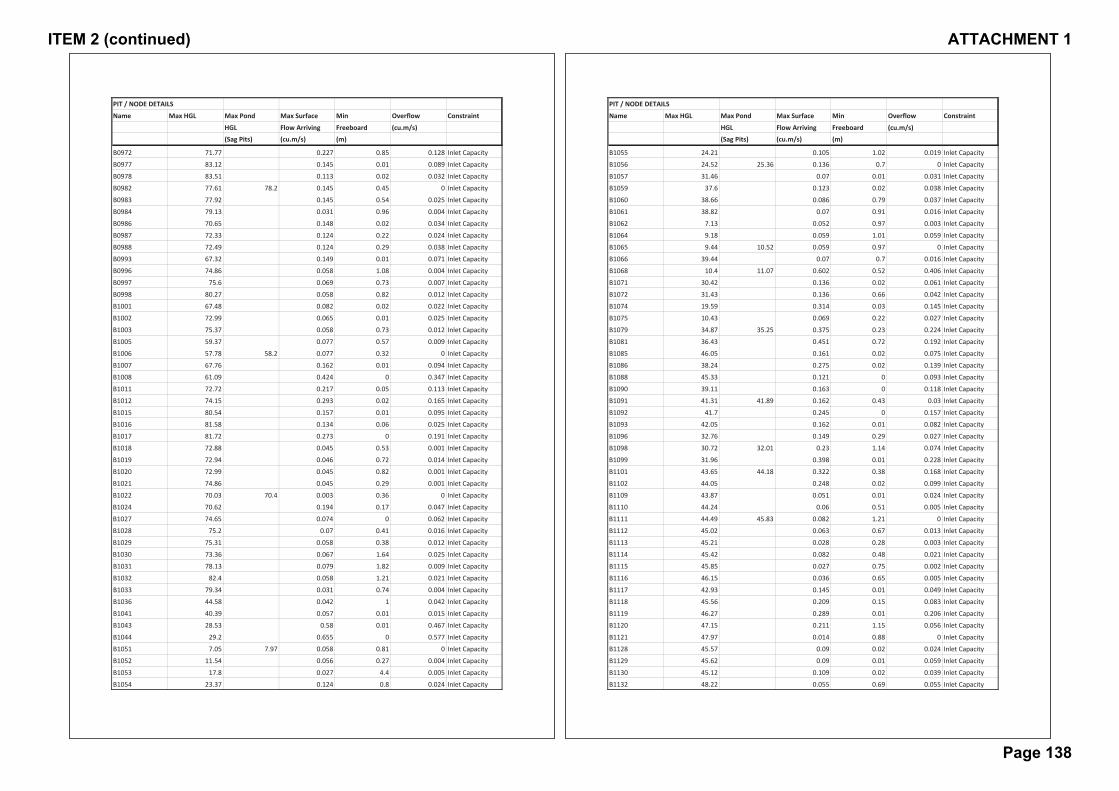
PIT / NODE DETAILS
Name Max HGL Max Pond Max Surface Min Overflow Constraint
HGL Flow Arriving Freeboard (cu.m/s)(Sag Pits) (cu.m/s) (m)
B0972 71.77 0.227 0.85 0.128 Inlet Capacity
B0977 83.12 0.145 0.01 0.089 Inlet Capacity
B0978 83.51 0.113 0.02 0.032 Inlet Capacity
B0982 77.61 78.2 0.145 0.45 0 Inlet Capacity
B0983 77.92 0.145 0.54 0.025 Inlet Capacity
B0984 79.13 0.031 0.96 0.004 Inlet Capacity
B0986 70.65 0.148 0.02 0.034 Inlet Capacity
B0987 72.33 0.124 0.22 0.024 Inlet Capacity
B0988 72.49 0.124 0.29 0.038 Inlet Capacity
B0993 67.32 0.149 0.01 0.071 Inlet Capacity
B0996 74.86 0.058 1.08 0.004 Inlet Capacity
B0997 75.6 0.069 0.73 0.007 Inlet Capacity
B0998 80.27 0.058 0.82 0.012 Inlet Capacity
B1001 67.48 0.082 0.02 0.022 Inlet Capacity
B1002 72.99 0.065 0.01 0.025 Inlet Capacity
B1003 75.37 0.058 0.73 0.012 Inlet Capacity
B1005 59.37 0.077 0.57 0.009 Inlet Capacity
B1006 57.78 58.2 0.077 0.32 0 Inlet Capacity
B1007 67.76 0.162 0.01 0.094 Inlet Capacity
B1008 61.09 0.424 0 0.347 Inlet Capacity
B1011 72.72 0.217 0.05 0.113 Inlet Capacity
B1012 74.15 0.293 0.02 0.165 Inlet Capacity
B1015 80.54 0.157 0.01 0.095 Inlet Capacity
B1016 81.58 0.134 0.06 0.025 Inlet Capacity
B1017 81.72 0.273 0 0.191 Inlet Capacity
B1018 72.88 0.045 0.53 0.001 Inlet Capacity
B1019 72.94 0.046 0.72 0.014 Inlet Capacity
B1020 72.99 0.045 0.82 0.001 Inlet Capacity
B1021 74.86 0.045 0.29 0.001 Inlet Capacity
B1022 70.03 70.4 0.003 0.36 0 Inlet Capacity
B1024 70.62 0.194 0.17 0.047 Inlet Capacity
B1027 74.65 0.074 0 0.062 Inlet Capacity
B1028 75.2 0.07 0.41 0.016 Inlet Capacity
B1029 75.31 0.058 0.38 0.012 Inlet Capacity
B1030 73.36 0.067 1.64 0.025 Inlet Capacity
B1031 78.13 0.079 1.82 0.009 Inlet Capacity
B1032 82.4 0.058 1.21 0.021 Inlet Capacity
B1033 79.34 0.031 0.74 0.004 Inlet Capacity
B1036 44.58 0.042 1 0.042 Inlet Capacity
B1041 40.39 0.057 0.01 0.015 Inlet Capacity
B1043 28.53 0.58 0.01 0.467 Inlet Capacity
B1044 29.2 0.655 0 0.577 Inlet Capacity
B1051 7.05 7.97 0.058 0.81 0 Inlet Capacity
B1052 11.54 0.056 0.27 0.004 Inlet Capacity
B1053 17.8 0.027 4.4 0.005 Inlet Capacity
B1054 23.37 0.124 0.8 0.024 Inlet Capacity
PIT / NODE DETAILS
Name Max HGL Max Pond Max Surface Min Overflow Constraint
HGL Flow Arriving Freeboard (cu.m/s)(Sag Pits) (cu.m/s) (m)
B1055 24.21 0.105 1.02 0.019 Inlet Capacity
B1056 24.52 25.36 0.136 0.7 0 Inlet Capacity
B1057 31.46 0.07 0.01 0.031 Inlet Capacity
B1059 37.6 0.123 0.02 0.038 Inlet Capacity
B1060 38.66 0.086 0.79 0.037 Inlet Capacity
B1061 38.82 0.07 0.91 0.016 Inlet Capacity
B1062 7.13 0.052 0.97 0.003 Inlet Capacity
B1064 9.18 0.059 1.01 0.059 Inlet Capacity
B1065 9.44 10.52 0.059 0.97 0 Inlet Capacity
B1066 39.44 0.07 0.7 0.016 Inlet Capacity
B1068 10.4 11.07 0.602 0.52 0.406 Inlet Capacity
B1071 30.42 0.136 0.02 0.061 Inlet Capacity
B1072 31.43 0.136 0.66 0.042 Inlet Capacity
B1074 19.59 0.314 0.03 0.145 Inlet Capacity
B1075 10.43 0.069 0.22 0.027 Inlet Capacity
B1079 34.87 35.25 0.375 0.23 0.224 Inlet Capacity
B1081 36.43 0.451 0.72 0.192 Inlet Capacity
B1085 46.05 0.161 0.02 0.075 Inlet Capacity
B1086 38.24 0.275 0.02 0.139 Inlet Capacity
B1088 45.33 0.121 0 0.093 Inlet Capacity
B1090 39.11 0.163 0 0.118 Inlet Capacity
B1091 41.31 41.89 0.162 0.43 0.03 Inlet Capacity
B1092 41.7 0.245 0 0.157 Inlet Capacity
B1093 42.05 0.162 0.01 0.082 Inlet Capacity
B1096 32.76 0.149 0.29 0.027 Inlet Capacity
B1098 30.72 32.01 0.23 1.14 0.074 Inlet Capacity
B1099 31.96 0.398 0.01 0.228 Inlet Capacity
B1101 43.65 44.18 0.322 0.38 0.168 Inlet Capacity
B1102 44.05 0.248 0.02 0.099 Inlet Capacity
B1109 43.87 0.051 0.01 0.024 Inlet Capacity
B1110 44.24 0.06 0.51 0.005 Inlet Capacity
B1111 44.49 45.83 0.082 1.21 0 Inlet Capacity
B1112 45.02 0.063 0.67 0.013 Inlet Capacity
B1113 45.21 0.028 0.28 0.003 Inlet Capacity
B1114 45.42 0.082 0.48 0.021 Inlet Capacity
B1115 45.85 0.027 0.75 0.002 Inlet Capacity
B1116 46.15 0.036 0.65 0.005 Inlet Capacity
B1117 42.93 0.145 0.01 0.049 Inlet Capacity
B1118 45.56 0.209 0.15 0.083 Inlet Capacity
B1119 46.27 0.289 0.01 0.206 Inlet Capacity
B1120 47.15 0.211 1.15 0.056 Inlet Capacity
B1121 47.97 0.014 0.88 0 Inlet Capacity
B1128 45.57 0.09 0.02 0.024 Inlet Capacity
B1129 45.62 0.09 0.01 0.059 Inlet Capacity
B1130 45.12 0.109 0.02 0.039 Inlet Capacity
B1132 48.22 0.055 0.69 0.055 Inlet Capacity
ITEM 2 (continued) ATTACHMENT 1
Page 138
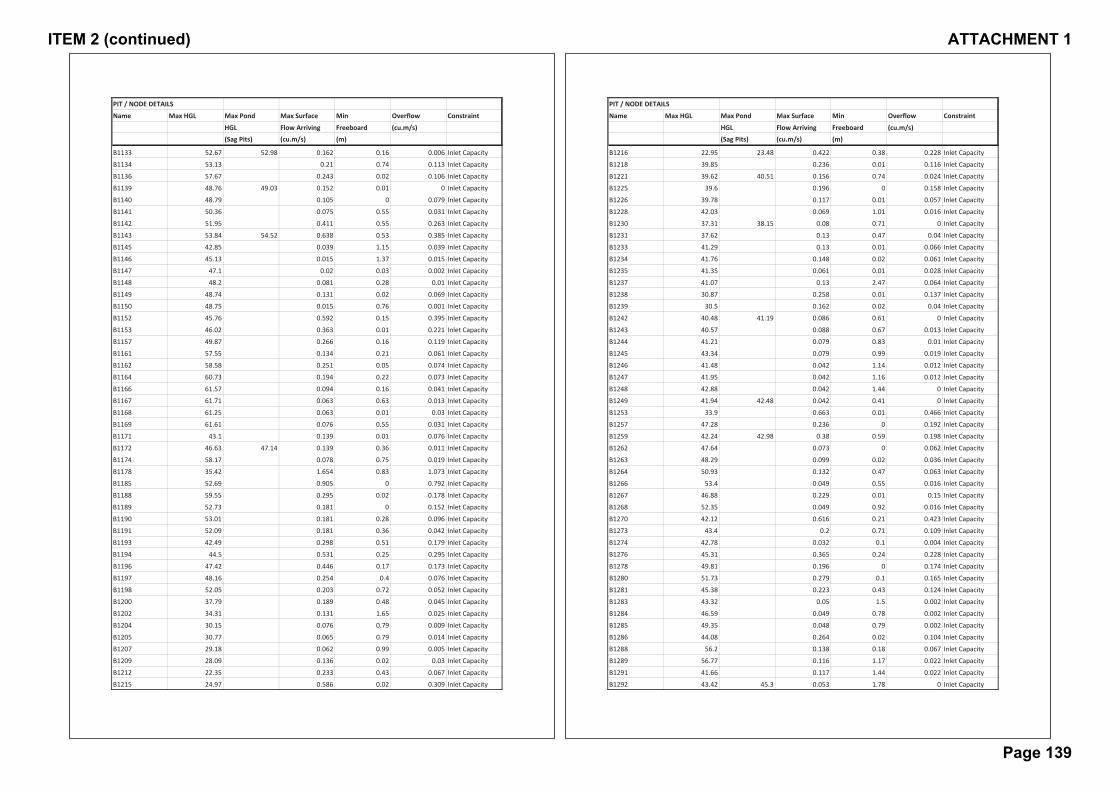
PIT / NODE DETAILS
Name Max HGL Max Pond Max Surface Min Overflow Constraint
HGL Flow Arriving Freeboard (cu.m/s)(Sag Pits) (cu.m/s) (m)
B1133 52.67 52.98 0.162 0.16 0.006 Inlet Capacity
B1134 53.13 0.21 0.74 0.113 Inlet Capacity
B1136 57.67 0.243 0.02 0.106 Inlet Capacity
B1139 48.76 49.03 0.152 0.01 0 Inlet Capacity
B1140 48.79 0.105 0 0.079 Inlet Capacity
B1141 50.36 0.075 0.55 0.031 Inlet Capacity
B1142 51.95 0.411 0.55 0.263 Inlet Capacity
B1143 53.84 54.52 0.638 0.53 0.385 Inlet Capacity
B1145 42.85 0.039 1.15 0.039 Inlet Capacity
B1146 45.13 0.015 1.37 0.015 Inlet Capacity
B1147 47.1 0.02 0.03 0.002 Inlet Capacity
B1148 48.2 0.081 0.28 0.01 Inlet Capacity
B1149 48.74 0.131 0.02 0.069 Inlet Capacity
B1150 48.75 0.015 0.76 0.001 Inlet Capacity
B1152 45.76 0.592 0.15 0.395 Inlet Capacity
B1153 46.02 0.363 0.01 0.221 Inlet Capacity
B1157 49.87 0.266 0.16 0.119 Inlet Capacity
B1161 57.55 0.134 0.21 0.061 Inlet Capacity
B1162 58.58 0.251 0.05 0.074 Inlet Capacity
B1164 60.73 0.194 0.22 0.073 Inlet Capacity
B1166 61.57 0.094 0.16 0.041 Inlet Capacity
B1167 61.71 0.063 0.63 0.013 Inlet Capacity
B1168 61.25 0.063 0.01 0.03 Inlet Capacity
B1169 61.61 0.076 0.55 0.031 Inlet Capacity
B1171 43.1 0.139 0.01 0.076 Inlet Capacity
B1172 46.63 47.14 0.139 0.36 0.011 Inlet Capacity
B1174 58.17 0.078 0.75 0.019 Inlet Capacity
B1178 35.42 1.654 0.83 1.073 Inlet Capacity
B1185 52.69 0.905 0 0.792 Inlet Capacity
B1188 59.55 0.295 0.02 0.178 Inlet Capacity
B1189 52.73 0.181 0 0.152 Inlet Capacity
B1190 53.01 0.181 0.28 0.096 Inlet Capacity
B1191 52.09 0.181 0.36 0.042 Inlet Capacity
B1193 42.49 0.298 0.51 0.179 Inlet Capacity
B1194 44.5 0.531 0.25 0.295 Inlet Capacity
B1196 47.42 0.446 0.17 0.173 Inlet Capacity
B1197 48.16 0.254 0.4 0.076 Inlet Capacity
B1198 52.05 0.203 0.72 0.052 Inlet Capacity
B1200 37.79 0.189 0.48 0.045 Inlet Capacity
B1202 34.31 0.131 1.65 0.025 Inlet Capacity
B1204 30.15 0.076 0.79 0.009 Inlet Capacity
B1205 30.77 0.065 0.79 0.014 Inlet Capacity
B1207 29.18 0.062 0.99 0.005 Inlet Capacity
B1209 28.09 0.136 0.02 0.03 Inlet Capacity
B1212 22.35 0.233 0.43 0.067 Inlet Capacity
B1215 24.97 0.586 0.02 0.309 Inlet Capacity
PIT / NODE DETAILS
Name Max HGL Max Pond Max Surface Min Overflow Constraint
HGL Flow Arriving Freeboard (cu.m/s)(Sag Pits) (cu.m/s) (m)
B1216 22.95 23.48 0.422 0.38 0.228 Inlet Capacity
B1218 39.85 0.236 0.01 0.116 Inlet Capacity
B1221 39.62 40.51 0.156 0.74 0.024 Inlet Capacity
B1225 39.6 0.196 0 0.158 Inlet Capacity
B1226 39.78 0.117 0.01 0.057 Inlet Capacity
B1228 42.03 0.069 1.01 0.016 Inlet Capacity
B1230 37.31 38.15 0.08 0.71 0 Inlet Capacity
B1231 37.62 0.13 0.47 0.04 Inlet Capacity
B1233 41.29 0.13 0.01 0.066 Inlet Capacity
B1234 41.76 0.148 0.02 0.061 Inlet Capacity
B1235 41.35 0.061 0.01 0.028 Inlet Capacity
B1237 41.07 0.13 2.47 0.064 Inlet Capacity
B1238 30.87 0.258 0.01 0.137 Inlet Capacity
B1239 30.5 0.162 0.02 0.04 Inlet Capacity
B1242 40.48 41.19 0.086 0.61 0 Inlet Capacity
B1243 40.57 0.088 0.67 0.013 Inlet Capacity
B1244 41.21 0.079 0.83 0.01 Inlet Capacity
B1245 43.34 0.079 0.99 0.019 Inlet Capacity
B1246 41.48 0.042 1.14 0.012 Inlet Capacity
B1247 41.95 0.042 1.16 0.012 Inlet Capacity
B1248 42.88 0.042 1.44 0 Inlet Capacity
B1249 41.94 42.48 0.042 0.41 0 Inlet Capacity
B1253 33.9 0.663 0.01 0.466 Inlet Capacity
B1257 47.28 0.236 0 0.192 Inlet Capacity
B1259 42.24 42.98 0.38 0.59 0.198 Inlet Capacity
B1262 47.64 0.073 0 0.062 Inlet Capacity
B1263 48.29 0.099 0.02 0.036 Inlet Capacity
B1264 50.93 0.132 0.47 0.063 Inlet Capacity
B1266 53.4 0.049 0.55 0.016 Inlet Capacity
B1267 46.88 0.229 0.01 0.15 Inlet Capacity
B1268 52.35 0.049 0.92 0.016 Inlet Capacity
B1270 42.12 0.616 0.21 0.423 Inlet Capacity
B1273 43.4 0.2 0.71 0.109 Inlet Capacity
B1274 42.78 0.032 0.1 0.004 Inlet Capacity
B1276 45.31 0.365 0.24 0.228 Inlet Capacity
B1278 49.81 0.196 0 0.174 Inlet Capacity
B1280 51.73 0.279 0.1 0.165 Inlet Capacity
B1281 45.38 0.223 0.43 0.124 Inlet Capacity
B1283 43.32 0.05 1.5 0.002 Inlet Capacity
B1284 46.59 0.049 0.78 0.002 Inlet Capacity
B1285 49.35 0.048 0.79 0.002 Inlet Capacity
B1286 44.08 0.264 0.02 0.104 Inlet Capacity
B1288 56.2 0.138 0.18 0.067 Inlet Capacity
B1289 56.77 0.116 1.17 0.022 Inlet Capacity
B1291 41.66 0.117 1.44 0.022 Inlet Capacity
B1292 43.42 45.3 0.053 1.78 0 Inlet Capacity
ITEM 2 (continued) ATTACHMENT 1
Page 139

PIT / NODE DETAILS
Name Max HGL Max Pond Max Surface Min Overflow Constraint
HGL Flow Arriving Freeboard (cu.m/s)(Sag Pits) (cu.m/s) (m)
B1293 44.58 0.058 0.78 0.012 Inlet Capacity
B1294 44.88 0.058 0.88 0.012 Inlet Capacity
B1295 45.67 0.079 0.32 0.01 Inlet Capacity
B1296 45.78 0.167 0.24 0.058 Inlet Capacity
B1297 47.83 0.113 0.46 0.054 Inlet Capacity
B1298 49.89 0.221 0.02 0.091 Inlet Capacity
B1301 55.86 0.048 0.02 0.006 Inlet Capacity
B1306 58.88 0.127 0.02 0.026 Inlet Capacity
B1310 63.48 0.985 0.01 0.789 Inlet Capacity
B1313 73.16 0.102 0 0.069 Inlet Capacity
B1316 47.93 49.76 0.07 1.71 0 Inlet Capacity
B1317 52.95 53.14 0.251 0.04 0.083 Inlet Capacity
B1318 42.39 0.147 0.99 0.026 Inlet Capacity
B1319 47.39 0.037 0.98 0.005 Inlet Capacity
B1321 49.26 0.344 0.02 0.132 Inlet Capacity
B1324 54.1 0.387 0.01 0.306 Inlet Capacity
B1325 54.52 0.423 0 0.313 Inlet Capacity
B1327 47.71 0.077 0.02 0.014 Inlet Capacity
B1328 47.29 0.077 0 0.058 Inlet Capacity
B1331 48 0.034 1.49 0.008 Inlet Capacity
B1332 49.24 0.176 0.02 0.094 Inlet Capacity
B1334 52.22 53.83 0.298 1.46 0.175 Inlet Capacity
B1335 53.7 0.25 0.01 0.174 Inlet Capacity
B1337 55.39 0.13 0.44 0.04 Inlet Capacity
B1338 55.83 0.101 0.43 0.028 Inlet Capacity
B1340 59.83 0.1 0.71 0.028 Inlet Capacity
B1341 51.75 0.449 0.01 0.31 Inlet Capacity
B1345 56.95 0.151 0.01 0.093 Inlet Capacity
B1346 64 0.126 0.56 0.024 Inlet Capacity
B1350 67.47 0.059 0.34 0.004 Inlet Capacity
B1351 71.86 0.057 0.13 0.011 Inlet Capacity
B1352 75.58 0.048 0.57 0.009 Inlet Capacity
B1353 75.89 0.055 0.74 0.011 Inlet Capacity
B1354 61.93 0.077 0.17 0.017 Inlet Capacity
B1355 64.72 0.087 0.21 0.023 Inlet Capacity
B1359 67.05 0.124 0.46 0.061 Inlet Capacity
B1360 67.58 0.079 0.59 0.033 Inlet Capacity
B1363 61.85 0.617 0 0.493 Inlet Capacity
B1369 69.54 0.188 0 0.139 Inlet Capacity
B1370 71.94 0.066 0.45 0.024 Inlet Capacity
B1371 57.66 58.4 0.044 0.67 0 Inlet Capacity
B1372 69.52 0.152 0.01 0.073 Inlet Capacity
B1381 76.39 0.165 0.01 0.067 Inlet Capacity
B1382 62.84 0.018 0.39 0 Inlet Capacity
B1383 63.89 0.137 0.01 0.072 Inlet Capacity
B1386 76 0.137 0.02 0.045 Inlet Capacity
PIT / NODE DETAILS
Name Max HGL Max Pond Max Surface Min Overflow Constraint
HGL Flow Arriving Freeboard (cu.m/s)(Sag Pits) (cu.m/s) (m)
B1387 64.82 0.185 0.02 0.111 Inlet Capacity
B1389 77.28 0.111 0 0.093 Inlet Capacity
B1390 78.02 0.12 1.18 0.035 Inlet Capacity
B1391 79.32 0.141 0.54 0.044 Inlet Capacity
B1393 18.25 18.79 0.757 0.39 0.487 Inlet Capacity
B1402 53.6 54.21 0.033 0.55 0 Inlet Capacity
B1404 59.76 0.077 0.02 0.025 Inlet Capacity
B1405 60.63 0.195 0.21 0.075 Inlet Capacity
B1406 55.96 0.166 0.07 0.058 Inlet Capacity
B1407 57.42 0.27 0.4 0.158 Inlet Capacity
B1408 58.67 0.424 0.01 0.26 Inlet Capacity
B1411 59.31 0.357 0.05 0.221 Inlet Capacity
B1415 67.35 0.178 0.22 0.04 Inlet Capacity
B1418 47.6 0.058 0.57 0.004 Inlet Capacity
B1419 51.71 0.139 0.16 0.025 Inlet Capacity
B1421 32.35 0.096 0.28 0.015 Inlet Capacity
B1422 47.43 0.26 0.02 0.118 Inlet Capacity
B1426 52.35 0.119 0 0.079 Inlet Capacity
B1428 63.16 0.06 0.02 0.018 Inlet Capacity
B1429 64.54 0.05 0.69 0.009 Inlet Capacity
B1430 66.26 0.077 0.3 0.032 Inlet Capacity
B1432 57.81 0.122 0.65 0.036 Inlet Capacity
B1434 63.76 0.109 0.27 0.019 Inlet Capacity
B1435 61.49 0.08 1.61 0.01 Inlet Capacity
B1439 67.29 0.219 0.19 0.102 Inlet Capacity
B1441 60.51 0.041 1.45 0.011 Inlet Capacity
B1442 60.85 0.041 1.14 0 Inlet Capacity
B1443 59.9 0.052 2.05 0.017 Inlet Capacity
B1444 68.84 0.174 1.18 0.083 Inlet Capacity
B1445 61.94 0.098 0.02 0.035 Inlet Capacity
B1447 63.24 0.098 0.74 0.046 Inlet Capacity
B1448 65.48 0.096 0.77 0.015 Inlet Capacity
B1449 59.4 61.08 0.021 1.58 0 Inlet Capacity
B1450 60.72 0.014 0.77 0 Inlet Capacity
B1451 42.04 0.097 0.01 0.044 Inlet Capacity
B1452 42.76 0.105 0.7 0.018 Inlet Capacity
B1453 44.75 0.098 0.1 0.027 Inlet Capacity
B1454 45.99 0.078 0.69 0.019 Inlet Capacity
B1455 41.14 0.773 0 0.679 Inlet Capacity
B1456 42.44 0.299 0.01 0.19 Inlet Capacity
B1457 48.22 0.196 0.01 0.129 Inlet Capacity
B1458 49.5 0.132 0.11 0.064 Inlet Capacity
B1463 67.2 0.063 0 0.038 Inlet Capacity
B1464 68.77 0.085 0.23 0.012 Inlet Capacity
B1465 71.61 0.06 0.39 0.004 Inlet Capacity
B1466 72.22 0.077 0.5 0.009 Inlet Capacity
ITEM 2 (continued) ATTACHMENT 1
Page 140
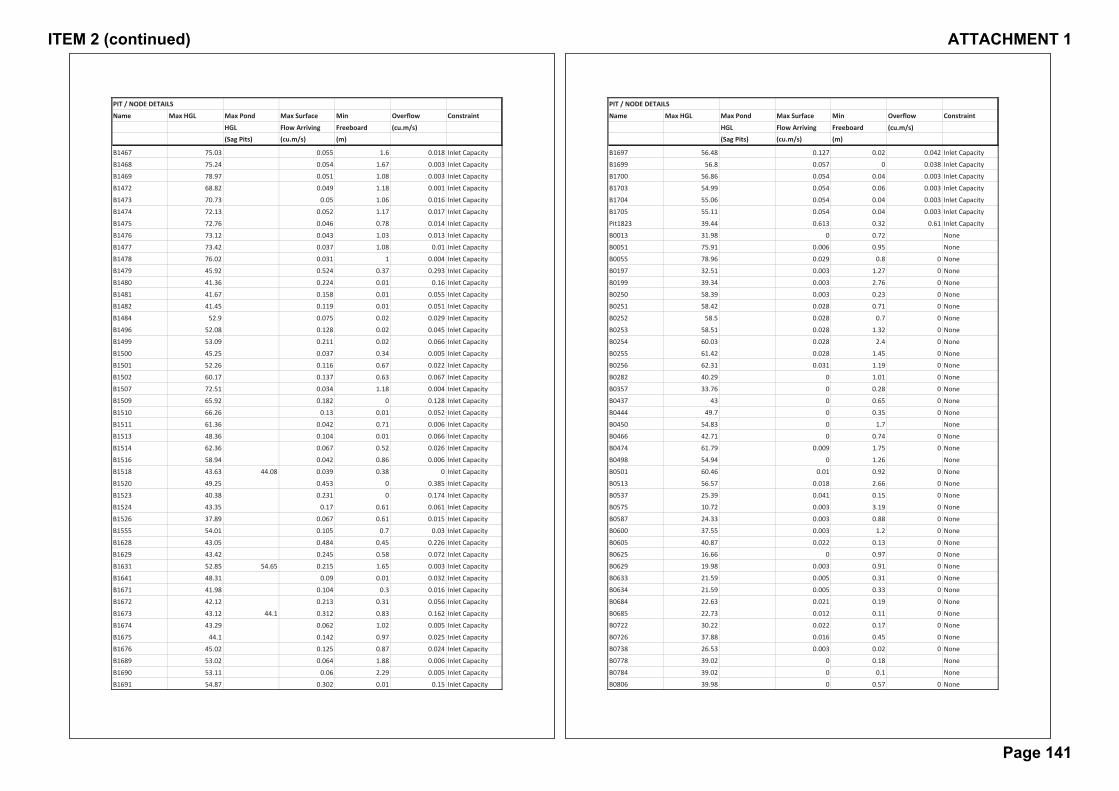
PIT / NODE DETAILS
Name Max HGL Max Pond Max Surface Min Overflow Constraint
HGL Flow Arriving Freeboard (cu.m/s)(Sag Pits) (cu.m/s) (m)
B1467 75.03 0.055 1.6 0.018 Inlet Capacity
B1468 75.24 0.054 1.67 0.003 Inlet Capacity
B1469 78.97 0.051 1.08 0.003 Inlet Capacity
B1472 68.82 0.049 1.18 0.001 Inlet Capacity
B1473 70.73 0.05 1.06 0.016 Inlet Capacity
B1474 72.13 0.052 1.17 0.017 Inlet Capacity
B1475 72.76 0.046 0.78 0.014 Inlet Capacity
B1476 73.12 0.043 1.03 0.013 Inlet Capacity
B1477 73.42 0.037 1.08 0.01 Inlet Capacity
B1478 76.02 0.031 1 0.004 Inlet Capacity
B1479 45.92 0.524 0.37 0.293 Inlet Capacity
B1480 41.36 0.224 0.01 0.16 Inlet Capacity
B1481 41.67 0.158 0.01 0.055 Inlet Capacity
B1482 41.45 0.119 0.01 0.051 Inlet Capacity
B1484 52.9 0.075 0.02 0.029 Inlet Capacity
B1496 52.08 0.128 0.02 0.045 Inlet Capacity
B1499 53.09 0.211 0.02 0.066 Inlet Capacity
B1500 45.25 0.037 0.34 0.005 Inlet Capacity
B1501 52.26 0.116 0.67 0.022 Inlet Capacity
B1502 60.17 0.137 0.63 0.067 Inlet Capacity
B1507 72.51 0.034 1.18 0.004 Inlet Capacity
B1509 65.92 0.182 0 0.128 Inlet Capacity
B1510 66.26 0.13 0.01 0.052 Inlet Capacity
B1511 61.36 0.042 0.71 0.006 Inlet Capacity
B1513 48.36 0.104 0.01 0.066 Inlet Capacity
B1514 62.36 0.067 0.52 0.026 Inlet Capacity
B1516 58.94 0.042 0.86 0.006 Inlet Capacity
B1518 43.63 44.08 0.039 0.38 0 Inlet Capacity
B1520 49.25 0.453 0 0.385 Inlet Capacity
B1523 40.38 0.231 0 0.174 Inlet Capacity
B1524 43.35 0.17 0.61 0.061 Inlet Capacity
B1526 37.89 0.067 0.61 0.015 Inlet Capacity
B1555 54.01 0.105 0.7 0.03 Inlet Capacity
B1628 43.05 0.484 0.45 0.226 Inlet Capacity
B1629 43.42 0.245 0.58 0.072 Inlet Capacity
B1631 52.85 54.65 0.215 1.65 0.003 Inlet Capacity
B1641 48.31 0.09 0.01 0.032 Inlet Capacity
B1671 41.98 0.104 0.3 0.016 Inlet Capacity
B1672 42.12 0.213 0.31 0.056 Inlet Capacity
B1673 43.12 44.1 0.312 0.83 0.162 Inlet Capacity
B1674 43.29 0.062 1.02 0.005 Inlet Capacity
B1675 44.1 0.142 0.97 0.025 Inlet Capacity
B1676 45.02 0.125 0.87 0.024 Inlet Capacity
B1689 53.02 0.064 1.88 0.006 Inlet Capacity
B1690 53.11 0.06 2.29 0.005 Inlet Capacity
B1691 54.87 0.302 0.01 0.15 Inlet Capacity
PIT / NODE DETAILS
Name Max HGL Max Pond Max Surface Min Overflow Constraint
HGL Flow Arriving Freeboard (cu.m/s)(Sag Pits) (cu.m/s) (m)
B1697 56.48 0.127 0.02 0.042 Inlet Capacity
B1699 56.8 0.057 0 0.038 Inlet Capacity
B1700 56.86 0.054 0.04 0.003 Inlet Capacity
B1703 54.99 0.054 0.06 0.003 Inlet Capacity
B1704 55.06 0.054 0.04 0.003 Inlet Capacity
B1705 55.11 0.054 0.04 0.003 Inlet Capacity
Pit1823 39.44 0.613 0.32 0.61 Inlet Capacity
B0013 31.98 0 0.72 None
B0051 75.91 0.006 0.95 None
B0055 78.96 0.029 0.8 0 None
B0197 32.51 0.003 1.27 0 None
B0199 39.34 0.003 2.76 0 None
B0250 58.39 0.003 0.23 0 None
B0251 58.42 0.028 0.71 0 None
B0252 58.5 0.028 0.7 0 None
B0253 58.51 0.028 1.32 0 None
B0254 60.03 0.028 2.4 0 None
B0255 61.42 0.028 1.45 0 None
B0256 62.31 0.031 1.19 0 None
B0282 40.29 0 1.01 0 None
B0357 33.76 0 0.28 0 None
B0437 43 0 0.65 0 None
B0444 49.7 0 0.35 0 None
B0450 54.83 0 1.7 None
B0466 42.71 0 0.74 0 None
B0474 61.79 0.009 1.75 0 None
B0498 54.94 0 1.26 None
B0501 60.46 0.01 0.92 0 None
B0513 56.57 0.018 2.66 0 None
B0537 25.39 0.041 0.15 0 None
B0575 10.72 0.003 3.19 0 None
B0587 24.33 0.003 0.88 0 None
B0600 37.55 0.003 1.2 0 None
B0605 40.87 0.022 0.13 0 None
B0625 16.66 0 0.97 0 None
B0629 19.98 0.003 0.91 0 None
B0633 21.59 0.005 0.31 0 None
B0634 21.59 0.005 0.33 0 None
B0684 22.63 0.021 0.19 0 None
B0685 22.73 0.012 0.11 0 None
B0722 30.22 0.022 0.17 0 None
B0726 37.88 0.016 0.45 0 None
B0738 26.53 0.003 0.02 0 None
B0778 39.02 0 0.18 None
B0784 39.02 0 0.1 None
B0806 39.98 0 0.57 0 None
ITEM 2 (continued) ATTACHMENT 1
Page 141

PIT / NODE DETAILS
Name Max HGL Max Pond Max Surface Min Overflow Constraint
HGL Flow Arriving Freeboard (cu.m/s)(Sag Pits) (cu.m/s) (m)
B0807 39.98 0 0.47 0 None
B0825 56.72 0.012 0.46 0 None
B0828 51.76 0.015 0.85 0 None
B0841 51.27 0.022 0.33 0 None
B0851 47.83 0.023 0.94 0 None
B0852 48 0.023 0.99 0 None
B0854 32.1 0.003 0.88 0 None
B0855 32.66 0.02 1.31 0 None
B0880 39.11 0.003 0.98 0 None
B0892 43.33 0 0.64 None
B0899 46.53 0.003 0.96 0 None
B0900 48.01 0.003 1.24 0 None
B0901 49.7 0.003 2.01 0 None
B0909 47.65 0 1.14 0 None
B0915 52.15 0.003 0.91 0 None
B0917 45.44 0.033 0.59 0 None
B0973 71.77 0.003 1.27 0 None
B0974 73.79 0.003 0.85 0 None
B0975 73.01 0.003 0.58 0 None
B0980 36.54 0.003 0.44 0 None
B0981 36.79 0.003 0.77 0 None
B1004 57.66 0.012 0.56 0 None
B1025 70.62 0.003 0.44 0 None
B1026 67.2 0.02 0.83 0 None
B1034 56.56 0.015 2.77 0 None
B1039 56.59 0.015 2.74 0 None
B1122 48.59 0.014 0.95 0 None
B1123 48.77 0.014 0.88 0 None
B1151 48.75 0.015 0.63 0 None
B1156 46.31 0.012 0.79 0 None
B1175 58.66 0 0.87 0 None
B1220 40.65 0.011 1.28 0 None
B1240 30.08 0.003 0.9 0 None
B1241 40.32 0 0.62 0 None
B1279 50.36 0 0.85 None
B1282 50.37 0.009 0.82 0 None
B1300 57.03 0.003 0.84 0 None
B1315 54.54 0.01 2.42 0 None
B1320 48.53 0.037 0.76 0 None
B1322 49.28 0.037 0.18 0 None
B1339 47.18 0.029 0.1 0 None
B1356 55.42 0.003 0.9 0 None
B1357 56.21 0.003 1.04 0 None
B1358 56.83 0.003 1.24 0 None
B1375 62.78 0 0.42 None
B1376 63.15 0 0.53 None
PIT / NODE DETAILS
Name Max HGL Max Pond Max Surface Min Overflow Constraint
HGL Flow Arriving Freeboard (cu.m/s)(Sag Pits) (cu.m/s) (m)
B1403 59.35 0.027 0.2 0 None
B1409 58.77 0 0.29 0 None
B1420 51.92 0.003 0.8 0 None
B1433 63.29 0 0.06 0 None
B1470 79.14 0.003 1.95 0 None
B1483 44.38 0.003 0.25 0 None
B1485 39.97 0.012 0.03 0 None
B1503 60.17 0.003 0.74 0 None
B1506 73.2 0.034 0.77 0 None
B1515 68.18 0.038 0.73 0 None
B1521 52.45 0.003 0.65 0 None
B1525 37.83 0.01 0.65 0 None
B1527 38.5 0.007 1.1 0 None
B1528 39.21 0.007 0.41 0 None
B1529 40.86 0.007 0.49 0 None
B1530 42.34 0.003 0.56 0 None
B1531 43.2 0.007 0.6 0 None
B1532 43.65 0.007 0.35 0 None
B1533 39.24 0.007 0.66 0 None
B1636 45.03 0.022 0.57 0 None
B1637 45.67 0.035 2.13 0 None
B1638 47.32 0.019 2.18 0 None
B1640 45.86 0.029 0.04 0 None
B1642 48.32 0.029 0.18 0 None
B1678 52.1 0.03 0.85 0 None
B1679 52.63 0.03 0.62 0 None
B1681 43.14 0.038 0.86 0 None
B1682 55.53 0.013 0.89 0 None
B1683 56.28 0.013 1.07 0 None
B1684 56.94 0.013 1.23 0 None
B1701 56.87 0.008 0.08 0 None
B0020 35.53 9.38 0.11 10.195 Outlet System
B0021 35.95 8.855 0.05 9.34 Outlet System
B0025 38.6 8.363 0.13 9.417 Outlet System
B0029 39.2 5.692 0 6.891 Outlet System
B0030 39.64 5.435 0.12 5.427 Outlet System
B0031 40.52 5.278 0.64 5.254 Outlet System
B0032 41.03 4.925 0.53 4.925 Outlet System
B0033 41.11 4.977 0.57 4.925 Outlet System
B0034 42.83 2.157 0.11 2.683 Outlet System
B0035 44.53 1.893 0.03 2.127 Outlet System
B0041 47.96 1.317 0 1.91 Outlet System
B0047 58.34 0.838 0.18 1.053 Outlet System
B0048 60.57 0.647 0.07 0.769 Outlet System
B0057 46.59 0.915 0.19 1.146 Outlet System
B0058 47.11 0.732 0.01 0.776 Outlet System
ITEM 2 (continued) ATTACHMENT 1
Page 142
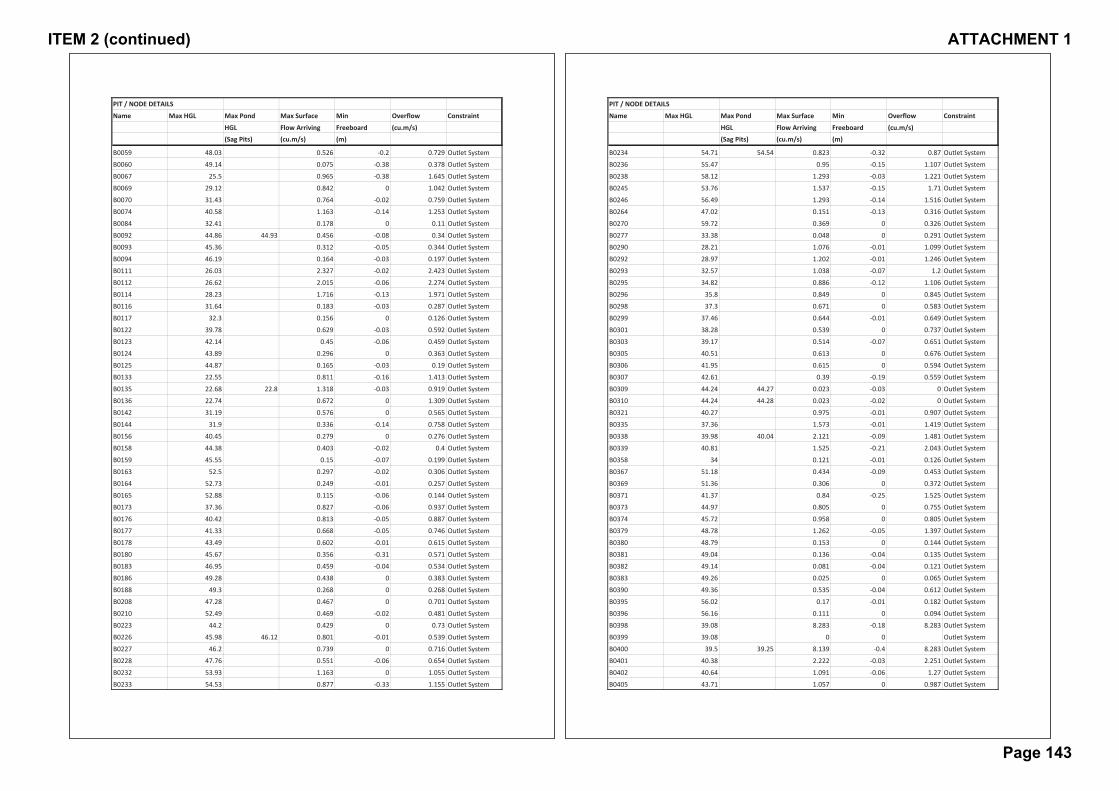
PIT / NODE DETAILS
Name Max HGL Max Pond Max Surface Min Overflow Constraint
HGL Flow Arriving Freeboard (cu.m/s)(Sag Pits) (cu.m/s) (m)
B0059 48.03 0.526 0.2 0.729 Outlet System
B0060 49.14 0.075 0.38 0.378 Outlet System
B0067 25.5 0.965 0.38 1.645 Outlet System
B0069 29.12 0.842 0 1.042 Outlet System
B0070 31.43 0.764 0.02 0.759 Outlet System
B0074 40.58 1.163 0.14 1.253 Outlet System
B0084 32.41 0.178 0 0.11 Outlet System
B0092 44.86 44.93 0.456 0.08 0.34 Outlet System
B0093 45.36 0.312 0.05 0.344 Outlet System
B0094 46.19 0.164 0.03 0.197 Outlet System
B0111 26.03 2.327 0.02 2.423 Outlet System
B0112 26.62 2.015 0.06 2.274 Outlet System
B0114 28.23 1.716 0.13 1.971 Outlet System
B0116 31.64 0.183 0.03 0.287 Outlet System
B0117 32.3 0.156 0 0.126 Outlet System
B0122 39.78 0.629 0.03 0.592 Outlet System
B0123 42.14 0.45 0.06 0.459 Outlet System
B0124 43.89 0.296 0 0.363 Outlet System
B0125 44.87 0.165 0.03 0.19 Outlet System
B0133 22.55 0.811 0.16 1.413 Outlet System
B0135 22.68 22.8 1.318 0.03 0.919 Outlet System
B0136 22.74 0.672 0 1.309 Outlet System
B0142 31.19 0.576 0 0.565 Outlet System
B0144 31.9 0.336 0.14 0.758 Outlet System
B0156 40.45 0.279 0 0.276 Outlet System
B0158 44.38 0.403 0.02 0.4 Outlet System
B0159 45.55 0.15 0.07 0.199 Outlet System
B0163 52.5 0.297 0.02 0.306 Outlet System
B0164 52.73 0.249 0.01 0.257 Outlet System
B0165 52.88 0.115 0.06 0.144 Outlet System
B0173 37.36 0.827 0.06 0.937 Outlet System
B0176 40.42 0.813 0.05 0.887 Outlet System
B0177 41.33 0.668 0.05 0.746 Outlet System
B0178 43.49 0.602 0.01 0.615 Outlet System
B0180 45.67 0.356 0.31 0.571 Outlet System
B0183 46.95 0.459 0.04 0.534 Outlet System
B0186 49.28 0.438 0 0.383 Outlet System
B0188 49.3 0.268 0 0.268 Outlet System
B0208 47.28 0.467 0 0.701 Outlet System
B0210 52.49 0.469 0.02 0.481 Outlet System
B0223 44.2 0.429 0 0.73 Outlet System
B0226 45.98 46.12 0.801 0.01 0.539 Outlet System
B0227 46.2 0.739 0 0.716 Outlet System
B0228 47.76 0.551 0.06 0.654 Outlet System
B0232 53.93 1.163 0 1.055 Outlet System
B0233 54.53 0.877 0.33 1.155 Outlet System
PIT / NODE DETAILS
Name Max HGL Max Pond Max Surface Min Overflow Constraint
HGL Flow Arriving Freeboard (cu.m/s)(Sag Pits) (cu.m/s) (m)
B0234 54.71 54.54 0.823 0.32 0.87 Outlet System
B0236 55.47 0.95 0.15 1.107 Outlet System
B0238 58.12 1.293 0.03 1.221 Outlet System
B0245 53.76 1.537 0.15 1.71 Outlet System
B0246 56.49 1.293 0.14 1.516 Outlet System
B0264 47.02 0.151 0.13 0.316 Outlet System
B0270 59.72 0.369 0 0.326 Outlet System
B0277 33.38 0.048 0 0.291 Outlet System
B0290 28.21 1.076 0.01 1.099 Outlet System
B0292 28.97 1.202 0.01 1.246 Outlet System
B0293 32.57 1.038 0.07 1.2 Outlet System
B0295 34.82 0.886 0.12 1.106 Outlet System
B0296 35.8 0.849 0 0.845 Outlet System
B0298 37.3 0.671 0 0.583 Outlet System
B0299 37.46 0.644 0.01 0.649 Outlet System
B0301 38.28 0.539 0 0.737 Outlet System
B0303 39.17 0.514 0.07 0.651 Outlet System
B0305 40.51 0.613 0 0.676 Outlet System
B0306 41.95 0.615 0 0.594 Outlet System
B0307 42.61 0.39 0.19 0.559 Outlet System
B0309 44.24 44.27 0.023 0.03 0 Outlet System
B0310 44.24 44.28 0.023 0.02 0 Outlet System
B0321 40.27 0.975 0.01 0.907 Outlet System
B0335 37.36 1.573 0.01 1.419 Outlet System
B0338 39.98 40.04 2.121 0.09 1.481 Outlet System
B0339 40.81 1.525 0.21 2.043 Outlet System
B0358 34 0.121 0.01 0.126 Outlet System
B0367 51.18 0.434 0.09 0.453 Outlet System
B0369 51.36 0.306 0 0.372 Outlet System
B0371 41.37 0.84 0.25 1.525 Outlet System
B0373 44.97 0.805 0 0.755 Outlet System
B0374 45.72 0.958 0 0.805 Outlet System
B0379 48.78 1.262 0.05 1.397 Outlet System
B0380 48.79 0.153 0 0.144 Outlet System
B0381 49.04 0.136 0.04 0.135 Outlet System
B0382 49.14 0.081 0.04 0.121 Outlet System
B0383 49.26 0.025 0 0.065 Outlet System
B0390 49.36 0.535 0.04 0.612 Outlet System
B0395 56.02 0.17 0.01 0.182 Outlet System
B0396 56.16 0.111 0 0.094 Outlet System
B0398 39.08 8.283 0.18 8.283 Outlet System
B0399 39.08 0 0 Outlet System
B0400 39.5 39.25 8.139 0.4 8.283 Outlet System
B0401 40.38 2.222 0.03 2.251 Outlet System
B0402 40.64 1.091 0.06 1.27 Outlet System
B0405 43.71 1.057 0 0.987 Outlet System
ITEM 2 (continued) ATTACHMENT 1
Page 143
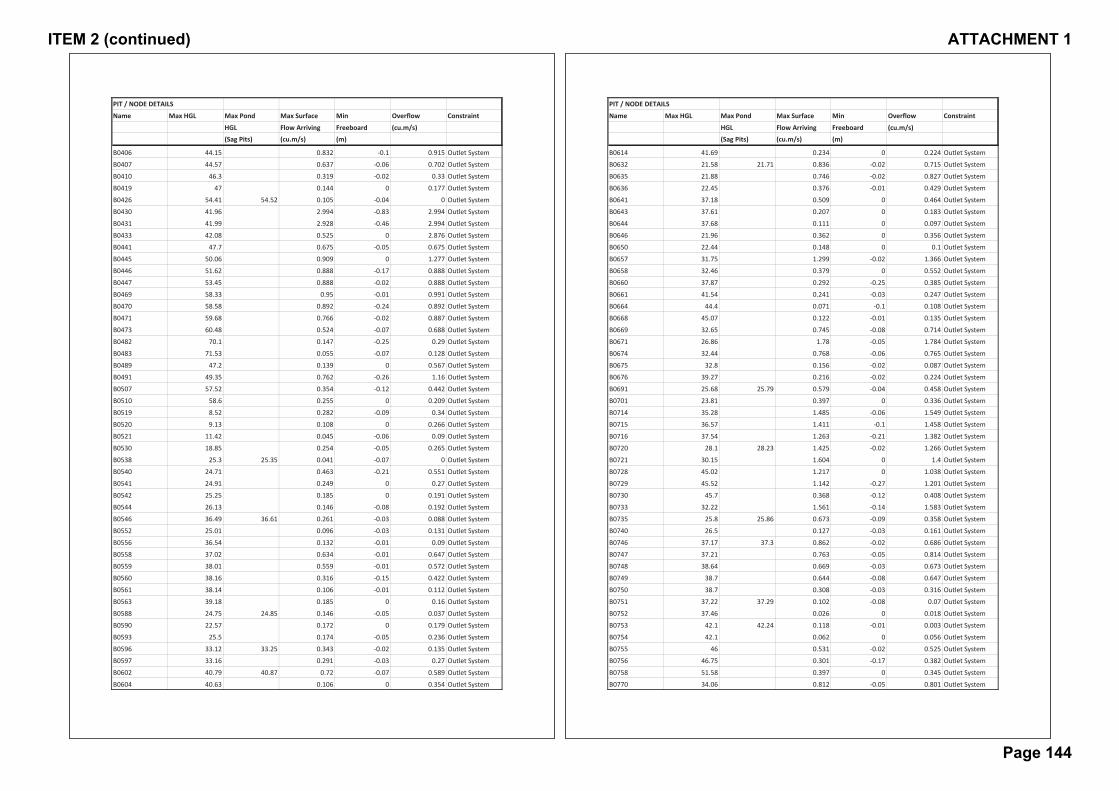
PIT / NODE DETAILS
Name Max HGL Max Pond Max Surface Min Overflow Constraint
HGL Flow Arriving Freeboard (cu.m/s)(Sag Pits) (cu.m/s) (m)
B0406 44.15 0.832 0.1 0.915 Outlet System
B0407 44.57 0.637 0.06 0.702 Outlet System
B0410 46.3 0.319 0.02 0.33 Outlet System
B0419 47 0.144 0 0.177 Outlet System
B0426 54.41 54.52 0.105 0.04 0 Outlet System
B0430 41.96 2.994 0.83 2.994 Outlet System
B0431 41.99 2.928 0.46 2.994 Outlet System
B0433 42.08 0.525 0 2.876 Outlet System
B0441 47.7 0.675 0.05 0.675 Outlet System
B0445 50.06 0.909 0 1.277 Outlet System
B0446 51.62 0.888 0.17 0.888 Outlet System
B0447 53.45 0.888 0.02 0.888 Outlet System
B0469 58.33 0.95 0.01 0.991 Outlet System
B0470 58.58 0.892 0.24 0.892 Outlet System
B0471 59.68 0.766 0.02 0.887 Outlet System
B0473 60.48 0.524 0.07 0.688 Outlet System
B0482 70.1 0.147 0.25 0.29 Outlet System
B0483 71.53 0.055 0.07 0.128 Outlet System
B0489 47.2 0.139 0 0.567 Outlet System
B0491 49.35 0.762 0.26 1.16 Outlet System
B0507 57.52 0.354 0.12 0.442 Outlet System
B0510 58.6 0.255 0 0.209 Outlet System
B0519 8.52 0.282 0.09 0.34 Outlet System
B0520 9.13 0.108 0 0.266 Outlet System
B0521 11.42 0.045 0.06 0.09 Outlet System
B0530 18.85 0.254 0.05 0.265 Outlet System
B0538 25.3 25.35 0.041 0.07 0 Outlet System
B0540 24.71 0.463 0.21 0.551 Outlet System
B0541 24.91 0.249 0 0.27 Outlet System
B0542 25.25 0.185 0 0.191 Outlet System
B0544 26.13 0.146 0.08 0.192 Outlet System
B0546 36.49 36.61 0.261 0.03 0.088 Outlet System
B0552 25.01 0.096 0.03 0.131 Outlet System
B0556 36.54 0.132 0.01 0.09 Outlet System
B0558 37.02 0.634 0.01 0.647 Outlet System
B0559 38.01 0.559 0.01 0.572 Outlet System
B0560 38.16 0.316 0.15 0.422 Outlet System
B0561 38.14 0.106 0.01 0.112 Outlet System
B0563 39.18 0.185 0 0.16 Outlet System
B0588 24.75 24.85 0.146 0.05 0.037 Outlet System
B0590 22.57 0.172 0 0.179 Outlet System
B0593 25.5 0.174 0.05 0.236 Outlet System
B0596 33.12 33.25 0.343 0.02 0.135 Outlet System
B0597 33.16 0.291 0.03 0.27 Outlet System
B0602 40.79 40.87 0.72 0.07 0.589 Outlet System
B0604 40.63 0.106 0 0.354 Outlet System
PIT / NODE DETAILS
Name Max HGL Max Pond Max Surface Min Overflow Constraint
HGL Flow Arriving Freeboard (cu.m/s)(Sag Pits) (cu.m/s) (m)
B0614 41.69 0.234 0 0.224 Outlet System
B0632 21.58 21.71 0.836 0.02 0.715 Outlet System
B0635 21.88 0.746 0.02 0.827 Outlet System
B0636 22.45 0.376 0.01 0.429 Outlet System
B0641 37.18 0.509 0 0.464 Outlet System
B0643 37.61 0.207 0 0.183 Outlet System
B0644 37.68 0.111 0 0.097 Outlet System
B0646 21.96 0.362 0 0.356 Outlet System
B0650 22.44 0.148 0 0.1 Outlet System
B0657 31.75 1.299 0.02 1.366 Outlet System
B0658 32.46 0.379 0 0.552 Outlet System
B0660 37.87 0.292 0.25 0.385 Outlet System
B0661 41.54 0.241 0.03 0.247 Outlet System
B0664 44.4 0.071 0.1 0.108 Outlet System
B0668 45.07 0.122 0.01 0.135 Outlet System
B0669 32.65 0.745 0.08 0.714 Outlet System
B0671 26.86 1.78 0.05 1.784 Outlet System
B0674 32.44 0.768 0.06 0.765 Outlet System
B0675 32.8 0.156 0.02 0.087 Outlet System
B0676 39.27 0.216 0.02 0.224 Outlet System
B0691 25.68 25.79 0.579 0.04 0.458 Outlet System
B0701 23.81 0.397 0 0.336 Outlet System
B0714 35.28 1.485 0.06 1.549 Outlet System
B0715 36.57 1.411 0.1 1.458 Outlet System
B0716 37.54 1.263 0.21 1.382 Outlet System
B0720 28.1 28.23 1.425 0.02 1.266 Outlet System
B0721 30.15 1.604 0 1.4 Outlet System
B0728 45.02 1.217 0 1.038 Outlet System
B0729 45.52 1.142 0.27 1.201 Outlet System
B0730 45.7 0.368 0.12 0.408 Outlet System
B0733 32.22 1.561 0.14 1.583 Outlet System
B0735 25.8 25.86 0.673 0.09 0.358 Outlet System
B0740 26.5 0.127 0.03 0.161 Outlet System
B0746 37.17 37.3 0.862 0.02 0.686 Outlet System
B0747 37.21 0.763 0.05 0.814 Outlet System
B0748 38.64 0.669 0.03 0.673 Outlet System
B0749 38.7 0.644 0.08 0.647 Outlet System
B0750 38.7 0.308 0.03 0.316 Outlet System
B0751 37.22 37.29 0.102 0.08 0.07 Outlet System
B0752 37.46 0.026 0 0.018 Outlet System
B0753 42.1 42.24 0.118 0.01 0.003 Outlet System
B0754 42.1 0.062 0 0.056 Outlet System
B0755 46 0.531 0.02 0.525 Outlet System
B0756 46.75 0.301 0.17 0.382 Outlet System
B0758 51.58 0.397 0 0.345 Outlet System
B0770 34.06 0.812 0.05 0.801 Outlet System
ITEM 2 (continued) ATTACHMENT 1
Page 144
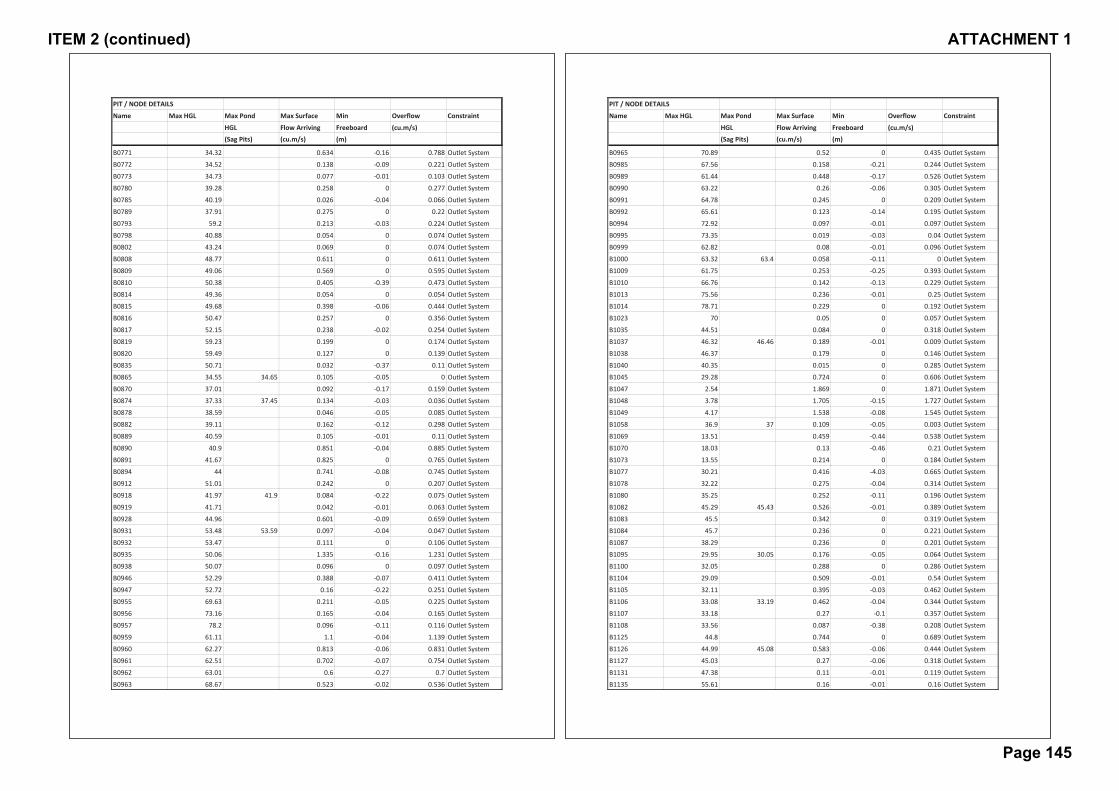
PIT / NODE DETAILS
Name Max HGL Max Pond Max Surface Min Overflow Constraint
HGL Flow Arriving Freeboard (cu.m/s)(Sag Pits) (cu.m/s) (m)
B0771 34.32 0.634 0.16 0.788 Outlet System
B0772 34.52 0.138 0.09 0.221 Outlet System
B0773 34.73 0.077 0.01 0.103 Outlet System
B0780 39.28 0.258 0 0.277 Outlet System
B0785 40.19 0.026 0.04 0.066 Outlet System
B0789 37.91 0.275 0 0.22 Outlet System
B0793 59.2 0.213 0.03 0.224 Outlet System
B0798 40.88 0.054 0 0.074 Outlet System
B0802 43.24 0.069 0 0.074 Outlet System
B0808 48.77 0.611 0 0.611 Outlet System
B0809 49.06 0.569 0 0.595 Outlet System
B0810 50.38 0.405 0.39 0.473 Outlet System
B0814 49.36 0.054 0 0.054 Outlet System
B0815 49.68 0.398 0.06 0.444 Outlet System
B0816 50.47 0.257 0 0.356 Outlet System
B0817 52.15 0.238 0.02 0.254 Outlet System
B0819 59.23 0.199 0 0.174 Outlet System
B0820 59.49 0.127 0 0.139 Outlet System
B0835 50.71 0.032 0.37 0.11 Outlet System
B0865 34.55 34.65 0.105 0.05 0 Outlet System
B0870 37.01 0.092 0.17 0.159 Outlet System
B0874 37.33 37.45 0.134 0.03 0.036 Outlet System
B0878 38.59 0.046 0.05 0.085 Outlet System
B0882 39.11 0.162 0.12 0.298 Outlet System
B0889 40.59 0.105 0.01 0.11 Outlet System
B0890 40.9 0.851 0.04 0.885 Outlet System
B0891 41.67 0.825 0 0.765 Outlet System
B0894 44 0.741 0.08 0.745 Outlet System
B0912 51.01 0.242 0 0.207 Outlet System
B0918 41.97 41.9 0.084 0.22 0.075 Outlet System
B0919 41.71 0.042 0.01 0.063 Outlet System
B0928 44.96 0.601 0.09 0.659 Outlet System
B0931 53.48 53.59 0.097 0.04 0.047 Outlet System
B0932 53.47 0.111 0 0.106 Outlet System
B0935 50.06 1.335 0.16 1.231 Outlet System
B0938 50.07 0.096 0 0.097 Outlet System
B0946 52.29 0.388 0.07 0.411 Outlet System
B0947 52.72 0.16 0.22 0.251 Outlet System
B0955 69.63 0.211 0.05 0.225 Outlet System
B0956 73.16 0.165 0.04 0.165 Outlet System
B0957 78.2 0.096 0.11 0.116 Outlet System
B0959 61.11 1.1 0.04 1.139 Outlet System
B0960 62.27 0.813 0.06 0.831 Outlet System
B0961 62.51 0.702 0.07 0.754 Outlet System
B0962 63.01 0.6 0.27 0.7 Outlet System
B0963 68.67 0.523 0.02 0.536 Outlet System
PIT / NODE DETAILS
Name Max HGL Max Pond Max Surface Min Overflow Constraint
HGL Flow Arriving Freeboard (cu.m/s)(Sag Pits) (cu.m/s) (m)
B0965 70.89 0.52 0 0.435 Outlet System
B0985 67.56 0.158 0.21 0.244 Outlet System
B0989 61.44 0.448 0.17 0.526 Outlet System
B0990 63.22 0.26 0.06 0.305 Outlet System
B0991 64.78 0.245 0 0.209 Outlet System
B0992 65.61 0.123 0.14 0.195 Outlet System
B0994 72.92 0.097 0.01 0.097 Outlet System
B0995 73.35 0.019 0.03 0.04 Outlet System
B0999 62.82 0.08 0.01 0.096 Outlet System
B1000 63.32 63.4 0.058 0.11 0 Outlet System
B1009 61.75 0.253 0.25 0.393 Outlet System
B1010 66.76 0.142 0.13 0.229 Outlet System
B1013 75.56 0.236 0.01 0.25 Outlet System
B1014 78.71 0.229 0 0.192 Outlet System
B1023 70 0.05 0 0.057 Outlet System
B1035 44.51 0.084 0 0.318 Outlet System
B1037 46.32 46.46 0.189 0.01 0.009 Outlet System
B1038 46.37 0.179 0 0.146 Outlet System
B1040 40.35 0.015 0 0.285 Outlet System
B1045 29.28 0.724 0 0.606 Outlet System
B1047 2.54 1.869 0 1.871 Outlet System
B1048 3.78 1.705 0.15 1.727 Outlet System
B1049 4.17 1.538 0.08 1.545 Outlet System
B1058 36.9 37 0.109 0.05 0.003 Outlet System
B1069 13.51 0.459 0.44 0.538 Outlet System
B1070 18.03 0.13 0.46 0.21 Outlet System
B1073 13.55 0.214 0 0.184 Outlet System
B1077 30.21 0.416 4.03 0.665 Outlet System
B1078 32.22 0.275 0.04 0.314 Outlet System
B1080 35.25 0.252 0.11 0.196 Outlet System
B1082 45.29 45.43 0.526 0.01 0.389 Outlet System
B1083 45.5 0.342 0 0.319 Outlet System
B1084 45.7 0.236 0 0.221 Outlet System
B1087 38.29 0.236 0 0.201 Outlet System
B1095 29.95 30.05 0.176 0.05 0.064 Outlet System
B1100 32.05 0.288 0 0.286 Outlet System
B1104 29.09 0.509 0.01 0.54 Outlet System
B1105 32.11 0.395 0.03 0.462 Outlet System
B1106 33.08 33.19 0.462 0.04 0.344 Outlet System
B1107 33.18 0.27 0.1 0.357 Outlet System
B1108 33.56 0.087 0.38 0.208 Outlet System
B1125 44.8 0.744 0 0.689 Outlet System
B1126 44.99 45.08 0.583 0.06 0.444 Outlet System
B1127 45.03 0.27 0.06 0.318 Outlet System
B1131 47.38 0.11 0.01 0.119 Outlet System
B1135 55.61 0.16 0.01 0.16 Outlet System
ITEM 2 (continued) ATTACHMENT 1
Page 145
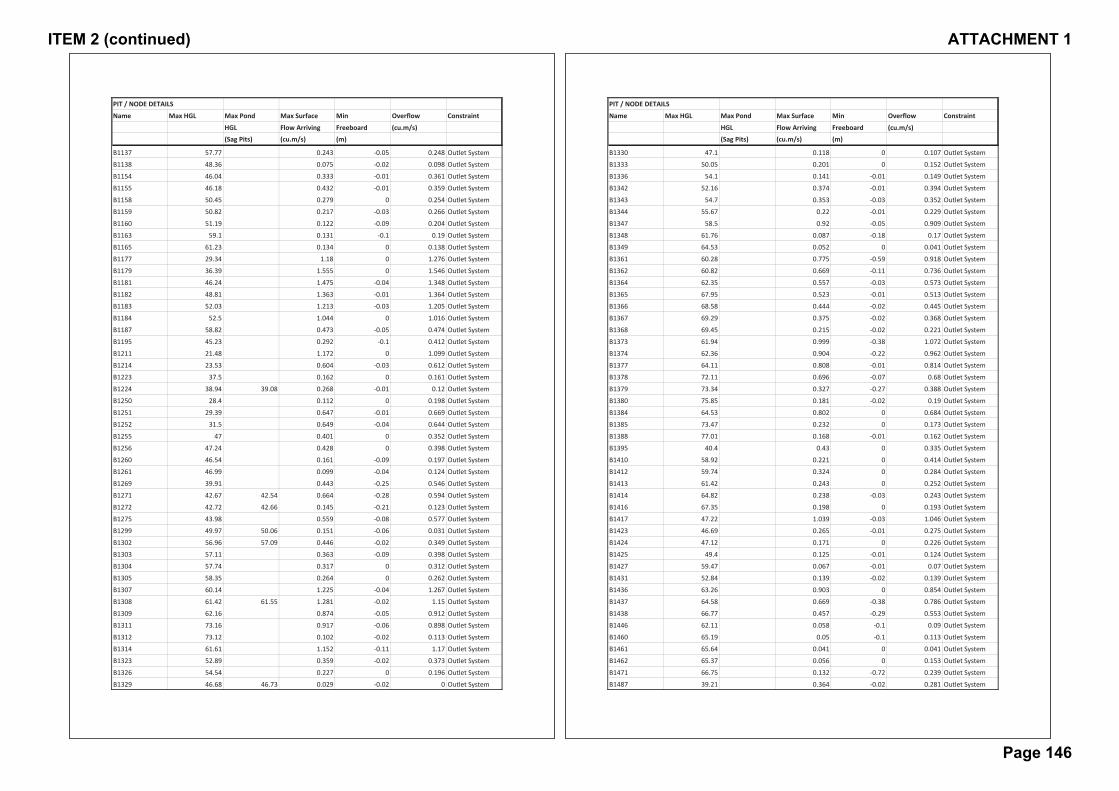
PIT / NODE DETAILS
Name Max HGL Max Pond Max Surface Min Overflow Constraint
HGL Flow Arriving Freeboard (cu.m/s)(Sag Pits) (cu.m/s) (m)
B1137 57.77 0.243 0.05 0.248 Outlet System
B1138 48.36 0.075 0.02 0.098 Outlet System
B1154 46.04 0.333 0.01 0.361 Outlet System
B1155 46.18 0.432 0.01 0.359 Outlet System
B1158 50.45 0.279 0 0.254 Outlet System
B1159 50.82 0.217 0.03 0.266 Outlet System
B1160 51.19 0.122 0.09 0.204 Outlet System
B1163 59.1 0.131 0.1 0.19 Outlet System
B1165 61.23 0.134 0 0.138 Outlet System
B1177 29.34 1.18 0 1.276 Outlet System
B1179 36.39 1.555 0 1.546 Outlet System
B1181 46.24 1.475 0.04 1.348 Outlet System
B1182 48.81 1.363 0.01 1.364 Outlet System
B1183 52.03 1.213 0.03 1.205 Outlet System
B1184 52.5 1.044 0 1.016 Outlet System
B1187 58.82 0.473 0.05 0.474 Outlet System
B1195 45.23 0.292 0.1 0.412 Outlet System
B1211 21.48 1.172 0 1.099 Outlet System
B1214 23.53 0.604 0.03 0.612 Outlet System
B1223 37.5 0.162 0 0.161 Outlet System
B1224 38.94 39.08 0.268 0.01 0.12 Outlet System
B1250 28.4 0.112 0 0.198 Outlet System
B1251 29.39 0.647 0.01 0.669 Outlet System
B1252 31.5 0.649 0.04 0.644 Outlet System
B1255 47 0.401 0 0.352 Outlet System
B1256 47.24 0.428 0 0.398 Outlet System
B1260 46.54 0.161 0.09 0.197 Outlet System
B1261 46.99 0.099 0.04 0.124 Outlet System
B1269 39.91 0.443 0.25 0.546 Outlet System
B1271 42.67 42.54 0.664 0.28 0.594 Outlet System
B1272 42.72 42.66 0.145 0.21 0.123 Outlet System
B1275 43.98 0.559 0.08 0.577 Outlet System
B1299 49.97 50.06 0.151 0.06 0.031 Outlet System
B1302 56.96 57.09 0.446 0.02 0.349 Outlet System
B1303 57.11 0.363 0.09 0.398 Outlet System
B1304 57.74 0.317 0 0.312 Outlet System
B1305 58.35 0.264 0 0.262 Outlet System
B1307 60.14 1.225 0.04 1.267 Outlet System
B1308 61.42 61.55 1.281 0.02 1.15 Outlet System
B1309 62.16 0.874 0.05 0.912 Outlet System
B1311 73.16 0.917 0.06 0.898 Outlet System
B1312 73.12 0.102 0.02 0.113 Outlet System
B1314 61.61 1.152 0.11 1.17 Outlet System
B1323 52.89 0.359 0.02 0.373 Outlet System
B1326 54.54 0.227 0 0.196 Outlet System
B1329 46.68 46.73 0.029 0.02 0 Outlet System
PIT / NODE DETAILS
Name Max HGL Max Pond Max Surface Min Overflow Constraint
HGL Flow Arriving Freeboard (cu.m/s)(Sag Pits) (cu.m/s) (m)
B1330 47.1 0.118 0 0.107 Outlet System
B1333 50.05 0.201 0 0.152 Outlet System
B1336 54.1 0.141 0.01 0.149 Outlet System
B1342 52.16 0.374 0.01 0.394 Outlet System
B1343 54.7 0.353 0.03 0.352 Outlet System
B1344 55.67 0.22 0.01 0.229 Outlet System
B1347 58.5 0.92 0.05 0.909 Outlet System
B1348 61.76 0.087 0.18 0.17 Outlet System
B1349 64.53 0.052 0 0.041 Outlet System
B1361 60.28 0.775 0.59 0.918 Outlet System
B1362 60.82 0.669 0.11 0.736 Outlet System
B1364 62.35 0.557 0.03 0.573 Outlet System
B1365 67.95 0.523 0.01 0.513 Outlet System
B1366 68.58 0.444 0.02 0.445 Outlet System
B1367 69.29 0.375 0.02 0.368 Outlet System
B1368 69.45 0.215 0.02 0.221 Outlet System
B1373 61.94 0.999 0.38 1.072 Outlet System
B1374 62.36 0.904 0.22 0.962 Outlet System
B1377 64.11 0.808 0.01 0.814 Outlet System
B1378 72.11 0.696 0.07 0.68 Outlet System
B1379 73.34 0.327 0.27 0.388 Outlet System
B1380 75.85 0.181 0.02 0.19 Outlet System
B1384 64.53 0.802 0 0.684 Outlet System
B1385 73.47 0.232 0 0.173 Outlet System
B1388 77.01 0.168 0.01 0.162 Outlet System
B1395 40.4 0.43 0 0.335 Outlet System
B1410 58.92 0.221 0 0.414 Outlet System
B1412 59.74 0.324 0 0.284 Outlet System
B1413 61.42 0.243 0 0.252 Outlet System
B1414 64.82 0.238 0.03 0.243 Outlet System
B1416 67.35 0.198 0 0.193 Outlet System
B1417 47.22 1.039 0.03 1.046 Outlet System
B1423 46.69 0.265 0.01 0.275 Outlet System
B1424 47.12 0.171 0 0.226 Outlet System
B1425 49.4 0.125 0.01 0.124 Outlet System
B1427 59.47 0.067 0.01 0.07 Outlet System
B1431 52.84 0.139 0.02 0.139 Outlet System
B1436 63.26 0.903 0 0.854 Outlet System
B1437 64.58 0.669 0.38 0.786 Outlet System
B1438 66.77 0.457 0.29 0.553 Outlet System
B1446 62.11 0.058 0.1 0.09 Outlet System
B1460 65.19 0.05 0.1 0.113 Outlet System
B1461 65.64 0.041 0 0.041 Outlet System
B1462 65.37 0.056 0 0.153 Outlet System
B1471 66.75 0.132 0.72 0.239 Outlet System
B1487 39.21 0.364 0.02 0.281 Outlet System
ITEM 2 (continued) ATTACHMENT 1
Page 146
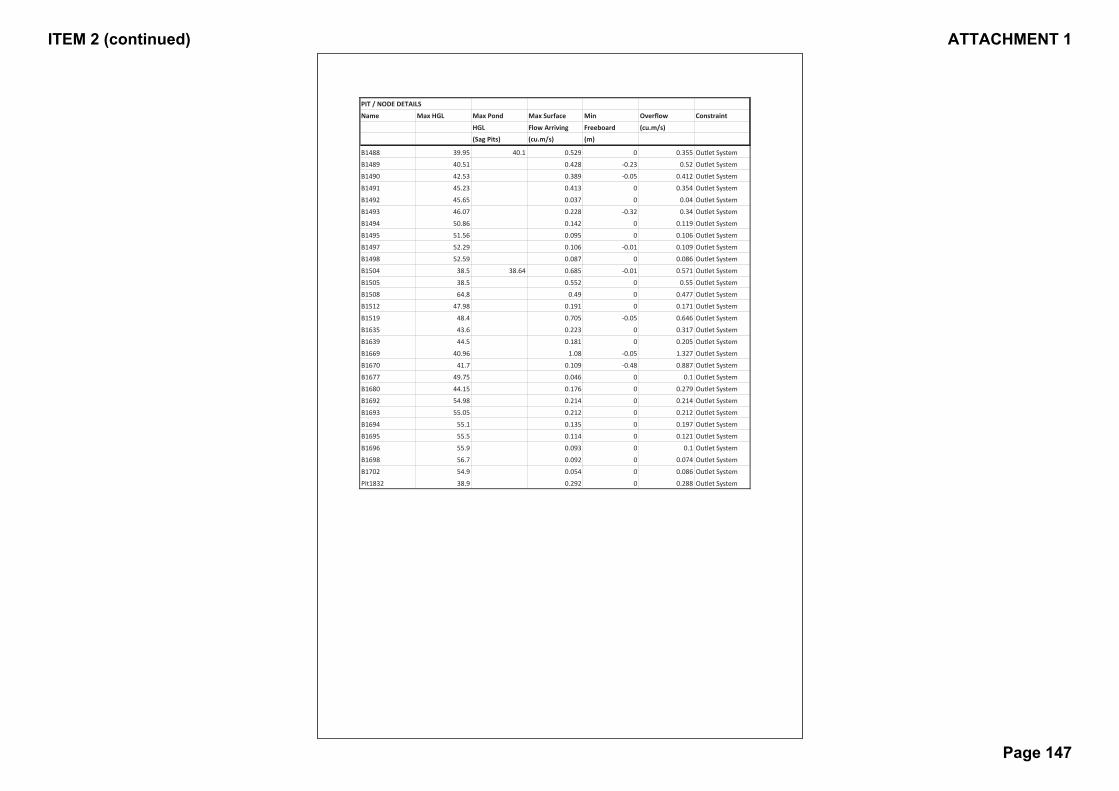
PIT / NODE DETAILS
Name Max HGL Max Pond Max Surface Min Overflow Constraint
HGL Flow Arriving Freeboard (cu.m/s)(Sag Pits) (cu.m/s) (m)
B1488 39.95 40.1 0.529 0 0.355 Outlet System
B1489 40.51 0.428 0.23 0.52 Outlet System
B1490 42.53 0.389 0.05 0.412 Outlet System
B1491 45.23 0.413 0 0.354 Outlet System
B1492 45.65 0.037 0 0.04 Outlet System
B1493 46.07 0.228 0.32 0.34 Outlet System
B1494 50.86 0.142 0 0.119 Outlet System
B1495 51.56 0.095 0 0.106 Outlet System
B1497 52.29 0.106 0.01 0.109 Outlet System
B1498 52.59 0.087 0 0.086 Outlet System
B1504 38.5 38.64 0.685 0.01 0.571 Outlet System
B1505 38.5 0.552 0 0.55 Outlet System
B1508 64.8 0.49 0 0.477 Outlet System
B1512 47.98 0.191 0 0.171 Outlet System
B1519 48.4 0.705 0.05 0.646 Outlet System
B1635 43.6 0.223 0 0.317 Outlet System
B1639 44.5 0.181 0 0.205 Outlet System
B1669 40.96 1.08 0.05 1.327 Outlet System
B1670 41.7 0.109 0.48 0.887 Outlet System
B1677 49.75 0.046 0 0.1 Outlet System
B1680 44.15 0.176 0 0.279 Outlet System
B1692 54.98 0.214 0 0.214 Outlet System
B1693 55.05 0.212 0 0.212 Outlet System
B1694 55.1 0.135 0 0.197 Outlet System
B1695 55.5 0.114 0 0.121 Outlet System
B1696 55.9 0.093 0 0.1 Outlet System
B1698 56.7 0.092 0 0.074 Outlet System
B1702 54.9 0.054 0 0.086 Outlet System
Pit1832 38.9 0.292 0 0.288 Outlet System
ITEM 2 (continued) ATTACHMENT 1
Page 147

DRAINS OUTPUT – LOW FLOW ASSESSMENT BUFFALO CREEK CATCHMENT – 5yr ARI
ITEM 2 (continued) ATTACHMENT 1
Page 148

Exported DRAINS results BUFFALO CREEK PEAK 5YR ARI
PIT / NODE DETAILS
Name Max HGL Max Pond Max Surface Min Overflow Constraint
HGL Flow Arriving Freeboard (cu.m/s)(Sag Pits) (cu.m/s) (m)
B0009 28.39 8.929 1.61 8.929 Inlet Capacity
B0010 29.98 8.925 0.62 8.923 Inlet Capacity
B0011 30.29 9.558 1.84 8.915 Inlet Capacity
B0012 30.67 10.078 1.73 9.547 Inlet Capacity
B0014 32.64 9.948 1.14 9.948 Inlet Capacity
B0015 33.61 10.597 0.69 9.948 Inlet Capacity
B0016 33.97 10.505 0.73 10.505 Inlet Capacity
B0017 34.53 11.147 0.27 10.505 Inlet Capacity
B0018 34.93 11.783 0.02 11.14 Inlet Capacity
B0019 35.29 12.18 0.06 11.776 Inlet Capacity
B0022 36.76 10.295 0.28 10.295 Inlet Capacity
B0023 37.13 10.295 0.45 10.295 Inlet Capacity
B0024 37.7 10.937 0.5 10.295 Inlet Capacity
B0026 38.7 9.772 0.1 9.772 Inlet Capacity
B0027 38.78 0.437 0.07 0.437 Inlet Capacity
B0036 46.34 46.8 2.229 0.31 2.071 Inlet Capacity
B0038 46.98 47.35 2.189 0.17 1.946 Inlet Capacity
B0039 47.31 0.167 0.16 0.035 Inlet Capacity
B0040 47.83 2.95 0.03 2.184 Inlet Capacity
B0042 49.73 2.435 0.97 1.938 Inlet Capacity
B0044 56.85 58.03 2.575 0.98 2.337 Inlet Capacity
B0046 57.99 2.957 0.02 2.526 Inlet Capacity
B0049 75.15 0.233 0.88 0.119 Inlet Capacity
B0050 76.03 0.046 1.87 0.046 Inlet Capacity
B0052 77.03 78.23 0.234 1.05 0 Inlet Capacity
B0053 78.83 0.1 0.68 0.044 Inlet Capacity
B0054 78.97 0.044 0.77 0.013 Inlet Capacity
B0061 50 50.78 0.512 0.28 0 Inlet Capacity
B0062 50.53 0.509 0.16 0.337 Inlet Capacity
B0063 50.69 0.44 0.01 0.331 Inlet Capacity
B0064 50.81 0.079 0.01 0.033 Inlet Capacity
B0066 24.73 2.098 0.1 1.435 Inlet Capacity
B0068 27.5 1.239 0.05 0.743 Inlet Capacity
B0071 35.86 0.863 0.05 0.563 Inlet Capacity
B0072 36.51 1.021 0 0.743 Inlet Capacity
B0073 37.82 1.284 0.23 0.958 Inlet Capacity
B0080 44.05 0.564 0 0.48 Inlet Capacity
B0081 48.48 0.426 0 0.348 Inlet Capacity
B0082 49.53 0.319 0.01 0.202 Inlet Capacity
B0083 49.76 0.203 0.01 0.095 Inlet Capacity
B0085 38.46 0.316 0.01 0.18 Inlet Capacity
B0089 40.75 0.39 0.01 0.274 Inlet Capacity
B0090 44.26 0.447 0.01 0.317 Inlet Capacity
B0095 49.09 0.179 0 0.128 Inlet Capacity
PIT / NODE DETAILS
Name Max HGL Max Pond Max Surface Min Overflow Constraint
HGL Flow Arriving Freeboard (cu.m/s)(Sag Pits) (cu.m/s) (m)
B0096 50.1 0.171 0.02 0.043 Inlet Capacity
B0097 50.67 0.136 0.02 0.034 Inlet Capacity
B0100 14.44 0.987 3.28 0.561 Inlet Capacity
B0101 16.05 1.457 4.7 0.919 Inlet Capacity
B0102 18.25 2.064 2.92 1.407 Inlet Capacity
B0103 21.25 2.767 0.15 2.014 Inlet Capacity
B0104 21.33 2.663 0.17 2.192 Inlet Capacity
B0105 21.34 0.19 0.26 0.045 Inlet Capacity
B0106 21.34 0.218 0.36 0.058 Inlet Capacity
B0107 21.34 0.168 0.46 0.087 Inlet Capacity
B0108 23.68 3.34 0.16 2.639 Inlet Capacity
B0109 23.81 3.234 0.59 3.231 Inlet Capacity
B0110 25.86 3.61 0.01 3.154 Inlet Capacity
B0113 27.96 2.819 0.02 2.328 Inlet Capacity
B0115 29.4 2.303 0.5 2.324 Inlet Capacity
B0118 32.62 0.199 0.39 0.199 Inlet Capacity
B0119 35.37 0.308 0.73 0.184 Inlet Capacity
B0120 36.13 0.415 0.42 0.217 Inlet Capacity
B0121 36.8 0.018 0.27 0.001 Inlet Capacity
B0126 49.52 0.363 0.28 0.139 Inlet Capacity
B0129 13.26 1.027 2.54 0.76 Inlet Capacity
B0130 16.3 1.342 1.33 1.025 Inlet Capacity
B0131 18.33 1.663 0.85 1.301 Inlet Capacity
B0132 21.14 2.027 0.11 1.62 Inlet Capacity
B0134 22.61 22.78 1.482 0.02 1.317 Inlet Capacity
B0137 25.67 0.783 1.77 0.556 Inlet Capacity
B0138 26.68 0.919 1.02 0.671 Inlet Capacity
B0139 28.55 1.139 0.05 0.831 Inlet Capacity
B0140 29.51 31.08 1.439 1.42 1.023 Inlet Capacity
B0143 31.61 0.989 0.15 0.727 Inlet Capacity
B0145 32.66 0.305 0.5 0.174 Inlet Capacity
B0146 33.27 0.263 0.54 0.151 Inlet Capacity
B0147 33.78 0.25 0.45 0.145 Inlet Capacity
B0148 34.68 0.247 0.52 0.144 Inlet Capacity
B0149 35.36 0.327 1.15 0.199 Inlet Capacity
B0150 36.75 0.433 0.7 0.28 Inlet Capacity
B0151 37.07 0.567 0.59 0.385 Inlet Capacity
B0152 37.62 0.799 0.82 0.566 Inlet Capacity
B0153 37.91 38.61 1.078 0.55 0.744 Inlet Capacity
B0154 38.27 1.106 0.21 1.072 Inlet Capacity
B0160 50.22 0.269 0.01 0.212 Inlet Capacity
B0161 51.83 0.416 0.15 0.266 Inlet Capacity
B0162 52.26 0.422 0 0.363 Inlet Capacity
B0166 53.06 0.171 0.01 0.079 Inlet Capacity
B0167 32.22 1.17 0.25 0.863 Inlet Capacity
B0168 32.4 0.664 0.82 0.453 Inlet Capacity
ITEM 2 (continued) ATTACHMENT 1
Page 149

PIT / NODE DETAILS
Name Max HGL Max Pond Max Surface Min Overflow Constraint
HGL Flow Arriving Freeboard (cu.m/s)(Sag Pits) (cu.m/s) (m)
B0169 33.78 0.821 0.01 0.578 Inlet Capacity
B0170 34.48 0.981 0.01 0.727 Inlet Capacity
B0171 35.58 36.49 1.162 0.76 0.901 Inlet Capacity
B0172 36.84 1.603 0.29 1.036 Inlet Capacity
B0181 46.72 1.03 0.01 0.809 Inlet Capacity
B0182 46.88 0.19 0.05 0.102 Inlet Capacity
B0184 47.48 0.723 0.02 0.52 Inlet Capacity
B0185 47.73 0.648 0.53 0.642 Inlet Capacity
B0193 40.69 1.221 0.38 0.815 Inlet Capacity
B0194 41.54 0.411 0.02 0.29 Inlet Capacity
B0195 42.96 0.12 3.54 0.022 Inlet Capacity
B0196 44.17 0.102 2.65 0.018 Inlet Capacity
B0201 40.43 42.66 0.637 2.08 0.262 Inlet Capacity
B0202 42.38 0.312 0.78 0.146 Inlet Capacity
B0203 43.07 0.28 0.99 0.162 Inlet Capacity
B0204 44.88 0.513 1.16 0.229 Inlet Capacity
B0205 45.51 0.746 1 0.458 Inlet Capacity
B0206 46.64 46.79 0.908 0 0.705 Inlet Capacity
B0207 46.89 0.912 0 0.81 Inlet Capacity
B0209 47.63 0.875 0.01 0.673 Inlet Capacity
B0211 53.84 0.161 0.34 0.08 Inlet Capacity
B0212 56.08 0.175 0.21 0.087 Inlet Capacity
B0213 59.51 0.172 0.76 0.06 Inlet Capacity
B0214 59.84 0.131 0.71 0.04 Inlet Capacity
B0216 42.78 1.026 0.78 0.743 Inlet Capacity
B0220 43.6 0.84 0.35 0.452 Inlet Capacity
B0222 43.82 0.849 0.28 0.539 Inlet Capacity
B0224 45.53 0.709 0.52 0.499 Inlet Capacity
B0225 45.78 46.07 0.798 0.14 0.649 Inlet Capacity
B0229 49.4 49.95 1.022 0.4 0.797 Inlet Capacity
B0230 49.95 1.149 0.01 0.864 Inlet Capacity
B0231 53.43 1.434 0.47 1.105 Inlet Capacity
B0235 54.88 1.516 0.01 1.116 Inlet Capacity
B0237 57.18 1.405 0.45 1.073 Inlet Capacity
B0239 41.3 42.64 0.735 1.19 0.633 Inlet Capacity
B0240 44.27 0.959 0.94 0.703 Inlet Capacity
B0241 45.47 47.45 1.085 1.83 0.937 Inlet Capacity
B0242 48.86 1.674 0.02 1.077 Inlet Capacity
B0243 50.75 1.771 0.66 1.343 Inlet Capacity
B0244 52.86 2.267 0.49 1.699 Inlet Capacity
B0247 57.65 2.808 0.79 2.049 Inlet Capacity
B0248 58.43 58.59 2.903 0.01 2.688 Inlet Capacity
B0249 58.54 0.04 0 0.019 Inlet Capacity
B0256 62.42 0.058 1.08 0.004 Inlet Capacity
B0257 63.31 0.129 1.3 0.024 Inlet Capacity
B0258 64.45 0.289 0.91 0.096 Inlet Capacity
PIT / NODE DETAILS
Name Max HGL Max Pond Max Surface Min Overflow Constraint
HGL Flow Arriving Freeboard (cu.m/s)(Sag Pits) (cu.m/s) (m)
B0259 65.79 0.402 1.07 0.255 Inlet Capacity
B0260 69.33 0.389 0 0.31 Inlet Capacity
B0261 69.39 0.099 0.01 0.043 Inlet Capacity
B0262 43.6 0.327 0.01 0.2 Inlet Capacity
B0263 46.22 0.42 0.46 0.27 Inlet Capacity
B0265 50.96 0.284 0.31 0.169 Inlet Capacity
B0266 52.22 0.138 0.96 0.043 Inlet Capacity
B0267 53 0.472 0.01 0.348 Inlet Capacity
B0269 54.54 0.608 0.01 0.471 Inlet Capacity
B0274 27.86 0.501 0.01 0.388 Inlet Capacity
B0275 30.15 0.074 0.8 0.03 Inlet Capacity
B0276 32.66 0.442 0.62 0.278 Inlet Capacity
B0278 35.34 0.049 1.14 0.016 Inlet Capacity
B0279 36.5 37.65 0.071 1 0 Inlet Capacity
B0280 37.82 0.06 0.27 0.022 Inlet Capacity
B0281 39.97 0.039 0.67 0.011 Inlet Capacity
B0283 40.95 0.172 0.8 0.037 Inlet Capacity
B0284 41.47 0.292 0.53 0.096 Inlet Capacity
B0285 43.34 0.208 0.01 0.141 Inlet Capacity
B0286 44.16 0.17 0.81 0.086 Inlet Capacity
B0287 46.48 0.103 0.78 0.047 Inlet Capacity
B0289 27.85 1.397 0.01 1.18 Inlet Capacity
B0291 28.35 29.06 1.534 0.56 1.385 Inlet Capacity
B0294 34.4 1.402 0 1.265 Inlet Capacity
B0297 36.99 1.378 0.11 1.008 Inlet Capacity
B0302 38.86 0.898 0.01 0.781 Inlet Capacity
B0304 40.09 0.938 0.01 0.754 Inlet Capacity
B0308 44.38 0.973 0.08 0.553 Inlet Capacity
B0312 26.2 1.435 1.7 1.101 Inlet Capacity
B0313 28.04 1.499 0 1.345 Inlet Capacity
B0314 32.51 1.526 0.01 1.344 Inlet Capacity
B0317 40.22 1.566 0.01 1.199 Inlet Capacity
B0318 40.23 1.283 0.01 1.283 Inlet Capacity
B0319 40.23 1.283 0.02 1.283 Inlet Capacity
B0320 40.23 1.283 0.02 1.283 Inlet Capacity
B0322 40.26 0.138 0.01 0.096 Inlet Capacity
B0323 30.21 0.525 0.79 0.241 Inlet Capacity
B0324 32.13 34.11 1.023 1.83 0.509 Inlet Capacity
B0325 32.68 0.89 1.29 0.571 Inlet Capacity
B0326 32.94 0.562 1.31 0.381 Inlet Capacity
B0327 33.31 0.787 0.91 0.488 Inlet Capacity
B0329 33.86 0.995 0.47 0.732 Inlet Capacity
B0331 34.28 0.922 1.27 0.888 Inlet Capacity
B0332 34.45 0.905 1.35 0.509 Inlet Capacity
B0333 35.69 1.347 0.58 0.839 Inlet Capacity
B0334 36.6 1.729 0 1.334 Inlet Capacity
ITEM 2 (continued) ATTACHMENT 1
Page 150
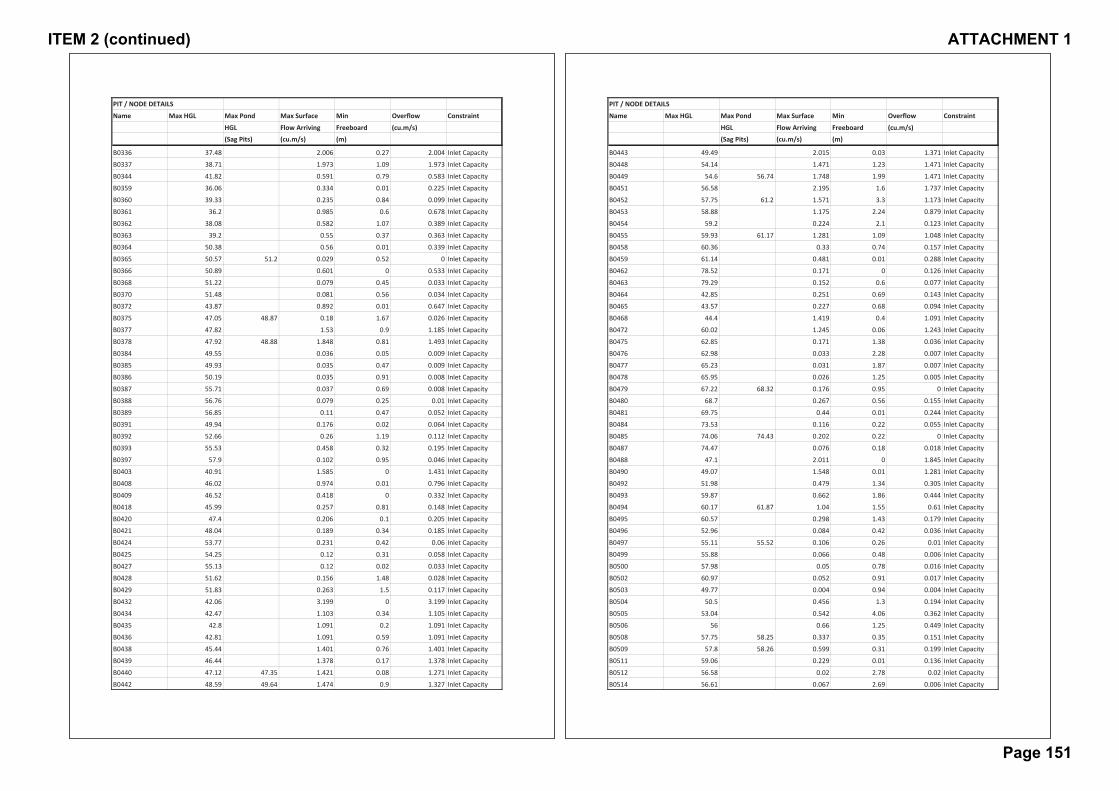
PIT / NODE DETAILS
Name Max HGL Max Pond Max Surface Min Overflow Constraint
HGL Flow Arriving Freeboard (cu.m/s)(Sag Pits) (cu.m/s) (m)
B0336 37.48 2.006 0.27 2.004 Inlet Capacity
B0337 38.71 1.973 1.09 1.973 Inlet Capacity
B0344 41.82 0.591 0.79 0.583 Inlet Capacity
B0359 36.06 0.334 0.01 0.225 Inlet Capacity
B0360 39.33 0.235 0.84 0.099 Inlet Capacity
B0361 36.2 0.985 0.6 0.678 Inlet Capacity
B0362 38.08 0.582 1.07 0.389 Inlet Capacity
B0363 39.2 0.55 0.37 0.363 Inlet Capacity
B0364 50.38 0.56 0.01 0.339 Inlet Capacity
B0365 50.57 51.2 0.029 0.52 0 Inlet Capacity
B0366 50.89 0.601 0 0.533 Inlet Capacity
B0368 51.22 0.079 0.45 0.033 Inlet Capacity
B0370 51.48 0.081 0.56 0.034 Inlet Capacity
B0372 43.87 0.892 0.01 0.647 Inlet Capacity
B0375 47.05 48.87 0.18 1.67 0.026 Inlet Capacity
B0377 47.82 1.53 0.9 1.185 Inlet Capacity
B0378 47.92 48.88 1.848 0.81 1.493 Inlet Capacity
B0384 49.55 0.036 0.05 0.009 Inlet Capacity
B0385 49.93 0.035 0.47 0.009 Inlet Capacity
B0386 50.19 0.035 0.91 0.008 Inlet Capacity
B0387 55.71 0.037 0.69 0.008 Inlet Capacity
B0388 56.76 0.079 0.25 0.01 Inlet Capacity
B0389 56.85 0.11 0.47 0.052 Inlet Capacity
B0391 49.94 0.176 0.02 0.064 Inlet Capacity
B0392 52.66 0.26 1.19 0.112 Inlet Capacity
B0393 55.53 0.458 0.32 0.195 Inlet Capacity
B0397 57.9 0.102 0.95 0.046 Inlet Capacity
B0403 40.91 1.585 0 1.431 Inlet Capacity
B0408 46.02 0.974 0.01 0.796 Inlet Capacity
B0409 46.52 0.418 0 0.332 Inlet Capacity
B0418 45.99 0.257 0.81 0.148 Inlet Capacity
B0420 47.4 0.206 0.1 0.205 Inlet Capacity
B0421 48.04 0.189 0.34 0.185 Inlet Capacity
B0424 53.77 0.231 0.42 0.06 Inlet Capacity
B0425 54.25 0.12 0.31 0.058 Inlet Capacity
B0427 55.13 0.12 0.02 0.033 Inlet Capacity
B0428 51.62 0.156 1.48 0.028 Inlet Capacity
B0429 51.83 0.263 1.5 0.117 Inlet Capacity
B0432 42.06 3.199 0 3.199 Inlet Capacity
B0434 42.47 1.103 0.34 1.105 Inlet Capacity
B0435 42.8 1.091 0.2 1.091 Inlet Capacity
B0436 42.81 1.091 0.59 1.091 Inlet Capacity
B0438 45.44 1.401 0.76 1.401 Inlet Capacity
B0439 46.44 1.378 0.17 1.378 Inlet Capacity
B0440 47.12 47.35 1.421 0.08 1.271 Inlet Capacity
B0442 48.59 49.64 1.474 0.9 1.327 Inlet Capacity
PIT / NODE DETAILS
Name Max HGL Max Pond Max Surface Min Overflow Constraint
HGL Flow Arriving Freeboard (cu.m/s)(Sag Pits) (cu.m/s) (m)
B0443 49.49 2.015 0.03 1.371 Inlet Capacity
B0448 54.14 1.471 1.23 1.471 Inlet Capacity
B0449 54.6 56.74 1.748 1.99 1.471 Inlet Capacity
B0451 56.58 2.195 1.6 1.737 Inlet Capacity
B0452 57.75 61.2 1.571 3.3 1.173 Inlet Capacity
B0453 58.88 1.175 2.24 0.879 Inlet Capacity
B0454 59.2 0.224 2.1 0.123 Inlet Capacity
B0455 59.93 61.17 1.281 1.09 1.048 Inlet Capacity
B0458 60.36 0.33 0.74 0.157 Inlet Capacity
B0459 61.14 0.481 0.01 0.288 Inlet Capacity
B0462 78.52 0.171 0 0.126 Inlet Capacity
B0463 79.29 0.152 0.6 0.077 Inlet Capacity
B0464 42.85 0.251 0.69 0.143 Inlet Capacity
B0465 43.57 0.227 0.68 0.094 Inlet Capacity
B0468 44.4 1.419 0.4 1.091 Inlet Capacity
B0472 60.02 1.245 0.06 1.243 Inlet Capacity
B0475 62.85 0.171 1.38 0.036 Inlet Capacity
B0476 62.98 0.033 2.28 0.007 Inlet Capacity
B0477 65.23 0.031 1.87 0.007 Inlet Capacity
B0478 65.95 0.026 1.25 0.005 Inlet Capacity
B0479 67.22 68.32 0.176 0.95 0 Inlet Capacity
B0480 68.7 0.267 0.56 0.155 Inlet Capacity
B0481 69.75 0.44 0.01 0.244 Inlet Capacity
B0484 73.53 0.116 0.22 0.055 Inlet Capacity
B0485 74.06 74.43 0.202 0.22 0 Inlet Capacity
B0487 74.47 0.076 0.18 0.018 Inlet Capacity
B0488 47.1 2.011 0 1.845 Inlet Capacity
B0490 49.07 1.548 0.01 1.281 Inlet Capacity
B0492 51.98 0.479 1.34 0.305 Inlet Capacity
B0493 59.87 0.662 1.86 0.444 Inlet Capacity
B0494 60.17 61.87 1.04 1.55 0.61 Inlet Capacity
B0495 60.57 0.298 1.43 0.179 Inlet Capacity
B0496 52.96 0.084 0.42 0.036 Inlet Capacity
B0497 55.11 55.52 0.106 0.26 0.01 Inlet Capacity
B0499 55.88 0.066 0.48 0.006 Inlet Capacity
B0500 57.98 0.05 0.78 0.016 Inlet Capacity
B0502 60.97 0.052 0.91 0.017 Inlet Capacity
B0503 49.77 0.004 0.94 0.004 Inlet Capacity
B0504 50.5 0.456 1.3 0.194 Inlet Capacity
B0505 53.04 0.542 4.06 0.362 Inlet Capacity
B0506 56 0.66 1.25 0.449 Inlet Capacity
B0508 57.75 58.25 0.337 0.35 0.151 Inlet Capacity
B0509 57.8 58.26 0.599 0.31 0.199 Inlet Capacity
B0511 59.06 0.229 0.01 0.136 Inlet Capacity
B0512 56.58 0.02 2.78 0.02 Inlet Capacity
B0514 56.61 0.067 2.69 0.006 Inlet Capacity
ITEM 2 (continued) ATTACHMENT 1
Page 151
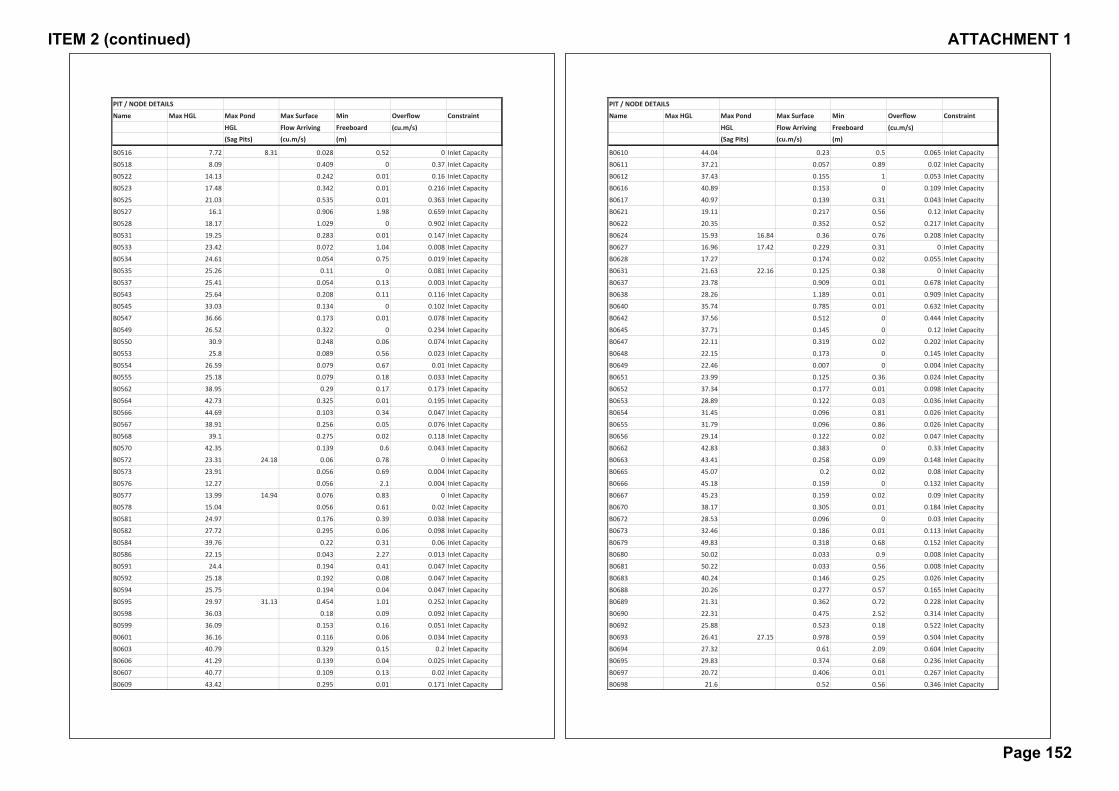
PIT / NODE DETAILS
Name Max HGL Max Pond Max Surface Min Overflow Constraint
HGL Flow Arriving Freeboard (cu.m/s)(Sag Pits) (cu.m/s) (m)
B0516 7.72 8.31 0.028 0.52 0 Inlet Capacity
B0518 8.09 0.409 0 0.37 Inlet Capacity
B0522 14.13 0.242 0.01 0.16 Inlet Capacity
B0523 17.48 0.342 0.01 0.216 Inlet Capacity
B0525 21.03 0.535 0.01 0.363 Inlet Capacity
B0527 16.1 0.906 1.98 0.659 Inlet Capacity
B0528 18.17 1.029 0 0.902 Inlet Capacity
B0531 19.25 0.283 0.01 0.147 Inlet Capacity
B0533 23.42 0.072 1.04 0.008 Inlet Capacity
B0534 24.61 0.054 0.75 0.019 Inlet Capacity
B0535 25.26 0.11 0 0.081 Inlet Capacity
B0537 25.41 0.054 0.13 0.003 Inlet Capacity
B0543 25.64 0.208 0.11 0.116 Inlet Capacity
B0545 33.03 0.134 0 0.102 Inlet Capacity
B0547 36.66 0.173 0.01 0.078 Inlet Capacity
B0549 26.52 0.322 0 0.234 Inlet Capacity
B0550 30.9 0.248 0.06 0.074 Inlet Capacity
B0553 25.8 0.089 0.56 0.023 Inlet Capacity
B0554 26.59 0.079 0.67 0.01 Inlet Capacity
B0555 25.18 0.079 0.18 0.033 Inlet Capacity
B0562 38.95 0.29 0.17 0.173 Inlet Capacity
B0564 42.73 0.325 0.01 0.195 Inlet Capacity
B0566 44.69 0.103 0.34 0.047 Inlet Capacity
B0567 38.91 0.256 0.05 0.076 Inlet Capacity
B0568 39.1 0.275 0.02 0.118 Inlet Capacity
B0570 42.35 0.139 0.6 0.043 Inlet Capacity
B0572 23.31 24.18 0.06 0.78 0 Inlet Capacity
B0573 23.91 0.056 0.69 0.004 Inlet Capacity
B0576 12.27 0.056 2.1 0.004 Inlet Capacity
B0577 13.99 14.94 0.076 0.83 0 Inlet Capacity
B0578 15.04 0.056 0.61 0.02 Inlet Capacity
B0581 24.97 0.176 0.39 0.038 Inlet Capacity
B0582 27.72 0.295 0.06 0.098 Inlet Capacity
B0584 39.76 0.22 0.31 0.06 Inlet Capacity
B0586 22.15 0.043 2.27 0.013 Inlet Capacity
B0591 24.4 0.194 0.41 0.047 Inlet Capacity
B0592 25.18 0.192 0.08 0.047 Inlet Capacity
B0594 25.75 0.194 0.04 0.047 Inlet Capacity
B0595 29.97 31.13 0.454 1.01 0.252 Inlet Capacity
B0598 36.03 0.18 0.09 0.092 Inlet Capacity
B0599 36.09 0.153 0.16 0.051 Inlet Capacity
B0601 36.16 0.116 0.06 0.034 Inlet Capacity
B0603 40.79 0.329 0.15 0.2 Inlet Capacity
B0606 41.29 0.139 0.04 0.025 Inlet Capacity
B0607 40.77 0.109 0.13 0.02 Inlet Capacity
B0609 43.42 0.295 0.01 0.171 Inlet Capacity
PIT / NODE DETAILS
Name Max HGL Max Pond Max Surface Min Overflow Constraint
HGL Flow Arriving Freeboard (cu.m/s)(Sag Pits) (cu.m/s) (m)
B0610 44.04 0.23 0.5 0.065 Inlet Capacity
B0611 37.21 0.057 0.89 0.02 Inlet Capacity
B0612 37.43 0.155 1 0.053 Inlet Capacity
B0616 40.89 0.153 0 0.109 Inlet Capacity
B0617 40.97 0.139 0.31 0.043 Inlet Capacity
B0621 19.11 0.217 0.56 0.12 Inlet Capacity
B0622 20.35 0.352 0.52 0.217 Inlet Capacity
B0624 15.93 16.84 0.36 0.76 0.208 Inlet Capacity
B0627 16.96 17.42 0.229 0.31 0 Inlet Capacity
B0628 17.27 0.174 0.02 0.055 Inlet Capacity
B0631 21.63 22.16 0.125 0.38 0 Inlet Capacity
B0637 23.78 0.909 0.01 0.678 Inlet Capacity
B0638 28.26 1.189 0.01 0.909 Inlet Capacity
B0640 35.74 0.785 0.01 0.632 Inlet Capacity
B0642 37.56 0.512 0 0.444 Inlet Capacity
B0645 37.71 0.145 0 0.12 Inlet Capacity
B0647 22.11 0.319 0.02 0.202 Inlet Capacity
B0648 22.15 0.173 0 0.145 Inlet Capacity
B0649 22.46 0.007 0 0.004 Inlet Capacity
B0651 23.99 0.125 0.36 0.024 Inlet Capacity
B0652 37.34 0.177 0.01 0.098 Inlet Capacity
B0653 28.89 0.122 0.03 0.036 Inlet Capacity
B0654 31.45 0.096 0.81 0.026 Inlet Capacity
B0655 31.79 0.096 0.86 0.026 Inlet Capacity
B0656 29.14 0.122 0.02 0.047 Inlet Capacity
B0662 42.83 0.383 0 0.33 Inlet Capacity
B0663 43.41 0.258 0.09 0.148 Inlet Capacity
B0665 45.07 0.2 0.02 0.08 Inlet Capacity
B0666 45.18 0.159 0 0.132 Inlet Capacity
B0667 45.23 0.159 0.02 0.09 Inlet Capacity
B0670 38.17 0.305 0.01 0.184 Inlet Capacity
B0672 28.53 0.096 0 0.03 Inlet Capacity
B0673 32.46 0.186 0.01 0.113 Inlet Capacity
B0679 49.83 0.318 0.68 0.152 Inlet Capacity
B0680 50.02 0.033 0.9 0.008 Inlet Capacity
B0681 50.22 0.033 0.56 0.008 Inlet Capacity
B0683 40.24 0.146 0.25 0.026 Inlet Capacity
B0688 20.26 0.277 0.57 0.165 Inlet Capacity
B0689 21.31 0.362 0.72 0.228 Inlet Capacity
B0690 22.31 0.475 2.52 0.314 Inlet Capacity
B0692 25.88 0.523 0.18 0.522 Inlet Capacity
B0693 26.41 27.15 0.978 0.59 0.504 Inlet Capacity
B0694 27.32 0.61 2.09 0.604 Inlet Capacity
B0695 29.83 0.374 0.68 0.236 Inlet Capacity
B0697 20.72 0.406 0.01 0.267 Inlet Capacity
B0698 21.6 0.52 0.56 0.346 Inlet Capacity
ITEM 2 (continued) ATTACHMENT 1
Page 152

PIT / NODE DETAILS
Name Max HGL Max Pond Max Surface Min Overflow Constraint
HGL Flow Arriving Freeboard (cu.m/s)(Sag Pits) (cu.m/s) (m)
B0699 21.76 0.457 0.69 0.455 Inlet Capacity
B0700 23.23 0.579 0.06 0.393 Inlet Capacity
B0702 23.89 0.202 0.01 0.138 Inlet Capacity
B0703 21.94 22.36 0.07 0.3 0 Inlet Capacity
B0704 23.33 0.06 0.05 0.012 Inlet Capacity
B0707 37.69 0.092 1.21 0.024 Inlet Capacity
B0708 38.33 0.093 0.77 0.025 Inlet Capacity
B0709 39.69 0.075 0.72 0.018 Inlet Capacity
B0710 39.23 0.075 0.74 0.009 Inlet Capacity
B0712 33.51 0.116 0 0.082 Inlet Capacity
B0713 34.4 0.092 0.7 0.025 Inlet Capacity
B0719 26.39 1.967 0 1.727 Inlet Capacity
B0725 37.88 0.281 0.01 0.167 Inlet Capacity
B0731 46.58 0.345 0.02 0.231 Inlet Capacity
B0736 26.2 26.38 1.301 0.03 0.841 Inlet Capacity
B0737 26.52 1.246 0.01 1.077 Inlet Capacity
B0738 26.54 0.004 0.01 0.001 Inlet Capacity
B0739 25.82 0.018 0 0.011 Inlet Capacity
B0741 27.73 0.162 0.33 0.032 Inlet Capacity
B0742 29 0.149 0.65 0.027 Inlet Capacity
B0744 29.06 29.63 0.187 0.42 0.061 Inlet Capacity
B0745 29.54 0.234 0.02 0.136 Inlet Capacity
B0757 51.54 0.807 0.01 0.505 Inlet Capacity
B0759 37.44 37.81 0.034 0.31 0 Inlet Capacity
B0760 37.62 38.12 0.023 0.45 0 Inlet Capacity
B0761 35.44 0.44 0.06 0.172 Inlet Capacity
B0762 35.61 0.336 0.01 0.237 Inlet Capacity
B0764 37.54 0.471 0 0.368 Inlet Capacity
B0765 38.19 0.08 0.48 0.02 Inlet Capacity
B0766 38.51 0.062 0.58 0.005 Inlet Capacity
B0767 38.66 0.059 0.72 0.012 Inlet Capacity
B0768 38.7 0.05 0.83 0.009 Inlet Capacity
B0769 34.57 1.252 0 1.088 Inlet Capacity
B0774 35.33 0.244 0.17 0.104 Inlet Capacity
B0775 35.85 0.081 0.25 0.02 Inlet Capacity
B0777 36.29 0.132 0.24 0.025 Inlet Capacity
B0779 39.31 0.143 0.02 0.037 Inlet Capacity
B0781 43.01 0.143 0.51 0.045 Inlet Capacity
B0783 39.35 0.342 0.01 0.245 Inlet Capacity
B0786 41.03 0.089 0.02 0.029 Inlet Capacity
B0787 41.97 0.189 0.11 0.069 Inlet Capacity
B0788 42.14 0.182 0.02 0.089 Inlet Capacity
B0790 39.12 0.236 0.25 0.134 Inlet Capacity
B0791 51.86 0.431 0.01 0.323 Inlet Capacity
B0796 62.89 0.19 0.76 0.046 Inlet Capacity
B0799 41.84 0.13 0.26 0.039 Inlet Capacity
PIT / NODE DETAILS
Name Max HGL Max Pond Max Surface Min Overflow Constraint
HGL Flow Arriving Freeboard (cu.m/s)(Sag Pits) (cu.m/s) (m)
B0800 42.28 0.233 0.5 0.098 Inlet Capacity
B0803 44.63 0.117 0.02 0.034 Inlet Capacity
B0804 45.38 0.094 0.27 0.041 Inlet Capacity
B0805 46.85 0.075 0.86 0.018 Inlet Capacity
B0812 55.37 0.372 0.03 0.217 Inlet Capacity
B0813 55.46 0.207 0 0.165 Inlet Capacity
B0818 58.65 0.352 0 0.247 Inlet Capacity
B0821 59.83 0.11 0.28 0.052 Inlet Capacity
B0822 59.95 0.095 0.77 0.015 Inlet Capacity
B0823 59.98 0.11 0.03 0.032 Inlet Capacity
B0824 60.11 0.095 0.38 0.015 Inlet Capacity
B0828 51.97 0.06 0.64 0.012 Inlet Capacity
B0829 54.43 0.119 0.01 0.057 Inlet Capacity
B0830 55.13 0.142 0.01 0.074 Inlet Capacity
B0831 55.61 0.232 0.3 0.097 Inlet Capacity
B0836 51.57 0.055 0.05 0.019 Inlet Capacity
B0837 52.91 0.033 1.31 0.027 Inlet Capacity
B0838 54.36 0.061 0.76 0.005 Inlet Capacity
B0839 54.51 0.038 0.93 0.005 Inlet Capacity
B0840 55.69 0.077 2.37 0.01 Inlet Capacity
B0841 51.58 0.028 0.02 0.004 Inlet Capacity
B0843 51.12 0.034 0.92 0.008 Inlet Capacity
B0844 51.15 0.028 1.35 0.006 Inlet Capacity
B0845 43.65 44.79 0.028 1.07 0 Inlet Capacity
B0846 55.85 0.119 0.54 0.057 Inlet Capacity
B0847 56.25 0.102 0.37 0.018 Inlet Capacity
B0848 50.02 0.155 0.01 0.08 Inlet Capacity
B0849 52.9 0.1 0.85 0.017 Inlet Capacity
B0850 50.26 0.117 1.06 0.055 Inlet Capacity
B0853 31.18 0.036 0.81 0.009 Inlet Capacity
B0856 33.08 0.066 0.89 0.006 Inlet Capacity
B0857 33.81 0.297 0.01 0.152 Inlet Capacity
B0858 33.66 33.95 0.156 0.14 0 Inlet Capacity
B0859 33.27 0.023 0.6 0.001 Inlet Capacity
B0860 34.55 0.149 0 0.118 Inlet Capacity
B0861 36.38 0.27 0.14 0.114 Inlet Capacity
B0862 37.67 0.151 0 0.106 Inlet Capacity
B0863 38.28 0.09 0 0.061 Inlet Capacity
B0864 38.71 0.126 0.21 0.038 Inlet Capacity
B0866 35.38 36.19 0.138 0.66 0 Inlet Capacity
B0867 38.24 0.194 2.16 0.194 Inlet Capacity
B0868 39.03 39.45 0.379 0.27 0.09 Inlet Capacity
B0869 36.67 0.371 0.02 0.156 Inlet Capacity
B0872 37.67 0.172 0.01 0.082 Inlet Capacity
B0873 38.67 0.146 0.13 0.026 Inlet Capacity
B0876 37.71 0.047 0.61 0.014 Inlet Capacity
ITEM 2 (continued) ATTACHMENT 1
Page 153
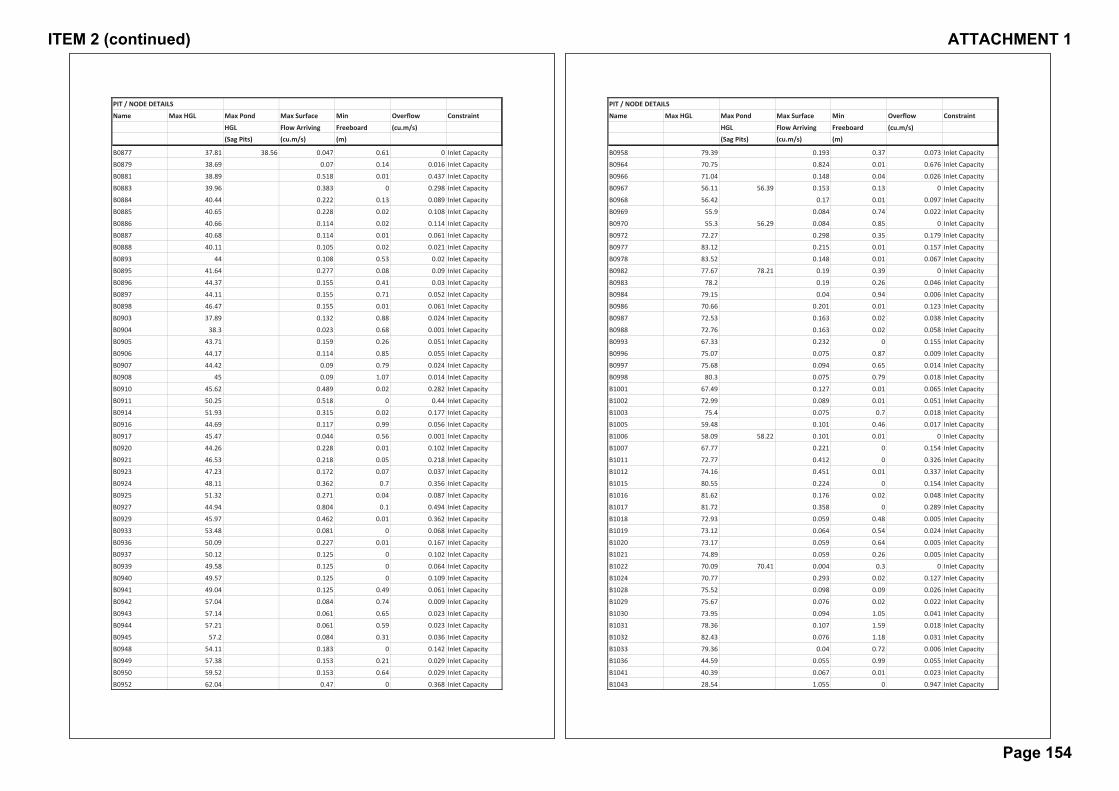
PIT / NODE DETAILS
Name Max HGL Max Pond Max Surface Min Overflow Constraint
HGL Flow Arriving Freeboard (cu.m/s)(Sag Pits) (cu.m/s) (m)
B0877 37.81 38.56 0.047 0.61 0 Inlet Capacity
B0879 38.69 0.07 0.14 0.016 Inlet Capacity
B0881 38.89 0.518 0.01 0.437 Inlet Capacity
B0883 39.96 0.383 0 0.298 Inlet Capacity
B0884 40.44 0.222 0.13 0.089 Inlet Capacity
B0885 40.65 0.228 0.02 0.108 Inlet Capacity
B0886 40.66 0.114 0.02 0.114 Inlet Capacity
B0887 40.68 0.114 0.01 0.061 Inlet Capacity
B0888 40.11 0.105 0.02 0.021 Inlet Capacity
B0893 44 0.108 0.53 0.02 Inlet Capacity
B0895 41.64 0.277 0.08 0.09 Inlet Capacity
B0896 44.37 0.155 0.41 0.03 Inlet Capacity
B0897 44.11 0.155 0.71 0.052 Inlet Capacity
B0898 46.47 0.155 0.01 0.061 Inlet Capacity
B0903 37.89 0.132 0.88 0.024 Inlet Capacity
B0904 38.3 0.023 0.68 0.001 Inlet Capacity
B0905 43.71 0.159 0.26 0.051 Inlet Capacity
B0906 44.17 0.114 0.85 0.055 Inlet Capacity
B0907 44.42 0.09 0.79 0.024 Inlet Capacity
B0908 45 0.09 1.07 0.014 Inlet Capacity
B0910 45.62 0.489 0.02 0.282 Inlet Capacity
B0911 50.25 0.518 0 0.44 Inlet Capacity
B0914 51.93 0.315 0.02 0.177 Inlet Capacity
B0916 44.69 0.117 0.99 0.056 Inlet Capacity
B0917 45.47 0.044 0.56 0.001 Inlet Capacity
B0920 44.26 0.228 0.01 0.102 Inlet Capacity
B0921 46.53 0.218 0.05 0.218 Inlet Capacity
B0923 47.23 0.172 0.07 0.037 Inlet Capacity
B0924 48.11 0.362 0.7 0.356 Inlet Capacity
B0925 51.32 0.271 0.04 0.087 Inlet Capacity
B0927 44.94 0.804 0.1 0.494 Inlet Capacity
B0929 45.97 0.462 0.01 0.362 Inlet Capacity
B0933 53.48 0.081 0 0.068 Inlet Capacity
B0936 50.09 0.227 0.01 0.167 Inlet Capacity
B0937 50.12 0.125 0 0.102 Inlet Capacity
B0939 49.58 0.125 0 0.064 Inlet Capacity
B0940 49.57 0.125 0 0.109 Inlet Capacity
B0941 49.04 0.125 0.49 0.061 Inlet Capacity
B0942 57.04 0.084 0.74 0.009 Inlet Capacity
B0943 57.14 0.061 0.65 0.023 Inlet Capacity
B0944 57.21 0.061 0.59 0.023 Inlet Capacity
B0945 57.2 0.084 0.31 0.036 Inlet Capacity
B0948 54.11 0.183 0 0.142 Inlet Capacity
B0949 57.38 0.153 0.21 0.029 Inlet Capacity
B0950 59.52 0.153 0.64 0.029 Inlet Capacity
B0952 62.04 0.47 0 0.368 Inlet Capacity
PIT / NODE DETAILS
Name Max HGL Max Pond Max Surface Min Overflow Constraint
HGL Flow Arriving Freeboard (cu.m/s)(Sag Pits) (cu.m/s) (m)
B0958 79.39 0.193 0.37 0.073 Inlet Capacity
B0964 70.75 0.824 0.01 0.676 Inlet Capacity
B0966 71.04 0.148 0.04 0.026 Inlet Capacity
B0967 56.11 56.39 0.153 0.13 0 Inlet Capacity
B0968 56.42 0.17 0.01 0.097 Inlet Capacity
B0969 55.9 0.084 0.74 0.022 Inlet Capacity
B0970 55.3 56.29 0.084 0.85 0 Inlet Capacity
B0972 72.27 0.298 0.35 0.179 Inlet Capacity
B0977 83.12 0.215 0.01 0.157 Inlet Capacity
B0978 83.52 0.148 0.01 0.067 Inlet Capacity
B0982 77.67 78.21 0.19 0.39 0 Inlet Capacity
B0983 78.2 0.19 0.26 0.046 Inlet Capacity
B0984 79.15 0.04 0.94 0.006 Inlet Capacity
B0986 70.66 0.201 0.01 0.123 Inlet Capacity
B0987 72.53 0.163 0.02 0.038 Inlet Capacity
B0988 72.76 0.163 0.02 0.058 Inlet Capacity
B0993 67.33 0.232 0 0.155 Inlet Capacity
B0996 75.07 0.075 0.87 0.009 Inlet Capacity
B0997 75.68 0.094 0.65 0.014 Inlet Capacity
B0998 80.3 0.075 0.79 0.018 Inlet Capacity
B1001 67.49 0.127 0.01 0.065 Inlet Capacity
B1002 72.99 0.089 0.01 0.051 Inlet Capacity
B1003 75.4 0.075 0.7 0.018 Inlet Capacity
B1005 59.48 0.101 0.46 0.017 Inlet Capacity
B1006 58.09 58.22 0.101 0.01 0 Inlet Capacity
B1007 67.77 0.221 0 0.154 Inlet Capacity
B1011 72.77 0.412 0 0.326 Inlet Capacity
B1012 74.16 0.451 0.01 0.337 Inlet Capacity
B1015 80.55 0.224 0 0.154 Inlet Capacity
B1016 81.62 0.176 0.02 0.048 Inlet Capacity
B1017 81.72 0.358 0 0.289 Inlet Capacity
B1018 72.93 0.059 0.48 0.005 Inlet Capacity
B1019 73.12 0.064 0.54 0.024 Inlet Capacity
B1020 73.17 0.059 0.64 0.005 Inlet Capacity
B1021 74.89 0.059 0.26 0.005 Inlet Capacity
B1022 70.09 70.41 0.004 0.3 0 Inlet Capacity
B1024 70.77 0.293 0.02 0.127 Inlet Capacity
B1028 75.52 0.098 0.09 0.026 Inlet Capacity
B1029 75.67 0.076 0.02 0.022 Inlet Capacity
B1030 73.95 0.094 1.05 0.041 Inlet Capacity
B1031 78.36 0.107 1.59 0.018 Inlet Capacity
B1032 82.43 0.076 1.18 0.031 Inlet Capacity
B1033 79.36 0.04 0.72 0.006 Inlet Capacity
B1036 44.59 0.055 0.99 0.055 Inlet Capacity
B1041 40.39 0.067 0.01 0.023 Inlet Capacity
B1043 28.54 1.055 0 0.947 Inlet Capacity
ITEM 2 (continued) ATTACHMENT 1
Page 154
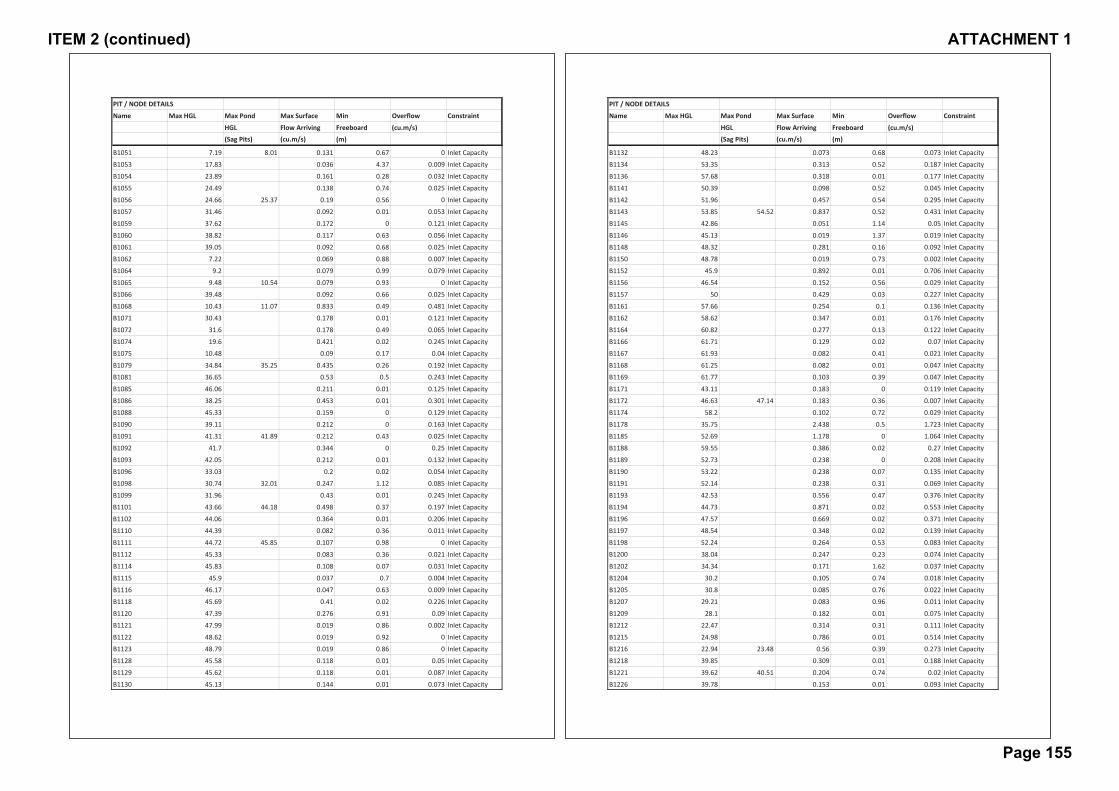
PIT / NODE DETAILS
Name Max HGL Max Pond Max Surface Min Overflow Constraint
HGL Flow Arriving Freeboard (cu.m/s)(Sag Pits) (cu.m/s) (m)
B1051 7.19 8.01 0.131 0.67 0 Inlet Capacity
B1053 17.83 0.036 4.37 0.009 Inlet Capacity
B1054 23.89 0.161 0.28 0.032 Inlet Capacity
B1055 24.49 0.138 0.74 0.025 Inlet Capacity
B1056 24.66 25.37 0.19 0.56 0 Inlet Capacity
B1057 31.46 0.092 0.01 0.053 Inlet Capacity
B1059 37.62 0.172 0 0.121 Inlet Capacity
B1060 38.82 0.117 0.63 0.056 Inlet Capacity
B1061 39.05 0.092 0.68 0.025 Inlet Capacity
B1062 7.22 0.069 0.88 0.007 Inlet Capacity
B1064 9.2 0.079 0.99 0.079 Inlet Capacity
B1065 9.48 10.54 0.079 0.93 0 Inlet Capacity
B1066 39.48 0.092 0.66 0.025 Inlet Capacity
B1068 10.43 11.07 0.833 0.49 0.481 Inlet Capacity
B1071 30.43 0.178 0.01 0.121 Inlet Capacity
B1072 31.6 0.178 0.49 0.065 Inlet Capacity
B1074 19.6 0.421 0.02 0.245 Inlet Capacity
B1075 10.48 0.09 0.17 0.04 Inlet Capacity
B1079 34.84 35.25 0.435 0.26 0.192 Inlet Capacity
B1081 36.65 0.53 0.5 0.243 Inlet Capacity
B1085 46.06 0.211 0.01 0.125 Inlet Capacity
B1086 38.25 0.453 0.01 0.301 Inlet Capacity
B1088 45.33 0.159 0 0.129 Inlet Capacity
B1090 39.11 0.212 0 0.163 Inlet Capacity
B1091 41.31 41.89 0.212 0.43 0.025 Inlet Capacity
B1092 41.7 0.344 0 0.25 Inlet Capacity
B1093 42.05 0.212 0.01 0.132 Inlet Capacity
B1096 33.03 0.2 0.02 0.054 Inlet Capacity
B1098 30.74 32.01 0.247 1.12 0.085 Inlet Capacity
B1099 31.96 0.43 0.01 0.245 Inlet Capacity
B1101 43.66 44.18 0.498 0.37 0.197 Inlet Capacity
B1102 44.06 0.364 0.01 0.206 Inlet Capacity
B1110 44.39 0.082 0.36 0.011 Inlet Capacity
B1111 44.72 45.85 0.107 0.98 0 Inlet Capacity
B1112 45.33 0.083 0.36 0.021 Inlet Capacity
B1114 45.83 0.108 0.07 0.031 Inlet Capacity
B1115 45.9 0.037 0.7 0.004 Inlet Capacity
B1116 46.17 0.047 0.63 0.009 Inlet Capacity
B1118 45.69 0.41 0.02 0.226 Inlet Capacity
B1120 47.39 0.276 0.91 0.09 Inlet Capacity
B1121 47.99 0.019 0.86 0.002 Inlet Capacity
B1122 48.62 0.019 0.92 0 Inlet Capacity
B1123 48.79 0.019 0.86 0 Inlet Capacity
B1128 45.58 0.118 0.01 0.05 Inlet Capacity
B1129 45.62 0.118 0.01 0.087 Inlet Capacity
B1130 45.13 0.144 0.01 0.073 Inlet Capacity
PIT / NODE DETAILS
Name Max HGL Max Pond Max Surface Min Overflow Constraint
HGL Flow Arriving Freeboard (cu.m/s)(Sag Pits) (cu.m/s) (m)
B1132 48.23 0.073 0.68 0.073 Inlet Capacity
B1134 53.35 0.313 0.52 0.187 Inlet Capacity
B1136 57.68 0.318 0.01 0.177 Inlet Capacity
B1141 50.39 0.098 0.52 0.045 Inlet Capacity
B1142 51.96 0.457 0.54 0.295 Inlet Capacity
B1143 53.85 54.52 0.837 0.52 0.431 Inlet Capacity
B1145 42.86 0.051 1.14 0.05 Inlet Capacity
B1146 45.13 0.019 1.37 0.019 Inlet Capacity
B1148 48.32 0.281 0.16 0.092 Inlet Capacity
B1150 48.78 0.019 0.73 0.002 Inlet Capacity
B1152 45.9 0.892 0.01 0.706 Inlet Capacity
B1156 46.54 0.152 0.56 0.029 Inlet Capacity
B1157 50 0.429 0.03 0.227 Inlet Capacity
B1161 57.66 0.254 0.1 0.136 Inlet Capacity
B1162 58.62 0.347 0.01 0.176 Inlet Capacity
B1164 60.82 0.277 0.13 0.122 Inlet Capacity
B1166 61.71 0.129 0.02 0.07 Inlet Capacity
B1167 61.93 0.082 0.41 0.021 Inlet Capacity
B1168 61.25 0.082 0.01 0.047 Inlet Capacity
B1169 61.77 0.103 0.39 0.047 Inlet Capacity
B1171 43.11 0.183 0 0.119 Inlet Capacity
B1172 46.63 47.14 0.183 0.36 0.007 Inlet Capacity
B1174 58.2 0.102 0.72 0.029 Inlet Capacity
B1178 35.75 2.438 0.5 1.723 Inlet Capacity
B1185 52.69 1.178 0 1.064 Inlet Capacity
B1188 59.55 0.386 0.02 0.27 Inlet Capacity
B1189 52.73 0.238 0 0.208 Inlet Capacity
B1190 53.22 0.238 0.07 0.135 Inlet Capacity
B1191 52.14 0.238 0.31 0.069 Inlet Capacity
B1193 42.53 0.556 0.47 0.376 Inlet Capacity
B1194 44.73 0.871 0.02 0.553 Inlet Capacity
B1196 47.57 0.669 0.02 0.371 Inlet Capacity
B1197 48.54 0.348 0.02 0.139 Inlet Capacity
B1198 52.24 0.264 0.53 0.083 Inlet Capacity
B1200 38.04 0.247 0.23 0.074 Inlet Capacity
B1202 34.34 0.171 1.62 0.037 Inlet Capacity
B1204 30.2 0.105 0.74 0.018 Inlet Capacity
B1205 30.8 0.085 0.76 0.022 Inlet Capacity
B1207 29.21 0.083 0.96 0.011 Inlet Capacity
B1209 28.1 0.182 0.01 0.075 Inlet Capacity
B1212 22.47 0.314 0.31 0.111 Inlet Capacity
B1215 24.98 0.786 0.01 0.514 Inlet Capacity
B1216 22.94 23.48 0.56 0.39 0.273 Inlet Capacity
B1218 39.85 0.309 0.01 0.188 Inlet Capacity
B1221 39.62 40.51 0.204 0.74 0.02 Inlet Capacity
B1226 39.78 0.153 0.01 0.093 Inlet Capacity
ITEM 2 (continued) ATTACHMENT 1
Page 155

PIT / NODE DETAILS
Name Max HGL Max Pond Max Surface Min Overflow Constraint
HGL Flow Arriving Freeboard (cu.m/s)(Sag Pits) (cu.m/s) (m)
B1228 42.07 0.09 0.97 0.024 Inlet Capacity
B1230 37.52 38.17 0.116 0.5 0 Inlet Capacity
B1231 37.77 0.175 0.32 0.064 Inlet Capacity
B1233 41.29 0.208 0.01 0.142 Inlet Capacity
B1234 41.77 0.194 0.01 0.107 Inlet Capacity
B1235 41.35 0.08 0.01 0.048 Inlet Capacity
B1237 41.11 0.17 2.43 0.088 Inlet Capacity
B1238 30.87 0.304 0.01 0.182 Inlet Capacity
B1239 30.5 0.206 0.02 0.083 Inlet Capacity
B1243 41.18 0.121 0.06 0.023 Inlet Capacity
B1244 41.8 0.103 0.24 0.018 Inlet Capacity
B1245 43.49 0.103 0.84 0.029 Inlet Capacity
B1246 42.31 0.058 0.31 0.02 Inlet Capacity
B1247 42.64 0.055 0.47 0.019 Inlet Capacity
B1248 42.91 0.055 1.41 0.004 Inlet Capacity
B1257 47.28 0.309 0 0.264 Inlet Capacity
B1259 42.24 42.98 0.521 0.59 0.208 Inlet Capacity
B1263 48.3 0.132 0.01 0.084 Inlet Capacity
B1264 51.03 0.173 0.37 0.087 Inlet Capacity
B1266 53.43 0.064 0.52 0.024 Inlet Capacity
B1267 46.88 0.301 0.01 0.22 Inlet Capacity
B1268 52.38 0.064 0.89 0.024 Inlet Capacity
B1270 42.14 0.702 0.19 0.491 Inlet Capacity
B1273 43.43 0.262 0.68 0.153 Inlet Capacity
B1274 42.76 0.042 0.12 0.006 Inlet Capacity
B1276 45.53 0.482 0.02 0.328 Inlet Capacity
B1280 51.81 0.366 0.02 0.244 Inlet Capacity
B1281 45.57 0.292 0.24 0.175 Inlet Capacity
B1282 50.48 0.011 0.71 0 Inlet Capacity
B1283 43.36 0.069 1.46 0.007 Inlet Capacity
B1284 46.63 0.068 0.74 0.006 Inlet Capacity
B1285 49.37 0.063 0.77 0.005 Inlet Capacity
B1286 44.09 0.343 0.01 0.192 Inlet Capacity
B1288 56.36 0.181 0.02 0.098 Inlet Capacity
B1289 56.87 0.152 1.07 0.029 Inlet Capacity
B1291 42.04 0.153 1.06 0.029 Inlet Capacity
B1292 43.52 45.32 0.075 1.68 0 Inlet Capacity
B1293 44.63 0.076 0.73 0.019 Inlet Capacity
B1294 44.91 0.076 0.85 0.019 Inlet Capacity
B1295 45.85 0.123 0.14 0.024 Inlet Capacity
B1296 46 0.221 0.02 0.097 Inlet Capacity
B1297 47.86 0.148 0.43 0.073 Inlet Capacity
B1298 49.9 0.29 0.01 0.15 Inlet Capacity
B1301 55.86 0.063 0.02 0.012 Inlet Capacity
B1306 58.89 0.167 0.01 0.065 Inlet Capacity
B1310 63.48 1.321 0.01 1.116 Inlet Capacity
PIT / NODE DETAILS
Name Max HGL Max Pond Max Surface Min Overflow Constraint
HGL Flow Arriving Freeboard (cu.m/s)(Sag Pits) (cu.m/s) (m)
B1313 73.16 0.134 0 0.099 Inlet Capacity
B1316 48.07 49.78 0.092 1.57 0 Inlet Capacity
B1317 52.97 53.14 0.473 0.02 0.181 Inlet Capacity
B1318 42.52 0.193 0.86 0.047 Inlet Capacity
B1319 47.42 0.051 0.95 0.01 Inlet Capacity
B1320 48.55 0.049 0.74 0.002 Inlet Capacity
B1321 49.27 0.486 0.01 0.329 Inlet Capacity
B1322 49.33 0.049 0.13 0.002 Inlet Capacity
B1324 54.11 0.55 0 0.468 Inlet Capacity
B1327 47.72 0.101 0.01 0.037 Inlet Capacity
B1331 48.04 0.045 1.45 0.014 Inlet Capacity
B1332 49.24 0.197 0.02 0.113 Inlet Capacity
B1333 50.05 0.225 0 0.173 Inlet Capacity
B1334 52.22 53.83 0.459 1.46 0.199 Inlet Capacity
B1335 53.7 0.367 0.01 0.296 Inlet Capacity
B1337 55.54 0.173 0.29 0.062 Inlet Capacity
B1338 56.02 0.133 0.24 0.041 Inlet Capacity
B1340 59.87 0.131 0.67 0.04 Inlet Capacity
B1346 64.3 0.166 0.26 0.034 Inlet Capacity
B1350 67.74 0.105 0.07 0.016 Inlet Capacity
B1351 71.98 0.076 0.01 0.043 Inlet Capacity
B1352 75.73 0.063 0.42 0.013 Inlet Capacity
B1353 75.93 0.072 0.7 0.017 Inlet Capacity
B1354 62.08 0.112 0.02 0.038 Inlet Capacity
B1355 64.91 0.123 0.02 0.04 Inlet Capacity
B1359 67.28 0.163 0.23 0.083 Inlet Capacity
B1360 67.9 0.109 0.27 0.051 Inlet Capacity
B1370 72.1 0.089 0.29 0.037 Inlet Capacity
B1371 57.86 58.42 0.059 0.47 0 Inlet Capacity
B1372 69.52 0.209 0.01 0.124 Inlet Capacity
B1381 76.39 0.216 0.01 0.117 Inlet Capacity
B1382 62.88 0.024 0.35 0.002 Inlet Capacity
B1383 63.89 0.179 0.01 0.113 Inlet Capacity
B1386 76.01 0.179 0.01 0.086 Inlet Capacity
B1387 64.83 0.246 0.01 0.171 Inlet Capacity
B1390 78.07 0.167 1.13 0.058 Inlet Capacity
B1391 79.5 0.184 0.36 0.069 Inlet Capacity
B1393 18.25 18.79 0.998 0.39 0.557 Inlet Capacity
B1402 53.8 54.22 0.044 0.35 0 Inlet Capacity
B1403 59.49 0.122 0.06 0.024 Inlet Capacity
B1405 60.82 0.263 0.02 0.116 Inlet Capacity
B1407 57.65 0.437 0.17 0.283 Inlet Capacity
B1408 58.67 0.599 0.01 0.427 Inlet Capacity
B1411 59.34 0.497 0.02 0.327 Inlet Capacity
B1415 67.37 0.234 0.2 0.068 Inlet Capacity
B1418 47.84 0.098 0.33 0.015 Inlet Capacity
ITEM 2 (continued) ATTACHMENT 1
Page 156

PIT / NODE DETAILS
Name Max HGL Max Pond Max Surface Min Overflow Constraint
HGL Flow Arriving Freeboard (cu.m/s)(Sag Pits) (cu.m/s) (m)
B1419 51.85 0.182 0.02 0.053 Inlet Capacity
B1421 32.52 0.125 0.11 0.024 Inlet Capacity
B1422 47.44 0.356 0.01 0.206 Inlet Capacity
B1426 52.35 0.194 0 0.16 Inlet Capacity
B1428 63.18 0.079 0 0.06 Inlet Capacity
B1429 64.65 0.065 0.58 0.014 Inlet Capacity
B1430 66.29 0.101 0.27 0.046 Inlet Capacity
B1432 58.04 0.172 0.42 0.06 Inlet Capacity
B1434 64.01 0.147 0.02 0.038 Inlet Capacity
B1435 61.54 0.104 1.56 0.018 Inlet Capacity
B1439 67.46 0.317 0.02 0.188 Inlet Capacity
B1441 60.56 0.057 1.4 0.02 Inlet Capacity
B1442 60.89 0.058 1.1 0.004 Inlet Capacity
B1443 60.16 0.073 1.79 0.029 Inlet Capacity
B1444 69.06 0.229 0.96 0.12 Inlet Capacity
B1445 61.96 0.158 0 0.113 Inlet Capacity
B1447 63.96 0.127 0.02 0.074 Inlet Capacity
B1448 65.56 0.137 0.69 0.025 Inlet Capacity
B1449 59.43 61.09 0.028 1.55 0 Inlet Capacity
B1450 60.73 0.018 0.76 0.001 Inlet Capacity
B1452 43.16 0.167 0.3 0.033 Inlet Capacity
B1453 44.84 0.131 0.01 0.065 Inlet Capacity
B1454 46.02 0.102 0.66 0.029 Inlet Capacity
B1456 42.45 0.418 0 0.304 Inlet Capacity
B1457 48.23 0.27 0 0.197 Inlet Capacity
B1458 49.59 0.173 0.02 0.098 Inlet Capacity
B1464 68.99 0.111 0.01 0.052 Inlet Capacity
B1465 71.91 0.106 0.09 0.016 Inlet Capacity
B1466 72.71 0.107 0.01 0.04 Inlet Capacity
B1467 75.08 0.076 1.55 0.03 Inlet Capacity
B1468 75.3 0.074 1.61 0.008 Inlet Capacity
B1469 79 0.067 1.05 0.006 Inlet Capacity
B1472 69.98 0.072 0.02 0.015 Inlet Capacity
B1473 71.38 0.074 0.41 0.028 Inlet Capacity
B1474 72.29 0.075 1.01 0.03 Inlet Capacity
B1475 72.82 0.066 0.72 0.024 Inlet Capacity
B1476 73.16 0.06 0.99 0.022 Inlet Capacity
B1477 73.46 0.05 1.04 0.016 Inlet Capacity
B1478 76.04 0.04 0.98 0.006 Inlet Capacity
B1479 46.27 0.884 0.02 0.569 Inlet Capacity
B1480 41.37 0.328 0 0.279 Inlet Capacity
B1481 41.66 0.206 0.02 0.083 Inlet Capacity
B1482 41.45 0.156 0.01 0.089 Inlet Capacity
B1484 52.91 0.1 0.01 0.053 Inlet Capacity
B1485 39.98 0.016 0.02 0 Inlet Capacity
B1496 52.09 0.211 0.01 0.128 Inlet Capacity
PIT / NODE DETAILS
Name Max HGL Max Pond Max Surface Min Overflow Constraint
HGL Flow Arriving Freeboard (cu.m/s)(Sag Pits) (cu.m/s) (m)
B1499 53.1 0.277 0.02 0.131 Inlet Capacity
B1500 45.27 0.048 0.32 0.009 Inlet Capacity
B1501 52.35 0.152 0.58 0.029 Inlet Capacity
B1502 60.2 0.177 0.6 0.093 Inlet Capacity
B1506 73.26 0.044 0.71 0.001 Inlet Capacity
B1507 72.53 0.044 1.16 0.007 Inlet Capacity
B1509 65.92 0.263 0 0.204 Inlet Capacity
B1510 66.26 0.171 0.01 0.092 Inlet Capacity
B1511 61.38 0.055 0.69 0.011 Inlet Capacity
B1513 48.36 0.135 0.01 0.098 Inlet Capacity
B1514 62.44 0.088 0.44 0.038 Inlet Capacity
B1515 68.21 0.05 0.7 0.002 Inlet Capacity
B1516 58.96 0.055 0.84 0.011 Inlet Capacity
B1518 43.64 44.09 0.051 0.37 0 Inlet Capacity
B1520 49.25 0.595 0 0.529 Inlet Capacity
B1524 43.6 0.225 0.36 0.093 Inlet Capacity
B1526 38.01 0.087 0.49 0.023 Inlet Capacity
B1555 54.06 0.138 0.65 0.043 Inlet Capacity
B1628 43.13 0.731 0.37 0.361 Inlet Capacity
B1629 43.58 0.396 0.42 0.159 Inlet Capacity
B1631 52.87 54.65 0.266 1.63 0.047 Inlet Capacity
B1637 45.74 0.048 2.06 0.001 Inlet Capacity
B1638 47.41 0.052 2.09 0.003 Inlet Capacity
B1671 42.21 0.104 0.07 0.018 Inlet Capacity
B1672 42.38 0.169 0.05 0.035 Inlet Capacity
B1673 43.15 44.1 0.384 0.8 0.115 Inlet Capacity
B1674 43.32 0.099 0.99 0.015 Inlet Capacity
B1675 44.13 0.201 0.94 0.049 Inlet Capacity
B1676 45.03 0.165 0.86 0.033 Inlet Capacity
B1679 52.75 0.069 0.5 0.007 Inlet Capacity
B1681 43.19 0.05 0.81 0.002 Inlet Capacity
B1689 53.16 0.087 1.74 0.012 Inlet Capacity
B1690 53.29 0.077 2.11 0.01 Inlet Capacity
B1691 54.87 0.322 0.01 0.168 Inlet Capacity
B1697 56.49 0.189 0.01 0.101 Inlet Capacity
B1700 56.88 0.07 0.02 0.015 Inlet Capacity
B1703 55 0.07 0.05 0.007 Inlet Capacity
B1704 55.07 0.07 0.03 0.007 Inlet Capacity
B1705 55.11 0.07 0.04 0.007 Inlet Capacity
Pit1823 39.46 0.85 0.3 0.84 Inlet Capacity
B0013 31.97 0 0.73 None
B0051 76.08 0.008 0.78 None
B0055 79.04 0.038 0.72 0 None
B0197 32.66 0.004 1.12 0 None
B0199 39.35 0.004 2.75 0 None
B0251 58.77 0.037 0.36 0 None
ITEM 2 (continued) ATTACHMENT 1
Page 157
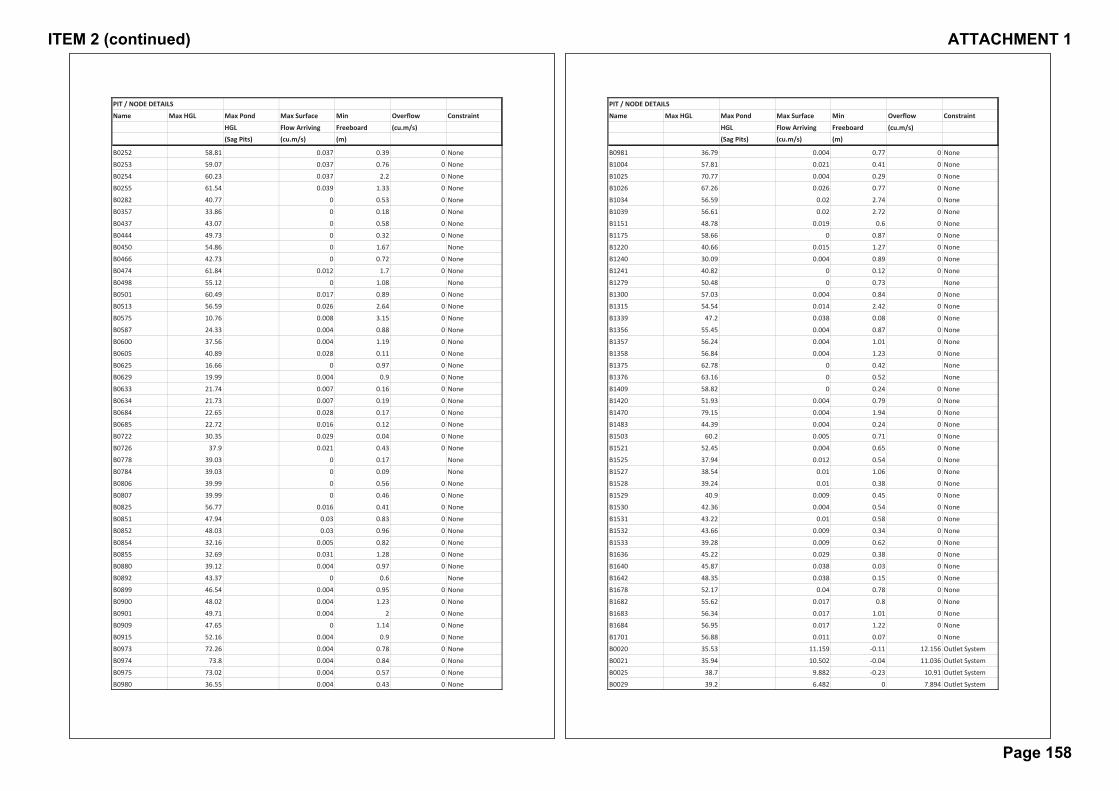
PIT / NODE DETAILS
Name Max HGL Max Pond Max Surface Min Overflow Constraint
HGL Flow Arriving Freeboard (cu.m/s)(Sag Pits) (cu.m/s) (m)
B0252 58.81 0.037 0.39 0 None
B0253 59.07 0.037 0.76 0 None
B0254 60.23 0.037 2.2 0 None
B0255 61.54 0.039 1.33 0 None
B0282 40.77 0 0.53 0 None
B0357 33.86 0 0.18 0 None
B0437 43.07 0 0.58 0 None
B0444 49.73 0 0.32 0 None
B0450 54.86 0 1.67 None
B0466 42.73 0 0.72 0 None
B0474 61.84 0.012 1.7 0 None
B0498 55.12 0 1.08 None
B0501 60.49 0.017 0.89 0 None
B0513 56.59 0.026 2.64 0 None
B0575 10.76 0.008 3.15 0 None
B0587 24.33 0.004 0.88 0 None
B0600 37.56 0.004 1.19 0 None
B0605 40.89 0.028 0.11 0 None
B0625 16.66 0 0.97 0 None
B0629 19.99 0.004 0.9 0 None
B0633 21.74 0.007 0.16 0 None
B0634 21.73 0.007 0.19 0 None
B0684 22.65 0.028 0.17 0 None
B0685 22.72 0.016 0.12 0 None
B0722 30.35 0.029 0.04 0 None
B0726 37.9 0.021 0.43 0 None
B0778 39.03 0 0.17 None
B0784 39.03 0 0.09 None
B0806 39.99 0 0.56 0 None
B0807 39.99 0 0.46 0 None
B0825 56.77 0.016 0.41 0 None
B0851 47.94 0.03 0.83 0 None
B0852 48.03 0.03 0.96 0 None
B0854 32.16 0.005 0.82 0 None
B0855 32.69 0.031 1.28 0 None
B0880 39.12 0.004 0.97 0 None
B0892 43.37 0 0.6 None
B0899 46.54 0.004 0.95 0 None
B0900 48.02 0.004 1.23 0 None
B0901 49.71 0.004 2 0 None
B0909 47.65 0 1.14 0 None
B0915 52.16 0.004 0.9 0 None
B0973 72.26 0.004 0.78 0 None
B0974 73.8 0.004 0.84 0 None
B0975 73.02 0.004 0.57 0 None
B0980 36.55 0.004 0.43 0 None
PIT / NODE DETAILS
Name Max HGL Max Pond Max Surface Min Overflow Constraint
HGL Flow Arriving Freeboard (cu.m/s)(Sag Pits) (cu.m/s) (m)
B0981 36.79 0.004 0.77 0 None
B1004 57.81 0.021 0.41 0 None
B1025 70.77 0.004 0.29 0 None
B1026 67.26 0.026 0.77 0 None
B1034 56.59 0.02 2.74 0 None
B1039 56.61 0.02 2.72 0 None
B1151 48.78 0.019 0.6 0 None
B1175 58.66 0 0.87 0 None
B1220 40.66 0.015 1.27 0 None
B1240 30.09 0.004 0.89 0 None
B1241 40.82 0 0.12 0 None
B1279 50.48 0 0.73 None
B1300 57.03 0.004 0.84 0 None
B1315 54.54 0.014 2.42 0 None
B1339 47.2 0.038 0.08 0 None
B1356 55.45 0.004 0.87 0 None
B1357 56.24 0.004 1.01 0 None
B1358 56.84 0.004 1.23 0 None
B1375 62.78 0 0.42 None
B1376 63.16 0 0.52 None
B1409 58.82 0 0.24 0 None
B1420 51.93 0.004 0.79 0 None
B1470 79.15 0.004 1.94 0 None
B1483 44.39 0.004 0.24 0 None
B1503 60.2 0.005 0.71 0 None
B1521 52.45 0.004 0.65 0 None
B1525 37.94 0.012 0.54 0 None
B1527 38.54 0.01 1.06 0 None
B1528 39.24 0.01 0.38 0 None
B1529 40.9 0.009 0.45 0 None
B1530 42.36 0.004 0.54 0 None
B1531 43.22 0.01 0.58 0 None
B1532 43.66 0.009 0.34 0 None
B1533 39.28 0.009 0.62 0 None
B1636 45.22 0.029 0.38 0 None
B1640 45.87 0.038 0.03 0 None
B1642 48.35 0.038 0.15 0 None
B1678 52.17 0.04 0.78 0 None
B1682 55.62 0.017 0.8 0 None
B1683 56.34 0.017 1.01 0 None
B1684 56.95 0.017 1.22 0 None
B1701 56.88 0.011 0.07 0 None
B0020 35.53 11.159 0.11 12.156 Outlet System
B0021 35.94 10.502 0.04 11.036 Outlet System
B0025 38.7 9.882 0.23 10.91 Outlet System
B0029 39.2 6.482 0 7.894 Outlet System
ITEM 2 (continued) ATTACHMENT 1
Page 158

PIT / NODE DETAILS
Name Max HGL Max Pond Max Surface Min Overflow Constraint
HGL Flow Arriving Freeboard (cu.m/s)(Sag Pits) (cu.m/s) (m)
B0030 39.78 6.214 0.25 6.206 Outlet System
B0031 40.81 6.133 0.93 6.104 Outlet System
B0032 41.33 5.214 0.83 5.214 Outlet System
B0033 41.4 5.374 0.86 5.214 Outlet System
B0034 42.88 2.499 0.16 3.031 Outlet System
B0035 44.53 2.237 0.03 2.476 Outlet System
B0041 47.96 1.975 0 2.912 Outlet System
B0047 58.38 1.231 0.22 1.465 Outlet System
B0048 60.63 0.969 0.13 1.145 Outlet System
B0057 46.59 1.107 0.19 1.318 Outlet System
B0058 47.11 0.809 0.01 0.86 Outlet System
B0059 48.03 0.592 0.2 0.806 Outlet System
B0060 49.14 0.098 0.38 0.39 Outlet System
B0067 25.56 1.128 0.44 1.876 Outlet System
B0069 29.12 1.038 0 1.166 Outlet System
B0070 31.42 0.714 0.01 0.786 Outlet System
B0074 40.59 1.29 0.15 1.199 Outlet System
B0084 32.41 0.187 0 0.156 Outlet System
B0092 44.85 44.93 0.653 0.07 0.354 Outlet System
B0093 45.36 0.471 0.05 0.502 Outlet System
B0094 46.2 0.283 0.04 0.317 Outlet System
B0099 12.75 0.62 0.04 0.865 Outlet System
B0111 26.03 3.413 0.02 3.527 Outlet System
B0112 26.65 2.989 0.09 3.328 Outlet System
B0114 28.31 2.397 0.21 2.703 Outlet System
B0116 31.64 0.321 0.03 0.43 Outlet System
B0117 32.31 0.213 0.01 0.243 Outlet System
B0122 39.82 0.891 0.07 0.861 Outlet System
B0123 42.15 0.587 0.07 0.592 Outlet System
B0124 43.89 0.47 0 0.457 Outlet System
B0125 44.94 0.276 0.1 0.326 Outlet System
B0127 49.81 0.401 0 0.325 Outlet System
B0133 22.56 1.362 0.17 1.982 Outlet System
B0135 22.69 22.8 1.555 0.04 1.449 Outlet System
B0136 22.74 0.87 0 1.549 Outlet System
B0141 30.98 31.06 1.626 0.07 1.408 Outlet System
B0142 31.19 0.755 0 0.824 Outlet System
B0144 31.96 0.464 0.2 0.96 Outlet System
B0156 40.45 0.433 0 0.428 Outlet System
B0157 41.04 0.829 0 0.723 Outlet System
B0158 44.38 0.656 0.02 0.639 Outlet System
B0159 45.57 0.301 0.09 0.358 Outlet System
B0163 52.5 0.42 0.02 0.422 Outlet System
B0164 52.74 0.36 0.02 0.364 Outlet System
B0165 52.88 0.179 0.06 0.208 Outlet System
B0173 37.45 1.311 0.15 1.486 Outlet System
PIT / NODE DETAILS
Name Max HGL Max Pond Max Surface Min Overflow Constraint
HGL Flow Arriving Freeboard (cu.m/s)(Sag Pits) (cu.m/s) (m)
B0175 39.7 1.292 0 1.189 Outlet System
B0176 40.42 1.212 0.05 1.289 Outlet System
B0177 41.32 1.042 0.04 1.121 Outlet System
B0178 43.49 0.968 0.01 0.973 Outlet System
B0179 44.71 0.955 0 0.896 Outlet System
B0180 45.78 0.643 0.42 0.882 Outlet System
B0183 46.99 0.686 0.08 0.786 Outlet System
B0186 49.36 0.571 0.08 0.564 Outlet System
B0188 49.3 0.35 0 0.35 Outlet System
B0208 47.28 0.832 0 0.834 Outlet System
B0210 52.56 0.691 0.09 0.758 Outlet System
B0223 44.2 0.642 0 0.816 Outlet System
B0226 45.99 46.12 0.973 0.02 0.792 Outlet System
B0227 46.2 1.005 0 0.909 Outlet System
B0228 47.76 0.883 0.06 0.969 Outlet System
B0232 53.93 1.516 0 1.424 Outlet System
B0233 54.53 1.234 0.33 1.506 Outlet System
B0234 54.72 54.54 1.12 0.33 1.223 Outlet System
B0236 55.52 1.095 0.2 1.245 Outlet System
B0238 58.14 1.489 0.05 1.376 Outlet System
B0245 53.83 2.02 0.22 2.243 Outlet System
B0246 56.58 2.159 0.23 1.995 Outlet System
B0250 58.62 0.004 0 0.004 Outlet System
B0264 47.11 0.22 0.22 0.416 Outlet System
B0270 59.72 0.529 0 0.483 Outlet System
B0271 63.47 0.553 0 0.396 Outlet System
B0272 63.48 0.286 0 0.267 Outlet System
B0277 33.38 0.065 0 0.354 Outlet System
B0290 28.21 1.429 0.01 1.357 Outlet System
B0292 28.97 1.488 0.01 1.53 Outlet System
B0293 32.57 1.31 0.07 1.483 Outlet System
B0295 34.82 1.134 0.12 1.357 Outlet System
B0296 35.8 1.045 0 1.089 Outlet System
B0298 37.3 0.99 0 0.87 Outlet System
B0299 37.46 0.95 0.01 0.964 Outlet System
B0300 38.01 1.065 0 0.903 Outlet System
B0301 38.28 0.784 0 1.026 Outlet System
B0303 39.17 0.757 0.07 0.896 Outlet System
B0305 40.51 0.918 0 0.916 Outlet System
B0306 41.97 0.881 0.02 0.894 Outlet System
B0307 42.65 0.625 0.23 0.81 Outlet System
B0309 44.36 44.36 0.03 0.15 0 Outlet System
B0310 44.36 44.37 0.03 0.14 0 Outlet System
B0321 40.27 1.332 0.01 1.283 Outlet System
B0335 37.36 2.035 0.01 1.706 Outlet System
B0338 39.99 40.04 2.091 0.1 1.973 Outlet System
ITEM 2 (continued) ATTACHMENT 1
Page 159

PIT / NODE DETAILS
Name Max HGL Max Pond Max Surface Min Overflow Constraint
HGL Flow Arriving Freeboard (cu.m/s)(Sag Pits) (cu.m/s) (m)
B0339 40.81 1.419 0.21 1.923 Outlet System
B0358 34.04 0.225 0.05 0.277 Outlet System
B0367 51.18 0.506 0.09 0.529 Outlet System
B0369 51.36 0.414 0 0.444 Outlet System
B0371 41.37 0.817 0.25 1.419 Outlet System
B0373 44.97 0.991 0 0.89 Outlet System
B0374 45.73 1.185 0.01 0.991 Outlet System
B0379 48.78 1.716 0.05 1.837 Outlet System
B0380 48.79 0.163 0 0.156 Outlet System
B0381 49.04 0.141 0.04 0.151 Outlet System
B0382 49.14 0.086 0.04 0.126 Outlet System
B0383 49.26 0.036 0 0.07 Outlet System
B0390 49.44 0.649 0.12 0.815 Outlet System
B0394 55.95 0.367 0 0.301 Outlet System
B0395 56.02 0.257 0.01 0.268 Outlet System
B0396 56.19 0.148 0.03 0.155 Outlet System
B0398 39.08 9.683 0.18 9.683 Outlet System
B0399 39.08 0 0 Outlet System
B0400 39.5 39.25 9.332 0.4 9.683 Outlet System
B0401 40.38 3.179 0.03 3.192 Outlet System
B0402 40.65 1.711 0.07 1.908 Outlet System
B0404 41.54 1.598 0 1.462 Outlet System
B0405 43.75 1.465 0.04 1.468 Outlet System
B0406 44.18 1.182 0.13 1.277 Outlet System
B0407 44.58 0.944 0.07 1.015 Outlet System
B0410 46.29 0.418 0.01 0.429 Outlet System
B0419 47 0.205 0 0.238 Outlet System
B0426 54.46 54.52 0.153 0.09 0.001 Outlet System
B0430 42.24 3.274 1.11 3.274 Outlet System
B0431 42.11 3.275 0.58 3.274 Outlet System
B0433 42.08 1.138 0 3.199 Outlet System
B0441 47.81 1.327 0.16 1.327 Outlet System
B0445 50.06 1.503 0 2.036 Outlet System
B0446 51.8 1.475 0.35 1.475 Outlet System
B0447 53.85 1.494 0.42 1.475 Outlet System
B0460 63.84 0.507 0 0.439 Outlet System
B0461 68.38 0.411 0 0.354 Outlet System
B0469 58.34 1.497 0.02 1.578 Outlet System
B0470 58.6 1.42 0.26 1.42 Outlet System
B0471 59.7 1.246 0.04 1.414 Outlet System
B0473 60.55 0.807 0.14 1.096 Outlet System
B0482 70.22 0.242 0.37 0.416 Outlet System
B0483 71.69 0.082 0.23 0.217 Outlet System
B0486 74.29 0.16 0 0.131 Outlet System
B0489 47.2 0.182 0 0.593 Outlet System
B0491 49.42 0.963 0.33 1.405 Outlet System
PIT / NODE DETAILS
Name Max HGL Max Pond Max Surface Min Overflow Constraint
HGL Flow Arriving Freeboard (cu.m/s)(Sag Pits) (cu.m/s) (m)
B0507 57.63 0.337 0.23 0.46 Outlet System
B0510 58.69 0.365 0.09 0.37 Outlet System
B0519 8.52 0.351 0.09 0.409 Outlet System
B0520 9.13 0.277 0 0.335 Outlet System
B0521 11.49 0.185 0.13 0.254 Outlet System
B0524 20.45 0.391 0 0.314 Outlet System
B0529 18.75 0.669 0 0.55 Outlet System
B0530 18.88 0.332 0.08 0.341 Outlet System
B0536 25.36 0.057 0 0.057 Outlet System
B0538 25.32 25.38 0.054 0.09 0 Outlet System
B0540 24.71 0.63 0.21 0.717 Outlet System
B0541 24.91 0.303 0 0.322 Outlet System
B0542 25.25 0.238 0 0.229 Outlet System
B0544 26.12 0.128 0.07 0.173 Outlet System
B0546 36.49 36.61 0.381 0.03 0.093 Outlet System
B0551 24.83 0.269 0 0.235 Outlet System
B0552 25.06 0.135 0.08 0.19 Outlet System
B0556 36.55 0.173 0.02 0.13 Outlet System
B0558 37.02 0.949 0.01 0.946 Outlet System
B0559 38.03 0.823 0.03 0.869 Outlet System
B0560 38.23 0.449 0.22 0.573 Outlet System
B0561 38.14 0.139 0.01 0.15 Outlet System
B0563 39.2 0.282 0.02 0.287 Outlet System
B0580 24.29 0.118 0.01 0.14 Outlet System
B0588 24.78 24.85 0.192 0.08 0.05 Outlet System
B0590 22.62 0.24 0.05 0.265 Outlet System
B0593 25.56 0.241 0.11 0.324 Outlet System
B0596 33.13 33.25 0.353 0.03 0.133 Outlet System
B0597 33.16 0.253 0.03 0.252 Outlet System
B0602 40.8 40.87 1.065 0.08 0.707 Outlet System
B0604 40.63 0.139 0 0.345 Outlet System
B0614 41.69 0.395 0 0.382 Outlet System
B0615 40.8 0.262 0 0.259 Outlet System
B0632 21.61 21.71 1.289 0.05 1.089 Outlet System
B0635 21.92 1.15 0.06 1.275 Outlet System
B0636 22.46 0.687 0.02 0.749 Outlet System
B0641 37.18 0.713 0 0.668 Outlet System
B0643 37.61 0.277 0 0.248 Outlet System
B0644 37.68 0.145 0 0.132 Outlet System
B0646 21.96 0.514 0 0.507 Outlet System
B0650 22.44 0.197 0 0.139 Outlet System
B0657 31.75 1.957 0.02 1.866 Outlet System
B0658 32.46 0.573 0 0.677 Outlet System
B0659 33.68 0.597 0 0.53 Outlet System
B0660 37.87 0.46 0.25 0.552 Outlet System
B0661 41.54 0.396 0.03 0.402 Outlet System
ITEM 2 (continued) ATTACHMENT 1
Page 160
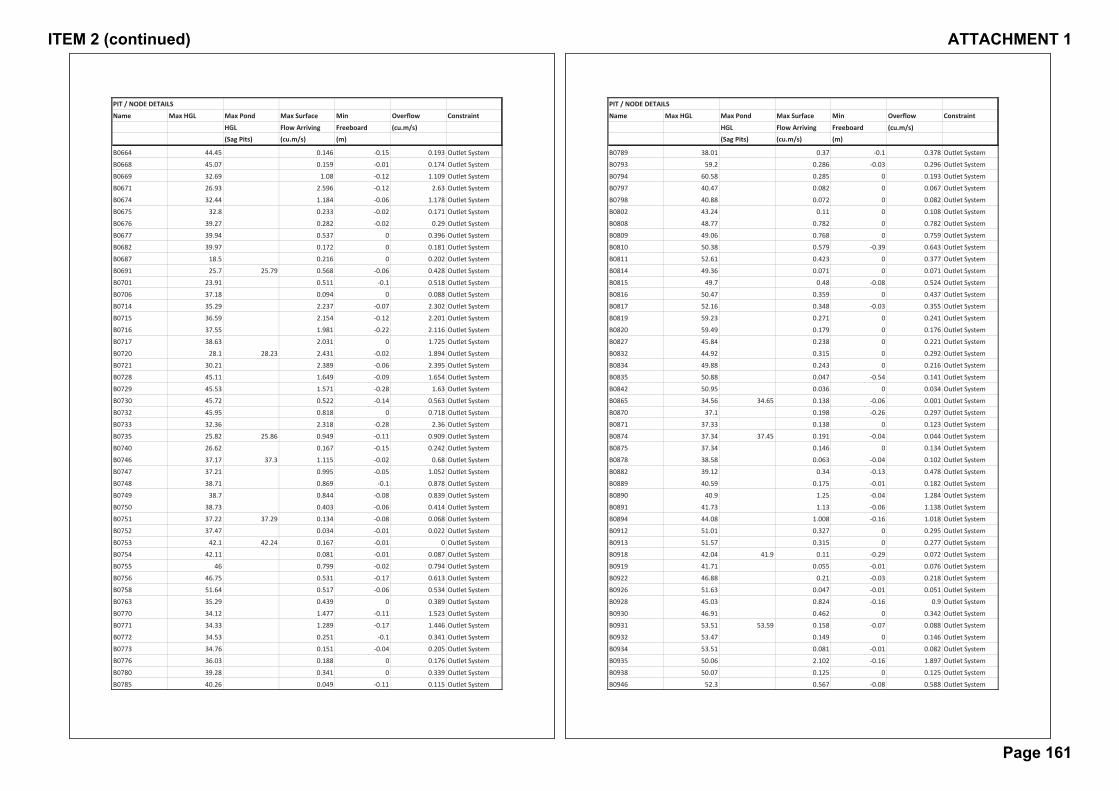
PIT / NODE DETAILS
Name Max HGL Max Pond Max Surface Min Overflow Constraint
HGL Flow Arriving Freeboard (cu.m/s)(Sag Pits) (cu.m/s) (m)
B0664 44.45 0.146 0.15 0.193 Outlet System
B0668 45.07 0.159 0.01 0.174 Outlet System
B0669 32.69 1.08 0.12 1.109 Outlet System
B0671 26.93 2.596 0.12 2.63 Outlet System
B0674 32.44 1.184 0.06 1.178 Outlet System
B0675 32.8 0.233 0.02 0.171 Outlet System
B0676 39.27 0.282 0.02 0.29 Outlet System
B0677 39.94 0.537 0 0.396 Outlet System
B0682 39.97 0.172 0 0.181 Outlet System
B0687 18.5 0.216 0 0.202 Outlet System
B0691 25.7 25.79 0.568 0.06 0.428 Outlet System
B0701 23.91 0.511 0.1 0.518 Outlet System
B0706 37.18 0.094 0 0.088 Outlet System
B0714 35.29 2.237 0.07 2.302 Outlet System
B0715 36.59 2.154 0.12 2.201 Outlet System
B0716 37.55 1.981 0.22 2.116 Outlet System
B0717 38.63 2.031 0 1.725 Outlet System
B0720 28.1 28.23 2.431 0.02 1.894 Outlet System
B0721 30.21 2.389 0.06 2.395 Outlet System
B0728 45.11 1.649 0.09 1.654 Outlet System
B0729 45.53 1.571 0.28 1.63 Outlet System
B0730 45.72 0.522 0.14 0.563 Outlet System
B0732 45.95 0.818 0 0.718 Outlet System
B0733 32.36 2.318 0.28 2.36 Outlet System
B0735 25.82 25.86 0.949 0.11 0.909 Outlet System
B0740 26.62 0.167 0.15 0.242 Outlet System
B0746 37.17 37.3 1.115 0.02 0.68 Outlet System
B0747 37.21 0.995 0.05 1.052 Outlet System
B0748 38.71 0.869 0.1 0.878 Outlet System
B0749 38.7 0.844 0.08 0.839 Outlet System
B0750 38.73 0.403 0.06 0.414 Outlet System
B0751 37.22 37.29 0.134 0.08 0.068 Outlet System
B0752 37.47 0.034 0.01 0.022 Outlet System
B0753 42.1 42.24 0.167 0.01 0 Outlet System
B0754 42.11 0.081 0.01 0.087 Outlet System
B0755 46 0.799 0.02 0.794 Outlet System
B0756 46.75 0.531 0.17 0.613 Outlet System
B0758 51.64 0.517 0.06 0.534 Outlet System
B0763 35.29 0.439 0 0.389 Outlet System
B0770 34.12 1.477 0.11 1.523 Outlet System
B0771 34.33 1.289 0.17 1.446 Outlet System
B0772 34.53 0.251 0.1 0.341 Outlet System
B0773 34.76 0.151 0.04 0.205 Outlet System
B0776 36.03 0.188 0 0.176 Outlet System
B0780 39.28 0.341 0 0.339 Outlet System
B0785 40.26 0.049 0.11 0.115 Outlet System
PIT / NODE DETAILS
Name Max HGL Max Pond Max Surface Min Overflow Constraint
HGL Flow Arriving Freeboard (cu.m/s)(Sag Pits) (cu.m/s) (m)
B0789 38.01 0.37 0.1 0.378 Outlet System
B0793 59.2 0.286 0.03 0.296 Outlet System
B0794 60.58 0.285 0 0.193 Outlet System
B0797 40.47 0.082 0 0.067 Outlet System
B0798 40.88 0.072 0 0.082 Outlet System
B0802 43.24 0.11 0 0.108 Outlet System
B0808 48.77 0.782 0 0.782 Outlet System
B0809 49.06 0.768 0 0.759 Outlet System
B0810 50.38 0.579 0.39 0.643 Outlet System
B0811 52.61 0.423 0 0.377 Outlet System
B0814 49.36 0.071 0 0.071 Outlet System
B0815 49.7 0.48 0.08 0.524 Outlet System
B0816 50.47 0.359 0 0.437 Outlet System
B0817 52.16 0.348 0.03 0.355 Outlet System
B0819 59.23 0.271 0 0.241 Outlet System
B0820 59.49 0.179 0 0.176 Outlet System
B0827 45.84 0.238 0 0.221 Outlet System
B0832 44.92 0.315 0 0.292 Outlet System
B0834 49.88 0.243 0 0.216 Outlet System
B0835 50.88 0.047 0.54 0.141 Outlet System
B0842 50.95 0.036 0 0.034 Outlet System
B0865 34.56 34.65 0.138 0.06 0.001 Outlet System
B0870 37.1 0.198 0.26 0.297 Outlet System
B0871 37.33 0.138 0 0.123 Outlet System
B0874 37.34 37.45 0.191 0.04 0.044 Outlet System
B0875 37.34 0.146 0 0.134 Outlet System
B0878 38.58 0.063 0.04 0.102 Outlet System
B0882 39.12 0.34 0.13 0.478 Outlet System
B0889 40.59 0.175 0.01 0.182 Outlet System
B0890 40.9 1.25 0.04 1.284 Outlet System
B0891 41.73 1.13 0.06 1.138 Outlet System
B0894 44.08 1.008 0.16 1.018 Outlet System
B0912 51.01 0.327 0 0.295 Outlet System
B0913 51.57 0.315 0 0.277 Outlet System
B0918 42.04 41.9 0.11 0.29 0.072 Outlet System
B0919 41.71 0.055 0.01 0.076 Outlet System
B0922 46.88 0.21 0.03 0.218 Outlet System
B0926 51.63 0.047 0.01 0.051 Outlet System
B0928 45.03 0.824 0.16 0.9 Outlet System
B0930 46.91 0.462 0 0.342 Outlet System
B0931 53.51 53.59 0.158 0.07 0.088 Outlet System
B0932 53.47 0.149 0 0.146 Outlet System
B0934 53.51 0.081 0.01 0.082 Outlet System
B0935 50.06 2.102 0.16 1.897 Outlet System
B0938 50.07 0.125 0 0.125 Outlet System
B0946 52.3 0.567 0.08 0.588 Outlet System
ITEM 2 (continued) ATTACHMENT 1
Page 161

PIT / NODE DETAILS
Name Max HGL Max Pond Max Surface Min Overflow Constraint
HGL Flow Arriving Freeboard (cu.m/s)(Sag Pits) (cu.m/s) (m)
B0947 52.73 0.295 0.23 0.386 Outlet System
B0951 61.81 61.94 0.126 0 0 Outlet System
B0953 64.63 0.511 0 0.386 Outlet System
B0955 69.63 0.299 0.05 0.314 Outlet System
B0956 73.16 0.233 0.04 0.239 Outlet System
B0957 78.34 0.138 0.25 0.169 Outlet System
B0959 61.11 1.537 0.04 1.527 Outlet System
B0960 62.34 1.105 0.13 1.137 Outlet System
B0961 62.52 0.989 0.08 1.039 Outlet System
B0962 63.01 0.887 0.27 0.987 Outlet System
B0963 68.67 0.805 0.02 0.815 Outlet System
B0965 70.93 0.666 0.04 0.667 Outlet System
B0985 67.6 0.286 0.25 0.381 Outlet System
B0989 61.45 0.721 0.18 0.797 Outlet System
B0990 63.22 0.454 0.06 0.5 Outlet System
B0991 64.83 0.371 0.05 0.385 Outlet System
B0992 65.61 0.227 0.14 0.299 Outlet System
B0994 72.92 0.155 0.01 0.158 Outlet System
B0995 73.48 0.031 0.16 0.08 Outlet System
B0999 62.82 0.14 0.01 0.154 Outlet System
B1000 63.33 63.41 0.075 0.12 0 Outlet System
B1008 61.12 0.696 0.03 0.721 Outlet System
B1009 61.75 0.513 0.25 0.657 Outlet System
B1010 66.77 0.369 0.14 0.472 Outlet System
B1013 75.57 0.387 0.02 0.397 Outlet System
B1014 78.75 0.329 0.04 0.33 Outlet System
B1023 70.04 0.131 0.04 0.156 Outlet System
B1027 74.74 0.102 0.09 0.138 Outlet System
B1035 44.51 0.11 0 0.316 Outlet System
B1037 46.32 46.46 0.254 0.01 0.016 Outlet System
B1038 46.37 0.235 0 0.198 Outlet System
B1040 40.35 0.023 0 0.301 Outlet System
B1044 29.2 1.152 0 1.053 Outlet System
B1045 29.36 1.088 0.08 1.097 Outlet System
B1047 2.54 2.345 0 2.338 Outlet System
B1048 3.8 2.122 0.17 2.14 Outlet System
B1049 4.22 1.896 0.13 1.905 Outlet System
B1052 11.81 0.077 0 0.058 Outlet System
B1058 36.9 37 0.213 0.05 0.006 Outlet System
B1069 13.51 0.679 0.44 0.751 Outlet System
B1070 18.04 0.211 0.47 0.294 Outlet System
B1073 13.55 0.335 0 0.3 Outlet System
B1077 30.21 0.434 4.03 0.681 Outlet System
B1078 32.22 0.254 0.04 0.308 Outlet System
B1080 35.23 0.302 0.09 0.278 Outlet System
B1082 45.29 45.43 0.725 0.01 0.468 Outlet System
PIT / NODE DETAILS
Name Max HGL Max Pond Max Surface Min Overflow Constraint
HGL Flow Arriving Freeboard (cu.m/s)(Sag Pits) (cu.m/s) (m)
B1083 45.5 0.474 0 0.45 Outlet System
B1084 45.7 0.335 0 0.315 Outlet System
B1087 38.34 0.353 0.05 0.354 Outlet System
B1095 29.97 30.05 0.254 0.07 0.088 Outlet System
B1100 32.05 0.32 0 0.313 Outlet System
B1104 29.09 0.655 0.01 0.685 Outlet System
B1105 32.11 0.542 0.03 0.609 Outlet System
B1106 33.09 33.19 0.741 0.05 0.491 Outlet System
B1107 33.18 0.388 0.1 0.476 Outlet System
B1108 33.57 0.181 0.39 0.304 Outlet System
B1109 43.89 0.071 0.01 0.095 Outlet System
B1113 45.49 0.037 0 0.036 Outlet System
B1117 42.94 0.309 0 0.242 Outlet System
B1119 46.3 0.394 0.02 0.407 Outlet System
B1125 44.8 0.791 0 0.703 Outlet System
B1126 44.99 45.08 0.754 0.06 0.474 Outlet System
B1127 45.03 0.354 0.06 0.403 Outlet System
B1131 47.4 0.147 0.03 0.189 Outlet System
B1133 52.83 52.98 0.251 0 0.037 Outlet System
B1135 55.61 0.249 0.01 0.247 Outlet System
B1137 57.77 0.318 0.05 0.329 Outlet System
B1138 48.38 0.098 0.04 0.135 Outlet System
B1139 48.79 49.12 0.24 0.02 0 Outlet System
B1140 48.79 0.143 0 0.142 Outlet System
B1147 47.14 0.104 0.01 0.14 Outlet System
B1149 48.76 0.242 0 0.267 Outlet System
B1153 46.11 0.504 0.08 0.42 Outlet System
B1154 46.08 0.466 0.05 0.501 Outlet System
B1155 46.2 0.566 0.03 0.477 Outlet System
B1158 50.47 0.401 0.02 0.413 Outlet System
B1159 50.83 0.325 0.04 0.386 Outlet System
B1160 51.24 0.203 0.14 0.31 Outlet System
B1163 59.15 0.197 0.15 0.27 Outlet System
B1165 61.23 0.199 0 0.197 Outlet System
B1177 29.34 1.865 0 1.869 Outlet System
B1179 36.39 2.297 0 2.292 Outlet System
B1181 46.24 2.046 0.04 2.01 Outlet System
B1182 48.81 1.901 0.01 1.897 Outlet System
B1183 52.04 1.7 0.04 1.691 Outlet System
B1184 52.5 1.413 0 1.407 Outlet System
B1187 58.83 0.656 0.06 0.653 Outlet System
B1195 45.4 0.526 0.27 0.721 Outlet System
B1211 21.48 1.57 0 1.562 Outlet System
B1214 23.53 0.881 0.03 0.886 Outlet System
B1223 37.5 0.168 0 0.166 Outlet System
B1224 38.94 39.08 0.383 0.01 0.126 Outlet System
ITEM 2 (continued) ATTACHMENT 1
Page 162

PIT / NODE DETAILS
Name Max HGL Max Pond Max Surface Min Overflow Constraint
HGL Flow Arriving Freeboard (cu.m/s)(Sag Pits) (cu.m/s) (m)
B1225 39.6 0.257 0 0.22 Outlet System
B1242 41.1 41.23 0.133 0.01 0 Outlet System
B1249 42.37 42.5 0.055 0.02 0 Outlet System
B1250 28.4 0.146 0 0.198 Outlet System
B1251 29.4 1.003 0.02 1.026 Outlet System
B1252 31.57 0.995 0.11 1 Outlet System
B1253 33.91 0.955 0 0.768 Outlet System
B1255 47.08 0.55 0.08 0.557 Outlet System
B1256 47.24 0.573 0 0.546 Outlet System
B1260 46.55 0.242 0.1 0.277 Outlet System
B1261 46.99 0.17 0.04 0.195 Outlet System
B1262 47.64 0.131 0 0.122 Outlet System
B1269 39.92 0.51 0.26 0.608 Outlet System
B1271 42.67 42.54 0.764 0.28 0.68 Outlet System
B1272 42.71 42.66 0.201 0.2 0.12 Outlet System
B1275 43.98 0.76 0.08 0.753 Outlet System
B1278 49.81 0.284 0 0.274 Outlet System
B1299 49.99 50.06 0.197 0.08 0.045 Outlet System
B1302 56.96 57.09 0.599 0.02 0.451 Outlet System
B1303 57.11 0.502 0.09 0.536 Outlet System
B1304 57.74 0.441 0 0.436 Outlet System
B1305 58.35 0.376 0 0.369 Outlet System
B1307 60.14 1.419 0.04 1.458 Outlet System
B1308 61.43 61.55 1.744 0.03 1.33 Outlet System
B1309 62.16 1.224 0.05 1.268 Outlet System
B1311 73.19 1.204 0.09 1.204 Outlet System
B1312 73.12 0.134 0.02 0.138 Outlet System
B1314 61.63 1.571 0.13 1.585 Outlet System
B1323 52.89 0.537 0.02 0.546 Outlet System
B1325 54.52 0.559 0 0.452 Outlet System
B1326 54.54 0.298 0 0.261 Outlet System
B1328 47.29 0.101 0 0.081 Outlet System
B1329 46.68 46.74 0.038 0.02 0 Outlet System
B1330 47.1 0.136 0 0.092 Outlet System
B1336 54.14 0.195 0.05 0.235 Outlet System
B1341 51.76 0.636 0 0.541 Outlet System
B1342 52.17 0.539 0.02 0.562 Outlet System
B1343 54.8 0.505 0.13 0.51 Outlet System
B1344 55.68 0.333 0.02 0.341 Outlet System
B1345 56.96 0.2 0 0.167 Outlet System
B1347 58.6 1.312 0.15 1.345 Outlet System
B1348 61.85 0.184 0.27 0.285 Outlet System
B1349 64.61 0.076 0.08 0.125 Outlet System
B1361 60.34 1.152 0.65 1.309 Outlet System
B1362 60.84 1.025 0.13 1.099 Outlet System
B1363 61.85 0.842 0 0.718 Outlet System
PIT / NODE DETAILS
Name Max HGL Max Pond Max Surface Min Overflow Constraint
HGL Flow Arriving Freeboard (cu.m/s)(Sag Pits) (cu.m/s) (m)
B1364 62.35 0.759 0.03 0.776 Outlet System
B1365 67.94 0.717 0 0.703 Outlet System
B1366 68.57 0.615 0.01 0.614 Outlet System
B1367 69.29 0.523 0.02 0.509 Outlet System
B1368 69.46 0.28 0.03 0.29 Outlet System
B1369 69.54 0.236 0 0.185 Outlet System
B1373 61.96 1.5 0.4 1.574 Outlet System
B1374 62.37 1.393 0.23 1.451 Outlet System
B1377 64.11 1.247 0.01 1.252 Outlet System
B1378 72.11 0.951 0.07 0.929 Outlet System
B1379 73.34 0.453 0.27 0.513 Outlet System
B1380 75.85 0.265 0.02 0.274 Outlet System
B1384 64.62 1.089 0.09 1.093 Outlet System
B1385 73.47 0.334 0 0.261 Outlet System
B1388 77.02 0.275 0.02 0.264 Outlet System
B1389 77.29 0.156 0.01 0.176 Outlet System
B1395 40.4 0.564 0 0.46 Outlet System
B1404 59.78 0.12 0 0.119 Outlet System
B1406 56.03 0.292 0 0.214 Outlet System
B1410 58.92 0.345 0 0.589 Outlet System
B1412 59.74 0.428 0 0.395 Outlet System
B1413 61.42 0.323 0 0.323 Outlet System
B1414 64.83 0.327 0.04 0.323 Outlet System
B1416 67.35 0.259 0 0.259 Outlet System
B1417 47.22 1.445 0.03 1.478 Outlet System
B1423 46.69 0.344 0.01 0.355 Outlet System
B1424 47.12 0.273 0 0.305 Outlet System
B1425 49.4 0.217 0.01 0.217 Outlet System
B1427 59.49 0.126 0.03 0.137 Outlet System
B1431 52.85 0.195 0.03 0.189 Outlet System
B1433 63.35 0 0 0 Outlet System
B1436 63.26 1.248 0 1.217 Outlet System
B1437 64.59 0.98 0.39 1.097 Outlet System
B1438 66.86 0.723 0.38 0.83 Outlet System
B1446 62.21 0.091 0.2 0.147 Outlet System
B1451 42.05 0.134 0 0.124 Outlet System
B1455 41.14 1.052 0 0.944 Outlet System
B1460 65.19 0.144 0.1 0.208 Outlet System
B1461 65.64 0.134 0 0.134 Outlet System
B1462 65.37 0.078 0 0.154 Outlet System
B1463 67.21 0.12 0.01 0.13 Outlet System
B1471 67.33 0.181 1.3 0.32 Outlet System
B1487 39.21 0.57 0.02 0.58 Outlet System
B1488 39.95 40.1 0.812 0 0.56 Outlet System
B1489 40.51 0.708 0.23 0.801 Outlet System
B1490 42.55 0.666 0.07 0.69 Outlet System
ITEM 2 (continued) ATTACHMENT 1
Page 163

PIT / NODE DETAILS
Name Max HGL Max Pond Max Surface Min Overflow Constraint
HGL Flow Arriving Freeboard (cu.m/s)(Sag Pits) (cu.m/s) (m)
B1491 45.32 0.613 0.09 0.627 Outlet System
B1492 45.66 0.048 0.01 0.057 Outlet System
B1493 46.08 0.418 0.33 0.527 Outlet System
B1494 50.89 0.268 0.03 0.278 Outlet System
B1495 51.59 0.192 0.03 0.221 Outlet System
B1497 52.29 0.182 0.01 0.186 Outlet System
B1498 52.59 0.158 0 0.157 Outlet System
B1504 38.51 38.64 1.086 0.02 0.872 Outlet System
B1505 38.5 0.902 0 0.9 Outlet System
B1508 64.8 0.763 0 0.75 Outlet System
B1512 48.03 0.261 0.05 0.266 Outlet System
B1519 48.4 0.949 0.05 0.886 Outlet System
B1523 40.44 0.318 0.06 0.321 Outlet System
B1635 43.6 0.389 0 0.386 Outlet System
B1639 44.5 0.337 0 0.333 Outlet System
B1641 48.33 0.122 0.01 0.124 Outlet System
B1669 41.01 1.328 0.1 1.655 Outlet System
B1670 41.87 0.16 0.65 1.065 Outlet System
B1677 49.75 0.063 0 0.163 Outlet System
B1680 44.15 0.328 0 0.332 Outlet System
B1692 54.98 0.246 0 0.246 Outlet System
B1693 55.05 0.245 0 0.244 Outlet System
B1694 55.1 0.209 0 0.23 Outlet System
B1695 55.5 0.185 0 0.183 Outlet System
B1696 55.9 0.167 0 0.163 Outlet System
B1698 56.7 0.14 0 0.124 Outlet System
B1699 56.8 0.085 0 0.071 Outlet System
B1702 54.9 0.07 0 0.087 Outlet System
Pit1832 38.9 0.411 0 0.406 Outlet System
ITEM 2 (continued) ATTACHMENT 1
Page 164
DRAINS OUTPUT – LOW FLOW ASSESSMENT KITTYS CREEK CATCHMENT – 2yr ARI
ITEM 2 (continued) ATTACHMENT 1
Page 165
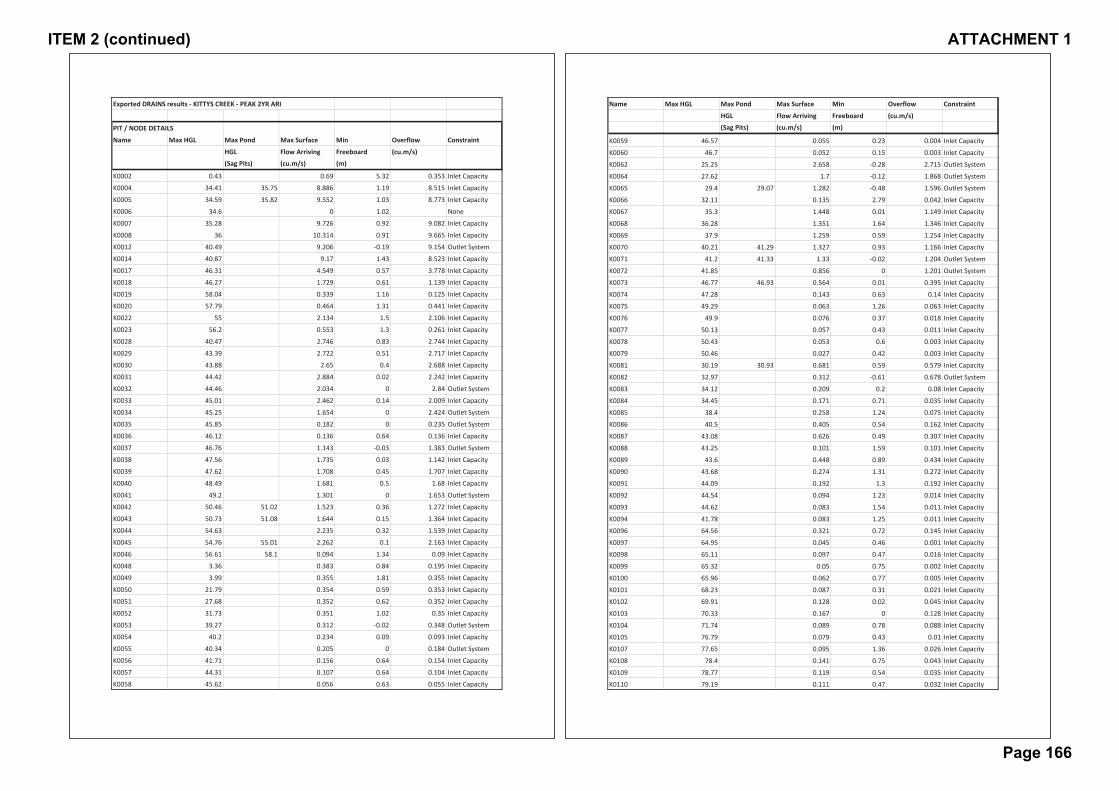
Exported DRAINS results KITTYS CREEK PEAK 2YR ARI
PIT / NODE DETAILS
Name Max HGL Max Pond Max Surface Min Overflow Constraint
HGL Flow Arriving Freeboard (cu.m/s)(Sag Pits) (cu.m/s) (m)
K0002 0.43 0.69 5.32 0.353 Inlet Capacity
K0004 34.41 35.75 8.886 1.19 8.515 Inlet Capacity
K0005 34.59 35.82 9.552 1.03 8.773 Inlet Capacity
K0006 34.6 0 1.02 None
K0007 35.28 9.726 0.92 9.082 Inlet Capacity
K0008 36 10.314 0.91 9.665 Inlet Capacity
K0012 40.49 9.206 0.19 9.154 Outlet System
K0014 40.87 9.17 1.43 8.523 Inlet Capacity
K0017 46.31 4.549 0.57 3.778 Inlet Capacity
K0018 46.27 1.729 0.61 1.139 Inlet Capacity
K0019 58.04 0.339 1.16 0.125 Inlet Capacity
K0020 57.79 0.464 1.31 0.441 Inlet Capacity
K0022 55 2.134 1.5 2.106 Inlet Capacity
K0023 56.2 0.553 1.3 0.261 Inlet Capacity
K0028 40.47 2.746 0.83 2.744 Inlet Capacity
K0029 43.39 2.722 0.51 2.717 Inlet Capacity
K0030 43.88 2.65 0.4 2.688 Inlet Capacity
K0031 44.42 2.884 0.02 2.242 Inlet Capacity
K0032 44.46 2.034 0 2.84 Outlet System
K0033 45.01 2.462 0.14 2.009 Inlet Capacity
K0034 45.25 1.654 0 2.424 Outlet System
K0035 45.85 0.182 0 0.235 Outlet System
K0036 46.12 0.136 0.64 0.136 Inlet Capacity
K0037 46.76 1.143 0.03 1.383 Outlet System
K0038 47.56 1.735 0.03 1.142 Inlet Capacity
K0039 47.62 1.708 0.45 1.707 Inlet Capacity
K0040 48.49 1.681 0.5 1.68 Inlet Capacity
K0041 49.2 1.301 0 1.653 Outlet System
K0042 50.46 51.02 1.523 0.36 1.272 Inlet Capacity
K0043 50.73 51.08 1.644 0.15 1.364 Inlet Capacity
K0044 54.63 2.235 0.32 1.539 Inlet Capacity
K0045 54.76 55.01 2.262 0.1 2.163 Inlet Capacity
K0046 56.61 58.1 0.094 1.34 0.09 Inlet Capacity
K0048 3.36 0.383 0.84 0.195 Inlet Capacity
K0049 3.99 0.355 1.81 0.355 Inlet Capacity
K0050 21.79 0.354 0.59 0.353 Inlet Capacity
K0051 27.68 0.352 0.62 0.352 Inlet Capacity
K0052 31.73 0.351 1.02 0.35 Inlet Capacity
K0053 39.27 0.312 0.02 0.348 Outlet System
K0054 40.2 0.234 0.09 0.093 Inlet Capacity
K0055 40.34 0.205 0 0.184 Outlet System
K0056 41.71 0.156 0.64 0.154 Inlet Capacity
K0057 44.31 0.107 0.64 0.104 Inlet Capacity
K0058 45.62 0.056 0.63 0.055 Inlet Capacity
Name Max HGL Max Pond Max Surface Min Overflow Constraint
HGL Flow Arriving Freeboard (cu.m/s)(Sag Pits) (cu.m/s) (m)
K0059 46.57 0.055 0.23 0.004 Inlet Capacity
K0060 46.7 0.052 0.15 0.003 Inlet Capacity
K0062 25.25 2.658 0.28 2.715 Outlet System
K0064 27.62 1.7 0.12 1.868 Outlet System
K0065 29.4 29.07 1.282 0.48 1.596 Outlet System
K0066 32.11 0.135 2.79 0.042 Inlet Capacity
K0067 35.3 1.448 0.01 1.149 Inlet Capacity
K0068 36.28 1.351 1.64 1.346 Inlet Capacity
K0069 37.9 1.259 0.59 1.254 Inlet Capacity
K0070 40.21 41.29 1.327 0.93 1.166 Inlet Capacity
K0071 41.2 41.33 1.33 0.02 1.204 Outlet System
K0072 41.85 0.856 0 1.201 Outlet System
K0073 46.77 46.93 0.564 0.01 0.395 Inlet Capacity
K0074 47.28 0.143 0.63 0.14 Inlet Capacity
K0075 49.29 0.063 1.26 0.063 Inlet Capacity
K0076 49.9 0.076 0.37 0.018 Inlet Capacity
K0077 50.13 0.057 0.43 0.011 Inlet Capacity
K0078 50.43 0.053 0.6 0.003 Inlet Capacity
K0079 50.46 0.027 0.42 0.003 Inlet Capacity
K0081 30.19 30.93 0.681 0.59 0.579 Inlet Capacity
K0082 32.97 0.312 0.61 0.678 Outlet System
K0083 34.12 0.209 0.2 0.08 Inlet Capacity
K0084 34.45 0.171 0.71 0.035 Inlet Capacity
K0085 38.4 0.258 1.24 0.075 Inlet Capacity
K0086 40.5 0.405 0.54 0.162 Inlet Capacity
K0087 43.08 0.626 0.49 0.307 Inlet Capacity
K0088 43.25 0.101 1.59 0.101 Inlet Capacity
K0089 43.6 0.448 0.89 0.434 Inlet Capacity
K0090 43.68 0.274 1.31 0.272 Inlet Capacity
K0091 44.09 0.192 1.3 0.192 Inlet Capacity
K0092 44.54 0.094 1.23 0.014 Inlet Capacity
K0093 44.62 0.083 1.54 0.011 Inlet Capacity
K0094 41.78 0.083 1.25 0.011 Inlet Capacity
K0096 64.56 0.321 0.72 0.145 Inlet Capacity
K0097 64.95 0.045 0.46 0.001 Inlet Capacity
K0098 65.11 0.097 0.47 0.016 Inlet Capacity
K0099 65.32 0.05 0.75 0.002 Inlet Capacity
K0100 65.96 0.062 0.77 0.005 Inlet Capacity
K0101 68.23 0.087 0.31 0.021 Inlet Capacity
K0102 69.91 0.128 0.02 0.045 Inlet Capacity
K0103 70.33 0.167 0 0.128 Inlet Capacity
K0104 71.74 0.089 0.78 0.088 Inlet Capacity
K0105 76.79 0.079 0.43 0.01 Inlet Capacity
K0107 77.65 0.095 1.36 0.026 Inlet Capacity
K0108 78.4 0.141 0.75 0.043 Inlet Capacity
K0109 78.77 0.119 0.54 0.035 Inlet Capacity
K0110 79.19 0.111 0.47 0.032 Inlet Capacity
ITEM 2 (continued) ATTACHMENT 1
Page 166
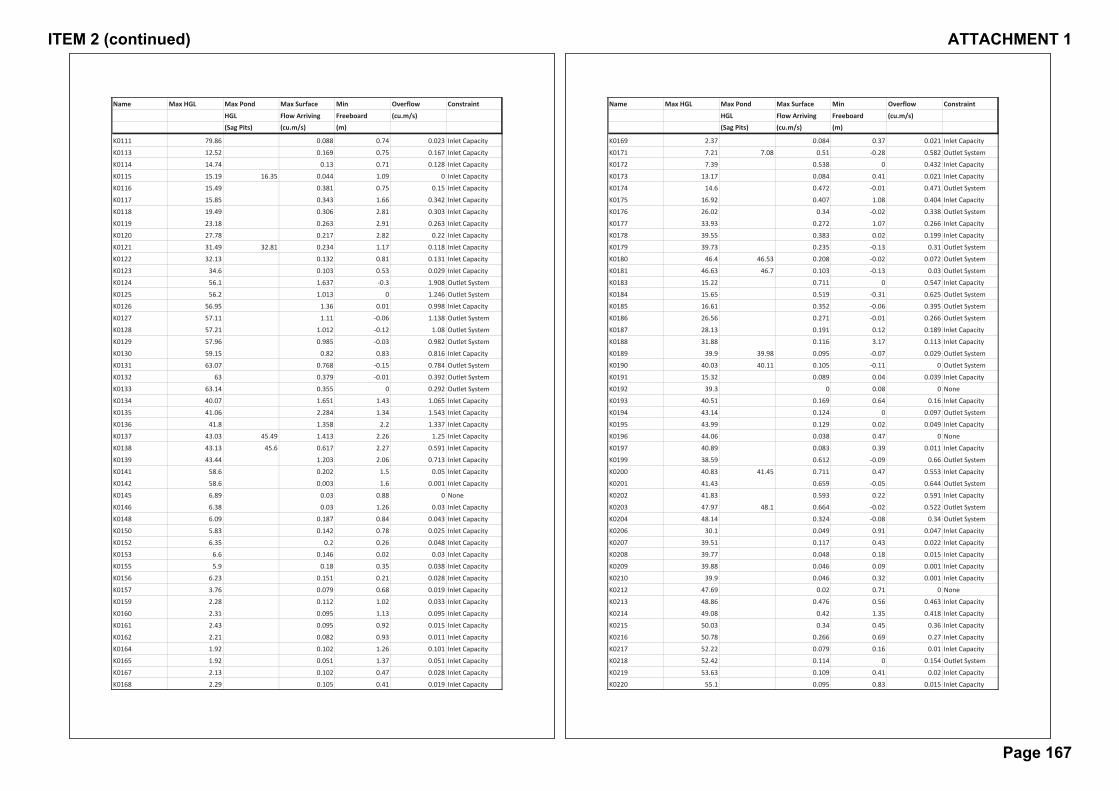
Name Max HGL Max Pond Max Surface Min Overflow Constraint
HGL Flow Arriving Freeboard (cu.m/s)(Sag Pits) (cu.m/s) (m)
K0111 79.86 0.088 0.74 0.023 Inlet Capacity
K0113 12.52 0.169 0.75 0.167 Inlet Capacity
K0114 14.74 0.13 0.71 0.128 Inlet Capacity
K0115 15.19 16.35 0.044 1.09 0 Inlet Capacity
K0116 15.49 0.381 0.75 0.15 Inlet Capacity
K0117 15.85 0.343 1.66 0.342 Inlet Capacity
K0118 19.49 0.306 2.81 0.303 Inlet Capacity
K0119 23.18 0.263 2.91 0.263 Inlet Capacity
K0120 27.78 0.217 2.82 0.22 Inlet Capacity
K0121 31.49 32.81 0.234 1.17 0.118 Inlet Capacity
K0122 32.13 0.132 0.81 0.131 Inlet Capacity
K0123 34.6 0.103 0.53 0.029 Inlet Capacity
K0124 56.1 1.637 0.3 1.908 Outlet System
K0125 56.2 1.013 0 1.246 Outlet System
K0126 56.95 1.36 0.01 0.998 Inlet Capacity
K0127 57.11 1.11 0.06 1.138 Outlet System
K0128 57.21 1.012 0.12 1.08 Outlet System
K0129 57.96 0.985 0.03 0.982 Outlet System
K0130 59.15 0.82 0.83 0.816 Inlet Capacity
K0131 63.07 0.768 0.15 0.784 Outlet System
K0132 63 0.379 0.01 0.392 Outlet System
K0133 63.14 0.355 0 0.292 Outlet System
K0134 40.07 1.651 1.43 1.065 Inlet Capacity
K0135 41.06 2.284 1.34 1.543 Inlet Capacity
K0136 41.8 1.358 2.2 1.337 Inlet Capacity
K0137 43.03 45.49 1.413 2.26 1.25 Inlet Capacity
K0138 43.13 45.6 0.617 2.27 0.591 Inlet Capacity
K0139 43.44 1.203 2.06 0.713 Inlet Capacity
K0141 58.6 0.202 1.5 0.05 Inlet Capacity
K0142 58.6 0.003 1.6 0.001 Inlet Capacity
K0145 6.89 0.03 0.88 0 None
K0146 6.38 0.03 1.26 0.03 Inlet Capacity
K0148 6.09 0.187 0.84 0.043 Inlet Capacity
K0150 5.83 0.142 0.78 0.025 Inlet Capacity
K0152 6.35 0.2 0.26 0.048 Inlet Capacity
K0153 6.6 0.146 0.02 0.03 Inlet Capacity
K0155 5.9 0.18 0.35 0.038 Inlet Capacity
K0156 6.23 0.151 0.21 0.028 Inlet Capacity
K0157 3.76 0.079 0.68 0.019 Inlet Capacity
K0159 2.28 0.112 1.02 0.033 Inlet Capacity
K0160 2.31 0.095 1.13 0.095 Inlet Capacity
K0161 2.43 0.095 0.92 0.015 Inlet Capacity
K0162 2.21 0.082 0.93 0.011 Inlet Capacity
K0164 1.92 0.102 1.26 0.101 Inlet Capacity
K0165 1.92 0.051 1.37 0.051 Inlet Capacity
K0167 2.13 0.102 0.47 0.028 Inlet Capacity
K0168 2.29 0.105 0.41 0.019 Inlet Capacity
Name Max HGL Max Pond Max Surface Min Overflow Constraint
HGL Flow Arriving Freeboard (cu.m/s)(Sag Pits) (cu.m/s) (m)
K0169 2.37 0.084 0.37 0.021 Inlet Capacity
K0171 7.21 7.08 0.51 0.28 0.582 Outlet System
K0172 7.39 0.538 0 0.432 Inlet Capacity
K0173 13.17 0.084 0.41 0.021 Inlet Capacity
K0174 14.6 0.472 0.01 0.471 Outlet System
K0175 16.92 0.407 1.08 0.404 Inlet Capacity
K0176 26.02 0.34 0.02 0.338 Outlet System
K0177 33.93 0.272 1.07 0.266 Inlet Capacity
K0178 39.55 0.383 0.02 0.199 Inlet Capacity
K0179 39.73 0.235 0.13 0.31 Outlet System
K0180 46.4 46.53 0.208 0.02 0.072 Outlet System
K0181 46.63 46.7 0.103 0.13 0.03 Outlet System
K0183 15.22 0.711 0 0.547 Inlet Capacity
K0184 15.65 0.519 0.31 0.625 Outlet System
K0185 16.61 0.352 0.06 0.395 Outlet System
K0186 26.56 0.271 0.01 0.266 Outlet System
K0187 28.13 0.191 0.12 0.189 Inlet Capacity
K0188 31.88 0.116 3.17 0.113 Inlet Capacity
K0189 39.9 39.98 0.095 0.07 0.029 Outlet System
K0190 40.03 40.11 0.105 0.11 0 Outlet System
K0191 15.32 0.089 0.04 0.039 Inlet Capacity
K0192 39.3 0 0.08 0 None
K0193 40.51 0.169 0.64 0.16 Inlet Capacity
K0194 43.14 0.124 0 0.097 Outlet System
K0195 43.99 0.129 0.02 0.049 Inlet Capacity
K0196 44.06 0.038 0.47 0 None
K0197 40.89 0.083 0.39 0.011 Inlet Capacity
K0199 38.59 0.612 0.09 0.66 Outlet System
K0200 40.83 41.45 0.711 0.47 0.553 Inlet Capacity
K0201 41.43 0.659 0.05 0.644 Outlet System
K0202 41.83 0.593 0.22 0.591 Inlet Capacity
K0203 47.97 48.1 0.664 0.02 0.522 Outlet System
K0204 48.14 0.324 0.08 0.34 Outlet System
K0206 30.1 0.049 0.91 0.047 Inlet Capacity
K0207 39.51 0.117 0.43 0.022 Inlet Capacity
K0208 39.77 0.048 0.18 0.015 Inlet Capacity
K0209 39.88 0.046 0.09 0.001 Inlet Capacity
K0210 39.9 0.046 0.32 0.001 Inlet Capacity
K0212 47.69 0.02 0.71 0 None
K0213 48.86 0.476 0.56 0.463 Inlet Capacity
K0214 49.08 0.42 1.35 0.418 Inlet Capacity
K0215 50.03 0.34 0.45 0.36 Inlet Capacity
K0216 50.78 0.266 0.69 0.27 Inlet Capacity
K0217 52.22 0.079 0.16 0.01 Inlet Capacity
K0218 52.42 0.114 0 0.154 Outlet System
K0219 53.63 0.109 0.41 0.02 Inlet Capacity
K0220 55.1 0.095 0.83 0.015 Inlet Capacity
ITEM 2 (continued) ATTACHMENT 1
Page 167

Name Max HGL Max Pond Max Surface Min Overflow Constraint
HGL Flow Arriving Freeboard (cu.m/s)(Sag Pits) (cu.m/s) (m)
K0221 33.79 0.193 0.29 0.047 Inlet Capacity
K0222 33.03 0.083 0.19 0.011 Inlet Capacity
K0223 46.88 0.404 0.09 0.403 Outlet System
K0224 48.45 0.226 0.02 0.108 Inlet Capacity
K0225 48.46 0.226 0 0.203 Outlet System
K0226 50.41 50.53 0.152 0.03 0.037 Outlet System
K0227 50.41 0.081 0.01 0.081 Outlet System
K0228 52.02 0.051 0.26 0.002 Inlet Capacity
K0229 52.26 0.053 0.08 0.01 Inlet Capacity
K0230 52.3 0.041 0.2 0.012 Inlet Capacity
K0231 52.84 0.071 1.09 0.008 Inlet Capacity
K0232 46.76 46.98 0.334 0.07 0.16 Inlet Capacity
K0233 46.89 0.281 0 0.2 Inlet Capacity
K0235 48.93 2.208 0.12 2.202 Outlet System
K0236 55.14 1.82 0.28 1.847 Outlet System
K0237 56.53 1.438 0.22 1.42 Inlet Capacity
K0238 63.97 1.063 0.02 1.027 Inlet Capacity
K0239 64.17 0.253 0 0.25 Outlet System
K0240 64.89 0.184 0.17 0.069 Inlet Capacity
K0241 47.17 0.147 0.34 0.073 Inlet Capacity
K0242 64.12 0.399 0.05 0.395 Inlet Capacity
K0243 64.63 0.184 0.01 0.081 Inlet Capacity
K0245 59.11 1.312 0.11 1.335 Outlet System
K0246 60.07 0.97 0.77 1.073 Outlet System
K0247 60.1 0.486 0 0.726 Outlet System
K0248 60.41 60.65 0.648 0.09 0.484 Inlet Capacity
K0249 60.44 0.089 0.22 0.038 Inlet Capacity
K0250 60.65 0.25 0 0.275 Outlet System
K0251 60.85 0.2 0.01 0.212 Outlet System
K0252 61.59 0.223 0 0.165 Inlet Capacity
K0253 63.25 0.188 0.03 0.188 Outlet System
K0254 64.02 0.164 0.01 0.111 Inlet Capacity
K0255 64.21 0.09 0 0.087 Outlet System
K0256 64.42 0.076 0.02 0.013 Inlet Capacity
K0257 60.51 0.046 0.84 0.008 Inlet Capacity
K0258 60.6 0.041 0.98 0.006 Inlet Capacity
K0259 60.44 0.041 0.31 0.041 Inlet Capacity
K0260 60.47 0.041 0.31 0 None
K0261 60.72 0.041 0.03 0.006 Inlet Capacity
K0262 78.52 0.111 0.73 0.018 Inlet Capacity
K0263 78.95 0.088 0.79 0.023 Inlet Capacity
K0265 78.53 78.93 0.003 0.39 0 Inlet Capacity
K0267 15.74 0.102 0.71 0.029 Inlet Capacity
K0268 16.17 0.187 0.02 0.087 Inlet Capacity
K0270 39.93 40.26 0.089 0.22 0 Inlet Capacity
K0272 26.62 27.81 0.286 1.04 0.116 Inlet Capacity
K0273 28.03 0.26 0.11 0.08 Inlet Capacity
Name Max HGL Max Pond Max Surface Min Overflow Constraint
HGL Flow Arriving Freeboard (cu.m/s)(Sag Pits) (cu.m/s) (m)
K0274 31.58 0.206 0.73 0.053 Inlet Capacity
K0276 16.78 0.261 0.69 0.253 Inlet Capacity
K0277 18.4 0.208 0.24 0.081 Inlet Capacity
K0278 18.72 0.155 0.43 0.052 Inlet Capacity
K0279 18.63 0.003 1.05 0 None
K0280 19.21 0.13 0.59 0.025 Inlet Capacity
K0281 19.4 0.11 0.94 0.02 Inlet Capacity
K0284 19.64 0.564 0.78 0.563 Inlet Capacity
K0285 20.41 0.53 0.7 0.529 Inlet Capacity
K0286 21.48 0.49 0.74 0.489 Inlet Capacity
K0287 22.39 0.455 0.53 0.454 Inlet Capacity
K0288 23.63 0.291 0.17 0.417 Outlet System
K0289 27.01 0.265 0.01 0.166 Inlet Capacity
K0290 28.85 0.106 0.35 0.224 Outlet System
K0291 30.19 0.122 0 0.104 Outlet System
K0292 31.28 0.158 0.01 0.078 Inlet Capacity
K0293 31.74 0.115 0.8 0.022 Inlet Capacity
K0294 19.79 0.044 0.58 0.001 Inlet Capacity
K0295 21.99 0.044 0.16 0.007 Inlet Capacity
K0296 24.34 0.297 0.02 0.109 Inlet Capacity
K0297 29.37 0.309 0.02 0.148 Inlet Capacity
K0298 31.23 0.003 0.84 0 None
K0299 31.77 0.115 0.66 0.022 Inlet Capacity
K0301 29.51 30.21 0.036 0.64 0 Inlet Capacity
K0302 29.61 0.075 0.7 0.009 Inlet Capacity
K0304 32.88 0.243 0.15 0.072 Inlet Capacity
K0305 44.49 0.08 0.01 0.039 Inlet Capacity
K0306 44.22 0.584 0.7 0.582 Inlet Capacity
K0307 44.71 0.537 0.78 0.535 Inlet Capacity
K0308 45.59 0.597 0 0.486 Inlet Capacity
K0309 46.29 0.965 0.02 0.594 Inlet Capacity
K0310 44.11 44.53 0.09 0.28 0 Inlet Capacity
K0311 44.27 0.053 0.7 0.01 Inlet Capacity
K0312 44.77 0.08 0.61 0.02 Inlet Capacity
K0313 44.38 0.101 0.04 0.027 Inlet Capacity
K0314 45.47 0.089 0.02 0.015 Inlet Capacity
K0315 46.69 1.526 0.1 1.467 Outlet System
K0316 46.86 1.405 0.27 1.505 Outlet System
K0317 47.83 0.146 0.04 0.163 Outlet System
K0318 49.94 0.176 0.01 0.107 Inlet Capacity
K0319 51.03 0.2 0.02 0.083 Inlet Capacity
K0320 51.21 0.144 0.02 0.056 Inlet Capacity
K0321 47.61 0.046 0.01 0.04 Outlet System
K0322 49.94 0.046 0.27 0.046 Inlet Capacity
K0324 43.84 0.158 0.52 0.03 Inlet Capacity
K0325 45.54 0.13 0 0.11 Outlet System
K0326 48.44 0.125 0 0.093 Inlet Capacity
ITEM 2 (continued) ATTACHMENT 1
Page 168
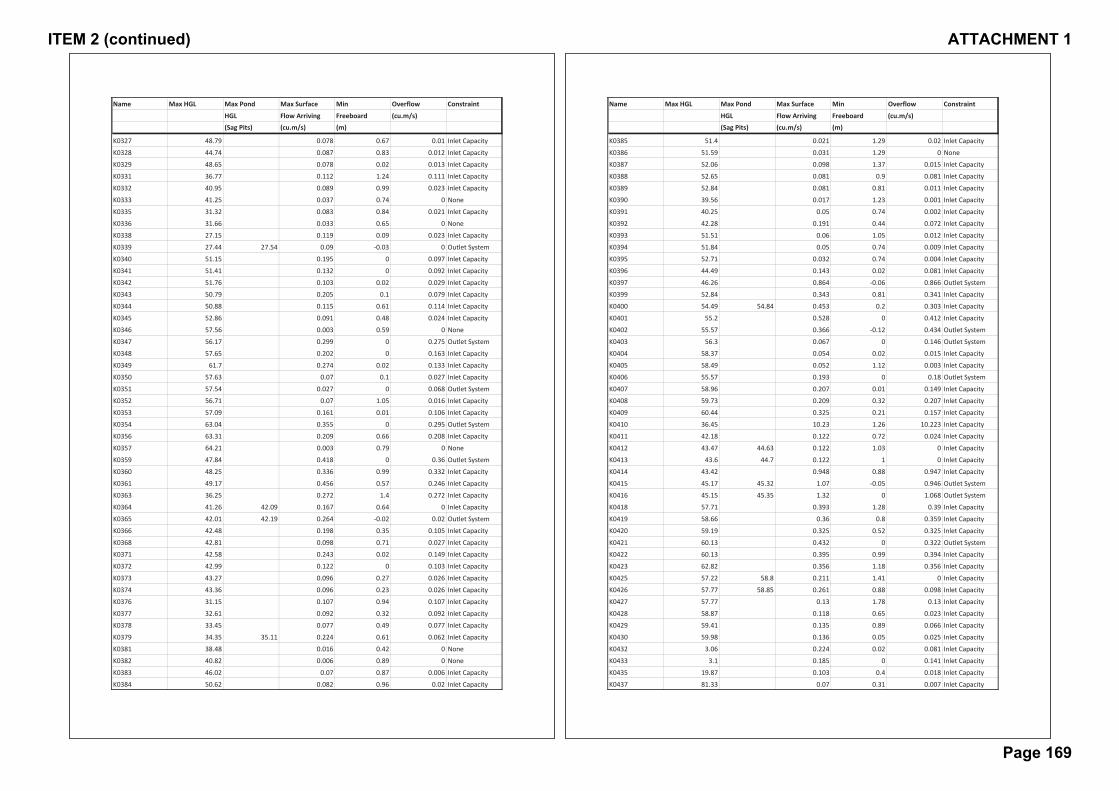
Name Max HGL Max Pond Max Surface Min Overflow Constraint
HGL Flow Arriving Freeboard (cu.m/s)(Sag Pits) (cu.m/s) (m)
K0327 48.79 0.078 0.67 0.01 Inlet Capacity
K0328 44.74 0.087 0.83 0.012 Inlet Capacity
K0329 48.65 0.078 0.02 0.013 Inlet Capacity
K0331 36.77 0.112 1.24 0.111 Inlet Capacity
K0332 40.95 0.089 0.99 0.023 Inlet Capacity
K0333 41.25 0.037 0.74 0 None
K0335 31.32 0.083 0.84 0.021 Inlet Capacity
K0336 31.66 0.033 0.65 0 None
K0338 27.15 0.119 0.09 0.023 Inlet Capacity
K0339 27.44 27.54 0.09 0.03 0 Outlet System
K0340 51.15 0.195 0 0.097 Inlet Capacity
K0341 51.41 0.132 0 0.092 Inlet Capacity
K0342 51.76 0.103 0.02 0.029 Inlet Capacity
K0343 50.79 0.205 0.1 0.079 Inlet Capacity
K0344 50.88 0.115 0.61 0.114 Inlet Capacity
K0345 52.86 0.091 0.48 0.024 Inlet Capacity
K0346 57.56 0.003 0.59 0 None
K0347 56.17 0.299 0 0.275 Outlet System
K0348 57.65 0.202 0 0.163 Inlet Capacity
K0349 61.7 0.274 0.02 0.133 Inlet Capacity
K0350 57.63 0.07 0.1 0.027 Inlet Capacity
K0351 57.54 0.027 0 0.068 Outlet System
K0352 56.71 0.07 1.05 0.016 Inlet Capacity
K0353 57.09 0.161 0.01 0.106 Inlet Capacity
K0354 63.04 0.355 0 0.295 Outlet System
K0356 63.31 0.209 0.66 0.208 Inlet Capacity
K0357 64.21 0.003 0.79 0 None
K0359 47.84 0.418 0 0.36 Outlet System
K0360 48.25 0.336 0.99 0.332 Inlet Capacity
K0361 49.17 0.456 0.57 0.246 Inlet Capacity
K0363 36.25 0.272 1.4 0.272 Inlet Capacity
K0364 41.26 42.09 0.167 0.64 0 Inlet Capacity
K0365 42.01 42.19 0.264 0.02 0.02 Outlet System
K0366 42.48 0.198 0.35 0.105 Inlet Capacity
K0368 42.81 0.098 0.71 0.027 Inlet Capacity
K0371 42.58 0.243 0.02 0.149 Inlet Capacity
K0372 42.99 0.122 0 0.103 Inlet Capacity
K0373 43.27 0.096 0.27 0.026 Inlet Capacity
K0374 43.36 0.096 0.23 0.026 Inlet Capacity
K0376 31.15 0.107 0.94 0.107 Inlet Capacity
K0377 32.61 0.092 0.32 0.092 Inlet Capacity
K0378 33.45 0.077 0.49 0.077 Inlet Capacity
K0379 34.35 35.11 0.224 0.61 0.062 Inlet Capacity
K0381 38.48 0.016 0.42 0 None
K0382 40.82 0.006 0.89 0 None
K0383 46.02 0.07 0.87 0.006 Inlet Capacity
K0384 50.62 0.082 0.96 0.02 Inlet Capacity
Name Max HGL Max Pond Max Surface Min Overflow Constraint
HGL Flow Arriving Freeboard (cu.m/s)(Sag Pits) (cu.m/s) (m)
K0385 51.4 0.021 1.29 0.02 Inlet Capacity
K0386 51.59 0.031 1.29 0 None
K0387 52.06 0.098 1.37 0.015 Inlet Capacity
K0388 52.65 0.081 0.9 0.081 Inlet Capacity
K0389 52.84 0.081 0.81 0.011 Inlet Capacity
K0390 39.56 0.017 1.23 0.001 Inlet Capacity
K0391 40.25 0.05 0.74 0.002 Inlet Capacity
K0392 42.28 0.191 0.44 0.072 Inlet Capacity
K0393 51.51 0.06 1.05 0.012 Inlet Capacity
K0394 51.84 0.05 0.74 0.009 Inlet Capacity
K0395 52.71 0.032 0.74 0.004 Inlet Capacity
K0396 44.49 0.143 0.02 0.081 Inlet Capacity
K0397 46.26 0.864 0.06 0.866 Outlet System
K0399 52.84 0.343 0.81 0.341 Inlet Capacity
K0400 54.49 54.84 0.453 0.2 0.303 Inlet Capacity
K0401 55.2 0.528 0 0.412 Inlet Capacity
K0402 55.57 0.366 0.12 0.434 Outlet System
K0403 56.3 0.067 0 0.146 Outlet System
K0404 58.37 0.054 0.02 0.015 Inlet Capacity
K0405 58.49 0.052 1.12 0.003 Inlet Capacity
K0406 55.57 0.193 0 0.18 Outlet System
K0407 58.96 0.207 0.01 0.149 Inlet Capacity
K0408 59.73 0.209 0.32 0.207 Inlet Capacity
K0409 60.44 0.325 0.21 0.157 Inlet Capacity
K0410 36.45 10.23 1.26 10.223 Inlet Capacity
K0411 42.18 0.122 0.72 0.024 Inlet Capacity
K0412 43.47 44.63 0.122 1.03 0 Inlet Capacity
K0413 43.6 44.7 0.122 1 0 Inlet Capacity
K0414 43.42 0.948 0.88 0.947 Inlet Capacity
K0415 45.17 45.32 1.07 0.05 0.946 Outlet System
K0416 45.15 45.35 1.32 0 1.068 Outlet System
K0418 57.71 0.393 1.28 0.39 Inlet Capacity
K0419 58.66 0.36 0.8 0.359 Inlet Capacity
K0420 59.19 0.325 0.52 0.325 Inlet Capacity
K0421 60.13 0.432 0 0.322 Outlet System
K0422 60.13 0.395 0.99 0.394 Inlet Capacity
K0423 62.82 0.356 1.18 0.356 Inlet Capacity
K0425 57.22 58.8 0.211 1.41 0 Inlet Capacity
K0426 57.77 58.85 0.261 0.88 0.098 Inlet Capacity
K0427 57.77 0.13 1.78 0.13 Inlet Capacity
K0428 58.87 0.118 0.65 0.023 Inlet Capacity
K0429 59.41 0.135 0.89 0.066 Inlet Capacity
K0430 59.98 0.136 0.05 0.025 Inlet Capacity
K0432 3.06 0.224 0.02 0.081 Inlet Capacity
K0433 3.1 0.185 0 0.141 Inlet Capacity
K0435 19.87 0.103 0.4 0.018 Inlet Capacity
K0437 81.33 0.07 0.31 0.007 Inlet Capacity
ITEM 2 (continued) ATTACHMENT 1
Page 169
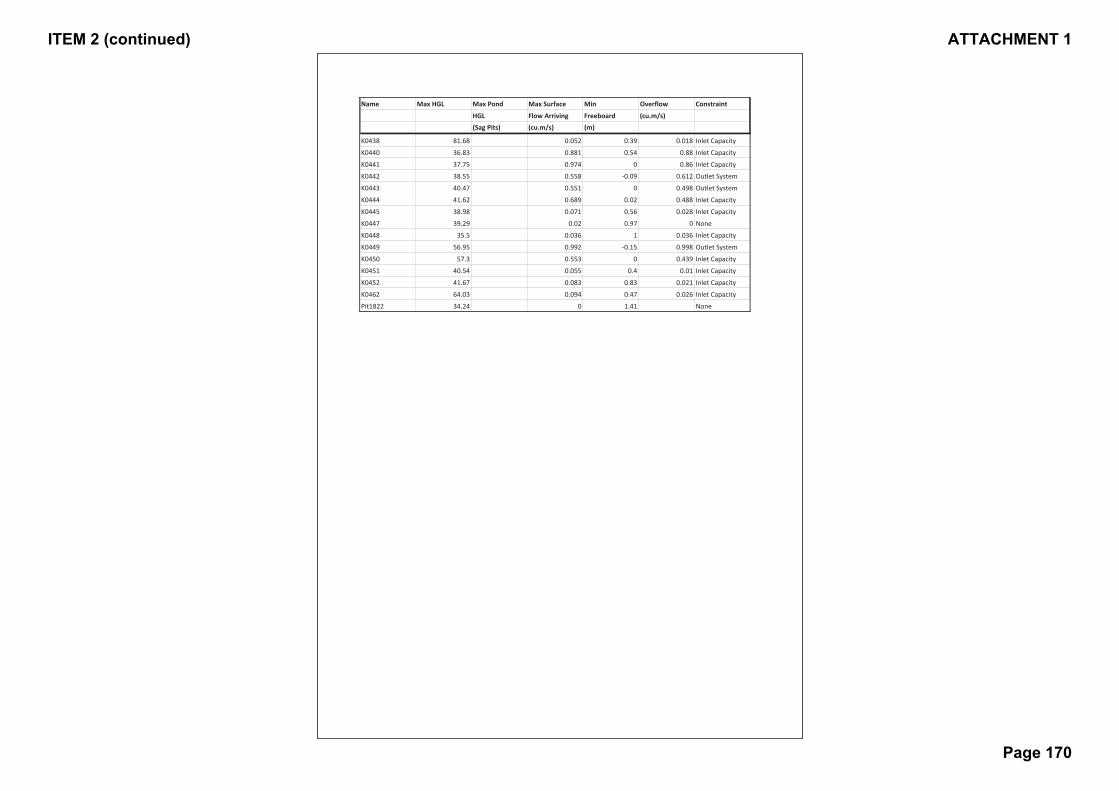
Name Max HGL Max Pond Max Surface Min Overflow Constraint
HGL Flow Arriving Freeboard (cu.m/s)(Sag Pits) (cu.m/s) (m)
K0438 81.68 0.052 0.39 0.018 Inlet Capacity
K0440 36.83 0.881 0.54 0.88 Inlet Capacity
K0441 37.75 0.974 0 0.86 Inlet Capacity
K0442 38.55 0.558 0.09 0.612 Outlet System
K0443 40.47 0.551 0 0.498 Outlet System
K0444 41.62 0.689 0.02 0.488 Inlet Capacity
K0445 38.98 0.071 0.56 0.028 Inlet Capacity
K0447 39.29 0.02 0.97 0 None
K0448 35.5 0.036 1 0.036 Inlet Capacity
K0449 56.95 0.992 0.15 0.998 Outlet System
K0450 57.3 0.553 0 0.439 Inlet Capacity
K0451 40.54 0.055 0.4 0.01 Inlet Capacity
K0452 41.67 0.083 0.83 0.021 Inlet Capacity
K0462 64.03 0.094 0.47 0.026 Inlet Capacity
Pit1822 34.24 0 1.41 None
ITEM 2 (continued) ATTACHMENT 1
Page 170

DRAINS OUTPUT – LOW FLOW ASSESSMENT KITTYS CREEK CATCHMENT – 5yr ARI
ITEM 2 (continued) ATTACHMENT 1
Page 171

Exported DRAINS results KITTYS CREEK PEAK 5YR ARI
PIT / NODE DETAILS
Name Max HGL Max Pond Max Surface Min Overflow Constraint
HGL Flow Arriving Freeboard (cu.m/s)(Sag Pits) (cu.m/s) (m)
K0002 0.48 0.996 5.27 0.574 Inlet Capacity
K0014 40.87 11.343 1.43 10.698 Inlet Capacity
K0017 46.3 6.237 0.58 5.595 Inlet Capacity
K0018 46.34 1.823 0.54 1.213 Inlet Capacity
K0019 58.08 0.443 1.12 0.19 Inlet Capacity
K0020 57.81 0.633 1.29 0.605 Inlet Capacity
K0023 56.25 0.745 1.25 0.392 Inlet Capacity
K0022 55.02 2.949 1.48 2.903 Inlet Capacity
K0060 46.84 0.068 0.01 0.024 Inlet Capacity
K0059 46.74 0.092 0.06 0.013 Inlet Capacity
K0058 45.64 0.081 0.61 0.079 Inlet Capacity
K0057 44.33 0.147 0.62 0.143 Inlet Capacity
K0056 41.74 0.21 0.61 0.207 Inlet Capacity
K0054 40.27 0.368 0.02 0.197 Inlet Capacity
K0052 31.73 0.575 1.02 0.574 Inlet Capacity
K0051 27.68 0.577 0.62 0.577 Inlet Capacity
K0050 21.72 0.58 0.66 0.58 Inlet Capacity
K0049 3.99 0.58 1.81 0.583 Inlet Capacity
K0048 3.54 0.642 0.66 0.38 Inlet Capacity
K0079 50.87 0.036 0.01 0.021 Inlet Capacity
K0078 50.87 0.07 0.16 0.007 Inlet Capacity
K0077 50.54 0.077 0.02 0.019 Inlet Capacity
K0076 50.25 0.123 0.02 0.049 Inlet Capacity
K0075 49.42 0.082 1.13 0.082 Inlet Capacity
K0074 47.31 0.213 0.6 0.204 Inlet Capacity
K0070 40.21 41.29 1.659 0.93 1.494 Inlet Capacity
K0069 37.9 1.592 0.59 1.587 Inlet Capacity
K0068 36.28 1.679 1.64 1.662 Inlet Capacity
K0067 35.3 1.738 0.01 1.431 Inlet Capacity
K0066 32.17 0.177 2.73 0.065 Inlet Capacity
K0093 44.66 0.108 1.5 0.02 Inlet Capacity
K0092 44.58 0.128 1.19 0.024 Inlet Capacity
K0091 44.12 0.262 1.27 0.261 Inlet Capacity
K0090 43.72 0.37 1.27 0.366 Inlet Capacity
K0089 43.62 0.601 0.87 0.583 Inlet Capacity
K0088 43.28 0.137 1.56 0.137 Inlet Capacity
K0087 43.18 0.845 0.39 0.462 Inlet Capacity
K0086 40.73 0.593 0.31 0.285 Inlet Capacity
K0085 38.72 0.412 0.92 0.167 Inlet Capacity
K0084 34.89 0.29 0.27 0.097 Inlet Capacity
K0081 30.2 30.93 1.242 0.58 1.061 Inlet Capacity
K0094 41.81 0.111 1.22 0.02 Inlet Capacity
K0105 76.91 0.104 0.31 0.018 Inlet Capacity
K0104 71.77 0.122 0.75 0.12 Inlet Capacity
PIT / NODE DETAILS
Name Max HGL Max Pond Max Surface Min Overflow Constraint
HGL Flow Arriving Freeboard (cu.m/s)(Sag Pits) (cu.m/s) (m)
K0102 69.92 0.201 0.01 0.122 Inlet Capacity
K0101 68.43 0.176 0.11 0.062 Inlet Capacity
K0100 66.34 0.113 0.39 0.02 Inlet Capacity
K0099 65.94 0.077 0.13 0.008 Inlet Capacity
K0098 65.58 0.127 0 0.085 Inlet Capacity
K0097 65.37 0.059 0.04 0.005 Inlet Capacity
K0096 64.83 0.498 0.45 0.261 Inlet Capacity
K0111 79.91 0.116 0.69 0.034 Inlet Capacity
K0110 79.65 0.15 0.01 0.079 Inlet Capacity
K0109 79.18 0.194 0.13 0.07 Inlet Capacity
K0108 78.66 0.205 0.49 0.079 Inlet Capacity
K0107 77.71 0.144 1.3 0.045 Inlet Capacity
K0123 34.75 0.135 0.38 0.042 Inlet Capacity
K0122 32.14 0.176 0.8 0.175 Inlet Capacity
K0121 31.56 32.81 0.31 1.1 0.127 Inlet Capacity
K0120 27.8 0.23 2.8 0.233 Inlet Capacity
K0119 23.19 0.279 2.9 0.28 Inlet Capacity
K0118 19.5 0.326 2.8 0.328 Inlet Capacity
K0117 15.87 0.376 1.64 0.378 Inlet Capacity
K0116 15.52 0.43 0.72 0.182 Inlet Capacity
K0115 15.23 16.36 0.057 1.05 0 Inlet Capacity
K0114 14.76 0.165 0.69 0.166 Inlet Capacity
K0113 12.53 0.218 0.74 0.217 Inlet Capacity
K0130 59.15 1.107 0.83 1.103 Inlet Capacity
K0126 56.95 1.816 0.01 1.464 Inlet Capacity
K0046 56.61 58.1 0.124 1.34 0.094 Inlet Capacity
K0044 54.75 2.769 0.2 1.998 Inlet Capacity
K0043 50.8 51.08 2.097 0.08 1.681 Inlet Capacity
K0042 50.42 51.02 1.871 0.4 1.65 Inlet Capacity
K0040 48.49 2.154 0.5 2.153 Inlet Capacity
K0039 47.66 2.179 0.41 2.177 Inlet Capacity
K0038 47.58 2.2 0.01 1.581 Inlet Capacity
K0036 46.14 0.178 0.62 0.178 Inlet Capacity
K0033 45.03 2.476 0.12 2.022 Inlet Capacity
K0031 44.42 3.022 0.02 2.364 Inlet Capacity
K0030 43.9 2.855 0.38 2.82 Inlet Capacity
K0029 43.39 2.873 0.51 2.878 Inlet Capacity
K0028 40.48 2.936 0.82 2.938 Inlet Capacity
K0139 43.49 1.455 2.01 0.914 Inlet Capacity
K0138 43.16 45.6 0.821 2.24 0.72 Inlet Capacity
K0137 43.06 45.49 1.897 2.23 1.666 Inlet Capacity
K0136 41.81 1.765 2.19 1.752 Inlet Capacity
K0135 41.09 3.053 1.31 2.179 Inlet Capacity
K0134 40.06 2.286 1.44 1.579 Inlet Capacity
K0410 36.48 11.93 1.23 11.773 Inlet Capacity
K0008 36.04 11.913 0.87 11.262 Inlet Capacity
ITEM 2 (continued) ATTACHMENT 1
Page 172

PIT / NODE DETAILS
Name Max HGL Max Pond Max Surface Min Overflow Constraint
HGL Flow Arriving Freeboard (cu.m/s)(Sag Pits) (cu.m/s) (m)
K0007 35.32 11.358 0.88 10.713 Inlet Capacity
K0005 34.63 35.82 11.616 0.99 11.186 Inlet Capacity
K0004 34.45 35.75 11.316 1.15 11.169 Inlet Capacity
K0142 58.95 0.004 1.25 0.001 Inlet Capacity
K0141 58.94 0.27 1.16 0.084 Inlet Capacity
K0146 6.4 0.04 1.24 0.04 Inlet Capacity
K0148 6.27 0.246 0.66 0.072 Inlet Capacity
K0150 6.01 0.203 0.6 0.048 Inlet Capacity
K0153 6.61 0.193 0.01 0.113 Inlet Capacity
K0152 6.49 0.353 0.12 0.13 Inlet Capacity
K0156 6.42 0.20 0.02 0.067 Inlet Capacity
K0155 6.06 0.264 0.19 0.067 Inlet Capacity
K0157 3.81 0.12 0.63 0.036 Inlet Capacity
K0160 2.63 0.125 0.81 0.125 Inlet Capacity
K0159 2.63 0.153 0.67 0.051 Inlet Capacity
K0161 2.82 0.125 0.53 0.024 Inlet Capacity
K0162 2.26 0.116 0.88 0.021 Inlet Capacity
K0164 1.95 0.135 1.23 0.134 Inlet Capacity
K0165 1.96 0.068 1.33 0.068 Inlet Capacity
K0169 2.72 0.111 0.02 0.04 Inlet Capacity
K0168 2.62 0.151 0.08 0.026 Inlet Capacity
K0167 2.35 0.136 0.25 0.042 Inlet Capacity
K0172 7.39 0.74 0 0.632 Inlet Capacity
K0178 39.56 0.426 0.01 0.246 Inlet Capacity
K0177 33.93 0.326 1.07 0.331 Inlet Capacity
K0175 16.92 0.537 1.08 0.537 Inlet Capacity
K0173 13.23 0.111 0.35 0.032 Inlet Capacity
K0188 31.88 0.125 3.17 0.125 Inlet Capacity
K0187 28.18 0.242 0.07 0.239 Inlet Capacity
K0191 15.29 0.117 0.07 0.057 Inlet Capacity
K0196 44.11 0.05 0.42 0.002 Inlet Capacity
K0195 44 0.171 0.01 0.099 Inlet Capacity
K0193 40.52 0.26 0.63 0.25 Inlet Capacity
K0197 41.26 0.109 0.02 0.032 Inlet Capacity
K0451 40.87 0.093 0.07 0.023 Inlet Capacity
K0202 41.92 0.68 0.13 0.677 Inlet Capacity
K0200 40.83 41.45 0.823 0.47 0.672 Inlet Capacity
K0209 39.97 0.06 0 0.037 Inlet Capacity
K0208 39.94 0.102 0.01 0.066 Inlet Capacity
K0207 39.72 0.2 0.22 0.045 Inlet Capacity
K0206 30.11 0.078 0.9 0.075 Inlet Capacity
K0210 40.11 0.06 0.11 0.005 Inlet Capacity
K0220 55.15 0.124 0.78 0.024 Inlet Capacity
K0219 53.89 0.148 0.15 0.026 Inlet Capacity
K0217 52.3 0.109 0.08 0.02 Inlet Capacity
K0216 50.98 0.318 0.49 0.307 Inlet Capacity
PIT / NODE DETAILS
Name Max HGL Max Pond Max Surface Min Overflow Constraint
HGL Flow Arriving Freeboard (cu.m/s)(Sag Pits) (cu.m/s) (m)
K0215 50.12 0.399 0.36 0.39 Inlet Capacity
K0214 49.1 0.467 1.33 0.467 Inlet Capacity
K0213 48.87 0.557 0.55 0.551 Inlet Capacity
K0221 33.84 0.258 0.24 0.08 Inlet Capacity
K0222 33.21 0.111 0.01 0.044 Inlet Capacity
K0224 48.46 0.296 0.01 0.176 Inlet Capacity
K0230 52.4 0.054 0.1 0.019 Inlet Capacity
K0228 52.25 0.114 0.03 0.021 Inlet Capacity
K0231 52.88 0.094 1.05 0.015 Inlet Capacity
K0233 46.89 0.373 0 0.291 Inlet Capacity
K0232 46.77 46.98 0.466 0.06 0.207 Inlet Capacity
K0240 65.04 0.241 0.02 0.111 Inlet Capacity
K0238 63.98 1.445 0.01 1.387 Inlet Capacity
K0237 56.53 1.93 0.22 1.907 Inlet Capacity
K0241 47.32 0.193 0.19 0.104 Inlet Capacity
K0243 64.63 0.241 0.01 0.137 Inlet Capacity
K0242 64.13 0.553 0.04 0.548 Inlet Capacity
K0256 64.43 0.1 0.01 0.036 Inlet Capacity
K0254 64.03 0.232 0 0.174 Inlet Capacity
K0252 61.59 0.315 0 0.257 Inlet Capacity
K0249 60.48 0.123 0.18 0.059 Inlet Capacity
K0248 60.46 60.65 0.857 0.04 0.57 Inlet Capacity
K0258 60.66 0.053 0.92 0.01 Inlet Capacity
K0257 60.6 0.06 0.75 0.013 Inlet Capacity
K0260 60.54 0.053 0.24 0.003 Inlet Capacity
K0259 60.49 0.056 0.26 0.056 Inlet Capacity
K0261 60.73 0.053 0.02 0.011 Inlet Capacity
K0263 79 0.12 0.74 0.034 Inlet Capacity
K0262 78.85 0.15 0.4 0.025 Inlet Capacity
K0265 78.84 78.94 0.004 0.08 0 Inlet Capacity
K0267 15.89 0.134 0.56 0.041 Inlet Capacity
K0268 16.18 0.235 0.01 0.113 Inlet Capacity
K0270 40.13 40.28 0.116 0.02 0 Inlet Capacity
K0274 31.63 0.271 0.68 0.087 Inlet Capacity
K0273 28.13 0.357 0.01 0.188 Inlet Capacity
K0272 26.81 27.81 0.458 0.85 0.136 Inlet Capacity
K0278 18.95 0.203 0.2 0.08 Inlet Capacity
K0277 18.62 0.283 0.02 0.137 Inlet Capacity
K0276 16.82 0.371 0.65 0.358 Inlet Capacity
K0281 19.95 0.144 0.39 0.025 Inlet Capacity
K0280 19.63 0.169 0.17 0.035 Inlet Capacity
K0293 31.82 0.151 0.72 0.028 Inlet Capacity
K0289 27.02 0.424 0 0.323 Inlet Capacity
K0287 22.39 0.78 0.53 0.779 Inlet Capacity
K0286 21.48 0.827 0.74 0.825 Inlet Capacity
K0285 20.42 0.879 0.69 0.879 Inlet Capacity
ITEM 2 (continued) ATTACHMENT 1
Page 173
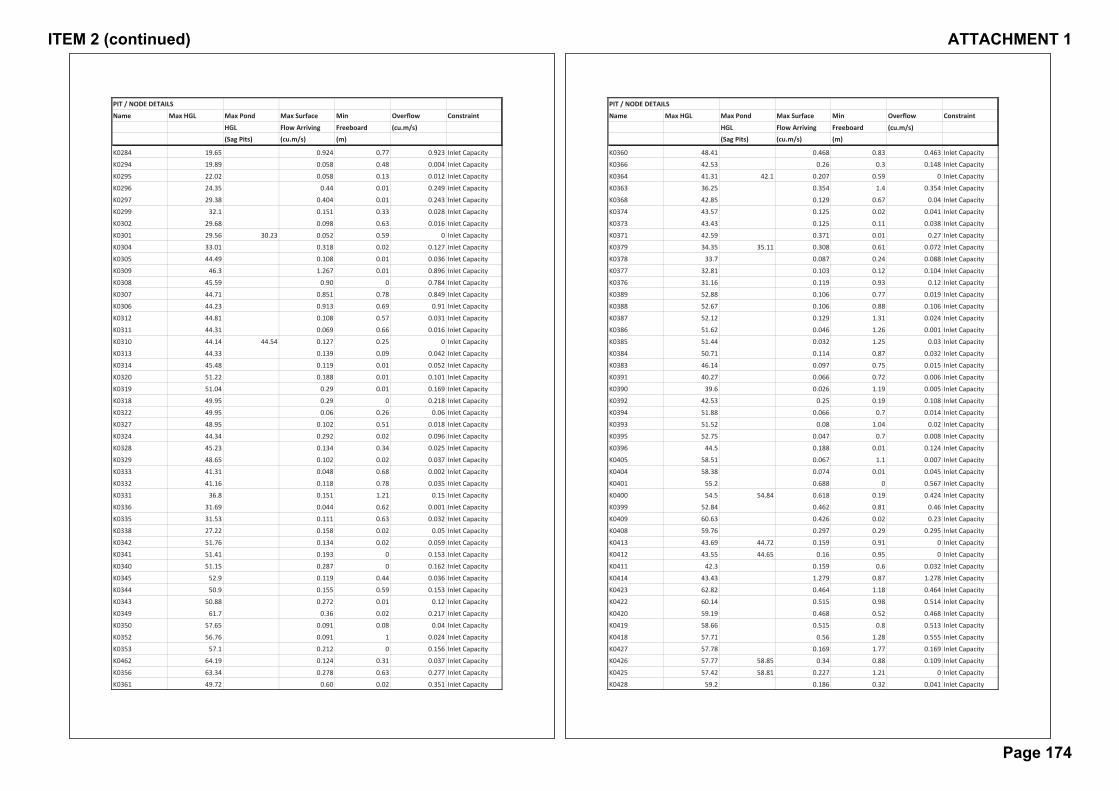
PIT / NODE DETAILS
Name Max HGL Max Pond Max Surface Min Overflow Constraint
HGL Flow Arriving Freeboard (cu.m/s)(Sag Pits) (cu.m/s) (m)
K0284 19.65 0.924 0.77 0.923 Inlet Capacity
K0294 19.89 0.058 0.48 0.004 Inlet Capacity
K0295 22.02 0.058 0.13 0.012 Inlet Capacity
K0296 24.35 0.44 0.01 0.249 Inlet Capacity
K0297 29.38 0.404 0.01 0.243 Inlet Capacity
K0299 32.1 0.151 0.33 0.028 Inlet Capacity
K0302 29.68 0.098 0.63 0.016 Inlet Capacity
K0301 29.56 30.23 0.052 0.59 0 Inlet Capacity
K0304 33.01 0.318 0.02 0.127 Inlet Capacity
K0305 44.49 0.108 0.01 0.036 Inlet Capacity
K0309 46.3 1.267 0.01 0.896 Inlet Capacity
K0308 45.59 0.90 0 0.784 Inlet Capacity
K0307 44.71 0.851 0.78 0.849 Inlet Capacity
K0306 44.23 0.913 0.69 0.91 Inlet Capacity
K0312 44.81 0.108 0.57 0.031 Inlet Capacity
K0311 44.31 0.069 0.66 0.016 Inlet Capacity
K0310 44.14 44.54 0.127 0.25 0 Inlet Capacity
K0313 44.33 0.139 0.09 0.042 Inlet Capacity
K0314 45.48 0.119 0.01 0.052 Inlet Capacity
K0320 51.22 0.188 0.01 0.101 Inlet Capacity
K0319 51.04 0.29 0.01 0.169 Inlet Capacity
K0318 49.95 0.29 0 0.218 Inlet Capacity
K0322 49.95 0.06 0.26 0.06 Inlet Capacity
K0327 48.95 0.102 0.51 0.018 Inlet Capacity
K0324 44.34 0.292 0.02 0.096 Inlet Capacity
K0328 45.23 0.134 0.34 0.025 Inlet Capacity
K0329 48.65 0.102 0.02 0.037 Inlet Capacity
K0333 41.31 0.048 0.68 0.002 Inlet Capacity
K0332 41.16 0.118 0.78 0.035 Inlet Capacity
K0331 36.8 0.151 1.21 0.15 Inlet Capacity
K0336 31.69 0.044 0.62 0.001 Inlet Capacity
K0335 31.53 0.111 0.63 0.032 Inlet Capacity
K0338 27.22 0.158 0.02 0.05 Inlet Capacity
K0342 51.76 0.134 0.02 0.059 Inlet Capacity
K0341 51.41 0.193 0 0.153 Inlet Capacity
K0340 51.15 0.287 0 0.162 Inlet Capacity
K0345 52.9 0.119 0.44 0.036 Inlet Capacity
K0344 50.9 0.155 0.59 0.153 Inlet Capacity
K0343 50.88 0.272 0.01 0.12 Inlet Capacity
K0349 61.7 0.36 0.02 0.217 Inlet Capacity
K0350 57.65 0.091 0.08 0.04 Inlet Capacity
K0352 56.76 0.091 1 0.024 Inlet Capacity
K0353 57.1 0.212 0 0.156 Inlet Capacity
K0462 64.19 0.124 0.31 0.037 Inlet Capacity
K0356 63.34 0.278 0.63 0.277 Inlet Capacity
K0361 49.72 0.60 0.02 0.351 Inlet Capacity
PIT / NODE DETAILS
Name Max HGL Max Pond Max Surface Min Overflow Constraint
HGL Flow Arriving Freeboard (cu.m/s)(Sag Pits) (cu.m/s) (m)
K0360 48.41 0.468 0.83 0.463 Inlet Capacity
K0366 42.53 0.26 0.3 0.148 Inlet Capacity
K0364 41.31 42.1 0.207 0.59 0 Inlet Capacity
K0363 36.25 0.354 1.4 0.354 Inlet Capacity
K0368 42.85 0.129 0.67 0.04 Inlet Capacity
K0374 43.57 0.125 0.02 0.041 Inlet Capacity
K0373 43.43 0.125 0.11 0.038 Inlet Capacity
K0371 42.59 0.371 0.01 0.27 Inlet Capacity
K0379 34.35 35.11 0.308 0.61 0.072 Inlet Capacity
K0378 33.7 0.087 0.24 0.088 Inlet Capacity
K0377 32.81 0.103 0.12 0.104 Inlet Capacity
K0376 31.16 0.119 0.93 0.12 Inlet Capacity
K0389 52.88 0.106 0.77 0.019 Inlet Capacity
K0388 52.67 0.106 0.88 0.106 Inlet Capacity
K0387 52.12 0.129 1.31 0.024 Inlet Capacity
K0386 51.62 0.046 1.26 0.001 Inlet Capacity
K0385 51.44 0.032 1.25 0.03 Inlet Capacity
K0384 50.71 0.114 0.87 0.032 Inlet Capacity
K0383 46.14 0.097 0.75 0.015 Inlet Capacity
K0391 40.27 0.066 0.72 0.006 Inlet Capacity
K0390 39.6 0.026 1.19 0.005 Inlet Capacity
K0392 42.53 0.25 0.19 0.108 Inlet Capacity
K0394 51.88 0.066 0.7 0.014 Inlet Capacity
K0393 51.52 0.08 1.04 0.02 Inlet Capacity
K0395 52.75 0.047 0.7 0.008 Inlet Capacity
K0396 44.5 0.188 0.01 0.124 Inlet Capacity
K0405 58.51 0.067 1.1 0.007 Inlet Capacity
K0404 58.38 0.074 0.01 0.045 Inlet Capacity
K0401 55.2 0.688 0 0.567 Inlet Capacity
K0400 54.5 54.84 0.618 0.19 0.424 Inlet Capacity
K0399 52.84 0.462 0.81 0.46 Inlet Capacity
K0409 60.63 0.426 0.02 0.23 Inlet Capacity
K0408 59.76 0.297 0.29 0.295 Inlet Capacity
K0413 43.69 44.72 0.159 0.91 0 Inlet Capacity
K0412 43.55 44.65 0.16 0.95 0 Inlet Capacity
K0411 42.3 0.159 0.6 0.032 Inlet Capacity
K0414 43.43 1.279 0.87 1.278 Inlet Capacity
K0423 62.82 0.464 1.18 0.464 Inlet Capacity
K0422 60.14 0.515 0.98 0.514 Inlet Capacity
K0420 59.19 0.468 0.52 0.468 Inlet Capacity
K0419 58.66 0.515 0.8 0.513 Inlet Capacity
K0418 57.71 0.56 1.28 0.555 Inlet Capacity
K0427 57.78 0.169 1.77 0.169 Inlet Capacity
K0426 57.77 58.85 0.34 0.88 0.109 Inlet Capacity
K0425 57.42 58.81 0.227 1.21 0 Inlet Capacity
K0428 59.2 0.186 0.32 0.041 Inlet Capacity
ITEM 2 (continued) ATTACHMENT 1
Page 174

PIT / NODE DETAILS
Name Max HGL Max Pond Max Surface Min Overflow Constraint
HGL Flow Arriving Freeboard (cu.m/s)(Sag Pits) (cu.m/s) (m)
K0429 59.44 0.177 0.86 0.093 Inlet Capacity
K0430 60.01 0.179 0.02 0.062 Inlet Capacity
K0432 3.07 0.31 0.01 0.163 Inlet Capacity
K0435 19.92 0.14 0.35 0.025 Inlet Capacity
K0438 81.7 0.07 0.37 0.026 Inlet Capacity
K0437 81.37 0.09 0.27 0.014 Inlet Capacity
K0444 41.62 0.93 0.02 0.724 Inlet Capacity
K0440 36.83 1.315 0.54 1.314 Inlet Capacity
K0445 39 0.091 0.54 0.04 Inlet Capacity
K0448 35.5 0.047 1 0.047 Inlet Capacity
K0452 41.75 0.109 0.75 0.031 Inlet Capacity
K0006 34.64 0 0.98 None
Pit1822 34.28 0 1.37 None
K0145 6.92 0.04 0.85 0 None
K0192 39.29 0 0.09 0 None
K0212 47.71 0.027 0.69 0 None
K0279 18.63 0.004 1.05 0 None
K0298 31.24 0.004 0.83 0 None
K0346 57.56 0.004 0.59 0 None
K0357 64.22 0.004 0.78 0 None
K0382 40.94 0.015 0.77 0 None
K0381 38.73 0.025 0.17 0 None
K0447 39.31 0.027 0.95 0 None
K0012 40.49 11.402 0.19 11.4 Outlet System
K0055 40.36 0.274 0.02 0.303 Outlet System
K0053 39.28 0.526 0.03 0.571 Outlet System
K0062 25.26 2.762 0.29 2.8 Outlet System
K0073 46.79 46.93 0.782 0.01 0.566 Outlet System
K0072 41.85 1.159 0 1.511 Outlet System
K0071 41.2 41.33 1.652 0.02 1.525 Outlet System
K0065 29.4 29.07 1.526 0.48 1.722 Outlet System
K0064 27.62 1.817 0.12 1.984 Outlet System
K0083 34.35 0.338 0.03 0.481 Outlet System
K0082 33.12 0.797 0.76 1.239 Outlet System
K0103 70.33 0.223 0 0.201 Outlet System
K0133 63.14 0.465 0 0.406 Outlet System
K0132 63.01 0.521 0.02 0.533 Outlet System
K0131 63.11 1.058 0.19 1.059 Outlet System
K0129 57.96 1.337 0.03 1.329 Outlet System
K0128 57.22 1.371 0.13 1.438 Outlet System
K0127 57.11 1.479 0.06 1.494 Outlet System
K0125 56.2 1.487 0 1.688 Outlet System
K0124 56.1 2.198 0.3 2.451 Outlet System
K0045 54.87 55.01 2.847 0.01 2.695 Outlet System
K0041 49.2 1.678 0 2.127 Outlet System
K0037 46.76 1.583 0.03 1.762 Outlet System
PIT / NODE DETAILS
Name Max HGL Max Pond Max Surface Min Overflow Constraint
HGL Flow Arriving Freeboard (cu.m/s)(Sag Pits) (cu.m/s) (m)
K0035 45.85 0.238 0 0.269 Outlet System
K0034 45.25 2.08 0 2.45 Outlet System
K0032 44.46 2.04 0 2.983 Outlet System
K0171 7.22 7.08 0.76 0.29 0.757 Outlet System
K0181 46.63 46.7 0.14 0.13 0.034 Outlet System
K0180 46.4 46.53 0.243 0.02 0.093 Outlet System
K0179 39.73 0.274 0.13 0.349 Outlet System
K0176 26.02 0.425 0.02 0.437 Outlet System
K0174 14.61 0.637 0.02 0.643 Outlet System
K0186 26.57 0.356 0.02 0.349 Outlet System
K0185 16.62 0.463 0.07 0.511 Outlet System
K0184 15.65 0.68 0.31 0.786 Outlet System
K0183 15.22 0.9 0 0.742 Outlet System
K0190 40.04 40.12 0.143 0.12 0.017 Outlet System
K0189 39.93 39.98 0.13 0.1 0.038 Outlet System
K0194 43.14 0.20 0 0.168 Outlet System
K0204 48.14 0.425 0.08 0.434 Outlet System
K0203 47.97 48.1 0.855 0.02 0.605 Outlet System
K0201 41.43 0.748 0.05 0.753 Outlet System
K0199 38.59 0.74 0.09 0.789 Outlet System
K0218 52.42 0.15 0 0.167 Outlet System
K0223 46.87 0.573 0.08 0.559 Outlet System
K0225 48.46 0.296 0 0.294 Outlet System
K0227 50.41 0.114 0.01 0.115 Outlet System
K0226 50.42 50.53 0.209 0.04 0.05 Outlet System
K0229 52.34 0.073 0 0.061 Outlet System
K0239 64.17 0.352 0 0.344 Outlet System
K0236 55.14 2.436 0.28 2.452 Outlet System
K0235 48.95 2.933 0.14 2.929 Outlet System
K0255 64.21 0.136 0 0.132 Outlet System
K0253 63.25 0.27 0.03 0.268 Outlet System
K0251 60.85 0.302 0.01 0.298 Outlet System
K0250 60.65 0.35 0 0.351 Outlet System
K0247 60.1 0.573 0 0.781 Outlet System
K0246 60.08 1.08 0.78 1.18 Outlet System
K0245 59.1 1.469 0.1 1.476 Outlet System
K0292 31.29 0.21 0 0.182 Outlet System
K0291 30.21 0.24 0.02 0.25 Outlet System
K0290 28.85 0.253 0.35 0.372 Outlet System
K0288 23.64 0.59 0.18 0.731 Outlet System
K0317 47.83 0.27 0.04 0.29 Outlet System
K0316 46.86 1.79 0.27 1.884 Outlet System
K0315 46.71 1.906 0.12 1.915 Outlet System
K0321 47.6 0.06 0 0.041 Outlet System
K0326 48.47 0.168 0.03 0.172 Outlet System
K0325 45.56 0.219 0.02 0.221 Outlet System
ITEM 2 (continued) ATTACHMENT 1
Page 175
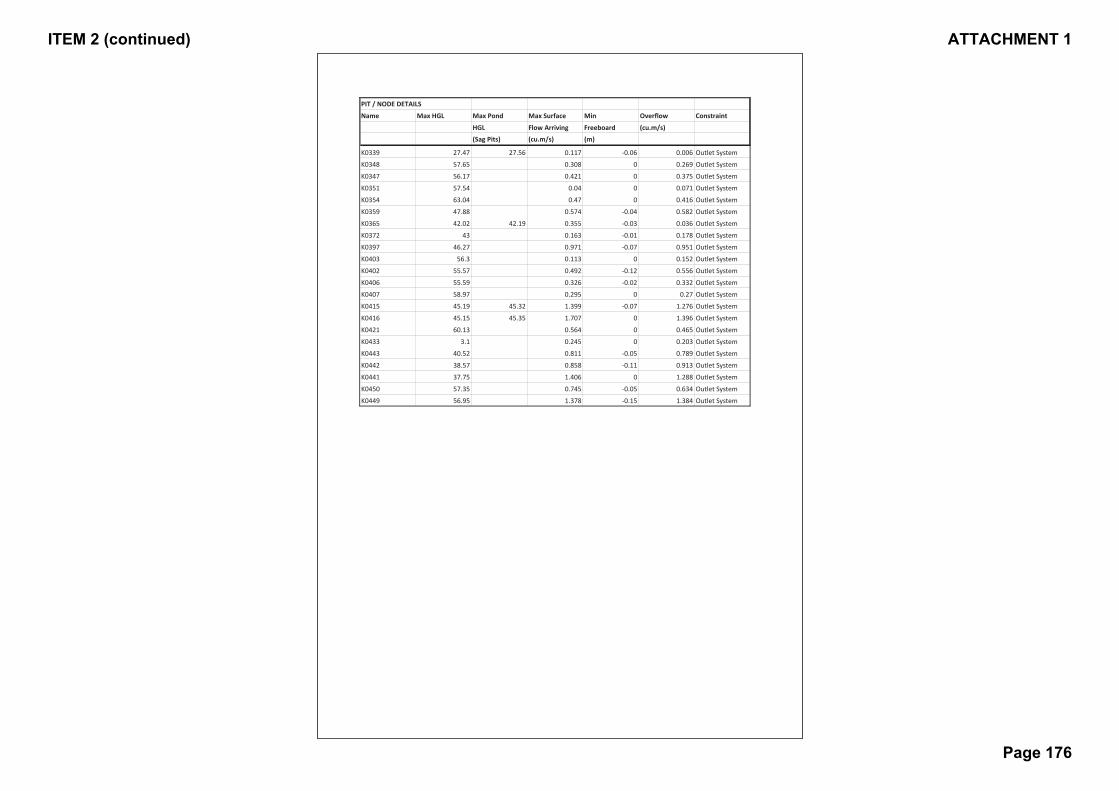
PIT / NODE DETAILS
Name Max HGL Max Pond Max Surface Min Overflow Constraint
HGL Flow Arriving Freeboard (cu.m/s)(Sag Pits) (cu.m/s) (m)
K0339 27.47 27.56 0.117 0.06 0.006 Outlet System
K0348 57.65 0.308 0 0.269 Outlet System
K0347 56.17 0.421 0 0.375 Outlet System
K0351 57.54 0.04 0 0.071 Outlet System
K0354 63.04 0.47 0 0.416 Outlet System
K0359 47.88 0.574 0.04 0.582 Outlet System
K0365 42.02 42.19 0.355 0.03 0.036 Outlet System
K0372 43 0.163 0.01 0.178 Outlet System
K0397 46.27 0.971 0.07 0.951 Outlet System
K0403 56.3 0.113 0 0.152 Outlet System
K0402 55.57 0.492 0.12 0.556 Outlet System
K0406 55.59 0.326 0.02 0.332 Outlet System
K0407 58.97 0.295 0 0.27 Outlet System
K0415 45.19 45.32 1.399 0.07 1.276 Outlet System
K0416 45.15 45.35 1.707 0 1.396 Outlet System
K0421 60.13 0.564 0 0.465 Outlet System
K0433 3.1 0.245 0 0.203 Outlet System
K0443 40.52 0.811 0.05 0.789 Outlet System
K0442 38.57 0.858 0.11 0.913 Outlet System
K0441 37.75 1.406 0 1.288 Outlet System
K0450 57.35 0.745 0.05 0.634 Outlet System
K0449 56.95 1.378 0.15 1.384 Outlet System
ITEM 2 (continued) ATTACHMENT 1
Page 176
City of Ryde Council Buffalo and Kittys Creek Floodplain Risk Management Study
and Plan Final Report
November 2014
ITEM 2 (continued) ATTACHMENT 2
Page 177

ITEM 2 (continued) ATTACHMENT 2
Page 178

GHD | Report for City of Ryde Council - Buffalo and Kittys Creek Floodplain Risk Management Study and Plan,
21/21394 | i
This report has been prepared by GHD for City of Ryde Council and may only be used and relied on by City of Ryde Council for the purpose agreed between GHD and the City of Ryde Council as set out in section 1of this report.
GHD otherwise disclaims responsibility to any person other than City of Ryde Council arising in connection with this report. GHD also excludes implied warranties and conditions, to the extent legally permissible.
The services undertaken by GHD in connection with preparing this report were limited to those specifically detailed in the report and are subject to the scope limitations set out in the report.
The opinions, conclusions and any recommendations in this report are based on conditions encountered and information reviewed at the date of preparation of the report. GHD has no responsibility or obligation to update this report to account for events or changes occurring subsequent to the date that the report was prepared.
The opinions, conclusions and any recommendations in this report are based on assumptions made by GHD described in this report. GHD disclaims liability arising from any of the assumptions being incorrect.
GHD has prepared this report on the basis of information provided by City of Ryde Council and others who provided information to GHD (including Government authorities)], which GHD has not independently verified or checked beyond the agreed scope of work. GHD does not accept liability in connection with such unverified information, including errors and omissions in the report which were caused by errors or omissions in that information.
GHD has prepared the preliminary cost estimate set out in section 8.5.3 of this report (“Preliminary Cost of Potential Options”) using information reasonably available to the GHD employee(s) who prepared this report; and based on assumptions and judgments made by GHD.
The Cost Estimate has been prepared for the purpose of comparing potential flood mitigation options and must not be used for any other purpose.The Cost Estimate is a preliminary estimate only. Actual prices, costs and other variables may be different to those used to prepare the Cost Estimate and may change. Unless as otherwise specified in this report, no detailed quotation has been obtained for actions identified in this report. GHD does not represent, warrant or guarantee that the works can or will be undertaken at a cost which is the same or less than the Cost Estimate.
GHD excludes and disclaims all liability for all claims, expenses, losses, damages and costs, including indirect, incidental or consequential loss, legal costs, special or exemplary damages and loss of profits, savings or economic benefit, City of Ryde Council may incur as a direct or indirect result of the database being transferred to council, for any reason being inaccurate, incomplete or incapable of being processed on City of Ryde Council’s equipment or systems or failing to achieve any particular purpose. To the extent permitted by law, GHD excludes any warranty, condition, undertaking or term, whether express or implied, statutory or otherwise, as to the condition, quality, performance, merchantability or fitness for purpose of the information database transferred to Council. This study was commissioned by the City of Ryde with financial assistance from the NSW Government through its Floodplain Management Program. This document does not necessarily represent the opinions of the NSW Government or the Office of Environment and Heritage.
ITEM 2 (continued) ATTACHMENT 2
Page 179

ii | GHD | Report for City of Ryde Council - Buffalo and Kittys Creek Floodplain Risk Management Study and Plan, 21/21394
This page has been left blank intentionally
ITEM 2 (continued) ATTACHMENT 2
Page 180
GHD | Report for City of Ryde Council - Buffalo and Kittys Creek Floodplain Risk Management Study and Plan,
21/21394 | iii
Table of contents 1. Introduction.....................................................................................................................................1
1.1 NSW Floodplain Management Policy ..................................................................................1 1.2 Background of the Study .....................................................................................................2 1.3 Report Outline ......................................................................................................................3
2. Background Information .................................................................................................................4
2.1 Catchment Background .......................................................................................................4 2.2 Heritage ...............................................................................................................................4 2.3 History of Flooding ...............................................................................................................4 2.4 Previous Flood Investigations ..............................................................................................5
3. Community Consultation ................................................................................................................7
3.1 General ................................................................................................................................7 3.2 Floodplain Risk Management Committee ............................................................................7 3.3 Community Questionnaire ...................................................................................................7 3.4 Public Exhibition .................................................................................................................10
4. Existing Flood Behaviour .............................................................................................................11
4.1 Buffalo and Kittys Creek Flood Study ................................................................................11 4.2 Flood Risk and Flood Hazard ............................................................................................11 4.3 Existing Flooding Conditions .............................................................................................14
5. Social and Economic Impacts of Flooding ...................................................................................16
5.1 Impacts of Flooding ............................................................................................................16
5.2 Social Impacts of Flooding ................................................................................................. 16 5.3 Economic Impacts ..............................................................................................................17
6. Potential Flood Damage ...............................................................................................................19
6.1 Types of Flood Damage.....................................................................................................19 6.2 Flood Damages Database ................................................................................................. 20 6.3 Basis of Flood Damage Calculations .................................................................................23 6.4 Potential Flood Damages for Existing Catchments ...........................................................25
7. Floodplain Management Measures ..............................................................................................29
7.1 Floodplain Management Approach ....................................................................................29 7.2 Property Modification Measures ........................................................................................29
7.3 Response Modification Measures ......................................................................................32 7.4 Flood Modification Measures .............................................................................................33
8. Preliminary Floodplain Management Options Identified ..............................................................35
8.1 Preliminary Floodplain Management Options Identified ....................................................35 8.2 Identified Flood Modification Options .................................................................................39 8.3 Identified Property Modification Options ............................................................................49 8.4 Identified Response Modification Options .........................................................................50
ITEM 2 (continued) ATTACHMENT 2
Page 181
iv | GHD | Report for City of Ryde Council - Buffalo and Kittys Creek Floodplain Risk Management Study and Plan, 21/21394
9. Detailed Assessment of Preliminary Options ...............................................................................52
9.1 Hydraulic Assessment of Preliminary Flood Modification Options ....................................52 9.2 Assessment of Property and Response Modification Measures .......................................58 9.3 Preliminary Cost of Potential Options ................................................................................59 9.4 Multi-Criteria Analysis of Options .......................................................................................60 9.5 Feasible Options for Consideration ...................................................................................61
10. Recommended Floodplain Management Plan .............................................................................62
10.1 The Recommended Measures ..........................................................................................62 10.2 On-going review of Floodplain Risk Management Plan .....................................................64
11. Glossary .......................................................................................................................................68
12. References ...................................................................................................................................71
Table index Table 3-1 Preferences for mitigation measures within the catchment .....................................................9
Table 4-1 Peak flood levels at selected locations – Kittys Creek catchment .........................................14
Table 4-2 Peak flood levels at selected locations – Buffalo Creek catchment ......................................14
Table 5-1 Age and Population Profile ....................................................................................................17
Table 5-2 Potential Socio-Economic Impacts ........................................................................................17
Table 5-3 Housing Profile .......................................................................................................................18
Table 6-1 Relationship between Depth of Flooding and Damage (After DECCW Flood Damage Curve Spreadsheet) ............................................................................................23
Table 6-2 Property and Contents Value Assumption and Term ............................................................24
Table 6-3 Properties Inundated Above Floor Level................................................................................25
Table 6-4 Predicted Total Flood Damages under Existing Conditions ..................................................26
Table 8-1 Preliminary Flood Modification Options .................................................................................35
Table 8-2 Preliminary Property Modification Options .............................................................................36
Table 8-3 Preliminary Response Modification Options ..........................................................................36
Table 8-4 Preliminary Detention Basin Options .....................................................................................39
Table 8-5 Preliminary Stormwater Infrastructure Upgrade Options .......................................................43
Table 9-1 Flood Mitigation Options ........................................................................................................52
Table 9-2 Options Assessment - Properties Affected Above Floor Level (Buffalo Catchment) .............53
Table 9-3 Options Assessment – Flood Damage ..................................................................................56
Table 9-4 Options Considered for Further Assessment .........................................................................56
Table 9-5 Summary of Flood Modification Options ................................................................................57
Table 9-6 Summary of Property and Response Modification Options ...................................................58
Table 9-7 Capital Cost of Floodplain Management Options ..................................................................59
ITEM 2 (continued) ATTACHMENT 2
Page 182

GHD | Report for City of Ryde Council - Buffalo and Kittys Creek Floodplain Risk Management Study and Plan,
21/21394 | v
Table 9-8 Social, Economic and Environmental Issues for Assessing Options .....................................60
Table 9-9 Option Assessment Matrix – Buffalo Creek Catchment .........................................................60
Table 9-10 Option Assessment Matrix – Kitty Creek Catchment ...........................................................61
Table 9-11 Feasible Options for Consideration ......................................................................................61
Table 10-1 Floodplain Risk Management Option Assessment Matrix ...................................................62
ITEM 2 (continued) ATTACHMENT 2
Page 183
vi | GHD | Report for City of Ryde Council - Buffalo and Kittys Creek Floodplain Risk Management Study and Plan, 21/21394
Figure indexFigure 1-1 Floodplain Risk Management Process ...................................................................................1
Figure 2-1 Locality Plan ............................................................................................................................6
Figure 4-1 Buffalo Creek Catchment Hazard Map .................................................................................12
Figure 4-2 Kitty Creek Catchment Hazard Map .....................................................................................13
Figure 6-1 Types of Flood Damage........................................................................................................20
Figure 6-2 Surveyed Properties – Buffalo Creek Catchment ................................................................. 21
Figure 6-3 Surveyed Properties – Kitty Creek Catchment .....................................................................22
Figure 6-4 Relationship between Depth of Flooding and Damage ........................................................23
Figure 6-5 Average Annual Damage Curve – Buffalo Creek ................................................................. 27
Figure 6-6 Average Annual Damage Curve – Kitty Creek .....................................................................28
Figure 7-1 Floodplain Management Measures ......................................................................................29
Figure 8-1 Preliminary Flood Modification Options – Detention Basin ...................................................37
Figure 8-2 Preliminary Flood Modification Options – Stormwater Infrastructure Upgrades...................38
Figure 9-1 Flood Hazard – Scenario 1 ...................................................................................................54
Figure 9-2 Flood Hazard – Scenario 2 ...................................................................................................55
Figure 9-3 Damage Curve of Modelled Scenarios .................................................................................56
Figure 10-1 Emergency Flood Evacuation – Buffalo Creek Catchment ................................................65
Figure 10-2 Emergency Flood Evacuation – Kittys Creek Catchment ...................................................66
Appendices Appendix A – Preliminary Cost of Options
Appendix B – Multi-Criteria Analysis
Appendix C – Public Exhibition
ITEM 2 (continued) ATTACHMENT 2
Page 184
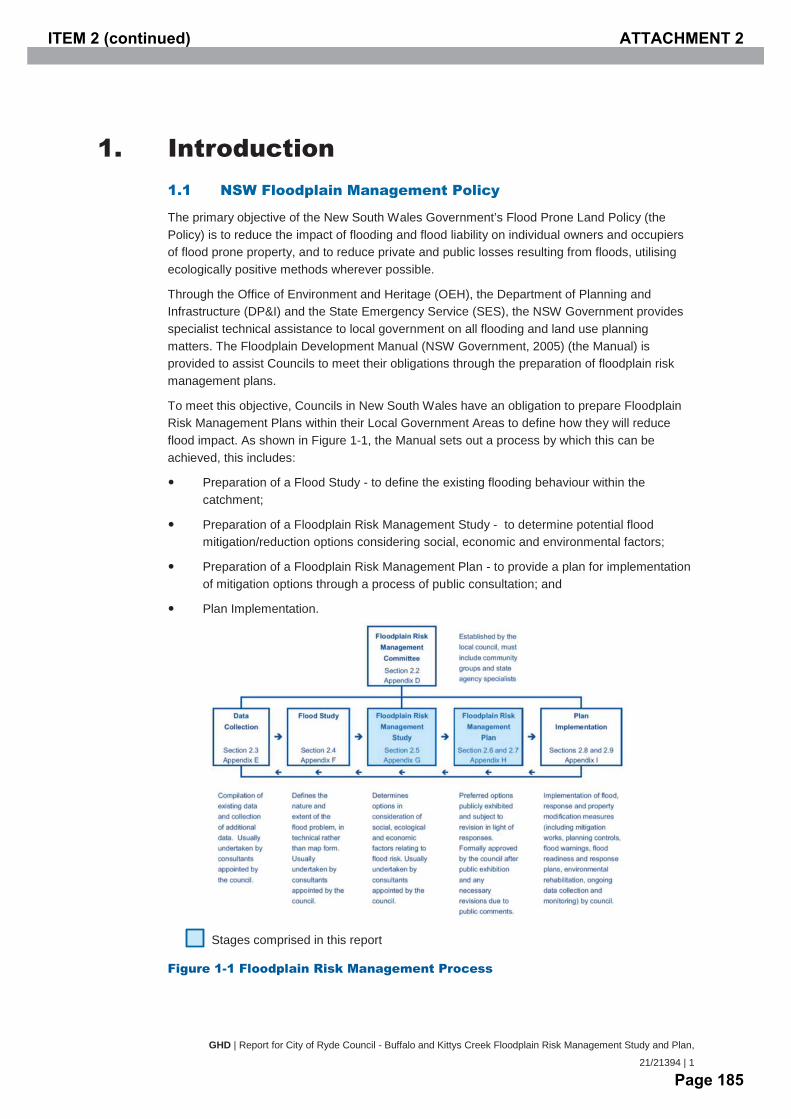
GHD | Report for City of Ryde Council - Buffalo and Kittys Creek Floodplain Risk Management Study and Plan,
21/21394 | 1
1. Introduction 1.1 NSW Floodplain Management Policy
The primary objective of the New South Wales Government’s Flood Prone Land Policy (the Policy) is to reduce the impact of flooding and flood liability on individual owners and occupiers of flood prone property, and to reduce private and public losses resulting from floods, utilising ecologically positive methods wherever possible.
Through the Office of Environment and Heritage (OEH), the Department of Planning and Infrastructure (DP&I) and the State Emergency Service (SES), the NSW Government provides specialist technical assistance to local government on all flooding and land use planning matters. The Floodplain Development Manual (NSW Government, 2005) (the Manual) is provided to assist Councils to meet their obligations through the preparation of floodplain risk management plans.
To meet this objective, Councils in New South Wales have an obligation to prepare Floodplain Risk Management Plans within their Local Government Areas to define how they will reduce flood impact. As shown in Figure 1-1, the Manual sets out a process by which this can be achieved, this includes:
Preparation of a Flood Study - to define the existing flooding behaviour within thecatchment;
Preparation of a Floodplain Risk Management Study - to determine potential flood mitigation/reduction options considering social, economic and environmental factors;
Preparation of a Floodplain Risk Management Plan - to provide a plan for implementation of mitigation options through a process of public consultation; and
Plan Implementation.
Stages comprised in this report
Figure 1-1 Floodplain Risk Management Process
ITEM 2 (continued) ATTACHMENT 2
Page 185
2 | GHD | Report for City of Ryde Council - Buffalo and Kittys Creek Floodplain Risk Management Study and Plan, 21/21394
1.2 Background of the Study
The Buffalo and Kittys Creek catchments (the study area) are located within the City of Ryde local government area (LGA). The suburbs within the catchments include North Ryde, West Ryde, Gladesville and Hunters Hill. Both catchments are tributaries of the Lane Cove River and drain a combined area of approximately 740 ha.
Both catchments in the past have experienced several large storm events in the 1980s that have caused widespread flooding. Since then, rainfall events in May 1998 and April 2003 have caused significant problems but not to the extent experienced in the late 1980s; this was mainly due to stormwater improvement works completed in the area, acquisition of some of the worst affected properties and the adoption of more stringent development controls.
As City of Ryde Council (Council) is responsible for local land use planning in the study area and its floodplains. Council’s Floodplain Risk Management Committee (the committee) commissioned GHD in early 2012 to undertake a comprehensive floodplain risk management plan (the Plan) for the study area. This was conducted under the NSW Flood Prone Land Policy.
This plan is inclusive of the stages as outlined in the Manual and described in Section 1.1. Key outcomes of this plan will include the development of the Buffalo and Kittys Creek Flood Study (Flood Study) and the Floodplain Risk Management Study and Plan (FRMS&P), hereby referred to as ‘the Study’.
The draft Flood Study (GHD, 2013) was submitted to Council in March 2013 for review by the committee. In addition, the draft Flood Study and will be on public exhibition for community consultation prior to finalisation.
The focus on this current stage of the Plan is the FRMS&P and is presented in this report. The development of this report was overseen by the committee. The committee consists of members from City of Ryde Council, State Emergency Services (SES), Office of Environment and Heritage (OEH) and members of the community.
This report should be read in conjunction with the Flood Study.
ITEM 2 (continued) ATTACHMENT 2
Page 186
GHD | Report for City of Ryde Council - Buffalo and Kittys Creek Floodplain Risk Management Study and Plan,
21/21394 | 3
1.3 Report Outline
The structure of this report contains the following sections:
Section 1 – An Introduction to the Study;
Section 2 – Background information, including a description of the catchment, history of flooding and previous flood investigations;
Section 3 – A review of community consultation activities undertaken during the study;
Section 4 – Description of the existing flood behaviour as identified from the Flood Study, including existing flood hazards;
Section 5 – Social-Economic description of the Study area and potential effects;
Section 6 – Flood damage assessments identifying the average annual damage (AAD) costs;
Section 7 – The types of floodplain management measures and options currently used in practice to mitigate and/or reduce flood impacts;
Section 8 – A review of the potential flood mitigation options and an assessment of these options based on the social, economic and environment criterion;
Section – The recommended Floodplain Management Plan for the Buffalo and Kittys CreekFloodplain.
Section 9 –
ITEM 2 (continued) ATTACHMENT 2
Page 187
4 | GHD | Report for City of Ryde Council - Buffalo and Kittys Creek Floodplain Risk Management Study and Plan, 21/21394
2. Background Information 2.1 Catchment Background
Detailed information on the catchment characteristics of the Buffalo and Kittys Creek catchments are provided in the Flood Study (GHD, 2013), a summary is provided in this report.
2.1.1 Description of the Catchment
As previously described, the Buffalo and Kittys Creek catchments are located within the City of Ryde local government area. This is shown in locality plan Figure 2-1. The catchments are bounded by Victoria Road to the west and by Pittwater Road to the east and south-east. Both creeks rise in the north-west and flows in a south easterly direction, draining into Lane Cove River.
Buffalo Creek Catchment
The Buffalo Creek catchment is the larger catchment of the two and is located south-west of Kittys Creek catchment. The topography of the catchment is predominantly steep with its highest elevations in excess of approximately 85 mAHD on the north western extent. The terrain generally slopes downwards in an easterly direction draining towards Lane Cove River. The downstream discharge point of the catchment (beneath Pittwater Road) exhibits an elevation of 0.44 mAHD.
Land use in the area is predominately urban and consists of mainly residential precincts with minor commercial and industrial developments. Parks are found to be scattered throughout the catchment and forested reserves are dominant along the creek banks and within the floodplain.
Residential areas throughout the catchment generally exhibit slopes varying from 5 to 20%, creek banks in the downstream areas can be as steep as 30 to 40%. The creek slope itself generally varies from 0.1 to 1.0% in the lower reaches to approximately 1.0 to 2.5% in the upper reaches.
Kittys Creek Catchment
The Kittys Creek catchment exhibits similar characteristics to the larger Buffalo Creek catchment. The terrain is also predominantly steep, exhibiting slopes in residential areas of 5 to 15% and approximately 20 to 30% in the downstream creek banks.
Land use in the area is primarily residential with scattered parks and forested areas. Heavily forested areas such as Wallumatta Nature Reserve, Portius Park, Martin, Boobajool and Kittys Creek Reserve surrounds the creek, making the creek heavily vegetated throughout the entire reach.
2.2 Heritage
Heritage issues are important in forming an understanding of the social and cultural context of the floodplain. Advice from the Heritage Council is advised prior to any item of State Significance being demolished, defaced or damaged. The Ryde Local Environmental Plan No. 105 provides a schedule of heritage items within the City of Ryde and should be referenced prior to implementation of any flood mitigation works.
2.3 History of Flooding
The City of Ryde experienced several large storm events in the 1980s that caused widespread flooding. Since then, rainfall events in May 1998 and April 2003 caused significant problems but
ITEM 2 (continued) ATTACHMENT 2
Page 188
GHD | Report for City of Ryde Council - Buffalo and Kittys Creek Floodplain Risk Management Study and Plan,
21/21394 | 5
not to the extent experienced in the late 1980s; this was mainly due to stormwater improvement works completed in the area, acquisition of some of the worst affected properties and the adoption of more stringent development controls.
2.4 Previous Flood Investigations
GHD completed the draft Buffalo and Kittys Creek Flood Study in March 2013. This report was reviewed by Council in conjunction with members of the City of Ryde Floodplain Risk Management Committee. This report will be placed on public exhibition prior to finalisation.
No previous Flood Studies have been conducted for the catchment prior to GHDs investigation. The GHD Flood Study report will form the basis for all future floodplain management activities.
ITEM 2 (continued) ATTACHMENT 2
Page 189

Level 15, 133 Castlereagh Street Sydney NSW 2000 T 61 2 9239 7100 F 61 2 9239 7199 E [email protected] W www.ghd.com.au
COXS RDTWIN RD
CRESSY
RD
MELBA DR
PITTWATE
R R
D
WIC
KS RD
MAGDALA RD
BADAJO
Z RD
ELLIOTT AVE
BLENHEIM
RD
JOPLIN
G ST
FOX RD
CUTLER P
DE
LONG AVE
PAGE RD
BRONHILL AVE
LUMSDAINE AVE
TOBRUK S
T
KOKODA ST
EDMONDSON ST
CONRAD S
T
NERANG ST
JEANETTE ST
HARFORD S
T
SHAW
ST
IAN ST
WOLF
E RD
CHAUVEL ST
BLUE GUM DR
NASH PL
NEIL STPACEY AVE
SCHUMACK ST
MONCRIEFF DR
LIONEL AVE
STROUD S
T
RUDD ST
CARRAMAR AVE
BOYCE S
T
DOWD L
NBLUETT
AVE
SAGER
PL
BUFFALO RD
QUARRY RD
LAN
E C
OV
E R
D
PITTWATER RD
HIGH ST
MONAS
H RD
CRESSY RD
PRIN
CES ST
MONCRIEFF DR
BOYCE S
T
GREENE AVE
AEOLUS AVE
KELLS R
D
KUPPA RD
WES
TMIN
STER
RD
THOMPSON ST
GARDENER AVE
FINCH AVE
HIGGINBOTHAM RD
AITCHANDAR R
D
JONES S
T
COLLEGE ST
BRUCE ST
SMIT
H ST
WOODBIN
E CRES
WOLGER RD
PRICE ST
GOULDIN
G RD
DEV
LIN
ST
ARGYLE
AVE
BADAJO
Z RD
SWAN
ST
KULGOA AVE
MAR
S LN
FORREST RD
ARTHUR S
T
ELLIOTT AVE
KEPPEL RD
POOLE
Y ST
WELLINGTON RD
THE
STRA
ND
HANCOTT ST
RYDE RD
FISHER AVE
MACLEAY ST
TUNKS ST
SHO
RT S
T
KENN
EDY
ST
BLA
XLA
ND
RD
PROVIDENCE R
D
OATES AVE
CHURCH ST
BIRD S
T
POPE ST
NUMA RD
MILNE ST
TUCKER
ST
ORIENT S
T
MINGA ST
ELTHAM ST
MALVIN
A ST
DOBSON CRES
WILL
IAM S
T
ELIZABETH ST
BUNA CT
BIDGEE RD
ROBINSON ST
GANNET ST
BAIRD AVE
IRVIN
E CRES
STUART ST
BEAZLEY S
T
BAVIN
AVE
RE
NE S
T
BRIGHT ST
OWEN S
T
GOWRIE ST
FRANK S
T
ISABEL ST
VICTORIA RD
MYRA AVE
CLAYTON ST
BYR
ON
AV
E
TURNER AVE
JOY ST
NELSON S
T
CURZON ST
DOLAN ST
IVY
ST CALLAGHAN ST
ARRAS
PDE
IMPE
RIAL
AVE
NERANG ST
KIM
ST
DIGGERS AVE
HATTO
N ST
LAURA ST
EDW
ARD ST
BOYD LN
PRAT
TEN AV
E
BYGRAVE ST JOHN M
ILLER S
T
BERRIP
A CL
MCCALLUM AVE
WATT AVE
BETO
LA P
L
KELLAWAY ST
ST ANNES ST
STROUD S
T
BAMBI ST
HOLLY AVE
MAZE AVE
GAN
ORA
ST
RUND
LE P
L
PID
DIN
G R
D
MARTIN ST
NO
RTH
RD
EILE
EN
ST
SEMPLE ST
BEIHLER LN
KEAT
S AV
E
ADAM ST
CRESSY
RD
BLAXLAND RD
PRINCES ST
VICTORIA RD
G:\21\21394\GIS\ArcGIS\Maps\MXD\Map Publishing - FINAL Flood Study Report\Catchment Info Mapping\A1 Locality Plan.mxd© 2010. While GHD has taken care to ensure the accuracy of this product, GHD and DATA CUSTODIAN, make no representations or warranties about its accuracy, completeness or suitability for any particular purpose. GHD and DATA CUSTODIAN, cannot accept liability of any kind (whether in contract, tort or otherwise) for any expenses, losses, damages and/or costs (including indirect or consequential damage) which are or may be incurred as a result of the product being inaccurate, incomplete or unsuitable in any way and for any reason.
0 130 260 390 52065
Metres
Map Projection: Transverse MercatorHorizontal Datum: Geocentric Datum of Australia (GDA)
Grid: Map Grid of Australia 1994, Zone 56
Figure
Job NumberRevision A
21-21394
06 Nov 2014o Date
Data Source: NSW Department of Lands: Cadastre - Jan 2011; Geoscience Australia: 250k Data - Jan 2011. Created by: jlam
1:13,000 (at A3)
SYDNEY
City of Ryde CouncilBuffalo and Kittys CreekFlood Study and FRMS&P
Locality Plan
Site Location
Regional Locality Map
Buffalo CreekCatchment
Kitty CreekCatchment
Buf falo Creek
Kitty Creek
LaneC
oveR
iver
North Ryde
Gladesville
Ryde
East Ryde
Victoria Road
Pittwater R
oad
LegendCatchment Boundary
Lot Cadastral
ITEM 2 (continued) ATTACHMENT 2
Page 190
GHD | Report for City of Ryde Council - Buffalo and Kittys Creek Floodplain Risk Management Study and Plan,
21/21394 | 7
3. Community Consultation 3.1 General
The community’s involvement in preparation of the Floodplain Risk Management Plan is integral. The mitigation options selected within the catchment will affect residents and business owners and Council is committed to considering their views in developing the Plan.
The community may also have important information relating to flood history which can help to confirm flood behaviour within the catchment and identify areas of concern.
As part of the community consultation conducted for the Flood Study and the FRMS&P, a survey was sent to residents of the catchment to ask for their input. A copy of this Questionnaire can be found in Appendix C of the Flood Study report. The views, information and suggestions have been considered throughout the course of this Study.
3.2 Floodplain Risk Management Committee
The Buffalo and Kittys Creek Floodplain Risk Management Committee was involved in the preparation of this FRMS&P. The committee comprised of representatives from:
City of Ryde Council;
State Emergency Service (SES);
Office of Environment and Heritage (OEH); and
Community representatives.
The Committee played an active role in reviewing the Flood Study, selecting floodplain management options to be investigated, evaluating results and outcomes from those options and identifying the preferred floodplain management measures to be included in the final plan.
A presentation of the results and recommendations of the Flood Study and Floodplain Risk Management Study was given to the full Committee on the 2 April 2014 as part of the process.
3.3 Community Questionnaire
In November of 2012, a newsletter and questionnaire was sent to residents and business owners of the Buffalo and Kittys Creek Catchments. It was agreed with Council that all residents within the study area be consulted regarding flood experience and potential flood mitigation measures within the catchment.
Questionnaires, together with newsletters and reply paid response envelopes were printed and posted to all properties and businesses on Council’s address list. A link to an online version of the questionnaire was also provided on the City of Ryde Council website.
Of the 3247 surveys sent, 622 provided a response, either through reply paid response or through Council’s website, this represented a 19% response rate. These results were analysed and are summarised in the following sections.
ITEM 2 (continued) ATTACHMENT 2
Page 191
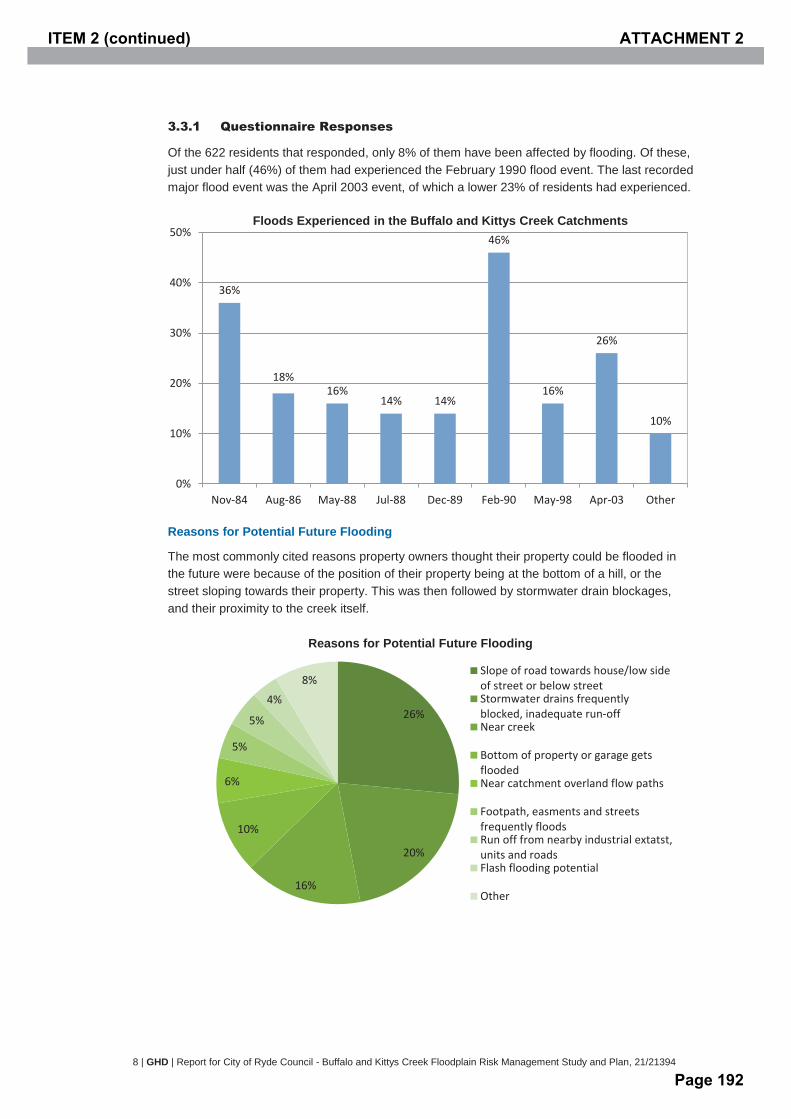
8 | GHD | Report for City of Ryde Council - Buffalo and Kittys Creek Floodplain Risk Management Study and Plan, 21/21394
3.3.1 Questionnaire Responses
Of the 622 residents that responded, only 8% of them have been affected by flooding. Of these, just under half (46%) of them had experienced the February 1990 flood event. The last recorded major flood event was the April 2003 event, of which a lower 23% of residents had experienced.
Reasons for Potential Future Flooding
The most commonly cited reasons property owners thought their property could be flooded in the future were because of the position of their property being at the bottom of a hill, or the street sloping towards their property. This was then followed by stormwater drain blockages, and their proximity to the creek itself.
36%
18% 16%
14% 14%
46%
16%
26%
10%
0%
10%
20%
30%
40%
50%
Nov-84 Aug-86 May-88 Jul-88 Dec-89 Feb-90 May-98 Apr-03 Other
Floods Experienced in the Buffalo and Kittys Creek Catchments
26%
20%
16%
10%
6%
5%
5%
4% 8%
Reasons for Potential Future Flooding
Slope of road towards house/low sideof street or below streetStormwater drains frequentlyblocked, inadequate run-offNear creek
Bottom of property or garage getsfloodedNear catchment overland flow paths
Footpath, easments and streetsfrequently floodsRun off from nearby industrial extatst,units and roadsFlash flooding potential
Other
ITEM 2 (continued) ATTACHMENT 2
Page 192

GHD | Report for City of Ryde Council - Buffalo and Kittys Creek Floodplain Risk Management Study and Plan,
21/21394 | 9
Reasons against Future Potential Flooding
The most commonly stated reasons for those who did not think their properties were at risk were; the property being on the higher end of a slope, the property itself being elevated, or the property being located far from the creek. New or improved drainage installation was commonly cited as having removed flood risk that had existed previously. Furthermore, some property owners had never experienced any flooding at their properties so did not perceive this to be a threat.
Mitigation Works and Development Controls
Residents were asked about their preference for types of mitigation works within the catchment. These preferences are presented in Table 3-1.
Table 3-1 Preferences for mitigation measures within the catchment
Rank Suggestion Precent of Respondents
1 Better drains/check drainage system/sewers/higher capacity.
30.4
2 Clearing drains, gutters and pipes full of leaves, rubbish, weed, debris – regular street sweeping.
26.1
3 Clear the creek, river banks of weeds and plants 16.7 4 Check redirection of water flow (footpaths) 4.3 5 Enforce new building, development specifications, over
development concerns. 3.6
6 Enforce open wire fences, restrict hard surface areas, nature strips, for less run-off
3.6
7 Re-use rainwater 2.9 8 Tree logs, branches keep falling into creek – tree
maintenance 2.9
9 Check easements flood coping capacity 2.2 10 Council approved constructions, previous decision has led
to more flooding, requires review 2.2
Other 5.1%
40%
21%
15%
13%
8% 3%
Reasons against Future Flooding Potential
House is on higher end of slope
Elevation of block/land raised/livein upper floors
Property far from Creek
Drainage system – new, improved, or adequate
Never had a flood problem before,even during heavy rain
Other
ITEM 2 (continued) ATTACHMENT 2
Page 193

10 | GHD | Report for City of Ryde Council - Buffalo and Kittys Creek Floodplain Risk Management Study and Plan, 21/21394
The most commonly suggested preference of additional works were improvements to drainage or installation of drain systems, clearing existing drains of leaves and other rubbish through regular street sweeping, and clearing the creek of weeds and other plants.
3.4 Public Exhibition
As part of the public exhibition process, a letter was sent to each of the Committee Members, and newsletters were sent to residents in the catchment area informing them of the Public Exhibition. Advertisements were also placed in the local newspapers and Council’s website inviting participation from the community.
The Public Exhibition was conducted from the 10th September 2014 to the 3 October 2014. Hard copies of the reports and posters were presented as part of the exhibition. An information session was also held at North Ryde Library where the community could come to speak to Council and Consultant representatives.
Additional details of the Public Exhibition program are included in Appendix C.
Two written responses were received from the community during the Exhibition period. The first response expressed appreciation and satisfaction of the work done to date. The second response suggested potential dredging of the lower reaches of Kittys Creek to alleviate flooding and sought discussions related to wildlife protection and the management of domestic pets.
Dredging of the lower reaches of Kittys Creek was investigated further after the exhibition period. It was confirmed to be ineffective under design flood conditions, and was therefore not pursued further as a potential option. Issues related to wildlife protection and domestic pets have been referred to the relevant departments within Council.
An additional item was discussed with Council during a subsequent site visit. This relates to an inlet and culvert under Pittwater Road at the end of Imperial Avenue within the Buffalo Creek catchment. It is noted that this drainage node has no bearing on the overall flood behaviour of Buffalo Creek and does not impact on any housing in the area. This is because this area is very steep and discharges directly into the downstream reaches of Buffalo Creek.
Additional DRAINS modelling was undertaken to investigate the flow behaviour at this location. The results indicate that overflows across the road are likely to occur for flood events greater than the 20% AEP event. Preliminary details of these results are presented in Appendix C.2. Based on discussions with Council, it was considered that further and more detailed investigations would be required before a recommendation can be made on how drainage can be improved at this location.
ITEM 2 (continued) ATTACHMENT 2
Page 194

GHD | Report for City of Ryde Council - Buffalo and Kittys Creek Floodplain Risk Management Study and Plan,
21/21394 | 11
4. Existing Flood Behaviour 4.1 Buffalo and Kittys Creek Flood Study
The Buffalo and Kittys Creek Flood Study was carried out by GHD as part of the first phase of the floodplain risk management plan. This report was submitted to Council in March 2013 (Draft) and will be made available for public exhibition prior to finalisation.
The primary objectives of the Flood Study was to define the flood behaviour of the Buffalo and Kittys Creek catchments under historical and existing floodplain conditions, while addressing possible future variations to climate change. The Flood Study provided information on;
Flood extents and flows;
Hydraulic Categories;
Preliminary hazard categories; and
Result sensitivity due to climate change.
Process of the Flood Study
The flood study provided an assessment of flood behaviour under the existing conditions and highlighted the flooding problems in the area.
DRAINS was used to model the drainage networks within the Buffalo and Kittys Creek catchments using the ILSAX hydrologic method to simulate the catchment rain-fall runoff processes. Hydrographs produced from catchment run-off were then used in the hydraulic TUFLOW model.
The TUFLOW model was constructed using information provided by Council in addition to externally sourced information. The model was then validated and calibrated through flood survey results provided through community consultation, as well as the validation against a HEC-RAS hydraulic model.
Model parameters and assumptions were adjusted and modified as part of the validation and calibration process.
The models were used to simulate a range of design storm events including the 1% 2%, 5% and 20% AEPs as well as the PMF event. These results were then used to analyse the flood behaviour of the catchments. A set of additional model runs were conducted to assess the models sensitivity against particular parameters and changes to due climate change.
Maps showing the extents of the flood inundation and flood levels have been produced for the different design floods and have been included in the Flood Study.
4.2 Flood Risk and Flood Hazard
Floodplain management is about managing the risk of flooding across the floodplain. It should be recognised that different parts of the floodplain are subject to different degrees of flood risk.
Provisional flood hazard is determined in accordance with the Floodplain Development Manual as part of the Flood Study. Flooded areas are defined as being either low, medium or high hazard based on a combination of velocity and depth ratio. This “velocity-depth” product is measured in square metres per second (m2/s) and recognises that both the velocity of flood waters and the depth of flood waters influence the potential flood hazard.
Figure 4-1 and Figure 4-2 presents the existing hazard conditions for the catchments.
ITEM 2 (continued) ATTACHMENT 2
Page 195

Level 15, 133 Castlereagh Street Sydney NSW 2000 T 61 2 9239 7100 F 61 2 9239 7199 E [email protected] W www.ghd.com.auG:\21\21394\GIS\ArcGIS\Maps\MXD\Map Publishing - Draft FRMS Report\Buffalo_Creek_Results Hazard.mxd© 2010. While GHD has taken care to ensure the accuracy of this product, GHD and DATA CUSTODIAN, make no representations or warranties about its accuracy, completeness or suitability for any particular purpose. GHD and DATA CUSTODIAN, cannot accept liability of any kind (whether in contract, tort or otherwise) for any expenses, losses, damages and/or costs (including indirect or consequential damage) which are or may be incurred as a result of the product being inaccurate, incomplete or unsuitable in any way and for any reason.
LEGEND0 100 200 300 40050
Metres
Map Projection: Transverse MercatorHorizontal Datum: Geocentric Datum of Australia (GDA)
Grid: Map Grid of Australia 1994, Zone 56
Figure 4-1
Job NumberRevision A
21-21394
12 Nov 2013o Date
Data Source: NSW Department of Lands: Cadastre - Jan 2011; Geoscience Australia: 250k Data - Jan 2011. Created by: jlam
1:10,000 (at A3) City of Ryde CouncilBuffalo and Kittys CreekFlood Study and FRMS&P
Buffalo Creek CatchmentHazard Classification
Catchment Boundary
High HazardMedium HazardLow Hazard
ITEM 2 (continued) ATTACHMENT 2
Page 196

Level 15, 133 Castlereagh Street Sydney NSW 2000 T 61 2 9239 7100 F 61 2 9239 7199 E [email protected] W www.ghd.com.auG:\21\21394\GIS\ArcGIS\Maps\MXD\Map Publishing - Draft Flood Study Report\Sensitivity Mapping\Kitty_Creek_Results Hazard.mxd© 2010. While GHD has taken care to ensure the accuracy of this product, GHD and DATA CUSTODIAN, make no representations or warranties about its accuracy, completeness or suitability for any particular purpose. GHD and DATA CUSTODIAN, cannot accept liability of any kind (whether in contract, tort or otherwise) for any expenses, losses, damages and/or costs (including indirect or consequential damage) which are or may be incurred as a result of the product being inaccurate, incomplete or unsuitable in any way and for any reason.
0 60 120 180 24030
Metres
Map Projection: Transverse MercatorHorizontal Datum: Geocentric Datum of Australia (GDA)
Grid: Map Grid of Australia 1994, Zone 56
Figure 4-2
Job NumberRevision A
21-21394
12 Nov 2013o Date
Data Source: NSW Department of Lands: Cadastre - Jan 2011; Geoscience Australia: 250k Data - Jan 2011. Created by: jlam
City of Ryde CouncilBuffalo and Kittys Creek
Kitty Creek CatchmentHazard Classification
Flood Study and FRMS&PHigh HazardMedium HazardLow Hazard
Catchment Boundary
ITEM 2 (continued) ATTACHMENT 2
Page 197

14 | GHD | Report for City of Ryde Council - Buffalo and Kittys Creek Floodplain Risk Management Study and Plan, 21/21394
4.3 Existing Flooding Conditions
4.3.1 Peak Flood Levels at Selected Locations
As part of the Flood Study, peak flood levels for various locations within the study area were monitored for a range of design storm events. These locations were mainly located on roads to assess the degree of road inundation, this is of particular interest for flood evacuation.
The predicted peak flood levels extracted from the Flood Study at the observed locations within the Kittys Creek and Buffalo’s Creek catchment is shown in Table 4-1 and Table 4-2 respectively.
Table 4-1 Peak flood levels at selected locations – Kittys Creek catchment
Location Modelled Peak Flood Levels (mAHD)
20% AEP 5% AEP 2% AEP 1% AEP PMF Coxs Road 20.88 20.91 20.96 20.97 20.98 Long Avenue (Near) 33.17 33.23 33.28 33.43 33.97 Melba Drive (Near) 28.34 29.59 30.88 30.91 31.41 Melba Drive (South) 39.83 39.84 39.86 39.88 39.94 Jeanette Street (Near) 11.62 13.20 13.31 13.36 13.44 Bronhill Avenue 10.41 10.44 10.49 10.51 10.61 Fox Road 31.12 31.13 31.19 31.24 31.41 Badajoz Road 53.50 53.52 53.56 53.58 53.62 Blenheim Road 55.81 55.88 55.89 55.90 55.95 Nash Place 47.26 47.31 47.33 47.35 47.51
Table 4-2 Peak flood levels at selected locations – Buffalo Creek catchment
Location Modelled Peak Flood Levels (mAHD)
20% AEP 5% AEP 2% AEP 1% AEP PMF Lane Cove Road 47.04 47.11 47.13 47.15 47.37 Smith Street 44.37 44.39 44.40 44.41 44.56 Dobson Crescent 51.24 51.25 51.33 51.35 51.64 Quarry Road 56.95 57.24 57.28 57.30 57.47 Gardener Road 43.65 43.71 43.75 43.79 44.16 Gannan Park 50.52 50.53 50.54 50.55 50.57 Baird Avenue 29.29 29.34 29.35 29.39 29.64 Buffalo Road 29.28 29.30 29.31 29.32 29.35 Higginbotham Road 22.93 22.96 22.98 22.99 23.14 Lyndhurst Street 26.36 26.37 26.38 26.39 26.40 Finch Avenue 32.31 32.32 32.33 32.35 32.39
4.3.1 Critical Storm Duration
A range of storm durations were modelled for the Buffalo and Kittys Creek catchments in order to identify the critical storm duration for design event flooding. Design durations modelled for each AEP event included the 0.5 hour, 1 hour, 1.5 hour, 2 hour, 3 hour, 4.5 hour and 6 hour durations. Outputs from the hydrologic model simulations indicate that the maximum peak inflows for the Buffalo Creek catchment are generally derived when using storm durations of 1.5 to 2 hours. Similarly, Hydraulic modelling also identifies that peak flows within that catchment occurs within the 1.5 to 2 hours. This information, in conjunction with road inundation levels is important for emergency flood evacuation planning.
ITEM 2 (continued) ATTACHMENT 2
Page 198
GHD | Report for City of Ryde Council - Buffalo and Kittys Creek Floodplain Risk Management Study and Plan,
21/21394 | 15
4.3.2 Flood Map Results
The results from the design flood simulations can be found in Appendix C of the Flood Study. These are presented as a series of flood maps showing flood depth (in blue), overlain by flood level contours.
Referring to the flood maps, the following is noted:
Buffalo Creek Catchment
Flooding is generally contained within the creek for the 20%, 5% and 2% AEP flood events. Minor road flooding occurs in the lower reaches of the catchments and in backyards of properties in the most upstream reaches;
Flooding in the 1% AEP and PMF event is more widespread. Flood waters are expected to inundate a larger area of the catchment with increased backyard and road flooding;
Flooding in property backyards is observed for all storm events, most visibly in the upstream catchment areas. Flood waters in these backyards ranges in depth from 100 mm to 250 mm. This is expected as these residential backyards naturally form part of the tributary draining into Buffalo Creek. However, it is unclear whether these houses will be flooded as floor survey levels have not yet been surveyed. This will be conducted as part of the next phase.
Greater flood depths are observed in the lower reaches of Buffalo Creek. As observed in the creek topography, flood waters are attenuated in the lower creek reaches before discharging through the culverts underneath Pittwater Road and into Lane Cove River; and
In the PMF flood event, flood levels are approximately in excess of 1 m deeper than the 1% AEP in the downstream reaches of the creek. Road flooding and flooding in residential and commercial areas in this vicinity may reach 200 to 300 mm in depth.
Kittys Creek Catchment
Flooding is generally contained within the creek for the 20%, 5%, 2% and 1% AEP flood events. Minor road flooding occurs along Badajoz road, but flood depths are minor and are within 100 to 150 mm;
In the downstream reach, flood waters can be expected to inundate Pittwater Road and the areas adjoining this road;
Flooding in the PMF event is generally more widespread. Flooding is more apparent in various residential zones and on roads; and
Minor flooding in backyards is observed mainly in the upper reaches of the catchment. This is expected as these residential backyards naturally form part of the tributary draining into Buffalo Creek. However, it is unclear whether these houses will be flooded as floor survey levels have not yet been surveyed. This will be conducted as part of the next phase.
ITEM 2 (continued) ATTACHMENT 2
Page 199
16 | GHD | Report for City of Ryde Council - Buffalo and Kittys Creek Floodplain Risk Management Study and Plan, 21/21394
5. Social and Economic Impacts of Flooding 5.1 Impacts of Flooding
Impacts from flood events can be measured in the form of flood damages, these damages can be considered as either social or financial and can be categorised as:
Direct costs – Direct damages quantified in monetary terms. These include damages such as structural damage, contents damage and clean-up costs;
Indirect costs – Indirect damages can be translated into monetary values but are secondary impacts, such as the loss of business revenue and changes to employment patterns; and
Intangible costs – Intangible damages are difficult to quantify in meaningful dollar terms and include impacts such as individual health impacts and the loss of sentimental items.
5.2 Social Impacts of Flooding
The major impacts of flooding can be devastating, causing a great deal of distress to people’s lives. Impacts can range from death, injury and harm from sources such as contaminated water through to lasting psychological consequences caused by damages to homes, loss of personal possessions and financial worries.
Social costs are often intangible damages and relate to changes to social networks, lifestyles, community activities and individual state of well-being. The degree of disruption to people’s lives depends on the severity of flooding and the ability of the community and individuals to recover from the flood event.
Residential damages may also have the potential to cause lifestyle changes as members of the community adjust personal activities to address food damages.
Flooding may also cause stress and depression for individual community members related to the loss of sentimental and personally valuable items. These social costs are particularly difficult to quantify as the personal and emotional value of loss often exceeds that of material value. Anxiety, panic and insecurity may also increase amongst the community as a response to the possibility of future flood events.
It is generally acknowledged that the degree of social impact caused by flooding is likely to reduce if the community is prepared for a flood event and has adequate access to support services.
Age and Population Profile
Analysis of the population and age profile was drawn from the Australia Bureau of Statistics, 2011, Population and Housing Census. The population within the catchment was calculated utilising the statistical local division tool within the Table Builder profiles. This information is presented in Table 5-1.
Understanding the age profile of the catchment is important, particularly in planning for emergency services or evacuations. Of particular interest would be of infants, young children or the elderly that may require additional assistance in the event of emergencies. As presented in Table 5-1, the age group categories of 0-14 years and 65 years and over accounts for 30.8% of the population in the catchment.
ITEM 2 (continued) ATTACHMENT 2
Page 200
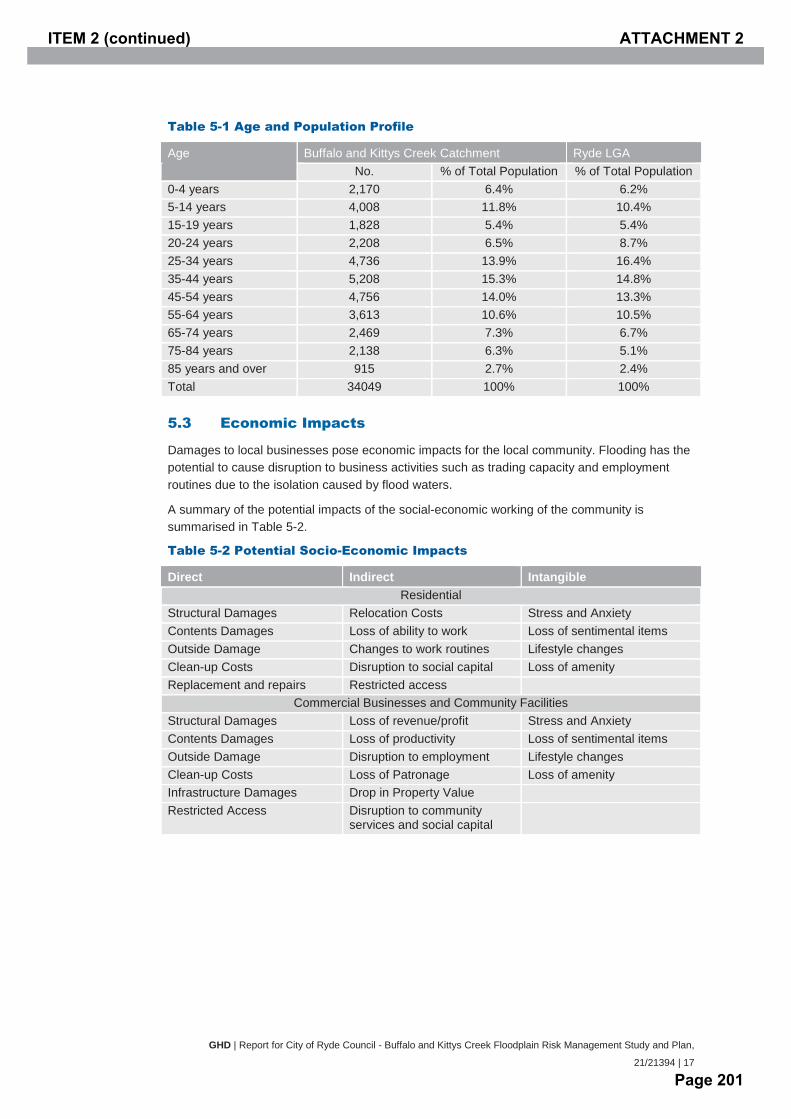
GHD | Report for City of Ryde Council - Buffalo and Kittys Creek Floodplain Risk Management Study and Plan,
21/21394 | 17
Table 5-1 Age and Population Profile
Age Buffalo and Kittys Creek Catchment Ryde LGA No. % of Total Population % of Total Population
0-4 years 2,170 6.4% 6.2% 5-14 years 4,008 11.8% 10.4% 15-19 years 1,828 5.4% 5.4% 20-24 years 2,208 6.5% 8.7% 25-34 years 4,736 13.9% 16.4% 35-44 years 5,208 15.3% 14.8% 45-54 years 4,756 14.0% 13.3% 55-64 years 3,613 10.6% 10.5% 65-74 years 2,469 7.3% 6.7% 75-84 years 2,138 6.3% 5.1% 85 years and over 915 2.7% 2.4% Total 34049 100% 100%
5.3 Economic Impacts
Damages to local businesses pose economic impacts for the local community. Flooding has the potential to cause disruption to business activities such as trading capacity and employment routines due to the isolation caused by flood waters.
A summary of the potential impacts of the social-economic working of the community is summarised in Table 5-2.
Table 5-2 Potential Socio-Economic Impacts
Direct Indirect Intangible Residential
Structural Damages Relocation Costs Stress and Anxiety Contents Damages Loss of ability to work Loss of sentimental items Outside Damage Changes to work routines Lifestyle changes Clean-up Costs Disruption to social capital Loss of amenity Replacement and repairs Restricted access
Commercial Businesses and Community Facilities Structural Damages Loss of revenue/profit Stress and Anxiety Contents Damages Loss of productivity Loss of sentimental items Outside Damage Disruption to employment Lifestyle changes Clean-up Costs Loss of Patronage Loss of amenity Infrastructure Damages Drop in Property Value Restricted Access Disruption to community
services and social capital
ITEM 2 (continued) ATTACHMENT 2
Page 201
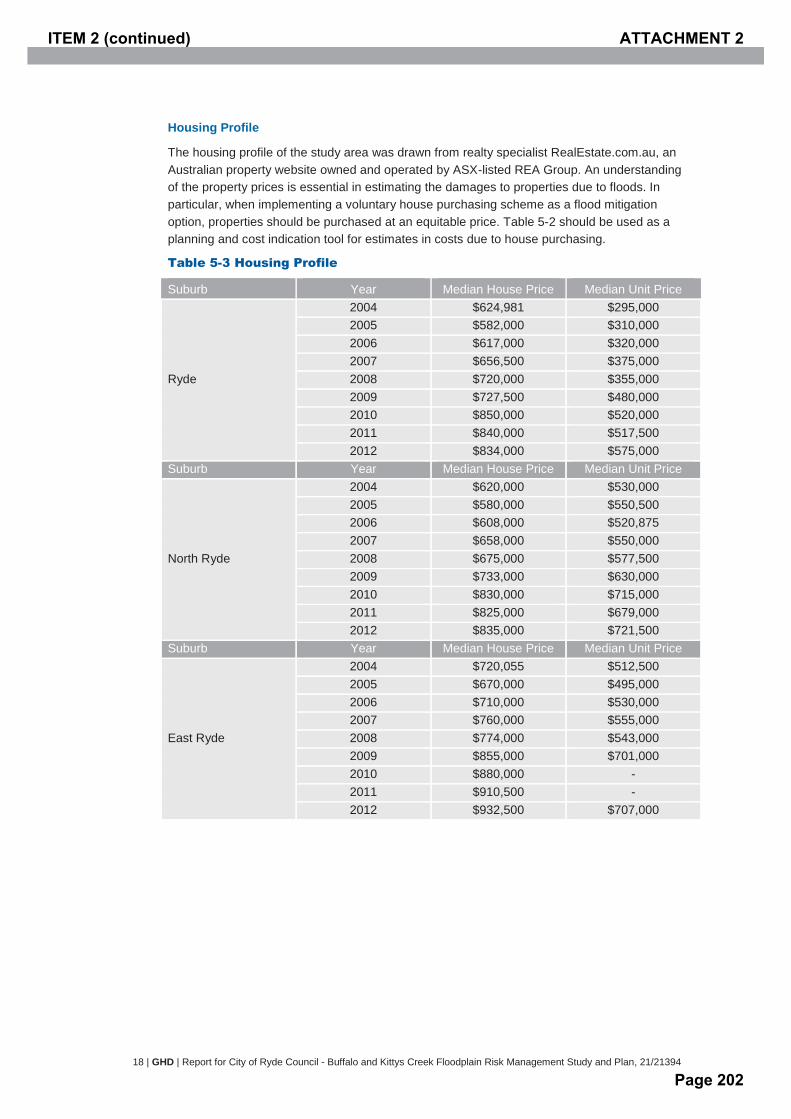
18 | GHD | Report for City of Ryde Council - Buffalo and Kittys Creek Floodplain Risk Management Study and Plan, 21/21394
Housing Profile
The housing profile of the study area was drawn from realty specialist RealEstate.com.au, an Australian property website owned and operated by ASX-listed REA Group. An understanding of the property prices is essential in estimating the damages to properties due to floods. In particular, when implementing a voluntary house purchasing scheme as a flood mitigation option, properties should be purchased at an equitable price. Table 5-2 should be used as a planning and cost indication tool for estimates in costs due to house purchasing.
Table 5-3 Housing Profile
Suburb Year Median House Price Median Unit Price
Ryde
2004 $624,981 $295,000 2005 $582,000 $310,000 2006 $617,000 $320,000 2007 $656,500 $375,000 2008 $720,000 $355,000 2009 $727,500 $480,000 2010 $850,000 $520,000 2011 $840,000 $517,500 2012 $834,000 $575,000
Suburb Year Median House Price Median Unit Price
North Ryde
2004 $620,000 $530,000 2005 $580,000 $550,500 2006 $608,000 $520,875 2007 $658,000 $550,000 2008 $675,000 $577,500 2009 $733,000 $630,000 2010 $830,000 $715,000 2011 $825,000 $679,000 2012 $835,000 $721,500
Suburb Year Median House Price Median Unit Price
East Ryde
2004 $720,055 $512,500 2005 $670,000 $495,000 2006 $710,000 $530,000 2007 $760,000 $555,000 2008 $774,000 $543,000 2009 $855,000 $701,000 2010 $880,000 - 2011 $910,500 - 2012 $932,500 $707,000
ITEM 2 (continued) ATTACHMENT 2
Page 202
GHD | Report for City of Ryde Council - Buffalo and Kittys Creek Floodplain Risk Management Study and Plan,
21/21394 | 19
6. Potential Flood Damage Flood damage assessments were undertaken to identify the extent of the damages in economic terms for the existing flood conditions. This assessment included an analysis of all the properties within the catchments susceptible to flooding. The purpose of this analysis was to provide an assessment of the relative merit of potential flood mitigation options by a means of a cost-benefit analysis.
The process for undertaking a flood damages assessment is documented in this section, but generally includes the following steps:
The identification of properties susceptible to flooding;
Determination of the flood depths per property and identifying the depth of inundation above floor level;
Defining appropriate stage-damage relationships for various property types and uses;
Estimating the potential flood damage for each property; and
Determining the total flood damage for a range of design events.
Flood damages are typically determined by first making an assessment of which properties are flood affected, then estimating a direct damage cost for a range of flooding events. The resulting stage-damage curves are used as a basis for estimating other direct and indirect costs from flooding, such as those listed in Table 5-2.
6.1 Types of Flood Damage
As previously described in Section 5, the types of economic impacts due to flood damages can be categorised as Direct, Indirect and Intangible costs, this is summarised in Table 5-2.
This can be further categorised into the broader terms of ‘tangible’ and ‘intangible’ flood damages. Tangible flood damages are those that can be more readily evacuated in monetary terms, while intangible damages relate to the social cost of flooding and therefore are much more difficult to quantify.
Tangible flood damages are further divided into direct and indirect damages. Direct flood damages related to the loss or loss in value of an object or a piece of property caused by direct contact with floodwaters. Indirect damages relate to loss in production or revenue, loss of wages, additional accommodation and living expenses, and any extra outlay that occurs because of the flood. This is summarised in Table 6-1.
ITEM 2 (continued) ATTACHMENT 2
Page 203
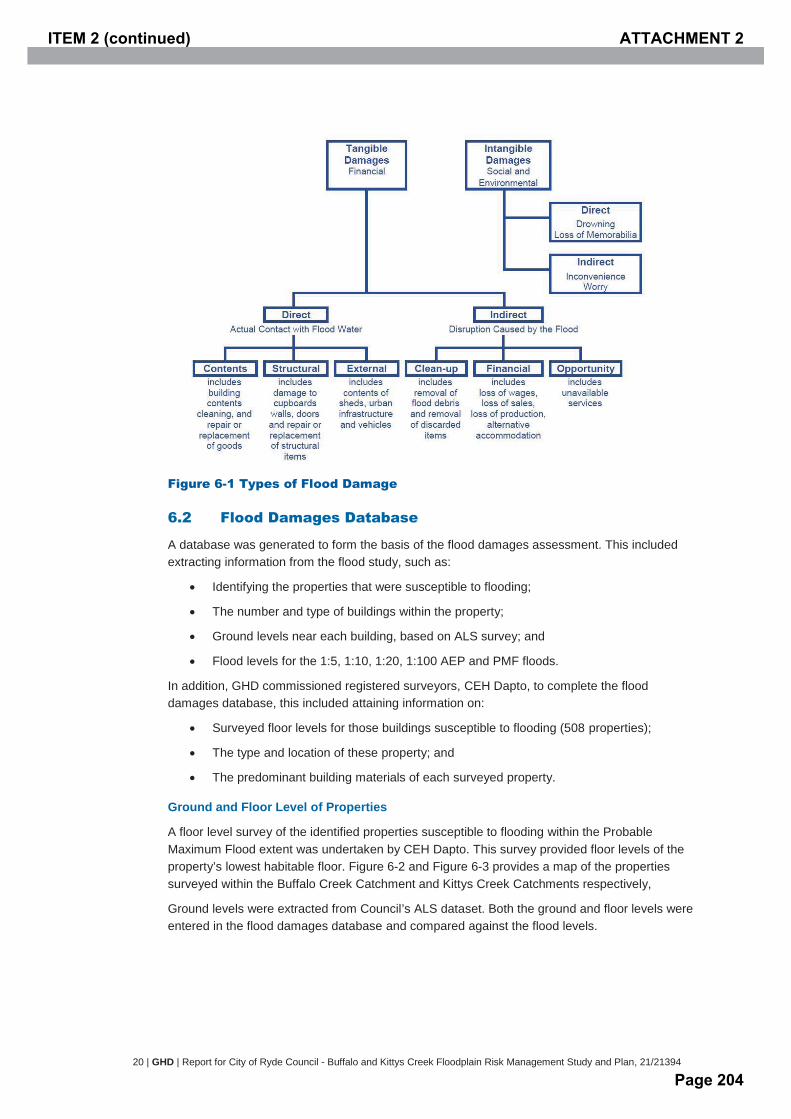
20 | GHD | Report for City of Ryde Council - Buffalo and Kittys Creek Floodplain Risk Management Study and Plan, 21/21394
Figure 6-1 Types of Flood Damage
6.2 Flood Damages Database
A database was generated to form the basis of the flood damages assessment. This included extracting information from the flood study, such as:
Identifying the properties that were susceptible to flooding;
The number and type of buildings within the property;
Ground levels near each building, based on ALS survey; and
Flood levels for the 1:5, 1:10, 1:20, 1:100 AEP and PMF floods.
In addition, GHD commissioned registered surveyors, CEH Dapto, to complete the flood damages database, this included attaining information on:
Surveyed floor levels for those buildings susceptible to flooding (508 properties);
The type and location of these property; and
The predominant building materials of each surveyed property.
Ground and Floor Level of Properties
A floor level survey of the identified properties susceptible to flooding within the Probable Maximum Flood extent was undertaken by CEH Dapto. This survey provided floor levels of the property’s lowest habitable floor. Figure 6-2 and Figure 6-3 provides a map of the properties surveyed within the Buffalo Creek Catchment and Kittys Creek Catchments respectively,
Ground levels were extracted from Council’s ALS dataset. Both the ground and floor levels were entered in the flood damages database and compared against the flood levels.
ITEM 2 (continued) ATTACHMENT 2
Page 204
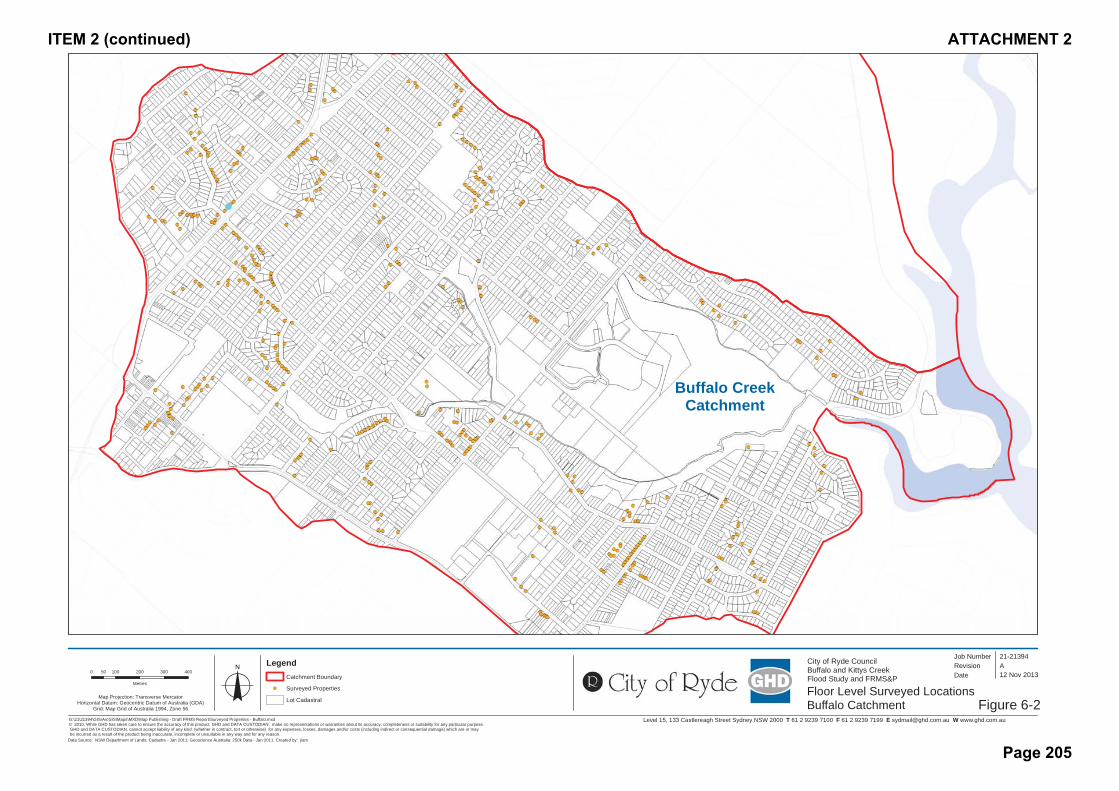
Level 15, 133 Castlereagh Street Sydney NSW 2000 T 61 2 9239 7100 F 61 2 9239 7199 E [email protected] W www.ghd.com.auG:\21\21394\GIS\ArcGIS\Maps\MXD\Map Publishing - Draft FRMS Report\Surveyed Properties - Buffalo.mxd© 2010. While GHD has taken care to ensure the accuracy of this product, GHD and DATA CUSTODIAN, make no representations or warranties about its accuracy, completeness or suitability for any particular purpose. GHD and DATA CUSTODIAN, cannot accept liability of any kind (whether in contract, tort or otherwise) for any expenses, losses, damages and/or costs (including indirect or consequential damage) which are or may be incurred as a result of the product being inaccurate, incomplete or unsuitable in any way and for any reason.
0 100 200 300 40050
Metres
Map Projection: Transverse MercatorHorizontal Datum: Geocentric Datum of Australia (GDA)
Grid: Map Grid of Australia 1994, Zone 56
Figure 6-2
Job NumberRevision A
21-21394
12 Nov 2013o Date
Data Source: NSW Department of Lands: Cadastre - Jan 2011; Geoscience Australia: 250k Data - Jan 2011. Created by: jlam
City of Ryde CouncilBuffalo and Kittys CreekFlood Study and FRMS&P
Floor Level Surveyed Locations Buffalo Catchment
Buffalo CreekCatchment
LegendCatchment Boundary
!( Surveyed Properties
Lot Cadastral
ITEM 2 (continued) ATTACHMENT 2
Page 205
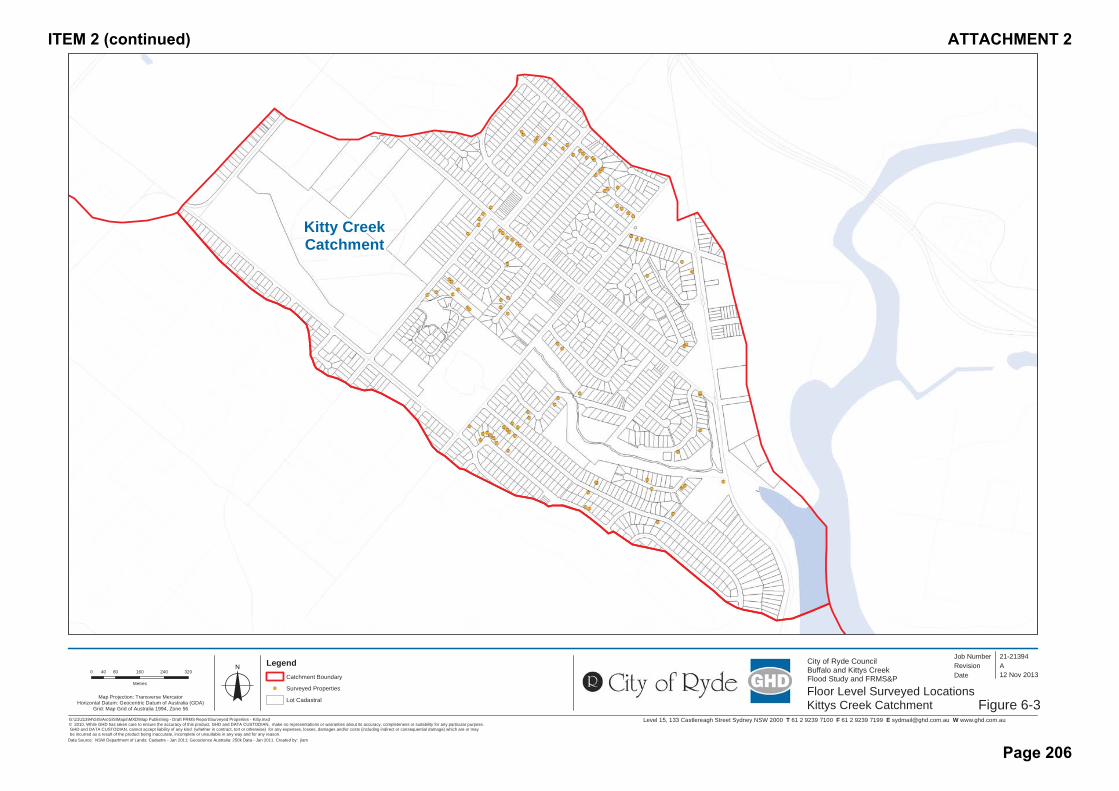
Level 15, 133 Castlereagh Street Sydney NSW 2000 T 61 2 9239 7100 F 61 2 9239 7199 E [email protected] W www.ghd.com.auG:\21\21394\GIS\ArcGIS\Maps\MXD\Map Publishing - Draft FRMS Report\Surveyed Properties - Kitty.mxd© 2010. While GHD has taken care to ensure the accuracy of this product, GHD and DATA CUSTODIAN, make no representations or warranties about its accuracy, completeness or suitability for any particular purpose. GHD and DATA CUSTODIAN, cannot accept liability of any kind (whether in contract, tort or otherwise) for any expenses, losses, damages and/or costs (including indirect or consequential damage) which are or may be incurred as a result of the product being inaccurate, incomplete or unsuitable in any way and for any reason.
0 80 160 240 32040
Metres
Map Projection: Transverse MercatorHorizontal Datum: Geocentric Datum of Australia (GDA)
Grid: Map Grid of Australia 1994, Zone 56
Figure 6-3
Job NumberRevision A
21-21394
12 Nov 2013o Date
Data Source: NSW Department of Lands: Cadastre - Jan 2011; Geoscience Australia: 250k Data - Jan 2011. Created by: jlam
City of Ryde CouncilBuffalo and Kittys CreekFlood Study and FRMS&P
Floor Level Surveyed Locations Kittys Creek Catchment
Kitty CreekCatchment
LegendCatchment Boundary
!( Surveyed Properties
Lot Cadastral
ITEM 2 (continued) ATTACHMENT 2
Page 206

GHD | Report for City of Ryde Council - Buffalo and Kittys Creek Floodplain Risk Management Study and Plan,
21/21394 | 23
Flood Levels
Flood levels predicted from the TUFLOW model during the Flood Study stage were extracted for each of the 508 properties. These levels were entered into the flood damages database and assessed against its flooding above ground level and property floor level.
6.3 Basis of Flood Damage Calculations
As a general guide for most residential buildings, flood damage increases with the depth of flooding. The Floodplain Management and Coastal Support section of the Department of Environment, Climate Change and Water (DECCW) has developed a relationship between flood depth and damage based on various parameters for house and contents value, and flooding characteristics. A spreadsheet was supplied by DECCW for this calculation. The resulting relationship is illustrated in Figure 6-4 and has been simplified as shown in Table 6-1.
Figure 6-4 Relationship between Depth of Flooding and Damage
Table 6-1 Relationship between Depth of Flooding and Damage (After DECCW Flood Damage Curve Spreadsheet)
Flooding Depth above Floor Level Damage to Dwelling (Single Storey Slab/Low Set)
< -0.5 $0 -0.1 $10,183 0 $27,188 0.1 $55,525 0.5 $65,542 1.0 $78,063 1.5 $90,584 2.0 $103,105 >2.0 $104,364
ITEM 2 (continued) ATTACHMENT 2
Page 207
24 | GHD | Report for City of Ryde Council - Buffalo and Kittys Creek Floodplain Risk Management Study and Plan, 21/21394
Residential
The damage curves have been adjusted based on a number of parameters specific to the Buffalo and Kittys Creek catchments. These include:
Regional cost variations;
Average house size;
Typical duration of immersion;
Average contents value;
Level of flood awareness;
Effective warning time (1 hours); and
Damage reduction factor (ratio of actual potential losses) of 0.96 based on the flood awareness and effective warning time.
Table 6-2 presents the typical property contents value assumptions and term.
Table 6-2 Property and Contents Value Assumption and Term
Parameter Value Typical contents value $60,000 (Recommended estimate) Term 30 years
Using the above information, the following methodology was used to estimate the Average Annual Damage (AAD) and present value of the AAD over a 30-year period:
Based on the flood maps produced in the Flood Study, properties affected by flooding were identified;
The cost of damage for the flooding was estimated for each flood event and depth range by multiplying the number of buildings with typical house and contents cost and the percentage of damage for the particular depth (a stage-damage curve);
A direct damage bill for each storm was calculated;
Flood AEP was plotted against storm damage and integrated to find the area under the graph, which provides the AAD; and
A present value for the AAD was estimated based on a 7% discount rate over a 30-year period (In accordance with the NSW Treasury Policy Paper “Economic Appraisal Principles and Procedures Simplified” July 2007.
The results of this investigation are further detailed in Section 6.4.
ITEM 2 (continued) ATTACHMENT 2
Page 208
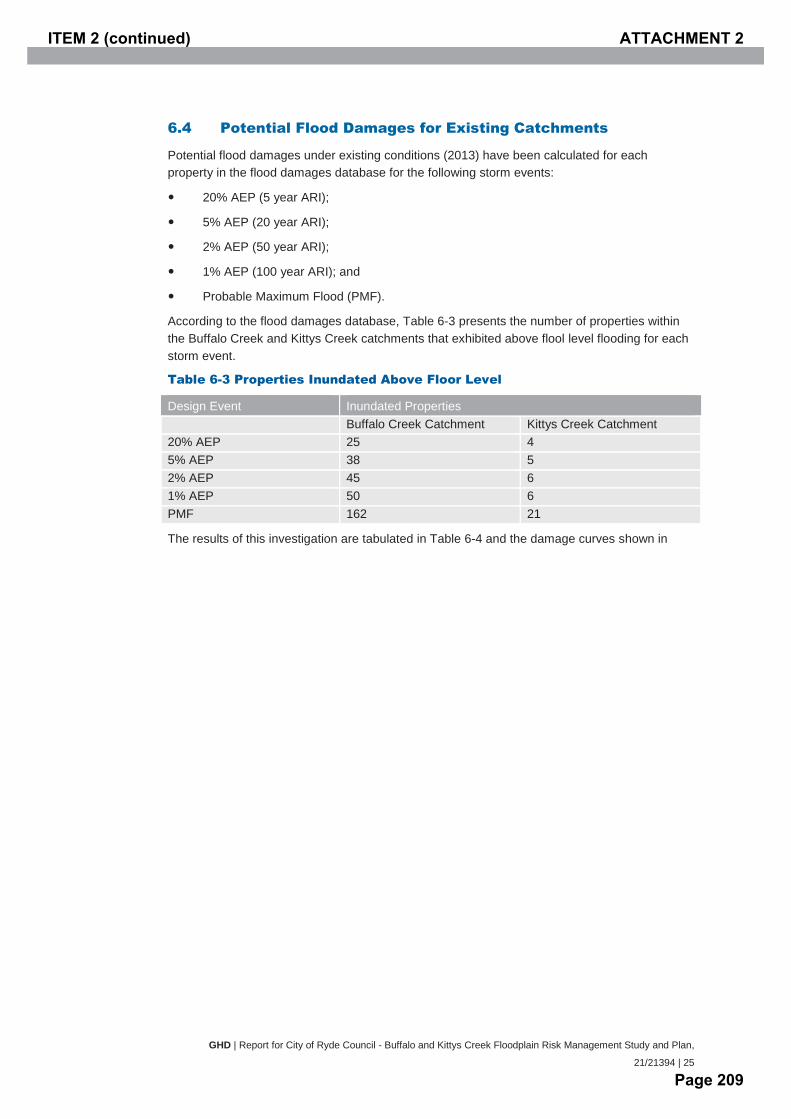
GHD | Report for City of Ryde Council - Buffalo and Kittys Creek Floodplain Risk Management Study and Plan,
21/21394 | 25
6.4 Potential Flood Damages for Existing Catchments
Potential flood damages under existing conditions (2013) have been calculated for each property in the flood damages database for the following storm events:
20% AEP (5 year ARI);
5% AEP (20 year ARI);
2% AEP (50 year ARI);
1% AEP (100 year ARI); and
Probable Maximum Flood (PMF).
According to the flood damages database, Table 6-3 presents the number of properties within the Buffalo Creek and Kittys Creek catchments that exhibited above flool level flooding for each storm event.
Table 6-3 Properties Inundated Above Floor Level
Design Event Inundated Properties Buffalo Creek Catchment Kittys Creek Catchment 20% AEP 25 4 5% AEP 38 5 2% AEP 45 6 1% AEP 50 6 PMF 162 21
The results of this investigation are tabulated in Table 6-4 and the damage curves shown in
ITEM 2 (continued) ATTACHMENT 2
Page 209
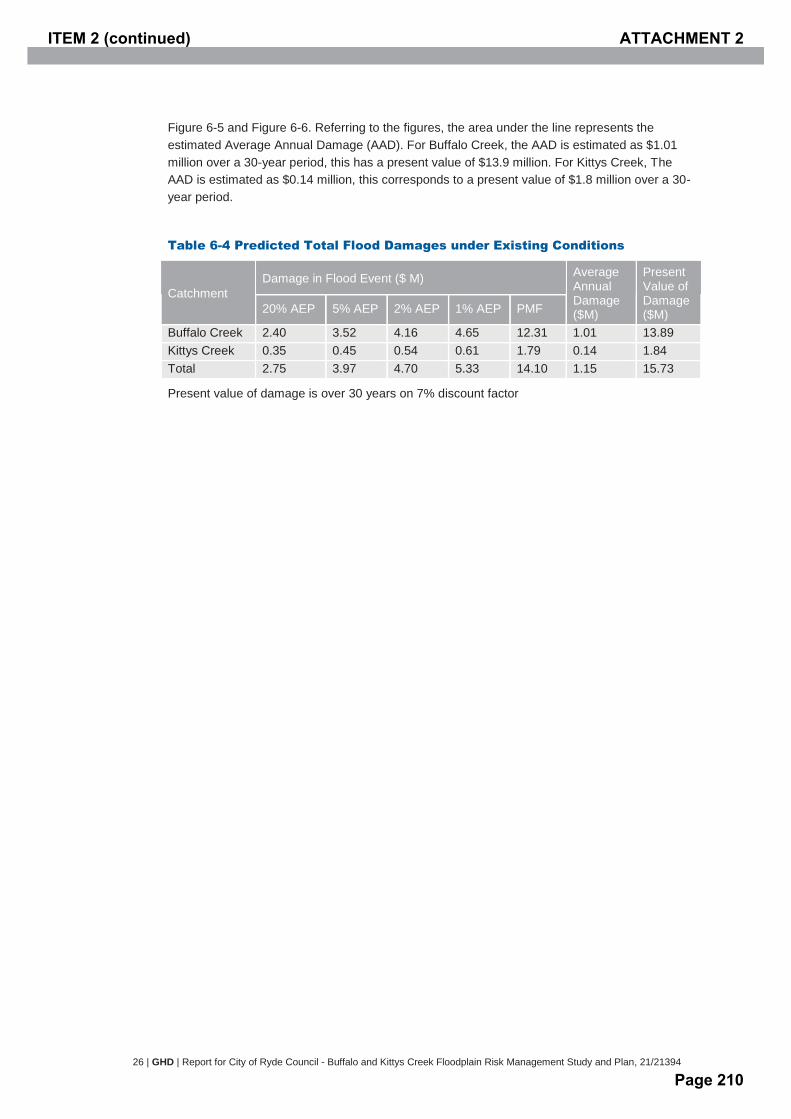
26 | GHD | Report for City of Ryde Council - Buffalo and Kittys Creek Floodplain Risk Management Study and Plan, 21/21394
Figure 6-5 and Figure 6-6. Referring to the figures, the area under the line represents the estimated Average Annual Damage (AAD). For Buffalo Creek, the AAD is estimated as $1.01 million over a 30-year period, this has a present value of $13.9 million. For Kittys Creek, The AAD is estimated as $0.14 million, this corresponds to a present value of $1.8 million over a 30-year period.
Table 6-4 Predicted Total Flood Damages under Existing Conditions
Catchment Damage in Flood Event ($ M) Average
Annual Damage ($M)
Present Value of Damage ($M) 20% AEP 5% AEP 2% AEP 1% AEP PMF
Buffalo Creek 2.40 3.52 4.16 4.65 12.31 1.01 13.89 Kittys Creek 0.35 0.45 0.54 0.61 1.79 0.14 1.84 Total 2.75 3.97 4.70 5.33 14.10 1.15 15.73
Present value of damage is over 30 years on 7% discount factor
ITEM 2 (continued) ATTACHMENT 2
Page 210
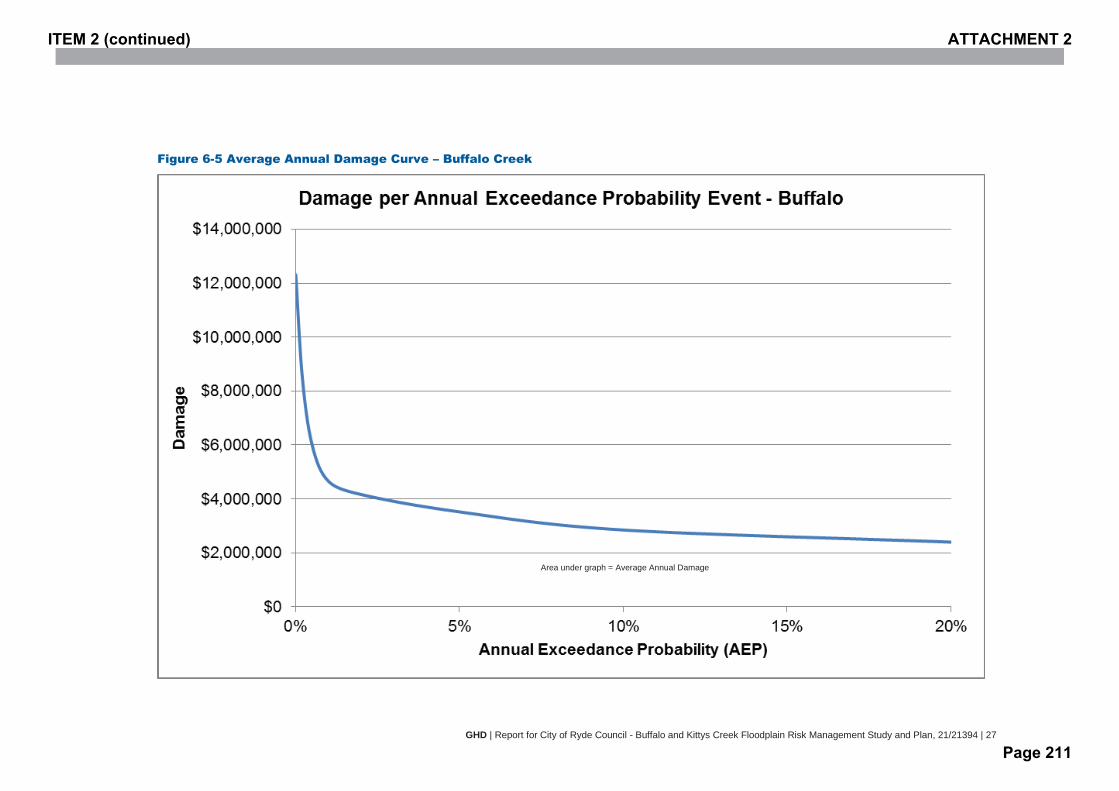
GHD | Report for City of Ryde Council - Buffalo and Kittys Creek Floodplain Risk Management Study and Plan, 21/21394 | 27
Figure 6-5 Average Annual Damage Curve – Buffalo Creek
Area under graph = Average Annual Damage
ITEM 2 (continued) ATTACHMENT 2
Page 211
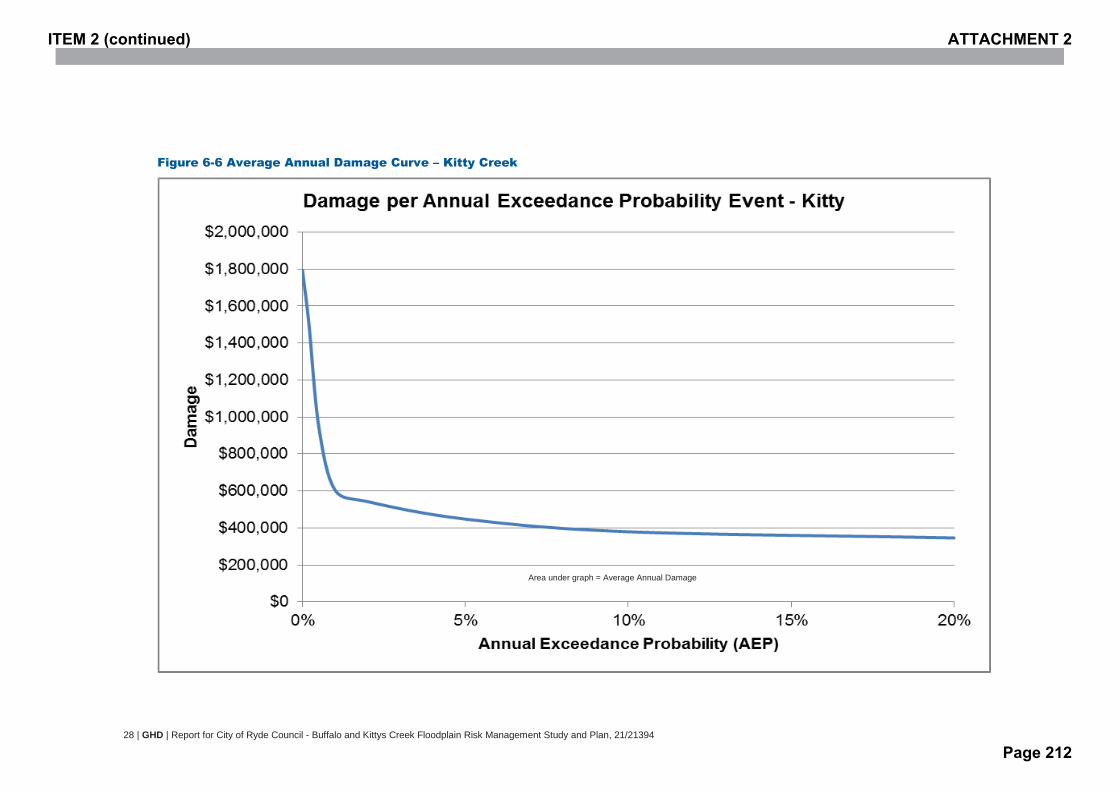
28 | GHD | Report for City of Ryde Council - Buffalo and Kittys Creek Floodplain Risk Management Study and Plan, 21/21394
Figure 6-6 Average Annual Damage Curve – Kitty Creek
Area under graph = Average Annual Damage
ITEM 2 (continued) ATTACHMENT 2
Page 212
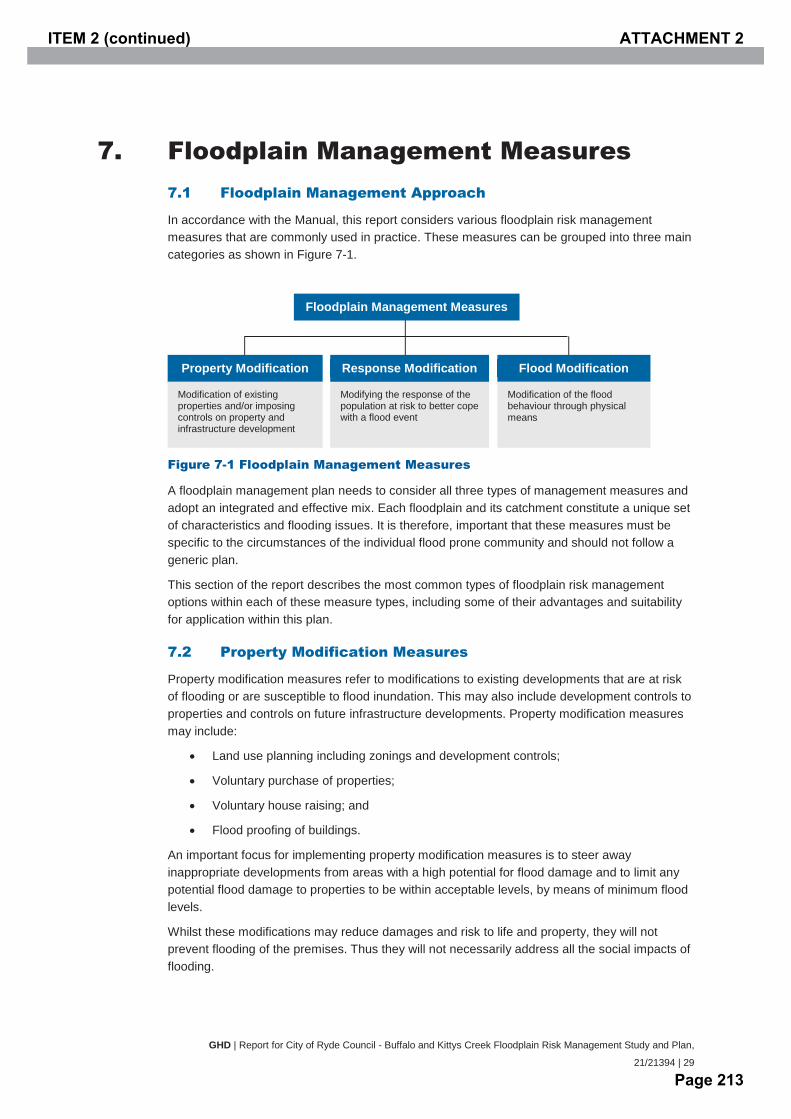
GHD | Report for City of Ryde Council - Buffalo and Kittys Creek Floodplain Risk Management Study and Plan,
21/21394 | 29
7. Floodplain Management Measures 7.1 Floodplain Management Approach
In accordance with the Manual, this report considers various floodplain risk management measures that are commonly used in practice. These measures can be grouped into three main categories as shown in Figure 7-1.
Figure 7-1 Floodplain Management Measures
A floodplain management plan needs to consider all three types of management measures and adopt an integrated and effective mix. Each floodplain and its catchment constitute a unique set of characteristics and flooding issues. It is therefore, important that these measures must be specific to the circumstances of the individual flood prone community and should not follow a generic plan.
This section of the report describes the most common types of floodplain risk management options within each of these measure types, including some of their advantages and suitability for application within this plan.
7.2 Property Modification Measures
Property modification measures refer to modifications to existing developments that are at risk of flooding or are susceptible to flood inundation. This may also include development controls to properties and controls on future infrastructure developments. Property modification measures may include:
Land use planning including zonings and development controls;
Voluntary purchase of properties;
Voluntary house raising; and
Flood proofing of buildings.
An important focus for implementing property modification measures is to steer away inappropriate developments from areas with a high potential for flood damage and to limit any potential flood damage to properties to be within acceptable levels, by means of minimum flood levels.
Whilst these modifications may reduce damages and risk to life and property, they will not prevent flooding of the premises. Thus they will not necessarily address all the social impacts of flooding.
Floodplain Management Measures
Property Modification Response Modification Flood Modification
Modification of existing properties and/or imposing controls on property and infrastructure development
Modification of the flood behaviour through physical means
Modifying the response of the population at risk to better cope with a flood event
ITEM 2 (continued) ATTACHMENT 2
Page 213
30 | GHD | Report for City of Ryde Council - Buffalo and Kittys Creek Floodplain Risk Management Study and Plan, 21/21394
7.2.1 Development Control Planning
Appropriate zoning provides control on future land uses considering the flood risk. In the areas where development is considered acceptable, development controls are the appropriate means of implementing detailed aspects of council’s floodplain risk management plan, particularly when addressing future flood risk. Development control planning may take into consideration the following aspects:
Access to the Site During Flood Events;
Fill or Excavation in the Floodplain;
Freeboard;
Floor Levels;
Differences between Land uses;
Services;
Impact on Flood Behaviour;
Structural Soundness When Flooded;
Building Materials; and
Fencing.
7.2.2 Land Use Planning
Land use planning limits and controls are an essential element in managing flood risk and an effective way of ensuring flood risk is managed appropriately. Effective consideration of future development involves a strategic assessment of flood risk to future development areas to guide councils, in wisely and rationally controlling development to reduce the risk exposure of new development in an acceptable level. For example, areas within a floodplain identified to be of high hazard should be zoned against future development.
7.2.3 Voluntary Purchase of High Hazard Properties
In certain high hazard areas of the floodplain it may be impractical or uneconomical to mitigate or reduce the severity of flooding to the existing properties. In such circumstances it may be appropriate to cease occupation of such properties in order to free both residents and potential rescuers from the danger and cost of future floods. This is achieved by the purchase of the properties and their removal or demolition as part of an adopted floodplain risk management plan.
Under such circumstances, the properties should be purchased at an equitable price.
7.2.4 Voluntary House Raising
Voluntary house raising includes the elevation of a property’s floor level to above a safe flood level, minimising the potential for inundation. In the instance that a dwelling is located within a flood zone, and whereby no other modification measures are appropriate, voluntary house raising may be a viable option. Home owners generally have strong sentimental and emotional attachments to their dwellings and house raising will contribute positively towards social impacts compared with vacating the premise through house purchase.
Avoidance of flood damage by house raising may achieve the following:
A reduction in personal loss;
ITEM 2 (continued) ATTACHMENT 2
Page 214

GHD | Report for City of Ryde Council - Buffalo and Kittys Creek Floodplain Risk Management Study and Plan,
21/21394 | 31
A reduction in danger to personal safety and in the costs of servicing isolated people who remain in their homes to protect possessions; and
A reduction in stress and post-flood trauma.
Capital costs for house raising may be significant, and is dependent on the property’s predominant construction material.
In general, voluntary house raising is a suitable management measure only for low hazard areas on the floodplain. In high hazard areas, this option does not mitigate against other potential risk factors such as high flood velocities, deep flood depths and isolation for extended period of times.
7.2.5 Flood Proofing
Flood proofing of building involves the designing and constructing of buildings with appropriate water resistant building materials to reduce flood damage. This solution reduces damage to the building structure but in most cases does not protect building contents. In this situation, flood proofing will need to be retrofitted to existing buildings or included as a development control.
Since much of the catchment comprises of substantial dwellings flood proofing is not considered as a broad floodplain risk management option. Flood proofing will not be looked at further as a potential option.
ITEM 2 (continued) ATTACHMENT 2
Page 215
32 | GHD | Report for City of Ryde Council - Buffalo and Kittys Creek Floodplain Risk Management Study and Plan, 21/21394
7.3 Response Modification Measures
Flood response measures encompass various means of modifying the response of the population to the flood threat. Such measures include plans for:
Flood warning and effective warning time;
The protection and/or evacuation of an area;
The relief of evacuees; and
The recovery of the area once the flood subsides.
Planning for these measures are generally incorporated in the local flood plan guide usually prepared under the guidance of the SES. The local flood plan is complementary to the floodplain risk management plan.
7.3.1 Flood Warning Systems
Flood warning systems and evacuation plans are used to prepare a community for an impending flood. Depending on the warning time and resources available, flood warning systems and evacuation plans can be used to protect buildings, evacuate people and provide relief to evacuees and recover the flood affected areas.
7.3.2 Public Awareness and Evacuation Plan
A public awareness and evacuation plan would assist in raising flood awareness and readiness, and increase the appreciation of the flood problem and prevention activities. Implementation of a flood awareness scheme will also assist in minimizing the social and economic impacts of flooding. Measures to increase flood awareness could include:
The dissemination of a Flood Information Pack that could be sent to all owners, business operators and residents of potential flood impacted properties;
The dissemination of flood certificates on a regular basis which would inform each property owner of the flood situation at their particular property, flood data and advice;
Signage in flood prone areas giving notification of potential and historical flood levels; and
Make real time data (creek levels and rainfall) available to the public, and providing a readily accessible information portal on Council’s website.
ITEM 2 (continued) ATTACHMENT 2
Page 216
GHD | Report for City of Ryde Council - Buffalo and Kittys Creek Floodplain Risk Management Study and Plan,
21/21394 | 33
7.4 Flood Modification Measures
The purpose of flood modification measures is to modify the behaviour of the flood itself by reducing flood levels or velocities or by excluding floodwaters from areas under threat. It is essential that these measures are assessed individually or in isolation. Such measures include plans for:
Flood Mitigation Dams;
Detention Basins; and
Stormwater Infrastructure Upgrades.
7.4.1 Flood Mitigation Dams
Flood mitigation dams reduce downstream flood discharges. As the flood wave passes through the dam, the dam is progressively filled to the point of overflow, trapping a portion of the floodwaters. The full dam then provides temporary storage for floodwaters subsequently passing through it.
The mitigating effects of a large dam on a major flood are often surprisingly small for the following reasons:
The volume of water in a major flood may be greater than the storage capacity of even a large dam;
The dam may be nearly full at the start of a flood; and
Floods may result from rainfall in parts of the catchment that are not commanded by dams.
Flood mitigation dams are generally more appropriate for rural catchments with large available amounts of land. Conversely, the Buffalo and Kittys Creek catchments are highly urbanised catchments within an inner city suburb, making it inappropriate as part of this plan. Flood mitigation dams will not be considered further, although a smaller version, namely detention basins, may be more appropriate based the physical characteristics of the catchment.
7.4.2 Detention Basins
A detention basin is a small dam that provides temporary storage for floodwaters. Detention basins are being used increasingly as a means of controlling the peak discharge from newly urbanised areas. Some of these basins are becoming quite large, and in fact, are more properly regarded as small dams and have to be designed as such.
A detention basin behaves in the same way as a flood mitigation dam, but on a much smaller scale. In urban areas, detention basins are most suitable for small streams that respond quickly to rapidly rising flooding. In particular, detention basins are associated with the following points:
Require a substantial area to achieve the necessary storage;
Where they involve multi-purpose uses, safety aspects during flooding need to be addressed;
Long durations of multi-peak storms (when the basin is filled by the first peak) can increase the likelihood of overtopping or embankment breaching or failure, and the resulting personal danger and damage; and
They provide little attenuation effect when overtopping occurs.
ITEM 2 (continued) ATTACHMENT 2
Page 217

34 | GHD | Report for City of Ryde Council - Buffalo and Kittys Creek Floodplain Risk Management Study and Plan, 21/21394
A number of vegetated open spaces are present within the Buffalo and Kittys Creek catchments. As overland flooding is an issue in parts of the floodplain, detention basins have been further assessed. This is detailed in Section 8.
7.4.3 Stormwater Infrastructure Upgrade
Stormwater infrastructure upgrades include the improvement of council’s local stormwater drainage network. This may be in the form of amplifying the dimensions of an existing pipe network, supplementing an existing drainage line with additional pipes, or the servicing of new areas currently not covered by the existing drainage network.
The benefits of providing the aforementioned drainage work upgrades could include allowing for a greater flow conveyance and pipe capacity. In addition, it could also redirect flows away from properties or targeted flood prone areas.
Typically, local drainage networks across NSW are designed to pass through peak storm events of between the 20 to 10% AEP. Newer drainage networks in highly urbanised areas may be designed for up to the 5% AEP. Through the Flood Study, it was identified that pipe capacity issues caused overland flooding in certain residential areas. Stormwater infrastructure upgrades can potentially benefit the Buffalo and Kittys Creek catchment and is considered as part of this plan. More details on this assessment are provided in Section 8.
ITEM 2 (continued) ATTACHMENT 2
Page 218
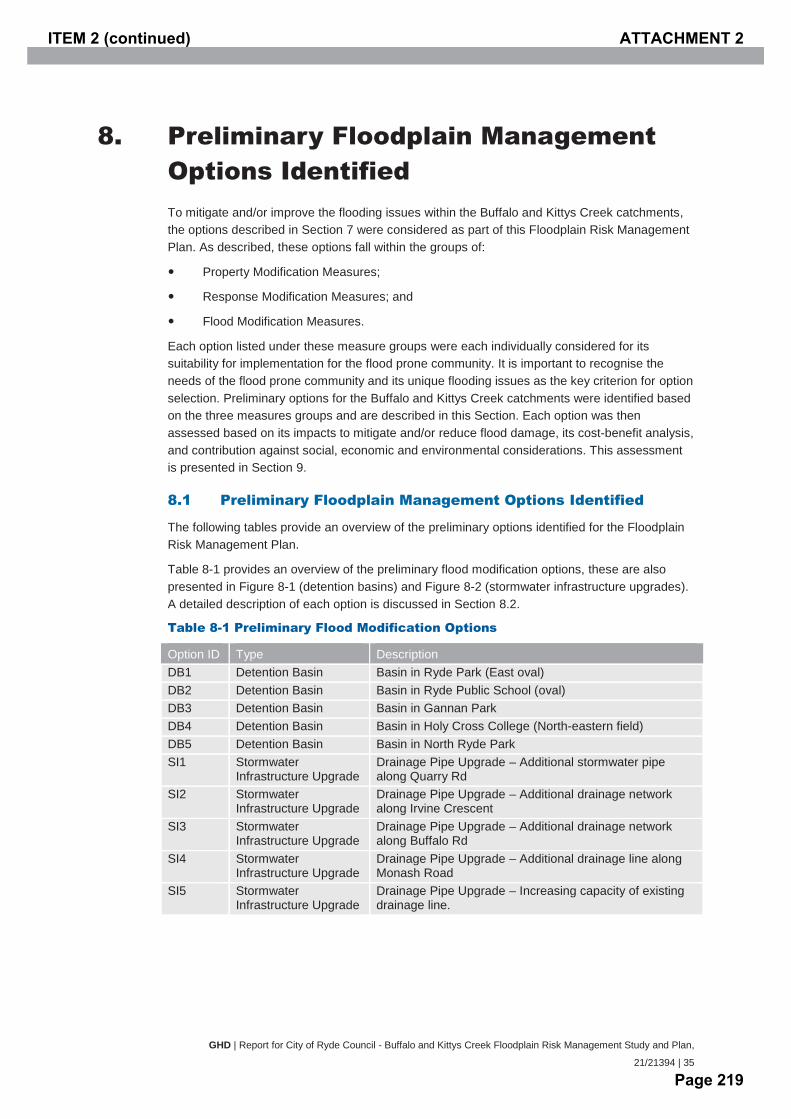
GHD | Report for City of Ryde Council - Buffalo and Kittys Creek Floodplain Risk Management Study and Plan,
21/21394 | 35
8. Preliminary Floodplain Management Options Identified To mitigate and/or improve the flooding issues within the Buffalo and Kittys Creek catchments, the options described in Section 7 were considered as part of this Floodplain Risk Management Plan. As described, these options fall within the groups of:
Property Modification Measures;
Response Modification Measures; and
Flood Modification Measures.
Each option listed under these measure groups were each individually considered for its suitability for implementation for the flood prone community. It is important to recognise the needs of the flood prone community and its unique flooding issues as the key criterion for option selection. Preliminary options for the Buffalo and Kittys Creek catchments were identified based on the three measures groups and are described in this Section. Each option was then assessed based on its impacts to mitigate and/or reduce flood damage, its cost-benefit analysis, and contribution against social, economic and environmental considerations. This assessment is presented in Section 9.
8.1 Preliminary Floodplain Management Options Identified
The following tables provide an overview of the preliminary options identified for the Floodplain Risk Management Plan.
Table 8-1 provides an overview of the preliminary flood modification options, these are also presented in Figure 8-1 (detention basins) and Figure 8-2 (stormwater infrastructure upgrades). A detailed description of each option is discussed in Section 8.2.
Table 8-1 Preliminary Flood Modification Options
Option ID Type Description DB1 Detention Basin Basin in Ryde Park (East oval) DB2 Detention Basin Basin in Ryde Public School (oval) DB3 Detention Basin Basin in Gannan Park DB4 Detention Basin Basin in Holy Cross College (North-eastern field) DB5 Detention Basin Basin in North Ryde Park SI1 Stormwater
Infrastructure Upgrade Drainage Pipe Upgrade – Additional stormwater pipe along Quarry Rd
SI2 Stormwater Infrastructure Upgrade
Drainage Pipe Upgrade – Additional drainage network along Irvine Crescent
SI3 Stormwater Infrastructure Upgrade
Drainage Pipe Upgrade – Additional drainage network along Buffalo Rd
SI4 Stormwater Infrastructure Upgrade
Drainage Pipe Upgrade – Additional drainage line along Monash Road
SI5 Stormwater Infrastructure Upgrade
Drainage Pipe Upgrade – Increasing capacity of existing drainage line.
ITEM 2 (continued) ATTACHMENT 2
Page 219
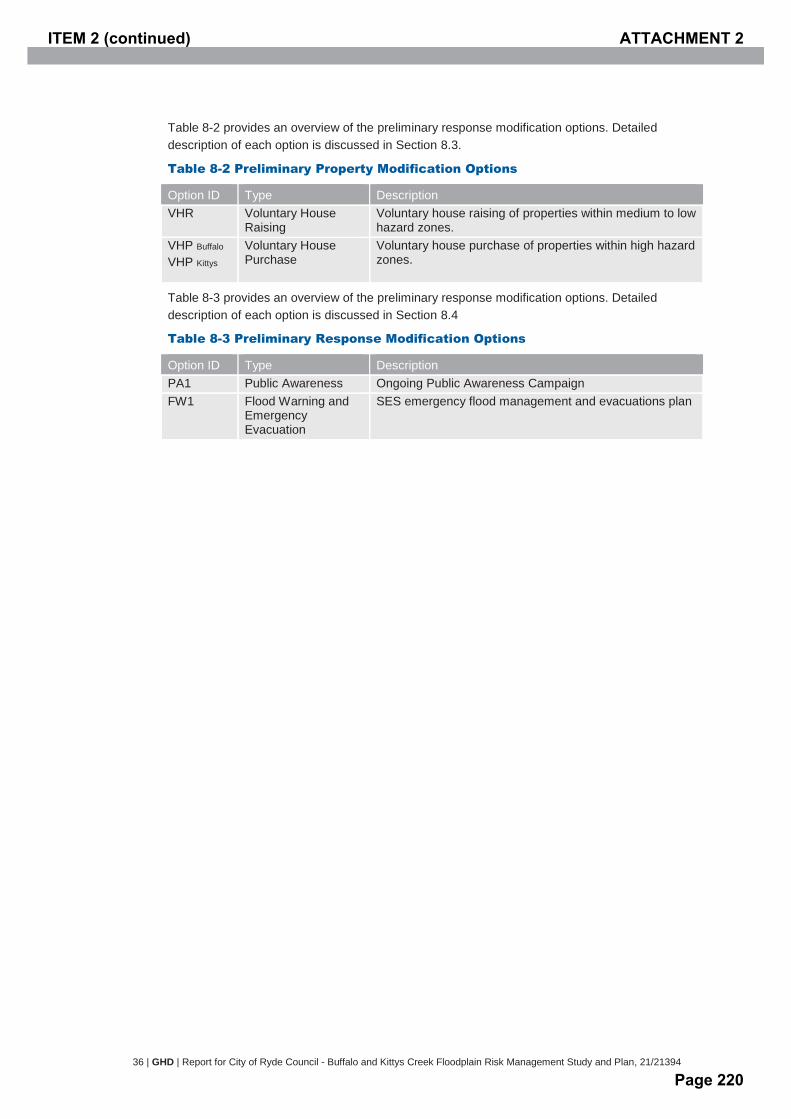
36 | GHD | Report for City of Ryde Council - Buffalo and Kittys Creek Floodplain Risk Management Study and Plan, 21/21394
Table 8-2 provides an overview of the preliminary response modification options. Detailed description of each option is discussed in Section 8.3.
Table 8-2 Preliminary Property Modification Options
Option ID Type Description VHR Voluntary House
Raising Voluntary house raising of properties within medium to low hazard zones.
VHP Buffalo VHP Kittys
Voluntary House Purchase
Voluntary house purchase of properties within high hazard zones.
Table 8-3 provides an overview of the preliminary response modification options. Detailed description of each option is discussed in Section 8.4
Table 8-3 Preliminary Response Modification Options
Option ID Type Description PA1 Public Awareness Ongoing Public Awareness Campaign FW1 Flood Warning and
Emergency Evacuation
SES emergency flood management and evacuations plan
ITEM 2 (continued) ATTACHMENT 2
Page 220
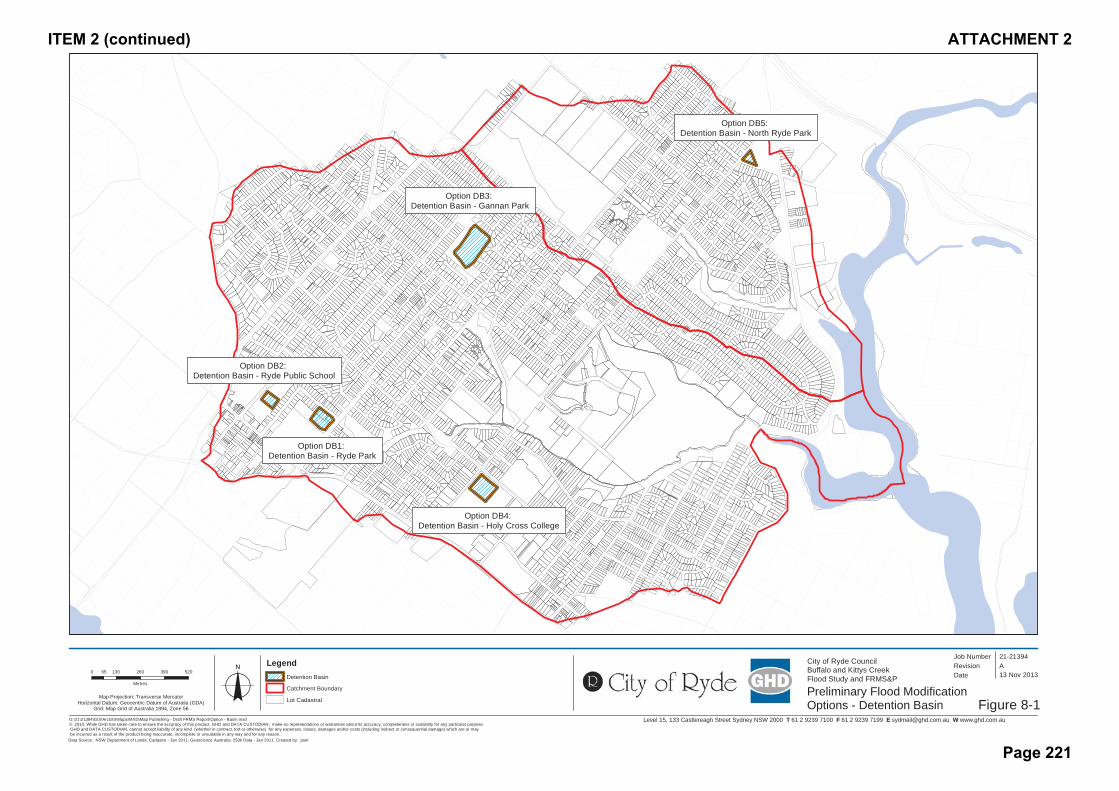
Level 15, 133 Castlereagh Street Sydney NSW 2000 T 61 2 9239 7100 F 61 2 9239 7199 E [email protected] W www.ghd.com.auG:\21\21394\GIS\ArcGIS\Maps\MXD\Map Publishing - Draft FRMS Report\Option - Basin.mxd© 2010. While GHD has taken care to ensure the accuracy of this product, GHD and DATA CUSTODIAN, make no representations or warranties about its accuracy, completeness or suitability for any particular purpose. GHD and DATA CUSTODIAN, cannot accept liability of any kind (whether in contract, tort or otherwise) for any expenses, losses, damages and/or costs (including indirect or consequential damage) which are or may be incurred as a result of the product being inaccurate, incomplete or unsuitable in any way and for any reason.
0 130 260 390 52065
Metres
Map Projection: Transverse MercatorHorizontal Datum: Geocentric Datum of Australia (GDA)
Grid: Map Grid of Australia 1994, Zone 56
Figure 8-1
Job NumberRevision A
21-21394
13 Nov 2013o Date
Data Source: NSW Department of Lands: Cadastre - Jan 2011; Geoscience Australia: 250k Data - Jan 2011. Created by: jlam
City of Ryde CouncilBuffalo and Kittys CreekFlood Study and FRMS&P
Preliminary Flood Modification Options - Detention Basin
Option DB2: Detention Basin - Ryde Public School
LegendDetention Basin
Catchment Boundary
Lot Cadastral
Option DB1: Detention Basin - Ryde Park
Option DB4: Detention Basin - Holy Cross College
Option DB3: Detention Basin - Gannan Park
Option DB5: Detention Basin - North Ryde Park
ITEM 2 (continued) ATTACHMENT 2
Page 221
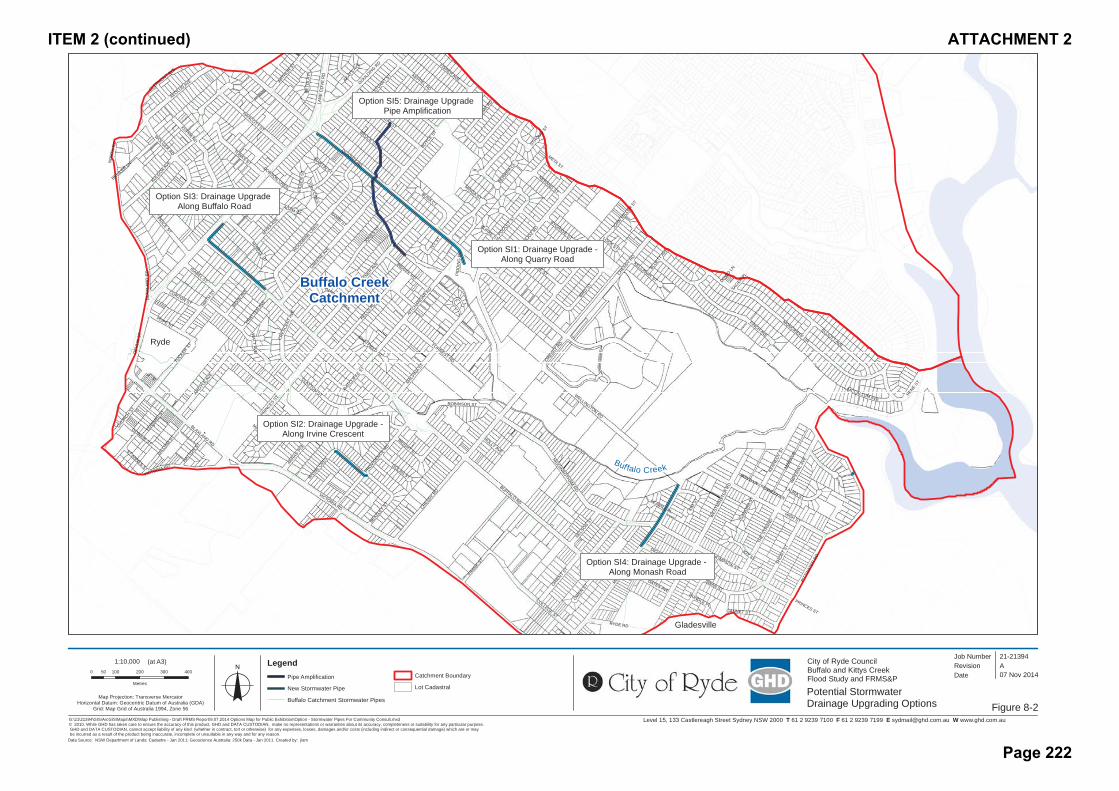
Level 15, 133 Castlereagh Street Sydney NSW 2000 T 61 2 9239 7100 F 61 2 9239 7199 E [email protected] W www.ghd.com.au
BUFFALO RD
QUARRY RD
VICTORIA RD
LAN
E C
OV
E R
D
PITT
WAT
ER R
D
HIGH ST
MONAS
H RD
CRESSY RD
PRIN
CES ST
MONCRIEFF DR
BOYCE S
T
GREENE AVE
AEOLUS AVE
KELLS R
D
KUPPA RD
WES
TMIN
STER
RD
THOMPSON ST
FINCH AVE
GARDENER AVE
HIGGINBOTHAM RD
JONES S
T
AITCHANDAR R
D
COLLEGE ST
BRUCE ST
SMIT
H ST
WOODBIN
E CRES
WOLGER RD
PRICE ST
DEV
LIN
ST
SWAN ST
ARGYLE
AVE
BADAJO
Z RD
MAR
S LN
KULGOA A
VE
FORREST RD
KEPPEL RD
ELLIOTT AVE
POOLE
Y ST
WELLINGTON RD
RYDE RD
THE
STRA
ND
HANCOTT ST
TUNKS ST
MACLEAY ST
GOULDIN
G RD
SHO
RT S
T
KENN
EDY
ST
BLA
XLA
ND
RD
OATES AVE
PROVIDENCE R
D
BIRD S
T
CHURCH ST
POPE ST
NUMA RD
MILNE ST
TUCKER
ST
ORIENT S
T
MINGA ST
MALVIN
A ST
WILL
IAM S
TDOBSON CRES
BUNA CT
BIDGEE RD
ELIZABETH ST
ROBINSON ST
FISHER AVE
GANNET ST
BAIRD AVE
IRVIN
E CRES
STUART ST
BEAZLEY S
T
BAVIN
AVE
ARTHUR S
T
RENE ST
OWEN S
T
BRIGHT ST
FRANK S
T
GOWRIE ST
ISABEL ST
MYRA AVE
JOY ST
CLAYTON ST
TURNER AVE
NELSON S
T
IVY
ST
DOLAN ST
CURZON ST
CRES
CEN
T AV
EAR
RAS P
DE
BLUETT
AVE
CALLAGHAN ST
KIM
ST
IMPE
RIAL
AVE
NERANG ST
RATCLIF
FE ST
HATTO
N ST
DIGGERS AVE
LAURA ST
EDW
ARD ST
BOYD LN
PRAT
TEN AV
E
BYGRAVE ST
BERRIP
A CL
JOHN M
ILLER S
T
MCCALLUM AVE
WATT AVE
CAMERON CRESBE
TOLA
PL
KELLAWAY ST
ST ANNES ST
STROUD S
T
BAMBI ST
HOLLY AVE
MAZE AVE
GAN
ORA
ST
RUNDLE PL
DOWD L
N
META ST
PID
DIN
G R
D
LOCK ST
SAGER
PL
MARTIN ST
NO
RTH
RD
KENNEDY LN
EILE
EN
ST
BURKE ST
LEAWILL PL
SEMPLE ST
BEIHLER LN
KEATS AV
E
ADAM ST
CLERMONT AVE
CHATFIELD ST
TON
I CRES
VICTORIA RD
PRINCES STCRESS
Y RD
CRESSY
RD
BLAXLAND RD
G:\21\21394\GIS\ArcGIS\Maps\MXD\Map Publishing - Draft FRMS Report\9.07.2014 Options Map for Public Exhibition\Option - Stormwater Pipes For Community Consult.mxd© 2010. While GHD has taken care to ensure the accuracy of this product, GHD and DATA CUSTODIAN, make no representations or warranties about its accuracy, completeness or suitability for any particular purpose. GHD and DATA CUSTODIAN, cannot accept liability of any kind (whether in contract, tort or otherwise) for any expenses, losses, damages and/or costs (including indirect or consequential damage) which are or may be incurred as a result of the product being inaccurate, incomplete or unsuitable in any way and for any reason.
0 100 200 300 40050
Metres
Map Projection: Transverse MercatorHorizontal Datum: Geocentric Datum of Australia (GDA)
Grid: Map Grid of Australia 1994, Zone 56
Job NumberRevision A
21-21394
07 Nov 2014o Date
Data Source: NSW Department of Lands: Cadastre - Jan 2011; Geoscience Australia: 250k Data - Jan 2011. Created by: jlam
1:10,000 (at A3) City of Ryde CouncilBuffalo and Kittys CreekFlood Study and FRMS&P
Potential StormwaterDrainage Upgrading Options
Option SI3: Drainage Upgrade Along Buffalo Road
LegendPipe Amplification
New Stormwater Pipe
Buffalo Catchment Stormwater Pipes
Option SI2: Drainage Upgrade -Along Irvine Crescent
Option SI4: Drainage Upgrade - Along Monash Road
Option SI5: Drainage Upgrade Pipe Amplification
Option SI1: Drainage Upgrade -Along Quarry Road
Catchment Boundary
Lot Cadastral
Buffalo CreekCatchment
Buf falo Creek
Gladesville
Ryde
Figure 8-2
ITEM 2 (continued) ATTACHMENT 2
Page 222

GHD | Report for City of Ryde Council - Buffalo and Kittys Creek Floodplain Risk Management Study and Plan,
21/21394 | 39
8.2 Identified Flood Modification Options
As listed in Table 8-1, ten flood modification options were identified as having potential in mitigating and/or reducing flood impacts within the floodplain. This included the implementation of detention basins and upgrading sections of the existing stormwater infrastructure network. These options are detailed in Section 8.2.1 for detention basins and 8.2.2 for stormwater infrastructure network.
8.2.1 Preliminary Detention Basin Options
A number of sites within the Buffalo and Kittys Creek catchments were identified as being possible locations for the implementation of detention basins. These were predominantly located within the Buffalo Creek catchment (Options DB1, DB2, DB3 and DB4). A single location was identified for the Kittys Creek catchment (Option DB5).
A summary describing each of these preliminary options is discussed in Table 8-4.
Table 8-4 Preliminary Detention Basin Options
Option No. Type Description Location DB1 Detention Basin Basin in Ryde Park (East
Oval) Cnr. Princes St and Argyle Avenue, Ryde
A basin in Ryde Park will involve the conversion of an existing sports field into a stormwater detention basin. The size of this basin will cover an area of approximately 7850 m2 and will involve the lowering of the ground depth by over 0.5 metres. In addition, this option will also involve the replacement of the existing stormwater pipes underneath the basin with smaller pipes to encourage pit surcharging into the basin during large storm events.
Currently, the stormwater pipes shown in the figure above are running at capacity for the 1% AEP peak storm event, restricting the capacity to convey any additional catchment run-off.
This congestion is resulting to excessive overland flooding and creating an overland flow path crossing residential properties. Analysis of this stormwater network for the peak 1% AEP event shows that the discharge pipe (discharging into Buffalo Creek) in which the two main drainage arms combine exceeds the capacity that the pipes can handle and causes the aforementioned problems. A potential solution is to place a detention basin at Ryde Park and to contain the flows from the left drainage arm (pipe network which runs underneath the park) and enabling flows from the adjacent arm to pass through first.
ITEM 2 (continued) ATTACHMENT 2
Page 223
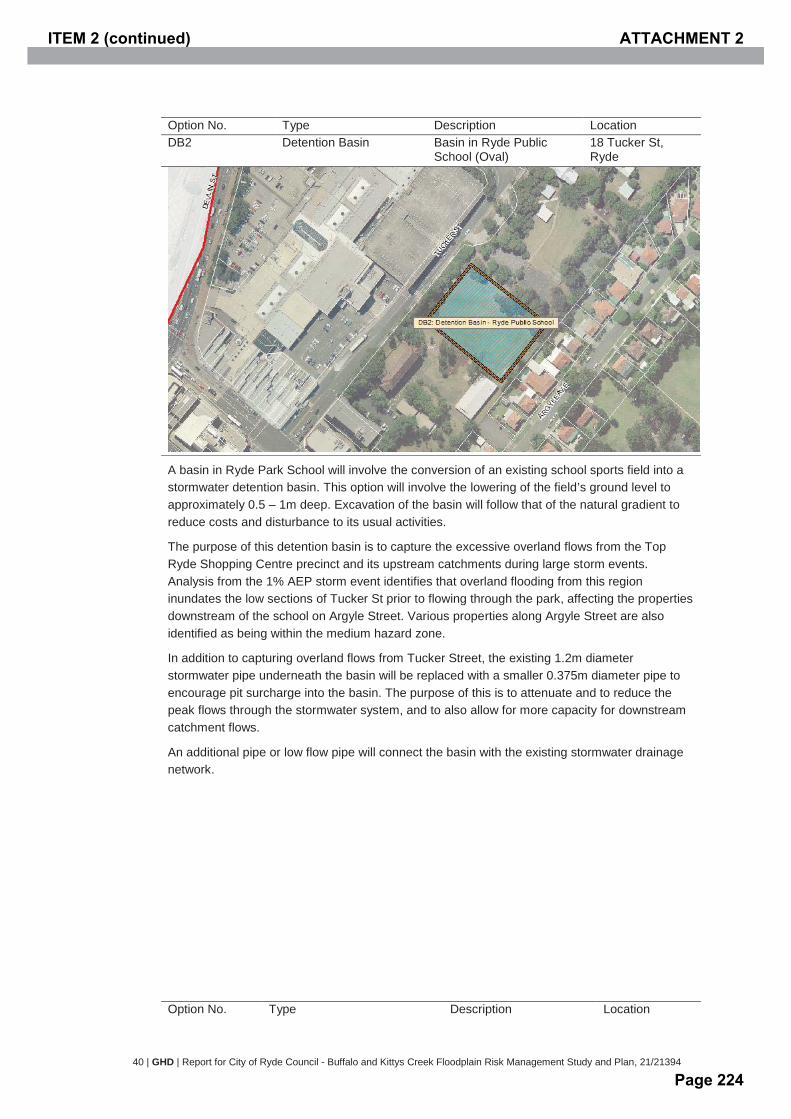
40 | GHD | Report for City of Ryde Council - Buffalo and Kittys Creek Floodplain Risk Management Study and Plan, 21/21394
Option No. Type Description Location DB2 Detention Basin Basin in Ryde Public
School (Oval) 18 Tucker St, Ryde
A basin in Ryde Park School will involve the conversion of an existing school sports field into a stormwater detention basin. This option will involve the lowering of the field’s ground level to approximately 0.5 – 1m deep. Excavation of the basin will follow that of the natural gradient to reduce costs and disturbance to its usual activities.
The purpose of this detention basin is to capture the excessive overland flows from the Top Ryde Shopping Centre precinct and its upstream catchments during large storm events. Analysis from the 1% AEP storm event identifies that overland flooding from this region inundates the low sections of Tucker St prior to flowing through the park, affecting the properties downstream of the school on Argyle Street. Various properties along Argyle Street are also identified as being within the medium hazard zone.
In addition to capturing overland flows from Tucker Street, the existing 1.2m diameter stormwater pipe underneath the basin will be replaced with a smaller 0.375m diameter pipe to encourage pit surcharge into the basin. The purpose of this is to attenuate and to reduce the peak flows through the stormwater system, and to also allow for more capacity for downstream catchment flows.
An additional pipe or low flow pipe will connect the basin with the existing stormwater drainage network.
Option No. Type Description Location
ITEM 2 (continued) ATTACHMENT 2
Page 224
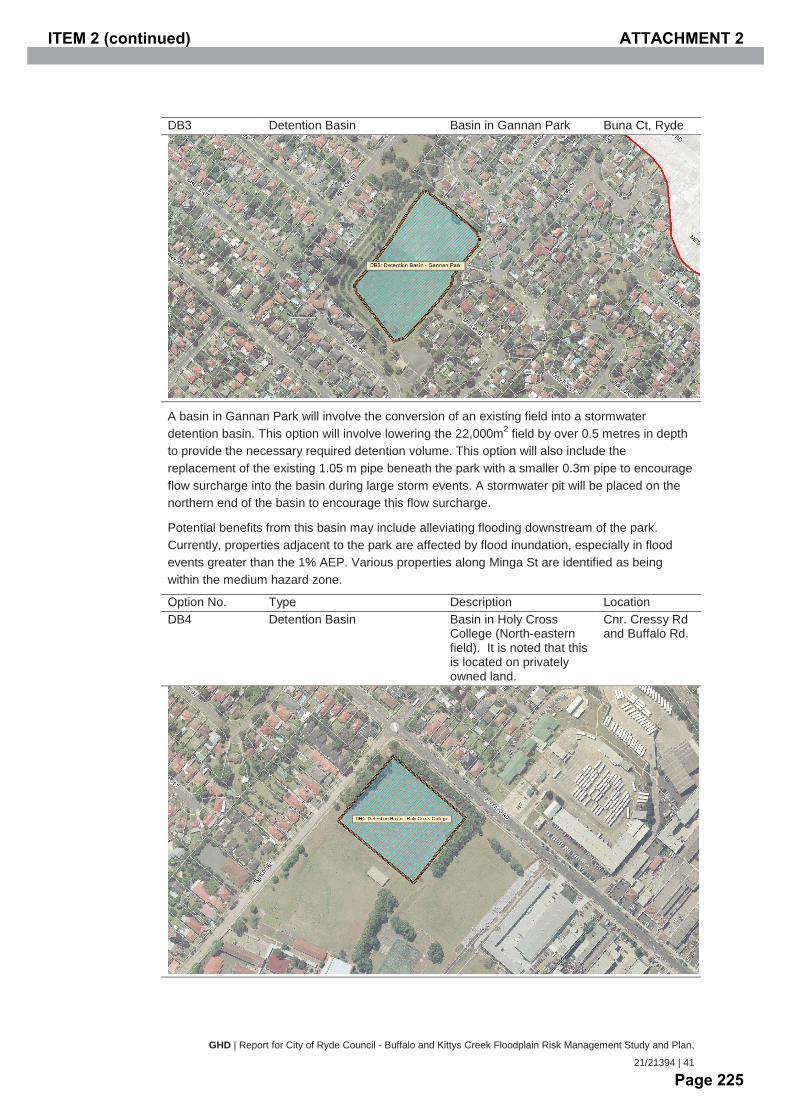
GHD | Report for City of Ryde Council - Buffalo and Kittys Creek Floodplain Risk Management Study and Plan,
21/21394 | 41
DB3 Detention Basin Basin in Gannan Park Buna Ct, Ryde
A basin in Gannan Park will involve the conversion of an existing field into a stormwater detention basin. This option will involve lowering the 22,000m2 field by over 0.5 metres in depth to provide the necessary required detention volume. This option will also include the replacement of the existing 1.05 m pipe beneath the park with a smaller 0.3m pipe to encourage flow surcharge into the basin during large storm events. A stormwater pit will be placed on the northern end of the basin to encourage this flow surcharge.
Potential benefits from this basin may include alleviating flooding downstream of the park. Currently, properties adjacent to the park are affected by flood inundation, especially in flood events greater than the 1% AEP. Various properties along Minga St are identified as being within the medium hazard zone.
Option No. Type Description Location DB4 Detention Basin Basin in Holy Cross
College (North-eastern field). It is noted that this is located on privately owned land.
Cnr. Cressy Rd and Buffalo Rd.
ITEM 2 (continued) ATTACHMENT 2
Page 225

42 | GHD | Report for City of Ryde Council - Buffalo and Kittys Creek Floodplain Risk Management Study and Plan, 21/21394
Currently, Holy Cross College is not predicted to be subject to any flooding for any storm event.
A basin in Holy Cross College will involve the conversion of the northern sports field into a stormwater detention basin. This option will involve lowering the 10,800 m2 park to provide the necessary required detention volume. It is noted, however, that this option is located on privately owned land.
The college itself including the sports fields are located on high ground and is not subject to any flooding issues. However, the purpose of this basin is to capture run-off from its immediate and adjacent catchment area and to attenuate this flow from discharging down Buffalo Road. Flood waters are identified to be escaping this low point on Buffalo Road and onto the paved areas of the commercial zone and again ponding on Higginbotham Road.
As Holy Cross College drains a moderately sized catchment, it may be beneficial to place a detention basin in its vicinity to capture flows running off from this immediate sub catchment.
Option No. Type Description Location DB5 Detention Basin Basin in North Ryde Park Basin in North
Ryde Park
A basin was considered for implementation in corner of North Ryde Park to attenuate some of the overland flows identified from the Flood Study. This overland flow, predominantly inundating minor sections of Magdala Road and Cressy Road in the 1% AEP storm event was intended to be diverted to the basin to reduce road flood levels and minor flooding in adjacent properties. However, upon inspection of this site, it was identified that this corner of the field is too small for implementation of a basin for any beneficial purpose. Option DB5 was not considered for further assessment as it is not feasible.
ITEM 2 (continued) ATTACHMENT 2
Page 226
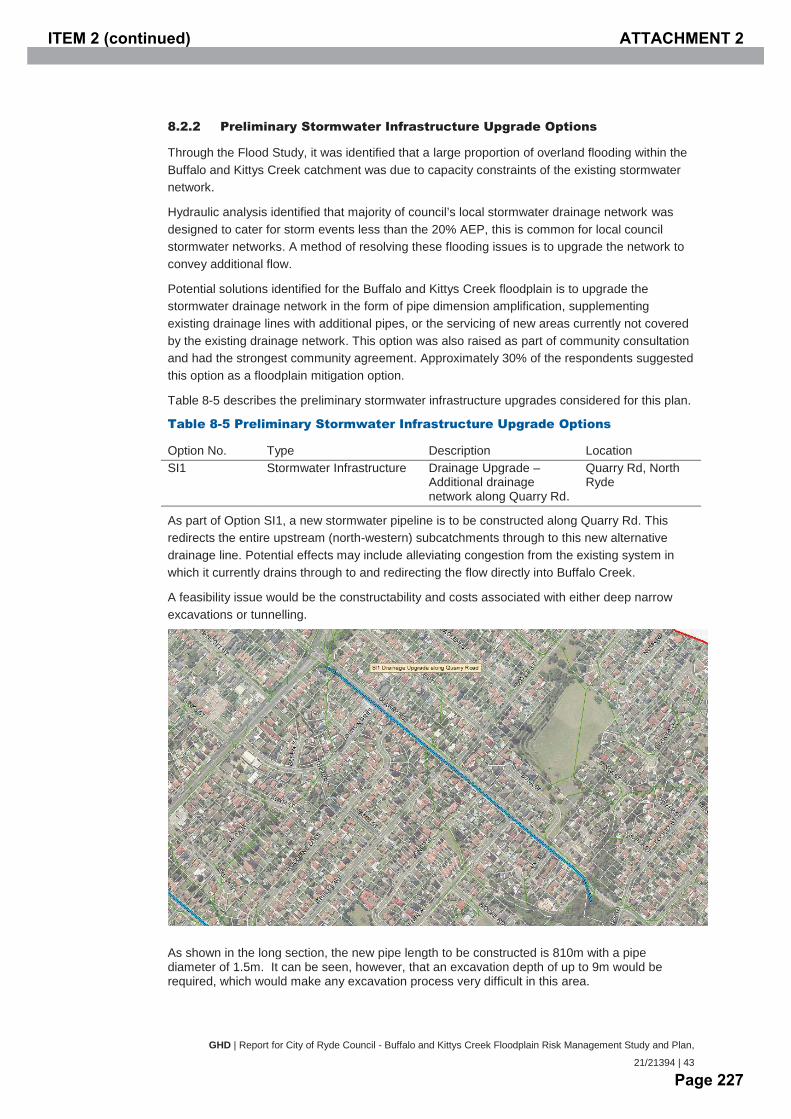
GHD | Report for City of Ryde Council - Buffalo and Kittys Creek Floodplain Risk Management Study and Plan,
21/21394 | 43
8.2.2 Preliminary Stormwater Infrastructure Upgrade Options
Through the Flood Study, it was identified that a large proportion of overland flooding within the Buffalo and Kittys Creek catchment was due to capacity constraints of the existing stormwater network.
Hydraulic analysis identified that majority of council’s local stormwater drainage network was designed to cater for storm events less than the 20% AEP, this is common for local council stormwater networks. A method of resolving these flooding issues is to upgrade the network to convey additional flow.
Potential solutions identified for the Buffalo and Kittys Creek floodplain is to upgrade the stormwater drainage network in the form of pipe dimension amplification, supplementing existing drainage lines with additional pipes, or the servicing of new areas currently not covered by the existing drainage network. This option was also raised as part of community consultation and had the strongest community agreement. Approximately 30% of the respondents suggested this option as a floodplain mitigation option.
Table 8-5 describes the preliminary stormwater infrastructure upgrades considered for this plan.
Table 8-5 Preliminary Stormwater Infrastructure Upgrade Options
Option No. Type Description Location SI1 Stormwater Infrastructure Drainage Upgrade –
Additional drainage network along Quarry Rd.
Quarry Rd, North Ryde
As part of Option SI1, a new stormwater pipeline is to be constructed along Quarry Rd. This redirects the entire upstream (north-western) subcatchments through to this new alternative drainage line. Potential effects may include alleviating congestion from the existing system in which it currently drains through to and redirecting the flow directly into Buffalo Creek.
A feasibility issue would be the constructability and costs associated with either deep narrow excavations or tunnelling.
As shown in the long section, the new pipe length to be constructed is 810m with a pipe diameter of 1.5m. It can be seen, however, that an excavation depth of up to 9m would be required, which would make any excavation process very difficult in this area.
ITEM 2 (continued) ATTACHMENT 2
Page 227
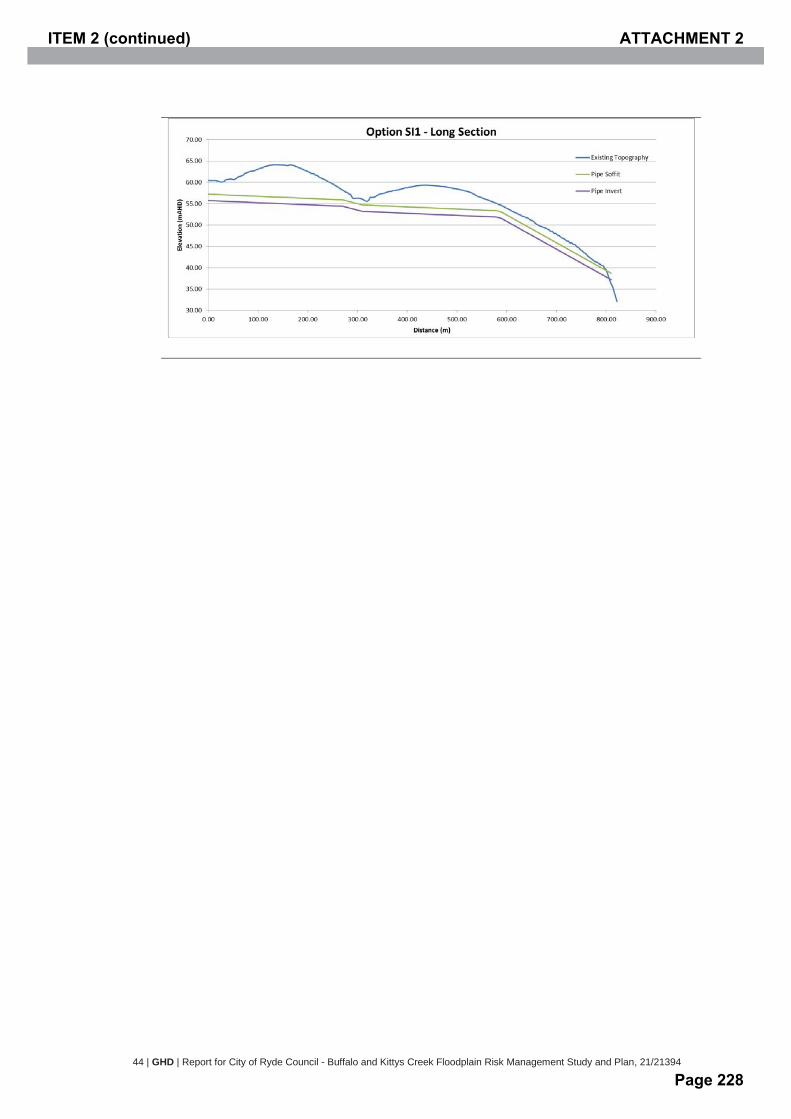
44 | GHD | Report for City of Ryde Council - Buffalo and Kittys Creek Floodplain Risk Management Study and Plan, 21/21394
ITEM 2 (continued) ATTACHMENT 2
Page 228
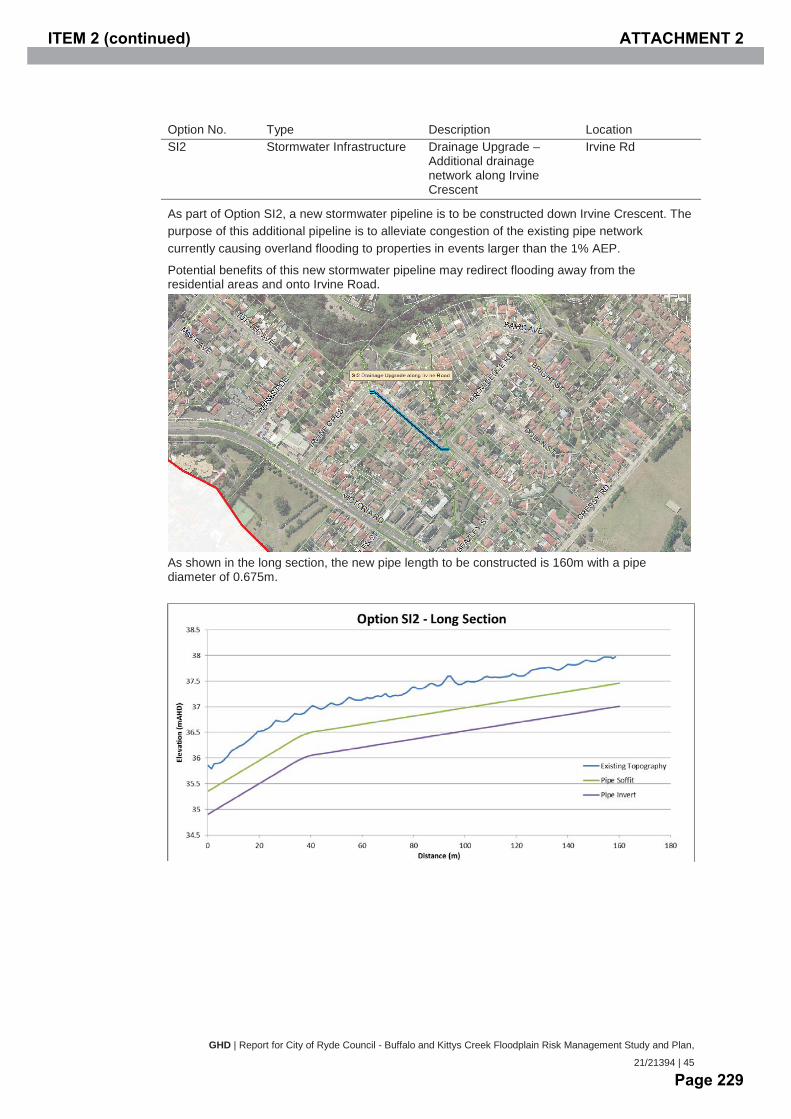
GHD | Report for City of Ryde Council - Buffalo and Kittys Creek Floodplain Risk Management Study and Plan,
21/21394 | 45
Option No. Type Description Location SI2 Stormwater Infrastructure Drainage Upgrade –
Additional drainage network along Irvine Crescent
Irvine Rd
As part of Option SI2, a new stormwater pipeline is to be constructed down Irvine Crescent. The purpose of this additional pipeline is to alleviate congestion of the existing pipe network currently causing overland flooding to properties in events larger than the 1% AEP.
Potential benefits of this new stormwater pipeline may redirect flooding away from the residential areas and onto Irvine Road.
As shown in the long section, the new pipe length to be constructed is 160m with a pipe diameter of 0.675m.
ITEM 2 (continued) ATTACHMENT 2
Page 229
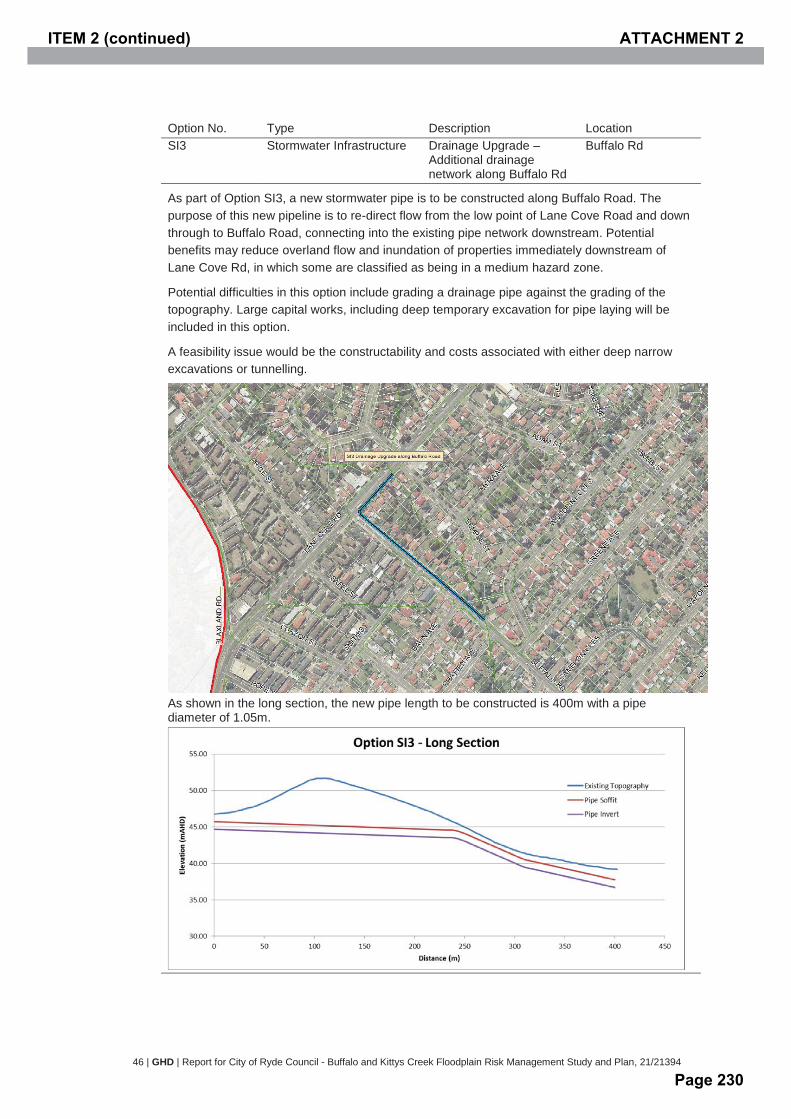
46 | GHD | Report for City of Ryde Council - Buffalo and Kittys Creek Floodplain Risk Management Study and Plan, 21/21394
Option No. Type Description Location SI3 Stormwater Infrastructure Drainage Upgrade –
Additional drainage network along Buffalo Rd
Buffalo Rd
As part of Option SI3, a new stormwater pipe is to be constructed along Buffalo Road. The purpose of this new pipeline is to re-direct flow from the low point of Lane Cove Road and down through to Buffalo Road, connecting into the existing pipe network downstream. Potential benefits may reduce overland flow and inundation of properties immediately downstream of Lane Cove Rd, in which some are classified as being in a medium hazard zone.
Potential difficulties in this option include grading a drainage pipe against the grading of the topography. Large capital works, including deep temporary excavation for pipe laying will be included in this option.
A feasibility issue would be the constructability and costs associated with either deep narrow excavations or tunnelling.
As shown in the long section, the new pipe length to be constructed is 400m with a pipe diameter of 1.05m.
ITEM 2 (continued) ATTACHMENT 2
Page 230
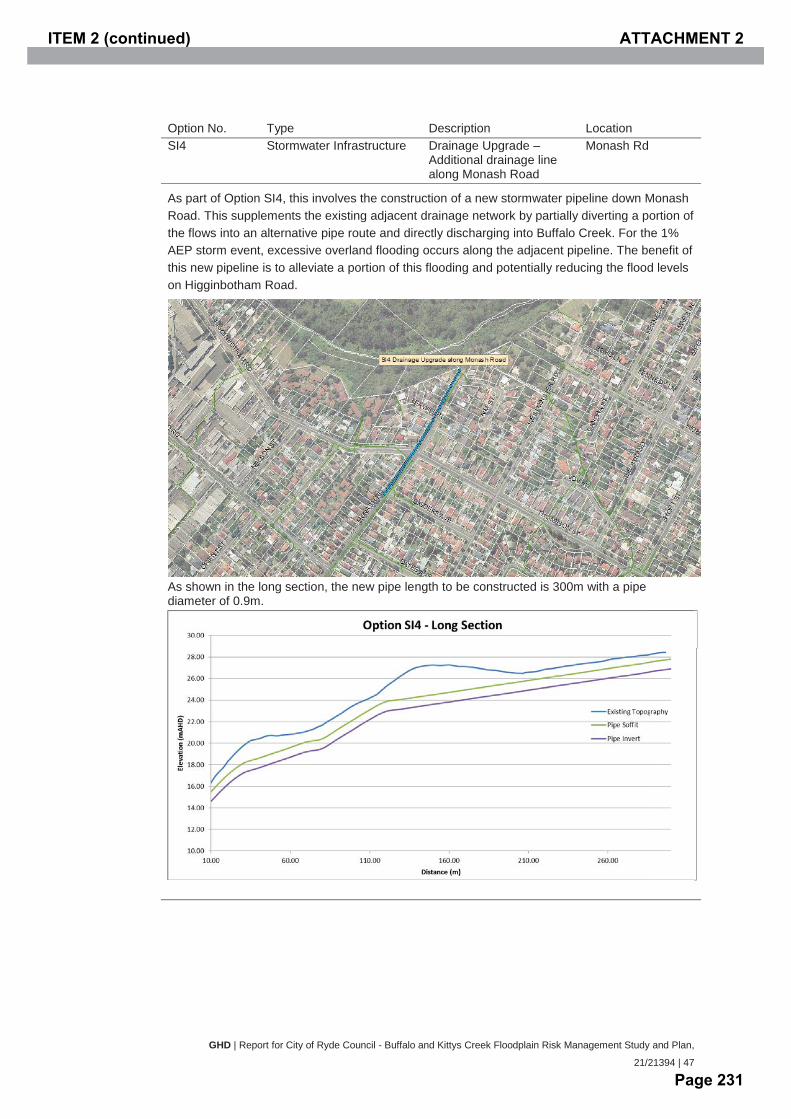
GHD | Report for City of Ryde Council - Buffalo and Kittys Creek Floodplain Risk Management Study and Plan,
21/21394 | 47
Option No. Type Description Location SI4 Stormwater Infrastructure Drainage Upgrade –
Additional drainage line along Monash Road
Monash Rd
As part of Option SI4, this involves the construction of a new stormwater pipeline down Monash Road. This supplements the existing adjacent drainage network by partially diverting a portion of the flows into an alternative pipe route and directly discharging into Buffalo Creek. For the 1% AEP storm event, excessive overland flooding occurs along the adjacent pipeline. The benefit of this new pipeline is to alleviate a portion of this flooding and potentially reducing the flood levels on Higginbotham Road.
As shown in the long section, the new pipe length to be constructed is 300m with a pipe diameter of 0.9m.
ITEM 2 (continued) ATTACHMENT 2
Page 231
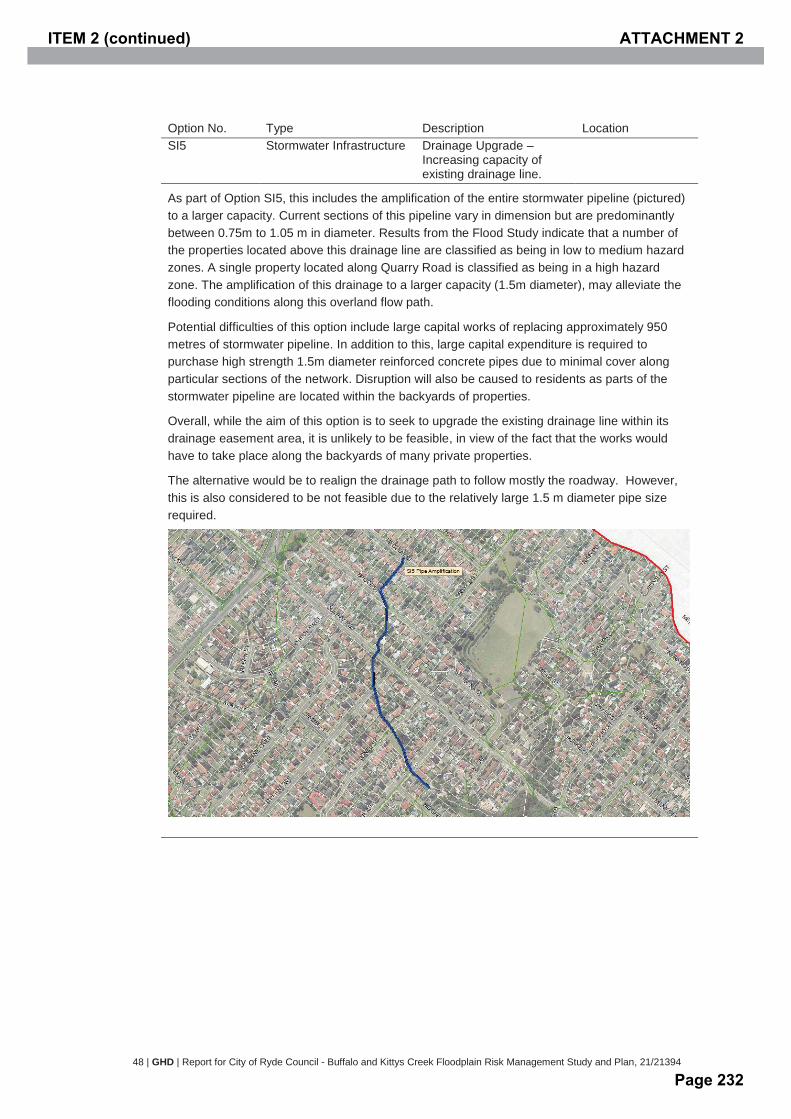
48 | GHD | Report for City of Ryde Council - Buffalo and Kittys Creek Floodplain Risk Management Study and Plan, 21/21394
Option No. Type Description Location SI5 Stormwater Infrastructure Drainage Upgrade –
Increasing capacity of existing drainage line.
As part of Option SI5, this includes the amplification of the entire stormwater pipeline (pictured) to a larger capacity. Current sections of this pipeline vary in dimension but are predominantly between 0.75m to 1.05 m in diameter. Results from the Flood Study indicate that a number of the properties located above this drainage line are classified as being in low to medium hazard zones. A single property located along Quarry Road is classified as being in a high hazard zone. The amplification of this drainage to a larger capacity (1.5m diameter), may alleviate the flooding conditions along this overland flow path.
Potential difficulties of this option include large capital works of replacing approximately 950 metres of stormwater pipeline. In addition to this, large capital expenditure is required to purchase high strength 1.5m diameter reinforced concrete pipes due to minimal cover along particular sections of the network. Disruption will also be caused to residents as parts of the stormwater pipeline are located within the backyards of properties.
Overall, while the aim of this option is to seek to upgrade the existing drainage line within its drainage easement area, it is unlikely to be feasible, in view of the fact that the works would have to take place along the backyards of many private properties.
The alternative would be to realign the drainage path to follow mostly the roadway. However, this is also considered to be not feasible due to the relatively large 1.5 m diameter pipe size required.
ITEM 2 (continued) ATTACHMENT 2
Page 232
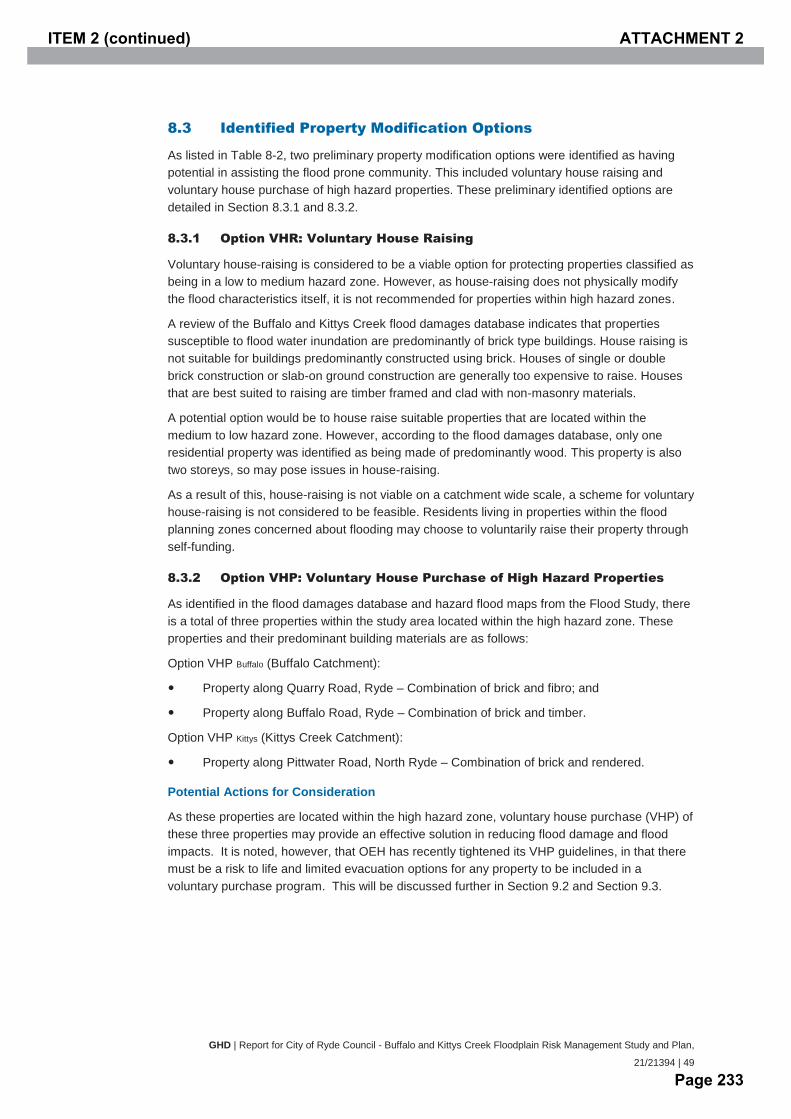
GHD | Report for City of Ryde Council - Buffalo and Kittys Creek Floodplain Risk Management Study and Plan,
21/21394 | 49
8.3 Identified Property Modification Options
As listed in Table 8-2, two preliminary property modification options were identified as having potential in assisting the flood prone community. This included voluntary house raising and voluntary house purchase of high hazard properties. These preliminary identified options are detailed in Section 8.3.1 and 8.3.2.
8.3.1 Option VHR: Voluntary House Raising
Voluntary house-raising is considered to be a viable option for protecting properties classified as being in a low to medium hazard zone. However, as house-raising does not physically modify the flood characteristics itself, it is not recommended for properties within high hazard zones.
A review of the Buffalo and Kittys Creek flood damages database indicates that properties susceptible to flood water inundation are predominantly of brick type buildings. House raising is not suitable for buildings predominantly constructed using brick. Houses of single or double brick construction or slab-on ground construction are generally too expensive to raise. Houses that are best suited to raising are timber framed and clad with non-masonry materials.
A potential option would be to house raise suitable properties that are located within the medium to low hazard zone. However, according to the flood damages database, only one residential property was identified as being made of predominantly wood. This property is also two storeys, so may pose issues in house-raising.
As a result of this, house-raising is not viable on a catchment wide scale, a scheme for voluntary house-raising is not considered to be feasible. Residents living in properties within the flood planning zones concerned about flooding may choose to voluntarily raise their property through self-funding.
8.3.2 Option VHP: Voluntary House Purchase of High Hazard Properties
As identified in the flood damages database and hazard flood maps from the Flood Study, there is a total of three properties within the study area located within the high hazard zone. These properties and their predominant building materials are as follows:
Option VHP Buffalo (Buffalo Catchment):
Property along Quarry Road, Ryde – Combination of brick and fibro; and
Property along Buffalo Road, Ryde – Combination of brick and timber.
Option VHP Kittys (Kittys Creek Catchment):
Property along Pittwater Road, North Ryde – Combination of brick and rendered.
Potential Actions for Consideration
As these properties are located within the high hazard zone, voluntary house purchase (VHP) of these three properties may provide an effective solution in reducing flood damage and flood impacts. It is noted, however, that OEH has recently tightened its VHP guidelines, in that there must be a risk to life and limited evacuation options for any property to be included in a voluntary purchase program. This will be discussed further in Section 9.2 and Section 9.3.
ITEM 2 (continued) ATTACHMENT 2
Page 233
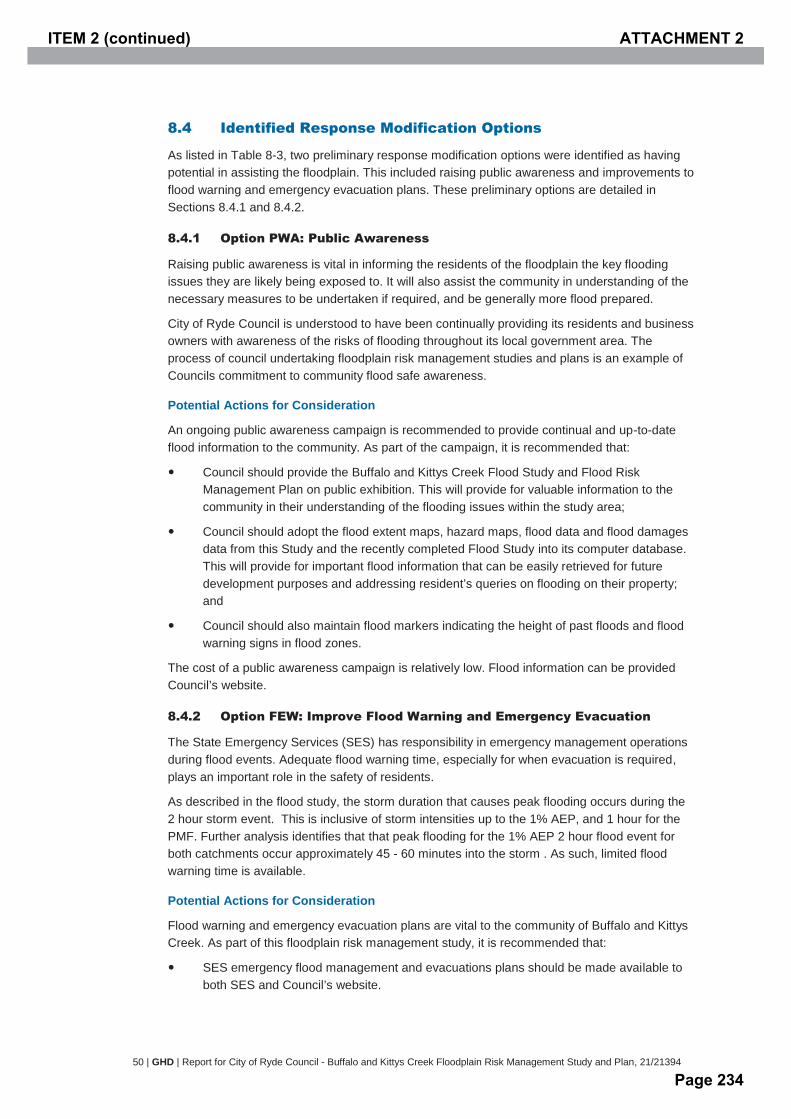
50 | GHD | Report for City of Ryde Council - Buffalo and Kittys Creek Floodplain Risk Management Study and Plan, 21/21394
8.4 Identified Response Modification Options
As listed in Table 8-3, two preliminary response modification options were identified as having potential in assisting the floodplain. This included raising public awareness and improvements to flood warning and emergency evacuation plans. These preliminary options are detailed in Sections 8.4.1 and 8.4.2.
8.4.1 Option PWA: Public Awareness
Raising public awareness is vital in informing the residents of the floodplain the key flooding issues they are likely being exposed to. It will also assist the community in understanding of the necessary measures to be undertaken if required, and be generally more flood prepared.
City of Ryde Council is understood to have been continually providing its residents and business owners with awareness of the risks of flooding throughout its local government area. The process of council undertaking floodplain risk management studies and plans is an example of Councils commitment to community flood safe awareness.
Potential Actions for Consideration
An ongoing public awareness campaign is recommended to provide continual and up-to-date flood information to the community. As part of the campaign, it is recommended that:
Council should provide the Buffalo and Kittys Creek Flood Study and Flood Risk Management Plan on public exhibition. This will provide for valuable information to the community in their understanding of the flooding issues within the study area;
Council should adopt the flood extent maps, hazard maps, flood data and flood damages data from this Study and the recently completed Flood Study into its computer database. This will provide for important flood information that can be easily retrieved for future development purposes and addressing resident’s queries on flooding on their property; and
Council should also maintain flood markers indicating the height of past floods and flood warning signs in flood zones.
The cost of a public awareness campaign is relatively low. Flood information can be provided Council’s website.
8.4.2 Option FEW: Improve Flood Warning and Emergency Evacuation
The State Emergency Services (SES) has responsibility in emergency management operations during flood events. Adequate flood warning time, especially for when evacuation is required, plays an important role in the safety of residents.
As described in the flood study, the storm duration that causes peak flooding occurs during the 2 hour storm event. This is inclusive of storm intensities up to the 1% AEP, and 1 hour for the PMF. Further analysis identifies that that peak flooding for the 1% AEP 2 hour flood event for both catchments occur approximately 45 - 60 minutes into the storm . As such, limited flood warning time is available.
Potential Actions for Consideration
Flood warning and emergency evacuation plans are vital to the community of Buffalo and Kittys Creek. As part of this floodplain risk management study, it is recommended that:
SES emergency flood management and evacuations plans should be made available to both SES and Council’s website.
ITEM 2 (continued) ATTACHMENT 2
Page 234

GHD | Report for City of Ryde Council - Buffalo and Kittys Creek Floodplain Risk Management Study and Plan,
21/21394 | 51
SES should also take into consideration the Emergency Flood Evacuation plan as detailed in Section 10.1.2 to provide information for their flood emergency management operations.
ITEM 2 (continued) ATTACHMENT 2
Page 235
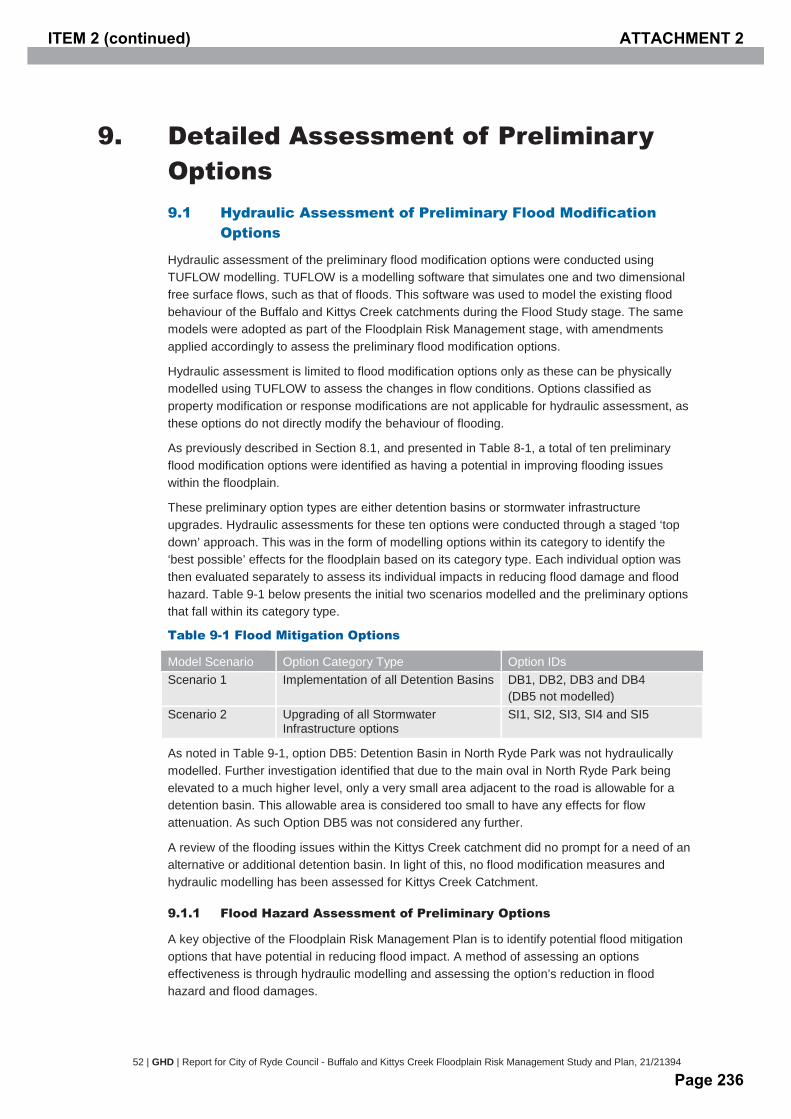
52 | GHD | Report for City of Ryde Council - Buffalo and Kittys Creek Floodplain Risk Management Study and Plan, 21/21394
9. Detailed Assessment of Preliminary Options 9.1 Hydraulic Assessment of Preliminary Flood Modification
Options
Hydraulic assessment of the preliminary flood modification options were conducted using TUFLOW modelling. TUFLOW is a modelling software that simulates one and two dimensional free surface flows, such as that of floods. This software was used to model the existing flood behaviour of the Buffalo and Kittys Creek catchments during the Flood Study stage. The same models were adopted as part of the Floodplain Risk Management stage, with amendments applied accordingly to assess the preliminary flood modification options.
Hydraulic assessment is limited to flood modification options only as these can be physically modelled using TUFLOW to assess the changes in flow conditions. Options classified as property modification or response modifications are not applicable for hydraulic assessment, as these options do not directly modify the behaviour of flooding.
As previously described in Section 8.1, and presented in Table 8-1, a total of ten preliminary flood modification options were identified as having a potential in improving flooding issues within the floodplain.
These preliminary option types are either detention basins or stormwater infrastructure upgrades. Hydraulic assessments for these ten options were conducted through a staged ‘top down’ approach. This was in the form of modelling options within its category to identify the ‘best possible’ effects for the floodplain based on its category type. Each individual option was then evaluated separately to assess its individual impacts in reducing flood damage and flood hazard. Table 9-1 below presents the initial two scenarios modelled and the preliminary options that fall within its category type.
Table 9-1 Flood Mitigation Options
Model Scenario Option Category Type Option IDs Scenario 1 Implementation of all Detention Basins DB1, DB2, DB3 and DB4
(DB5 not modelled) Scenario 2 Upgrading of all Stormwater
Infrastructure options SI1, SI2, SI3, SI4 and SI5
As noted in Table 9-1, option DB5: Detention Basin in North Ryde Park was not hydraulically modelled. Further investigation identified that due to the main oval in North Ryde Park being elevated to a much higher level, only a very small area adjacent to the road is allowable for a detention basin. This allowable area is considered too small to have any effects for flow attenuation. As such Option DB5 was not considered any further.
A review of the flooding issues within the Kittys Creek catchment did no prompt for a need of an alternative or additional detention basin. In light of this, no flood modification measures and hydraulic modelling has been assessed for Kittys Creek Catchment.
9.1.1 Flood Hazard Assessment of Preliminary Options
A key objective of the Floodplain Risk Management Plan is to identify potential flood mitigation options that have potential in reducing flood impact. A method of assessing an options effectiveness is through hydraulic modelling and assessing the option’s reduction in flood hazard and flood damages.
ITEM 2 (continued) ATTACHMENT 2
Page 236
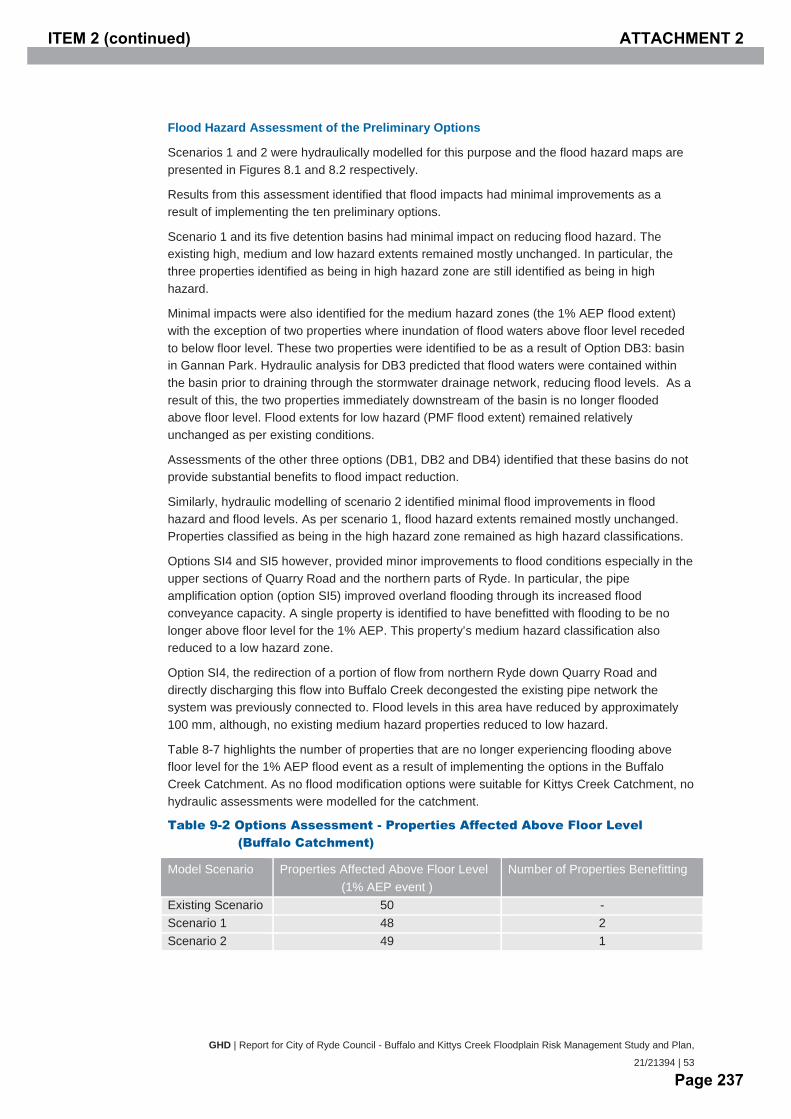
GHD | Report for City of Ryde Council - Buffalo and Kittys Creek Floodplain Risk Management Study and Plan,
21/21394 | 53
Flood Hazard Assessment of the Preliminary Options
Scenarios 1 and 2 were hydraulically modelled for this purpose and the flood hazard maps are presented in Figures 8.1 and 8.2 respectively.
Results from this assessment identified that flood impacts had minimal improvements as a result of implementing the ten preliminary options.
Scenario 1 and its five detention basins had minimal impact on reducing flood hazard. The existing high, medium and low hazard extents remained mostly unchanged. In particular, the three properties identified as being in high hazard zone are still identified as being in high hazard.
Minimal impacts were also identified for the medium hazard zones (the 1% AEP flood extent) with the exception of two properties where inundation of flood waters above floor level receded to below floor level. These two properties were identified to be as a result of Option DB3: basin in Gannan Park. Hydraulic analysis for DB3 predicted that flood waters were contained within the basin prior to draining through the stormwater drainage network, reducing flood levels. As a result of this, the two properties immediately downstream of the basin is no longer flooded above floor level. Flood extents for low hazard (PMF flood extent) remained relatively unchanged as per existing conditions.
Assessments of the other three options (DB1, DB2 and DB4) identified that these basins do not provide substantial benefits to flood impact reduction.
Similarly, hydraulic modelling of scenario 2 identified minimal flood improvements in flood hazard and flood levels. As per scenario 1, flood hazard extents remained mostly unchanged. Properties classified as being in the high hazard zone remained as high hazard classifications.
Options SI4 and SI5 however, provided minor improvements to flood conditions especially in the upper sections of Quarry Road and the northern parts of Ryde. In particular, the pipe amplification option (option SI5) improved overland flooding through its increased flood conveyance capacity. A single property is identified to have benefitted with flooding to be no longer above floor level for the 1% AEP. This property’s medium hazard classification also reduced to a low hazard zone.
Option SI4, the redirection of a portion of flow from northern Ryde down Quarry Road and directly discharging this flow into Buffalo Creek decongested the existing pipe network the system was previously connected to. Flood levels in this area have reduced by approximately 100 mm, although, no existing medium hazard properties reduced to low hazard.
Table 8-7 highlights the number of properties that are no longer experiencing flooding above floor level for the 1% AEP flood event as a result of implementing the options in the Buffalo Creek Catchment. As no flood modification options were suitable for Kittys Creek Catchment, no hydraulic assessments were modelled for the catchment.
Table 9-2 Options Assessment - Properties Affected Above Floor Level (Buffalo Catchment)
Model Scenario Properties Affected Above Floor Level (1% AEP event )
Number of Properties Benefitting
Existing Scenario 50 - Scenario 1 48 2 Scenario 2 49 1
ITEM 2 (continued) ATTACHMENT 2
Page 237
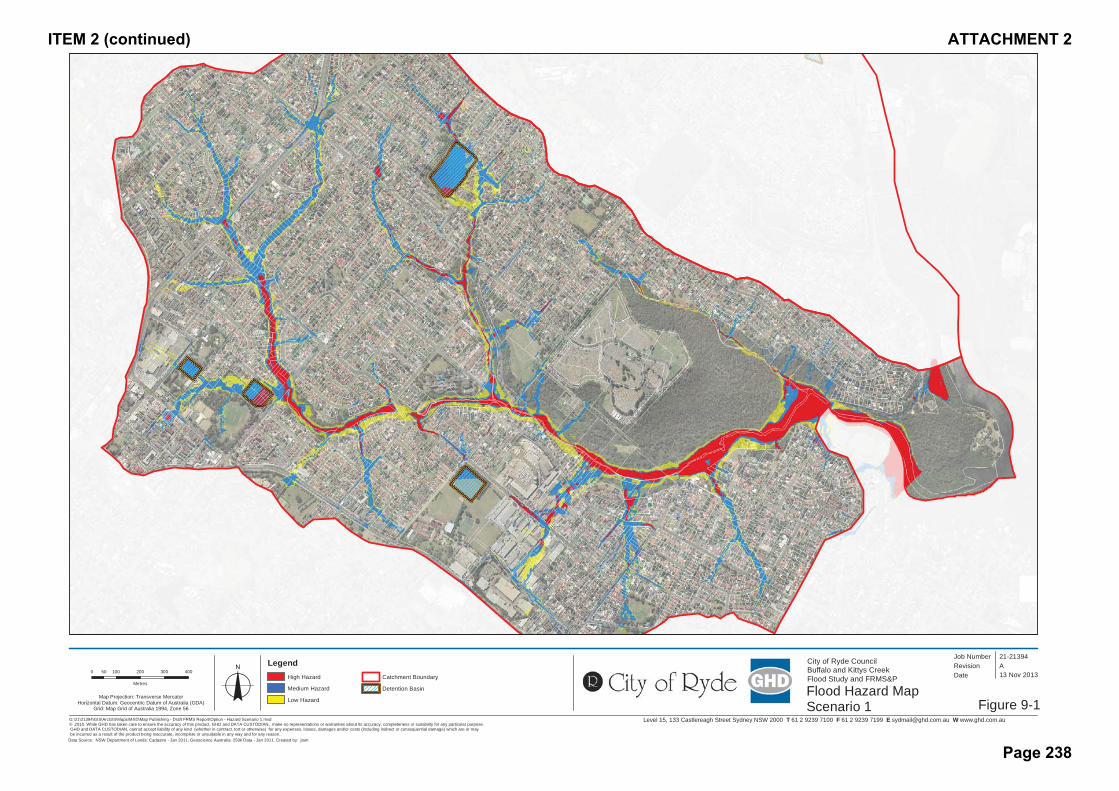
Level 15, 133 Castlereagh Street Sydney NSW 2000 T 61 2 9239 7100 F 61 2 9239 7199 E [email protected] W www.ghd.com.auG:\21\21394\GIS\ArcGIS\Maps\MXD\Map Publishing - Draft FRMS Report\Option - Hazard Scenario 1.mxd© 2010. While GHD has taken care to ensure the accuracy of this product, GHD and DATA CUSTODIAN, make no representations or warranties about its accuracy, completeness or suitability for any particular purpose. GHD and DATA CUSTODIAN, cannot accept liability of any kind (whether in contract, tort or otherwise) for any expenses, losses, damages and/or costs (including indirect or consequential damage) which are or may be incurred as a result of the product being inaccurate, incomplete or unsuitable in any way and for any reason.
0 100 200 300 40050
Metres
Map Projection: Transverse MercatorHorizontal Datum: Geocentric Datum of Australia (GDA)
Grid: Map Grid of Australia 1994, Zone 56
Figure 9-1
Job NumberRevision A
21-21394
13 Nov 2013o Date
Data Source: NSW Department of Lands: Cadastre - Jan 2011; Geoscience Australia: 250k Data - Jan 2011. Created by: jlam
City of Ryde CouncilBuffalo and Kittys CreekFlood Study and FRMS&P
Flood Hazard Map Scenario 1
LegendHigh Hazard
Medium Hazard
Low Hazard
Catchment Boundary
Detention Basin
ITEM 2 (continued) ATTACHMENT 2
Page 238
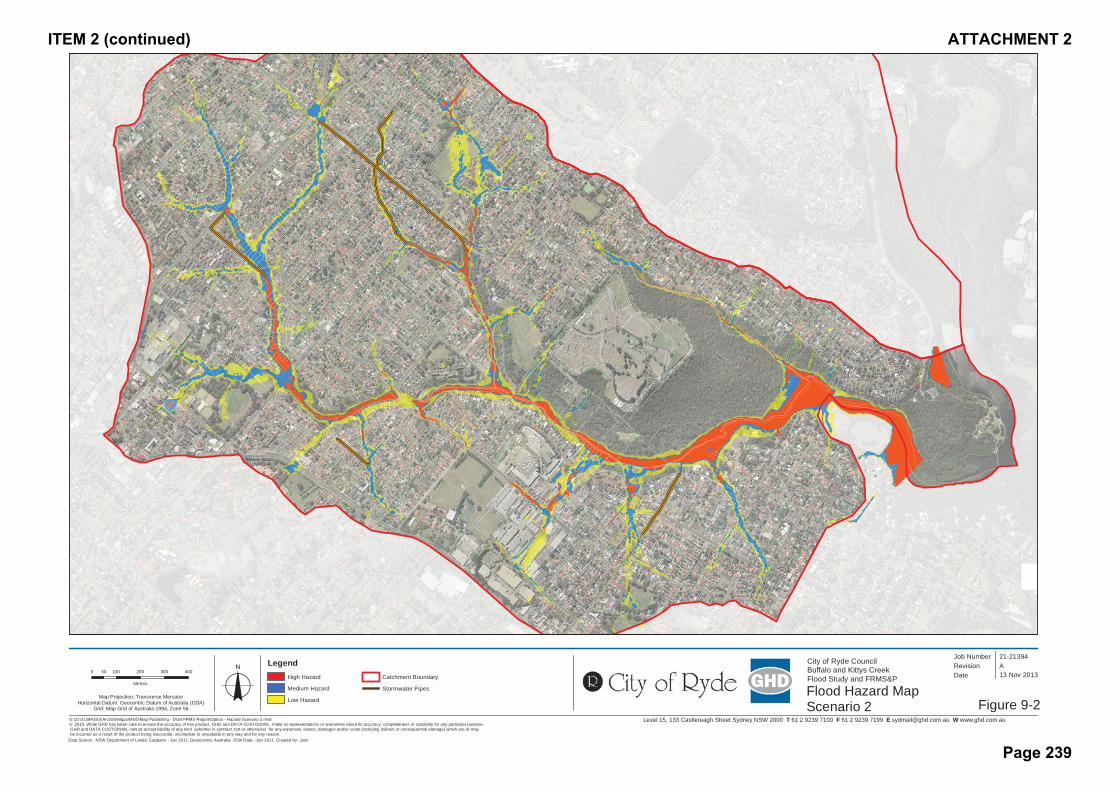
Level 15, 133 Castlereagh Street Sydney NSW 2000 T 61 2 9239 7100 F 61 2 9239 7199 E [email protected] W www.ghd.com.auG:\21\21394\GIS\ArcGIS\Maps\MXD\Map Publishing - Draft FRMS Report\Option - Hazard Scenario 2.mxd© 2010. While GHD has taken care to ensure the accuracy of this product, GHD and DATA CUSTODIAN, make no representations or warranties about its accuracy, completeness or suitability for any particular purpose. GHD and DATA CUSTODIAN, cannot accept liability of any kind (whether in contract, tort or otherwise) for any expenses, losses, damages and/or costs (including indirect or consequential damage) which are or may be incurred as a result of the product being inaccurate, incomplete or unsuitable in any way and for any reason.
0 100 200 300 40050
Metres
Map Projection: Transverse MercatorHorizontal Datum: Geocentric Datum of Australia (GDA)
Grid: Map Grid of Australia 1994, Zone 56
Figure 9-2
Job NumberRevision A
21-21394
13 Nov 2013o Date
Data Source: NSW Department of Lands: Cadastre - Jan 2011; Geoscience Australia: 250k Data - Jan 2011. Created by: jlam
City of Ryde CouncilBuffalo and Kittys CreekFlood Study and FRMS&P
Flood Hazard Map Scenario 2
LegendHigh Hazard
Medium Hazard
Low Hazard
Catchment Boundary
Stormwater Pipes
ITEM 2 (continued) ATTACHMENT 2
Page 239
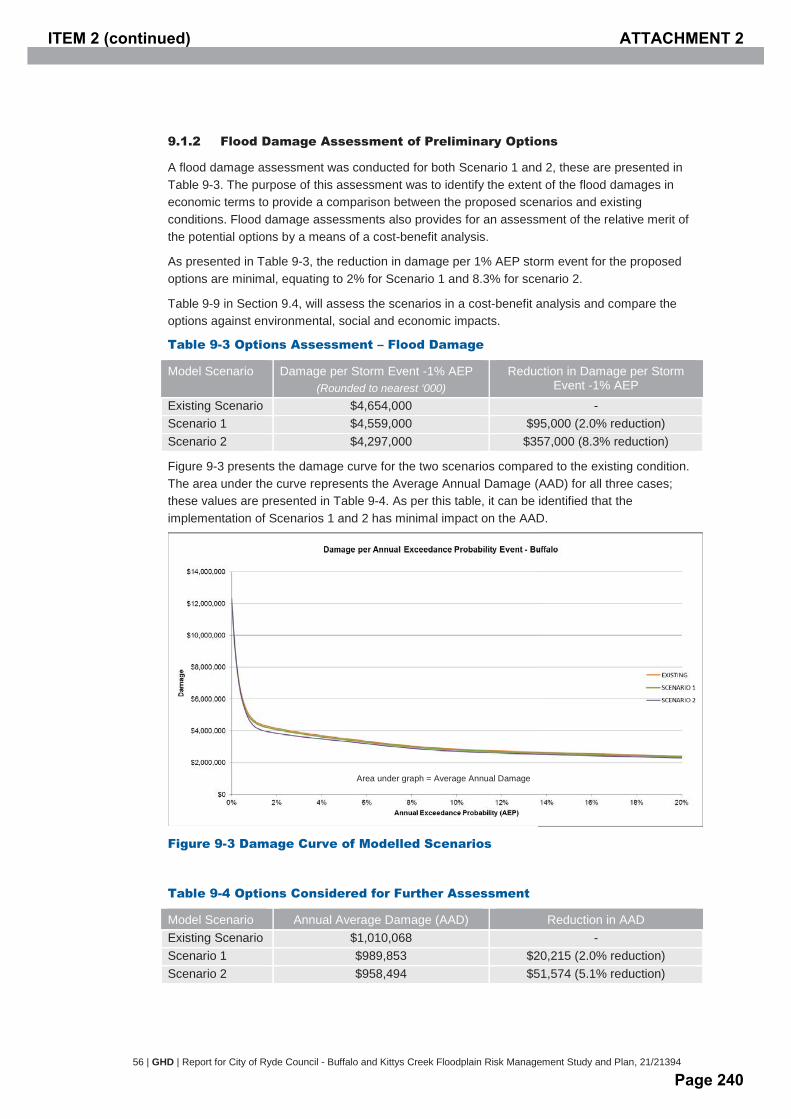
56 | GHD | Report for City of Ryde Council - Buffalo and Kittys Creek Floodplain Risk Management Study and Plan, 21/21394
9.1.2 Flood Damage Assessment of Preliminary Options
A flood damage assessment was conducted for both Scenario 1 and 2, these are presented in Table 9-3. The purpose of this assessment was to identify the extent of the flood damages in economic terms to provide a comparison between the proposed scenarios and existing conditions. Flood damage assessments also provides for an assessment of the relative merit of the potential options by a means of a cost-benefit analysis.
As presented in Table 9-3, the reduction in damage per 1% AEP storm event for the proposed options are minimal, equating to 2% for Scenario 1 and 8.3% for scenario 2.
Table 9-9 in Section 9.4, will assess the scenarios in a cost-benefit analysis and compare the options against environmental, social and economic impacts.
Table 9-3 Options Assessment – Flood Damage
Model Scenario Damage per Storm Event -1% AEP (Rounded to nearest ‘000)
Reduction in Damage per Storm Event -1% AEP
Existing Scenario $4,654,000 - Scenario 1 $4,559,000 $95,000 (2.0% reduction) Scenario 2 $4,297,000 $357,000 (8.3% reduction)
Figure 9-3 presents the damage curve for the two scenarios compared to the existing condition. The area under the curve represents the Average Annual Damage (AAD) for all three cases; these values are presented in Table 9-4. As per this table, it can be identified that the implementation of Scenarios 1 and 2 has minimal impact on the AAD.
Figure 9-3 Damage Curve of Modelled Scenarios
Table 9-4 Options Considered for Further Assessment
Model Scenario Annual Average Damage (AAD) Reduction in AAD Existing Scenario $1,010,068 - Scenario 1 $989,853 $20,215 (2.0% reduction) Scenario 2 $958,494 $51,574 (5.1% reduction)
Area under graph = Average Annual Damage
ITEM 2 (continued) ATTACHMENT 2
Page 240
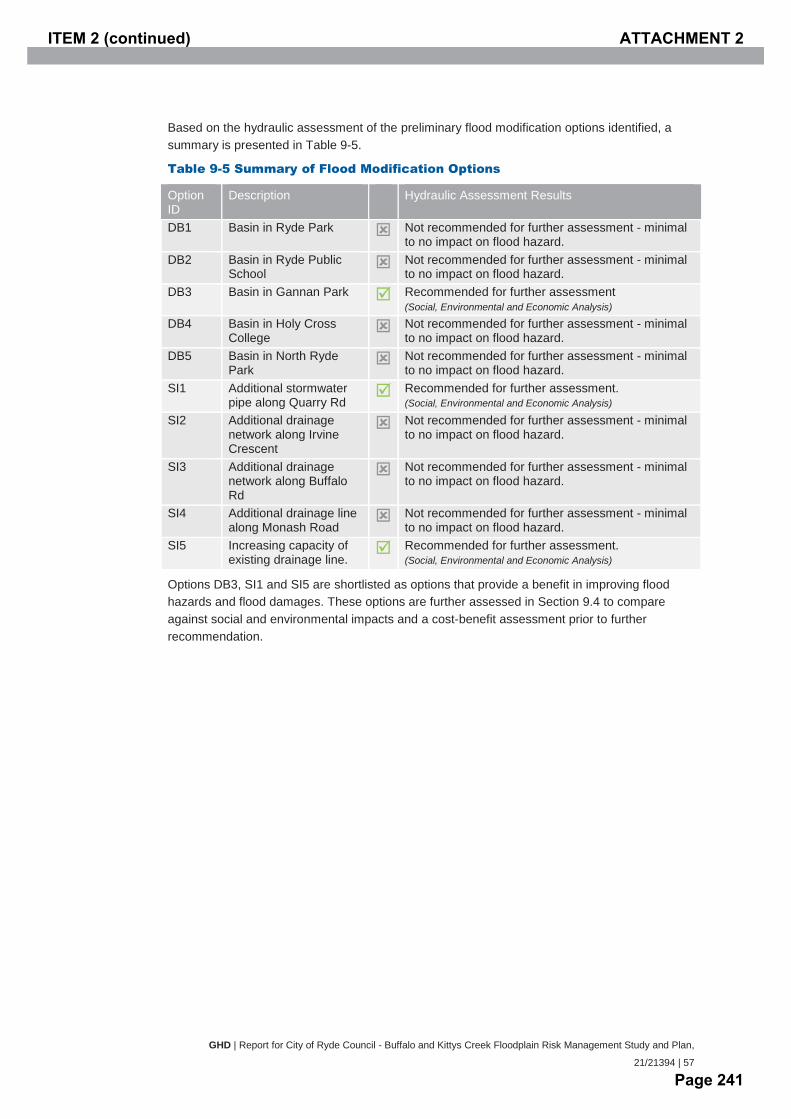
GHD | Report for City of Ryde Council - Buffalo and Kittys Creek Floodplain Risk Management Study and Plan,
21/21394 | 57
Based on the hydraulic assessment of the preliminary flood modification options identified, a summary is presented in Table 9-5.
Table 9-5 Summary of Flood Modification Options
Option ID
Description Hydraulic Assessment Results
DB1 Basin in Ryde Park Not recommended for further assessment - minimal to no impact on flood hazard.
DB2 Basin in Ryde Public School
Not recommended for further assessment - minimal to no impact on flood hazard.
DB3 Basin in Gannan Park Recommended for further assessment (Social, Environmental and Economic Analysis)
DB4 Basin in Holy Cross College
Not recommended for further assessment - minimal to no impact on flood hazard.
DB5 Basin in North Ryde Park
Not recommended for further assessment - minimal to no impact on flood hazard.
SI1 Additional stormwater pipe along Quarry Rd
Recommended for further assessment. (Social, Environmental and Economic Analysis)
SI2 Additional drainage network along Irvine Crescent
Not recommended for further assessment - minimal to no impact on flood hazard.
SI3 Additional drainage network along Buffalo Rd
Not recommended for further assessment - minimal to no impact on flood hazard.
SI4 Additional drainage line along Monash Road
Not recommended for further assessment - minimal to no impact on flood hazard.
SI5 Increasing capacity of existing drainage line.
Recommended for further assessment. (Social, Environmental and Economic Analysis)
Options DB3, SI1 and SI5 are shortlisted as options that provide a benefit in improving flood hazards and flood damages. These options are further assessed in Section 9.4 to compare against social and environmental impacts and a cost-benefit assessment prior to further recommendation.
ITEM 2 (continued) ATTACHMENT 2
Page 241
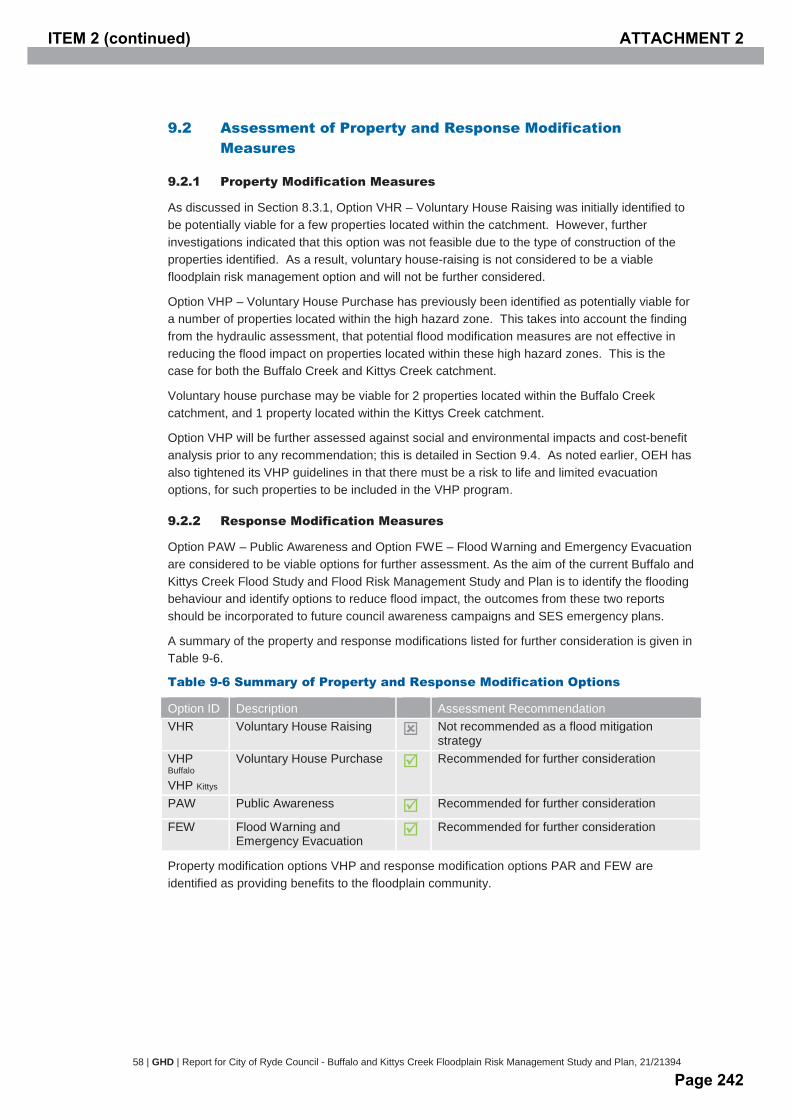
58 | GHD | Report for City of Ryde Council - Buffalo and Kittys Creek Floodplain Risk Management Study and Plan, 21/21394
9.2 Assessment of Property and Response Modification Measures
9.2.1 Property Modification Measures
As discussed in Section 8.3.1, Option VHR – Voluntary House Raising was initially identified to be potentially viable for a few properties located within the catchment. However, further investigations indicated that this option was not feasible due to the type of construction of the properties identified. As a result, voluntary house-raising is not considered to be a viable floodplain risk management option and will not be further considered.
Option VHP – Voluntary House Purchase has previously been identified as potentially viable for a number of properties located within the high hazard zone. This takes into account the finding from the hydraulic assessment, that potential flood modification measures are not effective in reducing the flood impact on properties located within these high hazard zones. This is the case for both the Buffalo Creek and Kittys Creek catchment.
Voluntary house purchase may be viable for 2 properties located within the Buffalo Creek catchment, and 1 property located within the Kittys Creek catchment.
Option VHP will be further assessed against social and environmental impacts and cost-benefit analysis prior to any recommendation; this is detailed in Section 9.4. As noted earlier, OEH has also tightened its VHP guidelines in that there must be a risk to life and limited evacuation options, for such properties to be included in the VHP program.
9.2.2 Response Modification Measures
Option PAW – Public Awareness and Option FWE – Flood Warning and Emergency Evacuation are considered to be viable options for further assessment. As the aim of the current Buffalo and Kittys Creek Flood Study and Flood Risk Management Study and Plan is to identify the flooding behaviour and identify options to reduce flood impact, the outcomes from these two reports should be incorporated to future council awareness campaigns and SES emergency plans.
A summary of the property and response modifications listed for further consideration is given in Table 9-6.
Table 9-6 Summary of Property and Response Modification Options
Option ID Description Assessment Recommendation VHR Voluntary House Raising Not recommended as a flood mitigation
strategy VHP Buffalo VHP Kittys
Voluntary House Purchase Recommended for further consideration
PAW Public Awareness Recommended for further consideration
FEW Flood Warning and Emergency Evacuation
Recommended for further consideration
Property modification options VHP and response modification options PAR and FEW are identified as providing benefits to the floodplain community.
ITEM 2 (continued) ATTACHMENT 2
Page 242
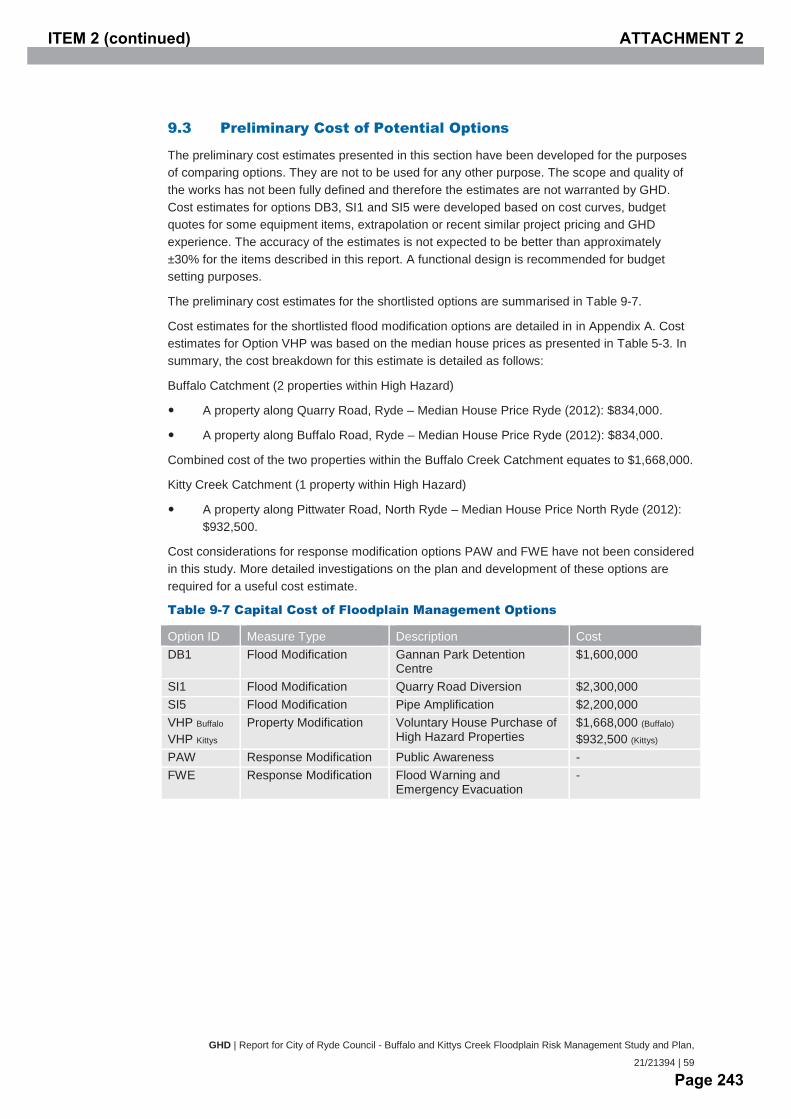
GHD | Report for City of Ryde Council - Buffalo and Kittys Creek Floodplain Risk Management Study and Plan,
21/21394 | 59
9.3 Preliminary Cost of Potential Options
The preliminary cost estimates presented in this section have been developed for the purposes of comparing options. They are not to be used for any other purpose. The scope and quality of the works has not been fully defined and therefore the estimates are not warranted by GHD. Cost estimates for options DB3, SI1 and SI5 were developed based on cost curves, budget quotes for some equipment items, extrapolation or recent similar project pricing and GHD experience. The accuracy of the estimates is not expected to be better than approximately ±30% for the items described in this report. A functional design is recommended for budget setting purposes.
The preliminary cost estimates for the shortlisted options are summarised in Table 9-7.
Cost estimates for the shortlisted flood modification options are detailed in in Appendix A. Cost estimates for Option VHP was based on the median house prices as presented in Table 5-3. In summary, the cost breakdown for this estimate is detailed as follows:
Buffalo Catchment (2 properties within High Hazard)
A property along Quarry Road, Ryde – Median House Price Ryde (2012): $834,000.
A property along Buffalo Road, Ryde – Median House Price Ryde (2012): $834,000.
Combined cost of the two properties within the Buffalo Creek Catchment equates to $1,668,000.
Kitty Creek Catchment (1 property within High Hazard)
A property along Pittwater Road, North Ryde – Median House Price North Ryde (2012): $932,500.
Cost considerations for response modification options PAW and FWE have not been considered in this study. More detailed investigations on the plan and development of these options are required for a useful cost estimate.
Table 9-7 Capital Cost of Floodplain Management Options
Option ID Measure Type Description Cost DB1 Flood Modification Gannan Park Detention
Centre $1,600,000
SI1 Flood Modification Quarry Road Diversion $2,300,000 SI5 Flood Modification Pipe Amplification $2,200,000 VHP Buffalo VHP Kittys
Property Modification Voluntary House Purchase of High Hazard Properties
$1,668,000 (Buffalo) $932,500 (Kittys)
PAW Response Modification Public Awareness - FWE Response Modification Flood Warning and
Emergency Evacuation -
ITEM 2 (continued) ATTACHMENT 2
Page 243

60 | GHD | Report for City of Ryde Council - Buffalo and Kittys Creek Floodplain Risk Management Study and Plan, 21/21394
9.4 Multi-Criteria Analysis of Options
The floodplain management options were assessed both hydraulically and with a broader assessment procedure to consider the social, economic and environmental considerations. These issues are listed in in Table 9-8. For each of these considerations, weightings were applied to give an ‘intangibles’ score, listed in Table 9-9 and Table 9-10.
Table 9-8 Social, Economic and Environmental Issues for Assessing Options
Category Issues Social The capacity of the option to reduce flood hazards and personal
safety risks to the community;
How the option will influence property values;
The capacity of the option to promote community growth; and
The level of disruption to the community, either through implementing the option or through the resulting floodplain behaviour.
Economic and Financial The capital costs associated with implementing the option;
The ongoing or maintenance costs of the option; and
The costs or saving of flood damage after the option is implemented.
Environmental Change to ecology, habitats, riparian vegetation, and the “natural state” of the creek;
Pollution;
Energy and resources required to implement the option; and
Energy and resources required for maintaining and decommissioning the option.
The considerations listed in Table 9-8 were weighted as a score of 1 to 5 (where 1 is the worst, 3 represents no change or neutral effect and 5 is the best). Details of this assessment matrix, is provided in Appendix B. A do nothing option has been included to compare the options against existing conditions. The results of the final ranking, once weightings were applied, is provided in Table 9-9 for Buffalo Creek catchment and Table 9-10 for Kittys Creek catchment.
Table 9-9 Option Assessment Matrix – Buffalo Creek Catchment
Scenario / Option
Social and Environmental Score
Social and Environmental Ranking
Capital Costs Estimate
Capital Costs Ranking
Economic Benefit / Cost
Economic Ranking
Do Nothing 56 3 - 1 1 1 DB3 56 4 $1,600,000 2 0.17 3 SI1 & SI5 58 2 $4,500,000 4 0.16 4 VHP Buffalo 68 1 $1,668,000 3 0.18 2
Note: Option VHP for Buffalo Creek Catchment considers the 2 properties within its catchment only.
ITEM 2 (continued) ATTACHMENT 2
Page 244
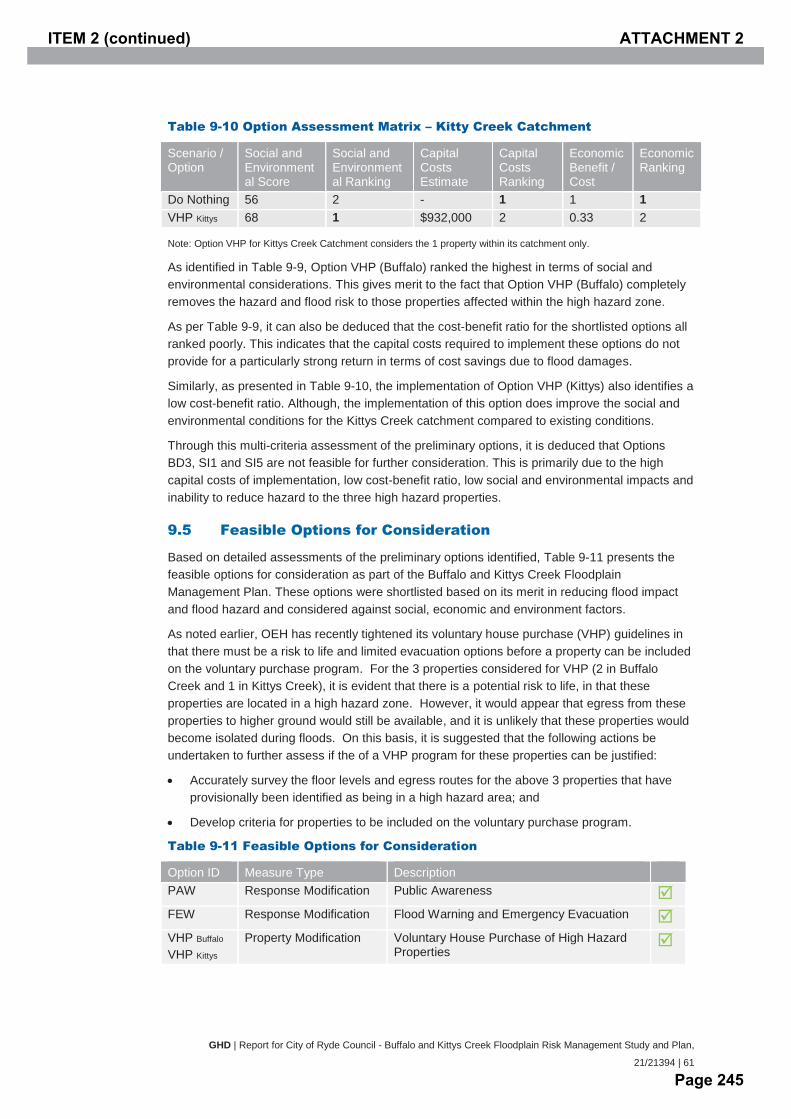
GHD | Report for City of Ryde Council - Buffalo and Kittys Creek Floodplain Risk Management Study and Plan,
21/21394 | 61
Table 9-10 Option Assessment Matrix – Kitty Creek Catchment
Scenario / Option
Social and Environmental Score
Social and Environmental Ranking
Capital Costs Estimate
Capital Costs Ranking
Economic Benefit / Cost
Economic Ranking
Do Nothing 56 2 - 1 1 1 VHP Kittys 68 1 $932,000 2 0.33 2
Note: Option VHP for Kittys Creek Catchment considers the 1 property within its catchment only.
As identified in Table 9-9, Option VHP (Buffalo) ranked the highest in terms of social and environmental considerations. This gives merit to the fact that Option VHP (Buffalo) completely removes the hazard and flood risk to those properties affected within the high hazard zone.
As per Table 9-9, it can also be deduced that the cost-benefit ratio for the shortlisted options all ranked poorly. This indicates that the capital costs required to implement these options do not provide for a particularly strong return in terms of cost savings due to flood damages.
Similarly, as presented in Table 9-10, the implementation of Option VHP (Kittys) also identifies a low cost-benefit ratio. Although, the implementation of this option does improve the social and environmental conditions for the Kittys Creek catchment compared to existing conditions.
Through this multi-criteria assessment of the preliminary options, it is deduced that Options BD3, SI1 and SI5 are not feasible for further consideration. This is primarily due to the high capital costs of implementation, low cost-benefit ratio, low social and environmental impacts and inability to reduce hazard to the three high hazard properties.
9.5 Feasible Options for Consideration
Based on detailed assessments of the preliminary options identified, Table 9-11 presents the feasible options for consideration as part of the Buffalo and Kittys Creek Floodplain Management Plan. These options were shortlisted based on its merit in reducing flood impact and flood hazard and considered against social, economic and environment factors.
As noted earlier, OEH has recently tightened its voluntary house purchase (VHP) guidelines in that there must be a risk to life and limited evacuation options before a property can be included on the voluntary purchase program. For the 3 properties considered for VHP (2 in Buffalo Creek and 1 in Kittys Creek), it is evident that there is a potential risk to life, in that these properties are located in a high hazard zone. However, it would appear that egress from these properties to higher ground would still be available, and it is unlikely that these properties would become isolated during floods. On this basis, it is suggested that the following actions be undertaken to further assess if the of a VHP program for these properties can be justified:
Accurately survey the floor levels and egress routes for the above 3 properties that have provisionally been identified as being in a high hazard area; and
Develop criteria for properties to be included on the voluntary purchase program.
Table 9-11 Feasible Options for Consideration
Option ID Measure Type Description PAW Response Modification Public Awareness
FEW Response Modification Flood Warning and Emergency Evacuation
VHP Buffalo VHP Kittys
Property Modification Voluntary House Purchase of High Hazard Properties
ITEM 2 (continued) ATTACHMENT 2
Page 245
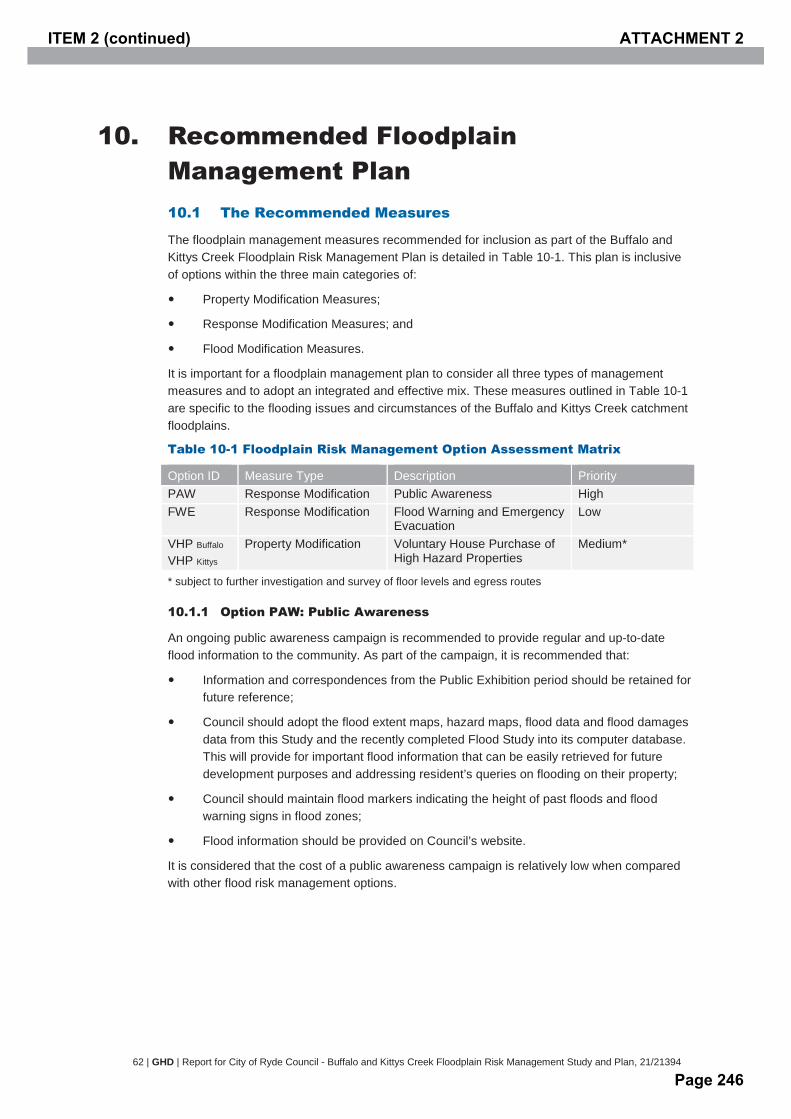
62 | GHD | Report for City of Ryde Council - Buffalo and Kittys Creek Floodplain Risk Management Study and Plan, 21/21394
10. Recommended Floodplain Management Plan 10.1 The Recommended Measures
The floodplain management measures recommended for inclusion as part of the Buffalo and Kittys Creek Floodplain Risk Management Plan is detailed in Table 10-1. This plan is inclusive of options within the three main categories of:
Property Modification Measures;
Response Modification Measures; and
Flood Modification Measures.
It is important for a floodplain management plan to consider all three types of management measures and to adopt an integrated and effective mix. These measures outlined in Table 10-1 are specific to the flooding issues and circumstances of the Buffalo and Kittys Creek catchment floodplains.
Table 10-1 Floodplain Risk Management Option Assessment Matrix
Option ID Measure Type Description Priority PAW Response Modification Public Awareness High FWE Response Modification Flood Warning and Emergency
Evacuation Low
VHP Buffalo VHP Kittys
Property Modification Voluntary House Purchase of High Hazard Properties
Medium*
* subject to further investigation and survey of floor levels and egress routes
10.1.1 Option PAW: Public Awareness
An ongoing public awareness campaign is recommended to provide regular and up-to-date flood information to the community. As part of the campaign, it is recommended that:
Information and correspondences from the Public Exhibition period should be retained for future reference;
Council should adopt the flood extent maps, hazard maps, flood data and flood damages data from this Study and the recently completed Flood Study into its computer database. This will provide for important flood information that can be easily retrieved for future development purposes and addressing resident’s queries on flooding on their property;
Council should maintain flood markers indicating the height of past floods and flood warning signs in flood zones;
Flood information should be provided on Council’s website.
It is considered that the cost of a public awareness campaign is relatively low when compared with other flood risk management options.
ITEM 2 (continued) ATTACHMENT 2
Page 246
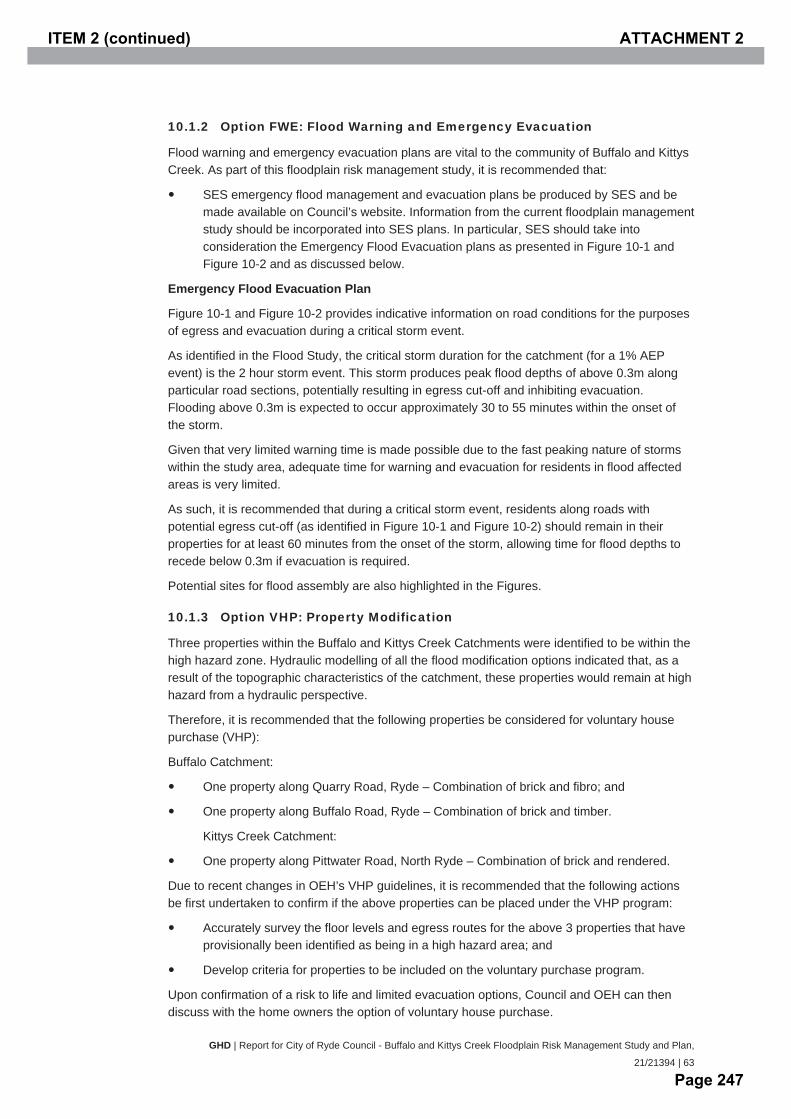
GHD | Report for City of Ryde Council - Buffalo and Kittys Creek Floodplain Risk Management Study and Plan,
21/21394 | 63
10.1.2 Option FWE: Flood Warning and Emergency Evacuation
Flood warning and emergency evacuation plans are vital to the community of Buffalo and Kittys Creek. As part of this floodplain risk management study, it is recommended that:
SES emergency flood management and evacuation plans be produced by SES and be made available on Council’s website. Information from the current floodplain management study should be incorporated into SES plans. In particular, SES should take into consideration the Emergency Flood Evacuation plans as presented in Figure 10-1 and Figure 10-2 and as discussed below.
Emergency Flood Evacuation Plan
Figure 10-1 and Figure 10-2 provides indicative information on road conditions for the purposes of egress and evacuation during a critical storm event.
As identified in the Flood Study, the critical storm duration for the catchment (for a 1% AEP event) is the 2 hour storm event. This storm produces peak flood depths of above 0.3m along particular road sections, potentially resulting in egress cut-off and inhibiting evacuation. Flooding above 0.3m is expected to occur approximately 30 to 55 minutes within the onset of the storm.
Given that very limited warning time is made possible due to the fast peaking nature of storms within the study area, adequate time for warning and evacuation for residents in flood affected areas is very limited.
As such, it is recommended that during a critical storm event, residents along roads with potential egress cut-off (as identified in Figure 10-1 and Figure 10-2) should remain in their properties for at least 60 minutes from the onset of the storm, allowing time for flood depths to recede below 0.3m if evacuation is required.
Potential sites for flood assembly are also highlighted in the Figures.
10.1.3 Option VHP: Property Modification
Three properties within the Buffalo and Kittys Creek Catchments were identified to be within the high hazard zone. Hydraulic modelling of all the flood modification options indicated that, as a result of the topographic characteristics of the catchment, these properties would remain at high hazard from a hydraulic perspective.
Therefore, it is recommended that the following properties be considered for voluntary house purchase (VHP):
Buffalo Catchment:
One property along Quarry Road, Ryde – Combination of brick and fibro; and
One property along Buffalo Road, Ryde – Combination of brick and timber.
Kittys Creek Catchment:
One property along Pittwater Road, North Ryde – Combination of brick and rendered.
Due to recent changes in OEH’s VHP guidelines, it is recommended that the following actions be first undertaken to confirm if the above properties can be placed under the VHP program:
Accurately survey the floor levels and egress routes for the above 3 properties that have provisionally been identified as being in a high hazard area; and
Develop criteria for properties to be included on the voluntary purchase program.
Upon confirmation of a risk to life and limited evacuation options, Council and OEH can then discuss with the home owners the option of voluntary house purchase.
ITEM 2 (continued) ATTACHMENT 2
Page 247

64 | GHD | Report for City of Ryde Council - Buffalo and Kittys Creek Floodplain Risk Management Study and Plan, 21/21394
10.1.4 Flood Modification Measures
None of the flood modification measures investigated in Sections 8 and 9 were found to be cost effective. No flood modification option is therefore recommended as part of this Floodplain Management Plan.
Further to the exhibition period, an additional investigation was undertaken on the possibility of dredging the lower reaches of Kittys Creek. This was found to be ineffective and not pursued further.
A further option was investigated on the possibility of improving the local flow behaviour in a culvert section at Pittwater Road at the downstream end of Imperial Avenue within the Buffalo Creek catchment. Preliminary investigations indicated that this area is relatively steep, discharges directly into the downstream reaches of Buffalo Creek, and has no impact on the overall flow behaviour within Buffalo Creek. Based on discussions with Council, it is recommended that this improvement measure be investigated further and in detail when necessary.
10.2 On-going review of Floodplain Risk Management Plan
This plan should be regarded as an on-going dynamic planning tool for the purposes of monitoring flood risk and mitigation options for the Study area.
A thorough review of the Plan every 5 years is recommended to ensure on-going relevance of the Plan.
ITEM 2 (continued) ATTACHMENT 2
Page 248
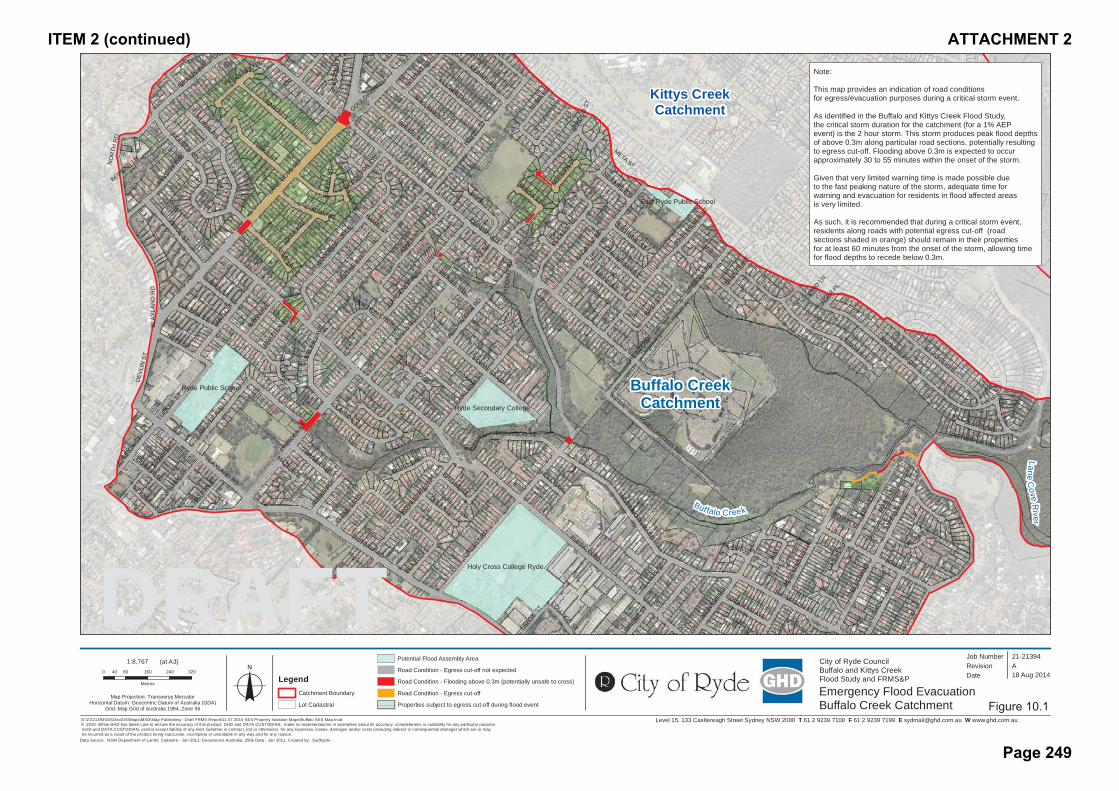
Level 15, 133 Castlereagh Street Sydney NSW 2000 T 61 2 9239 7100 F 61 2 9239 7199 E [email protected] W www.ghd.com.au
Holy Cross College Ryde
Ryde Public School
Ryde Secondary College
East Ryde Public School
BUFFALO RD
QUARRY RD
VICTORIA RD
LANE C
OVE RD
HIGH ST
PITTWATER RD
CRESSY RD
PRINCES S
T
MONCRIEFF DR
BOYCE ST
GREENE AVE
KELLS R
D
KUPPA RD
FINCH AVE
GARDENER AVE
HIGGINBOTHAM RD
JONES S
T
AITCHANDAR R
D
AEOLUS AVE
BRUCE ST
SMIT
H ST
WOODBIN
E CRES
WOLGER RD
PRICE ST
MONASH R
D
DEV
LIN
ST
ARGYL
E AVE
BADAJOZ
RD
MAR
S LN
KULGOA A
VE
FORREST RD
ELLIOTT AVE
WES
TMIN
STER
RD
POOLEY S
T
WELLINGTON RD
THE
STRA
ND
HANCOTT ST
THOMPSON ST
TUNKS ST
MACLEAY ST
KENN
EDY
ST
BLA
XLA
ND
RD
PROVIDENCE R
D
BIRD S
T
CHURCH ST
POPE ST
NUMA RD
SHO
RT S
T
MILNE ST
TUCKER S
T
KEPPEL RD
MINGA ST
GOULDIN
G RD
MALVIN
A ST
WILL
IAM S
T
DOBSON CRES
BUNA CT
BIDGEE RD
ELIZABETH ST
ROBINSON ST
BAIRD AVE
IRVIN
E CRES
BEAZLEY S
T
BAVIN
AVE
STUART ST
REN
E ST
BRIGHT ST
GOWRIE ST
ISABEL STMYRA AV
E
JOY ST
CLAYTON ST
TURNER AVE
NELSON S
T
IVY
ST
DOLAN ST
CURZON ST
CRES
CENT
AVE
ARRAS PDE
BLUETT
AVE
CALLAGHAN ST
KIM
ST
IMPE
RIAL
AVE
NERANG STHAT
TON S
T
DIGGERS AVE
LAURA ST
FRANK S
T
EDWARD S
T
BOYD LN
PRAT
TEN AV
E
BYGRAVE ST
BERRIP
A CL
JOHN M
ILLER S
T
MCCALLUM AVE
WATT AV
E
CAMERON CRES
ORIENT S
T
ST ANNES ST
STRO
UD S
T
COLLEGE ST
BAMBI ST
HOLLY AVE
MAZE AVE
GAN
ORA
ST
BETO
LA P
L
DOWD LN
META ST
PID
DIN
G R
D
SAGER PL
NO
RTH
RD
EILE
EN S
T
LEAWILL PL
SEMPLE ST
BEIHLE
R LN
ADAM ST
CHATFIELD ST
READFORD PL
TON
I CRES
BLAXLAND RD
CRESSY RD
CRESSY RD
G:\21\21394\GIS\ArcGIS\Maps\MXD\Map Publishing - Draft FRMS Report\11.07.2014 SES Property Isolation Maps\Buffalo SES Map.mxd© 2010. While GHD has taken care to ensure the accuracy of this product, GHD and DATA CUSTODIAN, make no representations or warranties about its accuracy, completeness or suitability for any particular purpose. GHD and DATA CUSTODIAN, cannot accept liability of any kind (whether in contract, tort or otherwise) for any expenses, losses, damages and/or costs (including indirect or consequential damage) which are or may be incurred as a result of the product being inaccurate, incomplete or unsuitable in any way and for any reason.
0 80 160 240 32040
Metres
Map Projection: Transverse MercatorHorizontal Datum: Geocentric Datum of Australia (GDA)
Grid: Map Grid of Australia 1994, Zone 56
Job NumberRevision A
21-21394
18 Aug 2014o Date
Data Source: NSW Department of Lands: Cadastre - Jan 2011; Geoscience Australia: 250k Data - Jan 2011. Created by: Sydhydro
1:8,767 (at A3) City of Ryde CouncilBuffalo and Kittys CreekFlood Study and FRMS&P
Emergency Flood EvacuationBuffalo Creek Catchment
DRAFT
Buffalo CreekCatchment
LegendCatchment Boundary
Lot Cadastral
Potential Flood Assembly Area
Road Condition - Egress cut-off not expected
Road Condition - Flooding above 0.3m (potentially unsafe to cross)
Road Condition - Egress cut-off
Properties subject to egress cut-off during flood event
Kittys CreekCatchment
Buf falo Creek
LaneC
oveR
iverNote:
This map provides an indication of road conditions for egress/evacuation purposes during a critical storm event.
As identified in the Buffalo and Kittys Creek Flood Study, the critical storm duration for the catchment (for a 1% AEP event) is the 2 hour storm. This storm produces peak flood depthsof above 0.3m along particular road sections, potentially resultingto egress cut-off. Flooding above 0.3m is expected to occur approximately 30 to 55 minutes within the onset of the storm.
Given that very limited warning time is made possible due to the fast peaking nature of the storm, adequate time for warning and evacuation for residents in flood affected areas is very limited.
As such, it is recommended that during a critical storm event,residents along roads with potential egress cut-off (roadsections shaded in orange) should remain in their properties for at least 60 minutes from the onset of the storm, allowing timefor flood depths to recede below 0.3m.
ITEM 2 (continued) ATTACHMENT 2
Page 249
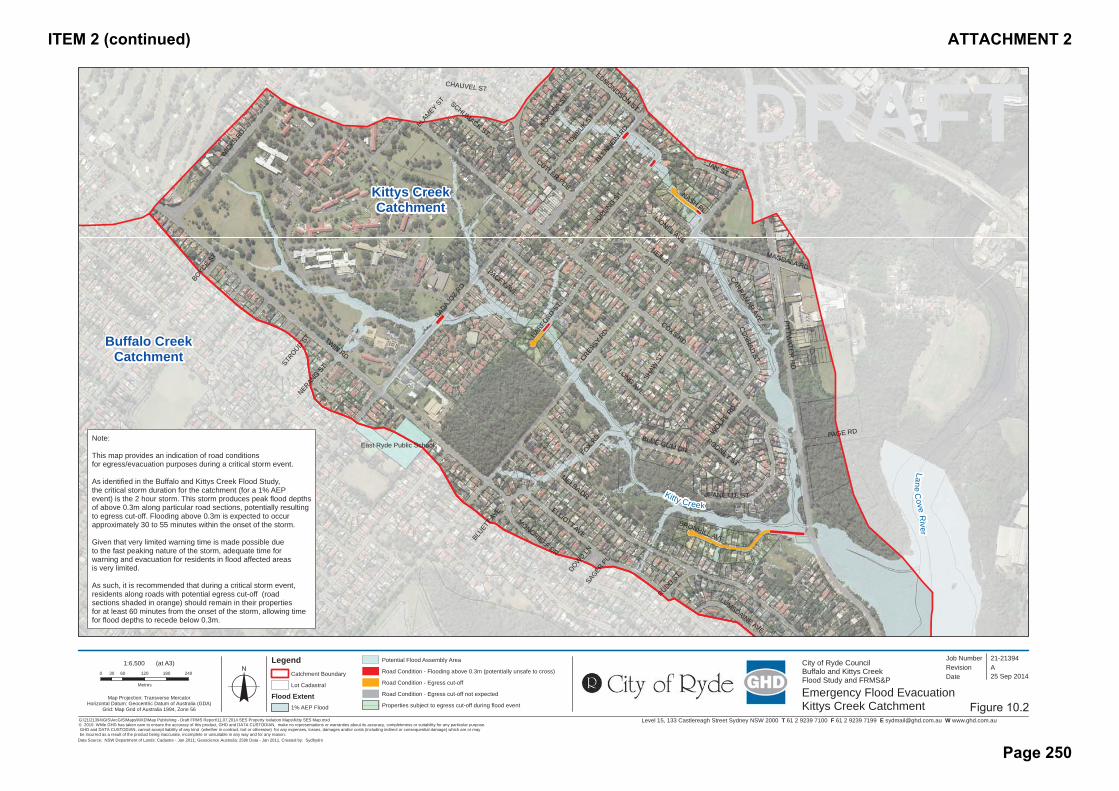
Level 15, 133 Castlereagh Street Sydney NSW 2000 T 61 2 9239 7100 F 61 2 9239 7199 E [email protected] W www.ghd.com.au
COXS RDTWIN RD
CRESSY RD
MELBA DR
PITTWATE
R R
D
MAGDALA RD
WIC
KS RD
BADAJOZ
RD
ELLIOTT AVE
BLENHEIM
RD
JOPLIN
G ST
FOX R
D
CUTLER PDE
PAGE RD
LONG AVE
BRONHILL AVE
TOBRUK S
T
KOKODA ST
CONRAD ST
NERANG ST
JEANETTE ST
HARFORD S
T
SHAW
ST
IAN ST
WOLF
E RD
NASH PL
CHAUVEL ST
BLUE GUM DR
NEIL STPACEY AVE
EDMONDSON STSCHUMACK ST
LUMSDAINE AVE
LIONEL AVE
RUDD ST
MONCRIEFF DR
STROUD S
T
CARRAMAR AVE
BOYCE ST
RODNEY ST
DOWD LN
BLUETT
AVE
SAGER PL
BLAMEY S
TEast Ryde Public School
G:\21\21394\GIS\ArcGIS\Maps\MXD\Map Publishing - Draft FRMS Report\11.07.2014 SES Property Isolation Maps\Kitty SES Map.mxd© 2010. While GHD has taken care to ensure the accuracy of this product, GHD and DATA CUSTODIAN, make no representations or warranties about its accuracy, completeness or suitability for any particular purpose. GHD and DATA CUSTODIAN, cannot accept liability of any kind (whether in contract, tort or otherwise) for any expenses, losses, damages and/or costs (including indirect or consequential damage) which are or may be incurred as a result of the product being inaccurate, incomplete or unsuitable in any way and for any reason.
0 60 120 180 24030
Metres
Map Projection: Transverse MercatorHorizontal Datum: Geocentric Datum of Australia (GDA)
Grid: Map Grid of Australia 1994, Zone 56
Job NumberRevision A
21-21394
25 Sep 2014o Date
Data Source: NSW Department of Lands: Cadastre - Jan 2011; Geoscience Australia: 250k Data - Jan 2011. Created by: Sydhydro
1:6,500 (at A3) City of Ryde CouncilBuffalo and Kittys CreekFlood Study and FRMS&P
Emergency Flood EvacuationKittys Creek Catchment
DRAFT
LegendCatchment Boundary
Lot Cadastral
Flood Extent1% AEP Flood
Potential Flood Assembly Area
Road Condition - Flooding above 0.3m (potentially unsafe to cross)
Road Condition - Egress cut-off
Road Condition - Egress cut-off not expected
Properties subject to egress cut-off during flood event
Buffalo CreekCatchment
Kittys CreekCatchment
Kitty Creek
LaneC
oveR
iver
Note:
This map provides an indication of road conditions for egress/evacuation purposes during a critical storm event.
As identified in the Buffalo and Kittys Creek Flood Study, the critical storm duration for the catchment (for a 1% AEP event) is the 2 hour storm. This storm produces peak flood depthsof above 0.3m along particular road sections, potentially resultingto egress cut-off. Flooding above 0.3m is expected to occur approximately 30 to 55 minutes within the onset of the storm.
Given that very limited warning time is made possible due to the fast peaking nature of the storm, adequate time for warning and evacuation for residents in flood affected areas is very limited.
As such, it is recommended that during a critical storm event,residents along roads with potential egress cut-off (roadsections shaded in orange) should remain in their properties for at least 60 minutes from the onset of the storm, allowing timefor flood depths to recede below 0.3m.
ITEM 2 (continued) ATTACHMENT 2
Page 250

GHD | Report for City of Ryde Council - Buffalo and Kittys Creek Floodplain Risk Management Study and Plan,
21/21394 | 67
ITEM 2 (continued) ATTACHMENT 2
Page 251

GHD | Report for City of Ryde Council - Buffalo and Kittys Creek Floodplain Risk Management Study and Plan, 21/21394
11. Glossary Annual Exceedance Probability (AEP) - AEP (measured as a percentage) is a term used to describe flood size. AEP is the long-term probability between floods of a certain magnitude. For example, a 1% AEP flood is a flood that occurs on average once every 100 years. It is also referred to as the ‘100 year flood’ or 1 in 100 year flood’. The terms 100-year flood, 50-year flood, 20-year flood etc, have been used in this study. See also average recurrence interval (ARI):
1e-4% (approx) AEP sometimes referred to as the PMF Event;
0.2% AEP sometimes referred to as the 1 in 500 year ARI Event;
1% AEP sometimes referred to as the 1 in 100 year ARI Event;
2% AEP sometimes referred to as the 1 in 50 year ARI Event;
5% AEP sometimes referred to as the 1 in 20 year ARI Event;
10% AEP sometimes referred to as the 1 in 10 year ARI Event; and
20% AEP sometimes referred to as the 1 in 5 year ARI Event
Average recurrence interval (ARI) - ARI (measured in years) is a term used to describe flood size. It is a means of describing how likely a flood is to occur in a given year. For example, a 100-year ARI flood is a flood that occurs or is exceeded on average once every 100 years. The terms 100-year flood, 50-year flood, 20-year flood etc., have been used in this study. See also annual exceedance probability (AEP).
Development Control Plan (DCP) - A DCP is a plan prepared in accordance with Section 72 of the Environmental Planning and Assessment Act, 1979 that provides detailed guidelines for the assessment of development applications.
Design flood level - A flood with a nominated probability or average recurrence interval, for example the 1% AEP flood is commonly use throughout NSW.
DRAINS – The software programs used to develop a computer model that analyses the hydrology (rainfall-runoff processes) of the catchment and calculates hydrographs and peak discharges. Known as a hydrological model.
OEH (formerly DECCW, DECC, DNR, DLWC, DIPNR) - Office of Environment and Heritage. Covers a range of conservation and natural resources science and programs, including native vegetation, biodiversity and environmental water recovery to provide an integrated approach to natural resource management. The NSW State Government Office provides funding and support for flood studies.
Discharge - The rate of flow of water measured in terms of volume per unit time, for example, cubic metres per second (m3/s). Discharge is different from the speed or velocity of flow, which is a measure of how fast the water is moving.
EP&A Act - Act Environmental Planning and Assessment Act, 1979
Extreme flood - An estimate of the probable maximum flood (PMF), which is the largest flood likely to occur.
Flood - A relatively high stream flow that overtops the natural or artificial banks in any part of a stream, river, estuary, lake or dam, and/or local overland flooding associated with major drainage before entering a watercourse, and/or coastal inundation resulting from super-elevated sea levels and/or waves overtopping coastline defences excluding tsunami.
ITEM 2 (continued) ATTACHMENT 2
Page 252
GHD | Report for City of Ryde Council - Buffalo and Kittys Creek Floodplain Risk Management Study and Plan,
21/21394 | 69
Flood awareness - An appreciation of the likely effects of flooding and knowledge of the relevant flood warning, response and evacuation procedures.
Flood hazard - The potential for damage to property or risk to persons during a flood. Flood hazard is a key tool used to determine flood severity and is used for assessing the suitability of future types of land use.
Flood level - The height of the flood described either as a depth of water above a particular location (e.g. 1m above a floor, yard or road) or as a depth of water related to a standard level such as Australian
Height Datum (e.g. the flood level was 7.8m AHD). Terms also used include flood stage and water level.
Flood liable land - Land susceptible to flooding up to the Probable Maximum Flood (PMF). Also called flood prone land. Note that the term flood liable land now covers the whole of the floodplain, not just that part below the flood planning level, as indicated in the superseded Floodplain Development Manual (NSW Government, 2005).
Flood Planning Levels (FPLs) - The combination of flood levels and freeboards selected for planning purposes, as determined in floodplain management studies and incorporated in floodplain management plans. The concept of flood planning levels supersedes the designated flood or the flood standard used in earlier studies.
Flood Prone Land - Land susceptible to flooding up to the Probable Maximum Flood (PMF). Also called flood liable land.
Flood Study - A study that investigates flood behaviour, including identification of flood extents, flood levels and flood velocities for a range of flood sizes.
Floodplain - The area of land that is subject to inundation by floods up to and including the Probable Maximum Flood event, that is, flood prone land or flood liable land.
Floodplain Risk Management Study – Studies carried out in accordance with the Floodplain Development Manual and assess options for minimising the danger to life and property during floods.
Floodplain Risk Management Plan - The outcome of a Floodplain Management Risk Study.
Floodway - Those areas of the floodplain where a significant discharge of water occurs during floods. Floodways are often aligned with naturally defined channels. Floodways are areas that, even if only partially blocked, would cause a significant redistribution of flood flow, or a significant increase in flood levels.
High Flood Hazard - For a particular size flood, there would be a possible danger to personal safety, able-bodied adults would have difficulty wading to safety, evacuation by trucks would be difficult and there would be a potential for significant structural damage to buildings.
Hydraulics Term - given to the study of water flow in waterways, in particular, the evaluation of flow parameters such as water level and velocity.
Hydrology Term - given to the study of the rainfall and runoff process; in particular, the evaluation of peak discharges, flow volumes and the derivation of hydrographs (graphs that show how the discharge or stage/flood level at any particular location varies with time during a flood).
LGA - Local Government Area, or Council boundary.
Local catchments - Local catchments are river sub-catchments that feed river tributaries, creeks, and
ITEM 2 (continued) ATTACHMENT 2
Page 253

70 | GHD | Report for City of Ryde Council - Buffalo and Kittys Creek Floodplain Risk Management Study and Plan, 21/21394
watercourses and channelised or piped drainage systems.
Local Environmental Plan (LEP) – A Local Environmental Plan is a plan prepared in accordance with the Environmental Planning and Assessment Act, 1979, that defines zones, permissible uses within those zones and specifies development standards and other special matters for consideration with regard to the use or development of land.
Local overland flooding - Local overland flooding is inundation by local runoff within the local
catchment.
Local runoff - local runoff from the local catchment is categorised as either major drainage or local drainage in the NSW Floodplain Development Manual, 2005.
Low flood hazard - For a particular size flood, able-bodied adults would generally have little difficulty wading and trucks could be used to evacuate people and their possessions should it be necessary.
Flows or discharges - It is the rate of flow of water measured in terms of volume per unit time.
Overland flow path - The path that floodwaters can follow if they leave the confines of the main flow channel. Overland flow paths can occur through private property or along roads. Floodwaters travelling along overland flow paths, often referred to as ‘overland flows’, may or may not re-enter the main channel from which they left — they may be diverted to another watercourse.
Peak discharge - The maximum flow or discharge during a flood.
Present value - In relation to flood damage, is the sum of all future flood damages that can be expected over a fixed period (usually 20 years) expressed as a cost in today’s value.
Probable Maximum Flood (PMF) - The largest flood likely to ever occur. The PMF defines the extent of flood prone land or flood liable land, that is, the floodplain.
Reliable access - During a flood, reliable access means the ability for people to safely evacuate an area subject to imminent flooding within effective warning time, having regard to the depth and velocity of floodwaters, the suitability of the evacuation route, and other relevant factors.
Risk - Chance of something happening that will have an impact. It is measured in terms of consequences and likelihood. In the context of this study, it is the likelihood of consequences arising from the interaction of floods, communities and the environment.
Runoff - the amount of rainfall that ends up as flow in a stream, also known as rainfall excess.
SES - State Emergency Service of New South Wales
ITEM 2 (continued) ATTACHMENT 2
Page 254

GHD | Report for City of Ryde Council - Buffalo and Kittys Creek Floodplain Risk Management Study and Plan,
21/21394 | 71
12. References AR&R 2001, Australian Rainfall and Runoff, 2001;
BOM 2003, Bureau of Meteorology Australia Generalised Tropical Storm Method – Revised Version, November 2003;
NSW DECC 2005, NSW Government, Floodplain Development Manual, Management of Flood Liable Land 2005;
NSW DECC 2007, Practical Consideration of Climate Change, NSW Department of Environment & Climate Change;
NSW DECCM 2010, Flood Risk Management Guide, Incorporating Sea Level Rise Benchmarks in Flood Risk Assessments
OEH 2007, Department of Environment and Climate Change, Flood Risk Management Guideline,
ITEM 2 (continued) ATTACHMENT 2
Page 255

72 | GHD | Report for City of Ryde Council - Buffalo and Kittys Creek Floodplain Risk Management Study and Plan, 21/21394
ITEM 2 (continued) ATTACHMENT 2
Page 256

GHD | Report for City of Ryde Council - Buffalo and Kittys Creek Floodplain Risk Management Study and Plan,
21/21394 | 73
Appendices
ITEM 2 (continued) ATTACHMENT 2
Page 257

74 | GHD | Report for City of Ryde Council - Buffalo and Kittys Creek Floodplain Risk Management Study and Plan, 21/21394
Appendix A – Preliminary Cost of Options
ITEM 2 (continued) ATTACHMENT 2
Page 258
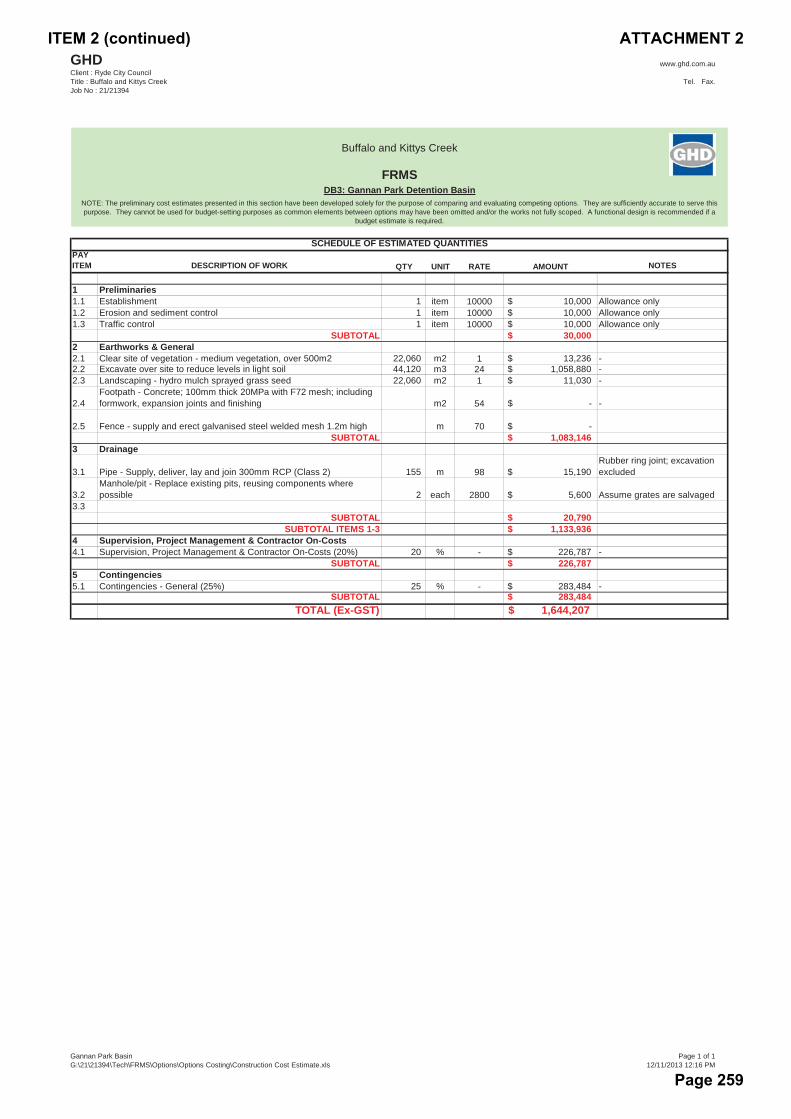
GHDClient : Ryde City CouncilTitle : Buffalo and Kittys CreekJob No : 21/21394
www.ghd.com.au
Tel. Fax.
Buffalo and Kittys Creek
FRMSDB3: Gannan Park Detention Basin
NOTE: The preliminary cost estimates presented in this section have been developed solely for the purpose of comparing and evaluating competing options. They are sufficiently accurate to serve this purpose. They cannot be used for budget-setting purposes as common elements between options may have been omitted and/or the works not fully scoped. A functional design is recommended if a
budget estimate is required.
SCHEDULE OF ESTIMATED QUANTITIESPAY ITEM DESCRIPTION OF WORK QTY UNIT RATE AMOUNT NOTES
1 Preliminaries1.1 Establishment 1 item 10000 $ 10,000 Allowance only1.2 Erosion and sediment control 1 item 10000 $ 10,000 Allowance only1.3 Traffic control 1 item 10000 $ 10,000 Allowance only
SUBTOTAL $ 30,000 2 Earthworks & General2.1 Clear site of vegetation - medium vegetation, over 500m2 22,060 m2 1 $ 13,236 -2.2 Excavate over site to reduce levels in light soil 44,120 m3 24 $ 1,058,880 -2.3 Landscaping - hydro mulch sprayed grass seed 22,060 m2 1 $ 11,030 -
2.4Footpath - Concrete; 100mm thick 20MPa with F72 mesh; including formwork, expansion joints and finishing m2 54 $ - -
2.5 Fence - supply and erect galvanised steel welded mesh 1.2m high m 70 $ - SUBTOTAL $ 1,083,146
3 Drainage
3.1 Pipe - Supply, deliver, lay and join 300mm RCP (Class 2) 155 m 98 $ 15,190 Rubber ring joint; excavation excluded
3.2Manhole/pit - Replace existing pits, reusing components where possible 2 each 2800 $ 5,600 Assume grates are salvaged
3.3SUBTOTAL $ 20,790
SUBTOTAL ITEMS 1-3 $ 1,133,936 4 Supervision, Project Management & Contractor On-Costs4.1 Supervision, Project Management & Contractor On-Costs (20%) 20 % - $ 226,787 -
SUBTOTAL $ 226,787 5 Contingencies5.1 Contingencies - General (25%) 25 % - $ 283,484 -
SUBTOTAL $ 283,484 TOTAL (Ex-GST) $ 1,644,207
Gannan Park BasinG:\21\21394\Tech\FRMS\Options\Options Costing\Construction Cost Estimate.xls
Page 1 of 112/11/2013 12:16 PM
ITEM 2 (continued) ATTACHMENT 2
Page 259
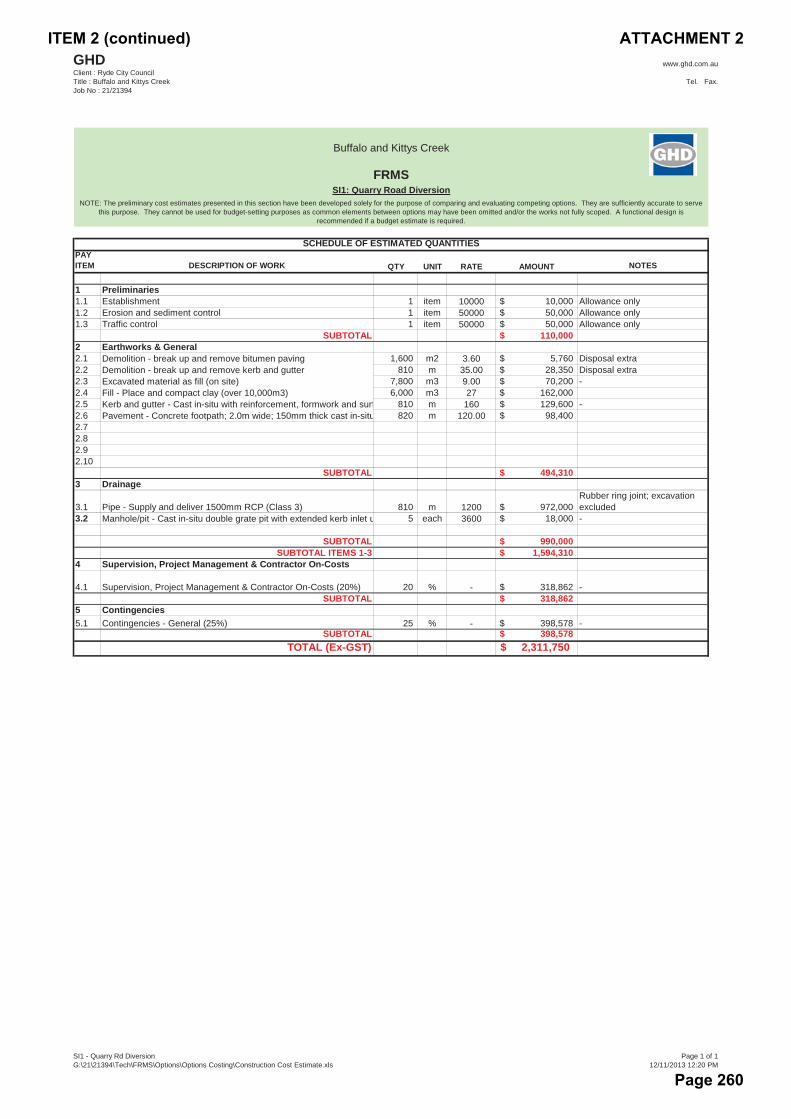
GHDClient : Ryde City CouncilTitle : Buffalo and Kittys CreekJob No : 21/21394
www.ghd.com.au
Tel. Fax.
Buffalo and Kittys Creek
FRMSSI1: Quarry Road Diversion
NOTE: The preliminary cost estimates presented in this section have been developed solely for the purpose of comparing and evaluating competing options. They are sufficiently accurate to serve this purpose. They cannot be used for budget-setting purposes as common elements between options may have been omitted and/or the works not fully scoped. A functional design is
recommended if a budget estimate is required.
SCHEDULE OF ESTIMATED QUANTITIESPAY ITEM DESCRIPTION OF WORK QTY UNIT RATE AMOUNT NOTES
1 Preliminaries1.1 Establishment 1 item 10000 $ 10,000 Allowance only1.2 Erosion and sediment control 1 item 50000 $ 50,000 Allowance only1.3 Traffic control 1 item 50000 $ 50,000 Allowance only
SUBTOTAL $ 110,000 2 Earthworks & General2.1 Demolition - break up and remove bitumen paving 1,600 m2 3.60 $ 5,760 Disposal extra2.2 Demolition - break up and remove kerb and gutter 810 m 35.00 $ 28,350 Disposal extra2.3 Excavated material as fill (on site) 7,800 m3 9.00 $ 70,200 -2.4 Fill - Place and compact clay (over 10,000m3) 6,000 m3 27 $ 162,000 2.5 Kerb and gutter - Cast in-situ with reinforcement, formwork and surf 810 m 160 $ 129,600 -2.6 Pavement - Concrete footpath; 2.0m wide; 150mm thick cast in-situ 820 m 120.00 $ 98,400 2.72.82.92.10
SUBTOTAL $ 494,310 3 Drainage
3.1 Pipe - Supply and deliver 1500mm RCP (Class 3) 810 m 1200 $ 972,000 Rubber ring joint; excavation excluded
3.2 Manhole/pit - Cast in-situ double grate pit with extended kerb inlet u 5 each 3600 $ 18,000 -
SUBTOTAL $ 990,000 SUBTOTAL ITEMS 1-3 $ 1,594,310
4 Supervision, Project Management & Contractor On-Costs
4.1 Supervision, Project Management & Contractor On-Costs (20%) 20 % - $ 318,862 -SUBTOTAL $ 318,862
5 Contingencies5.1 Contingencies - General (25%) 25 % - $ 398,578 -
SUBTOTAL $ 398,578 TOTAL (Ex-GST) $ 2,311,750
SI1 - Quarry Rd DiversionG:\21\21394\Tech\FRMS\Options\Options Costing\Construction Cost Estimate.xls
Page 1 of 112/11/2013 12:20 PM
ITEM 2 (continued) ATTACHMENT 2
Page 260
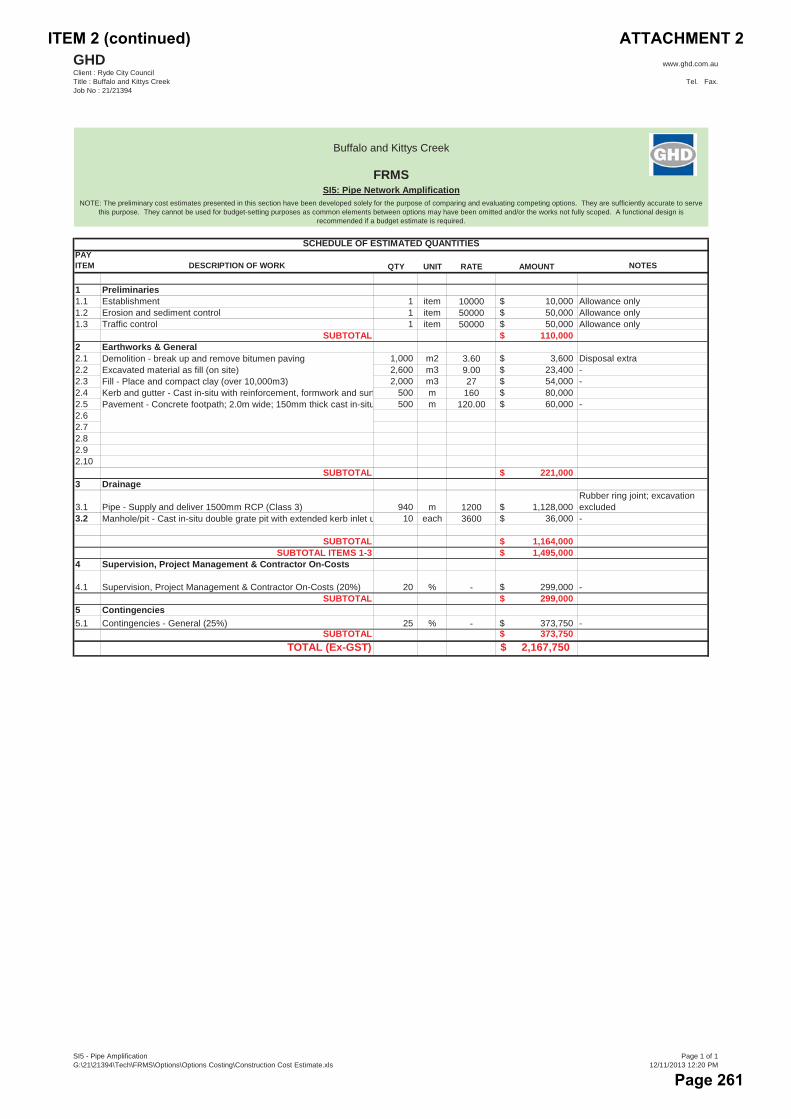
GHDClient : Ryde City CouncilTitle : Buffalo and Kittys CreekJob No : 21/21394
www.ghd.com.au
Tel. Fax.
Buffalo and Kittys Creek
FRMSSI5: Pipe Network Amplification
NOTE: The preliminary cost estimates presented in this section have been developed solely for the purpose of comparing and evaluating competing options. They are sufficiently accurate to serve this purpose. They cannot be used for budget-setting purposes as common elements between options may have been omitted and/or the works not fully scoped. A functional design is
recommended if a budget estimate is required.
SCHEDULE OF ESTIMATED QUANTITIESPAY ITEM DESCRIPTION OF WORK QTY UNIT RATE AMOUNT NOTES
1 Preliminaries1.1 Establishment 1 item 10000 $ 10,000 Allowance only1.2 Erosion and sediment control 1 item 50000 $ 50,000 Allowance only1.3 Traffic control 1 item 50000 $ 50,000 Allowance only
SUBTOTAL $ 110,000 2 Earthworks & General2.1 Demolition - break up and remove bitumen paving 1,000 m2 3.60 $ 3,600 Disposal extra2.2 Excavated material as fill (on site) 2,600 m3 9.00 $ 23,400 -2.3 Fill - Place and compact clay (over 10,000m3) 2,000 m3 27 $ 54,000 -2.4 Kerb and gutter - Cast in-situ with reinforcement, formwork and surf 500 m 160 $ 80,000 2.5 Pavement - Concrete footpath; 2.0m wide; 150mm thick cast in-situ 500 m 120.00 $ 60,000 -2.62.72.82.92.10
SUBTOTAL $ 221,000 3 Drainage
3.1 Pipe - Supply and deliver 1500mm RCP (Class 3) 940 m 1200 $ 1,128,000 Rubber ring joint; excavation excluded
3.2 Manhole/pit - Cast in-situ double grate pit with extended kerb inlet u 10 each 3600 $ 36,000 -
SUBTOTAL $ 1,164,000 SUBTOTAL ITEMS 1-3 $ 1,495,000
4 Supervision, Project Management & Contractor On-Costs
4.1 Supervision, Project Management & Contractor On-Costs (20%) 20 % - $ 299,000 -SUBTOTAL $ 299,000
5 Contingencies5.1 Contingencies - General (25%) 25 % - $ 373,750 -
SUBTOTAL $ 373,750 TOTAL (Ex-GST) $ 2,167,750
SI5 - Pipe AmplificationG:\21\21394\Tech\FRMS\Options\Options Costing\Construction Cost Estimate.xls
Page 1 of 112/11/2013 12:20 PM
ITEM 2 (continued) ATTACHMENT 2
Page 261

GHD | Report for City of Ryde Council - Buffalo and Kittys Creek Floodplain Risk Management Study and Plan,
21/21394 | 75
ITEM 2 (continued) ATTACHMENT 2
Page 262

76 | GHD | Report for City of Ryde Council - Buffalo and Kittys Creek Floodplain Risk Management Study and Plan, 21/21394
Appendix B – Multi-Criteria Analysis Multi-Criteria Analysis of Options
ITEM 2 (continued) ATTACHMENT 2
Page 263
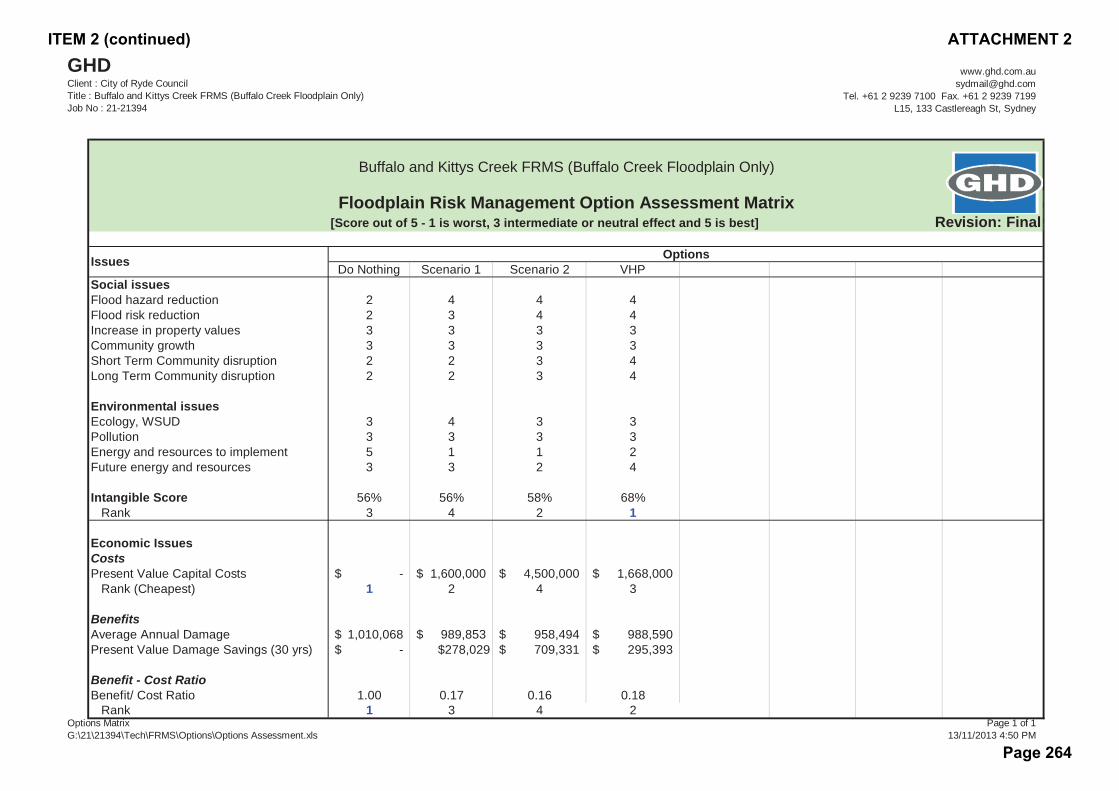
GHDClient : City of Ryde CouncilTitle : Buffalo and Kittys Creek FRMS (Buffalo Creek Floodplain Only)Job No : 21-21394
www.ghd.com.au [email protected]
Tel. +61 2 9239 7100 Fax. +61 2 9239 7199L15, 133 Castlereagh St, Sydney
Buffalo and Kittys Creek FRMS (Buffalo Creek Floodplain Only)
Floodplain Risk Management Option Assessment Matrix[Score out of 5 - 1 is worst, 3 intermediate or neutral effect and 5 is best] Revision: Final
OptionsDo Nothing Scenario 1 Scenario 2 VHP
Social issuesFlood hazard reduction 2 4 4 4Flood risk reduction 2 3 4 4Increase in property values 3 3 3 3Community growth 3 3 3 3Short Term Community disruption 2 2 3 4Long Term Community disruption 2 2 3 4
Environmental issuesEcology, WSUD 3 4 3 3Pollution 3 3 3 3Energy and resources to implement 5 1 1 2Future energy and resources 3 3 2 4
Intangible Score 56% 56% 58% 68%Rank 3 4 2 1
Economic IssuesCostsPresent Value Capital Costs -$ 1,600,000$ 4,500,000$ 1,668,000$
Rank (Cheapest) 1 2 4 3
BenefitsAverage Annual Damage 1,010,068$ 989,853$ 958,494$ 988,590$Present Value Damage Savings (30 yrs) -$ $278,029 709,331$ 295,393$
Benefit - Cost RatioBenefit/ Cost Ratio 1.00 0.17 0.16 0.18
Rank 1 3 4 2
Issues
Options MatrixG:\21\21394\Tech\FRMS\Options\Options Assessment.xls
Page 1 of 113/11/2013 4:50 PM
ITEM 2 (continued) ATTACHMENT 2
Page 264
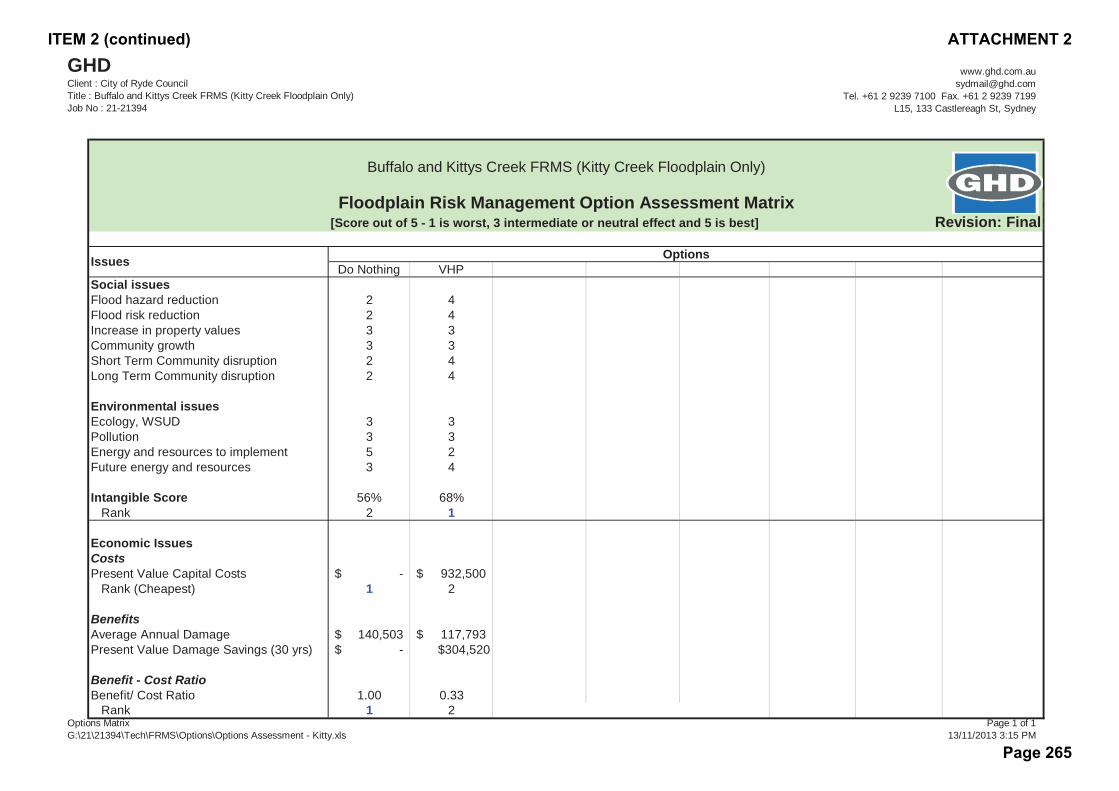
GHDClient : City of Ryde CouncilTitle : Buffalo and Kittys Creek FRMS (Kitty Creek Floodplain Only)Job No : 21-21394
www.ghd.com.au [email protected]
Tel. +61 2 9239 7100 Fax. +61 2 9239 7199L15, 133 Castlereagh St, Sydney
Buffalo and Kittys Creek FRMS (Kitty Creek Floodplain Only)
Floodplain Risk Management Option Assessment Matrix[Score out of 5 - 1 is worst, 3 intermediate or neutral effect and 5 is best] Revision: Final
OptionsDo Nothing VHP
Social issuesFlood hazard reduction 2 4Flood risk reduction 2 4Increase in property values 3 3Community growth 3 3Short Term Community disruption 2 4Long Term Community disruption 2 4
Environmental issuesEcology, WSUD 3 3Pollution 3 3Energy and resources to implement 5 2Future energy and resources 3 4
Intangible Score 56% 68%Rank 2 1
Economic IssuesCostsPresent Value Capital Costs -$ 932,500$
Rank (Cheapest) 1 2
BenefitsAverage Annual Damage 140,503$ 117,793$Present Value Damage Savings (30 yrs) -$ $304,520
Benefit - Cost RatioBenefit/ Cost Ratio 1.00 0.33
Rank 1 2
Issues
Options MatrixG:\21\21394\Tech\FRMS\Options\Options Assessment - Kitty.xls
Page 1 of 113/11/2013 3:15 PM
ITEM 2 (continued) ATTACHMENT 2
Page 265

GHD | Report for City of Ryde Council - Buffalo and Kittys Creek Floodplain Risk Management Study and Plan,
21/21394 | 77
Appendix C – Public Exhibition C.1 Public Exhibition Program
C.2 Potential Stormwater Drainage Upgrading Option at Pittwater Road and Preliminary DRAINS analysis
ITEM 2 (continued) ATTACHMENT 2
Page 266
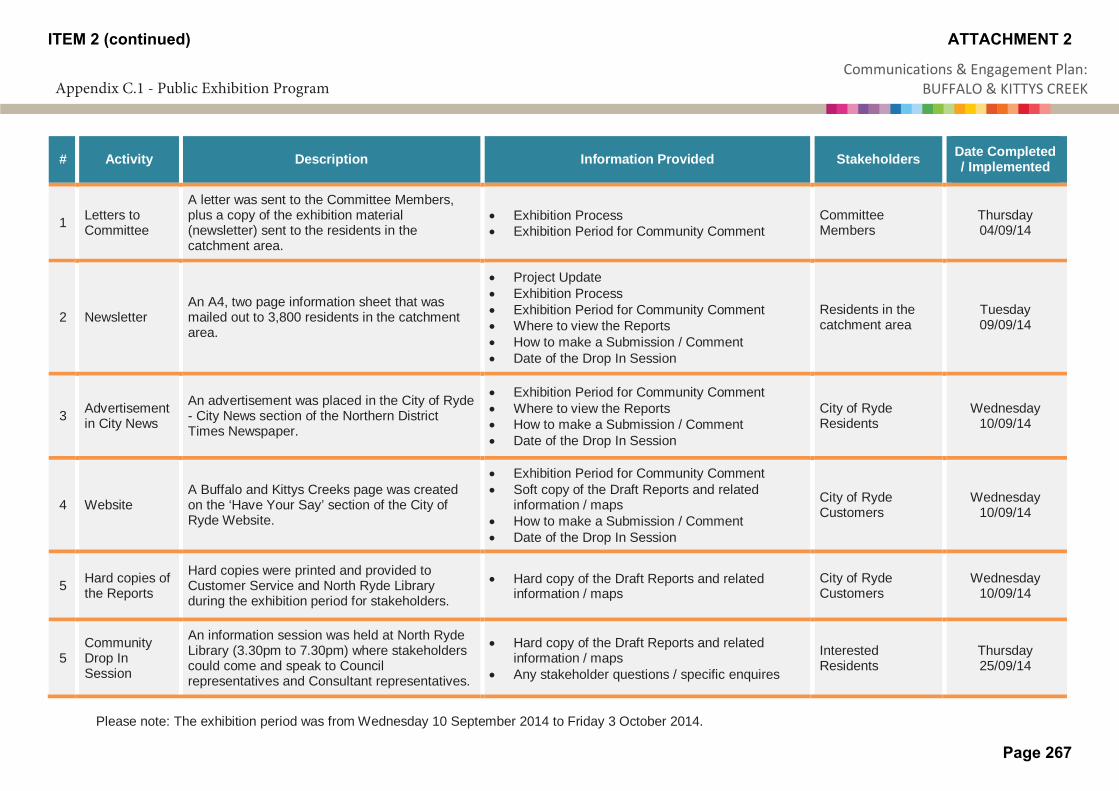
Communications & Engagement Plan: BUFFALO & KITTYS CREEK
# Activity Description Information Provided Stakeholders Date Completed / Implemented
1 Letters to Committee
A letter was sent to the Committee Members,plus a copy of the exhibition material (newsletter) sent to the residents in the catchment area.
Exhibition ProcessExhibition Period for Community Comment
Committee Members
Thursday04/09/14
2 NewsletterAn A4, two page information sheet that was mailed out to 3,800 residents in the catchment area.
Project UpdateExhibition ProcessExhibition Period for Community CommentWhere to view the ReportsHow to make a Submission / CommentDate of the Drop In Session
Residents in the catchment area
Tuesday09/09/14
3 Advertisement in City News
An advertisement was placed in the City of Ryde - City News section of the Northern District Times Newspaper.
Exhibition Period for Community CommentWhere to view the ReportsHow to make a Submission / CommentDate of the Drop In Session
City of Ryde Residents
Wednesday10/09/14
4 WebsiteA Buffalo and Kittys Creeks page was created on the ‘Have Your Say’ section of the City of Ryde Website.
Exhibition Period for Community CommentSoft copy of the Draft Reports and relatedinformation / mapsHow to make a Submission / CommentDate of the Drop In Session
City of RydeCustomers
Wednesday10/09/14
5 Hard copies of the Reports
Hard copies were printed and provided to Customer Service and North Ryde Library during the exhibition period for stakeholders.
Hard copy of the Draft Reports and relatedinformation / maps
City of Ryde Customers
Wednesday 10/09/14
5Community Drop In Session
An information session was held at North Ryde Library (3.30pm to 7.30pm) where stakeholders could come and speak to Council representatives and Consultant representatives.
Hard copy of the Draft Reports and relatedinformation / mapsAny stakeholder questions / specific enquires
Interested Residents
Thursday25/09/14
Please note: The exhibition period was from Wednesday 10 September 2014 to Friday 3 October 2014.
ITEM 2 (continued) ATTACHMENT 2
Page 267
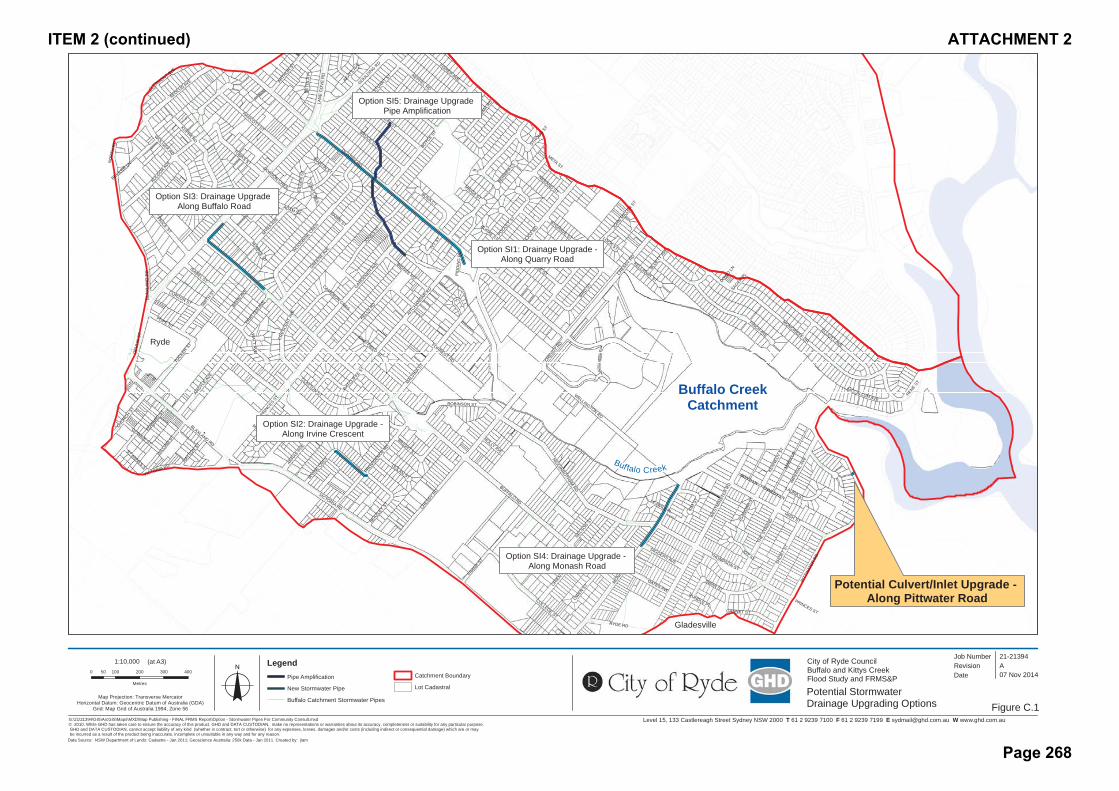
Level 15, 133 Castlereagh Street Sydney NSW 2000 T 61 2 9239 7100 F 61 2 9239 7199 E [email protected] W www.ghd.com.au
BUFFALO RD
QUARRY RD
VICTORIA RD
LAN
E C
OV
E R
D
PITT
WAT
ER R
D
HIGH ST
MONAS
H RD
CRESSY RD
PRIN
CES ST
MONCRIEFF DR
BOYCE S
T
GREENE AVE
AEOLUS AVE
KELLS R
D
KUPPA RD
WES
TMIN
STER
RD
THOMPSON ST
FINCH AVE
GARDENER AVE
HIGGINBOTHAM RD
JONES S
T
AITCHANDAR R
D
COLLEGE ST
BRUCE ST
SMIT
H ST
WOODBIN
E CRES
WOLGER RD
PRICE ST
DEV
LIN
ST
SWAN ST
ARGYLE
AVE
BADAJO
Z RD
MAR
S LN
KULGOA A
VE
FORREST RD
KEPPEL RD
ELLIOTT AVE
POOLE
Y ST
WELLINGTON RD
RYDE RD
THE
STRA
ND
HANCOTT ST
TUNKS ST
MACLEAY ST
GOULDIN
G RD
SHO
RT S
T
KENN
EDY
ST
BLA
XLA
ND
RD
OATES AVE
PROVIDENCE R
D
BIRD S
T
CHURCH ST
POPE ST
NUMA RD
MILNE ST
TUCKER
ST
ORIENT S
T
MINGA ST
MALVIN
A ST
WILL
IAM S
TDOBSON CRES
BUNA CT
BIDGEE RD
ELIZABETH ST
ROBINSON ST
FISHER AVE
GANNET ST
BAIRD AVE
IRVIN
E CRES
STUART ST
BEAZLEY S
T
BAVIN
AVE
ARTHUR S
T
RENE ST
OWEN S
T
BRIGHT ST
FRANK S
T
GOWRIE ST
ISABEL ST
MYRA AVE
JOY ST
CLAYTON ST
TURNER AVE
NELSON S
T
IVY
ST
DOLAN ST
CURZON ST
CRES
CEN
T AV
EAR
RAS P
DE
BLUETT
AVE
CALLAGHAN ST
KIM
ST
IMPE
RIAL
AVE
NERANG ST
RATCLIF
FE ST
HATTO
N ST
DIGGERS AVE
LAURA ST
EDW
ARD ST
BOYD LN
PRAT
TEN AV
E
BYGRAVE ST
BERRIP
A CL
JOHN M
ILLER S
T
MCCALLUM AVE
WATT AVE
CAMERON CRESBE
TOLA
PL
KELLAWAY ST
ST ANNES ST
STROUD S
T
BAMBI ST
HOLLY AVE
MAZE AVE
GAN
ORA
ST
RUNDLE PL
DOWD L
N
META ST
PID
DIN
G R
D
LOCK ST
SAGER
PL
MARTIN ST
NO
RTH
RD
KENNEDY LN
EILE
EN
ST
BURKE ST
LEAWILL PL
SEMPLE ST
BEIHLER LN
KEATS AV
E
ADAM ST
CLERMONT AVE
CHATFIELD ST
TON
I CRES
VICTORIA RD
PRINCES STCRESS
Y RD
CRESSY
RD
BLAXLAND RD
G:\21\21394\GIS\ArcGIS\Maps\MXD\Map Publishing - FINAL FRMS Report\Option - Stormwater Pipes For Community Consult.mxd© 2010. While GHD has taken care to ensure the accuracy of this product, GHD and DATA CUSTODIAN, make no representations or warranties about its accuracy, completeness or suitability for any particular purpose. GHD and DATA CUSTODIAN, cannot accept liability of any kind (whether in contract, tort or otherwise) for any expenses, losses, damages and/or costs (including indirect or consequential damage) which are or may be incurred as a result of the product being inaccurate, incomplete or unsuitable in any way and for any reason.
0 100 200 300 40050
Metres
Map Projection: Transverse MercatorHorizontal Datum: Geocentric Datum of Australia (GDA)
Grid: Map Grid of Australia 1994, Zone 56
Job NumberRevision A
21-21394
07 Nov 2014o Date
Data Source: NSW Department of Lands: Cadastre - Jan 2011; Geoscience Australia: 250k Data - Jan 2011. Created by: jlam
1:10,000 (at A3) City of Ryde CouncilBuffalo and Kittys CreekFlood Study and FRMS&P
Potential StormwaterDrainage Upgrading Options
Option SI3: Drainage Upgrade Along Buffalo Road
LegendPipe Amplification
New Stormwater Pipe
Buffalo Catchment Stormwater Pipes
Option SI2: Drainage Upgrade -Along Irvine Crescent
Option SI4: Drainage Upgrade - Along Monash Road
Option SI5: Drainage Upgrade Pipe Amplification
Option SI1: Drainage Upgrade -Along Quarry Road
Catchment Boundary
Lot Cadastral
Buffalo CreekCatchment
Buf falo Creek
Gladesville
Ryde
Figure C 1
Potential Culvert/Inlet Upgrade - Along Pittwater Road
ITEM 2 (continued) ATTACHMENT 2
Page 268

ITEM 2 (continued) ATTACHMENT 2
Page 269

ITEM 2 (continued) ATTACHMENT 2
Page 270