Age trajectories of physiological indices in relation to healthy life course
21
Age trajectories of physiological indices in relation to healthy life course Konstantin G. Arbeev * , Svetlana V. Ukraintseva, Igor Akushevich, Alexander M. Kulminski, Liubov S. Arbeeva, Lucy Akushevich, Irina V. Culminskaya, and Anatoliy I. Yashin Center for Population Health and Aging, Duke University, USA Abstract We analyzed relationship between the risk of onset of “unhealthy life” (defined as the onset of cancer, cardiovascular diseases, or diabetes) and longitudinal changes in body mass index, diastolic blood pressure, hematocrit, pulse pressure, pulse rate, and serum cholesterol in the Framingham Heart Study (original cohort) using the stochastic process model of human mortality and aging. The analyses demonstrate how decline in resistance to stresses and adaptive capacity accompanying human aging can be evaluated from longitudinal data. We showed how these components of the aging process, as well as deviation of the trajectories of physiological indices from those minimizing the risk at respective ages, can lead to an increase in the risk of onset of unhealthy life with age. The results indicate the presence of substantial gender difference in aging related decline in stress resistance and adaptive capacity, which can contribute to differences in the shape of the sex-specific patterns of incidence rates of aging related diseases. Keywords stress resistance; adaptive capacity; age-dynamics; physiological norm; Framingham Heart Study 1. Introduction Individual measurements of various physiological indices in humans represent “snapshots” of individual’s physiological state at particular ages. Longitudinal data on aging, health, and longevity describe individual age trajectories of such indices in connection with changes in health and survival status. Such data contain important information not only about values of physiological state at a given age, but also about dynamic characteristics of specific indices, which, together with values, may be associated with morbidity and mortality risks. In our earlier studies we showed that dynamic characteristics of blood glucose, body mass index, diastolic blood pressure, hematocrit, pulse pressure, pulse rate and total cholesterol at middle and old ages are related to risks of death and onset of cancer, cardiovascular diseases (CVD) and diabetes at later ages (Yashin et al., 2006; Yashin et al., 2010a). Note that many associations between selected characteristics and respective risks could be evaluated using standard statistical approaches. Such evaluations are useful at the initial step of analyses © 2011 Elsevier Ireland Ltd. All rights reserved. * Corresponding author: Dr. Konstantin G. Arbeev, Center for Population Health and Aging, Duke University, Trent Hall, Room 002, Box 90408, Durham, NC, 27708-0408, USA. Tel.: +1-919-668-2707; fax: +1-919-684-3861; [email protected]. Publisher's Disclaimer: This is a PDF file of an unedited manuscript that has been accepted for publication. As a service to our customers we are providing this early version of the manuscript. The manuscript will undergo copyediting, typesetting, and review of the resulting proof before it is published in its final citable form. Please note that during the production process errors may be discovered which could affect the content, and all legal disclaimers that apply to the journal pertain. NIH Public Access Author Manuscript Mech Ageing Dev. Author manuscript; available in PMC 2012 March 1. Published in final edited form as: Mech Ageing Dev. 2011 March ; 132(3): 93–102. doi:10.1016/j.mad.2011.01.001. NIH-PA Author Manuscript NIH-PA Author Manuscript NIH-PA Author Manuscript
Transcript of Age trajectories of physiological indices in relation to healthy life course

Age trajectories of physiological indices in relation to healthylife course
Konstantin G. Arbeev*, Svetlana V. Ukraintseva, Igor Akushevich, Alexander M. Kulminski,Liubov S. Arbeeva, Lucy Akushevich, Irina V. Culminskaya, and Anatoliy I. YashinCenter for Population Health and Aging, Duke University, USA
AbstractWe analyzed relationship between the risk of onset of “unhealthy life” (defined as the onset ofcancer, cardiovascular diseases, or diabetes) and longitudinal changes in body mass index,diastolic blood pressure, hematocrit, pulse pressure, pulse rate, and serum cholesterol in theFramingham Heart Study (original cohort) using the stochastic process model of human mortalityand aging. The analyses demonstrate how decline in resistance to stresses and adaptive capacityaccompanying human aging can be evaluated from longitudinal data. We showed how thesecomponents of the aging process, as well as deviation of the trajectories of physiological indicesfrom those minimizing the risk at respective ages, can lead to an increase in the risk of onset ofunhealthy life with age. The results indicate the presence of substantial gender difference in agingrelated decline in stress resistance and adaptive capacity, which can contribute to differences in theshape of the sex-specific patterns of incidence rates of aging related diseases.
Keywordsstress resistance; adaptive capacity; age-dynamics; physiological norm; Framingham Heart Study
1. IntroductionIndividual measurements of various physiological indices in humans represent “snapshots”of individual’s physiological state at particular ages. Longitudinal data on aging, health, andlongevity describe individual age trajectories of such indices in connection with changes inhealth and survival status. Such data contain important information not only about values ofphysiological state at a given age, but also about dynamic characteristics of specific indices,which, together with values, may be associated with morbidity and mortality risks. In ourearlier studies we showed that dynamic characteristics of blood glucose, body mass index,diastolic blood pressure, hematocrit, pulse pressure, pulse rate and total cholesterol at middleand old ages are related to risks of death and onset of cancer, cardiovascular diseases (CVD)and diabetes at later ages (Yashin et al., 2006; Yashin et al., 2010a). Note that manyassociations between selected characteristics and respective risks could be evaluated usingstandard statistical approaches. Such evaluations are useful at the initial step of analyses
© 2011 Elsevier Ireland Ltd. All rights reserved.*Corresponding author: Dr. Konstantin G. Arbeev, Center for Population Health and Aging, Duke University, Trent Hall, Room002, Box 90408, Durham, NC, 27708-0408, USA. Tel.: +1-919-668-2707; fax: +1-919-684-3861; [email protected]'s Disclaimer: This is a PDF file of an unedited manuscript that has been accepted for publication. As a service to ourcustomers we are providing this early version of the manuscript. The manuscript will undergo copyediting, typesetting, and review ofthe resulting proof before it is published in its final citable form. Please note that during the production process errors may bediscovered which could affect the content, and all legal disclaimers that apply to the journal pertain.
NIH Public AccessAuthor ManuscriptMech Ageing Dev. Author manuscript; available in PMC 2012 March 1.
Published in final edited form as:Mech Ageing Dev. 2011 March ; 132(3): 93–102. doi:10.1016/j.mad.2011.01.001.
NIH
-PA Author Manuscript
NIH
-PA Author Manuscript
NIH
-PA Author Manuscript

when the presence of specific effects has to be identified. However, for studyingmechanisms driving aging related changes such methods are not appropriate, because theyignore existing knowledge about regularities of such changes, and do not allow for linkingnew findings with available information and concepts of aging available in the literature.
In this paper we use such knowledge about several major concepts of aging to link observedoutcomes (morbidity/mortality risks, or longevity/healthy longevity) and longitudinalmeasurements of physiological indices. This allows for constructing dynamic modelsdescribing mechanisms of aging related changes involved in generating longitudinal data inconnection with morbidity/mortality risks. Respective mechanisms, as well as characteristicsof the risks, can be evaluated from longitudinal data by applying appropriate statisticalmodeling techniques (Yashin et al., 2007a). This approach has been applied to analyzingdata on longitudinal measurements of blood glucose (BG) in the Framingham Heart Study(FHS). It allowed for investigating dynamic mechanisms that relate age trajectories of BGand chances of reaching exceptional longevity. It also allowed for separating effects ofpersistent external disturbances (effects of allostatic adaptation) from “normal” aging-relatedchanges developing in human body due to the senescence process (Yashin et al., 2010b;Yashin et al., 2009).
In this paper we apply this approach to investigate mechanisms linking age trajectories ofphysiological indices and risks of onset of aging-related diseases. For this purpose, we applythe model by Yashin et al. (2007a) to analyze relationship between the risk of onset of“unhealthy life” (defined as onset of cancer, CVD, or diabetes) and longitudinal changes insix physiological indices (body mass index, diastolic blood pressure, hematocrit, pulsepressure, pulse rate, and serum cholesterol) whose dynamic characteristics have been shownto be related to the risk of onset of “unhealthy life” in participants of the original cohort ofthe Framingham Heart Study (FHS) (Yashin et al., 2010a). We show how differentcomponents of the aging process, such as the decline in resistance to stresses and adaptivecapacity, can be evaluated from age trajectories of these indices and data on onset ofdiseases, and how they can contribute to an increase in the risk of onset of “unhealthy life”with age. We calculate respective characteristics in females and males and evaluate theircontribution to the observed sex-specific patterns of incidence rate of onset of “unhealthylife.”
2. Data and Method2.1. Framingham Heart Study (FHS) data
The FHS Original Cohort consists of 5,209 respondents (nearly all are Caucasians, 46%male) aged 28-62 years at baseline and residing in Framingham, Massachusetts, between1948 and 1951, and who had not yet developed overt symptoms of cardiovascular disease orsuffered a heart attack or stroke (Dawber, 1980; Dawber et al., 1951). The study continues tothe present with biennial examinations (29 exams to date, data from exams 1-25 were usedin this study) that include detailed medical history, physical exams, and laboratory tests. TheFHS Original Cohort has been followed for about 60 years for the occurrence ofcardiovascular diseases (CVD), cancer, diabetes mellitus, and death through surveillance ofhospital admissions, death registries, and other available sources. Examination ofparticipants, including an interview, physical examination, and laboratory tests, has beentaken biennially. Phenotypic traits collected in the FHS Original Cohort over 60 years andrelevant to our analyses include: life span, ages at onset of diseases (with the emphasis oncardiovascular diseases (CVD), cancer, and diabetes mellitus), as well as indicescharacterizing physiological state. The occurrence of diseases (CVD and cancer) and deathhas been followed through continuous surveillance of hospital admissions, death registries,clinical exams, and other sources, so that all the respective events are included in the study.
Arbeev et al. Page 2
Mech Ageing Dev. Author manuscript; available in PMC 2012 March 1.
NIH
-PA Author Manuscript
NIH
-PA Author Manuscript
NIH
-PA Author Manuscript

We used data on first occurrence of CVD (defined by the FHS investigators as having any ofthe following: coronary heart disease, intermittent claudication, congestive heart failure, orstroke/transient ischemic attack) and cancer from the follow-up data, and data on currentdiabetes status (defined by the FHS investigators as a level of blood glucose exceeding 140mg/dl and/or taking insulin or oral hypoglycemics) in exams to calculate the age at onset of“unhealthy life” as the minimum of ages of occurrence of these diseases. If an individual didnot contract any of these diseases during the observation period, then that individual wasconsidered censored at the age of the last follow-up or death. Individuals who had any of thediseases before (for cancer and CVD) or at (for diabetes) the first FHS exam were excludedfrom the analyses of “unhealthy life.” Data on physiological indices that we used include:body mass index (BMI, exams 1-25), diastolic blood pressure (DBP, exams 1-25),hematocrit (HCT, exams 4-21), pulse pressure (PP, exams 1-25), pulse rate (PR, exams 1,4-25), and serum cholesterol (SCH, exams 1-11, 13-15, 20, 22-25).
2.2. The Underlying Paradigm Linking Age Dynamics of Physiological Indices andMorbidity Risks
The paradigm linking the age dynamics of physiological indices and morbidity risks is basedon several major concepts of aging known to date that are incorporated in the framework ofthe model by Yashin et al. (2007a).
The concept of allostasis describes the adaptive response of an organism to the persistentenvironmental and psychosocial situations, commonly referred to as “stresses” (Sterling andEyer, 1988). Allostasis means that an organism maintains “stability” of some functions bychanging the others. Unlike homeostasis, allostasis refers to the organism’s ability to copephysiologically, behaviorally, and emotionally with specific environmental challenges whilemaintaining the regulatory control of the homeostatic systems that operate within narrowparameters (McEwen and Wingfield, 2003). The body pays the “price” (allostatic load) forbeing forced to adapt to persistent environmental and psychosocial challenges. The allostaticload depends on how inefficient defense and compensatory mechanisms are, and/or howmany stressful challenges an individual experiences. Over time, allostatic load canaccumulate and the overexposure to neural, endocrine, and immune stress mediators canhave adverse effects on various organ systems leading to the development of a disease (and,eventually, increasing mortality risk). Thus, investigation of effects of allostatic adaptationprovides us with important indicators of physiological pre-disease pathways. Severalpractical procedures for evaluating allostatic load were suggested (Seeman et al., 2001;Seeman et al., 1997). These procedures, however, do not take into account the dynamicnature of physiological processes affecting individual health and survival. Importantinformation for understanding dynamic mechanisms regulating age trajectories ofphysiological state in individuals is that persistent exposure to external disturbances duringthe life course modifies set points of biological homeostatic regulation resulting in shiftingindividual’s physiological state from its “optimal” age trajectory where mortality risk isminimal. Thus the effects of allostatic adaptation are reflected in the individual agetrajectories of physiological indices, and, therefore, they need to be included in themathematical model describing age dynamics of these indices.
The decline in adaptive (homeostatic) capacity of physiological and biological systems withage (“homeostenosis”) has been shown to be an important characteristic of aging (Hall et al.,2000; Rankin and Kushner, 2009; Troncale, 1996) and, hence, it needs to be accounted forin description of the model.
In analyses of effects of persistent environmental and psychosocial challenges (which wename “stresses”) on an organism’s functioning one should take into account that availablelongitudinal studies (including the FHS) typically contain scarce (if any) information on
Arbeev et al. Page 3
Mech Ageing Dev. Author manuscript; available in PMC 2012 March 1.
NIH
-PA Author Manuscript
NIH
-PA Author Manuscript
NIH
-PA Author Manuscript

external disturbances affecting individuals during their life course. The intensities (andmagnitudes) of persistent external stresses that affect an organism’s functioning aregenerally unknown. Therefore, the direct estimation of such “stresses” from the data is notpossible. Our approach was developed to make possible estimation of the effects ofallostatic adaptation from longitudinal data. It includes effects of allostatic adaptation intothe model describing age trajectories of physiological state. As we show, these trajectoriescan be evaluated from the data, along with the negative feedback coefficient. The specific“stresses” causing this dynamics remain, nevertheless, unknown and unobserved.
Taken together, these considerations can be formalized in the following stochasticdifferential equation describing the age dynamics of a physiological index with age (Yashinet al., 2007a):
(1)
Here Yt is the value of a physiological index at age t. The function f1(t) describes the effectof allostatic adaptation, i.e., the trajectory that individual’s physiological index is forced tofollow by homeostatic forces in the presence of external disturbances described by a Wienerprocess Wt (which is independent of the initial normally distributed value Y0). The strengthof homeostatic forces is characterized by the negative feedback coefficient a(t): largervalues of this function correspond to faster return of the trajectory of the physiological indexto the allostatically prescribed values f1(t). Therefore, the decline in the absolute value ofthis function with age represents the effect of homeostenosis. In our applications to data ononset of “unhealthy life,” we used a linear approximation of such decline: a(t) = aY + bYt(with aY < 0 and bY ≥ 0). We used the quadratic function to model the “allostatic trajectory”f1(t) (which we denote the “mean allostatic state”): f1(t) = af1 + bf1t + cf1t2. The choice of thequadratic function for the “mean allostatic state” comes from the empirical observations ofthe average trajectories of the physiological indices in the FHS, which generally have aquadratic form (see Fig. 1), although, of course, the mean trajectories does not necessaryhave to follow those of f1(t) exactly.
The concept of allostatic adaptation implicitly assumes the notion of “deviation from thenorm,” that is, the “normal” state of an organism corresponding to “optimal” functioning interms of minimizing morbidity or mortality risk. The studies of how persistent externalunfavorable conditions get “under the skin” of affected person increasing his/hersusceptibility to diseases and death (McEwen, 2000; Sterling and Eyer, 1988) provideevidence that many such conditions affect set-points of physiological homeostasis changingphysiological balance from the “normal” to “abnormal” state. This means that the trajectoryof a physiological index that an organism is forced to follow under the persistent externaldisturbances (f1(t)) may be different from the “optimal” trajectory (which we denote f(t))minimizing mortality/morbidity risk that the homeostatic regulation would force to follow inthe absence of external disturbances. The difference between f1(t) and such “optimal”trajectory (which can be interpreted as age-specific “physiological norm”) provides themeasure of the allostatic load. In our applications to the data on onset of “unhealthy life,”we used a linear approximation of the “optimal” trajectory: f (t) = af + bft (see also“Sensitivity Analyses” in Appendix A).
Introduction of the notion of “optimal” age trajectory of physiological index allows forlinking longitudinal measurements of physiological indices and morbidity (or mortality)risk. As assumed in the definition of the “optimal” age trajectory f(t), deviations ofphysiological index from respective “optimal” levels for each age (represented by thisfunction f(t)) increase individual’s chances to develop a disease or die. Different studies
Arbeev et al. Page 4
Mech Ageing Dev. Author manuscript; available in PMC 2012 March 1.
NIH
-PA Author Manuscript
NIH
-PA Author Manuscript
NIH
-PA Author Manuscript

observed U- or J- shape of the risks as functions of various physiological indices (Allison etal., 1997; Boutitie et al., 2002; Kulminski et al., 2008a; Kuzuya et al., 2008; Mazza et al.,2007; Okumiya et al., 1999; Protogerou et al., 2007; Troiano et al., 1996; van Uffelen et al.,2010; Witteman et al., 1994; Yashin et al., 2001). Following these observations, wesuggested using a quadratic function to model dependence of the risk on deviations oftrajectories of physiological index Yt from the optimal trajectory f(t) (Arbeev et al., 2009;Yashin et al., 2010b; Yashin et al., 2007c; 2008; Yashin et al., 2009), although otherfunctional forms can be used as well (Yashin et al., 2007b). We use the following expressionfor the hazard rate (i.e., incidence rate for onset of “unhealthy life” in our applications) usingthe one-dimensional version of the model by Yashin et al. (2007a):
(2)
Here μ0(t) is the “residual” or “baseline” hazard that represents the risk which would remainif the index Yt followed the “optimal trajectory” represented by the function f(t). It modelsthe effect of other factors (such as the senescence process) that impact the incidence rate. Inapplications to data on onset of “unhealthy life,” we specified the logistic (gamma-
Gompertz) function for the baseline hazard: , where. The specific choice for the baseline hazard is motivated by the earlier
observations that the incidence rates of many aging-related diseases (including cancer, heartdisease, stroke and diabetes, which are used in the definition of onset of “unhealthy life” inour study) decelerate or even decline at advanced ages (Arbeev et al., 2005; Rockwood etal., 2000; Ukraintseva et al., 2006; Ukraintseva et al., 2010; Ukraintseva and Yashin, 2001;Ukraintseva and Yashin, 2003), and by empirical observations of the incidence rates of onsetof “unhealthy life” in the present study (Fig. 2).
The non-negative function Q(t) characterizes sensitivity of the risk function (incidence rate)to deviations of physiological variables from the “optimal” function f(t). This function canbe interpreted as the “vulnerability” index. It characterizes the “robustness”, or“vulnerability,” component of stress resistance. When the value of this function increases(i.e., the U-shape of the risk narrows), an organism becomes more vulnerable to deviationsfrom the “normal” state caused by external disturbances (because the same magnitude ofdeviation from the “optimal” trajectory results in a larger increase in the risk). An increasein this index with age (that is, the decline in stress resistance) can be considered as amanifestation of the senescence process (Strehler, 1962; Strehler and Mildvan, 1960;Ukraintseva and Yashin, 2003). In this study, we model the “vulnerability” index as a linearfunction of age: Q(t) = aQ + bQt (see also “Sensitivity Analyses” in Appendix A).
Fig. 3 schematically illustrates the main features of the model. A discrete-time version ofmodel (1)-(2) (with values of physiological indices evaluated at one-year age intervals usingrespective observations in the adjacent FHS exams) was applied to data on onset of“unhealthy life” in females and males in the FHS original cohort. Parameters of adaptivecapacity, mean allostatic state, the vulnerability index, the baseline hazard and the “optimal”trajectory were specified as described above. The diffusion coefficient b(t) was modeledconstant. We also performed several sensitivity analyses to test alternative specifications ofthe model (see “Sensitivity Analyses” in Appendix A).
3. Results and DiscussionEstimates of parameters of the baseline incidence rate, μ0(t), the “vulnerability” index, Q(t),the age-specific adaptive capacity a(t), the “mean allostatic state” f1(t), and the age-specific
Arbeev et al. Page 5
Mech Ageing Dev. Author manuscript; available in PMC 2012 March 1.
NIH
-PA Author Manuscript
NIH
-PA Author Manuscript
NIH
-PA Author Manuscript

“norm” f(t) for six physiological indices in the quadratic hazard model applied to data ononset of “unhealthy life” in females and males in the Framingham Heart Study (originalcohort) are given in Table 1.
3.1. Patterns of Baseline Incidence RateFig. 4 shows that for all indices and for both sexes the pattern of the baseline incidence ratedecelerates with age (respective estimates of parameter σ2 are non-zero, p < 0.0001). Thispattern contributes to the observed shape of the incidence rate at old ages (Fig. 2). Thus, oura priori expectations about the pattern of the risk of onset of “unhealthy life” correspondingto unspecified factors represented by μ0(t) are confirmed. Earlier we suggested that thedecelerated patterns of incidence rates observed for many chronic diseases at old ages mayreflect the contribution of basal process of aging in the body which is manifested inslowdown of metabolism, proliferative response and information processing with age(Ukraintseva and Yashin, 2001;Ukraintseva and Yashin, 2003).
3.2. Shape of “Vulnerability” Index and Stress ResistanceThe trajectories of the “vulnerability” index (Q(t)) increase with age for all indices and bothsexes as Fig. 5 illustrates (p-values for the null hypothesis about the constant Q(t) arerejected at different significance levels in all cases except for PP in females and males andSCH in females, see Table 1). This means that the width of the U-shape of the risk (as afunction of respective physiological index) is getting narrower with age. This, in turn,indicates that the range of the values of respective physiological indices corresponding to a“tolerable” increase in the risk is also getting narrower with age and the “price” for the samemagnitude of deviation from the “norm” (in terms of an absolute increase in the risk of onsetof “unhealthy life” compared to the baseline level μ0(t) at that age) is higher at older ages.For all indices (except for hematocrit), the trajectory of “vulnerability” index for males liesabove that of females meaning the higher “price” for deviations from the norm for malescompared to females (corresponding to a narrower U-shape of the risk at each age in males).This suggests that males have generally lower resistance to stresses than females: males aremore vulnerable to deviations from the “normal” state caused by external disturbances (thesame magnitude of deviation from the “optimal” trajectory results in a larger increase in therisk compared to females). In addition, the trajectories of Q(t) increase faster in males thanin females for all indices except for hematocrit. This means the faster decline in resistance tostresses in males compared to females. Combined with higher values of the baseline hazard,this contributes to the observed higher incidence rate for males, as well as to its fasterincrease with age (Fig. 2).
3.3. Decline in Adaptive CapacityThe absolute value of the feedback coefficient a(t) tends to decline with age in both femalesand males, see Fig. 6 (the decline is significant at different levels in all cases except for HCTin males, see Table 1). This means that the adaptive capacity declines with age in bothfemales and males for all analyzed physiological indices and more time is needed for thetrajectory of an index (Yt) to approach the “mean allostatic state” (f1(t)) at older agescompared to younger ages. The rate of decline differs in females and males for differentindices, as well as the initial values at age 40. For example, both the rate of decline and the(absolute value of) adaptive capacity at age 40 are higher in males than in females for DBP,while the opposite is observed for HCT and PP. In these cases, the trajectories for femalesand males intersect at ages about 60-70. For PP and SCH, the trajectories for females andmales go almost in parallel, but the relationship between the values of adaptive capacity atage 40 is the opposite for these two indices. These observations indicate that themechanisms underlying the decline in the adaptive capacity in females and males may notwork universally for all physiological indices and deserve further study.
Arbeev et al. Page 6
Mech Ageing Dev. Author manuscript; available in PMC 2012 March 1.
NIH
-PA Author Manuscript
NIH
-PA Author Manuscript
NIH
-PA Author Manuscript

3.4. Allostatic Adaptation and “Optimal” TrajectoriesFor all analyzed indices and both sexes, the resulting estimates of the “mean allostatic state”f1(t) are age-dependent (p-values for the null hypothesis about the constant f1(t) are: p =0.0002 for PR in males, p < 0.0001 for all other cases). The “optimal” trajectories f(t) arealso age-dependent, however, the null hypothesis about the constant f(t) was rejected onlyfor BMI (p = 0.035) and DBP (p = 0.0003) in females and HCT (p = 0.035) in males. Age-dependence of the “optimal” trajectory f(t) indicates that the values of these indices thatminimize the risk of onset of unhealthy life for young and middle-age adults may differ fromthose of old and oldest-old individuals. Therefore, the strategies aiming at maintaining thelevel of a physiological index at oldest ages similar to the level optimal for youngerindividuals may actually increase the risk of development of cancer, CVD or diabetes(Yashin et al., 2009). Furthermore, the notion of the “norm” used here corresponds, bydefinition, to the minimal risk of onset of any of the three diseases (cancer, CVD, diabetes)at respective ages. Hence, it is a “compromise” measure which may deviate from thedisease-specific “norms” (the latter may have different patterns if a physiological index hasnon-uniform impact on the different disease risks). However, if the goal is to minimize therisk of onset of any of the three diseases rather than to minimize the risk of one disease at apossible cost of increased risks for other diseases, then such approach may be preferable toanalyses of disease-specific data. Also, it may happen that the trajectory that minimizes therisk of onset of “unhealthy life” differs somewhat from that minimizing the risk of death.For example, at old ages, when the risk of a disease may decline, total mortality riskcontinues to increase, so that the factors minimizing the risks of the disease and death maybe different (Ukraintseva and Yashin, 2003). Thus, the concept of physiological “norm”deserves additional studies, which need to be performed to evaluate the “optimal”physiological trajectories corresponding to minimal mortality risks at different ages and tocompare them with those trajectories evaluated here for the onset of “unhealthy life.”
3.5. Measures of Allostatic Load and Differences in Healthy Life ExpectancyFor all indices and both sexes, the null hypotheses on coincidence of f1(t) and f(t) (in themodel with quadratic f1(t) and f(t)) were rejected (0.01 ≤ p < 0.05 for HCT and SCH infemales, p = 0.008 for BMI in males, p < 0.0001 in other cases). This means that theprocesses of compensatory adaptation and remodeling regulating the age dynamics ofrespective physiological states force the age trajectories of the indices to follow the curveswhich do not tend to minimize the risk of onset of “unhealthy life.” Persistent deviationsfrom the “norm” characterize the effects of allostatic adaptation and the magnitudes of suchdeviations for each physiological index can be associated with components of allostatic loadleading to increased chances of development of the diseases (if the estimates of the quadraticterm in the hazard, Q(t), are not zero, which is the case in our applications). If one takes twoindividuals, the first one being a “typical person” whose age trajectory of somephysiological index drifts along the “mean allostatic state” f1(t) and the second one whomanages to keep his/her age trajectory at the “optimal” level corresponding to f(t), then thefirst individual will have increased chances of getting the diseases compared to the secondone (if all other factors, i.e., those summarized in μ0(t), are the same). As the result, the“healthy life expectancy” in two individuals will be different and such a difference can beevaluated from the model. In case of our applications, the difference in healthy lifeexpectancy reaches 6.7 years for PP in females and 3.0 years for PP in males, although forother indices the increase is more moderate (about 1-2 years) indicating that the impact ofother (unobserved) factors (summarized collectively byμ0(t)) may be more pronounced indefining healthy lifespan compared to the analyzed indices.
Arbeev et al. Page 7
Mech Ageing Dev. Author manuscript; available in PMC 2012 March 1.
NIH
-PA Author Manuscript
NIH
-PA Author Manuscript
NIH
-PA Author Manuscript

3.6. Limitations of the Study and Alternative ApproachesThe limitations of the approach considered in this paper deal with the fact that it evaluatesaverage effects of allostatic adaptation and average “optimal” functions. It would be usefulto investigate individual dynamic effects of allostatic adaptation and individual optimal agetrajectories of physiological indices. Such extension, however, would involve more data andrequire development of more sophisticated dynamic models describing numerous agingrelated changes in their mutual connection and their effects on mortality/morbidity risk. Onemore limitation is that the approach uses a one-dimensional description of physiologicalstate. However, different physiological indices may be mutually dependent and evaluatingthe “norms” and other parameters independently may introduce a bias in estimates. Thus,multidimensional analysis of different indices is important. At the same time, a substantialdeviation of some indices from their one-dimensional “norms” may serve as an importantindicator of a possible pathological development that may lead to overt symptoms of chronicdiseases.
The method used in this paper for modeling aging related changes is not the only option toanalyze health deterioration with age or relationship between longitudinal measurements andmortality/morbidity data. Different methods for joint modeling of longitudinal and time-to-event data have been developed in biostatistics (see, e.g., reviews in Tsiatis and Davidian,2004; Yu et al., 2004). The reliability literature presents approaches for analyses of failuretime-degradation data with covariates which provide a powerful tool for investigation ofeffects of internal (degradation, wear) and external (covariates, stresses) explanatoryvariables on failure time distributions (see recent papers by Bagdonavicius and Nikulin,2009; Lehmann, 2009). Other approaches can be applied in different circumstancesdepending on availability of additional information apart from data on incidence of diseases.For example, the (random) vitality or a first-passage type models (Arbeev et al., 2005;Finkelstein, 2007; 2009; Li and Anderson, 2009; Strehler and Mildvan, 1960) can beemployed to investigate the shapes of the incidence rate curves. The availability ofindividual data on minor health deficits and symptoms collected in surveys allows forconstruction of a cumulative measure of health deterioration called a frailty index or anindex of cumulative deficits (Goggins et al., 2005; Kulminski et al., 2007; Kulminski et al.,2008b; Kulminski et al., 2008c; Mitnitski et al., 2001; Rockwood and Mitnitski, 2007;Yashin et al., 2007b; c) which proved to be an efficient empirical approach to investigateaging related processes of health deterioration. The availability of individual measurementsof biological parameters reflecting functioning of the hypothalamic–pituitary–adrenal axis,sympathetic nervous system, cardiovascular system, and metabolic processes allows forcalculation of cumulative physiological wear and tear measure of allostatic load and itseffect on health outcomes (Seeman et al., 2001; Seeman et al., 1997). However, informationon individual measurements of relevant biomarkers (such as those characterizing stressresistance, adaptive capacity, allostatic load, etc.) is often not available and some indirectmethods are needed to investigate the impact of respective aging-related processes onmortality/morbidity risks. The approach by Yashin et al. (2007a) provides a powerful toolfor comprehensive analyses of longitudinal data on aging, health, and longevity that allowsfor incorporating such aging-related mechanisms into the model and evaluating them fromdata on physiological indices and mortality/morbidity. This approach can quantify importantconnection between aging and development of chronic conditions, which have never beenevaluated from the analyses of longitudinal data before.
4. ConclusionsThe results of this study show that the model of human mortality and aging (Yashin et al.,2007a) can be successfully used for investigating physiological mechanisms regulatingduration of healthy life. The analyses demonstrate how decline in resistance to stresses and
Arbeev et al. Page 8
Mech Ageing Dev. Author manuscript; available in PMC 2012 March 1.
NIH
-PA Author Manuscript
NIH
-PA Author Manuscript
NIH
-PA Author Manuscript

adaptive capacity, accompanying human aging, can be evaluated from longitudinal data andshow how these key components of the aging process contribute to an increase in the risk ofonset of unhealthy life. The results indicate the presence of substantial gender difference inaging related decline in stress resistance and adaptive capacity, as well as in accumulation ofallostatic load, which contributes to the difference in the shape of the sex-specific patterns ofincidence rates of aging related diseases. These differences may have genetic origin or maybe caused by different roles males and females play in society. The determinants of suchdifferences deserve further study.
AcknowledgmentsThe research reported in this paper was supported by the National Institute on Aging grants R01AG028259,R01AG030198 and R01AG027019. The content is solely the responsibility of the authors and does not necessarilyrepresent the official views of the National Institute on Aging or the National Institutes of Health. The FraminghamHeart Study (FHS) is conducted and supported by the NHLBI in collaboration with the FHS Investigators. Thismanuscript was prepared using a limited access dataset obtained from the NHLBI and does not necessarily reflectthe opinions or views of the FHS or the NHLBI.
Appendix A. Sensitivity analyses
1. Shape of the “allostatic trajectory” (f1(t))The “basic” model applied to data on onset of “unhealthy life” used a quadratic function tospecify the “allostatic trajectory” f1(t). We also estimated the model with linear f1(t) andtested the null hypothesis in favor of the linear model. The null hypothesis was rejected forall indices and both sexes (p < 0.0001 in all cases except pulse rate for males (p = 0.002))excluding pulse pressure for females (p = 0.1). The model with linear f1(t) applied to for dataon pulse pressure for females produced the estimates similar to the model with quadraticf1(t) shown in Table 1.
2. Non-symmetric “vulnerability” index (Q(t))The “basic” model described in the text of the manuscript assumes the symmetric increase inthe risk due to the same magnitude of deviations of a physiological index to the left (i.e.,smaller than “optimal” values) or to the right (i.e., larger than “optimal” values) from the“optimal” trajectory f(t). We also estimated the model assuming a non-symmetric form ofQ(t) (i.e., different “penalties,” in terms of an additional risk, for deviations of the index tothe left and to the right from the “optimal” trajectory f(t)). Respective terms are modeled bytwo linear functions, QL(t) and QR(t). We tested the respective hypotheses on whether the“penalties” for deviations of the index to the left and to the right from the “norm” f(t) aredifferent. In all cases except for diastolic blood pressure in males (p = 0.037) the respectivenull hypotheses in favor of the simpler model (i.e., symmetric “penalties” for deviations tothe left and to the right from the “norm,” as used in the “basic” model) were not rejected atthe 0.05 significance level. The model with non-symmetric vulnerability index applied todata on diastolic blood pressure in males estimated a steeper increase of QL(t) than QR(t) anda lower “optimal” trajectory (af = 69.5, bf = −0.051) than the original model, with estimatesof all other parameters close to that in the “symmetric” model shown in Table 1.
3. Shape of the “optimal” trajectory (f(t))The “basic” model used a linear approximation of the “optimal” trajectory f(t). We alsoestimated the model with quadratic f(t) and tested the null hypothesis in favor of the linearmodel. The null hypothesis was not rejected at the 0.05 significance level for all indices andboth sexes except pulse pressure for males (p = 0.008) and pulse rate for females (p =
Arbeev et al. Page 9
Mech Ageing Dev. Author manuscript; available in PMC 2012 March 1.
NIH
-PA Author Manuscript
NIH
-PA Author Manuscript
NIH
-PA Author Manuscript

0.007). The model with quadratic f(t) applied to data on pulse pressure for males and pulserate for females produced the shapes of all components (except f(t)) similar to those in themodel with linear f(t) shown in Table 1. We also tested the null hypothesis that “optimal”values do not change with age in the model with quadratic f(t). The null hypothesis wasrejected at the 0.05 significance level for pulse rate in females (p = 0.022) and pulse pressurein males (p = 0.008).
4. Optimal ranges of values of physiological indicesThe “basic” model assumes a single “optimal” value of a physiological index thatcorresponds to the minimal risk of onset of “unhealthy life” at respective age. Alternatively,we can assume that there is a range of such values minimizing the risk at each age. To checksuch scenario, we estimated the model with “optimal range,” or
where I(.) is an indicator function (which equals one if the condition in the parentheses holdsand zero otherwise), fL(t) and fR(t) are two functions defining the left and right boundaries ofthe “optimal range,” which were modeled as linear functions.
We tested the respective null hypotheses in favor of the simpler model (i.e., with a single“optimal” value) and the null hypotheses were not rejected at the 0.05 level in all cases.Nevertheless, the optimal ranges fL(t) and fR(t), rather than the optimal trajectories f(t), wereestimated for the majority of indices. In all cases where such ranges were estimated, theranges narrowed with age indicating that the range of “acceptable” values of indices withminimal risk of onset of “unhealthy life” shrinks as an individual gets older. That is, therange of values of a physiological index with the same absolute increase in the risk(compared to the baseline level at respective age) narrows with age which can be consideredas a manifestation of decline in stress resistance with age. This leads to increased chances ofdevelopment of the diseases at older ages, compared to younger ages, associated with thesame magnitude of deviation from the “optimal” level.
ReferencesAllison DB, Faith MS, Heo M, Kotler DP. Hypothesis concerning the U-shaped relation between body
mass index and mortality. Am. J. Epidemiol. 1997; 146(4):339–349. [PubMed: 9270413]Arbeev KG, Akushevich I, Kulminski AM, Arbeeva LS, Akushevich L, Ukraintseva SV, Culminskaya
IV, Yashin AI. Genetic model for longitudinal studies of aging, health, and longevity and itspotential application to incomplete data. J. Theor. Biol. 2009; 258(1):103–111. [PubMed:19490866]
Arbeev KG, Ukraintseva SV, Arbeeva LS, Yashin AI. Mathematical models for human cancerincidence rates. Demographic Research. 2005; 12(10):237–271.
Bagdonavicius V, Nikulin M. Statistical Models to Analyze Failure, Wear, Fatigue, and DegradationData with Explanatory Variables. Communications in Statistics - Theory and Methods. 2009;38(16-17):3031–3047.
Boutitie F, Gueyffier F, Pocock S, Fagard R, Boissel JP. J-shaped relationship between blood pressureand mortality in hypertensive patients: New insights from a meta-analysis of individual-patient data.Ann. Intern. Med. 2002; 136(6):438–448. [PubMed: 11900496]
Dawber, TR. The Framingham Study: The Epidemiology of Atherosclerotic Disease. HarvardUniversity Press; Cambridge, MA: 1980.
Dawber TR, Meadors GF, Moore FE. Epidemiological approaches to heart disease: The FraminghamStudy. Am. J. Public Health. 1951; 41(3):279–286.
Arbeev et al. Page 10
Mech Ageing Dev. Author manuscript; available in PMC 2012 March 1.
NIH
-PA Author Manuscript
NIH
-PA Author Manuscript
NIH
-PA Author Manuscript

Finkelstein M. Aging: Damage accumulation versus increasing mortality rate. Math. Biosci. 2007;207(1):104–112. [PubMed: 17112546]
Finkelstein M. On damage accumulation and biological aging. Journal of Statistical Planning andInference. 2009; 139(5):1643–1648.
Goggins WB, Woo J, Sham A, Ho SC. Frailty index as a measure of biological age in a Chinesepopulation. J. Gerontol. A. Biol. Sci. Med. Sci. 2005; 60(8):1046–1051. [PubMed: 16127111]
Hall DM, Xu L, Drake VJ, Oberley LW, Oberley TD, Moseley PL, Kregel KC. Aging reducesadaptive capacity and stress protein expression in the liver after heat stress. J. Appl. Physiol. 2000;89(2):749–759. [PubMed: 10926662]
Kulminski A, Ukraintseva SV, Akushevich I, Arbeev KG, Land K, Yashin AI. Acceleratedaccumulation of health deficits as a characteristic of aging. Exp. Gerontol. 2007; 42(10):963–970.[PubMed: 17601693]
Kulminski AM, Arbeev KG, Kulminskaya IV, Ukraintseva SV, Land K, Akushevich I, Yashin AI.Body mass index and nine-year mortality in disabled and nondisabled older U.S. Individuals. J.Am. Geriatr. Soc. 2008a; 56(1):105–110. [PubMed: 18005352]
Kulminski AM, Arbeev KG, Ukraintseva SV, Culminskaya IV, Land K, Yashin AI. Changes in healthstatus among participants of the Framingham Heart Study from the 1960s to the 1990s:Application of an index of cumulative deficits. Ann. Epidemiol. 2008b; 18(9):696–701. [PubMed:18794010]
Kulminski AM, Ukraintseva SV, Culminskaya IV, Arbeev KG, Land KC, Akushevich L, Yashin AI.Cumulative Deficits and Physiological Indices as Predictors of Mortality and Long Life. J.Gerontol. A. Biol. Sci. Med. Sci. 2008c; 63(10):1053–1059. [PubMed: 18948555]
Kuzuya M, Enoki H, Iwata M, Hasegawa J, Hirakawa Y. J-shaped relationship between resting pulserate and all-cause mortality in community-dwelling older people with disabilities. J. Am. Geriatr.Soc. 2008; 56(2):367–368. [PubMed: 18251825]
Lehmann A. Joint modeling of degradation and failure time data. Journal of Statistical Planning andInference. 2009; 139(5):1693–1706.
Li T, Anderson JJ. The vitality model: A way to understand population survival and demographicheterogeneity. Theor. Popul. Biol. 2009; 76(2):118–131. [PubMed: 19500610]
Mazza A, Zamboni S, Rizzato E, Pessina AC, Tikhonoff V, Schiavon L, Casiglia E. Serum uric acidshows a J-shaped trend with coronary mortality in non-insulin-dependent diabetic elderly people.The CArdiovascular STudy in the ELderly (CASTEL). Acta Diabetol. 2007; 44(3):99–105.[PubMed: 17721747]
McEwen BS. Allostasis and allostatic load: Implications for neuropsychopharmacology.Neuropsychopharmacology. 2000; 22(2):108–124. [PubMed: 10649824]
McEwen BS, Wingfield JC. The concept of allostasis in biology and biomedicine. Horm. Behav. 2003;43(1):2–15. [PubMed: 12614627]
Mitnitski AB, Mogilner AJ, Rockwood K. Accumulation of deficits as a proxy measure of aging.ScientificWorldJournal. 2001; 1:323–336. [PubMed: 12806071]
Okumiya K, Matsubayashi K, Wada T, Fujisawa M, Osaki Y, Doi Y, Yasuda N, Ozawa T. A U-shaped association between home systolic blood pressure and four-year mortality in community-dwelling older men. J. Am. Geriatr. Soc. 1999; 47(12):1415–1421. [PubMed: 10591234]
Protogerou AD, Safar ME, Iaria P, Safar H, Le Dudal K, Filipovsky J, Henry O, Ducimetiere P,Blacher J. Diastolic blood pressure and mortality in the elderly with cardiovascular disease.Hypertension. 2007; 50(1):172–180. [PubMed: 17515449]
Rankin MM, Kushner JA. Adaptive beta-cell Proliferation Is Severely Restricted With Advanced Age.Diabetes. 2009; 58(6):1365–1372. [PubMed: 19265026]
Rockwood K, Awalt E, MacKnight C, McDowell I. Incidence and outcomes of diabetes mellitus inelderly people: report from the Canadian Study of Health and Aging. Can. Med. Assoc. J. 2000;162(6):769–772. [PubMed: 10750461]
Rockwood K, Mitnitski A. Frailty in relation to the accumulation of deficits. J. Gerontol. A. Biol. Sci.Med. Sci. 2007; 62(7):722–727. [PubMed: 17634318]
Arbeev et al. Page 11
Mech Ageing Dev. Author manuscript; available in PMC 2012 March 1.
NIH
-PA Author Manuscript
NIH
-PA Author Manuscript
NIH
-PA Author Manuscript

Seeman TE, McEwen BS, Rowe JW, Singer BH. Allostatic load as a marker of cumulative biologicalrisk: MacArthur studies of successful aging. Proc. Natl. Acad. Sci. U. S. A. 2001; 98(8):4770–4775. [PubMed: 11287659]
Seeman TE, Singer BH, Rowe JW, Horwitz RI, McEwen BS. Price of adaptation - Allostatic load andits health consequences: MacArthur studies of successful aging. Arch. Intern. Med. 1997; 157(19):2259–2268. [PubMed: 9343003]
Sterling, P.; Eyer, J. Allostasis: A New Paradigm to Explain Arousal Pathology. In: Fisher, S.; Reason,J., editors. Handbook of Life Stress, Cognition and Health. John Wiley & Sons; New York: 1988.p. 629-649.
Strehler, B. Time, Cells, and Aging. Academic Press; London: 1962.Strehler BL, Mildvan AS. General theory of mortality and aging. Science. 1960; 132(3418):14–21.
[PubMed: 13835176]Troiano RP, Frongillo EA, Sobal J, Levitsky DA. The relationship between body weight and mortality:
A quantitative analysis of combined information from existing studies. Int. J. Obesity. 1996; 20(1):63–75.
Troncale JA. The aging process: Physiologic changes and pharmacologic implications. Postgrad. Med.1996; 99(5):111–114. 120–122. [PubMed: 8650079]
Tsiatis AA, Davidian M. Joint modeling of longitudinal and time-to-event data: An overview.Statistica Sinica. 2004; 14(3):809–834.
Ukraintseva S, Sloan F, Arbeev K, Yashin A. Increasing rates of dementia at time of decliningmortality from stroke. Stroke. 2006; 37(5):1155–1159. [PubMed: 16601210]
Ukraintseva SV, Arbeev KG, Akushevich I, Kulminski A, Arbeeva L, Culminskaya I, Akushevich L,Yashin AI. Trade-offs between cancer and other diseases: Do they exist and influence longevity?Rejuvenation Research. 2010 in press, DOI: 10.1089/rej.2009.0941.
Ukraintseva SV, Yashin AI. How individual age-associated changes may influence human morbidityand mortality patterns. Mech. Ageing Dev. 2001; 122(13):1447–1460. [PubMed: 11470132]
Ukraintseva SV, Yashin AI. Individual aging and cancer risk: How are they related? DemographicResearch. 2003; 9(8):163–196.
van Uffelen JGZ, Berecki-Gisolf J, Brown WJ, Dobson AJ. What Is a Healthy Body Mass Index forWomen in Their Seventies? Results From the Australian Longitudinal Study on Women’s Health.J. Gerontol. A. Biol. Sci. Med. Sci. 2010 in press, doi:10.1093/gerona/glq1058.
Witteman JCM, Grobbee DE, Valkenburg HA, Vanhemert AM, Stijnen T, Burger H, Hofman A. J-shaped relation between change in diastolic blood-pressure and progression of aorticatherosclerosis. Lancet. 1994; 343(8896):504–507. [PubMed: 7906758]
Yashin AI, Akushevich IV, Arbeev KG, Akushevich L, Ukraintseva SV, Kulminski A. Insights onaging and exceptional longevity from longitudinal data: novel findings from the FraminghamHeart Study. Age. 2006; 28(4):363–374. [PubMed: 17895962]
Yashin AI, Arbeev KG, Akushevich I, Arbeeva L, Kravchenko J, Il’yasova D, Kulminski A,Akushevich L, Culminskaya I, Wu D, Ukraintseva SV. Dynamic determinants of longevity andexceptional health. Current Gerontology and Geriatrics Research. 2010a 2010, Article ID 381637.
Yashin AI, Arbeev KG, Akushevich I, Kulminski A, Akushevich L, Ukraintseva SV. Stochastic modelfor analysis of longitudinal data on aging and mortality. Math. Biosci. 2007a; 208(2):538–551.[PubMed: 17300818]
Yashin AI, Arbeev KG, Akushevich I, Ukraintseva SV, Kulminski A, Arbeeva LS, Culminskaya I.Exceptional survivors have lower age trajectories of blood glucose: lessons from longitudinal data.Biogerontology. 2010b; 11(3):257–265. [PubMed: 19644762]
Yashin AI, Arbeev KG, Kulminski A, Akushevich I, Akushevich L, Ukraintseva SV. Cumulativeindex of elderly disorders and its dynamic contribution to mortality and longevity. RejuvenationResearch. 2007b; 10(1):75–86. [PubMed: 17378754]
Yashin AI, Arbeev KG, Kulminski A, Akushevich I, Akushevich L, Ukraintseva SV. Health decline,aging and mortality: how are they related? Biogerontology. 2007c; 8(3):291–302. [PubMed:17242962]
Yashin AI, Arbeev KG, Kulminski A, Akushevich I, Akushevich L, Ukraintseva SV. What agetrajectories of cumulative deficits and medical costs tell us about individual aging and mortality
Arbeev et al. Page 12
Mech Ageing Dev. Author manuscript; available in PMC 2012 March 1.
NIH
-PA Author Manuscript
NIH
-PA Author Manuscript
NIH
-PA Author Manuscript

risk: Findings from the NLTCS-Medicare data. Mech. Ageing Dev. 2008; 129(4):191–200.[PubMed: 18242665]
Yashin AI, Ukraintseva SV, Arbeev KG, Akushevich I, Arbeeva LS, Kulminski AM. Maintainingphysiological state for exceptional survival: What is the normal level of blood glucose and does itchange with age? Mech. Ageing Dev. 2009; 130(9):611–618. [PubMed: 19635493]
Yashin AI, Ukraintseva SV, De Benedictis G, Anisimov VN, Butov AA, Arbeev K, Jdanov DA, BoikoSI, Begun AS, Bonafe M, Franceschi C. Have the oldest old adults ever been frail in the past? Ahypothesis that explains modern trends in survival. J. Gerontol. A. Biol. Sci. Med. Sci. 2001;56(10):B432–B442. [PubMed: 11584028]
Yu MG, Law NJ, Taylor JMG, Sandler HM. Joint longitudinal-survival-cure models and theirapplication to prostate cancer. Statistica Sinica. 2004; 14(3):835–862.
Arbeev et al. Page 13
Mech Ageing Dev. Author manuscript; available in PMC 2012 March 1.
NIH
-PA Author Manuscript
NIH
-PA Author Manuscript
NIH
-PA Author Manuscript

Fig. 1.Average trajectories (±s.e.) of six physiological indices in females and males in theFramingham Heart Study (original cohort). Note: values of the indices measured after theonset of any of the three diseases defining “unhealthy life” (i.e., cancer, CVD, diabetes) areexcluded from the calculations.
Arbeev et al. Page 14
Mech Ageing Dev. Author manuscript; available in PMC 2012 March 1.
NIH
-PA Author Manuscript
NIH
-PA Author Manuscript
NIH
-PA Author Manuscript

Fig. 2.Incidence rates (±s.e.) of onset of “unhealthy life” (i.e., cancer, CVD, or diabetes) in femalesand males in the Framingham Heart Study (original cohort)
Arbeev et al. Page 15
Mech Ageing Dev. Author manuscript; available in PMC 2012 March 1.
NIH
-PA Author Manuscript
NIH
-PA Author Manuscript
NIH
-PA Author Manuscript

Fig. 3.Illustration of the quadratic hazard model for a hypothetical physiological index Yt(mimicking pulse pressure, PP): increase of the hazard rate compared to the baseline level(i.e.,μ(t,Yt)– μ0(t) = (Yt – f (t))2 Q(t)) for ages 50 and 90. Compared to age 50, individuals atage 90 tend to have a larger increase in the risk (denoted by the dotted line) as the result oflarger deviations of the trajectory of the index (Yt, thin solid line) from the “optimal”trajectory (f(t), dash-dotted line) caused by the divergent trajectory of the “mean allostaticstate” (f1(t), dashed line) that an organism is forced to follow by the process of adaptiveregulation, and a narrower U-shape of the risk (μ(t,Yt) – μ0(t), thick solid line).
Arbeev et al. Page 16
Mech Ageing Dev. Author manuscript; available in PMC 2012 March 1.
NIH
-PA Author Manuscript
NIH
-PA Author Manuscript
NIH
-PA Author Manuscript

Fig. 4.Estimates of the baseline hazard rate (μ0(t)) in the quadratic hazard model applied to data ononset of “unhealthy life” (i.e., cancer, CVD, or diabetes) and longitudinal observations ofbody mass index, diastolic blood pressure, hematocrit, pulse pressure, pulse rate, and serumcholesterol, in females (solid lines) and males (dashed lines) in the Framingham Heart Study(original cohort)
Arbeev et al. Page 17
Mech Ageing Dev. Author manuscript; available in PMC 2012 March 1.
NIH
-PA Author Manuscript
NIH
-PA Author Manuscript
NIH
-PA Author Manuscript

Fig. 5.Estimates of the “vulnerability” index (Q(t)) in the quadratic hazard model applied to dataon onset of “unhealthy life” (i.e., cancer, CVD, or diabetes) and longitudinal observations ofbody mass index, diastolic blood pressure, hematocrit, pulse pressure, pulse rate, and serumcholesterol, in females (solid lines) and males (dashed lines) in the Framingham Heart Study(original cohort)
Arbeev et al. Page 18
Mech Ageing Dev. Author manuscript; available in PMC 2012 March 1.
NIH
-PA Author Manuscript
NIH
-PA Author Manuscript
NIH
-PA Author Manuscript

Fig. 6.Estimates of age-specific adaptive capacity (i.e., the negative feedback coefficient a(t)) inthe quadratic hazard model applied to data on onset of “unhealthy life” (i.e., cancer, CVD,or diabetes) and longitudinal observations of body mass index, diastolic blood pressure,hematocrit, pulse pressure, pulse rate, and serum cholesterol, in females (solid lines) andmales (dashed lines) in the Framingham Heart Study (original cohort)
Arbeev et al. Page 19
Mech Ageing Dev. Author manuscript; available in PMC 2012 March 1.
NIH
-PA Author Manuscript
NIH
-PA Author Manuscript
NIH
-PA Author Manuscript
NIH
-PA Author Manuscript
NIH
-PA Author Manuscript
NIH
-PA Author Manuscript
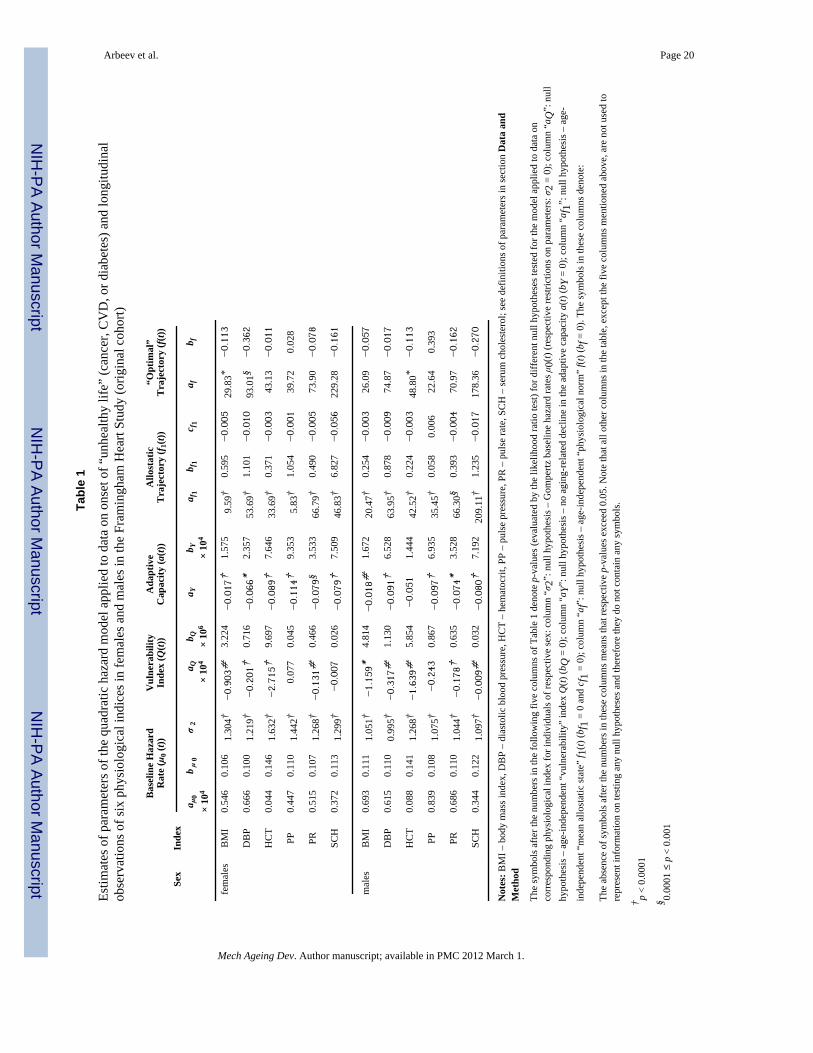
Arbeev et al. Page 20
Tabl
e 1
Estim
ates
of p
aram
eter
s of t
he q
uadr
atic
haz
ard
mod
el a
pplie
d to
dat
a on
ons
et o
f “un
heal
thy
life”
(can
cer,
CV
D, o
r dia
bete
s) a
nd lo
ngitu
dina
lob
serv
atio
ns o
f six
phy
siol
ogic
al in
dice
s in
fem
ales
and
mal
es in
the
Fram
ingh
am H
eart
Stud
y (o
rigin
al c
ohor
t)
Sex
Inde
x
Bas
elin
e H
azar
dR
ate
(μ0 (
t))V
ulne
rabi
lity
Inde
x (Q
(t))
Ada
ptiv
eC
apac
ity (a
(t))
Allo
stat
icT
raje
ctor
y (f 1
(t))
“Opt
imal
”T
raje
ctor
y (f(
t))
a μ0
× 10
4b μ
0σ
2a Q
× 10
4b Q × 10
6a Y
b Y × 10
4a f
1b f
1c f
1a f
b f
fem
ales
BM
I0.
546
0.10
61.
304†
−0.903#
3.22
4−0.017†
1.57
59.
59†
0.59
5−0.005
29.8
3*−0.113
DB
P0.
666
0.10
01.
219†
−0.201†
0.71
6−0.066*
2.35
753
.69†
1.10
1−0.010
93.0
1§−0.362
HC
T0.
044
0.14
61.
632†
−2.715†
9.69
7−0.089†
7.64
633
.69†
0.37
1−0.003
43.1
3−0.011
PP0.
447
0.11
01.
442†
0.07
70.
045
−0.114†
9.35
35.
83†
1.05
4−0.001
39.7
20.
028
PR0.
515
0.10
71.
268†
−0.131#
0.46
6−0.079§
3.53
366
.79†
0.49
0−0.005
73.9
0−0.078
SCH
0.37
20.
113
1.29
9†−0.007
0.02
6−0.079†
7.50
946
.83†
6.82
7−0.056
229.
28−0.161
mal
esB
MI
0.69
30.
111
1.05
1†−1.159*
4.81
4−0.018#
1.67
220
.47†
0.25
4−0.003
26.0
9−0.057
DB
P0.
615
0.11
00.
995†
−0.317#
1.13
0−0.091†
6.52
863
.95†
0.87
8−0.009
74.8
7−0.017
HC
T0.
088
0.14
11.
268†
−1.639#
5.85
4−0.051
1.44
442
.52†
0.22
4−0.003
48.8
0*−0.113
PP0.
839
0.10
81.
075†
−0.243
0.86
7−0.097†
6.93
535
.45†
0.05
80.
006
22.6
40.
393
PR0.
686
0.11
01.
044†
−0.178†
0.63
5−0.074*
3.52
866
.30§
0.39
3−0.004
70.9
7−0.162
SCH
0.34
40.
122
1.09
7†−0.009#
0.03
2−0.080†
7.19
220
9.11
†1.
235
−0.017
178.
36−0.270
Not
es: B
MI –
bod
y m
ass i
ndex
, DB
P –
dias
tolic
blo
od p
ress
ure,
HC
T –
hem
atoc
rit, P
P –
puls
e pr
essu
re, P
R –
pul
se ra
te, S
CH
– se
rum
cho
lest
erol
; see
def
initi
ons o
f par
amet
ers i
n se
ctio
n D
ata
and
Met
hod
The
sym
bols
afte
r the
num
bers
in th
e fo
llow
ing
five
colu
mns
of T
able
1 d
enot
e p-
valu
es (e
valu
ated
by
the
likel
ihoo
d ra
tio te
st) f
or d
iffer
ent n
ull h
ypot
hese
s tes
ted
for t
he m
odel
app
lied
to d
ata
onco
rres
pond
ing
phys
iolo
gica
l ind
ex fo
r ind
ivid
uals
of r
espe
ctiv
e se
x: c
olum
n “σ
2”: n
ull h
ypot
hesi
s – G
ompe
rtz b
asel
ine
haza
rd ra
tes μ
0(t)
(res
pect
ive
rest
rictio
ns o
n pa
ram
eter
s: σ
2 =
0); c
olum
n “a
Q”:
nul
lhy
poth
esis
– a
ge-in
depe
nden
t “vu
lner
abili
ty”
inde
x Q
(t) (b
Q =
0);
colu
mn
“aY”
: nul
l hyp
othe
sis –
no
agin
g-re
late
d de
clin
e in
the
adap
tive
capa
city
a(t)
(bY
= 0)
; col
umn
“af 1
”: n
ull h
ypot
hesi
s – a
ge-
inde
pend
ent “
mea
n al
lost
atic
stat
e” f 1
(t) (b
f 1 =
0 a
nd c
f 1 =
0);
colu
mn
“af”
: nul
l hyp
othe
sis –
age
-inde
pend
ent “
phys
iolo
gica
l nor
m”
f(t) (
b f =
0).
The
sym
bols
in th
ese
colu
mns
den
ote:
The
abse
nce
of sy
mbo
ls a
fter t
he n
umbe
rs in
thes
e co
lum
ns m
eans
that
resp
ectiv
e p-
valu
es e
xcee
d 0.
05. N
ote
that
all
othe
r col
umns
in th
e ta
ble,
exc
ept t
he fi
ve c
olum
ns m
entio
ned
abov
e, a
re n
ot u
sed
tore
pres
ent i
nfor
mat
ion
on te
stin
g an
y nu
ll hy
poth
eses
and
ther
efor
e th
ey d
o no
t con
tain
any
sym
bols
.
† p <
0.00
01
§ 0.00
01 ≤
p <
0.0
01
Mech Ageing Dev. Author manuscript; available in PMC 2012 March 1.

NIH
-PA Author Manuscript
NIH
-PA Author Manuscript
NIH
-PA Author Manuscript
Arbeev et al. Page 21# 0.
001 ≤
p <
0.01
* 0.01
≤ p
< 0
.05,
for r
espe
ctiv
e nu
ll hy
poth
eses
Mech Ageing Dev. Author manuscript; available in PMC 2012 March 1.