Age, Product Nutrition, and Label Format Effects on Consumer Perceptions and Product Evaluations
22
68 THE JOURNAL OF CONSUMER AFFAIRS SCOT BURTON AND J. CRAIG ANDREWS Age, Product Nutrition, and Label Format Effects on Consumer Perceptions and Product Evaluations Nutrition label format effects across different levels of product nutrition value and groups of younger (under 58 years; average 46 years) and older consumers (58 years or more; average 70 years) are examined using a 3 x 2 X 2 experimental design. Age interacts with nutrition level in affecting nutrition evaluation measures with older consumers displaying smaller differences in nutrition attitude and pur- chase likelihood for a low versus a high nutrition value product. Older consumers also perceive all labels as more difficult to understand. Consumer performance on judgment tasks vary across label formats and nutrition value manipulations. Implications for consumer welfare and future research are offered. The Nutrition Labeling and Education Act (NLEA) has resulted in significant changes in the manner in which nutrition information is provided on food labels (“FDA Backgrounder” 1993). An objective of this law is to provide information on nutrition labels in a manner that increases the usefulness of the nutrition information and helps consumers make more informed choices (NLEA 1990). Because of the links between dietary choices and long-term health, changes that result in decisions to choose more nutritious food products potential- ly have important implications for consumer welfare (Levy, Fein, and Stephenson 1993). One of the major provisions of the NLEA is the requirement to identify specific amounts per serving of nutrients such as total calories, calories derived from total fat, total fat, saturated fat, cholesterol, sodium, carbohydrates, dietary fiber, and protein. In addition, recommended daily value percentages are listed for total fat, saturated fat, cholesterol, sodium, carbohydrates, and fiber. These percentages indicate how the nutrient amounts contained per serving relate to the amounts recommended for a 2,000 calorie diet. Scot Burton is Associate Professor and Wal-Mart Chairholder in Marketing, Department of Marketing and Transportation, University of Arkansas, Fayetteville; and J. Craig Andrews is Associate Professor, Department of Marketing, Marquette University, Milwaukee, WI. The Journal of Consumer Affairs, Vol. 30, No. 1, 19% 1996 by The American Council on Consumer Interests 0022-0078/0002-068 1.50/0
-
Upload
independent -
Category
Documents
-
view
5 -
download
0
Transcript of Age, Product Nutrition, and Label Format Effects on Consumer Perceptions and Product Evaluations

68 THE JOURNAL OF CONSUMER AFFAIRS
SCOT BURTON AND J. CRAIG ANDREWS
Age, Product Nutrition, and Label Format Effects on Consumer Perceptions
and Product Evaluations Nutrition label format effects across different levels of product
nutrition value and groups of younger (under 58 years; average 46 years) and older consumers (58 years or more; average 70 years) are examined using a 3 x 2 X 2 experimental design. Age interacts with nutrition level in affecting nutrition evaluation measures with older consumers displaying smaller differences in nutrition attitude and pur- chase likelihood for a low versus a high nutrition value product. Older consumers also perceive all labels as more difficult to understand. Consumer performance on judgment tasks vary across label formats and nutrition value manipulations. Implications for consumer welfare and future research are offered.
The Nutrition Labeling and Education Act (NLEA) has resulted in significant changes in the manner in which nutrition information is provided on food labels (“FDA Backgrounder” 1993). An objective of this law is to provide information on nutrition labels in a manner that increases the usefulness of the nutrition information and helps consumers make more informed choices (NLEA 1990). Because of the links between dietary choices and long-term health, changes that result in decisions to choose more nutritious food products potential- ly have important implications for consumer welfare (Levy, Fein, and Stephenson 1993).
One of the major provisions of the NLEA is the requirement to identify specific amounts per serving of nutrients such as total calories, calories derived from total fat, total fat, saturated fat, cholesterol, sodium, carbohydrates, dietary fiber, and protein. In addition, recommended daily value percentages are listed for total fat, saturated fat, cholesterol, sodium, carbohydrates, and fiber. These percentages indicate how the nutrient amounts contained per serving relate to the amounts recommended for a 2,000 calorie diet.
Scot Burton is Associate Professor and Wal-Mart Chairholder in Marketing, Department of Marketing and Transportation, University of Arkansas, Fayetteville; and J. Craig Andrews is Associate Professor, Department of Marketing, Marquette University, Milwaukee, WI.
The Journal of Consumer Affairs, Vol. 30, No. 1, 19%
1996 by The American Council on Consumer Interests 0022-0078/0002-068 1.50/0

SUMMER 19% VOLUME 30, NUMBER 1 69
Inclusion of information on the amount and percentage of daily value for nutrients that may have a potential negative influence upon long-term health (e.g., total fat, saturated fat, cholesterol, sodium) is among the key changes stemming from the NLEA. It is hoped that these changes will ‘‘assist consumers in interpreting information about the amount of a nutrient present in a food and in comparing the nutrition values of food products’’ (Federal Register 1990, 29476).
Another important change in the new labels is the inclusion of a table of reference values for various nutrients. These reference values show the recommended daily intake values for several nutrients including total fat, saturated fat, cholesterol, sodium, total carbo- hydrates, and dietary fiber. Because fat, saturated fat, cholesterol, and sodium are among the most important nutrition elements used to assess nutrition value (Burton and Biswas 1993; Heimbach and Stokes 1982), inclusion of such reference values appears capable of affecting consumers’ nutrition evaluations of food products. These reference values provided in the full format adopted by the FDA (Federal Register 1993) also communicate information to consumers that possibly can increase consumer awareness of nutrition and thus help satisfy the educational objectives of the NLEA (1990).
Enhancing nutrition awareness and knowledge is especially impor- tant for older Americans who represent one of the fastest growing segments of food purchasers in the United States. Because older con- sumers suffer disproportionately from diet-related conditions such as coronary heart disease, hypertension, and diabetes, they are especial- ly in need of clear and accurate nutrition information (AARP 1992a, 1992b). Visual impairment and interpretation problems (Hunter 1987; Kurtzweil 1994), as well as diminished capacity to process com- plex nutritional information (Cole and Balasubramanian 1993), may result in potential problems for older consumers. Therefore, the objective of this paper is to examine potential effects of the new label formats across different levels of product nutrition value and con- sumer age.
NUTRITION LABEL FORMATS
We examine three label formats, two of which are currently in use on food packaging. As shown in Appendix 1, the full format is the nutrition label required on most products and includes information

70 THE JOURNAL OF CONSUMER AFFAIRS
on absolute nutrient per serving, percent daily values, a table of absolute daily values, and the number of calories contained in one gram of fat, carbohydrates, and protein. The second format is a “simplified” format, consistent with FDA requirements, that may be used on packages for which the surface area is less than 40 square inches. Primary differences between the full and simplified formats include elimination of the table of recommended daily values and calories per gram information shown in the bottom portion of the full label format. The third format shown in Appendix 1 is consistent with label requirements prior to recent changes made in response to nutrition label specifications resulting from passage of the NLEA (i.e., the pre-NLEA format). It includes only amounts per serving for a limited set of nutrients. Effects are assessed across three types of dependent variables: perceived understandability of the labels, nutri- tion evaluations (e.g. , nutrition attitude and purchase likelihood), and ability to use label information in nutrition and dietary judgment tasks. Each of these types of variables has been of interest in recent research involving nutrition label changes resulting from the NLEA (e.g., Burton, Biswas, and Netemeyer 1994; Federal Register 1993).
CONSUMER AGE AND NUTRITION INFORMATION PROCESSING
Empirical studies suggest that for tasks involving the format for nutrition information presentation, the manner in which information is presented may significantly interact with other variables (e.g., Brucks, Mitchell, and Staelin 1984; Burton, Biswas, and Netemeyer 1994). As shown in the Appendix, the full format offers an array of new information (such as daily values, percent of daily values, and reference tables). Some groups of older consumers have expressed preference for labels offering such detailed information compared to more simplified formats (e.g., AARP 1992a). However, research has suggested that for new and unfamiliar tasks, older consumers are more susceptible to interference from irrelevant information, and findings indicate differences in information encoding and retrieval between younger and older consumers (e.g., Cole and Gaeth 1990; John and Cole 1986). It may be postulated that for the new, more detailed label formats, older consumers may differ from younger consumers in their perceived understanding of the labels and in prod- uct nutrition evaluations across different levels of nutrition. Such predictions are consistent with research that shows performance on

SUMMER 1996 VOLUME 30, NUMBER 1 71
new and unfamiliar cognitive tasks diminishes for elderly consumers (e.g., Salthouse 1991).
Significant age by task interactions (for constrained versus uncon- strained tasks) for search intensity and search outcomes have also been reported recently for consumers selecting cereals (Cole and Balasubramanian 1993). The new nutrition labels contain much information that is new and unfamiliar, and for many consumers it may not be clear how this information can be best utilized to deter- mine the most nutritious food choices. For example, the new labels present information on “Daily Values” and ‘‘Yo Daily Values,” but it is not clear that all consumers know what the term “daily value” means or how best to use this information in making healthy dietary choices. While prior findings relating to age differences do not address nutrition label changes resulting from the NLEA, they sug- gest that older consumers may differ from younger consumers in tasks that involve using and processing nutrition information.
One of NLEA’s goals is to educate consumers to make more in- formed decisions in the selection of food products. Much of the added nutrition information deals with “negative” nutrients (e.g., calories from fat, saturated fat, and cholesterol) for which excessive consumption has been linked to unfavorable consequences such as cardiovascular disease. Prospect theory indicates the psychological value associated with a perceived loss is greater than that associated with a similar perceived “gain” (Tversky and Kahneman 1981). More specifically, a perceived value function is posited to be “steeper” for losses than it is for gains (Mowen 1995), resulting in losses being weighted more heavily than gains. Because of greater emphasis on “negative” information, there may be differences in how the pre- NLEA labels and newer labels affect both nutrition evaluations and judgment task accuracy involving use of the information across dif- ferent levels of product nutrition (Burton, Biswas, and Netemeyer 1994). Specifically, the information on the labels may be more useful and relevant to consumers for judgment tasks for a product poorer in nutrition value relative to one with a more favorable nutrition value (cf., Russo et al. 1986). This suggests possible interactions across
‘The term “negative” nutrient is somewhat imprecise. For some negative nutrients (e.g., sodium), a minimum level is needed by most consumers (Russo et al. 1986). The general dis- tinction between positive and negative nutrients is relevant for most consumers, however, and this terminology is consistent with prior research (e.g., Moorman 1990).

72 THE JOURNAL OF CONSUMER AFFAIRS
levels of nutrition value. In sum, this study seeks to add to the litera- ture on consumer use of nutrition information on food labels, and more specifically, to the developing research stream that addresses effects of nutrition label changes resulting from the NLEA.
METHOD
Subjects in the study were members of a consumer research panel who respond to mail surveys approximately once every three months. The response rate for this particular data collection was approxi- mately 64 percent, a rate consistent with the average response rate for this panel.
Subjects were sent a packet of materials that included the experi- mental labels and measures of dependent variables of interest. Demo- graphic information for the panel members who participated in the study was provided by the panel administrators; average family in- come was approximately $45,000, and the majority of respondents had at least some college education. Analyses for the 3 x 2 x 2 (label formats x level of nutrition x age) between subjects design used in this study were based on 191 usable surveys. Data were col- lected in May 1994, just prior to the date when the new nutrition labels became mandatory.
Independent Variables
The three label formats used are shown in Appendix 1 and have been discussed.' Each subject was exposed to only one format and one level of nutrition. That is, given three formats and two levels of nutrition, six label conditions were used in this between subjects experiment and each subject saw only one of the six label conditions.
The two levels of nutrition used in the study were based on two frozen chicken dinners marketed by the ConAgra Company. The two frozen dinners used as the basis for the experiment were chosen because they were approximately the same size, but differed signifi- cantly in the amounts of various nutrients per serving (ConAgra 1990). The nutrient levels provided by these two products are shown
'The print size used on the label stimuli was the same across the three label formats. The size and print of the labels shown in Appendix 1 differ from the labels used in the study.

SUMMER 19% VOLUME 30, NUMBER 1 13
in Appendix 2. A pretest involving these nutrient levels showed sig- nificant differences in overall product nutrition perceptions across equivalent labels used to present the information. In this pretest, two groups (half exposed to the low nutrition value condition and half to the high) rated the perceived product nutrition by responding to two seven-point scales (“DO you consider the nutrition level offered by the product to be. . .” (with endpoints of poor and good), and “Overall, how would you rate the level of nutritiousness suggested by the information on the label?” (endpoints of “not nutritious at all” and “very nutritious”)). The summed nutrition perception mean for the low nutrition condition was 6.8 compared to 9.7 for the high nutrition condition. The difference between the two groups was statistically significant (t = 4.0, p < .Ol), thus supporting use of these nutrient levels to operationalize lower and higher nutrition con- ditions in the main study.
To assess the effects of the third independent variable, age, a median split was performed to create two equal sized groups of “younger” and “older” consumers for use in subsequent analyses. The “younger” group ranged in age from 23 to 57 years with average and median ages of 46 and 47 years, respectively. The ages for the older group ranged from 58 to 88, and both the average and median ages were 70 years. The difference in the mean ages for these two groups was significant (t = 22.1, p < .01).
Dependent Measures
Five dependent measures were used to assess nutrition evaluations, label information usage, and perceived label understandability. An overview of each of these five dependent measures is offered here.
Nutrition attitude
Two product evaluation measures were assessed. The first per- tained to attitude toward the nutrition level of the product and was measured with three seven-point scale items (“Do you consider the nutrition level offered by the product to be. . .” (with endpoints of poor and good); “Overall, how would you rate the level of nutri- tiousness suggested by the information on the label?” (endpoints of “not nutritious at all” and “very nutritious”); and “In terms of overall level of nutrition, I think this product is. . .” (endpoints of

74 THE JOURNAL OF CONSUMER AFFAIRS
favorable and unfavorable which were reverse coded)). These items were summed, and the coefficient alpha reliability estimate assessing the internal consistency of the items comprising the scale was .90. This estimate (as well as the reliability estimates of the other multi- item measures used in this study) exceed the alpha level of .80 recom- mended by Nunnally and Bernstein (1994).
Purchase likelihood
The second evaluation measure assessed the likelihood of purchas- ing the product based on the information shown in the label. For this measure, the following three items were used: “Given the nutrition information on the label, how probable is it that you would consider the purchase of the product?” (endpoints of not probable and very probable); “How willing would you be to purchase the product, based on the nutrition information on the label?” (anchored by very willing to buy and not willing to buy (reverse coded)); and “How likely would you be to purchase the product, given the information shown on the label?” (endpoints of very likely and very unlikely (reverse coded)). Coefficient alpha for this summed scale was .88.
Label understandability
Two items were used to assess ease of understanding the label (“The nutrition information provided on the label is very easy to understand” and “The nutrition information provided is confusing” (reverse coded)). All items were measured with seven-point, disagree- agree scales, and the scales were summed to form an index of label understandability. The correlation between these two items was .’74.
Nutrition in formation awareness
This measure assessed how effectively the subjects could utilize the information on NLEA labels to answer general questions on nutri- tion. The purpose of this measure was to see how information on the new, required label format might help to achieve some of the specific education objectives of the NLEA (1990). This measure consisted of responses to five multiple choice questions; a correct response to a question was coded as a ‘1’ and an incorrect response as a ‘0.’ Each question could be answered correctly by utilizing the information on

SUMMER 19% VOLUME 30, NUMBER 1 75
the full label format used in the study. In contrast, the correct answers to none of these questions could be derived from the limited information in the pre-NLEA label format. The five questions used were originally drawn from information provided in the document, Dietary Guidelines f o r Americans (1990) (Appendix 3) . Subjects were asked not to use any source of information outside of the study instrument in responding to these questions.
Nutrient accuracy
The fifth dependent measure of interest assessed how accurately subjects could use the information provided to calculate if there was more than the recommended amount for eight different nutrients. As such, this measure was consistent with attempts to identify how well consumers understand the relative significance of nutrition informa- tion in the context of a total daily diet (Federal Register 1993, 2118). Subjects were asked if they were to consume three servings of the product in a day (and nothing else), for which of eight different nutrients would they consume more than the recommended amount. The eight nutrients were fat, cholesterol, sodium, saturated fat, calories from fat content, fiber, calcium, and carbohydrates. Based on government guidelines for consumption amounts, a response was considered incorrect if: (1) the nutrient was not included but should have been, or (2) the nutrient was included when it should not have been. For the “low” nutrition value condition, the product stimulus contained more than the recommended amount for five of the eight nutrients; for the “high” nutrition value condition, the stimulus did not contain more than the recommended amount for any of the nutrients (refer to Appendix 2). Percentage “accuracy” scores were computed by summing the number of correct responses across the eight nutrients, dividing by eight, and multiplying by
3 “ A ~ ~ u r a ~ y ” is used here as an efficient means of referring to subjects’ awareness of whether the product contained more than the recommended amount of eight nutrients based on government guidelines. Other “accuracy” measures are possible and it should be under- stood that other objective criteria for evaluating task judgment accuracy could be used.

76 THE JOURNAL OF CONSUMER AFFAIRS
TABLE 1 Cell Means of Dependent Variables -
Cell Means (Standard Deviations) for Dependent Variables
Independent Number Label Nutrition Variables of Nutrition Purchase Understand- Information Nutrient and Levels Subjects Attitude Likelihood ability Awareness Accuracy
Range of Scores 191
Nutrition Level (LOW) Pre-NLEA
Younger 15 Older 12
Simplified NL.EA
Younger 16 Older 18
Younger 15 Older 14
Nutrition Level (HIGH) Pre-NLEA
Younger 16 Older 17
Full format
Simplified NLEA
Younger 16 Older 18
Full Format Younger 17 Older 17
3-21 3-21 2-14 0-5 0-100
8.7(3.8) 12.8(4.1)
8.3 (3.2) 9.6(6.0)
10.7(4.0) 11.6(4.1)
2.0( 1.5) 2.1(1.4)
76.0(13.0) 70.8(13.4)
7.4(4.2) 9.1(4.0)
8.3(4.6) 9.0(4.3)
7.6(4.4) 9.6(5.2)
8.1(3.6) 9.2(5. I)
10.9(3.0) 9.7(4.1)
9.3(4.0) 7.5(4.3)
1.8(0.9) 1.8(1.1)
1.8( 1.5) 1.5(1.2)
85.9(17.6) 90.6 (8.5)
86.5(22.5) 84.1 (I 5.9)
13.5(4.4) 12.0(3.9)
13.6(4.7) 11.3(4.6)
12.q2.5) 7.5(4.5)
1.6( 1.2) l.l(l.1)
75.8(18.0) 78.1 (1 4.8)
13.9(4.7) 12.0(4.3)
11.5(4.9) 12.5(5.1)
1 3.8 (4.4) 10.6(3.5)
10.9(5.1) 12.0(5.3)
9.3(3.7) 8.q3.5)
9.5( 3.5) 9.4( 3.4)
1.6(1.1) 1.5(0.9)
2.9( 1.4) 1.7 (0.8)
71.9(24.4) 65.6(21.7)
7 1.7(33.9) 71.7(25.2)
RESULTS
Effects on Nutrition Evaluations and Label Understandability
Results pertaining to the effects of the independent variables on the dependent variables are shown in Tables 1 and 2. Dependent vari- able cell means are shown in Table 1. Results of the univariate analy- ses of variance used to test effects are shown in Table 2.4 As antici- pated, the nutrition level manipulation resulted in strong, significant effects on nutrition attitude and purchase likelihood. However, the
“Because most of the dependent variables were not significantly correlated with one another, univariate analyses of variance were used to test effects rather than a multivariate analysis of variance.

SUMMER 19% VOLUME 30, NUMBER 1 77
TABLE 2 Analyses of Variance Results for Effects of Nutrition Level, Label Format, and Age
F Values for Dependent Variables
Numer- Label Nutrition erator Nutrition Purchase Understand- Information Nutrient
Main Effects dfa Attitude Likelihood ability Awareness Accuracy
Nutrition
Label Format (LF) 2 1 .o 0.2 1.7 1.2 0.3
Level (NL) 1 29.5*** 23.6*** 0.9 0.5 11.1***
Age (A) 1 0.4 0.0 6.4** 3.1* 0.1
Interactions NL x LF 2 1.2 0.1 1.9 4.8*** 5.0*** NL x A 1 4.7** 4.5** 0.7 2.0 0 .o LF x A 2 0.4 0.8 0.6 1.2 0.0 NL x LF x A 2 1.7 1.3 3.5** 0.4 0.8 ~~
aLhe to missing values, denominator degrees of freedom for dependent variables varied from 152 for nutrition information awareness to 172 for understandability, nutrition attitude, and purchase likelihood.
*p < .lo. **p < .05.
***p < .01.
interaction between nutrition level and age also was significant (p c .05) for both nutrition attitude and purchase likelihood. Plots of these interactions are shown in Figure 1. Across age, both purchase likelihood and nutrition attitude means decrease (slightly) for the product with higher nutrition level and increase for the product with lower nutrition level. As Figure 1 suggests, this leads to smaller dif- ferences in purchase likelihood and nutrition attitude across nutrition value levels for the older group of consumers. For younger con- sumers, differences in nutrition attitude and purchase likelihood between nutrition levels are highly significant (t = 5.3 and 5.4, re- spectively, p < .OOl). For older consumers, the difference was sig- nificant for nutrition attitude (t = 2.2, p < .05) and marginally sig- nificant for purchase likelihood (t = 1.7, p < .lo).
Findings pertaining to the dependent measure of label understand- ability show a main effect of age (F = 6.4, p < .02), and means in Table 1 indicate that older consumers perceived the labels as less

78 THE JOURNAL OF CONSUMER AFFAIRS
11
9
7
FIGURE 1 Efjects of Age and Nutrition Level on Nutrition Attitude and Purchase Likelihood
__ Low Nutrition
_ _ 8.2 /
NUTRITION ATTITUDE
PURCHASE LIKELIHOOD
12.7
11 High Nutrition
L 8.0
YOUNGER OLDER 7
AGE

SUMMER 19% VOLUME 30, NUMBER 1
FIGURE 2 Effects of Label Format and Nutrition Level on Nutrition Information Awareness and on Nutrient Accuracy
NUTRITION INFORMATION AWARENESS
2.5 2 . 3 High Nutrition
1.5 1.6 Low Nutrition
0 : Pre-NLEA SIMPLIFIED FULL
LABEL FORMAT
NUTRIENT ACCURACY
(“h correct)
88.3
Pre-NLEA SIMPLIFIED FULL
LABEL FORMAT
79

80 THE JOURNAL OF CONSUMER AFFAIRS
understandable than younger consumers. However, these results should be interpreted with caution given the three-way interaction among format, age, and nutrition level (F = 3.5, p < .05). For three of the four age by nutrition level conditions, the full NLEA formal: is viewed as less understandable than the pre-NLEA label format. However, for the cell in which subjects were 58 years or older and nutrition level was high, the full format was perceived as more under- standable than the pre-NLEA or simplified NLEA formats.
Effects on Nutrition In formation Awareness
Results pertaining to nutrition information awareness are shown in the next to last column of Tables 1 and 2. The younger group of sub- jects had marginally greater mean scores on the nutrition informa- tion awareness measures than did the older group (F = 3. l , p < .08). Because all of the awareness questions could potentially be answered correctly from the information included in the full label format, sub- jects exposed to the full format could be expected to perform better on this measure. While the mean information awareness score was highest for the full NLEA label, the effect of format was not signifi- cant. The interaction between label format and nutrition level was significant (F = 4.8, p < .Ol ) , however. The plot of relevant means for the nutrition information awareness measure is shown in Figure 2. For the high nutrition level, there is the expected upward slope across the three format conditions. For this level, follow-up t-tests show that the full format condition is significantly greater than both the pre-NLEA format (t = 3.2, p < .01) and the simplified format (t = 2.5, p < .02). For the low nutrition level, follow-up contrasts show that neither the differences between the pre-NLEA and the full format condition (t = 0.5, p > .lo) nor the simplified and full format label (t = 1.3, p > .lo) were signifi~ant.~
Effects on Nutrient Accuracy
Results concerning our direct measure of how well the information could be used in a dietary judgment task are shown in the last column of Table 2. Findings indicate a significant main effect of nutrition
'At the suggestion of a reviewer, we also examined the effects of age and nutrition level on nutrition information awareness for the full format label condition alone. Both the main effects and two-way interaction were nonsignificant (p > .lo).

SUMMER 19% VOLUME 30, NUMBER 1 81
level, as well as a significant interaction between nutrition level and label format (F = 5.0, p < .01). A plot of the relevant cell means for this interaction is shown in Figure 2. For the low nutrition level con- dition, follow-up contrasts indicate that percentage accuracy scores for the simplified and full formats are both significantly greater than the pre-NLEA format (t = 3.6 and 2.7, respectively; p < .01 for both). For the high nutrition level condition, follow-up contrasts reveal no significant differences in percentage accuracy scores among the three label format conditions.6
DISCUSSION
Implications Concerning Consumer Age
The objective of this study was to examine effects associated with the nutritional labels mandated by the FDA across levels of nutrition and groups of older and younger consumers. There are several find- ings concerning consumer age that have consumer welfare implica- tions. The significant interactions between nutrition level and age for both the nutrition attitude and purchase likelihood dependent measures indicate concerns about the manner in which the older con- sumers process and interpret nutrition information relative to younger consumers. The plot of means in Figure 1 shows a smaller difference for both purchase likelihood and nutrition attitude be- tween the low and high nutrition level conditions for the older con- sumers. Thus, in this sample, older consumers were somewhat less responsive to product nutrition level in terms of their reported nutri- tion attitude and purchase likelihood than were younger consumers. Because the risk of cardiovascular disease in older consumers can be related to long-term dietary practices (e.g., Federal Register 1993), these results have important implications. Also, the older group of subjects, who averaged 70 years of age, generally perceived the labels as less understandable than the younger subjects.
These findings, taken in sum, suggest that special educational efforts would be beneficial to older consumers. More specifically,
6Because the specific nature of the nutrient accuracy test varies across nutrient levels pro- vided, effects of age and format on accuracy were also examined using separate ANOVAs for the two levels of nutrition value. Age and age by format interaction were nonsignificant (p > .lo) in both analyses. Format had a significant main effect (p < .05) for the low nutrition level, and it was nonsignificant for the high nutrition level analysis. These findings are consistent with results of the contrasts reported in the text and plots of the means in Figure 2.

82 THE JOURNAL OF CONSUMER AFFAIRS
older consumers should be instructed on how to use the information on the new nutrition labels to maintain a nutritious diet and of the importance of diet in reducing risks of some serious health problems. Assistance to older consumers could be provided by point-of- purchase visual aids describing appropriate nutrition label usage and how simple pencil and paper decision aids could be used (cf., Cole and Balasubramanian 1993).
Implications Concerning Label Format
In general, findings pertaining to the format manipulations suggest the complexity of understanding effects associated with changes in nutrition formats. Several interactions involving format had signifi- cant effects on dependent variables. For the high nutrition level prod- uct , information awareness varied across format with consumers able to answer more questions correctly when exposed to the full format adopted by the FDA. This supports the objective of the NLEA to increase the level of consumer knowledge about nutrition and its importance in maintaining a healthy diet. However, no significant differences across format were found for the low nutrition level product. It also should be noted that average nutrition information awareness scores across subjects were not high for this sample. This finding suggests the need for additional education efforts designed to explain information on the new labels and how the labels may be used to enhance consumer knowledge of relevant nutrition issues. While the FDA has initiated some educational campaign efforts (e.g., Burros 1994), the “nutritional learning curve” for the new label information and format may be steeper than expected, particu- larly for some specific segments of the population.
There also was a significant interaction between nutrition level and format for our judgment task that involved use of the nutrition infor- mation in the context of a daily diet (operationalized by the nutrient accuracy measure). For the low nutrition level, the simplified and full formats that have been adopted resulted in greater accuracy scores than the pre-NLEA format. For the higher nutrition level condition, there were no significant differences across label formats. These results suggest that the NLEA formats may be more helpful in accu- rately assessing products lower in nutrition value than products higher in nutrition value. These findings may be a function of the measures of nutrition label usage and the specific nutrition levels

SUMMER 19% VOLUME 30, NUMBER 1 83
used in this study. However, because such a finding has policy impli- cations in terms of specific education efforts that might be used to enhance interpretation for more nutritious products, research is warranted.
Limitations and Research Issues
A number of limitations restrict the generalizability of these results. Subjects were exposed to the labels outside of the grocery store environment in which purchase decisions are typically made. Motivation to process nutrition information also may be different for our task setting than in field settings. However, assessment of effects of label formats outside of store environments is not uncom- mon (e.g., Brucks, Mitchell, and Staelin 1984; Levy, Fein, and Schuker 1992, 1993) due to the problems of maintaining experimen- tal control for in-store field studies. Nonexperimental field studies that examine consumers’ awareness, usage, and understanding of the information on the new nutrition labels are of interest.
Results may not generalize beyond the specific dependent variables and manipulations used in this study. We assessed several different perceptual and usage-related dependent variables of interest to policymakers, but a variety of dependent variables and evaluation tasks is possible (Federal Register 1993). Different levels for the nutrition value manipulation may have resulted in different effects for this variable. Also, the sample was geographically representative of a single state, panel respondents were somewhat older than the average age of the adult population of the state, and sample size was smaller than studies often used to examine label formats (e.g., Levy, Fein, and Schuker 1993). Other categorizations of age (e.g., compar- ing consumers over 65 to those 65 or under) may have produced dif- ferent age-related results. Future research may extend the generaliza- bility of the results by employing large, national probability samples that better reflect the demographic composition of the United States.
Research designed to understand how consumers acquire and pro- cess nutrition information from the full and simplified NLEA labels is warranted. The full label format presents a large amount of infor- mation, much of which is new and unfamiliar to many consumers. The processing of such information probably varies across con- sumers’ levels of motivation and knowledge of nutrition (Brucks, Mitchell, and Staelin 1984; Moorman 1990). It would be interesting to compare specific processing and utilization of nutrition informa-

84 THE JOURNAL OF CONSUMER AFFAIRS
tion for a group of consumers highly motivated and very knowledge- able about nutrition relative to a group lower in motivation and nutrition knowledge (Food and Drug Administration 1992). Also, in this study no provisions were made to control for consumers with special dietary needs; knowledge and processing of nutrition infor- mation probably differs for these consumers. An understanding of the differences in usage of nutrition label information for consumers with specialized needs and more typical consumers also is of interest.
Given the results reported here for differences across nutrition values, a better understanding of what specific nutrient information drives overall perceptions of nutrition and affects purchases for products that vary in nutrition value seems warranted. An additional question pertains to the manner in which nutrition information from labels is cumulatively assessed across food items consumed on a per meal or daily basis in attempts to maintain a nutritious diet. For example, summing values for all amounts of all products consumed in a day is a daunting task, and the roles of decision heuristics and judgment biases (e.g., Hogarth 1985) seem to be worthy topics for future research. Also, how nutrition label information acquisition and interpretation interact with package labeling and perceptions created through advertising is an issue relevant to consumer welfare. Such research possibilities have policy implications for efforts to fur- ther educate consumers and increase effective use of information on nutrition labels.
APPENDIX 1
Nutrition Label Formats Used in the Study
FULL FORMAT
Nutrition Facts Serving Size 9oz. Servings Per Container 1
Amount Per Serving
Calories 430 Calories from Fat 198
070 Daily Value*
Total Fat 22g 34%
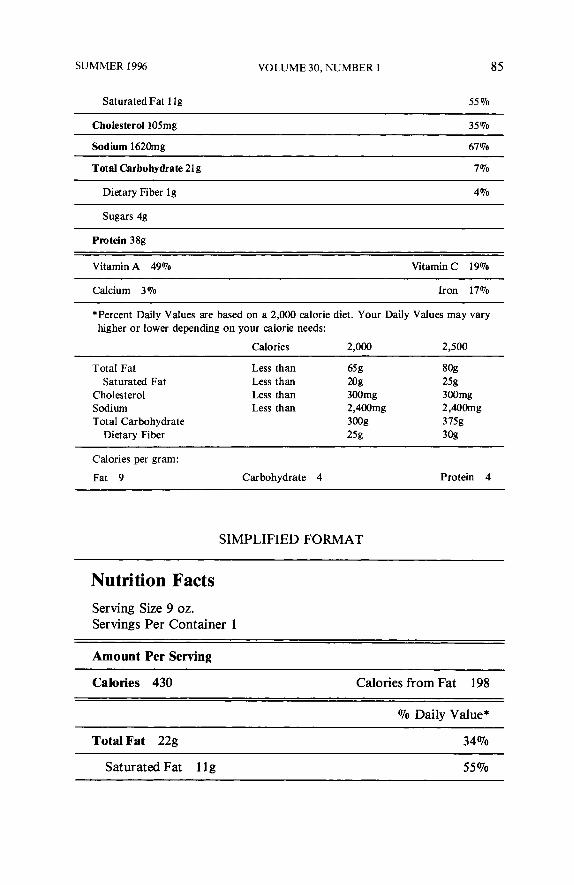
SUMMER 19% VOLUME 30, NUMBER 1 85
Saturated Fat 1 Ig 55 '70
Cholesterol lO5mg 35%
Sodium 162Omg 67 '70
Total Carbohydrate 21g 7 yo
Dietary Fiber Ig 4 yo
Sugars 4g
Protein 38g
Vitamin A 49% Vitamin C 19Vo
Calcium 3% Iron 17%
*Percent Daily Values are based on a 2,000 calorie diet. Your Daily Values may vary higher or lower depending on your calorie needs:
Calories 2,000 2,500
Total Fat Less than 65g 8%
Cholesterol Less than 300mg 300m Sodium Less than 2,400mg 2,400m Total Carbohydrate 300g 3758
Saturated Fat Less than m 25g
Dietary Fiber 2% 3og
Calories per gram:
Fat 9 Carbohydrate 4 Protein 4
SIMPLIFIED FORMAT
Nutrition Facts Serving Size 9 oz. Servings Per Container 1
Amount Per Serving
Calories 430 Calories from Fat 198 ~~ ~ ~
070 Daily Value*
Total Fat 22g 34%
Saturated Fat 1 l g 55%

86 THE JOURNAL OF CONSUMER AFFAIRS
Cholesterol 105mg 35%
Sodium 1620mg 67%
Total Carbohydrate 21g 7 vo ~~~
Dietary Fiber lg 4%
Sugars 4g
Protein 38g
VitaminA 49% VitaminC 19% - -
Calcium 3% Iron 17%
*Percent Daily Values are based on a 2,000 calorie diet. -
PRE-NLEA
Nutrition Facts
Serving Size Servings per Container Calories Protein Carbohydrate Fat Sodium
9 oz. 1 43 0 38g 21g 22g 1620mg
Percentage of U.S. Recommended Daily Allowances (U.S. RDA)
Vitamin A 49 Vitamin C 19 Calcium 3 Iron 17

SUMMER 19% VOLUME 30, NUMBER 1 87
APPENDIX 2
Nutrient Value Levels
Amount per Serving
Nutrienta “Low”
Nutrition Value ‘‘High” ~
Nutrition Value
Serving Size Calories Calories from fat Fat Saturated fat Carbohydrates Protein Cholesterol Sodium Fiber Vitamin A Vitamin C Calcium Iron
9oz 430 198 2% 1 k3 21g 38g
105mg 1620mg
k3 49% 19% 3 qo 17%
10.602 290 45 5g 2g 39g 21g
45mg 42Omg
2g 3 0% 15% 5 % 16%
aNot all nutrient information was offered across all label type conditions. For example, in the pre-NLEA condition (which is consistent with regulations prior to NLEA changes), informa- tion was shown only on serving size, calories, fat, sodium, carbohydrates, protein, and vitamins and minerals.
APPENDIX 3
Nutrition In formation A wareness Items
a. Nutrition guidelines suggest that no more than __percent of the calories consumed in a day should come from fat.
. . . . . . . . . . . . . . . . . 1 30% ............................. 3 20% . . . . . . . . . . . . . . . . . . . . . . 2 50% . . .................... 4
b. A gram of fat provides about __ as many calories as a gram of protein. one-half . . . . . . . . . . . . . . . . . . . . . . . . . . . . . 3 twice . . . . . . . . . . . . . . . . . 2
c. Nutrition guidelines indicate that you should consume no more than - milligrams of cholesterol per day. 200 .............................. 1 . . . . . . . . . . . . . . . . . 3 300 .............................. 2 . . . . . . . . 4
d. Nutrition guidelines suggest that no more than ___ percent of the calories consumed in a day should come from saturated fat. 1% .............................. 1 . . . . . . . . . 3
. . . . . . . . . . . . . . . . 2 . . . . . . . . . 4
e. A gram of protein provides about __ of calories as a gram of carbohydrates. 1 four times the amount . . . . . . . . . . . . . . 3
twice the amount . . . . . . . . . . . . . . . . . . 2 the same amount . . . . . . . . . . . . . . . . . . . 4

88 THE JOURNAL OF CONSUMER AFFAIRS
REFERENCES
“AARP Comments on ‘Food Labeling: Format for Nutrition Label’ ” (1992a), Docket No. 91N-0162, Washington, DC: American Association of Retired Persons: 1-8.
“AARP Comments on ‘Labeling: General Requirements for Health Claims for Food’ ” (1992b). Docket No. 85N-0061, Washington, DC: American Association of Retired Persons: 1-12.
Brucks. Merrie. Andrew A. Mitchell. and Richard Staelin (1984). “The Effect of Nutritional ~ ~I
Information Disclosure in Advertising: An Information Processing Approach,” Journal of Public Policy & Marketing, 3: 1-25.
Burros, Marian (1994), “Big Ad Blitz to Introduce Food Labels,” The New York Times (May 1): 1, 18.
Burton, Scot and Abhijit Biswas (1993), “A Preliminary Assessment of Changes in Food Labels Required by the Nutritional Labeling and Education Act of 1990,” The Journal of Consumer Affairs, 27(Summer): 127-144.
Burton, Scot, Abhijit Biswas, and Richard G. Netemeyer (1994), “Effects of Alternative Nutrition Label Formats and Nutrition Reference Information on Consumer Percep tions, Comprehension, and Product Evaluations,” Journal of Public Policy & Market- ing, 13(Spring): 36-47.
Cole, Catherine and Siva Balasubramanian (1993), “Age Differences in Consumers’ Search for Information: Public Policy Implications,” Journal of Consumer Research, 20(Ju1ie):
Cole, Catherine and Gary J. Gaeth (1990), “Cognitive and Age-related Differences in the Ability to Use Nutritional Information in a Complex Environment,” Journal of Marlcet- ing Research, 37(May): 175-184.
157-169.
ConAgra (1990), Product Nutrition Information. Omaha, NE. Dietary Guidelines for Americans (1990), U.S. Department of Agriculture, U.S. Department
“FDA Backgrounder: The New Food Label” (1993), FDA Consumer (May): 1-9. Federal Register (1990), “Food Labeling, Reference Daily Intakes and Daily Reference
Values,” 55(139): 29476-29486. Federal Register (1993), “Food Labeling Regulations Implementing the Nutritional Labeling
and Education Act of 1990,” 58(3): 20662190. Food and Drug Administration (1992), “Summary of Consumer Research on Health and Diet
Attitudes and Knowledge and Use of Food Labels,” Division of Consumer Studies, Center for Food Safety and Applied Nutrition (September).
Heimbach, James T. and Raymond C. Stokes (1982), “Nutrition Labeling and Public Health: Survey of American Institute of Nutrition Members, Food Industry, and Consumers,” American Journal of Clinical Nutrition, 36: 700-708.
of Health and Human Services.
Hogarth, Robin (1985), Judgement and Choice, New York: John Wiley & Sons. Hunter, Beatrice Trum (1987), “Food for Thought: Making the Food Labels Readable,”
Consumers’ Research, 70(December): 8-9. John, Deborah Roedder and Catherine A. Cole (1986), “Age Differences in Information Pro-
cessing: Understanding Deficits in Young and Elderly Consumers,” Journal of Con- sumer Research, 13(December): 297-315.
Kurtzweil, Paula (1994), “Food Labeling Education Serves Many Groups,” FDA Consumer (May): 610.
Levy, Alan S., Sara B. Fein, and Raymond E. Schucker (1992), “A Study of Nutrition Label Formats: Performance and Preference,” Food Technology, 45(July): 116-121.
Levy, Alan S., Sara B. Fein, and Raymond E. Schucker (1993). “Evaluation of Nutrition Label Formats: FDA Study 2,” Division of Consumer Studies, Food and Drug Admin- istration, Washington, DC.
Levy, Alan S., Sara B. Fein, and Marilyn Stephenson (1993), “Nutrition Knowledge Levels about Dietary Fats and Cholesterol: 1983-1988,” Journal of Nutrition Education, 25(March/April): 60-66.
Moorman, Christine (1990), “The Effects of Stimulus and Consumer Characteristics on the Utilization of Nutrition Information,” Journal of Consumer Research, 17(December): 362-374.

SUMMER 19% VOLUME 30, NUMBER 1 89
Mowen, John (1995), Consumer Behavior, Englewood Cliffs, NJ: Prentice-Hall. Nunnally, Jum and Ira H. Bernstein (1994), Psychometric Theory, New York: McGraw-Hill. Nutrition Labeling and Education Act of 1990 (Public Law 101-535). 21 USC 301 (November - ,.
8, 1990). Russo. J. Edward. Richard Staelin. Catherine A. Nolan. Garv J . Russell. and Barbara L.
Metcalf (1986), “Nutrition Information in the Supermarket,” Journal of Consumer Research, 13(June): 48-70.
Salthouse, Timothy (1991), “Mediation of Adult Age Differences in Cognition by Reductions in Working Memory and Speed of Processing,” Psychological Science, 2(May): 179-1 83.
Tversky, Amos and Daniel Kahneman (1981), “The Framing of Decisions and the Psychology of Choice,” Science, 21 l(January): 453-458.