Report format - Gorham, NY
313
-
Upload
khangminh22 -
Category
Documents
-
view
7 -
download
0
Transcript of Report format - Gorham, NY

Preliminary Engineering Report Town of Gorham Water Treatment Plant Improvements September 2021
MRB Group Project No. 0735.21001.000 Page i N:\0735.21001.000\REPORTS\T. Gorham - Water Treatment Plant Improvements.docx
TABLE OF CONTENTS
I. EXECUTIVE SUMMARY ........................................................................................................1
II. BACKGROUND ......................................................................................................................3
III. PROJECT PLANNING ............................................................................................................4
A. SITE INFORMATION ...................................................................................................4
B. ENVIRONMENTAL RESOURCES PRESENT ...................................................................4
C. OWNERSHIP AND SERVICE AREA ..............................................................................5
D. DESIGN CRITERIA .....................................................................................................7
E. EXISTING FACILITIES AND PRESENT CONDITION .......................................................7
F. WATER QUALITY ....................................................................................................14
G. FLOOD PROTECTION................................................................................................18
H. FINANCIAL STATUS .................................................................................................18
I. NEED FOR PROJECT .................................................................................................19
J. SYSTEM O&M ........................................................................................................20
K. GROWTH .................................................................................................................20
L. COMMUNITY ENGAGEMENT ....................................................................................20
IV. ALTERNATIVES ANALYSIS.................................................................................................21
A. ALTERNATIVE 1 – TREATMENT ENHANCEMENTS ....................................................21
B. ALTERNATIVE 2 – ABSORPTION CLARIFIER AND MULTIMEDIA FILTER PACKAGE
PLANT .....................................................................................................................24
C. ALTERNATIVE 3 – ULTRAFILTRATION PLANT .........................................................26
D. ADDITIONAL CONSIDERATIONS ..............................................................................27
V. COST ESTIMATES ..............................................................................................................30
A. CAPITAL COST ESTIMATES .....................................................................................30
B. EDU ANALYSIS ......................................................................................................30
C. FINANCING OPTIONS ...............................................................................................32
VI. RECOMMENDED AND SELECTED ALTERNATIVE ..............................................................33
A. PROJECT SCHEDULE ................................................................................................34
B. PERMIT REQUIREMENTS ..........................................................................................34

Preliminary Engineering Report Town of Gorham Water Treatment Plant Improvements September 2021
MRB Group Project No. 0735.21001.000 Page ii N:\0735.21001.000\REPORTS\T. Gorham - Water Treatment Plant Improvements.docx
C. ENGINEER’S OPINION OF PROBABLE COST ..............................................................35
D. ANNUAL OPERATING BUDGET ................................................................................35
VII. CONCLUSIONS AND RECOMMENDATIONS .........................................................................38
LIST OF APPENDICES
A. SITE MAPS
B. POPULATION ESTIMATES
C. WATER QUALITY
D. WATER SYSTEM
E. DMR SUMMARY AND DESIGN CRITERIA
F. WTP EXISTING SITE PLAN
G. CSLAP REPORTS
H. CHLORINE CONTACT CT CALCULATIONS
I. FEMA FLOOD INSURANCE RATE MAP
J. CENSUS BUREAU DATA
K. ALTERNATIVE 1 – SYSTEM UPGRADES
L. ALTERNATIVE 2 – MICROFILTRATION PACKAGE PLANT
M. ALTERNATIVE 3 – ULTRAFILTRATION PLANT
N. OVERALL COST ESTIMATES
O. EDU CALCULATIONS
P. FINANCING OPTIONS
Q. ENGINEERING REPORT CERTIFICATION
R. SMART GROWTH ASSESSMENT FORM
S. ELECTRICAL AND MECHANICAL EVALUATION (JADESTONE ENGINEERING)
T. PROPOSED SITE PLAN
Preliminary Engineering Report Town of Gorham Water Treatment Plant Improvements September 2021
MRB Group Project No. 0735.21001.000 Page 1
I. EXECUTIVE SUMMARY
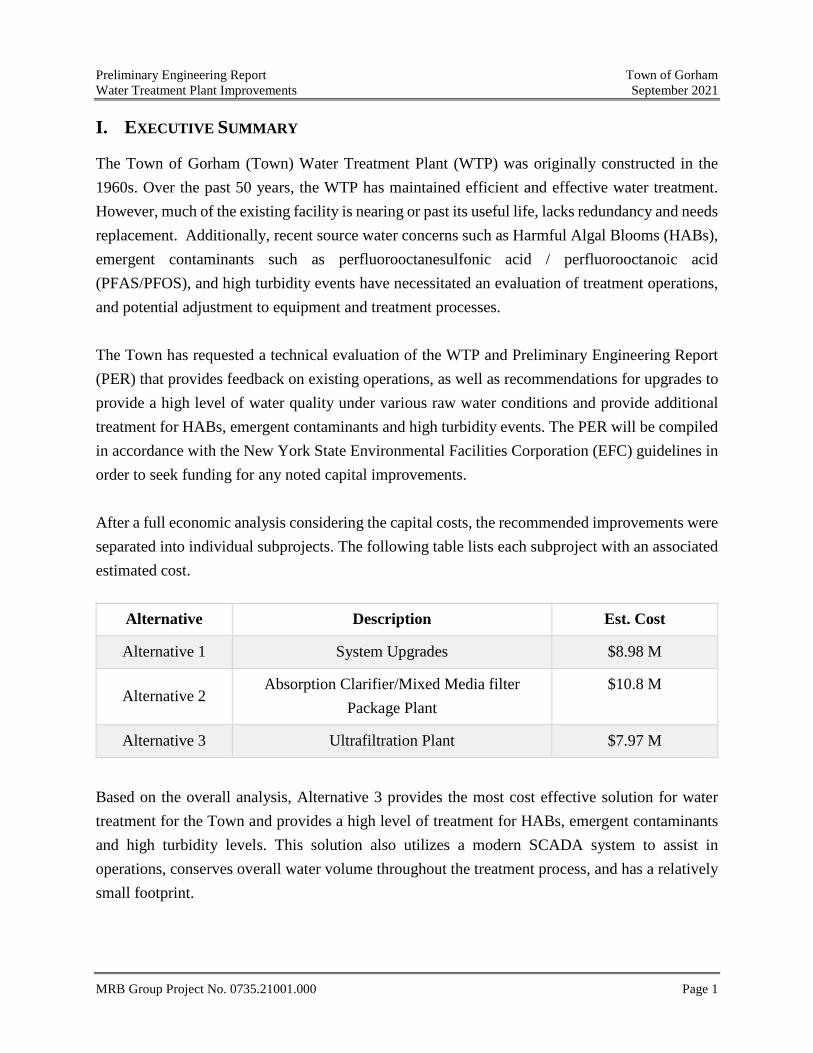
The Town of Gorham (Town) Water Treatment Plant (WTP) was originally constructed in the 1960s. Over the past 50 years, the WTP has maintained efficient and effective water treatment. However, much of the existing facility is nearing or past its useful life, lacks redundancy and needs replacement. Additionally, recent source water concerns such as Harmful Algal Blooms (HABs), emergent contaminants such as perfluorooctanesulfonic acid / perfluorooctanoic acid (PFAS/PFOS), and high turbidity events have necessitated an evaluation of treatment operations, and potential adjustment to equipment and treatment processes. The Town has requested a technical evaluation of the WTP and Preliminary Engineering Report (PER) that provides feedback on existing operations, as well as recommendations for upgrades to provide a high level of water quality under various raw water conditions and provide additional treatment for HABs, emergent contaminants and high turbidity events. The PER will be compiled in accordance with the New York State Environmental Facilities Corporation (EFC) guidelines in order to seek funding for any noted capital improvements. After a full economic analysis considering the capital costs, the recommended improvements were separated into individual subprojects. The following table lists each subproject with an associated estimated cost.
Alternative Description Est. Cost
Alternative 1 System Upgrades $8.98 M
Alternative 2 Absorption Clarifier/Mixed Media filter
Package Plant $10.8 M
Alternative 3 Ultrafiltration Plant $7.97 M
Based on the overall analysis, Alternative 3 provides the most cost effective solution for water treatment for the Town and provides a high level of treatment for HABs, emergent contaminants and high turbidity levels. This solution also utilizes a modern SCADA system to assist in operations, conserves overall water volume throughout the treatment process, and has a relatively small footprint.
Preliminary Engineering Report Town of Gorham Water Treatment Plant Improvements September 2021
MRB Group Project No. 0735.21001.000 Page 2
According to 2020 United States Census Bureau data, the total estimated population for the Town was 4,469, the MHI was $63,218, and the poverty level was 11%. Therefore, the Town does not meet the criteria for hardship grant funding, but would likely qualify for subsidized financing through EFC grant opportunities. Due to the magnitude of the project, the Town would significantly benefit from a low interest loan and/or some grant funds to help offset these costs. It is recommended that this Preliminary Engineering Report be used to pursue funding assistance from multiple agencies, including the EFC through the Drinking Water State Revolving Fund (DWSRF) and Water Infrastructure Improvement Act (WIIA), USDA Rural Development (RD), and the New York State Office of Community Renewal, Community Development Block Grant (CDBG) program.

Preliminary Engineering Report Town of Gorham Water Treatment Plant Improvements September 2021
MRB Group Project No. 0735.21001.000 Page 3
II. BACKGROUND
The Town of Gorham (Town)/Gorham Water District #1 owns and operates a Water Treatment Plant (WTP) located at 4285 New York State Route 364 at Crystal Beach and a water booster station on Turner Road. The water system includes a water storage tank on County Road 1, a water storage tank on Lake to Lake Road (with a booster station), and a distribution system that generally serves the hamlets of Crystal Beach and Gorham, and several roads within the Town of Gorham via the Gorham Water Districts. The Town also sells water to the Town of Hopewell. Although the WTP is operating fairly efficiently to meet current demands and providing treated water at or below mandated EPA quality thresholds, some of the existing equipment is old and outdated. There are seasonal algal blooms that create high turbidity influent to the treatment system, straining the existing DE filters. Therefore, the Town has requested a technical evaluation of the WTP that provides feedback on existing operations, as well as recommendations for upgrades and/or alternative treatment technologies. The following items were considered in the comprehensive analysis:
• Overall system capacity calculations based on existing and future development loads
• Age and condition of WTP components with respect to their intended useful life
• Discussion about existing intake pumping operations
• Condition of both raw and finished water quality and its impact on the community
• Treatment process calculations to determine maximum efficiency and redundancy
• Evaluation of filtration media and technology
• Environmental analysis of existing chemical treatment and disinfection processes
• Backwash and sludge removal efficiency in relation to discharge into Deep Run Creek or
the sanitary sewer system
Preliminary Engineering Report Town of Gorham Water Treatment Plant Improvements September 2021
MRB Group Project No. 0735.21001.000 Page 4
III. PROJECT PLANNING A. SITE INFORMATION
The Town is located in Central Ontario County surrounded by Canandaigua Lake, the Town of Canandaigua, the Town of Hopewell, the Town of Seneca, the Town of Potter, and the Town of Middlesex. The Town has a total area of 53.2 square miles, of which 48.9 square miles is land and 4.3 square miles is water. The Town sits at the south border of the county, southeast of Canandaigua. The Water Treatment Plant (WTP) located at 4285 New York State Route 364.
B. ENVIRONMENTAL RESOURCES PRESENT According to the DEC online Environmental Resource Mapper tool, the WWTP is not located in an area that requires special environmental permitting. The only area of rare plants and animals is within the bounds of Canandaigua Lake. Neither the Town nor the WTP are located in an Environmental Justice area. The United States Geographical Survey (USGS) 7.5 minute series quadrangle maps and United States Department of Agriculture (USDA) Natural Resource Conservation Service (NRCS) were used to compile information regarding the topography, soil data, depth to any restrictive layer, depth to groundwater, and flooding considerations. According to USGS, the bedrock types surrounding the WTP are defined by the Ludlowville Formation (Dhld). The Town encompasses three surficial geologic types. The WTP is located on an area of Till (t), with variable texture from boulders to silt and variable permeability with compaction. According to data from USDA-NRCS, the WTP sits on soils made up of Guyanoga channery silt loam (15B), Honeoye loam (101C), Palmyra and Howard Soils (120E), and Lima loam (201B). Soil 15B is classified as Hydrologic Soil B. It has a slope ranging from 3 to 8%, a depth to water table between 36 to 72 inches, a depth to a restrictive soil layer of more than 80 inches, rare frequency of flooding, no frequency of ponding, low available water storage (about 5.0 inches), and is considered well drained.

Preliminary Engineering Report Town of Gorham Water Treatment Plant Improvements September 2021
MRB Group Project No. 0735.21001.000 Page 5
Soil 101C is classified as Hydrologic Soil B. It has a slope ranging from 8 to 15%, a depth to water table more than 80 inches, a depth to a restrictive soil layer of more than 80 inches, no frequency of flooding or ponding, moderate available water storage (about 7.4 inches), and is considered well drained. Soil 120E is classified as Hydrologic Soil B. It has a slope ranging from 25 to 45%, a depth to water table more than 80 inches, a depth to a restrictive soil layer of more than 80 inches, no frequency of flooding or ponding, low available water storage (about 5.5 inches), and is considered well drained. Soil 201B is classified as Hydrologic Soil B/D. It has a slope ranging from 3 to 8%, a depth to water table between 18 to 24 inches, a depth to a restrictive soil layer of more than 80 inches, no frequency of flooding or ponding, moderate available water storage (about 7.2 inches), and is considered moderately well drained. Therefore, depending on the required depth, there is no anticipated difficulty during construction. An extensive geologic survey is recommended for any proposed construction. Site location, Environmental Resource and Waterbody, bedrock and surficial geology maps, and soil maps and descriptions are included in Appendix A.
C. OWNERSHIP AND SERVICE AREA
Ownership The Water Treatment Plant is owned and operated by the Gorham Water District #1. Improvements to the WTP will be subject to Town Law 202-b. Service Area According to the 2012 Recommended Standards for Water Works (Ten States), the design period for new processes and equipment should be 20 years. Therefore, both recorded and projected population estimates were considered. Population data for the Town was obtained from the Genesee/Finger Lakes Regional Planning Council and the U.S. Census Bureau. Based on the data provided, the Town population makes up about 3.9% of the entire population of Ontario County. Therefore, this percentage was used to aid in the estimated projected populations:
Preliminary Engineering Report Town of Gorham Water Treatment Plant Improvements September 2021
MRB Group Project No. 0735.21001.000 Page 6
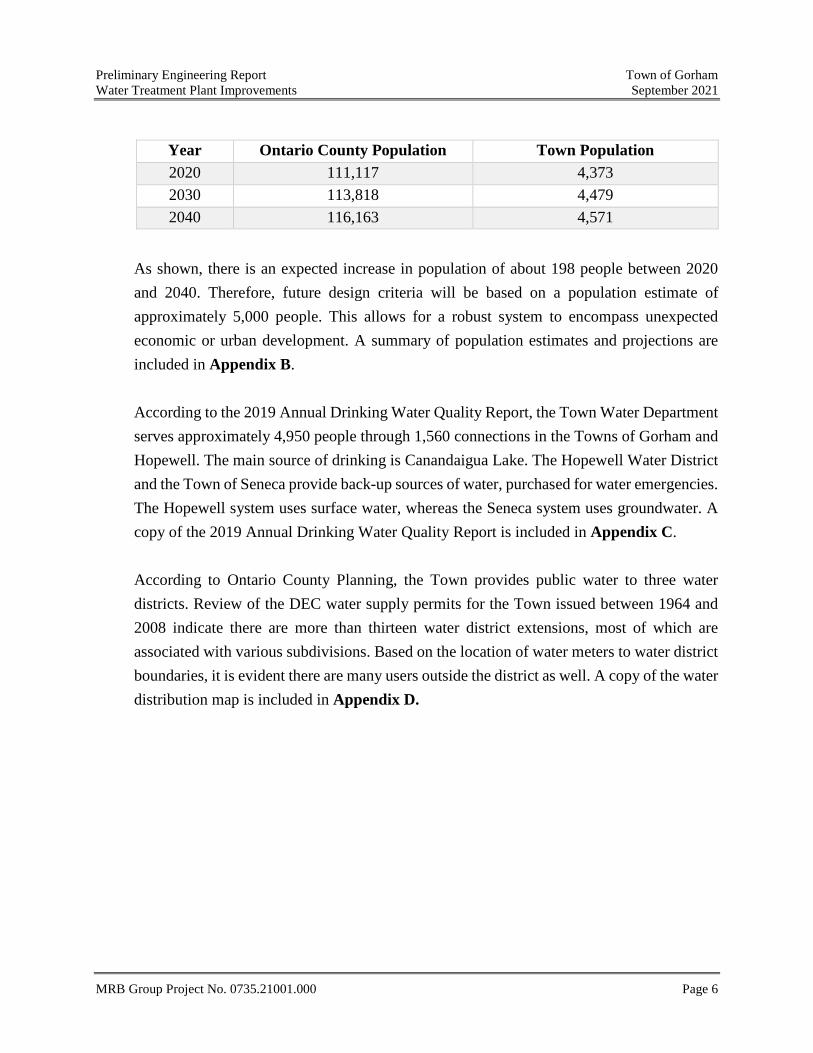
Year Ontario County Population Town Population 2020 111,117 4,373 2030 113,818 4,479 2040 116,163 4,571
As shown, there is an expected increase in population of about 198 people between 2020 and 2040. Therefore, future design criteria will be based on a population estimate of approximately 5,000 people. This allows for a robust system to encompass unexpected economic or urban development. A summary of population estimates and projections are included in Appendix B. According to the 2019 Annual Drinking Water Quality Report, the Town Water Department serves approximately 4,950 people through 1,560 connections in the Towns of Gorham and Hopewell. The main source of drinking is Canandaigua Lake. The Hopewell Water District and the Town of Seneca provide back-up sources of water, purchased for water emergencies. The Hopewell system uses surface water, whereas the Seneca system uses groundwater. A copy of the 2019 Annual Drinking Water Quality Report is included in Appendix C. According to Ontario County Planning, the Town provides public water to three water districts. Review of the DEC water supply permits for the Town issued between 1964 and 2008 indicate there are more than thirteen water district extensions, most of which are associated with various subdivisions. Based on the location of water meters to water district boundaries, it is evident there are many users outside the district as well. A copy of the water distribution map is included in Appendix D.

Preliminary Engineering Report Town of Gorham Water Treatment Plant Improvements September 2021
MRB Group Project No. 0735.21001.000 Page 7
D. DESIGN CRITERIA
Based on review of discharge monitoring reports (DMR) from January 2019 through May 2021, the existing two- and half-year average flow is summarized in the table below.
Existing Conditions Flow Factor Average Daily Flow 0.46 MGD - Peak Month ADF 0.46 MGD 1.0 Peak Day 0.85 MGD 1.8
WTP Design Conditions Flow Factor
Design Capacity 1.50 MGD -
In order to determine potential growth and future demand on operations, historical and projected population data from the Genesee/Finger Lakes Regional Planning Council was analyzed up to the year 2040 for the Town of Gorham and Town of Hopewell. Based on these estimates, there was a potential increase in service area of 210 persons, which equates to a demand of 0.05 MGD. Therefore, the following future flows including water demand were considered:
Future Conditions Flow Factor Est. Average Daily Flow 0.52 MGD - Est. Peak Month ADF 0.51 MGD 1.0 Est. Peak Day 0.94 MGD 1.8
The estimated peak day at 0.94 MGD is conservative, but still far below the rated max capacity of the WTP at 1.50 MGD. Therefore, design calculations are calculated for both growth and development options, as well as the maximum permitted withdrawal limit from Canandaigua Lake to ensure the proposed improvements meet Ten States. A summary of the DMR data, and design criteria calculations and estimates are included in Appendix E.
E. EXISTING FACILITIES AND PRESENT CONDITION
The following sections outline the flow of water through the system, starting at Canandaigua Lake, through treatment, into storage, and out to distribution. An existing site layout and

Preliminary Engineering Report Town of Gorham Water Treatment Plant Improvements September 2021
MRB Group Project No. 0735.21001.000 Page 8
process schematic are included in Appendix F. 1. Water Source
The Town obtains water from Canandaigua Lake under Water Supply Application No. 4788 issued in December 3, 1964. The Permit ID Number is 8-3232-0032/00013. According to the application, the WTP is permitted to withdraw up to a maximum of 1.5 MGD from the lake for use within the Gorham Water District. However, the actual diversion of water is limited to the existing capacity of the filter plant based on the design filter rate of 1.0 gpm/SF of filter area. In accordance with DEC and New York State Department of Health (DOH) standards, changes to the treatment process that allow withdrawal over 1.5 MGD, or increasing filter loading rate to be greater than 1.0 gpm/SF, require regulatory approval and modification of the water supply permit.
2. Water Treatment Plant The WTP is located at 4285 New York State Route 364. The treatment process consists of a raw water intake, raw water pumps, diatomaceous earth (DE) filters, and ultraviolet light (UV) reactor, chlorine gas, a clear well storage tank, and a high lift pump station. All unit processes are located inside a single building. The following sections summarize each of the components.
a. Raw Water Intake
The raw water intake consists of 1,175 feet of 12-inch steel pipe with an intake that is approximately 51.9 feet to 53.9 feet deep depending on the time of year. The intake can prove 1,320 gpm (1,9 MGD) at 5.8 feet of head loss when the lake is low. The raw water intake has sufficient capacity for existing and estimated future demands within the Town, the areas supplied in the Town of Hopewell, plus the Rushville/Middlesex water system.
b. Raw Water Pumps
The raw water pump station is located inside the WTP and contains two (2) pumps: 50 HP, Gould’s Model VIT-FFTM, size 8FLDLO, with 3 stages. Each pump is rated at 650 gpm at 235 feet, and 3,550 RPM.

Preliminary Engineering Report Town of Gorham Water Treatment Plant Improvements September 2021
MRB Group Project No. 0735.21001.000 Page 9
Flow from the raw water pumps is controlled by a variable frequency drive and a rate of flow control valve installed after the DE filters. Based on review, the pumps appear to operate at approximately 86.5% of speed (51.9 Hz); a single pump at full speed can provide up to 810 gpm, and both pumps at full speed can provide 1,320 gpm. Therefore, a single pump can provide the existing maximum day demand, but two pumps are required to meet peak hour demand. Additional pump capacity may be necessary to supply future system maximum day and peak hour demands.
c. DE Filters
The DE filters are an RP Adams Model IWF-269 four filter system with a capacity of 1,076 gpm with all four filters in service and loaded at 1.0 gpm/SF in accordance with the water supply permit. According to Ten States, the use of DE filters is best for application to surface waters with low turbidity and low bacterial contamination. At least two (2) filters should be provided, and the filters should be capable of meeting the WTP design capacity at the approved filtration rate with one filter removed from service. At 1.0 gpm/SF, this equates to approximately 807 gpm with one filter out of service. Ten States recommends a maximum filtration rate of 1.5 gpm/SF, which equates to approximately 1,210 gpm with one filter out of service. In order to increase the filtration rate from 1.0 gpm/SF to 1.5 gpm/SF, regulatory approval from the DOH would be required to increase the filter loading rate. Therefore, the existing DE filters can provide the average day demand with one unit out of service, while being loaded at 1.0 gpm/SF. Future maximum day demands would require all four filters to be in use.
It is important to note that the DE filter pre-coat on the bottom of the clear well should be cleaned and inspected to ensure the septum do not pass pre-coat media. According to Ten States, a uniform pre-coat shall be applied hydraulically to each septum by introducing a slurry to the tank influent line and employing a filter-to-waste or recirculation system.
Preliminary Engineering Report Town of Gorham Water Treatment Plant Improvements September 2021
MRB Group Project No. 0735.21001.000 Page 10
d. Wastewater (DE) Decant Basin
A dry feed system applies DE to the filters through the raw water pumps. When the headloss across the filters reaches a set point, the filters are backwashed to a wastewater decant basin adjacent to the WTP. The basin has an 8,900-gallon capacity at high water level. Filter backwash settles in the basin before being decanted to County Lake District Sewers adjacent to the plant. Decant drawdown volume is up to 5,050 gallons. Solids collected in the basin are routinely removed by the operator. The County Sewer District reports that DE frequently carries over from the decant basin to the County’s pump station to the immediate north of the WTP. The DE typically causes problems with the pump station necessitating maintenance. The county has requested any improvements to the WTP include provisions to eliminate the potential for DE reaching the pump station.
e. UV Reactor
Primary disinfection is provided by a single Trojan UV Swift TM 12 reactor with a design flow rate of 1,400 gpm and average flow rate of 400 gpm. The unit provides 40 mJ/cm2 based on a UV transmittance of 95%. According to Ten States, the installed unit provides the required dosage, but does not provide redundancy. In addition, the unit does not provide the required upstream and downstream pipe lengths.
f. High Lift Pumps
The two (2) high lift pumps are Gould VIT-DITM, 8RJHC 3-stage units with a design point of 650 gpm at 233 feet of head. Review of the system curve for the pumps determined that a single unit provides approximately 661 gpm at 228 feet of head during peak hour demands when Tank #1 is low. The flow increases to 1,249 gpm at 242 feet with both pumps operating. When system demands are low, Tank #1 level is high, and flow
Preliminary Engineering Report Town of Gorham Water Treatment Plant Improvements September 2021
MRB Group Project No. 0735.21001.000 Page 11
from a single pump reduces to 590 gpm at 250 feet. The flow from both pumps is approximately 991 gpm at 278 feet.
The 1996 plans indicate that the maximum depth in the clear well is 2 feet. Literature provided by the manufacturer indicate that the minimum submergence required for the proper pump operation is 2.1 feet. Therefore, depending on actual operation conditions, the raw water pumps may cavitate when the clear well approaches the low level. The high life pumps can provide existing maximum day demand in the lower service area with one pump in service. Future maximum day demands would require both pumps to be in service. The high lift pumps cannot provide the anticipated peak hour demands with both pumps in service. Therefore, the lower service area relies on storage to supplement flow during peak hour demands.
g. Clear Well
The clear well is located below the WTP and shares a wall with the raw water wet well. The normal volume of the clear well is 49,900 gallons at high operating level. The operating volume is 40,600 gallons, and volume at low level is 9,300 gallons. The low-level volume was used for disinfection contact time calculations. Flow to the clear well is controlled by a rate of flow control valve with a maximum rate limited to the capacity of the DE filters of 1,076 gpm. Under normal operating conditions, with only one high lift pump on at a time, the clear well fills while producing water. When both pumps operate simultaneously, the clear well drains in approximately 3.9 hours. Based on these factors, the WTP appears to have sufficient capacity to supply daily demands. However, additional controls may be required to maintain a proper operating level for 3-log disinfection inactivation. During review of the WTP, the level sensor for the clear well appears to measure the depth above the low operating level and not the actual depth.
Preliminary Engineering Report Town of Gorham Water Treatment Plant Improvements September 2021
MRB Group Project No. 0735.21001.000 Page 12
The level sensor should be adjusted or replaced to measure actual depth. Review of the record drawings for the WTP revealed an opening in the wall between the clear well and the raw water wet well that serves as an overflow. The elevation of the overflow invert is 694.43 feet, approximately 7 feet above the Canandaigua Lake rule curve high water level of 687.34 feet. Therefore, this separation provides a sufficient air-gap to prevent backflow of raw water into the finished water storage.
3. Electrical Systems & Mechanical Systems
As part of the Preliminary Engineering Report phase, Jadestone Engineering was retained to perform an Electrical and Mechanical review of the building systems. Generally, the systems are from the original construction of the water plant and are at the end of their useful life. The generator is also undersized for the existing building loads and would presumably be undersized with any improvements. A copy of the electrical and mechanical evaluation is included in Appendix S.
4. Distribution System
The Town distribution system is comprised of asbestos cement, ductile iron, steel, and PRV pipe, ranging from 0.75 to 10 inches in diameter. Overall, the pipe is in good condition, with the number of breaks commensurate with the age of the system.
5. Water Storage The distribution system contains two (2) storage tanks, one in the Lower Service Area and one in the Upper Service Area. Water storage tanks should contain the following storage components:
• Operating Storage
The volume between pump on and pump off levels
• Equalization Storage The volume between pump on and the level needed to maintain 35 psi at all points
Preliminary Engineering Report Town of Gorham Water Treatment Plant Improvements September 2021
MRB Group Project No. 0735.21001.000 Page 13
in the distribution system
• Fire Suppression Storage The volume between pump on and the level needed to maintain 20 psi at all points in the distribution system
• Standby Storage The volume between the levels needed to maintain 35 psi and 20 psi at all points in the distribution system
• Total Storage The volume between the overflow and the bottom of the tank
a. Lower Service Area
Tank #1 is located in the Lower Service Area, and provides system pressure
equalization and storage. Review of the tank and tank sizing guidelines
indicate that Tank #1 does not contain equalization of fire suppression
storage. This is primarily due to the ground elevations east of Summit
Parkway.
b. Upper Service Area
Tank #2 is located in the Upper Service Area, and provides system pressure equalization and storage. Review of the tank and tank sizing guidelines indicate that Tank #2 does not contain equalization storage. This is primarily due to the ground elevations along Depew Road between CR-17 and CR-18.
6. Turner Road Pump Station
The Turner Road pump station supplies water to the upper service area and fills Tank #2. Each pump is 50 HP with a design capacity of 600 gpm at 218 feet. Review of the system curves determined that a single pump can provide between 589 gpm at 253 feet of head and 661 gpm at 229 feet of head depending on system demands and tank water levels.
Preliminary Engineering Report Town of Gorham Water Treatment Plant Improvements September 2021
MRB Group Project No. 0735.21001.000 Page 14
With both pumps operating, the flow increases to between 992 gpm at 279 feet of head and 1,249 gpm at 242 feet of head depending on system demands and tank water levels. Therefore, the Turner Road pump station can adequately supply existing maximum day demand to the upper service area with one pump. Two pumps are required for peak hour demands. Comparison of the Turner Road pump station and high lift pump station indicates a similar capacity when one or two pumps are operating simultaneously. This indicates that during normal demands, when the same number of pumps are operating at each location, the system demands in the lower service area are supplied by Tank #1. In order to fill Tank #2, either both high life pumps need to operate while only one pump operates at Turner Road, or the one high lift pump can operate when the Turner Road pump station is off. The Turner Road pump station relies on a portable emergency generator stationed at the WTP for standby power in the event of a power failure. This generator also provides standby power for the WTP. It is recommended to install fixed generators at both locations to protect against a wide-spread power outage that may impact both facilities.
F. WATER QUALITY
To comply with New York State regulations, the Town issues annual drinking water quality reports. The purpose of the reports is to raise drinking water understanding and awareness needed to protect the drinking water source, Canandaigua Lake. In 2020, the Town conducted tests for various contaminants, including total coliform, inorganic compounds, nitrate, volatile organic compounds, and synthetic organic compounds. The following sections discuss leading water quality contaminants, and their impacts on the system. Copies of the Citizens Statewide Lake Assessment Program (CSLAP) reports are included in Appendix G.
1. Blue-Green Algae
According to the 2018 CSLAP report, cyanobacteria, or blue-green algae, had the highest populations in Canandaigua Lake. The water quality conditions indicate a low susceptibility to blooms, with frequent blooms along the shoreline or in open
Preliminary Engineering Report Town of Gorham Water Treatment Plant Improvements September 2021
MRB Group Project No. 0735.21001.000 Page 15
water. The site confirms the majority of algal blooms occur three times a year during the summer months. These blooms typically last a few days. Excessive growth of algae can cause problems such as bad taste and odor, potential cyanotoxins from lysed cells, increased color and turbidity, and decreased filter run times. The blooms are often controlled by reducing farm runoff into the water source. Although the site does not report excessively high turbidity or odor issues, it is recommended to consider additional filtration to control or mitigate the potential for cyanotoxins and/or turbidity levels caused by excessive seasonal algal blooms.
2. Turbidity
Turbidity is caused by particles suspended or dissolved in water that scatter light, making the water appear cloudy or murky. Particulate matter can include clay and silt sediment, fine organic and inorganic matter, soluble colored organic compounds, algae, and other microscopic organisms. Turbidity is tested in drinking water distribution systems to measure the filtration process effectiveness. Turbidity is measured in Nephelometric Turbidity Units (NTUs), where a greater scattering of light indicates low water clarity, and a lower scattering of light indicates high water clarity. The EPA maximum treated turbidity reading is 0.3 NTU, and New York State regulations require the treated turbidity always be below 1.0 NTU.
According to the Annual Water Quality Report, the highest monthly average turbidity recorded before treatment was 3.9 NTU, which is below the 5.0 NTU Maximum Containment Level (MCL). The average treated turbidity recorded at the filters was 0.16 NTU, well below the EPA and New York State regulations.
3. Invasive Species
Invasive species reported in Canandaigua Lake include Eurasian Watermilfoil, Curly Leafed Pondweed, and Water Chestnut. Fishhook Waterflea, Chinese Mystery Snail, Asian Clam, Common Carp, Quagga Mussel, Zebra Mussel, and Scud have also been reported. According to the site, there are no significant impacts on the treatment process or disinfected drinking water effluent from these species. However, Canandaigua Lake has a high vulnerability for new invasive species based on the calcium levels and available public access.
Preliminary Engineering Report Town of Gorham Water Treatment Plant Improvements September 2021
MRB Group Project No. 0735.21001.000 Page 16
4. Disinfection
The EPA reaffirms its commitment to the current Safe Water Drinking Act, which includes regulations related to disinfection and pathogenic organism control for drinking water supplies. The Surface Water Treatment Rule requires treatment for Giardia lamblia (Giardia) and viruses of all surface water and groundwater under the direct influence of surface water. Public water systems are required to comply with a new operating parameter referred to as a CT value, which is the concentration of free chlorine multiplied by the physical contact time in the storage tank. The CT value is used as an indicator of the effectiveness of the disinfection process. This parameter depends on pH and temperature to remove or inactivate Giardia and viruses that could pass through water treatment unit processes. According to Title 10 of New York Code of Rules and Regulations (10NYCRR), Subpart 5-1, Section 5-1.30 of the State Sanitary Code, total treatment of the system must achieve at least 99.9% (3-log) removal or inactivation of Giardia cysts and 99.99% (4-log) removal or inactivation of viruses.
The current treated water sampling point is downstream of the treatment plant. In order to determine the most conservative contact time, it was assumed that as the temperature decreases, the pH increases, and the chlorine residual is at a maximum value. The maximum pH was 8.0 and the minimum temperature was 1.7 deg-C. The chlorine residual for each piece of equipment was measured on site. The baffling factors for the raw water intake, DE filters, and clear well were estimated at 0.9, 0.7, and 0.5 respectively.
CT calculations were evaluated for three (3) different flow rates: existing max day, design max day, and max WTP capacity. These flow rates were based on existing WTP operating data and design criteria. Based on the analysis, the existing treatment system far exceeds the 4-log inactivation requirement for viruses for all flow rates, but only passes the 3-log inactivation requirement for Giardia under existing max day of 0.85 MGD and design max day at 0.94 MGD. For the existing max WTP capacity at 1.5 MGD, the 3-log inactivation fails. Further, the existing treatment system does not provide
Preliminary Engineering Report Town of Gorham Water Treatment Plant Improvements September 2021
MRB Group Project No. 0735.21001.000 Page 17
the required CT for treatment of Microcystin (MCLR) at existing average day flows. However, according to the EPA’s Surface Water Treatment Rule (SWTR), inactivation credits can be provided by filtration and UV. The max WTP capacity can only meet inactivation with the credits. Therefore, additional DE filters or a larger low-level operating volume in the clear well are required to meet the required CT time at these flow rates. Full CT contact time calculations are included in Appendix H.
5. Disinfection By-Products
Over the past years, the Environmental Protection Agency (EPA) has worked collaboratively with stakeholders to develop regulations that will provide a balance between the need to disinfect drinking water and the need to protect citizens from potentially harmful contaminants. The EPA has set MCLs for total trihalomethanes (TTHMs) and haloacetic acids (HAAs) of 80 and 60 micrograms per liter, respectively, based on annual averages of quarterly sample results taken from the distribution system. According to the Annual Water Quality Report, the average TTHM level recorded was 49 ug/L and the average HAA level recorded was 36 ug/L. Although none of the averaged TTHM data exceeds the EPA limit of 80 µg/L, there were samples above this point, ranging up to 100 ug/L. Therefore, it is important to implement improvements to address THM levels before distribution to the community.
6. Water Loss
Old and poorly constructed pipelines, inadequate corrosion protection, poorly maintained valves, and mechanical damage are some of the factors contributing to leakage. One important effect of water leakage, besides the loss of water resources, is reduced pressure in the system. Raising pressures to make up for these losses increases energy consumption as well as making leaking worse. In general, a 10 to 20% allowance for unaccounted water is normal. A loss of more than 20% requires priority attention and corrective actions.
Unaccounted water is the difference between water produced at the treatment facility and metered use by customers. In 2019, the total annual use drawn from
Preliminary Engineering Report Town of Gorham Water Treatment Plant Improvements September 2021
MRB Group Project No. 0735.21001.000 Page 18
Canandaigua Lake and treated at the WTP was approximately 115.1 MG, whereas the total amount consumed was about 155.8 MG. Approximately 19.8 MG were accounted for due to water main failures, frozen meters and services, Fire Department usage, and flushing hydrants. Therefore, the total unaccounted loss for the system is about 13%, which falls within the normal range. In order to prevent future leaks, it is recommended to initiate leak detection efforts in the near future that focus on distribution policies that encourage conservation, public education programs, pressure reduction, requests for voluntary cutbacks or bans on certain water uses, and water recycling.
G. FLOOD PROTECTION
According to the FEMA Flood Insurance Risk Map effective December 5, 1996, the existing WTP is located in Zone C, which is representative of areas of minimal flooding hazards. However, the Flood Insurance Rate Maps are only an approximation.
Ten States requires that other than surface water intakes, all water supply facilities and water treatment plant access roads shall be protected to at least the 100-year flood elevation or maximum flood of record, as required by the reviewing authority. A freeboard factor may also be required by the reviewing authority. It is also important to consider the impact climate change may have on the 20 year design life of the WTP installations. Climate change may increase currently identified flood risks due to increased precipitation, larger run-off volumes, sea-level rise, and higher storm surges. As shown, any new equipment would be far above the 100-year flood level. A FEMA Flood Insurance Rate Map is included in Appendix I.
H. FINANCIAL STATUS
The 2018 American Community Survey Statewide Median Household Income (MHI) for New York State is $62,765, which is adjusted for certain counties by a Regional Cost Factor (RCF). The RCF for Upstate is 1.0, and therefore the adjusted MHI is $62,765. The 80% MHI is $50,212. The Drinking Water State Revolving Fund (DWSRF) hardship program offers both interest free and/or grant funding to eligible projects.

Preliminary Engineering Report Town of Gorham Water Treatment Plant Improvements September 2021
MRB Group Project No. 0735.21001.000 Page 19
According to 2020 United States Census Bureau data, the total estimated population for the Town was 4,469, the MHI was $63,218, and the poverty level was 11%. Therefore, the Town does not meet the criteria for hardship grant funding, even if given a high enough IUP listing. A summary of the Census Bureau data for the Town is included in Appendix J.
I. NEED FOR PROJECT
1. Health and Safety
The Town of Gorham has identified a need to provide treatment enhancements to counter changing source water conditions, including Harmful Algal Blooms, Emergent Contaminants (such as PFAS/PFOS), and high turbidity events. Blue Green Algae (BGA) has been detected in the source water since the summer of 2016. The Gorham WTP is the only facility on Canandaigua Lake that does not provide enough CT to treat for the most prevalent cyanotoxin: MCLR. Additionally, the DE filters are the most likely treatment type (in the presence of chlorine) to lyse cells releasing cyanotoxins.
2. Aging infrastructure
The Town of Gorham’s WTP was constructed in the late 1960s with the current DE
Filters. These filters are showing signs of disrepair and are near the end of their
useful life (50 years +/-). Any future project needs to include replacement of these
filters (in kind or otherwise).
a. Loss of source capacity
The Town of Gorham’s WTP experiences loss of capacity during high
source-water turbidity events as is typical of most DE filtration plants.
Additionally, HAB events also decrease the capacity of the WTP to
minimize the potential for lysing BGA cells. Any future project needs to
include treatment for HABs and high turbidity events.
3. Compliance with current design standards
The existing WTP was evaluated against Ten States Standards and found the
following:

Preliminary Engineering Report Town of Gorham Water Treatment Plant Improvements September 2021
MRB Group Project No. 0735.21001.000 Page 20
• The DE Filters fail to provide the required redundancy with one (1) filter offline and meet the design flow of 1.5 MGD.
• The low lift (raw water) and high lift pumps do not provide the required redundancy at the design flow of 1.5 MGD.
• The clearwell lacks the necessary volume providing the required contact time to meet disinfection requirements at the design flow of 1.5 MGD.
• UV disinfection system fails to provide the required redundancy (single unit) and additionally does not comply with the installation requirements (straight pipe lengths upstream and downstream from the reactor) for the UV certification.
J. SYSTEM O&M
WTP and Distribution System Operation and Maintenance will continue to be the
responsibility of the Town of Gorham.
K. GROWTH
The water system design assumes a steady 1.5% annual increase in population in the Town
by the year 2040, based on documentation from the US Census Bureau and Genesee Finger
Lakes Regional Planning Council.
L. COMMUNITY ENGAGEMENT
The Town recently adopted the Gorham Water Master Plan prepared by MRB Group. The
Water Master Plan was presented to the public at a public hearing and after taking input from
the public, the planning document was adopted the next regular Town Board meeting. The
Water Master Plan identified several needs of the overall system, but the highest ranked
improvement was for upgrades to the WTP process to improve the resiliency under various
raw water conditions such as HABs, emergent contaminants and high turbidity events.

Preliminary Engineering Report Town of Gorham Water Treatment Plant Improvements September 2021
MRB Group Project No. 0735.21001.000 Page 21
IV. ALTERNATIVES ANALYSIS
Overall the WTP operates efficiently, however, the existing treatment system lacks redundancy and does not provide adequate treatment for HABs, emergent contaminates and high levels of turbidity. The existing DE filters are outdated, and do not sufficiently combat high turbidity. Due to the age of the system, various upgrades could provide redundancy to facilitate routine operation and maintenance, ensure a robust system, and provide for future growth. Based on the analysis of existing conditions and process data, the following sections outline system improvements, recommendations, and future capital projects as three varying treatment processes. All alternatives are designed with filter redundancy to be able to produce 1.5 MGD with a filter offline. Each alternative includes carbon filtration for treatment of cyanotoxins, emergent contaminants and potential taste and odor issues. All the alternatives consider a discharge to the County’s sewer and potentially Deep Run Creek. The existing sewer flows by gravity to a pump station of limited capacity. Design Criteria: The design criteria for each alternative will be consistent with “Recommended Standards for Water Works” (RSWW) or more commonly known as ‘Ten States Standards’ and/or the requirements and approval conditions of the NYSDOH. Each alternative considers the design flow of 1.5 MGD with a filter out of service and carbon filtration with at least 10 minutes of Empty Bed Contact Time (EBCT). Environmental Impacts: Each alternative will require the construction of a new Filter Building and an Equalization Tank of various sizes. Alternatives 1 and 2 may require a discharge to Deep Run Creek and a discharge to the County Lake Sewer District. Alternative 3 only requires a discharge to the county sewer. If necessary, the Town will work with NYSDEC and/or Ontario County to obtain any proper permits for those discharges. The SEQR/NEPA environmental review will document any design or construction constraints associated with archaeological sensitivity, endangered or threatened species, and rare plants or animals. A. ALTERNATIVE 1 – TREATMENT ENHANCEMENTS
Based on the varying turbidity levels over the course of the year, insufficient capacity for the existing DE filters, failure to meet Ten States standards for several thresholds, and the lack of redundancy to provide minimal risk during routine or unexpected operation and maintenance, Alternative 1 includes addition of pre-filtration, backwash recovery,
Preliminary Engineering Report Town of Gorham Water Treatment Plant Improvements September 2021
MRB Group Project No. 0735.21001.000 Page 22
replacement DE filters, carbon filtration, and a redundant UV system, construction of a backwash equalization tank. This system would be rated for 1.5 MGD to be consistent with the maximum withdrawal permit of 1.5 MGD. Details for the proposed system upgrades, along with a process schematic are included in Appendix K.
1. Pre-Filtration
In order to combat high turbidity levels at the intake, pre-filtration in the form of multimedia pressure filters will be added. Eight (8) carbon steel painted pressure filters are proposed to meet the 1.5 MGD total design capacity. The filters are designed for flow rates between 640 and 1,910 GPM, with an anticipated backwash rate of 240 GPM.
2. DE Filters
The existing are outdated, and will be replaced. Each filter will contain filter elements totaling 240 SF or filter area. Each filter tank will be fabricated of 304 stainless steel DE Filters with stainless steel internals and filter elements for 100 pounds of pressure. Each filter will have 6-inch flanged connections.
3. Carbon Filtration
In order to add another layer of filtration, while addressing any potential taste and odor complaints, it is proposed to install two (2) granular activated carbon (GAC) filters following the DE filters. GAC is used to adsorb a variety of natural organic, synthetic organic, and taste and odor compounds. In this process, the porous media provides a large surface area for containment adsorption. Water from the DE filters will be introduced to each cell, where it passes through a bed of GAC media to remove constituents. The water then passes through an underdrain plate and exits the system as treated effluent to the UV system. Filter piping and valving for a multiple unit system can be arranged to account for parallel flow, series flow, or single-unit flow patterns. This allows the operator flexibility to operate as needed. As the media is spent, the level of constituent in breakthrough will increase, indicating replacement is required. Backwashing is used to remove dust and fines
Preliminary Engineering Report Town of Gorham Water Treatment Plant Improvements September 2021
MRB Group Project No. 0735.21001.000 Page 23
after media replacement. It is proposed to send the backwash to the head of the plant and/or discharge to Deep Run Creek under a SPDES permit.
4. UV Disinfection
The proposed TrojanUVSwift™ ultraviolet system consists of an inline system with two (2) reactors. Each reactor contains two (2) lamps, for a total of 4 lamps. The system is rated for a peak design flow of 2.0 MGD, 95% UV transmittance, and a design does 40 mJ/cm2. A touch smart controller will be included for system control. The system includes the ActiClean™ automatic chemical and mechanical cleaning system. The proposed UV system, and associated electrical equipment will be housed inside an insulated pole barn structure to protect the equipment from direct sunlight and precipitation, and to assist in preventing algae growth.
5. Backwash Recovery
As part of future conservation efforts, and removal of excess solids, a backwash recovery system is proposed. The system will include an equalization tank and an inclined plate system. This system includes a combination rapid mix and flocculation tank. Water from the pre-filter units is fed to the rapid mix chamber, where coagulant is added to neutralize charge on the suspended particulates. Following a 30 to 60 second rapid mix period, the water flows over a baffle into the flocculation zone, where particles are gently mixed for approximately 5 to 10 minutes to promote collision and formation of larger flocs. The flocculated water then flows under another baffle to enter the separator transfer pipe under laminar flow conditions to the inclined plate basin. Water enters the inclined plate system at the base of the plates, where feed chemicals are specially designed to promote quiescent flow into the plates, minimizing re-entrainment of already settled solids. Water continues to slowly flow upwards through the plates, while solids settle and collect along each plate surface. Quiescent flow is critical for allowing the water to rise without affecting the settling velocity of the solids. As solids accumulate on the plate surface, they begin to slough off the plates and fall to the hopper at the bottom of the inclined plate basin.
Preliminary Engineering Report Town of Gorham Water Treatment Plant Improvements September 2021
MRB Group Project No. 0735.21001.000 Page 24
Solids collect at the bottom of the conical hopper, where an operator can blowdown the solids that have collected over time. Blowdown frequency is dependent on the solids loading to the system and how quickly the hopper bottom fills with settled solids. Sample taps at various heights are installed in the hopper to determine the level of solids and when blowdown is required. Settled solids are intermittently flushed from the sludge hopper and discharged. It is proposed to send supernatant from the backwash recovery system back to the head of the WTP, and the remaining waste will be sent to the sanitary sewer. The rate of discharge will be metered as to not overload the systems or exceed 10% of instantaneous raw water flow.
B. ALTERNATIVE 2 – ABSORPTION CLARIFIER AND MULTIMEDIA FILTER PACKAGE PLANT
Again, in order to combat varying turbidity levels and minimize strain on the existing filters, and minimize overall operations, Alternative 2 includes construction of a package plant. This system would include Trident® absorption clarifiers and filters to combat varying turbidity levels, a backwash recovery system, carbon filtration and UV to provide disinfection and algal toxin treatment. The Trident® filters would replace the existing DE filters. Details for the proposed system upgrades, along with a process schematic are included in Appendix L. 1. Package Plant
The Trident® system combines a variety of chemical treatment solutions, including a patented adsorption clarifier system and mixed media filter to deliver excellent predictable finished water quality. The system also includes a direct retention air/ water backwash underdrain system. Each system includes a program for continuous effluent quality control. Backwash will be sent to the backwash recovery system.
2. Backwash Recovery
As part of future conservation efforts, and removal of excess solids, a backwash recovery system is proposed. The inclined plate system includes a combination rapid mix and flocculation tank. Water from the pre-filter units is fed to the rapid mix chamber, where coagulant is added to neutralize charge on the suspended particulates. Following a 30 to 60 second rapid mix period, the water flows over a baffle into the flocculation zone, where particles are gently mixed for approximately
Preliminary Engineering Report Town of Gorham Water Treatment Plant Improvements September 2021
MRB Group Project No. 0735.21001.000 Page 25
5 to 10 minutes to promote collision and formation of larger flocs. The flocculated water then flows under another baffle to enter the separator transfer pipe under laminar flow conditions to the inclined plate basin.
Water enters the inclined plate system at the base of the plates, where feed chemicals are specially designed to promote quiescent flow into the plates, minimizing re-entrainment of already settled solids. Water continues to slowly flow upwards through the plates, while solids settle and collect along each plate surface. Quiescent flow is critical for allowing the water to rise without affecting the settling velocity of the solids. As solids accumulate on the plate surface, they begin to slough off the plates and fall to the hopper at the bottom of the inclined plate basin. Solids collect at the bottom of the conical hopper, where an operator can blowdown the solids that have collected over time., Blowdown frequency is dependent on the solids loading to the system and how quickly the hopper bottom fills with settled solids. Sample taps at various heights are installed in the hopper to determine the level of solids and when blowdown is required. Settled solids are intermittently flushed from the sludge hopper and discharged. It is proposed to send supernatant from the backwash recovery system back to the head of the WTP, a portion of the supernatant to discharge in Deep Run Creek under s SPDES permit via a monitoring manhole, and the remaining waste will be sent to the sanitary sewer. The rate of discharge will be metered as to not overload the systems.
3. UV Disinfection
As with Alternative 1, the proposed TrojanUVSwift™ ultraviolet system consists of
an inline system with two (2) reactors. Each reactor contains two (2) lamps, for a
total of 4 lamps. The system is rated for a peak design flow of 2.0 MGD, 95% UV
transmittance, and the design is 40 mJ/cm2.
A touch smart controller will be included for system control. The system includes
the ActiClean™ automatic chemical and mechanical cleaning system. The proposed
UV system, and associated electrical equipment will be housed inside an insulated
Preliminary Engineering Report Town of Gorham Water Treatment Plant Improvements September 2021
MRB Group Project No. 0735.21001.000 Page 26
pole barn structure to protect the equipment from direct sunlight and precipitation,
and to assist in preventing algae growth.
C. ALTERNATIVE 3 – ULTRAFILTRATION PLANT
In order to minimize overall operations, Alternative 3 includes construction of an ultrafiltration plant. This system would include ultrafiltration to combat varying turbidity levels and carbon filtration to address any potential cyanotoxins breakthrough or emergent contaminants as well as unwanted taste and odor. The ultrafiltration system would replace the existing DE filters and UV system. Details for the proposed system upgrades, along with a process schematic are included in Appendix M.
1. Ultrafiltration
The proposed ultrafiltration system consists of three (3) membrane filtration units sized to achieve a net production capacity of 1.5 MGD. Each unit has capacity for up to 34 modules, with 32 installed. The filtration process is an outside/inside, pressure-driven process to remove suspended solids and turbidity, and to achieve 4-log reduction of pathogens. Ultrafiltration membranes can also achieve greater than 1.5-log reduction of waterborne viruses. Raw water from Canandaigua Lake would be transferred to the feed tank. VFD-controlled feed pumps direct water to a 200 µm pre-filter for removal of larger debris. The feed pump controls will be configured to minimize flow variation between steps and instantaneous flux by operation of the maximum number of available units. Filtrate will then be sent to the backwash supply tank. Backwashing will be used to remove accumulated foulants by reversed inside/outside flow at an interval of 20 to 60 minutes with air scour for increased agitation. A drain or filter-to-waste step will be used to remove any additional accumulated material. Automated chemical cleaning will be performed biweekly to recover membrane permeability. Following chemical cleaning procedures, the membrane units are drained by gravity or a pressurized drain-to-waste, and waste is subsequently sent to the discharge location.

Preliminary Engineering Report Town of Gorham Water Treatment Plant Improvements September 2021
MRB Group Project No. 0735.21001.000 Page 27
Backwash water generated from the Ultrafiltration system will be discharged to an equalization tank and eventually the sanitary sewer. The rate of discharge will be controlled to not overwhelm the sanitary sewer.
2. Carbon Filtration
Carbon filtration is proposed to provide treatment of any potential cyanotoxins
breakthrough (from HABs), emergent contaminants and/or taste and odor issues.
The carbon system proposed will include two (2) granular activated carbon (GAC)
filters following the UF filters. The GAC filters are designed to provide ten (10)
minutes of EBCT at the design flow. Ten (10) minutes of EBCT is proposed since
UF provides a 78% reduction of cyanotoxins. GAC is used to adsorb a variety of
natural organic, synthetic organic, and taste and odor compounds. In this process, the
porous media provides a large surface area for containment adsorption.
Water from the DE filters will be introduced to each cell, where is passes through a
bed of GAC media to remove constituents. The water then passes through an
underdrain plate and exits the system as treated effluent to the UV system. Filter
piping and valving for a multiple unit system can be arranged to account for parallel
flow, series flow, or single-unit flow patterns. This allows the operator flexibility to
operate as needed.
As the media is spent, the level of constituent in breakthrough will increase,
indicating replacement is required. Backwashing is used to remove dust and fines
after media replacement. It is proposed to send the backwash to the head of the plant.
D. ADDITIONAL CONSIDERATIONS
The following sections discuss additional considerations for improvement in conjunction with the selection of one of the aforementioned alternatives.

Preliminary Engineering Report Town of Gorham Water Treatment Plant Improvements September 2021
MRB Group Project No. 0735.21001.000 Page 28
1. Pump Station Upgrades
With the addition of more complex treatment equipment and processes, it is recommended to upgrade both the low-lift (raw water) and high-lift pumps. The proposed high lift pumps include two (2) vertical turbine pumps each rated for 1,041 gpm at 245’ total dynamic head (TDH). The low-lift pumps are each rated for 1,041 gpm at 100’ TDH.
2. Filter Building
With the additional equipment, treatment systems, and infrastructure associated with
all three proposed alternatives, additional process space is required. Based on
available land space on the existing parcel, an insulated pole barn will be constructed
to house the new equipment. The filter building will also include laboratory space,
HVAC, mechanical and electrical rooms, an office, and a restroom for employees.
Any available space in the existing WTP building will be utilized if possible to
reduce overall energy costs.
3. Permitting
Coordination with the DEC and DOH will be required for all proposed system
improvements. Based on recent conversations with the DEC, once a SPDES
application is received, the DEC will begin drafting a permit, including a water
quality review for the receiving surface water. Any additional monitoring
requirements will be identified at this point.
Based on recent conversations with Ontario County, once final upgrade equipment
and processes are determined, the volume of potential waste effluent into the sanitary
sewer system will be quantified. Metering and monitoring operations will be
determined based on these findings, and regulated as needed in the future.

Preliminary Engineering Report Town of Gorham Water Treatment Plant Improvements September 2021
MRB Group Project No. 0735.21001.000 Page 29
4. Chlorine Analysis
The presence of chlorine residual in drinking water indicates that a sufficient amount
of chlorine was added initially to inactivate bacteria and viruses, and that the water
is protected from recontamination during storage. The project will have a water
quality monitoring panel that includes online measurement of finished water
turbidity, free chlorine, temperature, pH and conductivity for the purpose of
optimizing the treatment process and recording finished water quality.
In the event that a discharge to Deep Run Creek is necessary, a chlorine (TOC)
analyzer will monitor/record the chlorine levels in the discharge. The proposed
colorimetric chlorine analyzer uses colorimetric DPD chemistry to continuously
monitor water for free or total chlorine. The analyzer will operate unattended for 30
days and is compliant with US EPA regulation 40 CFR 141.74. Monthly routine
maintenance can be performed in a few minutes, including changing reagents and
cleaning the colorimetric cell.
Table IV.1: Summary of Alternatives
Alternatives Pros Cons Additional Comments
Alt 1 – Prefilter, DE Filter, Carbon Filtration, UV
• Treatment scheme is familiar to the operators
• Process does not require SCADA
• Capital Cost is high • Multiple treatment
steps
• May require a SPDES permit
Alt 2 – Absorption Clarifier, Multimedia Filter, Carbon Filtration, UV
• Simple operation • Proven technology
on various surface water supplies
• Generates a significant amount of wastewater
• Multiple treatment steps
• Relatively large footprint
• Capital Cost is high
• Will require a SPDES permit
Alt 3 – Ultrafiltration, Carbon Filtration
• Smallest footprint • Eliminates the need
for UV • Generates the least
amount of wastewater
• Membrane replacement costs
• Requires SCADA
• Will not require a SPDES permit

Preliminary Engineering Report Town of Gorham Water Treatment Plant Improvements September 2021
MRB Group Project No. 0735.21001.000 Page 30
V. COST ESTIMATES
The following economic analysis includes review of water use and associated costs per dwelling and type of user, and cost estimates for the proposed improvement alternatives. A. CAPITAL COST ESTIMATES
The 2021 water budget was estimated at $796,625, with about $27,000 spent on source of supply and transmission/distribution equipment. Based on the comprehensive WTP analysis, the cost estimates are separated by alternative:
Alternative Description Est. Cost
Alternative 1 Prefilter & DE Filter $8.98 M
Alternative 2 Absorption Clarifier & Multimedia
Filter Package Plant $10.8 M
Alternative 3 Ultrafiltration Plant $7.97 M
Further details of the overall cost estimates for each alternative are included in Appendix N.
B. EDU ANALYSIS
An Equivalent Dwelling Unit (EDU) is defined as a one single-family residential household. It is the unit of measure by which a user could be charged for water services provided by the municipal water district. Non-residential facilities EDU’s are calculated based on their demand. Agriculture is assessed at 50% of a typical single-family home usage. The Town serves a population of 4,373 through 1,590 water service connections. This includes services to the hamlets of Crystal Beach and Gorham, and several roads within the Town of Gorham. The Town also sells water to the Town of Hopewell. In 2018, the total annual use for the service area was approximately 125,458,549 gallons, with an average daily use of 343,722 gpd. Based on the calculations for water use in the community, the average single-family
residential consumption rate was 123 gpd or roughly 44,895 gpm. Residential EDUs total
2,055 due to the significant water usage by seasonal residential properties (24%) from 133
water accounts equaling 672 EDUs. The water usage by Agricultural operations represents
Preliminary Engineering Report Town of Gorham Water Treatment Plant Improvements September 2021
MRB Group Project No. 0735.21001.000 Page 31
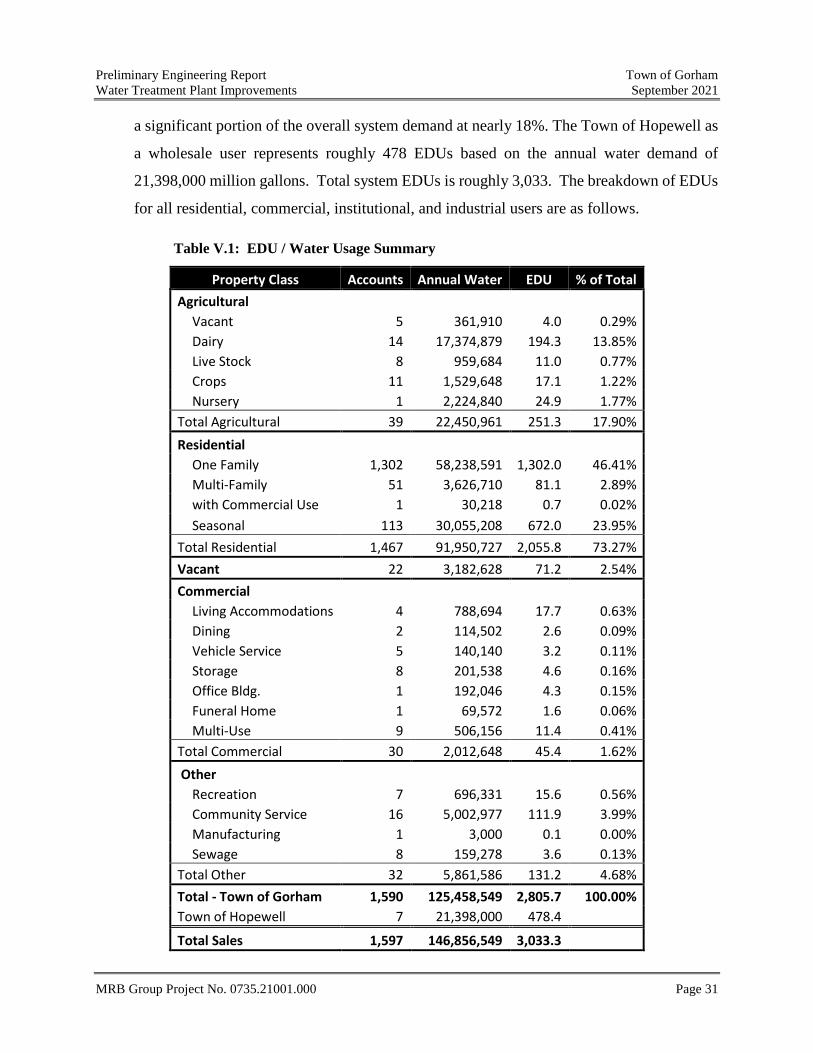
a significant portion of the overall system demand at nearly 18%. The Town of Hopewell as
a wholesale user represents roughly 478 EDUs based on the annual water demand of
21,398,000 million gallons. Total system EDUs is roughly 3,033. The breakdown of EDUs
for all residential, commercial, institutional, and industrial users are as follows.
Table V.1: EDU / Water Usage Summary
Property Class Accounts Annual Water EDU % of Total Agricultural
Vacant 5 361,910 4.0 0.29% Dairy 14 17,374,879 194.3 13.85% Live Stock 8 959,684 11.0 0.77% Crops 11 1,529,648 17.1 1.22% Nursery 1 2,224,840 24.9 1.77%
Total Agricultural 39 22,450,961 251.3 17.90% Residential
One Family 1,302 58,238,591 1,302.0 46.41% Multi-Family 51 3,626,710 81.1 2.89% with Commercial Use 1 30,218 0.7 0.02% Seasonal 113 30,055,208 672.0 23.95%
Total Residential 1,467 91,950,727 2,055.8 73.27% Vacant 22 3,182,628 71.2 2.54% Commercial
Living Accommodations 4 788,694 17.7 0.63% Dining 2 114,502 2.6 0.09% Vehicle Service 5 140,140 3.2 0.11% Storage 8 201,538 4.6 0.16% Office Bldg. 1 192,046 4.3 0.15% Funeral Home 1 69,572 1.6 0.06% Multi-Use 9 506,156 11.4 0.41%
Total Commercial 30 2,012,648 45.4 1.62% Other
Recreation 7 696,331 15.6 0.56% Community Service 16 5,002,977 111.9 3.99% Manufacturing 1 3,000 0.1 0.00% Sewage 8 159,278 3.6 0.13%
Total Other 32 5,861,586 131.2 4.68% Total - Town of Gorham 1,590 125,458,549 2,805.7 100.00% Town of Hopewell 7 21,398,000 478.4 Total Sales 1,597 146,856,549 3,033.3
Preliminary Engineering Report Town of Gorham Water Treatment Plant Improvements September 2021
MRB Group Project No. 0735.21001.000 Page 32
A copy of the 2020 water budget and full analysis of EDU calculations for the Town are included in Appendix O.
C. FINANCING OPTIONS
Current Town residents are charged a base water rate of $37.25 per quarter for up to 8,000 gallons, and $4.50 per 1,000 gallons additional. Out of district users are charged an additional 25 percent. The formula for calculating most quarterly bills is the base rate plus the quantity of water times the water rate.
The Drinking Water State Revolving Fund (DWSRF) and New York State Environmental Facilities Corporation (EFC) provides several options for funding opportunities through WIIA grant programs. The Town can submit the projects for one or both of these opportunities. The WIIA program provides a 60% match toward the total project cost, up to $3 million dollars. An analysis of the potential funding opportunities at both subsidized and market rates over 30-year loans, along with the latest water budget are included in Appendix P.
Preliminary Engineering Report Town of Gorham Water Treatment Plant Improvements September 2021
MRB Group Project No. 0735.21001.000 Page 33
VI. RECOMMENDED AND SELECTED ALTERNATIVE
The recommended alternative is selected based on the following design criteria:
• Ten States Standards • Ability to provide treatment for HABs • Ability to provide treatment for Emergent Contaminates like PFOS/PFAS • Provides the simplest treatment scheme • Produces the least amount of wastewater • Overall footprint • Capital cost • Will reliably produce high quality water
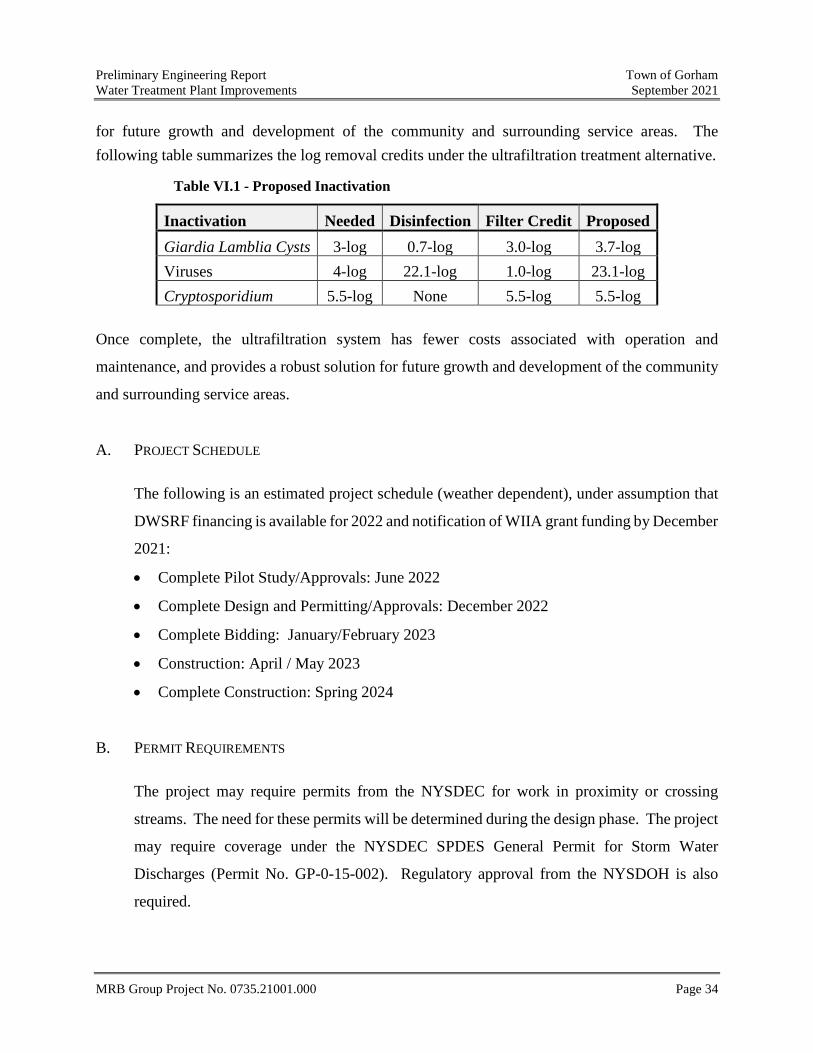
Based on a comprehensive WTP evaluation, there are a number of alternative improvements or upgrades to improve overall efficiency and address the need for treatment enhancements for HABs, Emergent Contaminants and high turbid events; however, Alternative 3 provides a comprehensive solution and excels based on the design criteria above. Alternative 3 includes ultrafiltration filters and carbon filters to treat for HABs, emergent contaminants and high turbid events, while also addressing CT issues without the need for a separate UV disinfection system. This alternative requires a lesser volume of backwash for the overall treatment process than the other alternatives. The overall system requires a smaller footprint because membranes are very compact and efficient. Additionally, this project will include conversion from gas chlorine to sodium hypochlorite for chlorination. See Appendix T for the Proposed Site Plan. Further, a backwash recovery system and UV system are not needed; the backwash-holding tank is approximately 1/3 of the volume needed for the other alternatives. Ultrafiltration can provide up to 3-log removal of Giardia and Cryptosporidium as filtration credits per EPA Guidance Manual for Compliance with the Filtration and Disinfection Requirements for Public Water Systems Using Surface Water Sources (1991). The basis of design ultrafiltration system completed a NSF/ANSI Standard 419-2018 challenge test (dated August 15, 2019) in which the reported log removal credits for cryptosporidium was reported to be >5-log. The NSF official listing for the Toray Industries, Inc. membranes is a log removal value of 6.05 log. Once complete, the ultrafiltration system has fewer costs associated with operation and maintenance, and provides a robust solution
Preliminary Engineering Report Town of Gorham Water Treatment Plant Improvements September 2021
MRB Group Project No. 0735.21001.000 Page 34
for future growth and development of the community and surrounding service areas. The following table summarizes the log removal credits under the ultrafiltration treatment alternative.
Table VI.1 - Proposed Inactivation
Inactivation Needed Disinfection Filter Credit Proposed Giardia Lamblia Cysts 3-log 0.7-log 3.0-log 3.7-log Viruses 4-log 22.1-log 1.0-log 23.1-log Cryptosporidium 5.5-log None 5.5-log 5.5-log
Once complete, the ultrafiltration system has fewer costs associated with operation and
maintenance, and provides a robust solution for future growth and development of the community
and surrounding service areas.
A. PROJECT SCHEDULE
The following is an estimated project schedule (weather dependent), under assumption that
DWSRF financing is available for 2022 and notification of WIIA grant funding by December
2021:
• Complete Pilot Study/Approvals: June 2022
• Complete Design and Permitting/Approvals: December 2022
• Complete Bidding: January/February 2023
• Construction: April / May 2023
• Complete Construction: Spring 2024
B. PERMIT REQUIREMENTS
The project may require permits from the NYSDEC for work in proximity or crossing
streams. The need for these permits will be determined during the design phase. The project
may require coverage under the NYSDEC SPDES General Permit for Storm Water
Discharges (Permit No. GP-0-15-002). Regulatory approval from the NYSDOH is also
required.
Preliminary Engineering Report Town of Gorham Water Treatment Plant Improvements September 2021
MRB Group Project No. 0735.21001.000 Page 35
C. ENGINEER’S OPINION OF PROBABLE COST
The Engineer’s Opinion of Probable Cost is $7,970,000.00, presented in Section V. and
Appendix H of the PER for the recommended alternatives, including requisite construction
and non-construction costs. A 20% construction contingency is incorporated into the total
estimated project cost.
Legal, Administrative and Engineering Costs have been estimated at 25% of the construction
cost, which is within the typical range for projects of this nature. A preliminary breakdown
of non-construction costs is as follows. This breakdown will be finalized when the requisite
Agreements are signed.
• Administration ..................$ 235,000.00 • Legal .................................$ 40,000.00 • Engineering .......................$1,099,000.00
There is no separate annual O&M budget for the project. The Town collects O&M via an
ad valorem charge. The 2021 O&M charge is approximately $0.237 cents per 1,000 TAV.
The Ad valorem charge generates roughly $121,000 per year in revenue according to the
Town’s budget records for 2019 and 2020.
D. ANNUAL OPERATING BUDGET
1. Income
The Town will continue to maintain and operate the system and deliver water to its
customers on a retail /ad valorem basis. The Town’s retail charge will need to be
increased to account for the Short-Lived Assets identified below.
2. Annual O&M Costs and Financing
Estimated project financing has been developed based on the following assumptions:
• Total project cost is estimated at $7,970,000.00 as per the Engineer’s Opinion of
Probable Cost in Appendix N.
• The project would qualify for a WIIA grant of $3,000,000.00 from NYSEFC
Preliminary Engineering Report Town of Gorham Water Treatment Plant Improvements September 2021
MRB Group Project No. 0735.21001.000 Page 36
• The project would qualify for a Grant/Loan funding package of $7,970,000.00
via the DWSRF program. Loan terms were assumed for 30 years at 2.5%
(assumed subsidized interest rate).
The ad valorem O&M charge for the Town will be not be changed as a result of this
project. Commodity charges will be made to all users on a quarterly schedule and
based on their individual metered consumption times the Town adopted rates. The
debt service charge will be included in the quarterly bills. The current Town water
quarterly $37.25 for the first 8,000 gallons plus $4.50/1,000 gallons after. Table VI.1
represents a summary of the estimated annual costs to a “typical single-family
residential property” within the District.
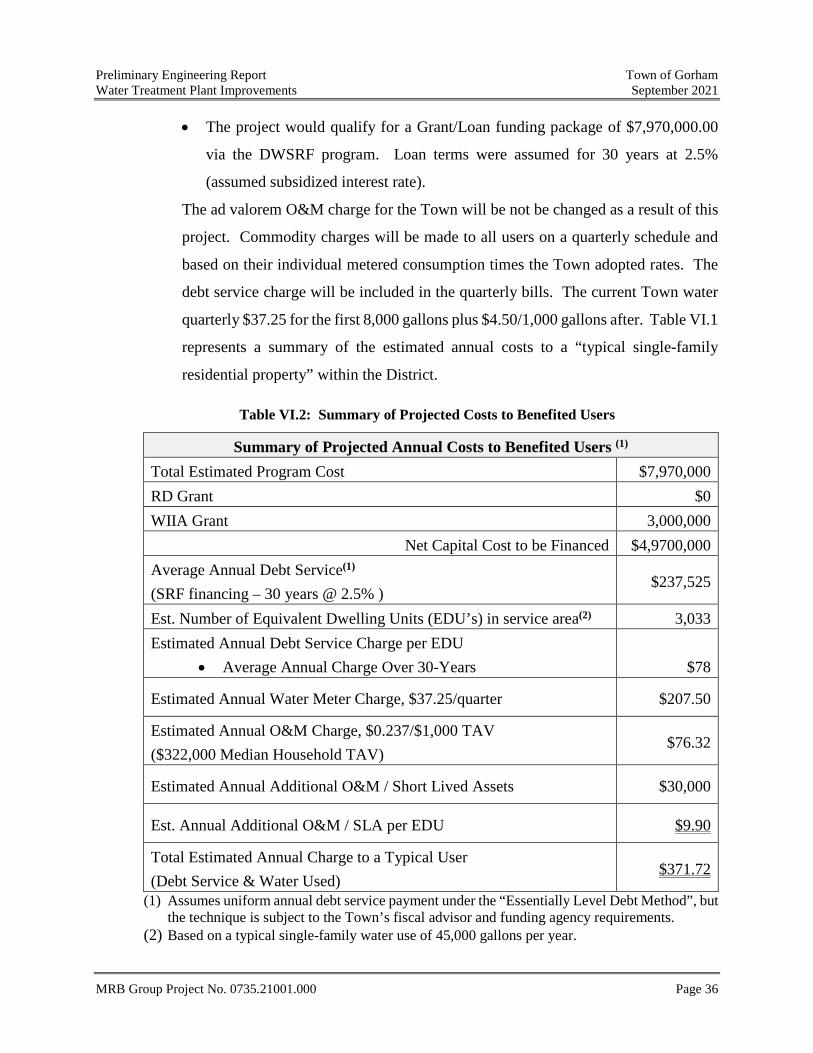
Table VI.2: Summary of Projected Costs to Benefited Users
Summary of Projected Annual Costs to Benefited Users (1) Total Estimated Program Cost $7,970,000 RD Grant $0 WIIA Grant 3,000,000
Net Capital Cost to be Financed $4,9700,000 Average Annual Debt Service(1) (SRF financing – 30 years @ 2.5% )
$237,525
Est. Number of Equivalent Dwelling Units (EDU’s) in service area(2) 3,033 Estimated Annual Debt Service Charge per EDU
• Average Annual Charge Over 30-Years $78
Estimated Annual Water Meter Charge, $37.25/quarter $207.50
Estimated Annual O&M Charge, $0.237/$1,000 TAV ($322,000 Median Household TAV)
$76.32
Estimated Annual Additional O&M / Short Lived Assets $30,000
Est. Annual Additional O&M / SLA per EDU $9.90
Total Estimated Annual Charge to a Typical User (Debt Service & Water Used)
$371.72
(1) Assumes uniform annual debt service payment under the “Essentially Level Debt Method”, but the technique is subject to the Town’s fiscal advisor and funding agency requirements.
(2) Based on a typical single-family water use of 45,000 gallons per year.

Preliminary Engineering Report Town of Gorham Water Treatment Plant Improvements September 2021
MRB Group Project No. 0735.21001.000 Page 37
3. Short-Lived Assets
The proposed project is a replacement water treatment system with a design life of
at least 30 years. There are no short-lived assets that would require expenditure of
capital dollars other than the normal O&M expenses associated with operating the
system. Table V-2 includes a summary of the Short-Lived Assets. O&M costs are
covered through the Town’s retail consumption rate structure and ad valorem charge.
Table VI.3: Summary of Short-Term Assets
Short-Lived Assets Replacement Item Estimated
Life Quantity Unit Cost Total
Solenoid Valves Misc. Equipment 10 15 $1,000 $1,500 Electric Exhaust Fan Misc. Equipment 10 1 $2,500 $250 Thermostat Misc. Equipment 10 1 $200 $20
Pump Controllers Pumps 10 2 $15,000 $3,000
Process gauges and sensors Gauges, Transmitters, Sensors
10 5 $3,500 $1,750
Gas Chlorination Equipment
Disinfection Equipment 10 1 $18,200 $1,820
Chlorine Residual Analyzer Meter 10 1 $7,000 $700 Controls integrated into Town's SCADA
Control Equipment 5 1 $5,000 $1,000
VFDs for Pumps Pumps 15 4 $20,000 $5,333 Electric Unit Heater Misc. Equipment 10 4 $3,000 $1,200 Carbon Replacement Carbon Filters 6 1 $60,000 $10,000 Membrane Replacement Membrane Filters 30 3 $80,000 $8,000
Total Annual Reserve = $34,573
Preliminary Engineering Report Town of Gorham Water Treatment Plant Improvements September 2021
MRB Group Project No. 0735.21001.000 Page 38
VII. CONCLUSIONS AND RECOMMENDATIONS The Town of Gorham has provided a reliable and cost-effective potable water service to residents for 50+ years. There is a substantial need to replace the aging water treatment plant, as documented in this report. In order for this project to be reasonably affordable to residents, financing in accordance with the information in Table VI.1 is required. Based on the favorable disposition of all of the above factors, it is the recommendation of MRB to apply for DWSRF/RD funding and implement the program, accordingly. Town of Gorham is also encouraged to apply for a NYS Water Infrastructure Improvement Act (WIIA) program grant. Improvements to the WTP would be pursuant to Town Law section 202-b.
Respectfully submitted,
Gregory J. Hotaling, P.E. MRB Group Engineering, Architecture & Surveying, D.P.C

Preliminary Engineering Report Town of Gorham Water Treatment Plant Improvements September 2021
MRB Group Project No. 0735.21001.000
APPENDIX A
SITE MAPS
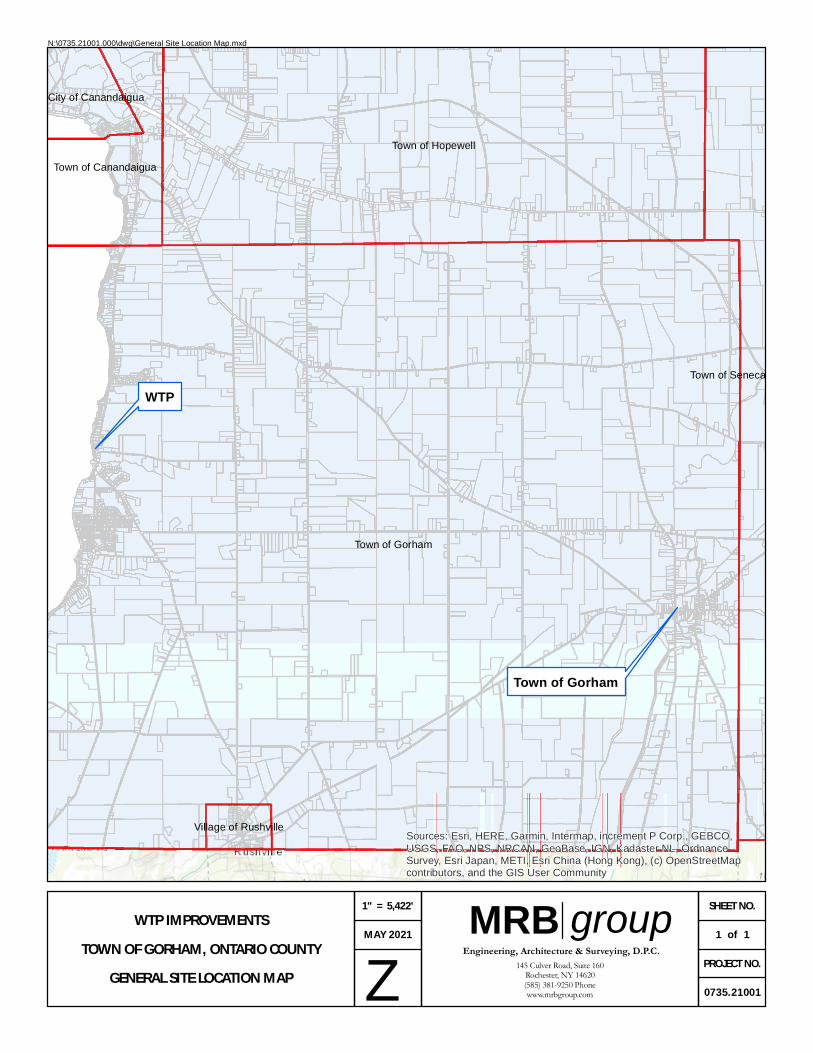
Town of Gorham
Town of Hopewell
Town of Canandaigua
Town of Seneca
City of Canandaigua
Village of RushvilleSources: Esri, HERE, Garmin, Intermap, increment P Corp., GEBCO,USGS, FAO, NPS, NRCAN, GeoBase, IGN, Kadaster NL, OrdnanceSurvey, Esri Japan, METI, Esri China (Hong Kong), (c) OpenStreetMapcontributors, and the GIS User Community
PROJECT NO.
SHEET NO.
1 of 1
0735.21001
WTP IMPROVEMENTS
TOWN OF GORHAM, ONTARIO COUNTY
GENERAL SITE LOCATION MAP
1" = 5,422'
MAY 2021
Z145 Culver Road, Suite 160
Rochester, NY 14620(585) 381-9250 Phonewww.mrbgroup.com
Engineering, Architecture & Surveying, D.P.C.
MRB group
N:\0735.21001.000\dwg\General Site Location Map.mxd
Town of Gorham
WTP
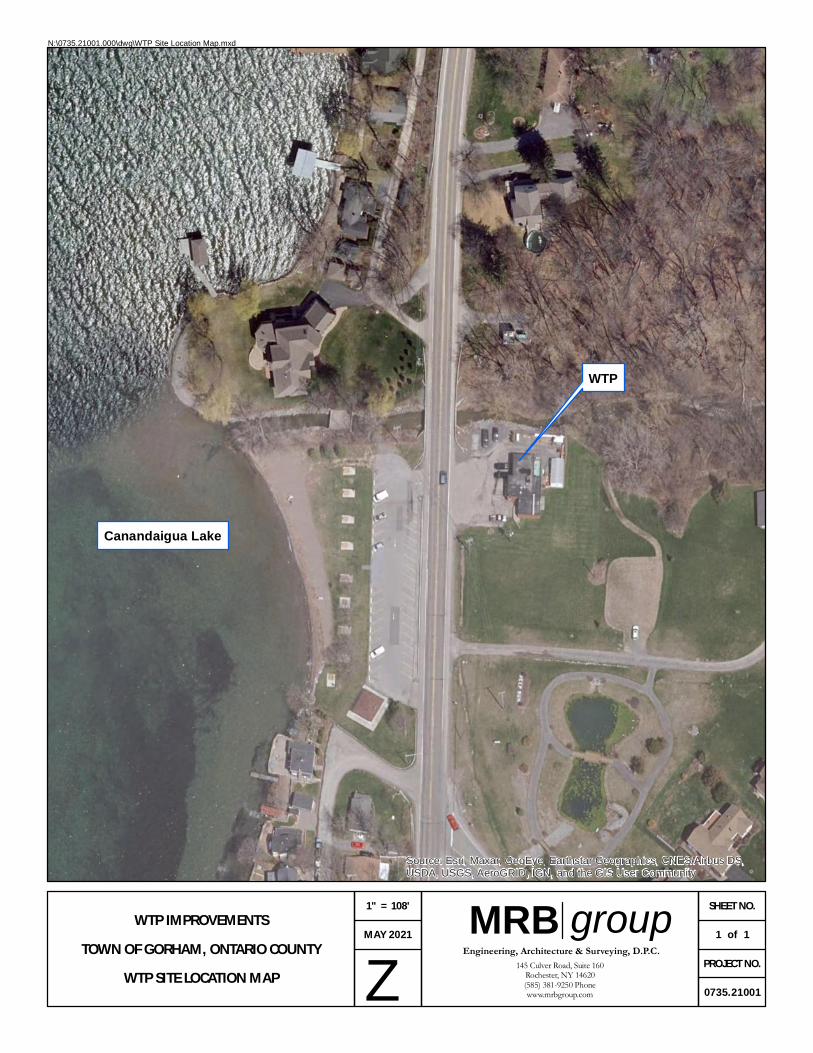
Source: Esri, Maxar, GeoEye, Earthstar Geographics, CNES/Airbus DS,USDA, USGS, AeroGRID, IGN, and the GIS User Community
PROJECT NO.
SHEET NO.
1 of 1
0735.21001
WTP IMPROVEMENTS
TOWN OF GORHAM, ONTARIO COUNTY
WTP SITE LOCATION MAP
1" = 108'
MAY 2021
Z145 Culver Road, Suite 160
Rochester, NY 14620(585) 381-9250 Phonewww.mrbgroup.com
Engineering, Architecture & Surveying, D.P.C.
MRB group
N:\0735.21001.000\dwg\WTP Site Location Map.mxd
Canandaigua Lake
WTP
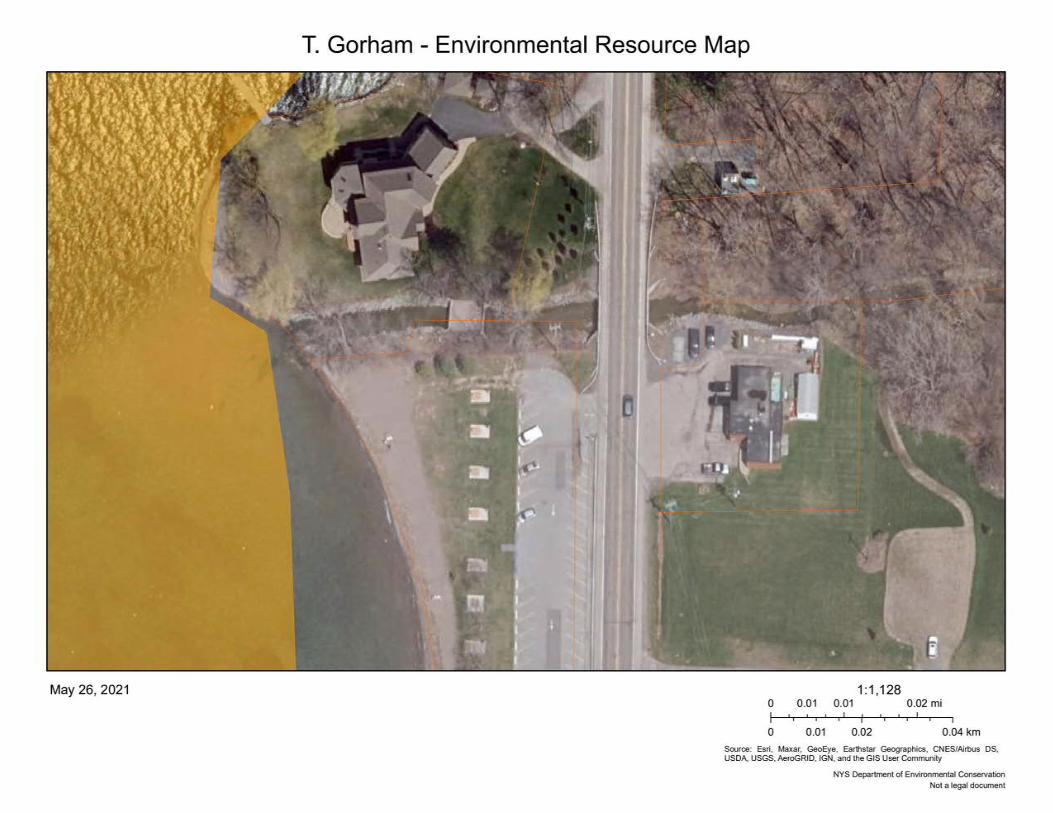
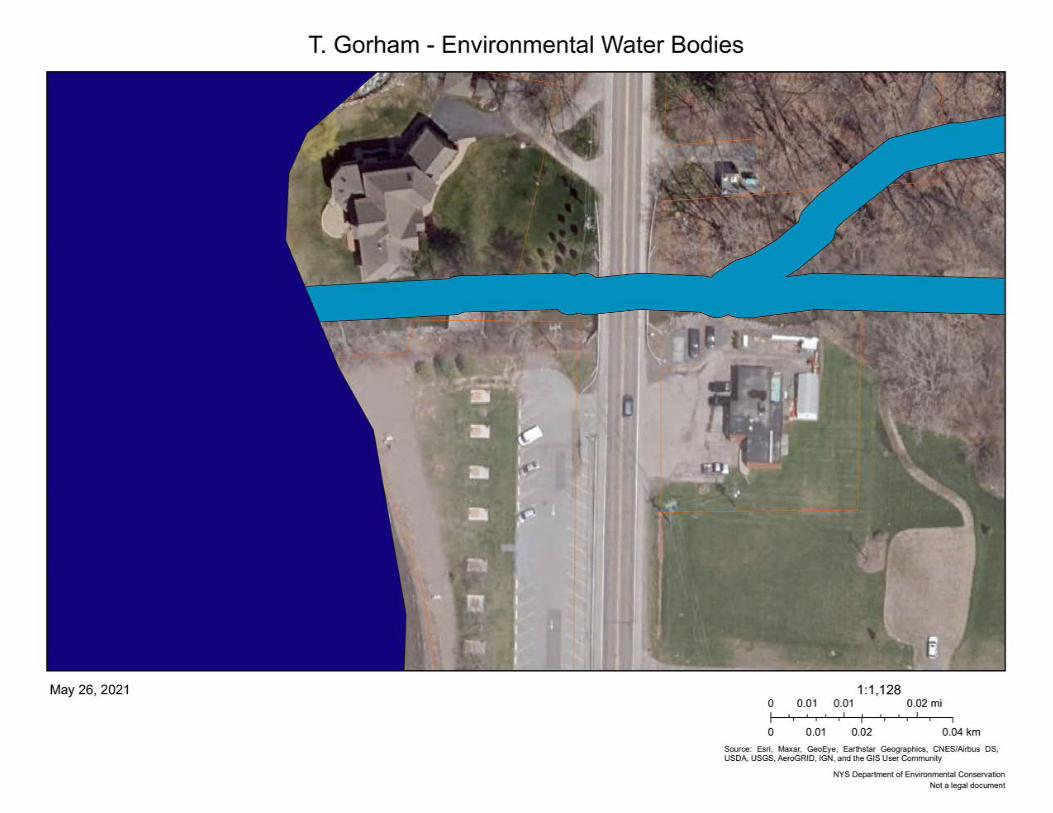


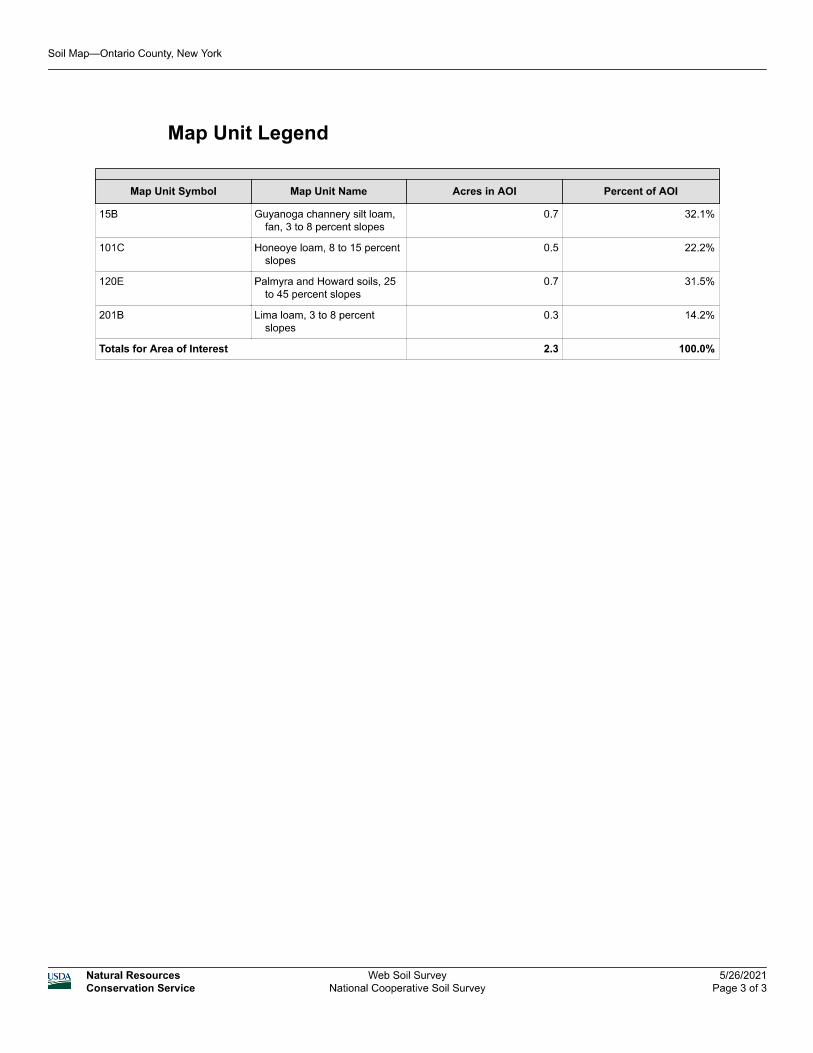


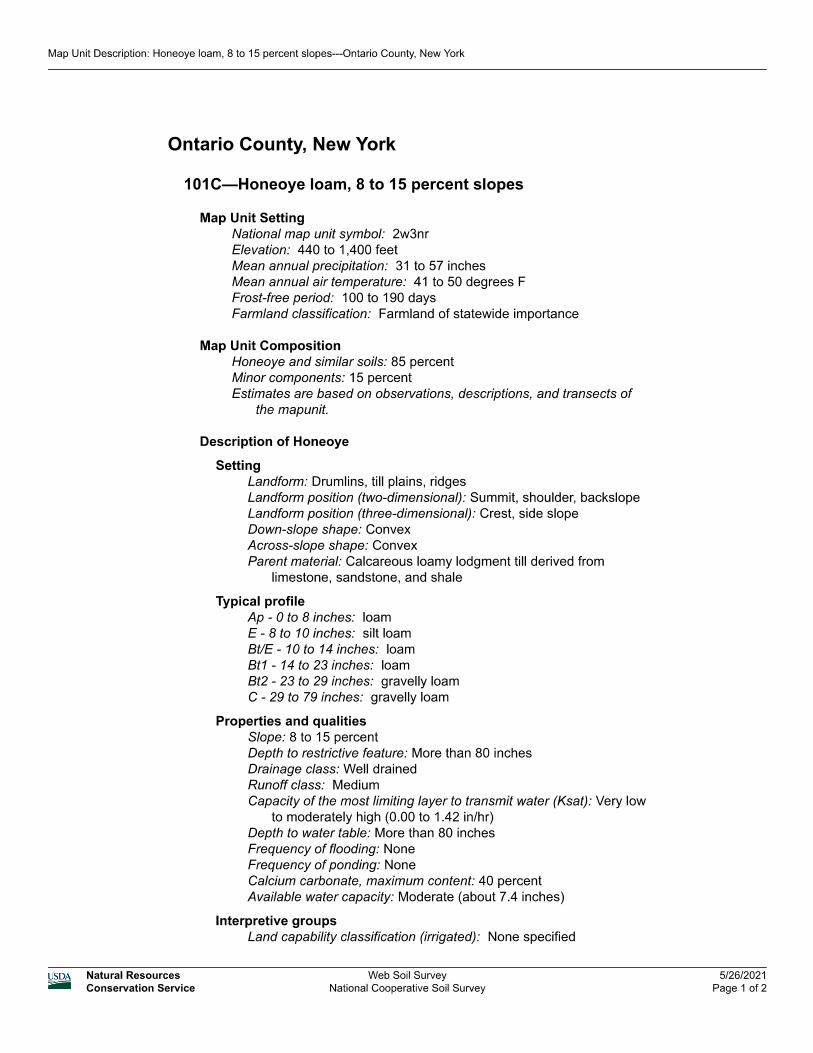

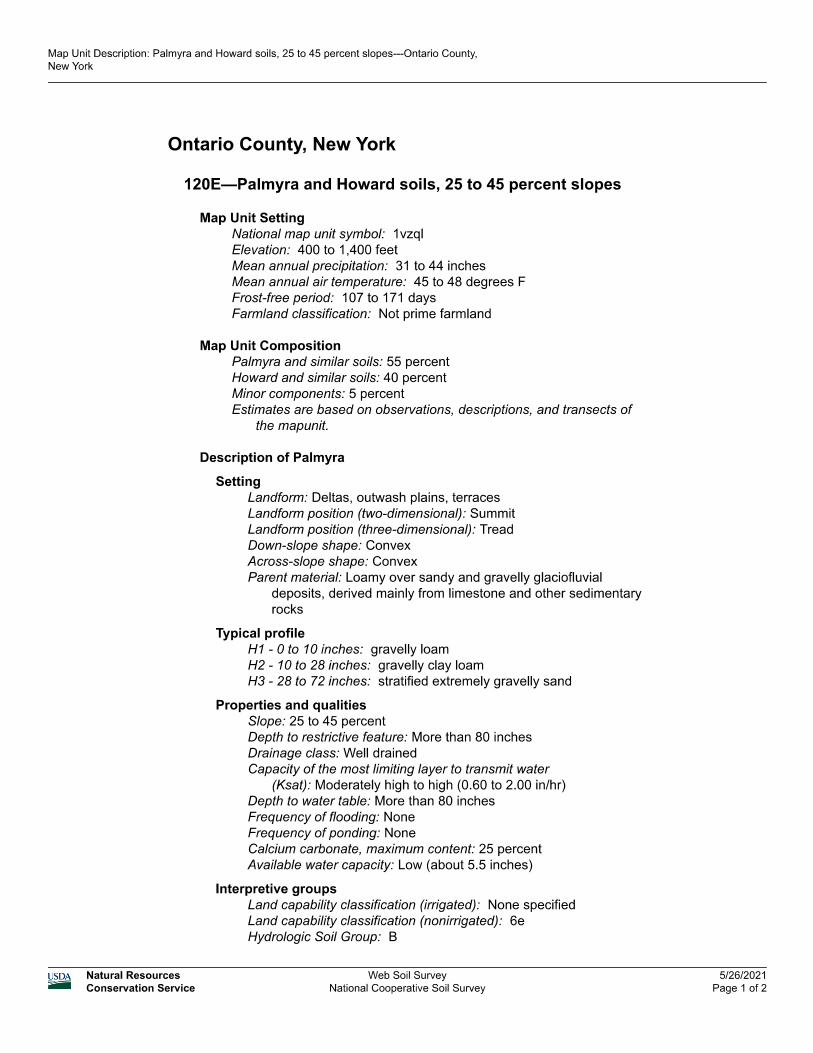


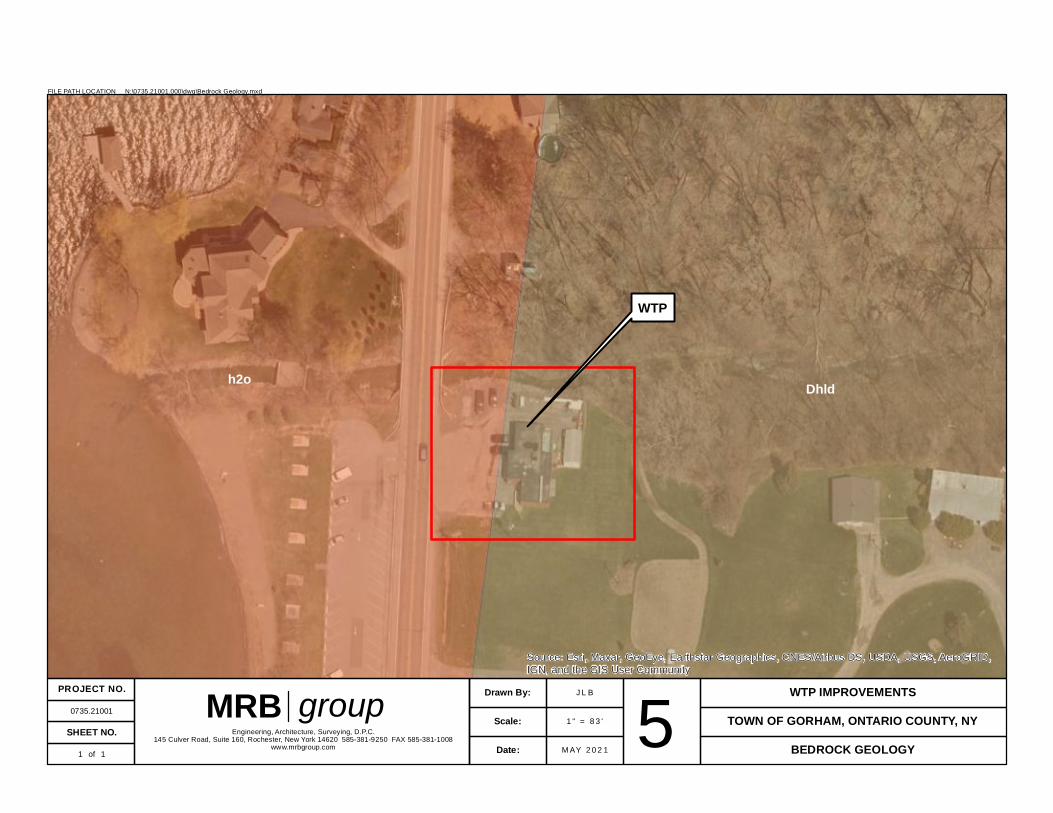
WTP
h2oDhld
Source: Esri, Maxar, GeoEye, Earthstar Geographics, CNES/Airbus DS, USDA, USGS, AeroGRID,IGN, and the GIS User Community
5Engineering, Architecture, Surveying, D.P.C.145 Culver Road, Suite 160, Rochester, New York 14620 585-381-9250 FAX 585-381-1008
www.mrbgroup.com
MRB groupPROJECT NO.
0735.21001
SHEET NO.
1 of 1
1 " = 8 3 '
J L B
M AY 2 0 2 1Date:
Scale:
Drawn By:
TOWN OF GORHAM, ONTARIO COUNTY, NY
WTP IMPROVEMENTS
BEDROCK GEOLOGY
FILE PATH LOCATION N:\0735.21001.000\dwg\Bedrock Geology.mxd

WTP
t
Source: Esri, Maxar, GeoEye, Earthstar Geographics, CNES/Airbus DS, USDA, USGS, AeroGRID,IGN, and the GIS User Community
5Engineering, Architecture, Surveying, D.P.C.145 Culver Road, Suite 160, Rochester, New York 14620 585-381-9250 FAX 585-381-1008
www.mrbgroup.com
MRB groupPROJECT NO.
0735.21001
SHEET NO.
1 of 1
1 " = 8 3 '
J L B
M AY 2 0 2 1Date:
Scale:
Drawn By:
TOWN OF GORHAM, ONTARIO COUNTY, NY
WTP IMPROVEMENTS
SURFICIAL GEOLOGY
FILE PATH LOCATION N:\0735.21001.000\dwg\Surficial Geology.mxd
Preliminary Engineering Report Town of Gorham Water Treatment Plant Improvements September 2021
MRB Group Project No. 0735.21001.000
APPENDIX B
POPULATION ESTIMATES


Regional Population Forecasts
County, City, Town and Village Projections for the Genesee-Finger Lakes Region
out to the year 2050
Prepared by:
May 2013

Regional Population Forecasts
County, City, Town and Village Projections for the Genesee-Finger Lakes Region
out to the year 2050
Prepared by:
Genesee/Finger Lakes Regional Planning Council
50 West Main Street, Suite 8107 Rochester, New York 14614
585-454-0190 www.gflrpc.org
Mission Statement
The Genesee/Finger Lakes Regional Planning Council (G/FLRPC) will identify, define and inform its member counties of issues and opportunities critical to the physical, economic, and social health of the region. G/FLRPC provides forums for discussion, debate, and
consensus building, and develops and implements a focused action plan with clearly defined outcomes, which include programs, personnel, and funding.
Prepared for:
Genesee Transportation Council 2012-2013 Unified Planning Work Program
Task #5231

Table of Contents I. Introduction ........................................................................................................................................................................................1
II. Methodology ........................................................................................................................................................................................1
A. Quantitative Stage ........................................................................................................................................................................1
B. Qualitative Stage ...........................................................................................................................................................................3
Input/Output ................................................................................................................................................................................3
Housing and Occupancy Data ....................................................................................................................................................4
Land Use and Regulatory Data ..................................................................................................................................................4
III. Review Process....................................................................................................................................................................................4
IV. Genesee-Finger Lakes Regional Trends .........................................................................................................................................9
V. Genesee County Trends .................................................................................................................................................................17
VI. Livingston County Trends ............................................................................................................................................................23
VII. Monroe County Trends .................................................................................................................................................................29
VIII. Ontario County Trends ................................................................................................................................................................35
IX. Orleans County Trends .................................................................................................................................................................41
X. Seneca County Trends ..................................................................................................................................................................47
XI. Wayne County Trends ..................................................................................................................................................................53
XII. Wyoming County Trends .............................................................................................................................................................59
XIII. Yates County Trends ...................................................................................................................................................................65
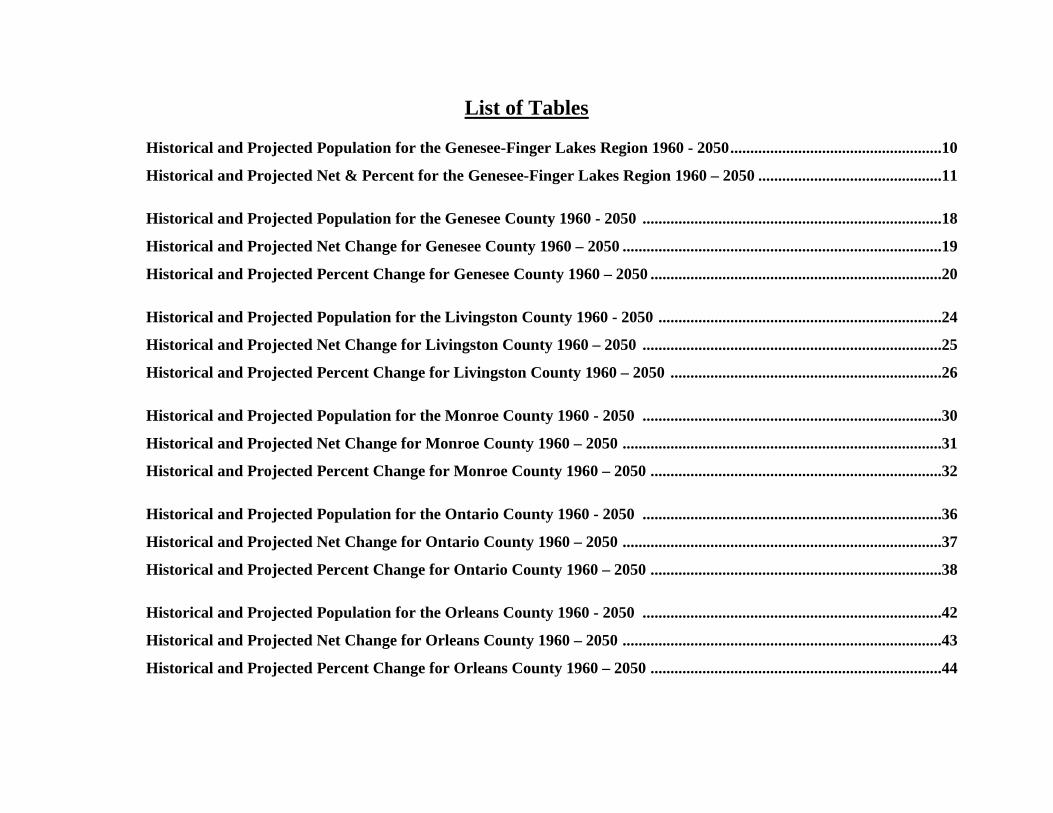
List of Tables
Historical and Projected Population for the Genesee-Finger Lakes Region 1960 - 2050 .....................................................10
Historical and Projected Net & Percent for the Genesee-Finger Lakes Region 1960 – 2050 ..............................................11
Historical and Projected Population for the Genesee County 1960 - 2050 ...........................................................................18
Historical and Projected Net Change for Genesee County 1960 – 2050 ................................................................................19
Historical and Projected Percent Change for Genesee County 1960 – 2050 .........................................................................20
Historical and Projected Population for the Livingston County 1960 - 2050 .......................................................................24
Historical and Projected Net Change for Livingston County 1960 – 2050 ...........................................................................25
Historical and Projected Percent Change for Livingston County 1960 – 2050 ....................................................................26
Historical and Projected Population for the Monroe County 1960 - 2050 ...........................................................................30
Historical and Projected Net Change for Monroe County 1960 – 2050 ................................................................................31
Historical and Projected Percent Change for Monroe County 1960 – 2050 .........................................................................32
Historical and Projected Population for the Ontario County 1960 - 2050 ...........................................................................36
Historical and Projected Net Change for Ontario County 1960 – 2050 ................................................................................37
Historical and Projected Percent Change for Ontario County 1960 – 2050 .........................................................................38
Historical and Projected Population for the Orleans County 1960 - 2050 ...........................................................................42
Historical and Projected Net Change for Orleans County 1960 – 2050 ................................................................................43
Historical and Projected Percent Change for Orleans County 1960 – 2050 .........................................................................44

Historical and Projected Population for the Seneca County 1960 - 2050 .............................................................................48
Historical and Projected Net Change for Seneca County 1960 – 2050 .................................................................................49
Historical and Projected Percent Change for Seneca County 1960 – 2050 ..........................................................................50
Historical and Projected Population for the Wayne County 1960 - 2050 .............................................................................54
Historical and Projected Net Change for Wayne County 1960 – 2050 .................................................................................55
Historical and Projected Percent Change for Wayne County 1960 – 2050 ..........................................................................56
Historical and Projected Population for the Wyoming County 1960 - 2050 ........................................................................60
Historical and Projected Net Change for Wyoming County 1960 – 2050 .............................................................................61
Historical and Projected Percent Change for Wyoming County 1960 – 2050 .....................................................................62
Historical and Projected Population for the Yates County 1960 - 2050 ...............................................................................66
Historical and Projected Net Change for Yates County 1960 – 2050 ....................................................................................67
Historical and Projected Percent Change for Yates County 1960 – 2050 .............................................................................68
List of Figures
Genesee-Finger Lakes Region Trend from 1960 - 2050 (excluding Monroe County) ..........................................................12
Genesee-Finger Lakes Region Trend from 1960 - 2050 (Monroe County) ...........................................................................13
Genesee-Finger Lakes Region Historic and Projected Percent Change 1960 - 2050 ...........................................................14
Genesee-Finger Lakes Region Percent of Region’s Population by County 1960, 2010, 2050 .............................................15
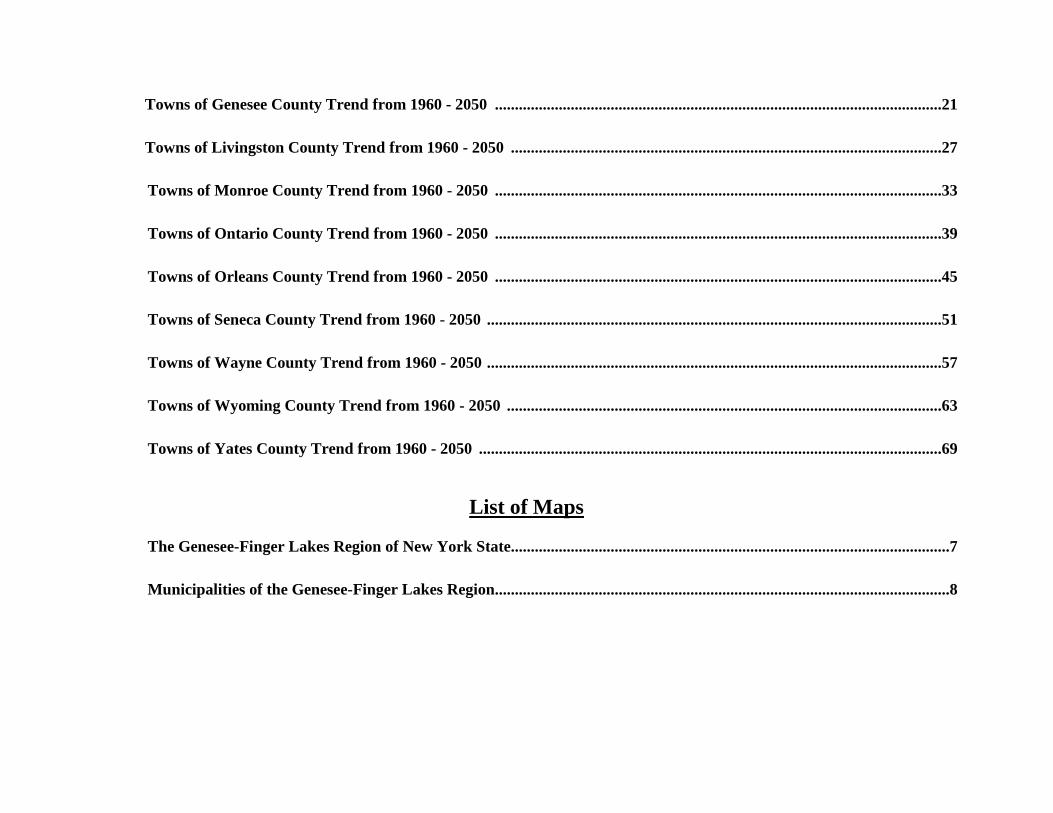
Towns of Genesee County Trend from 1960 - 2050 ................................................................................................................21
Towns of Livingston County Trend from 1960 - 2050 ............................................................................................................27 Towns of Monroe County Trend from 1960 - 2050 ................................................................................................................33 Towns of Ontario County Trend from 1960 - 2050 ................................................................................................................39 Towns of Orleans County Trend from 1960 - 2050 ................................................................................................................45 Towns of Seneca County Trend from 1960 - 2050 ..................................................................................................................51 Towns of Wayne County Trend from 1960 - 2050 ..................................................................................................................57 Towns of Wyoming County Trend from 1960 - 2050 .............................................................................................................63 Towns of Yates County Trend from 1960 - 2050 ....................................................................................................................69
List of Maps
The Genesee-Finger Lakes Region of New York State..............................................................................................................7 Municipalities of the Genesee-Finger Lakes Region..................................................................................................................8
I. Introduction This report includes population projections out to the year 2050 for the all counties, cities, towns and villages in the Genesee-Finger Lakes Region. A top down approach was used, where the region was capped within New York State, and then each county within the region, and finally all the municipalities within the counties were finalized.
II. Methodology
The methodology was developed primarily by the Capital District Regional Planning Commission, and has been reviewed and agreed upon by the other Regional Planning Organizations within New York State.
The Population Projection Model involves two distinct stages: a quantitative first stage using a log-linear projection model set up in a MS Excel Workbook, and a qualitative second stage using non-quantitative judgments of the likelihood and extent of future population change within particular jurisdictions. The result is a final population projection for each county, and the towns and villages within it.
A. Quantitative Stage
The Log-Linear model — so-called because of its straight-line form when plotted and a logarithmic scale for X-axis measurements — uses historic population to forecast or project future population based on a logarithmic curve, which is the best general model for natural populations. The mathematical form of the model is:
Y = b0 + b1 × ln(X) where Y = the Dependent Variable population and X = the Independent Variable for the time period (years or index years). The Y-Intercept (point at which ln(X) = 0) is represented by b0, while b1 represents the Coefficient or slope of the natural logarithm (base e = 2.71828183) of X [ln(X)]. After converting the Independent Variable X into logs (log transformation), the Model is “fitted” by the standard (least squares) method of minimizing the sum of the squares of the deviations between the Model values and the actual values as in a Simple Regression Model.
1

Log-Linear models when used for forecasts project the historic rate of change of the actual data into the future at a steadily declining rate (i.e., historic growth or decline will continue, but at a lesser rate). Log-linear models are an excellent basis for population forecasts because they project average historic rates of change into the future in a manner consistent with the average changes in natural populations. While short-term population data will typically exhibit some variety of saw tooth pattern when charted, long-term population data usually follow a log-linear trend. The MS Excel Workbook requires input of historic (and optionally, Census-estimated) population data for the region’s nine counties and its towns and villages. The sum of the historic populations of the sub-divisions (counties) should equal the region total, as should each county’s town and village total equal the county population. Thus, in the case of a county and its Minor Civil Divisions (MCDs), a town may be divided into its constituent villages together with the town population outside of the villages. A MCD may also be divided into the population in group quarters (e.g., for prisons and dormitories) and the population in households to better reflect the diverse population trends of the defined sub-divisions. The Workbook model uses "Index Years" in place of actual years for computing the natural logs of the Independent Variables, with the first year, 1960, set equal to one (1960 = 1). The default "Log Index Factor" for each area and sub-division has been set to one, so that 1961 = 2, 1962 = 3, 1990 = 31, etc. Varying the Log Index Factor will change the slopes of the Population Trend, Initial Projections, and Final Projections for the area or sub-division selected because the absolute value of the slope of a log-linear model declines as the model’s X-values increase. Thus, entering a number greater than one (e.g., 2, so that 1961 = 3, 1962 = 5, etc.) as a Log Index Factor will result in smaller slopes (absolute value) for the Population Trend, Initial Projections, and Final Projections. Whereas entering a number less than one but greater than zero (e.g., 0.5, so that 1961 = 1.5, 1962 = 2, etc.) will result in larger slopes (absolute value). Once the historic (and estimated) data was entered and the Log Index Factor set, the Workbook Model computed the Log-Linear Population Trends of the data using simple regressions on the population data and the natural log of the Index Years. It next computed Initial Projections based on the Population Trends and the historic (and estimated) data. The Initial Projections are derived by computing the difference between the actual data and the Population Trend data for the last year of the actual data (either historic or estimated), and adding that difference to the coefficients of the Population Trends. This creates new trend lines that extend directly from the last year of the actual data and have the same shape (slopes) as the Population Trend lines. The final procedure in the Quantitative Stage is to force the sum of the sub-divisions to equal the area total for each projection year. Given the independently derived nature of the area and sub-division projections, the sum of the sub-division projections for any particular projection year will virtually never equal the area total. The Workbook Model computes for each projection year the value (factor) which, when applied to all sub-division projections, will yield a sub-division sum equal to the area total.
2
The use of a constant factor (0% < Factor £ 300%) applied to all of the sub-divisions within a projection year results in distributing the required gain or loss of population in proportion to each sub-division’s population size. The extent to which sub-divisions must be adjusted to equal the area total checks the reasonableness of the log-linear trend used in the quantitative model. Adjustment factors for one or more projection years that are much less than 90% or much greater than 110% may indicate a discrepancy between the trends fitted to the area total and the trends fitted to the sub-divisions. This may be reduced by changing the Log Index Factor or making Flat Revisions to area or sub-division values.
B. Qualitative Stage The projections derived from the Log-Linear Model provide a basis from which to further analyze the forces that affect population change in each area and sub-division, and are not necessarily intended to represent final population projections. There are many historic trends other than simple population which may give an indication of the direction and extent of future population change, including but not limited to: average persons per household, persons in group quarters, building permit issuances, new home construction, immigration and emigration patterns, and labor force data. In addition, there may be new development opportunities or constraints for particular jurisdictions embodied in zoning and sub-division regulations, economic development programs, and capital budgets for transportation facilities. Infrastructure is also looked at as an asset or liability to growth and development in the municipalities. As much of this information as possible has been considered in reviewing the projections derived from the Log-Linear Model for each jurisdiction, and changes made as appropriate. The forecasts first take into consideration the population occupying group quarters. The number of people occupying group quarters were removed from the total population for each county, town and village before being run through the Model and were then added in as a flat revision after the projections have been made. This ensures that the group quarter numbers, which are typically static, are not factored in as a population that will have a natural increase over time. New or expanded group quarters and the elimination or downsizing of group quarters are additionally taken into account as flat revisions.
Additional considerations used to modify forecast numbers after being run through the model are as follows:
Input/Output
This includes looking at the total number of births and deaths for each town and village. In addition, the number of people migrating into and out of the area was taken into consideration. The total number of people coming into the area, through new births and in migration, minus the number of people who have died or left the area yields a new population through 2010. The birth and death rates in addition to in and out-migration trends can therefore be used for evaluating and modifying the initial population projections through 2050.
3
Housing and Occupancy Data
Following the trends in new housing construction in the towns and villages gives another check to the projections obtained through the model. By utilizing data such as the: 1) number of new major subdivisions, which is classified by producing at least four lots, 2) total number of lots resulting from new major subdivisions, 3) persons per household, 4) vacancy rate, and 5) building permit activity, new population entering the municipality can be estimated. The number of new housing lots, minus the number of vacant housing units, is multiplied by the average persons per household for that municipality resulting in the number of new residents in the municipality. This trend can then be projected through 2050 and used to modify initial forecast numbers.
Land Use and Regulatory Considerations
Each municipality has unique circumstances that require special consideration. Since quantitative data alone cannot accurately portray the possibilities for future growth or development, additional information was acquired from town and village officials. This includes the acreage available for residential development, the existence and condition of infrastructure, municipal growth management policies and the land use and zoning of available land. A contact at each county was actively involved in providing this information and supplying additional comments that may assist in modifying the initial population projections. This information provides an overview of the growth potential for each municipality and is an indicator of the type of future development that is likely to occur. Therefore, the quantitative data was complemented by qualitative information resulting in the best forecast possible.
III. Review Process Each county planner has had the opportunity to review and comment on the methodology, initial projections, and final projections. Once the initial projections were completed, staff went to each county with supporting data and discussed modifications that needed to be made that the quantitative portion of the model would not take into consideration. All modifications that were made to the initial figures were recorded and a justification was given to the planners for review. At every stage, the county planners have been involved in the process and have given staff the critical support and information to make the best possible forecasts. A few points of discussion were brought up regarding the population projections, especially by the rural counties. The model, which is heavily dependent on historical data, may be more appropriate for non-rural areas. Rural towns and villages can increase their
4

population by a significant percentage as a result of a new mobile home park or new subdivision. Since many of the towns and villages have a very small base population, this type of new development would greatly impact the growth rate. However, this type of development is not as predictable in rural areas as it may be in more urbanized areas. Furthermore, much of the data collected for the qualitative portion of the methodology is not as significant in rural counties. For example, looking at the amount of land available for residential development in a rural town is not indicative of the potential for growth. Although some urban towns are inhibited by the amount of land available for new development, rural areas have more land available than is often in demand. These types of qualitative indicators were, therefore, not given as much consideration in the projection process.
5

Genesee
Orleans
WyomingLivingston
Ontario
Monroe Wayne
Seneca
Yates
The Genesee-Finger Lakes Region of New York State
7

Genesee
Orleans
WyomingLivingston
Ontario
MonroeWayne
Seneca
Yates
Municipalities of the Genesee-Finger Lakes Region
8

IV. Genesee-Finger Lakes Region Trends The Genesee-Finger Lakes Region has been increasing in population since 1960. In the last 50 years, the population has increased by 30%, about 285,000 people. The future population is projected to increase as well but at a decreasing rate. It is projected the region will grow by 3.6% from 2010 to 2050, an increase of 44,394 people. Ontario County is projected to have the highest percent increase at 9.5%. Other counties with a higher rate than the region average include Orleans (8.0%), Wyoming (7.2%), Seneca (5.9%) and Livingston (4.1%). It is projected that Genesee (2.7%), Yates (3.0%) and Monroe County at 3.2% will fall slightly below the regional projected average. Having been the focal point for much of the region in the past 50 years, the projected population for Monroe County follows the regional trend of increasing at a decreasing rate. Monroe County has seen significant growth in the past, an increase of more than 180,000 people in the last 50 years. Recent trends show population moving outward and at a much slower rate. Overall, the population in the Genesee-Finger Lakes Region remains strong and it appears it will continue to be so in the future. Each county has remained stable with only slight increases and is projected to stay that way. The largest county, Monroe, decreased from 62.4% of the region's population in 1960, to 61.2% in 2010, to a projected 60.5% in 2050. The smallest county, Yates, went from 2.0% of the region's population in 1960, to 2.1% in 2010 is projected to remain constant at 2.1% in 2050.
9
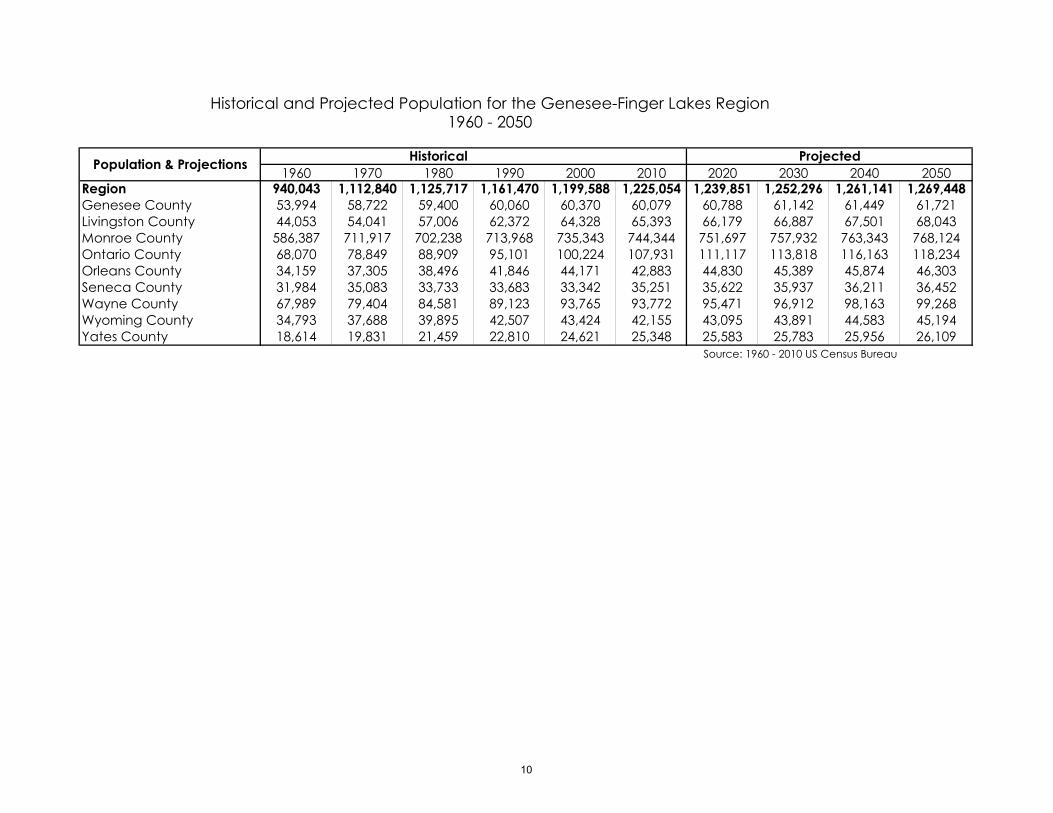
1960 1970 1980 1990 2000 2010 2020 2030 2040 2050Region 940,043 1,112,840 1,125,717 1,161,470 1,199,588 1,225,054 1,239,851 1,252,296 1,261,141 1,269,448Genesee County 53,994 58,722 59,400 60,060 60,370 60,079 60,788 61,142 61,449 61,721Livingston County 44,053 54,041 57,006 62,372 64,328 65,393 66,179 66,887 67,501 68,043Monroe County 586,387 711,917 702,238 713,968 735,343 744,344 751,697 757,932 763,343 768,124Ontario County 68,070 78,849 88,909 95,101 100,224 107,931 111,117 113,818 116,163 118,234Orleans County 34,159 37,305 38,496 41,846 44,171 42,883 44,830 45,389 45,874 46,303Seneca County 31,984 35,083 33,733 33,683 33,342 35,251 35,622 35,937 36,211 36,452Wayne County 67,989 79,404 84,581 89,123 93,765 93,772 95,471 96,912 98,163 99,268Wyoming County 34,793 37,688 39,895 42,507 43,424 42,155 43,095 43,891 44,583 45,194Yates County 18,614 19,831 21,459 22,810 24,621 25,348 25,583 25,783 25,956 26,109
Source: 1960 - 2010 US Census Bureau
Historical and Projected Population for the Genesee-Finger Lakes Region1960 - 2050
HistoricalPopulation & Projections Projected
10

Decennial Changes 1960-70 Net
1970-80 Net
1980-90 Net
1990-00 Net
2000-10 Net
2010-20 Net
2020-30 Net
2030-40 Net
2040-50 Net
Region 172,797 12,877 35,753 38,118 25,466 14,797 12,445 8,845 8,307Genesee County 4,728 678 660 310 -291 709 354 307 272Livingston County 9,988 2,965 5,366 1,956 1,065 786 708 614 542Monroe County 125,530 -9,679 11,730 21,375 9,001 7,353 6,235 5,411 4,781Ontario County 10,779 10,060 6,192 5,123 7,707 3,186 2,701 2,345 2,071Orleans County 3,146 1,191 3,350 2,325 -1,288 1,947 559 485 429Seneca County 3,099 -1,350 -50 -341 1,909 371 315 274 241Wayne County 11,415 5,177 4,542 4,642 7 1,699 1,441 1,251 1,105Wyoming County 2,895 2,207 2,612 917 -1,269 940 796 692 611Yates County 1,217 1,628 1,351 1,811 727 235 200 173 153
Decennial Changes 1960-70 Percent
1970-80 Percent
1980-90 Percent
1990-00 Percent
2000-10 Percent
2010-20 Percent
2020-30 Percent
2030-40 Percent
2040-50 Percent
Region 18.4% 1.2% 3.2% 3.3% 2.1% 1.2% 1.0% 0.7% 0.7%Genesee County 8.8% 1.2% 1.1% 0.5% -0.5% 1.2% 0.6% 0.5% 0.4%Livingston County 22.7% 5.5% 9.4% 3.1% 1.7% 1.2% 1.1% 0.9% 0.8%Monroe County 21.4% -1.4% 1.7% 3.0% 1.2% 1.0% 0.8% 0.7% 0.6%Ontario County 15.8% 12.8% 7.0% 5.4% 7.7% 3.0% 2.4% 2.1% 1.8%Orleans County 9.2% 3.2% 8.7% 5.6% -2.9% 4.5% 1.2% 1.1% 0.9%Seneca County 9.7% -3.8% -0.1% -1.0% 5.7% 1.1% 0.9% 0.8% 0.7%Wayne County 16.8% 6.5% 5.4% 5.2% 0.0% 1.8% 1.5% 1.3% 1.1%Wyoming County 8.3% 5.9% 6.5% 2.2% -2.9% 2.2% 1.8% 1.6% 1.4%Yates County 6.5% 8.2% 6.3% 7.9% 3.0% 0.9% 0.8% 0.7% 0.6%
Historical and Projected Percent Change for the Genesee-Finger Lakes Region
Historical and Projected Net Change for the Genesee-Finger Lakes Region
11

Prepared by Genesee/Finger Lakes Regional Planning Council March 2013
0
10,000
20,000
30,000
40,000
50,000
60,000
70,000
80,000
90,000
100,000
110,000
120,000
1960 1970 1980 1990 2000 2010 2020 2030 2040 2050
Popu
latio
n
Year
Genesee/Finger Lakes Region Trend from 1960-2050 (excluding Monroe County)
Genesee
Livingston
Ontario
Orleans
Seneca
Wayne
Wyoming
Yates
12

Prepared by Genesee/Finger Lakes Regional Planning Council March 2013
550,000
575,000
600,000
625,000
650,000
675,000
700,000
725,000
750,000
775,000
800,000
1960 1970 1980 1990 2000 2010 2020 2030 2040 2050
Popu
latio
n
Year
Monroe County Trend from 1960-2050
13

0.0%
10.0%
20.0%
30.0%
40.0%
50.0%
60.0%
70.0%
Region GeneseeCounty
LivingstonCounty
MonroeCounty
OntarioCounty
OrleansCounty
SenecaCounty
WayneCounty
WyomingCounty
Yates County
Cha
nge
Historical and Projected Percent Changes
1960-2010
2010-2050
14

Percent of Region's Population by County
Genesee 5.7%
Livingston 4.7%
Monroe 62.4%
Ontario 7.2%
Orleans 3.6%
Seneca 3.4%
Wayne 7.2%
Wyoming 3.7% Yates
2.0%
1960
Genesee 4.9%
Livingston 5.5%
Monroe 60.5%
Ontario 9.3%
Orleans 3.6%
Seneca 2.7%
Wayne 7.8%
Wyoming 3.6% Yates
2.1%
2050
Genesee 4.9%
Livingston 5.4%
Monroe 61.2%
Ontario 8.9%
Orleans 3.5%
Seneca 2.9%
Wayne 7.7%
Wyoming 3.5% Yates
2.1%
2010
15

V. Genesee County Trends Genesee County is made up of 13 towns, 6 villages and the City of Batavia and a portion of the Tonawanda Reservation. The projected rate of population is consistent with the historical patterns of the county. From 1960 to 1970 the population increased by 4,728. From 2000 to 2010 the population decreased by 291 people. As a percentage, the total gain through 2050 is projected to be 2.7%. The towns that are projected to have the greatest increase in population will be Batavia, LeRoy, and Bergen. These three towns, located in the northeast corner of Genesee County, have adequate land available for residential development and may see some migration from Monroe County. The population has historically been stable and will likely continue into the future. With a current population just under 16,000 people, the City of Batavia is the center of Genesee County. Although the historical trend has shown the decreasing rate to be declining, the projection still has the City slightly gaining population to 2020 then decreasing in subsequent decades. The City of Batavia has decreased in population by almost 2000 people since 1960 and is projected to gain just under 300 by the year 2050. The remaining towns and villages within Genesee County are projected to remain relatively stable, increasing or decreasing at an average rate around 0.5%.
17

1960 1970 1980 1990 2000 2010 2020 2030 2040 2050Genesee County 53,994 58,722 59,400 60,060 60,370 60,079 60,788 61,142 61,449 61,721Town of Alabama 1,931 1,872 1,926 1,998 1,881 1,869 1,880 1,880 1,879 1,879Town of Alexander 1,652 1,875 1,868 1,778 1,852 1,897 1,864 1,874 1,883 1,891Village of Alexander 335 474 483 445 481 509 491 499 506 512Village of Attica (Alexander) 0 2 16 10 118 128 125 131 136 141City of Batavia 18,210 17,338 16,703 16,310 16,256 15,465 16,090 15,952 15,830 15,724Town of Batavia 4,325 5,440 5,565 6,055 5,915 6,809 6,050 6,166 6,266 6,354Town of Bergen 1,032 1,263 1,592 1,691 1,942 1,944 2,006 2,061 2,108 2,150Village of Bergen 964 1,018 976 1,103 1,240 1,176 1,256 1,269 1,281 1,291Town of Bethany 1,569 1,978 1,876 1,808 1,760 1,765 1,770 1,778 1,785 1,791Town of Byron 1,589 2,020 2,242 2,345 2,493 2,369 2,552 2,602 2,646 2,684Town of Darien 2,357 2,745 2,950 2,979 3,048 3,158 3,099 3,142 3,180 3,213Village of Corfu (Darien) 0 0 0 0 13 0 14 14 15 15Town of Elba 1,521 1,560 1,737 1,704 1,743 1,694 1,759 1,772 1,784 1,794Village of Elba 739 752 750 703 696 676 692 689 686 683Town of Leroy 2,117 2,873 3,119 3,202 3,328 3,250 3,409 3,477 3,537 3,589Village of Leroy 4,662 5,118 4,900 4,974 4,462 4,391 4,447 4,433 4,421 4,412Town of Oakfield 1,318 1,400 1,422 1,494 1,398 1,437 1,406 1,413 1,419 1,424Village of Oakfield 2,070 1,964 1,791 1,818 1,805 1,813 1,786 1,769 1,755 1,742Town of Pavilion 1,721 2,122 2,375 2,327 2,467 2,495 2,519 2,562 2,600 2,634Town of Pembroke 2,835 3,237 3,457 3,477 3,748 3,583 3,805 3,853 3,894 3,931Village of Corfu (Pembroke) 616 722 689 755 782 709 791 798 804 810Town of Stafford 2,005 2,461 2,508 2,593 2,409 2,459 2,439 2,465 2,487 2,507Tonawanda Indian Res 426 488 455 491 533 483 538 543 547 550* NOTE - Town figures DO NOT include village (V) population. They are calculated as separate entities. Source: 1960 - 2010 US Census Bureau
Historical and Projected Population for Genesee County1960 - 2050
Population & Projections Historical Projected
18
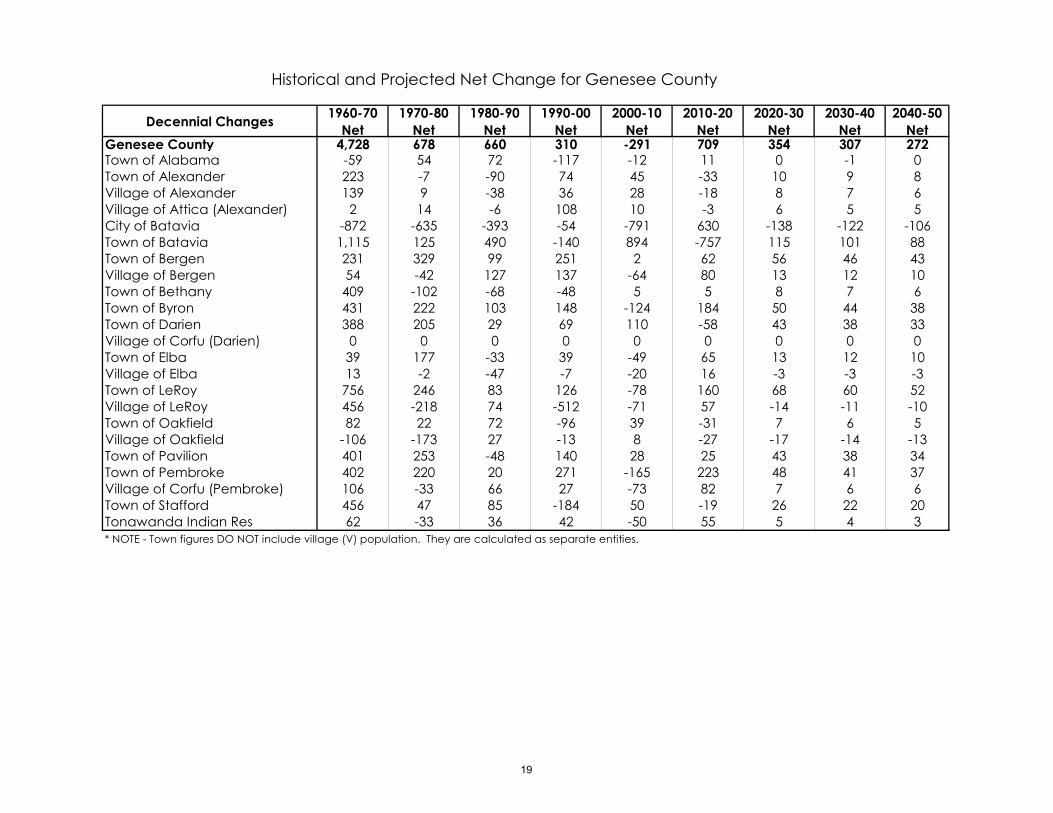
Decennial Changes 1960-70 Net
1970-80 Net
1980-90 Net
1990-00 Net
2000-10 Net
2010-20 Net
2020-30 Net
2030-40 Net
2040-50 Net
Genesee County 4,728 678 660 310 -291 709 354 307 272Town of Alabama -59 54 72 -117 -12 11 0 -1 0Town of Alexander 223 -7 -90 74 45 -33 10 9 8Village of Alexander 139 9 -38 36 28 -18 8 7 6Village of Attica (Alexander) 2 14 -6 108 10 -3 6 5 5City of Batavia -872 -635 -393 -54 -791 630 -138 -122 -106Town of Batavia 1,115 125 490 -140 894 -757 115 101 88Town of Bergen 231 329 99 251 2 62 56 46 43Village of Bergen 54 -42 127 137 -64 80 13 12 10Town of Bethany 409 -102 -68 -48 5 5 8 7 6Town of Byron 431 222 103 148 -124 184 50 44 38Town of Darien 388 205 29 69 110 -58 43 38 33Village of Corfu (Darien) 0 0 0 0 0 0 0 0 0Town of Elba 39 177 -33 39 -49 65 13 12 10Village of Elba 13 -2 -47 -7 -20 16 -3 -3 -3Town of LeRoy 756 246 83 126 -78 160 68 60 52Village of LeRoy 456 -218 74 -512 -71 57 -14 -11 -10Town of Oakfield 82 22 72 -96 39 -31 7 6 5Village of Oakfield -106 -173 27 -13 8 -27 -17 -14 -13Town of Pavilion 401 253 -48 140 28 25 43 38 34Town of Pembroke 402 220 20 271 -165 223 48 41 37Village of Corfu (Pembroke) 106 -33 66 27 -73 82 7 6 6Town of Stafford 456 47 85 -184 50 -19 26 22 20Tonawanda Indian Res 62 -33 36 42 -50 55 5 4 3* NOTE - Town figures DO NOT include village (V) population. They are calculated as separate entities.
Historical and Projected Net Change for Genesee County
19
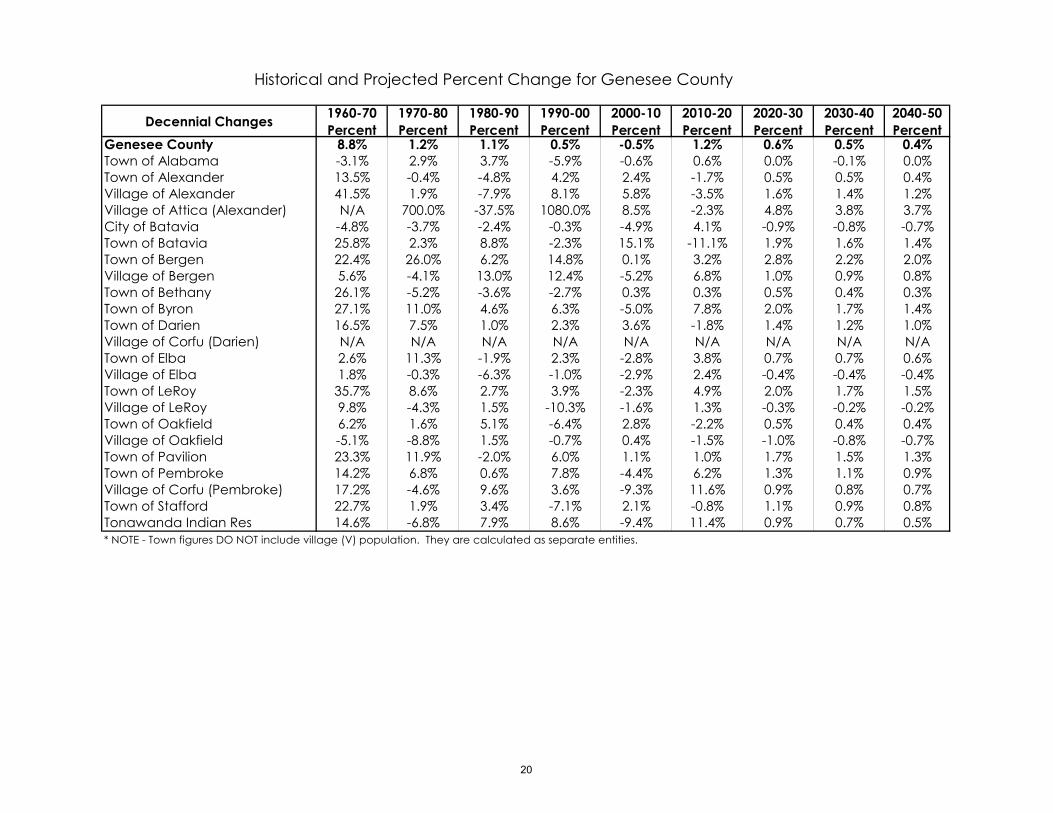
Decennial Changes 1960-70 Percent
1970-80 Percent
1980-90 Percent
1990-00 Percent
2000-10 Percent
2010-20 Percent
2020-30 Percent
2030-40 Percent
2040-50 Percent
Genesee County 8.8% 1.2% 1.1% 0.5% -0.5% 1.2% 0.6% 0.5% 0.4%Town of Alabama -3.1% 2.9% 3.7% -5.9% -0.6% 0.6% 0.0% -0.1% 0.0%Town of Alexander 13.5% -0.4% -4.8% 4.2% 2.4% -1.7% 0.5% 0.5% 0.4%Village of Alexander 41.5% 1.9% -7.9% 8.1% 5.8% -3.5% 1.6% 1.4% 1.2%Village of Attica (Alexander) N/A 700.0% -37.5% 1080.0% 8.5% -2.3% 4.8% 3.8% 3.7%City of Batavia -4.8% -3.7% -2.4% -0.3% -4.9% 4.1% -0.9% -0.8% -0.7%Town of Batavia 25.8% 2.3% 8.8% -2.3% 15.1% -11.1% 1.9% 1.6% 1.4%Town of Bergen 22.4% 26.0% 6.2% 14.8% 0.1% 3.2% 2.8% 2.2% 2.0%Village of Bergen 5.6% -4.1% 13.0% 12.4% -5.2% 6.8% 1.0% 0.9% 0.8%Town of Bethany 26.1% -5.2% -3.6% -2.7% 0.3% 0.3% 0.5% 0.4% 0.3%Town of Byron 27.1% 11.0% 4.6% 6.3% -5.0% 7.8% 2.0% 1.7% 1.4%Town of Darien 16.5% 7.5% 1.0% 2.3% 3.6% -1.8% 1.4% 1.2% 1.0%Village of Corfu (Darien) N/A N/A N/A N/A N/A N/A N/A N/A N/ATown of Elba 2.6% 11.3% -1.9% 2.3% -2.8% 3.8% 0.7% 0.7% 0.6%Village of Elba 1.8% -0.3% -6.3% -1.0% -2.9% 2.4% -0.4% -0.4% -0.4%Town of LeRoy 35.7% 8.6% 2.7% 3.9% -2.3% 4.9% 2.0% 1.7% 1.5%Village of LeRoy 9.8% -4.3% 1.5% -10.3% -1.6% 1.3% -0.3% -0.2% -0.2%Town of Oakfield 6.2% 1.6% 5.1% -6.4% 2.8% -2.2% 0.5% 0.4% 0.4%Village of Oakfield -5.1% -8.8% 1.5% -0.7% 0.4% -1.5% -1.0% -0.8% -0.7%Town of Pavilion 23.3% 11.9% -2.0% 6.0% 1.1% 1.0% 1.7% 1.5% 1.3%Town of Pembroke 14.2% 6.8% 0.6% 7.8% -4.4% 6.2% 1.3% 1.1% 0.9%Village of Corfu (Pembroke) 17.2% -4.6% 9.6% 3.6% -9.3% 11.6% 0.9% 0.8% 0.7%Town of Stafford 22.7% 1.9% 3.4% -7.1% 2.1% -0.8% 1.1% 0.9% 0.8%Tonawanda Indian Res 14.6% -6.8% 7.9% 8.6% -9.4% 11.4% 0.9% 0.7% 0.5%* NOTE - Town figures DO NOT include village (V) population. They are calculated as separate entities.
Historical and Projected Percent Change for Genesee County
20

Prepared by Genesee/Finger Lakes Regional Planning Council May 2013
0
1,000
2,000
3,000
4,000
5,000
6,000
7,000
1960 1970 1980 1990 2000 2010 2020 2030 2040 2050
Popu
latio
n
Year
Towns of Genesee County Trend from 1960-2050
Alabama
Alexander
Batavia
Bergen
Bethany
Byron
Darien
Elba
Leroy
Oakfield
Pavilion
Pembroke
Stafford
21

VI. Livingston County Trends Historically, Livingston County has had exceptional growth within the Genesee-Finger Lakes Region. In fact, Livingston County had the second highest growth rate (48.4%) within the region in the last 50 years. The growth is projected to remain, but not at as high rate of the past. One problem encountered when gathering historical data for Livingston County, was a misplacement of group quarters data within Mount Morris from the 2000 Census. These numbers were corrected so that the overall population would not reflect the error. The majority of the towns and villages in Livingston County have a projected increase in population. The Village of Geneseo has the largest projected increase due to the presence of SUNY Geneseo. Towns such as Avon and Lima will see an increase in population, likely due to its location in the Region. Avon is expected to continue to have sizeable development due to its proximity to Interstate 390. The Town of Livonia is projected to grow above an average of about 1.5% through 2050, while the Village is projected to increase by 1.0% over that same period.
23

1960 1970 1980 1990 2000 2010 2020 2030 2040 2050Livingston County 44,053 54,041 57,006 62,372 64,328 65,393 66,179 66,887 67,501 68,043Town of Avon 1,632 2,857 3,179 3,288 3,466 3,770 3,675 3,755 3,824 3,885Village of Avon 2,772 3,260 3,006 2,995 2,977 3,394 3,207 3,294 3,370 3,438Town of Caledonia 1,150 1,505 1,846 2,179 2,240 2,054 2,091 2,035 1,986 1,942Village of Caledonia 1,917 2,327 2,188 2,262 2,327 2,201 2,376 2,395 2,410 2,425Town of Conesus 1,221 1,533 1,970 2,196 2,353 2,473 2,506 2,564 2,615 2,660Town of Geneseo 1,053 1,564 1,927 1,991 2,075 2,452 2,216 2,271 2,318 2,360Village of Geneseo 3,284 5,714 6,746 7,187 7,579 8,031 8,159 8,382 8,574 8,744Town of Groveland 3,373 3,004 2,140 3,190 3,853 3,249 3,418 3,252 3,107 2,978Town of Leicester 1,027 1,431 1,426 1,818 1,818 1,732 1,923 1,963 1,998 2,028Village of Leicester 365 368 462 405 469 468 482 487 491 495Town of Lima 1,350 1,759 1,834 2,022 2,082 2,166 2,178 2,215 2,247 2,276Village of Lima 1,366 1,686 2,025 2,165 2,459 2,139 2,318 2,263 2,216 2,175Town of Livonia 2,580 4,026 4,504 5,370 5,913 6,400 6,334 6,496 6,635 6,759Village of Livonia 946 1,278 1,238 1,434 1,373 1,409 1,434 1,456 1,477 1,494Town of Mount Morris 1,317 1,162 1,439 1,531 1,301 1,479 1,323 1,332 1,339 1,346Village of Mount Morris 3,250 3,417 3,039 3,102 3,266 2,986 3,250 3,244 3,238 3,233Town of North Dansville 635 922 1,015 781 906 819 938 950 961 970Village of Dansville 5,460 5,436 4,979 5,002 4,832 4,719 4,753 4,723 4,697 4,673Town of Nunda 1,085 1,320 1,523 1,584 1,687 1,687 1,767 1,797 1,823 1,847Village of Nunda 1,224 1,254 1,169 1,347 1,330 1,377 1,343 1,349 1,354 1,358Town of Ossian 489 551 667 797 751 789 793 808 823 835Town of Portage 733 731 771 893 859 884 880 887 895 901Town of Sparta 1,019 1,157 1,458 1,578 1,627 1,624 1,714 1,747 1,775 1,801Town of Springwater 1,293 1,678 2,143 2,407 2,322 2,439 2,478 2,538 2,590 2,636Town of West Sparta 817 935 1,100 1,335 1,244 1,255 1,311 1,337 1,360 1,379Town of York 2,695 3,166 3,212 3,513 3,219 3,397 3,312 3,347 3,378 3,405* NOTE - Town figures DO NOT include village (V) population. They are calculated as separate entities. Source: 1960 - 2000 US Census Bureau
Historical and Projected Population for Livingston County1960 - 2050
Population & Projections Historical Projected
24
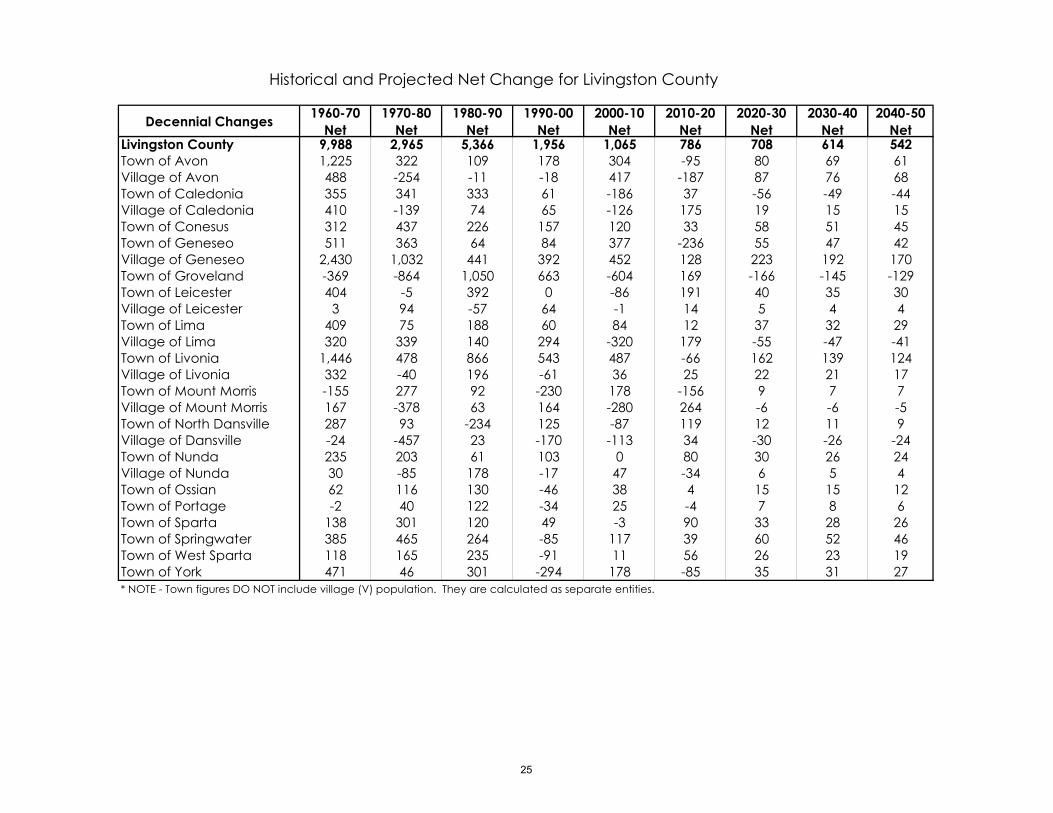
Decennial Changes 1960-70 Net
1970-80 Net
1980-90 Net
1990-00 Net
2000-10 Net
2010-20 Net
2020-30 Net
2030-40 Net
2040-50 Net
Livingston County 9,988 2,965 5,366 1,956 1,065 786 708 614 542Town of Avon 1,225 322 109 178 304 -95 80 69 61Village of Avon 488 -254 -11 -18 417 -187 87 76 68Town of Caledonia 355 341 333 61 -186 37 -56 -49 -44Village of Caledonia 410 -139 74 65 -126 175 19 15 15Town of Conesus 312 437 226 157 120 33 58 51 45Town of Geneseo 511 363 64 84 377 -236 55 47 42Village of Geneseo 2,430 1,032 441 392 452 128 223 192 170Town of Groveland -369 -864 1,050 663 -604 169 -166 -145 -129Town of Leicester 404 -5 392 0 -86 191 40 35 30Village of Leicester 3 94 -57 64 -1 14 5 4 4Town of Lima 409 75 188 60 84 12 37 32 29Village of Lima 320 339 140 294 -320 179 -55 -47 -41Town of Livonia 1,446 478 866 543 487 -66 162 139 124Village of Livonia 332 -40 196 -61 36 25 22 21 17Town of Mount Morris -155 277 92 -230 178 -156 9 7 7Village of Mount Morris 167 -378 63 164 -280 264 -6 -6 -5Town of North Dansville 287 93 -234 125 -87 119 12 11 9Village of Dansville -24 -457 23 -170 -113 34 -30 -26 -24Town of Nunda 235 203 61 103 0 80 30 26 24Village of Nunda 30 -85 178 -17 47 -34 6 5 4Town of Ossian 62 116 130 -46 38 4 15 15 12Town of Portage -2 40 122 -34 25 -4 7 8 6Town of Sparta 138 301 120 49 -3 90 33 28 26Town of Springwater 385 465 264 -85 117 39 60 52 46Town of West Sparta 118 165 235 -91 11 56 26 23 19Town of York 471 46 301 -294 178 -85 35 31 27* NOTE - Town figures DO NOT include village (V) population. They are calculated as separate entities.
Historical and Projected Net Change for Livingston County
25
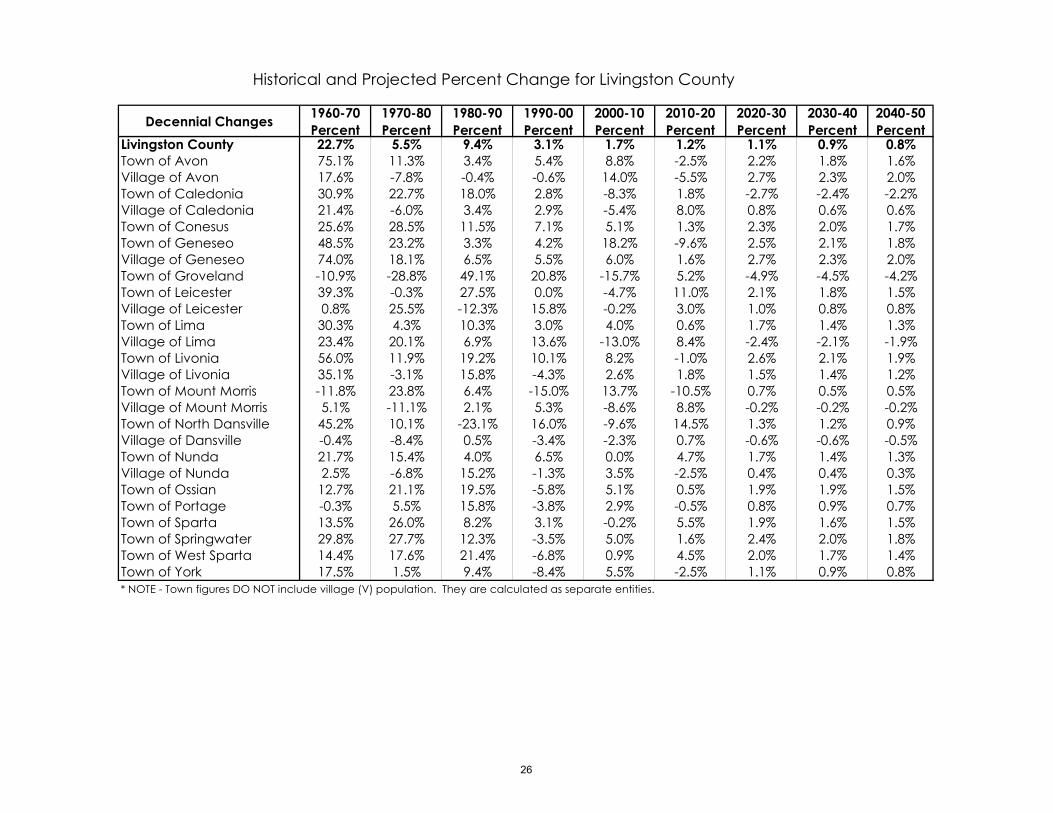
Decennial Changes 1960-70 Percent
1970-80 Percent
1980-90 Percent
1990-00 Percent
2000-10 Percent
2010-20 Percent
2020-30 Percent
2030-40 Percent
2040-50 Percent
Livingston County 22.7% 5.5% 9.4% 3.1% 1.7% 1.2% 1.1% 0.9% 0.8%Town of Avon 75.1% 11.3% 3.4% 5.4% 8.8% -2.5% 2.2% 1.8% 1.6%Village of Avon 17.6% -7.8% -0.4% -0.6% 14.0% -5.5% 2.7% 2.3% 2.0%Town of Caledonia 30.9% 22.7% 18.0% 2.8% -8.3% 1.8% -2.7% -2.4% -2.2%Village of Caledonia 21.4% -6.0% 3.4% 2.9% -5.4% 8.0% 0.8% 0.6% 0.6%Town of Conesus 25.6% 28.5% 11.5% 7.1% 5.1% 1.3% 2.3% 2.0% 1.7%Town of Geneseo 48.5% 23.2% 3.3% 4.2% 18.2% -9.6% 2.5% 2.1% 1.8%Village of Geneseo 74.0% 18.1% 6.5% 5.5% 6.0% 1.6% 2.7% 2.3% 2.0%Town of Groveland -10.9% -28.8% 49.1% 20.8% -15.7% 5.2% -4.9% -4.5% -4.2%Town of Leicester 39.3% -0.3% 27.5% 0.0% -4.7% 11.0% 2.1% 1.8% 1.5%Village of Leicester 0.8% 25.5% -12.3% 15.8% -0.2% 3.0% 1.0% 0.8% 0.8%Town of Lima 30.3% 4.3% 10.3% 3.0% 4.0% 0.6% 1.7% 1.4% 1.3%Village of Lima 23.4% 20.1% 6.9% 13.6% -13.0% 8.4% -2.4% -2.1% -1.9%Town of Livonia 56.0% 11.9% 19.2% 10.1% 8.2% -1.0% 2.6% 2.1% 1.9%Village of Livonia 35.1% -3.1% 15.8% -4.3% 2.6% 1.8% 1.5% 1.4% 1.2%Town of Mount Morris -11.8% 23.8% 6.4% -15.0% 13.7% -10.5% 0.7% 0.5% 0.5%Village of Mount Morris 5.1% -11.1% 2.1% 5.3% -8.6% 8.8% -0.2% -0.2% -0.2%Town of North Dansville 45.2% 10.1% -23.1% 16.0% -9.6% 14.5% 1.3% 1.2% 0.9%Village of Dansville -0.4% -8.4% 0.5% -3.4% -2.3% 0.7% -0.6% -0.6% -0.5%Town of Nunda 21.7% 15.4% 4.0% 6.5% 0.0% 4.7% 1.7% 1.4% 1.3%Village of Nunda 2.5% -6.8% 15.2% -1.3% 3.5% -2.5% 0.4% 0.4% 0.3%Town of Ossian 12.7% 21.1% 19.5% -5.8% 5.1% 0.5% 1.9% 1.9% 1.5%Town of Portage -0.3% 5.5% 15.8% -3.8% 2.9% -0.5% 0.8% 0.9% 0.7%Town of Sparta 13.5% 26.0% 8.2% 3.1% -0.2% 5.5% 1.9% 1.6% 1.5%Town of Springwater 29.8% 27.7% 12.3% -3.5% 5.0% 1.6% 2.4% 2.0% 1.8%Town of West Sparta 14.4% 17.6% 21.4% -6.8% 0.9% 4.5% 2.0% 1.7% 1.4%Town of York 17.5% 1.5% 9.4% -8.4% 5.5% -2.5% 1.1% 0.9% 0.8%* NOTE - Town figures DO NOT include village (V) population. They are calculated as separate entities.
Historical and Projected Percent Change for Livingston County
26

Prepared by Genesee/Finger Lakes Regional Planning Council May 2013
0
1,000
2,000
3,000
4,000
5,000
6,000
7,000
1960 1970 1980 1990 2000 2010 2020 2030 2040 2050
Popu
latio
n
Year
Towns of Livingston County Trend from 1960-2050
Avon
Caledonia
Conesus
Geneseo
Groveland
Leicester
Lima
Livonia
Mount Morris
North Dansville
Nunda
Ossian
Portage
Sparta
Springwater
West Sparta
York
27

VII. Monroe County Trends Major population changes have been happening within Monroe County for many years, and that scenario will likely continue. From 1960 to 2010, the population increased by 157,957 (26.9%) and is projected to increase by 23,780 (3.2%) by 2050. Municipalities that are projected to have a decrease in population include the City of Rochester, the Town of Irondequoit and the Town/Village of East Rochester. These three places have seen declining population for many years and appears this trend will continue. The City of Rochester has plans for residential development throughout the City but it appears the population will continue to decrease, although at a decreasing rate. The Towns of Greece and Webster have been gaining the most population the past few decades. Although the Town of Greece is projected to increase at a relatively small rate (1.5%), they will likely pass 100,000 population by the year 2040. The Town of Webster has seen the most growth since 1990. The Town of Penfield is projected to increase approximately 2.0% while the Town of Perinton is projected to increase about 3.0% through 2050.
29

Prepared by Genesee/Finger Lakes Regional Planning Council May 2013
1960 1970 1980 1990 2000 2010 2020 2030 2040 2050Monroe County 586,387 711,917 702,238 713,968 735,343 744,344 751,697 757,932 763,343 768,124Town of Brighton 27,849 35,065 35,776 34,455 35,588 36,609 36,754 36,877 36,984 37,078Town of Chili 11,237 19,609 23,676 25,178 27,638 28,625 29,443 30,138 30,742 31,277Town of Clarkson 2,339 3,642 4,016 4,417 5,928 6,588 6,627 6,660 6,688 6,714Village of Brockport (Part) 0 0 0 100 144 148 166 183 196 208T/V of East Rochester 8,152 8,347 7,596 6,932 6,650 6,587 6,479 6,386 6,306 6,234Town of Gates 13,755 26,442 29,756 28,583 29,275 28,400 29,647 30,705 31,626 32,441Town of Greece 48,670 75,136 81,367 90,106 94,141 96,095 97,929 99,486 100,840 102,035Town of Hamlin 2,755 4,167 7,675 9,203 9,355 9,045 9,627 10,122 10,552 10,933Town of Henrietta 11,598 33,017 36,134 36,376 39,028 42,581 44,290 45,741 47,003 48,120Town of Irondequoit 55,337 63,675 57,648 52,377 52,354 51,692 51,427 51,200 51,002 50,825Town of Mendon 1,759 2,293 3,024 4,505 5,775 6,478 6,554 6,620 6,676 6,726Village of Honeoye Falls 2,143 2,248 2,410 2,340 2,595 2,674 2,677 2,681 2,682 2,685Town of Ogden 4,801 8,807 11,269 13,306 14,933 16,255 16,576 16,849 17,087 17,297Village of Spencerport 2,461 2,929 3,424 3,606 3,559 3,601 3,667 3,722 3,771 3,813Town of Parma 4,943 8,308 8,434 8,657 8,966 9,747 9,777 9,801 9,823 9,843Village of Hilton 1,334 2,440 4,151 5,216 5,856 5,886 6,202 6,470 6,703 6,909Town of Penfield 12,601 23,782 27,201 30,219 34,645 36,242 37,239 38,085 38,822 39,472Town of Perinton 7,593 21,609 32,359 37,072 40,350 41,109 43,202 44,980 46,528 47,896Village of Fairport 5,507 6,474 5,970 5,943 5,740 5,353 5,397 5,435 5,467 5,497Town of Pittsford 8,469 18,441 21,052 23,009 25,801 28,050 28,558 28,989 29,364 29,695Village of Pittsford 1,749 1,755 1,568 1,488 1,418 1,355 1,346 1,338 1,330 1,324Town of Riga 1,797 2,681 2,910 3,383 3,550 3,629 3,724 3,805 3,874 3,936Village of Churchville 1,003 1,065 1,399 1,731 1,887 1,961 2,004 2,041 2,072 2,100City of Rochester 318,611 296,233 241,741 231,636 219,773 210,565 206,076 202,253 198,925 195,975Town of Rush 2,555 3,287 3,001 3,217 3,603 3,478 3,569 3,647 3,715 3,775Town of Sweden 1,968 3,583 5,083 5,432 5,757 5,957 6,166 6,345 6,500 6,637Village of Brockport (Part) 5,256 7,878 9,776 8,749 7,959 8,218 7,642 7,152 6,725 6,348Town of Webster 13,374 19,702 23,426 26,175 32,710 37,242 38,465 39,503 40,406 41,205Village of Webster 3,060 5,037 5,499 5,464 5,216 5,399 5,488 5,565 5,631 5,690Town of Wheatland 1,848 2,298 3,108 3,181 3,021 2,774 2,931 3,065 3,181 3,284Village of Scottsville 1,863 1,967 1,789 1,912 2,128 2,001 2,048 2,088 2,122 2,152* NOTE - Town figures DO NOT include village (V) population. They are calculated as separate entities. Source: 1960 - 2010 US Census Bureau
Historical and Projected Population for Monroe County1960 - 2050
Population & Projections Historical Projected
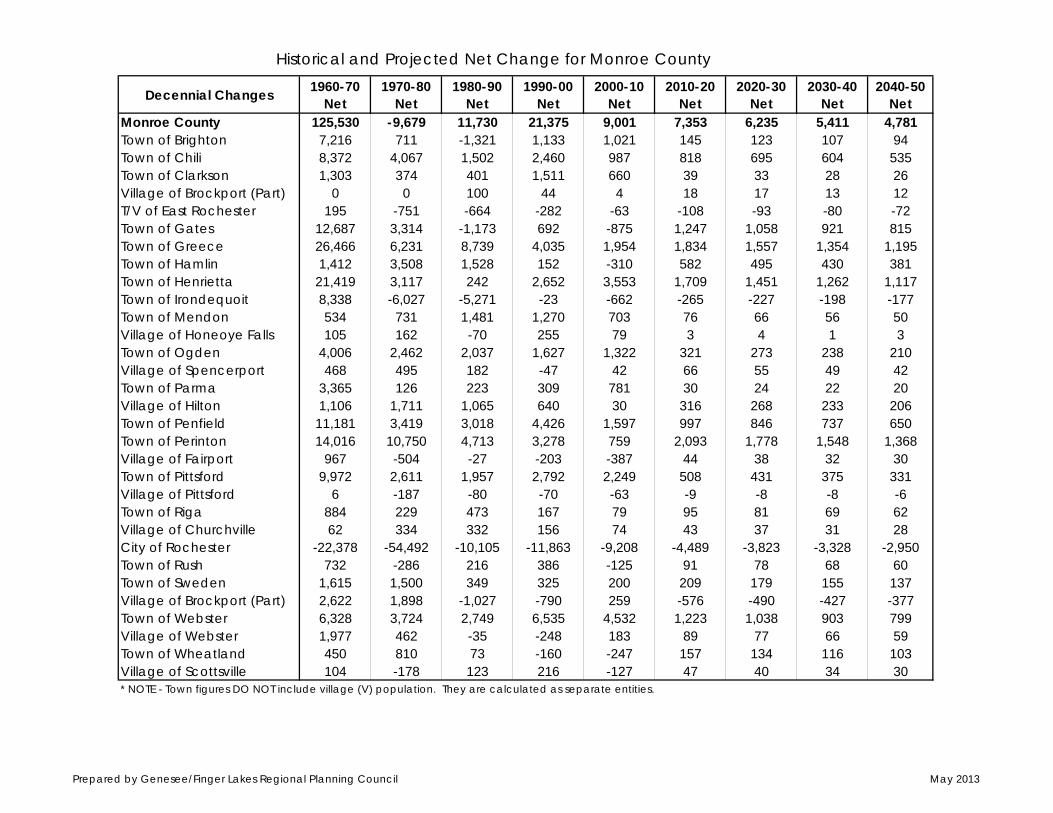
Prepared by Genesee/Finger Lakes Regional Planning Council May 2013
Decennial Changes 1960-70 Net
1970-80 Net
1980-90 Net
1990-00 Net
2000-10 Net
2010-20 Net
2020-30 Net
2030-40 Net
2040-50 Net
Monroe County 125,530 -9,679 11,730 21,375 9,001 7,353 6,235 5,411 4,781Town of Brighton 7,216 711 -1,321 1,133 1,021 145 123 107 94Town of Chili 8,372 4,067 1,502 2,460 987 818 695 604 535Town of Clarkson 1,303 374 401 1,511 660 39 33 28 26Village of Brockport (Part) 0 0 100 44 4 18 17 13 12T/V of East Rochester 195 -751 -664 -282 -63 -108 -93 -80 -72Town of Gates 12,687 3,314 -1,173 692 -875 1,247 1,058 921 815Town of Greece 26,466 6,231 8,739 4,035 1,954 1,834 1,557 1,354 1,195Town of Hamlin 1,412 3,508 1,528 152 -310 582 495 430 381Town of Henrietta 21,419 3,117 242 2,652 3,553 1,709 1,451 1,262 1,117Town of Irondequoit 8,338 -6,027 -5,271 -23 -662 -265 -227 -198 -177Town of Mendon 534 731 1,481 1,270 703 76 66 56 50Village of Honeoye Falls 105 162 -70 255 79 3 4 1 3Town of Ogden 4,006 2,462 2,037 1,627 1,322 321 273 238 210Village of Spencerport 468 495 182 -47 42 66 55 49 42Town of Parma 3,365 126 223 309 781 30 24 22 20Village of Hilton 1,106 1,711 1,065 640 30 316 268 233 206Town of Penfield 11,181 3,419 3,018 4,426 1,597 997 846 737 650Town of Perinton 14,016 10,750 4,713 3,278 759 2,093 1,778 1,548 1,368Village of Fairport 967 -504 -27 -203 -387 44 38 32 30Town of Pittsford 9,972 2,611 1,957 2,792 2,249 508 431 375 331Village of Pittsford 6 -187 -80 -70 -63 -9 -8 -8 -6Town of Riga 884 229 473 167 79 95 81 69 62Village of Churchville 62 334 332 156 74 43 37 31 28City of Rochester -22,378 -54,492 -10,105 -11,863 -9,208 -4,489 -3,823 -3,328 -2,950Town of Rush 732 -286 216 386 -125 91 78 68 60Town of Sweden 1,615 1,500 349 325 200 209 179 155 137Village of Brockport (Part) 2,622 1,898 -1,027 -790 259 -576 -490 -427 -377Town of Webster 6,328 3,724 2,749 6,535 4,532 1,223 1,038 903 799Village of Webster 1,977 462 -35 -248 183 89 77 66 59Town of Wheatland 450 810 73 -160 -247 157 134 116 103Village of Scottsville 104 -178 123 216 -127 47 40 34 30* NOTE - Town figures DO NOT include village (V) population. They are calculated as separate entities.
Historical and Projected Net Change for Monroe County
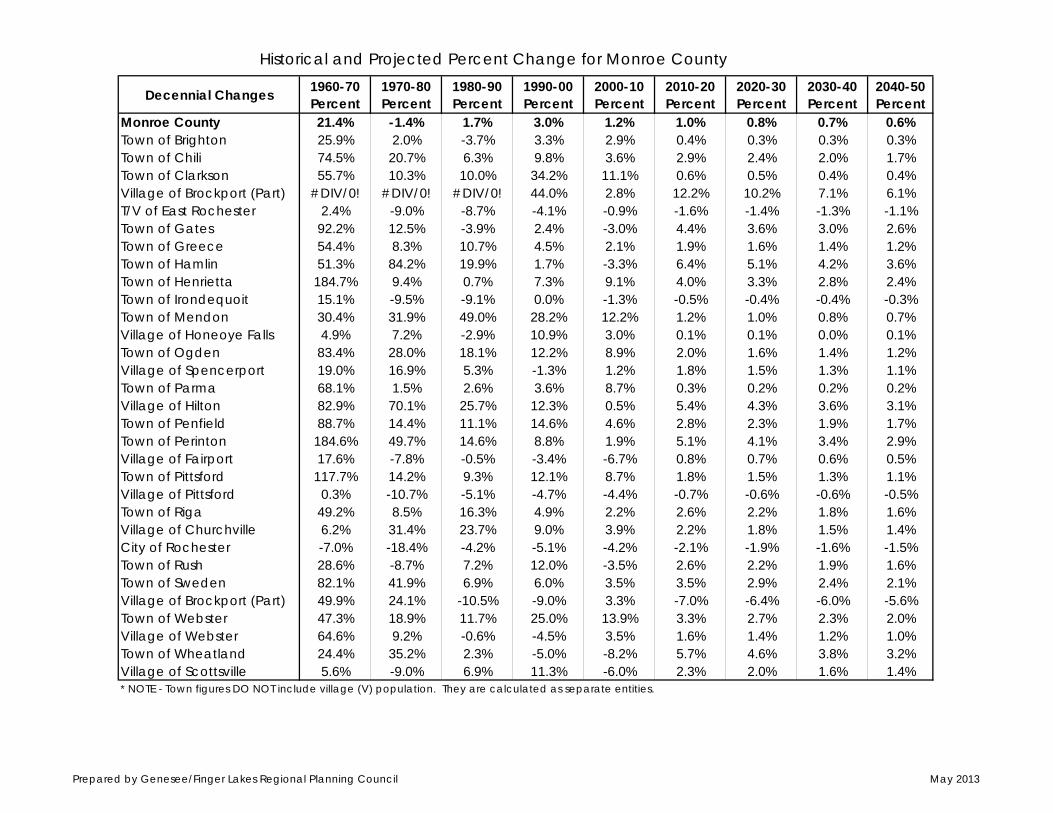
Prepared by Genesee/Finger Lakes Regional Planning Council May 2013
Decennial Changes 1960-70 Percent
1970-80 Percent
1980-90 Percent
1990-00 Percent
2000-10 Percent
2010-20 Percent
2020-30 Percent
2030-40 Percent
2040-50 Percent
Monroe County 21.4% -1.4% 1.7% 3.0% 1.2% 1.0% 0.8% 0.7% 0.6%Town of Brighton 25.9% 2.0% -3.7% 3.3% 2.9% 0.4% 0.3% 0.3% 0.3%Town of Chili 74.5% 20.7% 6.3% 9.8% 3.6% 2.9% 2.4% 2.0% 1.7%Town of Clarkson 55.7% 10.3% 10.0% 34.2% 11.1% 0.6% 0.5% 0.4% 0.4%Village of Brockport (Part) #DIV/0! #DIV/0! #DIV/0! 44.0% 2.8% 12.2% 10.2% 7.1% 6.1%T/V of East Rochester 2.4% -9.0% -8.7% -4.1% -0.9% -1.6% -1.4% -1.3% -1.1%Town of Gates 92.2% 12.5% -3.9% 2.4% -3.0% 4.4% 3.6% 3.0% 2.6%Town of Greece 54.4% 8.3% 10.7% 4.5% 2.1% 1.9% 1.6% 1.4% 1.2%Town of Hamlin 51.3% 84.2% 19.9% 1.7% -3.3% 6.4% 5.1% 4.2% 3.6%Town of Henrietta 184.7% 9.4% 0.7% 7.3% 9.1% 4.0% 3.3% 2.8% 2.4%Town of Irondequoit 15.1% -9.5% -9.1% 0.0% -1.3% -0.5% -0.4% -0.4% -0.3%Town of Mendon 30.4% 31.9% 49.0% 28.2% 12.2% 1.2% 1.0% 0.8% 0.7%Village of Honeoye Falls 4.9% 7.2% -2.9% 10.9% 3.0% 0.1% 0.1% 0.0% 0.1%Town of Ogden 83.4% 28.0% 18.1% 12.2% 8.9% 2.0% 1.6% 1.4% 1.2%Village of Spencerport 19.0% 16.9% 5.3% -1.3% 1.2% 1.8% 1.5% 1.3% 1.1%Town of Parma 68.1% 1.5% 2.6% 3.6% 8.7% 0.3% 0.2% 0.2% 0.2%Village of Hilton 82.9% 70.1% 25.7% 12.3% 0.5% 5.4% 4.3% 3.6% 3.1%Town of Penfield 88.7% 14.4% 11.1% 14.6% 4.6% 2.8% 2.3% 1.9% 1.7%Town of Perinton 184.6% 49.7% 14.6% 8.8% 1.9% 5.1% 4.1% 3.4% 2.9%Village of Fairport 17.6% -7.8% -0.5% -3.4% -6.7% 0.8% 0.7% 0.6% 0.5%Town of Pittsford 117.7% 14.2% 9.3% 12.1% 8.7% 1.8% 1.5% 1.3% 1.1%Village of Pittsford 0.3% -10.7% -5.1% -4.7% -4.4% -0.7% -0.6% -0.6% -0.5%Town of Riga 49.2% 8.5% 16.3% 4.9% 2.2% 2.6% 2.2% 1.8% 1.6%Village of Churchville 6.2% 31.4% 23.7% 9.0% 3.9% 2.2% 1.8% 1.5% 1.4%City of Rochester -7.0% -18.4% -4.2% -5.1% -4.2% -2.1% -1.9% -1.6% -1.5%Town of Rush 28.6% -8.7% 7.2% 12.0% -3.5% 2.6% 2.2% 1.9% 1.6%Town of Sweden 82.1% 41.9% 6.9% 6.0% 3.5% 3.5% 2.9% 2.4% 2.1%Village of Brockport (Part) 49.9% 24.1% -10.5% -9.0% 3.3% -7.0% -6.4% -6.0% -5.6%Town of Webster 47.3% 18.9% 11.7% 25.0% 13.9% 3.3% 2.7% 2.3% 2.0%Village of Webster 64.6% 9.2% -0.6% -4.5% 3.5% 1.6% 1.4% 1.2% 1.0%Town of Wheatland 24.4% 35.2% 2.3% -5.0% -8.2% 5.7% 4.6% 3.8% 3.2%Village of Scottsville 5.6% -9.0% 6.9% 11.3% -6.0% 2.3% 2.0% 1.6% 1.4%* NOTE - Town figures DO NOT include village (V) population. They are calculated as separate entities.
Historical and Projected Percent Change for Monroe County
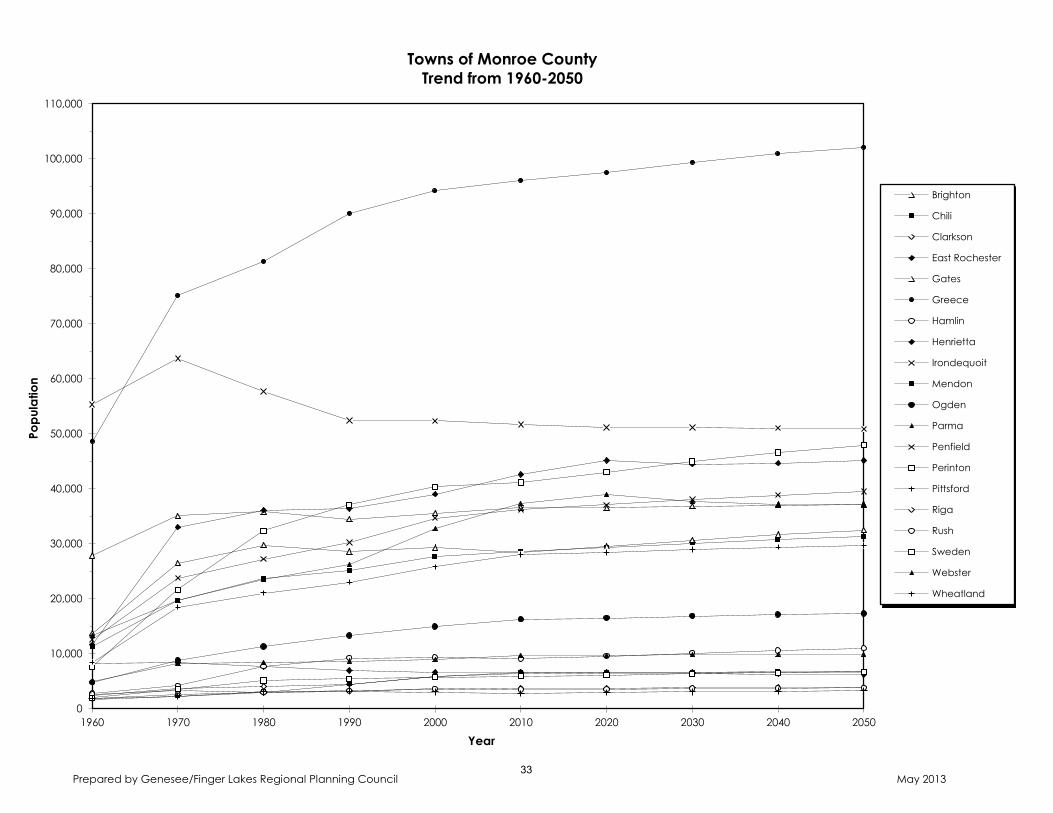
Prepared by Genesee/Finger Lakes Regional Planning Council May 2013
0
10,000
20,000
30,000
40,000
50,000
60,000
70,000
80,000
90,000
100,000
110,000
1960 1970 1980 1990 2000 2010 2020 2030 2040 2050
Popu
latio
n
Year
Towns of Monroe County Trend from 1960-2050
Brighton
Chili
Clarkson
East Rochester
Gates
Greece
Hamlin
Henrietta
Irondequoit
Mendon
Ogden
Parma
Penfield
Perinton
Pittsford
Riga
Rush
Sweden
Webster
Wheatland
33

VIII. Ontario County Trends With a growth rate of over 58%, Ontario County experienced the largest percent increase in population from 1960 to 2010 in the Region. The projected growth rate is 9.5%. Ontario County is projected to have a population close to 120,000 by 2050. While it is projected that the City of Geneva will continue to decline in population at a decreasing rate, the City of Canandaigua is projected to slowly increase. The Town of Canandaigua is projected to increase by about 3.0% per decade. The Town of Farmington has seen some major increases in the past and is projected to increase population at approximately 2.0% per decade. The Town of Victor is projected to have adecennial increase of 6.5% through 2050.
35

1960 1970 1980 1990 2000 2010 2020 2030 2040 2050Ontario County 68,070 78,849 88,909 95,101 100,224 107,931 111,117 113,818 116,163 118,234Town of Bristol 1,002 1,307 1,802 2,071 2,421 2,315 2,437 2,541 2,631 2,710Town of Canadice 558 971 1,467 1,857 1,846 1,664 1,814 1,941 2,051 2,149City of Canandaigua 9,370 10,488 10,419 10,725 11,418 10,545 11,244 11,838 12,354 12,809Town of Canandaigua 4,894 5,419 6,060 7,160 7,649 10,020 10,593 11,080 11,502 11,875Town of East Bloomfield 1,349 1,730 1,788 1,927 2,094 2,273 2,274 2,275 2,275 2,276Village of Bloomfield 948 1,421 1,539 1,331 1,267 1,361 1,370 1,377 1,383 1,389Town of Farmington 2,114 3,565 8,933 10,381 10,585 11,825 12,152 12,431 12,672 12,886City of Geneva (Part) 17,286 16,793 15,133 14,143 13,617 13,261 13,028 12,832 12,662 12,511Town of Geneva 2,603 2,781 3,077 2,967 3,289 3,291 3,355 3,409 3,456 3,498Town of Gorham 2,505 2,839 3,450 3,296 3,598 4,034 3,998 3,968 3,942 3,919Village of Rushville (Gorham) 159 194 148 201 178 213 215 216 218 219Town of Hopewell 1,822 2,347 2,509 3,016 3,346 3,747 3,741 3,736 3,731 3,727Town of Manchester 2,018 3,463 4,102 4,564 4,694 4,596 4,818 5,006 5,169 5,313Vil. of Clifton Springs (Manchester) 1,498 1,556 1,533 1,704 1,769 1,651 1,720 1,779 1,830 1,875Village of Manchester 1,344 1,305 1,698 1,598 1,475 1,709 1,668 1,633 1,603 1,576Village of Shortsville 1,382 1,516 1,669 1,485 1,320 1,439 1,409 1,383 1,361 1,341Town of Naples 718 912 1,113 1,322 1,369 1,461 1,488 1,510 1,530 1,547Village of Naples 1,237 1,324 1,225 1,237 1,072 1,041 1,040 1,039 1,038 1,037Town of Phelps 3,483 3,839 4,012 4,300 4,594 4,607 4,702 4,782 4,851 4,913Vil. of Clifton Springs (Phelps) 455 502 506 471 454 476 471 466 462 459Village of Phelps 1,887 1,989 2,004 1,978 1,969 1,989 1,990 1,990 1,991 1,991Town of Richmond 1,384 1,925 2,703 3,230 3,452 3,361 3,543 3,698 3,832 3,951Town of Seneca 2,698 2,808 2,749 2,747 2,731 2,721 2,728 2,735 2,740 2,745Town of South Bristol 617 794 1,205 1,663 1,645 1,590 1,689 1,773 1,846 1,911Town of Victor 2,115 2,884 3,414 4,883 7,390 11,579 12,982 14,173 15,207 16,120Village of Victor 1,180 2,187 2,370 2,308 2,433 2,696 2,752 2,799 2,841 2,877Town of West Bloomfield 1,444 1,990 2,281 2,536 2,549 2,466 2,573 2,663 2,742 2,811* NOTE - Town figures DO NOT include village (V) population. They are calculated as separate entities. Source: 1960 - 2010 US Census Bureau
Historical and Projected Population for Ontario County1960 - 2050
Population & Projections Historical Projected
36

Decennial Changes 1960-70 Net
1970-80 Net
1980-90 Net
1990-00 Net
2000-10 Net
2010-20 Net
2020-30 Net
2030-40 Net
2040-50 Net
Ontario County 10,779 10,060 6,192 5,123 7,707 3,186 2,701 2,345 2,071Town of Bristol 305 495 269 350 -106 122 104 90 79Town of Canadice 413 496 390 -11 -182 150 127 110 98City of Canandaigua 1,118 -69 306 539 -873 699 594 516 455Town of Canandaigua 525 641 1,100 489 2,371 573 487 422 373Town of East Bloomfield 381 58 139 167 179 1 1 0 1Village of Bloomfield 473 118 -208 -64 94 9 7 6 6Town of Farmington 1,451 5,368 1,448 204 1,240 327 279 241 214City of Geneva (Part) -493 -1,660 -990 -526 -356 -233 -196 -170 -151Town of Geneva 178 296 -110 322 2 64 54 47 42Town of Gorham 334 611 -154 302 436 -36 -30 -26 -23Village of Rushville (Gorham) 35 -46 53 -23 35 2 1 2 1Town of Hopewell 525 162 507 330 401 -6 -5 -5 -4Town of Manchester 1,445 639 462 130 -98 222 188 163 144Vil. of Clifton Springs (Manchester) 58 -23 171 65 -118 69 59 51 45Village of Manchester -39 393 -100 -123 234 -41 -35 -30 -27Village of Shortsville 134 153 -184 -165 119 -30 -26 -22 -20Town of Naples 194 201 209 47 92 27 22 20 17Village of Naples 87 -99 12 -165 -31 -1 -1 -1 -1Town of Phelps 356 173 288 294 13 95 80 69 62Vil. of Clifton Springs (Phelps) 47 4 -35 -17 22 -5 -5 -4 -3Village of Phelps 102 15 -26 -9 20 1 0 1 0Town of Richmond 541 778 527 222 -91 182 155 134 119Town of Seneca 110 -59 -2 -16 -10 7 7 5 5Town of South Bristol 177 411 458 -18 -55 99 84 73 65Town of Victor 769 530 1,469 2,661 4,189 1,403 1,191 1,034 913Village of Victor 1,007 183 -62 125 263 56 47 42 36Town of West Bloomfield 546 291 255 13 -83 107 90 79 69* NOTE - Town figures DO NOT include village (V) population. They are calculated as separate entities.
Historical and Projected Net Change for Ontario County
37
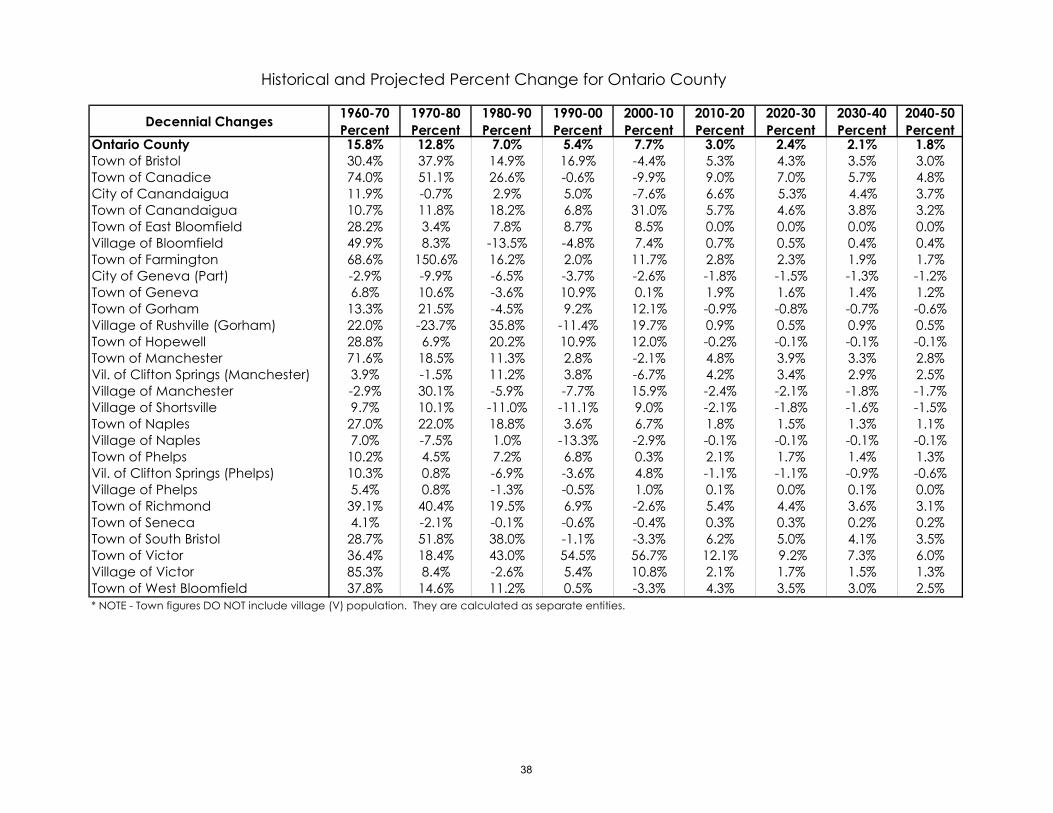
Decennial Changes 1960-70 Percent
1970-80 Percent
1980-90 Percent
1990-00 Percent
2000-10 Percent
2010-20 Percent
2020-30 Percent
2030-40 Percent
2040-50 Percent
Ontario County 15.8% 12.8% 7.0% 5.4% 7.7% 3.0% 2.4% 2.1% 1.8%Town of Bristol 30.4% 37.9% 14.9% 16.9% -4.4% 5.3% 4.3% 3.5% 3.0%Town of Canadice 74.0% 51.1% 26.6% -0.6% -9.9% 9.0% 7.0% 5.7% 4.8%City of Canandaigua 11.9% -0.7% 2.9% 5.0% -7.6% 6.6% 5.3% 4.4% 3.7%Town of Canandaigua 10.7% 11.8% 18.2% 6.8% 31.0% 5.7% 4.6% 3.8% 3.2%Town of East Bloomfield 28.2% 3.4% 7.8% 8.7% 8.5% 0.0% 0.0% 0.0% 0.0%Village of Bloomfield 49.9% 8.3% -13.5% -4.8% 7.4% 0.7% 0.5% 0.4% 0.4%Town of Farmington 68.6% 150.6% 16.2% 2.0% 11.7% 2.8% 2.3% 1.9% 1.7%City of Geneva (Part) -2.9% -9.9% -6.5% -3.7% -2.6% -1.8% -1.5% -1.3% -1.2%Town of Geneva 6.8% 10.6% -3.6% 10.9% 0.1% 1.9% 1.6% 1.4% 1.2%Town of Gorham 13.3% 21.5% -4.5% 9.2% 12.1% -0.9% -0.8% -0.7% -0.6%Village of Rushville (Gorham) 22.0% -23.7% 35.8% -11.4% 19.7% 0.9% 0.5% 0.9% 0.5%Town of Hopewell 28.8% 6.9% 20.2% 10.9% 12.0% -0.2% -0.1% -0.1% -0.1%Town of Manchester 71.6% 18.5% 11.3% 2.8% -2.1% 4.8% 3.9% 3.3% 2.8%Vil. of Clifton Springs (Manchester) 3.9% -1.5% 11.2% 3.8% -6.7% 4.2% 3.4% 2.9% 2.5%Village of Manchester -2.9% 30.1% -5.9% -7.7% 15.9% -2.4% -2.1% -1.8% -1.7%Village of Shortsville 9.7% 10.1% -11.0% -11.1% 9.0% -2.1% -1.8% -1.6% -1.5%Town of Naples 27.0% 22.0% 18.8% 3.6% 6.7% 1.8% 1.5% 1.3% 1.1%Village of Naples 7.0% -7.5% 1.0% -13.3% -2.9% -0.1% -0.1% -0.1% -0.1%Town of Phelps 10.2% 4.5% 7.2% 6.8% 0.3% 2.1% 1.7% 1.4% 1.3%Vil. of Clifton Springs (Phelps) 10.3% 0.8% -6.9% -3.6% 4.8% -1.1% -1.1% -0.9% -0.6%Village of Phelps 5.4% 0.8% -1.3% -0.5% 1.0% 0.1% 0.0% 0.1% 0.0%Town of Richmond 39.1% 40.4% 19.5% 6.9% -2.6% 5.4% 4.4% 3.6% 3.1%Town of Seneca 4.1% -2.1% -0.1% -0.6% -0.4% 0.3% 0.3% 0.2% 0.2%Town of South Bristol 28.7% 51.8% 38.0% -1.1% -3.3% 6.2% 5.0% 4.1% 3.5%Town of Victor 36.4% 18.4% 43.0% 54.5% 56.7% 12.1% 9.2% 7.3% 6.0%Village of Victor 85.3% 8.4% -2.6% 5.4% 10.8% 2.1% 1.7% 1.5% 1.3%Town of West Bloomfield 37.8% 14.6% 11.2% 0.5% -3.3% 4.3% 3.5% 3.0% 2.5%* NOTE - Town figures DO NOT include village (V) population. They are calculated as separate entities.
Historical and Projected Percent Change for Ontario County
38
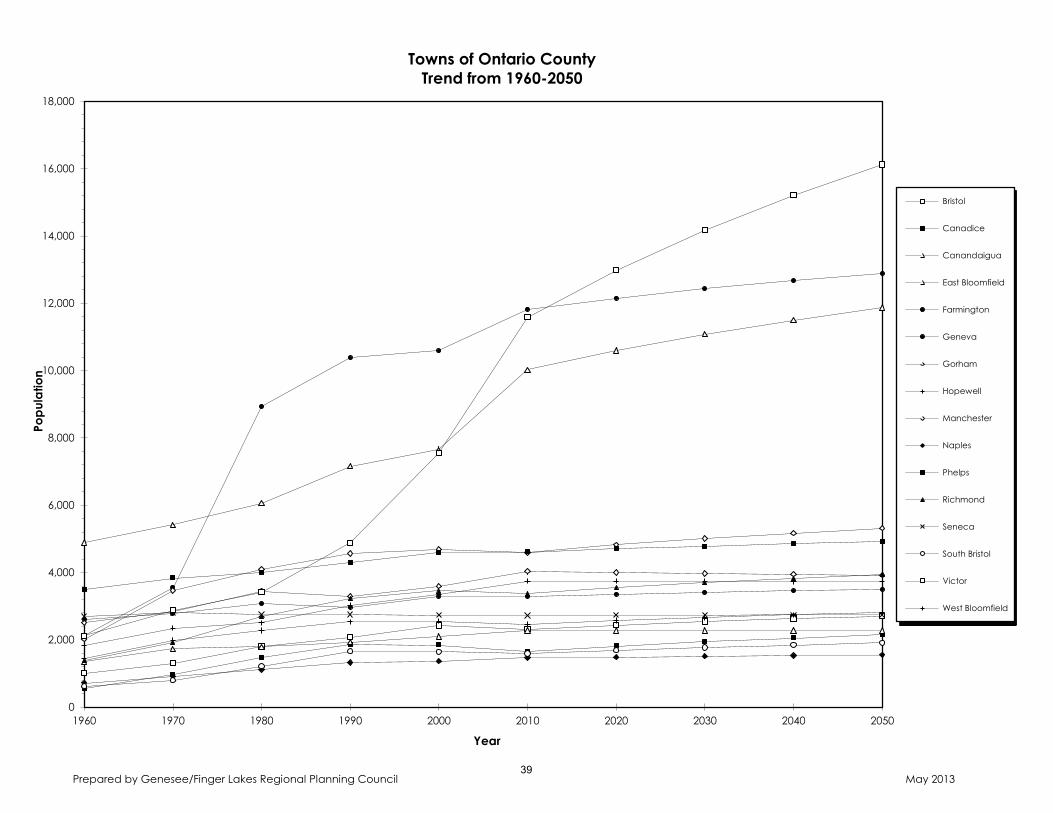
Prepared by Genesee/Finger Lakes Regional Planning Council May 2013
0
2,000
4,000
6,000
8,000
10,000
12,000
14,000
16,000
18,000
1960 1970 1980 1990 2000 2010 2020 2030 2040 2050
Popu
latio
n
Year
Towns of Ontario County Trend from 1960-2050
Bristol
Canadice
Canandaigua
East Bloomfield
Farmington
Geneva
Gorham
Hopewell
Manchester
Naples
Phelps
Richmond
Seneca
South Bristol
Victor
West Bloomfield
39
IX. Orleans County Trends Having been one of the Region’s fastest growing counties in the past, Orleans County is projected to continue to grow at high percentage rate. With an increase of 3,420 population through 2050, the average decennial rate of increase is projected to be 8.0%. Unlike the past, when the increase was credited to the county’s correctional facilities, the future growth rate appears to be based on the rise of seasonal houses being converted into year-round homes and the proximity to Monroe County. The Towns of Kendall, Murray and Clarendon all border Monroe County. Water lines along Route 531 appear to be promoting additional development in the eastern part of the county.
41
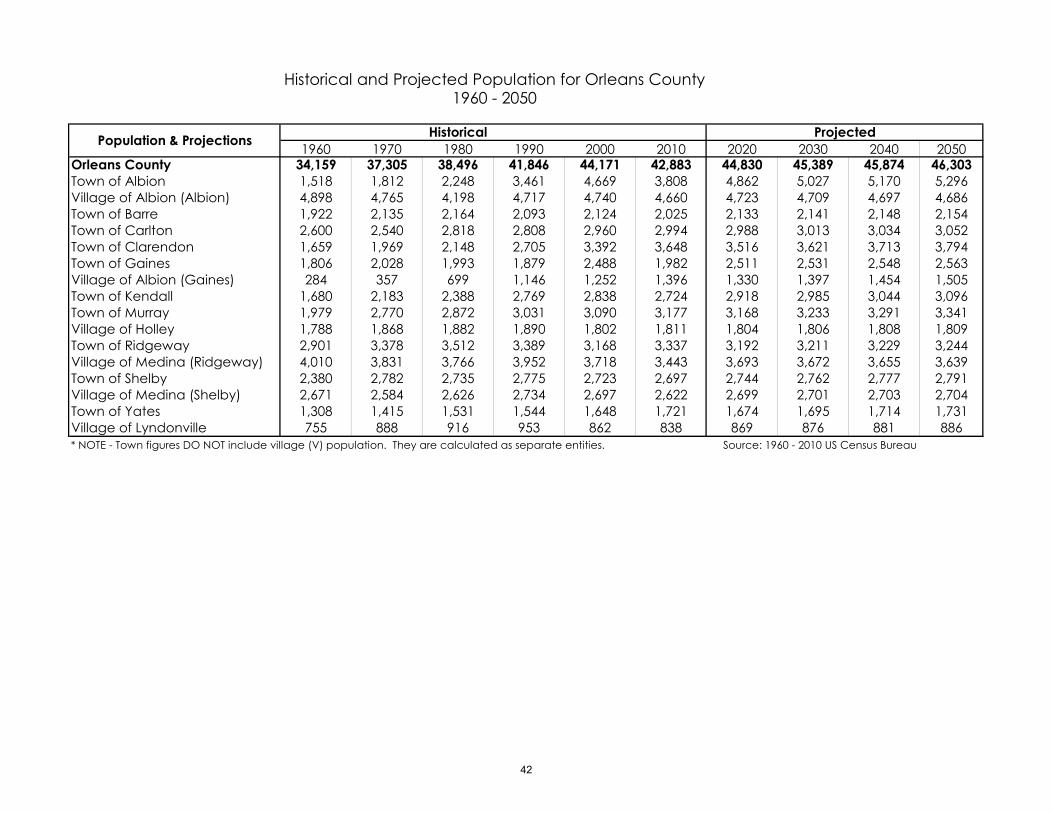
1960 1970 1980 1990 2000 2010 2020 2030 2040 2050Orleans County 34,159 37,305 38,496 41,846 44,171 42,883 44,830 45,389 45,874 46,303Town of Albion 1,518 1,812 2,248 3,461 4,669 3,808 4,862 5,027 5,170 5,296Village of Albion (Albion) 4,898 4,765 4,198 4,717 4,740 4,660 4,723 4,709 4,697 4,686Town of Barre 1,922 2,135 2,164 2,093 2,124 2,025 2,133 2,141 2,148 2,154Town of Carlton 2,600 2,540 2,818 2,808 2,960 2,994 2,988 3,013 3,034 3,052Town of Clarendon 1,659 1,969 2,148 2,705 3,392 3,648 3,516 3,621 3,713 3,794Town of Gaines 1,806 2,028 1,993 1,879 2,488 1,982 2,511 2,531 2,548 2,563Village of Albion (Gaines) 284 357 699 1,146 1,252 1,396 1,330 1,397 1,454 1,505Town of Kendall 1,680 2,183 2,388 2,769 2,838 2,724 2,918 2,985 3,044 3,096Town of Murray 1,979 2,770 2,872 3,031 3,090 3,177 3,168 3,233 3,291 3,341Village of Holley 1,788 1,868 1,882 1,890 1,802 1,811 1,804 1,806 1,808 1,809Town of Ridgeway 2,901 3,378 3,512 3,389 3,168 3,337 3,192 3,211 3,229 3,244Village of Medina (Ridgeway) 4,010 3,831 3,766 3,952 3,718 3,443 3,693 3,672 3,655 3,639Town of Shelby 2,380 2,782 2,735 2,775 2,723 2,697 2,744 2,762 2,777 2,791Village of Medina (Shelby) 2,671 2,584 2,626 2,734 2,697 2,622 2,699 2,701 2,703 2,704Town of Yates 1,308 1,415 1,531 1,544 1,648 1,721 1,674 1,695 1,714 1,731Village of Lyndonville 755 888 916 953 862 838 869 876 881 886* NOTE - Town figures DO NOT include village (V) population. They are calculated as separate entities. Source: 1960 - 2010 US Census Bureau
Historical and Projected Population for Orleans County1960 - 2050
Population & Projections Historical Projected
42
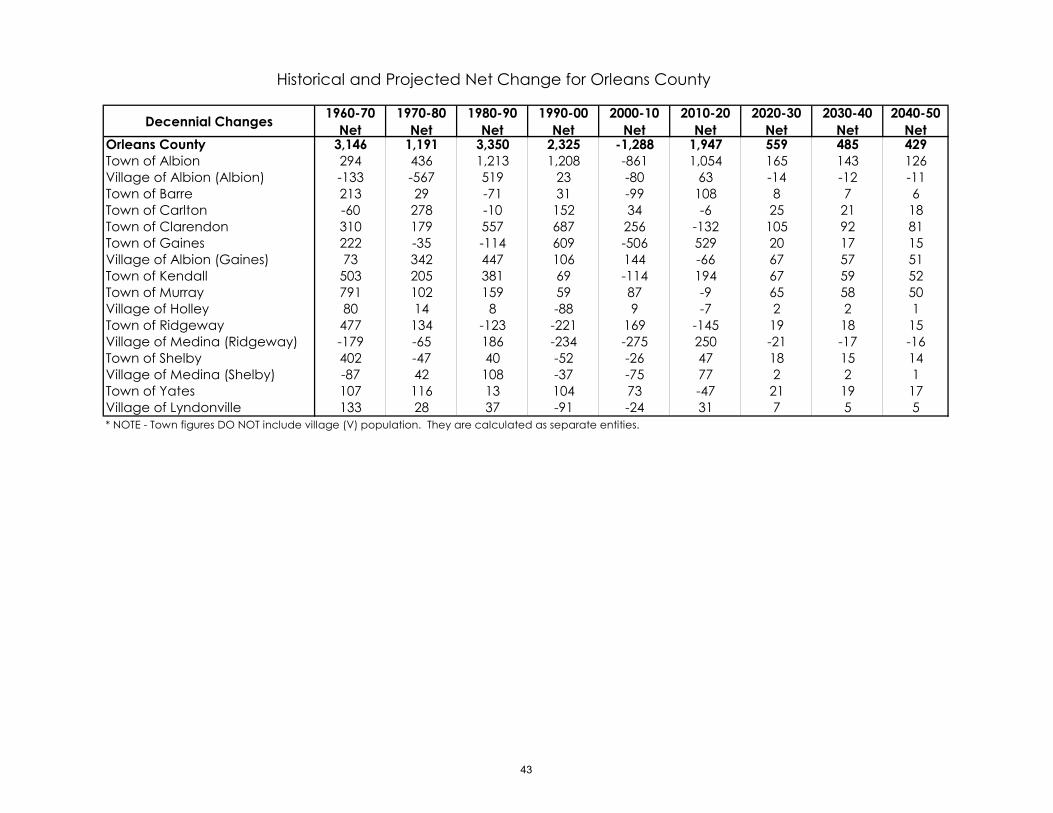
Decennial Changes 1960-70 Net
1970-80 Net
1980-90 Net
1990-00 Net
2000-10 Net
2010-20 Net
2020-30 Net
2030-40 Net
2040-50 Net
Orleans County 3,146 1,191 3,350 2,325 -1,288 1,947 559 485 429Town of Albion 294 436 1,213 1,208 -861 1,054 165 143 126Village of Albion (Albion) -133 -567 519 23 -80 63 -14 -12 -11Town of Barre 213 29 -71 31 -99 108 8 7 6Town of Carlton -60 278 -10 152 34 -6 25 21 18Town of Clarendon 310 179 557 687 256 -132 105 92 81Town of Gaines 222 -35 -114 609 -506 529 20 17 15Village of Albion (Gaines) 73 342 447 106 144 -66 67 57 51Town of Kendall 503 205 381 69 -114 194 67 59 52Town of Murray 791 102 159 59 87 -9 65 58 50Village of Holley 80 14 8 -88 9 -7 2 2 1Town of Ridgeway 477 134 -123 -221 169 -145 19 18 15Village of Medina (Ridgeway) -179 -65 186 -234 -275 250 -21 -17 -16Town of Shelby 402 -47 40 -52 -26 47 18 15 14Village of Medina (Shelby) -87 42 108 -37 -75 77 2 2 1Town of Yates 107 116 13 104 73 -47 21 19 17Village of Lyndonville 133 28 37 -91 -24 31 7 5 5* NOTE - Town figures DO NOT include village (V) population. They are calculated as separate entities.
Historical and Projected Net Change for Orleans County
43

Decennial Changes 1960-70 Percent
1970-80 Percent
1980-90 Percent
1990-00 Percent
2000-10 Percent
2010-20 Percent
2020-30 Percent
2030-40 Percent
2040-50 Percent
Orleans County 9.2% 3.2% 8.7% 5.6% -2.9% 4.5% 1.2% 1.1% 0.9%Town of Albion 19.4% 24.1% 54.0% 34.9% -18.4% 27.7% 3.4% 2.8% 2.5%Village of Albion (Albion) -2.7% -11.9% 12.4% 0.5% -1.7% 1.4% -0.3% -0.3% -0.2%Town of Barre 11.1% 1.4% -3.3% 1.5% -4.7% 5.3% 0.4% 0.3% 0.3%Town of Carlton -2.3% 10.9% -0.4% 5.4% 1.1% -0.2% 0.8% 0.7% 0.6%Town of Clarendon 18.7% 9.1% 25.9% 25.4% 7.5% -3.6% 3.0% 2.5% 2.2%Town of Gaines 12.3% -1.7% -5.7% 32.4% -20.3% 26.7% 0.8% 0.7% 0.6%Village of Albion (Gaines) 25.7% 95.8% 63.9% 9.2% 11.5% -4.7% 5.0% 4.1% 3.6%Town of Kendall 29.9% 9.4% 16.0% 2.5% -4.0% 7.1% 2.3% 2.0% 1.7%Town of Murray 40.0% 3.7% 5.5% 1.9% 2.8% -0.3% 2.1% 1.8% 1.5%Village of Holley 4.5% 0.7% 0.4% -4.7% 0.5% -0.4% 0.1% 0.1% 0.1%Town of Ridgeway 16.4% 4.0% -3.5% -6.5% 5.3% -4.3% 0.6% 0.6% 0.5%Village of Medina (Ridgeway) -4.5% -1.7% 4.9% -5.9% -7.4% 7.3% -0.6% -0.5% -0.4%Town of Shelby 16.9% -1.7% 1.5% -1.9% -1.0% 1.7% 0.7% 0.5% 0.5%Village of Medina (Shelby) -3.3% 1.6% 4.1% -1.4% -2.8% 2.9% 0.1% 0.1% 0.0%Town of Yates 8.2% 8.2% 0.8% 6.7% 4.4% -2.7% 1.3% 1.1% 1.0%Village of Lyndonville 17.6% 3.2% 4.0% -9.5% -2.8% 3.7% 0.8% 0.6% 0.6%* NOTE - Town figures DO NOT include village (V) population. They are calculated as separate entities.
Historical and Projected Percent Change for Orleans County
44
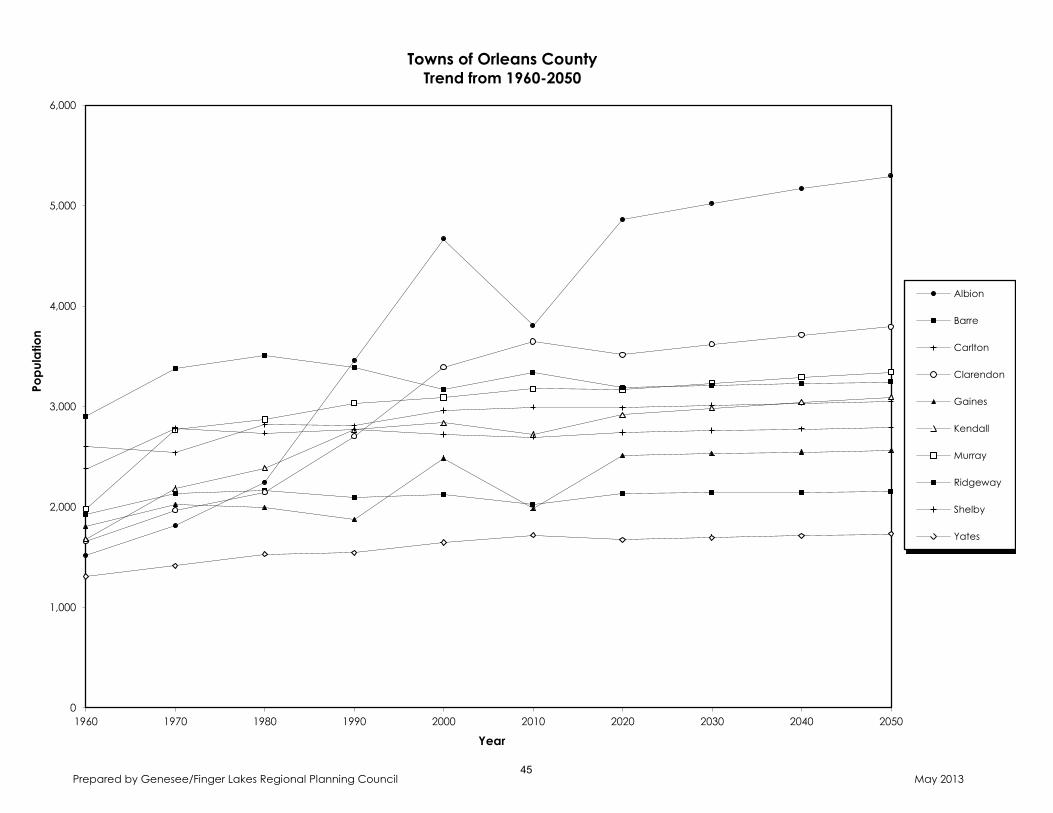
Prepared by Genesee/Finger Lakes Regional Planning Council May 2013
0
1,000
2,000
3,000
4,000
5,000
6,000
1960 1970 1980 1990 2000 2010 2020 2030 2040 2050
Popu
latio
n
Year
Towns of Orleans County Trend from 1960-2050
Albion
Barre
Carlton
Clarendon
Gaines
Kendall
Murray
Ridgeway
Shelby
Yates
45

X. Seneca County Trends
Seneca County is projected to increase at a stable rate (3.4%) through 2050. About 50% of the municipalities in the County are projected to have a steady increase in total population by the year 2050. Although many of the towns and villages are projected to lose population, that begins to taper off starting in the next decade.
47
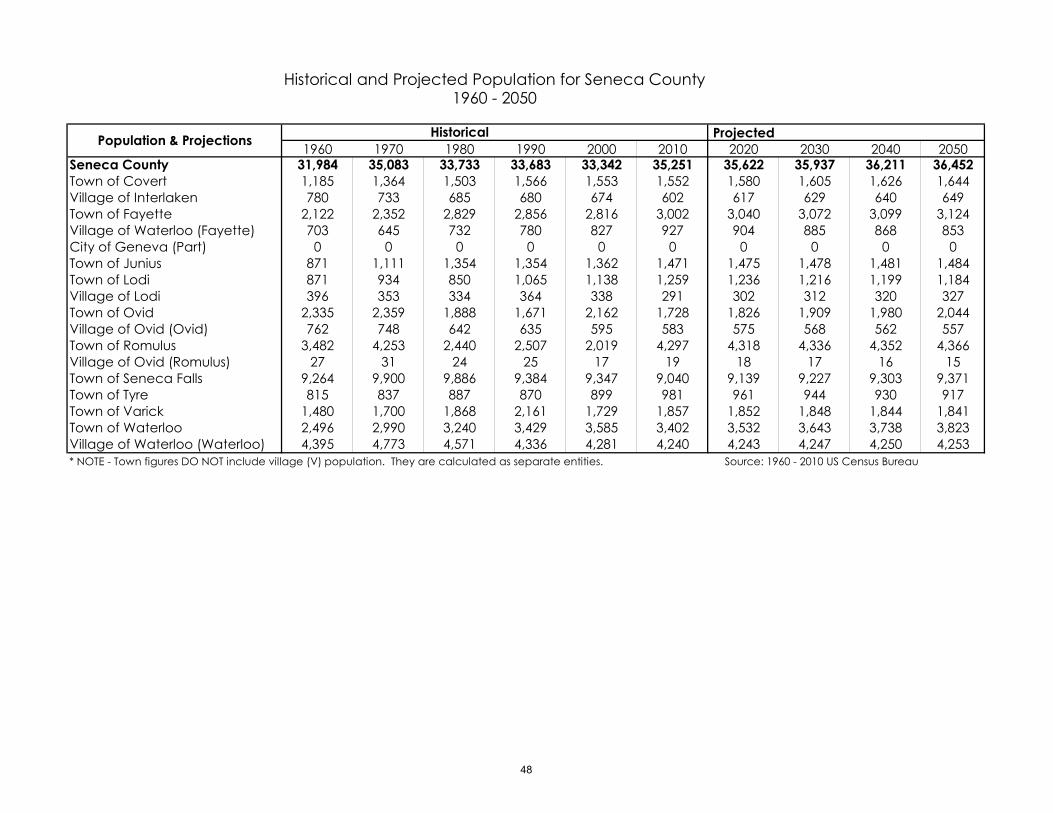
Projected1960 1970 1980 1990 2000 2010 2020 2030 2040 2050
Seneca County 31,984 35,083 33,733 33,683 33,342 35,251 35,622 35,937 36,211 36,452Town of Covert 1,185 1,364 1,503 1,566 1,553 1,552 1,580 1,605 1,626 1,644Village of Interlaken 780 733 685 680 674 602 617 629 640 649Town of Fayette 2,122 2,352 2,829 2,856 2,816 3,002 3,040 3,072 3,099 3,124Village of Waterloo (Fayette) 703 645 732 780 827 927 904 885 868 853City of Geneva (Part) 0 0 0 0 0 0 0 0 0 0Town of Junius 871 1,111 1,354 1,354 1,362 1,471 1,475 1,478 1,481 1,484Town of Lodi 871 934 850 1,065 1,138 1,259 1,236 1,216 1,199 1,184Village of Lodi 396 353 334 364 338 291 302 312 320 327Town of Ovid 2,335 2,359 1,888 1,671 2,162 1,728 1,826 1,909 1,980 2,044Village of Ovid (Ovid) 762 748 642 635 595 583 575 568 562 557Town of Romulus 3,482 4,253 2,440 2,507 2,019 4,297 4,318 4,336 4,352 4,366Village of Ovid (Romulus) 27 31 24 25 17 19 18 17 16 15Town of Seneca Falls 9,264 9,900 9,886 9,384 9,347 9,040 9,139 9,227 9,303 9,371Town of Tyre 815 837 887 870 899 981 961 944 930 917Town of Varick 1,480 1,700 1,868 2,161 1,729 1,857 1,852 1,848 1,844 1,841Town of Waterloo 2,496 2,990 3,240 3,429 3,585 3,402 3,532 3,643 3,738 3,823Village of Waterloo (Waterloo) 4,395 4,773 4,571 4,336 4,281 4,240 4,243 4,247 4,250 4,253* NOTE - Town figures DO NOT include village (V) population. They are calculated as separate entities. Source: 1960 - 2010 US Census Bureau
Historical and Projected Population for Seneca County1960 - 2050
Population & Projections Historical
48

Decennial Changes 1960-70 Net
1970-80 Net
1980-90 Net
1990-00 Net
2000-10 Net
2010-20 Net
2020-30 Net
2030-40 Net
2040-50 Net
Seneca County 3,099 -1,350 -50 -341 1,909 371 315 274 241Town of Covert 179 139 63 -13 -1 28 25 21 18Village of Interlaken -47 -48 -5 -6 -72 15 12 11 9Town of Fayette 230 477 27 -40 186 38 32 27 25Village of Waterloo (Fayette) -58 87 48 47 100 -23 -19 -17 -15City of Geneva (Part) 0 0 0 0 0 0 0 0 0Town of Junius 240 243 0 8 109 4 3 3 3Town of Lodi 63 -84 215 73 121 -23 -20 -17 -15Village of Lodi -43 -19 30 -26 -47 11 10 8 7Town of Ovid 24 -471 -217 491 -434 98 83 71 64Village of Ovid (Ovid) -14 -106 -7 -40 -12 -8 -7 -6 -5Town of Romulus 771 -1,813 67 -488 2,278 21 18 16 14Village of Ovid (Romulus) 4 -7 1 -8 2 -1 -1 -1 -1Town of Seneca Falls 636 -14 -502 -37 -307 99 88 76 68Town of Tyre 22 50 -17 29 82 -20 -17 -14 -13Town of Varick 220 168 293 -432 128 -5 -4 -4 -3Town of Waterloo 494 250 189 156 -183 130 111 95 85Village of Waterloo (Waterloo) 378 -202 -235 -55 -41 3 4 3 3* NOTE - Town figures DO NOT include village (V) population. They are calculated as separate entities.
Historical and Projected Net Change for Seneca County
49

Decennial Changes 1960-70 Percent
1970-80 Percent
1980-90 Percent
1990-00 Percent
2000-10 Percent
2010-20 Percent
2020-30 Percent
2030-40 Percent
2040-50 Percent
Seneca County 9.7% -3.8% -0.1% -1.0% 5.7% 1.1% 0.9% 0.8% 0.7%Town of Covert 15.1% 10.2% 4.2% -0.8% -0.1% 1.8% 1.6% 1.3% 1.1%Village of Interlaken -6.0% -6.5% -0.7% -0.9% -10.7% 2.5% 1.9% 1.7% 1.4%Town of Fayette 10.8% 20.3% 1.0% -1.4% 6.6% 1.3% 1.1% 0.9% 0.8%Village of Waterloo (Fayette) -8.3% 13.5% 6.6% 6.0% 12.1% -2.5% -2.1% -1.9% -1.7%City of Geneva (Part) 0.0% 0.0% 0.0% 0.0% 0.0% 0.0% 0.0% 0.0% 0.0%Town of Junius 27.6% 21.9% 0.0% 0.6% 8.0% 0.3% 0.2% 0.2% 0.2%Town of Lodi 7.2% -9.0% 25.3% 6.9% 10.6% -1.8% -1.6% -1.4% -1.3%Village of Lodi -10.9% -5.4% 9.0% -7.1% -13.9% 3.8% 3.3% 2.6% 2.2%Town of Ovid 1.0% -20.0% -11.5% 29.4% -20.1% 5.7% 4.5% 3.7% 3.2%Village of Ovid (Ovid) -1.8% -14.2% -1.1% -6.3% -2.0% -1.4% -1.2% -1.1% -0.9%Town of Romulus 22.1% -42.6% 2.7% -19.5% 112.8% 0.5% 0.4% 0.4% 0.3%Village of Ovid (Romulus) 14.8% -22.6% 4.2% -32.0% 11.8% -5.3% -5.6% -5.9% -6.3%Town of Seneca Falls 6.9% -0.1% -5.1% -0.4% -3.3% 1.1% 1.0% 0.8% 0.7%Town of Tyre 2.7% 6.0% -1.9% 3.3% 9.1% -2.0% -1.8% -1.5% -1.4%Town of Varick 14.9% 9.9% 15.7% -20.0% 7.4% -0.3% -0.2% -0.2% -0.2%Town of Waterloo 19.8% 8.4% 5.8% 4.5% -5.1% 3.8% 3.1% 2.6% 2.3%Village of Waterloo (Waterloo) 8.6% -4.2% -5.1% -1.3% -1.0% 0.1% 0.1% 0.1% 0.1%* NOTE - Town figures DO NOT include village (V) population. They are calculated as separate entities.
Historical and Projected Percent Change for Seneca County
50

Prepared by Genesee/Finger Lakes Regional Planning Council May 2013
0
1,000
2,000
3,000
4,000
1960 1970 1980 1990 2000 2010 2020 2030 2040 2050
Popu
latio
n
Year
Towns of Seneca County Trend from 1960-2050
Covert
Fayette
Junius
Lodi
Ovid
Romulus
Seneca Falls
Tyre
Varick
Waterloo
51

XI. Wayne County Trends Wayne County is projected to experience an increase in population of 5.9% through 2050. Since a large increase in population between 1960 and 1970 of 16.8%, Wayne County’s population has been increasing at a steady pace. The projected population follows this pattern but at a much lower, declining rate. The western most towns of Wayne County have historically been the most populated. The Town of Ontario has an average projected decennial rate of about 2.0% through 2050. The Town of Walworth has an average projected decennial rate of 3.5% through 2050. The Town of Macedon has an average projected decennial rate of about 2.5%. These three towns combined are projected to make up about 30% of the total population for Wayne County by 2050.
53

Projected1960 1970 1980 1990 2000 2010 2020 2030 2040 2050
Wayne County 67,989 79,404 84,581 89,123 93,765 93,772 95,471 96,912 98,163 99,268Town of Arcadia 1,968 3,601 4,680 5,006 5,207 5,099 5,359 5,579 5,770 5,938Village of Newark 13,868 11,644 10,017 9,849 9,682 9,145 8,979 8,841 8,720 8,615Town of Butler 1,168 1,279 1,474 1,914 1,968 1,752 1,789 1,820 1,847 1,872Village of Wolcott (Butler) 273 314 246 238 309 312 313 314 314 315Town of Galen 1,726 1,791 1,989 2,004 2,170 2,197 2,216 2,233 2,247 2,259Village of Clyde 2,693 2,828 2,491 2,409 2,269 2,093 2,115 2,133 2,149 2,163Town of Huron 1,356 1,739 1,820 2,025 2,117 2,118 2,167 2,209 2,244 2,276Town of Lyons 1,474 1,519 1,913 2,035 2,136 2,063 2,127 2,181 2,228 2,269Village of Lyons 4,673 4,496 4,160 4,280 3,695 3,619 3,582 3,551 3,524 3,500Town of Macedon 2,972 4,320 5,108 5,975 7,192 7,625 7,736 7,830 7,913 7,985Village of Macedon 645 1,168 1,400 1,400 1,496 1,523 1,572 1,613 1,648 1,680Town of Marion 2,785 3,784 4,456 4,901 4,974 4,746 4,966 5,151 5,312 5,455Town of Ontario 4,259 6,014 7,480 8,560 9,778 10,136 10,386 10,599 10,784 10,946Town of Palmyra 2,703 3,641 3,923 4,124 4,182 4,439 4,456 4,469 4,482 4,493Village of Palmyra 3,476 3,776 3,729 3,566 3,490 3,536 3,518 3,502 3,489 3,477Town of Rose 2,122 2,356 2,684 2,424 2,442 2,369 2,413 2,451 2,483 2,512Town of Savannah 1,667 1,676 1,905 1,768 1,838 1,730 1,740 1,749 1,757 1,764Town of Sodus 4,074 5,769 6,361 5,783 6,054 5,665 5,718 5,763 5,803 5,837Village of Sodus 1,645 1,813 1,790 1,904 1,735 1,819 1,801 1,786 1,773 1,762Village of Sodus Point 868 1,172 1,334 1,190 1,160 900 932 959 983 1,004Town of Walworth 2,782 4,584 5,281 6,945 8,402 9,449 9,833 10,158 10,440 10,688Town of Williamson 5,294 6,356 6,319 6,540 6,777 6,984 7,165 7,318 7,451 7,568Town of Wolcott 1,441 1,835 2,126 2,411 2,768 2,532 2,682 2,810 2,920 3,017Village of Red Creek 689 626 645 566 521 532 518 506 495 487Village of Wolcott (Red Creek) 1,368 1,303 1,250 1,306 1,403 1,389 1,388 1,387 1,387 1,386* NOTE - Town figures DO NOT include village (V) population. They are calculated as separate entities. Source: 1960 - 2010 US Census Bureau
Historical and Projected Population for Wayne County1960 - 2050
Population & Projections Historical
54
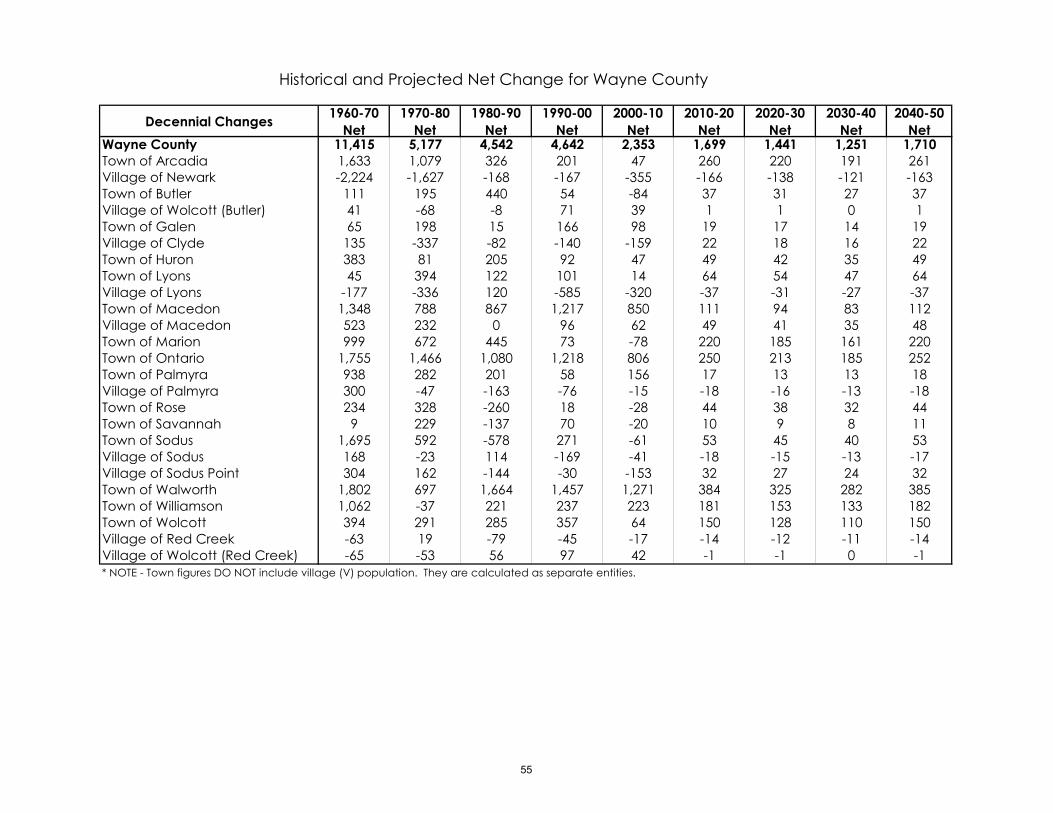
Decennial Changes 1960-70 Net
1970-80 Net
1980-90 Net
1990-00 Net
2000-10 Net
2010-20 Net
2020-30 Net
2030-40 Net
2040-50 Net
Wayne County 11,415 5,177 4,542 4,642 2,353 1,699 1,441 1,251 1,710Town of Arcadia 1,633 1,079 326 201 47 260 220 191 261Village of Newark -2,224 -1,627 -168 -167 -355 -166 -138 -121 -163Town of Butler 111 195 440 54 -84 37 31 27 37Village of Wolcott (Butler) 41 -68 -8 71 39 1 1 0 1Town of Galen 65 198 15 166 98 19 17 14 19Village of Clyde 135 -337 -82 -140 -159 22 18 16 22Town of Huron 383 81 205 92 47 49 42 35 49Town of Lyons 45 394 122 101 14 64 54 47 64Village of Lyons -177 -336 120 -585 -320 -37 -31 -27 -37Town of Macedon 1,348 788 867 1,217 850 111 94 83 112Village of Macedon 523 232 0 96 62 49 41 35 48Town of Marion 999 672 445 73 -78 220 185 161 220Town of Ontario 1,755 1,466 1,080 1,218 806 250 213 185 252Town of Palmyra 938 282 201 58 156 17 13 13 18Village of Palmyra 300 -47 -163 -76 -15 -18 -16 -13 -18Town of Rose 234 328 -260 18 -28 44 38 32 44Town of Savannah 9 229 -137 70 -20 10 9 8 11Town of Sodus 1,695 592 -578 271 -61 53 45 40 53Village of Sodus 168 -23 114 -169 -41 -18 -15 -13 -17Village of Sodus Point 304 162 -144 -30 -153 32 27 24 32Town of Walworth 1,802 697 1,664 1,457 1,271 384 325 282 385Town of Williamson 1,062 -37 221 237 223 181 153 133 182Town of Wolcott 394 291 285 357 64 150 128 110 150Village of Red Creek -63 19 -79 -45 -17 -14 -12 -11 -14Village of Wolcott (Red Creek) -65 -53 56 97 42 -1 -1 0 -1* NOTE - Town figures DO NOT include village (V) population. They are calculated as separate entities.
Historical and Projected Net Change for Wayne County
55

Decennial Changes 1960-70 Percent
1970-80 Percent
1980-90 Percent
1990-00 Percent
2000-10 Percent
2010-20 Percent
2020-30 Percent
2030-40 Percent
2040-50 Percent
Wayne County 16.8% 6.5% 5.4% 5.2% 2.5% 1.8% 1.5% 1.3% 1.7%Town of Arcadia 83.0% 30.0% 7.0% 4.0% 0.9% 5.1% 4.1% 3.4% 4.5%Village of Newark -16.0% -14.0% -1.7% -1.7% -3.7% -1.8% -1.5% -1.4% -1.9%Town of Butler 9.5% 15.2% 29.9% 2.8% -4.3% 2.1% 1.7% 1.5% 2.0%Village of Wolcott (Butler) 15.0% -21.7% -3.3% 29.8% 12.6% 0.3% 0.3% 0.0% 0.3%Town of Galen 3.8% 11.1% 0.8% 8.3% 4.5% 0.9% 0.8% 0.6% 0.8%Village of Clyde 5.0% -11.9% -3.3% -5.8% -7.0% 1.1% 0.9% 0.8% 1.0%Town of Huron 28.2% 4.7% 11.3% 4.5% 2.2% 2.3% 1.9% 1.6% 2.2%Town of Lyons 3.1% 25.9% 6.4% 5.0% 0.7% 3.1% 2.5% 2.2% 2.9%Village of Lyons -3.8% -7.5% 2.9% -13.7% -8.7% -1.0% -0.9% -0.8% -1.0%Town of Macedon 45.4% 18.2% 17.0% 20.4% 11.8% 1.5% 1.2% 1.1% 1.4%Village of Macedon 81.1% 19.9% 0.0% 6.9% 4.1% 3.2% 2.6% 2.2% 2.9%Town of Marion 35.9% 17.8% 10.0% 1.5% -1.6% 4.6% 3.7% 3.1% 4.1%Town of Ontario 41.2% 24.4% 14.4% 14.2% 8.2% 2.5% 2.1% 1.7% 2.3%Town of Palmyra 34.7% 7.7% 5.1% 1.4% 3.7% 0.4% 0.3% 0.3% 0.4%Village of Palmyra 8.6% -1.2% -4.4% -2.1% -0.4% -0.5% -0.5% -0.4% -0.5%Town of Rose 11.0% 13.9% -9.7% 0.7% -1.1% 1.9% 1.6% 1.3% 1.8%Town of Savannah 0.5% 13.7% -7.2% 4.0% -1.1% 0.6% 0.5% 0.5% 0.6%Town of Sodus 41.6% 10.3% -9.1% 4.7% -1.0% 0.9% 0.8% 0.7% 0.9%Village of Sodus 10.2% -1.3% 6.4% -8.9% -2.4% -1.0% -0.8% -0.7% -1.0%Village of Sodus Point 35.0% 13.8% -10.8% -2.5% -13.2% 3.6% 2.9% 2.5% 3.3%Town of Walworth 64.8% 15.2% 31.5% 21.0% 15.1% 4.1% 3.3% 2.8% 3.7%Town of Williamson 20.1% -0.6% 3.5% 3.6% 3.3% 2.6% 2.1% 1.8% 2.4%Town of Wolcott 27.3% 15.9% 13.4% 14.8% 2.3% 5.9% 4.8% 3.9% 5.1%Village of Red Creek -9.1% 3.0% -12.2% -8.0% -3.3% -2.6% -2.3% -2.2% -2.8%Village of Wolcott (Red Creek) -4.8% -4.1% 4.5% 7.4% 3.0% -0.1% -0.1% 0.0% -0.1%* NOTE - Town figures DO NOT include village (V) population. They are calculated as separate entities.
Historical and Projected Percent Change for Wayne County
56

Prepared by Genesee/Finger Lakes Regional Planning Council May 2013
0
1,000
2,000
3,000
4,000
5,000
6,000
7,000
8,000
9,000
10,000
11,000
1960 1970 1980 1990 2000 2010 2020 2030 2040 2050
Popu
latio
n
Year
Towns of Wayne County Trend from 1960-2050
Arcadia
Butler
Galen
Huron
Lyons
Macedon
Marion
Ontario
Palmyra
Rose
Savannah
Sodus
Walworth
Williamson
Wolcott
57
XII. Wyoming County Trends Wyoming County increased in population by nearly 10,000 from 1960 to 2000 but then experienced a decrease of -1,269 between 2000 and 2010. Migration patterns and lower birth rates have affected Wyoming County’s population, causing it have a lower total and rate of population increase The Town of Arcade is likely to continue to experience a population increase because of its inexpensive electric power that has facilitated economic and residential development. The projected total percent increase for the Town of Arcade is an average decennial rate of about 2.9%. The Town of Bennington is likely to experience some population growth as well because of its close proximity to a metropolitan center (City of Buffalo). It is likely that Bennington will have significant new public water in the coming decades and is projected to increase at an average decennial rate of about 2.0% through 2050. The Village of Castile also has inexpensive electric power and is actively pursuing a sewer system in the near future that could make it the most attractive community on the eastern part of Wyoming County.
59
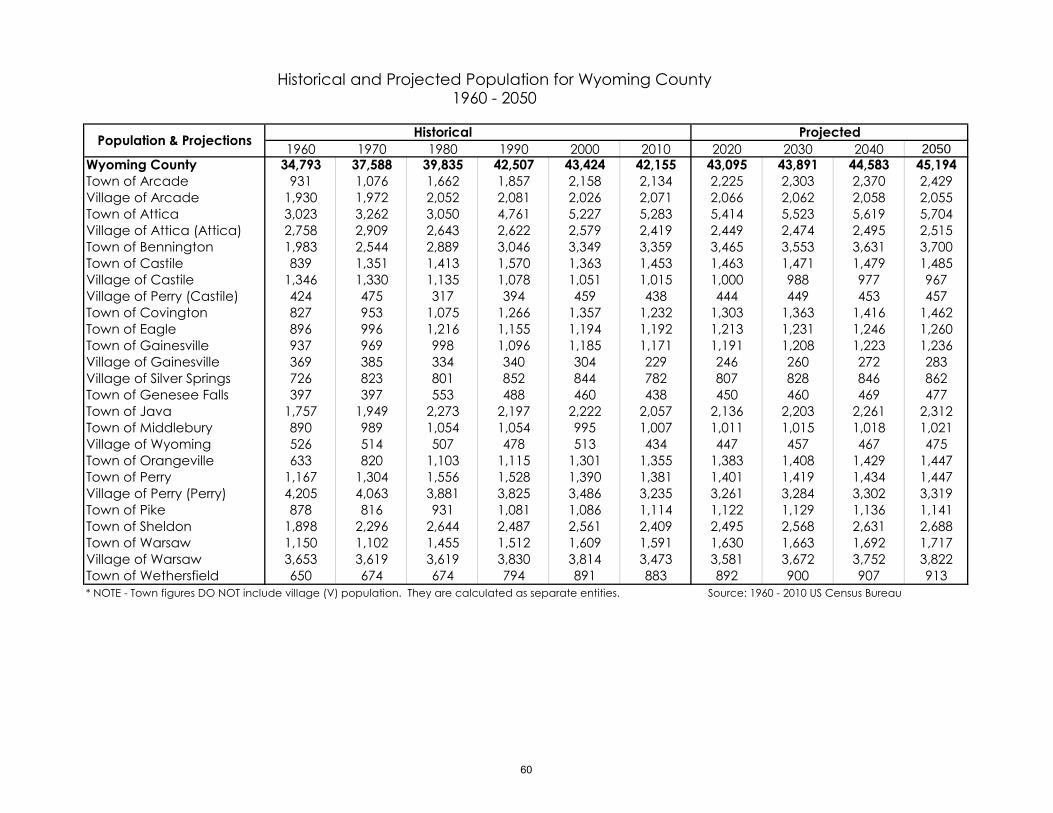
1960 1970 1980 1990 2000 2010 2020 2030 2040 2050Wyoming County 34,793 37,588 39,835 42,507 43,424 42,155 43,095 43,891 44,583 45,194Town of Arcade 931 1,076 1,662 1,857 2,158 2,134 2,225 2,303 2,370 2,429Village of Arcade 1,930 1,972 2,052 2,081 2,026 2,071 2,066 2,062 2,058 2,055Town of Attica 3,023 3,262 3,050 4,761 5,227 5,283 5,414 5,523 5,619 5,704Village of Attica (Attica) 2,758 2,909 2,643 2,622 2,579 2,419 2,449 2,474 2,495 2,515Town of Bennington 1,983 2,544 2,889 3,046 3,349 3,359 3,465 3,553 3,631 3,700Town of Castile 839 1,351 1,413 1,570 1,363 1,453 1,463 1,471 1,479 1,485Village of Castile 1,346 1,330 1,135 1,078 1,051 1,015 1,000 988 977 967Village of Perry (Castile) 424 475 317 394 459 438 444 449 453 457Town of Covington 827 953 1,075 1,266 1,357 1,232 1,303 1,363 1,416 1,462Town of Eagle 896 996 1,216 1,155 1,194 1,192 1,213 1,231 1,246 1,260Town of Gainesville 937 969 998 1,096 1,185 1,171 1,191 1,208 1,223 1,236Village of Gainesville 369 385 334 340 304 229 246 260 272 283Village of Silver Springs 726 823 801 852 844 782 807 828 846 862Town of Genesee Falls 397 397 553 488 460 438 450 460 469 477Town of Java 1,757 1,949 2,273 2,197 2,222 2,057 2,136 2,203 2,261 2,312Town of Middlebury 890 989 1,054 1,054 995 1,007 1,011 1,015 1,018 1,021Village of Wyoming 526 514 507 478 513 434 447 457 467 475Town of Orangeville 633 820 1,103 1,115 1,301 1,355 1,383 1,408 1,429 1,447Town of Perry 1,167 1,304 1,556 1,528 1,390 1,381 1,401 1,419 1,434 1,447Village of Perry (Perry) 4,205 4,063 3,881 3,825 3,486 3,235 3,261 3,284 3,302 3,319Town of Pike 878 816 931 1,081 1,086 1,114 1,122 1,129 1,136 1,141Town of Sheldon 1,898 2,296 2,644 2,487 2,561 2,409 2,495 2,568 2,631 2,688Town of Warsaw 1,150 1,102 1,455 1,512 1,609 1,591 1,630 1,663 1,692 1,717Village of Warsaw 3,653 3,619 3,619 3,830 3,814 3,473 3,581 3,672 3,752 3,822Town of Wethersfield 650 674 674 794 891 883 892 900 907 913* NOTE - Town figures DO NOT include village (V) population. They are calculated as separate entities. Source: 1960 - 2010 US Census Bureau
Historical and Projected Population for Wyoming County1960 - 2050
Population & Projections Historical Projected
60

Decennial Changes 1960-70 Net
1970-80 Net
1980-90 Net
1990-00 Net
2000-10 Net
2010-20 Net
2020-30 Net
2030-40 Net
2040-50 Net
Wyoming County 2,795 2,247 2,672 917 -1,269 940 796 692 611Town of Arcade 145 586 195 301 -24 91 78 67 59Village of Arcade 42 80 29 -55 45 -5 -4 -4 -3Town of Attica 239 -212 1,711 466 56 131 109 96 85Village of Attica (Attica) 151 -266 -21 -43 -160 30 25 21 20Town of Bennington 561 345 157 303 10 106 88 78 69Town of Castile 512 62 157 -207 90 10 8 8 6Village of Castile -16 -195 -57 -27 -36 -15 -12 -11 -10Village of Perry (Castile) 51 -158 77 65 -21 6 5 4 4Town of Covington 126 122 191 91 -125 71 60 53 46Town of Eagle 100 220 -61 39 -2 21 18 15 14Town of Gainesville 32 29 98 89 -14 20 17 15 13Village of Gainesville 16 -51 6 -36 -75 17 14 12 11Village of Silver Springs 97 -22 51 -8 -62 25 21 18 16Town of Genesee Falls 0 156 -65 -28 -22 12 10 9 8Town of Java 192 324 -76 25 -165 79 67 58 51Town of Middlebury 99 65 0 -59 12 4 4 3 3Village of Wyoming -12 -7 -29 35 -79 13 10 10 8Town of Orangeville 187 283 12 186 54 28 25 21 18Town of Perry 137 252 -28 -138 -9 20 18 15 13Village of Perry (Perry) -142 -182 -56 -339 -251 26 23 18 17Town of Pike -62 115 150 5 28 8 7 7 5Town of Sheldon 398 348 -157 74 -152 86 73 63 57Town of Warsaw -48 353 57 97 -18 39 33 29 25Village of Warsaw -34 0 211 -16 -341 108 91 80 70Town of Wethersfield 24 0 120 97 -8 9 8 7 6* NOTE - Town figures DO NOT include village (V) population. They are calculated as separate entities.
Historical and Projected Net Change for Wyoming County
61

Decennial Changes 1960-70 Percent
1970-80 Percent
1980-90 Percent
1990-00 Percent
2000-10 Percent
2010-20 Percent
2020-30 Percent
2030-40 Percent
2040-50 Percent
Wyoming County 8.0% 6.0% 6.7% 2.2% -2.9% 2.2% 1.8% 1.6% 1.4%Town of Arcade 15.6% 54.5% 11.7% 16.2% -1.1% 4.3% 3.5% 2.9% 2.5%Village of Arcade 2.2% 4.1% 1.4% -2.6% 2.2% -0.2% -0.2% -0.2% -0.1%Town of Attica 7.9% -6.5% 56.1% 9.8% 1.1% 2.5% 2.0% 1.7% 1.5%Village of Attica (Attica) 5.5% -9.1% -0.8% -1.6% -6.2% 1.2% 1.0% 0.8% 0.8%Town of Bennington 28.3% 13.6% 5.4% 9.9% 0.3% 3.2% 2.5% 2.2% 1.9%Town of Castile 61.0% 4.6% 11.1% -13.2% 6.6% 0.7% 0.5% 0.5% 0.4%Village of Castile -1.2% -14.7% -5.0% -2.5% -3.4% -1.5% -1.2% -1.1% -1.0%Village of Perry (Castile) 12.0% -33.3% 24.3% 16.5% -4.6% 1.4% 1.1% 0.9% 0.9%Town of Covington 15.2% 12.8% 17.8% 7.2% -9.2% 5.8% 4.6% 3.9% 3.2%Town of Eagle 11.2% 22.1% -5.0% 3.4% -0.2% 1.8% 1.5% 1.2% 1.1%Town of Gainesville 3.4% 3.0% 9.8% 8.1% -1.2% 1.7% 1.4% 1.2% 1.1%Village of Gainesville 4.3% -13.2% 1.8% -10.6% -24.7% 7.4% 5.7% 4.6% 4.0%Village of Silver Springs 13.4% -2.7% 6.4% -0.9% -7.3% 3.2% 2.6% 2.2% 1.9%Town of Genesee Falls 0.0% 39.3% -11.8% -5.7% -4.8% 2.7% 2.2% 2.0% 1.7%Town of Java 10.9% 16.6% -3.3% 1.1% -7.4% 3.8% 3.1% 2.6% 2.3%Town of Middlebury 11.1% 6.6% 0.0% -5.6% 1.2% 0.4% 0.4% 0.3% 0.3%Village of Wyoming -2.3% -1.4% -5.7% 7.3% -15.4% 3.0% 2.2% 2.2% 1.7%Town of Orangeville 29.5% 34.5% 1.1% 16.7% 4.2% 2.1% 1.8% 1.5% 1.3%Town of Perry 11.7% 19.3% -1.8% -9.0% -0.6% 1.4% 1.3% 1.1% 0.9%Village of Perry (Perry) -3.4% -4.5% -1.4% -8.9% -7.2% 0.8% 0.7% 0.5% 0.5%Town of Pike -7.1% 14.1% 16.1% 0.5% 2.6% 0.7% 0.6% 0.6% 0.4%Town of Sheldon 21.0% 15.2% -5.9% 3.0% -5.9% 3.6% 2.9% 2.5% 2.2%Town of Warsaw -4.2% 32.0% 3.9% 6.4% -1.1% 2.5% 2.0% 1.7% 1.5%Village of Warsaw -0.9% 0.0% 5.8% -0.4% -8.9% 3.1% 2.5% 2.2% 1.9%Town of Wethersfield 3.7% 0.0% 17.8% 12.2% -0.9% 1.0% 0.9% 0.8% 0.7%* NOTE - Town figures DO NOT include village (V) population. They are calculated as separate entities.
Historical and Projected Percent Change for Wyoming County
62
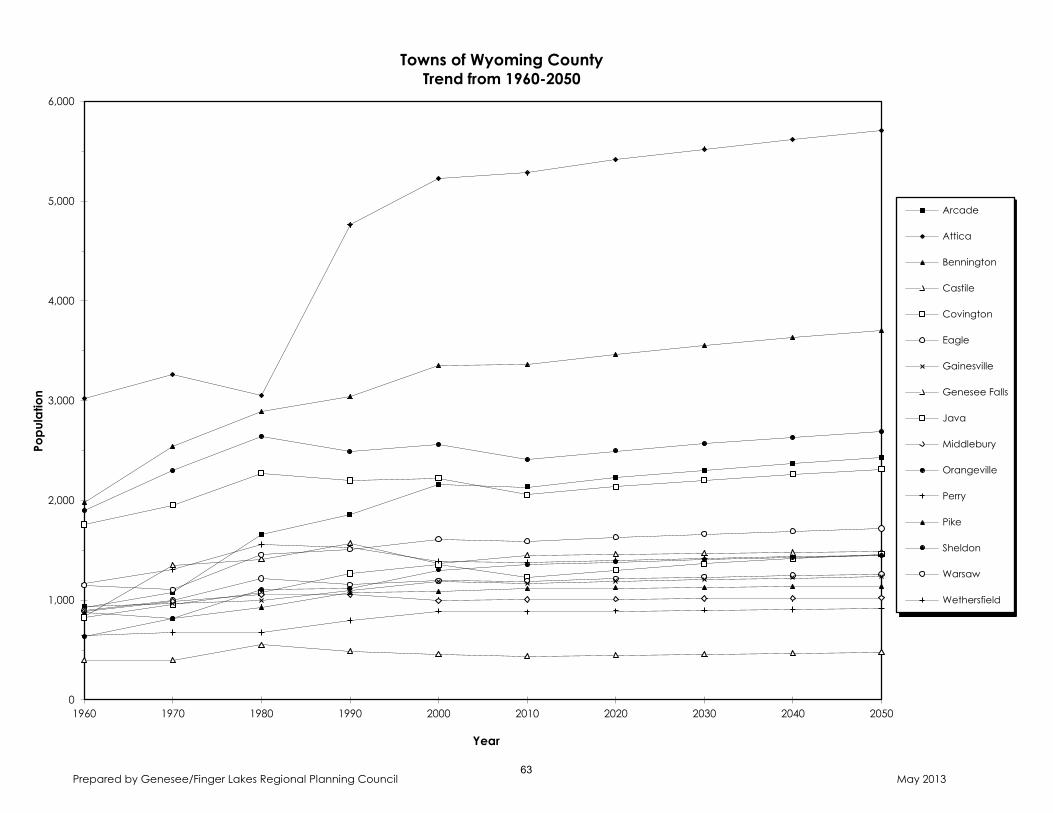
Prepared by Genesee/Finger Lakes Regional Planning Council May 2013
0
1,000
2,000
3,000
4,000
5,000
6,000
1960 1970 1980 1990 2000 2010 2020 2030 2040 2050
Popu
latio
n
Year
Towns of Wyoming County Trend from 1960-2050
Arcade
Attica
Bennington
Castile
Covington
Eagle
Gainesville
Genesee Falls
Java
Middlebury
Orangeville
Perry
Pike
Sheldon
Warsaw
Wethersfield
63

XIII. Yates County Trends Yates County is considered rural with the Village of Penn Yan being its most populated community of approximately 5,100 residents in 2010. The projected trend is that the Village will decline in population but only at an average decennial rate of about 0.3% through 2050. After a loss of population in the 1990’s, Penn Yan stabilized by 2010 likely by the efforts in removing brownfields near Keuka Lake and replacing them with single family homes. The largest gain in population is projected to occur in the Town of Jerusalem with an increase of about 350 people at an average decennial rate of about 2.5% by 2050. With its proximity to Keuka Lake, Jerusalem is feeling the growth pressure of the 2000’s when many people started to convert seasonal homes into year round housing. Many retirees are migrating to Yates County as well. The Town of Middlesex has seen over a 50% increase in its population over the past 50 years and will likely continue to increase in the future but not at the same rate. Many people living in Middlesex are located close to Canandaigua Lake and commute to the City of Canandaigua for work. The decennial net increase is projected to be similar to the historical figures but the total percent increase through 2050 is projected to be minimal. The Town of Benton has seen a large increase in population due largely to the increase of the Mennonite population. The last two decades saw an increase of over 20% in total population but is projected to be much lower in the future given the agricultural base in the community.
65
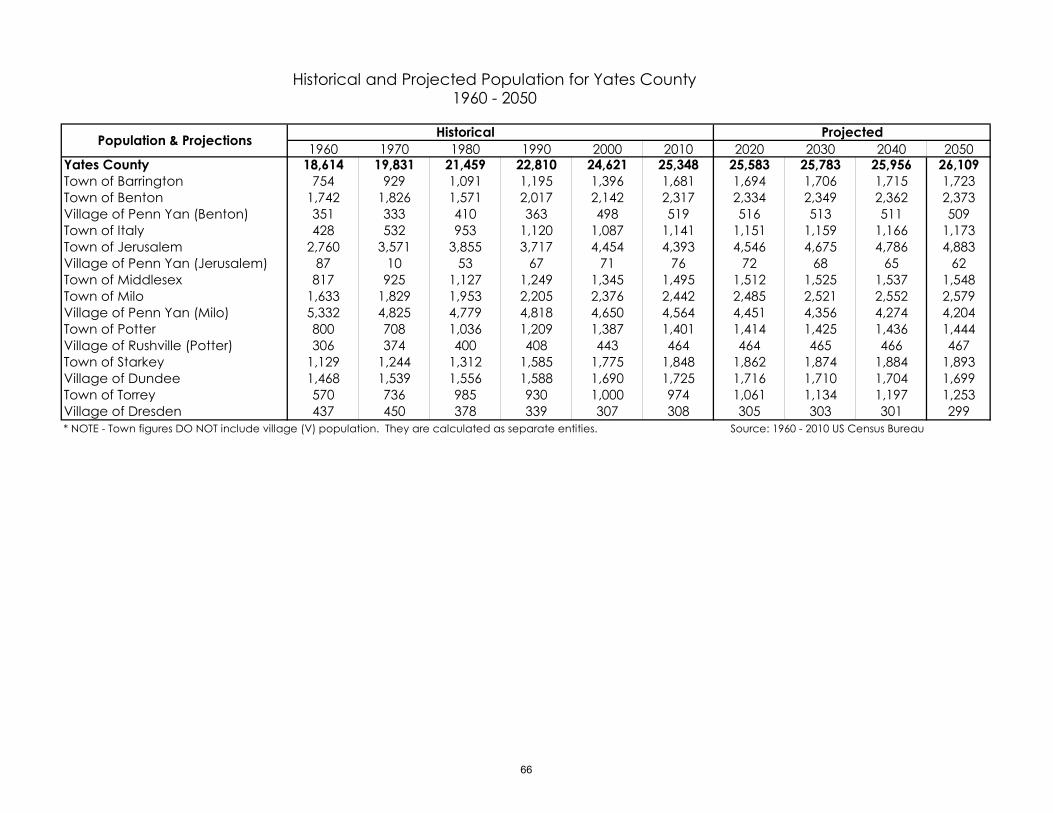
1960 1970 1980 1990 2000 2010 2020 2030 2040 2050Yates County 18,614 19,831 21,459 22,810 24,621 25,348 25,583 25,783 25,956 26,109Town of Barrington 754 929 1,091 1,195 1,396 1,681 1,694 1,706 1,715 1,723Town of Benton 1,742 1,826 1,571 2,017 2,142 2,317 2,334 2,349 2,362 2,373Village of Penn Yan (Benton) 351 333 410 363 498 519 516 513 511 509Town of Italy 428 532 953 1,120 1,087 1,141 1,151 1,159 1,166 1,173Town of Jerusalem 2,760 3,571 3,855 3,717 4,454 4,393 4,546 4,675 4,786 4,883Village of Penn Yan (Jerusalem) 87 10 53 67 71 76 72 68 65 62Town of Middlesex 817 925 1,127 1,249 1,345 1,495 1,512 1,525 1,537 1,548Town of Milo 1,633 1,829 1,953 2,205 2,376 2,442 2,485 2,521 2,552 2,579Village of Penn Yan (Milo) 5,332 4,825 4,779 4,818 4,650 4,564 4,451 4,356 4,274 4,204Town of Potter 800 708 1,036 1,209 1,387 1,401 1,414 1,425 1,436 1,444Village of Rushville (Potter) 306 374 400 408 443 464 464 465 466 467Town of Starkey 1,129 1,244 1,312 1,585 1,775 1,848 1,862 1,874 1,884 1,893Village of Dundee 1,468 1,539 1,556 1,588 1,690 1,725 1,716 1,710 1,704 1,699Town of Torrey 570 736 985 930 1,000 974 1,061 1,134 1,197 1,253Village of Dresden 437 450 378 339 307 308 305 303 301 299* NOTE - Town figures DO NOT include village (V) population. They are calculated as separate entities. Source: 1960 - 2010 US Census Bureau
Historical and Projected Population for Yates County1960 - 2050
Population & Projections Historical Projected
66
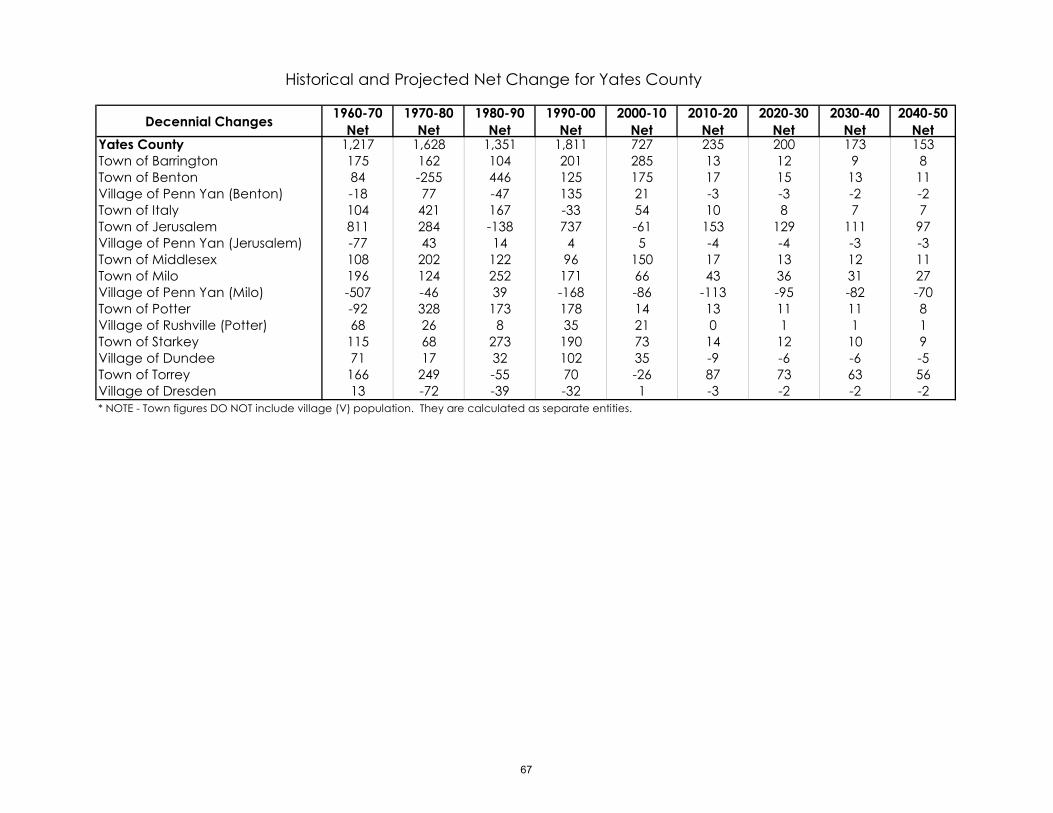
Decennial Changes 1960-70 Net
1970-80 Net
1980-90 Net
1990-00 Net
2000-10 Net
2010-20 Net
2020-30 Net
2030-40 Net
2040-50 Net
Yates County 1,217 1,628 1,351 1,811 727 235 200 173 153Town of Barrington 175 162 104 201 285 13 12 9 8Town of Benton 84 -255 446 125 175 17 15 13 11Village of Penn Yan (Benton) -18 77 -47 135 21 -3 -3 -2 -2Town of Italy 104 421 167 -33 54 10 8 7 7Town of Jerusalem 811 284 -138 737 -61 153 129 111 97Village of Penn Yan (Jerusalem) -77 43 14 4 5 -4 -4 -3 -3Town of Middlesex 108 202 122 96 150 17 13 12 11Town of Milo 196 124 252 171 66 43 36 31 27Village of Penn Yan (Milo) -507 -46 39 -168 -86 -113 -95 -82 -70Town of Potter -92 328 173 178 14 13 11 11 8Village of Rushville (Potter) 68 26 8 35 21 0 1 1 1Town of Starkey 115 68 273 190 73 14 12 10 9Village of Dundee 71 17 32 102 35 -9 -6 -6 -5Town of Torrey 166 249 -55 70 -26 87 73 63 56Village of Dresden 13 -72 -39 -32 1 -3 -2 -2 -2* NOTE - Town figures DO NOT include village (V) population. They are calculated as separate entities.
Historical and Projected Net Change for Yates County
67

Decennial Changes 1960-70 Percent
1970-80 Percent
1980-90 Percent
1990-00 Percent
2000-10 Percent
2010-20 Percent
2020-30 Percent
2030-40 Percent
2040-50 Percent
Yates County 6.5% 8.2% 6.3% 7.9% 3.0% 0.9% 0.8% 0.7% 0.6%Town of Barrington 23.2% 17.4% 9.5% 16.8% 20.4% 0.8% 0.7% 0.5% 0.5%Town of Benton 4.8% -14.0% 28.4% 6.2% 8.2% 0.7% 0.6% 0.6% 0.5%Village of Penn Yan (Benton) -5.1% 23.1% -11.5% 37.2% 4.2% -0.6% -0.6% -0.4% -0.4%Town of Italy 24.3% 79.1% 17.5% -2.9% 5.0% 0.9% 0.7% 0.6% 0.6%Town of Jerusalem 29.4% 8.0% -3.6% 19.8% -1.4% 3.5% 2.8% 2.4% 2.0%Village of Penn Yan (Jerusalem) -88.5% 430.0% 26.4% 6.0% 7.0% -5.3% -5.6% -4.4% -4.6%Town of Middlesex 13.2% 21.8% 10.8% 7.7% 11.2% 1.1% 0.9% 0.8% 0.7%Town of Milo 12.0% 6.8% 12.9% 7.8% 2.8% 1.8% 1.4% 1.2% 1.1%Village of Penn Yan (Milo) -9.5% -1.0% 0.8% -3.5% -1.8% -2.5% -2.1% -1.9% -1.6%Town of Potter -11.5% 46.3% 16.7% 14.7% 1.0% 0.9% 0.8% 0.8% 0.6%Village of Rushville (Potter) 22.2% 7.0% 2.0% 8.6% 4.7% 0.0% 0.2% 0.2% 0.2%Town of Starkey 10.2% 5.5% 20.8% 12.0% 4.1% 0.8% 0.6% 0.5% 0.5%Village of Dundee 4.8% 1.1% 2.1% 6.4% 2.1% -0.5% -0.3% -0.4% -0.3%Town of Torrey 29.1% 33.8% -5.6% 7.5% -2.6% 8.9% 6.9% 5.6% 4.7%Village of Dresden 3.0% -16.0% -10.3% -9.4% 0.3% -1.0% -0.7% -0.7% -0.7%* NOTE - Town figures DO NOT include village (V) population. They are calculated as separate entities.
Historical and Projected Percent Change for Yates County
68

Prepared by Genesee/Finger Lakes Regional Planning Council May 2013
0
500
1,000
1,500
2,000
2,500
3,000
3,500
4,000
4,500
5,000
5,500
1960 1970 1980 1990 2000 2010 2020 2030 2040 2050
Popu
latio
n
Year
Towns of Yates County Trend from 1960-2050
Barrington
Benton
Italy
Jerusalem
Middlesex
Milo
Potter
Starkey
Torrey
69
Preliminary Engineering Report Town of Gorham Water Treatment Plant Improvements September 2021
MRB Group Project No. 0735.21001.000
APPENDIX C
WATER QUALITY
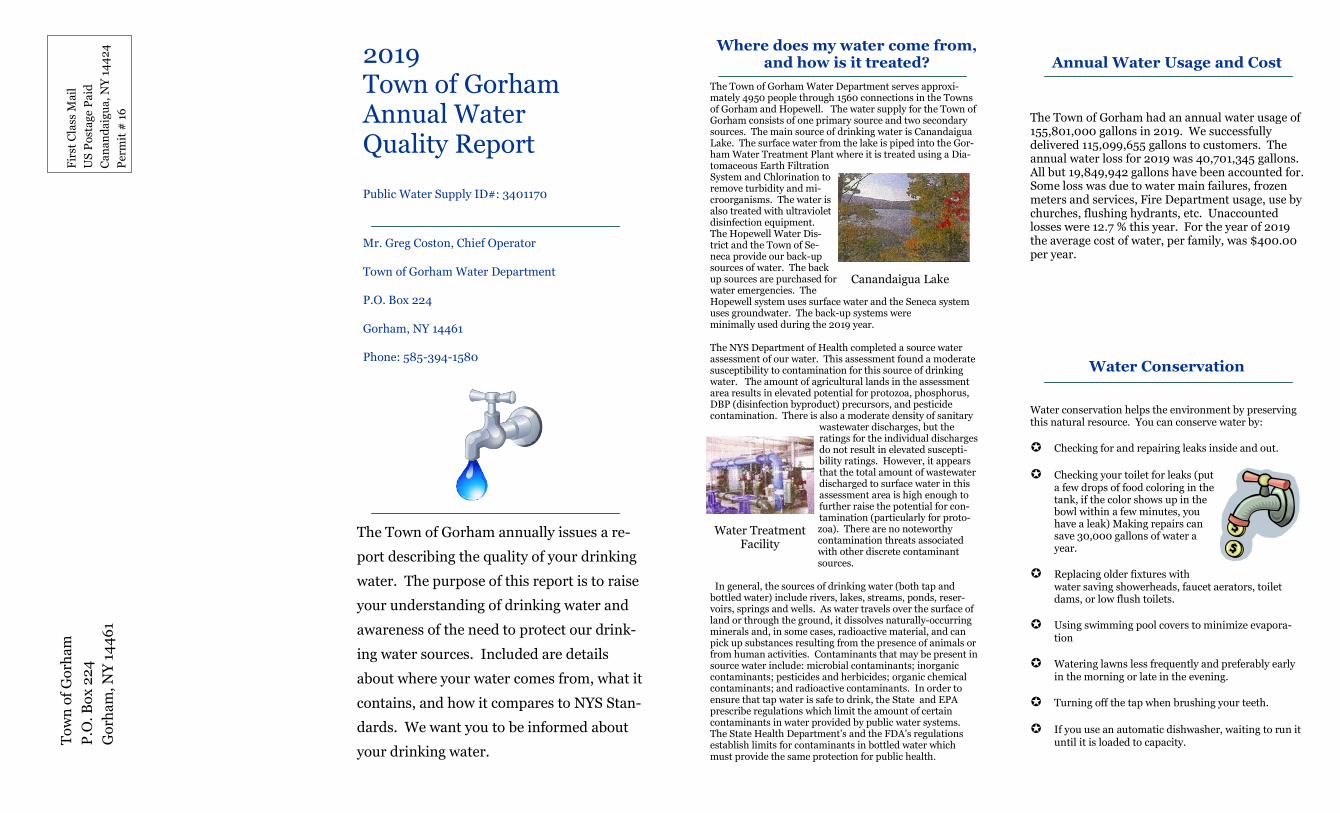
Where does my water come from, and how is it treated?
The Town of Gorham Water Department serves approxi-mately 4950 people through 1560 connections in the Towns of Gorham and Hopewell. The water supply for the Town of Gorham consists of one primary source and two secondary sources. The main source of drinking water is Canandaigua Lake. The surface water from the lake is piped into the Gor-ham Water Treatment Plant where it is treated using a Dia-tomaceous Earth Filtration System and Chlorination to remove turbidity and mi-croorganisms. The water is also treated with ultraviolet disinfection equipment. The Hopewell Water Dis-trict and the Town of Se-neca provide our back-up sources of water. The back up sources are purchased for water emergencies. The Hopewell system uses surface water and the Seneca system uses groundwater. The back-up systems were minimally used during the 2019 year.
The NYS Department of Health completed a source water assessment of our water. This assessment found a moderate susceptibility to contamination for this source of drinking water. The amount of agricultural lands in the assessment area results in elevated potential for protozoa, phosphorus, DBP (disinfection byproduct) precursors, and pesticide contamination. There is also a moderate density of sanitary
wastewater discharges, but the ratings for the individual discharges do not result in elevated suscepti-bility ratings. However, it appears that the total amount of wastewater discharged to surface water in this assessment area is high enough to further raise the potential for con-tamination (particularly for proto-zoa). There are no noteworthy contamination threats associated with other discrete contaminant sources.
In general, the sources of drinking water (both tap and bottled water) include rivers, lakes, streams, ponds, reser-voirs, springs and wells. As water travels over the surface of land or through the ground, it dissolves naturally-occurring minerals and, in some cases, radioactive material, and can pick up substances resulting from the presence of animals or from human activities. Contaminants that may be present in source water include: microbial contaminants; inorganic contaminants; pesticides and herbicides; organic chemical contaminants; and radioactive contaminants. In order to ensure that tap water is safe to drink, the State and EPA prescribe regulations which limit the amount of certain contaminants in water provided by public water systems. The State Health Department’s and the FDA’s regulations establish limits for contaminants in bottled water which must provide the same protection for public health.
Fir
st C
lass
Mai
l
US
Pos
tage
Pai
d
Can
and
aigu
a, N
Y 1
44
24
Per
mit
# 1
6
Tow
n o
f G
orh
am
P.O
. Box
224
G
orh
am, N
Y 1
446
1
2019 Town of Gorham Annual Water Quality Report
Public Water Supply ID#: 3401170
Mr. Greg Coston, Chief Operator
Town of Gorham Water Department
P.O. Box 224
Gorham, NY 14461
Phone: 585-394-1580
The Town of Gorham annually issues a re-
port describing the quality of your drinking
water. The purpose of this report is to raise
your understanding of drinking water and
awareness of the need to protect our drink-
ing water sources. Included are details
about where your water comes from, what it
contains, and how it compares to NYS Stan-
dards. We want you to be informed about
your drinking water.
Annual Water Usage and Cost
The Town of Gorham had an annual water usage of 155,801,000 gallons in 2019. We successfully delivered 115,099,655 gallons to customers. The annual water loss for 2019 was 40,701,345 gallons. All but 19,849,942 gallons have been accounted for. Some loss was due to water main failures, frozen meters and services, Fire Department usage, use by churches, flushing hydrants, etc. Unaccounted losses were 12.7 % this year. For the year of 2019 the average cost of water, per family, was $400.00 per year.
Water Conservation
Water conservation helps the environment by preserving this natural resource. You can conserve water by:
Checking for and repairing leaks inside and out.
Checking your toilet for leaks (put a few drops of food coloring in the tank, if the color shows up in the bowl within a few minutes, you have a leak) Making repairs can save 30,000 gallons of water a year.
Replacing older fixtures with water saving showerheads, faucet aerators, toilet dams, or low flush toilets.
Using swimming pool covers to minimize evapora-tion
Watering lawns less frequently and preferably early in the morning or late in the evening.
Turning off the tap when brushing your teeth.
If you use an automatic dishwasher, waiting to run it until it is loaded to capacity.
Canandaigua Lake
Water Treatment Facility

Contaminant Units MCL MCLG Date Collected Water Result Average/range
Violation? Typical Source of Contamination
Turbidity (Before Treatment)
NTU TT=5.0 N/A September 2019 3.9** NO Soil Runoff.
Turbidity (at filters) NTU TT=95% of samples <1 NTU
N/A 1/2019-12/2019 0.16 (0.12-0.17) 100% <1 NTU
NO Soil Runoff.
Radioactivity
Gross alpha pCi/L 15 0 12/2013 None Detected NO Erosion of natural deposits.
Radium 226 pCi/L 5*** 0 12/2013 None Detected NO Some people who drink water containing Radium 226 in excess of the MCL over many years have an in-creased risk of getting cancer.
Radium 228 pCi/L 5*** 0 12/2013 None Detected NO Some people who drink water containing Radium 228 in excess of the MCL over many years have an in-creased risk of getting cancer.
Inorganic Chemicals
Barium mg/l 2 2 10/2019 0.023 NO Discharge from drilling washes; Discharge from metal refineries; Erosion of natural deposits.
Chromium mg/l 0.1 0.1 10/2019 0.0012 NO Discharge from steel and pulp mills; Erosion of natural deposits.
Nickel mg/l N/A N/A 10/2019 0.00088 NO Corrosion of household plumbing systems; Erosion of natural deposits.
Copper mg/l AL=1.3 1.3 8/2017 *0.99 (0.094-1.1) NO Corrosion of household plumbing systems; Erosion of natural deposits; Leaching from wood preservatives.
Lead ug/l AL=15 0 8/2017 *12 (ND-17) NO Corrosion of household plumbing systems; Erosion of natural deposits.
Disinfection By-products
Total Trihalomethanes Stage 2
ug/l 80 N/A Quarterly 2019 49(20-100)**** NO By-product of drinking water disinfection needed to kill harmful organisms. TTHMs are formed when source water contains large amounts of organic matter.
Haloacetic Acids Stage 2 ug/l 60 N/A Quarterly 2019 36 (23-54)**** NO By-product of drinking water disinfection needed to kill harmful organisms.
Microbiological Contaminants
Total Coliform Bacteria N/A Two positive samples/month
0 Monthly 2019 No positive samples NO Naturally present in the environment.
Discussion of Testing Results
System Upgrades and
GET INVOLVED!
As you can see from the table, we had no viola-tions this year. Some people may be more vul-nerable to disease causing microorganisms or pathogens in drinking water than the general population. Immuno-compromised persons such as persons with cancer undergoing che-motherapy, persons who have undergone organ transplants, people with HIV/AIDS or other immune system disorders, some elderly, and infants can be particularly at risk from infec-tions. These people should seek advice from their health care provider about their drinking water. EPA/CDC guidelines on appropriate means to lessen the risk of infection by crypto-sporidium, giardia, and other microbial patho-gens are available from the Safe Drinking Wa-ter Hotline, 1-800-426-4791.
The Town of Gorham is required to monitor your drinking water for specific contaminants on a regular basis. Results of regular monitor-ing are an indicator of whether or not your drinking water meets health standards.
If you have any questions about this report or your water utility, call Greg Coston at 585-394-1580 or the NYSDOH at 315-789-3030.
In the 2019 year, the Town of Gorham con-ducted maintenance work on equipment throughout the water system. In addition cus-tomer water meters have been upgraded to a remote read system that provides capabilities of detecting water leaks.
In the year 2020, the Town, will be continuing maintenance to the existing equipment and distribution system. The Town is investigating the use of carbon filters to provide additional treatment of Canandaigua Lake water.
If you are interested in opportunities to become more involved with your water supply, the Canandaigua Lake Watershed Commission holds its meetings on the third Tuesday of January, March, June, September, and Decem-ber. For more information contact Jim Abra-ham or Gordy Frieda at the Canandaigua Hur-ley Building, 205 Saltonstall Street, Canandai-gua, NY 14424 or 585-396-5060.
TESTING RESULTS FOR 2019—TABLE OF DETECTED CONTAMINANTS As you review the results, keep in mind that all drinking water, including bottled drinking water, may be reasonably expected to contain at least small amounts of some contaminants. The presence of contaminants does not necessarily indicate that water poses a health risk. More information about contaminants and potential health effects can be obtained by calling the EPA’s Safe Drinking Water Hotline at 1-800-426-4791. As state regulations require, the Town of Gorham routinely monitors your drinking water for various contaminants. These contaminants include total coliform, inorganic compounds, nitrate, volatile organic compounds and synthetic organic compounds. The contaminants detected in your drinking water are included in the following table. The State allows us to monitor for some contaminants less than once per year because the concentrations of these contami-nants do not change frequently. Some of our data, though representative, is more than one year old.
*During 2017 we collected and analyzed 21 samples for lead and copper. The level included in the table represents the 90th percentile of the 21 sites tested. A percentile is a value on a scale of 100 that indicates the percent of a distribution that is equal to or below it. The 90th percentile is equal to or greater than 90% of the lead values detected at our water system. One site exceeded the action level for lead. The action level for copper was not ex-ceeded. **Highest monthly average. ***MLC for combined Radium 226 & 228. A MCL violation occurs when the annual composite of four quarterly samples or the average of the analysis of four quarterly samples exceeds the MCL. ****This level represents the highest locational running annual average calculated from data collected.
MCL - (Maximum Contaminant Level) - The highest level of a contaminant that is allowed in drinking water. AL - (Action Level) - The concentration which, if exceeded, triggers treatment or other requirements which
MCLG - (Maximum Contaminant Level Goal) - The level of a contaminant in drinking water below which there is no known expected risk to health. MCLGs allow for a margin of safety. MCLs are set as close to the MCLG as possible. MRDL - (Maximum Residual Disinfectant Level) - The highest level of a disinfectant allowed in drinking water. There is convincing evidence that addition of a disinfectant is necessary for control of microbial contaminants. MRDLG - (Maximum Residual Disinfectant Level Goal) - The level of a drinking water disinfectant below which there is no known or expected risk to health. MRDLGs do not reflect the benefits of the use of disinfectants to control microbial contamination. Turbidity - A measure of the cloudiness of water. It is a good indicator of the effectiveness of a filtration system.
Definitions TT - (Treatment Technique) - A required process intended to reduce the level of a contaminant in drinking water. pCi/L - (Picocuries per liter) - The measure of radioactivity in water. NTU - (Nephelometric Turbidity Units) - A measure of the clarity of water. Turbidity in excess of 5 NTUs is just noticeable to the average person. mg/l - (Milligrams per liter) - Corresponds to one part of liquid in one million parts of liquid (parts per million - ppm). ug/l - (Micrograms per liter) - Corresponds to one part of liquid in one billion parts of water (parts per billion - ppb). ND - Not Detected. NA - Not Applicable.

Preliminary Engineering Report Town of Gorham Water Treatment Plant Improvements September 2021
MRB Group Project No. 0735.21001.000
APPENDIX D
WATER SYSTEM

=
=
=
TURNER ROAD PUMP STATION
TOWN OF GORHAMWATER TREATMENT PLANT
TANK #1Overflow: 928.0
TANK #2, Overflow: 1,092.35andLAKE-TO-LAKE PUMP STATION
TOWN OF HOPEWELLMETER
TOWN OF HOPEWELLMETER
TOWN OF CANANDAIGUACONNECTION
VILLAGE OF RUSHVILLEWATER TREATMENT PLANT
RUSHVILLE TANKOverflow: 1,075.0
MARCUS WHITMAN TANKOverflow: 1,236.6
MARCUS WHITMAN PUMP STATION
TOWN OF SENECACLOSED VALVE CONNECTION
8 in
10 in
2 in
3 in
4 in
6 in
1.5
in
1 in
16 in
1.25
in
0.75 in
8 in
1.25 in
2 in
1.25
in
1 in
8 in 8
in
8 in
1.25 in
6 in
1.25 in
1 in
8 in
8 in
6 in
8 in
6 in
6 in
3 in1.25 in
3 in
2 in
2 in
2 in
10 in6 in
2 in
8 in
1 in
3 in
3 in
8 in
6 in
2 in
1 in
3 in
3 in
8 in
6 in
8 in2 in
2 in
2 in
1.5 in
6 in
8 in
4 in
3 in
3 in
1 in
2 in
3 in
3 in
3 in
2 in
STATE RT 364
STATE RT 245
YAU
TZY
RD
STAT
E R
T 24
7
LAKE TO LAKE RD
MID
DLE
RD
DEPEW RD
COUN
TY R
OAD
16
ROUTE 5 AND 20
KEARN
EY RD
OLD
MIL
L R
D
COUNTY ROAD 18
FLIN
T R
D
CO
UN
TY RO
AD 1
TOWNLINE RD
GO
OS
E S
T
STAT
E RT
21
ARN
OLD
RD
MID
DLE
CH
ES
HIR
E R
D
COUNTY R
OAD 11
CO
UN
TY R
OA
D 1
7
CLARK RD
KIPP RD
MU
MB
Y R
D
RO
BS
ON
RD
EAST
SW
AMP
RD
WES
T SW
AMP
RD
BAS
SA
GE
RD
CR
OW
E R
D
MOTT RD
GORHAM RD
CO
UN
TY RO
AD 29
CO
UN
TY R
OA
D 2
4
NOTT RD
WALTERS RD
TURNER RD
JONES RD
TWIT
CH
ELL
RD
CRAMER RD
TILEYARD RD
PHEL
PS R
D
WYFFELS RD
BLOD
GETT R
D
GREEN RD
FOSTER RD
HALL RDWELLS CURTICE RD
BUTLER RD
PHILLIPS RD
CHARLTON RD
GILLETTE R
D
HICKOX RD
BALDWIN RD
POWELL RD
DEW
EY A
VE
CONKLIN RD
DEUEL RD
MAIN ST
SOU
TH ST
GORHAM ROAD
JOHNSON RD
FERGUSON CORNERS ROAD
AUSTIN RD
LAURA LN
WEST RIDGE RUN
BARNES RD
RAILROAD AVE
VISTA
DR
ACO
RN
HIL
L D
R
PARK MEADOW LNCH
ATHAM
LN
WICKHAM LN
LINCO
LN HILL RD
RILEYS R
UN
ON
NAL
IND
A D
R
LEH
IGH
ST
EAST RID
GE R
UN
GREEN ST
SILVERNAIL DR
MO
UN
TAIN
AS
H D
R
LAKE
VIEW
LN
DE
POT
RD
WOODSIDE AVE
CONKLIN RD
GREEN RD
COUNTY ROAD 18
GO
OS
E S
T
STATE RT 245
DC
A
1"
= 2
,00
0'
JAN
20
21
5
TOW
N O
F G
OR
HA
M
ON
TAR
IO C
OU
NTY
, NEW
YO
RK
WAT
ER S
YSTE
M S
CH
EMAT
IC
FILE PATH LOCATION N:\0735.18001.000\dwg\Gorham_Water_Schematic.mxd
Draw
n By
:
Scal
e:
Date
:
PROJECT NO.
SHEET NO.
1 of 1
0735.18001.000
Engi
neer
ing,
Arc
hite
ctur
e, S
urve
ying
, D.P
.C.
145
Cul
ver R
oad,
Sui
te 1
60, R
oche
ster
, New
Yor
k 14
620
585
-381
-925
0 F
AX
585
-381
-100
8w
ww.
mrb
grou
p.co
m
MR
Bgro
up
LegendMunicipal Boundary
Pipe Diameter
< 2 Inch
2 Inch
3 Inch
4 Inch
6 Inch
8 Inch
10 Inch
12 Inch
14 Inch
16 Inch
18 Inch
20 Inch
24 Inch
30 Inch
> 30 Inch
Hydraulic Grade Zones
Lower Service Area
Upper Service Area
Lake-to-Lake Service Area
MWCS Service Area
Rushville Tank Service Area

Preliminary Engineering Report Town of Gorham Water Treatment Plant Improvements September 2021
MRB Group Project No. 0735.21001.000
APPENDIX E
DMR SUMMARY AND DESIGN CRITERIA

MRB|groupProject Title: Town of Gorham WTP EvaluationProject No.: 0735.21001Date: September 23, 2021Engineer: J. Lang-Bentley
Objective:
References: Ten States Recommended Standards for Water Works (2012)
Ontario County Population Estimates* 2020 2030 2040Town of Gorham 4,373 4,479 4,571 personsTown of Hopewell 3,791 3,797 3,803 personsTotal Potential Growth - 112 98 210*Historical population data and population projections obtained from the Genesee / Finger Lakes Regional Planning Council (G/FLRPC).
Est. Population Growth = 210 personsEst. Consumption = 250 gpcd
Est. Future Demand = 0.05 MGD
WTP Data (2019-2021) Existing Future Projected Future/Design UnitsAverage Daily Flow 0.46 0.05 0.52 MGDPeak Month Average Daily Flow 0.46 0.05 0.51 MGDMax Day 0.85 0.10 0.94 MGDMax WTP Capacity 1.50 1.50 1.50 MGDMax Canandaigua Lake Withdrawal 1.50 1.50 1.50 MGD
*Maximum capacity of WTP is 1.50 MGD; Future projected volume based on population growth.
Peak Month Factor = 1.0Peak Day Factor = 1.8
Treatment System Capacity Units NotesIntake Pump Station 1.73 MGD Meets WTP rated capacityDE Filters 1.60 MGD Meets WTP rated capacityClearwell 2.00 MGD Meets WTP rated capacity
Year Avg Max2019 0.43 0.69 MGD2020 0.50 0.85 MGD2021 0.83 0.23 MGD
0.58 0.85
Summary of WTP performance and effluent data for existing operations, future use, and design criteria based on historical and project population data for Ontario County.
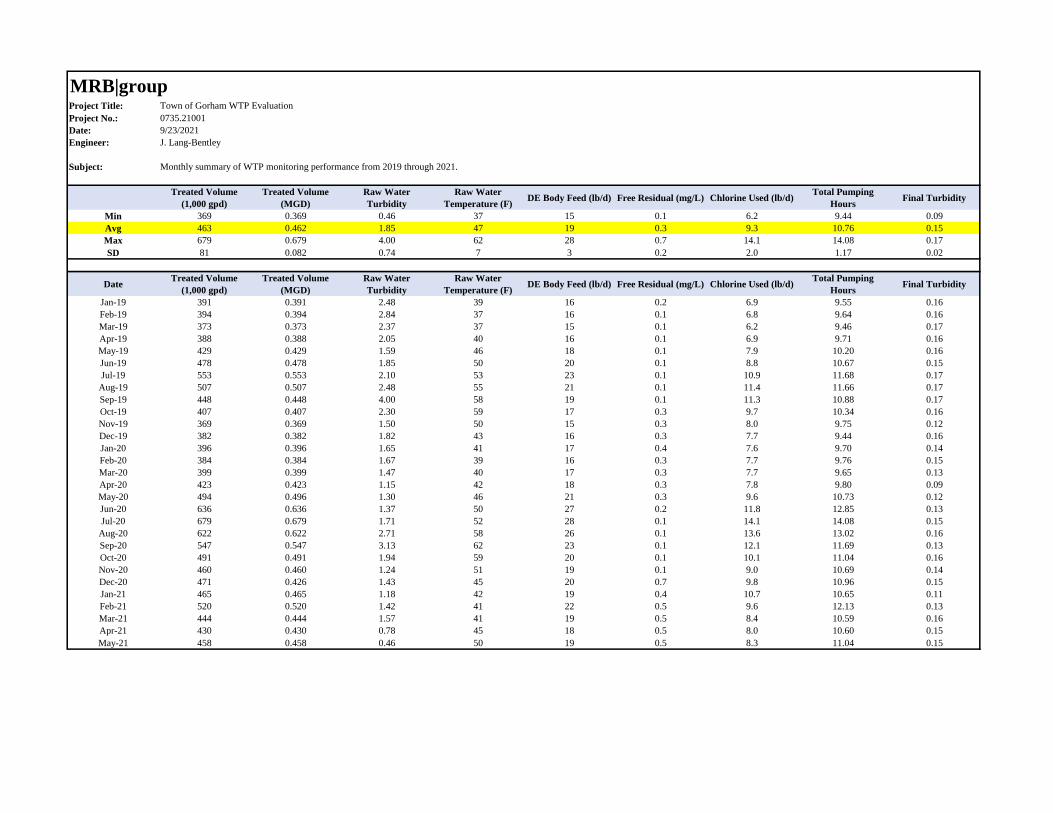
MRB|groupProject Title: Town of Gorham WTP EvaluationProject No.: 0735.21001Date: 9/23/2021Engineer: J. Lang-Bentley
Subject: Monthly summary of WTP monitoring performance from 2019 through 2021.
Treated Volume (1,000 gpd)
Treated Volume (MGD)
Raw Water Turbidity
Raw Water Temperature (F) DE Body Feed (lb/d) Free Residual (mg/L) Chlorine Used (lb/d) Total Pumping
Hours Final TurbidityMin 369 0.369 0.46 37 15 0.1 6.2 9.44 0.09Avg 463 0.462 1.85 47 19 0.3 9.3 10.76 0.15Max 679 0.679 4.00 62 28 0.7 14.1 14.08 0.17SD 81 0.082 0.74 7 3 0.2 2.0 1.17 0.02
Date Treated Volume (1,000 gpd)
Treated Volume (MGD)
Raw Water Turbidity
Raw Water Temperature (F) DE Body Feed (lb/d) Free Residual (mg/L) Chlorine Used (lb/d) Total Pumping
Hours Final TurbidityJan-19 391 0.391 2.48 39 16 0.2 6.9 9.55 0.16Feb-19 394 0.394 2.84 37 16 0.1 6.8 9.64 0.16Mar-19 373 0.373 2.37 37 15 0.1 6.2 9.46 0.17Apr-19 388 0.388 2.05 40 16 0.1 6.9 9.71 0.16May-19 429 0.429 1.59 46 18 0.1 7.9 10.20 0.16Jun-19 478 0.478 1.85 50 20 0.1 8.8 10.67 0.15Jul-19 553 0.553 2.10 53 23 0.1 10.9 11.68 0.17
Aug-19 507 0.507 2.48 55 21 0.1 11.4 11.66 0.17Sep-19 448 0.448 4.00 58 19 0.1 11.3 10.88 0.17Oct-19 407 0.407 2.30 59 17 0.3 9.7 10.34 0.16Nov-19 369 0.369 1.50 50 15 0.3 8.0 9.75 0.12Dec-19 382 0.382 1.82 43 16 0.3 7.7 9.44 0.16Jan-20 396 0.396 1.65 41 17 0.4 7.6 9.70 0.14Feb-20 384 0.384 1.67 39 16 0.3 7.7 9.76 0.15Mar-20 399 0.399 1.47 40 17 0.3 7.7 9.65 0.13Apr-20 423 0.423 1.15 42 18 0.3 7.8 9.80 0.09May-20 494 0.496 1.30 46 21 0.3 9.6 10.73 0.12Jun-20 636 0.636 1.37 50 27 0.2 11.8 12.85 0.13Jul-20 679 0.679 1.71 52 28 0.1 14.1 14.08 0.15
Aug-20 622 0.622 2.71 58 26 0.1 13.6 13.02 0.16Sep-20 547 0.547 3.13 62 23 0.1 12.1 11.69 0.13Oct-20 491 0.491 1.94 59 20 0.1 10.1 11.04 0.16Nov-20 460 0.460 1.24 51 19 0.1 9.0 10.69 0.14Dec-20 471 0.426 1.43 45 20 0.7 9.8 10.96 0.15Jan-21 465 0.465 1.18 42 19 0.4 10.7 10.65 0.11Feb-21 520 0.520 1.42 41 22 0.5 9.6 12.13 0.13Mar-21 444 0.444 1.57 41 19 0.5 8.4 10.59 0.16Apr-21 430 0.430 0.78 45 18 0.5 8.0 10.60 0.15May-21 458 0.458 0.46 50 19 0.5 8.3 11.04 0.15

Preliminary Engineering Report Town of Gorham Water Treatment Plant Improvements September 2021
MRB Group Project No. 0735.21001.000
APPENDIX F
WTP EXISTING SITE PLAN

WA
TER
TR
EATM
ENT
PLA
NT
TOW
N O
F G
OR
HA
MO
NTA
RIO
CO
UN
TY, N
EW Y
OR
K
0735.18001
Eng
inee
ring,
Arc
hite
ctur
e &
Sur
veyi
ng, D
.P.C
.Th
e C
ulve
r Roa
d A
rmor
y, 1
45 C
ulve
r Roa
d, S
uite
160
, Roc
hest
er, N
ew Y
ork
146
20Ph
one:
585
-381
-925
0
ww
w.m
rbg
rou
p.c
om
AutoCAD SHX Text
Scale:
AutoCAD SHX Text
Drawing Title:
AutoCAD SHX Text
Project Title:
AutoCAD SHX Text
of
AutoCAD SHX Text
Sheet No.
AutoCAD SHX Text
Project No.
AutoCAD SHX Text
Checked By:
AutoCAD SHX Text
Drawn By:
AutoCAD SHX Text
Date:
AutoCAD SHX Text
SEP 2021
AutoCAD SHX Text
Copyright C 20192019
AutoCAD SHX Text
MRB Group All Rights Reserved
AutoCAD SHX Text
No.
AutoCAD SHX Text
REVISIONS AND DESCRIPTIONS
AutoCAD SHX Text
BY
AutoCAD SHX Text
DATE
AutoCAD SHX Text
DRAWING ALTERATION THE FOLLOWING IS AN EXCERPT FROM THE NEW YORK EDUCATION LAW ARTICLE 145 SECTION 7209 AND APPLIES TO THIS DRAWING. "IT IS A VIOLATION OF THIS LAW FOR ANY PERSON UNLESS HE IS ACTING UNDER THE DIRECTION OF A LICENSED PROFESSIONAL ENGINEER OR LAND SURVEYOR TO ALTER AN ITEM IN ANY WAY. IF AN ITEM BEARING THE SEAL OF AN ENGINEER OR LAND SURVEYOR IS ALTERED, THE ALTERING ENGINEER OR LAND SURVEYOR SHALL AFFIX TO THE ITEM HIS SEAL AND THE NOTATION "ALTERED BY" FOLLOWED BY HIS SIGNATURE AND THE DATE OF SUCH ALTERATION AND A SPECIFIC DESCRIPTION OF THE ALTERATION".
AutoCAD SHX Text
N:\0735.18001.000\dwg\WTP

Preliminary Engineering Report Town of Gorham Water Treatment Plant Improvements September 2021
MRB Group Project No. 0735.21001.000
APPENDIX G
CSLAP REPORTS

Canandaigua Lake
Canandaigua Lake Association
Town of Gorham, Canandaigua, Middlesex, Italy, South Bristol
Ontario, Yates County
Lake Characteristics
Surface area (ac/ha) 10558 / 3852
Max depth (ft/m) 276 / 84
Mean depth (ft/m) 127 / 39
Retention time (years) 9.98
Lake Classification AATS
Dam Classification D
Watershed Characteristics
Watershed area (ac /ha) 119136/48212
Watershed / Lake ratio 13
Lake & wetlands % 12.1%
Agricultural % 35.7%
Forest, shrub, grasses % 45.3%
Residential 6.7%
Urban 0.1%
CSLAP Participation
Years 2017-2018
Volunteers Saralinda Hooker, Albert and Deirdre Crofton, Pamela Hart, Brendan Brady, Lindsay McMillan, Nadia Harvieux, and Rob Gray
Trophic state HABs Susceptibility
Invasive Vulnerability
PWL Assessment
Mesoligotrophic Frequent blooms, Low susceptibility
Invasives present, High Vulnerability
Threatened
Water quality values for Canandaigua Lake for the 2018 sampling season. “Seasonal change” shows current year
variability. Light red color indicates eutrophic conditions in top table and bloom conditions in bottom table.
Summer averages for each of the CSLAP years and long term trend analyses show trends in key water quality
indicators over a consistent index period (mid-June thru mid-September).
6/26 7/7 7/22 8/5 8/19 9/2 9/15 9/29
Clarity (m) 7.8 7.3 4.3 6.4 5.8 6.1 4.6 4.4 5.7 no no
Surface TP (mg/l) 0.004 0.006 0.007 0.008 0.002 0.006 0.007 no no
Surface TDP (mg/l) 0.003 0.003 0.003 0.003 0.002 0.002 0.004 0.003 0.003 no
Deep TP (mg/l) 0.005 0.007 0.007 0.006 0.005 0.005 0.006 0.009 0.007 no
Deep/Surface TP 1 1 1 1 2 2 1
TN (mg/l) 0.453 0.386 0.378 0.361 0.286 0.286 0.387 0.271 0.364 no no
TDN (mg/l) 0.480 0.405 0.365 0.358 0.352 0.302 0.415 0.244
N:P Ratio 108 67 55 48 119 47 47
Deep/Surface NH4
Chl.a (ug/l) 0.2 1.7 2.4 2.9 1.5 2.0 3.4 3.5 2.3 no no
pH 7.3 7.2 7.2 8.2 7.3 7.2 7.1 7.6 no no
Cond (umho/cm) 432 425 416 382 413 355 356 no no
Upper Temp (degC) 21 23 25 25 25 24 23 21 23 no no
Deep Temp (degC) 17 11 21 15 14 17 19 21 16 no no
FP BG Chl.a (ug/l) 0 0 0 1 1 2 2 0 no no
HABs reported? no no no no no shore no no
Open Water
Indicators
18 Diff
from Avg
2018 Sampling Results Seasonal
change
Long Term
Avg
Long Term
Trend?
South Site (2)

Shoreline bloom and HABs notifications
Date of first listing Date of last listing # weeks on the DEC notification list # Weeks with updates
8/24/2018 10/12/2018 8 6
Shoreline HAB Sample Dates 2018
HABs Status Open water Algae Shoreline Algae
HAB Indicators HAB criteria 8/16 8/19 8/27 9/4 9/4 9/4 9/4 9/4
BGA 25 - 30 ug/L 26.3 35.2 181.2 632.2 3.0 6340.5 59.6 121.6
microcystin 20 ug/L 19.0 20.0 110.0 400.0 3.8 320.0
anatoxin - a 4 ug/L
0
2
4
6
8
10
6/26 7/7 7/22 8/5 8/19 9/2 9/15 9/29
Ch
loro
ph
yll
a (
ug
/l)
2018 Open Water Algae Samples
BG Algae
Green Algae
Diatoms
Other Algae
0.1
1.0
10.0
100.0
5/30 6/24 7/19 8/13 9/7 10/2
Tota
l M
icro
cyst
in
(ug/
l)
2018 Open Water Toxin Levels
Open Microcystin
WHO Hi Risk Swimming Criteria
EPA Lo Risk Drinking Criteria
1
10
100
1000
10000
8/16 8/19 8/27 9/4 9/4 9/4 9/4 9/4C
hlo
rop
hyl
l a (
ug/
l)
2018 Shoreline Algae Samples
BG Algae
Green Algae
Diatoms
Other Algae
0.1
1.0
10.0
100.0
1000.0
5/30 6/24 7/19 8/13 9/7 10/2
Tota
l Mic
rocy
stin
(u
g/l)
2018 Shoreline Toxin Levels
Shoreline Microcystin
WHO Hi Risk Swimming Criteria
EPA Lo Risk Drinking Criteria

Canandaigua Lake (S2) Long Term Trend Analysis
Clarity
Surface Phosphorus
Nitrogen
pH
Chlorophyll a
Surface and Deep Phosphorus
TN : TP
Specific Conductance
0
1
2
3
4
5
6
7
1985 1990 1995 2000 2005 2010 2015 2020
Avg
Su
mm
er W
ater
Cla
rity
(m
)
Eutrophic
Oligotrophic
Mesotrophic
0.000
0.005
0.010
0.015
0.020
0.025
1985 1990 1995 2000 2005 2010 2015 2020
Avg
Sum
mer
TP
(mg/
l)
Eutrophic
Mesotrophic
Oligotrophic
0.01
0.10
1.00
1985 1990 1995 2000 2005 2010 2015 2020
Avg
Su
mm
er
Nit
roge
n (
mg
/l)
NOx NH4
TN
5
6
7
8
9
1985 1990 1995 2000 2005 2010 2015 2020
Avg
Sum
mer
pH
Highly Alkaline (Above NYS WQ standard)
Circumneutral (Acceptable)
Acidic (Below NYS WQ standard)
Slightly Alkaline (Acceptable)
0
1
2
3
4
5
6
7
8
9
1985 1990 1995 2000 2005 2010 2015 2020
Avg
Sum
mer
Chl
.a (
ug/l
)
Eutrophic
Mesotrophic
Oligotrophic
0.001
0.010
0.100
1985 1990 1995 2000 2005 2010 2015 2020
Avg
Sum
mer
TP
(mg/
l)
Surface
Bottom
Eutrophic
Mesotrophic
Oligotrophic
1
10
100
1985 1995 2005 2015
Avg
Su
mm
er
TN/T
P
Phosphorus Limited
Nitrogen Limited
N or P Limited
0
50
100
150
200
250
300
350
400
450
1985 1990 1995 2000 2005 2010 2015 2020
Avg
Su
mm
er C
on
d (u
mh
o/c
m) Hardwater
Softwater
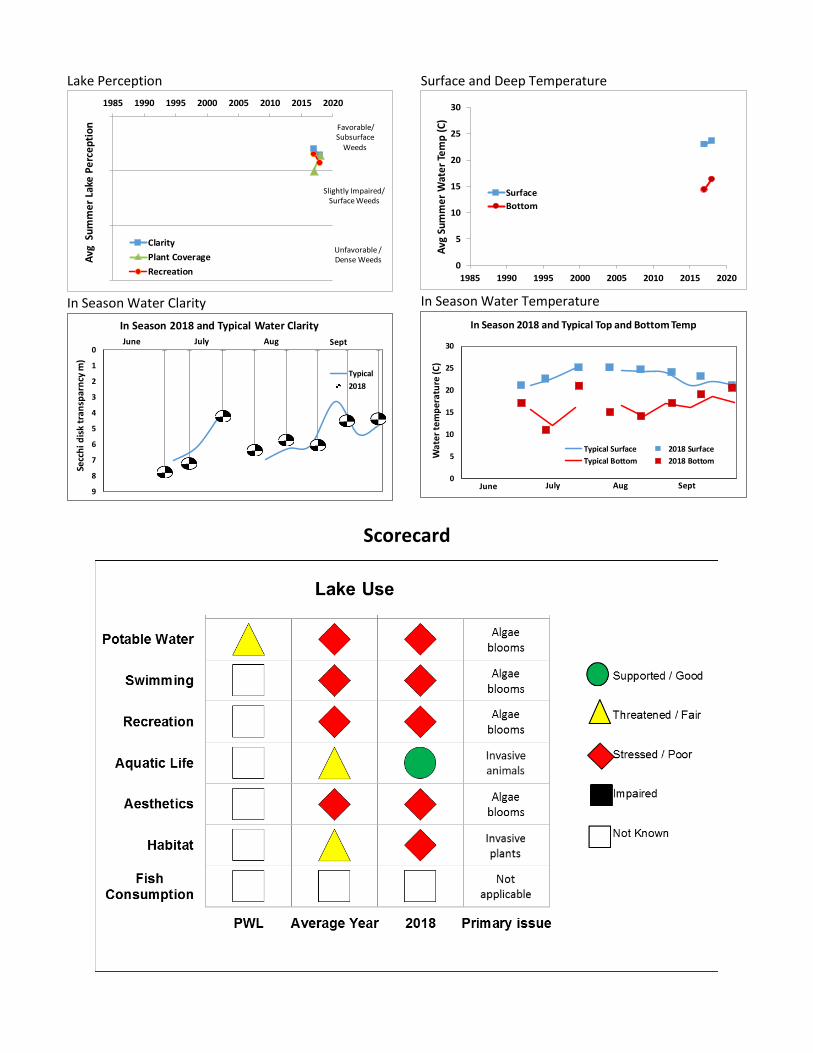
Lake Perception
In Season Water Clarity
Surface and Deep Temperature
In Season Water Temperature
Scorecard
1985 1990 1995 2000 2005 2010 2015 2020
Avg
Su
mm
er
Lake
Pe
rce
pti
on
Clarity
Plant Coverage
Recreation
Favorable/Subsurface
Weeds
Unfavorable / Dense Weeds
Slightly Impaired/ Surface Weeds
0
1
2
3
4
5
6
7
8
9
Secc
hi d
isk
tra
nsp
arn
cy m
)
In Season 2018 and Typical Water Clarity
Typical
2018
June July Aug Sept
0
5
10
15
20
25
30
1985 1990 1995 2000 2005 2010 2015 2020
Avg
Su
mm
er
Wat
er
Tem
p (
C)
Surface
Bottom
0
5
10
15
20
25
30
Wat
er
tem
per
atu
re (C
)
In Season 2018 and Typical Top and Bottom Temp
Typical Surface 2018 Surface
Typical Bottom 2018 Bottom
June July Aug Sept
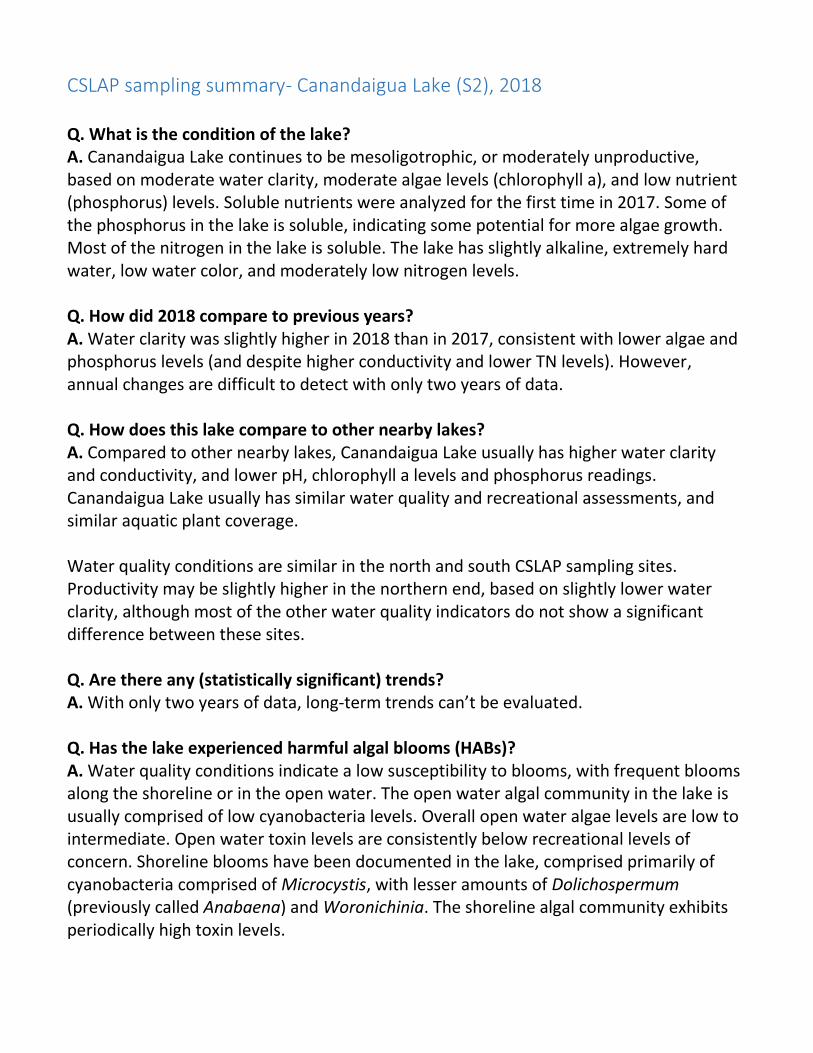
CSLAP sampling summary- Canandaigua Lake (S2), 2018 Q. What is the condition of the lake? A. Canandaigua Lake continues to be mesoligotrophic, or moderately unproductive, based on moderate water clarity, moderate algae levels (chlorophyll a), and low nutrient (phosphorus) levels. Soluble nutrients were analyzed for the first time in 2017. Some of the phosphorus in the lake is soluble, indicating some potential for more algae growth. Most of the nitrogen in the lake is soluble. The lake has slightly alkaline, extremely hard water, low water color, and moderately low nitrogen levels. Q. How did 2018 compare to previous years? A. Water clarity was slightly higher in 2018 than in 2017, consistent with lower algae and phosphorus levels (and despite higher conductivity and lower TN levels). However, annual changes are difficult to detect with only two years of data. Q. How does this lake compare to other nearby lakes? A. Compared to other nearby lakes, Canandaigua Lake usually has higher water clarity and conductivity, and lower pH, chlorophyll a levels and phosphorus readings. Canandaigua Lake usually has similar water quality and recreational assessments, and similar aquatic plant coverage. Water quality conditions are similar in the north and south CSLAP sampling sites. Productivity may be slightly higher in the northern end, based on slightly lower water clarity, although most of the other water quality indicators do not show a significant difference between these sites. Q. Are there any (statistically significant) trends? A. With only two years of data, long-term trends can’t be evaluated. Q. Has the lake experienced harmful algal blooms (HABs)? A. Water quality conditions indicate a low susceptibility to blooms, with frequent blooms along the shoreline or in the open water. The open water algal community in the lake is usually comprised of low cyanobacteria levels. Overall open water algae levels are low to intermediate. Open water toxin levels are consistently below recreational levels of concern. Shoreline blooms have been documented in the lake, comprised primarily of cyanobacteria comprised of Microcystis, with lesser amounts of Dolichospermum (previously called Anabaena) and Woronichinia. The shoreline algal community exhibits periodically high toxin levels.

In 2018, overall algae levels were low to intermediate, with diatoms the most common taxa in open water samples, and with low cyanobacteria levels. Open water toxin levels were undetectable. Shoreline blooms in 2018 were documented in the lake, generally at the South end of the lake, comprised primarily of cyanobacteria with high toxin levels. This led to a drinking water advisory for the Village of Rushville. The most common taxa were the same as reported in previous years. Q. Have any aquatic invasive species (AIS) been reported? A. There are invasive plants reported or present at Canandaigua Lake, and invasives have been reported in nearby waterbodies. Invasive species reported in the lake include Eurasian watermilfoil, curly leafed pondweed, water chestnut, and starry stonewort. Fishhook waterflea, Chinese mystery snail, Asian clam, common carp, quagga and zebra mussel, and scud have been reported in Canandaigua Lake. Canandaigua Lake has high vulnerability for new invasives, based on calcium levels, the presence of multiple AIS, and available public access. Q. Are any lake uses likely to be affected by these conditions? A. Canandaigua Lake supports potable water, recreation and public bathing use. It is likely that many of the actual or potential impacts described below are present in some parts of the lake, particularly the north end, and not present in other parts of the lake. Public water supply is stressed by drinking water advisories, and impacted by shoreline HABs and raw water cyanotoxins. Public bathing and recreation are stressed by shoreline cyanotoxins, and impacted by shoreline and open water HABs. Aquatic life is threatened by the presence of invasive animals. Aesthetics are poor due to HABs, and impacted by less than favorable recreational and water quality perception, and the presence of invasive aquatic plants. Habitat is fair due to the presence of invasive aquatic plants, although these conditions may be worsening due to the spread of starry stonewort. Fish Consumption use is considered to be unassessed. There are no health advisories limiting the consumption of fish from this waterbody (beyond the general advice for all waters). However, due to the lack of actual fish sampling data, fish consumption use is noted as unassessed, rather than fully supported but unconfirmed.

How to Read the Report This guide provides a description of the CSLAP report by section and a glossary. The sampling site is
indicated in the header for lakes with more than one routine sampling site.
Physical Characteristics influence lake quality:
• Surface area is the lake’s surface in acres and hectares.
• Max depth is the water depth measured at the deepest part of the lake in feet and meters.
• Mean depth is either known from lake bathymetry or is 0.46 of the maximum depth.
• Retention time is the time it takes for water to pass through a lake in years. This indicates
the influence of the watershed on lake conditions.
• Lake classification describes the “best uses” for this lake. Class AA, AAspec, and A lakes may
be used as sources of potable water. Class B lakes are suitable for contact recreational
activities, like swimming. Class C lakes are suitable for non-contact recreational activities,
including fishing, although they may still support swimming. The addition of a T or TS to any
of these classes indicates the ability of a lake to support trout populations and/or trout
spawning.
• Dam classification defines the hazard class of a dam. Class A, B, C, and D dams are defined as
low, intermediate, high, or negligible/no hazard dams in that order. “0” indicates that no
class has been assigned to a particular dam, or that no dam exists.
Watershed characteristics influence lake water quality:
• Watershed area in acres and hectares
• Land use data come from the most recent (2011) US Geological Survey National Land Use
Cover dataset
CSLAP Participation lists the sampling years and the current year volunteers.
Key lake status indicators summarize lake conditions:
• Trophic state of a lake refers to its nutrient loading and productivity, measured by
phosphorus, algae, and clarity. An oligotrophic lake has low nutrient and algae levels (low
productivity) and high clarity while a eutrophic lake has high nutrient and algae levels (high
productivity) and low clarity. Mesotrophic lakes fall in the middle.
• Harmful algal bloom susceptibility summarizes the available historical HAB data and indicates
the potential for future HAB events.
• Invasive vulnerability indicates whether aquatic invasive species are found in this lake or in
nearby lakes, indicating the potential for further introductions.
• Priority waterbody list (PWL) assessment is based on the assessment of use categories and
summarized as fully supported, threatened, stressed, impaired, or precluded. Aesthetics and
habitat are evaluated as good, fair, or poor. The cited PWL assessment reflects the “worst”
assessment for the lake. The full PWL assessment can be found at
http://www.dec.ny.gov/chemical/36730.html#WIPWL.

Current year sampling results
• Results for each of the sampling sessions in the year are in tabular form. The seasonal change graphically shows the current year results. Red shading indicates eutrophic readings.
• HAB notification periods on the DEC website, updated weekly http://www.dec.ny.gov/chemical/83310.html
• Shoreline HAB sample dates and results. Samples are collected from the area that appears to have the worst bloom. Red shading indicates a confirmed HAB.
• HAB sample algae analysis. Algae types typically change during the season. These charts show the amount of the different types of algae found in each mid-lake or shoreline sample. Samples with high levels of BGA are HABs. The second set of charts show the level of toxins found in open water and shoreline samples compared to the World Health Organization (WHO) guidelines.
• If there are more than ten shoreline bloom samples collected in a year, bloom sample information is instead summarized by month (May-Oct.) as minimum, average, and maximum values for blue-green algae and microcystin.
Long Term Trend Analysis puts the current year findings in context. Summer averages (mid-June
thru mid-September) for each of the CSLAP years show trends in key water quality indicators. The
graphs include relevant criteria (trophic categories, water quality standards, etc.) and boundaries
separating these criteria.
In-Season Analysis shows water temperature and water clarity during the sampling season. These
indicate seasonal changes and show the sample year results compared to the typical historical
readings for those dates.
The Lake Use Scorecard presents the results of the existing Priority Waterbody List assessment for
this lake in a graphical form and compares it to information from the current year and average
values from CSLAP data and other lake information. Primary issues that could impact specific use
categories are identified, although more issues could also affect each designated use.
The Lake Summary reviews and encapsulates the data in the lake report, including comparisons to
historical data from this lake, and results from nearby lakes.
Glossary of water quality and HAB indicators
Clarity (m): The depth to which a Secchi disk lowered into the water is visible, measured in meters.
Water clarity is one of the trophic indicators for each lake.
TP (mg/L): Total phosphorus, measured in milligrams per liter at the lake surface (1.5 meters below
the surface). TP includes all dissolved and particulate forms of phosphorus. TSP, or total soluble
phosphorus, was collected in 2018 and discussed in the lake narrative section.
Deep TP: Total phosphorus measured in milligrams per liter at depth (1-2 meters above the lake
bottom at the deepest part of the lake)
TN: Total nitrogen, measured in milligrams per liter at the lake surface. TN includes all forms of
nitrogen, including NOx (nitrite and nitrate) and NH4 (ammonia).
N:P Ratio: The ratio of total nitrogen to total phosphorus, unitless (mass ratio). This ratio helps
determine if a lake is phosphorous or nitrogen limited.
Chl.a (µg/L): Chlorophyll a, measured in micrograms per liter. Indicates the amount of algae in the
water column. This is an extracted chlorophyll measurement.
pH: A range from 0 to 14, with 0 being the most acidic and 14 being the most basic or alkaline. A
healthy lake generally ranges between 6.5 and 8.5.
Cond (µmho/cm): Specific conductance is a measure of the conductivity of water. A higher value
indicates the presence of more dissolved ions. High ion concentrations (> 250) usually indicate
hardwater, and low readings (< 125) usually show softwater.
Upper Temp (°C): Surface temperature, measured in degrees Celsius
Deep Temp (°C): Bottom temperature, measured in degrees Celsius
BG Chl.a (µg/L): Chlorophyll a from blue-green algae, measured in micrograms per liter. This is an
“unextracted” estimate using a fluoroprobe. This result is not as accurate as the extracted
chlorophyll measurement described above.
HABs: Harmful Algal Blooms. Algal blooms that have the appearance of cyanobacteria (BGA)
BGA: Blue-green algae, also known as cyanobacteria
Microcystin (µg/L): The most common HAB liver toxin; total microcystin above 20 micrograms per
liter indicates a “high toxin” bloom. However, ALL BGA blooms should be avoided, even if toxin levels
are low.
Anatoxin-a (µg/L): A toxin that may be produced in a HAB which targets the central nervous system.
Neither EPA nor NYS has developed a risk threshold for anatoxin-a, although readings above 4
micrograms per liter are believed to represent an elevated risk.

Canandaigua Lake
Canandaigua Lake Association
Town of Gorham, Canandaigua, Middlesex, Italy, South Bristol
Ontario, Yates County
Lake Characteristics
Surface area (ac/ha) 10558 / 3852
Max depth (ft/m) 274 / 84
Mean depth (ft/m) 127 / 39
Retention time (years) 9.98
Lake Classification AA(TS)
Dam Classification D
Watershed Characteristics
Watershed area (ac /ha) 119136/48212
Watershed / Lake ratio 13
Lake & wetlands % 12.1%
Agricultural % 35.7%
Forest, shrub, grasses % 45.3%
Residential 6.7%
Urban 0.1%
CSLAP Participation
Years 2017-2019
Volunteers Stephen Zumbo, Brendan Brady, Deirdre Crofton, Nadia Harvieux, Lindsay McMillan
Trophic state HABs Susceptibility
Invasive Vulnerability
PWL Assessment
Mesoligotrophic Frequent blooms, Low susceptibility
Invasives present, High Vulnerability
Threatened
Canandaigua Lake – 2019 Sampling Season Results “Seasonal change” shows current year variability. Light red color indicates eutrophic conditions in top table and
bloom conditions in bottom table. Summer averages for each of the CSLAP years and long term trend analyses
show trends in key water quality indicators over a consistent index period (mid-June thru mid-September).
6/17 7/6 7/20 8/3 8/18 8/31 9/15 9/29
Clarity (m) 4.6 4.9 6.7 4.4 3.9 2.9 3.4 4.8 no no
Surface TP (mg/l) 0.007 no
Surface TDP (mg/l)
Deep TP (mg/l) <0.01 0.007 no
Deep/Surface TP
TN (mg/l) 0.452 0.452 0.389 0.369 0.360 0.331 0.322 0.321 0.369 no no
TDN (mg/l) 0.478 0.426 0.348 0.370 0.306 0.343 0.263 0.259
N:P Ratio 45
Deep/Surface NH4
Chl.a (ug/l) 0.7 0.6 2.4 1.6 3.4 3.6 3.9 5.0 2.3 no no
pH 7.8 7.6 7.9 7.6 8.2 7.5 7.6 7.0 7.7 no no
Cond (umho/cm) 396 435 435 433 393 384 365 374 378 no no
Calcium (mg/L) 30 23 31 no ↓
Chloride (mg/L) 51 51 52 55 49 no no
Upper Temp (degC) 18 28 25 25 23 23 20 19 23 no no
Deep Temp (degC) 16 12 12 14 13 13 12 10 17 no no
FP BG Chl.a (ug/l) 0 0 0 0 1 3 2 2 1 no no
HABs reported? no no no no no no shore no
Open Water
Indicators
19 Diff
from Avg
2019 Sampling Results Seasonal
change
Long
Term Avg
Long Term
Trend?
North Site (1)

Shoreline bloom and HABs notifications
Date of first listing Date of last listing
8/13/2019 10/28/2019
Shoreline HAB Sample Dates 2019
HABs Status Open water Algae Shoreline Algae
HAB Indicators HAB criteria 8/19 8/20 8/20 8/20 8/20 9/3 9/3 9/3 9/3 9/3
BGA 25 - 30 ug/L 77.4 81.3 174.3 203.2 355.2 153.9 227.4 157.6 234.9 289.0
Microcystin 20 ug/L 50.0 75.0 75.0 75.0 75.0 75.0 75.0 40.0 75.0 75.0
Microscopy DominantMicrocystis,
CeratiumMicrocystis Microcystis
Microcystis,
CeratiumMicrocystis Microcystis
Microcystis,
DinobryonMicrocystis Microcystis Microcystis
0
2
4
6
8
10
6/17 7/6 7/20 8/3 8/18 8/31 9/15 9/29
Ch
loro
ph
yll
a (u
g/l)
2019 Open Water Algae Samples
BG Algae
Green Algae
Diatoms
Other Algae
0.1
1.0
10.0
100.0
5/30 6/24 7/19 8/13 9/7 10/2
Tota
l M
icro
cyst
in
(ug/
l)
2019 Open Water Toxin Levels
Open Microcystin
WHO Hi Risk Swimming Criteria
EPA Lo Risk Drinking Criteria
1
10
100
1000
8/19 8/20 8/20 8/20 8/20 9/3 9/3 9/3 9/3 9/3 9/3 9/3 9/3 9/10C
hlo
rop
hyl
l a
(ug/
l)
2019 Shoreline Algae SamplesBG Algae
Green Algae
Diatoms
Other Algae
0.1
1.0
10.0
100.0
5/30 6/24 7/19 8/13 9/7 10/2
Tota
l M
icro
cyst
in
(ug/
l)
2019 Shoreline Toxin Levels
Shoreline Microcystin
WHO Hi Risk Swimming Criteria
EPA Lo Risk Drinking Criteria

Canandaigua Lake – Long-Term Trend Analysis
Clarity
Surface Phosphorus
Nitrogen
pH
Chlorophyll a
Surface and Deep Phosphorus
TN : TP
Specific Conductance
0
1
2
3
4
5
6
7
1985 1990 1995 2000 2005 2010 2015 2020
Avg
Su
mm
er
Wat
er
Cla
rity
(m
)
Eutrophic
Oligotrophic
Mesotrophic
0.000
0.005
0.010
0.015
0.020
0.025
1985 1990 1995 2000 2005 2010 2015 2020
Avg
Su
mm
er
TP (
mg
/l)
Eutrophic
Mesotrophic
Oligotrophic
0.01
0.10
1.00
1985 1990 1995 2000 2005 2010 2015 2020
Avg
Su
mm
er
Nit
roge
n (m
g/l
)
NOx NH4
TN
5
6
7
8
9
1985 1990 1995 2000 2005 2010 2015 2020
Avg
Su
mm
er
pH
Highly Alkaline (Above NYS WQ standard)
Circumneutral (Acceptable)
Acidic (Below NYS WQ standard)
Slightly Alkaline (Acceptable)
0
1
2
3
4
5
6
7
8
9
1985 1990 1995 2000 2005 2010 2015 2020
Avg
Su
mm
er
Ch
l.a
(u
g/l
) Eutrophic
Mesotrophic
Oligotrophic
0.001
0.010
0.100
1985 1990 1995 2000 2005 2010 2015 2020
Avg
Su
mm
er
TP (
mg
/l)
Surface
Deep
Eutrophic
Mesotrophic
Oligotrophic
1
10
100
1985 1995 2005 2015
Avg
Su
mm
er
TN/T
P Phosphorus Limited
Nitrogen Limited
N or P Limited
0
50
100
150
200
250
300
350
400
450
500
1985 1990 1995 2000 2005 2010 2015 2020
Avg
Su
mm
er
Co
nd
(um
ho
/cm
) Hardwater
Softwater

Calcium
Color
Lake Perception
Canandaigua Lake – In-Season Analysis In Season Water Clarity
Chloride
Surface and Deep Temperature
In Season Water Temperature
0
5
10
15
20
25
30
35
40
1985 1990 1995 2000 2005 2010 2015 2020
Avg
Su
mm
er
Cal
ciu
m (
mg
/l)
Highly Susceptible to Zebra Mussels
Not Susceptible to Zebra Mussels
May Be Susceptible to Zebra Mussels
0
5
10
15
20
25
30
35
40
45
50
1985 1990 1995 2000 2005 2010 2015 2020
Avg
Su
mm
er
Co
lor
(ptu
) Colored
Weakly Colored
Uncolored
1985 1990 1995 2000 2005 2010 2015 2020
Avg
Su
mm
er
Lake
Pe
rce
pti
on
Clarity
Plant Coverage
Recreation
Favorable/Subsurface
Weeds
Unfavorable / Dense Weeds
Slightly Impaired/ Surface Weeds
0
1
2
3
4
5
6
7
8
Secc
hi d
isk
tran
spar
ncy
m)
In Season 2019 and Typical Water Clarity
Typical
2019
June July Aug Sept
0
50
100
150
200
250
300
1985 1990 1995 2000 2005 2010 2015 2020
Avg
Su
mm
er
Ch
lori
de
(mg
/l)
0
5
10
15
20
25
30
1985 1990 1995 2000 2005 2010 2015 2020
Avg
Su
mm
er
Wat
er
Tem
p (
C)
Surface
Deep
0
5
10
15
20
25
30
Wat
er
tem
pe
ratu
re (C
)
In Season 2019 and Typical Surface and Deep Temp
Typical Surface 2019 SurfaceTypical Deep 2019 Deep
June July Aug Sept

Canandaigua Lake – Lake Scorecard
Water Quality Assessments
The Waterbody Inventory/Priority Waterbodies List (WI/PWL) is a statewide inventory of New York's water resources that is used to track a waters ability to support its’ best use(s), identify pollutant(s) causing impairment of best use(s), and follow the status of restoration, protection and other water quality activities and efforts. Data collected through CSLAP contributes to the WI/PWL. In order to be included as an assessment unit in the WI/PWL, a lake, pond, or reservoir must be at least 6.4 acres in size.
To view current water quality assessment results: o Visit https://www.dec.ny.gov/pubs/109457.html - follow the link to launch the DECinfo Locator o Search for waterbody name, address or nearby landmark in the search tool at the top of the left
banner o Click and Expand the ‘DEC Information Layers’ tab of the left banner o Click and expand the 'Environmental Monitoring' tab of the left banner o Check the 'Lakes and Reservoirs' layer o Click on the waterbody of interest in the map view to display a pop-up with more information
about the waterbody o Follow the 'Fact Sheet' link in the pop-up to learn more about the current use assessment of the
waterbody
Lake Stewardship Actions
Individual stewardship activities can help improve water quality: maintain your septic system, reduce
fertilizer use, grow a buffer of native plants next to the lake shore, and reduce shoreline erosion and
runoff into the lake. Visiting boats should be inspected to prevent the spread of invasive species, and
continued community education about and monitoring for invasive species is recommended. Routine
education about algae and harmful algal blooms (HABs) within your lake community is recommended; to
learn more about HABs and see examples of HABs visit http://www.dec.ny.gov/chemical/81962.html.
Occurrences of HABs can be reported to NYSDEC. For more information on keeping New York waters
clean, visit http://www.dec.ny.gov/public/43661.html.
Average Year 2019
Phosphorus Oligotrophic
Chlorophyll A Mesotrophic Mesotrophic
Secchi Mesotrophic Mesotrophic
Aquatic Invasive Species
Fair Fair
Poor Poor
Good GoodOpen Water Algae Levels
Present
Water Quality Indicators
Trophic Status
Lake Perception
Harmful Algal Blooms

Canandaigua Lake - 2019 Lake Summary
Q. What is the condition of the lake? A. Canandaigua Lake - North Site continues to be mesoligotrophic, or moderately unproductive, based on moderate water clarity, moderate algae levels (chlorophyll a), and low nutrient (phosphorus) levels. Soluble nutrients were analyzed again 2019. Most of the nitrogen in the lake is soluble, indicating a potential for more algae growth. The lake has slightly alkaline, extremely hard water, low water color, and moderately low nitrogen levels. Q. How did 2019 compare to previous years? A. Calcium readings were lower than normal in 2019. Each of the other water quality indicators was close to normal in 2019. Q. How does this lake compare to other nearby lakes? A. Compared to other nearby lakes, Canandaigua Lake - North Site usually has higher water clarity, conductivity, calcium levels, and chloride levels, and lower chlorophyll a levels and phosphorus readings. Canandaigua Lake - North Site usually has similar water quality assessments, similar recreational assessments, and similar aquatic plant coverage. Q. Are there any (statistically significant) trends? A. Since 2017, there have been no significant water quality trends. Q. Has the lake experienced harmful algal blooms (HABs)? A. Water quality conditions generally indicate a low susceptibility to blooms, though frequent blooms along the shoreline or in the open water have been documented. The open water algal community in the lake is usually comprised of low cyanobacteria levels. This community is dominated by Microcystis. Typically, open water algae levels are intermediate. Overall open water toxin levels are consistently below recreational levels of concern. Shoreline blooms have previously been documented in the lake, comprised primarily of cyanobacteria dominated by Microcystis. The shoreline algal community typically exhibits high toxin levels.
In 2019, overall algae levels were intermediate, with green algae the most common taxa in open water samples, and with intermediate cyanobacteria levels. Open water toxin levels were at times low but detectable in 2019. Shoreline blooms in 2019 were documented in the lake, comprised primarily of cyanobacteria with high toxin levels. The most common taxa were Microcystis. Q. Have any aquatic invasive species (AIS) been reported? A. There is at least one invasive plant reported or present at Canandaigua Lake. Invasive species reported in the lake include Eurasian Watermilfoil, Curly Leafed Pondweed, and Water Chestnut. Fishhook Waterflea, Chinese Mystery Snail, Asian Clam, Common Carp, Quagga Mussel, Zebra Mussel, and Scud have been reported in Canandaigua Lake. Canandaigua Lake has high vulnerability for new invasives, based on calcium levels.

How to Read the Report This guide provides a description of the CSLAP report by section and a glossary. The sampling site is
indicated in the header for lakes with more than one routine sampling site.
Physical Characteristics influence lake quality:
• Surface area is the lake’s surface in acres and hectares.
• Max depth is the water depth measured at the deepest part of the lake in feet and meters.
• Mean depth is either known from lake bathymetry or is 0.46 of the maximum depth.
• Retention time is the time it takes for water to pass through a lake in years. This indicates
the influence of the watershed on lake conditions.
• Lake classification describes the “best uses” for this lake. Class AA, AAspec, and A lakes may
be used as sources of potable water. Class B lakes are suitable for contact recreational
activities, like swimming. Class C lakes are suitable for non-contact recreational activities,
including fishing, although they may still support swimming. The addition of a T or TS to any
of these classes indicates the ability of a lake to support trout populations and/or trout
spawning.
• Dam classification defines the hazard class of a dam. Class A, B, C, and D dams are defined as
low, intermediate, high, or negligible/no hazard dams in that order. “0” indicates that no
class has been assigned to a particular dam, or that no dam exists.
Watershed characteristics influence lake water quality:
• Watershed area in acres and hectares
• Land use data come from the most recent (2011) US Geological Survey National Land Use
Cover dataset
CSLAP Participation lists the sampling years and the current year volunteers.
Key lake status indicators summarize lake conditions:
• Trophic state of a lake refers to its nutrient loading and productivity, measured by
phosphorus, algae, and clarity. An oligotrophic lake has low nutrient and algae levels (low
productivity) and high clarity while a eutrophic lake has high nutrient and algae levels (high
productivity) and low clarity. Mesotrophic lakes fall in the middle.
• Harmful algal bloom susceptibility summarizes the available historical HAB data and indicates
the potential for future HAB events.
• Invasive vulnerability indicates whether aquatic invasive species are found in this lake or in
nearby lakes, indicating the potential for further introductions.
• Priority waterbody list (PWL) assessment is based on the assessment of use categories and
summarized as fully supported, threatened, stressed, impaired, or precluded. Aesthetics and
habitat are evaluated as good, fair, or poor. The cited PWL assessment reflects the “worst”
assessment for the lake.

Current year sampling results
• Results for each of the sampling sessions in the year are in tabular form. The seasonal change graphically shows the current year results. Red shading indicates eutrophic readings.
• HAB notification periods on the DEC website http://www.dec.ny.gov/chemical/83310.html
• Shoreline HAB sample dates and results. Samples are collected from the area that appears to have the worst bloom. Red shading indicates a confirmed HAB.
• HAB sample algae analysis. Algae types typically change during the season. These charts show the amount of the different types of algae found in each mid-lake or shoreline sample. Samples with high levels of BGA are HABs. The second set of charts show the level of toxins found in open water and shoreline samples compared to the World Health Organization (WHO) guidelines.
• If there are more than ten shoreline bloom samples collected in a year, bloom sample information is instead summarized by month (May-Oct.) as minimum, average, and maximum values for blue-green algae and microcystin.
Long-Term Trend Analysis puts the current year findings in context. Summer averages (mid-June
thru mid-September) for each of the CSLAP years show trends in key water quality indicators. The
graphs include relevant criteria (trophic categories, water quality standards, etc.) and boundaries
separating these criteria.
In-Season Analysis shows water temperature and water clarity during the sampling season. These
indicate seasonal changes and show the sample year results compared to the typical historical
readings for those dates.
The Lake Scorecard represents key water quality indicator results for this lake in an easy-to-read
format, comparing information from the current year and historical average of the CSLAP data.
Indicators include (1) trophic status of phosphorus, chlorophyll (or algae) and secchi (or clarity); (2)
presence or absence of aquatic invasive plants or animals; (3) lake user perception based on
perceived physical condition and recreational suitability of the lake; (4) harmful algal bloom samples
or reports; and (5) algae levels in the open water of routinely sampled sites.
The Lake Summary reviews and encapsulates the data in the lake report, including comparisons to
historical data from this lake, and results from nearby lakes.

Glossary of Water Quality and HAB Indicators
Clarity (m): The depth to which a Secchi disk lowered into the water is visible, measured in meters.
Water clarity is one of the trophic indicators for each lake.
TP (mg/L): Total phosphorus, measured in milligrams per liter at the lake surface (1.5 meters below
the surface). TP includes all dissolved and particulate forms of phosphorus.
Deep TP: Total phosphorus measured in milligrams per liter at depth (1-2 meters above the lake
bottom at the deepest part of the lake or a fixed depth in the hypolimnion of very deep lakes).
TN: Total nitrogen, measured in milligrams per liter at the lake surface. TN includes all forms of
nitrogen, including NOx (nitrite and nitrate) and NH4 (ammonia).
N:P Ratio: The ratio of total nitrogen to total phosphorus, unitless (mass ratio). This ratio helps
determine if a lake is phosphorous or nitrogen limited.
Chl.a (µg/L): Chlorophyll a, measured in micrograms per liter. Indicates the amount of algae in the
water column. This is an extracted chlorophyll measurement.
pH: A range from 0 to 14, with 0 being the most acidic and 14 being the most basic or alkaline. A
healthy lake generally ranges between 6.5 and 8.5.
Cond (µmho/cm): Specific conductance is a measure of the conductivity of water. A higher value
indicates the presence of more dissolved ions. High ion concentrations (> 250) usually indicate
hardwater, and low readings (< 125) usually show softwater.
Calcium (mg/L): Calcium, a component of lake buffering capacity (the ability to neutralize acid
inputs), as measured in milligrams per liter at the lake surface (1.5 meters below the surface).
Chloride (mg/L): Chloride, or chloride ions, as measured in milligrams per liter at the lake surface
(1.5 meters below the surface).
Upper Temp (°C): Surface temperature, measured in degrees Celsius.
Deep Temp (°C): Deep water temperature, measured in degrees Celsius.
BG Chl.a (µg/L): Chlorophyll a from blue-green algae, measured in micrograms per liter. This is an
“unextracted” estimate using a fluoroprobe. This result is different from the extracted chlorophyll
measurement described above.
HABs: Harmful Algal Blooms. Algal blooms that have the appearance of cyanobacteria (BGA).
BGA: Blue-green algae, also known as cyanobacteria.
Microcystin (µg/L): The most common HAB liver toxin; total microcystin above 20 micrograms per
liter indicates a “high toxin” bloom. However, ALL BGA blooms pose a potential health risk and
should be avoided.

Preliminary Engineering Report Town of Gorham Water Treatment Plant Improvements September 2021
MRB Group Project No. 0735.21001.000
APPENDIX H
CHLORINE CONTACT CT CALCULATIONS

MRB | groupProject Title: Town of Gorham Water Treatment Plant EvaluationProject No.: 0735.21001Date: August 5, 2021Engineer: J. Lang-Bentley
Objective:
References: Water and Wastewater Calculations Manual (Lin)EPA Guidance Manual, Disinfecting Profiling and Benchmarking
CT = Concentration*Contact TimeT = HRT = V/Q
ERT = HRT*BFCTcal = ERT*Cl2 Residual
Inactivation Ratio = CTcal/CTrequiredLog Inactivation = Log*Inactivation Ratio
Flow Rate 0.85 MGD587 gpm
pH 8.0 Based on recorded dataTemperature 1.7 deg-C Based on recorded data
Raw Water Intake DE Filters Clear WellVolume (gal) 414,172 555 9,284HRT (min) 706 1 16Baffling Factor 0.9 0.7 0.5ERT (min) 635 1 8Outlet Residual Chlorine (mg/L) 0.1 0.1 1.9CTcal (min) 63.5 0.1 15.0CT99.9 189 189 254 SUMMARY 3-Log 4-LogCT99.99 8 8 8 Log-Inactivation 1.2 39.3CTcal / CT99.9 0.34 0.00 0.06 DE Filter Credit 2.0 1.0CTcal / CT99.99 7.94 0.01 1.88 UV System Credit 4.0 0.53-Log Removal 1.01 0.00 0.18 TOTAL 7.2 40.84-Log Removal 31.76 0.03 7.52 RESULT Meets Criteria Meets Criteria
Flow Rate 0.94 MGD653 gpm
pH 8.0 Based on recorded dataTemperature 1.7 deg-C Based on recorded data
Raw Water Intake DE Filters Clear WellVolume (gal) 414,172 555 9,284HRT (min) 635 1 14Baffling Factor 0.9 0.7 0.5ERT (min) 571 1 7Outlet Residual Chlorine (mg/L) 0.1 0.1 1.9CTcal (min) 57.1 0.1 13.5CT99.9 189 189 254 SUMMARY 3-Log 4-LogCT99.99 8 8 8 Log-Inactivation 1.1 35.3CTcal / CT99.9 0.30 0.00 0.05 DE Filter Credit 2.0 1.0CTcal / CT99.99 7.14 0.01 1.69 UV System Credit 4.0 0.53-Log Removal 0.91 0.00 0.16 TOTAL 7.1 36.84-Log Removal 28.55 0.03 6.76 RESULT Meets Criteria Meets Criteria
Determine if proposed treated water storage meets 3-log inactivation for G. Lamblia and 4-log inactivation for viruses under existing and design peak flow loadings.
Existing Max Day
Design Max Day
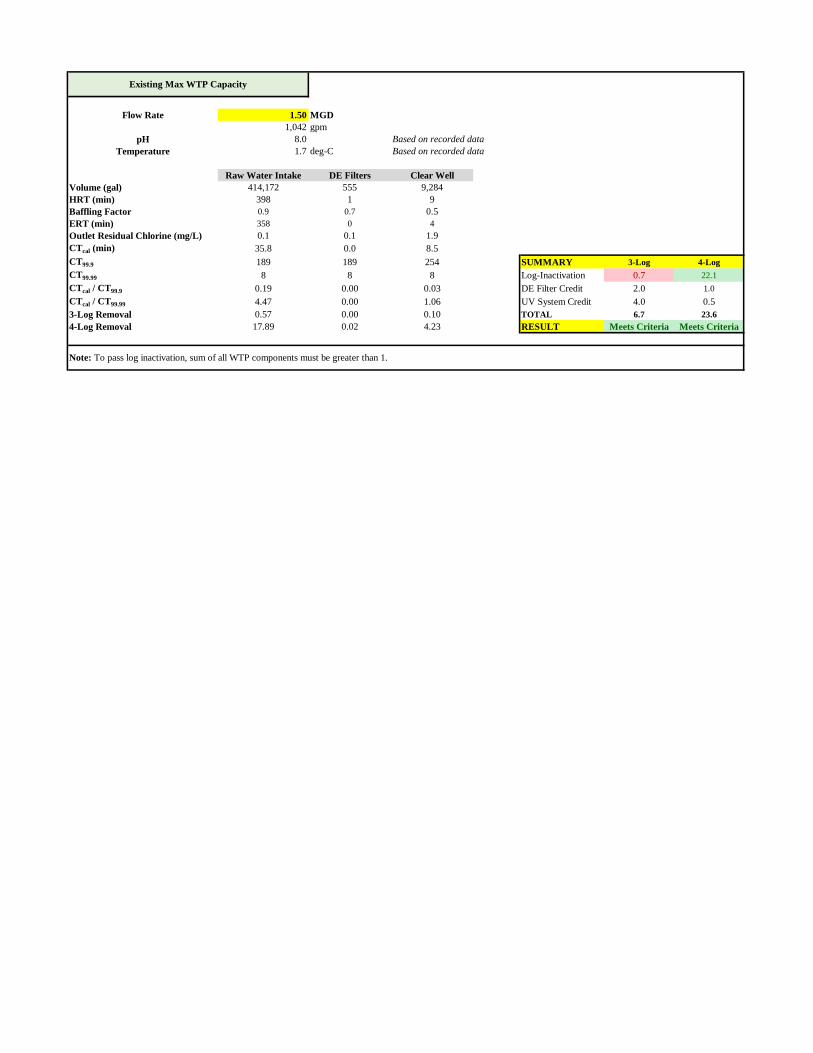
Flow Rate 1.50 MGD1,042 gpm
pH 8.0 Based on recorded dataTemperature 1.7 deg-C Based on recorded data
Raw Water Intake DE Filters Clear WellVolume (gal) 414,172 555 9,284HRT (min) 398 1 9Baffling Factor 0.9 0.7 0.5ERT (min) 358 0 4Outlet Residual Chlorine (mg/L) 0.1 0.1 1.9CTcal (min) 35.8 0.0 8.5CT99.9 189 189 254 SUMMARY 3-Log 4-LogCT99.99 8 8 8 Log-Inactivation 0.7 22.1CTcal / CT99.9 0.19 0.00 0.03 DE Filter Credit 2.0 1.0CTcal / CT99.99 4.47 0.00 1.06 UV System Credit 4.0 0.53-Log Removal 0.57 0.00 0.10 TOTAL 6.7 23.64-Log Removal 17.89 0.02 4.23 RESULT Meets Criteria Meets Criteria
Note: To pass log inactivation, sum of all WTP components must be greater than 1.
Existing Max WTP Capacity
Preliminary Engineering Report Town of Gorham Water Treatment Plant Improvements September 2021
MRB Group Project No. 0735.21001.000
APPENDIX I
FEMA FLOOD INSURANCE RATE MAP


Preliminary Engineering Report Town of Gorham Water Treatment Plant Improvements September 2021
MRB Group Project No. 0735.21001.000
APPENDIX J
CENSUS BUREAU DATA


Preliminary Engineering Report Town of Gorham Water Treatment Plant Improvements September 2021
MRB Group Project No. 0735.21001.000
APPENDIX K
ALTERNATIVE 1 – SYSTEM UPGRADES
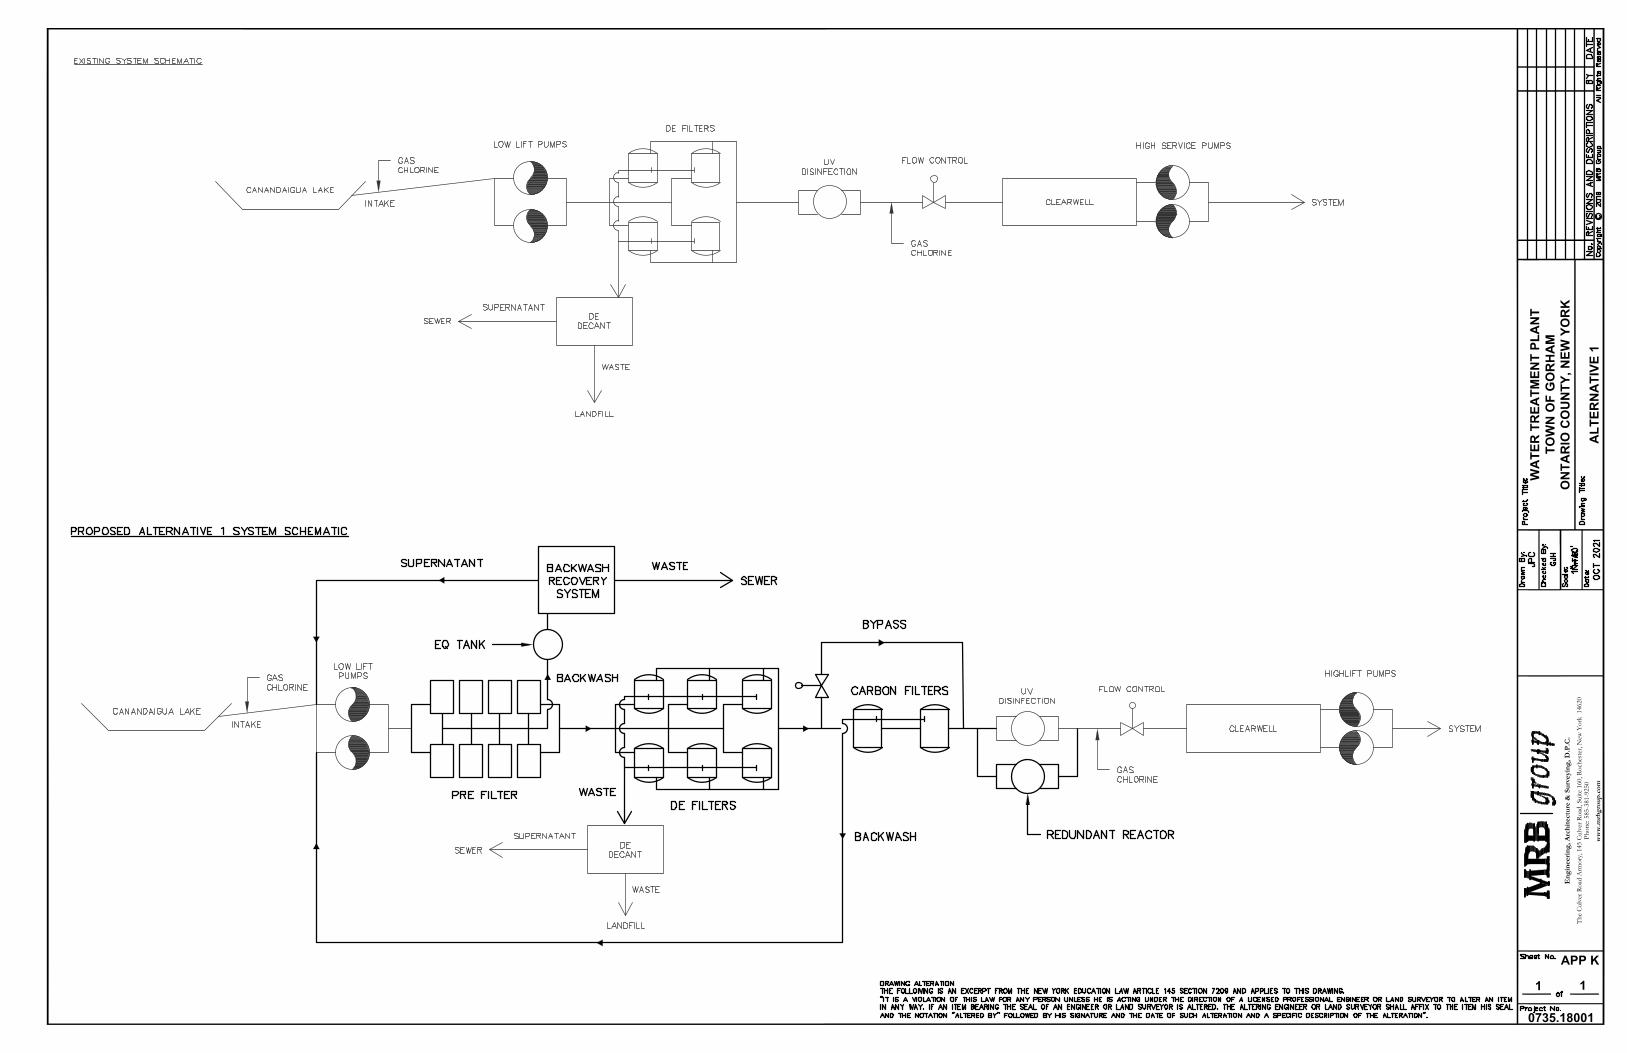
WA
TER
TR
EATM
ENT
PLA
NT
TOW
N O
F G
OR
HA
MO
NTA
RIO
CO
UN
TY, N
EW Y
OR
K
0735.18001
Eng
inee
ring,
Arc
hite
ctur
e &
Sur
veyi
ng, D
.P.C
.Th
e C
ulve
r Roa
d A
rmor
y, 1
45 C
ulve
r Roa
d, S
uite
160
, Roc
hest
er, N
ew Y
ork
146
20Ph
one:
585
-381
-925
0
ww
w.m
rbg
rou
p.c
om
1 1
APP K
ALT
ERN
ATI
VE 1


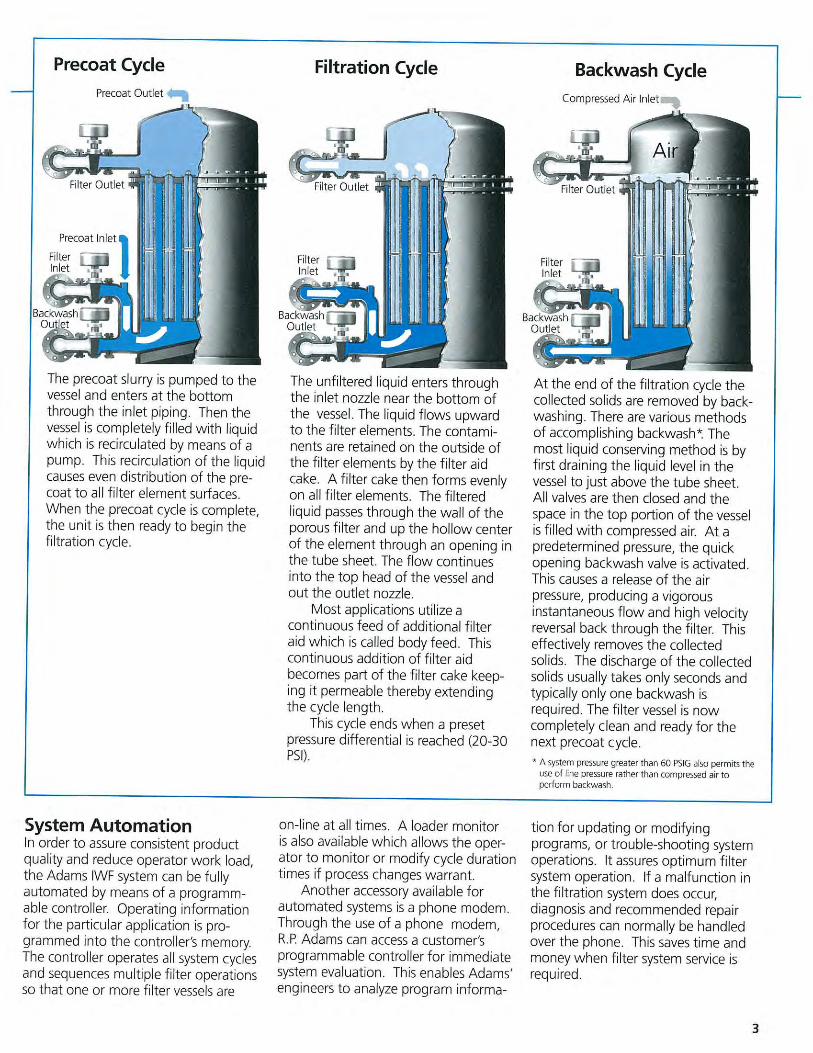

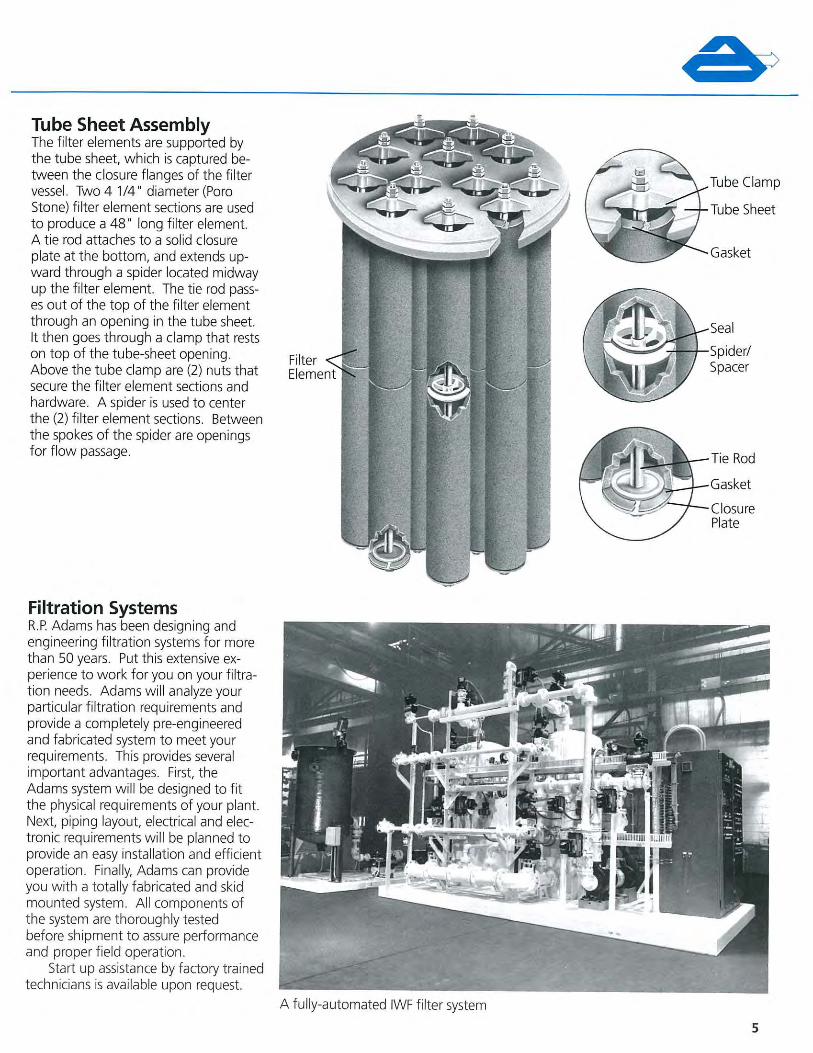

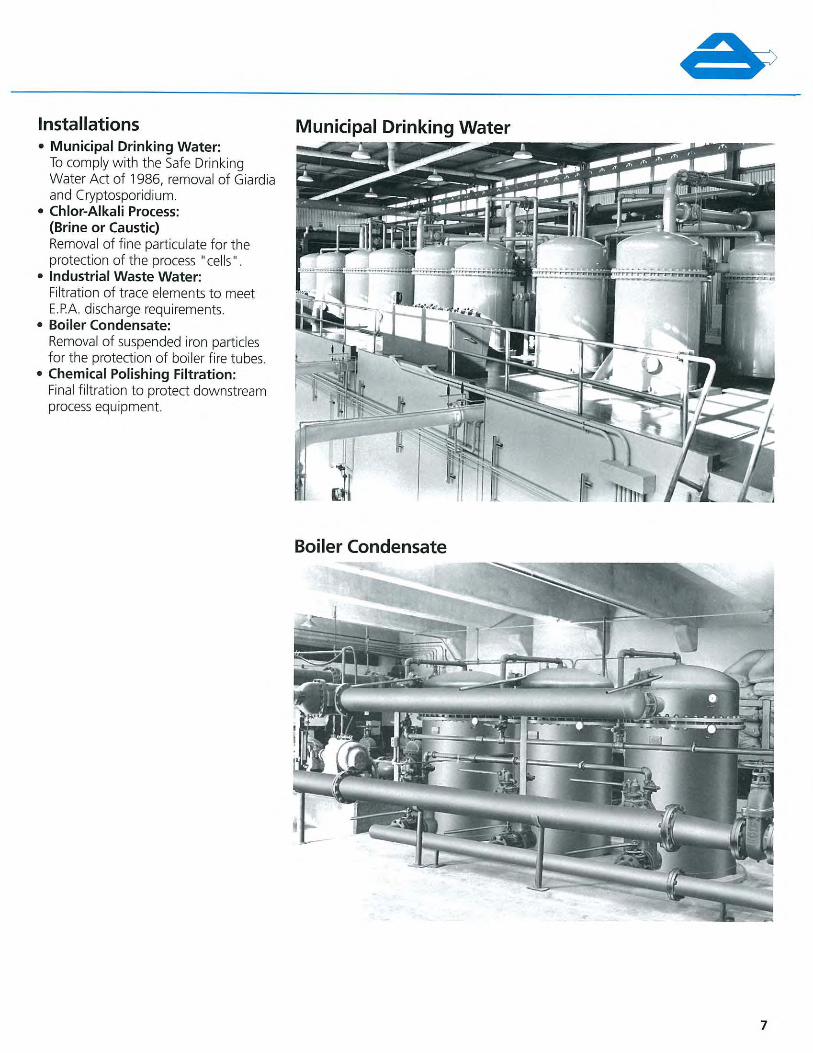


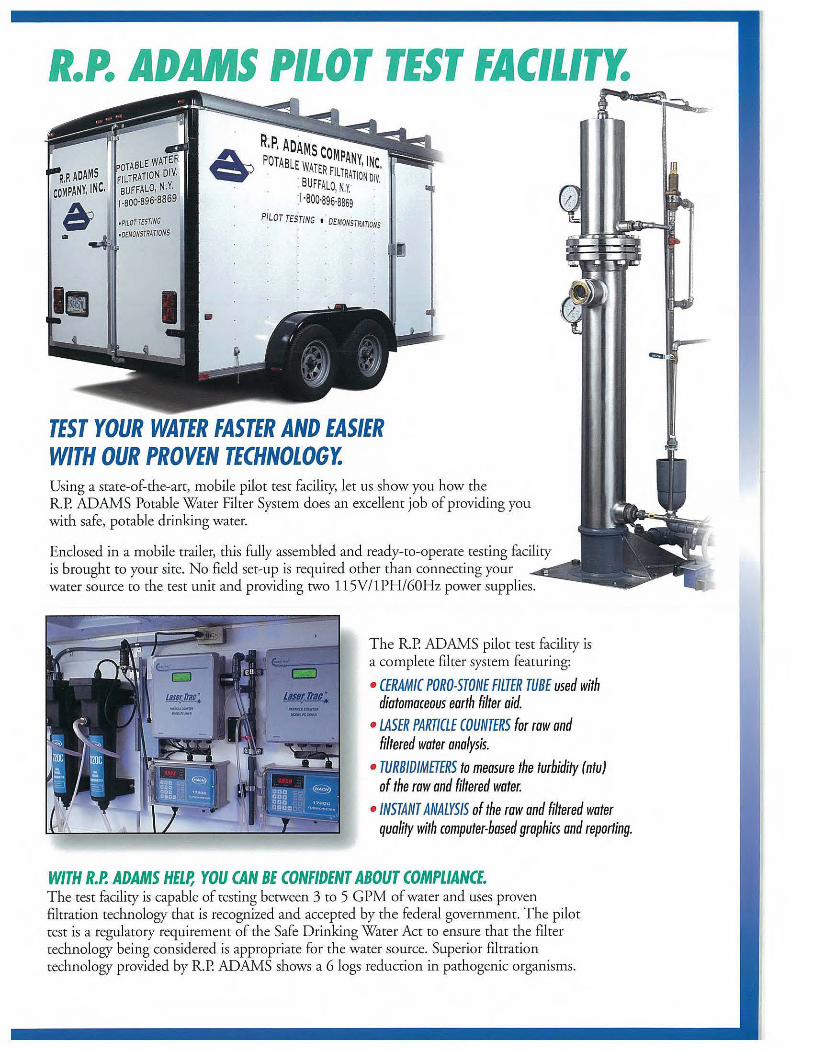

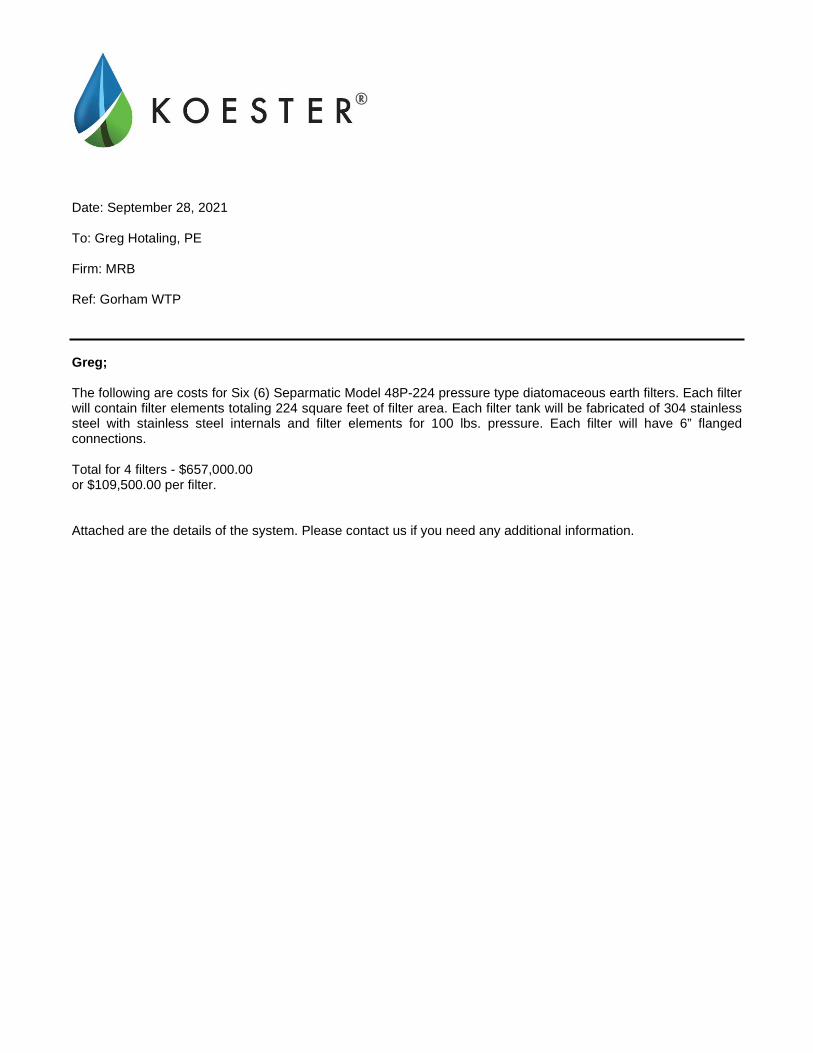
Date: September 28, 2021
To: Greg Hotaling, PE
Firm: MRB
Ref: Gorham WTP
Greg;
The following are costs for Six (6) Separmatic Model 48P-224 pressure type diatomaceous earth filters. Each filter will contain filter elements totaling 224 square feet of filter area. Each filter tank will be fabricated of 304 stainless steel with stainless steel internals and filter elements for 100 lbs. pressure. Each filter will have 6” flanged connections.
Total for 4 filters - $657,000.00 or $109,500.00 per filter.
Attached are the details of the system. Please contact us if you need any additional information.
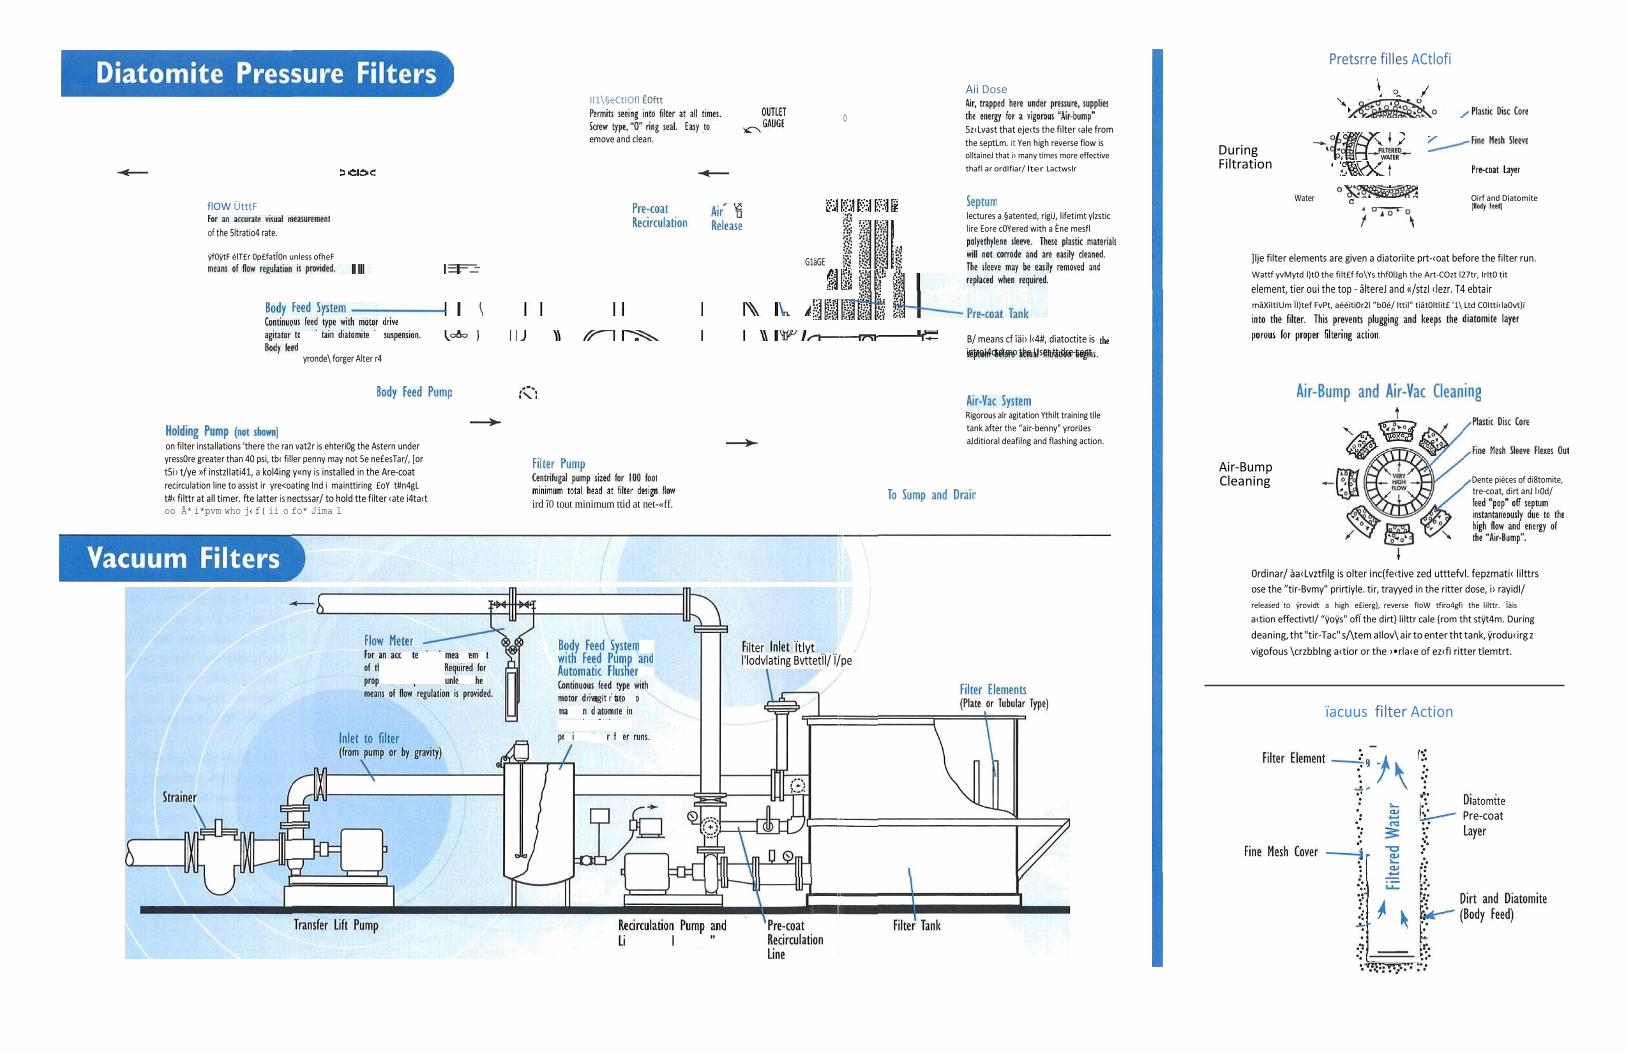
Pretsrre filles ACtlofi
flOW ÜtttF
of the 5ltratio4 rate.
II1\§eCtIOfl Ê0ftt
0
emove and clean.
Aii Dose
5z‹Lvast that eje‹ts the filter ‹ale from the septLm. it Yen high reverse flow is olltaineJ that i› many times more effective thafl ar ordIfiar/ lter Lactwslr
lectures a §atented, rigiJ, lifetimt ylzstic lire Eore c0Yered with a Ène mesfl
During Filtration
Water
Oirf and Diatomite
ÿf0ÿtF élT£r 0p£fatÎ0n unless ofheF
yronde\ forger Alter r4
on filter installations 'there the ran vat2r is ehteri0g the Astern under yress0re greater than 40 psi, tb‹ filler penny may not 5e ne£esTar/, [or t5i› t/ye »f instzIIati41, a kol4ing y«ny is installed in the Are-coat recirculation line to assist ir yre<oating Ind i mainttiring £oY t#n4gL t#‹ filttr at all timer. fte latter is nectssar/ to hold tte filter ‹ate i4ta‹t oo Â* i*pvm who j‹f( ii o fo* Jima l
ird î0 tout minimum ttid at net-«ff.
G1äGE
B/ means cf îäi› l‹4#, diatoctite is introJ4ctd mo the User tt dre-cent
Rigorous alr agitation Ythilt training tile tank after the “air-benny" yroriJes aJditioral deafilng and flashing action.
]lje filter elements are given a diatoriite prt-‹oat before the filter run. Wattf yvMytd l)t0 the filt£f fo\Ys thf0lJgh the Art-COzt l27tr, IrIt0 tit
element, tier oui the top - âltereJ and «/stzI ‹lezr. T4 ebtair mâXiItIUm Ïl)tef FvPt, aééiti0r2l ”b0é/ lttil" tiât0ltlit£ ’1\ Ltd C0Itti‹la0vt)ï
Air-Bump Cleaning
0rdinar/ àa‹Lvztfilg is olter inc(fe‹tive zed utttefvl. fepzmati‹ lilttrs ose the ”tir-Bvmy" prirtiyle. tir, trayyed in the ritter dose, i› rayidI/ released to ÿrovidt a high e£ierg}, reverse fIoW tfiro4gfi the lilttr. Ïàis
a‹tion effectivtI/ “ÿoÿs" ofÏ the dirt} lilttr cale (rom tht stÿt4m. During deaning, tht "tir-Tac" s/\tem aIlov\ air to enter tht tank, ÿrodu‹irg z vigofous \crzbblng a‹tior or the ›•rla‹e of ez‹fi ritter tlemtrt.
ïacuus filter Action

13-2 Bulletin 671-1
DIATOMITE PRE S S URE WATER FILTERS
• SWIMMING POOLS . . . for Top Efficiency • PROCESS WATER . . . for High Polish Water e CONDENSATE . . . for removal of Oil and Suspended
Metal Oxides e O I L FI E LD F LOOD ING . . . for High Clarity Injection Water • COOLING TOWERS . . to Remove Suspended Solids e POTABLE WAT ER . . . for Consistent Quality
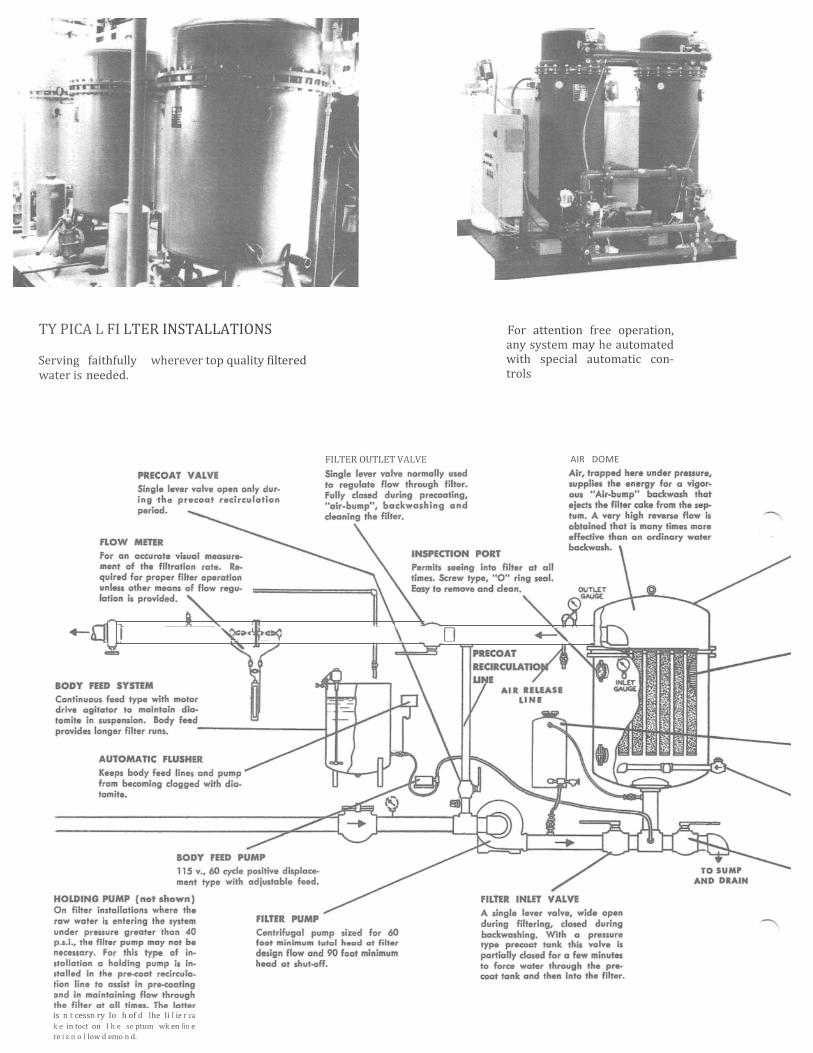
TY PICA L FI LTER INSTALLATIONS
Serving faithfully wherever top quality filtered water is needed.
is n t cessn ry Io h of d Ihe Ii I ie r ca k e in toct on I h e se ptum wk en fin e re i s n o I low d emo n d.
FILTER OUTLET VALVE
For attention free operation, any system may he automated with special automatic con- trols
AIR DOME

DURABLE PLASTIC " TUBU LAR ELEMENTS
(SEPT UM)
LIFETIME PLASTIC D ISC CORE . Tough , durable. will not corrode. Lasts
PLASTIC CLOTH SLEEVE — Seam- less orlon or polyethylene. Flexible, str‹›ng, woven inert materials that wi11 not corrode. rot or mildew. Flex in f ight agzins i the core during the I i Iter run, then I lex out with the air bump backw ash . This •'e• • •«'•• ”r t- off” the filter cake and keeps the fabric mtsh open and clear. This means lonke r f il ter runs.
Mu ltiple units may be combined to provide flexi bility for any requirement.
REMOVABLE — Each septumn *rmovv Gis wichout moving chs nubc shceK
I.IGHT &£tGHT — Only I o Jbs. for a 3 fooc length. Exsy co hgndlc. Lop'cr
STAINLESS STEEL TIE RODS — Eliminates corrosion and rust.
FILTER TANK Heovy go u ge steel, 1 00 ps work- ing pressu re, ISO pst test pres- sure. I nte r ior ond exterior sond - blo sfed, then three coots of epoxy resin for temperotures up to ) 40 ° F. Above ] 40 ° F. speciol coatings
U I II rat i o n
THE FILTER ACTION
SEPTUM
Feotures o potente d, rigid, life- time plostic disc core covered with o fine mesh polyethylene slaeve. These plastic moter ials will not corrode ond ore eosily cleoned. Sleeve moy be aosily removed ond re p I o ce d wh en required.
PRECOAI TAt'4K
By meo ns of this ton k diotomite is introduced into the filter to precoat tke septum before octuol f ilfrofion beg ins.
AIR-VAC SYSTEM V g o ro us o i r o g it o I io n wh i Ie dro ining the fonk ofrer the "o ir- bump" provides oddition•l cleon- ing ond II ushin g oct‹on.
AIR - BUMP BACKWASH VALVE Q ui ck o p en i n g I eve r o p e ro I e d vo lve ollowing o n explosive re- verse flow ro the droin. ResuIts in ro pid, effective seplum cleoning.
Tlic filter eleineri ts arc given a diatomite pi‘ecoat bcfore the filter run. Water pumped into the tiller flows through the precoat layer, into t he element . tl ten out the top - filtered and crystal clear. To obtain ma ximuir filter r uns, additional “ hody fecd” diatomite is fed con- t inuously in to the filter. This pt events plugging and keeps the diatomite layer porcatis for proper filtering action.
AI R-BUMP AND AI R-VAC CLEANING
Inet cad o f ordita a ry backvvasliini;, svhic li is oft en ineffective . Sep- armaiic filters use the ’Af R-BUMP” principle. A ir, trapped in the ti Iter dome, is rclcased sud derily to provide a high energy, reve rse l’low tlii ougli the ti lter . This action effectively pops off the dirty filter cake. our ing cleaning. the “.61R-VAC” system allows air to enter the ta nk, prod uciiig a vig‹irous scrubbing action on the surface of’ each filter element.
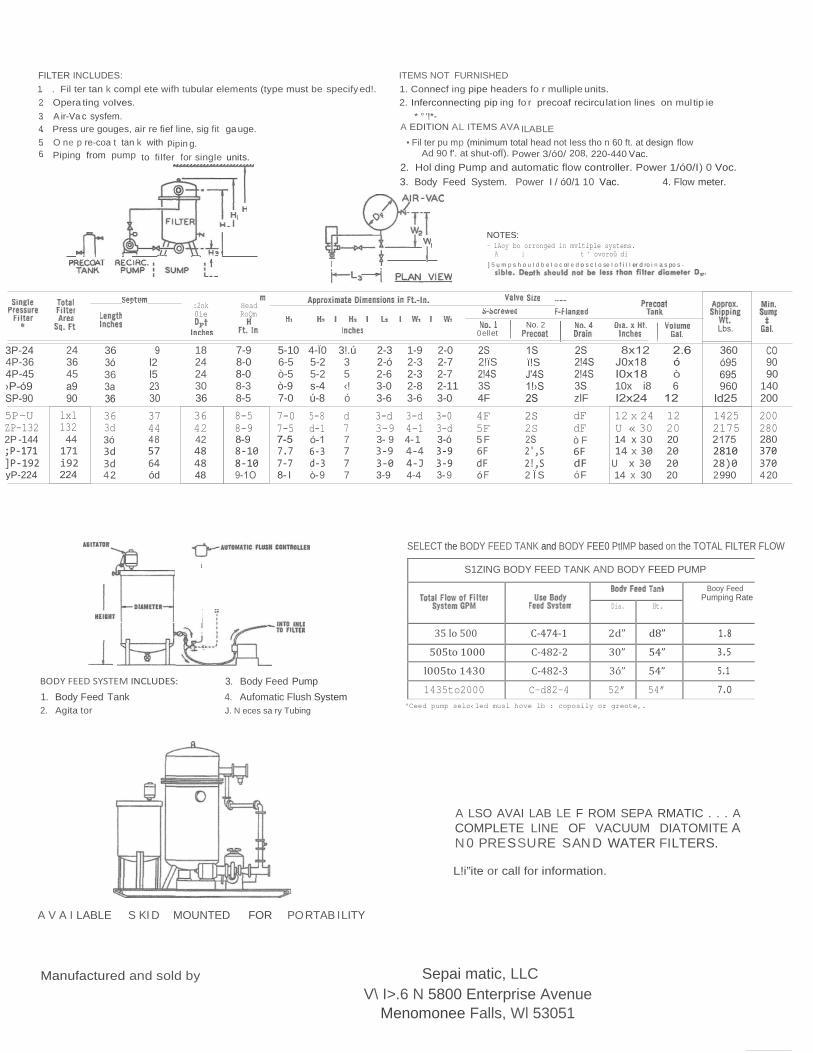
FILTER INCLUDES: ITEMS NOT FURNISHED 1. . Fil ter tan k compl ete wifh tubular elements (type must be specify ed!. 1. Connecf ing pipe headers fo r mulliple units. 2. Opera ting voIves. 2. Inferconnecting pip ing fo r precoaf recircu lat ion lines on mul tip ie 3. A ir-Va c sysfem. * ° '!*- 4. Press ure gouges, air re fief line, sig fit ga uge. A EDITION AL ITEMS AVA ILABLE 5. O ne p re-coa t tan k with pipin g. • Fil ter pu mp (minimum total head not Iess tho n 60 ft. at design flow 6. Piping from pump to fiIfer for singIe units. Ad 90 f'. at shut-ofÏ). Power 3/ó0/ 208, 220-440 Vac.
2. Hol ding Pump and automatic flow controller. Power 1/ó0/I ) 0 Voc. 3. Body Feed System. Power I / ó0/1 10 Vac. 4. Flow meter.
NOTES: - lAoy bo orronged in mvltiple systems.
A i t ’ ovoroü di ] 5 u m p s h o u I d b e I o c oI e d o s c I o se I o f i I I er d ro i n a s po s -
SELECT the BODY FEED TANK and BODY FEE0 PtlMP based on the TOTAL FILTER FLOW
BODY FEED SYSTEM INCLUDES:
1. Body Feed Tank 2. Ag ita tor
3. Body Feed Pump 4. Aufomatic Flush System J. N eces sa ry Tubing
"Ceed pump selo‹1ed musl hove lb : coposily or greote,.
A LSO AVAI LAB LE F ROM SEPA RMATIC . . . A COMPLETE LINE OF VACUUM DIATOMITE A N 0 PRE S S U RE S AN D WATER FI LTERS.
L!i”ite or call for information.
A V A I LABLE S KI D MOUNTED FOR PO RTAB I LITY
Manufactured and sold by Sepai matic, LLC V\ I>.6 N 5800 Enterprise Avenue
Menomonee Falls, Wl 53051
3P-24 4P-36 4P-45
5P-U
2P -144
yP-224
90
140 200
4 20
2810 28)0 2 990
14 x 3 0 20 14 x 30 20 U x 30 20 14 x 30 20
ò F 6F
ó F
2 Ï S
4F 5F 5 F
7 3- 9 4- 1 3-ó
7 3-9 4-4
42 42 48 48 48
57
ód
3ó 3d 3d 4 2
i92
360
960
10x i8 6
zlF
ï!S
2!ïS
4F
5-10 4-Ï0 3!.ú 2-3 1-9 2-0 6-5 5-2 3 2-ó 2-3 2-7 ò-5 5-2 5 2-6 2-3 2-7 ò-9 s-4 ‹! 3-0 2-8 2-11 7-0 ú-8 ó 3-6 3-6 3-0
7-9 8-0 8-0 8-3 8-5
18 24 24 30 36
l2 l5
36
36
24 36 45
0 ell et No. 2
S1ZING BODY FEED TANK AND BODY FEED PUMP
Booy Feed Pumping Rate
Dia. Ht.
35 lo 500 C-474-1 2d” d8” 1.8
505to 1000 C-482-2 30” 54” 3.5
l005to 1430 C-482-3 3ó” 54” 5.1
1435to2000 C-d82-4 52” 54” 7.O

lor high trrbidit/ environments, \eparr›atit suggesu ik line of sand and multi-media filten as
roUghiNg filttrs țri0r (0 final p0liSÎiing With 0Ur prt-C02t filttrs. TheSt fil(tKS drt
414.466.5200 wwwaeparmaticcom
pr0viding tÎie Îiigb£S( qlJalitj' effllJtfl( f0r th£ l0wtft upfr0nt
inytStlTlent afld ITliflilTlal 0g£Fa(iilg Âfld MaiflttnaflCt C0sk.
F0r IOW t‹lrbidit) applicati0ilS, f£pBrl lztit 0IÎtrS 2 t0lTlplttt
t f lt
fitld-ttst£d and SUcctfffull/ irlS(Âll£d in lTlan/ locations With
ÂYailablt ifl tUSt0lTl tngin£ertd siI£S Ând fI0W r2ttS tfld With a YaFitt)' 0(
l0W 0țeFating 4fld Mairl(tilarlCt C0StS. Alo 0th£r
I\ORI f 0f\ 0t/fl(/,
I£ndale, Julif0l”rlia

24
300 10
18
3g X ]b X /g
80 x 70 x 70
7-9
8-9
217S
200
lover flex ctcs r«soctn4ed for high sirtiidit/ eattr and tace oil
ftandard. Hightr flows ntts
Tt450 ¥U00
7000
J10 x 70 x 70 l20 x 70 x 70
500
1600
S‹Lnit‹Bo4 Fee*Ta *an0Bo Fe‹4*‹m *os *o›i*eToial*ilierFow
g00t’ £2ED SYSTEM INCLUDES -
4. Aalom4lic Flush System
fGlf/‹T0E ADTOhATC1lB›f 1OlTROf(fk
f2FA&3ATIC' Separmatic, LLC W 146 N 5800 Enterprise Avenue
fp1smGfi)t
5ee4Sptem
GLH ggmet0; N9 §t

Menomonee Falls, WI 53051

4 2 1
S EPTiJM DATA MODEL FLOW RATE NU MBER OF NUMBE2 GPM SEFTUMS
48F-192 192
LEIJG TH INCHES
INLET CA iJG
INSPtÜTION PORT
OLTLEÏ 6" NPS
AlQ-VAC SYSTEV
INSPECTIOÜ
INI ET ó” NPS
SEPAR MATIC LLC
PRESSURE FILTR/,TION TANK ASSEMBLY
48P-XXX
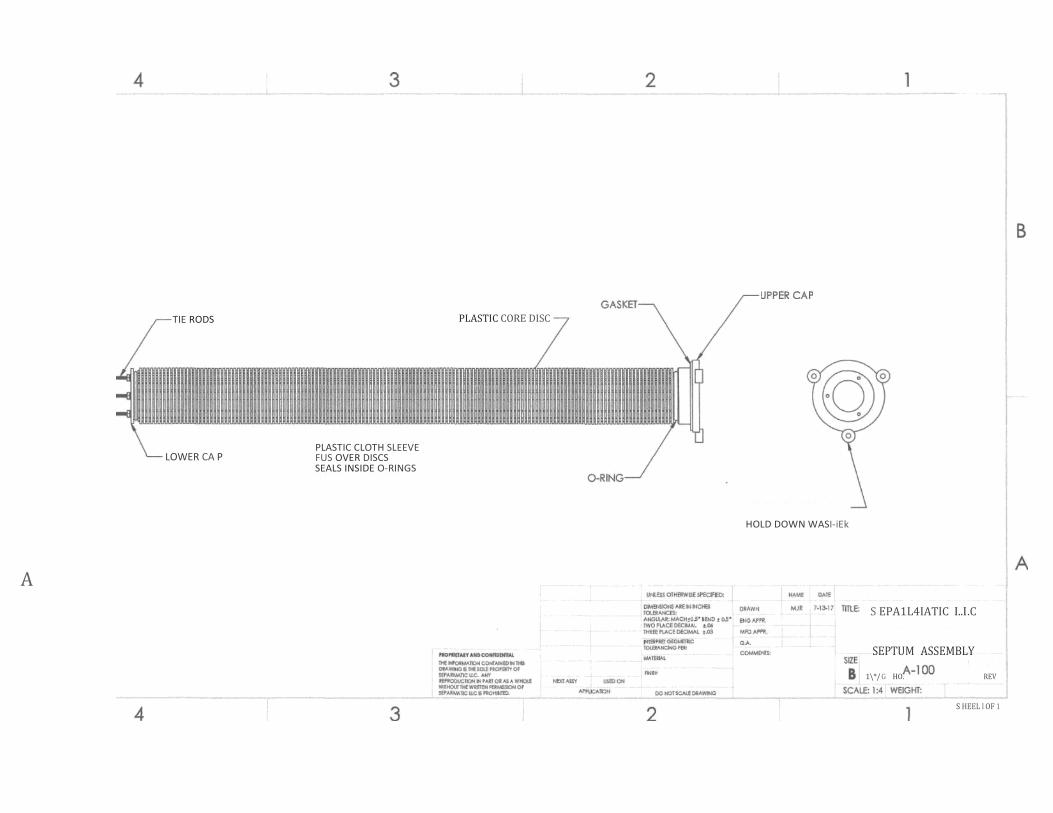
TIE RODS
LOWER CA P
PLASTIC CLOTH SLEEVE FUS OVER DISCS SEALS INSIDE O-RINGS
PLASTIC CORE DISC
HOLD DOWN WASI-iEk
A S EPA1L4IATIC I..I .C
SEPTUM ASSEMBLY
1\*/ G HO. REV
S HEEL I OF 1
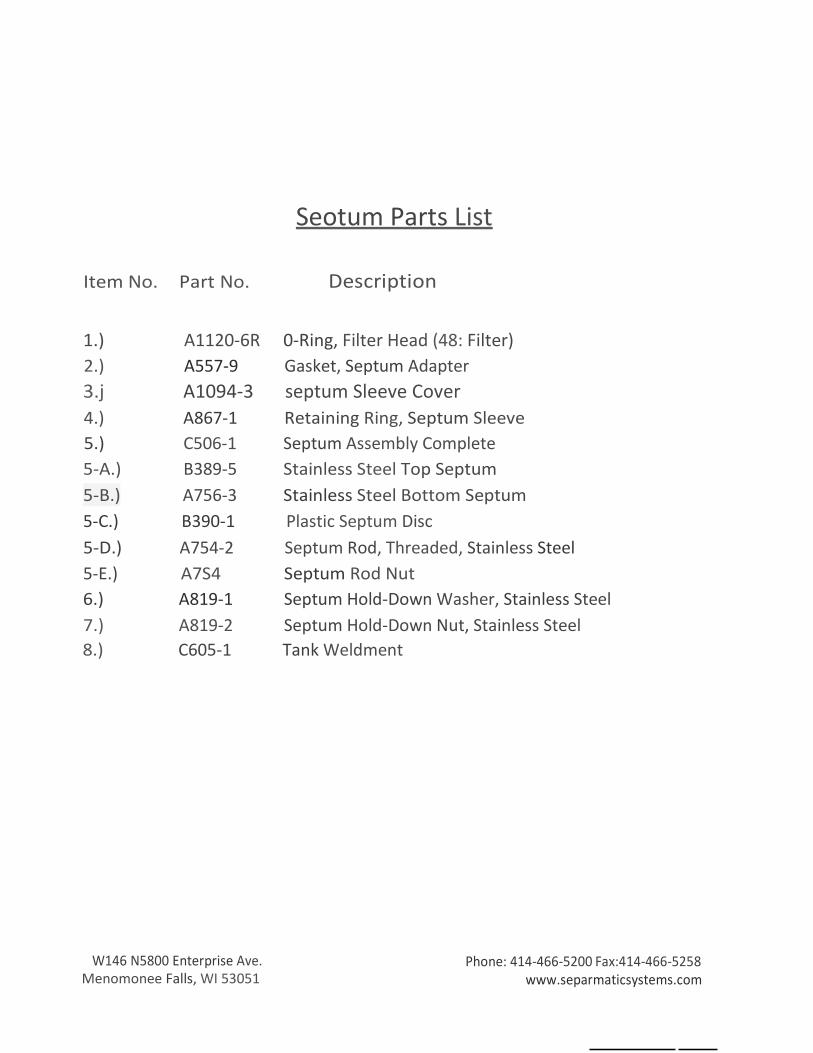
Seotum Parts List
Item No. Part No. Description
1.) A1120-6R 0-Ring, Filter Head (48: Filter) 2.) A557-9 Gasket, Septum Adapter 3.j A1094-3 septum Sleeve Cover 4.) A867-1 Retaining Ring, Septum Sleeve 5.) C506-1 Septum Assembly Complete 5-A.) B389-5 Stainless Steel Top Septum 5-B.) A756-3 Stainless Steel Bottom Septum 5-C.) B390-1 Plastic Septum Disc 5-D.) A754-2 Septum Rod, Threaded, Stainless Steel 5-E.) A7S4 Septum Rod Nut 6.) A819-1 Septum Hold-Down Washer, Stainless Steel 7.) A819-2 Septum Hold-Down Nut, Stainless Steel 8.) C605-1 Tank Weldment
W146 N5800 Enterprise Ave. Menomonee Falls, WI 53051
Phone: 414-466-5200 Fax:414-466-5258
www.separmaticsystems.com


PROPOSAL FOR THE GORHAM EXPANSION, NY
The TrojanUVSwift™ is currently being used to treat over 2 billion gallons a day in municipal drinking water plants around the world. With over 500 installed reactors, the TrojanUVSwift™ has demonstrated
its proven, validated solutions for disinfection and taste & odor treatment.

Gorham Expansion, NY - 2 -
We are pleased to provide the following TrojanUVSwift™ proposal for the Gorham Expansion, NY project.
The TrojanUVSwiftTM is well suited to meet current and upcoming regulations to protect the public from various pathogens including the chlorine-resistant Cryptosporidium and Giardia. The system uses high-intensity, medium- pressure lamps to minimize footprint and headloss. The ActiClean™ cleaning system meets NSF 60/61 compliance and eliminates routine quartz cleaning. All Trojan installations are supported by a global network of certified Service Representatives, providing local service and support.
The TrojanUVSwiftTM system can be initially designed to enable a simple and cost-effective upgrade in the future to a UV-oxidation system for the treatment of chemical contaminants. In addition to disinfection, the UV-oxidation process can be used for taste and odor treatment as well as the destruction of pesticides, volatile organic compounds, and pharmaceuticals/personal care products. Contact your Trojan Representative for more information.
Please do not hesitate to call us if you have any questions regarding this proposal. Thank you for the opportunity to quote the TrojanUVSwift™ and we look forward to working with you on this project.
With best regards,
John Faber 3020 Gore Road London, Ontario N5V 4T7 (519) 457-3400 ext. 2389 [email protected]
Local Representative: Koester Associates, Inc. 3101 Seneca Turnpike Canastota, NY 13032 (315) 697-3800
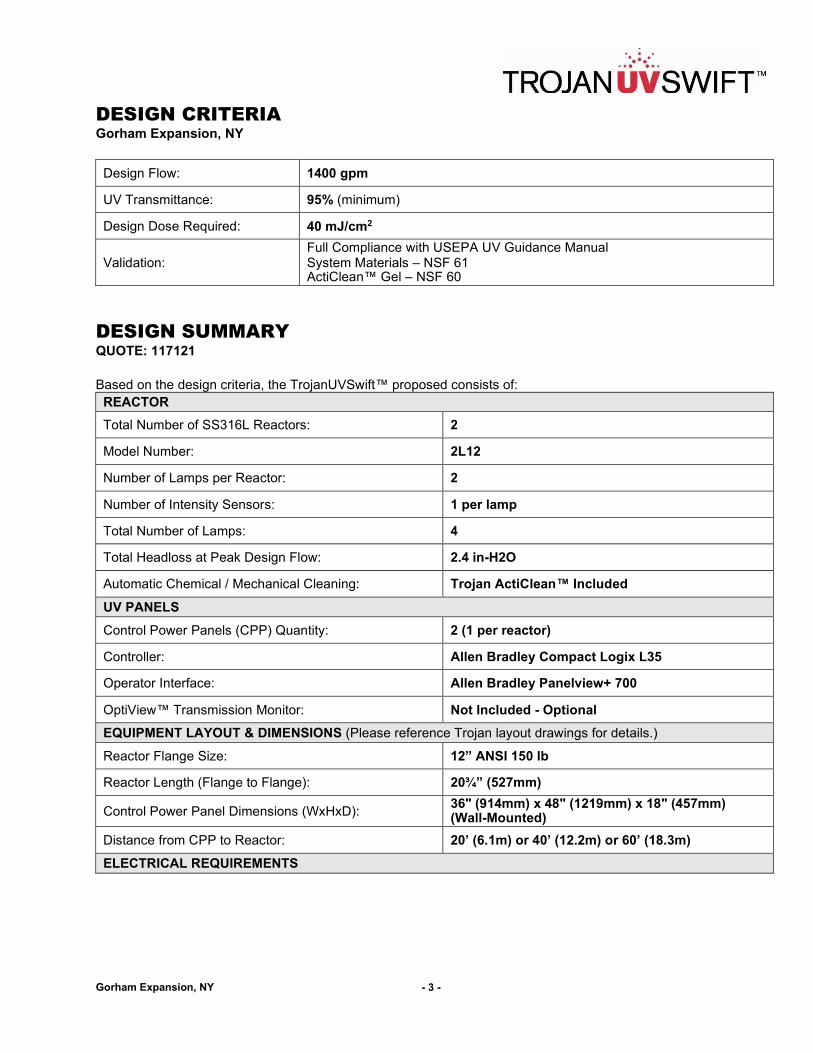
Gorham Expansion, NY - 3 -
DESIGN CRITERIA Gorham Expansion, NY
Design Flow: 1400 gpm
UV Transmittance: 95% (minimum)
Design Dose Required: 40 mJ/cm2
Validation:
Full Compliance with USEPA UV Guidance Manual System Materials – NSF 61 ActiClean™ Gel – NSF 60
DESIGN SUMMARY QUOTE: 117121
Based on the design criteria, the TrojanUVSwift™ proposed consists of:
REACTOR
Total Number of SS316L Reactors: 2
Model Number: 2L12
Number of Lamps per Reactor: 2
Number of Intensity Sensors: 1 per lamp
Total Number of Lamps: 4
Total Headloss at Peak Design Flow: 2.4 in-H2O
Automatic Chemical / Mechanical Cleaning: Trojan ActiClean™ Included
UV PANELS
Control Power Panels (CPP) Quantity: 2 (1 per reactor)
Controller: Allen Bradley Compact Logix L35
Operator Interface: Allen Bradley Panelview+ 700
OptiView™ Transmission Monitor: Not Included - Optional
EQUIPMENT LAYOUT & DIMENSIONS (Please reference Trojan layout drawings for details.)
Reactor Flange Size: 12” ANSI 150 lb
Reactor Length (Flange to Flange): 20¾” (527mm)
Control Power Panel Dimensions (WxHxD): 36" (914mm) x 48" (1219mm) x 18" (457mm) (Wall-Mounted)
Distance from CPP to Reactor: 20’ (6.1m) or 40’ (12.2m) or 60’ (18.3m)
ELECTRICAL REQUIREMENTS

Gorham Expansion, NY - 4 -
1. Each Control Power Panel (one per reactor) requires an electrical service of one (1) 480V, 60Hz, 3-phase, 4- wire + ground, 7.6 kVA.
2. The OptiView™ Panel (optional) requires an electrical service of one (1) 120V, single phase, 2 wire + ground, 250VA.
3. Electrical disconnects required per local code are not included in this proposal.

Gorham Expansion, NY - 5 -
Total Capital Cost: $185,000 (USD)
COMMERCIAL INFORMATION
This price excludes any taxes that may be applicable and is valid for 90 days from the date of this letter.
EQUIPMENT WARRANTEES
1. Trojan Technologies warrants all components of the system (excluding UV lamps) against faulty workmanship and materials for a period of 12 months from date of start-up or 18 months after shipment, which ever comes first.
2. UV lamps purchased are warranted for 5,000 hours of operation or 3 years from shipment, whichever comes first. The warranty is pro-rated after 3,000 hours of operation. This means that if a lamp fails prior to 3,000 hours of use, a new lamp is provided at no charge.
3. Electronic ballasts are warranted for 5 years, pro-rated after 1 year.
Preliminary Engineering Report Town of Gorham Water Treatment Plant Improvements September 2021
MRB Group Project No. 0735.21001.000
APPENDIX L
ALTERNATIVE 2 – MICROFILTRATION PACKAGE PLANT

WA
TER
TR
EATM
ENT
PLA
NT
TOW
N O
F G
OR
HA
MO
NTA
RIO
CO
UN
TY, N
EW Y
OR
K
0735.18001
Eng
inee
ring,
Arc
hite
ctur
e &
Sur
veyi
ng, D
.P.C
.Th
e C
ulve
r Roa
d A
rmor
y, 1
45 C
ulve
r Roa
d, S
uite
160
, Roc
hest
er, N
ew Y
ork
146
20Ph
one:
585
-381
-925
0
ww
w.m
rbg
rou
p.c
om
1 1
APP L
ALT
ERN
ATI
VE 2
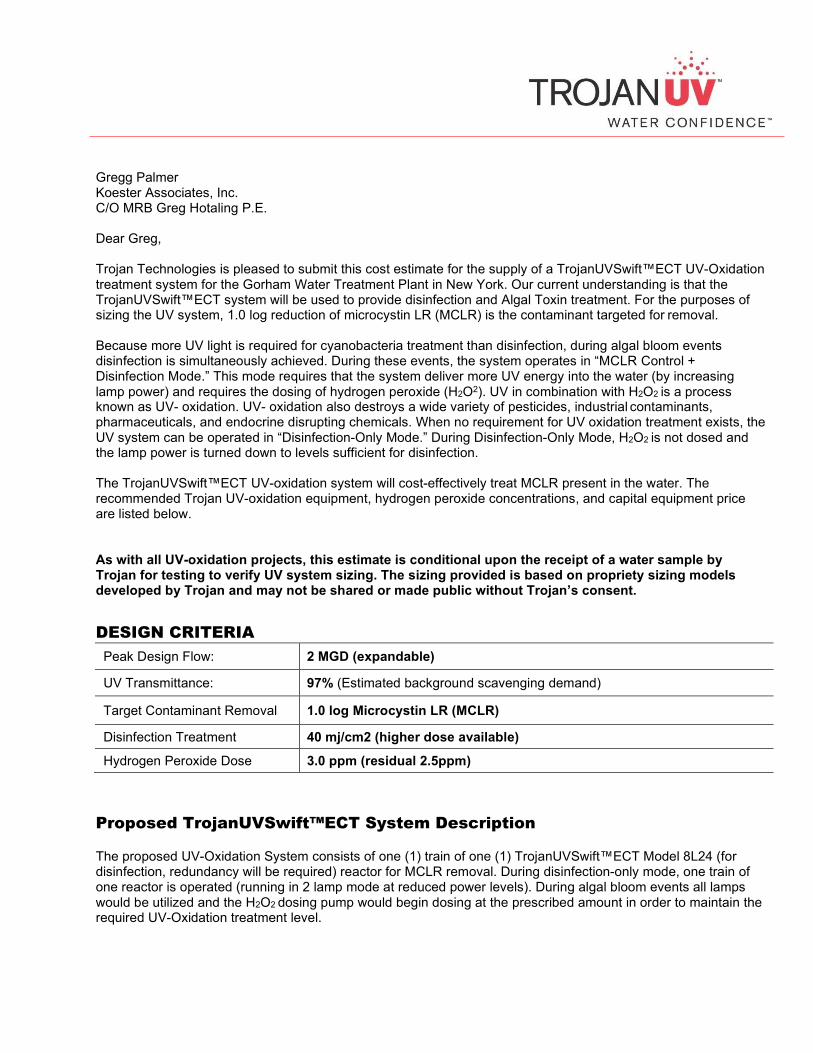
Gregg Palmer Koester Associates, Inc. C/O MRB Greg Hotaling P.E.
Dear Greg,
Trojan Technologies is pleased to submit this cost estimate for the supply of a TrojanUVSwift™ECT UV-Oxidation treatment system for the Gorham Water Treatment Plant in New York. Our current understanding is that the TrojanUVSwift™ECT system will be used to provide disinfection and Algal Toxin treatment. For the purposes of sizing the UV system, 1.0 log reduction of microcystin LR (MCLR) is the contaminant targeted for removal.
Because more UV light is required for cyanobacteria treatment than disinfection, during algal bloom events disinfection is simultaneously achieved. During these events, the system operates in “MCLR Control + Disinfection Mode.” This mode requires that the system deliver more UV energy into the water (by increasing lamp power) and requires the dosing of hydrogen peroxide (H2O2). UV in combination with H2O2 is a process known as UV- oxidation. UV- oxidation also destroys a wide variety of pesticides, industrial contaminants, pharmaceuticals, and endocrine disrupting chemicals. When no requirement for UV oxidation treatment exists, the UV system can be operated in “Disinfection-Only Mode.” During Disinfection-Only Mode, H2O2 is not dosed and the lamp power is turned down to levels sufficient for disinfection.
The TrojanUVSwift™ECT UV-oxidation system will cost-effectively treat MCLR present in the water. The recommended Trojan UV-oxidation equipment, hydrogen peroxide concentrations, and capital equipment price are listed below.
As with all UV-oxidation projects, this estimate is conditional upon the receipt of a water sample by Trojan for testing to verify UV system sizing. The sizing provided is based on propriety sizing models developed by Trojan and may not be shared or made public without Trojan’s consent.
DESIGN CRITERIA
Peak Design Flow: 2 MGD (expandable)
UV Transmittance: 97% (Estimated background scavenging demand)
Target Contaminant Removal 1.0 log Microcystin LR (MCLR)
Disinfection Treatment 40 mj/cm2 (higher dose available)
Hydrogen Peroxide Dose 3.0 ppm (residual 2.5ppm)
Proposed TrojanUVSwift™ECT System Description
The proposed UV-Oxidation System consists of one (1) train of one (1) TrojanUVSwift™ECT Model 8L24 (for disinfection, redundancy will be required) reactor for MCLR removal. During disinfection-only mode, one train of one reactor is operated (running in 2 lamp mode at reduced power levels). During algal bloom events all lamps would be utilized and the H2O2 dosing pump would begin dosing at the prescribed amount in order to maintain the required UV-Oxidation treatment level.
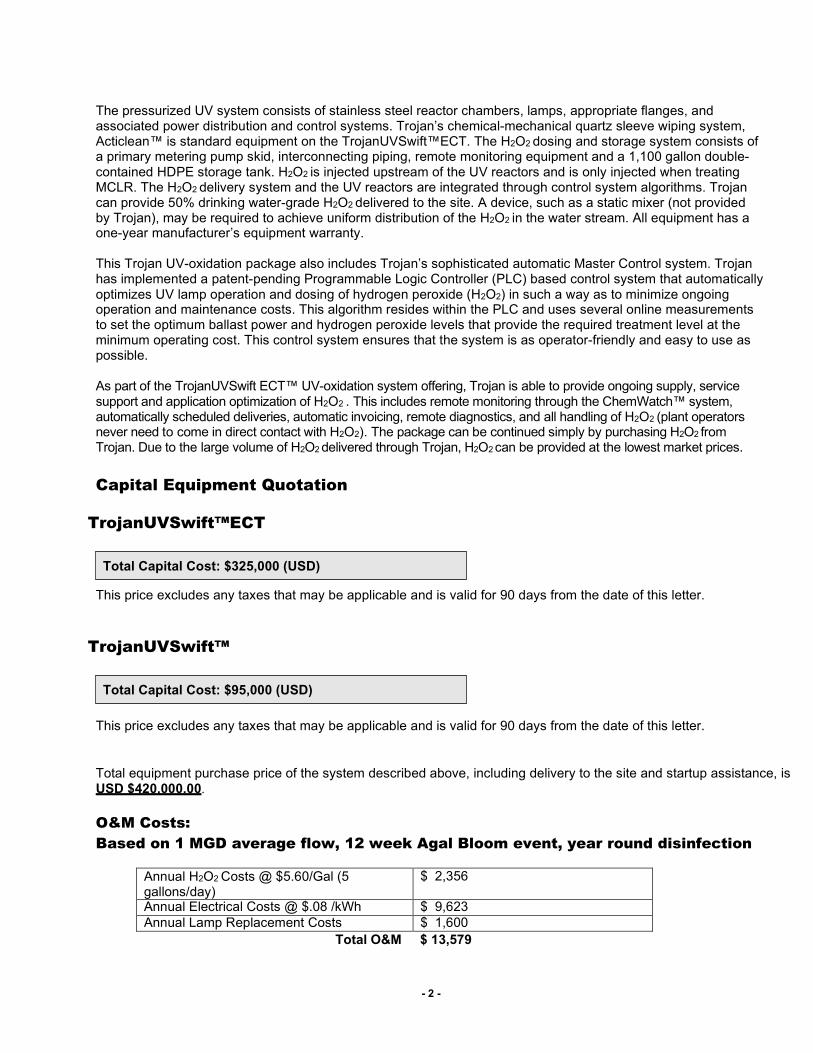
- 2 -
Total Capital Cost: $325,000 (USD)
Total Capital Cost: $95,000 (USD)
The pressurized UV system consists of stainless steel reactor chambers, lamps, appropriate flanges, and associated power distribution and control systems. Trojan’s chemical-mechanical quartz sleeve wiping system, Acticlean™ is standard equipment on the TrojanUVSwift™ECT. The H2O2 dosing and storage system consists of a primary metering pump skid, interconnecting piping, remote monitoring equipment and a 1,100 gallon double- contained HDPE storage tank. H2O2 is injected upstream of the UV reactors and is only injected when treating MCLR. The H2O2 delivery system and the UV reactors are integrated through control system algorithms. Trojan can provide 50% drinking water-grade H2O2 delivered to the site. A device, such as a static mixer (not provided by Trojan), may be required to achieve uniform distribution of the H2O2 in the water stream. All equipment has a one-year manufacturer’s equipment warranty.
This Trojan UV-oxidation package also includes Trojan’s sophisticated automatic Master Control system. Trojan has implemented a patent-pending Programmable Logic Controller (PLC) based control system that automatically optimizes UV lamp operation and dosing of hydrogen peroxide (H2O2) in such a way as to minimize ongoing operation and maintenance costs. This algorithm resides within the PLC and uses several online measurements to set the optimum ballast power and hydrogen peroxide levels that provide the required treatment level at the minimum operating cost. This control system ensures that the system is as operator-friendly and easy to use as possible.
As part of the TrojanUVSwift ECT™ UV-oxidation system offering, Trojan is able to provide ongoing supply, service support and application optimization of H2O2 . This includes remote monitoring through the ChemWatch™ system, automatically scheduled deliveries, automatic invoicing, remote diagnostics, and all handling of H2O2 (plant operators never need to come in direct contact with H2O2). The package can be continued simply by purchasing H2O2 from Trojan. Due to the large volume of H2O2 delivered through Trojan, H2O2 can be provided at the lowest market prices.
Capital Equipment Quotation
TrojanUVSwift™ECT
This price excludes any taxes that may be applicable and is valid for 90 days from the date of this letter.
TrojanUVSwift™
This price excludes any taxes that may be applicable and is valid for 90 days from the date of this letter.
Total equipment purchase price of the system described above, including delivery to the site and startup assistance, is USD $420,000.00.
O&M Costs:
Based on 1 MGD average flow, 12 week Agal Bloom event, year round disinfection
Annual H2O2 Costs @ $5.60/Gal (5 gallons/day)
$ 2,356
Annual Electrical Costs @ $.08 /kWh $ 9,623 Annual Lamp Replacement Costs $ 1,600
Total O&M $ 13,579

- 3 -
Should you have any comments or questions please feel free to contact me anytime at 519-457-3400.
Sincerely,
Terry Keep Sales Manager Environmental Contaminant Treatment (ECT) Trojan Technologies

- 4 -
About Trojan UV-Oxidation
UV-oxidation is a photochemical process that breaks down chemical constituents into their non-odorous component parts. Trojan has revolutionized UV-oxidation, making it an efficient and cost-effective approach to treating and destroying many T&O-causing compounds.
Trojan UV-oxidation involves the addition of H2O2 to the influent, and a photochemical reaction that occurs almost instantly within the UV reactor. UV light incident on H2O2 breaks H2O2 (through the UV- photolysis reaction illustrated at right) into two hydroxyl radicals. These highly reactive radicals destroy MIB and geosmin.
Benefits of Trojan UV-Oxidation
• Elimination of your taste and odor problem
• Disinfection in accordance with LT2 at no additional capital cost (i.e. 2-log crypto credit)
• The process does not form potentially hazardous by-products such as bromate
• Capital and O&M costs are both lower for the TrojanUVSwift™ECT Solution relative to ozone
• The footprint is very small relative to ozone and other technologies. This results in a simpler installation with a significantly reduced building capital cost
• Flexibility: if no T&O event, the system remains in disinfection-only mode and therefore annual O&M costs are in the range of 1 cent/1,000 gallons
• It can be easily retrofitted into existing plants • It is safer than ozone
The TrojanUVSwift™ECT
The TrojanUVSwift™ECT employs H2O2 and sophisticated controls to optimize the treatment of environmental contaminants. The broad light spectrum of light emitted by the medium pressure lamps in the TrojanUVSwift™ECT makes it extremely well suited for the treatment of many contaminants, particularly some pesticides and taste and odor-causing compounds found in surface waters. Its ultra-compact footprint, its ability to apply large amounts of UV light, and high flow capacity make it an excellent reactor for use as part of a multi- barrier system in large municipal applications.
Key Benefits of the TrojanUVSwift™ECT:
TrojanUVSwift™ECT is: • The most compact UV reactor available • Capable of treating hundreds of millions of gallons per day • Available in a variety of power capacities (i.e. number of lamps) • Designed for hydraulic efficiency using computational fluid dynamics • All wetted surfaces constructed of NSF-listed materials • Integrated (via control algorithms) with the H2O2 delivery system
• Equipped with a control algorithm to minimize electrical consumption by dimming lamps while still maintaining performance
• Available with Acticlean™, a chemical/mechanical wiper mechanism for maximization of quartz sleeve transmittance

- 5 -
EQUIPMENT WARRANTEES
1. Trojan Technologies warrants all components of the system (excluding UV lamps) against faulty workmanship and materials for a period of 12 months from date of start-up or 18 months after shipment, which ever comes first.
2. UV lamps purchased are warranted for 9,000 hours of operation or 3 years from shipment, whichever comes first. The warranty is pro-rated after 1,000 hours of operation. This means that if a lamp fails prior to 1,000 hours of use, a new lamp is provided at no charge.
3. Electronic ballasts are warranted for 10 years, pro-rated after 1 year.
FEATURES & BENEFITS
Lifetime Performance Guarantee Trojan offers an unparalleled Lifetime Performance Guarantee. The spirit of this guarantee is simple: the Trojan equipment, as sized for the project, will meet the disinfection requirements for the life of the system.
Validation The TrojanUVSwift™ is fully validated at a wide range of flow rates and UV transmittance levels in full compliance with the protocols of the USEPA UV Guidance Manual.
Multiple Barrier Treatment Approach UV offers an additional barrier of protection to safeguarding drinking water against virtually all microorganisms treated by chlorine – as well as proven inactivation of chlorine-resistant protozoa, including Cryptosporidium and Giardia.
Upgradability from Disinfection-only System If you choose to forego UV Oxidation for a disinfection system at this point in time, you may wish to explore the low-cost way of preparing to upgrade to UV Oxidation system for future treatment requirements. Ask your TrojanUV representative about this option.
TrojanUVSwift™ECT Components
UV Reactor • Hydraulically efficient reactor was designed with 3-D computational
fluid dynamic modeling to be extremely compact with minimal headloss and eliminate ‘short-circuiting’
• Can be installed vertically or horizontally and is rated for up to 150 psi (10 bar)
• Validated with a 90° elbow installed immediately before the reactor to ensure consistent dose delivery – even under challenging hydraulic conditions created by upstream pumping
• Additional lamps can be installed in response to increase in treatment capacity

- 6 -
Master Control Panel (MCP included in price) • PLC-based MCP monitors and controls all UV functions, including dose pacing – the
automatic, flow-based program that dims lamps to conserve power, while ensuring proper disinfection levels at all times
• Monitors and controls dosing of hydrogen peroxide (H2O2) in such a way as to minimize ongoing operation and maintenance costs
• User-friendly, touch-screen HMI display integrated into panel
• Uses several online measurements to set the optimum ballast power and hydrogen peroxide levels that provide the required treatment level at the minimum operating cost
(Included) ActiClean™ Cleaning System • Optional, automated ActiClean™ system – the industry’s only chemical and mechanical sleeve cleaning
system – reduces manual labor for operators by eliminating sleeve fouling • ActiClean™ cleaning system operates while the UV lamps are disinfecting and has been NWRI validated
with a fouling factor of 95% • ActiClean™ gel is a food-grade cleaning gel contained within the sleeve wiper collars and meets
NSF/ANSI Standard 60
Medium-Pressure UV Lamps
• High-output, medium-pressure lamps minimize the number of lamps required for a given flow
• Fewer lamps allow for an extremely compact reactor and lower O&M costs for lamp changes
• Routine procedures, including lamp change, are simple and require minimal time
OptiView™ UVT Monitor (included in price) • Optional, on-line UV transmittance (UVT) monitoring system
provides highly accurate readings and added reassurance that UV dose is maintained during water quality changes
• UVT readings are sent to the PLC located in the Control Power Panel in order to reduce or increase UV output in the lamps according to the water quality, thereby optimizing UV operations and reduce electrical power consumption

- 7 -
UV Intensity Sensor • UV sensors continuously monitors UV lamp output to ensure specified
dose is maintained • System can be configured with one sensor per lamp for maximum
assurance of disinfection performance Safety Advantages of UV Disinfection
• UV is a chemical-free process that adds nothing to the water but UV light • UV does not create disinfection by-products (DBPs) and does not affect taste
• UV is highly effective at inactivating a broad range of microorganisms – including chlorine resistant pathogens like Cryptosporidium and Giardia
• UV-oxidation process can be used to destroy nitrosamines, carcinogens, endocrine disruptors, pesticides, and other chemical compounds
Cost Advantages of UV Disinfection
• Annual lamp replacement and electrical consumption comprise the operating costs of UV disinfection
• UV is approximately 1/5th the cost of ozone disinfection and 1/10th the cost of membrane filtration making it the most cost-effective approach for multi-barrier protection
Environmental Advantages of UV Disinfection
• UV treatment creates no disinfection by-products that could adversely affect quality of the water
• Free lamp recycling is available when lamps are purchased through Trojan
About Trojan Technologies
Trojan is recognized around the world as the leader in advanced UV water treatment technology and is committed to aggressively leveraging its proprietary expertise in a growing number of key market sectors. These markets include municipal drinking water, municipal wastewater, environmental contaminant treatment and residential applications, as well as the ultra-purification of water used in food and beverage manufacturing, pharmaceutical processing, and semi-conductor applications around the world.
Trojan’s success is evident in more than 6,000 municipal UV disinfection facilities treating over 40 billion gallons a day – the largest installed base of UV systems in the world.
As a wholly-owned subsidiary of Danaher Corporation of Washington, D.C., Trojan designs, manufactures and sells UV systems for disinfection and advanced oxidation of municipal wastewater and drinking water, as well as for the industrial, commercial and residential markets.

Gorham New York
Representative Gregg Palmer Koester Associates Canastota, New York (315) 697-3800 [email protected]
Contact Matt Williams [email protected] Gerry Baker [email protected]
Proposal Number: 2030312 Tuesday, September 28, 2021

Proposal: 2030312_Rev11 2
Table of Contents Technical Proposal
Item A – Three (3) Trident® TR-420A Units; Model 1½TR-420A Item B – Two (2) Trident® TR-840A Units; Model TR-840A
Clarifications and Exceptions
Commercial Proposal Bidder’s Contact Information Pricing Payment Terms Schedule Freight
Warranty
Terms & Conditions
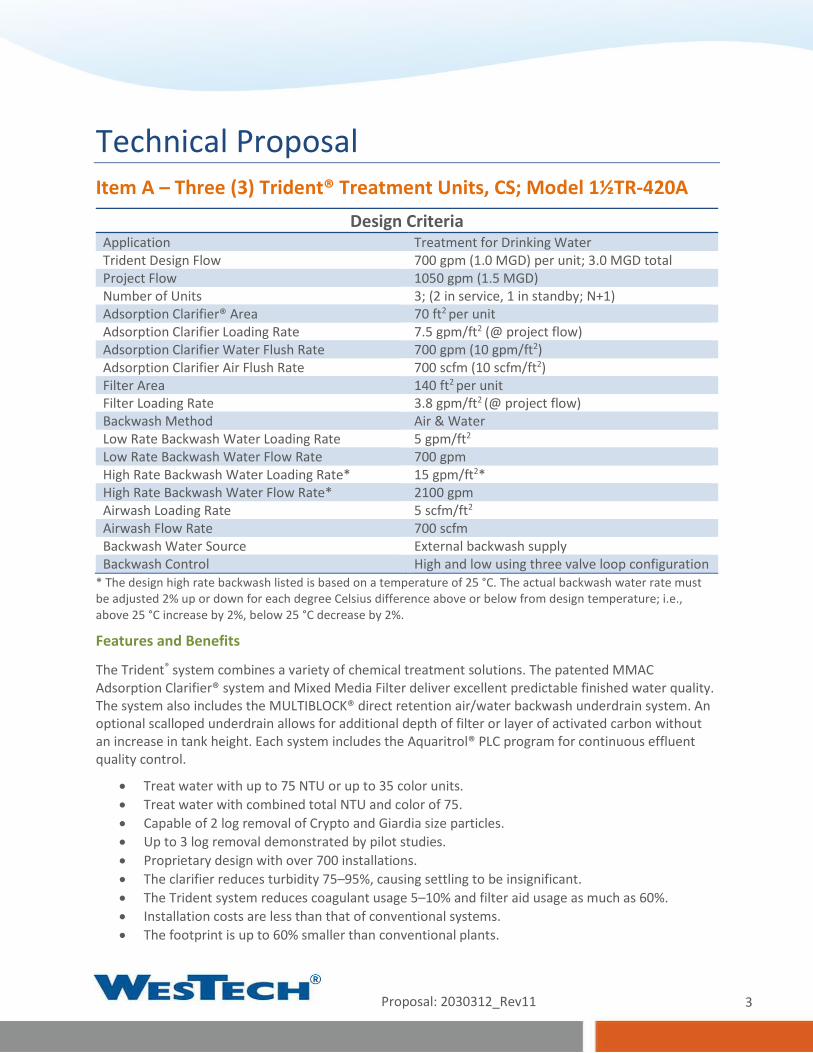
Proposal: 2030312_Rev11 3
Technical Proposal Item A – Three (3) Trident® Treatment Units, CS; Model 1½TR-420A
* The design high rate backwash listed is based on a temperature of 25 °C. The actual backwash water rate must be adjusted 2% up or down for each degree Celsius difference above or below from design temperature; i.e., above 25 °C increase by 2%, below 25 °C decrease by 2%.
Features and Benefits
The Trident® system combines a variety of chemical treatment solutions. The patented MMAC Adsorption Clarifier® system and Mixed Media Filter deliver excellent predictable finished water quality. The system also includes the MULTIBLOCK® direct retention air/water backwash underdrain system. An optional scalloped underdrain allows for additional depth of filter or layer of activated carbon without an increase in tank height. Each system includes the Aquaritrol® PLC program for continuous effluent quality control.
• Treat water with up to 75 NTU or up to 35 color units. • Treat water with combined total NTU and color of 75. • Capable of 2 log removal of Crypto and Giardia size particles. • Up to 3 log removal demonstrated by pilot studies. • Proprietary design with over 700 installations. • The clarifier reduces turbidity 75–95%, causing settling to be insignificant. • The Trident system reduces coagulant usage 5–10% and filter aid usage as much as 60%. • Installation costs are less than that of conventional systems. • The footprint is up to 60% smaller than conventional plants.
Design Criteria Application Treatment for Drinking Water Trident Design Flow 700 gpm (1.0 MGD) per unit; 3.0 MGD total Project Flow 1050 gpm (1.5 MGD) Number of Units 3; (2 in service, 1 in standby; N+1) Adsorption Clarifier® Area 70 ft2 per unit Adsorption Clarifier Loading Rate 7.5 gpm/ft2 (@ project flow) Adsorption Clarifier Water Flush Rate 700 gpm (10 gpm/ft2) Adsorption Clarifier Air Flush Rate 700 scfm (10 scfm/ft2) Filter Area 140 ft2 per unit Filter Loading Rate 3.8 gpm/ft2 (@ project flow) Backwash Method Air & Water Low Rate Backwash Water Loading Rate 5 gpm/ft2 Low Rate Backwash Water Flow Rate 700 gpm High Rate Backwash Water Loading Rate* 15 gpm/ft2* High Rate Backwash Water Flow Rate* 2100 gpm Airwash Loading Rate 5 scfm/ft2 Airwash Flow Rate 700 scfm Backwash Water Source External backwash supply Backwash Control High and low using three valve loop configuration
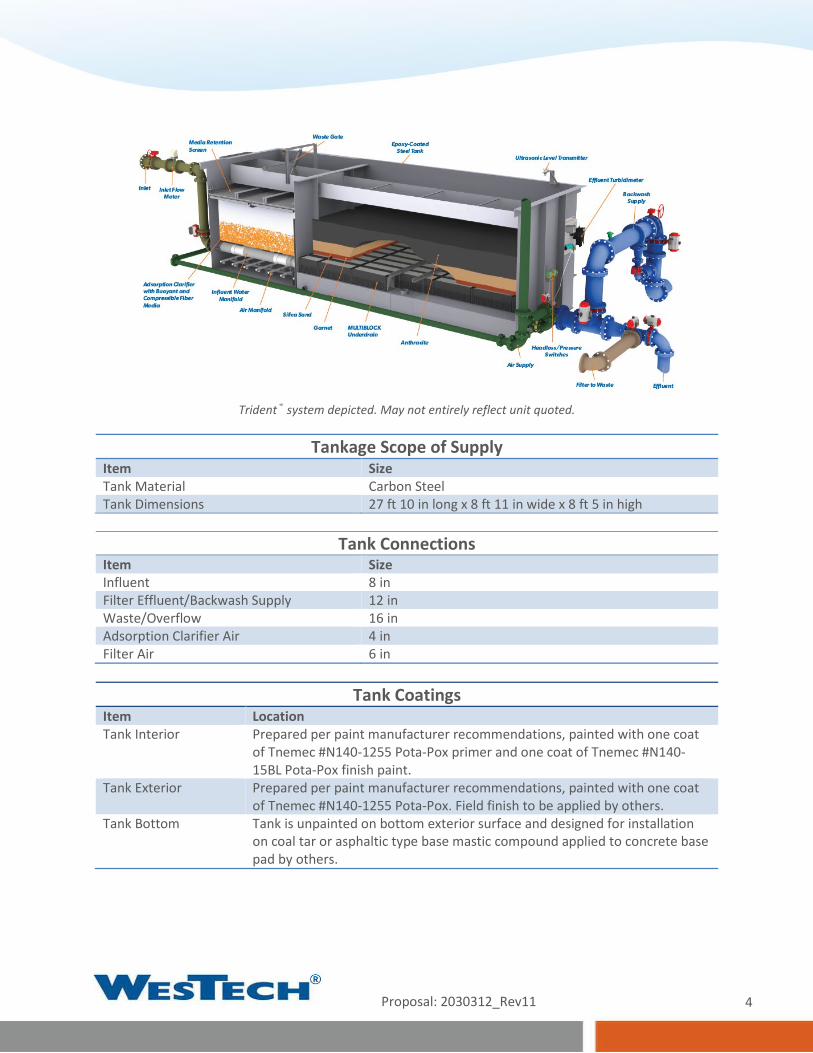
Proposal: 2030312_Rev11 4
Trident® system depicted. May not entirely reflect unit quoted.
Tankage Scope of Supply Item Size Tank Material Carbon Steel Tank Dimensions 27 ft 10 in long x 8 ft 11 in wide x 8 ft 5 in high
Tank Connections
Item Size Influent 8 in Filter Effluent/Backwash Supply 12 in Waste/Overflow 16 in Adsorption Clarifier Air 4 in Filter Air 6 in
Tank Coatings
Item Location Tank Interior Prepared per paint manufacturer recommendations, painted with one coat
of Tnemec #N140-1255 Pota-Pox primer and one coat of Tnemec #N140-15BL Pota-Pox finish paint.
Tank Exterior Prepared per paint manufacturer recommendations, painted with one coat of Tnemec #N140-1255 Pota-Pox. Field finish to be applied by others.
Tank Bottom Tank is unpainted on bottom exterior surface and designed for installation on coal tar or asphaltic type base mastic compound applied to concrete base pad by others.

Proposal: 2030312_Rev11 5
Adsorption Clarifier Scope of Supply Feature Quantity Notes
Adsorption Clarifier Media 280 ft3/unit
Media depth is 4 ft. Adsorption Clarifier media is 50% beads and 50% fiber balls. Beads are 50/50 R&S. All media is NSF Std. 61 approved.
Clarifier Media Retention 70 ft2/unit Stainless steel screen mesh under aluminum grating
Splash Guards 1 set/unit For placement around the top tank perimeter of AC section on three sides; with support angles & attachment hardware
Collection Trough 1/unit Rectangular trough with waste gate running length of AC section Inlet Distribution 1 Lot/unit PVC header-lateral pipe system with supports Air Distribution 1 Lot/unit PVC header-lateral pipe system with supports Lower media support grating 70 ft2/unit Aluminum grating at the bottom
Filter Scope of Supply
Feature Quantity Notes
MULTIBLOCK® Underdrain 140 ft2/unit
Dual lateral blocks, 11” wide x 12” high x 36” long designed to interlock with each other to form the overall lateral length. The underdrain system shall include a factory installed media-retaining Laser Shield™ plate constructed of 304 stainless steel.
Washtrough 1/unit Rectangular trough running length of filter section Air/Water Distribution 1 Lot/unit 304 stainless steel plenum with air and water connections (factory
installed)
Note • Concrete fill of 5.9 yd3/unit is required to be placed in the bottom of filter section for support of
MULTIBLOCK laterals. Concrete fill and grout not by WesTech. • All required hardware is supplied by WesTech for assembly of the tank internals at the jobsite by
the contractor.
Media Scope of Supply Type Quantity Layer
Depth Effective Size Uniformity
Coefficient Packaging
Anthracite 213 ft3/unit 18 in 1.0-1.1 mm <1.7 1-ft3 bags on pallets Silica Sand 111 ft3/unit 9 in 0.35-0.45 mm <1.4 1-ft3 bags on pallets Garnet 37 ft3/unit 3 in 0.2-0.32 mm <1.7 50# bags on pallets
Note
Media quantities include sufficient volume for skimming.

Proposal: 2030312_Rev11 6
Air Scour Blower Scope of Supply Quantity Volume Pressure Type Motor 2 350 scfm (each) 4.2 psig Regenerative 15 hp, 230/460 V, 60 Hz, 3 ph, TEFC Blower Accessories
Air intake filter with dirty filter indicator Pressure safety relief valve Check valve Blower pressure indicator
Note
Pressure gauge and switch to be placed in main air supply line.
Valves Scope of Supply Item Size Quantity Type Operator Type Influent 8 in 1/unit Butterfly, Wafer Electro-pneumatic, Modulating Backwash Inlet 12 in 1/unit Butterfly, Wafer Pneumatic, Open/Close Backwash High Rate 12 in 1/system Butterfly, Wafer Pneumatic, Open/Close Effluent 8 in 1/unit Butterfly, Wafer Electro-pneumatic, Modulating Filter to Waste 8 in 1/unit Butterfly, Wafer Electro-pneumatic, Modulating AC Air Scour 4 in 1/unit Butterfly, Wafer Pneumatic, Open/Close Filter Air Scour 6 in 1/unit Butterfly, Wafer Pneumatic, Open/Close Waste Gate N/A 1/unit Linear Cylinder Pneumatic, Open/Close Backwash Low Rate Set 4 in 1/system Butterfly, Wafer Manual, Handwheel Backwash High Rate Set 12 in 1/system Butterfly, Wafer Manual, Handwheel Influent Isolation 8 in 1/unit Butterfly, Wafer Manual, Handwheel AC Air Check 4 in 1/unit Check None Filter Air Check 6 in 1/unit Check None
Note
All butterfly valves are Bray wafer style with cast iron body, nylon coated disc, EPDM seat and shaft seal. Automatic butterfly valves have double acting, weatherproof pneumatic cylinder actuators manufactured by Bray.
Trident Master Control Panel Scope of Supply Feature Description Notes Number of Panels 1 Housing NEMA 4/12 Wall mounted PLC Allen Bradley CompactLogix Includes Aquaritrol program logic OIT Allen Bradley PanelView 10” color touchscreen interface SCADA Interface Communication protocol via Ethernet/IP
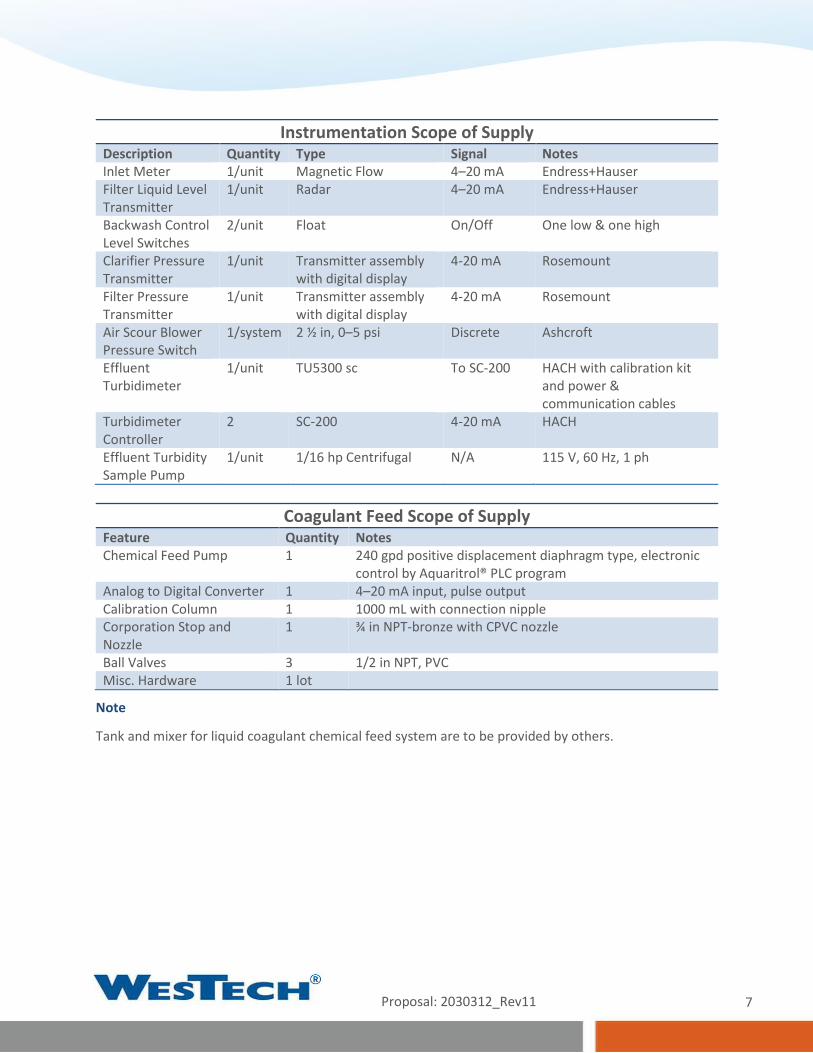
Proposal: 2030312_Rev11 7
Instrumentation Scope of Supply Description Quantity Type Signal Notes Inlet Meter 1/unit Magnetic Flow 4–20 mA Endress+Hauser Filter Liquid Level Transmitter
1/unit Radar 4–20 mA Endress+Hauser
Backwash Control Level Switches
2/unit Float On/Off One low & one high
Clarifier Pressure Transmitter
1/unit Transmitter assembly with digital display
4-20 mA Rosemount
Filter Pressure Transmitter
1/unit Transmitter assembly with digital display
4-20 mA Rosemount
Air Scour Blower Pressure Switch
1/system 2 ½ in, 0–5 psi Discrete Ashcroft
Effluent Turbidimeter
1/unit TU5300 sc To SC-200 HACH with calibration kit and power & communication cables
Turbidimeter Controller
2 SC-200 4-20 mA HACH
Effluent Turbidity Sample Pump
1/unit 1/16 hp Centrifugal N/A 115 V, 60 Hz, 1 ph
Coagulant Feed Scope of Supply
Feature Quantity Notes Chemical Feed Pump 1 240 gpd positive displacement diaphragm type, electronic
control by Aquaritrol® PLC program Analog to Digital Converter 1 4–20 mA input, pulse output Calibration Column 1 1000 mL with connection nipple Corporation Stop and Nozzle
1 ¾ in NPT-bronze with CPVC nozzle
Ball Valves 3 1/2 in NPT, PVC Misc. Hardware 1 lot
Note
Tank and mixer for liquid coagulant chemical feed system are to be provided by others.
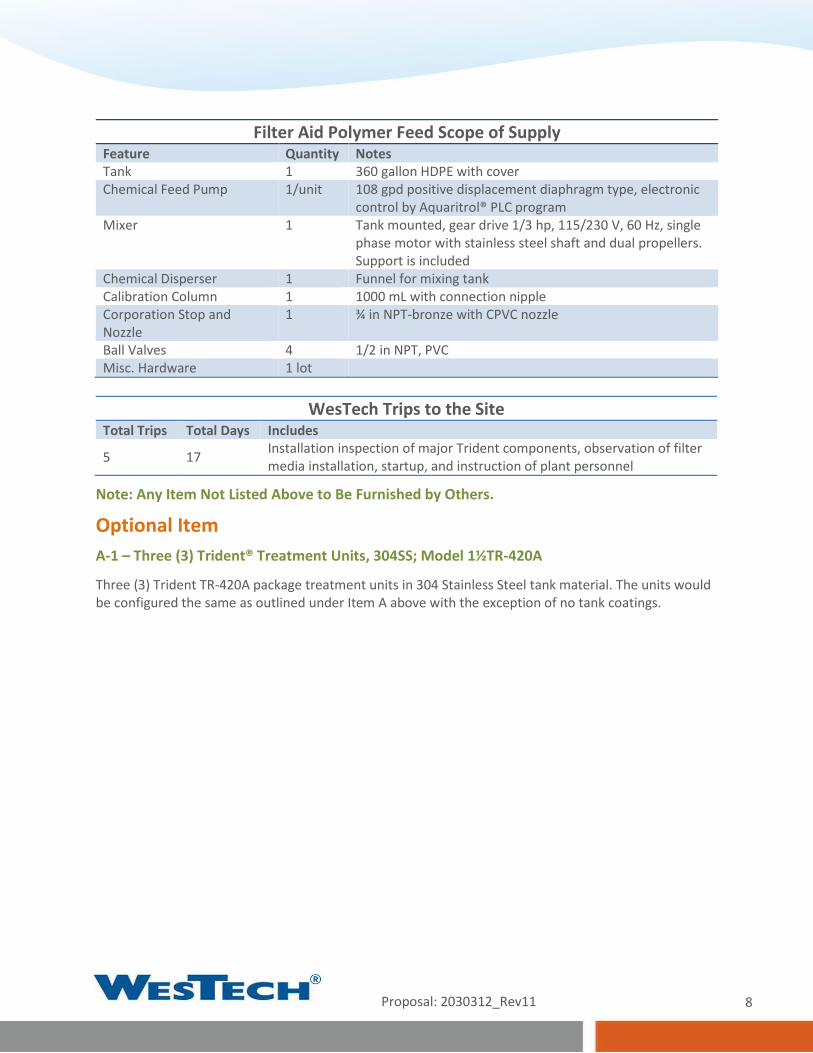
Proposal: 2030312_Rev11 8
Filter Aid Polymer Feed Scope of Supply Feature Quantity Notes Tank 1 360 gallon HDPE with cover Chemical Feed Pump 1/unit 108 gpd positive displacement diaphragm type, electronic
control by Aquaritrol® PLC program Mixer 1 Tank mounted, gear drive 1/3 hp, 115/230 V, 60 Hz, single
phase motor with stainless steel shaft and dual propellers. Support is included
Chemical Disperser 1 Funnel for mixing tank Calibration Column 1 1000 mL with connection nipple Corporation Stop and Nozzle
1 ¾ in NPT-bronze with CPVC nozzle
Ball Valves 4 1/2 in NPT, PVC Misc. Hardware 1 lot
WesTech Trips to the Site
Total Trips Total Days Includes
5 17 Installation inspection of major Trident components, observation of filter media installation, startup, and instruction of plant personnel
Note: Any Item Not Listed Above to Be Furnished by Others.
Optional Item A-1 – Three (3) Trident® Treatment Units, 304SS; Model 1½TR-420A
Three (3) Trident TR-420A package treatment units in 304 Stainless Steel tank material. The units would be configured the same as outlined under Item A above with the exception of no tank coatings.

Proposal: 2030312_Rev11 9
Item B – Two (2) Trident® Package Treatment Units, CS; Model TR-840A
* The design high rate backwash listed is based on a temperature of 25 °C. The actual backwash water rate must be adjusted 2% up or down for each degree Celsius difference above or below from design temperature; i.e., above 25 °C increase by 2%, below 25 °C decrease by 2%.
Tankage Scope of Supply Item Size Tank Material Carbon Steel Tank Dimensions 39 ft 10 in long x 11 ft 11 in wide x 10 ft 1 in tall
Tank Connections
Item Size Influent 12 in Filter Effluent/Backwash Supply 16 in Waste/Overflow 20 in Adsorption Clarifier Air 6 in Filter Air 8 in
Design Criteria Application Treatment for Drinking Water Trident Design Flow 1400 gpm (2.0 MGD) per unit; 4.0 MGD total Project Flow 1050 gpm (1.5 MGD) Number of Units 2; (1 in service, 1 in standby; N+1) Adsorption Clarifier® Area 140 ft2 Adsorption Clarifier Loading Rate 7.5 gpm/ft2 (@ project flow) Adsorption Clarifier Water Flush Rate 1400 gpm (10 gpm/ft2) Adsorption Clarifier Air Flush Rate 1425 scfm (10 scfm/ft2) Filter Area 280 ft2 Filter Loading Rate 3.8 gpm/ft2 (@ project flow) Backwash Method Air & Water Low Rate Backwash Water Loading Rate 5 gpm/ft2 Low Rate Backwash Water Flow Rate 1400 gpm High Rate Backwash Water Loading Rate* 15 gpm/ft2 High Rate Backwash Water Flow Rate* 4200 gpm Airwash Loading Rate 3.4 scfm/ft2 Airwash Flow Rate 950 scfm Backwash Water Source External backwash supply Backwash Control High and low using three valve loop configuration
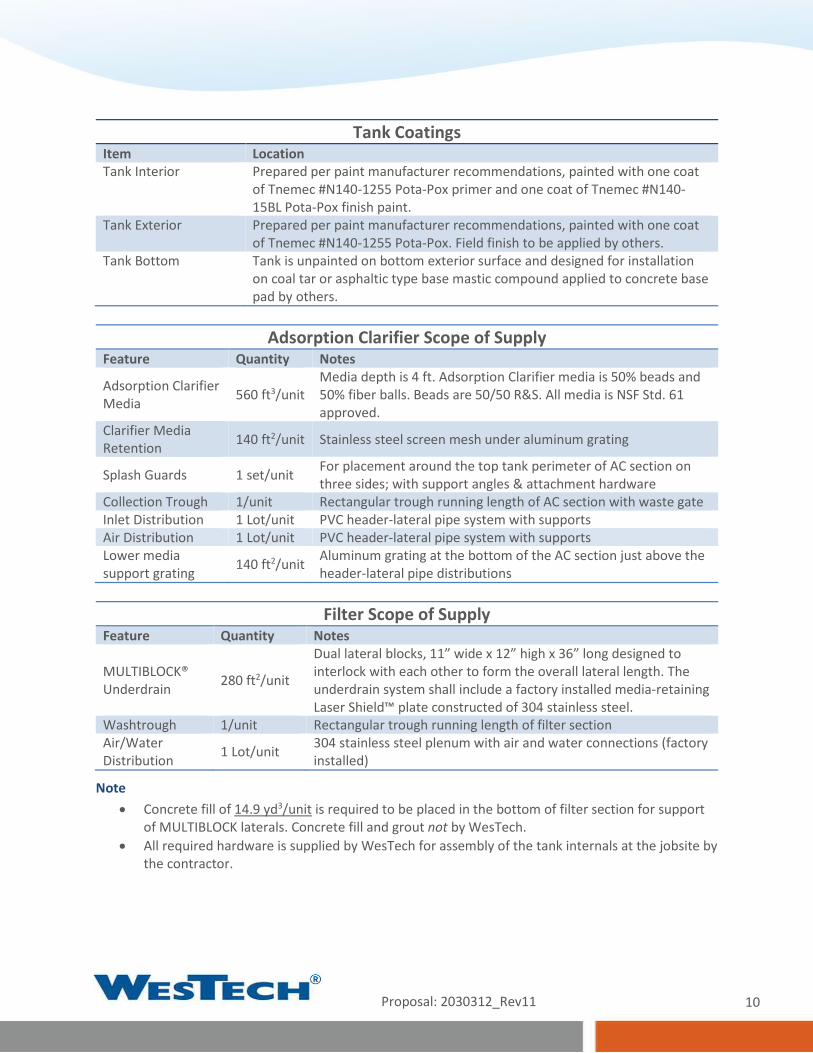
Proposal: 2030312_Rev11 10
Tank Coatings Item Location Tank Interior Prepared per paint manufacturer recommendations, painted with one coat
of Tnemec #N140-1255 Pota-Pox primer and one coat of Tnemec #N140-15BL Pota-Pox finish paint.
Tank Exterior Prepared per paint manufacturer recommendations, painted with one coat of Tnemec #N140-1255 Pota-Pox. Field finish to be applied by others.
Tank Bottom Tank is unpainted on bottom exterior surface and designed for installation on coal tar or asphaltic type base mastic compound applied to concrete base pad by others.
Adsorption Clarifier Scope of Supply
Feature Quantity Notes
Adsorption Clarifier Media 560 ft3/unit
Media depth is 4 ft. Adsorption Clarifier media is 50% beads and 50% fiber balls. Beads are 50/50 R&S. All media is NSF Std. 61 approved.
Clarifier Media Retention 140 ft2/unit Stainless steel screen mesh under aluminum grating
Splash Guards 1 set/unit For placement around the top tank perimeter of AC section on three sides; with support angles & attachment hardware
Collection Trough 1/unit Rectangular trough running length of AC section with waste gate Inlet Distribution 1 Lot/unit PVC header-lateral pipe system with supports Air Distribution 1 Lot/unit PVC header-lateral pipe system with supports Lower media support grating 140 ft2/unit Aluminum grating at the bottom of the AC section just above the
header-lateral pipe distributions
Filter Scope of Supply Feature Quantity Notes
MULTIBLOCK® Underdrain 280 ft2/unit
Dual lateral blocks, 11” wide x 12” high x 36” long designed to interlock with each other to form the overall lateral length. The underdrain system shall include a factory installed media-retaining Laser Shield™ plate constructed of 304 stainless steel.
Washtrough 1/unit Rectangular trough running length of filter section Air/Water Distribution 1 Lot/unit 304 stainless steel plenum with air and water connections (factory
installed)
Note • Concrete fill of 14.9 yd3/unit is required to be placed in the bottom of filter section for support
of MULTIBLOCK laterals. Concrete fill and grout not by WesTech. • All required hardware is supplied by WesTech for assembly of the tank internals at the jobsite by
the contractor.

Proposal: 2030312_Rev11 11
Media Scope of Supply Type Quantity Layer Depth Effective Size Uniformity
Coefficient Packaging
Anthracite 425 ft3/unit 18 in 1.0-1.1 mm <1.7 1-ft3 bags on pallets Silica Sand 221 ft3/unit 9 in 0.35-0.45 mm <1.4 1-ft3 bags on pallets Garnet 74 ft3/unit 3 in 0.2-0.32 mm <1.7 50# bags on pallets
Note
Media quantities include sufficient volume for skimming.
Air Scour Blower Scope of Supply Quantity Volume Pressure Type Motor 3 475 scfm (each) 4.1 PSG Regenerative 25 hp, 230/460 V, 60 Hz, 3 ph, TEFC Blower Accessories
Air intake filter with dirty filter indicator Pressure safety relief valve Check valve Blower pressure indicator
Note • Pressure gauge and switch to be placed in main air supply line. • Three blowers used for AC flush; two blowers used for filter backwash.
Valves Scope of Supply Item Size Quantity Type Operator Type Influent 12 in 1/unit Butterfly, Wafer Electro-pneumatic, Modulating Backwash Inlet 16 in 1/unit Butterfly, Wafer Pneumatic, Open/Close Backwash High Rate 16 in 1/system Butterfly, Wafer Pneumatic, Open/Close Effluent 12 in 1/unit Butterfly, Wafer Electro-pneumatic, Modulating Filter to Waste 12 in 1/unit Butterfly, Wafer Electro-pneumatic, Modulating AC Air Scour 6 in 1/unit Butterfly, Wafer Pneumatic, Open/Close Filter Air Scour 8 in 1/unit Butterfly, Wafer Pneumatic, Open/Close Waste Gate N/A 1/unit Linear Cylinder Pneumatic, Open/Close Backwash Low Rate Set 8 in 1/system Butterfly, Wafer Manual, Handwheel Backwash High Rate Set 16 in 1/system Butterfly, Wafer Manual, Handwheel Influent Isolation 8 in 1/unit Butterfly, Wafer Manual, Handwheel AC Air Check 6 in 1/unit Check None Filter Air Check 8 in 1/unit Check None
Note
All butterfly valves are Bray wafer style with cast iron body, nylon coated disc, EPDM seat and shaft seal. Automatic butterfly valves have double acting, weatherproof pneumatic cylinder actuators manufactured by Bray.

Proposal: 2030312_Rev11 12
Trident Master Control Panel Scope of Supply Feature Description Notes Number of Panels 1 For operation of five Trident units Housing NEMA 4/12 Wall mounted PLC Allen Bradley CompactLogix Includes Aquaritrol program logic OIT Allen Bradley PanelView 10” color touchscreen interface SCADA Interface Communication protocol via Ethernet/IP
Instrumentation Scope of Supply
Description Quantity Type Signal Notes Inlet Meter 1/unit Magnetic Flow 4–20 mA Endress+Hauser Filter Liquid Level Transmitter
1/unit Radar 4–20 mA Endress+Hauser
Backwash Control Level Switches
2/unit Float On/Off One low & one high
Clarifier Pressure Transmitter
1/unit Transmitter assembly with digital display
4-20 mA Rosemount
Filter Pressure Transmitter
1/unit Transmitter assembly with digital display
4-20 mA Rosemount
Air Scour Blower Pressure Switch
1/system 2 ½ in, 0–5 psi Discrete Ashcroft
Effluent Turbidimeter
1/unit TU5300 sc To SC-200 HACH with calibration kit and power & communication cables
Turbidimeter Controller
2 SC-200 4-20 mA HACH, one unit is used for each pair (two) turbidimeters
Effluent Turbidity Sample Pump
1/unit 1/16 hp Centrifugal N/A 115 V, 60 Hz, 1 ph
Coagulant Feed Scope of Supply
Feature Quantity Notes Chemical Feed Pump 1 480 gpd positive displacement diaphragm type, electronic
control by Aquaritrol® PLC program Analog to Digital Converter 1 4–20 mA input, pulse output Calibration Column 1 1000 mL with connection nipple Corporation Stop and Nozzle
1 ¾ in NPT-bronze with CPVC nozzle
Ball Valves 3 1/2 in NPT, PVC Misc. Hardware 1 lot
Note
Tank and mixer for liquid alum chemical feed system are to be provided by others.

Proposal: 2030312_Rev11 13
Filter Aid Polymer Feed Scope of Supply Feature Quantity Notes Tank 1 360 gallon HDPE with cover Chemical Feed Pump 1/unit 216 gpd positive displacement diaphragm type, electronic
control by Aquaritrol® PLC program Mixer 1 Tank mounted, direct drive 1/3 hp, 115/230 V, 60 Hz, single
phase motor with stainless steel shaft and dual propellers. Support is included
Chemical Disperser 1 Funnel for mixing tank Calibration Column 1 1000 mL with connection nipple Corporation Stop and Nozzle
1 ¾ in NPT-bronze with CPVC nozzle
Ball Valves 4 1/2 in NPT, PVC Misc. Hardware 1 lot
WesTech Trips to the Site
Total Trips Total Days Includes
5 20 Installation inspection of major Trident components, observation of filter media installation, startup, and instruction of plant personnel
Note: Any Item Not Listed Above to Be Furnished by Others.
Optional Item B-1 – Two (2) Trident® Treatment Units, 304SS; Model TR-840A
Two (2) Trident TR-840A package treatment units in 304 Stainless Steel tank material. The units would be configured the same as outlined under Item B above with the exception of no tank coatings.

Proposal: 2030312_Rev11 14
Clarifications and Exceptions General Clarifications Terms & Conditions: This proposal, including all terms and conditions contained herein, shall become part of any resulting contract or purchase order. Changes to any terms and conditions, including but not limited to submittal and shipment days, payment terms, and escalation clause shall be negotiated at order placement, otherwise the proposal terms and conditions contained herein shall apply.
Paint: If your equipment has paint included in the price, please take note to the following. Primer paints are designed to provide only a minimal protection from the time of application (usually for a period not to exceed 30 days). Therefore, it is imperative that the finish coat be applied within 30 days of shipment on all shop primed surfaces. Without the protection of the final coatings, primer degradation may occur after this period, which in turn may require renewed surface preparation and coating. If it is impractical or impossible to coat primed surfaces within the suggested time frame, WesTech strongly recommends the supply of bare metal, with surface preparation and coating performed in the field. All field surface preparation, field paint, touch-up, and repair to shop painted surfaces are not by WesTech.
Escalation: If during the performance of the contract, the price of labor, material, freight, and other costs significantly increase, through no fault of WesTech, the price shall be equitably adjusted and subject to escalation. A significant price increase shall mean any price increase from proposal date to material procurement greater than 2.5% from stated prices. Delays and costs associated with a Force Majeure event shall also be equitably adjusted and subject to a change in price and/or schedule. Escalation to be based on cost increases, (without additional profit, overhead or margin) and shall include labor, material, freight, and other costs to WesTech that occur in the specified time period. Any revisions or changes requested by the customer will be priced on a case-by-case basis. Such price increases shall be documented through third party sources. Carbon material escalation will be based on the US Midwest Domestic Index, current flats and longs indexes, in effect at the time of bid. Stainless material escalation will be based the Argus Metals Stainless Steel ex works US base price plus surcharge for flat and bar (per design specified alloy), in effect at the time of bid.
USA Tariffs and Current Trade Laws: All prices are based on current USA and North America tariffs and trade laws/agreements at time of bid. Any changes in costs due to USA Tariffs and trade laws/ agreements will be passed through to the purchaser at cost.
Trident Clarifications • Due to the current market volatility with material cost, the budget price should be updated
routinely or when there are changes in the scope of supply. Note the budget price is only valid for 30 days from dated of budget proposal.
• The Trident system design is for an N+1 redundancy condition to treat 1.5 MGD. • Tank is designed for installation on coal tar or asphaltic type base mastic compound applied to
concrete base pad by others. • The filter is periodically backwashed (using treated water). The Adsorption Clarifier is normally
washed (using influent water) one or more times between filter backwashes. The waste holding system should be sized to handle a total of two complete flush/wash volumes from each compartment.
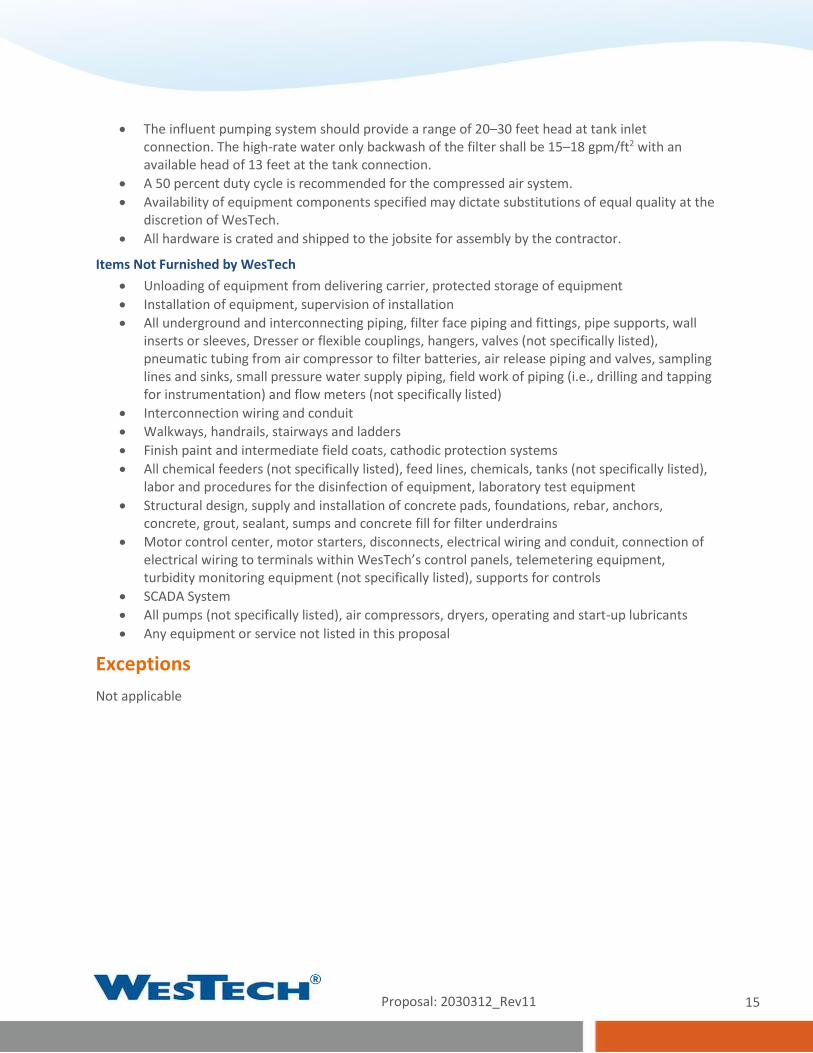
Proposal: 2030312_Rev11 15
• The influent pumping system should provide a range of 20–30 feet head at tank inlet connection. The high-rate water only backwash of the filter shall be 15–18 gpm/ft2 with an available head of 13 feet at the tank connection.
• A 50 percent duty cycle is recommended for the compressed air system. • Availability of equipment components specified may dictate substitutions of equal quality at the
discretion of WesTech. • All hardware is crated and shipped to the jobsite for assembly by the contractor.
Items Not Furnished by WesTech • Unloading of equipment from delivering carrier, protected storage of equipment • Installation of equipment, supervision of installation • All underground and interconnecting piping, filter face piping and fittings, pipe supports, wall
inserts or sleeves, Dresser or flexible couplings, hangers, valves (not specifically listed), pneumatic tubing from air compressor to filter batteries, air release piping and valves, sampling lines and sinks, small pressure water supply piping, field work of piping (i.e., drilling and tapping for instrumentation) and flow meters (not specifically listed)
• Interconnection wiring and conduit • Walkways, handrails, stairways and ladders • Finish paint and intermediate field coats, cathodic protection systems • All chemical feeders (not specifically listed), feed lines, chemicals, tanks (not specifically listed),
labor and procedures for the disinfection of equipment, laboratory test equipment • Structural design, supply and installation of concrete pads, foundations, rebar, anchors,
concrete, grout, sealant, sumps and concrete fill for filter underdrains • Motor control center, motor starters, disconnects, electrical wiring and conduit, connection of
electrical wiring to terminals within WesTech’s control panels, telemetering equipment, turbidity monitoring equipment (not specifically listed), supports for controls
• SCADA System • All pumps (not specifically listed), air compressors, dryers, operating and start-up lubricants • Any equipment or service not listed in this proposal
Exceptions Not applicable

Proposal: 2030312_Rev11 16
Commercial Proposal Proposal Name: Gorham, New York Proposal Number: 2030312 Tuesday, September 28, 2021 1. Bidder's Contact Information Company Name WesTech Engineering, LLC Primary Contact Name Matt Williams Phone 801.265.1000 Email [email protected] Address: Number/Street 3665 S West Temple Address: City, State, Zip Salt Lake City, UT 84115
2. Budget Pricing Currency: US Dollars Scope of Supply
A (3) Trident® TR-420A Units, Carbon Steel; Model 1½TR-420A $1,105,000 A-1 (3) Trident® TR-420A Units, 304SS; Model 1½TR-420A $1,640,000 B (2) Trident® TR-840A Units, Carbon Steel; Model TR-840A $1,225,000 B-1 (2) Trident® TR-840A Units, 304SS; Model 1½TR-840A $1,950,000 Taxes (sales, use, VAT, IVA, IGV, duties, import fees, etc.) Not Included Prices are valid for a period not to exceed 30 days from date of proposal.
Additional Field Service Daily Rate (Applicable Only to Field Service Not Included in Scope) $1,200 Pricing does not include field service unless noted in scope of supply, but is available at the daily rate plus expenses. The greater of a two week notice or visa procurement time is required prior to departure date. Our field service policy can be provided upon request for more details.
3. Payment Terms Purchase Order Acceptance and Contract Execution 10% Submittals Provided by WesTech 15% Release for Fabrication 35% Notification of Ready to Ship 40% All payments are net 30 days. Partial shipments are allowed. An approved Letter of Credit is required if Incoterms CIF, CFR, DAP, CIP, or CPT are applicable. Payment is required in full for all other Incoterms prior to international shipment. Other terms per WesTech proforma invoice. Please note that the advising bank must be named as: Wells Fargo Bank, International Department, 9000 Flair Drive, 3rd Floor, El Monte, California 91731, USA.
4. Schedule – GAC & SuperSettler Submittals, after Purchase Order Acceptance and Contract Execution 10 to 12 weeks Ready to Ship, after Receipt of Final Submittal Approval 22 to 24 weeks Estimated Weeks to Ready to Ship 32 to 36 weeks* *Customer submittal approval is typically required to proceed with equipment fabrication and is not accounted for in the schedule above. Project schedule will be extended to account for time associated with receipt of customer submittal approval.
5. Freight Domestic FOB Shipping Point - Full Freight Allowed to Jobsite (FSP-FFA) From Final Destination Number of Trucks or Containers WesTech Shops Gorham, NY TBD
Proposal: 2030312_Rev11 17
One-Year Warranty WesTech equipment is backed by WesTech's reputation as a quality manufacturer, and by many years of experience in the design of reliable equipment.
Equipment manufactured or sold by WesTech Engineering, LLC, once paid for in full, is backed by the following warranty:
For the benefit of the original user, WesTech warrants all new equipment manufactured by WesTech Engineering, LLC. to be free from defects in material and workmanship, and will replace or repair, F.O.B. its factories or other location designated by it, any part or parts returned to it which WesTech's examination shall show to have failed under normal use and service by the original user within one (1) year following initial start-up, or eighteen (18) months from shipment to the purchaser, whichever occurs first.
Such repair or replacement shall be free of charge for all items except for those items such as resin, filter media and the like that are consumable and normally replaced during maintenance, with respect to which, repair or replacement shall be subject to a pro-rata charge based upon WesTech's estimate of the percentage of normal service life realized from the part. WesTech's obligation under this warranty is conditioned upon its receiving prompt notice of claimed defects, which shall in no event be later than thirty (30) days following expiration of the warranty period, and is limited to repair or replacement as aforesaid.
This warranty is expressly made by WesTech and accepted by purchaser in lieu of all other warranties, including warranties of merchantability and fitness for particular purpose, whether written, oral, express, implied, or statutory. WesTech neither assumes nor authorizes any other person to assume for it any other liability with respect to its equipment. WesTech shall not be liable for normal wear and tear, corrosion, or any contingent, incidental, or consequential damage or expense due to partial or complete inoperability of its equipment for any reason whatsoever.
This warranty shall not apply to equipment or parts thereof which have been altered or repaired outside of a WesTech factory, or damaged by improper installation, application, or maintenance, or subjected to misuse, abuse, neglect, accident, or incomplete adherence to all manufacturer’s requirements, including, but not limited to, Operations & Maintenance Manual guidelines & procedures.
This warranty applies only to equipment made or sold by WesTech Engineering, LLC.
WesTech Engineering, LLC. makes no warranty with respect to parts, accessories, or components purchased by the customer from others. The warranties which apply to such items are those offered by their respective manufacturers.
Proposal: 2030312_Rev11 18
Terms & Conditions Terms and Conditions appearing in any order based on this proposal which are inconsistent herewith shall not be binding on WesTech Engineering, LLC The sale and purchase of equipment described herein shall be governed exclusively by the foregoing proposal and the following provisions: 1. SPECIFICATIONS: WesTech Engineering, LLC is furnishing its standard equipment as outlined in the proposal and as will be covered by final approved drawings. The equipment may not be in strict compliance with the Engineer’s/Owner’s plans, specifications, or addenda as there may be deviations. The equipment will, however, meet the general intention of the mechanical specifications of these documents. 2. ITEMS INCLUDED: This proposal includes only the equipment specified herein and does not include erection, installation, accessories, nor associated materials such as controls, piping, etc., unless specifically listed. 3. PARTIES TO CONTRACT: WesTech Engineering, LLC is not a party to or bound by the terms of any contract between WesTech Engineering, LLC’s customer and any other party. WesTech Engineering, LLC’s undertakings are limited to those defined in the contract between WesTech Engineering, LLC and its direct customers. 4. PRICE AND DELIVERY: All selling prices quoted are subject to change without notice after 30 days from the date of this proposal unless specified otherwise. Unless otherwise stated, all prices are F.O.B. WesTech Engineering, LLC or its supplier’s shipping points. All claims for damage, delay or shortage arising from such equipment shall be made by Purchaser directly against the carrier. When shipments are quoted F.O.B. job site or other designation, Purchaser shall inspect the equipment shipped, notifying WesTech Engineering, LLC of any damage or shortage within forty-eight hours of receipt, and failure to so notify WesTech Engineering, LLC shall constitute acceptance by Purchaser, relieving WesTech Engineering, LLC of any liability for shipping damages or shortages. 5. PAYMENTS: All invoices are net 30 days. Delinquencies are subject to a 1.5 percent service charge per month or the maximum permitted by law, whichever is less on all past due accounts. Pro rata payments are due as shipments are made. If shipments are delayed by the Purchaser, invoices shall be sent on the date when WesTech Engineering, LLC is prepared to make shipment and payment shall become due under standard invoicing terms. If the work to be performed hereunder is delayed by the Purchaser, payments shall be based on the purchase price and percentage of completion. Products held for the Purchaser shall be at the risk and expense of the Purchaser. Unless specifically stated otherwise, prices quoted are for equipment only. These terms are independent of and not contingent upon the time and manner in which the Purchaser receives payment from the owner. 6. PAYMENT TERMS: Credit is subject to acceptance by WesTech Engineering, LLC’s Credit Department. If the financial condition of the Purchaser at any time is such as to give WesTech Engineering, LLC, in its judgment, doubt concerning the Purchaser’s ability to pay, WesTech Engineering, LLC may require full or partial payment in advance or may suspend any further deliveries or continuance of the work to be performed by the WesTech Engineering, LLC until such payment has been received. 7. ESCALATION: If during the performance of the contract, the price of labor, material, freight, and other costs significantly increase, through no fault of WesTech, the price shall be equitably adjusted and subject to escalation. A significant price increase shall mean any price increase from proposal date to material procurement greater than 2.5% from stated prices. Delays and costs associated with a Force Majeure event shall also be equitably adjusted and subject to a change in price and/or schedule. Escalation to be based on cost increases, (without additional
profit, overhead or margin) and shall include labor, material, freight, and other costs to WesTech that occur in the specified time period. Any revisions or changes requested by the customer will be priced on a case-by-case basis. Such price increases shall be documented through third party sources. Carbon material escalation will be based on the US Midwest Domestic Index, current flats and longs indexes, in effect at the time of bid. Stainless material escalation will be based the Argus Metals Stainless Steel ex works US base price plus surcharge for flat and bar (per design specified alloy), in effect at the time of bid. 8. APPROVAL: If approval of equipment submittals by Purchaser or others is required, a condition precedent to WesTech Engineering, LLC supplying any equipment shall be such complete approval. 9. INSTALLATION SUPERVISION: Prices quoted for equipment do not include installation supervision. WesTech Engineering, LLC recommends and will, upon request, make available, at WesTech Engineering, LLC’s then current rate, an experienced installation supervisor to act as the Purchaser’s employee and agent to supervise installation of the equipment. Purchaser shall at its sole expense furnish all necessary labor equipment, and materials needed for installation. Responsibility for proper operation of equipment, if not installed by WesTech Engineering, LLC or installed in accordance with WesTech Engineering, LLC’s instructions, and inspected and accepted in writing by WesTech Engineering, LLC, rests entirely with Purchaser; and any work performed by WesTech Engineering, LLC personnel in making adjustment or changes must be paid for at WesTech Engineering, LLC’s then current per diem rates plus living and traveling expenses. WesTech Engineering, LLC will supply the safety devices described in this proposal or shown in WesTech Engineering, LLC’s drawings furnished as part of this order but excepting these, WesTech Engineering, LLC shall not be required to supply or install any safety devices whether required by law or otherwise. The Purchaser hereby agrees to indemnify and hold harmless WesTech Engineering, LLC from any claims or losses arising due to alleged or actual insufficiency or inadequacy of the safety devices offered or supplied hereunder, whether specified by WesTech Engineering, LLC or Purchaser, and from any damage resulting from the use of the equipment supplied hereunder. 10. ACCEPTANCE OF PRODUCTS: Products will be deemed accepted without any claim by Purchaser unless written notice of non-acceptance is received by WesTech Engineering, LLC within 30 days of delivery if shipped F.O.B. point of shipment, or 48 hours of delivery if shipped F.O.B. point of destination. Such written notice shall not be considered received by WesTech Engineering, LLC unless it is accompanied by all freight bills for said shipment, with Purchaser’s notations as to damages, shortages and conditions of equipment, containers, and seals. Non-accepted products are subject to the return policy stated below. 11. TAXES: Any federal, state, or local sales, use or other taxes applicable to this transaction, unless specifically included in the price, shall be for Purchaser’s account. 12. TITLE: The equipment specified herein, and any replacements or substitutes therefore shall, regardless of the manner in which affixed to or used in connection with realty, remain the sole and personal property of WesTech Engineering, LLC until the full purchase price has been paid. Purchaser agrees to do all things necessary to protect and maintain WesTech Engineering, LLC’s title and interest in and to such equipment; and upon Purchaser’s default, WesTech Engineering, LLC may retain as liquidated damages any and all partial payments made and shall be free to enter the premises where such equipment is located and remove the same
Proposal: 2030312_Rev11 19
as its property without prejudice to any further claims on account of damages or loss which WesTech Engineering, LLC may suffer from any cause. 13. INSURANCE: From date of shipment until the invoice is paid in full, Purchaser agrees to provide and maintain at its expense, but for WesTech Engineering, LLC’s benefit, adequate insurance including, but not limited to, builders risk insurance on the equipment against any loss of any nature whatsoever. 14. SHIPMENTS: Any shipment of delivery dates recited represent WesTech Engineering, LLC’s best estimate but no liability, direct or indirect, is assumed by WesTech Engineering, LLC for failure to ship or deliver on such dates. WesTech Engineering, LLC shall have the right to make partial shipments; and invoices covering the same shall be due and payable by Purchaser in accordance with the payment terms thereof. If Purchaser defaults in any payment when due hereunder, WesTech Engineering, LLC may, without incurring any liability therefore to Purchaser or Purchaser’s customers, declare all payments immediately due and payable with maximum legal interest thereon from due date of said payment, and at its option, stop all further work and shipments until all past due payments have been made, and/or require that any further deliveries be paid for prior to shipment. If Purchaser requests postponements of shipments, the purchase price shall be due and payable upon notice from WesTech Engineering, LLC that the equipment is ready for shipment; and thereafter any storage or other charge WesTech Engineering, LLC incurs on account of the equipment shall be for the Purchaser’s account. If delivery is specified at a point other than WesTech Engineering, LLC or its supplier’s shipping points, and delivery is postponed or prevented by strike, accident, embargo, or other cause beyond WesTech Engineering, LLC’s reasonable control and occurring at a location other than WesTech Engineering, LLC or its supplier’s shipping points, WesTech Engineering, LLC assumes no liability in delivery delay. If Purchaser refuses such delivery, WesTech Engineering, LLC may store the equipment at Purchaser’s expense. For all purposes of this agreement such tender of delivery or storage shall constitute delivery. 15. WARRANTY: WESTECH ENGINEERING, LLC WARRANTS EQUIPMENT IT SUPPLIES ONLY IN ACCORDANCE WITH THE WARRANTY EXPRESSED IN THE ATTACHED COPY OF “WESTECH WARRANTY” AGAINST DEFECTS IN WORKMANSHIP AND MATERIALS WHICH IS MADE A PART HEREOF. SUCH WARRANTY IN LIEU OF ALL OTHER WARRANTIES, INCLUDING WARRANTIES OF MERCHANTABILITY AND FITNESS FOR PARTICULAR PURPOSE, WHETHER WRITTEN, ORAL, EXPRESSED, IMPLIED OR STATUTORY, WESTECH ENGINEERING, LLC SHALL NOT BE LIABLE ANY CONTINGENT, INCIDENTAL, OR CONSEQUENTIAL DAMAGES FOR ANY REASON WHATSOEVER. 16. PATENTS: WesTech Engineering, LLC agrees that it will, at its own expense, defend all suits or proceedings instituted against Purchaser and pay any award of damages assessed against it in such suits or proceedings, so far as the same are based on any claim that the said equipment or any part thereof constitutes an infringement of any apparatus patent of the United States issued at the date of this Agreement, provided WesTech Engineering, LLC is given prompt notice in writing of the institution or threatened institution of any suit or proceeding and is given full control of the defense, settlement, or compromise of any such action; and Purchaser agrees to give WesTech Engineering, LLC needed information, assistance, and authority to enable WesTech Engineering, LLC so to do. In the event said equipment is held or conceded to infringe such a patent, WesTech Engineering, LLC shall have the right at its sole option and expense to a) modify the equipment to be non-infringing, b) obtain for Purchaser the license to continue using said equipment, or c) accept return of the equipment and refund to the Purchaser the purchase price thereof less a reasonable charge for the use thereof. WesTech Engineering, LLC will
reimburse Purchaser for actual out-of-pocket expenses, exclusive of legal fees, incurred in preparing such information and rendering such assistance at WesTech Engineering, LLC’s request. The foregoing states the entire liability of WesTech Engineering, LLC, with respect to patent infringement; and except as otherwise agreed to in writing, WesTech Engineering, LLC assumes no responsibility for process patent infringement. 17. SURFACE PREPARATION AND PAINTING: If furnished, shop primer paint is intended to serve only as minimal protective finish. WesTech Engineering, LLC will not be responsible for the condition of primed or finish painted surfaces after equipment leaves its shops. Purchasers are invited to inspect paint in shops for proper preparation and application prior to shipment. WesTech Engineering, LLC assumes no responsibility for field surface preparation or touch-up of shipping damage to paint. Painting of fasteners and other touch-up to painted surfaces will be by Purchaser’s painting contractor after mechanism installation. Motors, gear motors, and other components not manufactured by WesTech Engineering, LLC will be painted with that manufacturer’s standard paint system. It is WesTech Engineering, LLC’s intention to ship major steel components as soon as fabricated, often before drive, motors, and other manufactured components. Unless Purchaser can ensure that shop primed steel shall be field painted within thirty (30) days after arrival at the job site, WesTech Engineering, LLC encourages the Purchaser to order these components without primer. WesTech Engineering, LLC’s prices are based on paints and surface preparations as outlined in the main body of this proposal. In the event that an alternate paint system is selected, WesTech Engineering, LLC requests that Purchaser’s order advise of the paint selection. WesTech Engineering, LLC will then either adjust the price as may be necessary to comply or ship the material unpainted if compliance is not possible due to application problems or environmental controls. 18. CANCELLATION, SUSPENSION, OR DELAY: After acceptance by WesTech Engineering, LLC, this proposal, or Purchaser’s order based on this proposal, shall be a firm agreement and is not subject to cancellation, suspension, or delay except upon payment by Purchaser of appropriate charges which shall include all costs incurred by WesTech Engineering, LLC to date of cancellation, suspension, or delay plus a reasonable profit. Additionally, all charges related to storage and/or resumption of work, at WesTech Engineering, LLC’s plant or elsewhere, shall be for Purchaser’s sole account; and all risks incidental to storage shall be assumed by Purchaser. 19. FORCE MAJEURE: Neither party hereto shall be liable to the other for default or delay in delivery caused by extreme weather or other act of God, strike or other labor shortage or disturbance, fire, accident, war or civil disturbance, act of government, pandemic, delay of carriers, failure of normal sources of supply, complete or partial shutdown of plant by reason of inability to attain sufficient raw materials or power, and/or other similar contingency beyond the reasonable control of the respective parties. The time for delivery specified herein shall be extended during the continuance of such conditions, or any other cause beyond such party’s reasonable control. 20. RETURN OF PRODUCTS: No products may be returned to WesTech Engineering, LLC without WesTech Engineering, LLC’s prior written permission. Said permission may be withheld by WesTech Engineering, LLC at its sole discretion. 21. BACKCHARGES: WesTech Engineering, LLC will not approve or accept backcharges for labor, materials, or other costs incurred by Purchaser or others in modification, adjustment, service, or repair of WesTech Engineering, LLC-furnished materials unless such back charge has been authorized in advance in writing by a WesTech Engineering, LLC employee, by a WesTech Engineering, LLC purchase order, or work requisition signed by WesTech Engineering, LLC

Proposal: 2030312_Rev11 20
22. INDEMNIFICATION: Purchaser agrees to indemnify WesTech Engineering, LLC from all costs incurred, including but not limited to court costs and reasonable attorney fees, from enforcing any provisions of this contract, including but not limited to breach of contract or costs incurred in collecting monies owed on this contract. 23. ENTIRE AGREEMENT: This proposal expresses the entire agreement between the parties hereto superseding any prior understandings, and is not subject to modification except by a writing signed by an authorized officer of each party. 24. MOTORS AND MOTOR DRIVES: In order to avoid shipment delays of WesTech Engineering, LLC equipment, the motor drives may be sent directly to the job site for installation by the equipment installer. Minor fit-up may be required. 25. EXTENDED STORAGE: Extended storage instructions will be part of information provided to shipment. If equipment installation and start-up is delayed more than 30 days, the provisions of the storage instructions must be followed to keep WARRANTY in force. 26. LIABILITY: Professional liability insurance, including but not limited to, errors and omissions insurance, is included. In any event, liability for errors and omissions shall be limited to the lesser of $100,000USD or the value of the particular piece of equipment (not the value of the entire order) supplied by WesTech Engineering, LLC against which a claim is sought. 27. ARBITRATION NEGOTIATION: Any controversy or claim arising out of or relating to the performance of any contract resulting from this proposal or contract issued, or the breach thereof, shall be settled by arbitration in
accordance with the Construction Industry Arbitration Rules of the American Arbitration Association, and judgment upon the award rendered by the arbitrator(s) may be entered to any court having jurisdiction. ACCEPTED BY PURCHASER Customer Name: Customer Address: Contact Name: Contact Phone: Contact Email: Signature: Printed Name: Title: Date:
Preliminary Engineering Report Town of Gorham Water Treatment Plant Improvements September 2021
MRB Group Project No. 0735.21001.000
APPENDIX M
ALTERNATIVE 3 – ULTRAFILTRATION PLANT
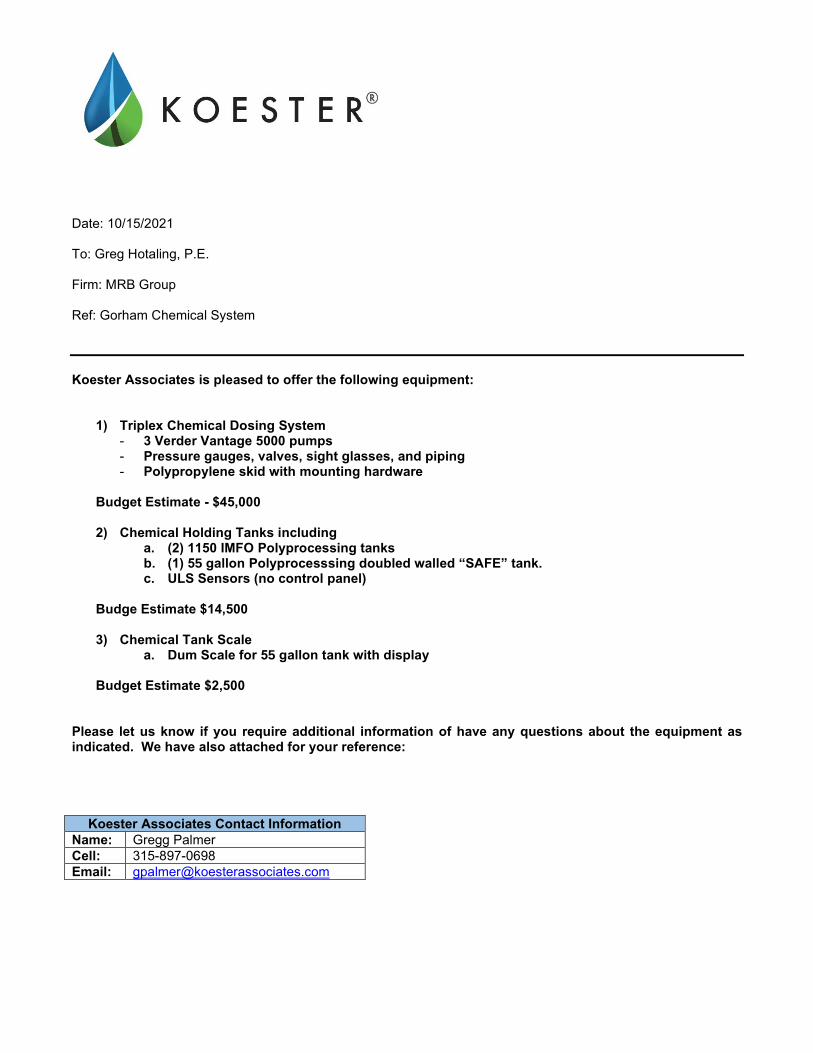
Date: 10/15/2021 To: Greg Hotaling, P.E. Firm: MRB Group Ref: Gorham Chemical System
Koester Associates is pleased to offer the following equipment:
1) Triplex Chemical Dosing System - 3 Verder Vantage 5000 pumps - Pressure gauges, valves, sight glasses, and piping - Polypropylene skid with mounting hardware
Budget Estimate - $45,000
2) Chemical Holding Tanks including
a. (2) 1150 IMFO Polyprocessing tanks b. (1) 55 gallon Polyprocesssing doubled walled “SAFE” tank. c. ULS Sensors (no control panel)
Budge Estimate $14,500
3) Chemical Tank Scale a. Dum Scale for 55 gallon tank with display
Budget Estimate $2,500 Please let us know if you require additional information of have any questions about the equipment as indicated. We have also attached for your reference:
Koester Associates Contact Information Name: Gregg Palmer
Cell: 315-897-0698
Email: [email protected]


www.polyprocessing.com
High�Density�Crosslinked�Polyethylene
High-density crosslinked polyethylene, or XLPE, is a thermoset resin that is specifi cally designed for critical applications like chemical storage. During the XLPE manufacturing process, a catalyst (peroxide) is built into the resin, which creates a free radical. The free radical generates the crosslinking of the polymer chain, so the tank essentially becomes one giant molecule. The result is a resin that is specifi cally designed for critical chemical applications.
XLPE versus Linear Polyethylene
• XLPE has 20 times the environmental stress crack resistance of HDPE.• It has 10 times the molecular weight of HDPE.• It has 5 times the impact and tensile strength of HDPE.
XLPE versus Fiberglass-Reinforced Plastic (FRP)
• XLPE off ers seamless construction for greater strength.• With FRP, chemicals can wick into the fi ber, compromising tank life.• XLPE can have a lower cost of ownership, due to the low amount of required maintenance compared to FRP.• FRP o� en requires special handling to avoid cracking.
XLPE versus Carbon and Stainless Steel
• XLPE has seamless one-piece construction, which eliminates the potential for chemical a� ack points and bad welds.
• Unlike carbon and stainless steel, XLPE has very broad chemical resistance capabilities without the need for high-cost coatings.
• XLPE does not require ongoing maintenance and inspection.• XLPE is a cost-eff ective solution to high-priced alloys.
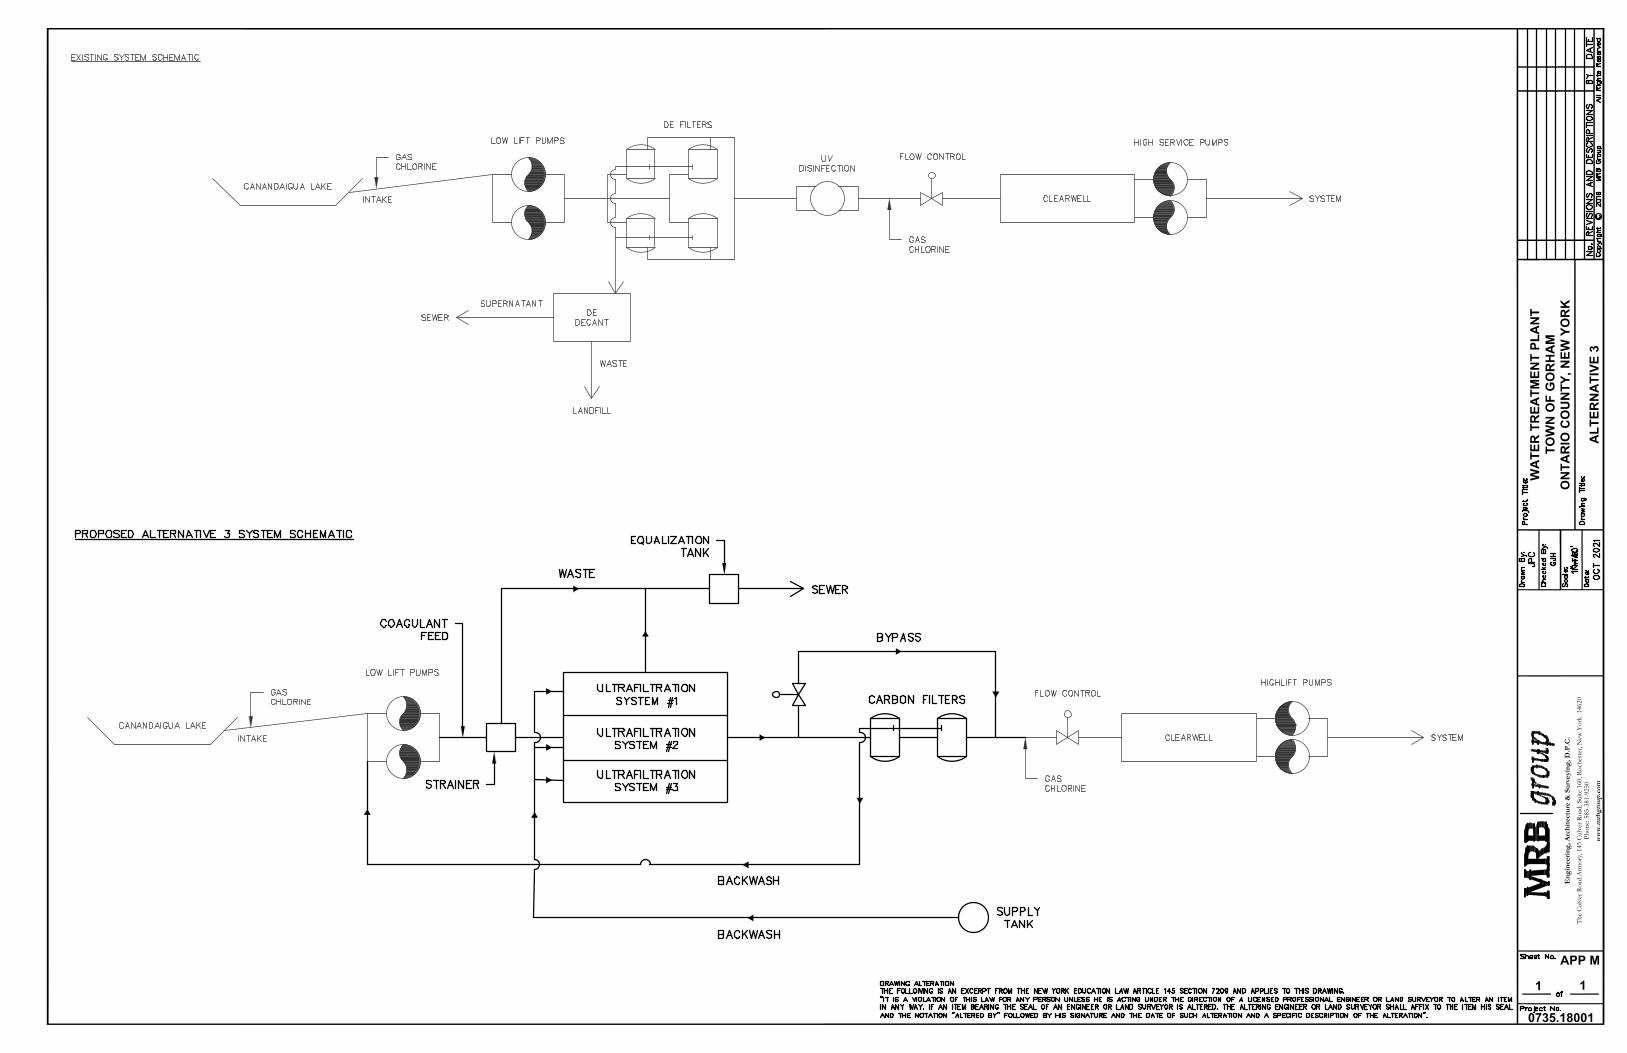
WA
TER
TR
EATM
ENT
PLA
NT
TOW
N O
F G
OR
HA
MO
NTA
RIO
CO
UN
TY, N
EW Y
OR
K
0735.18001
Eng
inee
ring,
Arc
hite
ctur
e &
Sur
veyi
ng, D
.P.C
.Th
e C
ulve
r Roa
d A
rmor
y, 1
45 C
ulve
r Roa
d, S
uite
160
, Roc
hest
er, N
ew Y
ork
146
20Ph
one:
585
-381
-925
0
ww
w.m
rbg
rou
p.c
om
1 1
APP M
ALT
ERN
ATI
VE 3
Gorham New York
Representative Gregg Palmer Koester Associates Canastota, New York (315) 697-3800 [email protected]
Contact Matt Williams [email protected] Chelsea Jensen [email protected]
Proposal Number: 2030312 Tuesday, October 05, 2021
Proposal: 2030312_Rev12 2
Table of Contents Technical Proposal
Item A – Ultrafiltration System, Model UFT83A
Clarifications and Exceptions
Commercial Proposal Bidder’s Contact Information Pricing Payment Terms Schedule Freight
Warranty
Terms & Conditions
Supplemental Information Operations and Maintenance Cost Summary General Arrangement Drawings

Proposal: 2030312_Rev12 3
Technical Proposal Item A – Ultrafiltration System, Model UFT83A
Design Overview Description Unit Dimension/Capacity Application - Municipal Drinking Water WesTech System Model - UFT83A, Ultrafiltration System Membrane Module - Toray HFUG-2020AN Net Product Flow Rate MGD 1.5 Redundancy and Unit Quantity - 3 x 50%; (3) total units Approximate Dimensions Per Unit 18’-0” L x 5’-4” W x 11’-5” H Number of Modules Per Unit 32 installed, 34 capacity
WesTech is a leader in innovative membrane filtration system technology, including VersaFilter™ open-platform systems, AltaPac™ packaged systems, retrofit engineering solutions, intelligent controls and performance analysis technology. Systems are skid-mounted and factory-tested for ease of installation, straightforward operation, and long-term reliability. Major equipment and valves are pre-configured for efficient and error-free commissioning. Controls are fully automated and completed by in-house electrical engineers and process automation experts.
In addition to UF/MF equipment, WesTech is one of the only membrane system suppliers that offers pre- and post-treatment equipment for an integrated, complete process with consolidated equipment support. Notably, WesTech has more pretreatment equipment to UF/MF systems than any supplier.
Our membrane filtration team has provided more than 130 membrane systems throughout North America with UF/MF installations ranging from 10 gpm to 13.3 MGD. As a company, WesTech has 530 employees, 140 degreed engineers, and more than 15,000 process equipment installations throughout the world. This significant experience translates into reliable, time-tested equipment.
A WesTech Ultrafiltration System rated for 3 MGD capacity.

Proposal: 2030312_Rev12 4
Design Information
Water Quality
WesTech UF/MF systems will consistently produce high purity treated water even with variation in the feed source due to a small nominal pore size in an absolute barrier configuration.
Feed Water Quality* Description Unit Concentration Source - Surface Water pH - 6.5 – 8.5 Temperature °C 5 – 20 Turbidity NTU < 25 Total Suspended Solids mg/L < 5 Total Organic Carbon mg/L < 3 Iron mg/L < 0.3 Manganese mg/L < 0.05
*Values are assumed and should be verified. It is noted that the use of charged polymeric flocculant aids increases risk of irreversible membrane fouling and should be discussed with WesTech, and this risk is applicable to all polymeric MF/UF membrane manufacturers. The presence of oil and grease in the source water should also be minimized.
Treated Water Quality Description Unit Concentration Turbidity NTU ≤ 0.10, 95% of the time
≤ 0.3 maximum Total Suspended Solids mg/L < 1 Silt Density Index - ≤ 3 Giardia Removal* - ≥ 4 log (99.99%) Cryptosporidium Removal* - ≥ 4 log (99.99%) Virus Removal* - ≥ 1.0 log removal (90.00%) Certification Standards NSF/ANSI 61, NSF/ANSI 419, UL 508A Listed
*Challenge-testing certification is provided by independent evaluation through NSF/ANSI 419. Typical removal levels exceed the certification level and are often on the order of 6-log. Additionally, the UF membranes achieve 1.5 log removals of viruses, though virus removal certification is only recognized up to 1.0 log by CDDW for any membrane filter.

Proposal: 2030312_Rev12 5
Process Description
Described in this proposal is the preliminary process and design of the WesTech membrane filtration system for the Gorham WTP project. The preliminary system design consists of three (3) membrane filtration units sized to achieve a net production capacity of 1.5 MGD with one unit offline. Accordingly, the system is designed with N+1 redundancy. Each unit has capacity for up to 34 modules, with 32 installed.
The filtration process is an outside/in, pressure-driven process to remove suspended solids and turbidity, and to achieve 4-log reduction of pathogens like Giardia and Cryptosporidium. Ultrafiltration membranes can also achieve >1.5 log reduction of waterborne viruses. Raw water from the water source is transferred to the feed tank. VFD-controlled feed pumps direct the source water to a 200 µm pre-filter for removal of larger debris. The feed pump controls will be configured to minimize flow variation between steps and instantaneous flux by operation of the maximum number of available units.
Filtrate is sent to the backwash supply tank (by others). Backwashing is used to remove accumulated foulants by reversed inside/out flow at an interval of 20 - 60 minutes with air scour for increased agitation. A drain or filter-to-waste step is used to remove any additional accumulated material. Membrane integrity testing is conducted automatically once every 24 hours. The pressure decay test (PDT) is capable of detecting a single fiber break.
Maintenance cleans (MCs)/chemically-enhanced backwashes (CEBs) and clean-in-place (CIP) procedures are automated chemical cleaning processes used to recover membrane permeability. MCs/CEBs are typically performed with NaOCl biweekly. The automated clean-in-place procedure is designed to occur no more frequently than once per month, is conducted with either NaOCl or acid, and is initiated when membrane permeability decreases to a specified value.
Following chemical cleaning procedures, the membrane units are drained by gravity or a pressurized drain-to-waste, and waste is subsequently sent to the discharge location. A rinse step and backwashing are used to remove residual chemical prior to resuming production. If desired, chemical cleaning waste can be captured and neutralized prior to discharge.

Proposal: 2030312_Rev12 6
Process Design Summary
Detailed Design Summary - One Unit Off Parameter AES SI Number of Units in Operation 2 WesTech System Model UFT83A, WesTech Ultrafiltration Installed Modules per Unit 32 Total Module Capacity per Unit 34 Module Model Toray HFUG-2020AN Membrane Area per Module 969 ft² 90 m² Membrane Area in Operation 62,016 ft² 5,760 m² Design Temperature 41.0 °F 5.0 °C Production Cycle Time 30 min Flux Rates
Instantaneous Flux at Design Temp. 27.9 gfd 47.4 lmh Normalized Flux (20°C) at Design Temp. 42.5 gfd 72.2 lmh
Flow Rates
Instantaneous Flow Rate 1,202 gpm 273 m³/hr Average Gross Flow Rate 1,092 gpm 248 m³/hr Average Net Filtrate 1,042 gpm 237 m³/hr Backwash Flow Rate 661 gpm 150 m³/hr
Approx. Net Filtrate Production per Day 1,500,000 gpd 5,678 m³/day Backwash Waste Volume per Day 28,542 gpd 109 m³/day Influent Used for Rinsing/Draining per Day 43,239 gpd 227 m³/day Water Recovery ≥ 95 % Estimated Maintenance Clean Frequency Daily to Weekly Estimated Clean-In-Place Frequency 30 days

Proposal: 2030312_Rev12 7
Scope of Supply
Scope of Supply – Ultrafiltration System Item Quantity Description Brand (or Equal) Membrane Modules 32/unit
96/system Hollow-fiber, outside-in UF, PVDF/TIPS, 0.01 µm
Toray
Skid Frames 3 X 50% 304 Stainless steel - Manifold and Supply Piping - Schedule 80 PVC/HDPE
6” feed/filtrate connections -
Feed Pump 3 x 50% Shipped loose Goulds Backwash Pump 2 x 100% Shipped loose Goulds Pre-filter 3 x 50% 200-micron, automatic
backwashing Valve and Filter
Compressed Air System 2 x 100% Compressor, receiver, oil filter, and dryer
Quincy
Turbidimeter 1 common feed 1/unit filtrate 4 total
TU5300 sc TU5300 sc
Hach Hach
Flow Meters 1/unit 3 total
Bi-directional magnetic flow meter with transmitter
Siemens
Pressure Instrumentation 1 lot Transmitters, gauges Trerice Pneumatic Valves / Actuators 1 lot Manual and pneumatically
actuated valves with polyurethane tubing
Bray
Electrical Controls 1 Master Panel 1 / skid Local I/O
NEMA 4, 480 V, 3 ph, PLC, HMI NEMA 4, 120 V, 1 ph
Allen-Bradley
Tanks By Others Feed, backwash HDPE with level measurement
-
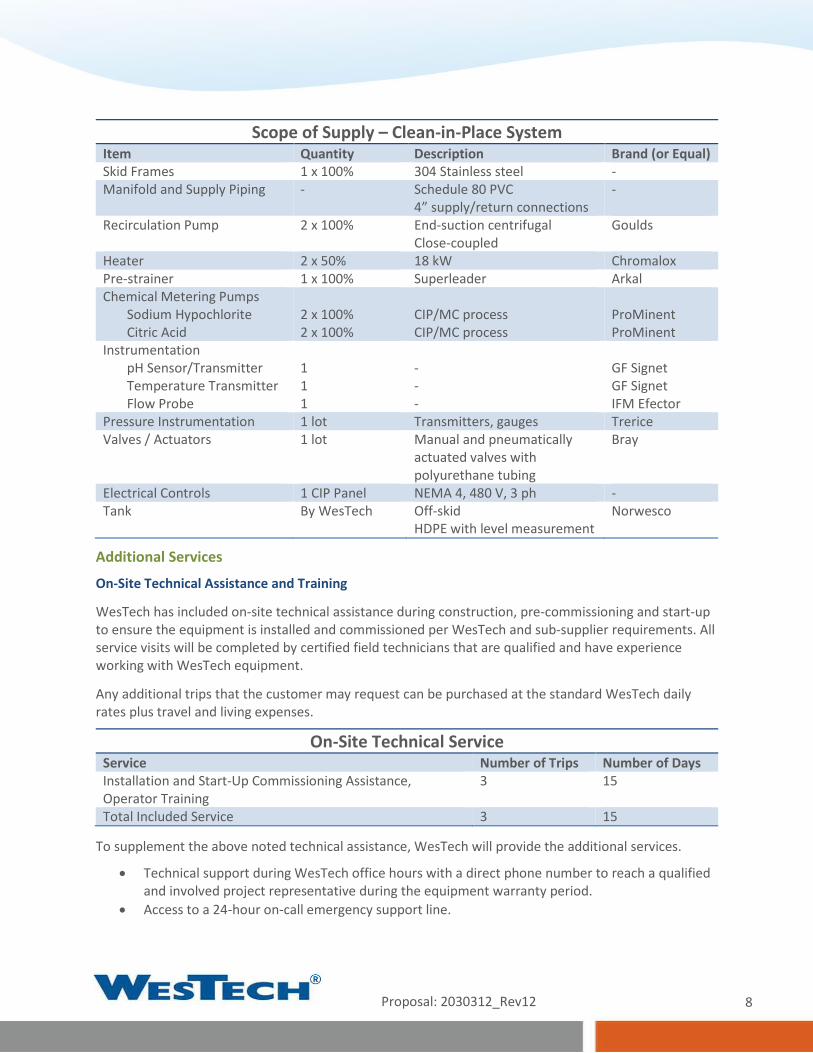
Proposal: 2030312_Rev12 8
Scope of Supply – Clean-in-Place System Item Quantity Description Brand (or Equal) Skid Frames 1 x 100% 304 Stainless steel - Manifold and Supply Piping - Schedule 80 PVC
4” supply/return connections -
Recirculation Pump 2 x 100% End-suction centrifugal Close-coupled
Goulds
Heater 2 x 50% 18 kW Chromalox Pre-strainer 1 x 100% Superleader Arkal Chemical Metering Pumps
Sodium Hypochlorite Citric Acid
2 x 100% 2 x 100%
CIP/MC process CIP/MC process
ProMinent ProMinent
Instrumentation pH Sensor/Transmitter Temperature Transmitter Flow Probe
1 1 1
- - -
GF Signet GF Signet IFM Efector
Pressure Instrumentation 1 lot Transmitters, gauges Trerice Valves / Actuators 1 lot Manual and pneumatically
actuated valves with polyurethane tubing
Bray
Electrical Controls 1 CIP Panel NEMA 4, 480 V, 3 ph - Tank By WesTech Off-skid
HDPE with level measurement Norwesco
Additional Services
On-Site Technical Assistance and Training
WesTech has included on-site technical assistance during construction, pre-commissioning and start-up to ensure the equipment is installed and commissioned per WesTech and sub-supplier requirements. All service visits will be completed by certified field technicians that are qualified and have experience working with WesTech equipment.
Any additional trips that the customer may request can be purchased at the standard WesTech daily rates plus travel and living expenses.
On-Site Technical Service Service Number of Trips Number of Days Installation and Start-Up Commissioning Assistance, Operator Training
3 15
Total Included Service 3 15
To supplement the above noted technical assistance, WesTech will provide the additional services.
• Technical support during WesTech office hours with a direct phone number to reach a qualified and involved project representative during the equipment warranty period.
• Access to a 24-hour on-call emergency support line.
Proposal: 2030312_Rev12 9
Clarifications and Exceptions General Clarifications Terms & Conditions: This proposal, including all terms and conditions contained herein, shall become part of any resulting contract or purchase order. Changes to any terms and conditions, including but not limited to submittal and shipment days, payment terms, and escalation clause shall be negotiated at order placement, otherwise the proposal terms and conditions contained herein shall apply.
Escalation: If during the performance of the contract, the price of labor, material, freight, and other costs significantly increase, through no fault of WesTech, the price shall be equitably adjusted and subject to escalation. A significant price increase shall mean any price increase from proposal date to material procurement greater than 2.5% from stated prices. Delays and costs associated with a Force Majeure event shall also be equitably adjusted and subject to a change in price and/or schedule. Escalation to be based on cost increases, (without additional profit, overhead or margin) and shall include labor, material, freight, and other costs to WesTech that occur in the specified time period. Any revisions or changes requested by the customer will be priced on a case-by-case basis. Such price increases shall be documented through third party sources. Carbon material escalation will be based on the US Midwest Domestic Index, current flats and longs indexes, in effect at the time of bid. Stainless material escalation will be based the Argus Metals Stainless Steel ex works US base price plus surcharge for flat and bar (per design specified alloy), in effect at the time of bid.
Exceptions Not applicable

Proposal: 2030312_Rev12 10
Commercial Proposal Proposal Name: Gorham, New York Proposal Number: 2030312 Tuesday, October 05, 2021 1. Bidder's Contact Information Company Name WesTech Engineering, LLC Primary Contact Name Matt Williams Phone 801.265.1000 Email [email protected] Address: Number/Street 3665 S West Temple Address: City, State, Zip Salt Lake City, UT 84115
2. Budget Pricing Currency: US Dollars Scope of Supply
A Ultrafiltration System, Model UFT83A $1,263,000 Taxes (sales, use, VAT, IVA, IGV, duties, import fees, etc.) Not Included Prices are valid for a period not to exceed 30 days from date of proposal.
Additional Field Service Daily Rate (Applicable Only to Field Service Not Included in Scope) $1,200 Pricing does not include field service unless noted in scope of supply, but is available at the daily rate plus expenses. The greater of a two week notice or visa procurement time is required prior to departure date. Our field service policy can be provided upon request for more details.
3. Payment Terms Purchase Order Acceptance and Contract Execution 10% Submittals Provided by WesTech 15% Release for Fabrication 35% Notification of Ready to Ship 40% All payments are net 30 days. Partial shipments are allowed. An approved Letter of Credit is required if Incoterms CIF, CFR, DAP, CIP, or CPT are applicable. Payment is required in full for all other Incoterms prior to international shipment. Other terms per WesTech proforma invoice. Please note that the advising bank must be named as: Wells Fargo Bank, International Department, 9000 Flair Drive, 3rd Floor, El Monte, California 91731, USA.
4. Schedule – GAC & SuperSettler Submittals, after Purchase Order Acceptance and Contract Execution 6 to 8 weeks Ready to Ship, after Receipt of Final Submittal Approval 18 to 20 weeks Estimated Weeks to Ready to Ship 24 to 28 weeks* *Customer submittal approval is typically required to proceed with equipment fabrication and is not accounted for in the schedule above. Project schedule will be extended to account for time associated with receipt of customer submittal approval.
5. Freight Domestic FOB Shipping Point - Full Freight Allowed to Jobsite (FSP-FFA) From Final Destination Number of Trucks or Containers WesTech Shops Gorham, NY Approximately 4

Proposal: 2030312_Rev12 11
One-Year Warranty WesTech equipment is backed by WesTech's reputation as a quality manufacturer, and by many years of experience in the design of reliable equipment.
Equipment manufactured or sold by WesTech Engineering, LLC, once paid for in full, is backed by the following warranty:
For the benefit of the original user, WesTech warrants all new equipment manufactured by WesTech Engineering, LLC. to be free from defects in material and workmanship, and will replace or repair, F.O.B. its factories or other location designated by it, any part or parts returned to it which WesTech's examination shall show to have failed under normal use and service by the original user within one (1) year following initial start-up, or eighteen (18) months from shipment to the purchaser, whichever occurs first.
Such repair or replacement shall be free of charge for all items except for those items such as resin, filter media and the like that are consumable and normally replaced during maintenance, with respect to which, repair or replacement shall be subject to a pro-rata charge based upon WesTech's estimate of the percentage of normal service life realized from the part. WesTech's obligation under this warranty is conditioned upon its receiving prompt notice of claimed defects, which shall in no event be later than thirty (30) days following expiration of the warranty period, and is limited to repair or replacement as aforesaid.
This warranty is expressly made by WesTech and accepted by purchaser in lieu of all other warranties, including warranties of merchantability and fitness for particular purpose, whether written, oral, express, implied, or statutory. WesTech neither assumes nor authorizes any other person to assume for it any other liability with respect to its equipment. WesTech shall not be liable for normal wear and tear, corrosion, or any contingent, incidental, or consequential damage or expense due to partial or complete inoperability of its equipment for any reason whatsoever.
This warranty shall not apply to equipment or parts thereof which have been altered or repaired outside of a WesTech factory, or damaged by improper installation, application, or maintenance, or subjected to misuse, abuse, neglect, accident, or incomplete adherence to all manufacturer’s requirements, including, but not limited to, Operations & Maintenance Manual guidelines & procedures.
This warranty applies only to equipment made or sold by WesTech Engineering, LLC.
WesTech Engineering, LLC. makes no warranty with respect to parts, accessories, or components purchased by the customer from others. The warranties which apply to such items are those offered by their respective manufacturers.

Proposal: 2030312_Rev12 12
Terms & Conditions Terms and Conditions appearing in any order based on this proposal which are inconsistent herewith shall not be binding on WesTech Engineering, LLC The sale and purchase of equipment described herein shall be governed exclusively by the foregoing proposal and the following provisions: 1. SPECIFICATIONS: WesTech Engineering, LLC is furnishing its standard equipment as outlined in the proposal and as will be covered by final approved drawings. The equipment may not be in strict compliance with the Engineer’s/Owner’s plans, specifications, or addenda as there may be deviations. The equipment will, however, meet the general intention of the mechanical specifications of these documents. 2. ITEMS INCLUDED: This proposal includes only the equipment specified herein and does not include erection, installation, accessories, nor associated materials such as controls, piping, etc., unless specifically listed. 3. PARTIES TO CONTRACT: WesTech Engineering, LLC is not a party to or bound by the terms of any contract between WesTech Engineering, LLC’s customer and any other party. WesTech Engineering, LLC’s undertakings are limited to those defined in the contract between WesTech Engineering, LLC and its direct customers. 4. PRICE AND DELIVERY: All selling prices quoted are subject to change without notice after 30 days from the date of this proposal unless specified otherwise. Unless otherwise stated, all prices are F.O.B. WesTech Engineering, LLC or its supplier’s shipping points. All claims for damage, delay or shortage arising from such equipment shall be made by Purchaser directly against the carrier. When shipments are quoted F.O.B. job site or other designation, Purchaser shall inspect the equipment shipped, notifying WesTech Engineering, LLC of any damage or shortage within forty-eight hours of receipt, and failure to so notify WesTech Engineering, LLC shall constitute acceptance by Purchaser, relieving WesTech Engineering, LLC of any liability for shipping damages or shortages. 5. PAYMENTS: All invoices are net 30 days. Delinquencies are subject to a 1.5 percent service charge per month or the maximum permitted by law, whichever is less on all past due accounts. Pro rata payments are due as shipments are made. If shipments are delayed by the Purchaser, invoices shall be sent on the date when WesTech Engineering, LLC is prepared to make shipment and payment shall become due under standard invoicing terms. If the work to be performed hereunder is delayed by the Purchaser, payments shall be based on the purchase price and percentage of completion. Products held for the Purchaser shall be at the risk and expense of the Purchaser. Unless specifically stated otherwise, prices quoted are for equipment only. These terms are independent of and not contingent upon the time and manner in which the Purchaser receives payment from the owner. 6. PAYMENT TERMS: Credit is subject to acceptance by WesTech Engineering, LLC’s Credit Department. If the financial condition of the Purchaser at any time is such as to give WesTech Engineering, LLC, in its judgment, doubt concerning the Purchaser’s ability to pay, WesTech Engineering, LLC may require full or partial payment in advance or may suspend any further deliveries or continuance of the work to be performed by the WesTech Engineering, LLC until such payment has been received. 7. ESCALATION: If during the performance of the contract, the price of labor, material, freight, and other costs significantly increase, through no fault of WesTech, the price shall be equitably adjusted and subject to escalation. A significant price increase shall mean any price increase from proposal date to material procurement greater than 2.5% from stated prices. Delays and costs associated with a Force Majeure event shall also be equitably adjusted and subject to a change in price and/or schedule. Escalation to be based on cost increases, (without additional
profit, overhead or margin) and shall include labor, material, freight, and other costs to WesTech that occur in the specified time period. Any revisions or changes requested by the customer will be priced on a case-by-case basis. Such price increases shall be documented through third party sources. Carbon material escalation will be based on the US Midwest Domestic Index, current flats and longs indexes, in effect at the time of bid. Stainless material escalation will be based the Argus Metals Stainless Steel ex works US base price plus surcharge for flat and bar (per design specified alloy), in effect at the time of bid. 8. APPROVAL: If approval of equipment submittals by Purchaser or others is required, a condition precedent to WesTech Engineering, LLC supplying any equipment shall be such complete approval. 9. INSTALLATION SUPERVISION: Prices quoted for equipment do not include installation supervision. WesTech Engineering, LLC recommends and will, upon request, make available, at WesTech Engineering, LLC’s then current rate, an experienced installation supervisor to act as the Purchaser’s employee and agent to supervise installation of the equipment. Purchaser shall at its sole expense furnish all necessary labor equipment, and materials needed for installation. Responsibility for proper operation of equipment, if not installed by WesTech Engineering, LLC or installed in accordance with WesTech Engineering, LLC’s instructions, and inspected and accepted in writing by WesTech Engineering, LLC, rests entirely with Purchaser; and any work performed by WesTech Engineering, LLC personnel in making adjustment or changes must be paid for at WesTech Engineering, LLC’s then current per diem rates plus living and traveling expenses. WesTech Engineering, LLC will supply the safety devices described in this proposal or shown in WesTech Engineering, LLC’s drawings furnished as part of this order but excepting these, WesTech Engineering, LLC shall not be required to supply or install any safety devices whether required by law or otherwise. The Purchaser hereby agrees to indemnify and hold harmless WesTech Engineering, LLC from any claims or losses arising due to alleged or actual insufficiency or inadequacy of the safety devices offered or supplied hereunder, whether specified by WesTech Engineering, LLC or Purchaser, and from any damage resulting from the use of the equipment supplied hereunder. 10. ACCEPTANCE OF PRODUCTS: Products will be deemed accepted without any claim by Purchaser unless written notice of non-acceptance is received by WesTech Engineering, LLC within 30 days of delivery if shipped F.O.B. point of shipment, or 48 hours of delivery if shipped F.O.B. point of destination. Such written notice shall not be considered received by WesTech Engineering, LLC unless it is accompanied by all freight bills for said shipment, with Purchaser’s notations as to damages, shortages and conditions of equipment, containers, and seals. Non-accepted products are subject to the return policy stated below. 11. TAXES: Any federal, state, or local sales, use or other taxes applicable to this transaction, unless specifically included in the price, shall be for Purchaser’s account. 12. TITLE: The equipment specified herein, and any replacements or substitutes therefore shall, regardless of the manner in which affixed to or used in connection with realty, remain the sole and personal property of WesTech Engineering, LLC until the full purchase price has been paid. Purchaser agrees to do all things necessary to protect and maintain WesTech Engineering, LLC’s title and interest in and to such equipment; and upon Purchaser’s default, WesTech Engineering, LLC may retain as liquidated damages any and all partial payments made and shall be free to enter the premises where such equipment is located and remove the same
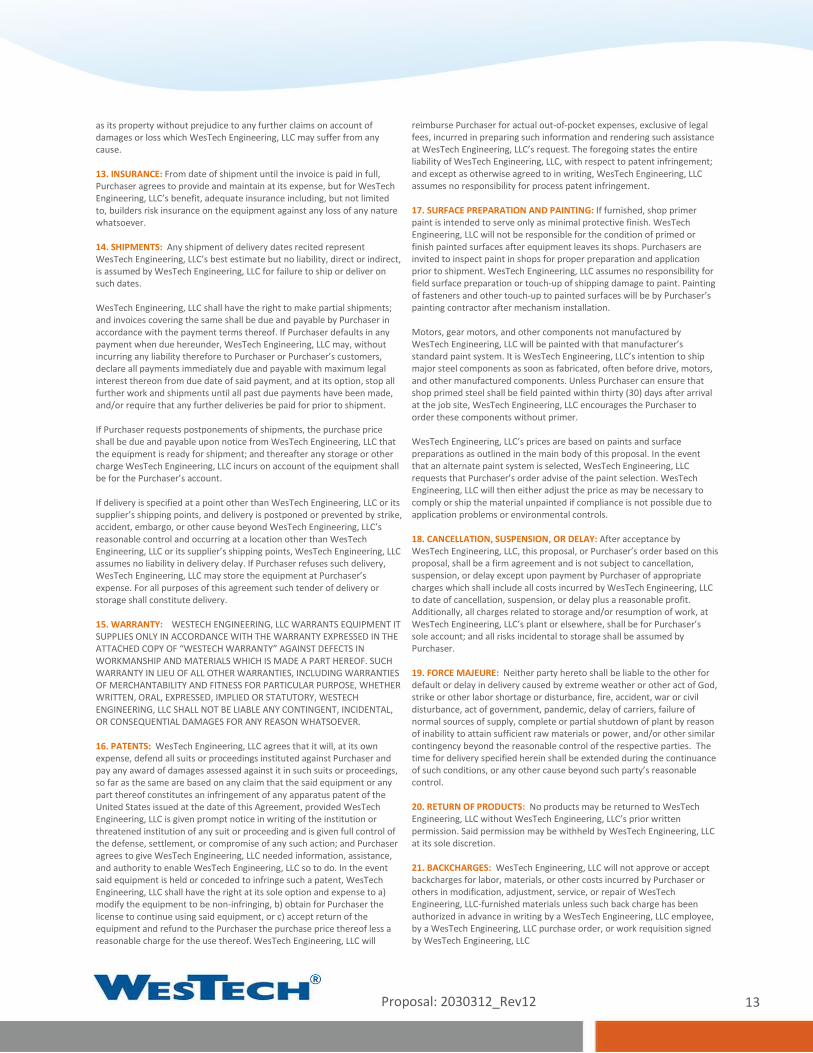
Proposal: 2030312_Rev12 13
as its property without prejudice to any further claims on account of damages or loss which WesTech Engineering, LLC may suffer from any cause. 13. INSURANCE: From date of shipment until the invoice is paid in full, Purchaser agrees to provide and maintain at its expense, but for WesTech Engineering, LLC’s benefit, adequate insurance including, but not limited to, builders risk insurance on the equipment against any loss of any nature whatsoever. 14. SHIPMENTS: Any shipment of delivery dates recited represent WesTech Engineering, LLC’s best estimate but no liability, direct or indirect, is assumed by WesTech Engineering, LLC for failure to ship or deliver on such dates. WesTech Engineering, LLC shall have the right to make partial shipments; and invoices covering the same shall be due and payable by Purchaser in accordance with the payment terms thereof. If Purchaser defaults in any payment when due hereunder, WesTech Engineering, LLC may, without incurring any liability therefore to Purchaser or Purchaser’s customers, declare all payments immediately due and payable with maximum legal interest thereon from due date of said payment, and at its option, stop all further work and shipments until all past due payments have been made, and/or require that any further deliveries be paid for prior to shipment. If Purchaser requests postponements of shipments, the purchase price shall be due and payable upon notice from WesTech Engineering, LLC that the equipment is ready for shipment; and thereafter any storage or other charge WesTech Engineering, LLC incurs on account of the equipment shall be for the Purchaser’s account. If delivery is specified at a point other than WesTech Engineering, LLC or its supplier’s shipping points, and delivery is postponed or prevented by strike, accident, embargo, or other cause beyond WesTech Engineering, LLC’s reasonable control and occurring at a location other than WesTech Engineering, LLC or its supplier’s shipping points, WesTech Engineering, LLC assumes no liability in delivery delay. If Purchaser refuses such delivery, WesTech Engineering, LLC may store the equipment at Purchaser’s expense. For all purposes of this agreement such tender of delivery or storage shall constitute delivery. 15. WARRANTY: WESTECH ENGINEERING, LLC WARRANTS EQUIPMENT IT SUPPLIES ONLY IN ACCORDANCE WITH THE WARRANTY EXPRESSED IN THE ATTACHED COPY OF “WESTECH WARRANTY” AGAINST DEFECTS IN WORKMANSHIP AND MATERIALS WHICH IS MADE A PART HEREOF. SUCH WARRANTY IN LIEU OF ALL OTHER WARRANTIES, INCLUDING WARRANTIES OF MERCHANTABILITY AND FITNESS FOR PARTICULAR PURPOSE, WHETHER WRITTEN, ORAL, EXPRESSED, IMPLIED OR STATUTORY, WESTECH ENGINEERING, LLC SHALL NOT BE LIABLE ANY CONTINGENT, INCIDENTAL, OR CONSEQUENTIAL DAMAGES FOR ANY REASON WHATSOEVER. 16. PATENTS: WesTech Engineering, LLC agrees that it will, at its own expense, defend all suits or proceedings instituted against Purchaser and pay any award of damages assessed against it in such suits or proceedings, so far as the same are based on any claim that the said equipment or any part thereof constitutes an infringement of any apparatus patent of the United States issued at the date of this Agreement, provided WesTech Engineering, LLC is given prompt notice in writing of the institution or threatened institution of any suit or proceeding and is given full control of the defense, settlement, or compromise of any such action; and Purchaser agrees to give WesTech Engineering, LLC needed information, assistance, and authority to enable WesTech Engineering, LLC so to do. In the event said equipment is held or conceded to infringe such a patent, WesTech Engineering, LLC shall have the right at its sole option and expense to a) modify the equipment to be non-infringing, b) obtain for Purchaser the license to continue using said equipment, or c) accept return of the equipment and refund to the Purchaser the purchase price thereof less a reasonable charge for the use thereof. WesTech Engineering, LLC will
reimburse Purchaser for actual out-of-pocket expenses, exclusive of legal fees, incurred in preparing such information and rendering such assistance at WesTech Engineering, LLC’s request. The foregoing states the entire liability of WesTech Engineering, LLC, with respect to patent infringement; and except as otherwise agreed to in writing, WesTech Engineering, LLC assumes no responsibility for process patent infringement. 17. SURFACE PREPARATION AND PAINTING: If furnished, shop primer paint is intended to serve only as minimal protective finish. WesTech Engineering, LLC will not be responsible for the condition of primed or finish painted surfaces after equipment leaves its shops. Purchasers are invited to inspect paint in shops for proper preparation and application prior to shipment. WesTech Engineering, LLC assumes no responsibility for field surface preparation or touch-up of shipping damage to paint. Painting of fasteners and other touch-up to painted surfaces will be by Purchaser’s painting contractor after mechanism installation. Motors, gear motors, and other components not manufactured by WesTech Engineering, LLC will be painted with that manufacturer’s standard paint system. It is WesTech Engineering, LLC’s intention to ship major steel components as soon as fabricated, often before drive, motors, and other manufactured components. Unless Purchaser can ensure that shop primed steel shall be field painted within thirty (30) days after arrival at the job site, WesTech Engineering, LLC encourages the Purchaser to order these components without primer. WesTech Engineering, LLC’s prices are based on paints and surface preparations as outlined in the main body of this proposal. In the event that an alternate paint system is selected, WesTech Engineering, LLC requests that Purchaser’s order advise of the paint selection. WesTech Engineering, LLC will then either adjust the price as may be necessary to comply or ship the material unpainted if compliance is not possible due to application problems or environmental controls. 18. CANCELLATION, SUSPENSION, OR DELAY: After acceptance by WesTech Engineering, LLC, this proposal, or Purchaser’s order based on this proposal, shall be a firm agreement and is not subject to cancellation, suspension, or delay except upon payment by Purchaser of appropriate charges which shall include all costs incurred by WesTech Engineering, LLC to date of cancellation, suspension, or delay plus a reasonable profit. Additionally, all charges related to storage and/or resumption of work, at WesTech Engineering, LLC’s plant or elsewhere, shall be for Purchaser’s sole account; and all risks incidental to storage shall be assumed by Purchaser. 19. FORCE MAJEURE: Neither party hereto shall be liable to the other for default or delay in delivery caused by extreme weather or other act of God, strike or other labor shortage or disturbance, fire, accident, war or civil disturbance, act of government, pandemic, delay of carriers, failure of normal sources of supply, complete or partial shutdown of plant by reason of inability to attain sufficient raw materials or power, and/or other similar contingency beyond the reasonable control of the respective parties. The time for delivery specified herein shall be extended during the continuance of such conditions, or any other cause beyond such party’s reasonable control. 20. RETURN OF PRODUCTS: No products may be returned to WesTech Engineering, LLC without WesTech Engineering, LLC’s prior written permission. Said permission may be withheld by WesTech Engineering, LLC at its sole discretion. 21. BACKCHARGES: WesTech Engineering, LLC will not approve or accept backcharges for labor, materials, or other costs incurred by Purchaser or others in modification, adjustment, service, or repair of WesTech Engineering, LLC-furnished materials unless such back charge has been authorized in advance in writing by a WesTech Engineering, LLC employee, by a WesTech Engineering, LLC purchase order, or work requisition signed by WesTech Engineering, LLC

Proposal: 2030312_Rev12 14
22. INDEMNIFICATION: Purchaser agrees to indemnify WesTech Engineering, LLC from all costs incurred, including but not limited to court costs and reasonable attorney fees, from enforcing any provisions of this contract, including but not limited to breach of contract or costs incurred in collecting monies owed on this contract. 23. ENTIRE AGREEMENT: This proposal expresses the entire agreement between the parties hereto superseding any prior understandings, and is not subject to modification except by a writing signed by an authorized officer of each party. 24. MOTORS AND MOTOR DRIVES: In order to avoid shipment delays of WesTech Engineering, LLC equipment, the motor drives may be sent directly to the job site for installation by the equipment installer. Minor fit-up may be required. 25. EXTENDED STORAGE: Extended storage instructions will be part of information provided to shipment. If equipment installation and start-up is delayed more than 30 days, the provisions of the storage instructions must be followed to keep WARRANTY in force. 26. LIABILITY: Professional liability insurance, including but not limited to, errors and omissions insurance, is included. In any event, liability for errors and omissions shall be limited to the lesser of $100,000USD or the value of the particular piece of equipment (not the value of the entire order) supplied by WesTech Engineering, LLC against which a claim is sought. 27. ARBITRATION NEGOTIATION: Any controversy or claim arising out of or relating to the performance of any contract resulting from this proposal or contract issued, or the breach thereof, shall be settled by arbitration in
accordance with the Construction Industry Arbitration Rules of the American Arbitration Association, and judgment upon the award rendered by the arbitrator(s) may be entered to any court having jurisdiction. ACCEPTED BY PURCHASER Customer Name: Customer Address: Contact Name: Contact Phone: Contact Email: Signature: Printed Name: Title: Date:

Proposal: 2030312_Rev12 15
Supplemental Information Operations and Maintenance Cost Summary General Arrangement Drawings

ISOMETRIC
REV
-
SHEETDOCUMENT NUMBER
1001 1 OF 3
TITLEGENERAL ARRANGEMENT
ULTRAFILTRATION(38) MODULE CAPACITY
10/28/2015VO00
DESIGNER CHECKER APPROVER
THIS DRAWING IS PROPERTY OF WESTECH ENGINEERING, INC. AND IS TRANSMITTED IN CONFIDENCE. NEITHER RECEIPT NOR POSSESSION CONFERS OR TRANSFERS ANY RIGHTS TO REPRODUCE, USE, OR DISCLOSE, IN WHOLE OR IN PART, DATA CONTAINED HEREIN FOR ANY PURPOSE, WITHOUT THE WRITTEN PERMISSION OF WESTECH ENGINEERING, INC.
DATE
REFERENCE DOCUMENTS
PREPARED FOR
ENGINEER
CONTRACTOR
PO/CONTRACT NUMBER
REV REVISION DESCRIPTION ECN DESIGNER APPROVER DATE
NOTES:
1. FOLLOW THE LISTED WESTECH REFERENCE DOCUMENTS EXCEPT AS NOTED ON THIS DRAWING. 2. ALL FLANGED CONNECTIONS TO BE 150#. 3. SKID CONNECTIONS NOT DESIGNED TO BEAR PLANT PIPING LOADS. PLANT PIPING MUST BE PROPERLY SUPPORTED. 4. EQUIPMENT MUST BE LEVEL AFTER INSTALLATION. 5. AIR HEADERS TO BE 304SS, MODULE HEADERS TO BE HDPE, ALL OTHER SKID PIPING TO BE SCH 80 PVC. 6. ALL VALVE AIR SUPPLY / SAMPLE / INSTRUMENT TUBING TO BE POLYURETHANE.
CONNECTION SUMMARY
NOZZLE SIZE TYPE DESCRIPTION
A 8" FLG UF FEED
B 8" FLG UF FILTRATE
C 8" FLG BW SUPPLY
D 8" FLG BW WASTE / DRAIN DOWN
E 4" FLG CIP SUPPLY
F 4" FLG CIP RETURN - UF FILTRATE
G 4" FLG CIP RETURN - BW WASTE
H 2" FLG AIR PURGE - UF FILTRATE
J 2" FLG AIR PURGE - BW WASTE
K 1" FLG AIR SUPPLY (NOT SHOWN)
ITEM EQUIPMENT DESCRIPTION MAT'L
1 ULTRAFILTRATION MODULES - (36) INSTALLED, (38) CAPACITY PVDF
2 MODULE SKID STL
3 CONTROL SKID STL
4 FLOW METER -
5 CONTROL PANEL -
ALTAFILTER PROCESS DESIGN INFORMATION
AVERAGE GROSS FLOW: - GPM
NET FLOW: - GPM
FLUX: - GFD
BACKWASH RATE: - GPM
RECOVERY: - %
AVERAGE NTU: - -
MINIMUM TEMP - °C
A
B
C
D
H
J
1
2
3
4
5
F
G
E
Chelsea JENSEN
Text Box
FOR REFERENCE ONLY SEE PROPOSAL FOR PROJECT SPECIFIC INFORMATION

ELEVATION
FRONT
REV
-
SHEETDOCUMENT NUMBER
1001 2 OF 3
TITLEGENERAL ARRANGEMENT
ULTRAFILTRATION(38) MODULE CAPACITY
10/28/2015VO00
DESIGNER CHECKER APPROVER
THIS DRAWING IS PROPERTY OF WESTECH ENGINEERING, INC. AND IS TRANSMITTED IN CONFIDENCE. NEITHER RECEIPT NOR POSSESSION CONFERS OR TRANSFERS ANY RIGHTS TO REPRODUCE, USE, OR DISCLOSE, IN WHOLE OR IN PART, DATA CONTAINED HEREIN FOR ANY PURPOSE, WITHOUT THE WRITTEN PERMISSION OF WESTECH ENGINEERING, INC.
DATE
A A
9'-834"
1'-2 316"
1'-2"
B
A
C
D
H
J
5
11'-4 516"
APPROXIMATEOVERALLHEIGHT
1'-3"
3'-8"
6'-0"
1'-2"
F
G
E
1
32
Chelsea JENSEN
Text Box
FOR REFERENCE ONLY SEE PROPOSAL FOR PROJECT SPECIFIC INFORMATION
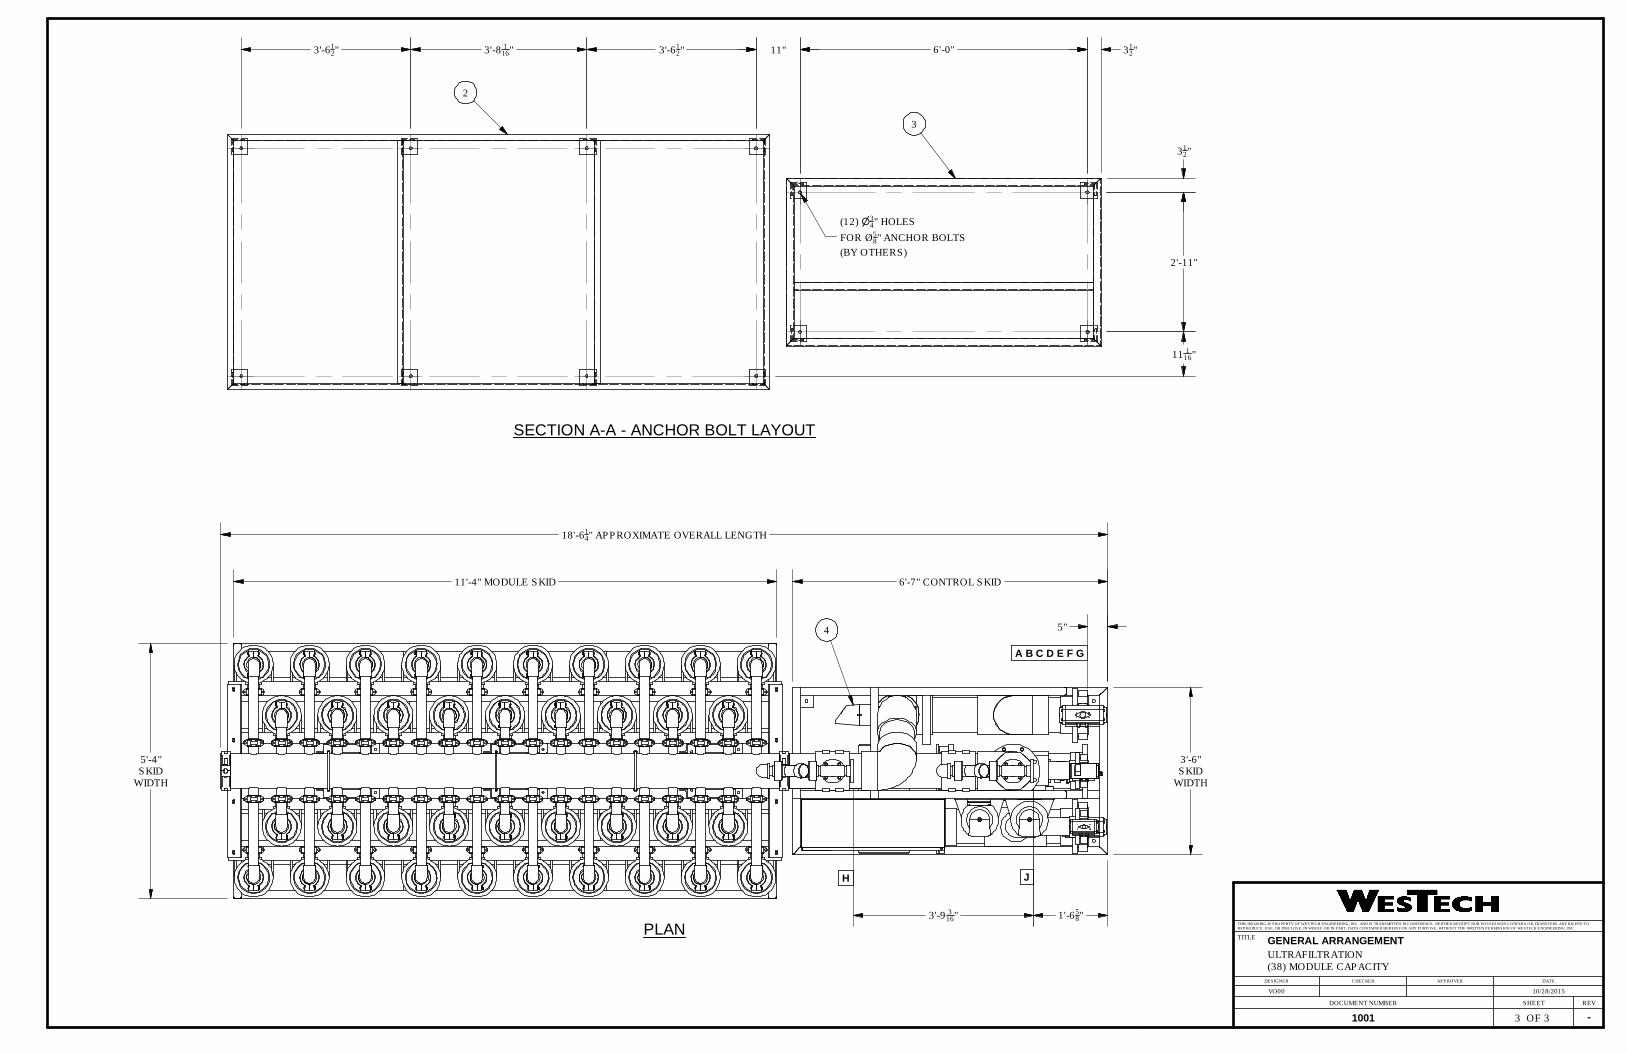
PLAN
SECTION A-A - ANCHOR BOLT LAYOUT
REV
-
SHEETDOCUMENT NUMBER
1001 3 OF 3
TITLEGENERAL ARRANGEMENT
ULTRAFILTRATION(38) MODULE CAPACITY
10/28/2015VO00
DESIGNER CHECKER APPROVER
THIS DRAWING IS PROPERTY OF WESTECH ENGINEERING, INC. AND IS TRANSMITTED IN CONFIDENCE. NEITHER RECEIPT NOR POSSESSION CONFERS OR TRANSFERS ANY RIGHTS TO REPRODUCE, USE, OR DISCLOSE, IN WHOLE OR IN PART, DATA CONTAINED HEREIN FOR ANY PURPOSE, WITHOUT THE WRITTEN PERMISSION OF WESTECH ENGINEERING, INC.
DATE
6'-7" CONTROL SKID11'-4" MODULE SKID
5'-4"SKID
WIDTH
3'-6"SKID
WIDTH
1'-658"3'-9 3
16"
18'-614" APPROXIMATE OVERALL LENGTH
11"
n34"(12) HOLES
FOR Ø58" ANCHOR BOLTS
(BY OTHERS)
2
3
4 5"
A B C D E F G
JH
6'-0"
2'-11"
312"
312"
11 116"
3'-612"3'-8 1
16"3'-612"
Chelsea JENSEN
Text Box
FOR REFERENCE ONLY SEE PROPOSAL FOR PROJECT SPECIFIC INFORMATION

Proposal: 2030312_Rev12 16
Operating Costs Summary Ultrafiltration System – WesTech Model Number UFT83A Design Information
2 Backwash Interval
Backwash Flux Citric MC/CEB Freq.
1041.7 gpmDaily Avg. Net Flow Rate
NaOCl CIP Frequency1.50 MGD
12 per Year
Units Operating
Water Produced / Day
Chlorinated Backwash32
Months in Operation8/20/2021
NaOCl MC/CEB Freq.
Operating Time / Day Acid CIP Frequency Conversion HP to kW Electricity Cost
24 hr$0.10 /kWh
12 per Year0.746 kW/HP
Project Name
Instantaneous Flux
WesTech Ultrafi ltrationDate Prepared
27.91 gfd
12 Months/Year365 Days
30 MinutesNot Applicable
3.0 per week0.0 per week
Equipment Type
Modules per Unit
30.71 gfd
Gorham Operation Days/Year
Membrane Replacement Cost/ModuleTypical LifespanMembrane Replacement Cost/Unit $80,000 USD
$2,500 USD10 Years
Chemical Purpose Dose (mg/L) Frequency Gal/Event (Per Unit)
Gal/Year (Total)
Bulk Cost ($/Gal)
Annual Cost
MC 300 2.3 days 0.88 276.21CIP 3,000 30 days 9.99 239.78
516 2.00$ 1,031.97$ MC 1,000 NA NA NACIP 5,000 30 days 3.92 94.11
94 9.00$ 846.96$ Total Annual Chemical Costs 1,879$
Citric (50%)
Total Sodium Hypochlorite:
Total Citric Acid:
NaOCl (12.5%)

Proposal: 2030312_Rev12 17
Electrical Cost – Represents Typical Operating Conditions
Estimate - Represents membrane operation at estimated average transmembrane pressure
Feed Backwash CIP Heater Compressor25 HP 25 HP 7.5 HP 18 kW 5 HP100 ft 90 ft 70 ft
601 gpm 661 gpm 256 gpm3 x 50% 2 x 100% 2 x 100% 2 x 50% 2 x 100%
2.0 1.0 1.0 2.0 1.030.0 psi 29.0 psi 26.0 psi
69.3 67.0 60.170.0 % 70.0 % 70.0 % 100.0 %98.0 % 98.0 % 98.0 %
15.33 HP 16.30 HP 5.66 HP7,660 264 144 312 129
175,128 3,213 608 4,761 327 $17,513 $321 $61 $476 $33
Pumps
Total Annual Energy Use (kw-hr/year)Time in Use Per Year (hr/year)
Motor Horsepower
Parameter
TDH (Design)
VFD Efficiency
Flow Rate RequiredRedundancyQty in Operation
Total Horsepower Required
Annual Cost
TDH (at avg. membrane TMP)Est. Efficiency
Avg Operating Pressure (psi)
18,404$ Total Annual Energy Cost
Other
Operating Cost per 1000 Gallons ProducedTotal Annual Estimated Chemical / Energy Cost 20,283$
0.04$
Assumptions
• Operating HP of equipment based on pump curves and VFD control• Pump and VFD efficiencies are estimates based on available information and may vary
• Chemical costs are assumed based on information from a supplier but may vary based on local availabil ity
This operating cost analysis is for information only and does not represent guaranteed operating costs• Module replacement cost estimates are subject to escalation per U.S. Consumer Price Index
• CIP interval is assumed in chemical calculations

Proposal: 2030312_Rev12 18
Life Cycle Cost Analysis
PV = Present Value Rate 6.0%
CF= Cash Flow Years 30r= interest rate PW Mult. 13.76t= time
Summary Year Multiplier Costs0 1.000 $1,263,000
Operating costs x present value factor 1 0.943 $19,106Operating costs x present value factor 2 0.890 $18,025Operating costs x present value factor 3 0.840 $17,005Operating costs x present value factor 4 0.792 $16,042Operating costs x present value factor 5 0.747 $15,134Operating costs x present value factor 6 0.705 $14,277Operating costs x present value factor 7 0.665 $13,469Operating costs x present value factor 8 0.627 $12,707Operating costs x present value factor 9 0.592 $11,988(Operating + Membrane) x present value fact 10 0.558 $55,981 Membranes ReplacedOperating costs x present value factor 11 0.527 $10,669Operating costs x present value factor 12 0.497 $10,065Operating costs x present value factor 13 0.469 $9,495Operating costs x present value factor 14 0.442 $8,958Operating costs x present value factor 15 0.417 $8,451Operating costs x present value factor 16 0.394 $7,972Operating costs x present value factor 17 0.371 $7,521Operating costs x present value factor 18 0.350 $7,095Operating costs x present value factor 19 0.331 $6,694(Operating + Membrane) x present value fact 20 0.312 $31,259 Membranes ReplacedOperating costs x present value factor 21 0.294 $5,957Operating costs x present value factor 22 0.278 $5,620Operating costs x present value factor 23 0.262 $5,302Operating costs x present value factor 24 0.247 $5,002Operating costs x present value factor 25 0.233 $4,719Operating costs x present value factor 26 0.220 $4,452Operating costs x present value factor 27 0.207 $4,200Operating costs x present value factor 28 0.196 $3,962Operating costs x present value factor 29 0.185 $3,738Operating costs x present value factor 30 0.174 $3,526
$1,611,392Total Lifecycle Costs (USD)
Capital costs x present value factor
Total Lifecycle Costs (USD) $1,564,913.29
𝑃𝑃𝑃𝑃= 𝐶𝐶𝐶𝐶/(1+𝑟𝑟)^𝑡𝑡 Present Value:

Proposal: 2030312_Rev12 19
Labor Estimate
The ultrafiltration system is programmed for automatic operation, but operator involvement is required to make system adjustments, monitor performance, and perform routine maintenance. It is requested that the operator complete a basic operating log. While many of these parameters are automatically logged by the system, it is beneficial for the operator to directly observe and understand these parameters on a regular basis to ensure proper operation. A basic outline of the operator time requirements to operate the ultrafiltration system is as follows.
• 1 hour per day to perform a daily check and complete daily operating logs • 4 hours per week to measure data in operating logs and to perform routine maintenance • 8 hours per month per skid to monitor clean-in-place procedures • Additional labor as required for maintenance
Maintenance and Parts
Components are selected by WesTech for their durability and reliability. The majority of components are not expected to require replacement in the first 10 years of operation. An example of parts that are recommended to be replaced and maintained are as follows:
• pH Electrode: Replace every 1-2 years • Compressor Oil and Oil Filter: Replace every year or every 2,000 hours operation • Compressor Air Filter and Oil Separator: Replace every year or every 4,000 hours operation • Butterfly Valves: Inspect and replace valve seat when necessary

Calgon Carbon Corporation P. O. Box 717, Pittsburgh, PA 15230-0717 Phone: (800) 4-CARBON, Fax: (412) 787-6676 Specification of Model 12 Adsorption System Page 1 of 6
August 2013
Model 12 Adsorption System for use with
Granular Activated Carbon PART 1 General 1.01 Section Includes
A. Adsorption System Description B. Adsorption System Specifications C. Installation and Start-up Services
1.02 References
A. ASME Section VIII, Division 1 – American Society of Mechanical Engineers Boiler and Pressure Vessel Code
B. ASME/ANSI B16.5 – American Society of Mechanical Engineers/American National Standard Institute
C. U.S. Food and Drug Administration, 21 CFR 175.300 and 177.2420 D. Steel Structures Painting Council Surface preparation Specifications and
National Association of Corrosion Engineers E. ASME Section II, American Society of Mechanical Engineers – Materials, Parts
A, B & C F. American Society of Testing Materials (ASTM) G. American Water Works Association (AWWA) – B604, Standard for Granular
Activated Carbon H. ANSI/NSF Standard Drinking Water System Components – Health Effects
1.03 System Description
A. Calgon Carbon Corporation will furnish the Model 12 Carbon Adsorption System described herein (for installation by others). The complete adsorption system includes the following. a. Carbon adsorbers with internals for carbon retention b. Activated carbon c. Influent, effluent and backwash piping with valves d. Carbon fill and discharge piping with valves e. Vent and pressure relief piping f. Water piping and utility connections g. Accessories as shown below h. Manufacturer’s services
B. The vessels, piping, valves, and carbon function as a system and are the end products of Calgon Carbon Corporation to achieve standardization for appearance, operation, maintenance, spare parts, and manufacturer’s services.
C. There will be one (1) Model 12 carbon adsorption system as delineated below:
System Number Quantity System Flow Rate
GPM1
(EBCT –minutes)
Pressure Drop – Normal
Operation PSI
Pressure Drop Backwash Operation
PSI 1 One (1) 700 (15) 8 -10 20
1 The maximum flow rate through the system is set by the Empty Bed Contact Time (EBCT) required to meet the treatment objective of the specific application, the mechanical design and available pressure drop.

Calgon Carbon Corporation P. O. Box 717, Pittsburgh, PA 15230-0717 Phone: (800) 4-CARBON, Fax: (412) 787-6676 Specification of Model 12 Adsorption System Page 2 of 6
August 2013
1.04 Supplier’s Qualifications A. Supplier of the adsorption system shall have the following minimum qualifications:
a. At least 20 years of experience successfully supplying both adsorption systems and GAC to treat water with flow rates greater than 500 gpm average daily flow.
b. Must own and operate an equipment fabrication facility with capabilities to both fabricate the equipment per applicable ASME code and finish lining and paint in a single facility.
c. Must own and operate at least two (2) GAC production facilities in the United States to guarantee the source of supply of activated carbon.
1.05 Submittals
A. One submittal package with the following information will be provided for approval by the Owner. Fabrication will begin upon receipt of Owner’s approval. a. Adsorber vessel specifications and drawing including design pressure,
dimensions, and capacity. b. System flow diagram showing all valves, components, instrumentation and
utilities. c. System general arrangement showing dimensions, weights, and elevations
including influent, effluent, backwash, and carbon exchange pipe connection locations.
d. Pressure drop information across the system. e. Specification of the granular activated carbon to be utilized in the system. f. Material specifications for pipe, fittings and instrumentation. g. Specifications for vessel lining. h. Specifications for vessel painting.
B. The system Operating & Maintenance Manual will be provided upon completion of the project/shipment of the system.
PART 2 Products 2.01 General
A. The Contract Documents indicate specific required features of the equipment, but do not purport to cover all details of design and construction.
2.02 Carbon Adsorber Vessels
A. The carbon adsorbers are Model 12 Carbon Adsorption Vessels, as designed by Calgon Carbon Corporation to meet the following specifications.
B. The carbon adsorber vessels are fabricated of carbon steel, conforming to ASTM A516 grade 70, 12’-0” diameter by 7’-9” straight side height with 2:1 elliptical top and bottom heads. Each vessel will be sized to contain 20,000 pounds of GAC and to accommodate approximately 30% bed expansion within the straight side of the vessel using Filtrasorb 300 GAC2
2 The percent bed expansion will vary depending on the apparent density of the GAC selected for a specific application.
. The vessels are designed, constructed and stamped in accordance with ASME Section VIII, Division 1 and registered with the National Board for a design pressure rating of 125 psig at 140°F. Each vessel will be provided with one (1) 20” diameter round manway located on the lower straight side portion of the vessel and one 14” x18” elliptical manway located on the bottom head. The vessels will be free standing utilizing four (4) structural steel support legs.

Calgon Carbon Corporation P. O. Box 717, Pittsburgh, PA 15230-0717 Phone: (800) 4-CARBON, Fax: (412) 787-6676 Specification of Model 12 Adsorption System Page 3 of 6
August 2013
C. The structural aspects of the vessel will be sufficient to meet the International Building Code - IBC 2012 requirements of Ss =1.0, Site Class D, I=1.25. Calgon Carbon Corporation can submit detailed calculations on request illustrating the seismic characteristics of the proposed vessel.
D. Each vessel will be designed with an underdrain system that provides uniform distribution of the treated water using a minimum of one (1) septa nozzle for every nominal square foot of vessel cross section, facilitates GAC removal without the need to open the manway to manually hose out the remaining spent GAC, and allows replacement of the septa without the need to remove external piping. The septa will be designed to contain the GAC within the adsorber and be constructed of polypropylene (ppl) material.
E. All surfaces will be degreased prior to sandblasting. The adsorber internal surface that will be lined will be blasted to a white metal surface (SSPC-SP5) to provide a 3 to 4 mil anchor pattern. The exterior surfaces of the adsorber will be prepared by blasting per SSPC-SP7.
F. The interior surfaces of the vessel will be lined. The surfaces above the internal cone are lined with a nominal lining thickness of 35 to 45 mil dry film (dft) and the surfaces under the internal cone bottom a nominal lining thickness of 10 to 12 mil dft. The lining material is a vinyl ester combined with a special curing system and inert flake pigment that meets the requirements of the U. S. Federal Register, Food and Drug Regulations Title 21, Paragraphs 175.300 and 177.2420 and the requirements of ANSI 61 when applied and cured per the manufacturer’s requirements.
G. The exterior surface of the adsorbers will be painted to a dry film thickness of 5 to 7 mil with a high solids epoxy (gray color) paint material.
2.03 Process and Utility Piping
A. The process and utility piping on the adsorption system will include influent water to the system, treated water (effluent), backwash water supply and discharge, adsorber vent lines and granular activated carbon fill and discharge piping.
B. The influent and effluent pipe network allows series (lead/lag) and parallel only operating modes. Lead/lag operation allows either; a) flow from the influent flange, to Adsorber A, to the pipe module, to Adsorber B, to the pipe module then to the effluent flange, or b) flow from the influent flange, to Adsorber B, to the pipe module, to Adsorber A, to the pipe module then to the effluent flange. The change in flow pattern is accomplished with a change of valve positions. The purpose of lead/lag operation allows an adsorber to act as an on-line backup and/or provides for sufficient contact time to allow adsorption of the contaminants of concern.
C. Process piping (influent, effluent and backwash) will be 8” diameter, constructed of schedule 40 carbon steel, ASTM A53 Grade B materials with 125# ASTM A126 Class B cast iron flanged fittings.
D. Vent piping will be 3” diameter, constructed of schedule 40 carbon steel, ASTM A53 Grade B materials.
E. Carbon fill piping will be 4” diameter, constructed of schedule 40 carbon steel, ASTM A53 Grade B materials.
F. Carbon discharge piping will be 4” diameter, constructed of schedule 40 polypropylene lined carbon steel, ASTM 53 Grade B materials with ppl lined flanged fittings.
G. Utility piping will be constructed of threaded schedule 80 carbon steel, ASTM 53 Grade B materials.
H. All piping surfaces will be prepared by blasting per SSPC-SP7.

Calgon Carbon Corporation P. O. Box 717, Pittsburgh, PA 15230-0717 Phone: (800) 4-CARBON, Fax: (412) 787-6676 Specification of Model 12 Adsorption System Page 4 of 6
August 2013
I. The exterior surface of the piping will be painted to a dry film thickness of 5 to 7 mil with a high solids epoxy (gray color) paint material prior to assembly to ensure minimum oxidation at flanged connections.
J. The piping network will be provided with a structural steel support frame for support of the piping module.
2.04 Process and Utility Valves
A. The process and utility piping; excluding GAC fill and discharge piping will be equipped with butterfly valves for flow control. A total of ten (10) 8” diameter butterfly valves will be supplied to accommodate the process and backwash control functions. Two (2) valves are needed for backwash control, two (2) valves are needed for influent isolation, two (2) valves for effluent isolation, two (2) valve for staging of the vessels and two (2) valves for the vent function.
B. The influent, effluent, and backwash control valves will be a cast iron wafer type body butterfly valve with aluminum-bronze disc, BUNA-N seats and stainless steel shaft to mate to 150 pound ANSI flanges. The valves are rated for 200 psig in closed position at 180°F, and meet or exceed section 5.0 of AWWA specification C-504-87.
C. The carbon fill and discharge valves are 4” diameter full port ball valves, 316 stainless steel construction with TFE seats and seals. A total of four (4) valves are supplied, two (2) for carbon fill and two (2) for carbon discharge.
D. Utility valves for the compressed air supply will be bronze or brass or barstock brass body regular port ball valves.
2.05 Instrumentation
A. Instrumentation will be accessible from grade. B. Pressure relief will be provided by a 3” rupture disk constructed of impervious
graphite and designed to relieve pressure at the design pressure of the vessel and at the maximum flow to the system. The rupture disks will be mounted off the vessel vent line and vent to atmosphere. A total of two (2) will be provided for the system.
C. Each vessel will be provided with an indicating differential pressure switch, 4” diameter dial, scaled for 20-0-20psi. The switch is rated at 1.0 amp @ 115 volts AC for remote indication. A total of two (2) will be provided for the system3
D. The process piping will be equipped with pressure gauges to indicate the pressure entering and exiting each adsorber and to provide information on pressure drop across each adsorber and the system. The pressure gauges will have 4 ½” face diameter with a stainless steel bourdon tube in a phenolic case housing (1 to 160 psig range). A total of three (3) will be provided for the system.
.
E. The process piping will be equipped with sample taps to enable sampling of the water entering and exiting each adsorber. A total of three (3) will be provided for the system.
2.06 Miscellaneous
A. The carbon fill and discharge will be fitted with hose connections, such that carbon transfer to and from the adsorbers can be facilitated using carbon transfer hoses. These connectors will be 4” Quick Disconnect Adaptors constructed of aluminum as manufactured by Dover Corp. as Kamlock connectors or equal.
B. Two (2) flush connections will be provided on each GAC fill line, one upstream and one downstream of the valve. One (1) flush connection will be provided on each GAC discharge line, downstream of the valve. The connections will be
3 The dP switches should be wired by the customer to a control system to provide an alarm on high differential pressure.

Calgon Carbon Corporation P. O. Box 717, Pittsburgh, PA 15230-0717 Phone: (800) 4-CARBON, Fax: (412) 787-6676 Specification of Model 12 Adsorption System Page 5 of 6
August 2013
welded into the steel or stainless steel pipe or screwed into solid propylene “spacers” for the lined pipe. Flush connections will consist of a short section of ¾” pipe, a ¾” full port ball valve and a ¾” quick disconnect adaptor to match with water hose fittings.
C. Each vessel will be provided with one (1) 8” stainless steel effluent strainer basket mounted in the effluent line from the vessel. The basket strainer shall be constructed of 316 stainless 14 gage plate with 1/8" diameter holes drilled on 3/16" centers, covered with 40 mesh 316 stainless steel screen and topped by a 4 mesh 316 stainless steel support screen (0.063" wire diameter). A total of two (2) will be provided for the system.
D. The influent and effluent pipe for each vessel will be provided with a molded neoprene reinforced rubber expansion joint which allows 4 way movement and 30° angular misalignment. A total of four (4) will be provided for the system.
E. The inlet nozzle of each vessel shall be equipped with a splash plate type upper distributor. The splash plate shall install through the inlet nozzle, be removable from outside the vessel and be constructed using 304 stainless steel.
2.07 Granular Activated Carbon – the specification for the activated carbon is provided
separately. PART 3 Execution 3.01 Calgon Carbon Services
A. Calgon Carbon will assign a Project Manager (PM) to facilitate the execution of the project. The PM will interface with the customer for both the technical and commercial aspects of the project.
B. Calgon Carbon will provide an Engineering Submittal Package as outlined in paragraph 1.05A
C. Calgon Carbon will supply Operation and Maintenance Instructions upon completion of the project/shipment of the system.
D. A manufacturer’s trained specialists, experienced in the installation of the Calgon Carbon’s Adsorption Systems, and with at least five (5) years of field experience will be present at the job site and/or classroom designated by the Owner/Contractor to provide the following services:
• Inspection of the installed equipment • Supervision of carbon loading • Start-up assistance • Troubleshooting • Operator training
E. Calgon Carbon will retain design and fabrication documentation for a minimum period of seven (7) years following completion of the project.
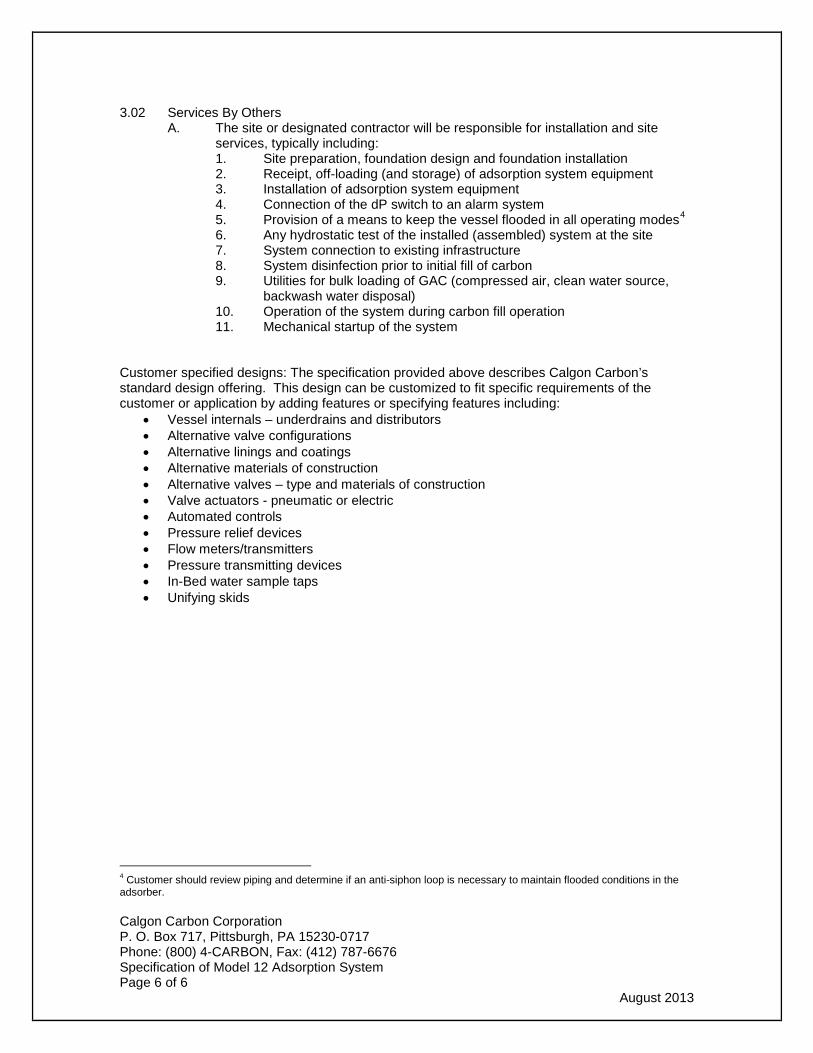
Calgon Carbon Corporation P. O. Box 717, Pittsburgh, PA 15230-0717 Phone: (800) 4-CARBON, Fax: (412) 787-6676 Specification of Model 12 Adsorption System Page 6 of 6
August 2013
3.02 Services By Others
A. The site or designated contractor will be responsible for installation and site services, typically including: 1. Site preparation, foundation design and foundation installation 2. Receipt, off-loading (and storage) of adsorption system equipment 3. Installation of adsorption system equipment 4. Connection of the dP switch to an alarm system 5. Provision of a means to keep the vessel flooded in all operating modes4
6. Any hydrostatic test of the installed (assembled) system at the site
7. System connection to existing infrastructure 8. System disinfection prior to initial fill of carbon 9. Utilities for bulk loading of GAC (compressed air, clean water source,
backwash water disposal) 10. Operation of the system during carbon fill operation 11. Mechanical startup of the system
Customer specified designs: The specification provided above describes Calgon Carbon’s standard design offering. This design can be customized to fit specific requirements of the customer or application by adding features or specifying features including:
• Vessel internals – underdrains and distributors • Alternative valve configurations • Alternative linings and coatings • Alternative materials of construction • Alternative valves – type and materials of construction • Valve actuators - pneumatic or electric • Automated controls • Pressure relief devices • Flow meters/transmitters • Pressure transmitting devices • In-Bed water sample taps • Unifying skids
4 Customer should review piping and determine if an anti-siphon loop is necessary to maintain flooded conditions in the adsorber.
Preliminary Engineering Report Town of Gorham Water Treatment Plant Improvements September 2021
MRB Group Project No. 0735.21001.000
APPENDIX N
OVERALL COST ESTIMATES

MRB|groupProject Title: Town of Gorham WTP Evaluation
Project No.: 0735.21001
Date: October 18, 2021
Engineer: J. Lang-Bentley
Subject: Alternative 1 - Estimated project cost to improve WTP.
1.1 Mobilization / Demobilization 1 LS 330,000.00$ 330,000.00$
1.2 Site Paving 1 LS 100,000.00$ 100,000.00$
1.3 Site Grading / Restoration 1 LS 100,000.00$ 100,000.00$
1.4 Site Demo 1 LS 50,000.00$ 50,000.00$
1.5 Site Piping / Process Piping 1 LS 350,000.00$ 350,000.00$
1.6 Process control (mag meters, actuator valves, etc.) 1 LS 75,000.00$ 75,000.00$
1.7 Miscellaneous Concrete 1 LS 25,000.00$ 25,000.00$
1,030,000.00$
2.1 Low Lift Pump Replacement 2 EA 42,000.00$ 84,000.00$
2.2 High Lift Pump Replacement 2 EA 42,000.00$ 84,000.00$
2.3 Pump Installation 1 LS 50,000.00$ 50,000.00$
218,000.00$
3.1 Insulated Pole Barn Structure 3,000 SF 150.00$ 450,000.00$
3.2 Total Chlorine Analyzer 1 EA 10,000.00$ 10,000.00$
3.3 WQMP & Sample Sink 1 LS 50,000.00$ 50,000.00$
3.4 Equalization Tank 1 EA 250,000.00$ 250,000.00$
760,000.00$
4.1 Pressure Pre-Filter 1 LS 200,000.00$ 200,000.00$
4.2 Pre-Filter Installation 1 LS 100,000.00$ 100,000.00$
300,000.00$
5.1 Backwash Recovery System 1 LS 140,000.00$ 140,000.00$
5.2 Walkway and Access Platform 1 LS 45,000.00$ 45,000.00$
5.3 Backwash Recovery System Installation 1 LS 70,000.00$ 70,000.00$
5.4 Coagulant Feed System 1 LS 25,000.00$ 25,000.00$
280,000.00$
6.1 Replacement DE Filters 1 LS 657,000.00$ 657,000.00$
6.2 DE Material Handling System 1 LS 100,000.00$ 100,000.00$
6.3 DE Filter Installation 1 LS 330,000.00$ 330,000.00$
6.4 Precoat pump, Slurry Indicator, Valves, Etc. 1 LS 95,000.00$ 95,000.00$
6.5 Precoat pump, Slurry Indicator, Valves, Etc. Installation 1 LS 47,500.00$ 47,500.00$
6.6 Hypo stoage and feed system 1 LS 100,000.00$ 100,000.00$
1,329,500.00$
DE Filters
Item Number Item Description Quantity Unit Unit Price Cost
Pump Stations
Item Number Item Description Quantity Unit Unit Price Cost
Sitework
Item Number Item Description Quantity Unit Unit Price Cost
New Pole Barn
Item Number Item Description Quantity Unit Unit Price Cost
Pre-Filtration
Item Number Item Description Quantity Unit Unit Price Cost
Backwash Recovery
Item Number Item Description Quantity Unit Unit Price Cost

7.1 Granulated Activated Carbon (GAC) Filters 1 LS 900,000.00$ 900,000.00$
7.2 GAC Filter Installation 1 LS 250,000.00$ 250,000.00$
1,150,000.00$
8.1 UV Disinfection Equipment 1 LS 200,000.00$ 200,000.00$
8.2 UV Disinfection Equipment Installation 1 LS 100,000.00$ 100,000.00$
300,000.00$
9.1 Pipe Supports & Apparatuses 1 LS 20,000.00$ 20,000.00$
9.2 Paintings / Coatings 1 LS 100,000.00$ 100,000.00$
9.3 Monitoring Manhole 1 EA 10,000.00$ 10,000.00$
9.4 Doors / Windows Replacement 1 LS 75,000.00$ 75,000.00$
205,000.00$
10.1 Electrical 1 LS 415,000.00$ 415,000.00$
10.2 HVAC 1 LS 115,000.00$ 115,000.00$
10.3 Plumbing 1 LS 70,000.00$ 70,000.00$
10.4 SCADA / Controls 1 LS 20,000.00$ 20,000.00$
620,000.00$
General Contract 5,572,500.00$
Electrical Contract 415,000.00$
HVAC Contract 115,000.00$
Plumbing Contract 70,000.00$
SCADA Contract 20,000.00$
Sub-Total Construction Cost 6,192,500.00$
Construction Contingency 1,238,500.00$
TOTAL CONSTRUCTION COST W/ CONTINGENCY 7,431,000.00$
Engineering, Bidding, & Construction Services 1,238,500.00$
Administration, Financial, & Legal Services 309,650.00$
TOTAL ENGINEERING, LEGAL, ADMIN COSTS 1,548,150.00$
Total Estimated Project Cost 8,979,150.00$
TOTAL PROJECT COST (ROUNDED) 8,980,000.00$
Carbon Filtration
Item Number Item Description Quantity Unit Unit Price Cost
UV System
Item Number Item Description Quantity Unit Unit Price Cost
Construction Cost Summary
Additional Contracts
Item Number Item Description Quantity Unit Unit Price Cost
Miscellaneous Improvements
Item Number Item Description Quantity Unit Unit Price Cost
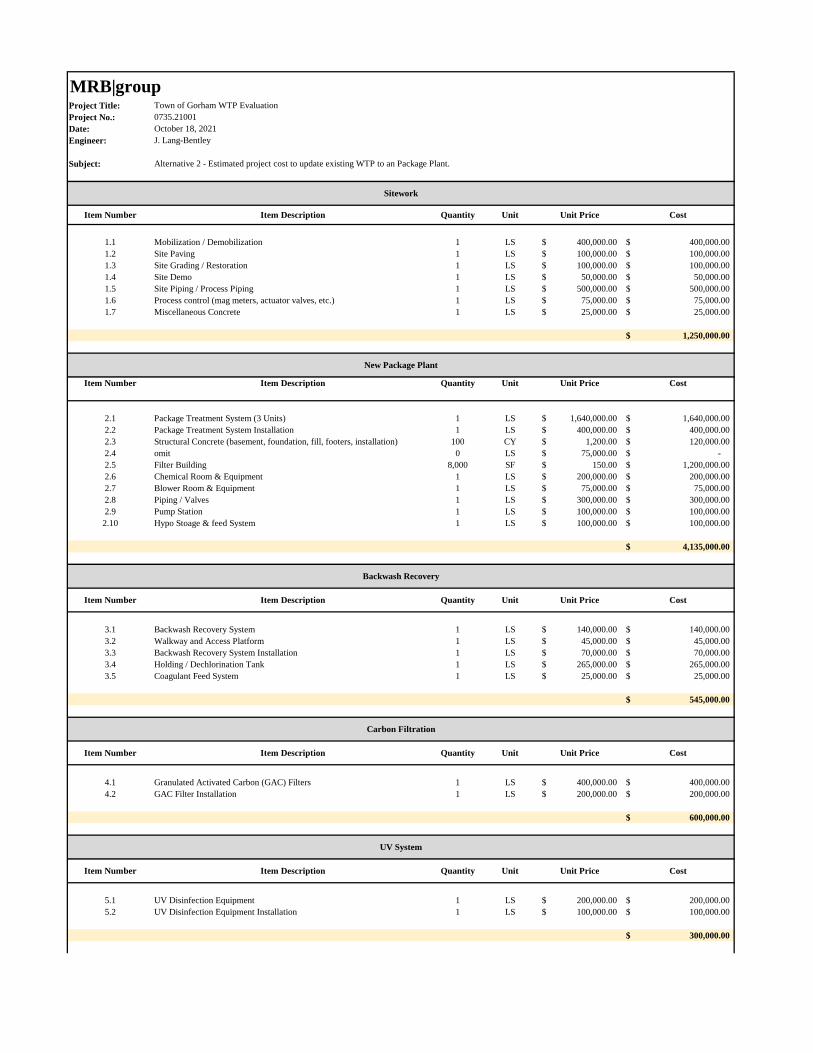
MRB|groupProject Title: Town of Gorham WTP Evaluation
Project No.: 0735.21001
Date: October 18, 2021
Engineer: J. Lang-Bentley
Subject: Alternative 2 - Estimated project cost to update existing WTP to an Package Plant.
1.1 Mobilization / Demobilization 1 LS 400,000.00$ 400,000.00$
1.2 Site Paving 1 LS 100,000.00$ 100,000.00$
1.3 Site Grading / Restoration 1 LS 100,000.00$ 100,000.00$
1.4 Site Demo 1 LS 50,000.00$ 50,000.00$
1.5 Site Piping / Process Piping 1 LS 500,000.00$ 500,000.00$
1.6 Process control (mag meters, actuator valves, etc.) 1 LS 75,000.00$ 75,000.00$
1.7 Miscellaneous Concrete 1 LS 25,000.00$ 25,000.00$
1,250,000.00$
Item Number Item Description Quantity Unit Unit Price Cost
2.1 Package Treatment System (3 Units) 1 LS 1,640,000.00$ 1,640,000.00$
2.2 Package Treatment System Installation 1 LS 400,000.00$ 400,000.00$
2.3 Structural Concrete (basement, foundation, fill, footers, installation) 100 CY 1,200.00$ 120,000.00$
2.4 omit 0 LS 75,000.00$ -$
2.5 Filter Building 8,000 SF 150.00$ 1,200,000.00$
2.6 Chemical Room & Equipment 1 LS 200,000.00$ 200,000.00$
2.7 Blower Room & Equipment 1 LS 75,000.00$ 75,000.00$
2.8 Piping / Valves 1 LS 300,000.00$ 300,000.00$
2.9 Pump Station 1 LS 100,000.00$ 100,000.00$
2.10 Hypo Stoage & feed System 1 LS 100,000.00$ 100,000.00$
4,135,000.00$
3.1 Backwash Recovery System 1 LS 140,000.00$ 140,000.00$
3.2 Walkway and Access Platform 1 LS 45,000.00$ 45,000.00$
3.3 Backwash Recovery System Installation 1 LS 70,000.00$ 70,000.00$
3.4 Holding / Dechlorination Tank 1 LS 265,000.00$ 265,000.00$
3.5 Coagulant Feed System 1 LS 25,000.00$ 25,000.00$
545,000.00$
4.1 Granulated Activated Carbon (GAC) Filters 1 LS 400,000.00$ 400,000.00$
4.2 GAC Filter Installation 1 LS 200,000.00$ 200,000.00$
600,000.00$
5.1 UV Disinfection Equipment 1 LS 200,000.00$ 200,000.00$
5.2 UV Disinfection Equipment Installation 1 LS 100,000.00$ 100,000.00$
300,000.00$
Sitework
Item Number Item Description Quantity Unit Unit Price Cost
New Package Plant
Backwash Recovery
UV System
Cost
CostItem Number Item Description Quantity Unit Unit Price
Item Number Item Description Quantity Unit Unit Price
Carbon Filtration
Item Number Item Description Quantity Unit Unit Price Cost

6.1 Electrical 1 LS 415,000.00$ 415,000.00$
6.2 HVAC 1 LS 115,000.00$ 115,000.00$
6.3 Plumbing 1 LS 70,000.00$ 70,000.00$
6.4 SCADA 1 LS 20,000.00$ 20,000.00$
620,000.00$
General Contract 6,830,000.00$
Electrical Contract 415,000.00$
HVAC Contract 115,000.00$
Plumbing Contract 70,000.00$
SCADA Contract 20,000.00$
Sub-Total Construction Cost 7,450,000.00$
Construction Contingency 1,490,000.00$
TOTAL CONSTRUCTION COST W/ CONTINGENCY 8,940,000.00$
Engineering, Bidding, & Construction Services 1,490,000.00$
Administration, Financial, & Legal Services 372,500.00$
TOTAL ENGINEERING, LEGAL, ADMIN COSTS 1,862,500.00$
Total Estimated Project Cost 10,802,500.00$
TOTAL PROJECT COST (ROUNDED) 10,803,000.00$
Construction Cost Summary
Additional Contracts
Item Number Item Description Quantity Unit Unit Price Cost

MRB|groupProject Title: Town of Gorham WTP Evaluation
Project No.: 0735.21001
Date: October 18, 2021
Engineer: J. Lang-Bentley
Subject: Alternative 3 - Estimated project cost to update existing WTP to an Ultrafiltration Plant.
1.1 Mobilization / Demobilization 1 LS 300,000.00$ 300,000.00$
1.2 Site Paving 1 LS 100,000.00$ 100,000.00$
1.3 Site Grading / Restoration 1 LS 100,000.00$ 100,000.00$
1.4 Site Demo 1 LS 50,000.00$ 50,000.00$
1.5 Site Piping / Process Piping 1 LS 350,000.00$ 350,000.00$
1.6 Process control (mag meters, actuator valves, etc.) 1 LS 75,000.00$ 75,000.00$
1.7 Miscellaneous Concrete 1 LS 25,000.00$ 25,000.00$
1,000,000.00$
2.1 Low Lift Pump Replacement 2 EA 42,000.00$ 84,000.00$
2.2 High Lift Pump Replacement 2 EA 42,000.00$ 84,000.00$
2.3 VFds 4 EA 10,000.00$ 40,000.00$
2.4 Pump Installation 1 LS 50,000.00$ 50,000.00$
258,000.00$
3.1 Insulated Pole Barn Structure 3,000 SF 150.00$ 450,000.00$
3.2 Total Chlorine Analyzer 1 EA 9,000.00$ 9,000.00$
3.3 WQMP & Sample Sink 1 LS 50,000.00$ 50,000.00$
3.4 Equalization Tank 1 EA 250,000.00$ 250,000.00$
759,000.00$
4.1 Ultrafiltration System 1 LS 1,265,000.00$ 1,265,000.00$
4.2 Ultrafiltration System Installation 1 LS 350,000.00$ 350,000.00$
4.3 Miscellaneous Materials, Chemicals, Chem Feed, Etc. 1 LS 340,000.00$ 340,000.00$
4.4 Hypo storage & chem feed 1 LS 100,000.00$ 100,000.00$
2,055,000.00$
6.1 Granulated Activated Carbon (GAC) Filters 1 LS 400,000.00$ 400,000.00$
6.2 GAC Filter Installation 1 LS 200,000.00$ 200,000.00$
600,000.00$
Ultrafiltration System
Item Number Item Description Quantity Unit Unit Price Cost
Sitework
Item Number Item Description Quantity Unit Unit Price Cost
New Pole Barn
Item Number Item Description Quantity Unit Unit Price Cost
Pump Stations
Item Number Item Description Quantity Unit Unit Price Cost
Carbon Filtration
Item Number Item Description Quantity Unit Unit Price Cost

7.1 Pipe Supports & Apparatuses 1 LS 20,000.00$ 20,000.00$
7.2 Paintings / Coatings 1 LS 100,000.00$ 100,000.00$
7.3 Monitoring Manhole 1 EA 10,000.00$ 10,000.00$
7.4 Doors / Windows Replacement 1 LS 75,000.00$ 75,000.00$
205,000.00$
8.1 Electrical 1 LS 415,000.00$ 415,000.00$
8.2 HVAC 1 LS 115,000.00$ 115,000.00$
8.3 Plumbing 1 LS 70,000.00$ 70,000.00$
8.4 SCADA / Controls 1 LS 20,000.00$ 20,000.00$
600,000.00$
General Contract 4,877,000.00$
Electrical Contract 415,000.00$
HVAC Contract 115,000.00$
Plumbing Contract 70,000.00$
SCADA Contract 20,000.00$
Sub-Total Construction Cost 5,497,000.00$
Construction Contingency 1,099,400.00$
TOTAL CONSTRUCTION COST W/ CONTINGENCY 6,596,400.00$
Engineering, Bidding, & Construction Services 1,099,400.00$
Administration, Financial, & Legal Services 274,850.00$
TOTAL ENGINEERING, LEGAL, ADMIN COSTS 1,374,250.00$
Total Estimated Project Cost 7,970,650.00$
TOTAL PROJECT COST (ROUNDED) 7,971,000.00$
Miscellaneous Improvements
Item Number Item Description Quantity Unit Unit Price Cost
Construction Cost Summary
Additional Contracts
Item Number Item Description Quantity Unit Unit Price Cost
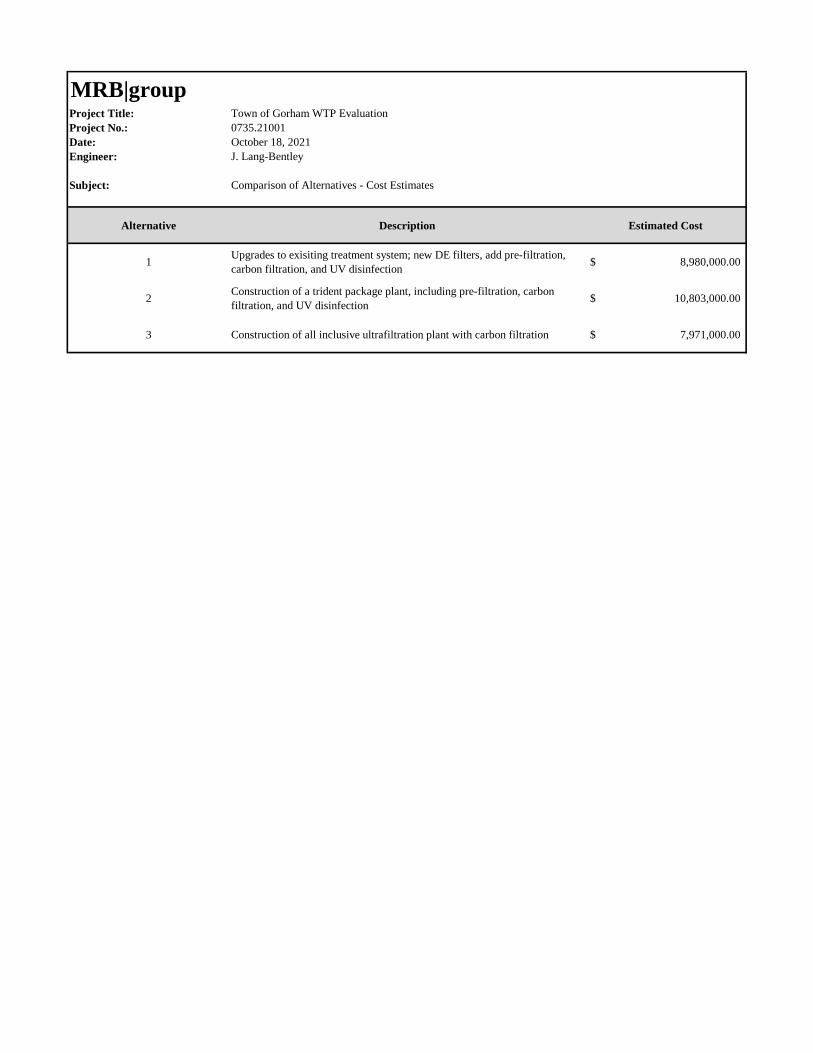
MRB|groupProject Title: Town of Gorham WTP Evaluation
Project No.: 0735.21001
Date: October 18, 2021
Engineer: J. Lang-Bentley
Subject: Comparison of Alternatives - Cost Estimates
Alternative Description Estimated Cost
1Upgrades to exisiting treatment system; new DE filters, add pre-filtration,
carbon filtration, and UV disinfection8,980,000.00$
2Construction of a trident package plant, including pre-filtration, carbon
filtration, and UV disinfection10,803,000.00$
3 Construction of all inclusive ultrafiltration plant with carbon filtration 7,971,000.00$

Preliminary Engineering Report Town of Gorham Water Treatment Plant Improvements September 2021
MRB Group Project No. 0735.21001.000
APPENDIX O
EDU CALCULATIONS

ADOPTED BUDGET
FOR 2020
TOWN OF GORHAM
COUNTY OF ONTARIO
CERTIFICATION OF TOWN CLERK
I, Darby Perrotte, Town Clerk, certify that the following is a true and correct copy of the 2020 budget of the Town of Gorham as adopted by the Town Board on the ________ day of ________________________________________, 2019.
IN

TOWN OF GORHAM
BUDGET2020
2020 2019 2020 2019 TAX RATES
FUND TITLEAssessor Codes APPROPRIATIONS REVENUES
APPROPRIATED FUND BALANCE
REAL PROPERTY TAX
REAL PROPERTY TAX
INCREASE (DECREASE)
ASSESSED VALUES/ UNITS
ASSESSED VALUES/ UNITS 2020 2019
General ‐ Townwide A 4,176,158 3,731,600 444,558 ‐ General ‐ Outside Village B 186,371 186,371 ‐ ‐ Highway ‐ Outside Village DB 1,718,174 1,480,148 238,026 ‐ 124,000Drainage SD ‐ ‐ ‐ ‐ 60 60 ‐ ‐ Gorham Fire District SF 125,596 125,596 123,133 2,463 141,711,059 139,844,222 0.88628 0.88050 Gorham Fire Protection SM 254,831 254,831 243,578 11,253 510,350,926 508,226,201 0.49933 0.47927 Gorham Ambulance SM 67,231 67,231 53,643 13,588 143,272,297 143,742,593 0.46925 0.37319 Lighting District SL 8,500 8,500 8,390 110 19,557,212 19,082,869 0.43462 0.43966 Sewer District SS 146,137 129,500 16,637 ‐ ‐ ‐ Water District #1 SW1 1,221,222 508,800 591,522 120,900 120,900 ‐ 468,486,546 465,845,984 0.25807 0.25953 Water District #6 SW6 3,879.50 3,879.50 3,942.50 (63) 15 15 258.63 262.83
7,908,100 6,036,419 1,290,743 580,938 553,587 27,351 ‐ ‐
Less Fire Disctric (125,596) Balance 455,342 Levy Limit 449,903 Over (Under) 5,438.65
Actual Acutal Estimated BudgetedSales Tax 2017 2018 2020 2020A Fund 604,823.00 766,840.00 650,000.00 610,000.00 B Fund 158,417.00 151,926.00 185,000.00 160,371.00
DB Fund 1,213,034.00 1,164,765.00 1,120,000.00 1,140,000.00 Total 1,976,274.00 2,083,531.00 1,955,000.00 1,910,371.00

TOWN OF GORHAMTAX CAP CALCULATION
DESCRIPTION 2016 2017 2018 2019 2020TAX LEVY FOR PRIOR YEAR 401,367.00 417,931.00 428,566 437,484 430,454 TAX BASE GROWTH FACTOR 1.0116 1.0114 1.0081 1.0075 1.0093
406,022.86 422,695.41 432,037.38 440,765.13 434,456.72 PRIOR YEAR PILOTS 315.00 300.00 300.00 300.00 300.00
406,337.86 422,995.41 432,337.38 441,065.13 434,756.72 ALLOWABLE LEVY GROWTH FACTOR 1.0073 1.0068 1.0184 1.0200 1.0200
409,304.12 425,871.78 440,292.39 449,886.43 443,451.85 PROJECTED PILOTS (300.00) (300.00) (300.00) (300.00) (300.00) AVAILABLE CARRYOVER FROM PRIOR YEAR ‐ 508.00 6,751.00
409,004.12 425,571.78 439,992.39 450,094.43 449,902.85
Taxes 417,931.00 428,566.00 437,484.00 430,453.50 455,341.50
Under/(Over) Tax Cap (8,926.88) (2,994.22) 2,508.39 19,640.93 (5,438.65)

TOWN OF GORHAMGENERAL FUND ‐ TOWNWIDE
2020 BUDGET
2017 2018 2019 2020 2020 2020
ACCOUNT TITLE ACTUAL ACTUAL BUDGET TENTATIVE PRELIM ADOPTEDREVENUE
A1090 PENALTIES & INTEREST 6,307.00 4,623.00 0.00 5,000.00 5,000.00 5,000.00A1120 NON‐PROPERTY TAX DISTRIBUTION 604,823.00 766,840.00 600,000.00 610,000.00 610,000.00 612,000.00A1255 CLERK FEES 278.00 294.00 100.00 300.00 300.00 300.00A1603 VITAL STATISTICS FEES 790.00 980.00 500.00 500.00 500.00 500.00A2001 PARK & RECREATION 6,521.00 6,500.00 2,000.00 6,500.00 6,500.00 6,500.00A2130 REFUSE & GARBAGE CHARGES 84,588.00 73,438.00 76,000.00 76,000.00 76,000.00 80,000.00A2210 TAX SERVICES FOR OTHER GOVERNMENTS 5,500.00 2,125.00 5,000.00 0.00 0.00 0.00A2401 INTEREST & EARNINGS ‐ RESERVE FUNDS 134.00 249.00 100.00 100.00 100.00 100.00A2410 RENTAL OF REAL PROPERTY 600.00 600.00 600.00 600.00 600.00 600.00A2544 DOG LICENSES 12,844.00 10,704.00 12,000.00 10,000.00 10,000.00 10,000.00A2545 MARRIAGE LICENSES 105.00 245.00 100.00 100.00 100.00 100.00A2610 FINES & FORFEITED BAIL 14,302.00 10,279.00 10,000.00 10,000.00 10,000.00 10,000.00A2650 SALE OF SCRAP & EXCESS MATERIALS 9,735.00 19,823.00 10,000.00 10,000.00 10,000.00 10,000.00A2655 MINOR SALES 53.00 35.00 0.00 0.00 0.00 0.00A2701 REFUND FROM PRIOR YEARS 0.00 0.00 0.00 0.00 0.00 0.00A2705 GIFTS AND DONATIONS 135.00 65.00 0.00 0.00 0.00 0.00A2770 OTHER, UNCLASSIFIED REVENUE 0.00 1,541.00 5,500.00 5,500.00 5,500.00 5,500.00A3001 STATE AID PER CAPITA 65,096.00 28,999.00 12,275.00 0.00 0.00 0.00A3005 MORTGAGE TAX 127,791.00 97,068.00 80,000.00 85,000.00 85,000.00 85,000.00A3089 ASSESSORS AID 0.00 6,970.00 0.00 0.00 0.00 0.00A5031 INTERFUND TRANSFERS 12,000.00 50,986.00 0.00 6,000.00 6,000.00 6,000.00A5730 BAN 0.00 0.00 0.00 2,500,000.00 2,500,000.00 2,500,000.00A5730 BAN 0.00 0.00 0.00 0.00 0.00 400,000.00A5999 UNEXPENDED BALANCE (RECREATION RSV) CM Parks 0.00 0.00 0.00 0.00 25,000.00A5999 UNEXPENDED BALANCE (RECREATION RSV) 0.00 0.00 0.00 0.00 0.00 68,000.00AUB UNEXPENDED BALANCE 0.00 0.00 401,938.00 357,558.00 357,558.00 351,558.00
TOTAL REVENUES 951,602.00 1,082,364.00 1,216,113.00 3,683,158.00 3,683,158.00 4,176,158.00

TOWN OF GORHAMGENERAL FUND ‐ TOWNWIDE
2020 BUDGET
2017 2018 2019 2020 2020 2020
ACCOUNT TITLE ACTUAL ACTUAL BUDGET TENTATIVE PRELIM ADOPTEDEXPENDITURES
A1010.1 TOWN BOARD ‐ PERSONAL SERVICES 16,148.00 16,900.00 17,238.00 17,240.00 17,584.00 17,240.00A1010.4 TOWN BOARD ‐ CONTRACTUAL 1,937.00 2,056.00 2,000.00 2,000.00 2,000.00 2,000.00A1110.1 TOWN JUSTICE ‐ JUDGES 32,586.00 32,265.00 23,216.00 23,680.00 23,680.00 23,680.00A1110.12 TOWN JUSTICE ‐ COURT CLERK 0.00 0.00 9,328.00 10,000.00 10,000.00 10,000.00A1110.2 TOWN JUSTICE ‐ EQUIPMENT 0.00 0.00 800.00 800.00 800.00 800.00A1110.4 TOWN JUSTICE ‐ CONTRACTUAL 18,814.00 7,183.00 13,300.00 13,300.00 13,300.00 13,300.00A1220.1 SUPERVISOR ‐ PERSONAL SERVICES 31,684.00 32,334.00 32,981.00 33,641.00 33,641.00 33,641.00A1220.4 SUPERVISOR ‐ CONTRACTUAL 6,455.00 4,062.00 9,000.00 7,000.00 7,000.00 7,000.00A1310.1 BOOKKEEPER 0.00 5,631.00 30,551.00 32,341.00 32,341.00 35,829.00A1310.4 BOOKKEEPER ‐ CONTRACTUAL 0.00 18,244.00 24,000.00 24,000.00 24,000.00 24,000.00A1320.4 AUDITOR ‐ CONTRACTUAL 16.00 6,600.00 10,000.00 0.00 0.00 0.00A1330.1 TAX COLLECTION ‐ PERSONAL SERVICES 10,111.00 9,333.00 8,242.00 8,407.00 8,407.00 8,407.00A1330.12 TAX COLLECTION ‐ DEPUTY PER SER 0.00 0.00 2,920.00 2,978.00 2,978.00 2,978.00A1330.2 TAX COLLECTION ‐ EQUIPMENT 0.00 0.00 0.00 0.00 0.00 0.00A1330.4 TAX COLLECTION ‐ CONTRACTUAL 2,310.00 1,113.00 2,500.00 3,000.00 3,000.00 3,000.00A1355.1 ASSESSMENT ‐ PERSONAL SERVICES 65,349.00 63,386.00 64,027.00 65,236.00 65,236.00 65,236.00A1355.2 ASSESSMENT ‐ EQUIPMENT 0.00 0.00 11,330.00 5,000.00 5,000.00 5,000.00A1355.4 ASSESSMENT ‐ CONTRACTUAL 10,843.00 20,499.00 21,000.00 10,000.00 10,000.00 10,000.00A1410.1 TOWN CLERK ‐ PERSONAL SERVICES 43,581.00 42,325.00 38,967.00 39,746.00 39,746.00 39,746.00A1410.12 TOWN CLERK ‐ DEPUTY 0.00 0.00 3,713.00 4,635.00 5,500.00 5,500.00A1410.4 TOWN CLERK ‐ CONTRACTUAL 3,573.00 5,164.00 5,000.00 5,000.00 5,000.00 5,000.00A1420.4 ATTORNEY ‐ CONTRACTUAL 6,434.00 10,534.00 12,000.00 12,000.00 12,000.00 12,000.00A1430.1 PERSONNEL ‐ PERSONAL SERVICES 31,208.00 21,058.00 0.00 0.00 0.00 0.00A1430.4 PERSONNEL ‐ CONTRACTUAL 4,079.00 5,686.00 4,500.00 4,500.00 4,500.00 4,500.00A1440.4 ENGINEER ‐ CONTRACTUAL 0.00 20,927.00 5,000.00 28,000.00 28,000.00 28,000.00A1450.4 ELECTIONS ‐ CONTRACTUAL 4,000.00 4,000.00 4,000.00 6,000.00 6,000.00 6,000.00A1620.1 BUILDINGS ‐ PERSONAL SERVICES 0.00 2,200.00 6,700.00 6,834.00 6,834.00 6,834.00A1620.4 BUILDINGS ‐ CONTRACTUAL 147,639.00 75,008.00 80,000.00 80,000.00 80,000.00 80,000.00A1670.1 CENTRAL PRINTING & MAILING ‐ PERSONAL SERVICE 0.00 0.00 0.00 1,500.00 1,500.00 1,500.00A1670.2 CENTRAL PRINTING & MAILING ‐ EQUIPMENT 0.00 0.00 10,000.00 0.00 0.00 0.00A1670.4 CENTRAL PRINTING & MAILING ‐ CONTRACTUAL 4,547.00 6,618.00 6,000.00 6,000.00 6,000.00 6,000.00A1680.4 CENTRAL DATA PROCESSING ‐ CONTRACTUAL 1,022.00 0.00 1,200.00 1,200.00 1,200.00 1,200.00A1910.4 UNALLOCATED INSURANCE 55,184.00 63,038.00 70,000.00 72,000.00 72,000.00 72,000.00A1920.4 MUNICIPAL ASSOCIATION DUES 1,100.00 1,125.00 1,300.00 1,300.00 1,300.00 1,300.00

TOWN OF GORHAMGENERAL FUND ‐ TOWNWIDE
2020 BUDGET
2017 2018 2019 2020 2020 2020
ACCOUNT TITLE ACTUAL ACTUAL BUDGET TENTATIVE PRELIM ADOPTEDA1930.4 JUDGEMENTS AND CLAIMS CONTRATUAL 0.00 20,000.00 100,000.00 10,000.00 10,000.00 10,000.00A1940.2 PUR OF LAND/RIGHT OF WAY 0.00 128,255.00 0.00 0.00 0.00 0.00A1972.4 PAYT TO CO TREA/REDUCE TAXES 0.00 0.00 0.00 0.00 0.00 0.00A1989.4 OTHER GENERAL GOVERNEMENT SUPPORT ‐ CONTRACTUAL 7,752.00 0.00 0.00 0.00 0.00 0.00A1990.4 CONTINGENT ACCOUNT 0.00 0.00 65,927.00 55,000.00 54,135.00 54,887.00A3310.4 TRAFFIC CONTROL ‐ CONTRACTUAL 26,845.00 17,703.00 35,000.00 35,000.00 35,000.00 30,000.00A3510.4 CONTROL OF DOGS ‐ CONTRACTUAL 13,454.00 13,723.00 14,000.00 14,000.00 14,000.00 14,000.00A4020.4 REGISTRAR/VITAL STATISTICS ‐ CONTRACTUAL 770.00 1,020.00 1,000.00 1,000.00 1,000.00 1,000.00A4050.4 PUBLIC HEALTH OTHER ‐ CONTRACTUAL 0.00 0.00 500.00 500.00 500.00 500.00A4540.4 AMBULANCE ‐ CONTRACTUAL 6,610.00 0.00 6,900.00 6,900.00 6,900.00 6,900.00A5010.1 HIGHWAY ADMINISTRATION ‐ PERSONAL SERVICE 67,625.00 66,596.00 67,600.00 72,523.00 72,523.00 72,777.00A5010.12 DEPUTY HIGHWAY SUPT SVC. 0.00 0.00 0.00 1,300.00 1,300.00 3,000.00A5010.2 HIGHWAY ADMINISTRATION ‐ EQUIPMENT 0.00 0.00 2,000.00 0.00 0.00 0.00A5010.4 HIGHWAY ADMINISTRATION ‐ CONTRACTUAL 2,505.00 2,444.00 2,000.00 2,000.00 2,000.00 2,000.00A5132.2 EQUIPMENT & CAPITAL OUTLAY 27,005.00 0.00 0.00 2,500,000.00 2,500,000.00 2,500,000.00A5132.4 GARAGE ‐ CONTRACTUAL 8,009.00 8,645.00 12,000.00 12,000.00 12,000.00 12,000.00A5182.4 STREET LIGHTING ‐ CONTRACTUAL 2,505.00 2,879.00 3,000.00 3,000.00 3,000.00 3,000.00A7110.2 PARKS EQUIP & CAP OUTLAY ‐ Lodge Interior 0.00 0.00 0.00 0.00 0.00 25,000.00A7110.21 PARKS EQUIP & CAP OUTLAY ‐ Lodge Exterior 0.00 0.00 0.00 0.00 0.00 68,000.00A7110.4 PARKS CONTRACTUAL 0.00 0.00 0.00 6,000.00 6,000.00 6,000.00A7310.4 YOUTH PROGRAM ‐ CONTRACTUAL 825.00 0.00 850.00 850.00 850.00 0.00A7410.2 LIBRARY EQUIP & CAP. OUTLAY 0.00 0.00 0.00 0.00 0.00 400,000.00A7410.41 LIBRARY ‐ CONTRACTUAL ‐ GORHAM 44,725.00 46,532.00 42,792.00 43,648.00 43,648.00 43,648.00A7410.43 LIBRARY ‐ CONTRACTUAL ‐ RUSHVILLE 0.00 0.00 3,740.00 3,815.00 3,815.00 3,815.00A7510.4 HISTORIAN ‐ CONTRACTUAL 3,640.00 3,713.00 3,713.00 3,713.00 3,713.00 3,713.00A8090.4 ENVIRONMENTAL CONTROL ‐WATERSHED 0.00 0.00 0.00 10,000.00 10,000.00 10,000.00A8160.1 REFUSE & GARBAGE ‐ PERSONAL SERVICE 79,038.00 85,704.00 65,756.00 78,838.00 78,838.00 78,838.00A8160.2 REFUSE & GARBAGE ‐ EQUIPMENT 14,252.00 2,444.00 15,000.00 15,000.00 15,000.00 15,000.00A8160.4 REFUSE & GARBAGE ‐ CONTRACTUAL 68,699.00 66,752.00 65,000.00 70,000.00 70,000.00 70,000.00A8510.4 SHADE TREES CONTRACTUAL 0.00 0.00 0.00 3,000.00 3,000.00 3,000.00A8540.4 DRAINAGE ‐ CONT ‐ TESTING/MONITOR 14,726.00 52,267.00 24,000.00 25,000.00 25,000.00 25,000.00A8810.4 CEMETERIES ‐ CONTRACTUAL 12,465.00 13,175.00 17,000.00 17,000.00 17,000.00 17,000.00A9010.8 STATE RETIREMENT 35,404.00 48,596.00 49,060.00 48,974.00 48,974.00 48,974.00A9030.8 SOCIAL SECURITY 28,557.00 28,506.00 28,026.00 32,530.00 32,530.00 32,530.00A9040.8 WORKMEN'S COMPENSATION 7,356.00 11,073.00 12,439.00 16,385.00 16,385.00 16,385.00A9050.8 UNEMPLOYMENT INSURANCE 0.00 1,978.00 0.00 0.00 0.00 0.00A9055.8 DISABILITY INSURANCE 297.00 411.00 500.00 500.00 500.00 500.00
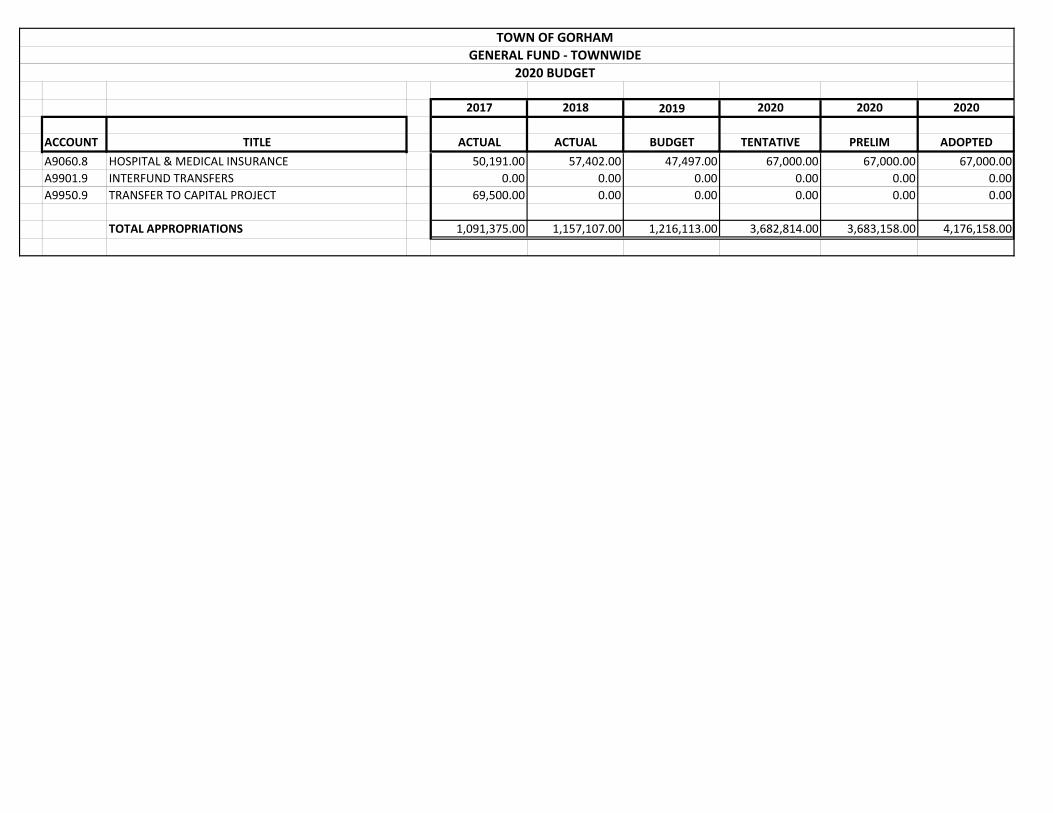
TOWN OF GORHAMGENERAL FUND ‐ TOWNWIDE
2020 BUDGET
2017 2018 2019 2020 2020 2020
ACCOUNT TITLE ACTUAL ACTUAL BUDGET TENTATIVE PRELIM ADOPTEDA9060.8 HOSPITAL & MEDICAL INSURANCE 50,191.00 57,402.00 47,497.00 67,000.00 67,000.00 67,000.00A9901.9 INTERFUND TRANSFERS 0.00 0.00 0.00 0.00 0.00 0.00A9950.9 TRANSFER TO CAPITAL PROJECT 69,500.00 0.00 0.00 0.00 0.00 0.00
TOTAL APPROPRIATIONS 1,091,375.00 1,157,107.00 1,216,113.00 3,682,814.00 3,683,158.00 4,176,158.00

TOWN OF GORHAMGENERAL FUND ‐ OUTSIDE VILLAGE
2020 BUDGET
2017 2018 2019 2020 2020 2020
ACCOUNT TITLE ACTUAL ACTUAL BUDGET TENTATIVE PRELIM ADOPTEDREVENUE
B1120 NON‐PROPERTY TAX DISTRIBUTION 158,417.00 151,926.00 184,792.00 165,180.00 160,371.00 172,871.00B2110 ZONING FEES 1,035.00 675.00 1,000.00 500.00 500.00 500.00B2115 PLANNING BOARD FEES 2,425.00 2,150.00 1,000.00 1,000.00 1,000.00 1,000.00B2401 INTEREST & EARNINGS 14.00 5.00 25.00 0.00 0.00 0.00B2401R INTEREST & EARNINGS ‐ RESERVE FUNDS 0.00 0.00 0.00 0.00 0.00 0.00B2555 BUILDING PERMIT FEE 16,212.00 15,296.00 15,000.00 12,000.00 12,000.00 12,000.00B5999 UNEXPENDED BALANCE 0.00 0.00 7,472.00 5,191.00 0.00 0.00
TOTAL REVENUES 178,103.00 170,052.00 209,289.00 183,871.00 173,871.00 186,371.00EXPENDITURES
B3620.1 SAFETY INSPECTOR PERSONAL SERVICES 22,285.00 22,927.00 25,586.00 21,879.00 21,879.00 21,879.00B4010.1 BOARD OF HEALTH ‐ PERSONAL SERVICES 1,415.00 54.00 0.00 0.00 0.00 0.00B8010.1 ZONING ‐ PERSONAL SERVICES 35,618.00 36,220.00 38,826.00 35,369.00 35,369.00 35,369.00B8010.2 ZONING ‐ EQUIPMENT 0.00 0.00 10,500.00 0.00 0.00 0.00B8010.4 ZONING ‐ CONTRACTUAL 7,497.00 8,204.00 7,500.00 8,000.00 8,000.00 8,000.00B8020.1 PLANNING ‐ PERSONAL SERVICES 38,205.00 39,467.00 42,138.00 38,747.00 38,747.00 38,747.00B8020.2 PLANNING ‐ EQUIPMENT 0.00 0.00 7,500.00 0.00 0.00 0.00B8020.4 PLANNING ‐ CONTRACTUAL 6,006.00 4,719.00 37,500.00 27,500.00 17,500.00 30,000.00B9010.8 STATEMENT RETIREMENT 11,655.00 14,530.00 14,193.00 15,536.00 15,536.00 15,536.00B9030.8 SOCIAL SECURITY 7,137.00 7,234.00 8,108.00 8,170.00 8,186.00 8,186.00B9040.8 WORKER'S COMPENSATION 2,864.00 3,138.00 3,598.00 2,820.00 2,820.00 2,820.00B9055.8 DISABILITY INSURANCE 38.00 51.00 100.00 100.00 100.00 100.00B9060.8 HOSPITAL & MEDICAL INSURANCE 18,498.00 14,956.00 13,740.00 15,734.00 15,734.00 15,734.00B9901.9 TRANSFERS TO OTHER FUNDS 0.00 0.00 0.00 0.00 0.00 0.00B9950.9 TRANSFERS EQUIPMENT RSV 0.00 0.00 0.00 10,000.00 10,000.00 10,000.00
TOTAL APPROPRIATIONS 151,218.00 151,500.00 209,289.00 183,855.00 173,871.00 186,371.00

TOWN OF GORHAMHIGHWAY FUND ‐ OUTSIDE VILLAGE
2020 BUDGET
2017 2018 2019 2020 2020 2020
ACCOUNT TITLE ACTUAL ACTUAL BUDGET TENTATIVE PRELIM ADOPTEDREVENUE
DB1120 NON‐PROPERTY TAX DISTRIBUTION BY COUNTY 1,213,034.00 1,164,765.00 1,120,000.00 1,140,000.00 1,140,000.00 1,140,000.00DB2300 TRANSPORTATION SERVICES 122,751.00 200,027.00 119,415.00 124,000.00 124,000.00 124,000.00DB2401 INTEREST & EARNINGS 302.00 99.00 200.00 0.00 0.00 0.00DB2401R INTEREST & EARNINGS ‐ RESERVE 0.00 0.00 0.00 0.00 0.00 0.00DB2655 MINOR SALES 0.00 0.00 0.00 0.00 0.00 0.00DB2665 SALES OF EQUIPMENT 0.00 46,640.00 40,000.00 50,000.00 50,000.00 50,000.00DB2701 REFUND FROM PRIOR YEAR 0.00 3,069.00 0.00 0.00 0.00 0.00DB2770 UNCLASSIFIED/FEMA 0.00 700.00 0.00 0.00 0.00 0.00DB3501 CONSOLIDATED HIGHWAY AID 70,054.00 508,723.00 235,175.00 166,148.00 166,148.00 166,148.00DB5731 INTERFUND TRANSFER 0.00 0.00 0.00 0.00 0.00 0.00DB5999 UNEXPENDED BALANCE 0.00 0.00 60,228.00 238,026.00 238,026.00 238,026.00
TOTAL REVENUES 1,406,141.00 1,924,023.00 1,575,018.00 1,718,174.00 1,718,174.00 1,718,174.00EXPENDITURES
DB5110.1 GENERAL REPAIRS ‐ PERSONAL SERVICES 330,792.00 336,808.00 363,271.00 354,355.00 354,355.00 354,355.00DB5110.4 GENERAL REPAIRS ‐ CONTRACTUAL 553,720.00 339,146.00 250,000.00 300,000.00 300,000.00 300,000.00DB5112.2 CHIPS PERMANENT IMPROVEMENT 0.00 0.00 235,175.00 166,148.00 166,148.00 166,148.00DB5130.2 MACHINERY ‐ EQUIPMENT 353,641.00 394,305.00 215,143.00 322,000.00 322,000.00 322,000.00DB5130.4 MACHINERY ‐ CONTRACTUAL 82,557.00 337,200.00 90,000.00 100,000.00 100,000.00 100,000.00DB5140.1 MISCELLANEOUS (BRUSH & WEEDS) ‐ PERS SER 1,456.00 4,496.00 1,599.00 4,730.00 4,730.00 4,730.00DB5140.4 MISCELLANEOUS (BRUSH & WEEDS) ‐ CONTRACT 270.00 1,477.00 1,000.00 1,000.00 1,000.00 1,000.00DB5142.1 SNOW REMOVAL ‐ PERSONAL SERVICES 65,091.00 74,058.00 71,482.00 77,916.00 77,916.00 77,916.00DB5142.4 SNOW REMOVAL ‐ CONTRACTUAL 185,985.00 340,051.00 185,000.00 210,000.00 210,000.00 210,000.00DB9010.8 STATE RETIREMENT 44,466.00 58,284.00 57,949.00 59,205.00 59,205.00 59,205.00DB9030.8 SOCIAL SECURITY 30,124.00 29,898.00 33,104.00 32,639.00 32,711.00 32,711.00DB9040.8 WORKER'S COMPENSATION 12,984.00 14,301.00 14,692.00 21,221.00 21,221.00 21,221.00DB9055.8 DISABILITY INSURANCE 126.00 154.00 500.00 500.00 500.00 500.00DB9060.8 HOSPITAL & MEDICAL INSURANCE 58,179.00 56,427.00 56,103.00 67,954.00 68,388.00 68,388.00
TOTAL APPROPRIATIONS 1,719,391.00 1,986,605.00 1,575,018.00 1,717,668.00 1,718,174.00 1,718,174.00
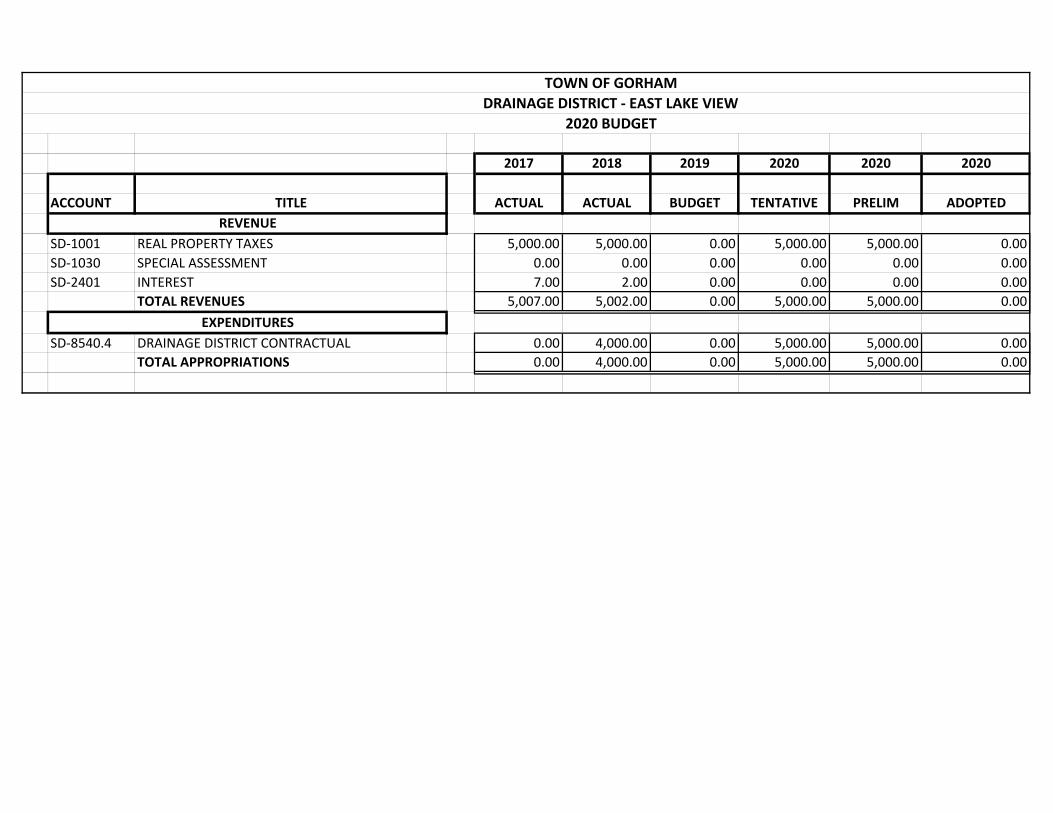
TOWN OF GORHAMDRAINAGE DISTRICT ‐ EAST LAKE VIEW
2020 BUDGET
2017 2018 2019 2020 2020 2020
ACCOUNT TITLE ACTUAL ACTUAL BUDGET TENTATIVE PRELIM ADOPTEDREVENUE
SD‐1001 REAL PROPERTY TAXES 5,000.00 5,000.00 0.00 5,000.00 5,000.00 0.00SD‐1030 SPECIAL ASSESSMENT 0.00 0.00 0.00 0.00 0.00 0.00SD‐2401 INTEREST 7.00 2.00 0.00 0.00 0.00 0.00
TOTAL REVENUES 5,007.00 5,002.00 0.00 5,000.00 5,000.00 0.00EXPENDITURES
SD‐8540.4 DRAINAGE DISTRICT CONTRACTUAL 0.00 4,000.00 0.00 5,000.00 5,000.00 0.00TOTAL APPROPRIATIONS 0.00 4,000.00 0.00 5,000.00 5,000.00 0.00

TOWN OF GORHAMGORHAM FIRE DISTRICT
2020 BUDGET
2017 2018 2019 2020 2020 2020 2020
ACCOUNT TITLE ACTUAL ACTUAL BUDGET PROJECTED TENTATIVE PRELIM ADOPTEDREVENUE
SF1‐1001 REAL PROPERTY TAXES 118,650.00 119,220.00 123,133.00 123,133.00 125,596.00 125,596.00 125,596.00TOTAL REVENUES 118,650.00 119,220.00 123,133.00 123,133.00 125,596.00 125,596.00 125,596.00
EXPENDITURESSF1‐3410.4 FIRE PROTECTION CONTRACTUAL 118,650.00 119,220.00 123,133.00 123,133.00 125,596.00 125,596.00 125,596.00
TOTAL APPROPRIATIONS 118,650.00 119,220.00 123,133.00 123,133.00 125,596.00 125,596.00 125,596.00

TOWN OF GORHAMCRYSTAL BEACH/RUSHVILLE FIRE PROTECTION
2020 BUDGET
2017 2018 2019 2020 2020 2020
ACCOUNT TITLE ACTUAL ACTUAL BUDGET TENTATIVE PRELIM ADOPTEDREVENUE
SF2‐1001 REAL PROPERTY TAXES 238,548.00 243,318.00 243,578.00 254,206.00 254,206.00 254,831.00TOTAL REVENUES 238,548.00 243,318.00 243,578.00 254,206.00 254,206.00 254,831.00
EXPENDITURESSF2‐3410.41 FIRE PROTECTION CONTRACTUAL ‐ CRYSTAL BEACH 208,018.00 212,178.00 212,178.00 222,178.00 222,178.00 222,178.00SF1‐3410.42 FIRE PROTECTION CONTRACTUAL ‐ RUSHVILLE 30,530.00 31,140.00 31,400.00 32,028.00 32,028.00 32,653.00
TOTAL APPROPRIATIONS 238,548.00 243,318.00 243,578.00 254,206.00 254,206.00 254,831.00

TOWN OF GORHAMLIGHTING DISTRICT
2020 BUDGET
2017 2018 2019 2020 2020 2020
ACCOUNT TITLE ACTUAL ACTUAL BUDGET TENTATIVE PRELIM ADOPTEDREVENUE
SL‐1001 REAL PROPERTY TAX 7,800.00 8,250.00 8,390.00 8,500.00 8,500.00 8,500.00TOTAL REVENUES 7,800.00 8,250.00 8,390.00 8,500.00 8,500.00 8,500.00
EXPENDITURESSL‐5182.4 CONTRACTUAL 7,885.05 9,206.00 8,390.00 8,500.00 8,500.00 8,500.00
TOTAL APPROPRIATIONS 7,885.05 9,206.00 8,390.00 8,500.00 8,500.00 8,500.00
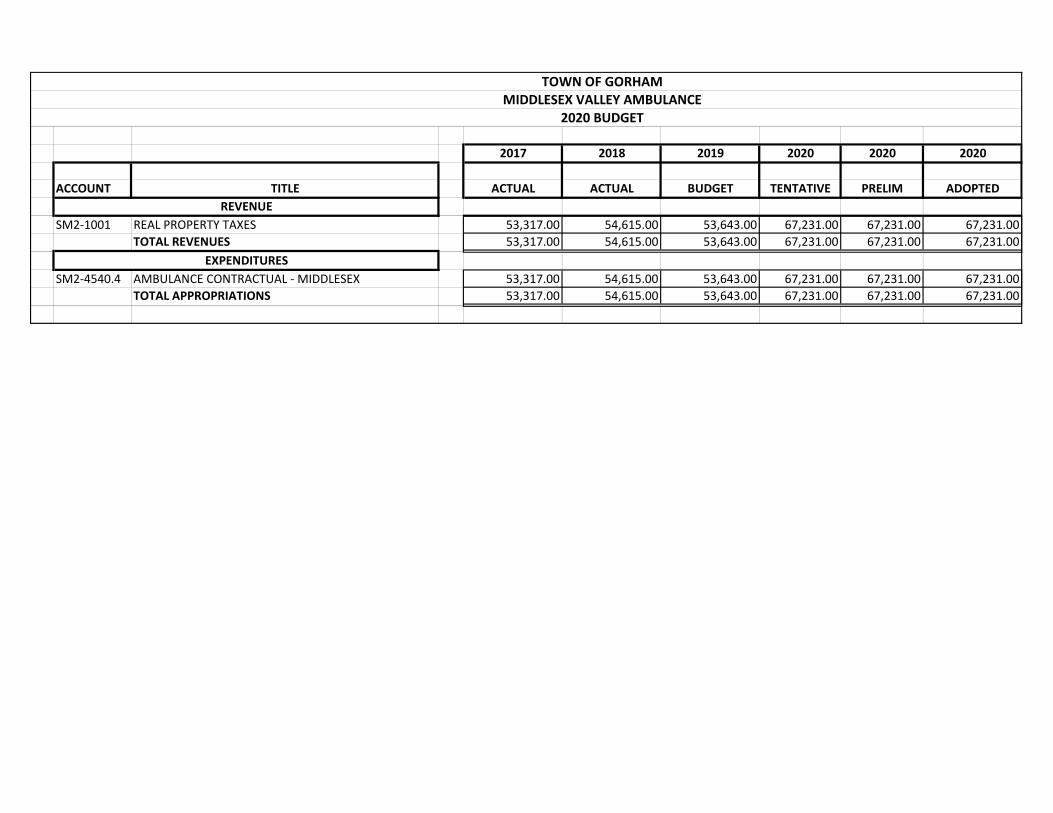
TOWN OF GORHAMMIDDLESEX VALLEY AMBULANCE
2020 BUDGET
2017 2018 2019 2020 2020 2020
ACCOUNT TITLE ACTUAL ACTUAL BUDGET TENTATIVE PRELIM ADOPTEDREVENUE
SM2‐1001 REAL PROPERTY TAXES 53,317.00 54,615.00 53,643.00 67,231.00 67,231.00 67,231.00TOTAL REVENUES 53,317.00 54,615.00 53,643.00 67,231.00 67,231.00 67,231.00
EXPENDITURESSM2‐4540.4 AMBULANCE CONTRACTUAL ‐ MIDDLESEX 53,317.00 54,615.00 53,643.00 67,231.00 67,231.00 67,231.00
TOTAL APPROPRIATIONS 53,317.00 54,615.00 53,643.00 67,231.00 67,231.00 67,231.00

TOWN OF GORHAMSEWER DISTRICT2020 BUDGET
2017 2018 2019 2020 2020 2020
ACCOUNT TITLE ACTUAL ACTUAL BUDGET TENTATIVE PRELIM ADOPTEDREVENUE
SS2120 SEWER RENTS 140,271.00 137,517.00 128,439.00 127,963.00 128,000.00 128,000.00SS2128 PENALTIES 1,577.00 2,935.00 1,500.00 1,500.00 1,500.00 1,500.00SS2401 INTEREST & EARNINGS 82.00 37.00 0.00 0.00 0.00 0.00SS2401R INTEREST & EARNINGS = RESERVE 0.00 0.00 0.00 0.00 0.00 0.00SS5031 INTERFUND TRANSFERS 5,000.00 0.00 0.00 0.00 0.00 0.00SS5999 UNEXPENDED BALANCE 0.00 0.00 0.00 27,213.00 16,637.00 16,637.00
TOTAL REVENUES 146,930.00 140,489.00 129,939.00 156,676.00 146,137.00 146,137.00EXPENDITURES
SS8110.1 SEWER ADMINISTRATION ‐ PERSONAL SERVICES 3,327.00 1,335.00 1,545.00 1,717.00 1,636.00 1,636.00SS8110.4 SEWER ADMINISTRATION ‐ CONTRACTUAL 2,384.00 2,087.00 4,000.00 4,000.00 4,000.00 4,000.00SS8120.2 SANITARY SEWERS ‐ EQUIPMENT 9,326.00 12,059.00 14,900.00 10,000.00 10,000.00 10,000.00SS8120.4 SANITARY SEWERS ‐ CONTRACTUAL 13,816.00 18,597.00 15,000.00 20,000.00 20,000.00 20,000.00SS8130.1 SEWAGE TREATMENT/DISPOSAL ‐ PERS SER 41,899.00 47,026.00 44,703.00 45,000.00 45,000.00 45,000.00SS8130.2 SEWAGE TREATMENT/DISPOSAL ‐EQUIPMENT 34,303.00 1,754.00 15,000.00 15,000.00 15,000.00 15,000.00SS8130.4 SEWAGE TREATMENT/DISPOSAL ‐CONTRACTUAL 21,497.00 5,541.00 23,500.00 23,500.00 23,500.00 23,500.00SS9010.8 STATE RETIREMENT 5,317.00 6,392.00 6,160.00 23,373.00 12,834.00 12,834.00SS9030.8 SOCIAL SECURITY 3,396.00 3,569.00 3,519.00 3,600.00 3,600.00 3,600.00SS9040.8 WORKER'S COMPENSATION 1,175.00 1,256.00 1,562.00 1,751.00 1,751.00 1,751.00SS9055.8 DISABILITY INSURANCE 20.00 22.00 50.00 50.00 50.00 50.00SS9060.8 HEALTH INSURANCE 0.00 0.00 0.00 3,766.00 3,766.00 3,766.00SS9950.9 TRANSFER TO CAPITAL RSV 5,000.00 0.00 0.00 5,000.00 5,000.00 5,000.00
TOTAL APPROPRIATIONS 141,460.00 99,638.00 129,939.00 156,757.00 146,137.00 146,137.00

TOWN OF GORHAMWATER DISTRICT #1
2020 BUDGET
2017 2018 2019 2020 2020 2020ACCOUNT TITLE
REVENUE ACTUAL ACTUAL BUDGET TENTATIVE PRELIM ADOPTEDSW1‐1001 REAL PROPERTY TAX 120,000.00 122,400.00 120,900.00 120,900.00 120,900.00 120,900.00SW1‐1081 PILOT 300.00 0.00 300.00 300.00 300.00 300.00SW1‐2140 METERED SALES 553,203.00 559,260.00 500,000.00 500,000.00 500,000.00 500,000.00SW1‐2142 UNMETERED WATER SALES 4,146.00 0.00 0.00 0.00 0.00 0.00SW1‐2144 WATER CONNECTION CHARGES 4,500.00 5,000.00 4,000.00 4,000.00 4,000.00 4,000.00SW1‐2148 INTEREST & PENALTIES 4,489.00 6,460.00 4,500.00 4,500.00 4,500.00 4,500.00SW1‐2378 SERVICE OTHER GOVERNMENT (NOT SALE) 0.00 5,000.00 0.00 0.00 0.00 0.00SW1‐2401 INTEREST & EARNINGS 339.00 279.00 0.00 0.00 0.00 0.00SW1‐2650 SALES OF SCRAP & EXCESS MATERIALS 11,094.00 0.00 0.00 0.00 0.00 0.00SW1‐2665 SALES OF EQUIPMENT 0.00 0.00 0.00 0.00 0.00 0.00SW1‐2701 REFUND OTHER YEAR 0.00 125.00 0.00 0.00 0.00 0.00SW1‐2770 REFUND PRIOR YEAR 0.00 1,250.00 0.00 0.00 0.00 0.00SW1‐5031 INTERFUND TRANSFERS 60,000.00 0.00 0.00 0.00 0.00 0.00SW1‐5999 UNEXPENDED FUND BALANCE 0.00 0.00 93,589.00 69,363.00 89,902.00 91,522.00SW1‐5999 UNEXPENDED FUND BALANCE (RSV) 0.00 0.00 0.00 0.00 0.00 500,000.00
TOTAL REVENUES 758,071.00 699,774.00 723,289.00 699,063.00 719,602.00 1,221,222.00EXPENDITURES
SW1‐8310.1 WATER ADMINISTRATION ‐ PERSONAL SERVICES 25,544.00 10,721.00 7,479.00 6,868.00 6,544.00 6,544.00SW1‐8310.2 WATER ADMINISTRATION ‐ CAPITAL OUTLAY 0.00 0.00 0.00 0.00 0.00 0.00SW1‐8310.4 WATER ADMINISTRATION ‐ CONTRACTUAL 9,332.00 23,049.00 50,000.00 40,000.00 40,000.00 40,000.00SW1‐8320.1 SOURCE OF SUPPLY ‐ PERSONAL SERVICES 107,054.00 100,189.00 104,008.00 104,000.00 104,000.00 105,620.00SW1‐8320.2 SOURCE OF SUPPLY ‐ EQUIPMENT 204.00 37,862.00 55,000.00 22,000.00 22,000.00 22,000.00SW1‐8320.4 SOURCE OF SUPPLY ‐ CONTRACTUAL 106,695.00 65,810.00 85,000.00 85,000.00 85,000.00 85,000.00SW1‐8340.1 TRANSMISSION/DISTRIBUTION ‐ PERSONAL SERVICE 143,589.00 155,392.00 170,425.00 170,000.00 170,000.00 170,000.00SW1‐8340.2 TRANSMISSION/DISTRIBUTION ‐ EQUIPMENT 40,832.00 16,381.00 71,000.00 45,000.00 45,000.00 45,000.00SW1‐8340.21 TRANSMISSION/DISTRIBUTION ‐ CAP OUTLAY 0.00 0.00 0.00 0.00 0.00 500,000.00SW1‐8340.4 TRANSMISSION/DISTRIBUTION ‐ CONTRACTUAL 67,250.00 90,679.00 75,000.00 75,000.00 75,000.00 75,000.00SW1‐9010.8 STATE RETIREMENT 22,407.00 35,632.00 37,551.00 9,112.00 29,651.00 29,651.00SW1‐9010.8 SOCIAL SECURITY 20,668.00 19,306.00 21,451.00 23,134.00 22,937.00 22,937.00SW1‐9040.8 WORKER'S COMPENSATION 7,440.00 8,782.00 9,521.00 9,745.00 9,745.00 9,745.00SW1‐9055.8 DISABILITY INSURANCE 88.00 95.00 500.00 500.00 500.00 500.00SW1‐9060.6 HOSPITAL & MEDICAL INSURANCE 51,129.00 46,534.00 36,354.00 50,255.00 50,255.00 50,255.00SW1‐9901.9 TRANSFERS, OTHER FUNDS 60,000.00 0.00 0.00 0.00 0.00 0.00SW1‐9950.9 TRANSFERS, CAPITAL FUNDS 60,000.00 0.00 0.00 58,970.00 58,970.00 58,970.00
TOTAL APPROPRIATIONS 722,232.00 610,432.00 723,289.00 699,584.00 719,602.00 1,221,222.00

TOWN OF GORHAMWATER DISTRICT #6
2020 BUDGET
2017 2018 2019 2020 2020 2020
ACCOUNT TITLE ACTUAL ACTUAL BUDGET TENTATIVE PRELIM ADOPTEDREVENUE
SW6‐1001 REAL ESTATE TAXES 0.00 3,901.00 3,942.50 3,879.50 3,879.50 3,879.50SW6‐2142 UNMETERED SALES 0.00 0.00 0.00 0.00 0.00 0.00SW6‐5031 INTERFUND TRANSFERS 0.00 0.00 0.00 0.00 0.00 0.00
TOTAL REVENUES 0.00 3,901.00 3,942.50 3,879.50 3,879.50 3,879.50EXPENDITURES
SW 6‐9710.6 DEBT PRINCIPAL, SERIAL BONDS 1,300.00 1,300.00 1,400.00 1,400.00 1,400.00 1,400.00SW6‐9710.7 DEBT INTERST, SERIAL BONDS 2,657.00 2,601.00 2,542.50 2,479.50 2,479.50 2,479.50
TOTAL APPROPRIATIONS 3,957.00 3,901.00 3,942.50 3,879.50 3,879.50 3,879.50
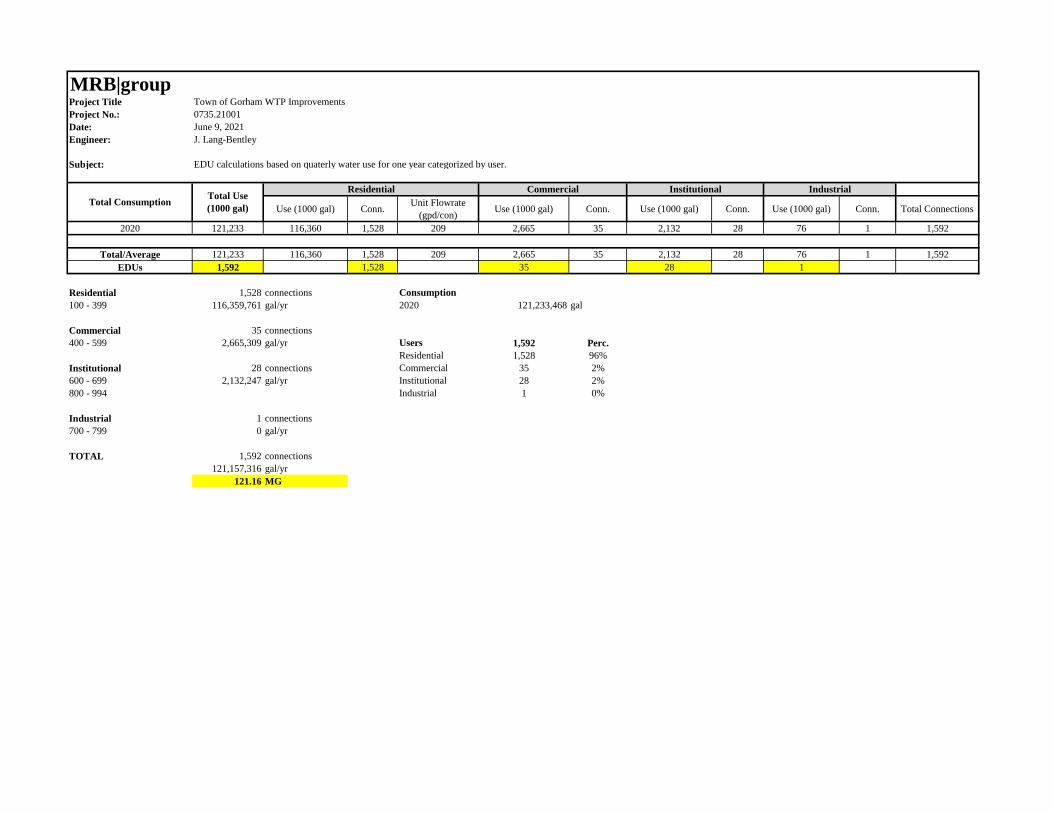
MRB|groupProject Title Town of Gorham WTP ImprovementsProject No.: 0735.21001Date: June 9, 2021Engineer: J. Lang-Bentley
Subject: EDU calculations based on quaterly water use for one year categorized by user.
Use (1000 gal) Conn. Unit Flowrate (gpd/con) Use (1000 gal) Conn. Use (1000 gal) Conn. Use (1000 gal) Conn. Total Connections
2020 121,233 116,360 1,528 209 2,665 35 2,132 28 76 1 1,592
Total/Average 121,233 116,360 1,528 209 2,665 35 2,132 28 76 1 1,592EDUs 1,592 1,528 35 28 1
Residential 1,528 connections Consumption100 - 399 116,359,761 gal/yr 2020 121,233,468 gal
Commercial 35 connections400 - 599 2,665,309 gal/yr Users 1,592 Perc.
Residential 1,528 96%Institutional 28 connections Commercial 35 2%600 - 699 2,132,247 gal/yr Institutional 28 2%800 - 994 Industrial 1 0%
Industrial 1 connections700 - 799 0 gal/yr
TOTAL 1,592 connections121,157,316 gal/yr
121.16 MG
Total Consumption Total Use (1000 gal)
Residential Commercial Institutional Industrial

Preliminary Engineering Report Town of Gorham Water Treatment Plant Improvements September 2021
MRB Group Project No. 0735.21001.000
APPENDIX P
FINANCING OPTIONS

MRB|groupProject Title: Town of Gorham WTP Evaluation
Project No.: 0735.21001
Date: October 18, 2021
Engineer: J. Lang-Bentley
Subject:
Total Project Cost = 7,971,000.00$
Eligible Project Costs = 7,971,000.00$
WIIA Award = 3,000,000.00$
Loan Rate Basis w/ various
grant optionsProject Cost Total EDUs Interest Rate (%) Loan Period (Yr)
New Debt Service
(annual payment)
New Debt Service
Cost per EDU
EFC Hardship Rate 7,971,000$ 3,033 0.0% 30 265,700$ 88$
EFC Subsidized Rate 7,971,000$ 3,033 2.5% 30 380,836$ 126$ EFC Market Rate 7,971,000$ 3,033 4.5% 30 489,352$ 161$
EFC Harship Rate w/ WIIA 4,971,000$ 3,033 0.0% 30 165,700$ 55$
EFC Subsidized Rate w/ WIIA 4,971,000$ 3,033 2.5% 30 237,503$ 78$ EFC Market Rate w/ WIIA 4,971,000$ 3,033 4.5% 30 305,177$ 101$
NOTES:
A project, including phases of the project, is limited to the lesser of $3 million or 60% of the net eligible project costs.
Alternative 3 cost and finance projection based on various EFC rates and potential WIIA drinking water project grant dollars.

Preliminary Engineering Report Town of Gorham Water Treatment Plant Improvements September 2021
MRB Group Project No. 0735.21001.000
APPENDIX Q
ENGINEERING REPORT CERTIFICATION

Appendix C: Engineering Report Certification
Engineering Report Certification To Be Provided by the Professional Engineer Preparing the Report
During the preparation of this Engineering Report, I have studied and evaluated the cost and effectiveness of the processes, materials, techniques, and technologies for carrying out the proposed project or activity for which assistance is being sought from the New York State Drinking Water State Revolving Fund. In my professional opinion, I have recommended for selection, to the maximum extent practicable, a project or activity that maximizes the potential for efficient water use, reuse, recapture, and conservation, and energy conservation, taking into account the cost of constructing the project or activity, the cost of operating and maintaining the project or activity over the life of the project or activity, and the cost of replacing the project and activity.
Title of Engineering Report: Engineering Report for the Town of Gorham WTP Evaluation
Date of Report: October 2021
Professional Engineer’s Name: Gregory J. Hotaling, P.E.
Signature:
Date: October 2021

Preliminary Engineering Report Town of Gorham Water Treatment Plant Improvements September 2021
MRB Group Project No. 0735.21001.000
APPENDIX R
SMART GROWTH ASSESSMENT FORM

Smart Growth Assessment Form
This form should be completed by the applicant’s project engineer or other design professional.1
Applicant InformationApplicant: Project No.:Project Name:Is project construction complete? ☐ Yes, date: ☐ NoProject Summary: (provide a short project summary in plain language including the location of the area the project serves)
Section 1 – Screening Questions1. Prior Approvals1A. Has the project been previously approved for EFC financial assistance? ☐ Yes ☐ No1B. If so, what was the project number(s) for the prior Project No.:
approval(s)?
Is the scope of the project substantially the same as that which was ☐ Yes ☐ Noapproved?
IF THE PROJECT WAS PREVIOUSLY APPROVED BY EFC’S BOARD AND THE SCOPEOF THE PROJECT HAS NOT MATERIALLY CHANGED, THE PROJECT IS NOT SUBJECT
TO SMART GROWTH REVIEW. SKIP TO SIGNATURE BLOCK.
2. New or Expanded Infrastructure2A. Does the project add new wastewater collection/new water mains or a ☐ Yes ☐ No
new wastewater treatment system/water treatment plant?Note: A new infrastructure project adds wastewater collection/water mains or awastewater treatment/water treatment plant where none existed previously
2B. Will the project result in either: ☐ Yes ☐ NoAn increase of the State Pollutant Discharge Elimination System(SPDES) permitted flow capacity for an existing treatment system;ORAn increase such that a NYSDEC water withdrawal permit will need to beobtained or modified, or result in the NYSDOH approving an increase inthe capacity of the water treatment plant?
Note: An expanded infrastructure project results in an increase of the SPDES permittedflow capacity for the wastewater treatment system, or an increase of the permitted waterwithdrawal or the permitted flow capacity for the water treatment system.
1 If project construction is complete and the project was not previously financed through EFC, anauthorized municipal representative may complete and sign this assessment.
Page 1Effective October 1, 2017

IF THE ANSWER IS “NO” TO BOTH “2A” and “2B” ON THE PREVIOUS PAGE, THEPROJECT IS NOT SUBJECT TO FURTHER SMART GROWTH REVIEW. SKIP TO
SIGNATURE BLOCK.
3. Court or Administrative Consent Orders3A. Is the project expressly required by a court or administrative consent ☐ Yes ☐ No
order?
3B. If so, have you previously submitted the order to NYS EFC or DOH? ☐ Yes ☐ NoIf not, please attach.
Section 2 – Additional Information Needed for Relevant Smart Growth CriteriaEFC has determined that the following smart growth criteria are relevant for EFC-fundedprojects and that projects must meet each of these criteria to the extent practicable:
1. Uses or Improves Existing Infrastructure1A. Does the project use or improve existing infrastructure? ☐ Yes ☐ No
Please describe:
2. Serves a Municipal CenterProjects must serve an area in either 2A, 2B or 2C to the extent practicable.
2A. Does the project serve an area limited to one or more of the following municipalcenters?
i. A City or incorporated Village ☐Yes ☐Noii. A central business district ☐Yes ☐Noiii. A main street ☐Yes ☐Noiv. A downtown area ☐Yes ☐Nov. A Brownfield Opportunity Area ☐Yes ☐No
(for more information, go to www.dos.ny.gov & search “Brownfield”)
vi. A downtown area of a Local Waterfront Revitalization Program Area ☐Yes ☐No(for more information, go to www.dos.ny.gov and search “Waterfront Revitalization”)
vii. An area of transit-oriented development ☐Yes ☐Noviii. An Environmental Justice Area ☐Yes ☐No
(for more information, go to www.dec.ny.gov/public/899.html)
ix. A Hardship/Poverty Area ☐Yes ☐NoNote: Projects that primarily serve census tracts and block numbering areas with apoverty rate of at least twenty percent according to the latest census data
Please describe all selections:
2 of 3Effective October 1, 2017

2B. If the project serves an area located outside of a municipal center, does it serve an arealocated adjacent to a municipal center which has clearly defined borders, designated forconcentrated development in a municipal or regional comprehensive plan and exhibitstrong land use, transportation, infrastructure and economic connections to an existingmunicipal center? ☐Yes ☐No
Please describe:
2C. If the project is not located in a municipal center as defined above, is the areadesignated by a comprehensive plan and identified in zoning ordinance as a futuremunicipal center? ☐Yes ☐No
Please describe and reference applicable plans:
3. Resiliency Criteria3A. Was there consideration of future physical climate risk due to sea-level rise, storm surge,
and/or flooding during the planning of this project? ☐Yes ☐No
Please describe:
Signature Block: By entering your name in the box below, you agree that you are authorized toact on behalf of the applicant and that the information contained in this Smart GrowthAssessment is true, correct and complete to the best of your knowledge and belief.
3 of 3Effective October 1, 2017
Applicant: Phone Number:
(Name & Title of Project Engineer or Design Professional or Authorized Municipal Representative)
(Signature) (Date)

Preliminary Engineering Report Town of Gorham Water Treatment Plant Improvements September 2021
MRB Group Project No. 0735.21001.000
APPENDIX S
ELECTRICAL AND MECHANICAL EVALUATION
(JADESTONE ENGINEERING)

Jade Stone Engineering, PLLC
1 Water Treatment Plant Evaluation Town of Gorham
Electrical Evaluation:
Electrical Service and Distribution Equipment:
The Water Treatment Plant (WTP) is served by an overhead 200 AMP, 480/277 volt, three phase, 4-wire electrical service. The electrical service originates from three utility pole-top transformers (NYSEG owned) located adjacent to the site. From utility pole-top transformers the electrical service enters the building overhead through a weather head with a 2” conduit down to the meter. The service entrance feeder terminates within a heavy-duty safety switch located on the exterior of the WTP. The utility owned metering equipment (meter, etc.) is located on an exterior wall of the WTP so that it is accessible to the utility company on an as needed basis. Once thru the main service disconnecting means, power is routed thru a 200-amp, ASCO, Automatic Transfer Switch (ATS), and then distributed throughout the building/site to various distribution panelboards, transformers, and devices/equipment.
The electrical distribution system is made up of a main service disconnect switch (MDS), an automatic transfer switch (ATS), distribution panelboard, process control panels, several dry-type transformers, several panelboards, and several equipment disconnects across the site. The distribution equipment is of various sizes, ratings, and manufacturers. That said, most equipment is as manufactured by Square D. It was observed that most distribution equipment appears original to the facility with the exception of the service entrance cable and a panelboard which were replaced within the last 15 years. Original construction is from the late-1960s. Cursory observations indicate that original electrical distribution equipment has not had industry accepted preventative maintenance which would provide a better understanding of the internal working condition. The overcurrent protective devices (circuit breakers & fuses) within the distribution equipment that is original to the 1960s is using outdated technology, and thus have slow clearing/trip times in the event of a fault/problem (in comparison to modern equipment). As a result of slow clearing/trip times the equipment has the potential to build energy and cause a significant arc flash event which can be extremely dangerous. Facility personnel noted nuisance circuit breaker tripping has been an issue.
Equipment that dates to the 1960s has reached the end of its useful life and is now considered obsolete. Note, typical useful life of distribution equipment like that installed around the WTP is 30 years. With replacement parts for the existing distribution equipment becoming increasingly difficult to locate, facility downtime could become a significant factor in the event of an equipment failure. Operators noted it being a challenge to find replacement circuit breakers.
An additional observation regarding the distribution equipment is that we observed some panelboards and motor control centers which were primarily full of branch breakers and buckets with little to no space for future additions.
Most existing interior conduit systems where visible and able to be inspected, appeared to be in satisfactory condition. Existing conduit systems (where in satisfactory condition) in the event of a capital improvements project have the potential to be reutilized where practical/feasible.
Emergency Generator System:

Jade Stone Engineering, PLLC
2 Water Treatment Plant Evaluation Town of Gorham
The WTP has one (1) existing emergency generator system (EGS). The EGS is natural gas fuel fired and is manufactured by Generac. The EGS is rated 25kW and housed in an outdoor enclosure. The EGS appears to be installed in 2011. The EGS system provides emergency power to select loads throughout the facility given a normal power failure. The transfer of power from normal to emergency power is accomplished by automatic means by use of an automatic transfer switch. The engine generator system is currently the only permanent means of emergency power for the WTP’s critical operations and systems given a normal power failure. Emergency power is only provided to select loads and not the entire WTP. Per conversations with facility personnel, it was noted that there is also a trailer mounted 127kW generator available that is capable of running the entire facility. The trailer mounted generator can be used through means of a double throw safety switch which allows selection of either the 25kW generator (mentioned above) or the trailer mounted generator (when connected).
Lighting Systems – General Lighting, Emergency Lighting, & Exit Signage:
Most of all interior and exterior lighting systems consist of LED fixtures. Most of the existing lighting control was observed to be by means of manual switching (no automatic control observed), which is not in compliance with the current New York State Energy Code. It was noted while on site that the exterior lighting is accomplished by means of exterior building mounted wall-pack lighting fixtures. The lights were all recently upgraded to LED.
Egress emergency lighting was not observed to follow current code requirements. It was also noted that exist signage needed a replacement along with the need for additional signs to follow current codes/standards.
Variable Frequency Drive Discussion:
Upon preliminary review, the only motors observed to utilize a variable frequency drive (VFD) for motor starting/control were the two (2) 50HP high lift pumps. All other major motors at the WTP appear to not have an associated VFD, but rather use an across the line style motor starter. The two (2) VFDs that were observed were installed in 2017. These VFDs appear in good working condition. It was noted that the VFDs do not appear to have bypass capability which would provide additional flexibility by allowing the motors to be started across the line and continue to be operational in the event there is an issue/failure with the VFD itself.
NEC Required Working Clearance:
There were instances around the WTP in which current NEC required working clearances were not adequate. Clearances are to provide protection to workers, access to the equipment, and protection of the equipment from nonelectric equipment. For example, per code dedicated working space is required from the floor to a height of 6’-6” and extend 3’-0” in front of a typical panelboard. No other objects are to be within this dedicated working space. We noted that in front of the panelboards and disconnects in the WTP there were stored items within the dedicated working space.

Jade Stone Engineering, PLLC
3 Water Treatment Plant Evaluation Town of Gorham
Exposed Equipment/Devices/Wiring:
It was observed that there are instances in which existing electrical equipment has missing covers and/or faceplates, exposing energized (live) electrical components. This creates an unsafe working environment.
Feeders/Branch Circuitry:
Existing electrical feeders and branch circuitry was not examined as part of the field survey as these items were not visible nor readily accessible without removing covers and panel doors. It is assumed that the majority or all electrical feeders and branch circuitry are original to the facility (date to the 1960s). It was noted during the site visit that the electrical service entrance feeder was recently replaced from the pole overhead to the facility.
New York State Energy Code Compliance:
The current New York State Energy Code requires spaces within administrative type areas to have automatic operation of lighting systems as a means of energy conservation. No automatic lighting controls were observed where required by code.
Power System Analysis:
Per NEC and NFPA, arc flash warning labels shall be applied to all electrical equipment likely to require examination, adjustment, servicing, or maintenance while energized. This may include, but is not limited to, motor control centers, panelboards, control panels, transfer switches, disconnects, controllers, etc. No arc flash labeling was observed during our field investigation at the WTP. In addition, service equipment shall clearly identify the maximum available fault current to properly verify equipment is sufficiently rated to withstand such a fault. The service equipment was observed to not be properly labeled.

Jade Stone Engineering, PLLC
4 Water Treatment Plant Evaluation Town of Gorham
Electrical Recommendations:
Electrical Service and Distribution Equipment:
As mentioned within the evaluation section above most electrical distribution equipment is original to the facility in which it is installed within, and dates to the late-1960s. This equipment has reached the end of its useful life and is now considered obsolete. Note, typical useful life of distribution equipment like that installed around the WTP is 30 years. With replacement parts for the existing distribution equipment becoming increasingly difficult to locate, facility downtime could become a significant factor in the event of an equipment failure.
For these reasons it is recommended that all original (late-1960s vintage) electrical distribution equipment such as the motor control center, panelboards, dry-type transformers, etc. be replaced with modern gear throughout the WTP. By replacing distribution equipment before it ultimately fails, staff will avoid the tedious process of seeking replacement parts for aging electrical equipment (a process with the potential for extended downtimes). Where installed, all new equipment to be by a single manufacturer for ease of operation and maintenance. As part of these replacements, the existing overcurrent protective devices (circuit breakers & fuses) will be replaced with new, which consist of modern technologies (electronic trip units) greatly reducing clearing/trip times and creating a much safer environment for personnel who come into contact and work around the distribution equipment (in comparison to current conditions). All new equipment to be rated and suitable for use with the electrical service. All new equipment to be rated and suitable for use with the existing electrical service.
Preliminary loading calculations were developed to verify existing electrical service size. An electrical service can be loaded to 80% its listed rating, thus the existing 200-amp service can safely support 160 amps worth of electrical load. The service calculation was developed using utility demand data for 2020. Utility data reviewed ranged from December 2019 through December 2020. Results of reviewing previous utility data showed that the peak demand over the range of dates was 95.6 kW within the month of July 2020. This equates to roughly 142.5 amps (built in 1.25% safety factor) of electrical load on the existing service. This indicates the electrical service is approaching its upper limits/capacity with little room for additional load.
During the final design phase an additional approach/calculation will be used to verify the capacity of the existing electrical service. This approach will involve creating an inventory of major motor loads and factoring load diversity such as operational procedures into the calculation. Although using previous utility demand information suggest that the electrical service is at maximum capacity, we want to ensure this is accurate given worst case operational scenarios that might not have been experienced over the course of 2020. Further evaluation and analysis required during the final design phase, but it is more than likely that a larger electrical service will be required if additional load (UV Disinfection System) is to be added to the facility.
The incoming electrical service conductors will be evaluated during the final design phase to ensure they have adequate capacity to carry the load of the WTP as outlined above. It is anticipated that the existing service conductors have a 200-amp capacity.

Jade Stone Engineering, PLLC
5 Water Treatment Plant Evaluation Town of Gorham
During a cursory review it was noted that the existing utility transformers where the electrical service is derived from is comprised of three (3) pole-mounted transformers. As it is anticipated that additional electrical load will be added to the WTP, updated loading information will be required to be submitted to the utility (NYSEG) to ensure proper utility transformer sizing. Utility coordination to occur during the final design phase.
Emergency Generator System (EGS):
Given the inadequate sizing and criticality of the existing emergency generator system (EGS) the existing system is recommended to be replaced with new. It is proposed that the replacement system be installed outdoor, in a weatherproof & sound attenuated enclosure. By installing a generator outdoors, numerous HVAC requirements and monitoring requirements can be avoided. Also, architectural, and structural modifications that might be necessary to achieve required clearances can be avoided. It is proposed that the replacement EGS be natural gas fuel fired.
As part of the recommended generator replacements, a new modern automatic transfer switch is recommended be installed with the new generator system to ensure complete system compatibility. The transfer switch is to be located at the beginning of the electrical distribution system. Note, with an ATS located at the front end of the electrical distribution system, the EGS will have the capability to power any electrical load associated with the WTP, it is simply a question of whether the generator has the capacity to do so. This provides the WTP staff additional flexibility when under emergency power situations. The ATS is to be utilized to transition to generator power automatically given a normal power failure.
During the final design phase emergency generator system sizing calculations will be performed for the proposed generator system to determine a size of the EGS with the capability of powering all critical loads. Close coordination with the WTP staff required to identify all emergency power requirements. The critical loads will be staged into different steps, assuming a slight time delay between each step to prevent large in-rush currents. This allows the generator systems to bring loads online at different times and recover engine capacity before starting the next critical load. Critical loads will be coordinated during final design.
The following parameters will be utilized when performing generator sizing calculations.
1. 480V, 3 phase, 60 Hertz
2. 125°C temperature rise
3. Class H insulation
4. 20 percent max allowable voltage dip
5. 10 percent max allowable frequency dip
6. Standby operation
7. PMG excitation
8. Outdoor generator set

Jade Stone Engineering, PLLC
6 Water Treatment Plant Evaluation Town of Gorham
9. Single engine generator set (no paralleling)
10. Load stepping
There would be a programmed time delay between the starting of each process/load. Utilizing multiple steps to load the generator prevents grossly oversizing an emergency generator by allowing the unit to recover after each loading step, separating out the load on the generator.
Based upon preliminary loading information, a new generator unit with ratings capable of handling the entire WTP (125kW) is anticipated, with a final size established upon coordinating critical loads. Final generator loading and parameters will be closely coordinated with the Town and facility personnel during final design.
Lighting (General Lighting, Emergency Lighting, & Exit Signage):
It is recommended that all interior fixtures be controlled by means of an occupancy sensor or vacancy switch where practical (administrative areas). All exterior lighting fixtures to be controlled via a programmable time switch for automatic control (on at sunset and off at sunrise). Inadequate illumination levels to be improved and corrected to current lighting standards. By utilizing improved controls, the WTP will experience a reduction in energy consumption and all facilities will meet/exceed current New York State Energy Code requirements.
It is also recommended that facility emergency lighting and exist signage be added/installed per current standard and codes throughout the WTP.
Variable Frequency Drive Discussion:
It is recommended to implement VFDs on any new process equipment with a significant motor size in lieu of across the line motor starters. VFDs allow motors to be brought up to speed gradually to reduce the amount of inrush current seen by the electrical distribution system (much less of a strain on the electrical distribution system) and to reduce harmonic transients. The VFDs will also allow for increased control flexibility, increased monitoring capability, increased efficiency, as well as allow for ease of integration within a future modern SCADA/Control system. Note, as part of implementing VFDs all new associated motors are to be of the inverter duty type and suitable for use with a VFD. Although this is not a National Electrical Code (NEC) requirement, it is good practice. New insulated-gate bipolar transistor (IGBT) types of VFDs will damage non-inverter duty rated motors due to their high harmonic content. The insulation inside a continuous duty rated motor is typically not suited for use on a VFD and the motor will likely fail at any given time due to high voltage peaks typically present on a VFD output feeder. An inverter duty rated motor provides increased longevity over a continuous duty rated motor when used with an associated VFD. For these reasons when VFDs are proposed it is suggested that the associated motors be of the inverter duty type.
Also note, VFDs with bypass capability provide additional flexibility by allowing the motors to be started across the line and continue to be operational in the event there is an issue/failure with the VFD itself.

Jade Stone Engineering, PLLC
7 Water Treatment Plant Evaluation Town of Gorham
Although a beneficial feature, this option adds substantial cost and size to the VFD enclosure. For these reasons it is not recommended to proceed with bypass capability on any new VFDs.
NEC Required Working Clearance:
All new electrical equipment installations to follow National Electric Code (NEC) required working clearance requirements. Where possible it is recommended that all existing National Electric Code (NEC) required working clearance violations be corrected.
Exposed Equipment/Devices/Wiring:
It is recommended that all existing electrical equipment, devices, boxes, or conduit systems with a missing or damaged cover/faceplate have one provided to eliminate the exposure of energized electrical components, creating a safer working environment for WTP personnel.
Feeders/Branch Circuitry:
It is recommended that new branch circuitry and electrical feeders be installed for all proposed process improvements. It is recommended to reuse electrical feeders to distribution equipment where feasible and practical. The underground distribution system is anticipated to be re-used to the greatest extent possible. Conduit material to vary by space. For example, in damp unconditioned spaces rigid galvanized conduit should be utilized, in finished and conditioned spaces electrical metallic conduit can be utilized, and in corrosive/hazardous areas it is recommended that PVC coated rigid conduit be utilized. Any new required conductors to be copper and utilize THHN (interior) or XHHW (exterior/underground) insulation.
Exposed Equipment/Devices/Wiring:
It is recommended that all existing electrical equipment, devices, boxes, or conduit systems with a missing or damaged cover/faceplate have one provided to eliminate the exposure of energized electrical components, creating a safer working environment for WTP personnel. It is also recommended that any junction boxes that have deteriorated or rotted out be replaced.
Motor Disconnects:
Motor disconnect switches to be implemented on all new equipment per current NEC requirements. In addition, all newly installed disconnect switches to comply with height restrictions outlined within the NEC to ensure the operating handle is no higher than 6 feet 6 inches above finished floor/grade for ease of accessibility.
New York State Energy Code Compliance:

Jade Stone Engineering, PLLC
8 Water Treatment Plant Evaluation Town of Gorham
The use of vacancy sensors to automatically turn lights off after a programmed time delay is the most common practice to meet the New York State Energy Code requirements. It is recommended to implement these automatic controls where practical in the form of occupancy sensors, vacancy switches, and programmable time switches. Refer to the above lighting article for additional information.
Power System Analysis:
A power system study is to be completed as part of the construction phase per current NEC, NFPA, and OSHA codes/requirements for all electrical distribution equipment. As a result, arc flash warning labels will be applied to new electrical equipment that is likely to require examination, adjustment, servicing, or maintenance while energized. Labels to provide qualified individuals who intend to perform tasks on equipment during an energized state critical personal protective equipment (PPE) information and boundary information (limited approach, restricted, approach, etc.). The power study will identify proper PPE that is required for qualified individuals to perform work on existing energized gear.
Preventative Maintenance:
It is recommended that a preventative maintenance plan be implemented for all electrical distribution equipment upon project completion. A preventative maintenance plan will increase life expectancy of equipment as well as provide advance warning of potential failures. Final preventative maintenance and testing actions to follow the current ANSI standard for maintenance testing specifications of electrical power equipment and systems. Preventative maintenance to include but is not limited to the following: equipment cleaning, connections torqued down, inspections made, megger tests completed, current injection testing, thermal imaging, lubrication applied, etc.
Temporary Power:
The proposed improvements are anticipated to require minor temporary power provisions to maintain normal plant operation during the electrical distribution equipment modifications, generator replacement, and select process improvements. A few options will be investigated during final design to maintain normal operations during select electrical replacements. One option investigated will be to install replacement gear (where necessary) in a different location versus current locations, to get new equipment installed/connected while maintaining existing equipment online and a second option investigated will be to install replacement gear in the same location as existing. All options will likely require the need for temporary power stations, temporary cabling, and a temporary trailer mounted generator to facilitate continued operations. Temporary power provisions and a phasing plan will be established and investigated further during the final design phase.
Energy Efficiency:
It is recommended that improvements follow the high standards of energy efficiency. A couple items of note, all proposed significant motors (greater than 10HP) to be provided with associated variable
Jade Stone Engineering, PLLC
9 Water Treatment Plant Evaluation Town of Gorham
frequency drives where practical to conserve energy and help mitigate any potential peaks in electrical demand, which would result in increased electrical utility costs. It is also recommended as previously stated that all new lighting systems be of modern energy efficient LED technology with associated automatic controls to reduce energy consumption. Lastly all motors and HVAC equipment are to be of the energy efficient type to follow the trend of high efficiency equipment installed within WTPs of the 20th century.
Codes and Standards:
There are a few primary codes and standards which are applicable and must be adhered to when designing/implementing the electrical systems associated with the project and mentioned throughout this document. The project to be designed to meet the following codes and standards at minimum:
1. NFPA 70-2017 National Electrical Code.
2. NFPA 70E-2018 Standard for Electrical Safety Requirements for Employee Workplaces.
3. 10 States Standards
4. Various NFPA and IEEE documents.
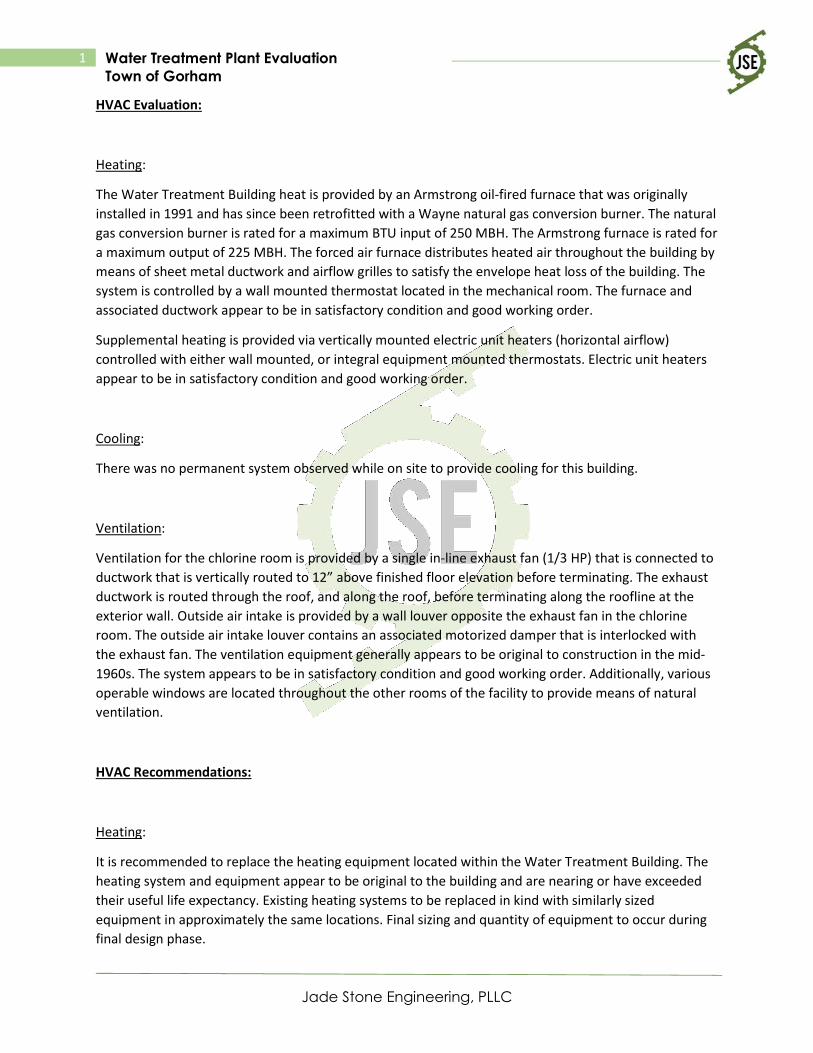
Jade Stone Engineering, PLLC
1 Water Treatment Plant Evaluation Town of Gorham
HVAC Evaluation:
Heating:
The Water Treatment Building heat is provided by an Armstrong oil-fired furnace that was originally installed in 1991 and has since been retrofitted with a Wayne natural gas conversion burner. The natural gas conversion burner is rated for a maximum BTU input of 250 MBH. The Armstrong furnace is rated for a maximum output of 225 MBH. The forced air furnace distributes heated air throughout the building by means of sheet metal ductwork and airflow grilles to satisfy the envelope heat loss of the building. The system is controlled by a wall mounted thermostat located in the mechanical room. The furnace and associated ductwork appear to be in satisfactory condition and good working order.
Supplemental heating is provided via vertically mounted electric unit heaters (horizontal airflow) controlled with either wall mounted, or integral equipment mounted thermostats. Electric unit heaters appear to be in satisfactory condition and good working order.
Cooling:
There was no permanent system observed while on site to provide cooling for this building.
Ventilation:
Ventilation for the chlorine room is provided by a single in-line exhaust fan (1/3 HP) that is connected to ductwork that is vertically routed to 12” above finished floor elevation before terminating. The exhaust ductwork is routed through the roof, and along the roof, before terminating along the roofline at the exterior wall. Outside air intake is provided by a wall louver opposite the exhaust fan in the chlorine room. The outside air intake louver contains an associated motorized damper that is interlocked with the exhaust fan. The ventilation equipment generally appears to be original to construction in the mid-1960s. The system appears to be in satisfactory condition and good working order. Additionally, various operable windows are located throughout the other rooms of the facility to provide means of natural ventilation.
HVAC Recommendations:
Heating:
It is recommended to replace the heating equipment located within the Water Treatment Building. The heating system and equipment appear to be original to the building and are nearing or have exceeded their useful life expectancy. Existing heating systems to be replaced in kind with similarly sized equipment in approximately the same locations. Final sizing and quantity of equipment to occur during final design phase.
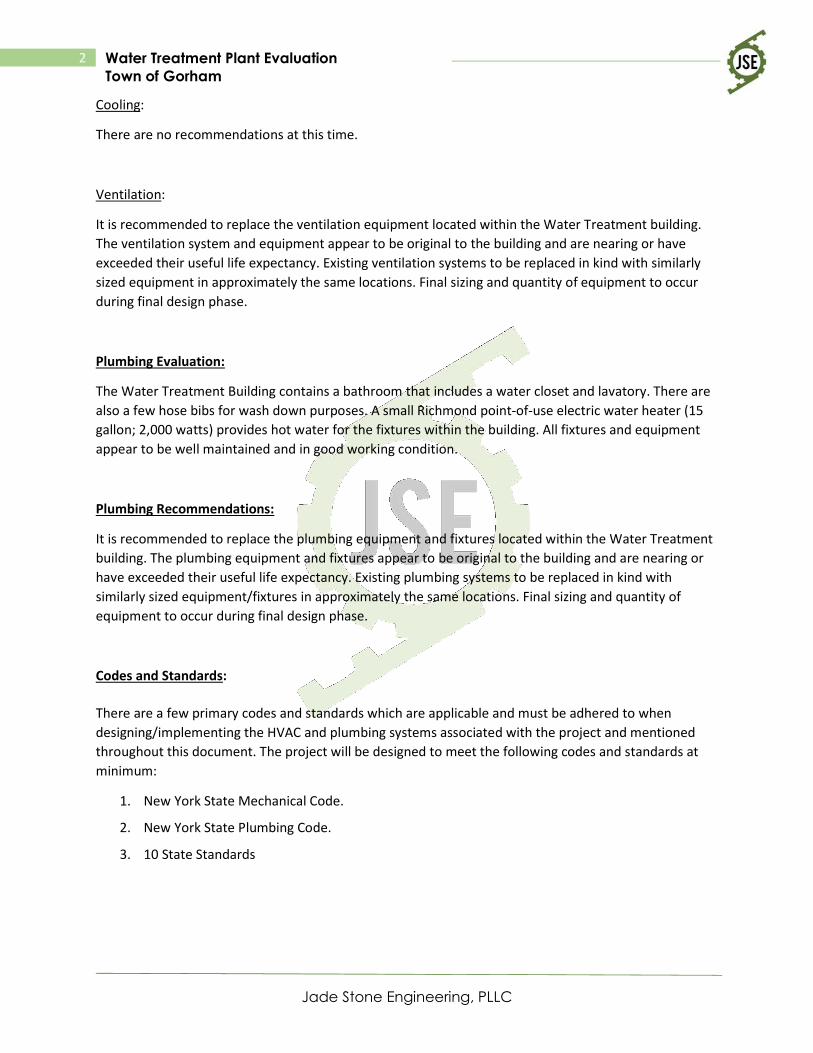
Jade Stone Engineering, PLLC
2 Water Treatment Plant Evaluation Town of Gorham
Cooling:
There are no recommendations at this time.
Ventilation:
It is recommended to replace the ventilation equipment located within the Water Treatment building. The ventilation system and equipment appear to be original to the building and are nearing or have exceeded their useful life expectancy. Existing ventilation systems to be replaced in kind with similarly sized equipment in approximately the same locations. Final sizing and quantity of equipment to occur during final design phase.
Plumbing Evaluation:
The Water Treatment Building contains a bathroom that includes a water closet and lavatory. There are also a few hose bibs for wash down purposes. A small Richmond point-of-use electric water heater (15 gallon; 2,000 watts) provides hot water for the fixtures within the building. All fixtures and equipment appear to be well maintained and in good working condition.
Plumbing Recommendations:
It is recommended to replace the plumbing equipment and fixtures located within the Water Treatment building. The plumbing equipment and fixtures appear to be original to the building and are nearing or have exceeded their useful life expectancy. Existing plumbing systems to be replaced in kind with similarly sized equipment/fixtures in approximately the same locations. Final sizing and quantity of equipment to occur during final design phase.
Codes and Standards:
There are a few primary codes and standards which are applicable and must be adhered to when designing/implementing the HVAC and plumbing systems associated with the project and mentioned throughout this document. The project will be designed to meet the following codes and standards at minimum:
1. New York State Mechanical Code.
2. New York State Plumbing Code.
3. 10 State Standards
Preliminary Engineering Report Town of Gorham Water Treatment Plant Improvements September 2021
MRB Group Project No. 0735.21001.000
APPENDIX T PROPOSED SITE PLAN

WA
TER
TR
EATM
ENT
PLA
NT
TOW
N O
F G
OR
HA
MO
NTA
RIO
CO
UN
TY, N
EW Y
OR
K
0735.18001
Eng
inee
ring,
Arc
hite
ctur
e &
Sur
veyi
ng, D
.P.C
.Th
e C
ulve
r Roa
d A
rmor
y, 1
45 C
ulve
r Roa
d, S
uite
160
, Roc
hest
er, N
ew Y
ork
146
20Ph
one:
585
-381
-925
0
ww
w.m
rbg
rou
p.c
om
G-11 1
N:\0
735.
2100
1.00
0\dw
g\C
AD\G
orha
m W
TP B
ase.
dwg,
10/
15/2
021
3:53
:49
PM, j
cala
bres
e
AutoCAD SHX Text
PROPOSED GRAVEL ACCESS ROAD
AutoCAD SHX Text
PROPOSED WATER TREATMENT BUILDING 50'x60' (3,000sf)
AutoCAD SHX Text
BUILDING LIMIT 50'x80' (4,000sf)
AutoCAD SHX Text
35' DIA. WATER HOLDING TANK
AutoCAD SHX Text
MONITORING MANHOLE
AutoCAD SHX Text
EXISTING GRAVEL ACCESS ROAD
AutoCAD SHX Text
PROPOSED ASPHALT ACCESS ROAD
AutoCAD SHX Text
PROPOSED PAVEMENT AREA ±7,900 SF
AutoCAD SHX Text
PROPOSED EASEMENT LINE
AutoCAD SHX Text
PROPOSED EASEMENT LINE
AutoCAD SHX Text
Scale:
AutoCAD SHX Text
Drawing Title:
AutoCAD SHX Text
Project Title:
AutoCAD SHX Text
of
AutoCAD SHX Text
Sheet No.
AutoCAD SHX Text
Project No.
AutoCAD SHX Text
Checked By:
AutoCAD SHX Text
Drawn By:
AutoCAD SHX Text
Date:
AutoCAD SHX Text
OCT 2021
AutoCAD SHX Text
Copyright C 20192019
AutoCAD SHX Text
MRB Group All Rights Reserved
AutoCAD SHX Text
No.
AutoCAD SHX Text
REVISIONS AND DESCRIPTIONS
AutoCAD SHX Text
BY
AutoCAD SHX Text
DATE
AutoCAD SHX Text
DRAWING ALTERATION THE FOLLOWING IS AN EXCERPT FROM THE NEW YORK EDUCATION LAW ARTICLE 145 SECTION 7209 AND APPLIES TO THIS DRAWING. "IT IS A VIOLATION OF THIS LAW FOR ANY PERSON UNLESS HE IS ACTING UNDER THE DIRECTION OF A LICENSED PROFESSIONAL ENGINEER OR LAND SURVEYOR TO ALTER AN ITEM IN ANY WAY. IF AN ITEM BEARING THE SEAL OF AN ENGINEER OR LAND SURVEYOR IS ALTERED, THE ALTERING ENGINEER OR LAND SURVEYOR SHALL AFFIX TO THE ITEM HIS SEAL AND THE NOTATION "ALTERED BY" FOLLOWED BY HIS SIGNATURE AND THE DATE OF SUCH ALTERATION AND A SPECIFIC DESCRIPTION OF THE ALTERATION".
AutoCAD SHX Text
1"=40'
AutoCAD SHX Text
JPC
AutoCAD SHX Text
North
AutoCAD SHX Text
1 inch = ft.
AutoCAD SHX Text
( IN FEET )
AutoCAD SHX Text
GRAPHIC SCALE
AutoCAD SHX Text
0
AutoCAD SHX Text
40
AutoCAD SHX Text
40
AutoCAD SHX Text
80
AutoCAD SHX Text
40
AutoCAD SHX Text
160
AutoCAD SHX Text
20