Africa The Great Lakes Corridor Study - World Bank Document
164
Report No. 8694-AFR Africa The GreatLakes CorridorStudy March, 1990 Infrastructure Division Africa Technical Department FOR OFFICIAL USE ONLY Docwnent of the Word Bank This document has a restricted distribution andmaybe used by recipients only in the performance of theirofficial duties. Itscontents may not otherwise be disclosed withoutWorldBank authorization. Public Disclosure Authorized Public Disclosure Authorized Public Disclosure Authorized Public Disclosure Authorized
-
Upload
khangminh22 -
Category
Documents
-
view
2 -
download
0
Transcript of Africa The Great Lakes Corridor Study - World Bank Document
Report No. 8694-AFR
AfricaThe Great Lakes Corridor Study
March, 1990
Infrastructure DivisionAfrica Technical Department
FOR OFFICIAL USE ONLY
Docwnent of the Word Bank
This document has a restricted distribution and may be used by recipientsonly in the performance of their official duties. Its contents may not otherwisebe disclosed without World Bank authorization.
Pub
lic D
iscl
osur
e A
utho
rized
Pub
lic D
iscl
osur
e A
utho
rized
Pub
lic D
iscl
osur
e A
utho
rized
Pub
lic D
iscl
osur
e A
utho
rized

GLOSSARY OF TERMS AND ABBREVIATIONS
AMI Agence Maritime Internationale (Belgian-ownedforwarding and clearing company)
BELBASE Former Belgian concessions at Dar es Salaam and KigomaB/L Bill of LadingBNR Banque Nationale du RwandaCIF Cost, Insurance and FreightC/F Clearing and ForwardingCMB Coffee Marketing Board (Uganda)CORWACO Private Rwandese trucking companyDSM Dar es SalaamECA Economic Commission for AfricaEEC European Economic CommunityESA Equivalent Standard AxleFOB Free On BoardF/E Foreign ExchangeGVW Gross Vehicle WeightICD Inland Clearance DepotKCHC Kenya Cargo Handling CompanyKPA Kenya Ports AuthorityKRC Kenya Railways CorporationL/C Letter of CreditLiberation War Overthrow of General AminLLC Landlocked CountryMAGERWA Rwandese warehousing company, joint public-private
ventureNCTA Northern Corridor Transit AgreementNRM National Resistance MovementODA Overseas Development Administration (UK)OTRABU Burundian parastatal trucking companyO/D Origin/DestinationPOL Petroleum, Oils and LubricantsPTA Preferential Trade AreaRCTD Road Customs Transit DeclarationSOCABU Burundian parastatal insurance companySTIR Rwandese parastatal trucking companyTC Transit CountryTHA Tanzania Harbors AuthorityTransocean Ugandan parastatal clearing and forwarding authorityTRC Tanzania Railways CorporationURC Uganda Railways CorporationZBR Zaire, Burundi and Rwanda

THE GREAT IA S CORRIDR STUDY
Table of Contents
EXECUTIVE ',UMHARY . . . . . . . . . . . . . . ... . . . . . . . . . . . i
I. INTRODtiCTION *.......... .... ......... 1A. Purpose and Scope of the Study . . . . . . . . . . . . . . .B. Geo-Political Developments Since 1971 . .. . . . . . . . . .C. The Transit Objectives of the Landlocked . . . . . . . . . . 2
II. PRESENT TRANSIT ROUTES .... . . . . . . . . .. . 3A. Introduction .... . . . . . .. 3B. The Northern Corridor .... . . . . .. 3
Port of Mombasa . . . . . . . . . . . . . . . . . . . . . . . 4Road Routes.. 4Rail Routes.. 6The Kenya Pipeline.. 7Transport and Transit Operators . . . . . . . . . . . . . . . 7
C. The Central Corridor . . . . . . . . . . . . . . . . . . . . 8Port of Dar es Salaam .. 8Rail/Lake Route via Kigoma .. 8All-Road Route to ZBR .. 9Isaka Rail/Road System .. 10Rail/Lake Route via Mwanza .. 10Transport and Transit Operators . . . . . . . . . . . . . . . 10
D. Potential New Transit Routes ..... . ...... . . . . 11Lake Transport: Kisumu-Kemondo Bay . . . . . . . . . . . . . 11Lake-River Transport: Kisumu-Kagituma . . . . . . . . . . . 11Rail Transport: Kampala-Kasese . . . . . . . . . . . . . . . 11Rail Transport: Musoma-Tanga . . . . . . . . . . . . . . . . 11Road Route: Mwanza-Arusha-Mombasa . . . . . . . . . . . . . 11
E. Additional Investment Studies ..... . ...... . . . . 12
III. TRAFFIC FLOWS.. ......... 12A. Total Intern.tional Traffic ...... . .. . .. . .. . . 12B. Growth Trends in International Traffic . . . . . . . . . . . 13C. Commodity Composition: International Trade . . . . . . . . . 14
Imports ........................... 14Exports ........... .... .... . 15
D. Distribution of Traffic by Mode and Corridor.15E. Relative Importance of Transit Traffic . . . . . . . . . . . 17
Kenya . . . . . . . . . . . . . . . . . . . . . . . . . . . . 17Tanzania . . . . . . . . . . . . . . . . . . . . . . . . . . 18
This Report was prepared on the basis of a World Bank Mission carried out inJune and July 1988, headed by Mr. B. Chatelin (AFTIN) and comprising Mr. B.Bostrom (AF3IN), Mr. D. Havlicek (INUTD), Mr. Ngwenya (a consultant from PTA),and Messrs. S. Thomas and Wartel, Consultants. Further discussions were heldin the Region during October and November 1989 as a follow up to the DraftReport. Mr. S. Thomas was responsible for the preparation of this Report.

IV. MAJOR ISSUES WITHIN THE NORTHERN CORRIDOR . . . . . . . . . . . . 19A. Infrastructure . . . . . . . . . . . . . . . 19
General Conditions . . . . . . . . . . .. . . . 19Specific Problems ..i...... ...... 19Potential Issues and Problems . . . . . . . . . . . . . . . . 20
B. Movement Capacity and Efficiency . . . . . . . . . . . . . . 21Mombasa Port . . . . . . . . . . . .21Kenya Railways . . . . . . . . .23
Road Transport . . . . . .. . . . . . . . . . . .* .* . 23C. Transit Regulations.. .*. .. ........ 25
Northern Corridor Transit Agreement (NCTA) . . . . . . . . . 25Transit Bonds . . . . . . . . . . . . . .25Security Regulations ................... 26
V. MAJOR ISSUES WITHIN THE CENTRAL CORRIDOR .. .28A. Infrastructure . . . . .. . . . . . . .. . . . .. . . . . 28
Roads . . . . . . . * .. . . . . . . . . . . . . . . .* * 28Rail ... .. 28DSM Port ...... . . . . ............ . 28
B. Movement and HandlingCapacit. .. .29DSM Port . . v. . . . . .. . . . . .. . . . . . . . . . . 29TRC . . . . .. . . . . . . .. . . . . . . .. . . . . . . . 30Kigoma Port . . . . .. ....... . ... . .32
C. Transit Systems for the Central Corridor . . . . . . . . . . 32The Transit Pass and Transit Formalities . . . . . . . . . . 32Belbase, Kigoma and AMI . . . . . . . . .. . 34The Isaka System ... . .35
VI. TRANSIT ISSUES WITHIN THE LLCs RWANDA. . . . .. 36A. Infrastructure .36B. Government Intervention: Present Situation . . . . . . . . . 36
Road Transport Policy . . ....... o. 36Air Transport Policy . . . . . . . . . . . . . . . . . . . . 41Magerwa.. . . . . . . .. . .... * 41National Bank of Rwanda (BNR) . . . . . . . . . . . . . . 42
C. Government Intervention: Possible Extension .42Extension of Road Transport Restrictions . . . . . . . . . . 43Rwanda Entrepot: Mombasa . . . . . . . . . . . . . . . . . . 43The Isaka Route . ... ... ... ... . . .. 44
VII. TRANSIT ISSUES WITHIN THE LLC: BURUNDI . . . . . . . . . . . . . . 45A. Infrastructure . . . . . . . . . . . . . . . . . . . . . 45
Present Transit Network .. . . . . 45Planned Developments ..... ...... . . .. 46
B. National Transit Policies. .. . . . .. . .46The Role of the Central Bank (BNB) . . . . . . . . . . . . . 46Other Transport Policies . .. .. .... . ..... 49Coffee Marketing . . . . . . . . .. .... 50Supply of Petroleum Products ... .. . . . . . . 51Customs Facilities . . . .. .. . .. . . . . .. . .. . . . 53

VII. TRANSIT ISSUES WITHIN THE LLC: UGANDA 53A. Introduction . . . . . . . . . . . . . . . . . . . . 53B. Traffic Direction ... . . . . . . . . 53
Mode Direction .... . . . . . . . . . . . . ....... . 54Route Direction . . . . . . . . . . . . . . . . 55Transocean . . . . . . . . . . . . . . . . . . 56
C. Future Role for Uganda Railwas. . . . .. . . .. 58Development of Kenya Route . . . . . . . . . . . . . . . . 58Development of the DSK Route . . . . . . .. . . .. 61Overall Development Strategy . . . . . . . . . . . . . . . 62
D. International Trucking Capacity . . . . . . . . 63E. Transit Taxes ........ ... . .. 64
IX. COSTS AND REVENUES IN THE TRANSIT SYSTEM . . . . . . . . . . . . . . 65A. Transit Costs to the LLC: Introduction . . . . . . . . . . . 65B. Transit Costs to Burundi ........ ... . ..... 65
Direct Transit Charges . . . . . . . . . . . . . . . . . . . 65Indirect Transit Costs . . . . . . . . . . . . . . . . . . . 66Total Transit Costs . . . . . . . . . . . . . . . . . . . . . 67
C. Transit Cost to Rwanda . . . . . . . .. . . . . . . . . . 68Direct Transit Costs . . . . . . . . . . . . . . . . . . . . 68Indirect Transit Costs . . . . . . . . . . . . . . . . . . . 69Total Transit Costs . . . . . . . . . . . . . . . . . . . . . 69
D. Transit Cost to Uganda .... . . . . . . . . ..... . . 69Direct Transit Costs .... . ...... . . . . . . . . . 70Indirect Transit Costs .... . . . . . . ........ . 70Total Transit Costs . . . . . . . . . . . . . . . . . . . . . 71
E. Revenues to the Transit Countriest Introduction . . . . . . 71F. Transit Revenues to Kenya ... . . . . . . .... . 72G. Transit Revenues to Tanzania . . . . . . . . . . . . .. . 73H. Transit Revenues to Burundi ... . . . . . . . ...... . 74I. Transit Revenues to Rwanda . . . . . .... . 74J. Transit Revenues to Uganda ... .74K. Transit Costs to the Transit Countries . ... 76
Background .. . .. 76Road Costs in East Africa .... 77PTA Harmonization Initiative . . . . . . . . . . . . . . . . 78Recommendations . . . . . . . . . . . . . . . . . . . . . . . 79
X. FUTURE DISTRIBUTION OF TRANSIT TRAFFIC . . . . . . . . . . . . . . . 79A. Routing Decisions . . . . . . . . . . . . . . . . . . . . . . 79
Generalized Transit Costs . . . . . . . . . . . . . . . . . 80Trade and Marketing Channels . .80Private and Public Interests .. 81Transit Security ... . .81
B. Traffic Distribution 1995: Least Cost Assignment . . . . . . 81C. Traffic Distribution 1995: Study Scenario . . . . . . . . . 82
Import Traffic. 83Export Traffic .. 84
D. Implications of Transit Routing Scenario . . . . . . . . . . 85Central Corriodr Routes .. 85Dar es Salaam Port . . . . . . . ** . . . . . . . 86Tanzanian Railways Corporation . . . . . . . . . . . . . . . 87Northern Corridor Routes . . . . . . . . . . . . . . . . . . 87Mombasa Port ... 87Klenrya Railways .. . .88

XI. ISSUES AND POLICY CONSIDERATIONSs AGENDA FOR DISCUSSION . . . . . . 88A. SummarU of Findings ........ . . . . . . . . 8B
Infrastructure . . . . . . . . . . . . . . . . . . . . . . . 88Rail Transport . . . . . . . . . . . . . . . . . . . . 89Road Transport . . . . . . .... . . . .. 89Ports. ................. 89Transit Procedures . . . . . . . . . . . . . . . . . . . . . 90
B. Priority Issues . . . . . . . . . . . . . . . . . . . . . . . 91C. Strategies and Priorities . . . . . . . . . . . . . . . .i . 91
Transport Competition . . . . . . . . . . . . . . . . . . . . 91Regional Transit Cooperation . . . . . . . . . . . . . . . . 93
D. Regional Framework for Bank Activities . . . . . . . . . . . 93Bank Structure . . . . . . . . . . . . . . . . . . . . . . . 93Bank Perspective . . . . . . . . . . . . . . . . . . . . . . 94Regional Policies . . . . . . . . . . . . . . . . . . . . . . 95
ANNEXES
Annex 1 Transit Routes (Kenya, Uganda, Rwanda, Burundi, Tanzania, Zaire)Annex 2 Burundi and Rwanda: Distribution of Imports (Corridor Analysis)Annex 3 Kenya Railways: Main Commodities to and from Uganda (1987)Annex 4 Uganda: Import and Export Traffic carried by Uganda RailwaysAnnex 5 Mombasa Portt Transit Traffic (1984-1987)Annex 6 Central Corridor: Modal Split RoadlRail (1986, 1987)Annex 7 Central Corridor; Transit Traffic through D'Salaam Port (1986, 1987)Annex 8 Deliveries of ZBR and Uganda Import Cargo from DSM PortAnnex 9 Transport Costs: RwandaAnnex 10 Mode Cost AnalysisAnnex 11 ContainerizationAnnex 12 Review of the Status of Implementation of Bilateral and Multilateral
Transit Agreements in the Central and Northern CorridorsAnnex 13 The Cost of Burundi Truck ProtectionAnnex 14 Transit Tolls and Vehicle Regulations in East Africa: A Cost Related
Approach
MAP IBRD 21189: The Great Lakes Region--International Surface TransportConnections
EXECUTIVE SUMMARY
Background to the Study
International transport-related trade costs are a serious constraint tothe development of the landlocked countries in Africa. The Bank, through itscountry transport investment programs, has assisted generally in the developmentof regional infrastructure but has no specific policy toward regional transportdevelopment. This study defines the issues and policies required to develop acoherent international transport-transit strategy for East-Central Africa andprovides the regional perspective for country economists in the preparation oftheir projects and in their dialogue with governments. The study assesses theregional infrastructure but focuses primarily on transport operations, the impactof government policies, and the response of shippers and transporters. The studyis not prescriptive but presents the policy issues and options for furtheranalysis and discussion.
The landlocked countries surrounding the Great Lakes of Central Africa-- Rwanda, Burundi, Uganda and the Ki-= Province of Zaire -- have faced majorinternational transport difficulties during much of the 1970s and 1980s. Thetraditional transport systems, based on the rail networks through Kenya andTanzania to the ports of Mombasa and Dar es Salaam, virtually collapsed underthe weight of political disagreement, civil disturbance and economic decline.Road transport replaced rail and, although truckers have been able to adapt tochanging transit conditions, international transport costs and transitdifficulties have increased significantly.
Lower transport costs, reduced dependence on individual transit routes,and greater national control of international transport have become majorpriorities for government policy in the landlocked countries. These policyobjectives may conflict, and a high economic price has perhaps been paid fortransit security and national control.
The trade of individual landlocked countries is small but, in aggregate,it forms an important element of regional transport demand, over 1.4 million tonsin 1987 and possibly over 2.1 million tons in 1995. International transportgenerates substantial revenue for some transit countries -- Kenya earns more than$80 million from international transport in the region -- but can also createserious infrastructure problems. Regional transit-transport strategies mustensure that the economic interests of both the lanalocked and transit countriesare safeguarded.
Transit Routes
Most international traffic in the region ures two sets of routesradiating from the ports of Mombasa and Dar es Salaam, known as the Northern andCentral Corridors. More recently, a Southern Corridor across Lake Tanganyikahas been developed for trade with Southern Africa.

- ii -
Northern Corridor
Three basic routes connect Kenya to the landlocked countries:
1) Road route via Kampala, serving Uganda and ZBR (Zaire, Burundi and Rwanda):Much of the route is in poor condition but a major program of road investmentis underway and should be completed by 1992.
2) Road route via Mwanza, serving ZBR: Much of the road route in Tanzania isunpaved and, although the road between the Kenyan border and Mwanza may bepaved by 1991, there are no plans for upgrading the entire route.
3) Rail route, serving Uganda: Since 1986, international rail traffic has beenrouted via Kisumu and a wagon ferry service to Jinja.
Central Corridor
Three routes are presently used, and a fourth is being developed:
1) Rail/Lake Tanganyika: The traditional route from DSM (Dar es Salaam), viaKigoma to ZBR, it is now mainly used by Burundi and Zaire. Pre-independenceBelbase concessions in DSM and Kigoma continue to be privately managed.
2) Road route, direct trucking to the ZBR countries, via Dodoma, and IsakatThis route has become important recently despite very poor road conditions.
3) Rail/Lake Victoria: This route uses wagon ferries over Lake Victoria and isan alternative to the Northern Corridor for Uganda transit traffic.
4) Rail/road via Isaka: This route is under development and should beoperational by 1992. It was designed primarily to service Rwanda butcould also benefit Burundi and Zaire.
Southern Corridor
The Lake Tanganyika route, Mpulungu-Bujumbura: This route was developedmainly for cement and sugar shipments from Southern Africa to Burundi and,to a much lesser extent, Rwanda. The route carries little or no overseastrade and is not considered in detail by the study.
Assessment of Present Systems
The Northern Corridor routes account for 72Z of total internationaltransport in the region, and trucks carry just over 75Z of traffic on thecorridor. Road conditions on the Kampala route will be improved verysignificantly by 1992 and thus will not represent a significant constraint. Therail/wagon ferry system has the capacity to carry substantially greater trafficand will be improved by a new terminal close to Kampala, additional rollingstock in Uganda, technical assistance to both Kenya and Uganda Railways, andpossibly by the upgrading of the Nakuru-Kisumu line which presently isconstrained by weight limitations.

- iii -
Until recently, the Northern Corridor was the more efficient and waspreferred by shippers. The situation is changing as DSM improved, and operatingdifficulties on the Northern Corridor increased: declining efficiency ofMombasa port, frequent verification of containers, police escorts for somecommodities, border delays, and the continued need for transit bonds. TheNorthern Corridor Transit Agreement was expected to significantly reduce theseproblems, but it is only slowly achieving this objective.
The Central Corridor rail routes are constrained by TRC (TanzaniaRailways Corporation) capacity which restricts traffic movement and reducesservice levels: 25,000 tons of Ugandan sugar were stranded at DSM for over ayear. The TRC Emergency Program will help alleviate the immediate problems butwill not generate sufficient capacity for large additional transit flows.Reconstruction of the roads connecting Isaka to Rwanda and Burundi should becompleted in 1991, however, paving of the Dodoma-Isaka section of the route fromDSM is unlikely in the near future. Capacity is being increased at DSM port butmay be exceeded in the mid-1990s, or if Southern Africa transit trafficsubstantially increases.
The Central Corridor is potentially very attractive for tranait trafficfor the following reasons: (i) customs arrangements are less costly, simplerand less restrictive; (ii) the number of transit countries is kept to a minimum;(iii) management and labor are more flexible at DSM; and (iv) direct transportcosts are significantly lower for ZBR.
Shippers have already responded to the improvements and have increasedtrade through the Central Corridor. Burundi now imports 802 and Rwanda 30? oftheir overseas dry cargo through DSM. If the inland movement constraints wereremoved, the Central Corridor routes would attract even more traffic. Thepotential loss of their transit traffic and revenue is increasingly realized bythe Kenyan transport industry. Competition between the routes for transittraffic may be more effective than regional agreements in changing Kenyanattitudes toward transit controls.
Major Issues in the Transit Countries
Deteriorated infrastructure bas been a significant issue in the region.However, to a great extent, the ongoing and committed investment program willprovide by 1992 the quality and capacity necessary for the traffic. Some partsof the infrastructure, such as TRC track, will not be fully improved by 1992,but these should not be binding constraints to transit movement. Overall, theneed for additional investment in transit infrastructure is very limited in themedium term. A more serious issue may be over-investment in transit facilities.Additional road links are proposed between Tanzania and Burundi, partly on thebasis of transit security; similarly, a new route between Rwanda and Burundi hasbeen suggested. These links do not reduce transit dependency and should bejustified solely on economic criteria.
The major issue will be, however, the maintenance of the infrastructure.The investments being undertaken on the Northern Corridor will largely reinstatewhat previously existed. If policies toward road use and maintenance are notimproved, the situation could again rapidly deteriorate. A series of problemsmust be solved: (i) maintenance expenditure, funding and organization;

- iv -
(ii) appropriate axleload and vehicle regulations; (iii) enforcement of theregulations; and (iv) efficient and equitable transit tolls and charges.
Unfortunately, the costs of the transit infrastructure can be incurredin one country while the benefits are enjoyed in others. If decisions are madeon purely national considerations, inefficient regional solutions will result.Suitable policies can be formulated, however, which can increase the benefitsof both the landlocked and transit countries.
The main physical transport constraint in the Central Corridor is themovement capacity of TRC. The Kigoma and Isaka routes are potentially thelowest cost transit alternatives for Burundi and Rwanda, and the Mwanza routeoffers Uganda its only feasible alternative to transit through Kenya. All theroutes are, however, crucially dependent on an adequate level of rail servicethrough Tanzania.
Substantial investments have been made in the Central Corridor, and theEEC is considering the provision of transit block trains for the transittraific. Unfortunately, little attention is being given to the operationalintegration of port, rail, and terminal infrastructure and services.Coordinated transport operating systems are necessary for the transitinfrastructure being developed in Tanzania, especially for the Isaka and Hwanzaroutes. If the routes can be operated efficiently, the potential exists forsubstantial traffic growth. The systems should include rail, port and terminaloperations. and cover ownership, management and pricing policies.
The basic problems on the Northern Corridor are the declining efficiencyof Mombasa Port, and the transit and security controls and re,ulations. Thecumbersome transit procedures are exacerbated by the security regulationsimposed by Kenya. Unless the system can be streamlined, the Corridor will losefurther traffic to DSM.
Rail provided an efficient, low cost transit system on the NorthernCorridor until the early 1970s and has the potential for recapturing asubstantial share of long distance traffic. The physical capacity will beavailable, but organization and coordination within, and between, Uganda andKenya Railways remain major bottlenecks.
Issues within the Landlocked Countries
In response to the disruption of their transit routes and dependencyon the transport capacity of the transit countries, the LLC (LandlockedCountry(ies)) have attempted to diversify their transit options and to encouragenational participation in international transport. Some intervention in theinternational transport sector may be necessary to provide transit security, butthe expected benefits must be carefully weighed against the cost of governmentintervention. In Rwanda, Burundi, and Uganda, the National Banks play animportant regulatory role through their control of import licensing and foreignexchange allocation, but more specific government intervention has becomecommon:
Rwanda: The Government has, since the early 1980s, pursued an activeinterventionist policy. A strongly protectionist policy toward international
- v -
trucking has been adopted on the Northern Corridor. Rwandese trucks now carry60Z of imports and 100l of exports, but at an additional cost to the economyestimated at $12.5 million, or 102 of export earnings. Protection isencouraging overcapacity in the trucking sector which could lead the Governmentto extend controls to the Central Corridor routes. The Government has alsointroduced mandatory air-freighting from Mombasa for some commodities,irrespective of the cost and availability of capacity, adding a further $1.5million to transit costs. Further controls could be introduced if the Mombasafreight terminal is developed and to ensure use of the Isaka Terminal.
Burundi: The Government has encouraged the development of local participationin international trucking by manipulating the effective exchange rates at whichtruckers are paid. All truckers are paid in local currency, brt local truckersreceive an allocation of foreign exchange to cover trip costs while foreigntruckers have to use the parallel market.
Uganda: The National Resistance Movement has stated that long distancetransport should be carried by rail, and the parastatal companies have beendirected to use Uganda Railways. This could be justified if they were makingtransport decisions on non-commercial grounds, but the lack of transportflexibility generates unnecessary costs. The use of Dar es Salaam has beenencouraged for barter trade, but even leasing locomotives to TRC has notprovided sufficient movement capacity. Storage costs and higher transport ratesincreased transport costs in 1987 by $3 million compared to the alternative ofrail transport from Mombasa. The Government has given the monopoly for clearingpublic sector imports to Transocean, but fortunately this requirement has notbeen fully applied.
Policy Considerations
The overall costs of international transport in East and Central Africaare unnecessarily high. These costs are not primarily the result of inadequateinfrastructure but are due to a number of factors:
- lack of effective and efficient rail transport- inefficiencies at Mombasa Port- border delays and transit regulations on the Northern Corridor- direction of traffic by goverNment rather than shippers- high cost of national transport protection- overloading of vehicles and inadequate road maintenance
The Bank has traditionally adopted a country-based approach to transportinvestment and policies. The country perspective is important and necessary indeveloping policy dialogue with the landlocked countries regarding the type andextent of government investment and intervention in their external transportsector. The study has indicated that there is the potential for the landlockedcountries to reduce their transport costs significantly by modifying their ownpolicies. These cost reductions can be achieved without the agreement of othergovernments and they should, therefore, receive high priority.
Reducing the high costs of government intervention must be a priorityin all landlocked countries. Shippers are generally far better placed to makerational transport decisions than government officials. The role of the

- vi -
government should be limited, as far as possible, to establishing the minimumframework of customs and vehicle use regulations with transit countries. Whereroute or mode diversification Zor transit security requires more activeintervention, the policies adopted must maintain maximum freedom of choicebetween routes, modes and carriers.
There are, however, several issues in the Great Lakes Region whichnecessarily involve both the LLC and the transit country. An increase in thecapacity of TRC to move transit traffic is crucial to regional transitdevelopment, but Tanzania may be unwilling to make the necessary investment asthe level of transit traffic cannot be guaranteed. Sharing the risks by jointparticipation may be necessary and desirable, however, problems of ownership,management and control must be resolved.
Under some circumstances, international cooperation may be bestorganized on a bilateral basis. There are, however, some issues -- such astransit documentation and road vehicle regulations -- which should be viewed ina wider context. It is debatable whether the broad regional approach advocatedby the PTA or a narrower, sub-regional or corridor approach would be moreeffective.
Regional harmonization of transit regulations has many attractions interms of overall economic integration but, in the case of the Central Corridor,it could result in the introduction of transit bonds which would not be in theinterest of the landlocked countries. Similarly, regionally harmonized transittaxes may not fully take into account the specific interests of both thelandlocked countries and the economic and transport realities of particularcorridors.
Whichever approach is used within the region, multilateral action isrequired on several important issues:
(i) vehiclelaxleload regulations, road maintenance funding, and transittaxes to ensure, as much as possible, minimum regional transport costs;
(ii) effective implementation of the Northern Corridor Transit Agreement andthe further reduction of the unnecessary costs of documentation andtransit bonds;
(iii) provision of additional movement capacity on TRC to handle the specificrequirements of transit traffic;
(iv) development of integrated transit-transport operating systems tomaximize the potential of the Kigoma, Isaka and Mwanza routes; and
(v) improved coordination between Uganda and Kenya Railways to increaserail transit capacity.
The Bank has the technical expertise to assist in these areas but lacksthe regional perspective developed by institutions such as the EEC and UNCTAD.A dialogue must be established with the countries and the other institutions toensure that transit imp:ovements and national transport projects be proposed andevaluated within an agreed regional framework, and that the potentialcontribution of the Bank to the development of regional transport infrastructureand policies be maximized.

1. INTRODUCTION
A. Purpose and Scope of the Study
1.01 Inadequately developed infrastructure and high-cost transportservices have long been recognized as major impediments to economic growth andtrade in Africa. The Second United Nations Transport and Communications Decadefor Africa (UNTACDA II) gives first priority to the promotion of regionalintegration, and intra-regional and international trade. International transportroutes have existed in Africa for many years, connecting landlocked countriesto the sea, and the transit difficulties encountered on these established routeswill probably be replicated elsewhere as intra-regional trade develops. TheWorld Bank is in the process of undertaking a series of regional studies toexamine the problems of international transport in Africa and to identify theactions that need to be taken to remove the obstacles to transport and trade.
1.02 This study examines the international transport problems faced bythe landlocked regioas surrounding the Great Lakes of East-Central Africa andthe potential role of the Bank in removing the transport constraints to thedevelopment of their external trade. Specifically, the report covers: Burundi,Rwanda, Uganda, and the Kivu Region of Zaire. (Although Zaire has direct accessto the sea, transport from Kivu to the port of Matadi is such that the regioncan be considered as functionally landlocked.)
1.03 Analysis of the transport-transit problems of the landlockedcountries must necessarily also consider the objectives and constraints of thetransit countries through which the landlocked operate. In the Great LakesRegion, Kenya and Tanzania provide access to the sea and are included in thestudy. There has been growth in trade from Southern Africa, through Zambia andZaire to Burundi and, to a much lesser extent, Rwanda. These movements are, toa great extent, commodity specific -- mainly cement and sugar, and may be arelatively temporary phenomenon.
1.04 The study provides a broad analysis of the infrastructure, transportoperations, transit systems and transit policies pursued by both the landlockedand transit governments. The study does not intend to provide a definitivesolution to the transit problem, rather the issues and policy options areoutlined and discussed as the basis for continuing dialogue within the regionand the Bank.
B. Geo-Political Developments Since '971
1.05 Major changes have taken place in the political and economicstructure of the region since the early 19708, and these changes have had majorimplications for the development of the transport routes and transit systems,e.g.:
- breakup of the East African Community and its institutions, resultingin Uganda facing the restrictions of a lxndlocked country (LLC), a collapsein the operating efficiency and capacity of the traditional rail routes,and considerable mistrust between the former members of the Community;

- 2 -
- decline of the Ugandan economy, resulting in a dramatic fall in Uganda'sinternational trade, and serious domestic financial problems leading tothe rapid deterioration of its infrastructure;
_ decline in the Tanzanian economy resulting in both inadequatemaintenance of its infrastructure and a serious decline in the effectivecapacity of its railways;
- the Liberation War, overthrowing President Amin, which seriously disruptedtransport within Uganda and, indirectly, Tanzania, and dislocated thetrade movements of the countries of 2aire, Burundi and Rwanda (ZBR); and
- civil war and continuing insecurity within Uganda and poor politicalrelations between Uganda and Kenya, periodically disrupting transittraffic.
The overall results of these developments have been a significant increase inoverall transit costs and the strong desire within the LLC to reduce transitdependency.
C. The Transit Objectives of the Landlocked
1.06 Past experience within the region has led the Governments of theLLC to pursue several objectives: (i) development of low cost, efficient transitroutes; (ii) diversification of transit routes and modes to provide additionaltransit security; and (iii) development of national capacity for internationaltransport.
1.07 It is clear that increased national control of internationaltransport often results in increased government intervention, direction andcontrol. Unfortunately, the objectives pursued by gover.iment often conflict.Under certain circumstances, such as the development of the Isaka roadlrailroute, the objectives of low-cost transport and increased transit security canboth be achieved but, in general, increased transit security will result inhigher transport costs. Increased national control can result in neitherlowering costs nor increasing security. Past and proposed transit developmentsin the region should be assessed in light of these objectives. Maintaining arealistic balance between the conflicting aims of policy is now, perhaps, thecritical issue for the Governments of the LLC.
1.08 Transit-transport is such that often the objectives of the LLC canonly be achieved with the tacit agreement or active participation of the transitcountries. The impact of proposed changes in the transit systems must,therefore, be considered in light of the interests of both the LLC and transitcountries. The attitudes of coastal countries toward transit traffic are notalways clear. Some countries view transit traffic as an important economicfactor, while others use it as an instrument for international politicalinfluence. In East Africa, a mixture of attitudes prevails; however, in mostcases, the interests of transit traffic are subordinate to the national interestsof the coastal countries.

1.09 It must be recognized that, given the growing choice of transitroutes in the region, it may not be in the economic interest of transit countriesto invest in transport capacity for external traffic which cannot be guaranteedin the long term. Joint participation in the provision of both infrastructureand movement capacity may, therefore, be necesaary to meet the objectives of theLLC and the legitimate concerns of the transit countries.
II. PRESENT TRANSIT ROUTES
A. Introduction
2.01 This section of the report provides a brief description of thepresent transit routes used within the region, their present condition, and theimprovements that are already envisaged.
2.02 Until the early 1980s, the transit routes could be reasonably welltypified in terms of corridors: Northern Corridor -- road and rail routes fromMombasa, through Kampala; and Central Corridor -- rail/lake route from Dar esSalaam, through Kigoma. Today, however, the simple corridor description nolonger applies, as transporters and governments have responded to changingconditions and problems by developing new routes. The terminology "Northern andCentral Corridors" is still used but the Corridors are now collections of routeswhich converge respectively on the ports of Mombasa and Dar es Salaam (DSM).
2.03 Imports from Southern Africa are shipped across Lake Tanganyika fromMpulungu and Kalemie to Bujumbura. This has been termed the Southern Corridorand is important for cement and sugar imports to Burundi. Local production ofsugar and possibly cement could reduce traffic on this corridor, but itsimportance would be enhanced for other commodities if trade were developed withinthe Preferential Trade Area (PTA), and if political rapprochement in SouthernAfrica were achieved. The study does not consider this corridor in detail.
2.04 Recently, the Governments of both Burundi and Rwanda have expressedinterest in the potential of the Benguela Railway to Lobito in Angola and therebyproviding access to the Atlantic. Even if the line is rehabilitated, thepotential advantage for Burundi and Rwanda appears limited in comparison withexisting routes.
B. The Northern Corridor
2.05 Traditionally the Northern Corridor route consisted of the main EastAfrican Railway Corporation (EARC) rail line, Mombasa-Nairobi-Malaba-Kampala,and its extension to Kasese. Transit traffic from Rwanda and Kivu was taken byroad to connect with rail at either Kampala or Kasese. In the early 1970s, railcarried almost 1002 of Uganda's international traffic and most of Rwandese andZairean traffic. Radical changes have since occurred, and road transport nowcarries over 75Z of total international traffic on the corridor.

-4-
Port of Mombasa
2.06 Mombasa is a well equipped port with 16 quay berths, six deep waterlighterage points, a modern container terminal, and specialized facilities forhandling bulk cargoes. The berths can be served by both road and rail, butthere has been an increasing trend toward road transport and the number of raillines in the port has been reduced.
2.07 The slower growth in Kenyan trade in the 1980s, the fall in Ugandandemand, and the growth in containerization from 28S to 45? of general cargotraffic since 1982, have resulted in berth occupancy rates of around 702, andno expansion in berth capacity is foreseen in the short-medium term. Acquisitionof additional handling equipment for both containers and general cargo, and theresurfacing of much of the port area are planned for the period to 1991/92.
Road Routes
2.08 The Malaba Route. This forms the main artery of the NorthernCorridor road route:
- Rabale - Gatuna -Mombasa-Nairobi-Malaba-Kampala-Mbarara Kigali-Bujumbura
- Kagitumba-Rayorza -
The route, except for short sections on the Rwanda-Uganda border, has been paved.However, several sections in Kenya have deteriorated, much of the route in Ugandahas been effectively destroyed, and parts of the route in Rwanda and Burundi arein poor condition. Road distances between the major traffic centers on the routeare:
Kampala Kigali Bujumbura
Mombasa 1200 km 1800 km 2100 kmNairobi 710 km 1310 km 1610 km
2.09 Major investment is being undertaken to upgrade the route; work hasalready commenced on some sections, and funding has been arranged for theremainder. The details of distances, road conditions, and the investmentprojects are provided in Annex 1, while the following summarizes the currentsituation.
ti) Kenya: The route is paved throughout, but only about 50S of the958 km is considered in good condition. Rehabilitation,reconstruction and/or strengthening of the remaining 470 km is eitheron-going or funded. It is expected that by 1991/92, most of theroute should be in good condition, although some work on the sectionsSultan Hamud-Ulu and Limuru-Lanet will be necessary.
(ii) Uganda: Much of the main transit route to Rwanda is in very poorcondition. Some 200 km have already been reconstructed, and therest of the work to Kabale should be completed by the end of 1991.Once the Kabale route is improved, there will remain only one short

- 5 -
section of unpaved road (29 km) connecting the Kagitumba road fromRwanda with the Kabale route. There are no plans, at present, toupgrade this section. Unfortunately, there are reports that partsof the road from Malaba to Jinja, reconstructed by force account,are already deteriorating.
(iii) Rwandas The Gatuna-Byumba-Kigali road has recently beenreconstructed and, except for some very short sections where theroad crosses marsh, is in very good condition. Technical solutionsfor the marsh crossings are being investigated. The alternativeroute to/from Uganda, via Kagitumba and Kayonza, has recently beenupgraded to a paved standard. The Kigali-Burundi road is ingenerally good condition, but some sections will need strengthening.
(iv) Burundi: The Rwanda border-Bujumbura road is paved but requiresrehabilitation and some geometric improvement. The EEC has agreedto fund this work which should be completed in 1990.
2.10 The Busia Route. The Malaba route is used primarily for the movementof dry cargo. Petroleum tankers generally collect fuel from Nairobi, leave theMalaba route after Nakuru and detour via Kisumu and Busia, rejoining the maintransit route after Tororo. Busia has been designated as the main petroleumproducts (POL) border crossing point. Border delays for tankers are reduced bythis specialization as transit procedures for bulk fuels can be completedquickly, and the tankers avoid queuing behind general cargo trucks. Thecondition of this route is good and no improvement is scheduled.
2.11 Links to Zaire. Zaire is connected to the main Malaba route bylinks from Bukavu, Goma, and Beni through Rwanda and Uganda. The road linksin Rwanda are paved while those in Uganda are in poor condition. The main roadnetwork in Eastern Zaire is also in very poor condition.
2.12 The Mwanza Route. Instability within Uganda and the imposition ofhigh transit fees resulted in trucks avoiding Uganda and going south of LakeVictoria, via Kisii, Isebania, Mwanza, and Rusomo Falls/Kobero to reach Rwanda,Burundi and Zaire. In terms of distance, the route is 100 km longer to Kigaliand approximately the same length as the Malaba route to Bujumbura. The routewithin Kenya is paved and generally in good condition. The EEC has beenapproached, however, to contribute funds for the rehabilitation of 50 km of theroute between Kisii and the Tanzanian border (Isebania) which was not designedfor heavy transit traffic.
2.13 Within Tanzania much of the route is unpaved. The 182 km Musoma-Mwanza-Usagara section has been paved, and the EEC has invited tenders for thedesign of the Kenya border-Musoma section. There are, however, no plans forthe paving of the Usagara-Biharamula section. The constraints imposed by theferry crossing between Kikonga and Busisi have been largely removed with the newferry which has the capacity for four to five trucks per crossing. As analternative, trucks can travel via Shinyanga to the new roads connecting Isakato Rwanda and Burundi (see this Chapter, sectiont C. The Central Corridor).

-6-
2.14 Trucks travelling to Burundi use either the direct Kobero track orpass through Rwanda. The direct route has poor vertical and horizontal alignmentand is only passable for the most powerful truck-trailer combinations. Semi-trailers and less powerful trucks are forced to use the longer Rwanda route.This restriction will be removed with the improvement of the Kobero route (seethis Chapter, section: C. The Central Corridor)
Rail Routes
2.15 The main line. In terms of the quality of the rail infrastructure,the main l-ine to Uganda is the Mombasa-Malaba-Jinja-Kampala route, a totaldistance of 1,338 km. The section Nakuru-Malaba-Jinja now carries, however,insignificant levels of transit traffic.
2.16 The operational route. Almost all Ugandan rail transit traffic onthe Northern Corridor now uses the wagon ferry service across Lake Victoria.between Kisumu and Jinja, a 12-hour voyage of 233 km. The Kisumu branch ofKenya Railways connects with the Malaba line at Nakuru. Despite the need foran additional transfer, this routing has several advantages for Uganda:
- shorter overall distance, approximately 100 km;- shorter distance within Kenya, 150 km;- utilizes available ferry capacity, releasing locos for other traffic
and- more efficient interchange system between the Uganda Railways
Corporation (URC) and Kenya Railways Corporation (KRC).
For KRC, however, the present traffic routing has significant disadvantages.The Kisumu line has lighter rail than the main line, and locomotive and trainweights are restricted by the bridges and viaducts. Class 62 locos are usedand their lack of availability is creating problems for KRC. An investigationof the strengthening requirements to eliminate these constraints is proposedunder the present Bank/U.K. assistance project to KRC.
2.17 The wagon ferry operation will be further strengthened by a Danidaproject which will construct a new ferry terminal at Port Bell and a short raillink to Kampala. Once this project is completed, international rail traffic toKampala will be able to avoid the steep gradients and train weight restrictionson the Jinja-Kampala section.
2.18 The Kasese Line. Transit traffic ceased to use this 332 km Kasese-Kampala line in the mid-1970s, and it is now in a seriously deterioratedcondition. Although the Ugandan Government has expressed its intention toupgrade the line, the proposed Bank project includes only very limitedimprovements to maintain operations. This could develop into the progressiverehabilitation of the track if traffic were to substantially increase, however,there is little prospect of transit traffic returning to the line in the nearfuture.

-7-
The Kenya Pipeline
2.19 POL traffic to the LLC generally starts at Nairobi where the whiteoil pipeline terminates. The extension of the pipeline to the west has beenunder consideration since the conception of the original project. A feasibilitystudy has been undertaken, and it is believed that the Kenyan Government intendsto extend the pipeline to both Kisumu and Eldoret. Work carried out by the Banksuggests that the project may not generate much higher economic returns than arevitalized rail-based operation. If an extension is undertaken, Kisumu shouldreceive priority.
2.20 The pipeline extension and the pricing policies used for costrecovery could have important implications for the LLC. Competition from theCentral Corridor should, however, limit Kenya's freedom of action in settingprices, especially if Tanzania Railway Corporation (TRC) capacity is expanded.A pricing dispute between the oil companies and the Kenyan Government severelydisrupted oil supplies in 1989, and Burundi, for example, was able to shift toa road-based supply route from Dar es Salaam with relatively few problems andat comparable costs. Once the roads in Tanzania are rehabilitated, and theoperating restrictions on the LLC tanker fleet removed, the potential of theDSM route will increase significantly.
Transport and Transit Operators
2.21 Although the railways carry about 250,000 tons of internationalUgandan traffic, the majority of traffic using the Northern Corridor routes iscarried, at present, by private road transporters contracted by privateforwarding and clearing agents. Parastatal companies do play an important role:
STIR: a Rwanda government-owned trucking company, established in 1972,which now also undertakes CIF activities. In addition to its own fleet,the company controls and often manages sub-contracted vehicles and has akey role in the control of Rwandese cargo movements through Kenya.
OTRABU: a Burundi government-owned transport company.
Transocean: a Uganda government clearing and forwarding (C/F) companywhich also used to be a major transport company on the route. Recentlythe company has been given a monopoly for the clearing of all governmentand parastatal import cargo and would like to re-establish its transportcapacity and take over CIF for the export of coffee.
2.22 The participation of national transport operators varies considerablybetween the LLC. The majority of Rwandese traffic on the Northern Corridor isnow carried in Rwandese trucks, mainly organized by STIR and CORWACO, a privatetrucking company which also has a fleet of sub-contractors. Burundi hasdeveloped a local international trucking capability, sufficient for 60Z-702 ofBurundi traffic on the Northern Corridor. The majority of Ugandan internationalroad traffic is carried by Kenyan-registered vehicles.

- 8-
C. The Central Corridor
2.23 The Central Corridor has been operational as a transit route sincethe early part of the 20th century, and specific institutional arrangements wereagreed in the 19209 for ZBR cargo at Dar es Salaam and Kigoma, the Belbaseconcessions. The legal position of the Belbases is now rather ambiguous buttheir de facto role has continued. While they may not ideally suit modernlogistical requirements, the Belbase arrangements do confer some benefits toZBR and may be difficult to modify. Additional routes from DSM becameoperational during the mid-1980s and others are planned.
Port of Dar es Salaam
2.24 By the late 1970s, the port had an unenviable reputation forcongestion, inefficiency and pilferage. There have been marked improvementsand these, combined with a fall in traffic, have eliminated major ship delays.The port is now often preferred to Mombasa despite its more limitedinfrastructure. Berth No. 1 and the surrounding area is the former Belgianconcession, till known as Belbase and operated by AMI, a Belgian owned C/Fcompany which is part of a larger company with extensive transport interests.Despite the concessions in port charges for ZBR cargo using Belbase, C/F agentsother than AMI use the normal port facilities for ZBR cargo.
2.25 The Port Rehabilitation Project, designed to increase capacity to3.7 million tons, is ongoing. The new container facilities are operational, andthe rehabilitation of the general cargo berths is expected by the end of 1991.The project will ease immediate constraints, but further capacity, especiallyfor container traffic, will be necessary in the relatively near future. A secondproject to raise container handling capacity is being negotiated. The projectwill also include a longer-term development study of berth extension which maybe necessary after 1995.
Rail/Lake Route via Zigoma
2.26 The traditional route for ZBR cargo is the 1,254 km central line ofTRC to the port of Kigoma, transshipment to Arnolac barges, and final deliveryto the port of Bujumbura. Other than TRC, management of the system is undertakenby the private sector; the Belbases at DSH and Kigoma are managed by AMI, Arnolacis privately owned, and Bujumbura port, though government owned, is privatelymanaged.
2.27 During the 1960s and 1970s, Rwanda ceased to use the route andconcentrated its traffic on the Northern Corridor. Burundi shifted traffic toMombasa when the Kigoma route almost ceased to function at the time of theeconomic crisis generated by the Liberation War. Conditions have improved butTRC remains a weak link in the transport chain.
2.28 Much of the fixed infrastructure of TRC is old and requiresreplacement but, in the short term, the track is not the major constraint toincreased performance. Work is continuing on relaying track, ballasting andreplacing/strengthening bridges. The capacity of TRC to undertake such work islimited, and it will probably be spread over a ten-year period.

- 9 -
2.29 The port of Kigoma has recently been rehabilitated, and the containerhandling constraint will soon be removed by the provision of a Belgium-fundedcontainer crane. The port vill then have considerable excess capacity.
2.30 The Arnolac fleet is old but has sufficient barge capacity (5,500tons), and a new 350 ton container vessel for the Kigoma traffic. Other Burundioperators will soon possess 2,500 tons of capacity. Their barges operate toZambia but if the Government's forecasts are correct, this traffic vill declinein the 19909, and the capacity will be available for the Kigoma route.
2.31 The port of Bujumbura has capacity to handle at least 400,000 tons,and is only 50 utilized. The maintenance of the port infrastructure has beenthe responsibility of the Government rather than the concessionaire and wasneglected for many years. To remedy the accumulated maintenance needs, theFrench Government funded a port rehabilitation project which vas completed inearly 1989. The planning of this project was undertaken without theparticipation of port management, and the works were to an unnecessarily highstandard, while other desirable improvements were not included. No additionalcapacity will be required at the port for many years. The French Government hascancelled part of the debt, but it is highly unlikely that the port can generatesufficient revenue to service the outstanding loan.
All-Road Route to 11E
2.32 Road transport from Dar es Salaam to 2BR has only developed recently.The route DSM-Dodoma-Singida-Lusahunga-Rusumo Falls-Kigali is described in Annex1. The overall length of the route to Kigali is 1,530 km, and about 452 is stillearthigravel. Serious problems were experienced in 1987 when the road betweenManyoni and Issuna was closed during the rains, and traffic had to detour viaArusha.
2.33 Trucks to Burundi either pass via Kigali (total distance 1,800 km)or use an earth track from close to Rusumo Falls and pass via Kobero and Muhinga.This alternative reduces the total distance by 170 km and eliminates one transitcountry, but the road is not all-weather and cannot be used by semi-trailers.
2.34 Roads in Tanzania are generally in very poor condition, but a majorrehabilitation project, designed to raise the proportion of trunk roads in goodcondition from 402 to 702, is in the course of preparation and funding. Thisrehabilitation program should allow more reliable road communications for theZBR countries, especially the improvement of the Manyoni-Issuna section whichwas included in the 1988 budget. The Dodoma-Mwanza road is currently the subjectof a feasibility study and while some improvement may take place, major upgradingcannot be expected in the near term.
2.35 The all-road route to Rwanda and Burundi will be improved by thecompletion of the road infrastructure planned for the Isaka route, describedbelow.

- 10 -
Isaka Rail/Road System
2.36 The creation of a raillroad transport system to Rwanda has beenunder discussion since the late 19709. Funding for the interchange terminalhas been agreed, and the contract for the first stage of the project is out totender. The terminal will provide facilities for 46,000 tons of general cargoand 43,000 tons of container traffic. Construction is expected to take 18months, and the terminal should be operational by 1992.
2.37 The road infrastructure from Isaka to Rwanda is now completed orfunded: Rusumo Falls to Lusahunga, 95 km, completed; Lusahunga to Bukombe, 127km, construction on-going, completion 1989; and Bukombe to lsaka, 112 km, outto tender, completion 1990/91.
2.38 The EEC is financing the updating of the design study to link Burundidirectly to the Rusumo Falls-Lusahunga route by upgrading the Muyinga-Kobero-Nyaka Sanza road (86 km). It seems likely that financing of the constructionwill then be agreed.
Rail/Lake Route via Mbanza
2.39 The rail/lake route via Mwanza to Uganda began operations in 1986/87using URC wagon ferries. The route comprises the 1,229 km Mwanza line of TRC,359 km by ferry across Lake Victoria, and 80 km rail from Jinja to Kampala --a total distance of 1,668 km. Kampala will be more directly served by the routewhen the Danida-funded Port Bell ferry terminal is completed.
2.40 Severe capacity constraints have been experienced on TRC, and someUgandan imports have been stranded at DSM for over a year. In an attempt toalleviate the capacity constraints, URC has hired up to four locos to TRC.There have been attempts to truck cargo between DSM and Mwanza where cargo istransshipped to/from URC wagons. This is, however, considered as only anemergenev measure. Delays on the route may have also been caused by the problemsthat Tanzanian transport operators face in obtaining payment for Ugandan traffic.
Transport and Transit Operators
2.41 Until relatively recently, transit traffic along the Central Corridorwas moved under the effective control of only three organizationst AM --managing Belbase and Kigoma port, and monopoly C/F agent; TRC -- providingtransport capacity between DSM and Kigoma; and Arnolac and Bujumbura Port --effectively the same management.
2.42 The development of the road transport alternative to ZBR countrieshas introduced effective competition to the traditional route and operators.STIR operates from DSM but only uses foreign sub-contractors on the route. OTRABUalso has offices in DSM.
2.43 Traffic to Uganda, using the raillferry route, is almost exclusivelyorganized for imports by Transocean and for coffee exports by the Uganda CoffeeMarketing Board.

- 11 -
D. Potential New Transit Routes
2.44 The main developments planned for the transit network have beendescribed in the previous sections. Several other potential routes for transittraffic have been discussed and are briefly outlined below.
Lake Transports Kisuu-m3Rmondo Bay
2.45 The use of the KRCITRC wagon ferries to move trucks/trailers acrossLake Victoria, thus avoiding Uganda, has not only been discussed but trial runshave been made. The system is technically feasible especially if someimprovements were made to the steep gradients on the Bukoba-Lusahunga road.There was such a wide difference in the price asked by the railways, basedprobably pro-rata to the revenue from the Jinja-Kisumu route, and the truckerswillingness to pay that no further action was taken. Many private truckers sawthe ferry operation as running contrary to their commercial interests.
Lake-River Transport: Kisuru-Kagituma
2.46 The use of oil barges from Kisumu, across Lake Victoria, and up theKagera river to Kagitumba has been suggested, and a preliminary study wasundertaken by the Economic Commission for Africa (ECA). Potentially, the systemmight be attractive to Rwanda, but there is no information on the navigabilityof the river nor the improvements that would be required. There is apparentlya disused hydro-electric generating plant on the river which would suggest thatsevere problems could be encountered. The present Rwanda POL demand of 90,000tons is too small to justify substantial investment.
Rail Transport: Rampala-lasese
2.47 Reactivation of rail/road transport along the Northern Corridorwould seem a logical long-term development if the operating efficiency andcoordination of KIC and URC were improved. Substantial investment on the KaseseLine would not seem to be justified for the traffic demands from either Rwandaor Burundi. Their other alternatives and the advantage of Kasese over Kampalaas a railhead would be small. The Kasese line would have significant potentialbenefits for North-Eastern Zaire.
Rail Transports Masoma-Tanga
2.48 Over the years the construction of a new transit route for Ugandatraffic to Tanga, with an extension of the TRC network from Arusha to Husoma,has been discussed several times. It is always possible that the concept willbe resurrected. Preliminary studies have indicated, several times, that theinvestment would generate low economic returns if based only on Uganda traffic.The project could also probably cause severe environmental damage.
Road Routes Kwanza-Arusha-MHombasa
2.49 Transport distances to Mombasa from both Rwanda and Burundi wouldbe considerably shortened by the construction of a direct road connection acrossthe Serengeti connecting with Arusha, accompanied by the construction of a bridgefor heavy commercial traffic at Taveta. The traffic flows generated by Burundiand Rvanda are so low that they alone could not justify the magnitude of theinvestment required.

- 12 -
E. Additional Investment Studies
2.50 The opportunities for economic investment in new transitinfrastructure are limited. Lake transport from Kisumu to Kemendo Bay mightprovide benefits for both Rwanda and Burundi. but this would depend on the scaleof road improvements required and the pricing of the ferry crossing. In viewof the competing demand for the Kenyan wagon ferry, the potential for the routeis limited unless there is major investment in new lake capacity.
2.51 The use of bulk oil barges across Lake Victoria could be veryattractive for Uganda and perhaps also Rwanda and Burundi, if the KenyanGovernment were to extend their pipeline from Nairobi to Kisumu. A new oiljetty would be required at Kisumu, and a somewhat more extensive investmentwould be necessary to connect Port Bell with the existing tank farm in Rampala.The costs of oil barges and the associated infrastructure would have to beassessed against the costs of shipping fuel by tanker wagon using the wagonferries.
2.52 Other than these studies, the real priorities for the governmentsand aid agencies should be to ensure that the planned rehabilitation program becompleted, and that the infrastructure then be maintained at the servicestandards expected to be attained by 1992.
III. TRAFFIC FLOWS
A. Total International Traffic
3.01 Overall, there are about 1.4 million tons of reported internationaltrade movements within East Africa (Table 3.1). The majority of the traffic hasits origin/destination outside the region, but there is significant reportedregional trade. It is important to distinguish between regional and non-regional trade, as direct trade between neighboring countries does not followtransit procedures.
Table 3.1 East Africa LLC Trade (1987) (1)(000 tons)
Imports Exports TotalNon-Region Region Total Non-Region Region Total Trade
Dry Cargo 485 180 665 340 15 355 1020POL 390 390 390
Total 875 180 1055 340 15 355 1410
(1) Based upon reported transport flows.
- 13 -
3.02 All Petroleum products are classified as essentially non-regionaltrade. Over 801 of the POL movements are included in Renya's export tradestatistics, but this is not reflected in the trade statistieu of Rwanda andBurundi. In any case the Kenyan value added on petroleum exports would belimited.
3.03 Regional trade is essentially exports from Kenya to the LLC,accounting for about 85Z of regional trade along the Northern and CentralCorridors. The domestic value added of some Kenyan regional exports may belimited; work by the UNDP Transport Planning Project, RWA/861005, in Rwandasuggested that some 502 were actually re-exports. In addition to regional tradewithin last Africa, 87,000 tons were imported from Southern Africa across LakeTanganyika.
3.04 A large import imbalance in the direction of dry cargo trade isindicated in Table 3.1, with imports some 851 higher than exports. Theseaggregate data mask an export imbalance from Zaire and 4sl import imbalancesfor Burundi and Rwanda.
B. Growth Trends in International Traffic
3.05 International traffic has shown little consistent growth during the1980s. Over a long period there has been significant growth in the flow oftraffic to Burundi and Rwanda, but this has been more than balanced by thedramatic fall in Ugandan traffic (in 1971, Ugandan traffic was 1.36 milliontons, about double the 1987 flow).
3.06 In the light of past experience in the region any forecasts of futuretraffic must be treated with caution. Only Burundi has attempted long-termforecasts of future traffic; the other projections in Table 3.2 are based uponavailable material and discussions within the region.
Burundi: Import estimates from the Ministry of Planning reflect the plannedlocal production of sugar and cement. POL estimates appear low andcould be 20,000 tons higher. Coffee exports increase at 3.32, otherexports by 10Z.
Rwanda: Import estimates for 1990 increased at an average rate of 42 perannum, coffee exports growing at 21 and other exports at 4.52.
Ugandat Dry cargo imports growing at 4.51, POL increasing at 5.52, reflectingthe release of suppressed transport demand. Total exports grow at72 per annum.
Zaires Flows will probably continue to show marked fluctuations. Theestimates are based on a 41 growth from the average of flows duringthe mid-1980s.

- 14 -
Table 3.2 Present and Potential 1995 International Traffic(000 tons)
Imports Total Total1987: Dry POL Total Exports TradeRwanda 165 90 255 58(1986) 313Burundi 175 52 227 50 277Uganda 332 200 532 173 705Zaire 50 49 99 89* 189Total 722 391 1113 356 1469
1995:Rwanda 286 139 425 72 497Burundi 228 52 280 71 351Uganda 492 307 799 286 1085Zaire 51 53 104 142* 246Total 1057 551 1608 571 2179
* includes euporU of apper end zinc from Shab
Overall traffic in the region could increase from between 1.4-1.5 million tonsto over 2.1 million tons in 1995.
C. Commodity Composition: International Trade
Imports
3.07 Present imports and a scenario for 1995 are outlined in Tables 3.1and 3.2, but, except for petroleum products, no commodity breakdown is attempted.Full import commodity classifications are only available for Burundi and Rwanda,and some broad magnitudes can be deduced for Uganda. It is clear, however, thatnew industrial projects and the re-activation of installed capacity within Ugandacould have marked effects upon the total volume and nature of imports.
Burundi: combined cement and sugar imports account for over 401 of total drycargo imports and local production of both commodities is planned. Sugarproduction is expected to start in 1989; cement production is more uncertainbut the Ministry of Planning assumes before 1995. If cement prodt-ction is notdeveloped dry cargo imports would increase by about 45,000 tons. This wouldhave little impacu upon transit routes to the sea as cement comes primarily fromZambia and Zaire, using barges across Lake Tanganyika.
Uganda: major imports are sugar (60,000 tons), salt (45,000 tons), molasses(23,000 tons), and cement (43,000 tons). Uganda used to be a major producer ofall these commodities, with the installed capacity to meet at least local needs.The import estimates make some allowance for increased local production and ashift toward higher value imports.
Rwanda: cement imports have been replaced but local production of other bulkimports sugar (16,000 tons), salt (30,000 tons), iron and steel (33,000 tons)

- 15 -
seems unlikely. A significant increase in Uganda production could, however,shift trade from Kenya and overseas.
Exports
3.08 Coffee is the primary export from Burundi, Rwanda and Uganda andalmost 502 of Zaire's exports through East Africa (Table 3.3). Coffee productionand prices are crucial in determining total export earnings within the region.Tea has developed as a significant second crop and probably has a higher grovthpotential.
Table 3.3 Exports Compositions East Africa(000 tons)
Rwanda Burundi Uganda Zaire(1986) (1986) (1987) (1987)
Coffee 41.2 28.3 150 143Tea 10.3 3.5 N.A )Hetals 1.2 46Other 5.0 10.5 23 -Total 57.7 42.3 173 89
3.09 The import imbalance makes export composition of limited importancein determining transport requirements. In certain circumstances, however, theestablished marketing channels make route decisions relatively insensitive tothe price of transport. Coffee is the dominant export but there are severalmarketing arrangementss
- Rwandese coffee is sold by auction at Mombasa;
- Burundi coffee is sold through limited tender with established shippingarrangements through Dar es Salaam; and
- Ugandan robusta coffee is sold in New York or London and can be shippedthrough either Mombasa or Dar es Salaam; Arabica is sold at Mombasa.
Tea is generally sold at either the Mombasa or London auctions, and routingthrough Mombasa has become standard.
D. Distribution of Traffic by Mode and Corridor
3.10 Estimates of the route and modal distribution for transit trafficin 1987 are shown in Table 3.4; a small volume of direct ove-4eas air cargoand some local regional trade are excluded. The estimates have been made froma variety of sources and may not fully correspond with other data. The routingof transit traffic has shown marked changes during the period 1978-1987. Burundiimports have, for example, shifted from almost total dependence on the CentralCorridor to extensive use of the Northern Corridor and then back again to DSM4.

- 16 -
3.11 Rwanda is now making increasing use of DSM. Until 1984, less than5Z of Rwanda's dry cargo Imports used DSM but during the period 1986-88, iwandeseimports via the Central Corridor quadrupled from 17,000 tons to 69,000 tons,around 40Z of total dry cargo imports. Rwandese exports continue to use Mombasa,but all coffee exports are trucked south of Lake Victoria rather than passingthrough Uganda.
3.12 Table 3.4 indicates that 95Z of POL was routed through the NorthernCorridor. The internal supply problems within Kenya reduced POL traffic during1989; Burundi and, to a lesser extent, Rwanda obtained fuel via DSM. POL hassince shifted back to the Northern Corridor, but experience has shown that useof DSM for POL supplies is technically and economically feasible.
Table 3.4 Traffic Distribution (1987): Corridor and Mode(000 tons)
(a) Northern Corridor
Imports:Mombasa POL Regional Total Road Rail Air
Rwanda 84 82 48 214 210 4Uganda 171 188 125 484 346 138Burundi 17 46 5 68 68Zaire 18 49 18 85 85Total 289 365 186 850 709 138 4
Exports :Rwanda 46 3 49 44 5Uganda 125 125 13 112Burundi 4 4 4Zaire 43 43 43Total 218 3 221 104 112 5
(b) Central Corridor
Imports:DSM POL Regional Total Road Rail
Rwanda 35 35 35(1) 0Uganda 36 12 48 48Burundi 73 5 11 89 20 7CZaire 14 14 5 9Total 158 17 11 186 60 126
(1) May include cao traffic transhippad from rail at Shiapaga
ExportssRvanda 1 1 1Uganda 48 48 48Burundi 37 37 8 30Zaire 46 46 11 35Total 132 132 20 113

- 17 -
(c) Southern Corridor
Imports:Burundi 87Rwanda 6Total 93
3.13 In terms of total traffic, the Northern Corridor dominates with 752of total Imports and over 60Z of exports. Sixty-five percent of total transittraffic is moved by road. Road traffic has increased significantly on theCentral Corridor, from lees than 52 in 1982, but it still only accounts forabout 25Z of traffic.
E. Relative Importance of Transit Traffic
3.14 The previous sections discussed the absolute magnitudes of transittraffic without indicating its scale relative to total traffic in the transitcountries and thus its likely importance in transport decision-making.
Kenya
(i) Port of Mombasa:
1987 Traffic(million tons)
Dry Cargo POLTotal 3.699 2.849Transit 0.479 0.365Transit 2 12.9 12.8
1ii) Kenya Railways:
1987 Traffic(million tons)Tons Ton-kms
Total 3.03 1.727Transit 0.25 * 221Transit 2 8.3 12.8
* includes regional trade from Kenya.
(iii) Roads: On the basis of 1987 cargo flows and an average payload of 30tons, it is estimated that the daily flow of transit trucks through Kenya isabout 130, approximately 75 loaded and 55 empty.
(iv) S-mmarys Transit flows are of significance but not of major Importanceat the present time to either KPA or IRC. It is possible, however, that thepotential exists for transit traffic to become very much more important to KRC;

- 18 -
130 heavy trucks per day is an important factor in determining decisions in theroads sector.
Tanzania
(i) Port of Dar es Salaam (THA):
1987 Dry Cargo(million tons)
Total 2.080Transit 0.298 *
Transit 1 14.3
* Central Corridor traffic only -- total transit traffic, including traffic toMalawi, Zambia and Southern Zaire, accounts for 52Z of dry cargo movements.
(ii) Tanzania Railway Corporation:
1987 Traffic(million)
Tons Ton-kasTotal 0.79 632Transit 0.24 292
Transit 2 30.3 46.2
(iii) Roads: Transit traffic flows, by road, along the Central Corridor arestill very low, averaging about ten trucks per day.
(iv) Summary: Transmit traffic using the Central Corridor routes is arelatively small proportion of total dry cargo traffic at DMS port. Transitflows, by road, are still very low, but transit traffic is of considerableimportance to TRC, generating over 302 of tons and around 45% of ton-kms. Thefuture of transit traffic should be of crucial importance to decision-making inTRC.

- 19 -
IV. MAJOR ISSUES WITHIN THE NORTHERN CORRIDOR
A. Infrastructure
General Conditions
4.01 By 1992, the general condition of the infrastructure on the NorthernCorridor should be relatively good and will not be a serious issue. The presentpoor operating concitions on some of the road sections within Renya and much ofthe Ugandan network will have been remedied. The port infrastructure at Mombasaneeds no expansion, and the infrastructure of KRC and URC should not be thelimiting factor to traffic expansion.
Specific Problems
4.02 While, in general, the condition of the infrastructure will beadequate, a number of specific problems will remain. These, as well as the moregeneral issue of maintaining the system are discussed below.
Kagitumba-Usanda Road Link: It has been the Rwandese Government policy sincethe late 1970s to develop the Kayonza-Kagitumba road as its major link to theNorthern Corridor. The upgrading of the earth track to a paved road wascompleted in 1988. Rwanda has, therefore, two paved connections with theNorthern Corridor: via Gatuna, and via Kagitumba.
4.03 The route via Gatuna has recently been reconstructed and reducestrip distance by 52 kms. Unfortunately, the vertical alignment of the route isdifficult and there are some long, steep downhill gradients for incoming trucks.Despite the distance saving, heavily laden trucks carrying imports may preferto use the Kagitumba route. It is possible that a circular movement pattern maydevelop with import trucks entering via Kagitumba, and export and empty trucksexiting via Gatuna.
4.04 The upgrading of a 29 km section of road is still required tocomplete the paving of the Kagitumba route. The short section, within Uganda,links Kagitumba to the main Kabale-Mbarara road. It is very unlikely that thissection has high priority in Ugandan road planning and thus Rwanda should beprepared to fund the necessary improvements.
Nakuru-Kisumu Rail Link: Uganda now routes most of its rail transit trafficthrough Kisumu rather than Malaba.
Uganda Rail Transit Traffic: Northern Corridor(toas)
KISUMU MALABAImports Exports Total Imports Exports Total
1987 135,800 104,000 239,800 3,500 12,200 15,7001988 124,000 121,100 245,100 4,700 11,800 16,500

- 20 -
4.05 The construction of a wagon ferry terminal at Port Bell will furtherincrease the cost effectiveness of the Kisumu route, and a major shift in trafficback to the Malaba route seems unlikely in the foreseeable future. Train costson the Kisumu branch line are higher than on the Malaba mainline as a result ofthe train load restrictions. KRC may recover these higher operating costs inthe tariffs that have been negotiated with URC, but the strengthening of thebridges and viaducts, to allow normal train operations, may be both economicallyand financially justified. The ongoing assistance project to KBC includesinvestigation of the engineering needs and costs on the Kisumu line. Once thesecosts have been assessed an investment appraisal should be undertaken.
Road Maintenance: Almost all ongoing investments in reconstruction andrehabilitation aim to reinstate the existing network of paved roads. The roaddeterioration can be ascribed to the combination of three factorst
(M) the roads were not designed for heavy commercial traffic whichwas supposed to move by rail;
(ii) excessive damage of the roads by trucks overloaded in relationto legal limits and road standards; and
(iii) inadequate and/or delayed road maintenance.
4.06 It is reasonably clear that unless overloading and road maintenancefunding are controlled, and organization and implementation are raised to thelevels commensurate with investment, there will again be a gradual decline inthe quality of the infrastructure. Maintenance and its financing are the keyissues for infrastructure on the Northern Corridor.
Potential Issues and Problems
4.07 A number of potential routing issues may have to be faced by theLLC as a consequence of investments either being made or being proposed by theTransit Countries. Essentially, these investments could shift traffic from roadto rail and would dovetail with the desire to preserve the newly improved roadnetwork. Three investments, in particular, could have an impacts
(1) Extension of the Kenya Pipelines When the pipeline is extended west fromNairobi it is almost inevitable that the LLC will be required to move theirwhite oils from the new terminAl. Whether this will be to their benefit willdepend upon the pricing arrangements for the extension. If the extension ismade to Eldoret or Malaba there could be the incentive to require on-wardmovement by rail, thus utilizing the available capacity on the Malaba line.This possibility also applies, however, from the existing terminal at Nairobi.
(ii) Inland Container Depot (ICD) at Malabas Cargo transshipment, from railto road at Malaba, was proposed by the World Bank in 1980 but no effective actionwas taken. KPA now proposes the creation of new ICDs for containers, similarto Embakasi, and Malaba is their first priority. Use of the existing ICD is notmandatory for Kenyan importers but, if a similar facility were created at theborder, it may be in the interests of both RPA and KRC for the Government torequire all transit containers to use the new ICD.
4.08 Such direction would not be in the interests of the LLC, given thecomparative road and rail rates for containers and the additional movement time

- 21 -
by rail. A Integrated KRC-URC through container rail service Mombasa-Kampala,possibly customs controlled and accompanied, might be attractive but not a partrail service with transshipment at the border.
(iii) Reactivation of the Rasese Lines The ilmmediate investment proposed forthe Kasese line is to maintain basic operations, but the NRM Government has madeit clear that total rehabilitation/upgrading is their ultimate objective. Ifthe RNE objective is achieved there would be strong pressure to maximize the useof the line, and this could include transit traffic. The Government has alreadyshown its willingness to intervene and directly assign traffic to particularmodes and simple cost calculations might suggest that use of the Kasese line wasthe least-cost alternative for both domestic and transit traffic.
4.09 These potential problems follow from the combination of investmentand government direction. In the case of Kenya it might be argued that, giventhe political power of the Kenyan trucking lobby, such direction of trafficwould be resisted as have been attempts to control vehicle overloading. It ispossible, however, to contemplate a scenario of much greater Kenyan Governmentinterventions
- desire to preserve new road investment;- inability to control transit vehicle overloading;- financial deficit on ERC, government reluctance to finance
unremunerative services and need to increase ERC revenue; and- reduced Kenyan earnings from international trucking as Uganda
shifts to rail and the ZBR countries use their own trucks.
4.10 Under these circumstances, maximization of net transit revenues toKenya could require the direction of transit traffic to rail. The reducedinternational demand for Kenyan trucking could diminish the resistance of thetrucking lobby to such direction. The other routes available to the LLC would,however, limit the impact of intervention as traffic could divert to DSM.
B. Movement Capacity and Efficiency
Mombasa Port
4.11 The reputation of Mombasa as a modern and efficient port has fallenvery considerably during the last few years. Port users tend to cite the mergerof the cargo handling company (Kenya Cargo Handling Company) with the KPA as thereal start of the downward trend in productivity and efficiency. The fall inproductivity has not noticeably increased berth congestion as the port has excessberth capacity, especially for general cargo.
4.12 Most port users complain about the inflexibility of IPA managementat both the top and middle levels. The low level of labor morale, the lack ofcommitment, restrictive practices by the union, and the need to make informalpayments are also frequently mentioned by port users. There is general agreementthat the port is grossly over-staffed with about 10,000 employees when 7,000-8,000 would be sufficient. Low wages may be one cause of poor labor morale;however, although rates are below those of the private sector, KPA employeesremain among the best paid in the public sector.
- 22 -
4.13 Shippers complain about the slow rate of ship turnaround, theunpredictability of port charges, and RPA's interpretation of the tariffstructure. CIP agents complain about the slow rate of clearance from the port,a lack of functioning equipment, and the poor quality of handling and loadingthat takes place within the port. Direct loading for onward transit movementrarely takes place at the port, and almost all cargo is taken to outsidewarehousing where it is reloaded. This short distance transport adds $5-$7 perton to the cost of transit.
4.14 During the first six months of 1989, ship-to-shore container handlingproductivity fell to levels experienced before the introduction of the containerterminal. The Conference lines estimated that they lost $500,000 from shippingdelays and introduced a container surcharge of $78(TEU. The surcharge led torapid action by the port management to increase availability of equipment, obtainspares, and manage more effectively. Ship-to-shore productivity rose quicklyand the surcharge was lifted in October. The situation is still closelymonitored by the Conference who will have little hesitation in reimposing thesurcharge if productivity falls again.
4.15 'While the loadinglunloading of container ships has improved, therehas been little improvement in other aspects of Mombasa port performance. Shorehandling of containers is still slow, and breakbulk and bulk handling continueto have low rates of productivity. According to one shipping agent there is animplicit surcharge on bulk charters to Mombasa through high rates and demurragepayments.
4.16 Management and labor problems are major causes of the decline inport performance, but a lack of functioning handling equipment also contributesto the problems. The fourth container crane is being erected; unfortunately,it is the same design as the two existing French gantry cranes which have a poorreputation among port users. It has also been suggested that the supply ofspare parts is a major cause of low equipment availability. Now that the portis charging shipping dues in foreign exchange, it might be desirable if the KPAwere to be allowed an overseas account for the purchase of spare parts, ratherthan having to go through the Central Bank.
4.17 The XPA has recently introduced a new tariff structure which hasraised very considerably shipping and cargo handling rates. A recent consultantstudy recommended these increases but accompanied by a significant reduction inwharfage payments, the new rates reduced wharfage by only 0.05Z. It has beensuggested that the new tariff makes Mombasa the most expensive port in theregion, and one of the more expensive ports in the world. Under the new tariffthe KPA has maintained the concessions in port charges for transit traffic:wharfage on imports, 0.952 of CIF value rather than 1.45Z; and preferentialstorage charges.
4.18 In general, port charges are a relatively small proportion of totaltransport-transit costs. Speed and efficiency in cargo handling are often ofgreater importance in the choice of port than small differences in port charges.On the other hand, it does seem possible that Mombasa is becoming inferior toDSM in terms of both cost and efficiency. The shipping agents believe that

- 23 -
Mombasa is now the most expensive port in the region, lacking a comparable levelof services.
4.19 KPA management recognizes that there are problems and that the eorthas lost transit traffic to other routes. Management views the major problemsas largely beyond its control, created by customs and the Kenysn securityservices (see this Chapter, section: C. Transit Regulations). To a considerableextent, this view is probably justified by the specific difficulties faced bytransit traffic. The more general problems of declining port performance are,however, much more the responsibility of KPA management.
Kenya Railvays
4.20 KRC still faces problems in increasing efficiency and becoming morecommercially orientated. Assistance from the Bank/U.K. project is directedtoward helping RRC in these respects. Domestic KRC traffic appears static andthe introduction of class 94 locos has given KRC sufficient movement capacityto handle more transit traffic. in Uganda the view was expressed that KRC hadthe movement capacity but lacked both the political goodwill and commercialinterest in moving more traffic. This may be simplistic but the apparent lackof KRC interest in developing transit traffic has puzzled observers for a numberof years. Given the traffic and the length of haul, transit traffic would appearpotentially a very profitable rail traffic.
4.21 Developing the potential transit market will require closer workingrelations with URC which are still characterized by mutual suspicion regardinginvoicing, wagon interchange, and rental payments. It will also require thestreamlining of KRC's operation and the re-establishment of block marshallingfrom Mombasa if not block trains through to Kisumu. Revision of tariffs andfaster transit times are prerequisites if KRC-URC are to take a substantialshare of the container market which is likely to increase as Uganda regainseconomic momentum and container handling facilities are developed. At present,rail cannot compete with road transport for container traffic on either tariffor service levels.
Road Transport
4.22 Road transport has dominated the Northern Corridor since the mid-1970s. Initially the Kenyan road transport almost monopolized traffic, butgrowing Rwanda and Burundi national fleets have depressed demand for Kenyantrucks and created some excess capacity. Increased competition for the remainingtraffic has reduced substantially the rates. It is difficult to see presenttransport rates covering full vehicle costs (Annex 10) unless:
- actual loads are well in excess of the 30 tons assumed;- export backhauls are much more extensive than the trade statistics suggest;- costs are reduced by truckers taking advantage of the distorted exchange
rates in the region, changing currency on the unofficial market and thenpurchasing vehicle inputs at official prices (the high transit tollsimposed by Uganda were intended to compensate for this activity); and
- vehicle operating costs are overestimated by the standard models for thistype of operation and/or owner.

- 24 -
It is also possible that many of the present vehicles are relatively old andthat their owners are willing to operate at little more than variable cost.
4.23 Loaded transit trucks operating on the Northern Corridor commonlyhave axleloads and gross vehicle weights well above national limits and thoseestablished under the Northern Corridor Transit Agreement. The lack of effectivevehicle weight control has encouraged truckers to purchase vehicles with thehighest possible load potential. The absence of coordination between theMinistries of Transport and those responsible for Issuing import permits hasmeant that vehicles have been imported into the LLC which make nonsense of theregulations.
4.24 Kenya has, for many years, accepted the need to control vehicleoverloading and, on occasion, control has been attempted. The political powerof the trucking industry and the prevalenceleffectiveness of unofficial paymentshave soon ended such attempts. The situation is viewed seriously by the Ministryof Public Works, and heavy commercial vehicles have not been allowed to use thenew Limuru-Nakuru road. There are also serious worries over the design life ofthe proposed Kabete-Limuru road reconstruction and widening, if axleloads arenot limited.
4.25 Consequently, the Kenyan Government is again trying to enforce thenational ten-ton axleload limit which has also been agreed by the NCTA, and isproposed as the standard for the PTA. The Government recognizes that pastattempts to enforce loading limits, using fixed weighbridges, have not beensuccessful, and therefore intends to use portable weighscales operated on anirregular schedule. If effective, the control could bring about quite majorchanges and create major short-term problems for the LLC, especially for themovement of petroleum products. The road transport industry is not, however,overly concerned and is confident that eventually this attempt at control willbe no more successful than previous efforts.
4.26 Active enforcement of the ten-ton axleload limit would undoubtedlyraise significantly the cost of using the Northern Corridor. Short-termdislocation in the petroleum supply industry would be experienced as so fewtransit tankers can meet the ten-ton limit. Even if there were only enforcementon axleloads in excess of 13 tons, which are the real target of Kenyanenforcement policy, there would still be serious problems for the tanker fleet.
4.27 In a situation of static traffic patterns, Kenya could benefitconsiderably from enforcement of axleloads: reduced road damage/ road maintenancecosts; increased demand for transport services; more transit vehicles and thusmore transit fees; and increased diesel sales and fuel taxes.
4.28 It is clear, however, that the LLC have become increasingly flexiblewith regard to transit routing. Enforcement of axleload and vehicle weightrestrictions in Kenya could result in the shift of transit movement to DSM andthe Central Corridor. Regional enforcement of harmonized regulations would,however, leave the comparative advantage of the routes unchanged. The PTA hasargued for regional harmonization of vehicle regulations, transit licenses androad-user taxes. Whether this harmonization, as proposed by the PTA, is in the

- 25 -
interests of either the LLC or transit countries is discussed later (seeChapter IX, section: K. Transit Costs to the Transit Countries).
C. Transit Regulations
Northern Corridor Transit Agreement (NCTA)
4.29 Customs regulations and documentation have long been recognized asan important cost-creation center on .he Northern Corridor. The regulationsincrease the cost of C/F activities and raise transport costs by reducing vehicleutilization through letngthy delays at border crossings. After several years ofnegotiation, supported by UNCTAD and the EEC, the Governments of Kenya, Uganda,Rwanda and Burundi signed the NCTA in 1985; Zaire acceded to the agreement in1987.
4.30 The NCTA established a single road transit document which wassupposed to meet the customs requirements throughout the Northern Corridor.The Road Customs Transit Declaration (RCTD) has been introduced on the Corridorand has been accepted as the norm by other members of the PTA. The reports ofCIF agents on the success of the RCTD are mixed. Overall there have been somedistinct benefits, but documentation costs and border delays have not beensignificantly reduced. One of the tangible benefits is the introduction ofdirect transit across Rwanda; previously, transit vehicles had to report toMagerwa in Kigali.
4.31 The general impression is that Kenya creates the major problem, asthe system works well in other countries. It is inevitable that the coastalcountry would require a document in addition to the RCTD which covers only atruck load rather than the total consignment. Kenya uses the RCTD, signed atthe border, to cancel the transit bond established on the basis of the C-34which is also used to calculate port charges. Malaba Customs still requiresoccasionally other documents to be produced.
4.32 The objectives of the RCTD system have been agreed and itsapplication is improving. Further improvements are possible, but the benefitsof the RCTD will always be limited as long as national transit bonds are requiredand suspicion continues both between and within customs' administrations.
Transit Bonds
4.33 All transit goods passing the Northern Corridor have to be transitbonded in each transit country. These bonds cover the lose of customs duty andsales tax if the goods are diverted into the domestic market of the transitcountry. As customs duties and sales taxes differ between countries, a standardbond cannot be issued. The required separate bond in each country is animportant cause of the problems encountered in implementing unified customsdocumentation.
4.34 The bonds are arranged with local banks and insurance companies whobasically guarantee payment of the duty if the goods are lost and the C/F agentdefaults. In essence, therefore, the bond is less for the goods and more for

- 26 -
the CIF company. According to the main C/F agents, the loss on road transportand thus payable duty is very small, and the bond only generates revenue for thebankslinsurance companies and indirectly for the C/F agents. Monitoring themovement of goods to ensure the speedy cancellation of bonds is a significantpart of the CIF agents overall costs but also provides large profits. Dependingupon the commodity the bond can add 1-22 of the CIF value to the cost of transit.
4.35 One of the principal advantages of the Central Corridor is the useof the Transit Pass to control the movement of transit goods. The Transit Passallows goods to pass through Tanzania without the need for transit bonds,reducing both the costs and administrative inconvenience. It is clear thattransit countries require some control over transit cargo but the use of nationaltransit bonds does appear excessive on the Northern Corridors
- transit goods can only be smuggled into one country, but the systemcan require several bonds;
- the bond is required even if the movement of cargo is undertaken bygovernment-owned transport, e.g., KRC; and
- the bond is required even if the goods must travel under policeescort.
4.36 According to the Secretariat of the NCTA, several countries areprepared to introduce the Transit Pass, but Kenya is insistent that the bondsystem continue. Even if the continued use of bonds must be accepted thereshould be ways in which the costs could be reduced and the formalitiesstreamlined. A regional transit bond, guaranteed by either the membergovernments of the NCTA or an international insurance company, would be one stepto simplification. To reduce border formalities a single bond covering allcountries is necessary. At present C/F agents have to complete the bondinformation at the border for each transit country.
Security Regulations
4.37 Cumbersome customs regulations have been exacerbated in Kenya byadditional restrictions, regulations and formalities on transit vehicles. Duringthe 1980s, a number of regulations were imposed and then removed: for example,the ban on night driving, escorts for coffee trucks, and 1002 verification ofall transit containers at Mombasa. The additional formalities which now haveto be followed by transit traffic in Kenya are:
Verification of Containers at Mombasa: Although 1002 verification is nolonger applied, a very significant proportion of containers (25%-302) arestill subject to verification at Mombasa. The verification has to takeplace in the presence of KPA, the police, Customs, the Audit Department,the Administrative police, and the C/F agent.
Presentation of Original Import License: This is a new requirementrecently introduced. A copy of the original import license, issued inthe LLC, must be presented before the goods can be cleared from the port.The measure seems specifically directed at Uganda, as special dispensationis given to Rwanda and Burundi allowing the Rwandese Consul and therepresentative of OTRABU to sign for the goods. In addition to the import

- 27 -
license, the Ugandan importer must also produce a copy of the company'sCertificate of Incorporation.
P27: The police have recently introduced a new truck control system ontransit vehicles. All transit trucks have to register at a series ofpolice checkpoints as they travel through Kenya.
Police Escort of Sensitive Cargo: A number of 'sensitive" commoditiesare required to travel by escorted convoy through Kenya. The list ofsensitive goods includes such items as secondhand clothes, tires and spareparts. The C/F agents estimate that about 40X of containers have to travelin convoy. The impact of the convoy system on the transit times isdramatic, raising the round trip time to Kampala from about eleven daysto three weeks. Even if a truck is escorted in a convoy, the P27 formalitymust still be followed.
4.38 These additional formalities have been imposed not by customs butby the security services. The security services rather than the customs arenow seen as the major impediment to the smooth operation of the transit corridor.The KPA, KRC and C/F agents all agree that these regulations are the primarycause of dissatisfaction with the route and the shift of traffic to the CentralCorridor. C/F agents estimate that it takes 24/25 different stamps on documentsand 10-12 days to clear goods out of the port ready for onward transit, whileit should only take three days. Even with the elaborate customs and securitysystems, trucks and containers are subjected to further inspection at both sidesof the Kenya-Uganda border; unbroken seals from Kenya Customs in Mombasa areapparently little valued by Kenya Customs at Malaba, and even less by UgandaCustoms.
4.39 Corridor or regional transit agreements have a role in establishingthe framework for efficient transit services, but they cannot guaranteeefficiency. Loss of transit traffic to the Central Corridor and decliningtransit revenues in Kenya may stimulate pressure from the transporters andclearing agents and help to generate political awareness of the economic coststhat the present restrictions are imposing.

- 26 -
V. MAJOR ISSUES WITHIN THE CENTRAL CORRIDOR
A. Infrastructure
Roads
5.01 Roads in Tanzania have been allowed to seriously deteriorate butaction is now underway to fund a major rehabilitation program for the main roadnetwork. Road connections between DSM and the LLC are likely to remain difficultfor the next few years, and it is possible that the projects will not proceedas fast as hoped. Assuming that the critical sections in the network receivepriority, road transport will continue to be a feasible alternative for the ZBRcountries.
5.02 While road rehabilitation is essential, it is critical that aneffective system for both funding and undertaking future maintenance isinstalled. Previous maintenance neglect was the critical factor in generatingthe present situation and if this neglect is repeated, the benefits of theproposed rehabilitation program will be short-lived.
Rail
5 03 While the fixed infrastructure of TRC is weak, it is not the criticalconstraint to operations on the corridor. On the other hand if transit trafficwere to reach the levels implied in Chapter X, section: B. Traffic Distribution1995: Least Cost Assignment, the infrastructure would have to carry freight oftwo million tons per annum, in addition to passenger traffic, and it is possiblethat track capacity on some critical sections may need to be raised. Such issueshave been addressed by the TRC Development Study.
DSN Port
5.04 The mid-term review of the THA Rehabilitation Project assumes a drycargo throughput of three million tons in 1992; 5O0 of the traffic is forecastto be containerized. The Project is expected to sufficiently raise capacity atthe port to handle this level of traffic, but a lower rate of containerizationcould quickly result in congestion at the general cargo berths.
5.05 In 1987, container traffic accounted for about 28? of total drycargo; this is expected to rise to 53? in 1992. Container penetration of thetransit market is expected to be high by 1992:
Imports ExportsZBR 502 702Uganda 60? 60?
5.06 In 1986, 7? of Rwanda dry cargo was containerized, and this is onlyexpected to rise to 13? by 1990, possibly an overly optimistic estimate. Rapidgrowth in containerization may be desirable, but it may require much more rapidimprovement in inland transport than is likely by 1992. The issues connectedwith the containerization of LLC traffic in the region are discussed further inAnnex 11.

- 29 -
5.07 The infrastructure of the inland transport systems will be in placeby 1992: Kigoma will hopefully be equipped with adequate container handlingfacilities; the Isaka terminal and associated road network should be operational;and the Port Bell wagon ferry terminal should be operational.
5.08 The major issue will be whether TRC has both the movement andmanagement capacity to handle the traffic and allow the turnaround of containerswithin the time permitted to avoid demurrage. It would appear that many of thecontainers delivered to Bujumbura are retained vithin Burundi and not returned.At present, road transport for Rwanda and Burundi seems the only feasible wayto transport containers within the time constraints and, even then, turnaroundtimes are slow. It is possible, therefore, that containers destined for the LLCmay have to be stuffed/stripped at DSM to avoid port congestion outside storagefacilities.
5.09 If the forecast rate of containerization does not take place andcongestion at the conventional berths becomes serious, it is probable thattransit traffic from ZBR and Uganda will diminish as shippers transfer back tothe Northern Corridor. CIF agents see the two corridors as very competitiveand have developed very flexible attitudes toward traffic routing.
5.10 The organization and provision of storage facilities for the ZBRand Uganda at DSM needs to be considered, bearing ln mind the potentialdevelopments elsewhere in the transit systems and the possibility of using BlockTrains operated by/for the LLC. Belbase continues to function, but if theforecasts of the Mid-Term Review are correct, there will be almost 0.5 milliontons of ZBR cargo transiting the port in 1992, well above the capacity of thepresent Belbase facilities.
5.11 Perhaps the space and capacity limitations of the port, which haveencouraged the establishment of terminals for Malawi and Zambia outside theimmediate port area, should be recognized and steps taken to apply similarsolutions to other transit cargo. The reorganization and relocation of Belbasecould well assist in the functioning not only of the port, but also of onwardtransport. This issue is discussed further in this Chapter, sections C. TransitSystems for the Central Corridor.
B. Movement and Handling Capacity
DSI Port
5.12 It is generally agreed that much improvement has taken place at theport during the last couple of years. Much of the change has been brought aboutby THA management adopting a flexible approach to the problems and acceptingassistance from not only the aid community but also the shipping lines andprincipal shippers. The attitude is reflected both in terms of accepting theuse of private equipment in the port and in terms of port handling charges tonew customers such as STIR and Transocean. Long-term users of the port reportthat the initial labor problems that faced the port after the creation of THA

- 30 -
have now been resolved and that labor relations and productivity have improvedsubstantially.
5.13 It is possible that some of the flexibility was forced on portmanagement through its recognition of the deficiencies of the port. There isa danger, therefore, that once the port rehabilitation is complete and thecontainer terminal fully operational, THA management will return to the attitudesmore characteristic of previous periods. To maintain and strengthen thecompetitive edge of the Central Corridor, which should be to the long-termadvantage of Tanzania, the present operational flexibility at DSM must bemaintained. Despite ongoing investment, capacity constraints may reoccur duringthe mid-1990s and, to avoid major additional investment, increased productivityrequiring flexibility from both THA and port users will be essential.
5.14 The port has limited spaced available for the storage of containersand thus the rapid throughput of containers is essential. Unfortunately, acombination of cashflow problems among parastatal importers, cumbersomeprocedures, and a less than fully motivated customs service have combined toproduce very long dwell times for domestic containers. While this long dwelltime is not an immediate problem for transit containers, storage congestion atthe port would quickly affect all container cargo, domestic and transit.
5.15 Considerable emphasis is given in the proposed port project tostrengthening management and improving productivity at the port. A much morearms-length relationship between the port and the government is suggested withport management being given much greater financial freedom in return for thepayment of higher returns back to the Treasury. Incentives to both portmanagement and labor will be provided by performance related bonus paymentswhich will be a condition of the loan. Improving staff productivity throughbetter motivation is critical for the port.
TRC
5.16 Increased movement capacity and efficiency on TRC is central to thedevelopment of the transit system in East-Central Africa. TRC is the link whichprevents fuller exploitation of the Central Corridor;
- Uganda has sufficient wagon capacity;- DSM port is being preferred to Mombasa and will soon have muchimproved container handling facilities;
- Kigoma port has been rehabilitated and should soon havecontainer handling capacity well above its needs;
- capacity on Lake Tanganyika and at the Port of Bujumbura isavailable; and
- funding for the Isaka terminal and the associated road network hasbeen agreed.
5.17 Unless TRC can move the traffic, Rwanda, Uganda and, to a lesserextent, Burundi will have to continue to rely upon the Northern Corridor, andthe very substantial investments made to achieve route diversification will notrealize their potential and provide the cost reduction and increased transitsecurity anticipated. Similarly, if transit times by TRC are not reduced, thedevelopment of containerization through DSM will be hampered. The movementconstraints upon TRC are recognized and are addressed in the Emergency Program

- 31 -
which is intended to increase both motive and wagon capacity. The additionalcapacity will be largely absorbed by increased Tanzania domestic movements, andfurther additions will be necessary if the potential total traffic demand of twomillion tons by 1995 is to be met.
5.18 Transit traffic in both East and SoutheLn Africa has been volatile,and it may be neither in the financial interests of TRC nor in the economicinterest of Tanzania to invest for traffic which could revert to other routes.It could be in the interests of all if the additional capacity was provided bythe LLC themselves. This issue was raised by Burundi as far back as 1979 whenTRC was prepared to accept additional rolling stock but was not prepared toconcede its dedicated use for Burundi traffic nor the concept of Burundi trains.For Rwanda and Burundi traffic, the use of dedicated trains may, given theimbalances in traffic, appear inefficient, increasing empty running. But if thecustomer is willing to pay for the enhanced service, then TRC should be willingto provide it, especially if its domestic traffic capacity is not affected. TheEEC is actively considering the provision of complete block trains to assist themovement of transit traffic. Initially the trains were to be given to the LLCbut this plan has been modified, and TRC would receive the locos and wagons.Burundi, under UNDP funding, is also receiving technical assistance to defineits equipment needs for operating Burundi unit trains on TRC.
5.19 Uganda's fleet of locomotives and wagons is being expanded verysignificantly with 13 additional locomotives and 600 wagons. URC should havethe capacity to run its own unit trains to DSM; it already provides almost allthe wagon stock used on the DSM-Jinja route. The 13 locomotives may be needed,however, within Uganda if the economy and URC traffic regain previous levels.In the event of the Ugandan Government wishing to make full security use of theDSH route, it may be faced with a choice between purchasing more locomotives orallocating domestic locomotives to international traffic.
5.20 The provision of locomotives and rolling stock is relatively easy,dependent only on funding and the time necessary for delivery. Making theequipment work efficiently, deciding the pricing of services, providing themanagement, and determining the division of responsibi'-ities between TRC and theLLC, with appropriate and enforceable penalties for the non-fuifillment ofcontractual obligations, could be much more difficult. TRC management is weak,and labor morale and motivation are very low. Unfortunately, unlike THA, thefinancial position of TRC is also very weak and, consequently, management maynot be able to consider the immediate inclusion of performance-related paymentsas part of the regular labor payment system.
5.21 There is general agreement that progress in improving the situationwill be slow and although movement capacity will expand, the present systemwould be incapable of handling the volumes of traffic that Uganda may choose toroute via DSM. If Uganda were forced to rely heavily on the Mwanza-DSM link,a very heavy involvement by URC would be necessary. Given the rapidity withwhich events in the region change, some prior contingency planning would bedesirable as well as more general planning to improve the efficiency with whichmore normal levels of transit traffic are handled.

- 32 -
5.22 It is essential that a full study be undertaken of the possiblearrangements for the ownership and operations of block trains before anynegotiations between the LLC and TRC take place. While Tanzania may have becomemore flexible, the concept of non-national trains running over TRC track is newto TRC management, and the details and implications will need to be fullyexplored. In the context of the limited management capacity of TRC, it seemsessential that the simplest operation be undertaken. This may require:
- a scheduled regular service which runs irrespective of whether afull train load is available;
- a point-to-point service: this might require the establishment ofrail-served entrepots outside the port area since attempting tooperate from within the port would be difficult and probably furtherlimit port capacity;
- a homogeneous train composition: this might take the form of eithercontainer trains or trains with fixed proportions of container flats,covered wagons, etc.; and
- train and wagon maintenance under contract to either TRC or perhapsto URC, if there is sufficient spare capacity at the new workshop.
5.23 There would also be the problem of fixing the appropriate chargingprinciples for use of TRC track, train running services, etc. Overall, thestudy would need to be very detailed if it were to establish the principles forservice and lay the framework for the actual operating agreements. Given thecrucial nature of capacity constraints for both TRC and the LLC, it would bemost appropriate if the study were to overlap with the present TRC DevelopmentStudy.
Kigoma Port
5.24 With the rehabilitation of the port and the provision of a containercrane, Kigoma should not be a constraint on the system, as long as theavailability of shunting capacity is maintained. Unfortunately, there havebeen delays in arranging for a suitable container crane, and some uncertaintyregarding the project has developed.
C. Transit Systems for the Central Corridor
The Transit Pass and Transit Formalities
5.25 One of the main advantages for the LLC in using the Central Corridorhas been the relaxed transit system employed by the Tanzanian Government. Thesystem was developed for ZBR cargo and works well. Transit goods are carriedunder a transit pass which is cancelled when the goods leave Tanzania.Originally, all transit goods were moved by rail and were thus effectively undergovernment control. There was thus no logical need for shippers to providetransit bonds.
5.26 The advent of road transport to the ZBR countries and of significantvolumes of Uganda cargo has resulted in two transit systems. For ZBR cargomoved by TRC and by some approved CIF agents using road transport, such as STIR,

- 33 -
the transit pass system is used. Some transporters still have to use the transitbond. When Uganda cargo started to use the route, a transit bond system wasrequired; this has since been changed and Uganda traffic now also uses thetransit pass system.
5.27 Unlike Mombasa and the Northern Corridor, transit regulations forcontainers are straight forward. Unless the seals have been broken or tamperedwith, transit containers are neither opened nor inspected at DSM, or at theborder. The container storage problems at DSM are mainly the result of customsinspection of domestic Tanzanian containers and the shortage of TRC movementcapacity to move transit containers.
5.28 In terms of the development of an overall transit system formovements through DSM, a unification of procedures within Tanzania might beuseful. A regional approach to transit facilitation has been encouraged by thePTA but extending the Northern Corridor Transit Agreement would be counter-productive. As far as possible, the essential elements of the present CentralCorridor system should be maintained. According to a PTA expert:
*The transit facilitation system on the Central Corridor isdefinitively superior to any other transit system within EastAfrica, in particular, and in the entire PTA subregion, in general;hence it is desirable that the modus operandi of extending it to theentire subregion should be considered."
5.29 Unfortunately, toward the end of 1989, the Tanzanian Government,through the Central Bank, started to introduce new transit documentationdesigned to control the foreign exchange generated by the transit system. TheTT2 form created considerable confusion within the transit industry as therewere many uncertainties and ambiguities regarding its application. There werefears, in Burundi at least, that the form was designed to give complete controlto Tanzanian-registered companies. The Central Bank has explained that the formis simply to assist in maintaining records of foreign exchange transactions forTanzanian companies. Fortunately the idea of the TT2 was dropped before it wasactually introduced, although it is perhaps too early to say whether this isonly a temporary postponement. The effect of such documentation is unclear, butat best it will simply generate additional, unnecessary and costly formalitiesand, at worst, it could seriously undermine the competitive advantage that theCentral Corridor has achieved.
5.30 The Tanzanian Government is concerned that there is a leakage offoreign exchange obtained by Tanzanian companies operating in the transitindustry. It is feared that foreign exchange is converted on the parallelmarket rather than through official channels. To a certain extent this is true,and the costs charged by truckers on the route reflect this situation. IfTanzanian truckers were to change all their earnings at the official rate, therates they would have to charge would rise very significantly, and they and theroute would become uncompetitive. By trying to increase official holdings offoreign exchange, therefore, the Tanzanian Government could substantially reduceforeign exchange earnings.

- 34 -
Belbase, Kigoma and AMI
5.31 Mhe present arrangements have served Burundi and Zaire reasonablywell, especially during periods when conditions in the port and on TRC resultedin severe operational problems. Management at both Belbase and the Port ofKigoma is competent and has often appeared well above the standards found on therest of the network. It is understandable that the LLC are unwilling to giveup the present arrangements without substantial compensation in either financialterms or alternative transit arrangements. There are, however, drawbacks in thesystem:
- Disruption in the port of DSM has been a complaint frequently raisedby THA management. In the past, the problems have been minor andthe argument weak, but dual management could become a more seriousproblem in the future. The space available at the port is limitedand integrated port management may be the smooth functioning of theport;
- The present legal status of Belbase is unclear and there isreluctance to finance rehabilitation and improvements until thestatus is resolved;
_ In the medium term, additional berths will be required at DSM. Oneoption for the expansion would entail construction of additionalberths alongside Belbase. If this option were adopted, thecontinuation of the Belbase arrangements would seem undesirable;
- Belbase is a relatively small area and is not the most suitableplace to organize the movement of regular block trains which shouldbecome an increasingly important part of transit to the ZBRcountries; and
- Belbase and its management by AMI intend to distort the choice oftransit routes. Only cargo consigned through AMI or Transintra,which has close connections with AMI, uses the Migoma route. Cargohandled by other transitaires is moved by road.
5.32 The dual role of AMI, C/F agent and managing agent for the Belbasesgives the company a quasi-monopoly upon the Kigoma route. Other CIF agents canonly obtain the concessionary rates for ZBR cargo if they use Belbase, and theythen have to pay AMI management fees, prepay charges in F/E, and the goods passunder AMI's control. Consequently other C/F agents use the general portfacilities, pay the normal wharfage and storage rates, and transport cargo tothe ZBR countries by road. For low-value bulk commodities, however, thewharfage concession may be little advantage to AMI, as it is a very smallcomponent of total transit-transport costs.
5.33 Rwanda cargo is a minor part of Belbase traffic, while Burundiimports and coffee exports, together with Zaire copper/zinc exports, are themain commodities handled. For a number of years Burundi has had the intentionto construct its own terminal in DSM and this may be a more viable long-termsolution. Belbase covered storage would form part of the general port

- 35 -
infrastructure and the open area could continue to act as a holding ground forZaire metal exports.
5.34 If the Isaka route handles traffic for all the ZBR countries, ratherthan just Rwanda, then a new consolidated transit storage area, with thecapacity to handle the expected growth in traffic, potentially around 150,000tons, may be desirable. Management of such facilities would need carefulconsideration and a renewable management contract, open to both AMI and othercompanies, may be one alternative to explore.
The Isaka System
5.35 The Isaka route is a major development in the region's transitinfrastructure. The capital costs associated with its development have beenconsiderable with the construction of over 330 km of paved roads and a raillroadinterchange terminal. The development of the route has been discussed since thelate 1970s, but unfortunately the discussions have rarely proceeded beyondgeneralities. The lack of attention to the details of what is actually requiredat the Isaka terminal, the arrangements for management, and relations betweenthe terminal and TRC may have been factors in the recent delays in proceedingwith the final agreement for construction of the terminal. The delaysintroduced by the Tanzanian authorities may also have been related to inter-governmental discussions on other issues.
5.36 The terminal should now be completed by 1992, and it is essentialthat an efficient operating system be in place when the route becomesoperational. This system must include not only the terminal itself, which willbe managed by Magerwa, but also the management of the port/rail interchange atDSM and the organization of the train movement between DSM and Isaka. The Isakaroute will mirror the present transport chain to Kigoma, and it will beimportant for its efficiency to avoid the type of monopolistic elements thathave developed on the Kigoma route and to introduce a management pattern thatmaintains freedom of choice between routes, C/F agents and transporters.
5.37 This is basically a problem for Rwanda, which has been leased theterminal site, but the system will also require terminal arrangeuients at DSM,either within or outside the port area, and an operating agreement with TRC.The terminal is expected to be operational by 1991/92, and serious discussionson the operating arrangements should now be a high priority.
5.38 There is still doubt over the role of the Isaka terminal in relationto non-Rwandese traffic. Clearly whether other traffic will use the terminalwill influence the scale of facilities required. From the viewpoint of Burundi,access to Isaka is desirable as an insuran-e against a major breakdown on theKigoma route. It is perhaps doubtful whether Burundi would be prepared to makea long-term commitment if the Isaka terminal was owned and operated entirely byRwandese-based organizations.

- 36 -
VI. TRANSIT ISSUES WITHIN THE LLCs RWANDA
A. Infrastructure
6.01 The quality of the road infrastructure within Rwanda has beenimproved considerably since 1980. With the completion of the paving of theKayonza-Kagitumba road and the reconstruction of sections of the Kigali-Gatunaroad, there is little or no additional investment required within Rwanda forinternational traffic.
6.02 Maintenance of the existing improved road network must now becomethe main priority. A Road Fund, drawing revenue from tolls and fuel tax, hasbeen established to finance road maintenance. Unfortunately, the projectedrevenue for the fund, RwF 730 million, is significantly below total estimatedroad maintenance requirements, and additional resources from the general budgetwill be necessary. If sufficient funds cannot be generated, then prioritiesbetween roads will have to be set and very -areful consideration given to anyfurther extension of the network.
B. Government Intervention: Present S .uation
6.03 Rwanda has been faced with serious disruption to its transit routeson a number of occasions. The Government has responded by placing considerableemphasis on national control of its transit traffic and, to a lesser extent,diversification of routes. Planning for route diversification seems largelyinspired by crises within the transit network. The Isaka terminal is about tobe constructed but discussions on the project were initiated almost ten yearsago. With the improvement of the Northern Corridor, following the LiberationWar in Uganda, the impetus waned only to be revived with the transit problemsof 1985.
6.04 Rwanda has adopted one of the most interventionist policies towardinternational traffic. In some respects, the policies have achieved theirobjectives, and the international land movement of Rwanda trade is largely underRwandese control. The objectives have, however, been achieved at a high costto the Rwandese consumer. The Government is making statements indicating arelaxation of the rigid controls and the stimulation of greater cotnpetitionwithin the Rwandese industry, as well as allowing more competition from thenationals of other countries. These statements have yet to be translated intopolicy changes and in some respects government control may even increase.
Road Transport Policy
The Policy
6.05 Rwanda is almost totally dependant upon trucking for itsinternational transport. This situation will continue as the economic prospectsfor viable rail connections, proposed by the Kagera Basin Organisation (KBO),are remote. The Rwanda Government has made great efforts to minimize dependenceupon foreign trucking capacity. This policy has been pursued by the creationand financial support of the parastatal transport company STIR, and by

- 37 -
administrative protection of all Rwandese truckers. The details of the policyhave changed but not the broad framework, for examples
_ transport can only be arranged through approved transport companies.The requirements for these companies is such that, at present, onlytwo companies -- STIR and CORWACO (a private company) -- fullyqualify, and a third -- Interfreight -- has partial recognition;
- all other transporters must act as sub-contractors to the approvedcompanies who charge a 52 commission;
- transport from Kenya has to be approved by the Rwandese consuls,acting on behalf of the Ministry of Transport, who issue anAuthorization for Transport (ITAR); Kenyan trucks are only usedwhen Rwandese trucks are not available; and
_ maximum transport rates, for both dry cargo and petroleum products,have been set by Government. The actual rates charged are slightlylower than the official maximum, but there is little pricecompetition and the same rates are charged for both import andexport cargo.
The Effect
6.06 Under this protection the Rwandese heavy truck fleet, operatingalmost exclusively on international routes, has grown rapidly from 229 trucksin 1982 to 565 in 1987. The growth is reflected in the proportion of Rwandeseimports carried by national vehicles, from 102 in 1981, to 31? in 1985, and 59Zin 1987.
6.07 All exports by road are carried in Rwandese trucks. There iscontinuing investment in heavy commercial vehicles, and the danger of excesscapacity exists, especially for petroleum products as Rwandese trucks alreadymove more than 75?. The policy of administrative protection has only beenapplied to the Northern Corridor, and there are no restrictions on roadtransport from DSM. As a consequence, while Rwandese trucks have almost 702 ofthe market on the Northern Corridor, they have less than 72 on otherinternational routes.
The Costs
6.08 Protection of the national fleet and the administrative allocationof transport have resulted in higher transport charges than would be expectedfrom a competitive industry. The tariff for the Mombasa-Kigali route has beenset at RwF 16,800/ton, approximately $210. Increasing capacity in the Rwandesetrucking industry has led to some limited price competition and, for very largeconsignments or for regular clients, the rates may fall to RwF 14,500/ton, butthe majority of cargo is still carried at the administrative rate. These ratesmust be compared with rates of around $190 -$200 for traffic between Mombasa andBujumbura, a trip of an additional 290 km and another border crossing.

- 38 -
6.09 A free market rate for Rwandese cargo might be around $160/ton fordry cargo. In very broad terms, the present system of national protectionprobably costs Rwanda about $S50/ton for dry cargo imports and $45Iton forpetroleum products. In 1987, Rwandese trucks carried 143,800 tons of cargo(POLT 62,300 mt; Dry Cargo: 82,500 mt) at a total additional cost of$6.9 million.
6.10 In addition, there is no backhaul rate for export traffic which ischarged the same rate as imports, i.e., RwF 16,800/ton. Burundi exports toMombasa are charged a backhaul rate of $125/ton, and there would seem littlereason for a backhaul rate of higher than $100/ton for Rwanda exports. Theextra costs for 50,000 tons of exports are thus $5.5 million. Overall,therefore, the present system of national protection could be costing Rwandaaround $12.5 million per annum. These estimates must be qualified by a numberof factorst
- Rwanda vehicle operating costs include local direct and indirecttaxes but Kenyan charges include the Rwandese transit tax of$142/trip;
the Rwanda franc is overvalued, possibly by 30-501. thus Kenyanrates understate their real economic cost to Rwanda. Devaluationwould, however, also increase Rwandese trucking costs which have a502 foreign exchange component;
3 the assumed backhaul rate is speculative and, if seasonal factorsand Zaire's export surplus are considered, may be slightlyoptimistic;
3 the increase in Rwandese trucking capacity has helped to depressthe market rates charged by Kenyan truckers; and
- Kenyan rates have fallen significantly, from $205-$235 per ton in1980, and may reflect short-term overcapacity in the sector. Thepresent Kenyan rates may not, therefore, be sustainable in thelonger term (Annex 10). On the other hand, the rates quoted fortraffic to Burundi are quoted by Burundi truckers.
6.11 Despite the qualifications it must be concluded that the costs ofprotection are high, and recent calculations even suggest that the presentadministrative rates are uneconomic for Rwandese trucks and increases have beenrequested. Rwandese trucking is a high cost operation:
- vehicle utilization is very low -- average annual utilization of thefleet is only 8.5 international trips, compared to 12-18 for Kenyantrucks and 24 for Kenyan tankers;
- vehicle input prices are high, partly as a result of the distancefrom the sea, partly from limited competition within Rwanda;
- owners expect very short vehicle lives and thus require very highreturns, to repay loans and generate profits; and

- 39 _
- most vehicles are purchased with loans which require very expensivecomprehensive insurance, approximately 16Z of the vehicle value perannum.
6.12 The present arrangements provide little incentive for competitionor efficiency within the Rwandese trucking sector. During part of 1989, coffeeexports from Rwanda were substantially reduced as a response to low coffeeprices and, as a consequence, there was a major shortage of Rwandese trucks atMombasa. The flow of imports was seriously disrupted and eventually Kenyantrucks had to be subcontracted. Basically, Rwandese trucks do not leave Rwandawithout a load of either coffee or tea, preferring to operate loaded in bothdirections rather than achieving a higher annual rotation.
6.13 The structure of ownership in the trucking industry (parastatal, orinfluential members of the civil and military elites) ensures that the dangersof the non-competitive, cost-plus approach to protect the least efficient willcontinue. Rather than reducing the rates to Mombasa as a means of encouragingthe more efficient utilization of trucks, export loads have been restricted to24 tons to ensure that more trucks receive some load. It is not surprising thatefficient companies, such as Interfreight, are content with the arrangements asthey must be making very substantial profits.
6.14 It has been suggested that Rwandese trucks' costs may beartificially inflated to increase the allocation of foreign exchange providedby the Central Bank, foreign exchange which is then either kept outside thecountry or used to purchase goods which are smuggled back into Rwanda.Conventional 'stimates of vehicle operating costs, based on Rwandese truckoperating characteristics, suggest that Rwandese trucks may not be covering fullcosts. Given the complications of calculating costs when the use of blackmarket exchange rates is endemic, the possibility that foreign exchange is beingexported cannot be rejected.
6.15 Rwandese trucks have taken a substantial share of the marketpreviously supplied by the Kenyan road transport industry. If Rwandese truckingcapacity continues to expand, it is possible that 10O2 of Rwandese traffic onthe Northern Corridor will be carried in Rwandese trucks. The Kenyan truckerswill thus be effectively excluded from the Rwandese market and the possibilityof retaliatory action by Kenya must exist. This could take the form ofmandatory traffic sharing as occurs on some West African transit corridors,enforcement of vehicle regulations or mandatory use of KRC for transit throughKenya with transshipment at the terminal planned for Malaba.
Possible Improvements
6.16 The present policy may cost Rwanda $12.5 million per annum,approximately 42 of imports or 102 of export earnings (rather less if thecurrency over-valuation is taken into account). The policy does give Rwandaconsiderable flexibility in terms of movement capacity, and it might be arguedthat 32 of total trade value is not an unreasonable insurance premium for thislevel of transit security.

- 40 -
6.17 It is unlikely that the Government would be willing to totallyderegulate and risk a return to almost total dependence on foreign truckers.There should be changes to the present policy, however, which would preserveRwandese participation while reducing the costs of protection. Essentiallycompetition must be introduced into the Rwandese Industry and increased vehicleutilization encouraged. Various policy initiatives such as those describedbelow should be evaluated:
- privatize STIR either as a single company or as separate transportand CIP companies;
- dissolve STIR and sell the assets to the private sector. This couldallow smaller, more efficient Rwandese truck operators to expandtheir fleets, and new companies to enter the industry at relativelylow cost;
- auction the ITAR rights for carrying transit cargo. A quota ofITARs could be reserved for Rwandese trucking companies, and theremainder auctioned on an open basis;
- reduce the restrictions on registration of approved transportcompanies and encourage the growth of professional transportersrather than simply ownership of vehicles;
- differentiate between the rates for import and export cargo todiscourage truckers from waiting excessive periods for return loadsor simply allow open competition for export cargo; and
- encourage tendering for the movement of government and parastataltransport.
6.18 The Rwandese trucking sector has grown very rapidly in response topositive government protection. It is possible that, given the lack of activemanagement participation by many owners, the industry would be seriouslydisrupted by sudden exposure to full international competition. Sometransitional arrangements may be necessary, initially encouraging competitionwithin the Rwandese industry. Transitaires must also now be registered and meetvarious requirements regarding capital, ownership, etc. It is redundant to havethis control on transitaires and still insist on the use of approved transportcompanies. An initial step toward competition within the industry might be toallow any nationally-registered transitaire to contract any Rwandese truckingcompany for the movement of cargo. Another possible approach would be to oveto the Burundi system where the industry is open to all, but rates are paid inlocal currency. Rwandese truckers would receive an allocation of foreignexchange for their external costs while foreign truckers would have to converttheir earnings on the parallel market. This would effectively replace thepresent quota system by tariff protection for the domestic trucking industry.

- 41 -
Air Transport Pplicy
6.19 Serious dislocation of coffee exports was threatened in 1979 and,largely in response, Rwanda purchased a Boeing 707 freighter to move coffee toMombasa and carry high value imports as return cargo. It is debateable whetherthe 3707 was the right aircraft for the Mombasa route, but it did give AirRwanda the additional capability of flying directly to Europe.
6.20 Unfortunately, the price charged for air cargo between Mombasa andKigali, RwF 40/kg, is unattractive under normal circumstances for almost allcargo when compared with the road rate of $210/ton. Shippers are normallyprepared to pay a premium for reduced transit times, higher reliability andreduced risks of loss and damage, but a premium of $300/ton is excessive whenthe shippers have already used sea transport to bring the cargo to Mombasa.
6.21 To provide cargo for the B707, the Government has made it mandatoryfor certain specified commodities to be flown from Mombasa. At the same timethe B707 has been sub-contracted for direct flights to Europe and can only makelimited flights to Mombasa. This places importers of the specified commoditiesin a very disadvantageous position since they have to pay the high cost of airtransport, while not reaping the full benefits. Not only are goods delayed atMombasa but often the Rwandese Government insists that containers, with thespecified cargo, be stripped at Mombasa for onward air transport. Loss anddamage are thereby increased, and the importer loses in a third fashion. Thepresent regulations increase total import costs by over $1.5 million withoutconferring any real benefits.
6.22 The utilization pattern of the B707 must change. From January 1990,it will no longer be allowed to land in Europe because it cannot meet noiseregulations. The resale value of the aircraft is low, but it has an operationallife of at least another five years if a substantial refit is undertaken in thenear future, costing around $2 million. The future role of the B707 and airtransport generally is already the subject of studies financed by CIDA and ICAO.
6.23 With the development of alternative transit routes through Tanzania,the security offered by domestic air transport is no longer of primaryimportance. The first policy priority must be the abolition of the obligatoryair-freighting of cargc, from Mombasa; the second priority must be to assesswhether the forthcoming maintenance of the B707 is justified either nationallyor within the context of the regional airline to which the countries of theCEPGL are supposedly committed. Rwanda's air transport needs are relativelysmall, and it may make far better economic and commercial sense to develop asingle, regional air-freight company rather than a number of small nationalcompanies.
Hagerwa
6.24 All domestic imports have to pass through Magerwa which providescargo storage and secure parking for vehicles. Customs can authorize directdelivery of cargo; otherwise goods have to be stored at Magerwa untildocumentation is completed. Magerwa allows 15 days free storage fordocumentation. Prior to 1989, all transit trucks also had to pass through

- 42 -
Magerwa for weighing and the collection of transit fees. kwanda has now agreedthat with the RCTD this is no longer necessary, and transit trucks can now passdirectly from border to border.
6.25 Magerwa charges importers 42 of the CIF value, for the servicesrendered. This may appear high, but 3Z of the CIF value goes to the DevelopmentBudget and is thus a blanket import tax. The net fee to Magerwa, 1 CIF, issimilar to the wharfage payment at Mombasa. A change to a cost-related chargingsystem has been suggested, with fees related to actual services anddifferentiated by type of cargo.
6.26 Magerwa centralizes customs clearance in Kigali but given the routestructure, this probably does not create significant additional costs. Anylosses will be further reduced with the planned new Magerwa facilities at Butareand Gisenyi. The need to either detain vehicles or off-load and store cargodoes create additional costs, and a more streamlined customs clearance procedureincreasing the possibility of direct delivery from the border, would bedesirable.
National Bank of Rwanda (BNR)
6.27 BNR plays a pervasive role in Rwanda's international transport.The Bank has the power through its approval of import licenses, as separate pro-forma invoices for goods and transport are required, and through its allocationof foreign exchange for the transport costs. The intervention of the Bankcovers a wide spectrum:
- it established the list of commodities which must be carried by airfrom Mombasa;
- it has influenced/directed the use of conference and non-conferenceshipping;
- it has attempted to reduce the use of direct air transport fromEurope; and
- it has probably restricted the use of containers by refusing torelease FIE for rental surcharges.
More generally the delay of two months in transferring funds for the payment oftransport from port to Rwanda raises the total costs to the consumer as thecharges are prepaid by the C/F agents who pass the cost to the importer.
6.28 There is obviously an important role for BNR in Rwanda'sinternational trade, but it is questionable whether the staff have thespecialized transport-transit expertise to make decisions upon detailedtransport issues without, it appears, significant interaction with the Ministryof Transport.
C. Government Intervention: Possible Extension
6.29 Government intervention is already pervasive but further controlsmay be introduced. If this occurs, it is highly probable that the domesticeconomy will pay an even heavier price for external trade security.

- 43
Extension of Road Transport Restrictions
6.30 Ilternational road transport is seen as profitable by those who havethe influence to obtain credit. High returns are required to service the loansand, partly as a consequence, transport rates to Mombasa are high.Increasingly, importers axe finding the use of DSM attractive due to betterservice from the port, simpler transit regulations, no transit bonds, and lowertransport costs ($150 rather than $210/ton). Rates are low on the DSM routebecause the Mombasa system of national protection has not been applied, andcompetition between truckers prevails.
6.31 Traffic is moving from the Northern Corridor and Rwandese are stillinvesting in trucks for the international market. If Rwandese truckers findover-capacity on the I4ombasa route, they will try to persuade the government toextend the transport authorization system to all international routes, includingDSM.
6.32 Rvandese truckers have offered to operate from DSM as long asnational protection was provided and the price was fixed at $200/ton.Calculations in Rwanda suggest that $200/ton may be below their costs but stillconsiderably higher than the present market rates. If it were applied on theroute, the additional costs to the importer would total about $2.8 million (1987import tonnage) and raise the total annual costs of protection to about $16million.
Rwanda Entrepot: Mombasa
6.33 For some years the Rwanda and Kenya Governments have discussed theestablishment of a Rwandese entrepot at Mombasa, and a study was undertaken in1980. A site of 12.9 ha has now been leased to Rwanda for the construction ofthe terminal. The original studies were based on an entrepot within the portarea; unfortunately the actual site is 9.2 km from the port and, under presentconditions, it is difficult to envisage the investment producing verysignificant benefits. Port storage charges are unlikely to be reduced as themajor C/F agents already move the cargo to their own storage facilities. Acentralized facility will simply add to existing capacity. Centralization couldlimit the role of the private C/F agents and give the Government greatercontrol, possibly protecting private or parastatal Rwandese CIF agents.
6.34 The depot site is about 500 m from a KRC siding, and there may besome merit in a centralized facility if block trains were to move cargoupcountry to either Malaba or Kampala/Kasese; but a voluntary return to arail/road solution along the Northern Corridor seems unlikely in the short term.More disturbing is the suggestion that rail would be used to transfer goods fromport to entrepot. Short distance road transport in Mombasa may be expensive butvery short distance rail transport is likely to be even more expensive as wellas considerably less flexible and efficient.
6.35 The ADB has been approached for the funding of the project, and anappraisal mission has completed its investigations. The Rwandese Government ishopeful that ADB funding will be approved. Unfortunately, investment in theterminal is very probably a misallocation of scarce resources as the project

- 44 -
will provide little economic benefit. One of the main attractions for theGovernment appears to be the increased control the terminal will give overtransit traffic as it has been suggested that all imports will be obliged touse the terminal. The Rwandese authorities should be persuaded to delay theimplementation of the project and devote available resources to the Isaka routewhich offers the prospect of far greater economic and security benefits.
The Isaka Route
6.36 Considerable international funding has been allocated to thedevelopment of the Isaka route, and the required infrastructure should becompletely open around mid-1991. Very much less attention seems to have beengiven to the operational issues, such as who will operate the system, how willthe system operate, what will be the role of the CIF agents, how will theservices be priced, who will have access to the terminal, and what additionalfacilities are required in DSM.
6.37 The Government has decided that Magerwa will operate the Isakaterminal and has established a committee to determine the detailed operationalaspects of the system. Unfortunately, the working party is only drawn from thegovernment, and no representatives from either the transitaires or transportcompanies are included. It is very hard to envisage an efficient system beingdevised without the participation of the potential users.
6.38 The EEC is considering the financing of block trains to run betweenDSM and Isaka. In some respects, the most attractive scenario would be trainsoperating between consolidated terminals at DSM and Isaka. The problems are toidentify suitable facilities in DSM (Belbase has insufficient capacity, and theinvolvement of AMI would deter other C/F agents), and to determine the form ofmanagement necessary to achieve the economies of scale while preservingcompetition within the transit industry.
6.39 Unless a considered and coherent operating system is developed priorto the opening of the facility it is quite easy to envisage the followingscenarios
(a) Terminal managed by Magerwa, this has now been announced;(b) Transport Isaka-Zigali contracted to Rkandese truckers;(c) Initial operating problems on the route, little coordination;(d) CIP agents continue to use all-road solution from DSM;(e) Isaka terminal underutilized and incurs operating losses;(f) Rwandese Government makes it mandatory that the Isaka terminal has
to be used on Central Corridor;(g) Private ClF agents switch back to Northern Corridor; and(h) Rwandese Government, through BNR, extends powers to direct traffic
to corridors, routes, modes and transporters.
6.40 The allocation system might look plausible on paper but would bealmost certainly extremely inefficient and costly in practice. The RwandeseGovernment would achieve effective total national control but at considerablecost. The Isaka route has the potential to significantly reduce Rwanda's totaltransit costs, but it is crucial that the system attract traffic through cost

- 45 -
and efficiency rather than Government direction. Importers must retain thefreedom to determine route, mode and transporter.
6.41 Without a much more detailed study, it is not possible to putforward the precise system that should be introduced on the Isaka route. It is.however, very clear that a full study of the operations for the Ilaka route isessential. Such a study must includes the ownership and management of thefacilities, including potential block trains; organization of movement withinand from DSM; organization of movement from Isaka; relationship of terminalmanagement with importers, government, C/F agents, TRC and road transporters;and accessibility of the terminal to Burundi and Zaire traffic.
6.42 The EEC has been largely responsible for the funding of theinfrastructure associated with the Isaka route, and it might be appropriate ifthey were encouraged to fund the operational study. The Bank was, however,closely involved in the development of the DSM transit system for Malawi whichis quite similar to the Isaka route. It would be beneficial if the experiencegained on the Northern Corridor were transferred to those developing the Isakaroute.
VII. TRANSIT ISSUES WITHIN THE LLC: BURUNDI
A. Infrastructure
Present Transit Network
7.01 The present transit network and developments already funded provideBurundi with as much infrastructure and transit security as the country islikely to achieves
- Bujumbura-Kigoma-DSM: rail/lake route;- Bujumbura-Kigali-Kampala-Mombasas road route;- Bujumbura-Mwanza-Nairobi-Mombasa: road route;- Bujumbura-Isaka-DSMt road and possibly rail/road route; and- Bujumbura-Mpulungu-Lusaka-Harares road/lake route.
7.02 Considerable route diversification has been achieved when comparedto the almost total dependence upon the Kigoma route during the 1970s. Despitethe available transit routes, however, the Burundi economy lost substantialforeign exchange earnings when TRC was unable to move coffee exports in 1986.Those responsible for coffee marketing in Burundi were unable to organizemovement by other routes and modes and thus failed to benefit from the highprices. The experience suggests that more routes will not necessarily solve thetransit problem unless accompanied by sufficient management capability andflexibility on the part of shippers.
7.03 Conditions on some road sections to Rwanda and Tanzanla are notideal, but rehabilitation and reconstruction have already been agreed. Oncethese projects are completed, there would seem little potential for furtherimprovement to the transit infrastructure within Burundi.

- 46
Planned Developments
7.04 Over-investment is probably now a greater potential problem than aninadequate infrastructure. Several recently completed, committed or proposedprojects are, at least, partly justified on the basis of improving transitconnections or route diversificationt
- Gitega-Cankuzo-Tanzania link with Isaka;- Road Link with Kigoma;- Additional road link with Rwanda via Kirundo;- Bujumbura Port rehabilitation and improvement; and- New shipyard at Bujumbura.
7.05 It is difficult to envisage Burundi's international trafficjustifying substantial new road links, especially given the existinginfrastructure. Careful consideration is required to ensure that theseinvestments are really justified by cost savings or revenue generation as theywill not increase Burundi's transit security.
7.06 There are still problems in the transit system but increasinglythese revolve around movement and handling capacity, management andorganization. The limitations on the Northern and Central Corridors have beendiscussed in Chapters IV and V and need not be repeated.
7.07 Burundi also receives a substantial volume of bulk cargo from theport of Mpulungu in Zambia. Inadequate handling capacity and the generalinefficiency of the port are said to be constraints. Burundi has already sentone crane to Mpulungu but additional improvements are necessary. The futureflow of imports through the Southern Corridor is, however, somewhat uncertain.At present they consist very largely of cement and sugar. Sugar imports willsoon be replaced by local production, and a local cement plant may beconstructed in the 1990s. Additional trade may, however, develop throughBurundi's membership of the PTA, but such trade is unlikely to generate thevolume of flows presently handled.
B. National Transit Policies
7.08 The Burundi Government has played an active role in improving thecountry's transit position. The Government has established a parastataltrucking company, and obtained additional lake transport capacity andimprovements in infrastructure within transit system. Burundi is a signatoryto the Northern Corridor Transit Agreement and has established regular bilateraltransit negotiations with Tanzania on the Central Corridor. Governmentintervention in transit operations may not be as extensive as some othergovernments in the region, but it is still considerable.
The Role of the Central Bank (BMO)
Route and Mode Choice
7.09 The Central Bank in Burundi plays an important role in the controlof Burundi's foreign trade and in the organization of transit. The BDallocates import licenses, fixes the routes for imports, and allocates funds to

- 47 -
transporters. Until recently, for example, the Bank only allowed the import ofvehicle spares by sea; this regulation has now been modified and most spares areflown to Bujumbura. Air transport may have a higher direct transport cost butmay be preferable in terms of generalized transit-transport cost, includingtransit time, loss/damage, inventory cost, etc.
7.10 Unfortunately the Central Bank, according to the C/F agents, has avery restricted perspective on transport costs, considering direct rather thantotal costs. More particularly, once decisions are made there is littleflexibility to adapt these to changing circumstances. The time validity forimport licenses has recently been extended from four to eight months, but somegoods are still delayed at port waiting for new licenses to be issued.Container movements to/from Bujumbura are slow, and the BNB is reluctant to fundthe demurrage payments which are often necessary. This may have reducedsignificantly the use of door-to-door containers. Containerization of importtraffic is probably inevitable, and Burundi must have the administrativeprocedures to take the maximum advantage from the development.
7.11 One of the major complaints from the transit industry is thearbitrary nature of the involvement of the Central Bank. The rules are notclearly established and may not be applied for extended periods of time.Importers and transitaires become used to one operating environment whensuddenly the BNB changes the parameters. It is clear from discussions that theENB has little intention of relaxing its control, and it is also clear that thelevel of its knowledge regarding detailed transport issues is limited. It isof paramount importance that, if the BNB is going to continue playing a role,the policies and regulations be clearly defined and transparent in order thatthe industry has confidence in the environment within which it must operate.
Protection of Domestic Trucking
7.12 Central Bank policy has also a distorting effect upon competitionbetween local and foreign trucking companies. The BNB generally refuses toallocate FIE for international road transport which has to be paid In FBu. TheBank will, however, issue to local truckers a fixed F/E allocation to meet costsin transit countries (fuel, transit tolls, crew expenses). Foreign truckers canstill carry cargo, but they are paid in FBu and receive no allocation of PFI andmust convert their revenue on the parallel market. The BNB does show someflexibility with regard to this policy and will authorize payment of FIE toforeign truckers if there are no Burundi trucks available to move the cargo.The recent movement of POL from DSM was largely undertaken by foreign trucksbecause Burundi truckers were either unable or unwilling to operate on theroute.
7.13 It is difficult to determine the level of protection provided bythe Central Bank. The parallel currency market is illegal and thus payment inFBu should have no interest for foreign truckers. On the other hand, theparallel market exists and PBu can be exchanged at a discount of 202-25Z. Truckdrivers certainly use the unofficial currency markets, but trucking companiesmay be unwilling to rely on such markets.
7.14 It is not clear whether the local currency payment requirement hashad the effect of totally eliminating international competition on the Mombasaroute. It is thought that about 702 of trucks operating to Kenya are now

- 48 -
Burundi registered. Kenyan trucks still operate the route and have aconsiderable share of dry cargo movements, but this does not mean that suchtrucks are prepared to accept FBu and use the illegal parallel marL:t. Thereare still a number of CIP Bujumbura contracts, generally aid-financed goods, forwhich international road transport would be paid in foreign currency.
7.15 While the policy undoubtedly raises the financial costs of roadtransport, its impact upon the national costs of transport is less clear andwill depend upon a number of factors, such as: (i) the overvaluation of theBurundi franc and the level of the foreign exchange payments made to Burundiantruckers; (ii) the incidence of Burundi taxation on vehicles and vehicleinputs; (iii) the relative efficiency of the Burundi industry and the extent towhich companies such as OTRABU act as price fixers; and (iv) the premium whichthe country is prepared to pay for the flexibility of its own internationaltrucking fleet.
7.16 On the basis of approximate calculations of F/E, local cost and taxelements in vehicle operating costs (Annex 13), the distortion caused by thepolicy is relatively small, and the additional costs to the Burundi economy areprobably rather less than 5Z of transport charges. Certainly the policy appearsless damaging than the more direct intervention policy applied in Rwanda whichfixes rates and allocates transport.
7.17 There has been a definite decrease in the cost of road transportduring the last few years. Transport rates on the Northern Corridor have fallenfrom around $340/ton in 1980 to S180-S200/ton in 1988. The policy pursued bythe Central Bank gives a cost advantage to the Burundian truck but does notinhibit competition within the Burundian trucking industry nor preventcompetition with international trucking companies for, at least, some contracts.
7.18 Competition within the international trucking sector could befurther increased if privatization were to bring about more efficientperformance by OTRABU, the largest Burundi trucking company. The Government hastaken the decision to privatize the company, but there are still verysignificant doubts over the extent of private participation and managementcontrol. There is the danger that the Government is intent on achieving formalprivatization while retaining ultimate control of the company.
7.19 While the present trucking policy is preferable to that pursues inRwanda, it still gives considerable arbitrary power to BNB to allocate transporton the basis of transport cost. The system could be made more transparent ifthe BNB was to issue tariff guidelines, for the use of foreign trucks, based onthe type of analysis used in Annex 13. If importers can obtain tariff ratesfrom foreign truckers below these guidelines, they should have the automaticright to employ these truckers. This would remove the illegality of the presentsystem and increase effective competition.

- 49 -
Other Transport Policies
Import Insurance
7.20 Until a year ago all import cargo into Burundi had to be insuredthrough the parastatal SOCABU. Insurance rates were high, possibly three timeshigher than normal international insurance, and probably reflected the company'smonopoly as much as high risks. A private insurance company has been operatingin Burundi for the last year, and this has slightly reduced the rates. Muchgreater competition may be necessary before insurance rates fully reflect theinherent risks of transit.
International Agreements
7.21 NCTh: Burundi is at the end of the Northern Corridor andconsequently has proportionately more transit documentation costs and delaysthan the other countries, and thus has more to gain from international transitfacilitation than either Rwanda or Uganda. On the Northern Corridor, Burundimust transit three transit countries from Mombasa, while Rwanda faces only twoborder crossings and Uganda one. Burundi would thus gain significantly ifdocumentation costs and border delays were reduced by full implementation of theNTCA, as well as its extension to cover such areas as long-term visas for truckdrivers operating within the region, regional vehicle insurance, etc.
7.22 Transit tollst Harmonization of transit tolls and vehicleregulations are major policy priorities of the PTA. In general, thesimplification of transit regulations is in the interests of LLC, such asBurundi. Unfortunately, the present proposals of an axleload limit of ten tonsand a simple vehicle-km transit toll could cause disruption to Burundi's fuelsupplies, and a significant increase in transit costs for all commodities.Severe disruption of fuel supplies would occur since very few Burundi tankerswould be able to meet the azleload limit and, consequently, the fleet would haveto be re-equipped with new tanks. Increased costs would result from the lowervehicle payloads that the regulations would impose. Burundi should seekharmonization of tolls using a more flexible approach based on the likely roaddamage attributable to different vehicles. One possible approach is outlinedin Annex 14.
Isaka RaillRoad Route
7.23 Burundi would like to be an active participant in the use andmanagement of the Isaka raillroad interchange terminal. Forecasts, preparedfor the Kobero road study, suggested that a significant volume of Burunditraffic would use the terminal, if an adequate level of rail efficiency wereachieved. The Burundi Government argues that as the development of the routewas financed from regional funds, it should benefit the region rather than onlyRwanda and should be regionally managed. The land for the terminal has,however, been leased by the Tanzanian Government to Rwanda, and it is unlikelythat Rwanda will agree to management participation as it has stated that Magerwawill operate the terminal.
7.24 There is a need to ensure that the size and type of facilities arerelated to the likely traffic demand and that, once constructed, they areutilized. Burundi should try to reach an agreement with Rwanda upon the type

- 50 -
of management, availability of capacity, and tariff structure. Alternatively,Burundi could contemplate the construction of its own limited terminal at Isaka.It is difficult, however, to see enormous advantage for Burundi in using Isakarather than the existing Kigoma route. Transport costs DSM-Bujumbura will besubstantially lower via Kigoma than through the Isaka route which includes acostly trucking component (see Chapter IX, section: A. Transit Costs to theLLC: Introduction). Isaka may be cheaper for traffic to the North and East ofBurundi, but changes in Burundi Lustoms procedures will be needed.
7.25 The Isaka route will only work well if there is a tremendousimprovement in the performance of TRC. If such a change occurs on the Mwanzaline it could equally occur on the Central line. The road improvementsconstructed for the Isaka route may give more benefits to Burundi than the routeitself as they will reduce the costs and transit times on the road routes to DSM4and to Kenya via Mwanza.
Burundi Terminal at DSM
7.26 There has been a long standing agreement with Tanzania for theconstruction of a Burundi terminal at DSM but no effective action has yet beentaken. If the concept of block trains for transit traffic on both the Isakaand Kigoma routes were seriously considered, the terminal could form part of theoverall operating system and could even act as reciprocal participation for theRwanda terminal at Isaka. It should form part of an overall operationalstrategy study for the transit route development (see Chapter VI, sectionsC: Government Intervention: Possible Extension).
Lake TransRort
7.27 Lake transport capacity to Kigoma is largely provided by the privatecompany Arnolac. Increasing capacity is now being developed by other companiesbut, in view of the low rates to Kigoma, they operate almost exclusively toMpulungu. The lake transport rates, for commodities other than coffee, haverecently been increased for the first time since 1980. Arnolac argues that theincreased revenue has been offset by higher payments at Kigoma, and the ratesare not sufficient to meet operating costs. If operating capacity is to bemaintained on the route, the rates may have to be further increased.Alternatively, given the increasing lake transport capacity, the rates could befreed and competition between Arnolac and the other companies encouraged.
Coffee Marketing
7.28 Coffee has traditionally been exported through the Kigoma route toDSM. The transit time can typically be two months which can seriously affectthe quality and thus price of the coffee. Erratic delays on the Kigoma routeeffectively prevent Burundi from reacting rapidly to changes in the world marketprice and selling on the spot market with guaranteed delivery dates at DSM. TheBank suggested very strongly for a number of years that Burundi should considerexporting its high quality 'fully washed' coffee by road. The Goveramentrejected these suggestions on the grounds that the coffee might be stolen andthat road transport was more expensive. During 1989, the increase in the flowof imports coming from DSM to Burundi by road has created a significant backhaulcapacity to DSH.

- 51 -
7.29 Trucking companies have offered extremely low rates for carryingcoffee as backhaul and as a consequence a significant volume of coffee is nowbeing exported by road. Rates for coffee as backhaul have fallen to $65/ton,lower than the costs by the traditional lake-rail route. Exporting coffee byroad is particularly attractive for the high quality coffee which is grown inthe north and east of the country and thus convenient for the new Isaka roadnetwork. Direct export avoids the need to transport the coffee to Bujumburawith the associated costs and losses of additional handling.
Supply of Petroleum Products
7.30 POL imports form a major part of Burundi's total imports and arecritical to the functioning of the economy. The Burundi Government is facedwith a number of important issues if fuel security is to be improved and fuelcosts reduced.
Route Security: Secure supply routes for POL imports are the majorpriority for the Government, low cost supply routes would be a furtheradvantage. Burundi's main supply route shifted to the Northern Corridorin the late 1970s and POL imports now form the main Burundi traffic onthis corridor. Supplies were, however, threatened by the recent domesticproblems in Kenya, and the petroleum companies were forced to use Dar esSalaam as a supply point, mainly trucking the POL to Burundi.
Contrary to previous preconceptions regarding supply through DSM, thepetroleum companies found that supply could be arranged relatively easilyand the route worked well, at costs comparable with those on the NorthernCorridor. The main problem with the road option through Tanzania is thatthe present Burundi tanker fleet, which has sufficient capacity to movealmost all Burundi POL imports, was either unable or unwilling to go toDSH and consequently foreign truckers had to be used. Completion of theKobero road link to Tanzania and the general improvement of roadconditions should significantly reduce the impediments to local truckparticipation. The Tanzanian experience does indicate the potential andadds to fuel security for Burundi.
Burundi Tanker Capacity: The present composition of the Burundi tankerfleet is a major obstacle to increased use of road routes to DSM. Thefleet will also face major problems if Kenya seriously enforces its policyon axleloads, as hardly any Burundi tanker can meet the ten-ton axle limitand relatively few could meet a 13-ton axleload limit. Seriousenforcement could, therefore, lead to the short-term immobilization of thefleet while tanks were modified to meet the load limits or new trailerswere purchased. The Burundi Government should seriously consider theeffects on Burundi trucks before agreeing to harmonized transit tollsbased on rigid axleload limits as a more flexible approach might bepreferable.
Kigoma Supply Route: Although some fuel has continued to be suppliedthrough Kigoma the amounts have been very limited. The costs by theKigoma route are, however, considerably lower than via road routes fromKenya or DSM (Table 7.1).

- 52 -
Table 7.1 Burundi POL Supply Costs(FBu per liter)
Petrol DieselKigoms DSM Nairobi Kigoma DSM Nairobi
Supply cost 44.81 31.69 36.17 41.77 27.37 31.21Transport 1.27 28.02 24.57 1.31 27.95 24.51Other costs 1.85 1.62 1.66 1.82 1.57 1.61Margins 15.00 12.00 12.00 15.00 12.00 12.00
Ex-tax cost 62.93 73.33 74.40 59.90 68.89 69.33Tax 37.07 26.67 25.60 32.10 23.11 22.67Pump price 100 100 100 92 92 92
7.31 While there is relatively little difference in the costs betweenroad routes from Nairobi and DSM, the Kigoma route is significantly cheaper forBurundi even when the fBu 3/liter (in 1988 FBu 2.5) incentive for the oilcompanies is included in the calculation. The present cost structure may givea greater incentive to use Kigoma; previously the added margin was more thanoffset by the differences between the official transport cost and the rates thatthe oil companies were actually paying.
7.32 It is difficult to see why the oil companies in Burundi should bepaid a FBu 3/liter incentive for using Kigoma. Some added margin may benecessary as the oil companies would need to hold somewhat greater stocks, butFBu 3 is probably excessive. For the Burundi oil companies the supply routefrom Kigoma is the simplest of the alternatives. The major problem on theKigoma route is getting the fuel to Kigoma, and that part of the operation isunder the responsibility of the oil companies in Tanzania.
7.33 Increased use of the Kigma route would result in significant costsavings to the Burundi economy. Providing an additional margin for the oilcompanies could encourage increased use of the route, but this margin mustenable the incentive to be passed to the companies in Tanzania who supply theoil to Kigoma. Transport capacity on the Central Line of TRC is limited andinformal arrangements have often to be made to secure movement. Burundi mustalso compete with Zaire for the oil that is available at Kigoma. Essentiallythe oil companies in Burundi need more price flexibility in bargaining withtheir counterparts in Tanzania.
7.34 There is the danger that an increased foreign exchange allocationfor the Kigoma route would simply result in an outflow of FIE without anyincreased supply through Kigoma. To guard against this possibility, the addedincentive could become effective only for supplies above the average level ofthe past few years. Burundi could gain P/E savings of about FBu 12/liter byswitching supplies to the Kigoma route, and thus the potential for increasingpayments on the route and reducing overall FIE costs is considerable.

- 53 -
Customs Facilities
Clearance Facilities
7.35 Central customs clearance may have been adequate when economicactivity was concentrated around Bujumbura and the Kigoma route carried alltransit traffic. It will become increasingly costly as development spreads andother transit routes are used. Central clearance may be administrativelyconvenient, but it is costly to have goods brought specifically to Bujumbura andthen sent back to towns like Gitega and Kayonza. In view of the increasingdevelopment of the Northern region, it would be appropriate to have full customsclearance at Kayonza and, when the Isaka infrastructure is completed, fullclearance facilities at Kobero. (The Government has already made the decisionto establish customs clearance at Gitega.)
Container Inspection
7.36 Customs decided in 1988 that all containers must be opened andstripped at the Port of Bujumbura. The decision was taken to improve the levelof control over customs revenue, and perhaps also over customs" officials. Itdoes, however, increase the costs relative to direct delivery and customsinspection at the final destination. At the very least, the appropriateinfrastructure needs to be developed at the port to minimize the delays andensure the safety of the cargo. A system based upon sample checks and heavierpenalties might be more cost-effective. The full costs of centralizedclearance for containers has been avoided by the number of exceptions allowedby Customs. The decision has not been officially altered but, in practice, ithas been allowed to lapse.
VIII. TRANSIT ISSUES WITHIN THE LLC: UGANDA
A. Introduction
8.01 Uganda is the major generator of international traffic in the EastAfrican region and a key transit country. Events within Uganda and betweenUganda and its neighbors have largely dictated the diversification of routesthat has taken place in the region during the last 15 years. Uganda could havethe objectives of both a transit and landlocked country: maximizing thebenefits from transit traffic through Uganda, while minimizing the costs for itsown international traffic and ensuring its own transit security. Uganda isfaced with a number of important issues, largely revolving around the extent ofgovernment control and regulation.
B. Traffic Direction
8.02 The National Resistance Movement (NRM) Government has issuedinstructions to the major government and parastatal importers and exportersregarding transport mode, transport route, and C/P agent. Given the importanceof these organizations, such as the Coffee Marketing Board and the Food andBeverages Corporation, government direction has a significant ,mpact upon theoverall orientation of Uganda's international transport system.

- 54 -
8.03 The Government has instructed thatt
(a) all long distance transport be undertaken by rail. To achieve this,URC entered into a service agreement with RRC for the movement of150,000 tons in each direction for Uganda;
(b) barter coffee exports be routed through Dar es Salasm, as returncargo for barter imports; and
(c) all government and parastatal imports be cleared by Transocean, thegovernment-owned C/F agent.
8.04 The Government's objectives are understandable, given theavailability of wagon ferry capacity, the length of haul from Mombasa, thelimited capacity of Uganda's international trucking fleet, and the desire forreduced dependence on Kenya. Some aspects of government direction, however,increase total transit costs. These aspects as well as the impact of governmentintervention are discussed below.
Node Direction
8.05 There has been some success in shifting traffic to rail; over 90?of exports and almost 5SOZ of total traffic are moved by rail. URC statisticsshow their international movements have increased from 169,000 tons in 1985 to278,000 tons in 1987, and 368,000 tons in 1988 (KRC and TRC statistics oftenshow somewhat higher flows). Transferring imports from road to rail reducesdirect movement costs from Mombasa from around $90 per ton to about $49 per ton(1989 cost levels). The savings are less for exports because the same rail rateis charged, and a lower back-haul road rate would probably apply.
8.06 The direct cost savings from using rail for imports will be partlyoffset by higher indirect costs (longer transit times, greater unreliability,and heavier loss and damage). On the other hand, the traffic carried by railis usually low-value, bulk commodities. KRC statistics on cargo to/from Ugandaillustrate the commodity distribution (Table 8.1).
Table 8.1 Uganda Traffic: Kenya Railways (1988-89)(000 tons)
Imports Exports
Cement 35 Coffee 128Salt 19 Timber 6'Wheat 14 Rides/skins 3Gunny 7 Other 5Sugar 6Lime 5 Total 142Textiles 4Fertilizer 3Other 26
Total 119

- 55 -
8.07 For coffee exports escorted to Mombasa and shipped from port stocks,the additional indirect costs are probably relatively small, and the majoradditional costs will be incurred by imports. The Coffee Marketing Boardwould, however, prefer to have the freedom to use both road and rail, suggestingthat CMB could be incurring some unnecessary costs. Unfortunately, choices byparastatals between state-owned rail and private sector trucking companies arenot always based on purely commercial grounds. Private inducements by truckingcompanies for transport contracts are relatively common and make it difficultto assess the real economic cost of directing traffic to rail.
8.08 The major issue for Uganda is to improve the efficiency of the railroute, increase capacity, and reduce the additional indirect costs of railtransit by raising service levels. Despite the increase in rail tonnage,Ugandan traffic has still not reached the flow levels agreed with KenyaRailways. The reasons for the shortfall in traffic are very difficult todetermine. Kenya Railways suggests that URC efficiency is still too low andcites the very low rate of utilization of two locomotives leased to URC. URCsuggests that political difficulties are the main factor underlying the trafficlevels and that KRC has been instructed, from time to time, not to load cargofor Uganda. Traffic flows of both petroleum products and cement have failed tomeet realistic expectations, but this could be explained by supply problemswithin Kenya. Certainly good political relations can facilitate the operatingrelationships between railways.
Route Direction
8.09 Less overall success has been achieved vith regard to the policy ofroute diversification. Barter goods, possibly unwelcome in Mombasa, have beenimported to Dar es Salaam; some coffee has also been exported by this route.Although URC traffic through Mwanza increased from 42,000 tons in 1987 to106,000 tons in 1988, the increase came about at a high cost to the Ugandaeconomy. Unfortunately TRC does not have the capacity to move the trafficefficiently and, consequently, imports have been delayed in Dar es Salaam forlong periods waiting for onward transport. These delays resulted in highstorage charges, at least $46,000/month, and possibly high storage losses,reportedly as much as 10X.
8.10 In an effort to increase the flow of goods, URC leased locomotivesto TRC. The Ugandan Government has also allowed road transport between DSM andthe ferry terminal at Mwanza. As shown below, movement costs rise verysignificantly with the use of road transport and the premium paid for routediversification becomes substantial.
Movement cost via Mombasa: road $90 per tonI rail $49 per ton
Movement cost via DSM s rail $66 per tons road/rail $111 per ton + additional handling and
storage cost/losses at Mvanza
8.11 On the basis of movement costs, the DSM route is feasible only ifreliable rail operations can be maintained. The rail/road option may benecessary to clear the backlog of cargo but cannot realistically be considered

- 56 -
a solution, except under the most extreme circumstances. ihen account is takenof the transport costs, storage charges and cargo losses, the use of the CentralCorridor in 1987 probably cost Uganda $3 million more than the Mombasa railroute.
Transoceam
8.12 This company was originally a private transportericlearing agencyand was taken over during the Amin period. By 1980, the company was virtuallydefunct and has continued only through large-scale government financialassistance and restructuring. Host of the previous management Was replaced bythe NRM government. Transocean has now been given the monopoly for clearing allgovernment and parastatal import cargo. The company expected to clear 150,000tons in 1988, about 502 imported under barter agreements. The company has evenwider ambitions and would like to take over coffee forwarding from the CoffeeMarketing Board (CMB) and act as a central freight bureau for all trade.Transocean would assume overall control for all international transport movementbut would delegate much of the actual C/P functions to others.
8.13 Even though Transocean had a monopoly in 1988, other CIF agents wereresponsible for clearing and forwarding most government cargo from Mombasa.This appears anomalous but much of the cargo was imported CIF Kampala and theprivate companies could clear cargo from the port, but Transocean had to clearthe cargo at the Ugandan border. This duplication was, at best, redundant andwas probably both inefficient and costly.
8.14 In May 1989, Transocean circulated guidelines to all Ministries andparastatals establishing procedures for public sector importings 'Governmenthas decided on a two Letters of Credit strategy for imports effected byGovernment and Parastatal Bodies." The guidelines establiRhed differentprocedures for three types of imports:
(a) Imports locally-financed -- Proforma invoice to contain details ofFOB cost, insurance premium and freight cost to final destination.One LIC to be opened for FOB purchase and another in favor ofTransocean for freight and Insurance.
(b) Imports donor-financed -- One LIC to be opened for CIF Kampala butwith mandatory instructions that Shipping and Forwarding be effectedby Transocean and that a full set of Blue Anchor Line Bills ofLading prepaid to free arrival be issued.
(c) Imports barter-financed -- LIC to CIF Mombasa or Dar es Salaam withTransocean nominated and another L/C in favor of Transocean forclearing and forwarding to final destination.
If fully implemented, these guideliaes would give Transocean and its overseasassociate, Kuhne and Nagel, the effective monopoly of public imports intoUganda. The private sector CIF agents in Uganda are very disturbed about thepotential loss of business, especially the effective monopoly given to anoverseas competitor who they consider obtains most of the benefits withoutproviding Transocean with much tangible return in the form of technical ormanagerial support. It is not, however, clear to what extent this policy hasbeen adopted in practice. Certainly the guideline for donor-financed Imports

- 57 -
would appear to violate Bank Procurement Guidelines. It should also be notedthat URc has entered into Clf activities especially on the DSM route. Accordingto URC, this was at the request of its clients, and it has cleared cargo forGovernment Ministries, such as the Ministry of Defense.
8.15 Importers dealing directly with Transocean suggest that theefficiency of the company has not improved and that it is a major bottleneck inthe transit system. The other CIP agents report that former clients, now forcedto use Transocean, complain that Transocean rates are much higher than those ofthe private sector. Transocean responds that the lower costs of private CIFagents are based on fraud rather than efficiency because the private sector usesthe parallel currency market very extensively. Whatever the reason, transitcosts to the importer would be reduced if there was freedom of choice.
8.16 There are a number of factors contributing to the poor performanceof Transocean, and in some respects the inefficiency of its operations is simplythe manifestation of more general public sector problems, outside the company'scontrols
_ Inadequate management capacity and experiences clearly these areproblems and are readily adaLtted. T-.ainirmg, technical support andmanagement equipment are requested. Transocean management haspreviously suggested close association with another CIP company,but their association with Kuhne and Nagel does not seem to providemuch local support and training;
- high proportion of barter trades it appears that many more problemsare raised in clearing barter goods than normal commercial cargo.Transocean complains that goods cannot be cleared because they havenot received the necessary documents; certainly on the two invoicesexamined, late documentation accounted for about 70? of total portcosts;
_ use of DSU and the Central Corridors much of Transocean's cargo isimported via DSM, and the company has been faced with long delays,doublehandling and storage costs. Importers are clearly unhappy butTransocean is constrained by available TRC capacity and UgandaGovernment policy;
- foreign exchange constraints: much of the cargo is imported CIF(or C&F) port and, in order to clear and transport the cargo,Transocean must have the necessary foreign exchange. Transoceanmanagement at Kampala, Mombasa and D$M all complain that, even ifthe Government departments and the parastatals pay, the Central Bankdoes not transfer the required Fig. During July 1988, Transoceanwas said to owe THA, TRC and private warehouses in DSM almost $3million.
8.17 Since the early 19809, the C/F market in Uganda has become highlycompetitive, leading to a substantial fall in the rates charged for clearingservices and transit bonds. There has been a recent reduction in the number ofsmall C/P agents as the result of increased C/P registration fees. Moreover,there is also a worldwide trend toward consolidation In the industry.Competition is still vigorous, however, and under these circumstances it is

- 58 -
difficult to see any economic benefits that Uganda will obtain from the roleenvisaged for Transocean, especially given its weak and inexperiencedmanagement. Transocean would have a monopoly of state traffic, and thereduction in the size of the total market could force some private companies towithdraw, thus limiting the choice available to the private sector.
8.18 In its policy dialogue with the Ugandan Government, the Bank shouldmake clear its opposition to the present policies and the monopolization of theCIF sector by Transocean. The Bank should consider supporting the complete orpartial privatization of the company as recommended by the financial advisersto the Government.
8 19 Transocean, or some similar organization, may have a useful role inthe system of barter trade. When the barter deals are politically sensitive,there might be a role fcr a state C/F agent. More particularly, Transocean hascome to appreciate the chaos that exists within the barter sector of Uganda'sforeign trade. The company's attempts to impose some type of order in thesector may not be effective, but it is clear that some mechanism needs to be putin place to regulate the deals and ensure some order. Transocean could play arole in such a mechanism but clearly the wider aspects of the barter sector,such as ensuring that there is no overcommitment of available coffee supplies,is outside its sphere of competence. If there is a role to be played, thepolicy objective should be to minimize additional costs by providing managementsupport and technical assistance to the company. The Bank could provide thissupport on the condition that Transocean's monopoly over government imports andits desire for a supervisory role over the C/F industry be abandoned.Transocean could then play a limited role more effectively. Activeparticipation in the company may be the only way to limit the potential wasteof resources.
C. Future Role for Uganda Railways
Development of Kenya Route
Uganda International Traffic
8.20 URC is moving away from conventional railway operations to laketransport. When the new wagon ferry terminal at Port Bell is completed, the twomain centers for international traffic, Jinja and Kampala, will be directlyserved by lake transport, and rail movement will have a negligible role ininternational traffic. Traffic along the main Kampala-Jinja-Tororo corridorwill be confined to domestic freight and passenger traffic. Once the roadimprovements underway are completed, even domestic demand for URC services alongthis corridor may be very limited.
8.21 It has been suggested that loaded fuel wagons be transported byferry and returned by rail through Malaba. The severe grades on the Kampala-Jinja section of track would not impose any limitation on this operation. Thelogic of the operating pattern is not clear, however, as it would entail emptyspace on the ferries to Kisumu and unutilized loco movements from Malaba.
8.22 There are strong economic arguments in favor of fully utilizing thewagon ferries and employing mainline locomotives elsewhere. For example:

_ 59 -
_ the introduction of the new German locomotives will relax motivepower constraints within Uganda but regional locomotive capacity,including TRC, is still limited;
- the wagon ferries are available and have little alternative use; and
_ the Jinja-Kampala rail section has severe gradient restrictions andis therefore a high-cost rail operation.
8.23 If standard international ferry operating practices were possible,full ferry utilization on the Kisumu route should be about 200 round trips perferrylyear. Unfortunately rotation is restricted by customs procedures,customs' working hours, and the problems of working at night. Unless relationsbetween Uganda and Kenya improve and special procedures for ferry clearance areagreed, 150 round trips per ferry/year may be the maximum possible, requiringa very efficiently managed maintenance schedule.
8.24 Hodal operating cost calculations, Annex 10, suggest that the totalcost of operating the ferries, excluding the non-escapable capital charges, isabout $0.021 per ton-km, assuming 150 trips/annum. Rail variable costs(including capital charges) are estimated at about $0.019 ton-km for the Malaba-Jinja section, and $0.034 per ton-km for the Jinja-Kampala section. Overalleconomic costs to Uganda of the rail only and railiferry options are shown inTable 8.2. The rate charged by KRC for transit services is taken as theeconomic cost to Uganda.
Table 8.2 Wagon Ferry - Rail Cost Comparison($ per ton)
Jinja Port Bell
Rail(l) Ferry(2) iail(l) Ferry(a)KMC (35 tons1vagon) $ 33.3 $ 28.6 $ 33.3 $ 28.6KRC Ferry 1:3 2.3 2.3URC Rail 3.0 5.7URC Ferry 2:3 3.2 3.2
Total $ 36.3 $ 34.1 $ 39.0 $ 34.1
(1) Dira rail via ialaboR(2) I 4 Ki.:waugon forry to Jiwlja r"il to Kamals
3) Rmi I o Kisum wanm frry to Port Lii
8.25 The cost comparisons are clearly incomplete as variable movementcosts are only about 5O0 of total rail costs. The other costs may not, however,be avoidable even in the long term. The ferry operation requires more wagonmarshalling, but wagon interchange between URC and KRC at Malaba is very time-consuming and thus expensive. It appears that the change of mode at Kisumu andgreater separation between the actual rail systems facilitates wagoninterchange. In terms of variable cost, there is relatively little differencebetween the ferry and rail option. More substantial savings could be achievedif URC were to escape from overhead costs associated with continued operationson the main line. Closure/mothballing of the line is not acceptable untildomestic traffic potential is fully identified and developed.

_ 60 -
8.26 The three URC ferries have a finite movement capacity -- possibly270,000 tons each way on the Kisumu route (360,000 tons if the KRC ferry isincluded) -- and provide Uganda with flexibility. The wagon ferries can providethe necessary movement capacity for international traffic (assuming thatbalanced flows are desired to maximize revenues) for the foreseeable future.Indeed it would seem that, at present, there is substantial underutilized ferrycapacity which could be economically employed in the movement of bulk fuels fromKenya to Uganda.
8.27 The analysis suggests that investment and maintenance on the mainline should be limited to retaining basic operational capability. Majorinvestment is not justified on the basis of international traffic for at leastthe medium term. The situation would need to be reassessed once the capacityof the existing ferries is reached (if ferry operations are costed to includecapital charges, the costs double and the ferry option becomes much lessattractive). Until ferry capacity is reached, URC rail services can beeffectively considered as a domestic operation.
8.28 The situation may change, however, if the pipeline is extended toEldoret/Malaba, or if KPA establishes an ICD for containers at Malaba andrequires all transit containers to use the facility. Under these circumstances,the strategy for both the main line and the wagon ferries may have to bereconsidered with the mainline providing the main movement capacity on theNorthern Corridor, and the wagon ferries concentrating upon the DSM route.Overall strategy for URC is discussed later in this section.
ZBR Transit Traffic
8.29 At present URC carries no transit traffic, and neither Rwanda norZaire are currently contemplating a return to a road/rail system through Uganda.In principle, however, such a system would seem logical and cost-effective forthe Northern Corridor, given the distances and the low movement costs of rail.Once URC receives the new locomotives and wagons and invests in therehabilitation of the Kasese Line, there will be pressure to make use of theseinvestments.
8.30 If Uganda's own traffic is insufficient to make full use of theavailable capacity, one possible scenario is for the Uganda Government to directtransit traffic to rail. For Uganda, the traffic diversion would increase theuse of its rail facilities and reduce the damage to its road infrastructure.If introduced, the policy may, however, generate little additional traffic asrecent experience has shown that transit demand for any individual route can bevery responsive to transit costs and conditions. Rwanda could switch trafficeither to DSM or through pwanza. Xivu traffic may be less flexible but couldbe diverted through Mwanza and Rwanda.
8.31 A road/rail transit route via Kampala or Kasese nay, in the longterm, be desirable for Rwanda and Zaire traffic, but a substantial improvementin service levels is required before the route would be acceptable to shippers.Operational efficiency on URC would need to be improved as vould cooperation andcoordination between URC and XRC. Kasese has, conventionally, been consideredthe appropriate transit terminal, but the costs of rehabilitating the track tothe standard necessary for a competitive transit service would be very

_ 61 -
substantial. In the short and medium term, URC should concentrate on developingservices to Kampala. Container interchange facilities exist, and a private Cl?agent who moved 200 containers through the system in 1989 found that theoperation proceeded very efficiently. In terms of transit traffic, URC couldobtain many of the benefits by establishing Kampala as the transit center.Rehabilitation of the Kasese line should be based on domestic needs rather thantransit traffic.
Development of the DSM Route
8.32 The NRM Government in Uganda gives strong priority to developingalternative routes for its international trade. DSM offers the only practicalalternative to Mombasa, and the available wagon ferry capacity makes rail themost attractive mode. Roads to the West of Lake Victoria are in very poorcondition and would need extensive improvement to handle major road transitflows.
8.33 The DSM route is restricted by the limited capacity of TRC and,consequently, Uganda is still heavily dependent upon Kenya. In terms of overalltransport-transit strategy, development of the DSM route capacity must receivehigh priority. It is also possible that transit conditions in Kenya will onlyimprove when the Kenya transport industry faces the loss of its main transittraffic. Competition may be a much more effective stimulus for improvement thanregional cooperation agreements between governments.
8.34 Movement capacity on TRC is the critical constraint, and while fourlocomotives have been hired from URC for use on the Mwanza-Tabora section, theimpact has not been substantial. The Emergency Program for TRC is expected toincrease capacity, however, as this will be required for domestic Tanzaniancargo, little additional capacity is expected for transit traffic. If it isserious in wishing to develop the DSM route, Uganda must be prepared to seekmore fundamental changes in the way in which the present system operates (seeChapter V, sectiont B. Movement and Handling Capacity).
8.35 The provision of URC block trains to operate DSM-Mvanza-Jinja-PortBell would clearly be one alternative. While the concept is potentiallyattractive it could fail if the train marshalling problems at DSM are notresolved. Additional shunting locomotives may be part of the required solution,but marshalling requires efficient organization and management and this is whereTRC is very weak.
8.36 The development of a substantial movement capacity may require thedevelopment of a complete system which would include not only the concept ofURC block trains, possibly using trackage rights, but also a specific Ugandanentrepot and marshalling yard at DSM. CMB has already been allocated land forstorage, and the Government may choose to seriously consider whether this shouldbe extended to provide the base for all Uganda transit cargo. URC trains couldthen operate from the depot, thus avoiding the problems of port marshalling.The clearance of Ugandan traffic out of the port would also follow the patternof operations being developed for Zambian and Halawian cargo and may be the onlymeans by which the port can provide for traffic needs after 1992.

_ 62 -
Overall Development Strategy
8.37 Uganda Railways must play a pivotal role if the objectives ofreducing transit-transport costs and increasing transit security are to be met.The Government now gives great weight to the latter objective and wishes tocreate the capacity to move 602 of imports through other routes -- the minimumlevel required for the functioning of the economy. Lake Victoria and the useof ferries may provide Uganda with its only realistic means of transitflexibility. The Government of Uganda has apparently taken the decision toincrease its lake movement capability through the addition of two ferries to itsexisting fleet. If these ferries are similar to those already operated, themovement capacity could reach 450,000 tons in each direction, largely meetingthe Government's objectives.
8.38 The costs of increasing lake and rail transit capacity to thislevel, in both initial capital and recurrent costs, would be very high.Internal and external transport needs for Uganda might, in these circumstances,justify limited road improvements west of Lake Victoria to enhance roadtransport potential. Truck transport can generally respond more rapidly thanrail to changing conditions, and the road improvements would assist in thedevelopment of the areas directly served.
8.39 Unfortunately the provision of additional wagon ferry capacity isonly a necessary rather than sufficient condition for route diversification andgreater transit security. The capability to move rail wagons across LakeVictoria may not achieve transit security if TRC does not have the capacity tomove the wagons up and down the line to DSM. Certainly there is little prospectthat TRC could accommodate, in the foreseeable future, the level of tonnageenvisaged in a 60X diversion of Ugandan international traffic. If Uganda is toseriously tackle the issue of transit security, there needs to be a reappraisalof lake transport capacity. The ferries presently have the capability to carryonly rail wagons and thus, to a considerable extent, the operation is dependenton TRC. Much greater transit security would be achieved if multi-purposeferries were utilized, having the ability to carry both rail wagons and roadvehicles.
8.40 Trial runs of the MV UHURU with road vehicles have been successful.The Ugandan ferries should have a similar capacity, 17 semi-trailers with a loadpotential of 500-600 tons. This load is somewhat lighter than if the ferry werecarrying rail wagons. The limited capacity of TRC would suggest, a priori, thatmovement of cargo to DSM by road may be the only solution to routediversification in an emergency. Under these circumstances the slightly highercosts of carrying road vehicles may be much more economic than either noadditional movement, if totally dependant on TRC, or moving goods by rail wagonacross Lake Victoria and transhipping at Mwanza. In terms of transit security,the strengthening of the decking on the present ferries, approximately$200,000lferry, would seem very cost-effective.
8.41 For similar reasons, close attention should be given to the designof additional lake movement capacity. There are economies to be gained if theferries are similar in equipment, power units, navigational aides, etc. to theexisting fleet, but some redesign might be desirable if the most effectivemultipurpose ships are to be purchased. Ideally the new ferries, if to carrydry cargo, should have the capability to load not only rail wagons but also
- 63 -
unaccompanied road trailers. Unaccompanied trailers would increasesignificantly the carrying capacity of the ferries, when operating in a roadmode, and improve the utilization of the tractor units.
8.42 An alternative scenario for increasing capacity on the Lake wouldinvolve the purchase of bulk oil barges rather than additional ferries. Thesebarges could make economic sense if Kenya extends its pipeline to Kisumu andwould enable POL to be shipped from the bulk storage tanks in M)anza which couldbe supplied by either road or rail.
8.43 Clearly lake transport is the key to Uganda's transit security, andURC is becoming increasingly a ferry operator rather than a conventionalrailway. This orientation will become even more marked with the constructionof the new wagon ferry terminal at Port Bell and if two more ferries /barges arepurchased. Under these circumstances, an overall study of the design,operation, maintenance and organization of lake transport seems justified. Atpresent, URC has an organizational structure, based on conventional railactivities, in which ferry operations are a peripberal activity. In many waysthe reality of URC is becoming the converse. A more autonomous management forthe ferries is desirable especially if a more multi-mode operation is thegeneral objective.
D. International Trucking Capacity
8.44 Uganda relies very heavily upon Kenya truckers for internationalroad transport. The capacity of the domestic trucking industry has beenseriously reduced by past security problems, and it is thought that an acutetransport shortage exists. The fleet suitable for long distance, internationaloperations is limited to possibly 200-300 vehicles, and these are generally old.
8.45 The development of a strong international trucking sector has beengiven high priority by both Rwanda and Burundi as a means to reduce FiE outflowsand to provide greater transit security. Uganda has given higher priority tore-establishing rail as the main international transport mode and has accordedlittle priority to long distance trucking operations. In the longer term,Uganda may wish to develop its own capacity, and it is important that rationalguidelines for its development are established. There is the danger thatparastatals such as Transocean may attempt to re-enter the trucking market (thecompany has apparently already received semi-trailers and is now looking for thefinancing of tractor units). Transocean's past performance as a transporter andgeneral experience with parastatal trucking companies dictates that this shouldbe strongly resisted.
8.46 Ugandan truck owners believe that they operate at a considerablecost disadvantage within an unfairly structured competitive market:
(a) Kenya truckers are paid 1002 in FIE while Ugandans receive 502 inlocal currency. The overvalued exchange rate makes the Kenyatruckers appear cheaper in local currency quotations;
(b) Kenya truckers purchase fuel, tires and spare parts in Uganda, usingmoney converted unofficially at the border;

- 64 -
(c) Kenya fuel tankers were given exemption from Ugandan transitcharges, but Ugandan truckers still face Kenyan transit charges.
Under these circumstances, the available Ugandan truckers find it moreprofitable to operate to third countries and get paid in FIE. If the UgandanGovernment wishes to re-establish a strong local participation in internationaltrucking, it must attempt to establish the framework that provides encouragementwithout the costs generated by the type of protection given by Rwanda to itstrucking sector.
8.47 Agreement with Kenya upon appropriate transit tolls and taxes wouldbe one necessary aspect of the framework but this, in itself, would not besufficient. One of the basic problems is the overvalued exchange rate and,until this is rectified, distortions in the economy will continue. Until thegap between official and parallel exchange rates is closed, second or third-best policies in the transport sector may have to be adopted. The present banon foreign truckers purchasing fuel in Uganda seems inappropriate and verydifficult to enforce. It would perhaps be more useful to lift the ban on thepurchase of fuel but require that truckers change a specified amount of F/E atthe border to cover the expected cost of local purchases (fuel, food, lodging,etc.) This would have the effect of bringing together the payment systems forlocal and Kenyan truckers and ensure competition on a reasonably equitablebasis. This measure could be applied to both Kenya truckers operating to Ugandaand transit trucks from ZBR.
8.48 If Uganda wishes to develop an efficient, locally-basedinternational truck fleet, the Central Bank must be prepared to issue importlicenses to the private sector. Any external donor considering financialassistance to the international trucking sector should make preference toprivate operators a condition for such assistance.
E. Transit Taxes
8.49 Uganda is centrally placed on the traditional Northern Corridor tothe ZBR countries. Relatively modest transit tolls were levied on foreignregistered vehicles for many years with no major complaints. Suddenly the rateswere raised to about $760 for a round trip, approximately $25 per ton carried.These charges were much higher than the tolls charged by neighboring countries.The Ugandan Government justified the high tolls as compensation for the loss ofF/E that arose from truckers using the unofficial currency market to financepurchases in Uganda. The tolls could also be interpreted as exploitation ofUganda's geographical position.
8.50 Many truckers responded to the high tolls by diverting to routessouth of Lake Victoria. When the tolls were reduced to $100, there was asubstantial switch of traffic back through Uganda. In view of the investmentmade in the rehabilitation of the transit route and the need for its continuedmaintenance, the use of transit tolls would seem legitimate. The major issueis the level at which they should be set. This is, however, not a problemunique to Uganda but also affects Kenya, Tanzania and Rwanda and is discussedfurther in Chapter IX, section: C. Transit Cost to Rwanda.
8.51 In undertaking negotiations on harmonized transit tolls andinternational trucking regulations, Uganda is in a much more ambivalent position

- 65 -
than other countries in the region. Any benefits that Uganda gains from reducedtransit tolls in Kenya could be offset, under the harmonized system, by losttransit revenues from vehicles passing through Uganda. The Government must,therefore, give careful consideration to the structure of any harmonized systemto ensure that net benefits are maximized. Its negotiating position should beframed in light of these considerations.
IX. COSTS AND REVENUES IN THE TRANSIT SYSTEM
A. Transit Costs to the LLC: Introduction
9.01 Estimates of transit costs have been developed for the existing mainroutes and those being actively developed. Some potential routes have not beencosted as they appear unlikely, highly speculative, or outside the time-frameof this analysis: kwanda's use of the Kigoma-DSM route, truck ferry servicesacross Lake Victoria to Bukoba, and a road-rail service via Kasese.
9.02 The costs have been calculated from a number of sources: CIPageuts, official tariffs, transporters, and government sources. Total costscharged by C/F agents are often differently structured. Therefore elementswithin these estimates may not be in accordance w.th individual invoices fromCfF agents. The overall cost levels are, however, a reasonable representation.The estimates use 1988 costs and some changes have occurred, most notably inMombasa port. These changes do not, however, alter the broad conclusions of theanalysis.
B. Transit Costs to Burundi
9.03 At the present time Burundi uses three main transit alternatives:all road from Mombasa; raililake from Dar es Salaam; and all road from Dar esSalaam. In the future the use of a rail/road alternative via Isaka may beanother alternative for Burundi.
Direct Transit Charges
Table 9.1 Transit Chargest Burundi(US$ per ton)
Road Road Rail/Lake Rail/RoadMombasa DSff Kigoma Isaka
PortWharfage l.OSCIF -
Handling 1.95 20.00(AMI) 20.00(AMI) 20.00(AMI)Local Transport/Storage 7.00 - -
CIF Commission l.OSCIF l.OZCIF l.OSCIF l.0OCIFBond 1.5SCIF - - -Road Transport 190.00 145.00 - 48.00Rail Transport - - 45.00 37.00Lake Transport - - 10.75 _Kigoma Port - - 16.00Bujumbura Port - - 5.35 _Isaka - - 18.00
$1 = Ksh 18: $1 - FBu 140: Costs in Tanzania paid in dollars.

- 66 -
Costs via Kigoma and tsaka could be increased by $6.00 if a rail terminaloutside Belbase were established for unit train operations.
Total Direct Transit Costs
All road from Mombasa $ 198.95 + 3.SZCIFAll road from DSM $ 165.00 + i.OZCIFRail/Lake via Kigoma $ 97.10 + 1.02CIFRail/Road via Isaka $ 123.00 + l.OZCIF
9.04 In terms of direct costs, the Mombasa route is clearly the mostexpensive and the traditional route via Kigoma the cheapest. All road via Dares Salaam and rail/road via Isaka fall between the two extremes. The Isakaalternative might, however, have broadly the same costs as the Kigoma route fordestinations in the North of Burundi, assuming that customs clearance could beperformed in the North rather than at Bujumbura.
Indirect Transit Costs
9.05 Direct transport charges are important, but other costs faced bythe importer/exporter can also be very significant and must be assessed, e.g.:total transit time; reliability of transit service; and loss and damage to goodsin transit. Unfortunately data on these service-related issues are very limitedand the estimates must be treated as indicative. More detailed informationcould be obtained but considerable additional fieldwork would be required.
Transit Time
9.06 Road via Mombasa: the average transit time from Mombasa, for aSample of Rwandese cargo, was 29 days. There is little reason to expect Burundicargo would be greatly different. Road transport time is about 12-14 days butcan vary greatly depending on whether the truck is required to move in convoythrough Kenya. The total transit time from arrival at port to delivery inBujumbura is about.six weeks.
9.07 Road via DSM: transit through DSM, for goods moving by road,appears to be somewhat faster, about 20 days. Truck time to Bujumbura can takebetween seven days in the dry season to 30 days in the wet. The trunk roadrehabilitation program should significantly reduce the wet season truck time andseven to eight days may become average. Overall, four weeks may be a reasonablereflection of total transit time.
9.08 Rail/Lake via Kigoma: when the system is working very well it cantake six weeks but, during other times, it can take four months or even longer.At present, AMI suggests that two to three months could be taken as the averagetime from arrival DSM to delivery Bujumbura.
9.09 Rail/Road via Isakas the route has not started and thus it isimpossible to provide more than a broad indication. In some respects, the routeis comparable with the Kigoma route, i.e, TRC, an interchange and then onwardtransport to Burundi. If an efficient rail movement operation is mounted toIsaka, a transit time of five weeks could be achieved. If efficient TRC

- 67 -
operations are assumed for the Isaka route, there is no particular reason whysimilar times should not be achieved on the Kigoma route.
Loss and Damage
9.10 Previous studies and mission discussions would tend to support thehypothesis that there is little loss, possibly IZ, by road transport. Thecondition of the roads in Tanzania are likely to increase damage costs, however,and may limit the use of road transport for fragile commodities. To reflect theincreased risk of damage, the total loss/damage on the all road DSM alternativeis increased to 22. Loss and damage by rail are probably in the range 2-sZ ofthe CIF value. These estimates were provided by sources in Uganda but arereasonably close to the estimates of more detailed studies undertaken in Burundiduring 1979180.
Reliability
9.11 It is quite clear that, under present circumstances, the all-roadalternatives provide a much higher level of reliability and predictability thansystems based around TRC. During the dry season, the DSM route, with fewerborder crossings, is probably a marginally more reliable service than theMombasa route; but the opposite is true during the wet season.
Valuation of Indirect Costs
9.12 To value indirect costs, an annual interest rate of 12t has beenapplied for transit time. The costs of reliability are very difficult toestimate, but studies have shown that shippers are willing to pay significantpremiums for faster/more reliable services. As an indication of the possibleimpact of reliability, it has been assumed that reliability is correlated withaverage transit time and an additional cost penalty, equivalent to 50? of theaverage time cost, has been included.
Total Indirect Transit Costs:All road from Mombasa : 3.OZCIFAll road from DSM : 3.3ZCIFRail/lake via Kigoma : 6.8SCIF (5.2X)Rail/road via Isaka : 6.8?CIF (5.2?)
(S) _own** mjor lprovwom1t to TRC and trnsit tie reduced to 6 wsk,.
Total Transit Costs
All road from Mombasa $ 198.95 + 6.5ZCIF,All road from DSM $ 165.00 + 4.3SCIFRail/lake via Kigoma $ 97.10 + 7.8ZCIF (6.2ZCIF)Rail/road via Isaka $ 123.00 + 7.8ZCIF (6.2XCIF)

- 68 -
9.13 Quite clearly the costs via DSH are vell below those on the NorthernCorridor, and the present routing of traffic reflects this cost structure. Asthe road network is improved In Tanzania the relatlve advantage of this roadroute will increase. On the other hand, the introduction of additionaldocumentation and the channelling of all payments through the official channelscould raise both direct charges and indirect costs.
C. Transit Cost to Rwanda
9.14 Rwanda currently uses two main transit routest all road to Mombasa,and all road to Dar es Salaam. The Isaka route is, however, belng developed andshould be operational by 199213. This study has assumed the terminal operatingcosts estimated in the feasibility study. The costs are in the right order ofmagnitude, though possibly somewhat high when compared to the costs through theother terminals.
Direct Transit Costs
Table 9.2 Transit Charges: Rwanda(USS per ton)
Road Road Rail/loadMombasa DSM Isaka
PortWharfage 1.02CIF - -
Handling 1.95 20.00(AMI) 20.00(AMI)Local Transport/Storage 7.00CIF Commission 1.02CIF 1.OZCIF 1.OZCIFBond 1.252CIP - -Road Transport 225.00 130.00 50.00Rail Transport - - 37.00Isaka Terminal - 18.00
9.15 Costs via Isaka would be increased by $6.00 if a terminal outsidethe port were established to handle the movement of unit trains. This costmight be offset, however, by increased efficiency within the system. The railcost included in the analysis is the TRC tariff. Rather different costs couldapply if Rwanda operated its own block trains, but the prospect of this seemsunlikely. Mombasa local trausport/storage costs assimed the continuation of thepresent operating practices. Rather different costs would be generated ifRwanda constructs a terminal at Mombasa and uses KRC to shuttle goods tolfromthe port.
Total Direct Transit Costs:All road from Mombasa $ 233.95 + 3.25ZCIPAll road from DSM $ 150.00 + 1.OOCIFRail/road via Isaka $ 125.00 + l.OOZCIF
- 69 -
Indirect Transit Costs
9.16 Indirect costs for Rwanda should be little different from those forBurundi, although there should be slightly shorter journey times. This distanceadvantage is, however, probably nullified by the bureaucratic procedures adoptedby the Rwandese. The same indirect costs have thus been applieds
All road from Mombasa s 3.OZCIFAll road from DSM : 3.3ZCIFRail/road via Isaka : 6.8ZCIF (5.22)
( A_wamm mjor Imreeeunt on I=C *m trm1t t;ie redu.e to tmee.,
Total Transit Costs
All road from Mombasa s $ 233.95 + 6.2S5CIFAll road from DSM s $ 150.00 + 4.30CIFRaillroad via Isaka : $ 125.00 + 7.80CIF (6.2Z)
9.17 It is perhaps surprising that any cargo is routed via Mombasa, giventhe costs of the present road routes. The all-road route via DSM appears tohave a clear competitive advantage in terms of both direct and indirect costsand, as discussed previously, DSM is developing the reputation as the preferredport. In fact, there has been a major shift in Rwandese direct overseas importsto DSM. In 1987, DSM handled over 402 of the recorded Rvandese dry cargoimports through the two ports, and in 1988 the volume of imports through DSMdoubled. (In 1984 DSM handled less than 5? of Rwandese imports.)
D. Transit Cost to Uganda
9.18 Uganda operates three- main transit routes and is beginning todevelop a fourth in response to the capacity limitations on TRC: all road fromMombasa, rail/ferry from Mombasa, rail/ferry from Dar es Salaam, and road/ferryfrom Dar es Salaam. The rail/ferry alternative from DSM has major capacitylimitations, and substantial volumes of cargo have been delayed at DSM for longperiods. These capacity limitations could be alleviated once the new URCrolling stock is delivered and the Emergency Rehabilitation Program for TRc iscompleted. Further capacity could become available if the EEC funds blocktrains for Uganda, as well as Rwanda and Burundi. Consequently, an attempt hasalso been made to estimate costs on an adequately functioning rail/ferry system.Such a system would also eliminate the late documentation charges vhich are nowprevalent at DSM.

- 70 -
Direct Transit Costs
Table 9.3 Transit Chargest Uganda(US$ per ton)
Road Rail/Ferry Rail/Ferry Rail/Ferry Road/FerryMombasa Mombasa DSM(l) DSM(2) DSH
PortWharfage 1.OSCIF l.OZCIF 1.252CIF 1.252CIF 1.251CIFHandling 1.94 1.94 2.22 2.22 2.22Storage - - 7.50 - -
Local Transport 3.00 3.00 9.00 5.50 5.50Handling/storage 4.95 1.80 9.40 1.80 1.80C/F Commission 0.252CIF l.OSCIF 1.OZCIF 1.OZCIF 1.02CIFBond 0.8ZCIF 0.4ZCIF --
Road Transport 90.00 - - - 90.00Rail Transport - 46.00 66.25 66.25 22.65Hwanza Handling - - - - 5.00
Total Direct Transit Costs
All Road from Mombasa $ 99.89 + 2.05XCIFRail/Ferry from Mombasa $ 52.74 + 2.402CIFRail/Ferry from DSH(1) Present conditions $ 94.37 + 2.252CIF(2) Potential conditions $ 75.77 + 2.252CIF
Road/Ferry from DSM $ 127.17 + 2.252CIF
9.19 The costs for road transport from Mombasa assume the use of privatesector C/F agents. They maintain their specific C/F charges at low levels butmake profits of $7-$15 per ton from the transport charges and generateadditional profits from the rapid turnover of their transit bonds. Railtransport from Mombasa and all the DSM options are assumed to be managed byTransocean.
indirect Transit Costs
Loss and Damage
9.20 One percent losses are assumed for transport by road and 3.51 forrail. Under present operating conditions at DSM, there is probably considerableloss/damage/deterioration during the extended storage periods; to account forthis. an additional average 52 loss has been assumed.

- 71 -
Transit Time
9.21 Overall transit times reported by the CIF agents and others wouldsuggest the followings
All road from Mombasa one mouthRail/ferry from Mombasa two monthsRaillferry from DSM
(1) Present conditions six/seven months(2) Potential conditions two months
Road/ferry from DSM two months
(iii) Total Indirect Costs
All road from Mombasa 2.40SCIFRail/ferry from Mombasa 6.352CIFRail/Ferry from DSM
(1) Present conditions 17.902CIF(2) Potential conditions 6.352CIF
Road/Ferry from DSM 6.35ZCTF
Total Transit Costs
All Road from Mombasa $ 99.89 + 4.45%CIFRail/Ferry from Mombasa $ 52.74 + 8.75ZCIFRail/Ferry from DSM(1) Present Conditions $ 94.37 + 20.15ZCIF(2) Potential conditions $ 75.77 + 8.55ZCIF
Road/Ferry from DSM $ 127.17 + 8.551CIF
9.22 Under present circumstances, movement through DSM is more expensivethan either the road or rail routes through Mombasa. If the major operatingproblems on the DSM route are resolved and the long storage periods and lossesare eliminated, then the DSM route will become cheaper than the Mombasa roadroute for lower-value cargo. Rail to DSM is, however, likely to remain morecostly than rail to Mombasa unless Uganda can achieve substantial savings byusing its own rolling stock on the TRC network.
E. Revenues to the Transit Countries: Introduction
9.23 The revenues that transit countries receive from the LLC, as aconsequence of transit, come from a variety of sources: port charges, transitfees and taxes, sales of transport inputs -- such as fuel, participation in themovement of transit cargo, income from forwarding and clearing, and income frombond guarantees.
9.24 The data required to make detailed ebtimates, with any degree ofconfidence, are not easily available and would need extensive research. Theestimates presented below are, at best, orders of magnitude and hopefully theerrors in specific elements balance.

- 72 -
9.25 It is also possible that the coastal countries benefit quiteconsiderably from the trade generated with the LLC as a consequence of thegeographic situation. Coastal countries, for example, benefit from exportingproducts from traditionally port-located industries, such as oil refining.
F. Transit Revenues to Kenva
9.26 It is clear that Kenya receives higher gross revenues frominternational traffic than other tranb,> countries in the region. Kenyaninfrastructure carries 75Z of the imports and over 602 of the exports of theLLC, and its transport industry still has a very significant, though diminishingshare of the international transport market.
Table 9.4 Gross Transit Revenue: Kenya
Gross RevenueSource US$ millionKenya Railways (221 million ton-km Uganda traffic) 7.34Mombasa Port
Export Wharfage (Hombasa Port Tariff study) 0.11Import Vharfage (257,000 tons x $750 x 12 dry cargo) 1.93Cargo Handling (18.92 of total general cargo) 5.87
TransportlStorage (average $6 per ton) 2.87Pipeline (448,000 m/3 x $16.9) 7.57Road Transport
Rwanda (rate: average free market and official) 11.35Uganda (market share 802, $90/mt dry cargo) 20.05Burundi (market share imports 402, exports 02) 5.25Zaire (market share 502) 11.34
Transit Fees/Tollss LLC Trucks 1.29Licenses: LLC Trucks 0.12Fuel Tax: LLC Trucks (752 fuel purchased in Kenya) 1.50Informal Payments (1500/- per trip) 0.92Bond Payment (0.52 cargo value) 4.85C/F Commission (1.O imports, 0.352 exports) 4.65
Total Revenue $ 87.01 m
9.27 Overall the estimates suggest that Kenya generates around $87million in gross transit revenues; real earnings are possibly between $80-$95million, equivalent to about 452 of Kenya's earnings from tea exports. Clearlythe $87 million do not represent a net financial profit to Kenya, nor does thedomestic value added as some of the elements, such as road transport costs, havea high import content.
9.28 The net benefit to Kenya of the transit traffic could be crudelyestimated by considering the import content of the variable cost of providingthe services rendered. Variable costs on URC, for example, are about 50 ofits total costs, and variable costs have an import content of approximately 602.Similarly the import content of trucking costs are usually about 502 of totalcosts. Using this approach for each of the transport elements and assuming that

- 73 -
bond charges and C/F commissions have relatively little direct import content,a net value-added to Kenya of about $53 million is obtained.
9.29 This estimate of benefits needs to be adjusted, however, for thedirect costs borne by the Kenyan Government for maintaining the transportinfrastructure used by transit traffic. The costs of road maintenance and theassociated issue of appropriate transit charges are considered in this chapter,sections K. Transit Costs to the Transit Countries.
G. Transit Revenues to Tanzania
9.30 The same calculations were performed for Tanzania as for Kenya.Estimates for port revenue are complicated by the Belbase arrangements by whichZBR cargo using the facility does not pay wharfage to the port, but does pay ahandling charge to AMI. The port revenue estimates include both revenueelements.
Table 9.5 Gross Transit Revenues Tanzania
Revenue Gross RevenueSource US$ millionTRC
ZBR (139,000 tons) 6.31Uganda 1 96,000 tons) 4.22
DS4 PortStevedoring (290,000 tons) 1.33Other Uganda 1.57Other ZBR 4.12
Road TransportRwanda (30,000 tons t lOOZshare) 3.90Burundi (20,400 tons : 502 share) 1.48Zaire (16,000 tons : 502 share) 1.20
Kigoma Port (144,000 tons) 2.30TransportlStorage (Ugandan imports) 0.46CIF commission (12 imports : 0.352 exports) 2.19Transit Fees : LLC Trucks 00.26
Total Revenue $ 29.38 m
9.31 Total gross revenue to Tanzania from transit traffic to ZBR andUganda is about $29 million, approximately one third of the revenue obtained byKenya from operations on the Northern Corridor. If the gross revenue isadjusted in the same fashion as the Kenyan revenues, the transit benefits toTanzania are about $18.5 million.
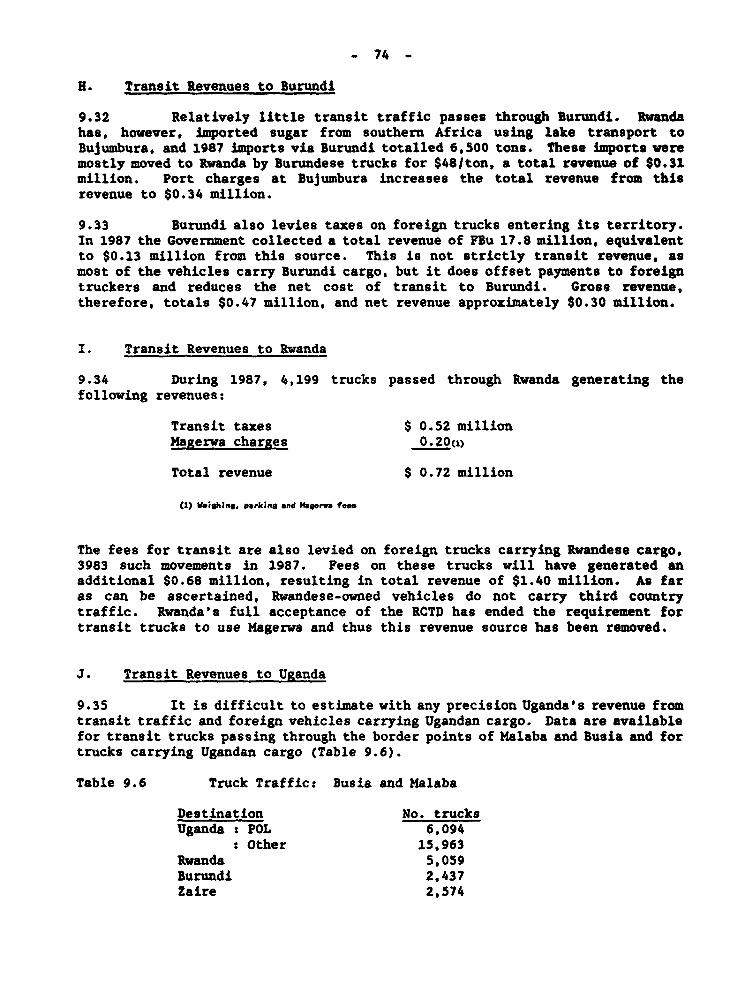
- 74 -
H. Transit Revenues to Burundi
9.32 Relatively little transit traffic passes through Burundi. Rwandahas, however, imported sugar from southern Africa using lake transport toBujumbura, and 1987 imports via Burundi totalled 6,500 tons. These imports weremostly moved to Rwanda by Burundese trucks for $48/ton, a total revenue of $0.31million. Port charges at Bujumbura increases the total revenue from thisrevenue to $0.34 million.
9.33 Burundi also levies taxes on foreign trucks entering its territory.In 1987 the Government collected a total revenue of FBu 17.8 million, equivalentto $0.13 million from this source. This is not strictly transit revenue, asmost of the vehicles carry Burundi cargo, but it does offset payments to foreigntruckers and reduces the net cost of transit to Burundi. Gross revenue,therefore, totals $0.47 million, and net revenue approximately $0.30 million.
I. Transit Revenues to Rwanda
9.34 During 1987, 4,199 trucks passed through Rwanda generating thefollowing revenues:
Transit taxes $ 0.52 millionM4axerwa charges 0.20(X)
Total revenue $ 0.72 million
(1) Veish;n*, purhins and Magerwa f1
The fees for transit are also levied on foreign trucks carrying Rwandese cargo,3983 such movements in 1987. Fees on these trucks will have generated anadditional $0.68 million, resulting in total revenue of $1.40 million. As faras can be ascertained, Rwandese-owned vehicles do not carry third countrytraffic. Rwanda's full acceptance of the RCTD has ended the requirement fortransit trucks to use Magerwa and thus this revenue source has been removed.
J. Transit Revenues to Uganda
9.35 It is difficult to estimate with any precision Uganda's revenue fromtransit traffic and foreign vehicles carrying Ugandan cargo. Data are availablefor transit trucks passing through the border points of Malaba and Busia and fortrucks carrying Ugandan cargo (Table 9.6).
Table 9.6 Truck Traffict Busia and Malaba
Destination No. trucksUganda : POL 6,094
: Other 15,963Rwanda 5,059Burundi 2,437Zaire 2,574

_ 75 -
9.36 Unfortunately the number of trucks does not match estimates derivedfrom other sources. It is possible that other types of vehicles may be includedin the category of non-petroleum trucks. Estimates from Rwanda suggest that theflow of Rwandese transit trucks via Uganda was about 3,950 + 200. Ugandan tradeestimates would suggest a general cargo flow of about 11,500 trucks. Even ifthe figures in Table 9.6 are accepted, there is no indication of the nationalityof trucks carrying Ugandan cargo. Foreign tankers carrying POL for Uganda wereexempted, however, from transit taxes.
9.37 Transit taxes in Uganda were reduced in the 1988 Budget from $600per trip to $100 for a temporary license, valid for 30 days which should begenerally sufficient for a round trip. This reduction in fees has reportedlyled to the return of foreign trucks to the Ugandan route.
9.38 The following estimates are based upon traffic returning to theUgandan route and the new fees of $100/round trip. It is assumed that allforeign vehicles carrying Ugandan traffic will be subject to the transit feeand that, in line with assumptions made elsewhere in this report, 802 of Ugandancargo is carried by Kenyan truckers. The $80 driver entry permit is assumed tostill apply, as is the annual Transit Goods License Fee of $200.
Table 9.7 Gross Transit Revenue: Uganda(US$ million)
Temporary Road LicenseUganda 0.92Rwanda 0.67Burundi 0.23Zaire .28Total 2.10
Transit Goods LicenseUganda 0.10Rwanda 0.13Burundi 0.05Zaire .05Total 0.33
Drivers Permit(,)Uganda 0.74Rwanda 1.07Burundi 0.36Zaire 0.45Total 2.62
Total Revenue $ 5.05 million
(1) Th;o *.. Is t-c.t in oend the "Vanua m be averosmated.
- 76 -
R. Transit Costs to the Transit Countries
Background
9.39 While transit traffic can generate substantial revenue for transitcountries, particularly coastal countries, there are also costs. Some costsare incurred by the transporter and are reflected in the prices charged fortransport. These costs have already been considered when determining the netrevenue benefits. Other costs, such as constructing and maintaining theinfrastructure, are borne by government and are not directly reflected intransport charges.
9.40 Governments usually meet road costs from general revenue, withoutearmarking specific revenues for road expenditure, although the use of earmarkedroad funds and road tolls is becoming more common in East Africa. Revenue fromroad users is mainly raised through licenses, registration fees, and taxes onvehicles, fuel, spare parts and tires. Non-national trucks must also payspecific transit fees and/or obtain transit licenses.
9.41 Governments may accept the need to fund an adequate regional roadnetwork and prevent rapid road deterioration, but there is little agreementregarding detailed policies. This is hardly surprising as the LLC and transitcountries have rather different objectives; the LLC wish to minimize theirtransit costs, while the transit countries want to maximize their net earningsand/or minimize their infrastructure costs. From Rwanda's perspective, forexample, transit costs may be minimized if there are no restrictions uponaxleloads or vehicle weights. The recent purchase of 60,000 ltr tankers, witha GVW of 75-80 tons, may reduce direct fuel transport costs, but they are welloutside the agreed NCTA vehicle limit of 46 tons. For Kenya, however, a lowaileload limit applied to transit traffic would increase the demand for truckmovement, raise transit revenues, and reduce road costs.
9.42 A minimum total transport cost, including both movement andinfrastructure costs, may be theoretically possible within an individual countrywithout international transit traffic. From this minimum cost, optimal asleloadand vehicle weight limits could be derived. Unfortunately the accuracy of roaddeterioration research, the difficulties of estimating the relevant costs, andenforcing the weight limits may make the optimum unattainable. Whereinternational traffic is an important element in total road deterioration, itis not clear whether an unique solution is even theoretically possible unlessa regional approach is adopted.
9.43 Unfortunately the costs of rehabilitating the Northern Corridor arevery high. The present system of transit fees associated with non-enforcementof any axleload restriction may be uneconomic and a source of considerablefriction between the transit countries and LLC. Transit vehicles are oftenperceived as the cause of bad road conditions but domestic traffic, inadequateor even non-existent road maintenance, inappropriate road design, and poorconstruction standards may also have been major contributory factors to thedeterioration of the regional road network.
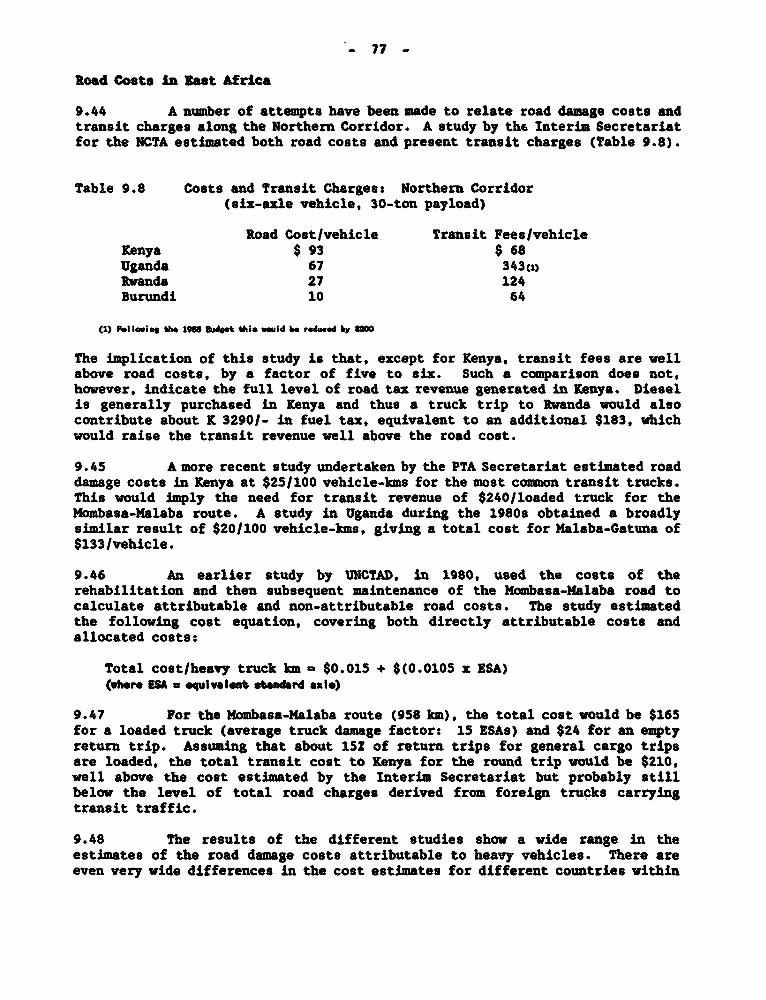
- 77 -
Road Costs In East Africa
9.44 A number of attempts have been made to relate road damage costs andtransit charges along the Northern Corridor. A study by the Interim Secretariatfor the NCTA estimated both road costs and present transit charges (Table 9.8).
Table 9.8 Costs and Transit Chargess Northern Corridor(six-axle vehicle, 30-ton payload)
Road Costivehicle Transit Fees/vehicleKenya $ 93 $ 68Uganda 67 3 4 3C1)Rwanda 27 124Burundi 10 64
(1) fI lowbis the 1S 5udgt th* wai-d be redued by OM
The implication of this study is that, except for Kenya, transit fees are wellabove road costs, by a factor of five to six. Such a comparison does not,however, indicate the full level of road tax revenue generated in Kenya. Dieselis generally purchased in Kenya and thus a truck trip to Rwanda would alsocontribute about K 32901- in fuel tax, equivalent to an additional $183, whichwould raise the transit revenue well above the road cost.
9.45 A more recent study undertaken by the PTA Secretariat estimated roaddamage costs in Kenya at $25/100 vehicle-kms for the most common transit trucks.This would imply the need for transit revenue of $240/loaded truck for theMombasa-Malaba route. A study in Uganda during the 19809 obtained a broadlysimilar result of $201100 vehicle-kms, giving a total cost for Malaba-Gatuna of$133/vehicle.
9.46 An earlier study by UNCTAD, in 1980, used the costs of therehabilitation and then subsequent maintenance of the Mombasa-Malaba road tocalculate attributable and non-attributable road costs. The study estimatedthe following cost equation, covering both directly attributable costs andallocated costs:
Total cost/heavy truck km - $0.015 + $(0.0105 x ESA)(wher ESA a euivalent standard axle)
9.47 For the Mombasa-Malaba route (958 km), the total cost would be $165for a loaded truck (average truck damage factor: 15 ESAs) and $24 for an emptyreturn trip. Assuming that about 152 of return trips for general cargo tripsare loaded, the total transit cost to Kenya for the round trip would be $210,well above the cost estimated by the Interim Secretariat but probably stillbelow the level of total road charges derived from foreign trucks carryingtransit traffic.
9.48 The results of the different studies show a wide range in theestimates of the road damage costs attributable to heavy vehicles. There areeven very wide differences in the cost estimates for different countries within

- 78 -
the same study. The PTA study thus estimated road damage costs of $25/100vehicle-kms for Kenya but $120 for Tanzania and $306 for Rwanda. Someintercountry variation could be expected, but the magnitude of the differencesseems implausible.
9.49 The main conclusion of these comparisons is that a definitive studyof road costs has yet to be produced for the region. Transit taxes are underdiscussion in the region at the present time, and it seems a matter ofconsiderable priority that an authoritative study of road damage costs shouldbe available to help guide such discussions and perhaps limit the areas fordisagreement. Determining costs is essential but a purely technical studycannot determine the relevance of particular costs. Charging for rehabilitationand reconstruction is reasonable, however, it could be considered inequitableif Kenya or Uganda were to gain revenue for improvements financed from grantsspecifically intended to benefit the region.
PTA Harmonization Initiative
9.50 The PTA Secretariat has recognized that the multitude of differenttransit taxes/fees/licenses, protection of national trucking fleets and thevariety of axleload and vehicle weight restrictions form a serious impedimentto both external and intra-regional trade. To assist in the removal of non-tariff barriers to trade, the PTA proposes regional harmonization andsimplification of the regulations and taxes related to international transport,as well as harmonization of axleload, vehicle size, and vehicle weightlegislation.
9.51 The aims of harmonization and simplification are very desirable andshould be supported. Unfortunately such aims must be underpinned by a soundknowledge of the relevant costs and realistic expectations regarding thelikelihood of legislation being effectively enforced. The PTA study of roaddamage costs was thus predicated on the assumption that a ten-ton axleload wouldbe introduced and enforced. Rather different conclusions regarding road costsand thus desirable road taxes would be reached if actual axleloads were used asthe basis of the study.
9.52 Simplification is desirable if the variety of taxes is reduced andreplaced by a single uniform system. The PTA has proposed that a single tax becharged, $x.x per l00/vehicle-kms, on all transit vehicles in all transitcountries. It is quite clear, however, that the damage caused to the roadsystem is not related to vehicle-kms but to ESA x vehicle-kms. The PTA proposalwould not penalize heavily overloaded trucks nor encourage the purchase of lessdamaging vehicles.
9.53 Ideally each truck should be charged according to the damage itcauses. For national traffic such a system is not feasible and may not be asnecessary because both the costs and benefits are internal to the nationaleconomy. For international traffic which must cross. by definition, nationalboundaries, a truck-based system does seem plausible if a transit form such asthe RCTD is used for the custom:s control of transit traffic. An outline ofsuch a system is presented and discussed in Annex 14.

- 79 -
Recommendations
9.54 This study cannot pretend to hAve the solution to the problem ofroad costs, transit fees, axleloads, vehicle weights, and overloading. Itrecognizes that the transit countries and the LLC have legitimate interestswhich may not always coincide. It is not a zero-sum situation, however, and ifa flexible approach is taken with transit taxes being used to transfer resourcesfrom one country to another, reasonable solutions should be possible. Up tocertain limits, the LLC should be able to compensate the Transit country for anyadditional costs involved in allowing heavier vehicles.
9.55 It is apparent that Kenya has little confidence in any relationshipbetween road damage and axleloads above 13 tons. The Ministry of Public Worksseems to be preparing to enforce strictly a 13-ton limit though perhaps not thelower, legal limit of ten tons. It is possible that instead of a legal limitof ten tons, a graduated transit fee -- based upon ESA's -- could be introducedat the border subject to either a prohibition of vehicles with axleloads of over13 tons or prohibitive transit fees. Whatever policy is introduced it will benecessary to ensure official flexibility in its application to cover exceptionalloads and changes in technology. The present GVW limit of 46 tons would, ifrigorously applied, make it impossible for the LLC to move fully loaded 40 ftcontainers. Similarly the rigid enforcement of the ten-ton axleload limit wouldresult in severe disruption to the transit sector, especially petroleummovements.
9.56 A more flexible, cost-based transit tax system would appear to havemany advantages, for both the LLC and transit countries, over rigid limits. Itis also clear that actions taken by Kenya will have a major Impact upon the restof the Northern Corridor, and strict limits and high transit fees could simplytransfer the problems to Tanzania. The experience of the transit industry'sresponse to high transit fees in Uganda has indicated that traffic routing canbe flexible.
9.57 There is an urgent need for a detailed regional study of the entireissue of road costs, vehicle regulations, and transit charges which takes intoaccount both transit and landlocked country interests. Work has beenundertaken in this field by the PTA and while the principle of harmonization hasbeen agreed, there has not been full agreement on the level of transit taxes.Close liaison must be maintained with the PTA as it is possible that theiractivities would benefit from technical and financial assistance to achieveefficient proposals which will be acceptable to all governments.
X. FUTURE DISTRIBUTION OF TRANSIT TRAPFIC
A. Routing Decisions
10.01 International traffic demand in 1995 could be around 2.1 milliontons. Approximately 502 of the demand is expected to come from Uganda andtraffic estimates must, therefore, be treated with considerable caution. Ifthere is some uncertainty over the total flow of traffic, its routing must beconsidered as near speculation.

- 80 _
10.02 If route decisions were based solely upon direct transport cost, adeterminate allocation could be developed using future costs and capacity levelsfor each route. On this basis. Ugandan traffic would use Mombasa and theoverseas trade of Burundi and Rwanda would use DSM. Unfortunately, many factorsenter into the choice of route and transport mode and direct transport costs maybe relatively unimportant.
Generalized Transit Costs
10.03 For the individual shipper there are many cost factors associatedwith transit-transport, in addition to direct movement costs. The generalizedcost of transit-transport would include such factors ass
- direct transport cost to the shipper;- likely storage costs;- pilferage and damage;- transit time and trade financing costs;- transit reliability;- management control over cargo;- management time and convenience;- documentation costs.
Unfortunately, it is almost impossible to specify and fully cost all of thesefactors. Some elements can be estimated accurately while others may be moreconstrainted than costs. For many cargoes, much of the responsibility for routeand mode choice is taken by the C/P agent whose considerations may not alwayscorrespond with those of the shipper. They may, for example, have financialinterests in the use of particular modes, routes andlor operators. It is alsoprobable that individual shippers will place different priorities upon theattributes associated with transit-transport. The parastatal importer may thusplace emphasis upon direct transport costs which can be easily accounted toauditors, while an aid donor may be more concerned with reliability. A privateimporter may differentiate between different goods and consignments.
Trade and Marketing Channels
10.04 For some cargoes, such as coffee exports from Rwanda or tea exports,there may be marketing considerations that make the routing relativelyinsensitive to changes in generalized transport costs. The cost structure ofRwanda's transit routes makes it surprising that any traffic uses Mombasa. Infact, there has been a shift in direct overseas imports to DSK which now handlesa very substantial proportion of dry cargo imports, compared with less than 51in 1984. Exports still use Mombasa where established marketing channels andcomiercial interests have developed.
10.05 Establishing new marketing channels for such traffic is likely tobe a major decision and would be prompted only by very major changes intransport considerations. A considerable volume of traffic is also consigpedthrough Hombasa but not as Rwandese imports. Such cargo must pass throughintermediary channels which may not be available in DSM.

. 81 -
Private *d Public Interests
10.06 It is possible that differences could exist between the interestsof the shipper, customer and CIP agent. It is also possible that there may bedifferences between the private interest of the shipper and the public interestof the government. The private shipper may wish to use the more expensivemodetroute if that enables a greater transfer of resources outside of thecountry. Government fears of FIE losses through the manipulation of transportcharges have led to increasingly restrictive controls over the allocation offoreign exchange for international transport and direct intervention in therouting of cargo.
10.07 Unfortunately wvhen emphasis is given to direct transport costs thepotential for additional unnecessary, generalized costs is considerable. Theuse of state ClF agents to ensure objective decisions upon traffic routing may,in principle, be attractive but Transocean's performance suggests that theresults are rarely satisfactory. Concentration of decision could also resultin further corruption within the system.
Transit Security
10.08 In addition to their interest in restricting the unnecessary outflowof foreign exchange, governments in the LLC have the legitimate concern toensure transit security. Developing the infrastructure is obviously importantbut, to maintain their operational effectiveness, it is essential that routesare used. The government may need to ensure that traffic uses the "routed'assurance' as well as the lowest cost route. Subsidies for the alternativeroute may be desirable, but direct intervention and direction of traffic mayappear more attractive to the governments facing budgetary constraints.
B. Traffic Distribution 1995: Least Cost Assignment
10.09 The transport rates and transit costs faced by the LLC on each oftheir main alternative routes were discussed in Chapter IX, section: A. TransitCosts to the LLCs Introduction. In the analysis of national transport projects,the difference between the financial price and economic cost is oftensignificant. In transit-transport analysis, the differences between economicand financial costs are usually much smaller as the financial prices charged bythe transit country are the real economic costs faced by the LLC. The nationaldistortions between financial and economic costs become relevant only if acompletely non-national, regional approach is adopted.
10.10 On the basis of the transport costs outlined in Chapter IX,sections A. Transit Costs to the LLCs Introduction, the LLC in East Africashould route their international traffic as follows:
Uganda s all traffic uses the Northern Corridor- low value goods by raillferry- high value goods by road

- 82 -
Rwanda s all overseas trade transits via DSH- low value goods by road/rail via Isaka- higher value goods by road
Burundi : all overseas trade transits via DSM- low value goods to/from Bujumbura by lakelrail(Kigoma)- low value goods to/from NE Burundi by raillroad(Isaka)- higher value goods by road
Zaire s traffic from north via road to Mombasatraffic from south via Kigoma to DSM
10.11 The analysis was based upon the financial costs faced by the LLC.It is theoretically possible that if the traffic distribution was made byregional economic costs, a somewhat different traffic distribution would result.Annex 10 considers the relationship between transport rates and economic costsfor the main modes. The analysis suggests that rail rates are close to totalallocated costs and that trucking rates may be below total financial cost. Theuse of regional economic costs might not, therefore, fundamentally alter thetraffic pattern.
C. Traffic Distribution 1995: Study Scenario
10.12 Traffic distributions, based on all or nothing assignments, arehighly unlikely. Costs play an important role, but the following factors andconstraints must also be taken into account when assessing the likelydistribution of international traffic flows in the region:
(i) the determination of the Ugandan Government to diversify its transitroutes and reduce its dependence upon Kenya;
(ii) the established marketing channels which influence the routing ofRwandese coffee as well as the region's tea exports; such channelsmay also limit the routing of imports, petroleum products forexample;
(iii) the regional imports from Kenya are unlikely to be available fromTanzania;
(iv) the overall capacity and uncertain operational efficiency of TRC;
(v) the total wagon ferry capacity available to Uganda;
(vi) the increase in the efficiency and flexibility of THA and thegrowing preference of shipping lines and shippers for DSHM and
(vii) the decline in the efficiency of Mombasa and the increasinglyrestrictive Kenyan transit 'security procedures.
10.13 The following traffic scenario was developed to illustrate thepossible flows for each corridor and to explore their implications. It is based

- 83 -
on the assumption that Tanzania will not introduce major changes to its transit-transport procedures. The scenario has built up from studies already undertakenin Rwanda and Burundi, and the following broad assumptions regarding thedistribution of Ugandan traffic:
- Uganda will wish to maintain transit routes through both Kenya andTanzania;
- Uganda will diversify its POL supply routes by utilizing the DSM route.The distribution of POL supplies is uncertain and a range of flows hasbeen used in the scenario;
- No new additions to the Ugandan ferry fleet will be in service by 1995;
- Two Ugandan wagon ferries will operate to Mwanza and the remaining ferrywill operate in conjunction with the Kenya ferry to Kisumu;
- Uganda will make maximum use of the ferries, 150 rotations per ferry.The average effective cargo load of the wagon ferry is assumed as 600tons; and
- The capacity of the Tanzanian transport infrastructure can be sufficientlyexpanded to handle the traffic.
Traffic tolfrom Zaire has varied quite considerably in the past and no fieldresearch was possible. Flows have been extrapolated from the trends of previousflows.
Import Traffic
Table 10.1 1995 Import Scenario: Central Corridor(000 tons)
Traffict DSM PortDry Cargo POL Total
Burundi 143 13 156Rwanda 90 70 160Uganda 140 - 70 40 - 110 180Zaire 14 - 14Total 387 - 317 123 - 193 S10
Traffic: CorridorDry Cargo POL Total
Rigoma 111 13 124lsaka 145 70 215Hwanza 140 - 70 40 - 110 180Total 396 - 326 123 - 193 529
trS mtfic via leaks includeS 53,000 tons at Burundi cargo. If the terminal i not aopen to Burundi traffic sawst this cargo would
2 Ia t f ic I oemue that ilenda .Ill decide to route 50S of its POL traffic through W4. POL tranaport camt>. vialeao. eld be S90/ton cheaper then the exiating Northern Corridor mcute and eti I I UO/ton cheaper if the pipeline Is oet nded.
S. Traffic flam through Dgr are loaer than TRC floms ae there art some regional exports froa Tanzanis.4. With efficient erntion. TM sehiuld carry all traffic.

- 84 -
Table 10.2 1995 Import Scenario: Northern Corridor
Traffict Mombasa PortDry Cargo POL Total
Burundi 25 39 64Rwanda 85 70 155Uganda 227 - 297 267 - 197 494Zaire 12 53 65
Total 349 - 419 429 - 359 778
Traffic: CorridorDry Cargo POL Total
Burundi 32 39 ,1Rwanda 185 70 255Uganda 352 - 422 267 - 197 619Zaire 37 53 90
Total 606 - 676 429 - 359 1035
1. It can be ire f asemned thaut except ter Ugandan trafic all trdfic *;11 eo by red.2. Two wag rr woitd prvid t a for about 111,0O tone.3. The snnual total road fleO vould = aromud 025.OOQ tAe. appreoasately zal te Th loaded tru.pt day.
Export Traffic
10.14 Under normal conditions, it is difficult to envisage major chagesin the routing of export traffic from Burundi, Rwanda and Zaire. The NRtGovernment in Uganda has, however, the objective of establishing a more equaldistribution of export traffic between Mombasa and DSM. If total exportsincreased to around 280,000, tons this objective would mean 140,000 tons viaeach route. Uhether this is feasible would depend upon the traffic capacityavailable and the routing of POL traffic. The import scenario gives an exportcapacity of between 70,000-140,000 tons for the DSM route.
10.15 Two wagon ferries operating at maxim=m utilization would give anannual capacity movement capacity of 180,000 tons. This would allow the evendistribution of export traffic but would only provide capacity for approximately13Z of Uganda's POL demand. In an emergency, Uganda's present wagon ferrycapacity would be sufficient to move all exports to Mwanza, but there would bevery little capacity available for POL imports using tanker wagons. Additionalwagon ferries may be the best means available to provide the transit flexibilityrequired but, as discussed in Chapter VIII, section: C. Future Role for UgandaRailways, there may be other alternatives.
10.16 The even distribution of export traffic is assumed in this scenario.Two wagon ferries operate to Mwanza, the remaining Uganda wagon ferry, operatingwith the Kenyan ferry, would have sufficient capacity to move the remainingexports from either Port Bell or Jinja to Kisumu (Table 10.3).

- 85 -
Table 10.3 1995 Export Traffic Scenario(000 tons)
Central Corridor Northern Corridorbarundi 38 8Rwanda 2 54Uganda 143 143Zaire 73 69
Total(l) 256 274
(1) *xctude *oca regionl trde
10.17 Dry cargo imports are expected to be very much greater than exportsfor the foreseeable future. Backhaul truck capacity should thus be availableto carry all export cargo although some triangular running to accommodate Zaireexports to Mombasa vill be required.
D. implications of Transit Routing Scenario
Central Corridor Routes
10.18 The main implication of the transit routing scenario is asignificant shift in traffic from Mombasa to the Central Corridor (Table 10.4).In terms of total traffic, however, the Northern Corridor is likely to remainthe more important.
Table 10.4 Present and Scenario Traffic Distribution(000 tons)
Central Corridor Northern Corridor1987 1995 1987 1995
imports 186 519 862 1035Exports 132 256 216 274
Total 318 775 1078 1309
10.19 Traffic through the Central Corridor routes could increase by 140Z,while along Northern Corridor routes the increase would be only 20Z. In thelight of past and present problems on the Central Corridor, this relative shiftin traffic may appear overly optimistic, and it should be remembered that thescenario is based upon potential demand rather than actual capacity. Trafficwill shift only if the efficiency of DSM is maintained and the capsrityjservicelevel on TRC is substantially improved. These issues are discussed below.

- 86 -
Dar eS Salaam Port
10.20 Dry cargo for the East African LLC totalled 290,000 tons in 1987;this could rise to around 640,000 tons by 1995. The recent Mid-Term Review ofthe DSM Port Project prepared estimates of future transit traffic (Table 10.5).
Table 10.5 Port Project Estimates: Transit Traffic 1992(000 tons)
Import Export Total
Burundi 100 80 180Rwanda 75 20 95Uganda 140 110 250Zaire 70 13S 205Total 385 345 730
The Port Project estimates for Zaire traffic include traffic transiting throughZambia. Excluding Zaire traffic from both estimates gives the comparison fortotal transit traffic shown in Table 10.6.
Table 10.6 Central Corridor Demand: DSM Port(000 tons)
Port Project Great LakesStudy : 1992 Study t 1995
Burundi 180 181Rwanda 95 92Uganda 250 280
Total 525 553
10.21 While there are differences in the distribution between imports andexports, the overall levels of traffic are broadly in agreement. Assuming,therefore, that port capacity is increased to handle Tanzania domestic cargo andthe transit needs of Southern African routes the transit demands from theCentral Corridor should not overwhelm the port. These estimates are based,however, on normal conditions in the region. Uganda wishes to have thecapacity to move 60S of its trade through DSM which would result in anadditional 300,000 tons of dry cargo Ugandan traffic, adding an additional 50Zto Central Corridor traffic. If the provision of capacity for this additionaltraffic were to substantially add to the cost of future capacity expansion,Uganda and Tanzania should discuss equitable financing arrangements.
10.22 Whether Belbase will have the capacity to handle the level oftraffic for the ZBR countries is more problematic and will depend upon theefficiency of TRC and the extent to which Belbase is integrated into the newroute via Isaka. It is probable that increased outside storage will be required

- 87 -
for efficient operations in the port. This is perhaps most important for thesubstantial increase in Uganda's flow of traffic. Uganda has already beenallocated land for the construction of warehousing for coffee exports.
TanaAnian Railvays Corporation
10.23 Capacity and efficiency on TRC could be a much more bindingconstraint on the system. The Emergency Program of Assistance to TRC isdesigned to provide sufficient capacity for 1990 demand of 1.22 million tons,of which transit traffic to ZBR and Uganda is expected to be around 210,000tons, approximately 17Z of the total. By 1995 transit demand on TRC could riseto around 750,000 tons (about 500,000 tons of imports and 250,000 tons ofexports). This level of transit traffic would be equivalent to 85Z of total TRCfreight traffic hauled in 1986 and an increase of over 40Z on the 1990 level.If it is assumed that Tanzanian domestic traffic increases by 52 per annum TRCwould be required to haul about two million tons by 1995, well beyond TRC's peakperformance of 1.6 million tons. The flow estimated in this study isapproximately equivalent to the high forecast flows used in the Interim Reportof the TRC Development Study and implies traffic substantially above theexpected motive power availability of the existing locomotive fleet. Thetransit flow can only be accommodated with additional locomotives.
10.24 Even more major problems would result if Uganda attempted to route60? of its imports through DSM. Ugandan traffic would rise from 340,000 tonsto 750,000 tons, 20? above the Development Study's high forecast total freightdemand. Under these circumstances, transit demand on TRC would be significantlyhigher than TRC's present total freight traffic. If Uganda seriously wishes tohave this level of rail movement capability, it will need to discuss with TRCwhat additional investments need to be made to raise track capacity, who shouldfinance them, and what operating arrangements could be devised to handle suchtraffic. It is implausible to expect TRC or Tanzania to invest heavily inproviding substantially increased capacity for Ugandan emergency needs.
10.25 The "normal" transit flow detailed in the scenario would beequivalent to 1,000 pairs of trains per annum, about three pairs of trains perday, one pair on the Kigoma line and two pairs on the Hwanza line. This levelof traffic should not exceed line capacity but could well exceed TRC movementcapacity and possibly managerial capacity. The EEC is prepared to considerfunding additional movement capacity for the LLC and, consequently, it will bethe managerial constraint that could be the main limitation on the developmentof the system.
Northern Corridor Routes
Mombasa Port
10.26 The diversion of traffic toward Dar es Salaam would result in a verylimited increase in traffic on the Northern Corridor Routes. Dry cargo transittraffic at Mombasa woulC increase by about 25? but, given that it is a verysmall proportion of total dry cargo movements (less than 15?) and that Kenyadomestic traffic is expected to increase at about 4? per annum, the impact ofthis growth will be of almost negligible importance.

_ 88 -
Kenya Railways
10.27 The scenario assumes that Uganda will move approximately 50-70 ofits exports through Keuya, about 140,000-200,000 tons. Assuming that the twoavailable wagon ferries are used fully, each ferry undertaking three tLlps perweek, there should be about 180,000 tons of capacity available in eachdirection. Assuming an even distribution of exports through the two corridorsand that dry cargo imports are carried to balance tne export traffic, anadditional 40,000 tons of ferry capacity is available to carry POL tankers oradditional dry cargo imports.
10.28 A balanced flow of 140,000 tons of dry cargo in each direction wouldbe close to the present service agreement between KRC and URC, total traffic of300,000 tons. The implications of any additional traffic on KRC would dependupon the type of traffic and the extension of the Nairobi pipeline. If thepipeline is extended to Kisumu, the benefits to KRC of POL traffic would consistsimply of additional revenue from their wagon ferry and some wagon hire charges,given the likely imbalance in wagon time within Kenya and Uganda. Moreover, itis not clear whether the use of wagons and the wagon ferry would be the mostcost-effective means of transporting bulk petroleum products from Kisumu toKampala: an oil barge and bulk storage at Port Bell, or a short pipeline toKampala might be more preferable.
10.29 More substantial benefits could be derived from the movement ofadditional dry cargo imports into Uganda. Import traffic above the flow ofexports would, however, result in an increase in empty wagon running. Changesin the level of charges would have to be expected with perhaps directionspecific rates, especially if the railways compete for private sector exports.
XI. ISSUES AND POLICY CONSIDERATIONS: AGENDA FOR DISCUSSION
A. Summary of Findings
11.01 The main limitations of the present transit-transport network in theGreat Lakes Region of East Africa identified during the course of the study arebriefly summarized below:
Infrastructure:
11.02 Road s By 1992 most of the critically deteriorated roadsections will have been improved, and the averagecondition of the main transit routes will be good.Maintenance and some strengthening of the road networkwill be the main priorities.
Rail s Some additional investment in track improvements may benecessary, but operations and management rather thaninfrastructure are the main constraints.
- 89 -
Port s No capacity expansion at Hombasa is necessary andincreased productivity is the priority. Capacity at Dares Salaam could become a constraint if containerizationis delayed. Additional capacity will be necessary after1995.
Overall, infraitructure is no longer the major short-term issue in the transitnetwork, priority attention must be turned to the capacity, efficiency and costsof the transpo-t organizations that use the infrastructure.
tail Transport:
11.03 Northern Corridor t A significant proportion of Uganda'sinternational trade is now using rail.There will soon be sufficient physicalcapacity to move additional traffic andcommercial management within the railways,and effective coordination between therailways will become the main issues.
Central Corridor s TRC is the primary constraint to developingthe potential of the Corridor. Additionallocomotives and wagons are necessary butmust be accompanied by the introduction ofefficient operating systems, extensivemanageAent improvements, and increased staffmotivation.
Road Transports
11.04 Trucks form the primary transport mode for international freightmovement in the region. Total truck capacity is not a constraint, but on theNorthern Corridor unnecessary costs are created by cumbersome transit andsecurity procedures which delay trucks and reduce vehicle utilization. Rwanda,and to a lesser extent Burundi, increase road transport costs by the protectionof inefficient national truck fleets.
Ports:
11.05 Mombasa s The efficiency of the port has declinedsignificantly and many users now considerthat the service offered is inferior to Dares Salaam. Management, governmentinterventions and labor problems, ratherthan physical assets, appear to be the mainfactors in this decline.

- 90 -
Dar es Salaam X Users' perceptions of the port have improveddramatically. A flexible managementapproach has played a major role in thisimprovement. Further improvement can beexpected when the present investment incontainer facilities and generalrehabilitation of the port is completed.Streamlined clearance procedures must beintroduced to prevent congestion in thecontainer stacking yards.
Lake Ports The ports on Lake Tanganyika have eitherbeen improved or are being improved. Theyhave excess capacity and impose no majorconstraints. Improved container handlingfacilities at Kigoma still have to beprovided.
Ferry Terminals s No major problems are reported at eitherMwanza, Kigoma or Jinja. The wagon ferrysystem on Lake Victoria will beiigalf icantly improved vhen the proposed newterminal at Port Bell is constructed. Thiswill allow direct service to Kampala,avoiding the rail operating restrictionsbetween Jinja and Kampala.
Transit Procedures:
11.06 Northern Corridor s The costs, delays and general managementproblems caused by the present transit andsecurity procedures are perceived as majordisadvantages of the corridor. The NorthernCorridor Transit Agreement was designed toeliminate many of the difficulties and isbeing increasingly implemented.Unfortunately, the NCTA does not eliminatethe need for transit bonds nor prevent theintroduction of additional securityrestrictions.
Central Corridor : The transit pass system creates no majordifficulties for either Tanzania or transittraffic. The system should, perhaps, betaken as the model for the region. It islegitimate for Tanzania to wish to increaseits income from transit traffic, but thisshould be achieved without the introductionof cumbersome procedures. These wouldreduce the benefit of the route to the LLCwithout necessarily increasing the benefitto Tanzania.

- 91 -
B. Priority Issues
11.07 The study identified several broad issues as well as specificbottlenecks and operating constraints. Two major issues must be considered byboth the countries within the region and the donors providing assistances
(a) How to balance the LLC's objectives of low cost transit-transport,transit security, a measure of national control, and someparticipation in international transport; and
(b) How to ensure that the legitimate interests of both the LLC and thetransit countries are safeguarded and their economic benefitsincreased by improvements in transit infrastructure and operations.
11.08 At the present time, the LLC are paying a heavy price, in terms ofincreased transport costs, for the security of route diversification andnational control and participation. The pattern of operations within the transitsystems must be examined critically to determine whether transport costs can bereduced while still maintaining route and mode diversification. The LLCthemselves must also assess the trade-offs between cost and security anddetermine the extent to which their economies can really afford additionaltransit costs.
11.09 The LLC and the transit countries are also paying a heavy price forinappropriate transit and transport regulations. The LLC suffer from additionalcosts generated by cumbersome documentation, multiple security checks, andunnecessary border delays. The road networks of the transit countries sufferfrom the damage caused by vehicle overloading while the benefits of lowertransport costs are enjoyed by the LLC. It is possible that Improvements inoperations within the transit countries may be delayed because of financial ormanagement constraints. These constraints could be removed with the jointparticipation of both the LLC and transit countries.
C. Strategies and Priorities
11.10 Investment needs for the transit infrastructure should be at verymodest levels after 1992, and maintenance and preservation of the existingnetwork must become the main priority. Additional infrastructure, beyond thatalready planned, will not make major improvements to the transit system.Reduced transport costs and increased transit efficiency must be achieved byconcentrating government objectives and donor assistance on improving the wayin which the infrastructure, the transport industries, and transit systems areoperated. To achieve the objective of low-cost, efficient transit/transportsystem, two broad strategies must be encouraged: Competition in the TransportSector and Regional Transit Cooperation.
Transport Competition
11.11 To reduce the costs of transport for the LLC, increased competitionin the regional transit-transport systems should be encouraged as much aspossible. The strategy should include: competition between transit corridors,competition between transport modes, and competition within transport modes.

_ 92 -
11.12 in many respects increased movement capacity and improved operatingefficiency on TRC are key to the strategy and to meeting many of the objectivesof the LLC. The transit security of Rwanda and Uganda would be increased, whilethe transport costs of Burundi and Rwanda would be substantially reduced. ForRwanda, the objectives of both low-cost transport and increased transit securitywould be achieved by efficient operations through the raillroad Isaka route.Signifi.nt diversion of traffic to routes through Tanzania could also give theKenyan Govsrnment the incentive to streamline their present transit and securityregulations, encourage more efficient services at Mombasa, and help improvecoordination between KRC. and URC.
11.13 Additional motive power and rolling stock will be required by TRCif substantially increased rail transit traffic is to be handled efficiently.Investment alone will, however, not provide the movement capacity and efficientmanagement and operating systems must accompany investment. Critical decisionsmust be made regarding how the investment for transit traffic should be financedand how transit services should be organized, operated and controlled. The fullintegration of transit services into TRC operations might potentially be mostefficient but, in view of TRC's present limitations, a quasi or fully paralleloperation based on trackage rights and rent might be more realistic alternative.
11.14 Improved rail services through Tanzania would also place competitivepressure upon road transport in the region and encourage increased efficiencyand cost reductions. The further priority should be to increase cooperation andcoordination between KRC and URC to raise the capacity and quality of railservices to Mombasa. Increased rail movement capacity and efficiency on thisroute could divert a substantial volume of traffic to rail. This would reducetransport costs for Uganda, improve the financial position of the railways, andreduce the road damage caused by transit traffic to the roads of both countries.
11.15 Unfortunately recommendation of increased rail cooperation has beenmade in almost every study since the late 19708 and, though the modus operandihas improved, much still remains to be achieved. The outlook may, however, benow more encouraging with the Ugandan Government's commitment to rail for longdistance transport, the increased rolling stock soon to be available on URC, thepriority for KRC to improve its financial position, and its adoption of morecommercially oriented management objectives. Additional investment will notnecessarily provide more capacity unless parallel improvements in managing andcosting through-transit rail services are also made. It may be desirable toprovide technical and managerial assistance specifically directed toward meetingthis objective.
11.16 Increased competition and efficiency In the road transport industrymust be the third broad priority. In the short term, some LLCs may continue toregard national trucking fleets as essential to national transit security.Every effort must be made, within the limits set by such broad securityobjectives, to encourage increased efficiency by competition within nationalfleets, and between these fleets and international competition.
11.17 The types of policy change required vary according to the LLC, butit is clear that improvements in the operational efficiency of its nationalfleet should be given a very high priority by Rwanda. Improvements in thecapacity and quality of regional rail systems would reduce the importance oftruck transport to both Burundi and Uganda. Rwanda, however, will remain

_ 93 -
dependent on international trucking even if rail services to Isaka areefficiently operated.
Regional Transit Cooperation
11.18 The Northern Corridor Transit Agreement has not been fullysuccessful in reducing road transport documentation and truck delays. Since theAgreement, transit restrictions, within Kenya at least, have increased. Thisdoes not, however, change the fundamental need for agreed and equitable transitframeworks within which transit competition between routes and modes can takeplace, and for transit regulations which protect the legitimate interests of thetransit country. Transit bonds, documentation and security restrictionsgenerate significant costs for the LLC, and it is not clear whether they meetthe legitimate interests of the transit country.
11.19 Preservation and maintenance will be the critical roadinfrastructure priority after 1992. Appropriate vehicle regulations must bedefined and enforced to prevent uneconomic road damage, and road maintenancemust be adequately funded and transit traffic must bear its share of cost.Unilateral action by national governments could well result in inefficientregional solutions and more benefit could be generated by regional agreement.Unfortunately, difficulties have been experienced in implementing such regionalagreements, especially where individuals/countries see benefit from ignoringeither the letter or spirit of the agreements.
11.20 Competition between corridors may be a powerful incentive fortransit countries to reach and implement agreements, while actual enforcementof the regulations may persuade the LLC to stay within agreed vehicle and loadlimits. Loss of transit traffic and revenue could encourage Kenya to modify itsvery restrictive transit and security regulations. Enforcement of vehicleregulations could prevent Rwanda from licensing vehicles well outside agreedlimits.
D. Regional Framework for Bank Activities
Bank Structure
11.21 The Bank has not consciously played an active regional role butprovides considerable financial and technical assistance to the transportsectors of the countries in the Great Lakes Region. While many of theseactivities have direct or indirect impacts upon transit traffic, the needs andpotential of this traffic are rarely assessed explicitly. This cannot beconsidered surprising given the national character of the Bank's activities andthe lack of a regional framework.
11.22 The Great Lakes Region consists of five countries and the Kivuregion of Zaire. There are significant differences between the countries, butthey form a distinct transport and, to a lesser extent, economic unit. Thecountries are allocated among three divisions of the Bank (AF2, AF3 and AP6),and the problems of cooperation and coordination within the region seem mirroredin Washington.

- 94 -
11.23 Many decisions within the transport sector of each country can betaken without reference to the regional perspective. Transit traffic is,however, sufficiently important in the region to justify a more coordinatedapproach in Bank policy and in the flow of information. A few examples indicatethe range of issues in which regional as well as local traffic has to beconsidered:
- The Bank has projects ongoing or about to start in all three railways, butthe traffic on each railway will depend upon the capacity, objectives andpolicies of the others.
- Preservation of the road infrastructure is largely a national concern buttransit trucks are often the largest and heaviest vehicles of the roads,and national actions could have serious implications for other countriesin the region.
- The Kenya pipeline will affect the LLC, but demand will depend uponpricing policy within Kenya and the capacity of the Tanzanian transportsystem.
- Transit traffic and administrative arrangements at DSM could play animportant role in determining capacity problems in the 1990s.
11.24 There is the need to recognize the fact that the Bank's presentcountry divisions do not reflect the reality of transport in the region and thatan information and liaison system should be established within the Bank tocoordinate its own policies and those of the other major regional agencies, inparticular EEC and UNCTAD. It Is also clear that transit-transport needs andproblems are not static but are subject to frequent change. Unfortunately thereis only limited monitoring of the transit-transport systems and little feedbackof information from the region to Washington. Resident Missions are concernedwith country issues and have little need for additional responsibilities. Aclearing house for transit-transport information would, however, be very useful,and the Bank should support any cost-effective initiatives in this direction.
Bank Perspective
11.25 The Bank has a country-based approach to transport investment,regulation and policy. Investments are assessed and policy advice given fromthe perspective of the economic development of the individual country. Thisapproach is clearly appropriate for most situations, especially when theindividual countzy must service its Bank loans. The country-orientated approachmay not always be economically efficient, however, for decisions involvingtransit-transport when the perspective of the regional economy rather than theindividual country is considered. Under present circumstances, it may beefficient for Kenya to reduce transit vehicle payloads, reduce road maintenancecosts, and preserve its road infrastructure. Regionally, it may be moreeconomic to retain or even increase vehicle weights and accept the consequenthigher road maintenance costs.

- 95 -
11.26 Theoretically, transfers between the LLC and the transit countryshould allow the regionally efficient solution to be obtained even whendecisions are country-based. In practice this may be extremely difficult toachieve and choices may have to be made on the continuum between the bestinterests of the country and the region. The potential for transfer paymentsbetween countries through pricing or taxation must, however, be examined inconjunction with both transit policy and investment in regional transportfacilities.
11.27 Attention must also be given to the most appropriate mechanisms forBank financing of transport projects benefitting more than one country. Bankloans for regional transport improvements were made to the East AfricanCommunity. Uhen the Community collapsed, there were major problems inallocating the assets and the liabilities. Regional investment may still berequired, but a new approach to funding will be necessary if the Bank wishes tobe involved and avoid the probloms that were encountered previously.Alternatively, the Bank may wish to avoid such investment, concentrating oncountry investment and allowing donors, such as the EDF, to undertake investmentusing regional grants. However, there will still be the need for a regionalperspective to ensure that compatible investments are being made and compatiblepoliciea being advocated.
Regional Policies
11.28 There are many issues to be resolved at the regional level but giventhe structure and its technical expertise, the Bank cannot be actively involvedin every issue. The EEC and UNCTAD may be better equipped in terms of regionalinvestment funds or technical capability to take the leading role in helping toresolve some of these issues. It is extremely important, however, that adialogue Is actively pursued with these other agencies to ensure that consistentapproaches to the problems in the region are being taken.
11.29 In terms of future actions the Bank must determine where it can makethe greatest contribution to improving the regional transit-transport system.The Bank should perhaps give highest priority to resolving the policy anomalieswithin LLC national transit policies. This action would be in line with itstraditional role, and this is where the Bank has, perhaps, the greatestleverage. A second important priority should be continuing technical,managerial and, where necessary, financial assistance to the railways as theseoffer a key to lower transit costs.
11.30 There are specific regional issues which need expert study and wherethe Bank's past experience within the region and its technical expertise couldbe of importance, for example:
- operational systems and capacity for transit traffic using TRC;- operational and management systems for the Isaka roadlrail route;- road transit vehicle regulation and taxation; and- coordination of rail traffic and efficiency within the region.
11.31 At the very least the Bank should have internally agreed policiesin these areas to ensure consistent dialogue with the countries in the region

- 96 -
and with other donors wishing to provide assistance. There is the danger that,while the transit problems are perceived, many donors still consider thatsolutions can be achieved by the provision of additional transport hardware whenthe real priority must be to improve the operational and management systems.
11.32 In terms of Bank investment policy, little action is required asmost of the major regional investments have been already committed. Theextension of the Kenya pipeline is clearly an exception where large funds couldbe devoted for essentially a regional project. If the Bank were to considerassistance for this project the regional implications and potential alternativeTanzanian supply routes must be assessed before a realistic view on the projectcould be made. Rehabilitation and expansion of DSM and rehabilitation of theTanzanian road network are important regionally but action is already underway.
11.33 The countries along the Northern Corridor have made a regionalagreement which has yet to be fully implemented. The Bank took little part inthe negotiations although Bank studies indicated the very large benefits thatcould be potentially derived from streamlined customs and border procedures.It is perhaps doubtful whether the Bank should attempt to play an independentactive role in this area and attempt to initiate change. It should discuss withthe other agencles whether additional technical assistance, data collection orspecific studies would assist in achieving the level of regional cooperation andbenefits that were initially expected.
11.34 The Bank does need, however, to consider its policies to regionaltransport agreement in general and whether the PTA approach, based upon theentire region, should be supported or whether more limited approaches such asbilateral or corridor agreements offer the potential for greater benefits. Itmight be hoped that limited agreements would be easier to arrange and implement,but this is not fully supported by the experience of the NCTA. 0n the otherhand, the regional approach may mean that only agreements on generaclities canbe reached, as the specific problems and needs of particular countries an sub-regions cannot be fully encompassed. The NCTA exists and the regional problemsremain to be solved; in the short term, there is little alternative but supportfor the Agreement and the Permanent Secretariat even though, in the longer term,the Bank may consider the PTA regional approach more productive.
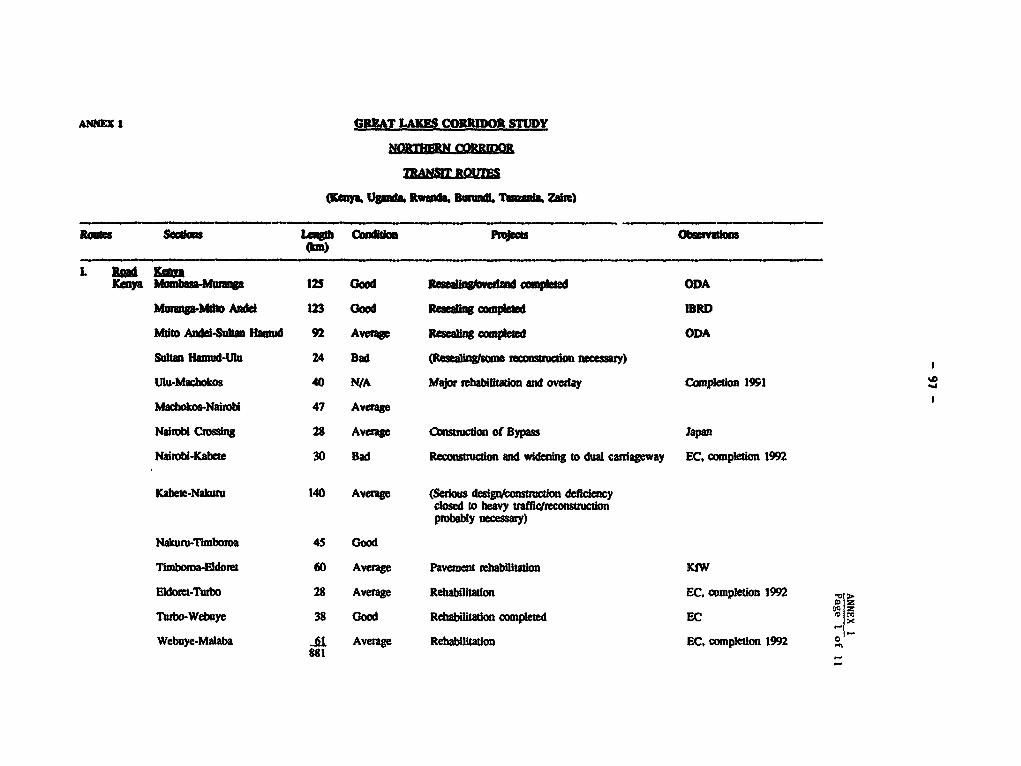
ANNE I GRAT LAW CORRIDOR STUDY
OCI U8Ql RWdl BOALT k ZdM)
Room Scs _b c On)
L 39 NeaMKeya 1255 Good _ Uamped ODA
Muang It Anded 123 Oood Reusalngcotld IDRD
Mdto Andeleuilta HaW 92 Avaage Realding cmpled ODA
Sultan Hamud-Wlu 24 Bad / necessuy)
Ulo-Macbokos 40 N/A Major whabilkadon ad ovela Cymnpeon 1991
Machoko-Nairobi 47 Avage
Naibi C(ssn 28 Avaage Cbns rw of Bypass lap
Naiub-Kabete 30 Bad Rec _suaco and wideni to dual cariageway EC. complefion 1992
Kabete-Nakur 140 Average (Sedous deficidecyclosed to heavy traffic/mco uctionprobay necssay)
Nakuru-Tlnboros 45 Good
Tlmboa-Eldoret 60 Average Pavement wehabflitaton KtW
Eldet-Turbo 28 Average Rehabilitation EC. cnmpletion 1992
Tusbo-Webuye 38 Good Rdiabilitadon completed EC ¢|
Webuye-Malaba §1 Averag Rehabilitaion EC, completion 1992881

Annex Ij ~~~~~~~~~~~~Page 2 o' 11
*1 0 i-03 I - 3i ^ t
I 4]- a iE X
3 * !3. S1 CI X e.X
tr~~ ~ ! s i!!g ts 1g l ft
j !? | l t X 4 1' t I 4XI
S i -!1wD ji T4dQ Z-§~~~~~~~~~~~~'

new. L.gth Stat Cemd1fiom Projecte Pbeewol1m
zal toe
i. K er eaKs. Mbarara-Iaboka 84 Paved Bad R ebbilIt.ation Port at books 4tia Ity Project
Isholgo4sooe 89 Paosd Averap/BSd Rebabilitatlon ADS
Kesa (15 km 25-30 Pow"d oodsoth)-Kalad)(border)
XCelndl-Set 78 Earth Sd
2. Mb tarr-4m Ubarara-Kabalo 140 Paved bad Rehab I itaion EC
Kab.lR"heerl 108 Earth (except Avarepfor Rpue*elUgandan border:Paved)
Rubhperl-Om 8 PWed Good
S. Kabele- Kab.l-iKleoro 124 Earth AverageRetehuru (border)-Rliehirm
4. RaIl-Road The line sod Its ioetllatioaril: Ke rT- 332 are serioutly detorloratd. Ban
Kr_e" I conulderlog _mrgeyrood: me. 1 aIbove ebli I lattion.
KRIUllb Klotol-Ruha art 117 Paved 4ood
Ruhe eri-eom Paed oed
estare-Cyvaoguu 142 Paved Cod so" steep adS.
eeIi

ReAs Seotie" 14"tOb State Conditlin Projocek 0ba.ortlo
From BurundiBujumbura-Bukavu Bujuabura- 91 Paved Good(Zaire) sugarnt
Sugar,.- 40 Paved Poor Rehabtlitetion Part of Beak'ks Cth Hwy RePbb.
Cyengugu project.
Burundt SuruediAkantyar,(border)- Akenyar,-SBjuJmurr Bujumbars 114 Paved Average RobablIitation EC (on *ppro.ai)
M ROTDAL 1,10
Alternative X
KWO K"nMeeh relb1- -
Nekure (te In Inreaed *pOlon) 004
N*kru-Zlseebe t wn Kr4elelAe 107 Paved 4od °
(horder) 0
Kerieko4laIi 104 Pawd GoodKetII-Saheel* 8O Paved Average IC *"Wesce fat. rebI.Iltatioa
of so km I. Ieed
t_I"ararl)-11 _es-%mm Si rarl _u 100 Eath averg EIC fimeed dI eg tubdy.
Uuenn-Vae i09s Pere bed
a-

Roes Soctlono Lnth Stat Condition ProJ Ob tie(kim)
Umegara-i hera- Ferry crossing (ow ferry) betwienmulo-Luanhunga 287 Earth Average Kikonga (ner Visnza/Uaagara) and
Buaiel. Capacity 4-S trucki percross ing.
Lueabunga-Rueumu 9S Paved Good Note: Frm R _ou traffic c n moveUvC onotrol Corridor routes IntoUgands, Riands and Burundi
via Central
Alterntiv 2
Ro_d-1akeRod
Ma.boss-fairobl-makers.00
NakstruKieu 187 Pae Iood
Kln.. (Konya)- 0i8kob. (Tene.Ia) Lake 8O _
Bukobe-lharal,lo 174 Earth Bad Portly very difficult roe eithsteep itade. Experliment to mmethbi road yielded *ied reuita.
lharu i.o-Lushmungs 40 Earth Averaep
Ko
U,#
0

Routes Stlo St C dit ProjoeW _e(h)
Ut. Rail Re lesR Rehabi I tation
Ki- ra -ongoing (UR. Second Railway
MIlaba (Kenya) 1,0I Project being conesdered.
me, -( EC, bilateral doners. Prore-
Ibloi- iija- ent oft rollinI atock (Ioco.
Kompl 2Uon). Sm lie rbtli-
tatlon pr?at Kep Is-Kass)er conedratint (RD). The
Total 1,818 rOute Melaba-Iampela et presentcarries only Inaignifieant
Alternative transit taffic.
lleoMb0l reJbl-;WaNiwriaew 982
Tr,in weight limltaltns on ectionWlauru"lowim (about 6 wagonatrain).
Lake trnerort to tran0
Jinja (o PoaIl , Kampala)
Rail JinJa-Kampe 80
Altiw"l 2Re I I -MoOd
RoRl line Kapoala-Kesee. In wrgnt
momIrobi- need of reabilitation. Small IDA
Malabs-Kope l crteit being conIdad before
Kases (rail) 1,072 decIsion on tull fledge rehabili-tation.
Kaeeae-fterara-**tuna (reod) 282
1,964
III. Transport of Ol Proaducts (White Products)
linUombiii"Nl&rObi 462
Extenio. of pipeline to Ugandbordar undr stvdy.
>

- 10)3 -
Annex 1Page 7of 11
I
0I
e.
S X11Sd
a }jgSfif

1IT LUIES tOim S~lV
TrmIt Reet.
(Teen.tm. Roe"d, Ibrew1d *le*r)
_ets SWAIM* Leth State Coditlio Project. 1ewvtiae
nb teelm- hbor-CaIm 110 Paved Good
_ Oe4e . 6lll r 90 Pave AWeae habib Itettee 1967-190 (tDA) SlAt IDA reed reehi bitatlo project.
e".o -Dodams no0 P_e Avon"
bhdef-Soghlb 170 gt"r Averag Ra ill iao f etottee The setile" Usk)oe1-Iama _eamedNYIttt-X tzl 10) -Oh_ 1 to ,91. tealle I* 1 - O:r
~~ ~~" '~~~~ 9o IDA OtS t redelabb I llttionpWe MctPc" rt ef Dwe Ambbililt tn wojets >
IOST-lon$ 160.0 km; Inc-lout: Ill7.6 It
Slogids,4 1G tavell fortl AverageI
1eega-bab. 71 Grovel Avrg
Iaaima4uboehe 11 Grave AverageGe Rod it I be to peved EC fitald, per% of tae tCetaadrd for lO (*lgr*) *x1t effort to prvdeo = couatwiebloade. wit railroad limi via ftke" Imala
rilroa t11 ermial Wori will beteaded Oct. 1606; coatratloe time
1u&omb-Luab"" 1t? Gravel Average Rood elil be -pgrded to pavd EC f*1aacd. Work elesat Completed.staard for L0 (aIngla) *XlI
_ _ 9S Paed God*"be}~~156

_aee $"kw" LeA*b S_ae tedtItAe Prvjoot _bteecvaim
_nseen RUuen4bejOn 94 PaWed Avere Rehbi9itattio. (llS) FROKigali- gc fmna.,co ?oo.blitIt.i.. campiated laAnbc Iapoas-ritll t2 P avd Good t some bittatle l 1 1e(boid)1. e eetle ed r ee e.
ftuae-Aba"er p g Paved coed
_e,ge lolst d gt)il| I O 1* t)
i__ sosw t _lt
Apro,~ ~ ~ ~ ~ ~ ~ ~ ~ ~ ~ ~ ~ ~ ~ ~ ~~~~~~~~~~~~~~~~~~Uljb_l_euea U Pave _vep Rbb bo m besonnbc
as _ M
alsohens.)osee" Sad SC f lassoe ftmlblI loy NoG pecaebl.e ceee fI_ { _ ~ ~ ~ ~ ~ ~ ~ ~~~~aupo~ee 15,L? -clGmw_} ~1

Roted Sctions LentA Sutt Coedltlom Prpjeca Oberwatiena
I. Rail-road Rolls Der-Tabor.- 962 took% So v Node".Rails Dar-Isak o-Wo rail/road station at
terminatli prosentRoad: Road: tIako- inadequateTl;h-KtlI, uG'u..iSllO 580 m I, aboveSXuJsburr Kigli4 umburo 1142 asr r, obovo
or
takaKobero- RoaI aiternaOtiVMuyinga4ujr *sat from lNj San:.,
(on Isaoka-Rtuosread) via Kobero-1hn rto 0e"Ihmwft 8 ona 1, abon
Po. allL k-RailDer-KoiaDi nais Dar-Thbora- 1,2S0 Emrgacy aseetemnc for TRC conolottn(Uganda Uei;a of reabilltation of rolling stock,
Lake: V.aosa- 869 roylayin of Control line, improvementJinTJ (Ug ) of tlo-MCntIctioe, 1tr.ngthOPIg Of Mem terminal to be constrteedReilf JInjA- maintanance cpacity Improvement of *t Part Soll (near apla withRiqle eoperation and manageriol performner. Dandad fund t n nw rail i nlic
VWt rtlProgram comploen (flirt phas) 19P. to Kap"la.lore." tin carnying capacity by 256 to1.4 - 1.6 *IllIon tons p.a.
IV. Rai -LakeDa r-U ~- Rel:l t Sar-KAtmea 1,256(Burndi) GM Kioma- Cont"iner capacity of ?let may not
Sujumera 175 be sufileent for espected traftfc;140 *almost Complete , *b ee of navia-
tion aide, hydroraphic conditionslargely unknon.
V. Nod"
Der to Saloe Port vajor port rehabiitation project Container termlnal expected to bebeing implemented, corele1g i.e. fully operational tist quorterconatruction of a contineot terminal 1069; completion of berths 1 - t(bertos 10 and tt), rehabliltation of oxpected 1991.berths 1 - t, procuremnt of contalnerand car"e handling quipment.
x

Ret"e Setles i..eth Su%* Cediitlso Piejecte OJew tloas
loosh Tran.-shipment Terminal EC tinance. conatruction of rai l-road Contract ward stoge. Constructon
torminel with facllltiea for oil period betweon 18-10 months. Theproducts, dry frelght, general and loaks terminal will be laid out forcontetneorizd, and agriculturol produce. a cxpacity of 48,000 t contatiner-
ised corgo (imports) and 48,000 tonsgeneral cargo imorts end exports).Store ltcilttt for oil erodueU(1,000 I kerosenei 2,000 s ditel2,000 a solin, service stationw th 700 *o tank).
lien:. Port
K1ome Port Bridge container crae to be provided Port recently reabllitee_d.
under Belgion oad. bolivery expe Satitfactory condition. lRC hao1l0g/89 s problem. with handling of
contitner. expected to bo solvedby brideo conteloer crane.
Bujumbura Port Port being rehabilitated. Financed by C*lise Controle(rance ).
_x
e- '
0
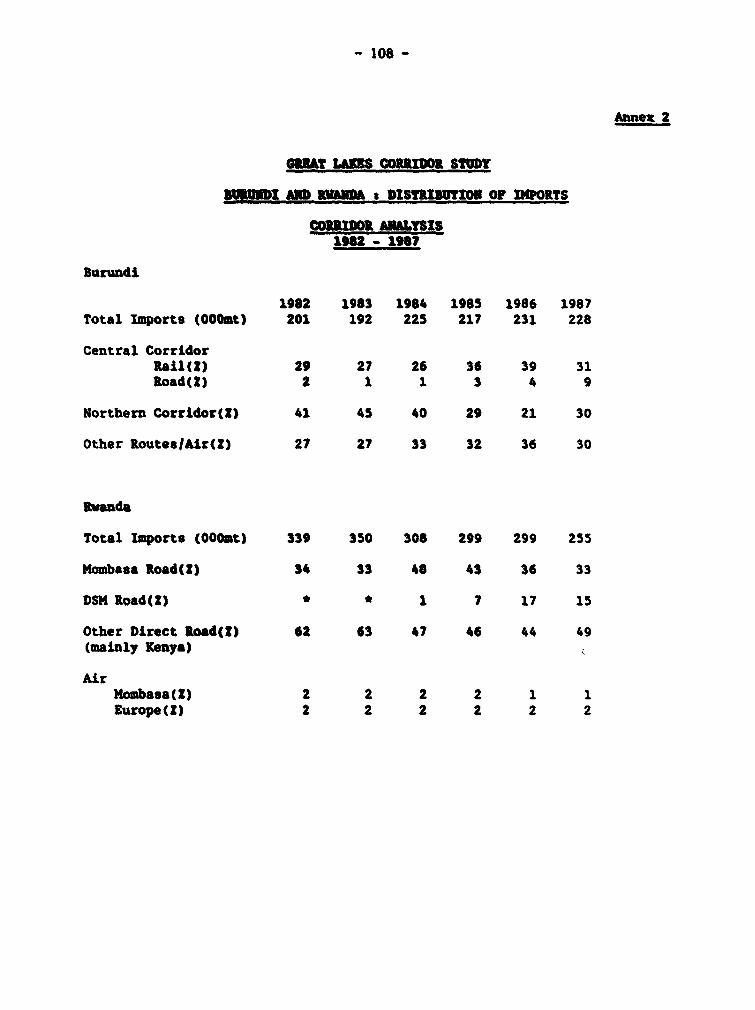
- 108 -
Annex 2
GQutA LAKS CORRIDOR STUDY
I DI an RVM: DISTRI SUTCO OF IMCORTS
COORIDOR AnLYSIS1982 - 198?
Burundi
1982 1983 1984 1985 1986 1987Total Imports (OOOt) 201 192 225 217 231 228
Central CorridorRail(2) 29 27 26 36 39 31Road(%) 2 1 1 3 4 9
Northern Corridor(Z) 41 45 40 29 21 30
Other Routes/Air(l) 27 27 33 32 36 30
va=d&
Total Imports (00Ost) 339 350 308 299 299 255
Mombasa Road(2) 34 33 48 43 36 33
DSM Road(Z) * * 1 7 17 15
Other Direct Road(l) 62 63 47 46 44 49(mainly Kenya)
AirMombasa(?) 2 2 2 2 1 1Europe(S) 2 2 2 2 2 2

ANNEX 3
Mg LAMES cinIM StU
mm COR1M
lMA RA%LlSI NM CeoMiSI la M FROM USAA, - 73 TMS U ToN-"
To Uwm_ FO01 UIUIMcomm Tom ISHAO gmm TM 111B
Cement 17,62 56,no,6n FruIt., Fresh or DrOled 6 20,742erl.y 642 8704,70 Cot.. 108,95 97,111,280Chemlal, 400 446,n20 Cotton 1,001 1,0701Mmrduoroa 448 411,478 Kid. and Skins 2,870 2,2606#0U11et 6,161 4,768,960 Coca beasn - -WAset Floor 4,409 4,097,002 Maize 1,99 1,446,106tree and Steel 104 04,681 Text1ee 58 S6,462Llm . nd Litmest.. 8,212 447,088 Tc 02 84,614Mechlbory, Agriulture 061 0"1,8" Timber 511 808,100Olles Keremsa la t*k 54U 66,81Oilo: Petrol Ir t..k* 16,188 s,7n2,50Ollot be la tInk. 1,026 951,468Pae _8JJ 891,559S"lt and SW mpesud 1 ,109 10,666,786SJbr 85,100 88,000,400Pevlelos 964 695,494Soap 1,25 1,197,487Dairy Produc 181 108,188Fibre 888 89,907bouy 212 240,080Rnic aN ricef lour 59 40,71Tallow 217 258,480
51110-TOTAL 118,287 101,047,688 109,490 108,09M,1M1
cOi CloOIDIDES 19,621 15,000,697 2,606 2,177,790
GMUUD TOTIAL 157,908 116,106,580 112,101 106,270,061

- 110 -
AWIX 4
GMTY LAKB3 CORRIDOR STUDY
loITRE CORRDOR
UGAND
IMPORT AND miR TRAFFIC CARRIED BY UGANDA RAILWAYS
YAR (IPOTS ITONS) EMRO1S(tOWS) TOTAL(TONS)
1980 59,256 43,786 102,042
1981 115,760 78,820 194,586
1982 126.511 102,913 229,424
1983 121,751 115,211 236,962
1984 157,399 93,370 250,769
1985 158,299 100,620 258,960
1986* 139,549 112,428 251,987
1987* 167,468 121,251 288,719
Source s PTA - 7th Meeting of Transport and Communications Committee
* Uganda Railways Corporation

- 111 -
ANNEX 5
GREAt LAKES CORRIDOR STUDY
NORTUE CORRIOR
MOMLASA PORT: TRANSIT TRAMFIC 1984 - 1987
PARTICULARS 1984 1985 1986 1987
3GAhNA: Imports 97,200 60,149 92,874 170,550Exports 158.903 164,193 147,832 124,575Total 256,103 224,342 240,706 295,125
EURUND:t Imports 27,811 20,157 12,673 17,308Exports 1,132 1,628 1,407 272Total 28,943 21,785 14,080 17,580
IWANDA: Imports 119,100 56,166 63,035 51,214Exports 37,464 38,132 41,329 53,658Total 156,564 94,298 104,364 104,872
ZAIRE: Imports 7,994 6,575 3,981 17,926Exports 20,148 27,198 42,740 -43,780Total 28,142 33,773 46,721 61,706
GRAND TOTALtImports 252,105 143,047 172,563 256,998Exports 217,647 231,151 233,308 222,285Total 469,752 374,198 405,871 479,283
Source: KPA Monthly Review of Port Working

ANNEX 6
a_ a. _aur s~~Io- low
m. m. a a *naa m t a 1 d***
1001.hub.a Import, Boet TOtal .ort bwpt Total t ,oeo"t Total Zhoro bpot TOtal Zort b,o,Z Total
1WO6 bad lso2 10om 1 , 1 4,87 4.8V 11,746 1.680 18,406 - -- 40.,#a 12.870 8.95
bB 30 1,782 84,95 44.00 s688 86.982 9119 82.6 Su1 80.96 6,949 17.874 20.808 6.66 8.O7 018,40
1967 bad 5.470 ",11.966 16.6 10 90411 76 90 2 *70 29.5O IQ1 80.9t1 7.U6 - 7.646 82,997 10.86 8.6
RaIl 8,.8 81.8 4.480 82,2 9,6 salon 8.88 - 6.8a8 86.674 46.66 68.94 9,46 112.5 218.n
Al I mod" 4,0 46.8 8O,1 7.040 5.17 110.W7 U4.s88 an s5s. 48.40 4.06 91.48 S6,8 IM.244 907,704
* a ataics eotl_mt
S9': TRC, TN

AXXEX,7
CE? LAMES CORRIDOR STY?
COIThAI ORSR1OOR: UAMSII TAFFIC THROUC bSAIAAU PORT 196, 1987 (tONS)
I 1 6 0 1 9 a 7
CSURTRIES IWRTS EXPORTS TOTAL IWIRTS EXPORtS TOTAL
Ztebia 3U,623 394,65 751,286 303,924 466,926 770,352
Zaire 34,944 46,228 60,172 14,062 46,036 60,100
Surundl 60,694 29,601 90,195 71,040 7?,317 110,3S5
Rwanda S4,426 1,931 ",357 14,930 S21 36,769
Hal el 4,66 8,473 13,141 9,641 11,747 20,38S
Uands 694 10,942 11,636 43,420 42,79S 96,216
timbabwe - - - 268 - 268
SU-TOTAL(M ctsatriea,Uganda) 130 -68 6,602 219,360 165,460 126,971 292,431
TotaITFransIt 492,049 490,740 982,799 479,203 060,646 1,083,929
Local 670,964 176,633 749,497 724,067 273,077 997,934
GRANDTOTAL 1,063,013 669,273 1,732,286 1,202,340 879,623 2,081,883
Proportion of transit traffic: I198 1987Transit 572 62XLocal 43X 490
Source: THA

ANNEX 8
oEAT LAWES COhIs S= T
-unwIL aomnDm
DELInME S OF S AM UGM DPWRT CARMO FRiM OSM PORt
Ram AmS RAIL OJVIVZS tJULY. l9OS - UNsE. 1988)
Zaire Burundi Rwanda Uganda Total
1987 Road Rai I Road Rai I Road Rai I Road Rai I Road Rail
July 1,861 So6 8,797 1,158 4,886 80 11,692 8,178 21,148 4,776
Auguat 966 1,266 2,856 1,787 1,410 886 1,148 1,481 6,80 5,871
Sepembr 1,664 2,149 2,748 221 2,618 - 9,629 8,228 16,654 5,659
October 719 1,717 8,167 941 8,623 145 2,108 206 0,607 2,828
November 946 18 2,179 2,067 2802 86 2,686 1,282 8,061 8,s80
December 2,887 1,002 4,6sa 1,289 8,068 262 127 793 10,650 8,846
1980
January 1,887 676 8,182 1,860 2,886 1,88 1,448 1,008 8,848 4,872
February 8,729 121 2,494 971 4,172 87 701 1,108 11,096 2,287
March 1,444 820 2,692 8,887 6,400 899 658 87 9,974 4,648
Aprll 1,096 215 1,806 2,215 6,788 1,618 168 6s8 6,a62 4,701
may 5,047 642 8,198 926 4,86 884 140 878 12,784 2,179
June 1,174 592 4,826 1,886 7,188 1,164 589 620 8,2m 8,662
TOTALS 22,8s6 8,986 86,940 18,096 47,199 6,279 80,661 18,941 187,068 84,740
Souree TM4

- 115 -
Annex 9
GMAT LAUS CORRIDoR STUDY
TRANSPORT COSTS a RVANDA
US $ per tonne
(i) Steel (FOB $277/tonne)Mombasa DSM DSM DSMRoad Isaka Road Kigoma
Sea transport 63.5 63.5 63.5 63.5Port charges 19.7 8.8 8.8 8.8Land transport 224.0 87.9 140.0 102.5
Total transport 307.2 160.2 212.3 174.8
(ii) Container s Secondhand Clothing (FOB $790/tonne)
Hombasa DSM DSM DSMRoad Isaka Road Kigoma
Sea transport 205.8 205.8 205.8 205.8Port charges 44.2 15.5 15.5 15.5Land transport 338.7 91.2 140.0 102.5
Total transport 588.7 312.5 361.3 323.8
Source 2 RWA1861005
The analysis shows some differences to Section 9 of the Report but theoverall conclusions are similar. The routes via DSM, whether by road orraillroad, offer significantly lower costs than the Mombasa route. Thecost differences would be substantially reduced if Rwanda's protectionpolicies were to be introduced to the DSM route as the road transport costwould rise to $ 200/tonne

- 116 -
Annex 10Page 1 of 6
GREAT L-AKS CORRIDOR STUDY
MODE COST ANALYSIS
WAGON FERRY COSTS
Similar ferries are operated by all three railways in the region and theyhave become a key element in Uganda's international transport strategy.Unfortunately there is little information available on the operating costsof Uganda's ferries. An attempt has been, therefore, to collateinformation from all ferries and produce cost estimates for those operatedby Uganda Railways.
Direct Costs
(i) Fuel : TRC operating ststistics show fuel consumption of 16.71tlkm,similar consumption is reflected in KR accounts. The Danida estimates of251tlkm appear high and the TRC figure has been taken.
(ii) Oil : all estimates give oil consumption at 1.12 of fuel consumption
{iii) Maintenance : Danida estimates $28,500 per annum, KR accounts areabout $50,000 and a 1980 study estimated $34,000. The KR figue has beenused although it is well below conventional rule of thumb which rangebetween 1.0Z - l.52 of capital costs. 50? of maintenance is assumed to beuse related.
(iv) Crew Costs : basic crew salaries can be assumed as a fixed cost but asubstantial proportion of total crew costs are related to food and othertrip allowances. 50X of total crew costs are, therefore, assumed to bevariable.
(v) Utilisation : Danida assumes 100 round trips per annum, Jinja-Kisumu.The ferries should be capable of 200 round trips as the one-way sailingtime is 12 hours and turnaround could be reduced to less than 2 hours.
Variable Costs s Annual Costs t$ S
Fuel (750,0001t) 250000 Maintenance 25000Oil (82001t) 18000 Crew 31000Maintenance 25000 1"surance 124000Crew 31000Total 324000 Total 180000
Variable costs $ 7.26/km

- 117 - Annex 10Page 2 of 6
Total Direct Costs s Jinia - Kisum
100 trips/annum 200 tripslannum
Variable $ 324000 $ 648000Fixed 180000 180000
Total 504000 828000
$Itrip 5040 4070$/km 11.3 9.1Slton-km 0.0188 0.0152
Total Costs s Jinia - Kisumu
Danida estimated that indirect costs would add 151 to direct costs,previous cost studies of the TRC ferry estimated 472. In this studyindirect costs of 252 have been assumed.
Total costs s Ton-km Ton(100 round trips) $ 0.0235 $ 5.24 ton(200 round trips) $ 0.0190 $ 4.24 ton
These total costs have not included any element of capital charges, on theassumption that the ferries have little opportunity cost. Expansion of thefleet would, however, require consideration of both operating and capitalcosts. The replacement cost for the type of ferry used on Lake Victoria isin the order of $ 10 million. If full capital charges, with a lOZ interestrate and a 30 year life, are included the ferry costs rise appreciably
Total costs s Ton-km Ton(including capital charges) (100 round trips) $ 0.0631 $ 14.08
(200 round trips) $ 0.0388 $ 8.65
Even with high ferry utilisation the inclusion of full capital chargesdoubles costs.
It appears that KR charge Uganda the same rate for ferry and rail services,K19.2/- per bogie-km. Revenue per tonne, assuming an average 32tonnes perbogie, would be $ 7.43, giving a mark-up over direct costs (low rate offerry utilisation) of just over 40X.

Annex 10- 118 - Page 3 of 6
RAmL COSS
Rail Costs B last Africa
While no attempt has been made to prepare detailed rail costs thea. is theneed to consider what contribution international traffic makes to thefinances of the railways of Uganda, Kenya and Tanzania.
A number of rail cost estimates were found during the course of the study s
TRC t Long-run variable costs (1987) T 1.331- per ton-km. equivalent to$0.0196 per ton-km. This estimte is based upon an average haul of 800kmand would thus tend to overestimate the costs for transit traffic withaverage hauls of '. 1200kms
KR t Full costs of x 0.85/- per ton-km were quoted, equivalent to $0.047per ton-km. This total cost would probably mean a variable cost of$0.0241-$0.02S3 3er ton-km. As vith TRC this estimate is probably anoverestimate for transit traffic given the average haul on KR is 570kms andthat of transit traffic 88Skms.
UK s A number of estimates of railway costs for Uganda have been prepared,unfortunately they range widely from $0.14 to $0.0163 per ton-km.
Masterplan Year 0 $0.14 ton-km5 $0.1020 $0.055
Danida $0.0223 (no capital charges)
CIE $0.021 (no interest charge)$0.0163 (variable cost)
Synthetic Rail Variable Costs
To check the plausibility of these estimates a synthetic estimate ofvariable rail costs was constructed, using assumptions that are standardlymade.
(i) Locomotive capital costs t $ 1.4 million, 25 year life, 102 interestrate, annual utilisation 750OOkm
($$) Fuel consumption t 61t/km at US 21c per liter
(iii) Locomotive maintenance : 52 of capital costs per annum
(iv) Crew costs t $4000/crew, 40000km per annum
(v) Wagon capital costs t $0.055 million, 30 year life
(vi) Wagon maintenance s 21 of capital costs per annum, annual utilisation30000km
(vii) Loco terminal costs s $1020, wagon terminal costs assumed withinannual utilisation

119 - ~~~~~Annex 10- 119 - Page 4 of 6
tail Long-Run Variable CostsUS $/km
Loco costs t Capital 2.06Maintenance 0.93Fuel 1.26Crew 0.10
Total 4.35
wagon costs s Capital 0.194Maintenance 0.037
Total 0.231/wagon
20 vagons 4.628 wagons 1.85
Train costs : 20 wagons 8.978 wagons 6.20
Costs Major Transit Routes
(i) DSM - KigomaTotal costs per train 20 wagons s US $ 12145Cost per tonne (500 at payload) s $ 24.3
(600 mt payload) s $ 20.2Cost per ton-km (SOOmt) $ S 0.0193
(600mt) s $ 0.0161TRC Tariff per tonne s $ 41 - 45
The costs estimated by this approach are very similar to those prepared bythe Bank from TRC accounts for 1987. Transit traffic covers not its long-run variable costs and contributes approximately an equal amount to fixedcosts.
(ii) DSK - Hwanza
Similar results should hold true for the DSM - Mwanza route as thedistance, costs and revenues are little different.
(iii) Mombasa - Kisumu
Costs for the Mombasa - Kisumu haul must take into account the train loadrestrictions upon the NIakuru - Kisumu section. Based on the costs outlineabove the total movement cost for 20 wagons to Kisumu is $9814. Terminalcosts will be increased above the $1020 because of the need to remarshallat Nakuru, assume $1500. Total costs are, therefore, estimated at $11314,equivalent to $0.607/wagon-km. This compares with the contract rate KR-URof $1.067/wagon-km.
The tariff charged would seem to be sufficient to cover KR's total costs asthe variable costs are somewhat exaggerated as they assume heavy mainlinelocos working Nakuru-Kisumu when, in fact lighter branchline locos would beoperating.

- 120 - Annex 10Page 5 of 6
ROAD TRANSPORT COSTS
The following estimates of vehicle operating costs have been derived from avariety of sources
- the TRRL cost model- transporters in Uganda and Kenya- UNDP/Bank expert's estimates for Rwanda- mission experience
Two sets of costs have been estimated to illustrate the range of costs thatcan be produced using 'reasonable' assumptions :
(i) Conventional estimates based mainly upon TRRL model and informationfrom major transporters in the region
(li) Minimum cost estimates assuming that transporters make use of thedistorted exchange rates to reduce their costs and have lower overheadcosts.
Running CostsKsh/km
Conventional MinimumFuel 2.86 0.75Oil .29 .07Tyres 4.47 4.47Maintenance 14.77 7.39
Total 22.39 12.68
Depreciation 5.00 5.00
Annual CostsKshIannum
Crew 96000 96000Overheads 180000 90000Licence Kenya 21000 21000
Uganda 3600 3600Insurance 14000 14000
Total 314600 224600
Interest 180000 180000
Trip CostsKsh/trip
Crew 3000 3000Kenya tolls 600 600Uganda licence 1800 1800Other 1500 1500
Total 6900 6900

121 - Annex 10Page 6 of 6
Total Round Trip Costs
Running Costs2360ki 52840 $2935 29925 81662Depreciation 11800 655 11800 655Fixed costs24 tripslyear 13108 728 9358 520Interest 7500 417 7500 417Trip costs 6900 383 6900 383
Total 92148 $519 65463 $3638No capital 72848 $4047 46183 $2566
Total Revenue per trip
Transport rate : Mombasa - Kampala $903ackload 45
(30tonne payload)Backbaul X Truck Revenue
0 $ 270025 303750 3375
Implications
On the basis of conventional voc estimates it seems clear that presenttransport rates between Kenya and Uganda are well below total costs. Evenwith the minimum cost estimates only a very small contribution to capitalcharges is being made. With a 35 tonne payload, however, full minimumcosts are almost covered.

- 122 -
ANNEX 11
GRE&T LARKS CORRTDOR STUDY Page 1 of 6
CONTAIMERISATIIN
Introduction
Issues related to containerised traffic and containerisation were raisedseveral times in the study. The trends in international transportlogistics suggest that, irrespective of their wishes, the Landlockedcountries must be prepared for an increasing proportion of their generalcargo overseas trade to be containerised. In many respects containers arewell very suited to the requirements of transit-transport but significantobstacles must be overcome before their full potential for the landlockedcountries in the region can be realised. Unless improvements can be mademany containers may have to be stuffedistripped at port.
Existing Container Traffic
Data on the present flow of containers to the LLC are incomplete but it isclear that, despite the problems encountered, container traffic isincreasing quite rapidly. The following summarises the informationavailable to the study.
(1) Mombasa Port s
Total container traffic has increased rapidly at Mombasa during the 1980's,container penetration of the general cargo trade is expected to continuebut at a rather slower rate s
Containerisation of General Cargo
Imports Exports Total1982 18Z 402 2821984 20X 552 332198617 33Z 622 452Forecast199112 451 702 59Z
No details of containers in transit to the LLC are available though one CJFagent handled 200 per month and suggested that the total flow would beabout 1000 per month. This would imply an annual flow of about 140,000tonnes of cargo by container, this appears very high.
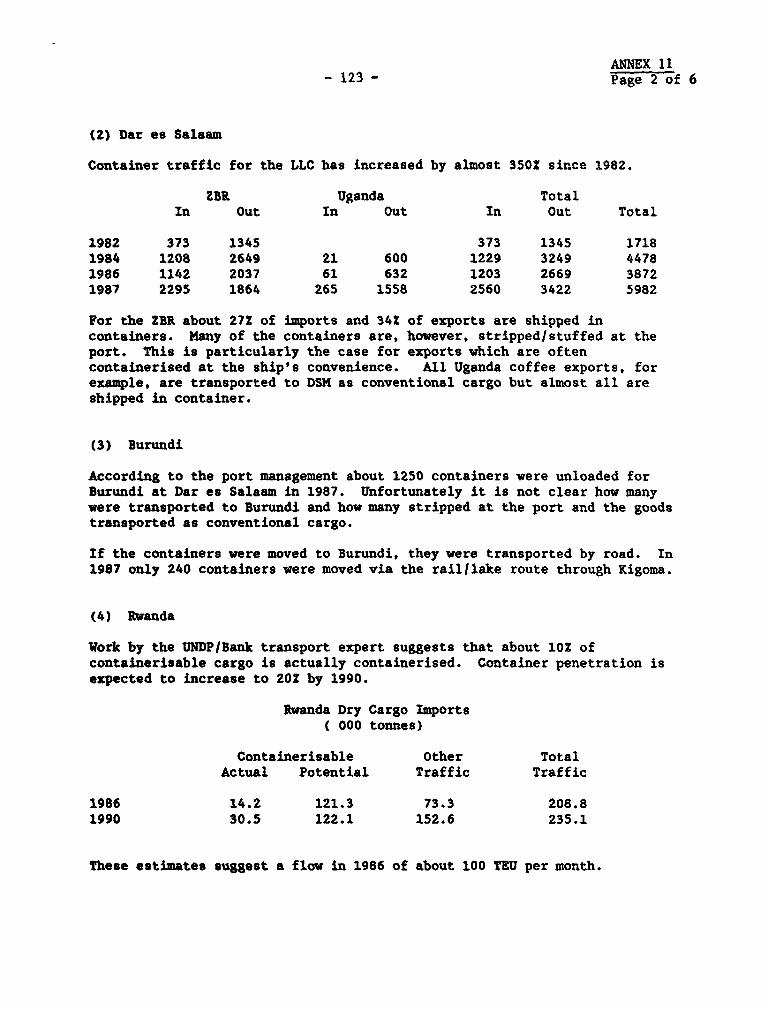
ANNEX 11-123 - Page 2 of 6
(2) Dar es Salaam
Container traffic for the LLC has increased by almost 350Z since 1982.
ZBR Uganda TotalIn Out In Out In Out Total
1982 373 1345 373 1345 17181984 1208 2649 21 600 1229 3249 44781986 1142 2037 61 632 1203 2669 38721987 2295 1864 265 1558 2560 3422 5982
For the ZBR about 27Z of imports and 34% of exports are shipped incontainers. Many of the containers are, however, stripped/stuffed at theport. This is particularly the case for exports which are oftencontainerised at the ship's convenience. All Uganda coffee exports, forexample, are transported to DSM as conventional cargo but almost all areshipped in container.
(3) Burundi
According to the port management about 1250 containers were unloaded forBurundi at Dar es Salaam in 1987. Unfortunately it is not clear how manywere transported to Burundi and how many stripped at the port and the goodstransported as conventional cargo.
If the containers were moved to Burundi, they were transported by road. In1987 only 240 containers were moved via the rail/lake route through Kigoma.
(4) Rwanda
Work by the UNDP/Bank transport expert suggests that about 102 ofcontainerisable cargo is actually containerised. Container penetration isexpected to increase to 202 by 1990.
Rwanda Dry Cargo Importst 000 tonnes)
Containerisable Other TotalActual Potential Traffic Traffic
1986 14.2 121.3 73.3 208.81990 30.5 122.1 152.6 235.1
These estimates suggest a flow in 1986 of about 100 TEU per month.

- 124 - ANNEX 11Page 3 of 6
(5) Uganda
The study found no quantitative information regarding current containermovements.
Major Problems
Present transit-transport conditions in the region create major problemsfor container movements. Unless the constraints can be removed theincreased use of containers for inland transport will be difficult toachieve.
Northern Corridor
The basic problem is that the transit governments on the Corridor do notappreciate the underlying concept of container transport. Consequently thepotential advantages generated by using sealed boxes are lost. Instead ofcontainers moving under customs seal from port to destination they areopened at the port and then again at each customs crossing point. Thisprocedure increases the transit time and the potential for pilferage. Themore specific problems on the corridor are as follows s
- inefficiencies within Mombasa port, poor availability of handlingequipment;
- 1002 verification of containers at the port, requiring police, customsand IPA officials;
- police convoys for some containerised cargo through Kenya which add2/3 days to transit times;
- delays ror container clearance at Mombasa as Kenya customs do notnormally work weekends;
- potential demurrage payments on the containers. It is impossible toachieve a container turnround to Rwanda or Burundi within the 28 daysallowed by the shipping lines. Demurrage of $5-$8 per day can then bechargeds
- inadequate rail service for containers. At present rail transit timesare far too long for containers and, as charges are also made forempty movement, rail rates are higher than trucking rates;
- inadequate container handling facilities in Uganda. There is no ICDin Kampala and only two C/V agents have their own handling equipment,the others have to hire the Post Office mobile crane. Containerhandling for rail movement should be improved with the purchase ofcontainer cranes by Uganda Railways;
- gross vehicle weight limitations, if enforced, would make itimpossible to move fully loaded 40ft containers to the LLC;
- The National Bank of Rwanda has directed that some commodities areair-freighted from Mombasa. If the goods arrive in containers theymay have to be stripped at Mombasa.

ANNEX 11- 125 - Page 4 of 6
There is also a major imbalance of traffic in the region which would resultin substantial flows of empty containers. This reflects the structure ofexport marketing in the region as most of the coffee and tea exported fromMombasa is shipped in containers. Tea and coffee is, however, generallysold at Mombasa or, in the case of Ugandan coffee, shipped ex-stock. Toincrease the inland use of containers for exports might require themodification of these arrangements. A further constraint on the use ofcontainers for export traffic from the LLC is that the lines bringingimport containers are often not those taking the export containers.
At present it appears that the great majority of containers move by road.KPA has, however, plans to establish a rail served Inland Container Depotat Malaba although it has not yet obtained the finance for construction.It is not clear whether this would be of significant benefit to the LLC,unless present transit regulations could be modified substantially. TheICD could make some reduction in transport costs but it would introduce amode interchange into the system and would probably further increasetransit delays.
Central Corridor
The basic problems on the Northern Corridor are the security and transitregulations, these are not a constraint on the Central Corridor. Transitcontainers are not opened at Dar es Salaam if the seals are unbroken, noescort is required and the transit pass system avoids the need for transitbonds. Container handling productivity at DSM is reasonable, despite thefact that the container terminal is not yet operational and ccntainers arehandled over general cargo berths. It would also appear that, during thedry season at least, turnround time for containers to Rwanda and Burundicould be kept within 28 days if road transport is used and the containerscan be rapidly cleared in the LLC. The return of containers is a problemand a deposit of Tsh 100,000 is required by the shipping lines forcontainers sent to ZBR. The Central Corridor also faces the same exporttraffic problems as the Northern Corridor.
Container movement on the traditional Kigoma raililake route faces,however, raised serious difficulties t
- TRC has only 30 specialised wagons so containers have to be lashedin standard wagons;
- slow transit times, well outside the 28 days allowed;- limited container handling equipment at Kigoma;
The physical problems of rail-based container movement in Tanzania areslowly being resolved.
- a container crane is being provided at Kigoma;- 125 container wagons are being purchased and a further 100 wagons
are being converted to carry containers;- TRC movement capability is being raised by the Emergency Program;

- 126 - ANNEX 11Page 5 of 6
- the EEC is considering the provision of block trains for theKigoma and Isaka routes:
- aditional container handling equipment is being provided for theport of Bujumbura;
- the Isaka raillroad terminal has been designed mainly as acontainer transfer facility.
By 1990 the equipment should be available for rail container movement, itwill then be problem of organising these equipment and facilities into anefficient operating system.
Choice of Container Route
Uganda has little effective choice between Mombasa and DSM for the routingof container traffic. The DSM-Mwanza route has not, at the present time,the operational capability to be a realistic alternative to Mombasa forcontainer movement. Previous studies of containerisation for Ugandaplanned on the basis of unit container trains operating direct betweenKampala and Mombasa. In the longer term this would still seem theappropriate system for low cost efficient services. The pattern ofoperations would probably require trains to use the Malaba route as thewagon ferry system through Kisumu could create the potential for delay.Until such direct services can be organised Uganda has little alternativeto road-based operations.
The situation is very different for Rwanda and Burundi and, in almost allrespects, the Central Corridor is more attractive :
(i) Port handling efficiency is similar but productivity at DSM shouldincrease once the present major improvements to container facilities arefully operational:(ii) Port charges are lower at DSM s
Mombasa Dar es Salaam( $ per TEU )
Ship charges 17 12Container handling 167 93Wharfage 78 98*
Total 262 203
* for ZBR cargo using Belbase the cost would be lower
(iii) Road transport costs are lower via the Central Corridor, this couldchange if Rwanda imposed its Northern Co-ridor controls to the DSMroute;
(iv) Transit times are faster by road on the Central Corridor, 7 dayscompared to 14 days via Kampala;

ANNEX I1I- 127 - Page 6 of 6
(v) Transit regulations are less cumbersome and no transit bond isrequired;
(vi) Container verification for transit traffic is not normally necessaryat DSM, 1002 verification of containers is applied at Mombasa;
(vii) Mombasa has better facilities but those at DSI are being improved.Container stacking space at DSM is limited and is currentlycongested with local and empty containers.
(viii) There is no significant shipping cost differential between the twoports.
Overall DSM has the potential to capture a very significant share of thecontainer traffic market to Rwanda and Burundi. The route has manyadvantages over the Northern Corridor and relatively few problems. Theinfrastructure on the Mombasa route is being improved but efficientoperating systems through Kigoma and Isaka would still give substantialadvatages to the DSM routes.
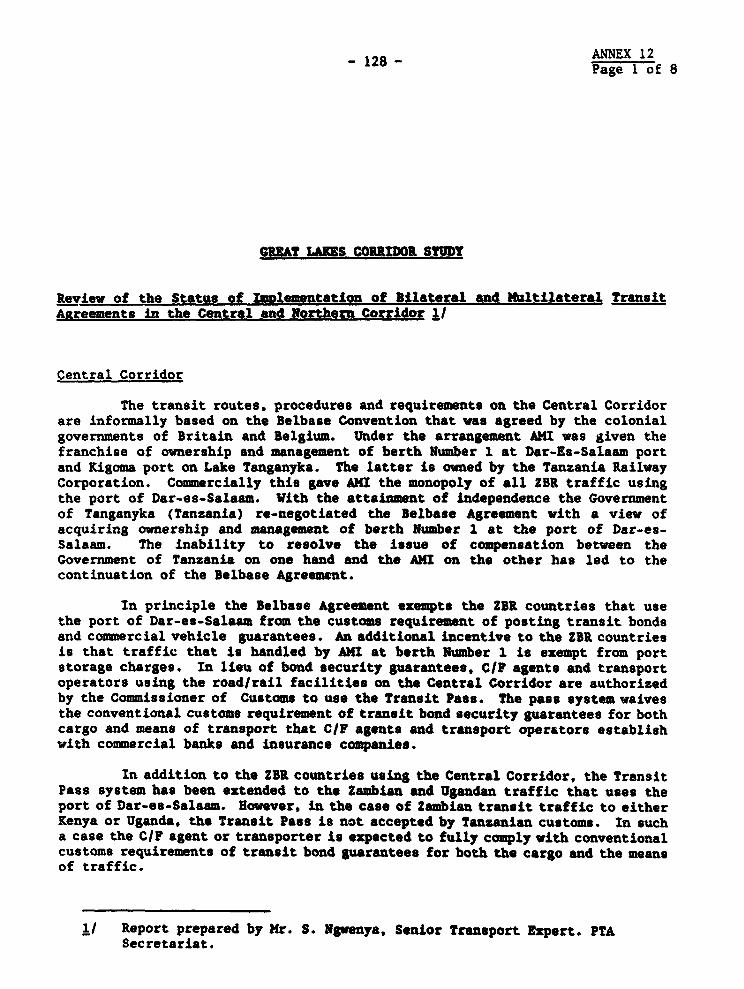
- 128 - ANNEX 12Page 1 of 8
GRAT SANES CORUDOR STUDY
Review of the Status of lmolementation of Bilateral and Multilateral TransitAQreements in the Central and Northern Corridor I1
Central Corridor
The transit routes, procedures and requirements on the Central Corridorare informally based on the Belbase Convention that was agreed by the colonialgovernments of Britain and Belgium. Under the arrangement AMI was given thefranchise of ownership and management of berth Number 1 at Dar-Es-Salaam portand Kigoma port on Lake Tanganyka. The latter is owned by the Tanzania RailwayCorporation. Conmercially this gave AMI the monopoly of all ZBR traffic usingthe port of Dar-es-Salasm. With the attainment of independence the Governmentof Tanganyka (Tanzania) re-negotiated the Belbase Agreement with a view ofacquiring ownership and management of berth Number 1 at the port of Dar-es-salaam. The inability to resolve the issue of compensation between theGovernment of Tanzania on one hand and the AMI on the other has led to thecontinuation of the Belbase Agreement.
In principle the Belbase Agreement exempts the ZBR countries that usethe port of Dar-es-Salasm from the customs requirement of posting transit bondsand commercial vehicle guarantees. An additional incentive to the ZBR countriesis that traffic that is handled by AMI at berth Number 1 is exempt from portstorage charges. In lieu of bond security guarantees, Cl? agents and transportoperators using the roadlrail facilities on the Central Corridor are authorizedby the Commissioner of Customs to use the Transit Pass. The pass system waivesthe conventional customs requirement of translt bond security guarantees for bothcargo and means of transport that C/F agents and transport operators establishwith commercial banks and insurance companies.
In addition to the ZBR countries using the Central Corridor, the TransitPass system has been extended to the Zambian and Ugandan traffic that uses theport of Dar-es-Salasm. However, in the case of Zambian transit traffic to eitherKenya or Uganda, the Transit Pass is not accepted by Tanzanian customs. In sucha case the ClF agent or transporter is expected to fully comply with conventionalcustoms requirements of transit bond guarantees for both the cargo and the meansof traffic.
1/ Report prepared by Mr. S. Ngwenya, Senior Transport Expert. PTASecretariat.

ANNEX 12- 129 - Page 2 of 8
The policy of the government of Tanzania is that preferential treatmentto transit traffic through the Transit Pass should only be given to traffic thatuses the port of Dar-es-Salaam. The Government of Tanzania has two transitpolicies which entail different rules and procedures. It is conceivable thatthe corridor approach to transit facilitation within Tanzar.ia would give riseto an array of different transit policies.
At the bilateral level, the Governments of Tanzania, Burundi and Rwandahave attempted to establish common heavy goods vehicle axle load limits andtechnical specifications on length, width and height. Given the regionaldifferences that exist, corridor standards would result in restrictions to freecirculation of heavy commercial goods vehicles. It is against this backgroundthat the PTA has undertaken studies aimed at establishing regional standards onaxle load limits and vehicle technical specifications.
Northern Corridor Transit Agreement (NCTA)
The Northern Corridor Transit Agreement (NCTA) was signed on February19, 1985 by Burundi, Kenya, Uganda and Rwanda. On November 15, 1986, theAgreement legally came in force. The object of the Agreement is twofold:firstly, to provide a mechanism to the signatory countries for the identificationand mobilization of financial resources required for the implementation ofregional corridor projects. And secondly, to streamline and harmonize transitregulatory procedures as a means of facilitating transit traffic. The Agreementenvisages that the latter objective would be realized through the implementationby contracting countries common programs that are provided for in the Protocolsof the NCTA.
Important aspects to the Agreement, inter alia, focus on: harmonizationof customs control and documentary requirements; road user taxes on transitvehicles; heavy goods vehicle axle load limits and other technical dimensionsand coordination of inter-state railway operations.
During the past two years of the existence of the Agreement, priorityhas been accorded to transit traffic facilitation. Taking into account thatabout 30Z of delays to transit traffic are due to cumbersome customs controlsand documention requirements,a unified Road Customs Transit Declaration Document(RCTD) was introduced in November 1986. It was envisaged that this documentwould replace existing national transit documents, thus expediting the movementof transit traffic and reducing transit costs. Unfortunately the wrongapplication of the RCTD along the Corridor has frustrated the full realizationof expected benefits. The absence of a regional bond guarantee arrangement hasbeen the primary factor that has hindered the full implementation of thedocument. It is therefore essential that a study on the institutionalorganization and management of a regional guarantee system should be undertaken.Further delays in addressing this issue will seriously undermine the faith thatthe Northern Corridor countries have in the Agreement.

- 130 - ANNEX 12Page 3 of 8
Common axle load limits and vehicle technical specifications and roadtransit user taxes are issues that have a regional and not a corridor dimension.Attempts in both the Central and Northern Corridors to establish corridorstandards have been misplaced because transit vehicles circulate in economicregions rather than in "linear" corridors.
The PTA Transit Regime
The provisions of Article 19 of the Protocol on Transit Trade and TransitFacilities are primarily aimed at facilitating regional trade and transittraffic. Consequently PTA programs are focussed on the implementation of auniform regional transit policy for all modes of transport. This is in contrastto the Northern and Central Corridor transit facilitation approaches which aremode specific.
Among others the PTA transit facilitation programs address issues suchas rates and tariffs, licensing of carriers and transit traffic operators,approval of the means of transport, common bonds and sureties arrangements.standardized documentation and harmonized customs transit rules and procedures.Furthermore, PTA programs are either being developed or have been implementedconcerning third-party insurance, harmonized road user taxes, highway designstandards for inter-state trunk roads, etc.
Table 1 shows existing road user charges in PTA countries. The chargesthat affect transit include road service license/permits, entry fees, foreigncommercial licenses, transit goods licenses and road colls. A significantfeature of existing road user charges in the PTA is that they are largelyadministered by the Ministries of Finance. Further, the levels are determinedmore by considerations of revenue generation by Governments than by economicconsiderations of meeting the costs of road provisions and use. It is againstthe background of existing different road user charges that the PTA has carriedout studies aimed at harmonizing both direct and indirect road user transitcharges, axle loads and vehicle dimensions.
With regard to road user charges the PTA approach is based on the followingprinciples and concepts:
(i) transit traffic must pay for the use of PTA highway infrastructure;
(ii) payment must be related to the cost of providing and maintainingthe highways used;
(iii)revenue realized from payments made by transit traffic must beutilized in maintaining and improving the highway links in questionso as to minimize vehicle operating costs;
(iv) there should be no other charges whatsoever imposedon vehicles engaged in PTA transit traffic operations.

- 131 - ANNEX 12Page 4 of 8
It is envisaged that as from July 1, 1989, a PTA harmonized road usertax that takes into account the relationship between pavement damage caused byheavy goods vehicles, construction and maintenance costs would come into force.
Regarding heavy goods axle load limits, Schedule 1 shows existingregional standards and the proposed PTA standards which are expected to comeinto force on July 1, 1989. In the interim, PTA member states would enact thenecessary legislation. The proposed PTA axle road limits vehicle limitationsand road taxes are based on technical and economic studies that have beencarried out by the PTA Secretariat.
With regard to the licensing of transit vehicles, the PTA region has amultiplicity of national licenses and capacity regulating regimes which resultin higher freight rates than would be the case if there was market competition.Taking inte account the economic cost of these national controls which aresometimes justified on the basis of security, etc., the PTA has proposed thatmember states should comply by July 1, 1989 with the provisions of Article 4,paragraph (1) on Annex V to the Treaty. According to this provision, eachmember state is responsible for the licensing of all transit traffic operatorsthat are registered and resident in their respective countries. Consequently,transit countries are obliged to accept vehicles that are licensed by othermember states for transit operations. The implications of this policy is thatroad service permits, transport authorizations, etc. should not be used asinstruments for capacity and freight allocations.
The managerial and operational expenses incurred by CIF agents andtransporters in the administration of the existing system are extremelydifferent to quantify yet they are substantial. The proposed methods ofcharging and the licensing system will be relatively cheaper and simpler toadminister. The windfall benefits from freeing regional transport capacity fromcumbersome and costly administrative national regulations will usher acompetitive environment which will reduce regional road transportation freightcosts.
Other programs that the PTA has implemented at the regional level amongothers includes
- PTA Third Party motor vehicle insurance card (known as theYellow Card);
- standardized customs seals;
- asimplified' and standardized railway transport documents whichreplace seven different documents previously used;

ANNEX 12- 132 - Page 5 of 8
The Need for a Regional Transit Policy
The corridor approach to regional operations is counter productivebecause it gives rise to a multiplicity of rules, procedures, documentationrequirements and standards. In a region with a plethora of rules, regulationsand procedures, the promotion of bilateral and multilateral corridor policiesmakes heavy demands on the administrative infrastructure. For example, acountry that is a member of both the Central and Northern Corridors has toparticipate in meetings for both corridors. To compound matters, theimplementation of corridor programs entails costs which could be avoided ifthere was a common regional transit policy.
It is advisable that both donors and countries that are involved indeveloping transit policies for corridors should be dissuaded from experimentingwith strategies and policies that weaken efforts towards regional integrationin Africa that are being promoted by intergovernmental organizations such as thePTA and SADCC. In the case of the PTA a regional program of transit trafficfacilitation is now in place.

TABLE IExisting Road User Charges in PTA Countries
COUNTRIES/TYPE OF CHARGES Angola e1tswana Butundt Lhttopia Ke,nta tesotho mtIaw, Mozambuitiv. Iwarda Sw.u,.ida 1.a.uztn.a Ikj.anil.i Zjnmbs 2i.. u
(a) Charges bnked to acquisitiondf ve'r*fev
ilmpont Dutls on vehcbs x x x x a x I x x a x * a £
(is) Vehcles Registraton Fees NIL a x x a x x NiL x a * * a
lb) Chages for tie ownwshp anduse d vehcles
() Road L.cences NIL a X It X a NIL a I t x x
(i) Road Serice Lxeences NIL x x x x * x NIL NIL x x x x
(m) Dut akdlor sale la onspare parts. Iuel andtyr &s tubes x x a x a a a x x a a
(cti Chages on Foregn Vehices
(e) ,Poad Servce LicencesPermut NIL x NIL x NIL x x NIL tI x NIL NIL a
(a. Entry lees NIL NIL x NIL NIL NIL NIL NIL x NIlL NIL NIL x 9.
(.3) Foreagn CormercialLicences NIL NIL NIL NIL x NIL NIL NIL NIL NIL a NIL N.
(Iv) Transt Goods Licences NIL tIlL NIL NIL x NIL NIL NIL NIL NIL a x NIL Nil(d) QDtect Charges lor use of road
space:NIL
(j Road Tolls NIL NIL NIL filL A tilL NIL NI' NIL .ilL x NIL NIL fi
o,~X.°.
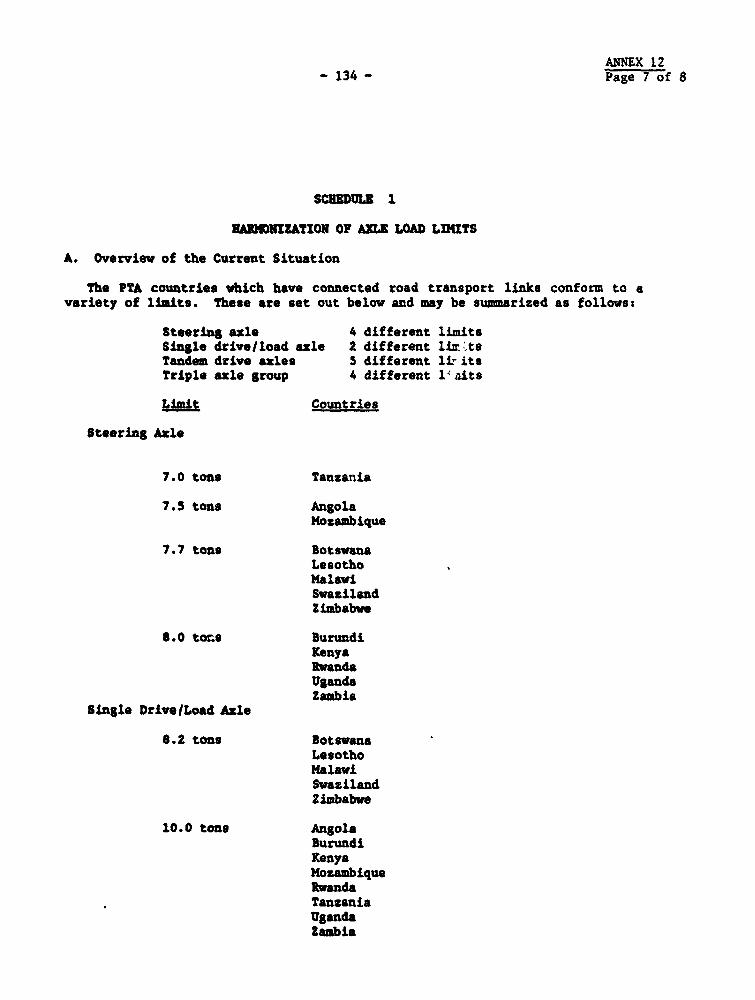
ANN1X 12- 134 - Page 7 of 8
SCUL3 1
3A3IUUIZATION OF AXLE LOAD LIMITS
A. Overview of the Current Situation
The PTA countries which have connected road transport links conform to avariety of limits. These are set out below and may be summarized as follows:
Steering axle 4 different limitsSingle drivelload axle 2 different lir tsTandem drive azles S different 1 itsTriple axle group 4 different lVaits
Limit Countries
Steering Azle
7.0 tons Tanzania
7.5 tons AngolaMozambique
7.7 tons BotswanaLesothoMalawiSwazilandZimbabwe
S.0 tons BurundiKenyaRwandaUgandaZambia
Single Drive/Load Axle
8.2 tons BotswanaLesothoMalawiSwazilandZimbabwe
10.0 tons AngolaBurundiKenyaMozambiqueRwandaTanzaniaUgandaZambia

ANMEX 12- 135- Page 8 of 8
Limit Country
Tandem Drive/Load
16.0 tons AngolaBurundiKenyaMozambiqueRwandaUganda
16.3 tons Zambia
16.4 tons MalawiZimbabwe
18.0 tons Tanzania
19.6 tons BotswanaLesothoSwaziland
Triple Axle Group
23.0 tons Zambia
23.2 tons BotwanaLesothoSwaziland
B. Recommended Axle Load Limits
8.0 tons Steering Axle10.0 tons Single Drive/Load Axle16.0 tons Tandem Drive/Load Axle24.0 tons Triple Axle Group

- 136 -ANNEX 13Page 1 of 4
GMRET LAfS COBRIDOR STODY
THE COST OF BURUMDI TRUCR PROTECTION
Introduction
The National Bank of Burundi (BNB) gives a significant element ofeffective protection to local trucking companies operating in the inter-national transport sector. In normal circumstances BNB will only paytrucking charges in FBu, but will provide an allocation of foreign exchangeto local companies to pay for external costs such as crew expenses, fueland border fees. There is no ban on foreign truckers competing in themarket for Burundi cargo, but their earnings will be in local currencywhich can only be exchanged on the parallel market. The parallel market isillegal, and though tolerated for most of the time, there is always someuncertainty. While this may be satisfactory for truck drivers, it may notbe adequate for larger scale transactions. The FBu is traded at a signi-ficant discount, approximately 251, thus reducing the real value oftrucking revenue to foreign operations.
Implications of the Protection System
Local payment gives protection to local truckers and their participa-tion in international trucking increased dramatically during the 1980's.In general, it is presumed that protection will encourage inefficiency andthat open competition is to be preferred. The elimination of all protec-tion of local truckers may not, however, be in the interests of thenational economy, and careful consideration must be given to the extent ofthe net price distortion generated by local currency revenue payment. Anumber of factors must be taken into account when assessing protection ininternational trucking:
(i) Burundi Indirect Taxations the transport rates charged byBurundi truckers reflect their financial costs and not theeconomic costs to Burundi. Import duties and purchase taxes onvehicles and other vehicle operating inputs normally raisefinancial operating costs above economic costs. Within the ratecharged by the Burundi trucker, there is thus a transfer elementto the Government. The transport rate paid to a foreign truckeris, however, the real economic cost to the Burundi economy.Rates charged by Burundi truckers can thus be higher than thosecharged by foreign truckers and still have the same cost to theeconomy.
(ii) Overvalued FBU: the Burundi currency is overvalued and in thesecircumstances local currency charges have a lower economic costthan equivalent charges paid to foreign truckers at the officialexchange rate. This does not imply that the transport rates candiffer by the full extent of the foreign exchange premium as theoverall import content of Burundi trucking costs, especially onthe transit routes, will be very high.

- 137 -ANNEX 13Page 2 of 4
MOi) National Security: Burundi is a landlocked country which hassuffered from considerable disruption to its external traderoutes. A locally based international trucking capability isone means of providing transit flexibility and security, andBurundi may thus be prepared to pay the equivalent of an in-surance premium for its own truckers. In these circumstances, atransport rate paid in FBu to a Burundi trucker will be prefer-able to an equivalent PIE payment to a foreign trucker.
The problem is to determine the level of protection which isjustified from the point of view of the Burundi economy. Thelevel of a security premium is a policy issue, but the otherelements of the calculation can, in principle, be derived fromthe analysis of Burundi trucking costs.
Burundi International Trucking Rates and Costs
The analysis of Burundi international trucking costs has been made onthe basis of unit costs obtained in Burundi, and operating cost formulaederived from East African experience. The total level of costs generatedby this procedure is significantly higher than the actual level of costsimplied by present transport rates. This is not unusual in this type ofanalysis, and costs have been reduced to those implied by the ratesactually charged.
Ci) Transport Rate Assumptionst Mombasa - Bujumbura
Imports: 35 tonne payload FBu 30,000/tonneExports: 26 tonne payload FBu 20,000/tonne,
only 30Z of trucks obtain an export backhaul
Total expected revenue: FBu 1.206 million
(ii} Transport Cost Structure;* FIE cost Taxes Local Cost
Fuelloil 100l rn-..
Crew trip expenses 1OOS rn- -Border fees 100l rnrnVehicle/spare parts 60? 25? 15?Tires 562 242 20SMaintenance Labor charge 20S 52 75?Crew Wages - - lOOZBurundi licenses GD 100 mm

- 138 - ANNEX 13
Page 3 of 4
(iii) Round trip Variable Costs:
Direct foreign exchange payment = $2680
Other Costs (FBu '000)
F/E TAXES LOCAL TOTALSpare parts 240 100 60 400Maintenance labor 8 2 30 40Tires 116 50 41 207Depreciation 91 38 23 152
Total 455 190 154 800
(iv) Fixed Costs
Annual Costs (FBu '000)
F/E TAXES LOCAL TOTALCrew wages == 9= 720 720Interest on capital (lIZy 516 309 2062Annual licence -- 130 M ==
Overhead 531 265 1859 2655Insurance /a = 50 50
Total annual 1768 911 2938 5617
Annual No. of Trips: 15
Average CostlTrip (FBu '000)
118 61 196 374
/a Third party lnsurnoe: trucks bought with bank loans must be insured forall risks and this comprehensive Insurance is extremely costly In Burundi. Thisinsurance cost only applies to newer vehicles and Is offset by lower vehiclemaintenance costs.
(v) Average Total Trip Costs
Estimated Costs (FBu '000)
FtE TAXES LOCAL TOTALFIE allocation 421 == - 421Other trip costs 455 190 154 800Fixed costs 118 61 196 374
Total 994 251 350 1595
These costs are significantly higher than estimated revenue ofFBu 1.206 million and consequently they have been adjusted toequate with revenue. The FPE allocation has been taken as datumand the adjustment has been made pro-rata to other costs.
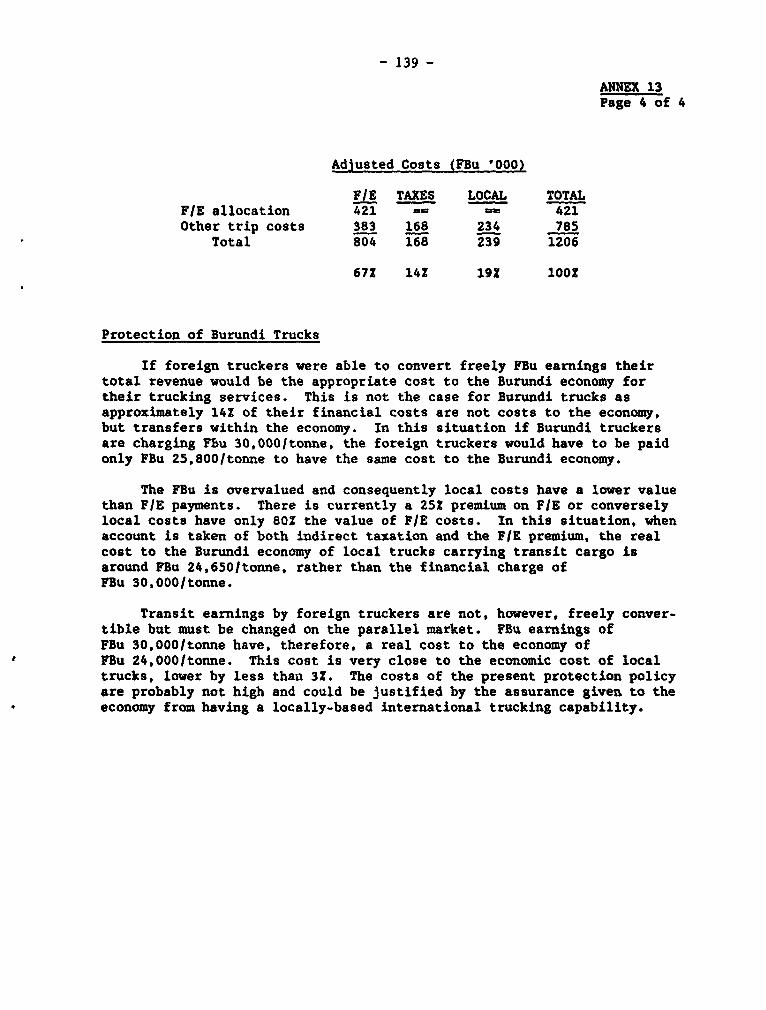
- 139 -
ANNEX 13Page 4 of 4
Adjusted Costs (FBu '000)
F/E TAXES LOCAL TOTALFIE allocation 421 == 421Other trip costs 383 168 234 785
Total 804 168 239 1206
671 142 192 100S
Protection of Burundi Trucks
If foreign truckers were able to convert freely FBu earnings theirtotal revenue would be the appropriate cost to the Burundi economy fortheir trucking services. This is not the case for Burundi trucks asapproximately 141 of their financial costs are not costs to the economy,but transfers within the economy. In this situation if Burundi truckersare charging Flu 30,0001tonne, the foreign truckers would have to be paidonly FBu 25,800/tonne to have the same cost to the Burundi economy.
The FBu is overvalued and consequently local costs have a lower valuethan FIE payments. There is currently a 252 premium on F/E or converselylocal costs have only 80X the value of F/E costs. In this situation, whenaccount is taken of both indirect taxation and the FIE premium, the realcost to the Burundi economy of local trucks carrying transit cargo isaround FBu 24,650/tonne, rather than the financial charge ofFBu 30,000/tonne.
Transit earnings by foreign truckers are not, however, freely conver-tible but must be changed on the parallel market. FBu earnings ofFBu 30,000/tonne have, therefore, a real cost to the economy ofPBu 24,000/tonne. This cost is very close to the economic cost of localtrucks, lower by less than 32. The costs of the present protection policyare probably not high and could be justified by the assurance given to theeconomy from having a locally-based international trucking capability.

- 140 - ANNEX 14
Page I of 12
RRAT LAES CORROR STUDY
TRUASIT TOLLS AND VEHICLE REGLATIONS IN EST AFRICA
A COST RELATED APPROACH
1. Introduction
Truck transport has replaced rail as the primary means of internationalfreight transport mode in East Africa. The unexpected increase ininternational trucking movements was a significant factor in thedeterioration of the main road network during the 1970's and the consequentsubstantial road investment costs. In 1971 rail carried almost 100? ofUgandan international traffic, by 1979 Ugandan was dependent on internationaltrucking. Efforts are underway to increase rail capacity but a major shiftin traffic distribution may take several years.
Transit trucks form a large and very visible proportion of the flow ofmulti-axle vehicles (truck+trailer combinations and semi-trailers) along theNorthern Corridor. Domestic truck traffic, except for bulk liquid transport,in both Kenya and Uganda is normally confined to two or three axle trucks.Transit trucks are perceived as very heavily overloaded and provide a moreconvenient explanation for the destruction of the road network thaninadequate road maintenance and/or excessive axle-loads on all trucks, bothdomestic and transit.
Transit countries have, for many years, charged tolls and required thatforeign trucks have special licenses but there is little evidence that thetolls have been related directly to road costs. The revenue generated hasnot been earmarked for the maintenance of the transit routes and has beensimply another source of general government revenue. Most countries do notattempt to enforce vehicle and axleload regulations and control has provedineffective where it has been tried.
There are now efforts within the PTA to harmonise vehicle and axleloadregulations and simplify transit requirements and tolls. The PTA objectiveof simplification and harmonisation are welcome but some of the specificproposals could create additional problems for transit traffic in the region.An alternative approach which relates tolls to the specific costs imposed bytransit vehicles would be preferable and, as this annex attempts to show,feasible in the region.
2. Recent Developments
A number of agreements have been negotiated to regulate as well asfacilitate transit traffic in the region. The Northern Corridor TransitAgreement (NCTA) attempts to simplify transit procedures for truck trafficand has proved increasingly successful in most countries. The Protocol tothe Agreement does, however establish vehicle regulations for the NorthernCorridor, including an axleload limit of 10 tonnes and a gross vehicle weightof 46 tonnes.

- 141 -ANNEX 14Page 2 of 12
A more general agreement is in the process of being established amongthe member states of the PTA. The intention is to reduce barriers to tradewithin the PTA region by simplifying transit and harmonising regulations andtransit tolls. The system of transit documentation developed for the NCTA,the Road Customs Transit Declaration (RCTD), is being applied elsewhere andthe 10 tonne axleload has been adopted as the regional norm. While theobjective of a harmonised toll has apparently been agreed there is stilldiscussion over the precise level. At a meeting in Nairobi, late 1989, auniform transit toll for the PTA region of $4 per 100 truck-kms wasdiscussed. Other proposals of $20 - $25 per 100 truck-kms have also beenmade. It is not clear, however, whether the underlying basis for the tollis established : maintenance or maintenance plus attributable capital costs.
Transit facilitation and toll harmonisation may, however, be accompaniedby the increased enforcement of vehicle regulations. Aid donors, such as theWorld Bank, have stressed the need to control the widespread overloading ofaxles and have often provided enforcement equipment in the form of fixedweighbridges and mobile weighing scales. Generally, however, the impact ofaxleload restrictions has been minimal :
- informal payments to enforcers- splitting of loads between vehicles before weighing points- use of minor roads to avoid weighbridges- political pressure by the trucking lobby
The situation may be changing and a commitment to controlling overloadsmay have developed in some countries such as Kenya. On the otherhand truckowners show little concern, confident that they can suitably 'arrange, anycontrol initiative.
Uniform transit tolls and enforcement of axle-load restrictions mightseem attractive but there is little evidence that they will be to theadvantage of the landlocked countries nor to the maximum advantage of thetransit country, especially if regulations are not effectively enforced. The
e appropriate uniform toll could be very different depending on whetheraxleload regulations were or were not enforced.
3. Truck Loading Characteristics in East Africa
A recent survey, in Kenya, gives a realistic indication of the presentdistribution of transit truck weights and axleloads on the Northern Corridor.Discussions with operators suggest that load characteristics on routes toDar es Salaam are similar. The average and maximum gross vehicle weight(GVW) and number of equivalent standard axles (ESA) of vehicles carryingimports are shown in Table 1. The overall distributions of axleloads forloaded trucks, by movement direction and cargo type, are given in Table 2.

- 142 -
ANNEX 14Pate 3 of 12
Table 1 Gross Vehicle Weight and Axleloads(Westbound Vehicles)
Axle Average MaximumConfiguration GVW No. GVW No.
(m.t) ESA (m.t) ESATruck Trailer1.1 - 1.1 28.4 7.9 44.3 22.91.1 - 1.2 40.6 11.4 66.9 70.21.2 - 1.1 39.5 10.7 53.2 20.81.2 - 1.2 46.6 11.5 73.8 46.9
Semi - Trailer1.1 - 2 22.9 4.0 44.6 26.21.1 - 3 39.2 10.1 54.3 50.91.2 - 2 40.8 13.7 61.8 60.21.2 - 3 48.3 12.8 76.5 70.3
Note t the axle configuration shows the total number of axles and theirdistribution between truck (tractor) and trailer (semi-trailer). For example1.2 - 1.1 indicates a three axle truck pulling a two axle drawbar trailer,while 1.2 - 3 is a three axle tractor pulling a three axle semi-trailer.
Table 2 Axleload Distribution: Loaded Multi-Axle Commercial Vehicles(Z of axleloads)Axleload (tonnes)
< 6 6 - 8 8 - 10 10 - 12 12 - 14 14 - 16 16 - 18 18+
To West 24.6 22.3 25.7 15.9 8.5 2.6 0.3 *
From West 44.6 22.6 18.2 9.1 4.2 1.2 *
Dry cargo 31.7 22.1 22.6 15.2 6.2 2.0 0.2 *
Tanker 27.1 22.9 25.6 12.4 8.9 2.6 0.4 0.1
It is clear that among the vehicles using the Northern Corridor thereare some vehicle with grossly overloaded axles (the maximum single axleloadis >18 tonnLes), resulting in very significant road damage. While there aremarked differences between vehicle categories there are also very distinctloading patterns within vehicle categories. Differences exist between drycargo and tanker trucks but the most significant feature is within the 3 axletruck category which can be divided into two distinct groups s
- trucks with tandem driving axles- trucks with one driving axle and a trailing axle
The rear axleloads for vehicles with tandem driving axles are broadlybalanced, typically + 1.0 tonne. The rear axleloads of trucks with a singledriving axle are highly imbalanced, if 16 tonnes are distributed between therear -sles the driving axle will typically carry 12.5 tonnes and the trailingaxle 3.5 tonnes. The difference in road damage effect is dramatic, Table 3.

- 143 -ANNEX 14Page 4 of 12
Table 3 Equivalent Standard Axles s Three Axle Trucks
GVW(tonnes) No. ESA
Balanced rear axles 50.0 8.6Imbalanced rear axles 50.0 19.8
Three axle trucks with trailing rear axles are mainly, but notexclusively, older Fiats, Table 4. It has been suggested that the trailingaxles often with single rather than double wheels, were introduced inresponse to World Bank policy initiatives to reduce road damage byencouraging the use of multi-axle vehicles.
Table 4 Rear Axle Weight Distribution : Three Axle Trucks(1 of trucks)
Fiat Other TotalImbalanced 94? 22? 602Balanced 62 78? 40?
The impact of the three axle trucks with imbalanced axles is mitigated,to an extent. as their GVW is generally lower than trucks with balanced rearaxles. A more detailed distribution of the weight characteristics of loadedtrucks is given in Table 5.
Table 5 Gross Vehicle Weights 2 Westbound Loaded Trucks(tonnes)
3 of Vehicles with GWAverage
Dry Cargo GVW <30 30 - 40 40 - 49 50 - 59 60 -69 70+
1.1 - 1.1 33.0 27 55 18 - - -
1.1 - 2 31.2 39 41 20 - _ _1.1 - 3 40.2 7 38 46 9 - _1.1 - 1.2 40.8 4 25 71 - - -
1.2 - 1.2 Imbalanced 40.6 7 50 38 5 - -
1.2 - 1.2 Balanced 53.7 - 7 11 70 11 -1.2 - 3 52.5 6 11 17 51 13 3
Tanker
1.1 - 2 34.8 20 53 27 - - -
1.1 - 3 42.9 - 25 69 6 - -
1.1 - 1.2 43.2 - 21 72 6 1 -
1.2 - 1.2 Imbalanced 44.4 - 10 57 19 11 31.2 - 1.2 Balanced 54.6 4 - 18 39 32 71.2 - 3 54.9 - 4 18 45 31 2

- 144 -
ANNEX 14Page 5 of 12
4. Consequences of Uniform Toll and Axleload Control
(a) Tax Revenue to Coastal Countries
It is clear that a uniform transit toll, applied on a $/km basis torecover road damage costs, will tend to benefit the coastal country. Fuelprices are usually lower than in the LLC and transit trucks purchase fuel atthe cheapest source. In East Africa transit trucks are normally equippedwith additional fuel tanks and sufficient fuel is purchased for the roundtrip.
If the transit toll is set to recover attributable road costs thecoastal country will enjoy a net resource gain equivalent to the tax on thefuel purchased. Assuming that diesel tax is set to recover attributable roadcosts from domestic trucks a coastal country, such as Kenya, could obtaintransit revenue up to three times the attributable road costs of transittrucks :
- the transit toll- the diesel tax on consumption within Kenya, 1920 kms- the diesel tax on consumption for the remaining kms of the
transit trip, 2070 kms for Burundi.
Strictly enforcing the axleload limits will increase the volume of truckmovements required and thus the net transfer to the coastal country. Thissituation may be inevitable and the price the LLC must pay for simplifiedtransit. The provision of duty free fuel for transit vehicles might beequitable but is probably implausible in practice. It is also probable thatfor many LLC the pump price for fuel at the coast is lower than the economiccost of fuel purchased domestically.
(b) Enforcement of Axleload Regulations
Strict enforcement of the 10 tonne axleload limit could have a seriousimpact on the LLC, especially in the short-term. Transport rates willincrease as payloads are restricted and this increase in the costs to theLLC may not be balanced by an equivalent fall in the road costs for thetransit countries. There is little evidence to suggest that a 10 tonneaxleload limit minimizes total road transport costs (movement costs + roadcosts) although the curve relating total costs to axleloads is probablyfairly flat in the region of 10 - 13 tonnes.
More particularly, in the short term, there could be major disruptionin fuel supplies to the LLC. From the evidence of the Kenyan survey it wouldappear that few transit tankers can meet the proposed axleload limits. Forsome countries, such as Burundi, there would still be problems if an axleloadlimit of 13 tonnes was enforced, Table 6.

- 145 -ANNEX 14Page 6 of 12
Table 6 Axleloads: LLC Registered Tankers
Vehicles with Heaviest Axleload
< 10 mt 10 - 13mt >13mt
Burundi 5Z 30S 65ZRwanda 22? 44Z 33ZUganda ex 52Z 40?
All LLC 14? 431 43?
Unlike general cargo trucks the tankers cannot run less than fully ladenas they become unstable. If the 10 tonne axleload limit was enforcedstrictly considerable disruption would result as less than 15Z of the fleetcan meet the limit. Effective enforcement of a 13 tonne limit would stillcreate difficulties, affecting probably 50? of fuel supplies. Enforcementwould result in the need to replace the fuel tanks. In most cases this wouldmean the mounting of new tanks on existing chassis but for some of the newestand largest LLC vehicles the complete replacement of the tanker trailerswould be necessary.
Unless the LLC can negotiate arrangements for an adjustment period, atleast, the economic costs could be very considerable. While certain typesof vehicle should probably be removed from the transit industry, especiallythose with imbalanced rear axles, a transition period with vehicles beingcharged for their actual road damage would be desirable. The problems of theaxleload limit would be compounded if the present 46 tonne GVW limit was alsoenforced as this would have serious implications for the movement ofcontainers, a rapidly expanding sector in the region.
(c) Non-Enforcement of Axleload Regulations
In the light of past experience, non-enforcement of the 10 tonneaxleload restriction is more probable than enforcement. If only one transitcountry enforces the limits vehicles are likely to divert to routes throughcountries without effective limits. Without enforcement of the axleloadlimits the present proposals will
- change the total level of transit vehicle revenue in the transitcountries
- may result in some simplification of the toll structure- reduce the sources for potential disagreement between countries
The proposals are, however, unlikely to improve resource allocation withinthe transit-transport sector.
(i) Without axleload enforcement it is not clear whether therevenue raised from transit trucks will cover attributableroad damage.
(ii) If total road costs are covered it is certain that some truckswill be paying far more than their attributable costs whileothers will cause damage well in excess of the transit tax.

- 146 -
ANNEX 14Page 7 of 12
(iii) The uniform tax will not reduce the incentive to maximizevehicle loads. The same tax will be paid irrespectivt~ ofwhether a truck is carrying 25 tonnes, 35 tonnes or 45 tonnes.A uniform tax will, however, give an incentive to use vehicleswith greater load capacity.
The uniform toll on transit trucks, without axleload enforcement, isunlikely to change fundamentally the present situation and reduce road damageon the transit routes. In these circumstances an alternative approach to theproblem of road damage and transit taxation should perhaps be considered.
5. Transit Vehicles and Taxation : An Alternative Approach
The proposals for a 10 tonne axleload limit and a uniform transit taxare unlikely to improve significantly the transit situation. If the axleloadlimit is enforced there will be short term economic costs and there is noevidence that this limit minimizes total transport costs (vehicle plus roadcosts). If the axleload regulation is not enforced the level of transitrevenue may change but the fundamental problems of overloading and roaddamage are not resolved.
Ideally the transit toll should vary according to the level of roaddamage attributed to individual trucks. The operator can then decide thelevel of payload which will minimize total costs. If the trucker decides ona heavy load then the road damage and the assessed road toll will be high.On the otherhand lightly loaded trucks will only pay low tolls.
For domestic trucking the assessment of individual truck movements isnot practicable and the more conventional approach of road user taxation andefforts at axleload enforcement may be the only, although inefficient,solution. Control of domestic truck loadings may also be rather lessimportant as both the benefits of overloading and the coata of road damageare felt by the domestic economy.
For transit traffic the benefits are received by the LLC vhile the costsare borne by the transit country. Individual assessment of transit truckscould be practical, however, as, by definition, they cross borders and thefrontier crossing points make an ideal toll location.
(a) Road Damage Assessment : Use of frontier weighbridges
Most frontier posts are now installed with weighbridges and these givethe opportunity for strict control and assessment. Each vehicle could beweighed as it crosses the border and transit tolls charged according to theaxleloads. Unfortunately experience with control by fixed weighbridge hasbeen extremely disappointing. Within a very short time, arrangements aremade between truck operators and the weighbridge attendants. Mobileweighbridges may offer a better means of control but would not be suitablefor assessing border fees related to individual trucks.
The assessment of road damage by weighing individual vehicles would bethe ideal solution but in the context of transit-transport in East Africa isunworkable. Fortunately there is a second-best alternative which wouldprovide a close approximation.

- 147 - ANNEX 14
Page 8 of 12
(b) Road Damage Assessment s Use of transit documentation
A second best solution to the. problem of assessing the road damageattributable to individual transit trucks relies on the followingpropositions :
- Road damage is a function of axleloadings- Axleloads are a function of the gross vehicle weight, the number
of axles and the axle configuration- Gross vehicle weight is the sum of the payload and the tare weight
of the vehicle- The tare weight of different vehicle types is known with a
reasonable level of accuracy.
If a sufficiently robust relationship can be estimated between gross vehicleweight and axleloads, road damage can be estimated on vehicle type andvehicle payload.
The truck and its axle configuration can be easily observed at theborder, the main problem is the estimate of the vehicle payload. Thepayload on transit trucks is, however, an essential element of theinformation already recorded on the transit documents used in the region, theRCTD. The special customs arrangements for transit traffic provides both theopportunity for a variable transit tax related to road damage and the abilityto enforce such a system.
The payload is recorded accurately on the RCTD as the transitaire mustdemonstrate to Customs that the goods which have enL'.ered the transit countryhave been exported. The size of a transit consignment is thus recorded byKenya Customs and Port officials when it is landed at Mombasa. A transitbond is raised on the consignment which can only be cancelled when thetransitaire shows that the goods have left Kenya by producing the RCTD issuedat Mombasa and endorsed at the border. Under-declaration of the payload onthe RCTD, to reduce a variable transit toll, would mean that the transitairecould not demonstrate that all the goods had left Kenya. The transitairewould then be responsible for paying all Kenyan import duties and other taxeson the goods not proven to have left Kenya. The customs penalties for thetransitaires would be very much higher than the cost savings on the transittax.
Discussions with many transitaires in the region indicate that the loadsrecorded on the RCTD are accurate. It is theoretically possible that asystem of evasion could be established but it would require participation bymany elements in the chain and the profits, compared with other possiblefrauds would be small. The accuracy of the payloads could and perhaps shouldbe verified by sample weighings before a change in the toll system wasintroduced and periodically as a monitoring control on its effectiveness.
If a reasonably accurate relationship can be established between GVW andequivalent standard axles, for specific axle configurations, the payloadrecorded on the existing transit documentation can be used as the basis fora variable transit tax system, linking the toll to the estimated road damage.The toll could be collected as part of existing customs procedures thusminimizing collection costs and providing a control mechanism for collection.An outline for such a tax, based on Kenyan data, is given in the finalsection of this annex.

- 148 -ANNEX 14Page 9 of 12
6. A Variable Transit Tax for the Northern Corridor
The data provided by the recent axleload survey at Gilgil were used toestimate the relationship between GVW and Equivalent Standard Axles (ESA).The estimated relationships are not perfect but, in general, provide areasonable approximation, Table 5.
Table 5 Goodness of Fit . Relationship GVW and ESA(R2)
Vehicle TypeAxle Configuration General Cargo TankerTruck + Trailer1.1 - 1.1 0.88 N.A1.1 - 1.2 0.95 0.921.2 - 1.2 Balanced 0.92 0.941.2 - 1.2 Imbalanced 0.88 0.66
Semi - Trailer1.1 - 2 0.96 0.861.1 - 3 0.90 0.911.2 - 2 0.92 0.991.2 - 3 0.94 0.94
The only vehicle category with a poorly fitting relationship between GVWand ESA is the 3 axle truck with only one driving axle. Given the damagecaused by this type of vehicle it might be appropriate to charge a transittoll toward the upper end of the confidence limits for the relationship.Fortunately these vehicles are now becoming very old and are being replacedby more acceptable vehicles. Higher transit tolls would accelerate thereplacement process.
Based on the relationships between the GVW and ESA and the tare weightof vehicle types, estimates of relative road damage by vehicle type andpayload for general cargo trucks were developed, Table 6. The tare weightof trucks were estimated on the basis of the weights of unladen vehicles inthe Kenyan survey and thus take some allowance for the fuel carried.

- 149 - ANNEX 14
Page 10 of 12
Table 6 Road Damage and General Cargo Payloads(No. ESA per vehicle)
Vehicle Payload (tonnes)VehicleCategory 15.0 21.0 27.0 30.0 33.0 36.0 39.0 42.0 45.0 48.0
1.1 - 2 3.3 8.1 16.8 23.4 31.8 42.4 * * * *1.1 - 1.1 3.4 8.7 18.8 26.6 36.8 49.8 * * * *
1.1 - 3 2.9 6.0 11.0 14.5 18.8 23.9 30.0 37.3 45.8 *1.2 - 2 2.6 5.9 11.9 16.3 21.9 29.0 37.7 48.4 61.3 *1.1 - 1.2 2.5 5.4 10.4 13.9 18.2 23.6 30.0 37.6 46.7 *1.2 - 1.2(I) 2.2 4.9 9.9 13.6 18.3 24.1 31.4 40.3 51.0 *
1.2- 3 1.7 3.5 6.4 9.1 10.8 13.7 17.3 21.5 26.4 32.21.2 - 1.2(B) 1.6 3.2 5.5 7.1 9.0 11.2 13.9 17.0 20.5 24.6
(I) - imbalanced rear axles (3) - balanced rear axlesTable 6 shows that if a two axle truck with a two axle trailer has a
payload of 33.0 tonnes its damage effect will be equivalent to almost 37standard axles. A six axle semi-trailer with the same payload will onlygenerate 9 standard axles. In terms of the damage - payload relationship thevehicle categories can be broadly considered in three groups:
- 4 axle vehicles and combinations- 5 axle vehicles and combinations- 6 axle vehicles and combinations
Unfortunately the 3 axle Fiat truck has the characteristics of the 5 axlerather than the 6 axle combination and thus any classification would have toinclude both total and driving axles.
The information contained in Table 6 can be converted to an appropriatetoll by applying an ESA related road damage cost. The main Report indicatedthat a definitive study of road damage costs is still required in the regionand should be undertaken as the basis for whatever system of toll is finallyagreed. To illustrate the approach to transit tolls proposed in this annexthe damage cost from a previous UNCTAD study, quoted in the main report, hasbeen used :
Damage per vehicle-km a $ (0.015 + 0.0105 * ESA)
Using this damage cost relationship the appropriate transit toll forpetrol tankers travelling between Nairobi and Busia has been calculated asan example of the size of transit tax which would be necessary, Table 7.Similar tables could be calculated for diesel and black oil tanker movementsas well as for general cargo/container movements. In view of the relativelysmall differences between the categories of 4,5 and 6 axle vehicles arealistic transit tax might simply consist of four cargo categories and threevehicle types.

- 150 -ANNEX 14Page 11 of 12
Table 7 Transit Toll for Petrol Tankers s Nairobi - Busia(K sh per round trip - 924 kms)
Fuel Carried (litres)VehicleCategory 20 000 30 000 40 000 45 000 50 000 55 000 60 000
1.1 - 2 765 1 646 3 490 4 918
1.1 - 1.2 563 1 030 1 972 2 696 3 6691.1 - 3 511 961 1 971 2 799 3 962 5 4831.2 - 2 575 1 055 2 028 2 781 3 804 5 0951.2 - 1.2(I) 559 932 1 609 2 095 2 724 3 483
1.2 - 1.2(B) 511 746 1 127 1 384 1 701 2 069 2 5151.2 - 3 445 679 1 137 1 482 1 944 2 519 3 262
Even if the variable transit toll is not considered a long term solutionto transit taxes and vehicle overloading the above approach could be veryuseful an adjustment period for tanker traffic. Tanker traffic is ideallysuited to the proposed approach : the size of the tank is known and transittankers are driven fully loaded or empty. The toll can be applied withoutthe RCTD.
In terms of the type of road toll suggested by the PTA, expressed in $per 100 kms, the proposed approach would give the tolls shown in Table 8.if the road damage cost used to illustrate the approach is in the right orderof magnitude the proposed uniform toll of $4 per 100 kms is clearlyinadequate.
Table 8 Road Damage Toll for General Cargo PayloadsC$ per 100 vehicle-kms)
Vehicle Payload (tonnes)VehicleCategory 15.0 21.0 27.0 30.0 33.0 36.0 39.0 42.0 45.0 48.0
1.1 - 2 5.0 10.1 19.2 26.1 34.9 46.0 * * * *1.1 - 1.1 5.1 10.6 21.3 29.5 40.1 53.8 * * * *
1.1 - 3 4.6 7.8 13.1 16.7 21.2 26.6 33.0 40.7 49.6 *1.2 - 2 4.2 7.7 14.0 18.6 24.5 31.9 41.1 52.3 65.9 *1.1 - 1.2 4.2 7.2 12.4 16.1 20.6 26.2 32.9 41.0 50.6 *1.2 - 1.2(I) 3.8 6.7 11.9 15.8 20.7 26.8 34.5 43.8 55.1 *
1.2 - 3 3.3 5.2 8.2 11.1 12.8 15.9 19.7 24.1 29.3 35.31.2 - 1.2(B) 3.2 4.8 7.3 9.0 10.9 13.3 16.1 19.3 23.0 27.3

- 151 - ANNEX 14
Page 12 of 12
If individual tolls were to be established on the basis of most likelyvehicle payloads the following would apply
Typical Payload Range Toll RangeFour axle vehicles 18 - 21 tonnes $ 7 - $ 10 per lOOkmsFive axle vehicles 24 - 27 a $ 10 - $ 13 a nSix axle truck-trailer 3t - 36 n $ 11 - $ 13 - aSix axle semi-trailer 33 - 36 " $ 13 - $ 16 n
The tolls for the typical payloads are in general 2 - 4 times the levelproposed by the PTA. The introduction of such average tolls would not,however, help substantially to reduce the level of road damage, nor generatethe funds necessary to make good the damage, given the experimentalrelationship between axle bond and road damage, unless vehicles were r....to typical payloads.
.

W~~~~~~~~~~~~' fg °; 1r* 40
( / g U G A N DWAelbo w..e GREAT LAKES REGIONKAMP1 Beir Ildorat INTERNATIONAL SURFACE TRANSPORT
Ko555e, Onomo mboro ~~~~~~~~~CONNECTIONS. 1991
0- K,sumu mboto ~~~~~~~~~~~~~~~~~~~~~~~~~~~~~~~~~~~~~~~~~~~Paved roods
v Nakum Wisoved~~~~~~~~~ roadsbarara
Ra~~~~~~~~~~~-.--iloways
.f0.2 t Bushengamo t / ffi z | 2Ksl K \ E N Y A Lak*.toke navigation
<* \ , A I y Z a ke. 1 2 / P @~~~~~~~~~~~~~~~~~~~~~~~~~~~~~~~ Noiionol capitoh.
C r o ldloeslo 0 ~~~~~~~~~~~~~~~~~~~~Cities or towns~ AROshur sh_e> Ka I/ C-Lt i r Li * Internotionol boundories
< Got t / I(Ne.rnond'o jr MosO NAIRO[
G. t JMoottkos
SERENGETI RHUN,DAAu~~~ (t} tLutcmbar~~~~~~~~~~~~~~s j iNyn br / '
BUk. ~ ~ ~ ~ ~ ~ ~ ~ ~ ~ ~ ~ ~ ~ ~ v
b.~~~~~~~~~~~~~~~~n p-ssreb 5 .w8oe.aa4f,c ,,ro
? \ X Yi t X Ls~~~Wa uko | <
f Y g X = Ytant I f J~~~tarbar
s taX is tanGaRr0Xta h (d ) wANnBJLR~yQr'a
La
*,NTEAL 'o 1 1 ZA A AA fl *t A vT Z A Na
4 755 0eANZ 7BAI
Z~~~~~~~~~~4.4 A.f If 15 E, ,5R5I)A Of# /__~,SAO%WKIBEES005*5 200 3Po0p00s 00*p55,
AO.,A A\S CV C. S -
I___________________ J\N '
MZp.#l} ~ _W Wb°ifnwt~__>_La ZBW tA3 S O3ER 198